Dell Latitude 7230 Rugged Extreme Tablet im Test: Eines der besten Displays seiner Klasse

Das Latitude 7230 Rugged Extreme wurde im Oktober letzten Jahres als Nachfolger des Latitude 7220 Rugged Extreme präsentiert. Das neue Modell bietet ein aktualisiertes Gehäuse mit einem größeren Display (nun 12 Zoll ca. 30 cm statt 11,6 Zoll), schnellere Intel CPU-Optionen und schnellere Verbindungsmöglichkeiten (Wi-Fi 6 bis 6E, 5G).
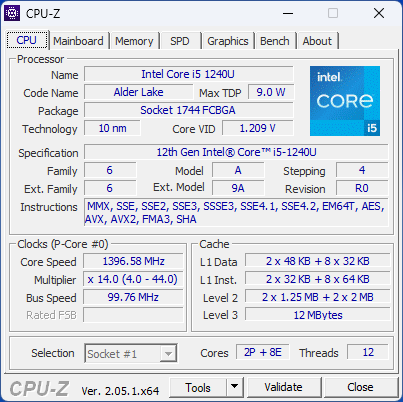
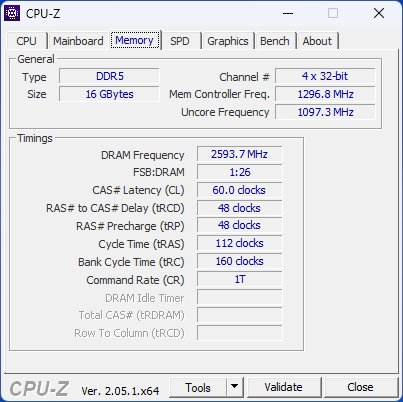
Bei unserem Testgerät handelt es sich um eine Mittelklassevariante mit Core i5-1240U, 16 GB RAM und 512 GB NVMe SSD für ca. 3.200 US-Dollar. Weitere Modellvarianten sind mit dem langsameren Core i3-1210U, dem schnelleren i7-1260U, mehr RAM oder Speicher und anderen Erweiterungen erhältlich. Alle Konfigurationen verfügen über den gleichen IPS-Touchscreen mit 1.920 x 1.200 Pixel Auflösung und 1.200 cd Helligkeit. Dell stellt hier das vollständige Datenblatt des Latitude 7230 Rugged Extreme zur Verfügung.
Alternativen sind das Acer Enduro T1, die Samsung Galaxy Tab Active Serie oder die Panasonic Toughbook FZ-G2 Serie.
Weitere Testberichte zu Geräten von Dell:
Mögliche Konkurrenten im Vergleich
Bew. | Datum | Modell | Gewicht | Dicke | Größe | Auflösung | Preis ab |
|---|---|---|---|---|---|---|---|
| 83.9 % v7 (old) | 04 / 2023 | Dell Latitude 7230 Rugged Extreme i5-1240U, Iris Xe G7 80EUs | 1.6 kg | 23.9 mm | 12.00" | 1920x1200 | |
v (old) | 05 / 2022 | Dell Latitude 7330 Rugged Extreme i7-1185G7, Iris Xe G7 96EUs | 2.7 kg | 36.5 mm | 13.30" | 1920x1080 | |
v (old) | 07 / 2022 | Panasonic Toughbook 40 i7-1185G7, Iris Xe G7 96EUs | 3.9 kg | 53.4 mm | 14.00" | 1920x1080 | |
| 83.8 % v7 (old) | 01 / 2022 | Getac B360 i7-10710U, UHD Graphics 620 | 2.4 kg | 34.9 mm | 13.30" | 1920x1080 | |
| 82.4 % v7 (old) | 12 / 2021 | Acer Enduro Urban N3 EUN314 i7-1165G7, Iris Xe G7 96EUs | 1.8 kg | 21.95 mm | 14.00" | 1920x1080 | |
v (old) | 09 / 2021 | Durabook S14I i7-1165G7, Iris Xe G7 96EUs | 3 kg | 38.1 mm | 14.00" | 1920x1080 |
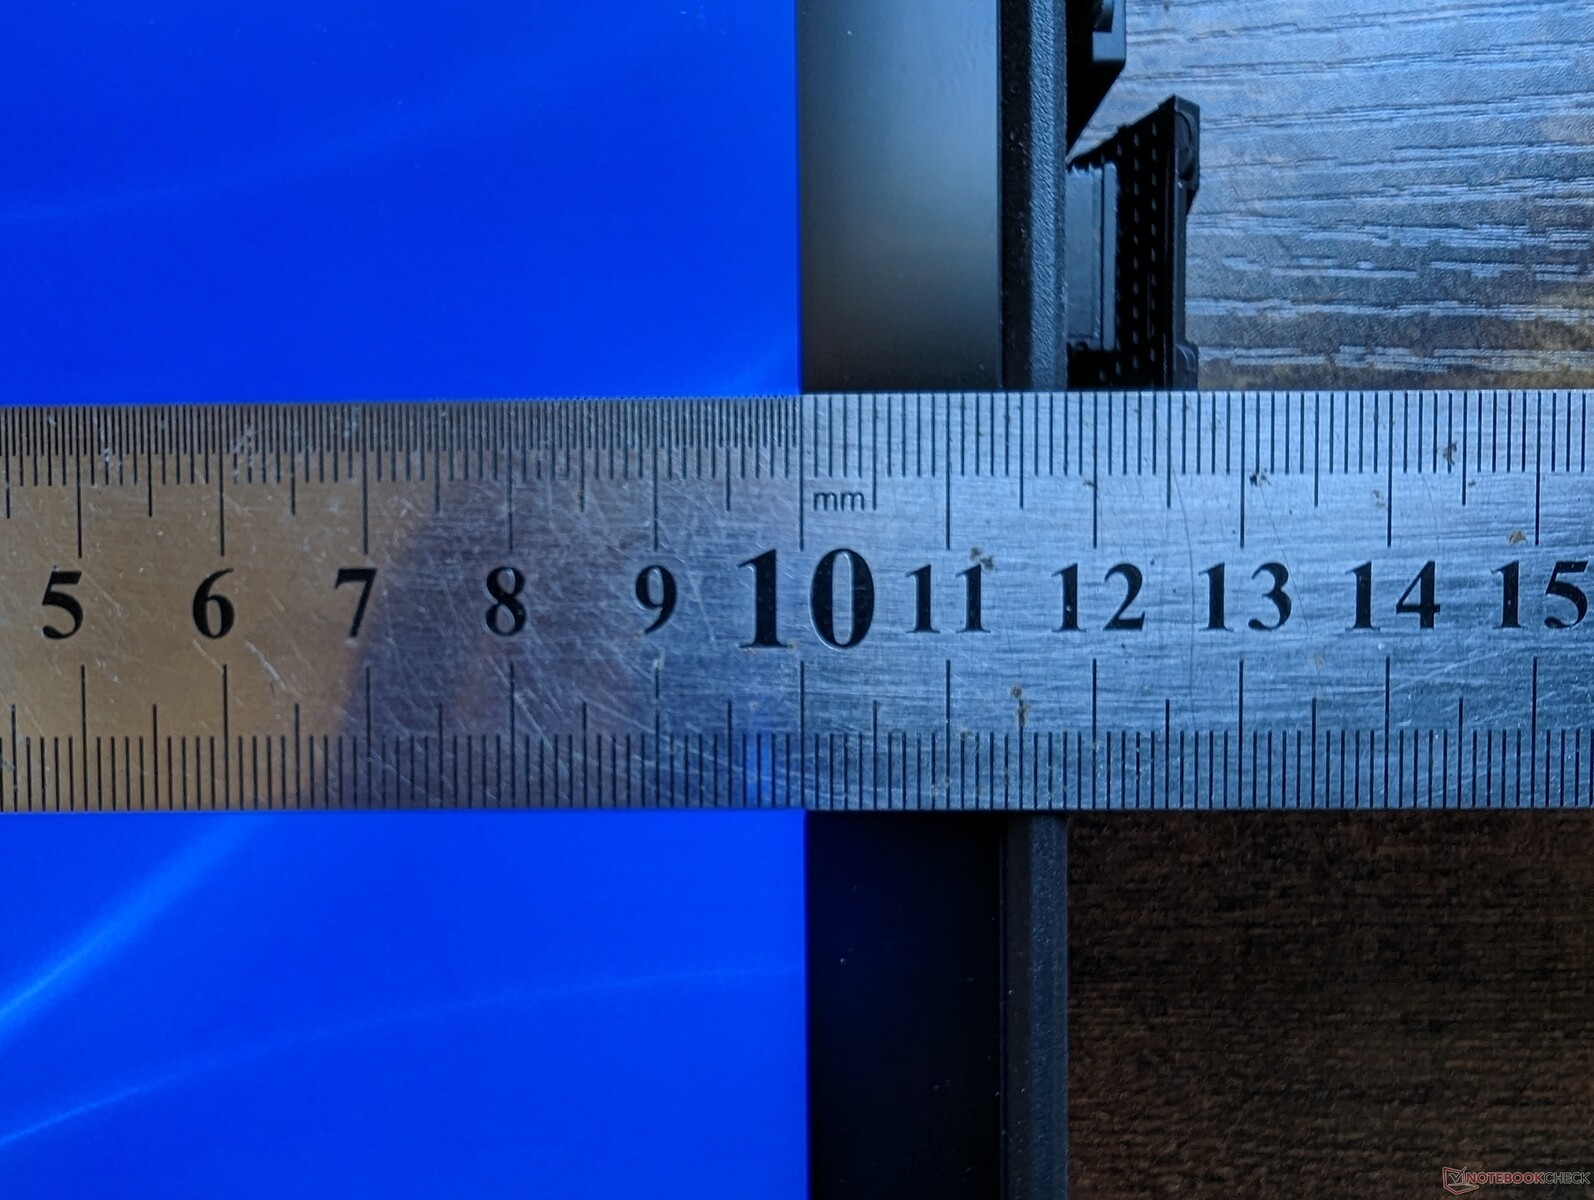
Gehäuse - Dick mit relativ schmalen Displayrändern
Die Stabilität des Gehäuses ist in jeder Hinsicht gegeben, vor allem die gummierten Kanten und Ecken erlauben einen recht groben Umgang mit dem Dell-Tablet. Der schwächste Punkt ist direkt in der Mitte des Touchscreens zu finden, wo sich das Gerät bei festem Druck mit dem Finger leicht eindrücken lässt. Auch wenn dies kein großes Problem ist, ist die Verformung des Touchscreens dennoch eine Erwähnung wert.
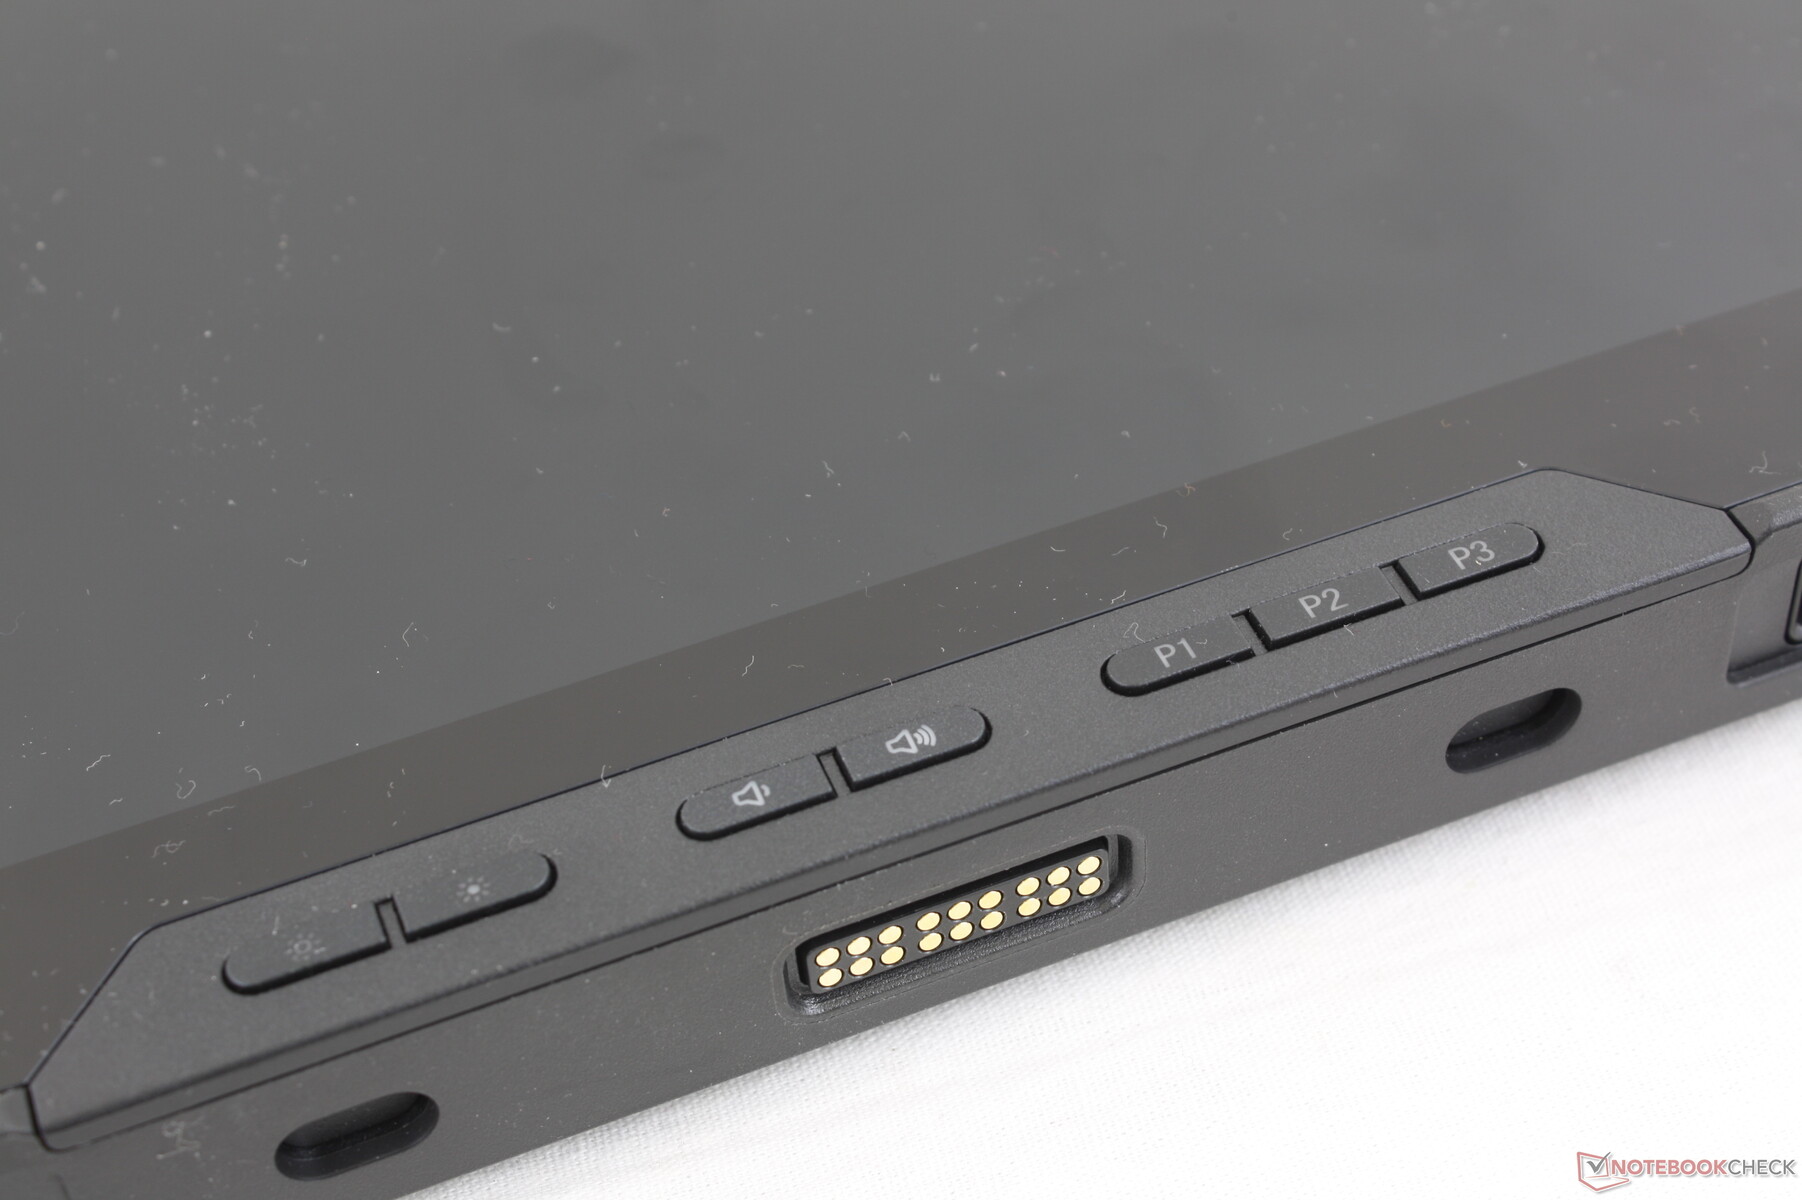
Zu den störenden Aspekten des Gehäuses gehören die fummeligen Anschlussabdeckungen und die schwammigen Tasten auf der Vorderseite. Die Anschlussabdeckungen sind schwer zu greifen und die Tasten reagieren erst auf starken Druck. Das konkurrierende Toughbook FZ-G2 ist in dieser Hinsicht etwas besser.
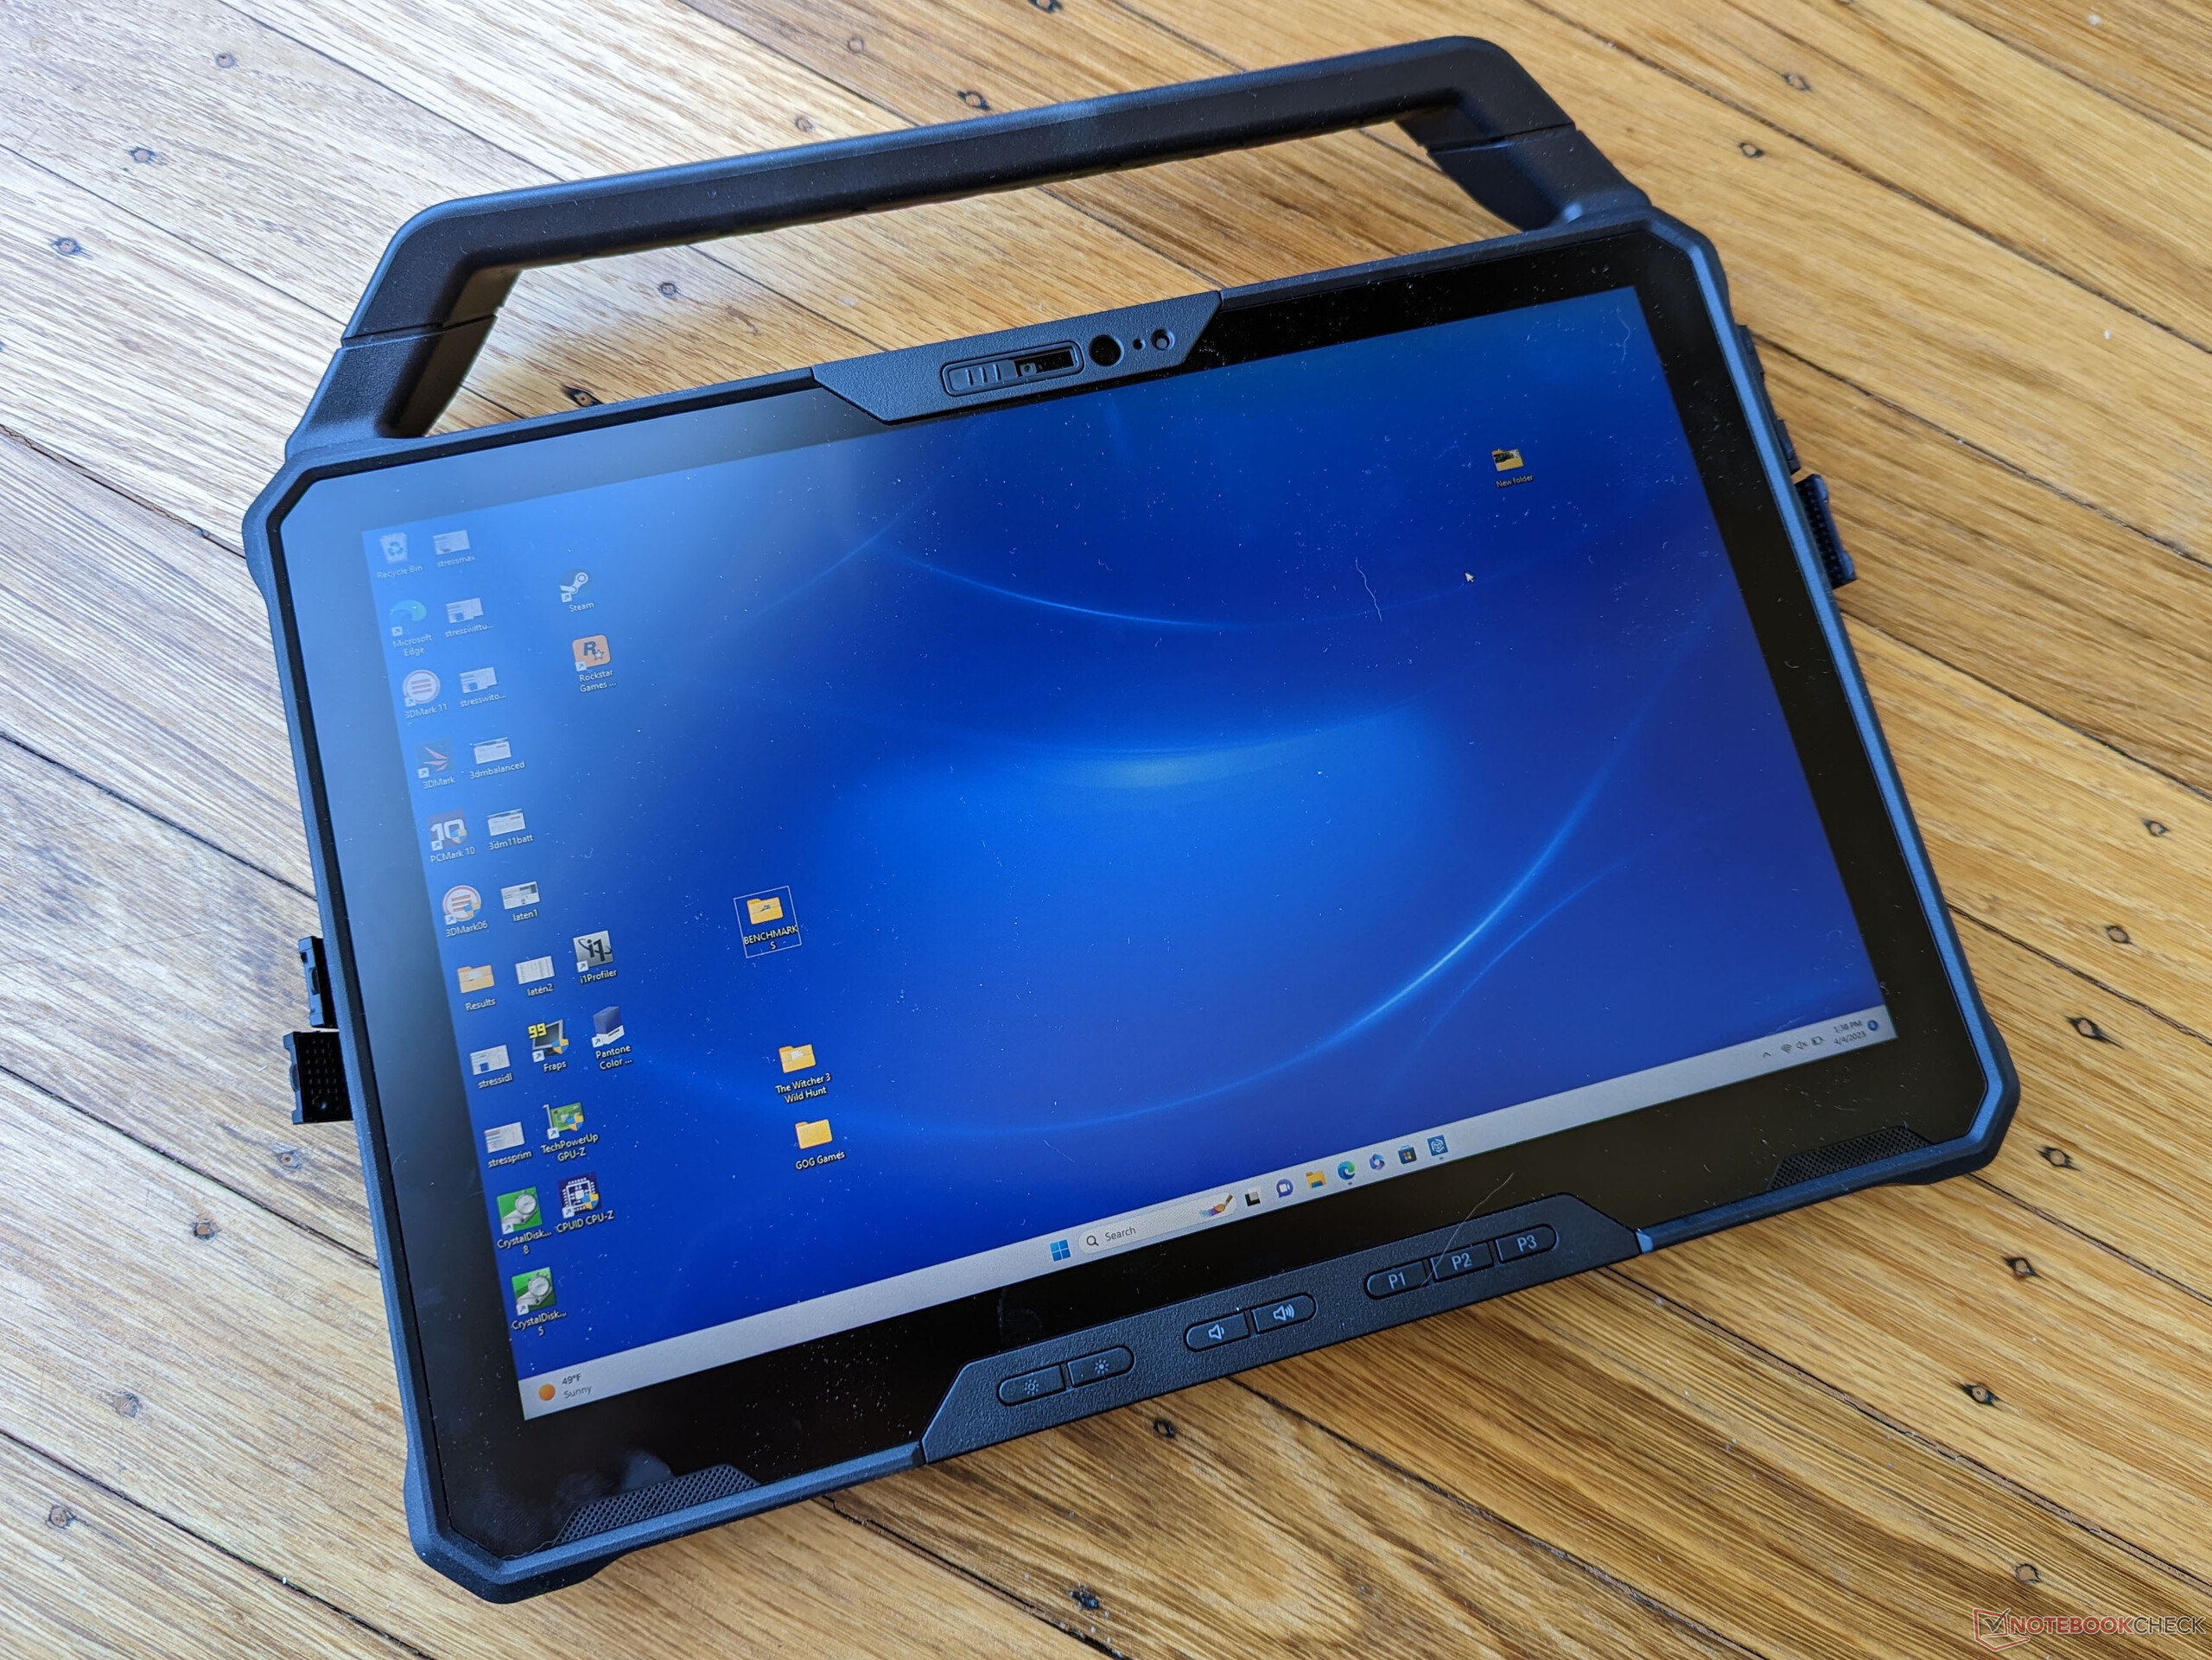
Mit einem Gewicht von 1,6 kg inklusive der beiden austauschbaren Akkus gehört das Gerät zu den leichteren robusten Tablets seiner Klasse. Länge und Breite entsprechen in etwa einem DIN-A4-Blatt, wenn man vom abnehmbaren Tragegriff absieht.
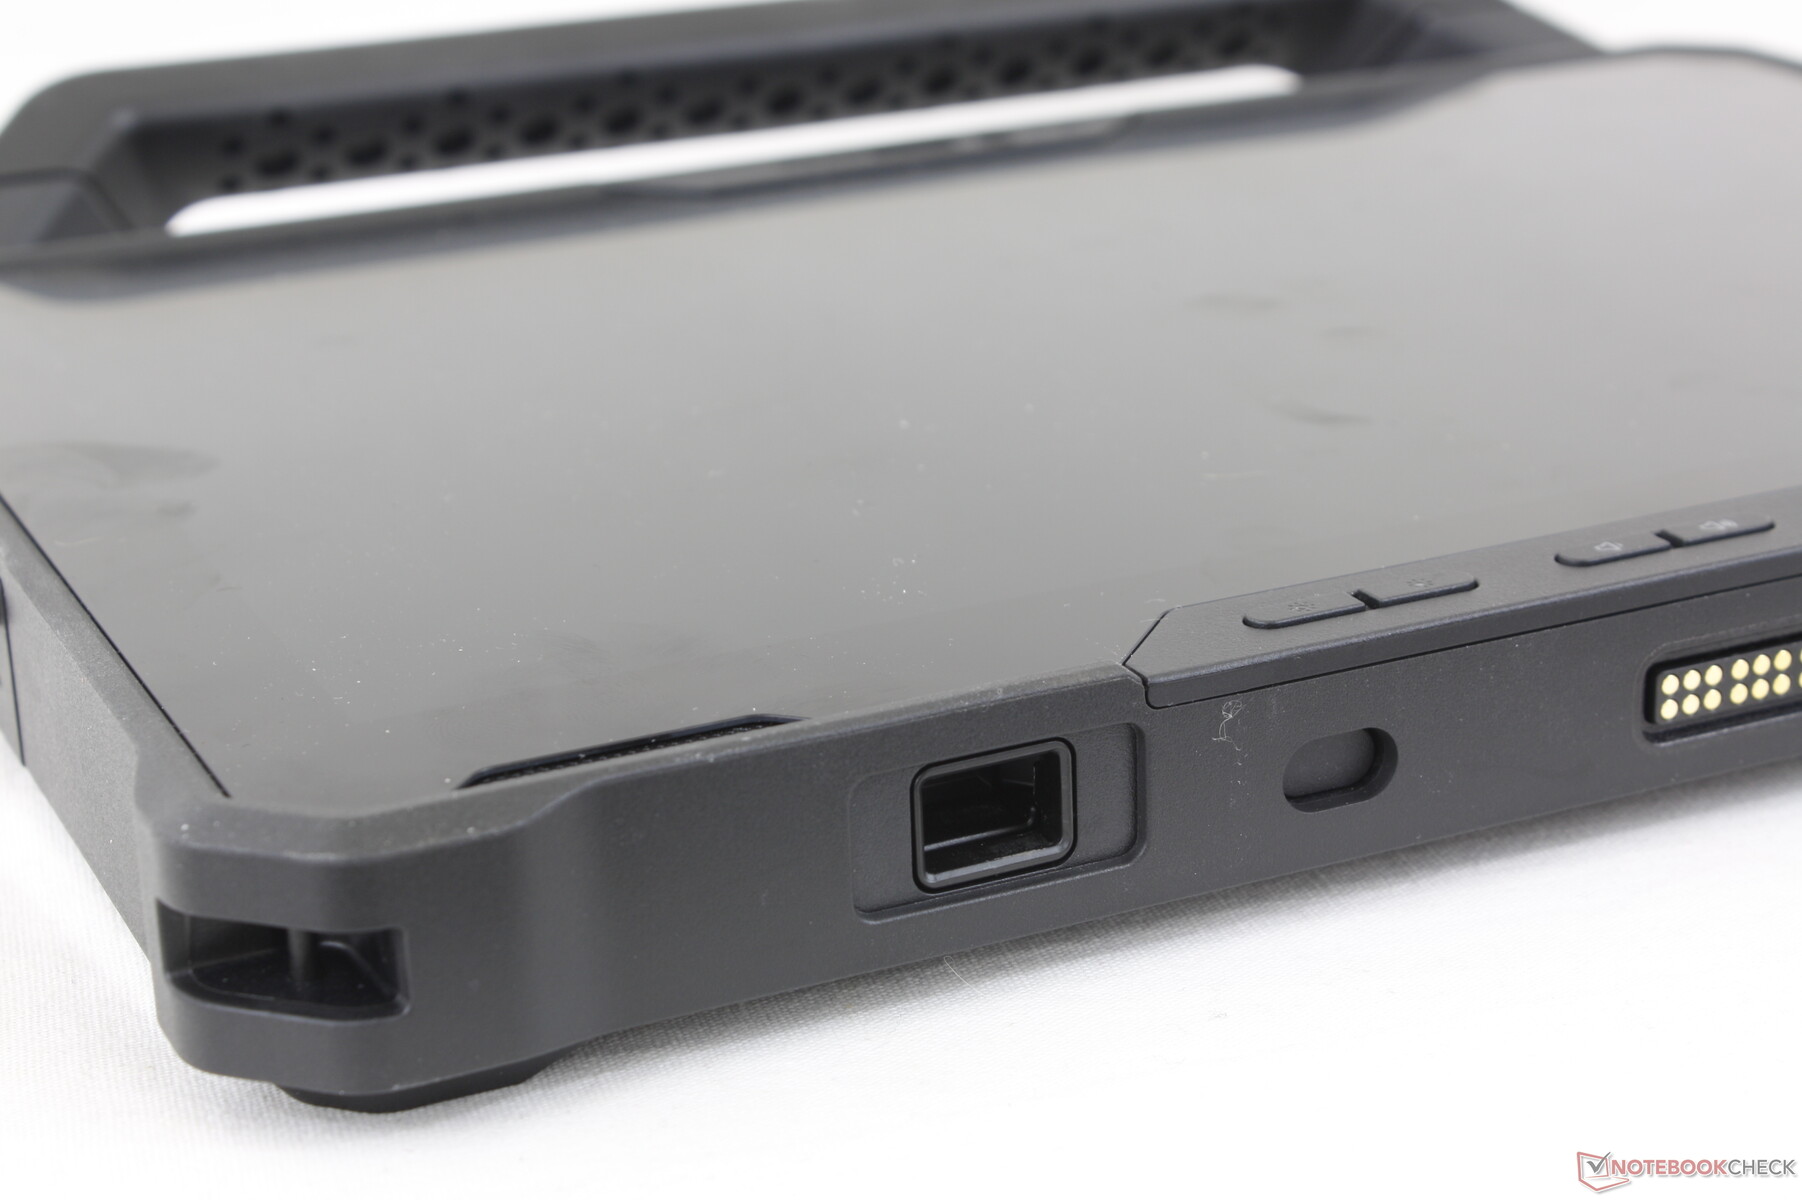
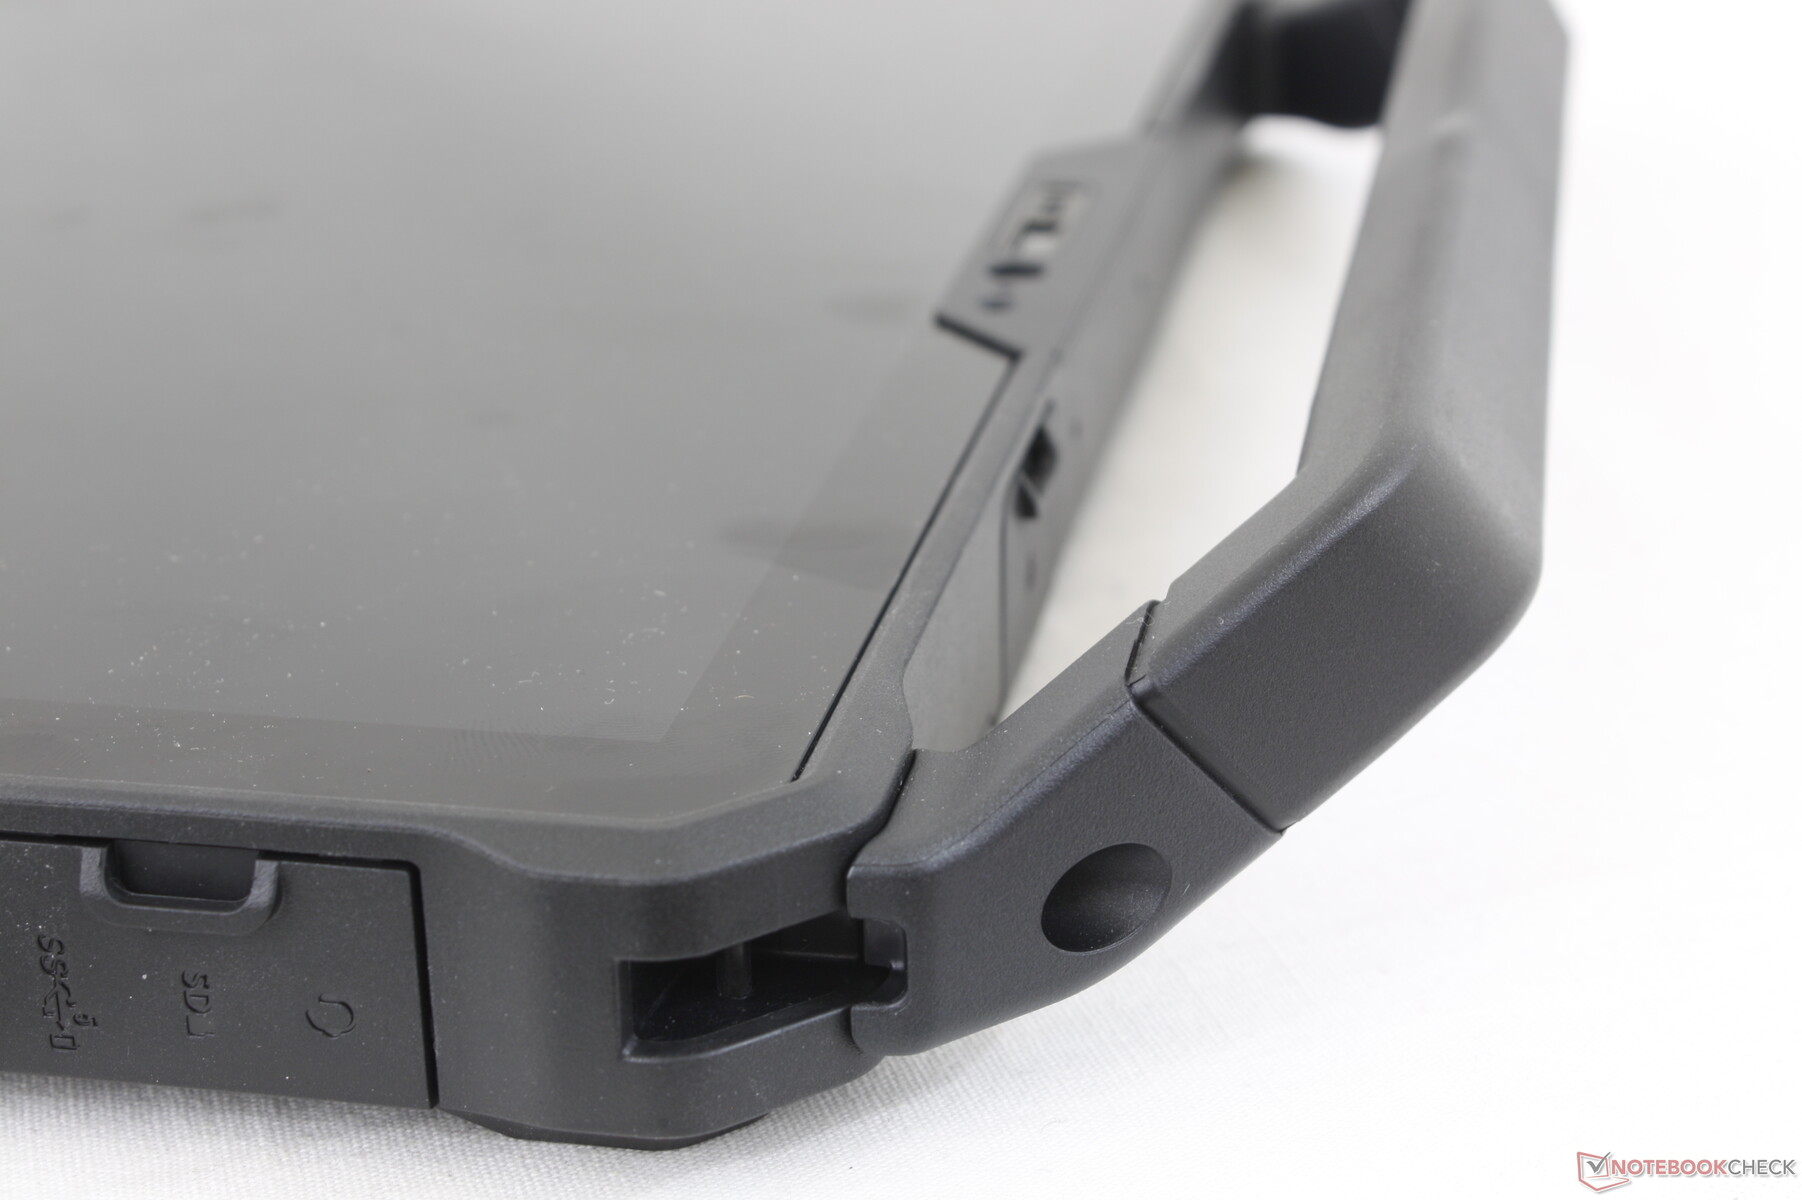


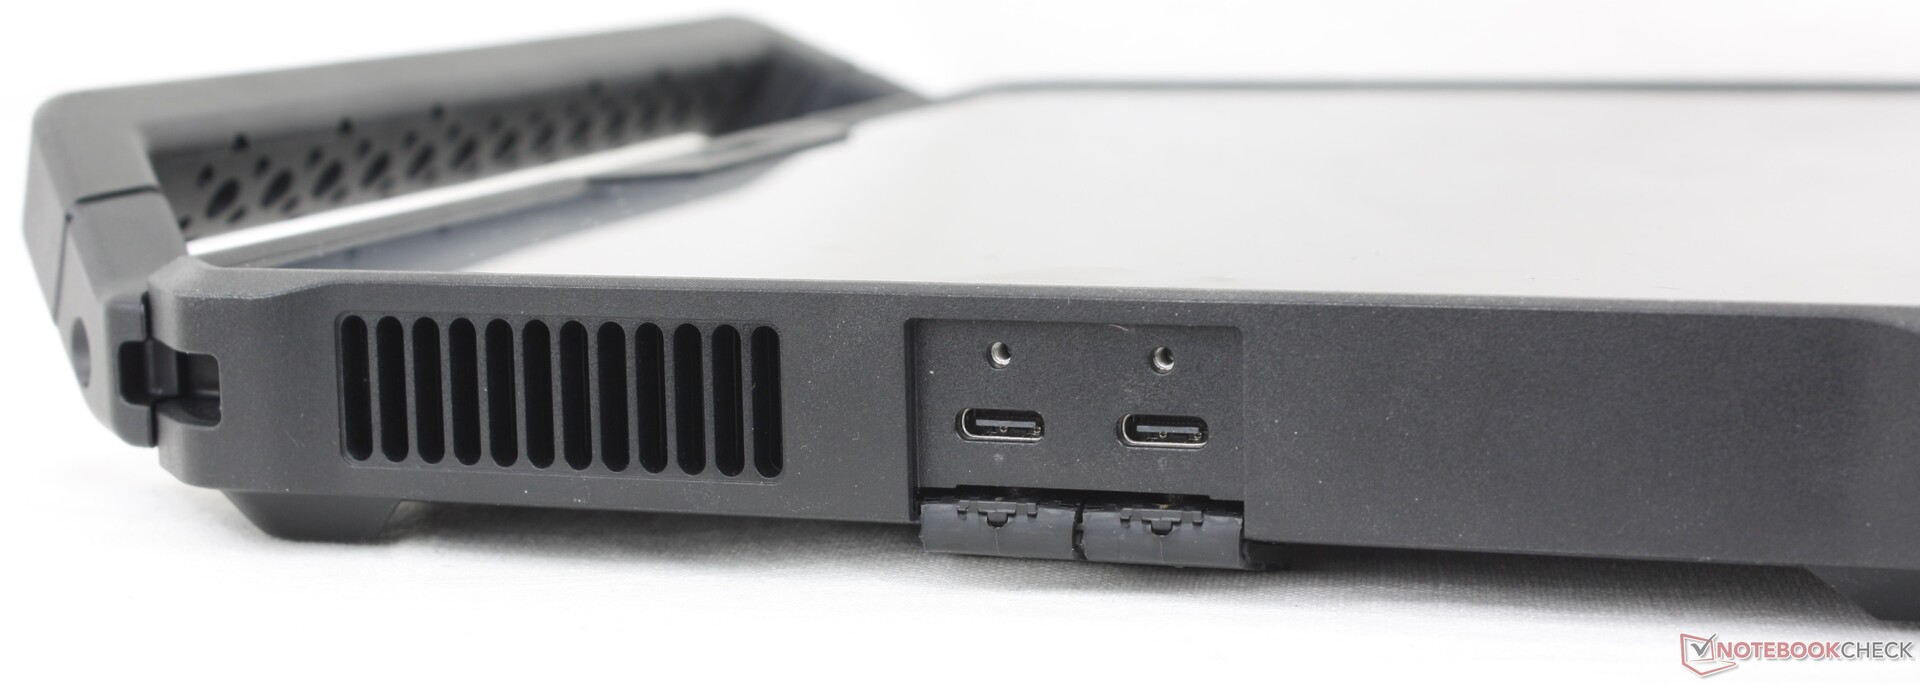
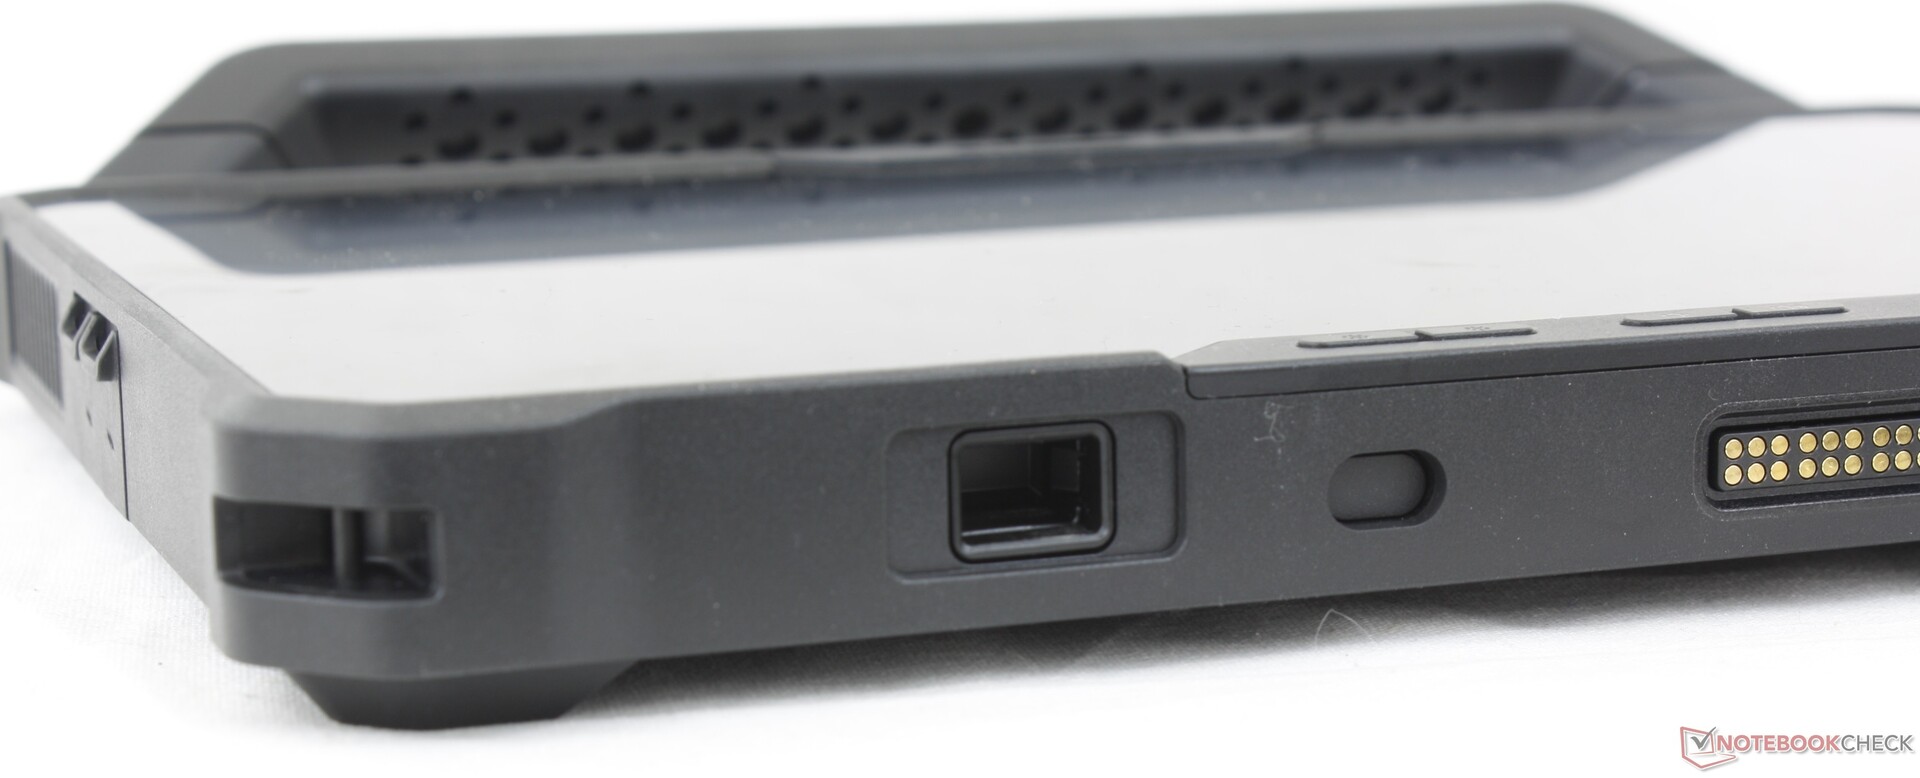
Ausstattung — 2 mal Thunderbolt 4
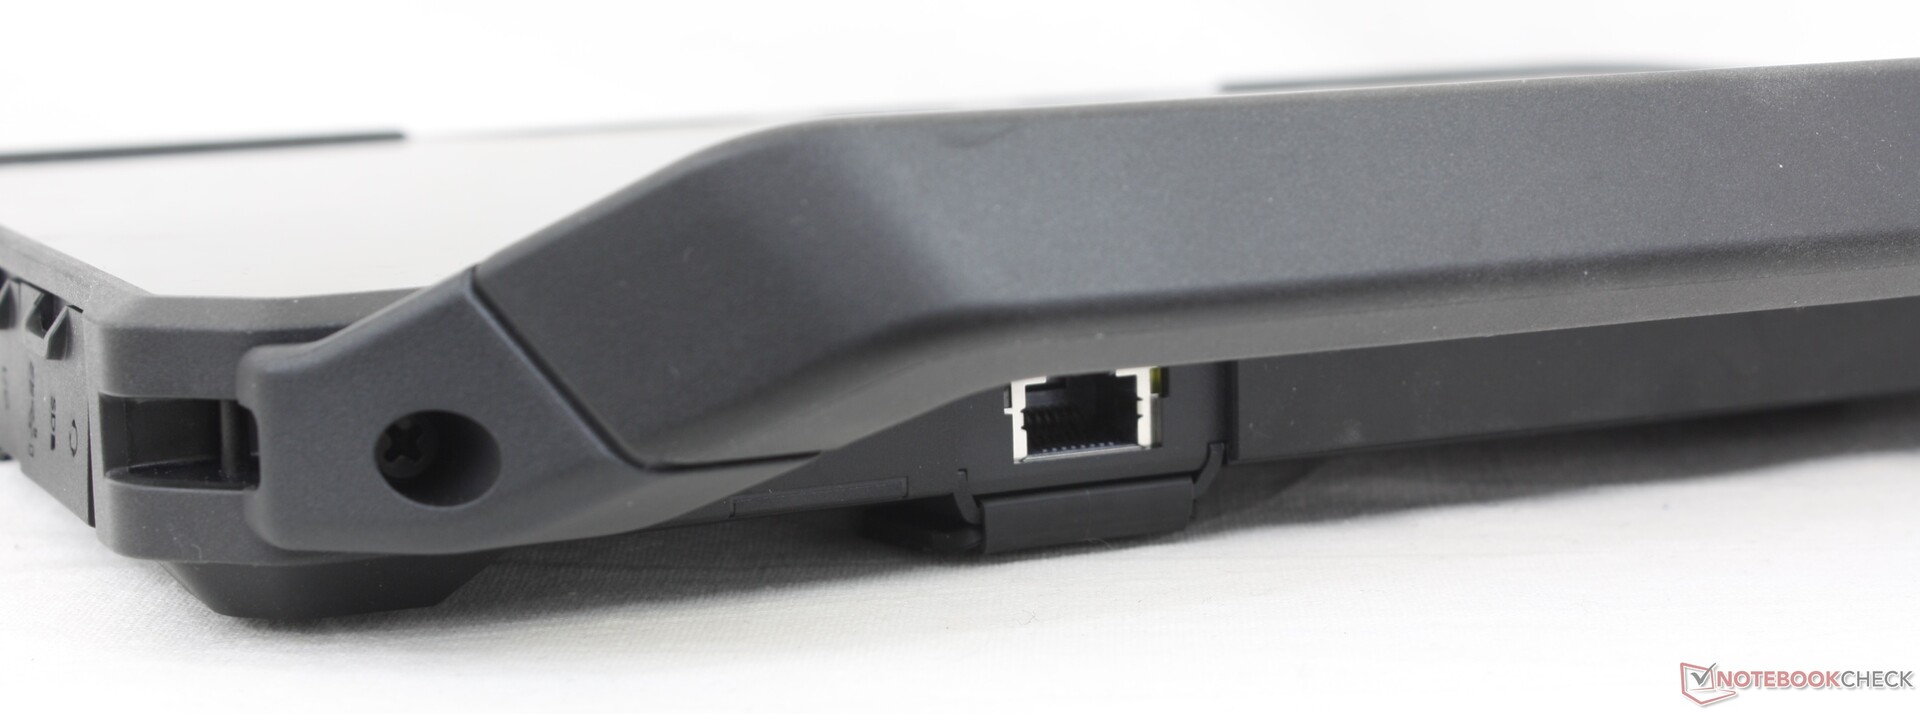
Das Dell Latitude 7230 Rugged Extreme bietet eine große Auswahl an Anschlüssen. Besonders hervorzuheben sind die beiden Thunderbolt 4-Anschlüsse, die die gleichen Docking-Möglichkeiten und Unterstützung für externe Monitore bieten wie moderne Consumer-Ultrabooks. Allerdings ist einer der USB-C-Anschlüsse während des Ladevorgangs gesperrt, wenn man nicht auf die Option des extern aufladbaren Akkus zurückgreift.
Die meisten anderen Anschlüsse sind optional und können beim Kauf konfiguriert werden, darunter HDMI 2.0, USB-A, RJ-45, RS-232 oder ein Barcode-Scanner.

SD-Kartenleser
| SD Card Reader | |
| average JPG Copy Test (av. of 3 runs) | |
| Dell Latitude 7330 Rugged Extreme (AV Pro V60) | |
| Dell Latitude 7230 Rugged Extreme (AV Pro V60) | |
| Panasonic Toughbook 40 (AV Pro V60) | |
| Acer Enduro Urban N3 EUN314 (AV Pro V60) | |
| Durabook S14I (Angelbird 128GB AV Pro UHS-II) | |
| maximum AS SSD Seq Read Test (1GB) | |
| Dell Latitude 7330 Rugged Extreme (AV Pro V60) | |
| Dell Latitude 7230 Rugged Extreme (AV Pro V60) | |
| Panasonic Toughbook 40 (AV Pro V60) | |
| Durabook S14I (Angelbird 128GB AV Pro UHS-II) | |
| Acer Enduro Urban N3 EUN314 (AV Pro V60) | |
Kommunikation
Das Intel AX211 WLAN-Modul arbeitet stabil mit unserem Asus AXE11000 Testrouter zusammen. Die erreichten Übertragungsgeschwindigkeiten sind in Ordnung.
Man kann das Dell Latitude 7230 auch ohne vorinstalliertes WLAN bestellen, um einen Air-Gapped-PC zu erhalten. Dies sollte mit Bedacht geschehen, da das Nachrüsten eines WLAN-Moduls mit erheblichem Aufwand verbunden ist.
| Networking | |
| iperf3 transmit AX12 | |
| Acer Enduro Urban N3 EUN314 | |
| Durabook S14I | |
| Dell Latitude 7330 Rugged Extreme | |
| Getac B360 | |
| iperf3 receive AX12 | |
| Durabook S14I | |
| Acer Enduro Urban N3 EUN314 | |
| Getac B360 | |
| Dell Latitude 7330 Rugged Extreme | |
| iperf3 transmit AXE11000 | |
| Panasonic Toughbook 40 | |
| Dell Latitude 7230 Rugged Extreme | |
| iperf3 receive AXE11000 | |
| Panasonic Toughbook 40 | |
| Dell Latitude 7230 Rugged Extreme | |
| iperf3 transmit AXE11000 6GHz | |
| Dell Latitude 7230 Rugged Extreme | |
| iperf3 receive AXE11000 6GHz | |
| Dell Latitude 7230 Rugged Extreme | |
Webcam
Das Dell Latitude 7230 verfügt über eine Front- und eine Rückkamera. Beide verfügen über einen mechanischen Privacy Shutter. Die Rückkamera hat eine Auflösung von 11 MP und einen LED-Blitz. Die Frontkamera hat eine Auflösung von 5 MP und ist Windows Hello fähig. Damit bietet sie eine deutlich höhere Auflösung als die meisten Endgeräte.


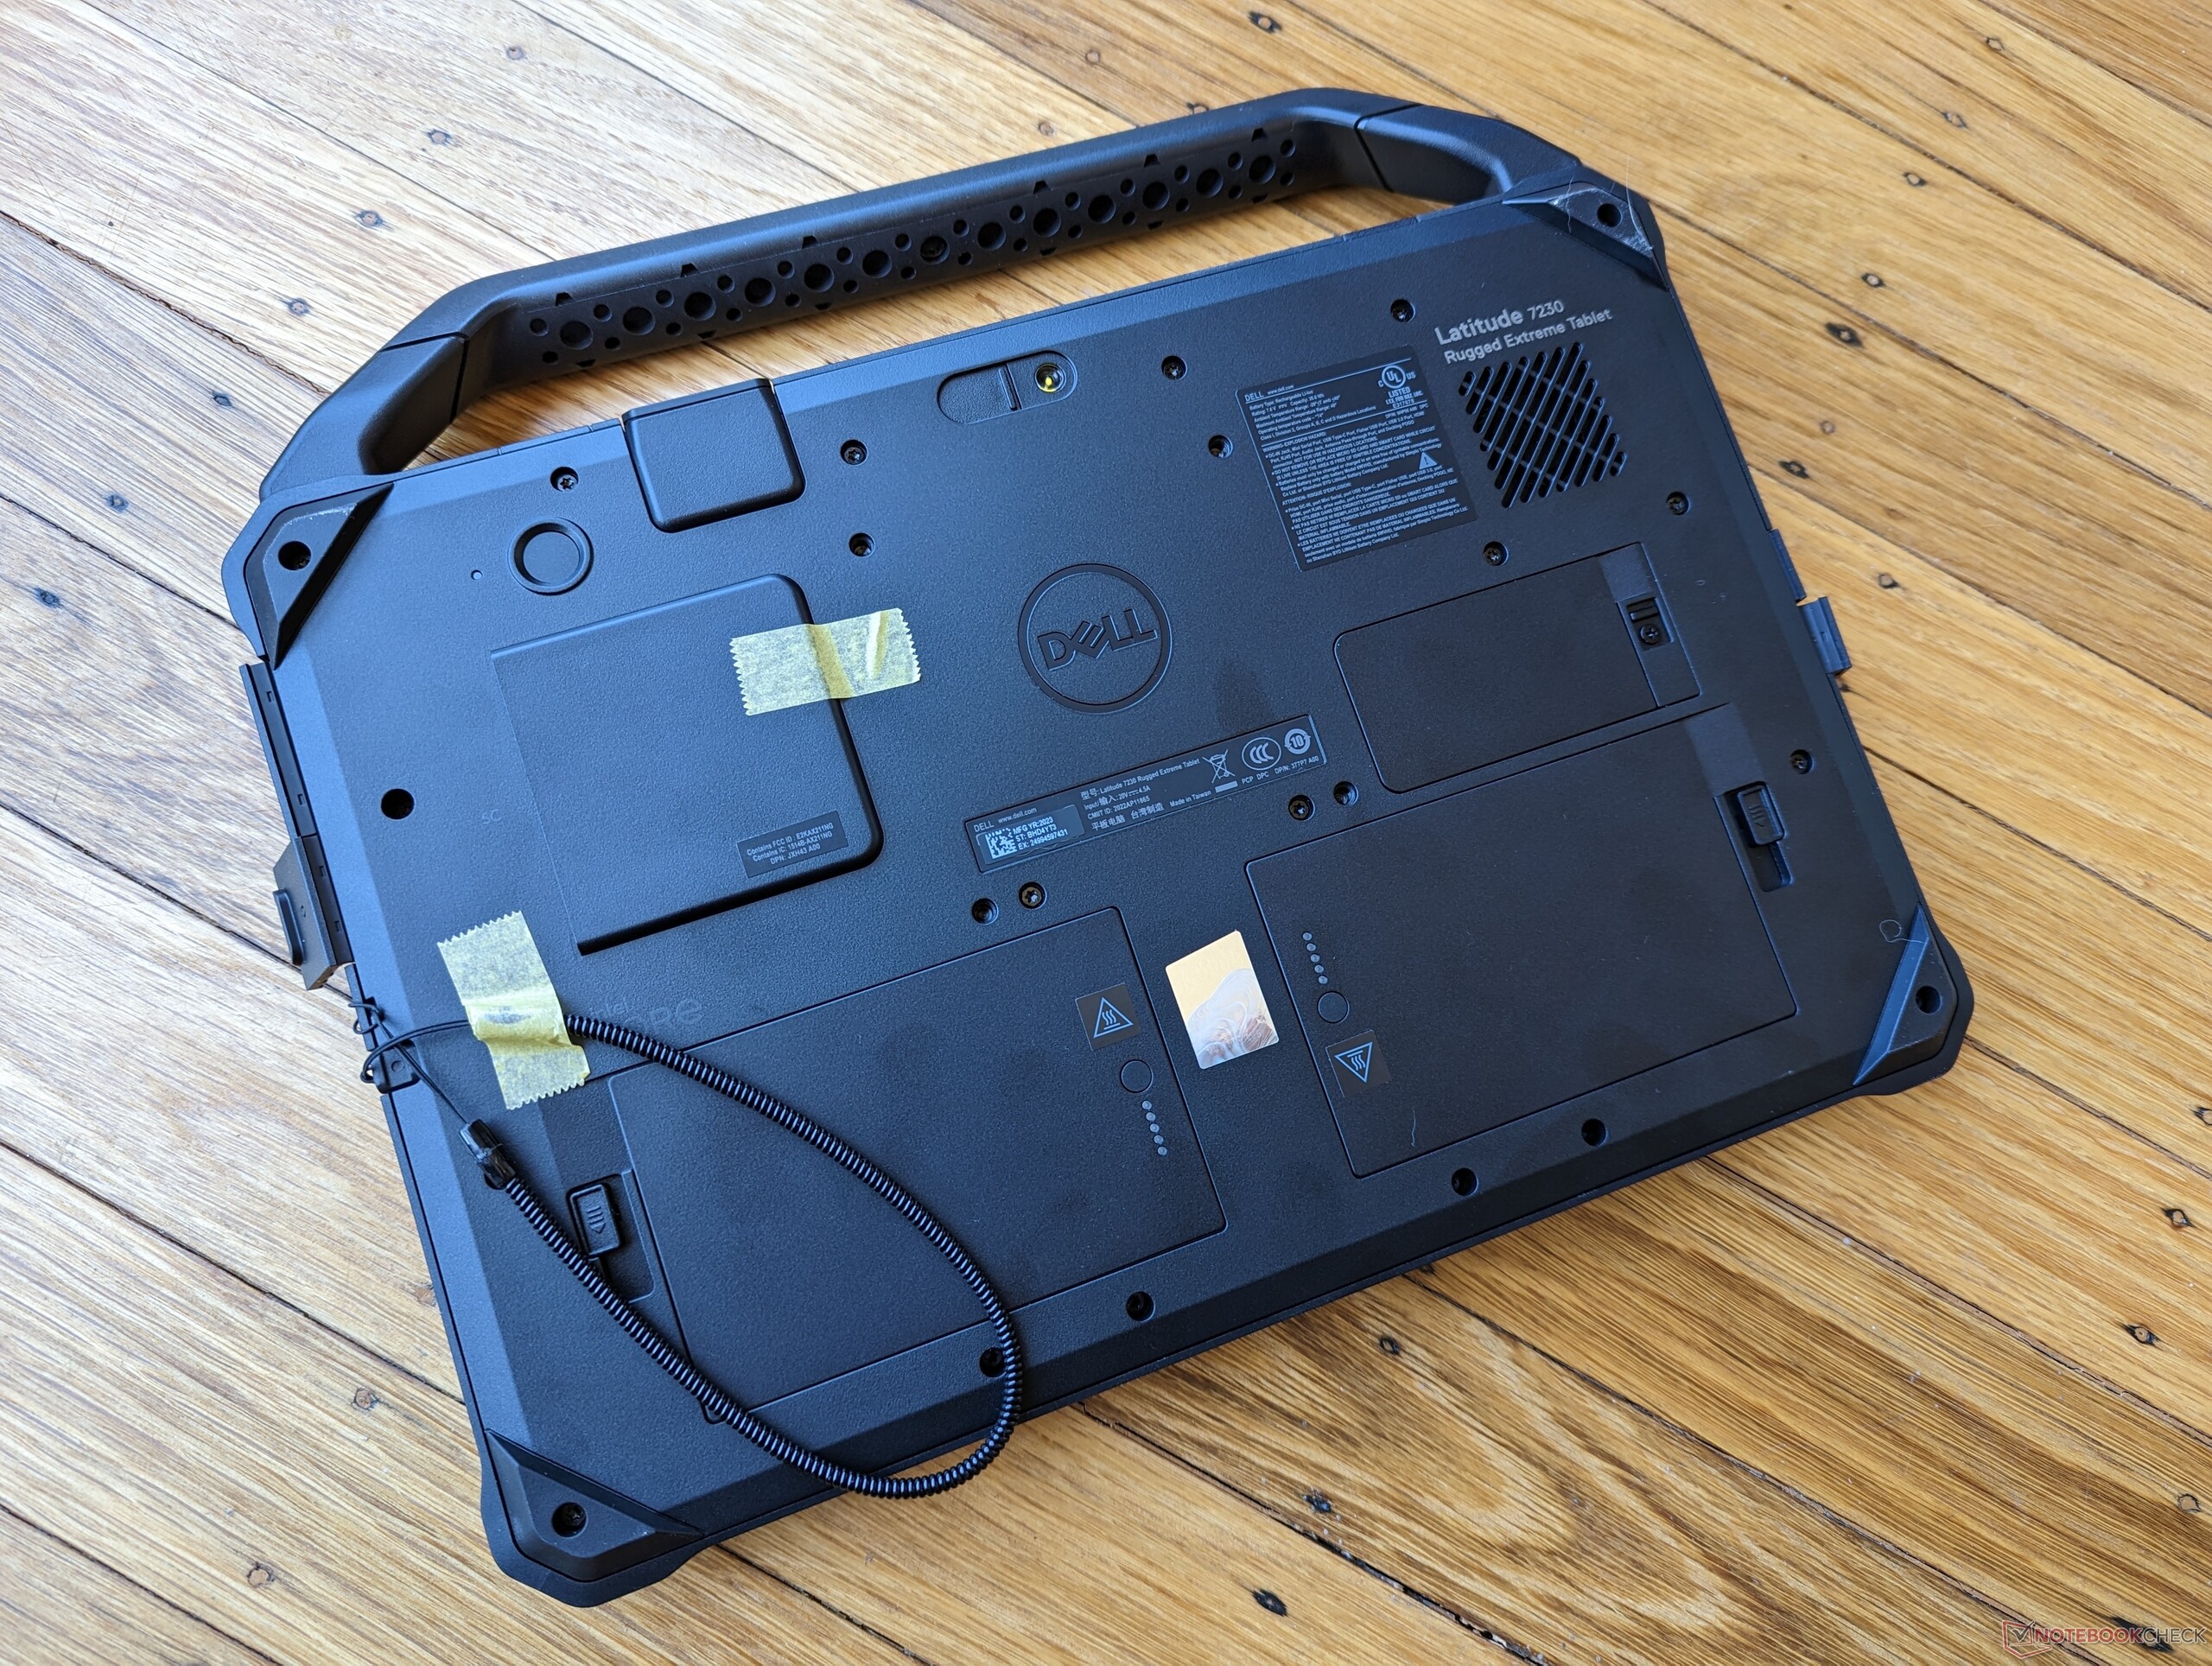
Wartung
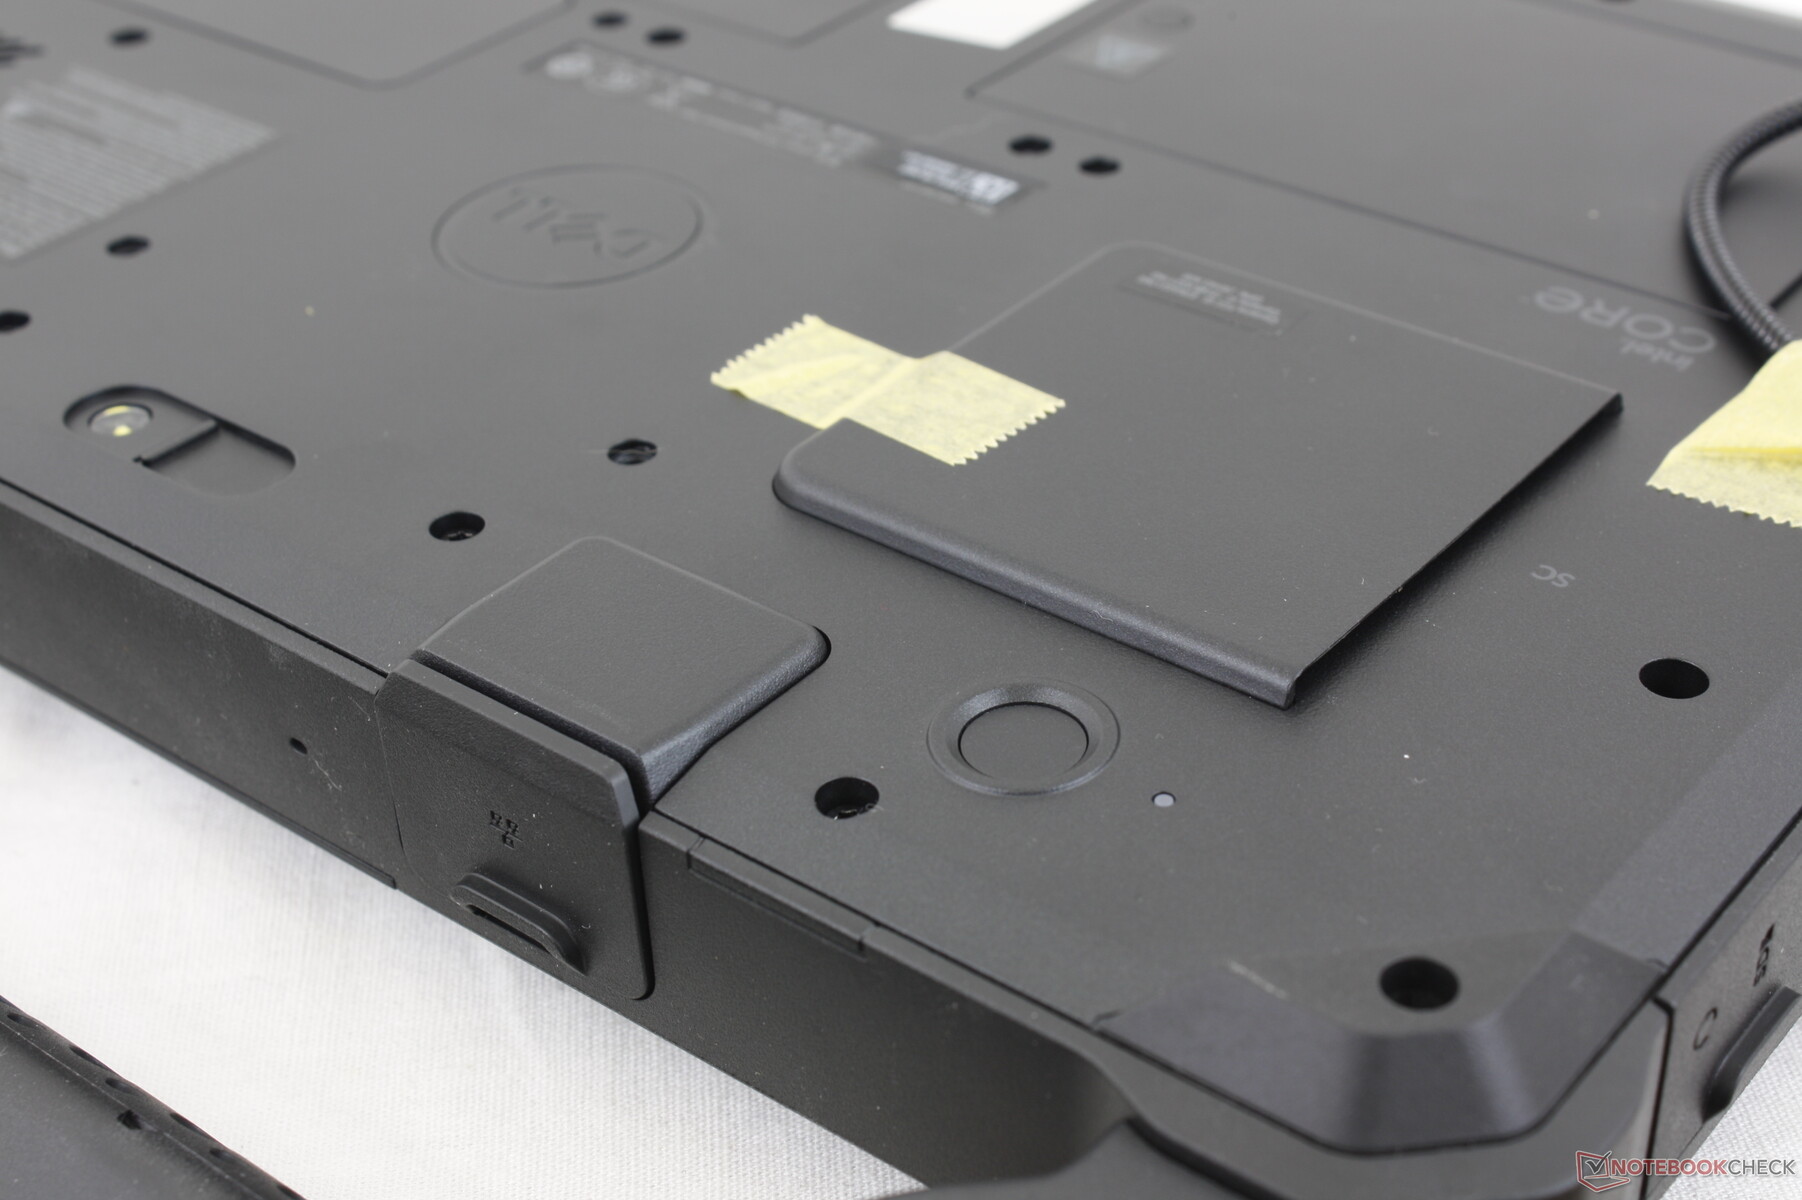
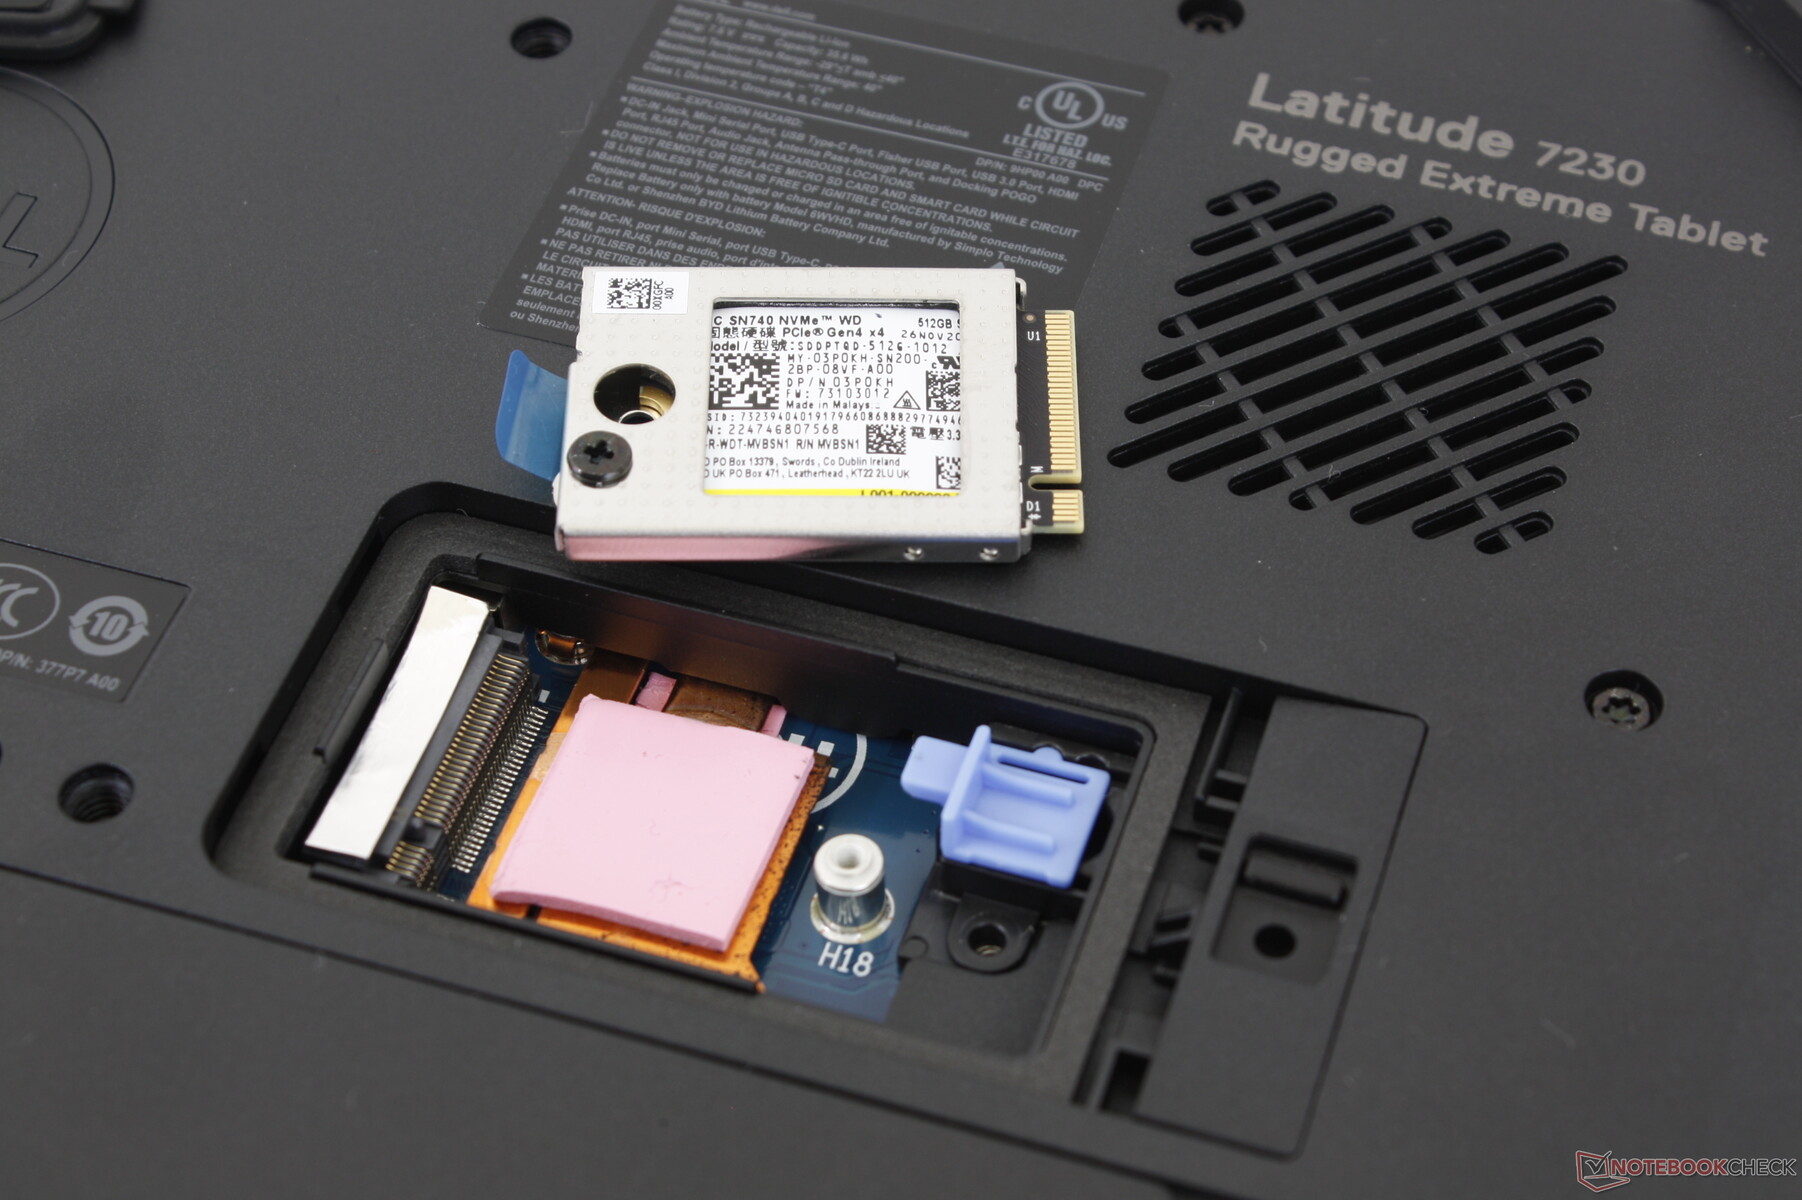
Nicht weniger als zwei Dutzend Schrauben sichern die Rückseite. Während im Wartungshandbuch von Dell (Link) Kreuzschlitzschrauben abgebildet sind, finden wir hier Torxschrauben. Zum Glück lassen sich zumindest die M.2 SSD und die beiden Akkus recht einfach herausnehmen.
Zubehöhr und Garantie
Für den robusten Tablet-Computer von Dell gibt es umfangreiches Zubehör. Im Karton befinden sich ein passiver Eingabestift und ein stabiler Tragegriff. Optional sind eine passende Tastatur, ein aktiver Eingabestift, eine Handschlaufe und viele weitere Zubehörteile erhältlich.
Dell gewährt Käufern in den USA drei Jahre Garantie.
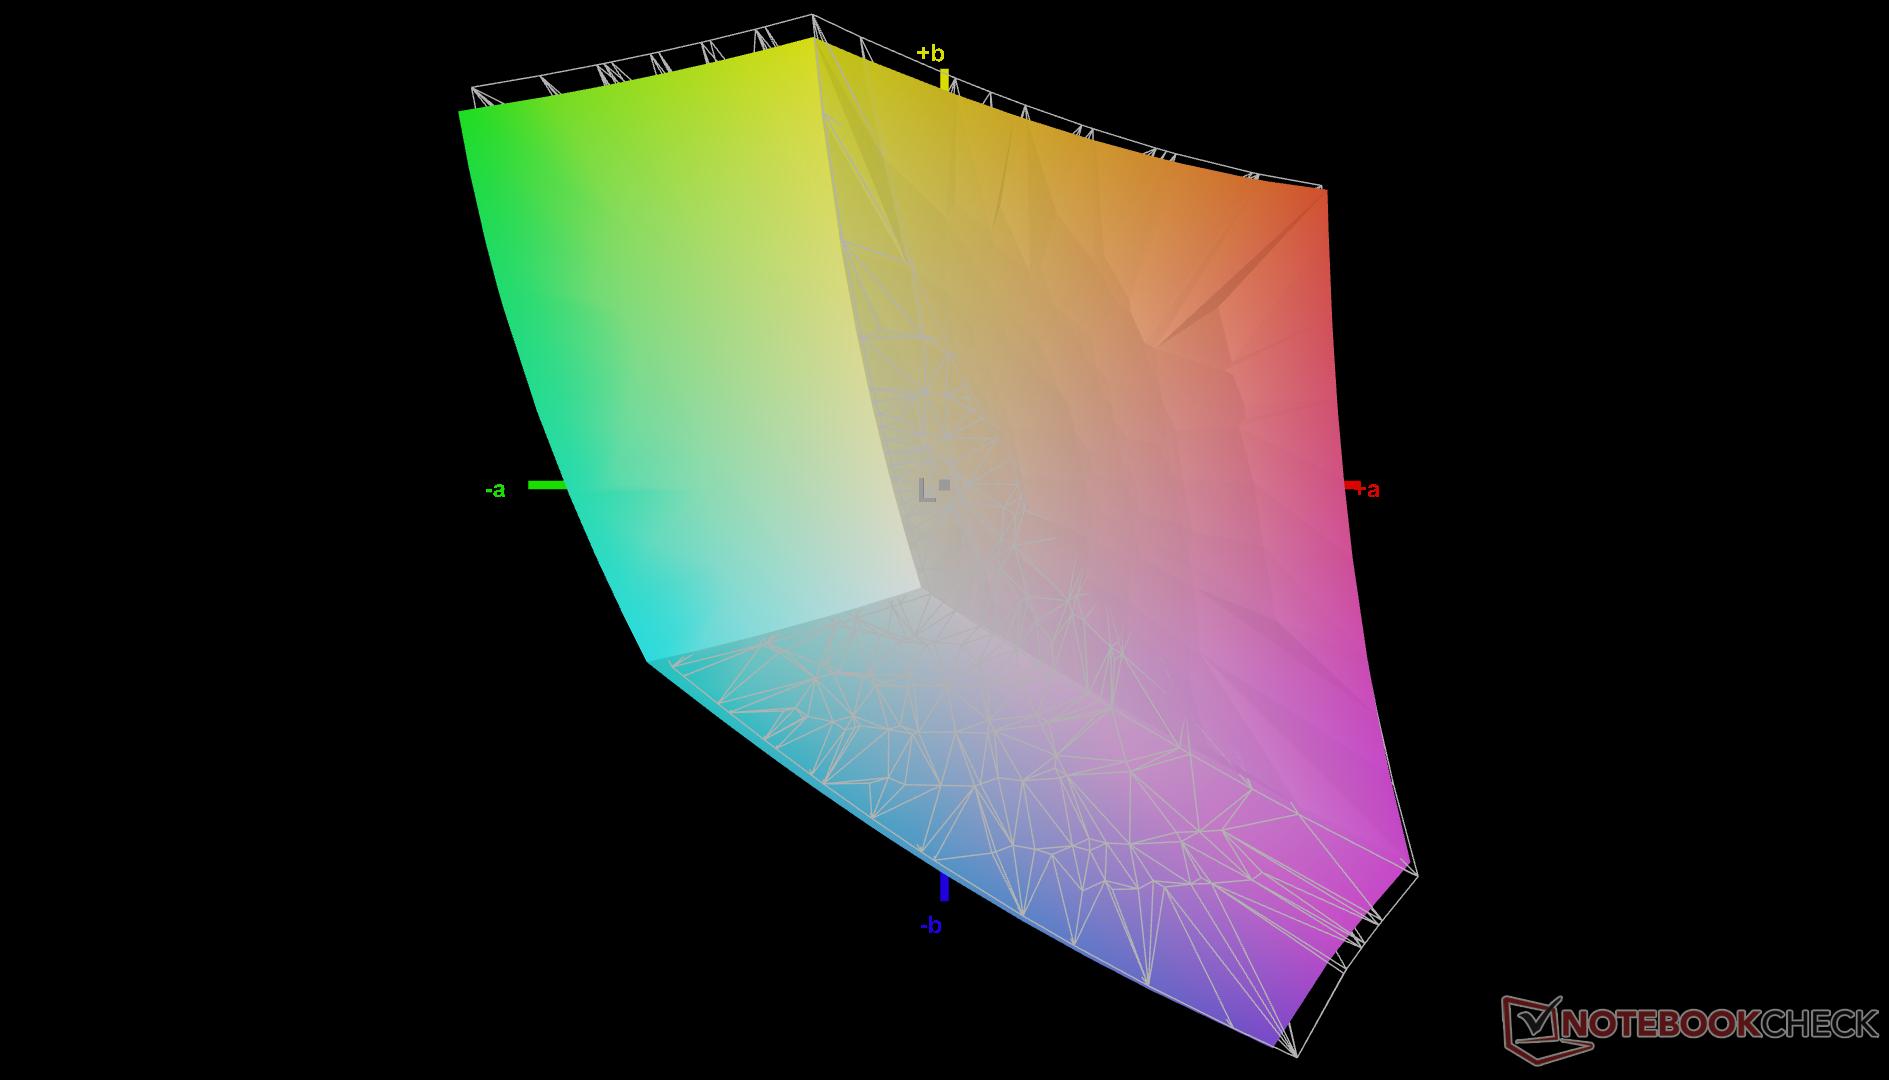
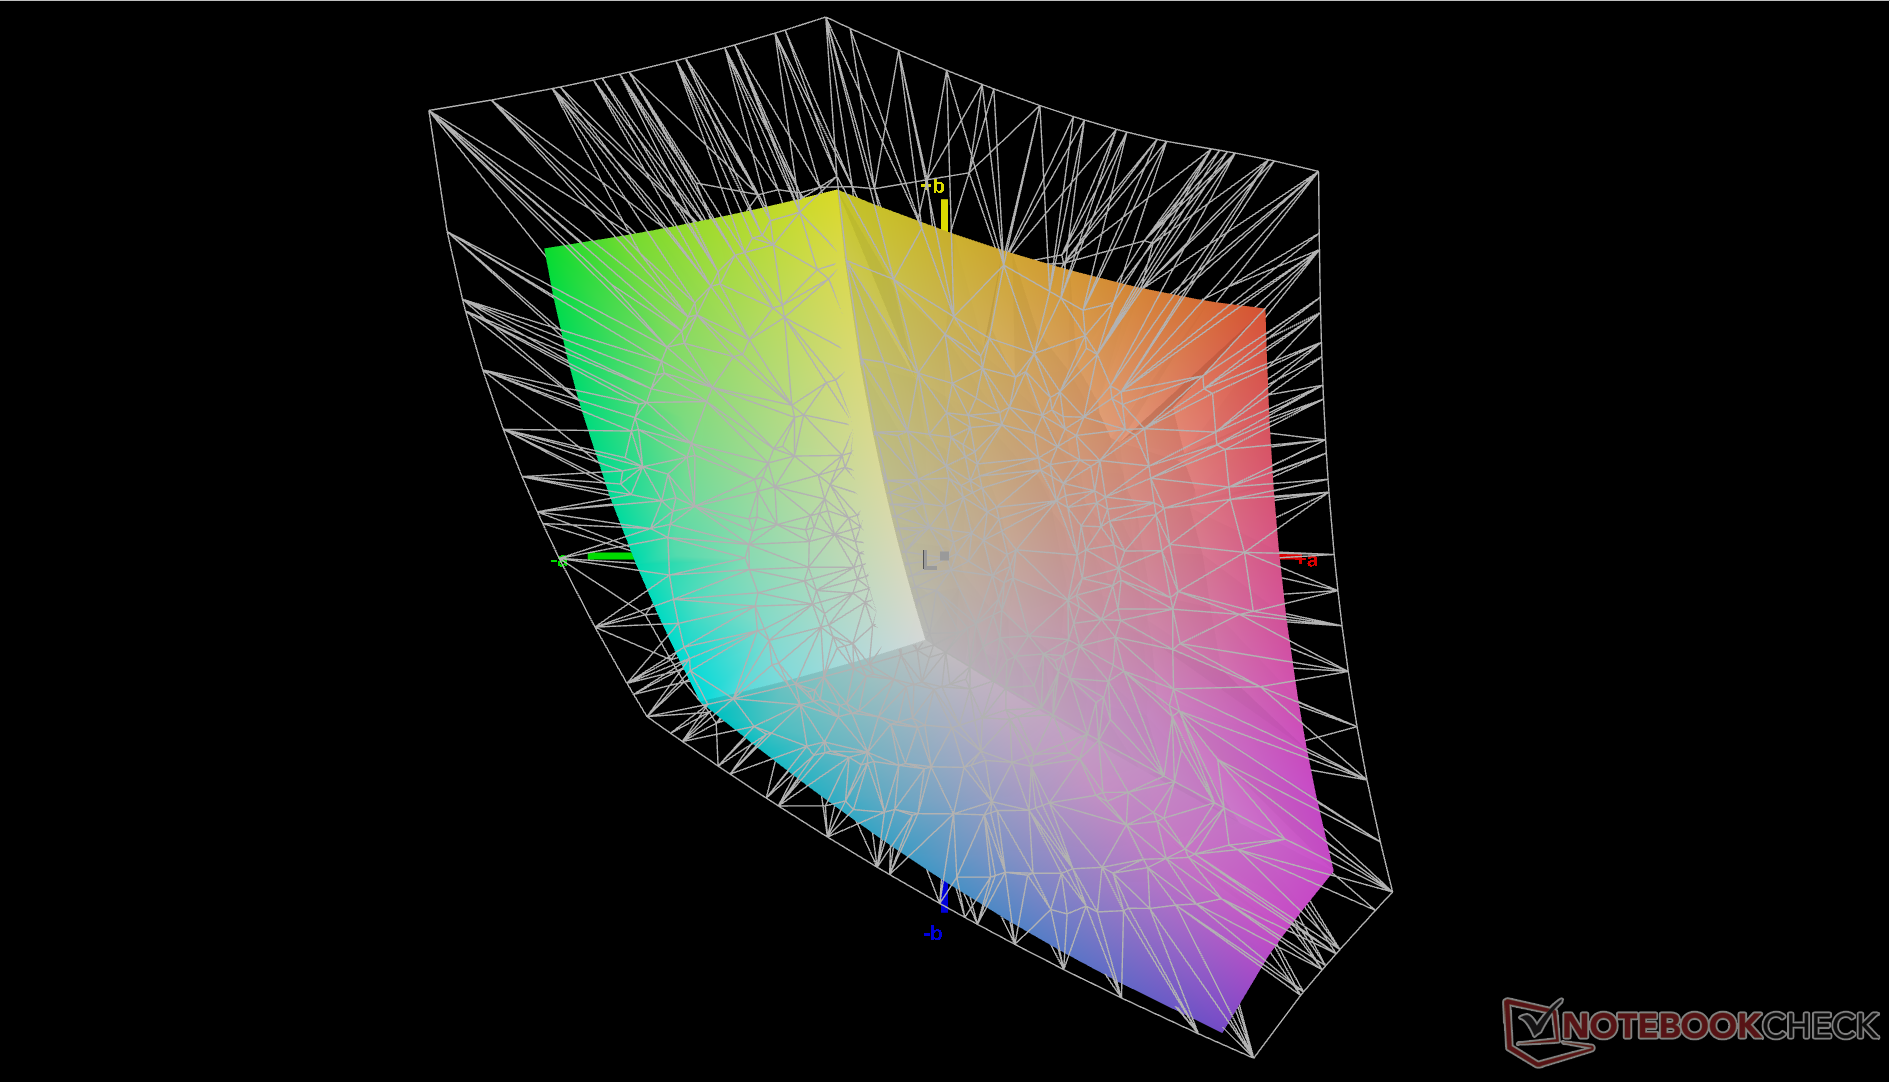
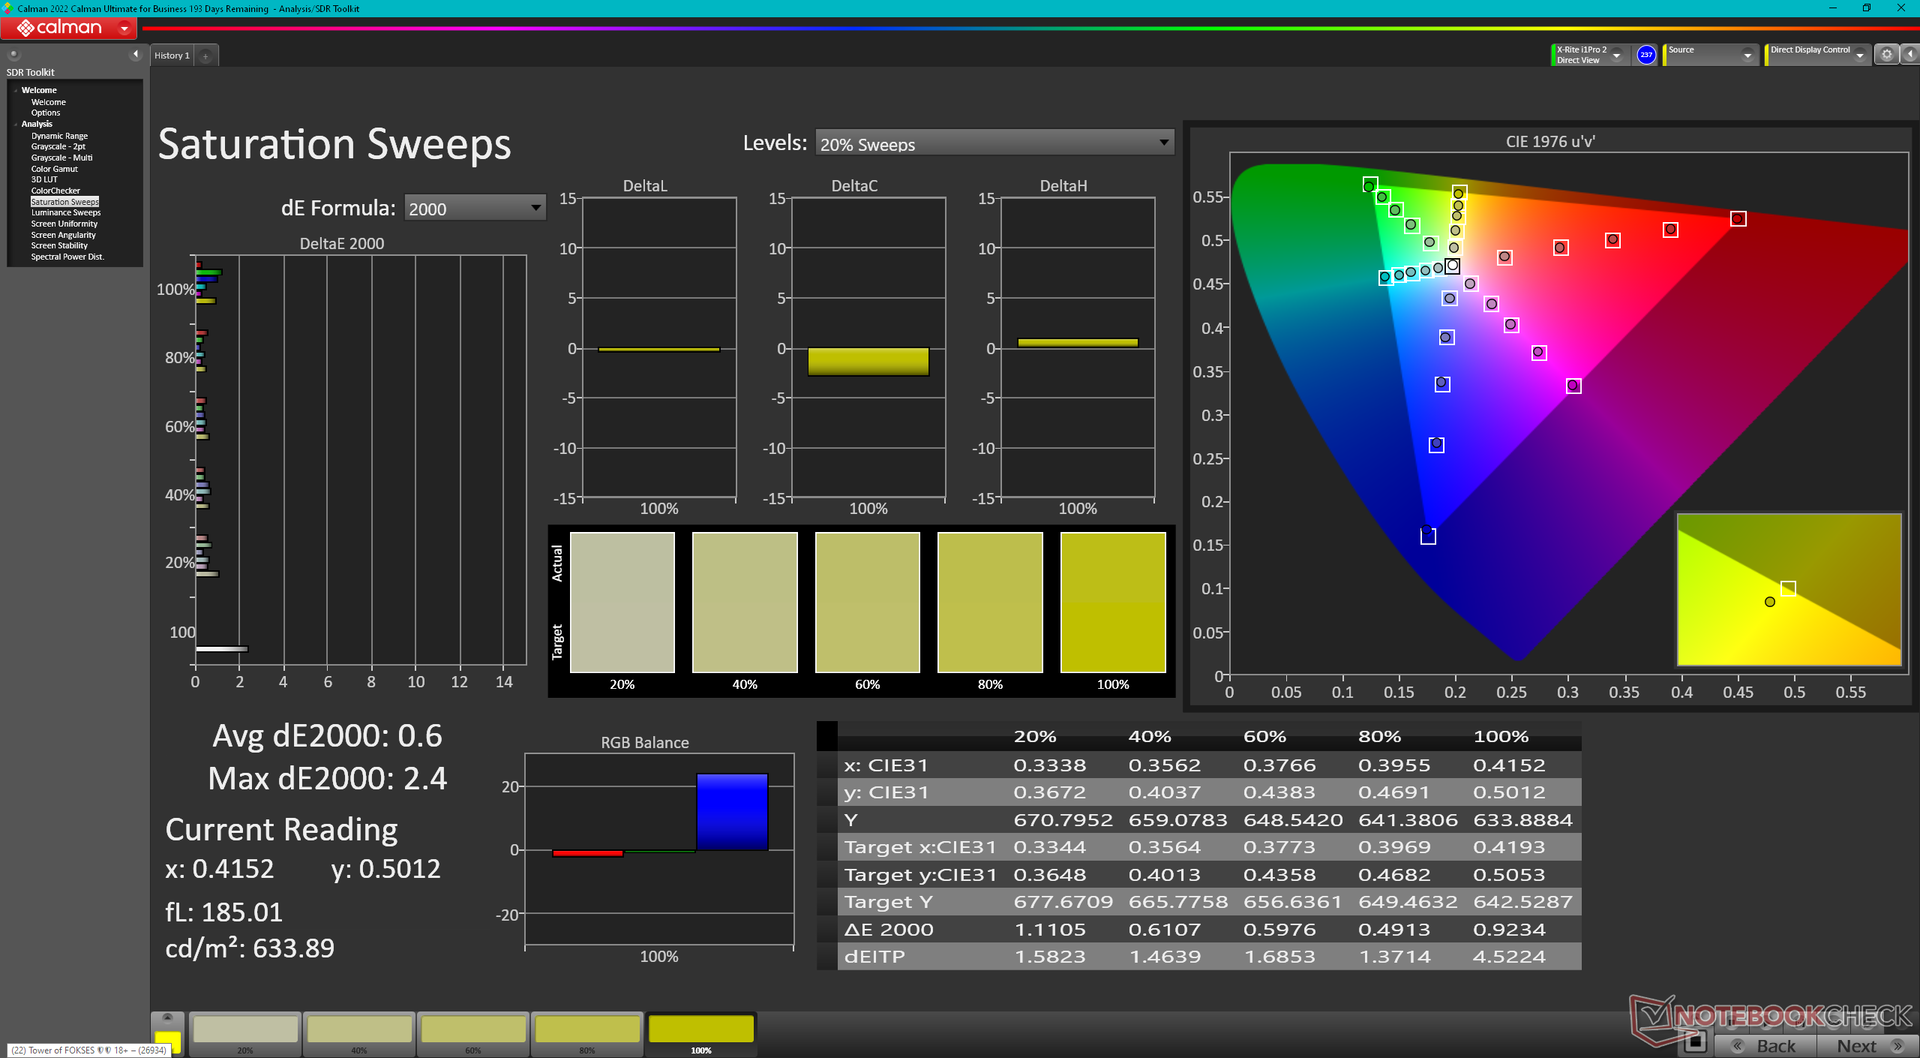
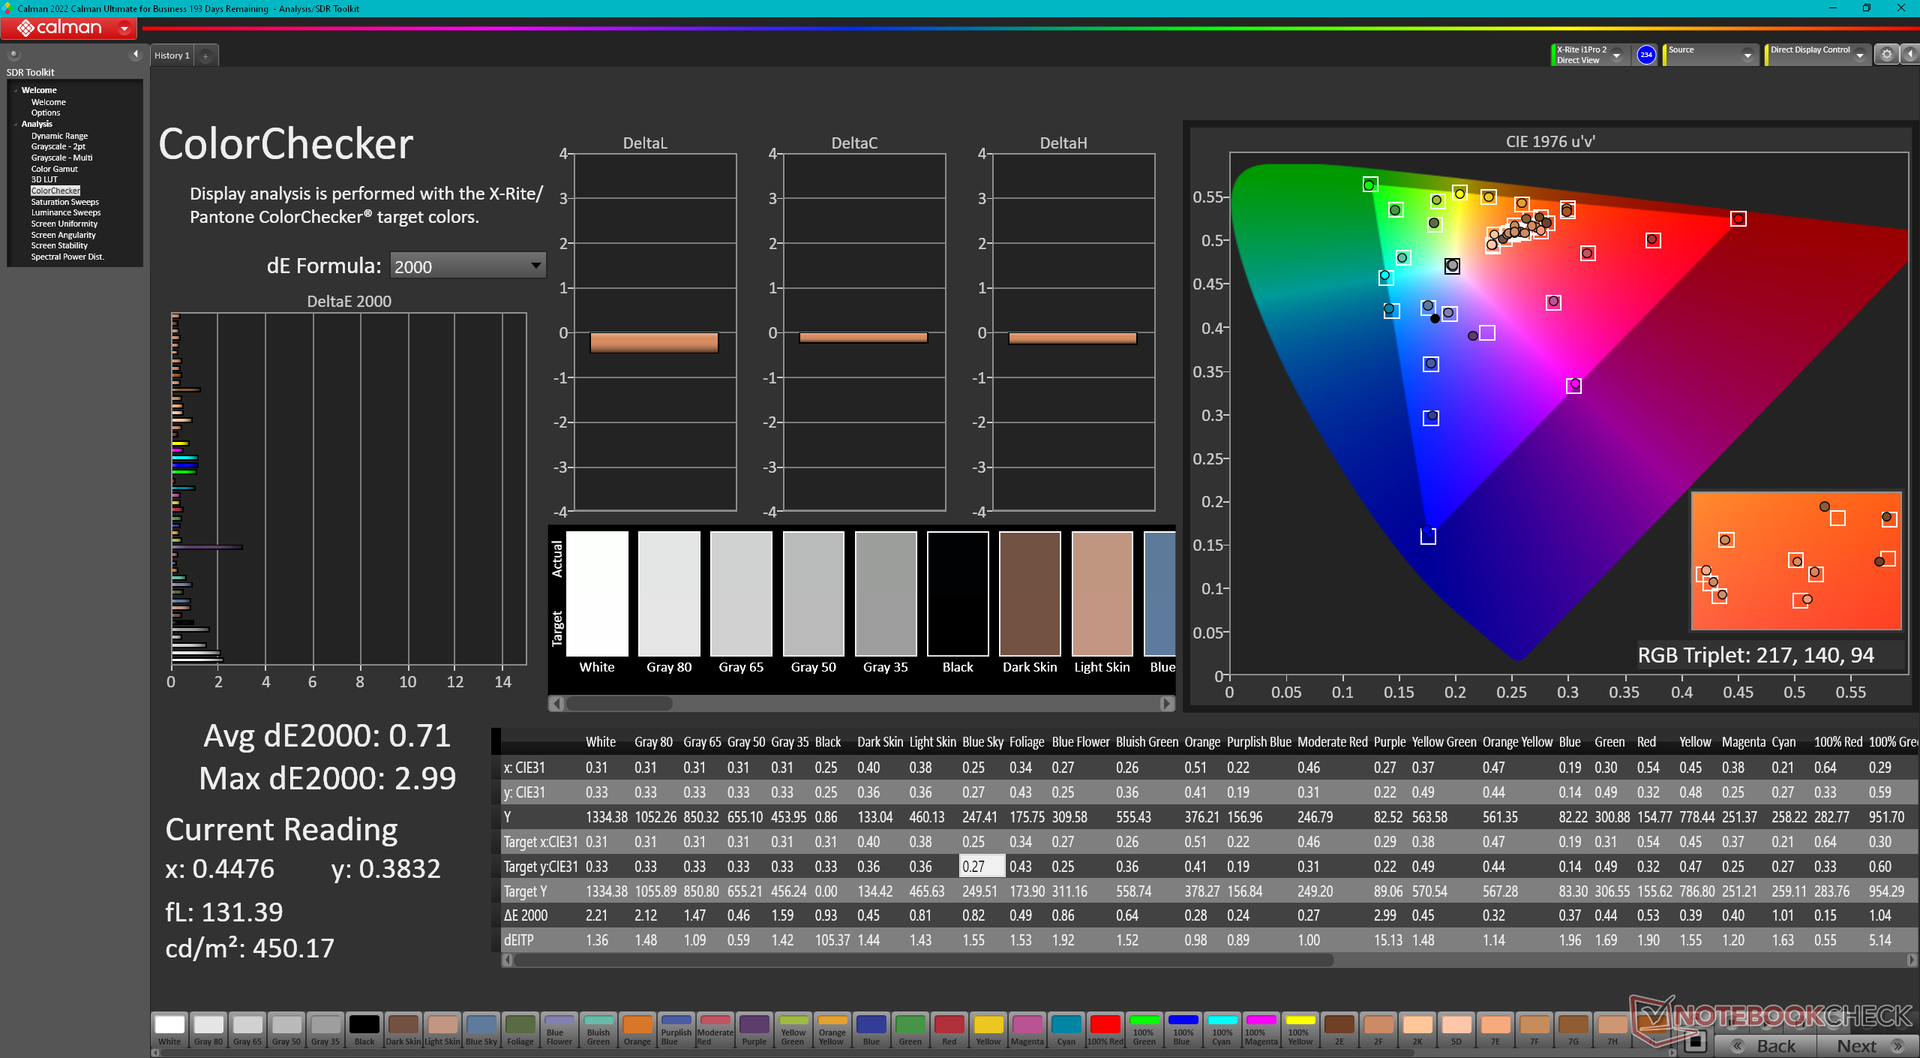
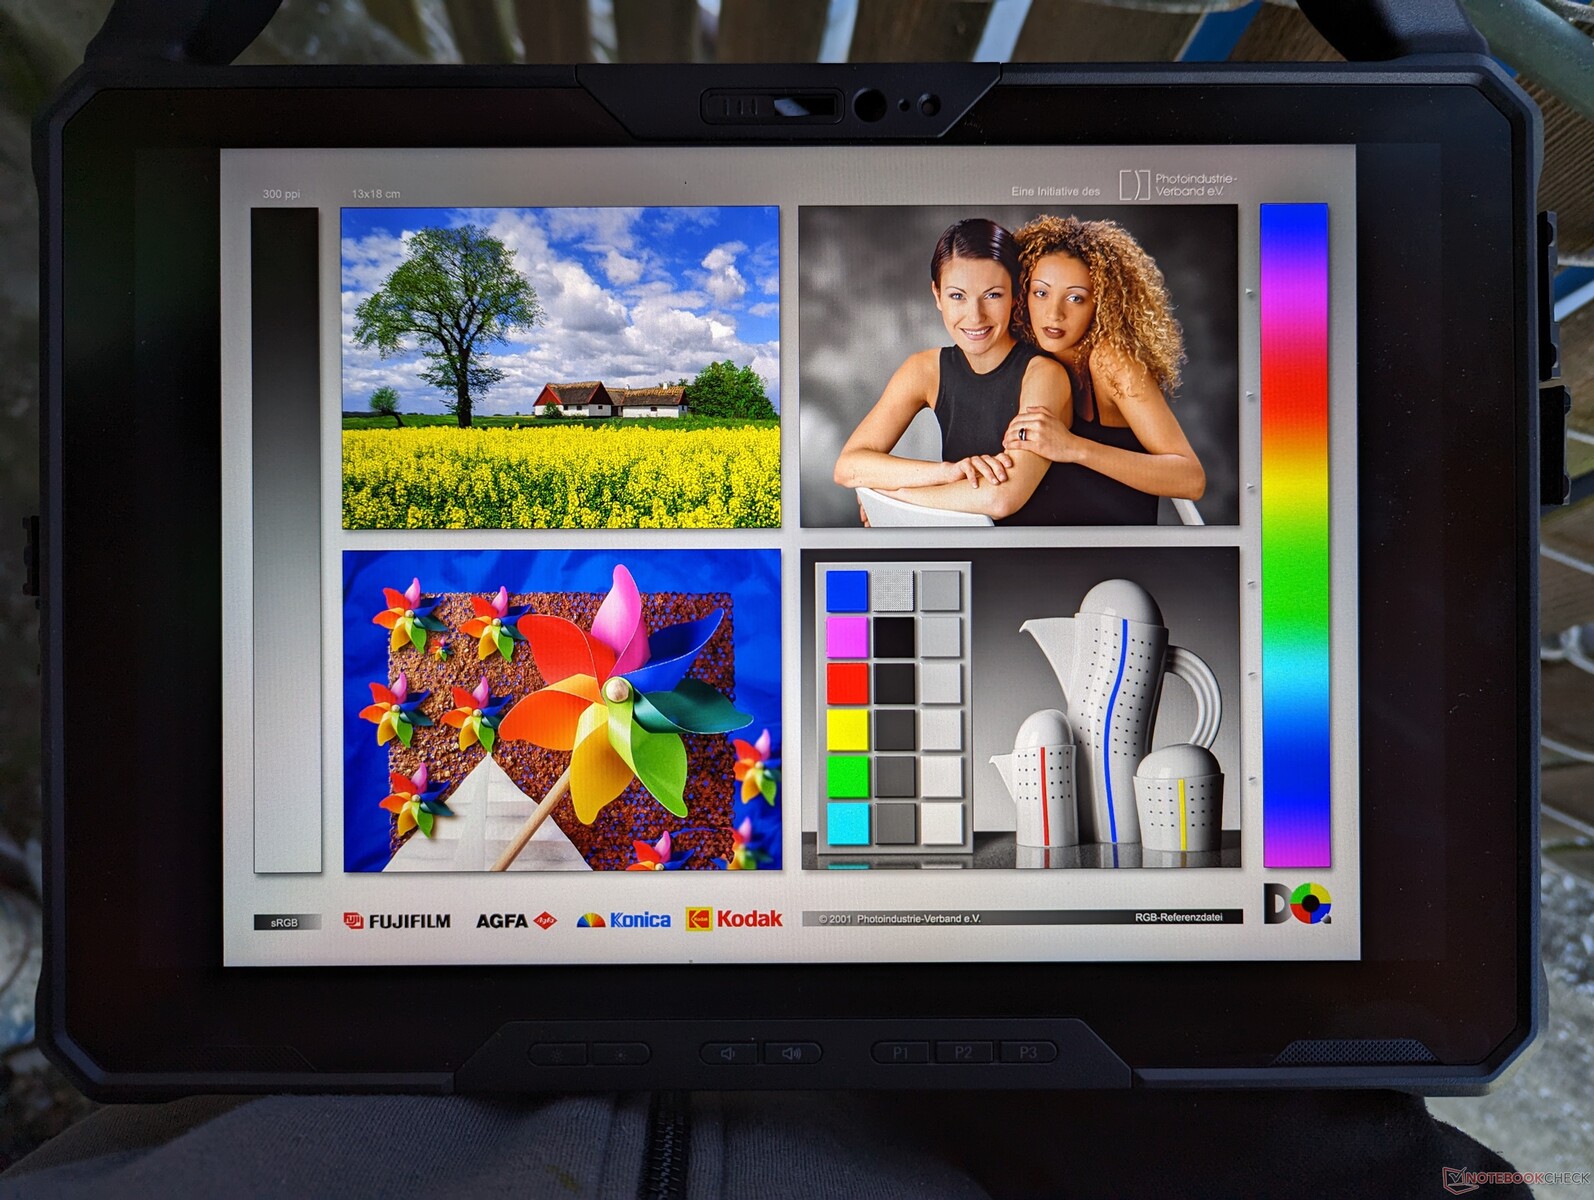
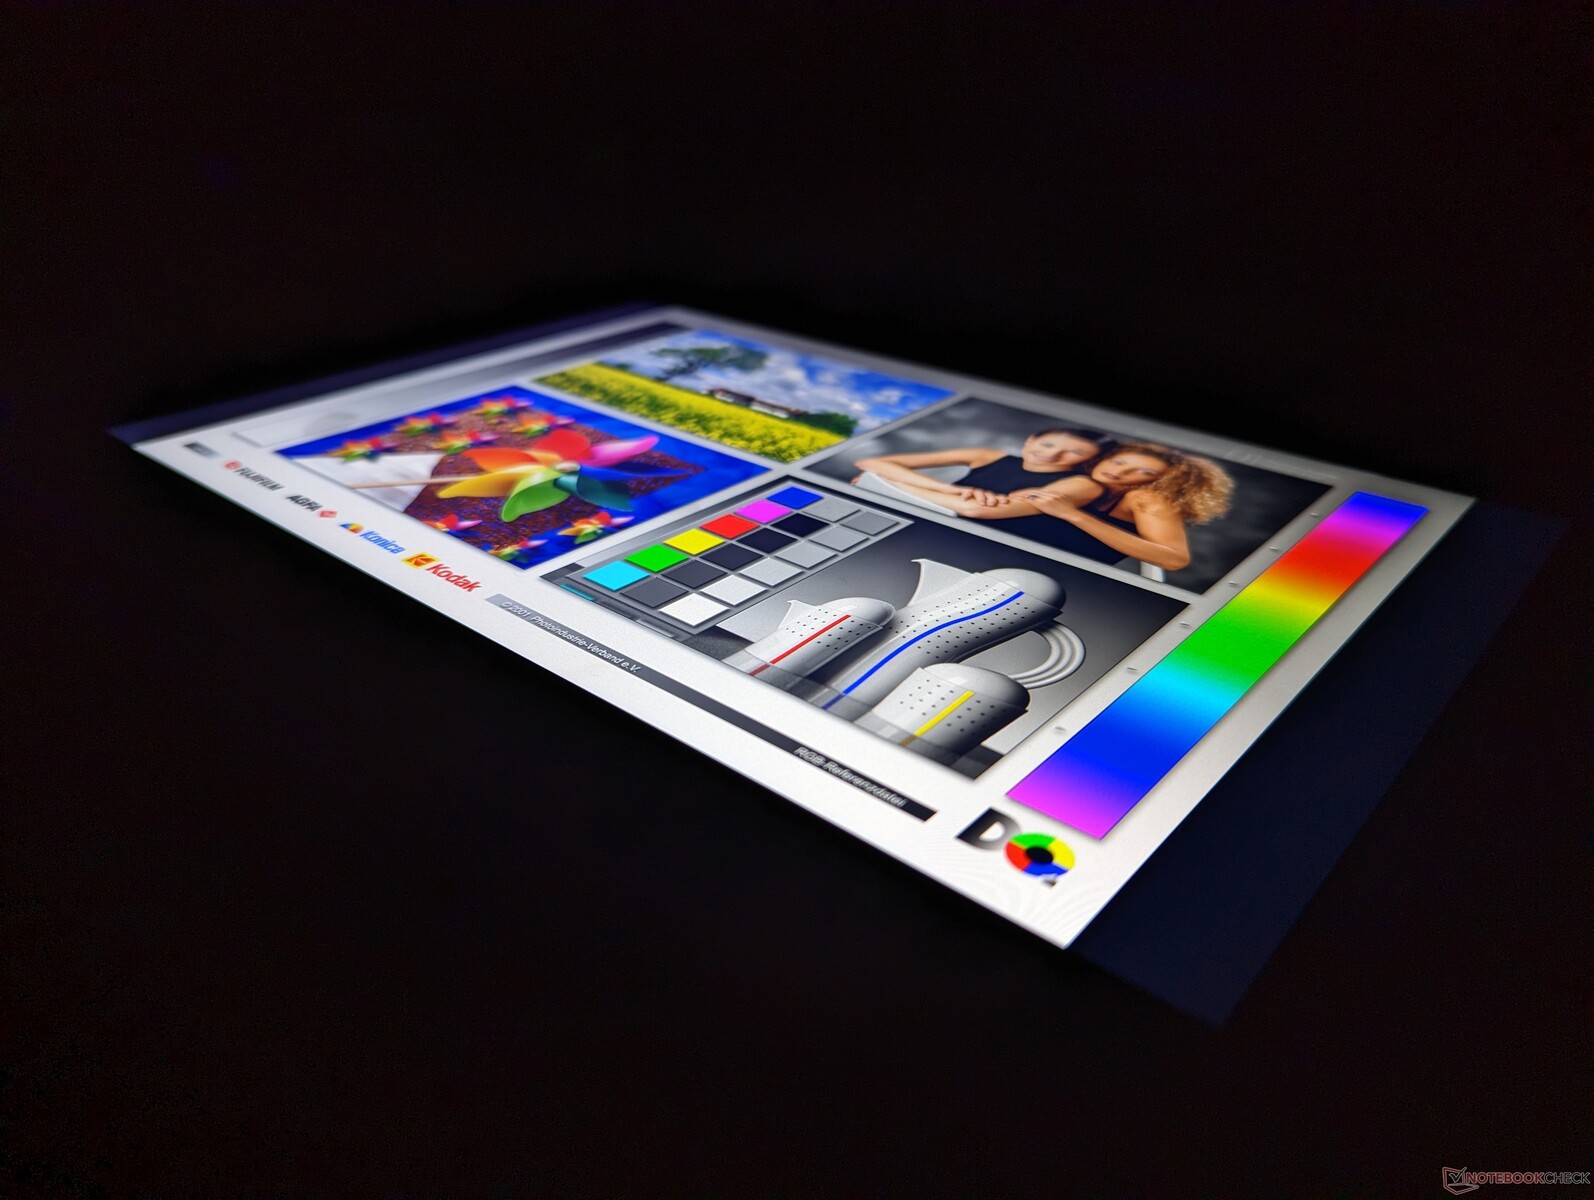
Display - 1.200 cd/m² und komplette sRGB-Farbraum-Abdeckung
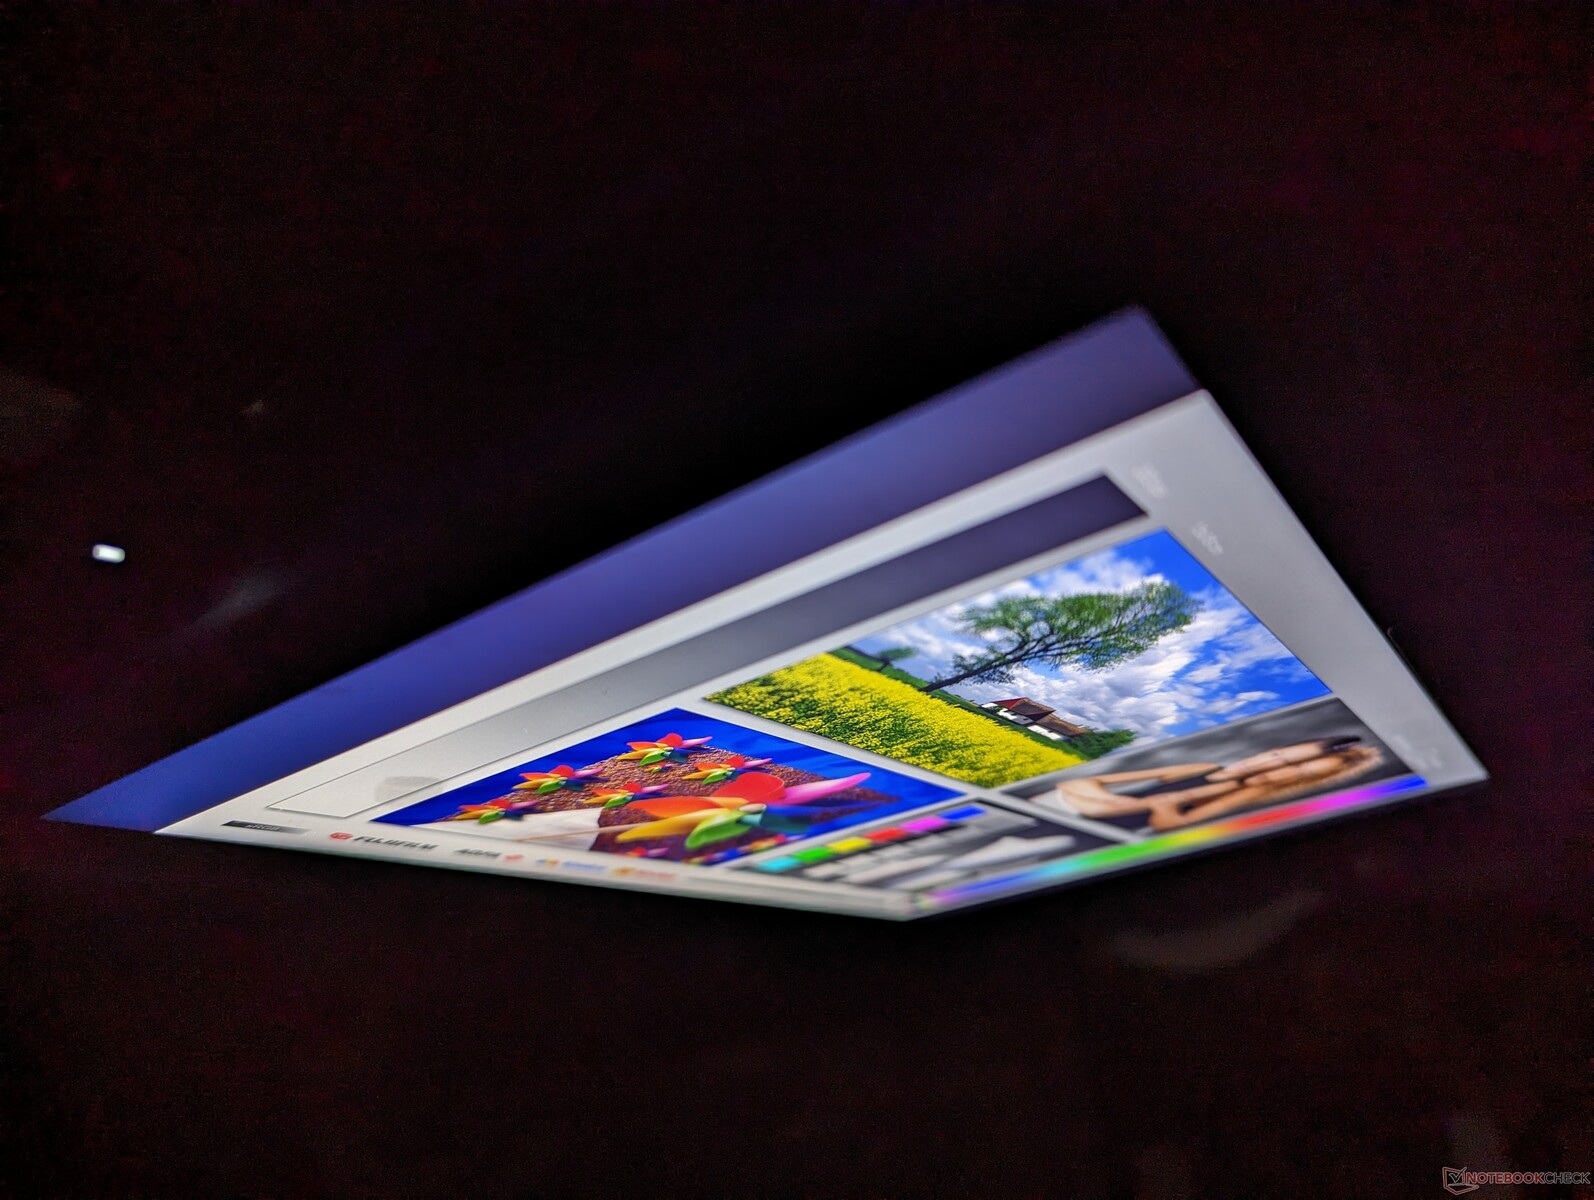
Das Latitude 7230 Rugged ist eines der wenigen Geräte in seiner Kategorie und Größe, das mehr als 95 Prozent des sRGB-Farbraums abdeckt. Das Ergebnis sind genauere und lebendigere Farben. Die Schwarz-Weiß- und Grau-Grau-Reaktionszeiten sind ebenfalls relativ schnell und reduzieren Geisterbilder. Die Helligkeit wird nicht PWM gesteuert, so kann man auch bei sehr geringer Helligkeit arbeiten, ohne dass die Augen ermüden oder zu flimmern beginnen. Es handelt sich damit um eines der besten Displays, die wir bissher bei einem Rugged Tablet gesehen haben.
Der größte Nachteil des Displays ist seine Körnigkeit, trotz der ausgezeichneten Farben und der hellen Hintergrundbeleuchtung. Im Vergleich zu den schärferen Displays von Consumer-Tablets oder Laptops befindet sich der Touchscreen des Latitude 7230 Rugged unter dickeren Glas- und Schutzschichten, was sich letztendlich auf die Bildqualität auswirkt. Für die Zielgruppe stehen gestochen scharfe Bilder jedoch in der Regel nicht im Vordergrund.


| |||||||||||||||||||||||||
Ausleuchtung: 82 %
Helligkeit Akku: 1326.7 cd/m²
Kontrast: 1561:1 (Schwarzwert: 0.85 cd/m²)
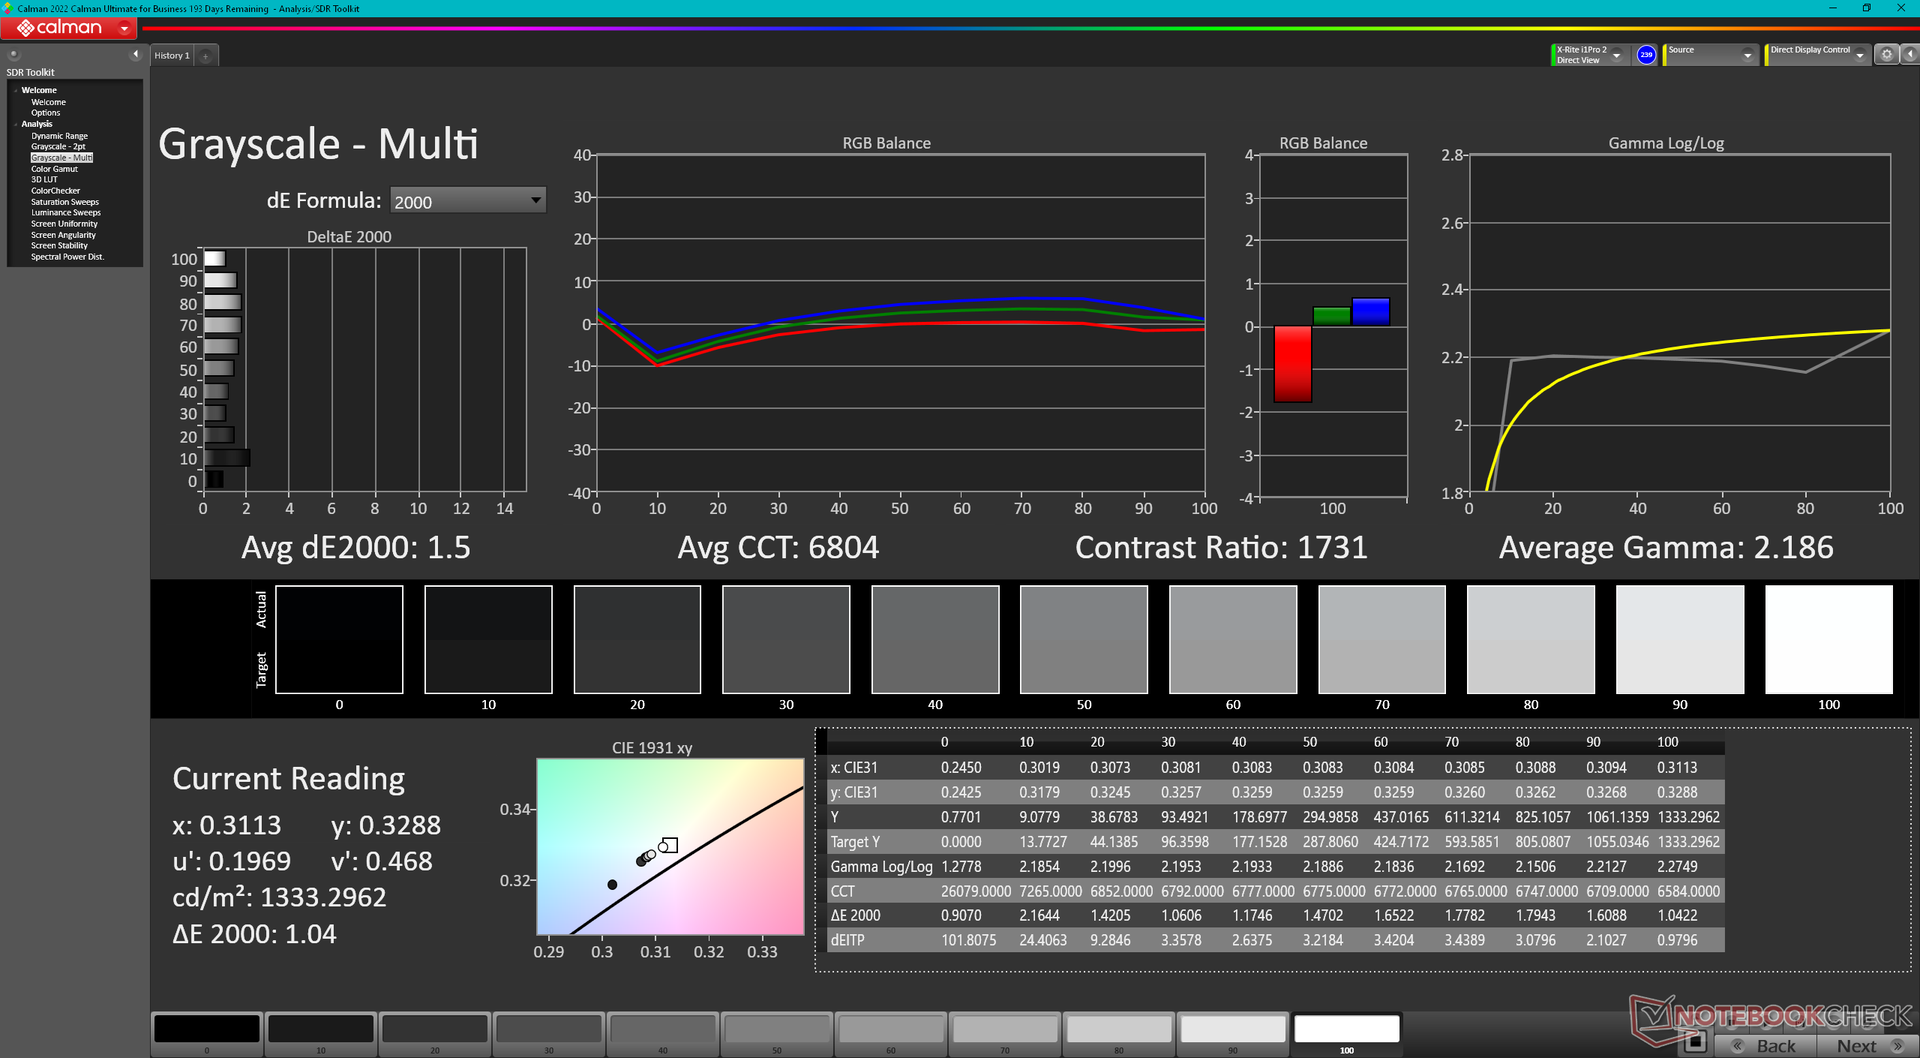
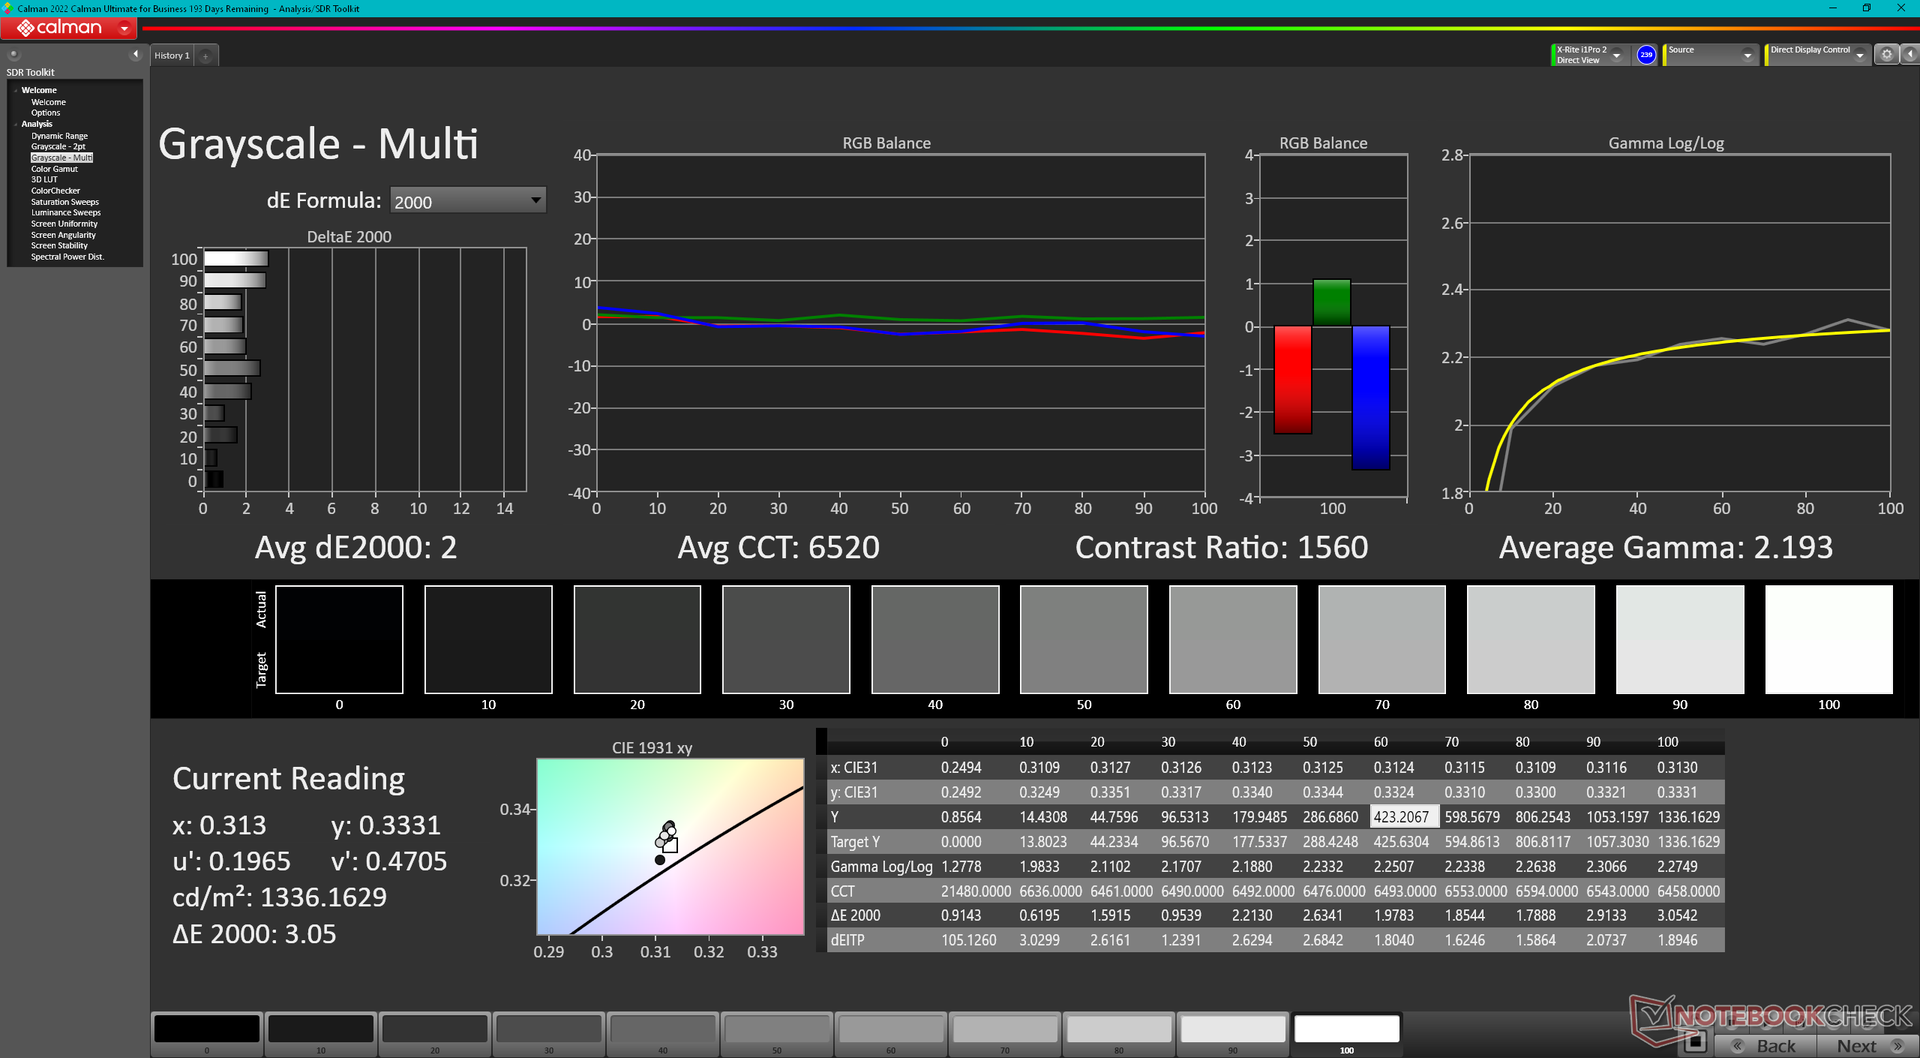
ΔE ColorChecker Calman: 1.06 | ∀{0.5-29.43 Ø4.72}
calibrated: 0.71
ΔE Greyscale Calman: 1.5 | ∀{0.09-98 Ø4.97}
68.4% AdobeRGB 1998 (Argyll 3D)
96.1% sRGB (Argyll 3D)
66.2% Display P3 (Argyll 3D)
Gamma: 2.19
CCT: 6804 K
| Dell Latitude 7230 Rugged Extreme Sharp LQ120N1, IPS, 1920x1200, 12" | Dell Latitude 7330 Rugged Extreme Sharp LQ133M1, IPS, 1920x1080, 13.3" | Panasonic Toughbook 40 InfoVision M140NWF5 R3, IPS, 1920x1080, 14" | Getac B360 AU Optronics AUO572D, IPS, 1920x1080, 13.3" | Acer Enduro Urban N3 EUN314 XR140EA6T, IPS, 1920x1080, 14" | Durabook S14I KD140N0730A01, TN, 1920x1080, 14" | |
|---|---|---|---|---|---|---|
| Display | 1% | -45% | -24% | -4% | -33% | |
| Display P3 Coverage (%) | 66.2 | 67.1 1% | 35.8 -46% | 51.3 -23% | 63.5 -4% | 43.55 -34% |
| sRGB Coverage (%) | 96.1 | 98.2 2% | 53.8 -44% | 72 -25% | 91.9 -4% | 65.4 -32% |
| AdobeRGB 1998 Coverage (%) | 68.4 | 69 1% | 37 -46% | 52.2 -24% | 65.5 -4% | 45 -34% |
| Response Times | -141% | -60% | -58% | -89% | 16% | |
| Response Time Grey 50% / Grey 80% * (ms) | 28.4 ? | 74.4 ? -162% | 50.4 ? -77% | 33 ? -16% | 56 ? -97% | 30.4 ? -7% |
| Response Time Black / White * (ms) | 19.4 ? | 42.4 ? -119% | 27.6 ? -42% | 38.8 ? -100% | 35.2 ? -81% | 11.8 ? 39% |
| PWM Frequency (Hz) | 694.4 ? | 870 ? | 1000 ? | 304.9 ? | ||
| Bildschirm | -16% | -118% | -216% | -154% | -348% | |
| Helligkeit Bildmitte (cd/m²) | 1326.7 | 1414.1 7% | 1284.3 -3% | 1505.6 13% | 487.8 -63% | 1180.7 -11% |
| Brightness (cd/m²) | 1193 | 1282 7% | 1289 8% | 1383 16% | 464 -61% | 1102 -8% |
| Brightness Distribution (%) | 82 | 84 2% | 82 0% | 86 5% | 89 9% | 89 9% |
| Schwarzwert * (cd/m²) | 0.85 | 0.83 2% | 0.89 -5% | 0.95 -12% | 0.48 44% | 1.91 -125% |
| Kontrast (:1) | 1561 | 1704 9% | 1443 -8% | 1585 2% | 1016 -35% | 618 -60% |
| Delta E Colorchecker * | 1.06 | 1.99 -88% | 4.67 -341% | 9.81 -825% | 6.51 -514% | 13.45 -1169% |
| Colorchecker dE 2000 max. * | 3.78 | 3.75 1% | 19.85 -425% | 16.64 -340% | 11.36 -201% | 22.52 -496% |
| Colorchecker dE 2000 calibrated * | 0.71 | 0.72 -1% | 2.21 -211% | 1.44 -103% | 1.77 -149% | 3.19 -349% |
| Delta E Graustufen * | 1.5 | 2.8 -87% | 2.7 -80% | 12 -700% | 7.8 -420% | 15.4 -927% |
| Gamma | 2.19 100% | 2.06 107% | 1.97 112% | 1.98 111% | 2.28 96% | 1.97 112% |
| CCT | 6804 96% | 6775 96% | 6222 104% | 4838 134% | 8102 80% | 21134 31% |
| Farbraum (Prozent von AdobeRGB 1998) (%) | 41.6 | |||||
| Color Space (Percent of sRGB) (%) | 65.5 | |||||
| Durchschnitt gesamt (Programm / Settings) | -52% /
-30% | -74% /
-94% | -99% /
-152% | -82% /
-113% | -122% /
-229% |
* ... kleinere Werte sind besser
Das Display des Industrie-Tablets von Dell ist ab Werk gut kalibriert. Die durchschnittlichen Farbabweichungen für Farben und Graustufen betragen nur ΔΕ 1,5 bzw. ΔΕ 1,06. Eine zusätzliche Kalibrierung mit unserem X-Rite Colorimeter verbessert die Farbdarstellung kaum. Eine Farbanpassung durch den Endanwender ist daher nicht erforderlich.


Reaktionszeiten (Response Times) des Displays
| ↔ Reaktionszeiten Schwarz zu Weiß | ||
|---|---|---|
| 19.4 ms ... steigend ↗ und fallend ↘ kombiniert | ↗ 9.7 ms steigend | 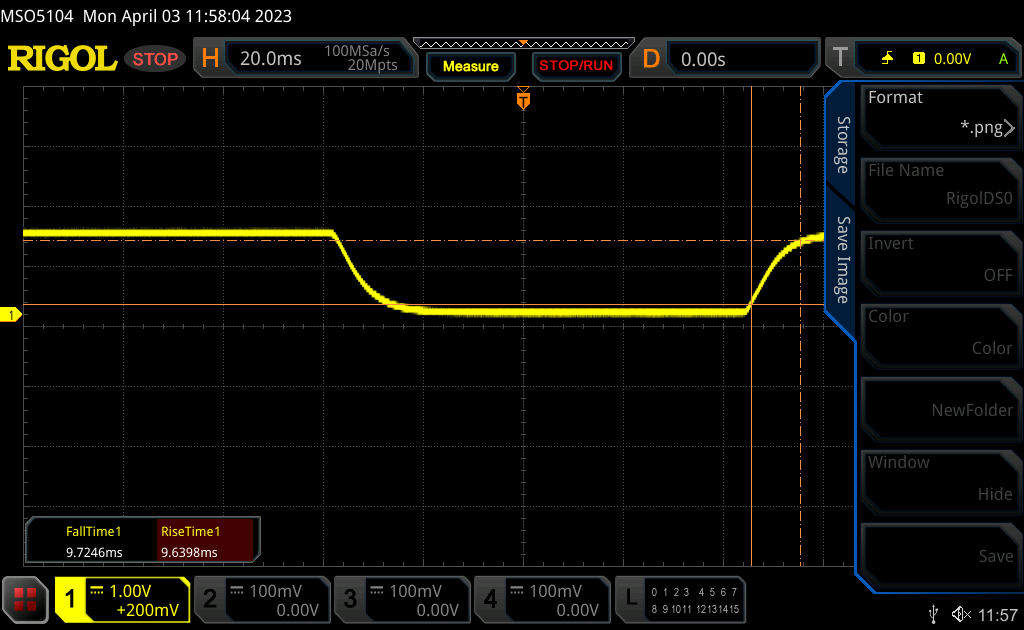 |
| ↘ 9.7 ms fallend | ||
| Die gemessenen Reaktionszeiten sind gut, für anspruchsvolle Spieler könnten der Bildschirm jedoch zu langsam sein. Im Vergleich rangierten die bei uns getesteten Geräte von 0.1 (Minimum) zu 240 (Maximum) ms. » 43 % aller Screens waren schneller als der getestete. Daher sind die gemessenen Reaktionszeiten durchschnittlich (19.8 ms). | ||
| ↔ Reaktionszeiten 50% Grau zu 80% Grau | ||
| 28.4 ms ... steigend ↗ und fallend ↘ kombiniert | ↗ 13.8 ms steigend | 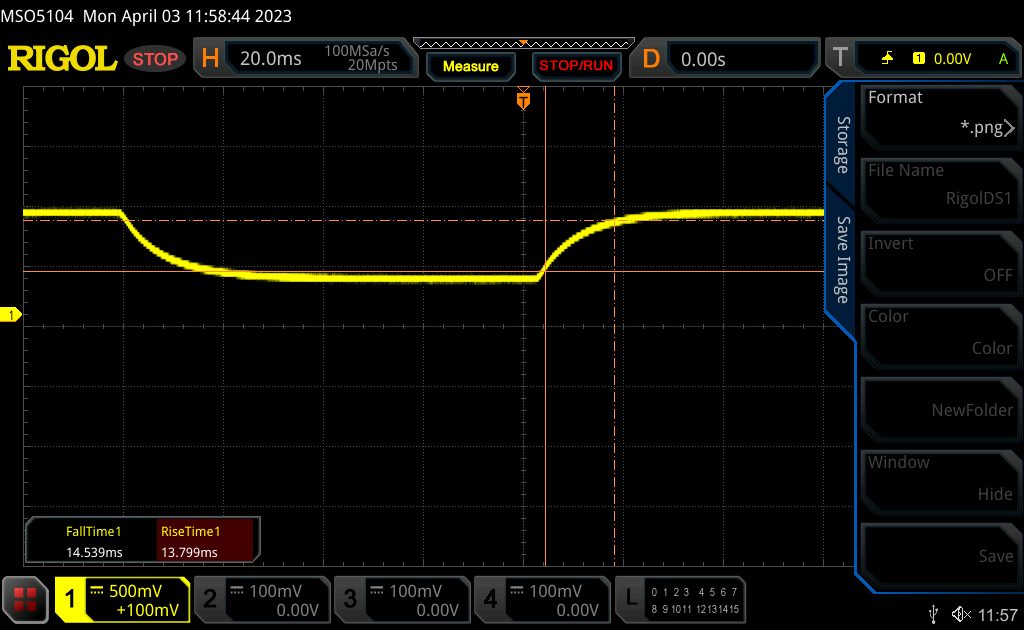 |
| ↘ 14.6 ms fallend | ||
| Die gemessenen Reaktionszeiten sind mittelmäßig und dadurch für Spieler eventuell zu langsam. Im Vergleich rangierten die bei uns getesteten Geräte von 0.165 (Minimum) zu 636 (Maximum) ms. » 38 % aller Screens waren schneller als der getestete. Daher sind die gemessenen Reaktionszeiten durchschnittlich (31 ms). | ||
Bildschirm-Flackern / PWM (Pulse-Width Modulation)
| Flackern / PWM nicht festgestellt | 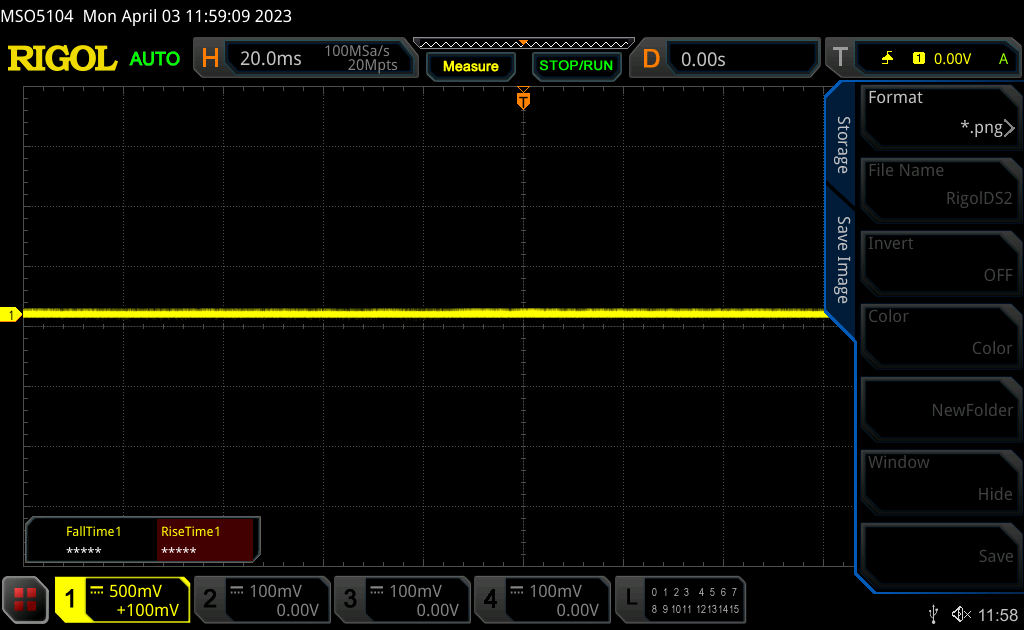 | ||
Im Vergleich: 52 % aller getesteten Geräte nutzten kein PWM um die Helligkeit zu reduzieren. Wenn PWM eingesetzt wurde, dann bei einer Frequenz von durchschnittlich 7753 (Minimum 5, Maximum 343500) Hz. | |||
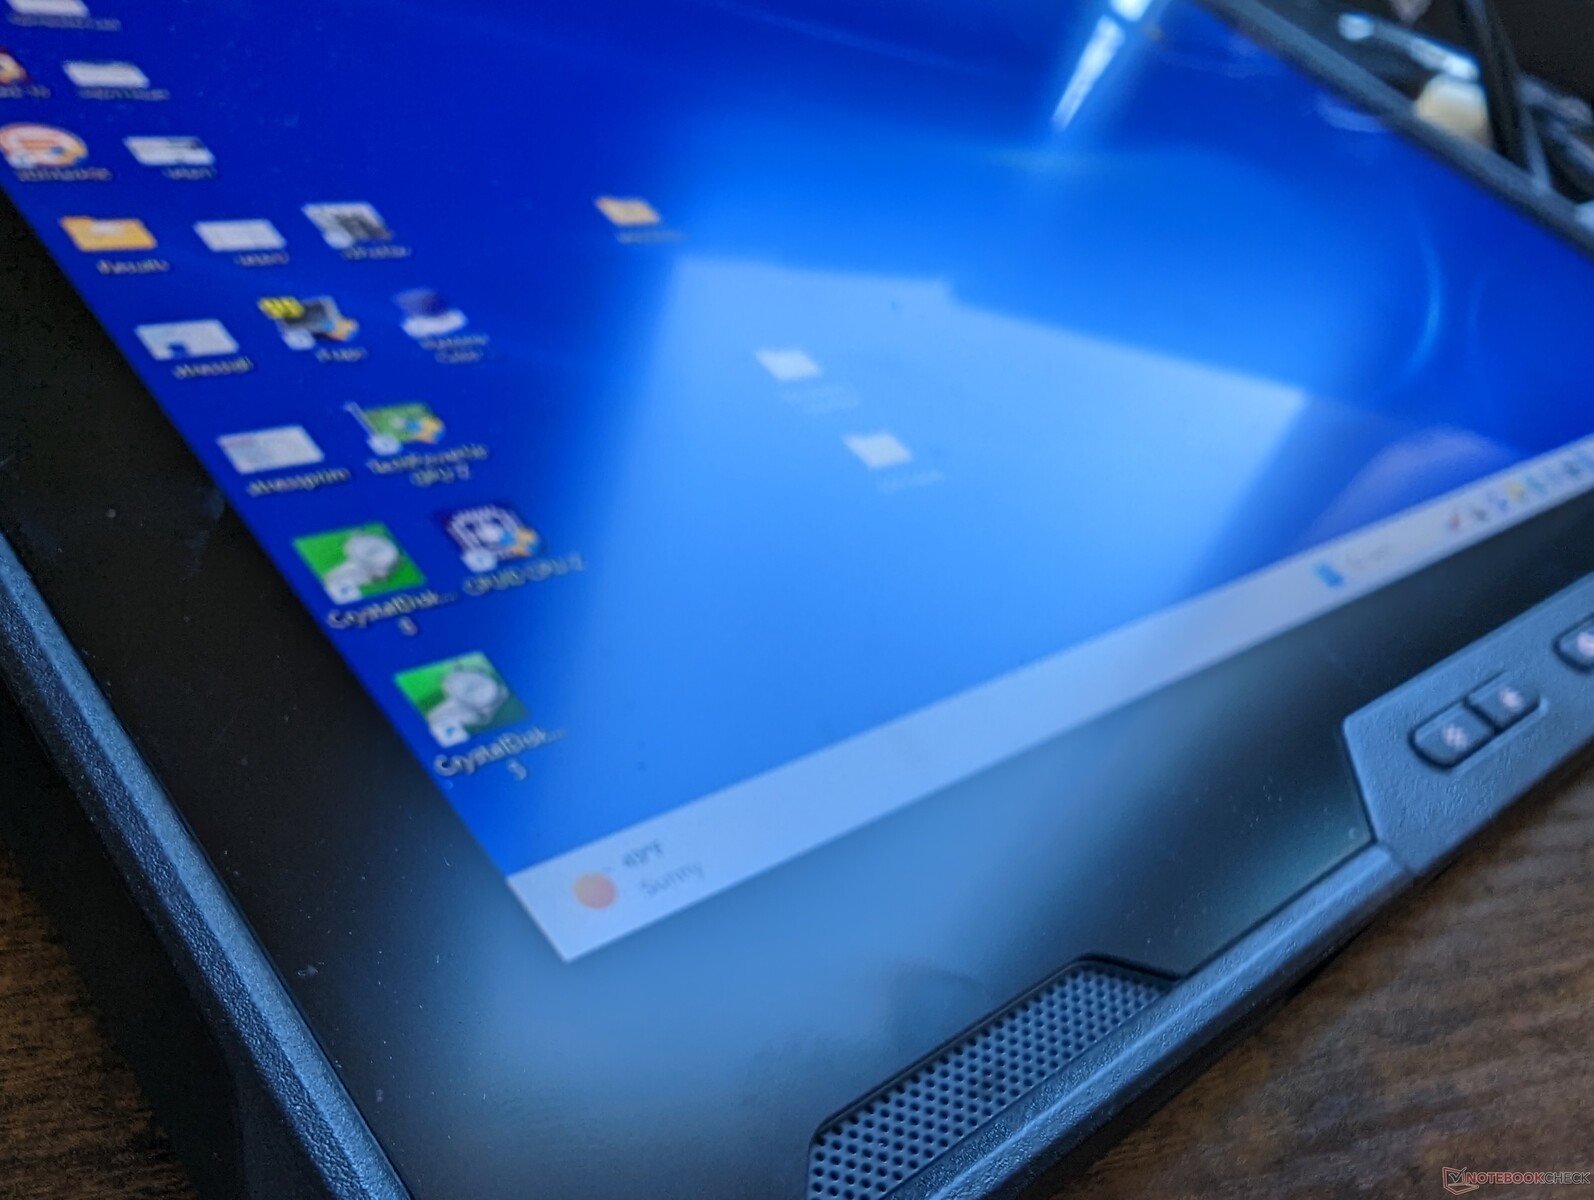
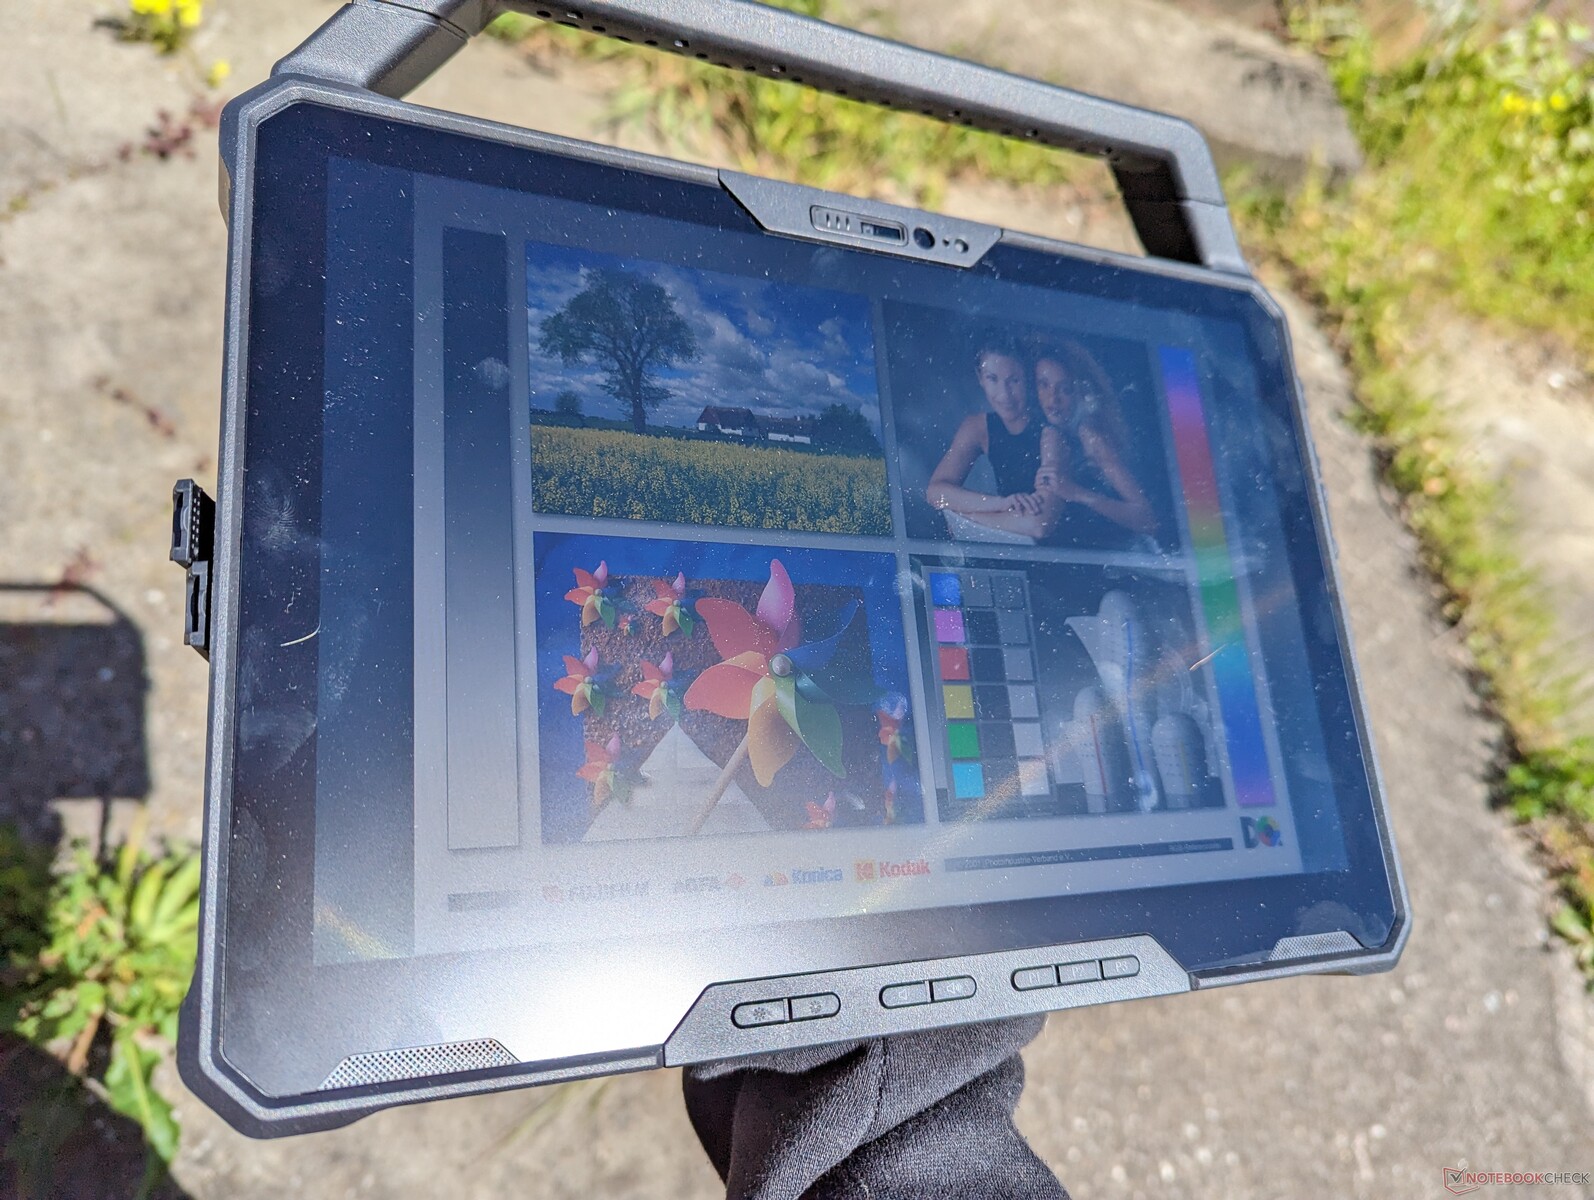
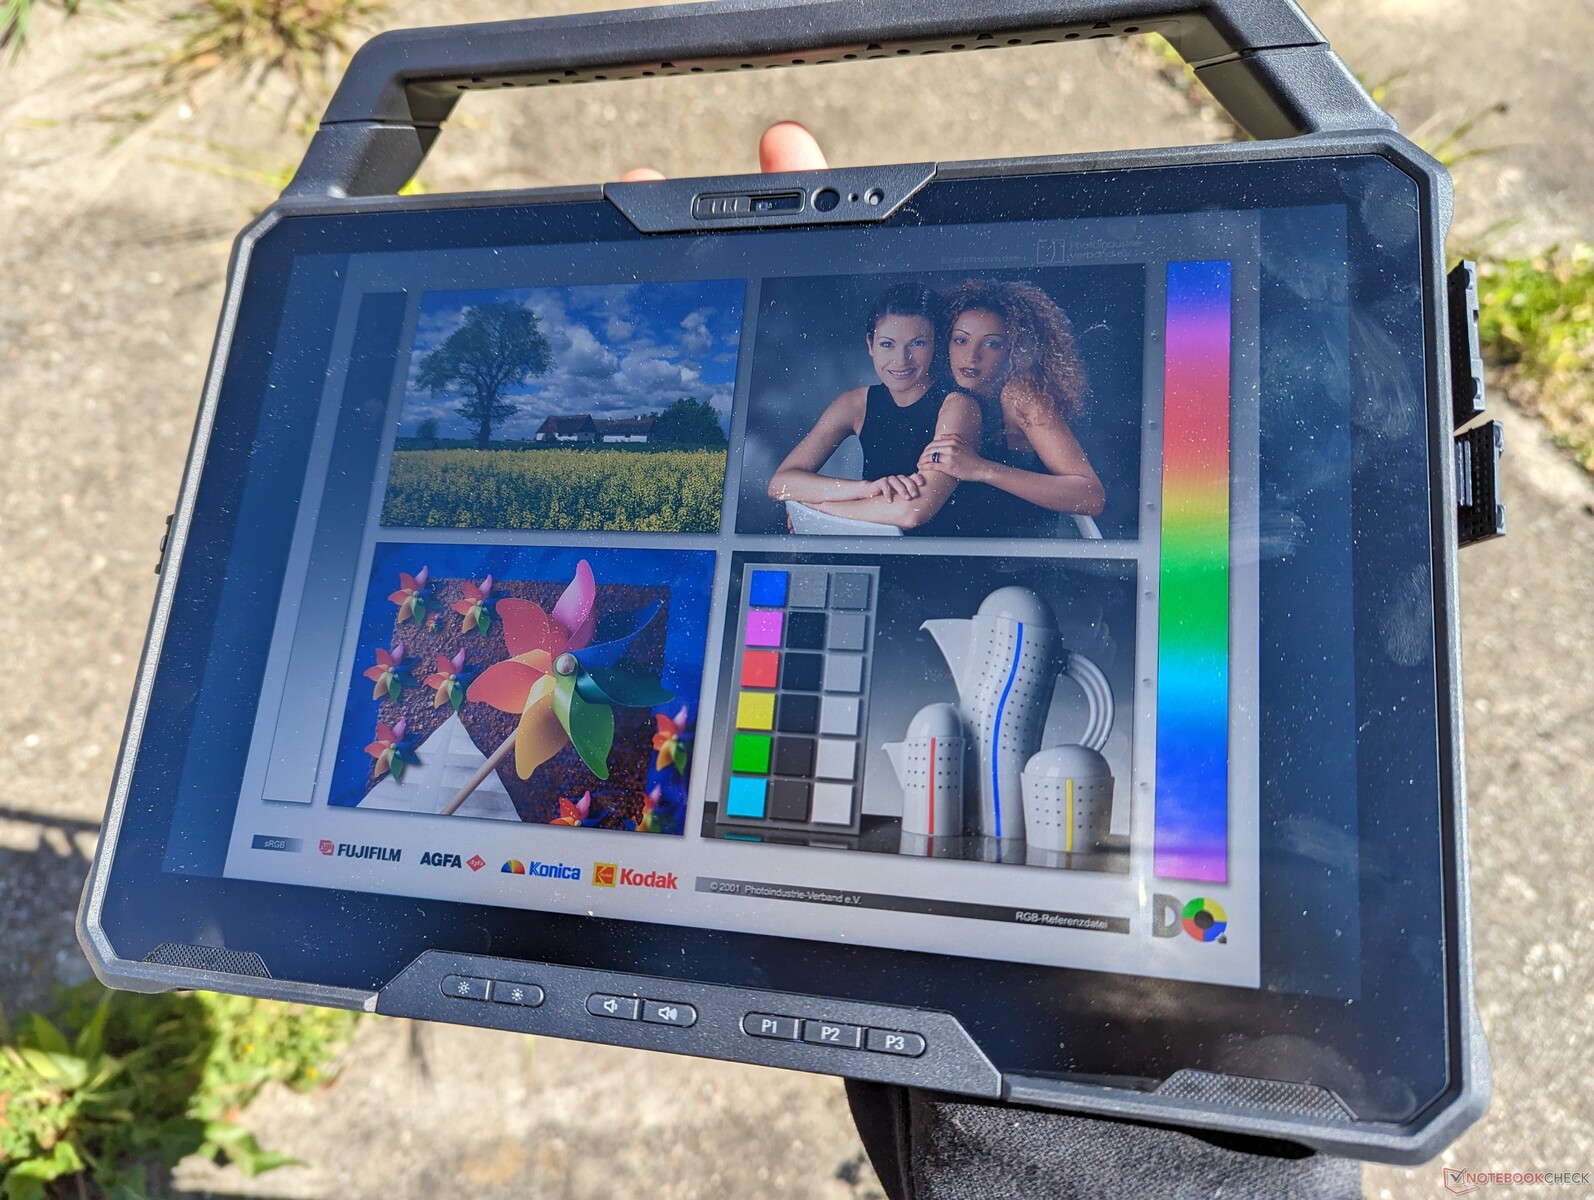
Mit über 1.000 cd/m² ist das Display auch bei direkter Sonneneinstrahlung hervorragend ablesbar. Damit ist der Bildschirm doppelt so hell wie die meisten Consumer-Tablets. Dennoch könnten Reflexionen die Bildqualität beeinträchtigen, wie die folgenden Anwendungsbeispiele zeigen. Durch die hohe Blickwinkelstabilität des Displays ist es jedoch möglich, die Reflexionen mit einer entsprechenden Ausrichtung des Gerätes zu vermeiden.

Leistung
Testbedingungen
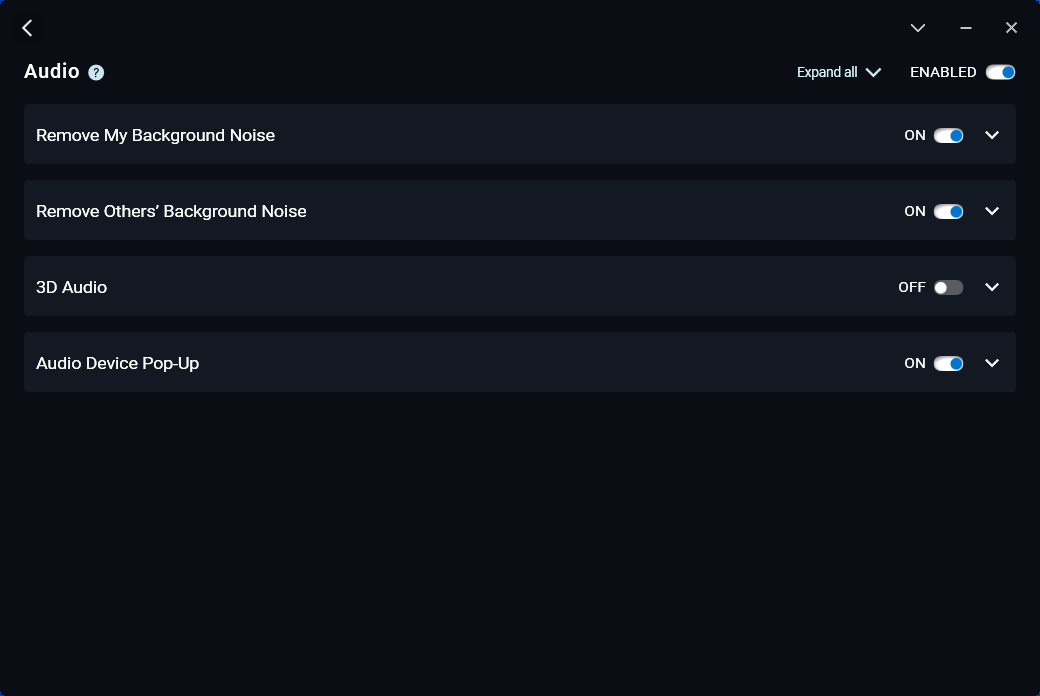
Für die Leistungs-Benchmarks haben wir das Tablet in den Ultra Performance Modus mit der vorinstallierten Dell Optimizer Software versetzt. Benutzer sollten sich mit den wichtigsten Funktionen der umfangreichen Software vertraut machen. Den sie bietet unter anderem die Anpassung der Leistungsprofile, Audioeinstellungen, Mikrofoneinstellungen und drahtlosen Verbindungen.
Dell Presence Detection wird von unserem Testgerät nicht unterstützt.


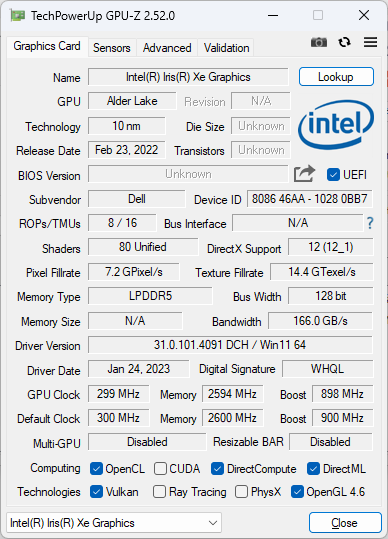
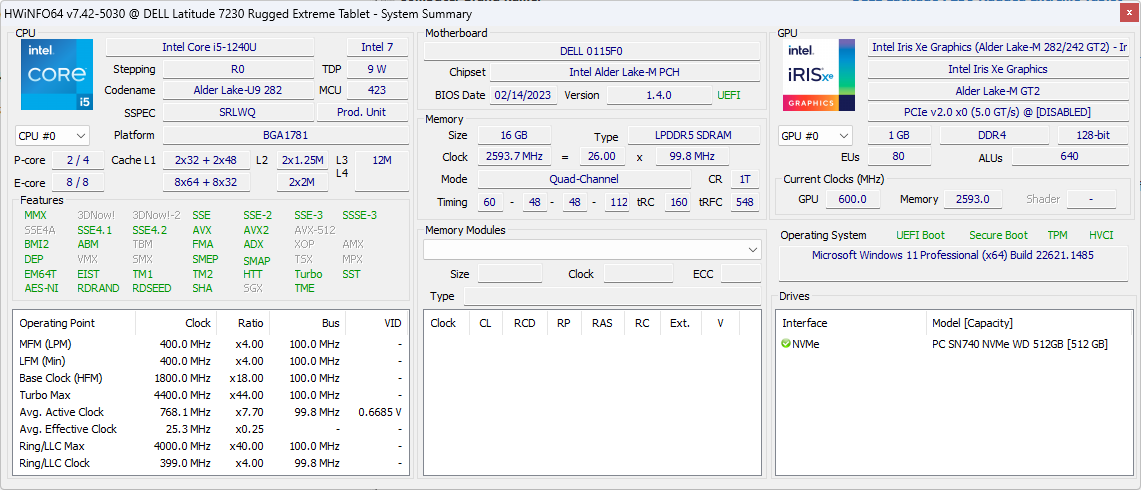
Prozessorleistung - So schnell wie der Intel Core i7-1260U
Im Dell Latitude 7230 ist die Leistung des Intel Core i5-1240U ausgezeichnet. Gerade im Vergleich mit dem vermeintlich stärkeren Core i7-1260U im Latitude 7330 zeigt sich die Leistungsfähigkeit. In der Mehrkernperformance ist der i5 deutlich stärker als die Core i7 Prozessoren der 11. Generation, die in den meisten Rugged-Tablets des letzten Jahres zum Einsatz kamen.
Bei der Konfiguration des Tablets kann zwischen verschiedenen Prozessoroptionen gewählt werden. Intel Core i5-1240U und i7-1260U dürften in der Prozessorleistung nahezu gleichauf liegen. Allerdings dürfte die Leistung der iGPU beim i7 deutlich höher sein.
Cinebench R15 Multi Loop
Cinebench R23: Multi Core | Single Core
Cinebench R20: CPU (Multi Core) | CPU (Single Core)
Cinebench R15: CPU Multi 64Bit | CPU Single 64Bit
Blender: v2.79 BMW27 CPU
7-Zip 18.03: 7z b 4 | 7z b 4 -mmt1
Geekbench 5.5: Multi-Core | Single-Core
HWBOT x265 Benchmark v2.2: 4k Preset
LibreOffice : 20 Documents To PDF
R Benchmark 2.5: Overall mean
* ... kleinere Werte sind besser
| Blender | |
| v3.3 Classroom HIP/AMD | |
| Lenovo ThinkPad P14s G3 AMD 21J6S05000 | |
| Lenovo ThinkPad P14s G3 AMD 21J6S05000 | |
| v3.3 Classroom OPTIX/RTX | |
| HP ZBook Firefly 14 G9-6B8A2EA | |
| v3.3 Classroom CUDA | |
| HP ZBook Firefly 14 G9-6B8A2EA | |
| v3.3 Classroom CPU | |
| Dell Latitude 7230 Rugged Extreme | |
| HP ProBook 440 G9-5Y3Z3EA | |
| HP ZBook Firefly 14 G9-6B8A2EA | |
| HP EliteBook 840 G9 | |
| Asus ExpertBook B5 Flip B5602FBN | |
| Lenovo ThinkPad P14s G3 AMD 21J6S05000 | |
* ... kleinere Werte sind besser
AIDA64: FP32 Ray-Trace | FPU Julia | CPU SHA3 | CPU Queen | FPU SinJulia | FPU Mandel | CPU AES | CPU ZLib | FP64 Ray-Trace | CPU PhotoWorxx
| Performance Rating | |
| Dell Latitude 7330 Rugged Extreme | |
| Acer Enduro Urban N3 EUN314 | |
| Dell Latitude 7230 Rugged Extreme | |
| Durchschnittliche Intel Core i5-1240U | |
| Panasonic Toughbook 40 | |
| Getac B360 | |
| Durabook S14I | |
| AIDA64 / FP32 Ray-Trace | |
| Dell Latitude 7330 Rugged Extreme | |
| Acer Enduro Urban N3 EUN314 | |
| Dell Latitude 7230 Rugged Extreme | |
| Durchschnittliche Intel Core i5-1240U (n=1) | |
| Panasonic Toughbook 40 | |
| Durabook S14I | |
| Getac B360 | |
| AIDA64 / FPU Julia | |
| Dell Latitude 7230 Rugged Extreme | |
| Durchschnittliche Intel Core i5-1240U (n=1) | |
| Dell Latitude 7330 Rugged Extreme | |
| Acer Enduro Urban N3 EUN314 | |
| Getac B360 | |
| Panasonic Toughbook 40 | |
| Durabook S14I | |
| AIDA64 / CPU SHA3 | |
| Dell Latitude 7330 Rugged Extreme | |
| Acer Enduro Urban N3 EUN314 | |
| Dell Latitude 7230 Rugged Extreme | |
| Durchschnittliche Intel Core i5-1240U (n=1) | |
| Panasonic Toughbook 40 | |
| Durabook S14I | |
| Getac B360 | |
| AIDA64 / CPU Queen | |
| Getac B360 | |
| Dell Latitude 7330 Rugged Extreme | |
| Acer Enduro Urban N3 EUN314 | |
| Durabook S14I | |
| Dell Latitude 7230 Rugged Extreme | |
| Durchschnittliche Intel Core i5-1240U (n=1) | |
| Panasonic Toughbook 40 | |
| AIDA64 / FPU SinJulia | |
| Dell Latitude 7330 Rugged Extreme | |
| Acer Enduro Urban N3 EUN314 | |
| Getac B360 | |
| Panasonic Toughbook 40 | |
| Dell Latitude 7230 Rugged Extreme | |
| Durchschnittliche Intel Core i5-1240U (n=1) | |
| Durabook S14I | |
| AIDA64 / FPU Mandel | |
| Dell Latitude 7330 Rugged Extreme | |
| Acer Enduro Urban N3 EUN314 | |
| Dell Latitude 7230 Rugged Extreme | |
| Durchschnittliche Intel Core i5-1240U (n=1) | |
| Panasonic Toughbook 40 | |
| Durabook S14I | |
| Getac B360 | |
| AIDA64 / CPU AES | |
| Dell Latitude 7330 Rugged Extreme | |
| Acer Enduro Urban N3 EUN314 | |
| Durabook S14I | |
| Dell Latitude 7230 Rugged Extreme | |
| Durchschnittliche Intel Core i5-1240U (n=1) | |
| Panasonic Toughbook 40 | |
| Getac B360 | |
| AIDA64 / CPU ZLib | |
| Dell Latitude 7230 Rugged Extreme | |
| Durchschnittliche Intel Core i5-1240U (n=1) | |
| Dell Latitude 7330 Rugged Extreme | |
| Acer Enduro Urban N3 EUN314 | |
| Panasonic Toughbook 40 | |
| Getac B360 | |
| Durabook S14I | |
| AIDA64 / FP64 Ray-Trace | |
| Dell Latitude 7330 Rugged Extreme | |
| Acer Enduro Urban N3 EUN314 | |
| Dell Latitude 7230 Rugged Extreme | |
| Durchschnittliche Intel Core i5-1240U (n=1) | |
| Panasonic Toughbook 40 | |
| Durabook S14I | |
| Getac B360 | |
| AIDA64 / CPU PhotoWorxx | |
| Dell Latitude 7330 Rugged Extreme | |
| Dell Latitude 7230 Rugged Extreme | |
| Durchschnittliche Intel Core i5-1240U (n=1) | |
| Acer Enduro Urban N3 EUN314 | |
| Panasonic Toughbook 40 | |
| Getac B360 | |
| Durabook S14I | |
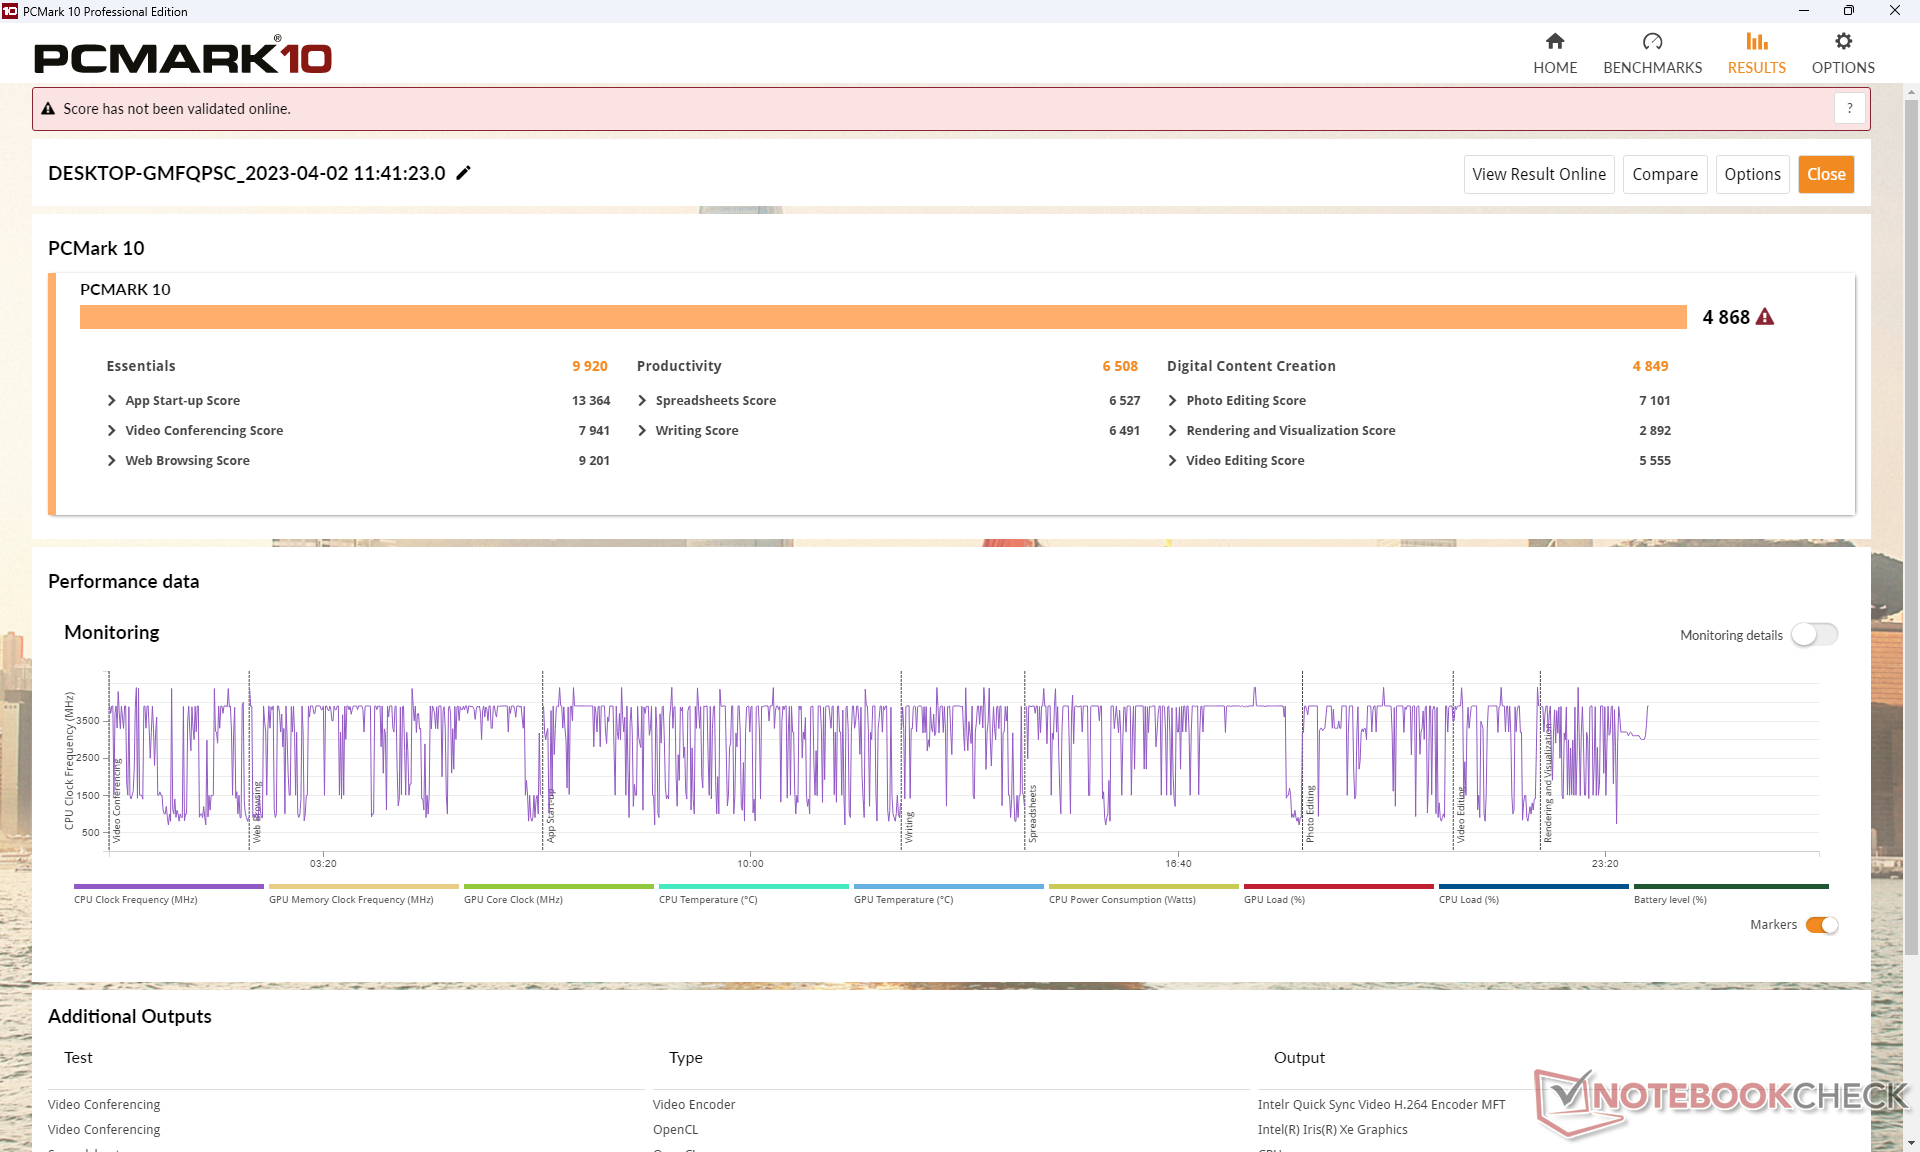
System Performance
CrossMark: Overall | Productivity | Creativity | Responsiveness
| PCMark 10 / Score | |
| Dell Latitude 7330 Rugged Extreme | |
| Panasonic Toughbook 40 | |
| Dell Latitude 7230 Rugged Extreme | |
| Durchschnittliche Intel Core i5-1240U, Intel Iris Xe Graphics G7 80EUs (n=1) | |
| Durabook S14I | |
| Acer Enduro Urban N3 EUN314 | |
| Getac B360 | |
| PCMark 10 / Essentials | |
| Dell Latitude 7330 Rugged Extreme | |
| Durabook S14I | |
| Dell Latitude 7230 Rugged Extreme | |
| Durchschnittliche Intel Core i5-1240U, Intel Iris Xe Graphics G7 80EUs (n=1) | |
| Panasonic Toughbook 40 | |
| Acer Enduro Urban N3 EUN314 | |
| Getac B360 | |
| PCMark 10 / Productivity | |
| Getac B360 | |
| Durabook S14I | |
| Dell Latitude 7330 Rugged Extreme | |
| Panasonic Toughbook 40 | |
| Dell Latitude 7230 Rugged Extreme | |
| Durchschnittliche Intel Core i5-1240U, Intel Iris Xe Graphics G7 80EUs (n=1) | |
| Acer Enduro Urban N3 EUN314 | |
| PCMark 10 / Digital Content Creation | |
| Dell Latitude 7330 Rugged Extreme | |
| Panasonic Toughbook 40 | |
| Acer Enduro Urban N3 EUN314 | |
| Dell Latitude 7230 Rugged Extreme | |
| Durchschnittliche Intel Core i5-1240U, Intel Iris Xe Graphics G7 80EUs (n=1) | |
| Durabook S14I | |
| Getac B360 | |
| CrossMark / Overall | |
| Dell Latitude 7230 Rugged Extreme | |
| Durchschnittliche Intel Core i5-1240U, Intel Iris Xe Graphics G7 80EUs (n=1) | |
| Panasonic Toughbook 40 | |
| CrossMark / Productivity | |
| Dell Latitude 7230 Rugged Extreme | |
| Durchschnittliche Intel Core i5-1240U, Intel Iris Xe Graphics G7 80EUs (n=1) | |
| Panasonic Toughbook 40 | |
| CrossMark / Creativity | |
| Dell Latitude 7230 Rugged Extreme | |
| Durchschnittliche Intel Core i5-1240U, Intel Iris Xe Graphics G7 80EUs (n=1) | |
| Panasonic Toughbook 40 | |
| CrossMark / Responsiveness | |
| Dell Latitude 7230 Rugged Extreme | |
| Durchschnittliche Intel Core i5-1240U, Intel Iris Xe Graphics G7 80EUs (n=1) | |
| Panasonic Toughbook 40 | |
| PCMark 10 Score | 4868 Punkte | |
Hilfe | ||
| AIDA64 / Memory Copy | |
| Dell Latitude 7230 Rugged Extreme | |
| Durchschnittliche Intel Core i5-1240U (n=1) | |
| Dell Latitude 7330 Rugged Extreme | |
| Acer Enduro Urban N3 EUN314 | |
| Panasonic Toughbook 40 | |
| Getac B360 | |
| Durabook S14I | |
| AIDA64 / Memory Read | |
| Dell Latitude 7330 Rugged Extreme | |
| Dell Latitude 7230 Rugged Extreme | |
| Durchschnittliche Intel Core i5-1240U (n=1) | |
| Acer Enduro Urban N3 EUN314 | |
| Panasonic Toughbook 40 | |
| Getac B360 | |
| Durabook S14I | |
| AIDA64 / Memory Write | |
| Dell Latitude 7330 Rugged Extreme | |
| Dell Latitude 7230 Rugged Extreme | |
| Durchschnittliche Intel Core i5-1240U (n=1) | |
| Acer Enduro Urban N3 EUN314 | |
| Getac B360 | |
| Panasonic Toughbook 40 | |
| Durabook S14I | |
| AIDA64 / Memory Latency | |
| Dell Latitude 7230 Rugged Extreme | |
| Durchschnittliche Intel Core i5-1240U (n=1) | |
| Panasonic Toughbook 40 | |
| Dell Latitude 7330 Rugged Extreme | |
| Acer Enduro Urban N3 EUN314 | |
| Durabook S14I | |
| Getac B360 | |
* ... kleinere Werte sind besser
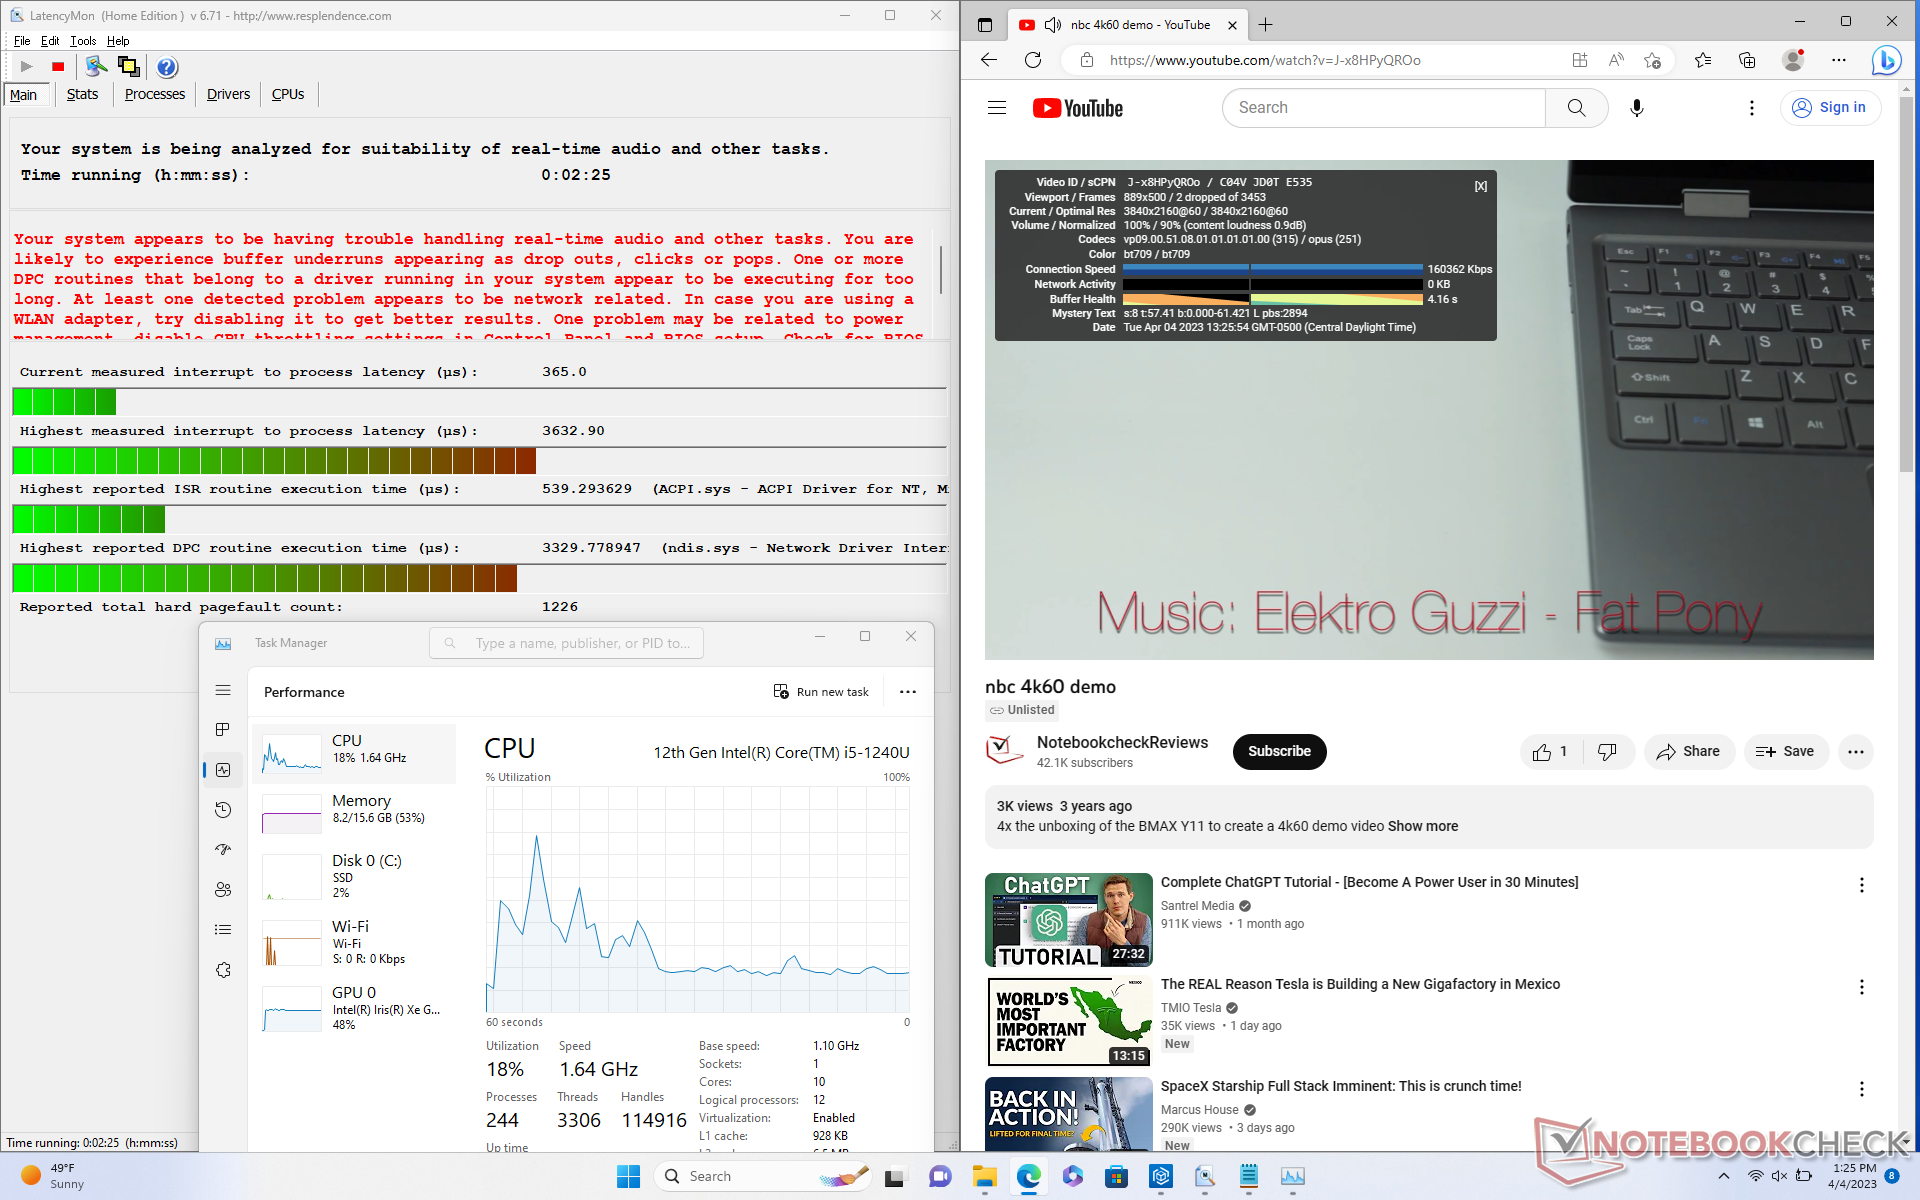
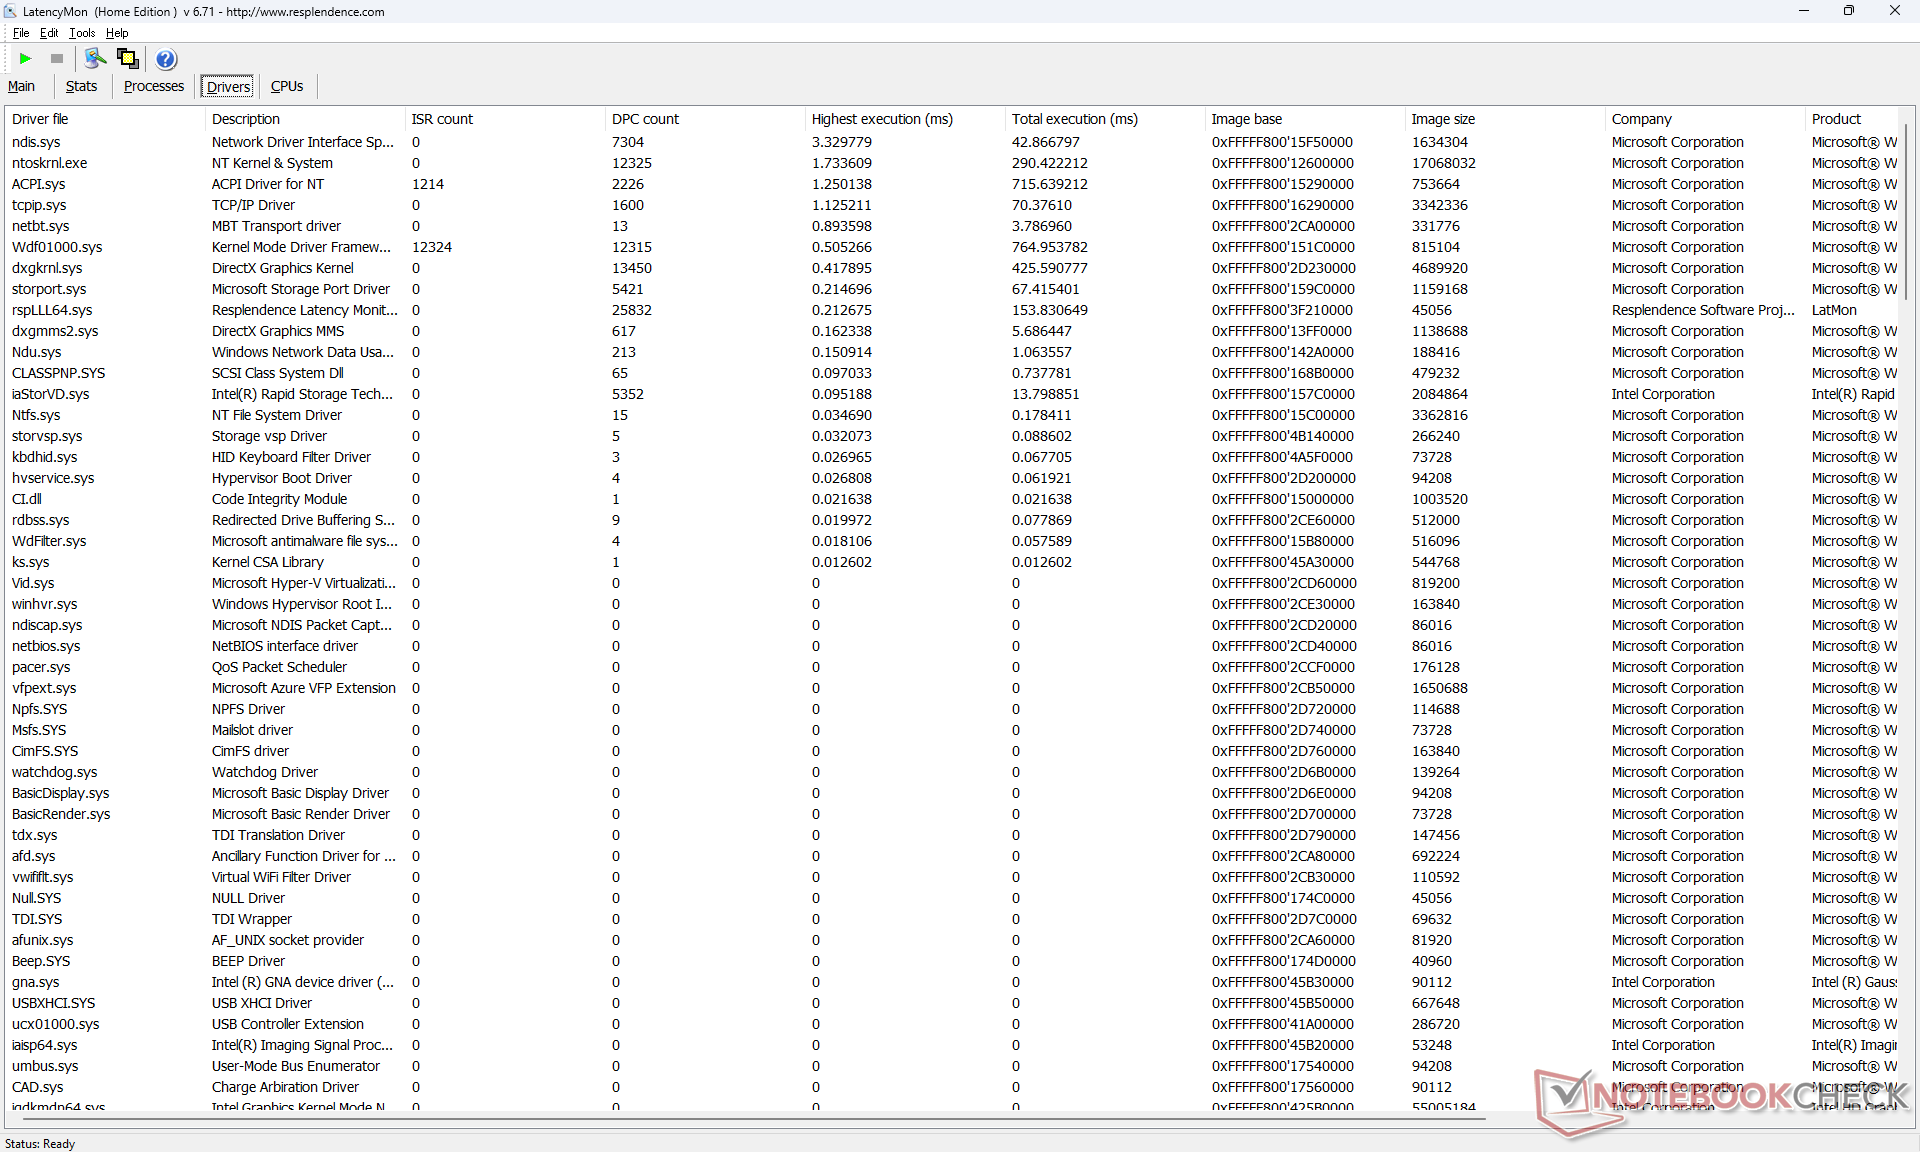
DPC Latenzen
LatencyMon zeigt DPC-Probleme beim Öffnen mehrerer Browser-Tabs auf unserer Homepage. Das ist enttäuschend für ein Gerät, das für industrielle Anwendungen gedacht ist. Die Stabilität der Leistung sollte hier an erster Stelle stehen. Auch die 4K-Videowiedergabe bei 60 FPS ist leider nicht ganz perfekt. Während unseres einminütigen Testvideos gab es zwei Bildaussetzer.
| DPC Latencies / LatencyMon - interrupt to process latency (max), Web, Youtube, Prime95 | |
| Acer Enduro Urban N3 EUN314 | |
| Dell Latitude 7230 Rugged Extreme | |
| Durabook S14I | |
| Panasonic Toughbook 40 | |
| Getac B360 | |
| Dell Latitude 7330 Rugged Extreme | |
* ... kleinere Werte sind besser
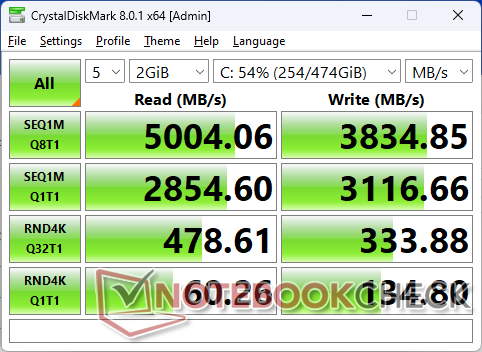
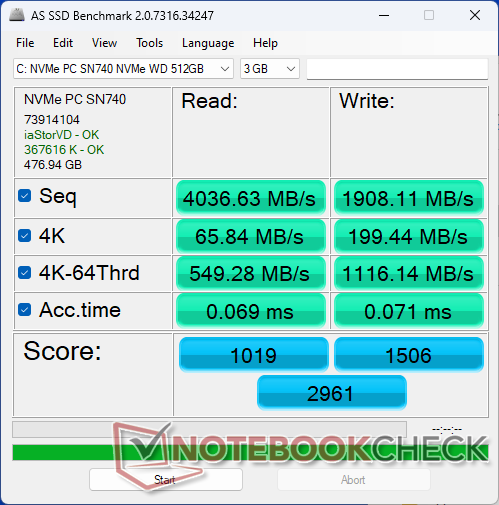
Massenspeicher
Unser Industrie-Tablet von Dell wurde mit der austauschbaren WD PC SN740 PCIe4 x4 NVMe SSD ausgeliefert. Im Testgerät liefert die SSD-Übertragungsgeschwindigkeiten von bis zu 4.800 MB/s. Allerdings kann der Speicher diese hohen Übertragungsraten nicht halten. Nach kurzer Zeit wird die Übertragungsrate, wohl aufgrund von Überhitzung, auf nur noch 2.300 MB/s gedrosselt.

| Drive Performance Rating - Percent | |
| Dell Latitude 7330 Rugged Extreme | |
| Dell Latitude 7230 Rugged Extreme | |
| Acer Enduro Urban N3 EUN314 | |
| Getac B360 | |
| Durabook S14I | |
| Panasonic Toughbook 40 | |
* ... kleinere Werte sind besser
Disk Throttling: DiskSpd Read Loop, Queue Depth 8
GPU Performance — Leicht unterdurchschnittliche Iris Xe 80 EUs
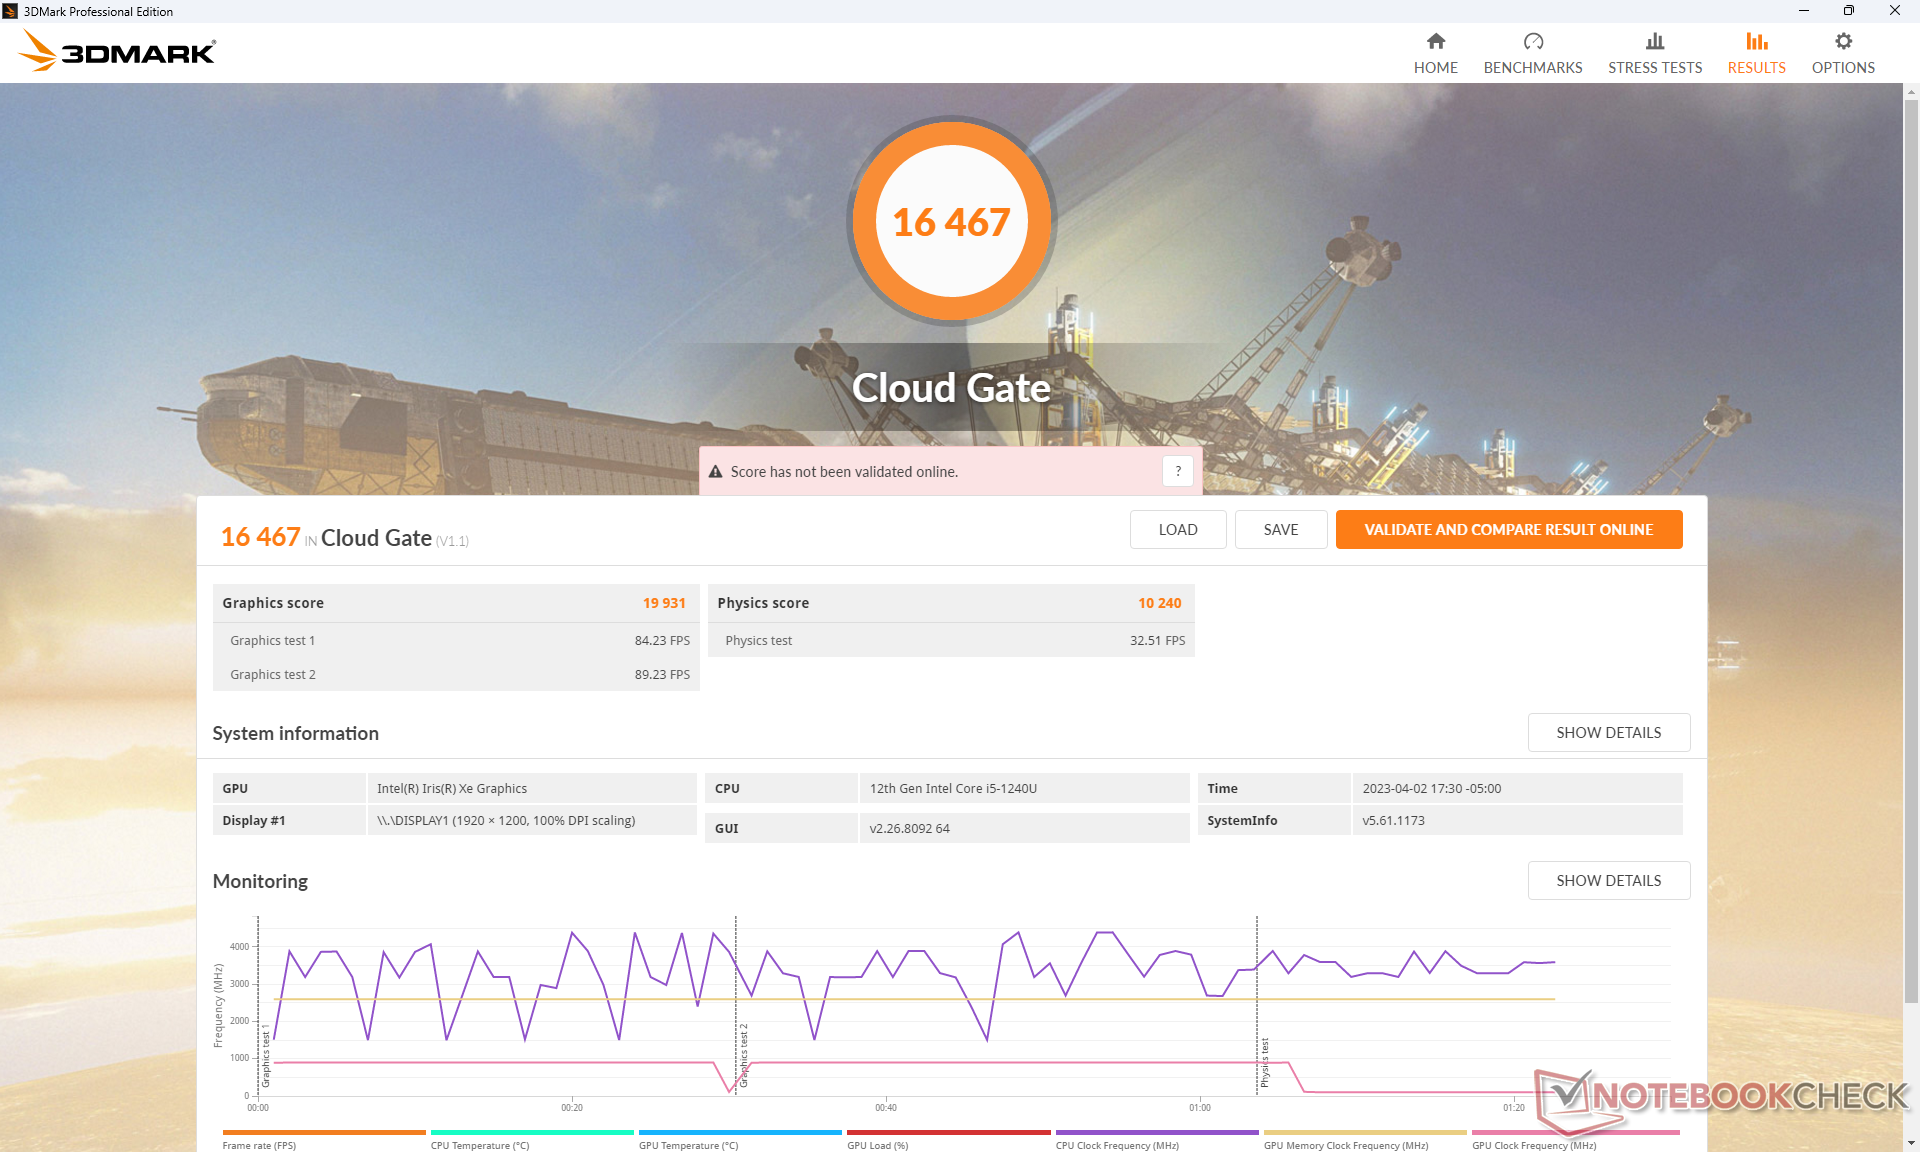
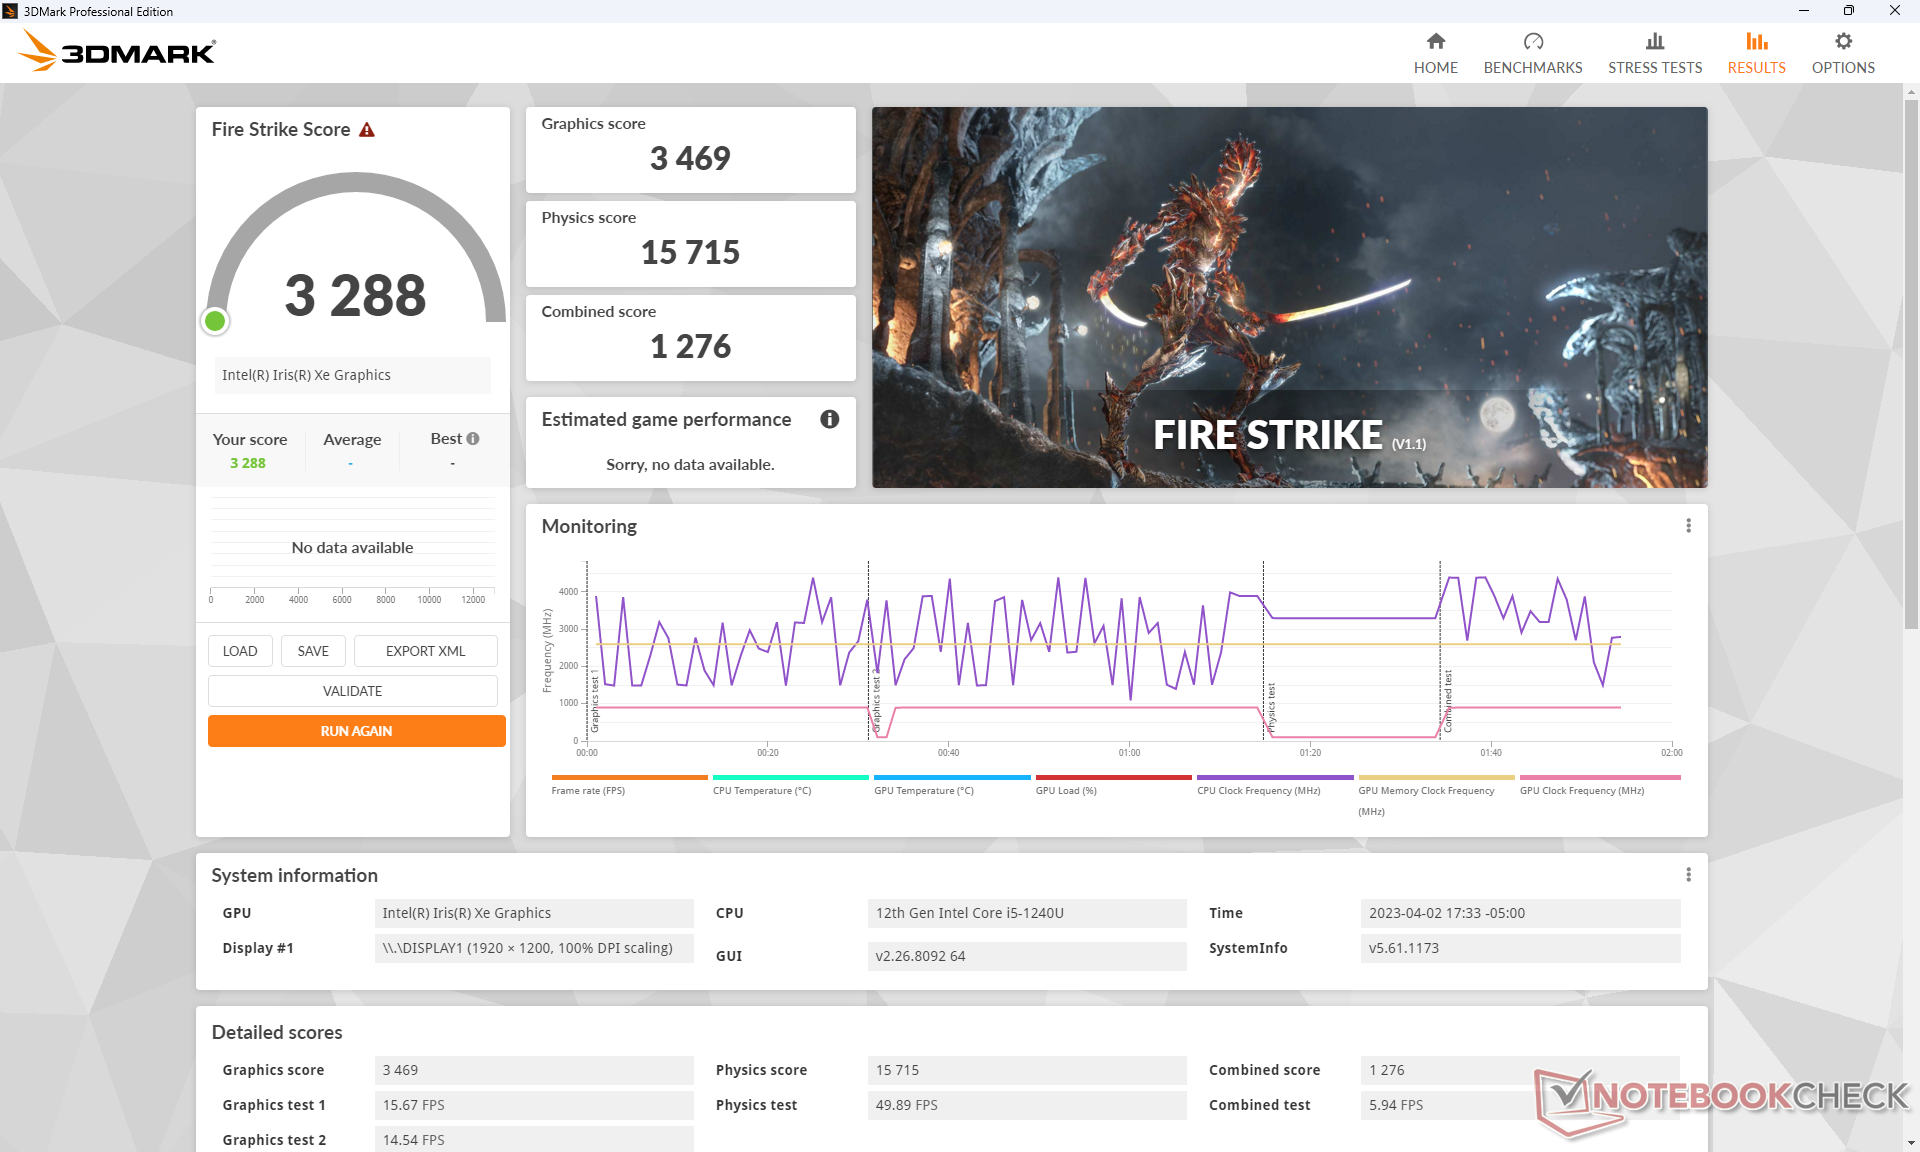
Die Grafikleistung des Dell Latitude 7230 liegt etwa 5 bis 15 Prozent unter dem, was man von einer Intel Iris XE mit 80 EUs erwarten kann. Gegenüber einer Iris Xe mit 96 EUs, wie sie im Core i7 zu finden ist, dürften sogar 30 bis 40 Prozent fehlen.
Zwischen den Leistungsprofilen Optimiert und Ultra Leistung gibt es hier kaum Unterschiede. Die Benchmark-Ergebnisse mit 3DMark 11 liegen somit in beiden Leistungsmodi nahezu gleichauf.
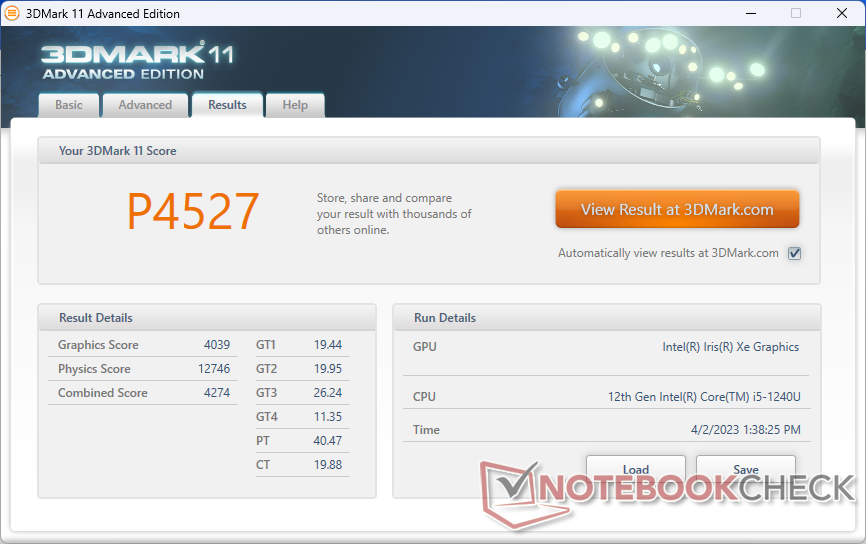
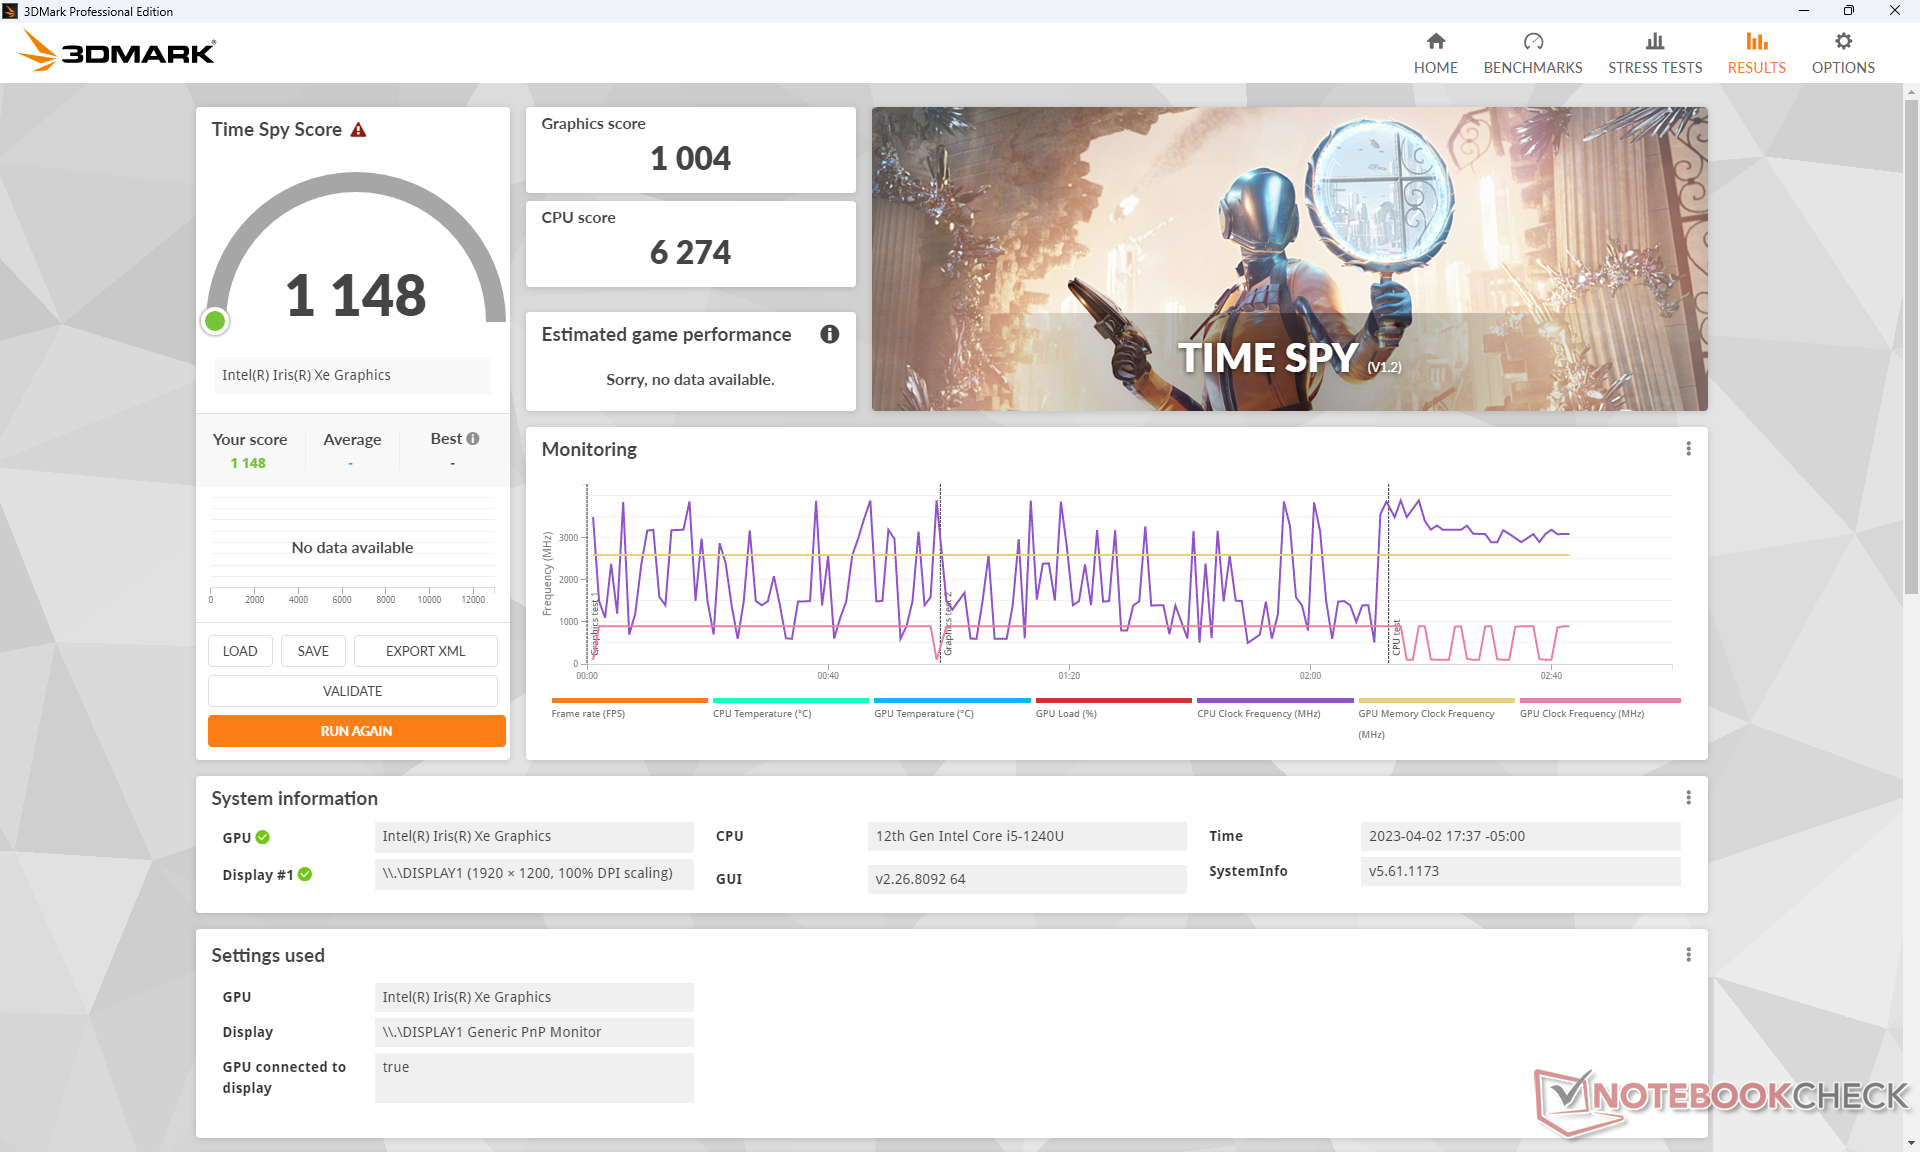
| 3DMark 11 Performance | 4527 Punkte | |
| 3DMark Cloud Gate Standard Score | 16467 Punkte | |
| 3DMark Fire Strike Score | 3288 Punkte | |
| 3DMark Time Spy Score | 1148 Punkte | |
Hilfe | ||
| GTA V - 1920x1080 Highest AA:4xMSAA + FX AF:16x | |
| HP ZBook Firefly 14 G9-6B8A2EA | |
| Lenovo ThinkPad P14s G3 AMD 21J6S05000 | |
| Asus ExpertBook B5 Flip B5602FBN | |
| HP EliteBook 840 G9 | |
| Acer Enduro Urban N3 EUN314 | |
| Dell Latitude 7230 Rugged Extreme | |
| Strange Brigade - 1920x1080 ultra AA:ultra AF:16 | |
| Asus ExpertBook B5 Flip B5602FBN | |
| HP ZBook Firefly 14 G9-6B8A2EA | |
| Lenovo ThinkPad P14s G3 AMD 21J6S05000 | |
| HP EliteBook 840 G9 | |
| Acer Enduro Urban N3 EUN314 | |
| Dell Latitude 7230 Rugged Extreme | |
Witcher 3 FPS Chart
| min. | mittel | hoch | max. | |
|---|---|---|---|---|
| GTA V (2015) | 103.3 | 93.3 | 18.5 | 7.79 |
| The Witcher 3 (2015) | 67.3 | 40.9 | 24.1 | 10.6 |
| Dota 2 Reborn (2015) | 98.9 | 77.8 | 50.7 | 45.7 |
| Final Fantasy XV Benchmark (2018) | 31 | 17.3 | 11.8 | |
| X-Plane 11.11 (2018) | 32.6 | 22.6 | 20.6 | |
| Strange Brigade (2018) | 60.2 | 27.4 | 21.4 | 17.9 |
Emissionen — Leise ... bis es dann doch laut wird
Geräuschemissionen
Meist sind die Lüftergeräusche des Dell-Tablets leise und bei geringer bis mittlerer Last praktisch nicht hörbar. Die erste Benchmark-Szene des 3DMark 06 verursacht zum Beispiel bis zum Ende des Benchmarks keine Lüftergeräusche.
Leider ist der Lüfter mit seinem kleinen Durchmesser etwas lauter als dies bei den meisten Laptops der Fall ist. Bei sehr anspruchsvollen Anwendungen wie Spielen oder Prime95 kann der Lüfter bis zu 43 dB(A) erreichen. Damit gehöhrt das Dell Latitude 7230 Rugged Extreme Tablet zu den lautesten robusten Tablets, die wir getestet haben. Allerdings muss man den Tablet-Computer wirklich an seine Grenzen treiben, um so hohe Geräuschpegel zu erreichen.
Lautstärkediagramm
| Idle |
| 22.9 / 22.9 / 22.9 dB(A) |
| Last |
| 24.5 / 43.2 dB(A) |
 | ||
30 dB leise 40 dB(A) deutlich hörbar 50 dB(A) störend |
||
min: | ||
| Dell Latitude 7230 Rugged Extreme Iris Xe G7 80EUs, i5-1240U, WD PC SN740 512GB SDDPMQD-512G-1101 | Dell Latitude 7330 Rugged Extreme Iris Xe G7 96EUs, i7-1185G7 | Panasonic Toughbook 40 Iris Xe G7 96EUs, i7-1185G7, Samsung PM991 MZVLQ1T0HALB | Getac B360 UHD Graphics 620, i7-10710U, Lite-On CA5-8D512 | Acer Enduro Urban N3 EUN314 Iris Xe G7 96EUs, i7-1165G7, Samsung PM991 MZVLQ1T0HALB | Durabook S14I Iris Xe G7 96EUs, i7-1165G7, UDinfo M2P M2P80DE512GBAEP | |
|---|---|---|---|---|---|---|
| Geräuschentwicklung | 2% | -13% | 0% | -3% | -18% | |
| aus / Umgebung * (dB) | 22.8 | 22.9 -0% | 22.8 -0% | 24.3 -7% | 23.8 -4% | 25.2 -11% |
| Idle min * (dB) | 22.9 | 23.1 -1% | 26 -14% | 24.5 -7% | 24.1 -5% | 25.2 -10% |
| Idle avg * (dB) | 22.9 | 23.1 -1% | 26 -14% | 24.5 -7% | 24.1 -5% | 25.2 -10% |
| Idle max * (dB) | 22.9 | 23.1 -1% | 26 -14% | 24.6 -7% | 24.1 -5% | 34.5 -51% |
| Last avg * (dB) | 24.5 | 28 -14% | 37.6 -53% | 29.8 -22% | 27.9 -14% | 34.5 -41% |
| Witcher 3 ultra * (dB) | 36 | 31.2 13% | 37.8 -5% | 27.3 24% | 35.7 1% | |
| Last max * (dB) | 43.2 | 36.2 16% | 40.3 7% | 30.8 29% | 38.6 11% | 36.2 16% |
* ... kleinere Werte sind besser
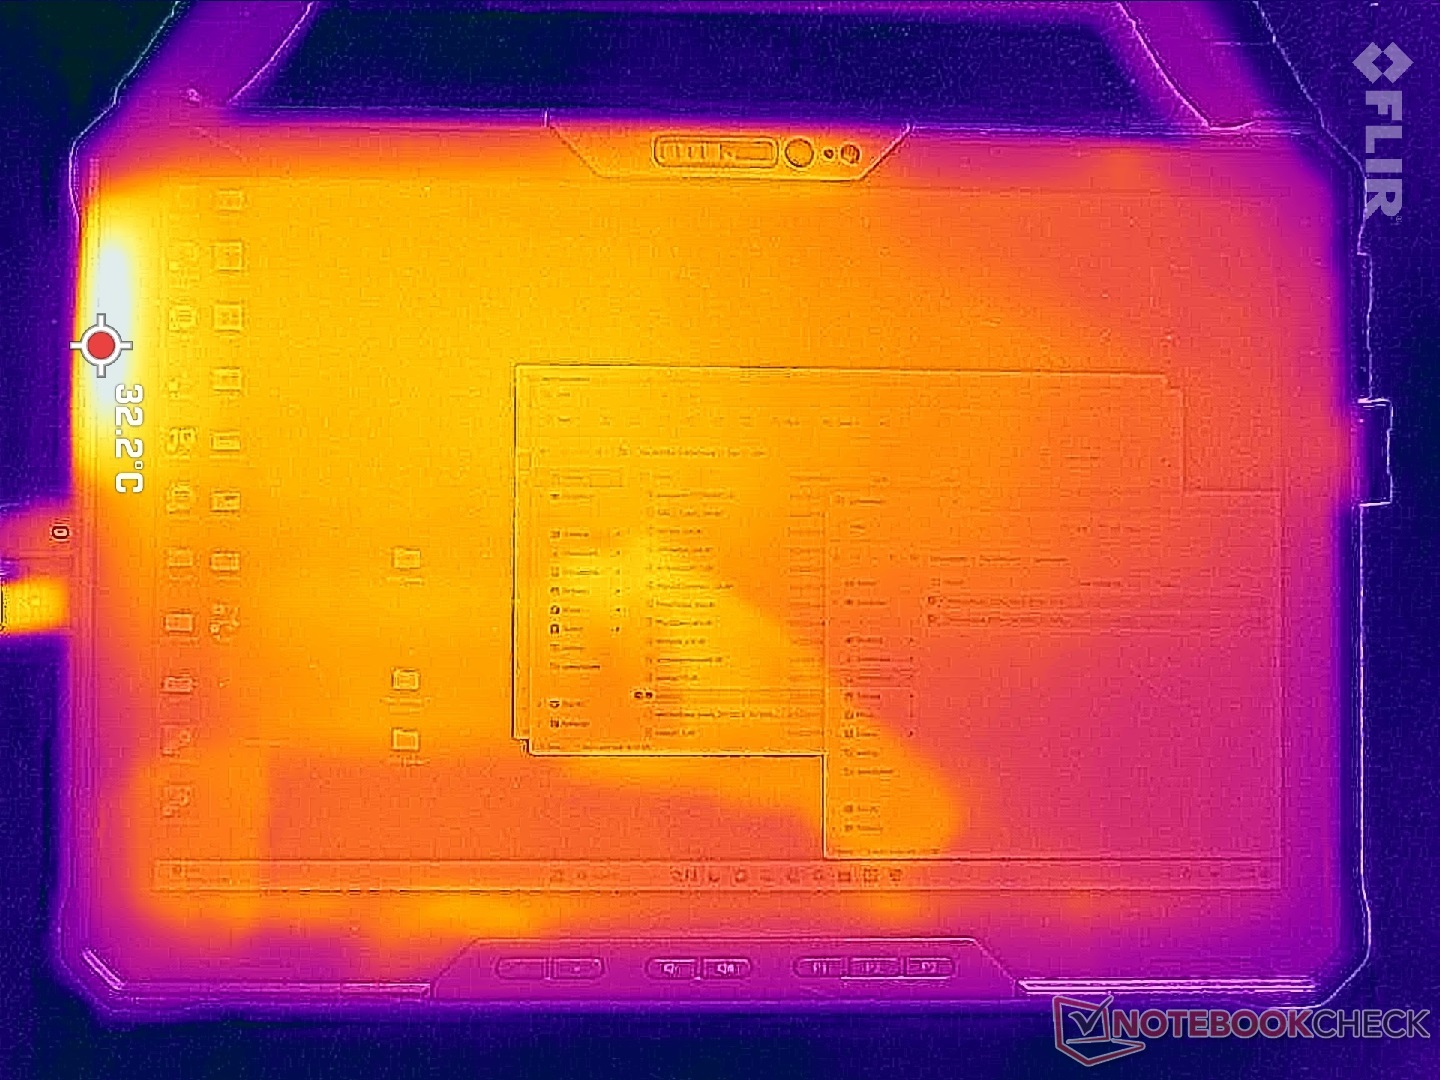
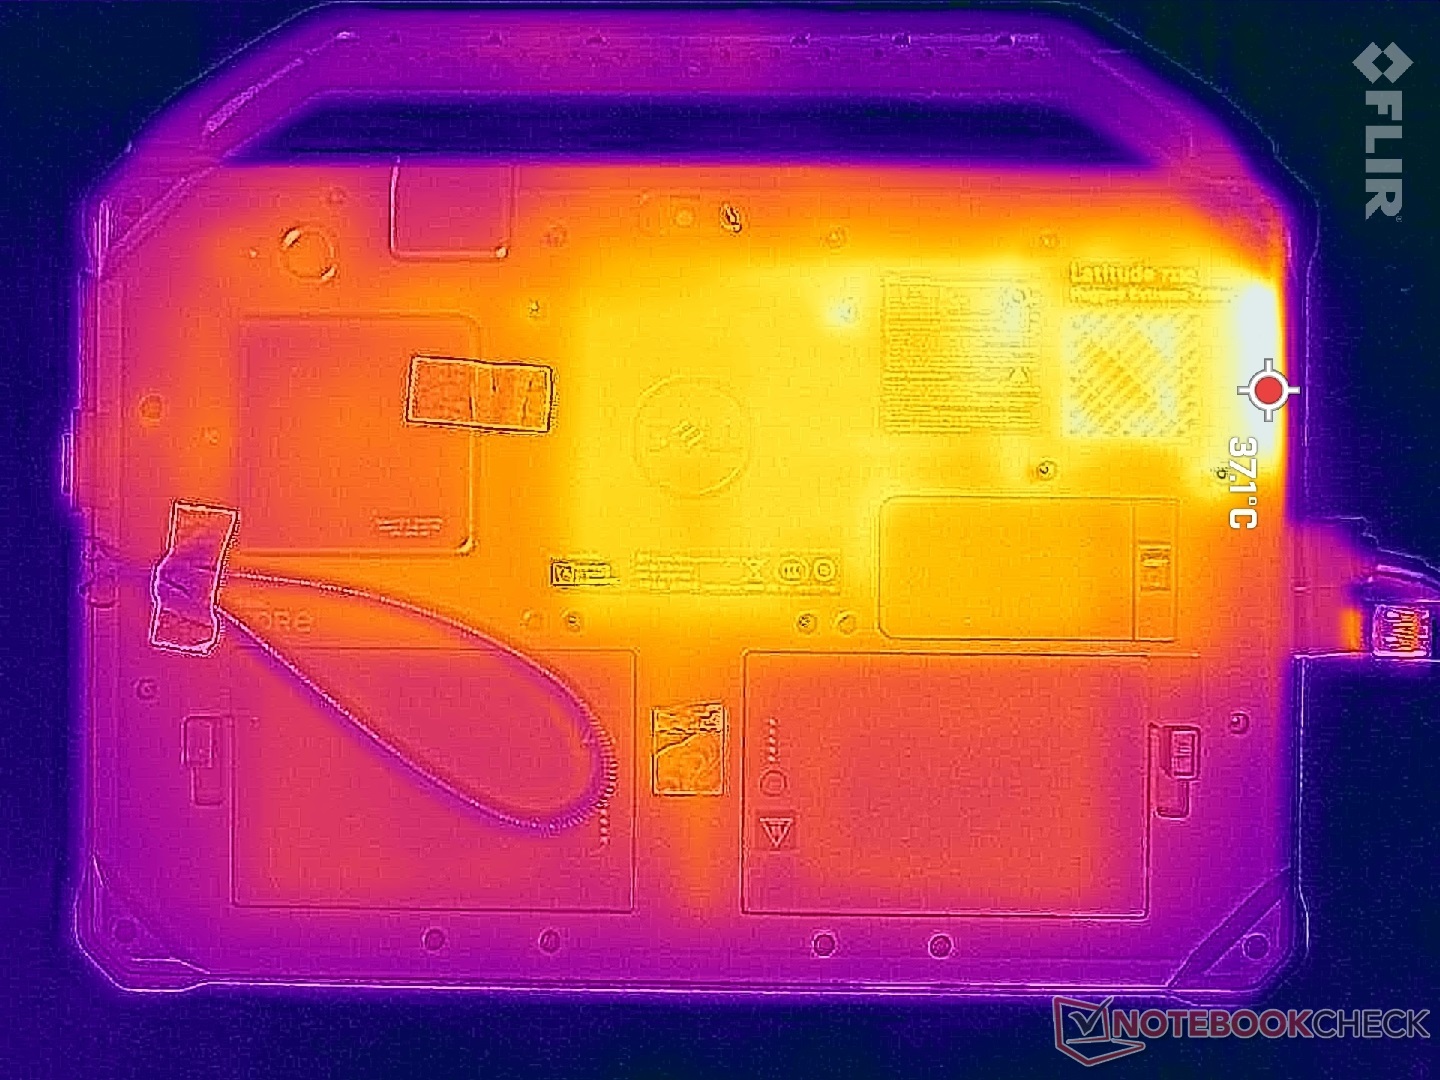
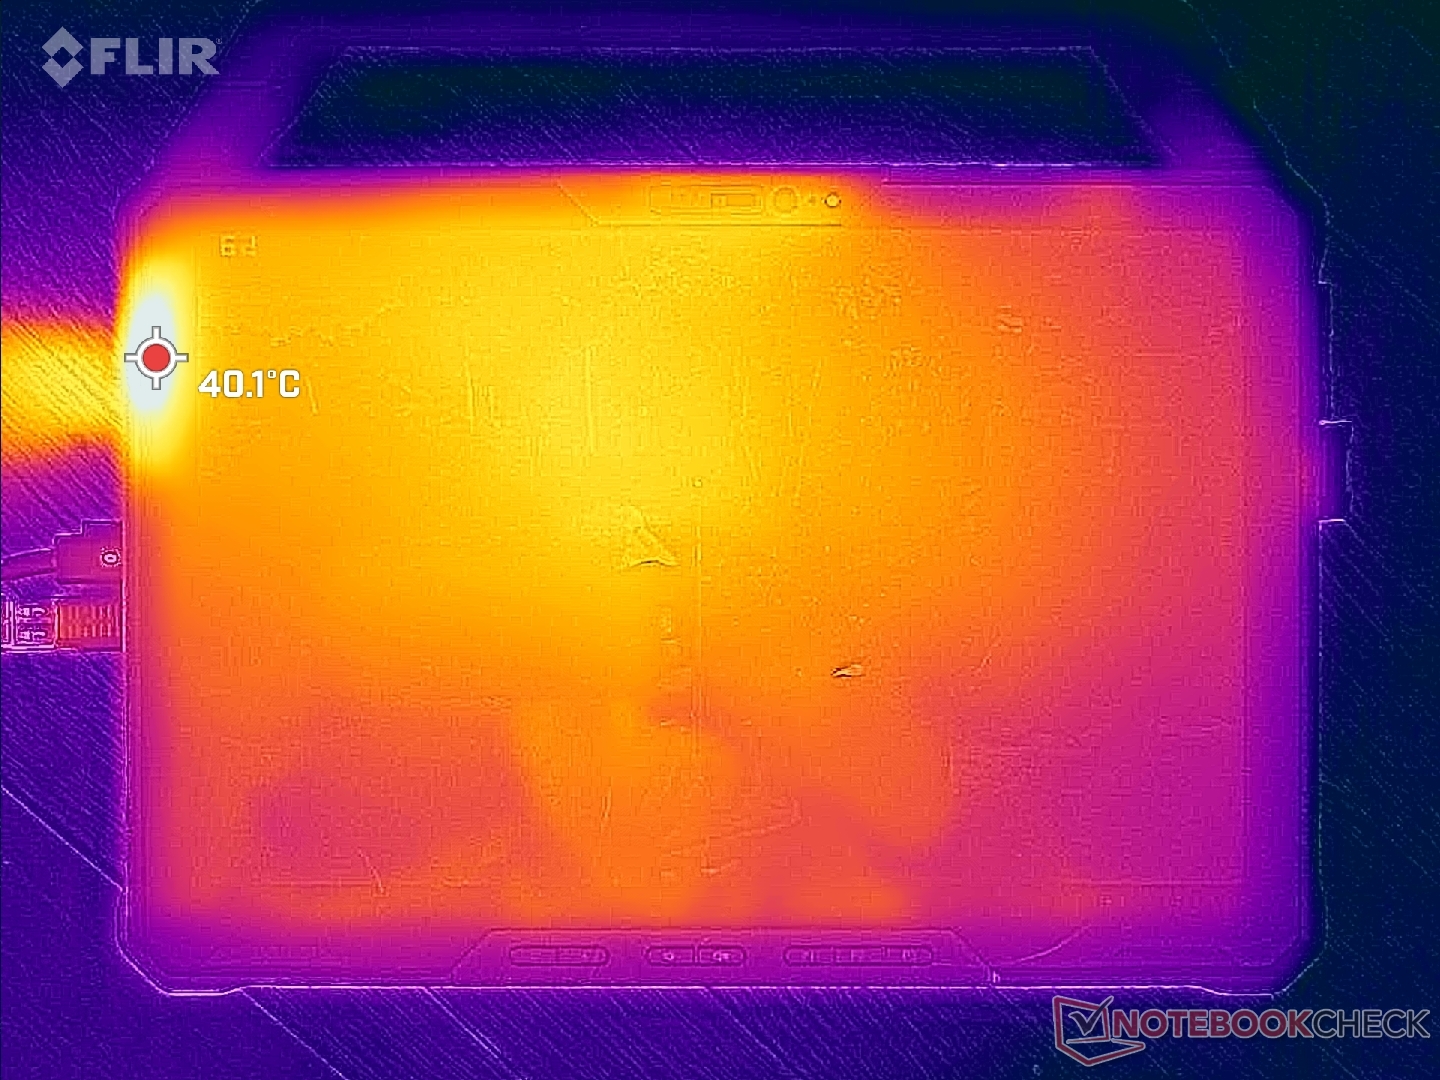
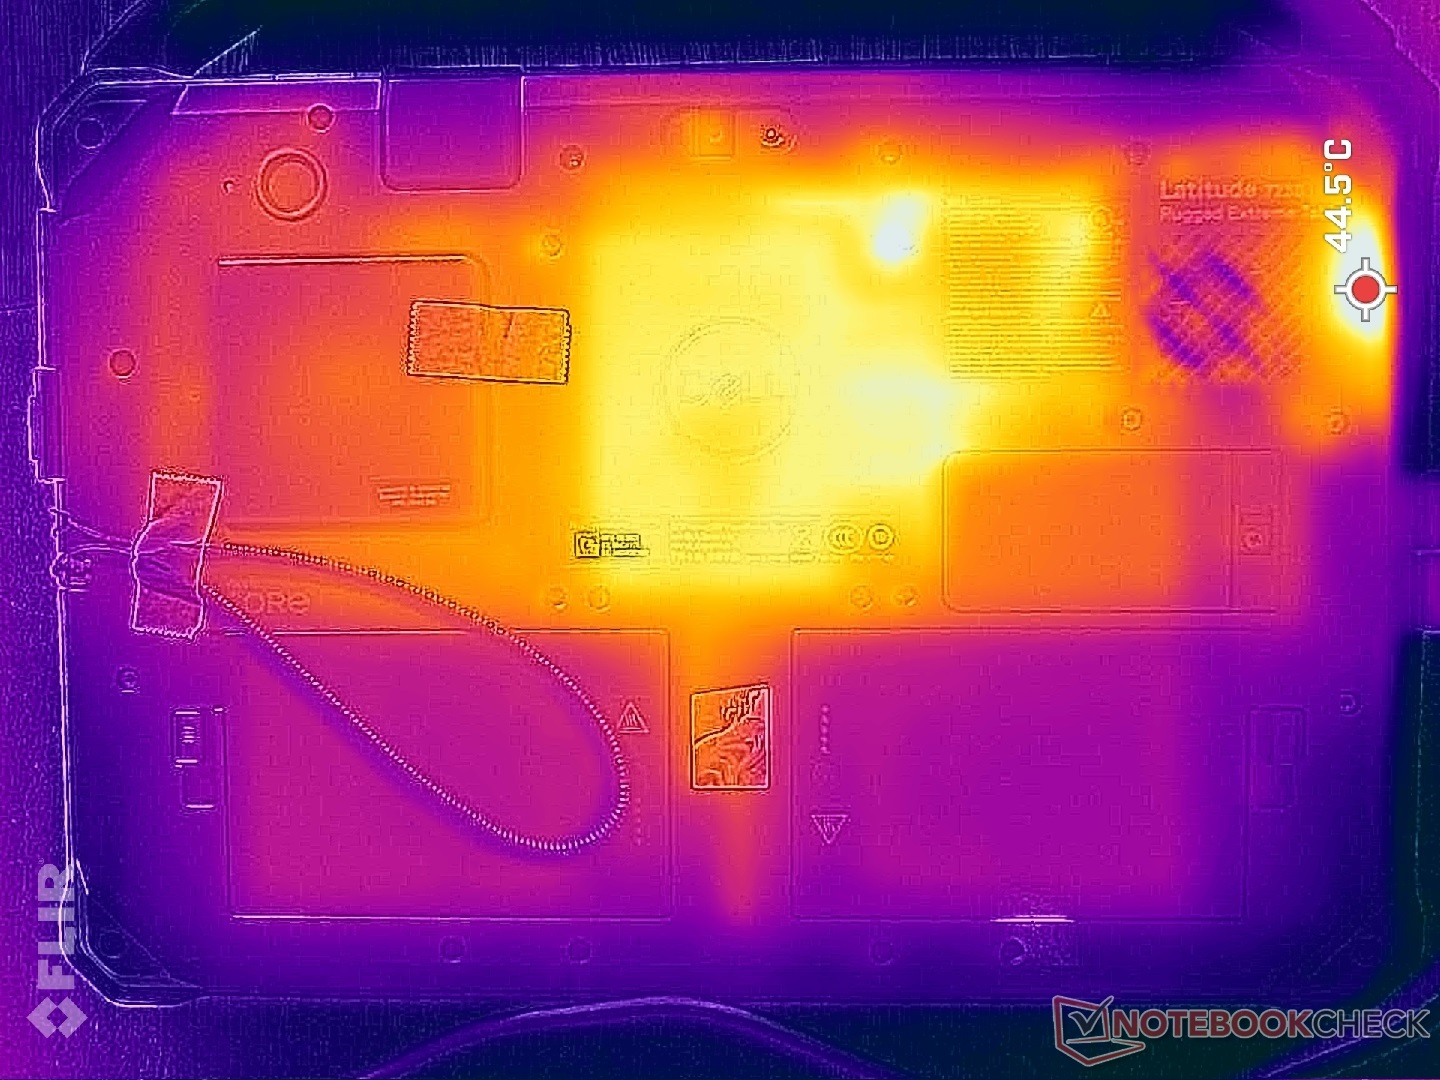
Temperaturen
Die Oberflächentemperaturen sind aufgrund des dicken und robusten Profils, wie bei den meisten anderen Rugged-Geräten, kein Problem. Im ungünstigsten Fall können wir einen Maximalwert von 40 °C an der Gerätekante in der Nähe der Lüftungsgitter bei 100 % CPU-Auslastung feststellen.
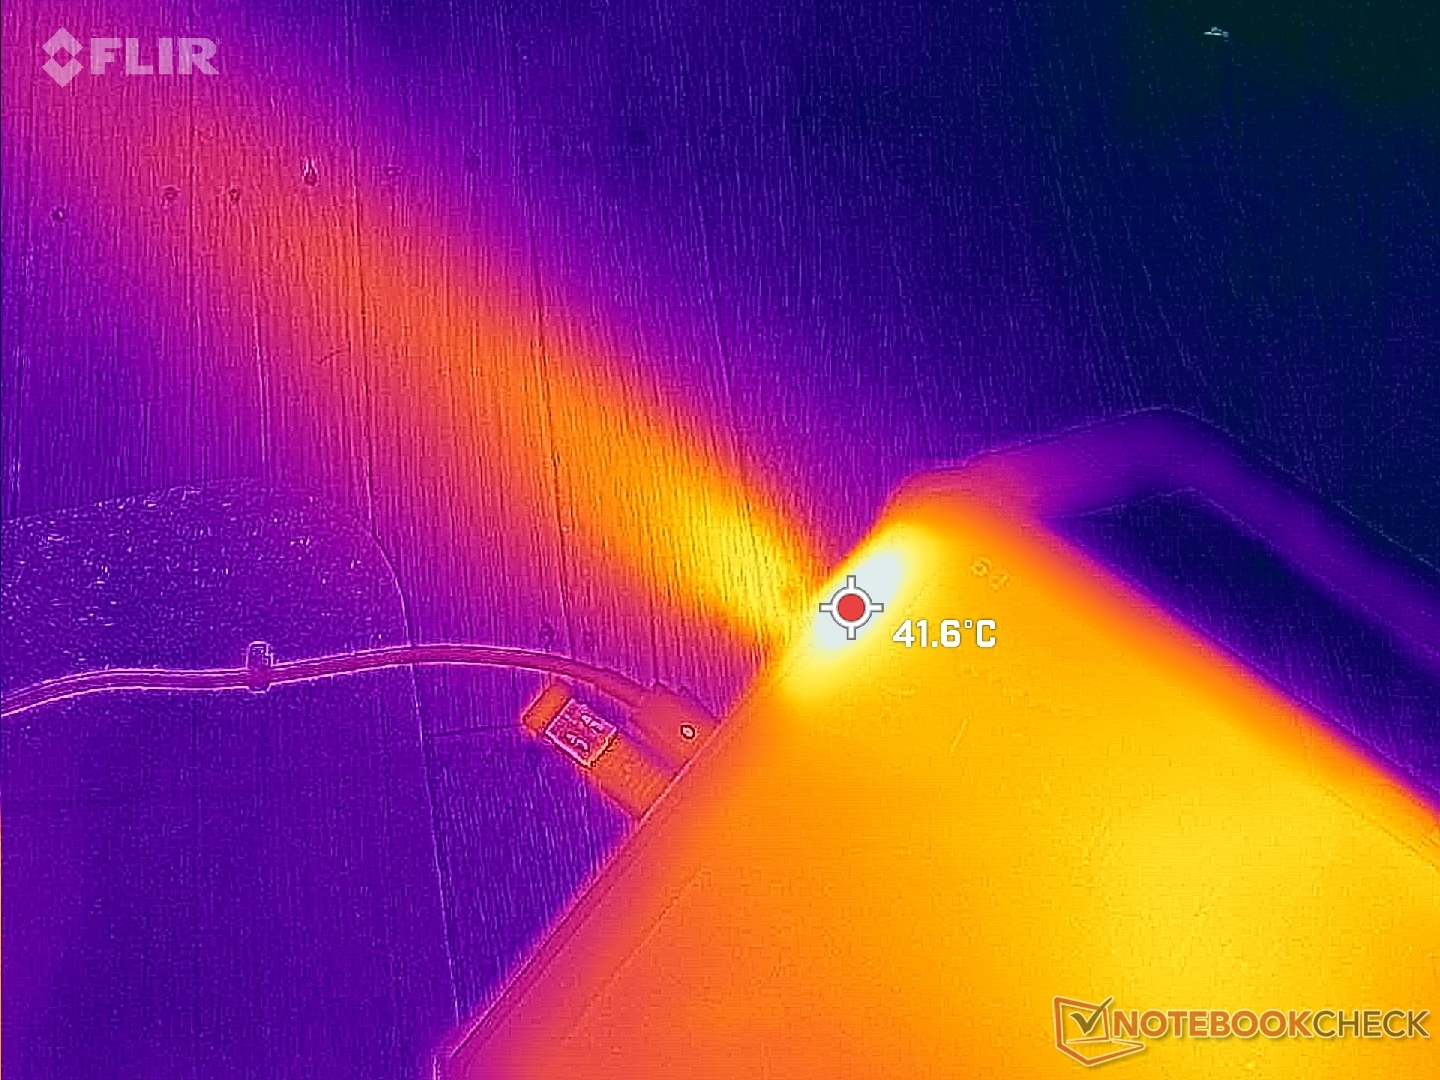
(+) Die maximale Temperatur auf der Oberseite ist 32.6 °C. Im Vergleich liegt der Klassendurchschnitt bei 33.7 °C (von 20.7 bis 53.2 °C für die Klasse Tablet).
(±) Auf der Unterseite messen wir eine maximalen Wert von 40.2 °C (im Vergleich zum Durchschnitt von 33.2 °C).
(+) Ohne Last messen wir eine durchschnittliche Temperatur von 29 °C auf der Oberseite. Der Klassendurchschnitt erreicht 30 °C.
| Dell Latitude 7230 Rugged Extreme Intel Core i5-1240U, Intel Iris Xe Graphics G7 80EUs | Dell Latitude 7330 Rugged Extreme Intel Core i7-1185G7, Intel Iris Xe Graphics G7 96EUs | Panasonic Toughbook 40 Intel Core i7-1185G7, Intel Iris Xe Graphics G7 96EUs | Getac B360 Intel Core i7-10710U, Intel UHD Graphics 620 | Acer Enduro Urban N3 EUN314 Intel Core i7-1165G7, Intel Iris Xe Graphics G7 96EUs | Durabook S14I Intel Core i7-1165G7, Intel Iris Xe Graphics G7 96EUs | |
|---|---|---|---|---|---|---|
| Hitze | 13% | 4% | 10% | -1% | -3% | |
| Last oben max * (°C) | 32.6 | 34.6 -6% | 35.6 -9% | 33.4 -2% | 37.8 -16% | 36.4 -12% |
| Last unten max * (°C) | 40.2 | 36.6 9% | 40 -0% | 42.6 -6% | 45.8 -14% | 38.6 4% |
| Idle oben max * (°C) | 30.6 | 24.8 19% | 28.6 7% | 24.2 21% | 26.4 14% | 32.6 -7% |
| Idle unten max * (°C) | 35 | 25.2 28% | 29.4 16% | 26.2 25% | 30.2 14% | 33.8 3% |
* ... kleinere Werte sind besser
Stresstest
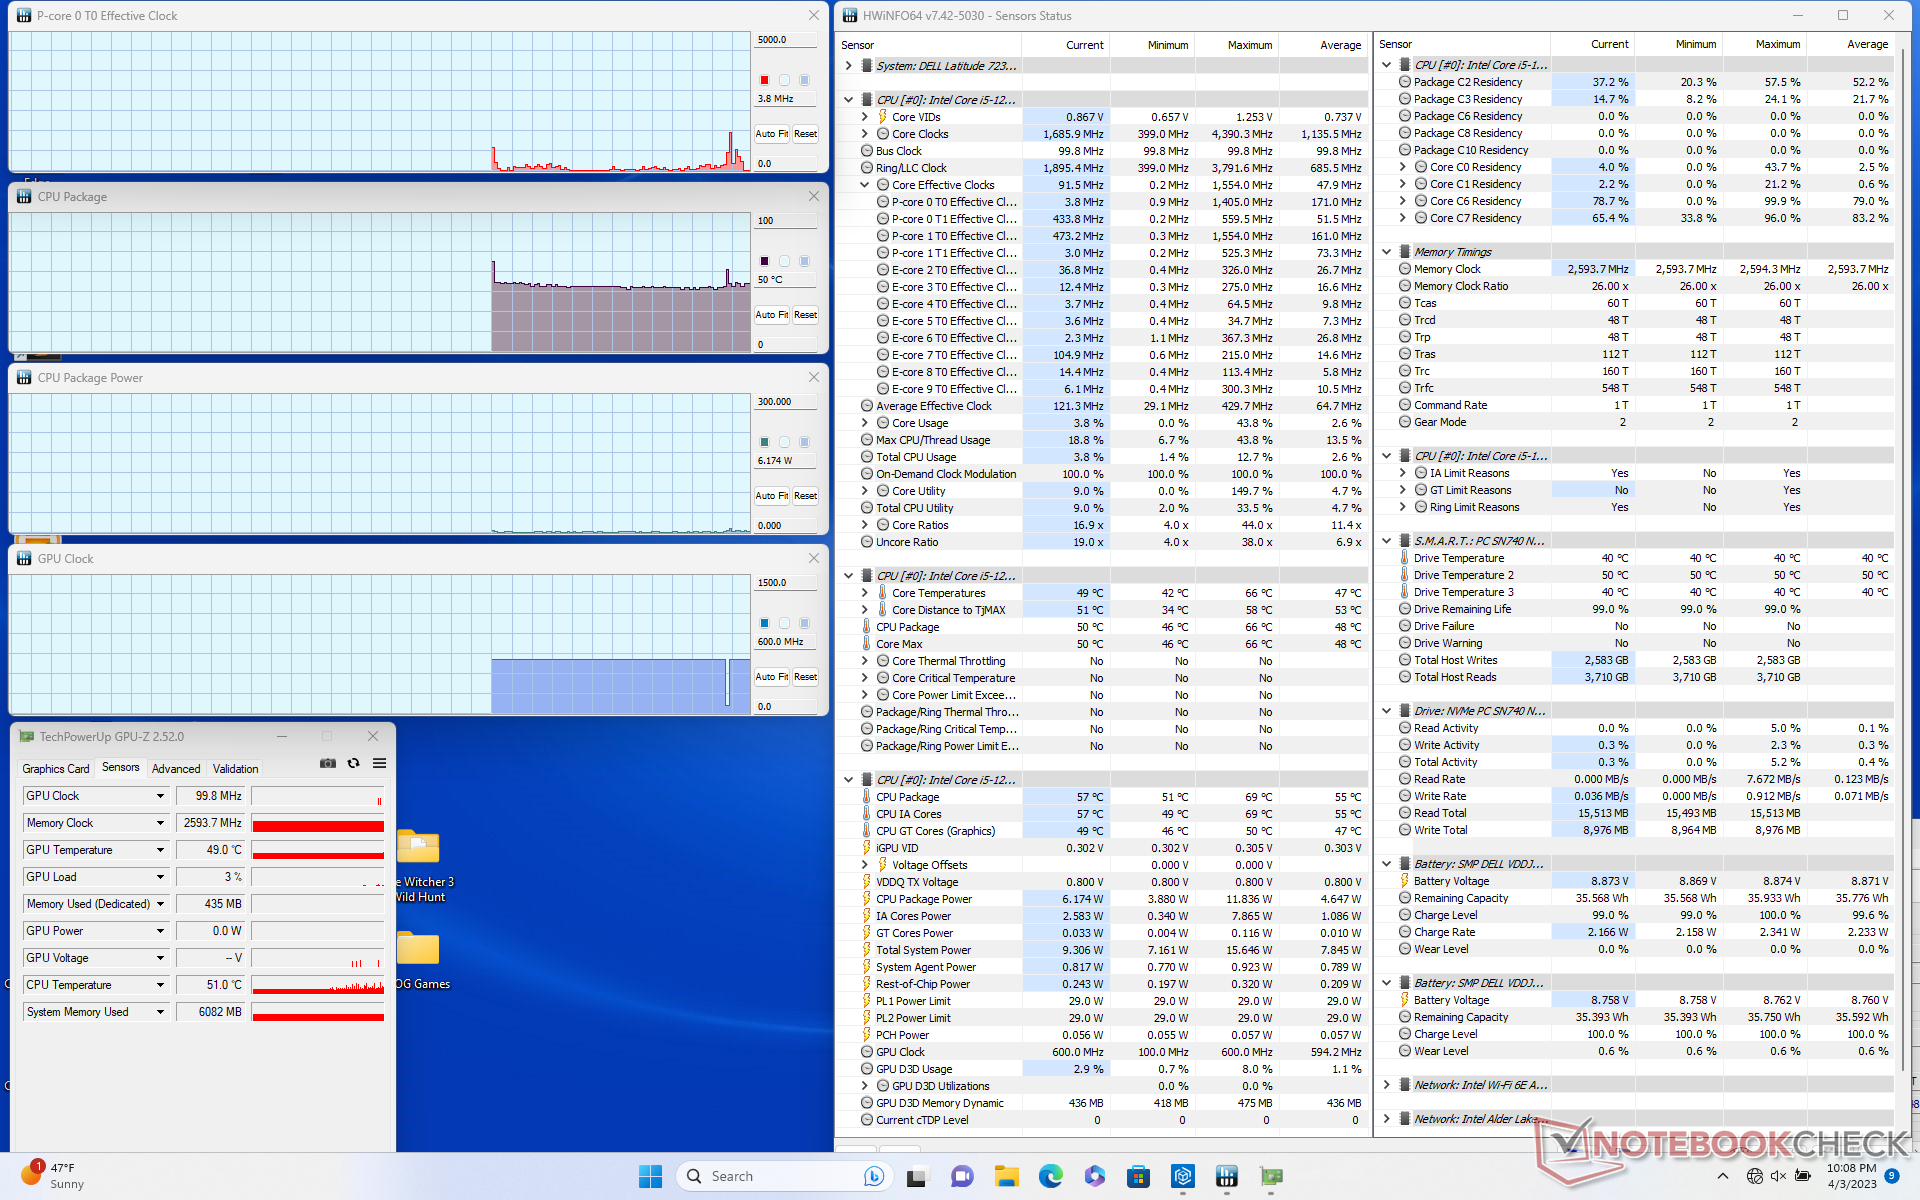
Beim Ausführen von Prime95 zur Belastung der CPU steigen die Taktraten und die Leistungsaufnahme des Boards auf 2,6 GHz bei 30 W, um einige Sekunden später auf 2,5 GHz bei 26 W zu fallen. Die Kerntemperatur pendelt sich bei sehr hohen 97 °C ein, was wärmer ist, als wir es uns wünschen würden. Dieser Test auf dem größeren Dell Latitude 7330 Rugged führte zu einer deutlich kühleren Kerntemperatur von nur 68 °C.
Der Akkubetrieb wirkt sich leicht auf die CPU-Leistung aus. Ein 3DMark 11 Test im Akkubetrieb liefert Physik- und Grafik-Scores von 10.743 und 4.041 Punkten im Vergleich zu 12.765 und 4.053 Punkten im Netzbetrieb.
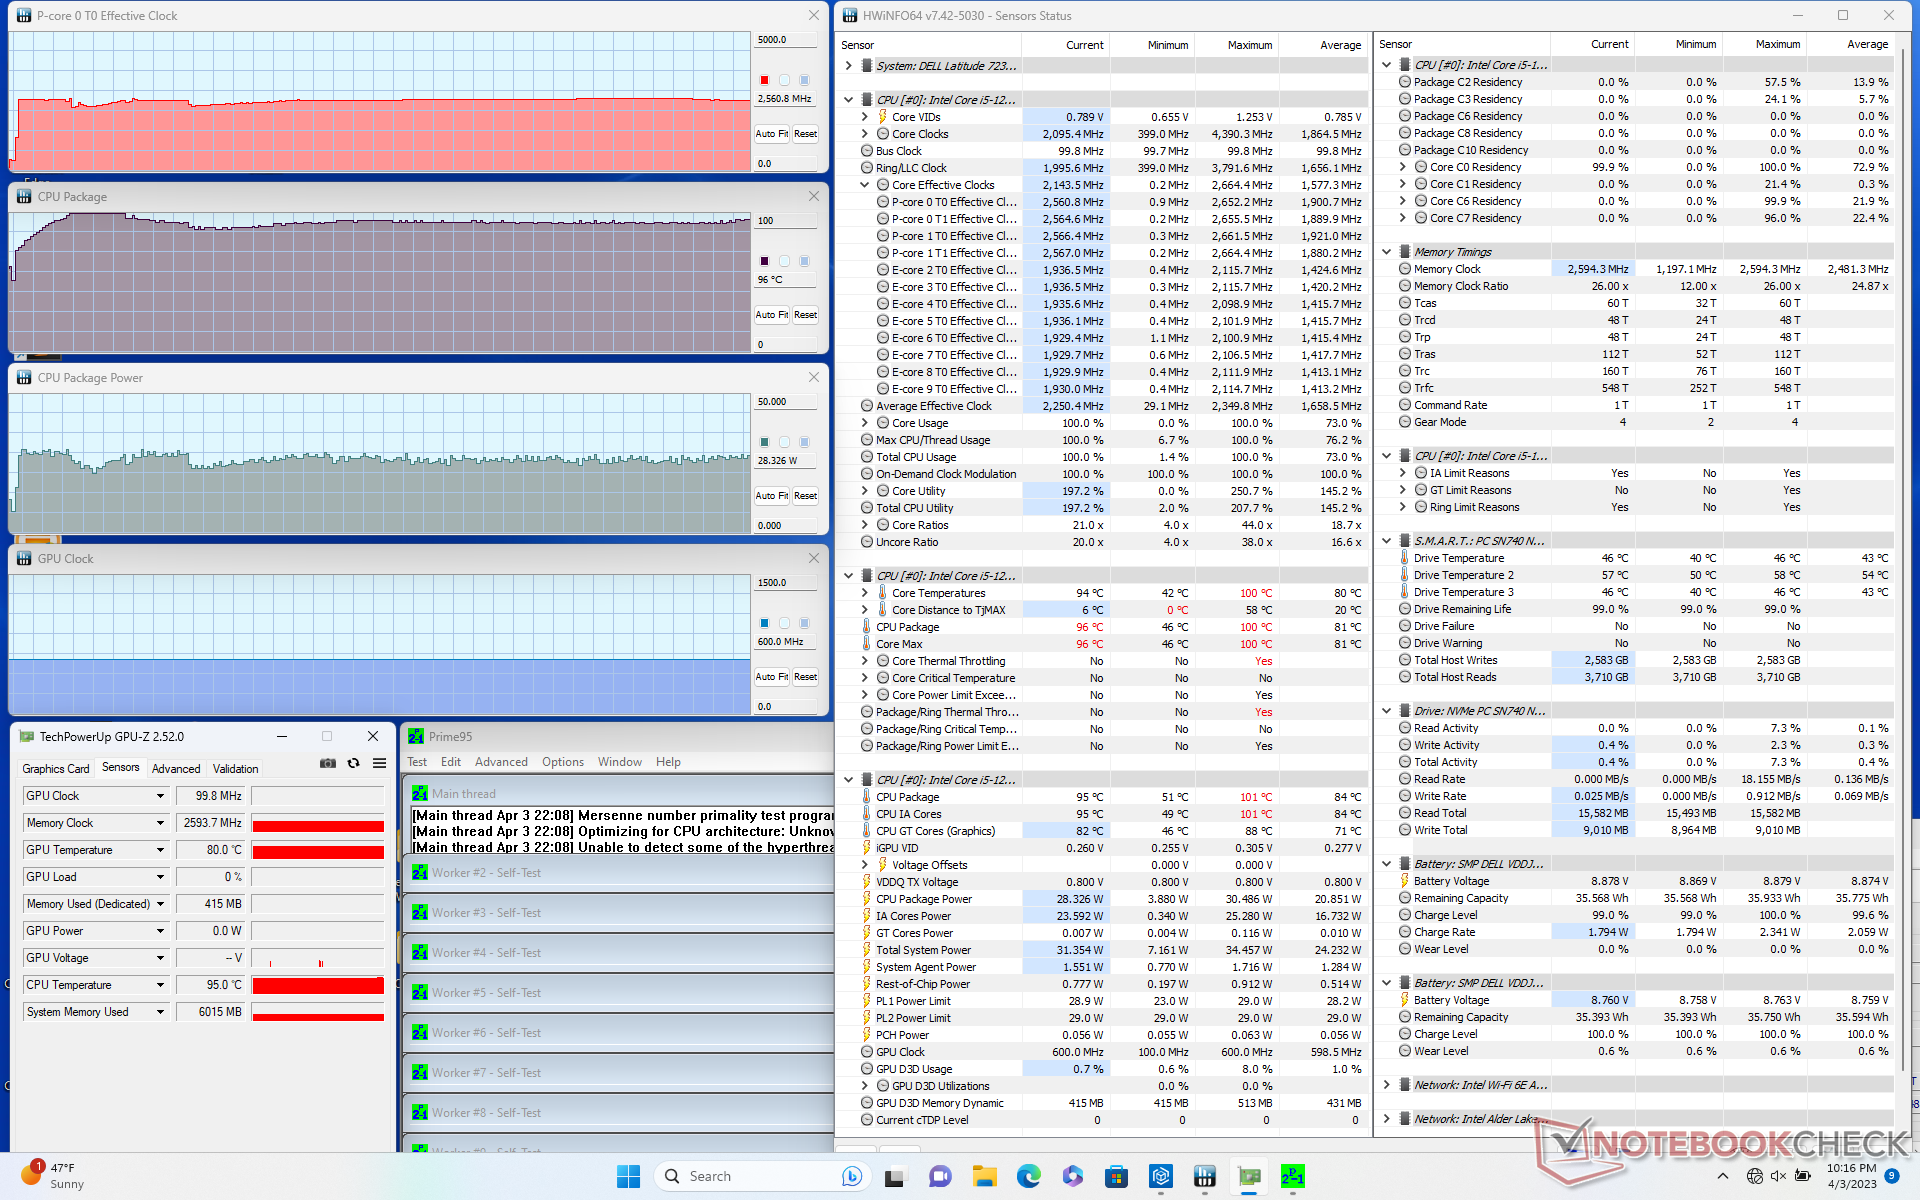
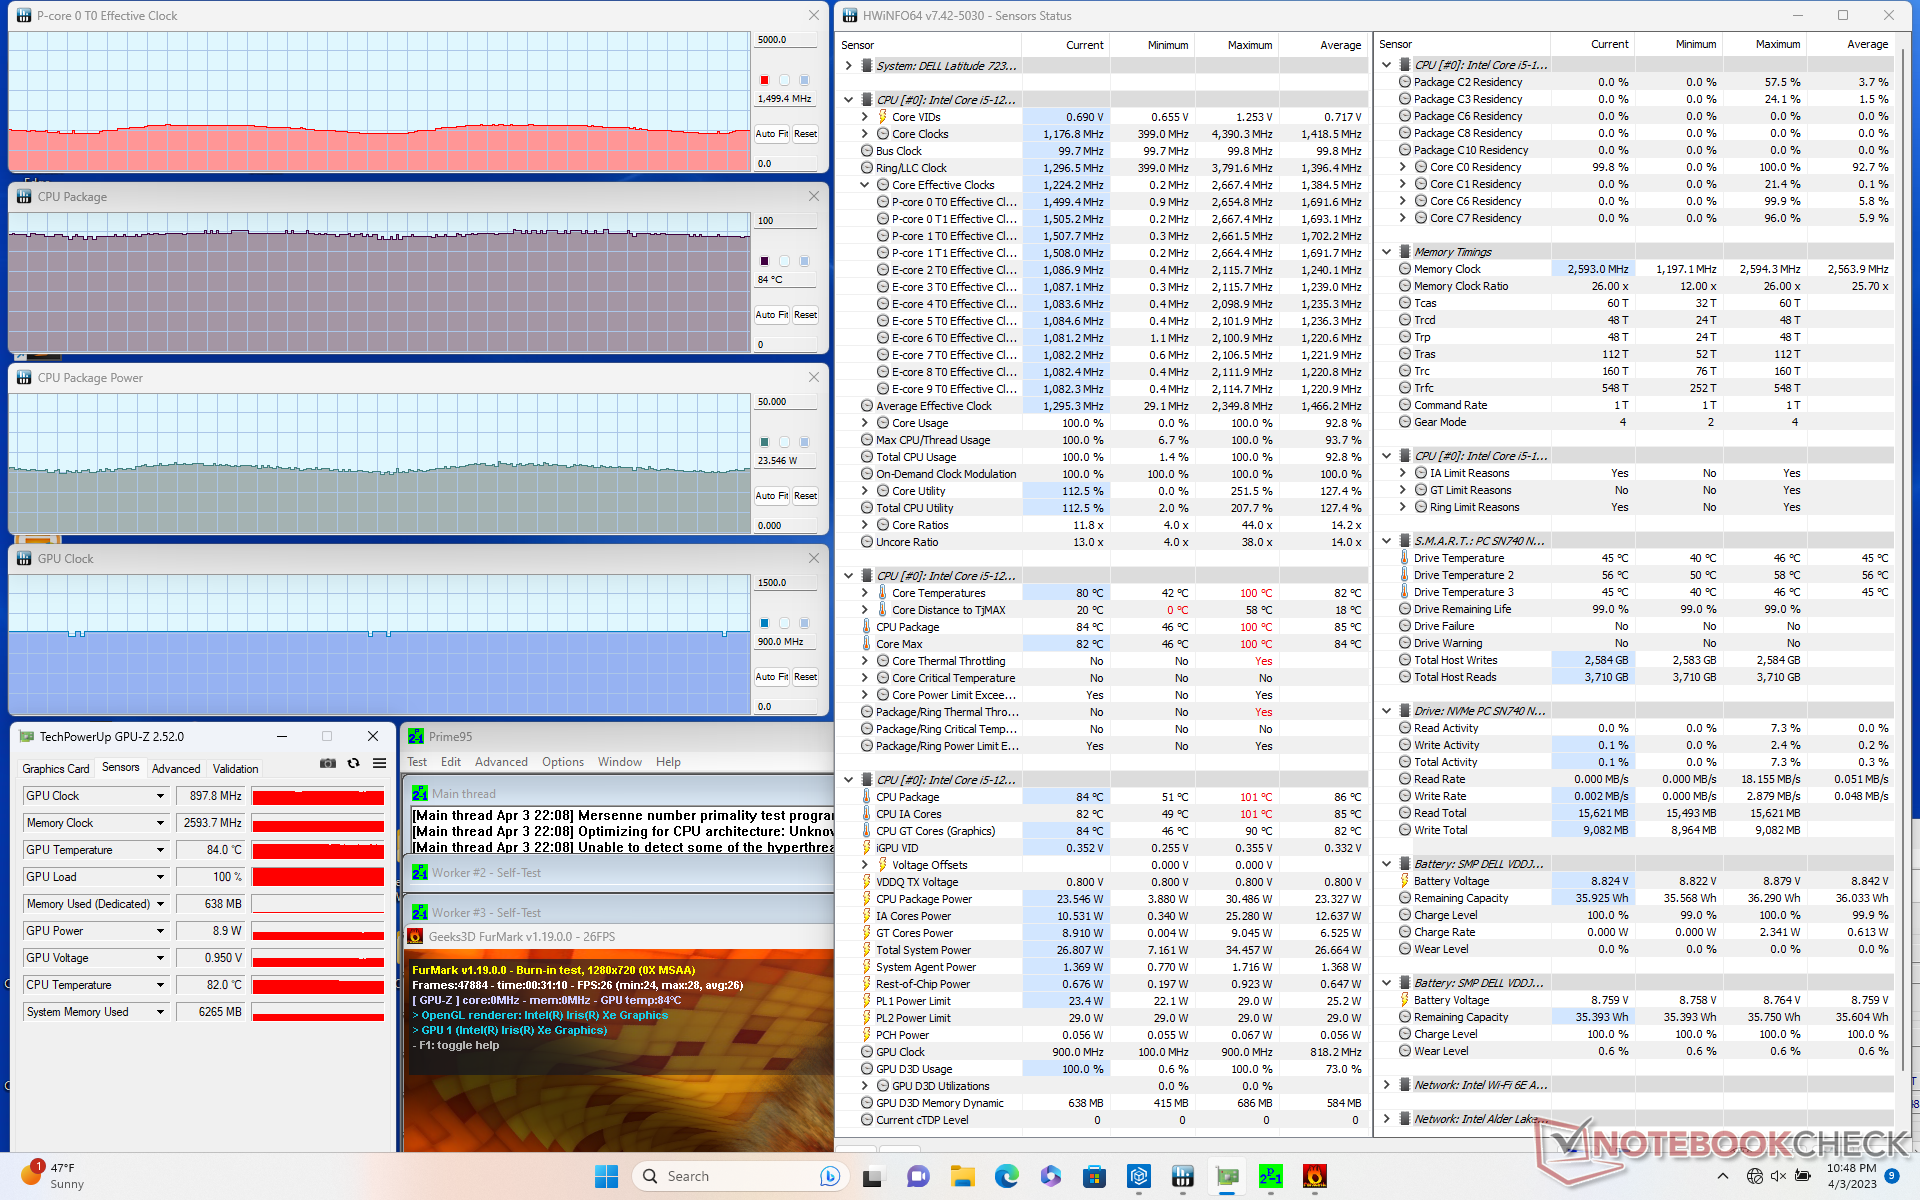
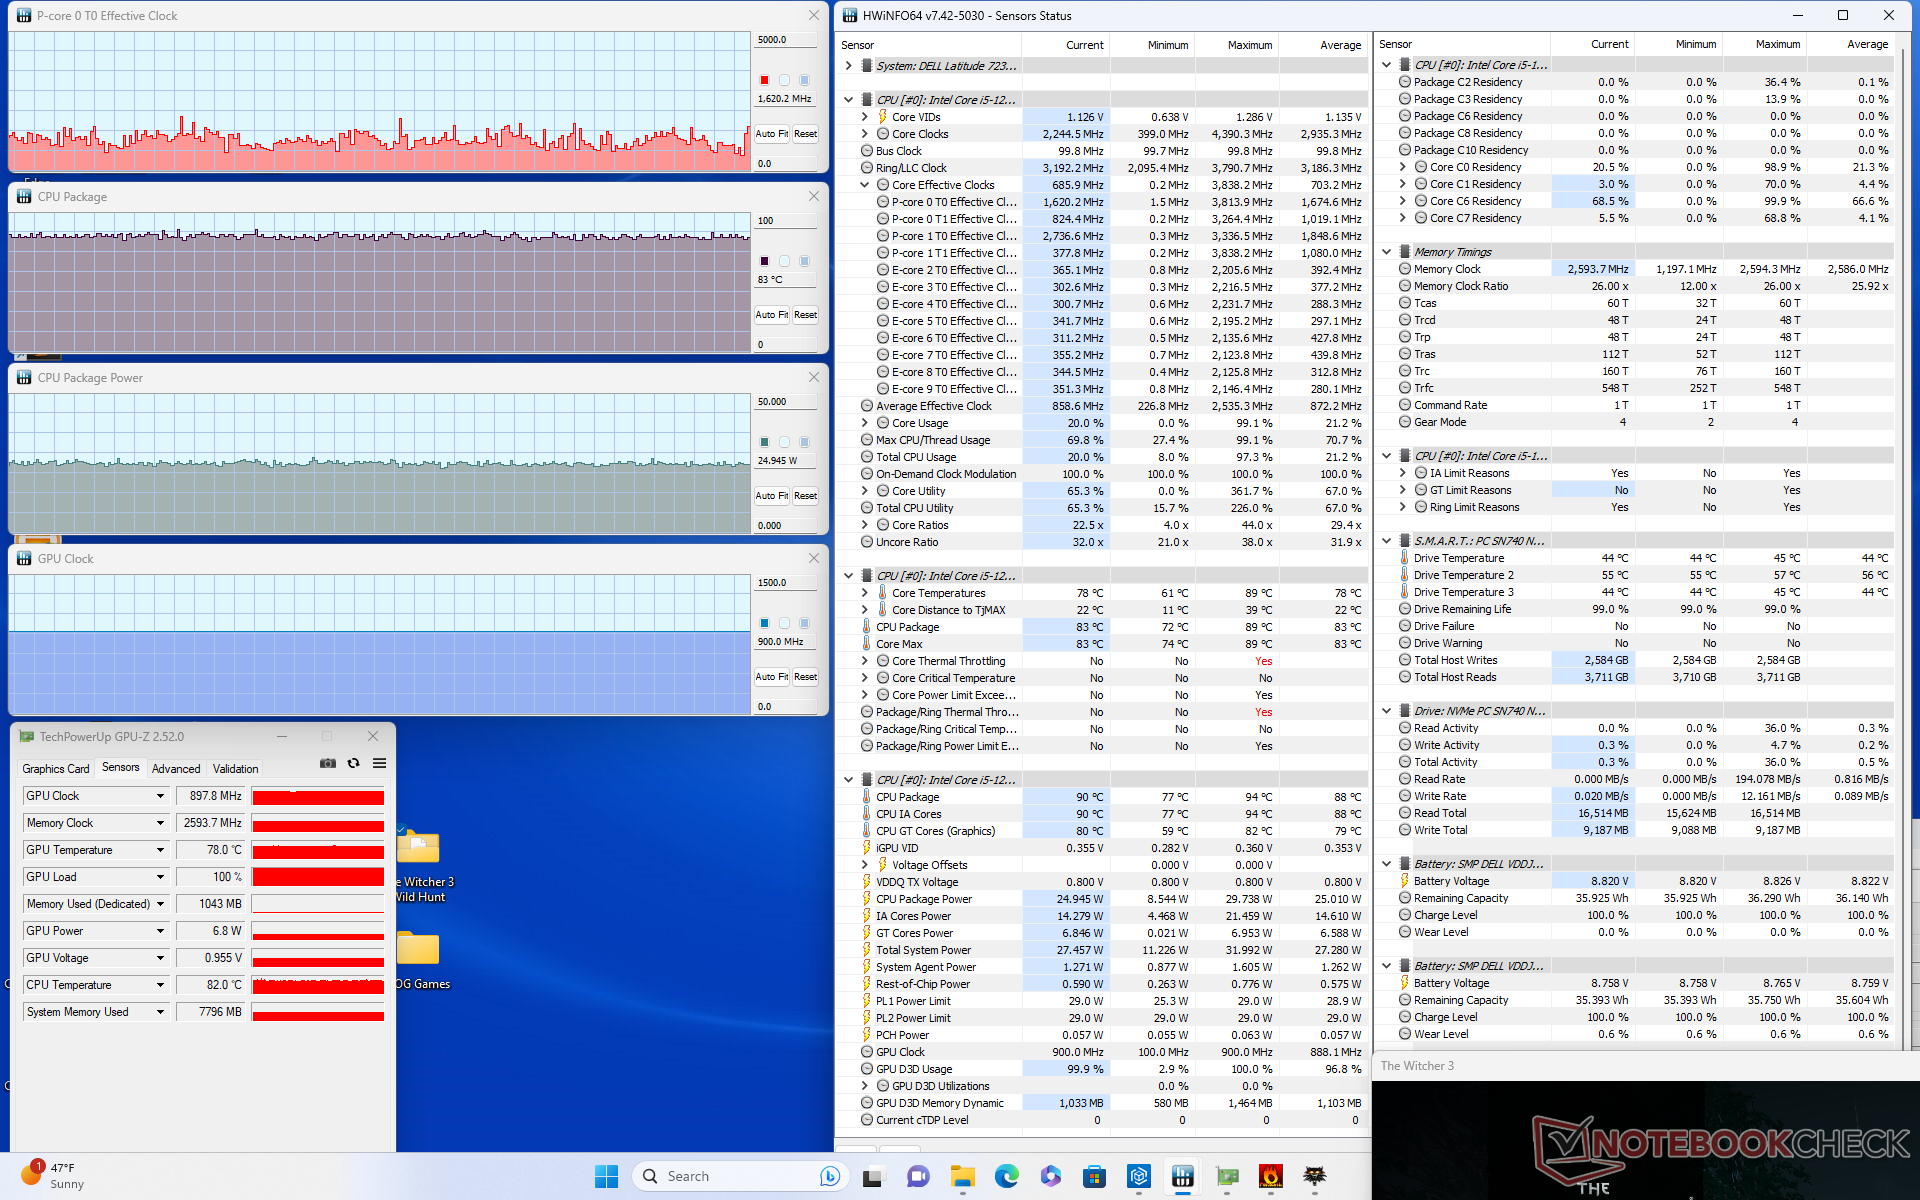

| CPU Takt(GHz) | GPU Takt (MHz) | Durchschntittliche CPU Temperatur (°C) | |
| System im Leerlauf | -- | -- | 50 |
| Prime95 Belastung | 2.6 | -- | 96 |
| Prime95 + FurMark Stresstest | 1.4 - 1.6 | 898 | 84 |
| Witcher 3 Langzeittest (Turbo Modus) | ~3.0 | 898 | 85 |
| Witcher 3 Langzeittest (Optimierter Modus) | ~1.7 | 898 | 83 |
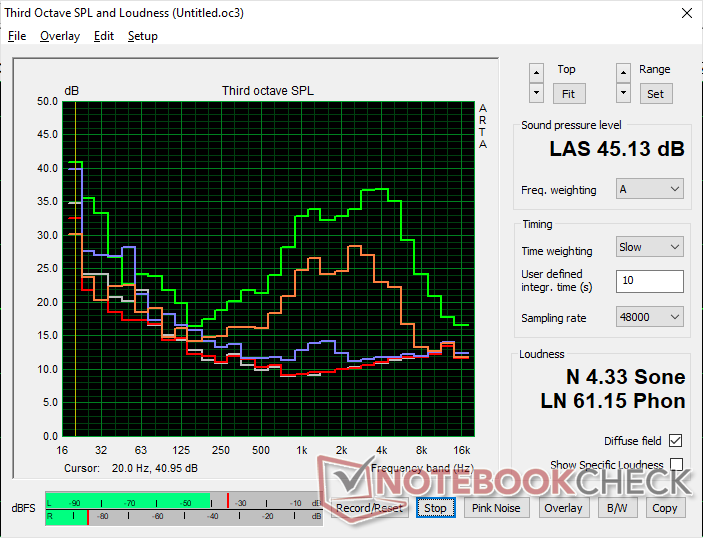
Lautsprecher
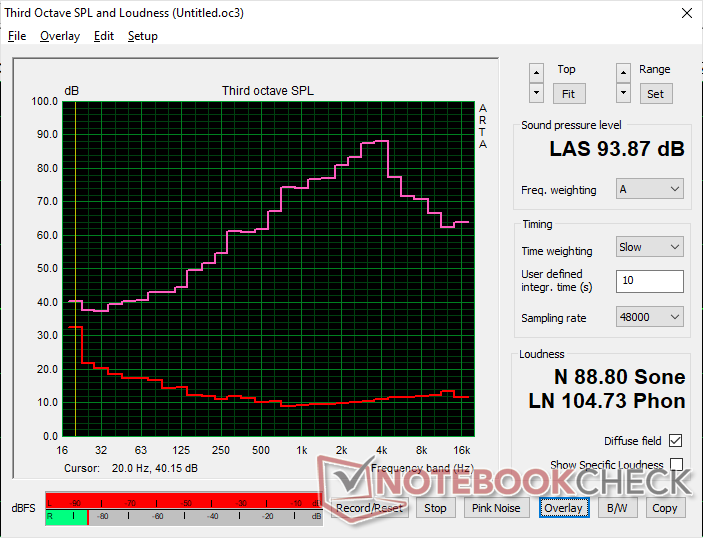
Dell Latitude 7230 Rugged Extreme Audio Analyse
(+) | Die Lautsprecher können relativ laut spielen (93.9 dB)
Bass 100 - 315 Hz
(-) | kaum Bass - 19.9% niedriger als der Median
(+) | lineare Bass-Wiedergabe (5.2% Delta zum Vorgänger)
Mitteltöne 400 - 2000 Hz
(±) | zu hohe Mitten, vom Median 6.5% abweichend
(+) | lineare Mitten (4.5% Delta zum Vorgänger)
Hochtöne 2 - 16 kHz
(±) | zu hohe Hochtöne, vom Median nur 8.4% abweichend
(±) | durchschnittlich lineare Hochtöne (7% Delta zum Vorgänger)
Gesamt im hörbaren Bereich 100 - 16.000 Hz
(±) | hörbarer Bereich ist durchschnittlich linear (19.4% Abstand zum Median)
Im Vergleich zu allen Geräten derselben Klasse
» 54% aller getesteten Geräte dieser Klasse waren besser, 7% vergleichbar, 39% schlechter
» Das beste Gerät hat einen Delta-Wert von 7%, durchschnittlich ist 20%, das schlechteste Gerät hat 129%
Im Vergleich zu allen Geräten im Test
» 48% aller getesteten Geräte waren besser, 7% vergleichbar, 45% schlechter
» Das beste Gerät hat einen Delta-Wert von 4%, durchschnittlich ist 23%, das schlechteste Gerät hat 134%
Apple MacBook Pro 16 2021 M1 Pro Audio Analyse
(+) | Die Lautsprecher können relativ laut spielen (84.7 dB)
Bass 100 - 315 Hz
(+) | guter Bass - nur 3.8% Abweichung vom Median
(+) | lineare Bass-Wiedergabe (5.2% Delta zum Vorgänger)
Mitteltöne 400 - 2000 Hz
(+) | ausgeglichene Mitten, vom Median nur 1.3% abweichend
(+) | lineare Mitten (2.1% Delta zum Vorgänger)
Hochtöne 2 - 16 kHz
(+) | ausgeglichene Hochtöne, vom Median nur 1.9% abweichend
(+) | sehr lineare Hochtöne (2.7% Delta zum Vorgänger)
Gesamt im hörbaren Bereich 100 - 16.000 Hz
(+) | hörbarer Bereich ist sehr linear (4.6% Abstand zum Median
Im Vergleich zu allen Geräten derselben Klasse
» 0% aller getesteten Geräte dieser Klasse waren besser, 0% vergleichbar, 100% schlechter
» Das beste Gerät hat einen Delta-Wert von 5%, durchschnittlich ist 17%, das schlechteste Gerät hat 45%
Im Vergleich zu allen Geräten im Test
» 0% aller getesteten Geräte waren besser, 0% vergleichbar, 100% schlechter
» Das beste Gerät hat einen Delta-Wert von 4%, durchschnittlich ist 23%, das schlechteste Gerät hat 134%
Energieverwaltung
Leistungsaufnahme
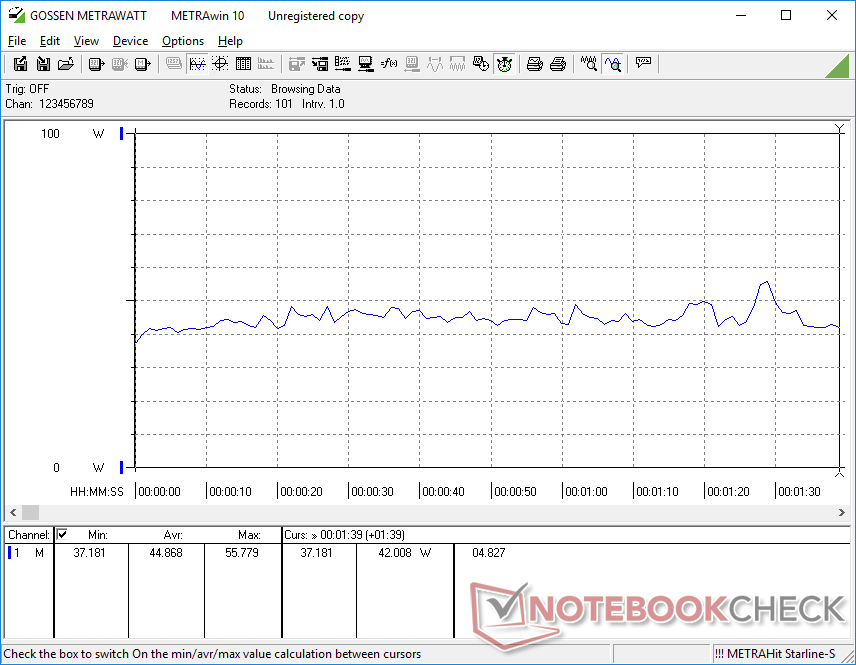
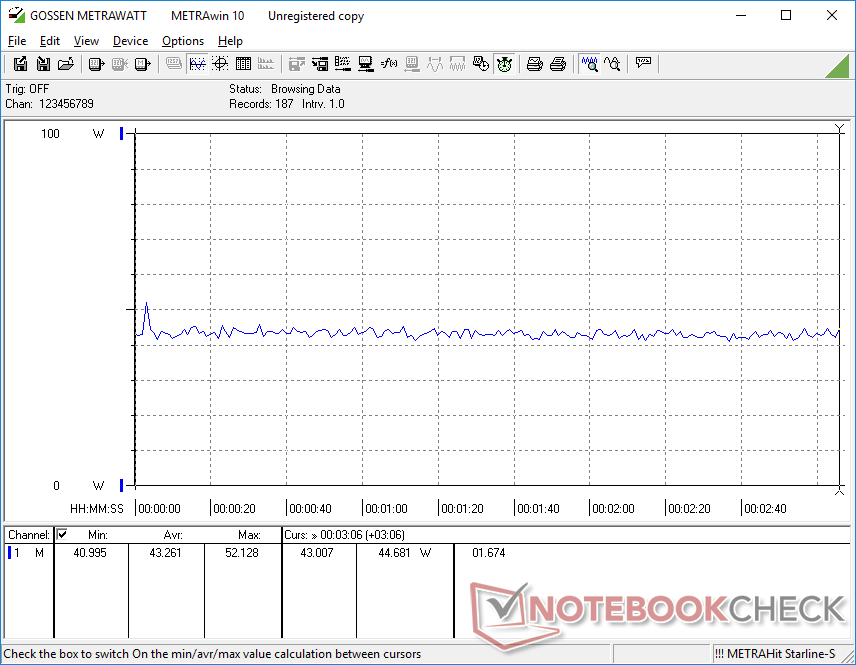
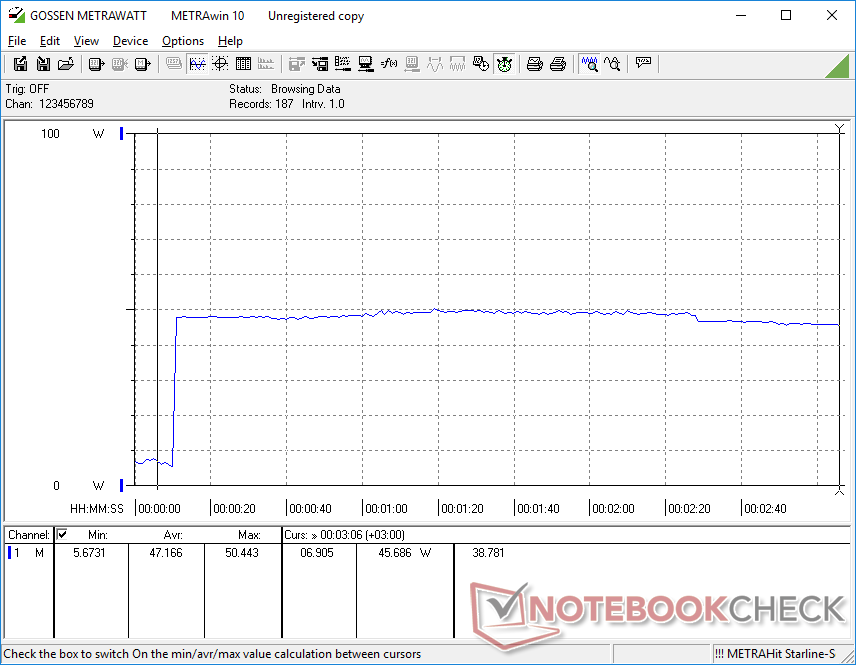
Der Stromverbrauch ist im Allgemeinen ähnlich wie bei anderen Rugged-Geräten. Mit den Geräten, die ältere CPUs der 11. Generation verwenden, wie etwa das Dell Latitude 7330 Rugged Extreme oder das Panasonic Toughbook 40 liegt die Leistungsaufnahme nahezu gleichauf. Aber das Verhältnis von Leistung pro Watt kann unterschiedlicher kaum sein. Genauer gesagt kann unser Latitude 7230 Rugged eine um 40 bis 50 Prozent schnellere Prozessorleistung bieten als der Core i7-1185G7 im Dell Latitude 7330 Rugged, ohne mehr Strom zu verbrauchen. Dafür ist die GPU-Leistung um 30 bis 40 Prozent langsamer.
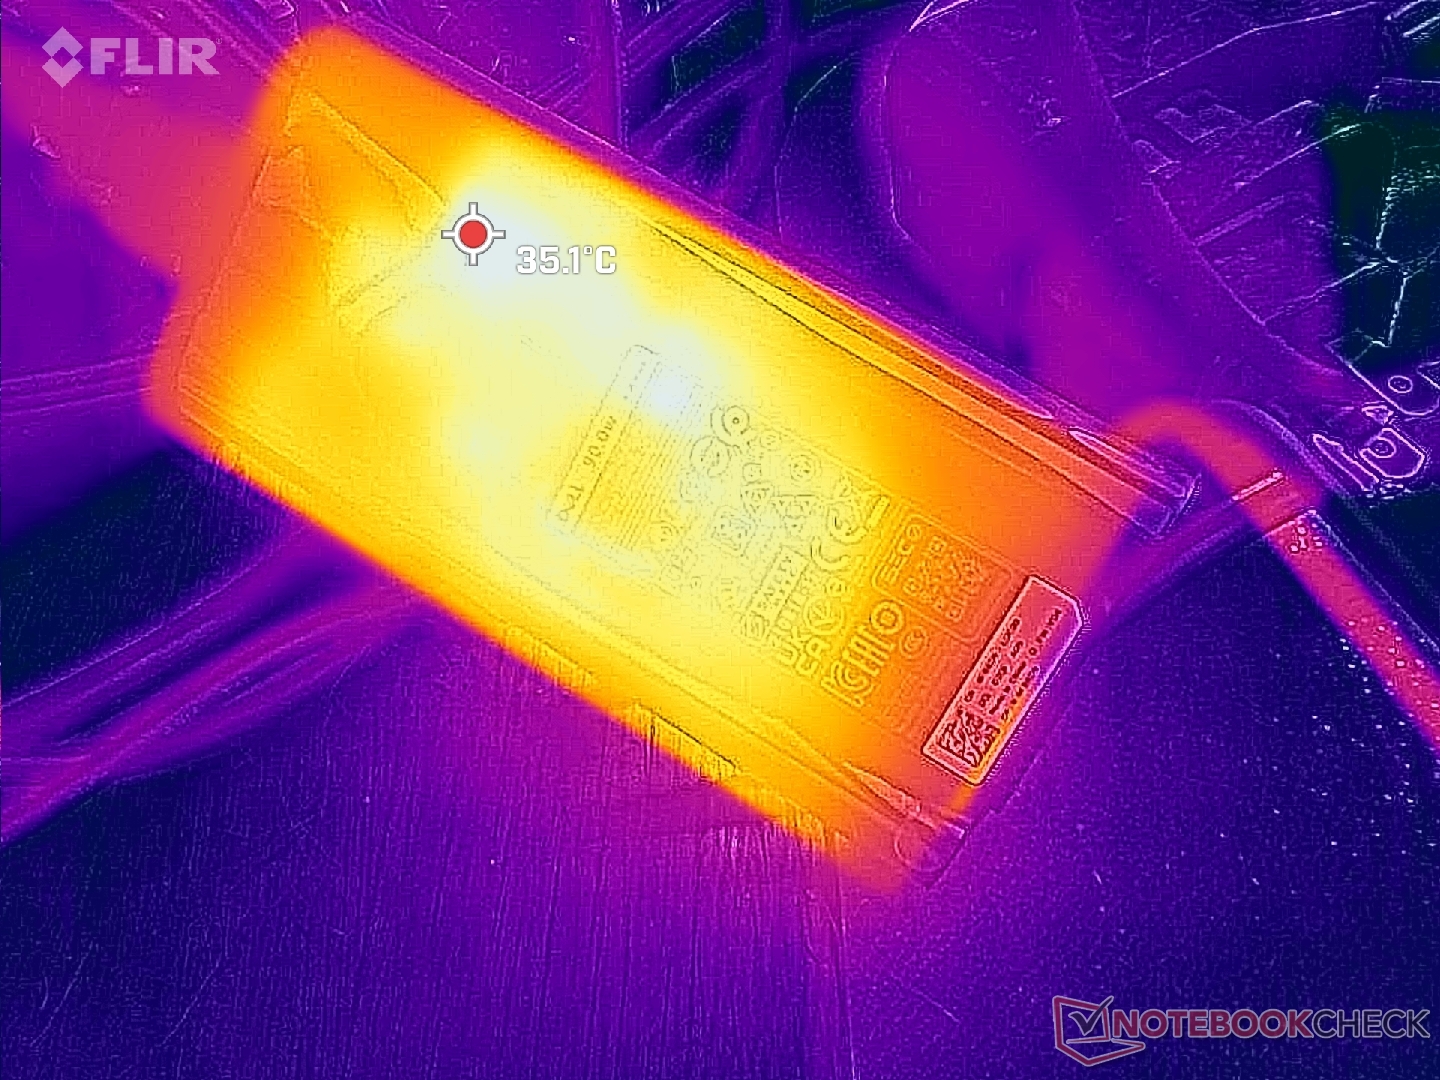
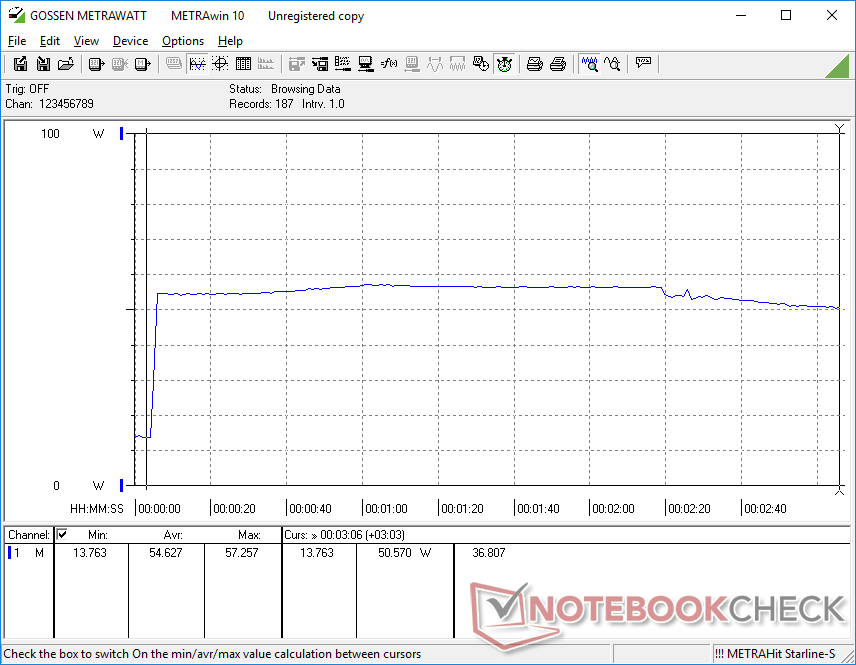
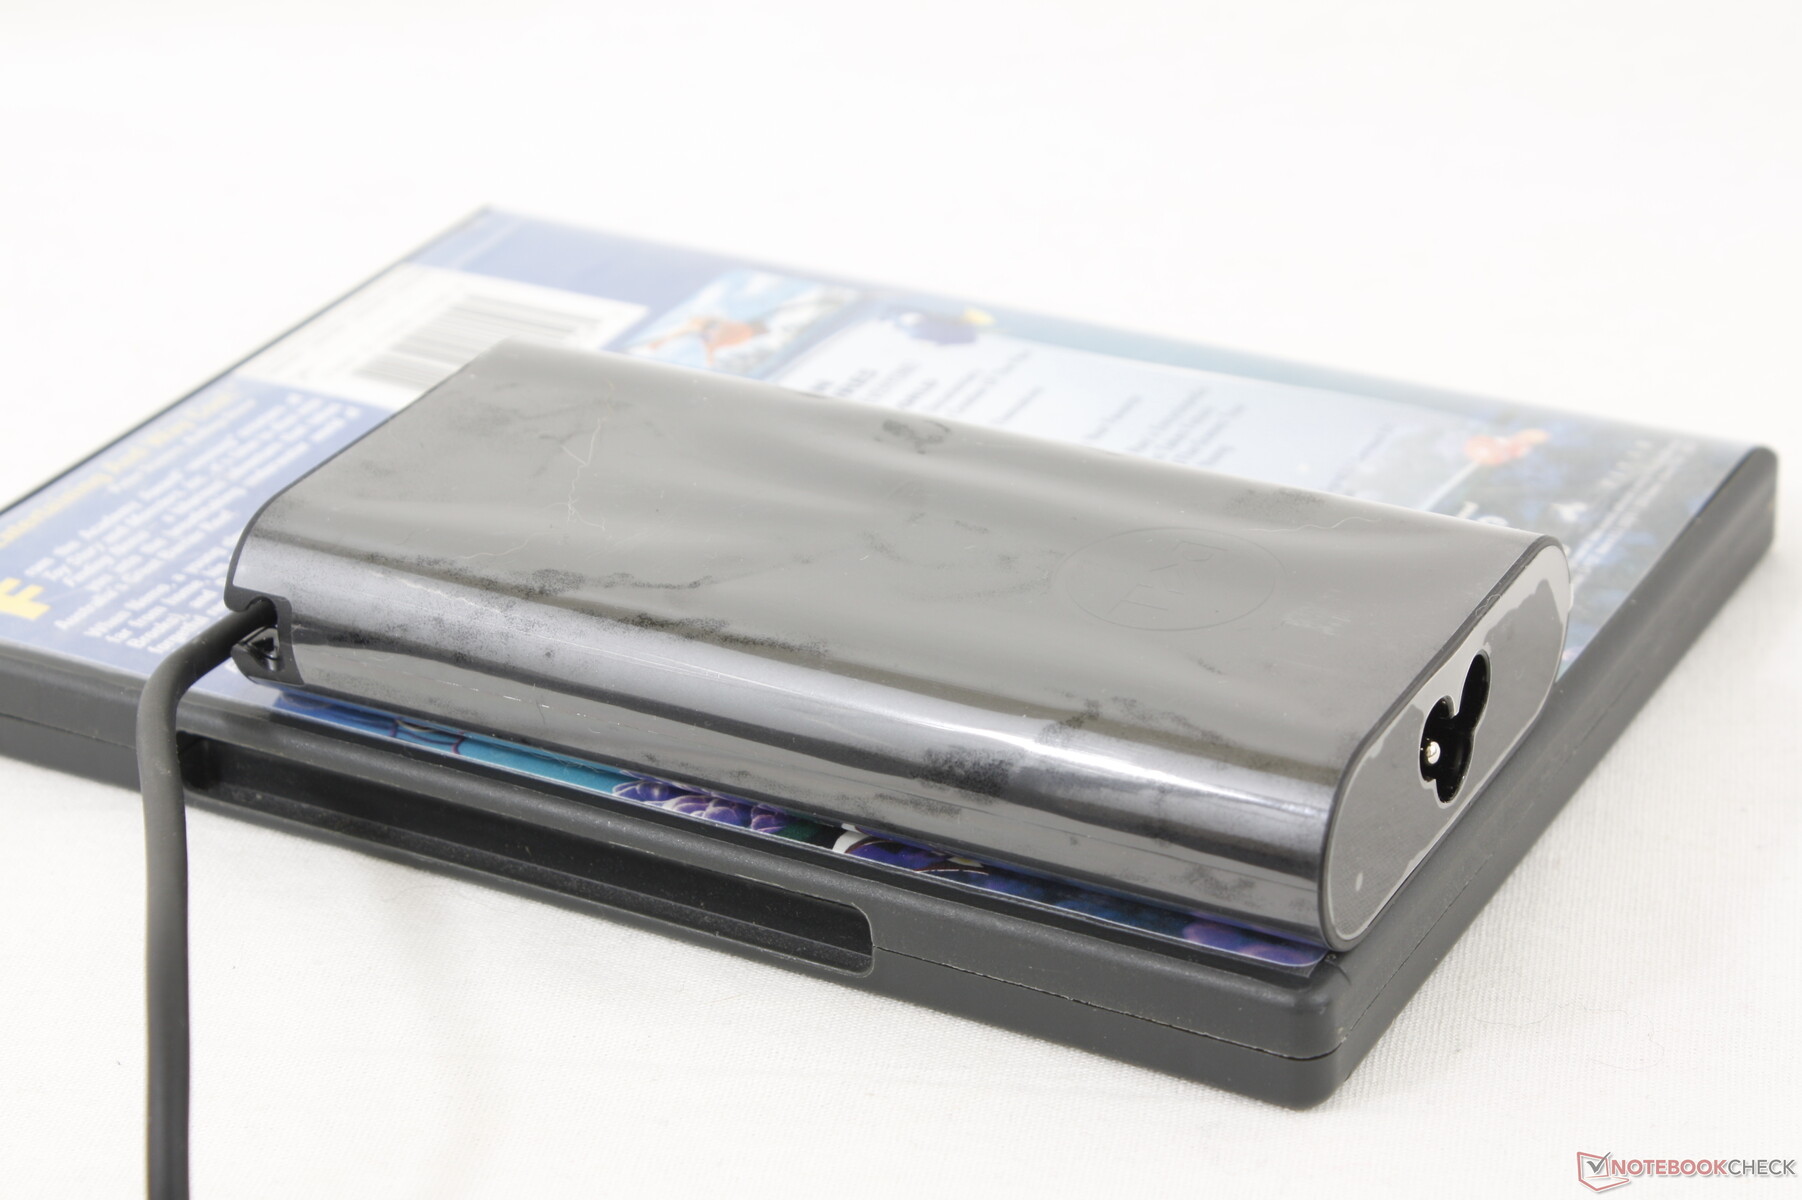
Mit dem mittelgroßen (~13 × 6,5 × 2,3 cm) 90 W USB-C Netzteil konnten wir eine maximale Leistungsaufnahme von 55 W messen. Dieser Maximalwert ist im Vergleich zu vielen Core i7 Alternativen relativ niedrig, da unser Core i5 eine niedrigere Turbo-Boost Grenze hat. Interessanterweise wird dieses Modell mit dem gleichen Netzteil ausgeliefert, wie einige XPS-Notebooks.
| Aus / Standby | |
| Idle | |
| Last |
|
Legende:
min: | |
| Dell Latitude 7230 Rugged Extreme i5-1240U, Iris Xe G7 80EUs, WD PC SN740 512GB SDDPMQD-512G-1101, IPS, 1920x1200, 12" | Dell Latitude 7330 Rugged Extreme i7-1185G7, Iris Xe G7 96EUs, , IPS, 1920x1080, 13.3" | Panasonic Toughbook 40 i7-1185G7, Iris Xe G7 96EUs, Samsung PM991 MZVLQ1T0HALB, IPS, 1920x1080, 14" | Getac B360 i7-10710U, UHD Graphics 620, Lite-On CA5-8D512, IPS, 1920x1080, 13.3" | Acer Enduro Urban N3 EUN314 i7-1165G7, Iris Xe G7 96EUs, Samsung PM991 MZVLQ1T0HALB, IPS, 1920x1080, 14" | Durabook S14I i7-1165G7, Iris Xe G7 96EUs, UDinfo M2P M2P80DE512GBAEP, TN, 1920x1080, 14" | |
|---|---|---|---|---|---|---|
| Stromverbrauch | -9% | -15% | -5% | 25% | -25% | |
| Idle min * (Watt) | 6.5 | 4.1 37% | 4.9 25% | 5.4 17% | 3.8 42% | 6.8 -5% |
| Idle avg * (Watt) | 8.9 | 11.7 -31% | 12.3 -38% | 12.2 -37% | 8 10% | 16.4 -84% |
| Idle max * (Watt) | 14.3 | 11.8 17% | 14 2% | 12.6 12% | 8.7 39% | 16.9 -18% |
| Last avg * (Watt) | 44.9 | 48.5 -8% | 54 -20% | 39.1 13% | 34.6 23% | 39.2 13% |
| Witcher 3 ultra * (Watt) | 43.2 | 44.3 -3% | 46.3 -7% | 36.5 16% | 35.4 18% | |
| Last max * (Watt) | 54.8 | 91 -66% | 83.6 -53% | 81.8 -49% | 45.4 17% | 73.1 -33% |
* ... kleinere Werte sind besser
Power Consumption Witcher 3 / Stresstest
Power Consumption external Monitor
Akkulaufzeit - Dreieinhalb Stunden unter Last
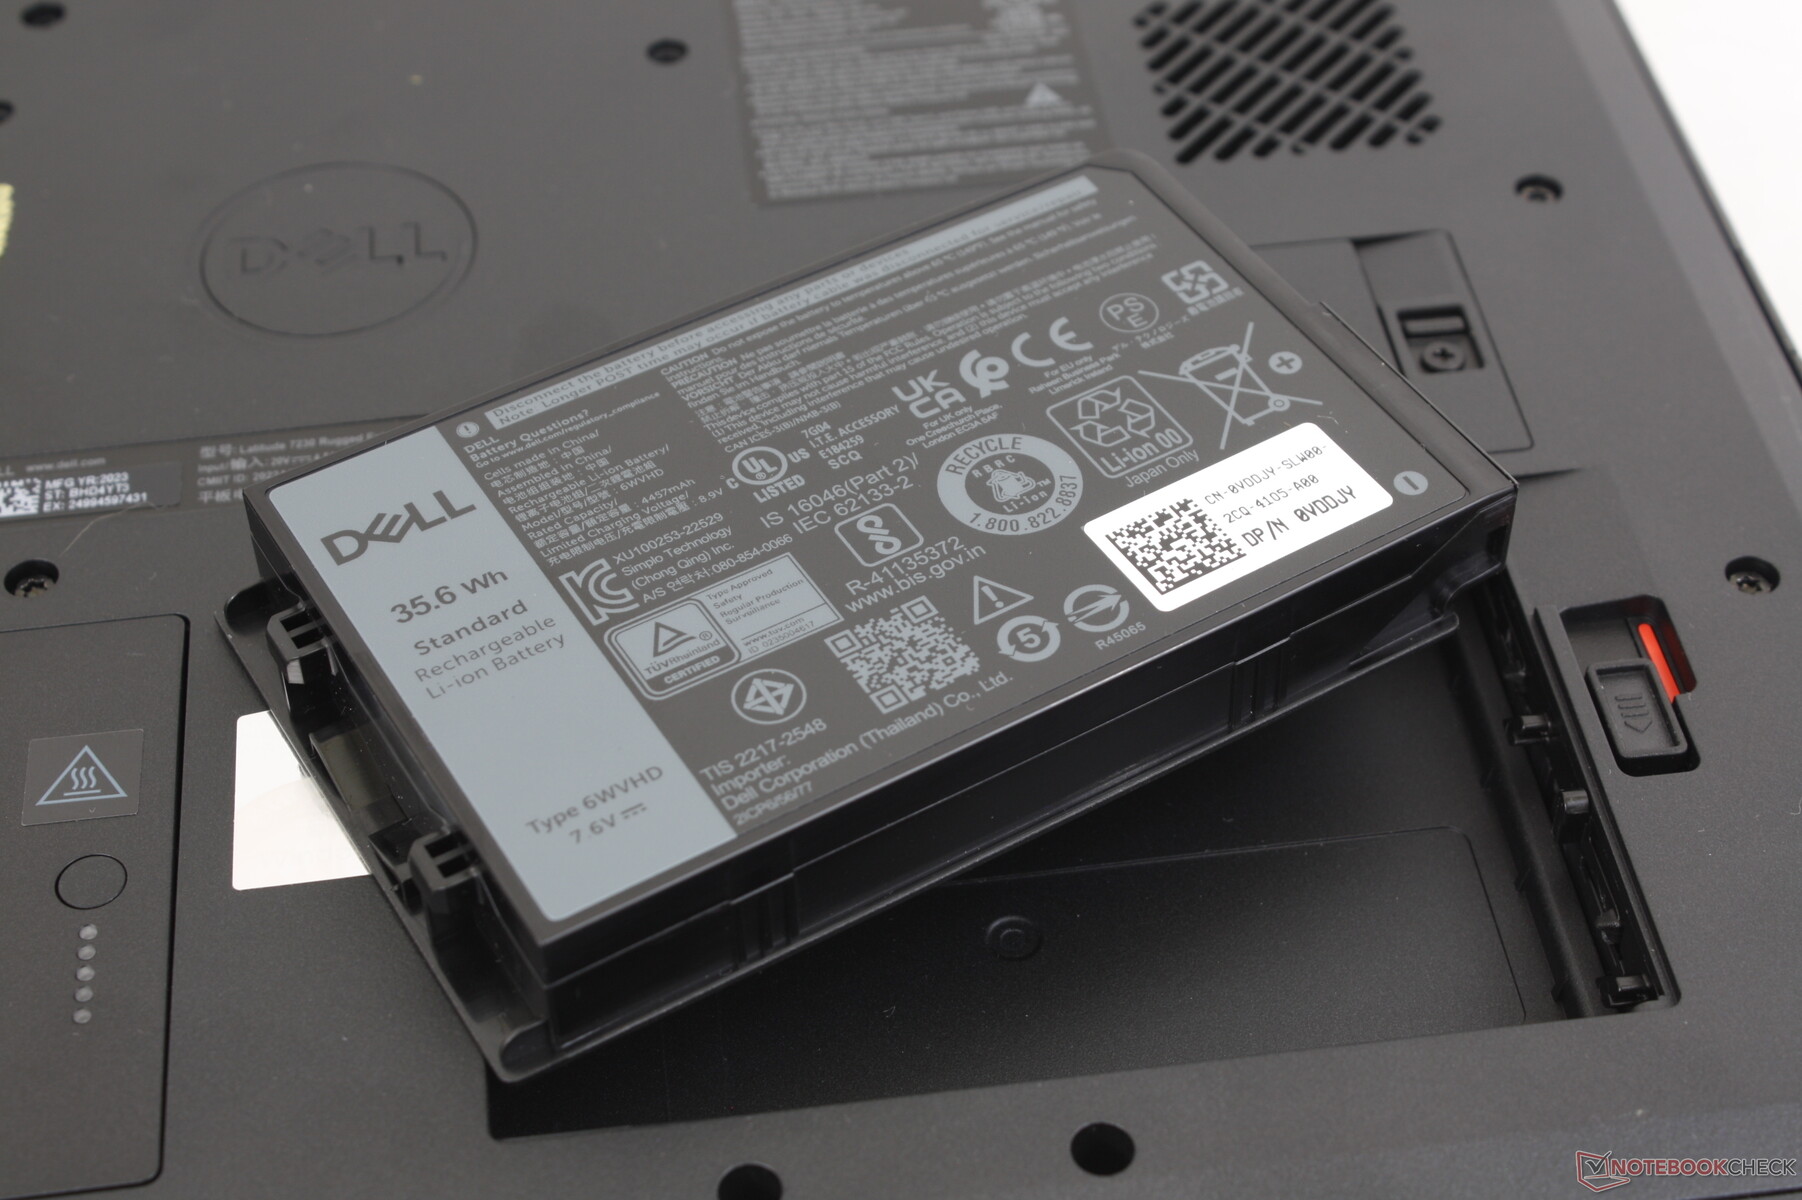
Das Dell Latitude 7230 kann mit bis zu zwei austauschbaren Akkus ausgestattet werden. Mit zwei 36Wh-Akkus erreicht unser Testgerät im Wi-Fi-Websurfing-Test eine Laufzeit von knapp 13 Stunden. Selbst bei hoher Last und maximaler Helligkeit stehen immer noch dreieinhalb Stunden Akkulaufzeit zur Verfügung.
Allerdings dauert der Ladevorgang hier vergleichsweise lange. Für eine vollständige Aufladung müssen vier bis fünf Stunden eingeplant werden. Im Vergleich zu den nur ein bis zwei Stunden, die wir bei verschiedenen Ultrabooks mit ähnlicher Akkukapazität immer wieder sehen, ist das recht lang.
| Dell Latitude 7230 Rugged Extreme i5-1240U, Iris Xe G7 80EUs, 72 Wh | Dell Latitude 7330 Rugged Extreme i7-1185G7, Iris Xe G7 96EUs, 107 Wh | Panasonic Toughbook 40 i7-1185G7, Iris Xe G7 96EUs, 136 Wh | Getac B360 i7-10710U, UHD Graphics 620, 46 Wh | Acer Enduro Urban N3 EUN314 i7-1165G7, Iris Xe G7 96EUs, 50.3 Wh | Durabook S14I i7-1165G7, Iris Xe G7 96EUs, 50 Wh | |
|---|---|---|---|---|---|---|
| Akkulaufzeit | 38% | 46% | -38% | -51% | -58% | |
| WLAN (h) | 13 | 18 38% | 19 46% | 8.1 -38% | 6.4 -51% | 5.5 -58% |
| Last (h) | 3.6 |
Pro
Contra
Fazit - Größtenteils ein Heimspiel für Dell
Fazit - Meist ein Volltreffer
Die herausragenden Merkmale des Latitude 7230 Rugged Extreme sind die vollständige sRGB-Abdeckung, die flotte CPU-Leistung und das geringe Gewicht im Vergleich zu anderen Rugged Tablets. Im Vergleich dazu haben die meisten Alternativen eine schlechtere Farbdarstellung und dickere Ränder.
Verbesserungen würden wir uns bei den Anschlussabdeckungen und den Fronttasten wünschen, die zu rutschig bzw. zu klein sind. Mit Handschuhen sind diese Tasten noch schwerer zu bedienen.
Das Latitude 7230 Rugged Extreme setzt mit seiner hervorragenden Akkulaufzeit, dem superhellen Display und der exzellenten Darstellung den Standard für zukünftige robuste Tablets.
Potenzielle Käuferinnen und Käufer sollten beachten, dass der günstigere Core i5-1240U eine ähnliche CPU-Leistung wie der Core i7-1260U bietet. Nutzerinnen und Nutzer sollten daher nur zu Letzterem greifen, wenn sie eine schnellere Grafikleistung benötigen. Bei anspruchsvolleren Aufgaben kann die Geräuschentwicklung des Lüfters jedoch höher sein als üblich.
Preise und Verfügbarkeit
Das Dell Latitude 7230 Rugged Extreme Tablet ist beim Hersteller ab rund 2.700 Euro erhältlich und über die Herstellerseite frei konfigurierbar. Unsere Testkonfiguration beinhaltet mehrere aufpreispflichtige Anpassungen, bei SSD, Rückcover, dem oberen Erweiterungsschacht, Netzteil, Akku, Tragegriff und vielen weiteren Punkten. Der Endpreis hierfür landet bei rund 3.240 Euro.
Dell Latitude 7230 Rugged Extreme
- 07.04.2023 v7 (old)
Allen Ngo
Transparenz
Die Auswahl der zu testenden Geräte erfolgt innerhalb der Redaktion. Das vorliegende Testmuster wurde dem Autor vom Hersteller oder einem Shop zu Testzwecken leihweise zur Verfügung gestellt. Eine Einflussnahme des Leihstellers auf den Testbericht gab es nicht, der Hersteller erhielt keine Version des Reviews vor der Veröffentlichung. Es bestand keine Verpflichtung zur Publikation. Als eigenständiges, unabhängiges Unternehmen unterliegt Notebookcheck keiner Diktion von Herstellern, Shops und Verlagen.
So testet Notebookcheck
Pro Jahr werden von Notebookcheck hunderte Laptops und Smartphones unabhängig in von uns standardisierten technischen Verfahren getestet, um eine Vergleichbarkeit aller Testergebnisse zu gewährleisten. Seit rund 20 Jahren entwickeln wir diese Testmethoden kontinuierlich weiter und setzen damit Branchenstandards. In unseren Testlaboren kommt ausschließlich hochwertiges Messequipment in die Hände erfahrener Techniker und Redakteure. Die Tests unterliegen einer mehrstufigen Kontrolle. Unsere komplexe Gesamtbewertung basiert auf hunderten fundierten Messergebnissen und Benchmarks, womit Ihnen Objektivität garantiert ist. Weitere Informationen zu unseren Testmethoden gibt es hier.
Preisvergleich

