Notebookcheck Logo
Teaser

Microsoft Surface Laptop 13 2026 im Test - Mit Snapdragon X2 Plus fast lautlos

Ein toller Laptop für den Alltag.

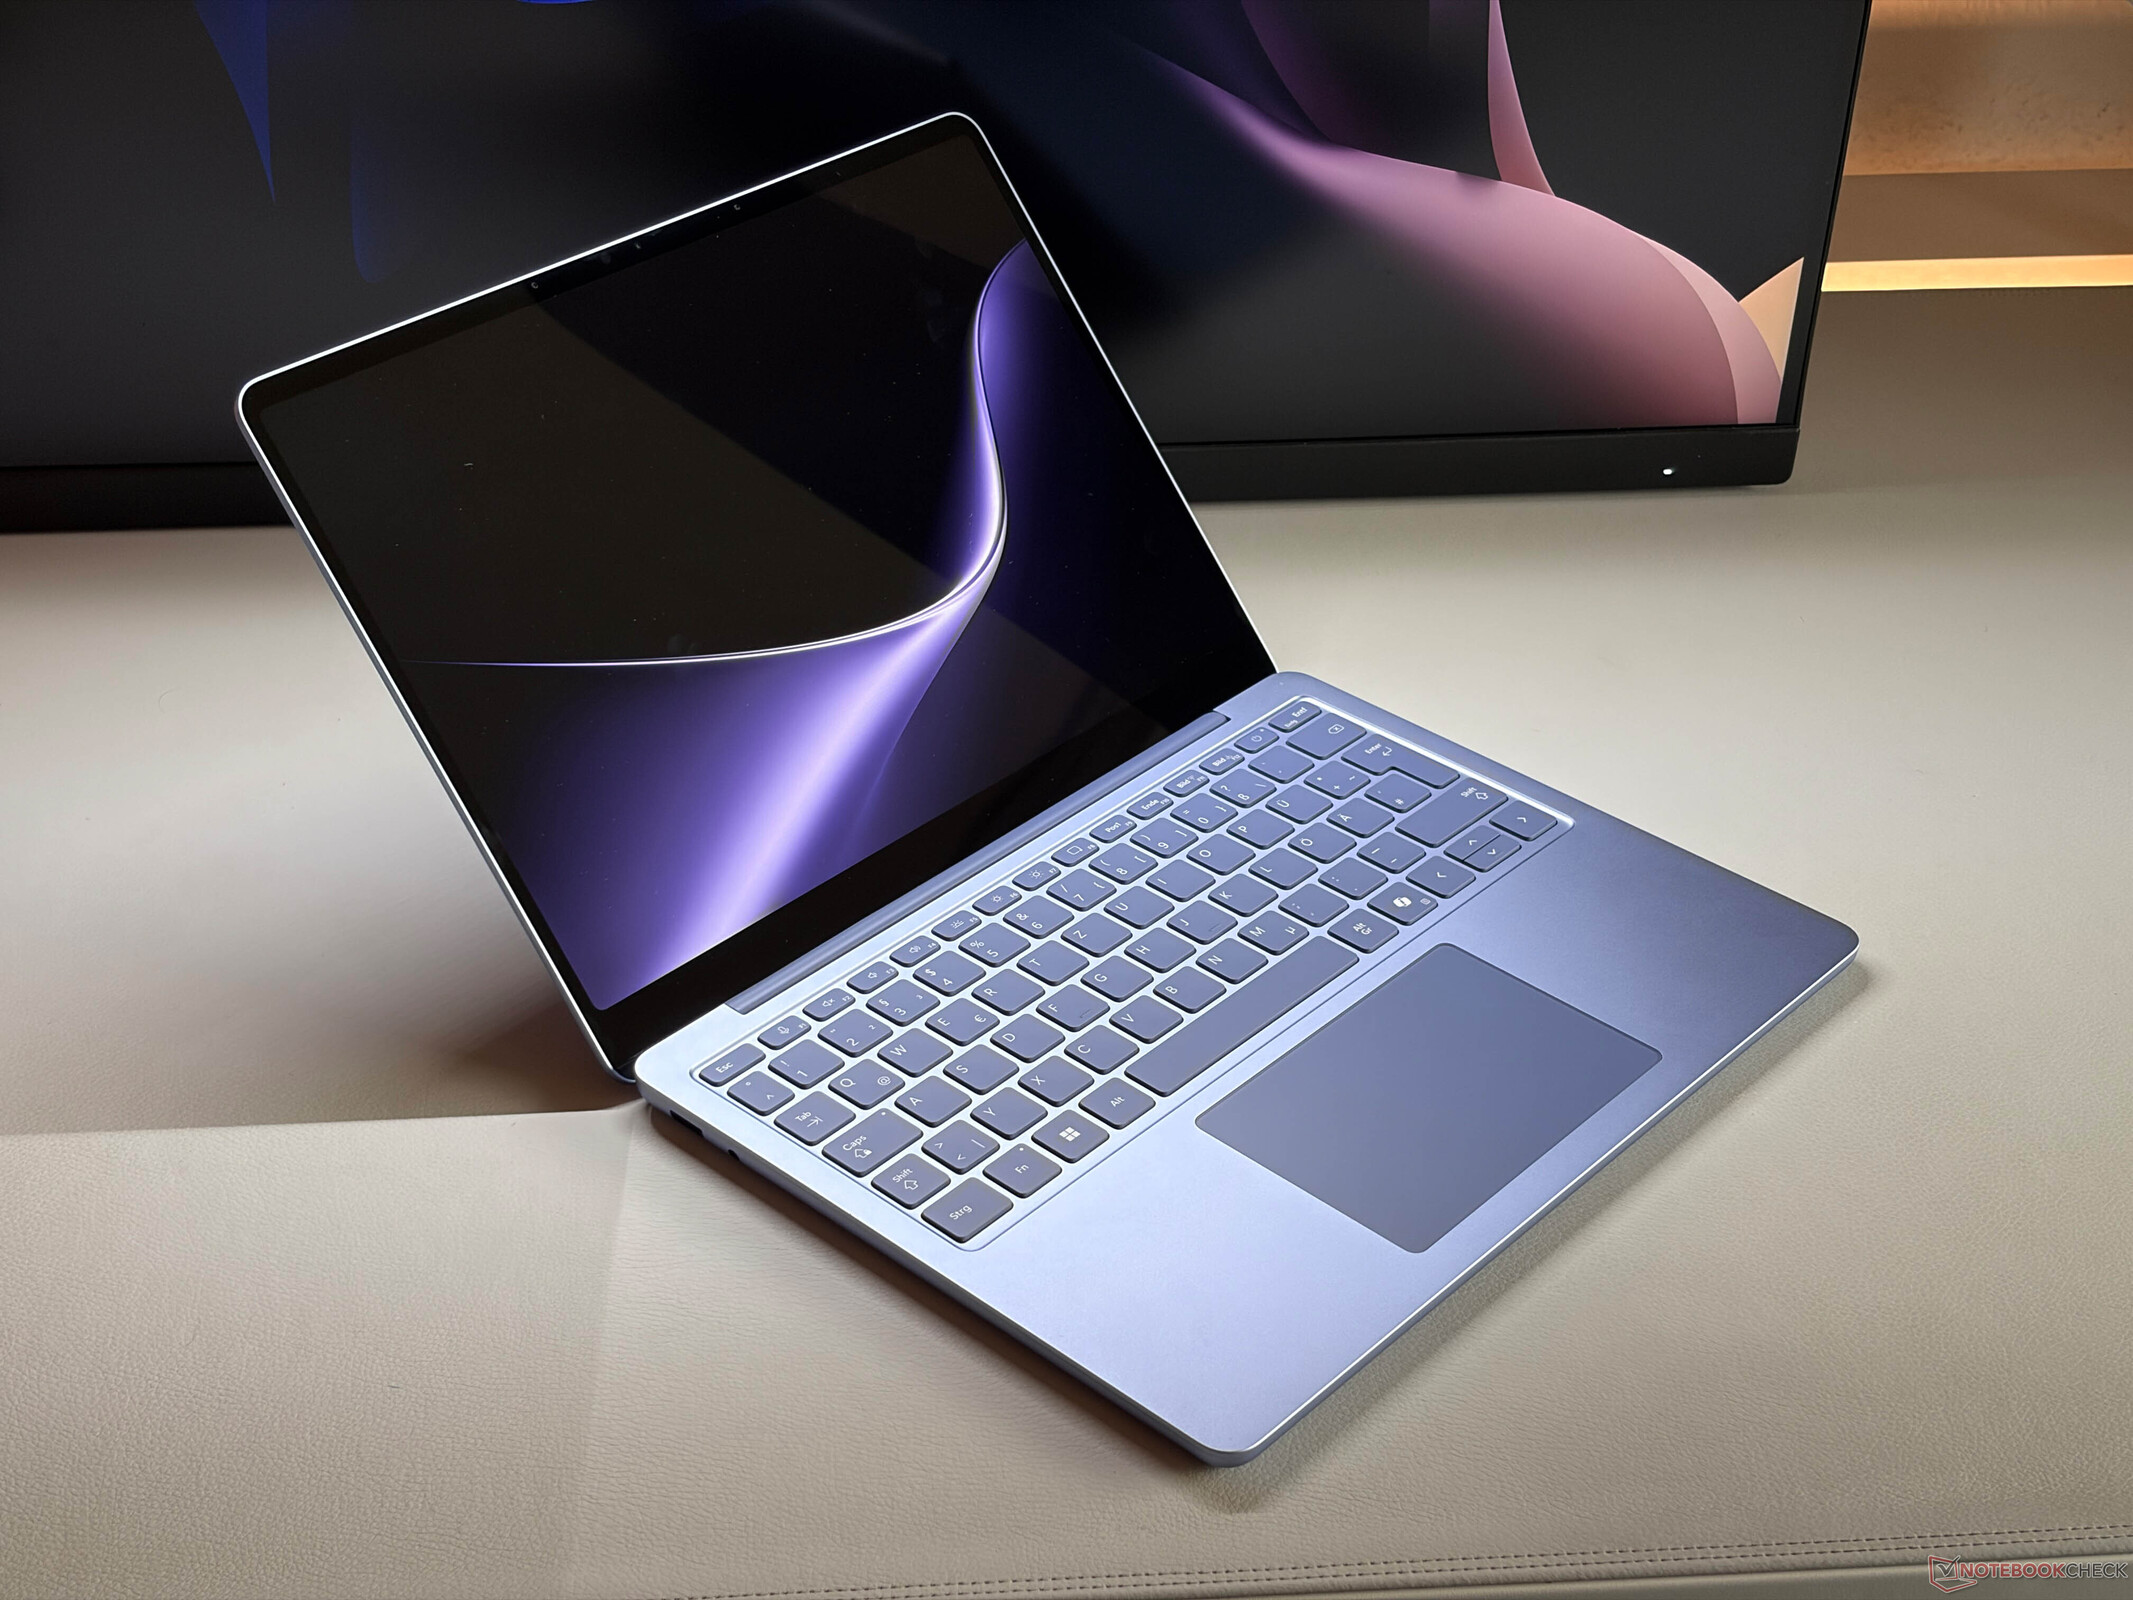
Microsoft aktualisiert den kleinen Surface Laptop 13 mit einem effizienten Snapdragon-X2-Plus-SoC und einem helleren Bildschirm. Zudem arbeitet es die meiste Zeit lautlos und ist derzeit wohl die Windows-Alternative, die dem MacBook Air am nächsten kommt.
Andreas Osthoff 👁 (übersetzt von Andreas Osthoff) Veröffentlicht am 🇺🇸 🇪🇸 ...
ARM Laptop / Notebook Microsoft MS Surface Snapdragon X Series Touchscreen Windows Wi-Fi 7

Fazit - Das Surface Laptop 13 ist besser als zuvor

Der neue Surface Laptop 13 2026 ist ein guter Alltagslaptop mit hochwertiger Verarbeitung, komfortablen Eingabegeräten und einem ordentlichen IPS-Touchscreen, auch wenn die Bildwiederholfrequenz von 60 Hz ein Nachteil ist. Die Helligkeit ist mit mehr als 500 cd/m² höher als zuvor, doch das Panel spiegelt weiterhin stark. Der neue Snapdragon-X2-Plus-SoC bietet eine ordentliche CPU-Leistung. Die größte Änderung betrifft das Lüfterverhalten, denn das neue Modell ist deutlich leiser als zuvor und der Lüfter ist praktisch nie zu hören. Das ist eine erhebliche Verbesserung, und das Surface Laptop 13 gehört derzeit zu den leisesten Windows-Laptops auf dem Markt.

Die neue CPU ist zudem effizienter, und die Akkulaufzeit fällt in unserem WLAN-Test bei 150 cd/m² mit fast 19 Stunden länger aus als zuvor. Bei maximaler Helligkeit ist die Laufzeit etwas kürzer, angesichts der nun höheren Helligkeit überrascht das jedoch kaum. Microsoft hat das letztjährige Modell mit 8 GB eingestellt und bietet jetzt mindestens 16 GB an. Dadurch ist allerdings auch der Einstiegspreis für die Variante mit 256 GB auf 1.319 Euro gestiegen. Weitere Nachteile sind der verlötete Arbeitsspeicher und der schwierige Zugang zu den Komponenten, der den Tausch der M.2-2242-SSD sehr aufwendig macht. 

Pro

+ Metallgehäuse mit guter Verarbeitung
+ helleres IPS-Panel als zuvor
+ lange Akkulaufzeit
+ komfortable Eingabegeräte
+ Wi-Fi 7
+ in vielen Situationen lautlos

Contra

- nur 60 Hz
- verlöteter Arbeitsspeicher
- schwieriger Zugang zu den Komponenten
- kein USB 4.0

Preis und Verfügbarkeit

Die Variante des Surface Laptop 13 mit 512 GB ist bei Amazon für 1.439 Euro erhältlich.

Amazon Logo
1.439,00 €
Microsoft Surface Laptop, 13" | Snapdragon X2 Plus | 16GB RAM, 512GB SSD | 13" LCD Touchscreen | Platin | Snapdragon X2 Plus (6 Kerne) | Windows 11 Home | Neuestes Modell (2. Edition)
Bestpreis 1389 € PC-KING
Microsoft Surface Laptop 13" - 2nd Edition, violett, Snapdragon X2 Plus - X2P-42-100, 16GB RAM, 512GB Flash, Windows 11 Home, DE [2026] (EP2-77934)
2. 1393.86 € Jacob Elektronik direkt
3. 1403 € HEINZSOFT
4. 1405.57 € Jacob Elektronik direkt (AT)

Technische Daten

Microsoft Surface Laptop 13 2026
Prozessor
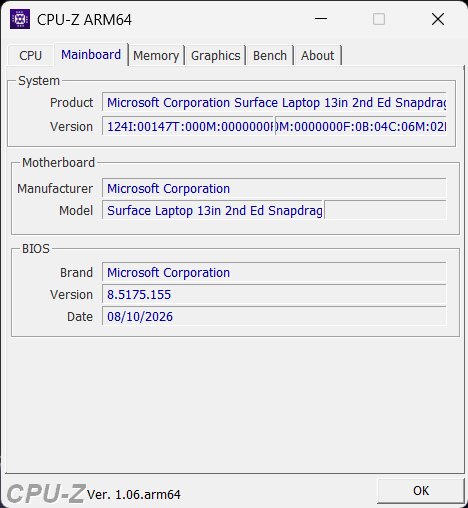
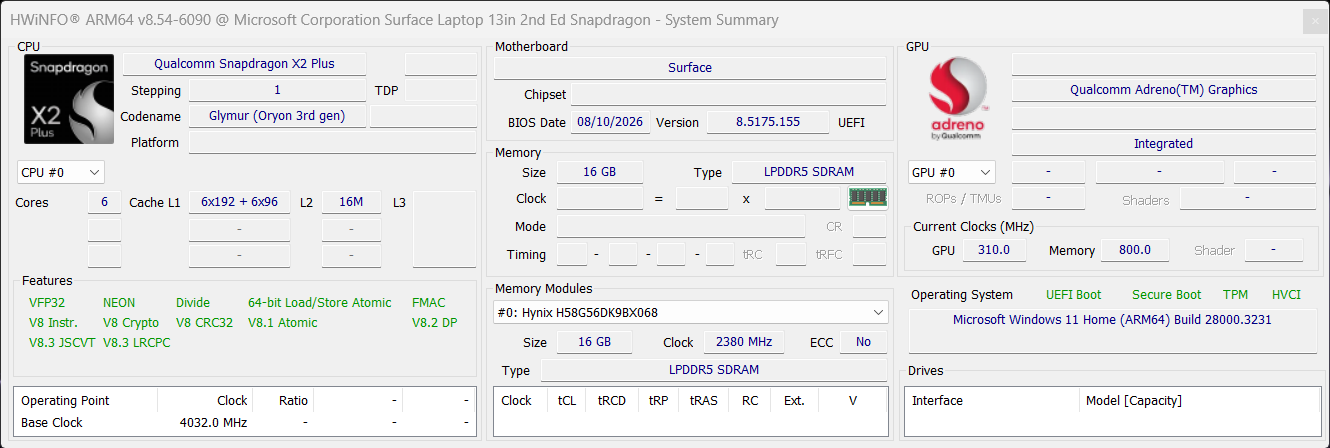
Qualcomm Snapdragon X2 Plus X2P-42-100 6c/6t, 6 x 4.0 GHz Qualcomm Oryon Gen 3 Prime, 28 W PL2 / Short Burst, 22 W PL1 / Sustained, Oryon v3
Grafikkarte
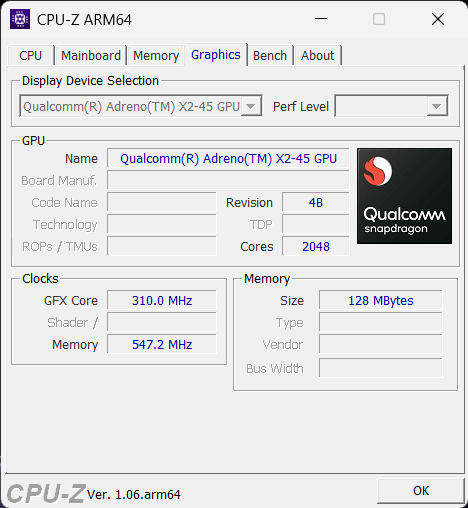
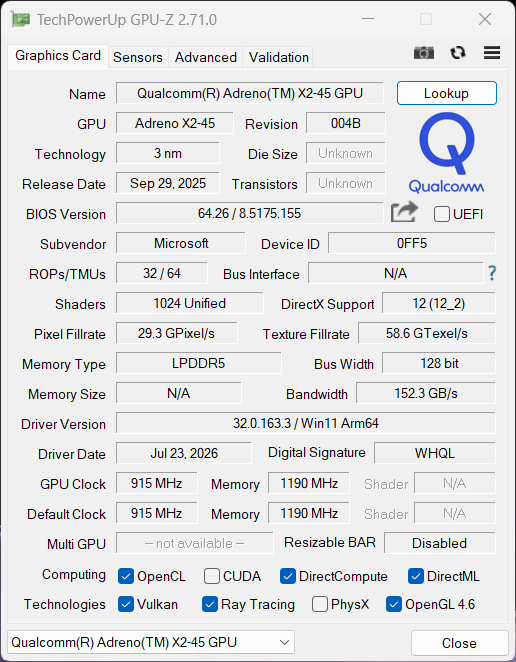
Qualcomm SD X2 Adreno X2-45, Kerntakt: 915 MHz, Speichertakt: 1190 MHz, 32.0.163.3
RAM
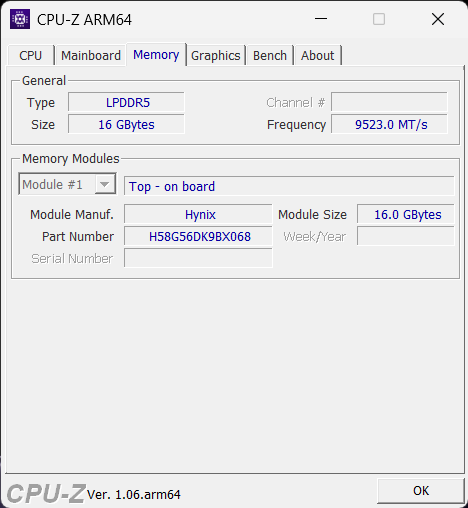
16 GB 
, LPDDR5x-9523
Bildschirm
13.00 Zoll 3:2, 1920 x 1280 Pixel 178 PPI, capacitive, LP130WU12241, IPS, spiegelnd: ja, 60 Hz
Massenspeicher
Kioxia THGJFJT2T85BAT01, 512 GB 
, 421 GB verfügbar
Anschlüsse
1 USB 3.0 / 3.1 Gen1, 2 USB 3.1 Gen2, USB-C Power Delivery (PD), 2 DisplayPort, Audio Anschlüsse: 3.5 mm, 1 Fingerprint Reader, Helligkeitssensor
Netzwerk
Qualcomm FastConnect 7800 (b/g/n = Wi-Fi 4/ac = Wi-Fi 5/ax = Wi-Fi 6/ Wi-Fi 6E 6 GHz be = Wi-Fi 7), Bluetooth 5.4
Abmessungen
Höhe x Breite x Tiefe (in mm): 15.6 x 286 x 214
Akku
50 Wh
Betriebssystem
Microsoft Windows 11 Home
Kamera
Webcam: 1080p
Primary Camera: 2 MPix
Sonstiges
Lautsprecher: Stereo, Tastatur: Chiclet, Tastatur-Beleuchtung: ja, 12 Monate Garantie
Gewicht
1.23 kg
Preis
1439 Euro
Geizhals
Preisvergleich
Geizhals Bestpreis 1389€
Microsoft Surface Laptop 13" - 2nd Edition, violett, Snapdragon X2 Plus - X2P-42-100, 16GB RAM, 512GB Flash, Windows 11 Home, DE [2026] (EP2-77934)
Hinweis: Der Hersteller kann abweichende Bauteile wie Bildschirme, Laufwerke und Speicherriegel mit ähnlichen Spezifikationen unter dem gleichen Modellnamen einsetzen.


Gehäuse, Ausstattung und Eingabegeräte

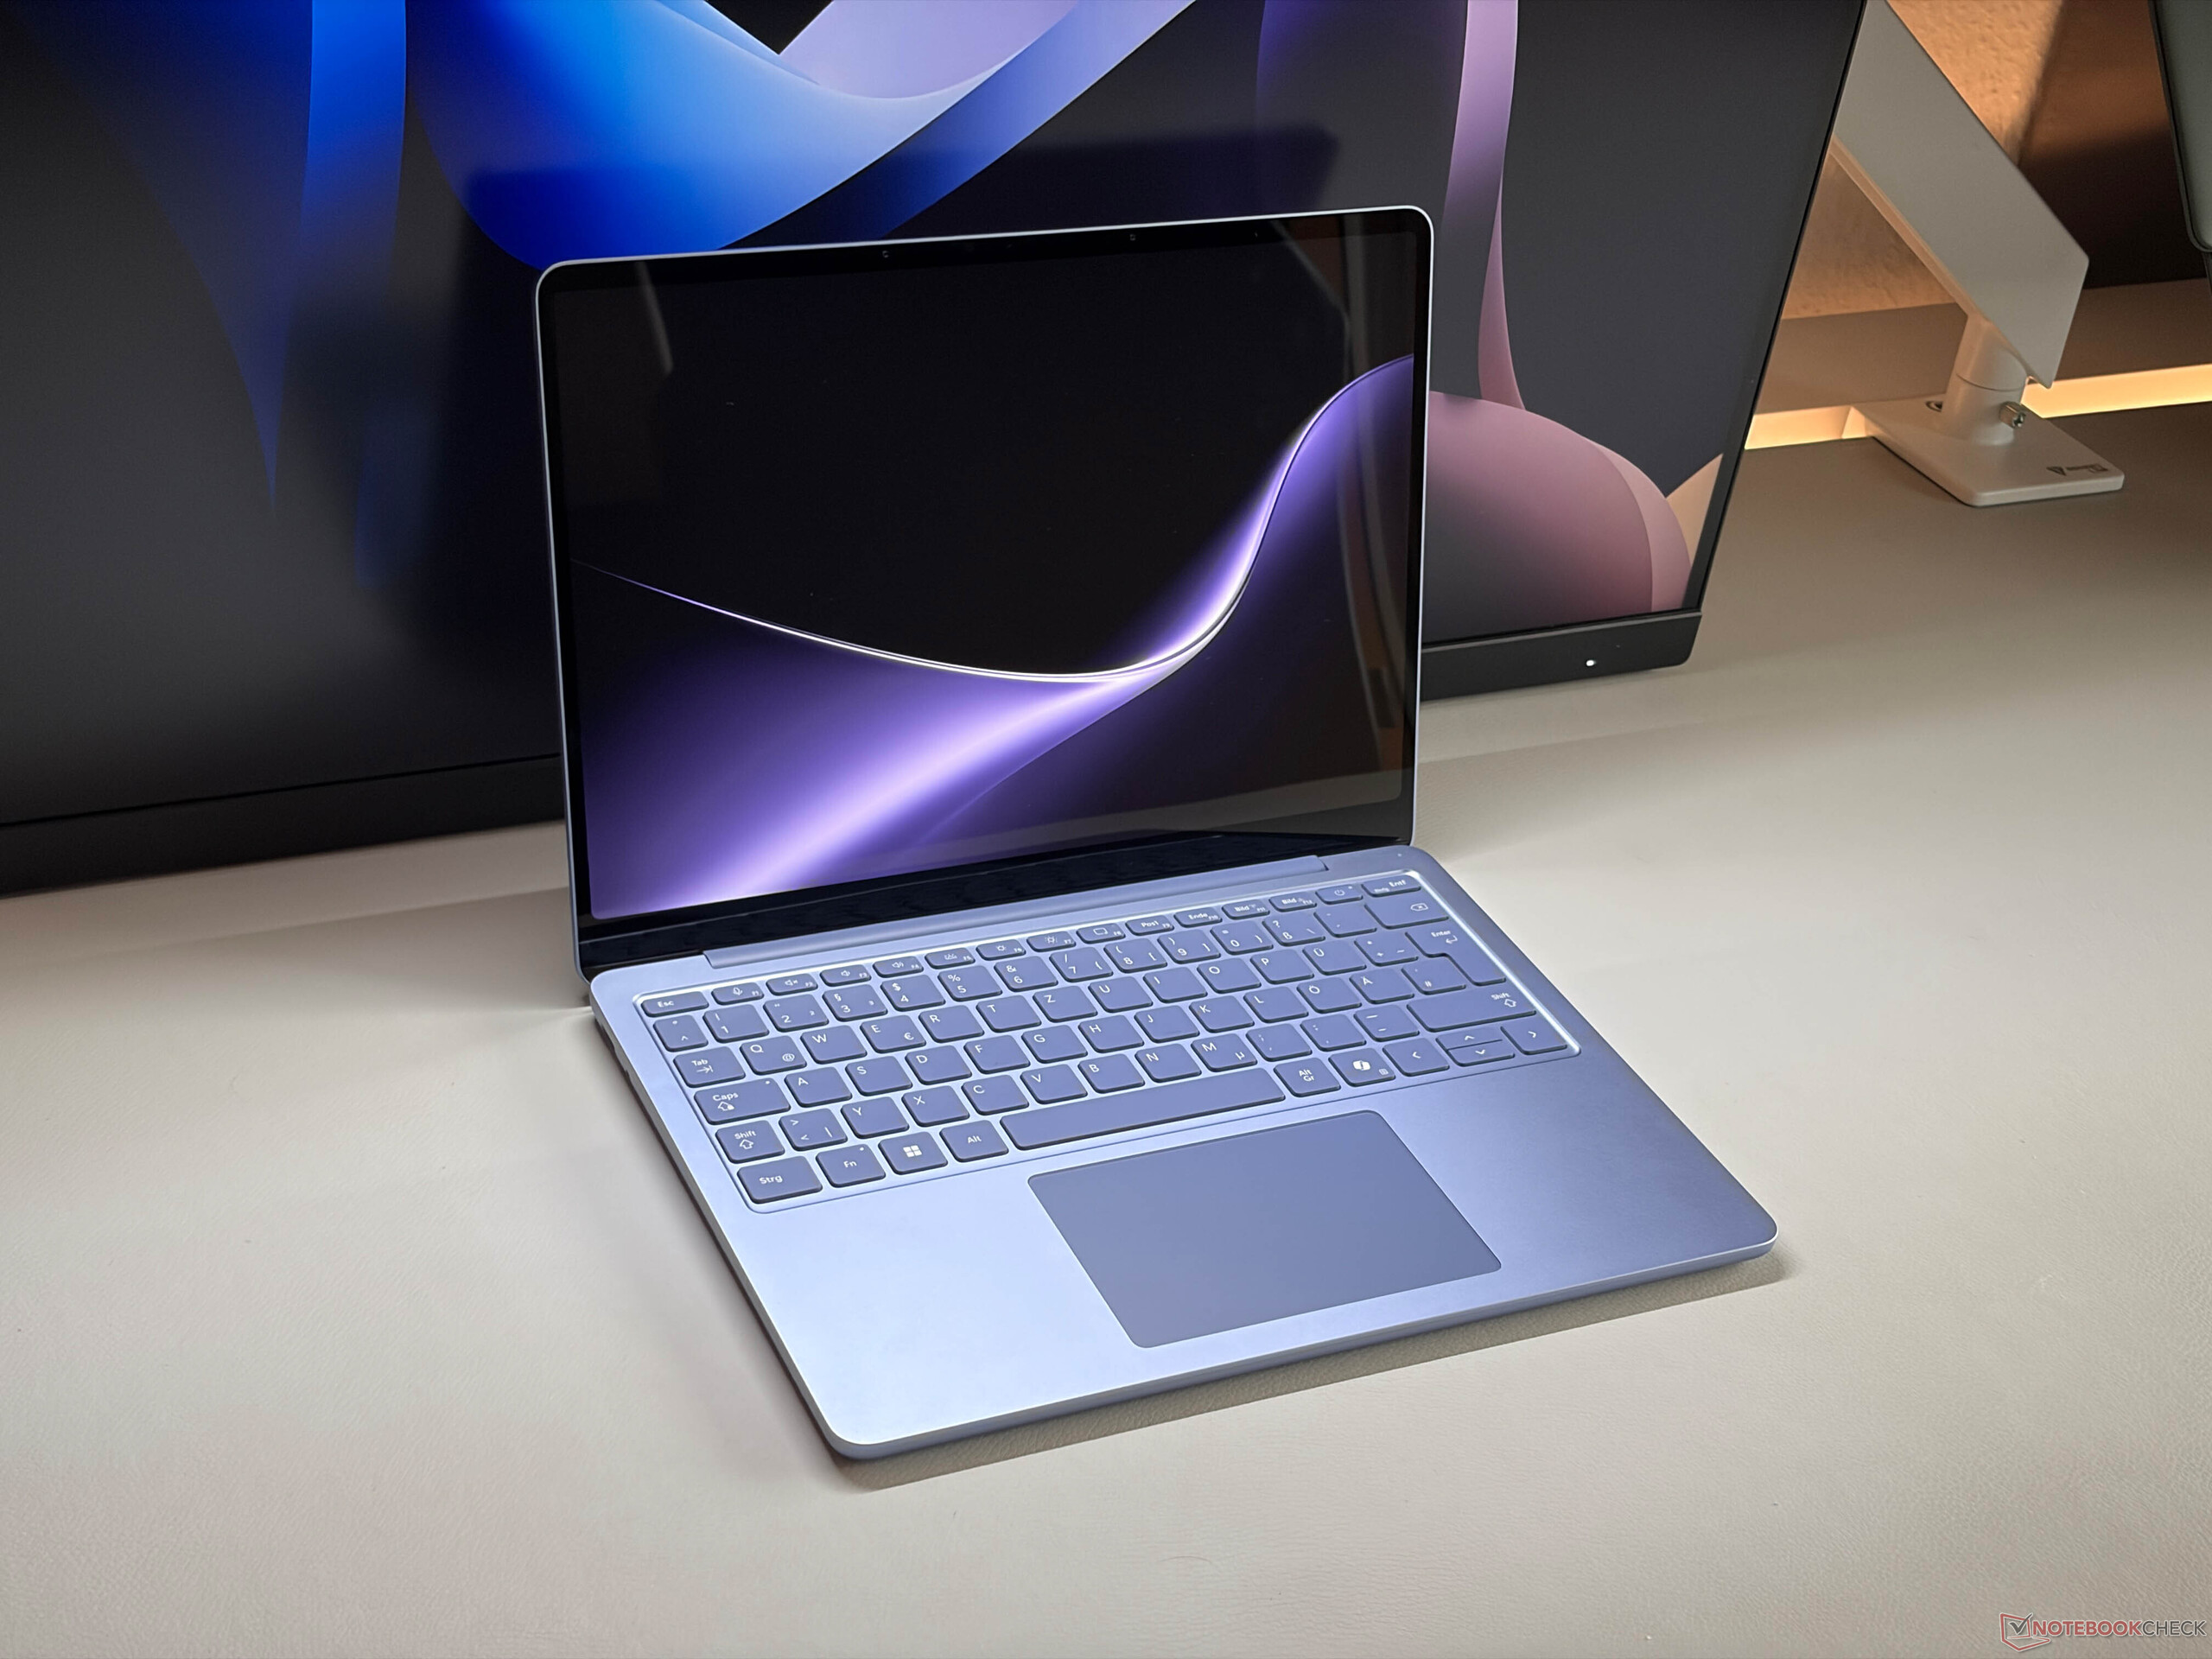
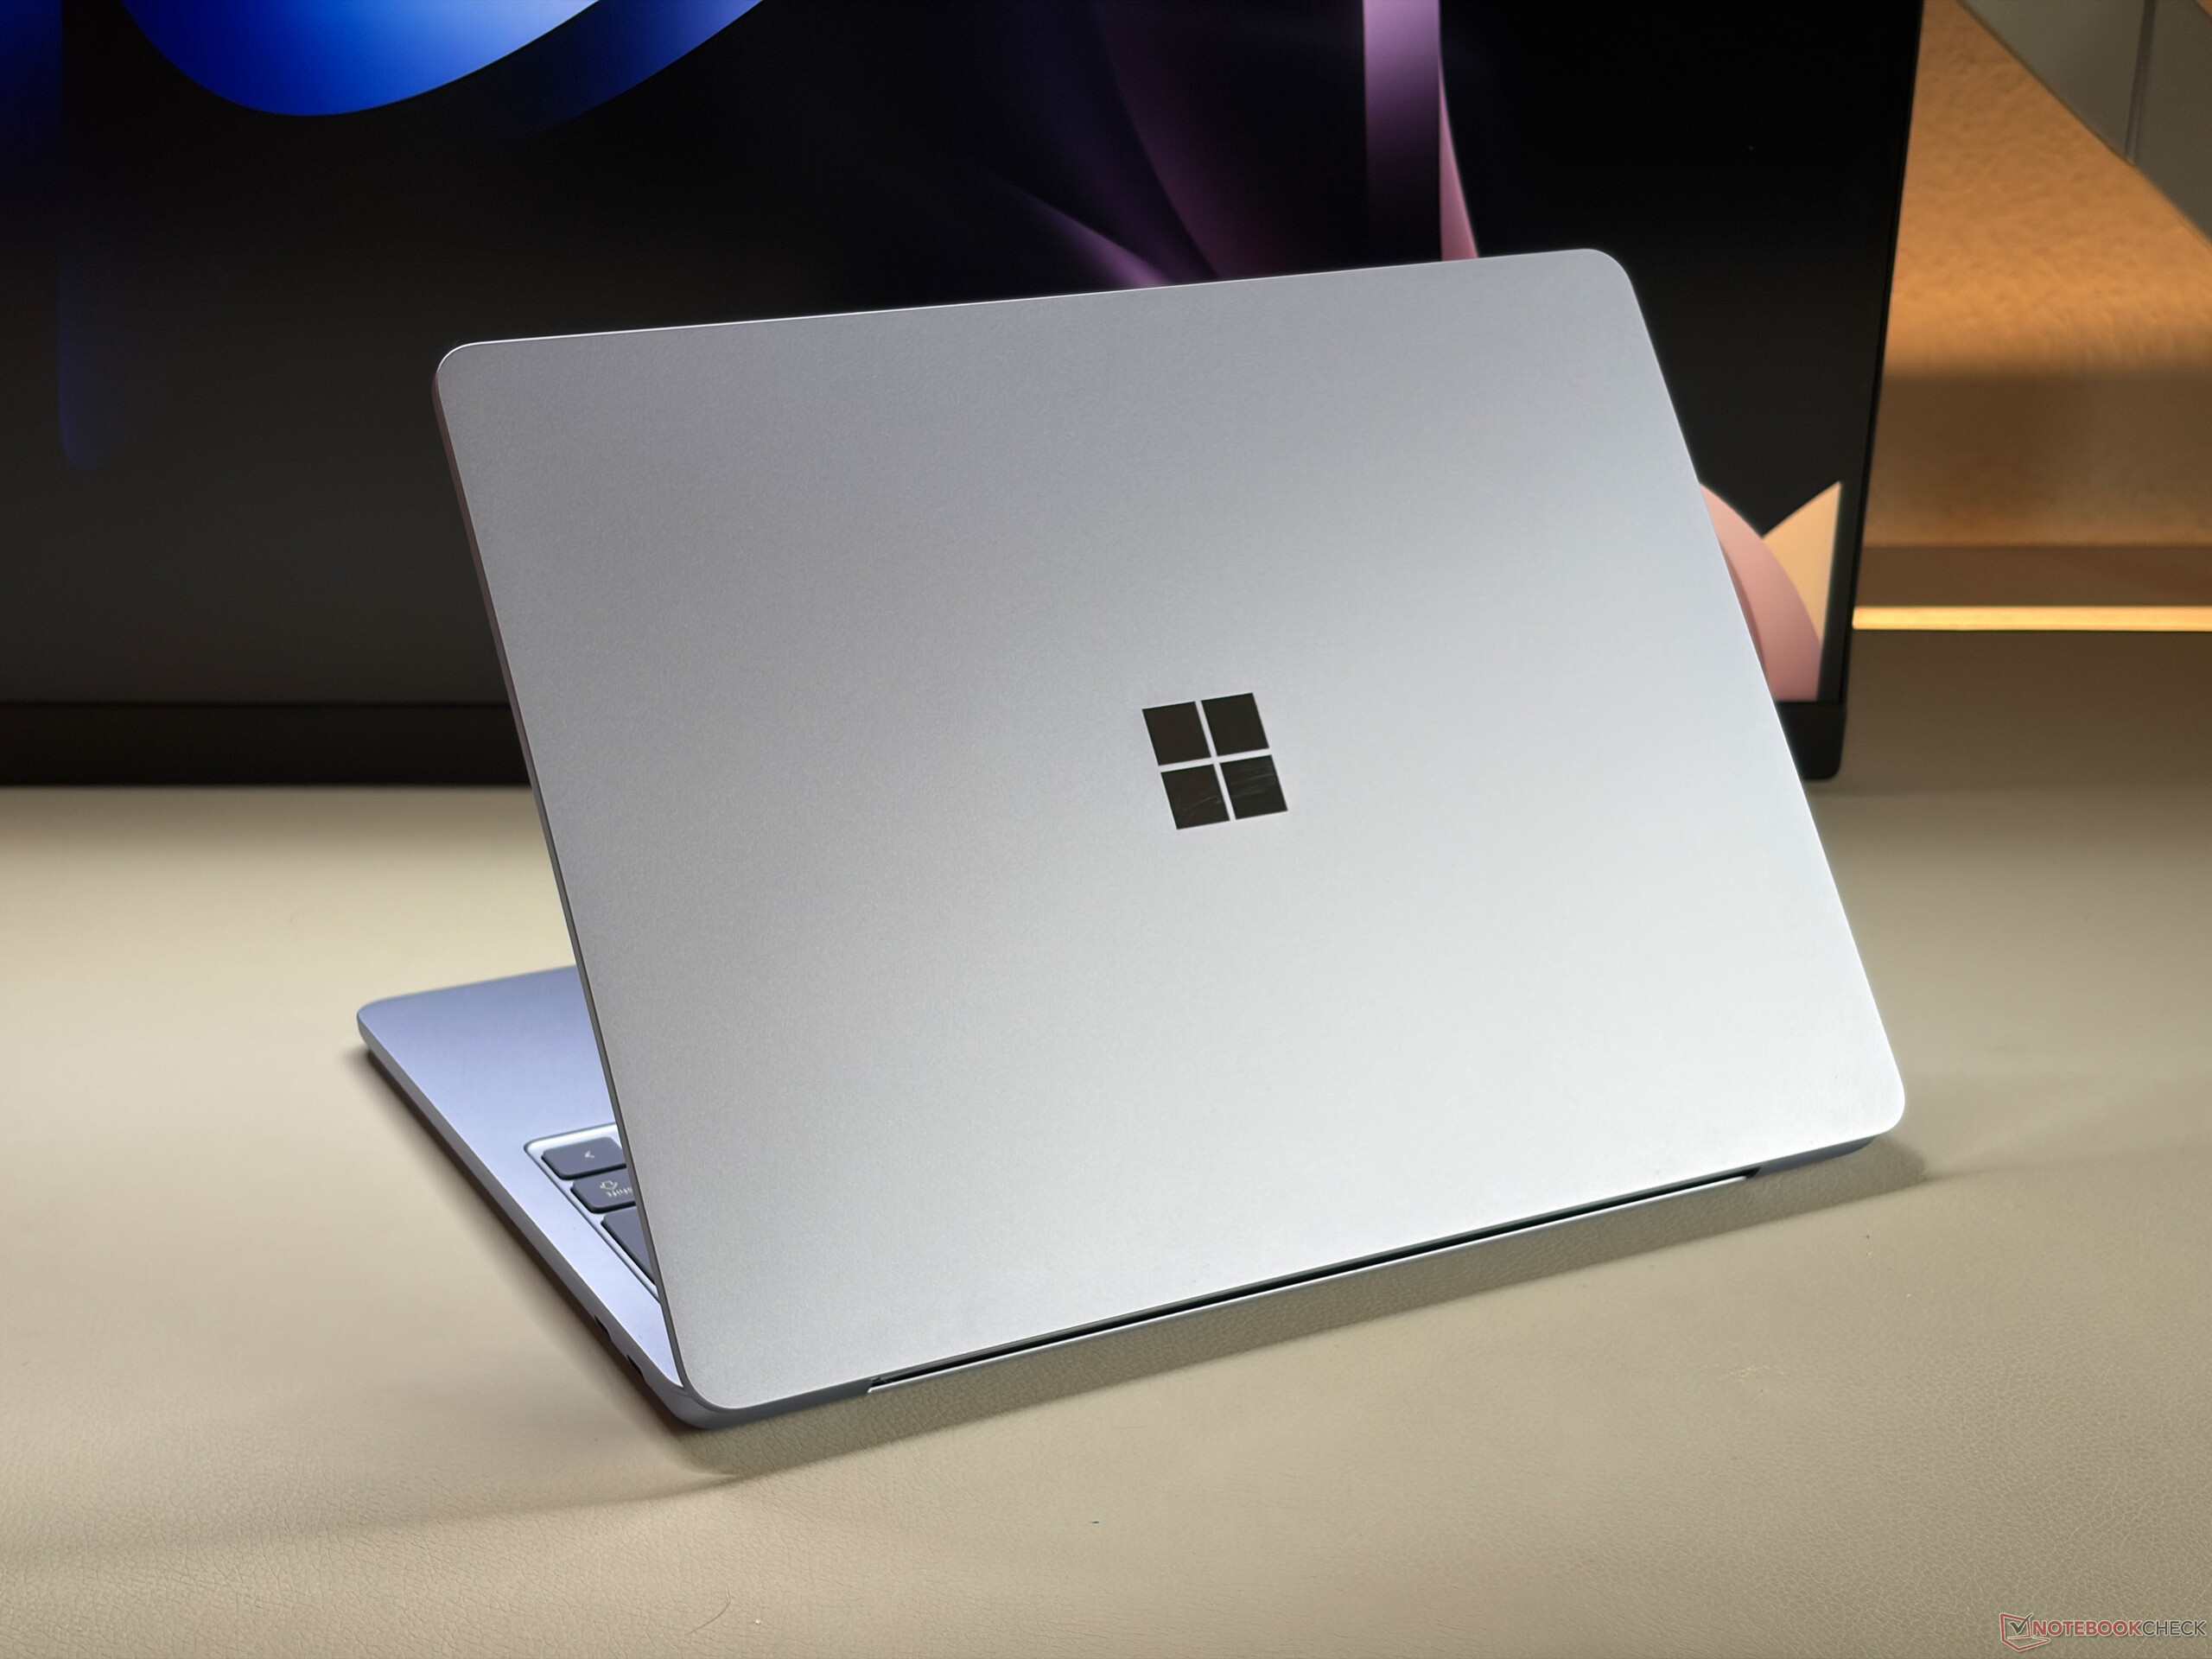
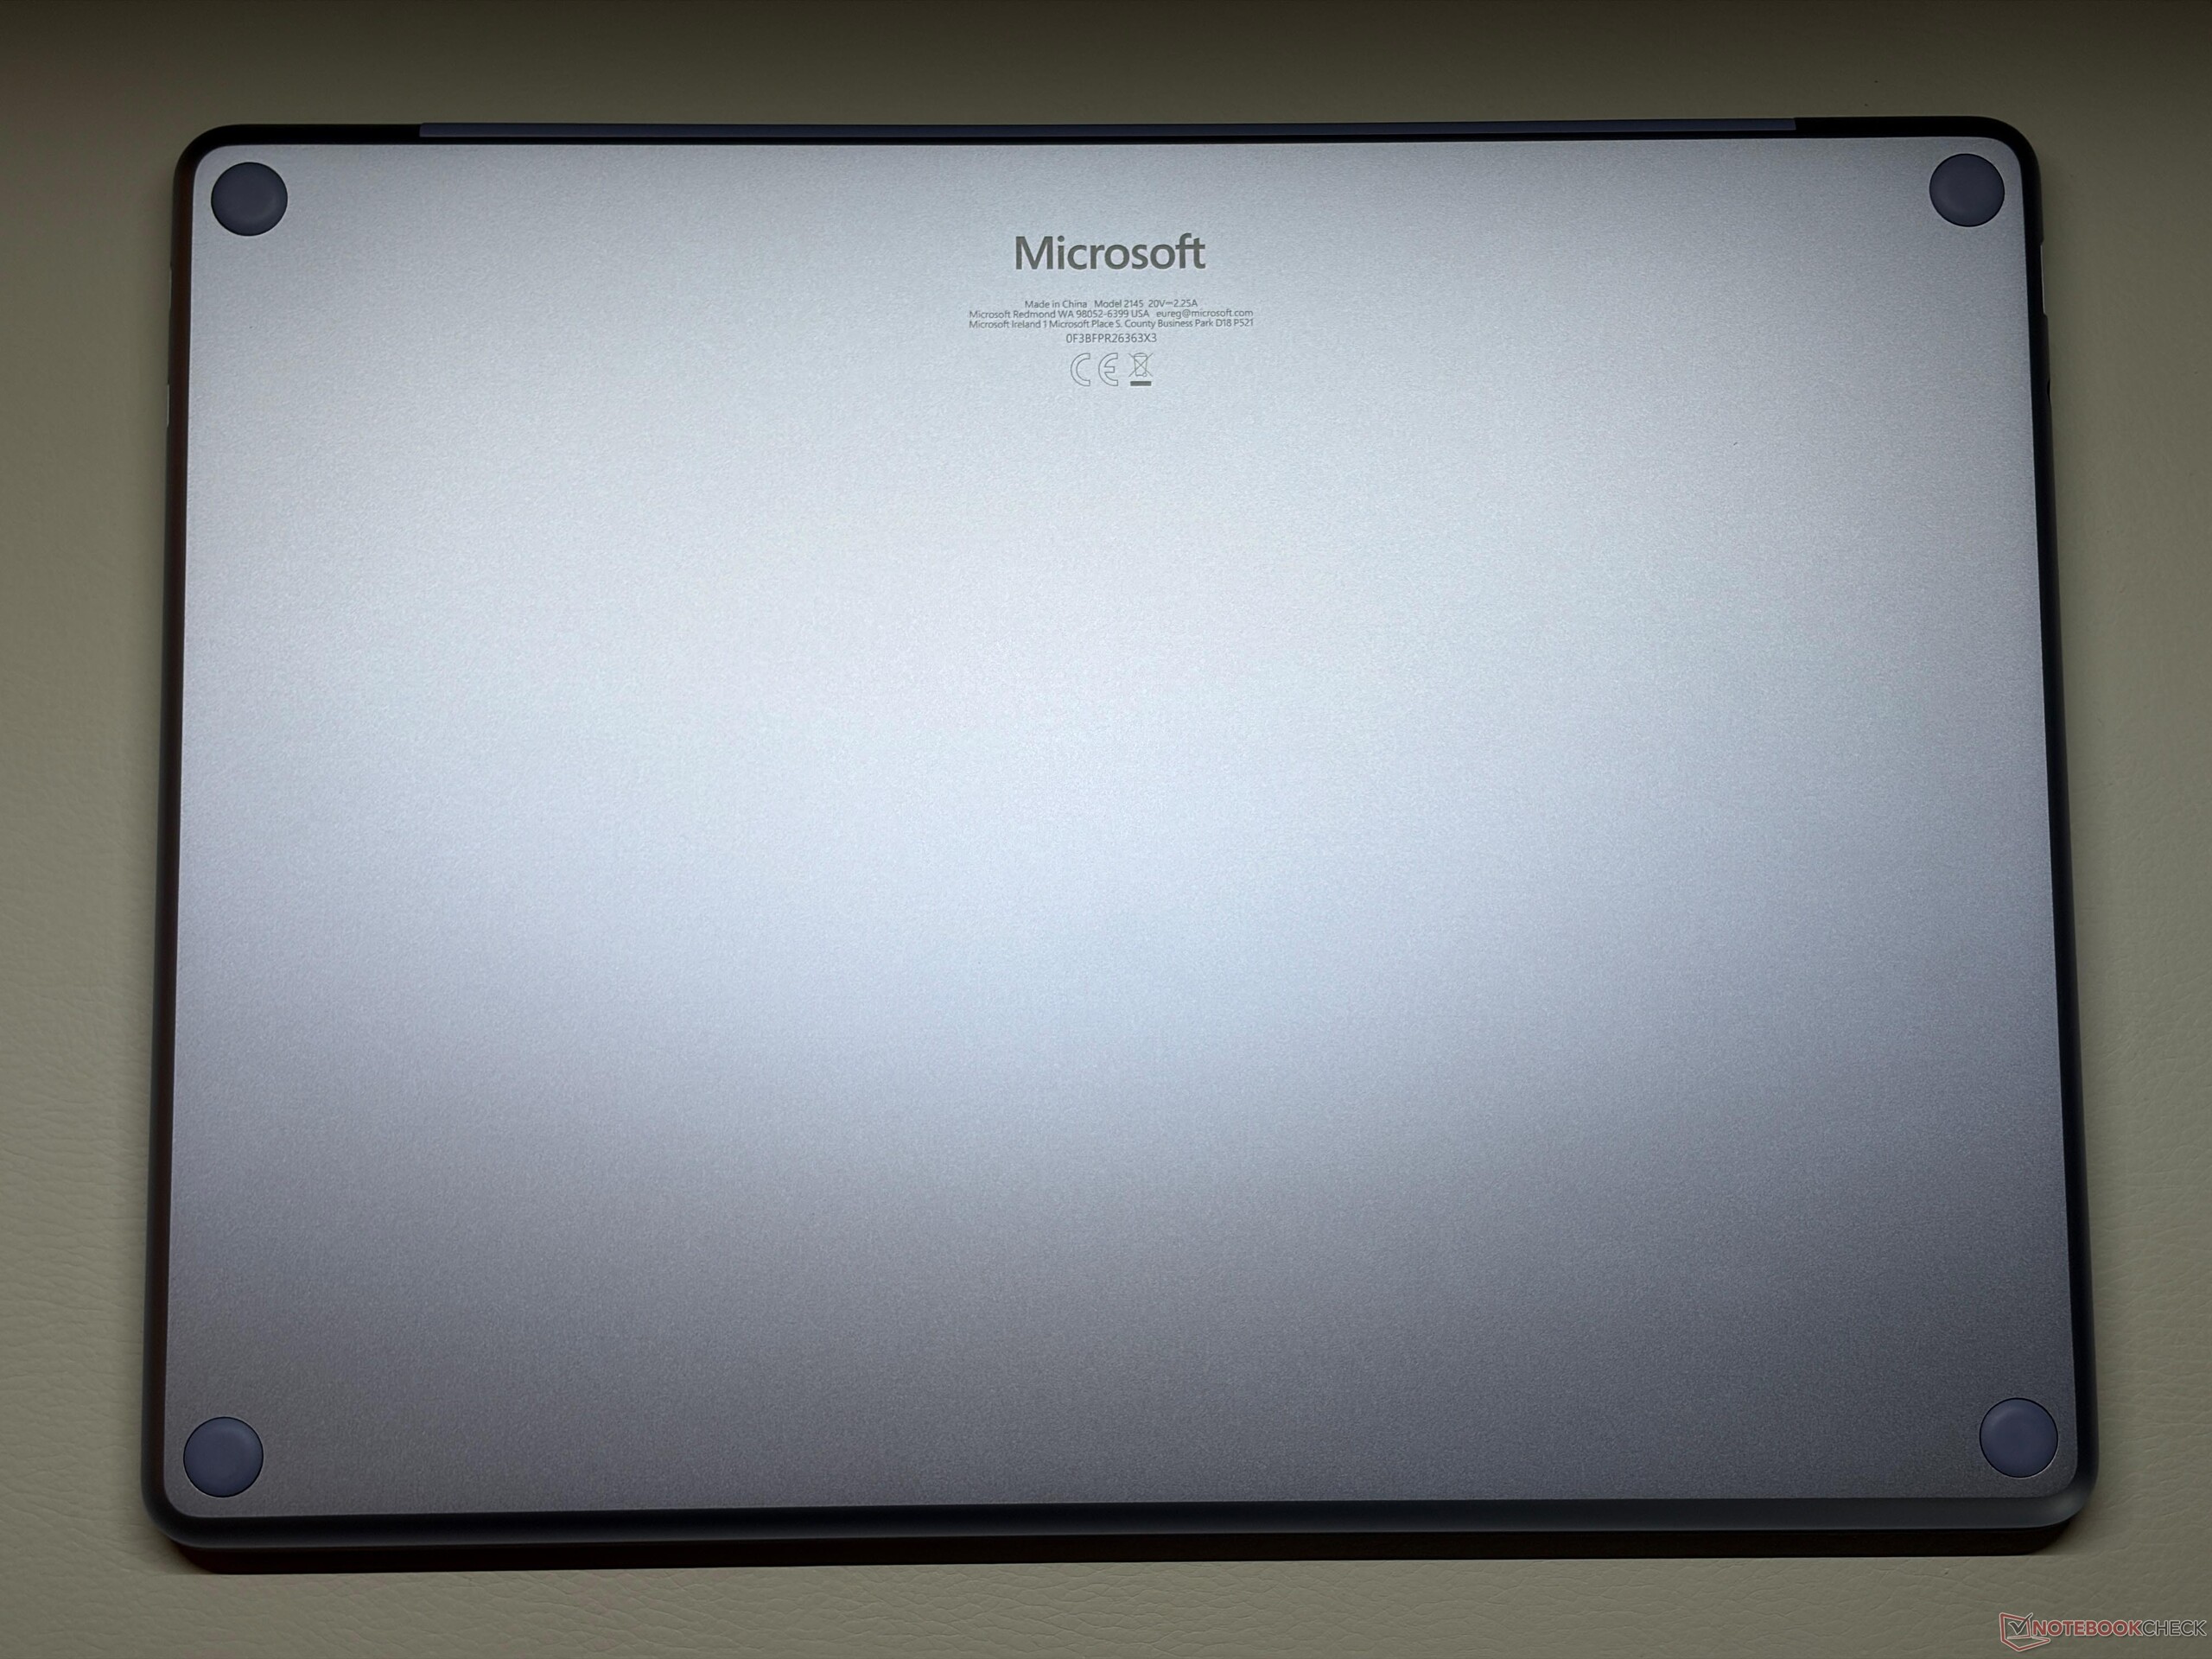
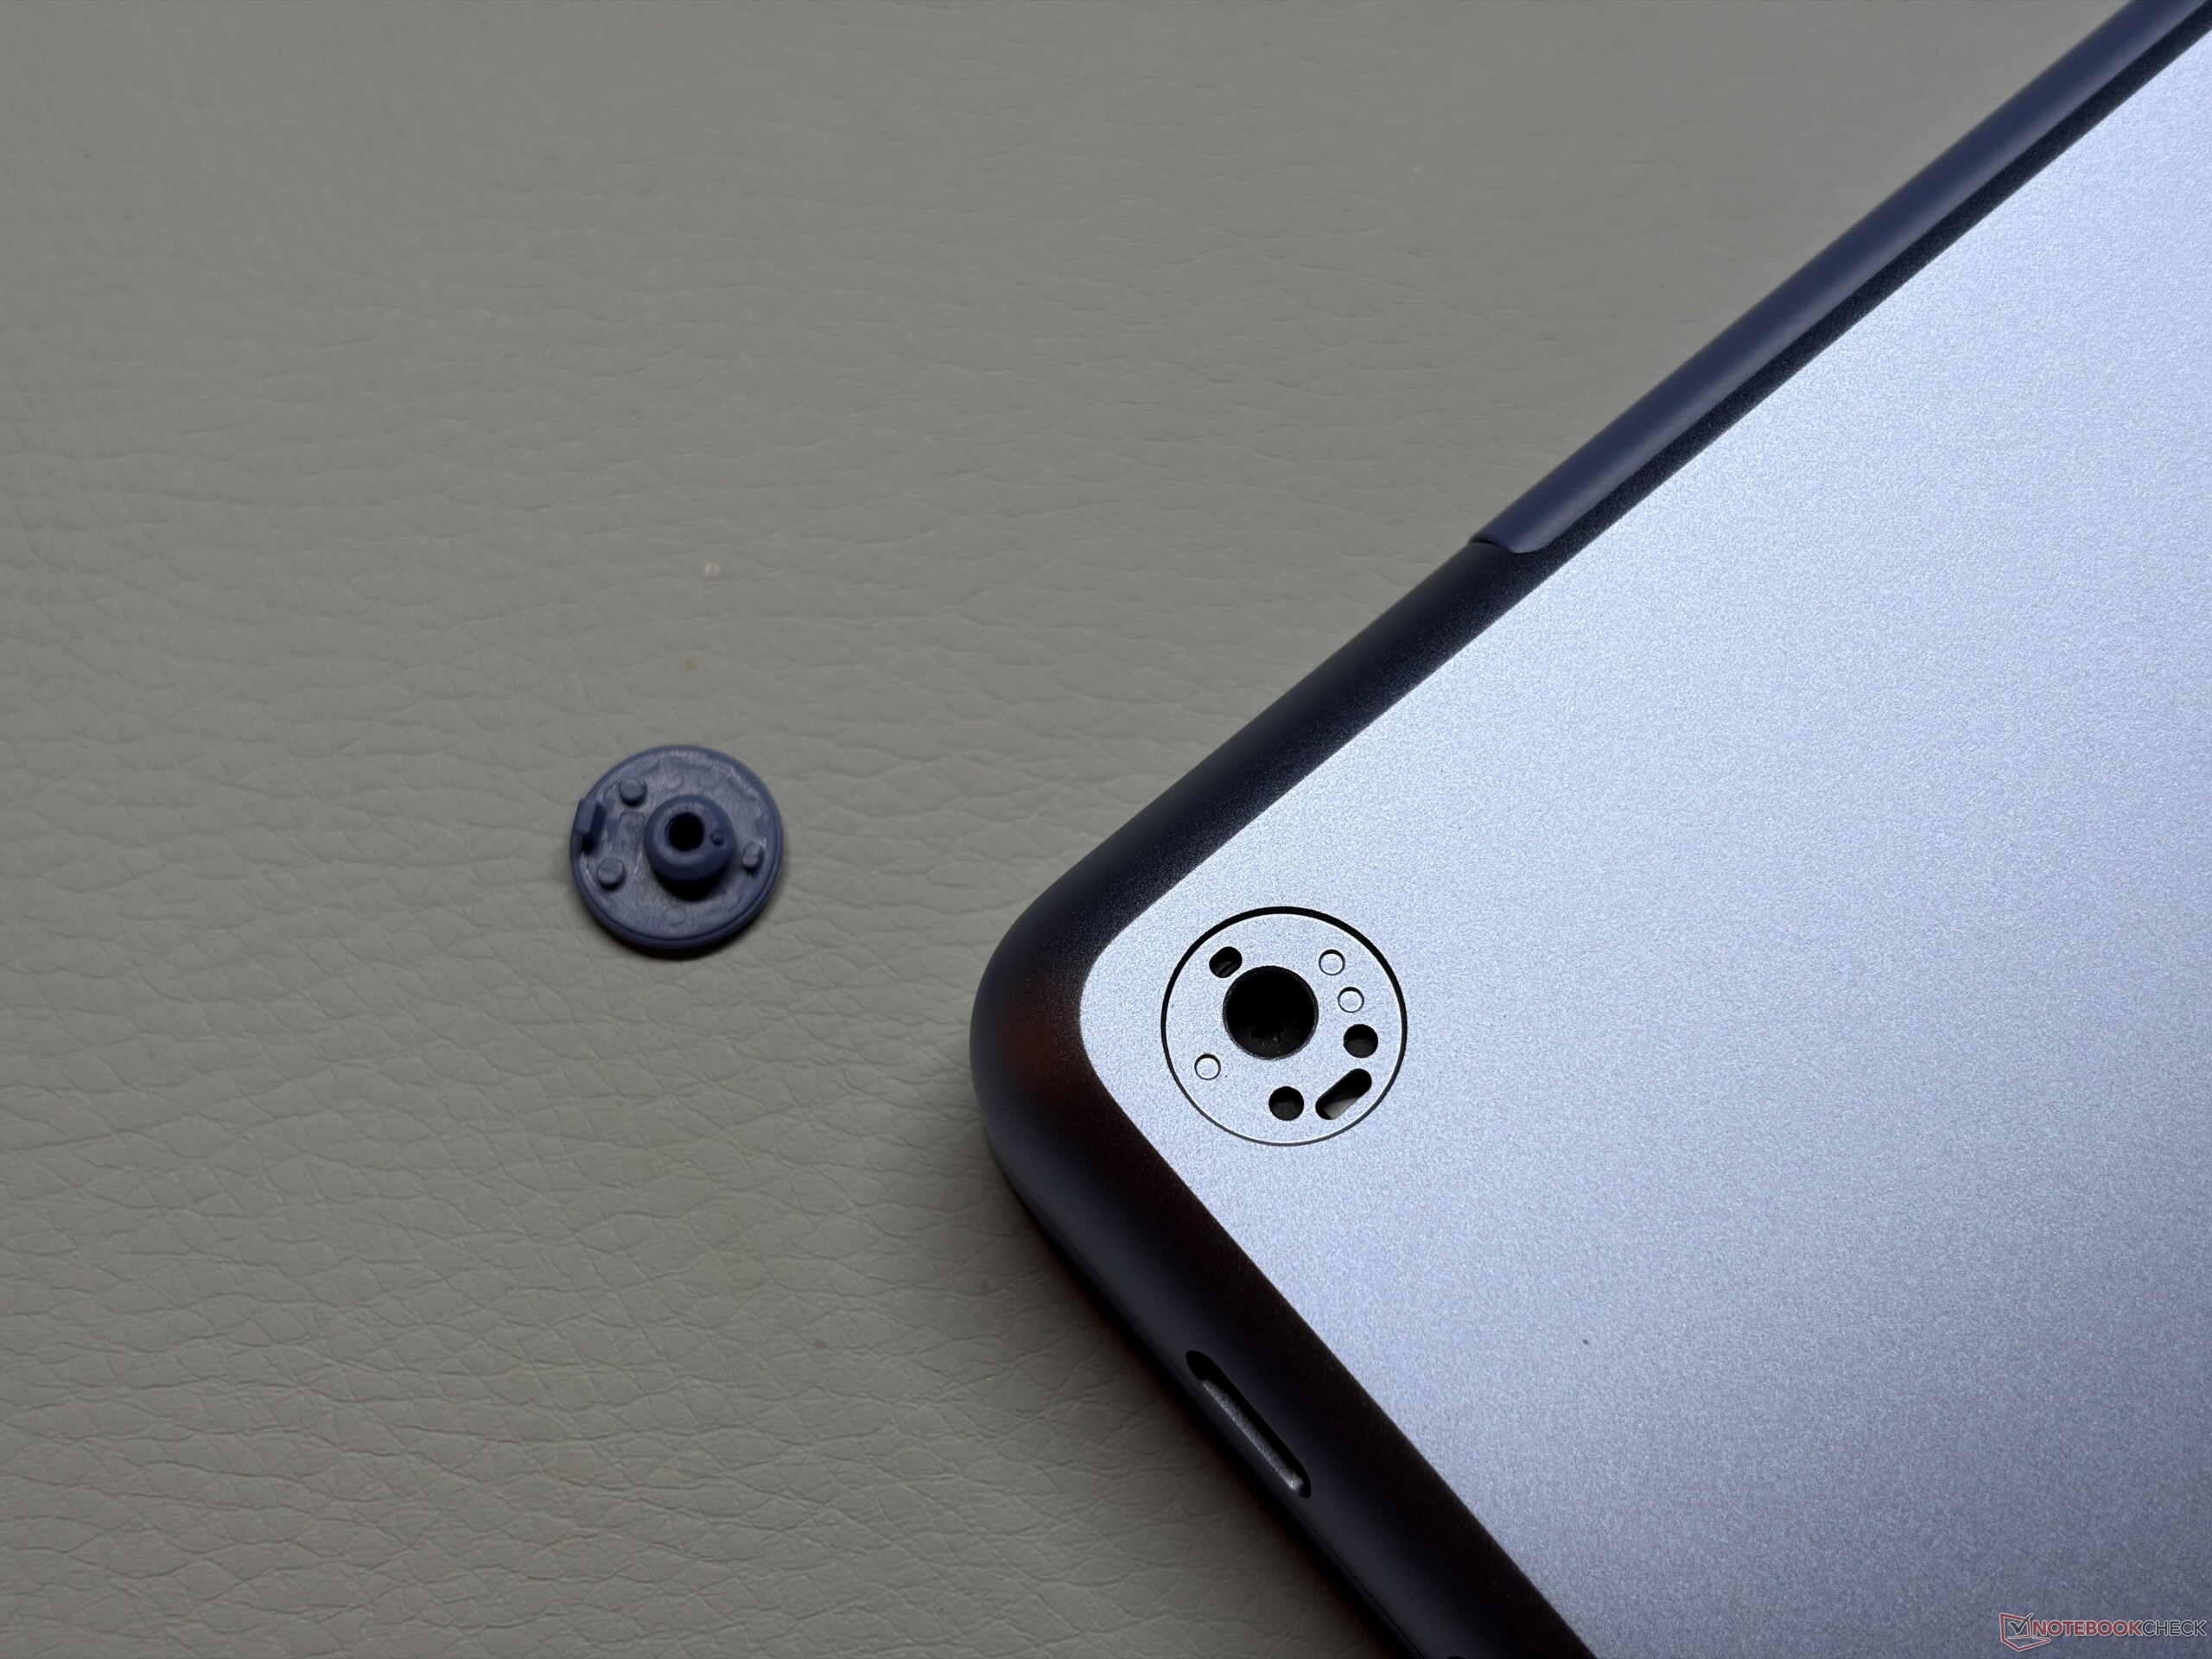
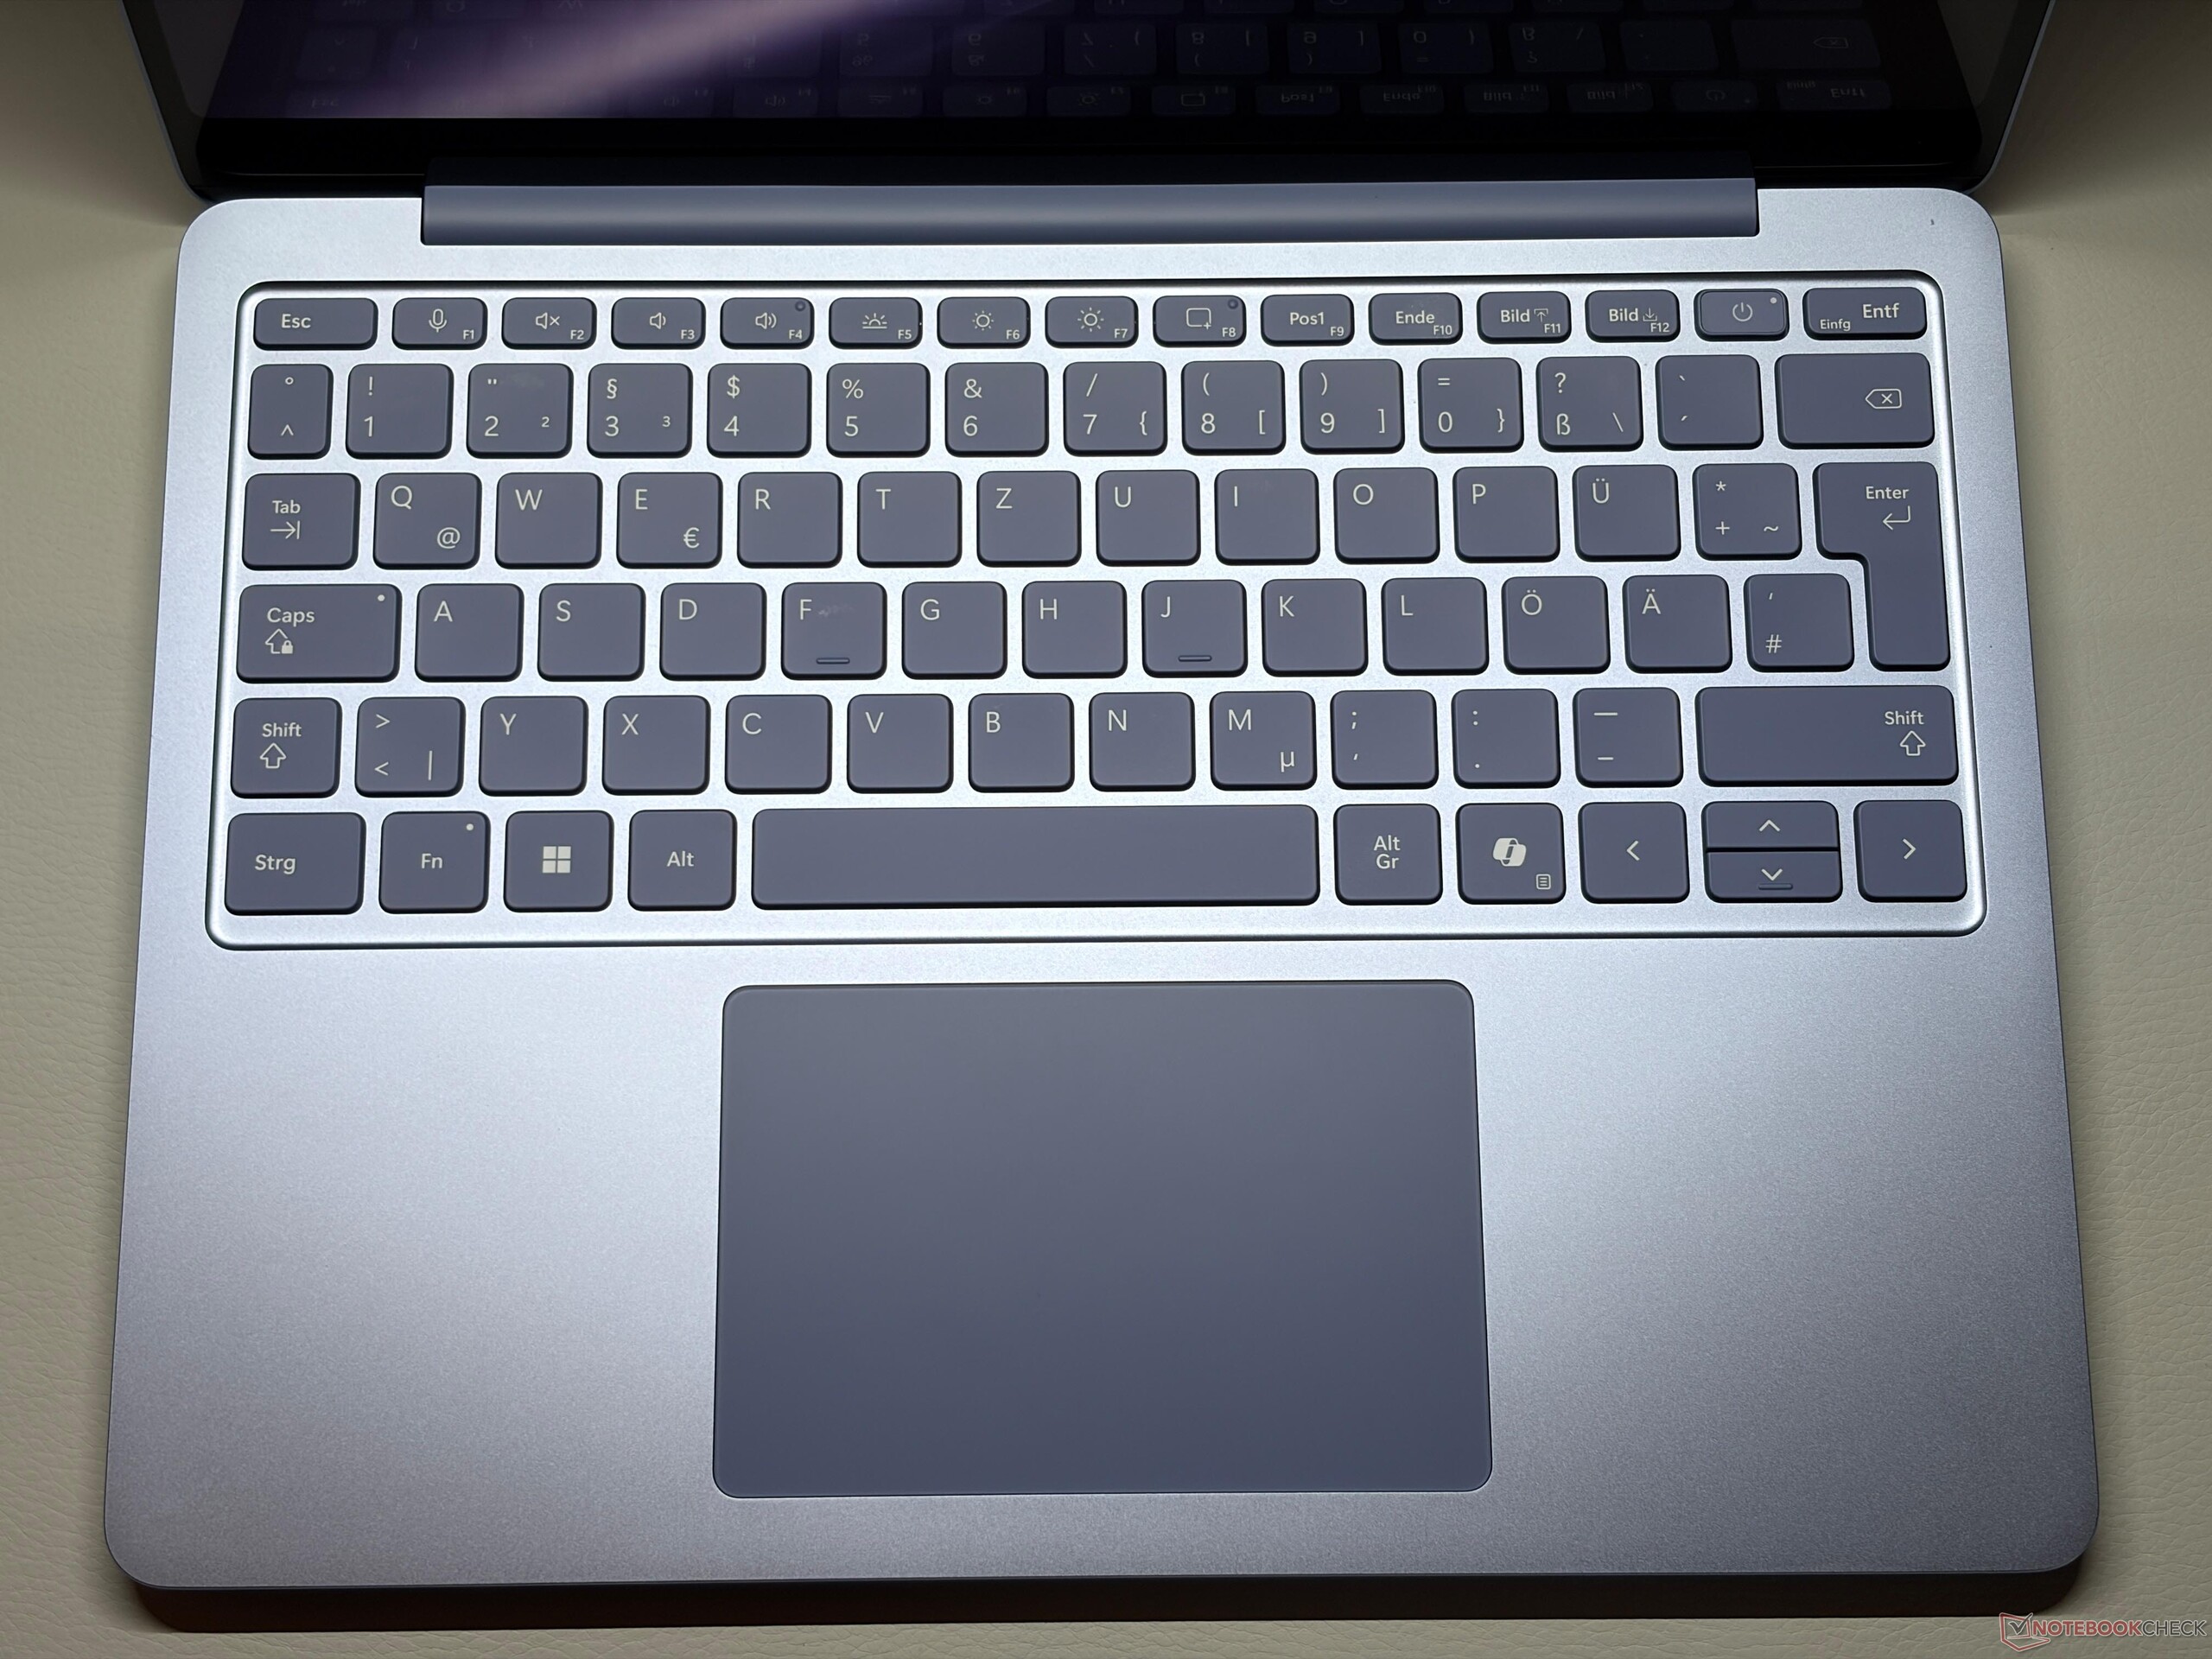
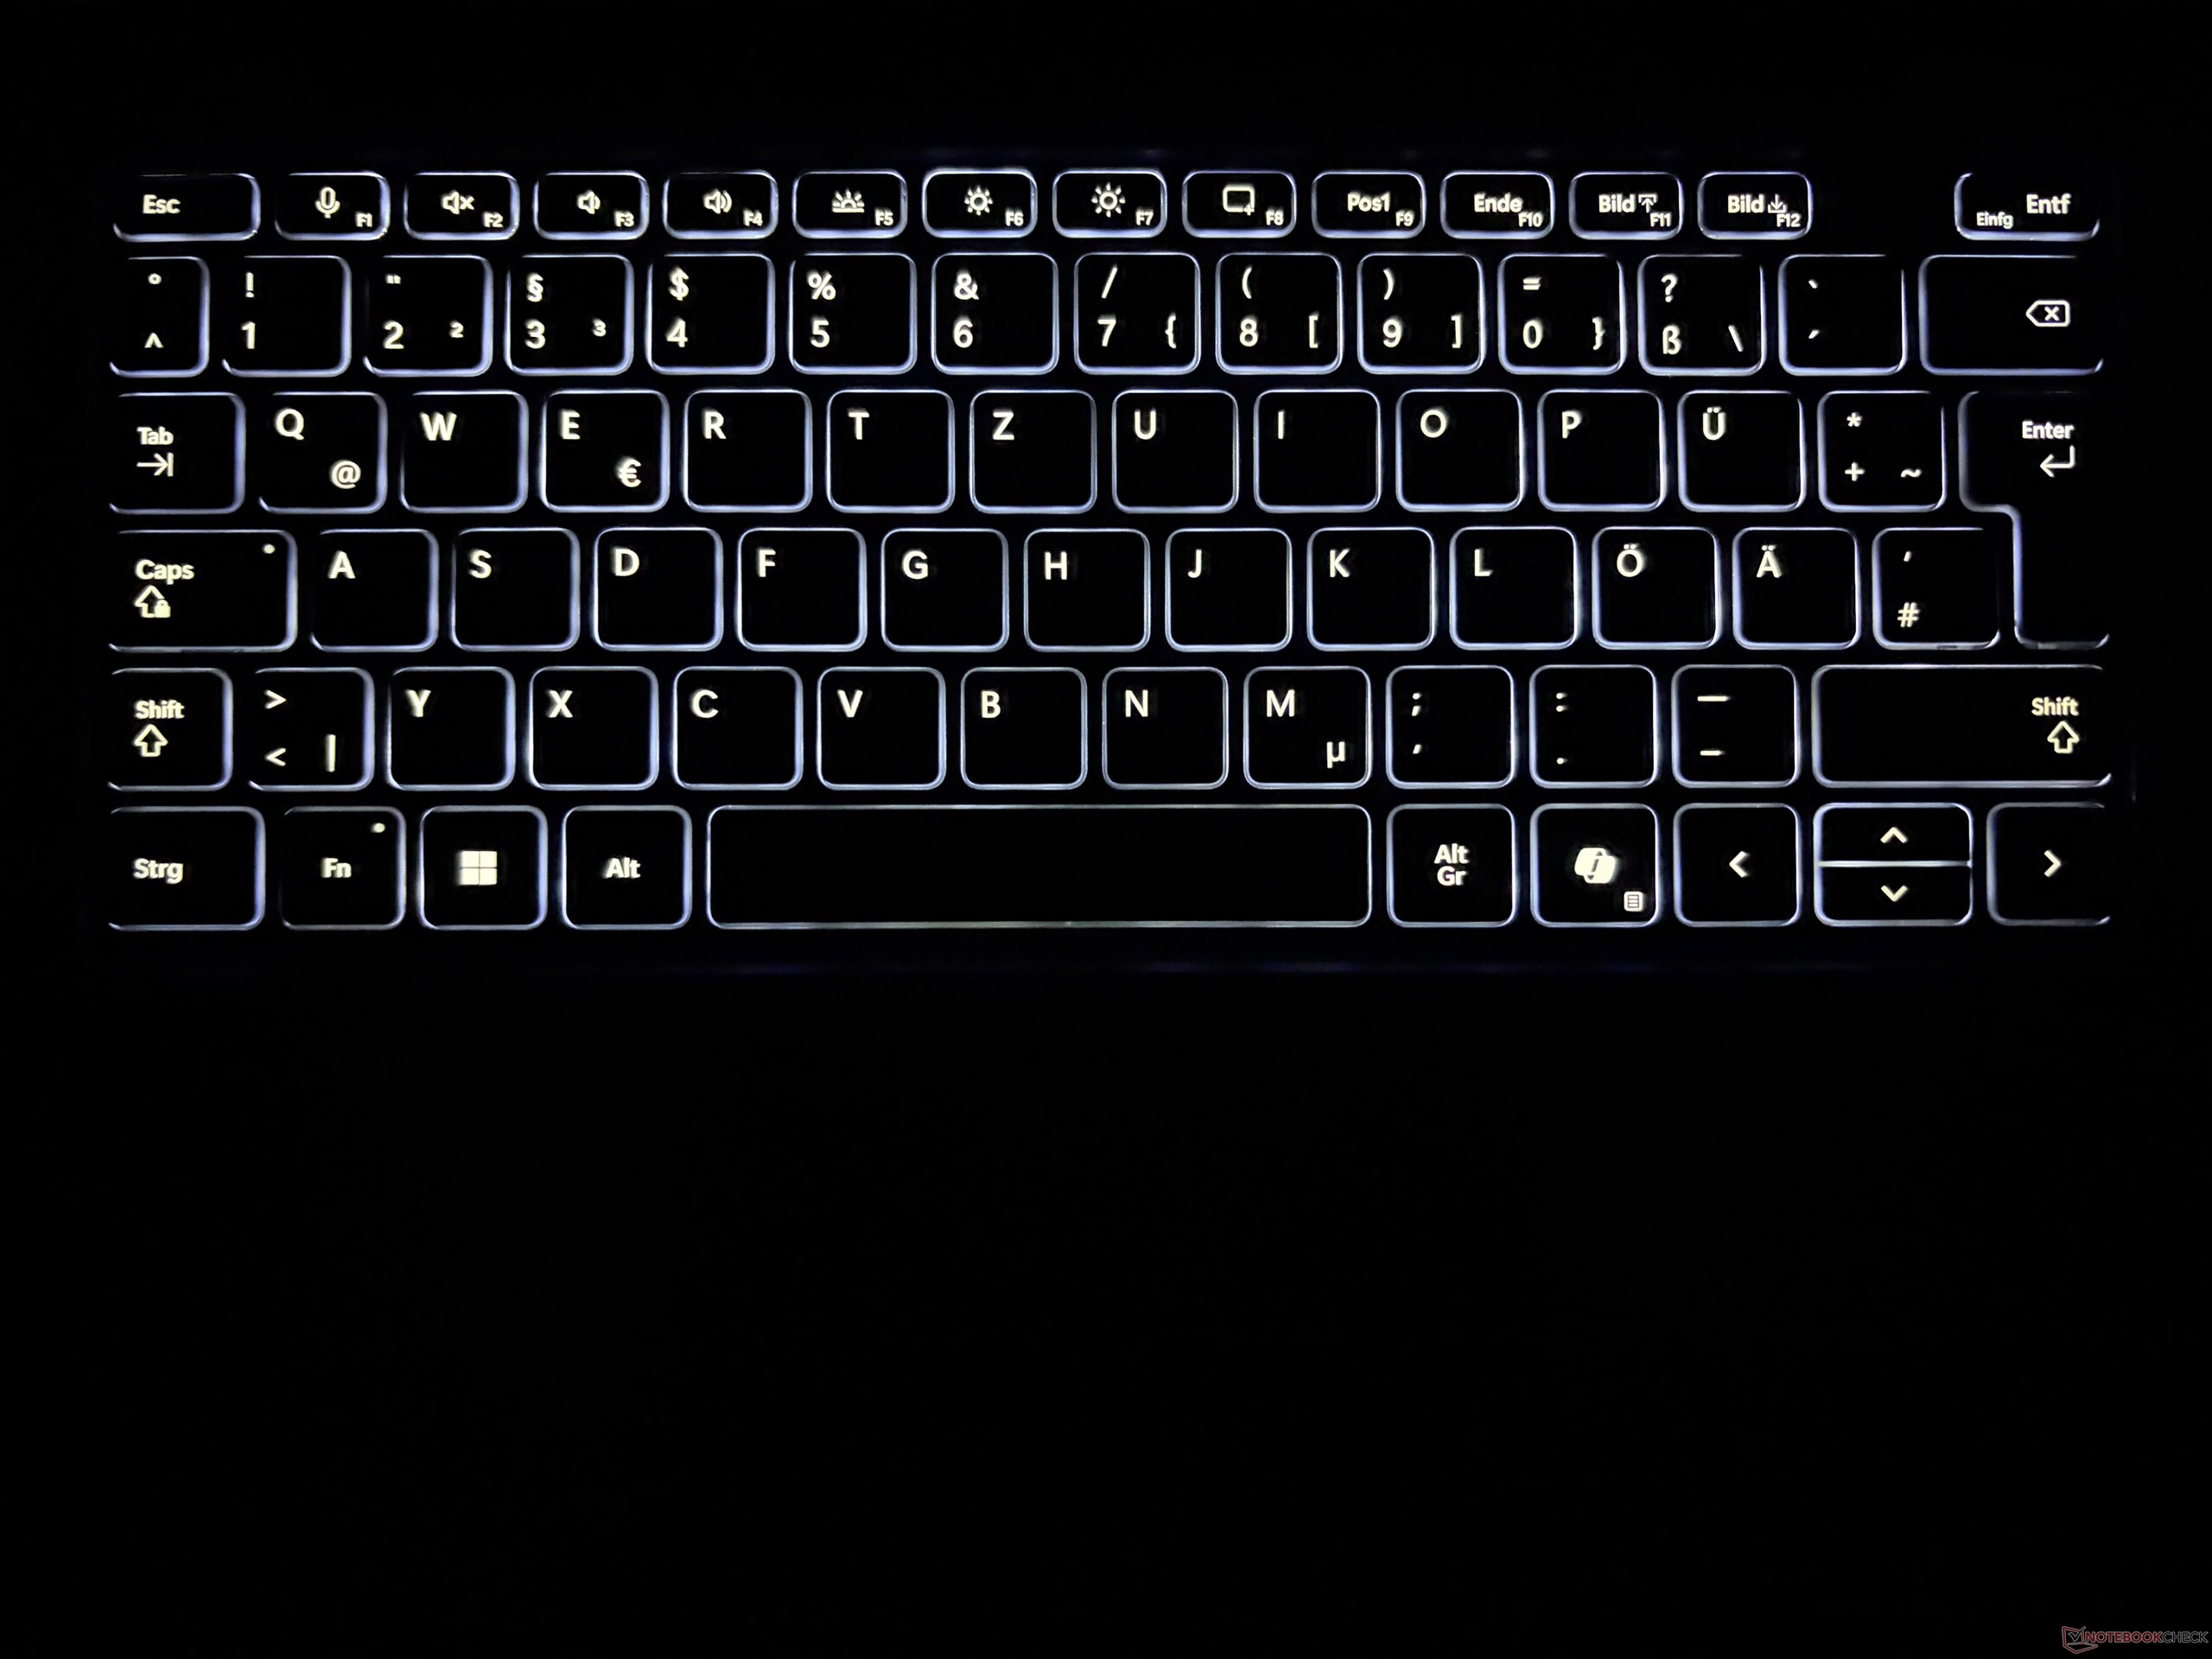
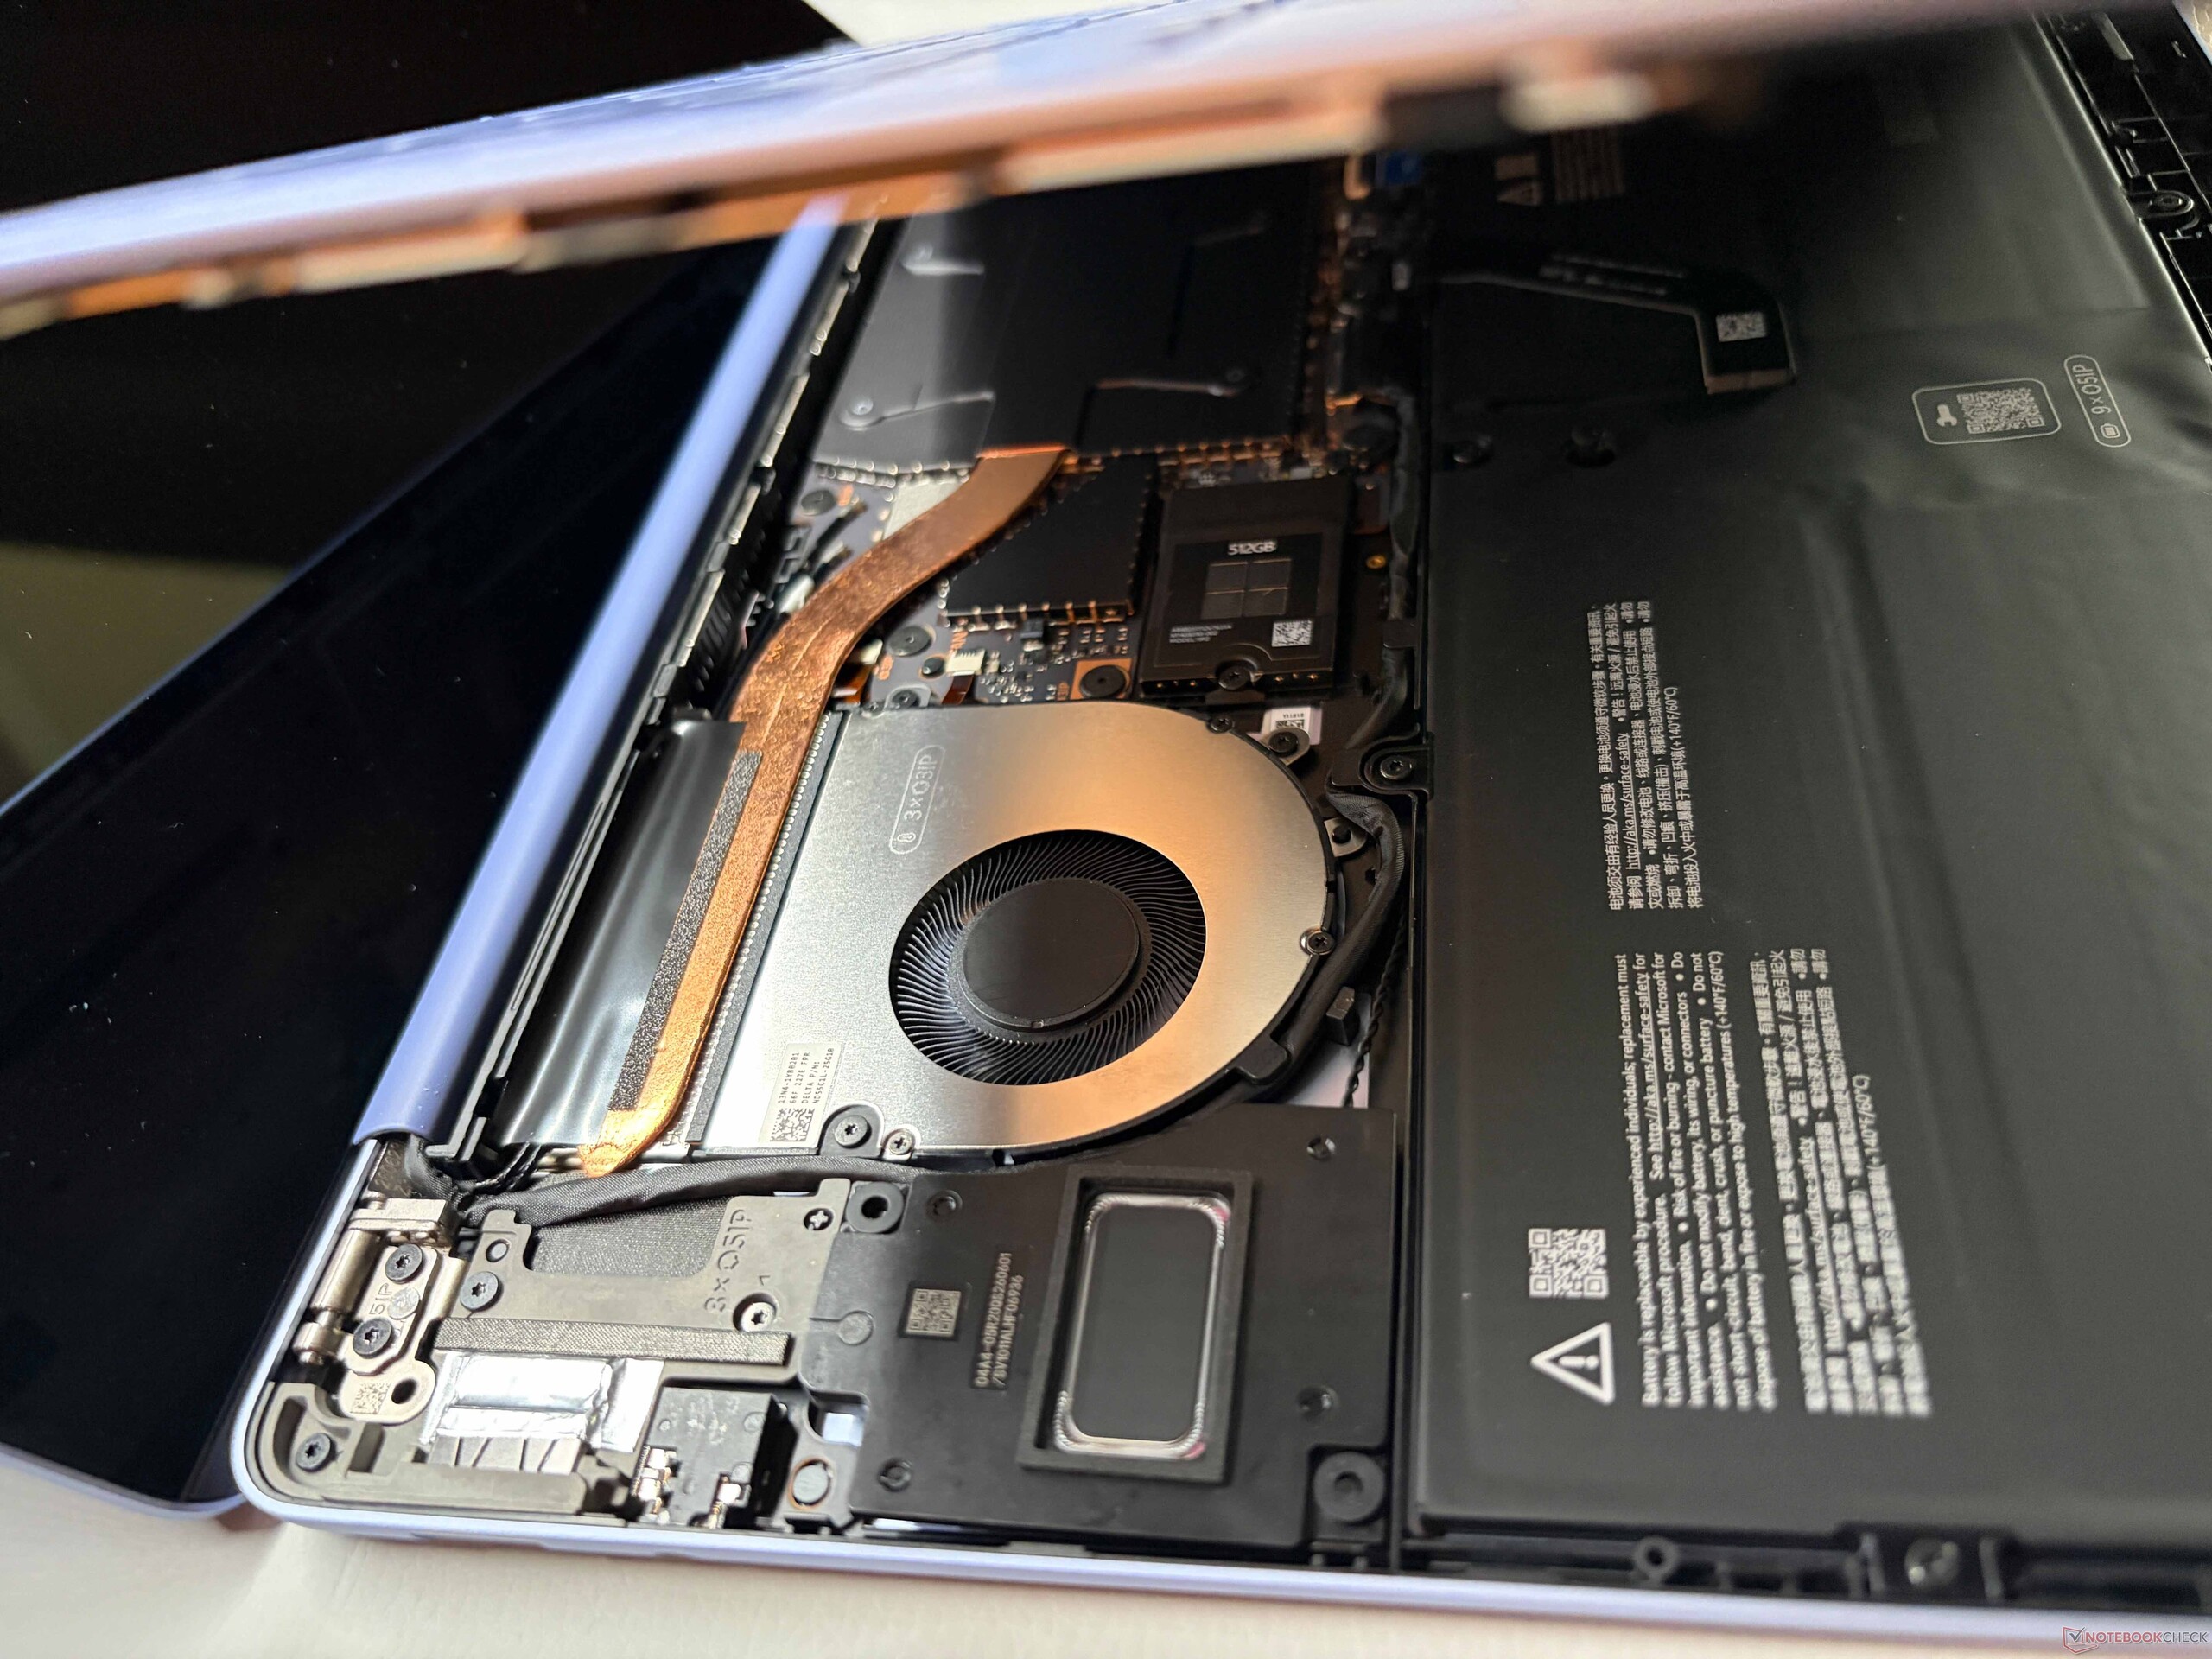
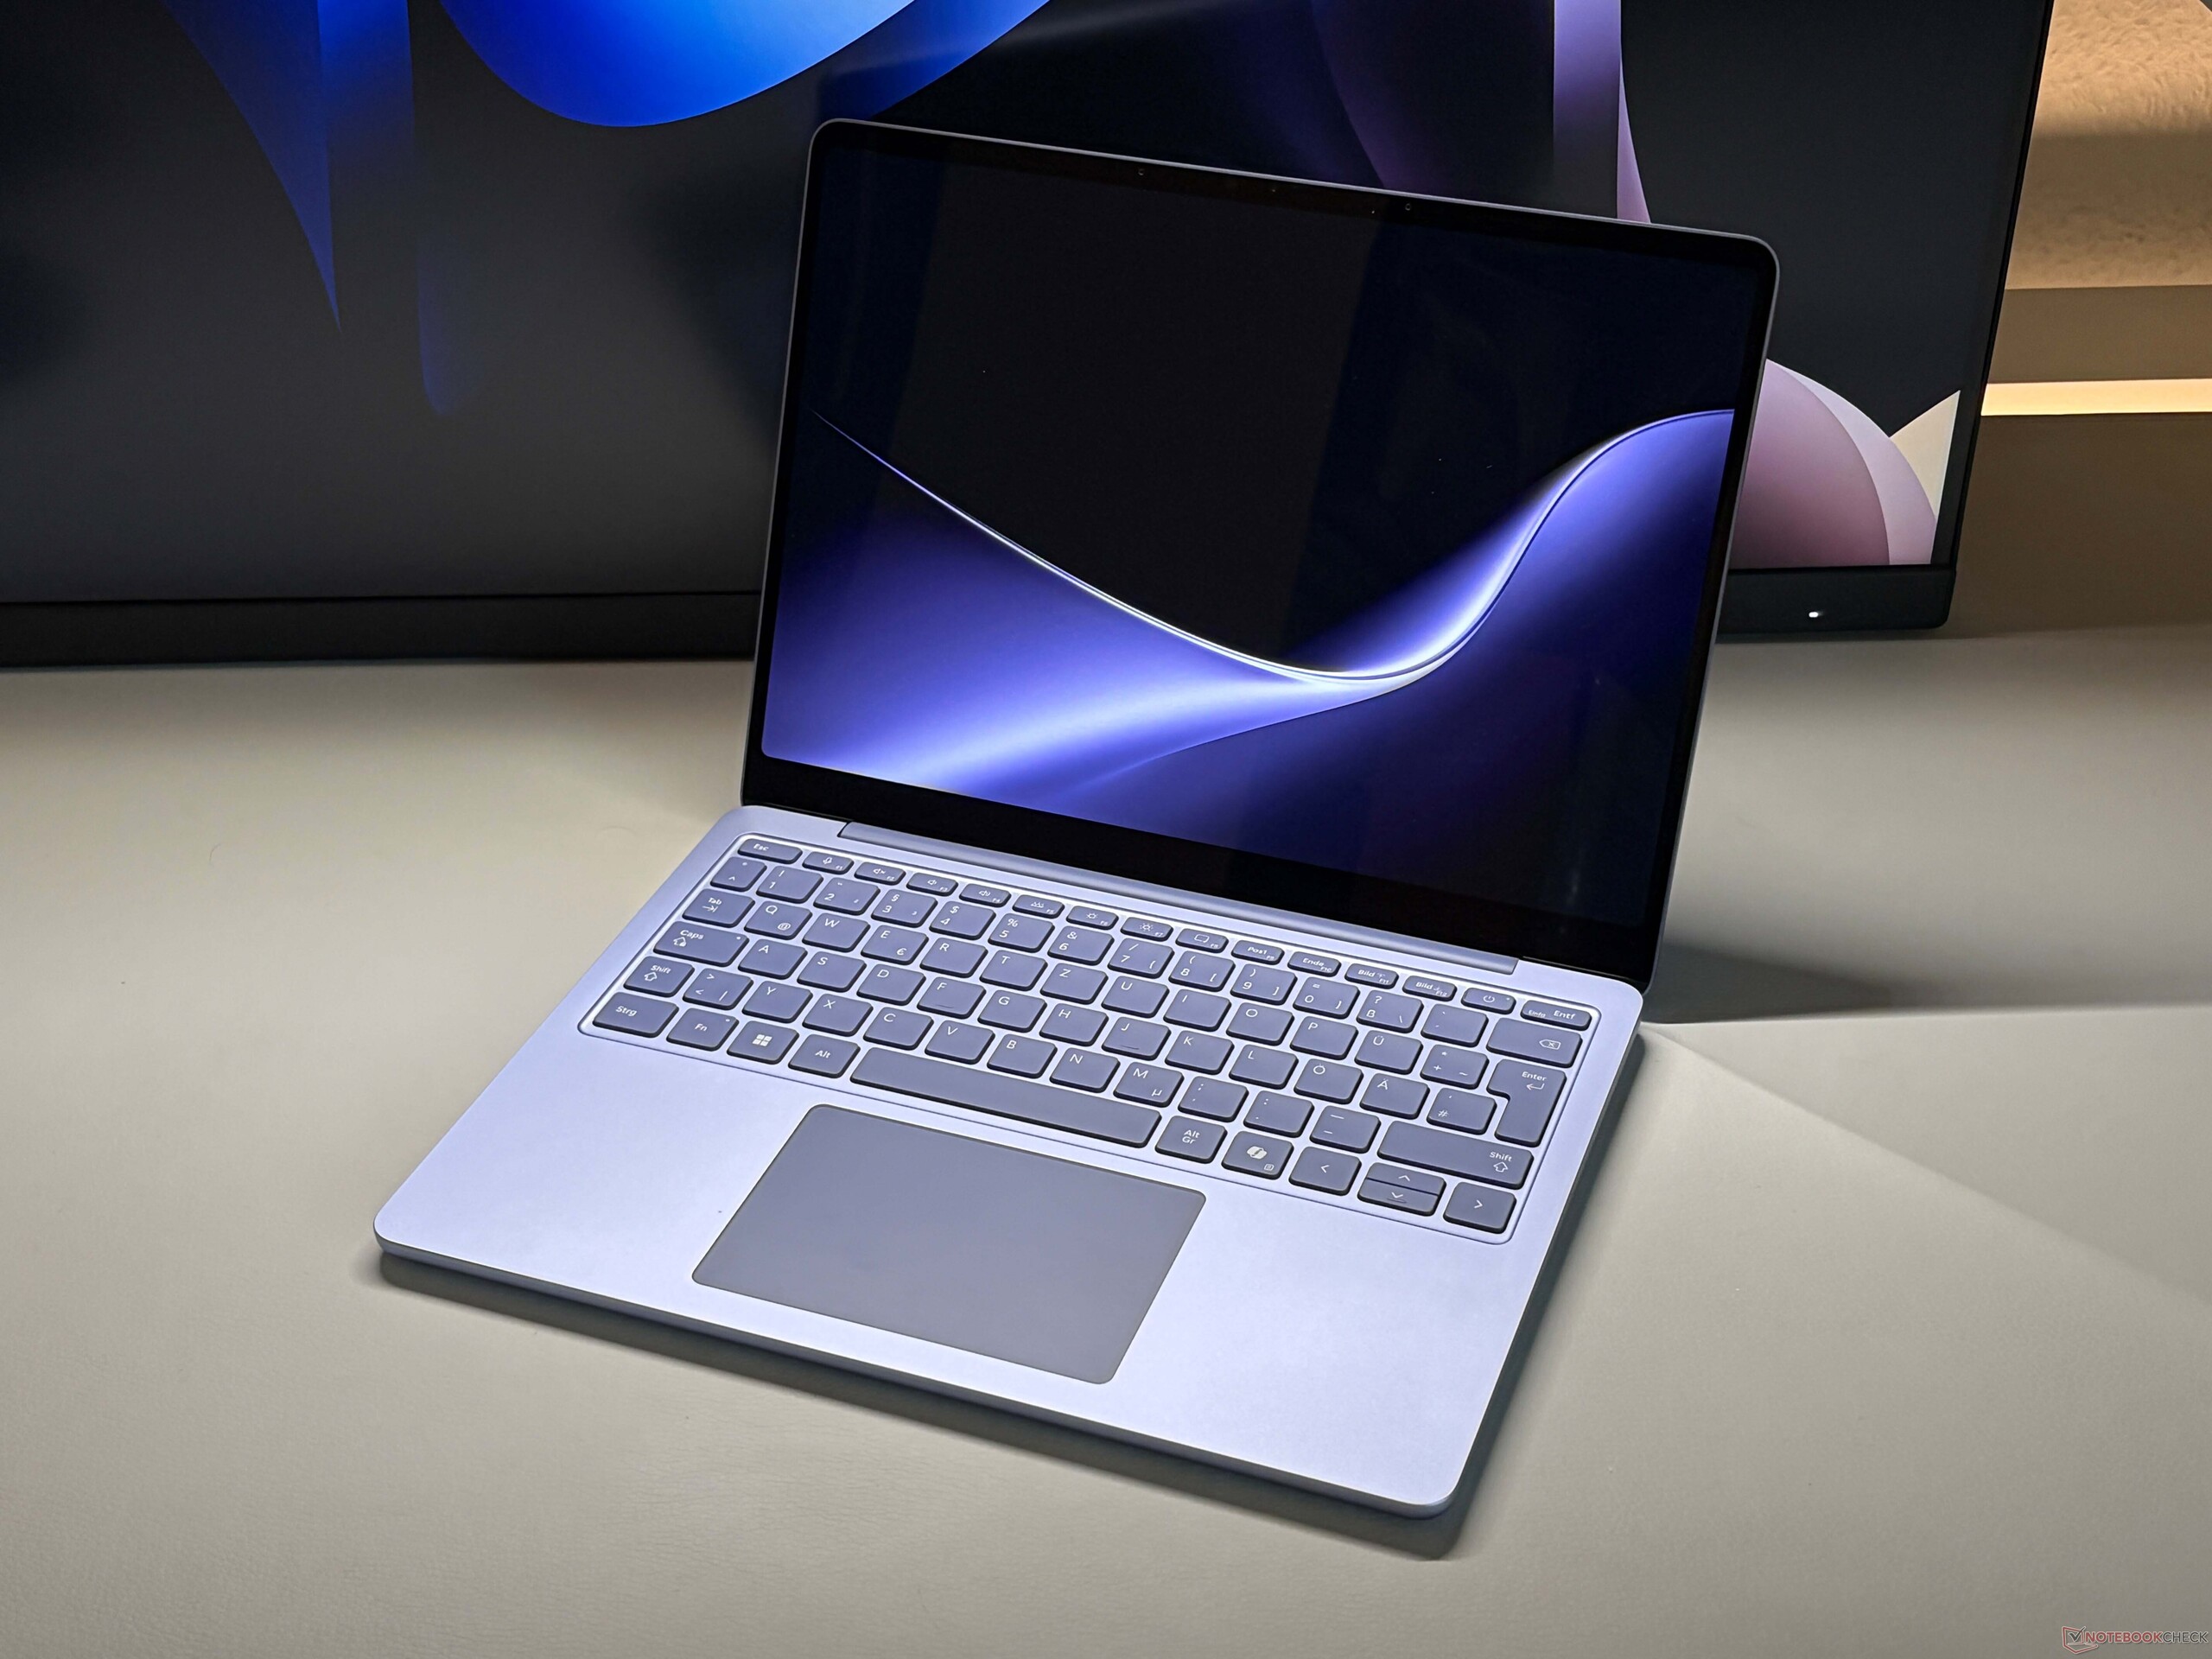
Das Gehäuse bleibt unverändert, und das Surface Laptop 13 bietet weiterhin ein hochwertiges Metallgehäuse mit guter Verarbeitung. Der Zugang zu den Komponenten ist allerdings nach wie vor sehr schwierig, da die Oberseite der Basiseinheit sowie Kabel entfernt werden müssen. Unser Testgerät ist die violette Variante, auch wenn das Gerät in der Praxis eher bläulich wirkt. Es ist außerdem in Silber oder Schwarz erhältlich. Die beleuchtete Tastatur ist komfortabel, und auch das Clickpad funktioniert problemlos.

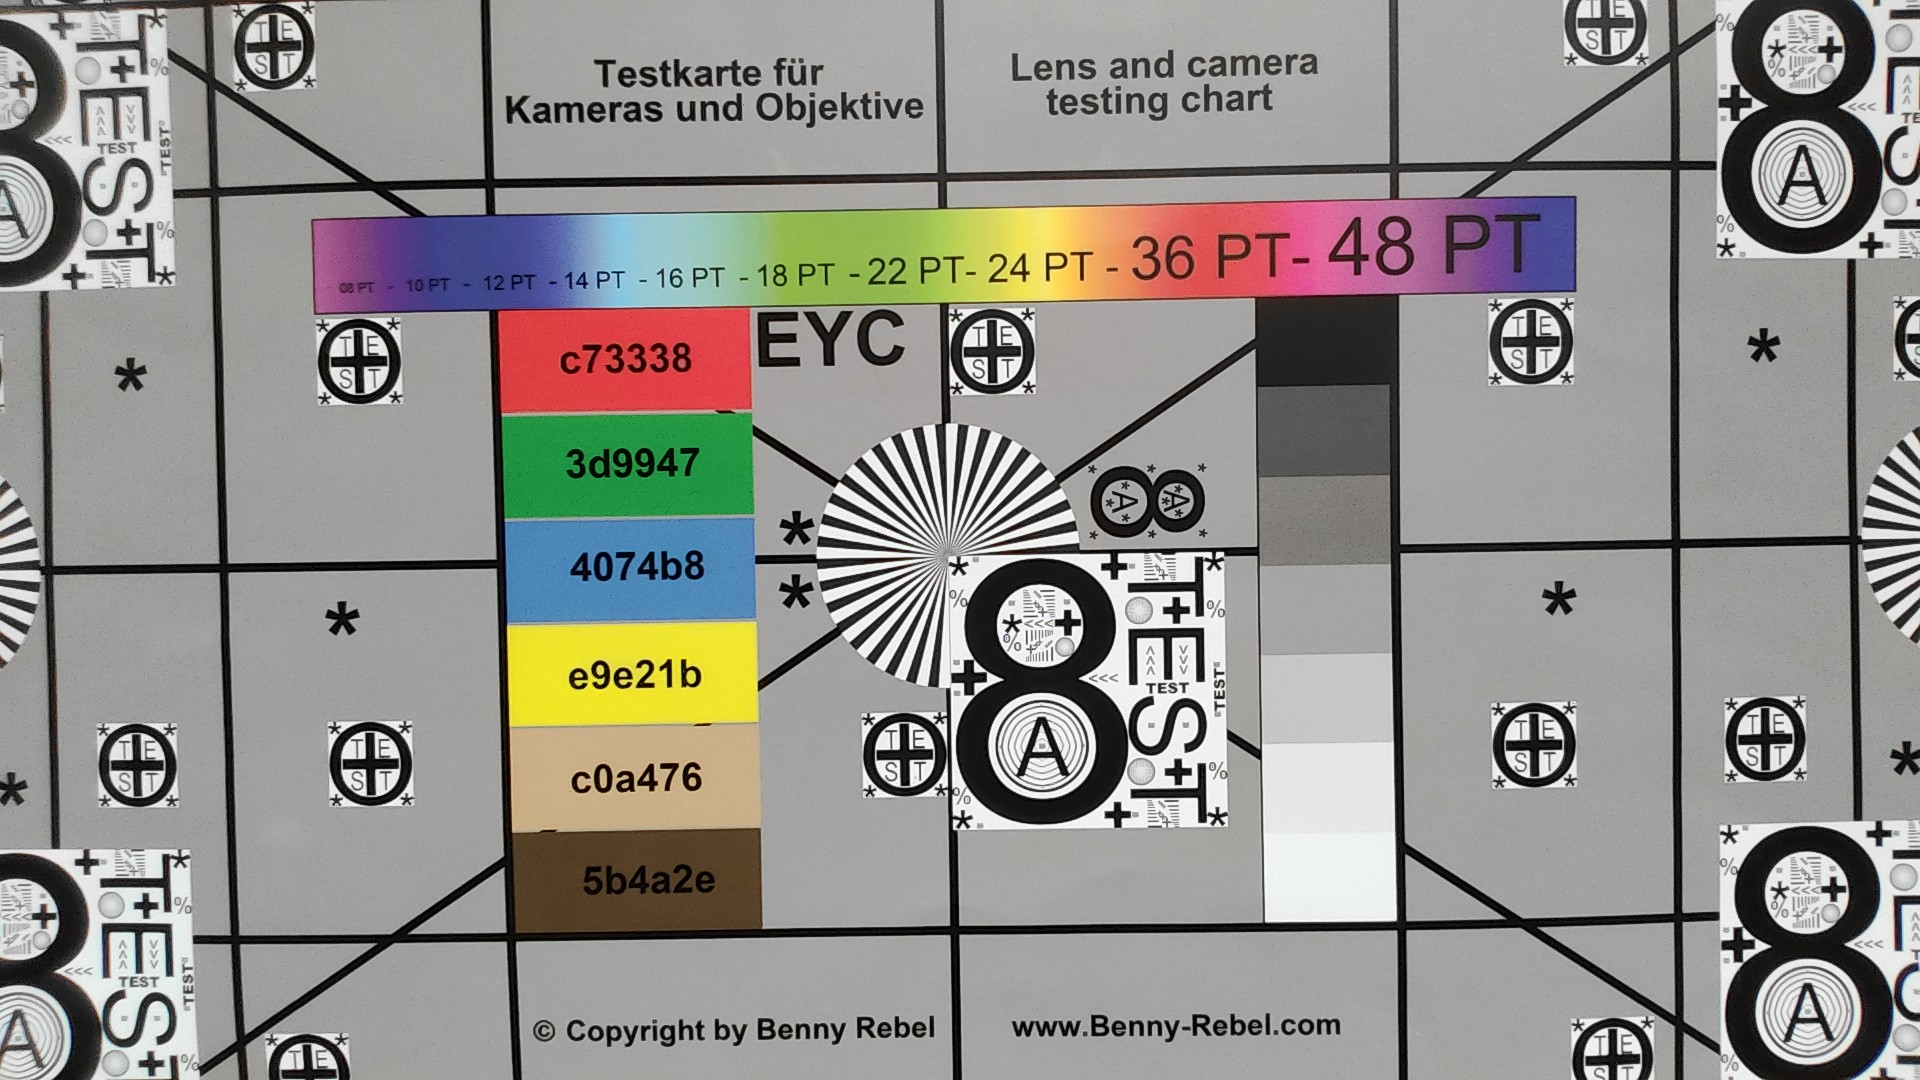
Die Anschlussausstattung beschränkt sich auf zwei USB-C-Anschlüsse rechts (kein USB 4.0) sowie einen herkömmlichen USB-A-Anschluss links. Einen zusätzlichen USB-C-Anschluss zum Laden auf der linken Seite wäre wünschenswert. Wi-Fi 7 wird unterstützt, und die Übertragungsraten waren in unserem Test sehr stabil. Die 1080p-Webcam liefert ordentliche Bilder, unterstützt aber kein Windows Hello. Dafür gibt es einen Fingerabdruckscanner im Power-Button.
Größenvergleich

❌
311.1 mm 215.8 mm 16.9 mm 1.1 kg312 mm 217 mm 15.6 mm 1 kg301 mm 220 mm 17.5 mm 1.3 kg304.1 mm 215 mm 11.3 mm 1.2 kg296.9 mm 200.66 mm 12.7 mm 1.1 kg286 mm 214 mm 15.6 mm 1.2 kg297 mm 210 mm 1 mm 5.7 g
Links: USB-A 3.2 Gen. 1 (5 Gbit/s), 3,5-mm-Stereo
Rechts: 2x USB-C 3.2 Gen. 2 (10 Gbit/s, DisplayPort 1.4a, Power Delivery)
Networking
Microsoft Surface Laptop 13 2026
Qualcomm FastConnect 7800
iperf3 transmit Wi-Fi6/7 RT-BE96U
2044 (min: 1901) MBit/s ∼56%
iperf3 receive Wi-Fi6/7 RT-BE96U
2054 MBit/s ∼67%
Microsoft Surface Laptop 8 13.8
Qualcomm FastConnect 7800
iperf3 transmit Wi-Fi6/7 RT-BE96U
3656 (min: 3471) MBit/s ∼100%
iperf3 receive Wi-Fi6/7 RT-BE96U
3088 (min: 2889) MBit/s ∼100%
Dell XPS 13 DX13260
Intel Wi-Fi 7 BE213 160MHz
iperf3 receive AXE11000 6GHz
1498 (min: 1435) MBit/s ∼100%
iperf3 transmit AXE11000 6GHz
1500 (min: 1399) MBit/s ∼100%
iperf3 transmit AXE11000
1179 (min: 636) MBit/s ∼77%
iperf3 receive AXE11000
1376 (min: 1302) MBit/s ∼89%
Apple MacBook Air 13 M5
Wi-Fi 7
iperf3 transmit AXE11000
1540 (min: 1405) MBit/s ∼100%
iperf3 receive AXE11000
1551 (min: 1406) MBit/s ∼100%
Asus Zenbook 14 UX3480QA
Qualcomm Fast Connect 6900 Wi-Fi 6E Dual Band Simultaneous
iperf3 transmit Wi-Fi6/7 RT-BE96U
2025 (min: 1872) MBit/s ∼55%
iperf3 receive Wi-Fi6/7 RT-BE96U
1920 (min: 1902) MBit/s ∼62%
Lenovo ThinkBook 14x, ILL, Ultra 5 226V
Intel BE201 320MHz
iperf3 transmit Wi-Fi6/7 RT-BE96U
3214 (min: 1848) MBit/s ∼88%
iperf3 receive Wi-Fi6/7 RT-BE96U
2844 (min: 2476) MBit/s ∼92%
0100200300400500600700800900100011001200130014001500160017001800190020002100Tooltip
Microsoft Surface Laptop 13 2026; iperf3 transmit Wi-Fi6/7 RT-BE96U; iperf 3.1.3: Ø2044 (1901-2123) MBit/s
Microsoft Surface Laptop 13 2026; iperf3 receive Wi-Fi6/7 RT-BE96U: Ø2054 (1702-2189) MBit/s
ColorChecker
22.5 ∆E
9.9 ∆E
15.8 ∆E
22.1 ∆E
13.3 ∆E
8.6 ∆E
8.8 ∆E
15.1 ∆E
13 ∆E
18.5 ∆E
9.3 ∆E
6.2 ∆E
13.3 ∆E
17.2 ∆E
16 ∆E
4.1 ∆E
11 ∆E
15.3 ∆E
5.6 ∆E
3.3 ∆E
9.8 ∆E
15.8 ∆E
20.3 ∆E
5.9 ∆E
ColorChecker Microsoft Surface Laptop 13 2026: 12.54 ∆E min: 3.3 - max: 22.53 ∆E

Display

Subpixel-Anordnung
Subpixel-Anordnung
Leichte Lichthöfe
Leichte Lichthöfe

Beim Display handelt es sich weiterhin um einen IPS-Touchscreen (1.920 x 1.280 Pixel, 3:2). Die Panel-ID ist sogar identisch mit der des Vorjahresmodells, doch Microsoft hat die Helligkeit auf mehr als 500 cd/m² erhöht. Der Schwarzwert ist für ein IPS-Panel weiterhin gut, was zu einem sehr guten Kontrastverhältnis führt. Auch die Bildqualität ist insgesamt gut. Der große Kritikpunkt bleibt jedoch die Bildwiederholfrequenz von nur 60 Hz. Hier hätten wir uns eine Steigerung auf 90 Hz gewünscht, wie beispielsweise beim aktualisierten Surface Pro 12. Zudem spiegelt das Display stark, was im Freien problematisch ist.

Unsere Analyse mit der professionellen CalMAN-Software zeigt bereits im Auslieferungszustand ordentliche Ergebnisse, auch wenn ein leichter Blaustich sichtbar ist, der sicherlich zur Steigerung der Helligkeit nötig war. Das Gerät unterstützt jedoch eine adaptive Farbanpassung, sodass dies kein größeres Problem im Alltag darstellt. Auch die Farbgenauigkeit ist ordentlich, und dank vollständiger sRGB-Abdeckung ist die Bildbearbeitung möglich.

516
cd/m²
505
cd/m²
495
cd/m²
513
cd/m²
520
cd/m²
496
cd/m²
496
cd/m²
505
cd/m²
471
cd/m²
Ausleuchtung des Bildschirms
LP130WU12241 getestet mit X-Rite i1Pro 3
Maximal: 520 cd/m² (Nits) Durchschnitt: 501.9 cd/m² Minimum: 5.3 cd/m²
Ausleuchtung: 91 %
Helligkeit Akku: 520 cd/m²
Kontrast: 1857:1 (Schwarzwert: 0.28 cd/m²)
ΔE ColorChecker Calman: 2.1 | ∀{0.5-29.43 Ø4.68}
ΔE Greyscale Calman: 3.2 | ∀{0.09-98 Ø4.93}
70.6% AdobeRGB 1998 (Argyll 3D)
95.3% sRGB (Argyll 3D)
70.2% Display P3 (Argyll 3D)
Gamma: 2.19
CCT: 7012 K
Microsoft Surface Laptop 13 2026
LP130WU12241, IPS, 1920x1280, 13", 60 Hz
Microsoft Surface Laptop 8 13.8
LQ138P1JX61, IPS, 2304x1536, 13.8", 120 Hz
Dell XPS 13 DX13260
LG Philips LP134WQ, IPS, 2560x1600, 13.4", 120 Hz
Apple MacBook Air 13 M5
IPS, 2560x1664, 13.6", 60 Hz
Asus Zenbook 14 UX3480QA
ATNA40KW01-0, OLED, 1920x1200, 14", 60 Hz
Lenovo ThinkBook 14x, ILL, Ultra 5 226V
TM140VDXY02, IPS, 1920x1200, 14", 120 Hz
Microsoft Surface Laptop 13
LP130WU112413, IPS, 1920x1280, 13", 60 Hz
Display
21%
23%
22%
24%
-0%
3%
Display P3 Coverage (%)
70.2
96.5
37%
98.2
40%
98.1
40%
99.6
42%
69.3
-1%
72.4
3%
sRGB Coverage (%)
95.3
97.8
3%
99.9
5%
98.6
3%
98.9
4%
92.2
-3%
97.6
2%
AdobeRGB 1998 Coverage (%)
70.6
86.5
23%
87.6
24%
86.8
23%
88.7
26%
72.9
3%
72.6
3%
Response Times
26%
-18%
47%
96%
20%
3%
Response Time Grey 50% / Grey 80% * (ms)
54.1 ?(25.6, 28.5)
38.8 ?(14.1, 24.7)
28%
51.2 ?(23.6, 27.6)
5%
24.3 ?(11.5, 12.8)
55%
1.65 ?(0.88, 0.77)
97%
36.2 ?(16, 20.2)
33%
48.7 ?(22.5, 26.2)
10%
Response Time Black / White * (ms)
24 ?(10.6, 13.4)
18.3 ?(5.8, 12.5)
24%
33.6 ?(14, 19.6)
-40%
14.7 ?(5.1, 9.6)
39%
1.41 ?(0.74, 0.67)
94%
22.4 ?(10.4, 12)
7%
25.3 ?(12.4, 12.9)
-5%
PWM Frequency (Hz)
480 ?(100)
PWM Amplitude * (%)
22
Bildschirm
14%
19%
-4%
190%
-11%
19%
Helligkeit Bildmitte (cd/m²)
520
617
19%
539.3
4%
546
5%
302
-42%
349
-33%
417
-20%
Brightness (cd/m²)
502
623
24%
503
0%
519
3%
304
-39%
322
-36%
409
-19%
Brightness Distribution (%)
91
91
0%
89
-2%
90
-1%
98
8%
82
-10%
92
1%
Schwarzwert * (cd/m²)
0.28
0.44
-57%
0.25
11%
0.38
-36%
0.01
96%
0.18
36%
0.17
39%
Kontrast (:1)
1857
1402
-25%
2157
16%
1437
-23%
30200
1526%
1939
4%
2453
32%
Delta E Colorchecker *
2.1
0.9
57%
1.2
43%
2.1
-0%
2.1
-0%
2.62
-25%
1.3
38%
Colorchecker dE 2000 max. *
5
2.2
56%
3.63
27%
4
20%
6
-20%
5.56
-11%
2.9
42%
Delta E Graustufen *
3.2
2
37%
1.4
56%
3.3
-3%
3.6
-13%
3.61
-13%
2
37%
Gamma
2.19 100%
2.19 100%
2.2 100%
2.22 99%
2.12 104%
2.33 94%
2.18 101%
CCT
7012 93%
6810 95%
6727 97%
7127 91%
6451 101%
7223 90%
6890 94%
Colorchecker dE 2000 calibrated *
0.92
0.9
6.46
Durchschnitt gesamt (Programm / Settings)
20% / 17%
8% / 15%
22% / 10%
103% / 137%
3% / -4%
8% / 13%

* ... kleinere Werte sind besser

CalMAN Graustufen
CalMAN Graustufen
CalMAN Sättigung
CalMAN Sättigung
CalMAN ColorChecker
CalMAN ColorChecker
vs. sRGB
vs. sRGB
vs. P3
vs. P3
vs. AdobeRGB
vs. AdobeRGB

Reaktionszeiten (Response Times) des Displays

ℹ
Die Reaktionszeiten (Response Times) beschreiben wie schnell zwischen zwei Farben eines Pixels umgeschaltet werden kann. Langsame Response Times können zu einer verschwommenen Darstellung, Schlieren und Geisterbilder führen. Besonders bei schnellen 3D-Spielen sind kurze Umschaltzeiten wichtig.
   ↔    Reaktionszeiten Schwarz zu Weiß
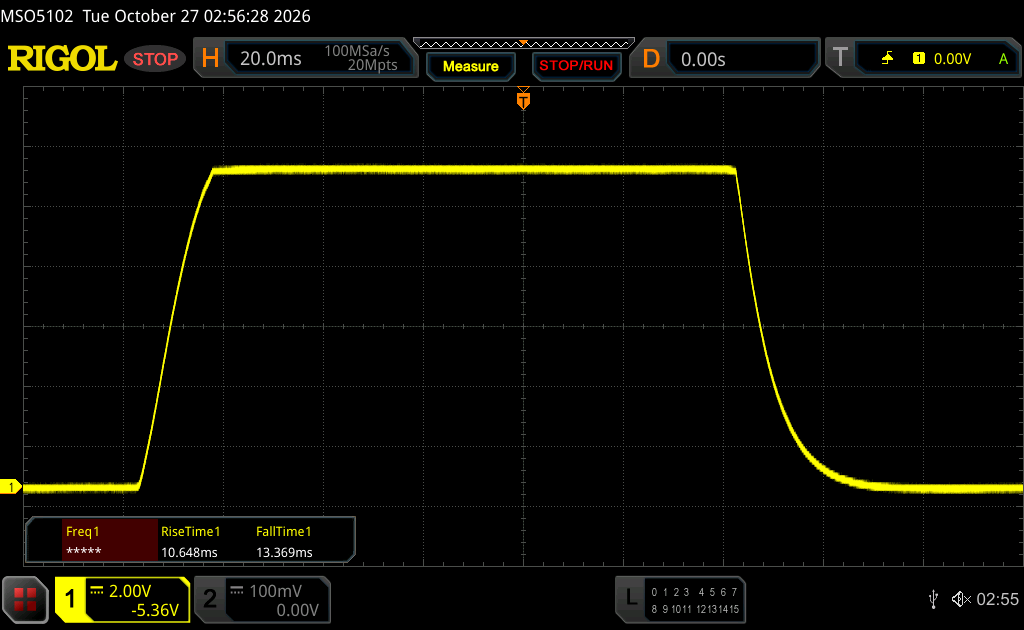
24 ms ... steigend ↗ und fallend ↘ kombiniert↗ 10.6 ms steigend
↘ 13.4 ms fallend
Die gemessenen Reaktionszeiten sind gut, für anspruchsvolle Spieler könnten der Bildschirm jedoch zu langsam sein.
Im Vergleich rangierten die bei uns getesteten Geräte von 0.1 (Minimum) zu 240 (Maximum) ms. » 55 % aller Screens waren schneller als der getestete.
Daher sind die gemessenen Reaktionszeiten schlechter als der Durchschnitt aller vermessenen Geräte (19.6 ms).
   ↔    Reaktionszeiten 50% Grau zu 80% Grau
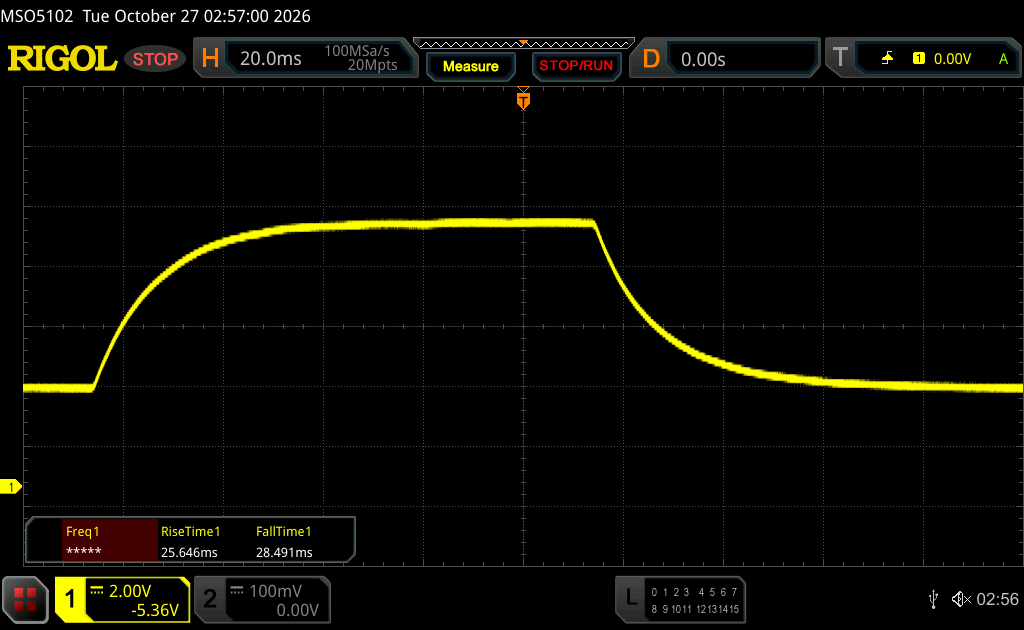
54.1 ms ... steigend ↗ und fallend ↘ kombiniert↗ 25.6 ms steigend
↘ 28.5 ms fallend
Die gemessenen Reaktionszeiten sind langsam und dadurch für viele Spieler wahrscheinlich zu langsam.
Im Vergleich rangierten die bei uns getesteten Geräte von 0.13 (Minimum) zu 636 (Maximum) ms. » 91 % aller Screens waren schneller als der getestete.
Daher sind die gemessenen Reaktionszeiten schlechter als der Durchschnitt aller vermessenen Geräte (30.6 ms).

Bildschirm-Flackern / PWM (Pulse-Width Modulation)

ℹ
Eine günstige Methode um die Helligkeit eines Bildschirms zu steuern, ist die Beleuchtung periodisch ein- und auszuschalten. Dies nennt sich PWM (Pulsweitenmodulation) Diese Umschaltung sollte mit einer hohen Frequenz stattfinden damit das menschliche Auge kein Flimmern wahrnimmt. Wenn die Frequenz zu niedrig ist, kann dies zu Ermüdungserscheinungen, Augenbrennen, Kopfweh und auch sichtbaren Flackern führen.
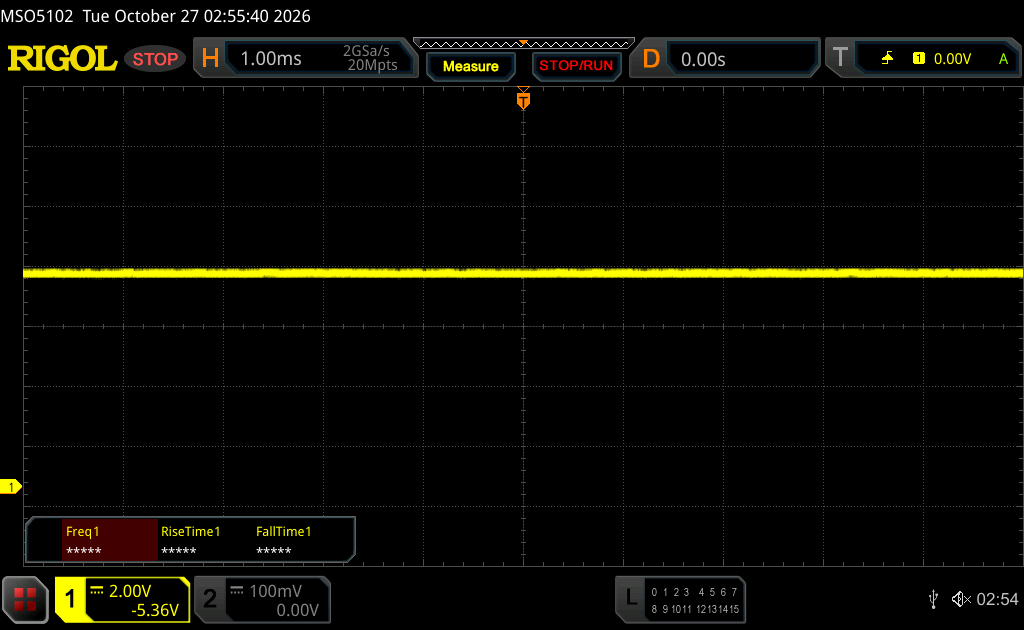
Flackern / PWM nicht festgestellt

Im Vergleich: 52 % aller getesteten Geräte nutzten kein PWM um die Helligkeit zu reduzieren. Wenn PWM eingesetzt wurde, dann bei einer Frequenz von durchschnittlich 7572 (Minimum 5, Maximum 343500) Hz.

Im Freien (sonniger Tag)
Blickwinkelstabilität

Leistung

Testbedingungen

Wir haben unsere Benchmarks im Modus Beste Leistung durchgeführt.

Prozessorleistung

Das Surface Laptop 13 ist mit dem neuen Snapdragon X2 Plus (X2P-42-100) ausgestattet, der sechs CPU-Kerne mit einem maximalen Takt von 4,0 GHz bietet. Er kann bis zu 28 Watt verbrauchen und pendelt sich bei anhaltender CPU-Last anschließend bei etwa 22 Watt ein. Die Leistung in nativen Benchmarks ist durchaus gut. Insgesamt ist er nur 11 % langsamer als der X2P-64-100 im größeren Surface Laptop 13.8. Apples M5-SoC ist zwar weiterhin überlegen, doch die Leistung reicht für alltägliche Aufgaben mehr als aus und bleibt auch im Akkubetrieb vollkommen stabil.

CPU Nativ Performance Rating: Percent
Cinebench 2024: CPU Multi Core | CPU Single Core
Geekbench 6.7: Multi-Core | Single-Core
CPU Nativ Performance Rating
Apple MacBook Air 13 M5
Apple M5 10-Core
100 pt
Microsoft Surface Laptop 8 13.8
Qualcomm Snapdragon X2 Plus X2P-64-100
79.5 pt
Microsoft Surface Laptop 13 2026
Qualcomm Snapdragon X2 Plus X2P-42-100
70.9 pt
Durchschnittliche Qualcomm Snapdragon X2 Plus X2P-42-100
 
70.7 pt
Durchschnitt der Klasse Subnotebook
 
70.4 pt
Microsoft Surface Laptop 13
Qualcomm Snapdragon X Plus X1P-42-100
62.5 pt
Asus Zenbook 14 UX3480QA
Qualcomm Snapdragon X X1-26-100
58.7 pt
Lenovo ThinkBook 14x, ILL, Ultra 5 226V
Intel Core Ultra 5 226V
57.6 pt
Dell XPS 13 DX13260 -2!
Intel Core 5 320
53.9 pt
Cinebench 2024 / CPU Multi Core
Apple MacBook Air 13 M5
Apple M5 10-Core
957 Points +43%
Microsoft Surface Laptop 8 13.8
Qualcomm Snapdragon X2 Plus X2P-64-100
854 Points +28%
Durchschnitt der Klasse Subnotebook
  (416 - 1471, n=52, der letzten 2 Jahre)
764 Points +14%
Microsoft Surface Laptop 13
Qualcomm Snapdragon X Plus X1P-42-100
723 Points +8%
Asus Zenbook 14 UX3480QA
Qualcomm Snapdragon X X1-26-100
701 Points +5%
Microsoft Surface Laptop 13 2026
Qualcomm Snapdragon X2 Plus X2P-42-100
669 Points
Durchschnittliche Qualcomm Snapdragon X2 Plus X2P-42-100
  (n=1)
669 Points 0%
Lenovo ThinkBook 14x, ILL, Ultra 5 226V
Intel Core Ultra 5 226V
512 Points -23%
Cinebench 2024 / CPU Single Core
Apple MacBook Air 13 M5
Apple M5 10-Core
200 Points +54%
Microsoft Surface Laptop 8 13.8
Qualcomm Snapdragon X2 Plus X2P-64-100
134 Points +3%
Microsoft Surface Laptop 13 2026
Qualcomm Snapdragon X2 Plus X2P-42-100
130 Points
Durchschnittliche Qualcomm Snapdragon X2 Plus X2P-42-100
  (n=1)
130 Points 0%
Durchschnitt der Klasse Subnotebook
  (83 - 200, n=50, der letzten 2 Jahre)
122 Points -6%
Lenovo ThinkBook 14x, ILL, Ultra 5 226V
Intel Core Ultra 5 226V
113 Points -13%
Microsoft Surface Laptop 13
Qualcomm Snapdragon X Plus X1P-42-100
109 Points -16%
Asus Zenbook 14 UX3480QA
Qualcomm Snapdragon X X1-26-100
96 Points -26%
Geekbench 6.7 / Multi-Core
Apple MacBook Air 13 M5
Apple M5 10-Core
17072 Points +41%
Microsoft Surface Laptop 8 13.8
Qualcomm Snapdragon X2 Plus X2P-64-100
14277 Points +18%
Durchschnitt der Klasse Subnotebook
  (5987 - 20325, n=59, der letzten 2 Jahre)
12544 Points +4%
Microsoft Surface Laptop 13 2026
Qualcomm Snapdragon X2 Plus X2P-42-100
12070 Points
Durchschnittliche Qualcomm Snapdragon X2 Plus X2P-42-100
  (12011 - 12070, n=2)
12041 Points 0%
Microsoft Surface Laptop 13
Qualcomm Snapdragon X Plus X1P-42-100
11125 Points -8%
Asus Zenbook 14 UX3480QA
Qualcomm Snapdragon X X1-26-100
10668 Points -12%
Lenovo ThinkBook 14x, ILL, Ultra 5 226V
Intel Core Ultra 5 226V
9980 Points -17%
Dell XPS 13 DX13260
Intel Core 5 320
7888 Points -35%
Geekbench 6.7 / Single-Core
Apple MacBook Air 13 M5
Apple M5 10-Core
4185 Points +28%
Microsoft Surface Laptop 13 2026
Qualcomm Snapdragon X2 Plus X2P-42-100
3269 Points
Microsoft Surface Laptop 8 13.8
Qualcomm Snapdragon X2 Plus X2P-64-100
3265 Points 0%
Durchschnittliche Qualcomm Snapdragon X2 Plus X2P-42-100
  (3209 - 3269, n=2)
3239 Points -1%
Durchschnitt der Klasse Subnotebook
  (1922 - 4195, n=59, der letzten 2 Jahre)
2815 Points -14%
Lenovo ThinkBook 14x, ILL, Ultra 5 226V
Intel Core Ultra 5 226V
2597 Points -21%
Dell XPS 13 DX13260
Intel Core 5 320
2575 Points -21%
Microsoft Surface Laptop 13
Qualcomm Snapdragon X Plus X1P-42-100
2287 Points -30%
Asus Zenbook 14 UX3480QA
Qualcomm Snapdragon X X1-26-100
2140 Points -35%

Cinebench R15 Multi-Dauertest

040801201602002402803203604004404805205606006406807207608008408809209601000104010801120116012001240128013201360140014401480152015601600164016801720176018001840188019201960Tooltip
Microsoft Surface Laptop 13 2026 Qualcomm Snapdragon X2 Plus X2P-42-100: Ø1272 (1213.92-1394.6) Points
Microsoft Surface Laptop 8 13.8 Qualcomm Snapdragon X2 Plus X2P-64-100: Ø1661 (1593.24-1992.73) Points
Dell XPS 13 DX13260 Intel Core 5 320: Ø940 (856.35-1053.52) Points
Asus Zenbook 14 UX3480QA Qualcomm Snapdragon X X1-26-100: Ø1410 (1355.24-1421.97) Points
Lenovo ThinkBook 14x, ILL, Ultra 5 226V Intel Core Ultra 5 226V: Ø1286 (1247.35-1468.86) Points
CPU Emuliert Performance Rating: Percent
Cinebench R23: Multi Core | Single Core
Cinebench R20: CPU (Multi Core) | CPU (Single Core)
Cinebench R15: CPU Multi 64Bit | CPU Single 64Bit
Blender: v2.79 BMW27 CPU
7-Zip 18.03: 7z b 4 | 7z b 4 -mmt1
HWBOT x265 Benchmark v2.2: 4k Preset
LibreOffice : 20 Documents To PDF
R Benchmark 2.5: Overall mean
CPU Emuliert Performance Rating
Durchschnitt der Klasse Subnotebook
 
81.9 pt
Microsoft Surface Laptop 8 13.8
Qualcomm Snapdragon X2 Plus X2P-64-100
70.1 pt
Lenovo ThinkBook 14x, ILL, Ultra 5 226V
Intel Core Ultra 5 226V
69.3 pt
Dell XPS 13 DX13260
Intel Core 5 320
61.4 pt
Microsoft Surface Laptop 13 2026
Qualcomm Snapdragon X2 Plus X2P-42-100
57.8 pt
Durchschnittliche Qualcomm Snapdragon X2 Plus X2P-42-100
 
57.8 pt
Asus Zenbook 14 UX3480QA -1!
Qualcomm Snapdragon X X1-26-100
49.3 pt
Cinebench R23 / Multi Core
Durchschnitt der Klasse Subnotebook
  (5263 - 20022, n=56, der letzten 2 Jahre)
12248 Points +79%
Lenovo ThinkBook 14x, ILL, Ultra 5 226V
Intel Core Ultra 5 226V
9851 Points +44%
Microsoft Surface Laptop 8 13.8
Qualcomm Snapdragon X2 Plus X2P-64-100
9777 Points +43%
Asus Zenbook 14 UX3480QA
Qualcomm Snapdragon X X1-26-100
7300 Points +7%
Microsoft Surface Laptop 13 2026
Qualcomm Snapdragon X2 Plus X2P-42-100
6827 Points
Durchschnittliche Qualcomm Snapdragon X2 Plus X2P-42-100
  (n=1)
6827 Points 0%
Dell XPS 13 DX13260
Intel Core 5 320
6197 (6096.49min - 6196.88max) Points -9%
Cinebench R23 / Single Core
Dell XPS 13 DX13260
Intel Core 5 320
1926 Points +38%
Lenovo ThinkBook 14x, ILL, Ultra 5 226V
Intel Core Ultra 5 226V
1800 Points +29%
Durchschnitt der Klasse Subnotebook
  (975 - 2213, n=56, der letzten 2 Jahre)
1789 Points +28%
Microsoft Surface Laptop 13 2026
Qualcomm Snapdragon X2 Plus X2P-42-100
1396 Points
Durchschnittliche Qualcomm Snapdragon X2 Plus X2P-42-100
  (n=1)
1396 Points 0%
Microsoft Surface Laptop 8 13.8
Qualcomm Snapdragon X2 Plus X2P-64-100
1390 Points 0%
Asus Zenbook 14 UX3480QA
Qualcomm Snapdragon X X1-26-100
978 Points -30%
Cinebench R20 / CPU (Multi Core)
Durchschnitt der Klasse Subnotebook
  (2072 - 7884, n=54, der letzten 2 Jahre)
4724 Points +76%
Lenovo ThinkBook 14x, ILL, Ultra 5 226V
Intel Core Ultra 5 226V
3780 Points +41%
Microsoft Surface Laptop 8 13.8
Qualcomm Snapdragon X2 Plus X2P-64-100
3773 Points +41%
Asus Zenbook 14 UX3480QA
Qualcomm Snapdragon X X1-26-100
2881 Points +8%
Microsoft Surface Laptop 13 2026
Qualcomm Snapdragon X2 Plus X2P-42-100
2679 Points
Durchschnittliche Qualcomm Snapdragon X2 Plus X2P-42-100
  (n=1)
2679 Points 0%
Dell XPS 13 DX13260
Intel Core 5 320
2371 Points -11%
Cinebench R20 / CPU (Single Core)
Dell XPS 13 DX13260
Intel Core 5 320
717 Points +35%
Lenovo ThinkBook 14x, ILL, Ultra 5 226V
Intel Core Ultra 5 226V
690 Points +30%
Durchschnitt der Klasse Subnotebook
  (366 - 832, n=54, der letzten 2 Jahre)
683 Points +28%
Microsoft Surface Laptop 8 13.8
Qualcomm Snapdragon X2 Plus X2P-64-100
533 Points 0%
Microsoft Surface Laptop 13 2026
Qualcomm Snapdragon X2 Plus X2P-42-100
532 Points
Durchschnittliche Qualcomm Snapdragon X2 Plus X2P-42-100
  (n=1)
532 Points 0%
Asus Zenbook 14 UX3480QA
Qualcomm Snapdragon X X1-26-100
374 Points -30%
Cinebench R15 / CPU Multi 64Bit
Microsoft Surface Laptop 8 13.8
Qualcomm Snapdragon X2 Plus X2P-64-100
1993 (1593.24min - 1992.73max) Points +43%
Durchschnitt der Klasse Subnotebook
  (849 - 3291, n=54, der letzten 2 Jahre)
1988 Points +43%
Lenovo ThinkBook 14x, ILL, Ultra 5 226V
Intel Core Ultra 5 226V
1459 Points +5%
Asus Zenbook 14 UX3480QA
Qualcomm Snapdragon X X1-26-100
1422 (1355.24min - 1421.97max) Points +2%
Microsoft Surface Laptop 13 2026
Qualcomm Snapdragon X2 Plus X2P-42-100
1395 (1213.92min - 1394.6max) Points
Durchschnittliche Qualcomm Snapdragon X2 Plus X2P-42-100
  (n=1)
1395 Points 0%
Dell XPS 13 DX13260
Intel Core 5 320
1054 (856.35min - 1053.52max) Points -24%
Cinebench R15 / CPU Single 64Bit
Dell XPS 13 DX13260
Intel Core 5 320
276 Points +7%
Lenovo ThinkBook 14x, ILL, Ultra 5 226V
Intel Core Ultra 5 226V
272 Points +5%
Durchschnitt der Klasse Subnotebook
  (184 - 322, n=55, der letzten 2 Jahre)
270 Points +4%
Microsoft Surface Laptop 8 13.8
Qualcomm Snapdragon X2 Plus X2P-64-100
260 Points 0%
Microsoft Surface Laptop 13 2026
Qualcomm Snapdragon X2 Plus X2P-42-100
259 Points
Durchschnittliche Qualcomm Snapdragon X2 Plus X2P-42-100
  (n=1)
259 Points 0%
Asus Zenbook 14 UX3480QA
Qualcomm Snapdragon X X1-26-100
184 Points -29%
Blender / v2.79 BMW27 CPU
Dell XPS 13 DX13260
Intel Core 5 320
494 Seconds * -0%
Microsoft Surface Laptop 13 2026
Qualcomm Snapdragon X2 Plus X2P-42-100
492 Seconds *
Durchschnittliche Qualcomm Snapdragon X2 Plus X2P-42-100
  (n=1)
492 Seconds * -0%
Lenovo ThinkBook 14x, ILL, Ultra 5 226V
Intel Core Ultra 5 226V
432 Seconds * +12%
Microsoft Surface Laptop 8 13.8
Qualcomm Snapdragon X2 Plus X2P-64-100
358 Seconds * +27%
Durchschnitt der Klasse Subnotebook
  (178 - 633, n=53, der letzten 2 Jahre)
314 Seconds * +36%
7-Zip 18.03 / 7z b 4
Durchschnitt der Klasse Subnotebook
  (16455 - 66177, n=52, der letzten 2 Jahre)
43980 MIPS +39%
Microsoft Surface Laptop 8 13.8
Qualcomm Snapdragon X2 Plus X2P-64-100
43860 MIPS +38%
Microsoft Surface Laptop 13 2026
Qualcomm Snapdragon X2 Plus X2P-42-100
31674 MIPS
Durchschnittliche Qualcomm Snapdragon X2 Plus X2P-42-100
  (n=1)
31674 MIPS 0%
Lenovo ThinkBook 14x, ILL, Ultra 5 226V
Intel Core Ultra 5 226V
31469 MIPS -1%
Asus Zenbook 14 UX3480QA
Qualcomm Snapdragon X X1-26-100
30075 MIPS -5%
Dell XPS 13 DX13260
Intel Core 5 320
23550 MIPS -26%
7-Zip 18.03 / 7z b 4 -mmt1
Microsoft Surface Laptop 8 13.8
Qualcomm Snapdragon X2 Plus X2P-64-100
5710 MIPS +4%
Durchschnitt der Klasse Subnotebook
  (4088 - 6699, n=54, der letzten 2 Jahre)
5624 MIPS +2%
Microsoft Surface Laptop 13 2026
Qualcomm Snapdragon X2 Plus X2P-42-100
5514 MIPS
Durchschnittliche Qualcomm Snapdragon X2 Plus X2P-42-100
  (n=1)
5514 MIPS 0%
Dell XPS 13 DX13260
Intel Core 5 320
5319 MIPS -4%
Lenovo ThinkBook 14x, ILL, Ultra 5 226V
Intel Core Ultra 5 226V
5317 MIPS -4%
Asus Zenbook 14 UX3480QA
Qualcomm Snapdragon X X1-26-100
4089 MIPS -26%
HWBOT x265 Benchmark v2.2 / 4k Preset
Durchschnitt der Klasse Subnotebook
  (3.16 - 23.3, n=54, der letzten 2 Jahre)
13.5 fps +153%
Lenovo ThinkBook 14x, ILL, Ultra 5 226V
Intel Core Ultra 5 226V
9.87 fps +85%
Dell XPS 13 DX13260
Intel Core 5 320
8.42 fps +58%
Microsoft Surface Laptop 8 13.8
Qualcomm Snapdragon X2 Plus X2P-64-100
7.14 fps +34%
Asus Zenbook 14 UX3480QA
Qualcomm Snapdragon X X1-26-100
5.46 fps +2%
Microsoft Surface Laptop 13 2026
Qualcomm Snapdragon X2 Plus X2P-42-100
5.34 fps
Durchschnittliche Qualcomm Snapdragon X2 Plus X2P-42-100
  (n=1)
5.34 fps 0%
LibreOffice / 20 Documents To PDF
Asus Zenbook 14 UX3480QA
Qualcomm Snapdragon X X1-26-100
68.3 s * -48%
Lenovo ThinkBook 14x, ILL, Ultra 5 226V
Intel Core Ultra 5 226V
56.5 s * -22%
Durchschnitt der Klasse Subnotebook
  (41.4 - 78.8, n=53, der letzten 2 Jahre)
53.9 s * -16%
Dell XPS 13 DX13260
Intel Core 5 320
47.7 s * -3%
Microsoft Surface Laptop 8 13.8
Qualcomm Snapdragon X2 Plus X2P-64-100
47.6 s * -3%
Microsoft Surface Laptop 13 2026
Qualcomm Snapdragon X2 Plus X2P-42-100
46.3 s *
Durchschnittliche Qualcomm Snapdragon X2 Plus X2P-42-100
  (n=1)
46.3 s * -0%
R Benchmark 2.5 / Overall mean
Asus Zenbook 14 UX3480QA
Qualcomm Snapdragon X X1-26-100
0.845 sec * -43%
Microsoft Surface Laptop 13 2026
Qualcomm Snapdragon X2 Plus X2P-42-100
0.59 sec *
Durchschnittliche Qualcomm Snapdragon X2 Plus X2P-42-100
  (n=1)
0.59 sec * -0%
Microsoft Surface Laptop 8 13.8
Qualcomm Snapdragon X2 Plus X2P-64-100
0.586 sec * +1%
Durchschnitt der Klasse Subnotebook
  (0.4024 - 0.861, n=54, der letzten 2 Jahre)
0.4989 sec * +15%
Lenovo ThinkBook 14x, ILL, Ultra 5 226V
Intel Core Ultra 5 226V
0.4931 sec * +16%
Dell XPS 13 DX13260
Intel Core 5 320
0.4748 sec * +20%

* ... kleinere Werte sind besser

Cinebench R10 Shading 32Bit
6803
Cinebench R10 Rendering Multiple CPUs 32Bit
15482
Cinebench R10 Rendering Single 32Bit
3419
Cinebench R11.5 CPU Single 64Bit
2.94 Points
Cinebench R11.5 CPU Multi 64Bit
16.51 Points
Cinebench R15 CPU Multi 64Bit
1395 Points
Cinebench R15 OpenGL 64Bit
35 fps
Cinebench R15 Ref. Match 64Bit
98 %
Cinebench R15 CPU Single 64Bit
259 Points
Cinebench R20 CPU (Single Core)
532 Points
Cinebench R20 CPU (Multi Core)
2679 Points
Cinebench R23 Multi Core
6827 Points
Cinebench R23 Single Core
1396 Points
Cinebench 2024 CPU Single Core
130 Points
Cinebench 2024 CPU Multi Core
669 Points
Hilfe
Performance Rating
Durchschnitt der Klasse Subnotebook
 
99 pt
Lenovo ThinkBook 14x, ILL, Ultra 5 226V
Intel Core Ultra 5 226V, Arc 130V
73.3 pt
Microsoft Surface Laptop 8 13.8 -1!
Qualcomm Snapdragon X2 Plus X2P-64-100, Adreno X2-45
57.6 pt
Asus Zenbook 14 UX3480QA -1!
Qualcomm Snapdragon X X1-26-100, Adreno X1-45 1.7 TFLOPS
45.8 pt
Microsoft Surface Laptop 13 2026 -1!
Qualcomm Snapdragon X2 Plus X2P-42-100, Adreno X2-45
42.7 pt
Durchschnittliche Qualcomm Snapdragon X2 Plus X2P-42-100 -1!
 
42.7 pt
Dell XPS 13 DX13260 -1!
Intel Core 5 320, Intel Graphics 2 Xe3 WCL
19.5 pt
AIDA64 / FP32 Ray-Trace
Durchschnitt der Klasse Subnotebook
  (2069 - 28231, n=54, der letzten 2 Jahre)
13253 KRay/s +185%
Lenovo ThinkBook 14x, ILL, Ultra 5 226V
Intel Core Ultra 5 226V, Arc 130V (v8.20.8100)
9083 KRay/s +95%
Lenovo ThinkBook 14x, ILL, Ultra 5 226V
Intel Core Ultra 5 226V, Arc 130V (v6.92.6600)
8855 KRay/s +90%
Microsoft Surface Laptop 8 13.8
Qualcomm Snapdragon X2 Plus X2P-64-100, Adreno X2-45 (v8.20.8100)
6001 KRay/s +29%
Asus Zenbook 14 UX3480QA
Qualcomm Snapdragon X X1-26-100, Adreno X1-45 1.7 TFLOPS (v8.20.8100)
5344 KRay/s +15%
Microsoft Surface Laptop 13 2026
Qualcomm Snapdragon X2 Plus X2P-42-100, Adreno X2-45 (v8.20.8100)
4652 KRay/s
Durchschnittliche Qualcomm Snapdragon X2 Plus X2P-42-100
  (n=1)
4652 KRay/s 0%
Dell XPS 13 DX13260
Intel Core 5 320, Intel Graphics 2 Xe3 WCL (v8.20.8100)
2545 KRay/s -45%
AIDA64 / FPU Julia
Durchschnitt der Klasse Subnotebook
  (11041 - 114866, n=54, der letzten 2 Jahre)
60319 Points +267%
Lenovo ThinkBook 14x, ILL, Ultra 5 226V
Intel Core Ultra 5 226V, Arc 130V (v8.20.8100)
45833 Points +179%
Lenovo ThinkBook 14x, ILL, Ultra 5 226V
Intel Core Ultra 5 226V, Arc 130V (v6.92.6600)
43868 Points +167%
Microsoft Surface Laptop 8 13.8
Qualcomm Snapdragon X2 Plus X2P-64-100, Adreno X2-45 (v8.20.8100)
24238 Points +48%
Microsoft Surface Laptop 13 2026
Qualcomm Snapdragon X2 Plus X2P-42-100, Adreno X2-45 (v8.20.8100)
16425 Points
Durchschnittliche Qualcomm Snapdragon X2 Plus X2P-42-100
  (n=1)
16425 Points 0%
Asus Zenbook 14 UX3480QA
Qualcomm Snapdragon X X1-26-100, Adreno X1-45 1.7 TFLOPS (v8.20.8100)
16101 Points -2%
Dell XPS 13 DX13260
Intel Core 5 320, Intel Graphics 2 Xe3 WCL (v8.20.8100)
13325 Points -19%
AIDA64 / CPU SHA3
Durchschnitt der Klasse Subnotebook
  (561 - 4973, n=54, der letzten 2 Jahre)
3045 MB/s +54%
Microsoft Surface Laptop 8 13.8
Qualcomm Snapdragon X2 Plus X2P-64-100, Adreno X2-45 (v8.20.8100)
2630 MB/s +33%
Asus Zenbook 14 UX3480QA
Qualcomm Snapdragon X X1-26-100, Adreno X1-45 1.7 TFLOPS (v8.20.8100)
2368 MB/s +20%
Lenovo ThinkBook 14x, ILL, Ultra 5 226V
Intel Core Ultra 5 226V, Arc 130V (v8.20.8100)
2145 MB/s +8%
Lenovo ThinkBook 14x, ILL, Ultra 5 226V
Intel Core Ultra 5 226V, Arc 130V (v6.92.6600)
2053 MB/s +4%
Microsoft Surface Laptop 13 2026
Qualcomm Snapdragon X2 Plus X2P-42-100, Adreno X2-45 (v8.20.8100)
1979 MB/s
Durchschnittliche Qualcomm Snapdragon X2 Plus X2P-42-100
  (n=1)
1979 MB/s 0%
Dell XPS 13 DX13260
Intel Core 5 320, Intel Graphics 2 Xe3 WCL (v8.20.8100)
645 MB/s -67%
AIDA64 / CPU Queen
Durchschnitt der Klasse Subnotebook
  (44593 - 90515, n=37, der letzten 2 Jahre)
60137 Points
Lenovo ThinkBook 14x, ILL, Ultra 5 226V
Intel Core Ultra 5 226V, Arc 130V (v6.92.6600)
46992 Points
AIDA64 / FPU SinJulia
Durchschnitt der Klasse Subnotebook
  (692 - 14208, n=54, der letzten 2 Jahre)
6131 Points +351%
Lenovo ThinkBook 14x, ILL, Ultra 5 226V
Intel Core Ultra 5 226V, Arc 130V (v8.20.8100)
3862 Points +184%
Lenovo ThinkBook 14x, ILL, Ultra 5 226V
Intel Core Ultra 5 226V, Arc 130V (v6.92.6600)
3750 Points +176%
Microsoft Surface Laptop 8 13.8
Qualcomm Snapdragon X2 Plus X2P-64-100, Adreno X2-45 (v8.20.8100)
2099 Points +55%
Microsoft Surface Laptop 13 2026
Qualcomm Snapdragon X2 Plus X2P-42-100, Adreno X2-45 (v8.20.8100)
1358 Points
Durchschnittliche Qualcomm Snapdragon X2 Plus X2P-42-100
  (n=1)
1358 Points 0%
Asus Zenbook 14 UX3480QA
Qualcomm Snapdragon X X1-26-100, Adreno X1-45 1.7 TFLOPS (v8.20.8100)
1356 Points 0%
Dell XPS 13 DX13260
Intel Core 5 320, Intel Graphics 2 Xe3 WCL (v8.20.8100)
910 Points -33%
AIDA64 / FPU Mandel
Durchschnitt der Klasse Subnotebook
  (5978 - 57729, n=54, der letzten 2 Jahre)
31777 Points +271%
Lenovo ThinkBook 14x, ILL, Ultra 5 226V
Intel Core Ultra 5 226V, Arc 130V (v8.20.8100)
23692 Points +177%
Lenovo ThinkBook 14x, ILL, Ultra 5 226V
Intel Core Ultra 5 226V, Arc 130V (v6.92.6600)
22768 Points +166%
Microsoft Surface Laptop 8 13.8
Qualcomm Snapdragon X2 Plus X2P-64-100, Adreno X2-45 (v8.20.8100)
12620 Points +47%
Asus Zenbook 14 UX3480QA
Qualcomm Snapdragon X X1-26-100, Adreno X1-45 1.7 TFLOPS (v8.20.8100)
9054 Points +6%
Microsoft Surface Laptop 13 2026
Qualcomm Snapdragon X2 Plus X2P-42-100, Adreno X2-45 (v8.20.8100)
8559 Points
Durchschnittliche Qualcomm Snapdragon X2 Plus X2P-42-100
  (n=1)
8559 Points 0%
Dell XPS 13 DX13260
Intel Core 5 320, Intel Graphics 2 Xe3 WCL (v8.20.8100)
6944 Points -19%
AIDA64 / CPU AES
Microsoft Surface Laptop 8 13.8
Qualcomm Snapdragon X2 Plus X2P-64-100, Adreno X2-45 (v8.20.8100)
53201 MB/s +29%
Durchschnitt der Klasse Subnotebook
  (6815 - 96917, n=54, der letzten 2 Jahre)
51976 MB/s +26%
Microsoft Surface Laptop 13 2026
Qualcomm Snapdragon X2 Plus X2P-42-100, Adreno X2-45 (v8.20.8100)
41102 MB/s
Durchschnittliche Qualcomm Snapdragon X2 Plus X2P-42-100
  (n=1)
41102 MB/s 0%
Asus Zenbook 14 UX3480QA
Qualcomm Snapdragon X X1-26-100, Adreno X1-45 1.7 TFLOPS (v8.20.8100)
39255 MB/s -4%
Lenovo ThinkBook 14x, ILL, Ultra 5 226V
Intel Core Ultra 5 226V, Arc 130V (v8.20.8100)
34181 MB/s -17%
Lenovo ThinkBook 14x, ILL, Ultra 5 226V
Intel Core Ultra 5 226V, Arc 130V (v6.92.6600)
32739 MB/s -20%
Dell XPS 13 DX13260
Intel Core 5 320, Intel Graphics 2 Xe3 WCL (v8.20.8100)
8293 MB/s -80%
AIDA64 / CPU ZLib
Durchschnitt der Klasse Subnotebook
  (127.2 - 1217, n=54, der letzten 2 Jahre)
731 MB/s +59%
Microsoft Surface Laptop 8 13.8
Qualcomm Snapdragon X2 Plus X2P-64-100, Adreno X2-45 (v8.20.8100)
653 MB/s +42%
Lenovo ThinkBook 14x, ILL, Ultra 5 226V
Intel Core Ultra 5 226V, Arc 130V (v8.20.8100)
513 MB/s +12%
Lenovo ThinkBook 14x, ILL, Ultra 5 226V
Intel Core Ultra 5 226V, Arc 130V (v6.92.6600)
490 MB/s +7%
Asus Zenbook 14 UX3480QA
Qualcomm Snapdragon X X1-26-100, Adreno X1-45 1.7 TFLOPS (v8.20.8100)
468 MB/s +2%
Microsoft Surface Laptop 13 2026
Qualcomm Snapdragon X2 Plus X2P-42-100, Adreno X2-45 (v8.20.8100)
459 MB/s
Durchschnittliche Qualcomm Snapdragon X2 Plus X2P-42-100
  (n=1)
459 MB/s 0%
Dell XPS 13 DX13260
Intel Core 5 320, Intel Graphics 2 Xe3 WCL (v8.20.8100)
135.3 MB/s -71%
AIDA64 / FP64 Ray-Trace
Durchschnitt der Klasse Subnotebook
  (953 - 15342, n=54, der letzten 2 Jahre)
7046 KRay/s +178%
Lenovo ThinkBook 14x, ILL, Ultra 5 226V
Intel Core Ultra 5 226V, Arc 130V (v8.20.8100)
4867 KRay/s +92%
Lenovo ThinkBook 14x, ILL, Ultra 5 226V
Intel Core Ultra 5 226V, Arc 130V (v6.92.6600)
4793 KRay/s +89%
Microsoft Surface Laptop 8 13.8
Qualcomm Snapdragon X2 Plus X2P-64-100, Adreno X2-45 (v8.20.8100)
3212 KRay/s +27%
Asus Zenbook 14 UX3480QA
Qualcomm Snapdragon X X1-26-100, Adreno X1-45 1.7 TFLOPS (v8.20.8100)
3111 KRay/s +23%
Microsoft Surface Laptop 13 2026
Qualcomm Snapdragon X2 Plus X2P-42-100, Adreno X2-45 (v8.20.8100)
2539 KRay/s
Durchschnittliche Qualcomm Snapdragon X2 Plus X2P-42-100
  (n=1)
2539 KRay/s 0%
Dell XPS 13 DX13260
Intel Core 5 320, Intel Graphics 2 Xe3 WCL (v8.20.8100)
1297 KRay/s -49%
AIDA64 / CPU PhotoWorxx
Lenovo ThinkBook 14x, ILL, Ultra 5 226V
Intel Core Ultra 5 226V, Arc 130V (v8.20.8100)
52964 MPixel/s +96%
Lenovo ThinkBook 14x, ILL, Ultra 5 226V
Intel Core Ultra 5 226V, Arc 130V (v6.92.6600)
44293 MPixel/s +64%
Durchschnitt der Klasse Subnotebook
  (10193 - 85600, n=54, der letzten 2 Jahre)
48555 MPixel/s +80%
Microsoft Surface Laptop 8 13.8
Qualcomm Snapdragon X2 Plus X2P-64-100, Adreno X2-45 (v8.20.8100)
35535 MPixel/s +32%
Asus Zenbook 14 UX3480QA
Qualcomm Snapdragon X X1-26-100, Adreno X1-45 1.7 TFLOPS (v8.20.8100)
31146 MPixel/s +15%
Microsoft Surface Laptop 13 2026
Qualcomm Snapdragon X2 Plus X2P-42-100, Adreno X2-45 (v8.20.8100)
26989 MPixel/s
Durchschnittliche Qualcomm Snapdragon X2 Plus X2P-42-100
  (n=1)
26989 MPixel/s 0%
Dell XPS 13 DX13260
Intel Core 5 320, Intel Graphics 2 Xe3 WCL (v8.20.8100)
11144 MPixel/s -59%
AIDA64 / CPU CheckMate
Durchschnitt der Klasse Subnotebook
  (471 - 5939, n=16, der letzten 2 Jahre)
2651 MP/s +329%
Lenovo ThinkBook 14x, ILL, Ultra 5 226V
Intel Core Ultra 5 226V, Arc 130V (v8.20.8100)
2384 MP/s +286%
Microsoft Surface Laptop 8 13.8
Qualcomm Snapdragon X2 Plus X2P-64-100, Adreno X2-45 (v8.20.8100)
756 MP/s +22%
Microsoft Surface Laptop 13 2026
Qualcomm Snapdragon X2 Plus X2P-42-100, Adreno X2-45 (v8.20.8100)
618 MP/s
Durchschnittliche Qualcomm Snapdragon X2 Plus X2P-42-100
  (n=1)
618 MP/s 0%
Dell XPS 13 DX13260
Intel Core 5 320, Intel Graphics 2 Xe3 WCL (v8.20.8100)
590 MP/s -5%
Asus Zenbook 14 UX3480QA
Qualcomm Snapdragon X X1-26-100, Adreno X1-45 1.7 TFLOPS (v8.20.8100)
570 MP/s -8%

Systemleistung und Massenspeicher

Die Systemleistung ist gut, und das Surface Laptop 13 reagiert sehr schnell auf Eingaben. Stabilitätsprobleme hatten wir ebenfalls nicht. Man sollte jedoch bedenken, dass nicht alle Anwendungen und Zubehörgeräte mit der ARM-Version von Windows funktionieren. Vor dem Kauf eines ARM-Laptops sollte man daher unbedingt die Kompatibilität prüfen. Die kompakte M.2-2242-SSD von Kioxia bietet in unserem Testgerät 512 GB Speicherplatz und erreicht Übertragungsraten von etwa 3-4 GB/s, was in Ordnung ist.

Performance Rating: Percent
CrossMark: Overall | Productivity | Creativity | Responsiveness
WebXPRT 4: Overall
WebXPRT 5: Overall
Mozilla Kraken 1.1: Total
Performance Rating
Apple MacBook Air 13 M5
M5 8-Core GPU, M5 10-Core, Apple SSD AP0512Z
93.7 pt
Microsoft Surface Laptop 8 13.8
Adreno X2-45, SD X2 Plus X2P-64-100, SK hynix PVC10 HFS512GEM4X182N
73.6 pt
Durchschnitt der Klasse Subnotebook
 
69 pt
Dell XPS 13 DX13260
Intel Graphics 2 Xe3 WCL, Core 5 320, Kioxia BG7 512 GB
64.2 pt
Lenovo ThinkBook 14x, ILL, Ultra 5 226V
Arc 130V, Core Ultra 5 226V, SAMSUNG MZAMX512HDLV-00BL2
61.7 pt
Microsoft Surface Laptop 13 2026
Adreno X2-45, SD X2 Plus X2P-42-100, Kioxia THGJFJT2T85BAT01
58.9 pt
Durchschnittliche Qualcomm Snapdragon X2 Plus X2P-42-100, Qualcomm SD X2 Adreno X2-45
 
58.9 pt
Asus Zenbook 14 UX3480QA
Adreno X1-45 1.7 TFLOPS, SD X1-26-100, Samsung PM9C1b MZVL8512HFLU-00BLL
52.9 pt
Microsoft Surface Laptop 13 -1!
Adreno X1-45 1.7 TFLOPS, SD X Plus X1P-42-100
48.3 pt
CrossMark / Overall
Apple MacBook Air 13 M5
M5 8-Core GPU, M5 10-Core, Apple SSD AP0512Z
2314 Points +64%
Durchschnitt der Klasse Subnotebook
  (1061 - 2356, n=58, der letzten 2 Jahre)
1707 Points +21%
Microsoft Surface Laptop 8 13.8
Adreno X2-45, SD X2 Plus X2P-64-100, SK hynix PVC10 HFS512GEM4X182N
1594 Points +13%
Lenovo ThinkBook 14x, ILL, Ultra 5 226V
Arc 130V, Core Ultra 5 226V, SAMSUNG MZAMX512HDLV-00BL2
1523 Points +8%
Dell XPS 13 DX13260
Intel Graphics 2 Xe3 WCL, Core 5 320, Kioxia BG7 512 GB
1511 Points +7%
Microsoft Surface Laptop 13 2026
Adreno X2-45, SD X2 Plus X2P-42-100, Kioxia THGJFJT2T85BAT01
1412 Points
Durchschnittliche Qualcomm Snapdragon X2 Plus X2P-42-100, Qualcomm SD X2 Adreno X2-45
  (n=1)
1412 Points 0%
Asus Zenbook 14 UX3480QA
Adreno X1-45 1.7 TFLOPS, SD X1-26-100, Samsung PM9C1b MZVL8512HFLU-00BLL
1135 Points -20%
Microsoft Surface Laptop 13
Adreno X1-45 1.7 TFLOPS, SD X Plus X1P-42-100
1061 Points -25%
CrossMark / Productivity
Apple MacBook Air 13 M5
M5 8-Core GPU, M5 10-Core, Apple SSD AP0512Z
2253 Points +69%
Durchschnitt der Klasse Subnotebook
  (1022 - 2277, n=58, der letzten 2 Jahre)
1622 Points +22%
Dell XPS 13 DX13260
Intel Graphics 2 Xe3 WCL, Core 5 320, Kioxia BG7 512 GB
1570 Points +18%
Lenovo ThinkBook 14x, ILL, Ultra 5 226V
Arc 130V, Core Ultra 5 226V, SAMSUNG MZAMX512HDLV-00BL2
1478 Points +11%
Microsoft Surface Laptop 8 13.8
Adreno X2-45, SD X2 Plus X2P-64-100, SK hynix PVC10 HFS512GEM4X182N
1468 Points +10%
Microsoft Surface Laptop 13 2026
Adreno X2-45, SD X2 Plus X2P-42-100, Kioxia THGJFJT2T85BAT01
1333 Points
Durchschnittliche Qualcomm Snapdragon X2 Plus X2P-42-100, Qualcomm SD X2 Adreno X2-45
  (n=1)
1333 Points 0%
Microsoft Surface Laptop 13
Adreno X1-45 1.7 TFLOPS, SD X Plus X1P-42-100
1059 Points -21%
Asus Zenbook 14 UX3480QA
Adreno X1-45 1.7 TFLOPS, SD X1-26-100, Samsung PM9C1b MZVL8512HFLU-00BLL
1056 Points -21%
CrossMark / Creativity
Apple MacBook Air 13 M5
M5 8-Core GPU, M5 10-Core, Apple SSD AP0512Z
2664 Points +73%
Durchschnitt der Klasse Subnotebook
  (1070 - 2743, n=58, der letzten 2 Jahre)
1917 Points +25%
Microsoft Surface Laptop 8 13.8
Adreno X2-45, SD X2 Plus X2P-64-100, SK hynix PVC10 HFS512GEM4X182N
1753 Points +14%
Lenovo ThinkBook 14x, ILL, Ultra 5 226V
Arc 130V, Core Ultra 5 226V, SAMSUNG MZAMX512HDLV-00BL2
1712 Points +11%
Microsoft Surface Laptop 13 2026
Adreno X2-45, SD X2 Plus X2P-42-100, Kioxia THGJFJT2T85BAT01
1537 Points
Durchschnittliche Qualcomm Snapdragon X2 Plus X2P-42-100, Qualcomm SD X2 Adreno X2-45
  (n=1)
1537 Points 0%
Dell XPS 13 DX13260
Intel Graphics 2 Xe3 WCL, Core 5 320, Kioxia BG7 512 GB
1505 Points -2%
Asus Zenbook 14 UX3480QA
Adreno X1-45 1.7 TFLOPS, SD X1-26-100, Samsung PM9C1b MZVL8512HFLU-00BLL
1206 Points -22%
Microsoft Surface Laptop 13
Adreno X1-45 1.7 TFLOPS, SD X Plus X1P-42-100
1070 Points -30%
CrossMark / Responsiveness
Apple MacBook Air 13 M5
M5 8-Core GPU, M5 10-Core, Apple SSD AP0512Z
1643 Points +26%
Microsoft Surface Laptop 8 13.8
Adreno X2-45, SD X2 Plus X2P-64-100, SK hynix PVC10 HFS512GEM4X182N
1536 Points +18%
Durchschnitt der Klasse Subnotebook
  (1010 - 1873, n=58, der letzten 2 Jahre)
1419 Points +9%
Dell XPS 13 DX13260
Intel Graphics 2 Xe3 WCL, Core 5 320, Kioxia BG7 512 GB
1363 Points +5%
Microsoft Surface Laptop 13 2026
Adreno X2-45, SD X2 Plus X2P-42-100, Kioxia THGJFJT2T85BAT01
1299 Points
Durchschnittliche Qualcomm Snapdragon X2 Plus X2P-42-100, Qualcomm SD X2 Adreno X2-45
  (n=1)
1299 Points 0%
Asus Zenbook 14 UX3480QA
Adreno X1-45 1.7 TFLOPS, SD X1-26-100, Samsung PM9C1b MZVL8512HFLU-00BLL
1176 Points -9%
Lenovo ThinkBook 14x, ILL, Ultra 5 226V
Arc 130V, Core Ultra 5 226V, SAMSUNG MZAMX512HDLV-00BL2
1174 Points -10%
Microsoft Surface Laptop 13
Adreno X1-45 1.7 TFLOPS, SD X Plus X1P-42-100
1037 Points -20%
WebXPRT 4 / Overall
Apple MacBook Air 13 M5
M5 8-Core GPU, M5 10-Core, Apple SSD AP0512Z
374 Points +66%
Microsoft Surface Laptop 8 13.8
Adreno X2-45, SD X2 Plus X2P-64-100, SK hynix PVC10 HFS512GEM4X182N
344 Points +53%
Asus Zenbook 14 UX3480QA
Adreno X1-45 1.7 TFLOPS, SD X1-26-100, Samsung PM9C1b MZVL8512HFLU-00BLL
286 Points +27%
Durchschnitt der Klasse Subnotebook
  (167.3 - 378, n=58, der letzten 2 Jahre)
277 Points +23%
Dell XPS 13 DX13260
Intel Graphics 2 Xe3 WCL, Core 5 320, Kioxia BG7 512 GB
269 Points +20%
Lenovo ThinkBook 14x, ILL, Ultra 5 226V
Arc 130V, Core Ultra 5 226V, SAMSUNG MZAMX512HDLV-00BL2
264 Points +17%
Microsoft Surface Laptop 13
Adreno X1-45 1.7 TFLOPS, SD X Plus X1P-42-100
263 Points +17%
Microsoft Surface Laptop 13 2026
Adreno X2-45, SD X2 Plus X2P-42-100, Kioxia THGJFJT2T85BAT01
225 Points
Durchschnittliche Qualcomm Snapdragon X2 Plus X2P-42-100, Qualcomm SD X2 Adreno X2-45
  (n=1)
225 Points 0%
WebXPRT 5 / Overall
Apple MacBook Air 13 M5
M5 8-Core GPU, M5 10-Core, Apple SSD AP0512Z
114 Points +14%
Dell XPS 13 DX13260
Intel Graphics 2 Xe3 WCL, Core 5 320, Kioxia BG7 512 GB
110 Points +10%
Lenovo ThinkBook 14x, ILL, Ultra 5 226V
Arc 130V, Core Ultra 5 226V, SAMSUNG MZAMX512HDLV-00BL2
107 Points +7%
Durchschnitt der Klasse Subnotebook
  (69 - 120, n=15, der letzten 2 Jahre)
105.1 Points +5%
Microsoft Surface Laptop 8 13.8
Adreno X2-45, SD X2 Plus X2P-64-100, SK hynix PVC10 HFS512GEM4X182N
102 Points +2%
Microsoft Surface Laptop 13 2026
Adreno X2-45, SD X2 Plus X2P-42-100, Kioxia THGJFJT2T85BAT01
100 Points
Durchschnittliche Qualcomm Snapdragon X2 Plus X2P-42-100, Qualcomm SD X2 Adreno X2-45
  (n=1)
100 Points 0%
Asus Zenbook 14 UX3480QA
Adreno X1-45 1.7 TFLOPS, SD X1-26-100, Samsung PM9C1b MZVL8512HFLU-00BLL
69 Points -31%
Mozilla Kraken 1.1 / Total
Lenovo ThinkBook 14x, ILL, Ultra 5 226V
Arc 130V, Core Ultra 5 226V, SAMSUNG MZAMX512HDLV-00BL2
530 ms * -8%
Dell XPS 13 DX13260
Intel Graphics 2 Xe3 WCL, Core 5 320, Kioxia BG7 512 GB
497 ms * -1%
Microsoft Surface Laptop 13 2026
Adreno X2-45, SD X2 Plus X2P-42-100, Kioxia THGJFJT2T85BAT01
490.2 ms *
Durchschnittliche Qualcomm Snapdragon X2 Plus X2P-42-100, Qualcomm SD X2 Adreno X2-45
  (n=1)
490 ms * -0%
Durchschnitt der Klasse Subnotebook
  (234 - 709, n=58, der letzten 2 Jahre)
462 ms * +6%
Asus Zenbook 14 UX3480QA
Adreno X1-45 1.7 TFLOPS, SD X1-26-100, Samsung PM9C1b MZVL8512HFLU-00BLL
419.9 ms * +14%
Microsoft Surface Laptop 13
Adreno X1-45 1.7 TFLOPS, SD X Plus X1P-42-100
407.5 ms * +17%
Microsoft Surface Laptop 8 13.8
Adreno X2-45, SD X2 Plus X2P-64-100, SK hynix PVC10 HFS512GEM4X182N
316.7 ms * +35%
Apple MacBook Air 13 M5
M5 8-Core GPU, M5 10-Core, Apple SSD AP0512Z
234.4 ms * +52%

* ... kleinere Werte sind besser

AIDA64 / Memory Copy
Lenovo ThinkBook 14x, ILL, Ultra 5 226V
Intel Core Ultra 5 226V, Arc 130V
98535 MB/s +101%
Lenovo ThinkBook 14x, ILL, Ultra 5 226V
Intel Core Ultra 5 226V, Arc 130V
97786 MB/s +99%
Durchschnitt der Klasse Subnotebook
  (15233 - 131023, n=54, der letzten 2 Jahre)
87659 MB/s +79%
Asus Zenbook 14 UX3480QA
Qualcomm Snapdragon X X1-26-100, Adreno X1-45 1.7 TFLOPS
62058 MB/s +26%
Microsoft Surface Laptop 8 13.8
Qualcomm Snapdragon X2 Plus X2P-64-100, Adreno X2-45
57846 MB/s +18%
Microsoft Surface Laptop 13 2026
Qualcomm Snapdragon X2 Plus X2P-42-100, Adreno X2-45
49091 MB/s
Durchschnittliche Qualcomm Snapdragon X2 Plus X2P-42-100
  (n=1)
49091 MB/s 0%
Dell XPS 13 DX13260
Intel Core 5 320, Intel Graphics 2 Xe3 WCL
16289 MB/s -67%
AIDA64 / Memory Read
Asus Zenbook 14 UX3480QA
Qualcomm Snapdragon X X1-26-100, Adreno X1-45 1.7 TFLOPS
124515 MB/s +52%
Microsoft Surface Laptop 8 13.8
Qualcomm Snapdragon X2 Plus X2P-64-100, Adreno X2-45
117229 MB/s +43%
Durchschnitt der Klasse Subnotebook
  (13982 - 127174, n=54, der letzten 2 Jahre)
83620 MB/s +2%
Lenovo ThinkBook 14x, ILL, Ultra 5 226V
Intel Core Ultra 5 226V, Arc 130V
83195 MB/s +2%
Lenovo ThinkBook 14x, ILL, Ultra 5 226V
Intel Core Ultra 5 226V, Arc 130V
82834 MB/s +1%
Microsoft Surface Laptop 13 2026
Qualcomm Snapdragon X2 Plus X2P-42-100, Adreno X2-45
81838 MB/s
Durchschnittliche Qualcomm Snapdragon X2 Plus X2P-42-100
  (n=1)
81838 MB/s 0%
Dell XPS 13 DX13260
Intel Core 5 320, Intel Graphics 2 Xe3 WCL
16674 MB/s -80%
AIDA64 / Memory Write
Lenovo ThinkBook 14x, ILL, Ultra 5 226V
Intel Core Ultra 5 226V, Arc 130V
111515 MB/s +162%
Lenovo ThinkBook 14x, ILL, Ultra 5 226V
Intel Core Ultra 5 226V, Arc 130V
111508 MB/s +162%
Durchschnitt der Klasse Subnotebook
  (17404 - 135141, n=54, der letzten 2 Jahre)
90067 MB/s +112%
Asus Zenbook 14 UX3480QA
Qualcomm Snapdragon X X1-26-100, Adreno X1-45 1.7 TFLOPS
48068 MB/s +13%
Microsoft Surface Laptop 8 13.8
Qualcomm Snapdragon X2 Plus X2P-64-100, Adreno X2-45
43017 MB/s +1%
Microsoft Surface Laptop 13 2026
Qualcomm Snapdragon X2 Plus X2P-42-100, Adreno X2-45
42504 MB/s
Durchschnittliche Qualcomm Snapdragon X2 Plus X2P-42-100
  (n=1)
42504 MB/s 0%
Dell XPS 13 DX13260
Intel Core 5 320, Intel Graphics 2 Xe3 WCL
18564 MB/s -56%
AIDA64 / Memory Latency
Dell XPS 13 DX13260
Intel Core 5 320, Intel Graphics 2 Xe3 WCL
317 ns *
Durchschnitt der Klasse Subnotebook
  (6.1 - 317, n=51, der letzten 2 Jahre)
101.7 ns *
Lenovo ThinkBook 14x, ILL, Ultra 5 226V
Intel Core Ultra 5 226V, Arc 130V
94.1 ns *
Lenovo ThinkBook 14x, ILL, Ultra 5 226V
Intel Core Ultra 5 226V, Arc 130V
92.6 ns *
Asus Zenbook 14 UX3480QA
Qualcomm Snapdragon X X1-26-100, Adreno X1-45 1.7 TFLOPS
7.7 ns *
Microsoft Surface Laptop 8 13.8
Qualcomm Snapdragon X2 Plus X2P-64-100, Adreno X2-45
6.2 ns *

* ... kleinere Werte sind besser

Kioxia THGJFJT2T85BAT01
CDM 5/6 Read Seq Q32T1: 3827 MB/s
CDM 5/6 Write Seq Q32T1: 3493 MB/s
CDM 5/6 Read 4K Q32T1: 773 MB/s
CDM 5/6 Write 4K Q32T1: 487 MB/s
CDM 5/6 Read 4K: 26.2 MB/s
CDM 5/6 Write 4K: 84.8 MB/s
CDM 6 Write 4K Q8T8: 1666 MB/s
CDM 6 Read 4K Q8T8: 1642 MB/s
Drive Performance Rating - Percent
Durchschnitt der Klasse Subnotebook
 
86.1 pt
Asus Zenbook 14 UX3480QA
Samsung PM9C1b MZVL8512HFLU-00BLL
76.9 pt
Dell XPS 13 DX13260
Kioxia BG7 512 GB
71.3 pt
Microsoft Surface Laptop 8 13.8
SK hynix PVC10 HFS512GEM4X182N
67.7 pt
Microsoft Surface Laptop 13 2026
Kioxia THGJFJT2T85BAT01
61.3 pt
Durchschnittliche Kioxia THGJFJT2T85BAT01
 
59.3 pt
Lenovo ThinkBook 14x, ILL, Ultra 5 226V
SAMSUNG MZAMX512HDLV-00BL2
49.5 pt
DiskSpd
seq read
Microsoft Surface Laptop 8 13.8
SK hynix PVC10 HFS512GEM4X182N
3599 (3587.34min - 3599.27max) MB/s +79%
Dell XPS 13 DX13260
Kioxia BG7 512 GB
3317 (3282.04min - 3316.51max) MB/s +65%
Durchschnitt der Klasse Subnotebook
  (1451 - 4974, n=53, der letzten 2 Jahre)
3137 MB/s +56%
Asus Zenbook 14 UX3480QA
Samsung PM9C1b MZVL8512HFLU-00BLL
2864 (2647.65min - 2863.87max) MB/s +42%
Durchschnittliche Kioxia THGJFJT2T85BAT01
  (2010 - 2188, n=2)
2099 MB/s +4%
Microsoft Surface Laptop 13 2026
Kioxia THGJFJT2T85BAT01
2010 (1967.39min - 2010.08max) MB/s
Lenovo ThinkBook 14x, ILL, Ultra 5 226V
SAMSUNG MZAMX512HDLV-00BL2
1530 (961.33min - 1529.87max) MB/s -24%
seq write
Microsoft Surface Laptop 8 13.8
SK hynix PVC10 HFS512GEM4X182N
3478 (3332.58min - 3477.92max) MB/s +46%
Dell XPS 13 DX13260
Kioxia BG7 512 GB
3272 (3191.03min - 3271.98max) MB/s +37%
Durchschnitt der Klasse Subnotebook
  (1201 - 5392, n=53, der letzten 2 Jahre)
3176 MB/s +33%
Asus Zenbook 14 UX3480QA
Samsung PM9C1b MZVL8512HFLU-00BLL
2902 (2719.81min - 2902.11max) MB/s +22%
Microsoft Surface Laptop 13 2026
Kioxia THGJFJT2T85BAT01
2385 (2309.17min - 2384.52max) MB/s
Lenovo ThinkBook 14x, ILL, Ultra 5 226V
SAMSUNG MZAMX512HDLV-00BL2
1723 (152.16min - 1722.72max) MB/s -28%
Durchschnittliche Kioxia THGJFJT2T85BAT01
  (557 - 2385, n=2)
1471 MB/s -38%
seq q8 t1 read
Dell XPS 13 DX13260
Kioxia BG7 512 GB
6964 (5869.51min - 6964.43max) MB/s +82%
Microsoft Surface Laptop 8 13.8
SK hynix PVC10 HFS512GEM4X182N
6522 (5401.21min - 6521.51max) MB/s +71%
Durchschnitt der Klasse Subnotebook
  (2107 - 13544, n=53, der letzten 2 Jahre)
6279 MB/s +64%
Asus Zenbook 14 UX3480QA
Samsung PM9C1b MZVL8512HFLU-00BLL
5147 (4192min - 5146.83max) MB/s +35%
Lenovo ThinkBook 14x, ILL, Ultra 5 226V
SAMSUNG MZAMX512HDLV-00BL2
3979 (3085.12min - 3978.94max) MB/s +4%
Microsoft Surface Laptop 13 2026
Kioxia THGJFJT2T85BAT01
3821 (3507.28min - 3820.71max) MB/s
Durchschnittliche Kioxia THGJFJT2T85BAT01
  (3331 - 3821, n=2)
3576 MB/s -6%
seq q8 t1 write
Dell XPS 13 DX13260
Kioxia BG7 512 GB
5647 (5306.51min - 5646.79max) MB/s +73%
Microsoft Surface Laptop 8 13.8
SK hynix PVC10 HFS512GEM4X182N
5577 (5179.55min - 5576.71max) MB/s +71%
Durchschnitt der Klasse Subnotebook
  (517 - 9702, n=53, der letzten 2 Jahre)
4913 MB/s +50%
Asus Zenbook 14 UX3480QA
Samsung PM9C1b MZVL8512HFLU-00BLL
3323 (3241.57min - 3323max) MB/s +2%
Microsoft Surface Laptop 13 2026
Kioxia THGJFJT2T85BAT01
3265 (3252.26min - 3265.03max) MB/s
Durchschnittliche Kioxia THGJFJT2T85BAT01
  (555 - 3265, n=2)
1910 MB/s -42%
Lenovo ThinkBook 14x, ILL, Ultra 5 226V
SAMSUNG MZAMX512HDLV-00BL2
517 (218.71min - 516.96max) MB/s -84%
4k q1 t1 read
Microsoft Surface Laptop 8 13.8
SK hynix PVC10 HFS512GEM4X182N
92.9 (90.22min - 92.9max) MB/s +159%
Asus Zenbook 14 UX3480QA
Samsung PM9C1b MZVL8512HFLU-00BLL
71.1 (70.55min - 71.06max) MB/s +99%
Dell XPS 13 DX13260
Kioxia BG7 512 GB
63.4 (62.65min - 63.44max) MB/s +77%
Durchschnitt der Klasse Subnotebook
  (28.9 - 95.2, n=53, der letzten 2 Jahre)
62.8 MB/s +75%
Lenovo ThinkBook 14x, ILL, Ultra 5 226V
SAMSUNG MZAMX512HDLV-00BL2
39 (36.34min - 39.03max) MB/s +9%
Durchschnittliche Kioxia THGJFJT2T85BAT01
  (35.8 - 40.3, n=2)
38.1 MB/s +6%
Microsoft Surface Laptop 13 2026
Kioxia THGJFJT2T85BAT01
35.8 (34.69min - 35.78max) MB/s
4k q1 t1 write
Microsoft Surface Laptop 8 13.8
SK hynix PVC10 HFS512GEM4X182N
217 (204.48min - 217.36max) MB/s +9%
Microsoft Surface Laptop 13 2026
Kioxia THGJFJT2T85BAT01
199 (198.5min - 198.95max) MB/s
Durchschnittliche Kioxia THGJFJT2T85BAT01
  (167.7 - 199, n=2)
183.4 MB/s -8%
Asus Zenbook 14 UX3480QA
Samsung PM9C1b MZVL8512HFLU-00BLL
176.4 (169.25min - 176.42max) MB/s -11%
Durchschnitt der Klasse Subnotebook
  (107 - 282, n=53, der letzten 2 Jahre)
162.4 MB/s -18%
Dell XPS 13 DX13260
Kioxia BG7 512 GB
154.1 (152.71min - 154.07max) MB/s -23%
Lenovo ThinkBook 14x, ILL, Ultra 5 226V
SAMSUNG MZAMX512HDLV-00BL2
148.2 (123.28min - 148.19max) MB/s -26%
4k q32 t16 read
Microsoft Surface Laptop 8 13.8
SK hynix PVC10 HFS512GEM4X182N
1375 (1350.46min - 1374.69max) MB/s +113%
Asus Zenbook 14 UX3480QA
Samsung PM9C1b MZVL8512HFLU-00BLL
1368 (1242.59min - 1368.37max) MB/s +112%
Durchschnitt der Klasse Subnotebook
  (228 - 4203, n=53, der letzten 2 Jahre)
1161 MB/s +80%
Microsoft Surface Laptop 13 2026
Kioxia THGJFJT2T85BAT01
645 (605.87min - 644.69max) MB/s
Durchschnittliche Kioxia THGJFJT2T85BAT01
  (588 - 645, n=2)
617 MB/s -4%
Dell XPS 13 DX13260
Kioxia BG7 512 GB
554 (539.77min - 554.36max) MB/s -14%
Lenovo ThinkBook 14x, ILL, Ultra 5 226V
SAMSUNG MZAMX512HDLV-00BL2
534 (438.38min - 534.26max) MB/s -17%
4k q32 t16 write
Microsoft Surface Laptop 8 13.8
SK hynix PVC10 HFS512GEM4X182N
966 (949.11min - 965.96max) MB/s +31%
Durchschnitt der Klasse Subnotebook
  (243 - 5007, n=53, der letzten 2 Jahre)
860 MB/s +17%
Microsoft Surface Laptop 13 2026
Kioxia THGJFJT2T85BAT01
736 (694.67min - 736.38max) MB/s
Asus Zenbook 14 UX3480QA
Samsung PM9C1b MZVL8512HFLU-00BLL
587 (576.19min - 587.03max) MB/s -20%
Durchschnittliche Kioxia THGJFJT2T85BAT01
  (373 - 736, n=2)
555 MB/s -25%
Dell XPS 13 DX13260
Kioxia BG7 512 GB
283 (279.07min - 282.59max) MB/s -62%
Lenovo ThinkBook 14x, ILL, Ultra 5 226V
SAMSUNG MZAMX512HDLV-00BL2
278 (156.1min - 278.37max) MB/s -62%
AS SSD
Score Total
Durchschnitt der Klasse Subnotebook
  (1439 - 9875, n=53, der letzten 2 Jahre)
4333 Points +108%
Dell XPS 13 DX13260
Kioxia BG7 512 GB
3136 Points +50%
Asus Zenbook 14 UX3480QA
Samsung PM9C1b MZVL8512HFLU-00BLL
3107 Points +49%
Durchschnittliche Kioxia THGJFJT2T85BAT01
  (2086 - 2761, n=2)
2424 Points +16%
Lenovo ThinkBook 14x, ILL, Ultra 5 226V
SAMSUNG MZAMX512HDLV-00BL2
2362 Points +13%
Microsoft Surface Laptop 13 2026
Kioxia THGJFJT2T85BAT01
2086 Points
Microsoft Surface Laptop 8 13.8
SK hynix PVC10 HFS512GEM4X182N
1492 Points -28%
Score Read
Durchschnitt der Klasse Subnotebook
  (340 - 4048, n=53, der letzten 2 Jahre)
1457 Points +88%
Dell XPS 13 DX13260
Kioxia BG7 512 GB
1224 Points +58%
Lenovo ThinkBook 14x, ILL, Ultra 5 226V
SAMSUNG MZAMX512HDLV-00BL2
1090 Points +41%
Asus Zenbook 14 UX3480QA
Samsung PM9C1b MZVL8512HFLU-00BLL
911 Points +18%
Durchschnittliche Kioxia THGJFJT2T85BAT01
  (773 - 955, n=2)
864 Points +12%
Microsoft Surface Laptop 13 2026
Kioxia THGJFJT2T85BAT01
773 Points
Microsoft Surface Laptop 8 13.8
SK hynix PVC10 HFS512GEM4X182N
515 Points -33%
Score Write
Durchschnitt der Klasse Subnotebook
  (616 - 4296, n=53, der letzten 2 Jahre)
2199 Points +144%
Asus Zenbook 14 UX3480QA
Samsung PM9C1b MZVL8512HFLU-00BLL
1816 Points +101%
Dell XPS 13 DX13260
Kioxia BG7 512 GB
1412 Points +57%
Durchschnittliche Kioxia THGJFJT2T85BAT01
  (902 - 1334, n=2)
1118 Points +24%
Microsoft Surface Laptop 13 2026
Kioxia THGJFJT2T85BAT01
902 Points
Lenovo ThinkBook 14x, ILL, Ultra 5 226V
SAMSUNG MZAMX512HDLV-00BL2
806 Points -11%
Microsoft Surface Laptop 8 13.8
SK hynix PVC10 HFS512GEM4X182N
773 Points -14%
Seq Read
Dell XPS 13 DX13260
Kioxia BG7 512 GB
5210.55 MB/s +70%
Durchschnitt der Klasse Subnotebook
  (2035 - 8075, n=53, der letzten 2 Jahre)
4747 MB/s +55%
Asus Zenbook 14 UX3480QA
Samsung PM9C1b MZVL8512HFLU-00BLL
4220 MB/s +37%
Lenovo ThinkBook 14x, ILL, Ultra 5 226V
SAMSUNG MZAMX512HDLV-00BL2
4214 MB/s +37%
Durchschnittliche Kioxia THGJFJT2T85BAT01
  (3071 - 3264, n=2)
3168 MB/s +3%
Microsoft Surface Laptop 13 2026
Kioxia THGJFJT2T85BAT01
3071 MB/s
Microsoft Surface Laptop 8 13.8
SK hynix PVC10 HFS512GEM4X182N
2945 MB/s -4%
Seq Write
Durchschnitt der Klasse Subnotebook
  (917 - 5481, n=53, der letzten 2 Jahre)
3095 MB/s +4%
Microsoft Surface Laptop 13 2026
Kioxia THGJFJT2T85BAT01
2985 MB/s
Durchschnittliche Kioxia THGJFJT2T85BAT01
  (2654 - 2985, n=2)
2820 MB/s -6%
Dell XPS 13 DX13260
Kioxia BG7 512 GB
2421.45 MB/s -19%
Lenovo ThinkBook 14x, ILL, Ultra 5 226V
SAMSUNG MZAMX512HDLV-00BL2
2198 MB/s -26%
Asus Zenbook 14 UX3480QA
Samsung PM9C1b MZVL8512HFLU-00BLL
2066 MB/s -31%
Microsoft Surface Laptop 8 13.8
SK hynix PVC10 HFS512GEM4X182N
1365 MB/s -54%
4K Read
Asus Zenbook 14 UX3480QA
Samsung PM9C1b MZVL8512HFLU-00BLL
65.8 MB/s +13%
Durchschnitt der Klasse Subnotebook
  (34.3 - 101.8, n=53, der letzten 2 Jahre)
61.2 MB/s +5%
Microsoft Surface Laptop 13 2026
Kioxia THGJFJT2T85BAT01
58.2 MB/s
Durchschnittliche Kioxia THGJFJT2T85BAT01
  (51.5 - 58.2, n=2)
54.9 MB/s -6%
Dell XPS 13 DX13260
Kioxia BG7 512 GB
53.66 MB/s -8%
Microsoft Surface Laptop 8 13.8
SK hynix PVC10 HFS512GEM4X182N
51.7 MB/s -11%
Lenovo ThinkBook 14x, ILL, Ultra 5 226V
SAMSUNG MZAMX512HDLV-00BL2
44.7 MB/s -23%
4K Write
Asus Zenbook 14 UX3480QA
Samsung PM9C1b MZVL8512HFLU-00BLL
185.3 MB/s +34%
Dell XPS 13 DX13260
Kioxia BG7 512 GB
175.33 MB/s +27%
Durchschnitt der Klasse Subnotebook
  (49 - 265, n=53, der letzten 2 Jahre)
165.4 MB/s +20%
Durchschnittliche Kioxia THGJFJT2T85BAT01
  (138.3 - 143.4, n=2)
140.9 MB/s +2%
Microsoft Surface Laptop 13 2026
Kioxia THGJFJT2T85BAT01
138.3 MB/s
Lenovo ThinkBook 14x, ILL, Ultra 5 226V
SAMSUNG MZAMX512HDLV-00BL2
131.9 MB/s -5%
Microsoft Surface Laptop 8 13.8
SK hynix PVC10 HFS512GEM4X182N
101.5 MB/s -27%
4K-64 Read
Durchschnitt der Klasse Subnotebook
  (102.1 - 3417, n=53, der letzten 2 Jahre)
923 MB/s +126%
Dell XPS 13 DX13260
Kioxia BG7 512 GB
649.63 MB/s +59%
Lenovo ThinkBook 14x, ILL, Ultra 5 226V
SAMSUNG MZAMX512HDLV-00BL2
624 MB/s +53%
Durchschnittliche Kioxia THGJFJT2T85BAT01
  (408 - 577, n=2)
493 MB/s +21%
Asus Zenbook 14 UX3480QA
Samsung PM9C1b MZVL8512HFLU-00BLL
423 MB/s +4%
Microsoft Surface Laptop 13 2026
Kioxia THGJFJT2T85BAT01
408 MB/s
Microsoft Surface Laptop 8 13.8
SK hynix PVC10 HFS512GEM4X182N
168.4 MB/s -59%
4K-64 Write
Durchschnitt der Klasse Subnotebook
  (356 - 3569, n=53, der letzten 2 Jahre)
1724 MB/s +271%
Asus Zenbook 14 UX3480QA
Samsung PM9C1b MZVL8512HFLU-00BLL
1424 MB/s +206%
Dell XPS 13 DX13260
Kioxia BG7 512 GB
994.65 MB/s +114%
Durchschnittliche Kioxia THGJFJT2T85BAT01
  (465 - 925, n=2)
695 MB/s +49%
Microsoft Surface Laptop 8 13.8
SK hynix PVC10 HFS512GEM4X182N
535 MB/s +15%
Microsoft Surface Laptop 13 2026
Kioxia THGJFJT2T85BAT01
465 MB/s
Lenovo ThinkBook 14x, ILL, Ultra 5 226V
SAMSUNG MZAMX512HDLV-00BL2
454 MB/s -2%
Access Time Read
Lenovo ThinkBook 14x, ILL, Ultra 5 226V
SAMSUNG MZAMX512HDLV-00BL2
0.283 ms * -515%
Dell XPS 13 DX13260
Kioxia BG7 512 GB
0.125 ms * -172%
Microsoft Surface Laptop 8 13.8
SK hynix PVC10 HFS512GEM4X182N
0.092 ms * -100%
Durchschnitt der Klasse Subnotebook
  (0.024 - 0.283, n=53, der letzten 2 Jahre)
0.07462 ms * -62%
Microsoft Surface Laptop 13 2026
Kioxia THGJFJT2T85BAT01
0.046 ms *
Durchschnittliche Kioxia THGJFJT2T85BAT01
  (0.041 - 0.046, n=2)
0.0435 ms * +5%
Asus Zenbook 14 UX3480QA
Samsung PM9C1b MZVL8512HFLU-00BLL
0.042 ms * +9%
Access Time Write
Dell XPS 13 DX13260
Kioxia BG7 512 GB
0.065 ms * -141%
Durchschnitt der Klasse Subnotebook
  (0.017 - 0.281, n=53, der letzten 2 Jahre)
0.05345 ms * -98%
Microsoft Surface Laptop 8 13.8
SK hynix PVC10 HFS512GEM4X182N
0.04 ms * -48%
Lenovo ThinkBook 14x, ILL, Ultra 5 226V
SAMSUNG MZAMX512HDLV-00BL2
0.03 ms * -11%
Durchschnittliche Kioxia THGJFJT2T85BAT01
  (0.027 - 0.028, n=2)
0.0275 ms * -2%
Microsoft Surface Laptop 13 2026
Kioxia THGJFJT2T85BAT01
0.027 ms *
Asus Zenbook 14 UX3480QA
Samsung PM9C1b MZVL8512HFLU-00BLL
0.02 ms * +26%

* ... kleinere Werte sind besser

Drosselung des Massenspeichers: DiskSpd-Lese-Dauertest, Warteschlangentiefe 8

0145290435580725870101511601305145015951740188520302175232024652610275529003045319033353480362537703915406042054350449546404785493050755220536555105655580059456090623563806525667068156960Tooltip
Microsoft Surface Laptop 13 2026 Kioxia THGJFJT2T85BAT01; diskspd 2.0.17 f: Ø3808 (3317.14-3830.76) MB/s
Microsoft Surface Laptop 8 13.8 SK hynix PVC10 HFS512GEM4X182N; diskspd 2.0.17 f: Ø6502 (5801.77-6529.75) MB/s
Dell XPS 13 DX13260 Kioxia BG7 512 GB; diskspd 2.0.17 f: Ø6973 (5927.07-7011.62) MB/s
Asus Zenbook 14 UX3480QA Samsung PM9C1b MZVL8512HFLU-00BLL; diskspd 2.0.17 f: Ø4555 (1346.37-4615.2) MB/s
Lenovo ThinkBook 14x, ILL, Ultra 5 226V SAMSUNG MZAMX512HDLV-00BL2; diskspd 2.0.17 f: Ø3975 (3207.38-4028.75) MB/s

Grafik- und Spieleleistung

Die GPU-Leistung der Adreno X2-45 (maximaler Takt 900 MHz) liegt etwa 20–40 % über der des alten Surface Laptop 13. Zum Surface Laptop 13.8 mit der schnelleren, mit 1350 MHz getakteten Adreno X2-45 besteht jedoch weiterhin ein spürbarer Abstand. Für alltägliche Aufgaben einschließlich der Wiedergabe hochauflösender Videos reicht die Leistung selbstverständlich aus, die Spieletauglichkeit ist allerdings stark eingeschränkt.

3DMark 11 - 1280x720 Performance GPU
Lenovo ThinkBook 14x, ILL, Ultra 5 226V
Intel Arc Graphics 130V, Intel Core Ultra 5 226V
10018 Points +97%
Durchschnitt der Klasse Subnotebook
  (2165 - 18489, n=52, der letzten 2 Jahre)
9353 Points +84%
Microsoft Surface Laptop 8 13.8
Qualcomm SD X2 Adreno X2-45, Qualcomm Snapdragon X2 Plus X2P-64-100
7647 Points +50%
Durchschnittliche Qualcomm SD X2 Adreno X2-45
  (5097 - 7647, n=2)
6372 Points +25%
Microsoft Surface Laptop 13 2026
Qualcomm SD X2 Adreno X2-45, Qualcomm Snapdragon X2 Plus X2P-42-100
5097 Points
Asus Zenbook 14 UX3480QA
Qualcomm SD X Adreno X1-45 1.7 TFLOPS, Qualcomm Snapdragon X X1-26-100
4160 Points -18%
Microsoft Surface Laptop 13
Qualcomm SD X Adreno X1-45 1.7 TFLOPS, Qualcomm Snapdragon X Plus X1P-42-100
4152 Points -19%
Dell XPS 13 DX13260
Intel Graphics 2 Xe3 Wildcat Lake iGPU, Intel Core 5 320
3822 Points -25%
3DMark
Steel Nomad Score
Apple MacBook Air 13 M5
Apple M5 8-Core GPU, Apple M5 10-Core
941 Points +129%
Lenovo ThinkBook 14x, ILL, Ultra 5 226V
Intel Arc Graphics 130V, Intel Core Ultra 5 226V
655 Points +59%
Lenovo ThinkBook 14x, ILL, Ultra 5 226V
Intel Arc Graphics 130V, Intel Core Ultra 5 226V
447 Points +9%
Durchschnitt der Klasse Subnotebook
  (184 - 3605, n=31, der letzten 2 Jahre)
645 Points +57%
Microsoft Surface Laptop 8 13.8
Qualcomm SD X2 Adreno X2-45, Qualcomm Snapdragon X2 Plus X2P-64-100
622 Points +51%
Durchschnittliche Qualcomm SD X2 Adreno X2-45
  (411 - 622, n=2)
517 Points +26%
Microsoft Surface Laptop 13 2026
Qualcomm SD X2 Adreno X2-45, Qualcomm Snapdragon X2 Plus X2P-42-100
411 Points
Microsoft Surface Laptop 13
Qualcomm SD X Adreno X1-45 1.7 TFLOPS, Qualcomm Snapdragon X Plus X1P-42-100
228 Points -45%
Steel Nomad Light Score
Apple MacBook Air 13 M5
Apple M5 8-Core GPU, Apple M5 10-Core
4405 Points +144%
Microsoft Surface Laptop 8 13.8
Qualcomm SD X2 Adreno X2-45, Qualcomm Snapdragon X2 Plus X2P-64-100
2935 Points +63%
Durchschnitt der Klasse Subnotebook
  (587 - 5084, n=25, der letzten 2 Jahre)
2530 Points +40%
Durchschnittliche Qualcomm SD X2 Adreno X2-45
  (1806 - 2935, n=2)
2371 Points +31%
Microsoft Surface Laptop 13 2026
Qualcomm SD X2 Adreno X2-45, Qualcomm Snapdragon X2 Plus X2P-42-100
1806 Points
Asus Zenbook 14 UX3480QA
Qualcomm SD X Adreno X1-45 1.7 TFLOPS, Qualcomm Snapdragon X X1-26-100
1140 Points -37%
Microsoft Surface Laptop 13
Qualcomm SD X Adreno X1-45 1.7 TFLOPS, Qualcomm Snapdragon X Plus X1P-42-100
1096 Points -39%
Wild Life Extreme
Apple MacBook Air 13 M5
Apple M5 8-Core GPU, Apple M5 10-Core
9617 Points +139%
Microsoft Surface Laptop 8 13.8
Qualcomm SD X2 Adreno X2-45, Qualcomm Snapdragon X2 Plus X2P-64-100
5776 Points +44%
Durchschnitt der Klasse Subnotebook
  (1308 - 11498, n=31, der letzten 2 Jahre)
5757 Points +43%
Durchschnittliche Qualcomm SD X2 Adreno X2-45
  (4019 - 5776, n=2)
4898 Points +22%
Microsoft Surface Laptop 13 2026
Qualcomm SD X2 Adreno X2-45, Qualcomm Snapdragon X2 Plus X2P-42-100
4019 Points
Microsoft Surface Laptop 13
Qualcomm SD X Adreno X1-45 1.7 TFLOPS, Qualcomm Snapdragon X Plus X1P-42-100
3274 Points -19%
Asus Zenbook 14 UX3480QA
Qualcomm SD X Adreno X1-45 1.7 TFLOPS, Qualcomm Snapdragon X X1-26-100
3267 Points -19%
1920x1080 Fire Strike Graphics
Lenovo ThinkBook 14x, ILL, Ultra 5 226V
Intel Arc Graphics 130V, Intel Core Ultra 5 226V
8551 Points +93%
Durchschnitt der Klasse Subnotebook
  (1998 - 32931, n=54, der letzten 2 Jahre)
8015 Points +81%
Microsoft Surface Laptop 8 13.8
Qualcomm SD X2 Adreno X2-45, Qualcomm Snapdragon X2 Plus X2P-64-100
6626 Points +50%
Durchschnittliche Qualcomm SD X2 Adreno X2-45
  (4430 - 6626, n=2)
5528 Points +25%
Microsoft Surface Laptop 13 2026
Qualcomm SD X2 Adreno X2-45, Qualcomm Snapdragon X2 Plus X2P-42-100
4430 Points
Asus Zenbook 14 UX3480QA
Qualcomm SD X Adreno X1-45 1.7 TFLOPS, Qualcomm Snapdragon X X1-26-100
3755 Points -15%
Microsoft Surface Laptop 13
Qualcomm SD X Adreno X1-45 1.7 TFLOPS, Qualcomm Snapdragon X Plus X1P-42-100
3734 Points -16%
Dell XPS 13 DX13260
Intel Graphics 2 Xe3 Wildcat Lake iGPU, Intel Core 5 320
3485 Points -21%
2560x1440 Time Spy Graphics
Lenovo ThinkBook 14x, ILL, Ultra 5 226V
Intel Arc Graphics 130V, Intel Core Ultra 5 226V
3470 Points +153%
Durchschnitt der Klasse Subnotebook
  (753 - 14477, n=52, der letzten 2 Jahre)
3178 Points +131%
Microsoft Surface Laptop 8 13.8
Qualcomm SD X2 Adreno X2-45, Qualcomm Snapdragon X2 Plus X2P-64-100
2262 Points +65%
Durchschnittliche Qualcomm SD X2 Adreno X2-45
  (1374 - 2262, n=2)
1818 Points +32%
Microsoft Surface Laptop 13 2026
Qualcomm SD X2 Adreno X2-45, Qualcomm Snapdragon X2 Plus X2P-42-100
1374 Points
Dell XPS 13 DX13260
Intel Graphics 2 Xe3 Wildcat Lake iGPU, Intel Core 5 320
1343 Points -2%
Microsoft Surface Laptop 13
Qualcomm SD X Adreno X1-45 1.7 TFLOPS, Qualcomm Snapdragon X Plus X1P-42-100
935 Points -32%
Asus Zenbook 14 UX3480QA
Qualcomm SD X Adreno X1-45 1.7 TFLOPS, Qualcomm Snapdragon X X1-26-100
924 Points -33%
3DMark 11 Performance
5602 Punkte
3DMark Fire Strike Score
4278 Punkte
3DMark Time Spy Score
1557 Punkte
3DMark Steel Nomad Score
411 Punkte
3DMark Steel Nomad Light Score
1806 Punkte
Hilfe
Blender / v3.3 Classroom METAL
Durchschnitt der Klasse Subnotebook
  (76.3 - 227, n=5, der letzten 2 Jahre)
121.9 Seconds *
Apple MacBook Air 13 M5
Apple M5 8-Core GPU, Apple M5 10-Core
93 Seconds *
Blender / v3.3 Classroom CPU
Microsoft Surface Laptop 13 2026
Qualcomm SD X2 Adreno X2-45, Qualcomm Snapdragon X2 Plus X2P-42-100
910 Seconds *
Microsoft Surface Laptop 13
Qualcomm SD X Adreno X1-45 1.7 TFLOPS, Qualcomm Snapdragon X Plus X1P-42-100
861 Seconds * +5%
Asus Zenbook 14 UX3480QA
Qualcomm SD X Adreno X1-45 1.7 TFLOPS, Qualcomm Snapdragon X X1-26-100
803 Seconds * +12%
Durchschnittliche Qualcomm SD X2 Adreno X2-45
  (693 - 910, n=2)
802 Seconds * +12%
Dell XPS 13 DX13260
Intel Graphics 2 Xe3 Wildcat Lake iGPU, Intel Core 5 320
799 Seconds * +12%
Lenovo ThinkBook 14x, ILL, Ultra 5 226V
Intel Arc Graphics 130V, Intel Core Ultra 5 226V
735 Seconds * +19%
Microsoft Surface Laptop 8 13.8
Qualcomm SD X2 Adreno X2-45, Qualcomm Snapdragon X2 Plus X2P-64-100
693 Seconds * +24%
Durchschnitt der Klasse Subnotebook
  (280 - 1117, n=59, der letzten 2 Jahre)
536 Seconds * +41%
Apple MacBook Air 13 M5
Apple M5 8-Core GPU, Apple M5 10-Core
359 Seconds * +61%

* ... kleinere Werte sind besser

Performance Rating - Percent
Durchschnitt der Klasse Subnotebook
 
95.2 pt
Apple MacBook Air 13 M5 -5!
Apple M5 10-Core, Apple M5 8-Core GPU
94.3 pt
Microsoft Surface Laptop 8 13.8
Qualcomm Snapdragon X2 Plus X2P-64-100, Qualcomm SD X2 Adreno X2-45
88.1 pt
Lenovo ThinkBook 14x, ILL, Ultra 5 226V
Intel Core Ultra 5 226V, Intel Arc Graphics 130V
78.4 pt
Microsoft Surface Laptop 13 2026
Qualcomm Snapdragon X2 Plus X2P-42-100, Qualcomm SD X2 Adreno X2-45
66.3 pt
Asus Zenbook 14 UX3480QA -1!
Qualcomm Snapdragon X X1-26-100, Qualcomm SD X Adreno X1-45 1.7 TFLOPS
54.2 pt
Dell XPS 13 DX13260 -2!
Intel Core 5 320, Intel Graphics 2 Xe3 Wildcat Lake iGPU
51.3 pt
Microsoft Surface Laptop 13 -3!
Qualcomm Snapdragon X Plus X1P-42-100, Qualcomm SD X Adreno X1-45 1.7 TFLOPS
47.5 pt
Cyberpunk 2077 - 1920x1080 Ultra Preset (FSR off)
Lenovo ThinkBook 14x, ILL, Ultra 5 226V
Intel Core Ultra 5 226V, Intel Arc Graphics 130V
22 (18.3min, 17.9P1) fps +80%
Durchschnitt der Klasse Subnotebook
  (5.6 - 78.6, n=57, der letzten 2 Jahre)
21.4 fps +75%
Apple MacBook Air 13 M5
Apple M5 10-Core, Apple M5 8-Core GPU
19.5 fps +60%
Microsoft Surface Laptop 8 13.8
Qualcomm Snapdragon X2 Plus X2P-64-100, Qualcomm SD X2 Adreno X2-45
19.1 (15.6min) fps +57%
Microsoft Surface Laptop 13 2026
Qualcomm Snapdragon X2 Plus X2P-42-100, Qualcomm SD X2 Adreno X2-45
12.2 (10.2min) fps
Microsoft Surface Laptop 13
Qualcomm Snapdragon X Plus X1P-42-100, Qualcomm SD X Adreno X1-45 1.7 TFLOPS
8.55 (7.08min) fps -30%
Asus Zenbook 14 UX3480QA
Qualcomm Snapdragon X X1-26-100, Qualcomm SD X Adreno X1-45 1.7 TFLOPS
8.36 (6.94min) fps -31%
Baldur's Gate 3 - 1920x1080 Ultra Preset AA:T
Apple MacBook Air 13 M5
Apple M5 10-Core, Apple M5 8-Core GPU
28.5 fps +95%
Durchschnitt der Klasse Subnotebook
  (10.2 - 115.5, n=50, der letzten 2 Jahre)
25.3 fps +73%
Microsoft Surface Laptop 8 13.8
Qualcomm Snapdragon X2 Plus X2P-64-100, Qualcomm SD X2 Adreno X2-45
21.4 (19.1min, 19.1P0.1, 19.5P1) fps +47%
Lenovo ThinkBook 14x, ILL, Ultra 5 226V
Intel Core Ultra 5 226V, Intel Arc Graphics 130V
20.3 (15.8min, 15.9P0.1, 16.2P1) fps +39%
Microsoft Surface Laptop 13 2026
Qualcomm Snapdragon X2 Plus X2P-42-100, Qualcomm SD X2 Adreno X2-45
14.6 (12min, 12P0.1, 12P1) fps
Dell XPS 13 DX13260
Intel Core 5 320, Intel Graphics 2 Xe3 Wildcat Lake iGPU
10.9 (9.5min, 9.53P0.1, 9.91P1) fps -25%
GTA V - 1920x1080 Highest AA:4xMSAA + FX AF:16x
Microsoft Surface Laptop 8 13.8
Qualcomm Snapdragon X2 Plus X2P-64-100, Qualcomm SD X2 Adreno X2-45
23 (3.03min, 15.9P1) fps +28%
Durchschnitt der Klasse Subnotebook
  (4.73 - 43.7, n=51, der letzten 2 Jahre)
22.2 fps +23%
Microsoft Surface Laptop 13 2026
Qualcomm Snapdragon X2 Plus X2P-42-100, Qualcomm SD X2 Adreno X2-45
18 (3.93min, 12.3P1) fps
Microsoft Surface Laptop 13
Qualcomm Snapdragon X Plus X1P-42-100, Qualcomm SD X Adreno X1-45 1.7 TFLOPS
15.3 (2.76min, 10.3P1) fps -15%
Asus Zenbook 14 UX3480QA
Qualcomm Snapdragon X X1-26-100, Qualcomm SD X Adreno X1-45 1.7 TFLOPS
15.1 (3.35min, 10.5P1) fps -16%
Lenovo ThinkBook 14x, ILL, Ultra 5 226V
Intel Core Ultra 5 226V, Intel Arc Graphics 130V
14.8 (1.603min, 7.63P1) fps -18%
Dell XPS 13 DX13260
Intel Core 5 320, Intel Graphics 2 Xe3 Wildcat Lake iGPU
7.71 (1.599min, 5.99P1) fps -57%
Final Fantasy XV Benchmark - 1920x1080 High Quality
Lenovo ThinkBook 14x, ILL, Ultra 5 226V
Intel Core Ultra 5 226V, Intel Arc Graphics 130V
27.8 fps +101%
Durchschnitt der Klasse Subnotebook
  (8.37 - 54.5, n=49, der letzten 2 Jahre)
26.4 fps +91%
Microsoft Surface Laptop 8 13.8
Qualcomm Snapdragon X2 Plus X2P-64-100, Qualcomm SD X2 Adreno X2-45
21.1 fps +53%
Dell XPS 13 DX13260
Intel Core 5 320, Intel Graphics 2 Xe3 Wildcat Lake iGPU
18.7 fps +36%
Microsoft Surface Laptop 13 2026
Qualcomm Snapdragon X2 Plus X2P-42-100, Qualcomm SD X2 Adreno X2-45
13.8 fps
Asus Zenbook 14 UX3480QA
Qualcomm Snapdragon X X1-26-100, Qualcomm SD X Adreno X1-45 1.7 TFLOPS
11.9 fps -14%
Strange Brigade - 1920x1080 ultra AA:ultra AF:16
Durchschnitt der Klasse Subnotebook
  (19 - 101.3, n=42, der letzten 2 Jahre)
47.6 fps +77%
Microsoft Surface Laptop 8 13.8
Qualcomm Snapdragon X2 Plus X2P-64-100, Qualcomm SD X2 Adreno X2-45
44 (9.2min, 12.6P1) fps +64%
Lenovo ThinkBook 14x, ILL, Ultra 5 226V
Intel Core Ultra 5 226V, Intel Arc Graphics 130V
35.8 (10.5min, 16P1) fps +33%
Microsoft Surface Laptop 13 2026
Qualcomm Snapdragon X2 Plus X2P-42-100, Qualcomm SD X2 Adreno X2-45
26.9 (5.7min, 8.73P1) fps
Microsoft Surface Laptop 13
Qualcomm Snapdragon X Plus X1P-42-100, Qualcomm SD X Adreno X1-45 1.7 TFLOPS
20 fps -26%
Asus Zenbook 14 UX3480QA
Qualcomm Snapdragon X X1-26-100, Qualcomm SD X Adreno X1-45 1.7 TFLOPS
19.3 (5min, 5P1) fps -28%
Dota 2 Reborn - 1920x1080 ultra (3/3) best looking
Durchschnitt der Klasse Subnotebook
  (29.9 - 97, n=54, der letzten 2 Jahre)
70.2 fps +7%
Microsoft Surface Laptop 13 2026
Qualcomm Snapdragon X2 Plus X2P-42-100, Qualcomm SD X2 Adreno X2-45
65.9 (58.2min) fps
Microsoft Surface Laptop 8 13.8
Qualcomm Snapdragon X2 Plus X2P-64-100, Qualcomm SD X2 Adreno X2-45
60.7 (46.4min) fps -8%
Asus Zenbook 14 UX3480QA
Qualcomm Snapdragon X X1-26-100, Qualcomm SD X Adreno X1-45 1.7 TFLOPS
50.7 (44.6min) fps -23%
Dell XPS 13 DX13260
Intel Core 5 320, Intel Graphics 2 Xe3 Wildcat Lake iGPU
45.7 (22.3min) fps -31%
Lenovo ThinkBook 14x, ILL, Ultra 5 226V
Intel Core Ultra 5 226V, Intel Arc Graphics 130V
36.1 (35min) fps -45%
Microsoft Surface Laptop 13
Qualcomm Snapdragon X Plus X1P-42-100, Qualcomm SD X Adreno X1-45 1.7 TFLOPS
29.9 (27.7min) fps -55%
X-Plane 11.11 - 1920x1080 high (fps_test=3)
Microsoft Surface Laptop 8 13.8
Qualcomm Snapdragon X2 Plus X2P-64-100, Qualcomm SD X2 Adreno X2-45
38.8 fps +27%
Durchschnitt der Klasse Subnotebook
  (16.2 - 50.5, n=50, der letzten 2 Jahre)
34.6 fps +13%
Lenovo ThinkBook 14x, ILL, Ultra 5 226V
Intel Core Ultra 5 226V, Intel Arc Graphics 130V
33.5 fps +9%
Microsoft Surface Laptop 13 2026
Qualcomm Snapdragon X2 Plus X2P-42-100, Qualcomm SD X2 Adreno X2-45
30.6 fps
Asus Zenbook 14 UX3480QA
Qualcomm Snapdragon X X1-26-100, Qualcomm SD X Adreno X1-45 1.7 TFLOPS
25.6 fps -16%
Dell XPS 13 DX13260
Intel Core 5 320, Intel Graphics 2 Xe3 Wildcat Lake iGPU
20.4 fps -33%

Cyberpunk 2077: FPS-Diagramm mit Ultra-Einstellungen

05101520Tooltip
Microsoft Surface Laptop 13 2026 SD X2 Plus X2P-42-100, Adreno X2-45: Ø11.2 (10.7-11.7) fps
Microsoft Surface Laptop 8 13.8 SD X2 Plus X2P-64-100, Adreno X2-45: Ø18.2 (16.2-18.4) fps
Asus Zenbook 14 UX3480QA SD X1-26-100, Adreno X1-45 1.7 TFLOPS: Ø7.28 (6.94-7.44) fps
Lenovo ThinkBook 14x, ILL, Ultra 5 226V Core Ultra 5 226V, Arc 130V: Ø18.8 (15.8-20.2) fps
min.mittelhochmax.
GTA V (2015) 111.6 101.4 43.1 18
Dota 2 Reborn (2015) 110.5 91.1 74.5 65.9
Final Fantasy XV Benchmark (2018) 47.3 24.6 13.8
X-Plane 11.11 (2018) 40.3 35 30.6
Strange Brigade (2018) 111.4 42.3 33 26.9
Baldur's Gate 3 (2023) 21.2 17 15 14.6
Cyberpunk 2077 (2023) 21.8 16.8 14.3 12.2

Emissionen und Energieverbrauch

Geräuschemissionen

Der Surface Laptop 13 besitzt zwar einen Lüfter, doch dieser ist praktisch nie zu hören, solange man die CPU nicht länger als ein paar Minuten stark belastet. Bei alltäglichen Aufgaben und sogar bei den vielen unserer Benchmarks im Modus Beste Leistung war der Lüfter überhaupt nicht hörbar. Das höchste von uns gemessene Lüftergeräusch lag im Stresstest bei 29 dB(A), beim Spielen waren es lediglich 27 dB(A). Andere elektronische Geräusche traten nicht auf.

Lautstärkediagramm

Idle
23.8 / 23.8 / 23.8 dB(A)
Last
23.8 / 29.6 dB(A)
  red to green bar
 
 
30 dB
leise
40 dB(A)
deutlich hörbar
50 dB(A)
störend
 
min: dark, med: mid, max: light   Earthworks M23R, Arta (aus 15 cm gemessen)   Umgebungsgeräusche: 23.8 dB(A)
dB(A) 0102030405060708090Deep BassMiddle BassHigh BassLower RangeMidsHigher MidsLower HighsMid HighsUpper HighsSuper Highs2040.141.840.82531.930.731.83132.227.528.94030.830.331.75027.725.927.36326.22727.18020.421.422.810020.218.821.112518.318.518.416018.71618.820020.118.918.225023.320.721.831517.414.81840016.212.317.150017.49.92063016.41220.780014.69.615.9100013.810.216.7125014.59.618.3160016.49.919.1200016.51019.2250015.110.919.6315014.611.318400013.411.414.7500013.211.915.4630013.113.113.8800012.51212.41000012.712.112.91250013.512.513.91600013.412.314.2SPL27.223.829.6N0.90.51.2median 15.1median 12median 18Delta2.52.82.3hearing rangehide median Fan NoiseMicrosoft Surface Laptop 13 2026
Microsoft Surface Laptop 13 2026
SD X2 Plus X2P-42-100, Adreno X2-45
Microsoft Surface Laptop 8 13.8
SD X2 Plus X2P-64-100, Adreno X2-45
Dell XPS 13 DX13260
Core 5 320, Intel Graphics 2 Xe3 WCL
Apple MacBook Air 13 M5
M5 10-Core, M5 8-Core GPU
Asus Zenbook 14 UX3480QA
SD X1-26-100, Adreno X1-45 1.7 TFLOPS
Lenovo ThinkBook 14x, ILL, Ultra 5 226V
Core Ultra 5 226V, Arc 130V
Geräuschentwicklung
-15%
-11%
-14%
-26%
aus / Umgebung * (dB)
23.8
25.1
-5%
23.3
2%
24.6
-3%
24.9
-5%
Idle min * (dB)
23.8
25.1
-5%
23.3
2%
24.6
-3%
24.9
-5%
Idle avg * (dB)
23.8
25.1
-5%
23.3
2%
24.6
-3%
24.9
-5%
Idle max * (dB)
23.8
25.1
-5%
23.3
2%
24.6
-3%
25
-5%
Last avg * (dB)
23.8
25.1
-5%
27.7
-16%
26.1
-10%
35.4
-49%
Cyberpunk 2077 ultra * (dB)
27.6
37.4
-36%
35.6
-29%
32.5
-18%
44.9
-63%
Last max * (dB)
29.6
42.4
-43%
40.7
-38%
47.4
-60%
44.9
-52%
Witcher 3 ultra * (dB)
35.2

* ... kleinere Werte sind besser

Temperatur

Unter maximaler Last werden die Oberflächen spürbar warm, im Alltag sind die Temperaturen jedoch völlig unproblematisch. Im Stresstest beginnt der SoC mit 32 Watt, fällt aber schnell auf 21 Watt ab und pendelt sich schließlich bei nur 17 Watt ein.

CPU-/iGPU-Informationen im Stresstest
Max. Last
39.2 °C39.9 °C39.8 °C
34.1 °C39.2 °C39.1 °C
32.6 °C32.2 °C36.3 °C
Maximal: 39.9 °C
Durchschnitt: 36.9 °C
46.6 °C46.3 °C45.7 °C
45.7 °C44.7 °C42.4 °C
39.7 °C39.2 °C37.9 °C
Maximal: 46.6 °C
Durchschnitt: 43.1 °C
Raumtemperatur 21.6 °C | Fluke t3000FC (calibrated), Voltcraft IR-900
(±) Die Durchschnittstemperatur auf der Oberseite unter extremer Last ist 36.9 °C. Im Vergleich erhitzte sich der Durchschnitt der Geräteklasse Subnotebook auf 30.8 °C.
(+) Die maximale Temperatur auf der Oberseite ist 39.9 °C. Im Vergleich liegt der Klassendurchschnitt bei 35.9 °C (von 21.4 bis 59 °C für die Klasse Subnotebook).
(-) Auf der Unterseite messen wir eine maximalen Wert von 46.6 °C (im Vergleich zum Durchschnitt von 39.2 °C).
(+) Ohne Last messen wir eine durchschnittliche Temperatur von 23.2 °C auf der Oberseite. Der Klassendurchschnitt erreicht 30.8 °C.
(±) 3: The average temperature for the upper side is 34.5 °C / 94 F, compared to the average of 30.8 °C / 87 F for the class Subnotebook.
(±) Die Handballen und der Touchpad-Bereich können sehr heiß werden mit maximal 36.3 °C.
(-) Die durchschnittliche Handballen-Temperatur anderer getesteter Geräte war 28.2 °C (-8.1 °C).
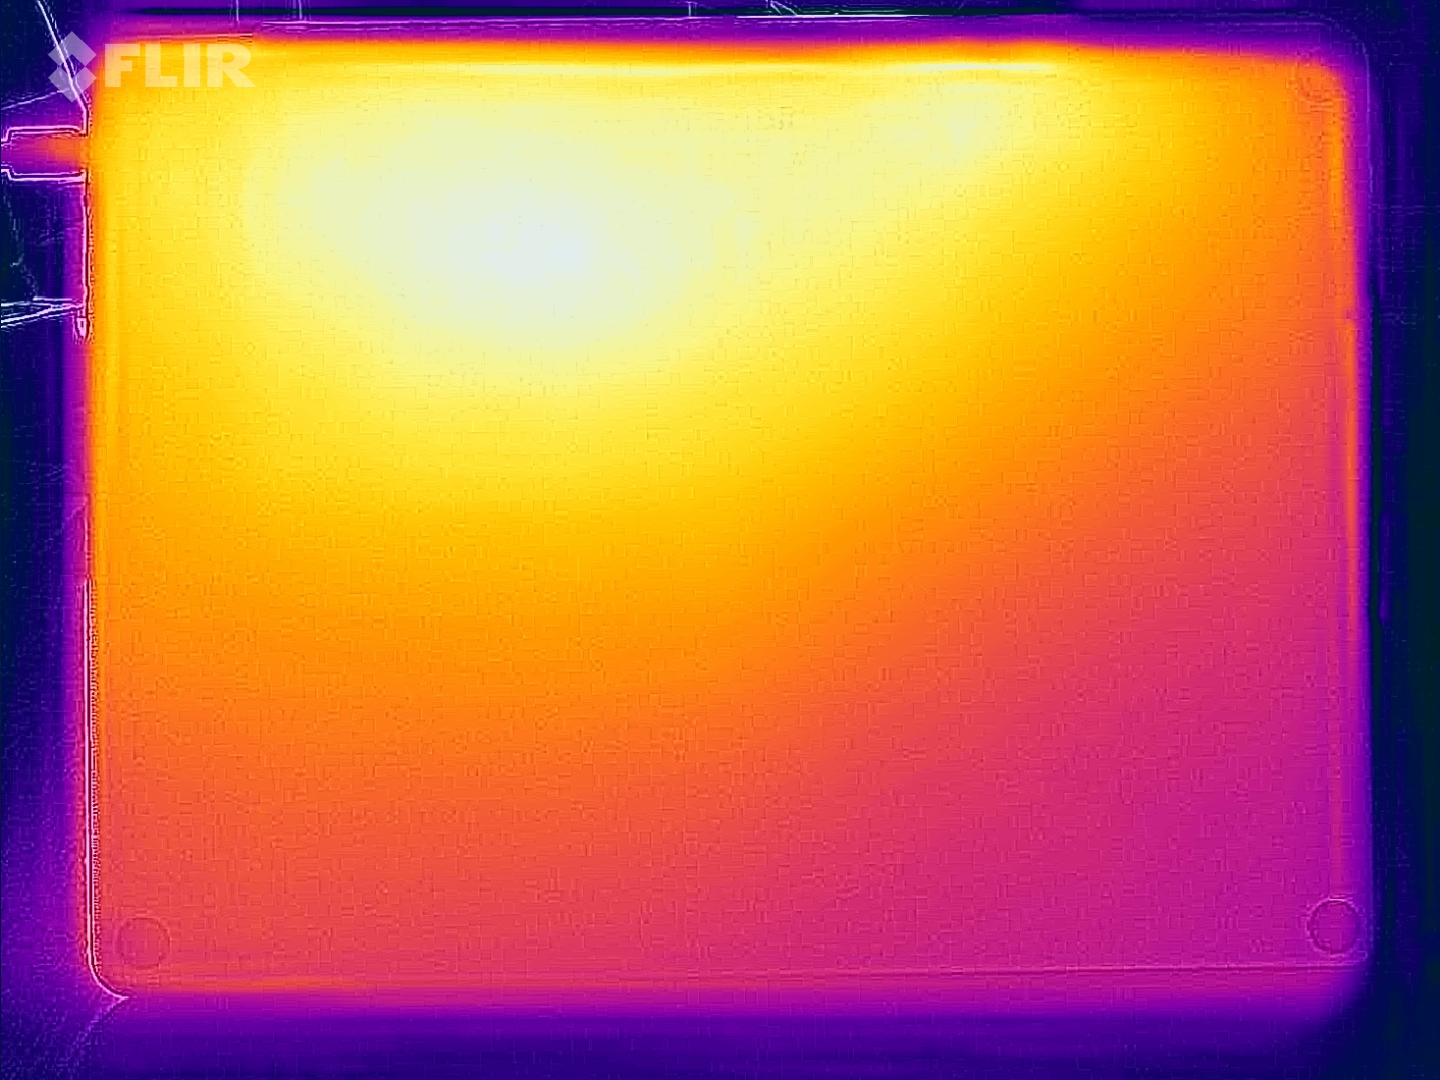
Oberflächentemperaturen Stresstest (Oberseite)
Oberflächentemperaturen Stresstest (Unterseite)
Microsoft Surface Laptop 13 2026
SD X2 Plus X2P-42-100, Adreno X2-45
Microsoft Surface Laptop 8 13.8
SD X2 Plus X2P-64-100, Adreno X2-45
Dell XPS 13 DX13260
Core 5 320, Intel Graphics 2 Xe3 WCL
Apple MacBook Air 13 M5
M5 10-Core, M5 8-Core GPU
Asus Zenbook 14 UX3480QA
SD X1-26-100, Adreno X1-45 1.7 TFLOPS
Lenovo ThinkBook 14x, ILL, Ultra 5 226V
Core Ultra 5 226V, Arc 130V
Hitze
-5%
0%
-0%
-6%
-14%
Last oben max * (°C)
39.9
44.4
-11%
39
2%
44.1
-11%
41.6
-4%
39.4
1%
Last unten max * (°C)
46.6
42.5
9%
38.2
18%
42.4
9%
43.8
6%
39.1
16%
Idle oben max * (°C)
23.5
25.9
-10%
26
-11%
23.7
-1%
27
-15%
32.3
-37%
Idle unten max * (°C)
24.2
26
-7%
26.2
-8%
23.8
2%
27.1
-12%
32.8
-36%

* ... kleinere Werte sind besser

Lautsprecher

Das Soundsystem ist ordentlich, es fehlt ihm aber etwas an Druck. Zudem klingt es nicht ganz so gut wie beim größeren Surface Laptop 13.8 oder beim MacBook Air 13.

dB(A) 0102030405060708090Deep BassMiddle BassHigh BassLower RangeMidsHigher MidsLower HighsMid HighsUpper HighsSuper Highs2041.8422530.728.43127.528.14030.329.45025.926.26327278021.424.210018.835.112518.542.61601648.220018.957.425020.759.231514.864.740012.364.85009.966.96301269.78009.670.9100010.271.812509.67416009.971.620001072.3250010.971.2315011.369.1400011.469.3500011.964.9630013.166.580001266.11000012.165.91250012.562.21600012.356.4SPL23.882.1N0.554.4median 12median 66.1Delta2.86.643.244.334.634.732.833.732.135.133.336.329.833.926.43226.941.119.548.223.553.523.261.124.263.616.767.813.767.511.570.611.572.310.56910.174.710.174.710.67410.869.611.871.612.172.61270.112.567.912.767.212.666.212.563.515.85813.355.325.183.30.759.1median 12.5median 67.83.65.639.839.22929.924.222.721.424.125.131.723.529.724.749.62354.918.955.115.458.314.462.513.666.214.470.712.177.611.380.411.276.511.17510.979.71076.910.373.710.368.810.673.111.370.311.367.311.767.411.765.811.766.111.866.51265.211.157.723.585.90.568.4median 11.7median 68.41.84.744.34834.937.435.236.833.54027.336.934.733.125.132.72243.518.251.918.153.520.458.122.260.71765.314.565.213.364.413.36612.263.81264.611.767.411.769.911.570.41268.512.36812.370.112.771.612.774.512.872.612.972.512.873.212.759.425.282.10.754.6median 12.8median 6625.442.140.832.935.526.832.13032.331.131.733.630.425.937.422.444.618.348.817.750.819.258.524.760.117.861.515.662.513.862.612.263.110.263.710.661.710.455.110.365.810.768.611.171.210.963.711.370.711.669.411.864.811.768.511.766.41266.311.257.224.679.20.645.3median 11.7median 63.13.34.437.437.431.638.831.945.625.329.230.627.425.532.410.825.313.130.511.734.912.640.21344.41248.29.954.39.259.310.763.99.666.29.269.810.770.110.467.911.168.412.467.912.670.113.767.71465.314.260.914.55914.758.414.958.114.755.214.647.424.978.90.642.1median 12.6median 59.329.9hearing rangehide median Pink NoiseMicrosoft Surface Laptop 13 2026Microsoft Surface Laptop 8 13.8Dell XPS 13 DX13260Apple MacBook Air 13 M5Asus Zenbook 14 UX3480QALenovo ThinkBook 14x, ILL, Ultra 5 226V
Frequenzdiagramm (für Vergleiche die Checkboxen oben an-/abwählen)
Microsoft Surface Laptop 13 2026 Audio Analyse

(+) | Die Lautsprecher können relativ laut spielen (82.1 dB)
Bass 100 - 315 Hz
(±) | abgesenkter Bass - 14.9% geringer als der Median
(±) | durchschnittlich lineare Bass-Wiedergabe (12.5% Delta zum Vorgänger)
Mitteltöne 400 - 2000 Hz
(+) | ausgeglichene Mitten, vom Median nur 4.5% abweichend
(+) | lineare Mitten (2.9% Delta zum Vorgänger)
Hochtöne 2 - 16 kHz
(+) | ausgeglichene Hochtöne, vom Median nur 1.9% abweichend
(+) | sehr lineare Hochtöne (2.6% Delta zum Vorgänger)
Gesamt im hörbaren Bereich 100 - 16.000 Hz
(+) | hörbarer Bereich ist sehr linear (13.3% Abstand zum Median
Im Vergleich zu allen Geräten derselben Klasse
» 23% aller getesteten Geräte dieser Klasse waren besser, 4% vergleichbar, 72% schlechter
» Das beste Gerät hat einen Delta-Wert von 5%, durchschnittlich ist 18%, das schlechteste Gerät hat 53%
Im Vergleich zu allen Geräten im Test
» 14% aller getesteten Geräte waren besser, 3% vergleichbar, 83% schlechter
» Das beste Gerät hat einen Delta-Wert von 4%, durchschnittlich ist 23%, das schlechteste Gerät hat 136%

Microsoft Surface Laptop 8 13.8 Audio Analyse

(+) | Die Lautsprecher können relativ laut spielen (83.3 dB)
Bass 100 - 315 Hz
(±) | abgesenkter Bass - 11.9% geringer als der Median
(±) | durchschnittlich lineare Bass-Wiedergabe (10.8% Delta zum Vorgänger)
Mitteltöne 400 - 2000 Hz
(+) | ausgeglichene Mitten, vom Median nur 3.9% abweichend
(+) | lineare Mitten (4.4% Delta zum Vorgänger)
Hochtöne 2 - 16 kHz
(+) | ausgeglichene Hochtöne, vom Median nur 2.5% abweichend
(+) | sehr lineare Hochtöne (3.1% Delta zum Vorgänger)
Gesamt im hörbaren Bereich 100 - 16.000 Hz
(+) | hörbarer Bereich ist sehr linear (12% Abstand zum Median
Im Vergleich zu allen Geräten derselben Klasse
» 15% aller getesteten Geräte dieser Klasse waren besser, 5% vergleichbar, 81% schlechter
» Das beste Gerät hat einen Delta-Wert von 5%, durchschnittlich ist 18%, das schlechteste Gerät hat 53%
Im Vergleich zu allen Geräten im Test
» 10% aller getesteten Geräte waren besser, 3% vergleichbar, 88% schlechter
» Das beste Gerät hat einen Delta-Wert von 4%, durchschnittlich ist 23%, das schlechteste Gerät hat 136%

Dell XPS 13 DX13260 Audio Analyse

(+) | Die Lautsprecher können relativ laut spielen (85.9 dB)
Bass 100 - 315 Hz
(±) | abgesenkter Bass - 7.9% geringer als der Median
(+) | lineare Bass-Wiedergabe (6.2% Delta zum Vorgänger)
Mitteltöne 400 - 2000 Hz
(±) | zu hohe Mitten, vom Median 7.6% abweichend
(+) | lineare Mitten (6.8% Delta zum Vorgänger)
Hochtöne 2 - 16 kHz
(+) | ausgeglichene Hochtöne, vom Median nur 2.2% abweichend
(+) | sehr lineare Hochtöne (3.1% Delta zum Vorgänger)
Gesamt im hörbaren Bereich 100 - 16.000 Hz
(+) | hörbarer Bereich ist sehr linear (11% Abstand zum Median
Im Vergleich zu allen Geräten derselben Klasse
» 10% aller getesteten Geräte dieser Klasse waren besser, 4% vergleichbar, 86% schlechter
» Das beste Gerät hat einen Delta-Wert von 5%, durchschnittlich ist 18%, das schlechteste Gerät hat 53%
Im Vergleich zu allen Geräten im Test
» 7% aller getesteten Geräte waren besser, 2% vergleichbar, 91% schlechter
» Das beste Gerät hat einen Delta-Wert von 4%, durchschnittlich ist 23%, das schlechteste Gerät hat 136%

Apple MacBook Air 13 M5 Audio Analyse

(+) | Die Lautsprecher können relativ laut spielen (82.1 dB)
Bass 100 - 315 Hz
(±) | abgesenkter Bass - 10.5% geringer als der Median
(±) | durchschnittlich lineare Bass-Wiedergabe (10.2% Delta zum Vorgänger)
Mitteltöne 400 - 2000 Hz
(+) | ausgeglichene Mitten, vom Median nur 2% abweichend
(+) | lineare Mitten (2.7% Delta zum Vorgänger)
Hochtöne 2 - 16 kHz
(±) | zu hohe Hochtöne, vom Median nur 5.1% abweichend
(+) | sehr lineare Hochtöne (3% Delta zum Vorgänger)
Gesamt im hörbaren Bereich 100 - 16.000 Hz
(+) | hörbarer Bereich ist sehr linear (11.7% Abstand zum Median
Im Vergleich zu allen Geräten derselben Klasse
» 14% aller getesteten Geräte dieser Klasse waren besser, 3% vergleichbar, 83% schlechter
» Das beste Gerät hat einen Delta-Wert von 5%, durchschnittlich ist 18%, das schlechteste Gerät hat 53%
Im Vergleich zu allen Geräten im Test
» 9% aller getesteten Geräte waren besser, 3% vergleichbar, 89% schlechter
» Das beste Gerät hat einen Delta-Wert von 4%, durchschnittlich ist 23%, das schlechteste Gerät hat 136%

Asus Zenbook 14 UX3480QA Audio Analyse

(±) | Mittelmäßig laut spielende Lautsprecher (79.2 dB)
Bass 100 - 315 Hz
(±) | abgesenkter Bass - 9% geringer als der Median
(±) | durchschnittlich lineare Bass-Wiedergabe (7.9% Delta zum Vorgänger)
Mitteltöne 400 - 2000 Hz
(+) | ausgeglichene Mitten, vom Median nur 2.4% abweichend
(+) | lineare Mitten (5.9% Delta zum Vorgänger)
Hochtöne 2 - 16 kHz
(+) | ausgeglichene Hochtöne, vom Median nur 4.8% abweichend
(±) | durchschnittlich lineare Hochtöne (8% Delta zum Vorgänger)
Gesamt im hörbaren Bereich 100 - 16.000 Hz
(+) | hörbarer Bereich ist sehr linear (11.7% Abstand zum Median
Im Vergleich zu allen Geräten derselben Klasse
» 14% aller getesteten Geräte dieser Klasse waren besser, 3% vergleichbar, 83% schlechter
» Das beste Gerät hat einen Delta-Wert von 5%, durchschnittlich ist 18%, das schlechteste Gerät hat 53%
Im Vergleich zu allen Geräten im Test
» 9% aller getesteten Geräte waren besser, 3% vergleichbar, 89% schlechter
» Das beste Gerät hat einen Delta-Wert von 4%, durchschnittlich ist 23%, das schlechteste Gerät hat 136%

Lenovo ThinkBook 14x, ILL, Ultra 5 226V Audio Analyse

(±) | Mittelmäßig laut spielende Lautsprecher (78.9 dB)
Bass 100 - 315 Hz
(-) | kaum Bass - 17.2% niedriger als der Median
(±) | durchschnittlich lineare Bass-Wiedergabe (10.4% Delta zum Vorgänger)
Mitteltöne 400 - 2000 Hz
(±) | zu hohe Mitten, vom Median 7.4% abweichend
(+) | lineare Mitten (5% Delta zum Vorgänger)
Hochtöne 2 - 16 kHz
(+) | ausgeglichene Hochtöne, vom Median nur 4.2% abweichend
(+) | sehr lineare Hochtöne (4.3% Delta zum Vorgänger)
Gesamt im hörbaren Bereich 100 - 16.000 Hz
(±) | hörbarer Bereich ist durchschnittlich linear (20.9% Abstand zum Median)
Im Vergleich zu allen Geräten derselben Klasse
» 69% aller getesteten Geräte dieser Klasse waren besser, 7% vergleichbar, 24% schlechter
» Das beste Gerät hat einen Delta-Wert von 5%, durchschnittlich ist 18%, das schlechteste Gerät hat 53%
Im Vergleich zu allen Geräten im Test
» 57% aller getesteten Geräte waren besser, 7% vergleichbar, 35% schlechter
» Das beste Gerät hat einen Delta-Wert von 4%, durchschnittlich ist 23%, das schlechteste Gerät hat 136%

Energieverbrauch und Akkulaufzeit

Der Surface Laptop 13 ist ein sehr effizientes Gerät, und der 50-Wh-Akku ermöglicht sehr lange Akkulaufzeiten. In unserem WLAN-Test haben wir bei 150 cd/m² fast 19 Stunden und bei voller Helligkeit immer noch mehr als 10,5 Stunden gemessen. Auf Grundlage unserer Verbrauchsmessungen empfehlen wir ein 65-Watt-Netzteil.

Stromverbrauch
Aus / Standbydarklight 0.15 / 0.35 Watt
Idledarkmidlight 2.1 / 6 / 6.6 Watt
Last midlight 14.7 / 54.8 Watt
 color bar
Legende: min: dark, med: mid, max: light        Metrahit Energy

Energieverbrauch Cyberpunk / Stresstest

05101520253035404550Tooltip
Microsoft Surface Laptop 13 2026; 1280x720 Prime95 28.10 and Furmark 1.25: Ø42.3 (30.4-54.8) Watt
Microsoft Surface Laptop 13 2026; Idle 150cd/m2: Ø3.74 (3.56-4.35) Watt
Microsoft Surface Laptop 13 2026; Cyberpunk 2077 FHD ultra no FSR 150cd: Ø21.9 (21-23.2) Watt

Energieverbrauch mit externem Monitor

051015202530354045Tooltip
Microsoft Surface Laptop 13 2026; Idle 1min (external Monitor): Ø4.13 (3.9-5.18) Watt
Microsoft Surface Laptop 13 2026; Cyberpunk 2077 FHD ultra no FSR (external Monitor): Ø22 (20.8-23.8) Watt
Microsoft Surface Laptop 13 2026; Cinebench 2024 Single Power (external Monitor): Ø13.7 (8.79-19.8) Watt
Microsoft Surface Laptop 13 2026; Cinebench 2024 Multi Power (external Monitor): Ø36.1 (25.8-47.2) Watt
Akkulaufzeit
WiFi Websurfing
18h 50min
WiFi Websurfing max. Brightness
10h 41min
Microsoft Surface Laptop 13 2026
SD X2 Plus X2P-42-100, Adreno X2-45, 50 Wh
Microsoft Surface Laptop 8 13.8
SD X2 Plus X2P-64-100, Adreno X2-45, 54 Wh
Dell XPS 13 DX13260
Core 5 320, Intel Graphics 2 Xe3 WCL, 52 Wh
Apple MacBook Air 13 M5
M5 10-Core, M5 8-Core GPU, 53.8 Wh
Asus Zenbook 14 UX3480QA
SD X1-26-100, Adreno X1-45 1.7 TFLOPS, 50 Wh
Lenovo ThinkBook 14x, ILL, Ultra 5 226V
Core Ultra 5 226V, Arc 130V, 65 Wh
Microsoft Surface Laptop 13
SD X Plus X1P-42-100, Adreno X1-45 1.7 TFLOPS, 50 Wh
Durchschnitt der Klasse Subnotebook
 
Battery Runtime
-9%
-2%
-26%
7%
-10%
-2%
-19%
WiFi Websurfing (h)
18.8
18.9
1%
18.4
-2%
16.2
-14%
20.2
7%
16.9
-10%
16.7
-11%
WiFi Websurfing max. Brightness (h)
10.7
8.7
-19%
6.7
-37%
11.3
6%
11.4
7%

Notebookcheck-Bewertung

Microsoft Surface Laptop 13 2026 - 28.10.2026 v8
Andreas Osthoff

Gehäuse
84 / 98 → 86%
Tastatur
85%
Pointing Device
89%
Konnektivität
62 / 74 → 83%
Gewicht
72 / 20-77 → 92%
Akkulaufzeit
92%
Display
79%
Leistung Spiele
32 / 75 → 43%
Leistung Anwendungen
81 / 92 → 88%
AI Performance
82%
Temperatur
91%
Lautstärke
98%
Audio
87 / 91 → 96%
Kamera
34 / 75 → 45%
Durchschnitt
73%
86%
Subnotebook - gewichteter Durchschnitt
Weitere Informationen über unsere Bewertung finden Sie hier.
CO2 Emissions
81.2%
Materials
50%
Packaging
100%
Power Use
91.3%
Repairability
50%
Software Updates
22.3%
Recycle Logo Total Sustainability Score: 65.8%

Mögliche Konkurrenten im Vergleich

Bild
Modell / Test
Preis ab
Gewicht
Dicke
Display
1.
86.3%
Microsoft Surface Laptop 13 2026
Qualcomm Snapdragon X2 Plus X2P-42-100 ⎘
Qualcomm SD X2 Adreno X2-45 ⎘
16 GB RAM, 512 GB UFS 4.x
Amazon: 1.439,00 €
Bestpreis 1389€ PC-KING
2. 1393.86€ Jacob Elektronik direkt
3. 1403€ HEINZSOFT
1.2 kg15.6 mm13.00"
1920x1280
178 PPI
IPS
2.
88.4%
Microsoft Surface Laptop 8 13.8
Qualcomm Snapdragon X2 Plus X2P-64-100 ⎘
Qualcomm SD X2 Adreno X2-45 ⎘
16 GB RAM, 512 GB SSD
Amazon: 1.553,84 €
Bestpreis 1469€ saturn
2. 1699€ Media Markt.at
3. 1699€ Mediamarkt.de
1.3 kg17.5 mm13.80"
2304x1536
201 PPI
IPS
3.
85.7%
Dell XPS 13 DX13260
Dell XPS 13 DX13260
Intel Core 5 320 ⎘
Intel Graphics 2 Xe3 Wildcat Lake iGPU ⎘
8 GB RAM, 512 GB SSD
Amazon: 3.599,00 €
Geizhals Suche
1.1 kg12.7 mm13.40"
2560x1600
225 PPI
IPS
4.
91.6%
Apple MacBook Air 13 M5
Apple M5 10-Core ⎘
Apple M5 8-Core GPU ⎘
16 GB RAM, 512 GB SSD
Amazon: 1.224,00 €
Bestpreis 1219.99€ Cosse
2. 1224€ Coolblue
3. 1224€ galaxus
1.2 kg11.3 mm13.60"
2560x1664
225 PPI
IPS
5.
85.6%
Asus Zenbook 14 UX3480QA
Qualcomm Snapdragon X X1-26-100 ⎘
Qualcomm SD X Adreno X1-45 1.7 TFLOPS ⎘
16 GB RAM, 512 GB SSD
Amazon:
1. 949,00 €
ASUS Zenbook 14 UX3480QA-SF0...
2. 949,00 €
ASUS Zenbook 14 UX3480QA-U10...
3. 1.006,99 €
ASUS Zenbook 14 UX3405CA Cop...
Listenpreis: 999€
1.1 kg16.9 mm14.00"
1920x1200
162 PPI
OLED
6.
84.8%
Lenovo ThinkBook 14x, ILL, Ultra 5 226V
Intel Core Ultra 5 226V ⎘
Intel Arc Graphics 130V ⎘
16 GB RAM, 512 GB SSD
Amazon: 912,02 €
Bestpreis 824.81€ Klarsicht IT
2. 825€ MetaComp
3. 828€ galaxus
1 kg15.6 mm14.00"
1920x1200
162 PPI
IPS

Transparenz

Die Auswahl der zu testenden Geräte erfolgt innerhalb der Redaktion. Das vorliegende Testmuster wurde dem Autor vom Hersteller oder einem Shop zu Testzwecken leihweise zur Verfügung gestellt. Eine Einflussnahme des Leihstellers auf den Testbericht gab es nicht, der Hersteller erhielt keine Version des Reviews vor der Veröffentlichung. Es bestand keine Verpflichtung zur Publikation. Als eigenständiges, unabhängiges Unternehmen unterliegt Notebookcheck keiner Diktion von Herstellern, Shops und Verlagen.

So testet Notebookcheck

Pro Jahr werden von Notebookcheck hunderte Laptops und Smartphones unabhängig in von uns standardisierten technischen Verfahren getestet, um eine Vergleichbarkeit aller Testergebnisse zu gewährleisten. Seit rund 20 Jahren entwickeln wir diese Testmethoden kontinuierlich weiter und setzen damit Branchenstandards. In unseren Testlaboren kommt ausschließlich hochwertiges Messequipment in die Hände erfahrener Techniker und Redakteure. Die Tests unterliegen einer mehrstufigen Kontrolle. Unsere komplexe Gesamtbewertung basiert auf hunderten fundierten Messergebnissen und Benchmarks, womit Ihnen Objektivität garantiert ist. Weitere Informationen zu unseren Testmethoden gibt es hier.

Google LogoAls bevorzugte Quelle auf Google hinzufügen
Mail Logo
Could not open connection to Notebookchat
static version load dynamic
> Notebook Test, Laptop Test und News > Tests > Notebook Testberichte > Microsoft Surface Laptop 13 2026 im Test - Mit Snapdragon X2 Plus fast lautlos
Autor: Andreas Osthoff, 29.10.2026 (Update: 29.10.2026)