Fazit - Evo 15 ist ein guter Allrounder
Mit dem Evo 15 bietet XMG erneut einen guten Allrounder an, der einige Kritikpunkte des Vorgängers behebt. Wi-Fi 7 ist nun vorhanden und der lahme USB-2.0-Anschluss wurde gestrichen. Der Arrow-Lake-Prozessor bietet eine sehr hohe und stabile Leistung, zudem sind die Wartungsmöglichkeiten sehr gut.
Das matte IPS-Panel eignet sich hervorragend für produktive Tätigkeiten und auch zum Spielen (schnelle Reaktionszeiten & 240 Hz), der einzige Schwachpunkt bleibt aber der erhöhte Schwarzwert und damit verbunden der recht geringe Kontrast. Zudem fallen auch die Akkulaufzeiten etwas schwächer aus als zuvor und hier bieten die Konkurrenten einfach mehr Ausdauer.
Pro
Contra
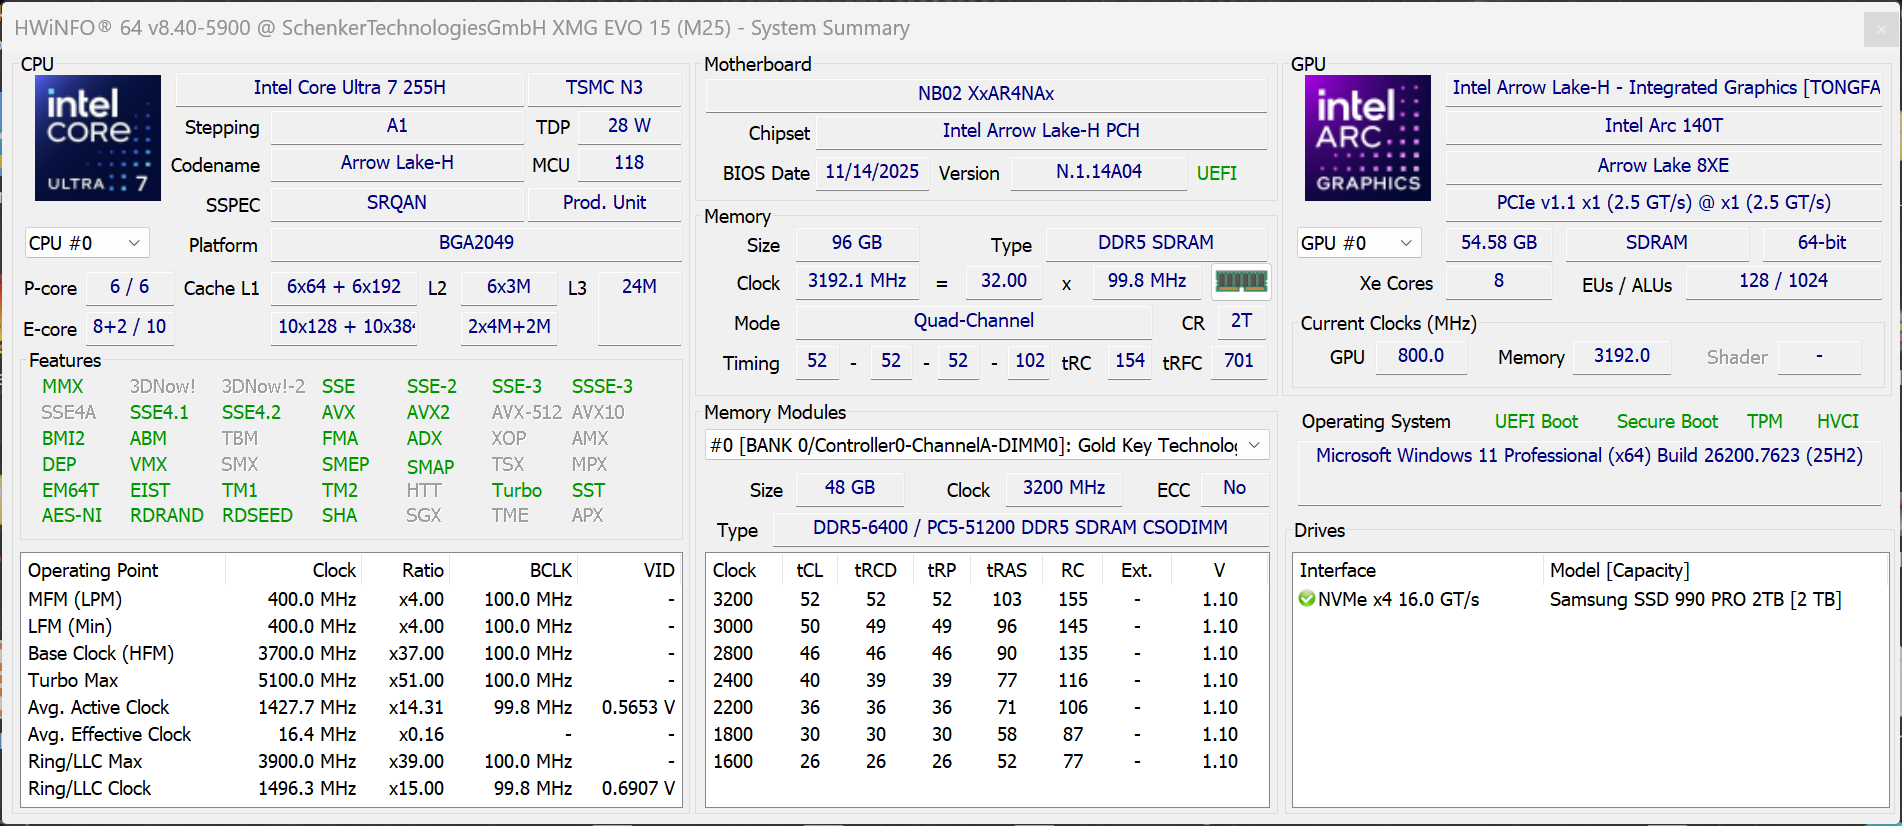
XMG hat sein schlankes 15-Zoll-Notebook Evo 15 aktualisiert und bietet Kunden erneut die Wahl zwischen einem AMD Ryzen AI 9 HX370 und dem Intel Core Ultra 7 255H. Unsere Testkonfiguration kostet aufgrund der üppigen Speicherausstattung 2.365 Euro (allein das Upgrade auf 96 GB RAM kostet derzeit 810 Euro).
Spezifikationen
Preisvergleich
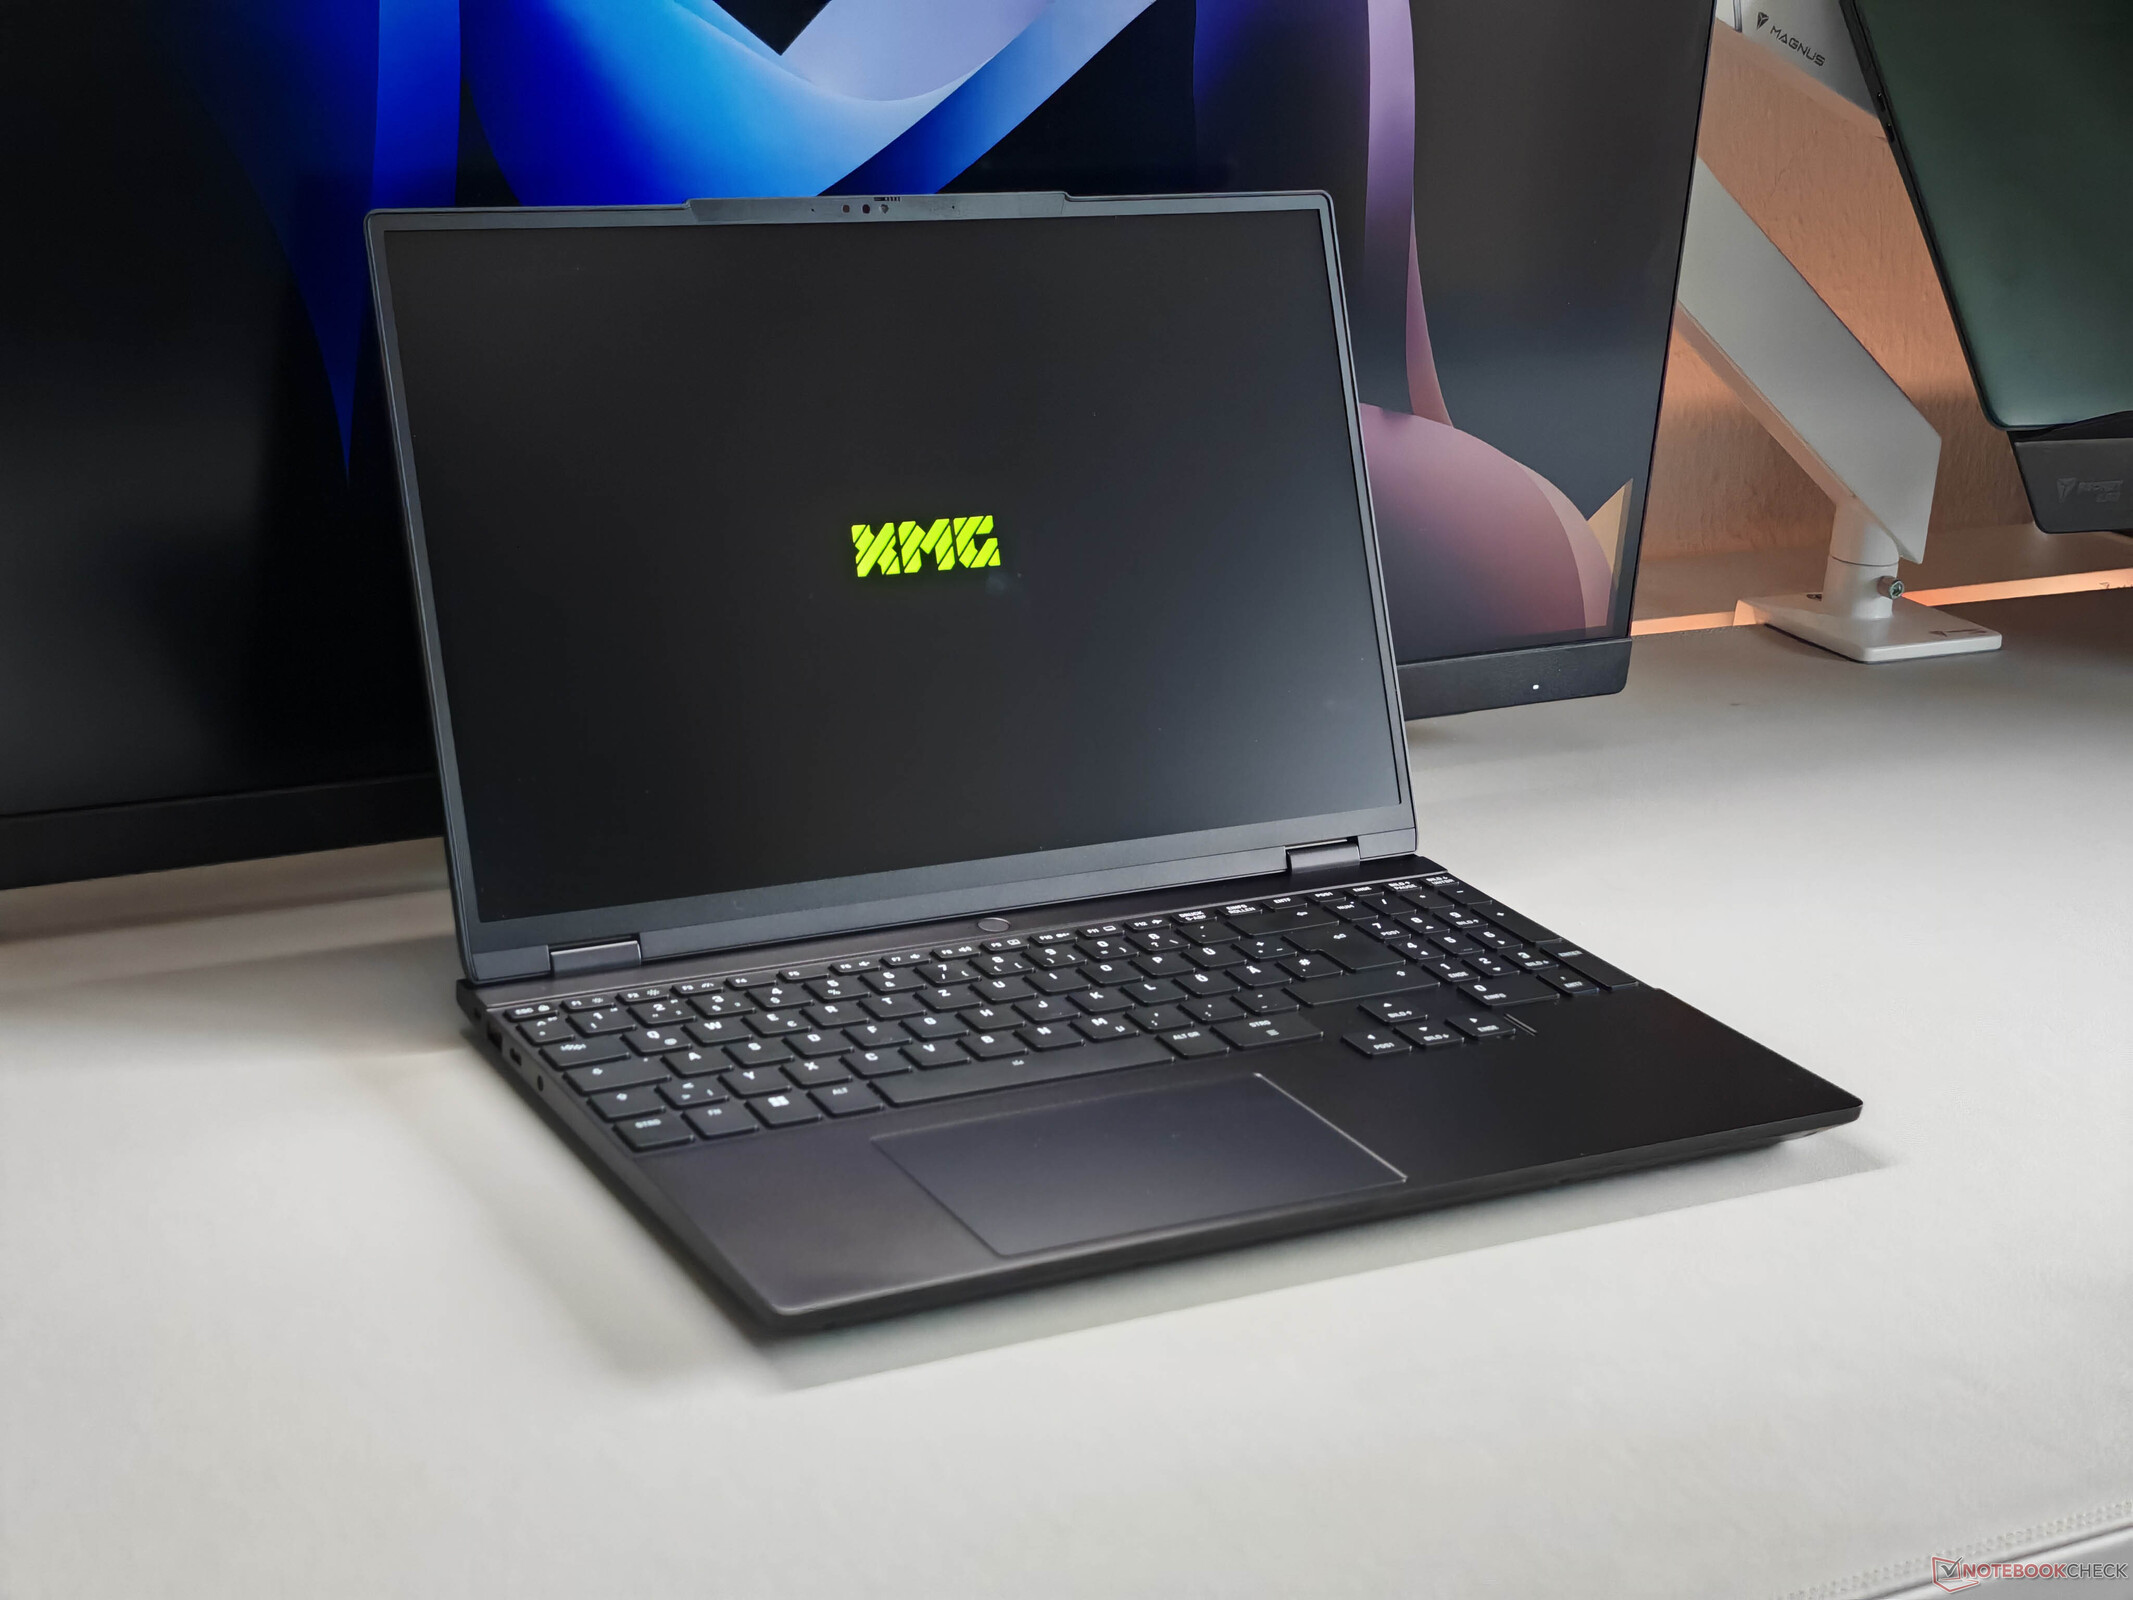
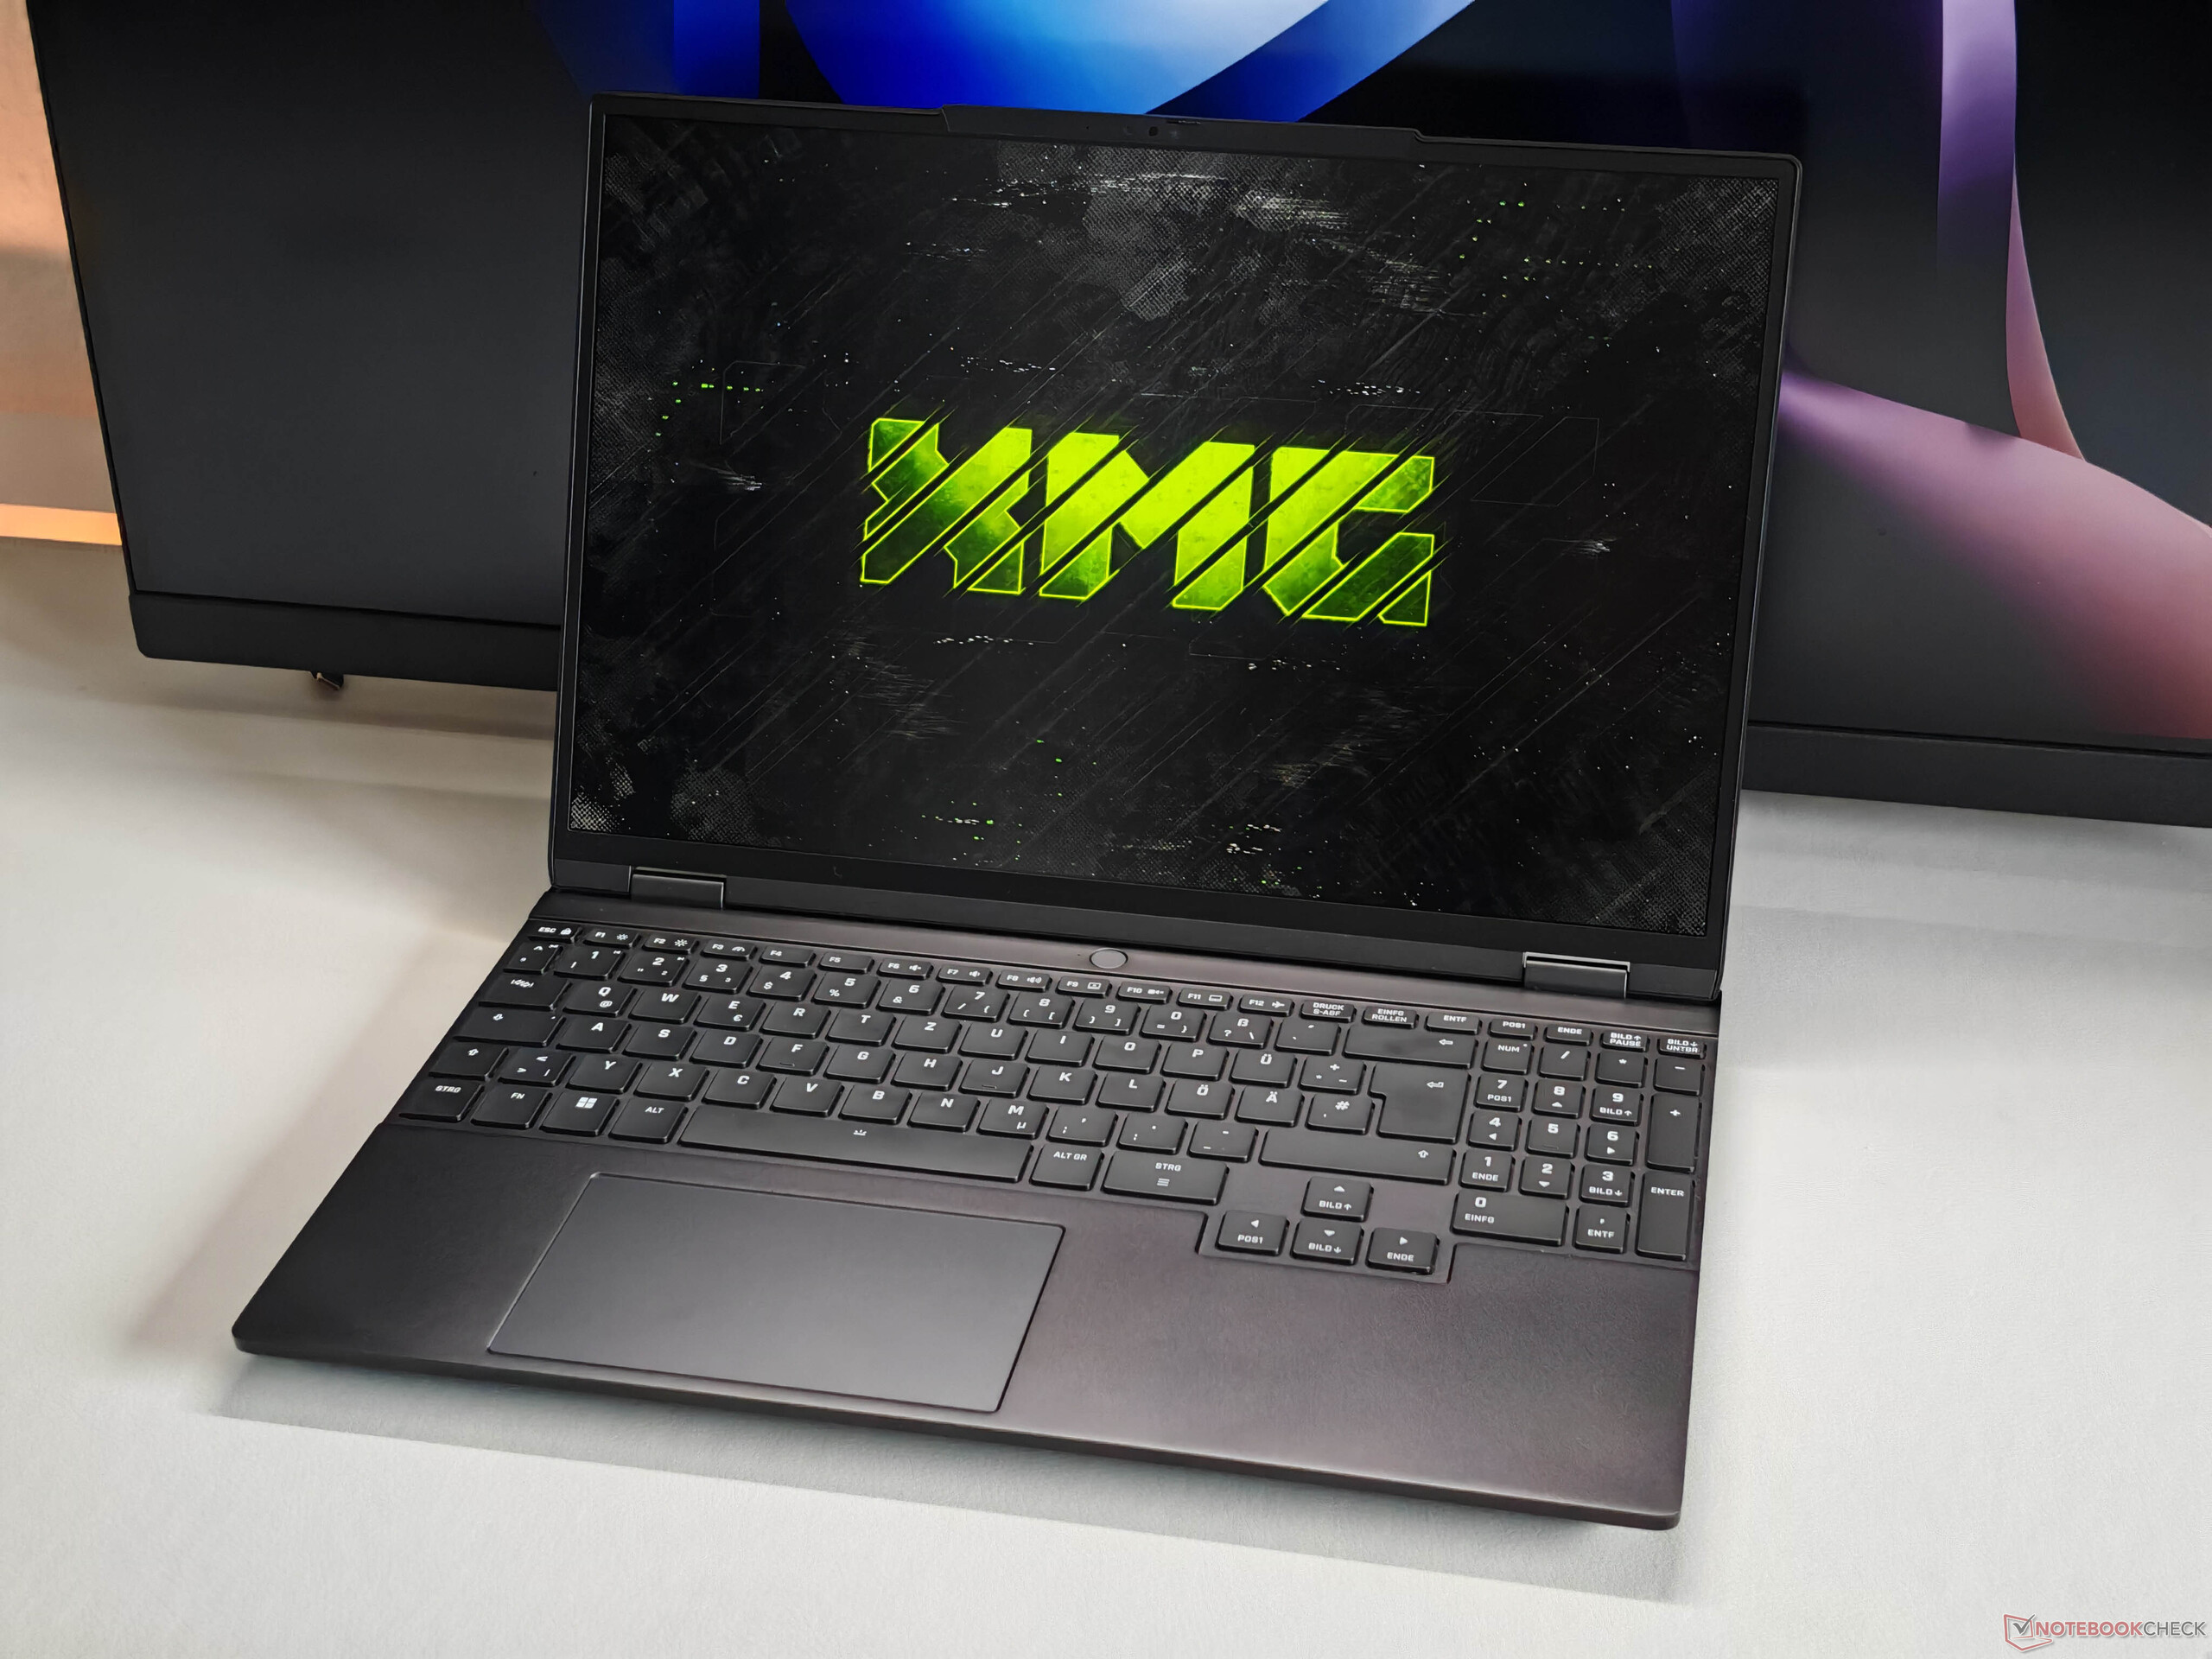
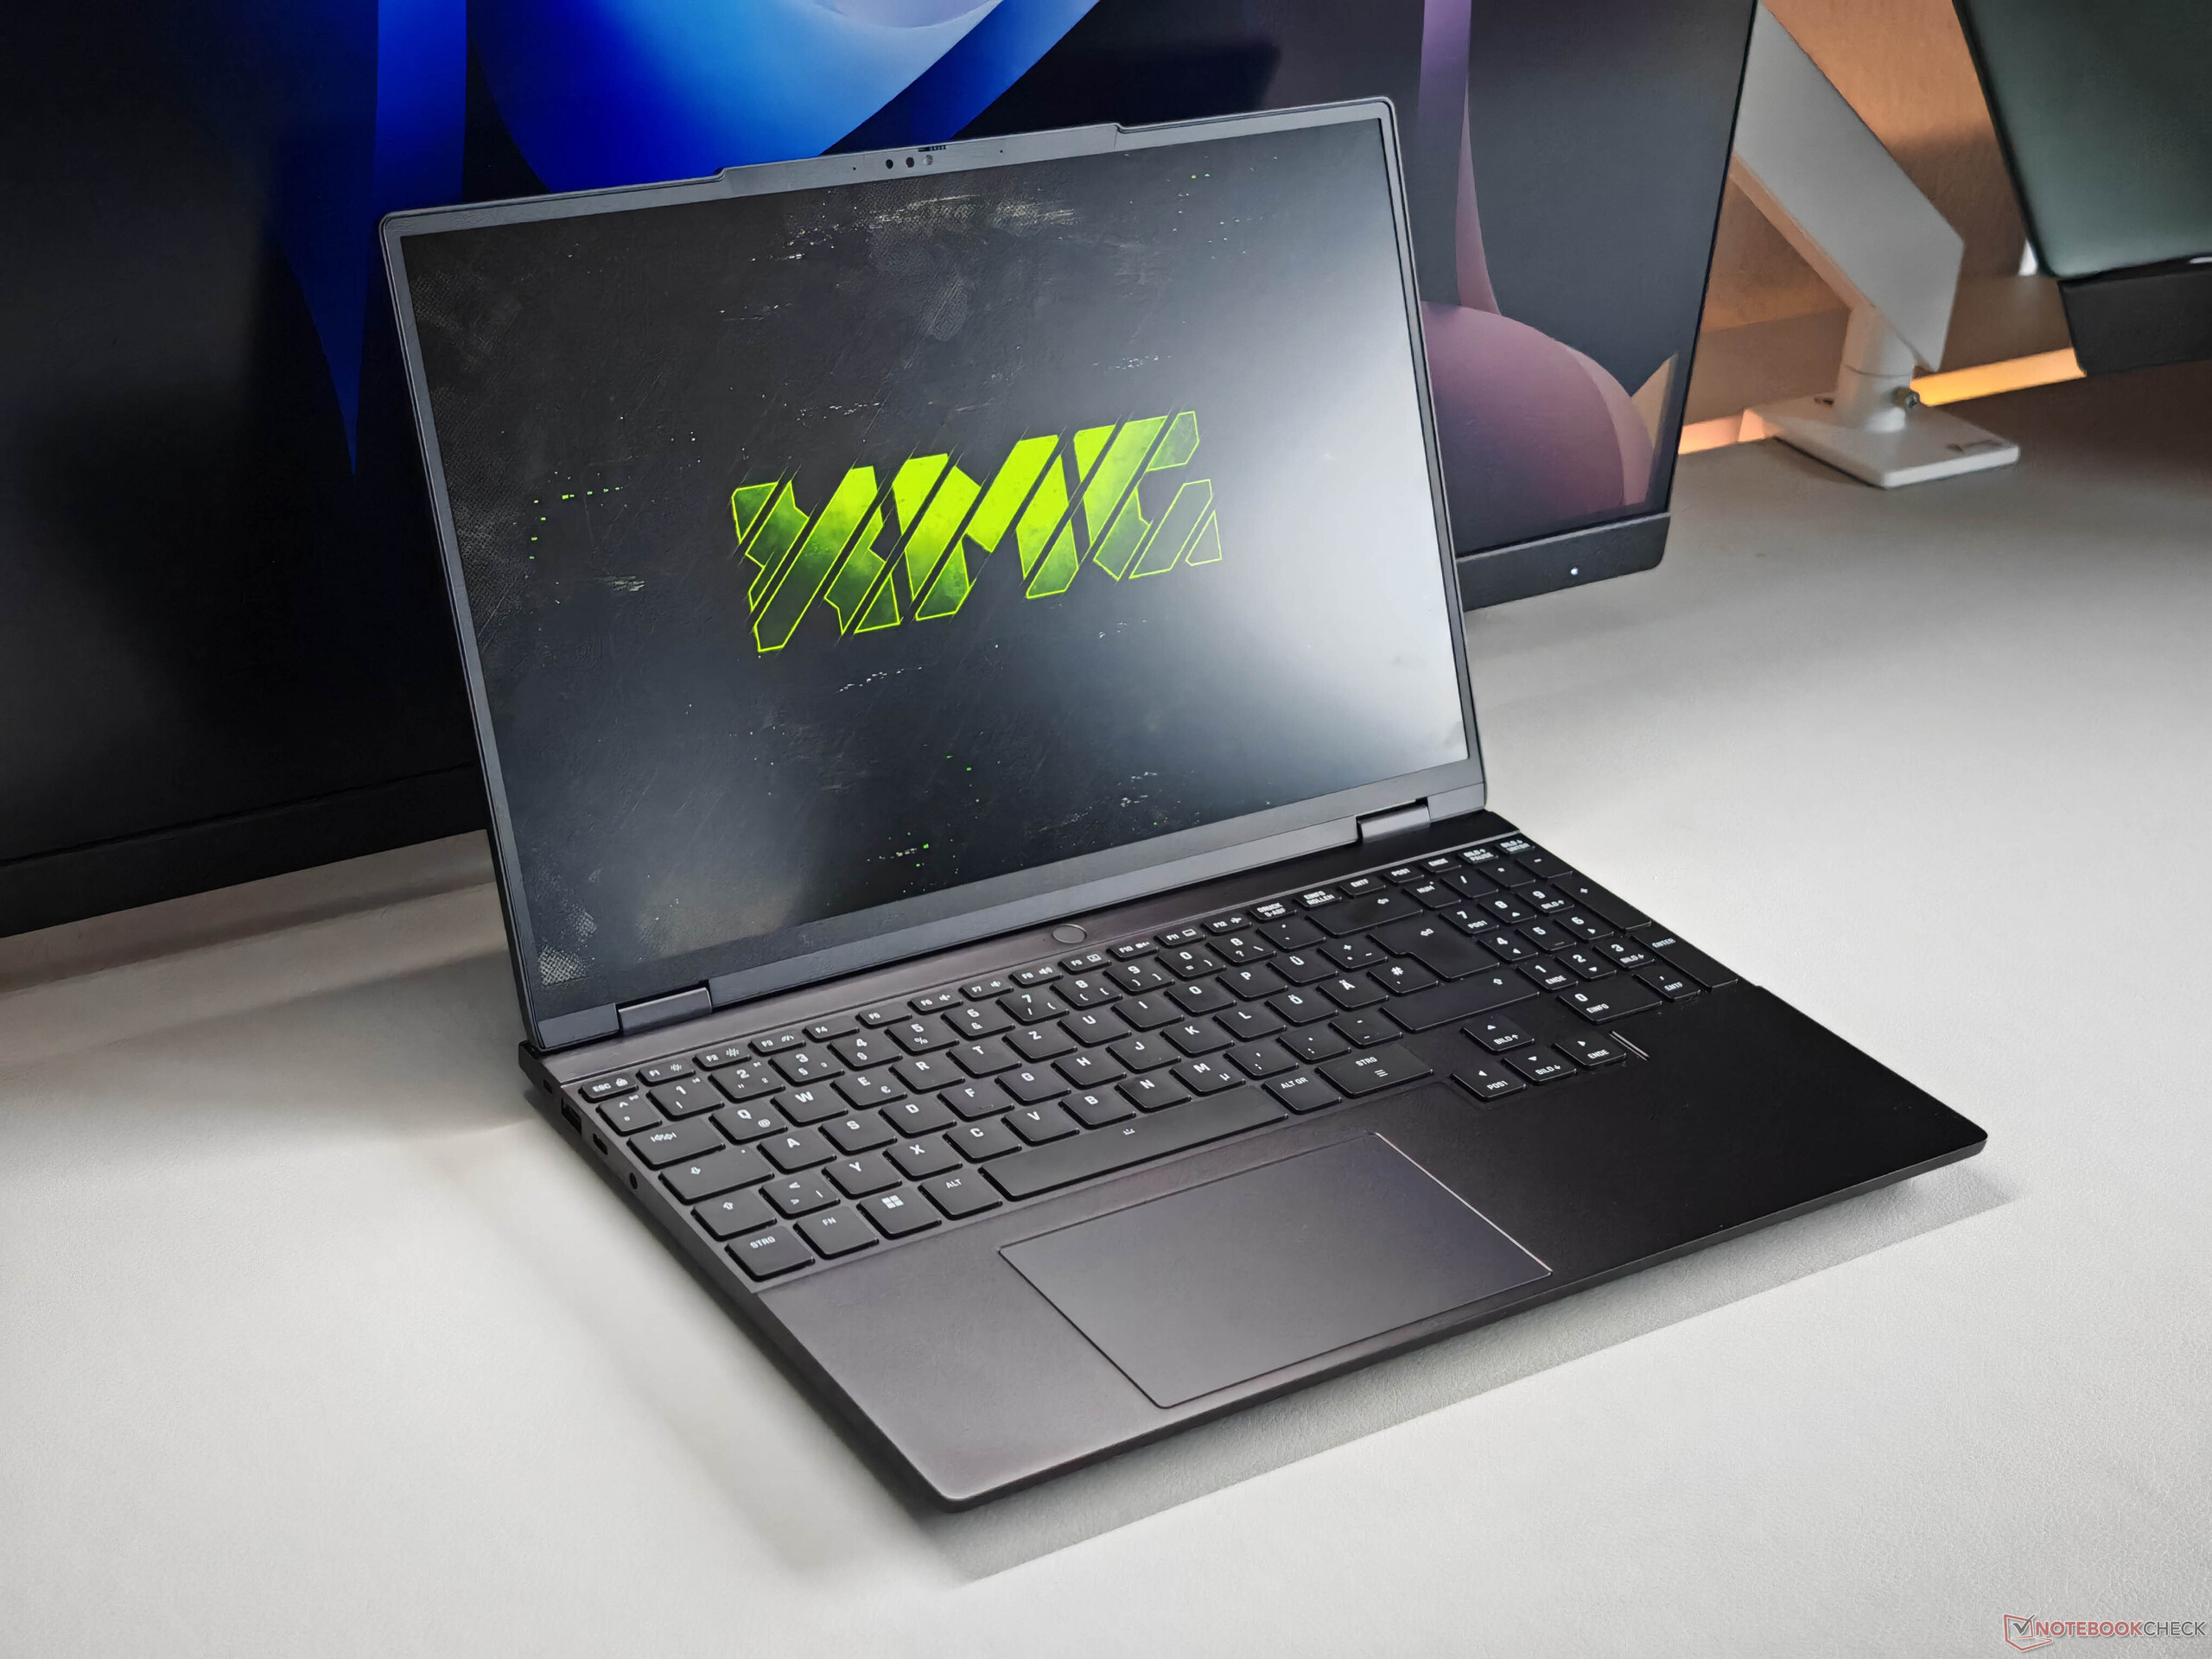
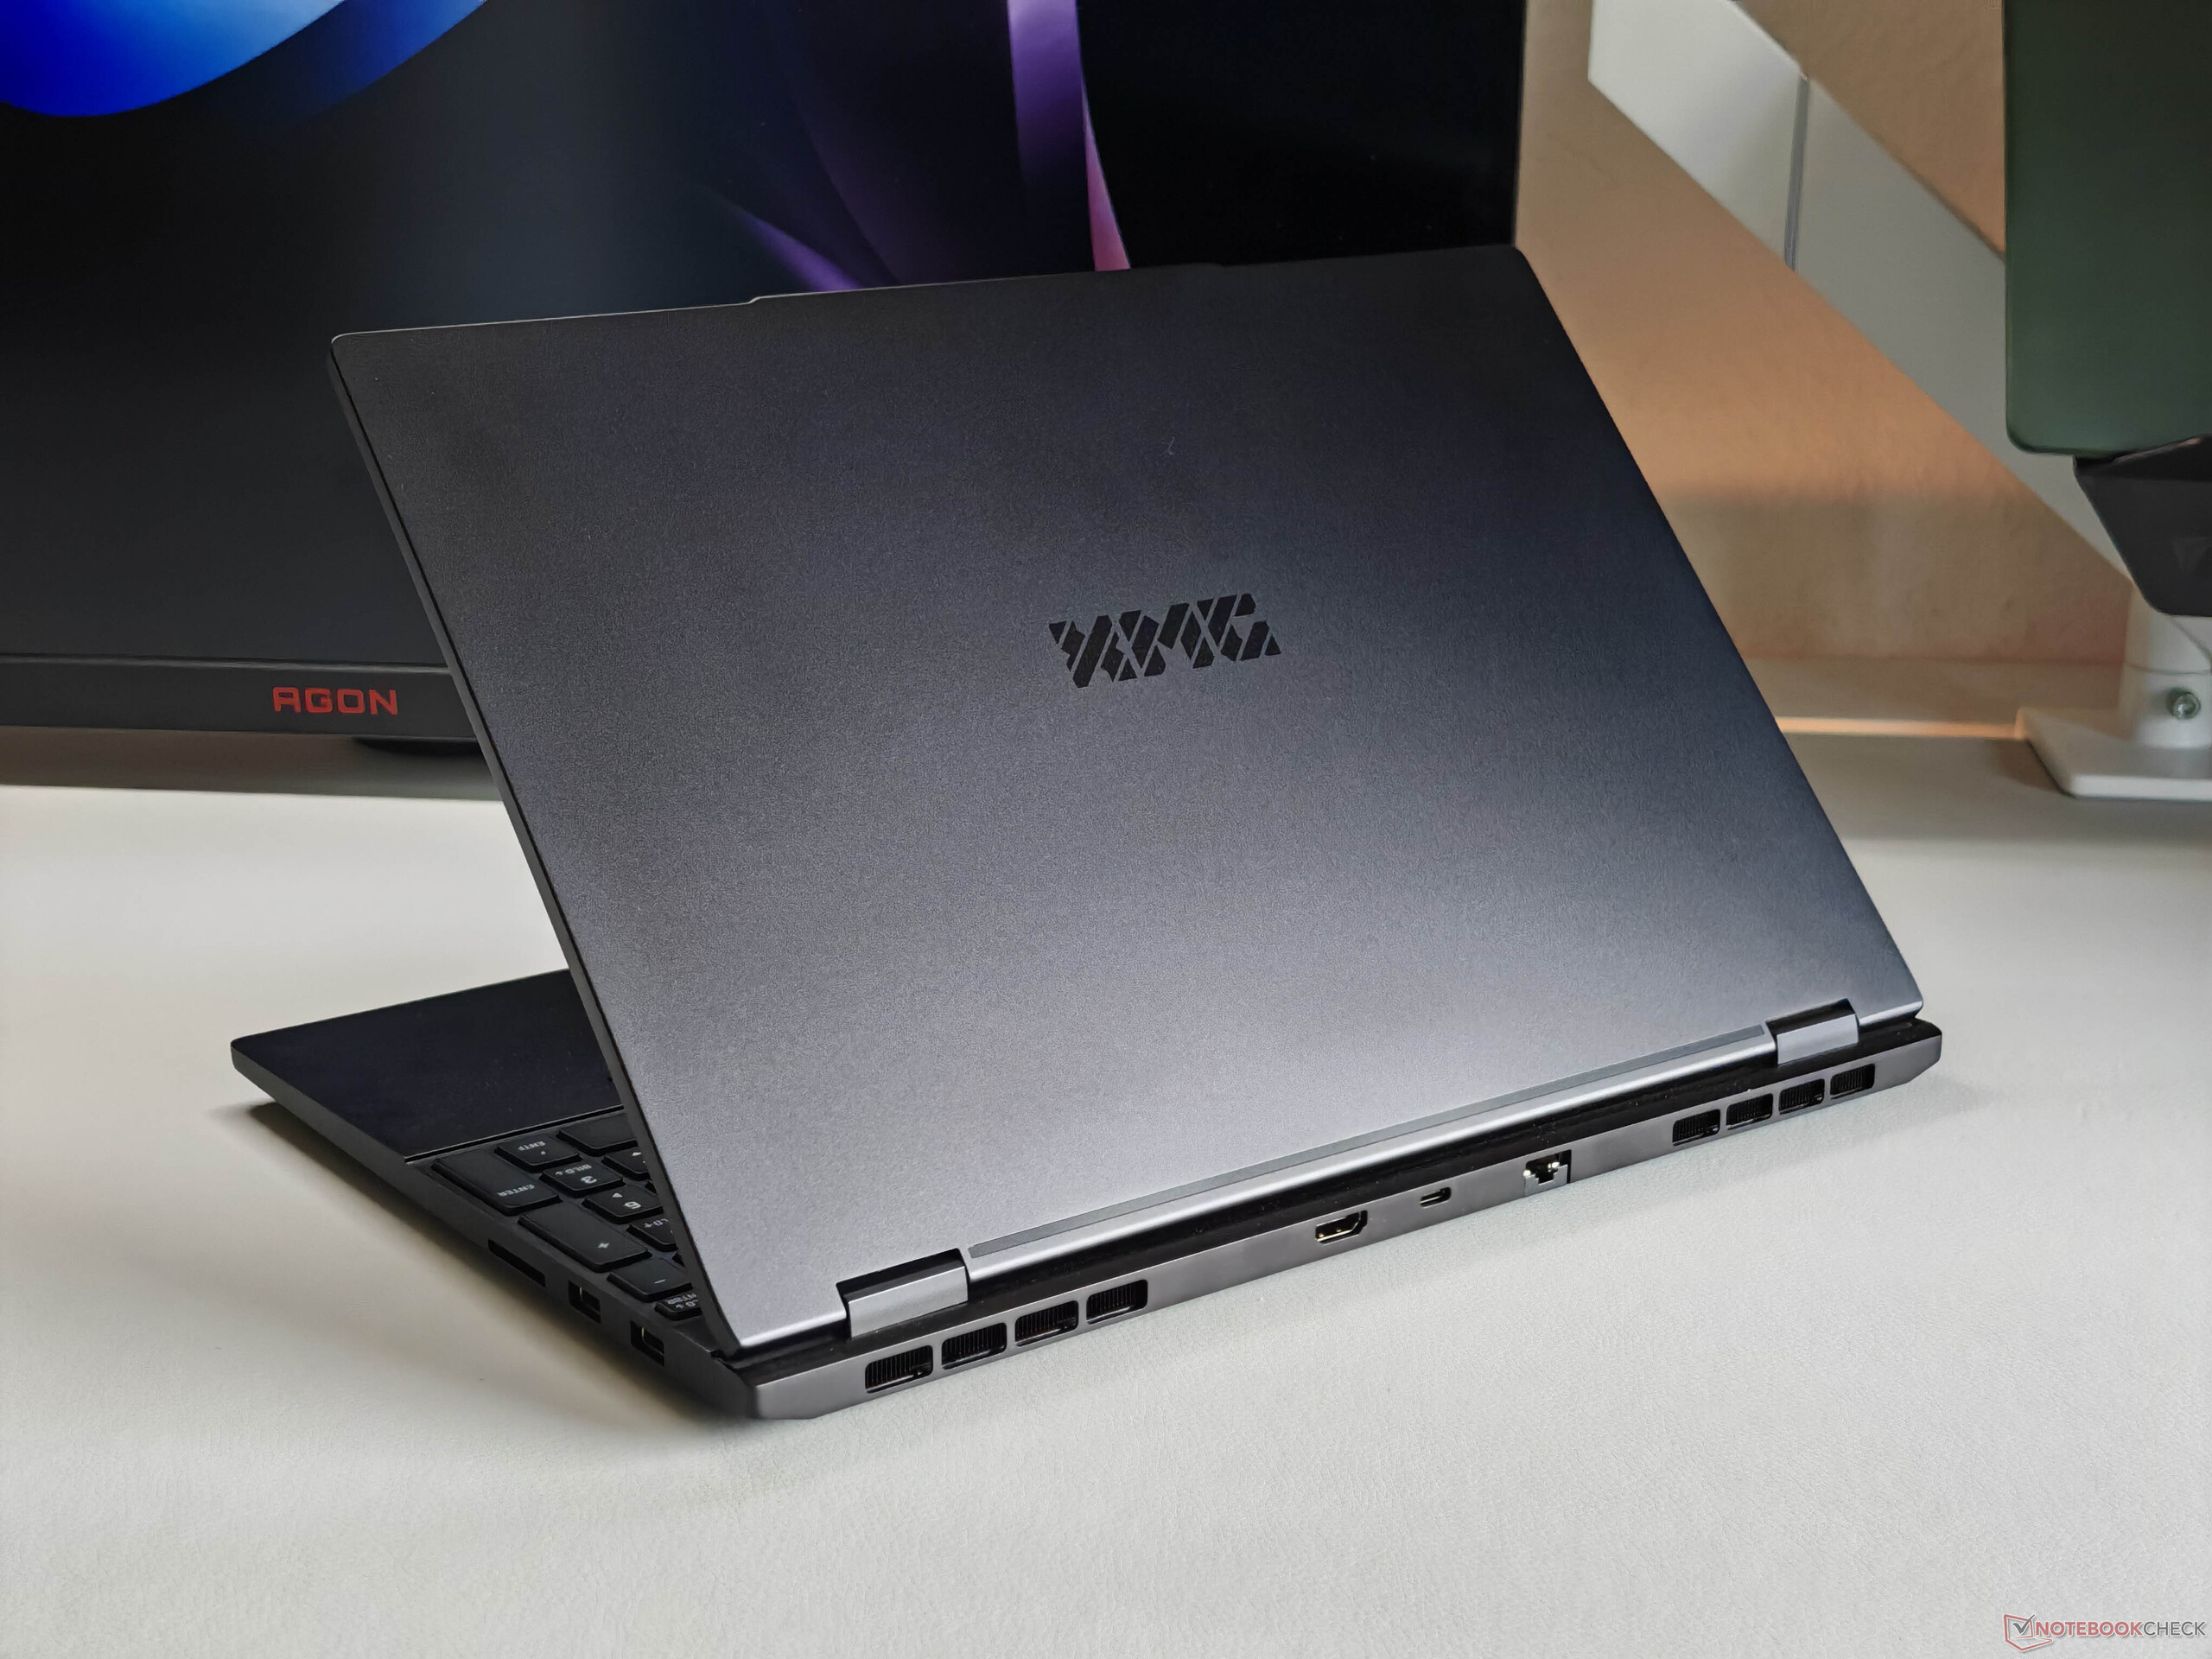
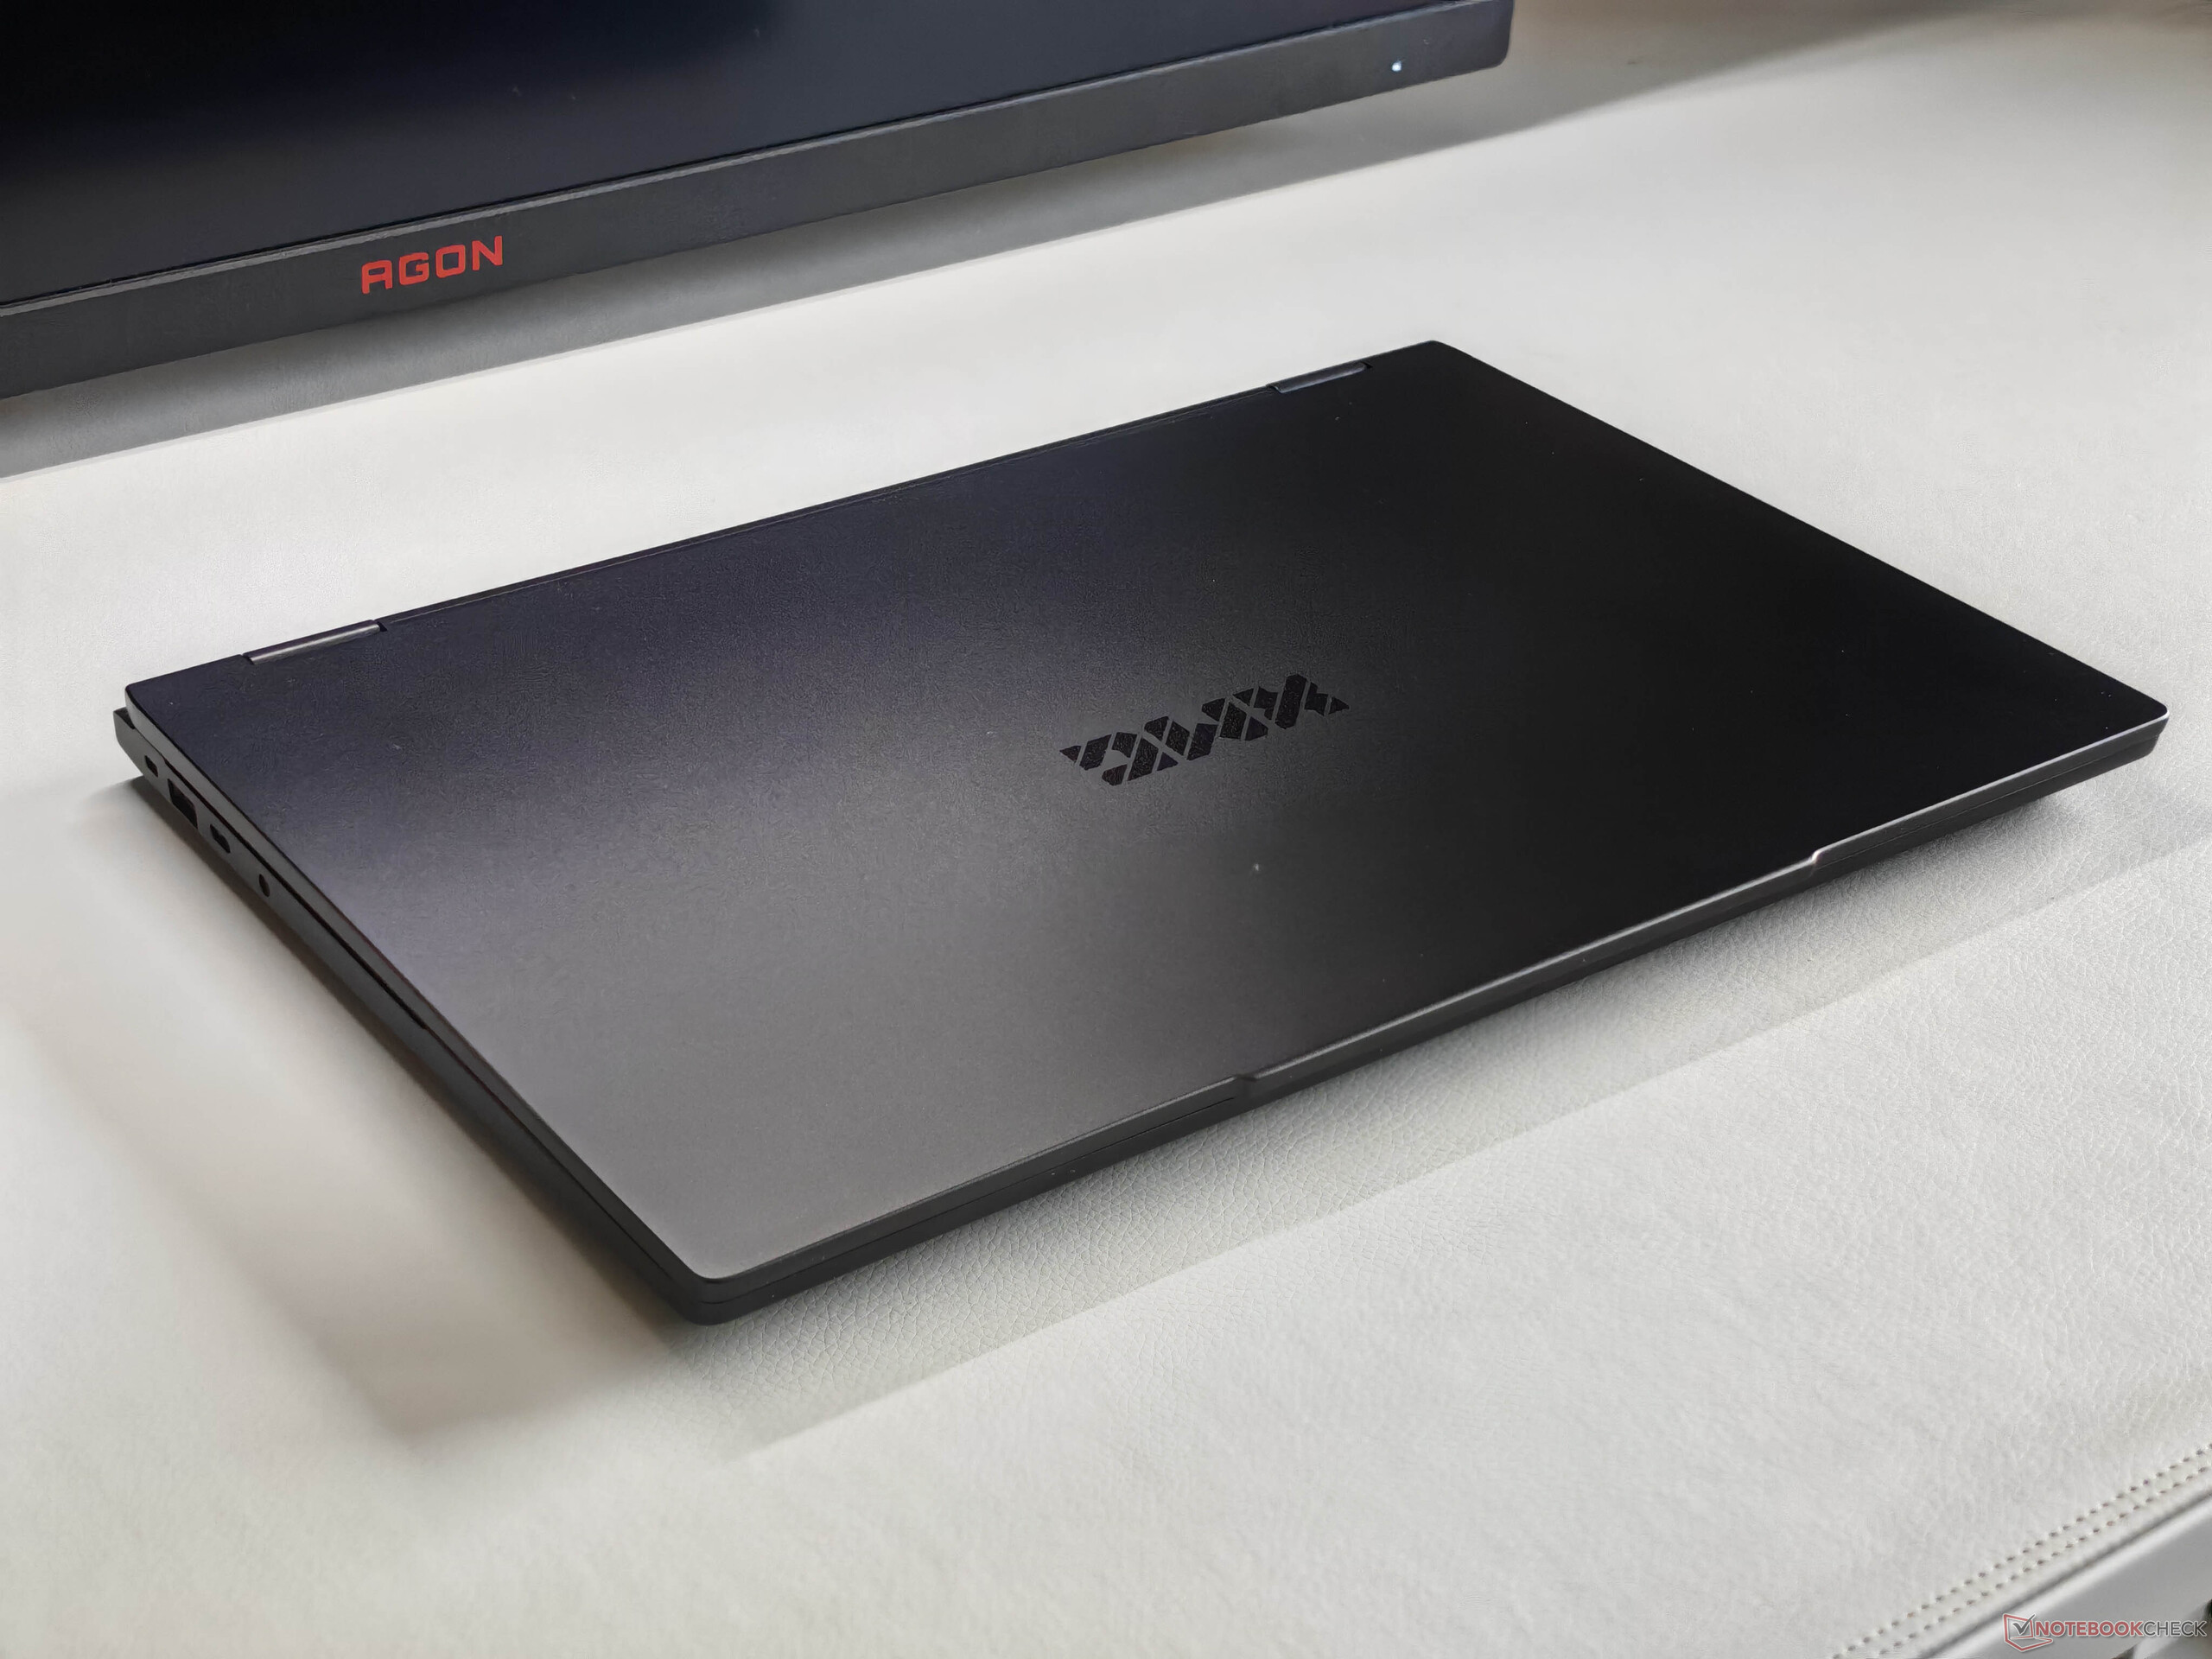
Gehäuse & Ausstattung
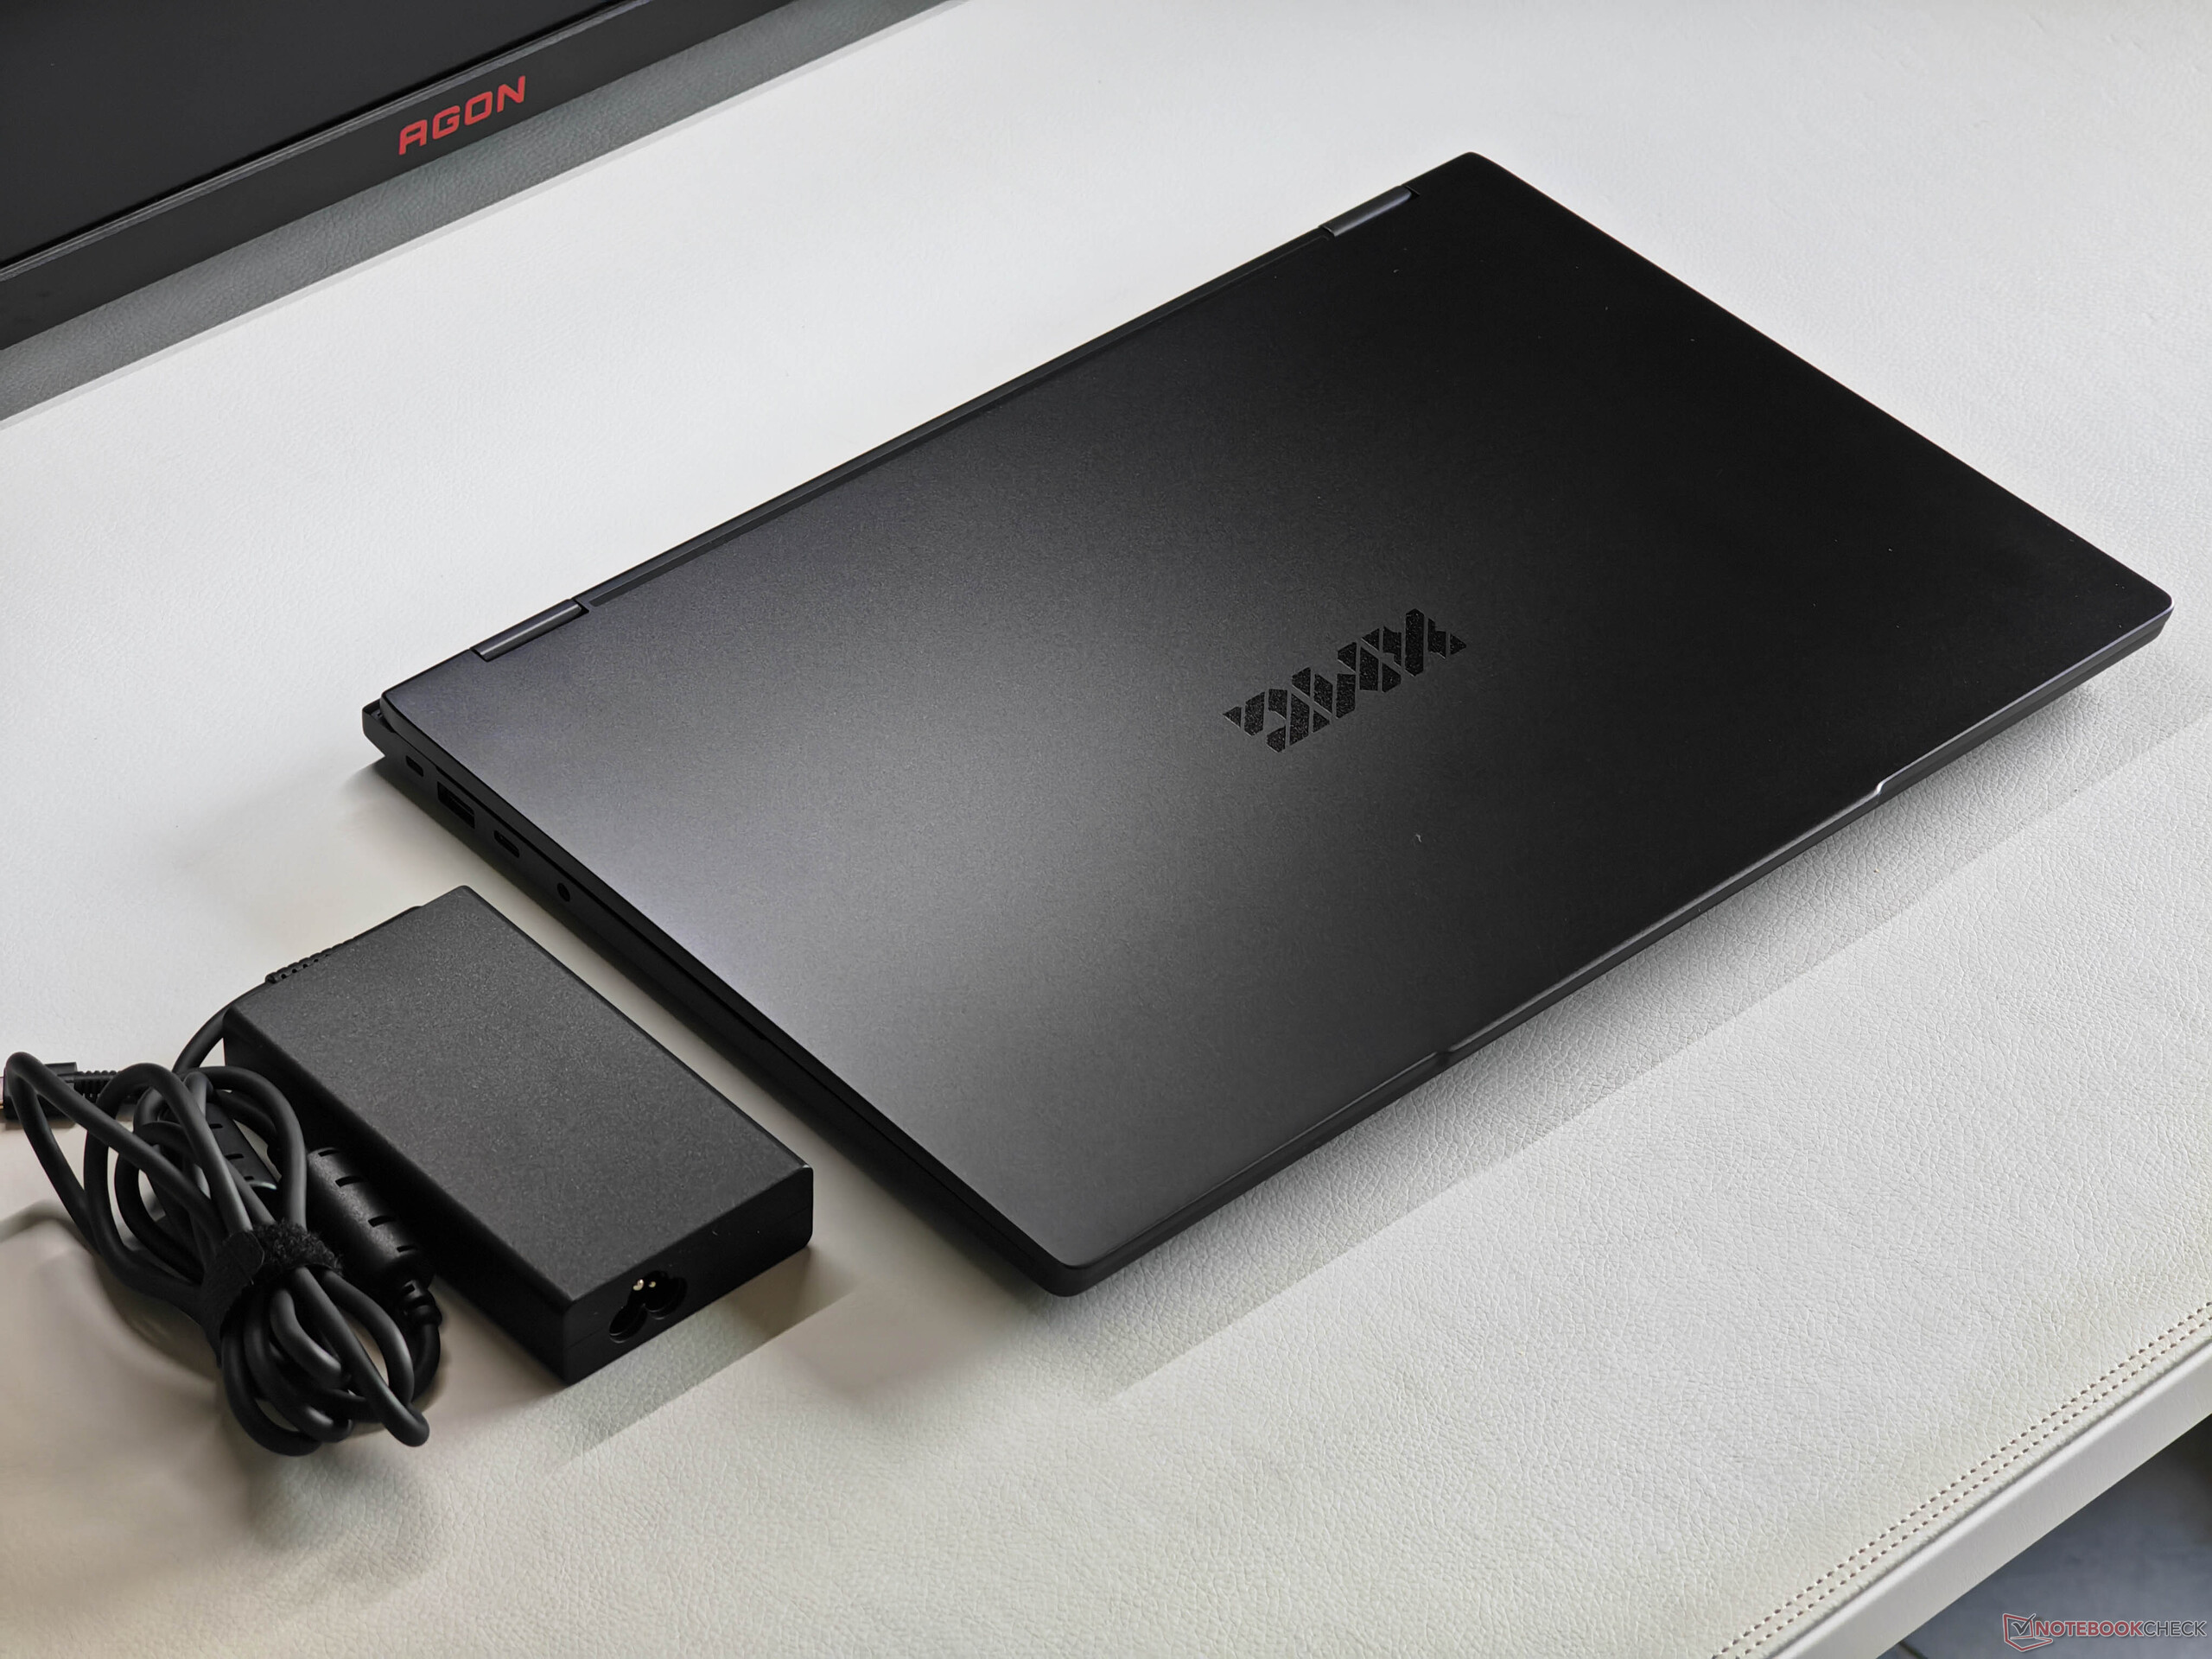
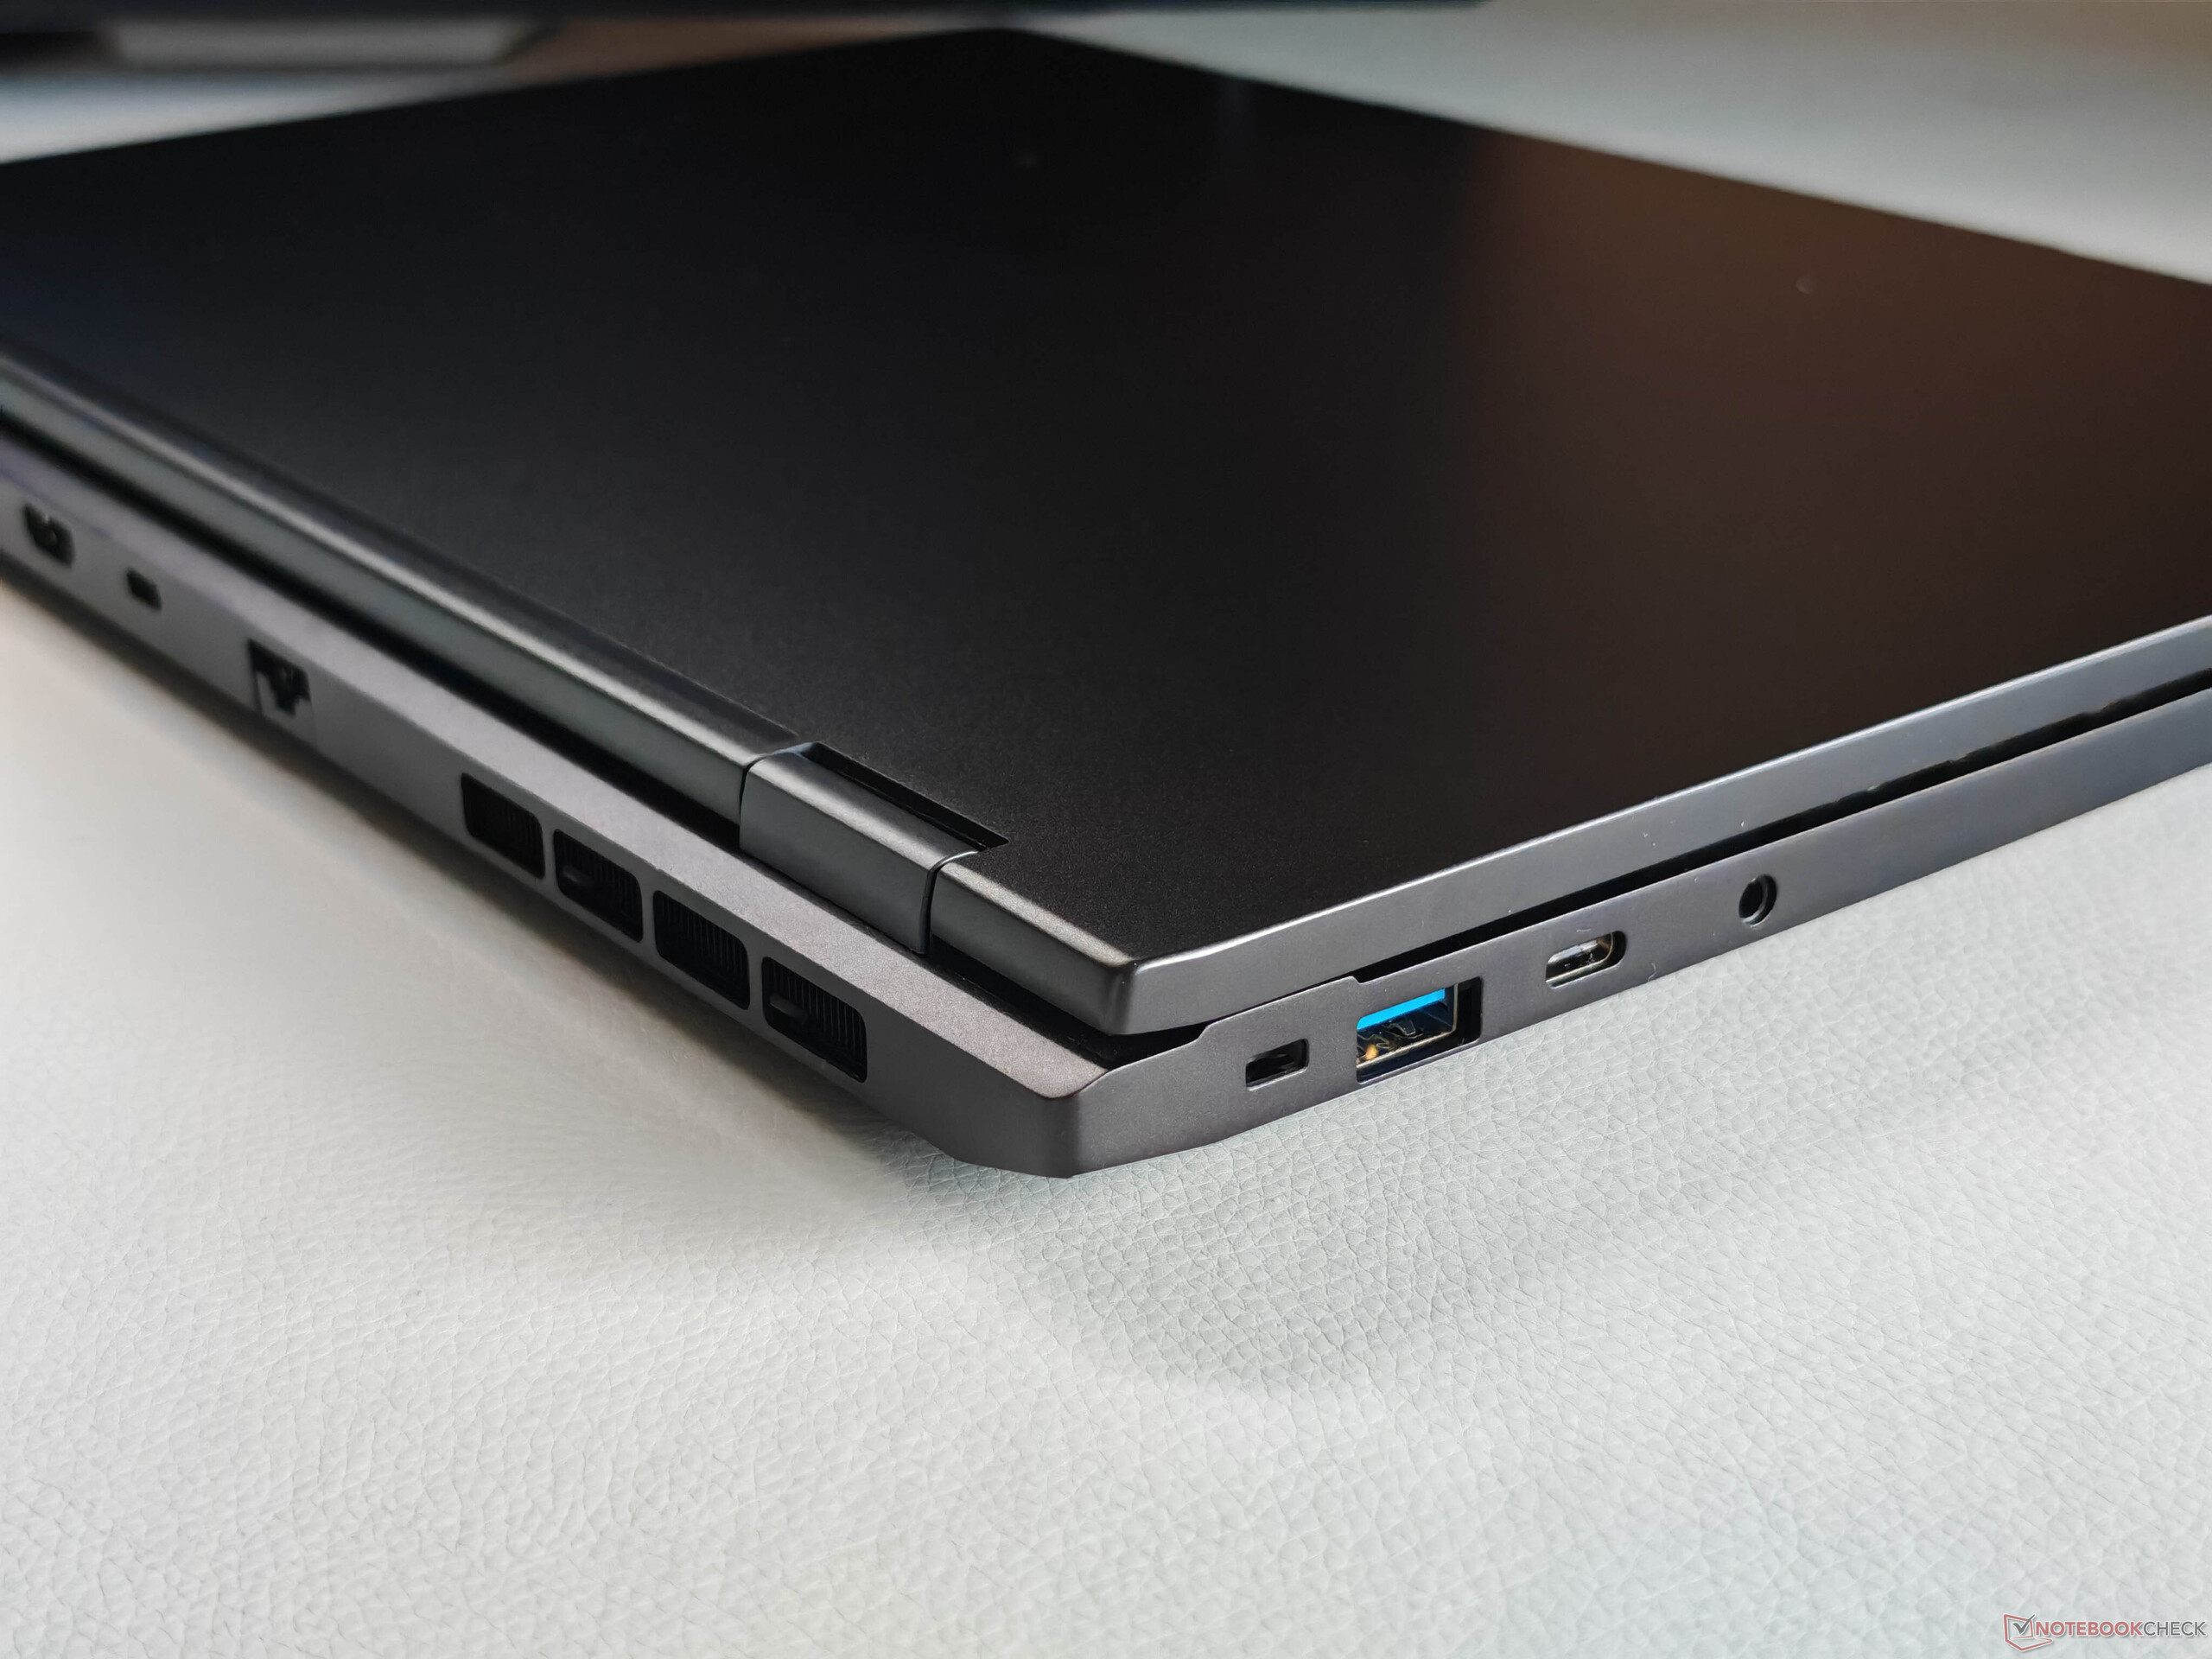
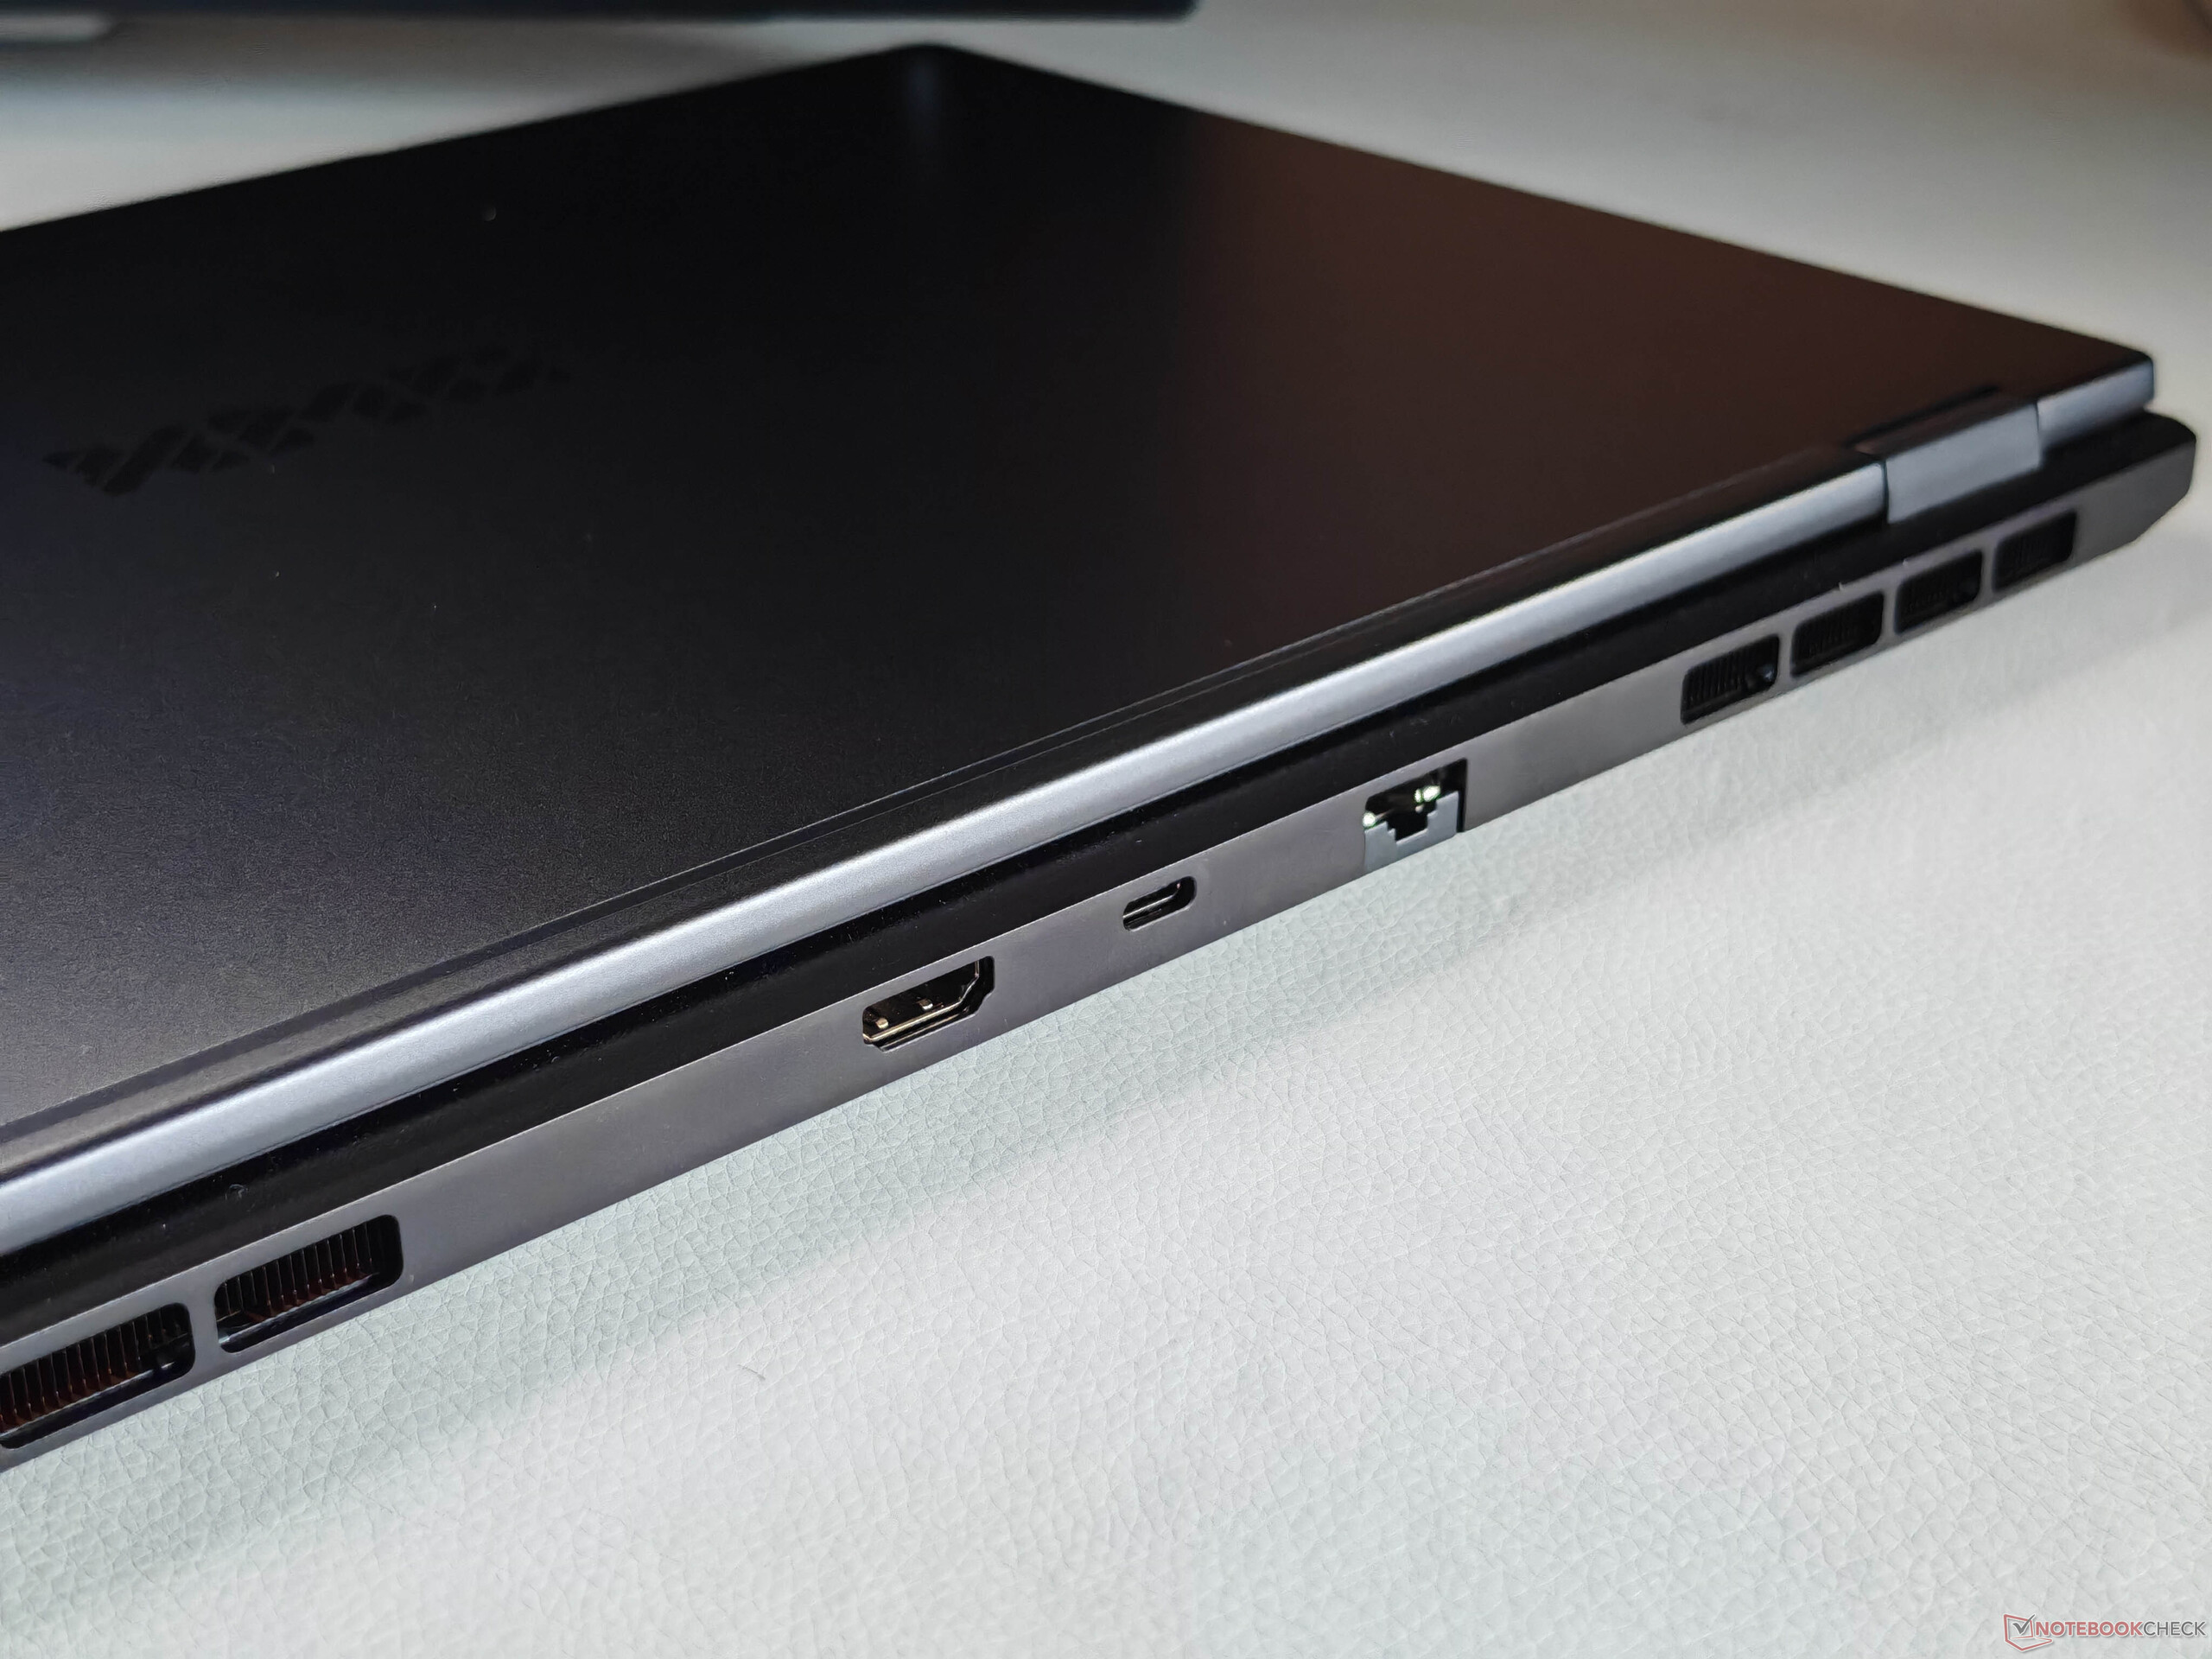
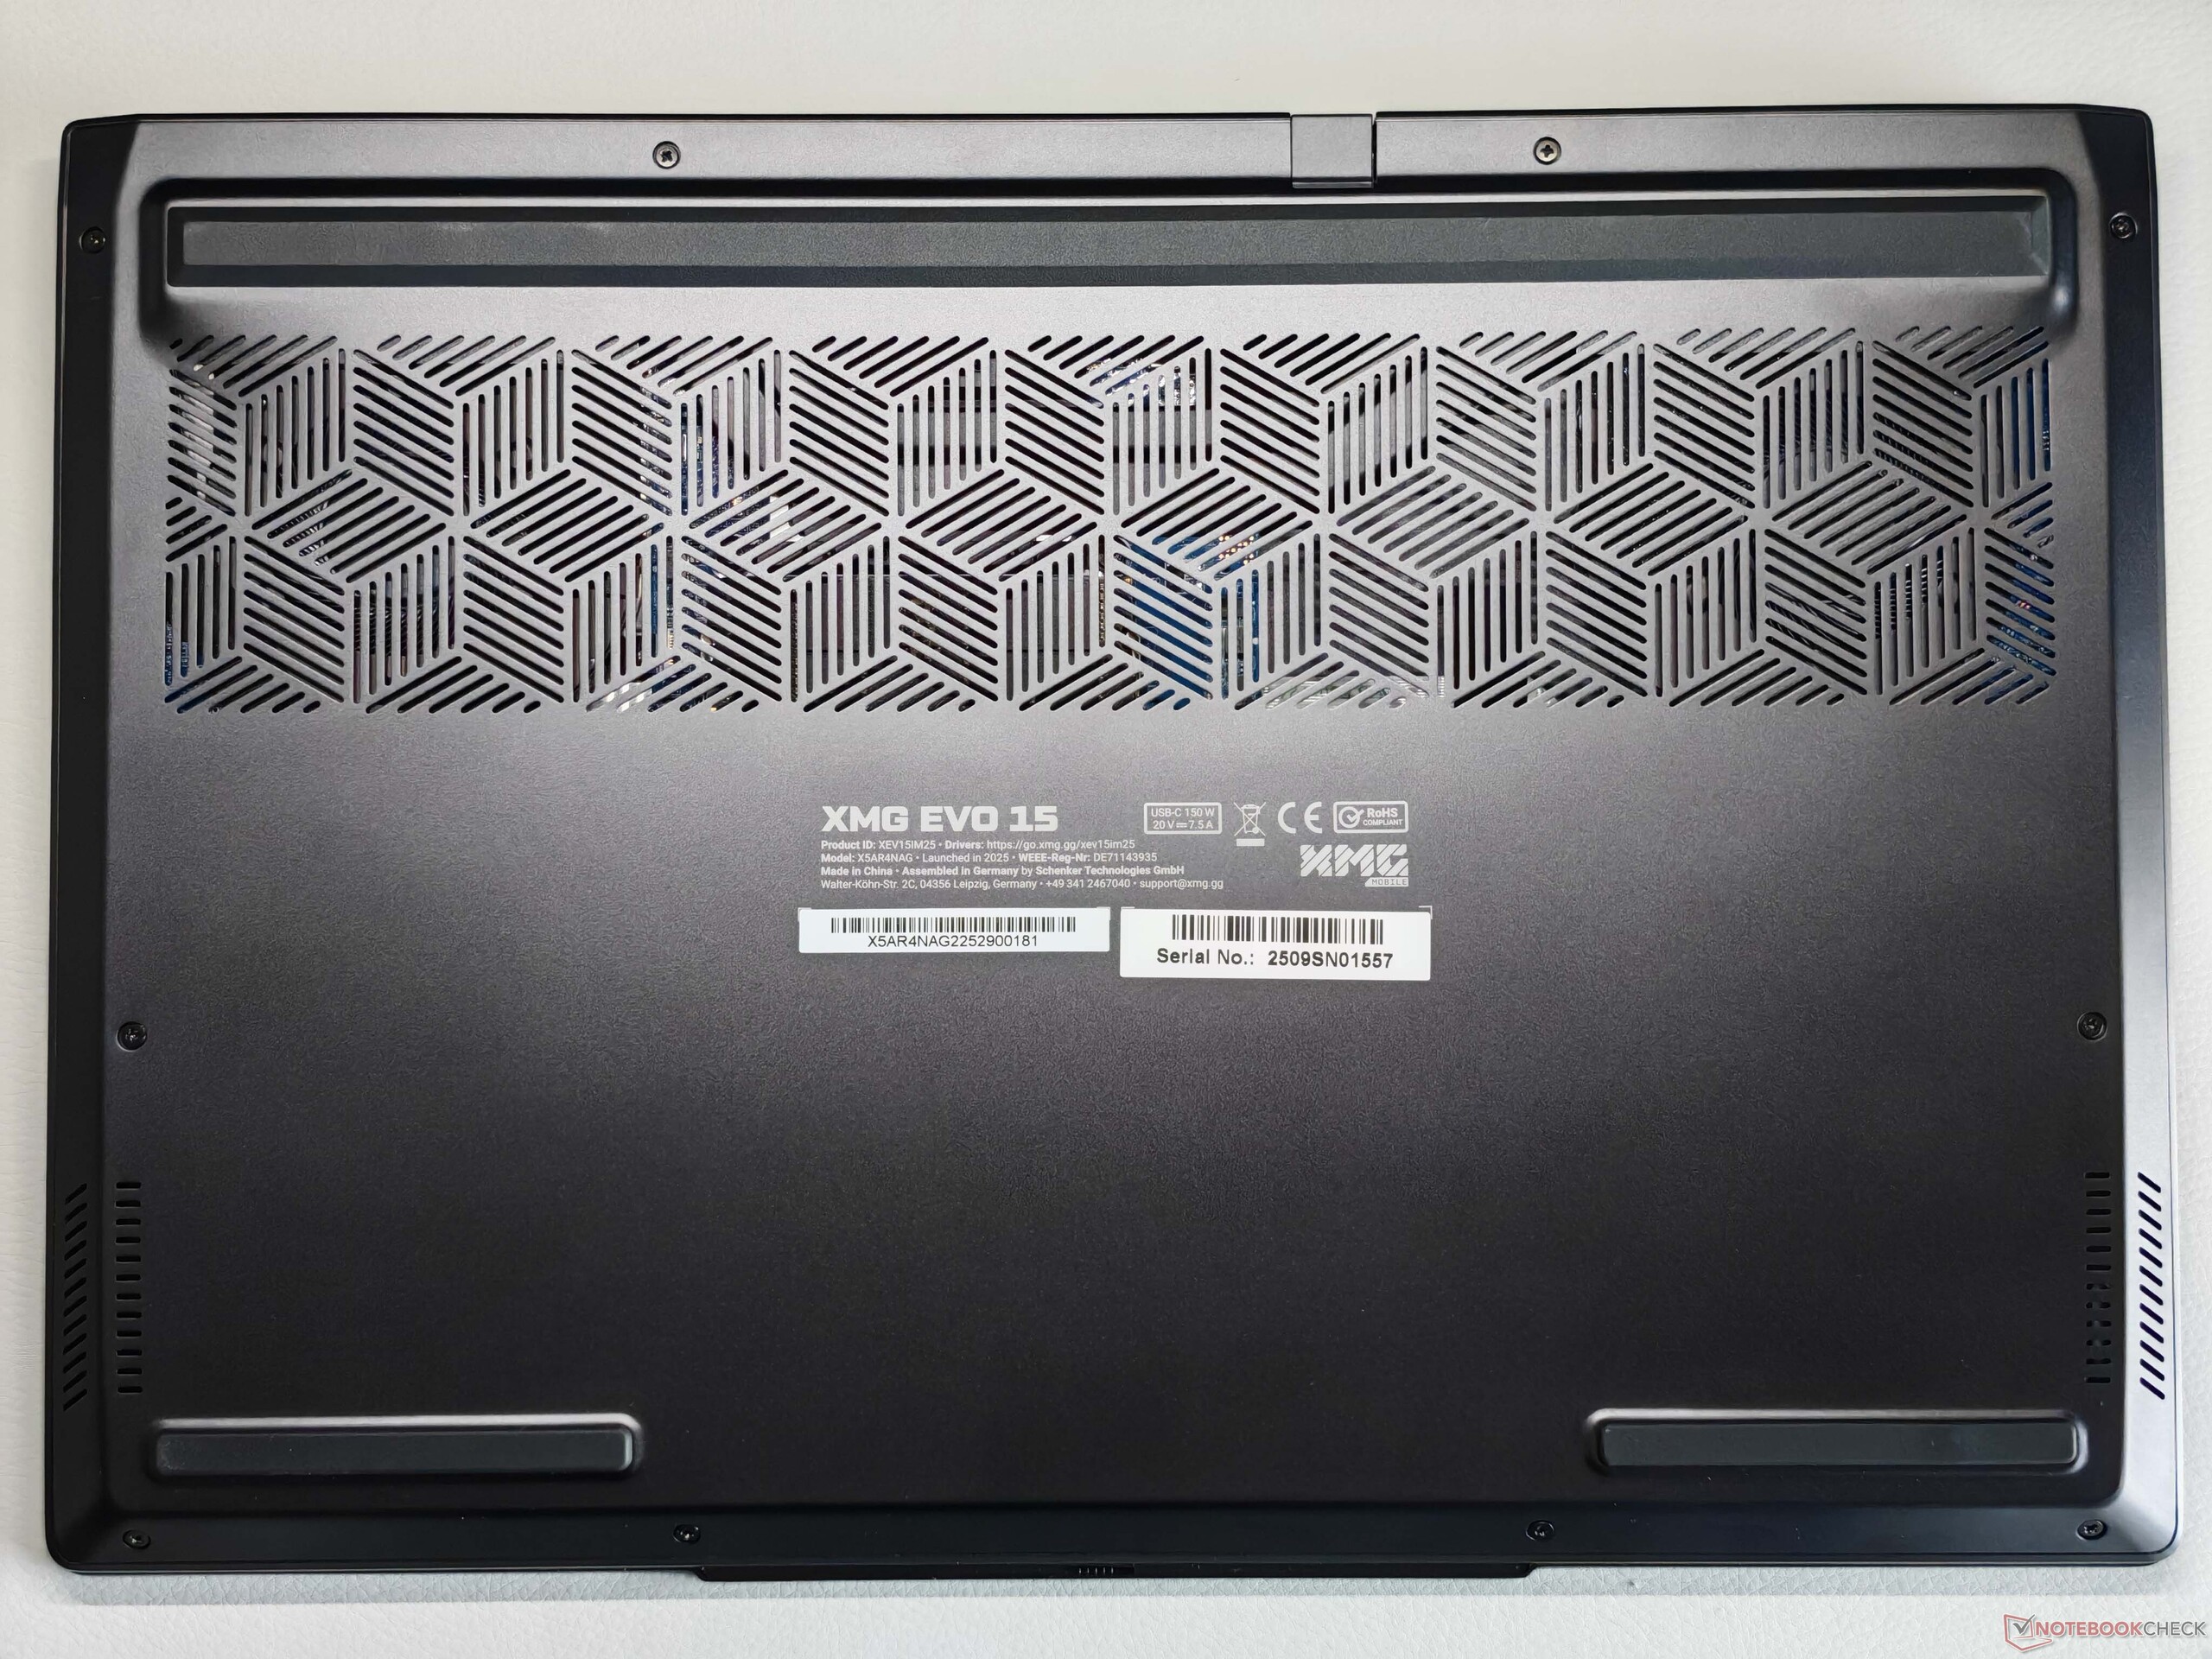
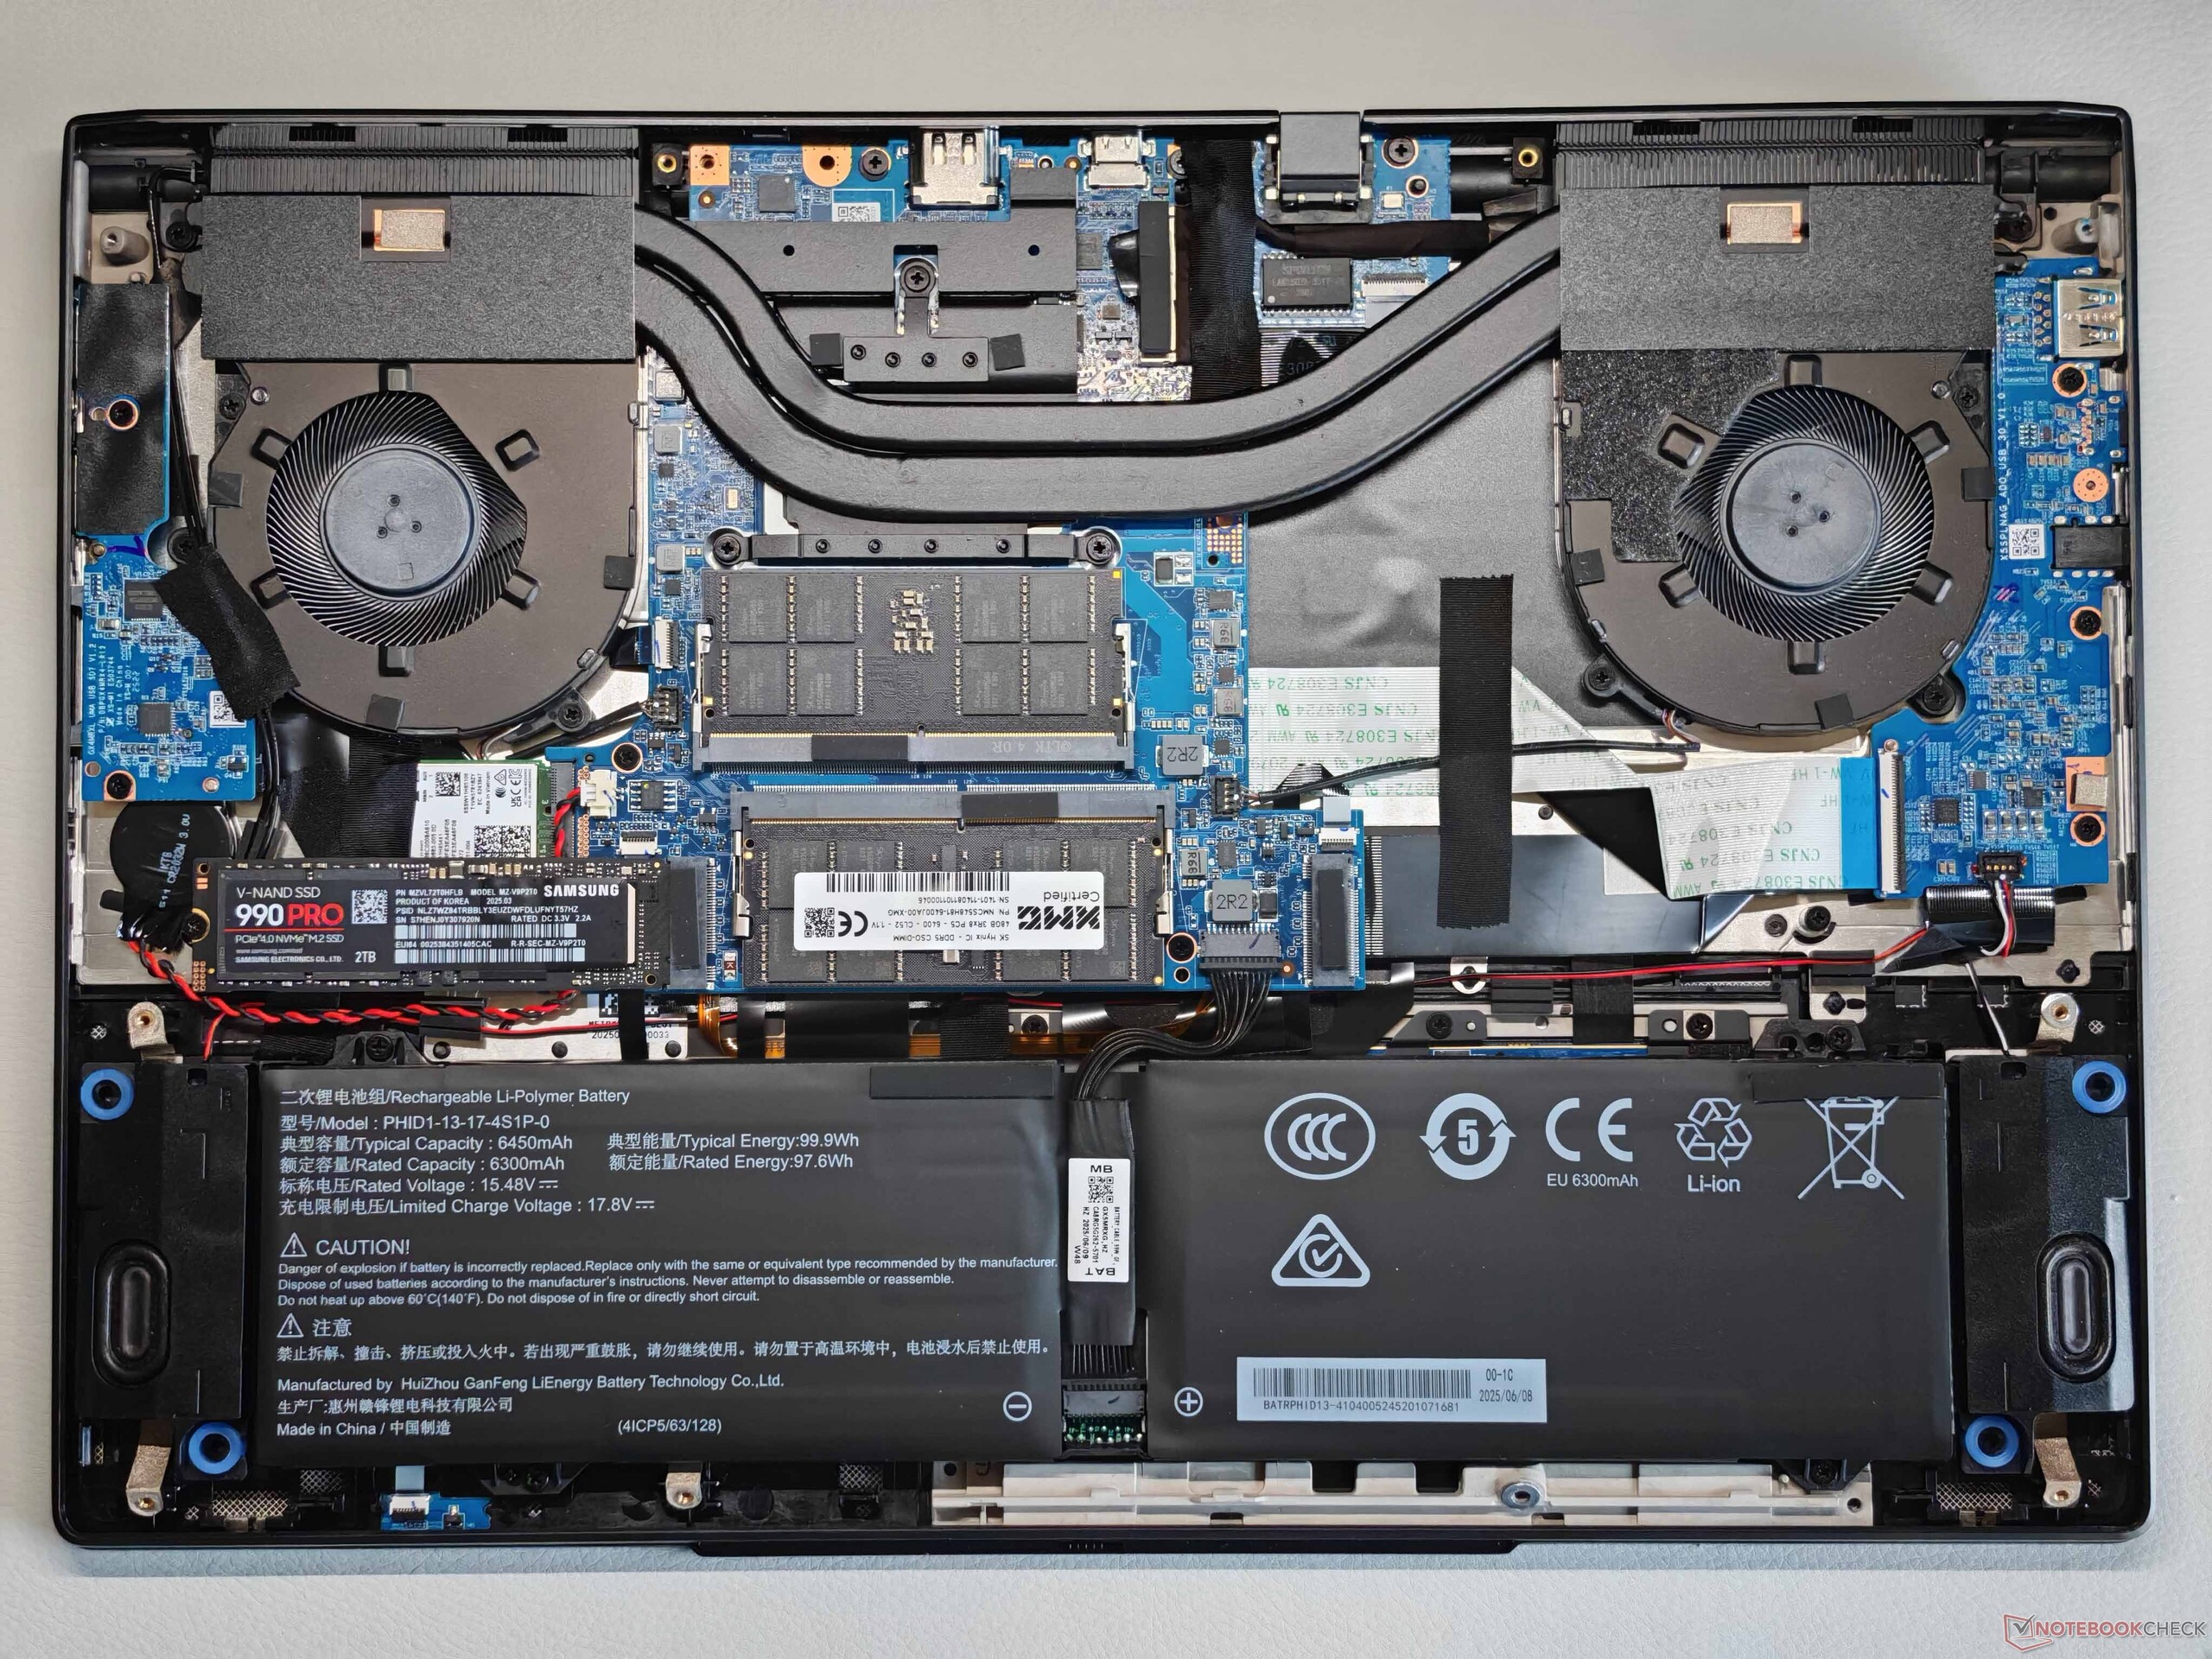
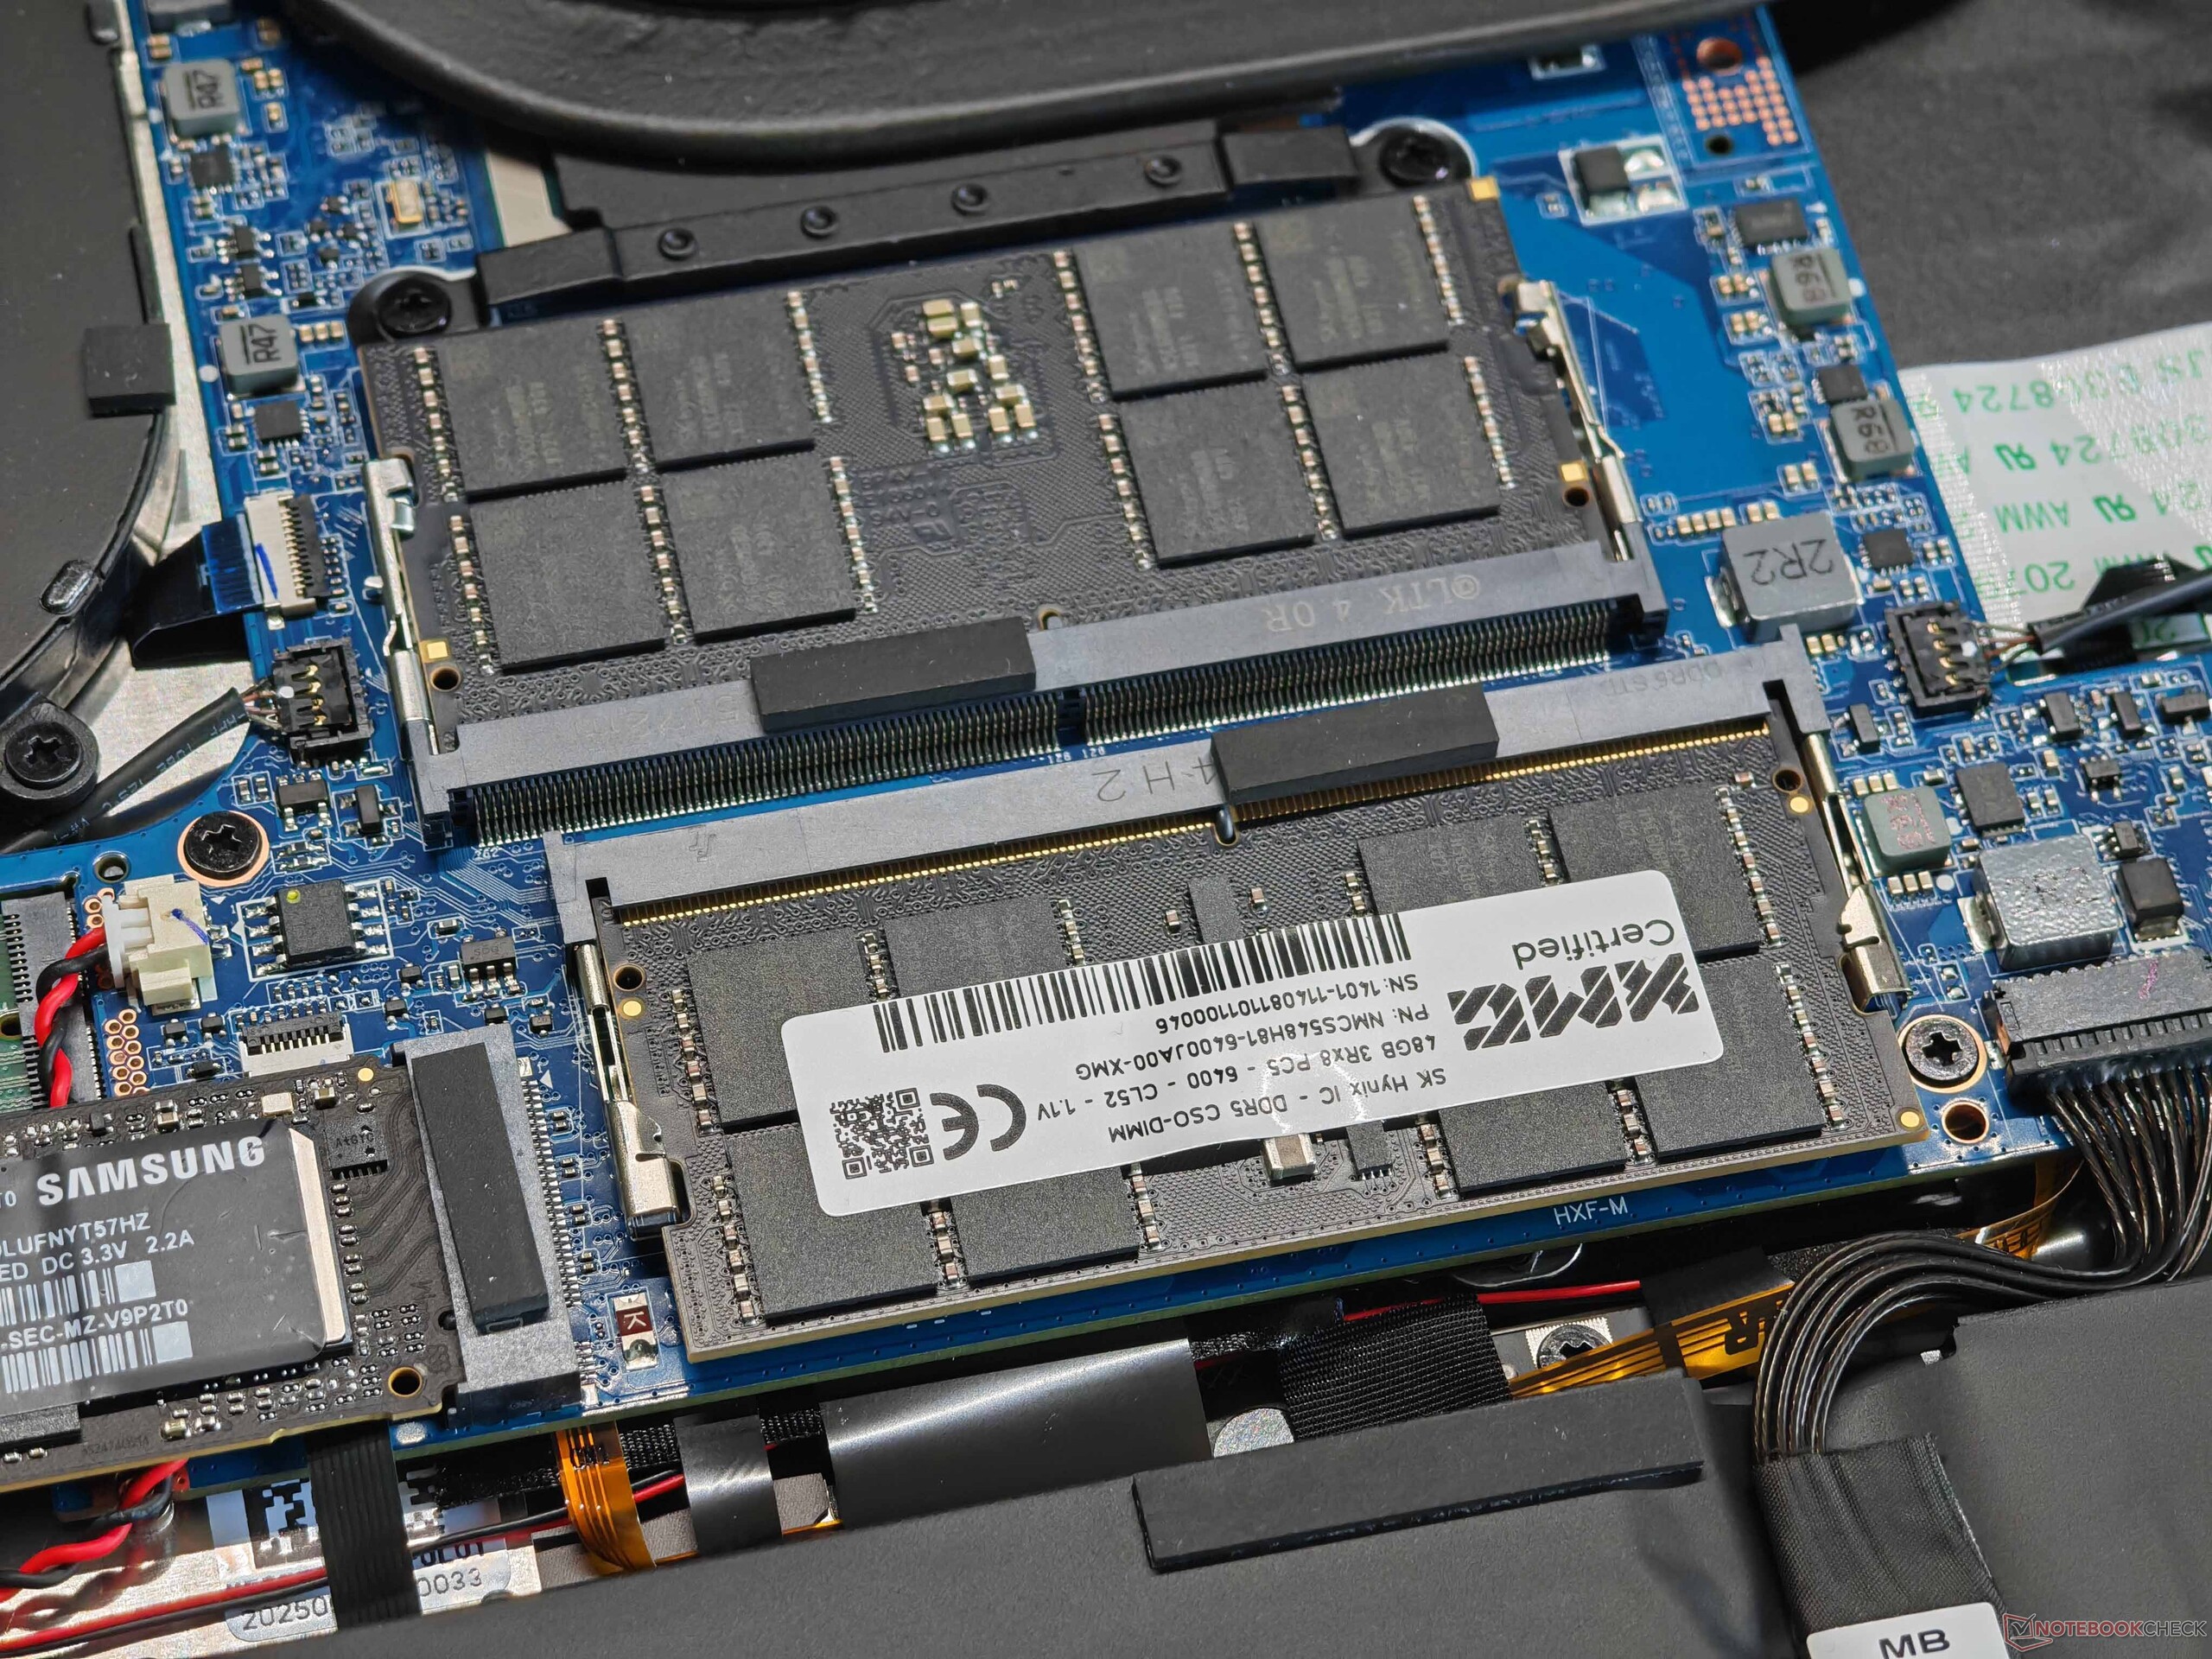
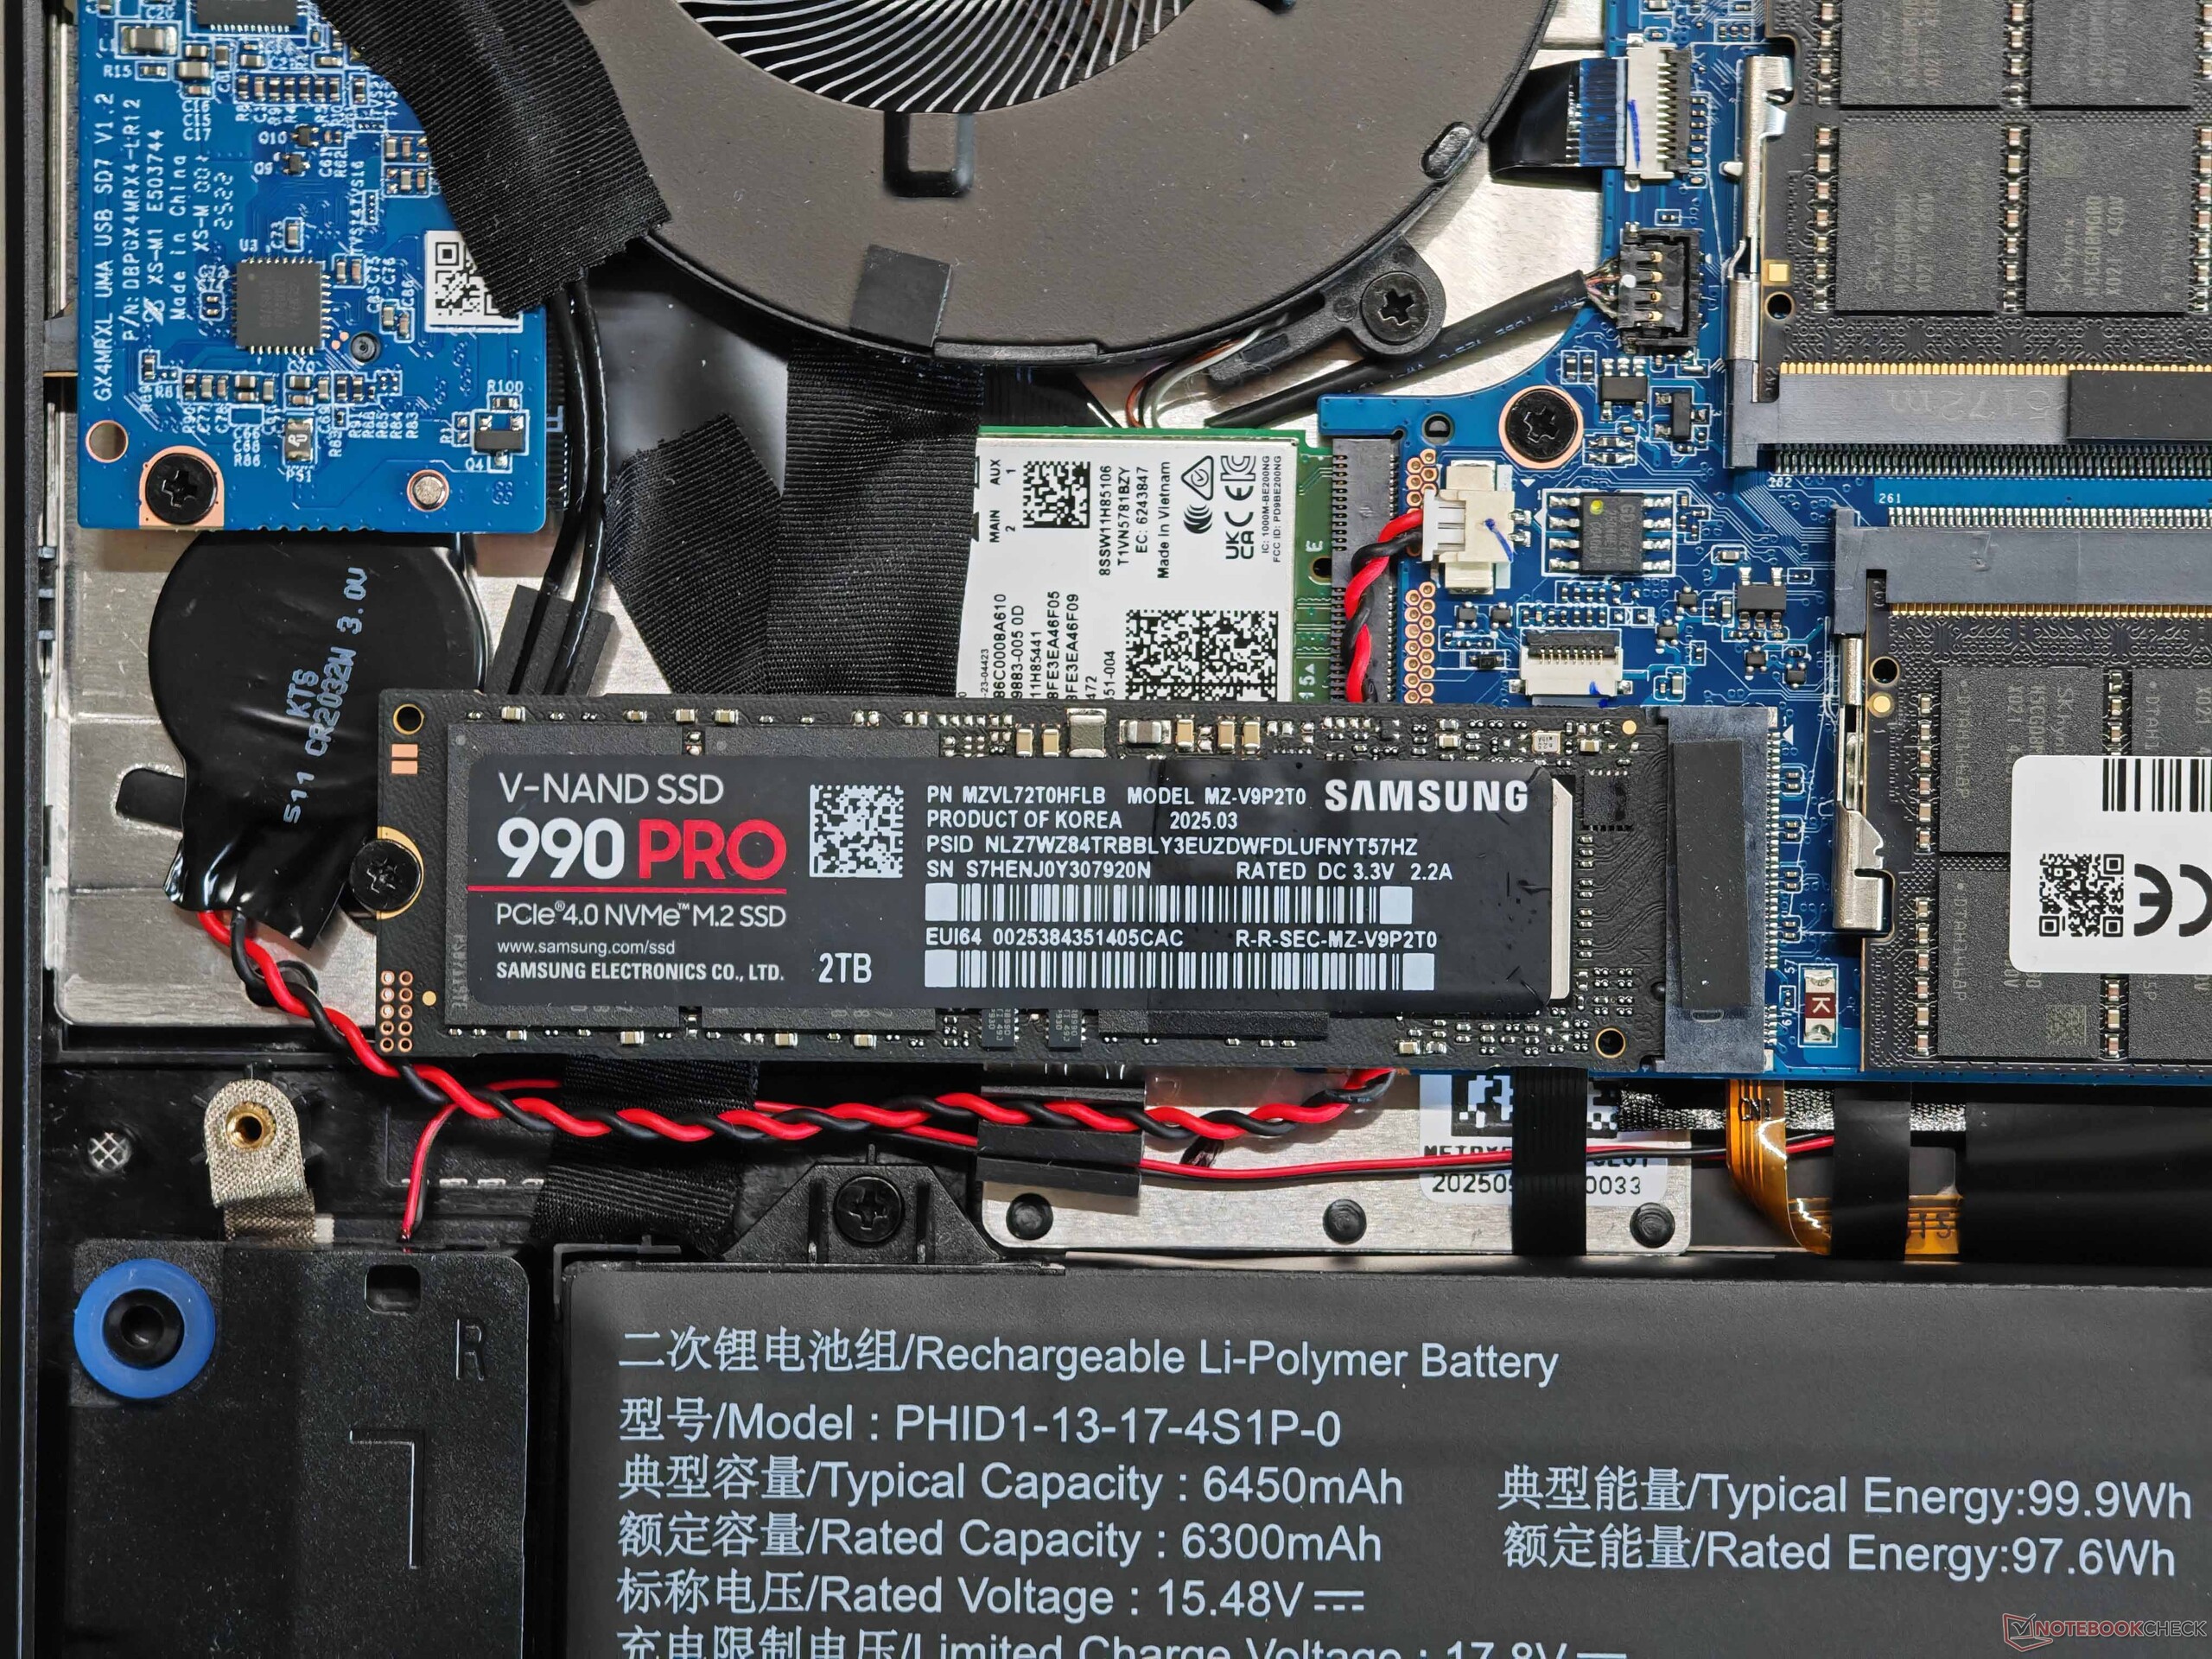
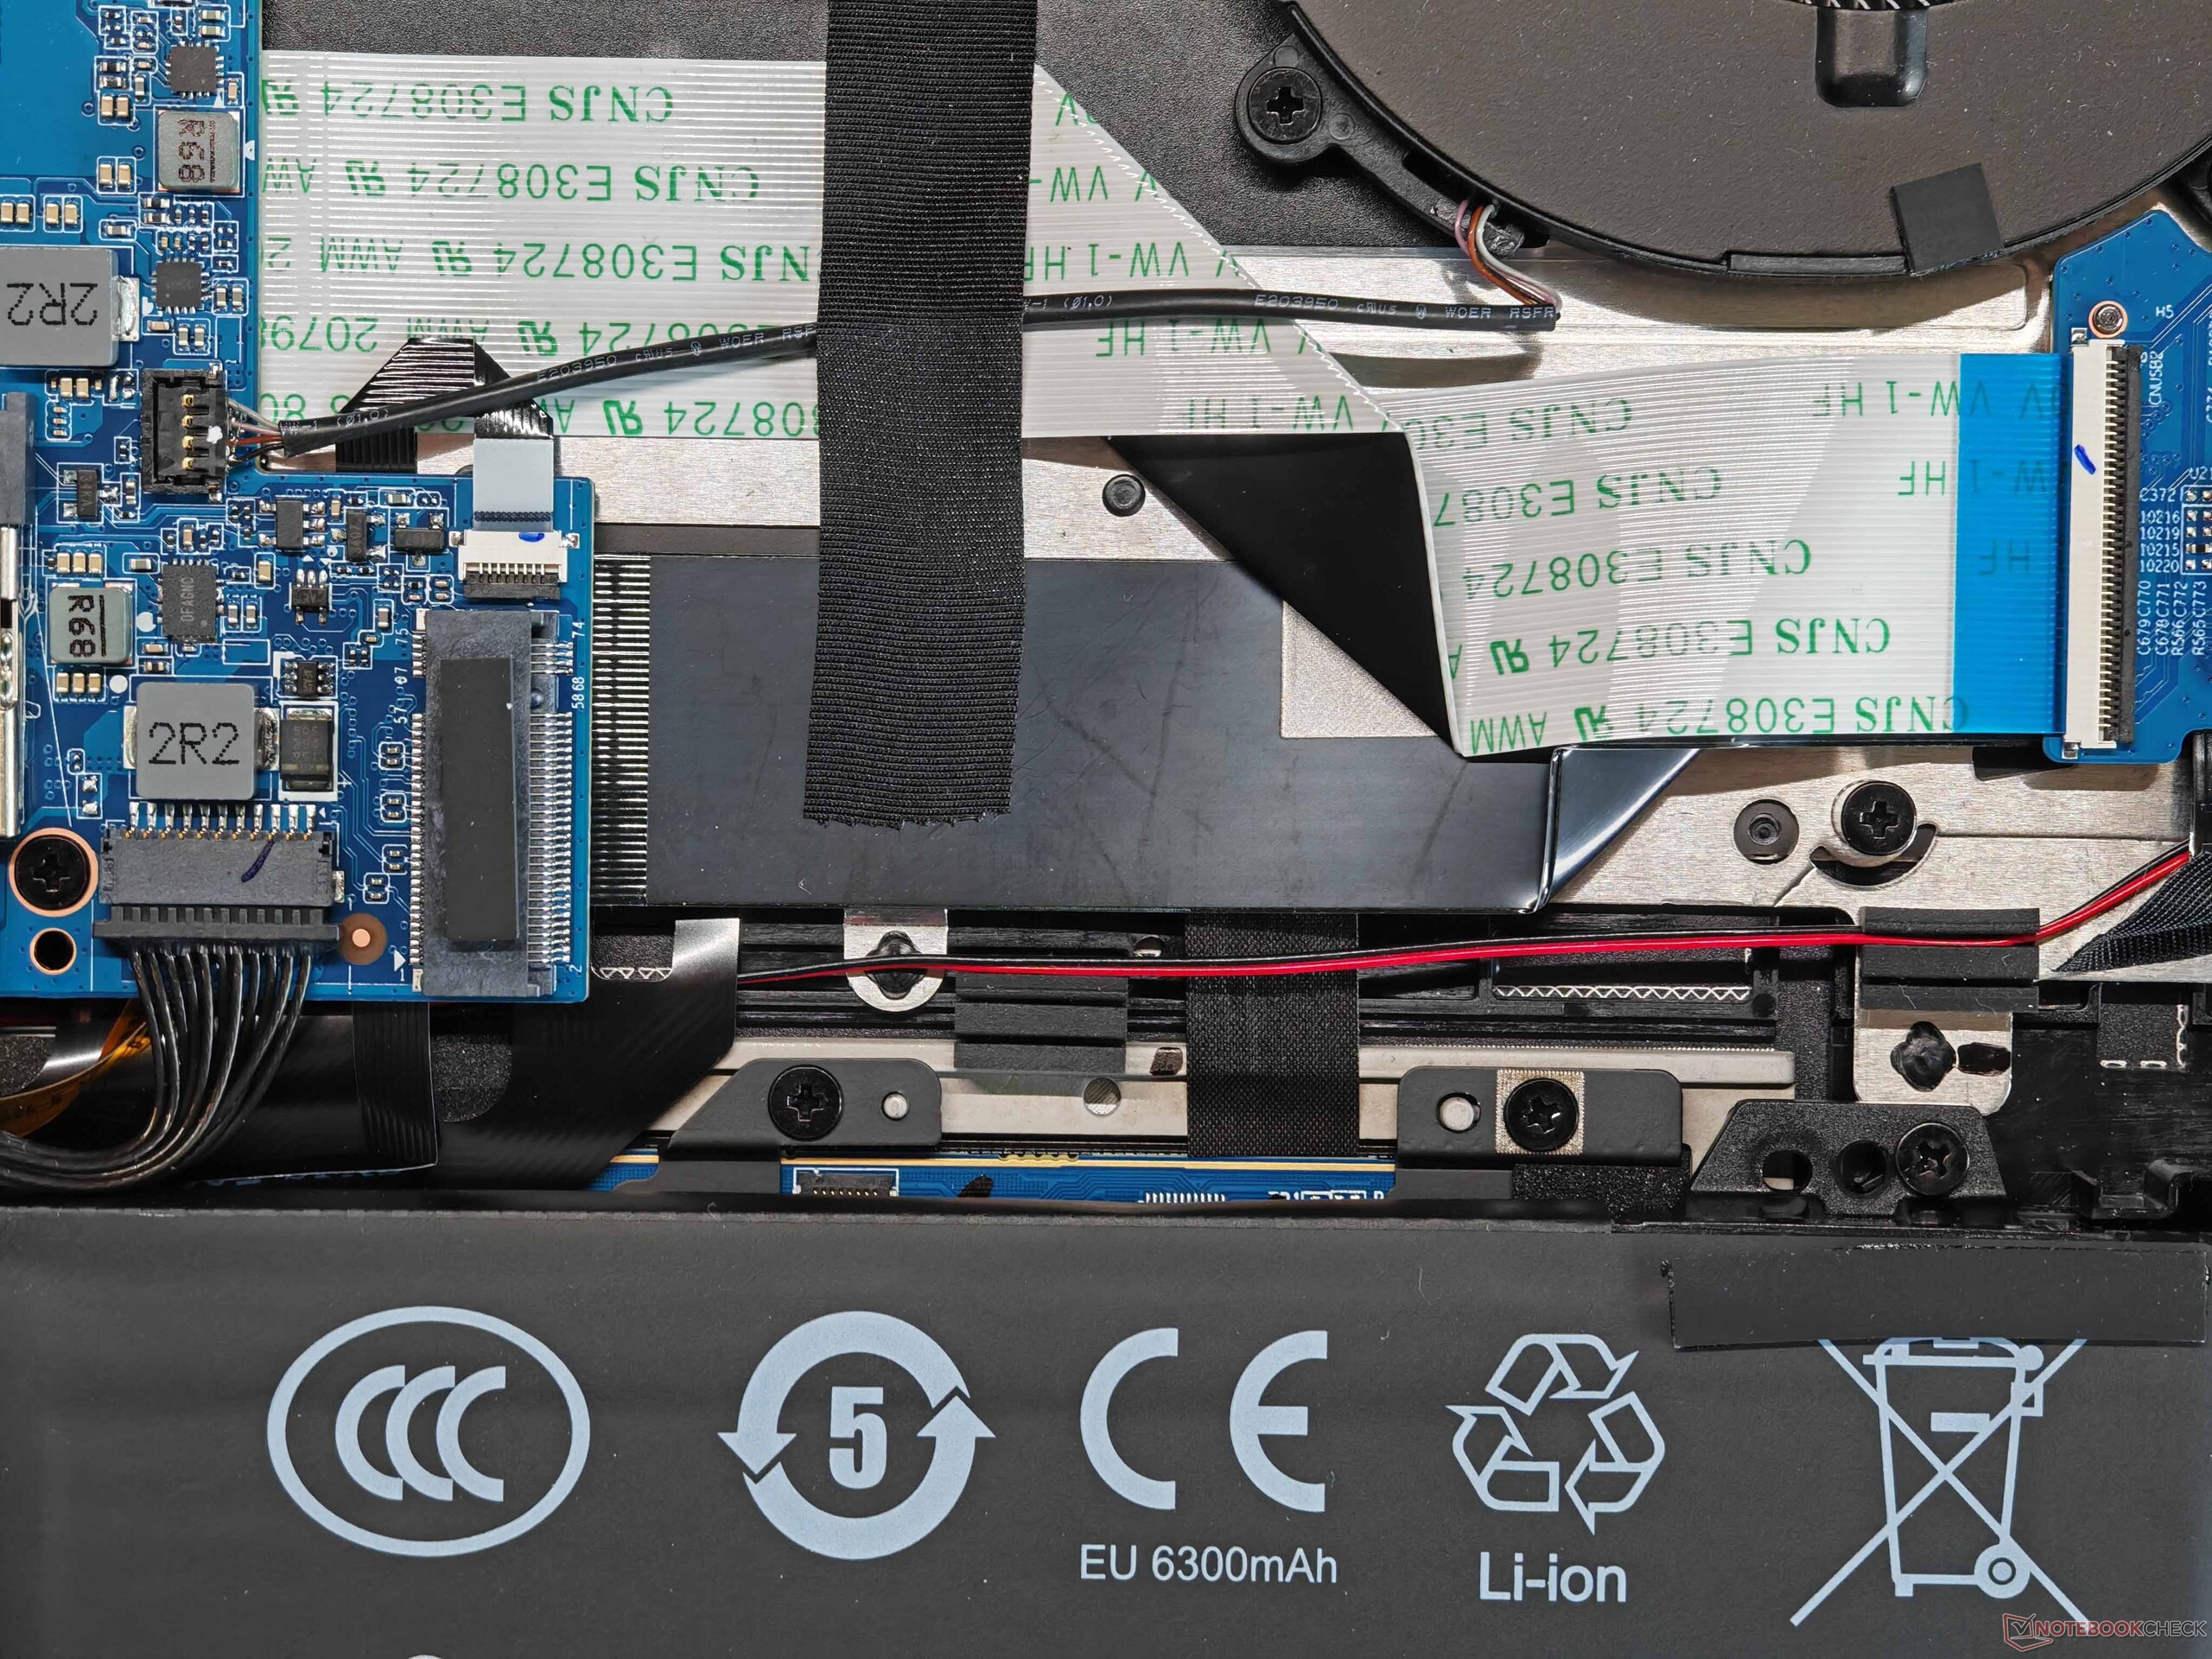
Beim Gehäuse gab es keine Veränderungen zum letztjährigen Modell und das Evo 15 ist weiterhin ein sehr schlanker und hochwertiger Rechner. Das schwarze Alu-Gehäuse ist sehr gut verarbeitet und stabil, allerdings sind schnell Fingerabdrücke sichtbar. Die Scharniere (max. Öffnungswinkel sind ebenfalls gut justiert und es gibt nur ein minimale Nachwippen. Die Wartungsmöglichkeiten (2x SO-DIMM, 2x SSD, WLAN-Modul) sind sehr gut und ein Wi-Fi-7-Modul ist ebenfalls verfügbar. In unserem Test hatten wir keine Probleme mit den Transferraten. Das Evo 15 bietet viele Anschlüsse inklusive Thunderbolt 4, HDMI sowie einem vollwertigen Kartenleser. Die 1080p-Webcam (inkl. Blende & IR-Modul) erfüllt ihren Zweck.


SD Card Reader - Update
Zusätzlich zu unserer normalen UHS-II-Karte haben wir die Leistung auch noch mit einer SD-Express-Karte (ADATA SD8.0 Express) überprüft, wo der Kartenleser laut XMG bis zu 900/500 MB/s (Lesen/Schreiben) erreichen soll. Wir ermitteln Transferraten von maximal 406 MB/s und noch 349 MB/s beim Kopieren von Bilddateien. Das ist deutlich schneller als mit normalen Karten, allerdings noch weit entfernt von der Herstellerangabe.
| SD Card Reader | |
| average JPG Copy Test (av. of 3 runs) | |
| Schenker XMG Evo 15 (M25) (ADATA SD80. Express 512 GB) | |
| Schenker XMG Evo 15 (M25) (Angelbird AV Pro V60) | |
| Durchschnitt der Klasse Multimedia (23 - 531, n=43, der letzten 2 Jahre) | |
| Microsoft Surface Laptop 7 15 Lunar Lake (Angelbird AV Pro V60) | |
| maximum AS SSD Seq Read Test (1GB) | |
| Schenker XMG Evo 15 (M25) (ADATA SD80. Express 512 GB) | |
| Schenker XMG Evo 15 (M25) (Angelbird AV Pro V60) | |
| Durchschnitt der Klasse Multimedia (27.9 - 1455, n=42, der letzten 2 Jahre) | |
| Microsoft Surface Laptop 7 15 Lunar Lake (Angelbird AV Pro V60) | |
| Networking | |
| Schenker XMG Evo 15 (M25) | |
| iperf3 transmit AXE11000 | |
| iperf3 receive AXE11000 | |
| Microsoft Surface Laptop 7 15 Lunar Lake | |
| iperf3 transmit AXE11000 | |
| iperf3 receive AXE11000 | |
| Apple MacBook Air 15 M4 | |
| iperf3 transmit AXE11000 | |
| iperf3 receive AXE11000 | |
| Lenovo ThinkPad X9-15 Aura Edition | |
| iperf3 transmit AXE11000 | |
| iperf3 receive AXE11000 | |
| Lenovo Yoga Slim 7 15ILL9 Aura | |
| iperf3 transmit AXE11000 | |
| iperf3 receive AXE11000 | |
| iperf3 transmit AXE11000 6GHz | |
| iperf3 receive AXE11000 6GHz | |

 Arc 140T, Ultra 7 255H, Samsung 990 Pro 2 TB MZVL72T0HDLB")
 Arc 140T, Ultra 7 255H, Samsung 990 Pro 2 TB MZVL72T0HDLB")
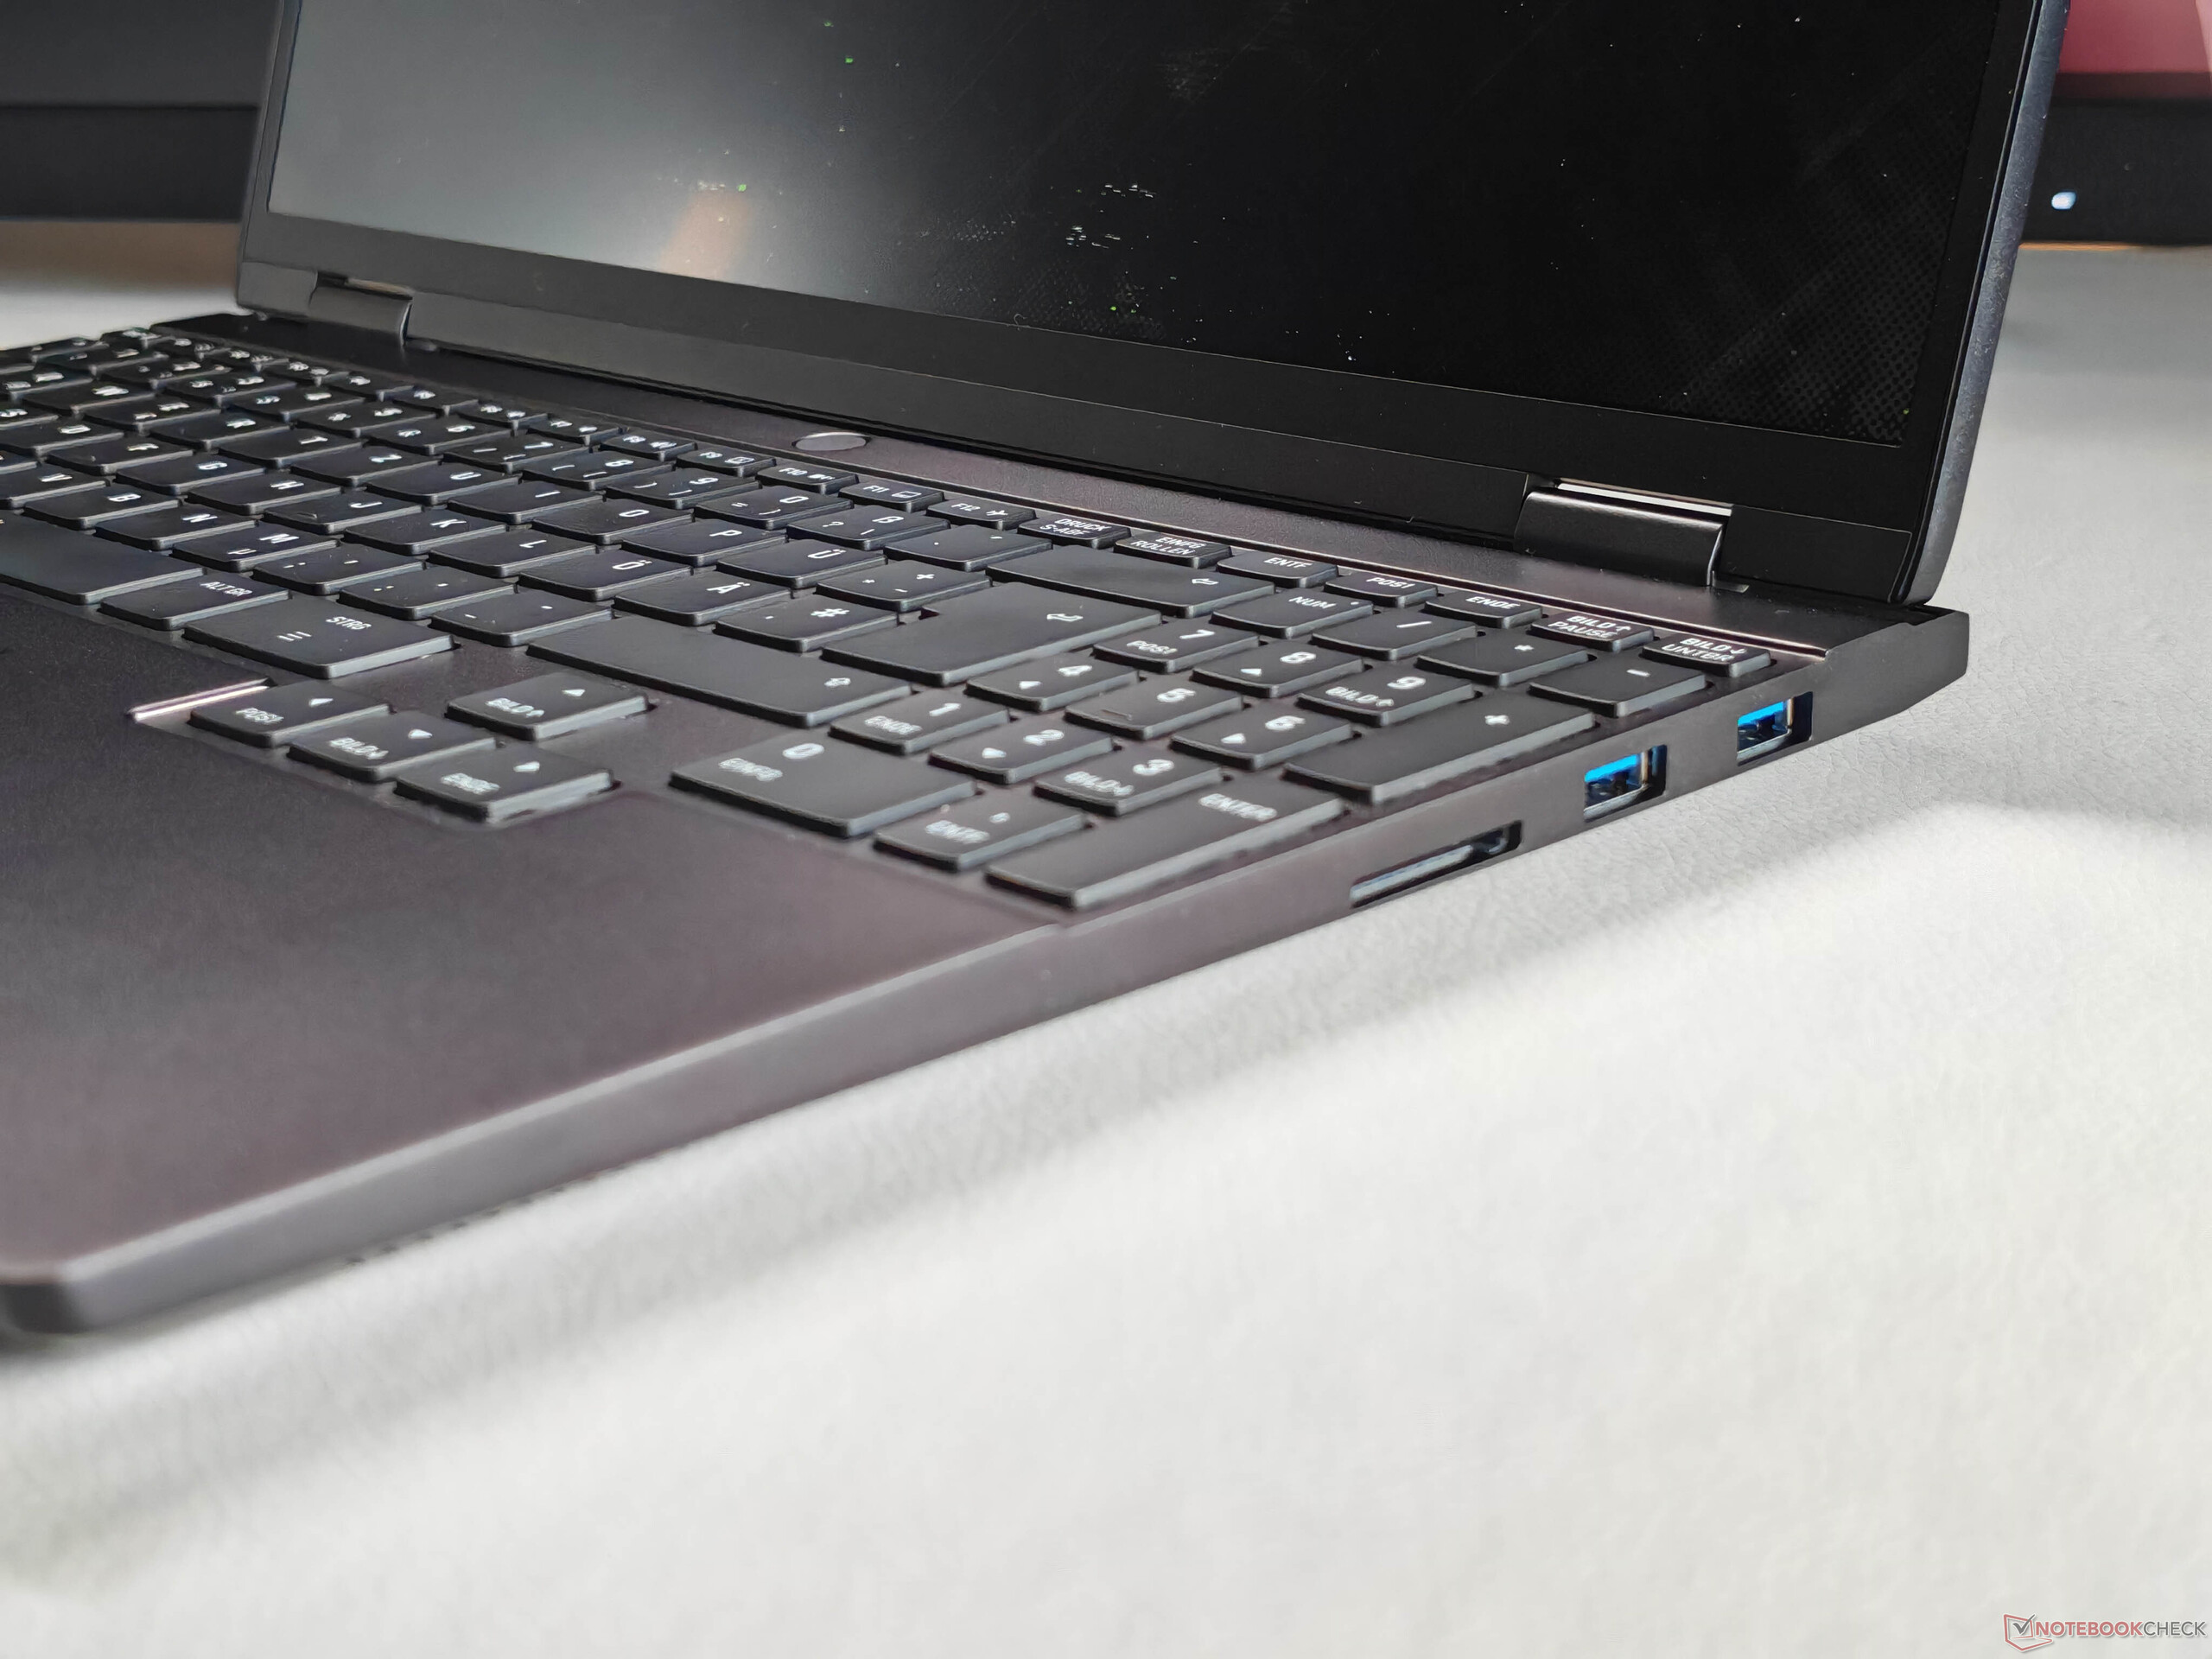
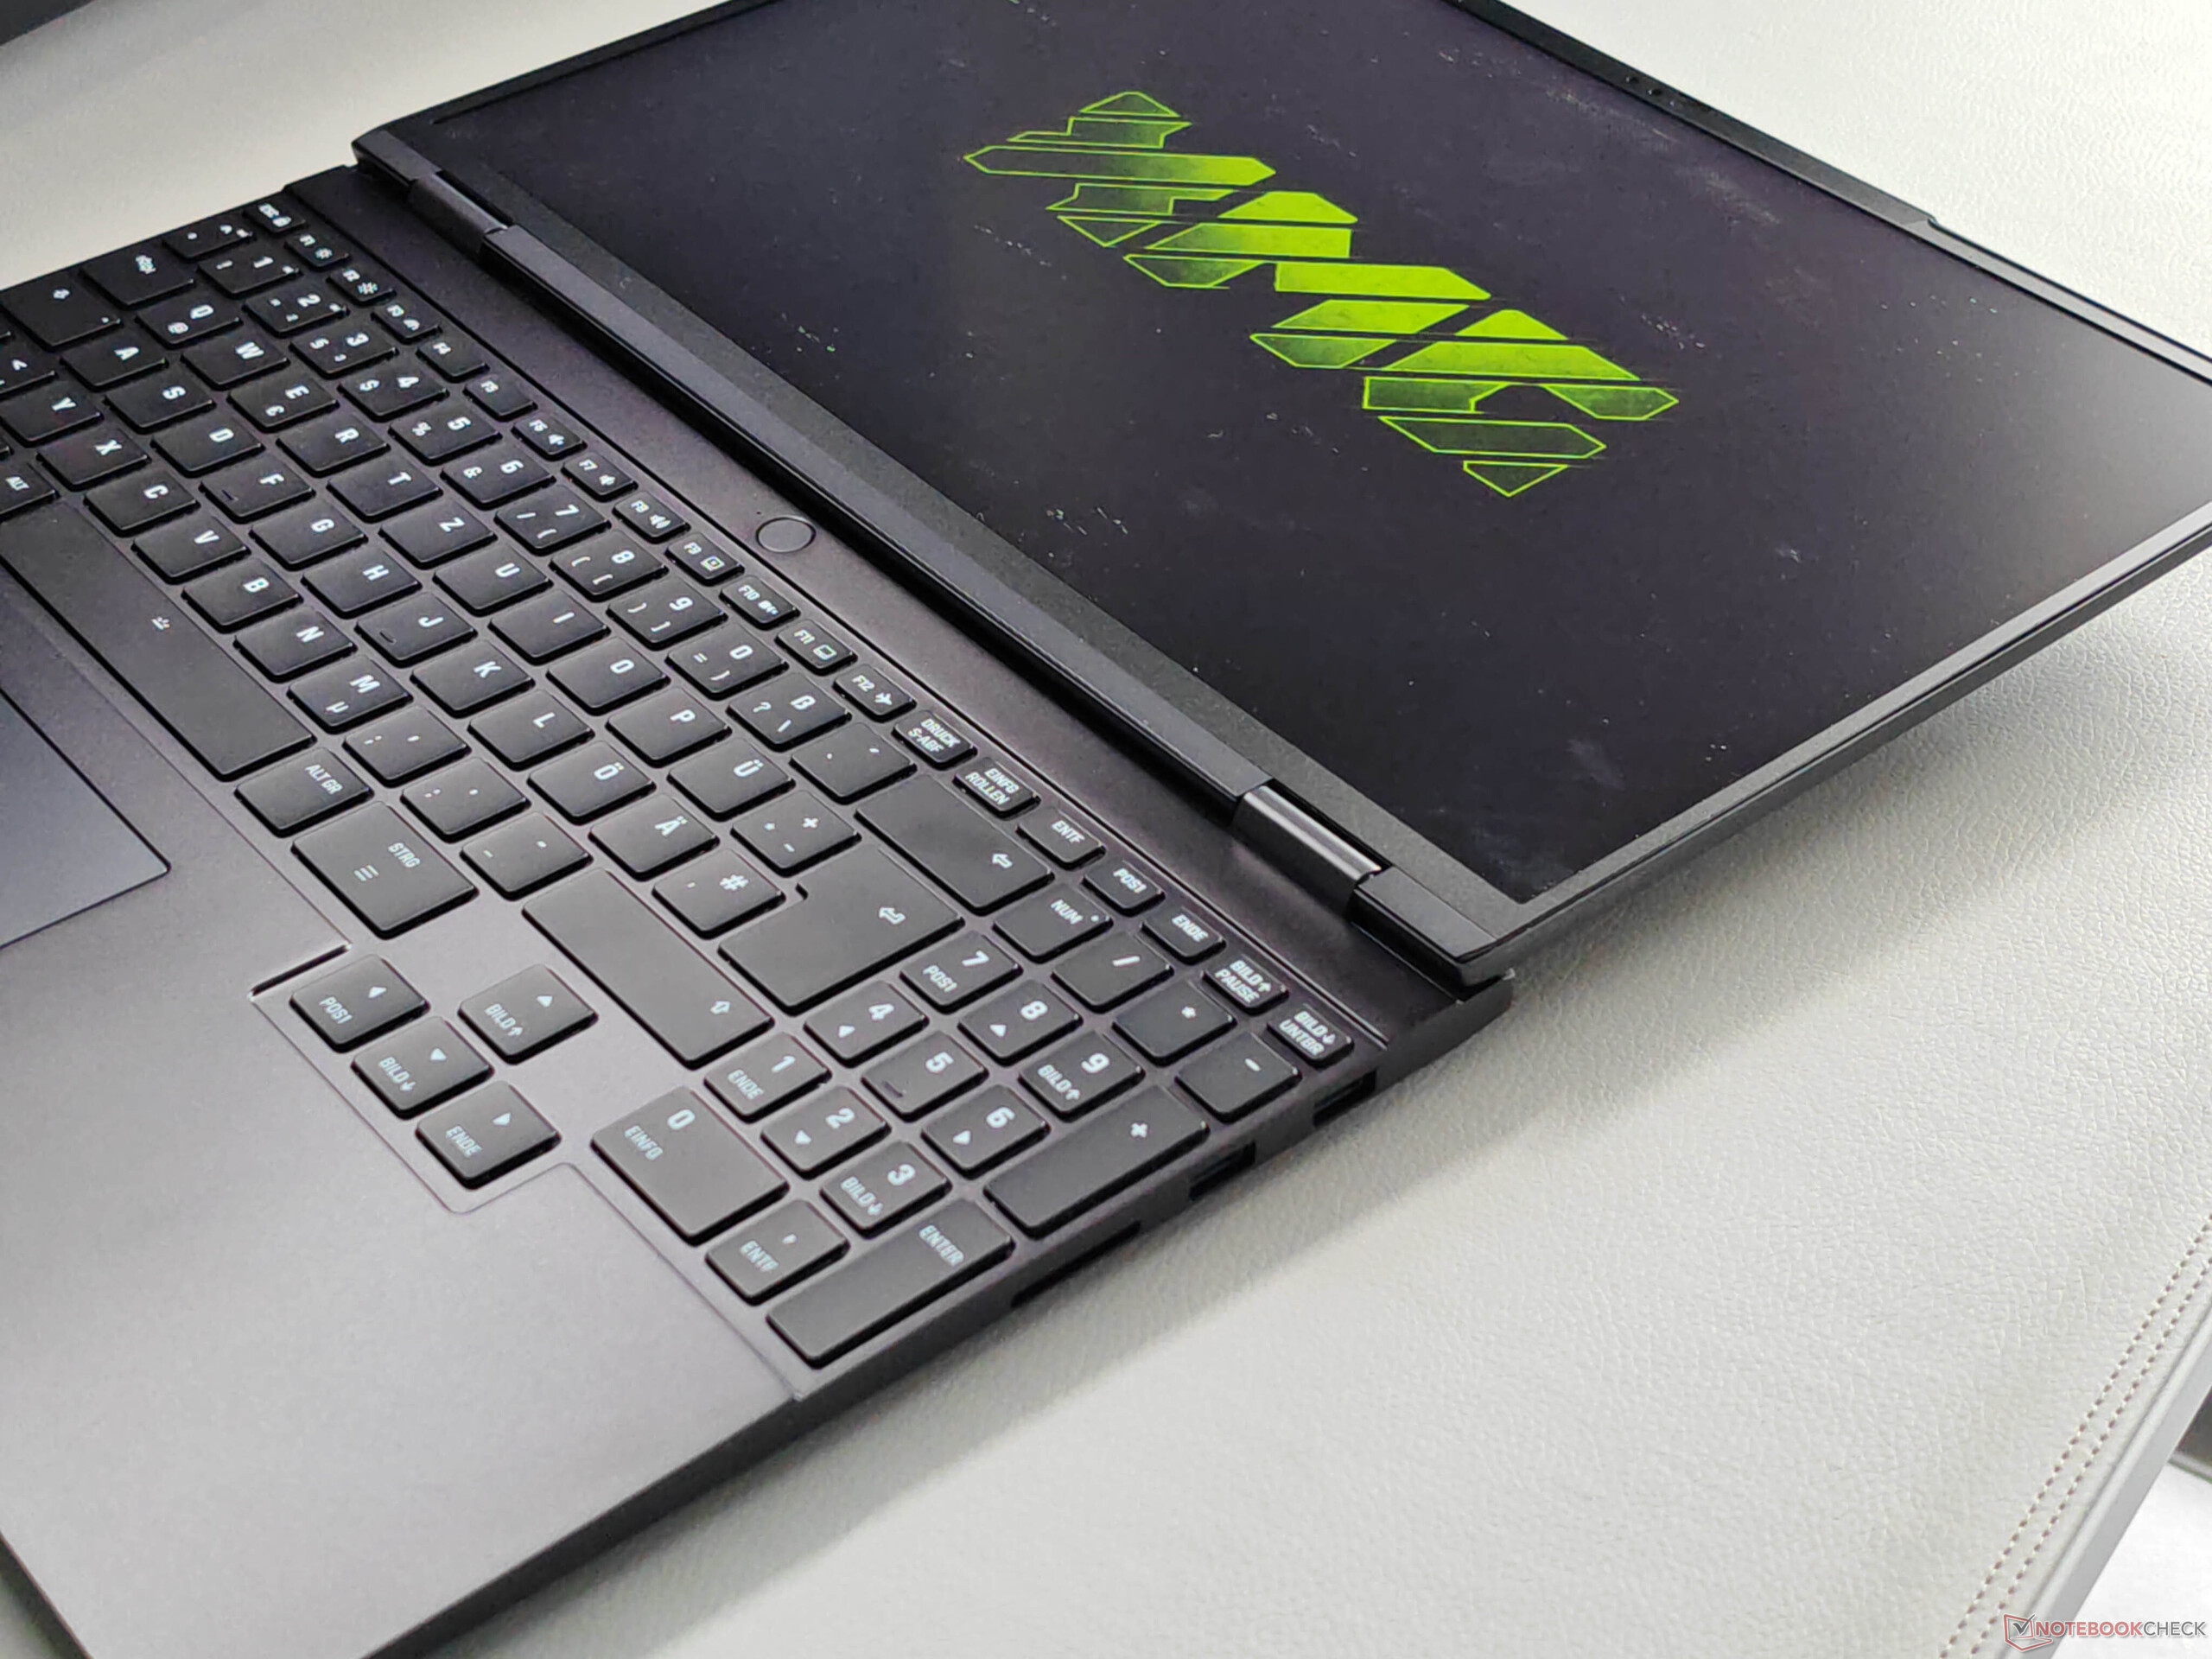
Eingabegeräte
Die Tastatur mach Gebrauch von der gesamten Gehäusebreite und bietet einen dedizierten Nummernblock sowie große Pfeiltasten. Insgesamt ist der Tippkomfort sehr gut und auch lange Texte lassen sich angenehm schreiben, lediglich die größeren Tasten sind etwas lauter. Die weiße Beleuchtung bietet vier Intensitätsstufen. Das ClickPad ist etwas nach links versetzt und bietet gute Gleiteigenschaften, die mechanischen Klicks im unteren Bereich sind aber etwas laut.


Display - IPS mit 240 Hz

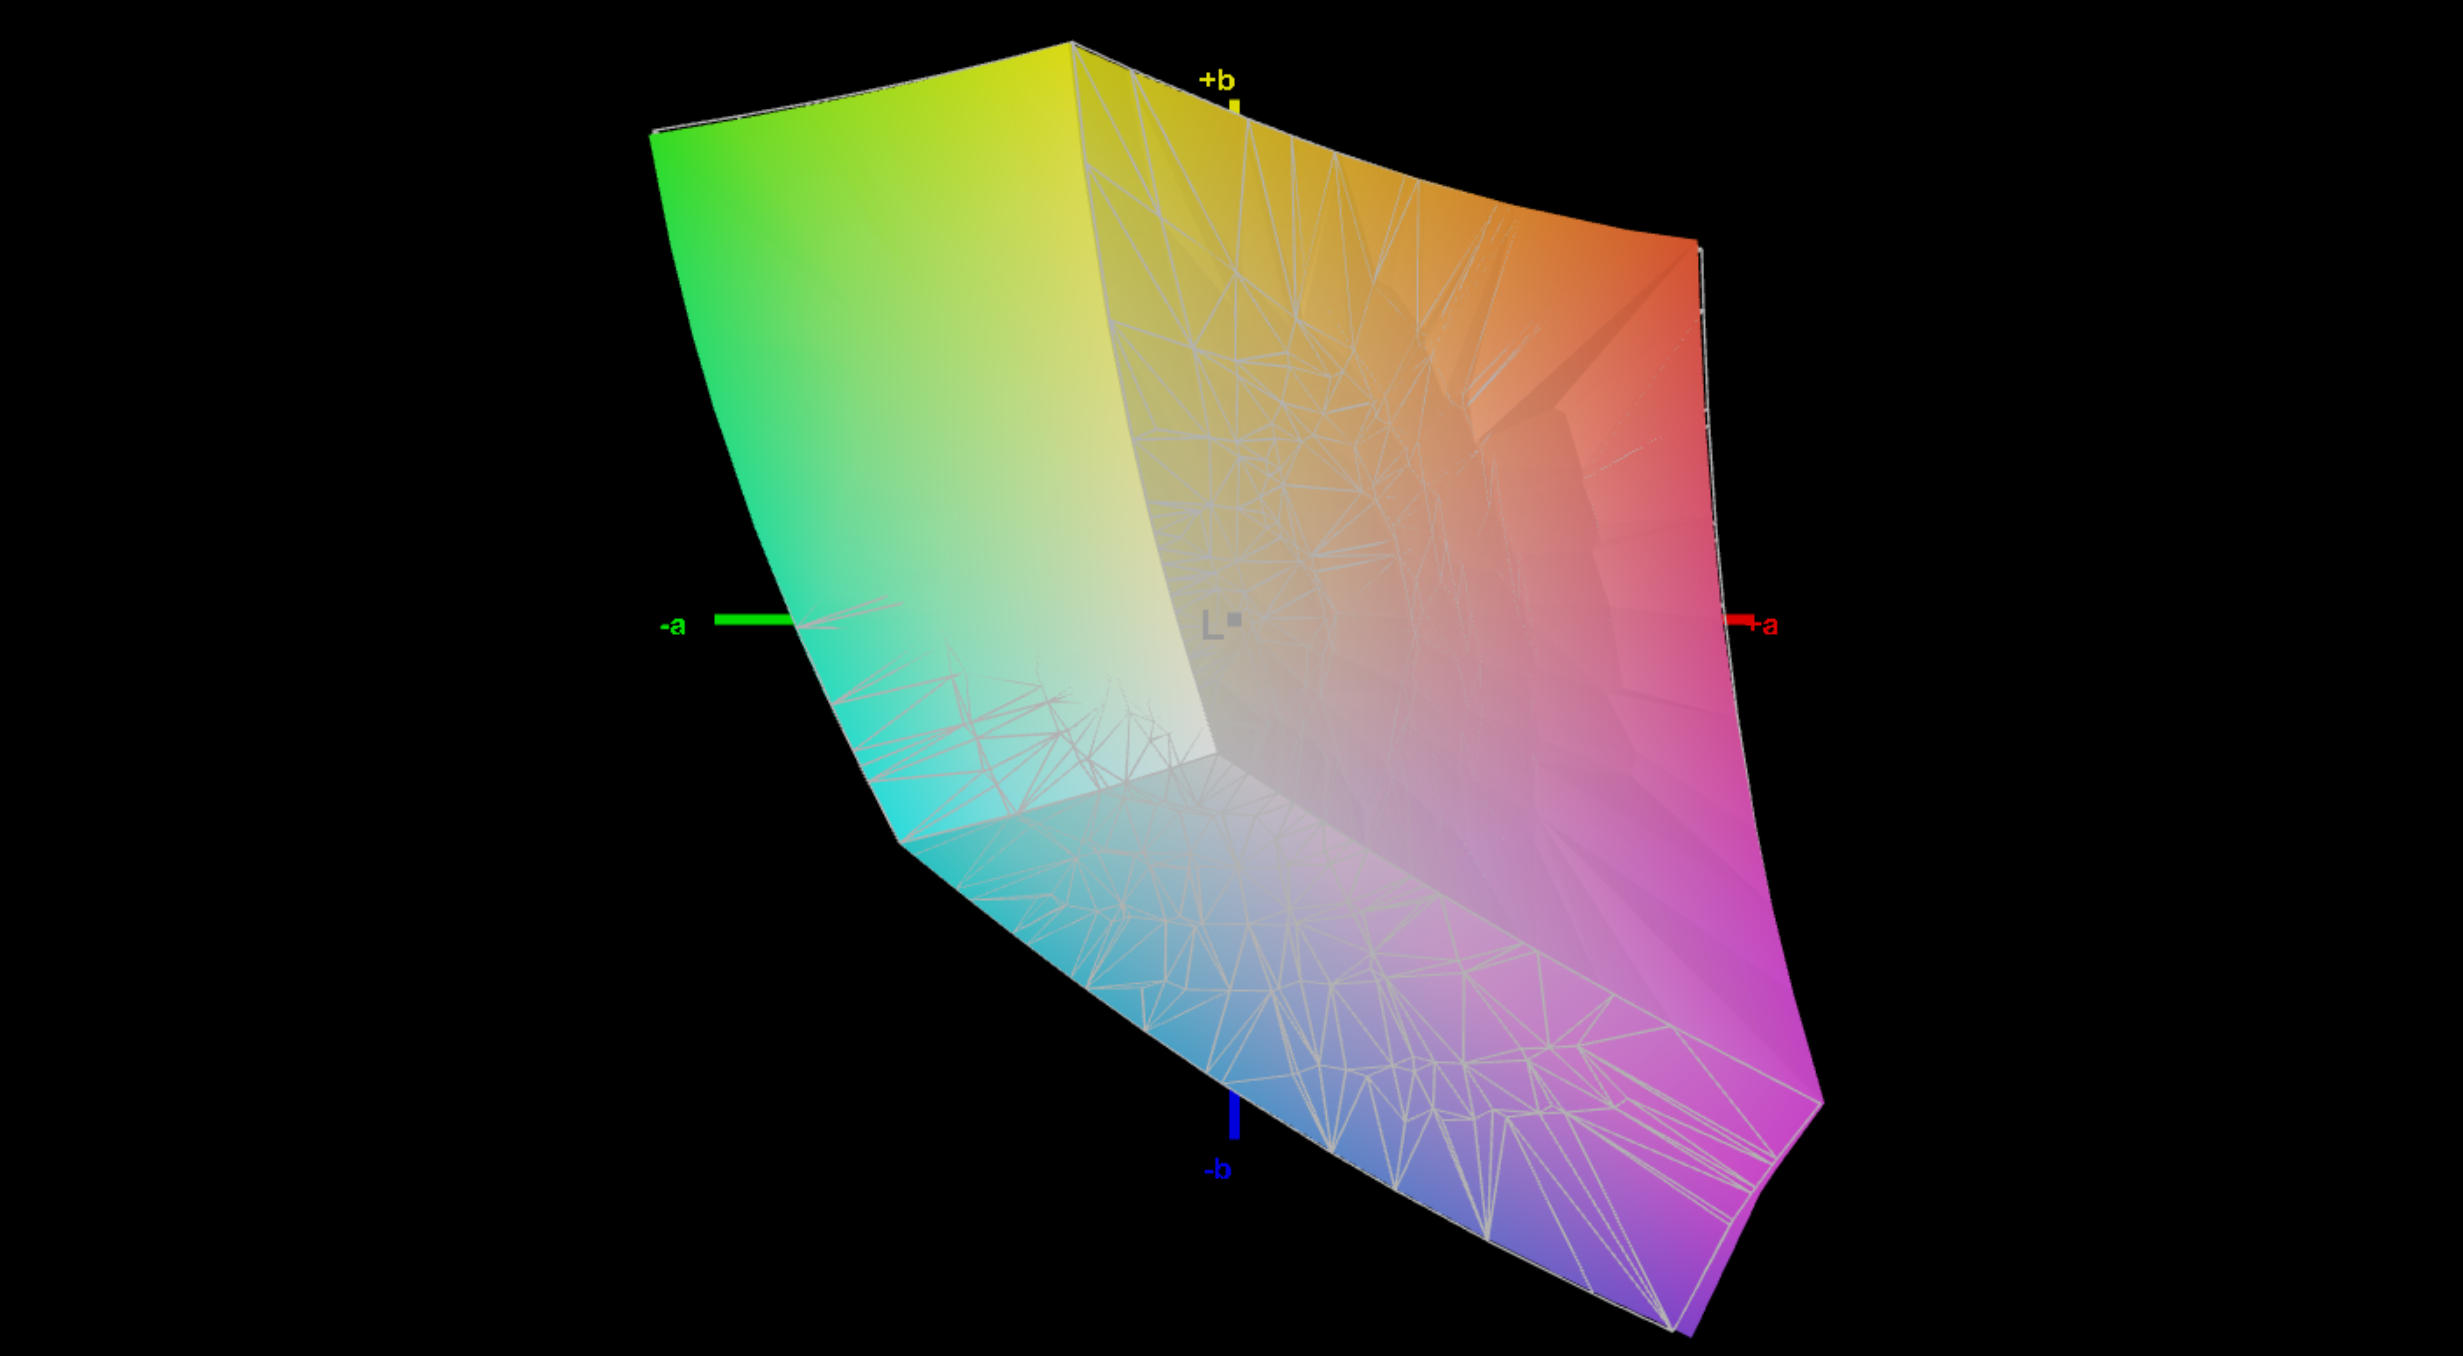
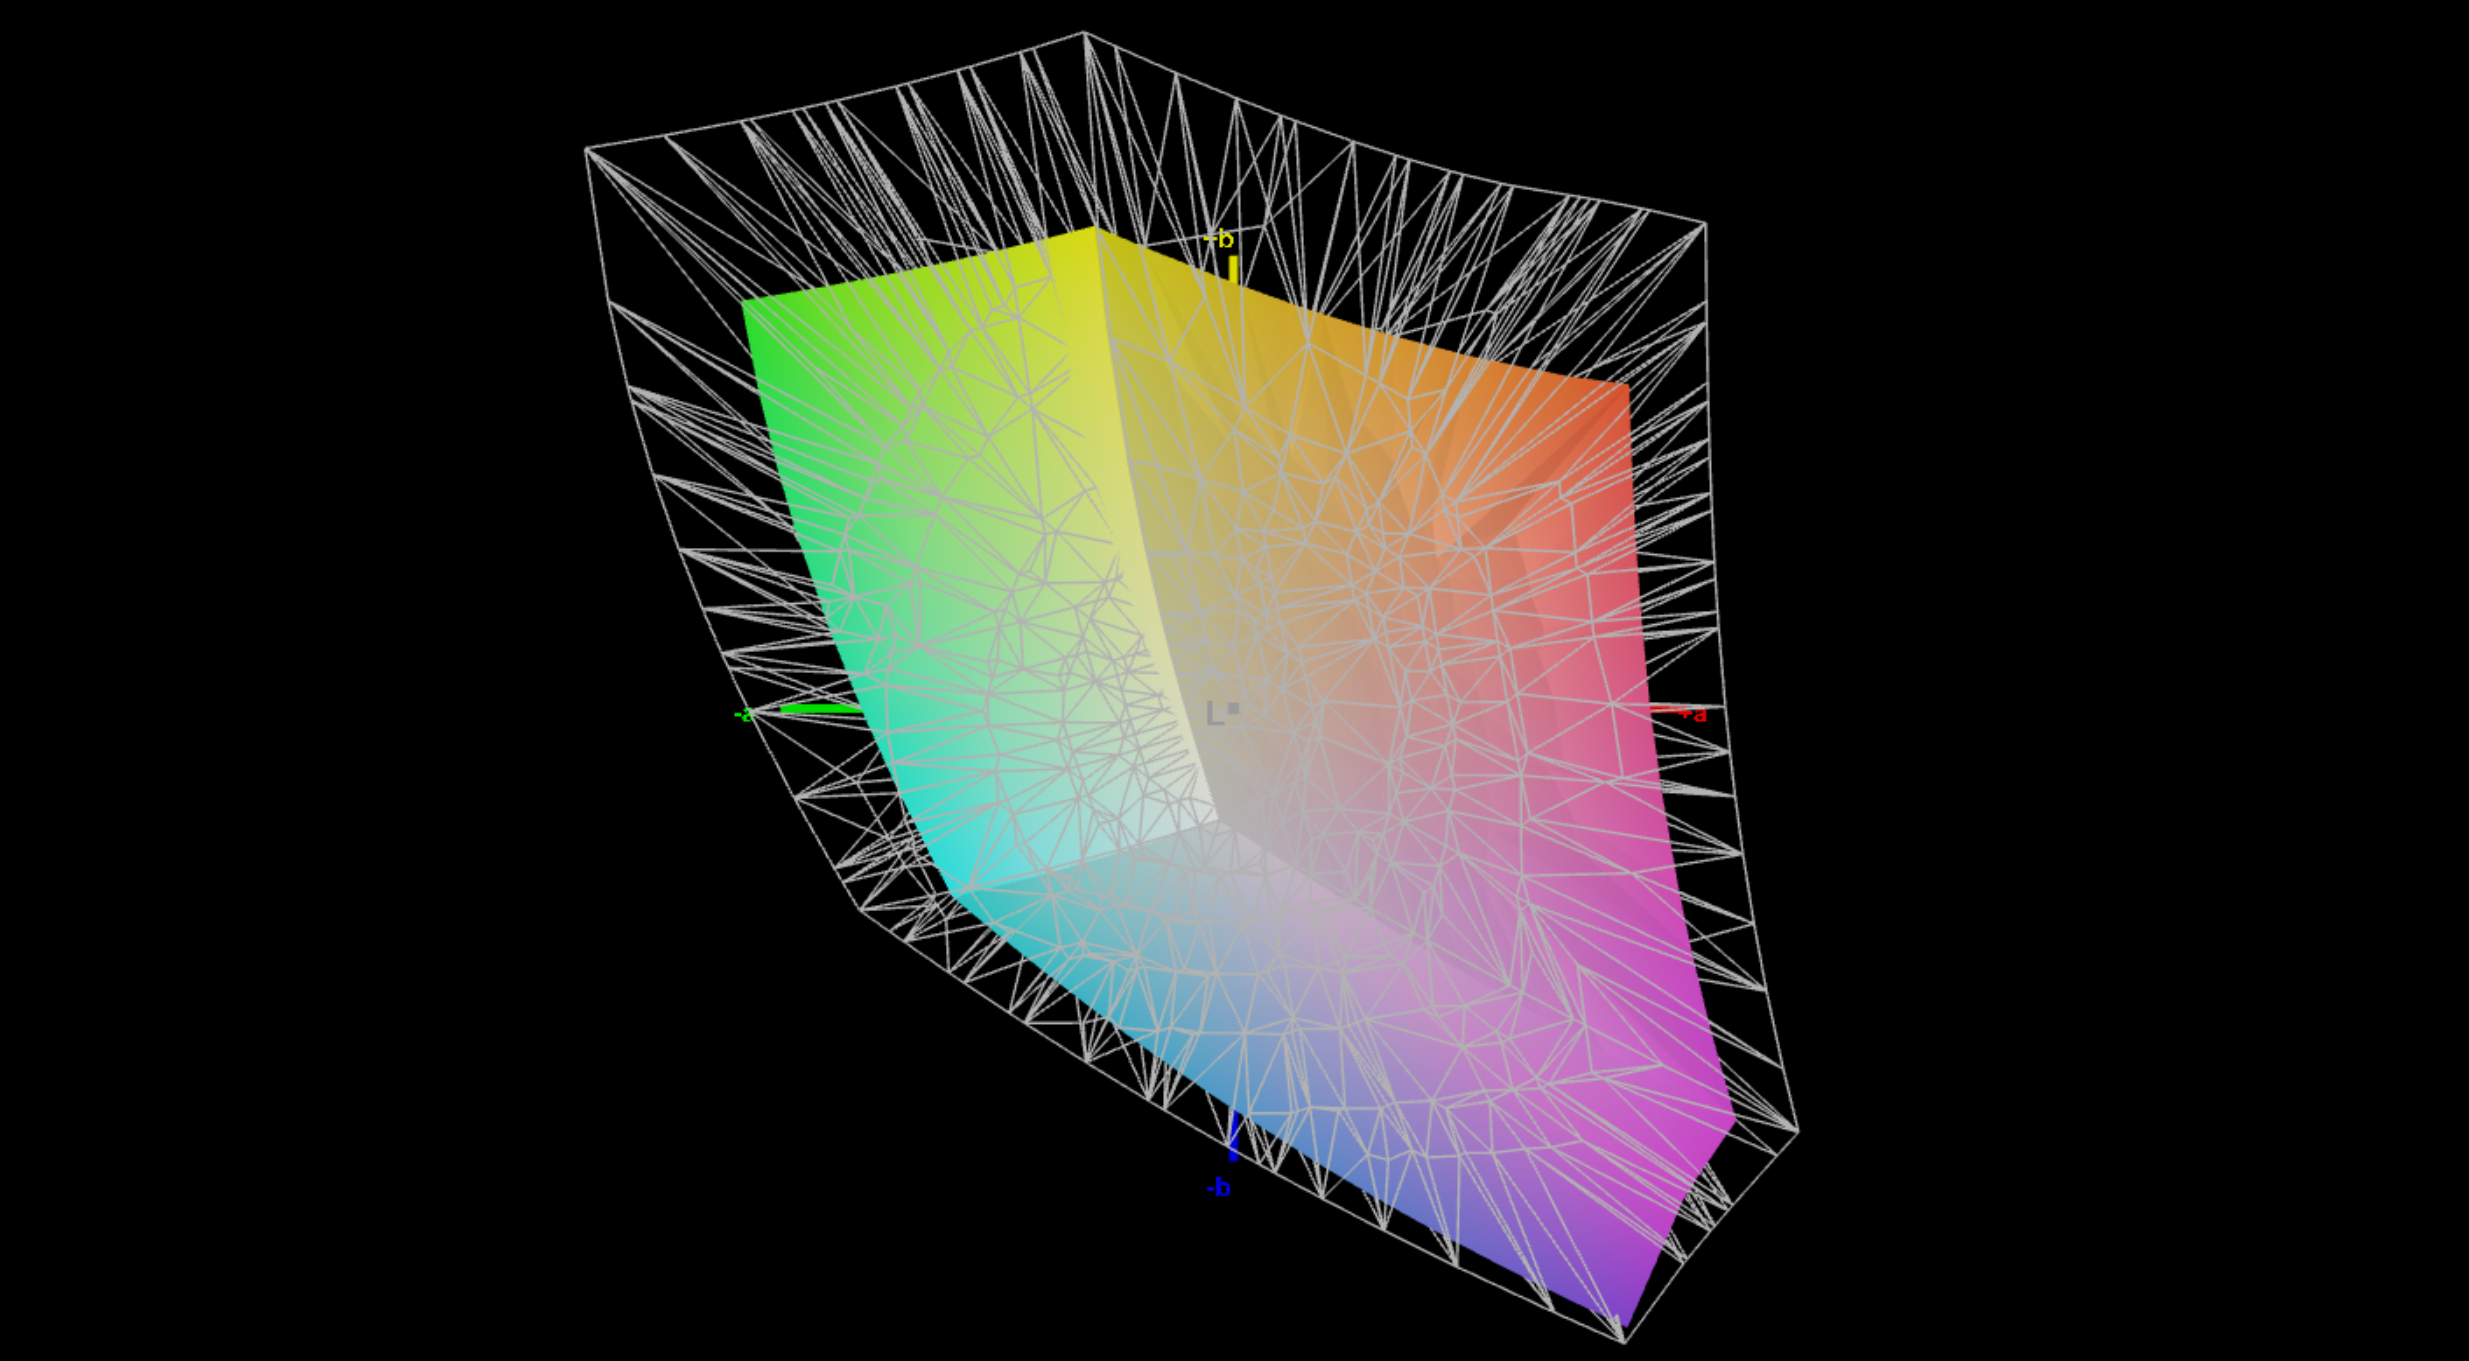
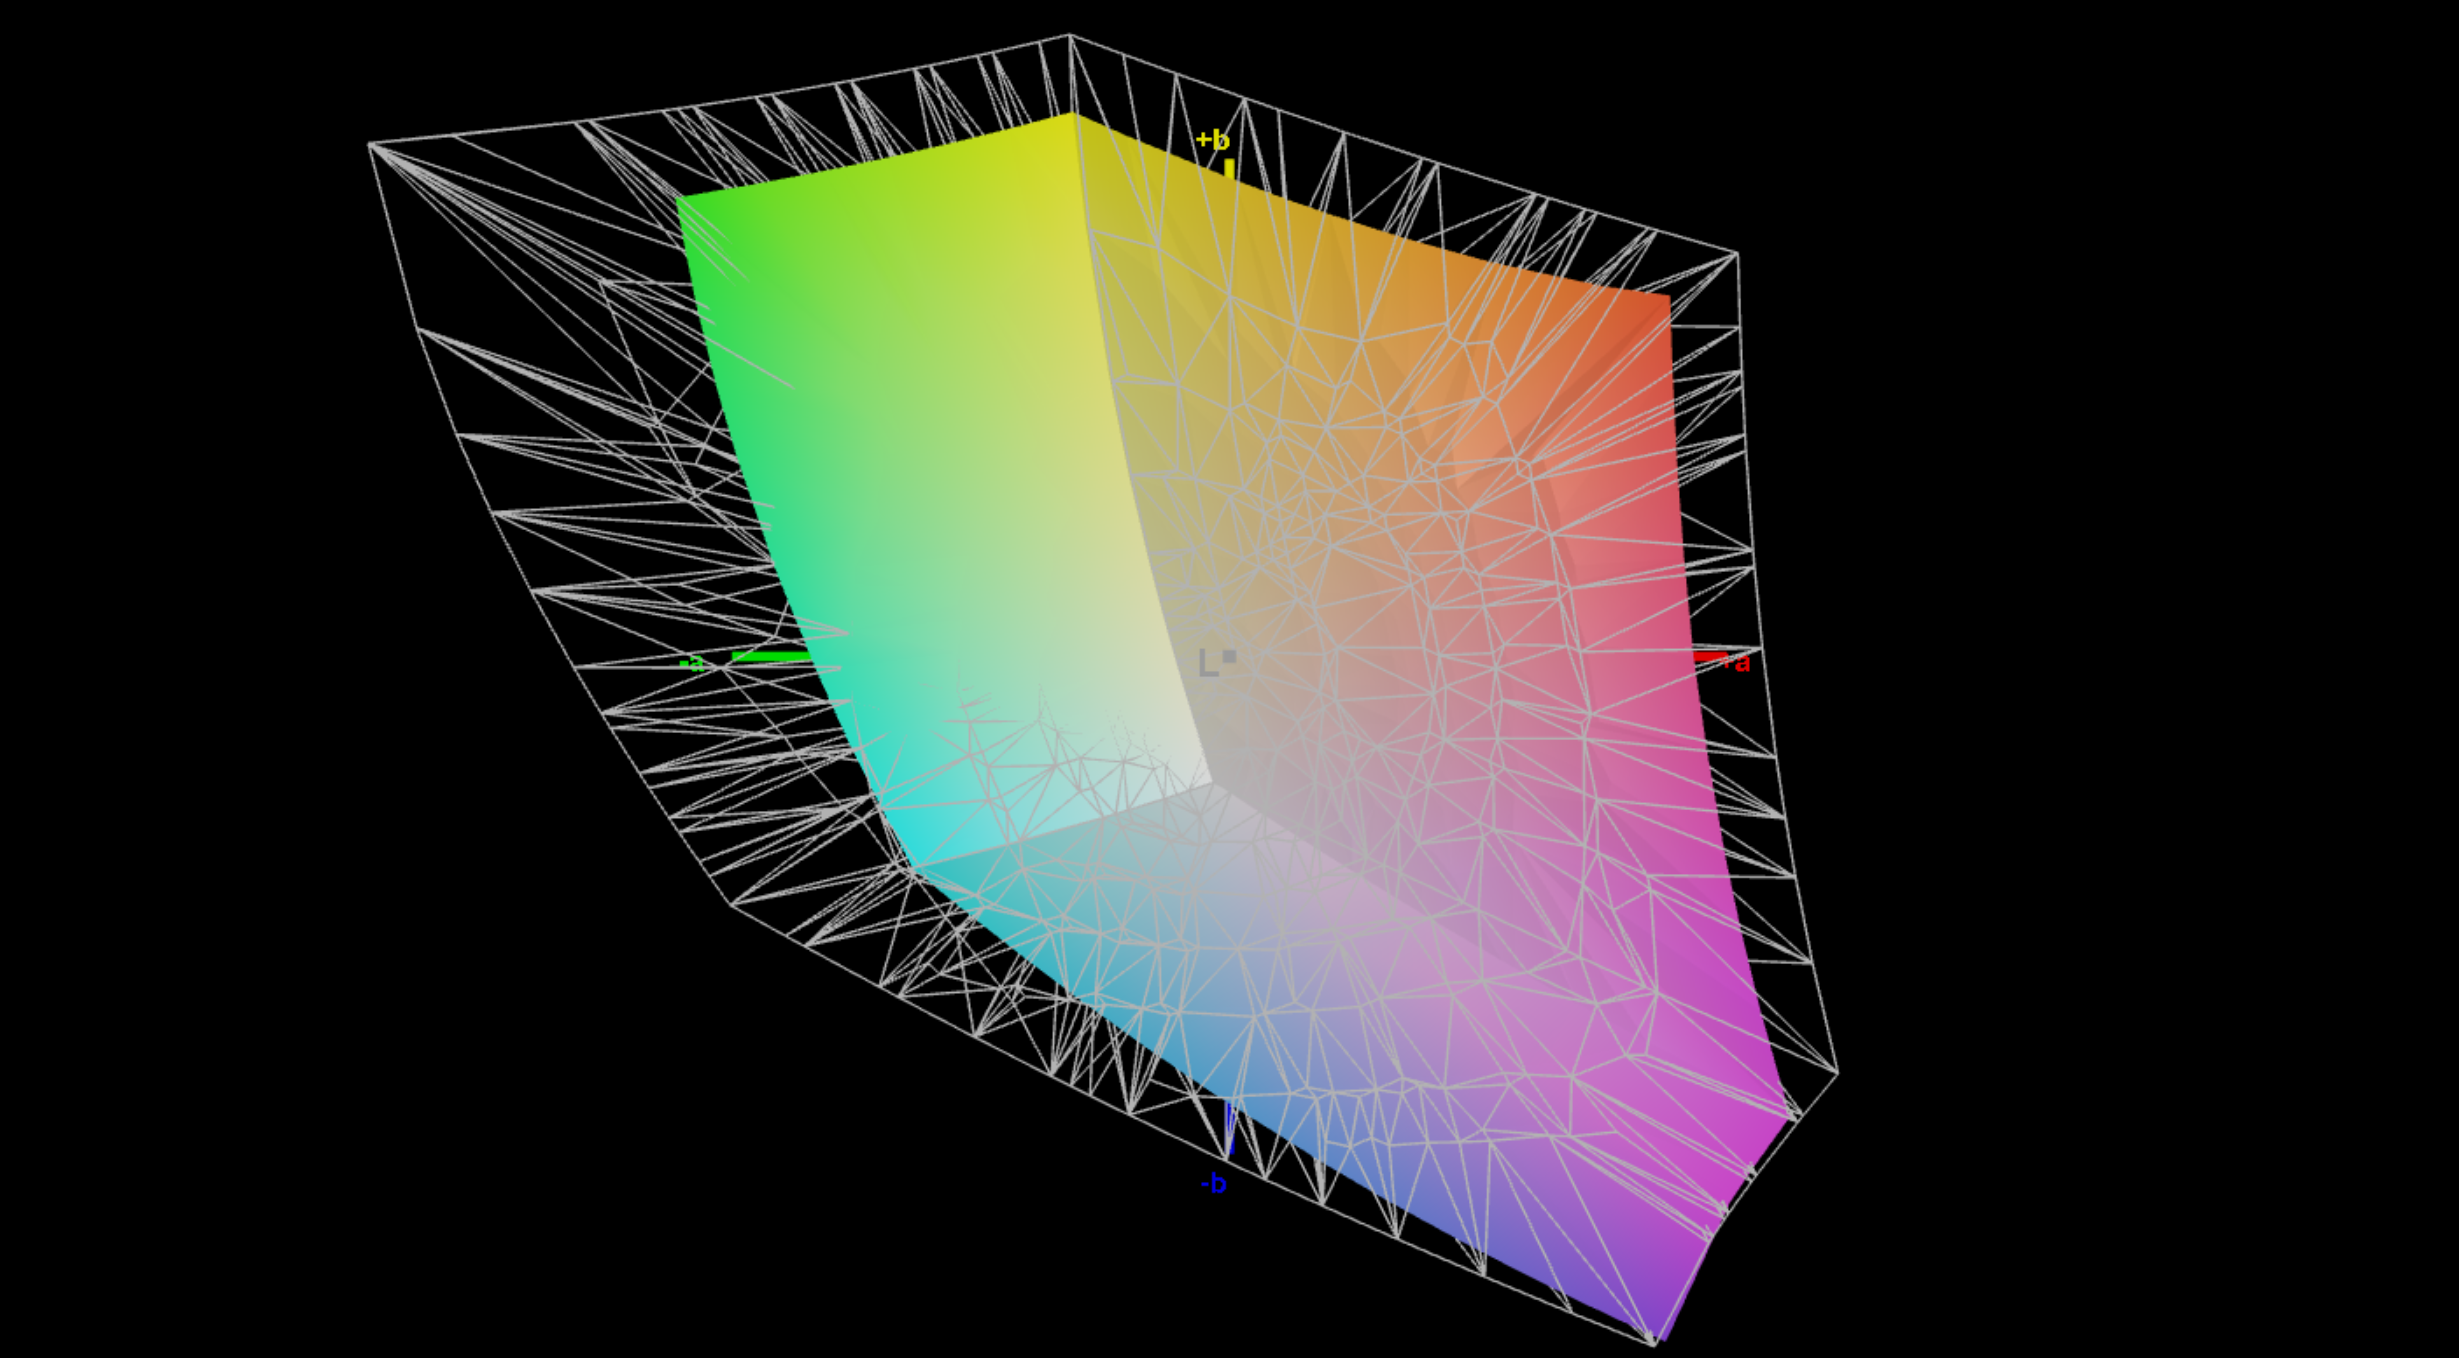
Die technischen Daten des matten IPS-Panels (2.560 x 1.600 Pixel, 16:10) mit 240 Hz haben sich nicht verändert, die Panel-ID ist aber anders. Die subjektive Bildqualität ist nach wie vor sehr gut und auch helle Flächen wirken nicht körnig. Der sRGB-Farbraum wird vollständig abgedeckt, die knalligen Farben von spiegelnden OLED-Panels darf man hier aber natürlich nicht erwarten. Dafür gibt es aber auch keine Probleme mit PWM und selbst Lichthöfe sind hier praktisch nicht vorhanden.
Die Helligkeitsangabe von 500 cd/m² wird erneut deutlich übertroffen, der einzige Schwachpunkt bleibt aber der erhöhte Schwarzwert (0,51 cd/m²), der wiederum zu einem recht geringen maximalen Kontrastverhältnis von ~1.100:1 führt. Die werksseitige Kalibrierung ist bereits sehr gut und wir konnten sie mit unserer eigenen Kalibrierung auch nicht weiter verbessern.
| |||||||||||||||||||||||||
Ausleuchtung: 89 %
Helligkeit Akku: 555 cd/m²
Kontrast: 1088:1 (Schwarzwert: 0.51 cd/m²)
ΔE ColorChecker Calman: 1.4 | ∀{0.5-29.43 Ø4.72}
ΔE Greyscale Calman: 2 | ∀{0.09-98 Ø4.97}
68.5% AdobeRGB 1998 (Argyll 3D)
99.5% sRGB (Argyll 3D)
66.6% Display P3 (Argyll 3D)
Gamma: 2.27
CCT: 6864 K
| Schenker XMG Evo 15 (M25) NE153QDM-NZ2, IPS, 2560x1600, 15.3", 240 Hz | Microsoft Surface Laptop 7 15 Lunar Lake LQ150P1JX61, IPS, 2496x1664, 15", 120 Hz | Apple MacBook Air 15 M4 IPS, 2880x1864, 15.3", 60 Hz | Lenovo ThinkPad X9-15 Aura Edition ATNA53JB01-0, OLED, 2880x1800, 15.3", 120 Hz | Lenovo Yoga Slim 7 15ILL9 Aura CSOT T3 MNF307ZB1-1, IPS, 2880x1800, 15.3", 120 Hz | Schenker XMG Evo 15 (M24) NE153QDM-NZ1, IPS, 2560x1600, 15.3", 240 Hz | |
|---|---|---|---|---|---|---|
| Display | 25% | 26% | 30% | 26% | 7% | |
| Display P3 Coverage (%) | 66.6 | 98.1 47% | 98.7 48% | 100 50% | 98.8 48% | 73.6 11% |
| sRGB Coverage (%) | 99.5 | 100 1% | 100 1% | 100 1% | 100 1% | 100 1% |
| AdobeRGB 1998 Coverage (%) | 68.5 | 87.2 27% | 88.3 29% | 94.6 38% | 87.5 28% | 74.2 8% |
| Response Times | -224% | -173% | 88% | -226% | 7% | |
| Response Time Grey 50% / Grey 80% * (ms) | 10 ? | 33.4 ? -234% | 23.2 ? -132% | 1.46 ? 85% | 27 ? -170% | 4.6 ? 54% |
| Response Time Black / White * (ms) | 4.7 ? | 14.7 ? -213% | 14.7 ? -213% | 0.44 ? 91% | 17.9 ? -281% | 6.6 ? -40% |
| PWM Frequency (Hz) | 1200 ? | |||||
| PWM Amplitude * (%) | 22 | |||||
| Bildschirm | 35% | -4% | 590% | -8% | -19% | |
| Helligkeit Bildmitte (cd/m²) | 555 | 599 8% | 525 -5% | 509 -8% | 509 -8% | 608 10% |
| Brightness (cd/m²) | 545 | 590 8% | 513 -6% | 508 -7% | 479 -12% | 585 7% |
| Brightness Distribution (%) | 89 | 93 4% | 87 -2% | 97 9% | 90 1% | 93 4% |
| Schwarzwert * (cd/m²) | 0.51 | 0.4 22% | 0.32 37% | 0.01 98% | 0.32 37% | 0.61 -20% |
| Kontrast (:1) | 1088 | 1498 38% | 1641 51% | 50900 4578% | 1591 46% | 997 -8% |
| Delta E Colorchecker * | 1.4 | 0.5 64% | 1.7 -21% | 1.1 21% | 2.47 -76% | 2.1 -50% |
| Colorchecker dE 2000 max. * | 2.7 | 0.9 67% | 4 -48% | 2.5 7% | 4.73 -75% | 4.3 -59% |
| Delta E Graustufen * | 2 | 0.6 70% | 2.7 -35% | 1.5 25% | 1.5 25% | 2.7 -35% |
| Gamma | 2.27 97% | 2.16 102% | 2.2 100% | 2.28 96% | 2.19 100% | 2.2 100% |
| CCT | 6864 95% | 6543 99% | 7010 93% | 6294 103% | 6790 96% | 6168 105% |
| Colorchecker dE 2000 calibrated * | 1.06 | 1.2 | ||||
| Durchschnitt gesamt (Programm / Settings) | -55% /
-7% | -50% /
-23% | 236% /
384% | -69% /
-34% | -2% /
-9% |
* ... kleinere Werte sind besser


Reaktionszeiten (Response Times) des Displays
| ↔ Reaktionszeiten Schwarz zu Weiß | ||
|---|---|---|
| 4.7 ms ... steigend ↗ und fallend ↘ kombiniert | ↗ 1.3 ms steigend | 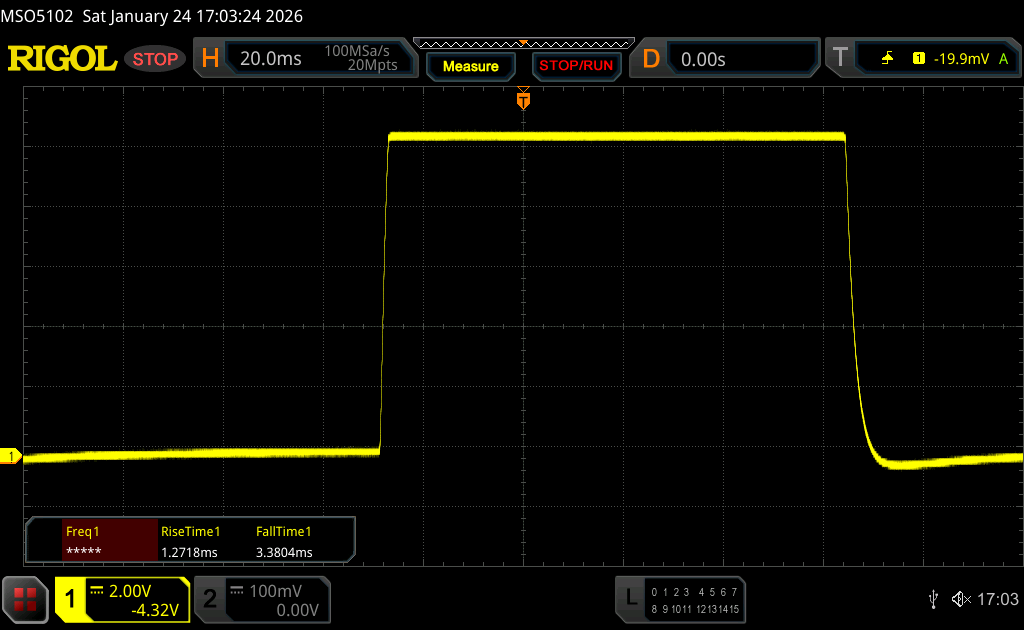 |
| ↘ 3.4 ms fallend | ||
| Die gemessenen Reaktionszeiten sind sehr kurz, wodurch sich der Bildschirm auch für schnelle 3D Spiele eignen sollte. Im Vergleich rangierten die bei uns getesteten Geräte von 0.1 (Minimum) zu 240 (Maximum) ms. » 17 % aller Screens waren schneller als der getestete. Daher sind die gemessenen Reaktionszeiten besser als der Durchschnitt aller vermessenen Geräte (19.8 ms). | ||
| ↔ Reaktionszeiten 50% Grau zu 80% Grau | ||
| 10 ms ... steigend ↗ und fallend ↘ kombiniert | ↗ 3.5 ms steigend | 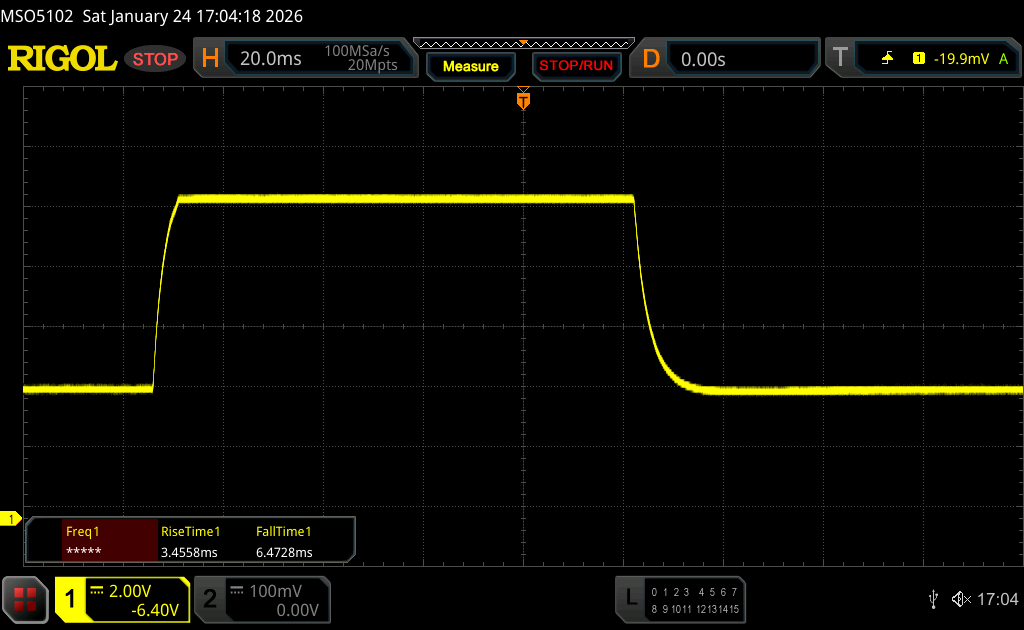 |
| ↘ 6.5 ms fallend | ||
| Die gemessenen Reaktionszeiten sind gut, für anspruchsvolle Spieler könnten der Bildschirm jedoch zu langsam sein. Im Vergleich rangierten die bei uns getesteten Geräte von 0.165 (Minimum) zu 636 (Maximum) ms. » 23 % aller Screens waren schneller als der getestete. Daher sind die gemessenen Reaktionszeiten besser als der Durchschnitt aller vermessenen Geräte (31 ms). | ||
Bildschirm-Flackern / PWM (Pulse-Width Modulation)
| Flackern / PWM nicht festgestellt |  | ||
Im Vergleich: 52 % aller getesteten Geräte nutzten kein PWM um die Helligkeit zu reduzieren. Wenn PWM eingesetzt wurde, dann bei einer Frequenz von durchschnittlich 7763 (Minimum 5, Maximum 343500) Hz. | |||


Leistung - Evo 15 mit bis zu 128 GB RAM
Testbedingungen
Wir haben die Benchmarks im Modus Overboost (90W) durchgeführt. Im Alltag kommt man aber auch sehr gut mit den beiden schwächeren Modi Balanced (35W) bzw. Enthusiast (45W) zurecht, bei denen die Lüfter auch deutlich leiser bleiben. Achtung: Um die volle Leistung abrufen zu können, muss das Netzteil am UBS-C-Anschluss auf der Rückseite angeschlossen werden, andernfalls wird die Leistungsaufnahme des Prozessors auf 70 Watt begrenzt.
Prozessor
Der Core Ultra 7 255H (Arrow Lake) darf dauerhaft 90 Watt verbrauchen und bietet damit eine sehr gut sowie stabile Leistung. Apples M4-SoC ist in Single-Core-Szenarien deutlich überlegen, der 255H hat aber bei Multi-Core-Last einen deutlichen Vorteil. Im Akkubetrieb gibt es verschiedene Schwellen; grundsätzlich darf die CPU 40 Watt verbrauchen, ab einem Akkustand von 70 % noch 25W und ab 30 % nur noch 20 Watt.
Cinebench R15 Multi Dauertest
Cinebench 2024: CPU Multi Core | CPU Single Core
Cinebench R23: Multi Core | Single Core
Cinebench R20: CPU (Multi Core) | CPU (Single Core)
Cinebench R15: CPU Multi 64Bit | CPU Single 64Bit
Blender: v2.79 BMW27 CPU
7-Zip 18.03: 7z b 4 | 7z b 4 -mmt1
Geekbench 6.7: Multi-Core | Single-Core
Geekbench 5.5: Multi-Core | Single-Core
HWBOT x265 Benchmark v2.2: 4k Preset
LibreOffice : 20 Documents To PDF
R Benchmark 2.5: Overall mean
| CPU Performance Rating | |
| Apple MacBook Air 15 M4 -12! | |
| Schenker XMG Evo 15 (M25) | |
| Durchschnittliche Intel Core Ultra 7 255H | |
| Durchschnitt der Klasse Multimedia | |
| Schenker XMG Evo 15 (M24) | |
| Microsoft Surface Laptop 7 15 Lunar Lake | |
| Lenovo ThinkPad X9-15 Aura Edition | |
| Lenovo Yoga Slim 7 15ILL9 Aura -2! | |
| Cinebench 2024 / CPU Multi Core | |
| Schenker XMG Evo 15 (M25) | |
| Durchschnitt der Klasse Multimedia (327 - 2437, n=78, der letzten 2 Jahre) | |
| Durchschnittliche Intel Core Ultra 7 255H (750 - 1201, n=13) | |
| Schenker XMG Evo 15 (M24) | |
| Apple MacBook Air 15 M4 | |
| Lenovo Yoga Slim 7 15ILL9 Aura | |
| Microsoft Surface Laptop 7 15 Lunar Lake | |
| Lenovo ThinkPad X9-15 Aura Edition | |
| Cinebench 2024 / CPU Single Core | |
| Apple MacBook Air 15 M4 | |
| Durchschnitt der Klasse Multimedia (72.5 - 201, n=62, der letzten 2 Jahre) | |
| Schenker XMG Evo 15 (M25) | |
| Durchschnittliche Intel Core Ultra 7 255H (119 - 128.1, n=15) | |
| Microsoft Surface Laptop 7 15 Lunar Lake | |
| Lenovo Yoga Slim 7 15ILL9 Aura | |
| Lenovo ThinkPad X9-15 Aura Edition | |
| Schenker XMG Evo 15 (M24) | |
| Cinebench R23 / Multi Core | |
| Schenker XMG Evo 15 (M25) | |
| Durchschnittliche Intel Core Ultra 7 255H (16105 - 22578, n=20) | |
| Durchschnitt der Klasse Multimedia (4861 - 33362, n=80, der letzten 2 Jahre) | |
| Schenker XMG Evo 15 (M24) | |
| Apple MacBook Air 15 M4 | |
| Lenovo Yoga Slim 7 15ILL9 Aura | |
| Microsoft Surface Laptop 7 15 Lunar Lake | |
| Lenovo ThinkPad X9-15 Aura Edition | |
| Cinebench R23 / Single Core | |
| Apple MacBook Air 15 M4 | |
| Durchschnittliche Intel Core Ultra 7 255H (1874 - 2152, n=20) | |
| Schenker XMG Evo 15 (M25) | |
| Durchschnitt der Klasse Multimedia (1128 - 2459, n=72, der letzten 2 Jahre) | |
| Microsoft Surface Laptop 7 15 Lunar Lake | |
| Lenovo Yoga Slim 7 15ILL9 Aura | |
| Lenovo ThinkPad X9-15 Aura Edition | |
| Schenker XMG Evo 15 (M24) | |
| Cinebench R20 / CPU (Multi Core) | |
| Schenker XMG Evo 15 (M25) | |
| Durchschnittliche Intel Core Ultra 7 255H (6356 - 8860, n=19) | |
| Durchschnitt der Klasse Multimedia (1887 - 12912, n=63, der letzten 2 Jahre) | |
| Schenker XMG Evo 15 (M24) | |
| Lenovo Yoga Slim 7 15ILL9 Aura | |
| Microsoft Surface Laptop 7 15 Lunar Lake | |
| Lenovo ThinkPad X9-15 Aura Edition | |
| Cinebench R20 / CPU (Single Core) | |
| Durchschnittliche Intel Core Ultra 7 255H (743 - 826, n=19) | |
| Schenker XMG Evo 15 (M25) | |
| Microsoft Surface Laptop 7 15 Lunar Lake | |
| Lenovo Yoga Slim 7 15ILL9 Aura | |
| Durchschnitt der Klasse Multimedia (425 - 853, n=63, der letzten 2 Jahre) | |
| Lenovo ThinkPad X9-15 Aura Edition | |
| Schenker XMG Evo 15 (M24) | |
| Cinebench R15 / CPU Multi 64Bit | |
| Schenker XMG Evo 15 (M25) | |
| Durchschnittliche Intel Core Ultra 7 255H (2414 - 3444, n=19) | |
| Durchschnitt der Klasse Multimedia (856 - 5224, n=67, der letzten 2 Jahre) | |
| Schenker XMG Evo 15 (M24) | |
| Microsoft Surface Laptop 7 15 Lunar Lake | |
| Lenovo ThinkPad X9-15 Aura Edition | |
| Cinebench R15 / CPU Single 64Bit | |
| Durchschnittliche Intel Core Ultra 7 255H (258 - 322, n=20) | |
| Schenker XMG Evo 15 (M25) | |
| Lenovo ThinkPad X9-15 Aura Edition | |
| Microsoft Surface Laptop 7 15 Lunar Lake | |
| Durchschnitt der Klasse Multimedia (184.8 - 326, n=65, der letzten 2 Jahre) | |
| Schenker XMG Evo 15 (M24) | |
| Blender / v2.79 BMW27 CPU | |
| Lenovo ThinkPad X9-15 Aura Edition | |
| Microsoft Surface Laptop 7 15 Lunar Lake | |
| Lenovo Yoga Slim 7 15ILL9 Aura | |
| Durchschnitt der Klasse Multimedia (100 - 557, n=64, der letzten 2 Jahre) | |
| Schenker XMG Evo 15 (M24) | |
| Durchschnittliche Intel Core Ultra 7 255H (156 - 293, n=19) | |
| Schenker XMG Evo 15 (M25) | |
| 7-Zip 18.03 / 7z b 4 | |
| Schenker XMG Evo 15 (M25) | |
| Schenker XMG Evo 15 (M24) | |
| Durchschnittliche Intel Core Ultra 7 255H (42155 - 70397, n=20) | |
| Durchschnitt der Klasse Multimedia (26062 - 130368, n=61, der letzten 2 Jahre) | |
| Lenovo Yoga Slim 7 15ILL9 Aura | |
| Microsoft Surface Laptop 7 15 Lunar Lake | |
| Lenovo ThinkPad X9-15 Aura Edition | |
| 7-Zip 18.03 / 7z b 4 -mmt1 | |
| Schenker XMG Evo 15 (M25) | |
| Microsoft Surface Laptop 7 15 Lunar Lake | |
| Durchschnittliche Intel Core Ultra 7 255H (4589 - 6385, n=20) | |
| Durchschnitt der Klasse Multimedia (3666 - 7545, n=62, der letzten 2 Jahre) | |
| Lenovo ThinkPad X9-15 Aura Edition | |
| Schenker XMG Evo 15 (M24) | |
| Lenovo Yoga Slim 7 15ILL9 Aura | |
| Geekbench 6.7 / Multi-Core | |
| Schenker XMG Evo 15 (M25) | |
| Durchschnittliche Intel Core Ultra 7 255H (11979 - 17489, n=20) | |
| Durchschnitt der Klasse Multimedia (4983 - 29415, n=75, der letzten 2 Jahre) | |
| Apple MacBook Air 15 M4 | |
| Schenker XMG Evo 15 (M24) | |
| Microsoft Surface Laptop 7 15 Lunar Lake | |
| Lenovo ThinkPad X9-15 Aura Edition | |
| Lenovo Yoga Slim 7 15ILL9 Aura | |
| Geekbench 6.7 / Single-Core | |
| Apple MacBook Air 15 M4 | |
| Schenker XMG Evo 15 (M25) | |
| Durchschnitt der Klasse Multimedia (1534 - 4335, n=74, der letzten 2 Jahre) | |
| Microsoft Surface Laptop 7 15 Lunar Lake | |
| Durchschnittliche Intel Core Ultra 7 255H (2712 - 2939, n=20) | |
| Lenovo ThinkPad X9-15 Aura Edition | |
| Lenovo Yoga Slim 7 15ILL9 Aura | |
| Schenker XMG Evo 15 (M24) | |
| Geekbench 5.5 / Multi-Core | |
| Schenker XMG Evo 15 (M25) | |
| Durchschnittliche Intel Core Ultra 7 255H (11348 - 17218, n=19) | |
| Durchschnitt der Klasse Multimedia (4652 - 20422, n=61, der letzten 2 Jahre) | |
| Schenker XMG Evo 15 (M24) | |
| Microsoft Surface Laptop 7 15 Lunar Lake | |
| Lenovo ThinkPad X9-15 Aura Edition | |
| Lenovo Yoga Slim 7 15ILL9 Aura | |
| Geekbench 5.5 / Single-Core | |
| Schenker XMG Evo 15 (M25) | |
| Microsoft Surface Laptop 7 15 Lunar Lake | |
| Durchschnittliche Intel Core Ultra 7 255H (1938 - 2121, n=19) | |
| Lenovo ThinkPad X9-15 Aura Edition | |
| Lenovo Yoga Slim 7 15ILL9 Aura | |
| Durchschnitt der Klasse Multimedia (805 - 2974, n=61, der letzten 2 Jahre) | |
| Schenker XMG Evo 15 (M24) | |
| HWBOT x265 Benchmark v2.2 / 4k Preset | |
| Schenker XMG Evo 15 (M25) | |
| Durchschnittliche Intel Core Ultra 7 255H (13.7 - 26.5, n=19) | |
| Durchschnitt der Klasse Multimedia (5.26 - 36.1, n=62, der letzten 2 Jahre) | |
| Schenker XMG Evo 15 (M24) | |
| Lenovo Yoga Slim 7 15ILL9 Aura | |
| Microsoft Surface Laptop 7 15 Lunar Lake | |
| Lenovo ThinkPad X9-15 Aura Edition | |
| LibreOffice / 20 Documents To PDF | |
| Lenovo Yoga Slim 7 15ILL9 Aura | |
| Durchschnitt der Klasse Multimedia (23.9 - 146.7, n=63, der letzten 2 Jahre) | |
| Microsoft Surface Laptop 7 15 Lunar Lake | |
| Durchschnittliche Intel Core Ultra 7 255H (41.1 - 61.6, n=19) | |
| Lenovo ThinkPad X9-15 Aura Edition | |
| Schenker XMG Evo 15 (M24) | |
| Schenker XMG Evo 15 (M25) | |
| R Benchmark 2.5 / Overall mean | |
| Lenovo ThinkPad X9-15 Aura Edition | |
| Durchschnitt der Klasse Multimedia (0.3604 - 0.947, n=62, der letzten 2 Jahre) | |
| Lenovo Yoga Slim 7 15ILL9 Aura | |
| Microsoft Surface Laptop 7 15 Lunar Lake | |
| Durchschnittliche Intel Core Ultra 7 255H (0.4233 - 0.515, n=19) | |
| Schenker XMG Evo 15 (M24) | |
| Schenker XMG Evo 15 (M25) | |
* ... kleinere Werte sind besser
AIDA64: FP32 Ray-Trace | FPU Julia | CPU SHA3 | CPU Queen | FPU SinJulia | FPU Mandel | CPU AES | CPU ZLib | FP64 Ray-Trace | CPU PhotoWorxx
| Performance Rating | |
| Schenker XMG Evo 15 (M25) | |
| Durchschnittliche Intel Core Ultra 7 255H | |
| Durchschnitt der Klasse Multimedia | |
| Schenker XMG Evo 15 (M24) | |
| Lenovo Yoga Slim 7 15ILL9 Aura | |
| Lenovo ThinkPad X9-15 Aura Edition | |
| Microsoft Surface Laptop 7 15 Lunar Lake | |
| AIDA64 / FP32 Ray-Trace | |
| Schenker XMG Evo 15 (M25) | |
| Durchschnittliche Intel Core Ultra 7 255H (13863 - 24741, n=17) | |
| Durchschnitt der Klasse Multimedia (2214 - 50388, n=59, der letzten 2 Jahre) | |
| Schenker XMG Evo 15 (M24) | |
| Lenovo Yoga Slim 7 15ILL9 Aura | |
| Lenovo ThinkPad X9-15 Aura Edition | |
| Lenovo ThinkPad X9-15 Aura Edition | |
| Lenovo ThinkPad X9-15 Aura Edition | |
| Microsoft Surface Laptop 7 15 Lunar Lake | |
| AIDA64 / FPU Julia | |
| Schenker XMG Evo 15 (M25) | |
| Durchschnittliche Intel Core Ultra 7 255H (71030 - 119222, n=17) | |
| Durchschnitt der Klasse Multimedia (12867 - 201874, n=60, der letzten 2 Jahre) | |
| Schenker XMG Evo 15 (M24) | |
| Lenovo Yoga Slim 7 15ILL9 Aura | |
| Lenovo ThinkPad X9-15 Aura Edition | |
| Lenovo ThinkPad X9-15 Aura Edition | |
| Lenovo ThinkPad X9-15 Aura Edition | |
| Microsoft Surface Laptop 7 15 Lunar Lake | |
| AIDA64 / CPU SHA3 | |
| Schenker XMG Evo 15 (M25) | |
| Durchschnittliche Intel Core Ultra 7 255H (3408 - 5548, n=17) | |
| Durchschnitt der Klasse Multimedia (626 - 8623, n=60, der letzten 2 Jahre) | |
| Schenker XMG Evo 15 (M24) | |
| Lenovo Yoga Slim 7 15ILL9 Aura | |
| Lenovo ThinkPad X9-15 Aura Edition | |
| Lenovo ThinkPad X9-15 Aura Edition | |
| Lenovo ThinkPad X9-15 Aura Edition | |
| Microsoft Surface Laptop 7 15 Lunar Lake | |
| AIDA64 / CPU Queen | |
| Schenker XMG Evo 15 (M24) | |
| Durchschnitt der Klasse Multimedia (13483 - 181505, n=47, der letzten 2 Jahre) | |
| Schenker XMG Evo 15 (M25) | |
| Durchschnittliche Intel Core Ultra 7 255H (59098 - 68460, n=16) | |
| Lenovo Yoga Slim 7 15ILL9 Aura | |
| Lenovo ThinkPad X9-15 Aura Edition | |
| Lenovo ThinkPad X9-15 Aura Edition | |
| Microsoft Surface Laptop 7 15 Lunar Lake | |
| AIDA64 / FPU SinJulia | |
| Schenker XMG Evo 15 (M24) | |
| Schenker XMG Evo 15 (M25) | |
| Durchschnitt der Klasse Multimedia (886 - 28794, n=60, der letzten 2 Jahre) | |
| Durchschnittliche Intel Core Ultra 7 255H (6716 - 9006, n=17) | |
| Lenovo ThinkPad X9-15 Aura Edition | |
| Lenovo ThinkPad X9-15 Aura Edition | |
| Lenovo ThinkPad X9-15 Aura Edition | |
| Microsoft Surface Laptop 7 15 Lunar Lake | |
| Lenovo Yoga Slim 7 15ILL9 Aura | |
| AIDA64 / FPU Mandel | |
| Schenker XMG Evo 15 (M25) | |
| Durchschnittliche Intel Core Ultra 7 255H (37031 - 63347, n=17) | |
| Durchschnitt der Klasse Multimedia (6395 - 105740, n=59, der letzten 2 Jahre) | |
| Schenker XMG Evo 15 (M24) | |
| Lenovo Yoga Slim 7 15ILL9 Aura | |
| Lenovo ThinkPad X9-15 Aura Edition | |
| Lenovo ThinkPad X9-15 Aura Edition | |
| Lenovo ThinkPad X9-15 Aura Edition | |
| Microsoft Surface Laptop 7 15 Lunar Lake | |
| AIDA64 / CPU AES | |
| Schenker XMG Evo 15 (M24) | |
| Schenker XMG Evo 15 (M25) | |
| Durchschnittliche Intel Core Ultra 7 255H (58402 - 83568, n=17) | |
| Durchschnitt der Klasse Multimedia (8171 - 126790, n=60, der letzten 2 Jahre) | |
| Lenovo Yoga Slim 7 15ILL9 Aura | |
| Lenovo ThinkPad X9-15 Aura Edition | |
| Lenovo ThinkPad X9-15 Aura Edition | |
| Lenovo ThinkPad X9-15 Aura Edition | |
| Microsoft Surface Laptop 7 15 Lunar Lake | |
| AIDA64 / CPU ZLib | |
| Schenker XMG Evo 15 (M25) | |
| Durchschnittliche Intel Core Ultra 7 255H (822 - 1316, n=17) | |
| Durchschnitt der Klasse Multimedia (143.8 - 2022, n=60, der letzten 2 Jahre) | |
| Schenker XMG Evo 15 (M24) | |
| Lenovo Yoga Slim 7 15ILL9 Aura | |
| Lenovo ThinkPad X9-15 Aura Edition | |
| Lenovo ThinkPad X9-15 Aura Edition | |
| Lenovo ThinkPad X9-15 Aura Edition | |
| Microsoft Surface Laptop 7 15 Lunar Lake | |
| AIDA64 / FP64 Ray-Trace | |
| Schenker XMG Evo 15 (M25) | |
| Durchschnittliche Intel Core Ultra 7 255H (7384 - 13231, n=17) | |
| Durchschnitt der Klasse Multimedia (1014 - 26875, n=60, der letzten 2 Jahre) | |
| Schenker XMG Evo 15 (M24) | |
| Lenovo Yoga Slim 7 15ILL9 Aura | |
| Lenovo ThinkPad X9-15 Aura Edition | |
| Lenovo ThinkPad X9-15 Aura Edition | |
| Lenovo ThinkPad X9-15 Aura Edition | |
| Microsoft Surface Laptop 7 15 Lunar Lake | |
| AIDA64 / CPU PhotoWorxx | |
| Schenker XMG Evo 15 (M25) | |
| Lenovo ThinkPad X9-15 Aura Edition | |
| Lenovo ThinkPad X9-15 Aura Edition | |
| Lenovo ThinkPad X9-15 Aura Edition | |
| Durchschnittliche Intel Core Ultra 7 255H (23836 - 65787, n=17) | |
| Microsoft Surface Laptop 7 15 Lunar Lake | |
| Lenovo Yoga Slim 7 15ILL9 Aura | |
| Durchschnitt der Klasse Multimedia (8187 - 88154, n=60, der letzten 2 Jahre) | |
| Schenker XMG Evo 15 (M24) | |
System Performance
Die Systemleistung des Evo 15 ist hervorragend und es handelt sich im Alltag um einen überaus reaktionsschnellen Rechner.
PCMark 10: Score | Essentials | Productivity | Digital Content Creation
CrossMark: Overall | Productivity | Creativity | Responsiveness
WebXPRT 3: Overall
WebXPRT 4: Overall
Mozilla Kraken 1.1: Total
| Performance Rating | |
| Apple MacBook Air 15 M4 -4! | |
| Schenker XMG Evo 15 (M25) | |
| Durchschnittliche Intel Core Ultra 7 255H, Intel Arc Graphics 140T | |
| Durchschnitt der Klasse Multimedia | |
| Schenker XMG Evo 15 (M24) | |
| Microsoft Surface Laptop 7 15 Lunar Lake | |
| Lenovo ThinkPad X9-15 Aura Edition | |
| Lenovo Yoga Slim 7 15ILL9 Aura | |
| PCMark 10 / Score | |
| Schenker XMG Evo 15 (M25) | |
| Durchschnittliche Intel Core Ultra 7 255H, Intel Arc Graphics 140T (6878 - 9156, n=13) | |
| Durchschnitt der Klasse Multimedia (4325 - 10386, n=57, der letzten 2 Jahre) | |
| Schenker XMG Evo 15 (M24) | |
| Microsoft Surface Laptop 7 15 Lunar Lake | |
| Lenovo ThinkPad X9-15 Aura Edition | |
| Lenovo Yoga Slim 7 15ILL9 Aura | |
| PCMark 10 / Essentials | |
| Schenker XMG Evo 15 (M25) | |
| Schenker XMG Evo 15 (M24) | |
| Durchschnittliche Intel Core Ultra 7 255H, Intel Arc Graphics 140T (10637 - 11556, n=13) | |
| Microsoft Surface Laptop 7 15 Lunar Lake | |
| Lenovo ThinkPad X9-15 Aura Edition | |
| Durchschnitt der Klasse Multimedia (8025 - 11664, n=56, der letzten 2 Jahre) | |
| Lenovo Yoga Slim 7 15ILL9 Aura | |
| PCMark 10 / Productivity | |
| Schenker XMG Evo 15 (M25) | |
| Durchschnitt der Klasse Multimedia (7323 - 18233, n=56, der letzten 2 Jahre) | |
| Durchschnittliche Intel Core Ultra 7 255H, Intel Arc Graphics 140T (7598 - 15694, n=13) | |
| Microsoft Surface Laptop 7 15 Lunar Lake | |
| Lenovo ThinkPad X9-15 Aura Edition | |
| Lenovo Yoga Slim 7 15ILL9 Aura | |
| Schenker XMG Evo 15 (M24) | |
| PCMark 10 / Digital Content Creation | |
| Schenker XMG Evo 15 (M25) | |
| Durchschnittliche Intel Core Ultra 7 255H, Intel Arc Graphics 140T (10461 - 12552, n=13) | |
| Schenker XMG Evo 15 (M24) | |
| Microsoft Surface Laptop 7 15 Lunar Lake | |
| Durchschnitt der Klasse Multimedia (3651 - 16240, n=56, der letzten 2 Jahre) | |
| Lenovo ThinkPad X9-15 Aura Edition | |
| Lenovo Yoga Slim 7 15ILL9 Aura | |
| CrossMark / Overall | |
| Apple MacBook Air 15 M4 | |
| Schenker XMG Evo 15 (M25) | |
| Durchschnittliche Intel Core Ultra 7 255H, Intel Arc Graphics 140T (1610 - 2018, n=13) | |
| Durchschnitt der Klasse Multimedia (866 - 2728, n=66, der letzten 2 Jahre) | |
| Schenker XMG Evo 15 (M24) | |
| Lenovo ThinkPad X9-15 Aura Edition | |
| Microsoft Surface Laptop 7 15 Lunar Lake | |
| Lenovo Yoga Slim 7 15ILL9 Aura | |
| CrossMark / Productivity | |
| Apple MacBook Air 15 M4 | |
| Schenker XMG Evo 15 (M25) | |
| Schenker XMG Evo 15 (M24) | |
| Durchschnittliche Intel Core Ultra 7 255H, Intel Arc Graphics 140T (1566 - 1908, n=13) | |
| Durchschnitt der Klasse Multimedia (931 - 2489, n=66, der letzten 2 Jahre) | |
| Lenovo ThinkPad X9-15 Aura Edition | |
| Microsoft Surface Laptop 7 15 Lunar Lake | |
| Lenovo Yoga Slim 7 15ILL9 Aura | |
| CrossMark / Creativity | |
| Apple MacBook Air 15 M4 | |
| Schenker XMG Evo 15 (M25) | |
| Durchschnitt der Klasse Multimedia (907 - 3465, n=66, der letzten 2 Jahre) | |
| Durchschnittliche Intel Core Ultra 7 255H, Intel Arc Graphics 140T (1827 - 2396, n=13) | |
| Lenovo ThinkPad X9-15 Aura Edition | |
| Microsoft Surface Laptop 7 15 Lunar Lake | |
| Schenker XMG Evo 15 (M24) | |
| Lenovo Yoga Slim 7 15ILL9 Aura | |
| CrossMark / Responsiveness | |
| Schenker XMG Evo 15 (M24) | |
| Durchschnittliche Intel Core Ultra 7 255H, Intel Arc Graphics 140T (1194 - 1781, n=13) | |
| Durchschnitt der Klasse Multimedia (605 - 2024, n=66, der letzten 2 Jahre) | |
| Apple MacBook Air 15 M4 | |
| Schenker XMG Evo 15 (M25) | |
| Lenovo ThinkPad X9-15 Aura Edition | |
| Microsoft Surface Laptop 7 15 Lunar Lake | |
| Lenovo Yoga Slim 7 15ILL9 Aura | |
| WebXPRT 3 / Overall | |
| Apple MacBook Air 15 M4 | |
| Durchschnitt der Klasse Multimedia (136.4 - 596, n=69, der letzten 2 Jahre) | |
| Schenker XMG Evo 15 (M25) | |
| Durchschnittliche Intel Core Ultra 7 255H, Intel Arc Graphics 140T (273 - 327, n=13) | |
| Microsoft Surface Laptop 7 15 Lunar Lake | |
| Lenovo Yoga Slim 7 15ILL9 Aura | |
| Lenovo ThinkPad X9-15 Aura Edition | |
| Schenker XMG Evo 15 (M24) | |
| WebXPRT 4 / Overall | |
| Apple MacBook Air 15 M4 | |
| Schenker XMG Evo 15 (M25) | |
| Durchschnittliche Intel Core Ultra 7 255H, Intel Arc Graphics 140T (247 - 317, n=13) | |
| Durchschnitt der Klasse Multimedia (167.3 - 402, n=70, der letzten 2 Jahre) | |
| Microsoft Surface Laptop 7 15 Lunar Lake | |
| Lenovo Yoga Slim 7 15ILL9 Aura | |
| Lenovo ThinkPad X9-15 Aura Edition | |
| Schenker XMG Evo 15 (M24) | |
| Mozilla Kraken 1.1 / Total | |
| Schenker XMG Evo 15 (M24) | |
| Microsoft Surface Laptop 7 15 Lunar Lake | |
| Lenovo Yoga Slim 7 15ILL9 Aura | |
| Lenovo ThinkPad X9-15 Aura Edition | |
| Schenker XMG Evo 15 (M25) | |
| Durchschnittliche Intel Core Ultra 7 255H, Intel Arc Graphics 140T (427 - 510, n=13) | |
| Durchschnitt der Klasse Multimedia (228 - 835, n=72, der letzten 2 Jahre) | |
| Apple MacBook Air 15 M4 | |
* ... kleinere Werte sind besser
| PCMark 10 Score | 9156 Punkte | |
Hilfe | ||
| AIDA64 / Memory Copy | |
| Lenovo ThinkPad X9-15 Aura Edition | |
| Microsoft Surface Laptop 7 15 Lunar Lake | |
| Lenovo Yoga Slim 7 15ILL9 Aura | |
| Schenker XMG Evo 15 (M25) | |
| Durchschnittliche Intel Core Ultra 7 255H (39188 - 110930, n=17) | |
| Durchschnitt der Klasse Multimedia (11299 - 132135, n=60, der letzten 2 Jahre) | |
| Schenker XMG Evo 15 (M24) | |
| AIDA64 / Memory Read | |
| Lenovo Yoga Slim 7 15ILL9 Aura | |
| Microsoft Surface Laptop 7 15 Lunar Lake | |
| Lenovo ThinkPad X9-15 Aura Edition | |
| Schenker XMG Evo 15 (M25) | |
| Durchschnitt der Klasse Multimedia (11624 - 174586, n=60, der letzten 2 Jahre) | |
| Durchschnittliche Intel Core Ultra 7 255H (43703 - 90552, n=17) | |
| Schenker XMG Evo 15 (M24) | |
| AIDA64 / Memory Write | |
| Lenovo Yoga Slim 7 15ILL9 Aura | |
| Microsoft Surface Laptop 7 15 Lunar Lake | |
| Lenovo ThinkPad X9-15 Aura Edition | |
| Schenker XMG Evo 15 (M25) | |
| Durchschnitt der Klasse Multimedia (11755 - 134998, n=60, der letzten 2 Jahre) | |
| Durchschnittliche Intel Core Ultra 7 255H (36438 - 87199, n=17) | |
| Schenker XMG Evo 15 (M24) | |
| AIDA64 / Memory Latency | |
| Schenker XMG Evo 15 (M24) | |
| Durchschnittliche Intel Core Ultra 7 255H (107.6 - 147.2, n=17) | |
| Durchschnitt der Klasse Multimedia (7 - 535, n=59, der letzten 2 Jahre) | |
| Schenker XMG Evo 15 (M25) | |
| Lenovo Yoga Slim 7 15ILL9 Aura | |
| Microsoft Surface Laptop 7 15 Lunar Lake | |
| Lenovo ThinkPad X9-15 Aura Edition | |
* ... kleinere Werte sind besser
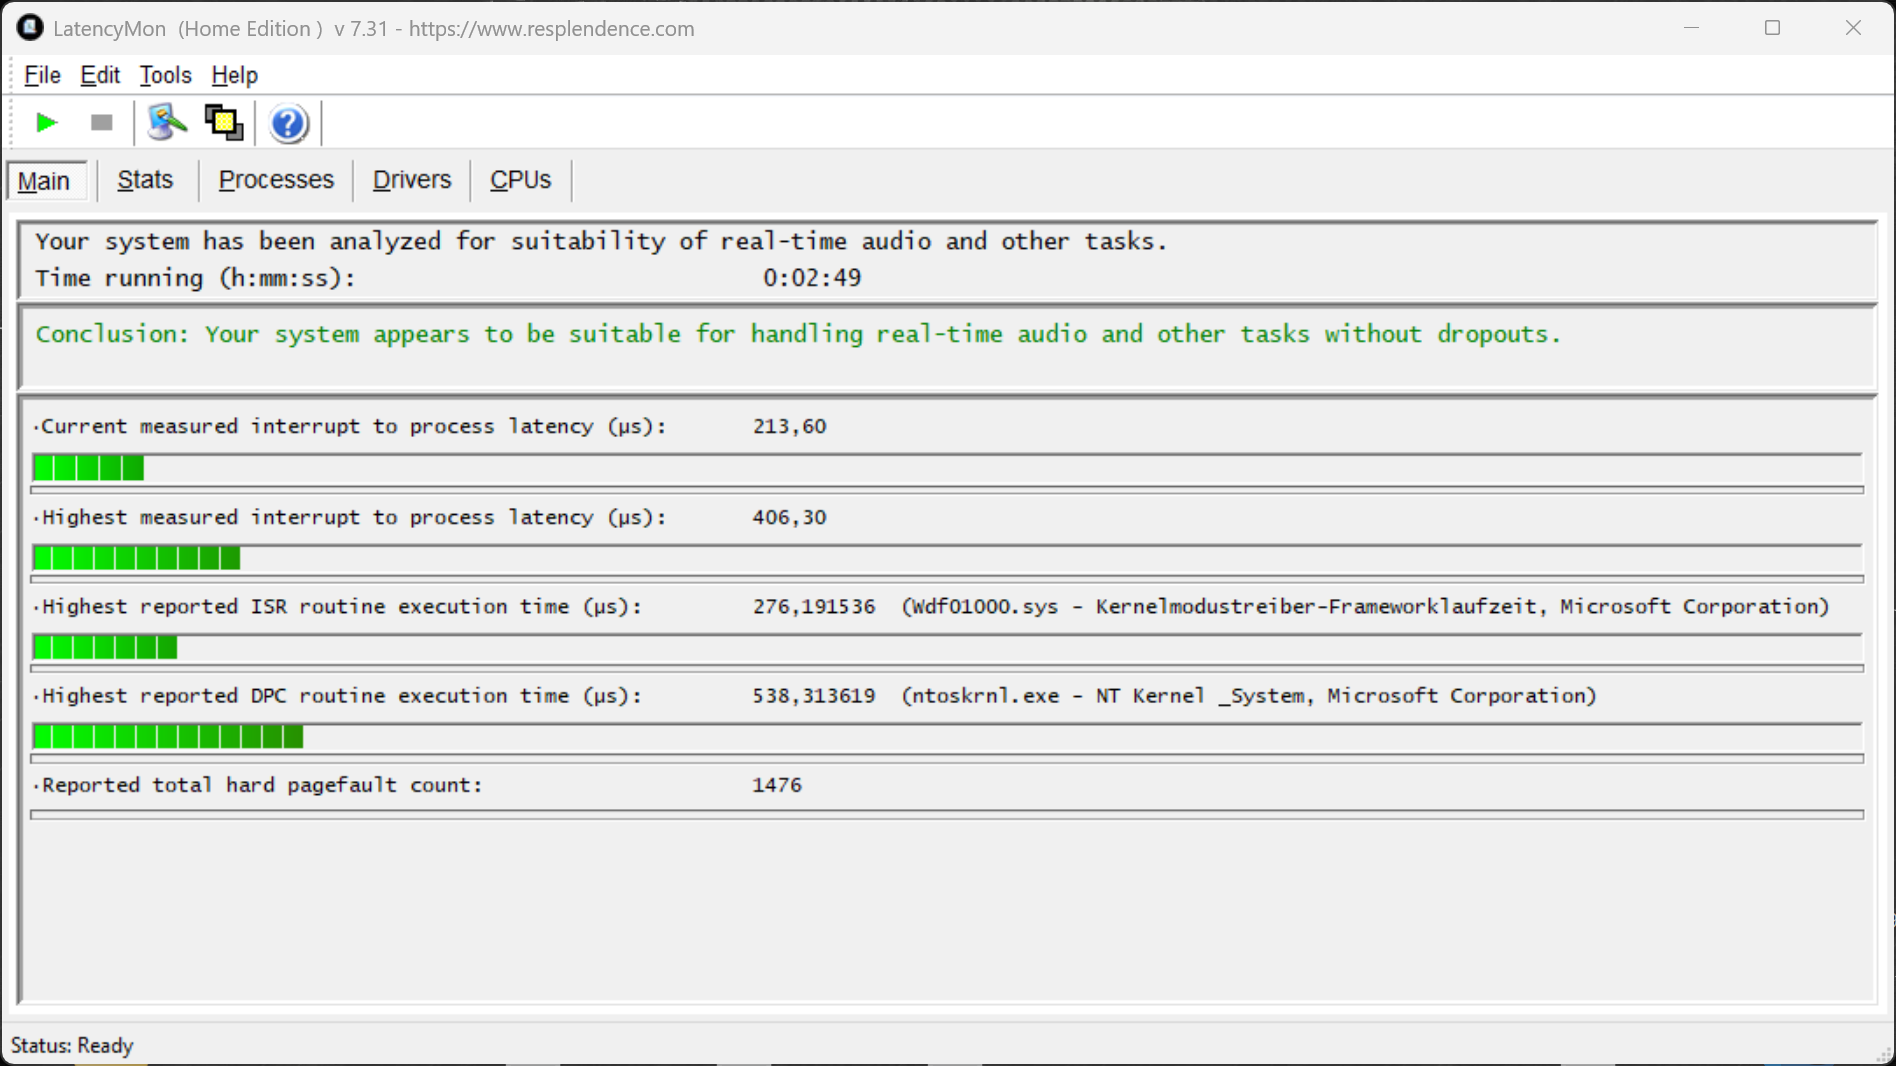
DPC-Latenzen
In unserem standardisierten Latency-Test zeigt das Evo 15 mit der aktuellen BIOS-Version keine Einschränkungen bei der Nutzung von Echtzeit-Audioanwendungen.
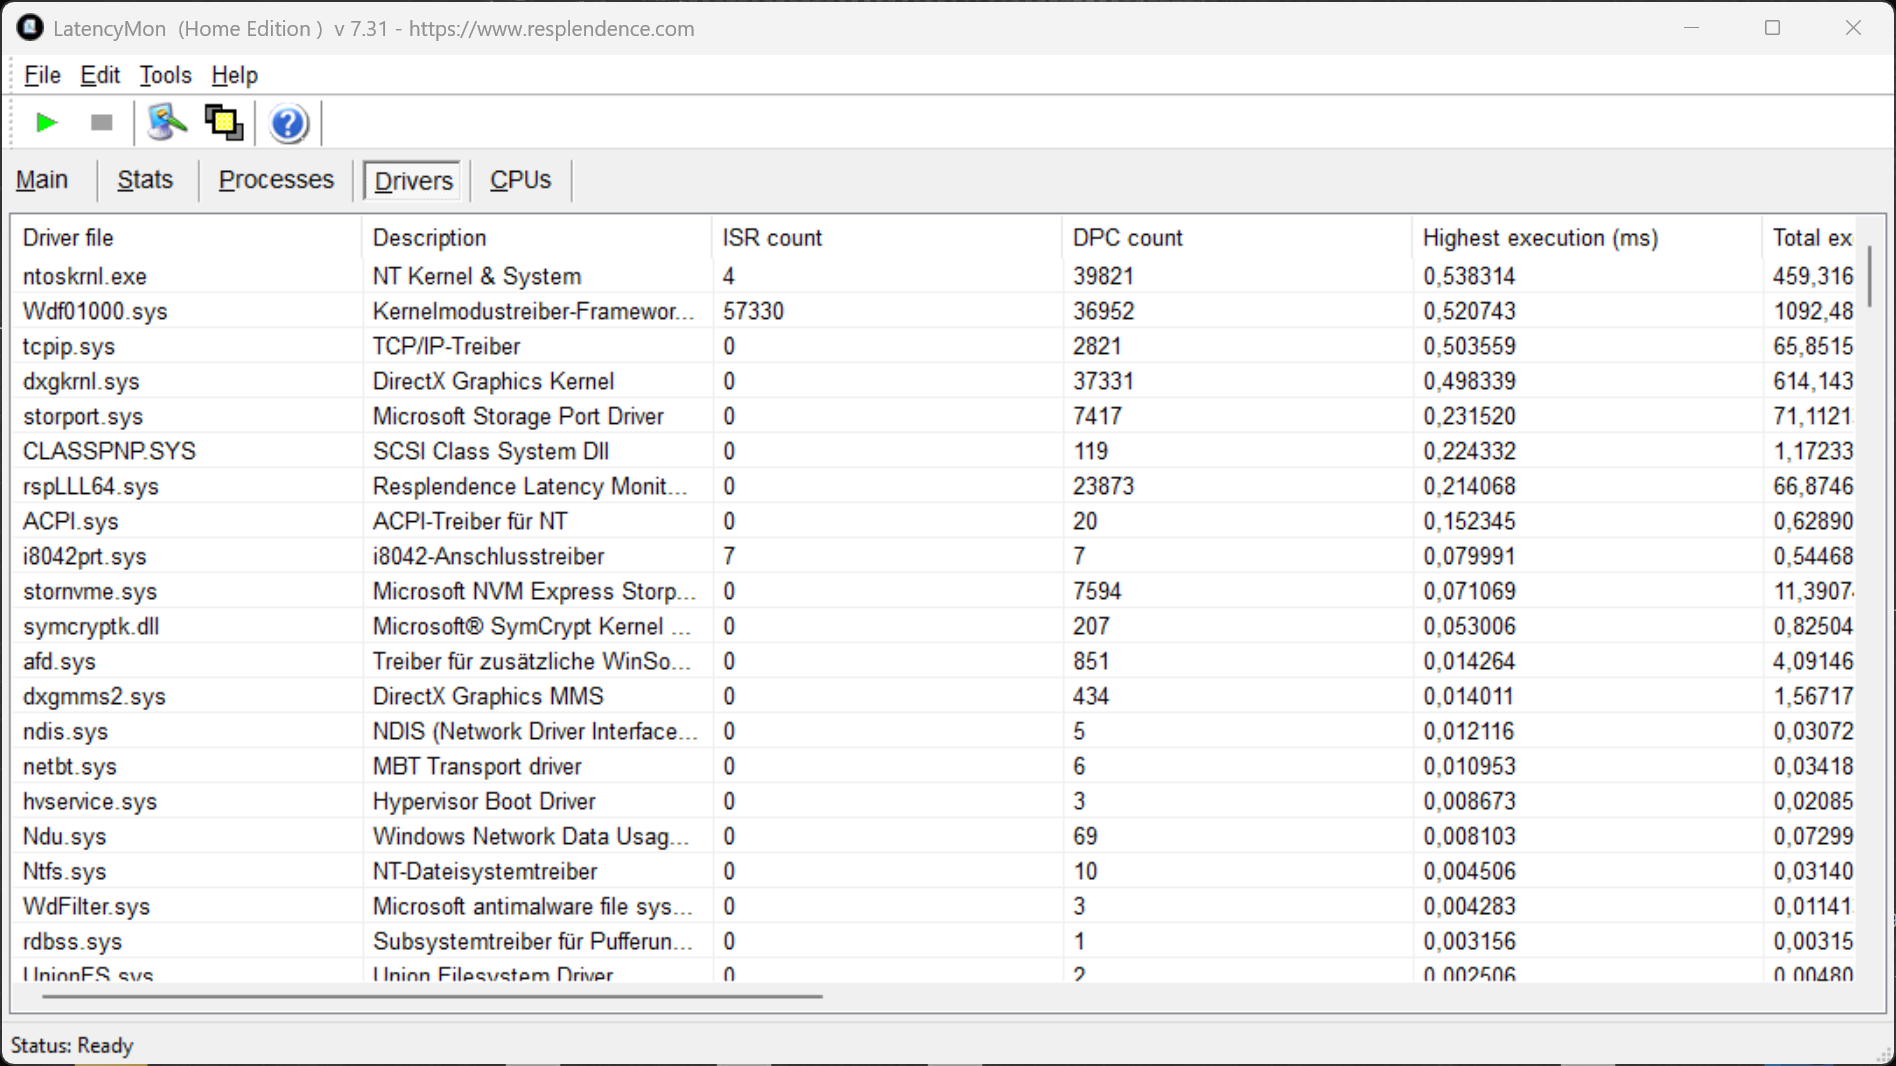
| DPC Latencies / LatencyMon - interrupt to process latency (max), Web, Youtube, Prime95 | |
| Lenovo ThinkPad X9-15 Aura Edition | |
| Schenker XMG Evo 15 (M24) | |
| Microsoft Surface Laptop 7 15 Lunar Lake | |
| Schenker XMG Evo 15 (M25) | |
* ... kleinere Werte sind besser
Massenspeicher
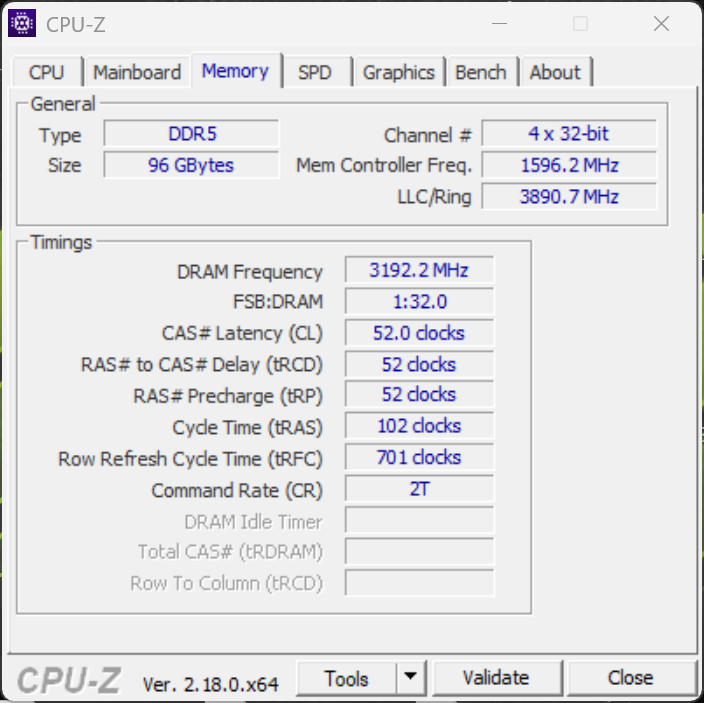
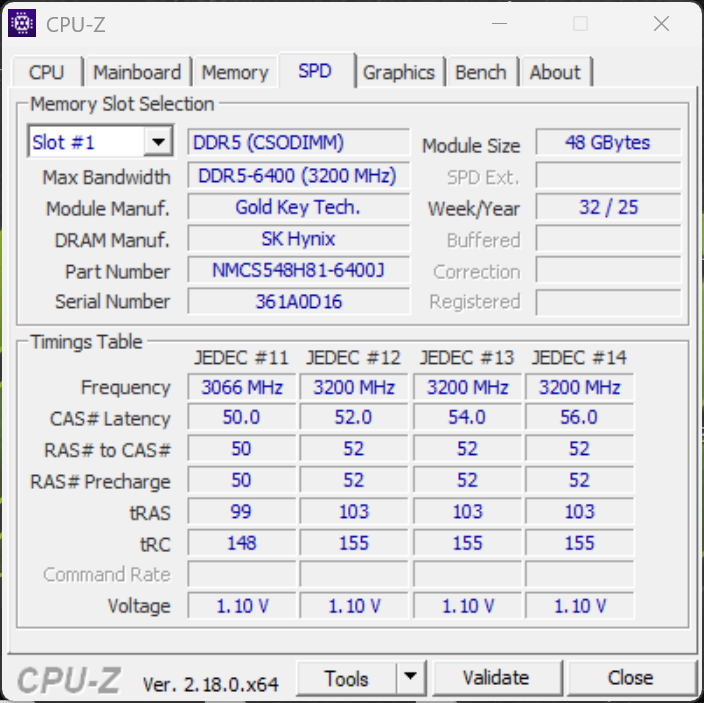
Es stehen zwei vollwertige M.2-2280-Steckplätze zur Verfügung, die via PCIe-4.0 angebunden sind. In unserer Testkonfiguration war die 2-TB-Variante (1,72 TB frei) der Samsung 990 Pro verbaut, die gute Transferraten von bis zu 7 GB/s erreicht.
Update 27.01.: Beim ursprünglichen Test war die Bitlocker-Verschlüsselung aktiv. Nach Deaktivierung fallen die Transferraten besser aus.

* ... kleinere Werte sind besser
Dauerleistung Lesen: DiskSpd Read Loop, Queue Depth 8
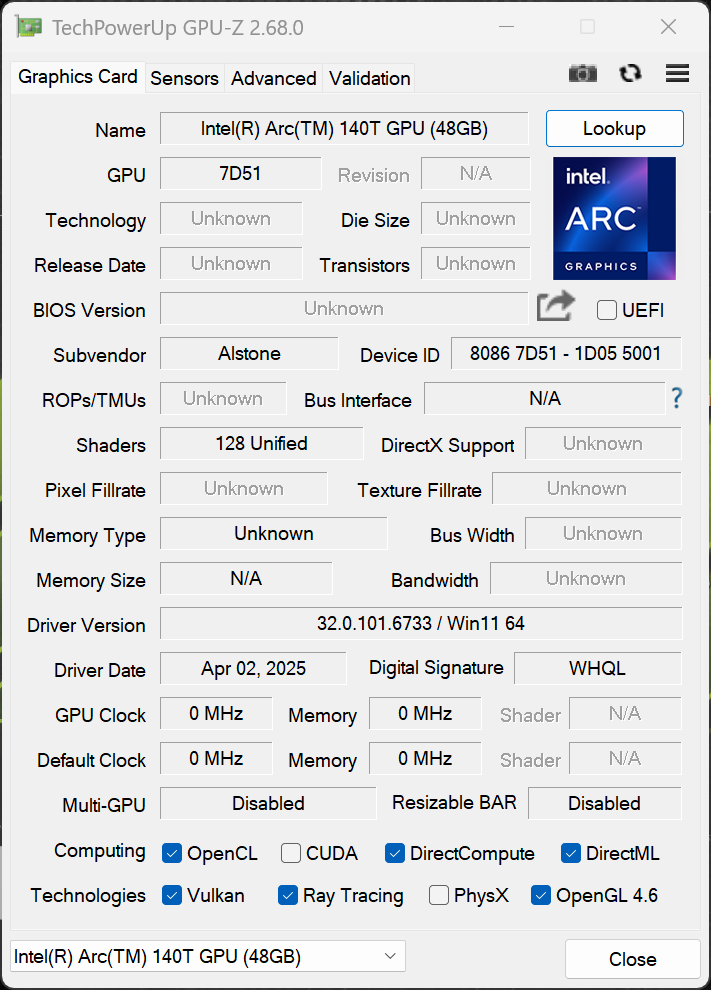
GPU Leistung
Die Leistung der Arc-140T-GPU liegt auf dem erwarteten Niveau und bleibt auch bei längerer Belastung vollkommen stabil. Etwas Gaming ist mit dem Evo 15 ebenfalls möglich, wobei die Spiele nicht zu anspruchsvoll sein sollten.
| 3DMark 11 Performance | 13648 Punkte | |
| 3DMark Fire Strike Score | 8561 Punkte | |
| 3DMark Time Spy Score | 4472 Punkte | |
| 3DMark Steel Nomad Score | 875 Punkte | |
| 3DMark Steel Nomad Light Score | 3473 Punkte | |
Hilfe | ||
| Blender / v3.3 Classroom METAL | |
| Apple MacBook Air 15 M4 | |
| Durchschnitt der Klasse Multimedia (17.8 - 68, n=5, der letzten 2 Jahre) | |
| Blender / v3.3 Classroom CPU | |
| Lenovo ThinkPad X9-15 Aura Edition | |
| Microsoft Surface Laptop 7 15 Lunar Lake | |
| Lenovo Yoga Slim 7 15ILL9 Aura | |
| Apple MacBook Air 15 M4 | |
| Durchschnitt der Klasse Multimedia (134.5 - 1042, n=66, der letzten 2 Jahre) | |
| Schenker XMG Evo 15 (M24) | |
| Durchschnittliche Intel Arc Graphics 140T (254 - 492, n=20) | |
| Schenker XMG Evo 15 (M25) | |
| Blender / v3.3 Classroom oneAPI/Intel | |
| Durchschnitt der Klasse Multimedia (105 - 492, n=18, der letzten 2 Jahre) | |
| Lenovo Yoga Slim 7 15ILL9 Aura | |
| Durchschnittliche Intel Arc Graphics 140T (147 - 396, n=6) | |
* ... kleinere Werte sind besser
Cyberpunk 2077 ultra FPS-Diagramm
| min. | mittel | hoch | max. | QHD | |
|---|---|---|---|---|---|
| GTA V (2015) | 178.7 | 170 | 46.6 | 18.9 | |
| Dota 2 Reborn (2015) | 109.7 | 97.5 | 91.6 | 90.1 | |
| Final Fantasy XV Benchmark (2018) | 91.3 | 45.8 | 32.6 | ||
| X-Plane 11.11 (2018) | 61.8 | 48.5 | 42.4 | ||
| Strange Brigade (2018) | 202 | 82.8 | 69.6 | 58.2 | 41.3 |
| Baldur's Gate 3 (2023) | 40.7 | 32.8 | 28.1 | 27.3 | |
| Cyberpunk 2077 (2023) | 43 | 34.8 | 29.9 | 27.4 | |
| F1 24 (2024) | 93.4 | 85.7 | 64.9 | 20.8 | 13.7 |
Emissionen & Energie
Geräuschemissionen

Im Alltag empfehlen wir entweder den Modus Balanced oder Enthusiast, da die Lüfter hier deutlich ruhiger bleiben. Im Overboost-Modus wird es mit bis zu 47,9 dB(A) im Stresstest und rund 41 dB(A) beim Spielen deutlich hörbar, auch hier bleiben die anderen beiden Modi deutlich leiser (Balanced: 32,9 dB(A), Enthusiast: 36,3 dB(A), Akku: 34,8 dB(A)). Spulenfiepen gab es beim Testgerät nicht.
Lautstärkediagramm
| Idle |
| 24.5 / 24.5 / 26.9 dB(A) |
| Last |
| 33.9 / 47.9 dB(A) |
 | ||
30 dB leise 40 dB(A) deutlich hörbar 50 dB(A) störend |
||
min: | ||
| Schenker XMG Evo 15 (M25) Ultra 7 255H, Arc 140T | Microsoft Surface Laptop 7 15 Lunar Lake Core Ultra 7 268V, Arc 140V | Lenovo ThinkPad X9-15 Aura Edition Core Ultra 7 258V, Arc 140V | Lenovo Yoga Slim 7 15ILL9 Aura Core Ultra 7 256V, Arc 140V | Schenker XMG Evo 15 (M24) Ultra 7 155H, Arc 8-Core | |
|---|---|---|---|---|---|
| Geräuschentwicklung | 6% | 2% | 7% | 2% | |
| aus / Umgebung * (dB) | 24.5 | 23.9 2% | 24.4 -0% | 23.2 5% | 24.7 -1% |
| Idle min * (dB) | 24.5 | 23.9 2% | 24.4 -0% | 23.2 5% | 24.7 -1% |
| Idle avg * (dB) | 24.5 | 23.9 2% | 24.4 -0% | 23.2 5% | 24.7 -1% |
| Idle max * (dB) | 26.9 | 23.9 11% | 24.4 9% | 26.1 3% | 28.9 -7% |
| Last avg * (dB) | 33.9 | 31.8 6% | 35.8 -6% | 30.9 9% | 32.7 4% |
| Cyberpunk 2077 ultra * (dB) | 41.3 | 38 8% | 39.4 5% | 34.1 17% | 40.4 2% |
| Last max * (dB) | 47.9 | 41.9 13% | 45 6% | 44.3 8% | 40.4 16% |
* ... kleinere Werte sind besser
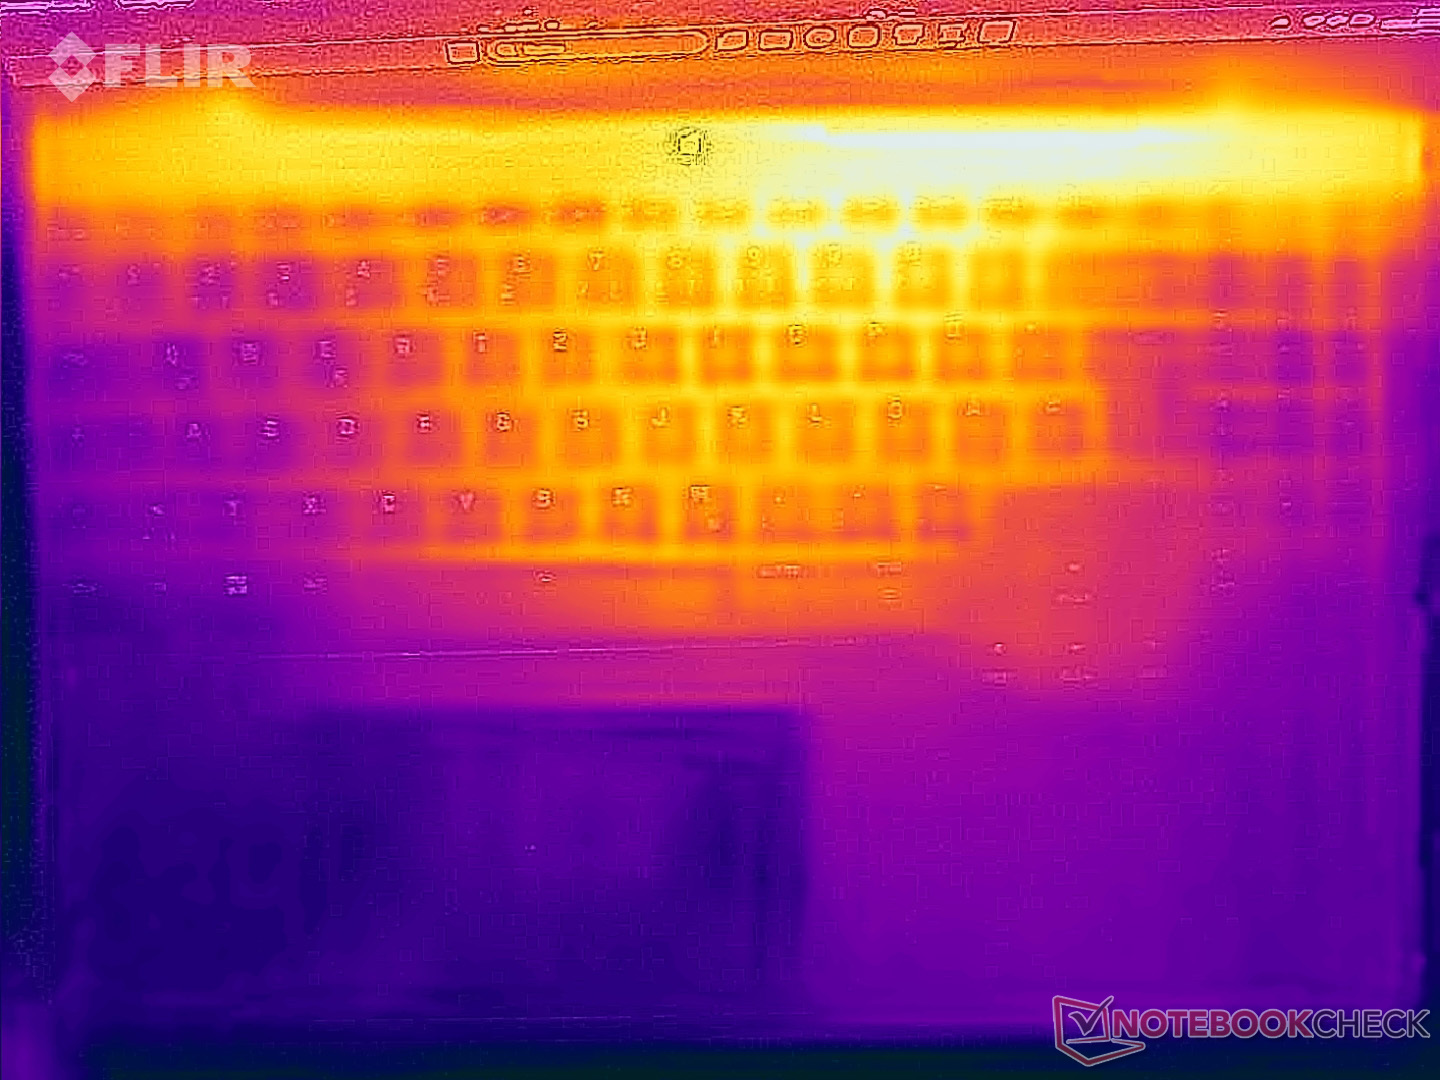
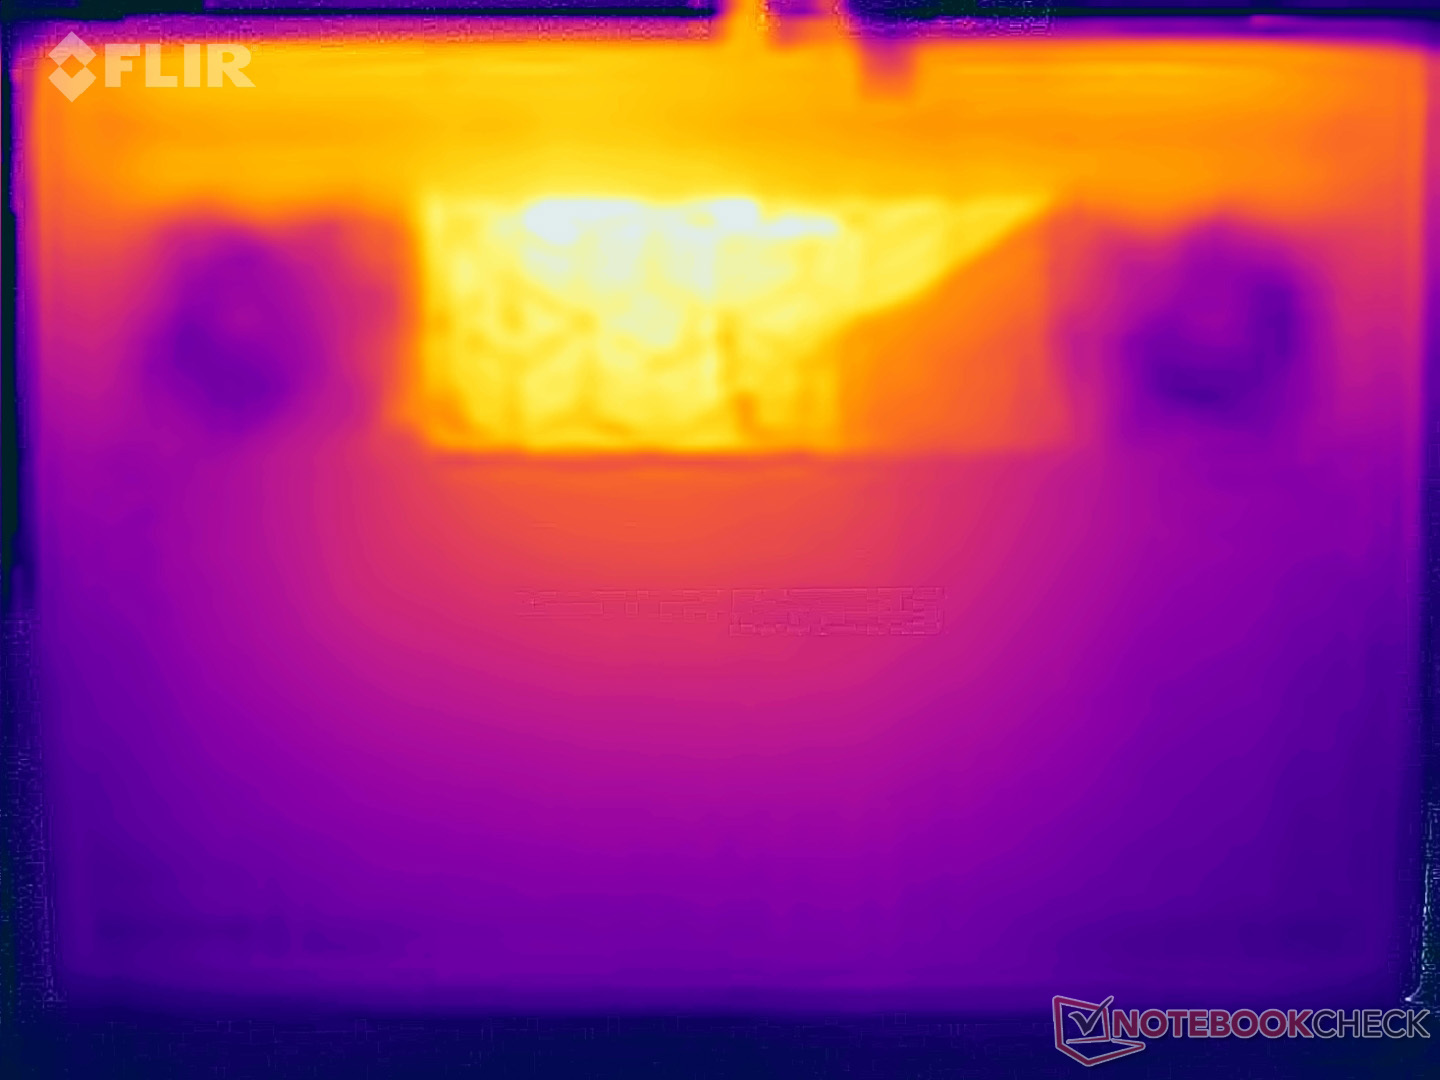
Temperatur
Wenn man den Laptop im Overboost-Modus voll auslastet, sollte man ihn nicht auf den Oberschenkeln abstellen, da wir auf der Unterseite mehr als 50 °C messen können. Ansonsten gibt es aber keine Temperaturprobleme und auch im Stresstest arbeitet der Prozessor konstant mit ~90 Watt.

(±) Die maximale Temperatur auf der Oberseite ist 42.3 °C. Im Vergleich liegt der Klassendurchschnitt bei 36.8 °C (von 21 bis 71 °C für die Klasse Multimedia).
(-) Auf der Unterseite messen wir eine maximalen Wert von 56 °C (im Vergleich zum Durchschnitt von 39.1 °C).
(+) Ohne Last messen wir eine durchschnittliche Temperatur von 25.7 °C auf der Oberseite. Der Klassendurchschnitt erreicht 31.3 °C.
(±) 3: The average temperature for the upper side is 32.8 °C / 91 F, compared to the average of 31.3 °C / 88 F for the class Multimedia.
(+) Die Handballen und der Touchpad-Bereich sind mit gemessenen 28.2 °C kühler als die typische Hauttemperatur und fühlen sich dadurch kühl an.
(±) Die durchschnittliche Handballen-Temperatur anderer getesteter Geräte war 28.7 °C (+0.5 °C).
| Schenker XMG Evo 15 (M25) Ultra 7 255H, Arc 140T | Microsoft Surface Laptop 7 15 Lunar Lake Core Ultra 7 268V, Arc 140V | Apple MacBook Air 15 M4 M4 10-Core, M4 10-Core GPU | Lenovo ThinkPad X9-15 Aura Edition Core Ultra 7 258V, Arc 140V | Lenovo Yoga Slim 7 15ILL9 Aura Core Ultra 7 256V, Arc 140V | Schenker XMG Evo 15 (M24) Ultra 7 155H, Arc 8-Core | |
|---|---|---|---|---|---|---|
| Hitze | 13% | 14% | 15% | -4% | -3% | |
| Last oben max * (°C) | 42.3 | 45.7 -8% | 44.9 -6% | 42.1 -0% | 46.2 -9% | 41.7 1% |
| Last unten max * (°C) | 56 | 42.9 23% | 43.9 22% | 39.5 29% | 41 27% | 49.6 11% |
| Idle oben max * (°C) | 27.4 | 23.6 14% | 23.4 15% | 24.5 11% | 34 -24% | 31.1 -14% |
| Idle unten max * (°C) | 30.5 | 23.1 24% | 23.5 23% | 24.4 20% | 33.8 -11% | 33.1 -9% |
* ... kleinere Werte sind besser
Lautsprecher
Schenker XMG Evo 15 (M25) Audio Analyse
(+) | Die Lautsprecher können relativ laut spielen (84.1 dB)
Bass 100 - 315 Hz
(-) | kaum Bass - 16.3% niedriger als der Median
(±) | durchschnittlich lineare Bass-Wiedergabe (13.4% Delta zum Vorgänger)
Mitteltöne 400 - 2000 Hz
(±) | zu hohe Mitten, vom Median 5.6% abweichend
(+) | lineare Mitten (5.9% Delta zum Vorgänger)
Hochtöne 2 - 16 kHz
(+) | ausgeglichene Hochtöne, vom Median nur 4.2% abweichend
(+) | sehr lineare Hochtöne (6.5% Delta zum Vorgänger)
Gesamt im hörbaren Bereich 100 - 16.000 Hz
(±) | hörbarer Bereich ist durchschnittlich linear (15.6% Abstand zum Median)
Im Vergleich zu allen Geräten derselben Klasse
» 39% aller getesteten Geräte dieser Klasse waren besser, 4% vergleichbar, 57% schlechter
» Das beste Gerät hat einen Delta-Wert von 5%, durchschnittlich ist 17%, das schlechteste Gerät hat 45%
Im Vergleich zu allen Geräten im Test
» 23% aller getesteten Geräte waren besser, 5% vergleichbar, 72% schlechter
» Das beste Gerät hat einen Delta-Wert von 4%, durchschnittlich ist 24%, das schlechteste Gerät hat 134%
Microsoft Surface Laptop 7 15 Lunar Lake Audio Analyse
(±) | Mittelmäßig laut spielende Lautsprecher (78.8 dB)
Bass 100 - 315 Hz
(±) | abgesenkter Bass - 9.3% geringer als der Median
(±) | durchschnittlich lineare Bass-Wiedergabe (8.4% Delta zum Vorgänger)
Mitteltöne 400 - 2000 Hz
(+) | ausgeglichene Mitten, vom Median nur 4.4% abweichend
(+) | lineare Mitten (3% Delta zum Vorgänger)
Hochtöne 2 - 16 kHz
(+) | ausgeglichene Hochtöne, vom Median nur 2.4% abweichend
(+) | sehr lineare Hochtöne (4.1% Delta zum Vorgänger)
Gesamt im hörbaren Bereich 100 - 16.000 Hz
(+) | hörbarer Bereich ist sehr linear (11.4% Abstand zum Median
Im Vergleich zu allen Geräten derselben Klasse
» 3% aller getesteten Geräte dieser Klasse waren besser, 2% vergleichbar, 95% schlechter
» Das beste Gerät hat einen Delta-Wert von 7%, durchschnittlich ist 21%, das schlechteste Gerät hat 53%
Im Vergleich zu allen Geräten im Test
» 7% aller getesteten Geräte waren besser, 2% vergleichbar, 91% schlechter
» Das beste Gerät hat einen Delta-Wert von 4%, durchschnittlich ist 24%, das schlechteste Gerät hat 134%
Apple MacBook Air 15 M4 Audio Analyse
(+) | Die Lautsprecher können relativ laut spielen (85.8 dB)
Bass 100 - 315 Hz
(±) | abgesenkter Bass - 8.2% geringer als der Median
(±) | durchschnittlich lineare Bass-Wiedergabe (9.4% Delta zum Vorgänger)
Mitteltöne 400 - 2000 Hz
(+) | ausgeglichene Mitten, vom Median nur 1.6% abweichend
(+) | lineare Mitten (2.4% Delta zum Vorgänger)
Hochtöne 2 - 16 kHz
(+) | ausgeglichene Hochtöne, vom Median nur 4.2% abweichend
(+) | sehr lineare Hochtöne (4.3% Delta zum Vorgänger)
Gesamt im hörbaren Bereich 100 - 16.000 Hz
(+) | hörbarer Bereich ist sehr linear (8% Abstand zum Median
Im Vergleich zu allen Geräten derselben Klasse
» 2% aller getesteten Geräte dieser Klasse waren besser, 1% vergleichbar, 97% schlechter
» Das beste Gerät hat einen Delta-Wert von 5%, durchschnittlich ist 18%, das schlechteste Gerät hat 53%
Im Vergleich zu allen Geräten im Test
» 2% aller getesteten Geräte waren besser, 1% vergleichbar, 98% schlechter
» Das beste Gerät hat einen Delta-Wert von 4%, durchschnittlich ist 24%, das schlechteste Gerät hat 134%
Lenovo ThinkPad X9-15 Aura Edition Audio Analyse
(+) | Die Lautsprecher können relativ laut spielen (87.5 dB)
Bass 100 - 315 Hz
(±) | abgesenkter Bass - 12.5% geringer als der Median
(+) | lineare Bass-Wiedergabe (6.8% Delta zum Vorgänger)
Mitteltöne 400 - 2000 Hz
(+) | ausgeglichene Mitten, vom Median nur 3.1% abweichend
(+) | lineare Mitten (5.3% Delta zum Vorgänger)
Hochtöne 2 - 16 kHz
(+) | ausgeglichene Hochtöne, vom Median nur 2.4% abweichend
(+) | sehr lineare Hochtöne (3.3% Delta zum Vorgänger)
Gesamt im hörbaren Bereich 100 - 16.000 Hz
(+) | hörbarer Bereich ist sehr linear (9.5% Abstand zum Median
Im Vergleich zu allen Geräten derselben Klasse
» 1% aller getesteten Geräte dieser Klasse waren besser, 0% vergleichbar, 99% schlechter
» Das beste Gerät hat einen Delta-Wert von 7%, durchschnittlich ist 21%, das schlechteste Gerät hat 53%
Im Vergleich zu allen Geräten im Test
» 4% aller getesteten Geräte waren besser, 1% vergleichbar, 95% schlechter
» Das beste Gerät hat einen Delta-Wert von 4%, durchschnittlich ist 24%, das schlechteste Gerät hat 134%
Lenovo Yoga Slim 7 15ILL9 Aura Audio Analyse
(+) | Die Lautsprecher können relativ laut spielen (83.5 dB)
Bass 100 - 315 Hz
(+) | guter Bass - nur 4.1% Abweichung vom Median
(+) | lineare Bass-Wiedergabe (5.5% Delta zum Vorgänger)
Mitteltöne 400 - 2000 Hz
(+) | ausgeglichene Mitten, vom Median nur 1.7% abweichend
(+) | lineare Mitten (1.6% Delta zum Vorgänger)
Hochtöne 2 - 16 kHz
(+) | ausgeglichene Hochtöne, vom Median nur 2.4% abweichend
(+) | sehr lineare Hochtöne (4.9% Delta zum Vorgänger)
Gesamt im hörbaren Bereich 100 - 16.000 Hz
(+) | hörbarer Bereich ist sehr linear (5.3% Abstand zum Median
Im Vergleich zu allen Geräten derselben Klasse
» 1% aller getesteten Geräte dieser Klasse waren besser, 1% vergleichbar, 98% schlechter
» Das beste Gerät hat einen Delta-Wert von 5%, durchschnittlich ist 17%, das schlechteste Gerät hat 45%
Im Vergleich zu allen Geräten im Test
» 0% aller getesteten Geräte waren besser, 0% vergleichbar, 100% schlechter
» Das beste Gerät hat einen Delta-Wert von 4%, durchschnittlich ist 24%, das schlechteste Gerät hat 134%
Energieaufnahme

Der maximale Idle-Verbrauch ist im Vergleich zum alten Modell um rund 2 Watt angestiegen. Im Stresstest messen wir maximal 132,9 Watt und am Ende des Stresstests sind es noch rund 125 Watt. Das mitgelieferte 150-Watt-Netzteil ist daher ausreichend.
| Aus / Standby | |
| Idle | |
| Last |
|
Legende:
min: | |
| Schenker XMG Evo 15 (M25) Ultra 7 255H, Arc 140T, Samsung 990 Pro 2 TB MZVL72T0HDLB, IPS, 2560x1600, 15.3" | Microsoft Surface Laptop 7 15 Lunar Lake Core Ultra 7 268V, Arc 140V, Samsung PM9C1a MZ9L81T0HDLB, IPS, 2496x1664, 15" | Apple MacBook Air 15 M4 M4 10-Core, M4 10-Core GPU, Apple SSD AP1024Z, IPS, 2880x1864, 15.3" | Lenovo ThinkPad X9-15 Aura Edition Core Ultra 7 258V, Arc 140V, WD PC SN740 SDDQMQD-1T00, OLED, 2880x1800, 15.3" | Lenovo Yoga Slim 7 15ILL9 Aura Core Ultra 7 256V, Arc 140V, , IPS, 2880x1800, 15.3" | Schenker XMG Evo 15 (M24) Ultra 7 155H, Arc 8-Core, Samsung 990 Pro 1 TB, IPS, 2560x1600, 15.3" | Durchschnittliche Intel Arc Graphics 140T | Durchschnitt der Klasse Multimedia | |
|---|---|---|---|---|---|---|---|---|
| Stromverbrauch | 46% | 56% | 59% | 46% | 15% | 29% | 25% | |
| Idle min * (Watt) | 9.3 | 3.2 66% | 2.2 76% | 2.4 74% | 3.4 63% | 7.7 17% | 6.59 ? 29% | 5.65 ? 39% |
| Idle avg * (Watt) | 15.1 | 8.7 42% | 11.5 24% | 3.9 74% | 8.8 42% | 13.2 13% | 9.52 ? 37% | 10 ? 34% |
| Idle max * (Watt) | 15.6 | 9 42% | 11.6 26% | 5.1 67% | 9.3 40% | 13.7 12% | 12.9 ? 17% | 12.3 ? 21% |
| Last avg * (Watt) | 77.5 | 44.7 42% | 34.5 55% | 42.5 45% | 45.4 41% | 76.2 2% | 57.7 ? 26% | 65.1 ? 16% |
| Cyberpunk 2077 ultra external monitor * (Watt) | 80.9 | 49.3 39% | 26.2 68% | 40.2 50% | 44.8 45% | 72.7 10% | ||
| Cyberpunk 2077 ultra * (Watt) | 86.9 | 51.1 41% | 24.4 72% | 43.5 50% | 49.4 43% | 76.7 12% | ||
| Last max * (Watt) | 132.7 | 64.6 51% | 37.5 72% | 64.4 51% | 66.3 50% | 78.1 41% | 87.9 ? 34% | 112.5 ? 15% |
* ... kleinere Werte sind besser
Energieaufnahme Cyberpunk / Stresstest
Energieaufnahme mit externem Monitor
Akkulaufzeit
Analog zum gestiegenen Idle-Verbrauch fallen auch die Laufzeiten etwas schwächer aus als zuvor. Im WLAN-Test ermitteln wir jetzt nur noch etwas mehr als 9 Stunden (150 cd/m²) bzw. 7 Stunden (volle Helligkeit).

Notebookcheck Gesamtbewertung
Schenker XMG Evo 15 (M25)
- 27.01.2026 v8
Andreas Osthoff
 Total Sustainability Score:
 Mögliche Alternativen im Vergleich
Bild | Modell / Test | Preis ab | Gewicht | Dicke | Display |
|---|---|---|---|---|---|
1. 85.2%  | Schenker XMG Evo 15 (M25) Intel Core Ultra 7 255H ⎘ Intel Arc Graphics 140T ⎘ 32 GB RAM, 2048 GB SSD | Amazon: Bestpreis 1779€ nullprozentshop.de 2. 1779€ notebooksbilliger.de 3. 1779€ Cyberport.de | 1.8 kg | 22 mm | 15.30" 2560x1600 197 PPI IPS |
2. 87.4%  | Microsoft Surface Laptop 7 15 Lunar Lake Intel Core Ultra 7 268V ⎘ Intel Arc Graphics 140V ⎘ 32 GB RAM, 1024 GB SSD | Amazon: 2.343,17 € Bestpreis 2999€ Saturn.de 2. 2999€ Mediamarkt.de 3. 3089.94€ Cyberport.de | 1.7 kg | 18.3 mm | 15.00" 2496x1664 200 PPI IPS |
3. 91.2%  | Apple MacBook Air 15 M4 Apple M4 10-Core ⎘ Apple M4 10-core GPU ⎘ 16 GB RAM, 1024 GB SSD | Amazon: Bestpreis 1039€ PreiswertePC.de 2. 1099€ tkwpart 3. 1100€ technikkenner_wernigerode | 1.5 kg | 11.5 mm | 15.30" 2880x1864 224 PPI IPS |
4. 90.1%  | Lenovo ThinkPad X9-15 Aura Edition Intel Core Ultra 7 258V ⎘ Intel Arc Graphics 140V ⎘ 32 GB RAM, 1024 GB SSD | Amazon: 1.856,39 € Bestpreis 1644.59€ Klarsicht IT 2. 1644.6€ TechnikDeals24 3. 1644.6€ HEINZSOFT | 1.4 kg | 17.7 mm | 15.30" 2880x1800 222 PPI OLED |
5. 84.3%  | Lenovo Yoga Slim 7 15ILL9 Aura Intel Core Ultra 7 256V ⎘ Intel Arc Graphics 140V ⎘ 16 GB RAM | Amazon: Geizhals Suche | 1.5 kg | 13.9 mm | 15.30" 2880x1800 222 PPI IPS |
Transparenz
Die Auswahl der zu testenden Geräte erfolgt innerhalb der Redaktion. Das vorliegende Testmuster wurde dem Autor vom Hersteller oder einem Shop zu Testzwecken leihweise zur Verfügung gestellt. Eine Einflussnahme des Leihstellers auf den Testbericht gab es nicht, der Hersteller erhielt keine Version des Reviews vor der Veröffentlichung. Es bestand keine Verpflichtung zur Publikation. Als eigenständiges, unabhängiges Unternehmen unterliegt Notebookcheck keiner Diktion von Herstellern, Shops und Verlagen.
So testet Notebookcheck
Pro Jahr werden von Notebookcheck hunderte Laptops und Smartphones unabhängig in von uns standardisierten technischen Verfahren getestet, um eine Vergleichbarkeit aller Testergebnisse zu gewährleisten. Seit rund 20 Jahren entwickeln wir diese Testmethoden kontinuierlich weiter und setzen damit Branchenstandards. In unseren Testlaboren kommt ausschließlich hochwertiges Messequipment in die Hände erfahrener Techniker und Redakteure. Die Tests unterliegen einer mehrstufigen Kontrolle. Unsere komplexe Gesamtbewertung basiert auf hunderten fundierten Messergebnissen und Benchmarks, womit Ihnen Objektivität garantiert ist. Weitere Informationen zu unseren Testmethoden gibt es hier.
