 Deutsch
 English
 Español
 Français
 Italiano
 Nederlands
 Polski
 Português
 Русский
 Türkçe
 Svenska
 Chinese
 Magyar
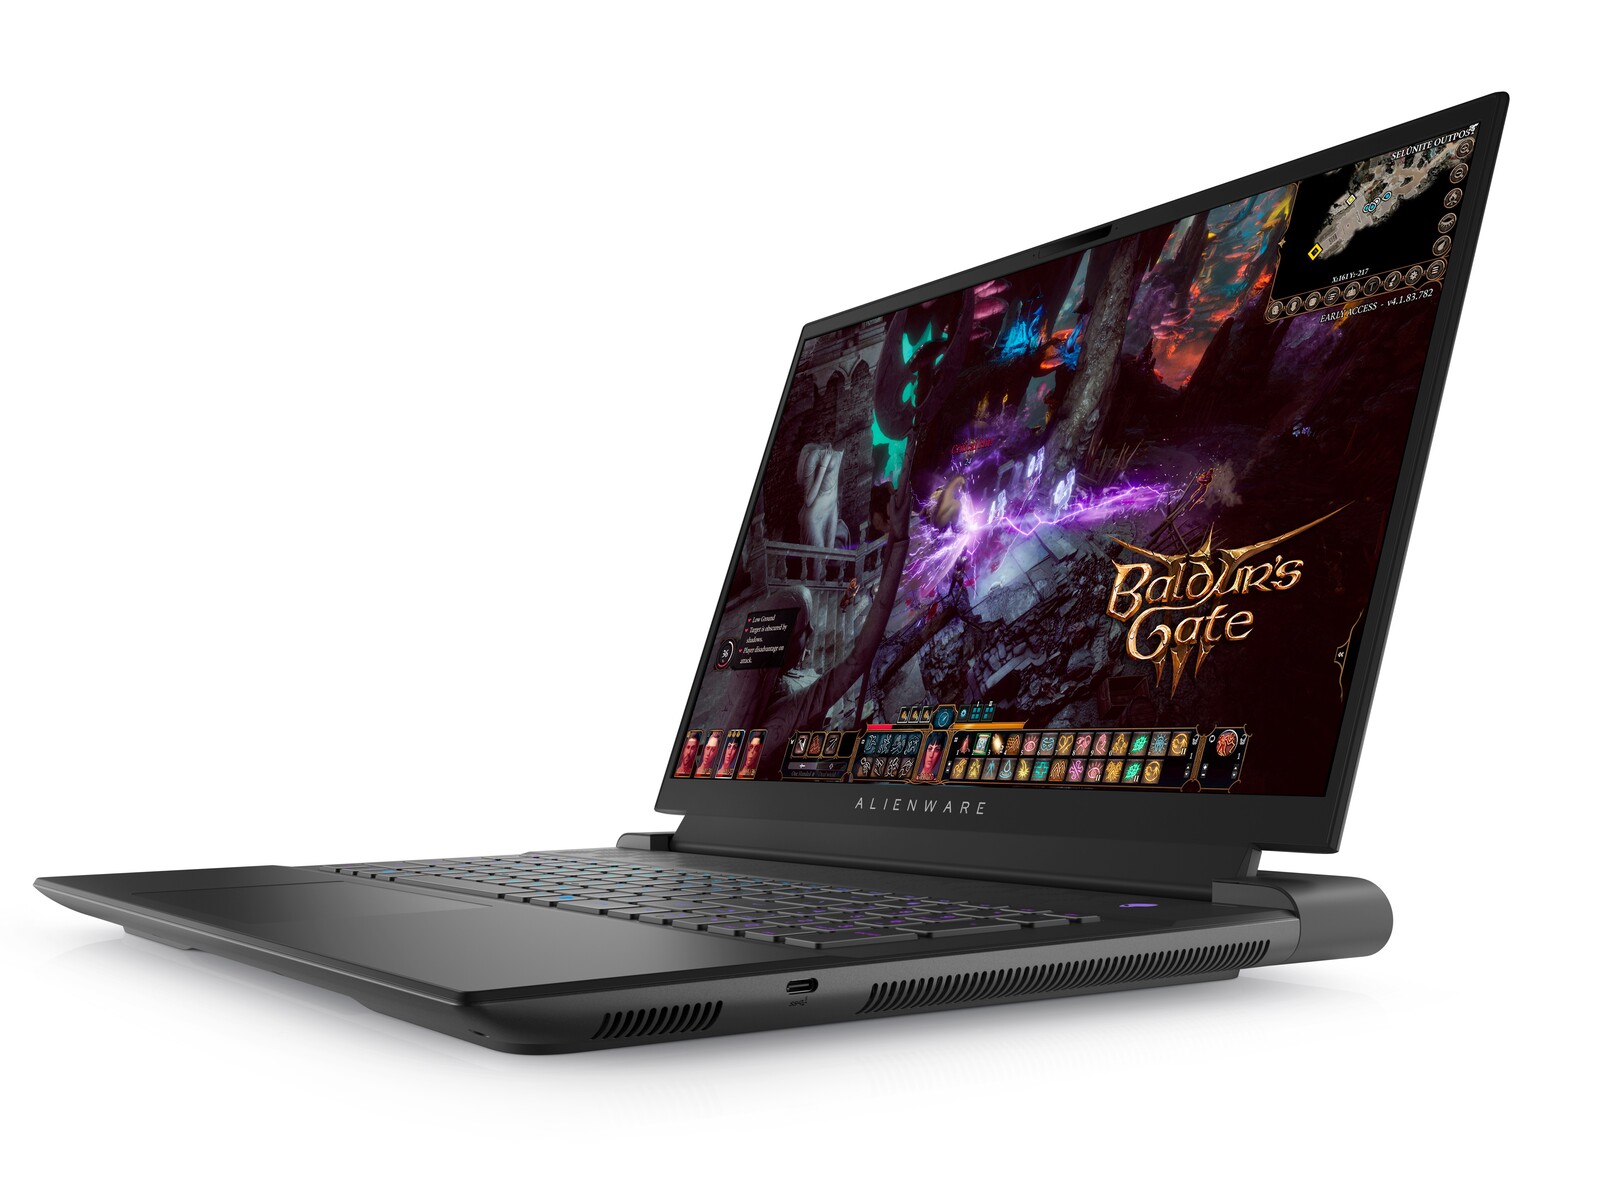
Alienware m18 R1 Laptop im Test: Größer und schwerer als das MSI Titan GT77
Zusammen mit Intel Raptor-Lake H Prozessoren und RTX 4000er GPUs wurde das Alienware M18 R1 Anfang des Jahres als Flaggschiff vorgestellt. Es ist das erste 18-Zoll-Modell von Alienware seit 2013 und seitdem hat sich natürlich viel getan. Performance-Jäger, die etwas Größeres als die üblichen 16- oder 17-Zoll-Lösungen suchen, werden an einem 18-Zoll-Formfaktor ihre Freude haben. Hier wurden Ausstattung und Wärmeabfuhr optimiert.
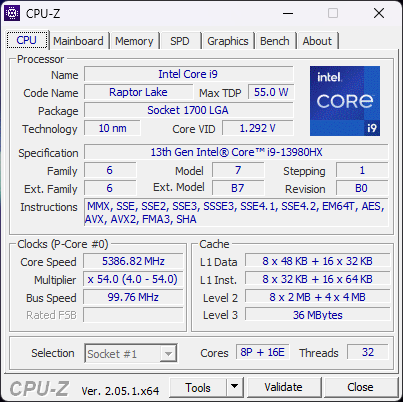
Bei unserer Testkonfiguration handelt es sich um eine High-End-Spezifikation mit einer Core i9-13980HX CPU der 13. Generation, einer GeForce RTX 4090 mit 175 W, einer membranbasierten RGB-Tastatur und einem 1200p 480 Hz IPS-Display für ca. 2900 USD. Weitere Ausstattungsvarianten sind ab RTX 4060, Core i7-13700HX und 1600p 165 Hz Display mit CherryMX ultra low-profile mechanischer Tastatur erhältlich. Alle Konfigurationen unterstützen zudem G-Sync und den vollen Display P3 Farbraum.
Zu den direkten Konkurrenten zählen weitere 18-Zoll-Gaming-Laptops wie das Razer Blade 18 oder das Asus ROG Strix Scar 18. MSI hat zum Zeitpunkt des Erscheinens dieses Artikels noch kein neues 18-Zoll-Modell angekündigt.
Weitere aktuelle Testberichte zu Dell-Laptops:
Mögliche Konkurrenten im Vergleich
Bew. | Datum | Modell | Gewicht | Dicke | Größe | Auflösung | Preis ab |
|---|---|---|---|---|---|---|---|
| 90.7 % | 04.2023 | Alienware m18 R1 i9-13980HX, NVIDIA GeForce RTX 4090 Laptop GPU | 3.9 kg | 26.7 mm | 18.00" | 1920x1200 | |
| 91.4 % | 02.2023 | Razer Blade 18 RTX 4070 i9-13950HX, NVIDIA GeForce RTX 4070 Laptop GPU | 3 kg | 21.9 mm | 18.00" | 2560x1600 | |
| 86.6 % | 02.2023 | Asus ROG Strix Scar 18 2023 G834JY-N6005W i9-13980HX, NVIDIA GeForce RTX 4090 Laptop GPU | 3.1 kg | 30.8 mm | 18.00" | 2560x1600 | |
| 88.3 % | 04.2023 | MSI GE78HX 13VH-070US i9-13950HX, NVIDIA GeForce RTX 4080 Laptop GPU | 3 kg | 23 mm | 17.00" | 2560x1600 | |
| 89.9 % | Eluktronics Mech-17 GP2 i9-13900HX, NVIDIA GeForce RTX 4090 Laptop GPU | 2.9 kg | 27 mm | 17.00" | 2560x1600 | ||
| 89 % | 02.2023 | MSI Titan GT77 HX 13VI i9-13950HX, NVIDIA GeForce RTX 4090 Laptop GPU | 3.5 kg | 23 mm | 17.30" | 3840x2160 |
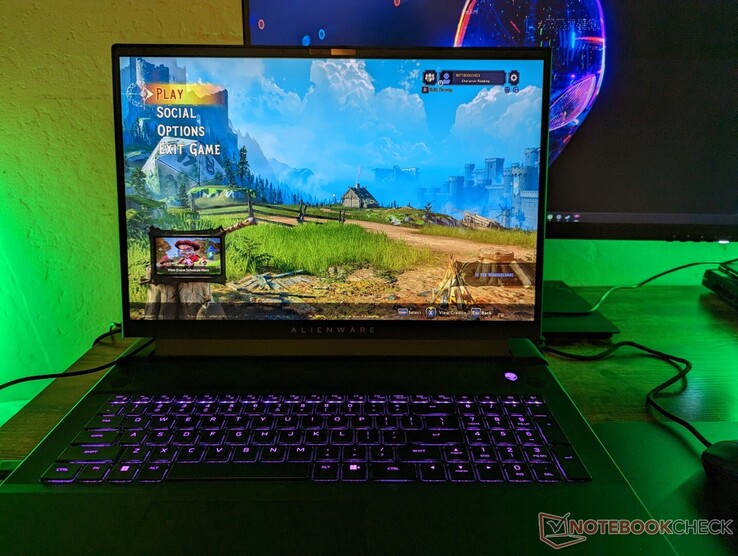
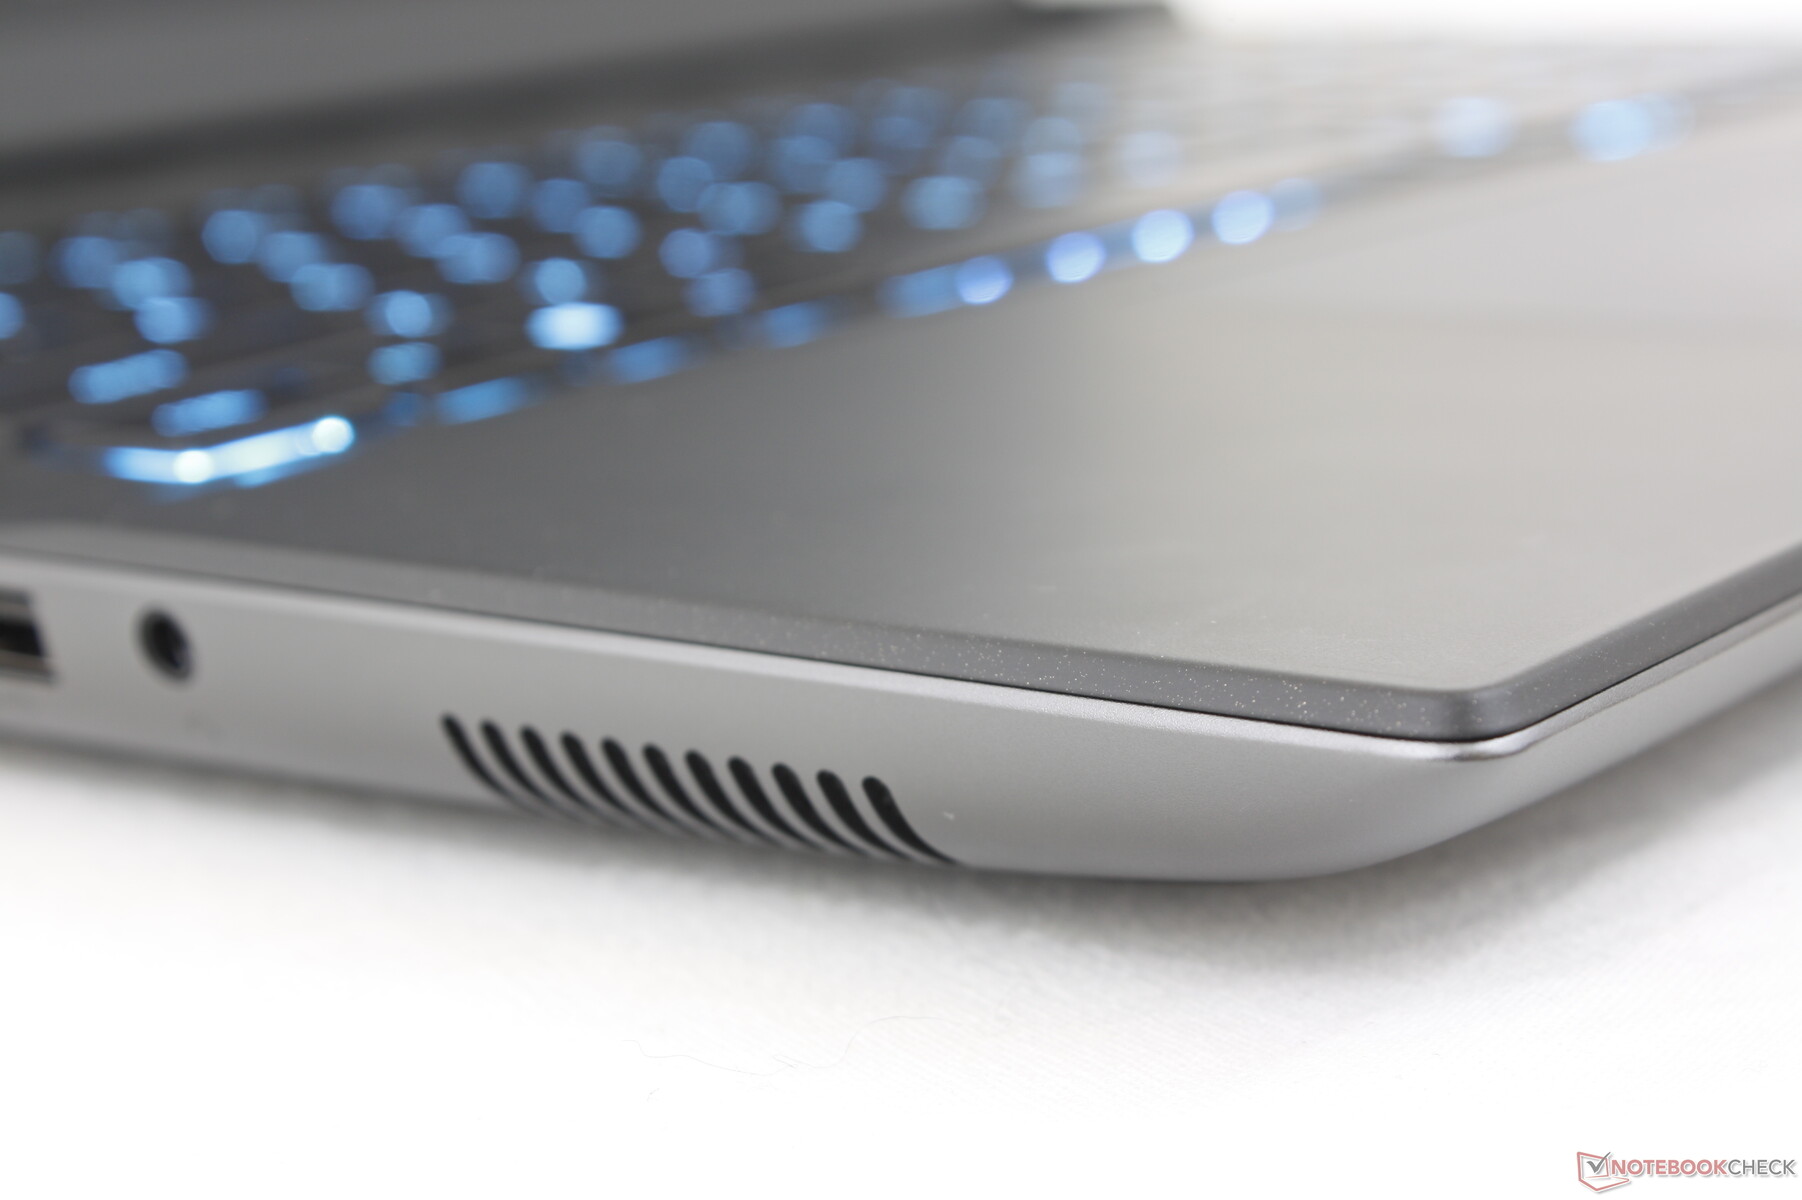
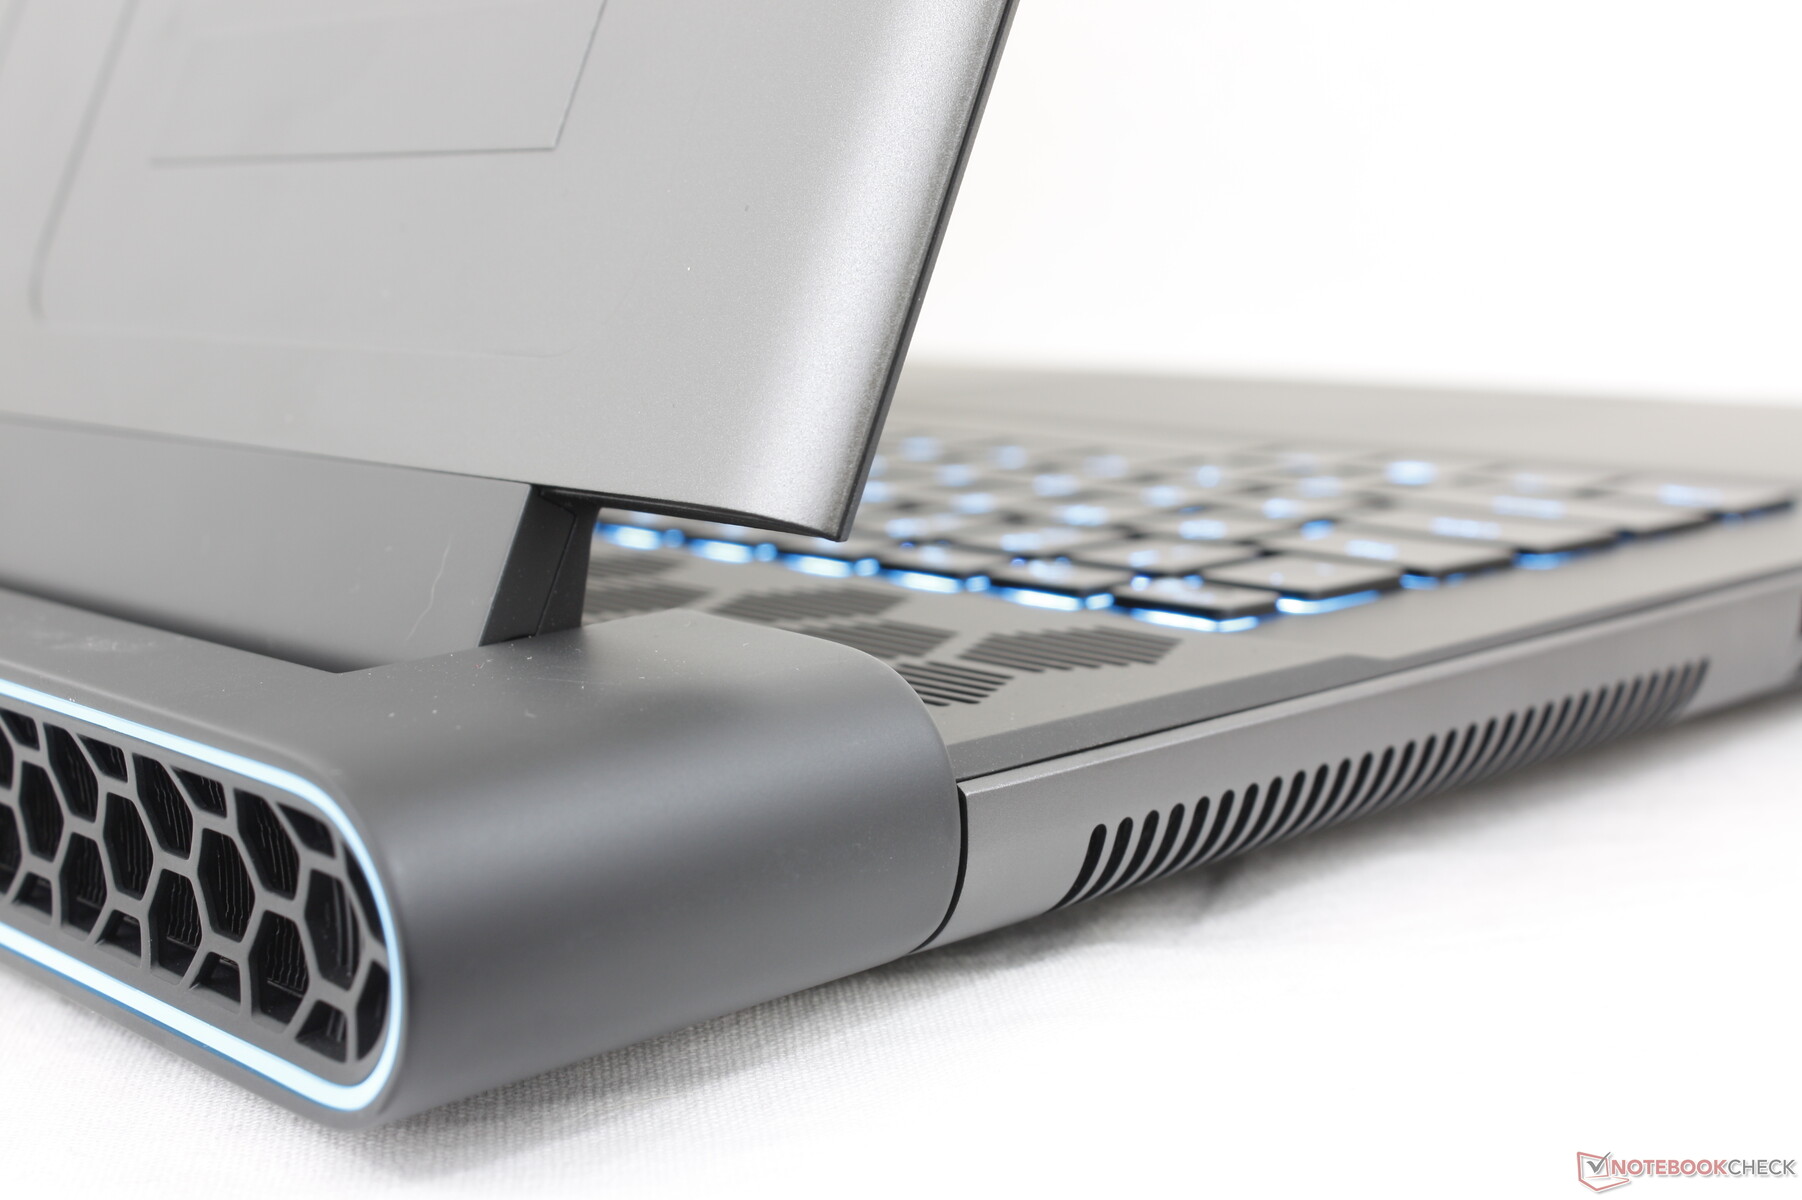
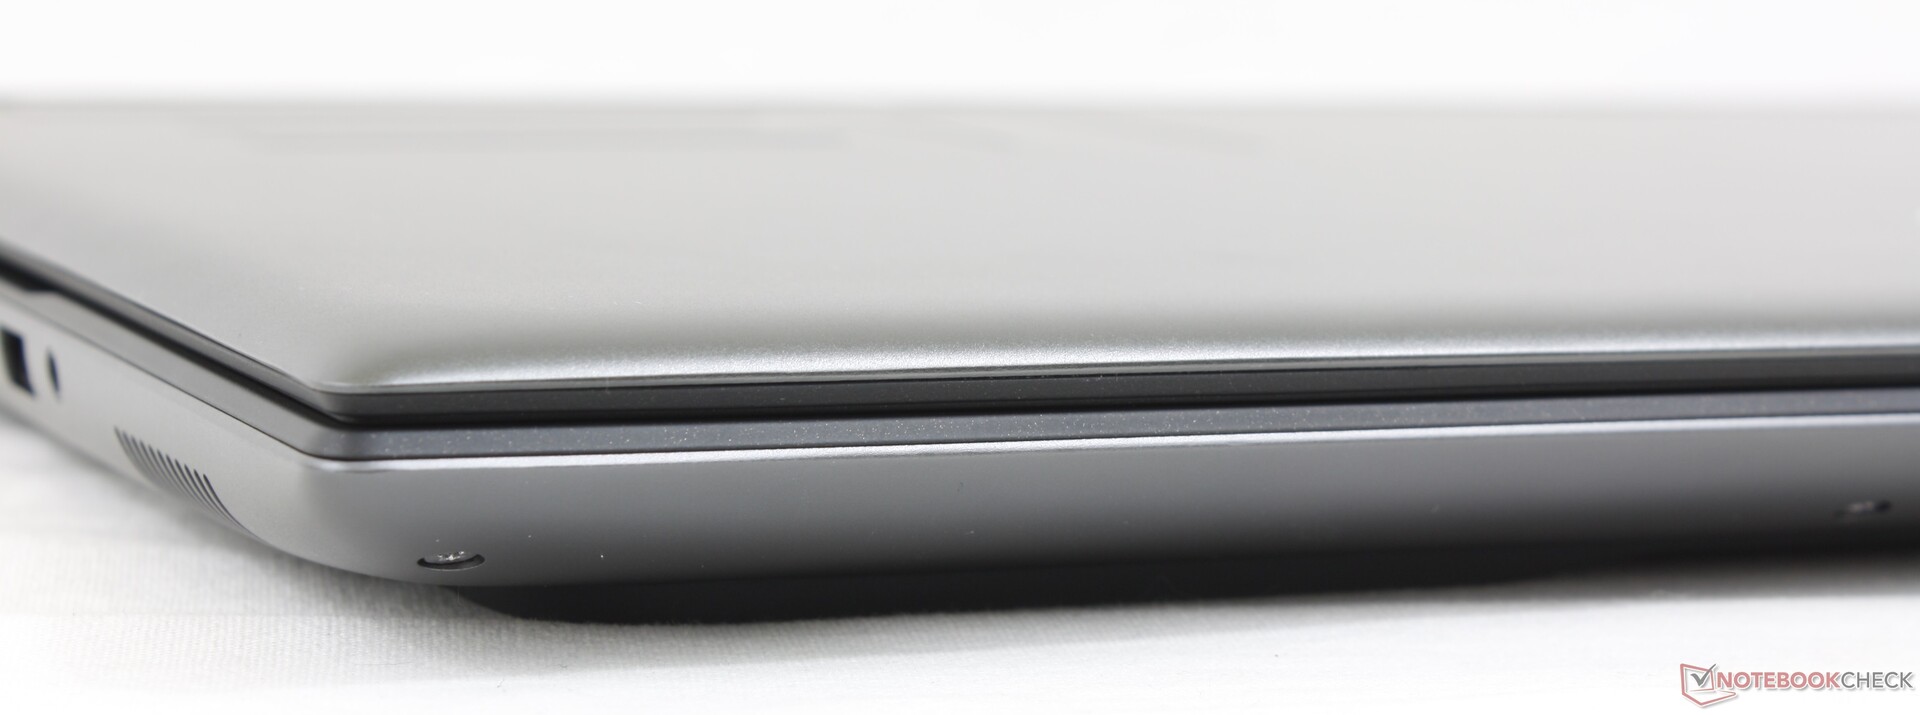
Gehäuse — Typisches Alienware-Design
Der erste Eindruck des Notebooks ähnelt dem des Alienware x17 R2, da das Alienware m18 R1 ähnliche Materialien verwendet. Die kompakte Bauweise und die sorgfältige Auswahl der Materialien zeigen, dass man kein Unibody-Design wie beim Razer Blade 18 benötigt, um ein hochwertiges Gehäuse zu erhalten. Alles, von der Mitte der Tastatur bis zum Außendeckel, ist stabiler und widerstandsfähiger gegen Verwindungen oder Stöße als bei vielen anderen Gaming-Notebooks, einschließlich des MSI GE78.
Die matte, gummierte Oberfläche der Tastatur mag jedoch ein zwiespältiges Erlebnis bieten, da sie im Laufe der Zeit leicht unansehnliche Fett- und Fingerabdrücke ansammelt.
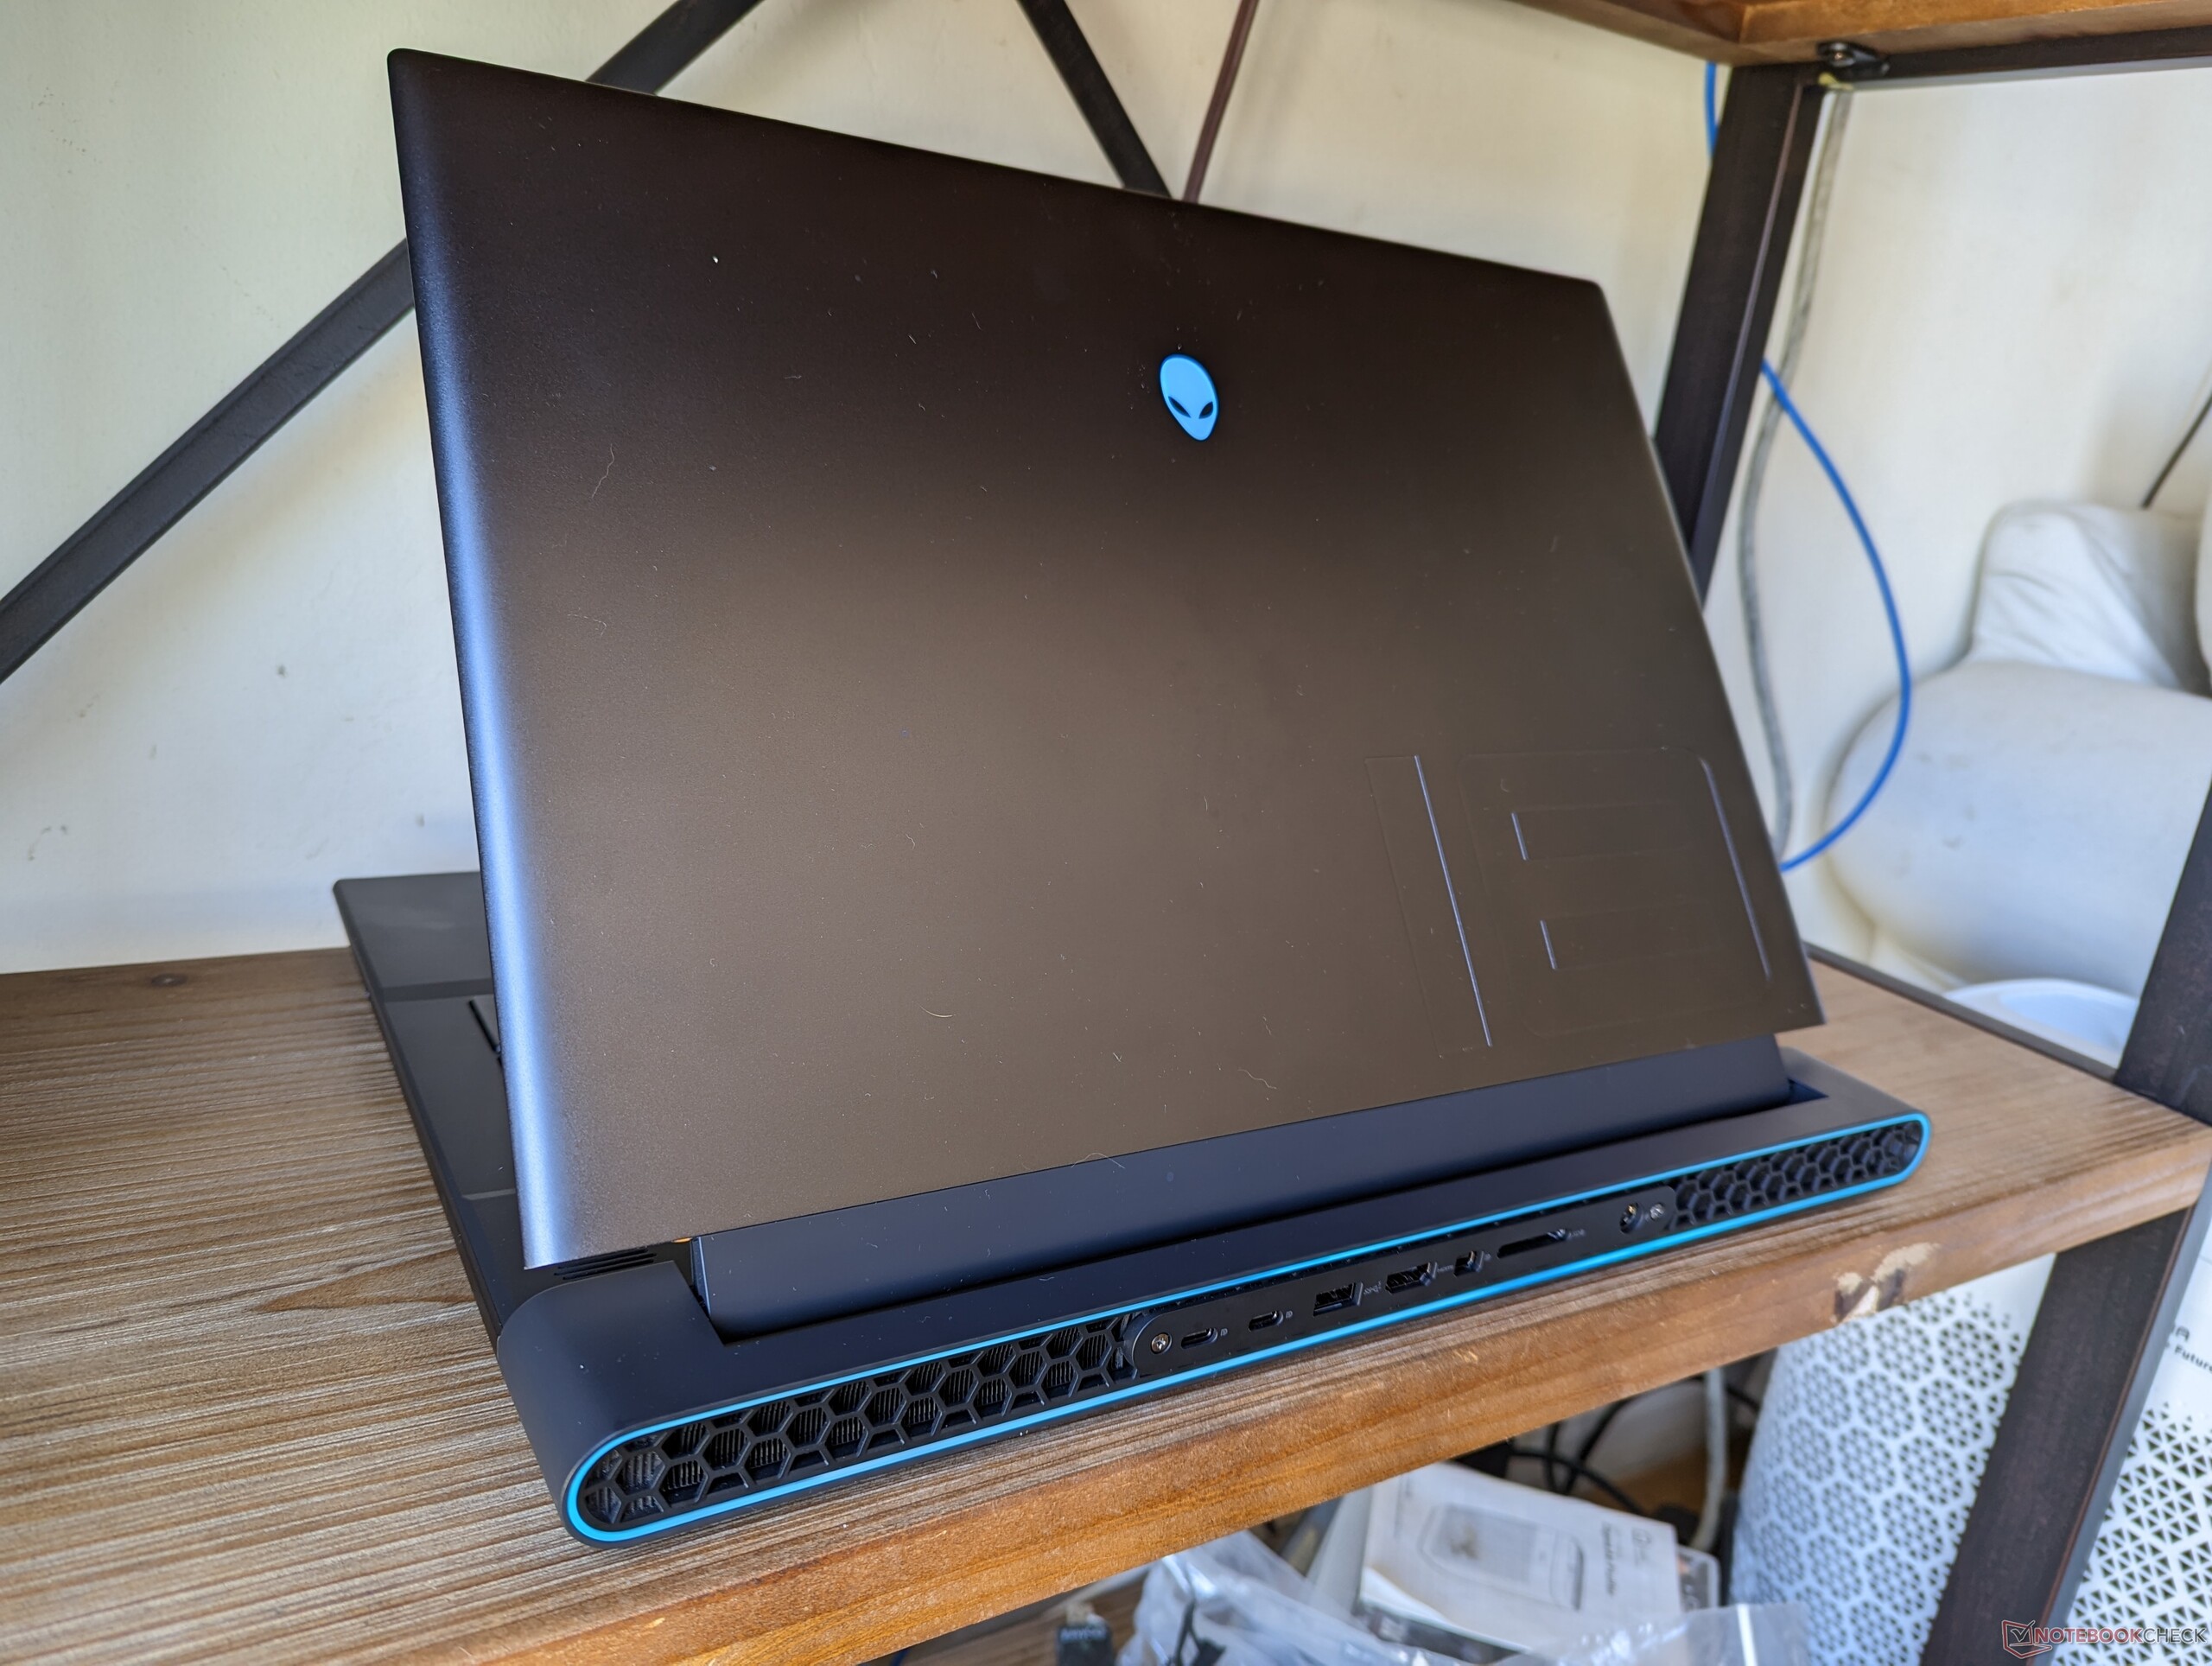
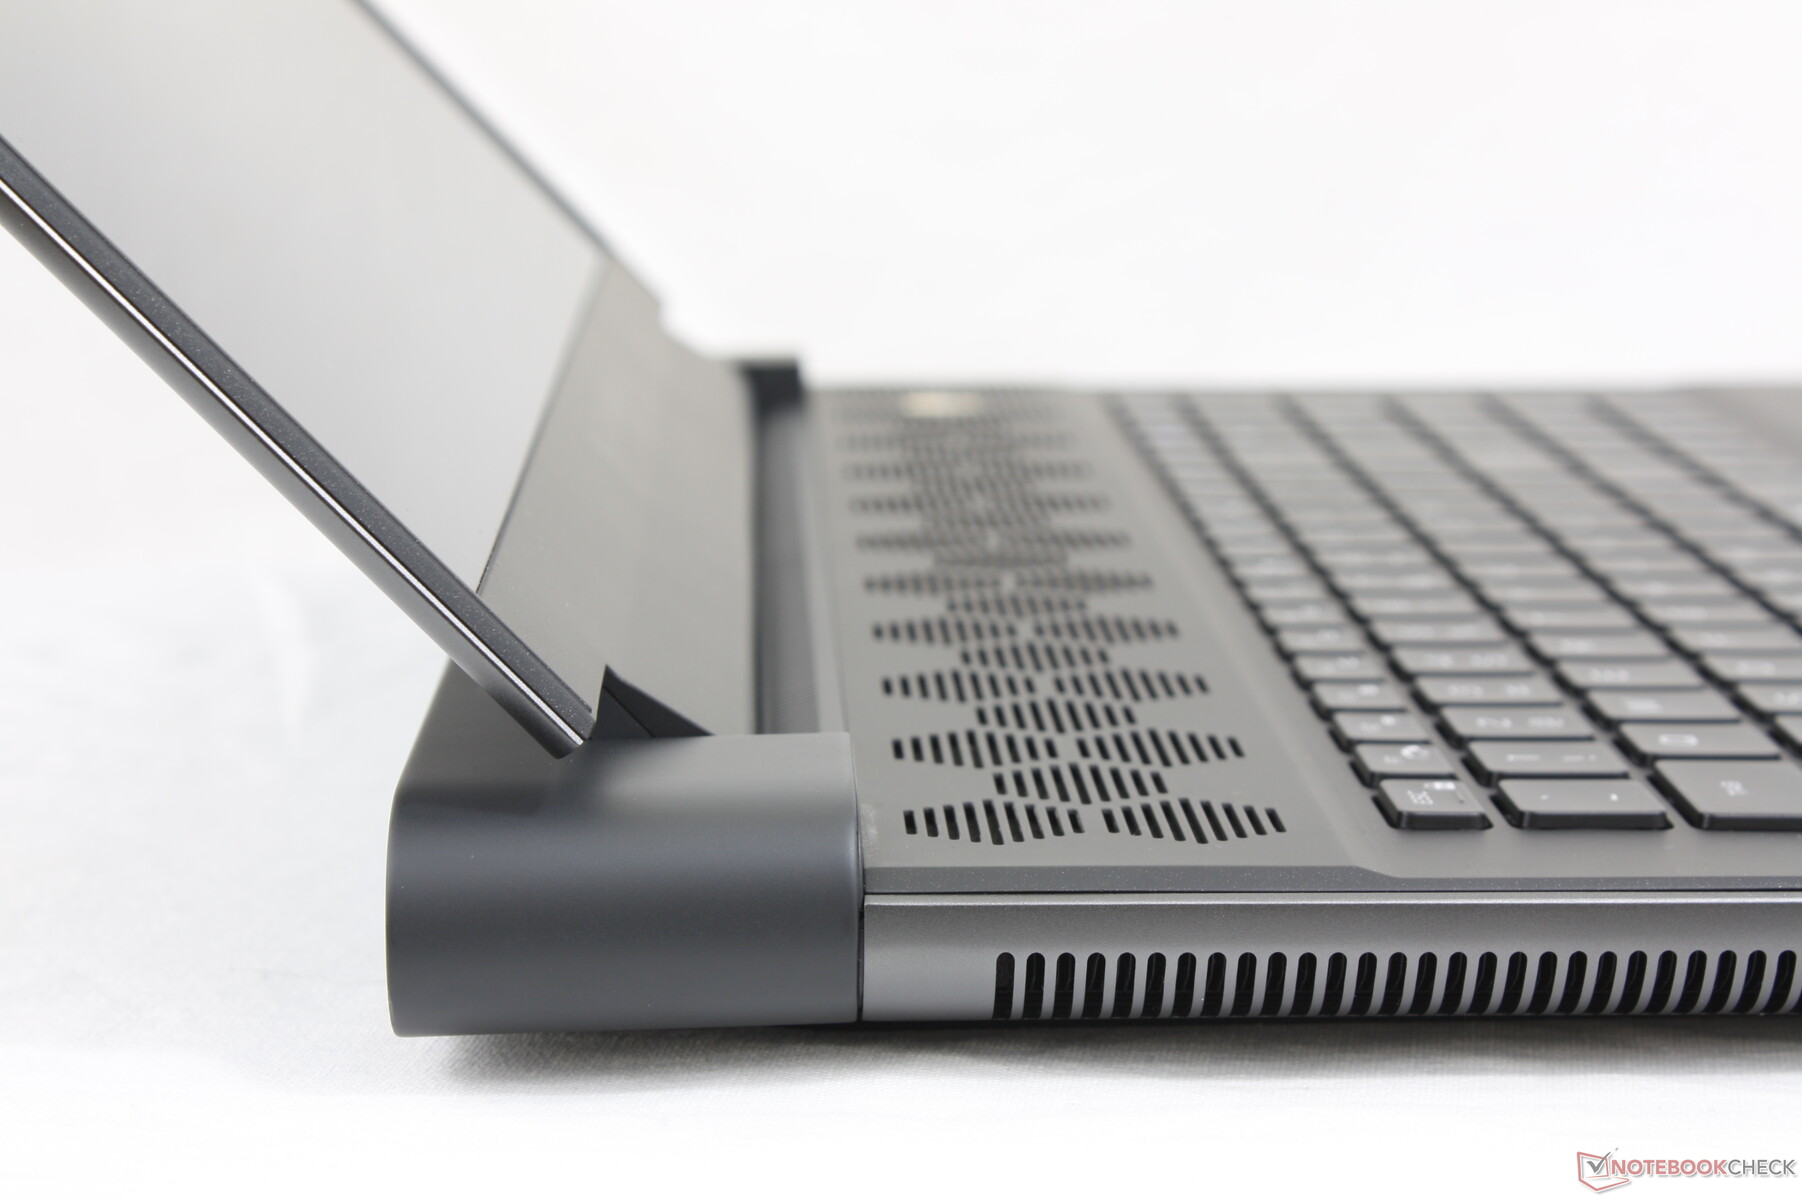
Das Alienware-Modell wiegt deutlich mehr als das Blade 18 oder das ROG Strix Scar 18, nämlich jeweils fast ein ganzes Kilogramm, was es zu einem der schwersten Notebooks des Jahres macht. Sogar unserem Lieferanten fiel auf, wie schwer der Versandkarton im Verhältnis zu seiner geringen Größe ausfällt. Ein Großteil des Gewichts geht auf das Konto der verlängerten Rückseite, des dickeren Profils und der Vapor Chamber. All das soll für eine bessere Kühlung sorgen. Wer auf ein geringes Gewicht Wert legt, sollte sich das MSI Titan GT77 ansehen, das tatsächlich leichter und dünner ist als unser Alienware.


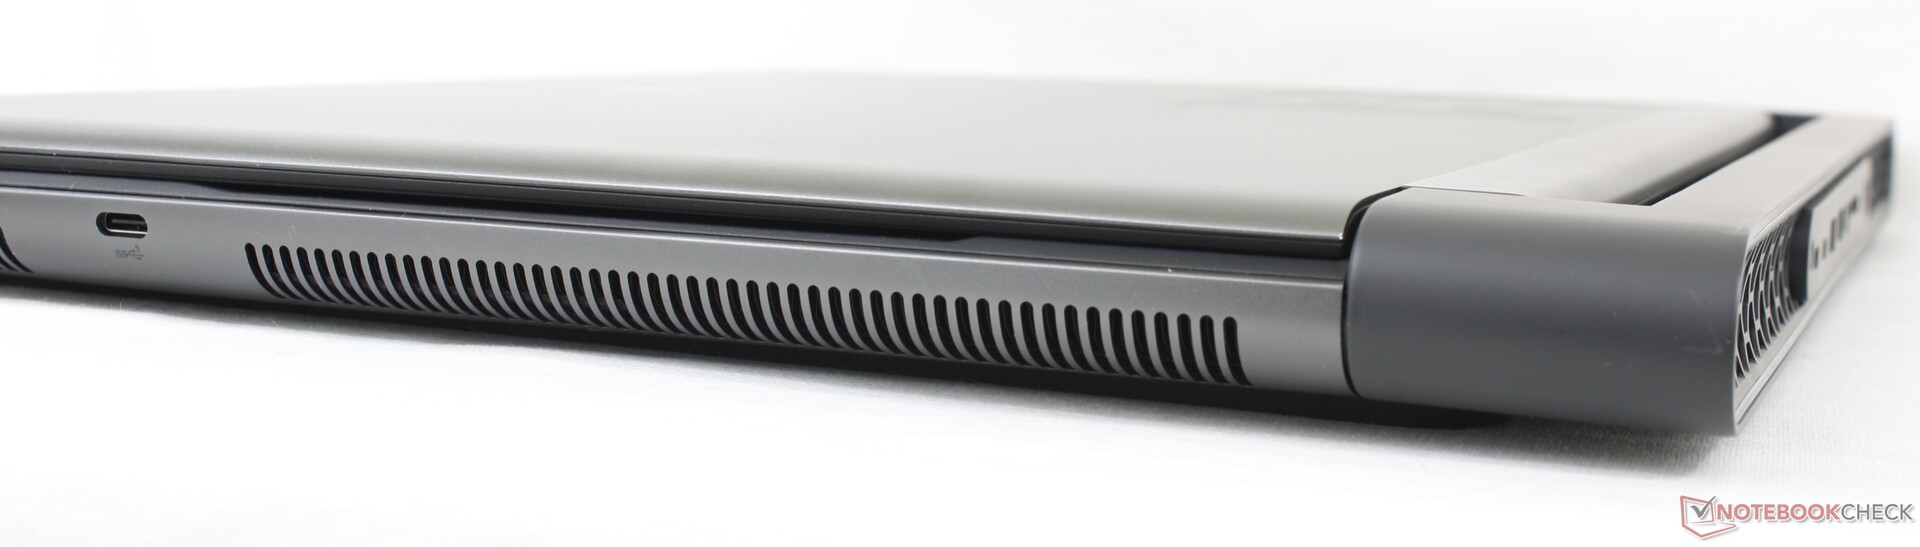
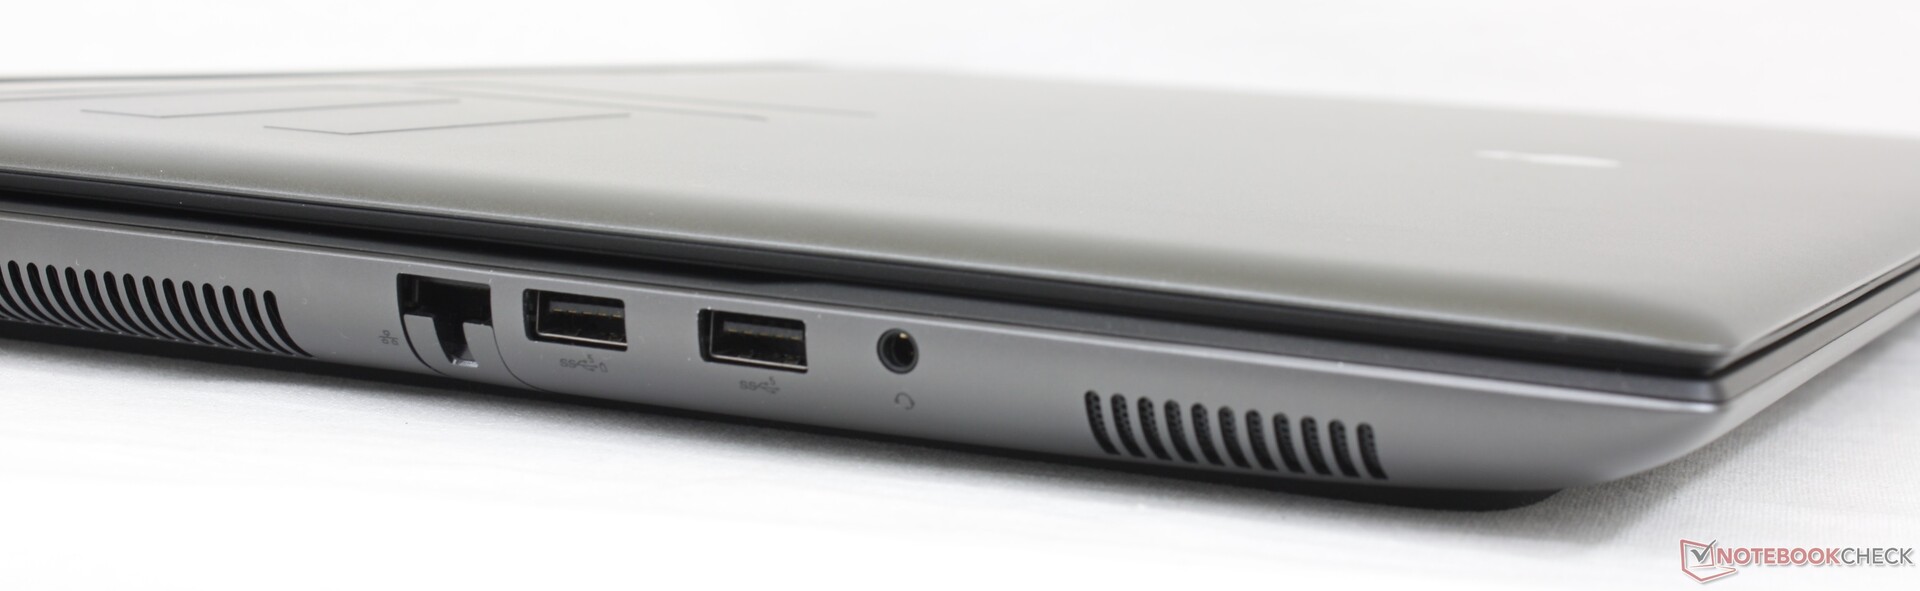
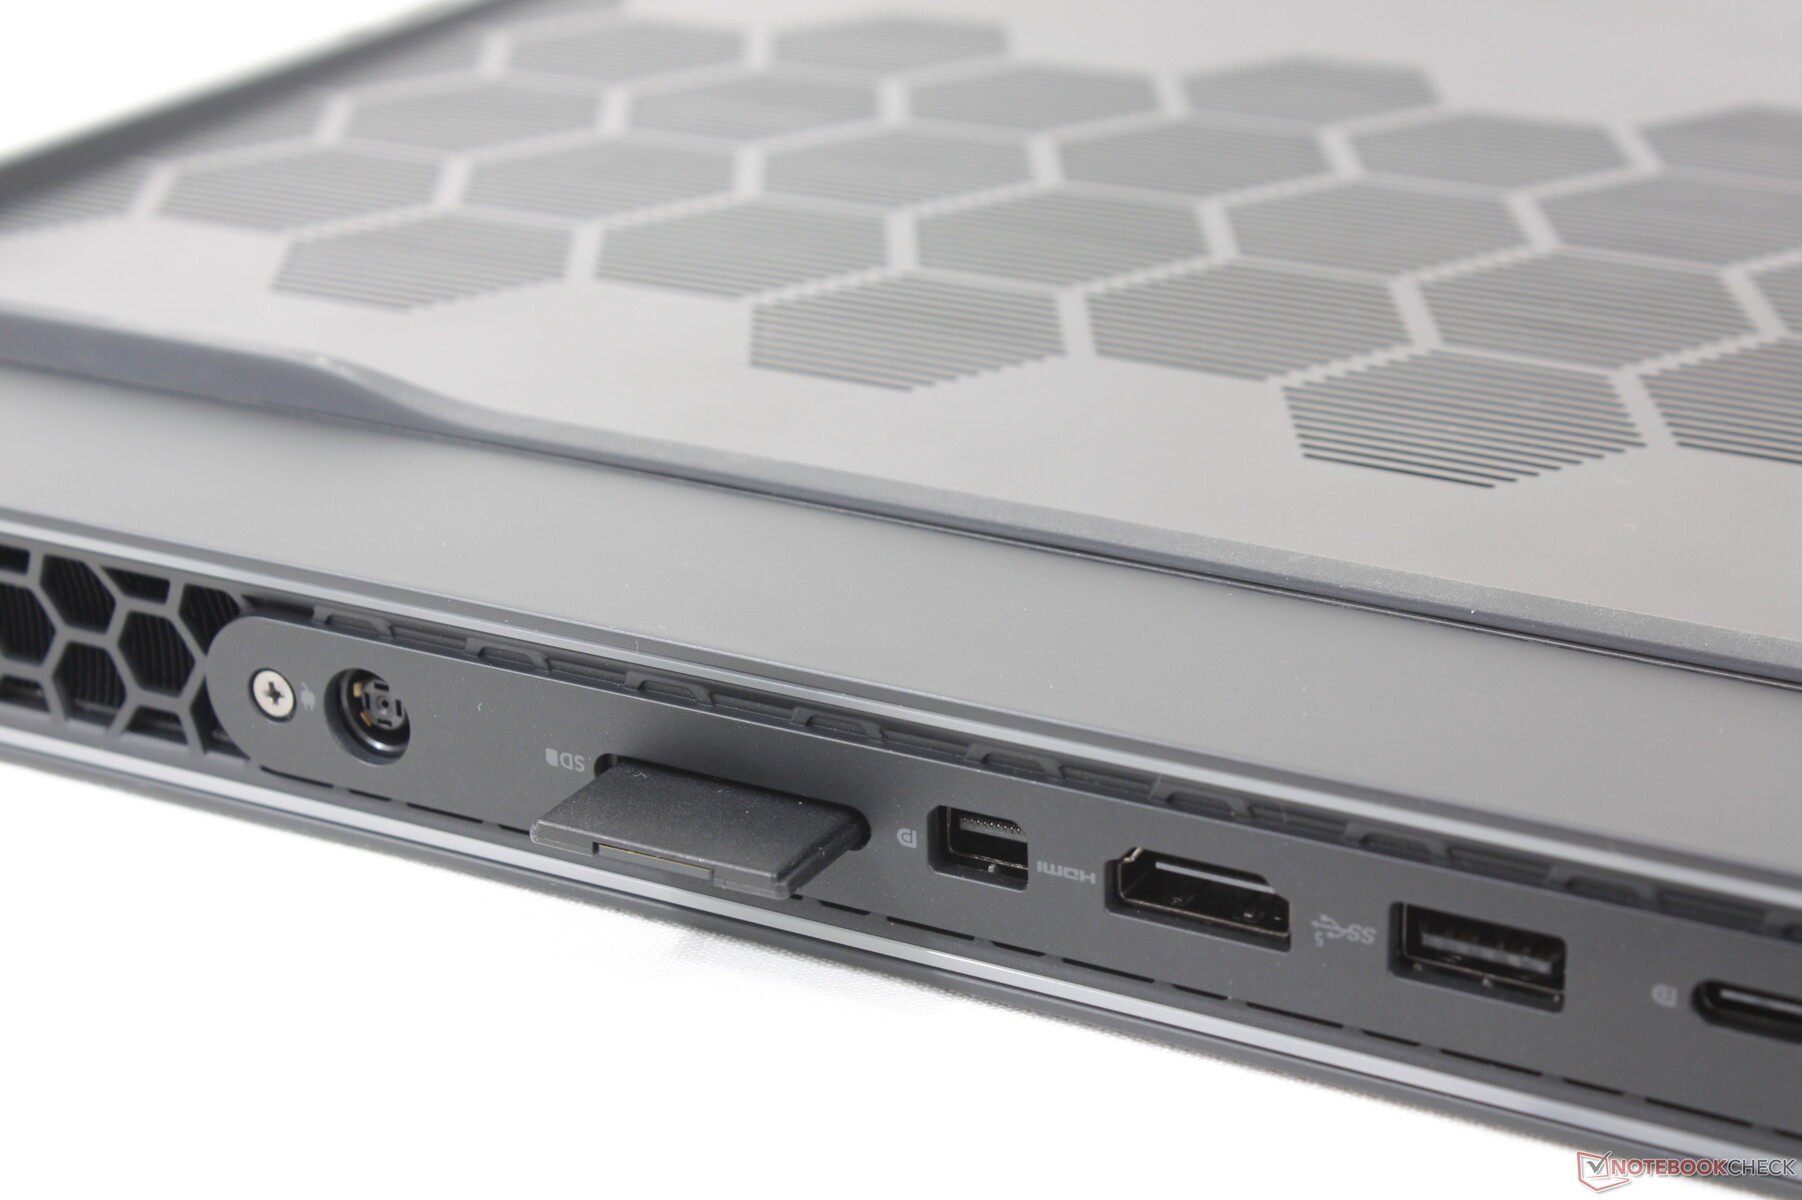
Anschlussausstattung - Mehr als üblich
Das Alienware m18 R1 hat deutlich mehr Anschlüsse als etwa das Razer Blade 18 oder das Asus ROG Strix Scar 18. Aber das Gros der Anschlüsse liegt hier schlecht erreichbar an der Rückseite des Laptops. So bieten auch nur die USB-C-Buchsen der Rückseite den vollen Funktionsumfang mit DisplayPort und Thunderbolt 4.
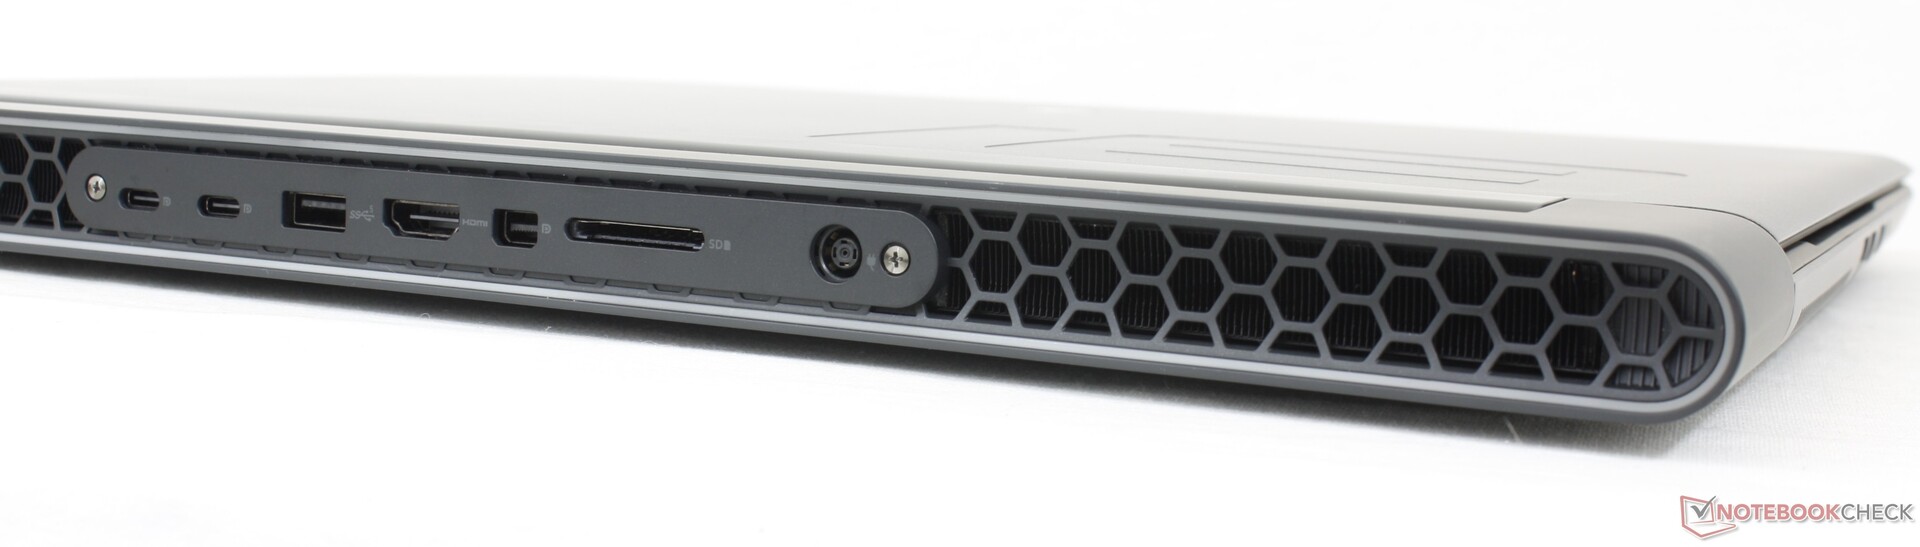
SD Kartenleser
Recht schlecht erreichbar ist so auch der SD-Kartenleser an der Rückseite des Alienware m18 R1. Dieser ist aber mehr als doppelt so schnell wie der des MSI Titan GT77.
| SD Card Reader | |
| average JPG Copy Test (av. of 3 runs) | |
| Razer Blade 18 RTX 4070 (Angelibird AV Pro V60) | |
| Alienware m18 R1 (Angelibird AV Pro V60) | |
| Alienware x17 R2 P48E (AV Pro V60) | |
| MSI Titan GT77 HX 13VI (Angelibird AV Pro V60) | |
| Eluktronics Mech-17 GP2 (Angelibird AV Pro V60) | |
| maximum AS SSD Seq Read Test (1GB) | |
| Alienware x17 R2 P48E (AV Pro V60) | |
| Alienware m18 R1 (Angelibird AV Pro V60) | |
| Razer Blade 18 RTX 4070 (Angelibird AV Pro V60) | |
| Eluktronics Mech-17 GP2 (Angelibird AV Pro V60) | |
| MSI Titan GT77 HX 13VI (Angelibird AV Pro V60) | |
Kommunikation
Das Intel Killer 1675i sorgt in unserem Gaming-Laptop für Wi-Fi 6E und Bluetooth 5.2 Verbindungen. Killer ist Sub-Marke von Intel. Im Kern handelt es sich beim 1675i um ein Intel AX 211 Modul. Dessen Leistung ist in Kombination mit unserem Asus AXE11000 Router hervorragend. Für die Netzwerkverbindung steht außerdem 2.5 Gbps LAN zur Verfügung. Auf der deutschen Vertriebsseite gibt Dell jedoch das MediaTek Wi-Fi 6 MT7921 als Wi-Fi-Modul an. Hier könnten sich die getestete US-Version und die deutsche Version des Laptops deutlich unterscheiden.
| Networking | |
| iperf3 transmit AX12 | |
| Alienware x17 R2 P48E | |
| iperf3 receive AX12 | |
| Alienware x17 R2 P48E | |
| iperf3 transmit AXE11000 | |
| MSI Titan GT77 HX 13VI | |
| Asus ROG Strix Scar 18 2023 G834JY-N6005W | |
| Eluktronics Mech-17 GP2 | |
| Alienware m18 R1 | |
| Razer Blade 18 RTX 4070 | |
| iperf3 receive AXE11000 | |
| Asus ROG Strix Scar 18 2023 G834JY-N6005W | |
| MSI Titan GT77 HX 13VI | |
| Razer Blade 18 RTX 4070 | |
| Eluktronics Mech-17 GP2 | |
| Alienware m18 R1 | |
| iperf3 transmit AXE11000 6GHz | |
| Alienware m18 R1 | |
| Razer Blade 18 RTX 4070 | |
| iperf3 receive AXE11000 6GHz | |
| Razer Blade 18 RTX 4070 | |
| Alienware m18 R1 | |
Webcam
Die FullHD-Webcam ist wohl typisch für aktuelle Notebooks. Bei der Größe des Alienware-Notebooks könnte aber auch ein 5-Megapixel-Sensor problemlos Platz finden. Dank Infrarot ist eine Gesichtserkennung per Windows Hello möglich. Allerdings vermissen wir hier einen mechanischen Shutter, wie er beim Razer Blade 18 zu finden ist.


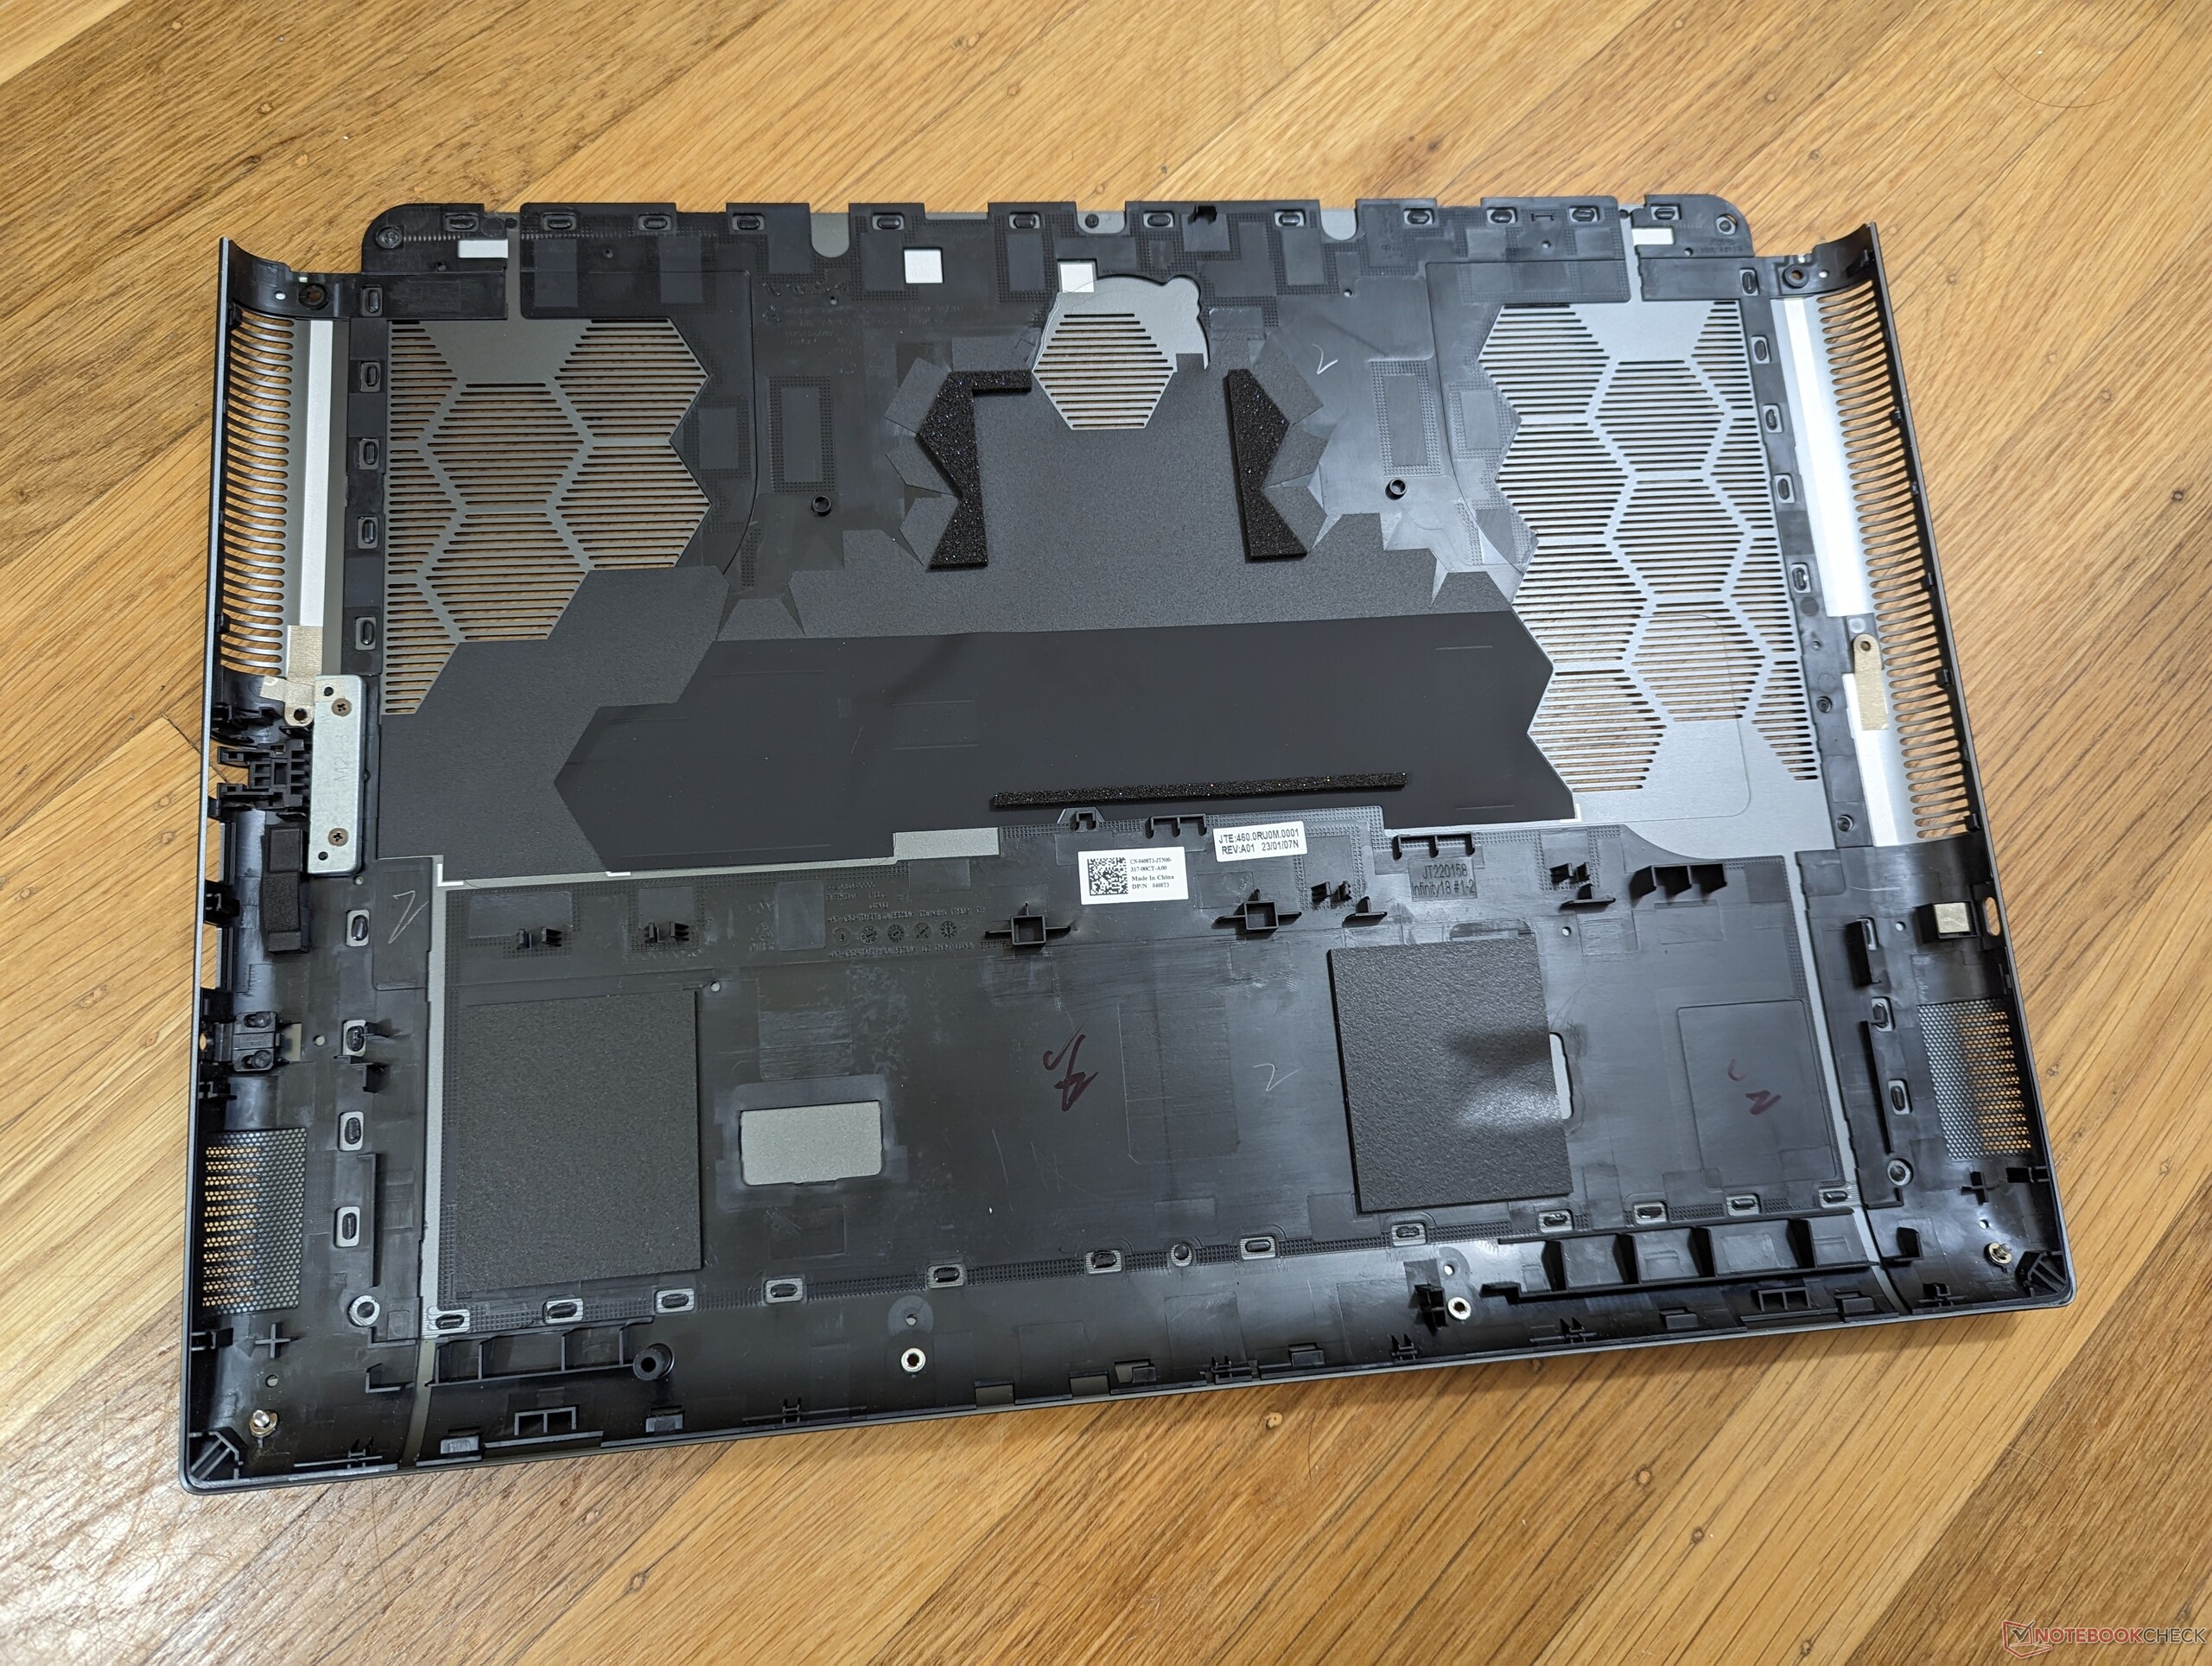
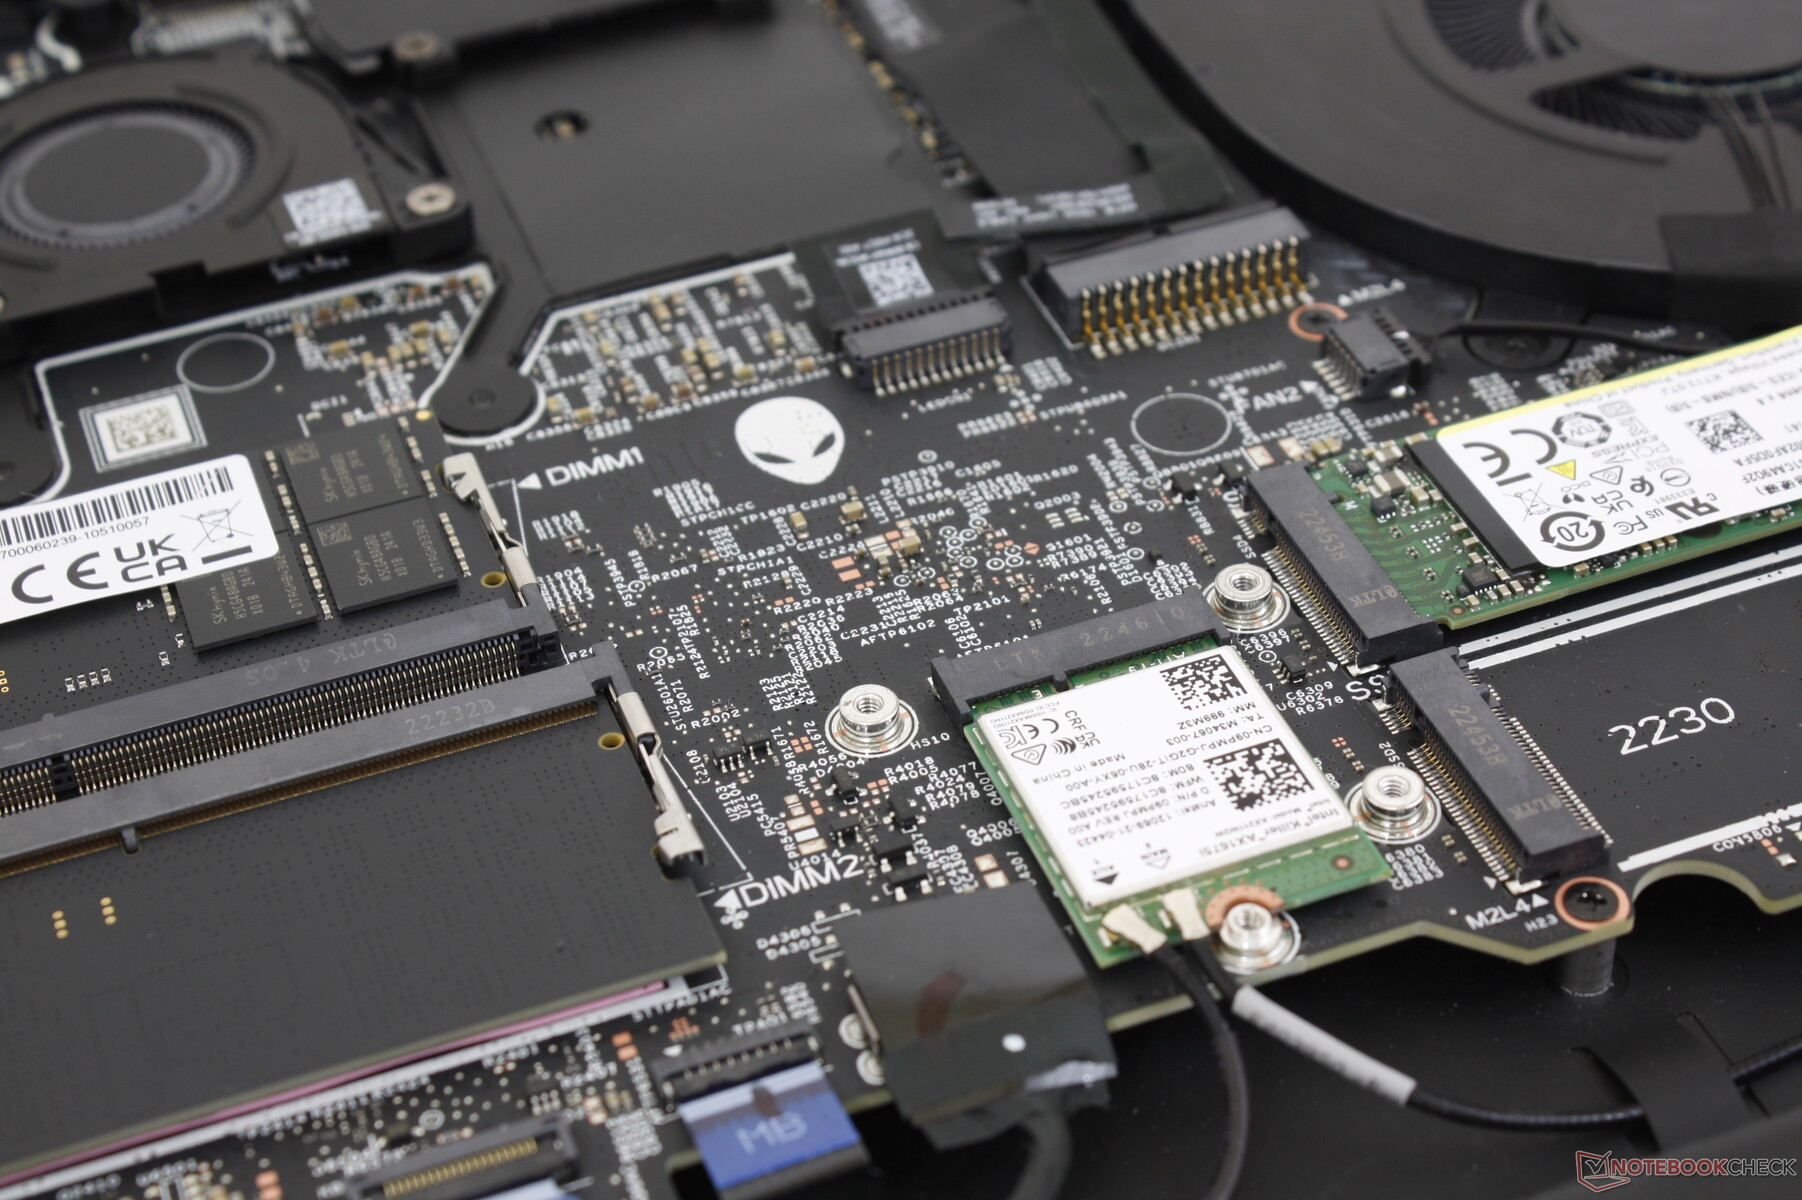
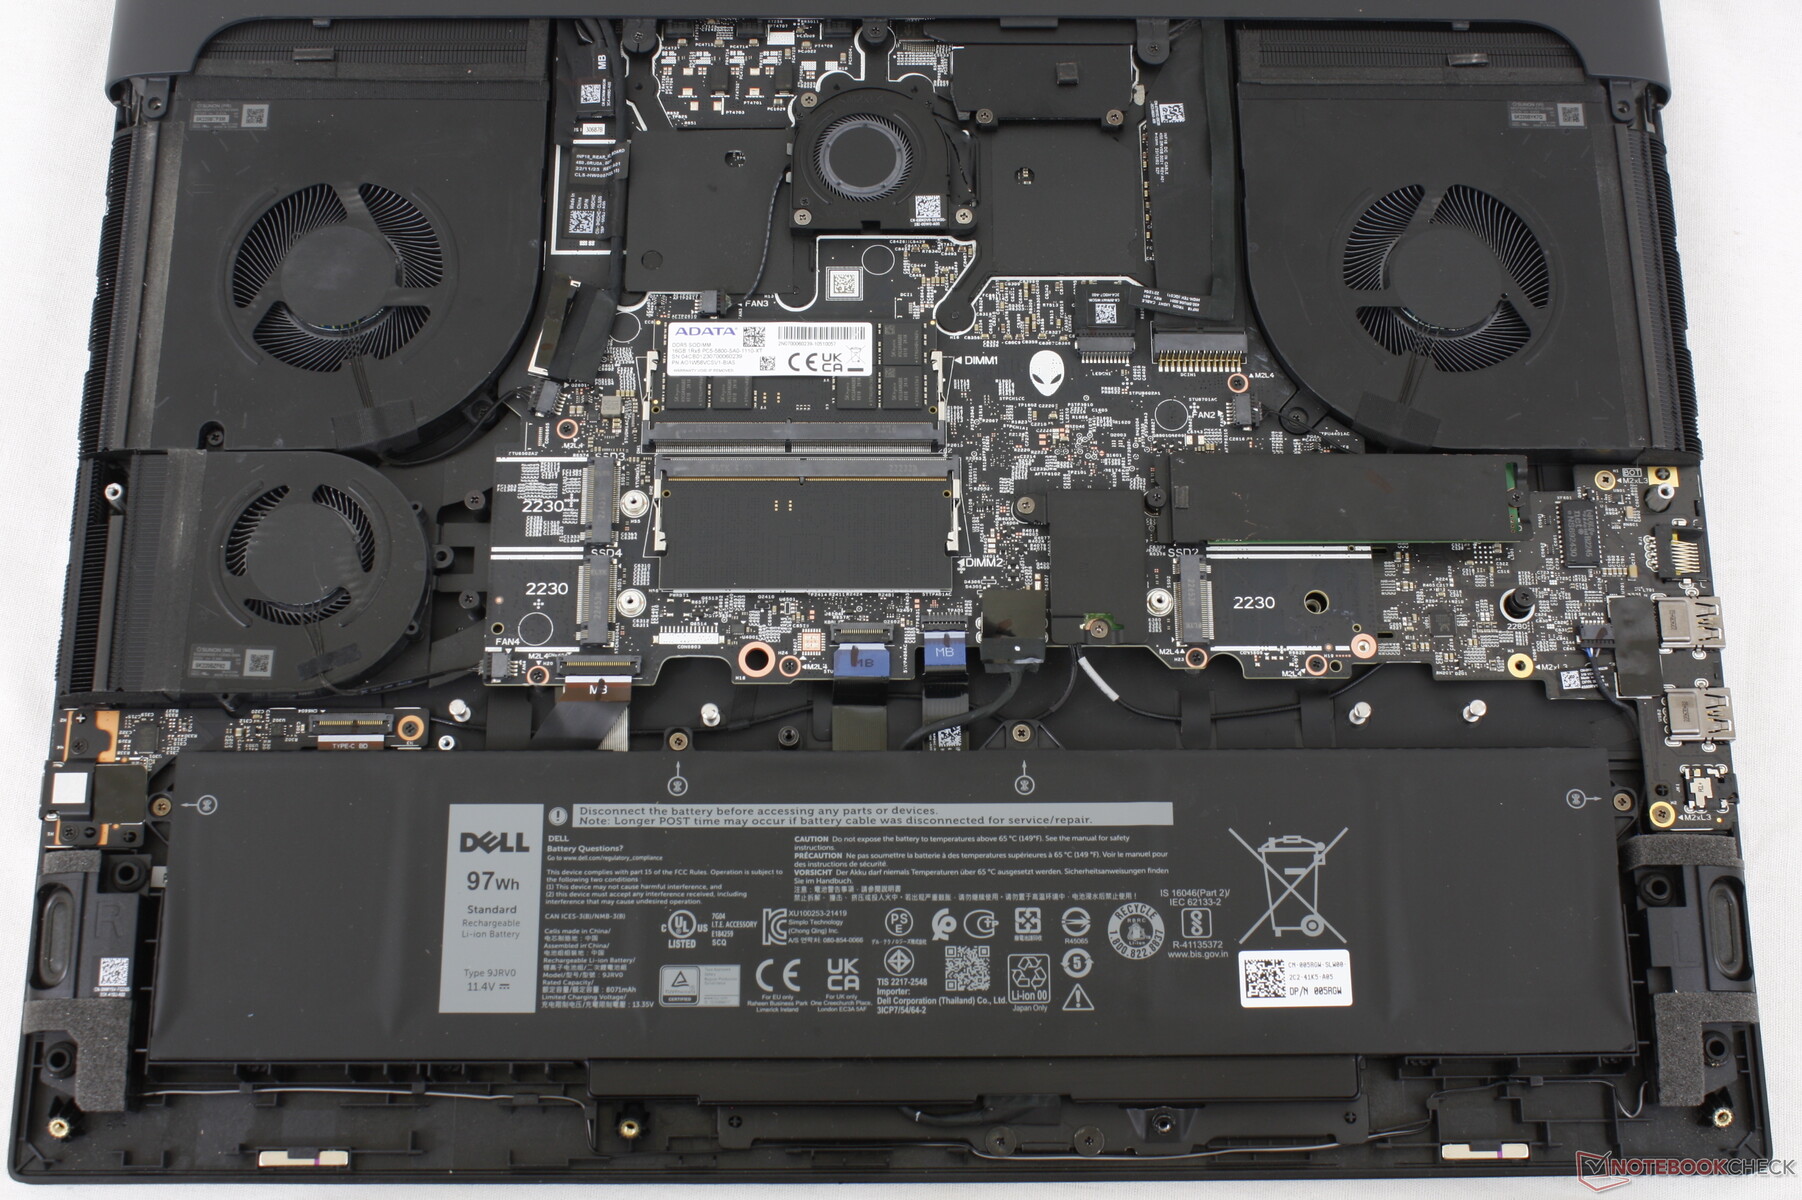
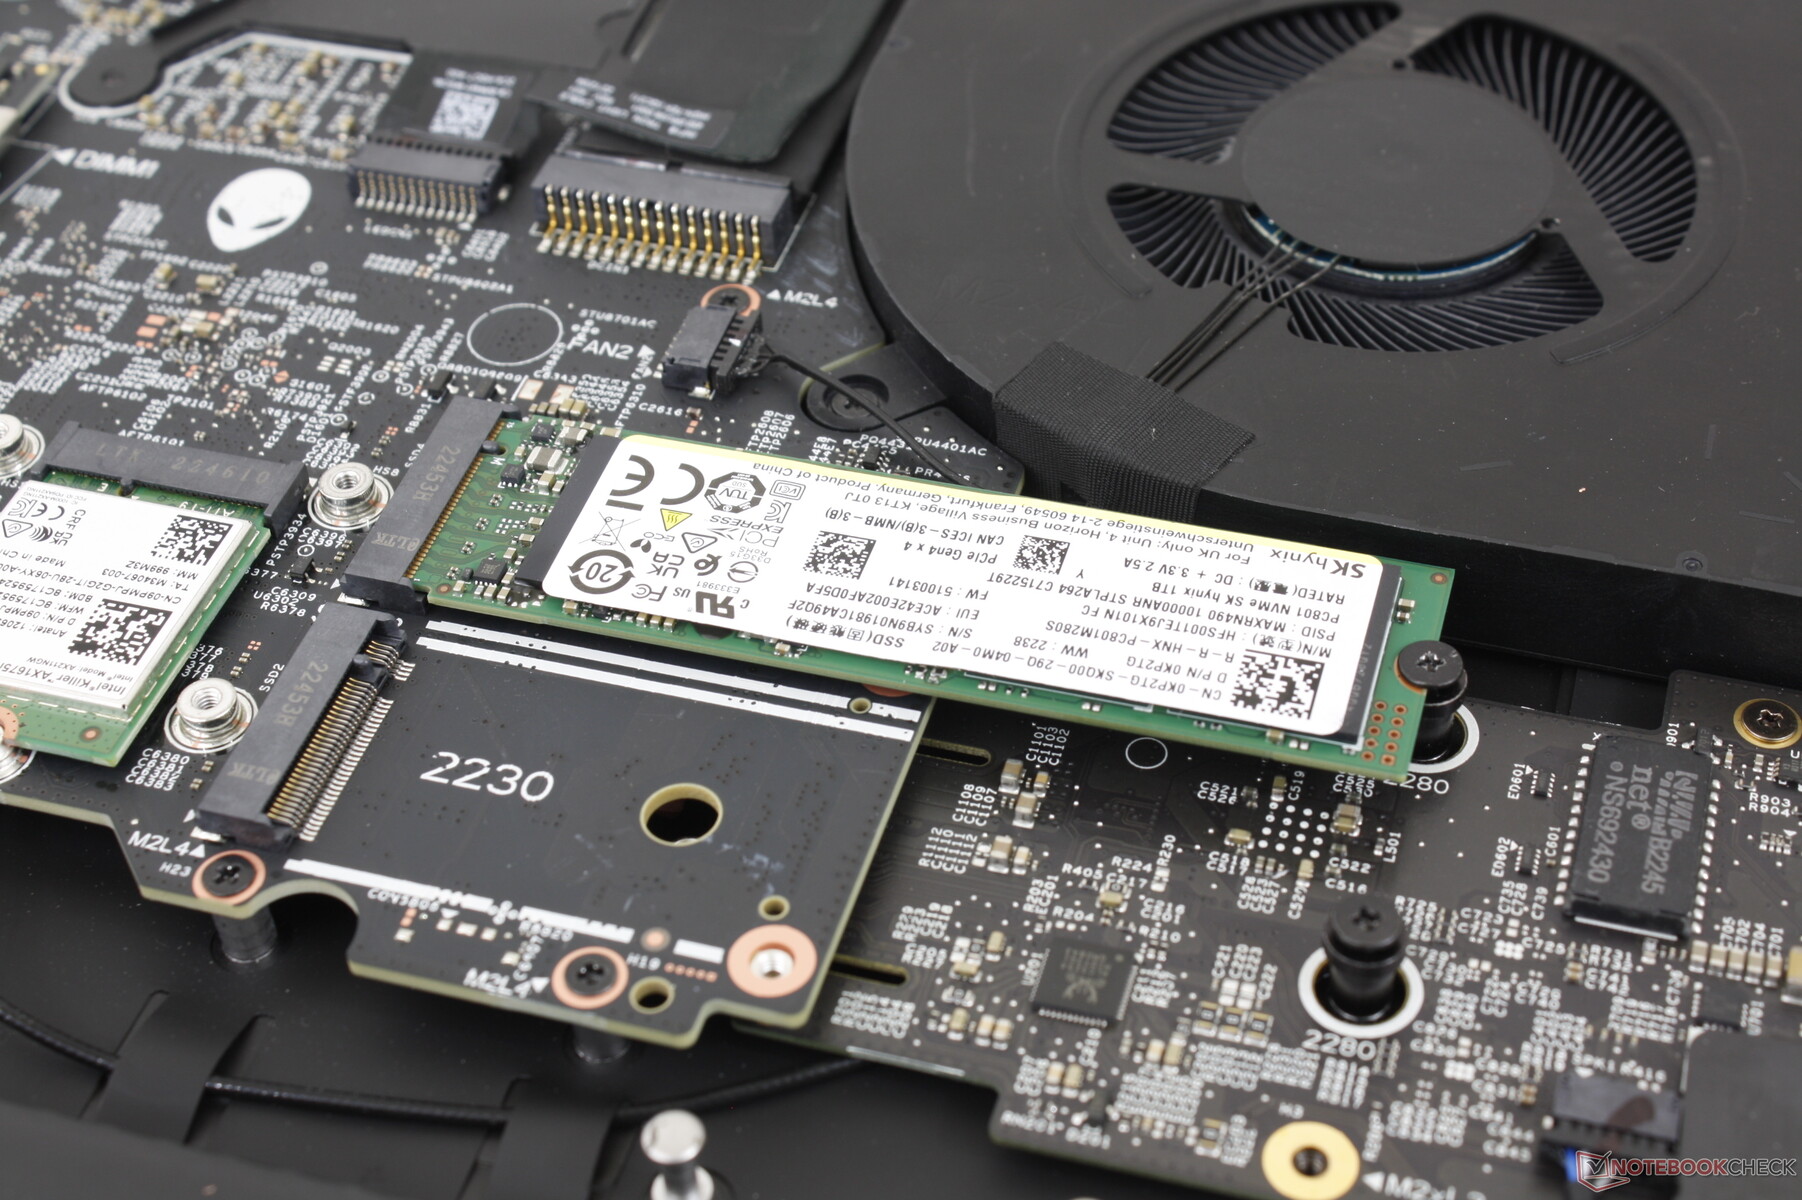
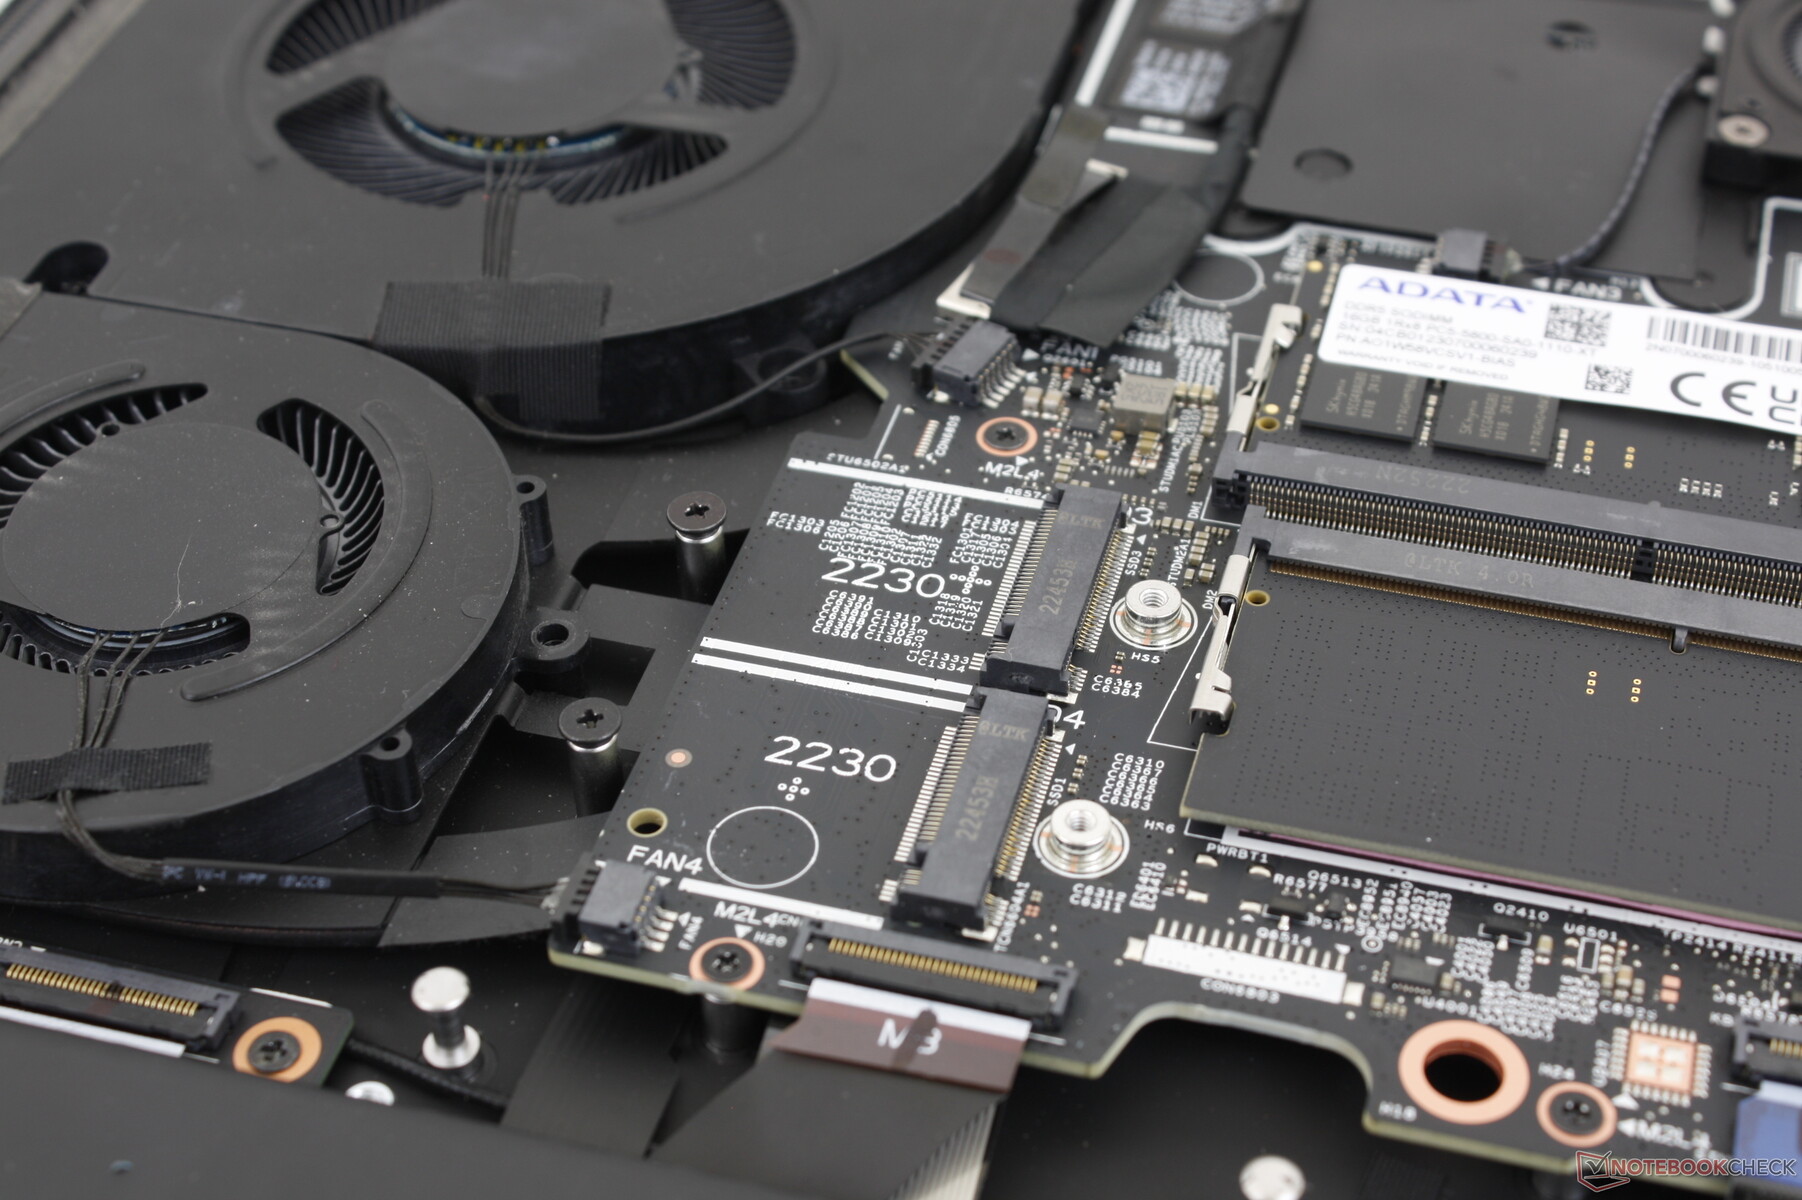
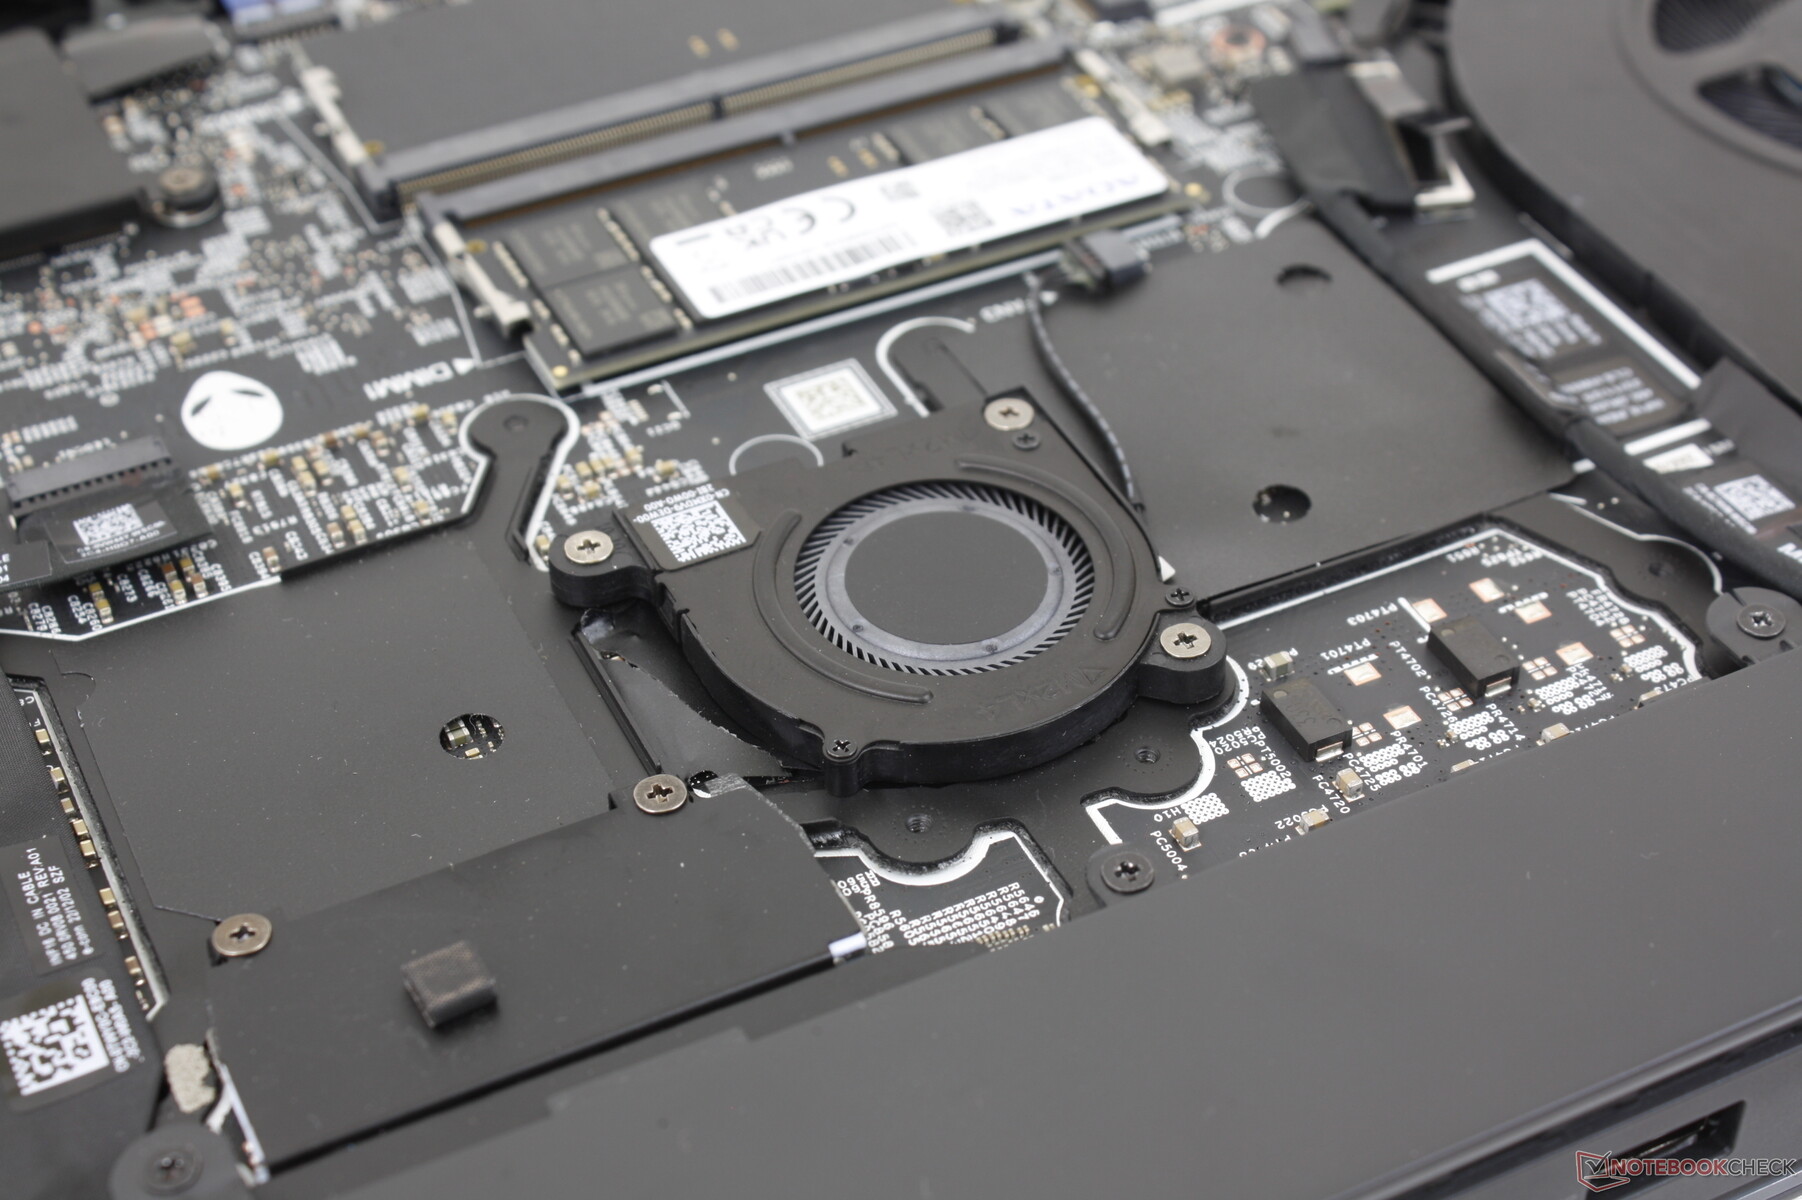
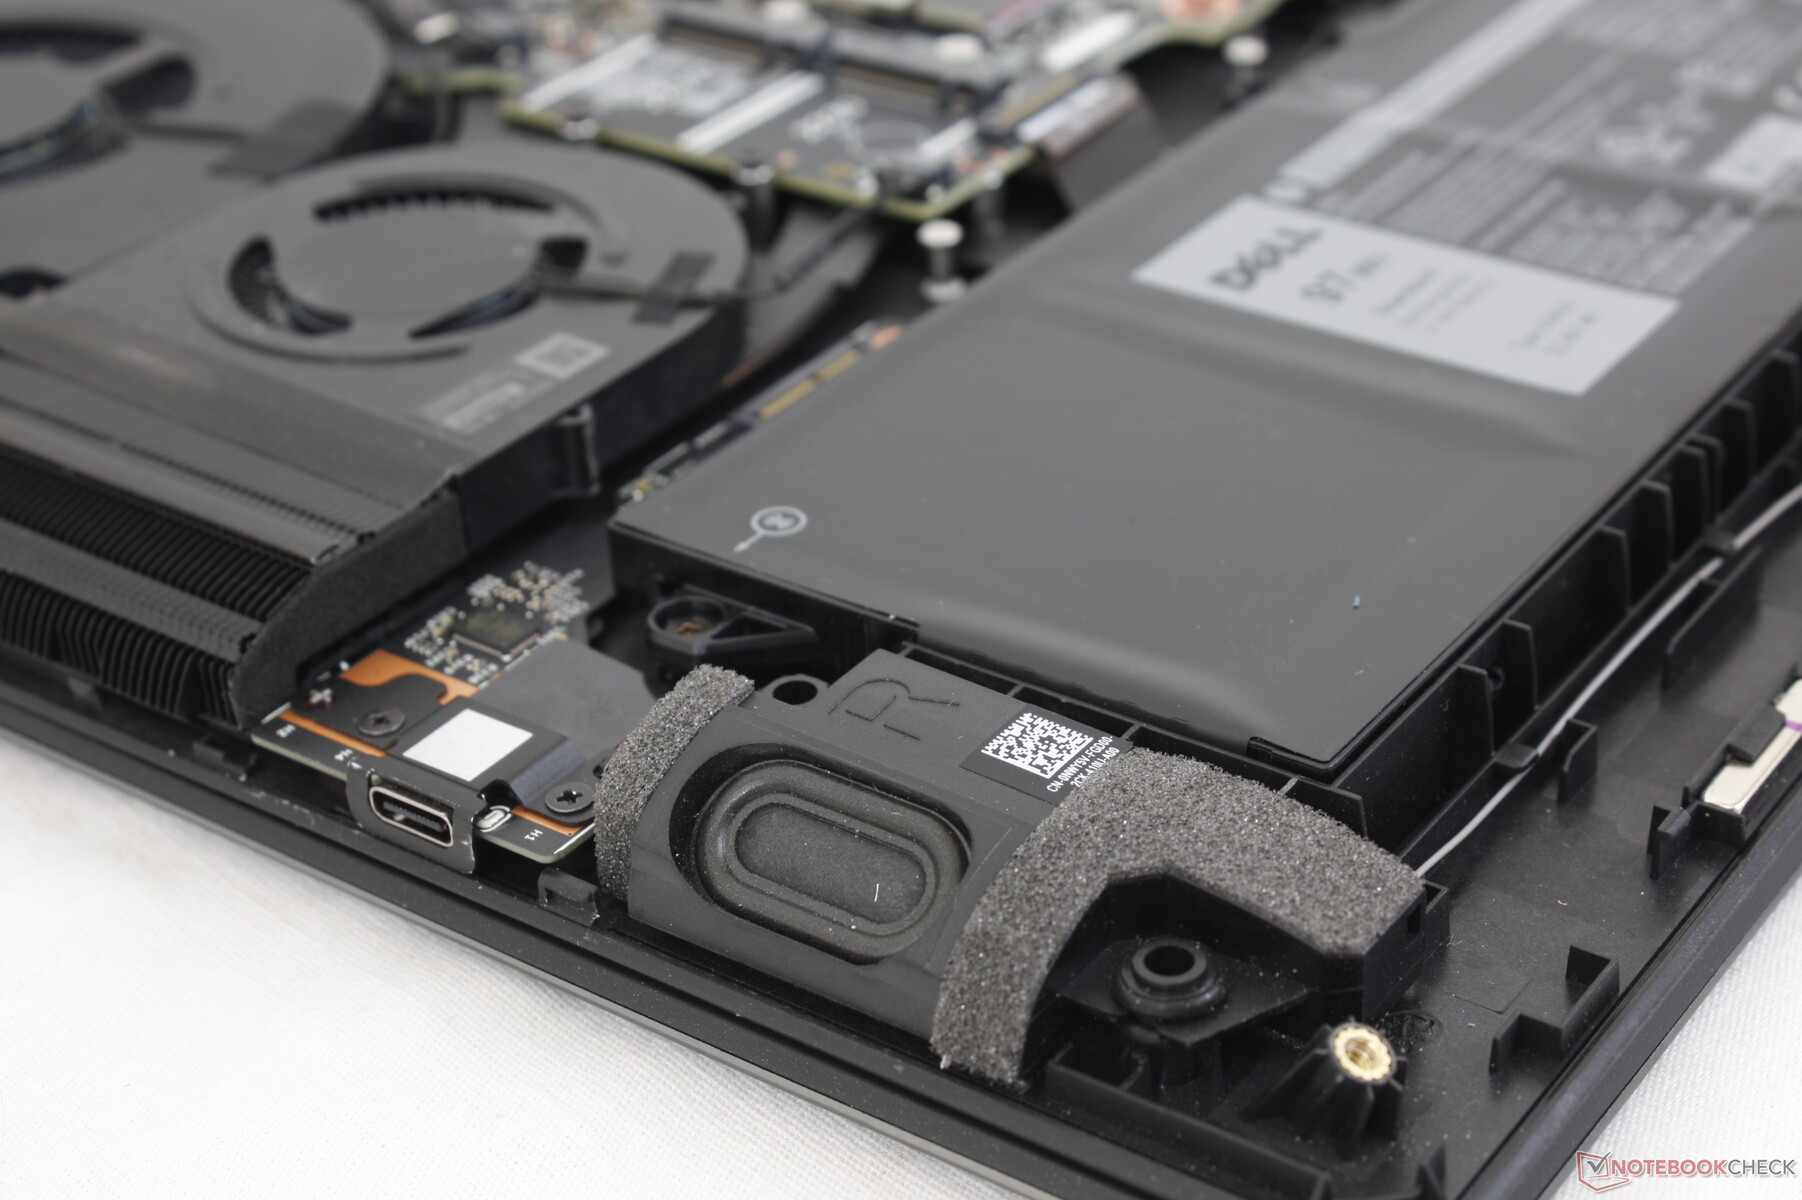
Wartung
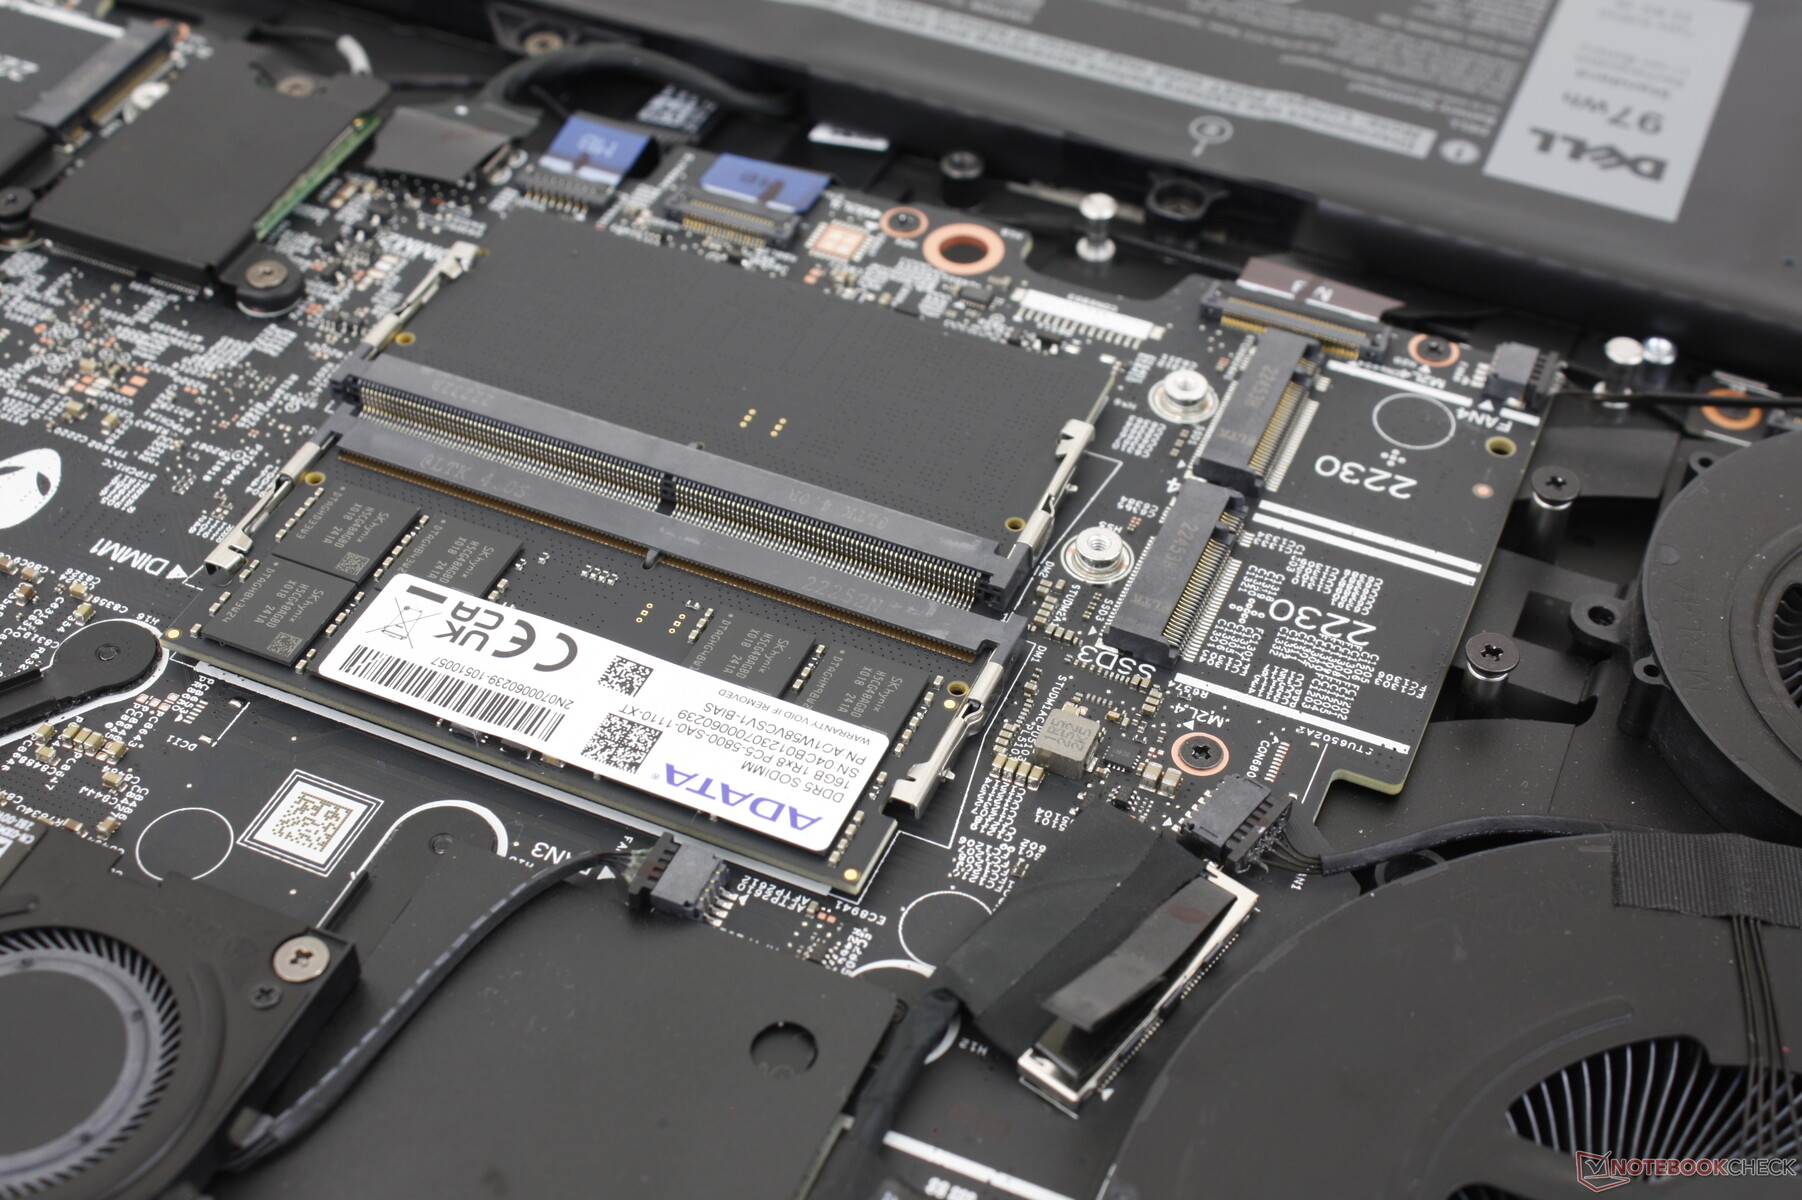
Als einziges Werkzeug benötigt man einen Kreuzschlitzschraubendreher, um die Unterseite des Laptops zu entfernen. Im Vergleich dazu erfordert die Bodenplatte des neuen MSI GE78 mehr Fummelei und das Brechen eines Garantiesiegels.
Auf gleich vier M.2-Steckplätze hat man als Nutzer hier Zugriff. Zwei davon sind allerdings nur für Module und SSDs im kurzen 2230er-Format ausgelegt. Abgesehen davon ist der Arbeitsspeicher auf zwei DDR-5SODIMMs aufgeteilt und ließe sich auch upgraden. Dell verzichtet hier auf den hauseigenen CAMM-RAM.
Zubehör und Garantie
In der Verpackung des Alienware m18 R1 befindet sich außer dem Netzteil kein weiteres Zubehör. Dell hat den proprietären Alienware Docking-Anschluss gestrichen. Somit ist älteres Zubehör wie die Alienware eGPU Docking Station nicht mehr mit aktuellen Geräten kompatibel.
In den USA wird das Alienware-Notebook mit einer eingeschränkten Garantie von einem Jahr ausgeliefert.
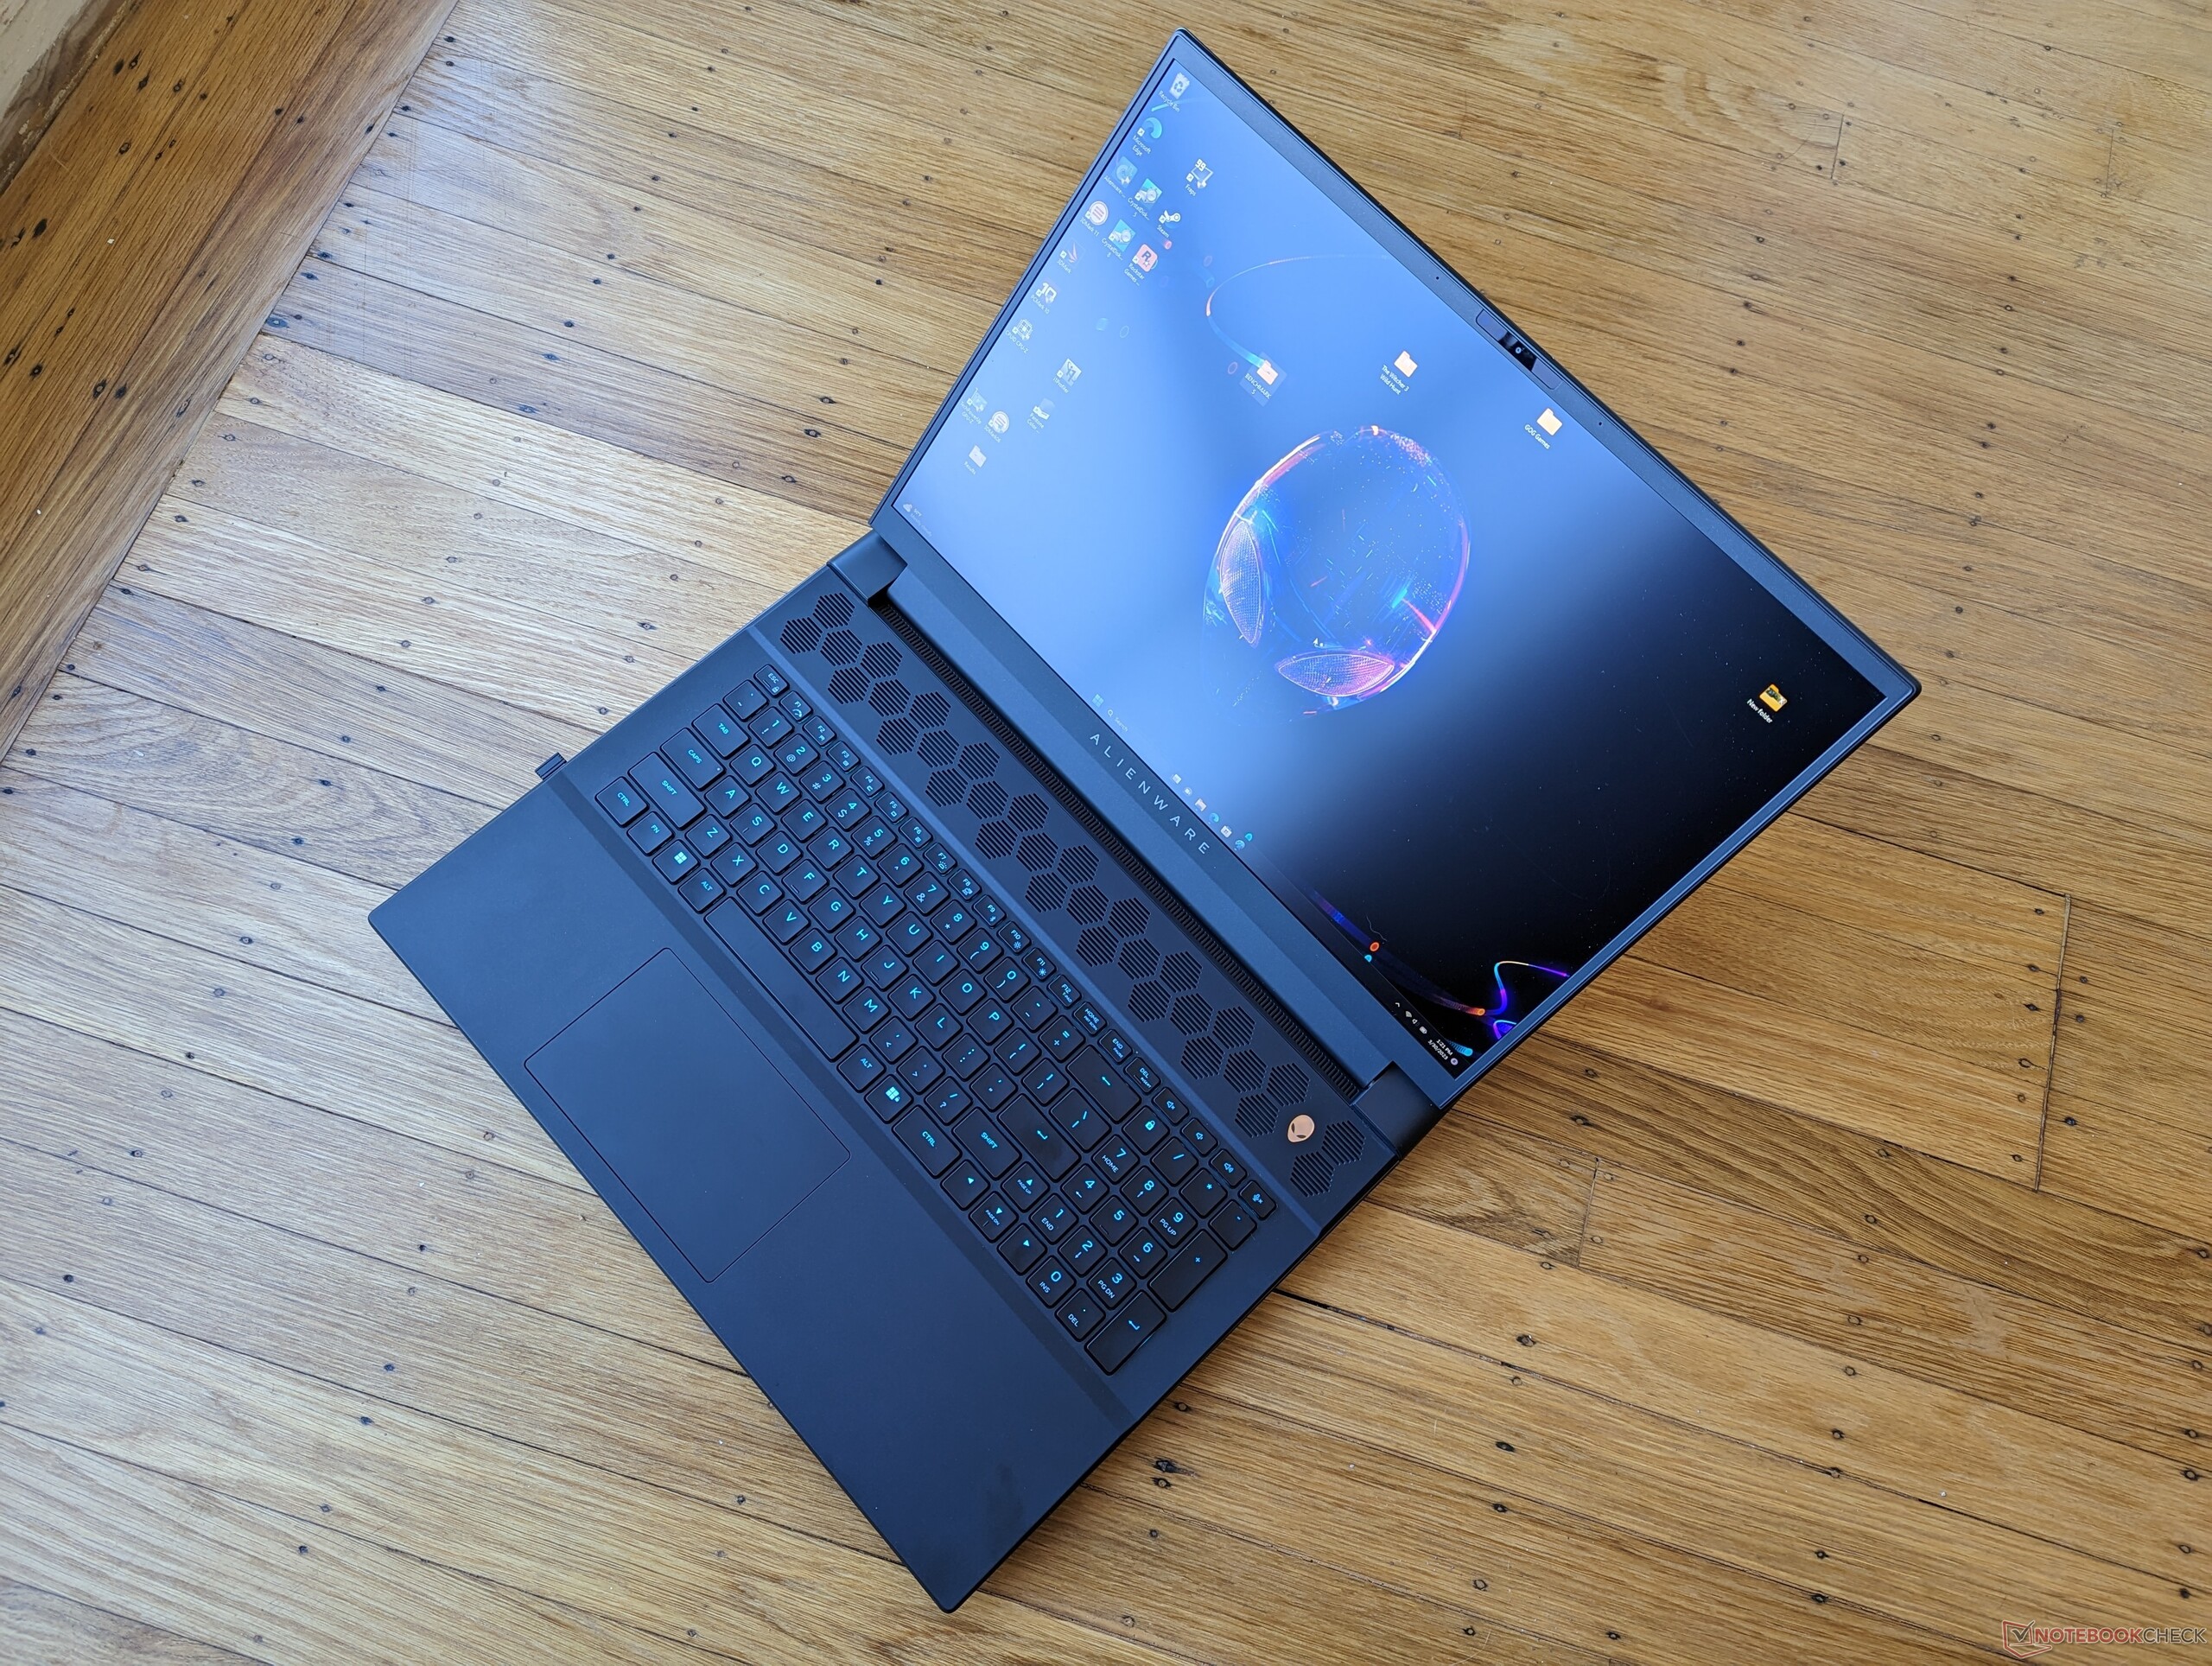
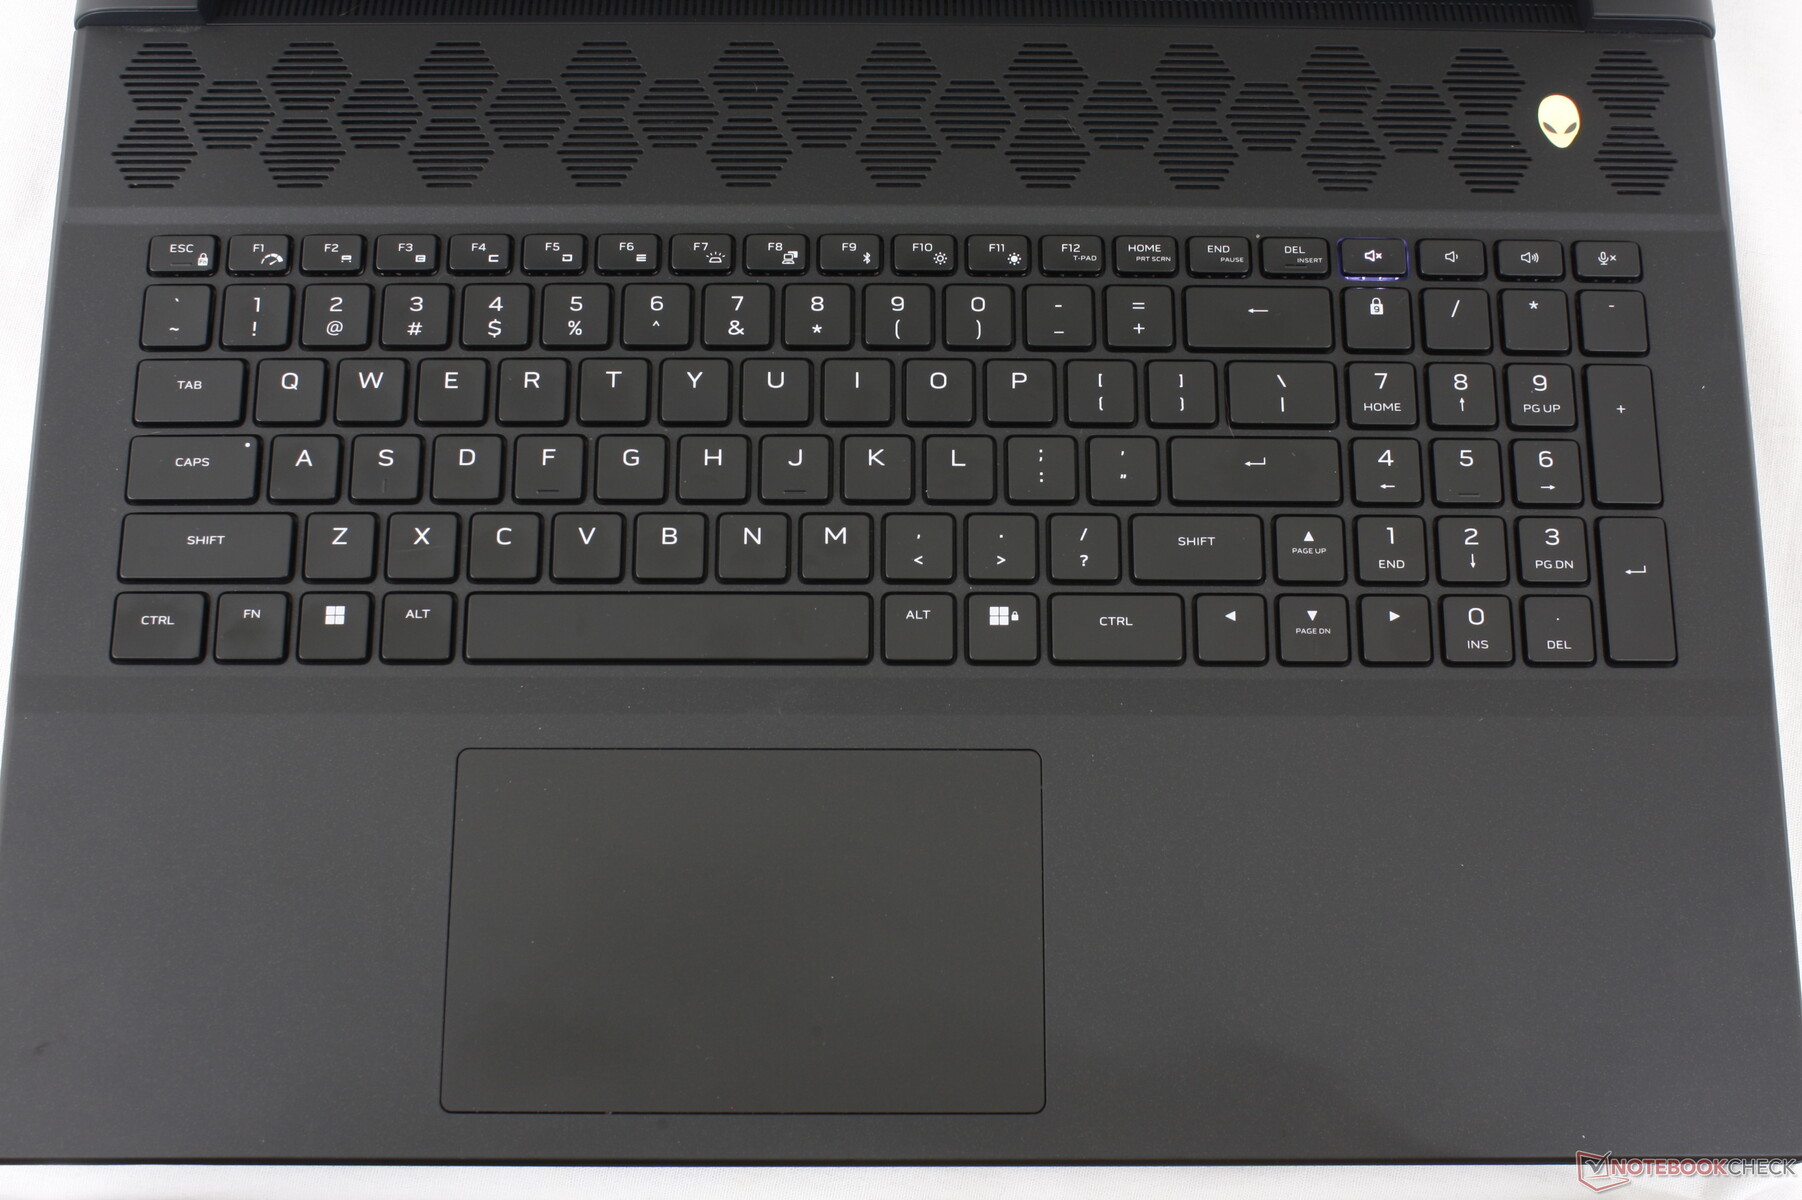
Eingabegeräte - Ergonomische Tastatur, schwammiges Touchpad
Tastatur
Die Membrantasten unseres Testgerätes sind wohl die besten, die wir je auf einem Gaming-Notebook ausprobiert haben. Der Hub fühlt sich satter an und das Feedback ist fester als bei den Tasten des MSI GE78 oder des Razer Blade 18. Bezüglich Komfort gibt es an der Tastatur kaum etwas zu bemängeln.
Die optionalen mechanischen MX Switches von Cherry sind wahrscheinlich klickfreudiger, aber auch deutlich lauter. Bei diesen Tasten handelt es sich vermutlich um die gleichen, die Dell auch für die bestehenden Alienware M15- und M17-Serien anbietet.
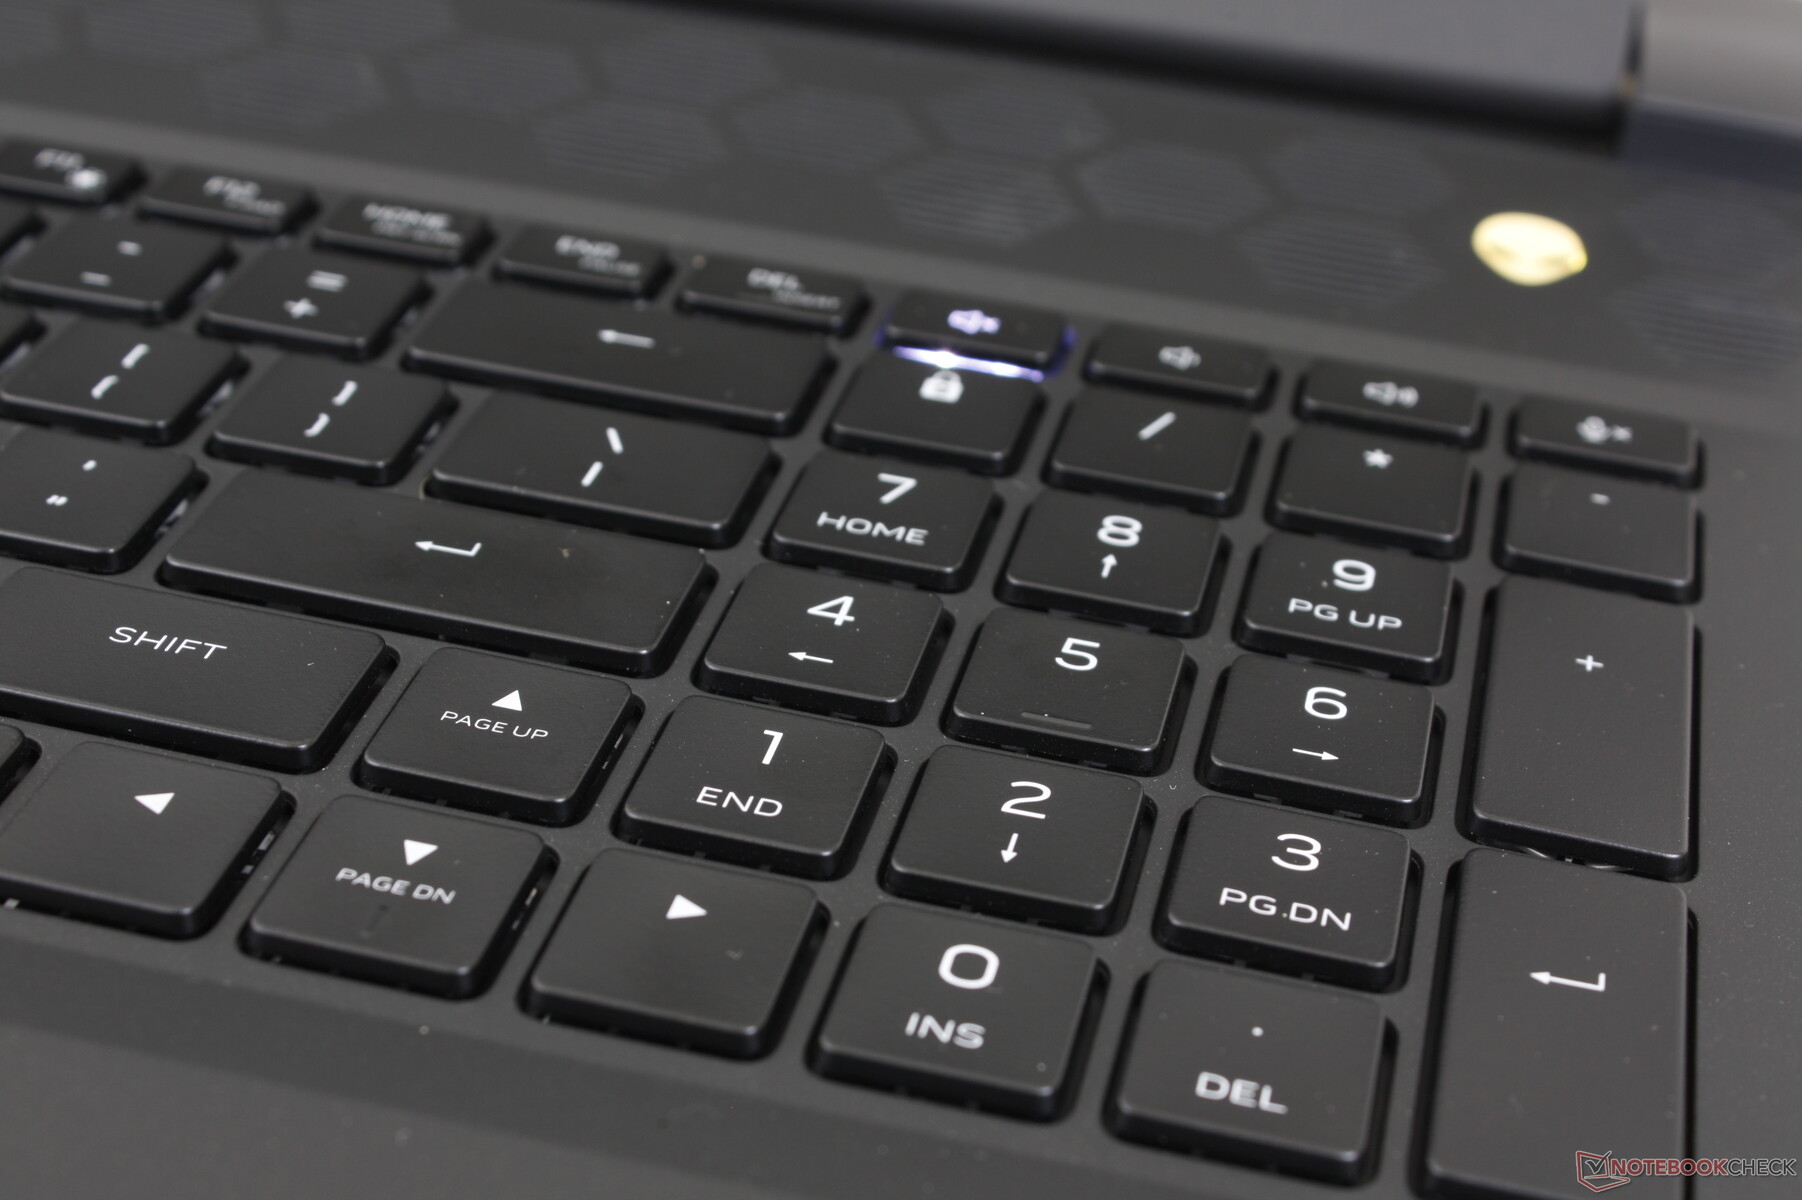
Alle Tastensymbole sind beleuchtet, wenn die Hintergrundbeleuchtung aktiviert ist, im Gegensatz zu älteren Alienware x15/x17 Modellen, bei denen die sekundären Symbole unbeleuchtet sind.
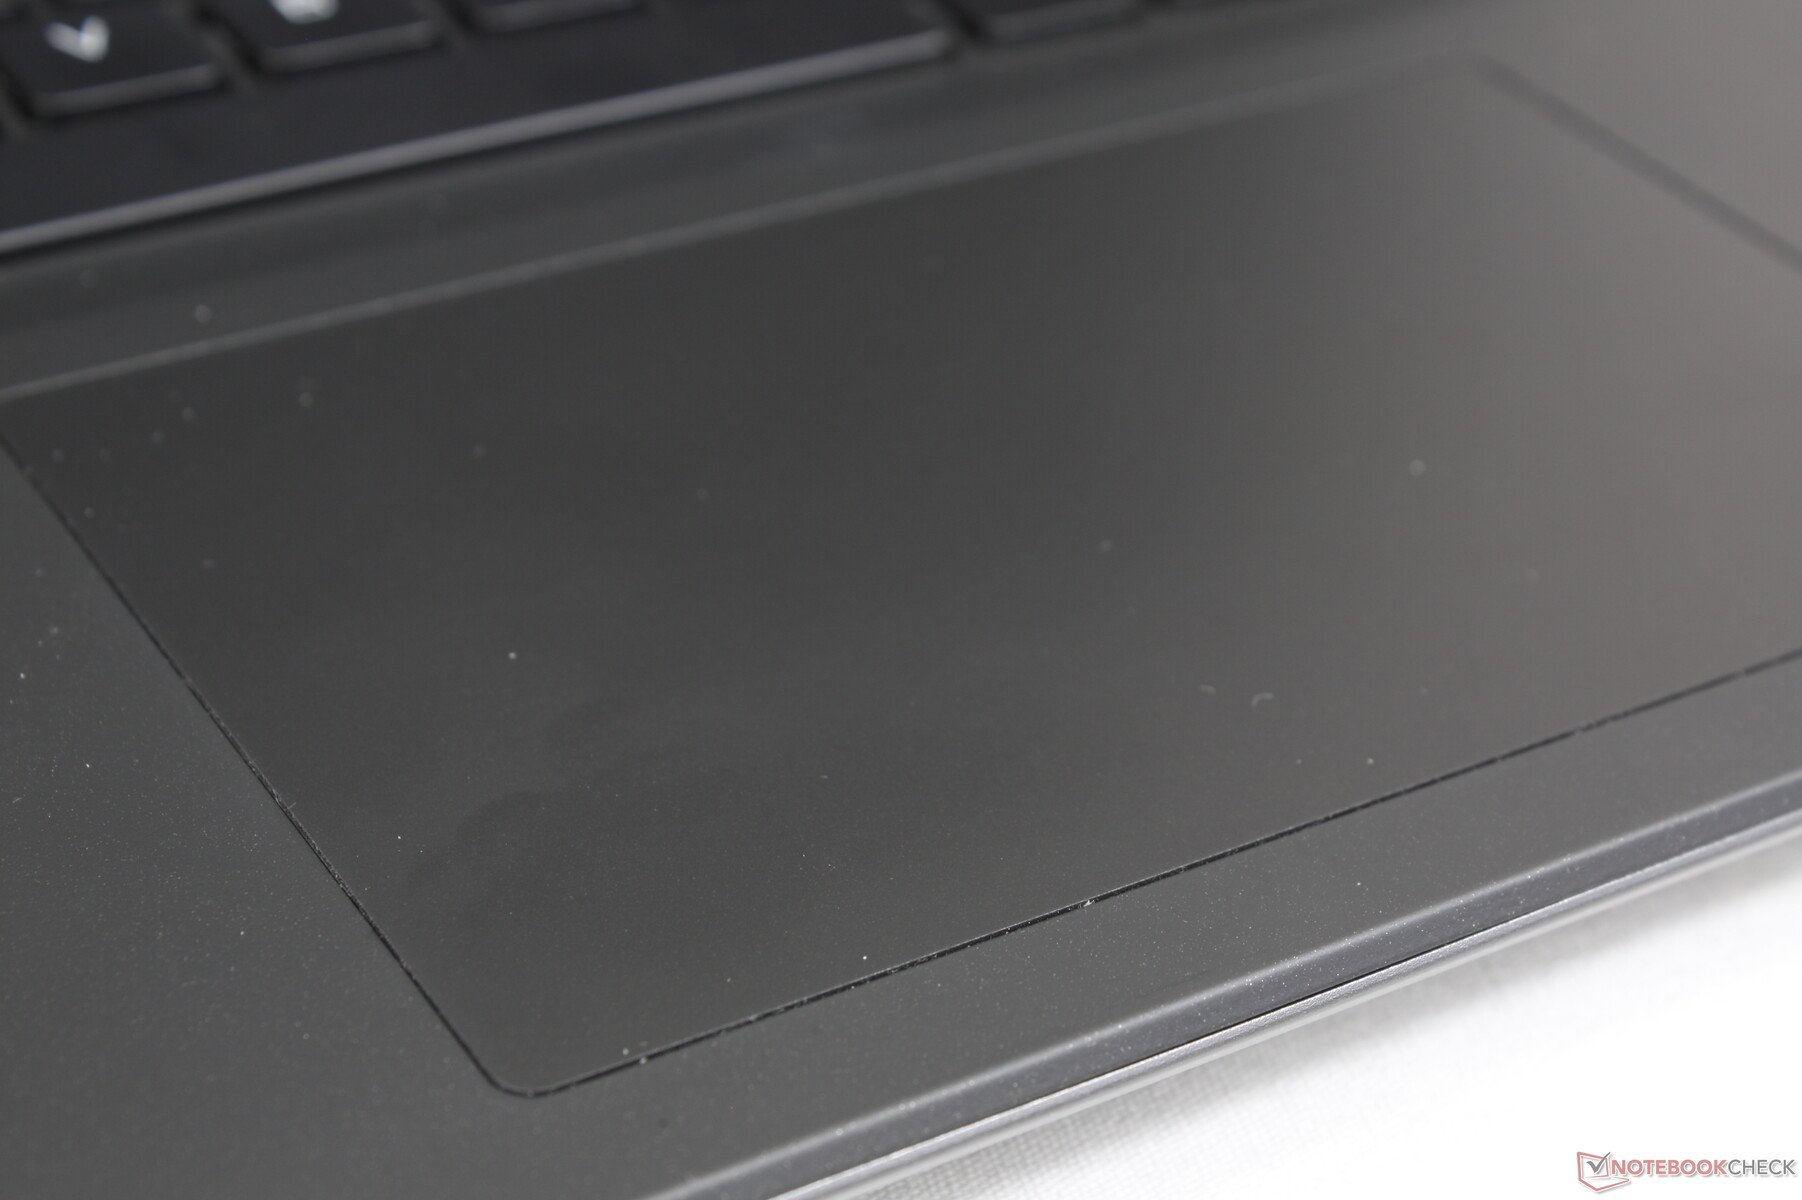
Touchpad
Bezogen auf die Größe liegen die Tochpads von MSI GE78 und Alienware m18 R1 nahezu gleichauf (13.2 x 8 cm vs. 13 x 8.2 cm) auch wenn das m18 deutlich größer ist. Obwohl die Gleitfähigkeit des Touckpads gut ist, mit minimaler Haftung beim Gleiten, ist die Rückmeldung beim Klicken eher weich, was die Bedienung eher unbefriedigend macht. Auch Doppelklicks können ermüdend sein, da jeder Klick etwas mehr Kraft vom Finger erfordert als bei den meisten anderen Laptops.

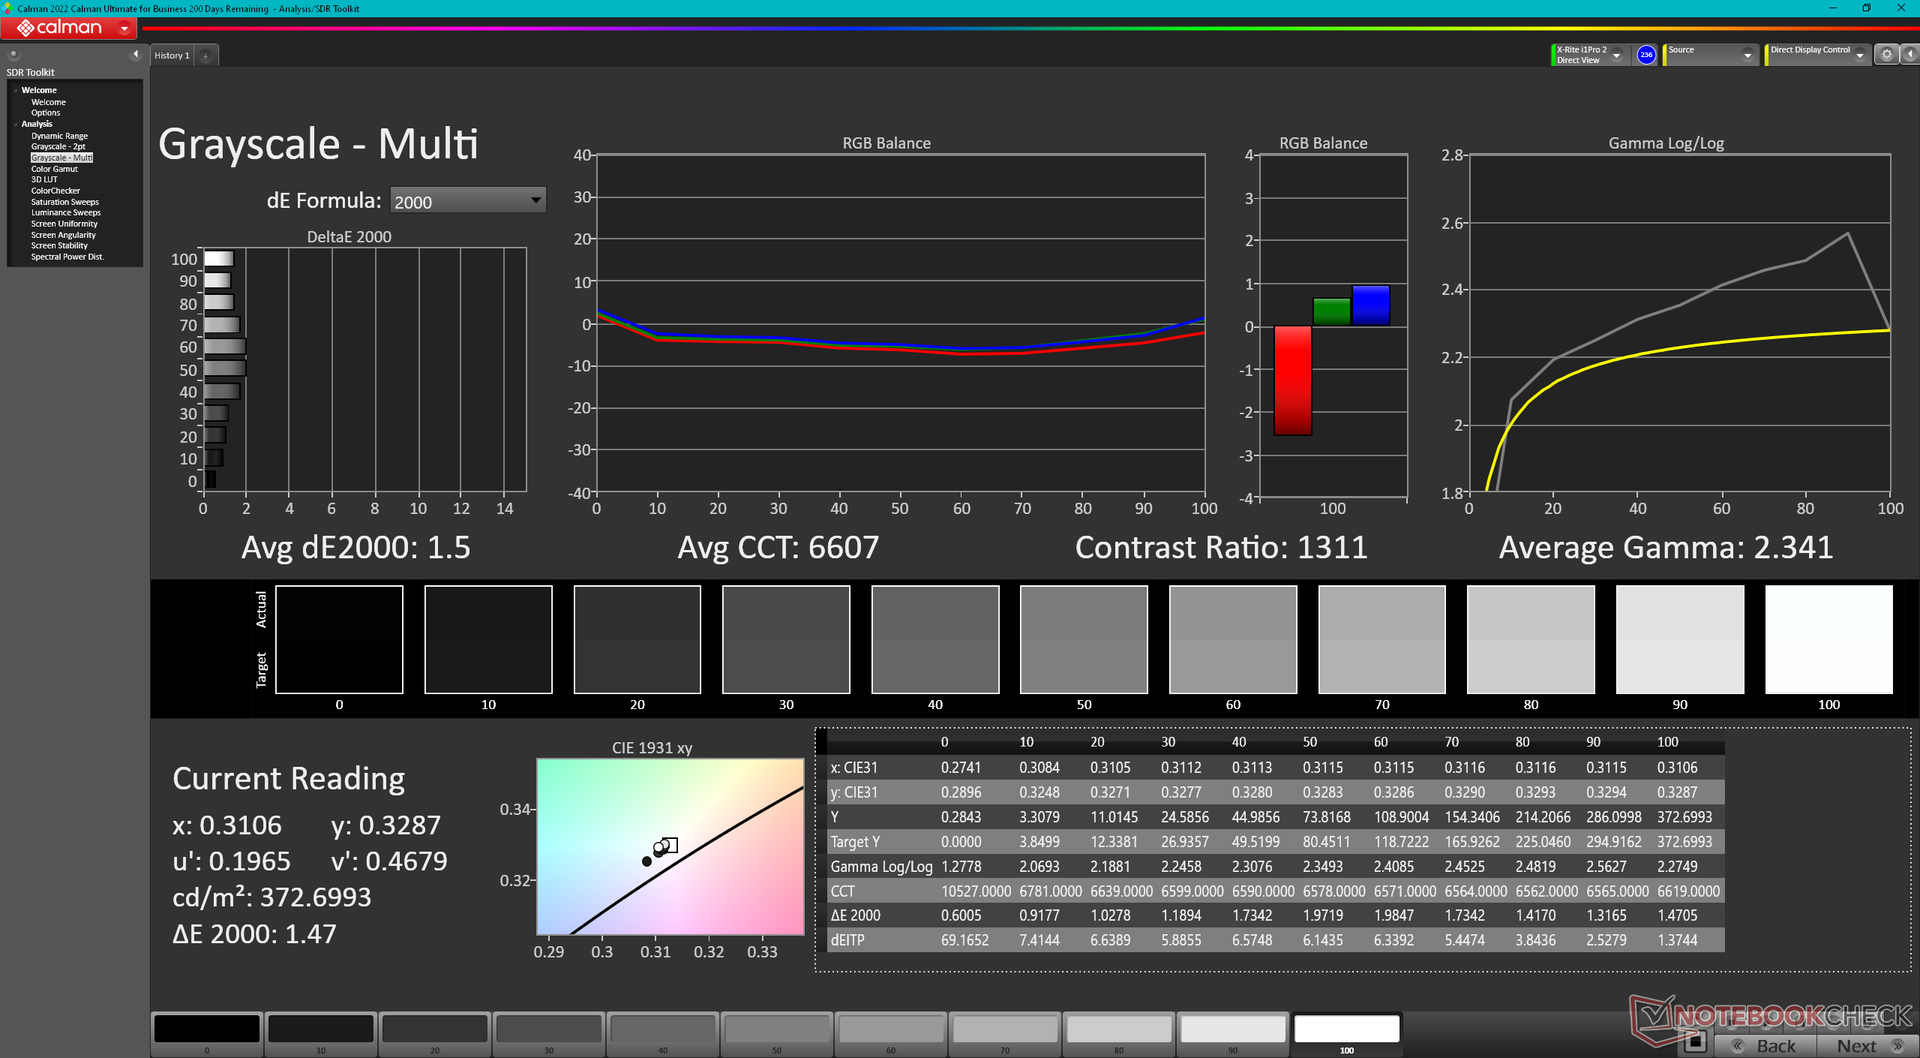
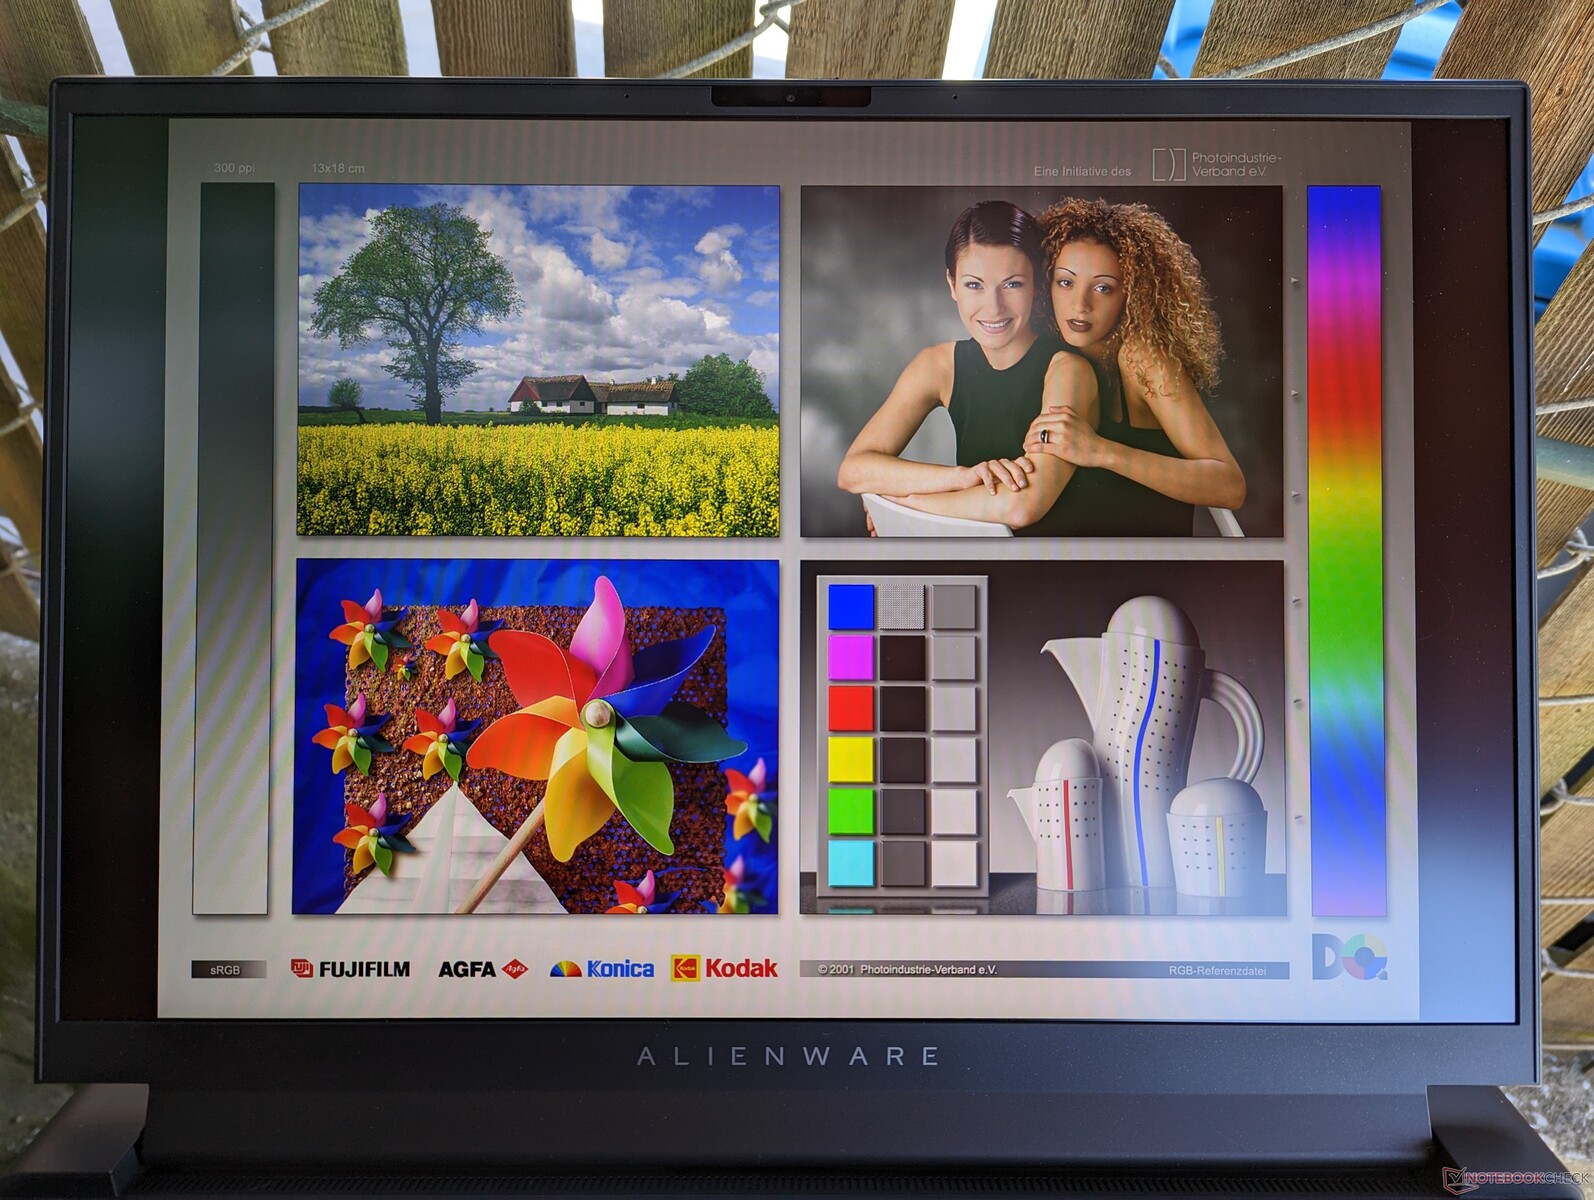
Display — Extrem schnelle 480 Hz
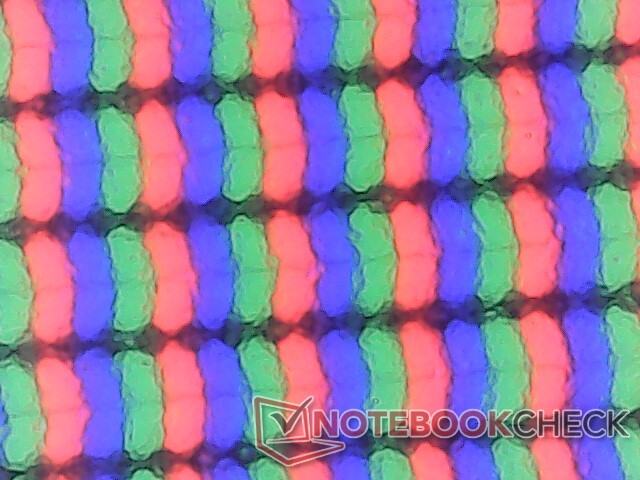
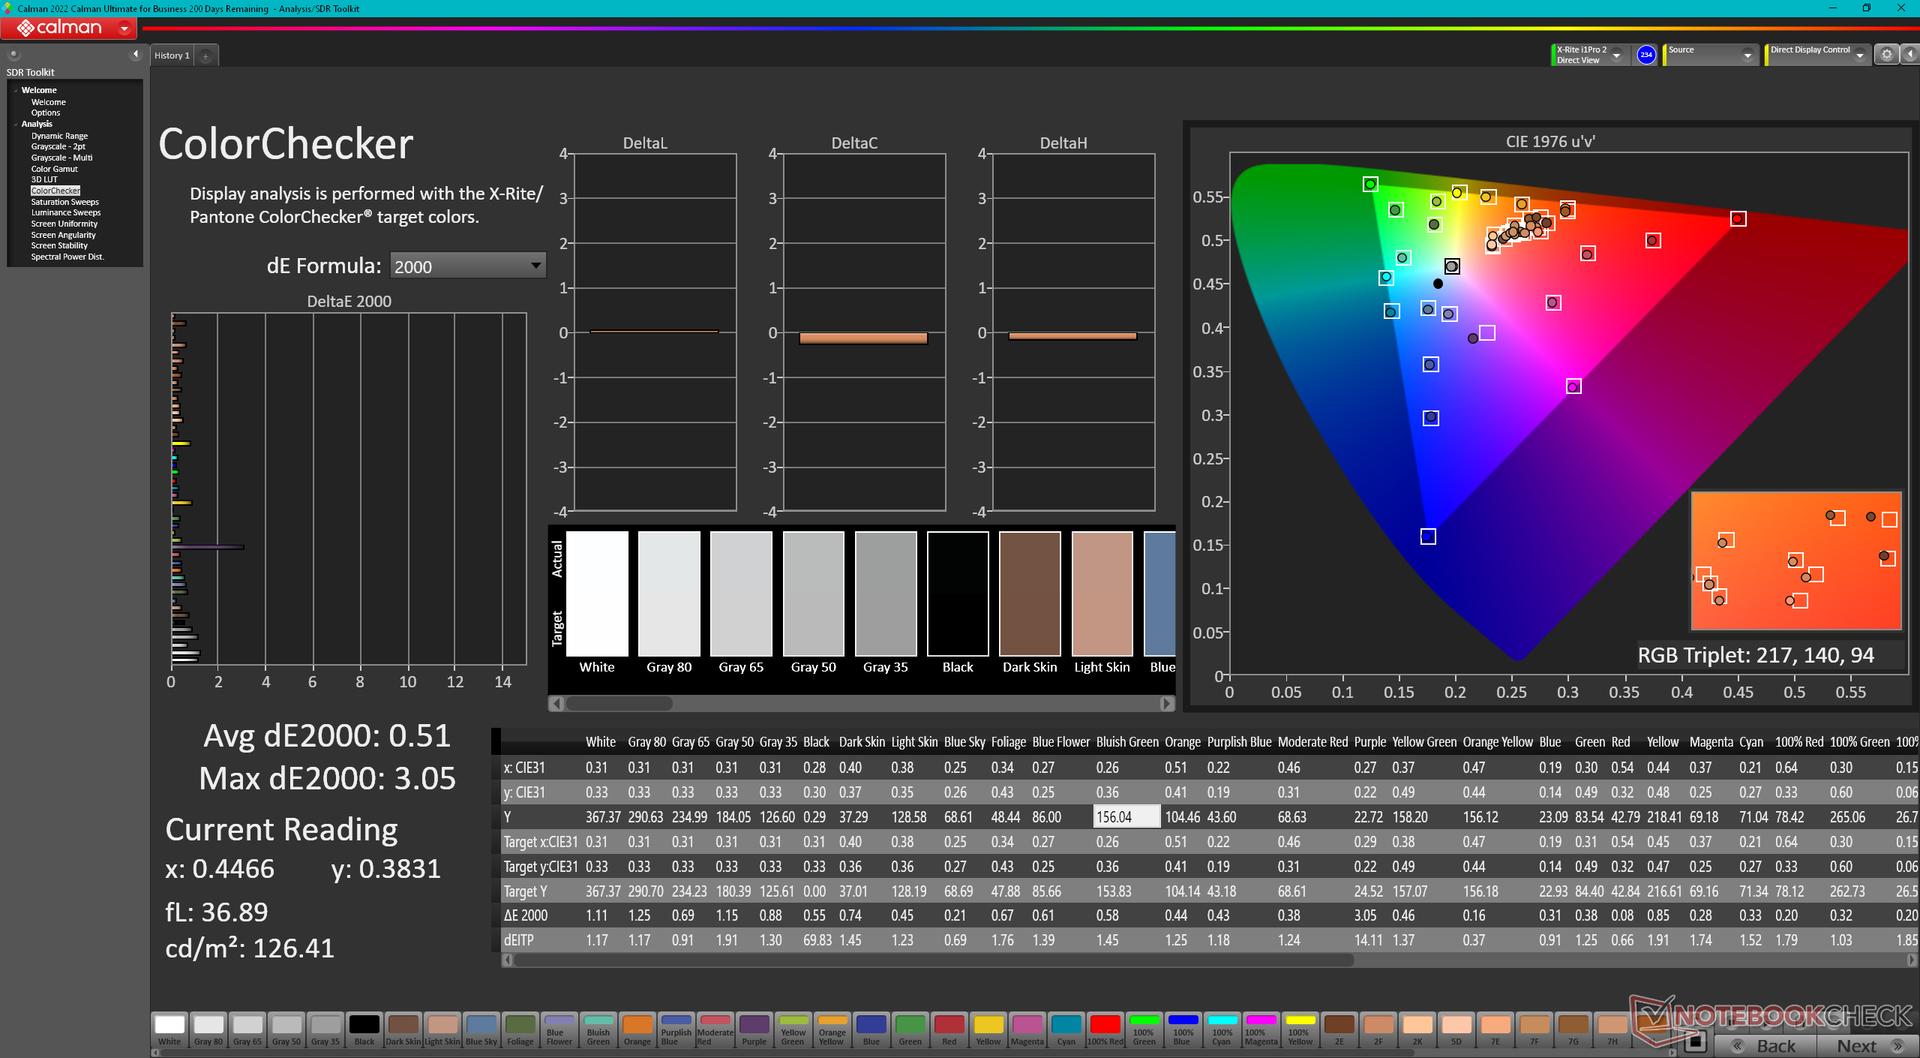
Unser Alienware m18 R1 wird mit einem 1200p Chi Mei 180JME Panel ausgeliefert, im Gegensatz zu den 1600p AU Optronics B180QAN01.0 oder BOE NE180QDM Panels des Razer Blade 18 bzw. Asus ROG Strix Scar 18. Das einzigartige Merkmal, das dieses Chi Mei-Panel von den anderen beiden unterscheidet, ist seine 2x höhere native Bildwiederholrate von 480 Hz statt 240 Hz. Ansonsten haben alle drei Panels eine ähnliche Farbabdeckung, Pixel-Reaktionszeiten und Kontrastverhältnisse. Die vollen P3-Farben und die schnelle Bildwiederholrate machen dieses spezielle Alienware-Modell sowohl für Spiele als auch für die Grafikbearbeitung geeignet.
Eine zweite Display-Option ist mit einer höheren nativen Auflösung von 1600p, aber einer niedrigeren Bildwiederholfrequenz von 165 Hz erhältlich.

| |||||||||||||||||||||||||
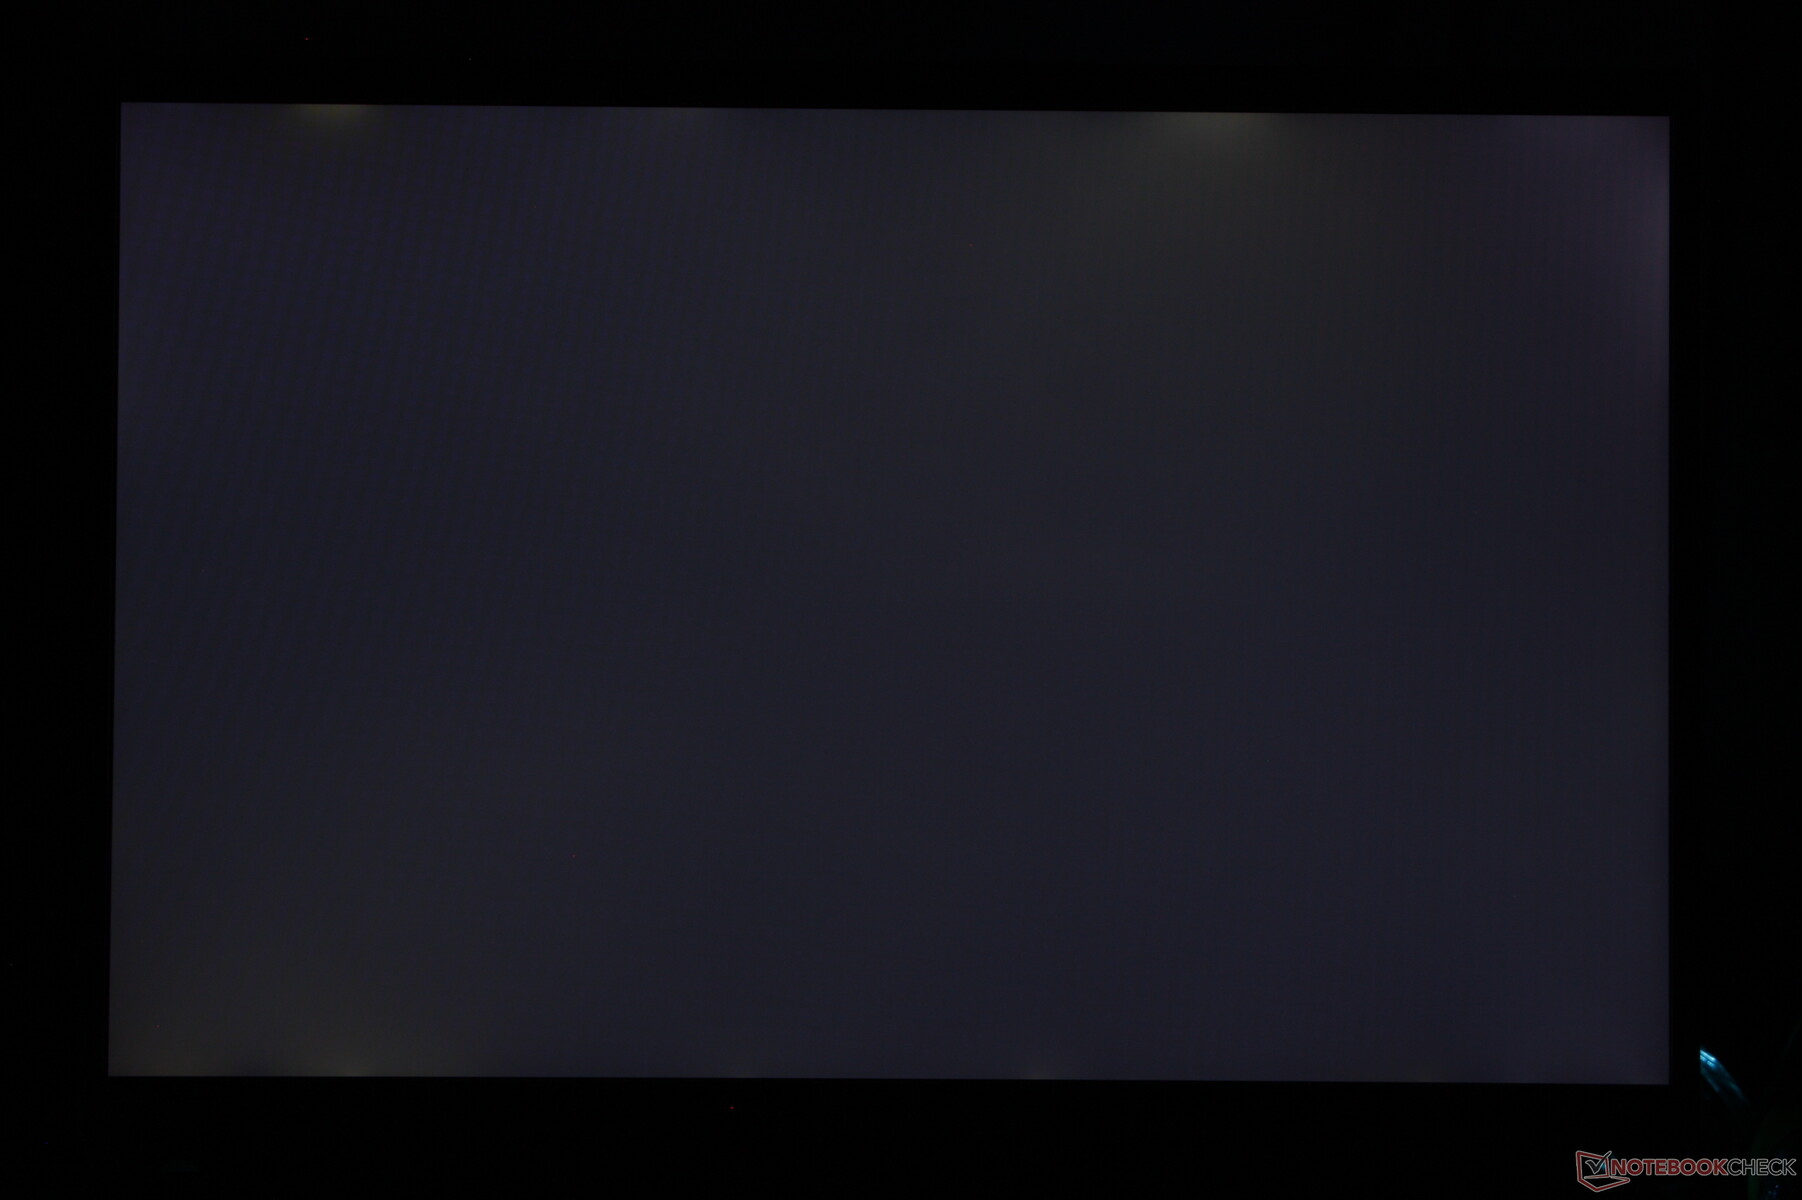
Ausleuchtung: 97 %
Helligkeit Akku: 372.8 cd/m²
Kontrast: 1165:1 (Schwarzwert: 0.32 cd/m²)
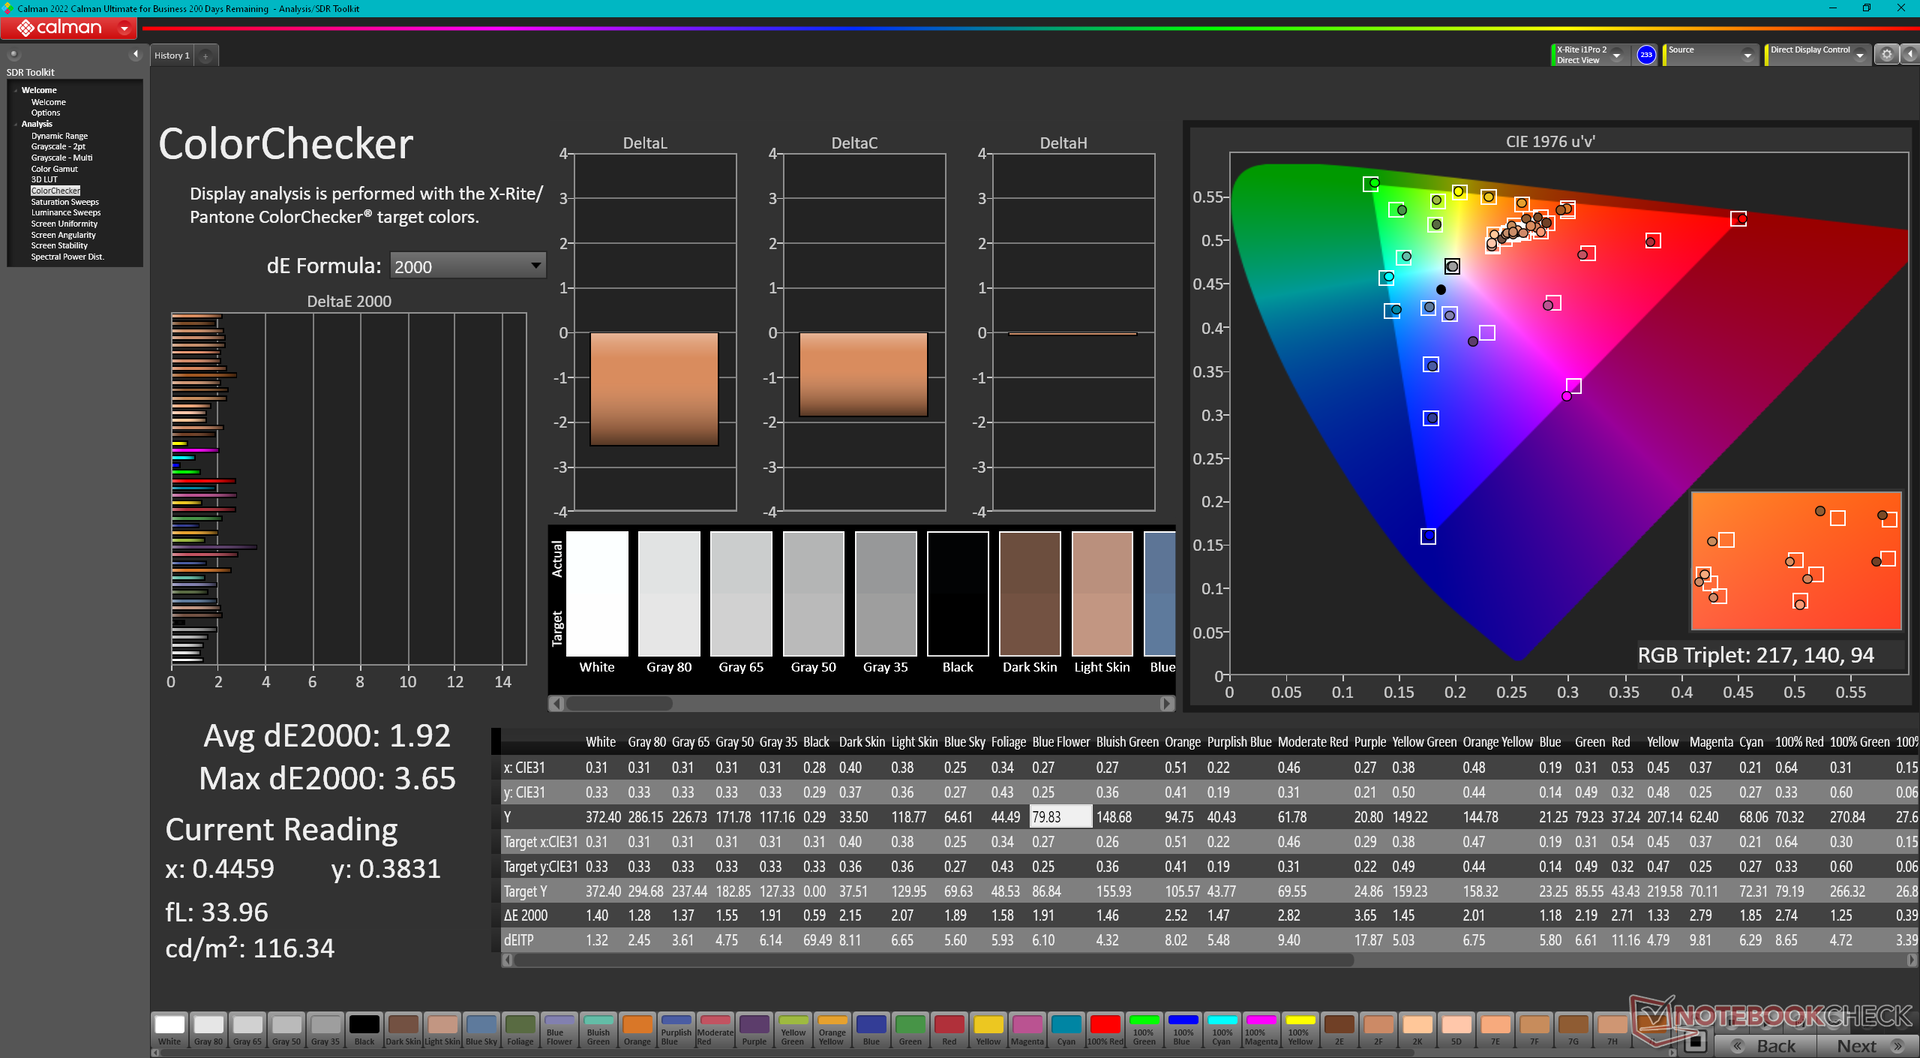
ΔE Color 1.92 | 0.5-29.43 Ø5, calibrated: 0.51
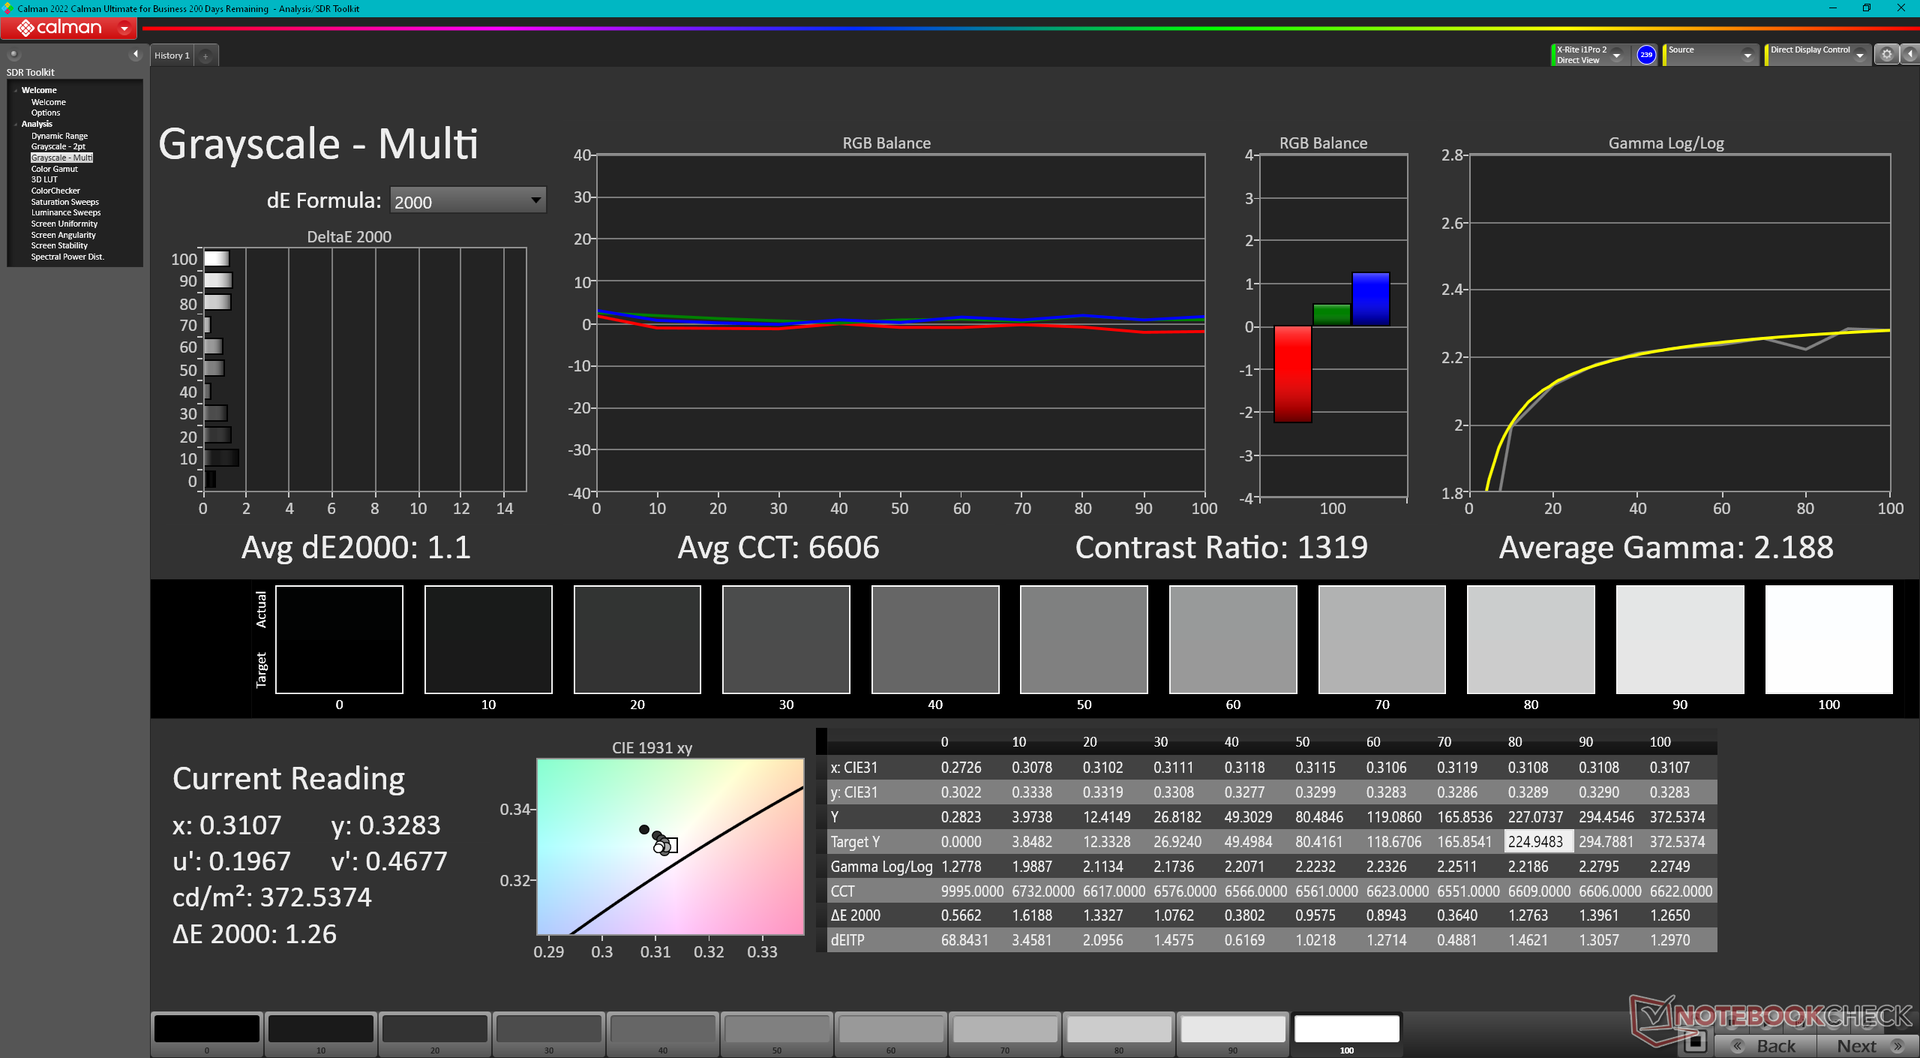
ΔE Greyscale 1.5 | 0.57-98 Ø5.3
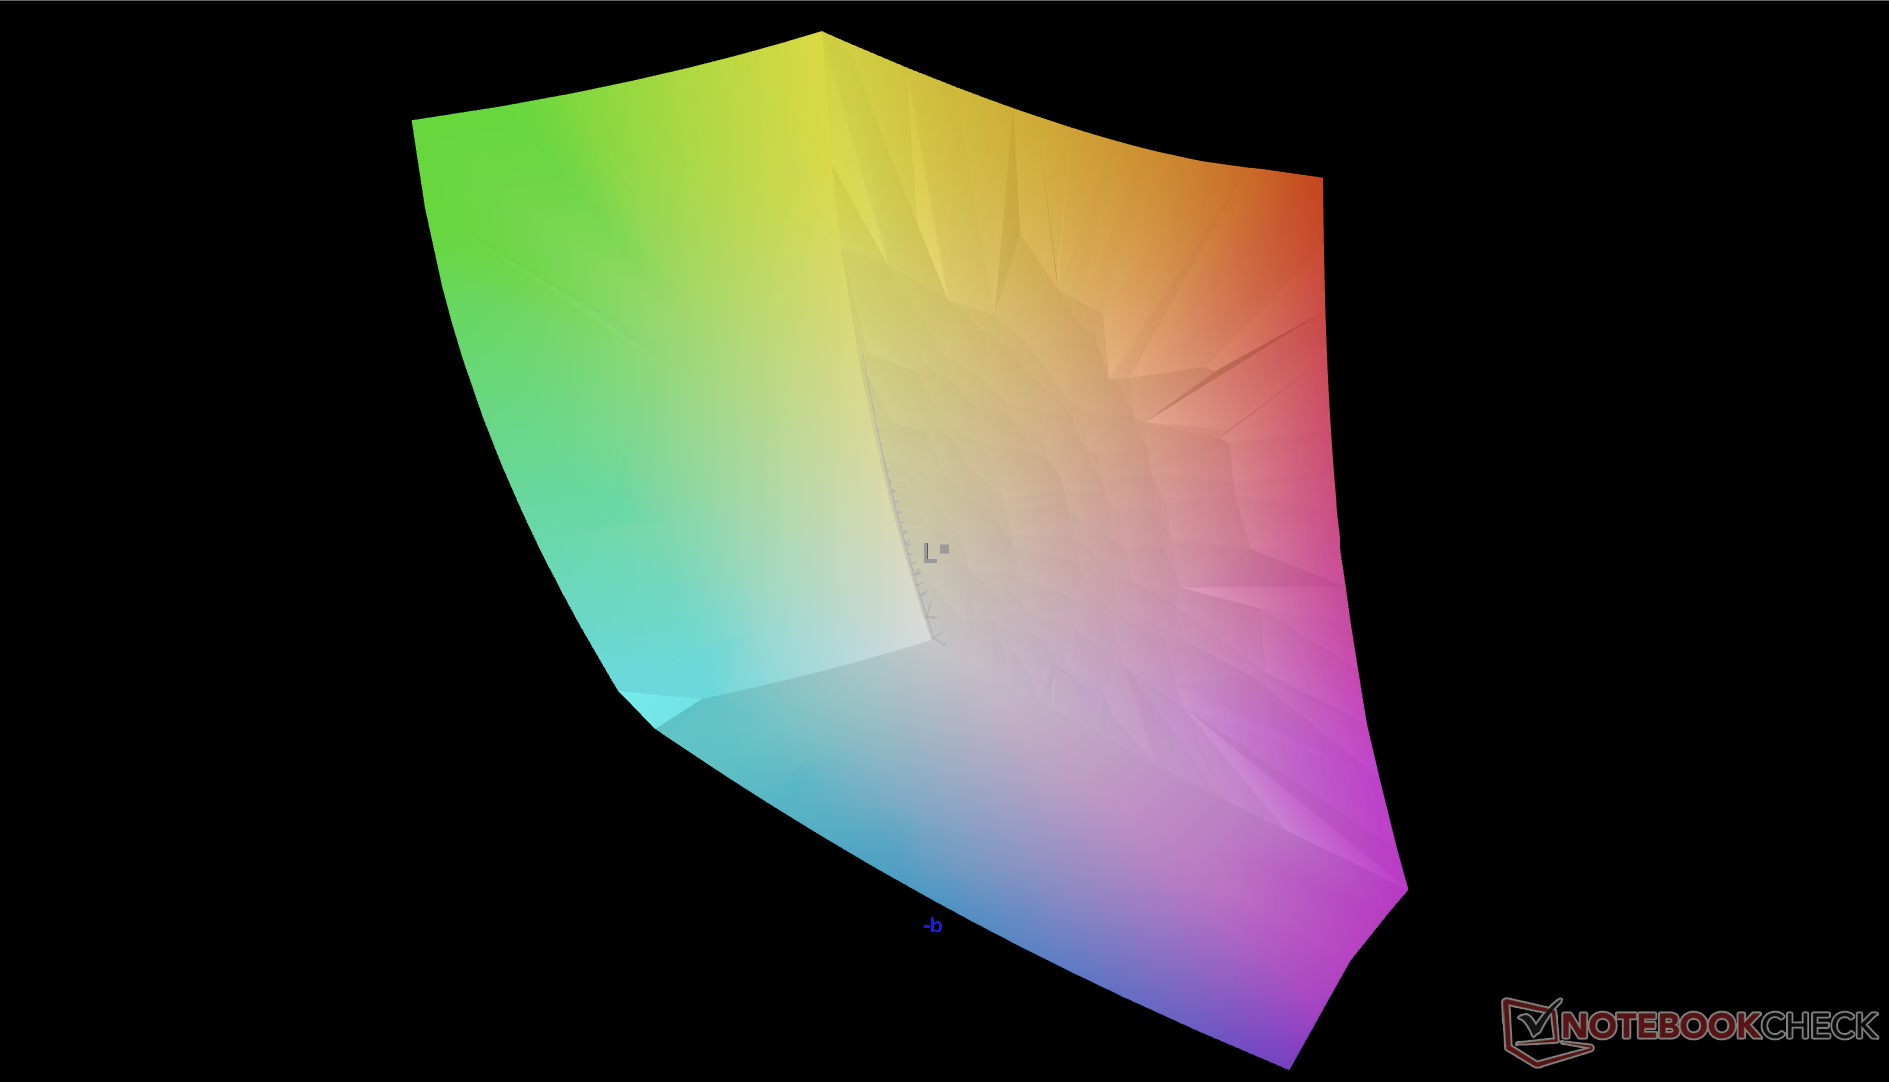
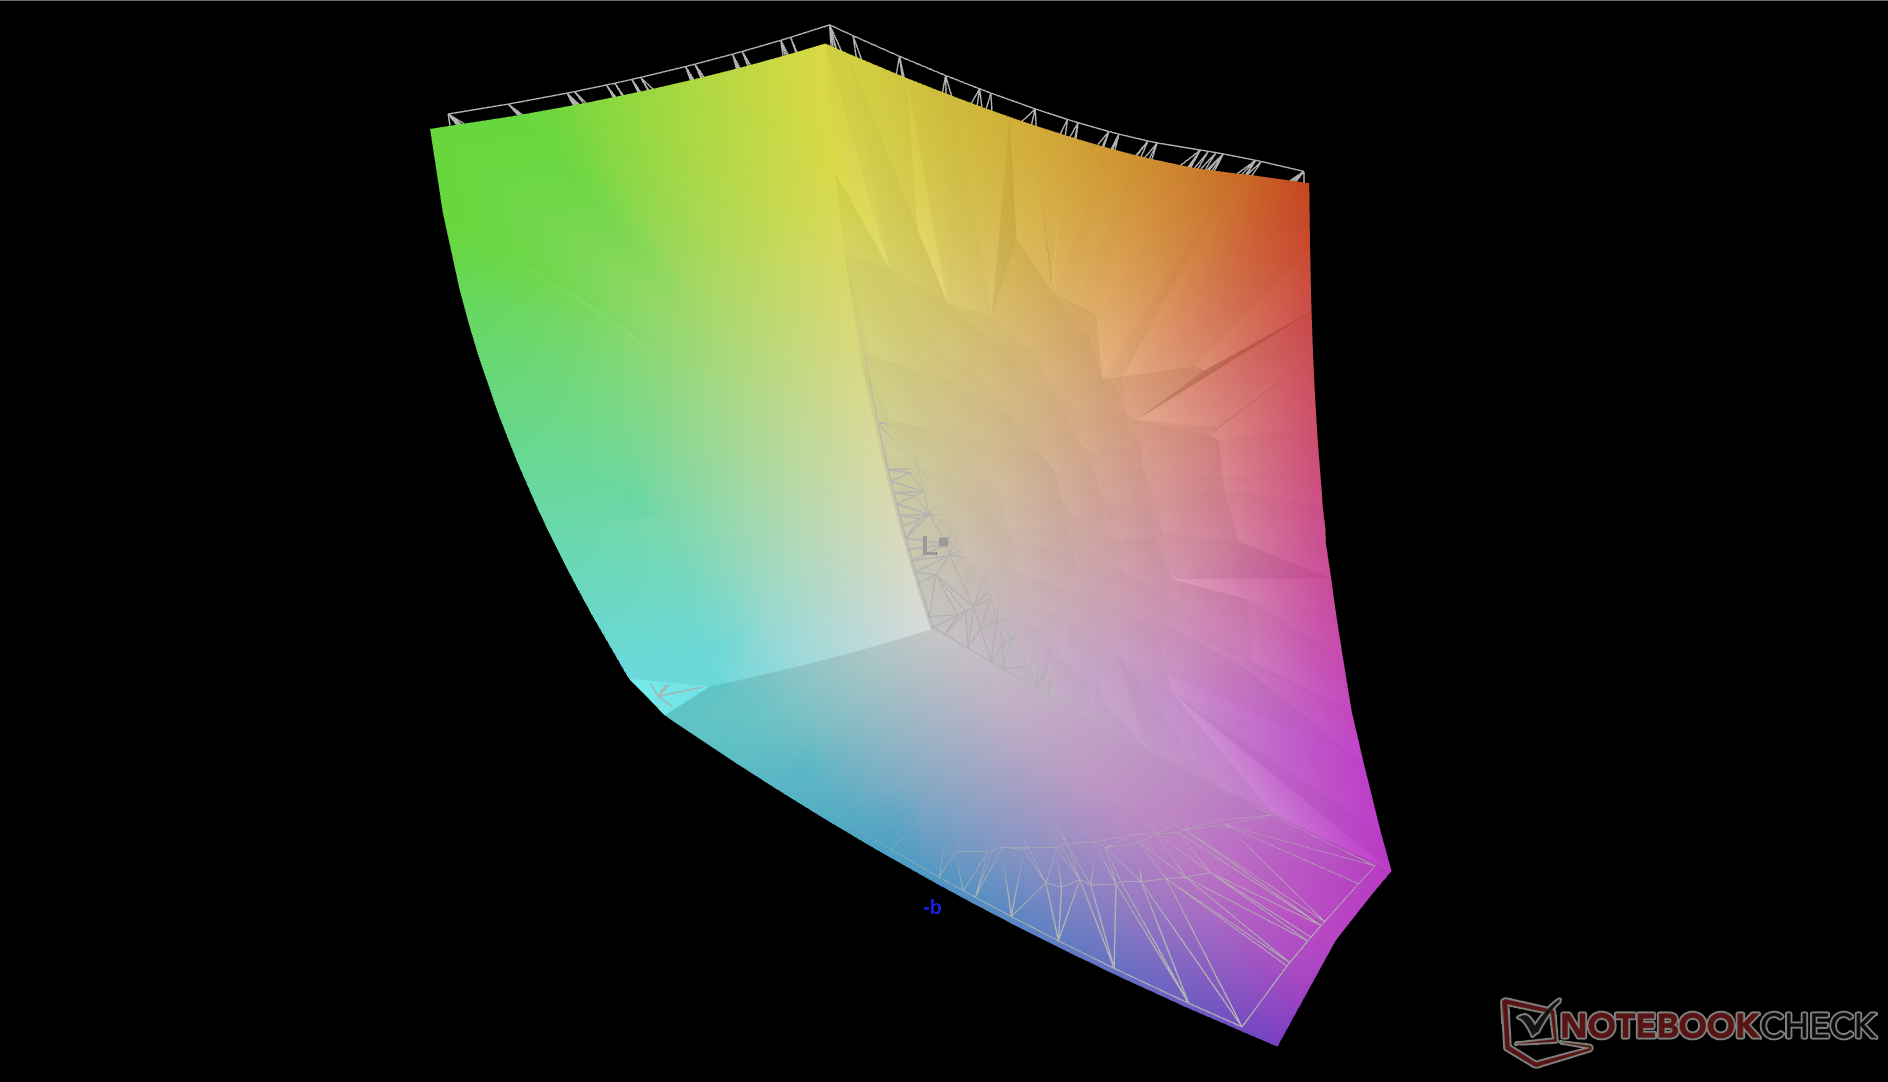
89.8% AdobeRGB 1998 (Argyll 2.2.0 3D)
100% sRGB (Argyll 2.2.0 3D)
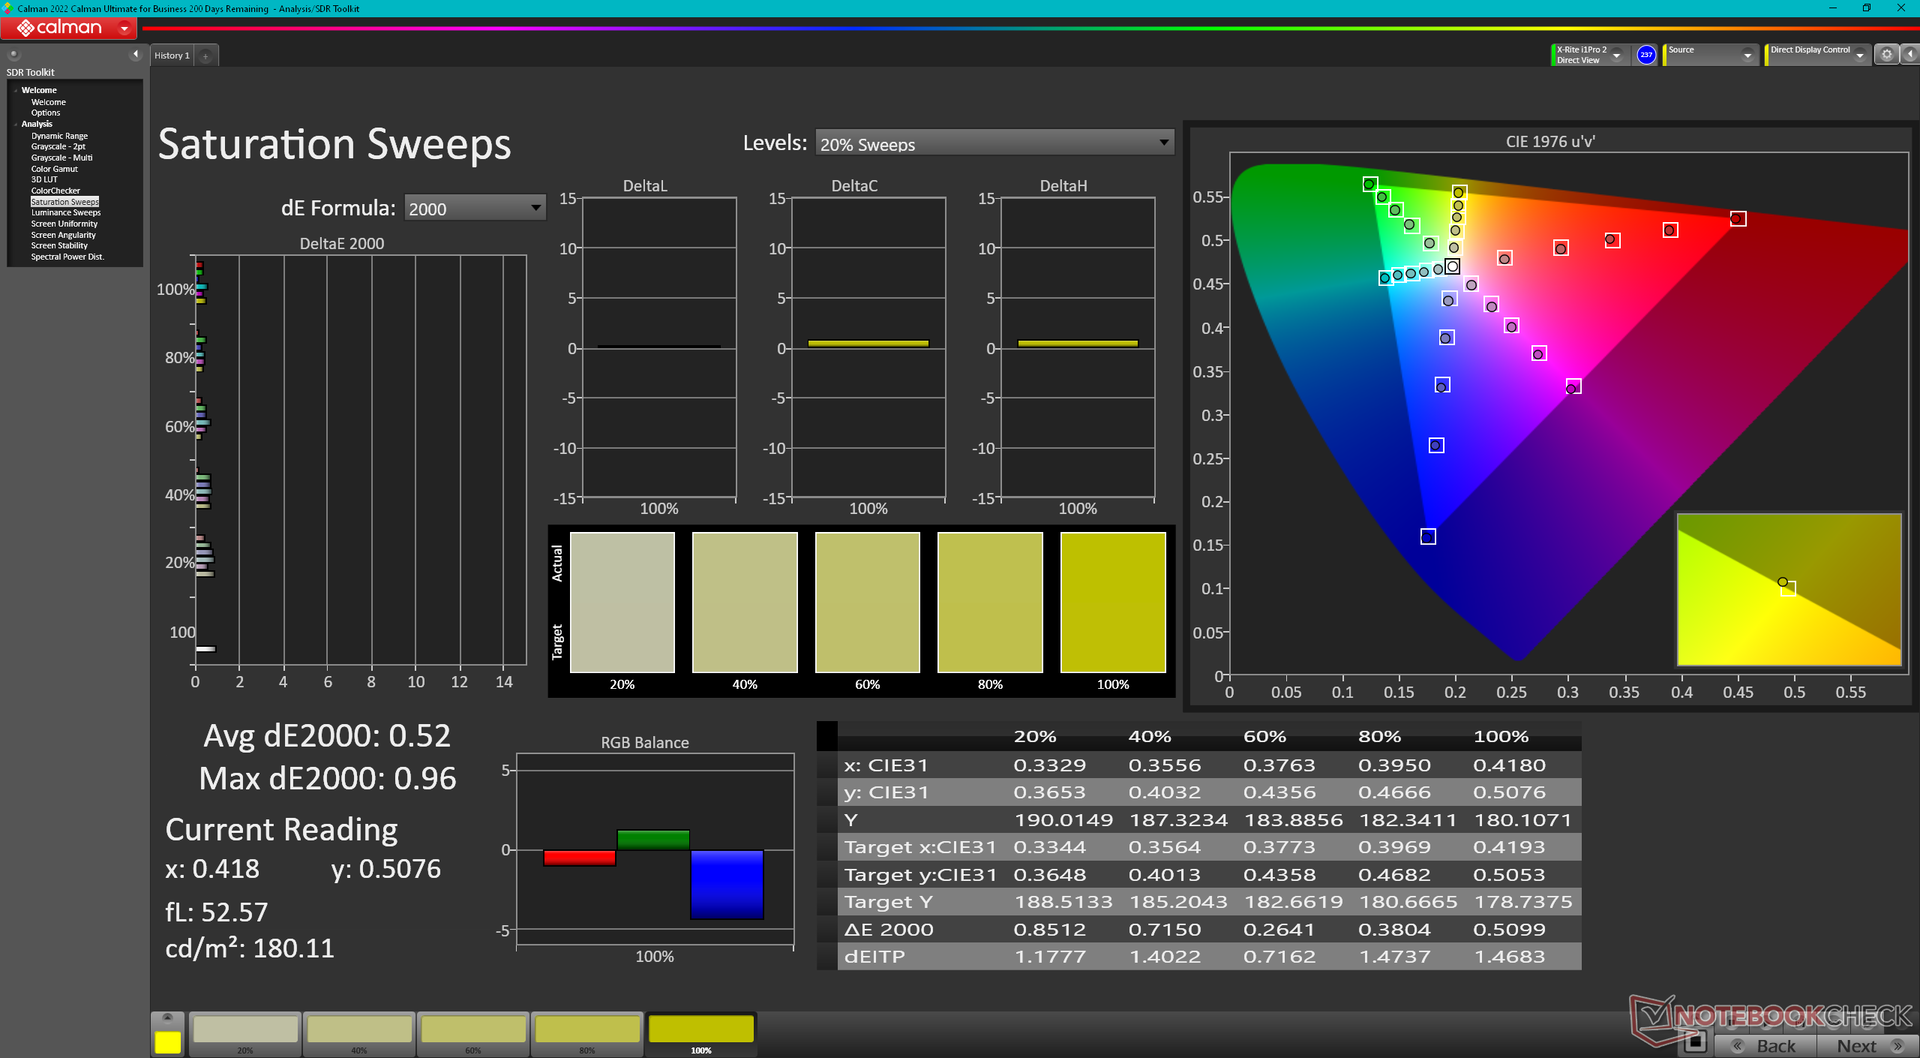
97.7% Display P3 (Argyll 2.2.0 3D)
Gamma: 2.34
| Alienware m18 R1 Chi Mei 180JME, IPS, 1920x1200, 18.00 | Razer Blade 18 RTX 4070 AU Optronics B180QAN01.0, IPS, 2560x1600, 18.00 | Asus ROG Strix Scar 18 2023 G834JY-N6005W NE180QDM-NZ2, IPS, 2560x1600, 18.00 | Eluktronics Mech-17 GP2 BOE NE170QDM-NZ1, IPS, 2560x1600, 17.00 | MSI Titan GT77 HX 13VI B173ZAN06.C, Mini-LED, 3840x2160, 17.30 | Alienware x17 R2 P48E AU Optronics B173HAN, IPS, 1920x1080, 17.30 | |
|---|---|---|---|---|---|---|
| Display | -2% | -2% | -17% | 0% | -10% | |
| Display P3 Coverage | 97.7 | 96.9 -1% | 97.2 -1% | 69.1 -29% | 94.9 -3% | 79.2 -19% |
| sRGB Coverage | 100 | 99.8 0% | 99.9 0% | 99.7 0% | 99.9 0% | 99.8 0% |
| AdobeRGB 1998 Coverage | 89.8 | 85.3 -5% | 84.9 -5% | 69.8 -22% | 92.4 3% | 79.6 -11% |
| Response Times | -11% | -34% | -148% | -675% | -153% | |
| Response Time Grey 50% / Grey 80% * | 3 ? | 4.2 ? -40% | 5.41 ? -80% | 12 ? -300% | 38.4 ? -1180% | 12.4 ? -313% |
| Response Time Black / White * | 9.9 ? | 8 ? 19% | 8.62 ? 13% | 9.4 ? 5% | 26.6 ? -169% | 9.2 ? 7% |
| PWM Frequency | 2380 ? | |||||
| Bildschirm | -68% | -141% | -17% | 57715% | -48% | |
| Helligkeit Bildmitte | 372.8 | 549.6 47% | 490 31% | 417.3 12% | 606 63% | 365.4 -2% |
| Brightness | 367 | 524 43% | 468 28% | 387 5% | 602 64% | 344 -6% |
| Brightness Distribution | 97 | 89 -8% | 86 -11% | 87 -10% | 93 -4% | 85 -12% |
| Schwarzwert * | 0.32 | 0.53 -66% | 0.54 -69% | 0.42 -31% | 0.0001 100% | 0.29 9% |
| Kontrast | 1165 | 1037 -11% | 907 -22% | 994 -15% | 6060000 520072% | 1260 8% |
| Delta E Colorchecker * | 1.92 | 3.32 -73% | 4.97 -159% | 2.14 -11% | 4.8 -150% | 3.17 -65% |
| Colorchecker dE 2000 max. * | 3.65 | 6.63 -82% | 11.02 -202% | 4.09 -12% | 8.2 -125% | 7.69 -111% |
| Colorchecker dE 2000 calibrated * | 0.51 | 2.7 -429% | 2.97 -482% | 0.42 18% | 1.8 -253% | 0.51 -0% |
| Delta E Graustufen * | 1.5 | 2 -33% | 7.2 -380% | 3.1 -107% | 6.5 -333% | 5.3 -253% |
| Gamma | 2.34 94% | 2.29 96% | 2.161 102% | 2.19 100% | 2.63 84% | 2.18 101% |
| CCT | 6607 98% | 6319 103% | 6515 100% | 6040 108% | 6596 99% | 5879 111% |
| Durchschnitt gesamt (Programm / Settings) | -27% /
-46% | -59% /
-96% | -61% /
-36% | 19013% /
37006% | -70% /
-55% |
* ... kleinere Werte sind besser
Der Bildschirm ist bereits im Auslieferungszustand auf exakte Farben und Graustufen kalibriert. Eine weitere Kalibrierung des Displays führt zu keiner signifikanten Verbesserung der durchschnittlichen DeltaE-Werte. So ist eine Kalibrierung durch den Endbenutzer nicht erforderlich. Das von uns erstellte ICC-Profil steht trotzdem in der Infobox zum Download zur Verfügung.

Reaktionszeiten (Response Times) des Displays
| ↔ Reaktionszeiten Schwarz zu Weiß | ||
|---|---|---|
| 9.9 ms ... steigend ↗ und fallend ↘ kombiniert | ↗ 5.4 ms steigend | 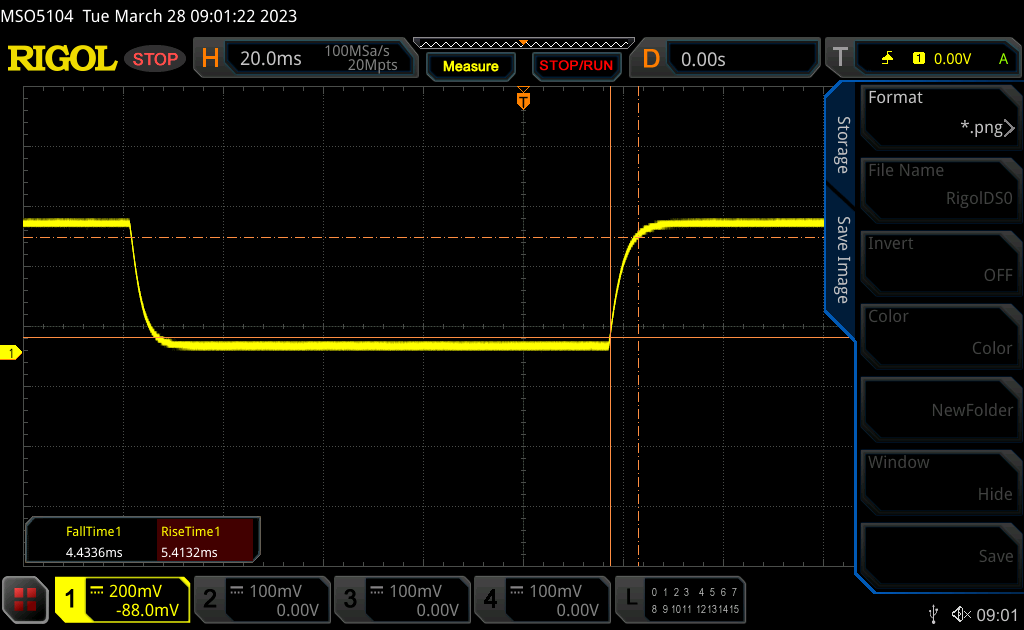 |
| ↘ 4.5 ms fallend | ||
| Die gemessenen Reaktionszeiten sind kurz wodurch sich der Bildschirm auch für Spiele gut eignen sollte. Im Vergleich rangierten die bei uns getesteten Geräte von 0.1 (Minimum) zu 240 (Maximum) ms. » 21 % aller Screens waren schneller als der getestete. Daher sind die gemessenen Reaktionszeiten besser als der Durchschnitt aller vermessenen Geräte (21.5 ms). | ||
| ↔ Reaktionszeiten 50% Grau zu 80% Grau | ||
| 3 ms ... steigend ↗ und fallend ↘ kombiniert | ↗ 1.5 ms steigend | 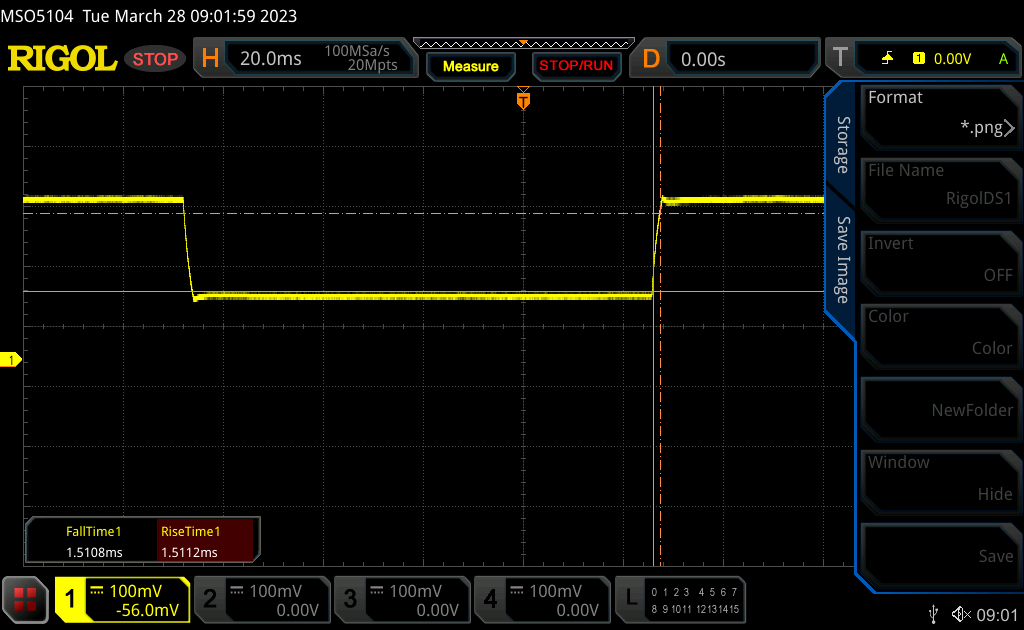 |
| ↘ 1.5 ms fallend | ||
| Die gemessenen Reaktionszeiten sind sehr kurz, wodurch sich der Bildschirm auch für schnelle 3D Spiele eignen sollte. Im Vergleich rangierten die bei uns getesteten Geräte von 0.2 (Minimum) zu 636 (Maximum) ms. » 8 % aller Screens waren schneller als der getestete. Daher sind die gemessenen Reaktionszeiten besser als der Durchschnitt aller vermessenen Geräte (33.7 ms). | ||
Bildschirm-Flackern / PWM (Pulse-Width Modulation)
| Flackern / PWM nicht festgestellt | 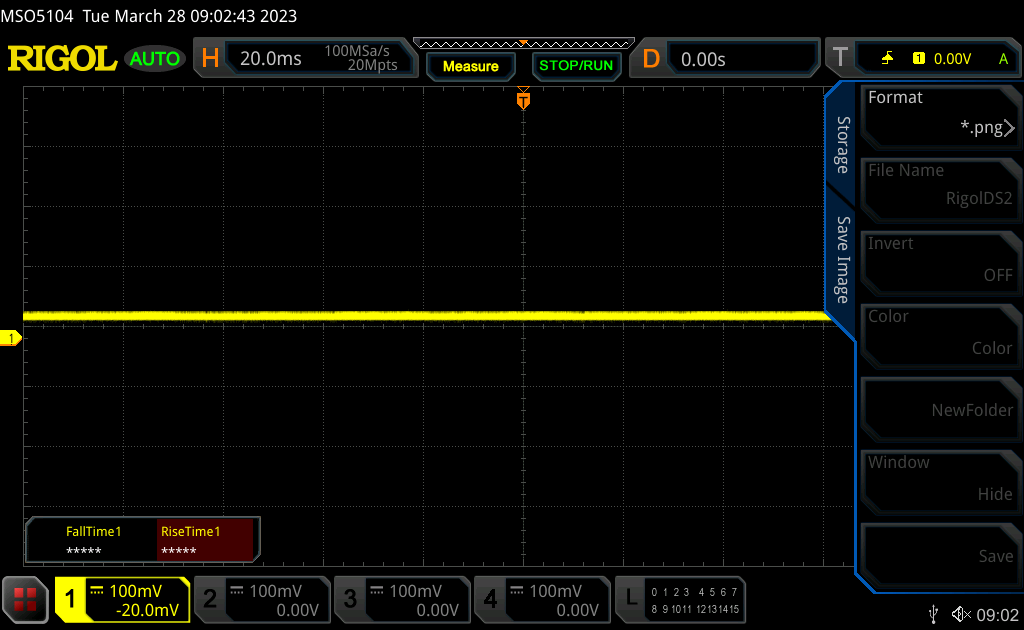 | ||
Im Vergleich: 53 % aller getesteten Geräte nutzten kein PWM um die Helligkeit zu reduzieren. Wenn PWM eingesetzt wurde, dann bei einer Frequenz von durchschnittlich 17908 (Minimum 5, Maximum 3846000) Hz. | |||
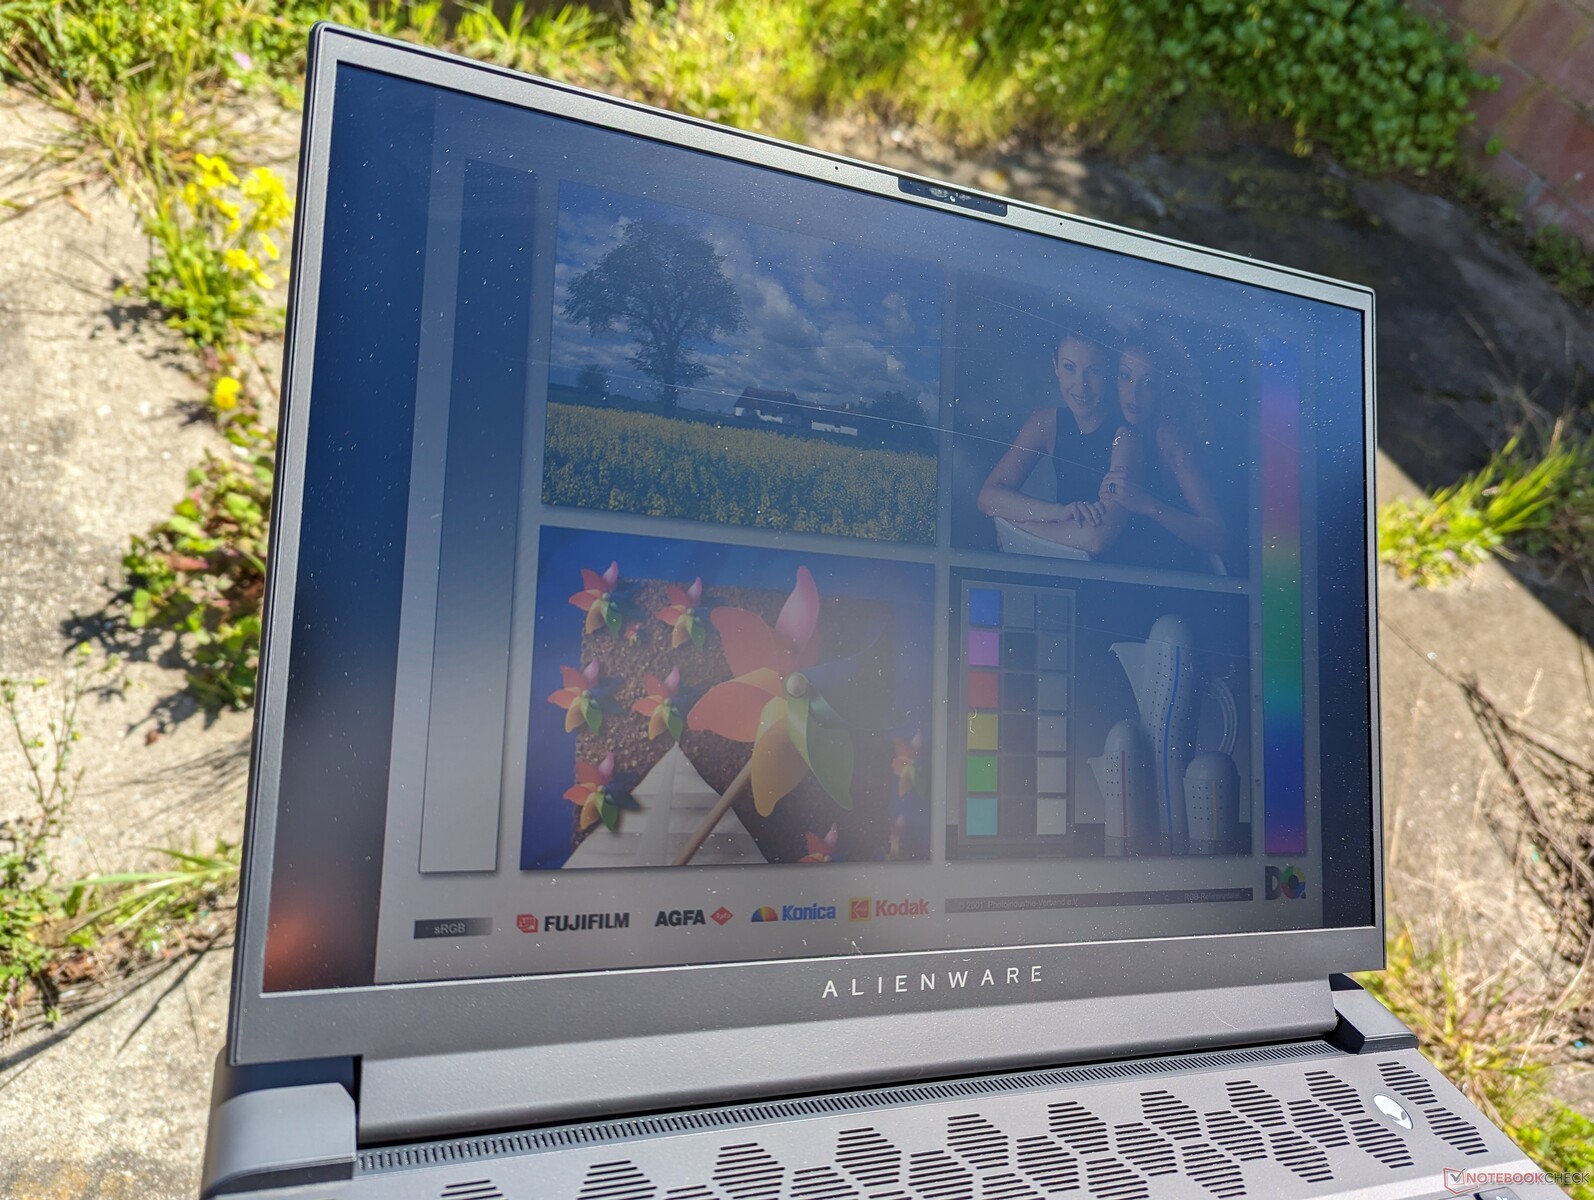
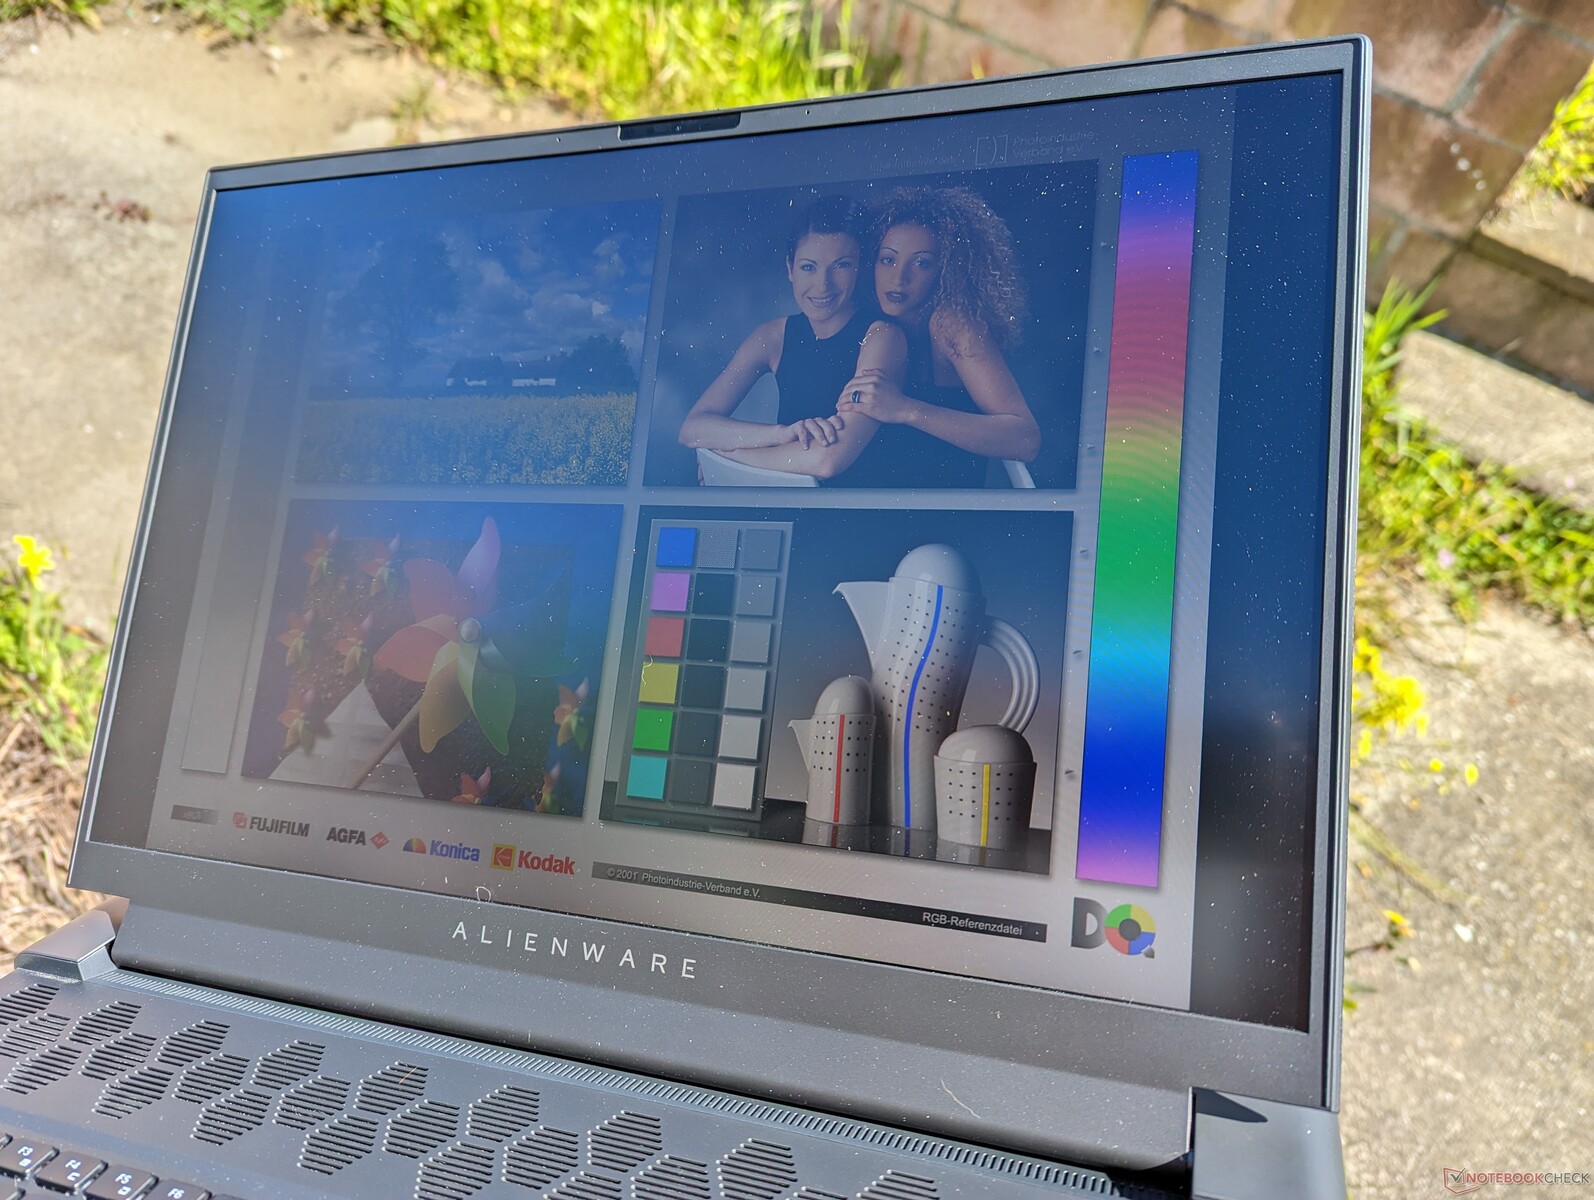
Die Ablesbarkeit im Freien ist für die Geräteklasse durchschnittlich, da die Displays der meisten Gaming-Notebooks im Bereich zwischen 300 und 400 cd/m² liegen. Allerdings schreckt das hohe Gewicht des Alienware m18 R1 von der Verwendung im Freien ab. Das Blade 18 und das Titan GT77 sind heller und bieten eine bessere Outdoor-Anzeige.
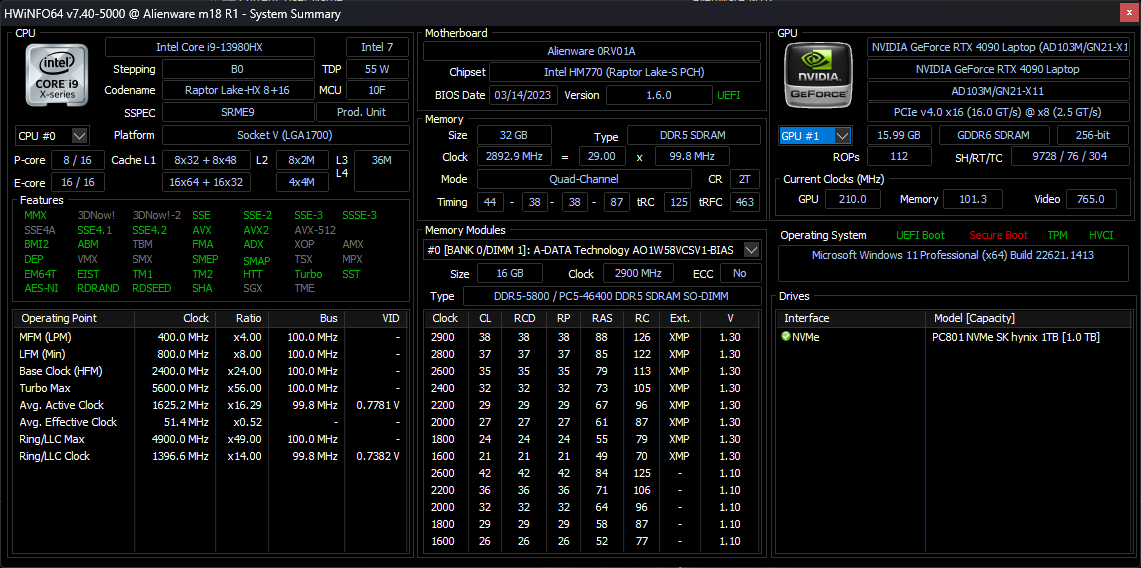
Leistung — Intel-Prozessor der 13. Generation und Nvidia Ada Lovelace GPU
Testbedingungen
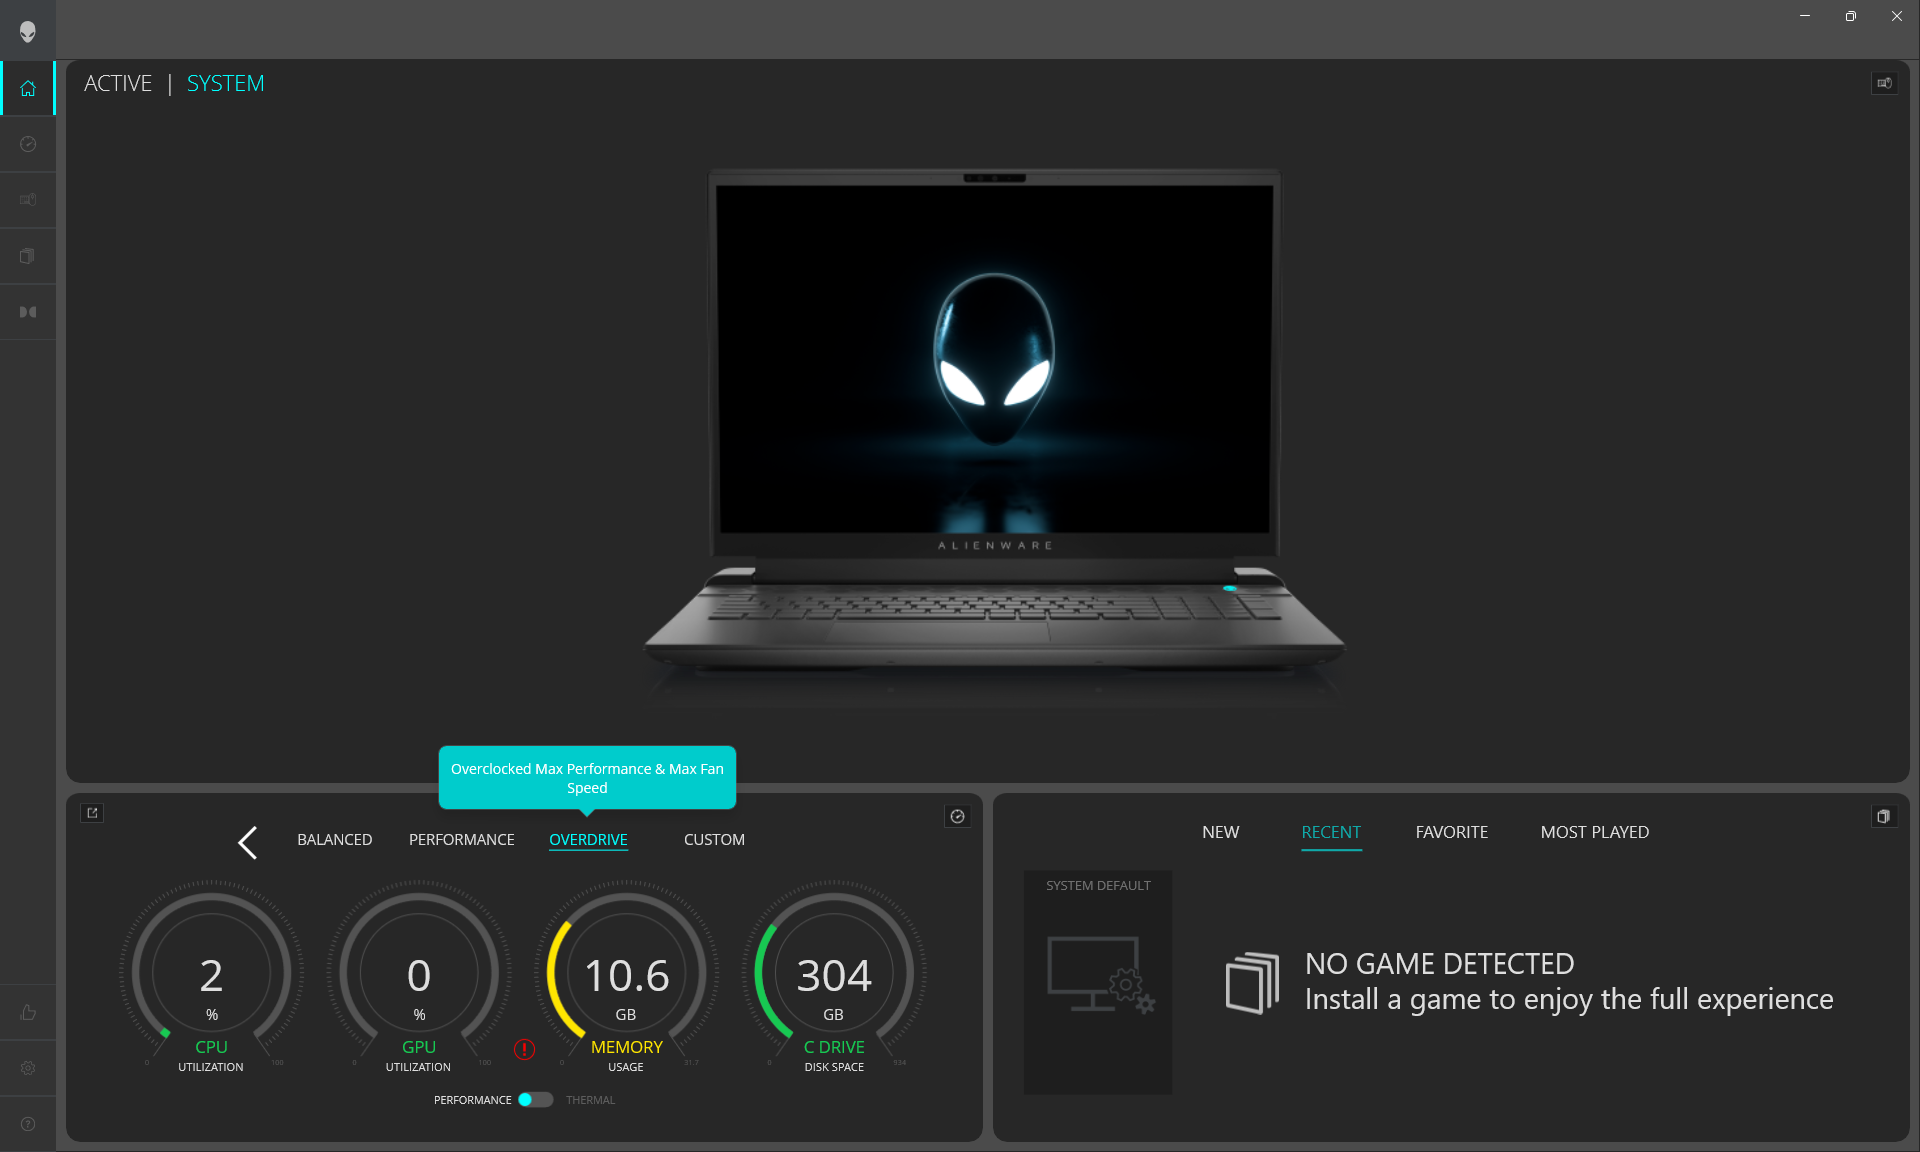
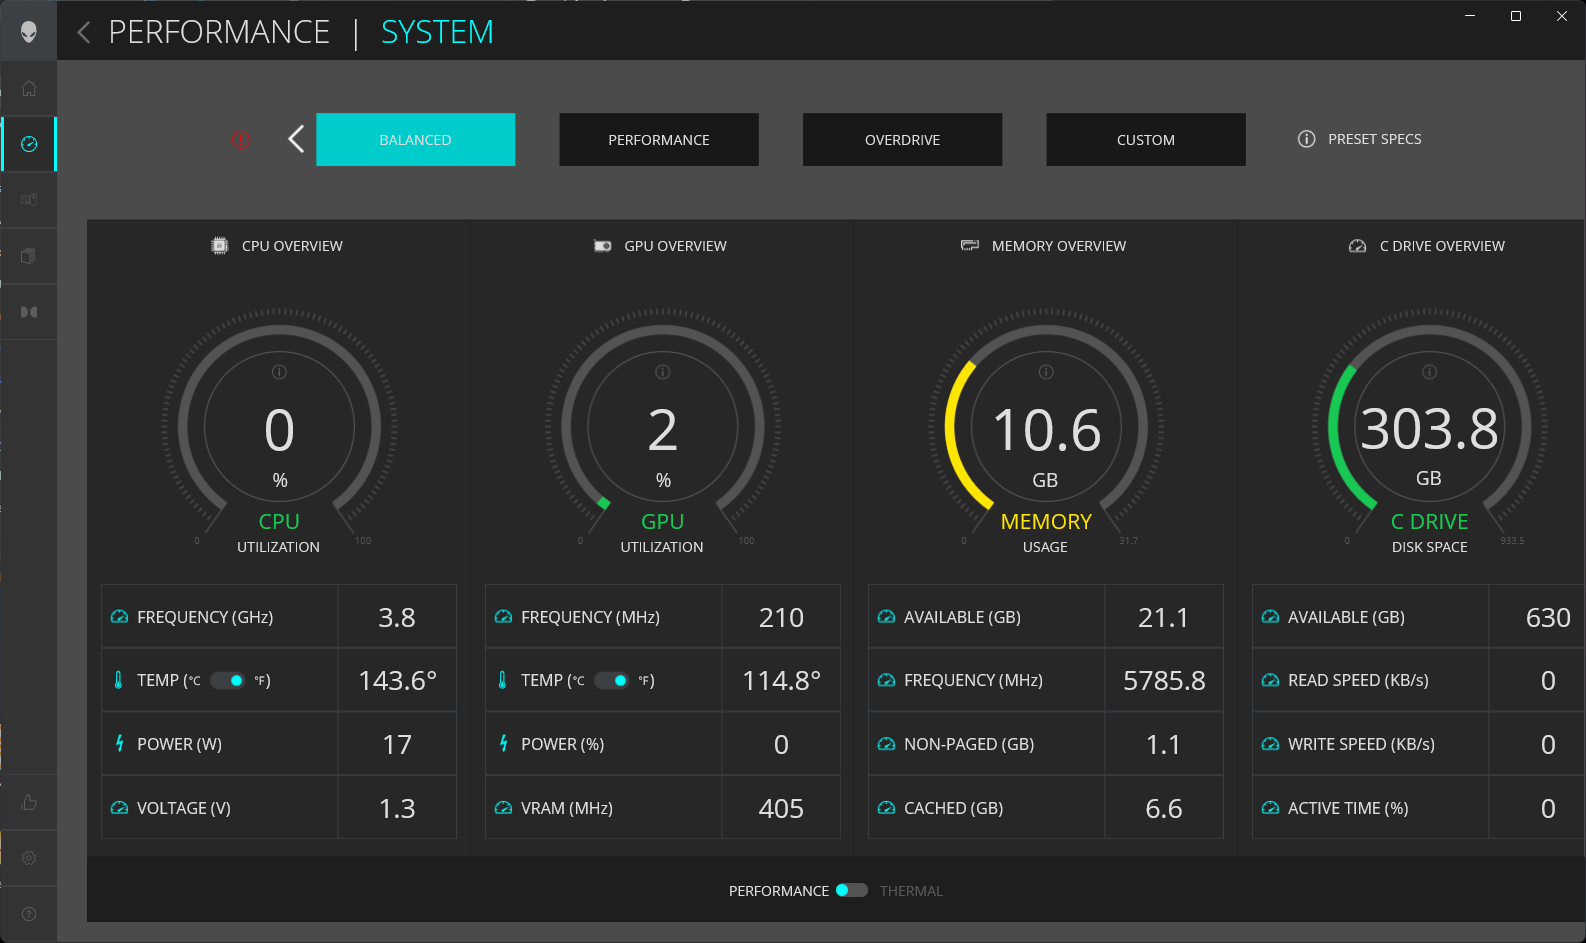
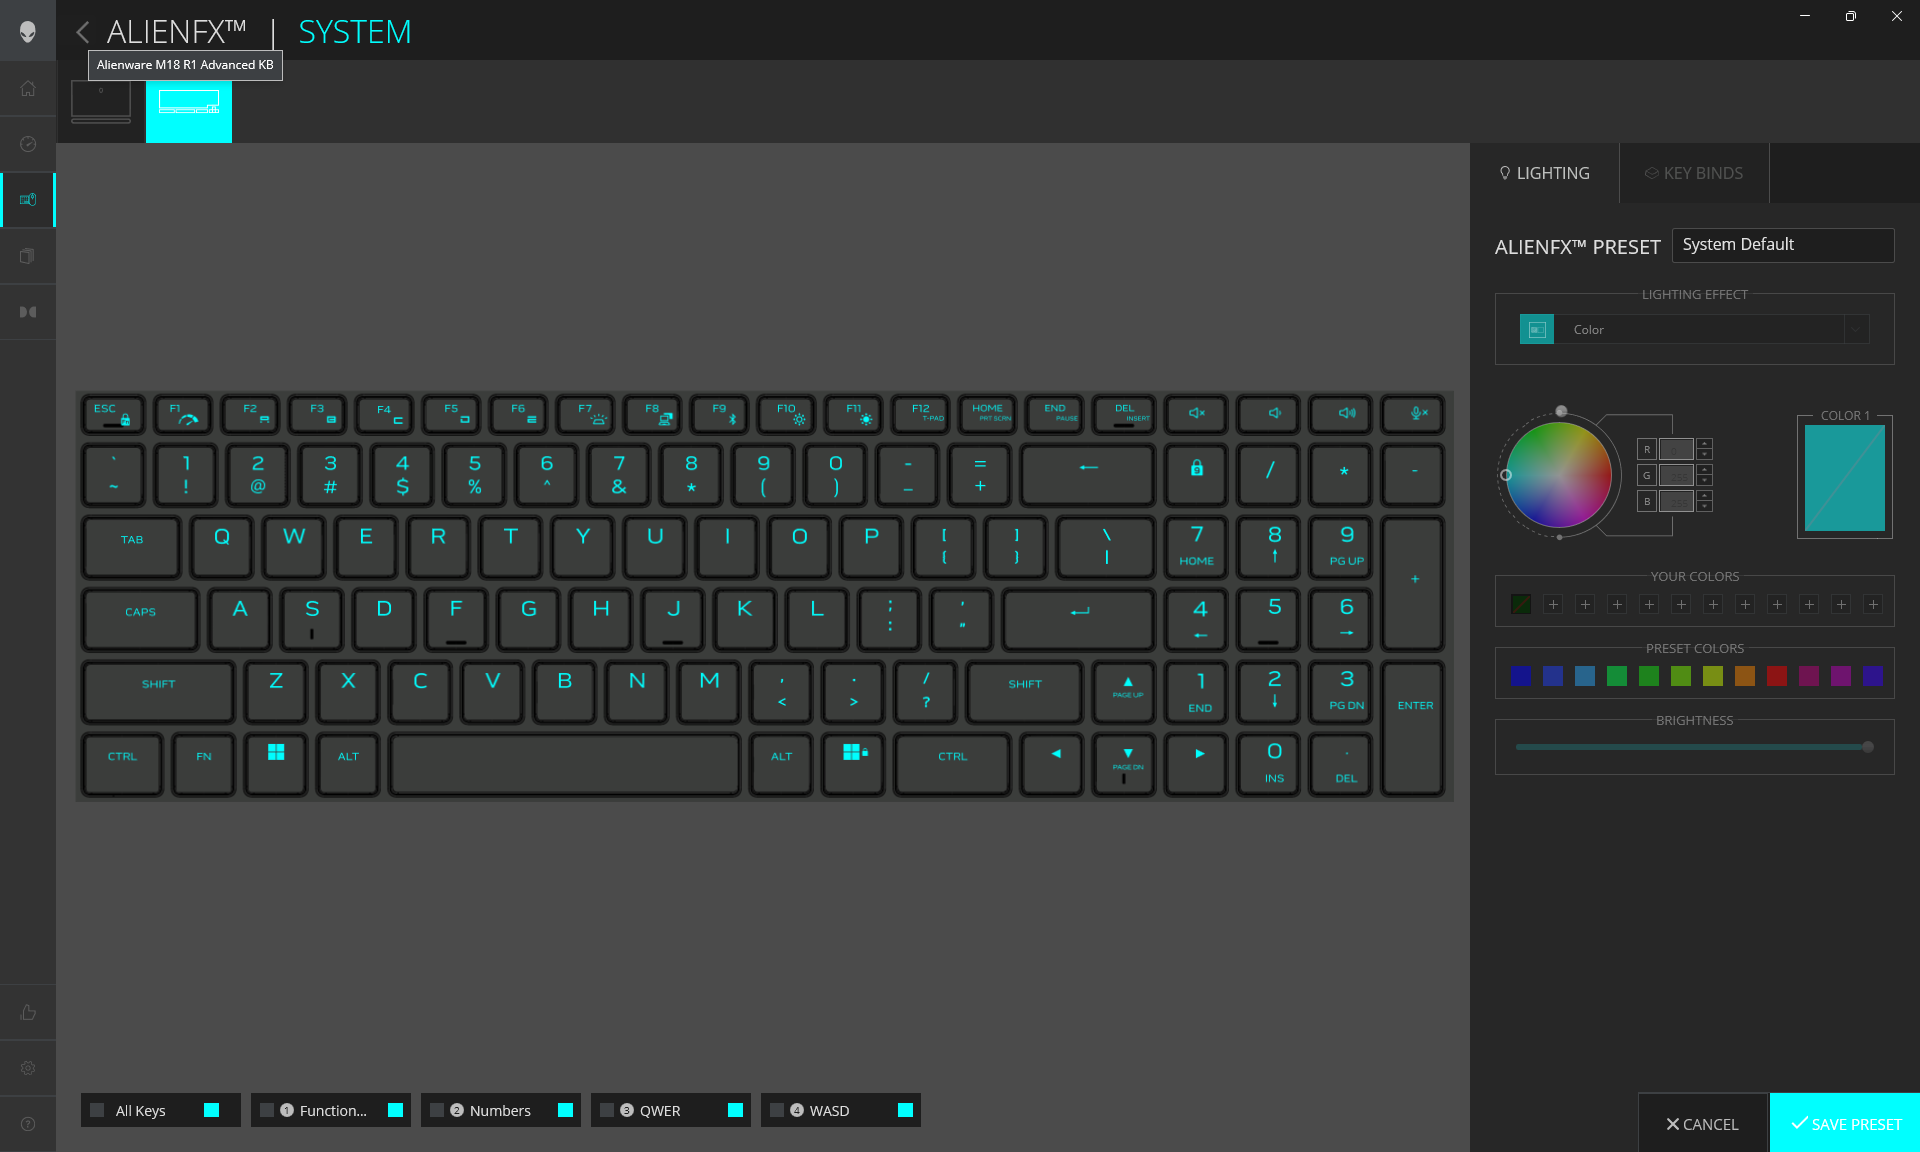
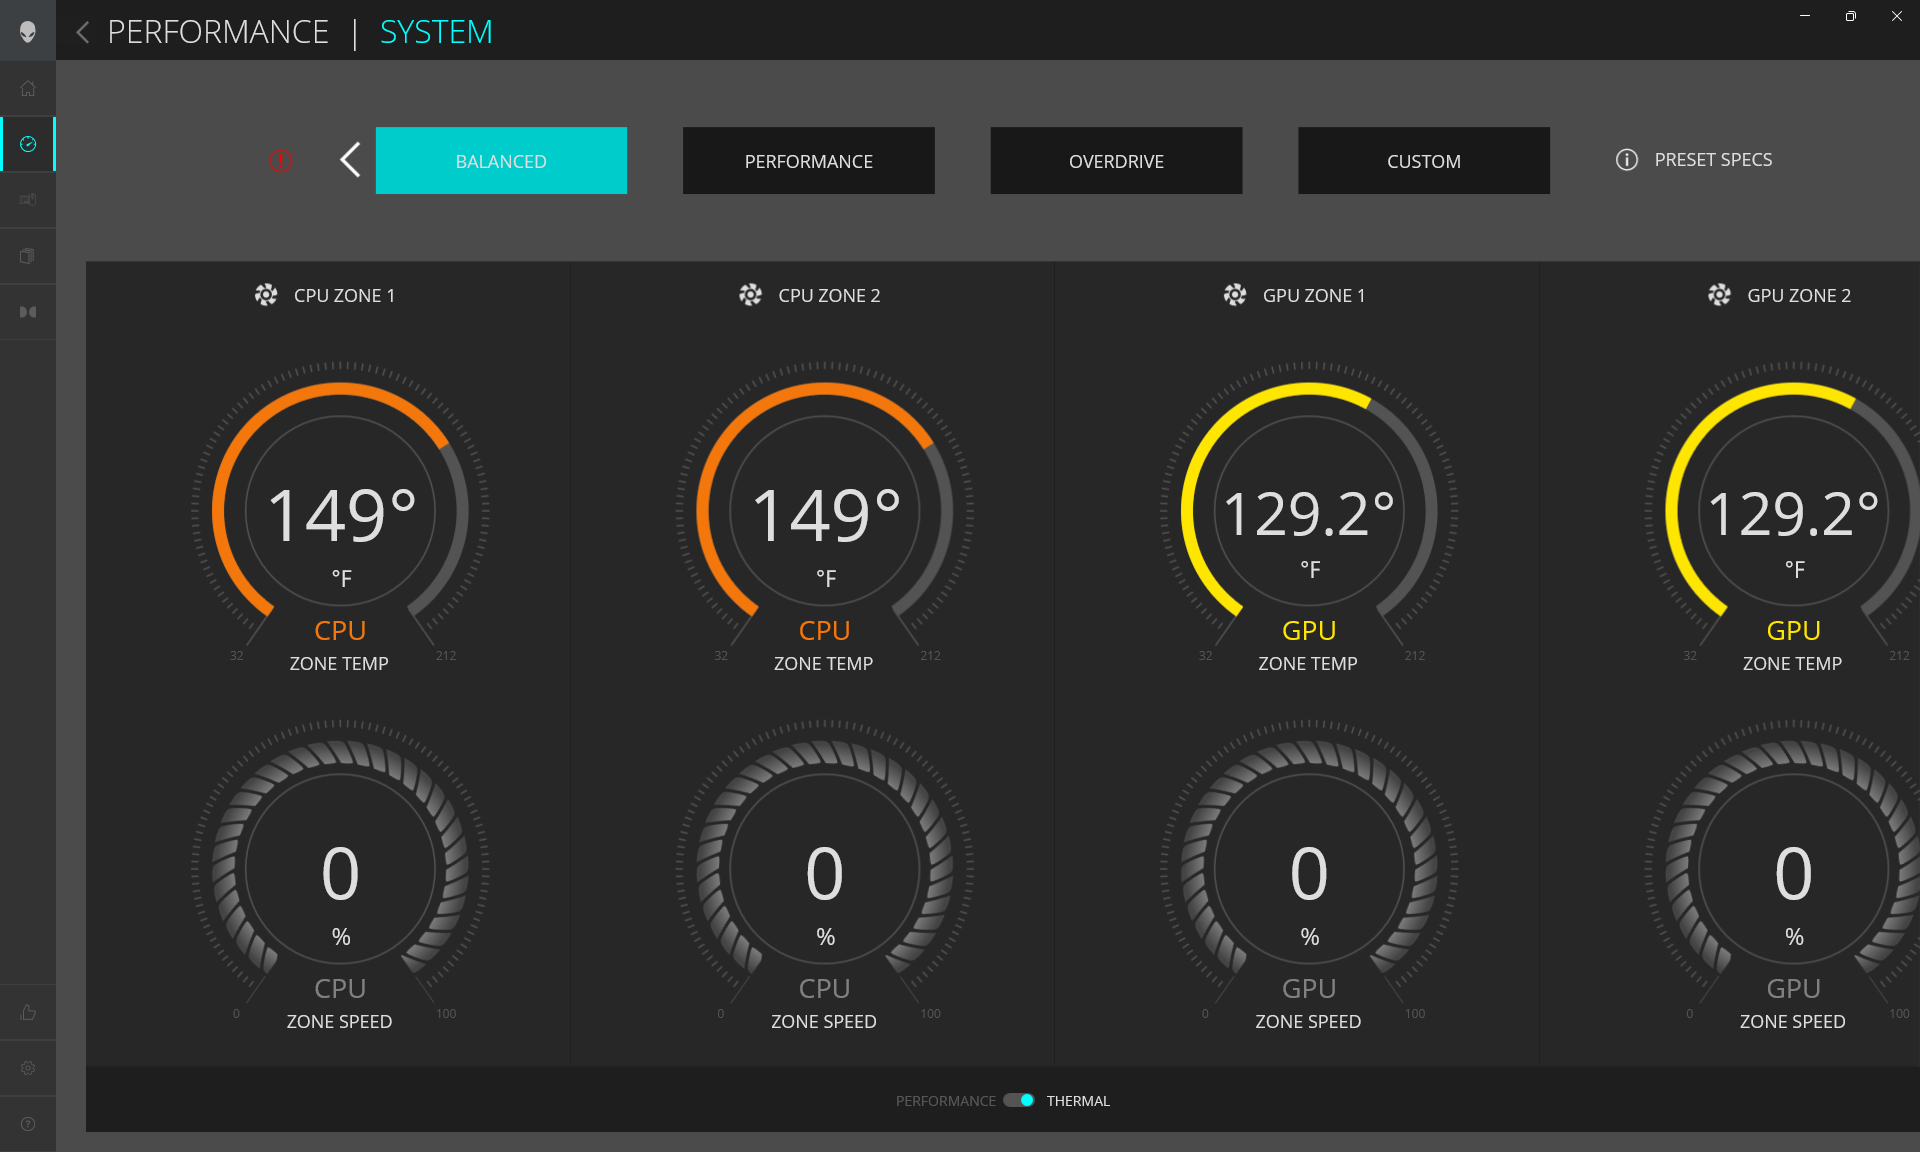
Wir haben unser System vor den folgenden Benchmarks über Windows in den Leistungsmodus, über die Nvidia Systemsteuerung in den diskreten GPU-Modus und über das Alienware Command Center in den Overdrive-Modus versetzt. Dell hat die Command Center Software in diesem Jahr komplett überarbeitet, und im Zuge dessen die Bedienung vereinfacht und die Schrift vergrößert. Dennoch sind die Ladezeiten nach wie vor sehr hoch, vor allem im Vergleich zum schnelleren MSI Center oder dem Schenker Control Center.
Auch nachdem das Alienware Command Center auf die zum Testzeitpunkt neueste Version aktualisiert wurde, sind wir auf einige Fehler gestoßen, die es zu erwähnen gilt. Erstens lädt die Software nicht, wenn ein externer Monitor angeschlossen ist. Zweitens, selbst wenn das System aus dem Performance- oder Overdrive-Modus in den Ruhezustand versetzt wurde, liefen die internen Lüfter manchmal sehr laut weiter.
Advanced Optimus wird unterstützt, das heißt der Benutzer kann über die Nvidia-Systemsteuerung zwischen diskretem GPU-Modus und Optimus-Modus wechseln, ohne dass ein Neustart erforderlich ist. G-Sync ist nur im dGPU-Modus verfügbar, während Optimus automatisch aktiviert wird, wenn ein externer Monitor angeschlossen ist.
Prozessor
Die Prozessorleistung des Intel Core i9-13980HX ist eine der schnellsten aller derzeit auf dem Markt erhältlichen mobilen CPUs. Nutzer können im Vergleich zum Core i9-12900HK der 12. Generation im älteren Alienware x17 R2 mit einem Single-Thread- und Multi-Thread-Leistungszuwachs von rund 10 Prozent respektive 75 Prozent rechnen. AMDs Top-Zen-4-Konkurrent Ryzen 9 7945HX liegt bei Single-Thread-Last etwa 10 bis 15 Prozent darunter.
Trotz des massiven Leistungssprungs gegenüber Alder Lake-H sind die Leistungsunterschiede zwischen Core i9-13900HX, Core i9-13950HX und Core i9-13980HX mit unter 5 Prozent sehr gering. Wer also die Wahl zwischen den drei CPUs hat, könnte also etwas Geld sparen und den „langsameren“ i9-13900HX nehmen.
Die niedrigste verfügbare CPU-Option im Alienware-Laptop ist der Core i7-13700HX. Dieser Prozessor dürfte gut 33 % langsamer ist als unser i9-13980HX sein.
Cinebench R15 Multi Loop
Cinebench R23: Multi Core | Single Core
Cinebench R20: CPU (Multi Core) | CPU (Single Core)
Cinebench R15: CPU Multi 64Bit | CPU Single 64Bit
Blender: v2.79 BMW27 CPU
7-Zip 18.03: 7z b 4 | 7z b 4 -mmt1
Geekbench 5.5: Multi-Core | Single-Core
HWBOT x265 Benchmark v2.2: 4k Preset
LibreOffice : 20 Documents To PDF
R Benchmark 2.5: Overall mean
| CPU Performance Rating | |
| Eluktronics Mech-17 GP2 | |
| Alienware m18 R1 | |
| MSI Titan GT77 HX 13VI | |
| Durchschnittliche Intel Core i9-13980HX | |
| Asus ROG Strix G17 G713PI | |
| Razer Blade 18 RTX 4070 | |
| Uniwill GM6PX7X RTX 4070 | |
| Alienware x17 R2 P48E | |
| Razer Blade 17 (i7-12800H, RTX 3070 Ti) | |
| Alienware m17 R5 (R9 6900HX, RX 6850M XT) | |
| Corsair Voyager a1600 | |
| MSI GS76 Stealth 11UH | |
| HP Omen 16-n0033dx | |
| Alienware x17 RTX 3080 P48E -2! | |
| Razer Blade Pro 17 2021 (QHD Touch) | |
| Cinebench R23 / Multi Core | |
| MSI Titan GT77 HX 13VI | |
| Eluktronics Mech-17 GP2 | |
| Alienware m18 R1 | |
| Asus ROG Strix G17 G713PI | |
| Durchschnittliche Intel Core i9-13980HX (28301 - 33052, n=11) | |
| Razer Blade 18 RTX 4070 | |
| Uniwill GM6PX7X RTX 4070 | |
| Alienware x17 R2 P48E | |
| Razer Blade 17 (i7-12800H, RTX 3070 Ti) | |
| Alienware x17 RTX 3080 P48E | |
| Alienware m17 R5 (R9 6900HX, RX 6850M XT) | |
| Corsair Voyager a1600 | |
| HP Omen 16-n0033dx | |
| MSI GS76 Stealth 11UH | |
| Razer Blade Pro 17 2021 (QHD Touch) | |
| Cinebench R23 / Single Core | |
| Alienware m18 R1 | |
| MSI Titan GT77 HX 13VI | |
| Eluktronics Mech-17 GP2 | |
| Durchschnittliche Intel Core i9-13980HX (1825 - 2169, n=9) | |
| Razer Blade 18 RTX 4070 | |
| Alienware x17 R2 P48E | |
| Asus ROG Strix G17 G713PI | |
| Razer Blade 17 (i7-12800H, RTX 3070 Ti) | |
| Uniwill GM6PX7X RTX 4070 | |
| MSI GS76 Stealth 11UH | |
| Corsair Voyager a1600 | |
| Alienware m17 R5 (R9 6900HX, RX 6850M XT) | |
| Alienware x17 RTX 3080 P48E | |
| HP Omen 16-n0033dx | |
| Razer Blade Pro 17 2021 (QHD Touch) | |
| Cinebench R20 / CPU (Multi Core) | |
| MSI Titan GT77 HX 13VI | |
| Eluktronics Mech-17 GP2 | |
| Alienware m18 R1 | |
| Durchschnittliche Intel Core i9-13980HX (10353 - 12437, n=10) | |
| Razer Blade 18 RTX 4070 | |
| Asus ROG Strix G17 G713PI | |
| Uniwill GM6PX7X RTX 4070 | |
| Alienware x17 R2 P48E | |
| Alienware x17 RTX 3080 P48E | |
| Razer Blade 17 (i7-12800H, RTX 3070 Ti) | |
| Alienware m17 R5 (R9 6900HX, RX 6850M XT) | |
| Corsair Voyager a1600 | |
| HP Omen 16-n0033dx | |
| MSI GS76 Stealth 11UH | |
| Razer Blade Pro 17 2021 (QHD Touch) | |
| Cinebench R20 / CPU (Single Core) | |
| Alienware m18 R1 | |
| MSI Titan GT77 HX 13VI | |
| Eluktronics Mech-17 GP2 | |
| Razer Blade 18 RTX 4070 | |
| Durchschnittliche Intel Core i9-13980HX (717 - 825, n=10) | |
| Alienware x17 R2 P48E | |
| Asus ROG Strix G17 G713PI | |
| Uniwill GM6PX7X RTX 4070 | |
| Razer Blade 17 (i7-12800H, RTX 3070 Ti) | |
| Alienware m17 R5 (R9 6900HX, RX 6850M XT) | |
| MSI GS76 Stealth 11UH | |
| HP Omen 16-n0033dx | |
| Corsair Voyager a1600 | |
| Alienware x17 RTX 3080 P48E | |
| Razer Blade Pro 17 2021 (QHD Touch) | |
| Cinebench R15 / CPU Multi 64Bit | |
| MSI Titan GT77 HX 13VI | |
| Asus ROG Strix G17 G713PI | |
| Alienware m18 R1 | |
| Eluktronics Mech-17 GP2 | |
| Durchschnittliche Intel Core i9-13980HX (4358 - 5172, n=11) | |
| Razer Blade 18 RTX 4070 | |
| Uniwill GM6PX7X RTX 4070 | |
| Alienware x17 R2 P48E | |
| Razer Blade 17 (i7-12800H, RTX 3070 Ti) | |
| Alienware m17 R5 (R9 6900HX, RX 6850M XT) | |
| Alienware x17 RTX 3080 P48E | |
| Corsair Voyager a1600 | |
| HP Omen 16-n0033dx | |
| MSI GS76 Stealth 11UH | |
| Razer Blade Pro 17 2021 (QHD Touch) | |
| Cinebench R15 / CPU Single 64Bit | |
| Alienware m18 R1 | |
| Durchschnittliche Intel Core i9-13980HX (289 - 312, n=11) | |
| MSI Titan GT77 HX 13VI | |
| Eluktronics Mech-17 GP2 | |
| Razer Blade 18 RTX 4070 | |
| Asus ROG Strix G17 G713PI | |
| Alienware x17 R2 P48E | |
| Razer Blade 17 (i7-12800H, RTX 3070 Ti) | |
| Uniwill GM6PX7X RTX 4070 | |
| Alienware m17 R5 (R9 6900HX, RX 6850M XT) | |
| Corsair Voyager a1600 | |
| HP Omen 16-n0033dx | |
| MSI GS76 Stealth 11UH | |
| Alienware x17 RTX 3080 P48E | |
| Razer Blade Pro 17 2021 (QHD Touch) | |
| Blender / v2.79 BMW27 CPU | |
| Razer Blade Pro 17 2021 (QHD Touch) | |
| MSI GS76 Stealth 11UH | |
| HP Omen 16-n0033dx | |
| Corsair Voyager a1600 | |
| Alienware m17 R5 (R9 6900HX, RX 6850M XT) | |
| Razer Blade 17 (i7-12800H, RTX 3070 Ti) | |
| Alienware x17 RTX 3080 P48E | |
| Alienware x17 R2 P48E | |
| Uniwill GM6PX7X RTX 4070 | |
| Razer Blade 18 RTX 4070 | |
| Durchschnittliche Intel Core i9-13980HX (97 - 136, n=10) | |
| Eluktronics Mech-17 GP2 | |
| MSI Titan GT77 HX 13VI | |
| Asus ROG Strix G17 G713PI | |
| Alienware m18 R1 | |
| 7-Zip 18.03 / 7z b 4 | |
| Alienware m18 R1 | |
| MSI Titan GT77 HX 13VI | |
| Eluktronics Mech-17 GP2 | |
| Asus ROG Strix G17 G713PI | |
| Durchschnittliche Intel Core i9-13980HX (104616 - 129804, n=10) | |
| Razer Blade 18 RTX 4070 | |
| Uniwill GM6PX7X RTX 4070 | |
| Alienware x17 R2 P48E | |
| Razer Blade 17 (i7-12800H, RTX 3070 Ti) | |
| Corsair Voyager a1600 | |
| Alienware m17 R5 (R9 6900HX, RX 6850M XT) | |
| HP Omen 16-n0033dx | |
| Alienware x17 RTX 3080 P48E | |
| MSI GS76 Stealth 11UH | |
| Razer Blade Pro 17 2021 (QHD Touch) | |
| 7-Zip 18.03 / 7z b 4 -mmt1 | |
| Asus ROG Strix G17 G713PI | |
| Eluktronics Mech-17 GP2 | |
| Durchschnittliche Intel Core i9-13980HX (6230 - 7163, n=10) | |
| MSI Titan GT77 HX 13VI | |
| Alienware m18 R1 | |
| Razer Blade 18 RTX 4070 | |
| Uniwill GM6PX7X RTX 4070 | |
| Corsair Voyager a1600 | |
| Alienware x17 R2 P48E | |
| Razer Blade 17 (i7-12800H, RTX 3070 Ti) | |
| Alienware m17 R5 (R9 6900HX, RX 6850M XT) | |
| HP Omen 16-n0033dx | |
| MSI GS76 Stealth 11UH | |
| Alienware x17 RTX 3080 P48E | |
| Razer Blade Pro 17 2021 (QHD Touch) | |
| Geekbench 5.5 / Multi-Core | |
| Alienware m18 R1 | |
| Eluktronics Mech-17 GP2 | |
| MSI Titan GT77 HX 13VI | |
| Durchschnittliche Intel Core i9-13980HX (18475 - 22200, n=10) | |
| Razer Blade 18 RTX 4070 | |
| Asus ROG Strix G17 G713PI | |
| Uniwill GM6PX7X RTX 4070 | |
| Alienware x17 R2 P48E | |
| Razer Blade 17 (i7-12800H, RTX 3070 Ti) | |
| Corsair Voyager a1600 | |
| Alienware m17 R5 (R9 6900HX, RX 6850M XT) | |
| MSI GS76 Stealth 11UH | |
| HP Omen 16-n0033dx | |
| Razer Blade Pro 17 2021 (QHD Touch) | |
| Geekbench 5.5 / Single-Core | |
| Eluktronics Mech-17 GP2 | |
| Alienware m18 R1 | |
| Asus ROG Strix G17 G713PI | |
| Durchschnittliche Intel Core i9-13980HX (1796 - 2139, n=10) | |
| MSI Titan GT77 HX 13VI | |
| Razer Blade 18 RTX 4070 | |
| Alienware x17 R2 P48E | |
| Uniwill GM6PX7X RTX 4070 | |
| Razer Blade 17 (i7-12800H, RTX 3070 Ti) | |
| MSI GS76 Stealth 11UH | |
| Alienware m17 R5 (R9 6900HX, RX 6850M XT) | |
| HP Omen 16-n0033dx | |
| Corsair Voyager a1600 | |
| Razer Blade Pro 17 2021 (QHD Touch) | |
| HWBOT x265 Benchmark v2.2 / 4k Preset | |
| Eluktronics Mech-17 GP2 | |
| Asus ROG Strix G17 G713PI | |
| Alienware m18 R1 | |
| MSI Titan GT77 HX 13VI | |
| Durchschnittliche Intel Core i9-13980HX (27 - 33.4, n=9) | |
| Razer Blade 18 RTX 4070 | |
| Uniwill GM6PX7X RTX 4070 | |
| Alienware x17 R2 P48E | |
| Alienware x17 RTX 3080 P48E | |
| Corsair Voyager a1600 | |
| Alienware m17 R5 (R9 6900HX, RX 6850M XT) | |
| HP Omen 16-n0033dx | |
| Razer Blade 17 (i7-12800H, RTX 3070 Ti) | |
| MSI GS76 Stealth 11UH | |
| Razer Blade Pro 17 2021 (QHD Touch) | |
| LibreOffice / 20 Documents To PDF | |
| HP Omen 16-n0033dx | |
| Alienware m17 R5 (R9 6900HX, RX 6850M XT) | |
| Corsair Voyager a1600 | |
| MSI GS76 Stealth 11UH | |
| Alienware m18 R1 | |
| Alienware x17 RTX 3080 P48E | |
| MSI Titan GT77 HX 13VI | |
| Asus ROG Strix G17 G713PI | |
| Razer Blade Pro 17 2021 (QHD Touch) | |
| Razer Blade 18 RTX 4070 | |
| Durchschnittliche Intel Core i9-13980HX (35 - 51.4, n=10) | |
| Razer Blade 17 (i7-12800H, RTX 3070 Ti) | |
| Alienware x17 R2 P48E | |
| Uniwill GM6PX7X RTX 4070 | |
| Eluktronics Mech-17 GP2 | |
| R Benchmark 2.5 / Overall mean | |
| Razer Blade Pro 17 2021 (QHD Touch) | |
| Alienware x17 RTX 3080 P48E | |
| MSI GS76 Stealth 11UH | |
| HP Omen 16-n0033dx | |
| Corsair Voyager a1600 | |
| Alienware m17 R5 (R9 6900HX, RX 6850M XT) | |
| Uniwill GM6PX7X RTX 4070 | |
| Razer Blade 17 (i7-12800H, RTX 3070 Ti) | |
| Alienware x17 R2 P48E | |
| Asus ROG Strix G17 G713PI | |
| MSI Titan GT77 HX 13VI | |
| Durchschnittliche Intel Core i9-13980HX (0.3793 - 0.4462, n=10) | |
| Razer Blade 18 RTX 4070 | |
| Alienware m18 R1 | |
| Eluktronics Mech-17 GP2 | |
Cinebench R23: Multi Core | Single Core
Cinebench R20: CPU (Multi Core) | CPU (Single Core)
Cinebench R15: CPU Multi 64Bit | CPU Single 64Bit
Blender: v2.79 BMW27 CPU
7-Zip 18.03: 7z b 4 | 7z b 4 -mmt1
Geekbench 5.5: Multi-Core | Single-Core
HWBOT x265 Benchmark v2.2: 4k Preset
LibreOffice : 20 Documents To PDF
R Benchmark 2.5: Overall mean
* ... kleinere Werte sind besser
AIDA64: FP32 Ray-Trace | FPU Julia | CPU SHA3 | CPU Queen | FPU SinJulia | FPU Mandel | CPU AES | CPU ZLib | FP64 Ray-Trace | CPU PhotoWorxx
| Performance Rating | |
| Alienware m18 R1 | |
| Eluktronics Mech-17 GP2 | |
| MSI Titan GT77 HX 13VI | |
| Asus ROG Strix Scar 18 2023 G834JY-N6005W | |
| Durchschnittliche Intel Core i9-13980HX | |
| Razer Blade 18 RTX 4070 | |
| Alienware x17 R2 P48E | |
| AIDA64 / FP32 Ray-Trace | |
| Alienware m18 R1 | |
| MSI Titan GT77 HX 13VI | |
| Asus ROG Strix Scar 18 2023 G834JY-N6005W | |
| Eluktronics Mech-17 GP2 | |
| Durchschnittliche Intel Core i9-13980HX (21332 - 29553, n=9) | |
| Razer Blade 18 RTX 4070 | |
| Alienware x17 R2 P48E | |
| AIDA64 / FPU Julia | |
| Alienware m18 R1 | |
| MSI Titan GT77 HX 13VI | |
| Asus ROG Strix Scar 18 2023 G834JY-N6005W | |
| Durchschnittliche Intel Core i9-13980HX (108001 - 148168, n=9) | |
| Eluktronics Mech-17 GP2 | |
| Razer Blade 18 RTX 4070 | |
| Alienware x17 R2 P48E | |
| AIDA64 / CPU SHA3 | |
| Alienware m18 R1 | |
| MSI Titan GT77 HX 13VI | |
| Eluktronics Mech-17 GP2 | |
| Asus ROG Strix Scar 18 2023 G834JY-N6005W | |
| Durchschnittliche Intel Core i9-13980HX (5264 - 7142, n=9) | |
| Razer Blade 18 RTX 4070 | |
| Alienware x17 R2 P48E | |
| AIDA64 / CPU Queen | |
| Alienware m18 R1 | |
| Asus ROG Strix Scar 18 2023 G834JY-N6005W | |
| Eluktronics Mech-17 GP2 | |
| MSI Titan GT77 HX 13VI | |
| Durchschnittliche Intel Core i9-13980HX (126758 - 143409, n=9) | |
| Razer Blade 18 RTX 4070 | |
| Alienware x17 R2 P48E | |
| AIDA64 / FPU SinJulia | |
| Eluktronics Mech-17 GP2 | |
| Asus ROG Strix Scar 18 2023 G834JY-N6005W | |
| MSI Titan GT77 HX 13VI | |
| Alienware m18 R1 | |
| Durchschnittliche Intel Core i9-13980HX (13785 - 17117, n=9) | |
| Razer Blade 18 RTX 4070 | |
| Alienware x17 R2 P48E | |
| AIDA64 / FPU Mandel | |
| Alienware m18 R1 | |
| MSI Titan GT77 HX 13VI | |
| Asus ROG Strix Scar 18 2023 G834JY-N6005W | |
| Eluktronics Mech-17 GP2 | |
| Durchschnittliche Intel Core i9-13980HX (53398 - 73758, n=9) | |
| Razer Blade 18 RTX 4070 | |
| Alienware x17 R2 P48E | |
| AIDA64 / CPU AES | |
| Eluktronics Mech-17 GP2 | |
| MSI Titan GT77 HX 13VI | |
| Alienware m18 R1 | |
| Asus ROG Strix Scar 18 2023 G834JY-N6005W | |
| Durchschnittliche Intel Core i9-13980HX (105169 - 136520, n=9) | |
| Razer Blade 18 RTX 4070 | |
| Alienware x17 R2 P48E | |
| AIDA64 / CPU ZLib | |
| MSI Titan GT77 HX 13VI | |
| Asus ROG Strix Scar 18 2023 G834JY-N6005W | |
| Alienware m18 R1 | |
| Eluktronics Mech-17 GP2 | |
| Durchschnittliche Intel Core i9-13980HX (1513 - 2039, n=9) | |
| Razer Blade 18 RTX 4070 | |
| Alienware x17 R2 P48E | |
| AIDA64 / FP64 Ray-Trace | |
| Alienware m18 R1 | |
| MSI Titan GT77 HX 13VI | |
| Asus ROG Strix Scar 18 2023 G834JY-N6005W | |
| Eluktronics Mech-17 GP2 | |
| Durchschnittliche Intel Core i9-13980HX (11431 - 16325, n=9) | |
| Razer Blade 18 RTX 4070 | |
| Alienware x17 R2 P48E | |
| AIDA64 / CPU PhotoWorxx | |
| Alienware m18 R1 | |
| Razer Blade 18 RTX 4070 | |
| Durchschnittliche Intel Core i9-13980HX (37069 - 52949, n=9) | |
| Eluktronics Mech-17 GP2 | |
| Asus ROG Strix Scar 18 2023 G834JY-N6005W | |
| MSI Titan GT77 HX 13VI | |
| Alienware x17 R2 P48E | |
Systemleistung
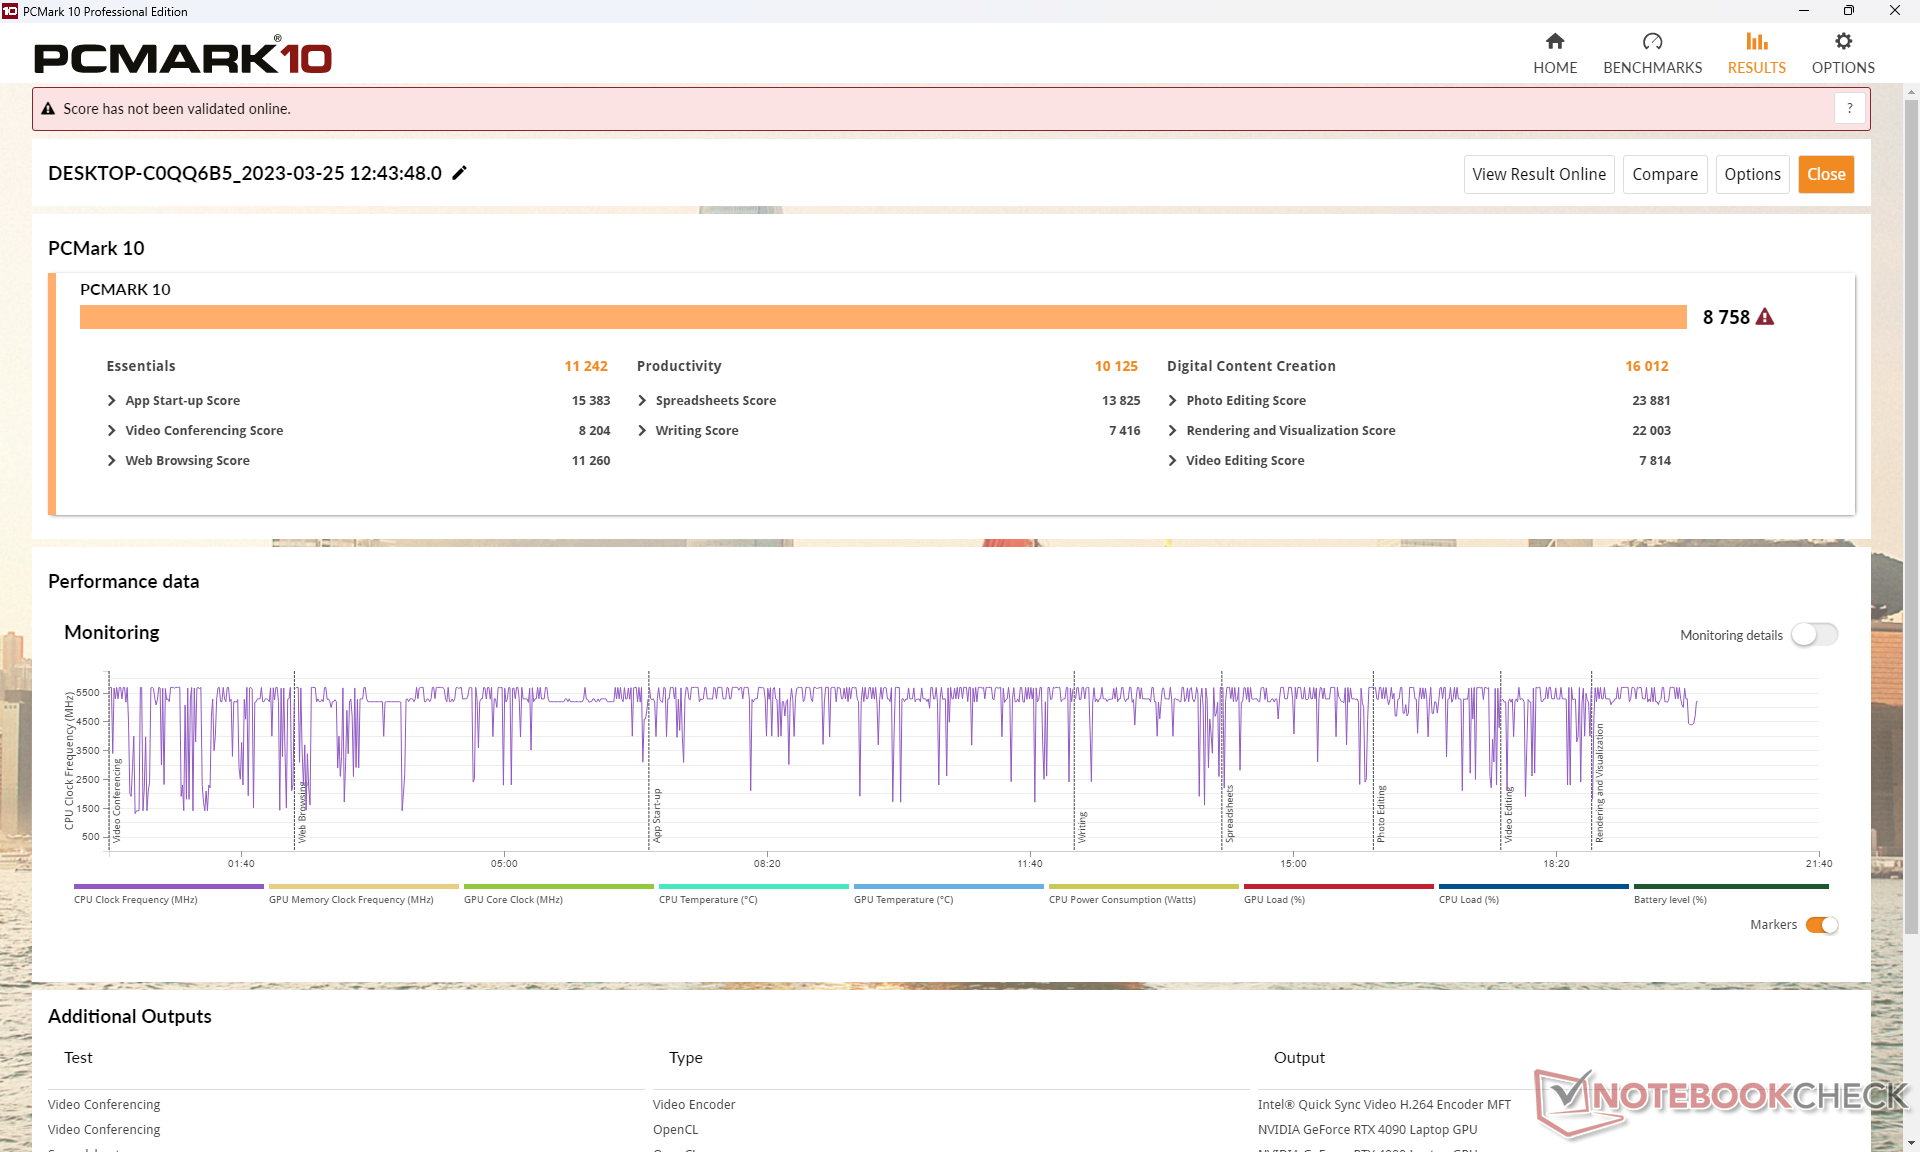
Die PCMark 10 Ergebnisse sind vergleichbar mit anderen Gaming-Notebooks mit ähnlichen 13th Gen Intel CPUs und GeForce 4000er GPUs wie dem Asus ROG Strix Scar 18 oder dem MSI Titan GT77 HX. Auch das ältere Alienware x17 R2, das mit zwei Samsung PM9A1 SSDs im RAID 0 Verbund ausgestattet ist, kann unser neues Alienware nicht schlagen.
CrossMark: Overall | Productivity | Creativity | Responsiveness
| PCMark 10 / Score | |
| Eluktronics Mech-17 GP2 | |
| MSI Titan GT77 HX 13VI | |
| Durchschnittliche Intel Core i9-13980HX, NVIDIA GeForce RTX 4090 Laptop GPU (8650 - 9068, n=4) | |
| Asus ROG Strix Scar 18 2023 G834JY-N6005W | |
| Alienware m18 R1 | |
| Alienware x17 R2 P48E | |
| Razer Blade 18 RTX 4070 | |
| PCMark 10 / Essentials | |
| Eluktronics Mech-17 GP2 | |
| MSI Titan GT77 HX 13VI | |
| Razer Blade 18 RTX 4070 | |
| Durchschnittliche Intel Core i9-13980HX, NVIDIA GeForce RTX 4090 Laptop GPU (11215 - 11644, n=3) | |
| Alienware m18 R1 | |
| Alienware x17 R2 P48E | |
| PCMark 10 / Productivity | |
| Eluktronics Mech-17 GP2 | |
| Durchschnittliche Intel Core i9-13980HX, NVIDIA GeForce RTX 4090 Laptop GPU (10125 - 11067, n=3) | |
| Alienware x17 R2 P48E | |
| Alienware m18 R1 | |
| MSI Titan GT77 HX 13VI | |
| Razer Blade 18 RTX 4070 | |
| PCMark 10 / Digital Content Creation | |
| MSI Titan GT77 HX 13VI | |
| Alienware m18 R1 | |
| Durchschnittliche Intel Core i9-13980HX, NVIDIA GeForce RTX 4090 Laptop GPU (15052 - 16012, n=3) | |
| Eluktronics Mech-17 GP2 | |
| Alienware x17 R2 P48E | |
| Razer Blade 18 RTX 4070 | |
| CrossMark / Overall | |
| Eluktronics Mech-17 GP2 | |
| Alienware m18 R1 | |
| MSI Titan GT77 HX 13VI | |
| Razer Blade 18 RTX 4070 | |
| Asus ROG Strix Scar 18 2023 G834JY-N6005W | |
| Durchschnittliche Intel Core i9-13980HX, NVIDIA GeForce RTX 4090 Laptop GPU (1935 - 2176, n=4) | |
| Alienware x17 R2 P48E | |
| CrossMark / Productivity | |
| Eluktronics Mech-17 GP2 | |
| Alienware m18 R1 | |
| MSI Titan GT77 HX 13VI | |
| Razer Blade 18 RTX 4070 | |
| Asus ROG Strix Scar 18 2023 G834JY-N6005W | |
| Durchschnittliche Intel Core i9-13980HX, NVIDIA GeForce RTX 4090 Laptop GPU (1764 - 2005, n=4) | |
| Alienware x17 R2 P48E | |
| CrossMark / Creativity | |
| Eluktronics Mech-17 GP2 | |
| Alienware m18 R1 | |
| Asus ROG Strix Scar 18 2023 G834JY-N6005W | |
| MSI Titan GT77 HX 13VI | |
| Durchschnittliche Intel Core i9-13980HX, NVIDIA GeForce RTX 4090 Laptop GPU (2267 - 2469, n=4) | |
| Razer Blade 18 RTX 4070 | |
| Alienware x17 R2 P48E | |
| CrossMark / Responsiveness | |
| Alienware m18 R1 | |
| Razer Blade 18 RTX 4070 | |
| MSI Titan GT77 HX 13VI | |
| Eluktronics Mech-17 GP2 | |
| Durchschnittliche Intel Core i9-13980HX, NVIDIA GeForce RTX 4090 Laptop GPU (1556 - 1904, n=4) | |
| Alienware x17 R2 P48E | |
| Asus ROG Strix Scar 18 2023 G834JY-N6005W | |
| PCMark 10 Score | 8758 Punkte | |
Hilfe | ||
| AIDA64 / Memory Copy | |
| Alienware m18 R1 | |
| Razer Blade 18 RTX 4070 | |
| Durchschnittliche Intel Core i9-13980HX (62189 - 80776, n=9) | |
| Eluktronics Mech-17 GP2 | |
| Asus ROG Strix Scar 18 2023 G834JY-N6005W | |
| MSI Titan GT77 HX 13VI | |
| Alienware x17 R2 P48E | |
| AIDA64 / Memory Read | |
| Alienware m18 R1 | |
| Razer Blade 18 RTX 4070 | |
| Durchschnittliche Intel Core i9-13980HX (62624 - 89096, n=9) | |
| Eluktronics Mech-17 GP2 | |
| Asus ROG Strix Scar 18 2023 G834JY-N6005W | |
| MSI Titan GT77 HX 13VI | |
| Alienware x17 R2 P48E | |
| AIDA64 / Memory Write | |
| Alienware m18 R1 | |
| Razer Blade 18 RTX 4070 | |
| Durchschnittliche Intel Core i9-13980HX (59912 - 79917, n=9) | |
| Eluktronics Mech-17 GP2 | |
| Asus ROG Strix Scar 18 2023 G834JY-N6005W | |
| MSI Titan GT77 HX 13VI | |
| Alienware x17 R2 P48E | |
| AIDA64 / Memory Latency | |
| Alienware x17 R2 P48E | |
| MSI Titan GT77 HX 13VI | |
| Asus ROG Strix Scar 18 2023 G834JY-N6005W | |
| Eluktronics Mech-17 GP2 | |
| Durchschnittliche Intel Core i9-13980HX (79.4 - 93.2, n=9) | |
| Razer Blade 18 RTX 4070 | |
| Alienware m18 R1 | |
* ... kleinere Werte sind besser
DPC Latenzen
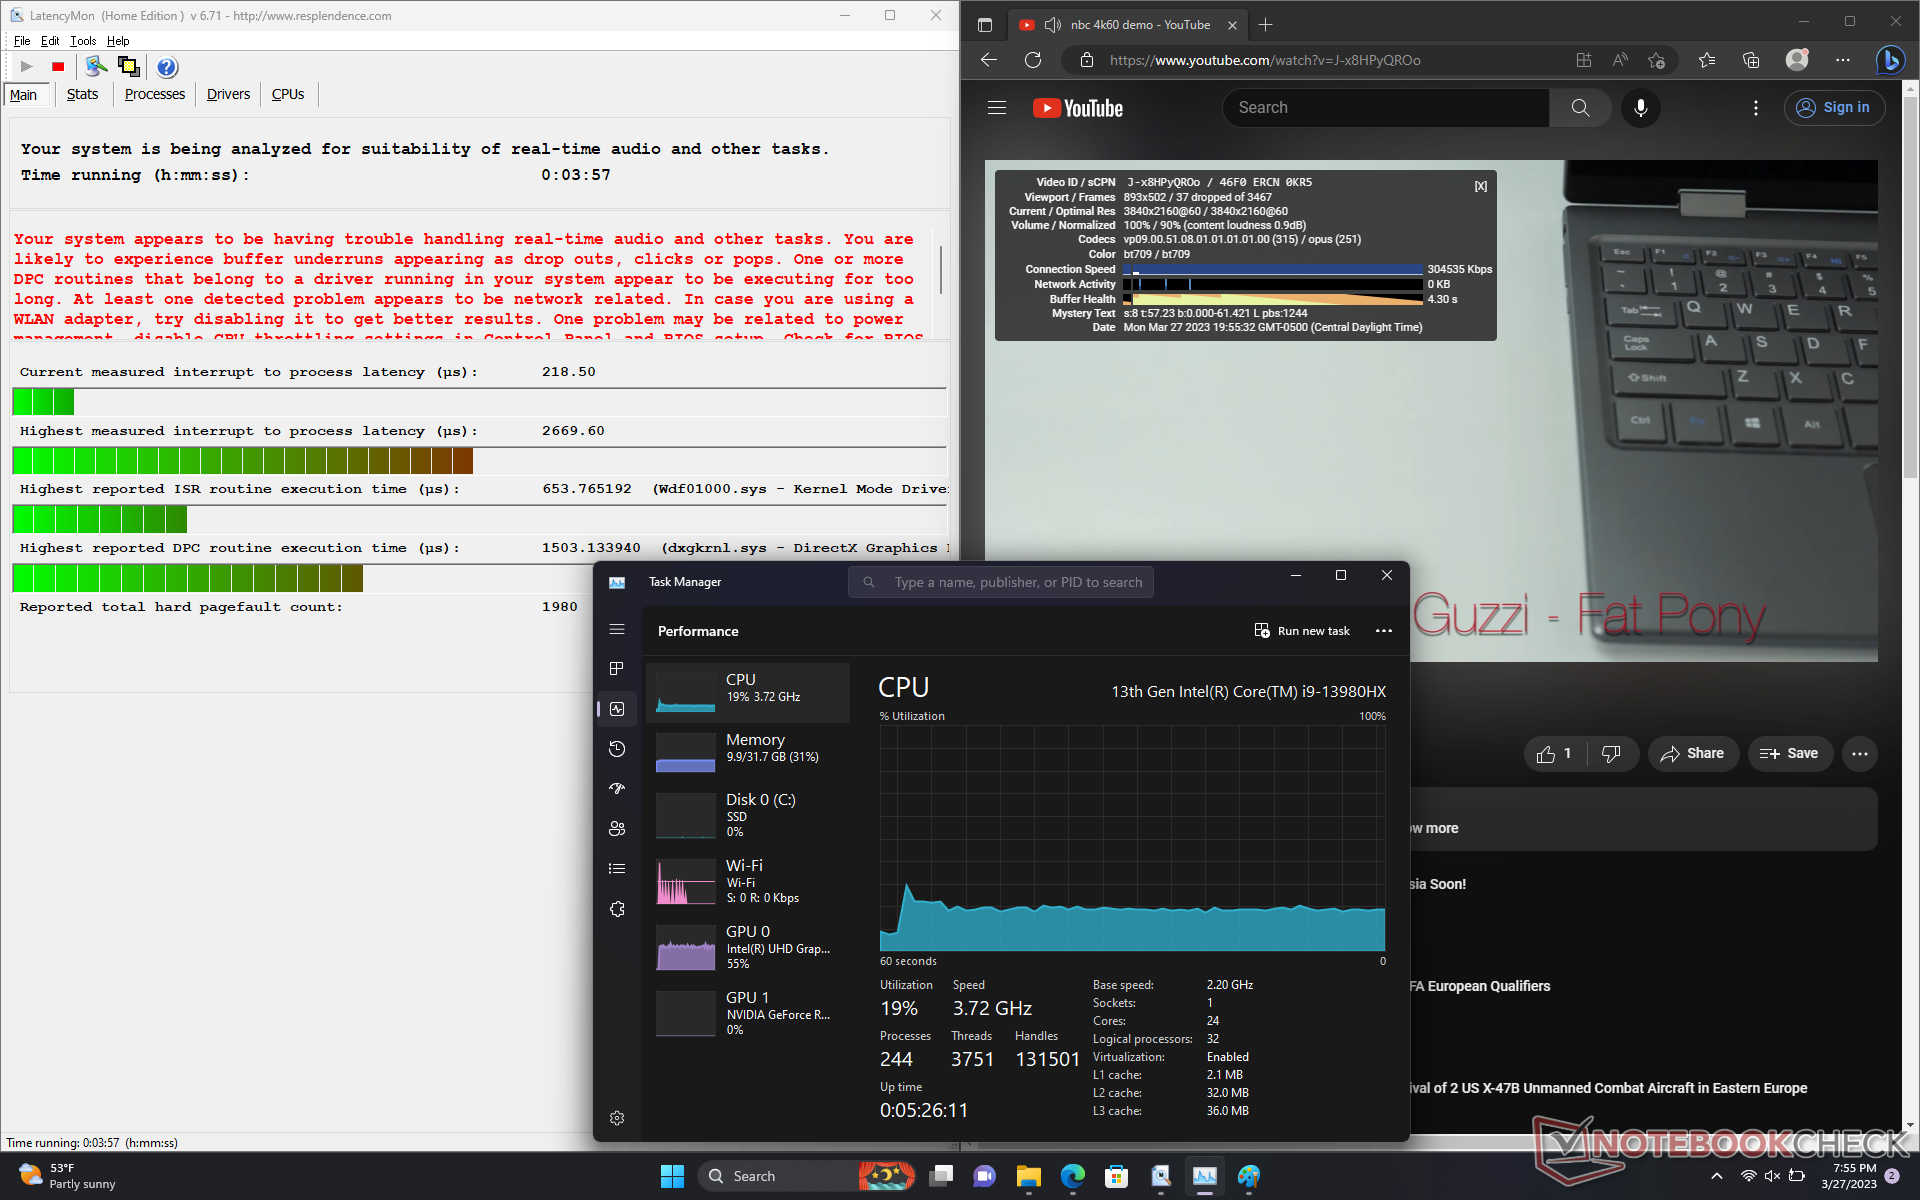
LatencyMon zeigt DPC-Probleme beim Öffnen mehrerer Browser-Tabs auf unserer Homepage. Außerdem hat das System Probleme bei der Wiedergabe von 4K-Videoinhalten, da wir bei unserem einminütigen Testvideo auch nach wiederholten Tests 37 ausgelassene Frames registrieren konnten. Die Auslastung von CPU und iGPU ist ebenfalls ungewöhnlich hoch. Sie liegt bei 19 Prozent respektive 55 Prozent. Diese Beobachtungen deuten auf ein schlechtes Management der Hintergrundprozesse hin, was sich auf die Aktivitäten im Vordergrund auswirken dürfte.
Nvidia hat einen Fehler im Zusammenhang mit einer erhöhten DPC-Latenz im Grafiktreiber 531.29 eingeräumt. Hoffentlich wird das Problem in naher Zukunft behoben.

| DPC Latencies / LatencyMon - interrupt to process latency (max), Web, Youtube, Prime95 | |
| MSI Titan GT77 HX 13VI | |
| Alienware m18 R1 | |
| Razer Blade 18 RTX 4070 | |
| Alienware x17 R2 P48E | |
| Asus ROG Strix Scar 18 2023 G834JY-N6005W | |
| Eluktronics Mech-17 GP2 | |
* ... kleinere Werte sind besser
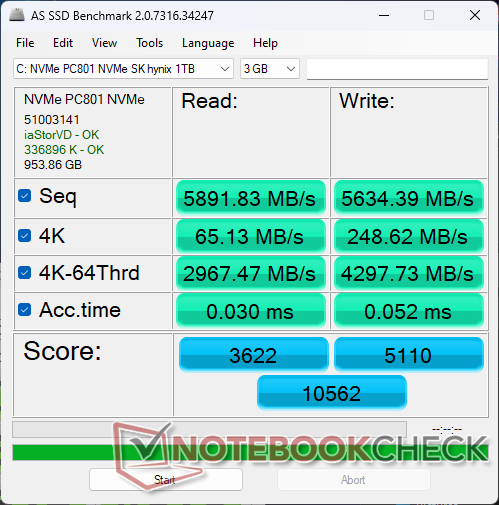
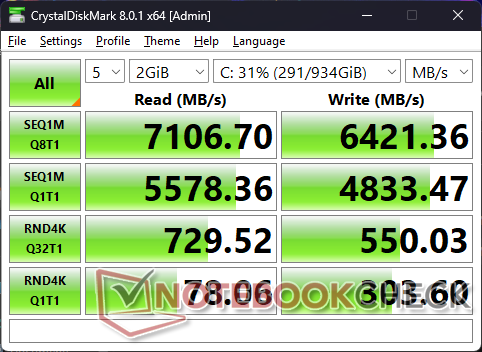
Massenspeicher — Bis zu vie M.2-SSD
Unser Gerät ist mit einer SK Hynix PC801 PCIe4 x4 NVMe SSD ausgestattet, die sequenzielle Lese- und Schreibgeschwindigkeiten von bis zu 7000 MB/s respektive 6500 MB/s erreicht. Diese Leistung ist vergleichbar mit der Samsung PMA1 Serie und unser Laufwerk hat keine Probleme, die maximalen Transferraten ohne Throttling aufrechtzuerhalten.
Im Gegensatz zur MSI GE78 oder GT77 Serie unterstützt das Alienware keine PCIe5 NVMe SSDs. Dafür bietet es mehr interne SSD-Slots als die meisten anderen Notebooks.

| Drive Performance Rating - Percent | |
| Alienware m18 R1 | |
| MSI Titan GT77 HX 13VI | |
| Razer Blade 18 RTX 4070 | |
| Alienware x17 R2 P48E | |
| Asus ROG Strix Scar 18 2023 G834JY-N6005W | |
| Eluktronics Mech-17 GP2 | |
* ... kleinere Werte sind besser
DiskSpd Read Loop, Queue Depth 8 - kein Throttling
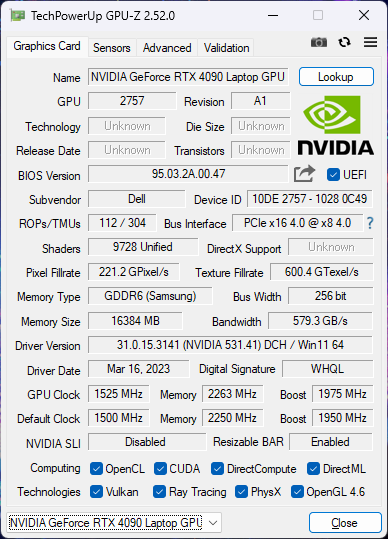
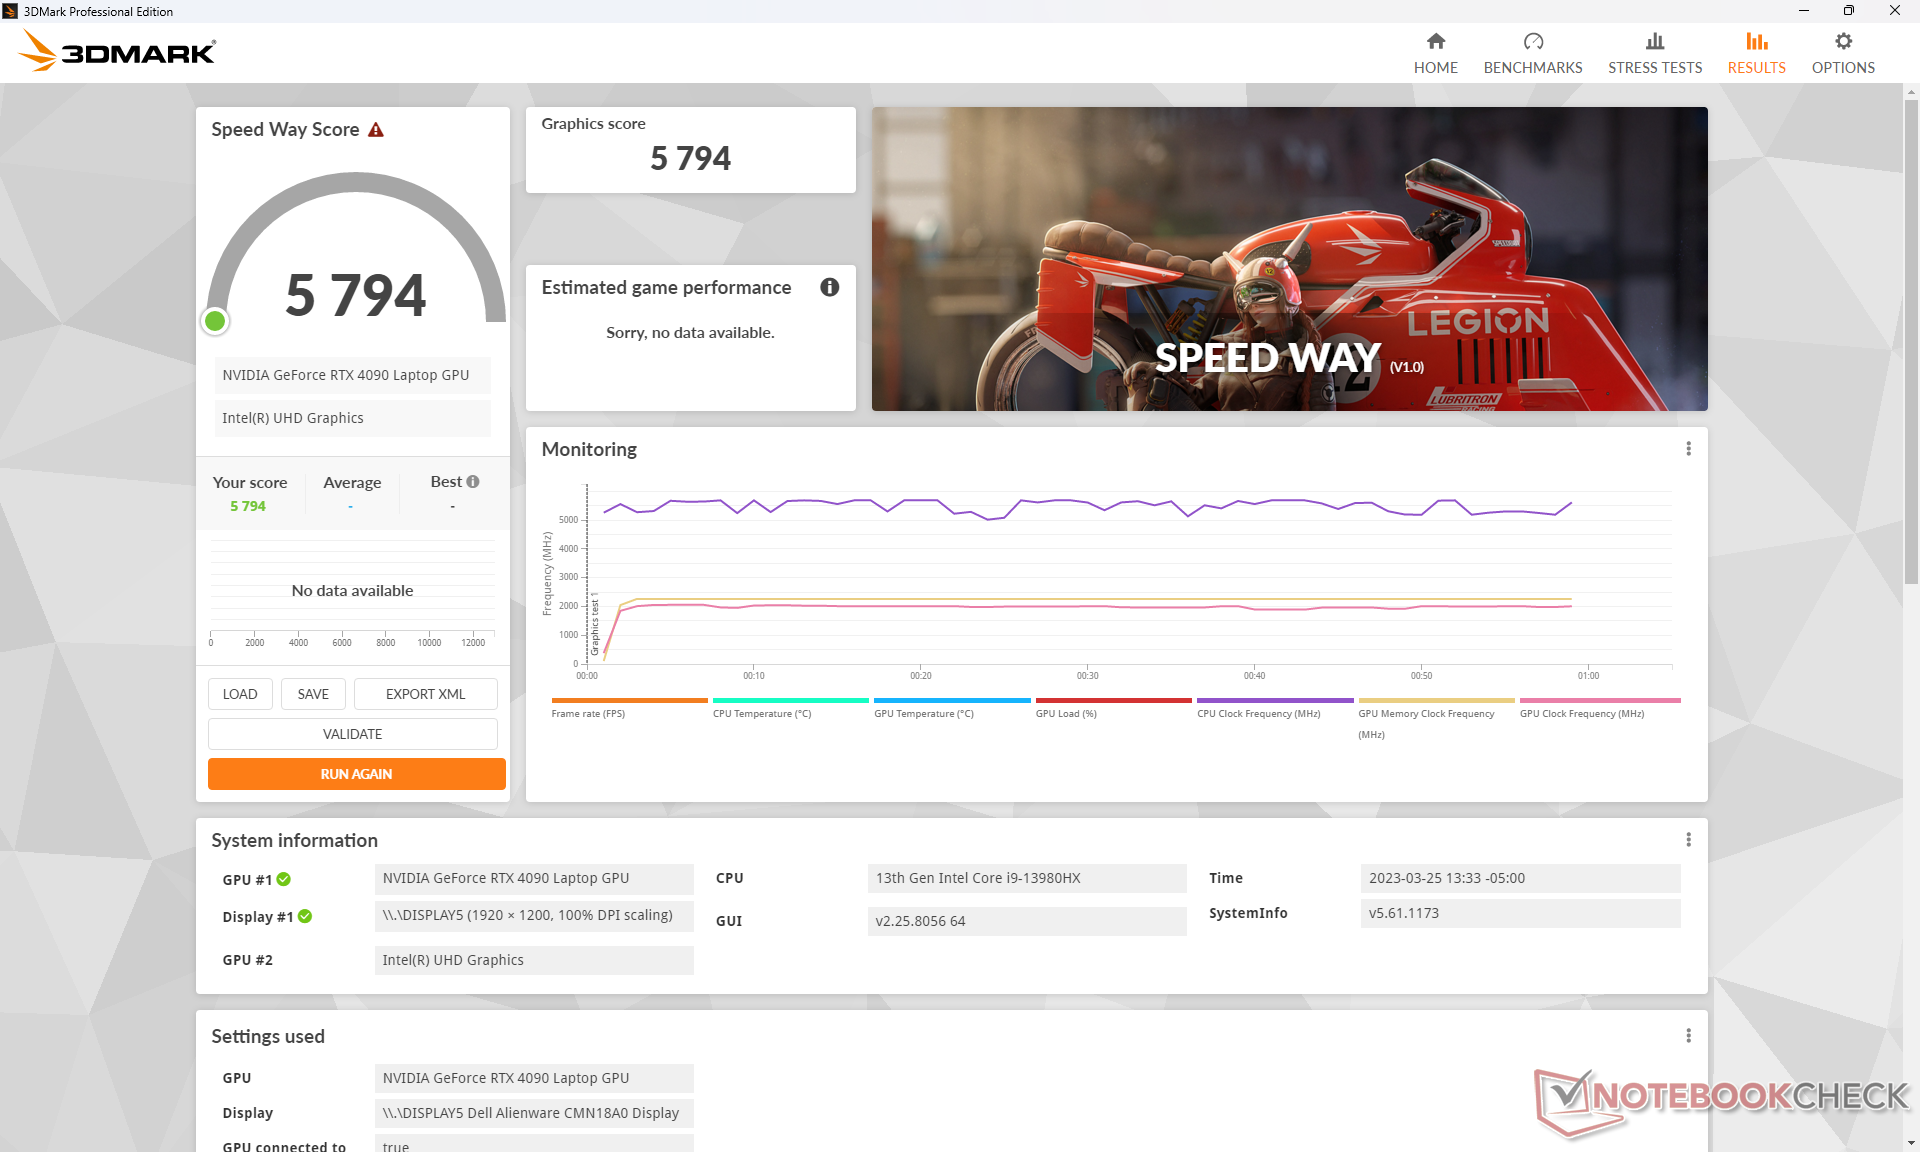
GPU Leistung — 175 W GeForce RTX 4090
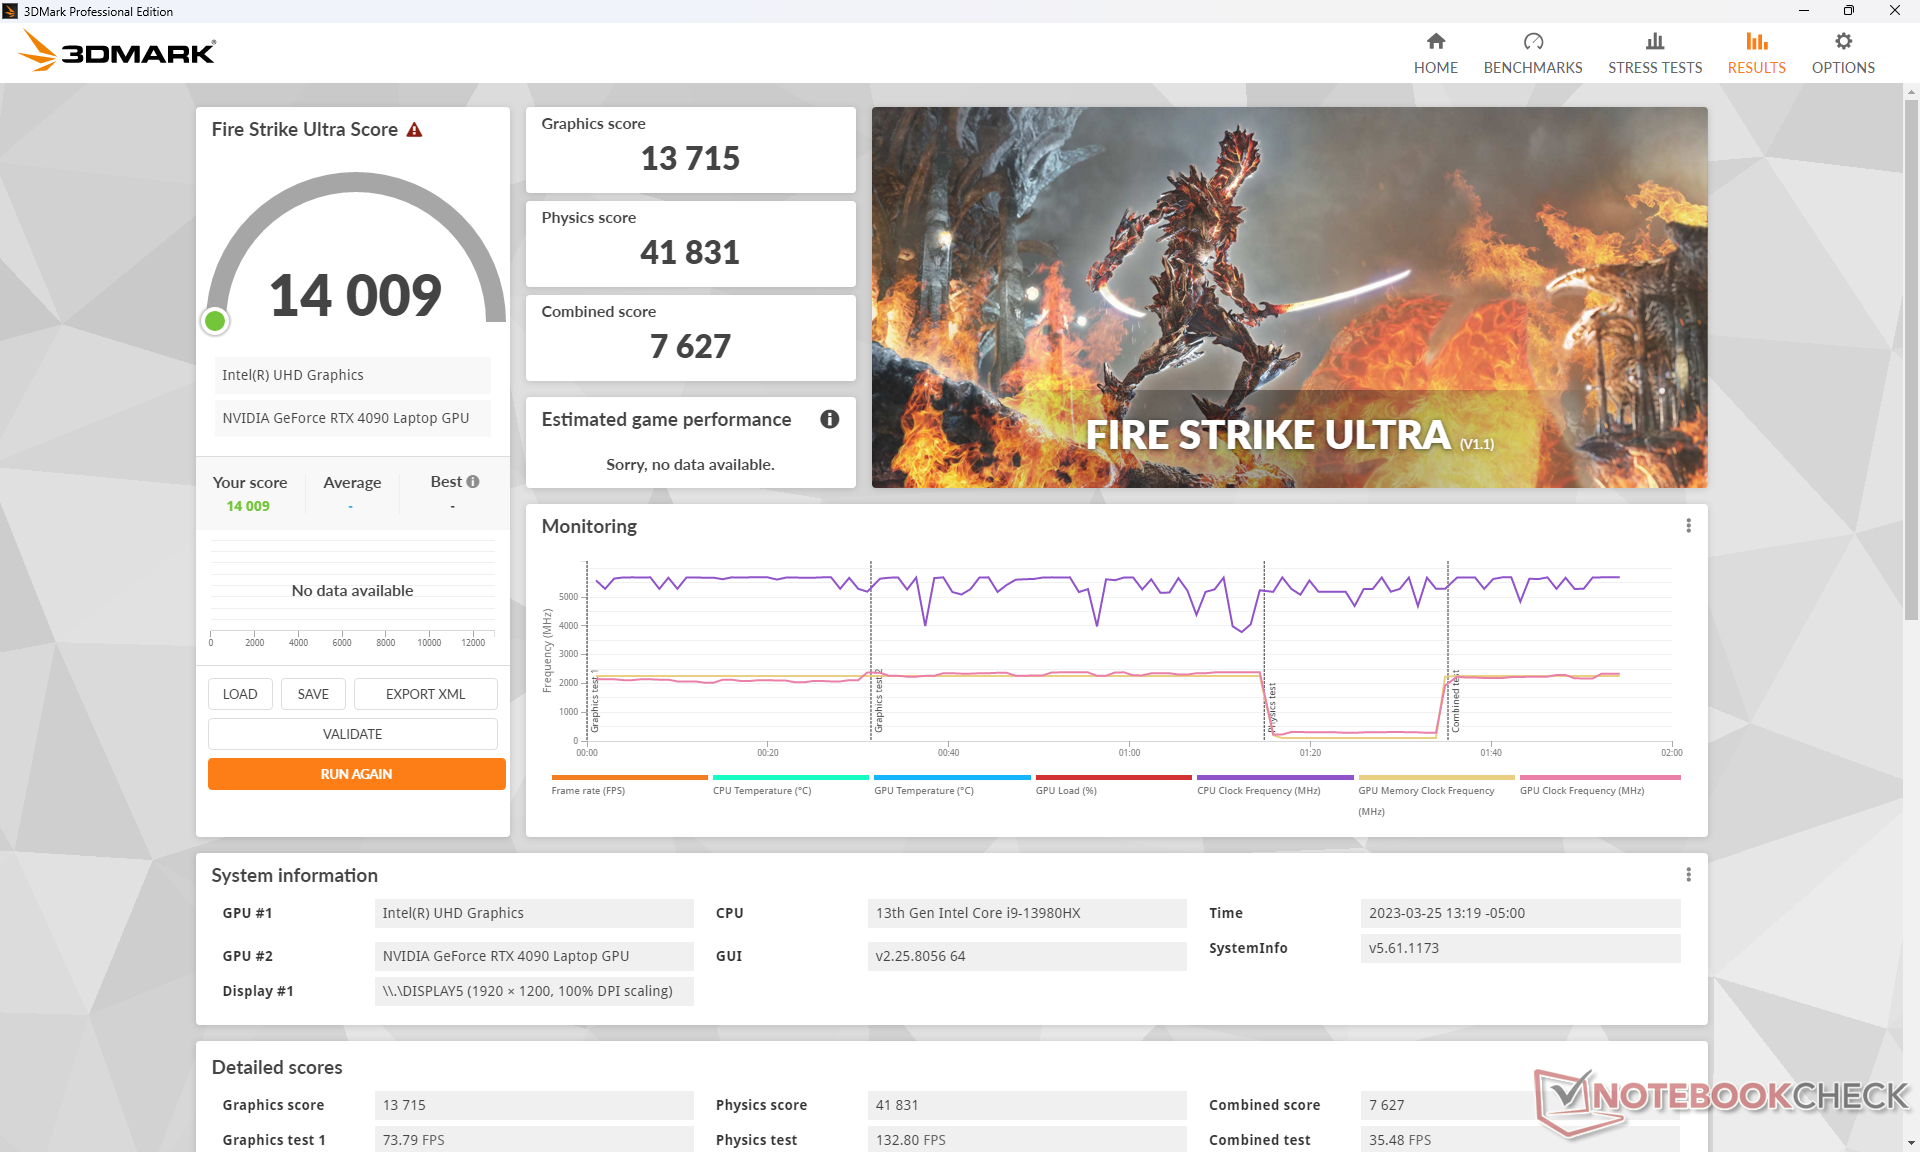
Insgesamt ist die Grafikleistung der mobilen GeForce RTX 4090 mit der Desktop-Grafikkarte GeForce RTX 4070 vergleichbar. Sie bietet genügend Leistung, um alle aktuellen Spiele mit 4K Ultra-Einstellungen einschließlich F1 22 zu spielen, aber bei aktiviertem Raytracing wird empfohlen, DLSS oder Frame-Generierung zu aktivieren, sofern dies unterstützt wird, um flüssige Bildraten zu erhalten.
Verglichen mit der letzten Generation der mobilen RTX 3080 Ti bietet die mobile RTX 4090 zwischen 40 und 70 Prozent mehr Leistung bei einer ähnlichen Leistungsaufnahme von 175 Watt.
Die Durchführung des Fire Strike Benchmarks im Overdrive Modus zeigt keinen großen Vorteil gegenüber dem leiseren Performance Modus, da beide Endergebnisse nahezu identisch sind. Eine Wiederholung des Tests im Modus Ausbalanciert" führt jedoch zu einem Rückgang der GPU- und CPU-Leistung um 5 respektive 9 Prozent.
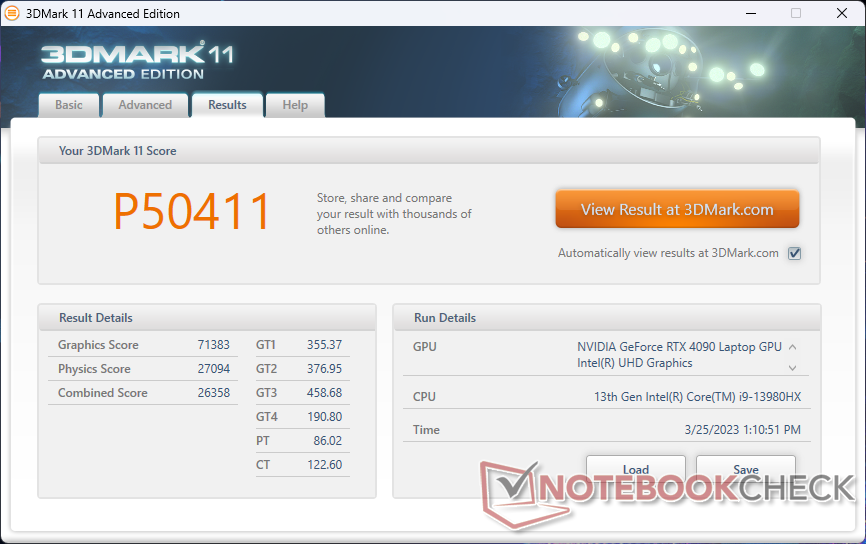
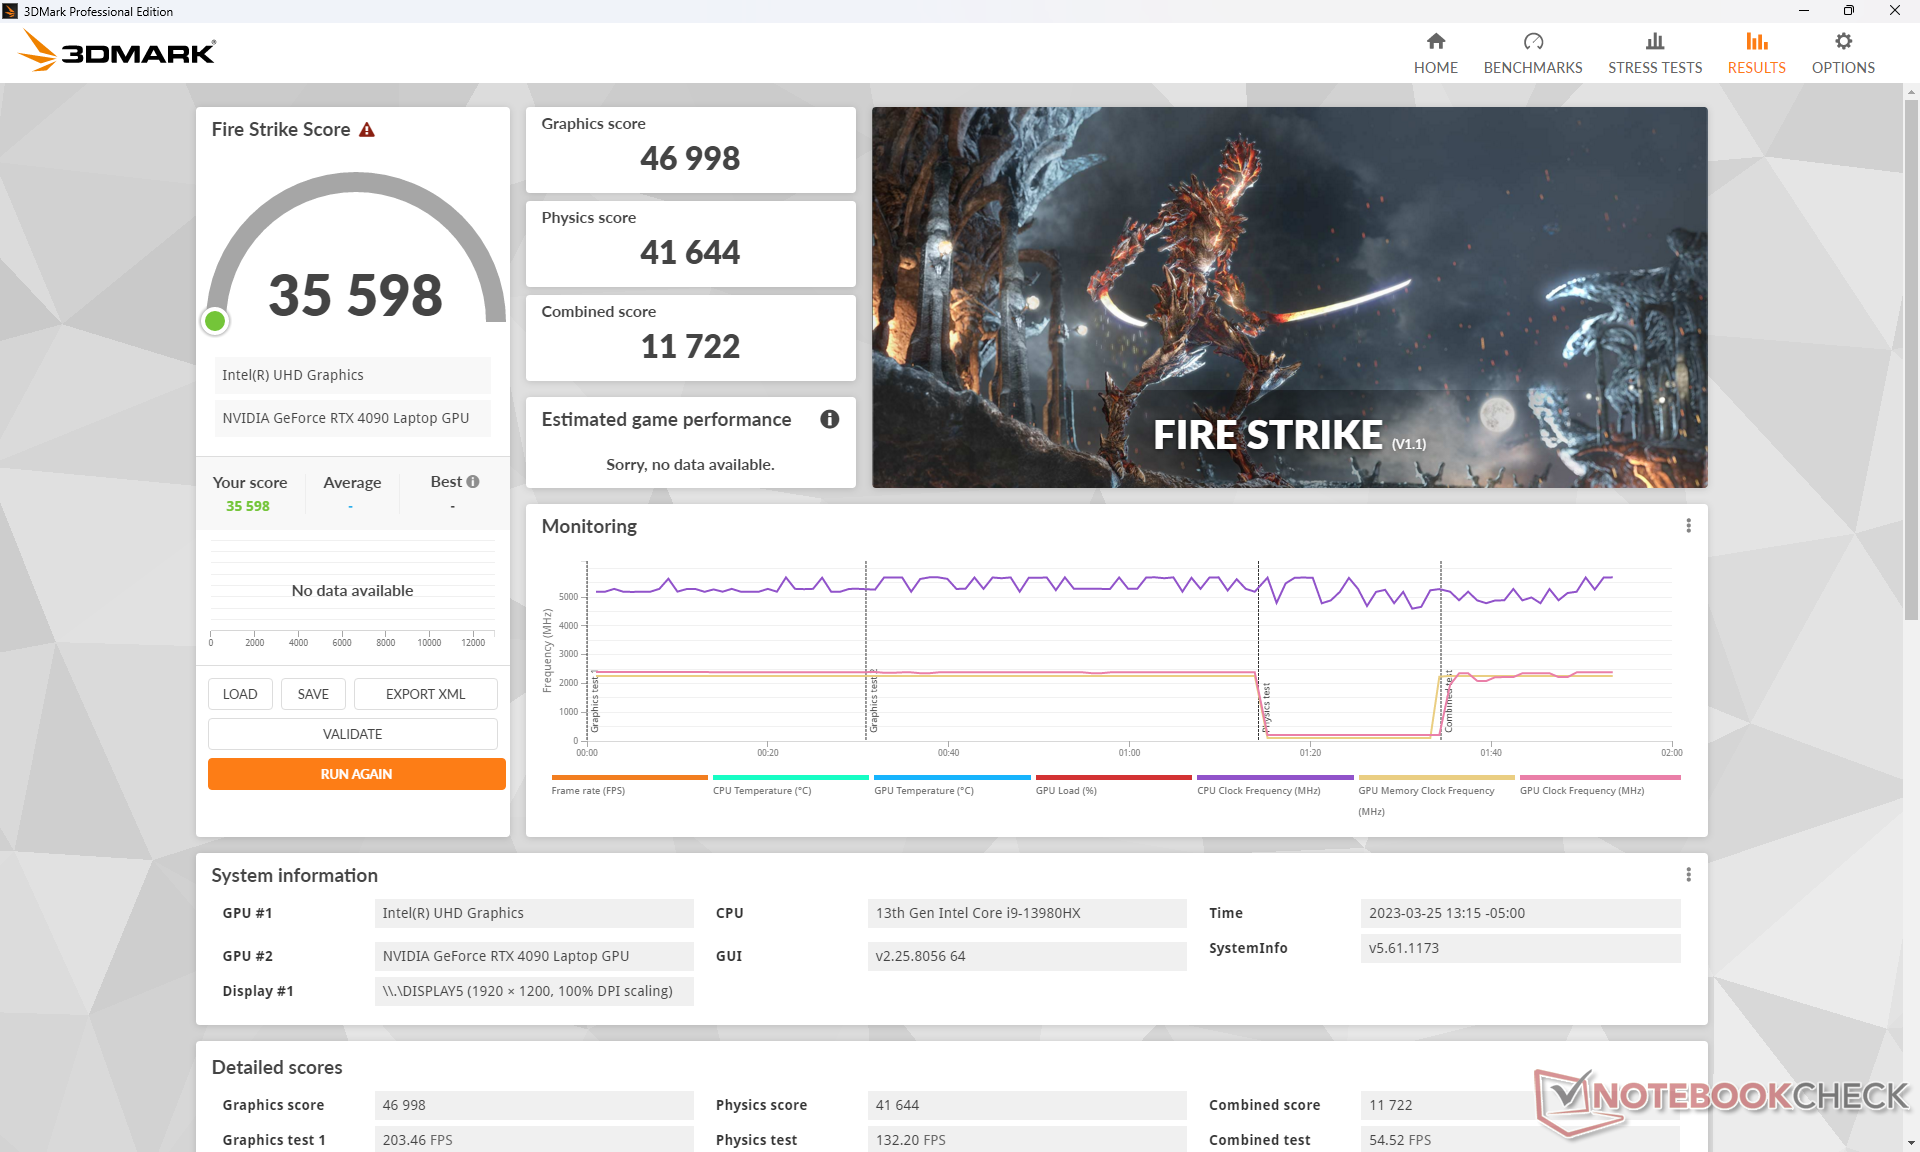
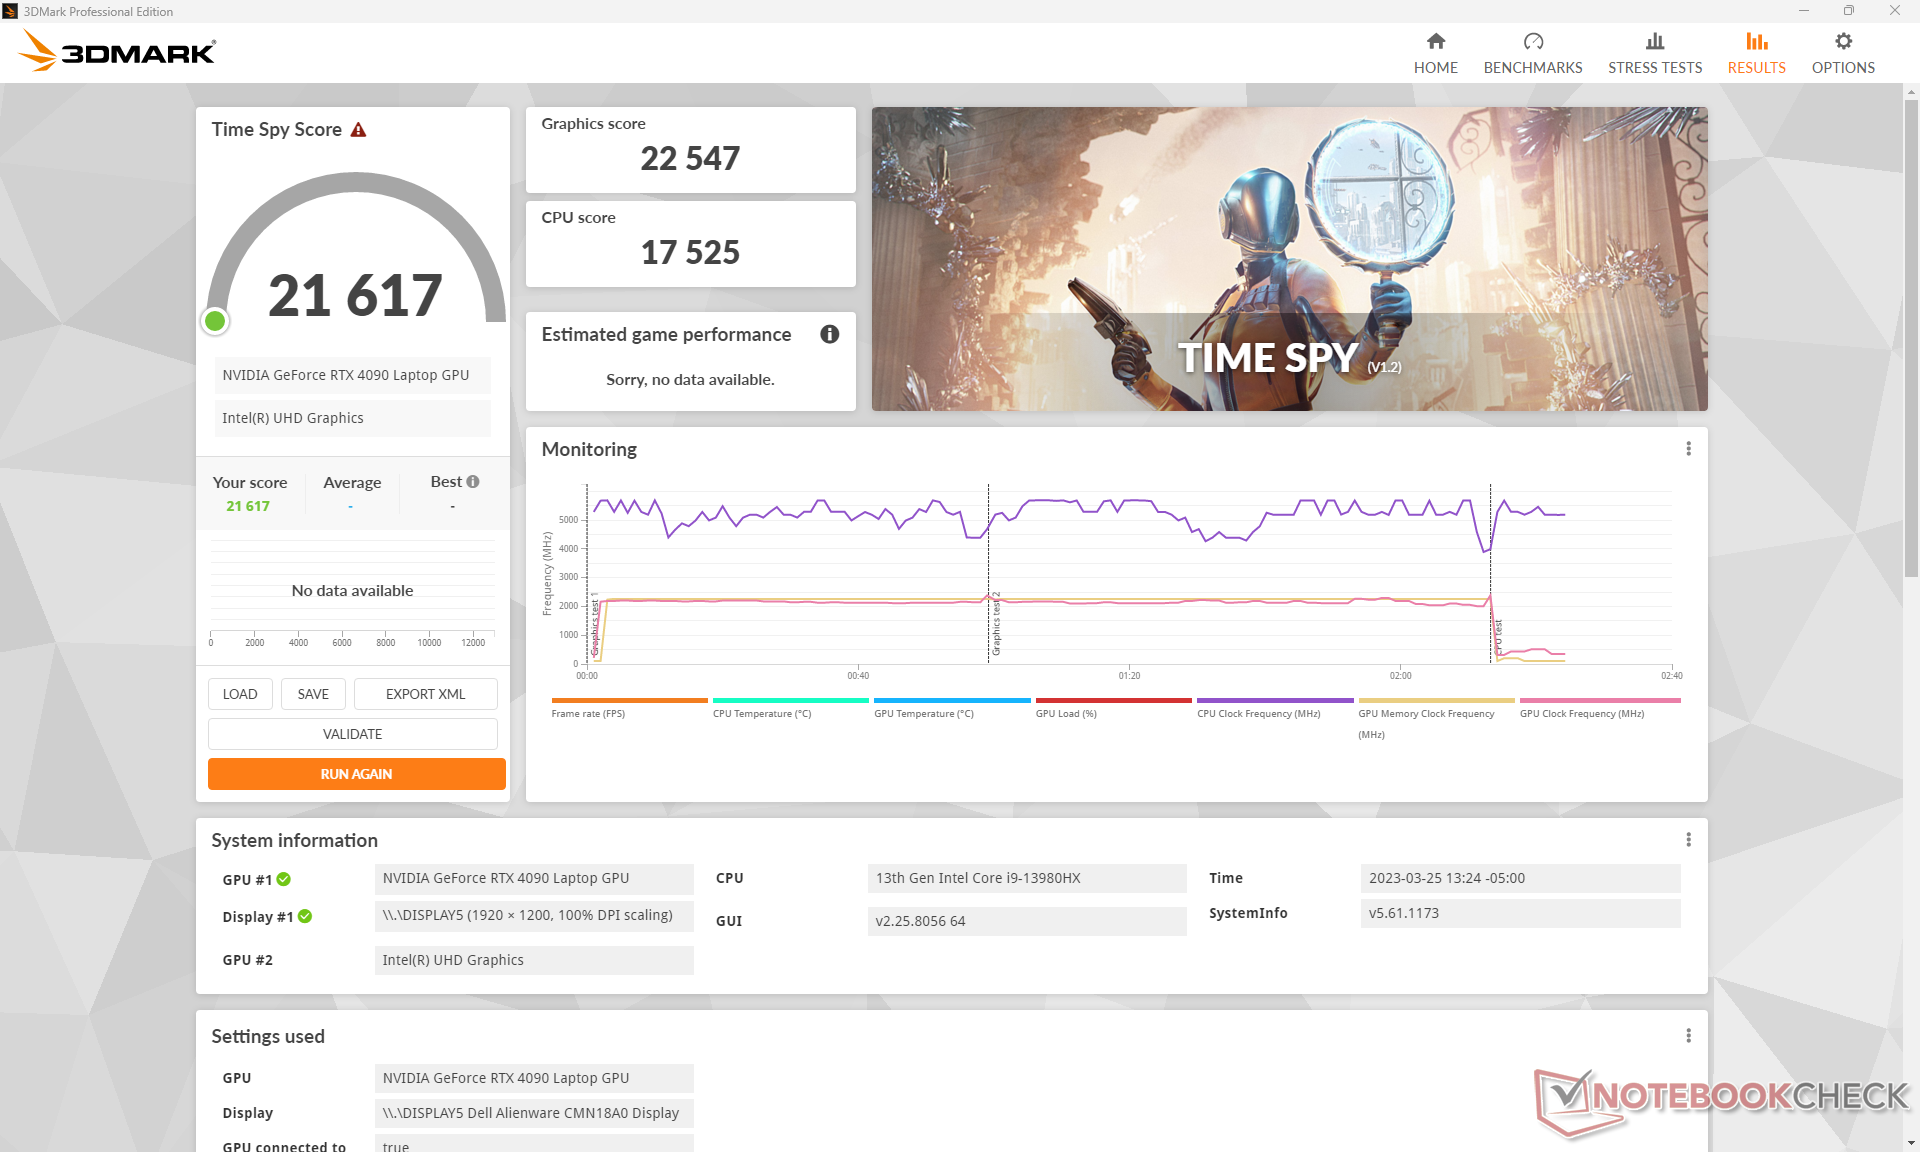

| 3DMark 11 Performance | 50411 Punkte | |
| 3DMark Fire Strike Score | 35598 Punkte | |
| 3DMark Time Spy Score | 21617 Punkte | |
Hilfe | ||
* ... kleinere Werte sind besser
Witcher 3 FPS Chart
| min. | mittel | hoch | max. | QHD | 4K | |
| GTA V (2015) | 186.7 | 185.3 | 184.5 | 149 | 145.5 | 176.4 |
| The Witcher 3 (2015) | 649.2 | 563.8 | 441.6 | 213.9 | 165.6 | |
| Dota 2 Reborn (2015) | 251 | 220 | 210 | 194.2 | 190.2 | |
| Final Fantasy XV Benchmark (2018) | 231 | 227 | 194.8 | 159.5 | 92.6 | |
| X-Plane 11.11 (2018) | 210 | 187.1 | 143.5 | 124 | ||
| Strange Brigade (2018) | 475 | 388 | 388 | 373 | 308 | 159.8 |
| Cyberpunk 2077 1.6 (2022) | 157.2 | 151.8 | 148.2 | 127.92 | 102.16 | 49.99 |
| Tiny Tina's Wonderlands (2022) | 359.1 | 301.8 | 232.5 | 187.7 | 133.8 | 71.3 |
| F1 22 (2022) | 336 | 320 | 318 | 144.7 | 92.2 | 45.5 |
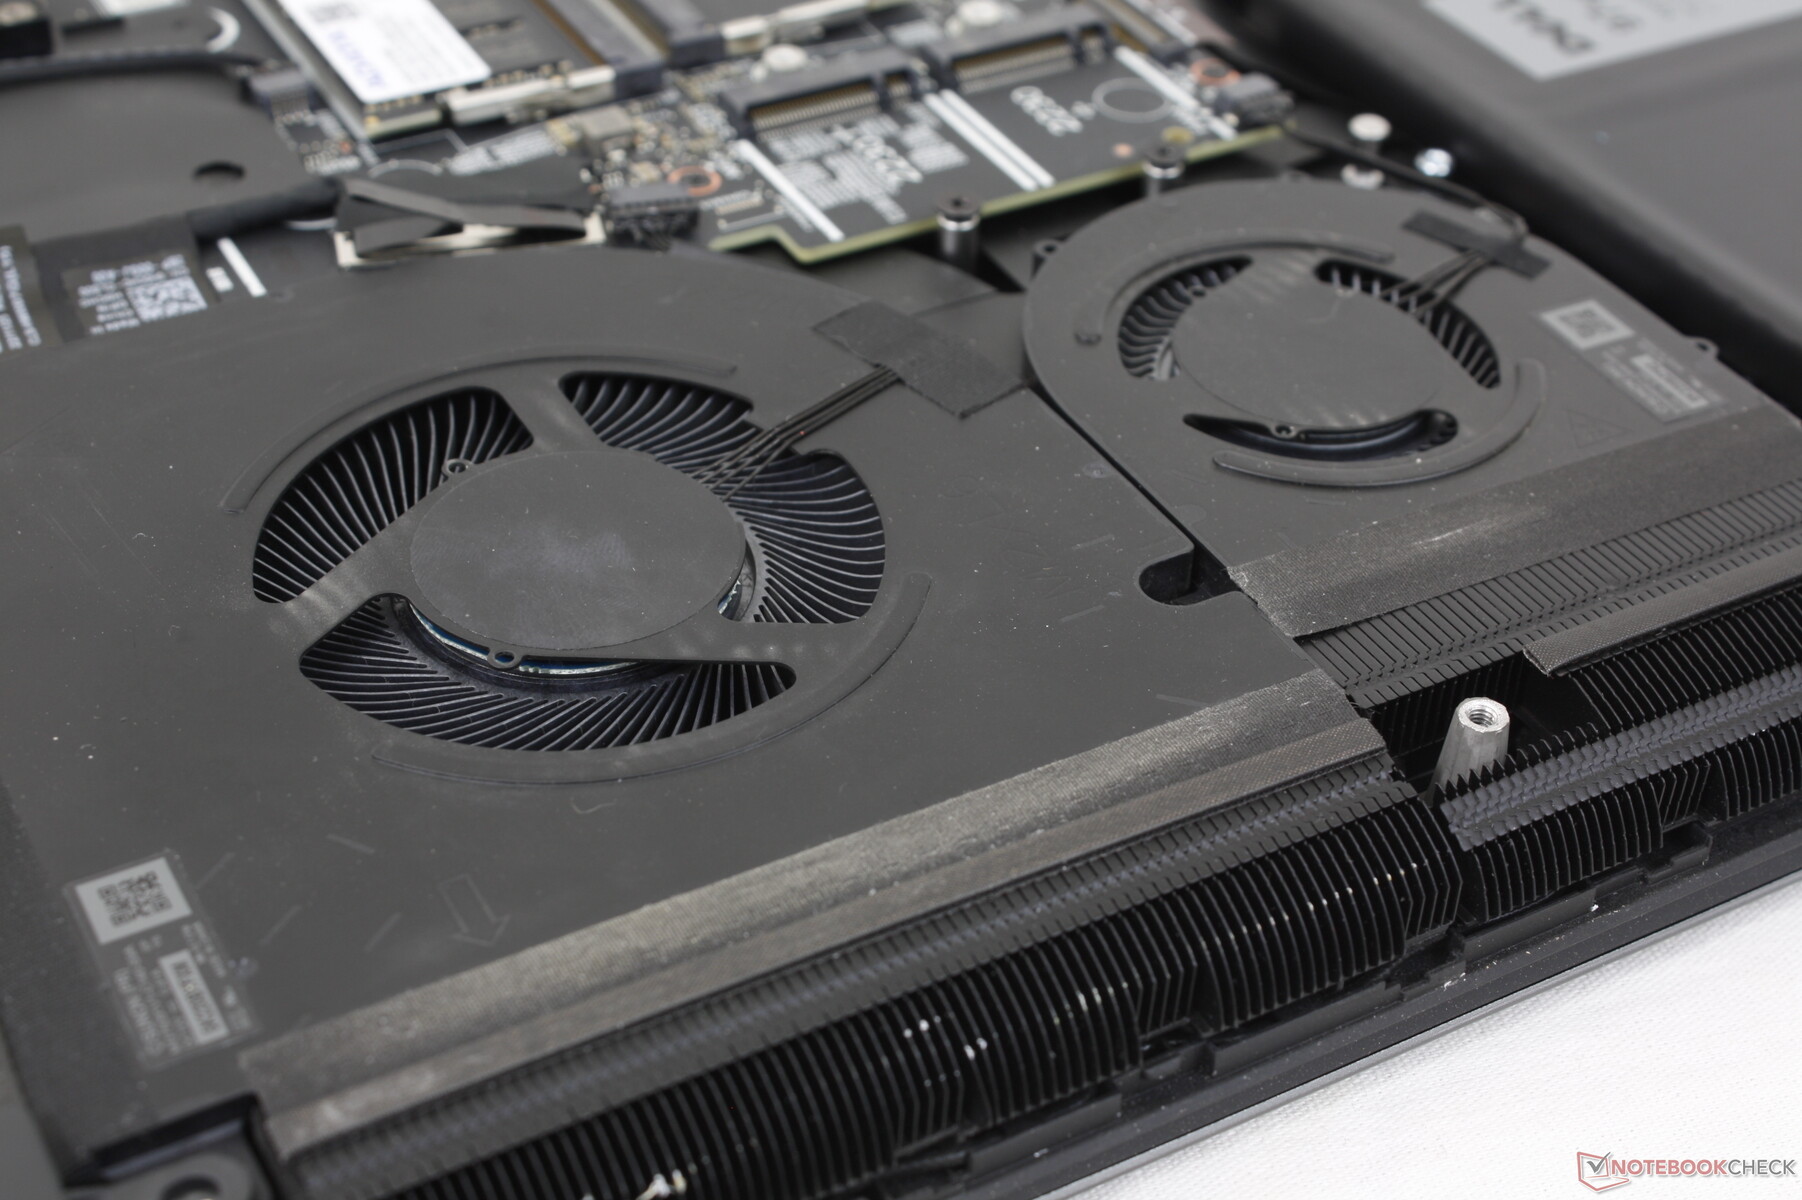
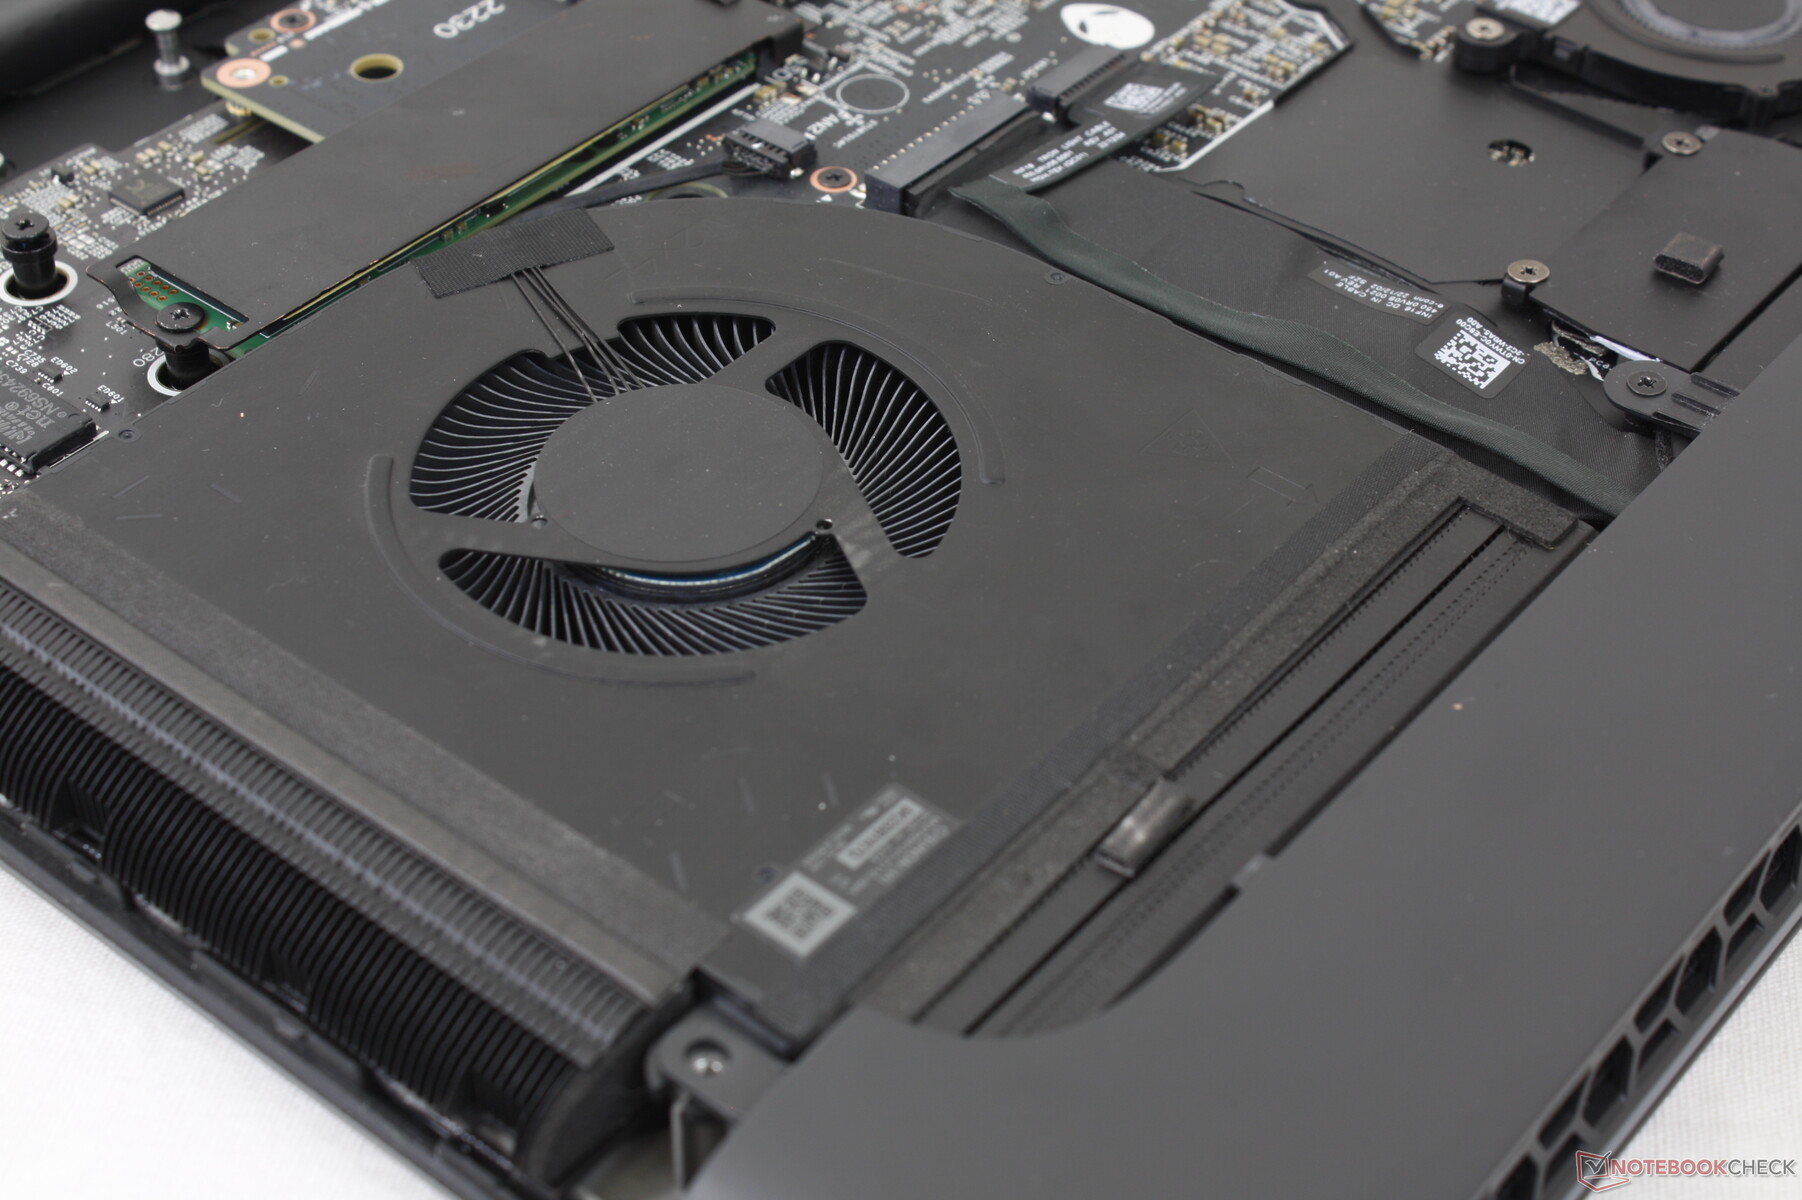
Emissionen — Schnell und Laut mit vier Lüftern
System Noise
Wie man es von einem Gaming-Laptop mit vier Lüftern leider erwarten muss, kommt das Alienware m18 R1 mit einer unangenehm hohen Lautstärke. Beim Gaming im Performance-Modus ermitteln wir bis zu 51 dB(A). Im Overdrive-Modus erzeugt der Gaming-Laptop bis zu 57 dB(A). So liegt die vom Laptop erzeugte Geräuschkulisse auf einem Level mit dem Eluktronics Mech-17 GP2 und noch über dem Razer Blade 18. Alles über 50 dB(A) erfordert ein Paar gute Kopfhörer, um das Surren der Lüfter zu übertönen. Der Overdrive-Modus ist allerdings für die meisten Spiele nicht notwendig, wie unser Stresstest weiter unten zeigen wird.
Glücklicherweise ist das System bei geringer Belastung leiser, da die Lüfter bei niedrigen Profileinstellungen kaum arbeiten. Das Surfen im Internet oder das Streamen von Videoinhalten ist somit bei einem angenehmen Geräuschpegel möglich.
Lautstärkediagramm
| Idle |
| 23 / 23 / 23 dB(A) |
| Last |
| 35.6 / 56.7 dB(A) |
 | ||
30 dB leise 40 dB(A) deutlich hörbar 50 dB(A) störend |
||
min: | ||
| Alienware m18 R1 NVIDIA GeForce RTX 4090 Laptop GPU, i9-13980HX, SK hynix PC801 HFS001TEJ9X101N | Razer Blade 18 RTX 4070 NVIDIA GeForce RTX 4070 Laptop GPU, i9-13950HX, SSSTC CA6-8D1024 | Asus ROG Strix Scar 18 2023 G834JY-N6005W NVIDIA GeForce RTX 4090 Laptop GPU, i9-13980HX, 2x Samsung PM9A1 MZVL21T0HCLR (RAID 0) | Eluktronics Mech-17 GP2 NVIDIA GeForce RTX 4090 Laptop GPU, i9-13900HX, Samsung PM9A1 MZVL21T0HCLR | MSI Titan GT77 HX 13VI NVIDIA GeForce RTX 4090 Laptop GPU, i9-13950HX, Samsung PM9A1 MZVL22T0HBLB | Alienware x17 R2 P48E GeForce RTX 3080 Ti Laptop GPU, i9-12900HK, 2x Samsung PM9A1 1TB (RAID 0) | |
|---|---|---|---|---|---|---|
| Geräuschentwicklung | -3% | -15% | -13% | -20% | 2% | |
| aus / Umgebung * | 22.8 | 23.5 -3% | 23.9 -5% | 25.2 -11% | 24.6 -8% | 22.7 -0% |
| Idle min * | 23 | 23.8 -3% | 23.9 -4% | 28 -22% | 29.2 -27% | 23.1 -0% |
| Idle avg * | 23 | 23.8 -3% | 32.6 -42% | 28 -22% | 29.2 -27% | 23.1 -0% |
| Idle max * | 23 | 26.8 -17% | 32.6 -42% | 30.4 -32% | 29.2 -27% | 23.1 -0% |
| Last avg * | 35.6 | 37.3 -5% | 35.9 -1% | 41 -15% | 50.7 -42% | 31.9 10% |
| Witcher 3 ultra * | 51.3 | 48 6% | 50.7 1% | 53.3 -4% | 52.5 -2% | |
| Last max * | 56.7 | 53.5 6% | 55.8 2% | 52.6 7% | 61 -8% | 52.5 7% |
* ... kleinere Werte sind besser
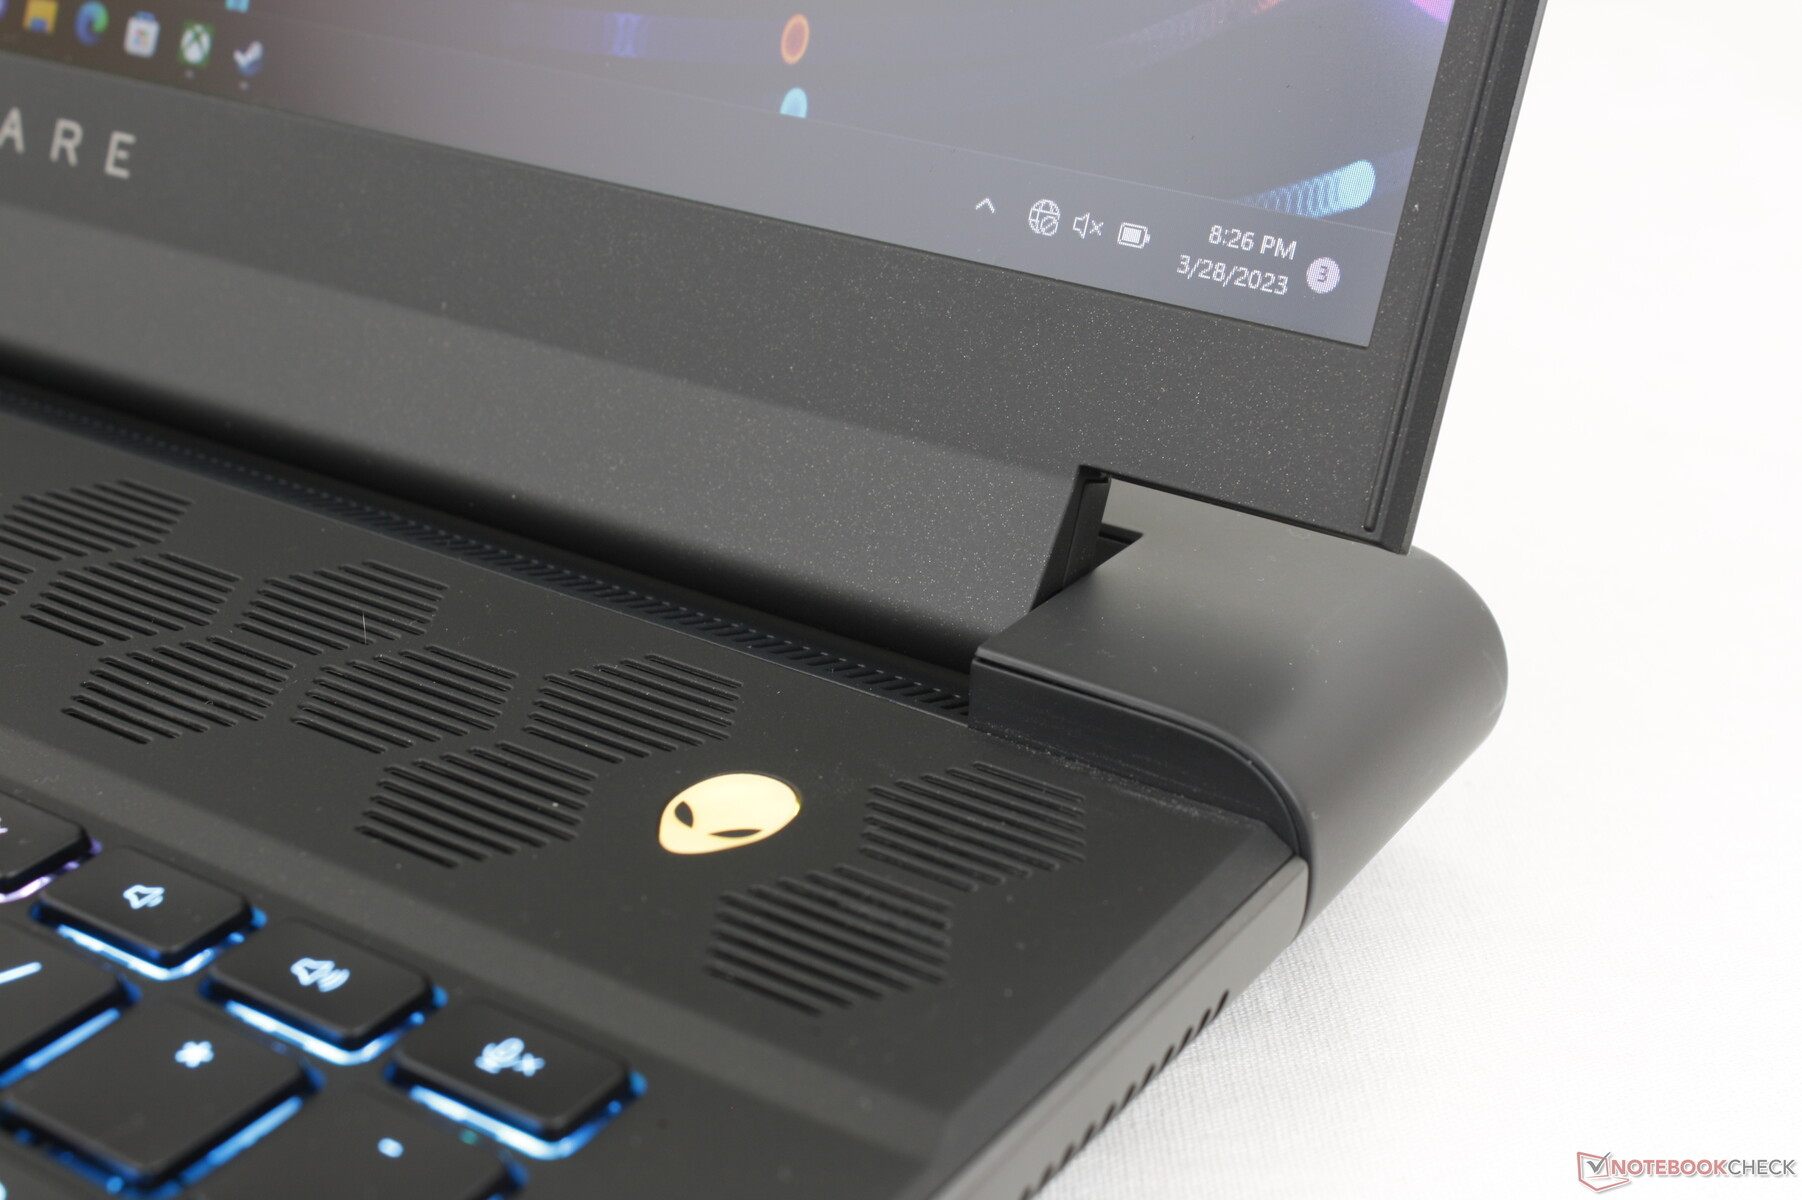
Temperaturen
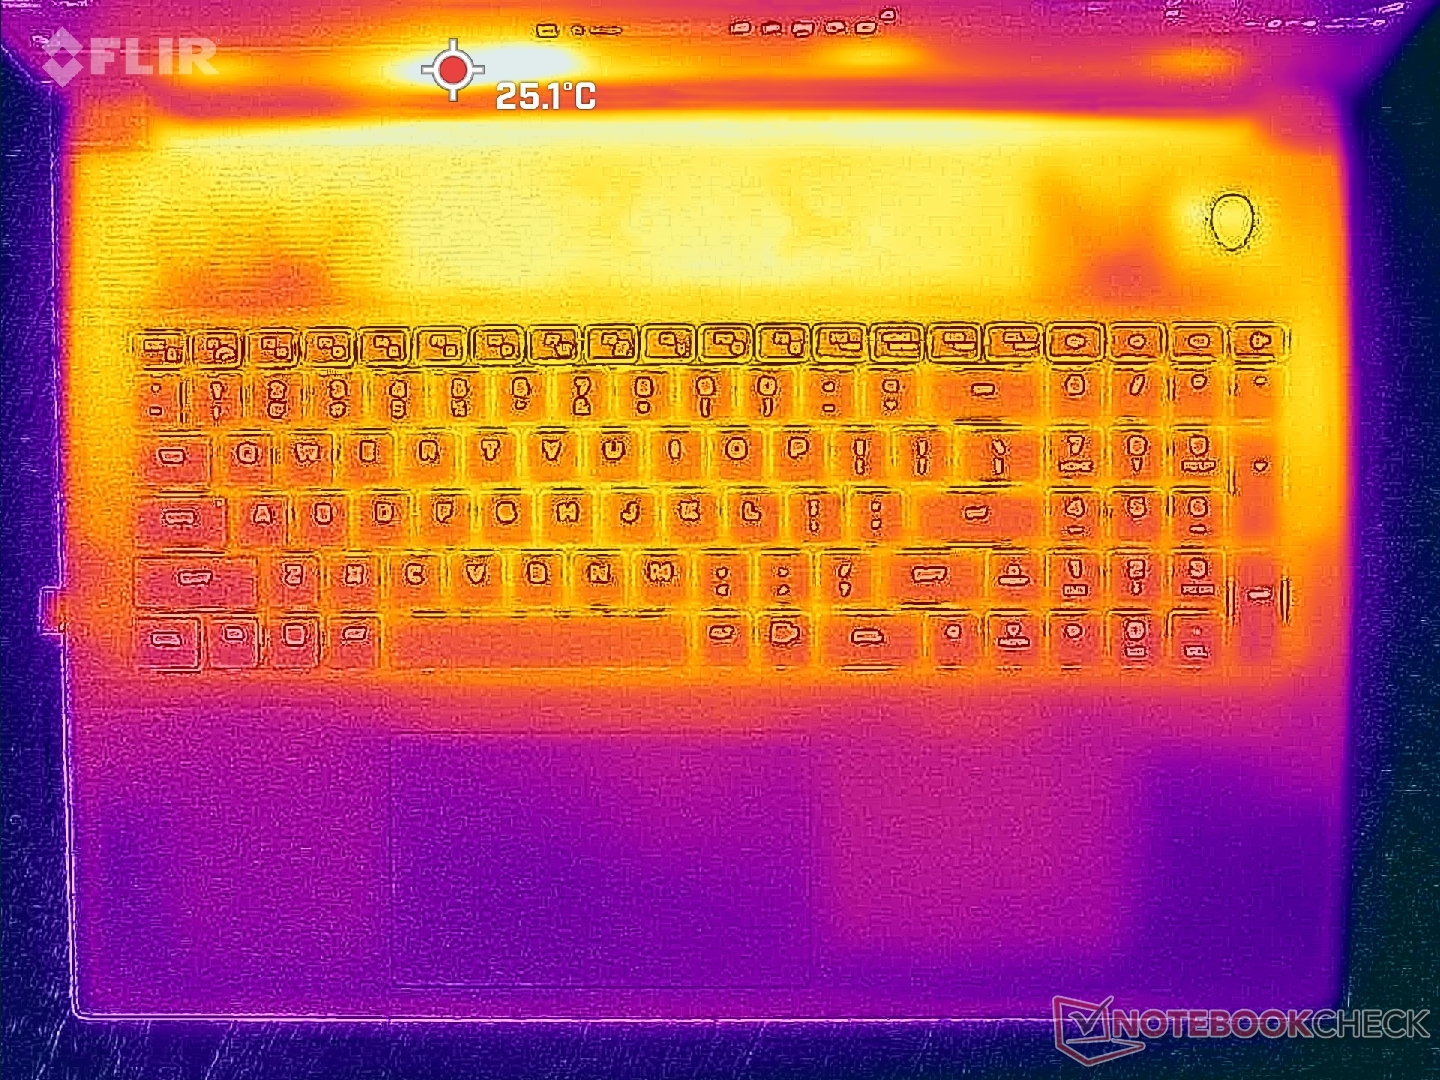
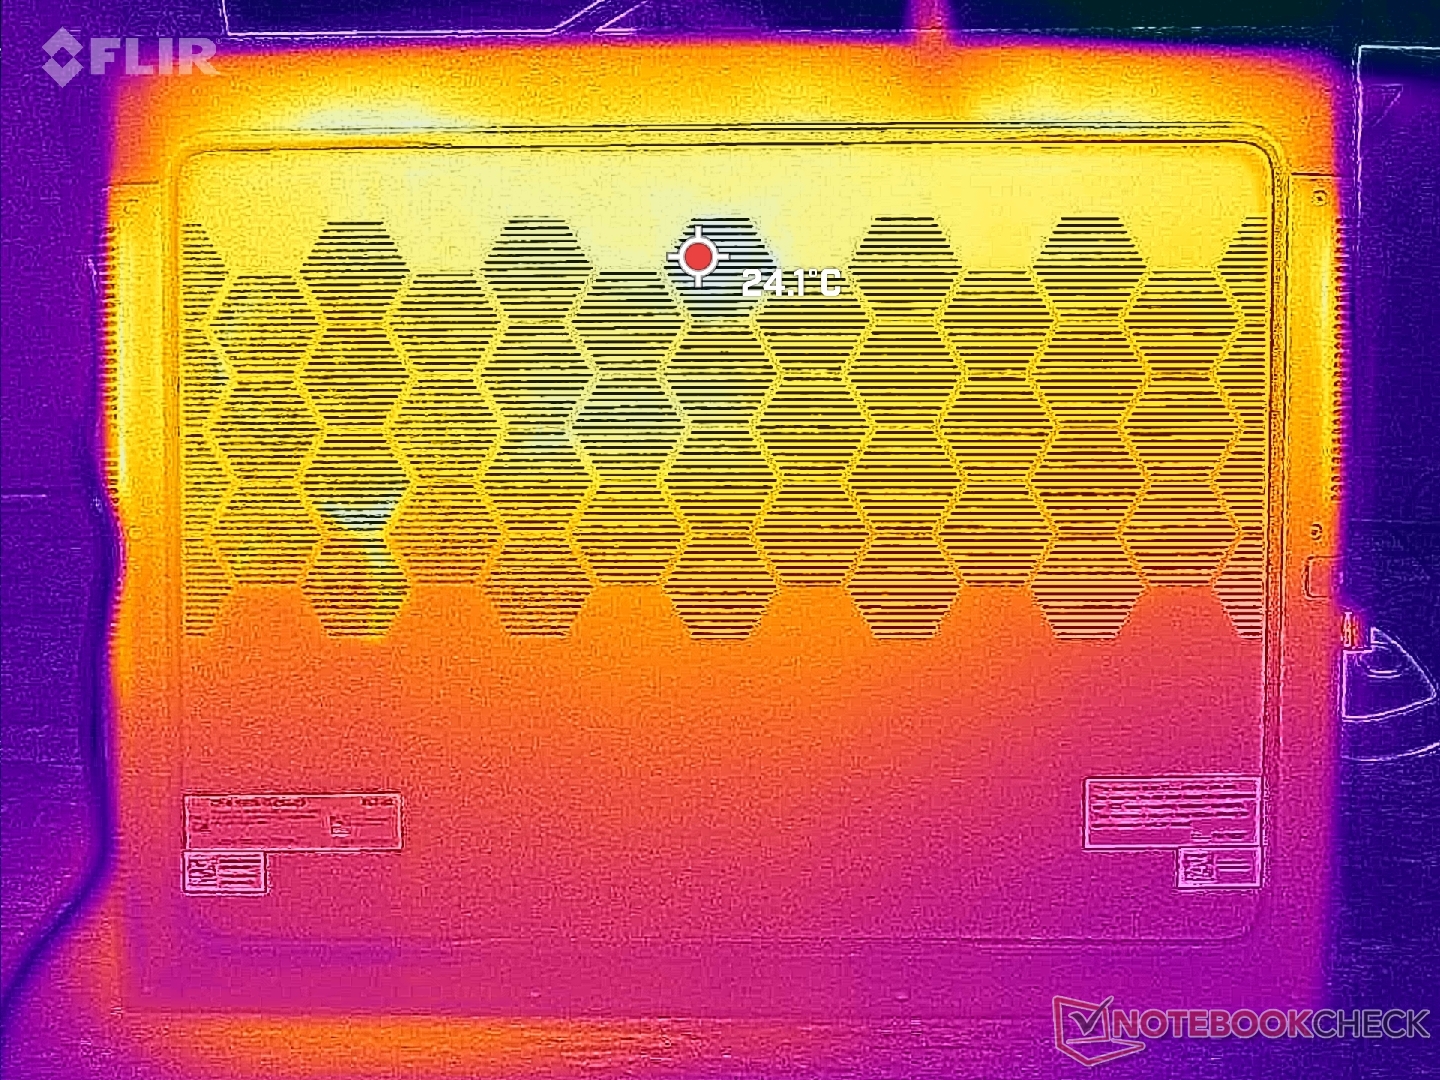
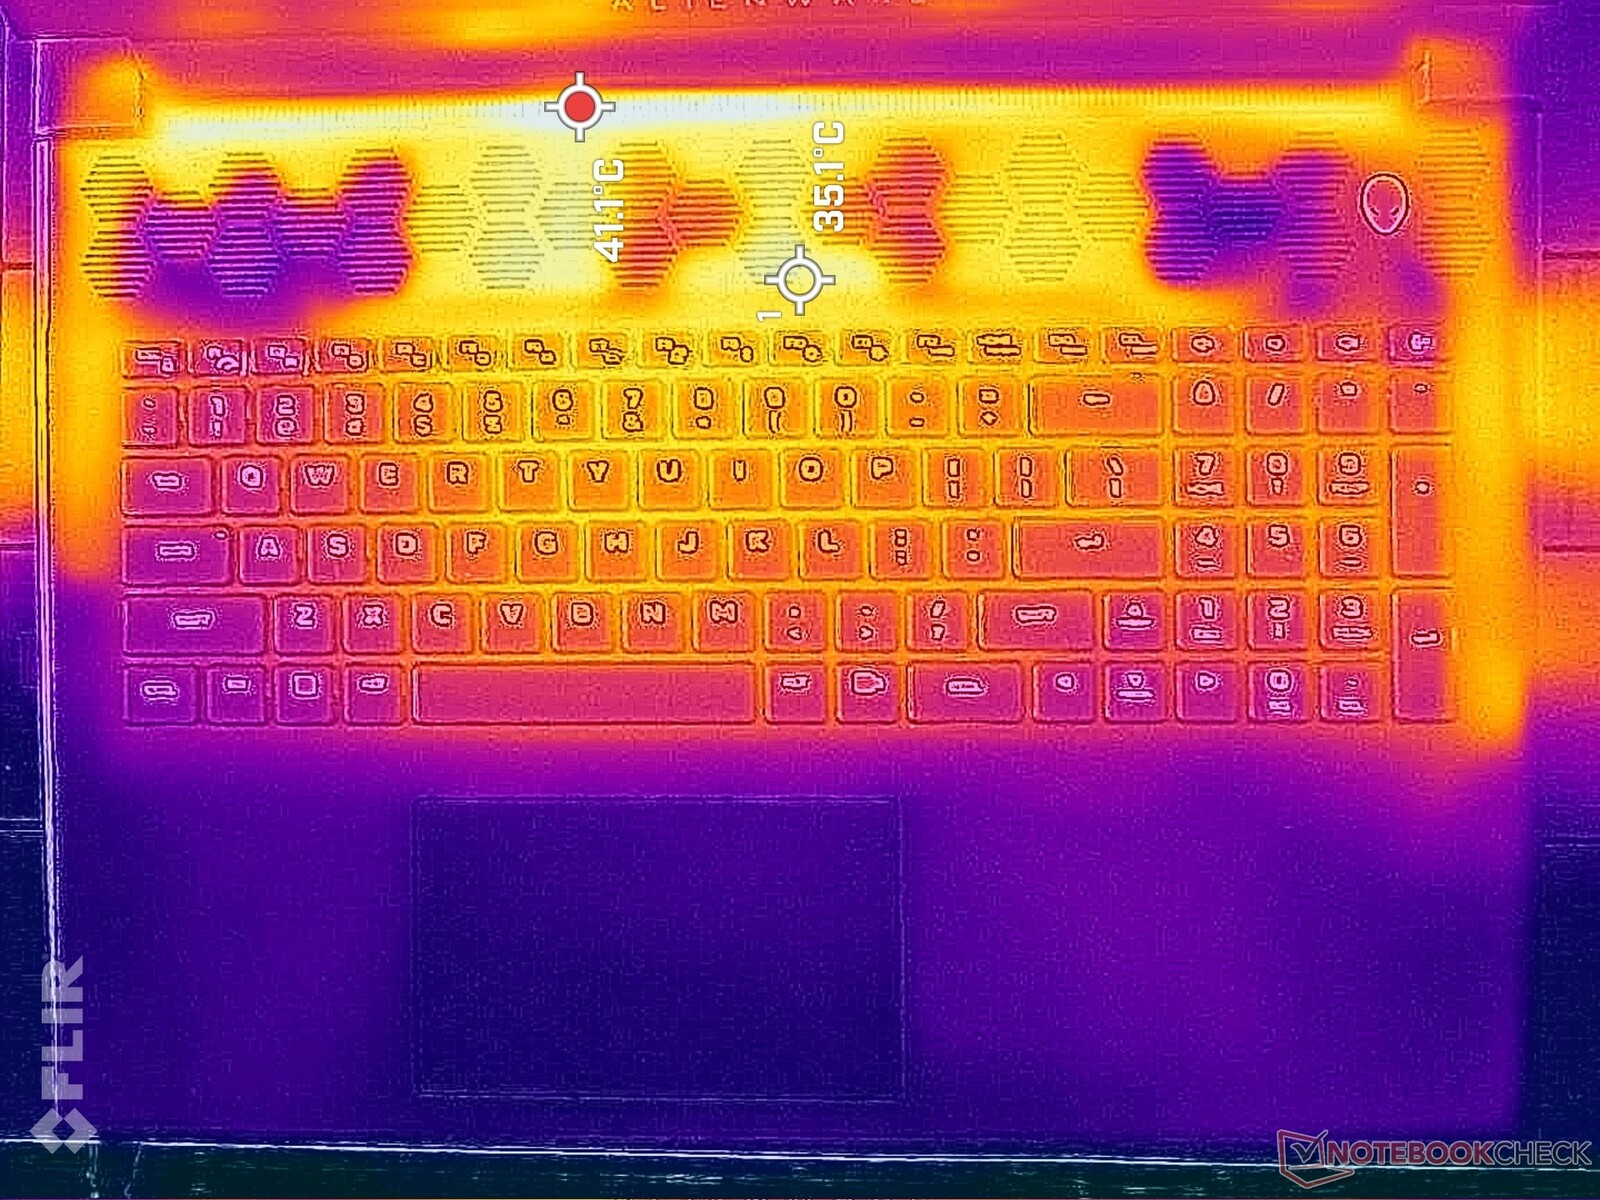
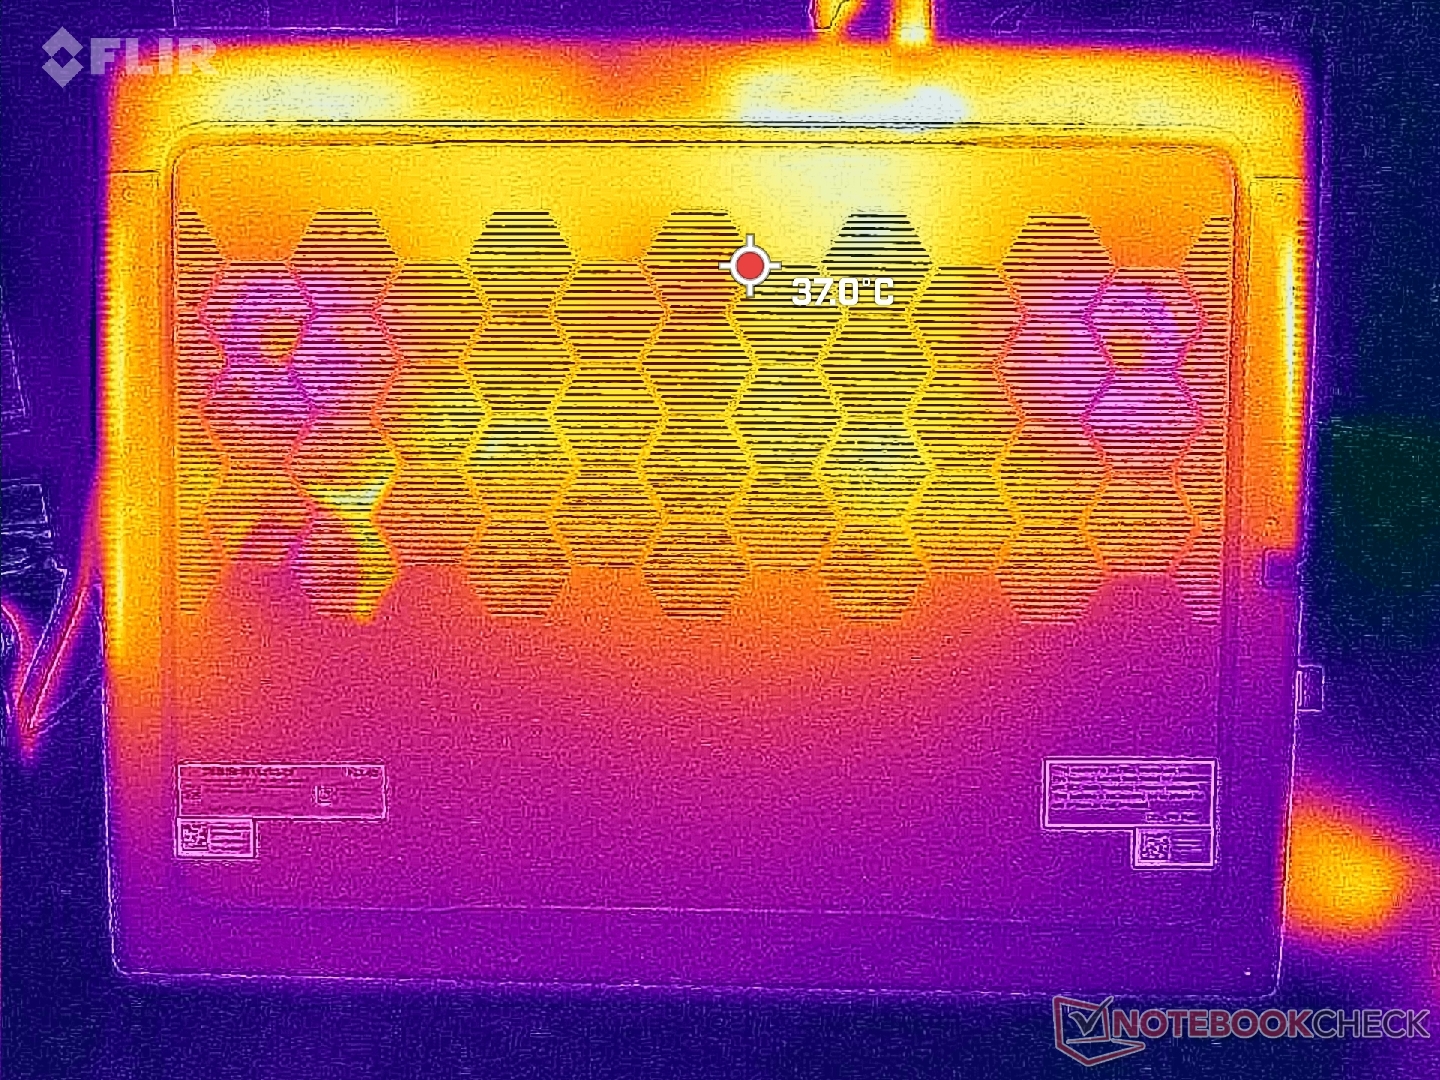
Oberflächentemperaturen sind beim Alienware-Notebook kein großes Thema. Das liegt auch an den großzügigen Lüftungsgittern auf fast allen Seiten des massiven Gehäuses. Die wärmsten Stellen befinden sich auf der Rückseite, weit entfernt von den Tasten und der Handballenauflage. So bleiben die Hände kühl.
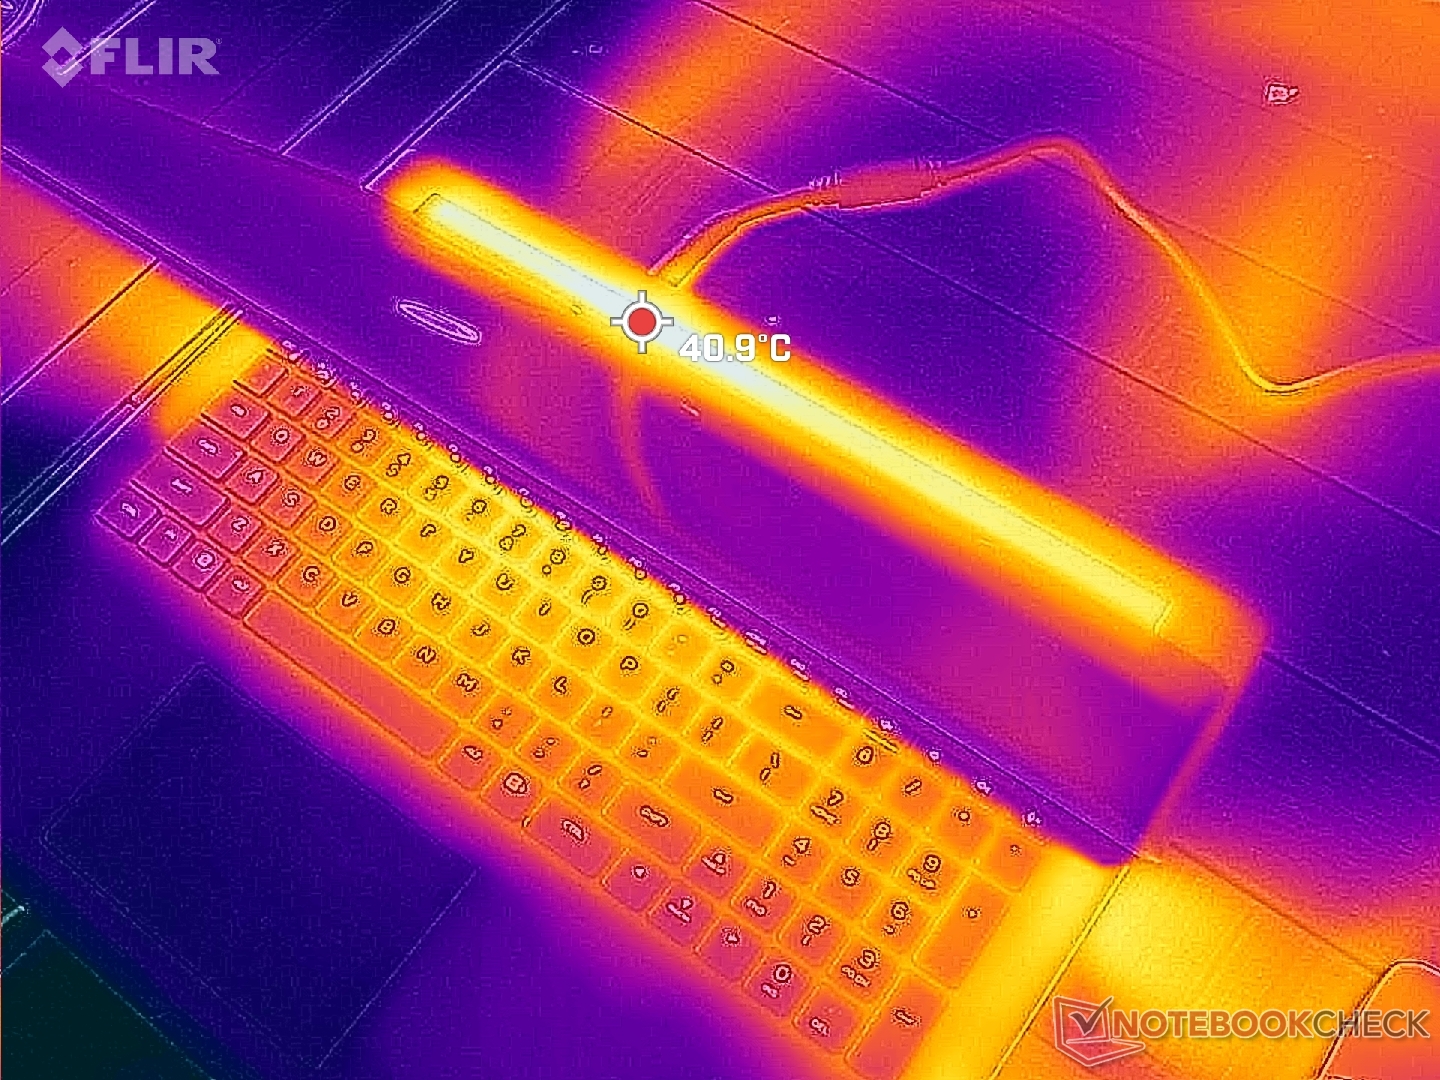
(+) Die maximale Temperatur auf der Oberseite ist 39 °C. Im Vergleich liegt der Klassendurchschnitt bei 40.4 °C (von 21.2 bis 68.8 °C für die Klasse Gaming v7).
(+) Auf der Unterseite messen wir eine maximalen Wert von 36.4 °C (im Vergleich zum Durchschnitt von 43.2 °C).
(+) Ohne Last messen wir eine durchschnittliche Temperatur von 25.2 °C auf der Oberseite. Der Klassendurchschnitt erreicht 33.8 °C.
(+) Beim längeren Spielen von The Witcher 3 erhitzt sich das Gerät durchschnittlich auf 29.8 °C. Der Durchschnitt der Klasse ist derzeit 33.8 °C.
(+) Die Handballen und der Touchpad-Bereich sind mit gemessenen 23.8 °C kühler als die typische Hauttemperatur und fühlen sich dadurch kühl an.
(+) Die durchschnittliche Handballen-Temperatur anderer getesteter Geräte war 28.9 °C (+5.1 °C).


| Alienware m18 R1 Intel Core i9-13980HX, NVIDIA GeForce RTX 4090 Laptop GPU | Razer Blade 18 RTX 4070 Intel Core i9-13950HX, NVIDIA GeForce RTX 4070 Laptop GPU | Asus ROG Strix Scar 18 2023 G834JY-N6005W Intel Core i9-13980HX, NVIDIA GeForce RTX 4090 Laptop GPU | Eluktronics Mech-17 GP2 Intel Core i9-13900HX, NVIDIA GeForce RTX 4090 Laptop GPU | MSI Titan GT77 HX 13VI Intel Core i9-13950HX, NVIDIA GeForce RTX 4090 Laptop GPU | Alienware x17 R2 P48E Intel Core i9-12900HK, NVIDIA GeForce RTX 3080 Ti Laptop GPU | |
|---|---|---|---|---|---|---|
| Hitze | -7% | -20% | -9% | -4% | -15% | |
| Last oben max * | 39 | 39.2 -1% | 54 -38% | 39 -0% | 40.6 -4% | 49.6 -27% |
| Last unten max * | 36.4 | 35.6 2% | 46 -26% | 44 -21% | 41.1 -13% | 42.4 -16% |
| Idle oben max * | 29.2 | 31.8 -9% | 30 -3% | 31 -6% | 26.2 10% | 29.2 -0% |
| Idle unten max * | 27.8 | 33.2 -19% | 31 -12% | 29.8 -7% | 30.3 -9% | 32 -15% |
* ... kleinere Werte sind besser
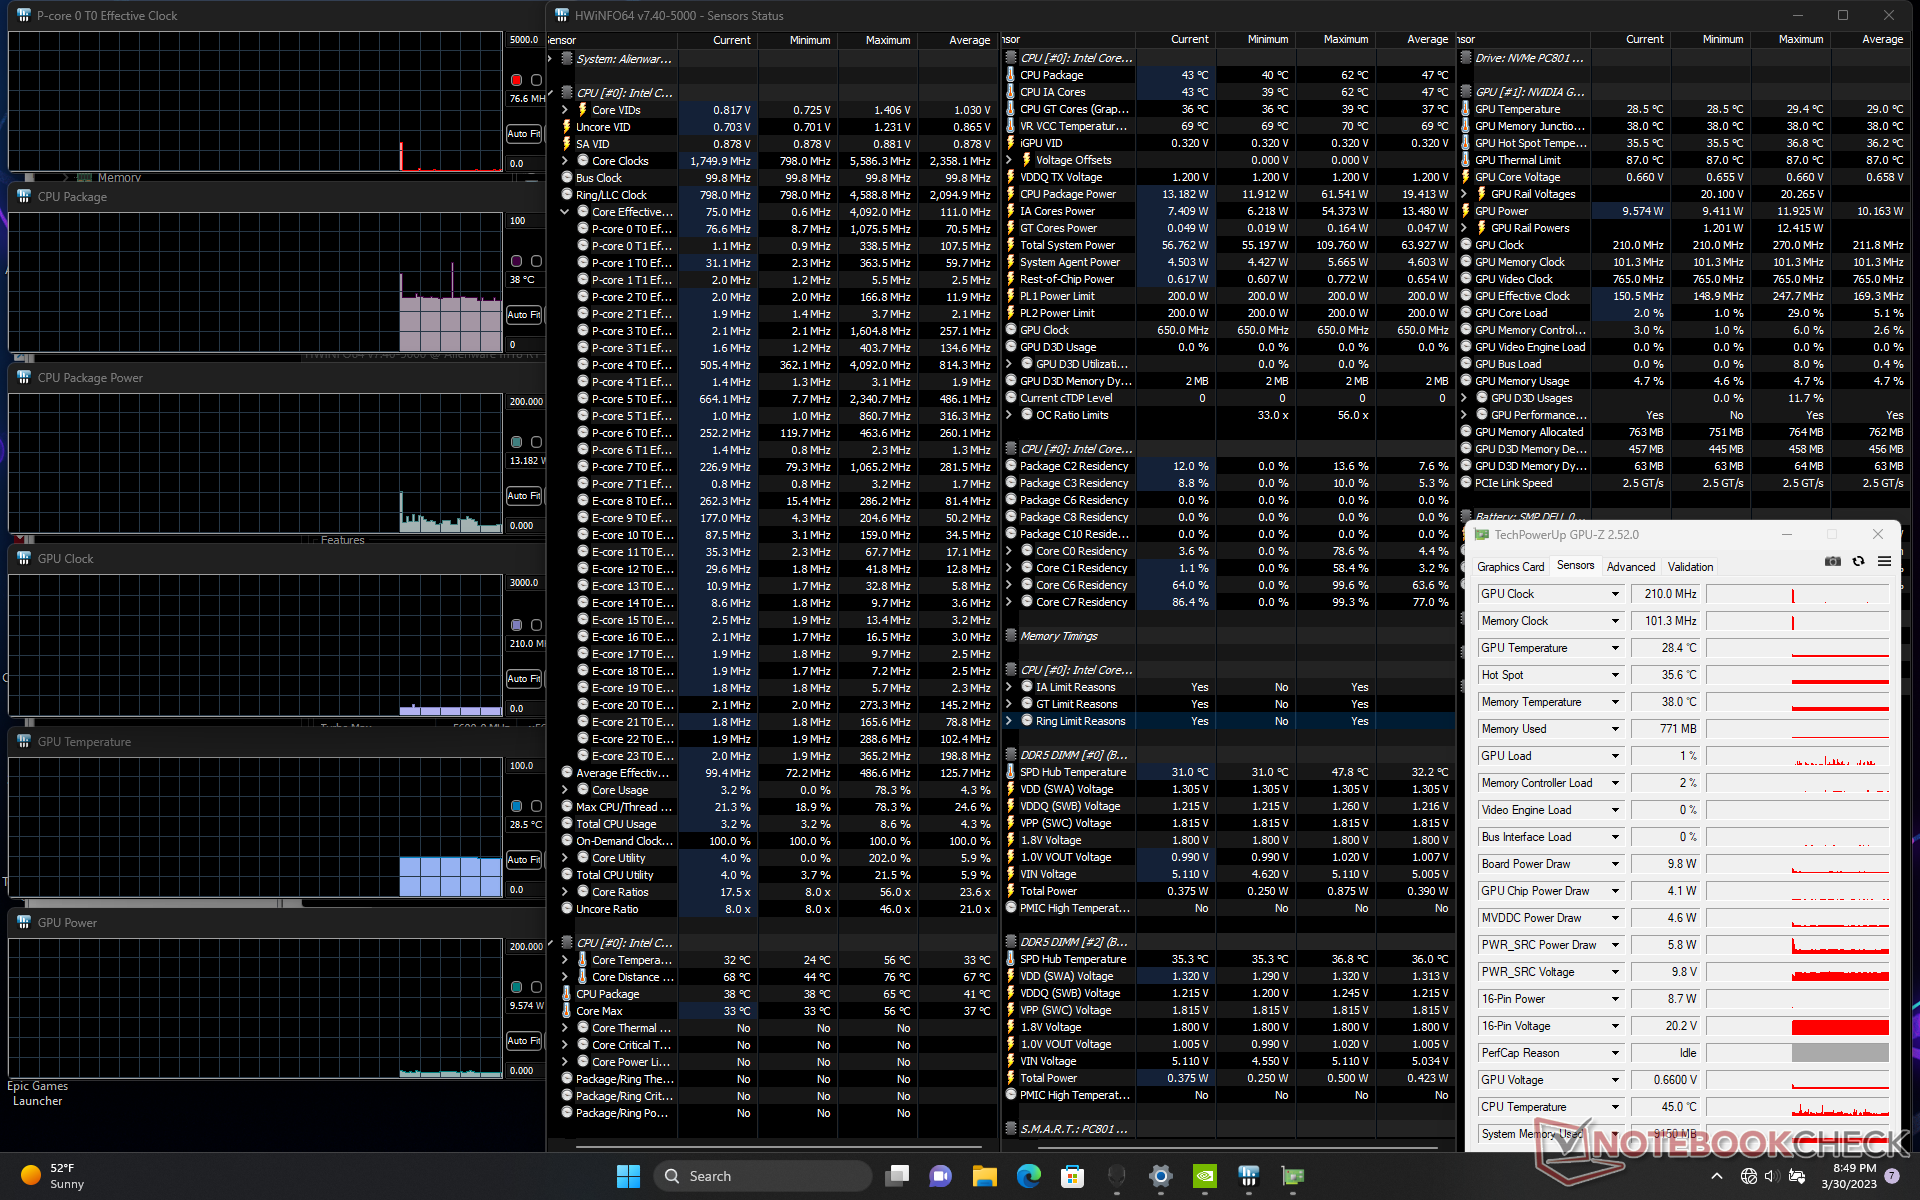
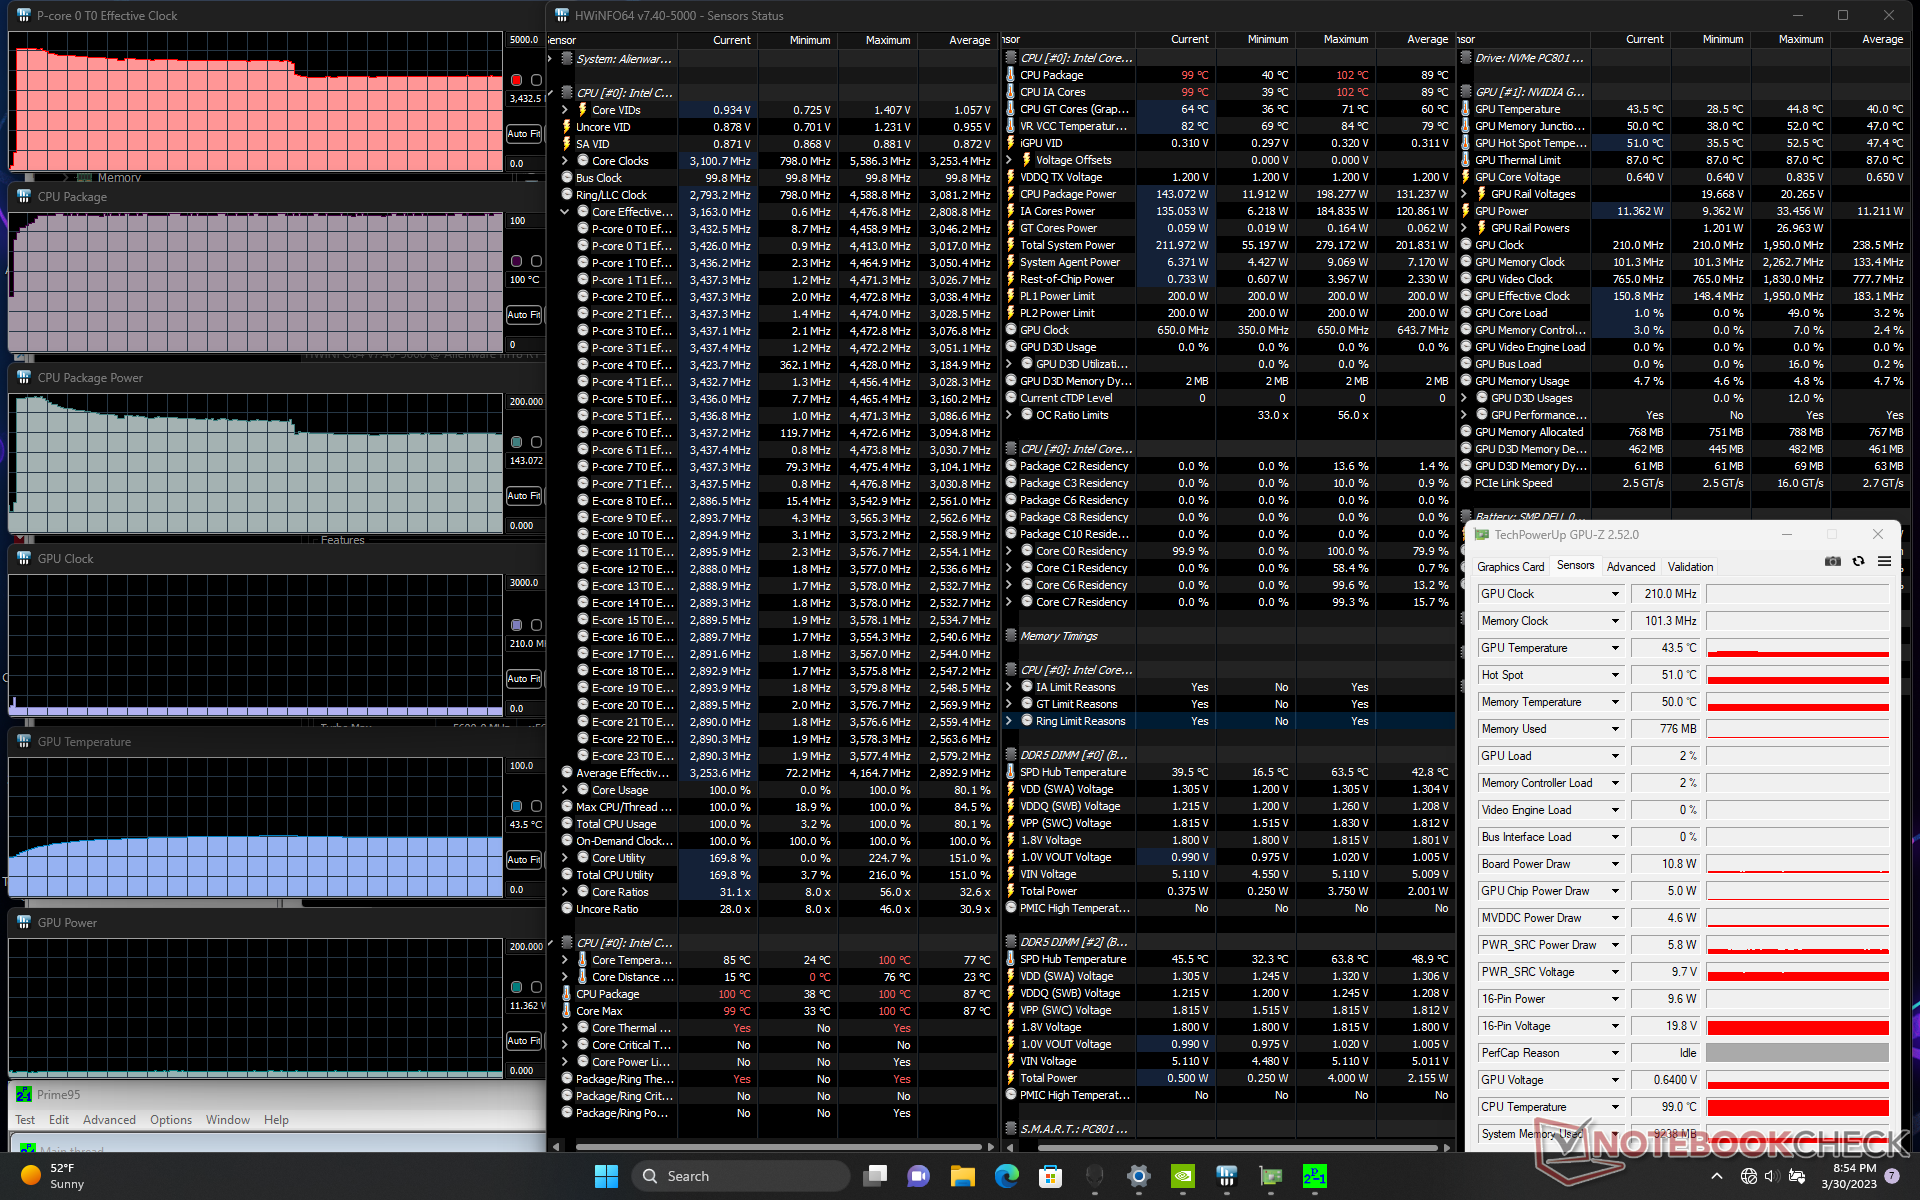
Stresstest
Lässt man Prime95 laufen, um die CPU zu belasten, steigen die Taktraten und die Leistungsaufnahme des Boards auf 4,5 GHz bzw. 198 W, was nur wenige Sekunden oder bis zu einer Kerntemperatur von 99 °C anhält. Anschließend fällt die CPU für die nächsten Minuten auf 4,2 GHz bei 175 W ab. Letztendlich pendelt sich die CPU bei 3,4 GHz, 143 W und 99 °C ein. Der maximale Turbo Boost ist also unabhängig vom Energiemodus nicht von Dauer. Die CPU-Temperaturen sind selbst für einen Gaming-Notebook extrem.
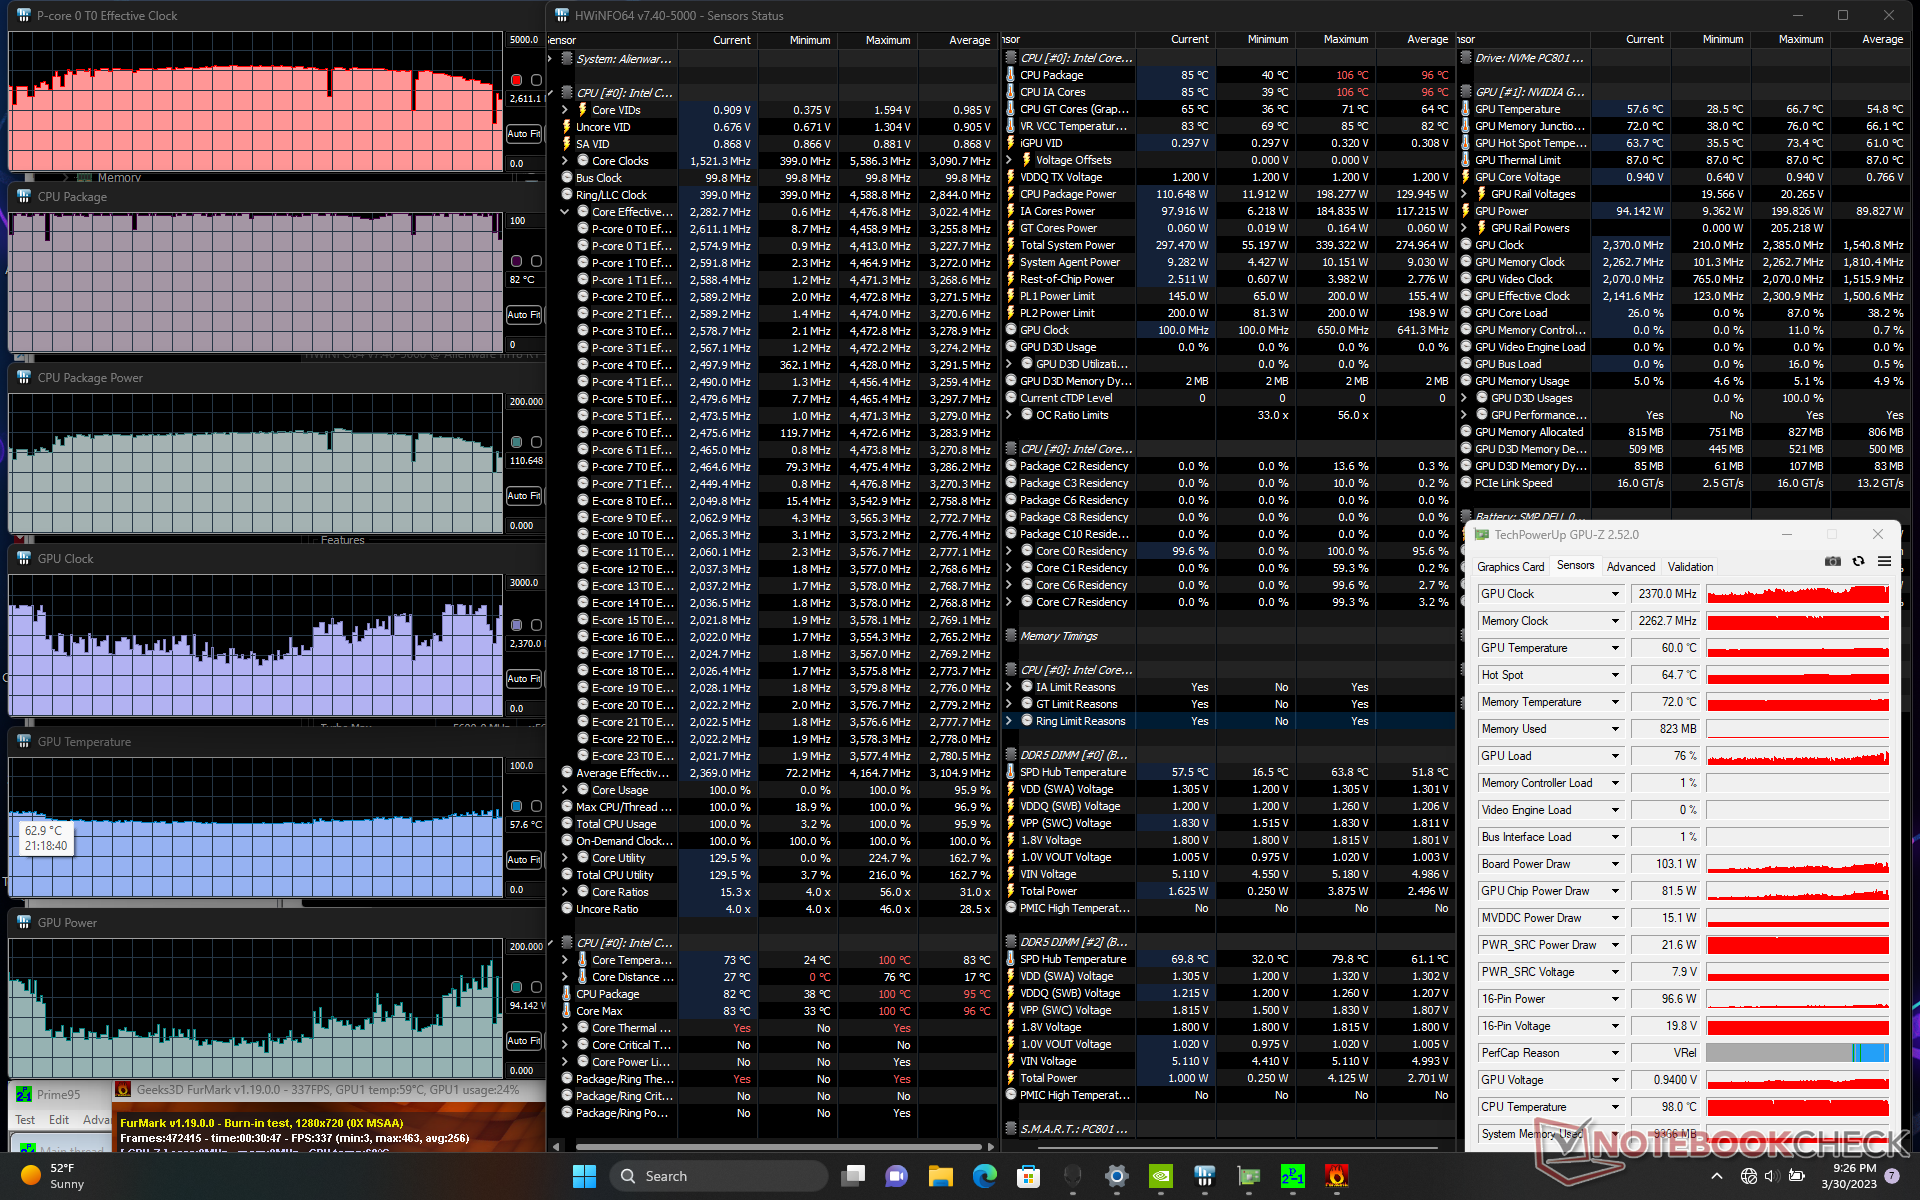
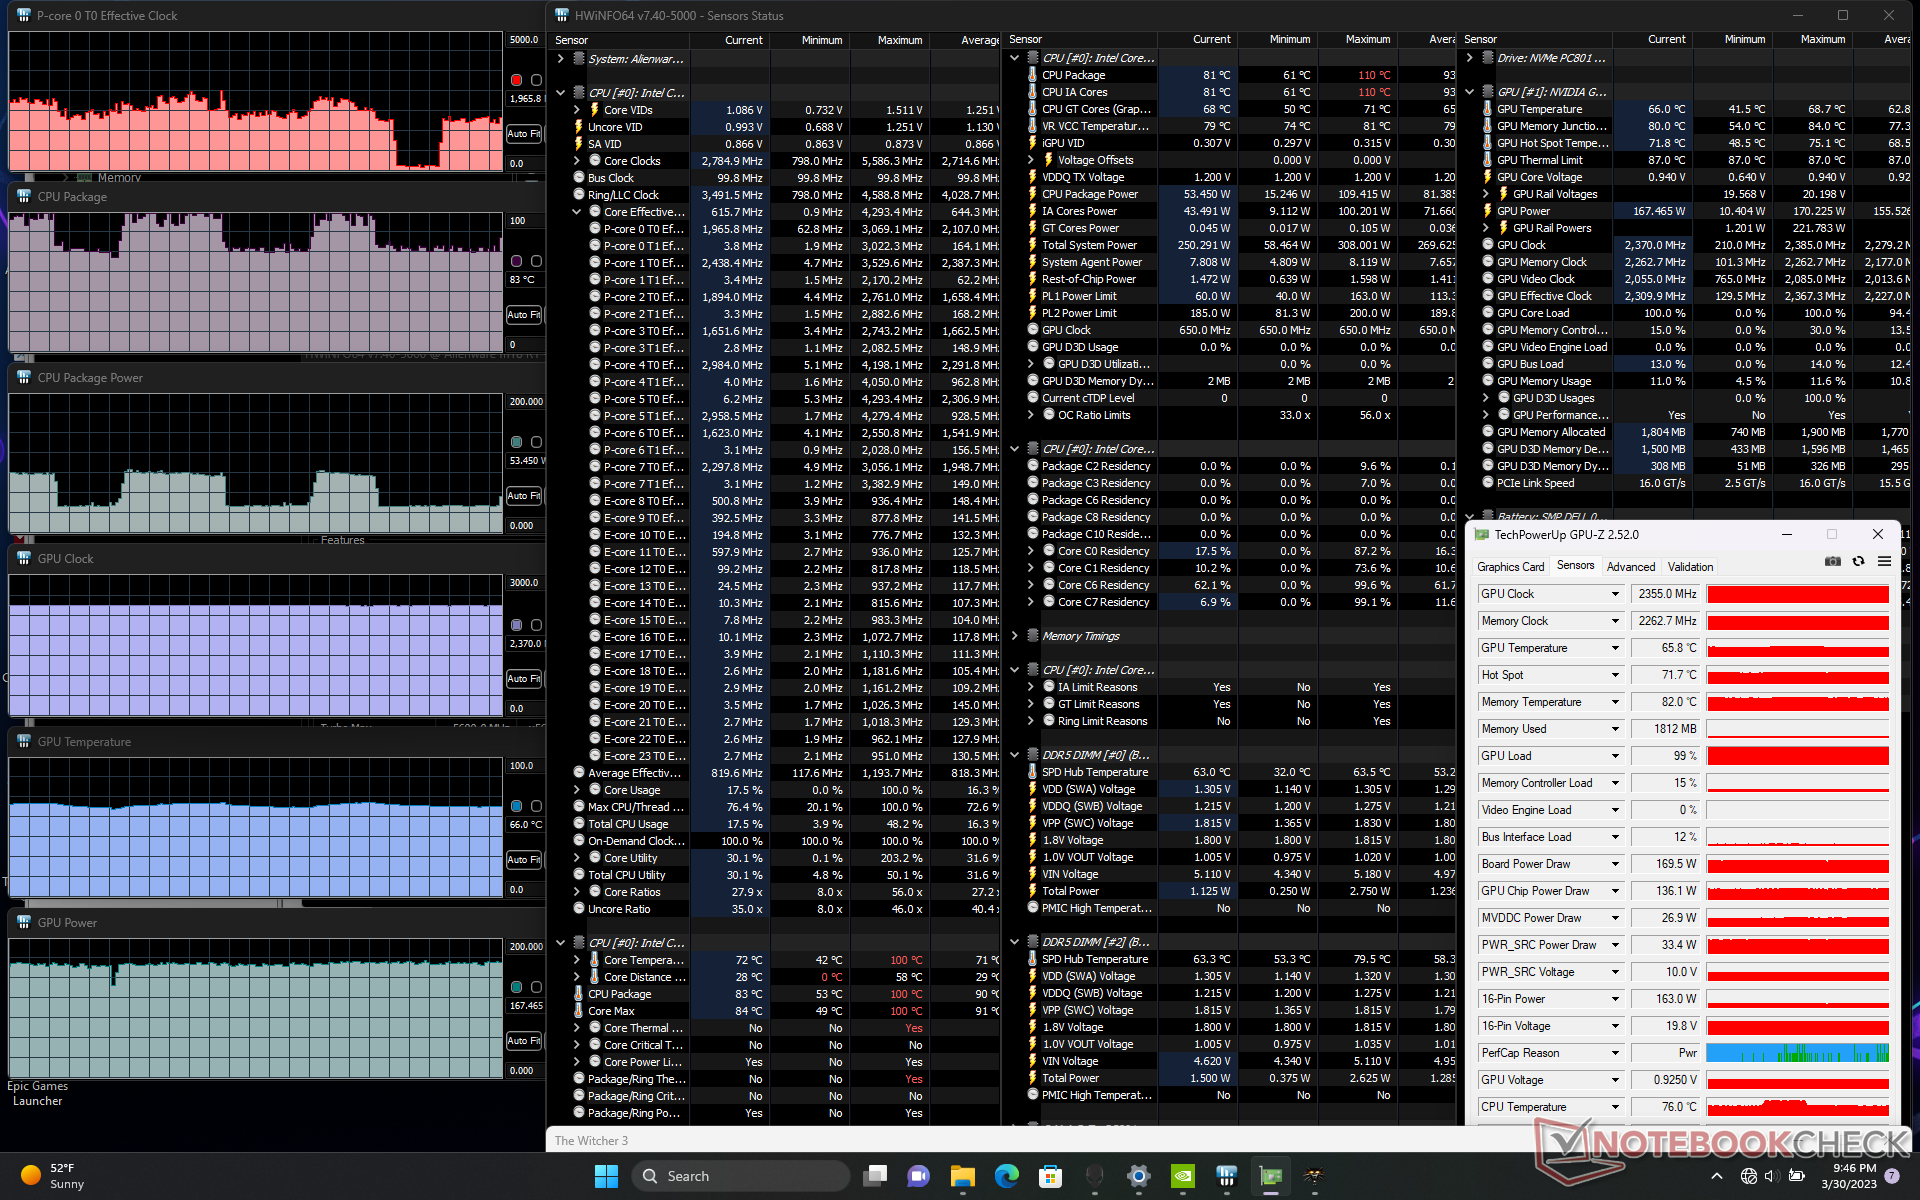
Läuft Witcher 3 über längere Zeit im Overdrive-Modus, stabilisieren sich die GPU-Taktraten, die Temperatur und die Leistungsaufnahme bei 2370 MHz, 63 °C und 162 W. Bemerkenswert ist, dass die GPU-Leistung beim Betrieb im leiseren Performance-Modus nicht beeinträchtigt wird, was mit unseren obigen Beobachtungen bei Fire Strike übereinstimmt. Stattdessen ist es die CPU, die einen leichten Leistungsabfall hinnehmen muss. Da die meisten Spiele GPU-abhängig sind, empfehlen wir den Performance-Modus dem lauteren Overdrive-Modus vorzuziehen, wenn Lüftergeräusche ein Problem darstellen.
Der Akkubetrieb schränkt die Leistung erwartungsgemäß ein. Bei einem Fire Strike Test im Akkubetrieb werden Physik- und Grafikwerte von 25319 bzw. 18778 Punkten erreicht, im Netzbetrieb sind es 41644 respektive 46998 Punkte.

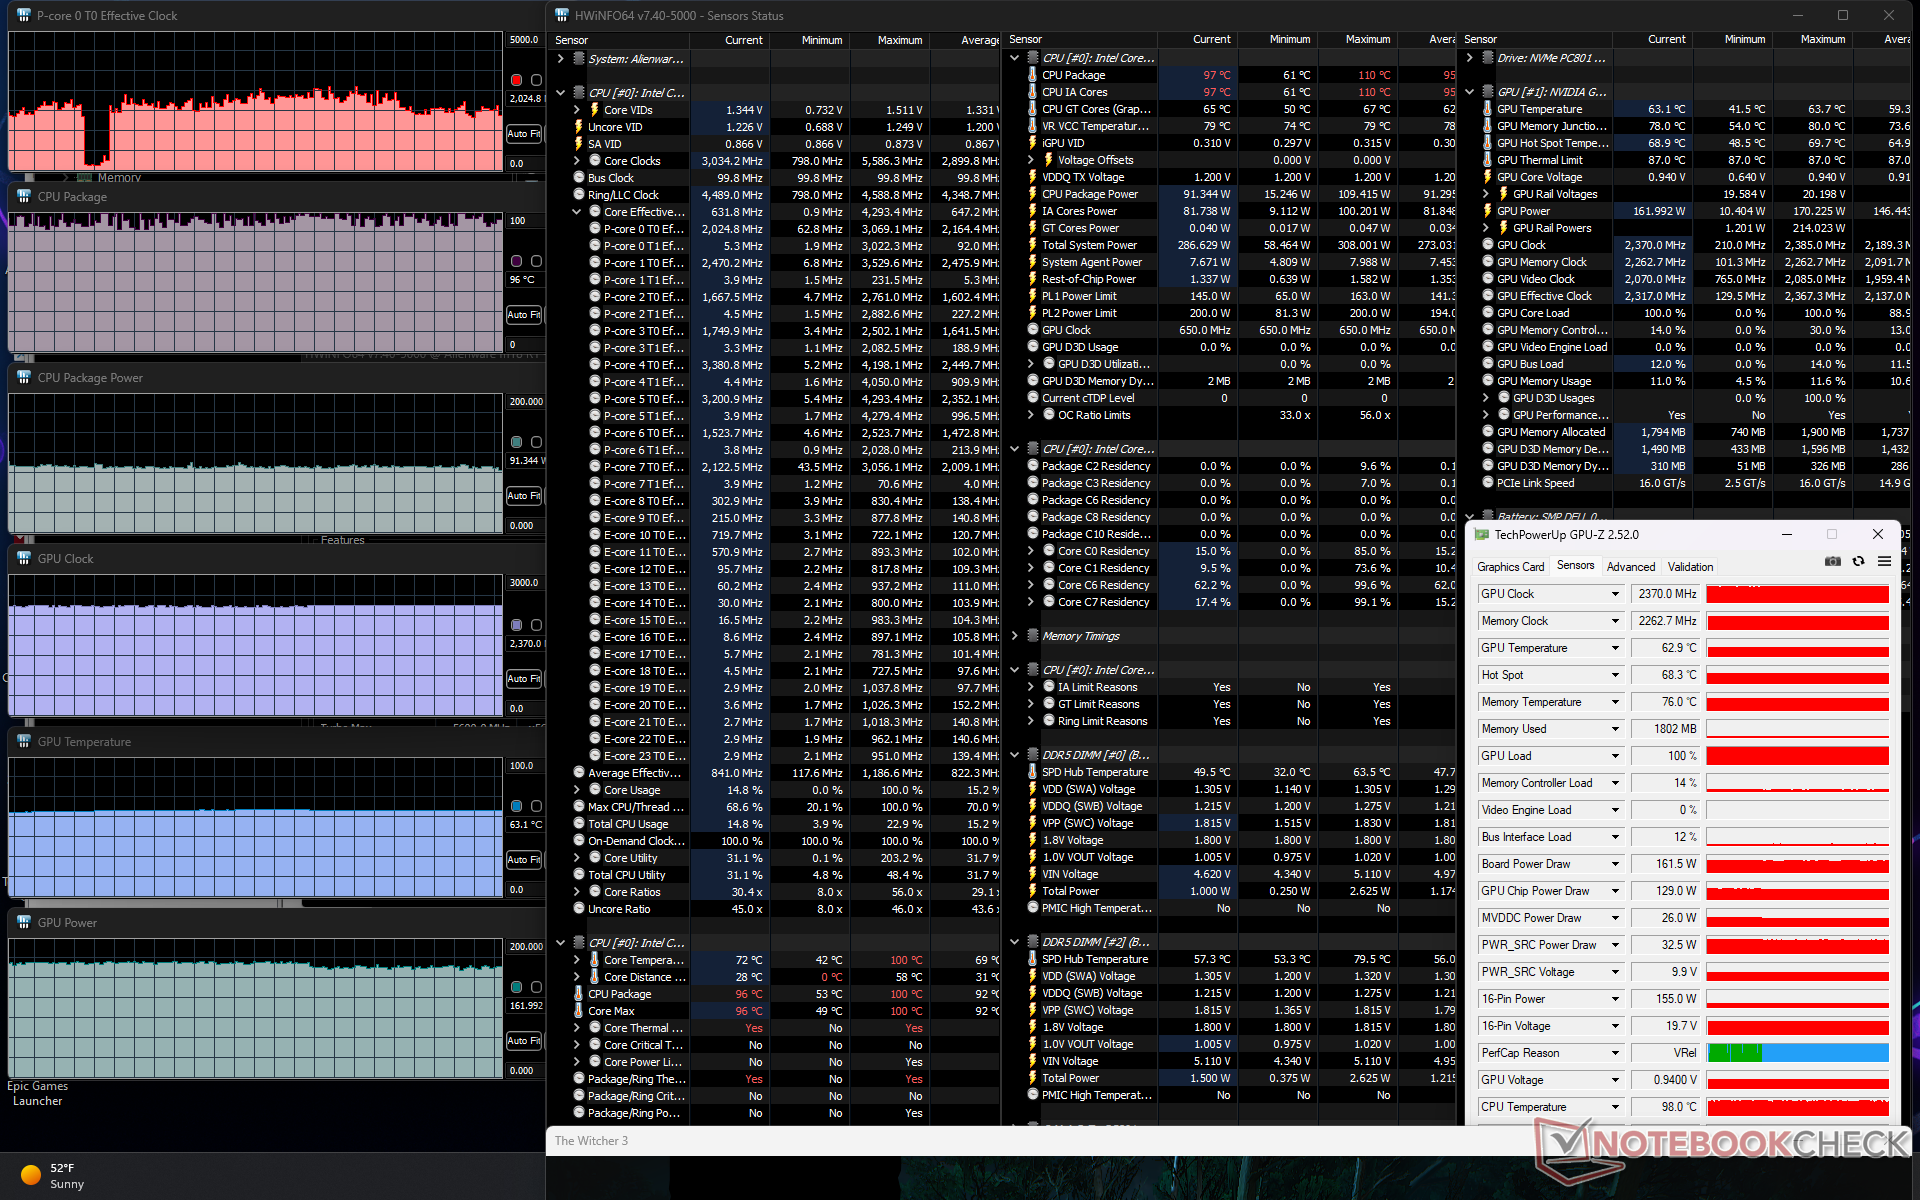
| CPU Takt (GHz) | GPU Takt (MHz) | Durchschnittliche CPU Temperatur (°C) | Durchschnittliche GPU Temperatur (°C) | |
| Leerlauf | -- | -- | 38 | 29 |
| Prime95 Stresstest | 3.4 | -- | 100 | 44 |
| Prime95 + FurMark Stresstest | 2.6+ | 1070 - 2370 | 82 - 100 | 57 |
| Witcher 3 Stresstest (Overdrive Modus) | ~2.0+ | 2370 | 96 | 63 |
| Witcher 3 Stresstest (Performance Modus) | ~1.8+ | 2370 | 81 | 66 |
| Witcher 3 Stresstest (Ausgeglichener Modus) | ~1.8 | 2310 | 81 | 67 |
Lautsprecher
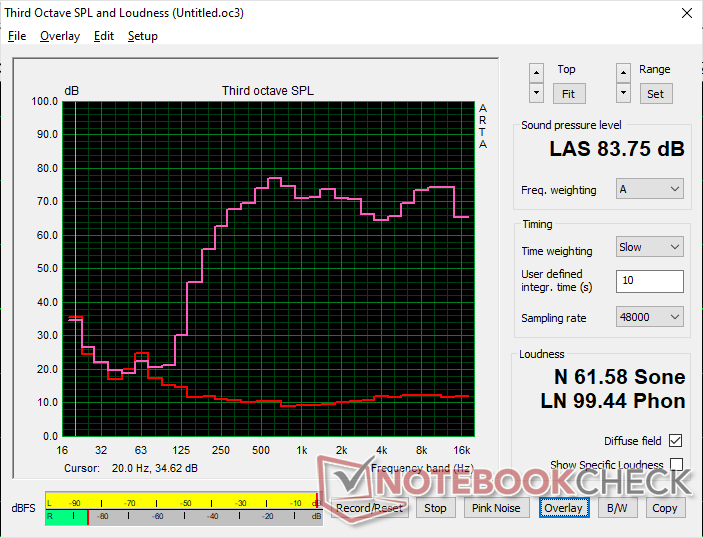
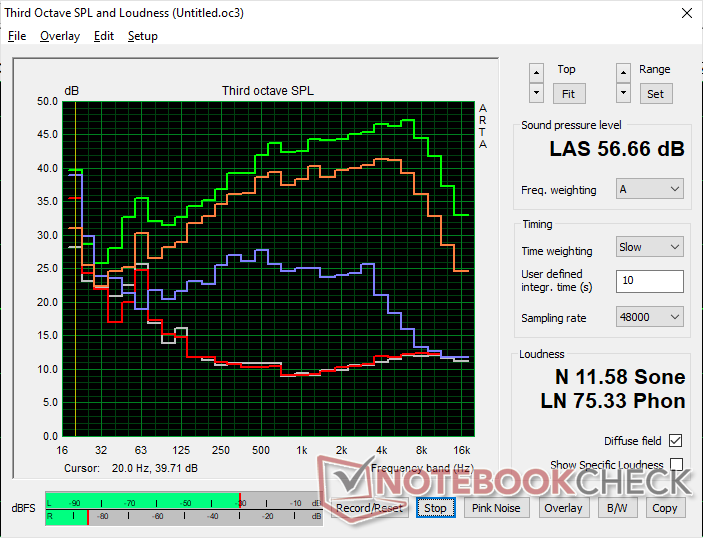
Alienware m18 R1 Audio Analyse
(+) | Die Lautsprecher können relativ laut spielen (83.8 dB)
Bass 100 - 315 Hz
(-) | kaum Bass - 22.4% niedriger als der Median
(±) | durchschnittlich lineare Bass-Wiedergabe (13.4% Delta zum Vorgänger)
Mitteltöne 400 - 2000 Hz
(+) | ausgeglichene Mitten, vom Median nur 3.2% abweichend
(+) | lineare Mitten (4.4% Delta zum Vorgänger)
Hochtöne 2 - 16 kHz
(+) | ausgeglichene Hochtöne, vom Median nur 3.2% abweichend
(+) | sehr lineare Hochtöne (4% Delta zum Vorgänger)
Gesamt im hörbaren Bereich 100 - 16.000 Hz
(+) | hörbarer Bereich ist sehr linear (14.6% Abstand zum Median
Im Vergleich zu allen Geräten derselben Klasse
» 25% aller getesteten Geräte dieser Klasse waren besser, 7% vergleichbar, 68% schlechter
» Das beste Gerät hat einen Delta-Wert von 6%, durchschnittlich ist 18%, das schlechteste Gerät hat 132%
Im Vergleich zu allen Geräten im Test
» 15% aller getesteten Geräte waren besser, 4% vergleichbar, 81% schlechter
» Das beste Gerät hat einen Delta-Wert von 4%, durchschnittlich ist 25%, das schlechteste Gerät hat 134%
Apple MacBook Pro 16 2021 M1 Pro Audio Analyse
(+) | Die Lautsprecher können relativ laut spielen (84.7 dB)
Bass 100 - 315 Hz
(+) | guter Bass - nur 3.8% Abweichung vom Median
(+) | lineare Bass-Wiedergabe (5.2% Delta zum Vorgänger)
Mitteltöne 400 - 2000 Hz
(+) | ausgeglichene Mitten, vom Median nur 1.3% abweichend
(+) | lineare Mitten (2.1% Delta zum Vorgänger)
Hochtöne 2 - 16 kHz
(+) | ausgeglichene Hochtöne, vom Median nur 1.9% abweichend
(+) | sehr lineare Hochtöne (2.7% Delta zum Vorgänger)
Gesamt im hörbaren Bereich 100 - 16.000 Hz
(+) | hörbarer Bereich ist sehr linear (4.6% Abstand zum Median
Im Vergleich zu allen Geräten derselben Klasse
» 0% aller getesteten Geräte dieser Klasse waren besser, 0% vergleichbar, 100% schlechter
» Das beste Gerät hat einen Delta-Wert von 5%, durchschnittlich ist 18%, das schlechteste Gerät hat 45%
Im Vergleich zu allen Geräten im Test
» 0% aller getesteten Geräte waren besser, 0% vergleichbar, 100% schlechter
» Das beste Gerät hat einen Delta-Wert von 4%, durchschnittlich ist 25%, das schlechteste Gerät hat 134%
Energiemanagement - Mehr als 300 Watt Leistungsaufnahme beim Gaming
Leistungsaufnahme
Wenig überraschend ist der Stromverbrauch des Systems auch dann hoch, wenn keine Anwendungen ausgeführt werden. Im Leerlauf mit Energiesparmodus, Optimus-Modus und niedrigster Helligkeitseinstellung konnten wir ein knappes Minimum von 21 W aufzeichnen. Der Idle-Betrieb im Performance- oder Turbo-Modus erhöht den Idle-Verbrauch um mehr als das Doppelte, daher ist es sehr empfehlenswert, die höheren Profileinstellungen zu vermeiden, wenn die zusätzliche Leistung nicht benötigt wird.
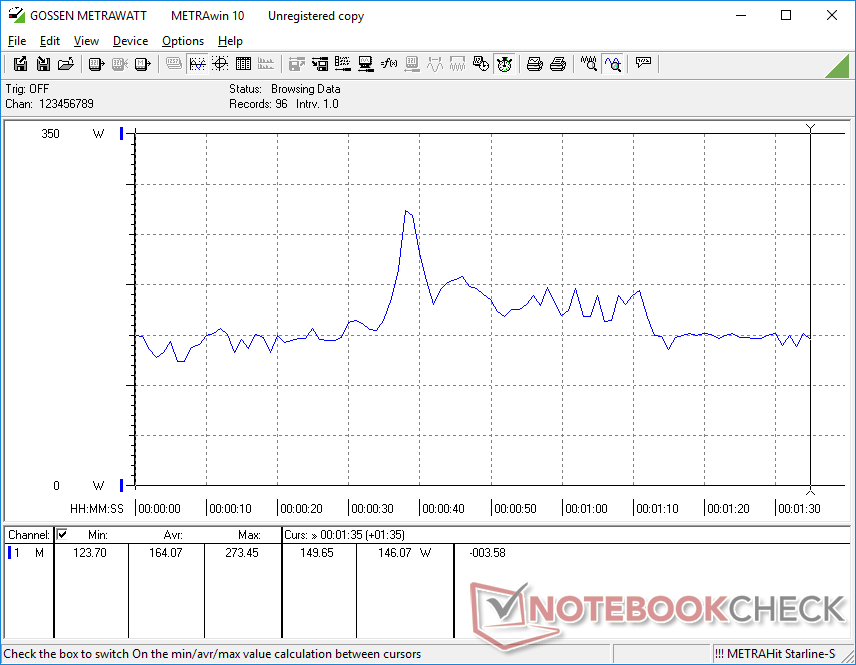
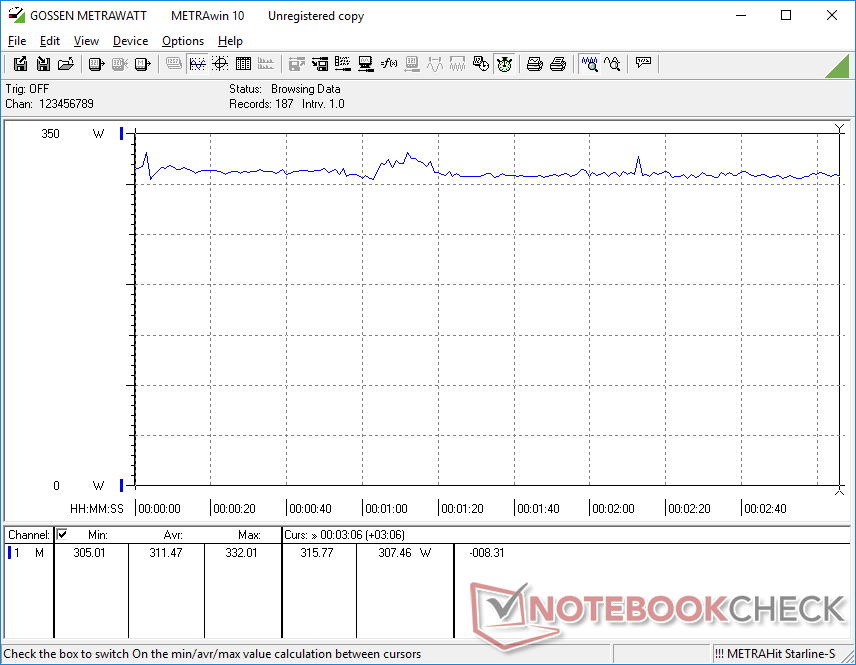
Die Ausführung von Witcher 3, welches eine typische Spiellast darstellt, verbraucht mit 311 Watt gut 50 Watt mehr als das letztjährige Alienware x17 R2 mit RTX 3080 Ti. Die gestiegene System-Leistung im Vergleich zum Vorgängermodell, muss der Nutzer also mit einer höheren Stromrechnung bezahlen.
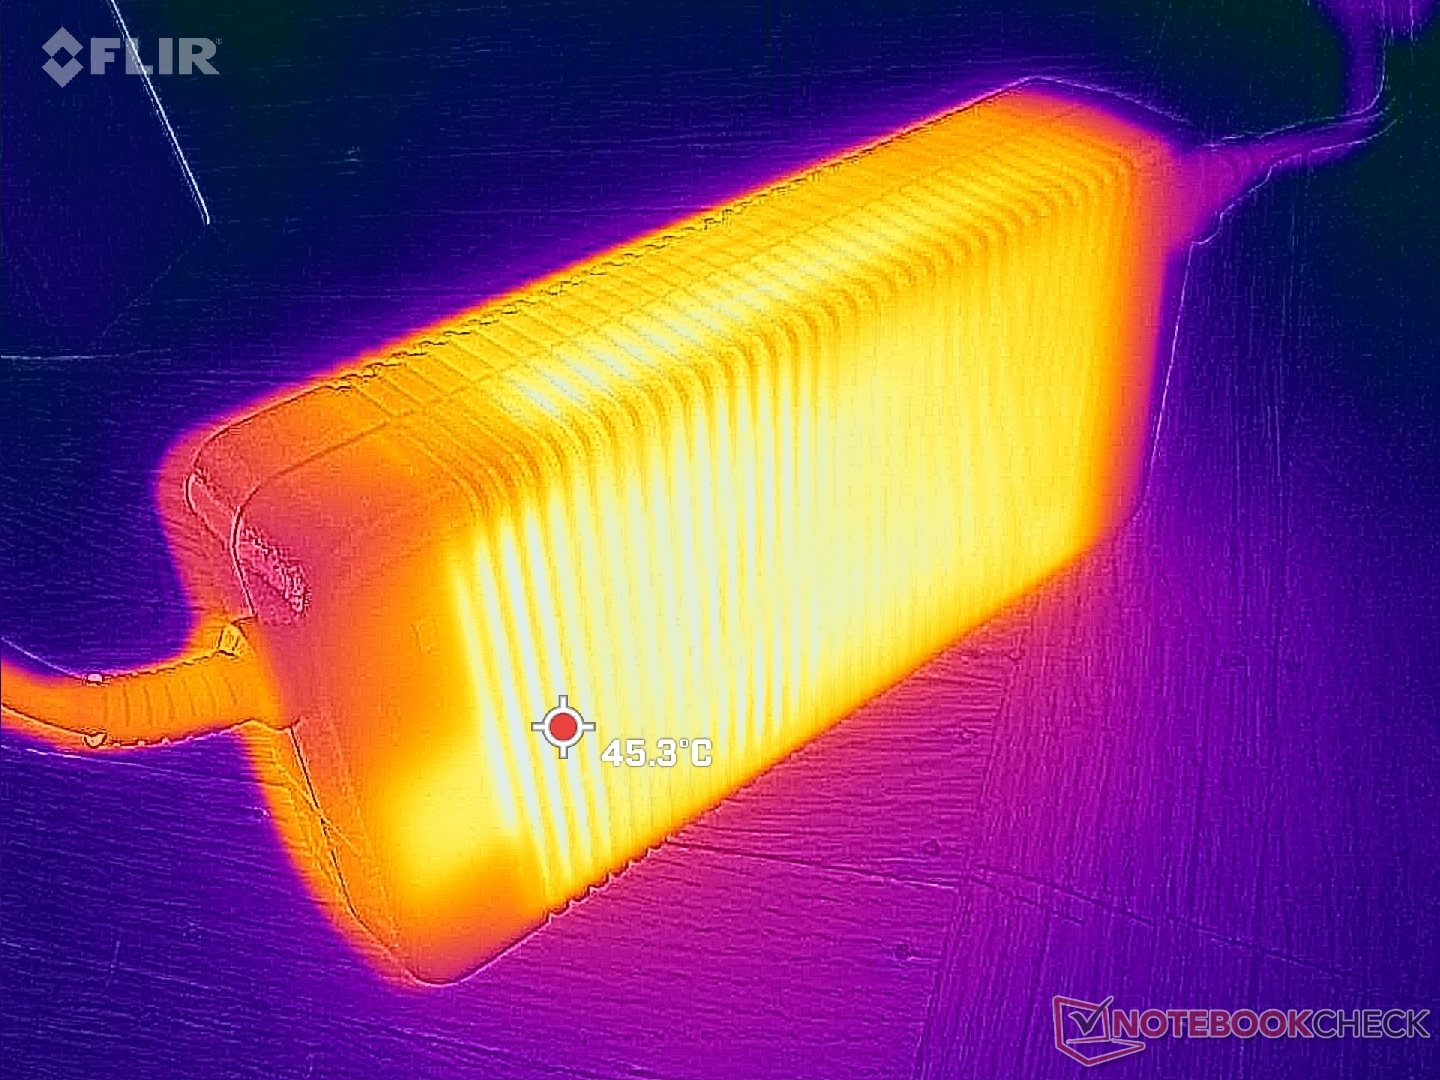
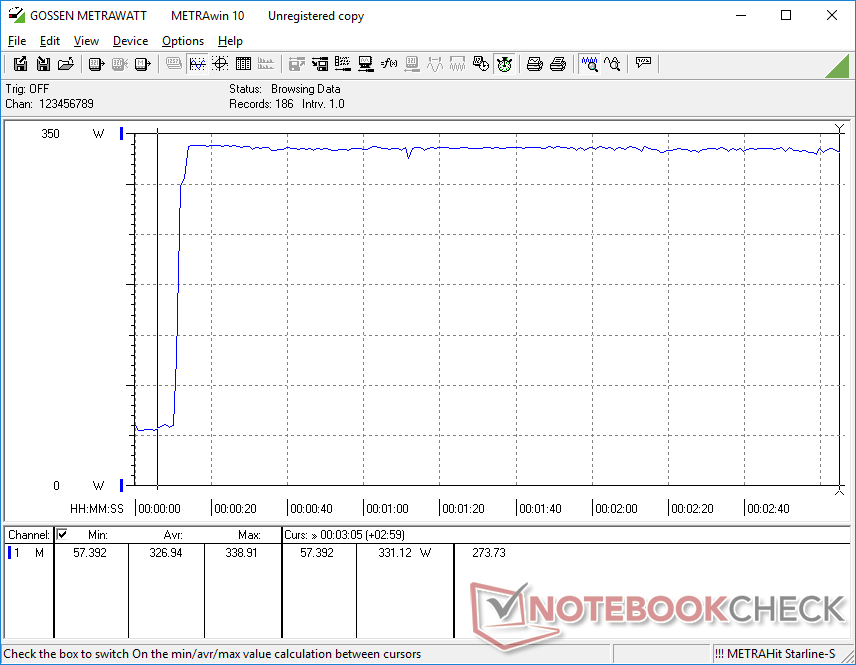
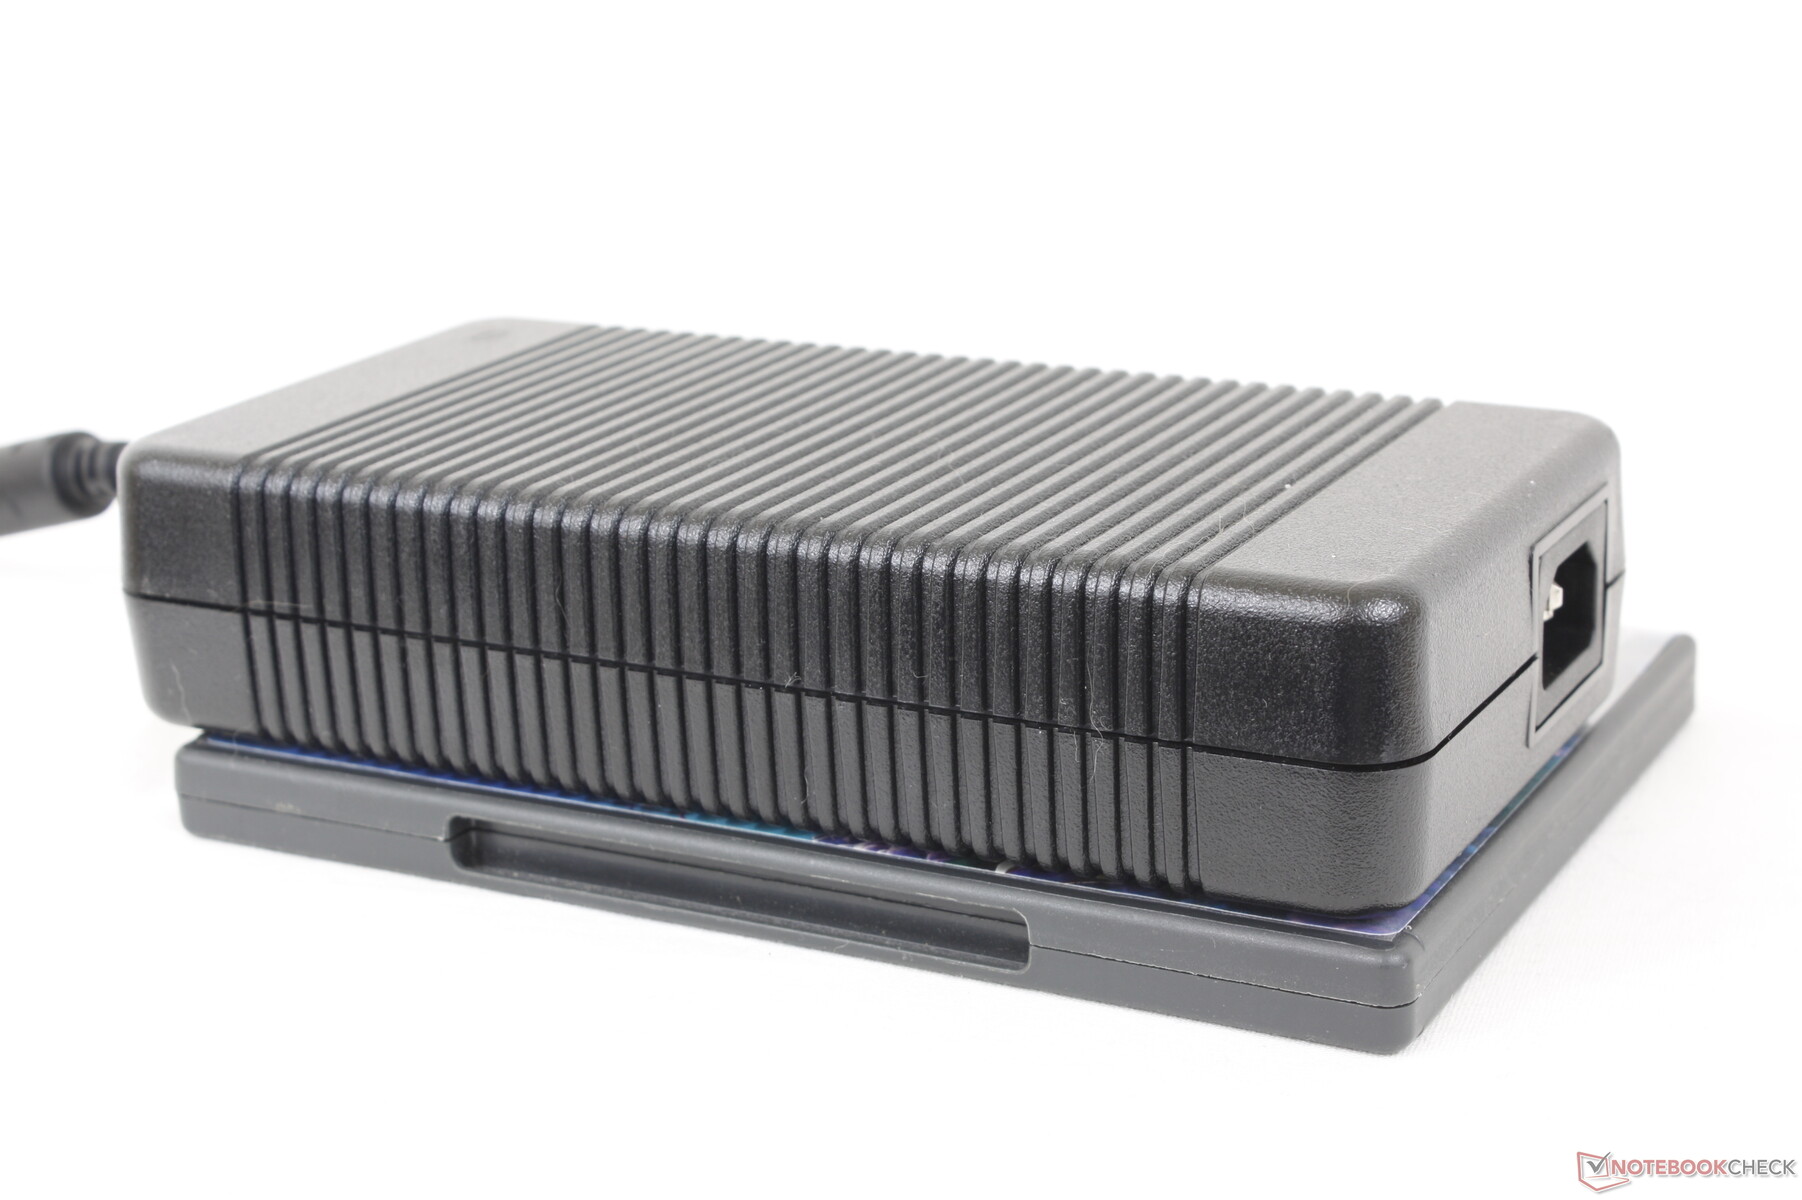
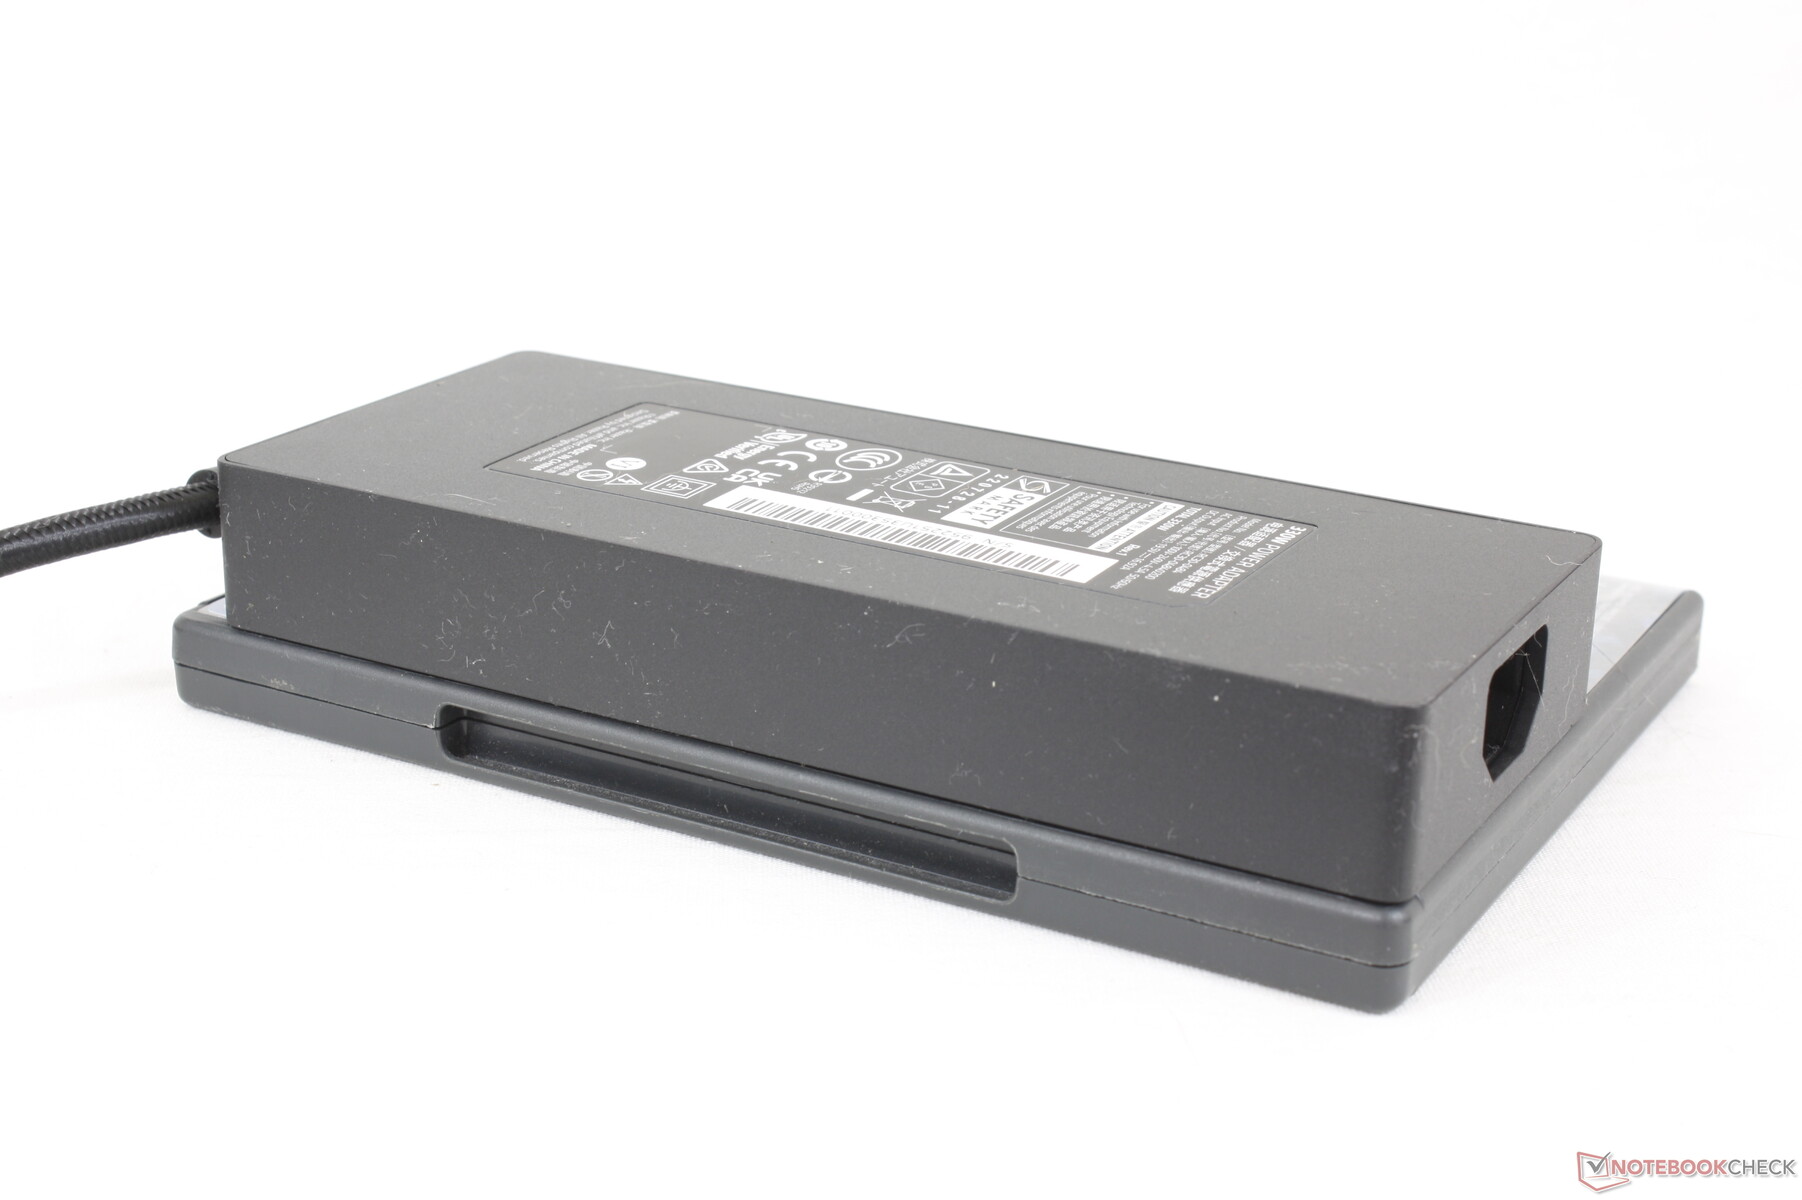
Bei 100-prozentiger Auslastung von CPU und GPU konnten wir einen maximalen Stromverbrauch von 339 Watt messen. Das sperrige Netzteil (~19,5 x 9,8 x 4 cm) ist für 330 W ausgelegt, so dass unser voll konfiguriertes Gerät die verfügbare Leistung voll ausnutzt. Zu beachten ist, dass sich die Ladegeschwindigkeit des Laptop-Akkus während des Spielens verlangsamt. Tatsächlich können wir beobachten, dass unser Akku von 100 % auf 91 % fällt, wenn wir extrem anspruchsvolle Aufgaben wie Prime95 und FurMark gleichzeitig ausführen.

| Aus / Standby | |
| Idle | |
| Last |
|
Legende:
min: Derzeit nutzen wir das Metrahit Energy, ein professionelles TRMS Leistungs-Multimeter und PQ Analysator, für unsere Messungen. Mehr Details zu dem Messgerät finden Sie hier. Alle unsere Testmethoden beschreiben wir in diesem Artikel. | |
| Alienware m18 R1 i9-13980HX, NVIDIA GeForce RTX 4090 Laptop GPU, SK hynix PC801 HFS001TEJ9X101N, IPS, 1920x1200, 18.00 | Razer Blade 18 RTX 4070 i9-13950HX, NVIDIA GeForce RTX 4070 Laptop GPU, SSSTC CA6-8D1024, IPS, 2560x1600, 18.00 | Asus ROG Strix Scar 18 2023 G834JY-N6005W i9-13980HX, NVIDIA GeForce RTX 4090 Laptop GPU, 2x Samsung PM9A1 MZVL21T0HCLR (RAID 0), IPS, 2560x1600, 18.00 | MSI GE78HX 13VH-070US i9-13950HX, NVIDIA GeForce RTX 4080 Laptop GPU, Samsung PM9A1 MZVL22T0HBLB, IPS, 2560x1600, 17.00 | Eluktronics Mech-17 GP2 i9-13900HX, NVIDIA GeForce RTX 4090 Laptop GPU, Samsung PM9A1 MZVL21T0HCLR, IPS, 2560x1600, 17.00 | MSI Titan GT77 HX 13VI i9-13950HX, NVIDIA GeForce RTX 4090 Laptop GPU, Samsung PM9A1 MZVL22T0HBLB, Mini-LED, 3840x2160, 17.30 | |
|---|---|---|---|---|---|---|
| Stromverbrauch | 7% | 11% | 20% | 21% | 20% | |
| Idle min * | 21.6 | 24.5 -13% | 17.3 20% | 16.1 25% | 14 35% | 14 35% |
| Idle avg * | 25.2 | 34.1 -35% | 27 -7% | 24 5% | 19.3 23% | 21.6 14% |
| Idle max * | 56.7 | 47.7 16% | 46 19% | 34 40% | 36.8 35% | 24.8 56% |
| Last avg * | 164.1 | 140 15% | 133 19% | 123.6 25% | 117.2 29% | 122.5 25% |
| Witcher 3 ultra * | 311 | 202 35% | 286 8% | 304 2% | 265 15% | |
| Last max * | 338.9 | 261 23% | 329 3% | 285.7 16% | 342.5 -1% | 418 -23% |
* ... kleinere Werte sind besser
Leistungsaufnahme Witcher 3 / Stresstest
Leistungsaufnahme externer Bildschirm
Akkuausdauer - Mittelmaß
Die Akkulaufzeit war noch nie eine Stärke der Alienware-Serie. Das letztjährige Alienware x17 R2 beispielsweise hielt nur wenige Stunden durch, wenngleich man nur im Internet surfte. Das Alienware m18 hat einen Akku mit höherer Kapazität (97 Wh gegenüber 87 Wh) und besserem Energiemanagement, was zu einer deutlich längeren Laufzeit von etwa 4 Stunden beim Surfen führt. Zwar ist das nicht so lange wie bei einem typischen Ultrabook, aber für ein so großes Gaming-Notebook ist die Akkuausdauer akzeptabel.
Das Aufladen von leer auf voll dauert mit dem mitgelieferten Netzteil etwa 2 Stunden. USB-C Ladegeräte werden nicht unterstützt, was schade ist, denn so ist man an das gigantische 330 Watt Netzteil gebunden.
| Alienware m18 R1 i9-13980HX, NVIDIA GeForce RTX 4090 Laptop GPU, 97 Wh | Razer Blade 18 RTX 4070 i9-13950HX, NVIDIA GeForce RTX 4070 Laptop GPU, 91.7 Wh | Asus ROG Strix Scar 18 2023 G834JY-N6005W i9-13980HX, NVIDIA GeForce RTX 4090 Laptop GPU, 90 Wh | Eluktronics Mech-17 GP2 i9-13900HX, NVIDIA GeForce RTX 4090 Laptop GPU, 99 Wh | MSI Titan GT77 HX 13VI i9-13950HX, NVIDIA GeForce RTX 4090 Laptop GPU, 99.9 Wh | Alienware x17 R2 P48E i9-12900HK, GeForce RTX 3080 Ti Laptop GPU, 87 Wh | |
|---|---|---|---|---|---|---|
| Akkulaufzeit | 33% | 46% | 17% | 59% | -27% | |
| Idle | 334 | 420 26% | 234 -30% | |||
| WLAN | 260 | 240 -8% | 428 65% | 305 17% | 319 23% | 117 -55% |
| Last | 44 | 80 82% | 56 27% | 86 95% | 46 5% | |
| H.264 | 419 | 358 | ||||
| Witcher 3 ultra | 53 |
Pro
Contra
Fazit - Vier Kilo pure Power
Alienware-Notebooks hatten schon immer diese "Leistung um jeden Preis"-Mentalität und das Alienware m18 R1 ist keine Ausnahme. Dell scheut sich nicht, eines der größten, schwersten und sogar lautesten Notebooks auf den Markt zu bringen, auch wenn es nur ein wenig mehr Leistung aus CPU und GPU herausquetscht. Dennoch bietet das kompromisslose Gaming-Notebook einige Features, die leidenschaftliche Gamer zu schätzen wissen. Gamer, die die vier M.2 SSDs, die zahlreichen Anschlussmöglichkeiten, den Num-Block und die schnelle Bildwiederholrate von 480 Hz nutzen wollen und sich nicht am hohen Gewicht oder dem riesigen Netzteil stören, könnten mit dem Alienware m18 R1 glücklich werden.
Das Alienware m18 R1 ist das ideale Notebook für alle, die auf der Suche nach maximaler Leistung und Funktionalität sind. Aber nur, wenn sie Lautstärke und Gewicht das Laptops akzeptieren.
Wem die oben genannten Zusatzfunktionen nicht wichtig sind, der kann mit dem deutlich leichteren Razer Blade 18 oder dem Asus ROG Strix G18 fast die gleiche Leistung erhalten. Verbesserungen wünschen wir uns auch beim neuen Alienware Command Center, das manchmal ungewöhnlich langsam lädt.
Preise und Verfügbarkeit
Das Alienware m18 R1 ist bei Dell in der günstigsten Konfiguration ab 2.500 Euro erhältlich. Unsere Testausstattung ist in Deutschland noch nicht erhältlich und liegt in den USA bei rund 5.000 USD ohne Umsatzsteuer.
Alienware m18 R1
-
01.04.2023 v7
Allen Ngo


Transparenz
Das vorliegende Testmuster wurde dem Autor vom Hersteller oder einem Shop zu Testzwecken leihweise zur Verfügung gestellt. Eine Einflussnahme des Leihstellers auf den Testbericht gab es nicht, der Hersteller hat keine Version des Reviews vor der Veröffentlichung erhalten. Es bestand keine Verpflichtung zur Veröffentlichung.
Preisvergleich

