MSI Thin GF63 12VE Laptop Test: GeForce RTX 4050 Gaming
Gekürzt an vielen Ecken.
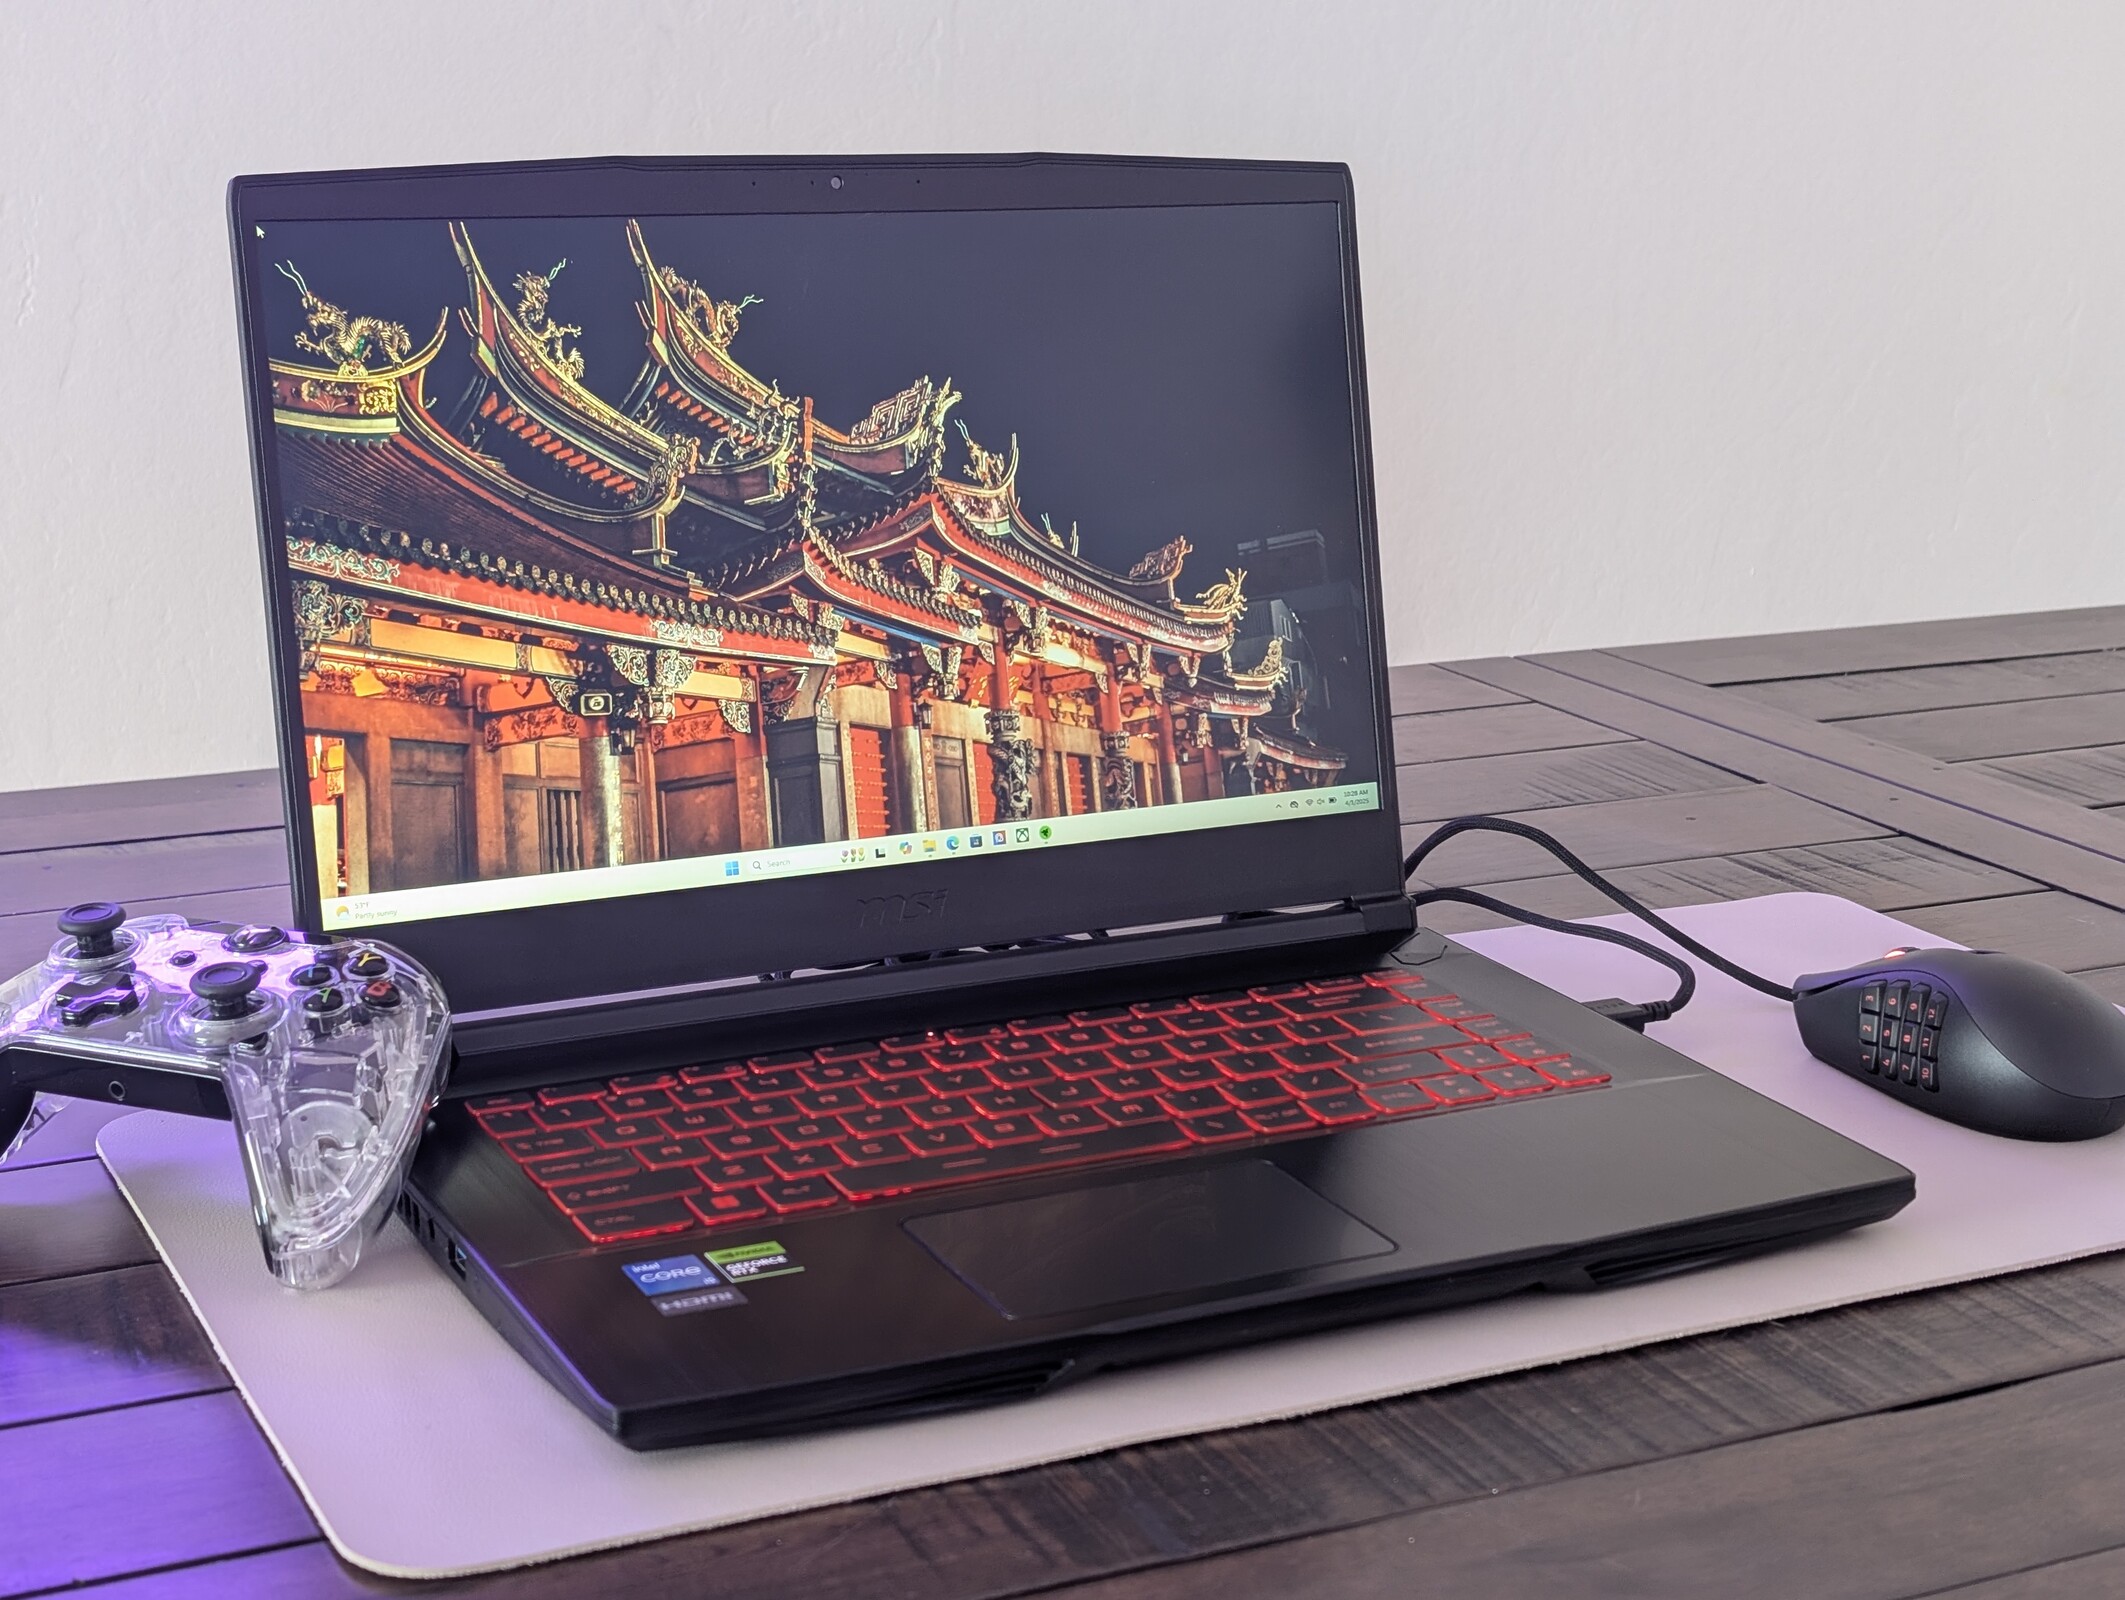
Das günstigste 15,6-Zoll-Gaming-Notebook von MSI verfügt über moderne Funktionen wie einen IPS-Bildschirm mit 144 Hz, eine GeForce-RTX-4050-Grafik und einen Prozessor der Core-H-Serie.Allen Ngo, 👁 Allen Ngo, ✓ Stefanie Voigt (übersetzt von DeepL / Ninh Duy) Veröffentlicht am 🇺🇸 🇫🇷 ...
Fazit - Holen Sie sich die 16-GB-Konfiguration
Der Preis von weniger als 900 US-Dollar reicht aus, um das Interesse eines jeden Budget-Gamers am MSI GF63 zu wecken. Seine Spezifikationen erfüllen viele Kriterien, darunter die schnelle Bildwiederholfrequenz von 144 Hz, die GeForce-RTX-4050-GPU, die relativ neue Core-i5- oder i7-H-CPU der 12. Generation und 512 GB Speicherplatz. Es ist im Grunde kein langsames Gerät, und es wird nur noch billiger werden, da GeForce-RTX-50-Laptops auf den Markt kommen. Das MSI System ist auch leichter als viele Alternativen, darunter das Acer Nitro V 15 oder Lenovo LOQ 15.
Leider bleibt die Benutzererfahrung unverändert gegenüber dem 2020er Modell, d. h. das Gehäuse fühlt sich immer noch billig an, und jede Wartung durch den Endbenutzer erfordert das Brechen eines Aufklebers gegen Manipulationen am Gerät. SKUs mit 8 GB RAM sollten daher vermieden werden, da der begrenzte Arbeitsspeicher die Gesamtleistung beeinträchtigt, während der Werksaufkleber von jeder Art von Nachrüstung abrät.
In Deutschland gibt es das Gerät ausschließlich mit 16 GB RAM, zudem duldet MSI hierzulande auch das sachgemäße Öffnen des Gehäuses.
Pro
Contra
Preis und Verfügbarkeit
Die Core-i7-Version des MSI Thin GF63 ist jetzt bei Amazon.de für 990 Euro erhältlich.
Das GF63 ist MSIs preisgünstigste Reihe von Gaming-Laptops für preisbewusste Gamer, die GeForce-RTX-Grafik ohne viel Schnickschnack wollen. Es ist fünf Jahre her, dass wir das letzte GF63 getestet haben, und so kommt dieses neueste Modell mit viel neueren Intel-Alder-Lake und Ada-Lovelace-GPU-Optionen.
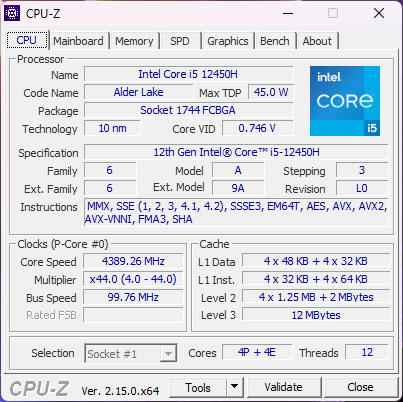
Unser Testgerät ist eine Low-End-Konfiguration, die bei Händlern wie Target und Amazon erhältlich ist. Es wird mit dem Core i5-12450H, 6 GB RTX 4050, 8 GB RAM und einem 144-Hz-1.080p-IPS-Display für ca. 850 bis 900 US-Dollar ausgeliefert. SKUs mit Core i7-12650H, RTX 4060 und der doppelten Menge an Arbeitsspeicher sind ebenfalls erhältlich.
Zu den Konkurrenten gehören andere Gaming-Notebooks der Einstiegsklasse wie das Lenovo LOQ 15, das Asus TUF A15 oder das Acer Nitro V 15.
Weitere MSI Testberichte:
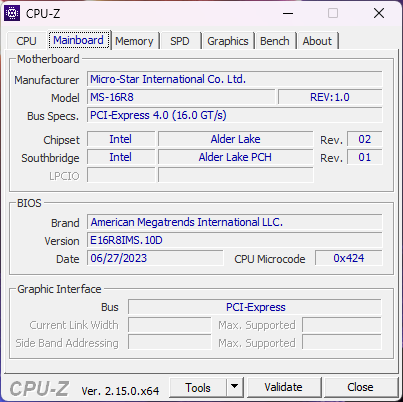
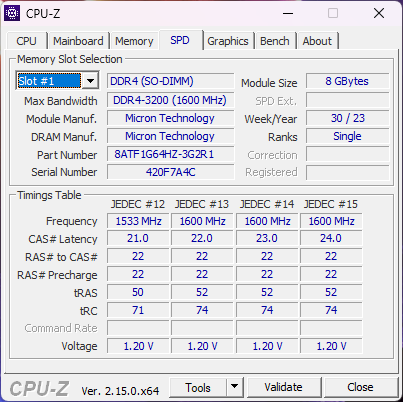
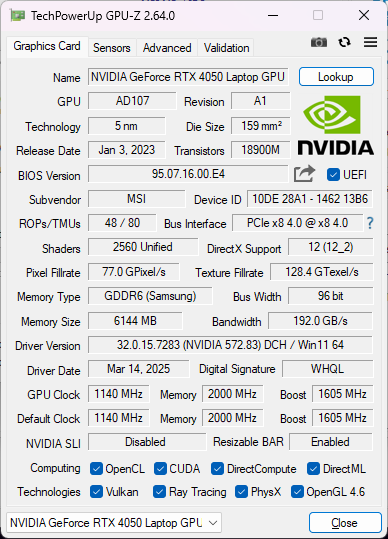
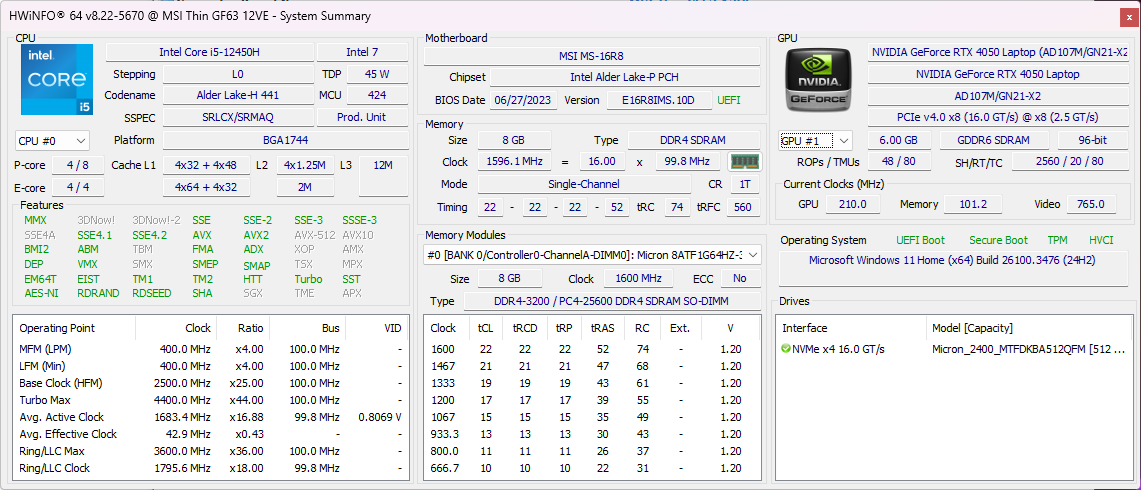
Spezifikationen
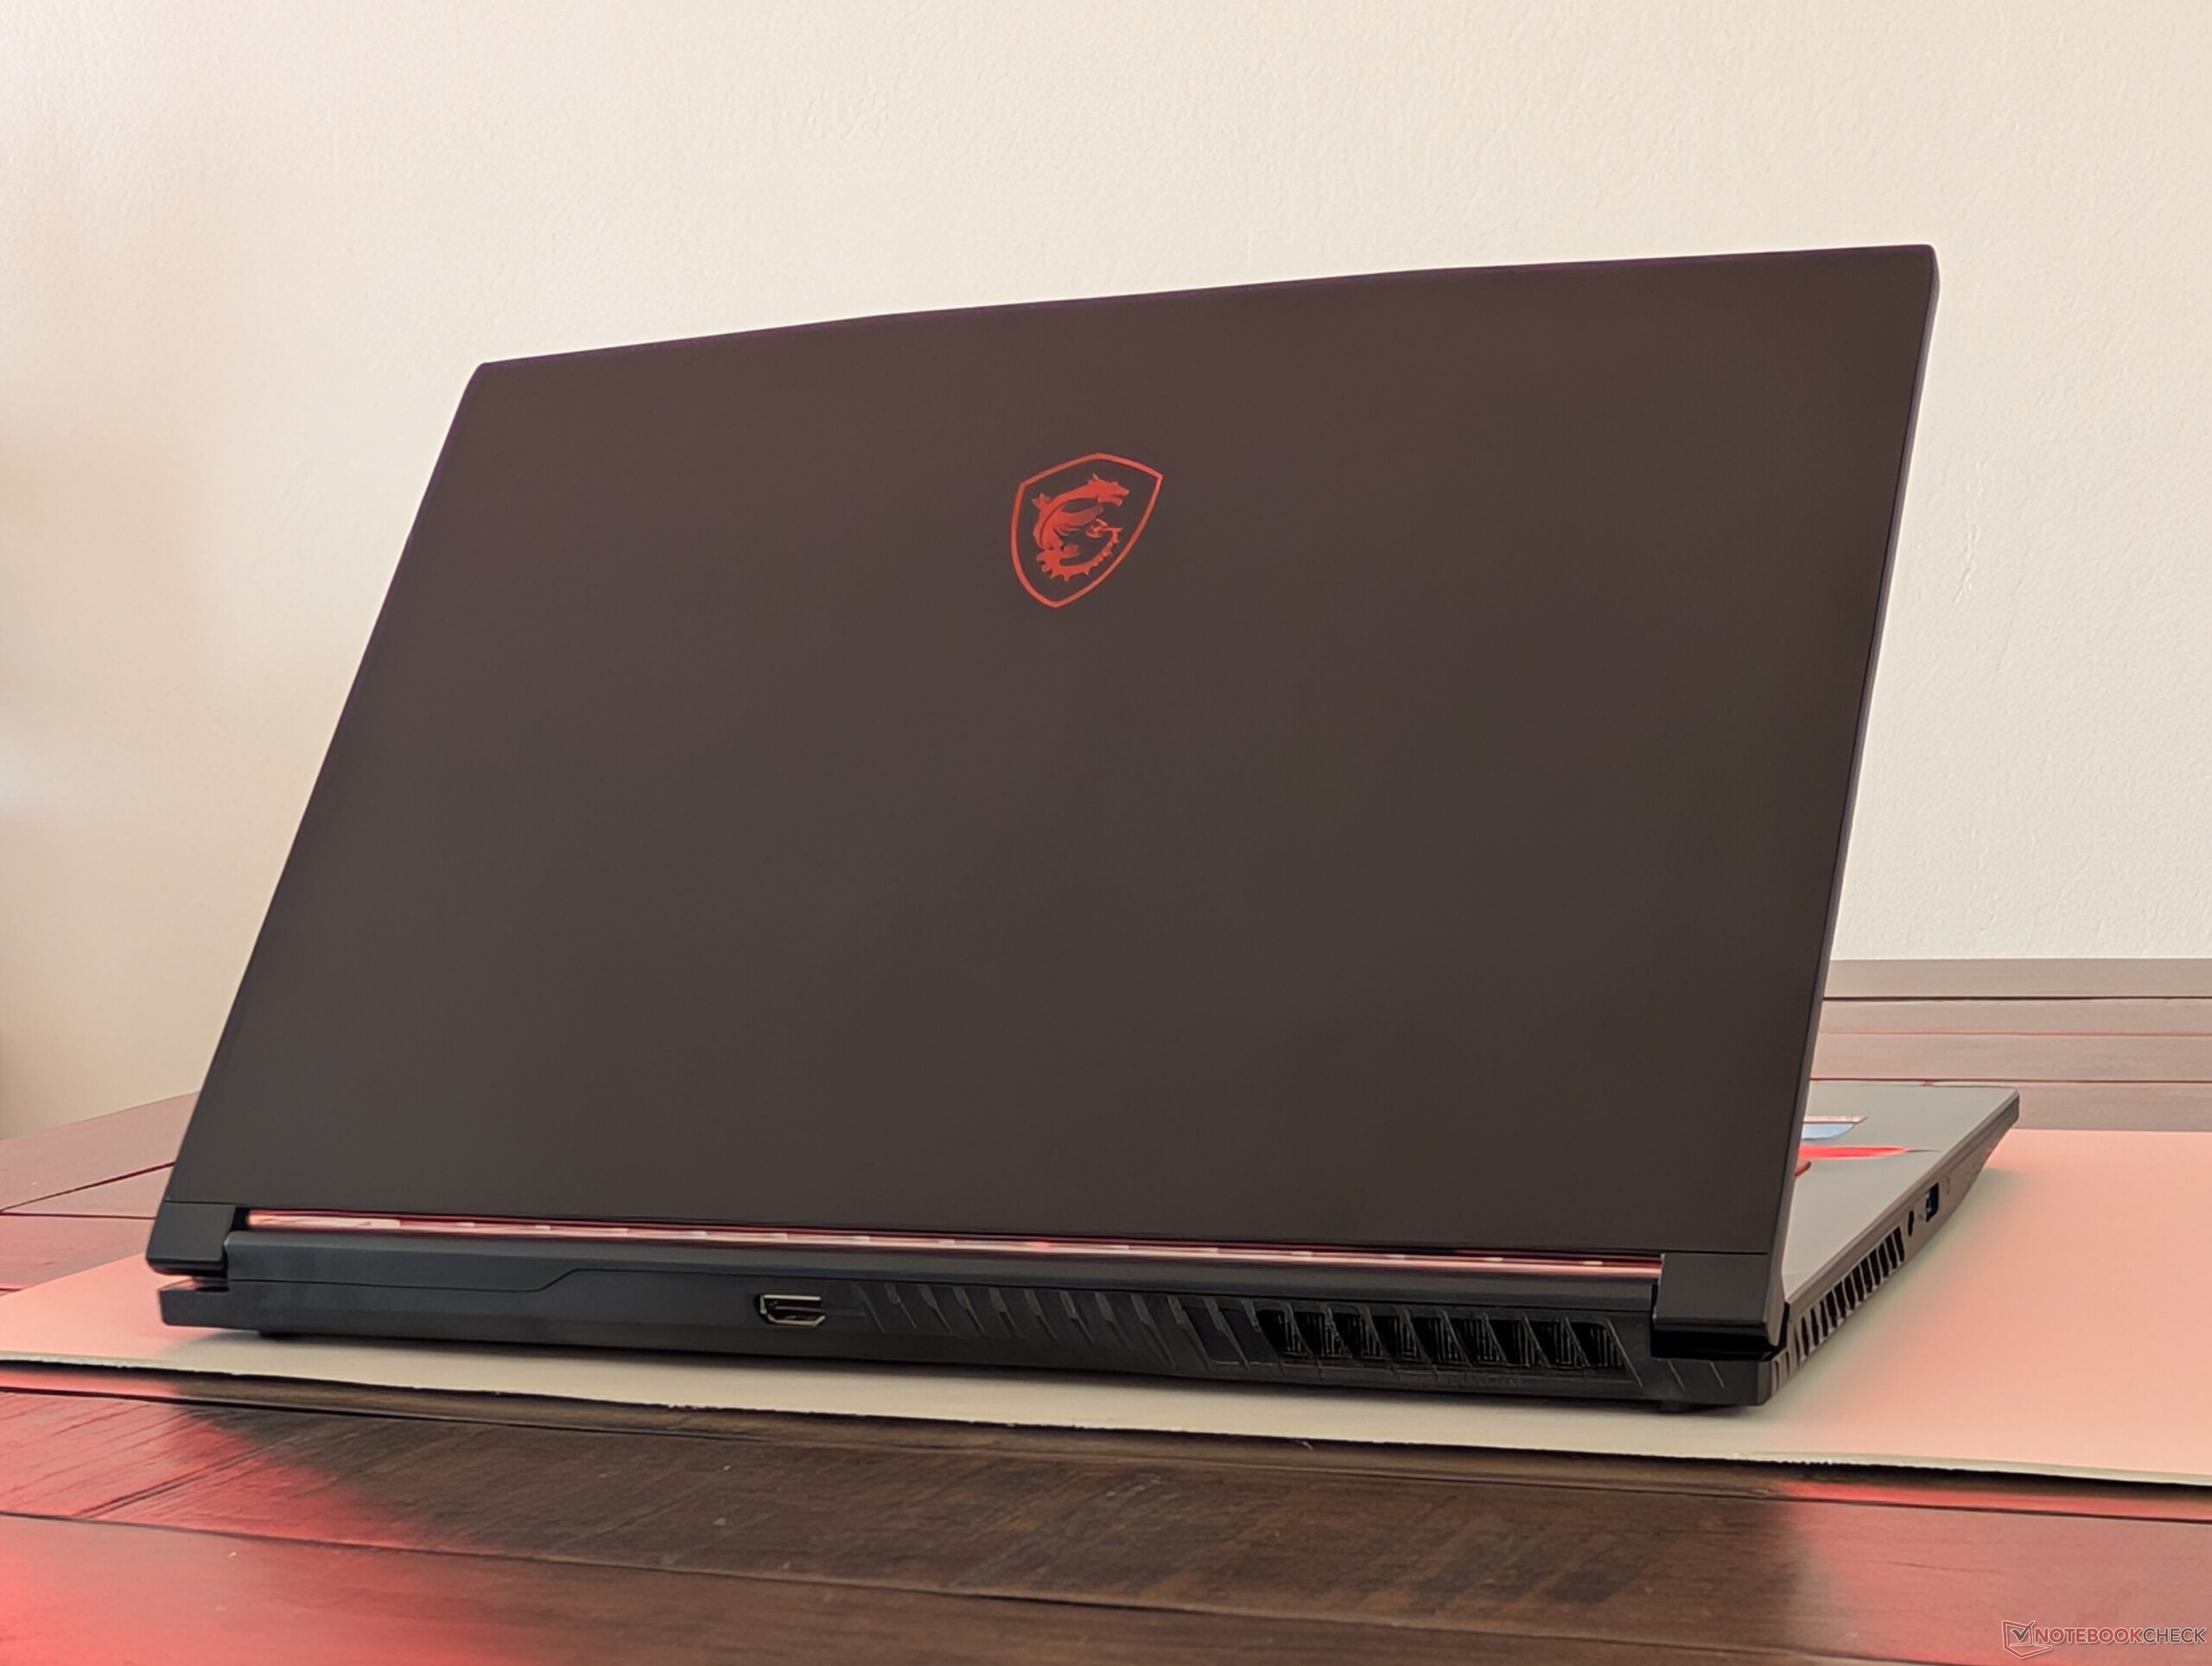
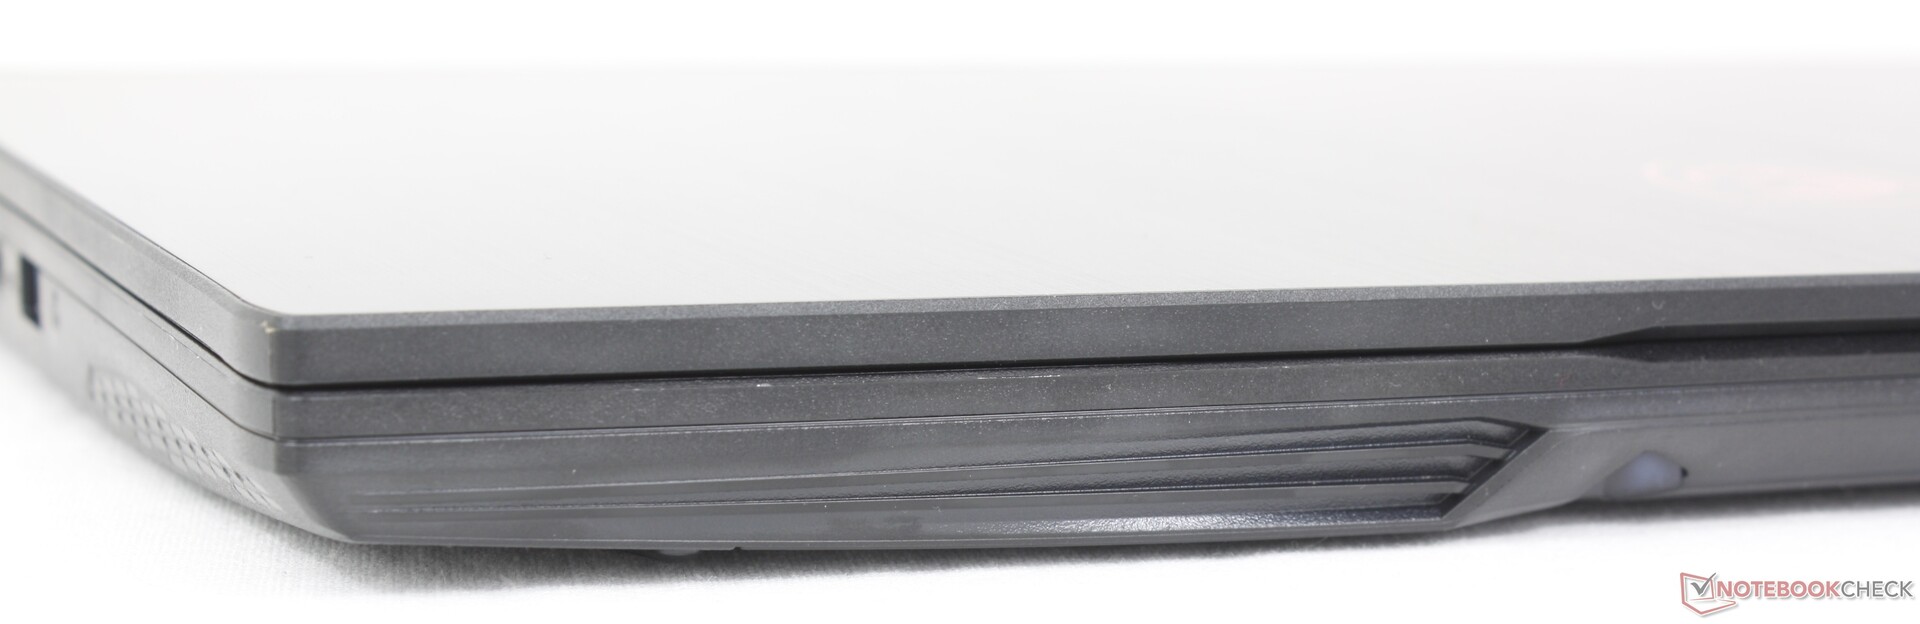
Gehäuse
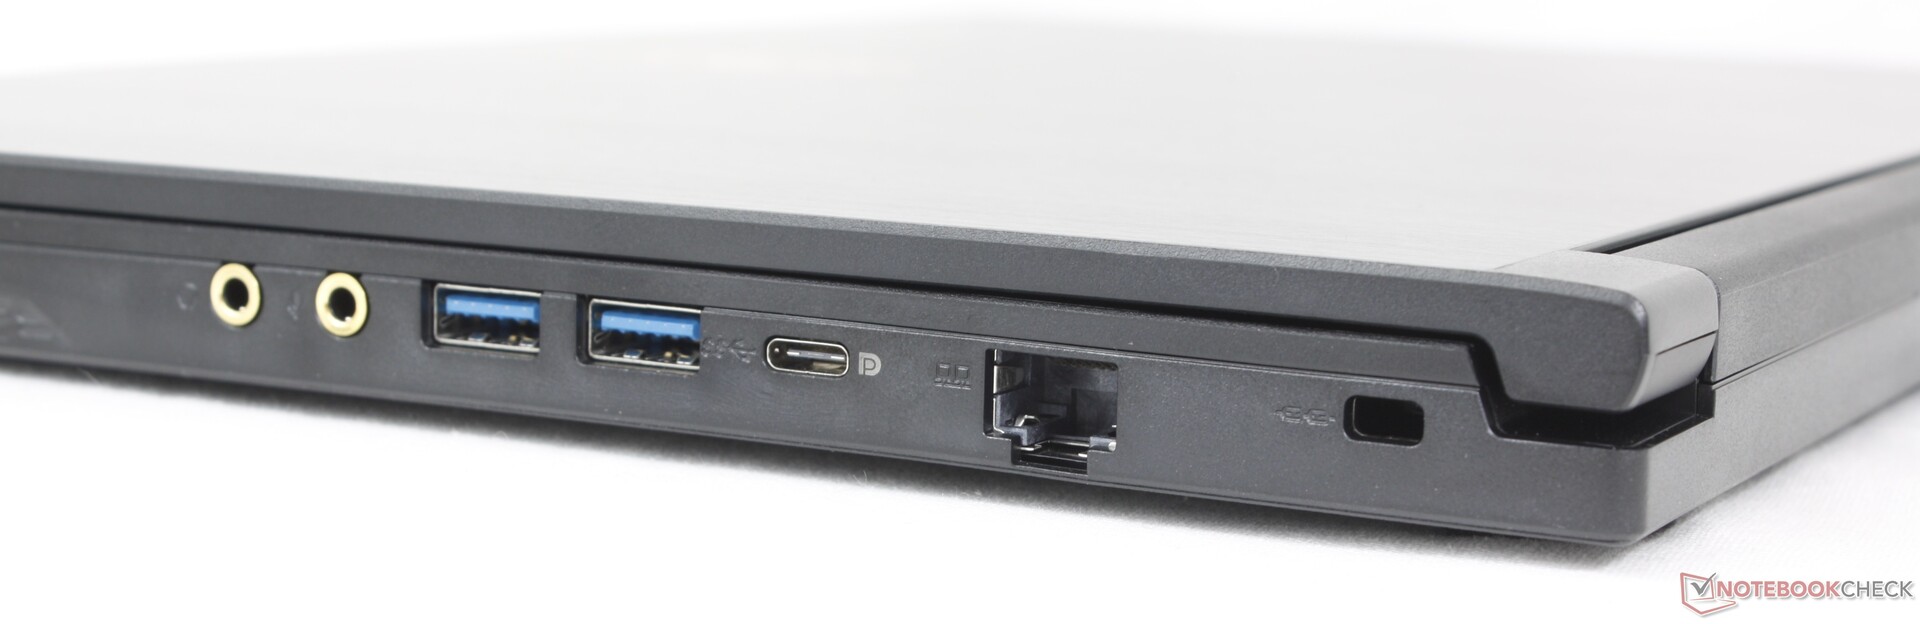
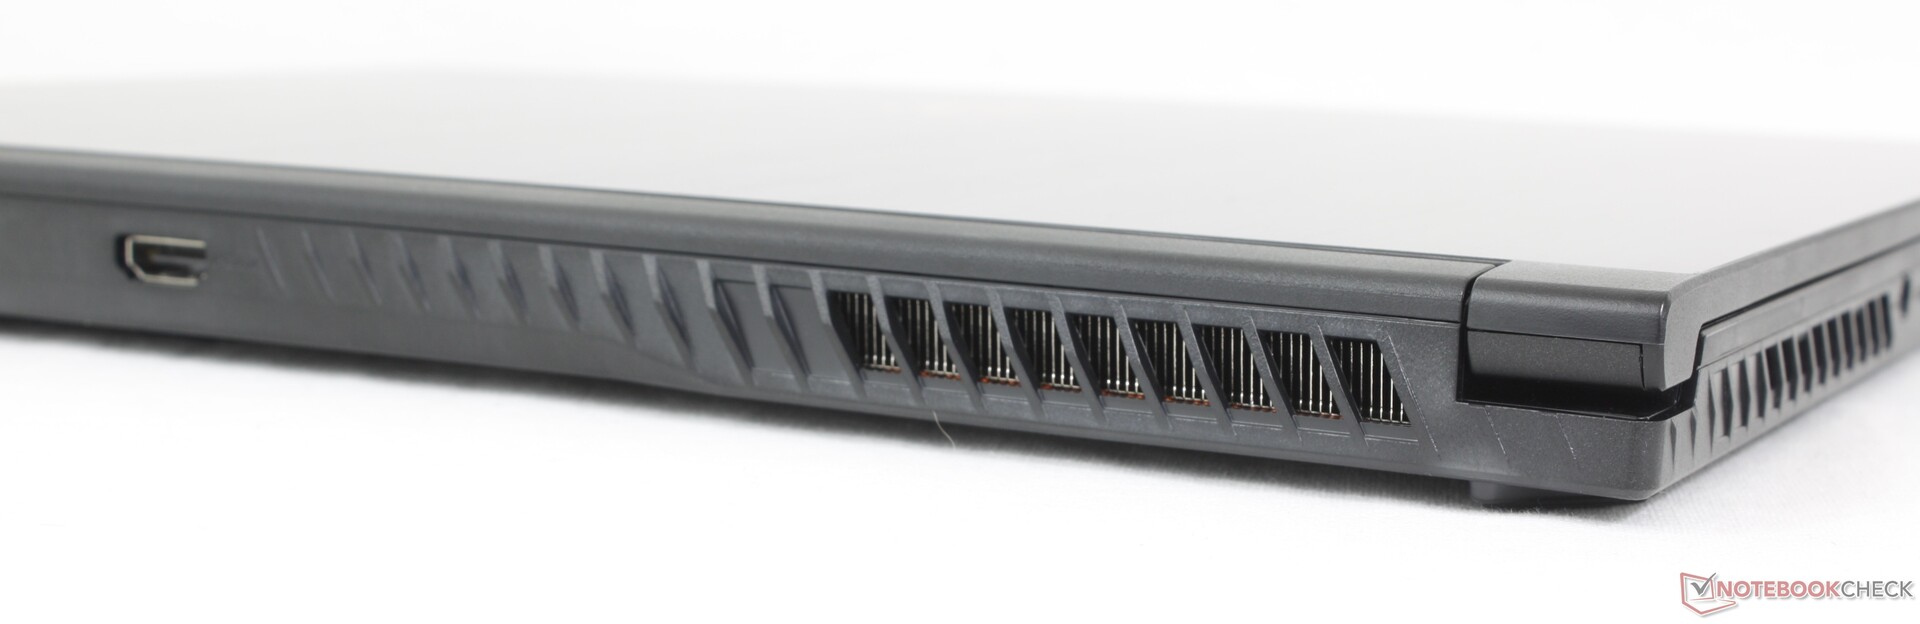
Anschlussausstattung

Kommunikation
| Networking | |
| iperf3 transmit AX12 | |
| MSI GF63 Thin 9SC | |
| iperf3 receive AX12 | |
| MSI GF63 Thin 9SC | |
| iperf3 transmit AXE11000 | |
| Asus TUF A15 FA507 | |
| MSI Thin GF63 12VE | |
| Lenovo LOQ 15IRX9 | |
| Acer Nitro V 15 ANV15-51-582S | |
| HP Victus 15-fa1057ng | |
| iperf3 receive AXE11000 | |
| Lenovo LOQ 15IRX9 | |
| Acer Nitro V 15 ANV15-51-582S | |
| Asus TUF A15 FA507 | |
| MSI Thin GF63 12VE | |
| HP Victus 15-fa1057ng | |
Webcam
Es gibt weder einen IR-Sensor noch einen physischen Kamera-Schieberegler. Stattdessen kann die Kamera elektronisch über einen Hotkey ausgeschaltet werden.


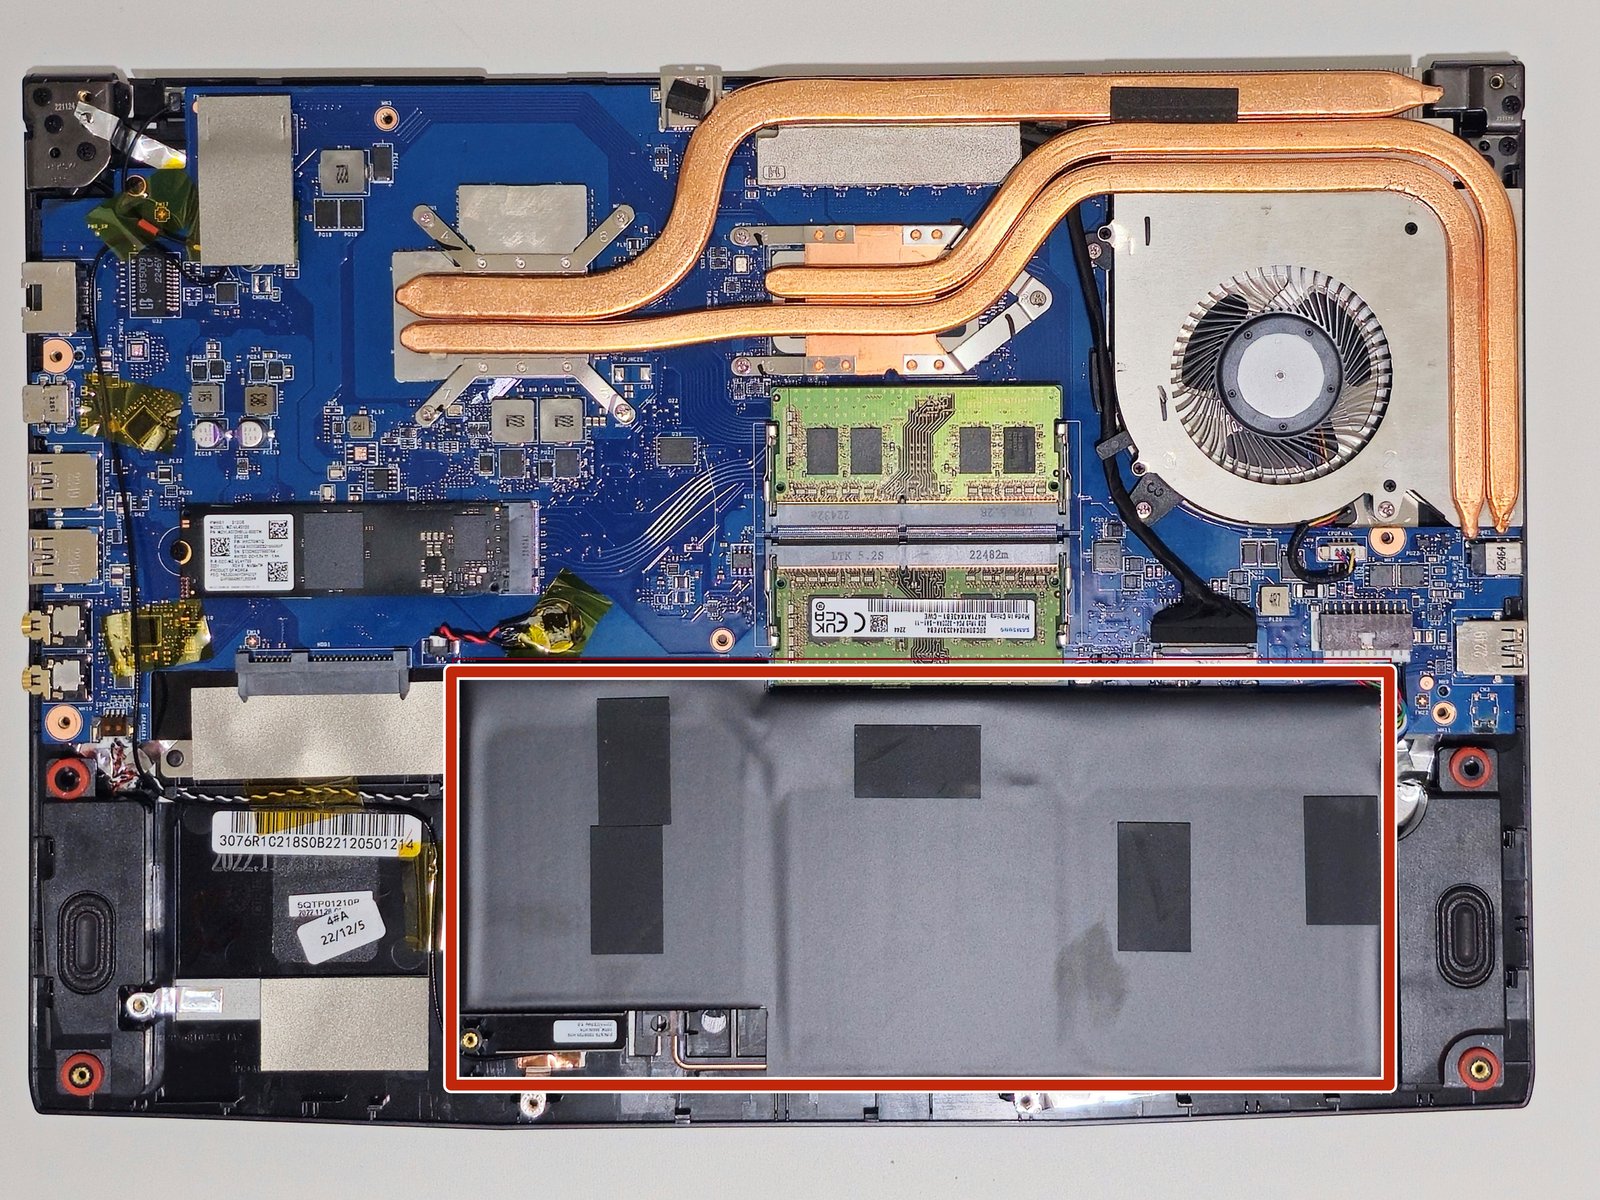
Wartung
Um die Bodenplatte zu entfernen, muss man einen Anti-Manipulations-Aufkleber abreißen. Ansonsten lässt sie sich leicht mit einem Kreuzschlitzschraubendreher entfernen.
Nachhaltigkeit
MSI wirbt nicht mit Nachhaltigkeitsmaßnahmen für die GF63-Serie. Die Verpackung besteht jedoch größtenteils aus Papier und Karton.
Zubehör und Garantie
In der Verpackung befinden sich keine Extras. Es gilt die einjährige beschränkte Herstellergarantie.
Eingabegeräte
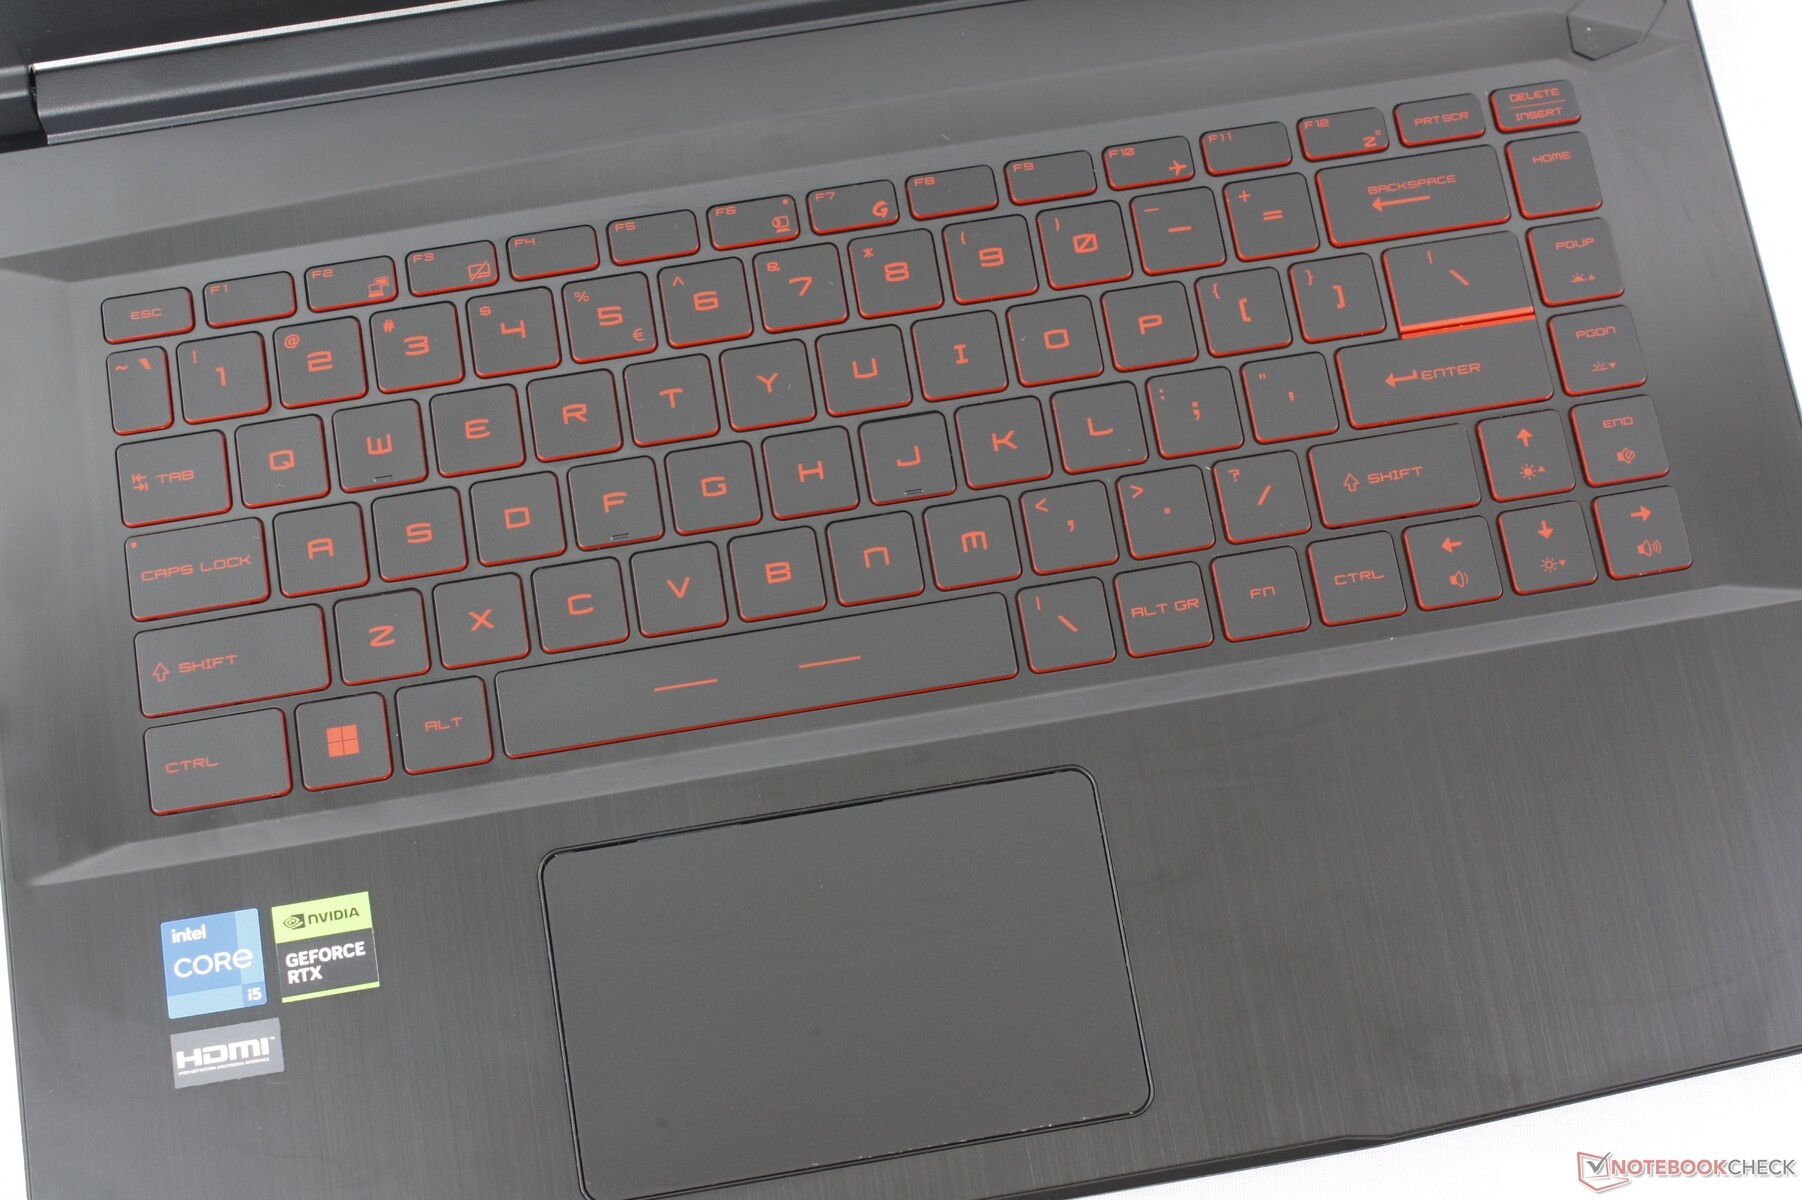
Tastatur und Touchpad
Das Clickpad und die Tastatur mit roter Hintergrundbeleuchtung wurden im Vergleich zum Modell 2020 nicht verändert. Sogar die Größe des Clickpads bleibt gleich.
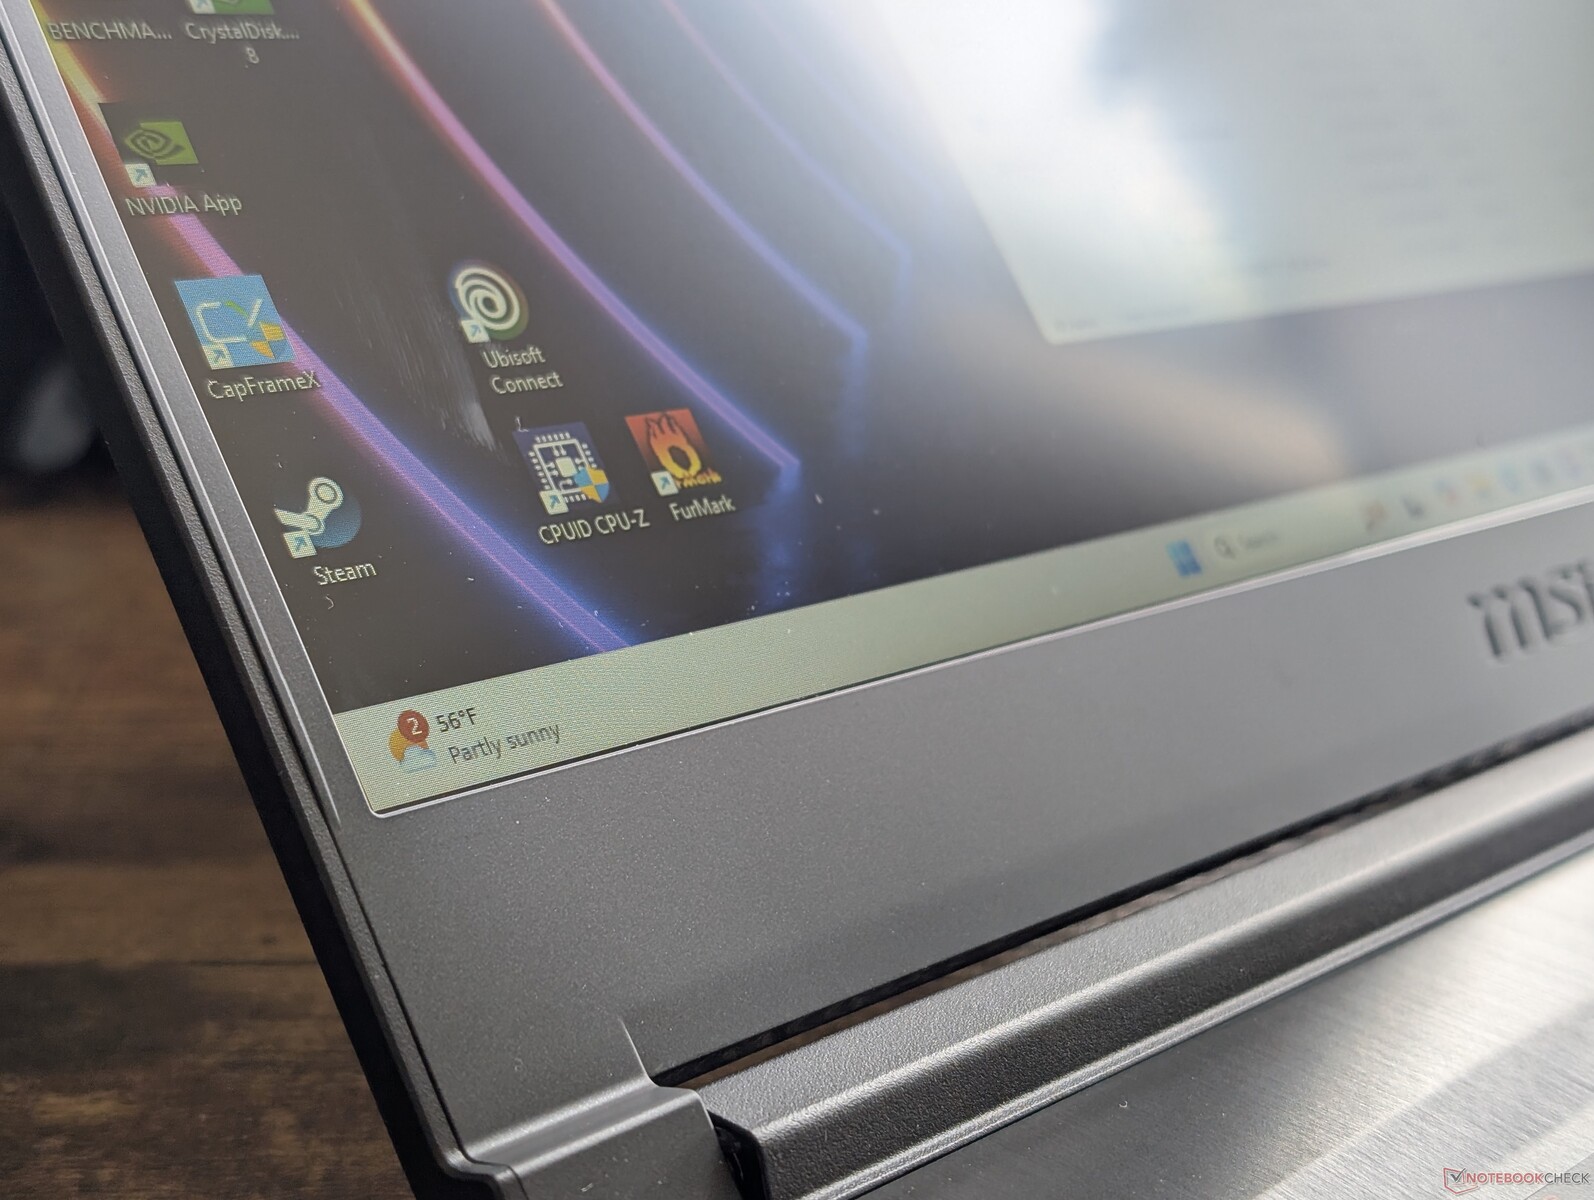
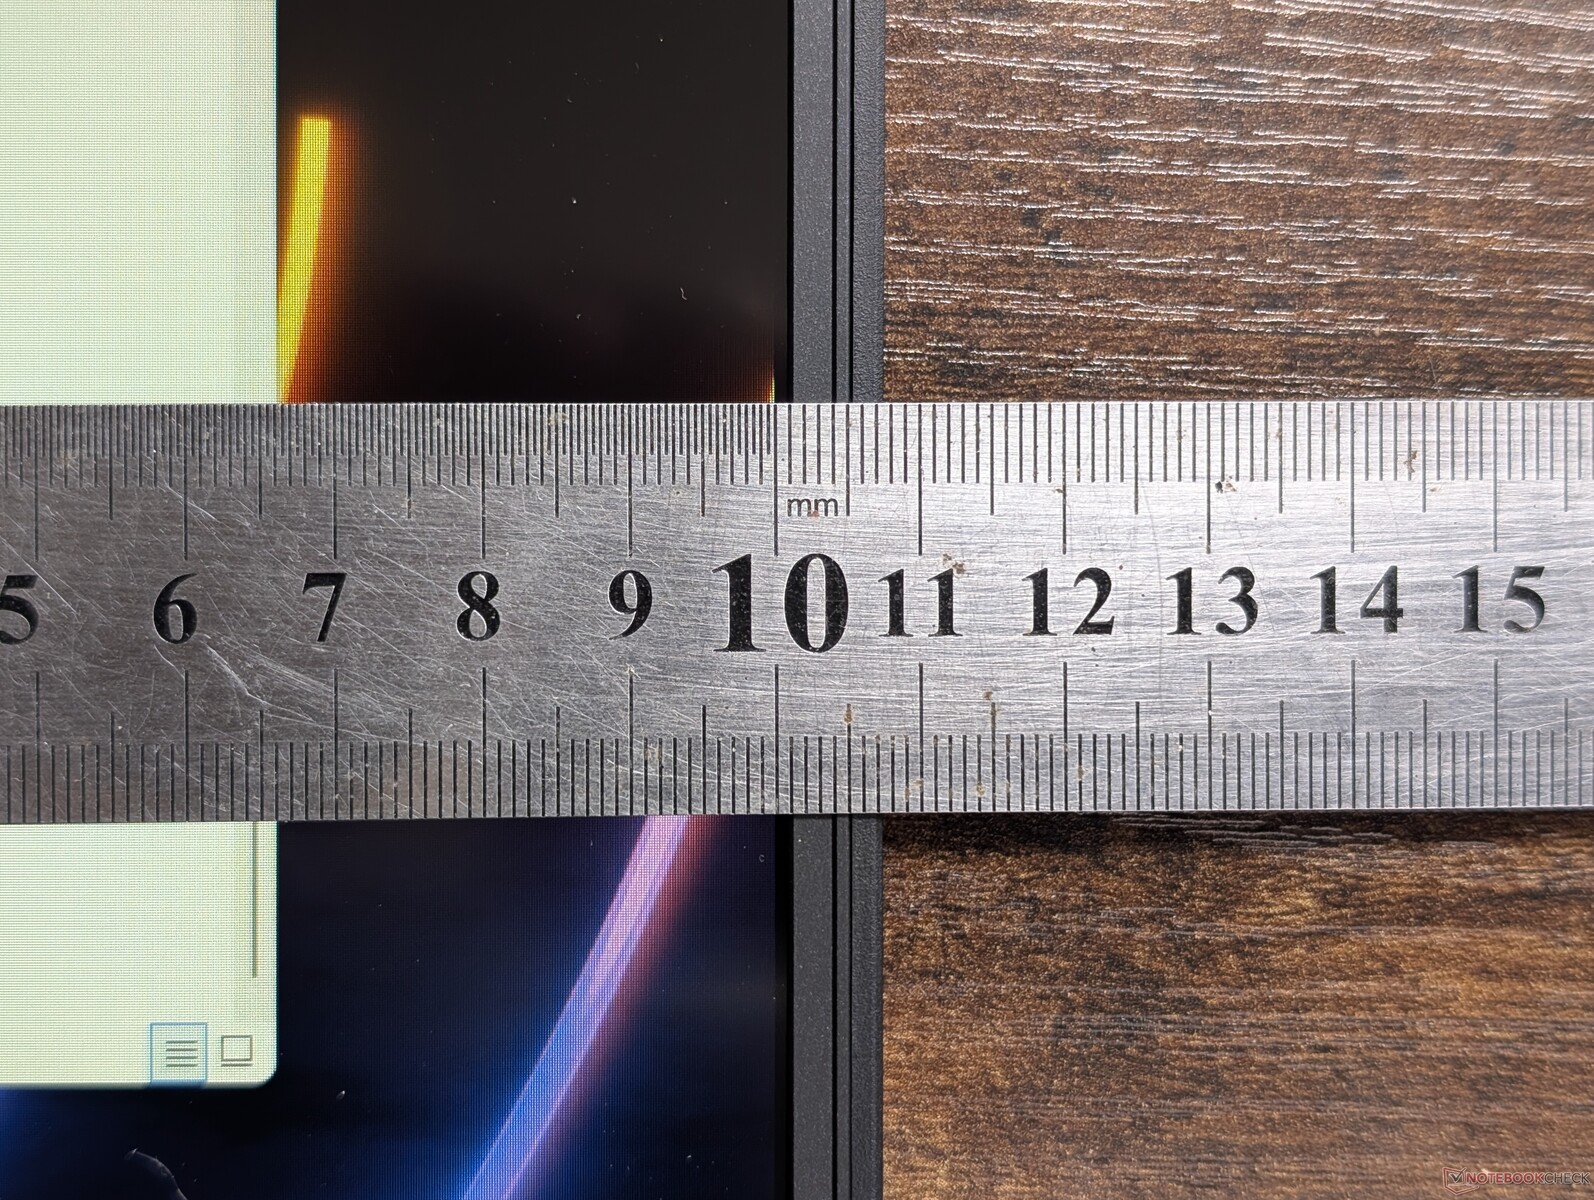
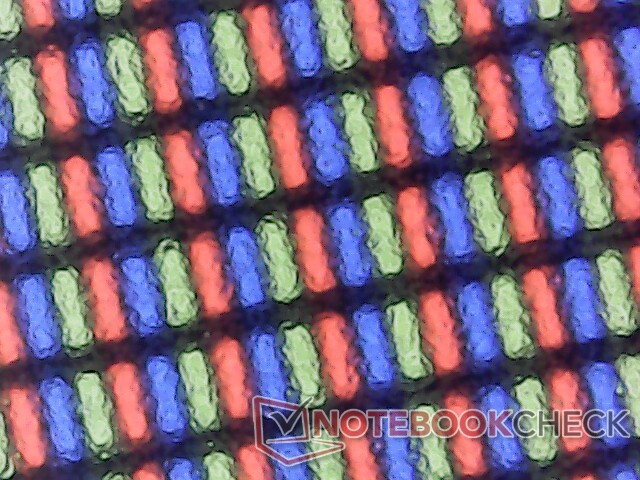
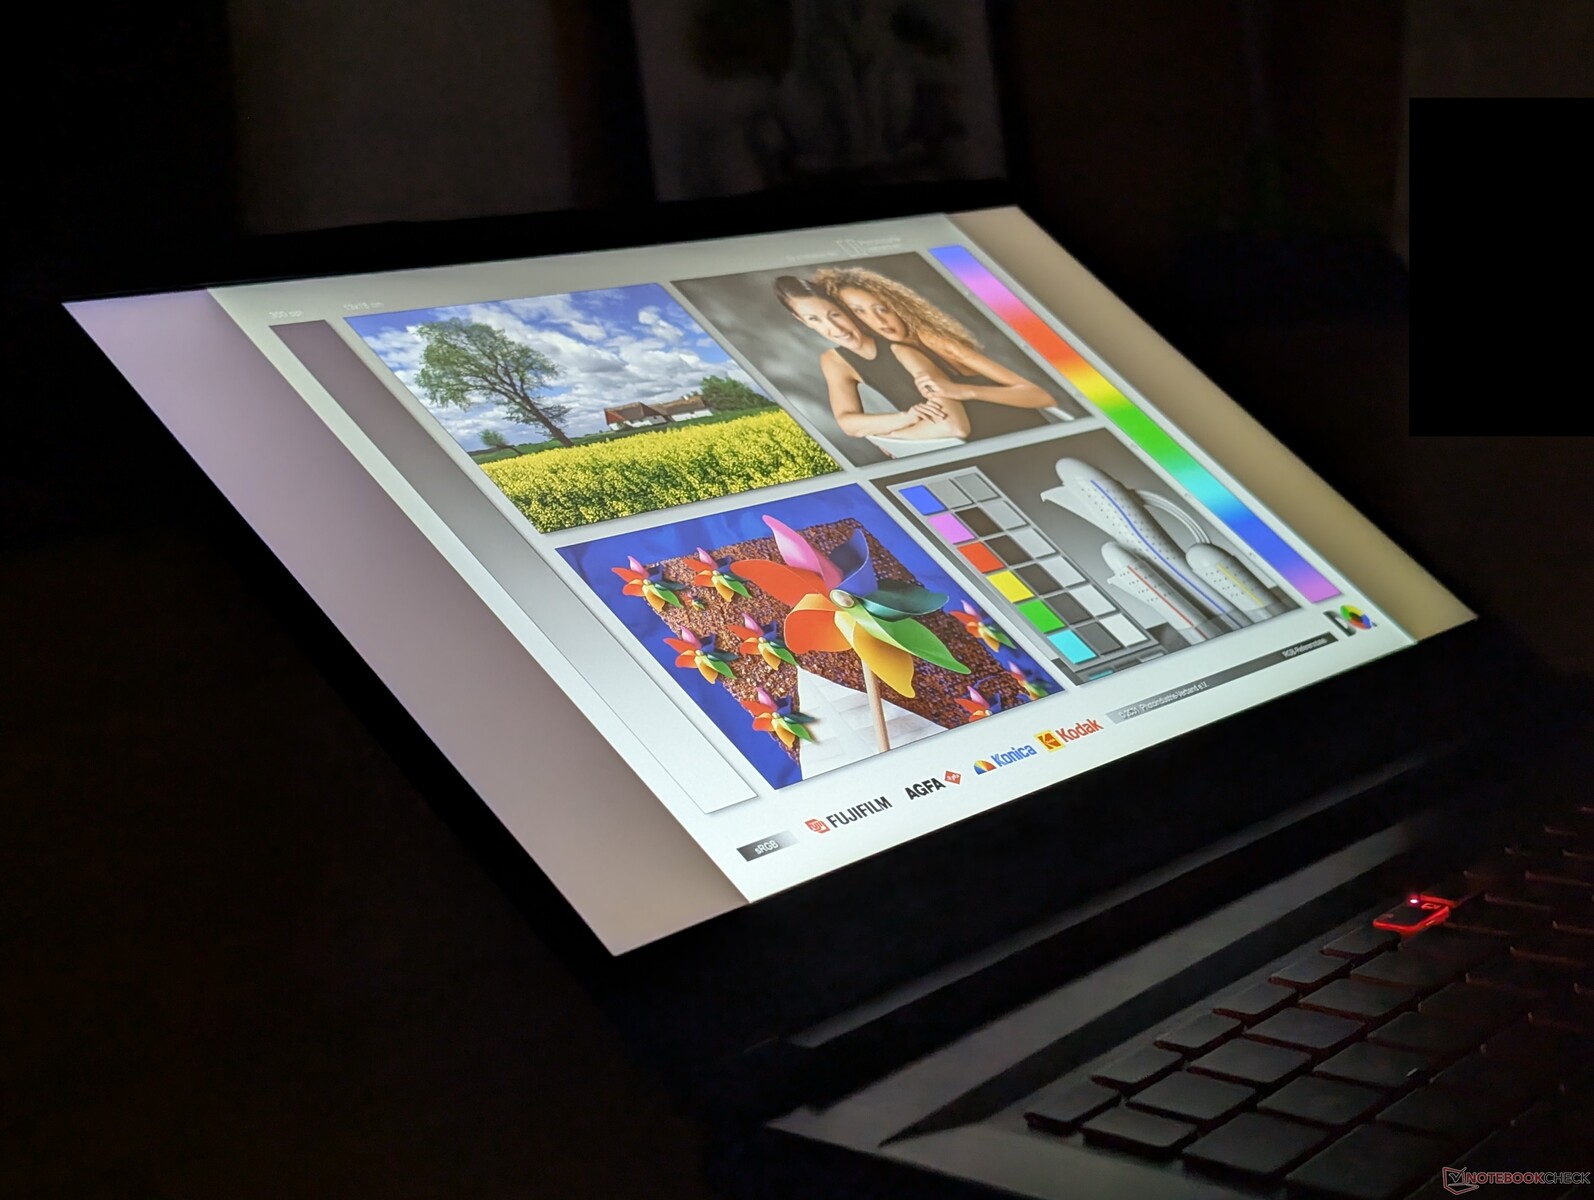
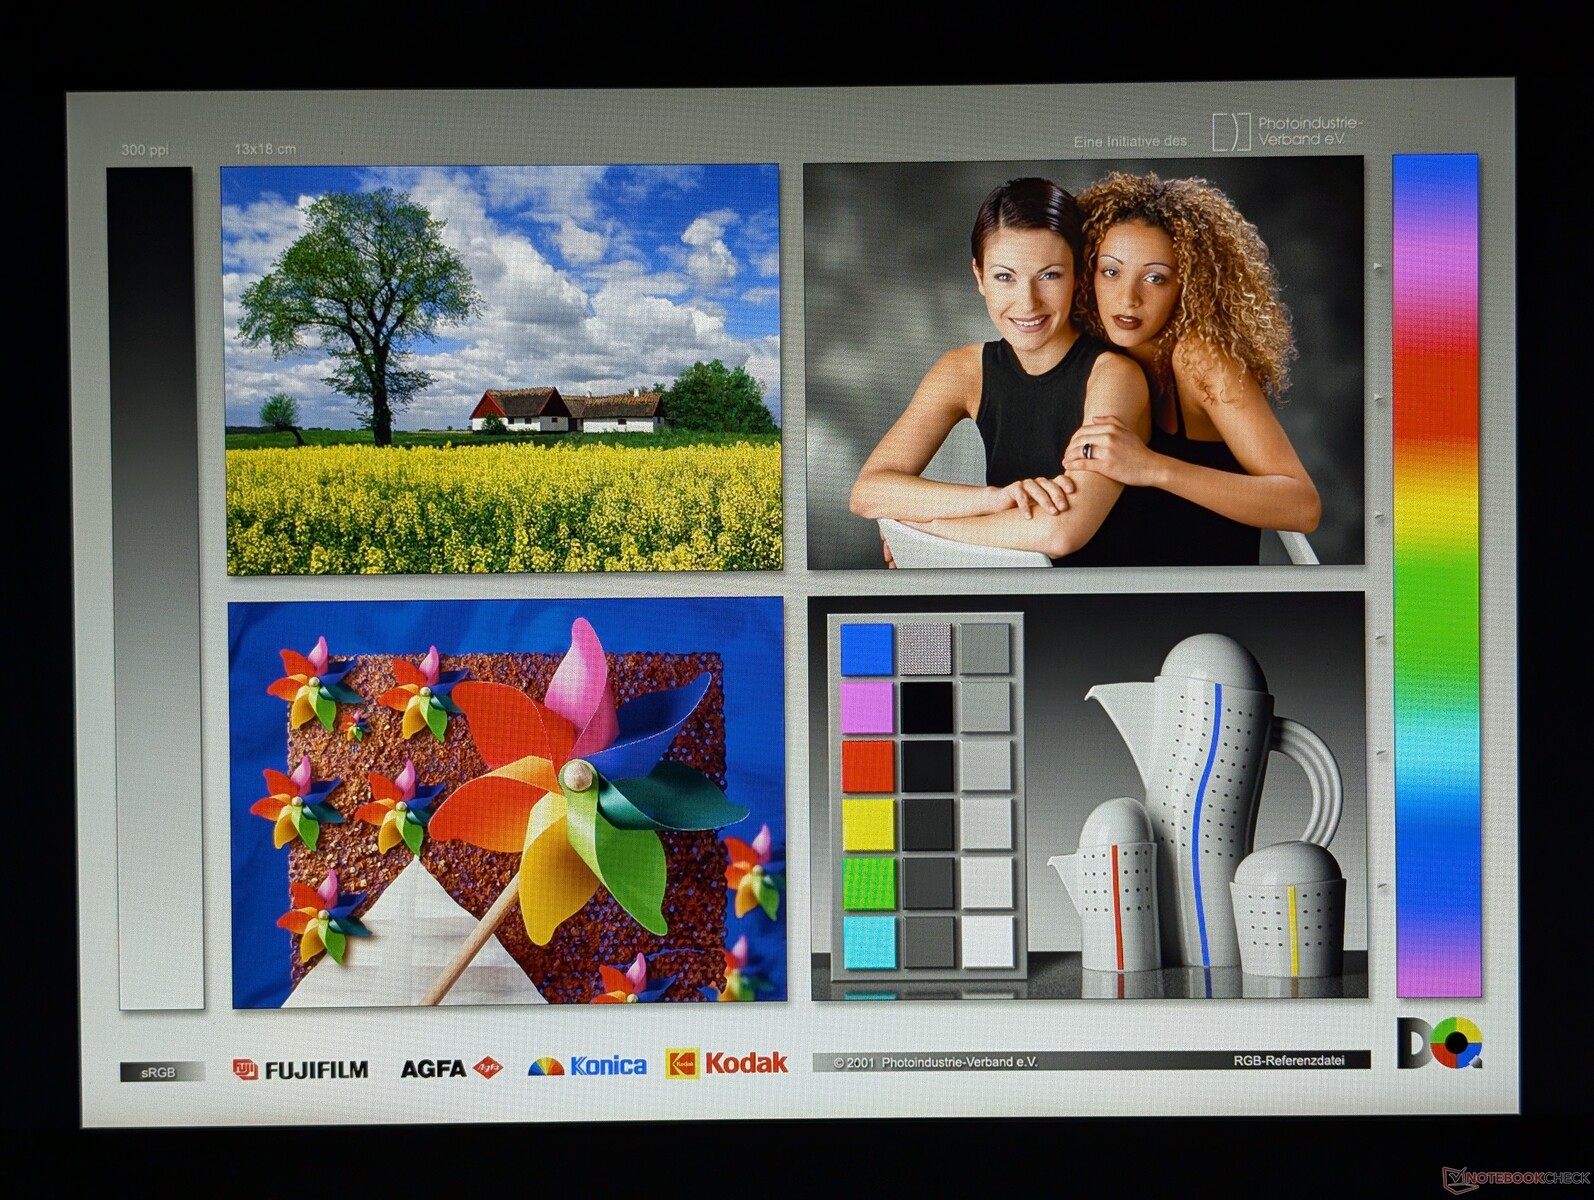
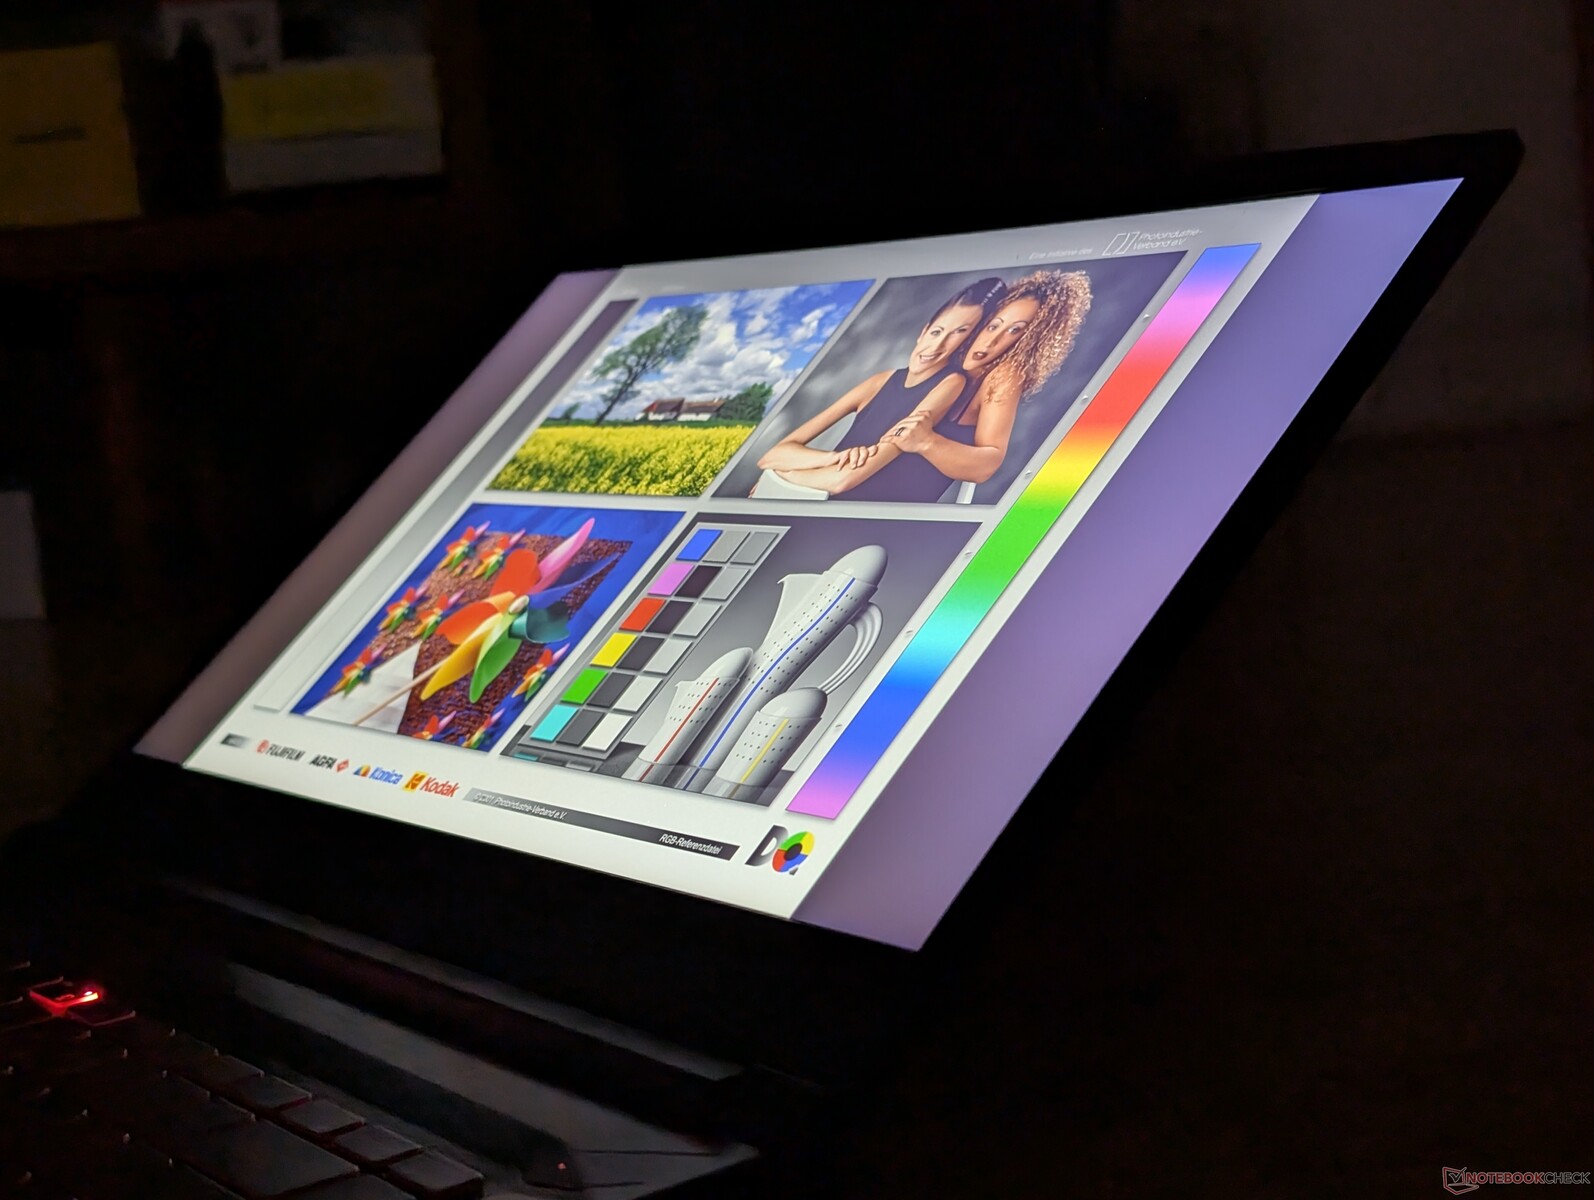
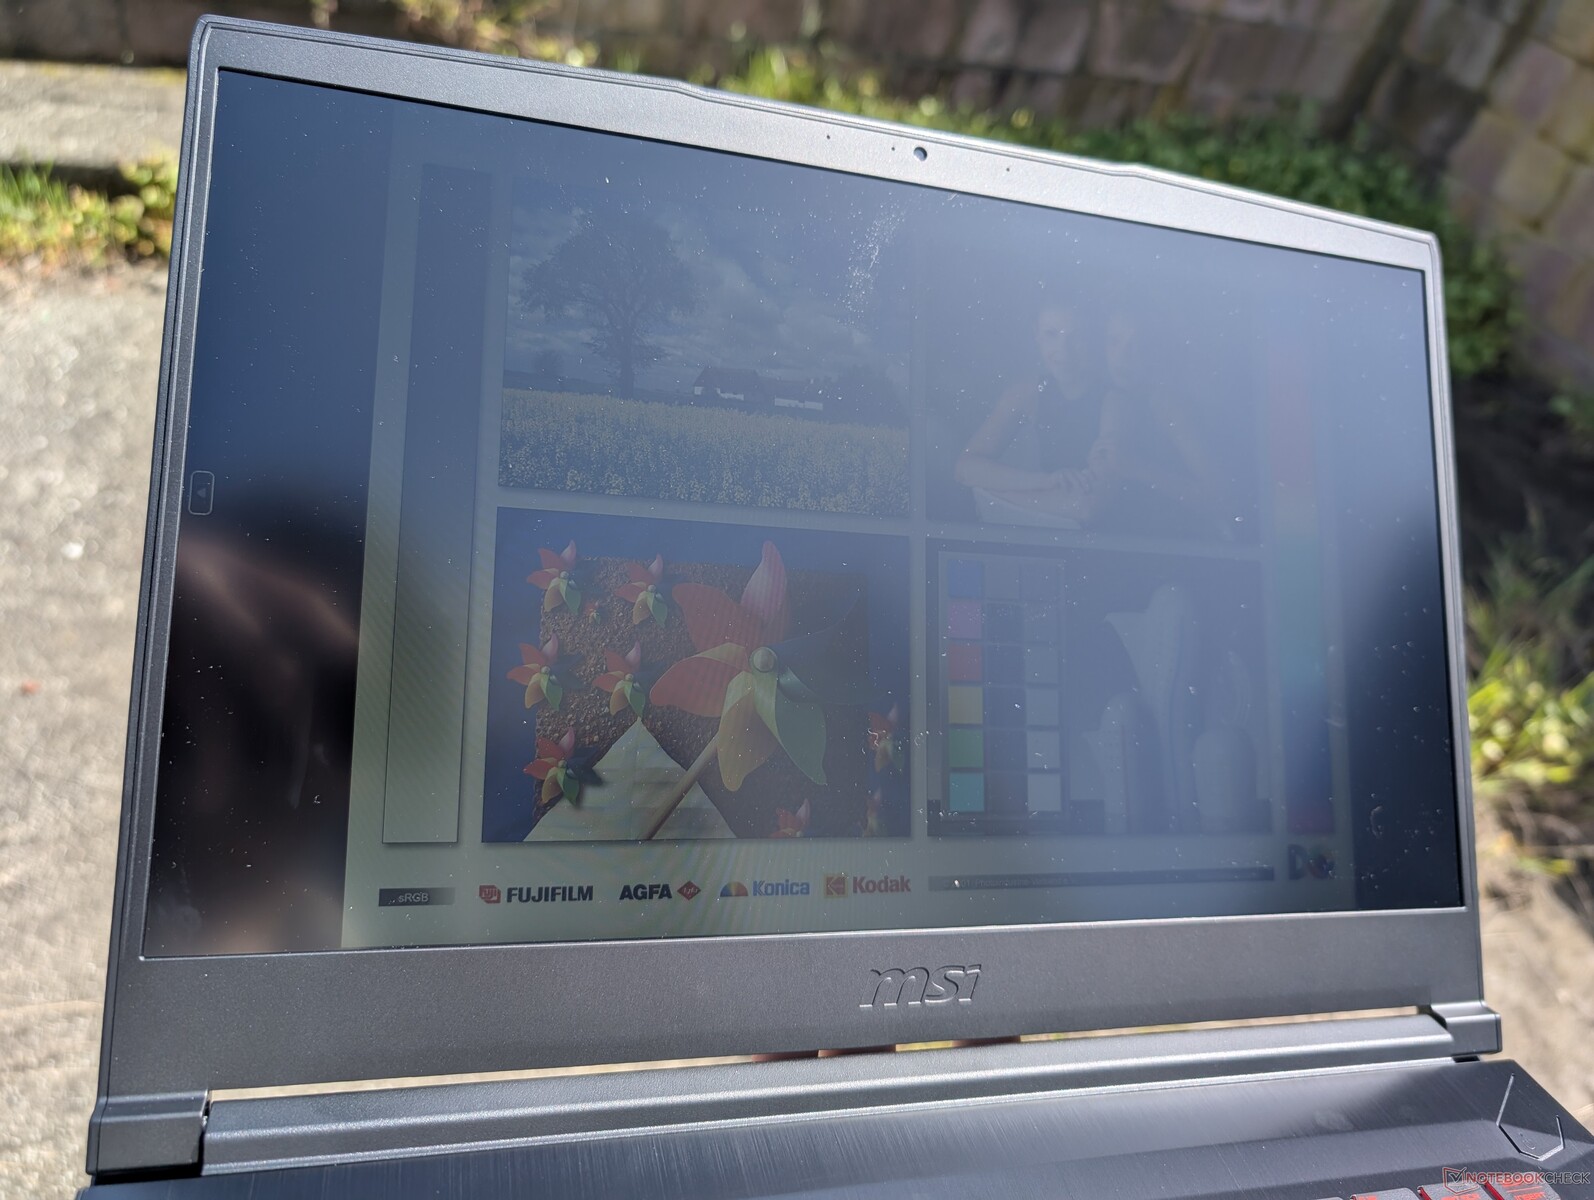
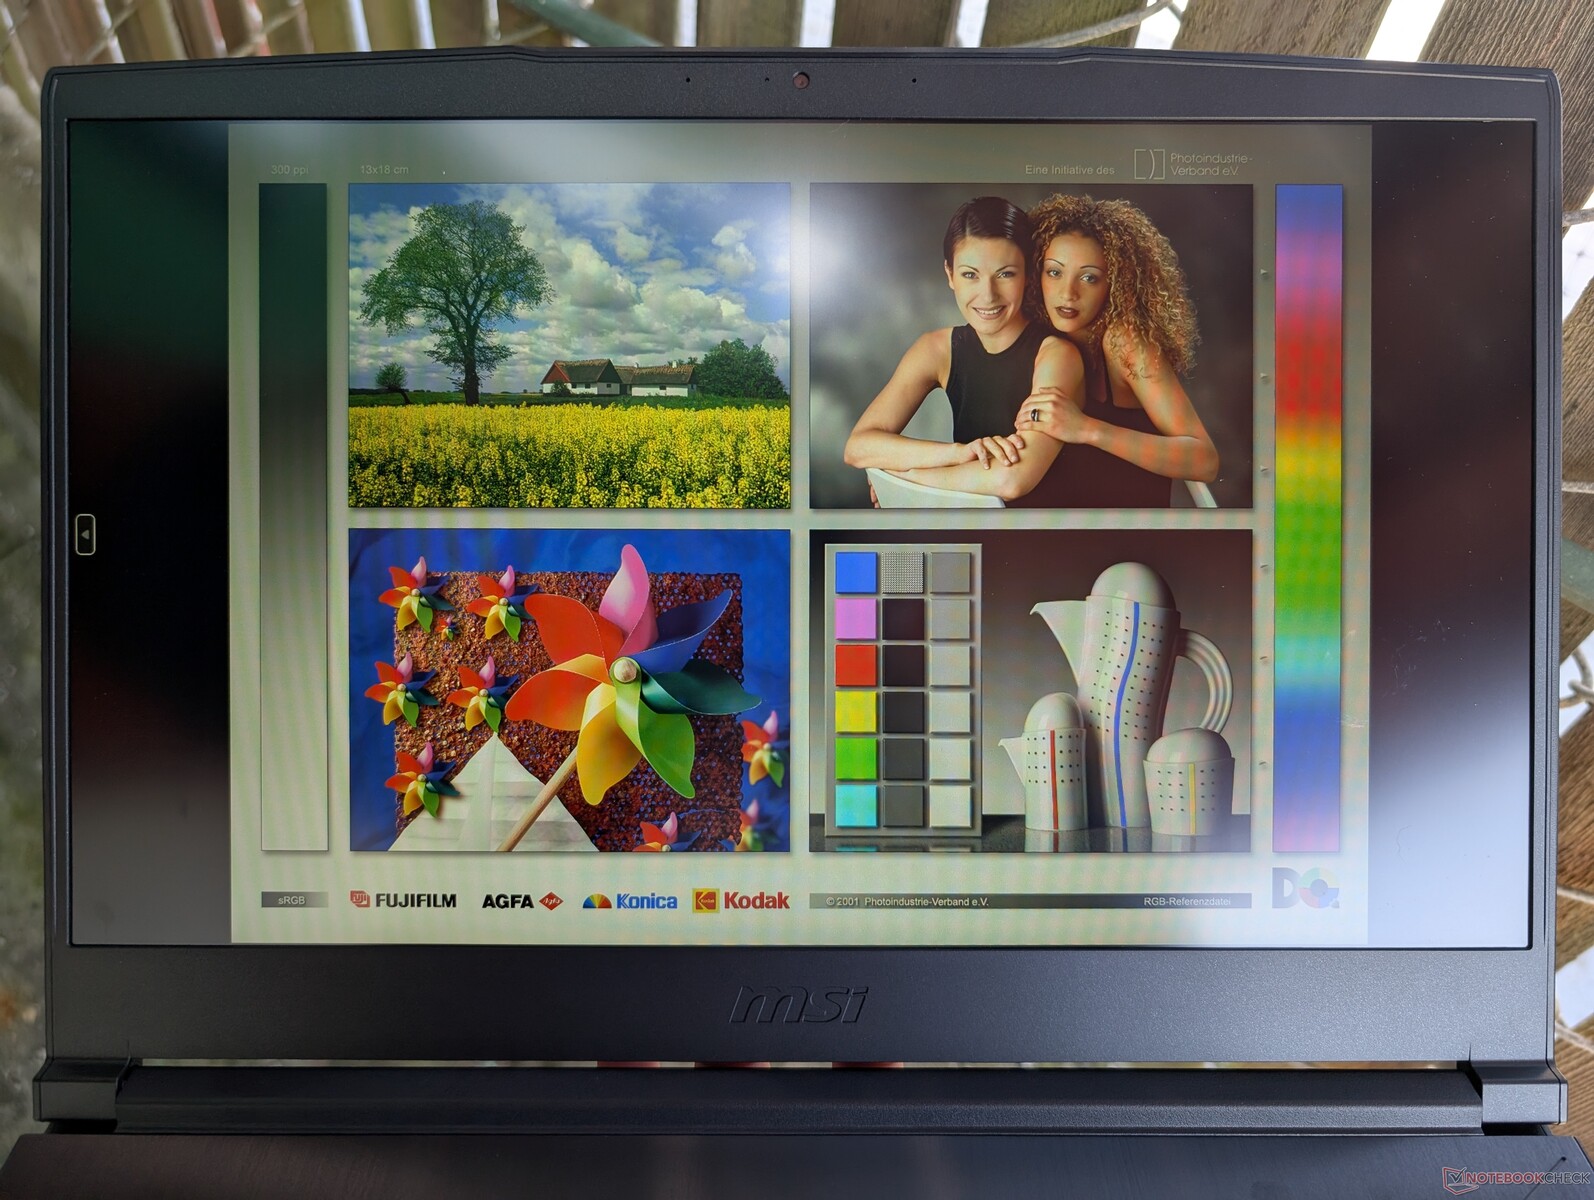
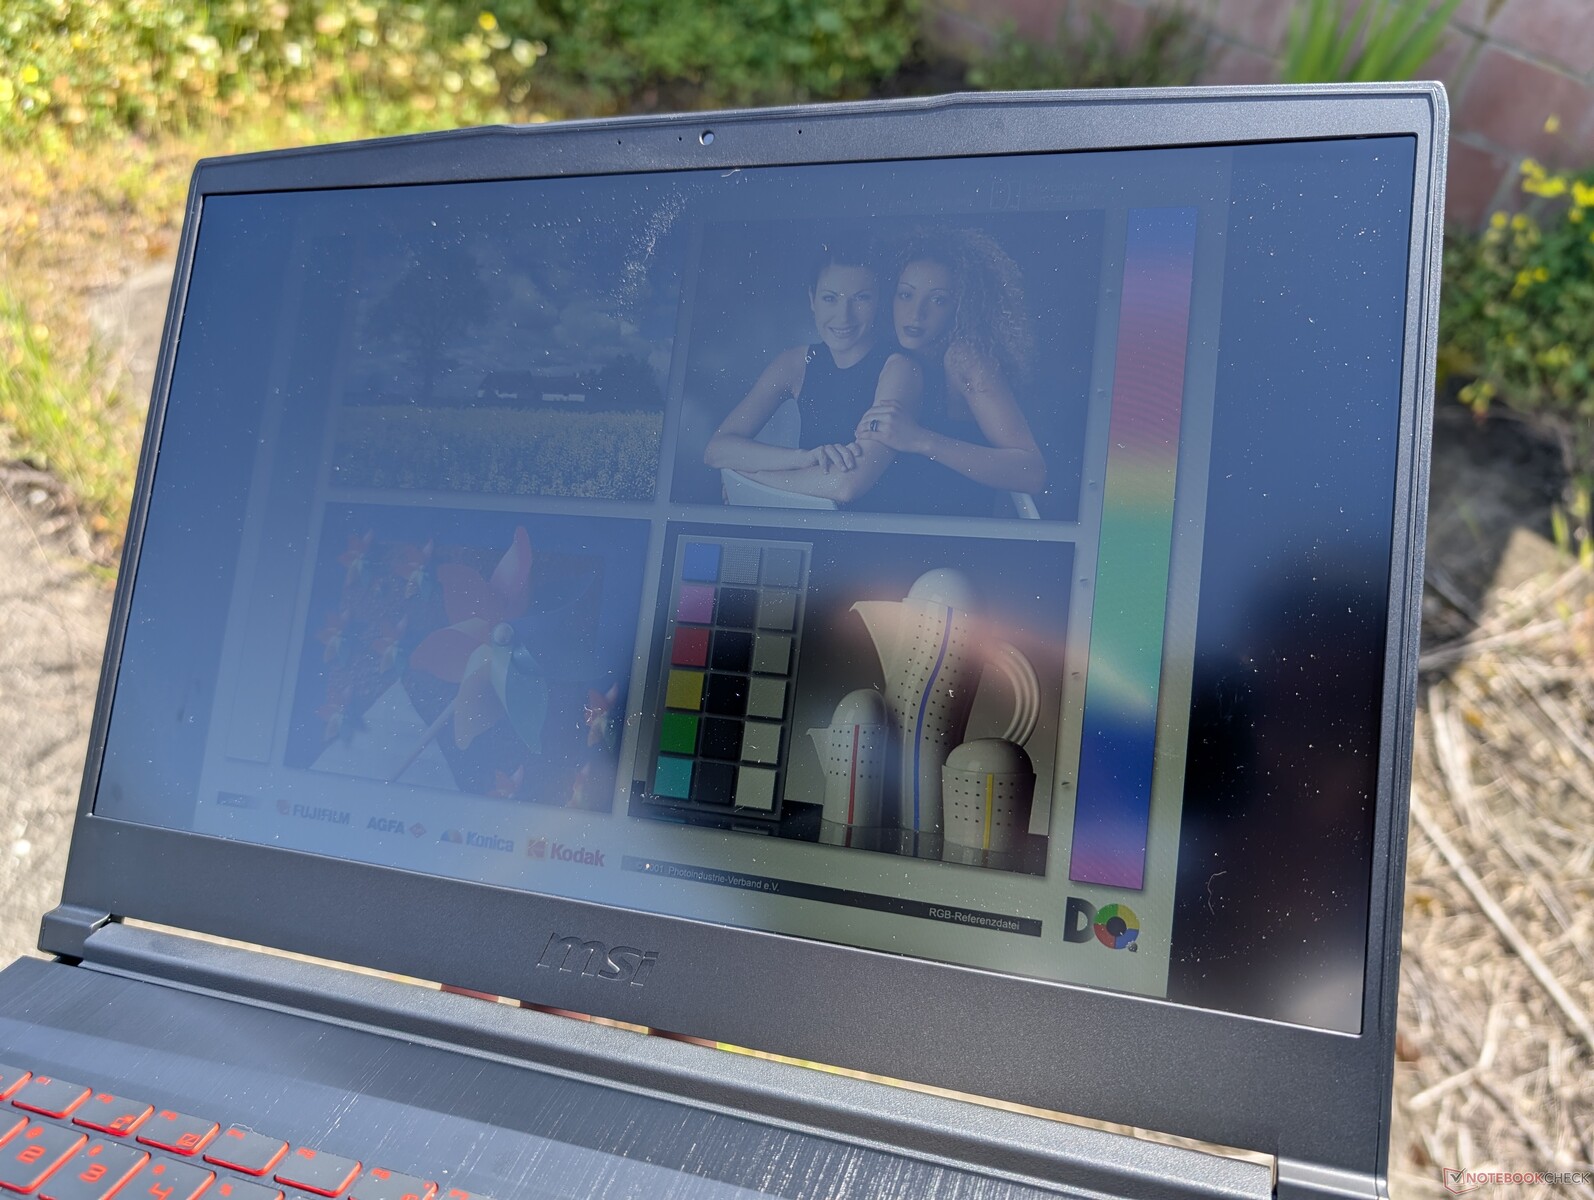
Display
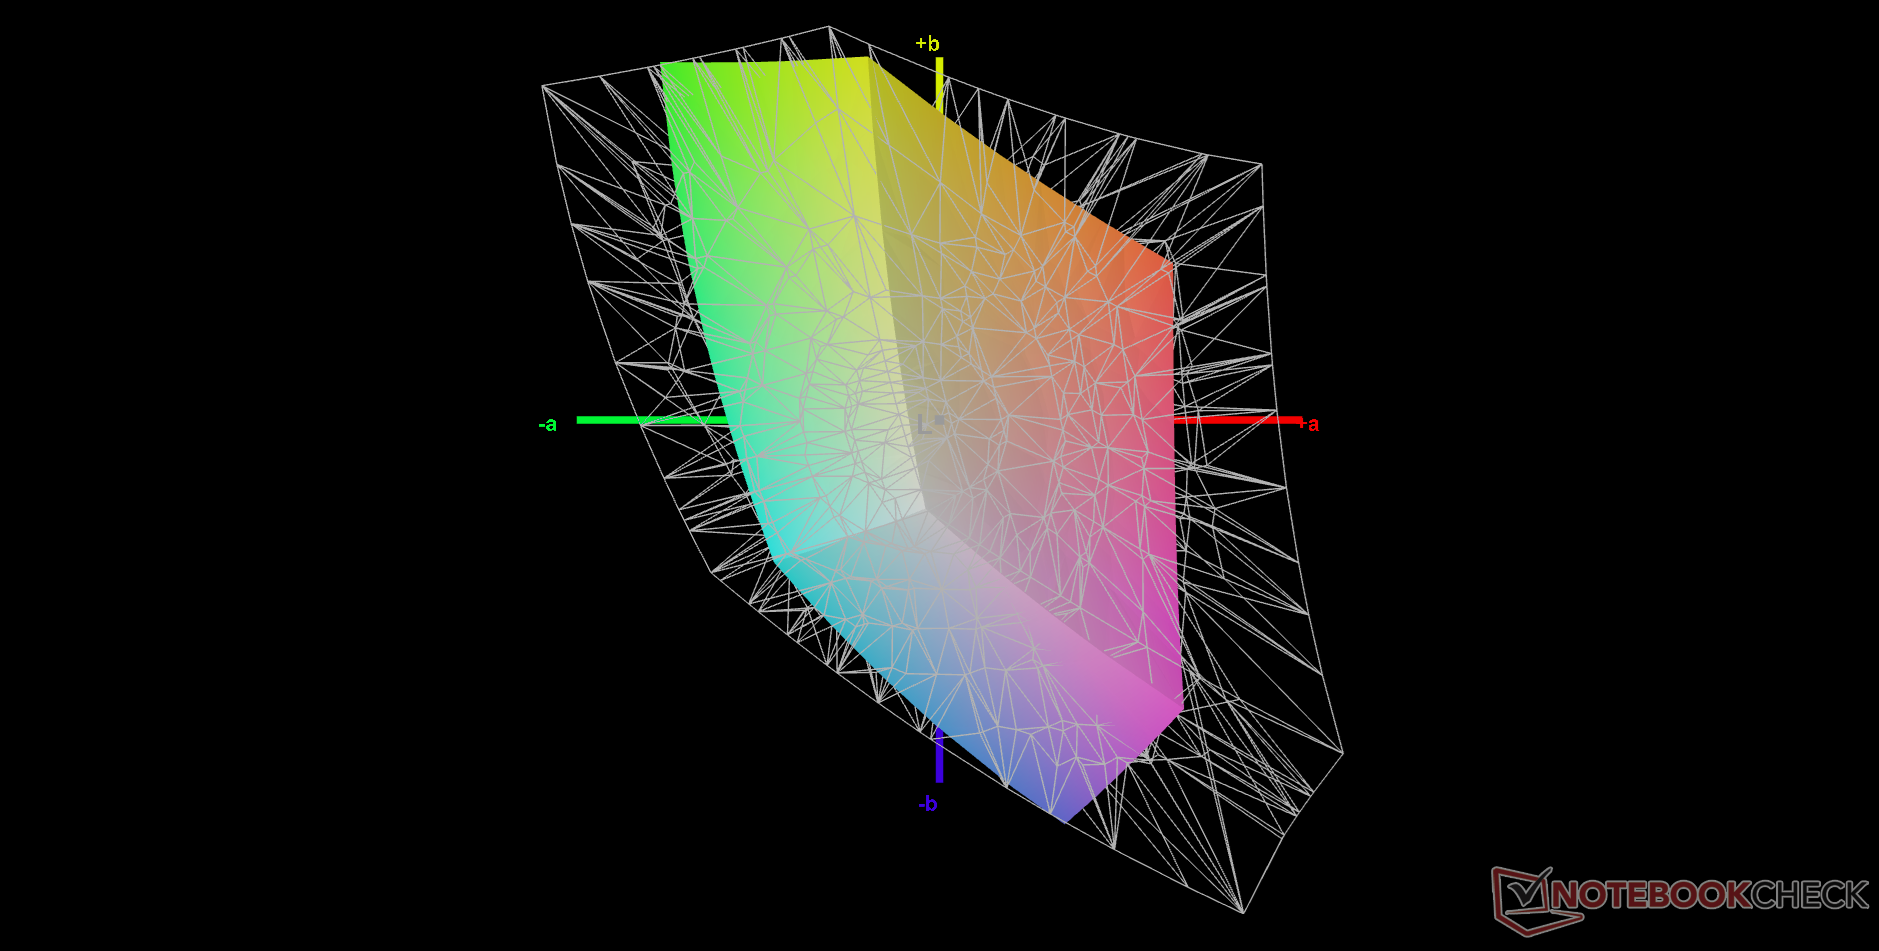
Unser AU Optronics B156HAN08.4 IPS-Panel ist ein Upgrade gegenüber dem AU Optronics B156HAN02.1 auf dem 2020 GF63 in Bezug auf die native Bildwiederholrate und die Reaktionszeiten. Allerdings bleiben die sRGB-Abdeckung und die Helligkeit schwach.
| |||||||||||||||||||||||||
Ausleuchtung: 96 %
Helligkeit Akku: 248.6 cd/m²
Kontrast: 1381:1 (Schwarzwert: 0.18 cd/m²)
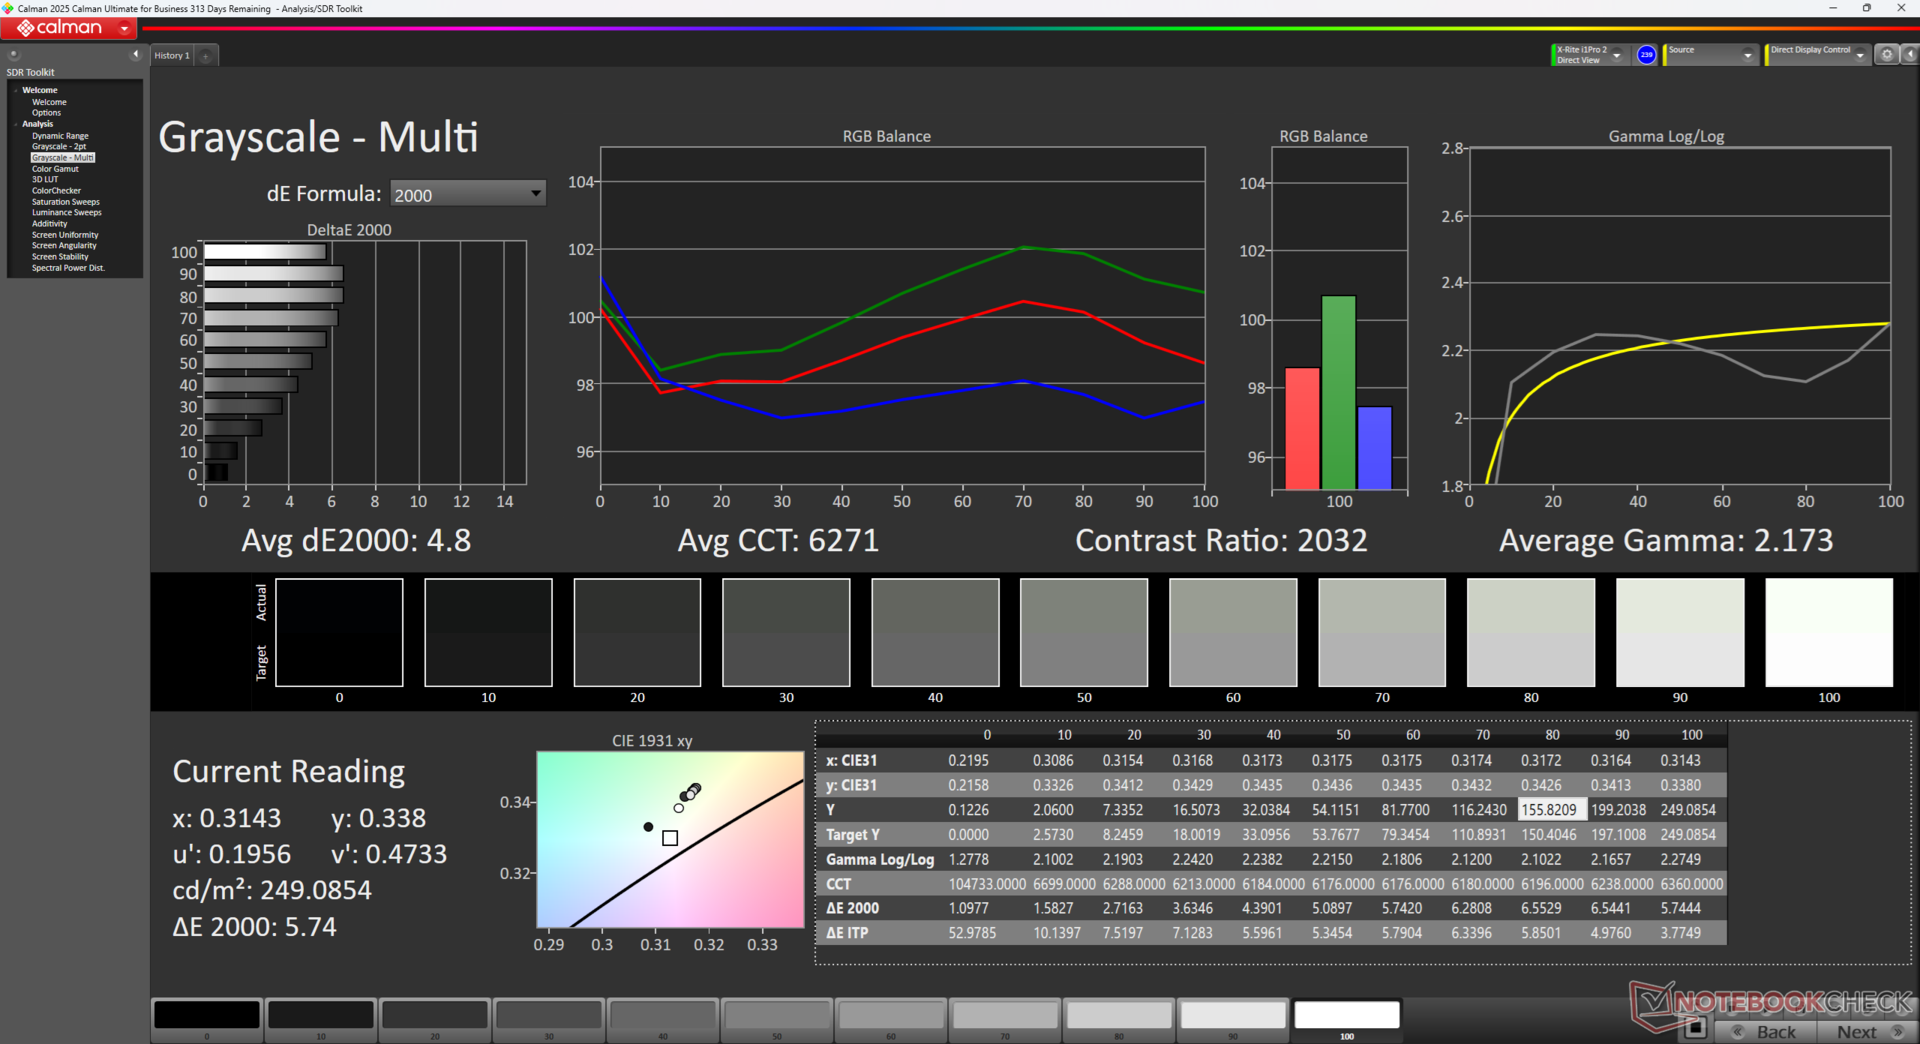
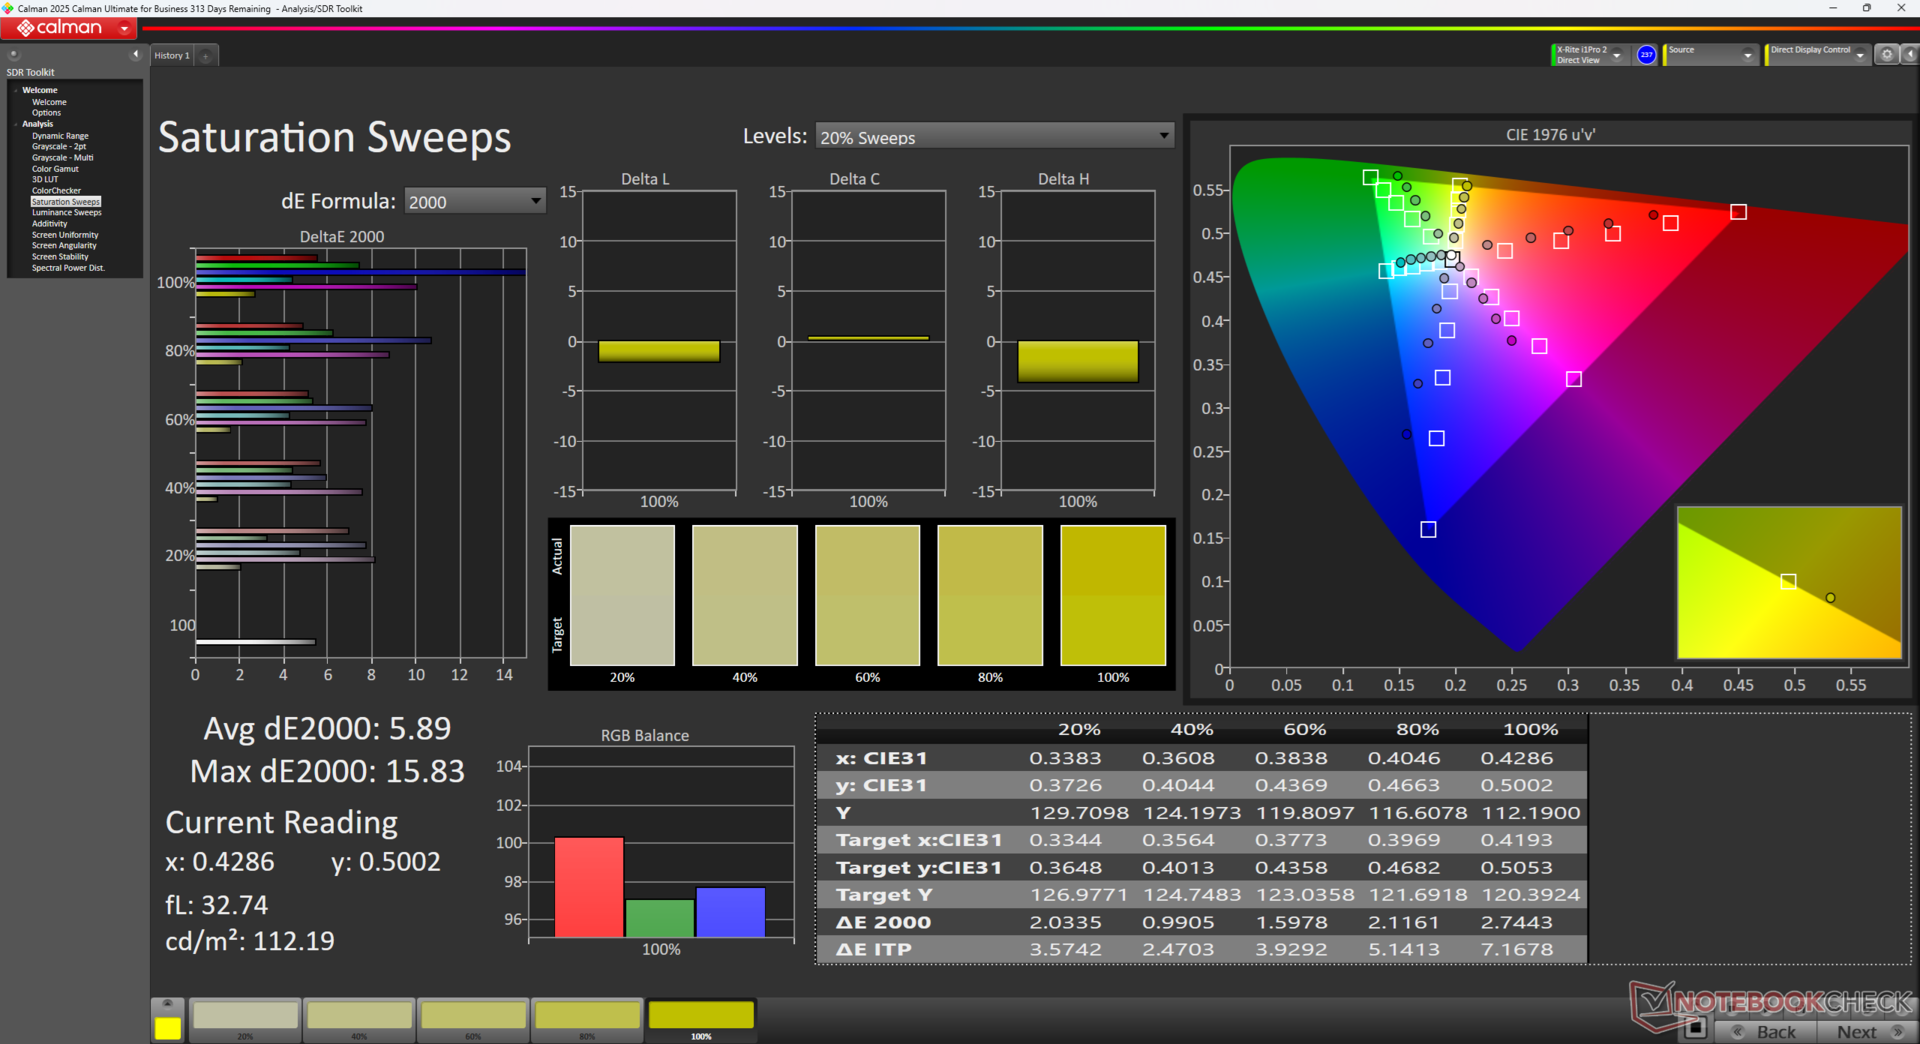
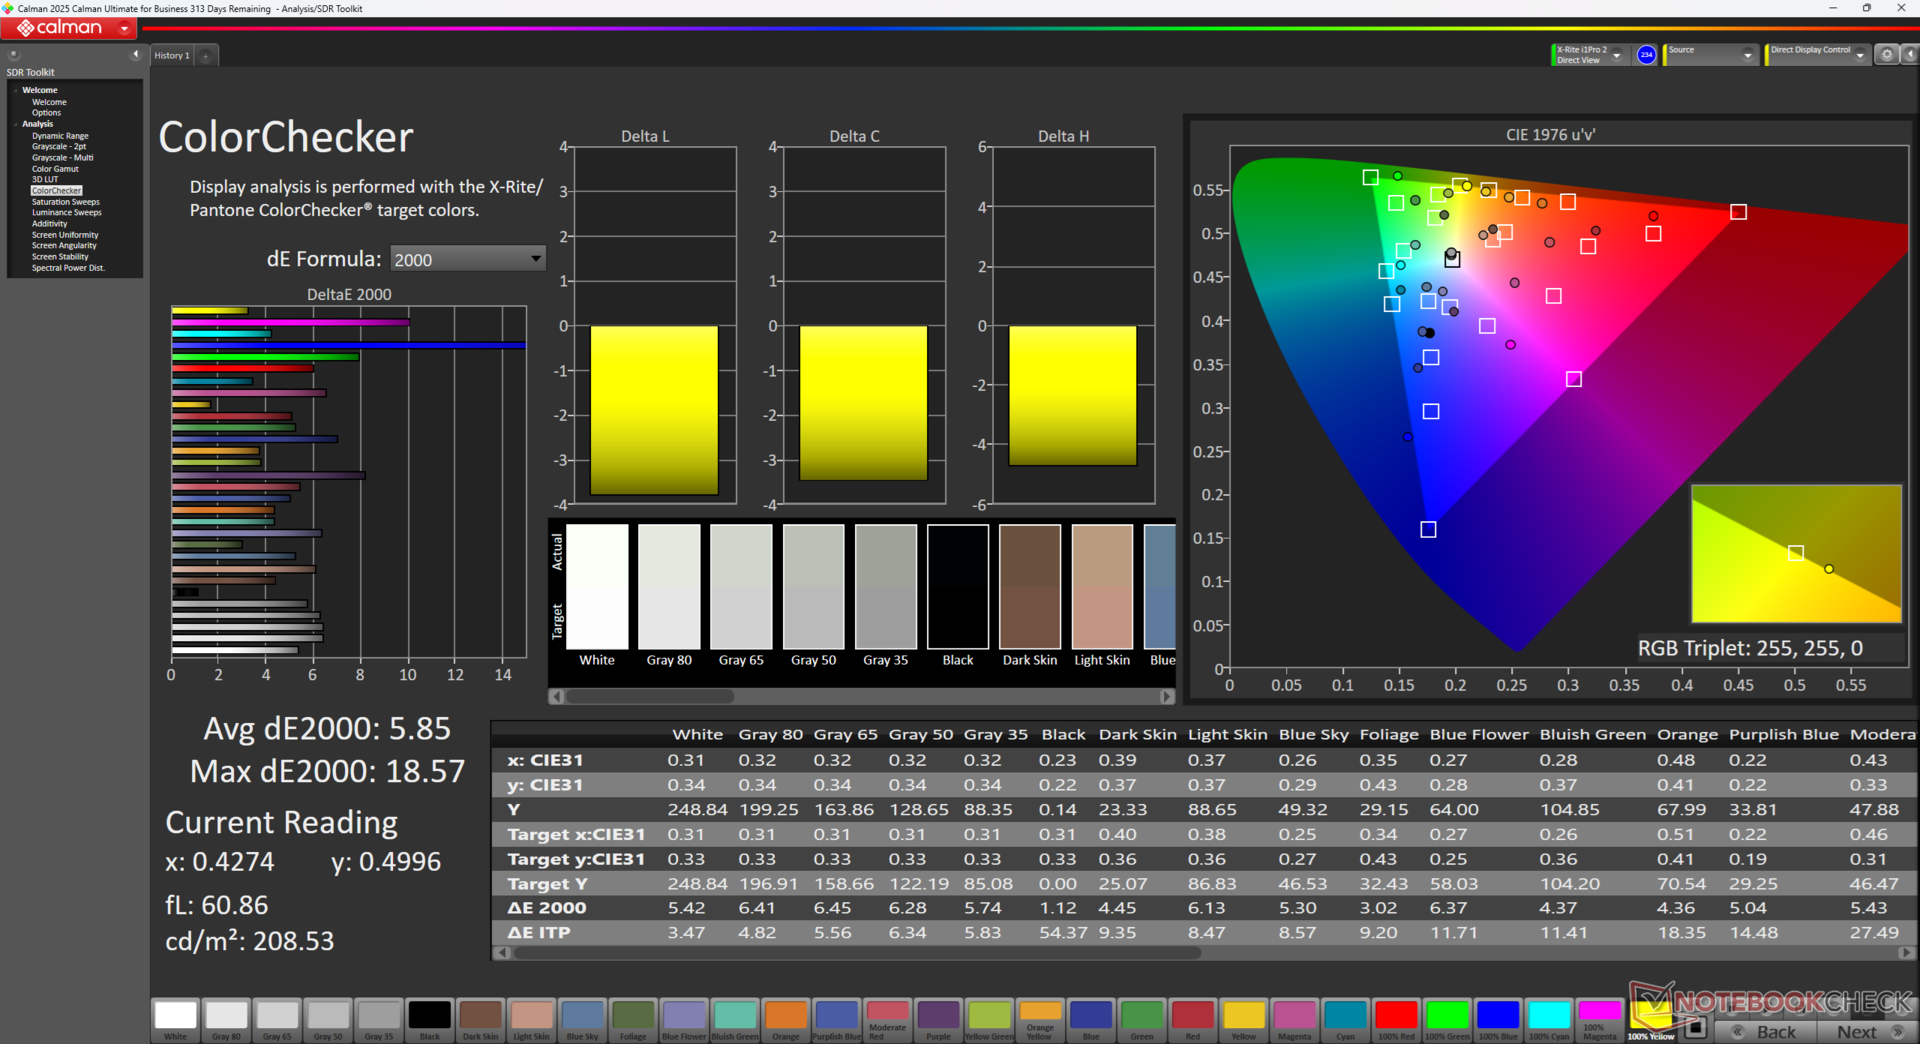
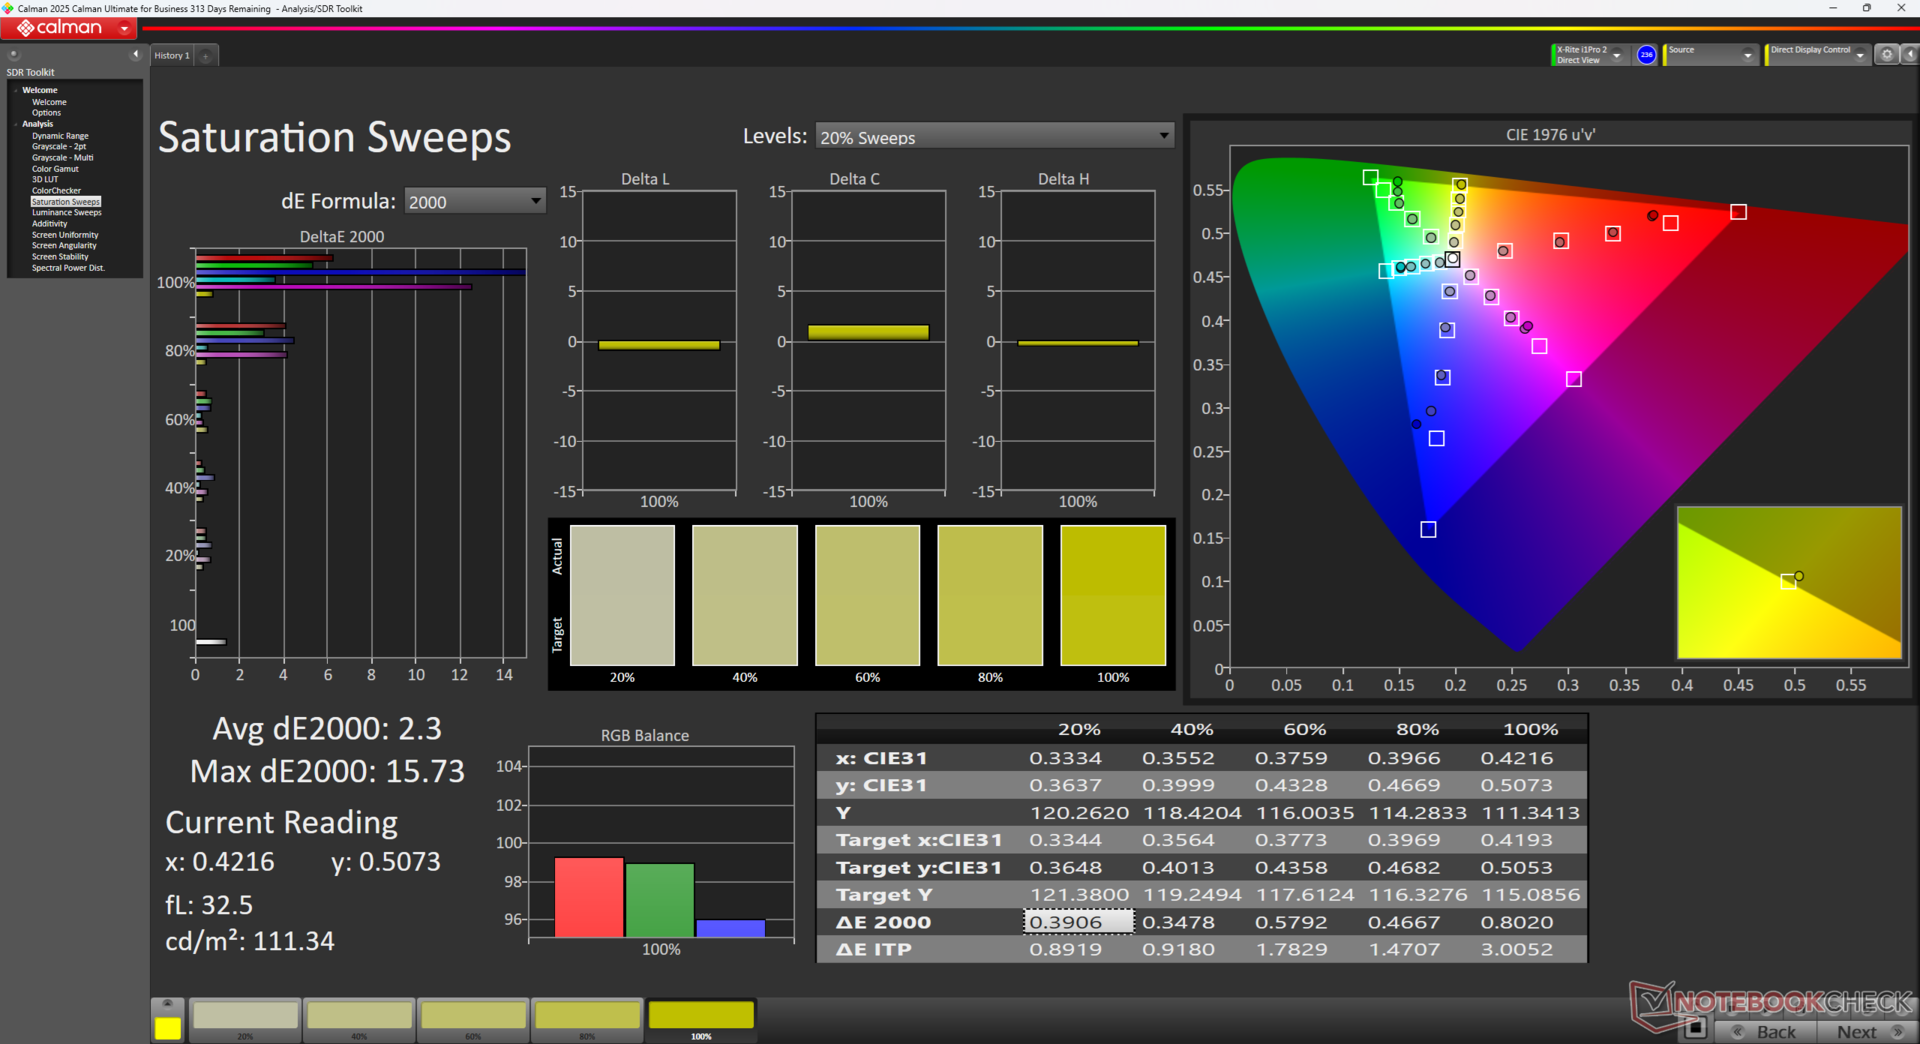
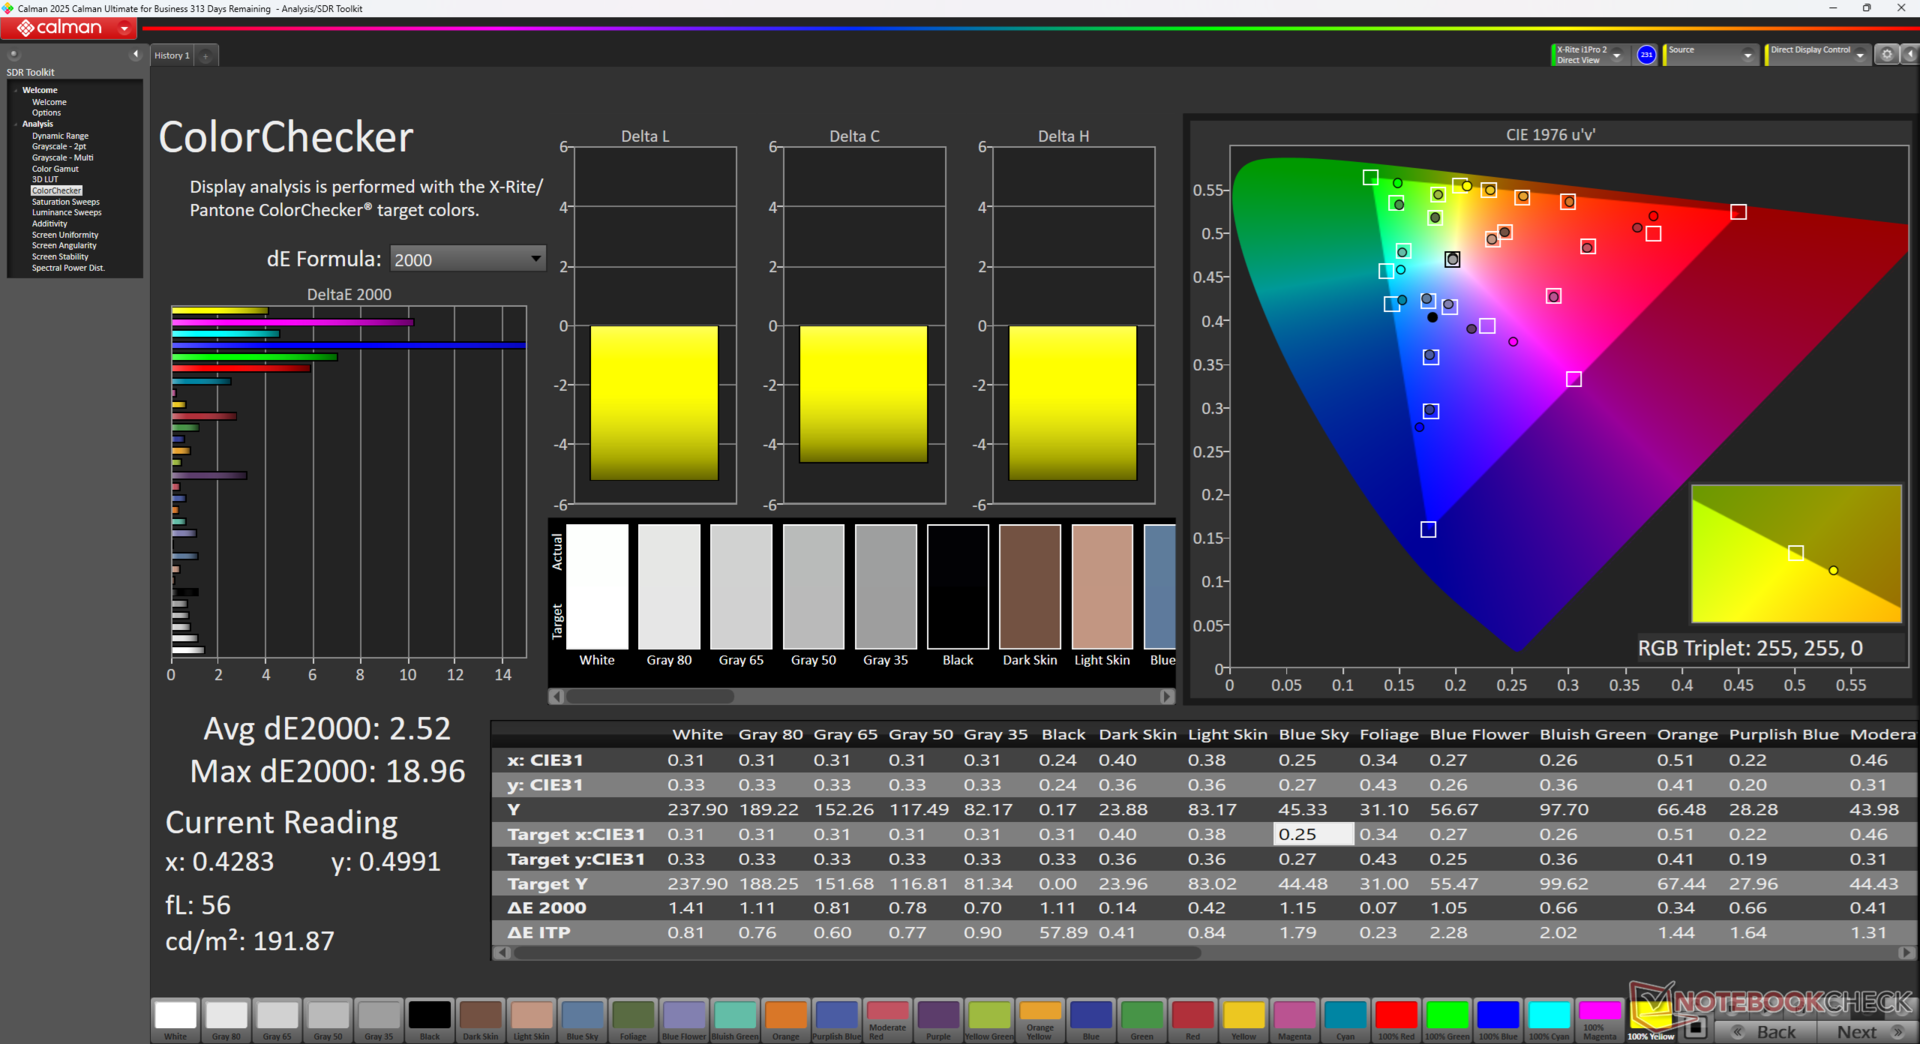
ΔE ColorChecker Calman: 5.85 | ∀{0.5-29.43 Ø4.71}
calibrated: 2.52
ΔE Greyscale Calman: 4.8 | ∀{0.09-98 Ø4.96}
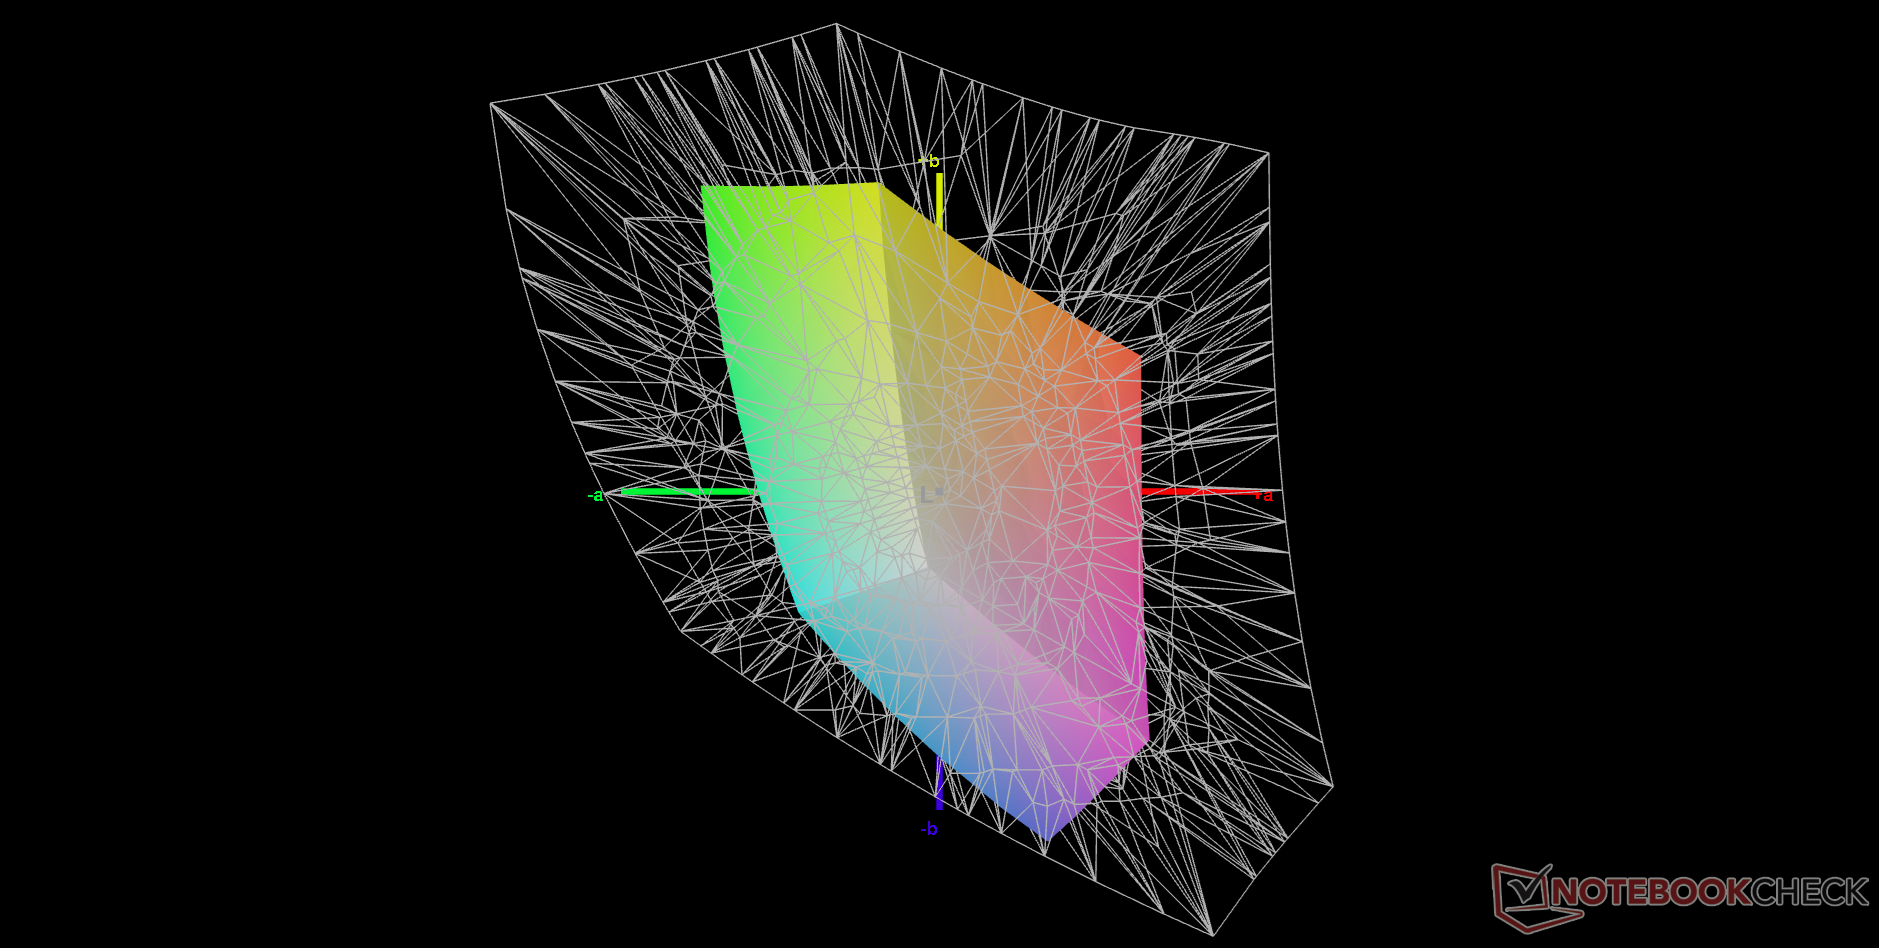
40.5% AdobeRGB 1998 (Argyll 3D)
58.4% sRGB (Argyll 3D)
39.2% Display P3 (Argyll 3D)
Gamma: 2.17
CCT: 6271 K
| MSI Thin GF63 12VE AU Optronics B156HAN08.4, IPS, 1920x1080, 15.6", 144 Hz | MSI GF63 Thin 9SC AU Optronics B156HAN02.1 (AUO21ED), IPS, 1920x1080, 15.6", Hz | Lenovo LOQ 15IRX9 BOE NJ NE156FHM-NX9, IPS, 1920x1080, 15.6", 144 Hz | HP Victus 15-fa1057ng BOE094D, IPS, 1920x1080, 15.6", 144 Hz | Acer Nitro V 15 ANV15-51-582S LG LP156WFJ-SPB4 (LGD0742), IPS, 1920x1080, 15.6", 144 Hz | Asus TUF A15 FA507 N156HMA-GA1, IPS, 1920x1080, 15.6", 144 Hz | |
|---|---|---|---|---|---|---|
| Display | -4% | 79% | -0% | 2% | 65% | |
| Display P3 Coverage (%) | 39.2 | 37.76 -4% | 73.7 88% | 39.2 0% | 40 2% | 64.9 66% |
| sRGB Coverage (%) | 58.4 | 56.5 -3% | 99.1 70% | 57.9 -1% | 60 3% | 96.5 65% |
| AdobeRGB 1998 Coverage (%) | 40.5 | 39.01 -4% | 72.6 79% | 40.5 0% | 41.4 2% | 66.6 64% |
| Response Times | -60% | -35% | 16% | -26% | -7% | |
| Response Time Grey 50% / Grey 80% * (ms) | 25.6 ? | 44.8 ? -75% | 42.2 ? -65% | 23.8 ? 7% | 34.2 ? -34% | 30.4 ? -19% |
| Response Time Black / White * (ms) | 21.8 ? | 31.6 ? -45% | 22.6 ? -4% | 16.3 ? 25% | 25.8 ? -18% | 20.8 ? 5% |
| PWM Frequency (Hz) | ||||||
| Bildschirm | 4% | 27% | -12% | -14% | 34% | |
| Helligkeit Bildmitte (cd/m²) | 248.6 | 260 5% | 306 23% | 273 10% | 292 17% | 288 16% |
| Brightness (cd/m²) | 257 | 249 -3% | 287 12% | 249 -3% | 263 2% | 271 5% |
| Brightness Distribution (%) | 96 | 92 -4% | 88 -8% | 84 -12% | 80 -17% | 91 -5% |
| Schwarzwert * (cd/m²) | 0.18 | 0.23 -28% | 0.21 -17% | 0.28 -56% | 0.25 -39% | 0.17 6% |
| Kontrast (:1) | 1381 | 1130 -18% | 1457 6% | 975 -29% | 1168 -15% | 1694 23% |
| Delta E Colorchecker * | 5.85 | 4.1 30% | 2.25 62% | 5.19 11% | 7.15 -22% | 1.9 68% |
| Colorchecker dE 2000 max. * | 18.57 | 7.93 57% | 4.84 74% | 21.16 -14% | 15.51 16% | 3.3 82% |
| Colorchecker dE 2000 calibrated * | 2.52 | 3.56 -41% | 1.45 42% | 4.54 -80% | 4.13 -64% | 0.9 64% |
| Delta E Graustufen * | 4.8 | 2.83 41% | 2.4 50% | 1.7 65% | 4.9 -2% | 2.7 44% |
| Gamma | 2.17 101% | 2.53 87% | 2.259 97% | 2.148 102% | 2.014 109% | 2.32 95% |
| CCT | 6271 104% | 6158 106% | 6790 96% | 6819 95% | 7178 91% | 6535 99% |
| Farbraum (Prozent von AdobeRGB 1998) (%) | 36 | |||||
| Color Space (Percent of sRGB) (%) | 56 | |||||
| Durchschnitt gesamt (Programm / Settings) | -20% /
-7% | 24% /
29% | 1% /
-6% | -13% /
-12% | 31% /
35% |
* ... kleinere Werte sind besser

Reaktionszeiten (Response Times) des Displays
| ↔ Reaktionszeiten Schwarz zu Weiß | ||
|---|---|---|
| 21.8 ms ... steigend ↗ und fallend ↘ kombiniert | ↗ 11.2 ms steigend | 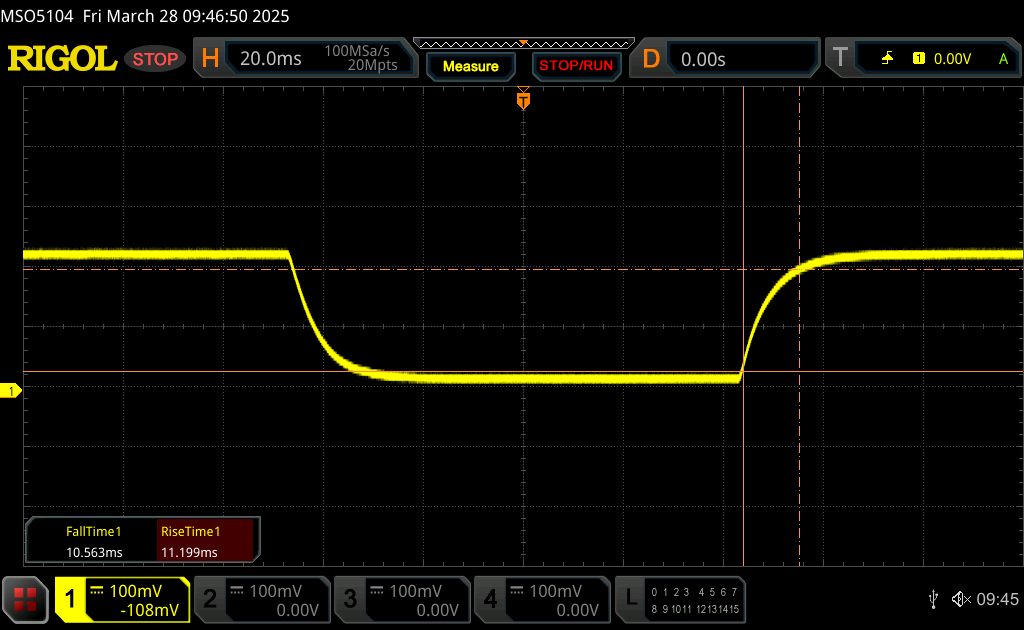 |
| ↘ 10.6 ms fallend | ||
| Die gemessenen Reaktionszeiten sind gut, für anspruchsvolle Spieler könnten der Bildschirm jedoch zu langsam sein. Im Vergleich rangierten die bei uns getesteten Geräte von 0.1 (Minimum) zu 240 (Maximum) ms. » 48 % aller Screens waren schneller als der getestete. Daher sind die gemessenen Reaktionszeiten schlechter als der Durchschnitt aller vermessenen Geräte (19.8 ms). | ||
| ↔ Reaktionszeiten 50% Grau zu 80% Grau | ||
| 25.6 ms ... steigend ↗ und fallend ↘ kombiniert | ↗ 12.2 ms steigend | 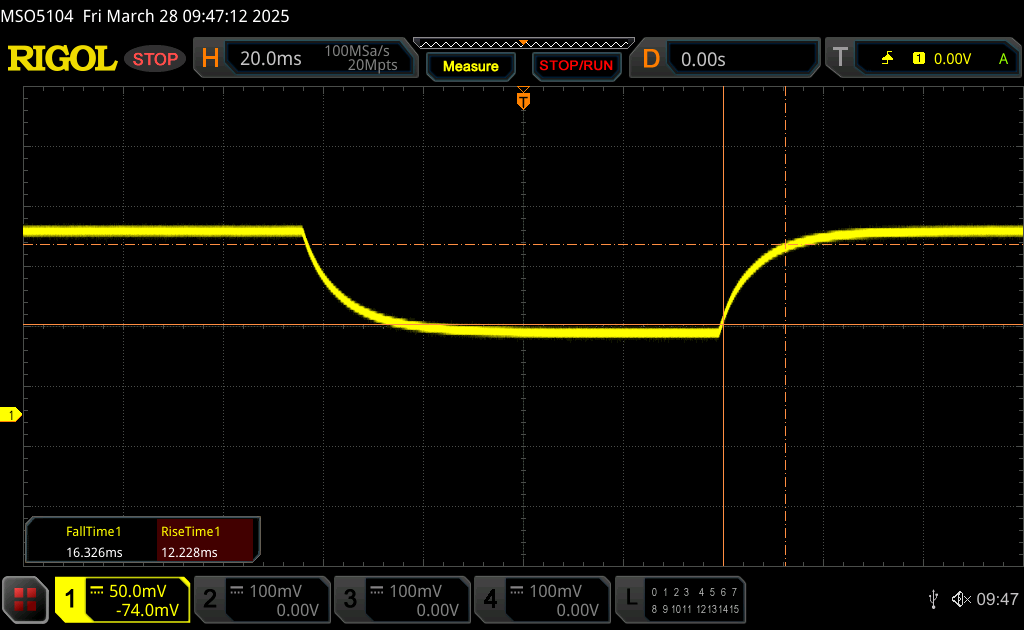 |
| ↘ 13.4 ms fallend | ||
| Die gemessenen Reaktionszeiten sind mittelmäßig und dadurch für Spieler eventuell zu langsam. Im Vergleich rangierten die bei uns getesteten Geräte von 0.165 (Minimum) zu 636 (Maximum) ms. » 36 % aller Screens waren schneller als der getestete. Daher sind die gemessenen Reaktionszeiten besser als der Durchschnitt aller vermessenen Geräte (31 ms). | ||
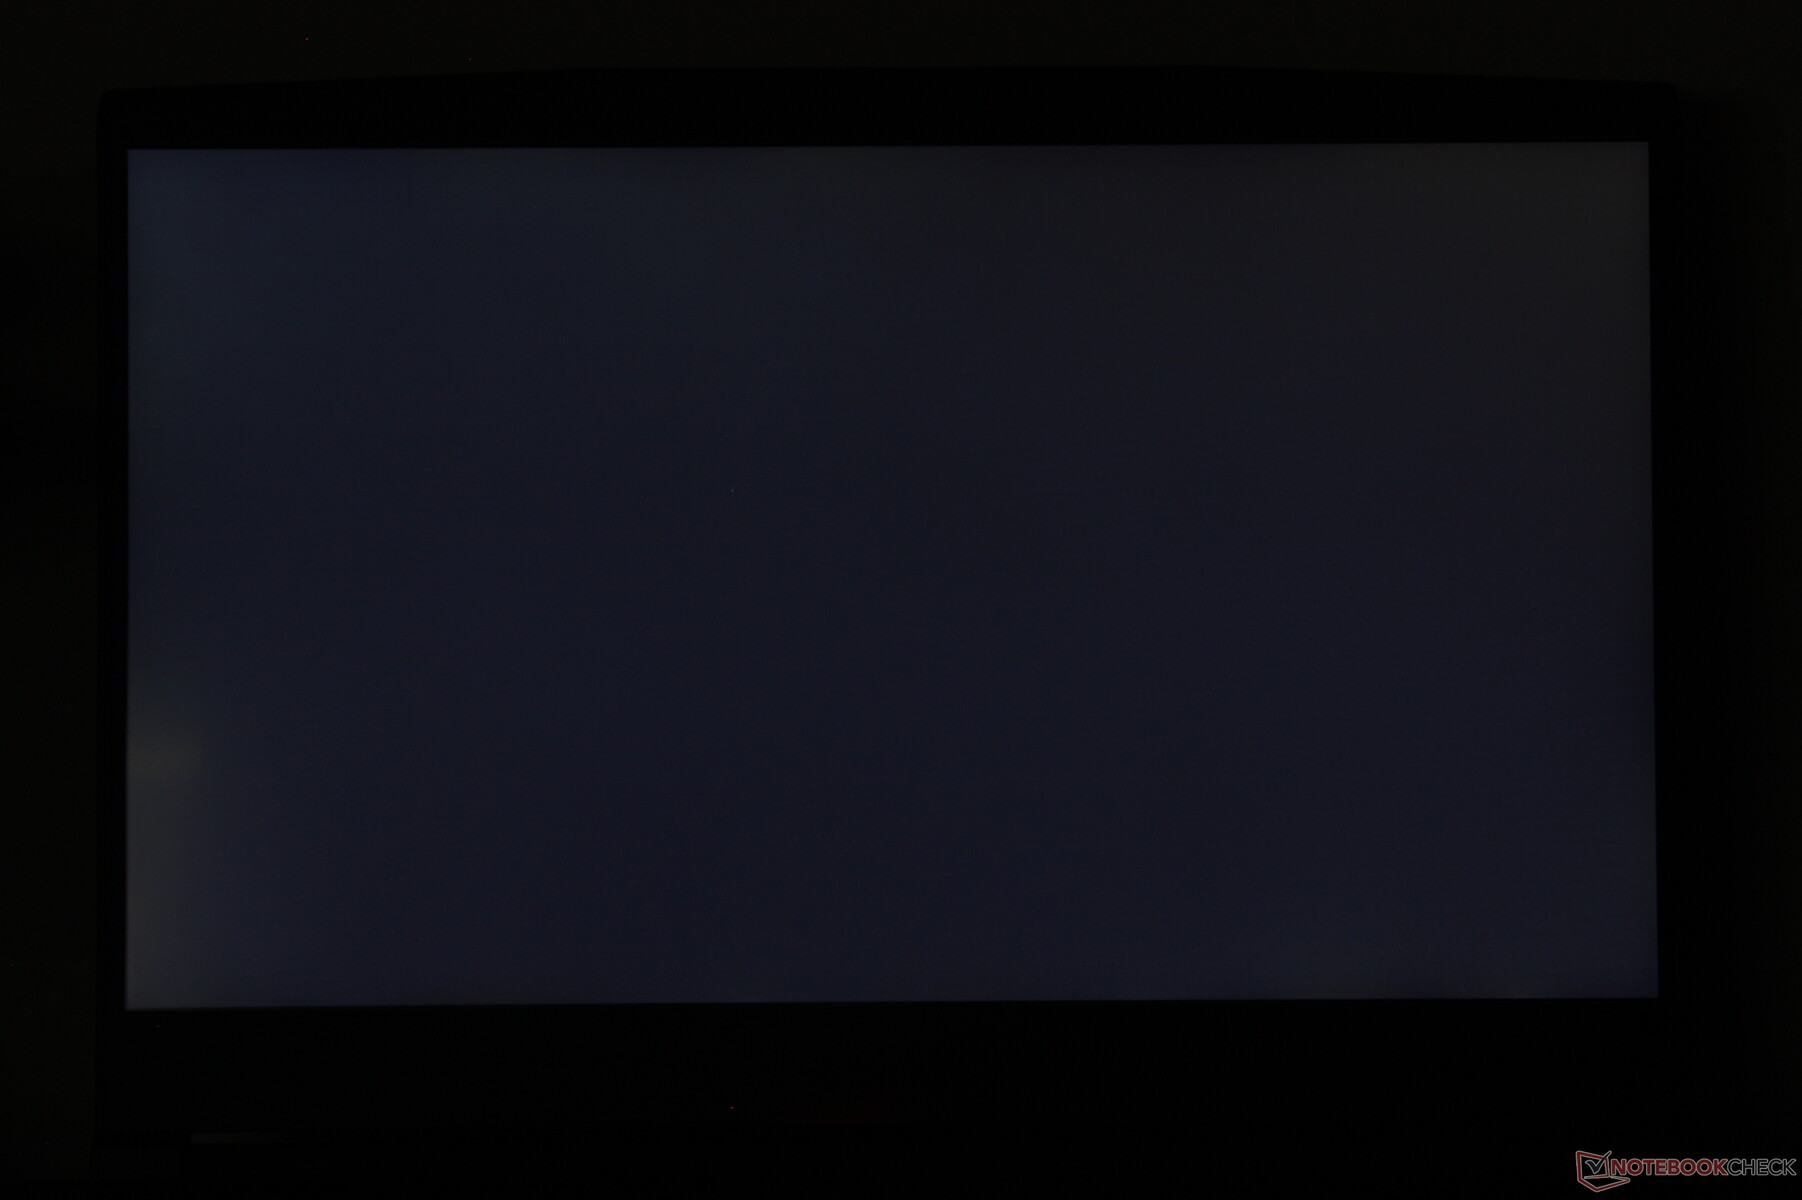
Bildschirm-Flackern / PWM (Pulse-Width Modulation)
| Flackern / PWM nicht festgestellt |  | ||
Im Vergleich: 52 % aller getesteten Geräte nutzten kein PWM um die Helligkeit zu reduzieren. Wenn PWM eingesetzt wurde, dann bei einer Frequenz von durchschnittlich 7757 (Minimum 5, Maximum 343500) Hz. | |||
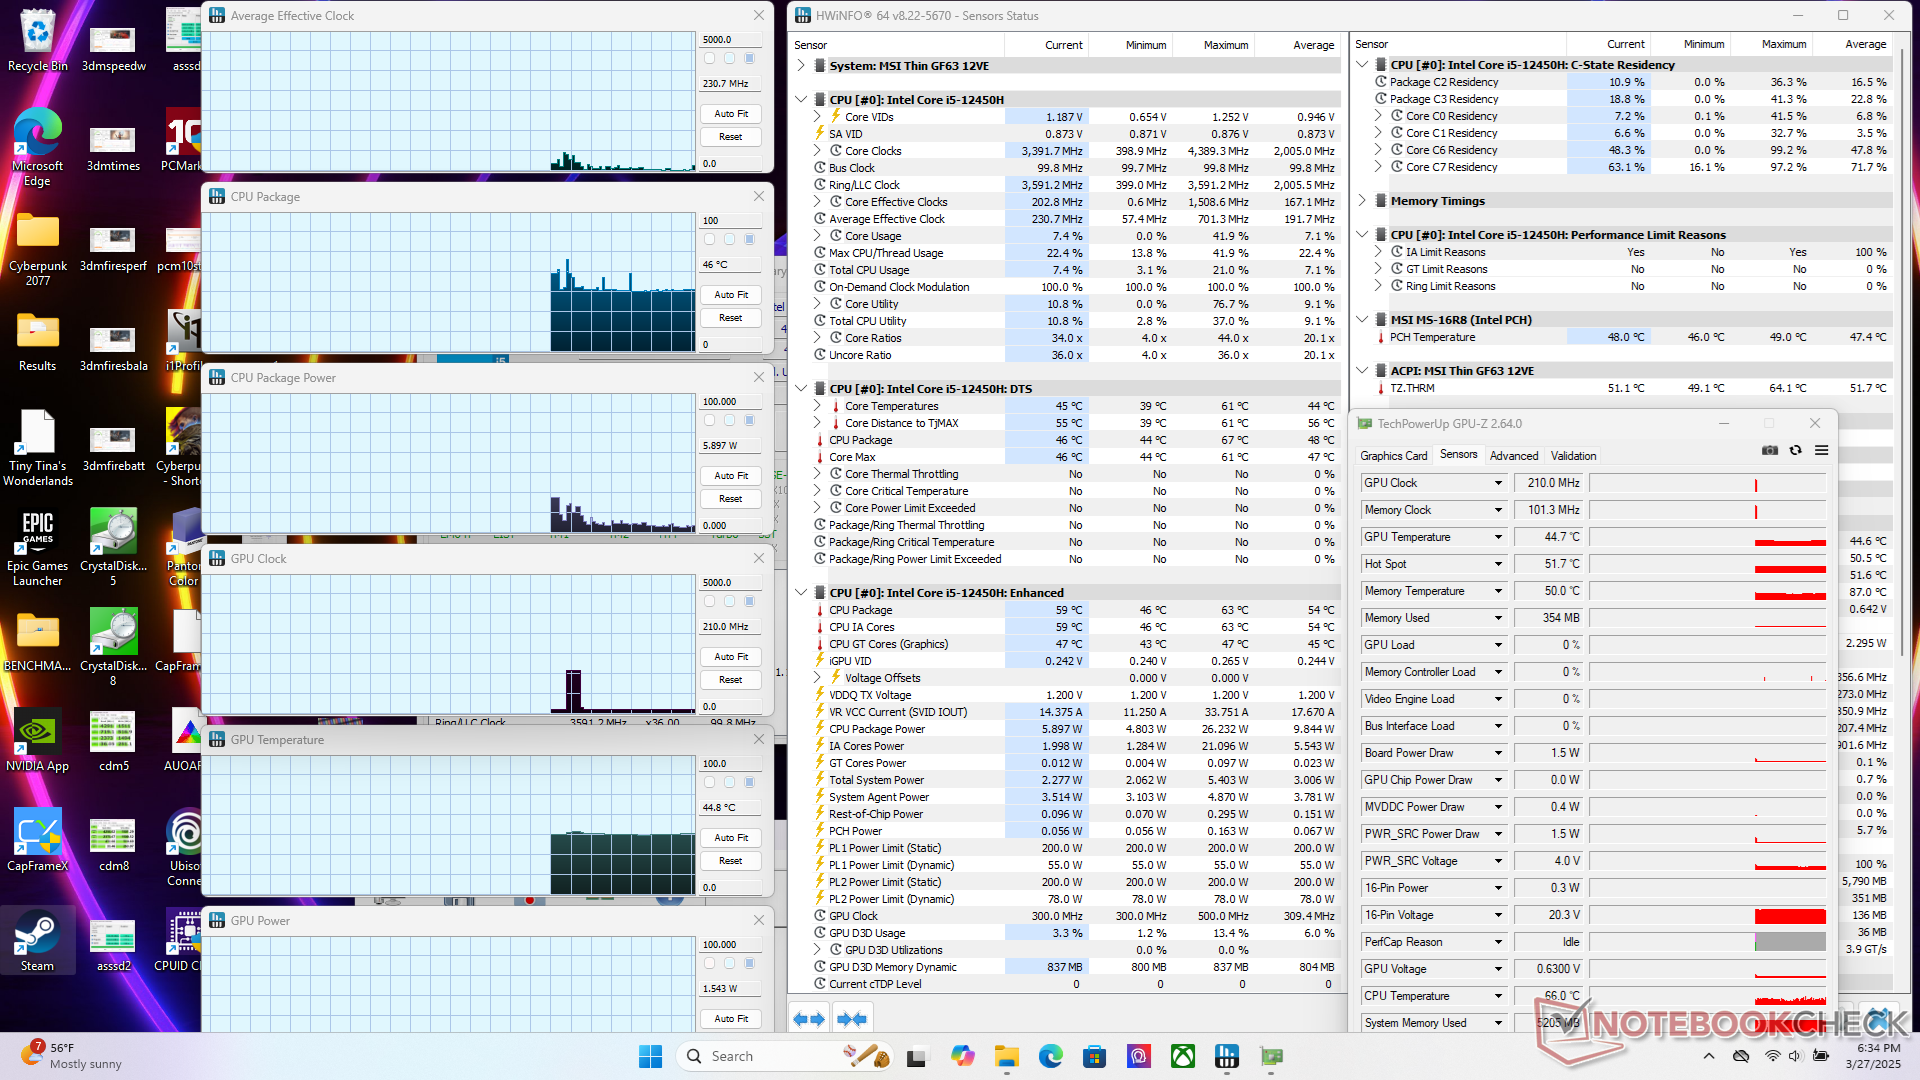
Performance

Testbedingungen
Wir haben das MSI Center auf den Modus Extreme Performance eingestellt, bevor wir die folgenden Benchmarks durchgeführt haben.
Prozessor
Cinebench R15 Multi Loop
Cinebench R23: Multi Core | Single Core
Cinebench R20: CPU (Multi Core) | CPU (Single Core)
Cinebench R15: CPU Multi 64Bit | CPU Single 64Bit
Blender: v2.79 BMW27 CPU
7-Zip 18.03: 7z b 4 | 7z b 4 -mmt1
Geekbench 6.7: Multi-Core | Single-Core
Geekbench 5.5: Multi-Core | Single-Core
HWBOT x265 Benchmark v2.2: 4k Preset
LibreOffice : 20 Documents To PDF
R Benchmark 2.5: Overall mean
| CPU Performance Rating | |
| Asus TUF Gaming A15 FA507UV | |
| Gigabyte G5 KF5 2024 | |
| Lenovo LOQ 15IRH8 Core i7 | |
| Lenovo LOQ 15IRX9 | |
| HP Victus 15 fa0020nr -2! | |
| Gigabyte G5 KE -2! | |
| HP Victus 15-fa1057ng -4! | |
| Acer Nitro V 15 ANV15-51-582S | |
| Durchschnittliche Intel Core i5-12450H | |
| MSI Thin GF63 12VE | |
| Lenovo IdeaPad Gaming 3 15ARH7 -2! | |
| Cinebench R23 / Multi Core | |
| Asus TUF Gaming A15 FA507UV | |
| Lenovo LOQ 15IRX9 | |
| HP Victus 15 fa0020nr | |
| Lenovo LOQ 15IRH8 Core i7 | |
| Gigabyte G5 KF5 2024 | |
| HP Victus 15-fa1057ng | |
| Gigabyte G5 KE | |
| Acer Nitro V 15 ANV15-51-582S | |
| MSI Thin GF63 12VE | |
| Lenovo IdeaPad Gaming 3 15ARH7 | |
| Durchschnittliche Intel Core i5-12450H (7662 - 10633, n=6) | |
| Cinebench R23 / Single Core | |
| Gigabyte G5 KF5 2024 | |
| Lenovo LOQ 15IRH8 Core i7 | |
| Asus TUF Gaming A15 FA507UV | |
| HP Victus 15 fa0020nr | |
| Lenovo LOQ 15IRX9 | |
| HP Victus 15-fa1057ng | |
| Acer Nitro V 15 ANV15-51-582S | |
| Durchschnittliche Intel Core i5-12450H (1601 - 1688, n=6) | |
| Gigabyte G5 KE | |
| MSI Thin GF63 12VE | |
| Lenovo IdeaPad Gaming 3 15ARH7 | |
| Cinebench R20 / CPU (Multi Core) | |
| Asus TUF Gaming A15 FA507UV | |
| Lenovo LOQ 15IRX9 | |
| HP Victus 15 fa0020nr | |
| Lenovo LOQ 15IRH8 Core i7 | |
| Gigabyte G5 KF5 2024 | |
| HP Victus 15-fa1057ng | |
| Gigabyte G5 KE | |
| Acer Nitro V 15 ANV15-51-582S | |
| MSI Thin GF63 12VE | |
| Lenovo IdeaPad Gaming 3 15ARH7 | |
| Durchschnittliche Intel Core i5-12450H (2952 - 4105, n=6) | |
| Cinebench R20 / CPU (Single Core) | |
| Lenovo LOQ 15IRH8 Core i7 | |
| Gigabyte G5 KF5 2024 | |
| HP Victus 15 fa0020nr | |
| Asus TUF Gaming A15 FA507UV | |
| HP Victus 15-fa1057ng | |
| Acer Nitro V 15 ANV15-51-582S | |
| Lenovo LOQ 15IRX9 | |
| Durchschnittliche Intel Core i5-12450H (622 - 646, n=6) | |
| Gigabyte G5 KE | |
| MSI Thin GF63 12VE | |
| Lenovo IdeaPad Gaming 3 15ARH7 | |
| Cinebench R15 / CPU Multi 64Bit | |
| Asus TUF Gaming A15 FA507UV | |
| HP Victus 15 fa0020nr | |
| Lenovo LOQ 15IRX9 | |
| Gigabyte G5 KF5 2024 | |
| Lenovo LOQ 15IRH8 Core i7 | |
| HP Victus 15-fa1057ng | |
| Gigabyte G5 KE | |
| Acer Nitro V 15 ANV15-51-582S | |
| Lenovo IdeaPad Gaming 3 15ARH7 | |
| MSI Thin GF63 12VE | |
| Durchschnittliche Intel Core i5-12450H (1150 - 1591, n=6) | |
| Cinebench R15 / CPU Single 64Bit | |
| Asus TUF Gaming A15 FA507UV | |
| Gigabyte G5 KF5 2024 | |
| Lenovo LOQ 15IRH8 Core i7 | |
| HP Victus 15 fa0020nr | |
| Gigabyte G5 KE | |
| HP Victus 15-fa1057ng | |
| Acer Nitro V 15 ANV15-51-582S | |
| Lenovo LOQ 15IRX9 | |
| Durchschnittliche Intel Core i5-12450H (225 - 239, n=6) | |
| Lenovo IdeaPad Gaming 3 15ARH7 | |
| MSI Thin GF63 12VE | |
| Blender / v2.79 BMW27 CPU | |
| Durchschnittliche Intel Core i5-12450H (330 - 429, n=7) | |
| MSI Thin GF63 12VE | |
| Lenovo IdeaPad Gaming 3 15ARH7 | |
| Acer Nitro V 15 ANV15-51-582S | |
| HP Victus 15-fa1057ng | |
| Lenovo LOQ 15IRH8 Core i7 | |
| HP Victus 15 fa0020nr | |
| Gigabyte G5 KE | |
| Lenovo LOQ 15IRX9 | |
| Gigabyte G5 KF5 2024 | |
| Asus TUF Gaming A15 FA507UV | |
| 7-Zip 18.03 / 7z b 4 | |
| Asus TUF Gaming A15 FA507UV | |
| Gigabyte G5 KF5 2024 | |
| Lenovo LOQ 15IRX9 | |
| Lenovo LOQ 15IRH8 Core i7 | |
| Gigabyte G5 KE | |
| HP Victus 15-fa1057ng | |
| HP Victus 15 fa0020nr | |
| Acer Nitro V 15 ANV15-51-582S | |
| Lenovo IdeaPad Gaming 3 15ARH7 | |
| Durchschnittliche Intel Core i5-12450H (31119 - 38415, n=7) | |
| MSI Thin GF63 12VE | |
| 7-Zip 18.03 / 7z b 4 -mmt1 | |
| Asus TUF Gaming A15 FA507UV | |
| Gigabyte G5 KF5 2024 | |
| Lenovo LOQ 15IRH8 Core i7 | |
| HP Victus 15 fa0020nr | |
| HP Victus 15-fa1057ng | |
| Lenovo IdeaPad Gaming 3 15ARH7 | |
| Gigabyte G5 KE | |
| Lenovo LOQ 15IRX9 | |
| Acer Nitro V 15 ANV15-51-582S | |
| Durchschnittliche Intel Core i5-12450H (4824 - 5386, n=7) | |
| MSI Thin GF63 12VE | |
| Geekbench 6.7 / Multi-Core | |
| Gigabyte G5 KF5 2024 | |
| Lenovo LOQ 15IRX9 | |
| Asus TUF Gaming A15 FA507UV | |
| Lenovo LOQ 15IRH8 Core i7 | |
| Acer Nitro V 15 ANV15-51-582S | |
| Durchschnittliche Intel Core i5-12450H (7081 - 9109, n=7) | |
| MSI Thin GF63 12VE | |
| Geekbench 6.7 / Single-Core | |
| Asus TUF Gaming A15 FA507UV | |
| Lenovo LOQ 15IRH8 Core i7 | |
| Gigabyte G5 KF5 2024 | |
| Lenovo LOQ 15IRX9 | |
| Acer Nitro V 15 ANV15-51-582S | |
| Durchschnittliche Intel Core i5-12450H (2155 - 2293, n=7) | |
| MSI Thin GF63 12VE | |
| Geekbench 5.5 / Multi-Core | |
| Lenovo LOQ 15IRX9 | |
| Asus TUF Gaming A15 FA507UV | |
| Gigabyte G5 KF5 2024 | |
| Lenovo LOQ 15IRH8 Core i7 | |
| HP Victus 15 fa0020nr | |
| Gigabyte G5 KE | |
| Acer Nitro V 15 ANV15-51-582S | |
| Durchschnittliche Intel Core i5-12450H (6777 - 8330, n=7) | |
| MSI Thin GF63 12VE | |
| Lenovo IdeaPad Gaming 3 15ARH7 | |
| Geekbench 5.5 / Single-Core | |
| Asus TUF Gaming A15 FA507UV | |
| Lenovo LOQ 15IRH8 Core i7 | |
| Gigabyte G5 KF5 2024 | |
| HP Victus 15 fa0020nr | |
| Lenovo LOQ 15IRX9 | |
| Acer Nitro V 15 ANV15-51-582S | |
| Gigabyte G5 KE | |
| Durchschnittliche Intel Core i5-12450H (1527 - 1665, n=7) | |
| MSI Thin GF63 12VE | |
| Lenovo IdeaPad Gaming 3 15ARH7 | |
| HWBOT x265 Benchmark v2.2 / 4k Preset | |
| Asus TUF Gaming A15 FA507UV | |
| Gigabyte G5 KF5 2024 | |
| Lenovo LOQ 15IRX9 | |
| Gigabyte G5 KE | |
| Lenovo LOQ 15IRH8 Core i7 | |
| HP Victus 15 fa0020nr | |
| HP Victus 15-fa1057ng | |
| Acer Nitro V 15 ANV15-51-582S | |
| Lenovo IdeaPad Gaming 3 15ARH7 | |
| MSI Thin GF63 12VE | |
| Durchschnittliche Intel Core i5-12450H (8.78 - 12.3, n=6) | |
| LibreOffice / 20 Documents To PDF | |
| HP Victus 15-fa1057ng | |
| MSI Thin GF63 12VE | |
| Acer Nitro V 15 ANV15-51-582S | |
| Lenovo LOQ 15IRX9 | |
| Lenovo IdeaPad Gaming 3 15ARH7 | |
| Gigabyte G5 KE | |
| Gigabyte G5 KF5 2024 | |
| HP Victus 15 fa0020nr | |
| Durchschnittliche Intel Core i5-12450H (41.1 - 60.3, n=7) | |
| Asus TUF Gaming A15 FA507UV | |
| Lenovo LOQ 15IRH8 Core i7 | |
| R Benchmark 2.5 / Overall mean | |
| MSI Thin GF63 12VE | |
| Lenovo IdeaPad Gaming 3 15ARH7 | |
| Durchschnittliche Intel Core i5-12450H (0.4949 - 0.54, n=7) | |
| Acer Nitro V 15 ANV15-51-582S | |
| HP Victus 15-fa1057ng | |
| Gigabyte G5 KE | |
| Lenovo LOQ 15IRX9 | |
| HP Victus 15 fa0020nr | |
| Lenovo LOQ 15IRH8 Core i7 | |
| Gigabyte G5 KF5 2024 | |
| Asus TUF Gaming A15 FA507UV | |
* ... kleinere Werte sind besser
AIDA64: FP32 Ray-Trace | FPU Julia | CPU SHA3 | CPU Queen | FPU SinJulia | FPU Mandel | CPU AES | CPU ZLib | FP64 Ray-Trace | CPU PhotoWorxx
| Performance Rating | |
| Asus TUF A15 FA507 | |
| Lenovo LOQ 15IRX9 | |
| HP Victus 15-fa1057ng | |
| Acer Nitro V 15 ANV15-51-582S | |
| MSI Thin GF63 12VE | |
| Durchschnittliche Intel Core i5-12450H | |
| AIDA64 / FP32 Ray-Trace | |
| Asus TUF A15 FA507 | |
| Lenovo LOQ 15IRX9 | |
| HP Victus 15-fa1057ng | |
| Acer Nitro V 15 ANV15-51-582S | |
| MSI Thin GF63 12VE | |
| Durchschnittliche Intel Core i5-12450H (7229 - 10474, n=6) | |
| AIDA64 / FPU Julia | |
| Asus TUF A15 FA507 | |
| Lenovo LOQ 15IRX9 | |
| Acer Nitro V 15 ANV15-51-582S | |
| HP Victus 15-fa1057ng | |
| MSI Thin GF63 12VE | |
| Durchschnittliche Intel Core i5-12450H (37583 - 51636, n=6) | |
| AIDA64 / CPU SHA3 | |
| Lenovo LOQ 15IRX9 | |
| Asus TUF A15 FA507 | |
| Acer Nitro V 15 ANV15-51-582S | |
| HP Victus 15-fa1057ng | |
| MSI Thin GF63 12VE | |
| Durchschnittliche Intel Core i5-12450H (1724 - 2359, n=6) | |
| AIDA64 / CPU Queen | |
| Asus TUF A15 FA507 | |
| Lenovo LOQ 15IRX9 | |
| HP Victus 15-fa1057ng | |
| Acer Nitro V 15 ANV15-51-582S | |
| MSI Thin GF63 12VE | |
| Durchschnittliche Intel Core i5-12450H (59539 - 68897, n=6) | |
| AIDA64 / FPU SinJulia | |
| Asus TUF A15 FA507 | |
| Lenovo LOQ 15IRX9 | |
| HP Victus 15-fa1057ng | |
| Acer Nitro V 15 ANV15-51-582S | |
| MSI Thin GF63 12VE | |
| Durchschnittliche Intel Core i5-12450H (5007 - 6147, n=6) | |
| AIDA64 / FPU Mandel | |
| Asus TUF A15 FA507 | |
| Lenovo LOQ 15IRX9 | |
| HP Victus 15-fa1057ng | |
| Acer Nitro V 15 ANV15-51-582S | |
| MSI Thin GF63 12VE | |
| Durchschnittliche Intel Core i5-12450H (18516 - 25115, n=6) | |
| AIDA64 / CPU AES | |
| Acer Nitro V 15 ANV15-51-582S | |
| Lenovo LOQ 15IRX9 | |
| Asus TUF A15 FA507 | |
| Durchschnittliche Intel Core i5-12450H (46835 - 78537, n=6) | |
| HP Victus 15-fa1057ng | |
| MSI Thin GF63 12VE | |
| AIDA64 / CPU ZLib | |
| Lenovo LOQ 15IRX9 | |
| HP Victus 15-fa1057ng | |
| Acer Nitro V 15 ANV15-51-582S | |
| MSI Thin GF63 12VE | |
| Asus TUF A15 FA507 | |
| Durchschnittliche Intel Core i5-12450H (490 - 708, n=6) | |
| AIDA64 / FP64 Ray-Trace | |
| Asus TUF A15 FA507 | |
| Lenovo LOQ 15IRX9 | |
| HP Victus 15-fa1057ng | |
| Acer Nitro V 15 ANV15-51-582S | |
| MSI Thin GF63 12VE | |
| Durchschnittliche Intel Core i5-12450H (4025 - 5614, n=6) | |
| AIDA64 / CPU PhotoWorxx | |
| Lenovo LOQ 15IRX9 | |
| Asus TUF A15 FA507 | |
| HP Victus 15-fa1057ng | |
| Durchschnittliche Intel Core i5-12450H (12271 - 28682, n=6) | |
| Acer Nitro V 15 ANV15-51-582S | |
| MSI Thin GF63 12VE | |
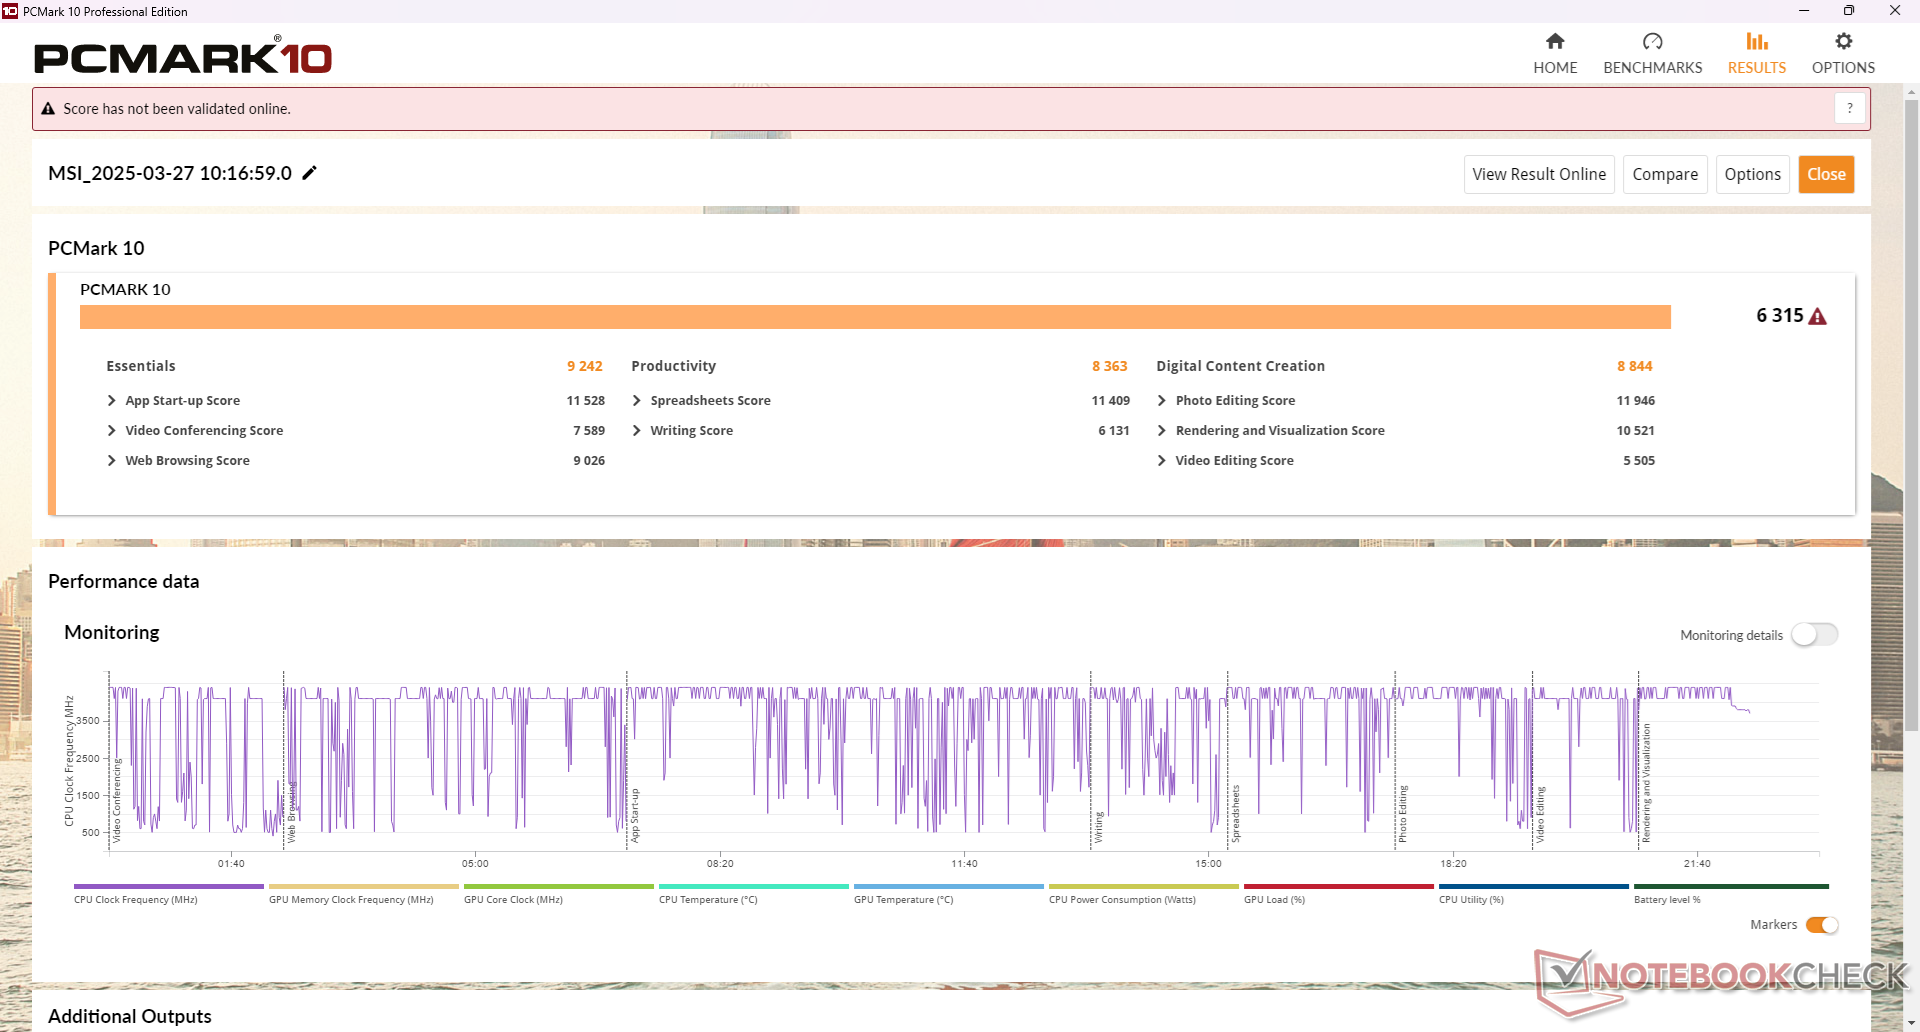
System Performance
Die PCMark Ergebnisse sind etwas niedriger als die vieler Core-i5-Konkurrenten, was zum Teil auf die begrenzten 8 GB Single-Channel-RAM auf unserem Testgerät zurückzuführen ist.
CrossMark: Overall | Productivity | Creativity | Responsiveness
WebXPRT 3: Overall
WebXPRT 4: Overall
Mozilla Kraken 1.1: Total
| PCMark 10 / Score | |
| Asus TUF A15 FA507 | |
| Lenovo LOQ 15IRX9 | |
| HP Victus 15-fa1057ng | |
| Acer Nitro V 15 ANV15-51-582S | |
| MSI Thin GF63 12VE | |
| Durchschnittliche Intel Core i5-12450H, NVIDIA GeForce RTX 4050 Laptop GPU (n=1) | |
| MSI GF63 Thin 9SC | |
| PCMark 10 / Essentials | |
| Asus TUF A15 FA507 | |
| HP Victus 15-fa1057ng | |
| Acer Nitro V 15 ANV15-51-582S | |
| Lenovo LOQ 15IRX9 | |
| MSI Thin GF63 12VE | |
| Durchschnittliche Intel Core i5-12450H, NVIDIA GeForce RTX 4050 Laptop GPU (n=1) | |
| MSI GF63 Thin 9SC | |
| PCMark 10 / Productivity | |
| Asus TUF A15 FA507 | |
| HP Victus 15-fa1057ng | |
| Lenovo LOQ 15IRX9 | |
| Acer Nitro V 15 ANV15-51-582S | |
| MSI Thin GF63 12VE | |
| Durchschnittliche Intel Core i5-12450H, NVIDIA GeForce RTX 4050 Laptop GPU (n=1) | |
| MSI GF63 Thin 9SC | |
| PCMark 10 / Digital Content Creation | |
| Lenovo LOQ 15IRX9 | |
| Asus TUF A15 FA507 | |
| HP Victus 15-fa1057ng | |
| Acer Nitro V 15 ANV15-51-582S | |
| MSI Thin GF63 12VE | |
| Durchschnittliche Intel Core i5-12450H, NVIDIA GeForce RTX 4050 Laptop GPU (n=1) | |
| MSI GF63 Thin 9SC | |
| CrossMark / Overall | |
| Lenovo LOQ 15IRX9 | |
| Asus TUF A15 FA507 | |
| MSI Thin GF63 12VE | |
| Durchschnittliche Intel Core i5-12450H, NVIDIA GeForce RTX 4050 Laptop GPU (n=1) | |
| CrossMark / Productivity | |
| Lenovo LOQ 15IRX9 | |
| MSI Thin GF63 12VE | |
| Durchschnittliche Intel Core i5-12450H, NVIDIA GeForce RTX 4050 Laptop GPU (n=1) | |
| Asus TUF A15 FA507 | |
| CrossMark / Creativity | |
| Lenovo LOQ 15IRX9 | |
| Asus TUF A15 FA507 | |
| MSI Thin GF63 12VE | |
| Durchschnittliche Intel Core i5-12450H, NVIDIA GeForce RTX 4050 Laptop GPU (n=1) | |
| CrossMark / Responsiveness | |
| Lenovo LOQ 15IRX9 | |
| MSI Thin GF63 12VE | |
| Durchschnittliche Intel Core i5-12450H, NVIDIA GeForce RTX 4050 Laptop GPU (n=1) | |
| Asus TUF A15 FA507 | |
| WebXPRT 3 / Overall | |
| Asus TUF A15 FA507 | |
| HP Victus 15-fa1057ng | |
| Acer Nitro V 15 ANV15-51-582S | |
| Lenovo LOQ 15IRX9 | |
| MSI Thin GF63 12VE | |
| Durchschnittliche Intel Core i5-12450H, NVIDIA GeForce RTX 4050 Laptop GPU (n=1) | |
| WebXPRT 4 / Overall | |
| Lenovo LOQ 15IRX9 | |
| Acer Nitro V 15 ANV15-51-582S | |
| MSI Thin GF63 12VE | |
| Durchschnittliche Intel Core i5-12450H, NVIDIA GeForce RTX 4050 Laptop GPU (n=1) | |
| Asus TUF A15 FA507 | |
| Mozilla Kraken 1.1 / Total | |
| Asus TUF A15 FA507 | |
| MSI Thin GF63 12VE | |
| Durchschnittliche Intel Core i5-12450H, NVIDIA GeForce RTX 4050 Laptop GPU (n=1) | |
| Acer Nitro V 15 ANV15-51-582S | |
| Lenovo LOQ 15IRX9 | |
| HP Victus 15-fa1057ng | |
* ... kleinere Werte sind besser
| PCMark 10 Score | 6315 Punkte | |
Hilfe | ||
| AIDA64 / Memory Copy | |
| Lenovo LOQ 15IRX9 | |
| Asus TUF A15 FA507 | |
| HP Victus 15-fa1057ng | |
| Durchschnittliche Intel Core i5-12450H (21750 - 43918, n=6) | |
| Acer Nitro V 15 ANV15-51-582S | |
| MSI Thin GF63 12VE | |
| AIDA64 / Memory Read | |
| Lenovo LOQ 15IRX9 | |
| Asus TUF A15 FA507 | |
| HP Victus 15-fa1057ng | |
| Durchschnittliche Intel Core i5-12450H (22956 - 47555, n=6) | |
| Acer Nitro V 15 ANV15-51-582S | |
| MSI Thin GF63 12VE | |
| AIDA64 / Memory Write | |
| Lenovo LOQ 15IRX9 | |
| Asus TUF A15 FA507 | |
| HP Victus 15-fa1057ng | |
| Durchschnittliche Intel Core i5-12450H (22297 - 46963, n=6) | |
| Acer Nitro V 15 ANV15-51-582S | |
| MSI Thin GF63 12VE | |
| AIDA64 / Memory Latency | |
| MSI Thin GF63 12VE | |
| Lenovo LOQ 15IRX9 | |
| Acer Nitro V 15 ANV15-51-582S | |
| HP Victus 15-fa1057ng | |
| Durchschnittliche Intel Core i5-12450H (76.5 - 100.9, n=6) | |
| Asus TUF A15 FA507 | |
* ... kleinere Werte sind besser
DPC-Latenzzeit
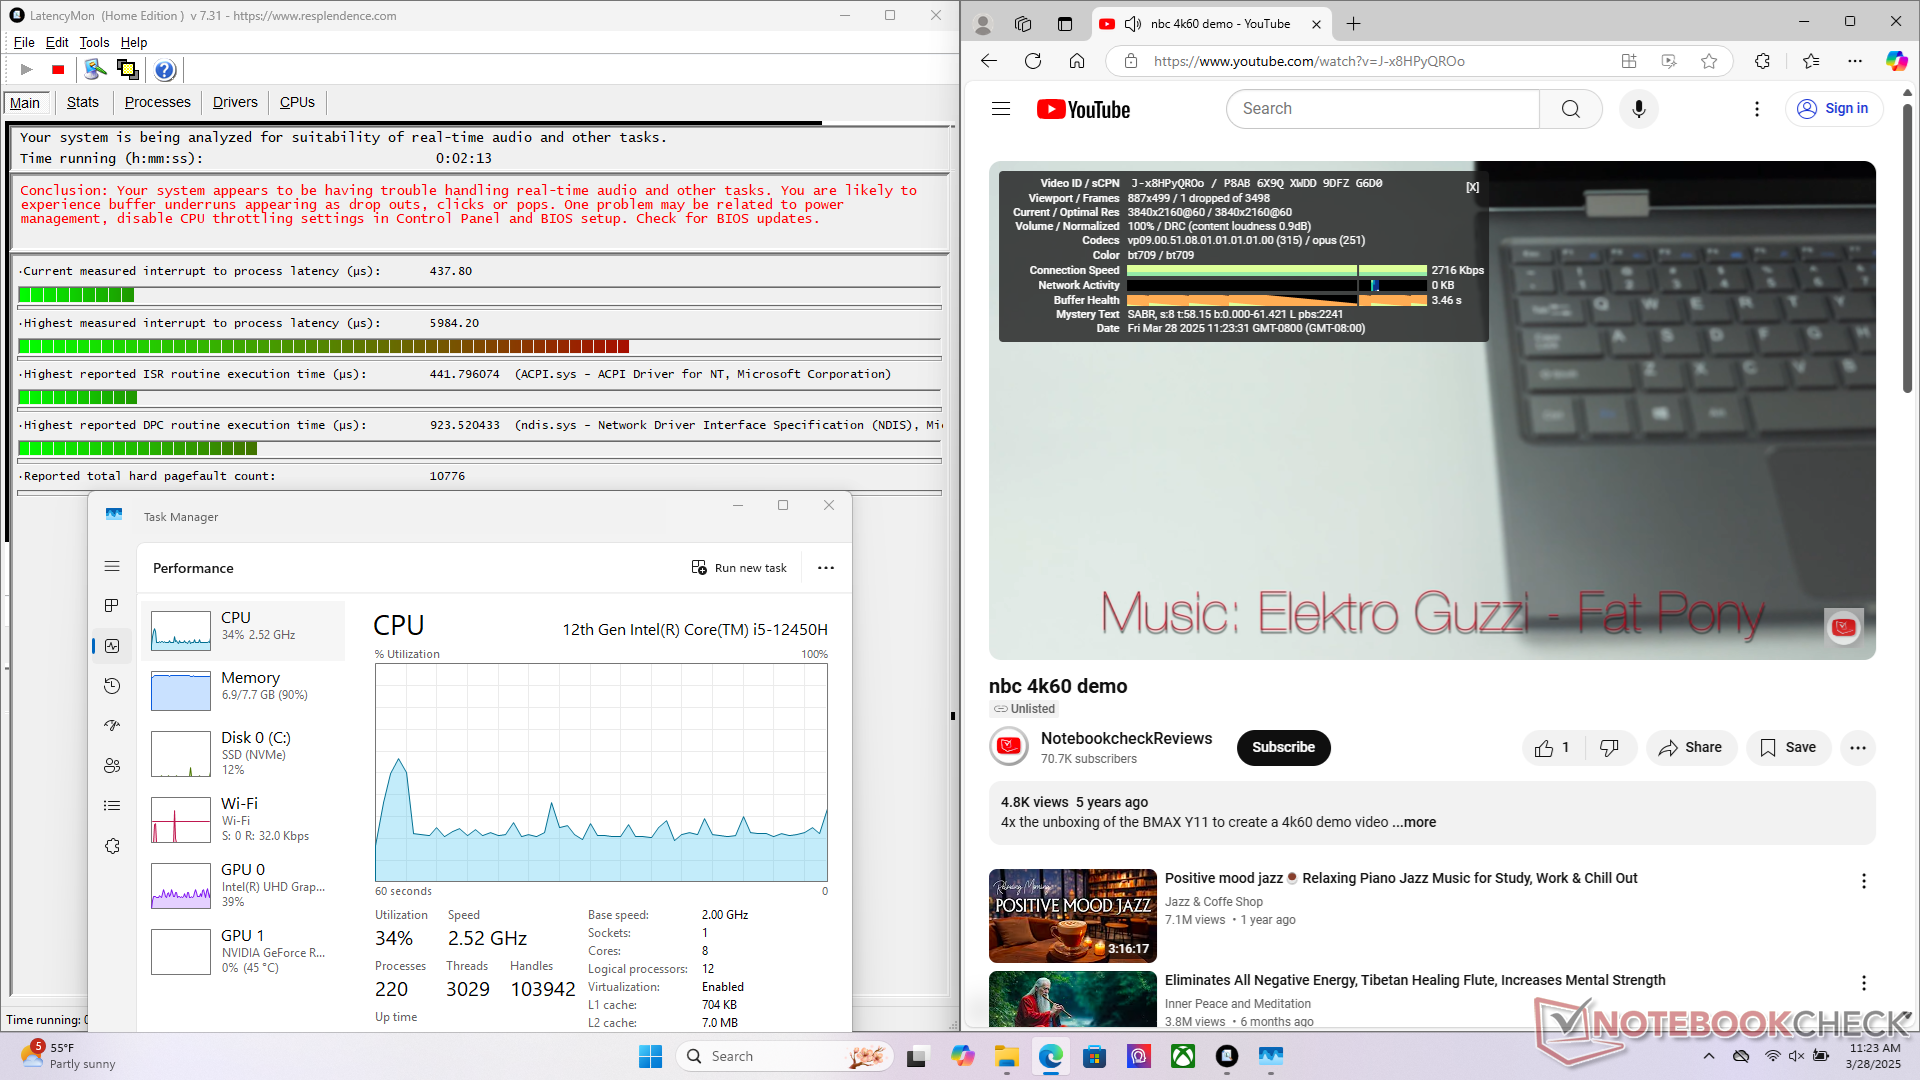
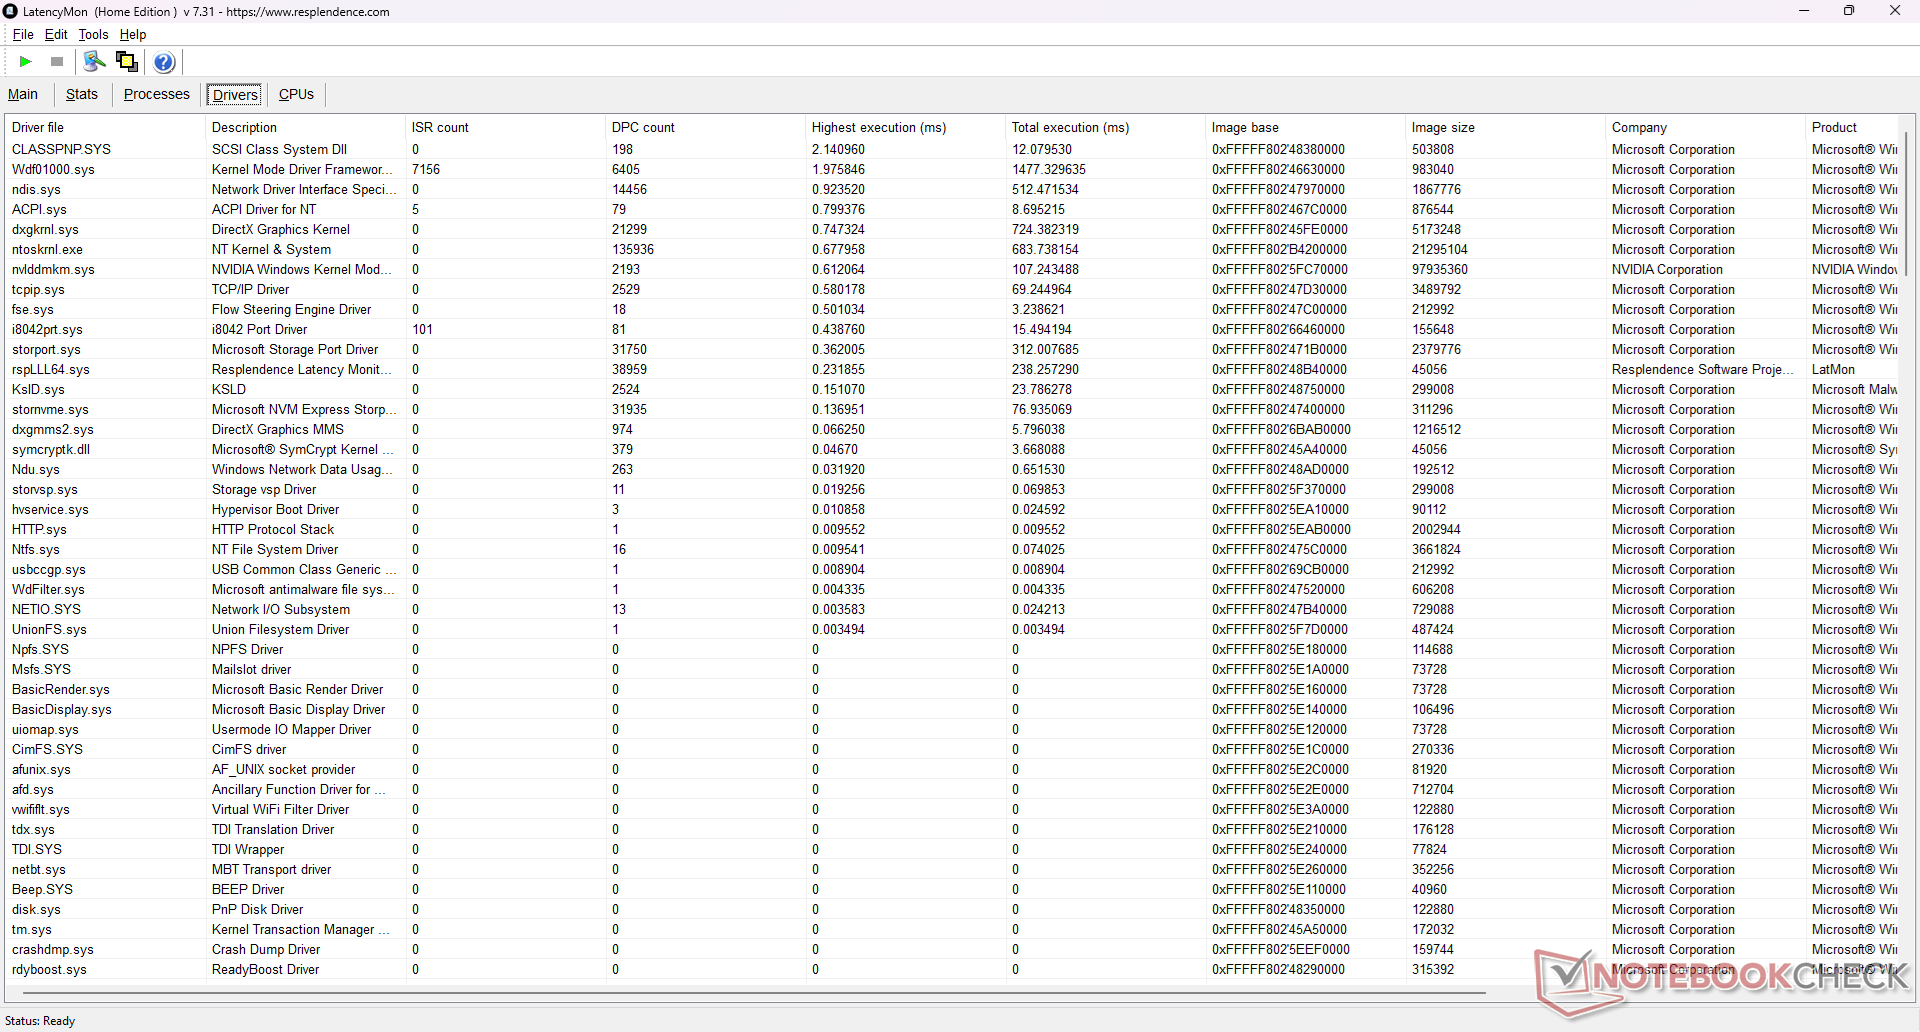
| DPC Latencies / LatencyMon - interrupt to process latency (max), Web, Youtube, Prime95 | |
| MSI Thin GF63 12VE | |
| HP Victus 15-fa1057ng | |
| Lenovo LOQ 15IRX9 | |
| Acer Nitro V 15 ANV15-51-582S | |
* ... kleinere Werte sind besser
Speichergeräte
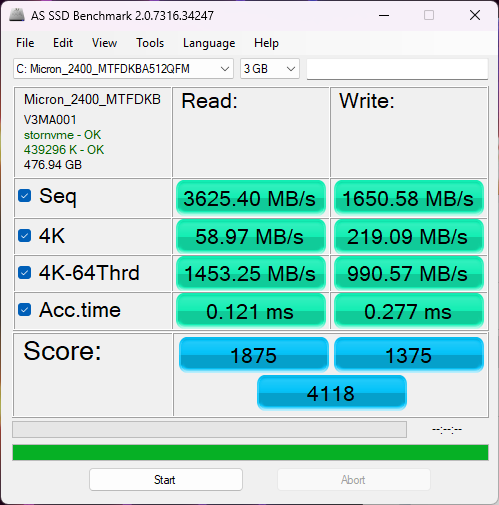
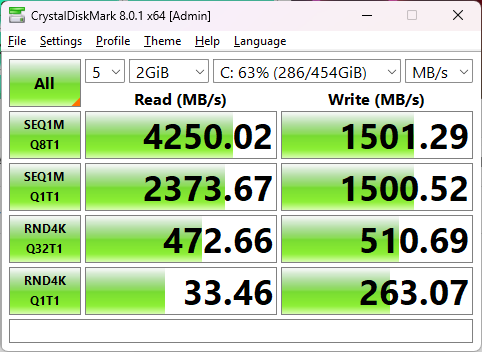

| Drive Performance Rating - Percent | |
| Acer Nitro V 15 ANV15-51-582S | |
| Lenovo LOQ 15IRX9 | |
| HP Victus 15-fa1057ng | |
| MSI Thin GF63 12VE | |
| Asus TUF A15 FA507 | |
| MSI GF63 Thin 9SC -8! | |
* ... kleinere Werte sind besser
Disk Throttling: DiskSpd Read Loop, Queue Depth 8
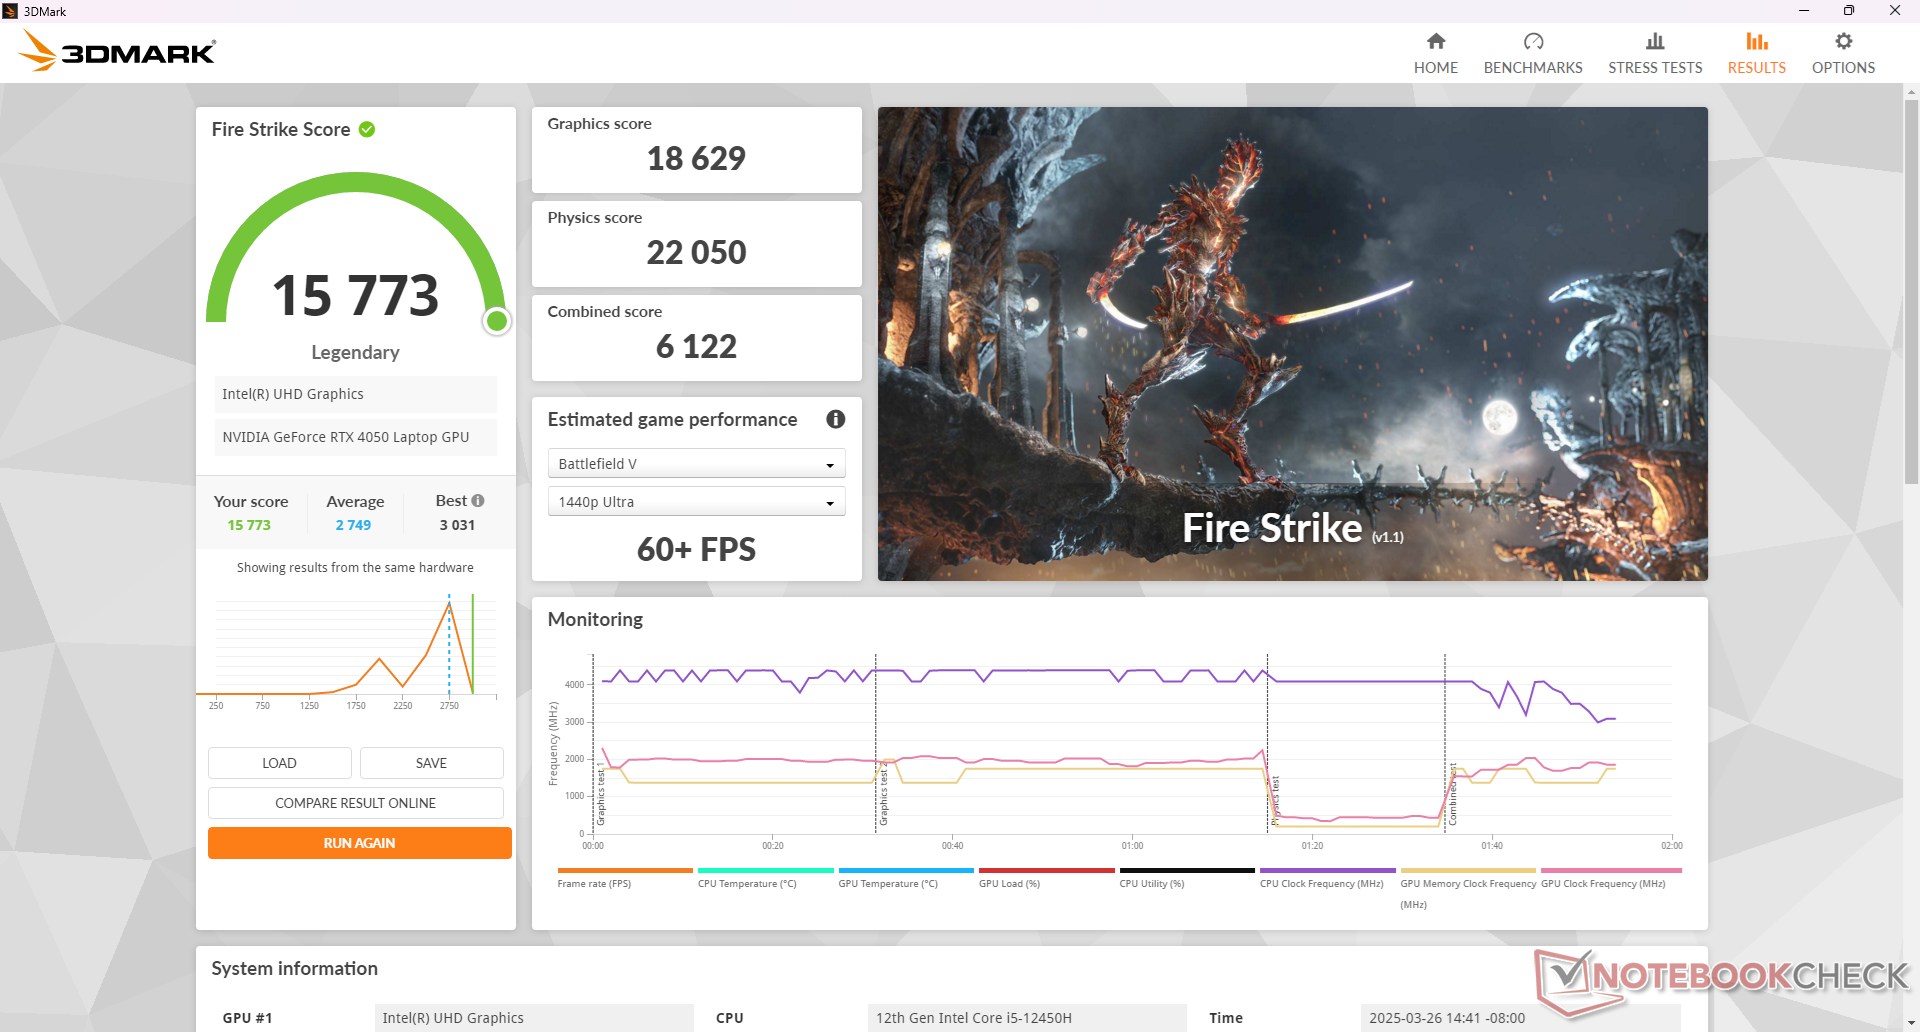
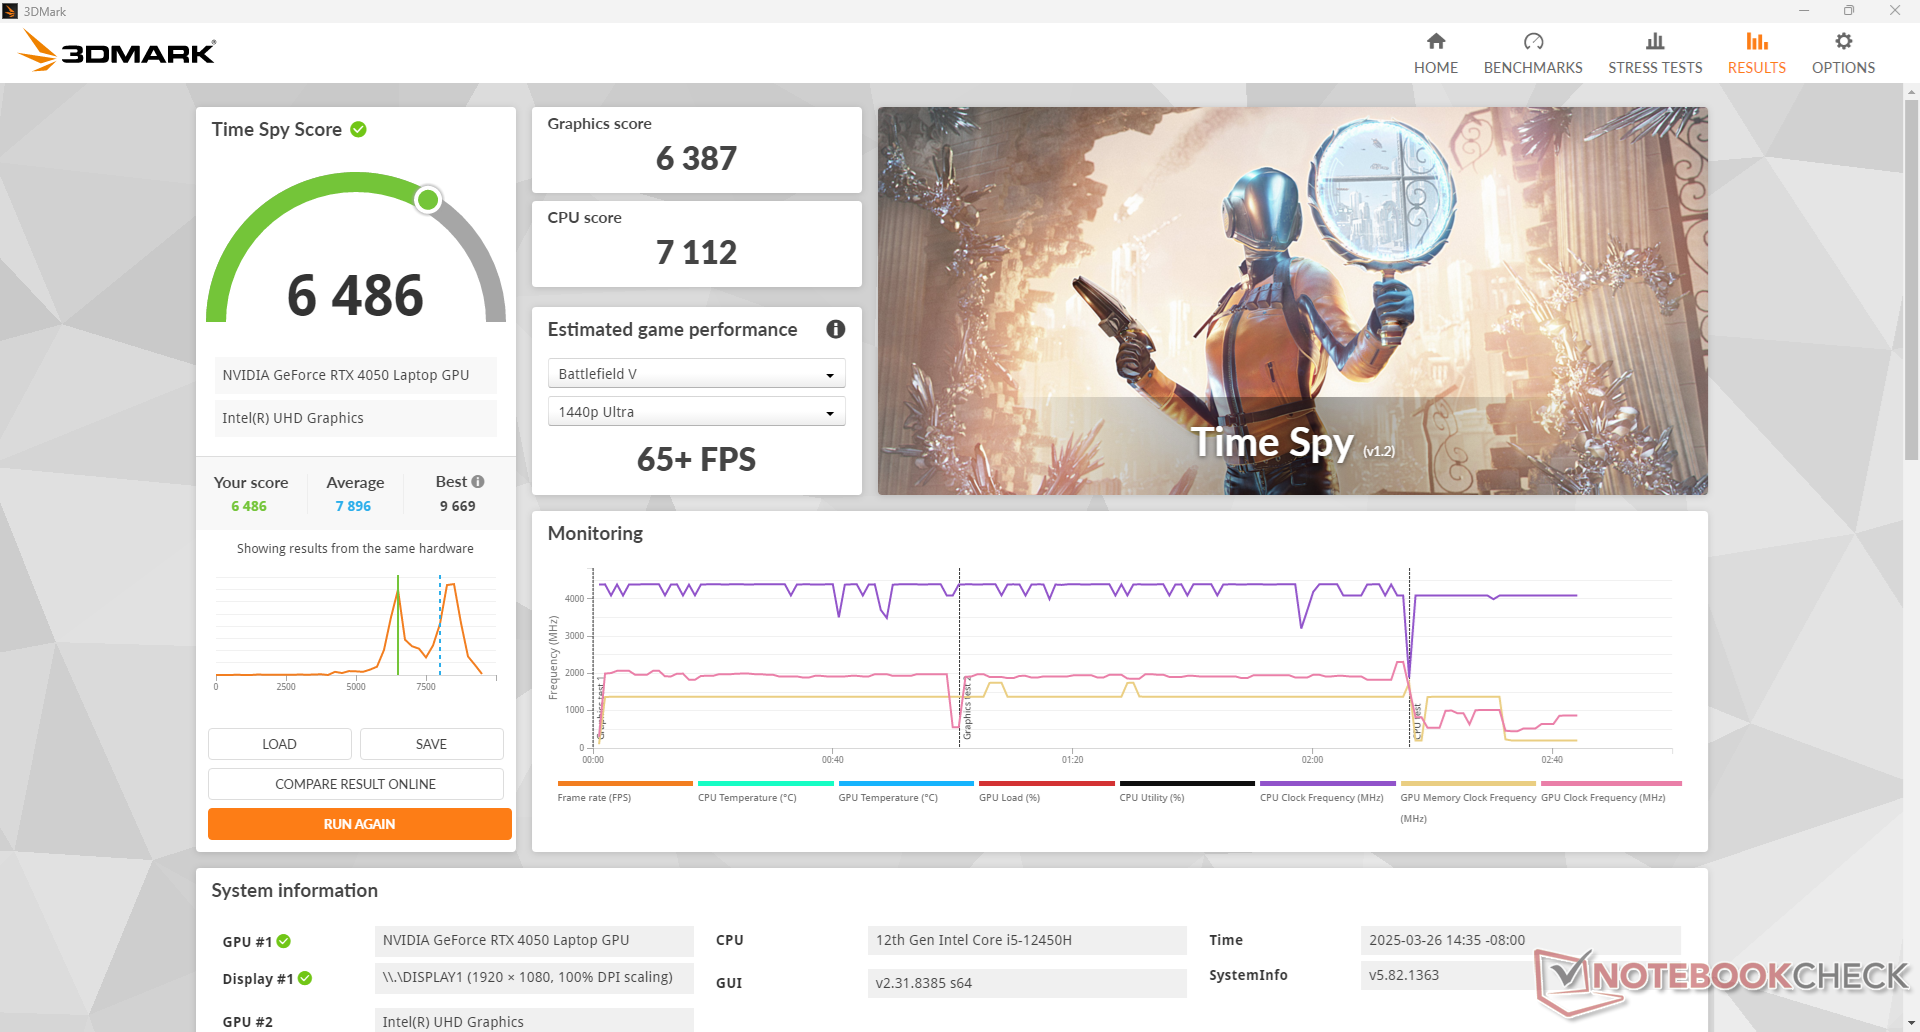
GPU Performance
Die Grafikleistung ist unterdurchschnittlich im Vergleich zu anderen Laptops mit der derselben RTX 4050 GPU das liegt vor allem an unseren begrenzten 8 GB System-RAM.
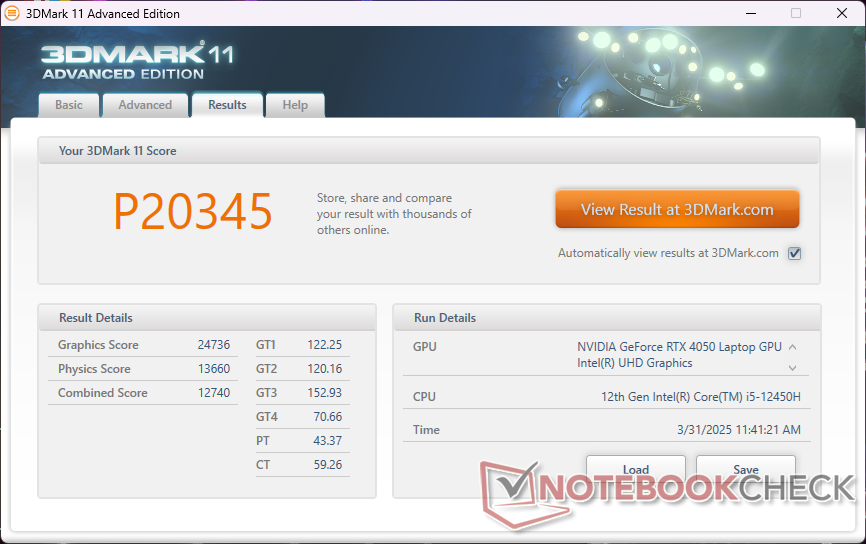
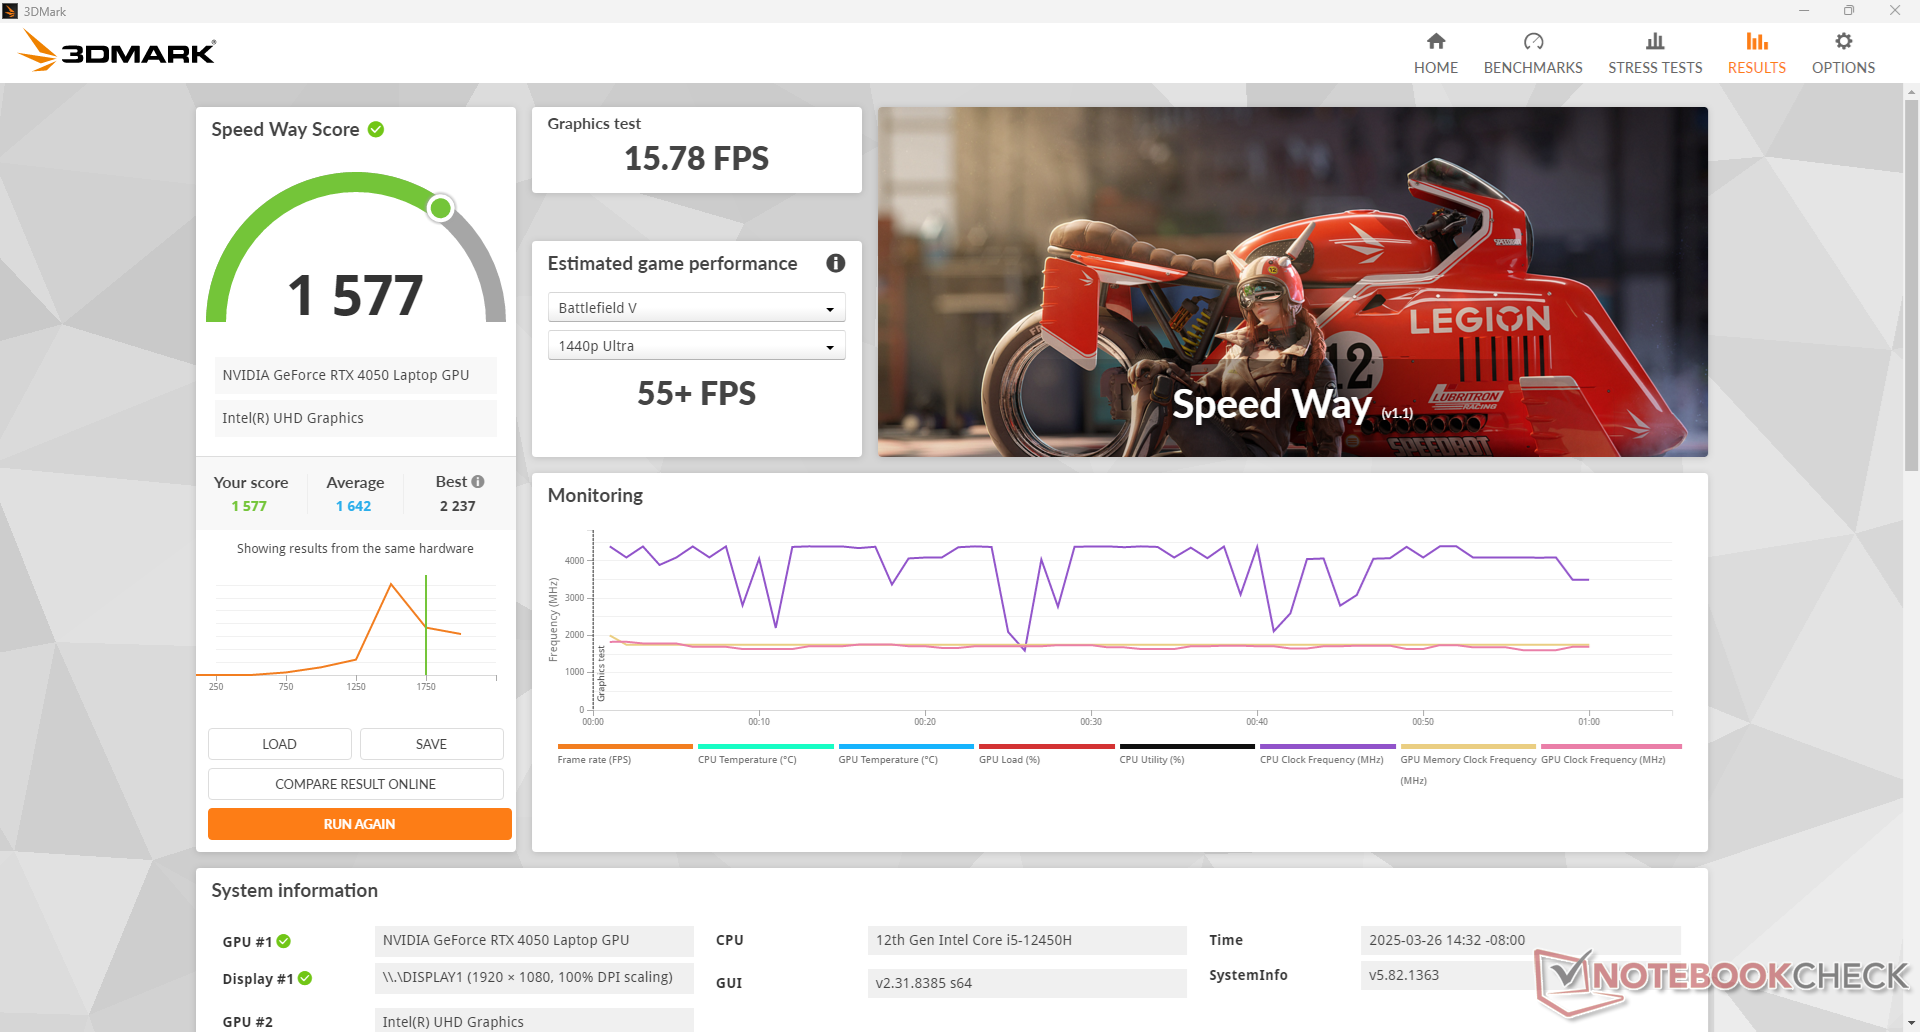
| 3DMark 11 Performance | 20345 Punkte | |
| 3DMark Fire Strike Score | 15773 Punkte | |
| 3DMark Time Spy Score | 6486 Punkte | |
Hilfe | ||
* ... kleinere Werte sind besser
| Tiny Tina's Wonderlands | |
| 1280x720 Lowest Preset (DX12) | |
| Durchschnittliche NVIDIA GeForce RTX 4050 Laptop GPU (109.3 - 250, n=4) | |
| MSI Thin GF63 12VE | |
| 1920x1080 Low Preset (DX12) | |
| Durchschnittliche NVIDIA GeForce RTX 4050 Laptop GPU (104.5 - 183.3, n=7) | |
| MSI Thin GF63 12VE | |
| 1920x1080 Medium Preset (DX12) | |
| Durchschnittliche NVIDIA GeForce RTX 4050 Laptop GPU (93.4 - 149.2, n=7) | |
| MSI Thin GF63 12VE | |
| 1920x1080 High Preset (DX12) | |
| Durchschnittliche NVIDIA GeForce RTX 4050 Laptop GPU (63.3 - 99.5, n=7) | |
| MSI Thin GF63 12VE | |
| 1920x1080 Badass Preset (DX12) | |
| Durchschnittliche NVIDIA GeForce RTX 4050 Laptop GPU (49.8 - 77.3, n=7) | |
| MSI Thin GF63 12VE | |
| F1 22 | |
| 1280x720 Ultra Low Preset AA:T AF:16x | |
| Lenovo LOQ 15IRH8 Core i7 | |
| Durchschnittliche NVIDIA GeForce RTX 4050 Laptop GPU (175.1 - 364, n=16) | |
| Gigabyte G5 KE | |
| MSI Thin GF63 12VE | |
| 1920x1080 Low Preset AA:T AF:16x | |
| Lenovo LOQ 15IRH8 Core i7 | |
| Gigabyte G5 KE | |
| Durchschnittliche NVIDIA GeForce RTX 4050 Laptop GPU (100.9 - 244, n=22) | |
| MSI Thin GF63 12VE | |
| 1920x1080 Medium Preset AA:T AF:16x | |
| Lenovo LOQ 15IRH8 Core i7 | |
| Gigabyte G5 KE | |
| Durchschnittliche NVIDIA GeForce RTX 4050 Laptop GPU (101.8 - 234, n=21) | |
| MSI Thin GF63 12VE | |
| 1920x1080 High Preset AA:T AF:16x | |
| Lenovo LOQ 15IRH8 Core i7 | |
| Gigabyte G5 KE | |
| Durchschnittliche NVIDIA GeForce RTX 4050 Laptop GPU (94.4 - 174.7, n=22) | |
| MSI Thin GF63 12VE | |
| 1920x1080 Ultra High Preset AA:T AF:16x | |
| Gigabyte G5 KE | |
| Lenovo LOQ 15IRH8 Core i7 | |
| Durchschnittliche NVIDIA GeForce RTX 4050 Laptop GPU (10.9 - 56.4, n=24) | |
| MSI Thin GF63 12VE | |
| Baldur's Gate 3 | |
| 1280x720 Low Preset AA:SM | |
| Gigabyte G5 KF5 2024 | |
| Durchschnittliche NVIDIA GeForce RTX 4050 Laptop GPU (108.6 - 148.9, n=3) | |
| MSI Thin GF63 12VE | |
| 1920x1080 Low Preset AA:SM | |
| Asus TUF Gaming A15 FA507UV | |
| Gigabyte G5 KF5 2024 | |
| Durchschnittliche NVIDIA GeForce RTX 4050 Laptop GPU (73.4 - 112.3, n=8) | |
| MSI Thin GF63 12VE | |
| 1920x1080 Medium Preset AA:T | |
| Asus TUF Gaming A15 FA507UV | |
| Gigabyte G5 KF5 2024 | |
| Durchschnittliche NVIDIA GeForce RTX 4050 Laptop GPU (56 - 91.9, n=10) | |
| MSI Thin GF63 12VE | |
| 1920x1080 High Preset AA:T | |
| Asus TUF Gaming A15 FA507UV | |
| Gigabyte G5 KF5 2024 | |
| Durchschnittliche NVIDIA GeForce RTX 4050 Laptop GPU (49.8 - 83.5, n=10) | |
| MSI Thin GF63 12VE | |
| 1920x1080 Ultra Preset AA:T | |
| Asus TUF Gaming A15 FA507UV | |
| Gigabyte G5 KF5 2024 | |
| MSI Thin GF63 12VE | |
| Durchschnittliche NVIDIA GeForce RTX 4050 Laptop GPU (48.3 - 81.3, n=11) | |
Cyberpunk 2077 ultra FPS Chart
| min. | mittel | hoch | max. | |
|---|---|---|---|---|
| GTA V (2015) | 150.9 | 142.2 | 110.7 | 67.1 |
| Dota 2 Reborn (2015) | 122.7 | 108.6 | 95.9 | 90.5 |
| Final Fantasy XV Benchmark (2018) | 123.2 | 85.7 | 64.2 | |
| X-Plane 11.11 (2018) | 70.1 | 63.8 | 55.5 | |
| Far Cry 5 (2018) | 97 | 84 | 82 | 70 |
| Strange Brigade (2018) | 299 | 160.9 | 129.5 | 113.6 |
| Tiny Tina's Wonderlands (2022) | 113 | 95.6 | 72.1 | 55 |
| F1 22 (2022) | 129.2 | 126.3 | 99.3 | 40.1 |
| Baldur's Gate 3 (2023) | 82.1 | 71.3 | 64 | 63.8 |
| Cyberpunk 2077 (2023) | 76.4 | 65.1 | 55.7 | 47.3 |
Emissionen
Systemrauschen
Beachten Sie, dass das Lüftergeräusch beim Spielen im Modus Balanced das gleiche ist wie beim Spielen im Modus Performance (47,7 dB(A)). Es wird daher empfohlen, im Modus Performance zu spielen, da die Lüftergeräusche dann nicht wesentlich lauter sind.
Lautstärkediagramm
| Idle |
| 24.3 / 24.3 / 24.3 dB(A) |
| Last |
| 36.2 / 59.3 dB(A) |
 | ||
30 dB leise 40 dB(A) deutlich hörbar 50 dB(A) störend |
||
min: | ||
| MSI Thin GF63 12VE GeForce RTX 4050 Laptop GPU, i5-12450H, Micron 2400 MTFDKBA512QFM | MSI GF63 Thin 9SC GeForce GTX 1650 Max-Q, i5-9300H, Toshiba KBG30ZMV512G | Lenovo LOQ 15IRX9 GeForce RTX 4060 Laptop GPU, i5-13450HX, Micron 2400 MTFDKCD1T0QFM | HP Victus 15-fa1057ng GeForce RTX 4050 Laptop GPU, i5-13500H, Kioxia XG8 KXG80ZNV512G | Acer Nitro V 15 ANV15-51-582S GeForce RTX 4050 Laptop GPU, i5-13420H, SK hynix PC801 HFS512GEJ9X115N | Asus TUF A15 FA507 GeForce RTX 4050 Laptop GPU, R7 7735HS, Micron 2400 MTFDKBA512QFM | |
|---|---|---|---|---|---|---|
| Geräuschentwicklung | -27% | -17% | -11% | -12% | 10% | |
| aus / Umgebung * (dB) | 24.3 | 30 -23% | 25 -3% | 25 -3% | 25 -3% | 23.3 4% |
| Idle min * (dB) | 24.3 | 35 -44% | 26 -7% | 29 -19% | 25 -3% | 23.3 4% |
| Idle avg * (dB) | 24.3 | 36 -48% | 34 -40% | 30 -23% | 29 -19% | 23.3 4% |
| Idle max * (dB) | 24.3 | 37 -52% | 36 -48% | 31 -28% | 30 -23% | 23.3 4% |
| Last avg * (dB) | 36.2 | 44 -22% | 48 -33% | 40 -10% | 49 -35% | 29.6 18% |
| Cyberpunk 2077 ultra * (dB) | 47.7 | 48 -1% | ||||
| Last max * (dB) | 59.3 | 43 27% | 50 16% | 48 19% | 51 14% | 43 27% |
| Witcher 3 ultra * (dB) | 41 | 42 | 49 | 43 |
* ... kleinere Werte sind besser
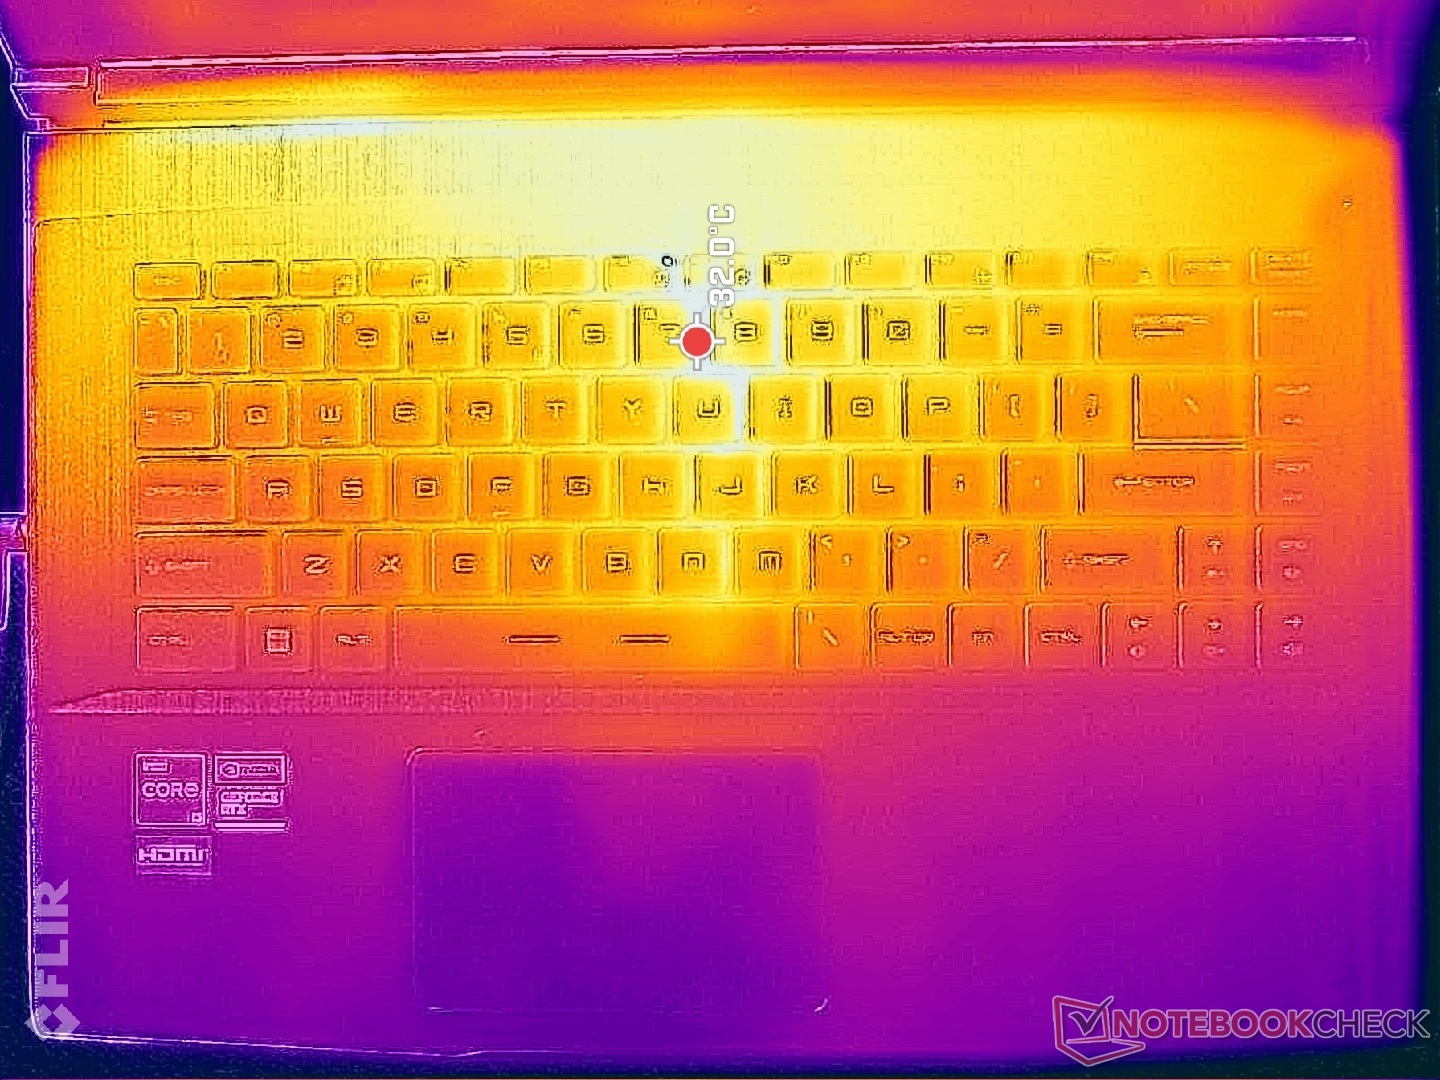
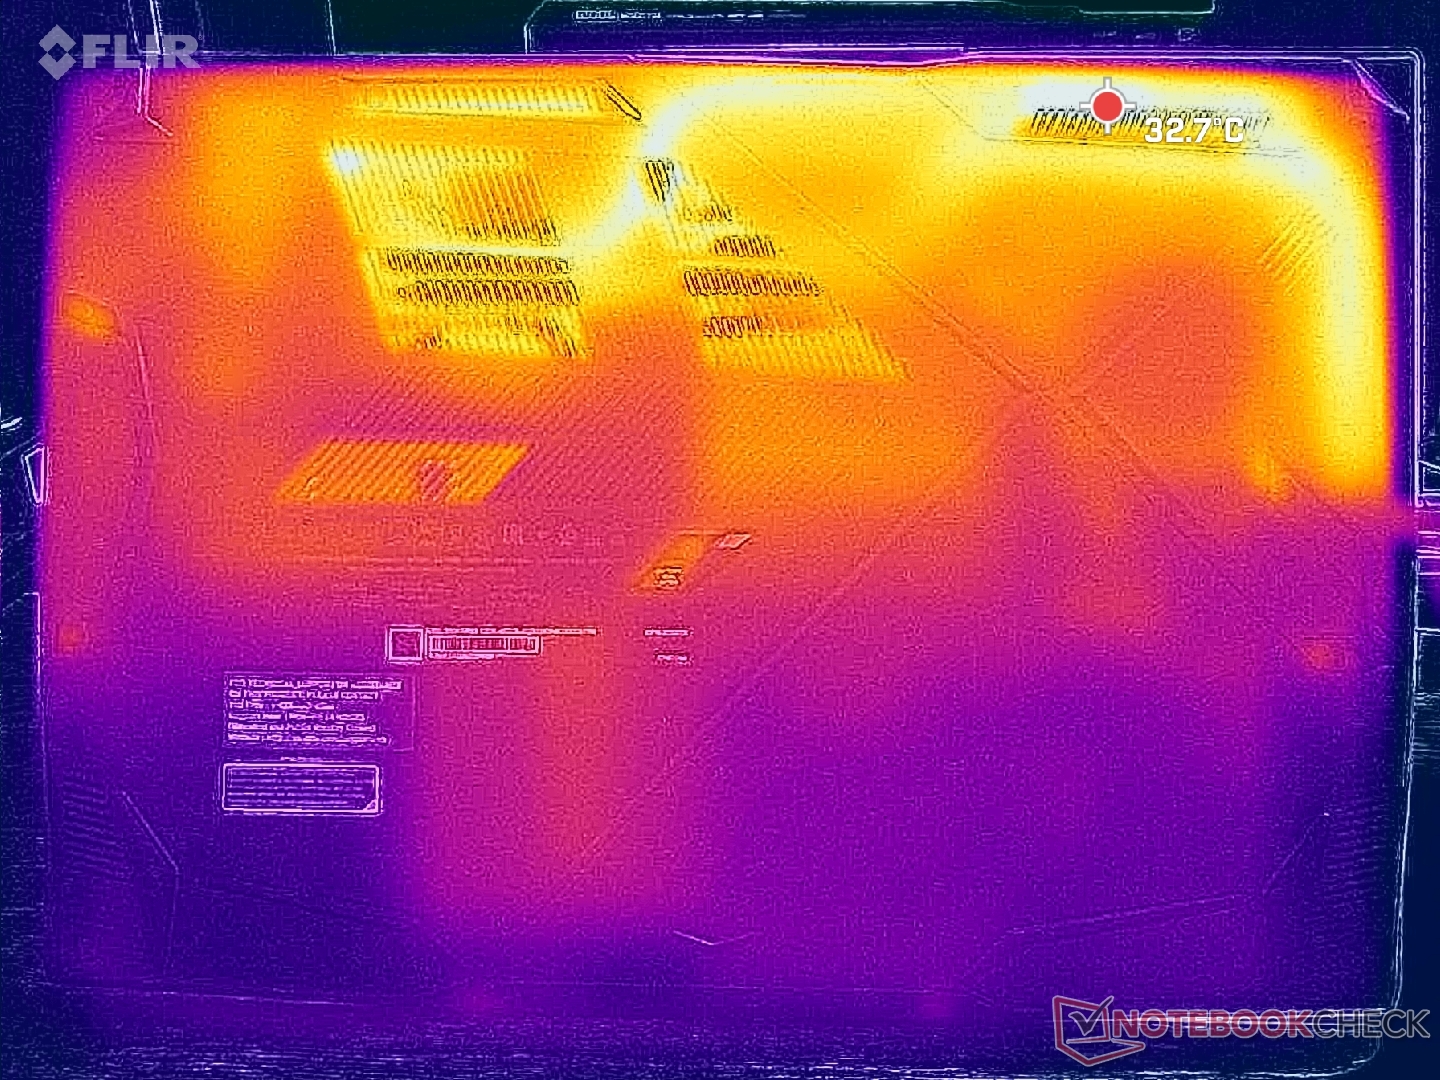
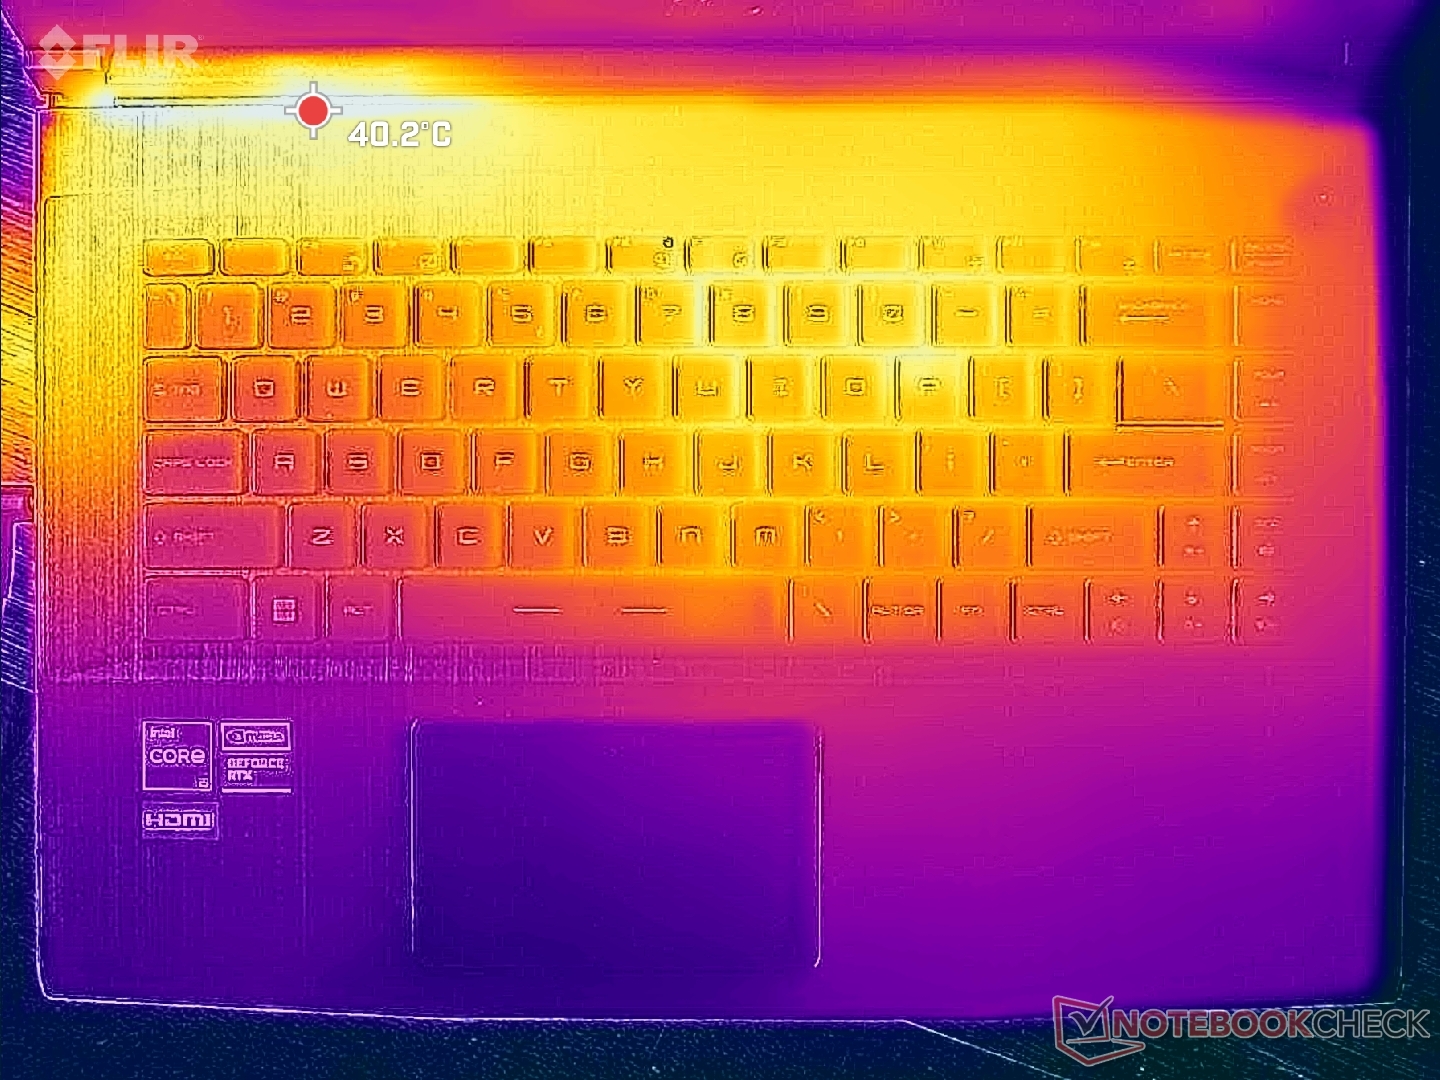
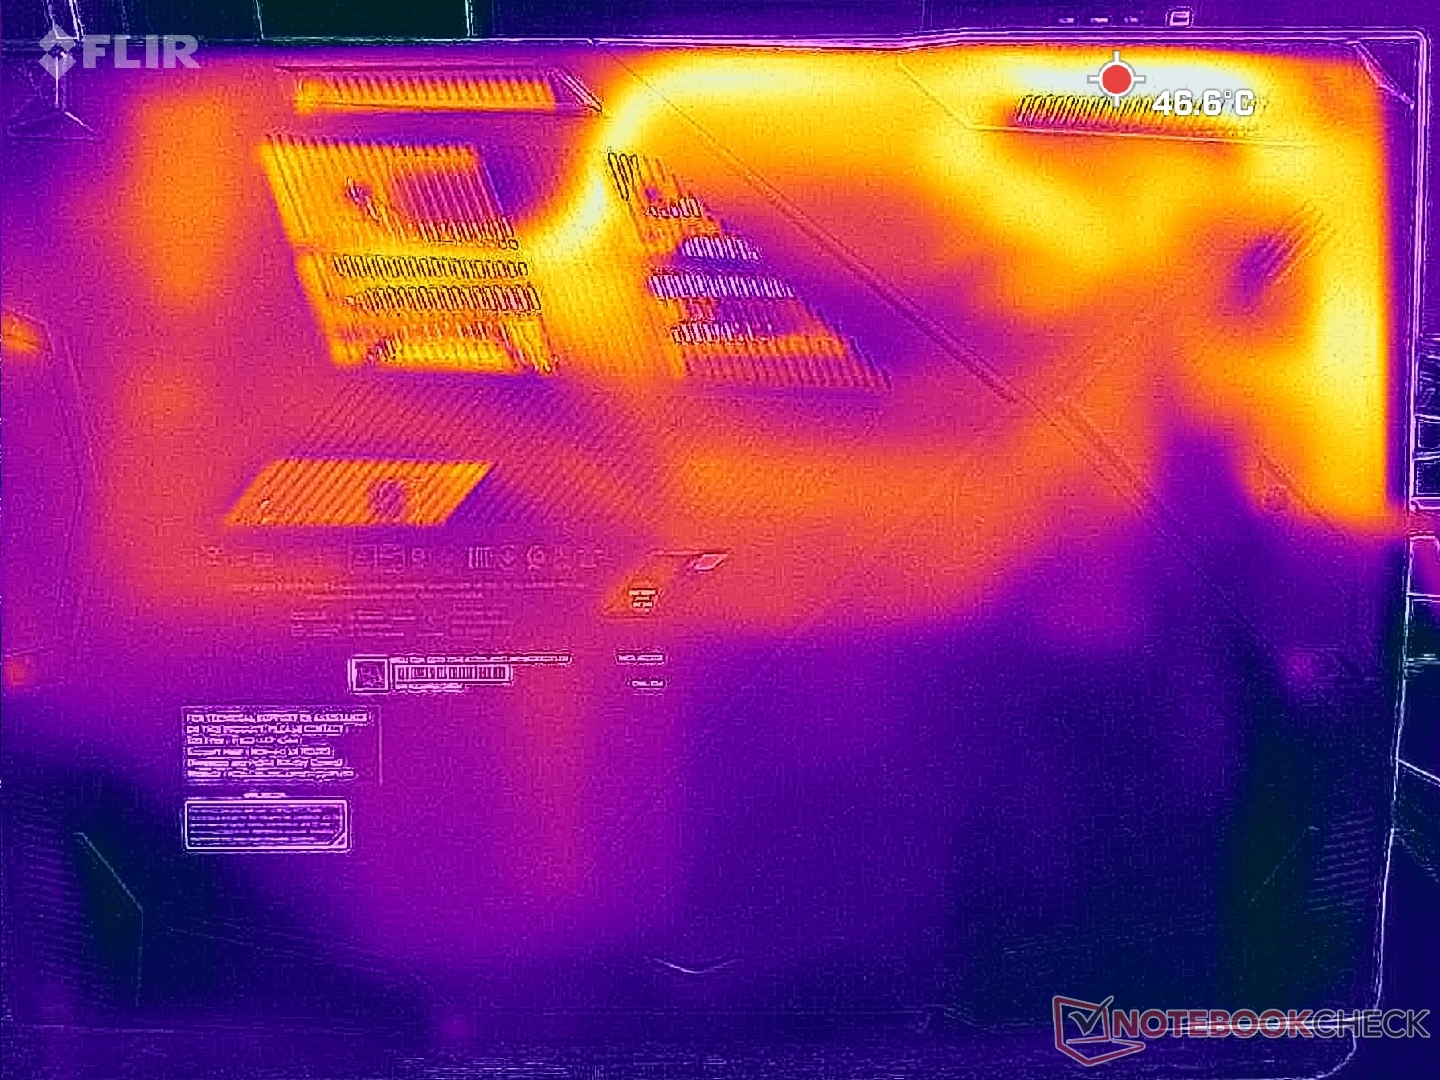
Temperatur
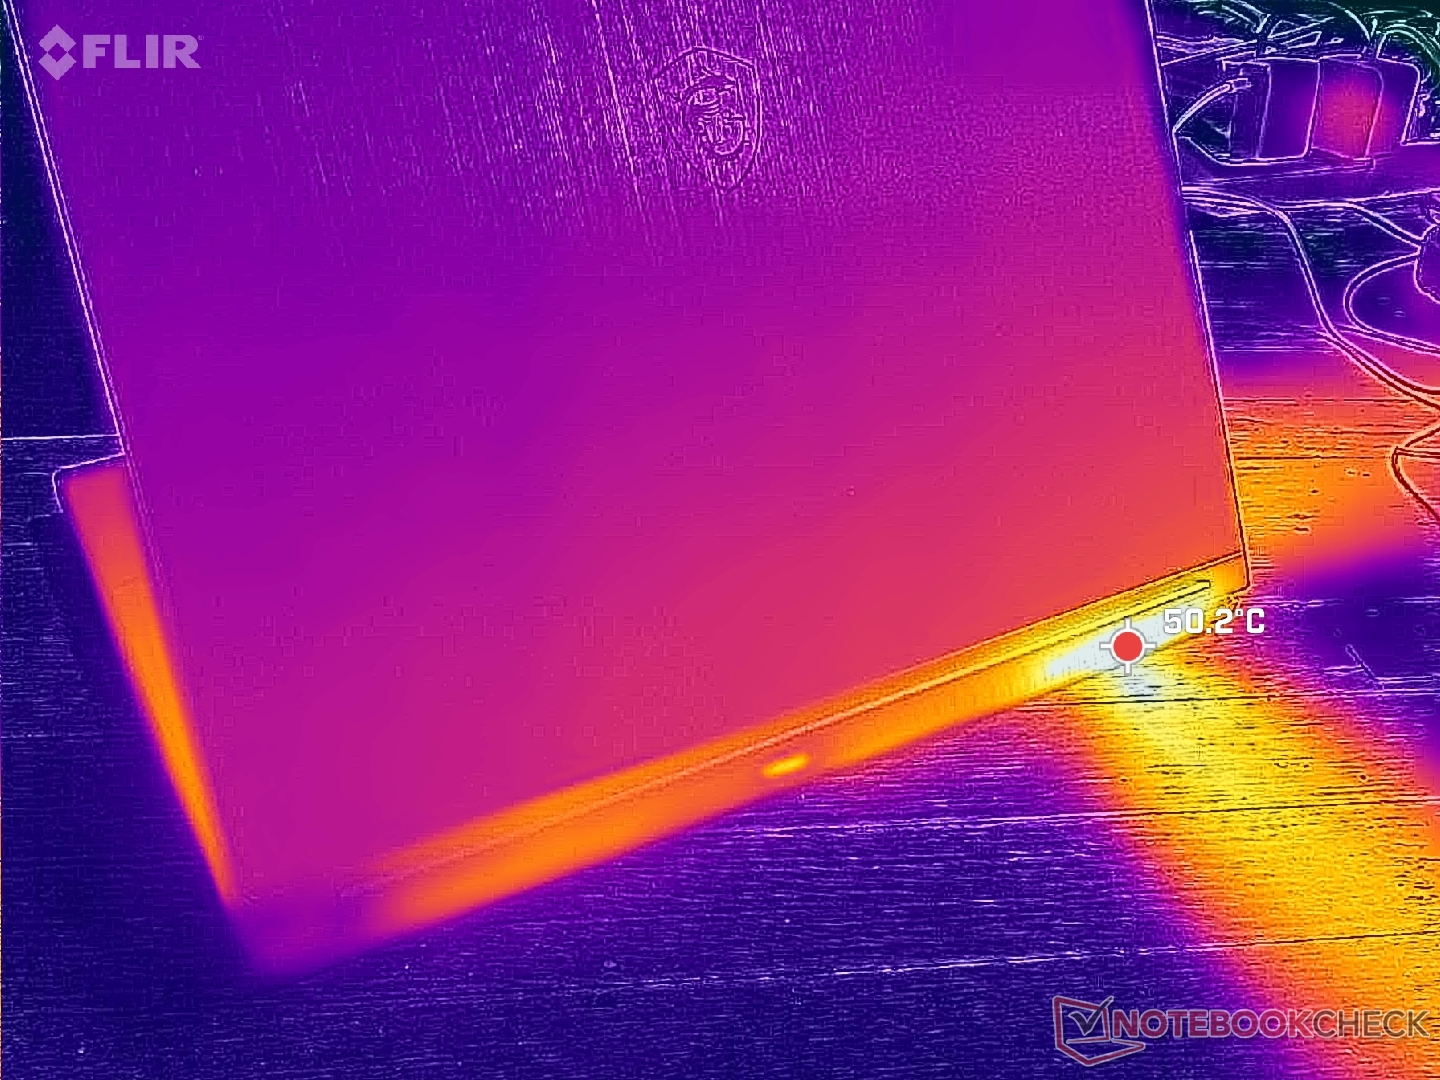
(+) Die maximale Temperatur auf der Oberseite ist 39.8 °C. Im Vergleich liegt der Klassendurchschnitt bei 40.4 °C (von 21.2 bis 68.8 °C für die Klasse Gaming).
(+) Auf der Unterseite messen wir eine maximalen Wert von 37.6 °C (im Vergleich zum Durchschnitt von 43.2 °C).
(+) Ohne Last messen wir eine durchschnittliche Temperatur von 28.5 °C auf der Oberseite. Der Klassendurchschnitt erreicht 33.9 °C.
(+) Die Handballen und der Touchpad-Bereich sind mit gemessenen 24.6 °C kühler als die typische Hauttemperatur und fühlen sich dadurch kühl an.
(+) Die durchschnittliche Handballen-Temperatur anderer getesteter Geräte war 28.8 °C (+4.2 °C).
| MSI Thin GF63 12VE Intel Core i5-12450H, NVIDIA GeForce RTX 4050 Laptop GPU | MSI GF63 Thin 9SC Intel Core i5-9300H, NVIDIA GeForce GTX 1650 Max-Q | Lenovo LOQ 15IRX9 Intel Core i5-13450HX, NVIDIA GeForce RTX 4060 Laptop GPU | HP Victus 15-fa1057ng Intel Core i5-13500H, NVIDIA GeForce RTX 4050 Laptop GPU | Acer Nitro V 15 ANV15-51-582S Intel Core i5-13420H, NVIDIA GeForce RTX 4050 Laptop GPU | Asus TUF A15 FA507 AMD Ryzen 7 7735HS, NVIDIA GeForce RTX 4050 Laptop GPU | |
|---|---|---|---|---|---|---|
| Hitze | 2% | -17% | 11% | 0% | 1% | |
| Last oben max * (°C) | 39.8 | 47 -18% | 47 -18% | 42 -6% | 46 -16% | 48.9 -23% |
| Last unten max * (°C) | 37.6 | 47 -25% | 58 -54% | 42 -12% | 48 -28% | 44.6 -19% |
| Idle oben max * (°C) | 32.8 | 26 21% | 32 2% | 24 27% | 27 18% | 27.1 17% |
| Idle unten max * (°C) | 37.6 | 26 31% | 36 4% | 24 36% | 28 26% | 27.5 27% |
* ... kleinere Werte sind besser
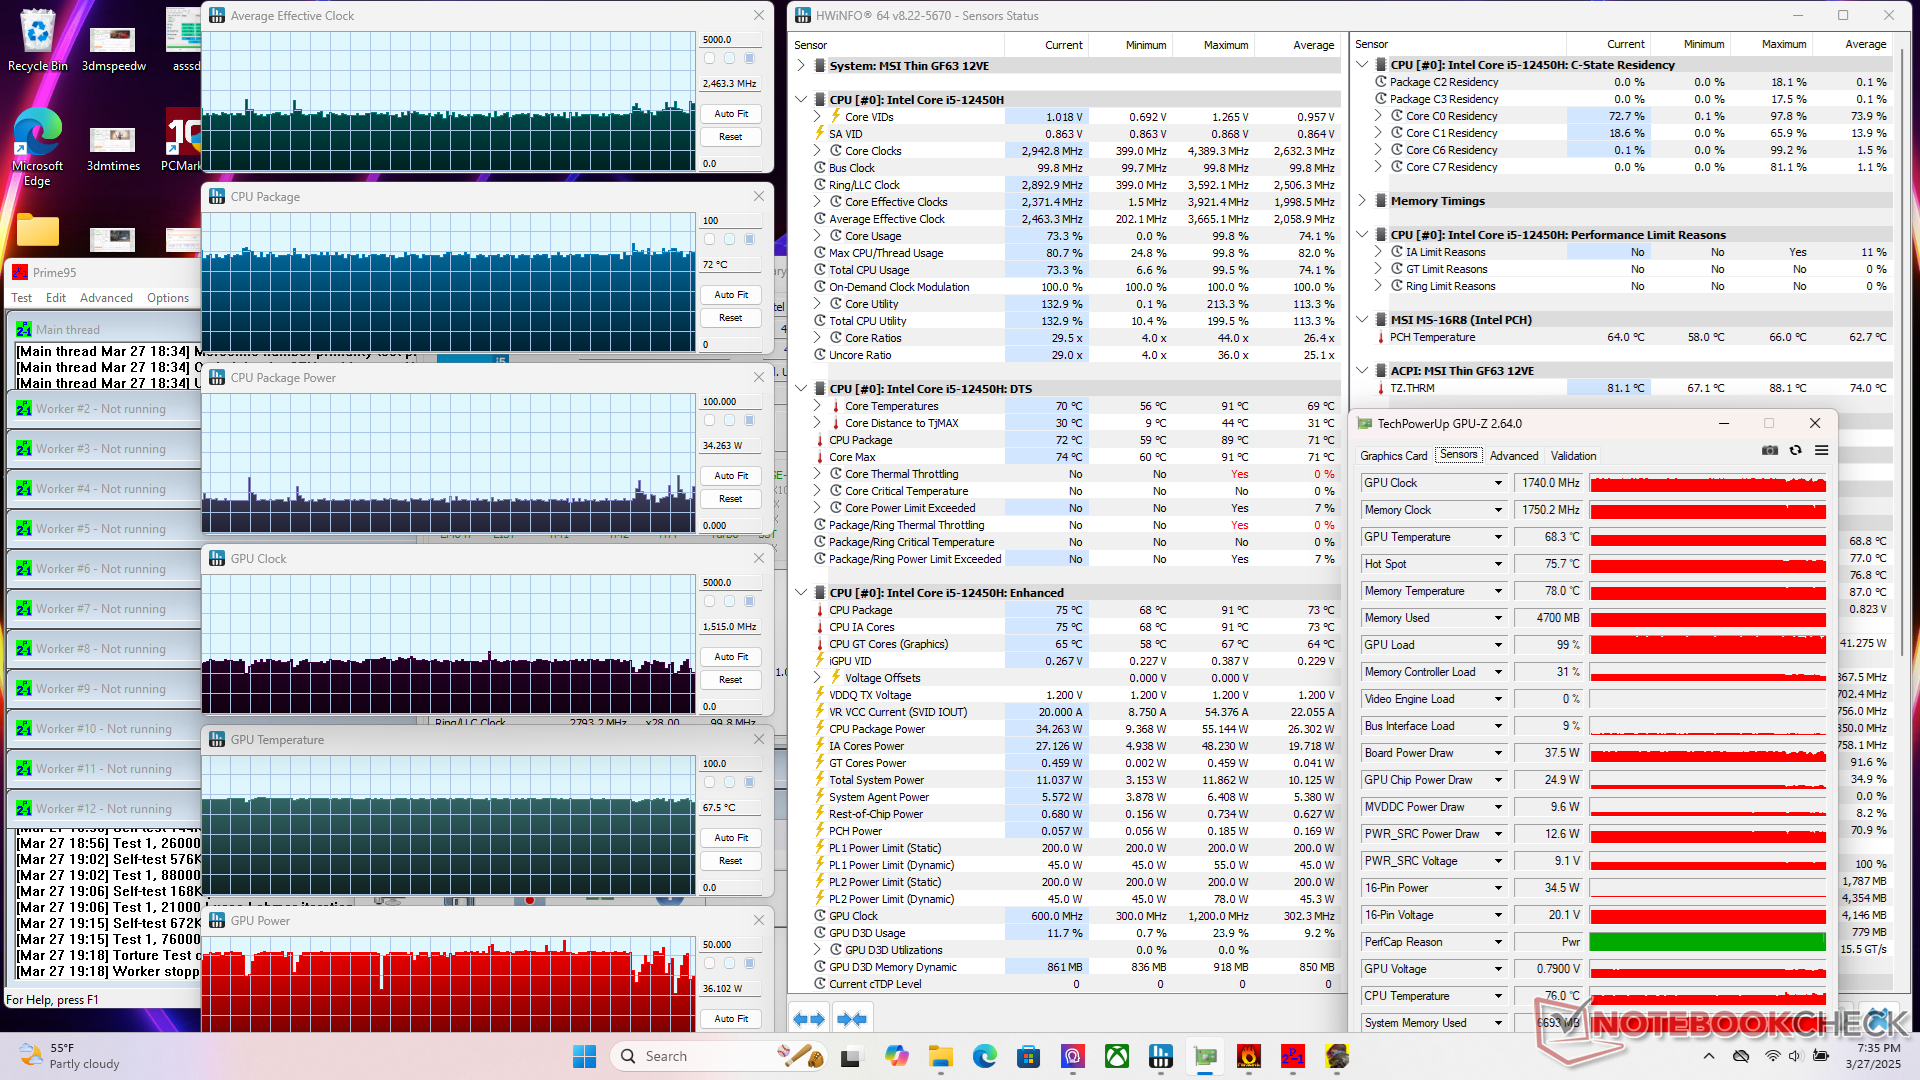
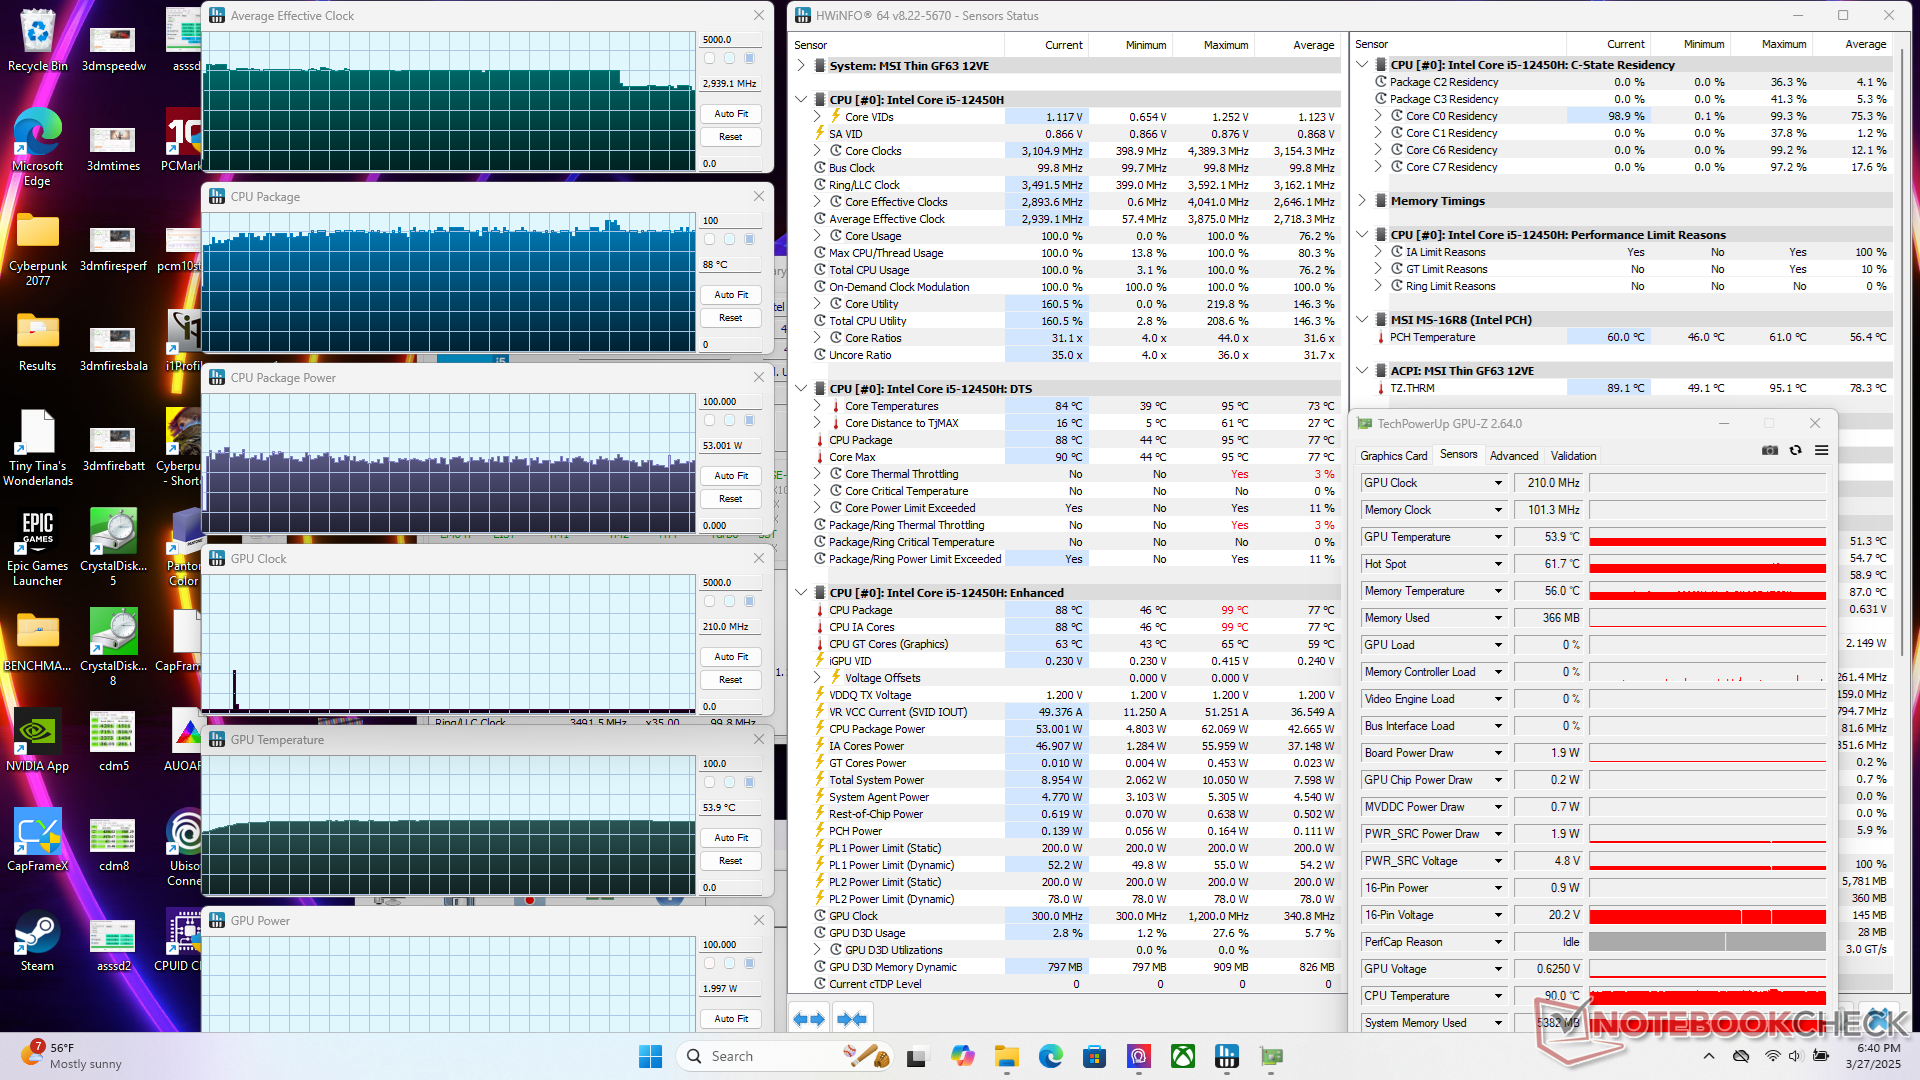
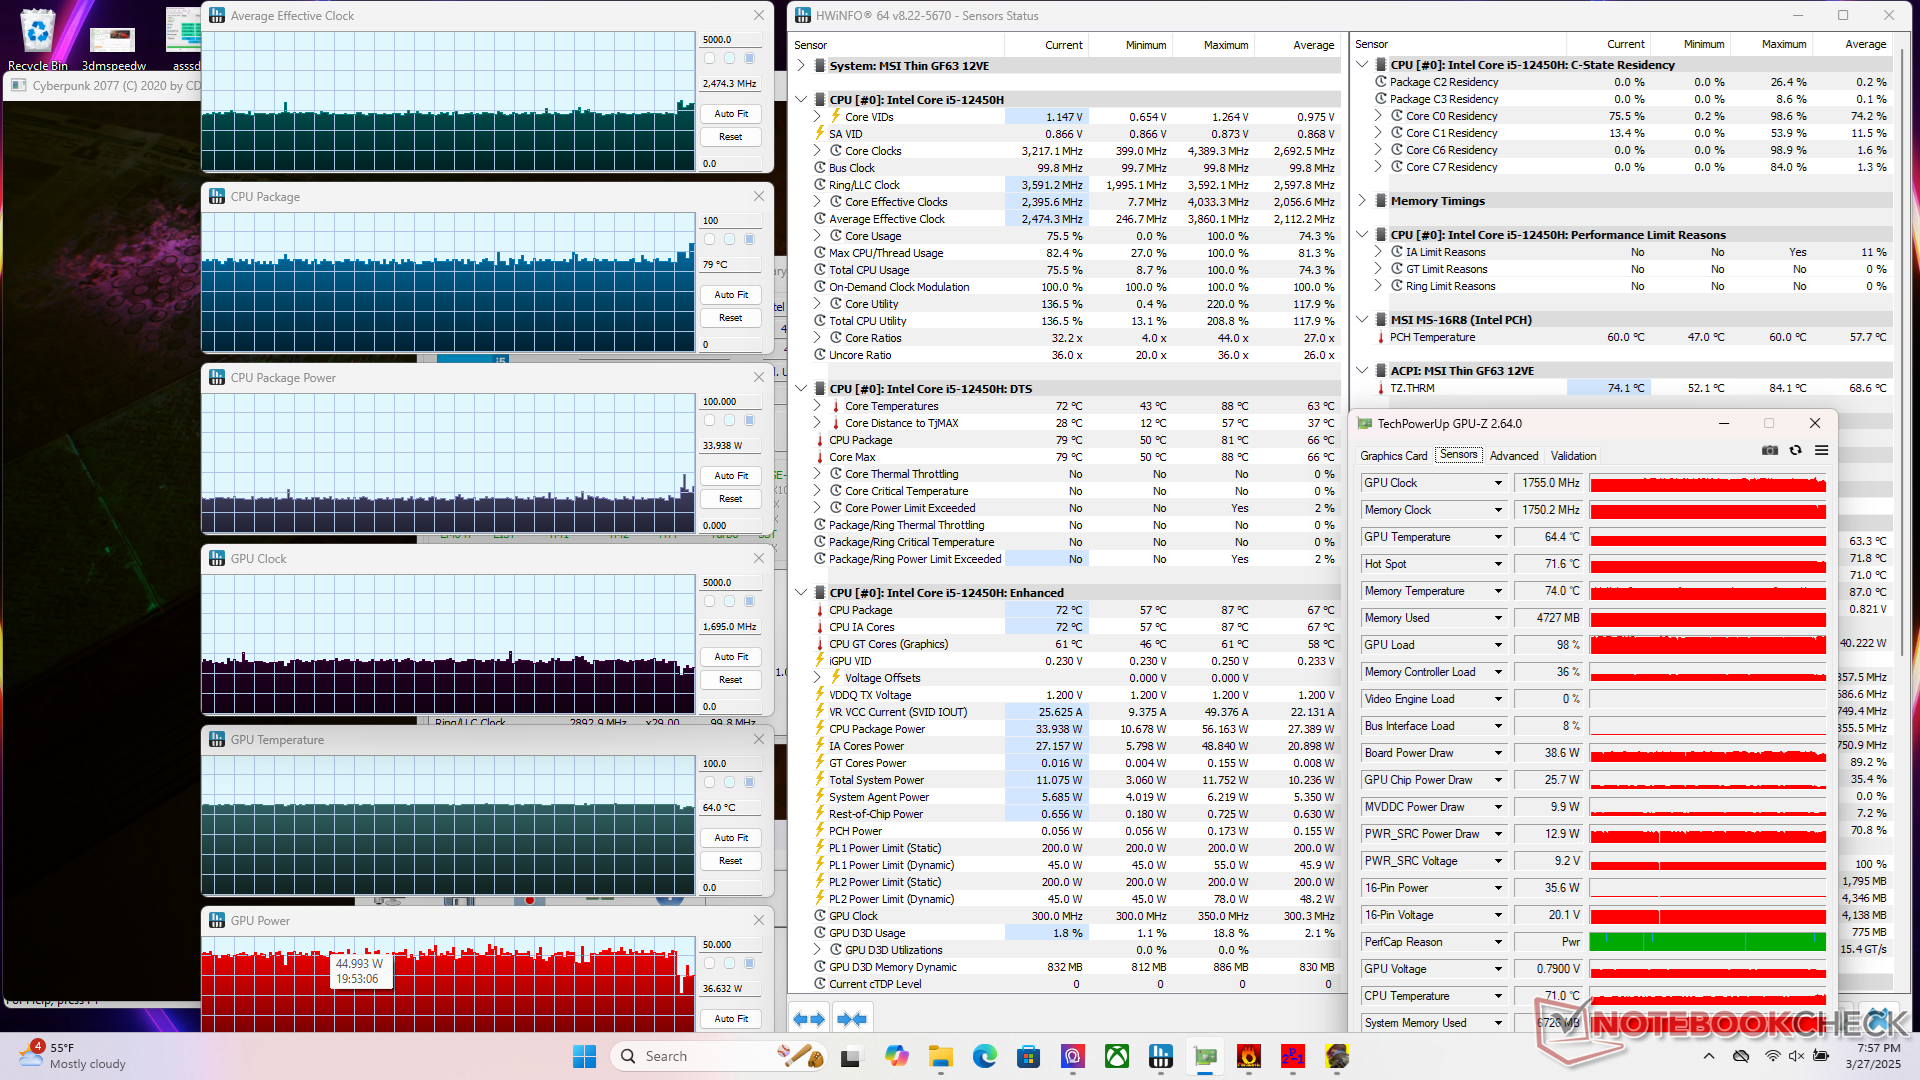
Stresstest
Die CPU wurde beim Starten von Prime95 auf 62 W, 88 °C und 3,9 GHz hochgefahren, bevor sie einige Augenblicke später auf 2,8 GHz und 53 W fällt. Die CPU- und GPU-Temperaturen beim Spielen sind mit <80 °C für ein Gaming-Notebook anständig, selbst wenn es nur im Modus "Ausbalanciert" läuft.
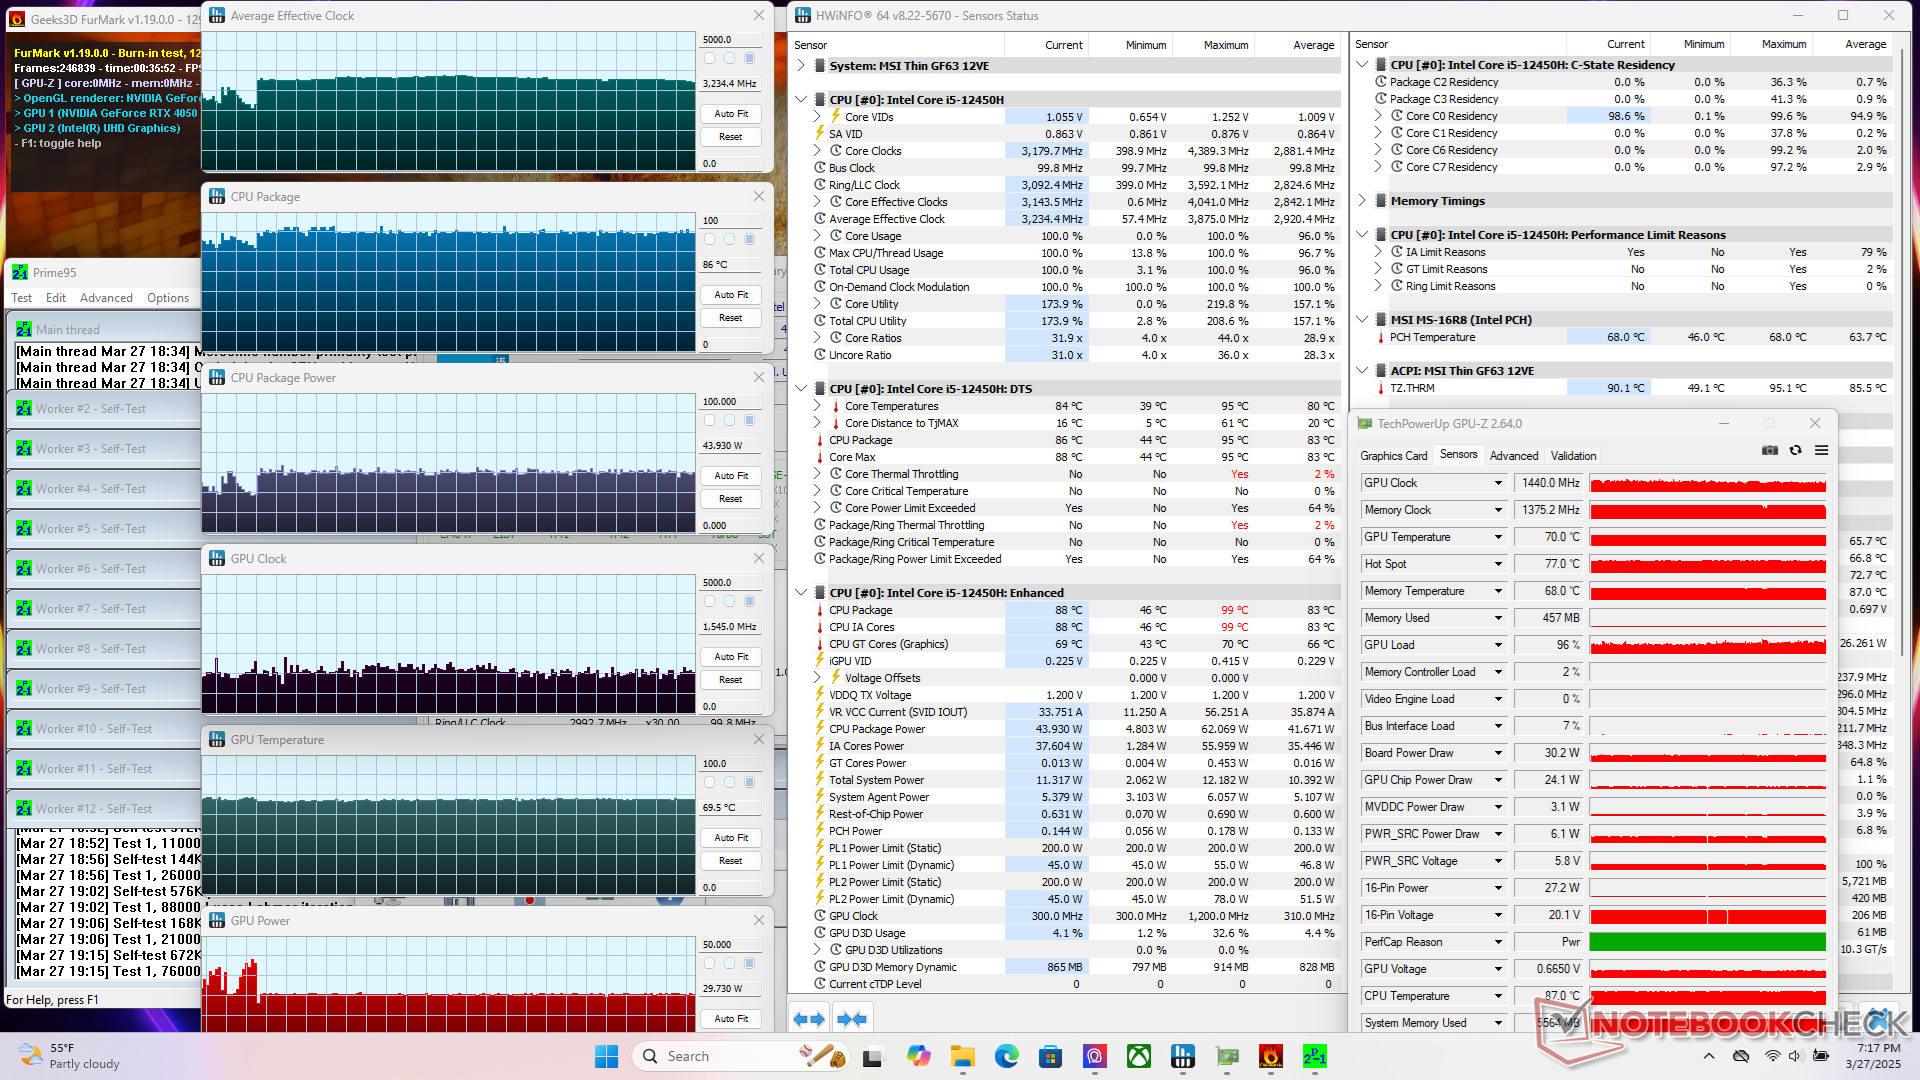
| durchschnittlicher CPU-Takt (GHz) | GPU-Takt (MHz) | durchschnittliche CPU-Temperatur (°C) | durchschnittliche GPU-Temperatur (°C) | |
| System Leerlauf | -- | -- | 46 | 45 |
| Prime95 Stress | 2,9 | -- | 88 | 54 |
| Prime95 + FurMark Stress | 3,2 | 1.440 | 86 | 70 |
| Cyberpunk 2077 Stress (Ausgewogener Modus) | 2,4 | 1.740 | 72 | 68 |
| Cyberpunk 2077 Stress (Performance-Modus) | 2,4 | 1.755 | 79 | 64 |
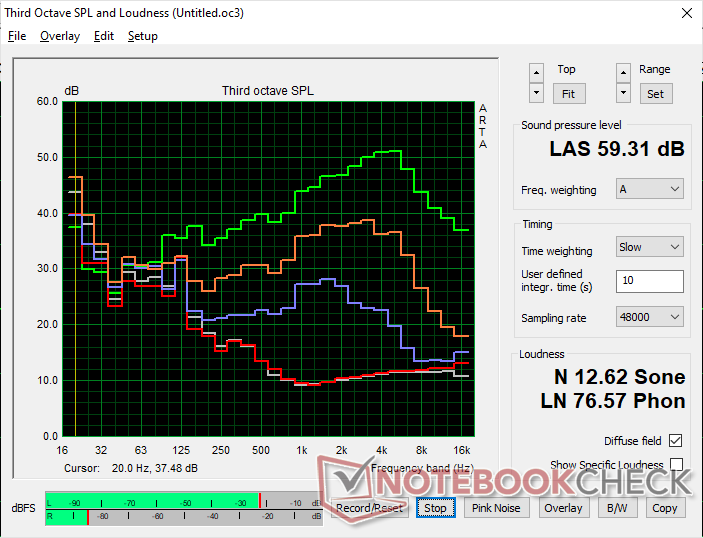
Lautsprecher
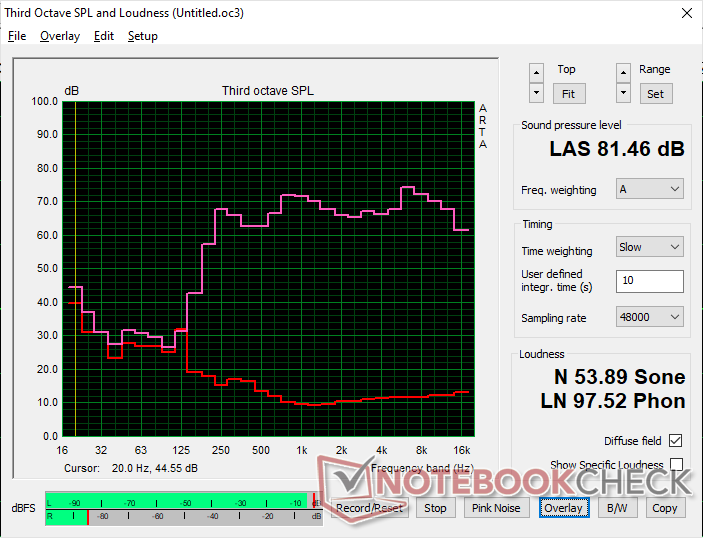
MSI Thin GF63 12VE Audio Analyse
(±) | Mittelmäßig laut spielende Lautsprecher (81.5 dB)
Bass 100 - 315 Hz
(-) | kaum Bass - 18.4% niedriger als der Median
(±) | durchschnittlich lineare Bass-Wiedergabe (14.2% Delta zum Vorgänger)
Mitteltöne 400 - 2000 Hz
(+) | ausgeglichene Mitten, vom Median nur 2.9% abweichend
(+) | lineare Mitten (4.3% Delta zum Vorgänger)
Hochtöne 2 - 16 kHz
(+) | ausgeglichene Hochtöne, vom Median nur 2.9% abweichend
(+) | sehr lineare Hochtöne (4% Delta zum Vorgänger)
Gesamt im hörbaren Bereich 100 - 16.000 Hz
(+) | hörbarer Bereich ist sehr linear (13.8% Abstand zum Median
Im Vergleich zu allen Geräten derselben Klasse
» 21% aller getesteten Geräte dieser Klasse waren besser, 7% vergleichbar, 71% schlechter
» Das beste Gerät hat einen Delta-Wert von 6%, durchschnittlich ist 18%, das schlechteste Gerät hat 132%
Im Vergleich zu allen Geräten im Test
» 15% aller getesteten Geräte waren besser, 4% vergleichbar, 81% schlechter
» Das beste Gerät hat einen Delta-Wert von 4%, durchschnittlich ist 23%, das schlechteste Gerät hat 134%
Apple MacBook Pro 16 2021 M1 Pro Audio Analyse
(+) | Die Lautsprecher können relativ laut spielen (84.7 dB)
Bass 100 - 315 Hz
(+) | guter Bass - nur 3.8% Abweichung vom Median
(+) | lineare Bass-Wiedergabe (5.2% Delta zum Vorgänger)
Mitteltöne 400 - 2000 Hz
(+) | ausgeglichene Mitten, vom Median nur 1.3% abweichend
(+) | lineare Mitten (2.1% Delta zum Vorgänger)
Hochtöne 2 - 16 kHz
(+) | ausgeglichene Hochtöne, vom Median nur 1.9% abweichend
(+) | sehr lineare Hochtöne (2.7% Delta zum Vorgänger)
Gesamt im hörbaren Bereich 100 - 16.000 Hz
(+) | hörbarer Bereich ist sehr linear (4.6% Abstand zum Median
Im Vergleich zu allen Geräten derselben Klasse
» 0% aller getesteten Geräte dieser Klasse waren besser, 0% vergleichbar, 100% schlechter
» Das beste Gerät hat einen Delta-Wert von 5%, durchschnittlich ist 17%, das schlechteste Gerät hat 45%
Im Vergleich zu allen Geräten im Test
» 0% aller getesteten Geräte waren besser, 0% vergleichbar, 100% schlechter
» Das beste Gerät hat einen Delta-Wert von 4%, durchschnittlich ist 23%, das schlechteste Gerät hat 134%
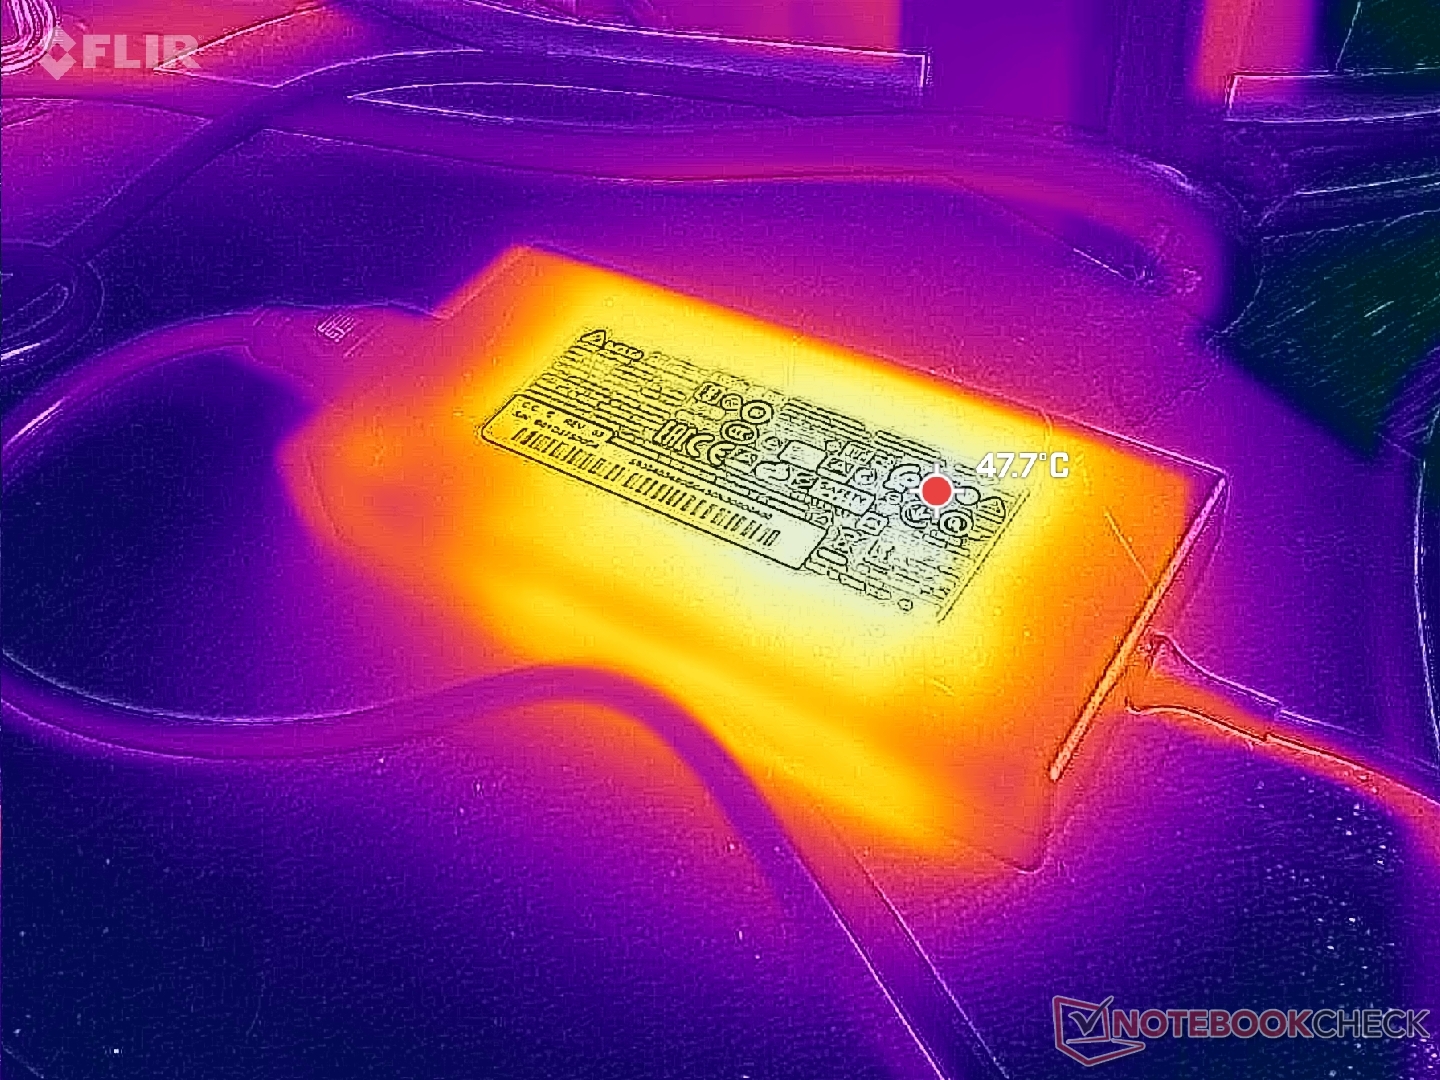
Energieverwaltung
Stromverbrauch

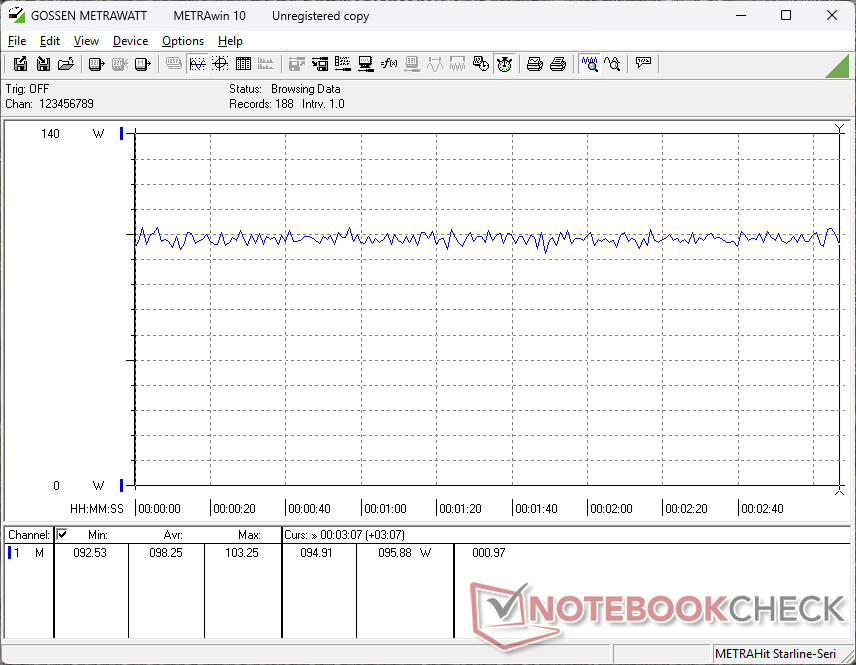
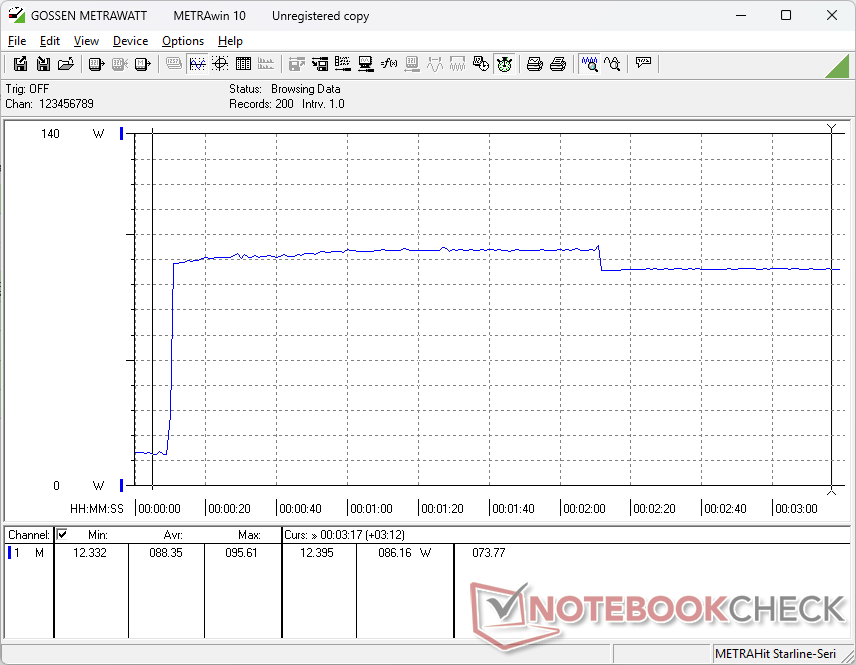
| Aus / Standby | |
| Idle | |
| Last |
|
Legende:
min: | |
| MSI Thin GF63 12VE i5-12450H, GeForce RTX 4050 Laptop GPU, Micron 2400 MTFDKBA512QFM, IPS, 1920x1080, 15.6" | MSI GF63 Thin 9SC i5-9300H, GeForce GTX 1650 Max-Q, Toshiba KBG30ZMV512G, IPS, 1920x1080, 15.6" | Lenovo LOQ 15IRX9 i5-13450HX, GeForce RTX 4060 Laptop GPU, Micron 2400 MTFDKCD1T0QFM, IPS, 1920x1080, 15.6" | HP Victus 15-fa1057ng i5-13500H, GeForce RTX 4050 Laptop GPU, Kioxia XG8 KXG80ZNV512G, IPS, 1920x1080, 15.6" | Acer Nitro V 15 ANV15-51-582S i5-13420H, GeForce RTX 4050 Laptop GPU, SK hynix PC801 HFS512GEJ9X115N, IPS, 1920x1080, 15.6" | Asus TUF A15 FA507 R7 7735HS, GeForce RTX 4050 Laptop GPU, Micron 2400 MTFDKBA512QFM, IPS, 1920x1080, 15.6" | |
|---|---|---|---|---|---|---|
| Stromverbrauch | -18% | -83% | -20% | -8% | -32% | |
| Idle min * (Watt) | 4.3 | 7 -63% | 13 -202% | 5 -16% | 7 -63% | 8 -86% |
| Idle avg * (Watt) | 9.2 | 9 2% | 18 -96% | 9 2% | 8 13% | 12.1 -32% |
| Idle max * (Watt) | 16.4 | 13 21% | 24 -46% | 22 -34% | 11 33% | 12.5 24% |
| Last avg * (Watt) | 67 | 79 -18% | 85 -27% | 72 -7% | 76 -13% | 74.9 -12% |
| Cyberpunk 2077 ultra external monitor * (Watt) | 94.2 | 150.9 -60% | ||||
| Cyberpunk 2077 ultra * (Watt) | 98.2 | 155.7 -59% | ||||
| Last max * (Watt) | 122 | 164 -34% | 232 -90% | 176 -44% | 136 -11% | 185 -52% |
| Witcher 3 ultra * (Watt) | 73 | 113 | 98.2 | 136.6 |
* ... kleinere Werte sind besser
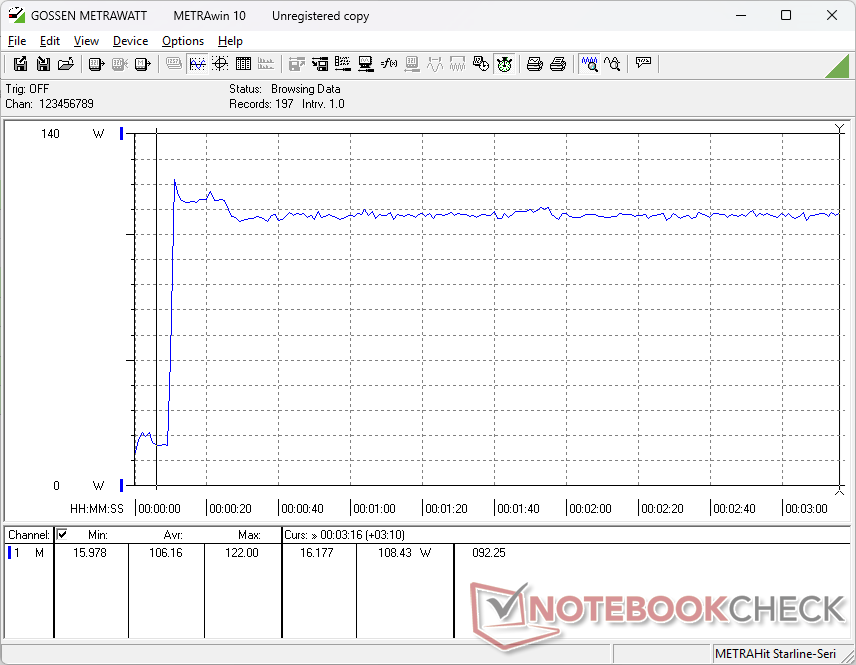
Power Consumption Cyberpunk / Stress Test
Energieverbrauch externer Monitor
Akkulaufzeit
| MSI Thin GF63 12VE i5-12450H, GeForce RTX 4050 Laptop GPU, 52.4 Wh | MSI GF63 Thin 9SC i5-9300H, GeForce GTX 1650 Max-Q, 51 Wh | Lenovo LOQ 15IRX9 i5-13450HX, GeForce RTX 4060 Laptop GPU, 60 Wh | HP Victus 15-fa1057ng i5-13500H, GeForce RTX 4050 Laptop GPU, 70 Wh | Acer Nitro V 15 ANV15-51-582S i5-13420H, GeForce RTX 4050 Laptop GPU, 57 Wh | Asus TUF A15 FA507 R7 7735HS, GeForce RTX 4050 Laptop GPU, 90 Wh | |
|---|---|---|---|---|---|---|
| Akkulaufzeit | 22% | 47% | 108% | 161% | 225% | |
| WLAN (h) | 3.6 | 4.4 22% | 5.3 47% | 7.5 108% | 9.4 161% | 11.7 225% |
| Idle (h) | 8.5 | 21.5 | ||||
| Last (h) | 1.2 | 1.7 | 1 | |||
| H.264 (h) | 12.5 |
Notebookcheck Bewertung
MSI Thin GF63 12VE
- 03.04.2025 v8
Allen Ngo
 Total Sustainability Score:
 Potential Competitors in Comparison
Bild | Modell / Test | Preis ab | Gewicht | Dicke | Display |
|---|---|---|---|---|---|
1. 74%  | MSI Thin GF63 12VE Intel Core i5-12450H ⎘ NVIDIA GeForce RTX 4050 Laptop GPU ⎘ 8 GB RAM, 512 GB SSD | Amazon: Geizhals Suche | 1.8 kg | 21.7 mm | 15.60" 1920x1080 141 PPI IPS |
2. 77.6% v7 (old)  | MSI GF63 Thin 9SC Intel Core i5-9300H ⎘ NVIDIA GeForce GTX 1650 Max-Q ⎘ 8 GB RAM, 512 GB SSD | Amazon: 1. 28,55 € JISHIYUFS Ersatz CPU Lüfter... 2. 29,88 € BTY-M6K Laptop-Akku 3. 51,95 € Laptiptop 15,6" LED Display ... Listenpreis: 975 EUR | 1.8 kg | 22 mm | 15.60" 1920x1080 141 PPI IPS |
3. 79%  | Lenovo LOQ 15IRX9 Intel Core i5-13450HX ⎘ NVIDIA GeForce RTX 4060 Laptop GPU ⎘ 16 GB RAM, 1024 GB SSD | Amazon: Geizhals Suche | 2.4 kg | 23.9 mm | 15.60" 1920x1080 141 PPI IPS |
4. 84% v7 (old)  | HP Victus 15-fa1057ng Intel Core i5-13500H ⎘ NVIDIA GeForce RTX 4050 Laptop GPU ⎘ 16 GB RAM, 512 GB SSD | Amazon: 1. 1.283,37 € HP Victus 15-FB3000SL Notebo... 2. 1.235,90 € HP Victus 15 Gaming Laptop, ... 3. 1.199,00 € HP Victus Gaming Laptop| 15,... Listenpreis: 1000 EUR | 2.3 kg | 24 mm | 15.60" 1920x1080 141 PPI IPS |
5. 82.8% v7 (old) 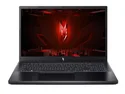 | Acer Nitro V 15 ANV15-51-582S Intel Core i5-13420H ⎘ NVIDIA GeForce RTX 4050 Laptop GPU ⎘ 16 GB RAM, 512 GB SSD | Amazon: 1. 965,42 € Acer Nitro V 15 (ANV15-52-70... 2. 1.099,00 € Acer Nitro V 15 (ANV15-52-71... 3. 30,99 € HSXIRQA 135W Ladekabel Netzt... Listenpreis: 900 EUR | 2.1 kg | 23.5 mm | 15.60" 1920x1080 141 PPI IPS |
6. 86.3% v7 (old)  | Asus TUF A15 FA507 AMD Ryzen 7 7735HS ⎘ NVIDIA GeForce RTX 4050 Laptop GPU ⎘ 16 GB RAM, 512 GB SSD | Amazon: 1. 43,37 € Etssembo 240W Laptop Ladekab... 2. 7,38 € Asus TUF Gaming A15/A17 Unte... 3. 82,00 € New 15.6" IPS QHD Screen Rep... Listenpreis: 1199€ | 2.2 kg | 24.9 mm | 15.60" 1920x1080 141 PPI IPS |
Transparenz
Die Auswahl der zu testenden Geräte erfolgt innerhalb der Redaktion. Das vorliegende Testmuster wurde vom Autor auf eigene Kosten im freien Handel erworben. Der Hersteller erhielt keine Version des Reviews vor der Veröffentlichung, es bestand keine Verpflichtung zur Publikation. Als eigenständiges, unabhängiges Unternehmen unterliegt Notebookcheck keiner Diktion von Herstellern, Shops und Verlagen.
So testet Notebookcheck
Pro Jahr werden von Notebookcheck hunderte Laptops und Smartphones unabhängig in von uns standardisierten technischen Verfahren getestet, um eine Vergleichbarkeit aller Testergebnisse zu gewährleisten. Seit rund 20 Jahren entwickeln wir diese Testmethoden kontinuierlich weiter und setzen damit Branchenstandards. In unseren Testlaboren kommt ausschließlich hochwertiges Messequipment in die Hände erfahrener Techniker und Redakteure. Die Tests unterliegen einer mehrstufigen Kontrolle. Unsere komplexe Gesamtbewertung basiert auf hunderten fundierten Messergebnissen und Benchmarks, womit Ihnen Objektivität garantiert ist. Weitere Informationen zu unseren Testmethoden gibt es hier.

