




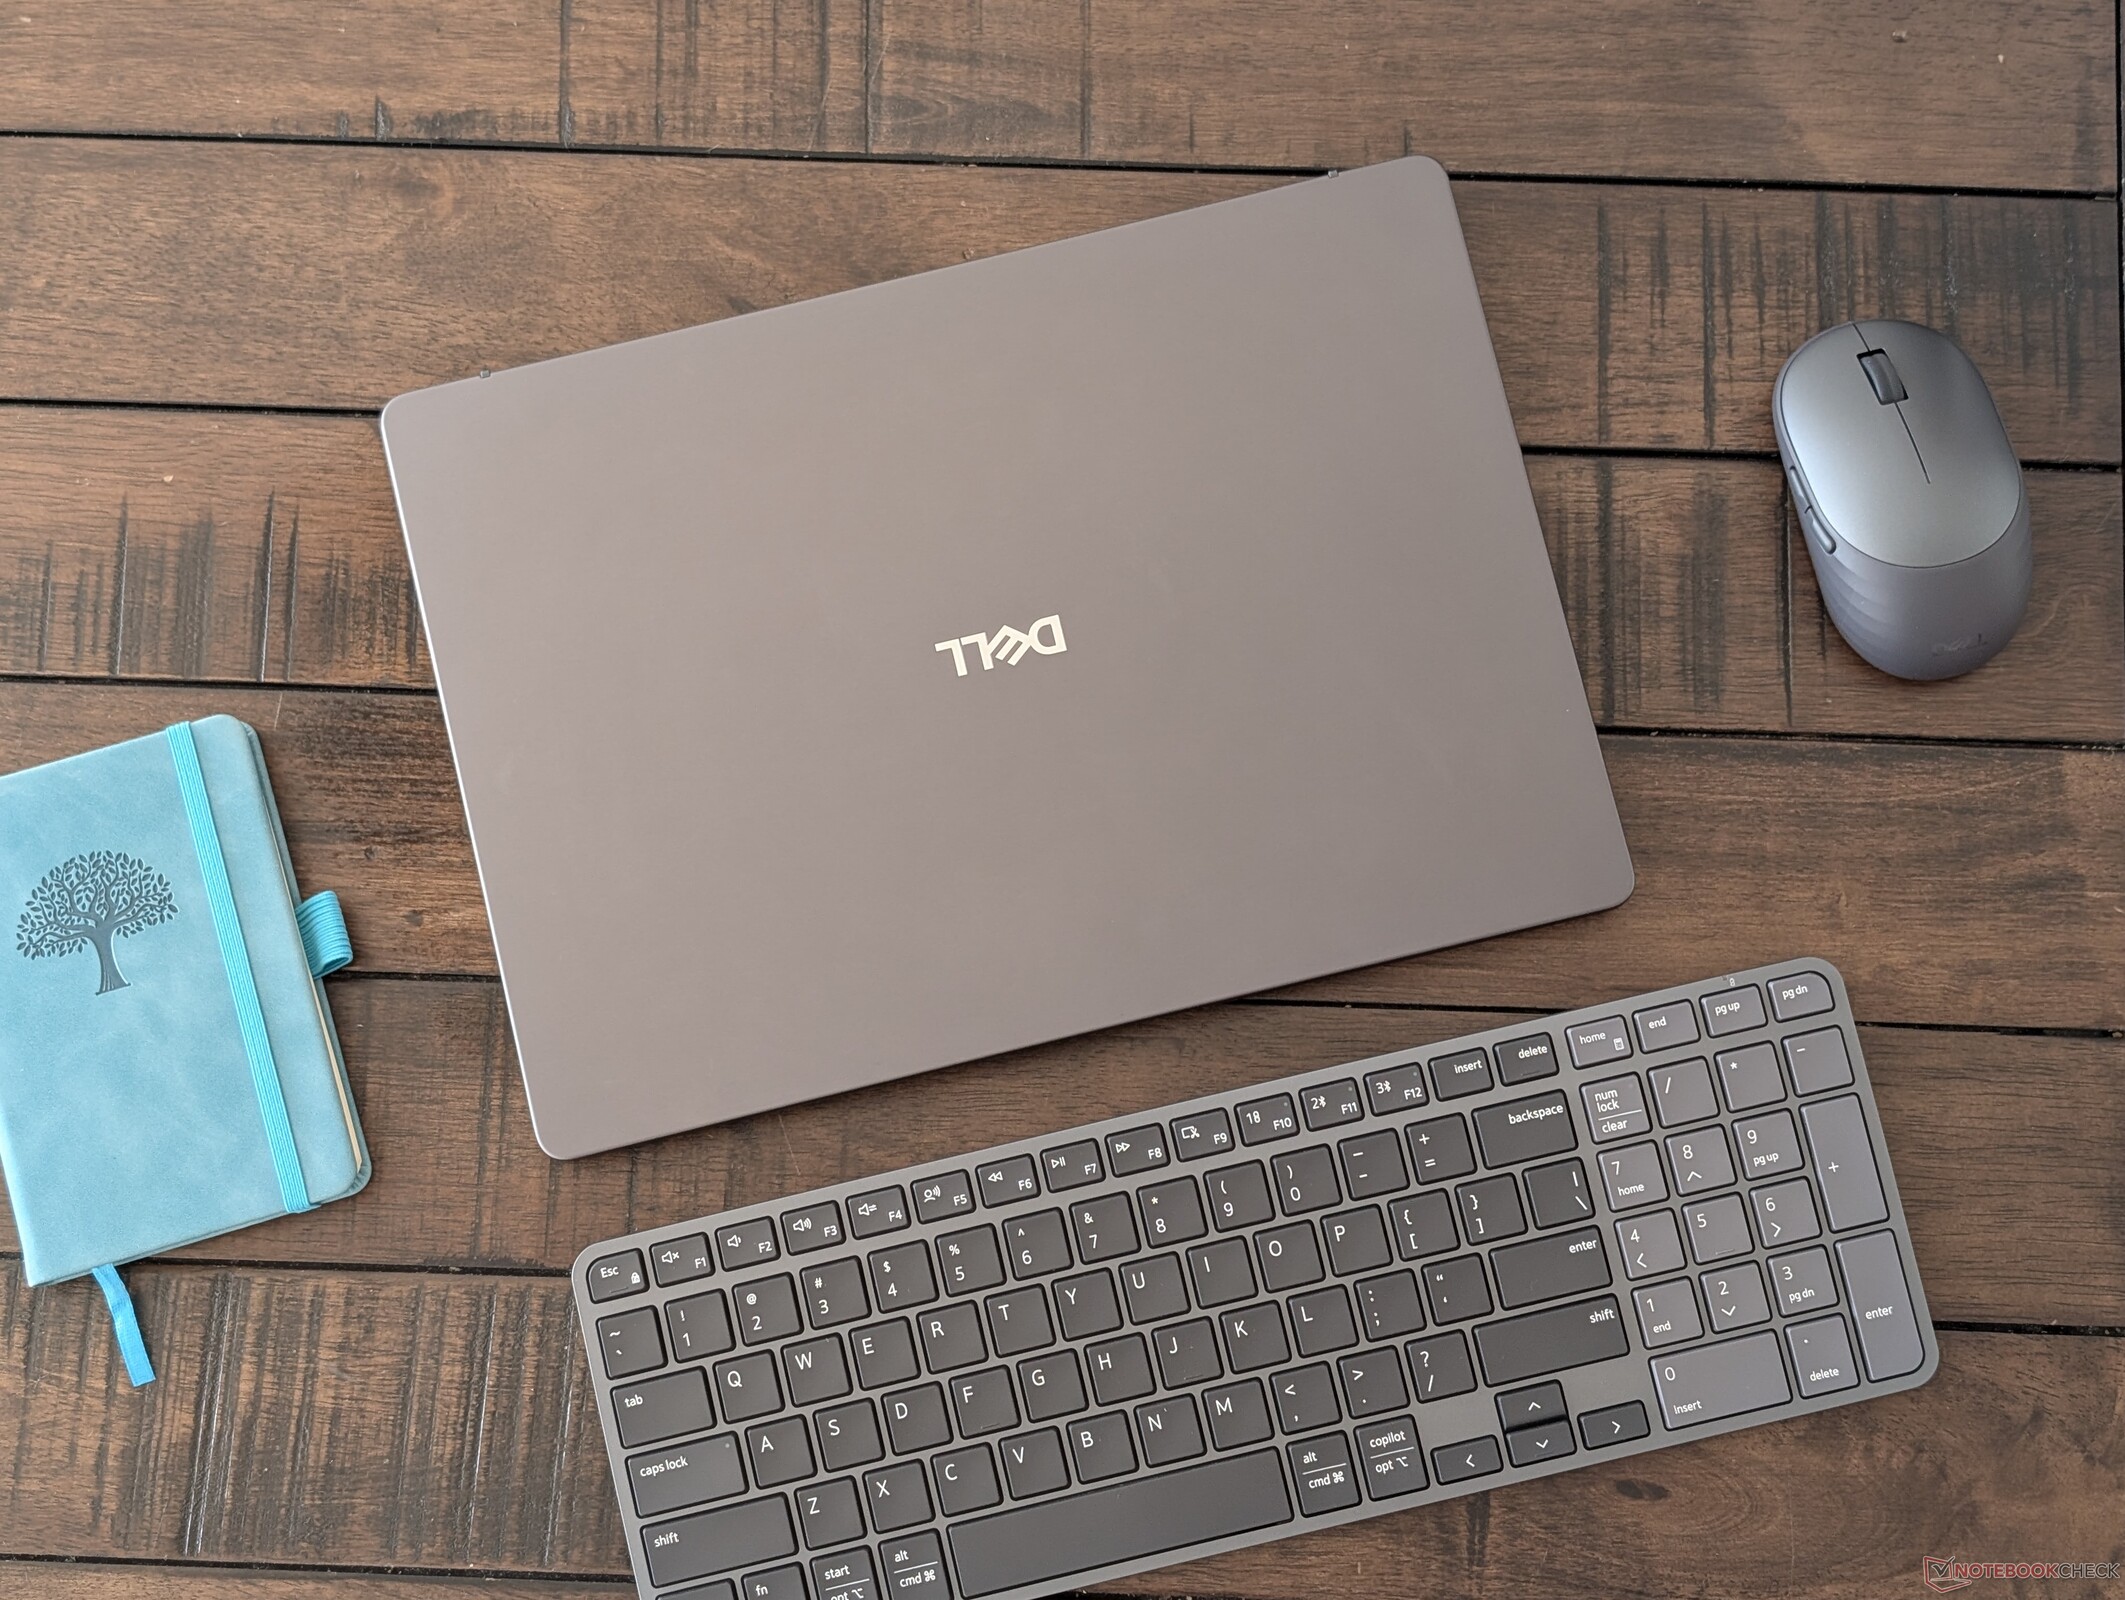
Fazit – Vielseitiger bei etwa gleichem Preis
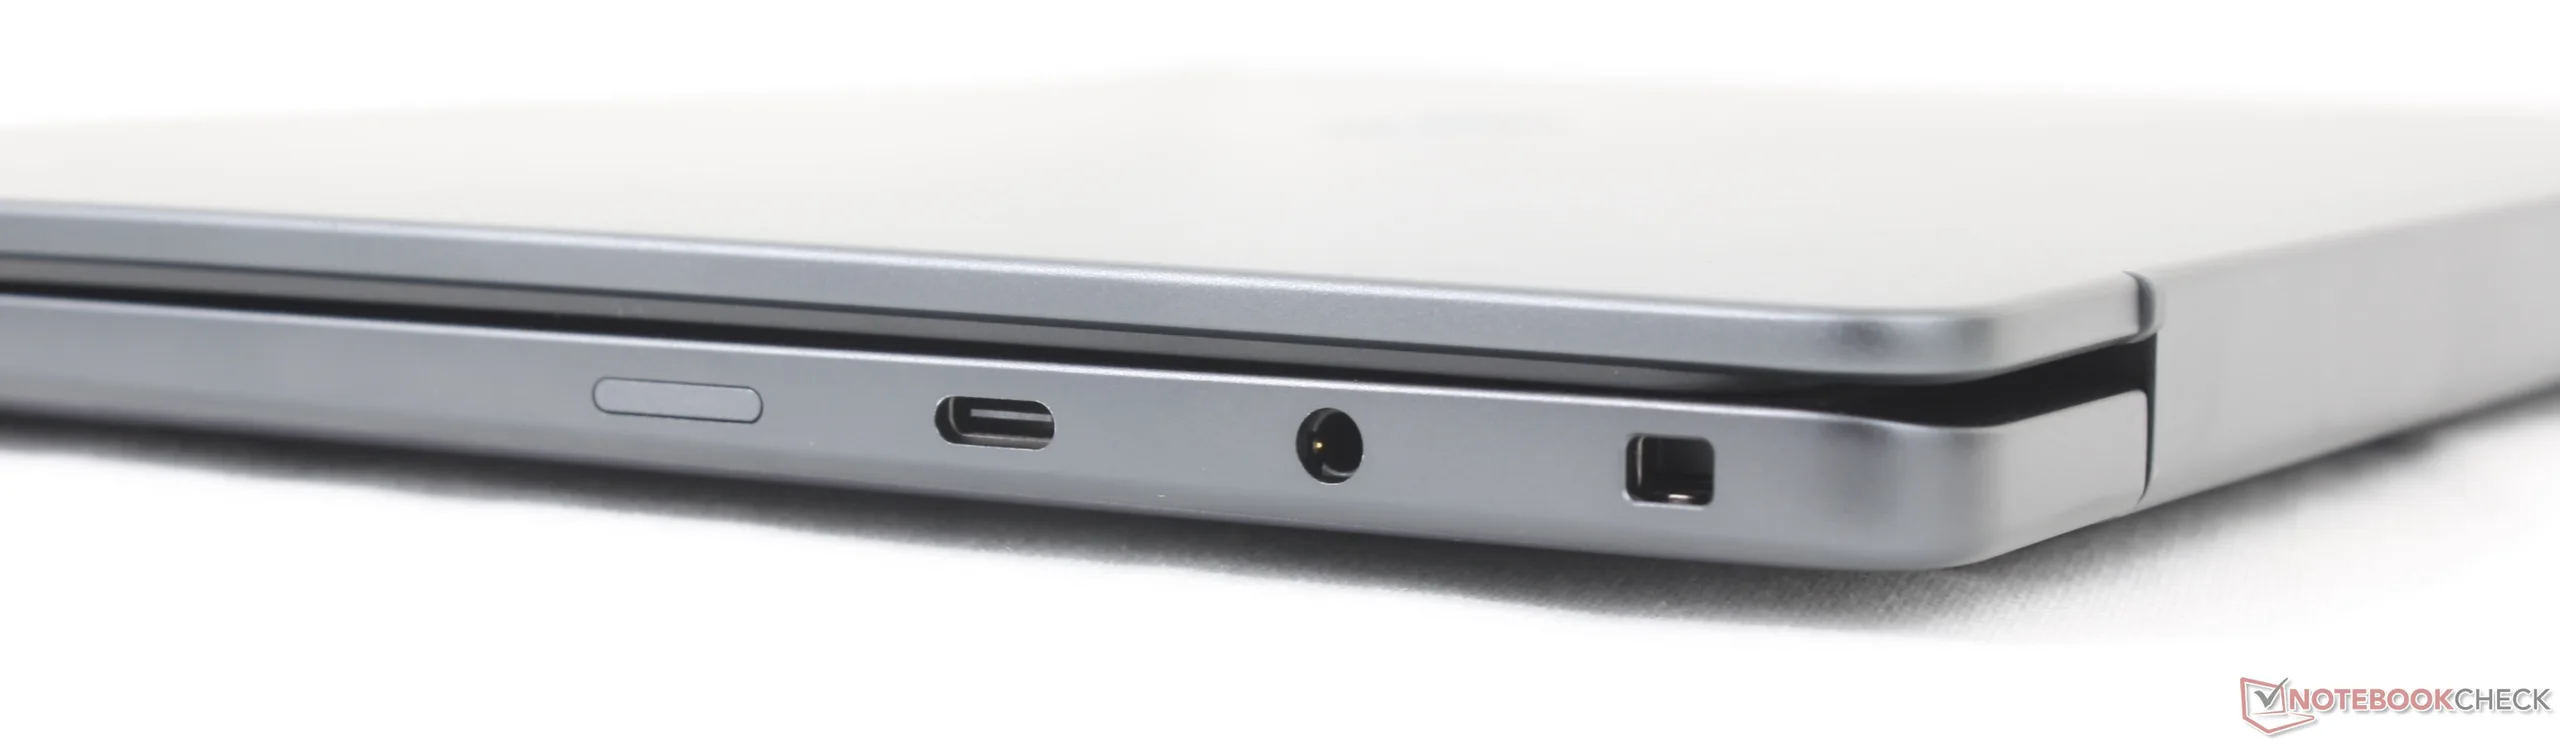
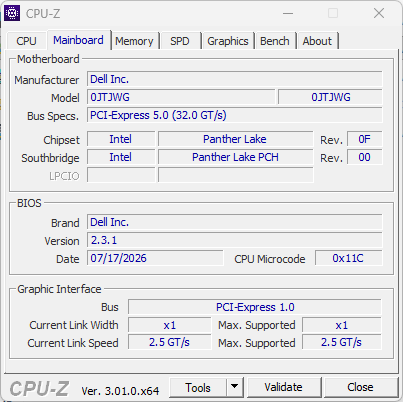
Für die meisten Nutzer sind die Unterschiede zwischen der AMD- und der Intel-Version des Dell Pro 7 14 relativ gering. Beide sind für ihre Größe leistungsstarke Systeme mit vPro/PRO-Sicherheit, hervorragender Akkulaufzeit, nahezu identischen Display-Optionen und Preisen. Für die kleine Gruppe von Usern haben die Intel-Versionen jedoch einen leichten Vorteil: Im Vergleich zu den AMD-Konfigurationen bietet die Intel-Version eine etwas schnellere Grafikleistung, Unterstützung für PCIe-5-SSDs, eine noch längere Akkulaufzeit sowie verbesserte Anschlussmöglichkeiten dank Thunderbolt 4. Diese Vorteile machen die Intel-Modelle vielseitiger, wenn es ums Mitnehmen und das Anschließen an Dockingstationen geht – also insbesondere für Nutzer, die zwischen mehreren Arbeitsplätzen, externen Monitoren oder eGPU-Konfigurationen wechseln.
Die reine Prozessorleistung ist beim Intel-Chip etwas geringer, doch die oben erwähnten Vorteile in anderen Bereichen könnten diesen Kompromiss für bestimmte Anwendungsszenarien lohnenswert machen.
Für zukünftige Versionen würden wir uns über mehr 1600p-Displayoptionen mit OLED oder Touchscreen freuen, da solche Ausstattungsmerkmale derzeit auf 1200p beschränkt sind. Ein geringeres Gesamtgewicht könnte ebenfalls von Vorteil sein, da bestimmte Konkurrenzmodelle wie das Asus ExpertBook Ultra oder das Lenovo ThinkPad T14s jeweils einige hundert Gramm leichter sind.
Pro
Contra
Preis und Verfügbarkeit
Direkt bei Dell können die neuesten Modelle des Dell Pro 7 14 bestellt werden. AMD-Modelle kosten ab 2.567 Euro, die Intel-Konfigurationen sind etwas teurer (ab 2.813 Euro).
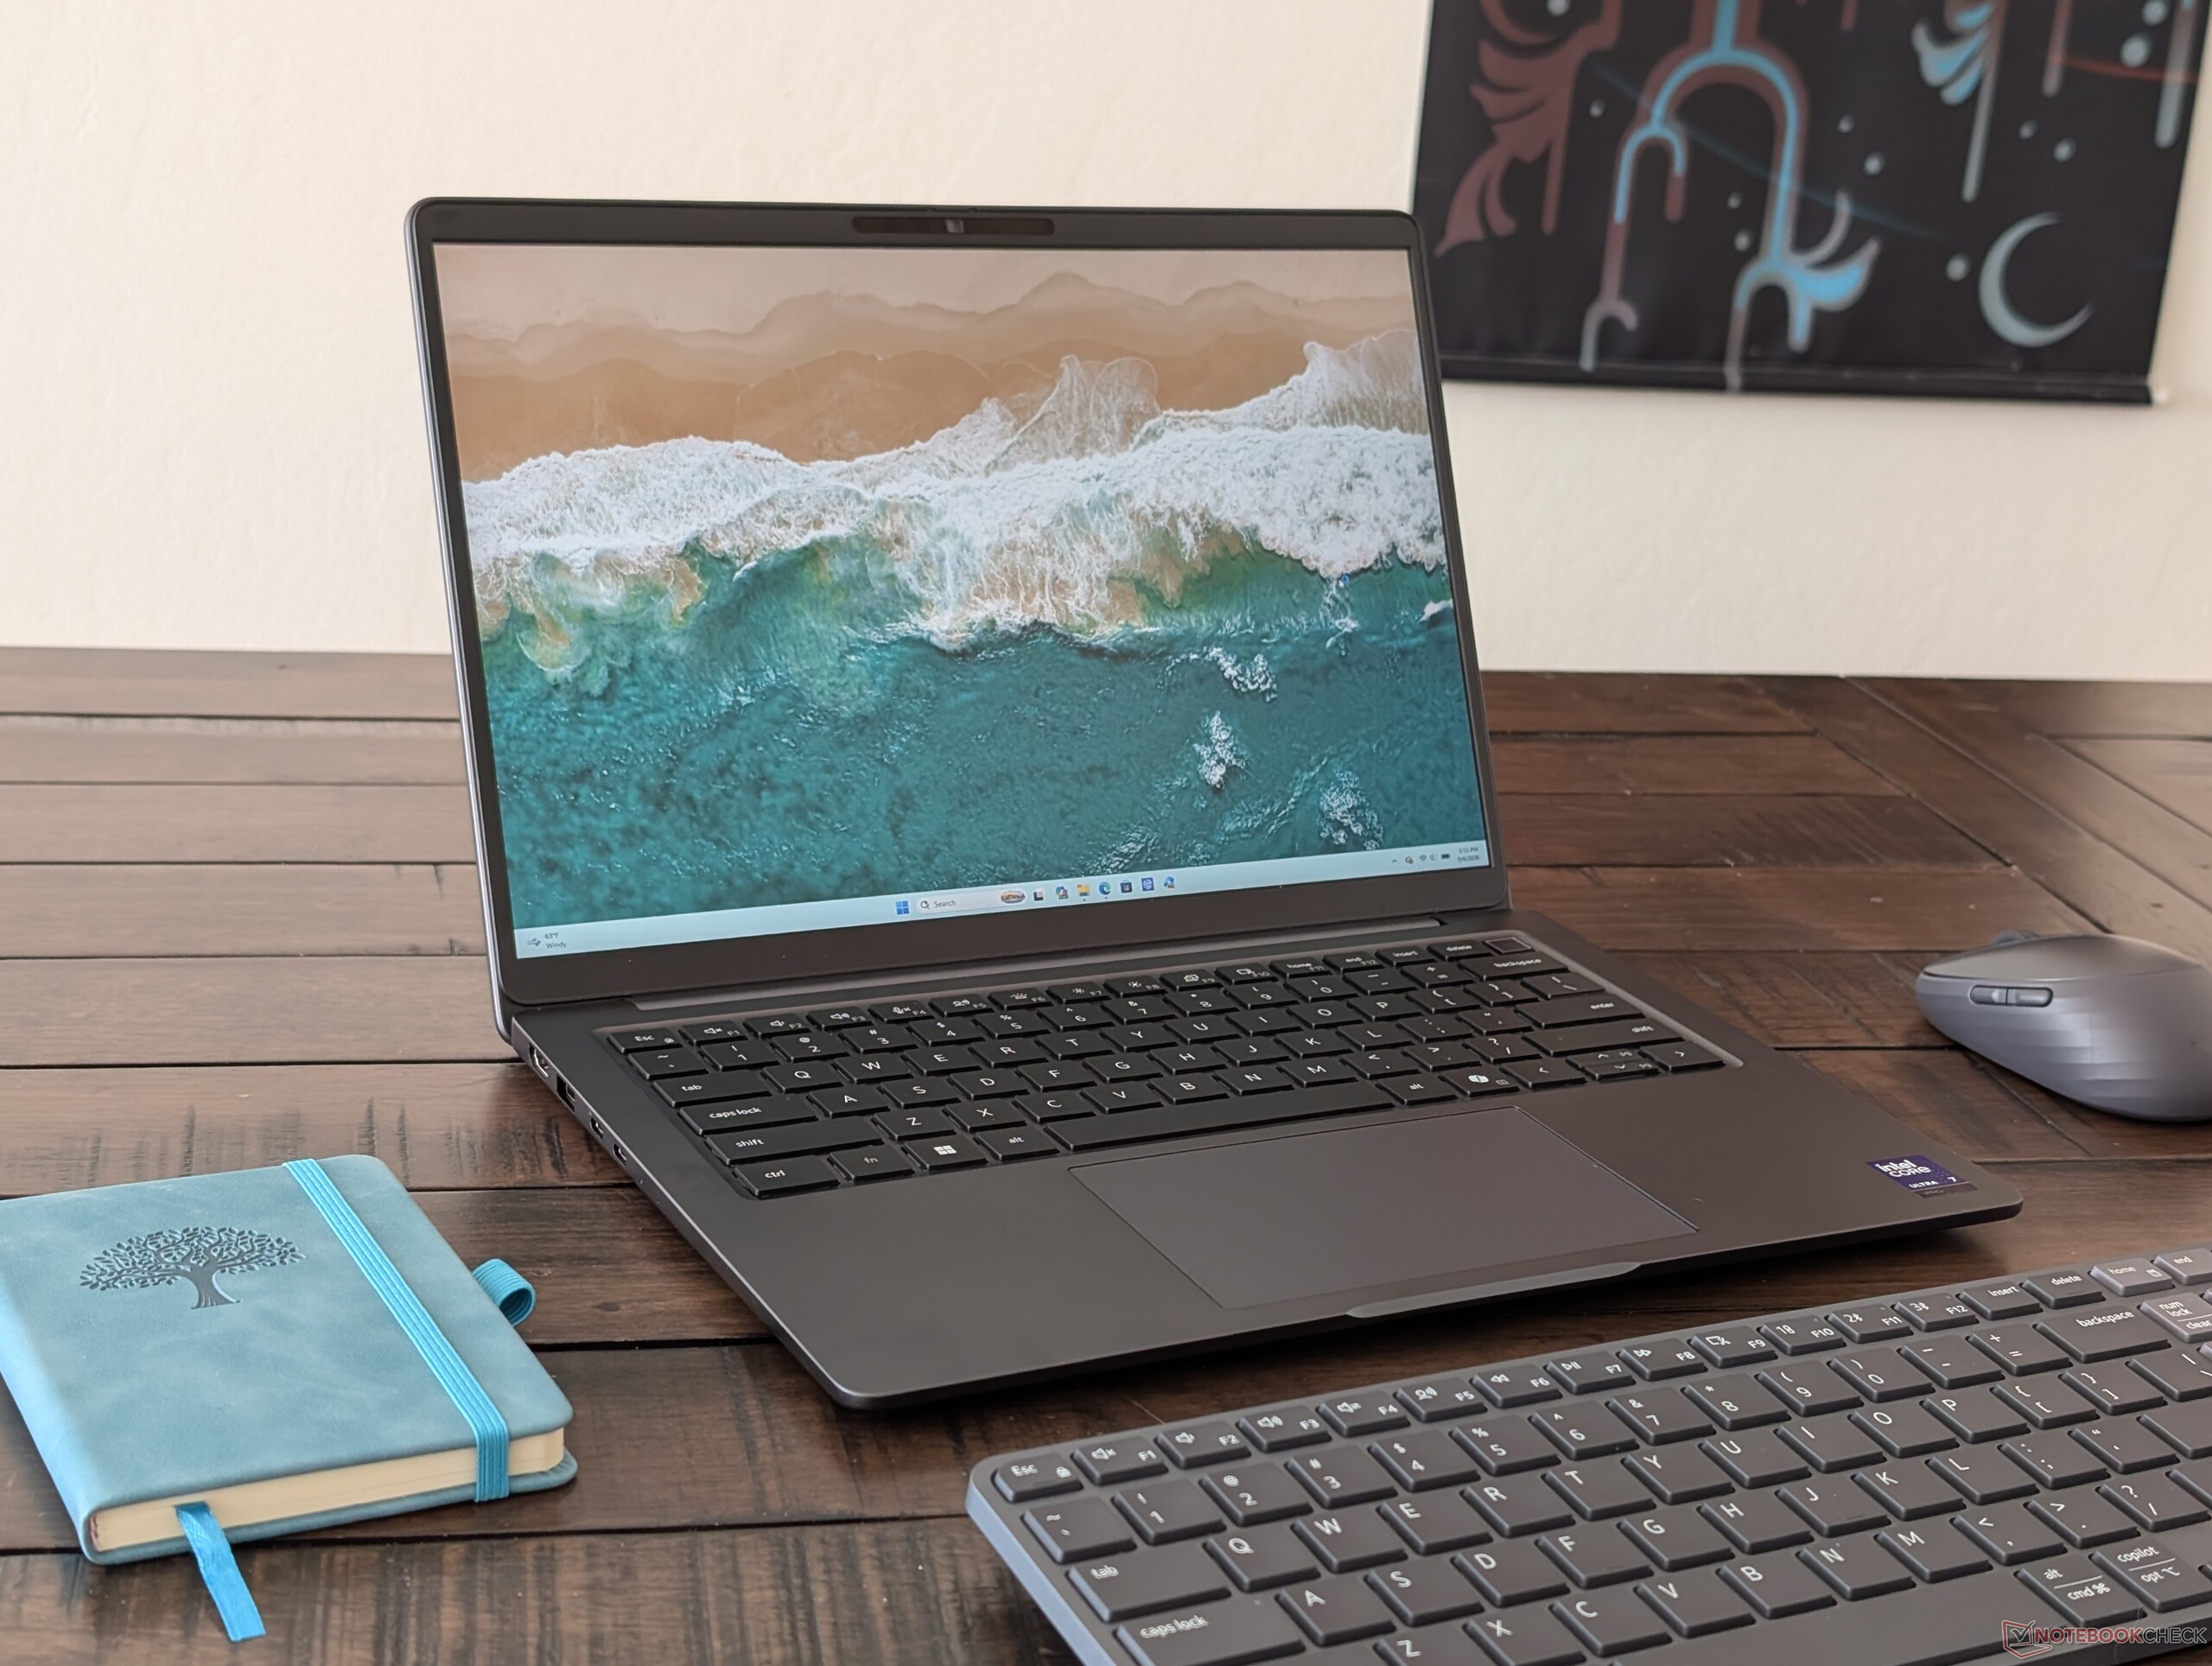
Das Dell Pro 7 14 P714260 ist die Intel-Version des AMD-basierten Dell Pro 7 14 P714265. Beide Versionen verfügen ansonsten über das gleiche Hardware-Design; daher empfehlen wir Ihnen, unseren Testbericht zur AMD-Version zu lesen, um mehr über die technischen Merkmale zu erfahren.
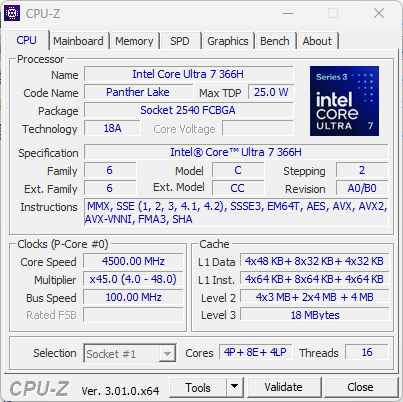
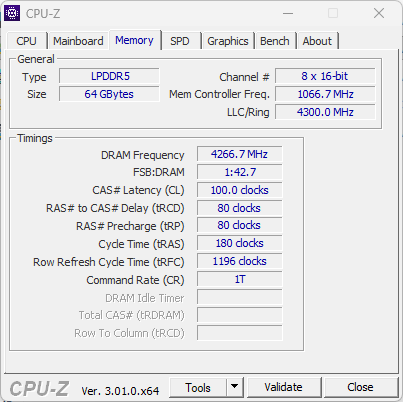
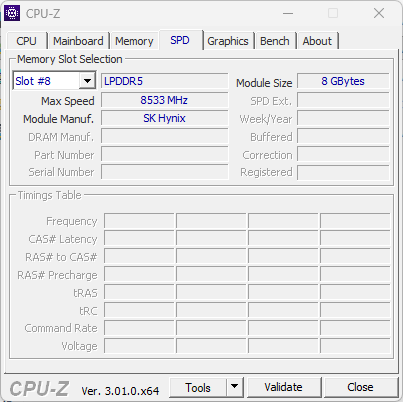
Unser heutiges Testgerät ist eine High-End-Konfiguration mit einem Panther Lake Core Ultra 7 366H vPro, 64 GB LPDDR5x-RAM und einem 1200p-IPS-Display mit 120 Hz zu einem Preis von etwa 4.900 US-Dollar. Günstigere Modelle sind bereits ab etwas über 2.000 US-Dollar erhältlich.
Zu den Alternativen in diesem Preissegment zählen andere 14-Zoll-Subnotebooks für den Officegebrauch wie die HP EliteBook X-Serie, das Lenovo ThinkPad T14s oder die Asus ExpertBook-Serie.
Weitere Dell-Testberichte:
Spezifikationen
Gehäuse

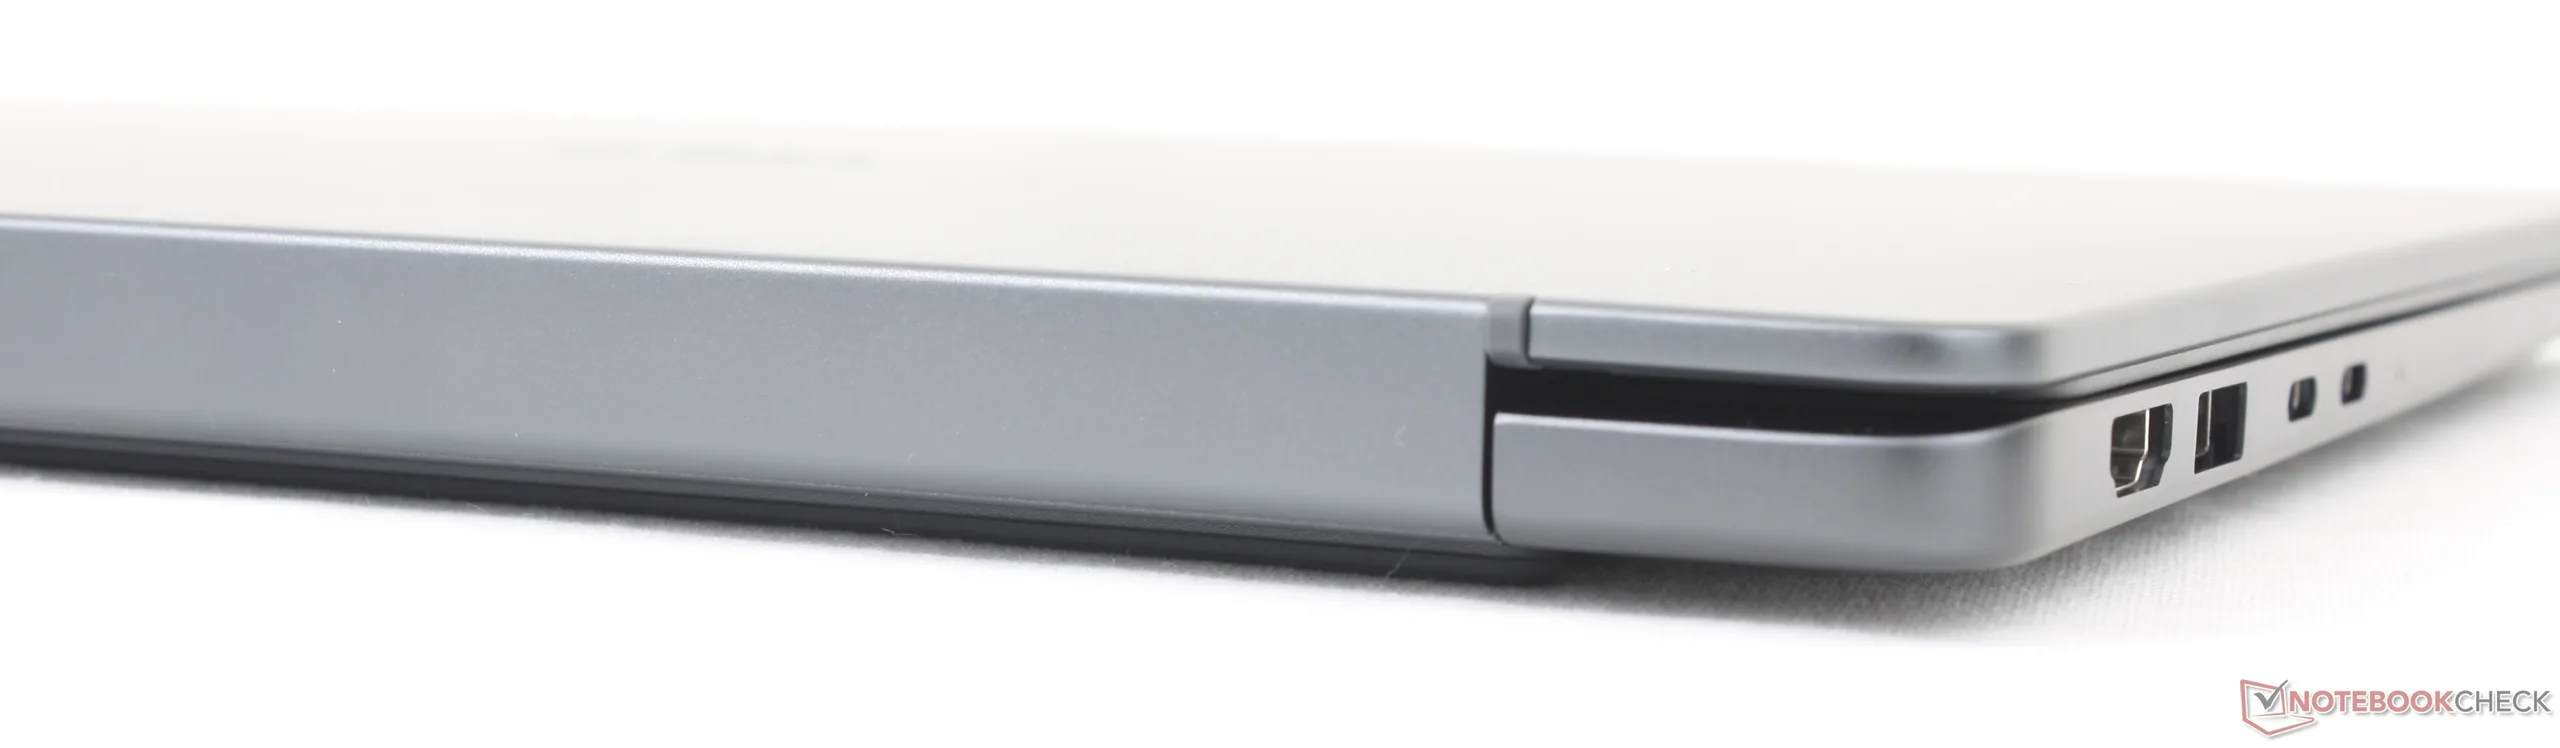
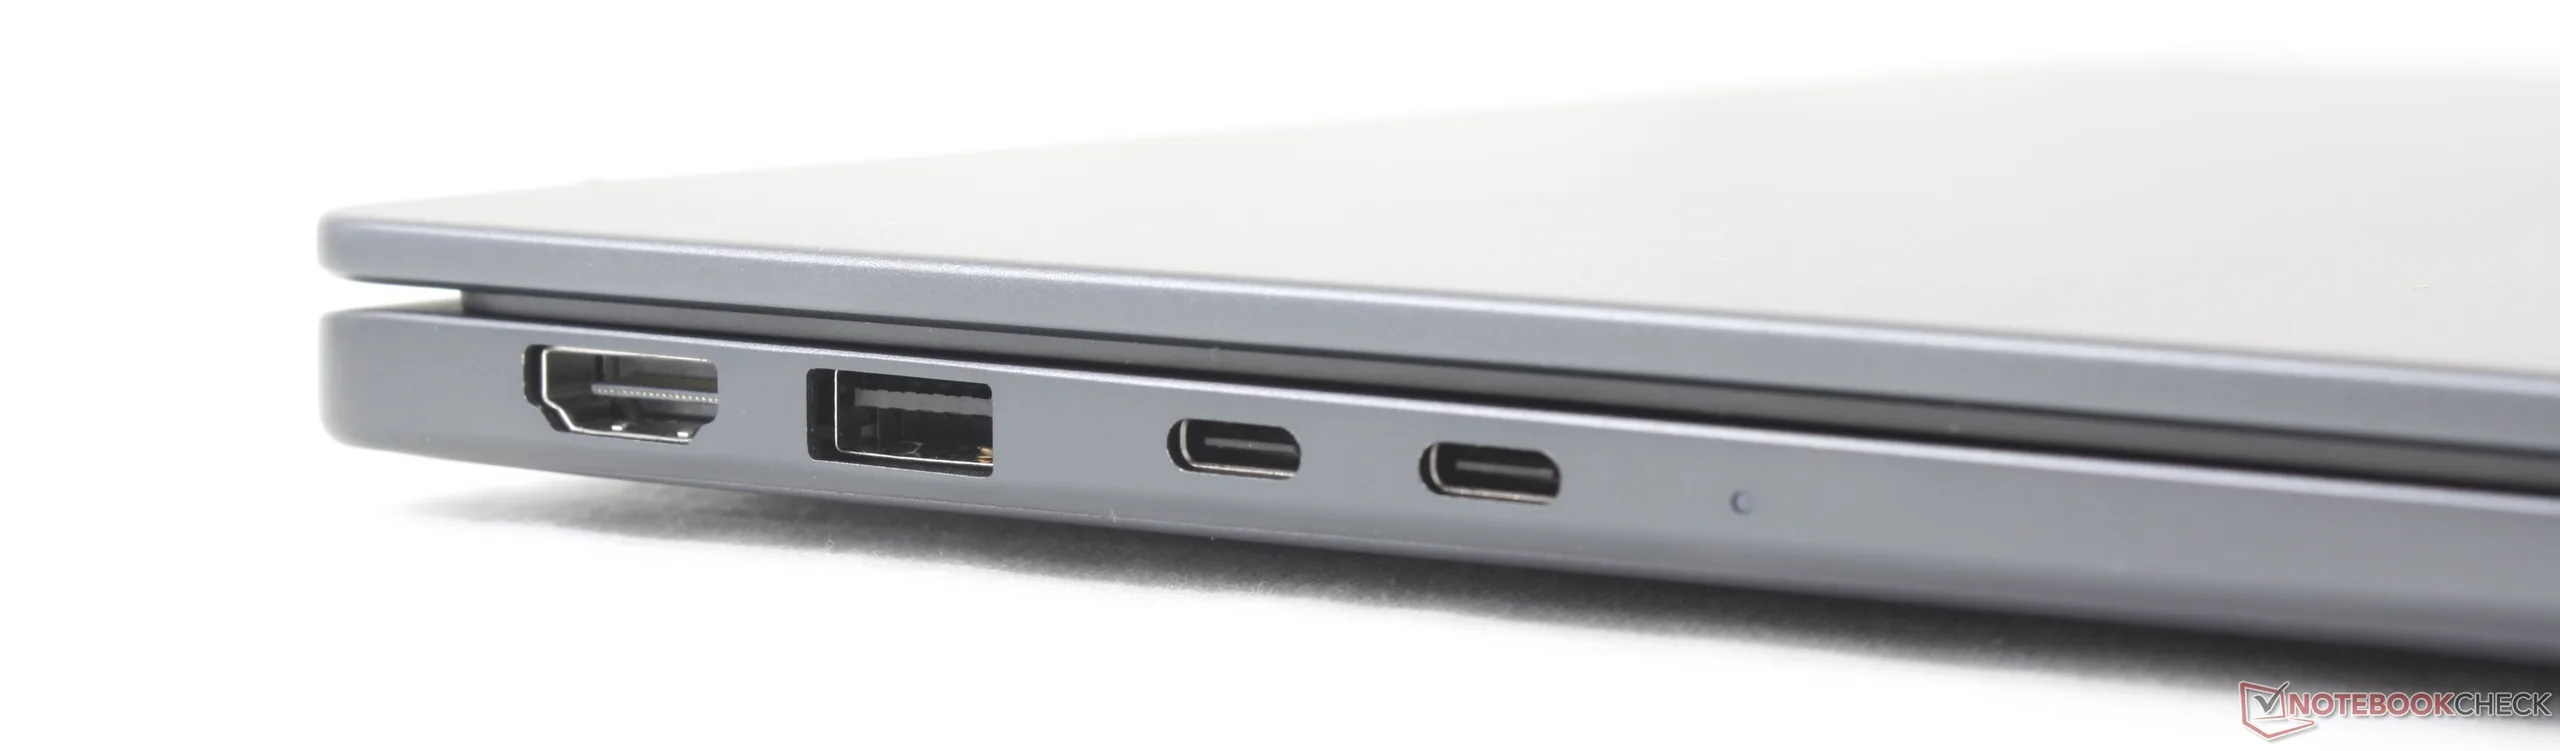
Anschlüsse
Kommunikation
| Networking | |
| iperf3 transmit Wi-Fi6/7 RT-BE96U | |
| HP EliteBook 8 G2a 14 | |
| Lenovo ThinkPad T14s Gen 7 21YW0022GE | |
| iperf3 receive Wi-Fi6/7 RT-BE96U | |
| HP EliteBook 8 G2a 14 | |
| Lenovo ThinkPad T14s Gen 7 21YW0022GE | |
| iperf3 receive AXE11000 6GHz | |
| Acer TravelMate P6 TMP614-54-TCO-553Z | |
| Dell Pro 7 14 P714265 | |
| Asus ExpertBook Ultra B9406CAA | |
| Dell Pro 7 14 P714260 | |
| iperf3 transmit AXE11000 6GHz | |
| Acer TravelMate P6 TMP614-54-TCO-553Z | |
| Dell Pro 7 14 P714260 | |
| Asus ExpertBook Ultra B9406CAA | |
| Dell Pro 7 14 P714265 | |
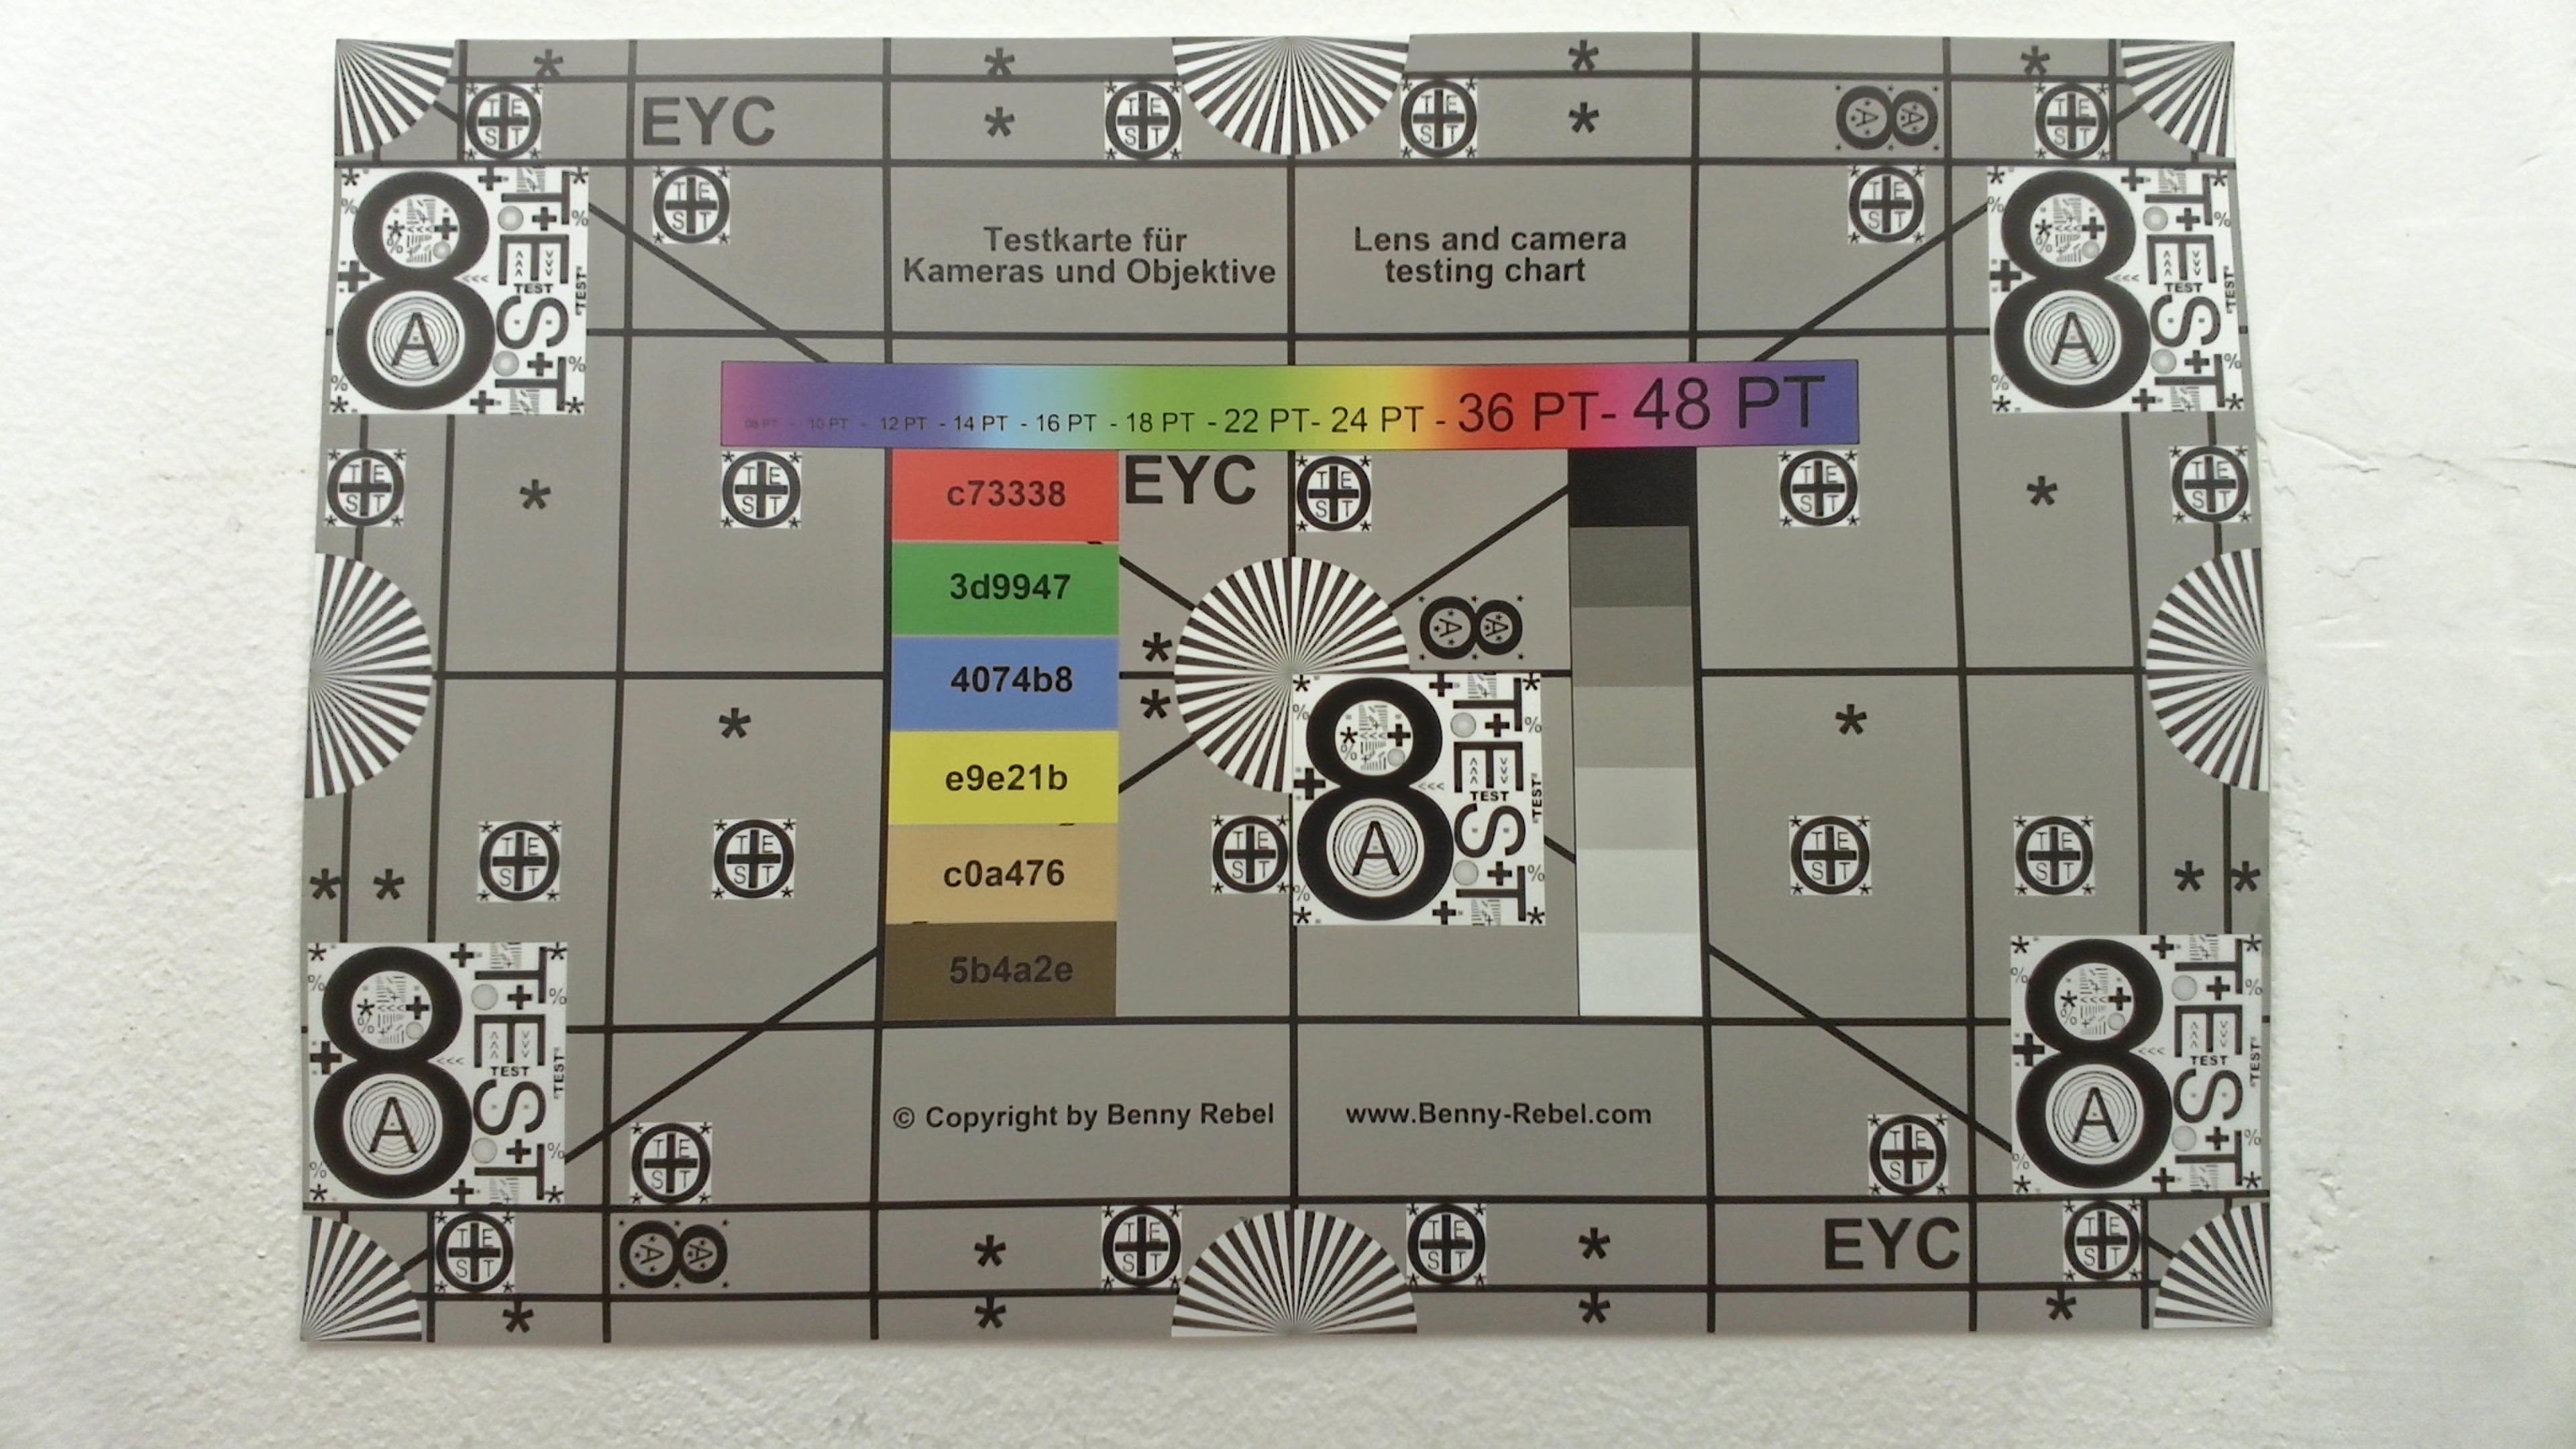
Webcam

Wartung
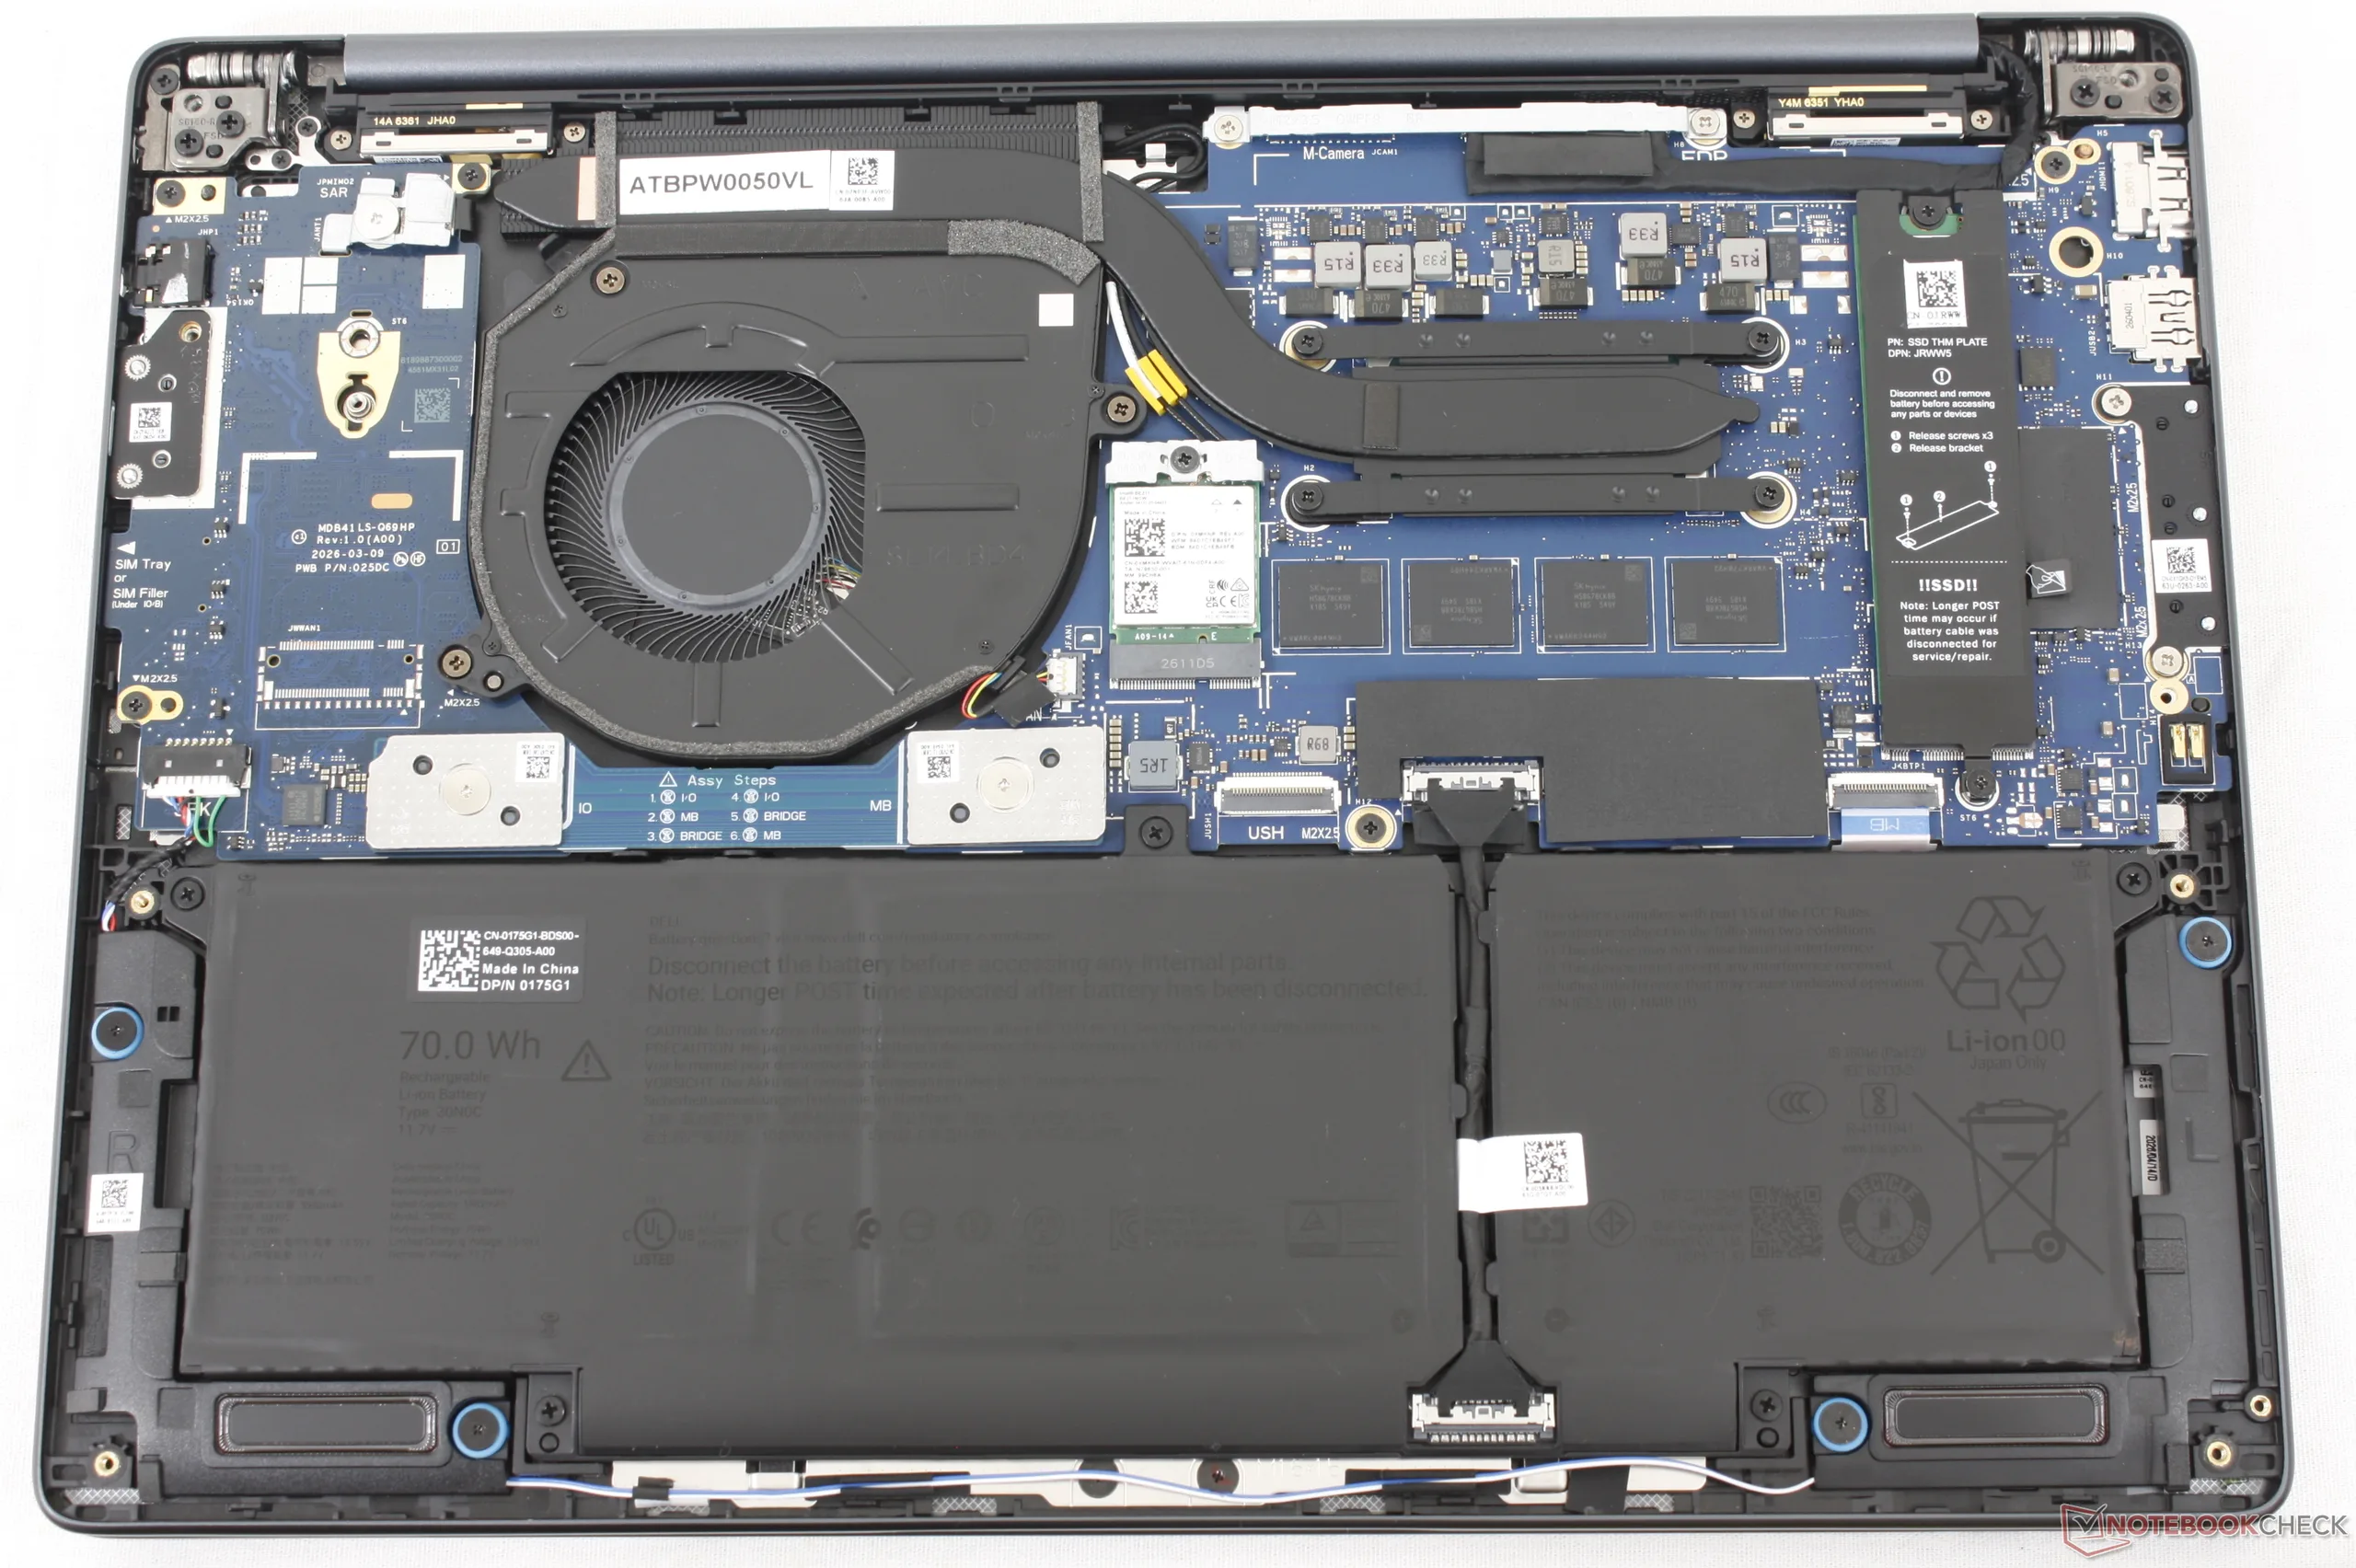
Nachhaltigkeit
Das Gehäuse und der Akku bestehen zu unterschiedlichen Anteilen aus recyceltem Kunststoff, Aluminium, Stahl, Glas und Kobalt. Die Verpackung ist kunststofffrei und vollständig recycelbar.
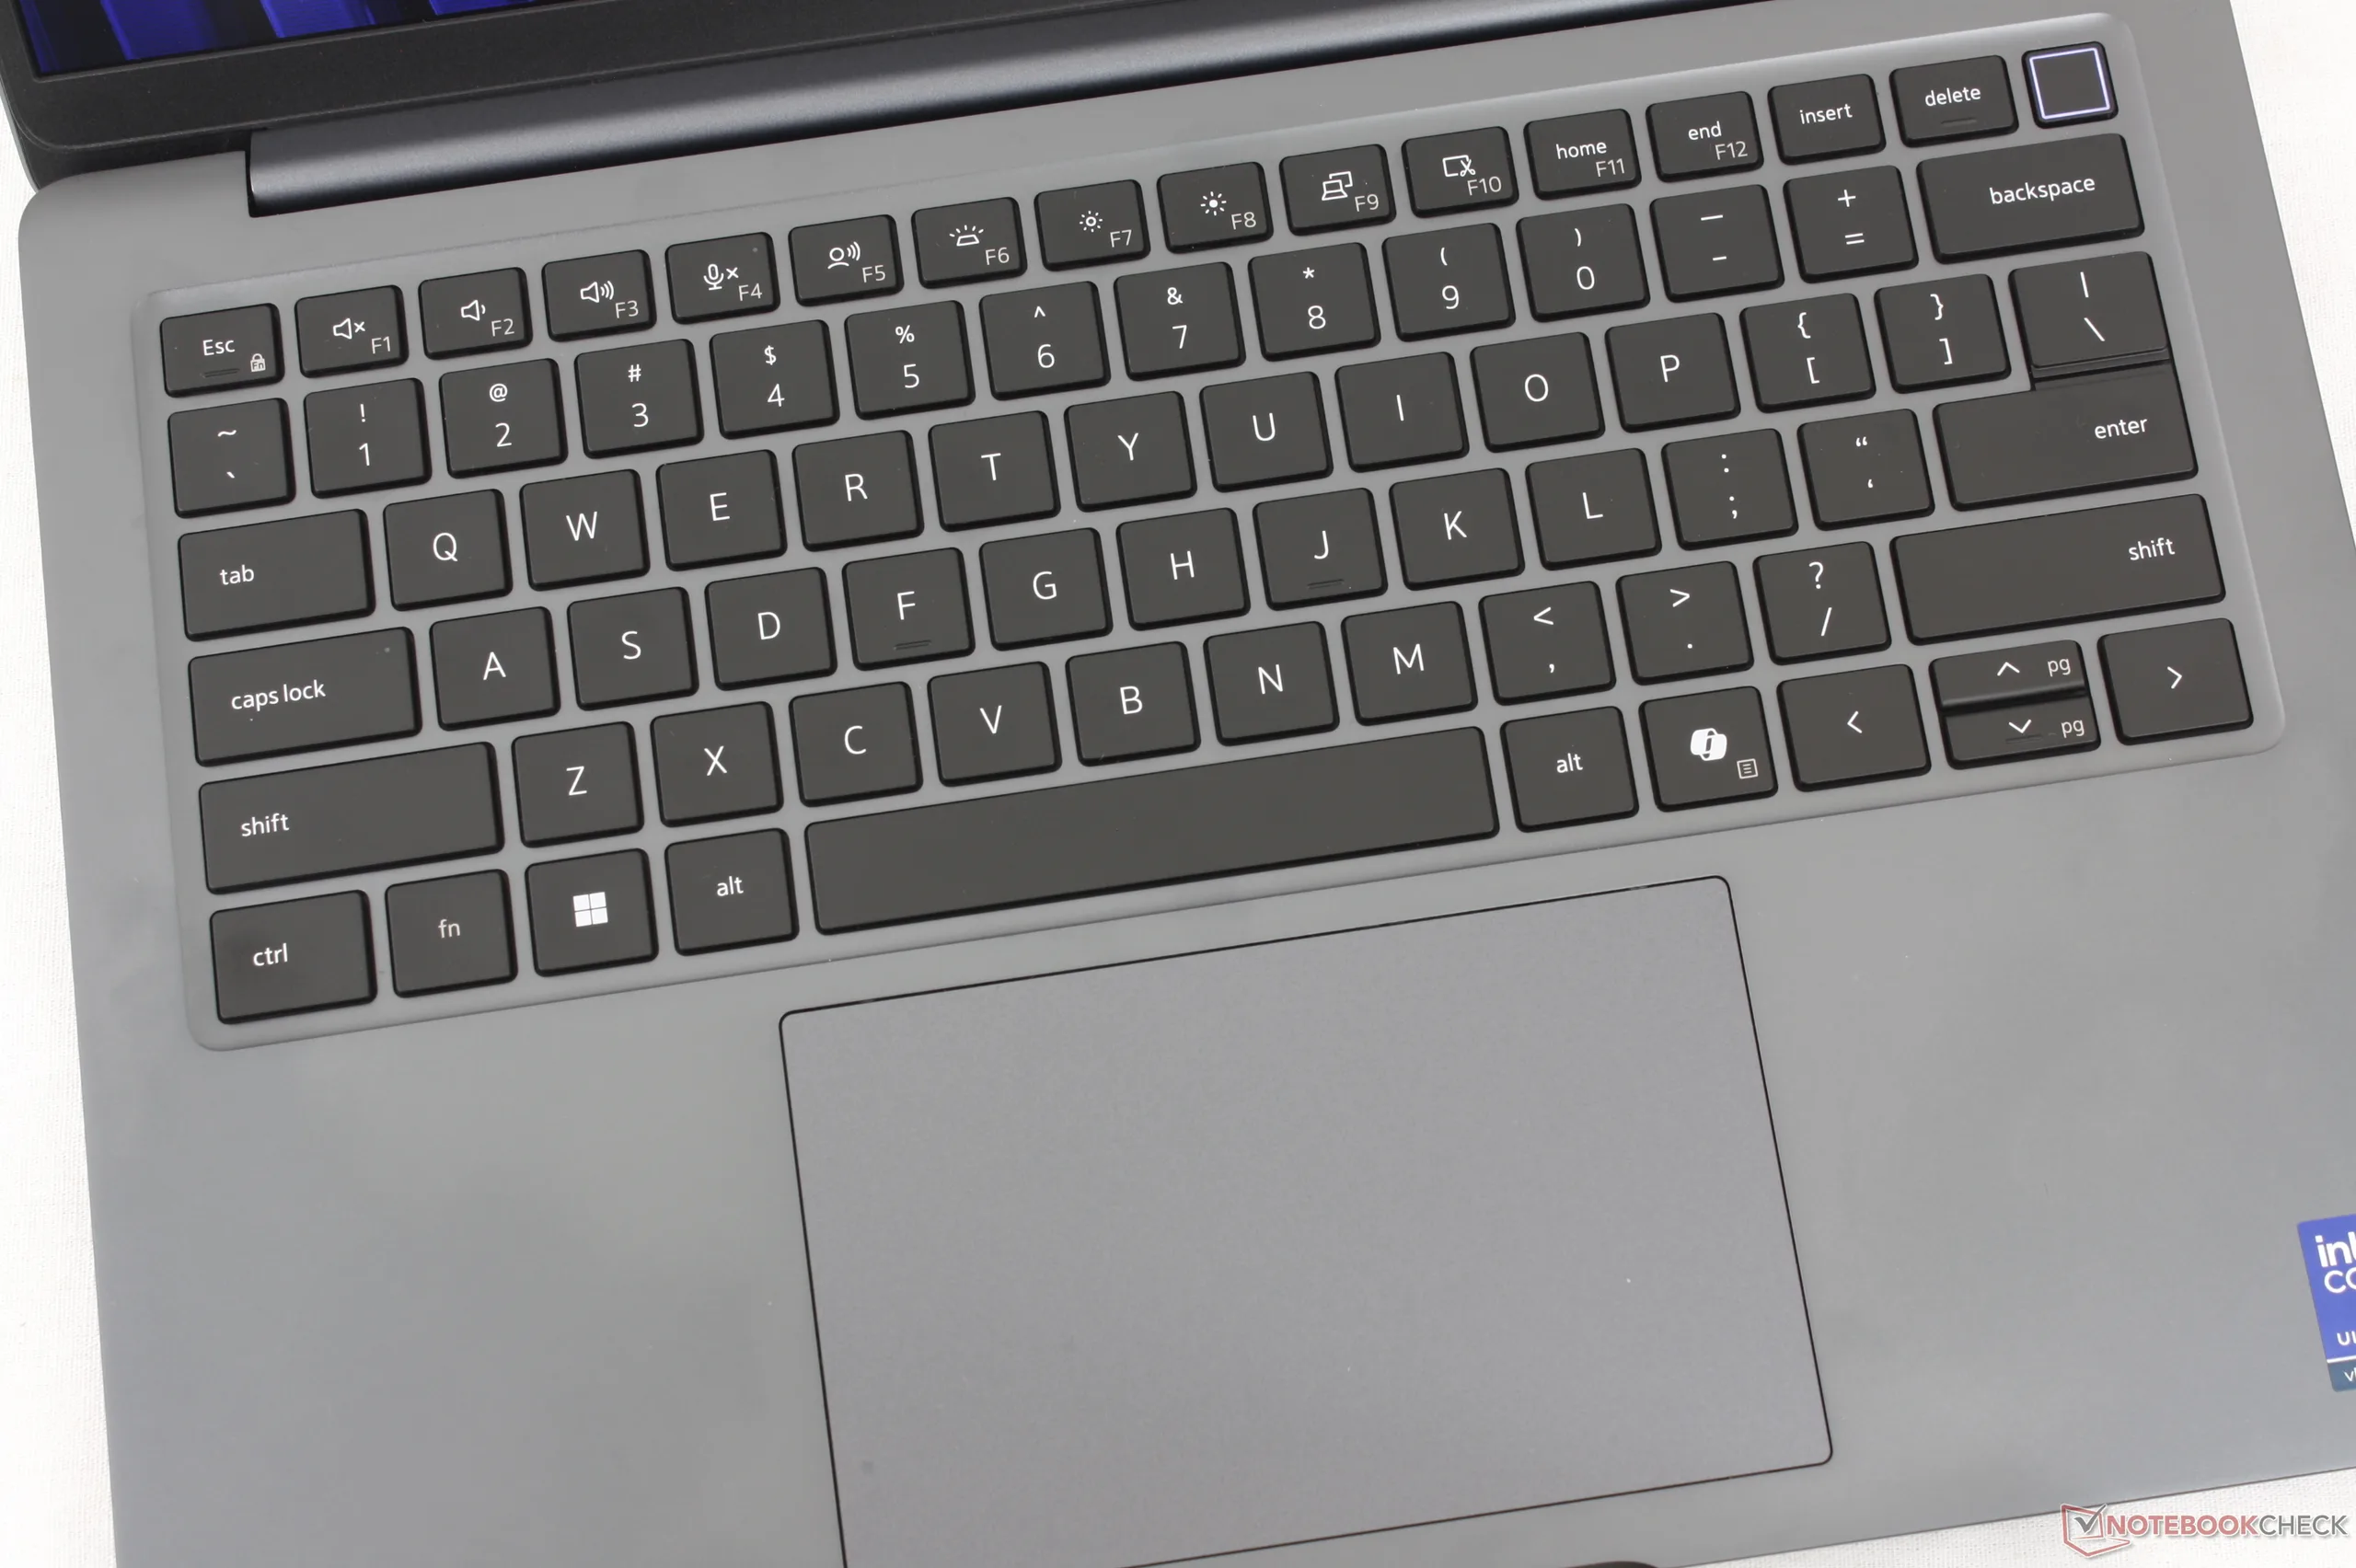
Eingabegeräte
Display
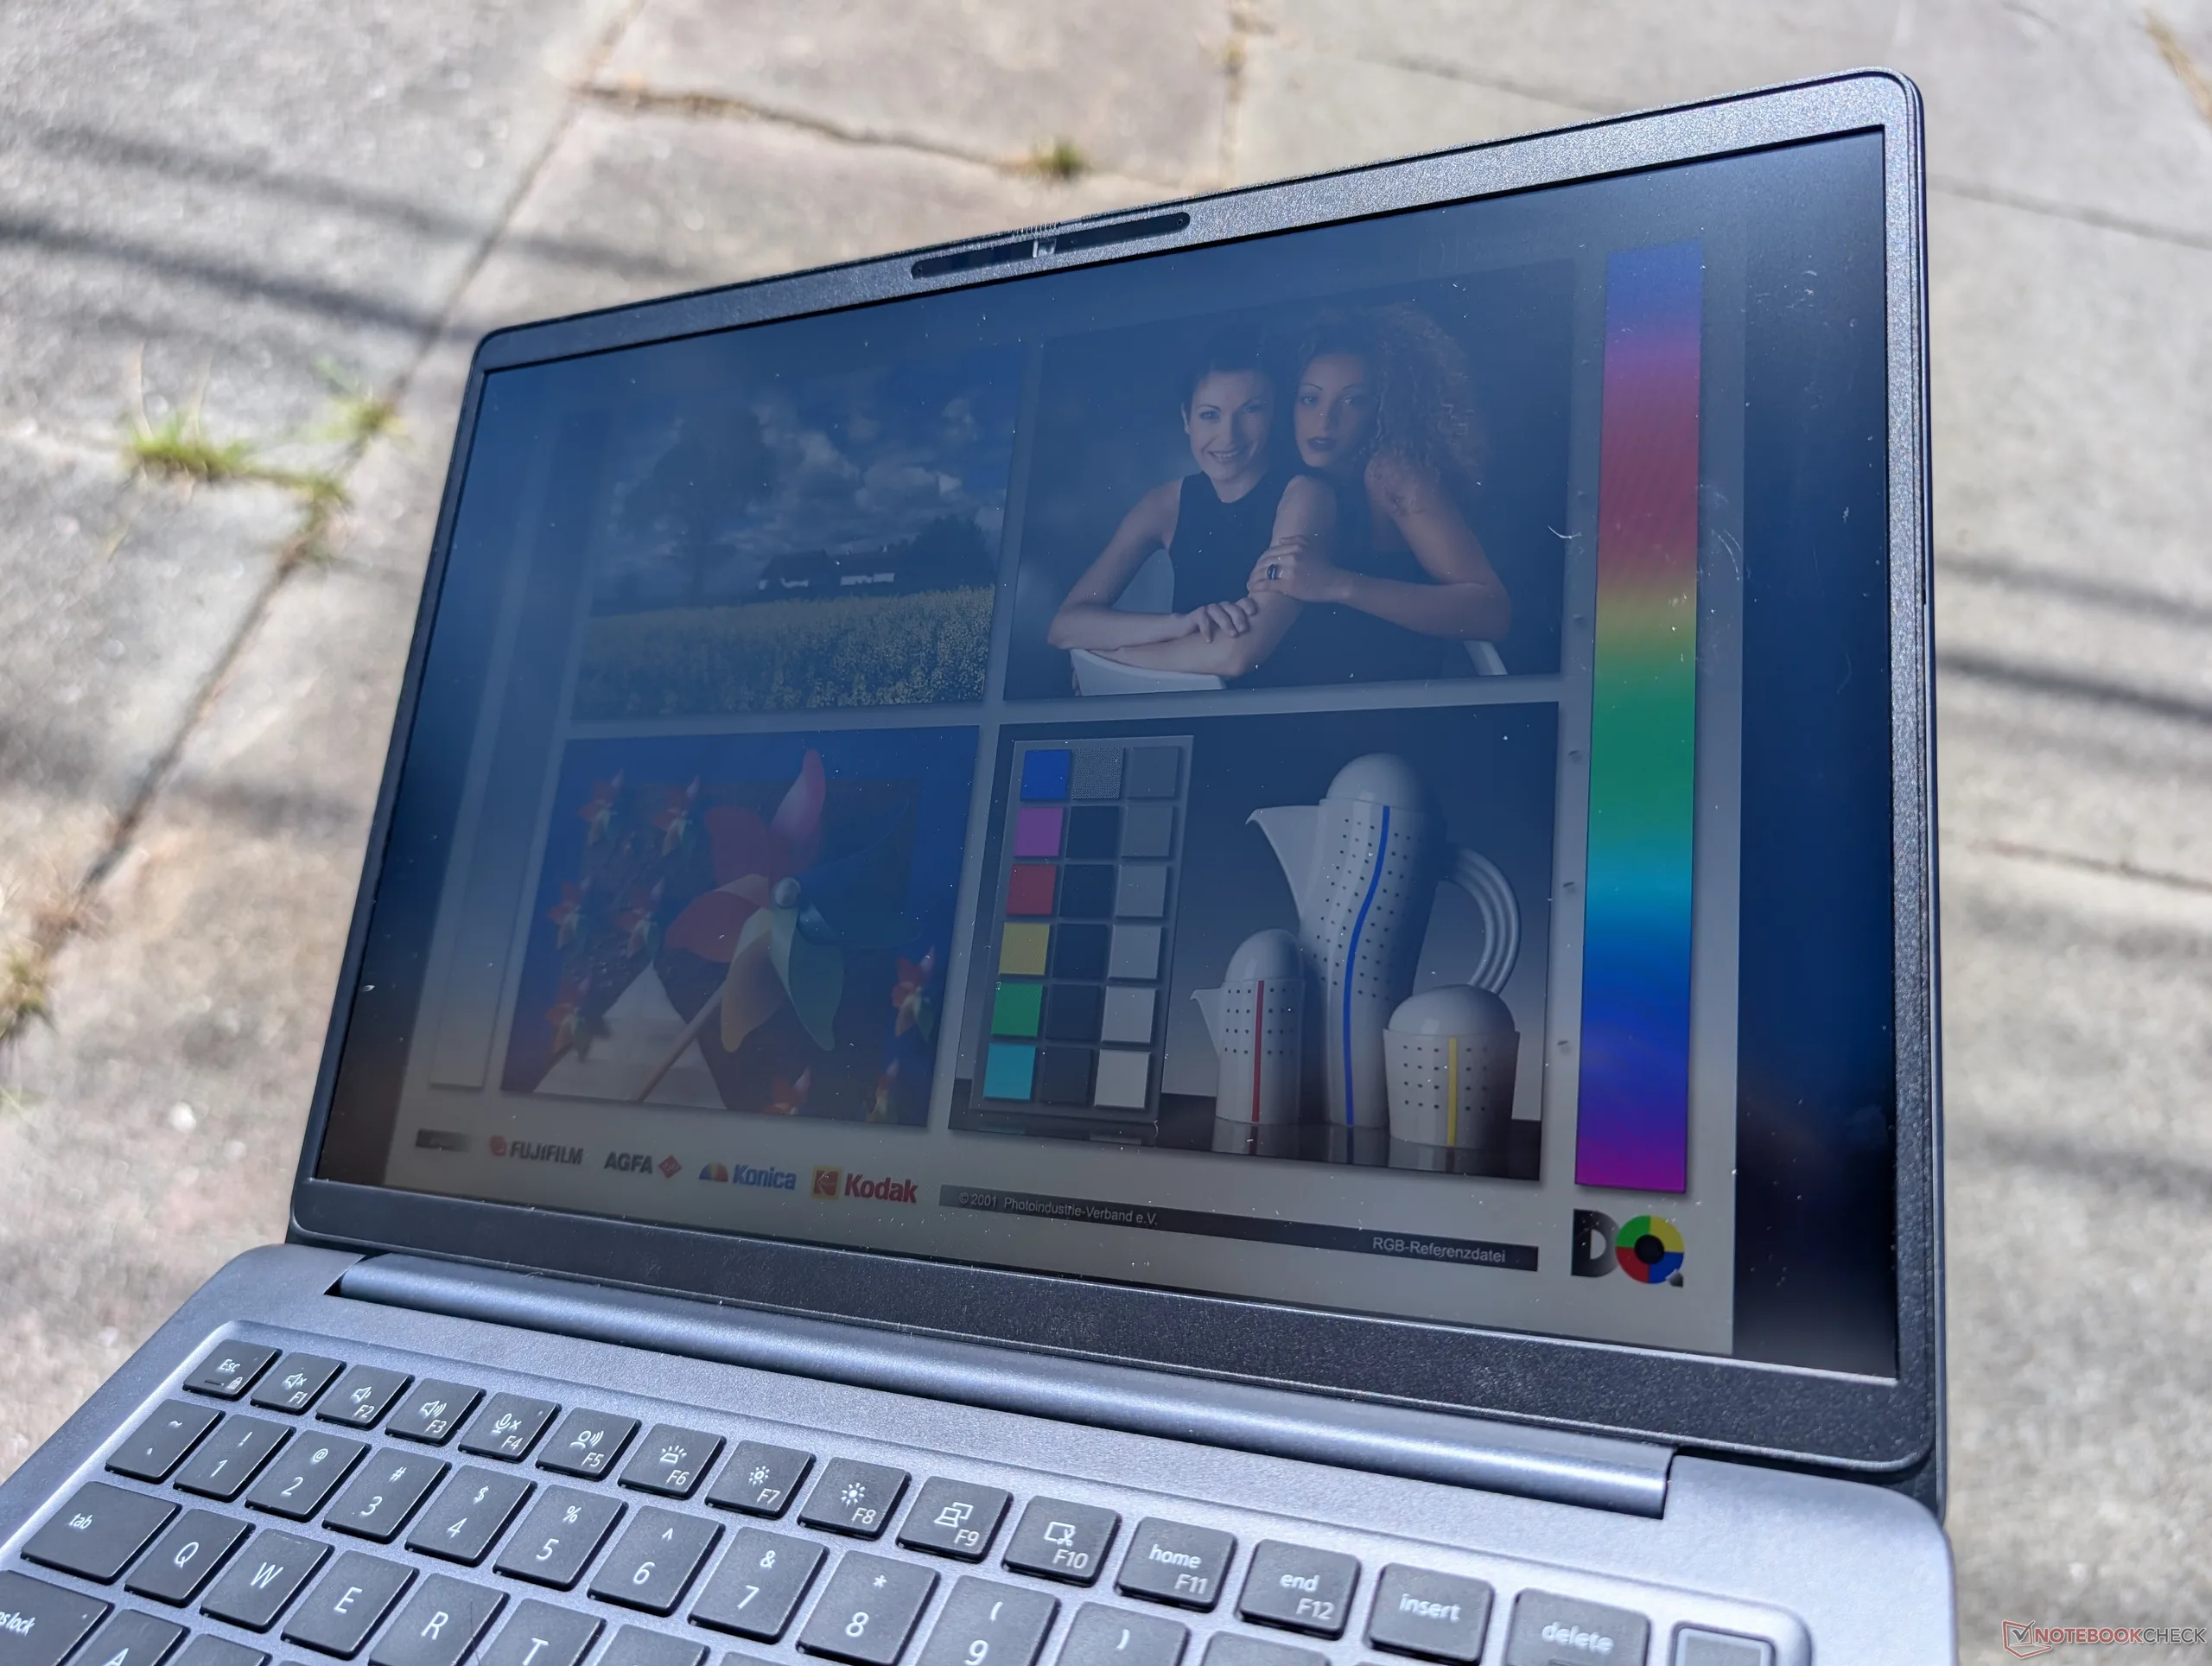
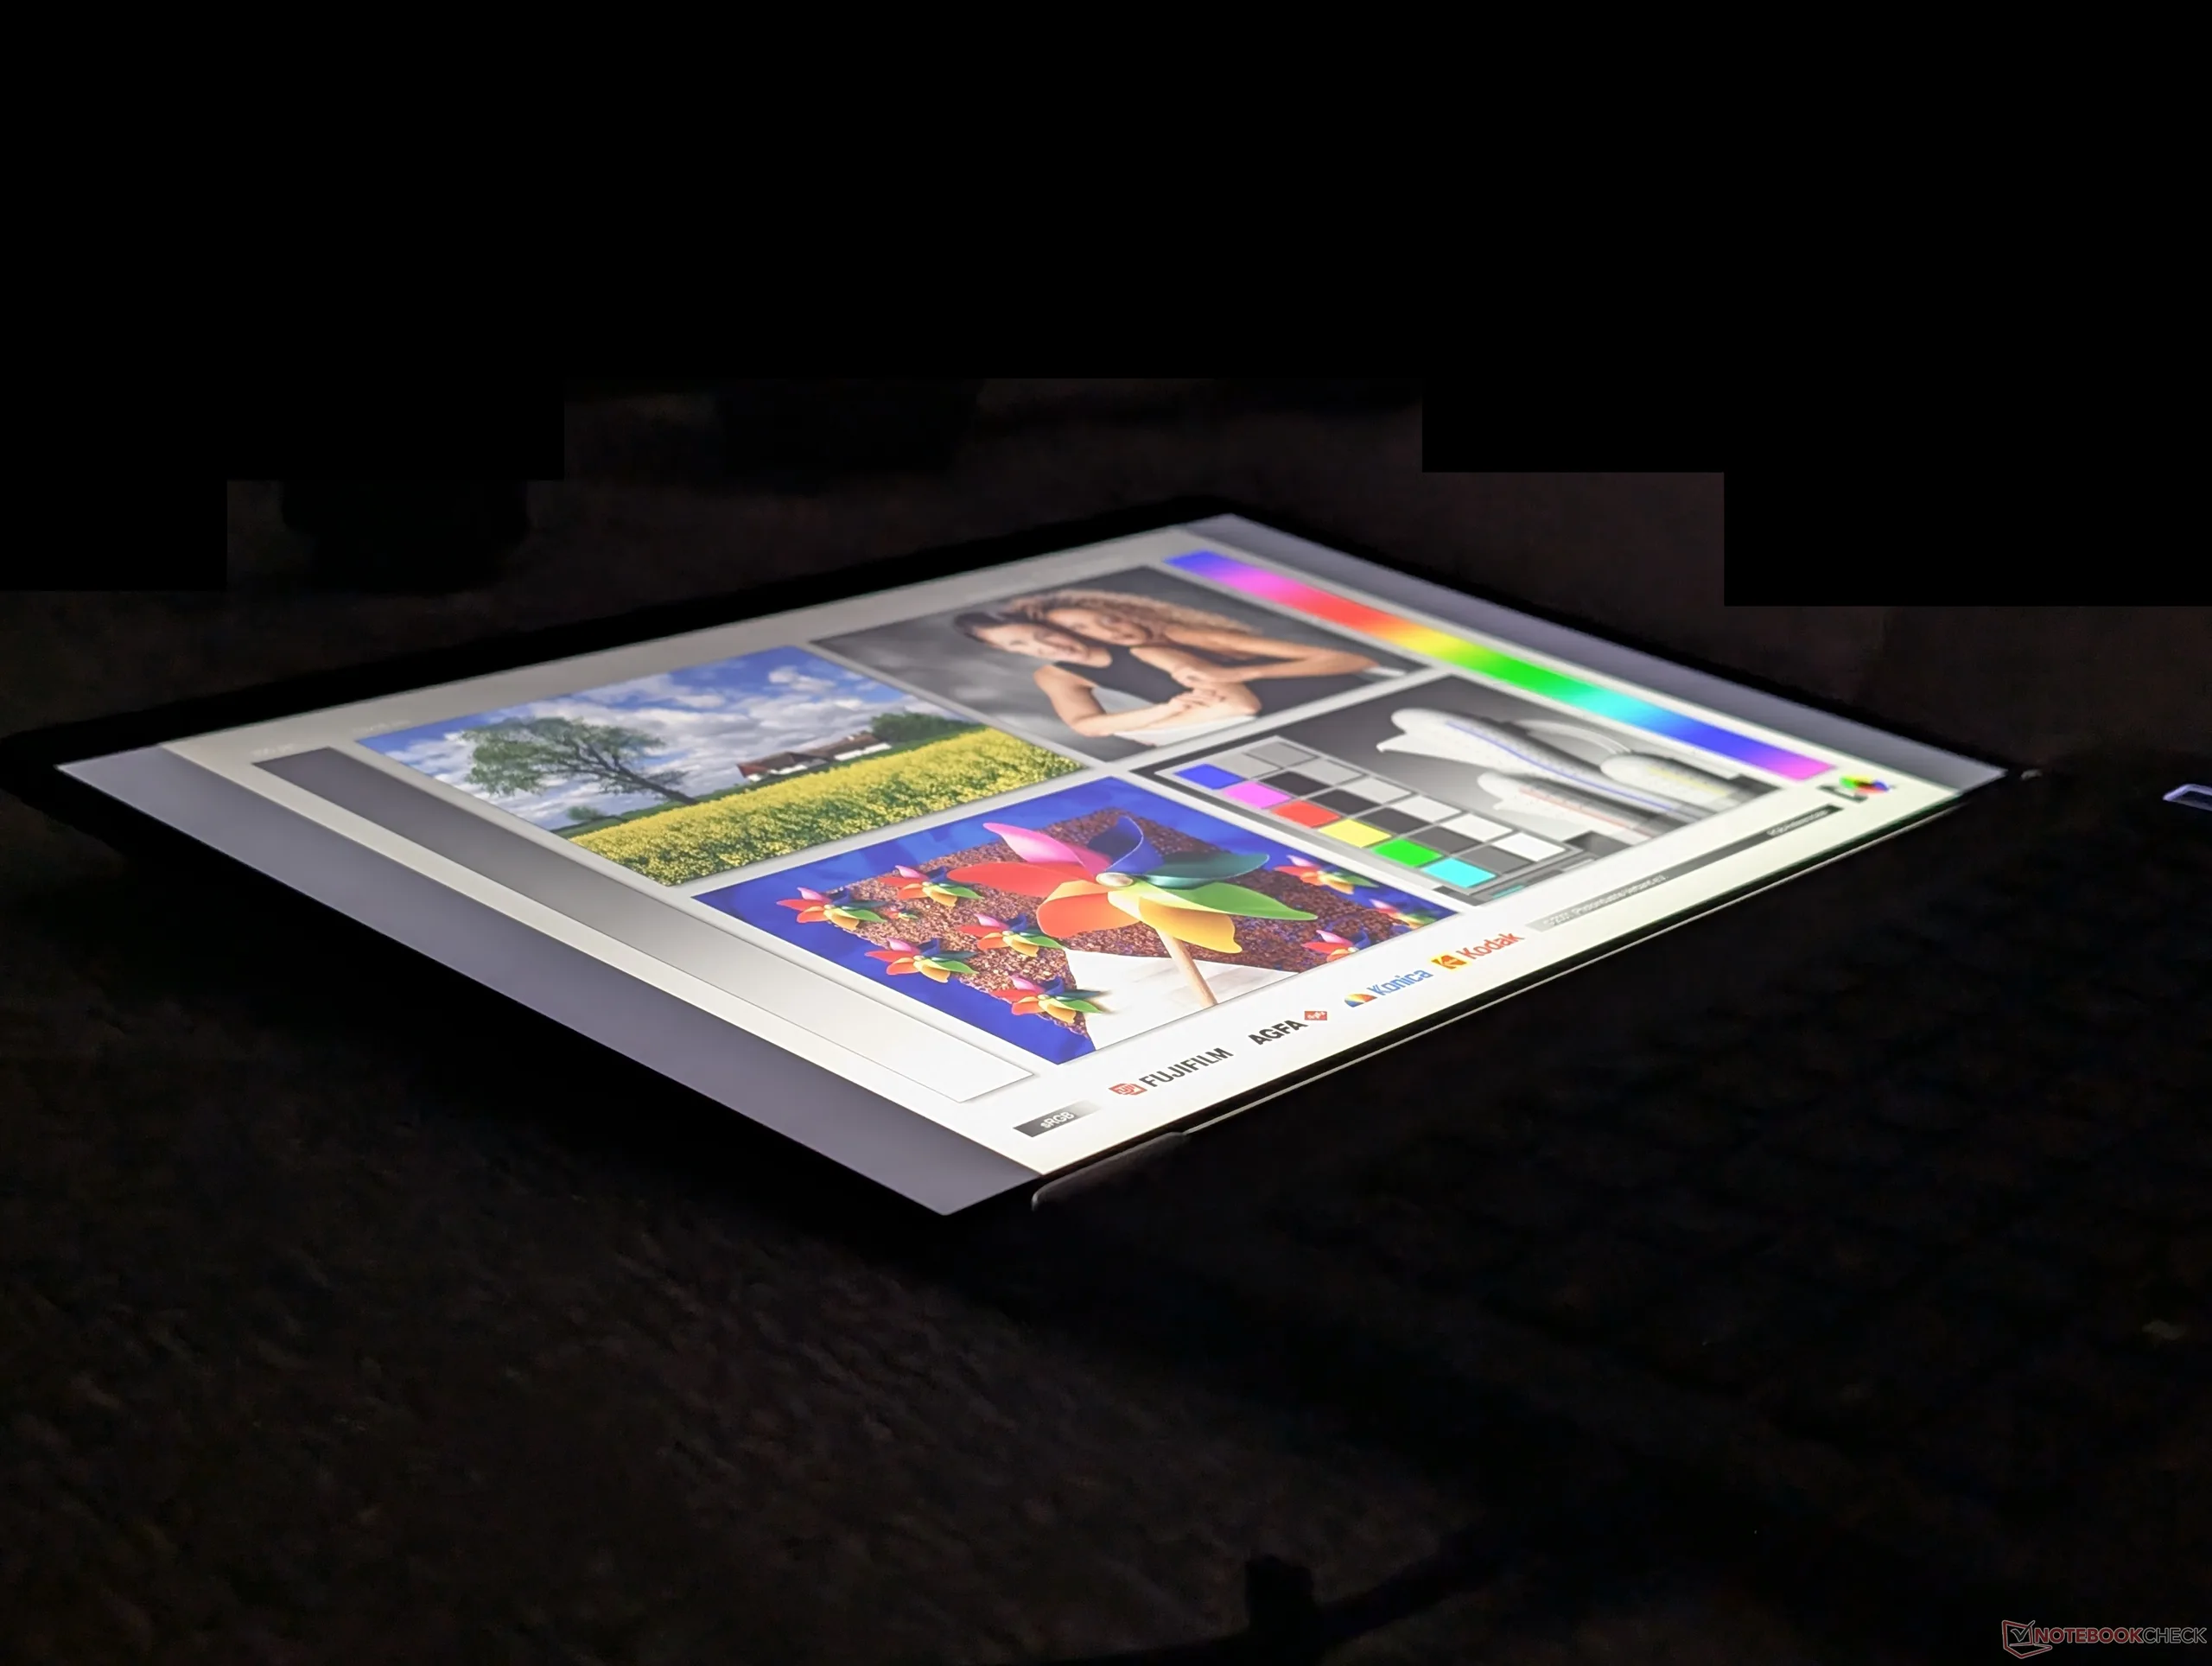
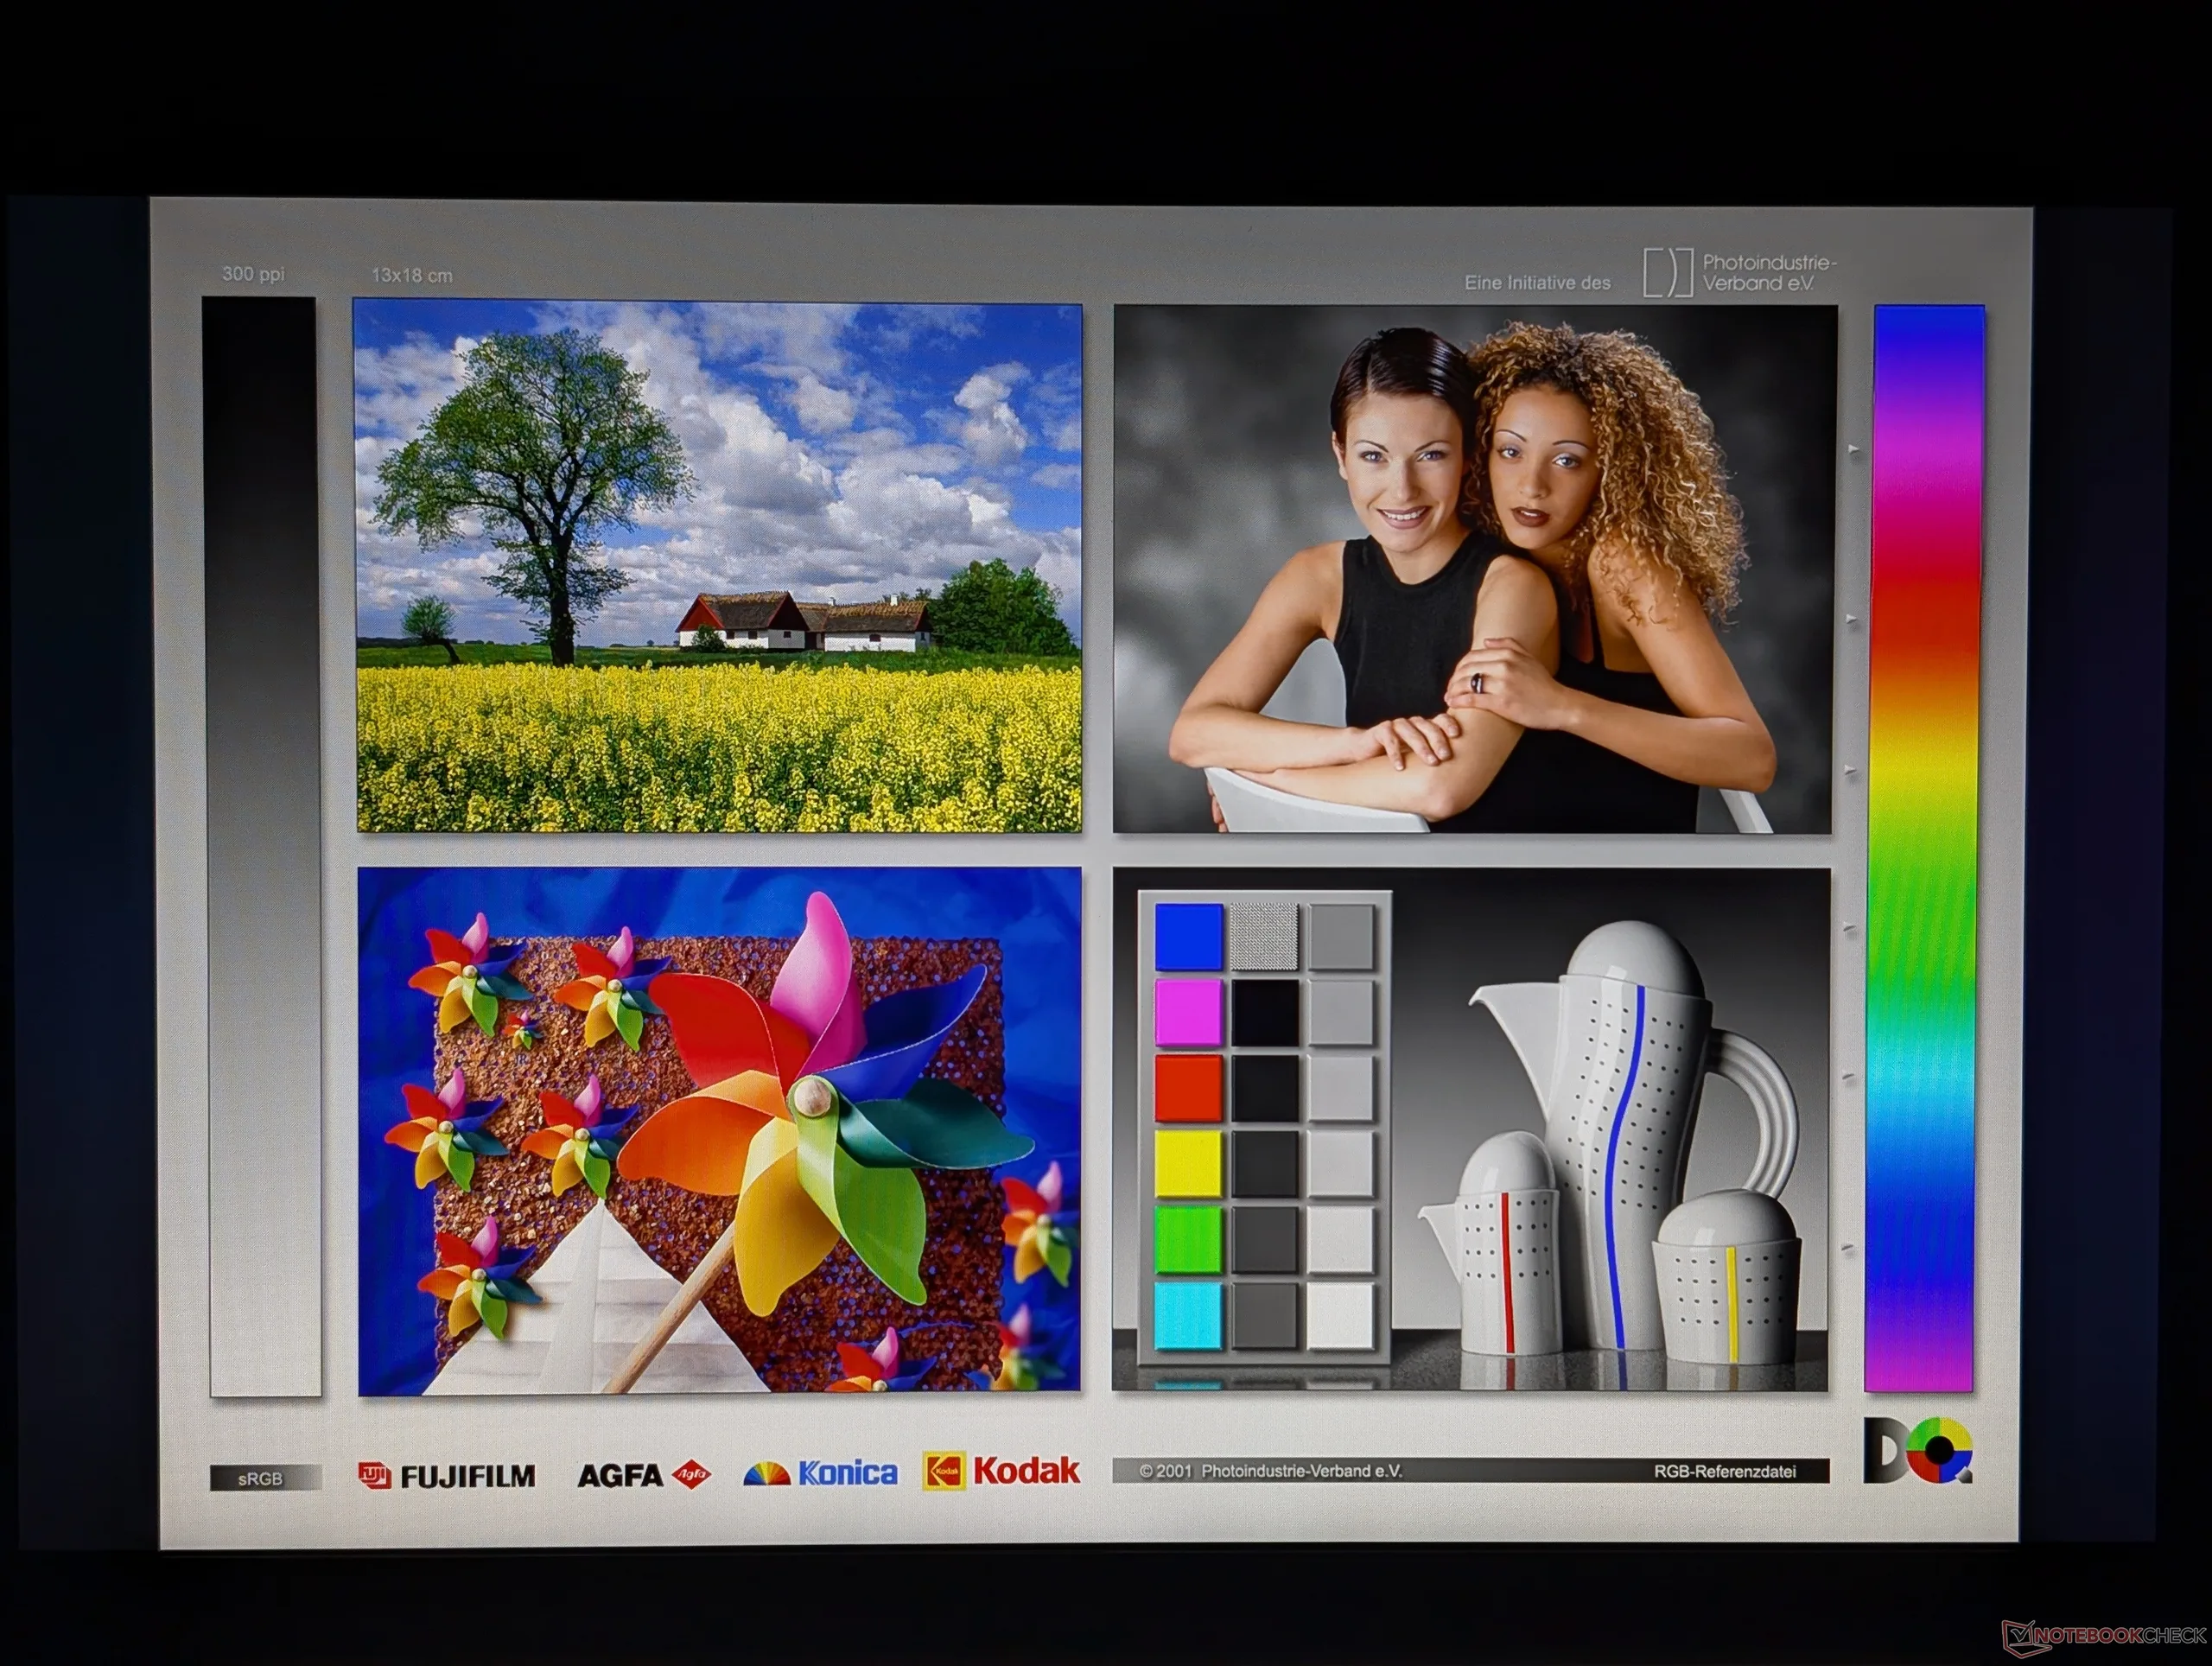
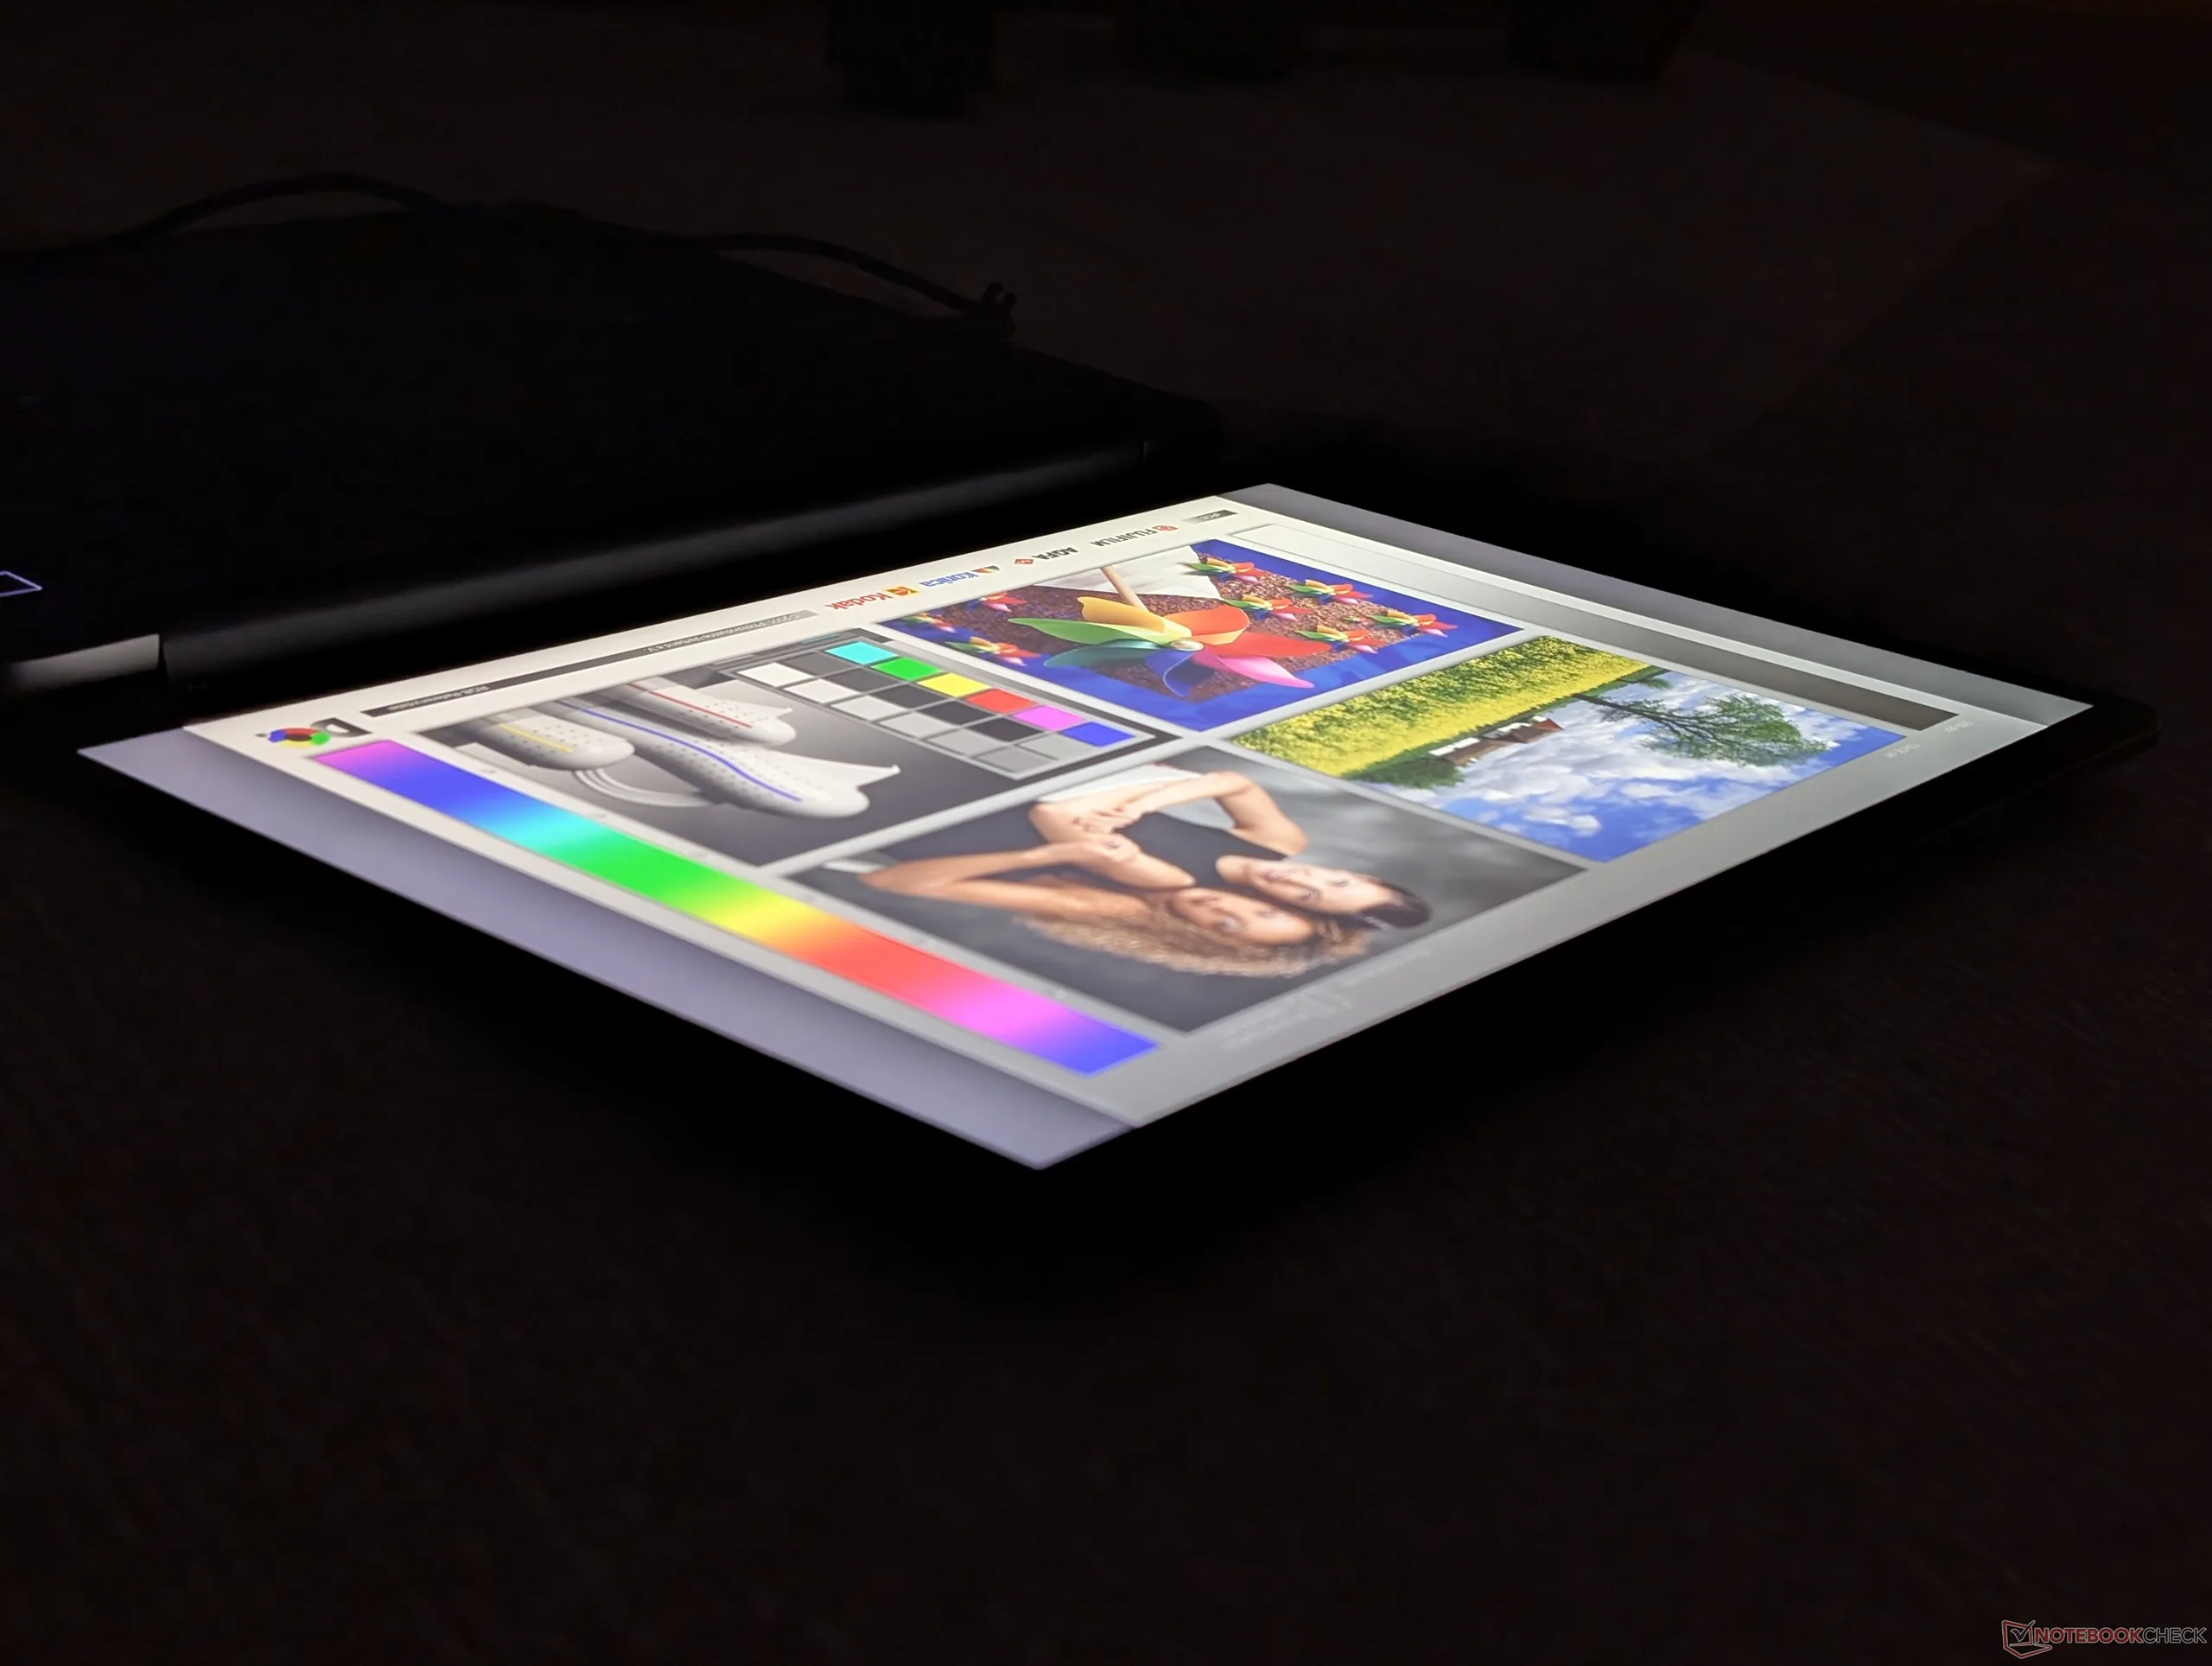
Es stehen fünf Optionen zur Verfügung, die von FHD- bis hin zu QHD-Auflösung reichen. Die OLED-Optionen sind jedoch auf FHD beschränkt und bieten bestenfalls eine unzureichende HDR-Unterstützung.

| |||||||||||||||||||||||||
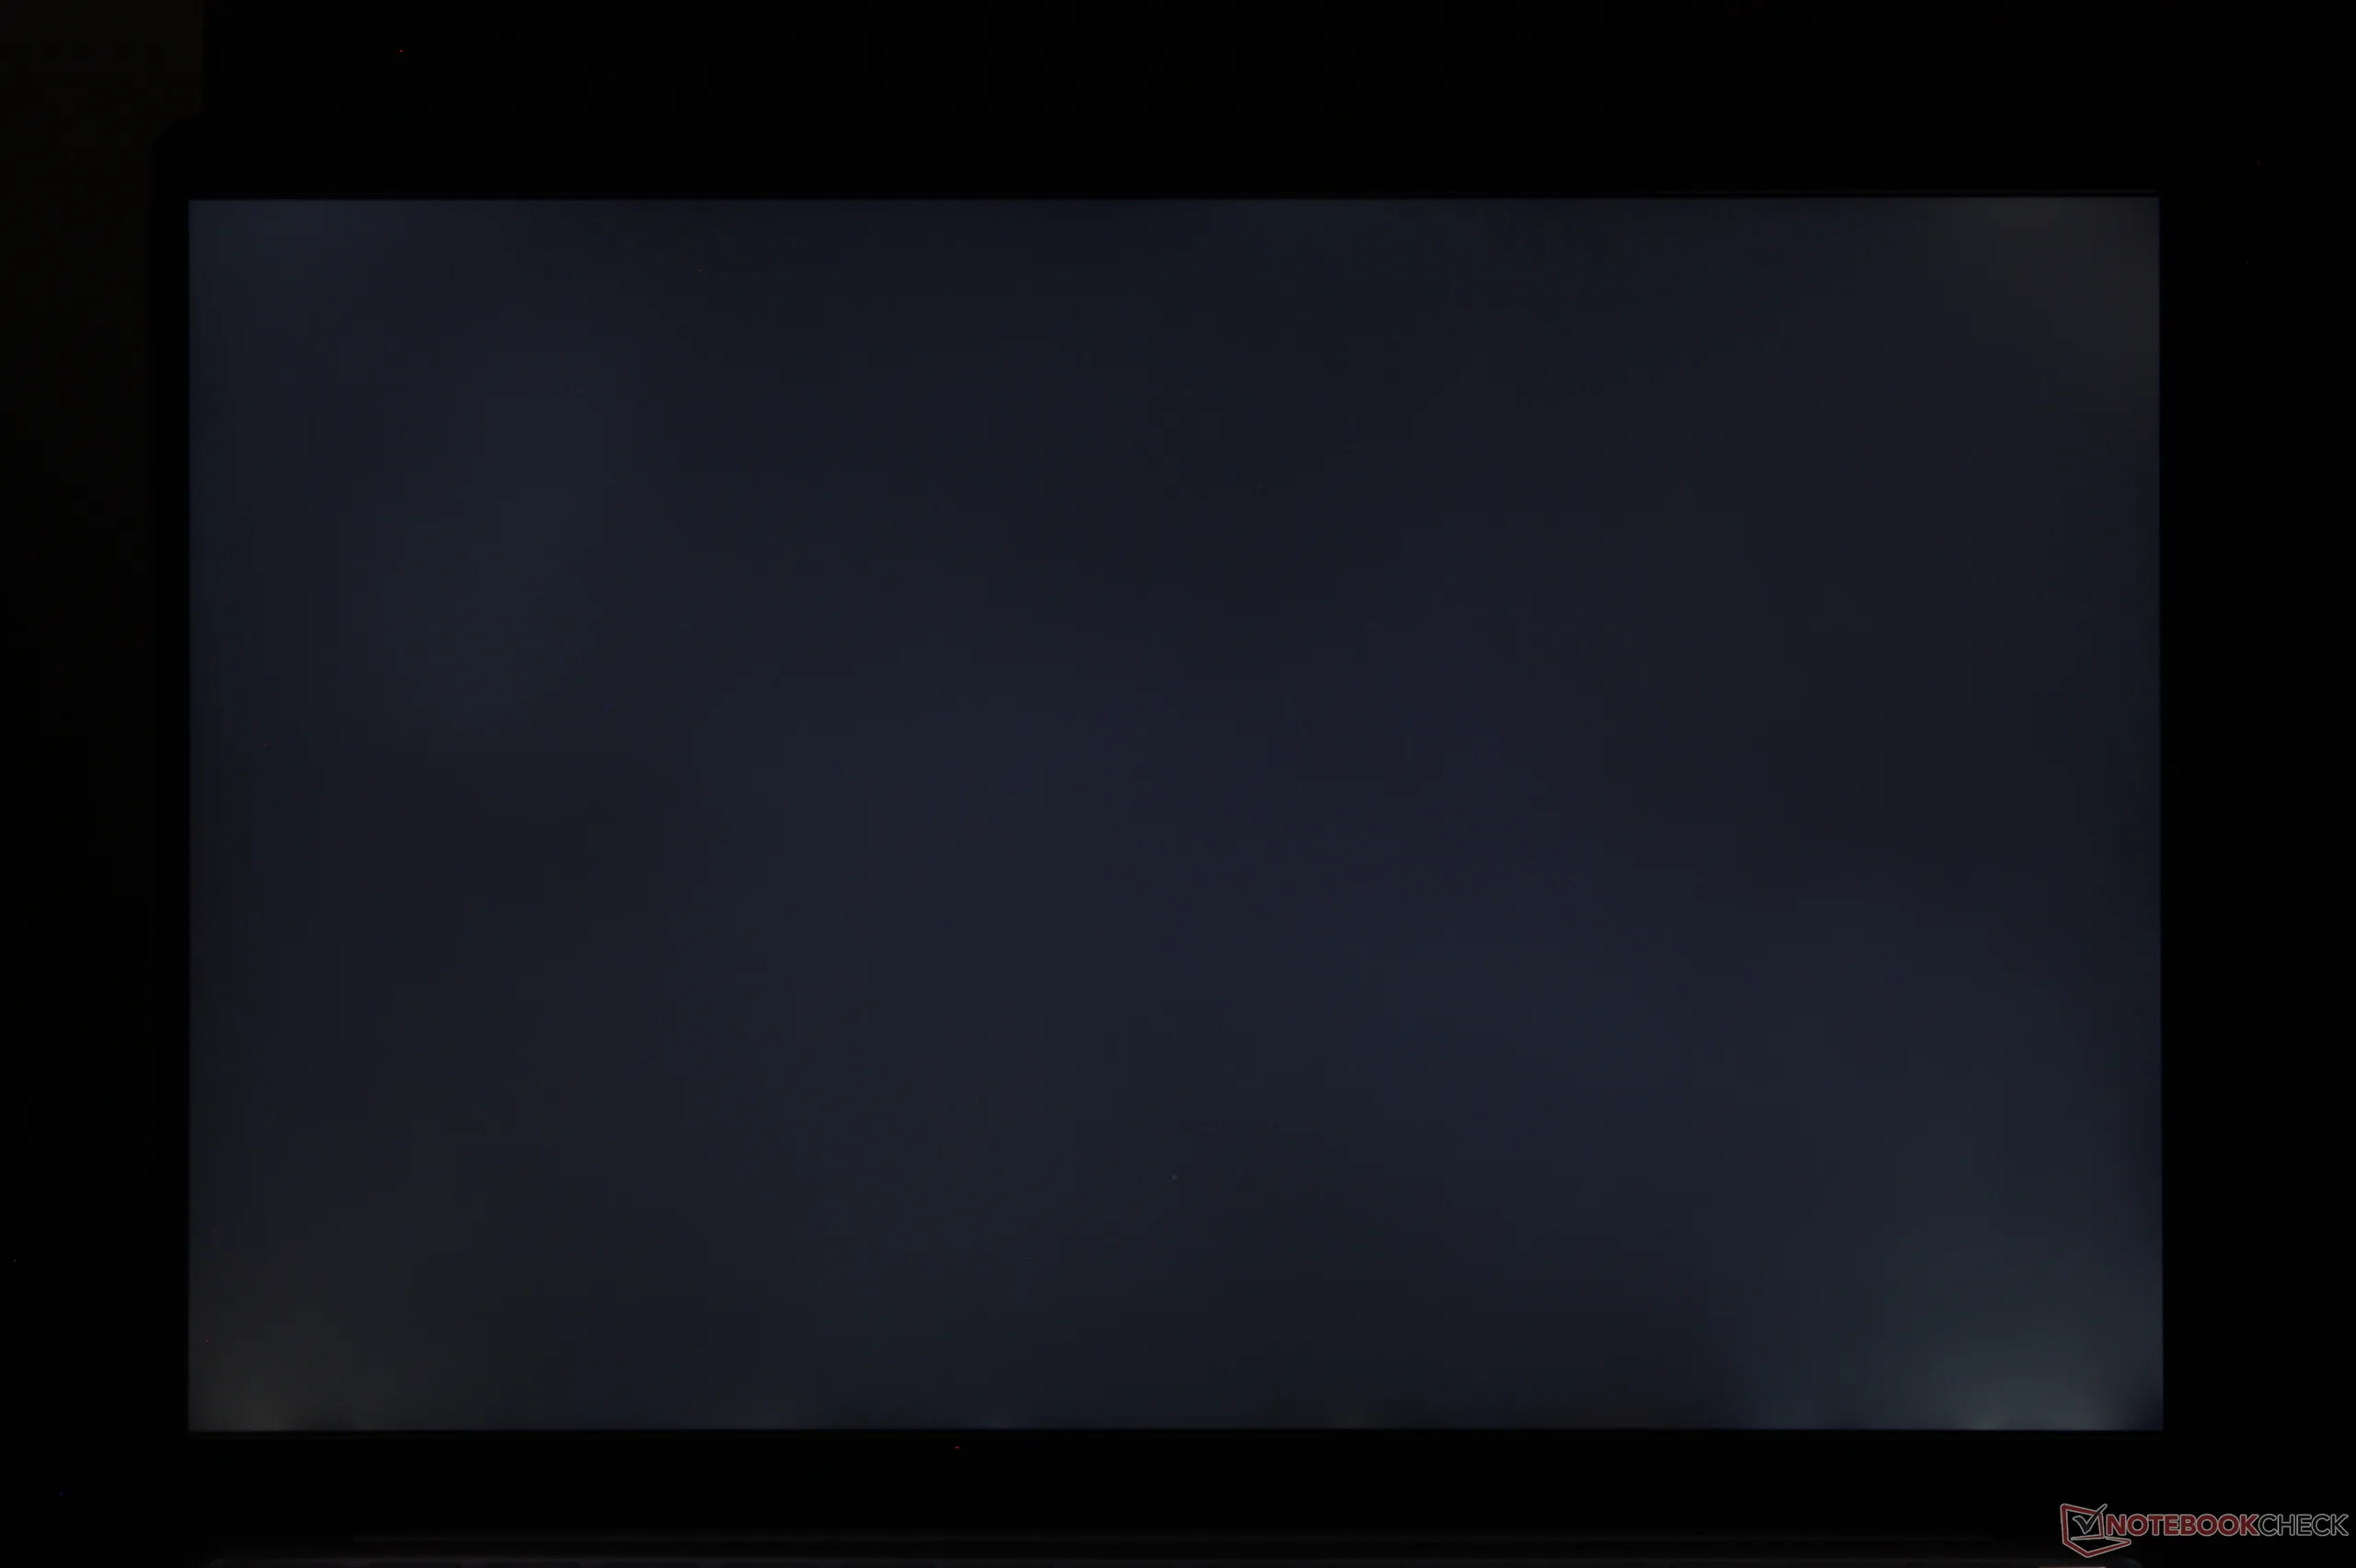
Ausleuchtung: 82 %
Helligkeit Akku: 575.7 cd/m²
Kontrast: 1799:1 (Schwarzwert: 0.32 cd/m²)
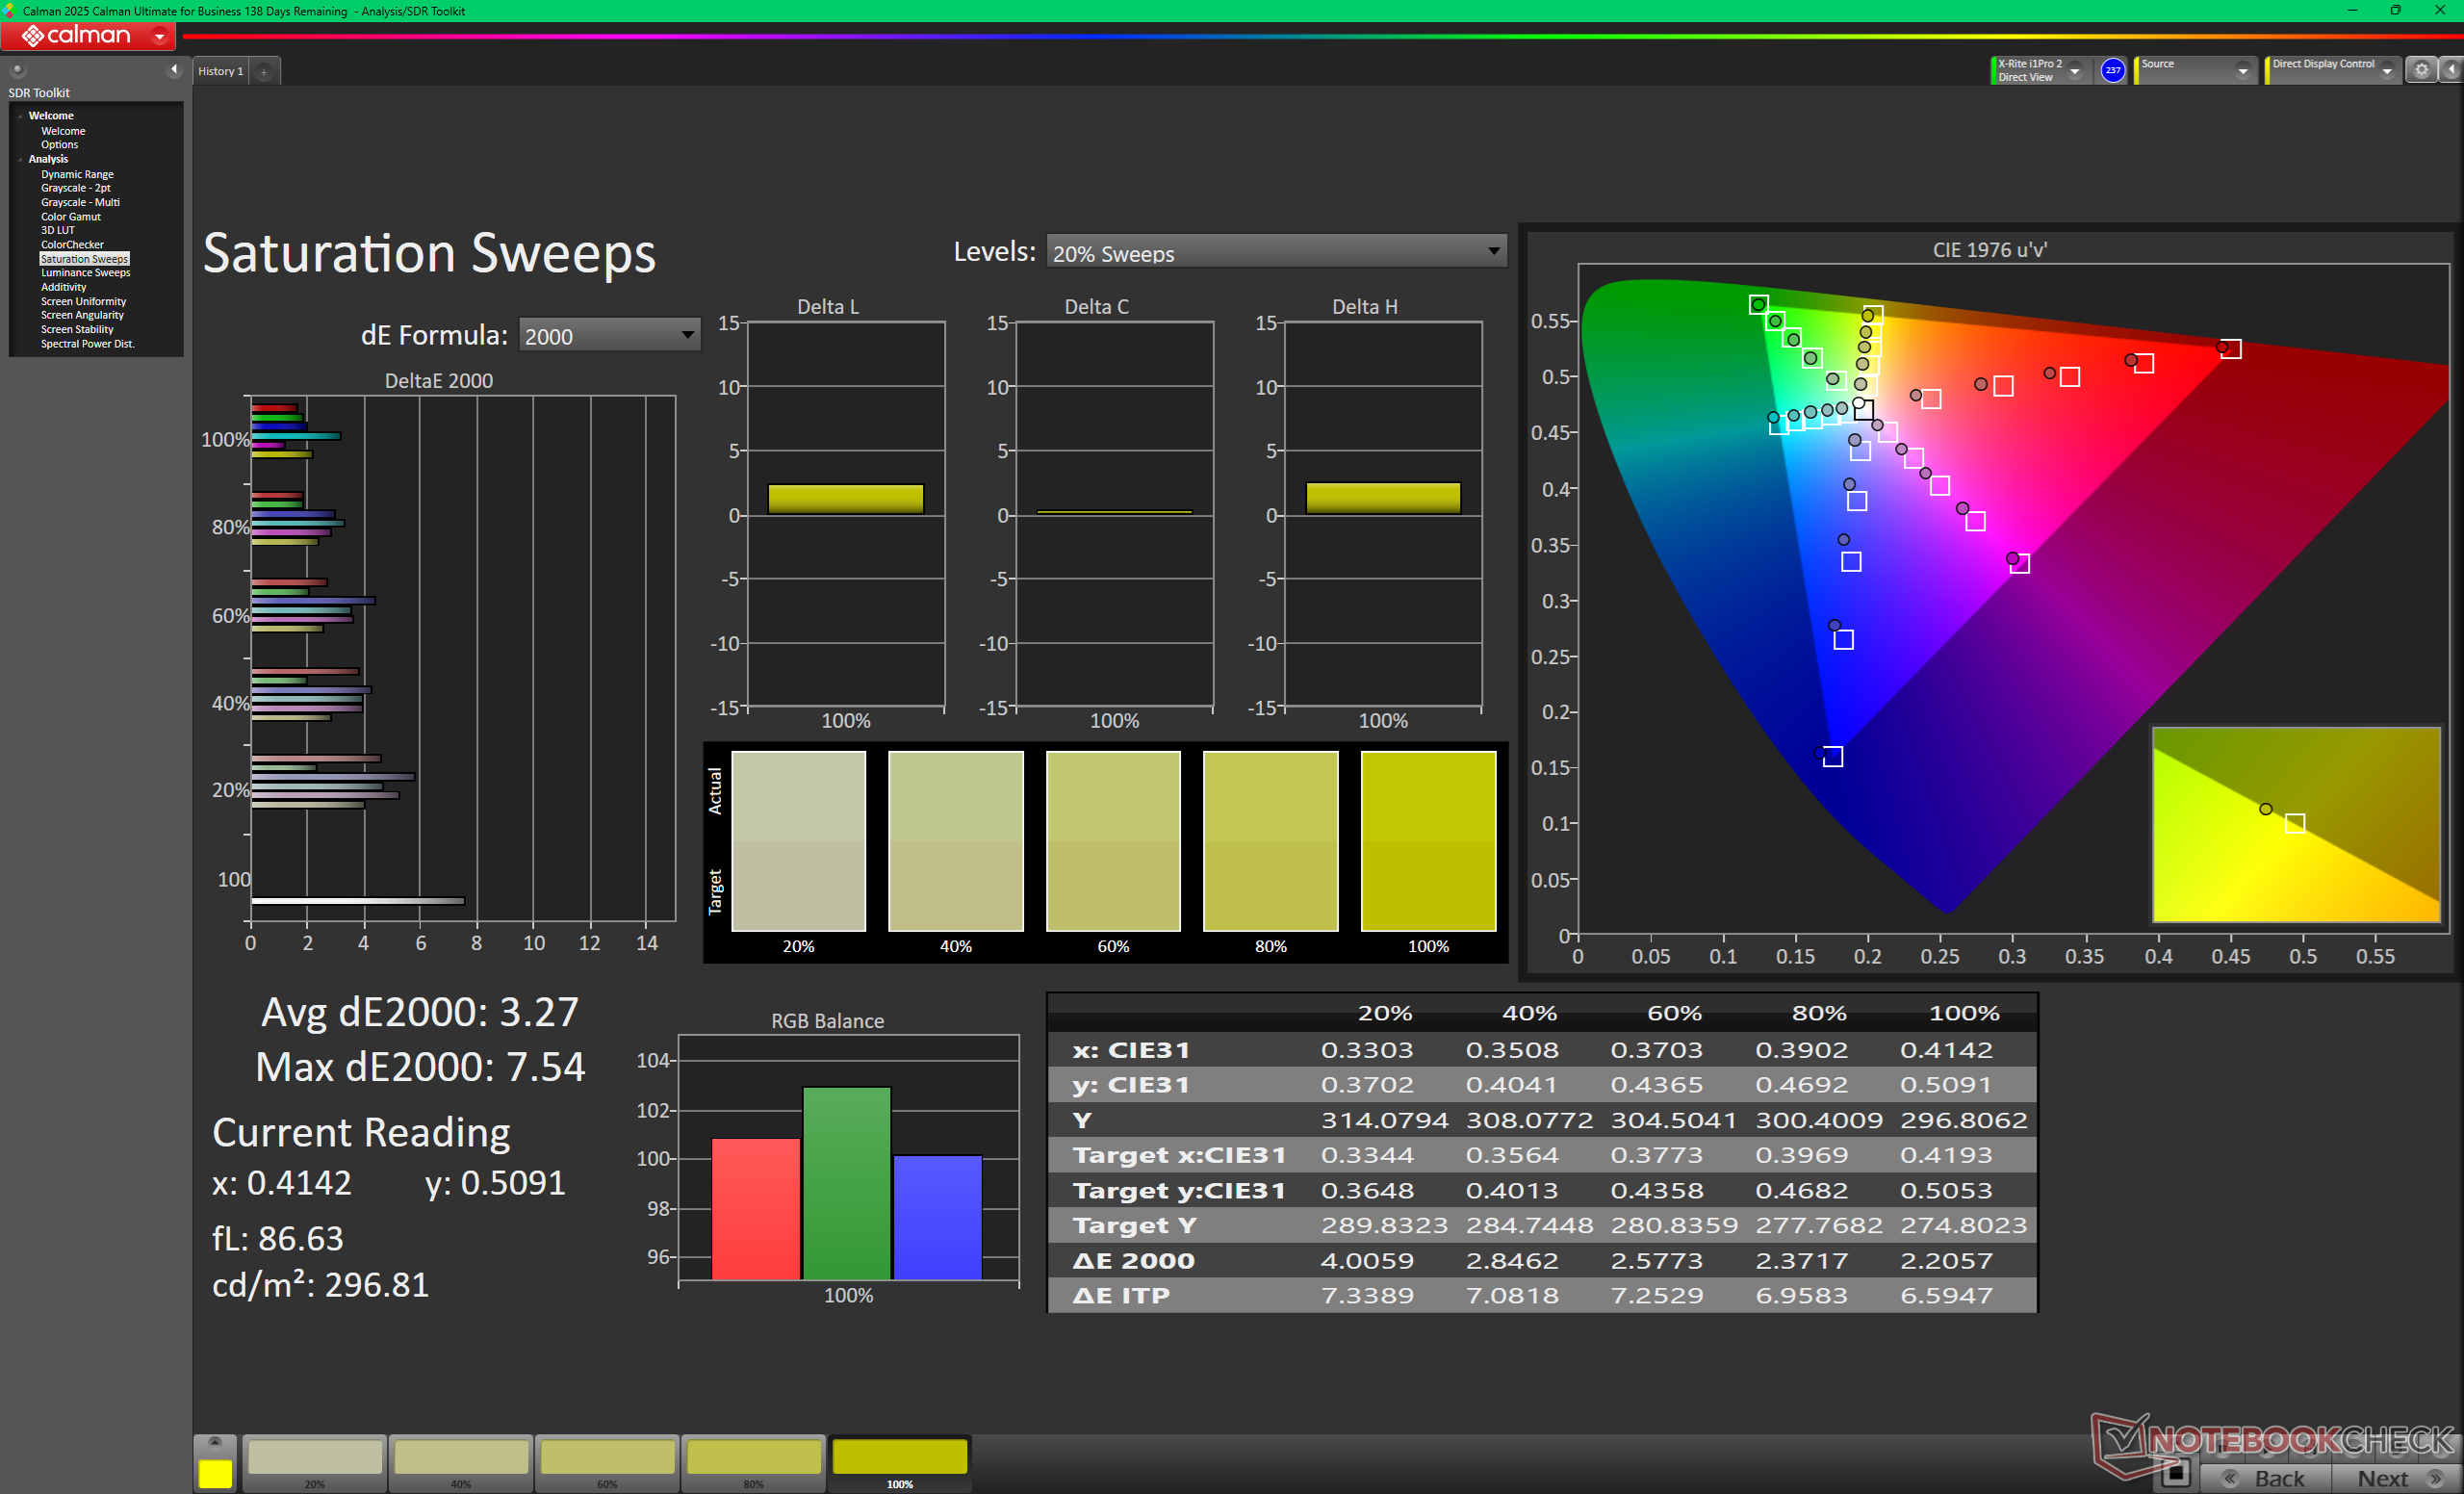
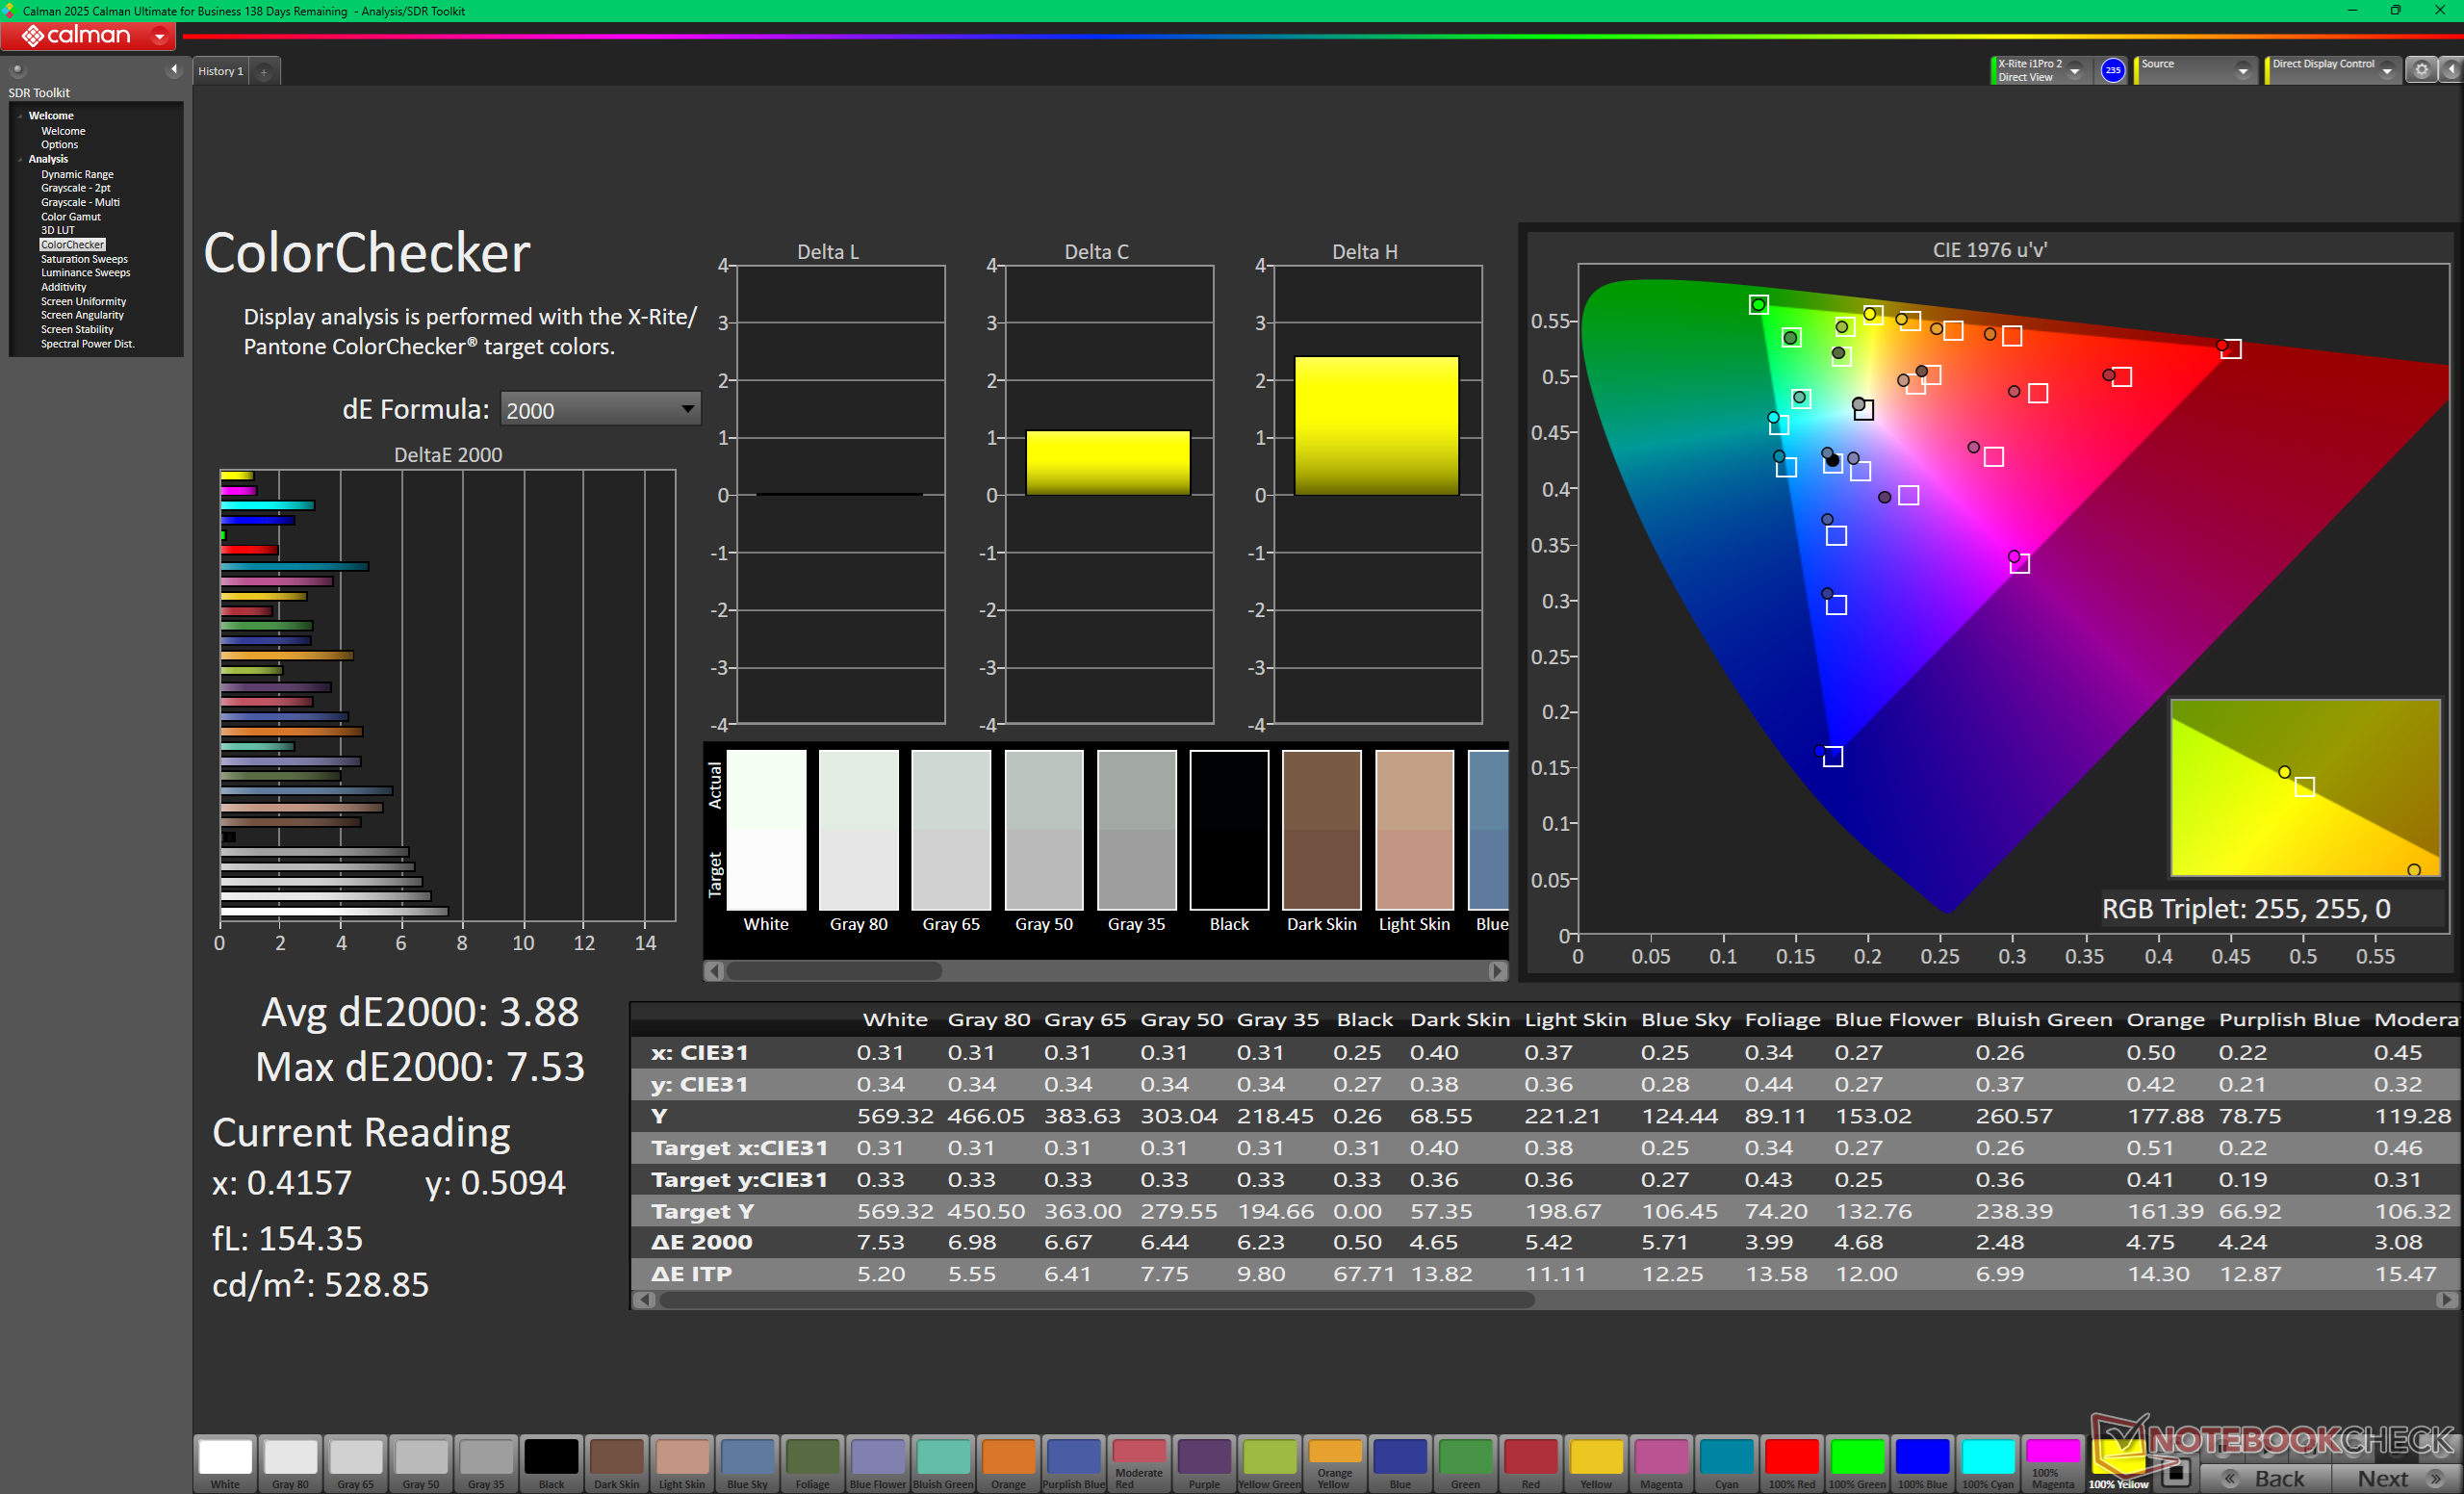
ΔE ColorChecker Calman: 3.88 | ∀{0.5-29.43 Ø4.68}
calibrated: 0.96
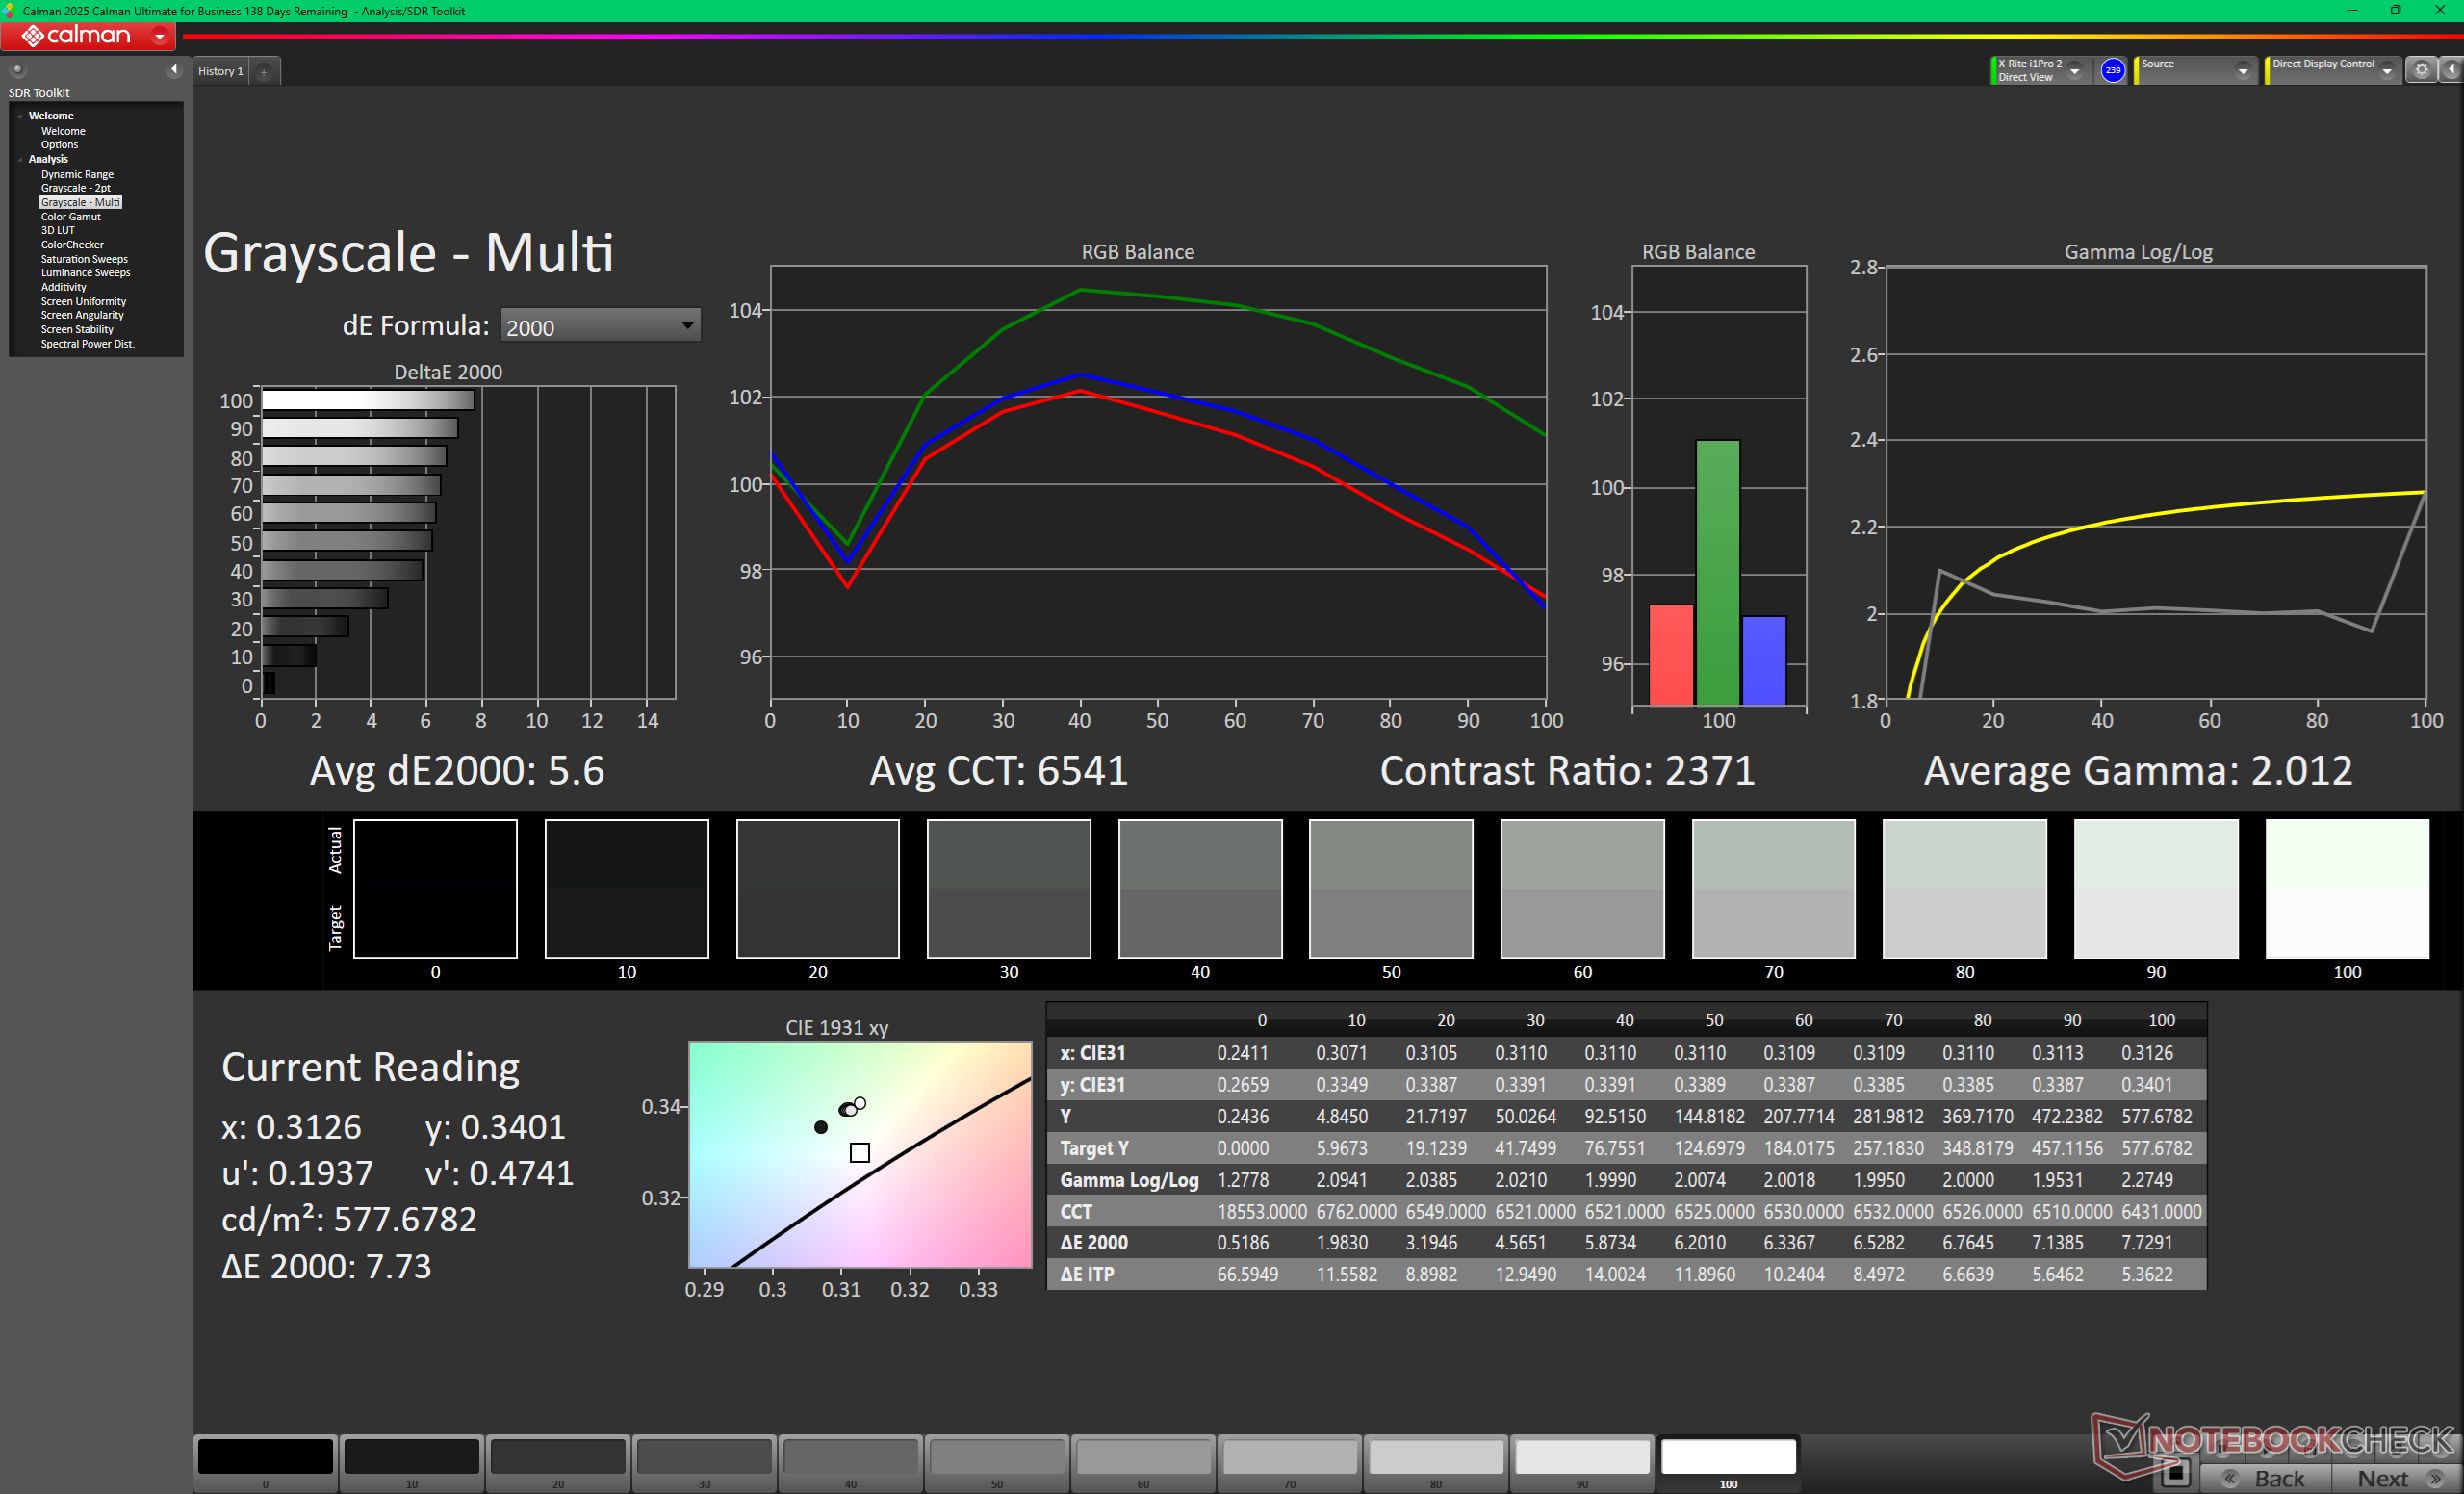
ΔE Greyscale Calman: 5.6 | ∀{0.09-98 Ø4.93}
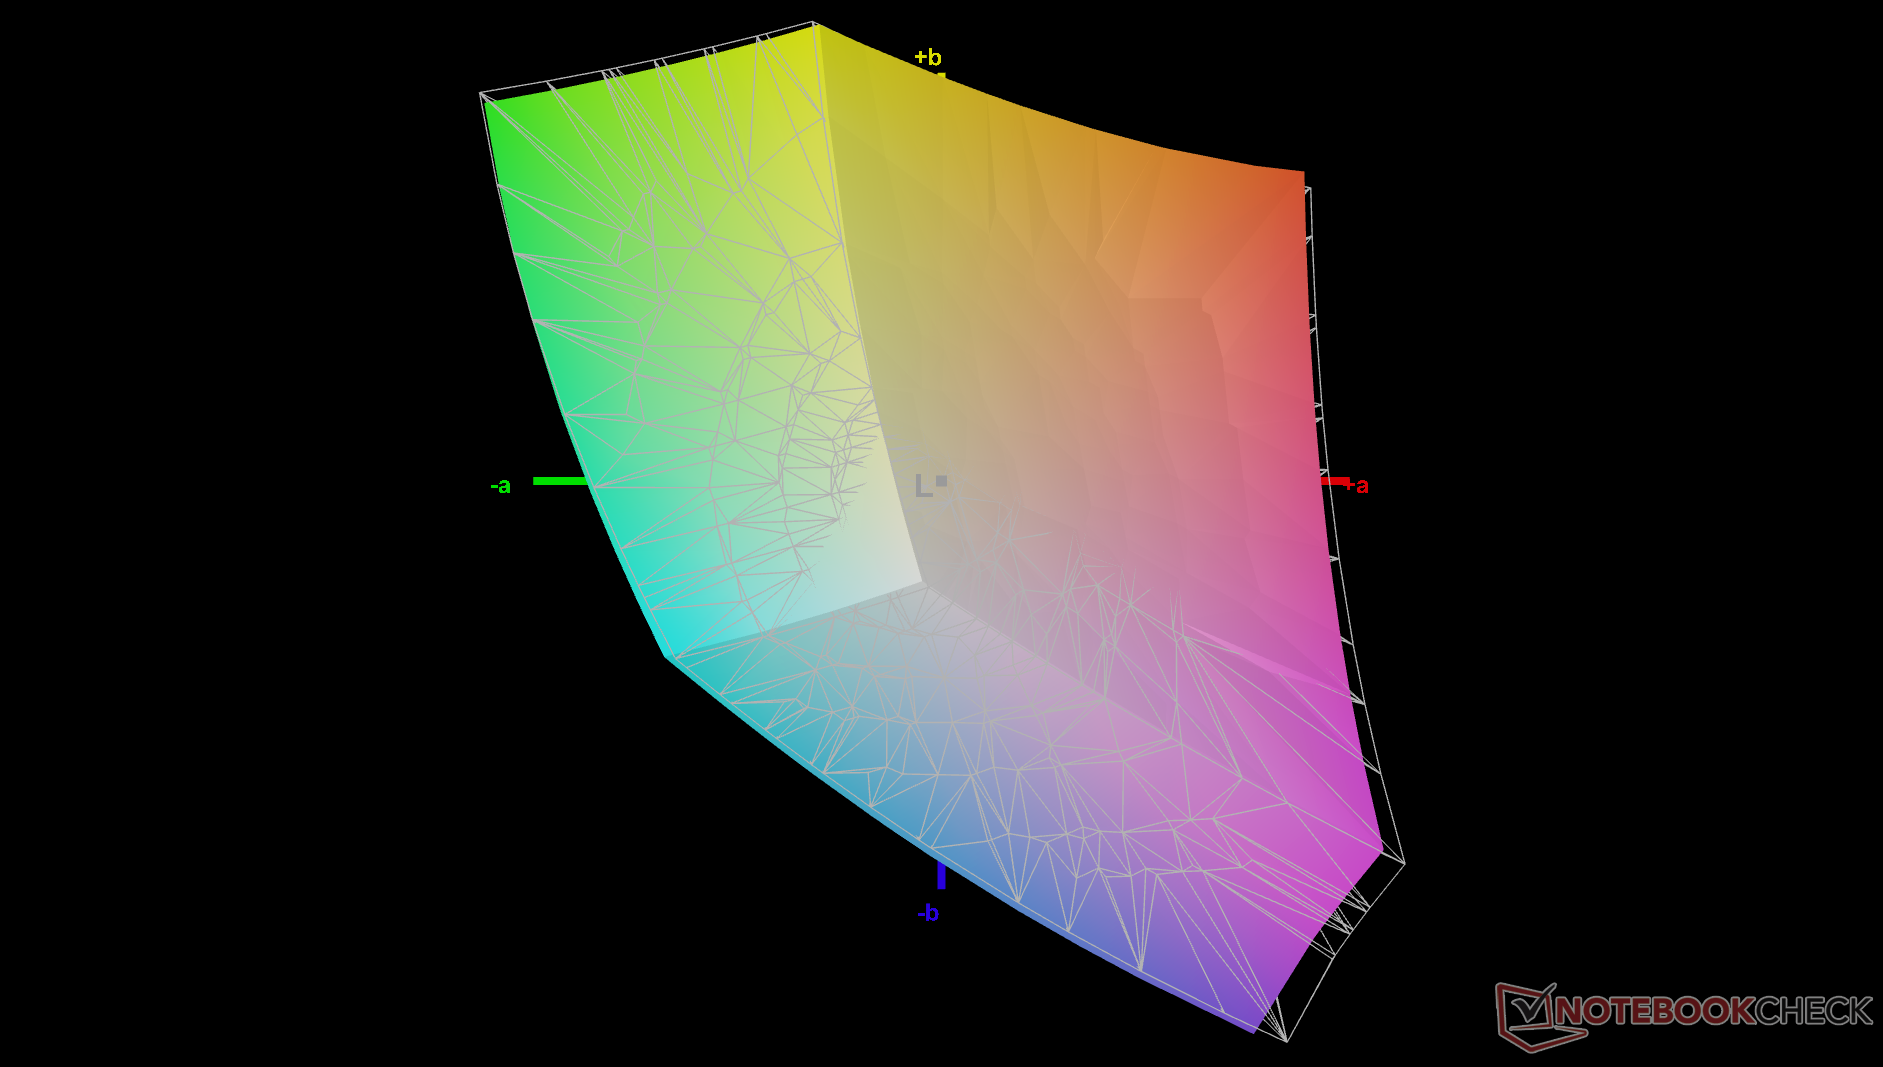
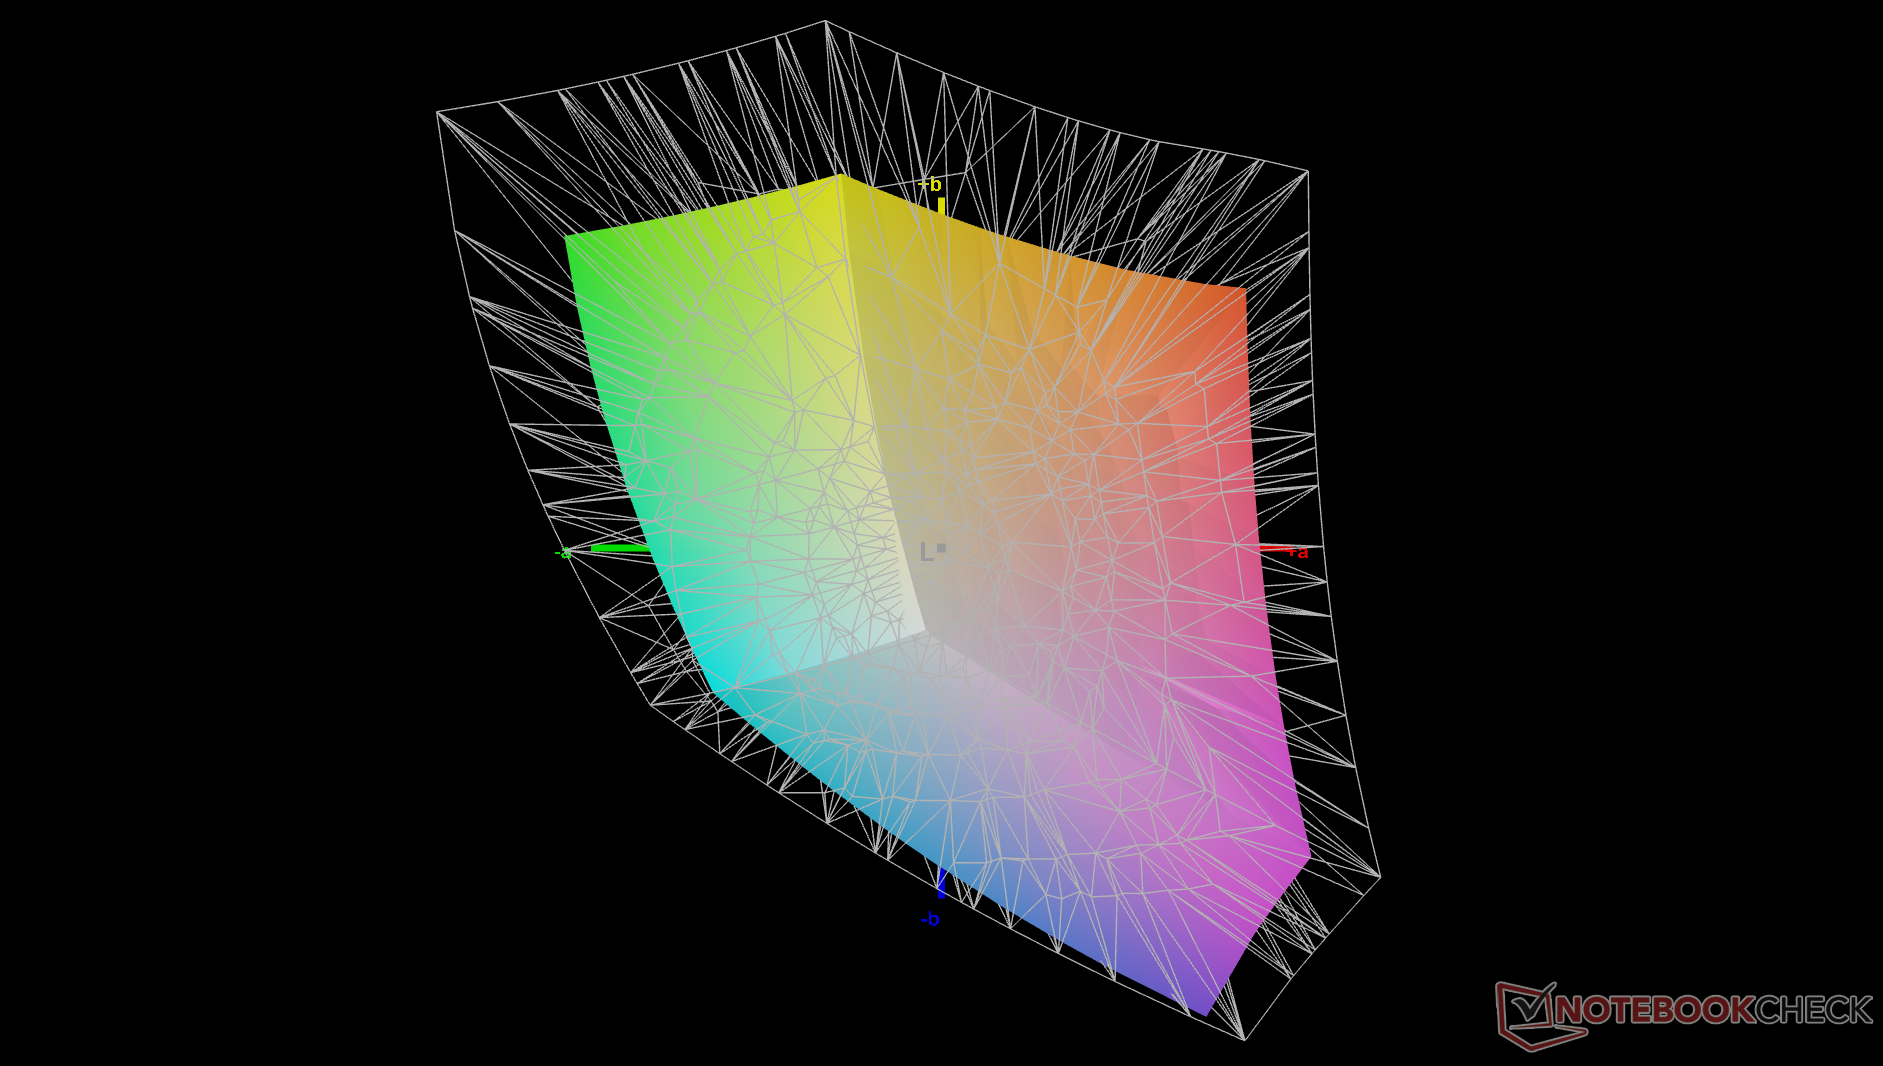
67.6% AdobeRGB 1998 (Argyll 3D)
96.2% sRGB (Argyll 3D)
65.4% Display P3 (Argyll 3D)
Gamma: 2.01
CCT: 6541 K
| Dell Pro 7 14 P714260 LG Philips LP140WU, IPS, 1920x1200, 14", 120 Hz | Dell Pro 7 14 P714265 LG Philips LP140WU, IPS, 1920x1200, 14", 120 Hz | HP EliteBook 8 G2a 14 IPS, 1920x1200, 14", 60 Hz | Lenovo ThinkPad T14s Gen 7 21YW0022GE MNE007QB1-1, IPS, 1920x1200, 14", 60 Hz | Asus ExpertBook Ultra B9406CAA Samsung ATNA40LE01-0, OLED, 2880x1800, 14", 120 Hz | Acer TravelMate P6 TMP614-54-TCO-553Z AUO77B2, IPS, 1920x1200, 14", 60 Hz | |
|---|---|---|---|---|---|---|
| Display | 1% | 3% | 5% | 26% | 7% | |
| Display P3 Coverage (%) | 65.4 | 65.9 1% | 67.5 3% | 71.6 9% | 96.2 47% | 73.49 12% |
| sRGB Coverage (%) | 96.2 | 96.4 0% | 99 3% | 97.4 1% | 100 4% | 97.5 1% |
| AdobeRGB 1998 Coverage (%) | 67.6 | 68.1 1% | 69.6 3% | 70.4 4% | 86.7 28% | 72.95 8% |
| Response Times | -14% | 27% | 46% | 98% | -13% | |
| Response Time Grey 50% / Grey 80% * (ms) | 43.8 ? | 50.5 ? -15% | 39.3 ? 10% | 27.8 ? 37% | 0.71 ? 98% | 54.8 ? -25% |
| Response Time Black / White * (ms) | 31.3 ? | 35.2 ? -12% | 17.8 ? 43% | 14 ? 55% | 0.94 ? 97% | 31.2 ? -0% |
| PWM Frequency (Hz) | 968.8 ? | |||||
| PWM Amplitude * (%) | 20 | |||||
| Bildschirm | -3% | 21% | 16% | 38% | -28% | |
| Helligkeit Bildmitte (cd/m²) | 575.7 | 571.5 -1% | 449 -22% | 574 0% | 600.5 4% | 465 -19% |
| Brightness (cd/m²) | 532 | 513 -4% | 434 -18% | 530 0% | 612 15% | 449 -16% |
| Brightness Distribution (%) | 82 | 83 1% | 90 10% | 87 6% | 96 17% | 88 7% |
| Schwarzwert * (cd/m²) | 0.32 | 0.29 9% | 0.22 31% | 0.32 -0% | 0.2821 12% | |
| Kontrast (:1) | 1799 | 1971 10% | 2041 13% | 1794 0% | 1648 -8% | |
| Delta E Colorchecker * | 3.88 | 4.58 -18% | 1.8 54% | 2 48% | 1.18 70% | 3.78 3% |
| Colorchecker dE 2000 max. * | 7.53 | 9.44 -25% | 4.2 44% | 3.7 51% | 3.4 55% | 7.58 -1% |
| Colorchecker dE 2000 calibrated * | 0.96 | 0.72 25% | 0.7 27% | 1.1 -15% | 0.73 24% | 3.3 -244% |
| Delta E Graustufen * | 5.6 | 6.8 -21% | 2.8 50% | 2.6 54% | 1 82% | 4.9 12% |
| Gamma | 2.01 109% | 2 110% | 2.22 99% | 2.27 97% | 2.27 97% | 2.278 97% |
| CCT | 6541 99% | 6303 103% | 7061 92% | 6910 94% | 6567 99% | 7594 86% |
| Durchschnitt gesamt (Programm / Settings) | -5% /
-4% | 17% /
18% | 22% /
18% | 54% /
45% | -11% /
-18% |
* ... kleinere Werte sind besser
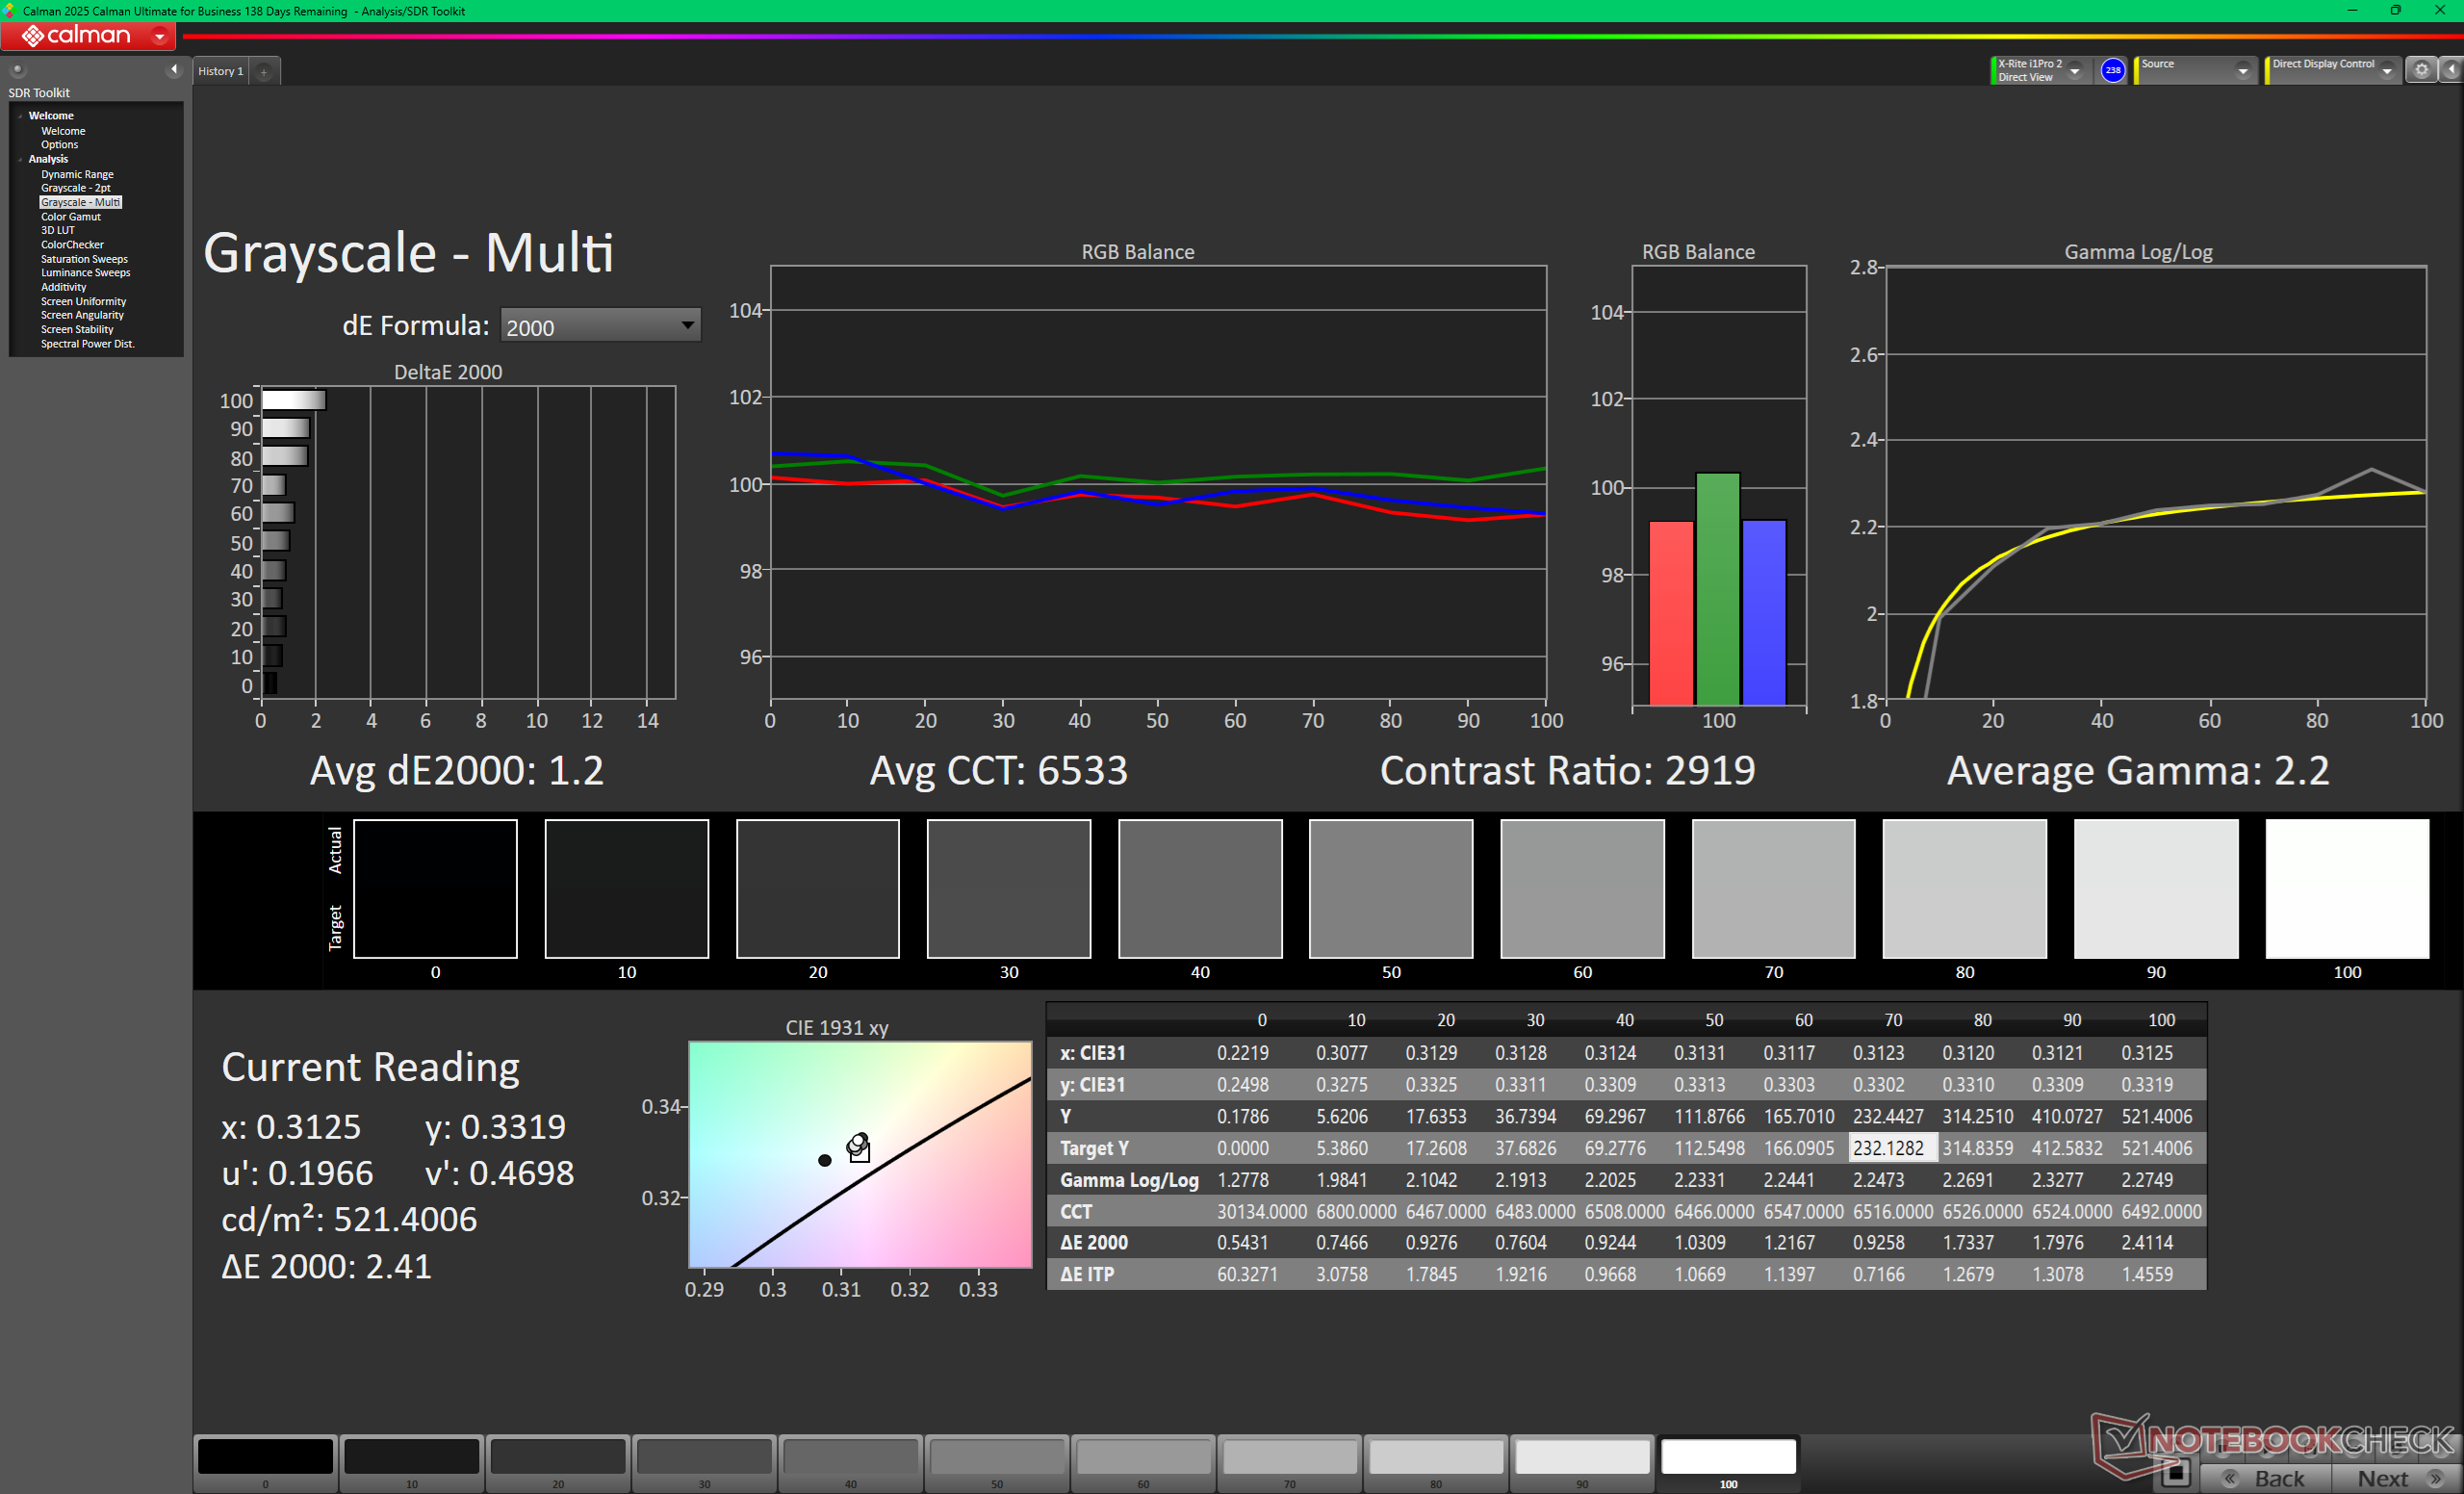
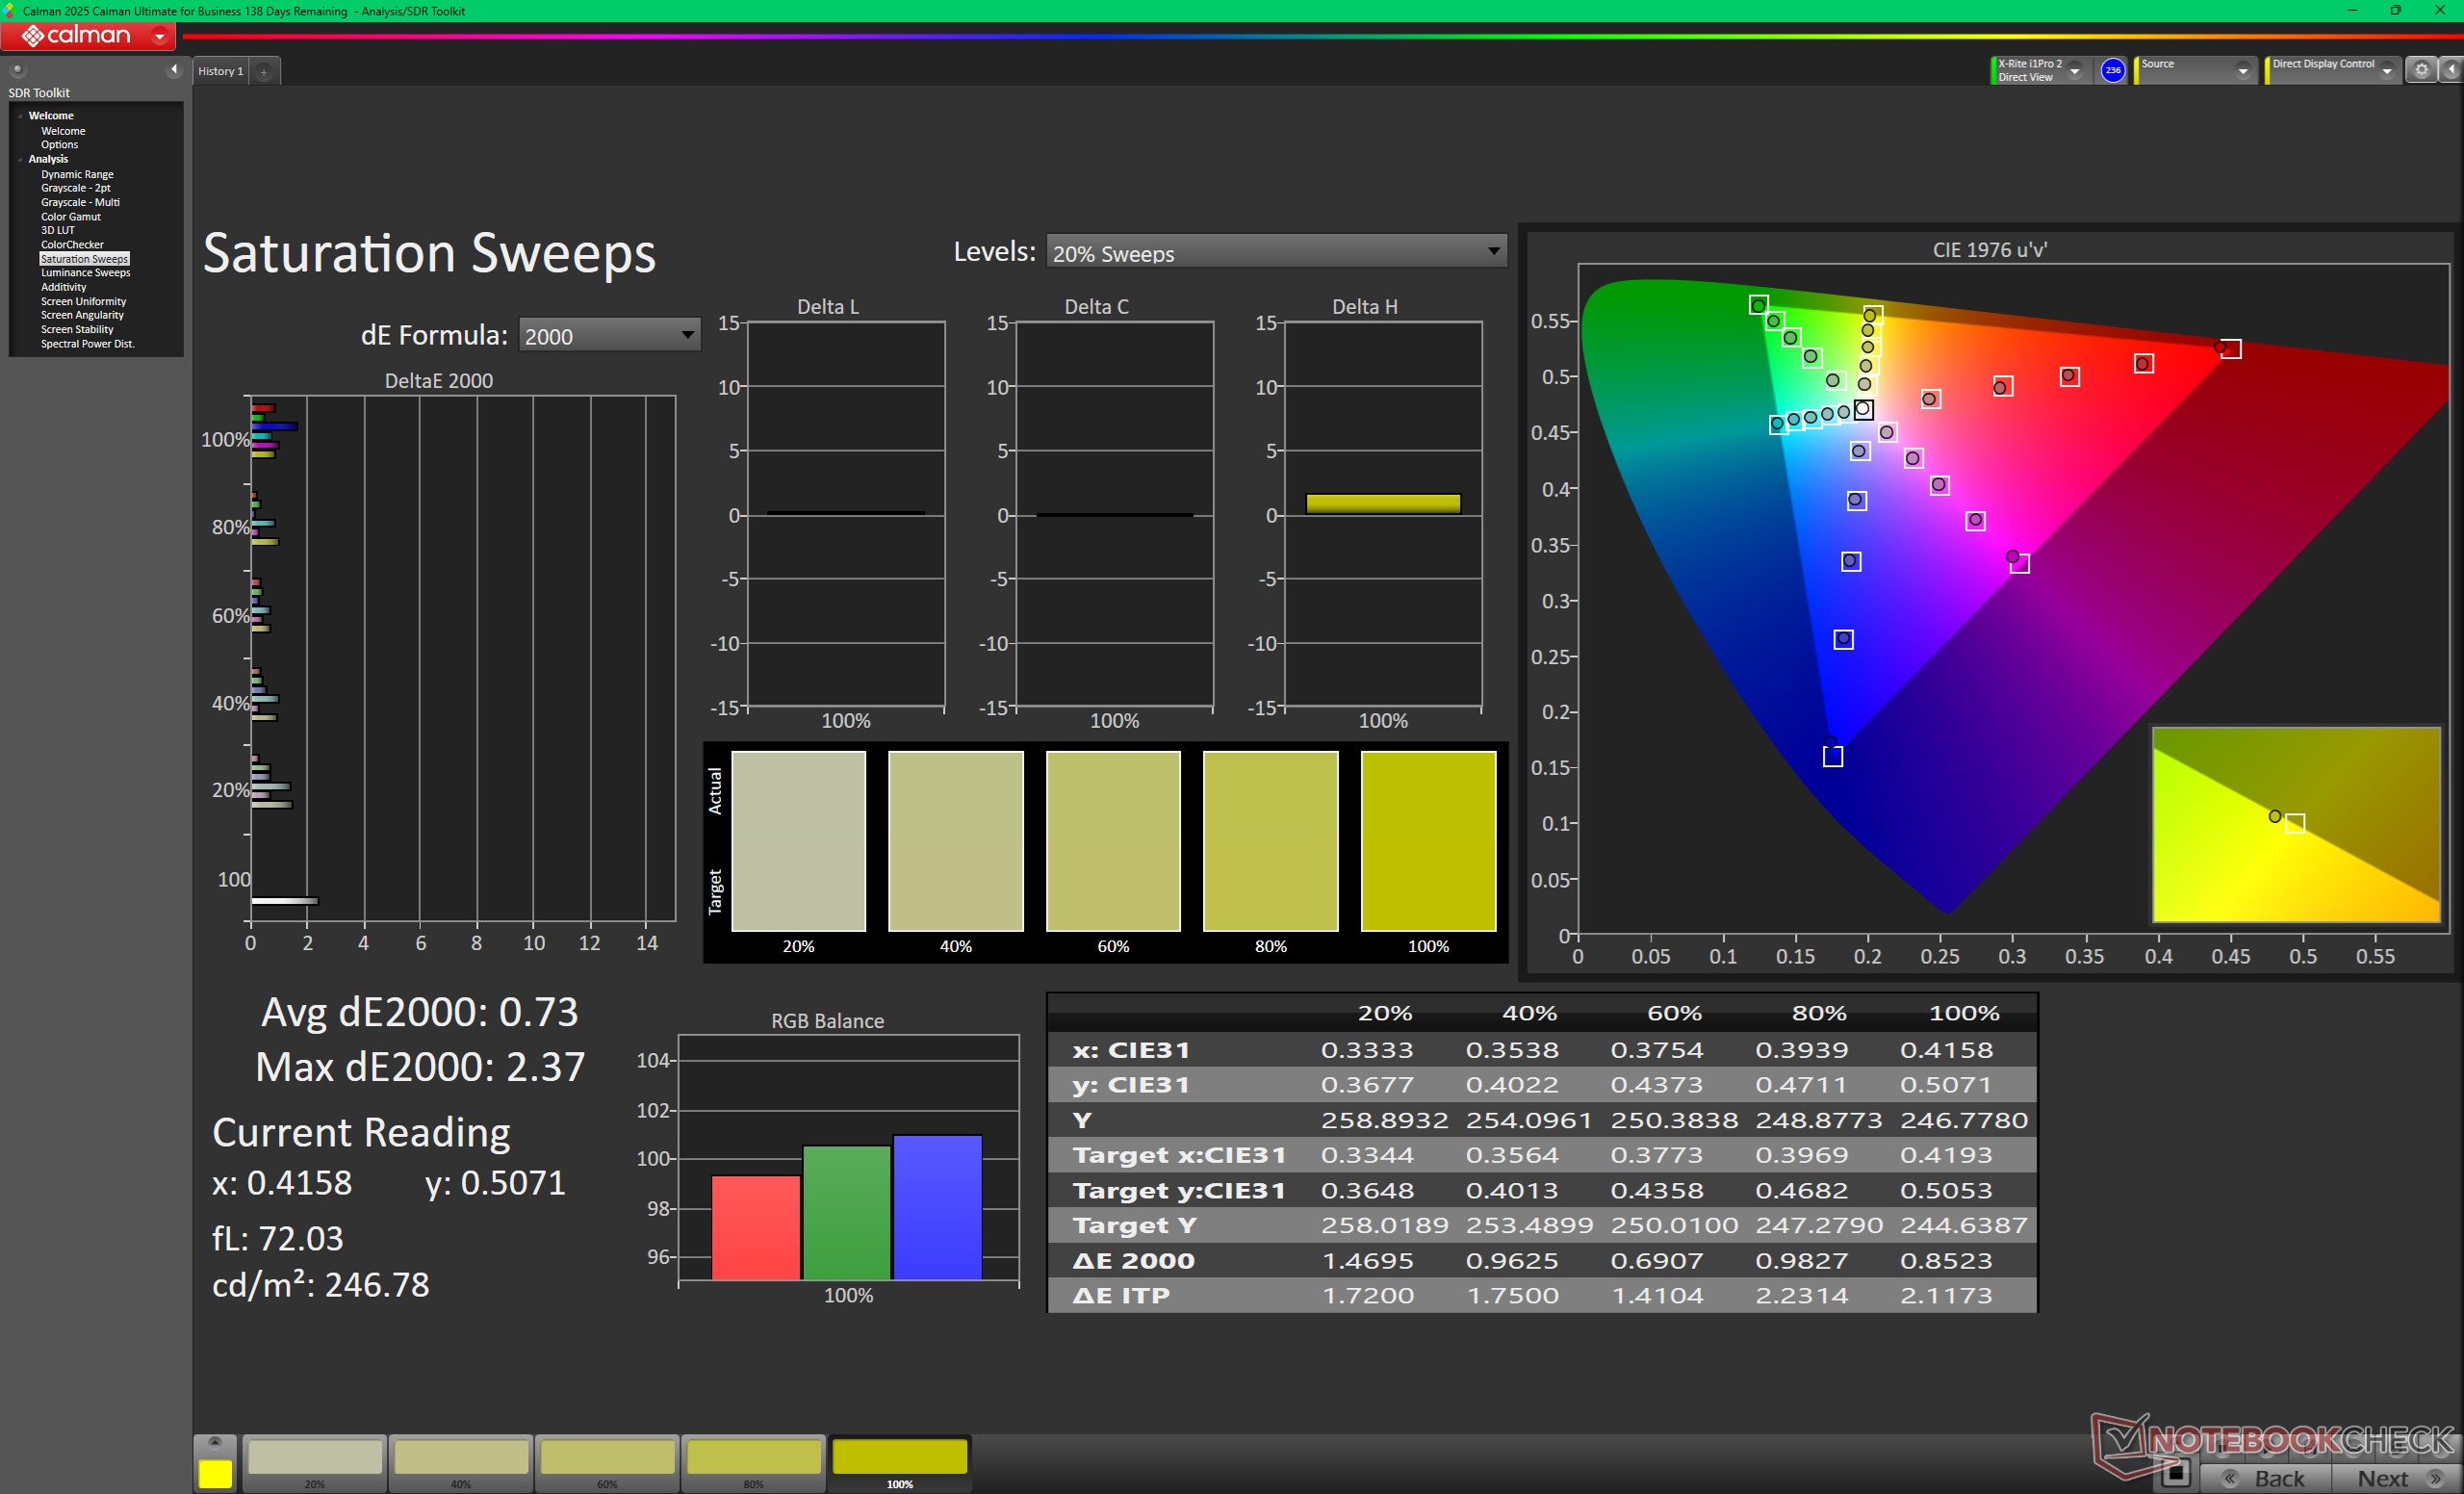
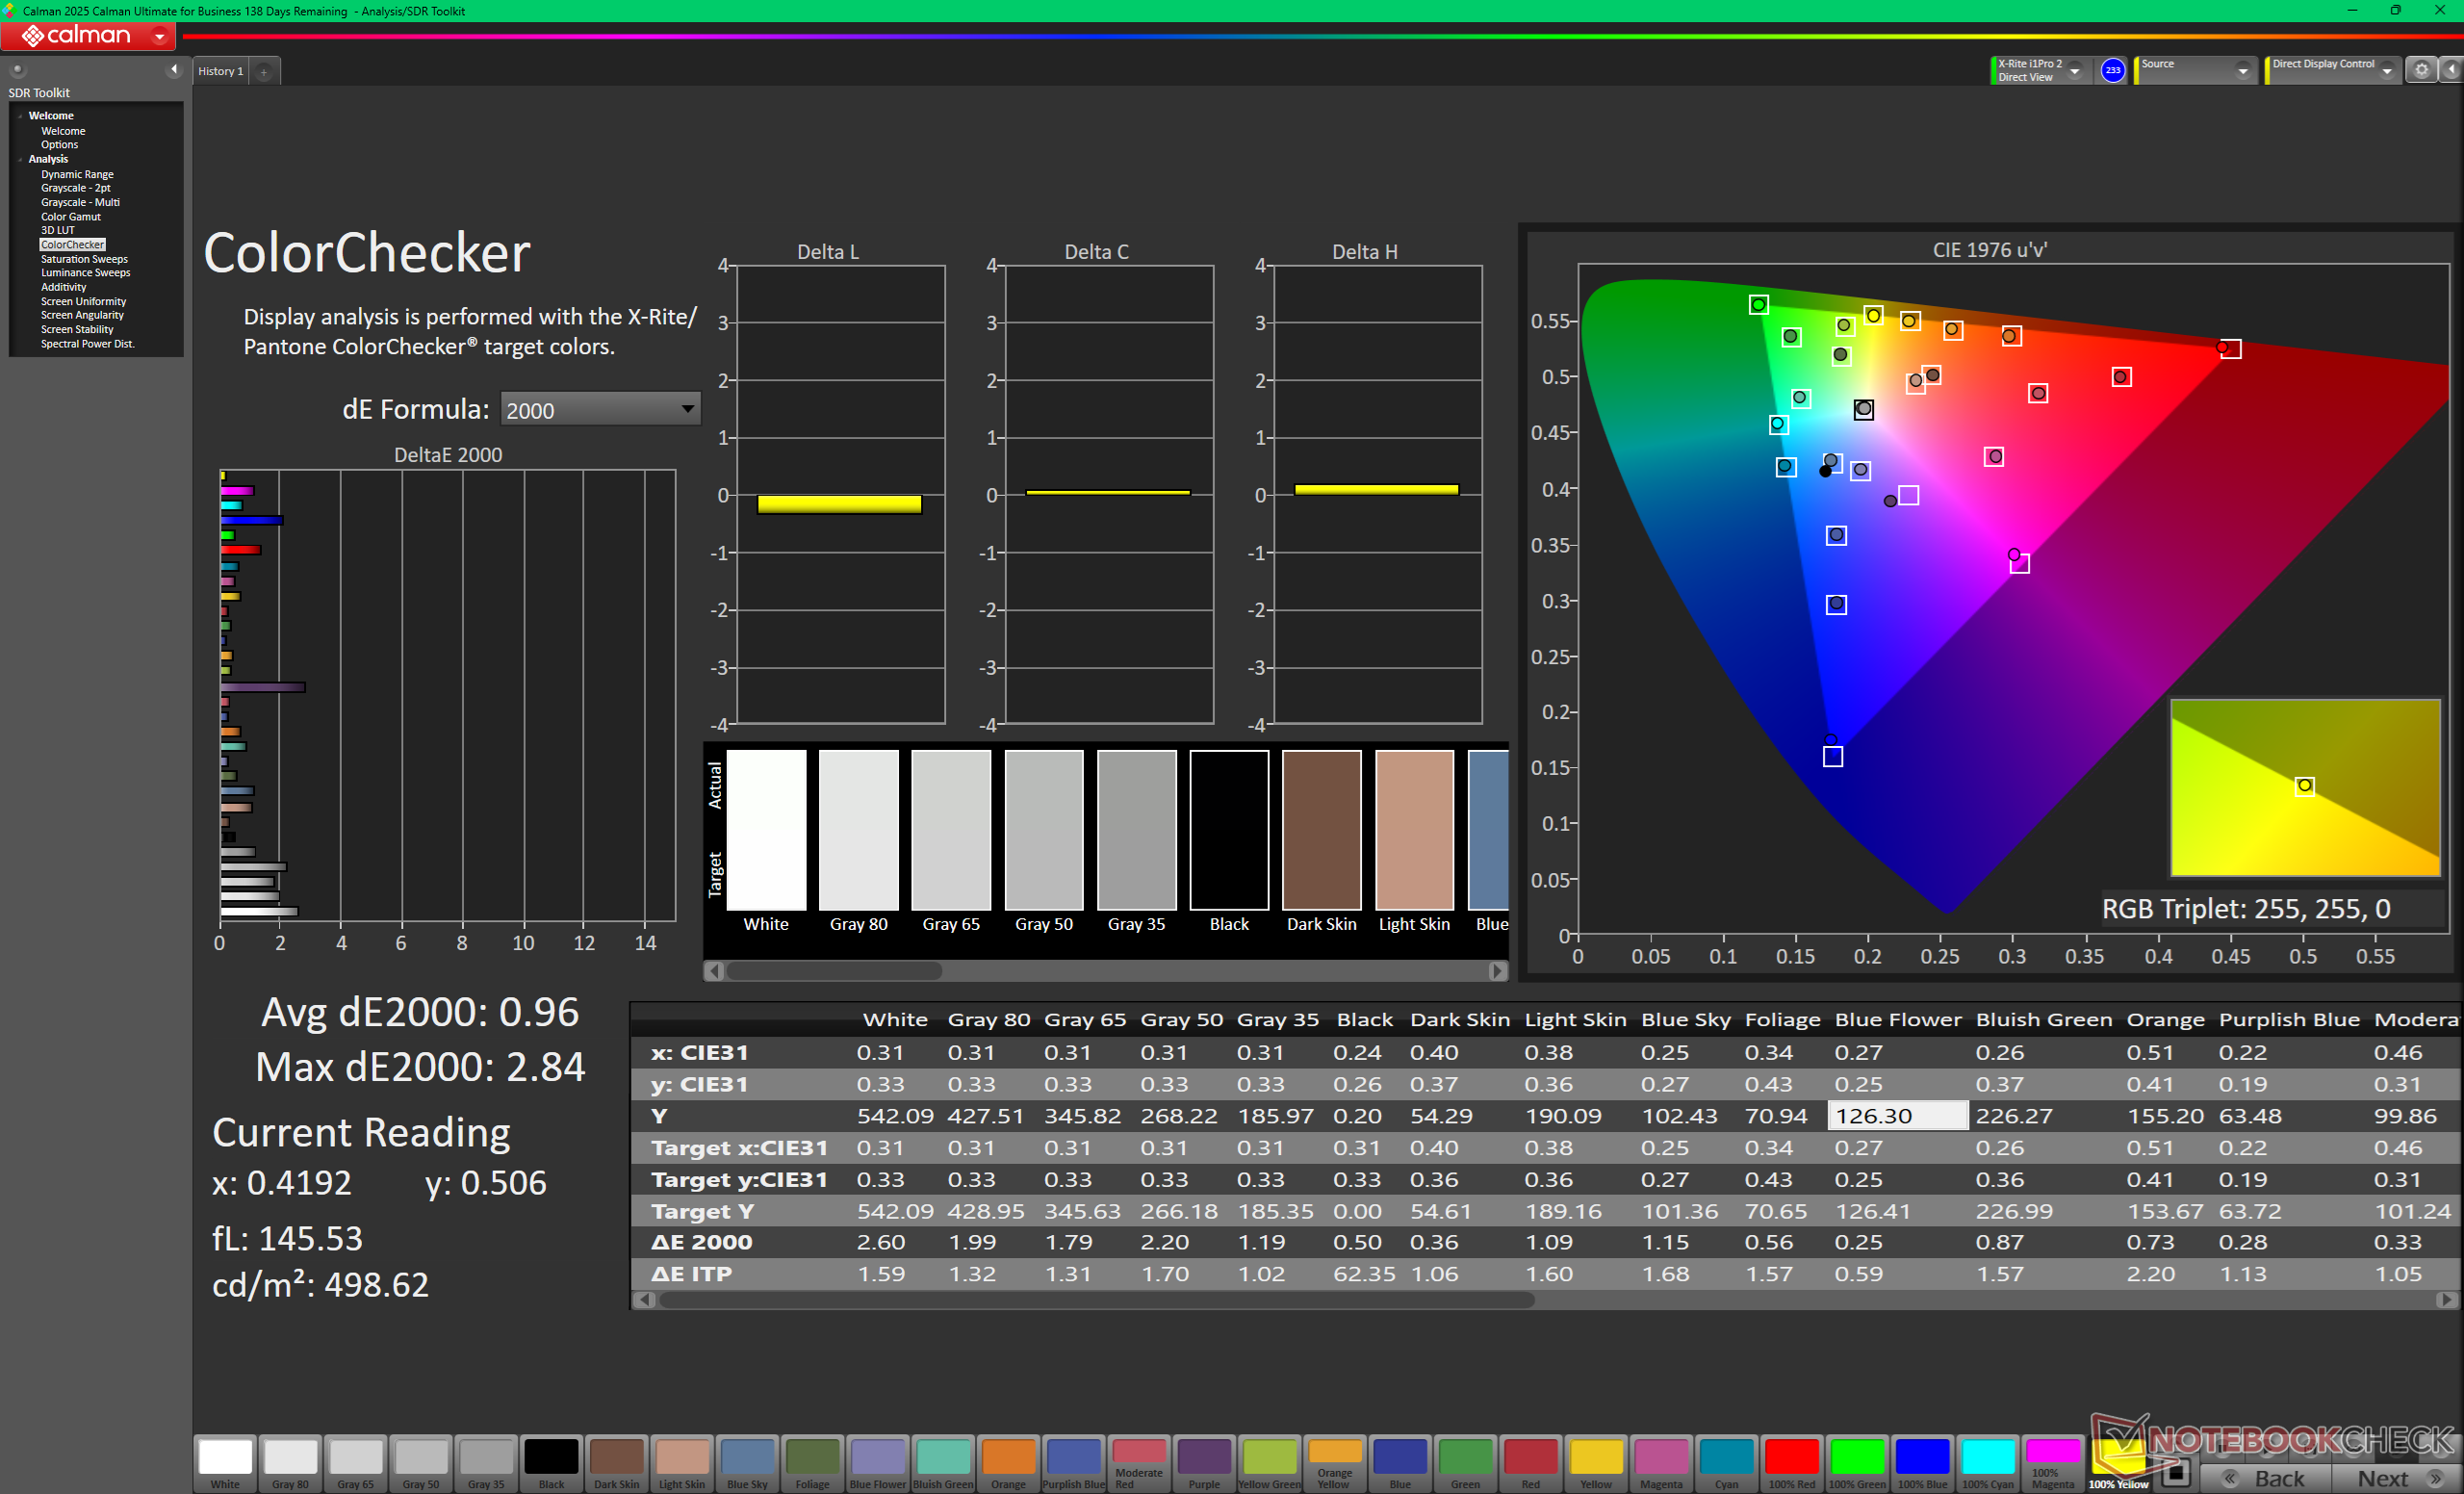
Reaktionszeiten (Response Times) des Displays
| ↔ Reaktionszeiten Schwarz zu Weiß | ||
|---|---|---|
| 31.3 ms ... steigend ↗ und fallend ↘ kombiniert | ↗ 13 ms steigend | 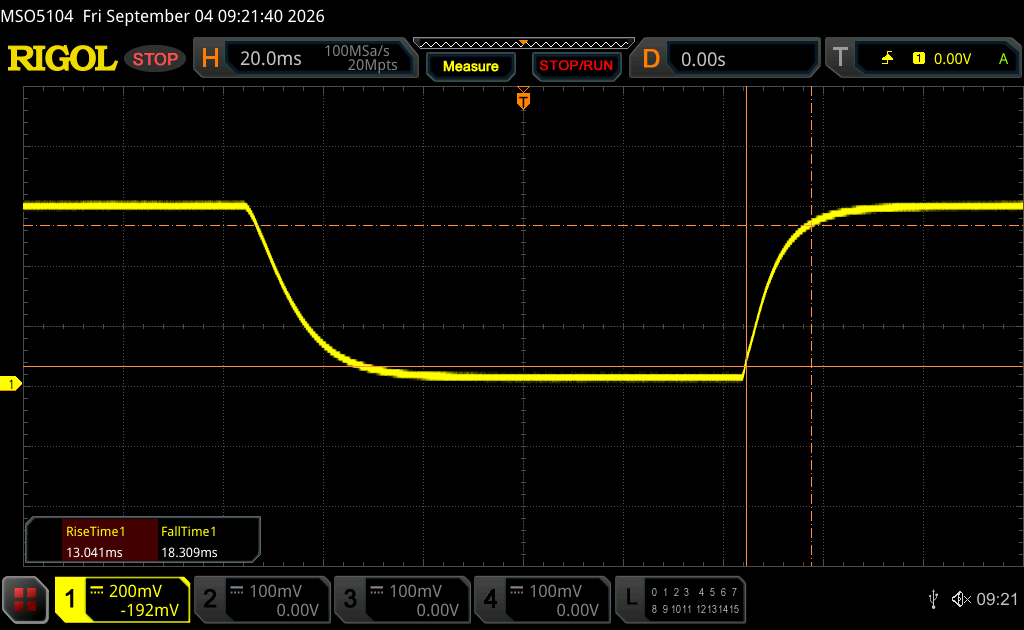 |
| ↘ 18.3 ms fallend | ||
| Die gemessenen Reaktionszeiten sind langsam und dadurch für viele Spieler wahrscheinlich zu langsam. Im Vergleich rangierten die bei uns getesteten Geräte von 0.1 (Minimum) zu 240 (Maximum) ms. » 85 % aller Screens waren schneller als der getestete. Daher sind die gemessenen Reaktionszeiten schlechter als der Durchschnitt aller vermessenen Geräte (19.6 ms). | ||
| ↔ Reaktionszeiten 50% Grau zu 80% Grau | ||
| 43.8 ms ... steigend ↗ und fallend ↘ kombiniert | ↗ 20.4 ms steigend | 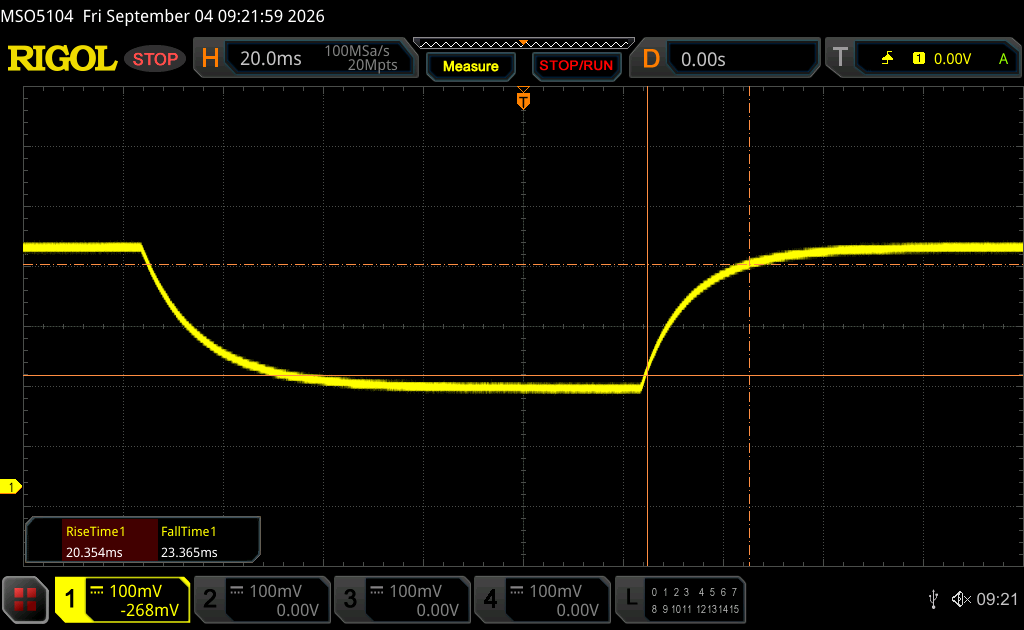 |
| ↘ 23.4 ms fallend | ||
| Die gemessenen Reaktionszeiten sind langsam und dadurch für viele Spieler wahrscheinlich zu langsam. Im Vergleich rangierten die bei uns getesteten Geräte von 0.13 (Minimum) zu 636 (Maximum) ms. » 74 % aller Screens waren schneller als der getestete. Daher sind die gemessenen Reaktionszeiten schlechter als der Durchschnitt aller vermessenen Geräte (30.7 ms). | ||
Bildschirm-Flackern / PWM (Pulse-Width Modulation)
| Flackern / PWM nicht festgestellt | 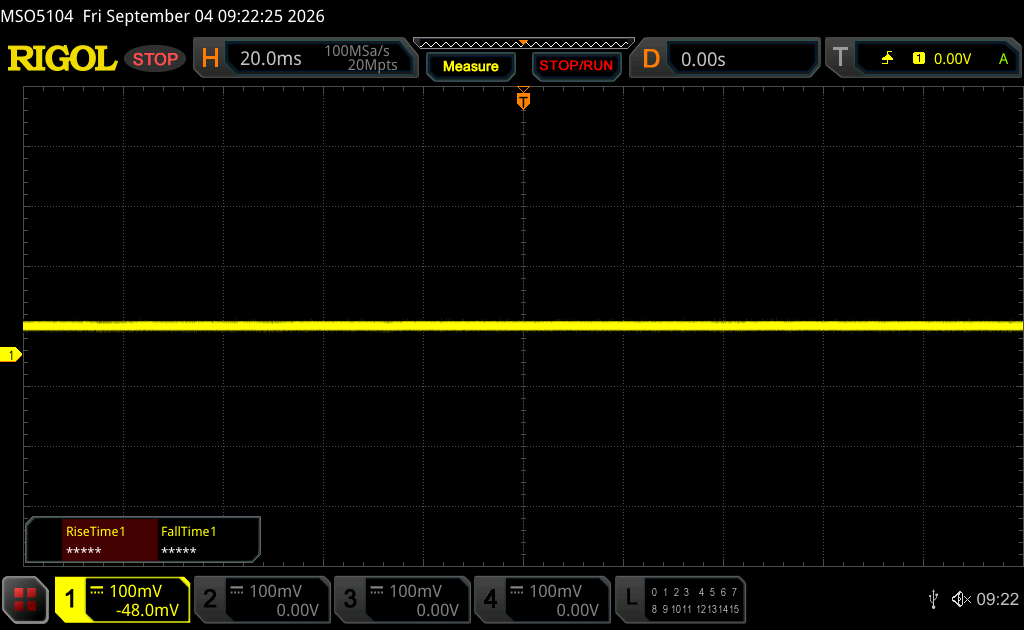 | ||
Im Vergleich: 52 % aller getesteten Geräte nutzten kein PWM um die Helligkeit zu reduzieren. Wenn PWM eingesetzt wurde, dann bei einer Frequenz von durchschnittlich 7572 (Minimum 5, Maximum 343500) Hz. | |||
Leistung
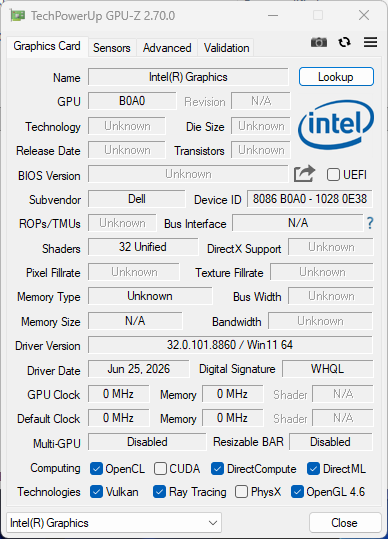
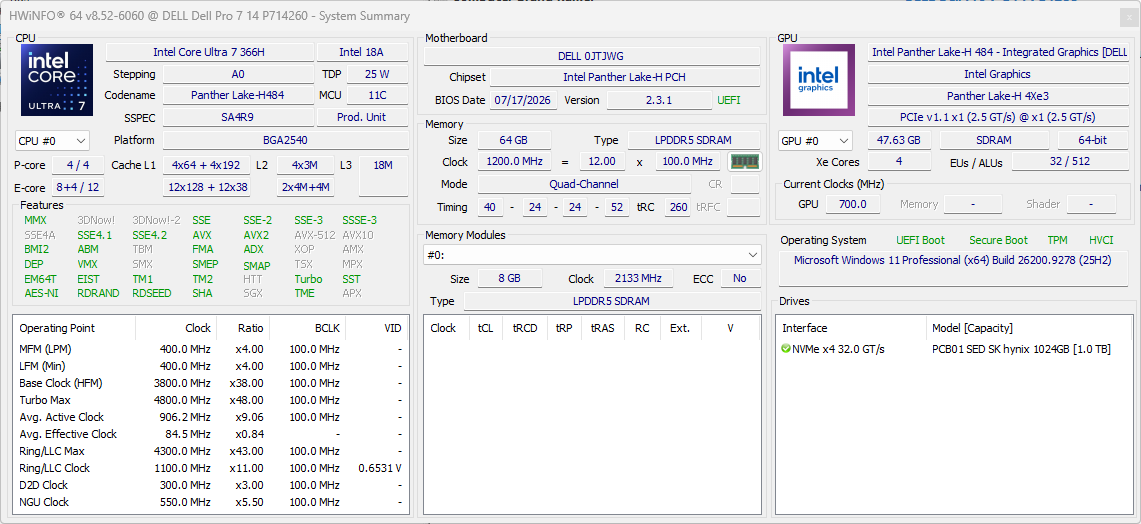
Testbedingungen
Wir haben Windows und den Dell Optimizer vor der Durchführung der folgenden Benchmarks in den Leistungsmodus versetzt.
Prozessorleistung
Cinebench R15 Multi Loop
Cinebench 2026: CPU Multi | CPU Single Thread
Cinebench R23: Multi Core | Single Core
Cinebench R20: CPU (Multi Core) | CPU (Single Core)
Cinebench R15: CPU Multi 64Bit | CPU Single 64Bit
Blender: v2.79 BMW27 CPU
7-Zip 18.03: 7z b 4 | 7z b 4 -mmt1
Geekbench 6.7: Multi-Core | Single-Core
Geekbench 5.5: Multi-Core | Single-Core
HWBOT x265 Benchmark v2.2: 4k Preset
LibreOffice : 20 Documents To PDF
R Benchmark 2.5: Overall mean
| CPU Performance Rating | |
| Asus ExpertBook Ultra B9406CAA | |
| Dell Pro 7 14 P714265 | |
| Durchschnittliche Intel Core Ultra 7 366H | |
| Dell Pro 7 14 P714260 | |
| Asus ZenBook S14 UX5406AA -2! | |
| HP EliteBook 8 G2a 14 -4! | |
| Lenovo ThinkPad T14s Gen 7 21YW0022GE -2! | |
| Dell 14S DS14260 | |
| Lenovo ThinkPad T14 Gen 6 21QG001VGE -2! | |
| Lenovo ThinkBook 14 G9 IPL 21UX005PGE -2! | |
| Acer TravelMate P6 TMP614-54-TCO-553Z -2! | |
| Cinebench 2026 / CPU Multi | |
| Asus ExpertBook Ultra B9406CAA | |
| Dell Pro 7 14 P714265 | |
| Durchschnittliche Intel Core Ultra 7 366H (3785 - 4305, n=3) | |
| Dell Pro 7 14 P714260 | |
| Dell 14S DS14260 | |
| Cinebench 2026 / CPU Single Thread | |
| Dell Pro 7 14 P714260 | |
| Durchschnittliche Intel Core Ultra 7 366H (506 - 510, n=3) | |
| Asus ExpertBook Ultra B9406CAA | |
| Dell Pro 7 14 P714265 | |
| Dell 14S DS14260 | |
| Cinebench R20 / CPU (Multi Core) | |
| Asus ExpertBook Ultra B9406CAA | |
| Dell Pro 7 14 P714265 | |
| Asus ZenBook S14 UX5406AA | |
| Durchschnittliche Intel Core Ultra 7 366H (6517 - 7804, n=5) | |
| Dell Pro 7 14 P714260 | |
| Lenovo ThinkPad T14s Gen 7 21YW0022GE | |
| HP EliteBook 8 G2a 14 | |
| Dell 14S DS14260 | |
| Lenovo ThinkPad T14 Gen 6 21QG001VGE | |
| Lenovo ThinkBook 14 G9 IPL 21UX005PGE | |
| Acer TravelMate P6 TMP614-54-TCO-553Z | |
| Cinebench R20 / CPU (Single Core) | |
| Dell Pro 7 14 P714265 | |
| Lenovo ThinkPad T14s Gen 7 21YW0022GE | |
| HP EliteBook 8 G2a 14 | |
| Asus ZenBook S14 UX5406AA | |
| Dell Pro 7 14 P714260 | |
| Asus ExpertBook Ultra B9406CAA | |
| Durchschnittliche Intel Core Ultra 7 366H (760 - 791, n=5) | |
| Dell 14S DS14260 | |
| Lenovo ThinkPad T14 Gen 6 21QG001VGE | |
| Lenovo ThinkBook 14 G9 IPL 21UX005PGE | |
| Acer TravelMate P6 TMP614-54-TCO-553Z | |
| Cinebench R15 / CPU Multi 64Bit | |
| Dell Pro 7 14 P714265 | |
| Asus ExpertBook Ultra B9406CAA | |
| Asus ZenBook S14 UX5406AA | |
| Durchschnittliche Intel Core Ultra 7 366H (2793 - 3222, n=5) | |
| Dell Pro 7 14 P714260 | |
| Lenovo ThinkPad T14s Gen 7 21YW0022GE | |
| HP EliteBook 8 G2a 14 | |
| Dell 14S DS14260 | |
| Lenovo ThinkPad T14 Gen 6 21QG001VGE | |
| Lenovo ThinkBook 14 G9 IPL 21UX005PGE | |
| Acer TravelMate P6 TMP614-54-TCO-553Z | |
| Cinebench R15 / CPU Single 64Bit | |
| Dell Pro 7 14 P714265 | |
| Asus ExpertBook Ultra B9406CAA | |
| Dell Pro 7 14 P714260 | |
| Asus ZenBook S14 UX5406AA | |
| Durchschnittliche Intel Core Ultra 7 366H (291 - 305, n=5) | |
| Dell 14S DS14260 | |
| Lenovo ThinkPad T14 Gen 6 21QG001VGE | |
| Lenovo ThinkBook 14 G9 IPL 21UX005PGE | |
| Acer TravelMate P6 TMP614-54-TCO-553Z | |
| HP EliteBook 8 G2a 14 | |
| Lenovo ThinkPad T14s Gen 7 21YW0022GE | |
| Geekbench 5.5 / Multi-Core | |
| Asus ExpertBook Ultra B9406CAA | |
| Asus ZenBook S14 UX5406AA | |
| Durchschnittliche Intel Core Ultra 7 366H (15891 - 16949, n=4) | |
| Dell Pro 7 14 P714260 | |
| Dell Pro 7 14 P714265 | |
| Lenovo ThinkPad T14s Gen 7 21YW0022GE | |
| Dell 14S DS14260 | |
| Lenovo ThinkPad T14 Gen 6 21QG001VGE | |
| Lenovo ThinkBook 14 G9 IPL 21UX005PGE | |
| Acer TravelMate P6 TMP614-54-TCO-553Z | |
| Geekbench 5.5 / Single-Core | |
| Lenovo ThinkPad T14s Gen 7 21YW0022GE | |
| Dell Pro 7 14 P714265 | |
| Dell Pro 7 14 P714260 | |
| Asus ExpertBook Ultra B9406CAA | |
| Asus ZenBook S14 UX5406AA | |
| Durchschnittliche Intel Core Ultra 7 366H (2085 - 2125, n=4) | |
| Lenovo ThinkPad T14 Gen 6 21QG001VGE | |
| Dell 14S DS14260 | |
| Lenovo ThinkBook 14 G9 IPL 21UX005PGE | |
| Acer TravelMate P6 TMP614-54-TCO-553Z | |
| HWBOT x265 Benchmark v2.2 / 4k Preset | |
| Asus ExpertBook Ultra B9406CAA | |
| Dell Pro 7 14 P714265 | |
| Asus ZenBook S14 UX5406AA | |
| HP EliteBook 8 G2a 14 | |
| Durchschnittliche Intel Core Ultra 7 366H (19.2 - 24.6, n=5) | |
| Lenovo ThinkPad T14s Gen 7 21YW0022GE | |
| Dell Pro 7 14 P714260 | |
| Dell 14S DS14260 | |
| Lenovo ThinkPad T14 Gen 6 21QG001VGE | |
| Lenovo ThinkBook 14 G9 IPL 21UX005PGE | |
| Acer TravelMate P6 TMP614-54-TCO-553Z | |
| LibreOffice / 20 Documents To PDF | |
| Acer TravelMate P6 TMP614-54-TCO-553Z | |
| Dell Pro 7 14 P714265 | |
| Lenovo ThinkPad T14s Gen 7 21YW0022GE | |
| Asus ExpertBook Ultra B9406CAA | |
| Asus ZenBook S14 UX5406AA | |
| Lenovo ThinkPad T14 Gen 6 21QG001VGE | |
| Durchschnittliche Intel Core Ultra 7 366H (40.3 - 52.7, n=5) | |
| HP EliteBook 8 G2a 14 | |
| Dell 14S DS14260 | |
| Dell Pro 7 14 P714260 | |
| Lenovo ThinkBook 14 G9 IPL 21UX005PGE | |
* ... kleinere Werte sind besser
AIDA64: FP32 Ray-Trace | FPU Julia | CPU SHA3 | CPU Queen | FPU SinJulia | FPU Mandel | CPU AES | CPU ZLib | FP64 Ray-Trace | CPU PhotoWorxx | CPU CheckMate
| Performance Rating | |
| Dell Pro 7 14 P714265 -1! | |
| Lenovo ThinkPad T14s Gen 7 21YW0022GE -1! | |
| HP EliteBook 8 G2a 14 -1! | |
| Durchschnittliche Intel Core Ultra 7 366H -1! | |
| Dell Pro 7 14 P714260 -1! | |
| Asus ExpertBook Ultra B9406CAA -1! | |
| Acer TravelMate P6 TMP614-54-TCO-553Z -1! | |
| AIDA64 / FP32 Ray-Trace | |
| Dell Pro 7 14 P714265 (v8.20.8100) | |
| HP EliteBook 8 G2a 14 (v8.20.8100) | |
| Lenovo ThinkPad T14s Gen 7 21YW0022GE (v8.20.8100) | |
| Durchschnittliche Intel Core Ultra 7 366H (14248 - 20583, n=5) | |
| Dell Pro 7 14 P714260 (v8.20.8100) | |
| Acer TravelMate P6 TMP614-54-TCO-553Z (v6.92.6600) | |
| Asus ExpertBook Ultra B9406CAA (v6.92.6600) | |
| AIDA64 / FPU Julia | |
| Dell Pro 7 14 P714265 (v8.20.8100) | |
| HP EliteBook 8 G2a 14 (v8.20.8100) | |
| Lenovo ThinkPad T14s Gen 7 21YW0022GE (v8.20.8100) | |
| Durchschnittliche Intel Core Ultra 7 366H (75534 - 107380, n=5) | |
| Dell Pro 7 14 P714260 (v8.20.8100) | |
| Acer TravelMate P6 TMP614-54-TCO-553Z (v6.92.6600) | |
| Asus ExpertBook Ultra B9406CAA (v6.92.6600) | |
| AIDA64 / CPU SHA3 | |
| Dell Pro 7 14 P714265 (v8.20.8100) | |
| Asus ExpertBook Ultra B9406CAA (v6.92.6600) | |
| Durchschnittliche Intel Core Ultra 7 366H (3837 - 5249, n=5) | |
| Lenovo ThinkPad T14s Gen 7 21YW0022GE (v8.20.8100) | |
| Dell Pro 7 14 P714260 (v8.20.8100) | |
| HP EliteBook 8 G2a 14 (v8.20.8100) | |
| Acer TravelMate P6 TMP614-54-TCO-553Z (v6.92.6600) | |
| AIDA64 / CPU Queen | |
| Asus ExpertBook Ultra B9406CAA (v6.92.6600) | |
| Acer TravelMate P6 TMP614-54-TCO-553Z (v6.92.6600) | |
| AIDA64 / FPU SinJulia | |
| Dell Pro 7 14 P714265 (v8.20.8100) | |
| Lenovo ThinkPad T14s Gen 7 21YW0022GE (v8.20.8100) | |
| HP EliteBook 8 G2a 14 (v8.20.8100) | |
| Dell Pro 7 14 P714260 (v8.20.8100) | |
| Durchschnittliche Intel Core Ultra 7 366H (6482 - 7136, n=5) | |
| Asus ExpertBook Ultra B9406CAA (v6.92.6600) | |
| Acer TravelMate P6 TMP614-54-TCO-553Z (v6.92.6600) | |
| AIDA64 / FPU Mandel | |
| Dell Pro 7 14 P714265 (v8.20.8100) | |
| Lenovo ThinkPad T14s Gen 7 21YW0022GE (v8.20.8100) | |
| HP EliteBook 8 G2a 14 (v8.20.8100) | |
| Durchschnittliche Intel Core Ultra 7 366H (40198 - 57706, n=5) | |
| Dell Pro 7 14 P714260 (v8.20.8100) | |
| Acer TravelMate P6 TMP614-54-TCO-553Z (v6.92.6600) | |
| Asus ExpertBook Ultra B9406CAA (v6.92.6600) | |
| AIDA64 / CPU AES | |
| Dell Pro 7 14 P714265 (v8.20.8100) | |
| Lenovo ThinkPad T14s Gen 7 21YW0022GE (v8.20.8100) | |
| HP EliteBook 8 G2a 14 (v8.20.8100) | |
| Durchschnittliche Intel Core Ultra 7 366H (57542 - 68072, n=5) | |
| Dell Pro 7 14 P714260 (v8.20.8100) | |
| Acer TravelMate P6 TMP614-54-TCO-553Z (v6.92.6600) | |
| Asus ExpertBook Ultra B9406CAA (v6.92.6600) | |
| AIDA64 / CPU ZLib | |
| Dell Pro 7 14 P714265 (v8.20.8100) | |
| Asus ExpertBook Ultra B9406CAA (v6.92.6600) | |
| Durchschnittliche Intel Core Ultra 7 366H (921 - 1219, n=5) | |
| HP EliteBook 8 G2a 14 (v8.20.8100) | |
| Lenovo ThinkPad T14s Gen 7 21YW0022GE (v8.20.8100) | |
| Dell Pro 7 14 P714260 (v8.20.8100) | |
| Acer TravelMate P6 TMP614-54-TCO-553Z (v6.92.6600) | |
| AIDA64 / FP64 Ray-Trace | |
| Dell Pro 7 14 P714265 (v8.20.8100) | |
| HP EliteBook 8 G2a 14 (v8.20.8100) | |
| Lenovo ThinkPad T14s Gen 7 21YW0022GE (v8.20.8100) | |
| Durchschnittliche Intel Core Ultra 7 366H (7395 - 11027, n=5) | |
| Dell Pro 7 14 P714260 (v8.20.8100) | |
| Acer TravelMate P6 TMP614-54-TCO-553Z (v6.92.6600) | |
| Asus ExpertBook Ultra B9406CAA (v6.92.6600) | |
| AIDA64 / CPU PhotoWorxx | |
| Dell Pro 7 14 P714260 (v8.20.8100) | |
| Durchschnittliche Intel Core Ultra 7 366H (74842 - 83297, n=5) | |
| Acer TravelMate P6 TMP614-54-TCO-553Z (v6.92.6600) | |
| Dell Pro 7 14 P714265 (v8.20.8100) | |
| HP EliteBook 8 G2a 14 (v8.20.8100) | |
| Lenovo ThinkPad T14s Gen 7 21YW0022GE (v8.20.8100) | |
| Asus ExpertBook Ultra B9406CAA (v6.92.6600) | |
| AIDA64 / CPU CheckMate | |
| Dell Pro 7 14 P714265 (v8.20.8100) | |
| Lenovo ThinkPad T14s Gen 7 21YW0022GE (v8.20.8100) | |
| HP EliteBook 8 G2a 14 (v8.20.8100) | |
| Durchschnittliche Intel Core Ultra 7 366H (4202 - 4591, n=5) | |
| Dell Pro 7 14 P714260 (v8.20.8100) | |
Systemleistung
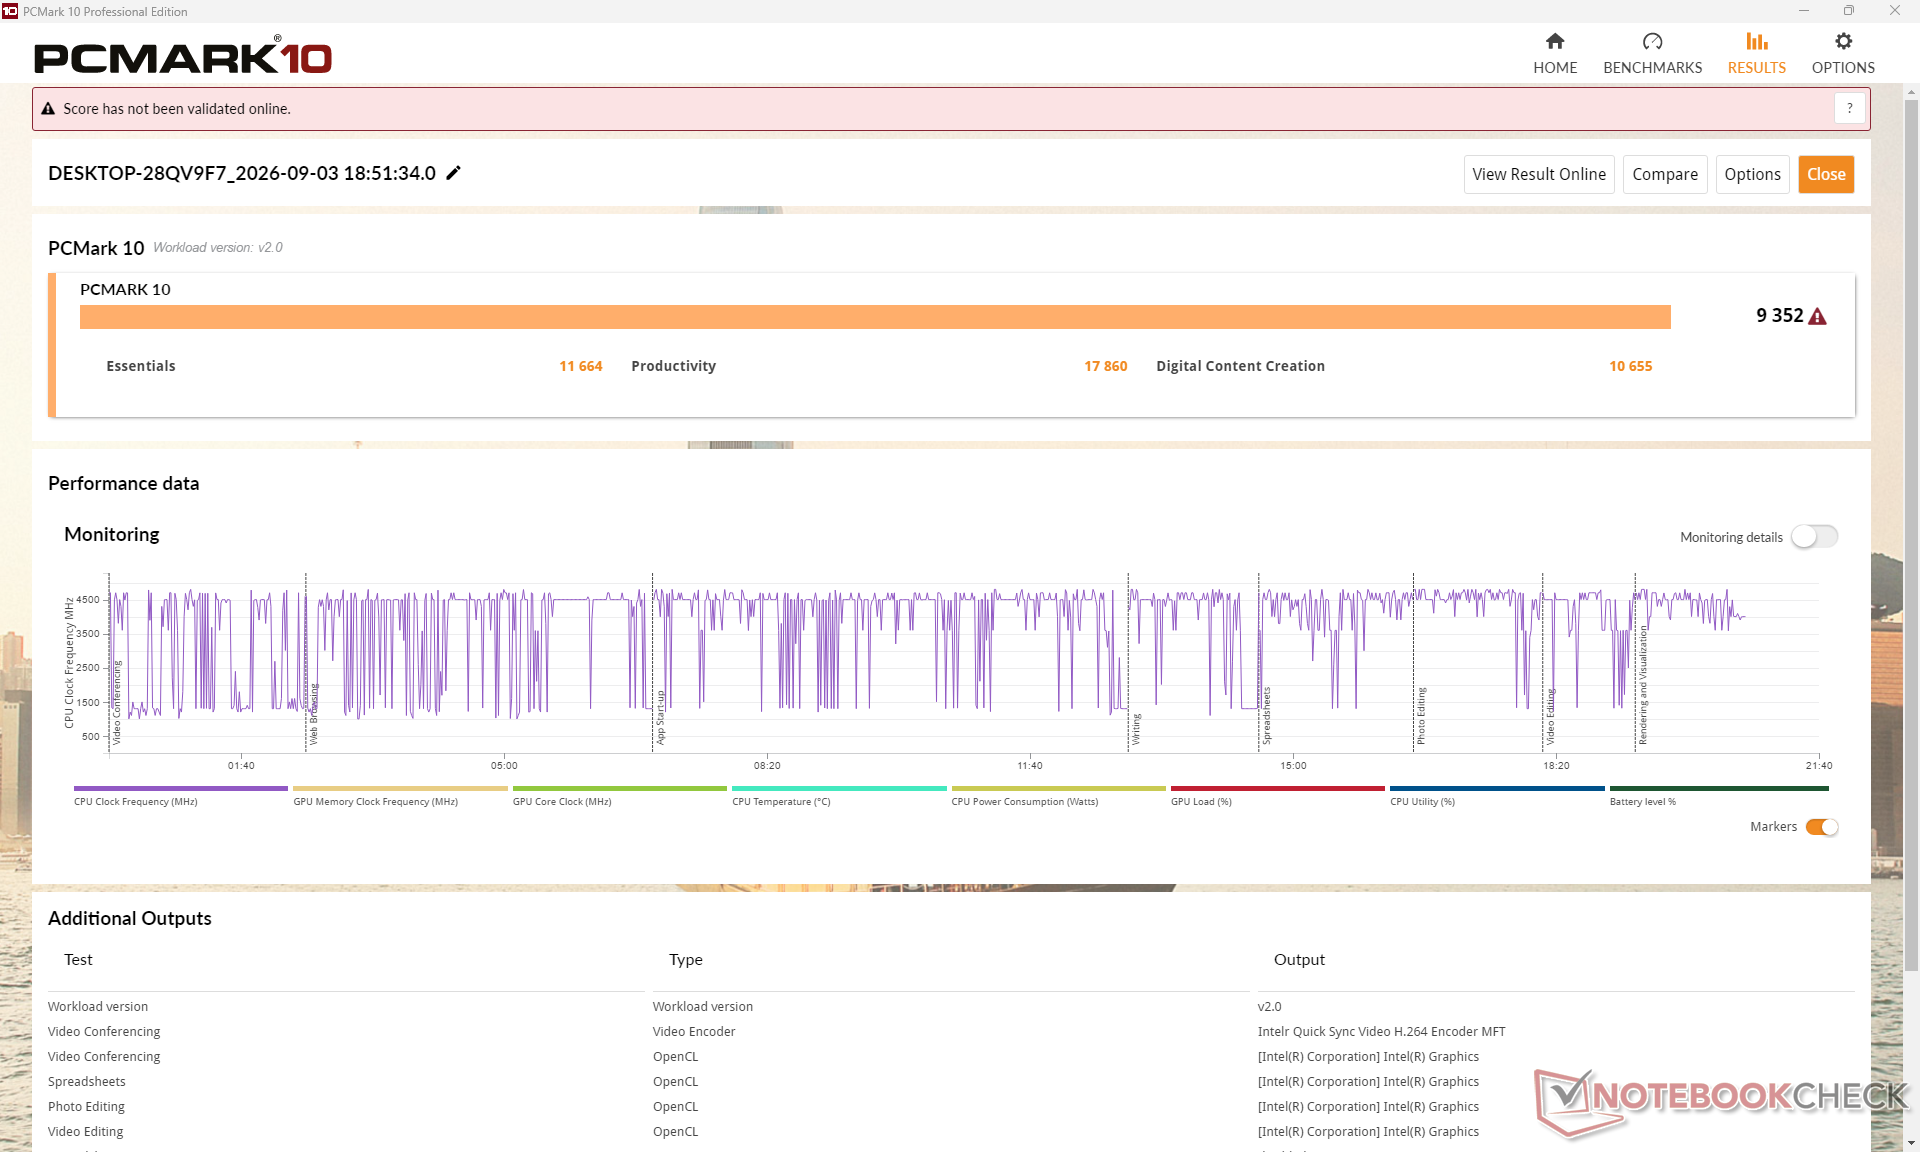
PCMark 10: Score | Essentials | Productivity | Digital Content Creation
CrossMark: Overall | Productivity | Creativity | Responsiveness
WebXPRT 3: Overall
WebXPRT 4: Overall
Mozilla Kraken 1.1: Total
Geekbench AI: Single Precision GPU 1.7 | Half Precision GPU 1.7 | Quantized GPU 1.7
| Performance Rating | |
| Asus ExpertBook Ultra B9406CAA | |
| Dell Pro 7 14 P714260 | |
| Durchschnittliche Intel Core Ultra 7 366H, Intel Graphics 4 Xe3 Panther Lake iGPU | |
| Dell Pro 7 14 P714265 | |
| Lenovo ThinkPad T14s Gen 7 21YW0022GE | |
| HP EliteBook 8 G2a 14 | |
| Acer TravelMate P6 TMP614-54-TCO-553Z | |
| PCMark 10 / Score | |
| Dell Pro 7 14 P714260 | |
| Asus ExpertBook Ultra B9406CAA | |
| Durchschnittliche Intel Core Ultra 7 366H, Intel Graphics 4 Xe3 Panther Lake iGPU (8600 - 9352, n=4) | |
| Dell Pro 7 14 P714265 | |
| Lenovo ThinkPad T14s Gen 7 21YW0022GE | |
| HP EliteBook 8 G2a 14 | |
| Acer TravelMate P6 TMP614-54-TCO-553Z | |
| PCMark 10 / Essentials | |
| Dell Pro 7 14 P714260 | |
| Durchschnittliche Intel Core Ultra 7 366H, Intel Graphics 4 Xe3 Panther Lake iGPU (10985 - 11664, n=4) | |
| Lenovo ThinkPad T14s Gen 7 21YW0022GE | |
| Asus ExpertBook Ultra B9406CAA | |
| Dell Pro 7 14 P714265 | |
| Acer TravelMate P6 TMP614-54-TCO-553Z | |
| HP EliteBook 8 G2a 14 | |
| PCMark 10 / Productivity | |
| Dell Pro 7 14 P714260 | |
| Durchschnittliche Intel Core Ultra 7 366H, Intel Graphics 4 Xe3 Panther Lake iGPU (14812 - 17860, n=4) | |
| Dell Pro 7 14 P714265 | |
| Asus ExpertBook Ultra B9406CAA | |
| Lenovo ThinkPad T14s Gen 7 21YW0022GE | |
| HP EliteBook 8 G2a 14 | |
| Acer TravelMate P6 TMP614-54-TCO-553Z | |
| PCMark 10 / Digital Content Creation | |
| Asus ExpertBook Ultra B9406CAA | |
| Dell Pro 7 14 P714260 | |
| Durchschnittliche Intel Core Ultra 7 366H, Intel Graphics 4 Xe3 Panther Lake iGPU (10339 - 10655, n=4) | |
| Dell Pro 7 14 P714265 | |
| Lenovo ThinkPad T14s Gen 7 21YW0022GE | |
| Acer TravelMate P6 TMP614-54-TCO-553Z | |
| HP EliteBook 8 G2a 14 | |
| CrossMark / Overall | |
| Durchschnittliche Intel Core Ultra 7 366H, Intel Graphics 4 Xe3 Panther Lake iGPU (2152 - 2214, n=4) | |
| Dell Pro 7 14 P714260 | |
| Asus ExpertBook Ultra B9406CAA | |
| HP EliteBook 8 G2a 14 | |
| Lenovo ThinkPad T14s Gen 7 21YW0022GE | |
| Dell Pro 7 14 P714265 | |
| Acer TravelMate P6 TMP614-54-TCO-553Z | |
| CrossMark / Productivity | |
| Durchschnittliche Intel Core Ultra 7 366H, Intel Graphics 4 Xe3 Panther Lake iGPU (1957 - 1988, n=4) | |
| Dell Pro 7 14 P714260 | |
| Lenovo ThinkPad T14s Gen 7 21YW0022GE | |
| HP EliteBook 8 G2a 14 | |
| Asus ExpertBook Ultra B9406CAA | |
| Dell Pro 7 14 P714265 | |
| Acer TravelMate P6 TMP614-54-TCO-553Z | |
| CrossMark / Creativity | |
| Durchschnittliche Intel Core Ultra 7 366H, Intel Graphics 4 Xe3 Panther Lake iGPU (2407 - 2556, n=4) | |
| Dell Pro 7 14 P714260 | |
| Asus ExpertBook Ultra B9406CAA | |
| HP EliteBook 8 G2a 14 | |
| Dell Pro 7 14 P714265 | |
| Lenovo ThinkPad T14s Gen 7 21YW0022GE | |
| Acer TravelMate P6 TMP614-54-TCO-553Z | |
| CrossMark / Responsiveness | |
| Dell Pro 7 14 P714260 | |
| Durchschnittliche Intel Core Ultra 7 366H, Intel Graphics 4 Xe3 Panther Lake iGPU (1864 - 1996, n=4) | |
| Lenovo ThinkPad T14s Gen 7 21YW0022GE | |
| Asus ExpertBook Ultra B9406CAA | |
| HP EliteBook 8 G2a 14 | |
| Dell Pro 7 14 P714265 | |
| Acer TravelMate P6 TMP614-54-TCO-553Z | |
| WebXPRT 3 / Overall | |
| Dell Pro 7 14 P714265 | |
| Dell Pro 7 14 P714260 | |
| HP EliteBook 8 G2a 14 | |
| Lenovo ThinkPad T14s Gen 7 21YW0022GE | |
| Durchschnittliche Intel Core Ultra 7 366H, Intel Graphics 4 Xe3 Panther Lake iGPU (318 - 334, n=4) | |
| Asus ExpertBook Ultra B9406CAA | |
| Acer TravelMate P6 TMP614-54-TCO-553Z | |
| WebXPRT 4 / Overall | |
| Dell Pro 7 14 P714260 | |
| Durchschnittliche Intel Core Ultra 7 366H, Intel Graphics 4 Xe3 Panther Lake iGPU (302 - 307, n=4) | |
| HP EliteBook 8 G2a 14 | |
| Asus ExpertBook Ultra B9406CAA | |
| Dell Pro 7 14 P714265 | |
| Lenovo ThinkPad T14s Gen 7 21YW0022GE | |
| Acer TravelMate P6 TMP614-54-TCO-553Z | |
| Mozilla Kraken 1.1 / Total | |
| Acer TravelMate P6 TMP614-54-TCO-553Z | |
| Durchschnittliche Intel Core Ultra 7 366H, Intel Graphics 4 Xe3 Panther Lake iGPU (449 - 453, n=4) | |
| Asus ExpertBook Ultra B9406CAA | |
| Dell Pro 7 14 P714260 | |
| Lenovo ThinkPad T14s Gen 7 21YW0022GE | |
| Dell Pro 7 14 P714265 | |
| HP EliteBook 8 G2a 14 | |
| Geekbench AI / Single Precision GPU 1.7 | |
| Asus ExpertBook Ultra B9406CAA | |
| Dell Pro 7 14 P714265 | |
| HP EliteBook 8 G2a 14 | |
| Lenovo ThinkPad T14s Gen 7 21YW0022GE | |
| Acer TravelMate P6 TMP614-54-TCO-553Z | |
| Durchschnittliche Intel Core Ultra 7 366H, Intel Graphics 4 Xe3 Panther Lake iGPU (6149 - 6747, n=3) | |
| Dell Pro 7 14 P714260 | |
| Geekbench AI / Half Precision GPU 1.7 | |
| Asus ExpertBook Ultra B9406CAA | |
| Acer TravelMate P6 TMP614-54-TCO-553Z | |
| Durchschnittliche Intel Core Ultra 7 366H, Intel Graphics 4 Xe3 Panther Lake iGPU (11904 - 12824, n=3) | |
| Dell Pro 7 14 P714260 | |
| Dell Pro 7 14 P714265 | |
| HP EliteBook 8 G2a 14 | |
| Lenovo ThinkPad T14s Gen 7 21YW0022GE | |
| Geekbench AI / Quantized GPU 1.7 | |
| Asus ExpertBook Ultra B9406CAA | |
| Dell Pro 7 14 P714265 | |
| HP EliteBook 8 G2a 14 | |
| Lenovo ThinkPad T14s Gen 7 21YW0022GE | |
| Acer TravelMate P6 TMP614-54-TCO-553Z | |
| Durchschnittliche Intel Core Ultra 7 366H, Intel Graphics 4 Xe3 Panther Lake iGPU (4230 - 4509, n=3) | |
| Dell Pro 7 14 P714260 | |
* ... kleinere Werte sind besser
| PCMark 10 Score | 9352 Punkte | |
Hilfe | ||
| AIDA64 / Memory Copy | |
| Dell Pro 7 14 P714260 | |
| Durchschnittliche Intel Core Ultra 7 366H (107814 - 120004, n=5) | |
| Acer TravelMate P6 TMP614-54-TCO-553Z | |
| Lenovo ThinkPad T14s Gen 7 21YW0022GE | |
| HP EliteBook 8 G2a 14 | |
| Dell Pro 7 14 P714265 | |
| AIDA64 / Memory Read | |
| Asus ExpertBook Ultra B9406CAA | |
| Dell Pro 7 14 P714260 | |
| Durchschnittliche Intel Core Ultra 7 366H (102778 - 111878, n=5) | |
| Dell Pro 7 14 P714265 | |
| Acer TravelMate P6 TMP614-54-TCO-553Z | |
| HP EliteBook 8 G2a 14 | |
| Lenovo ThinkPad T14s Gen 7 21YW0022GE | |
| AIDA64 / Memory Write | |
| Dell Pro 7 14 P714260 | |
| Asus ExpertBook Ultra B9406CAA | |
| Durchschnittliche Intel Core Ultra 7 366H (106062 - 120952, n=5) | |
| Acer TravelMate P6 TMP614-54-TCO-553Z | |
| Lenovo ThinkPad T14s Gen 7 21YW0022GE | |
| Dell Pro 7 14 P714265 | |
| HP EliteBook 8 G2a 14 | |
| AIDA64 / Memory Latency | |
| Lenovo ThinkPad T14s Gen 7 21YW0022GE | |
| Dell Pro 7 14 P714265 | |
| HP EliteBook 8 G2a 14 | |
| Acer TravelMate P6 TMP614-54-TCO-553Z | |
| Durchschnittliche Intel Core Ultra 7 366H (89.5 - 103, n=5) | |
| Dell Pro 7 14 P714260 | |
* ... kleinere Werte sind besser
DPC-Latenz
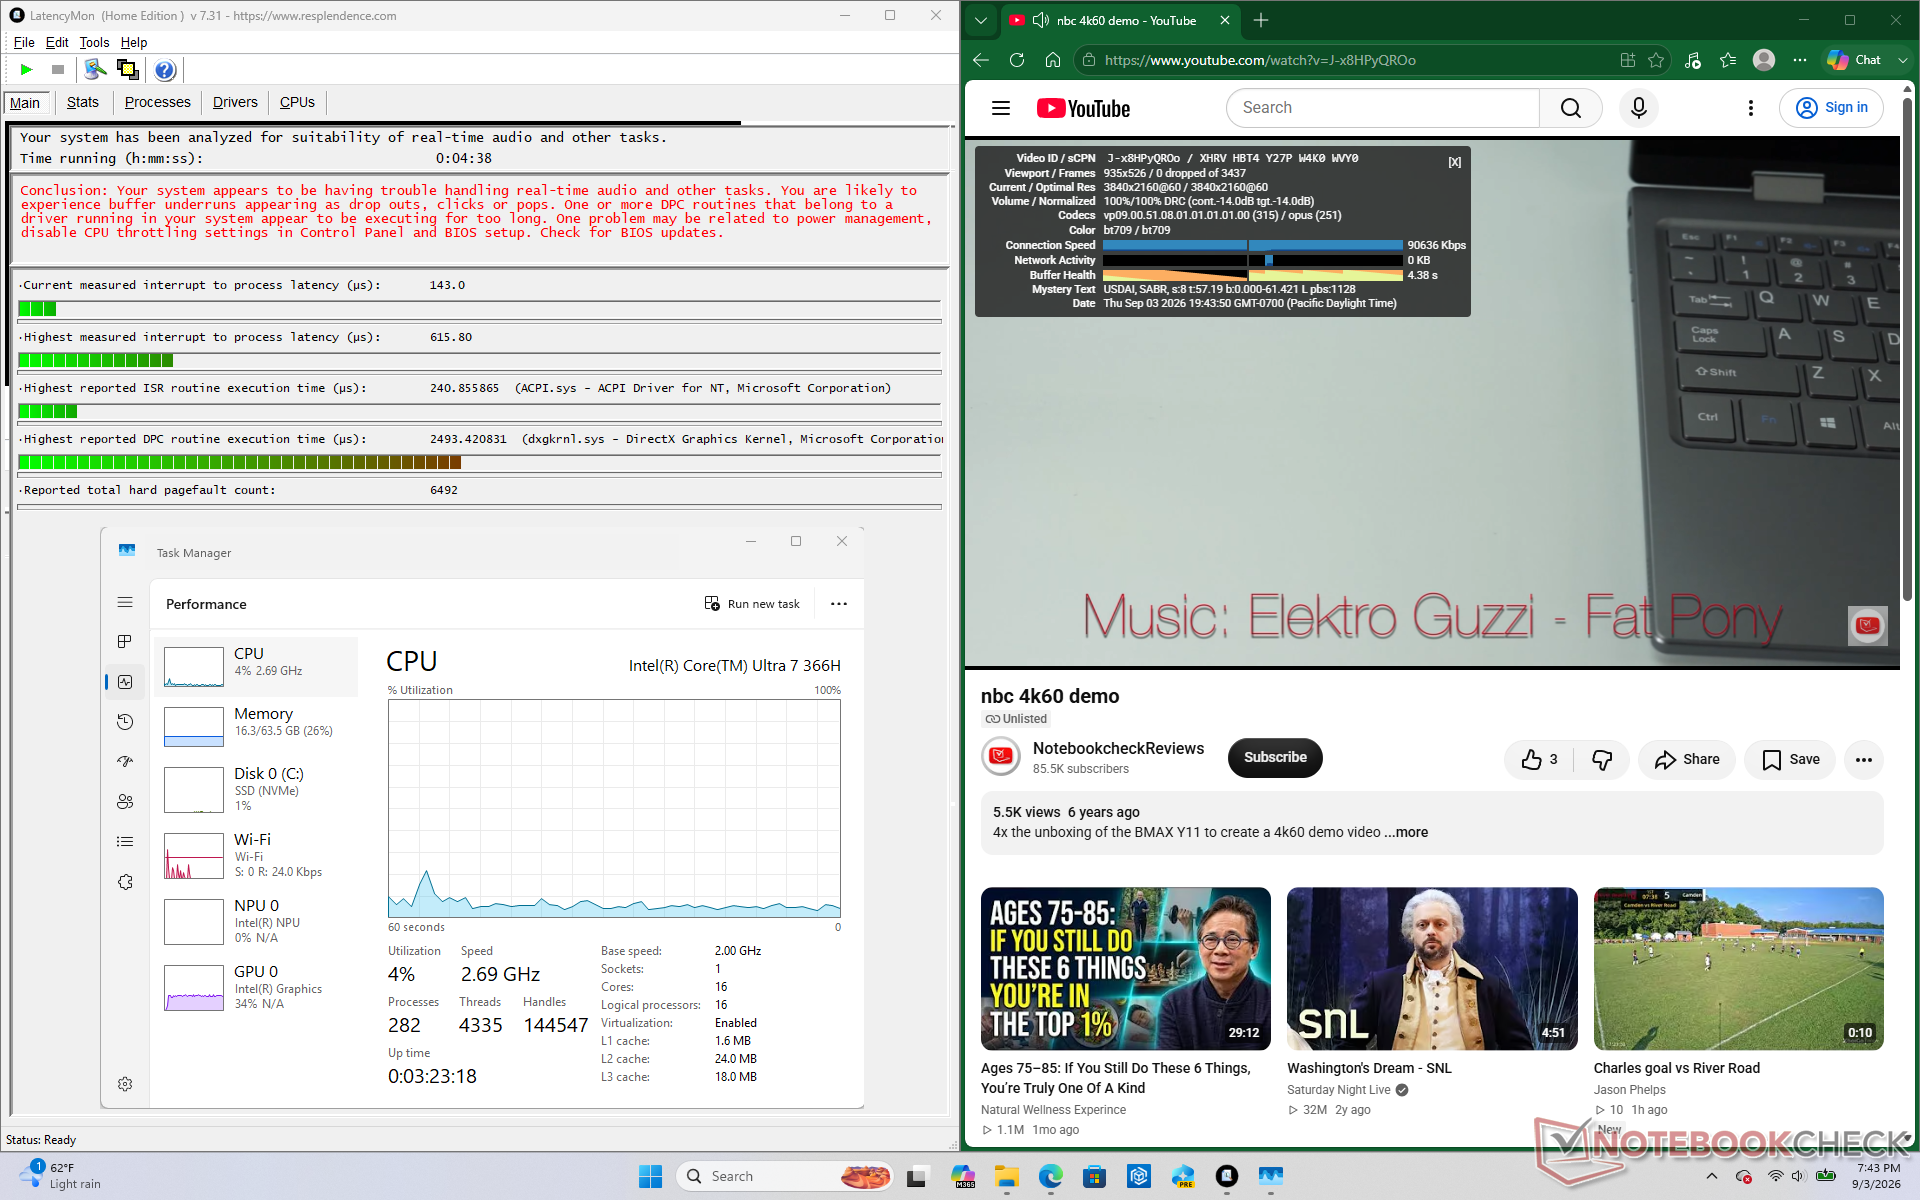
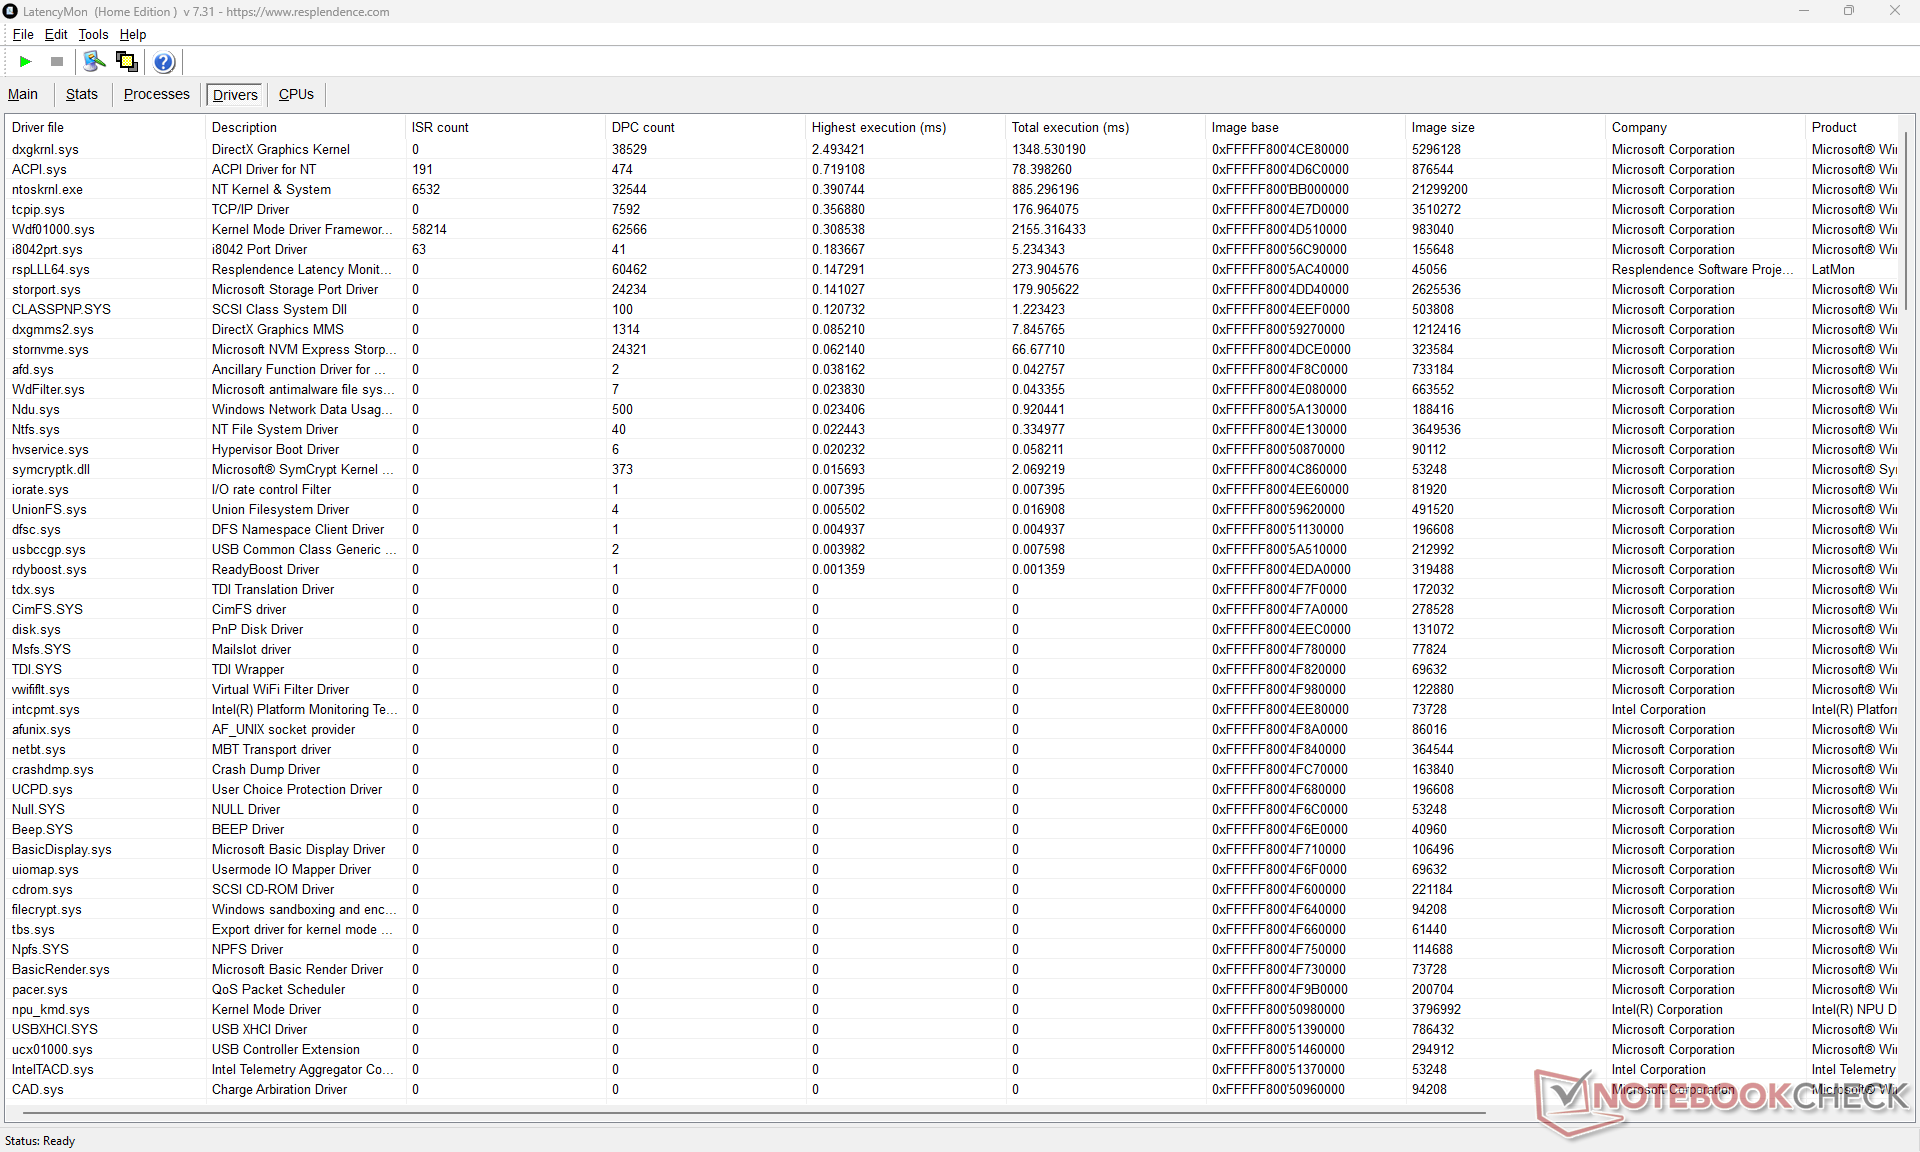
| DPC Latencies / LatencyMon - interrupt to process latency (max), Web, Youtube, Prime95 | |
| Dell Pro 7 14 P714265 | |
| Lenovo ThinkPad T14s Gen 7 21YW0022GE | |
| HP EliteBook 8 G2a 14 | |
| Acer TravelMate P6 TMP614-54-TCO-553Z | |
| Dell Pro 7 14 P714260 | |
| Asus ExpertBook Ultra B9406CAA | |
* ... kleinere Werte sind besser
Speichergeräte
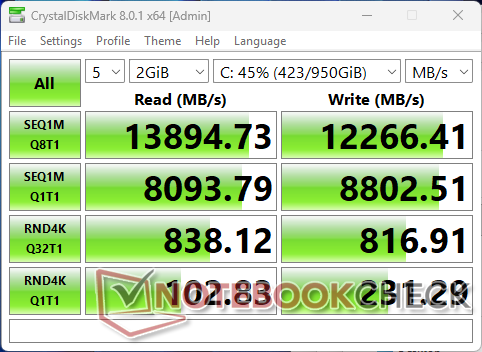
Da AS SSD auf unserem Testgerät mit Fehlern lief, sind die Ergebnisse dieses Programms im Folgenden nicht aufgeführt. Die SK Hynix PCB01 PCIe 5.0 NVMe-SSD erreichte dennoch Geschwindigkeiten von bis zu ~14 GB/s ohne Drosselungsprobleme, selbst unter hoher Belastung.

Festplattendrosselung: DiskSpd-Lese-Schleife, Warteschlangentiefe 8
GPU-Leistung
| Leistungsprofil | Grafik-Bewertung | Physik-Ergebnis | Kombinierte Bewertung |
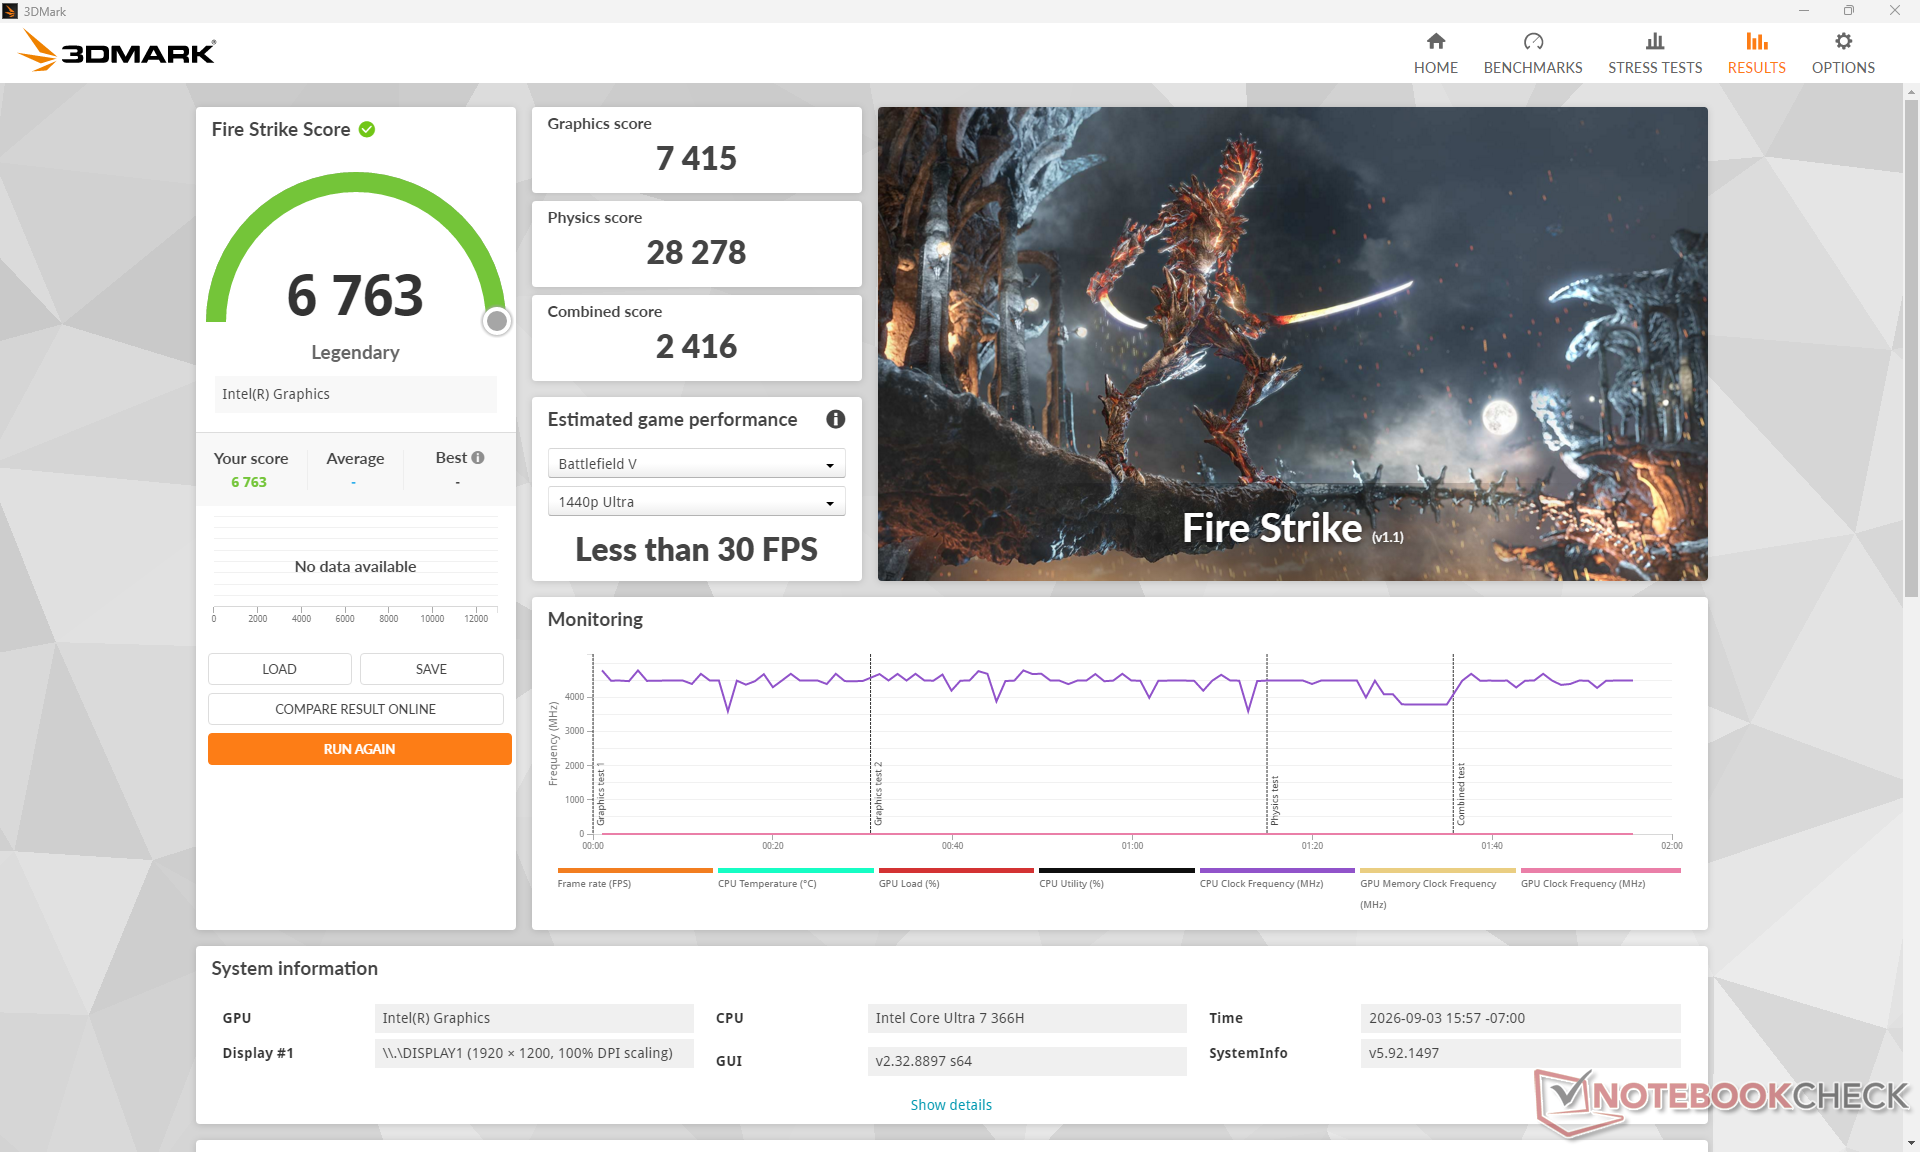
| Leistungsmodus | 7415 | 28.278 | 2416 |
| Ausgewogener Modus | 7.400 (-0 %) | 27.468 (-3 %) | 2.376 (-2 %) |
| Batterie | 6.993 (-6 %) | 20.262 (-28 %) | 2138 (-12 %) |
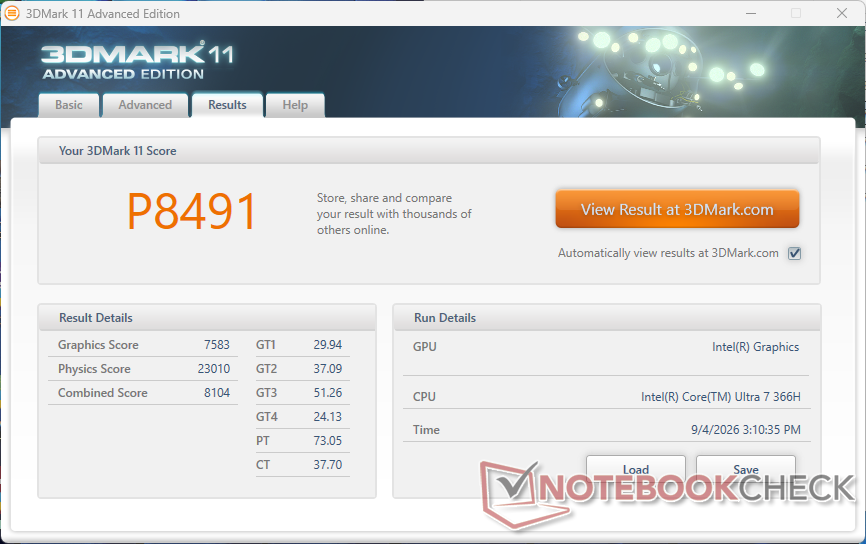
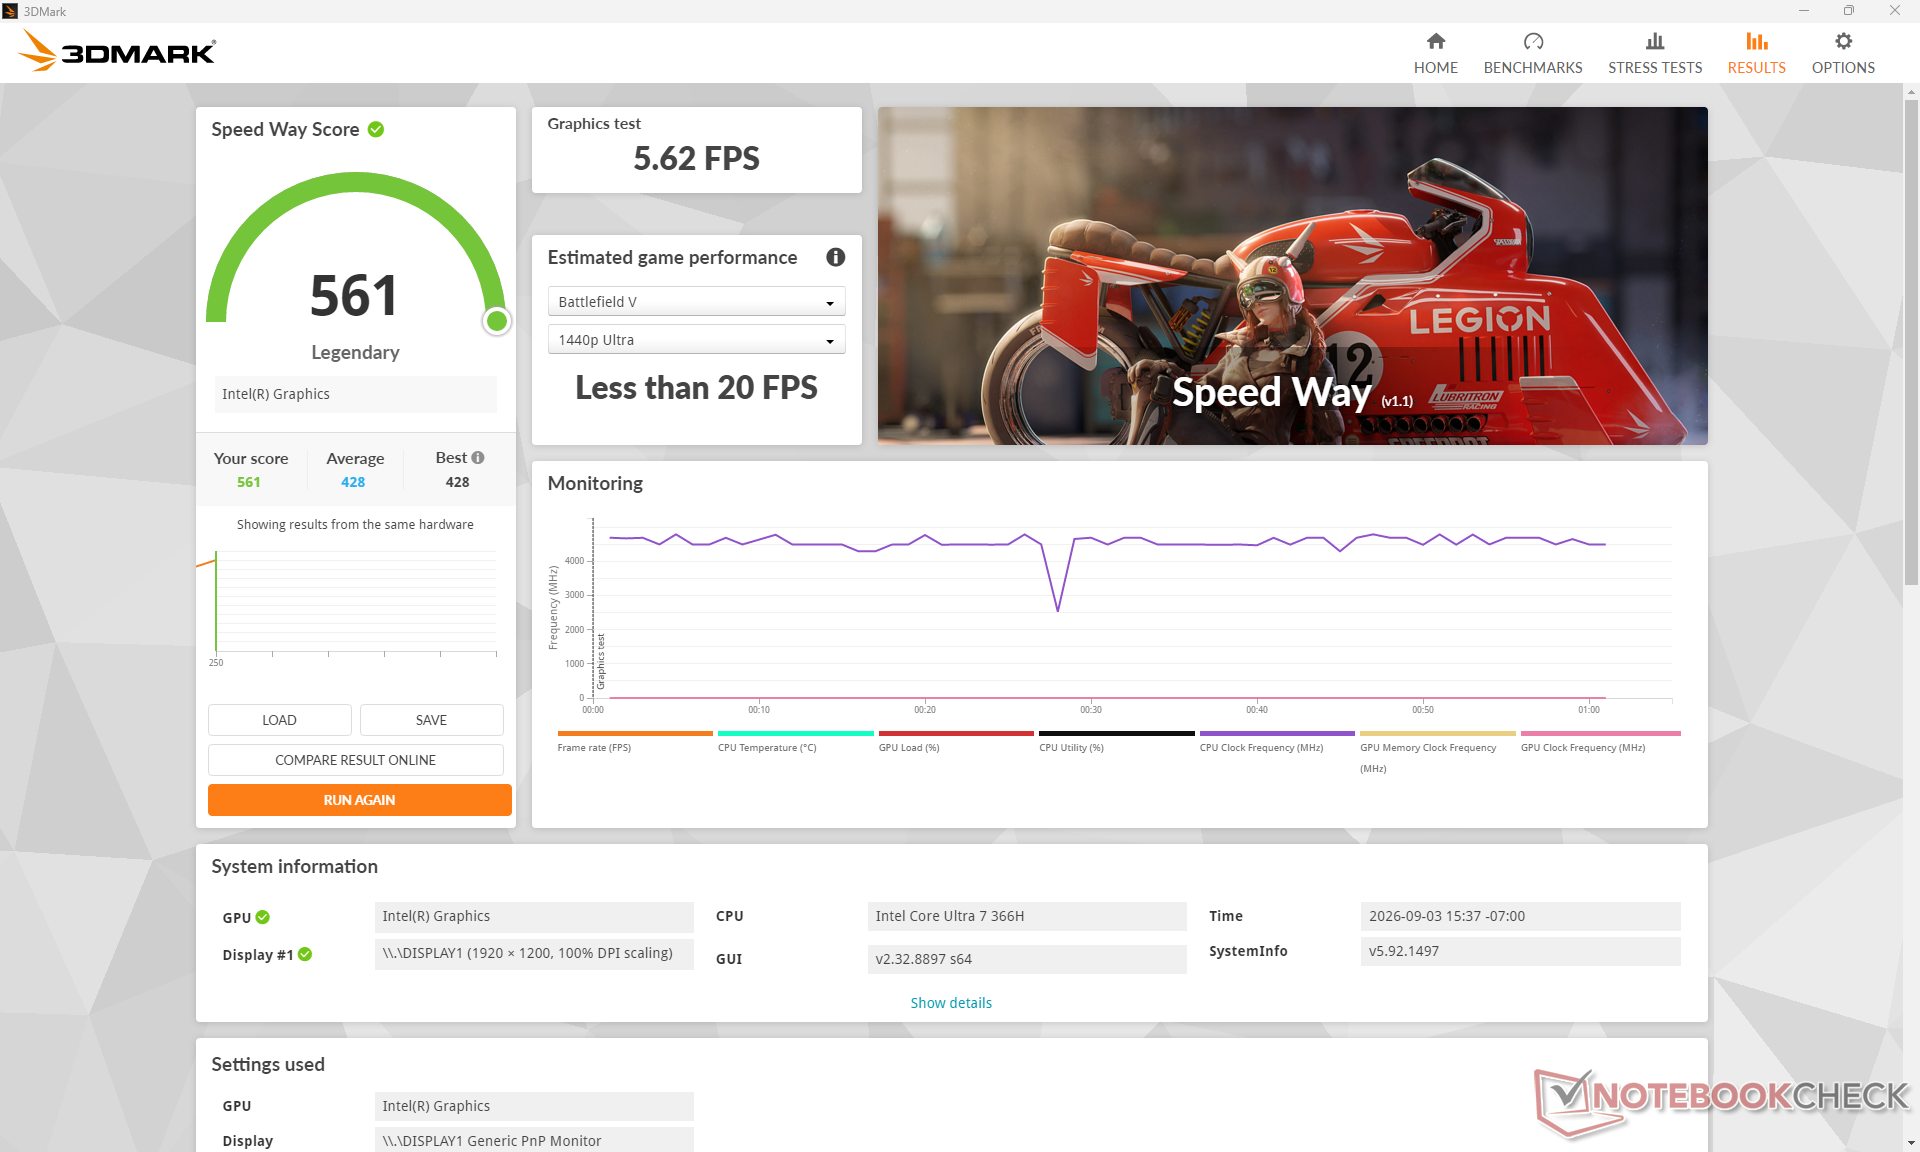
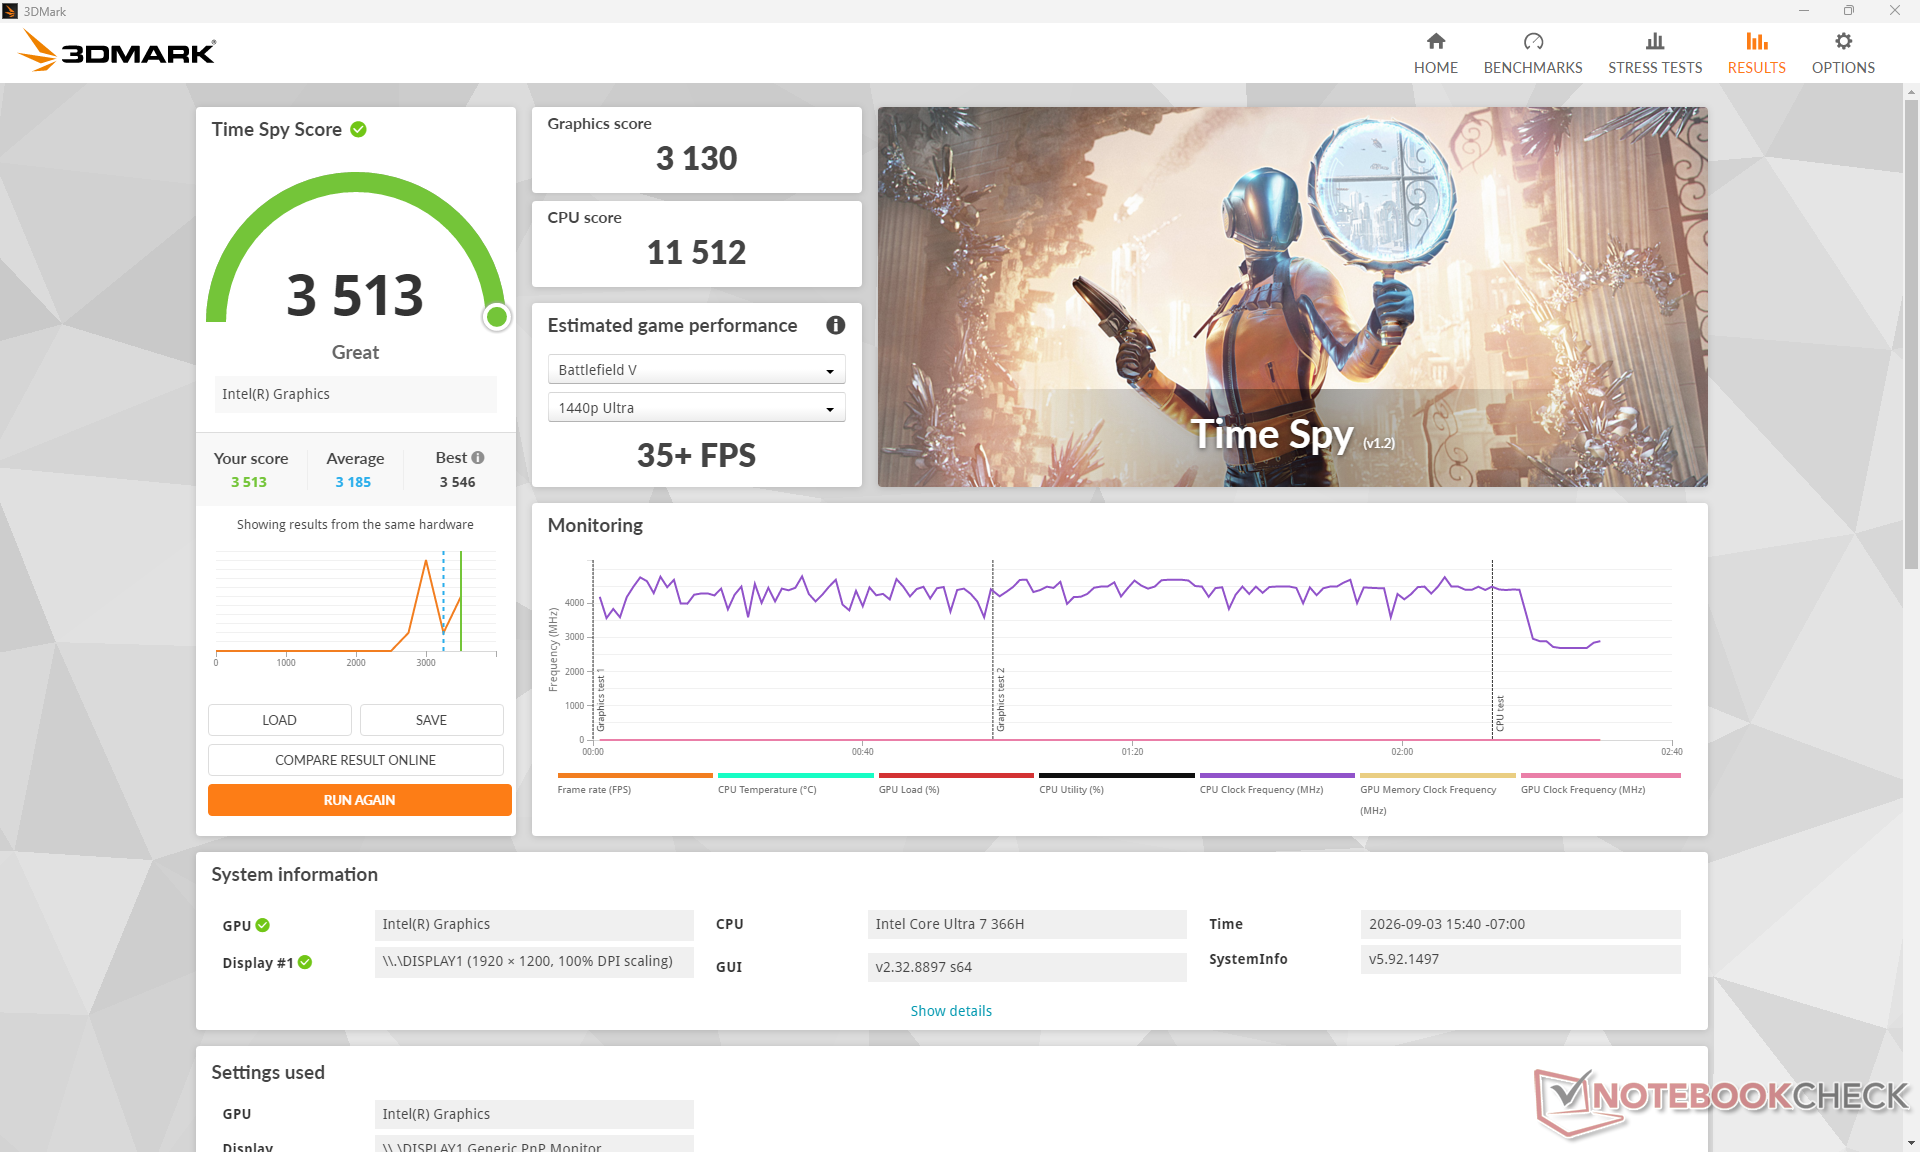
| 3DMark 11 Performance | 8491 Punkte | |
| 3DMark Cloud Gate Standard Score | 33645 Punkte | |
| 3DMark Fire Strike Score | 6763 Punkte | |
| 3DMark Time Spy Score | 3513 Punkte | |
Hilfe | ||
* ... kleinere Werte sind besser
| Performance Rating - Percent | |
| Asus ExpertBook Ultra B9406CAA | |
| Dell Pro 7 14 P714265 | |
| HP EliteBook 8 G2a 14 | |
| Dell Pro 7 14 P714260 | |
| Lenovo ThinkPad T14s Gen 7 21YW0022GE | |
| Acer TravelMate P6 TMP614-54-TCO-553Z | |
| Cyberpunk 2077 - 1920x1080 Ultra Preset (FSR off) | |
| Asus ExpertBook Ultra B9406CAA | |
| Dell Pro 7 14 P714265 | |
| Dell Pro 7 14 P714260 | |
| HP EliteBook 8 G2a 14 | |
| Acer TravelMate P6 TMP614-54-TCO-553Z | |
| Lenovo ThinkPad T14s Gen 7 21YW0022GE | |
| Baldur's Gate 3 - 1920x1080 Ultra Preset AA:T | |
| Asus ExpertBook Ultra B9406CAA | |
| Dell Pro 7 14 P714265 | |
| Dell Pro 7 14 P714260 | |
| Acer TravelMate P6 TMP614-54-TCO-553Z | |
| Lenovo ThinkPad T14s Gen 7 21YW0022GE | |
| HP EliteBook 8 G2a 14 | |
| GTA V - 1920x1080 Highest AA:4xMSAA + FX AF:16x | |
| Asus ExpertBook Ultra B9406CAA | |
| Dell Pro 7 14 P714265 | |
| HP EliteBook 8 G2a 14 | |
| Lenovo ThinkPad T14s Gen 7 21YW0022GE | |
| Dell Pro 7 14 P714260 | |
| Acer TravelMate P6 TMP614-54-TCO-553Z | |
| Final Fantasy XV Benchmark - 1920x1080 High Quality | |
| Asus ExpertBook Ultra B9406CAA | |
| Dell Pro 7 14 P714265 | |
| Acer TravelMate P6 TMP614-54-TCO-553Z | |
| Dell Pro 7 14 P714260 | |
| Lenovo ThinkPad T14s Gen 7 21YW0022GE | |
| HP EliteBook 8 G2a 14 | |
| Strange Brigade - 1920x1080 ultra AA:ultra AF:16 | |
| Asus ExpertBook Ultra B9406CAA | |
| Dell Pro 7 14 P714260 | |
| Dell Pro 7 14 P714265 | |
| Lenovo ThinkPad T14s Gen 7 21YW0022GE | |
| HP EliteBook 8 G2a 14 | |
| Acer TravelMate P6 TMP614-54-TCO-553Z | |
| Dota 2 Reborn - 1920x1080 ultra (3/3) best looking | |
| Asus ExpertBook Ultra B9406CAA | |
| Dell Pro 7 14 P714260 | |
| Acer TravelMate P6 TMP614-54-TCO-553Z | |
| HP EliteBook 8 G2a 14 | |
| Lenovo ThinkPad T14s Gen 7 21YW0022GE | |
| Dell Pro 7 14 P714265 | |
| X-Plane 11.11 - 1920x1080 high (fps_test=3) | |
| HP EliteBook 8 G2a 14 | |
| Lenovo ThinkPad T14s Gen 7 21YW0022GE | |
| Dell Pro 7 14 P714265 | |
| Asus ExpertBook Ultra B9406CAA | |
| Acer TravelMate P6 TMP614-54-TCO-553Z | |
| Dell Pro 7 14 P714260 | |
Cyberpunk 2077 – Ultra-FPS-Diagramm
| min. | mittel | hoch | max. | |
|---|---|---|---|---|
| GTA V (2015) | 177.4 | 168.9 | 51.5 | 23.8 |
| Dota 2 Reborn (2015) | 177 | 73.5 | 97.8 | 91.7 |
| Final Fantasy XV Benchmark (2018) | 74.4 | 37.2 | 27.4 | |
| X-Plane 11.11 (2018) | 45.7 | 37 | 29.5 | |
| Strange Brigade (2018) | 197.9 | 77.1 | 61.9 | 52.4 |
| Baldur's Gate 3 (2023) | 33.1 | 27.4 | 23.9 | 23.5 |
| Cyberpunk 2077 (2023) | 40.2 | 30.9 | 26.8 | 22.6 |
| F1 24 (2024) | 73.4 | 67.6 | 50.3 | 14.3 |
Emissionen
Geräuschemissionen
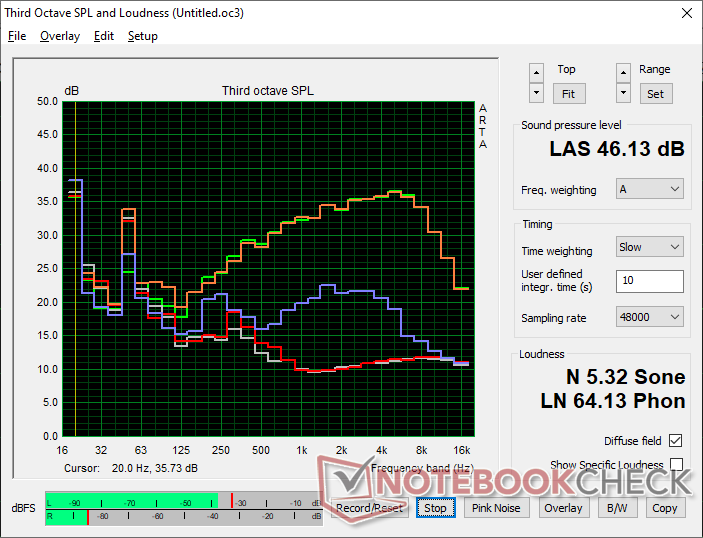
Lautstärkediagramm
| Idle |
| 23.8 / 23.8 / 23.8 dB(A) |
| Last |
| 31.9 / 46.3 dB(A) |
 | ||
30 dB leise 40 dB(A) deutlich hörbar 50 dB(A) störend |
||
min:  , med: , med:  , max: , max:  Earthworks M23R, Arta (aus 15 cm gemessen) Umgebungsgeräusche: 23.3 dB(A) Earthworks M23R, Arta (aus 15 cm gemessen) Umgebungsgeräusche: 23.3 dB(A) | ||
| Dell Pro 7 14 P714260 Ultra 7 366H, Intel Graphics 4 Xe3 PTL | Dell Pro 7 14 P714265 Ryzen AI 9 HX PRO 470, Radeon 890M | HP EliteBook 8 G2a 14 Ryzen AI 7 450, Radeon 860M | Lenovo ThinkPad T14s Gen 7 21YW0022GE Ryzen AI 7 PRO 450, Radeon 860M | Asus ExpertBook Ultra B9406CAA Ultra X7 358H, Arc B390 Panther Lake iGPU | Acer TravelMate P6 TMP614-54-TCO-553Z Core Ultra 5 226V, Arc 130V | |
|---|---|---|---|---|---|---|
| Geräuschentwicklung | 1% | 3% | -2% | 4% | -5% | |
| aus / Umgebung * (dB) | 23.3 | 23.2 -0% | 23.9 -3% | 24.8 -6% | 22.9 2% | 25.4 -9% |
| Idle min * (dB) | 23.8 | 23.2 3% | 23.9 -0% | 24.8 -4% | 23.4 2% | 25.4 -7% |
| Idle avg * (dB) | 23.8 | 23.2 3% | 23.9 -0% | 24.8 -4% | 23.4 2% | 25.4 -7% |
| Idle max * (dB) | 23.8 | 23.2 3% | 23.9 -0% | 24.8 -4% | 23.4 2% | 25.7 -8% |
| Last avg * (dB) | 31.9 | 37.5 -18% | 35.3 -11% | 36.7 -15% | 28.6 10% | |
| Cyberpunk 2077 ultra * (dB) | 46.1 | 37.7 18% | 38 18% | 41.6 10% | 42.8 7% | 44.72 3% |
| Last max * (dB) | 46.3 | 47.1 -2% | 38 18% | 41.6 10% | 45.2 2% | 47.4 -2% |
* ... kleinere Werte sind besser
Temperatur
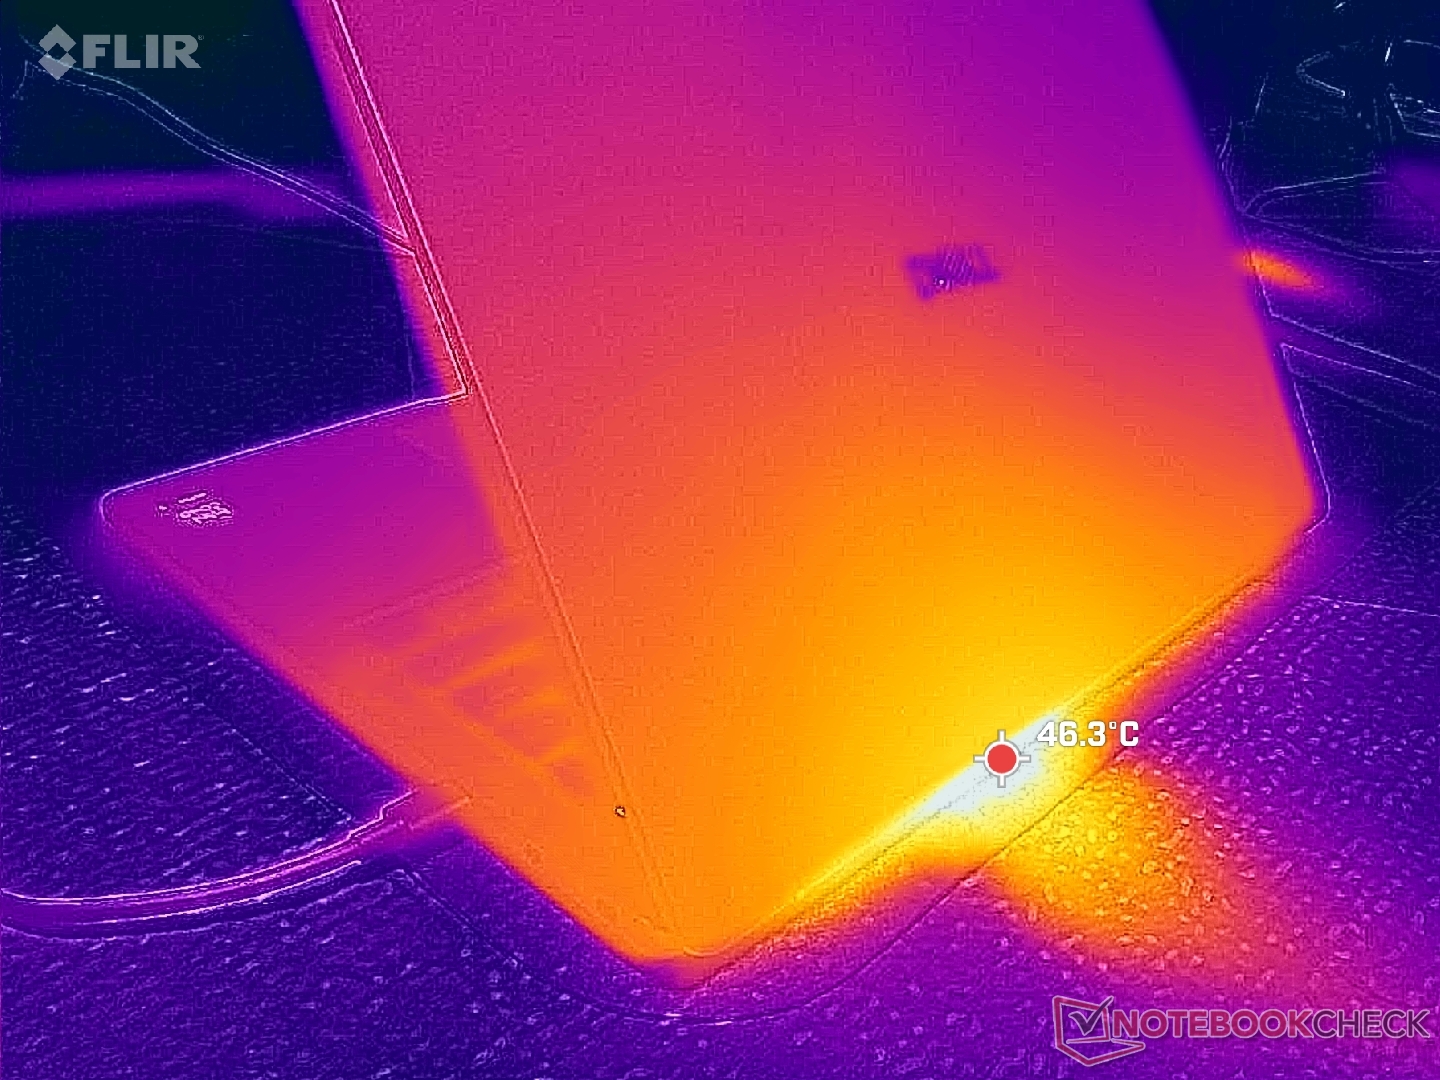
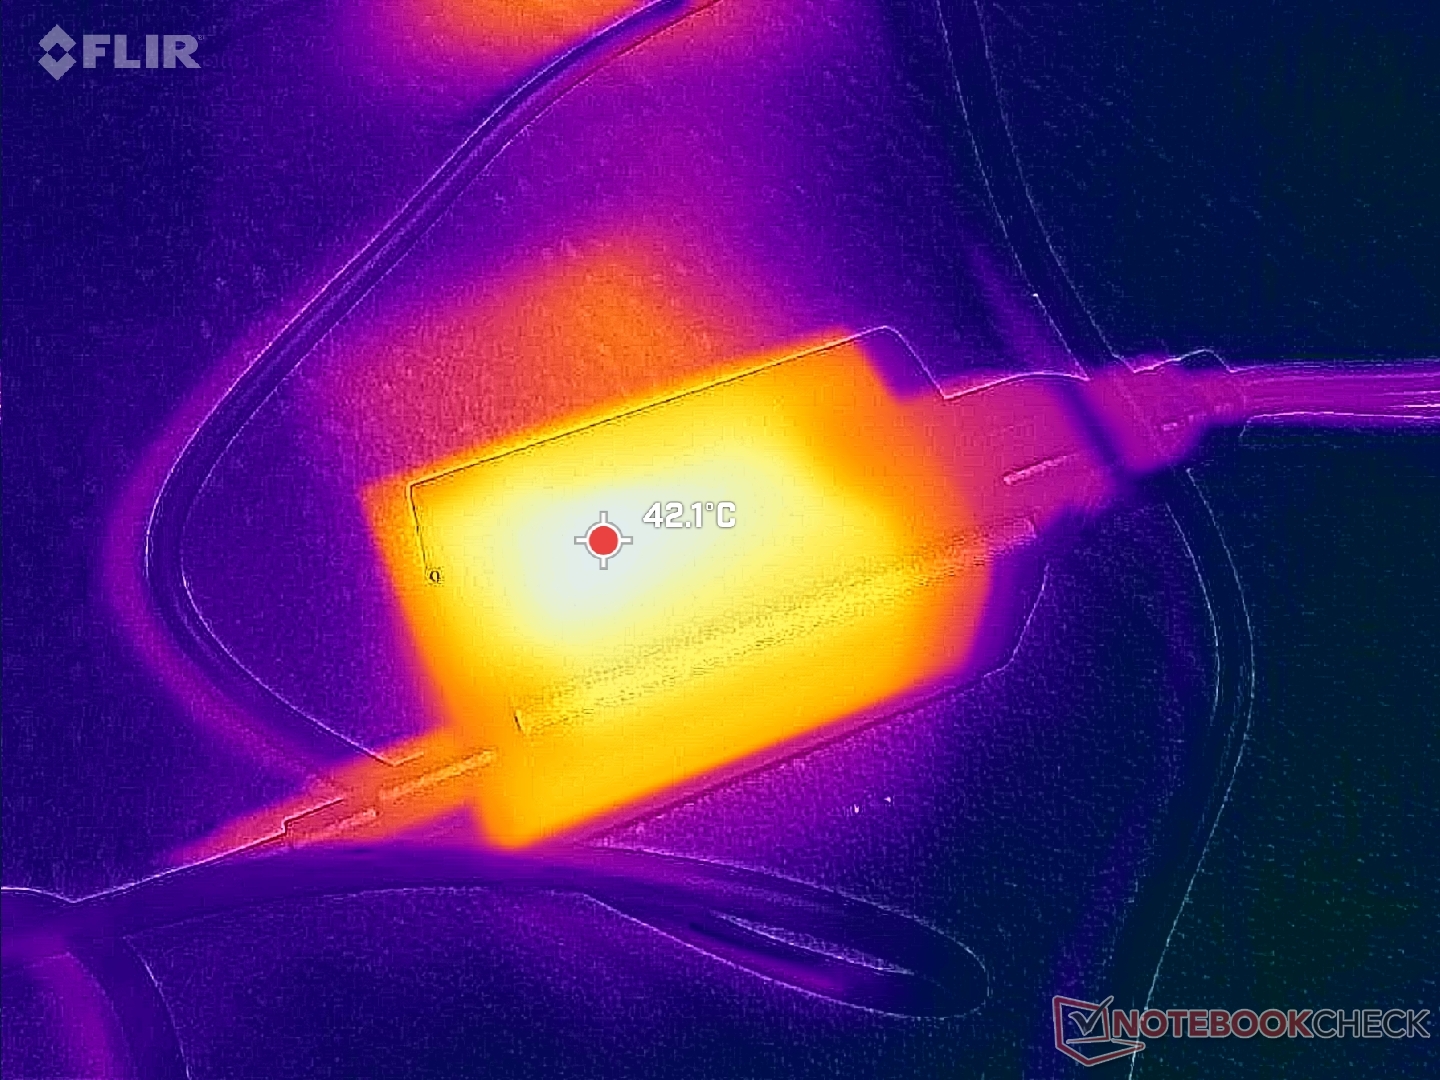
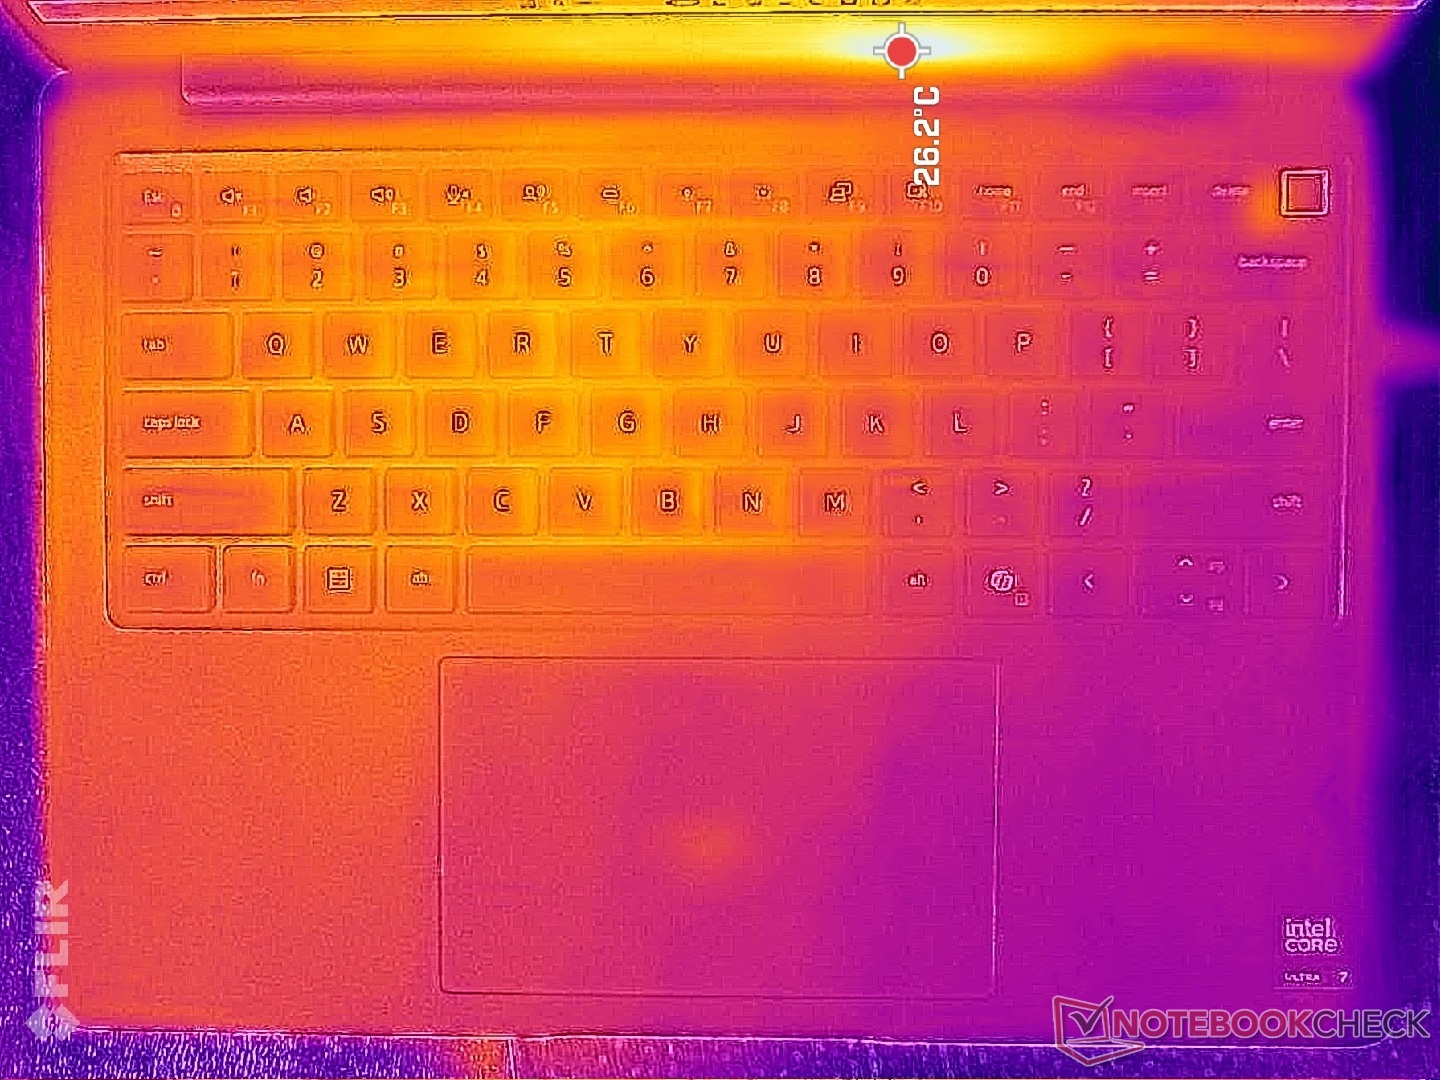
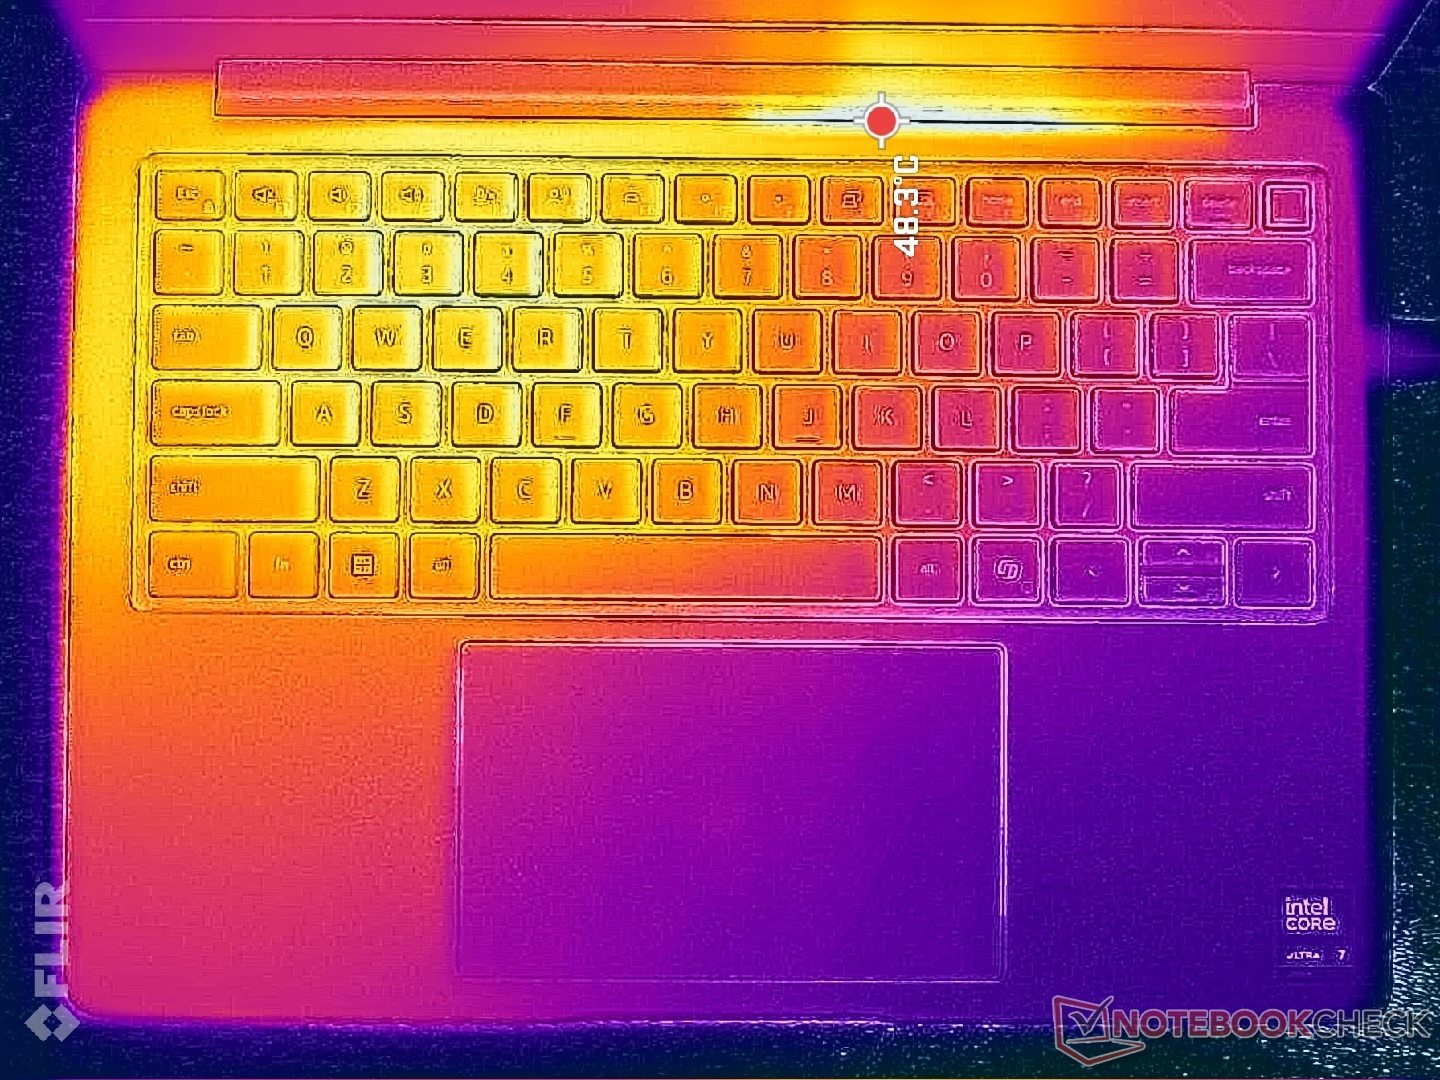
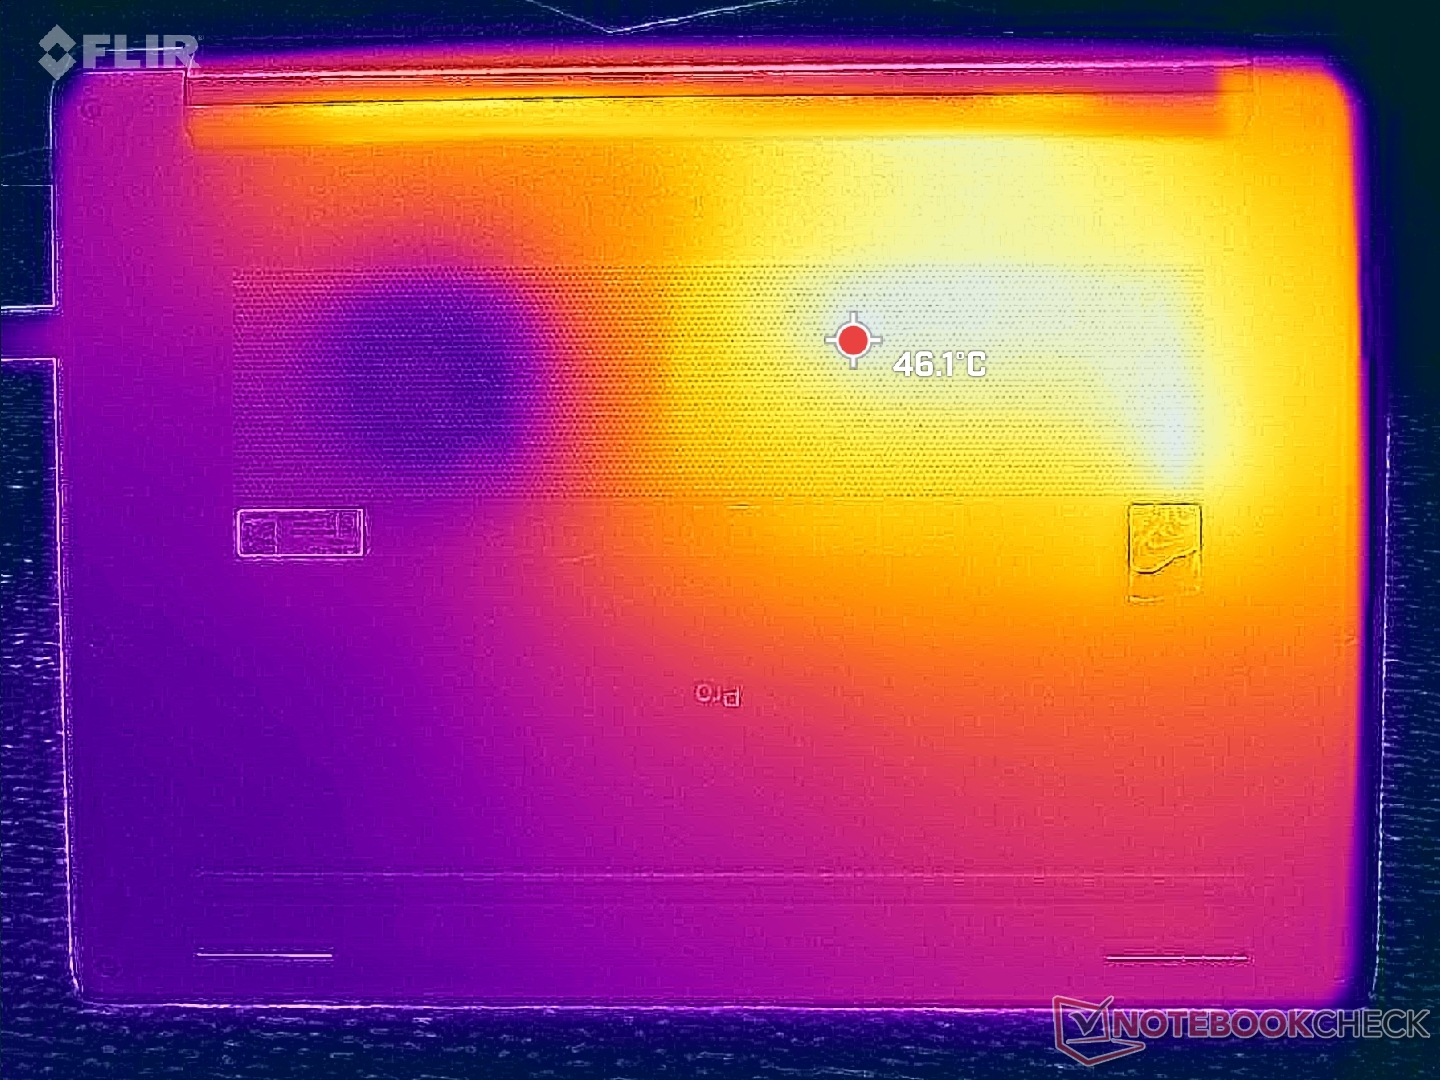
(±) Die maximale Temperatur auf der Oberseite ist 43.4 °C. Im Vergleich liegt der Klassendurchschnitt bei 34.4 °C (von 21.2 bis 62.5 °C für die Klasse Office).
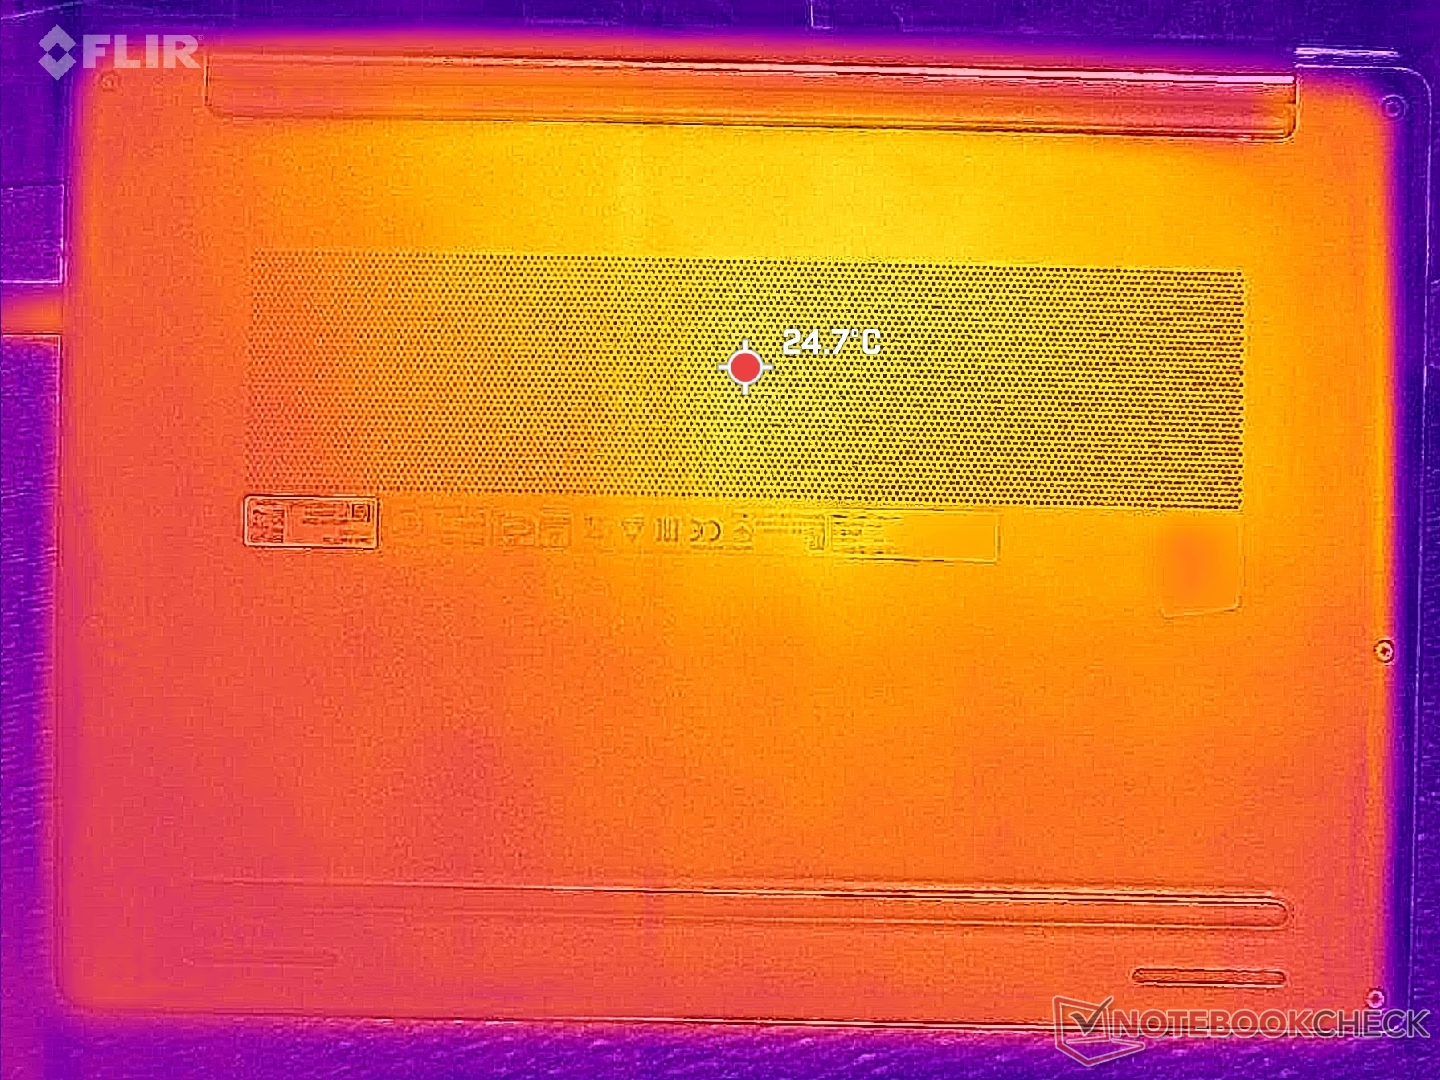
(±) Auf der Unterseite messen wir eine maximalen Wert von 44.6 °C (im Vergleich zum Durchschnitt von 36.8 °C).
(+) Ohne Last messen wir eine durchschnittliche Temperatur von 26.2 °C auf der Oberseite. Der Klassendurchschnitt erreicht 29.5 °C.
(+) Die Handballen und der Touchpad-Bereich erreichen maximal 33 °C und damit die typische Hauttemperatur und fühlen sich daher nicht heiß an.
(-) Die durchschnittliche Handballen-Temperatur anderer getesteter Geräte war 27.6 °C (-5.4 °C).
| Dell Pro 7 14 P714260 Ultra 7 366H, Intel Graphics 4 Xe3 PTL | Dell Pro 7 14 P714265 Ryzen AI 9 HX PRO 470, Radeon 890M | HP EliteBook 8 G2a 14 Ryzen AI 7 450, Radeon 860M | Lenovo ThinkPad T14s Gen 7 21YW0022GE Ryzen AI 7 PRO 450, Radeon 860M | Asus ExpertBook Ultra B9406CAA Ultra X7 358H, Arc B390 Panther Lake iGPU | Acer TravelMate P6 TMP614-54-TCO-553Z Core Ultra 5 226V, Arc 130V | |
|---|---|---|---|---|---|---|
| Hitze | 2% | 2% | 5% | 10% | -5% | |
| Last oben max * (°C) | 43.4 | 40.8 6% | 41.1 5% | 42.3 3% | 38.6 11% | 39.7 9% |
| Last unten max * (°C) | 44.6 | 42.6 4% | 44.2 1% | 43.8 2% | 38.4 14% | 38.9 13% |
| Idle oben max * (°C) | 27.2 | 26 4% | 26.9 1% | 25.2 7% | 24.6 10% | 32.5 -19% |
| Idle unten max * (°C) | 27.6 | 29.2 -6% | 27.6 -0% | 25.5 8% | 26 6% | 33.5 -21% |
* ... kleinere Werte sind besser
Stresstest
Die CPU taktet auf 2,6 GHz und 55 W hoch, bis sie nur wenige Sekunden später eine Kerntemperatur von 96 °C erreicht. Die Leistung sinkt dann auf 1,9 GHz und 31 W, um eine kühlere Kerntemperatur von 76 °C aufrechtzuerhalten.
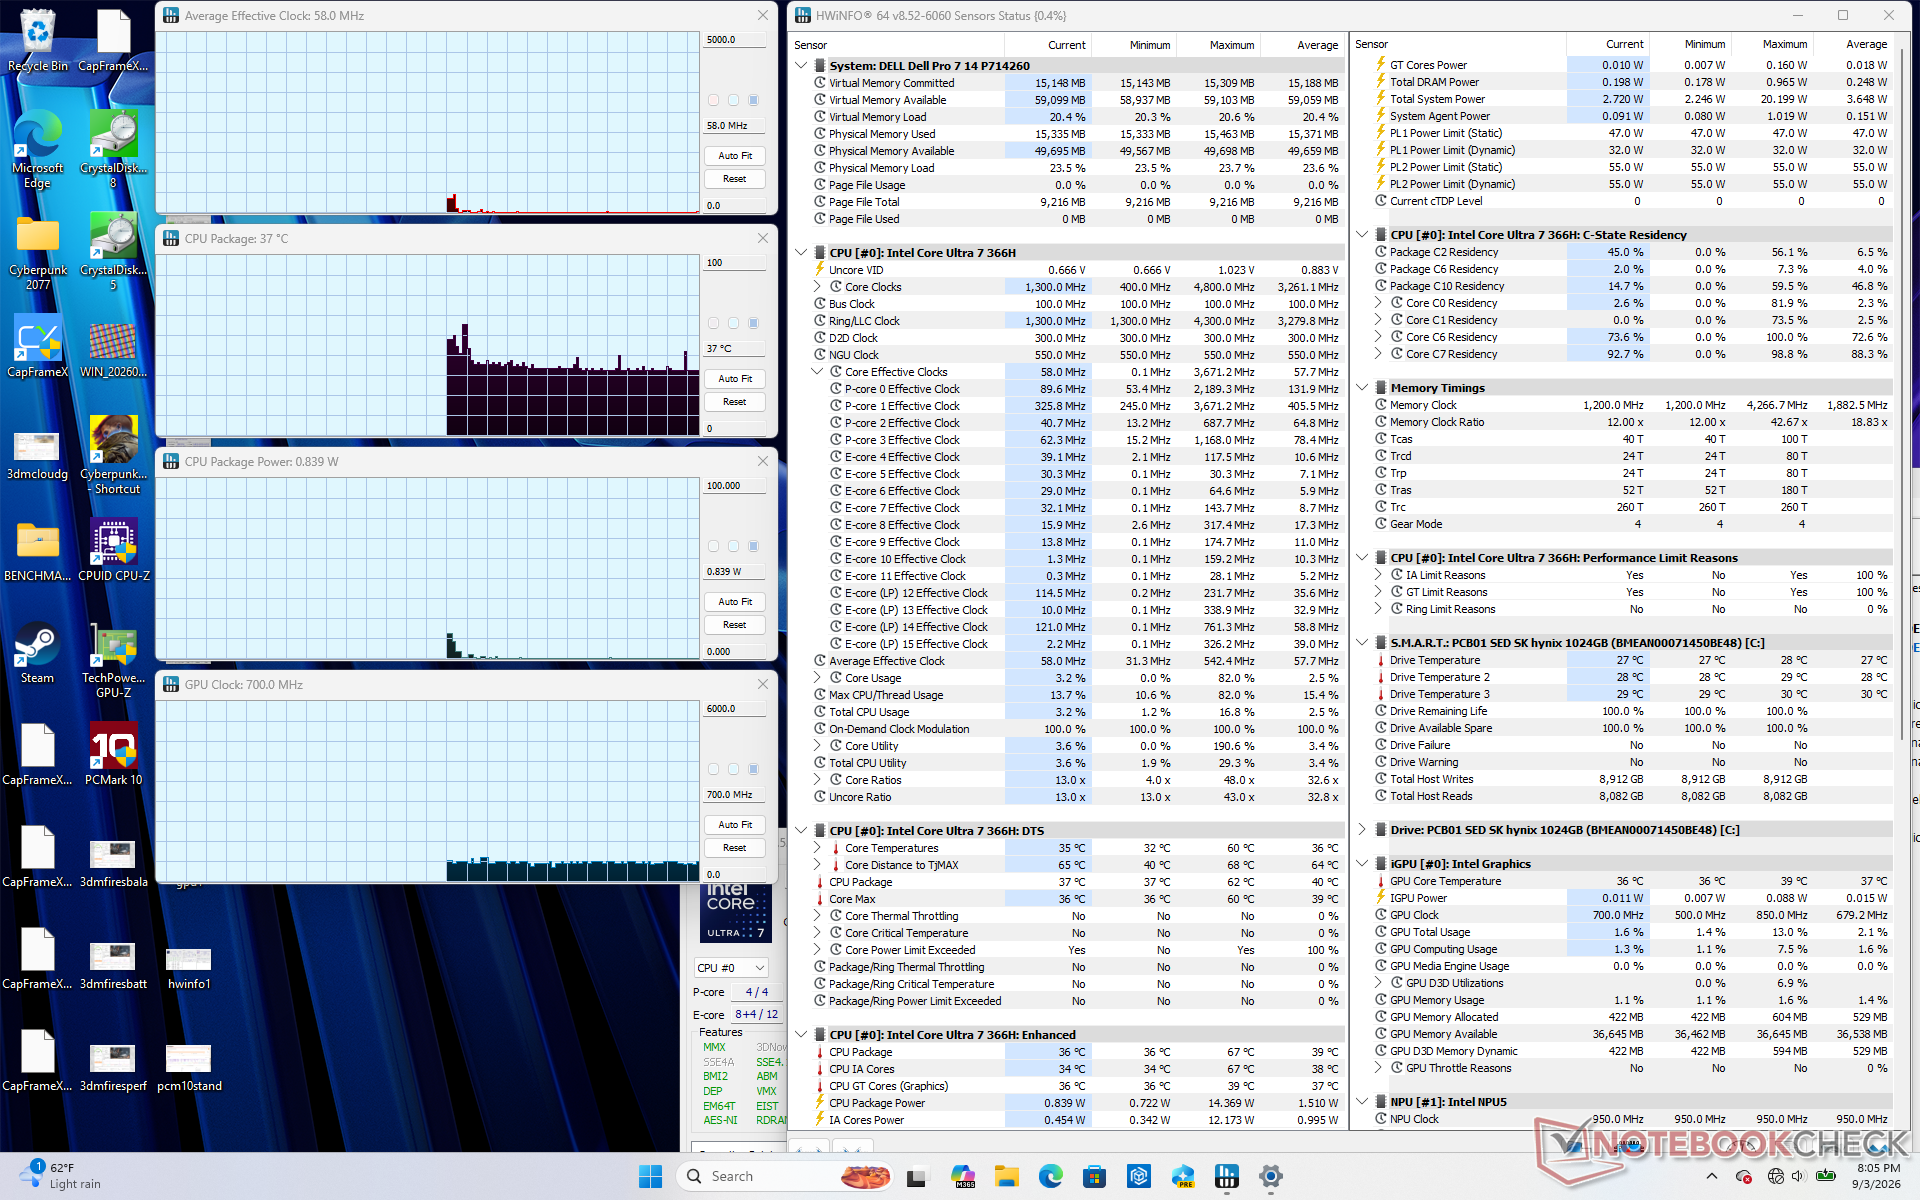
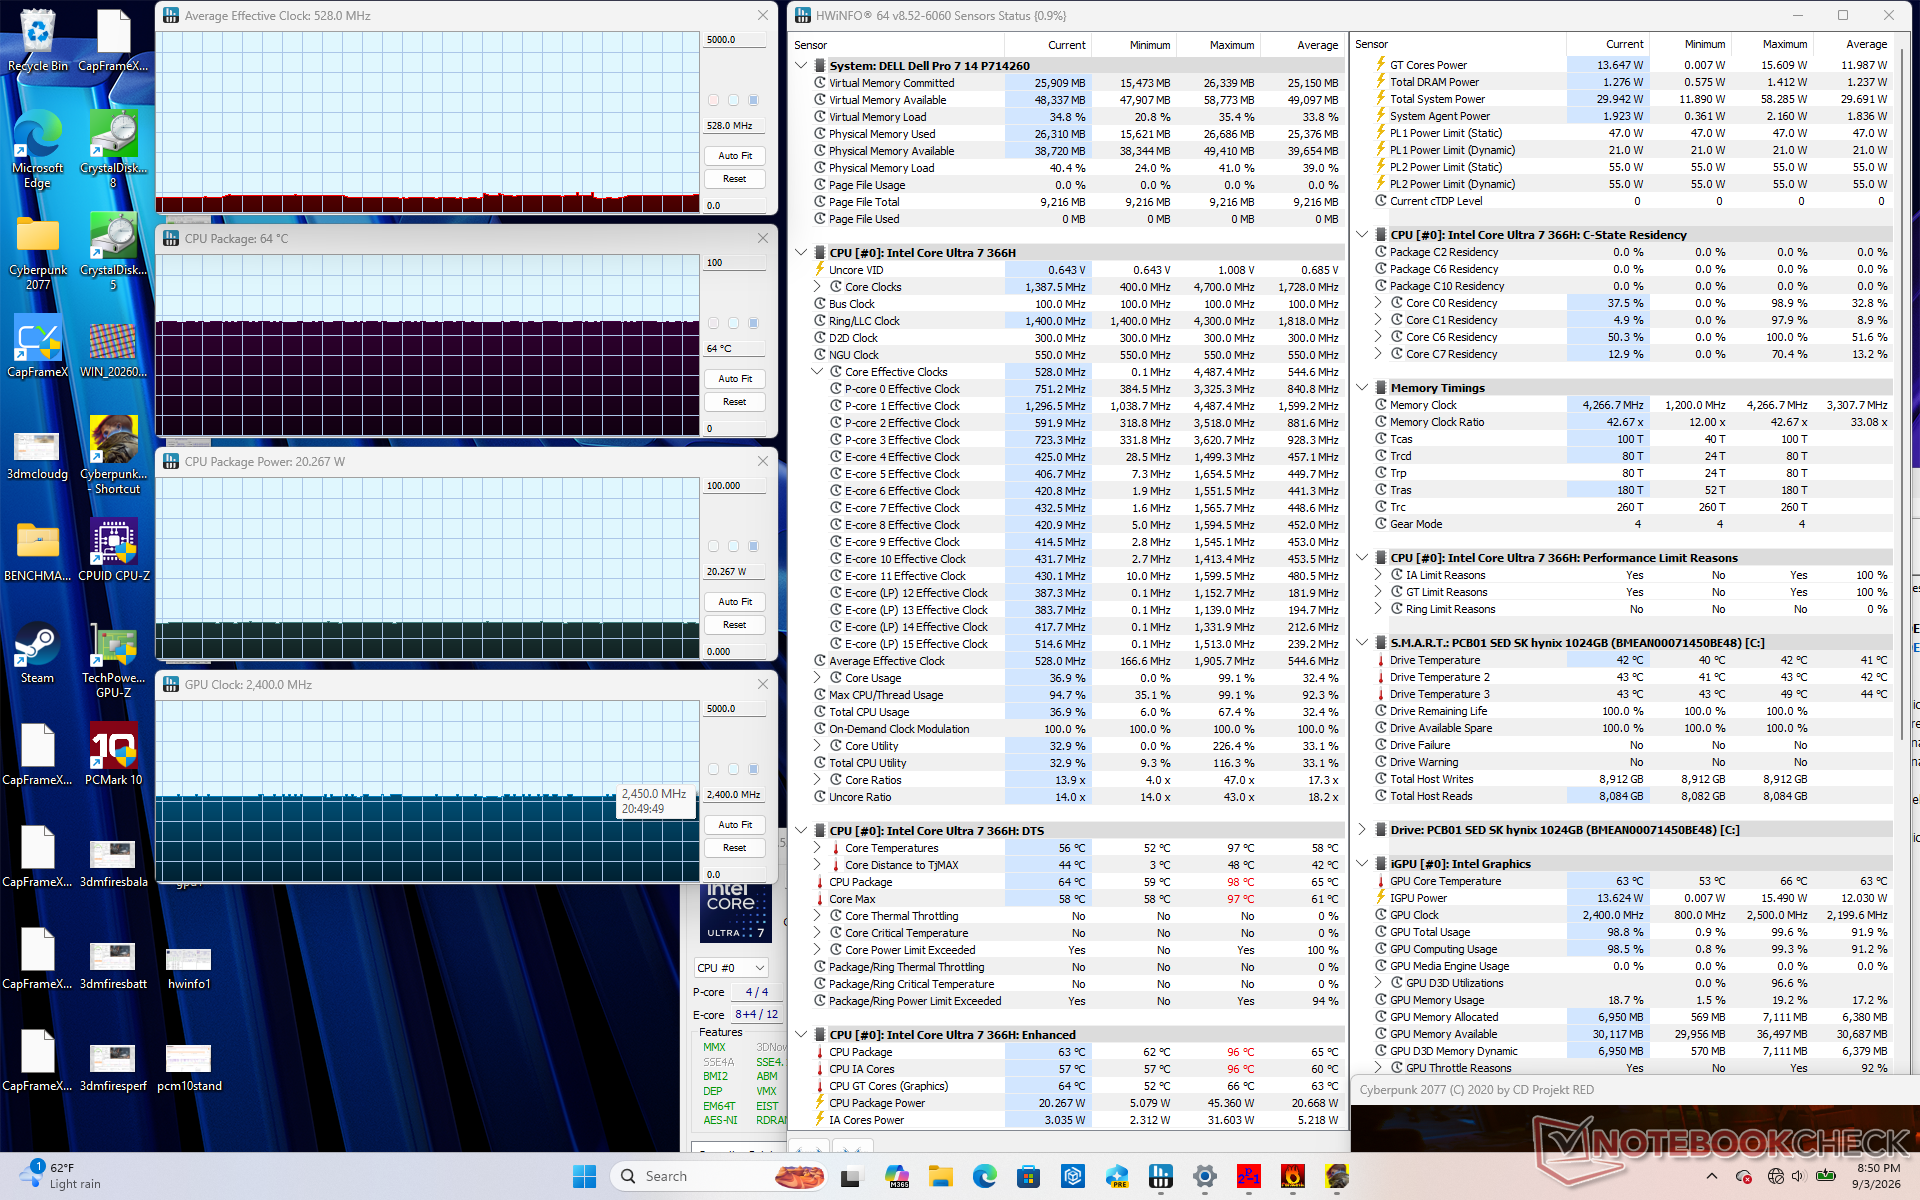
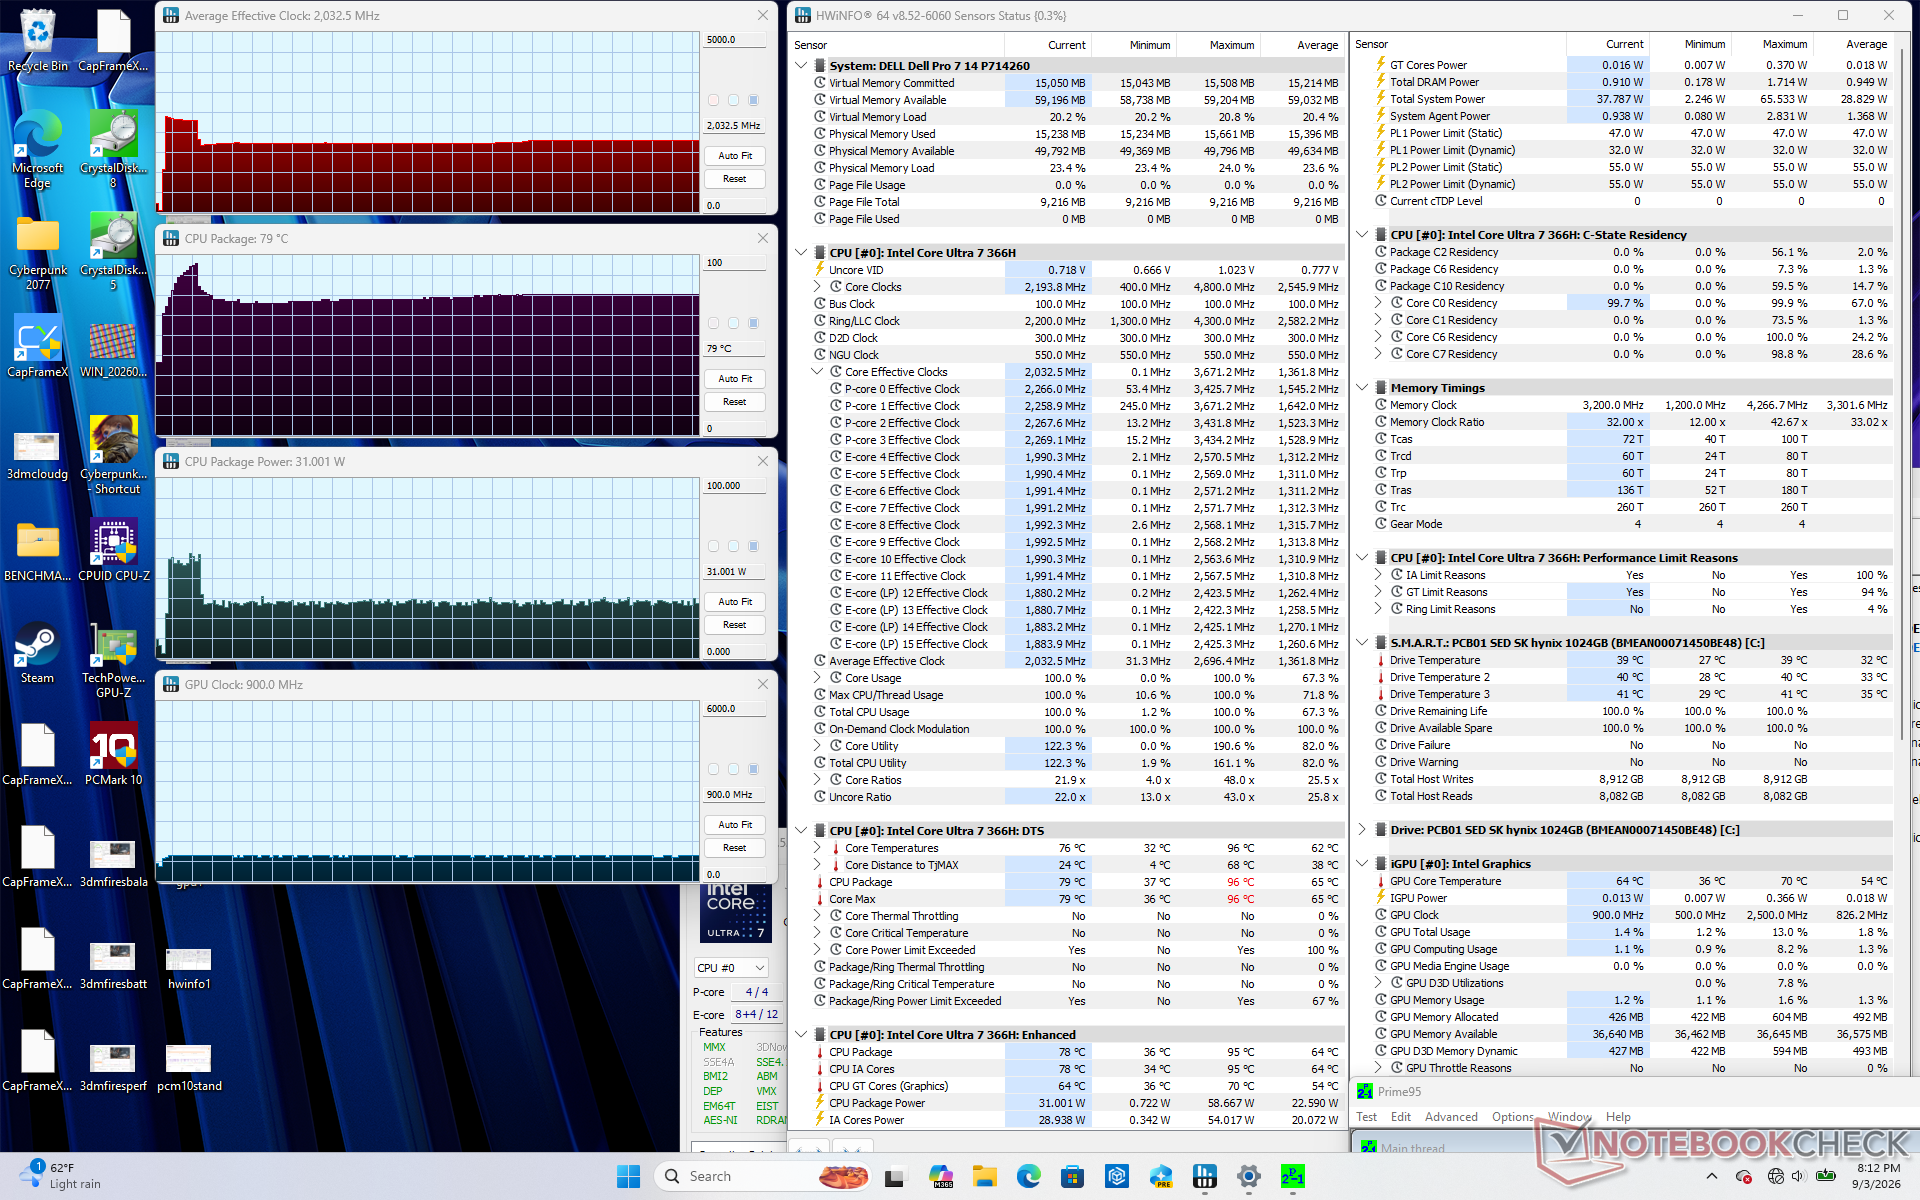
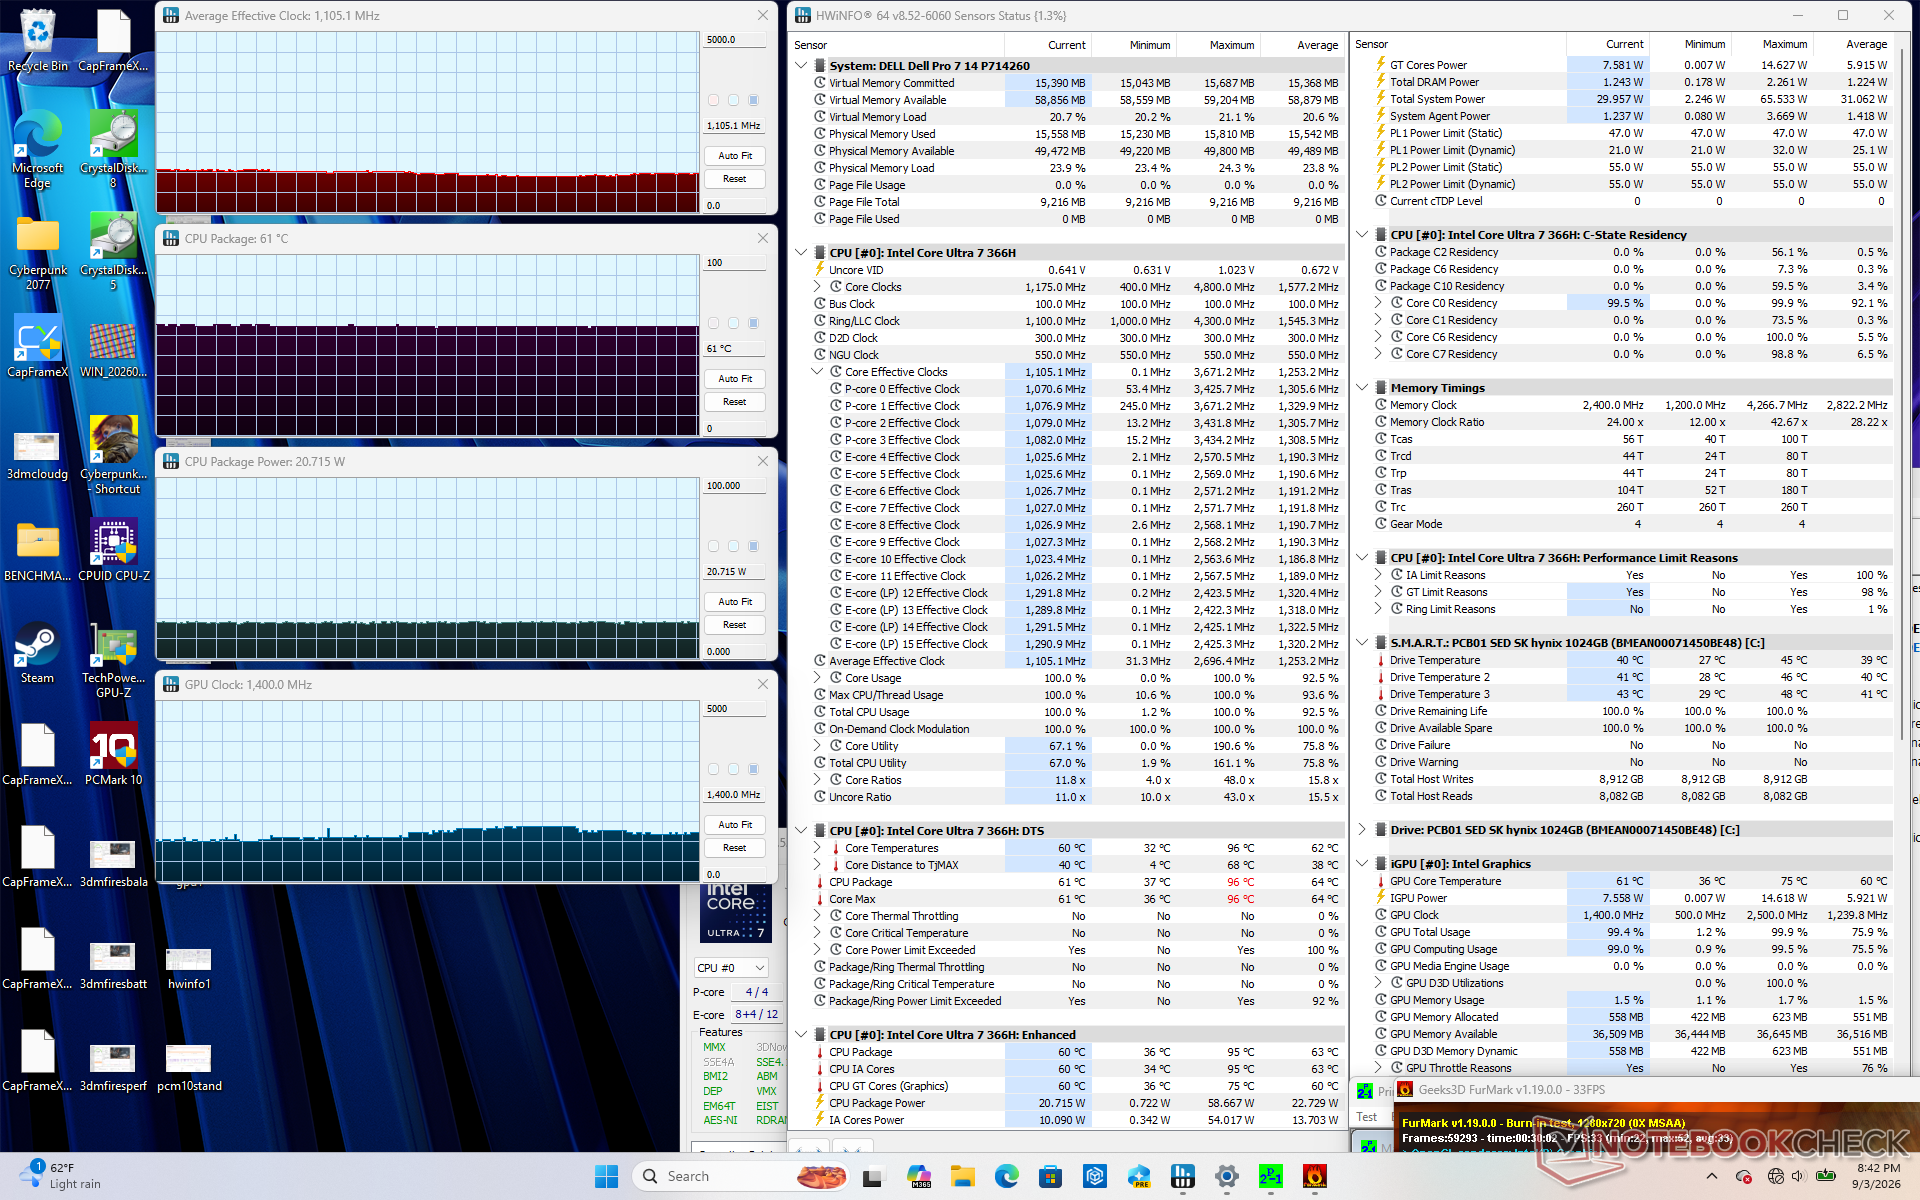
| Durchschnittliche CPU-Taktfrequenz (GHz) | GPU-Taktfrequenz (MHz) | Durchschnittliche CPU-Temperatur (°C) | |
| System im Leerlauf | -- | -- | 37 |
| Prime95-Stresstest | 2.0 | -- | 79 |
| Prime95 + FurMark-Stresstest | 1.1 | 1400 | 61 |
| Cyberpunk 2077 – Stress | 0,5 | 2400 | 64 |
Lautsprecher
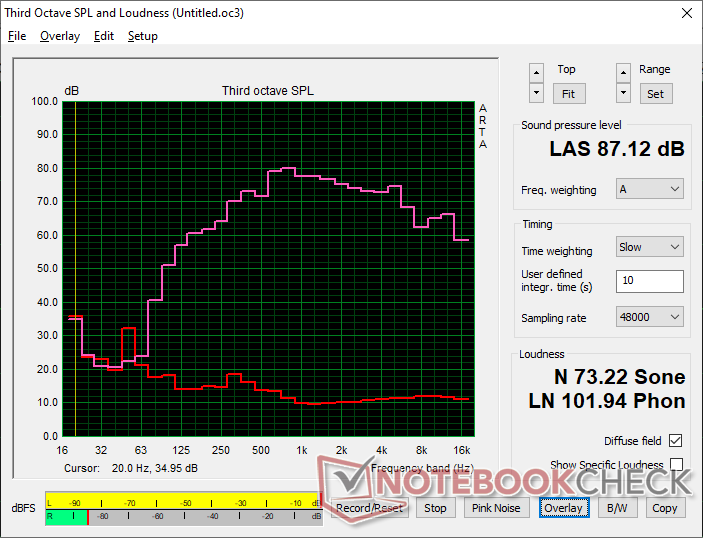
Dell Pro 7 14 P714260 Audio Analyse
(+) | Die Lautsprecher können relativ laut spielen (87.1 dB)
Bass 100 - 315 Hz
(±) | abgesenkter Bass - 12% geringer als der Median
(±) | durchschnittlich lineare Bass-Wiedergabe (8% Delta zum Vorgänger)
Mitteltöne 400 - 2000 Hz
(+) | ausgeglichene Mitten, vom Median nur 3.9% abweichend
(+) | lineare Mitten (3.7% Delta zum Vorgänger)
Hochtöne 2 - 16 kHz
(+) | ausgeglichene Hochtöne, vom Median nur 3.7% abweichend
(+) | sehr lineare Hochtöne (4.4% Delta zum Vorgänger)
Gesamt im hörbaren Bereich 100 - 16.000 Hz
(+) | hörbarer Bereich ist sehr linear (10.8% Abstand zum Median
Im Vergleich zu allen Geräten derselben Klasse
» 2% aller getesteten Geräte dieser Klasse waren besser, 2% vergleichbar, 96% schlechter
» Das beste Gerät hat einen Delta-Wert von 7%, durchschnittlich ist 21%, das schlechteste Gerät hat 53%
Im Vergleich zu allen Geräten im Test
» 6% aller getesteten Geräte waren besser, 2% vergleichbar, 92% schlechter
» Das beste Gerät hat einen Delta-Wert von 4%, durchschnittlich ist 23%, das schlechteste Gerät hat 136%
Apple MacBook Pro 16 2021 M1 Pro Audio Analyse
(+) | Die Lautsprecher können relativ laut spielen (84.7 dB)
Bass 100 - 315 Hz
(+) | guter Bass - nur 3.8% Abweichung vom Median
(+) | lineare Bass-Wiedergabe (5.2% Delta zum Vorgänger)
Mitteltöne 400 - 2000 Hz
(+) | ausgeglichene Mitten, vom Median nur 1.3% abweichend
(+) | lineare Mitten (2.1% Delta zum Vorgänger)
Hochtöne 2 - 16 kHz
(+) | ausgeglichene Hochtöne, vom Median nur 1.9% abweichend
(+) | sehr lineare Hochtöne (2.7% Delta zum Vorgänger)
Gesamt im hörbaren Bereich 100 - 16.000 Hz
(+) | hörbarer Bereich ist sehr linear (4.6% Abstand zum Median
Im Vergleich zu allen Geräten derselben Klasse
» 0% aller getesteten Geräte dieser Klasse waren besser, 0% vergleichbar, 100% schlechter
» Das beste Gerät hat einen Delta-Wert von 5%, durchschnittlich ist 17%, das schlechteste Gerät hat 45%
Im Vergleich zu allen Geräten im Test
» 0% aller getesteten Geräte waren besser, 0% vergleichbar, 100% schlechter
» Das beste Gerät hat einen Delta-Wert von 4%, durchschnittlich ist 23%, das schlechteste Gerät hat 136%
Energiemanagement
Stromverbrauch
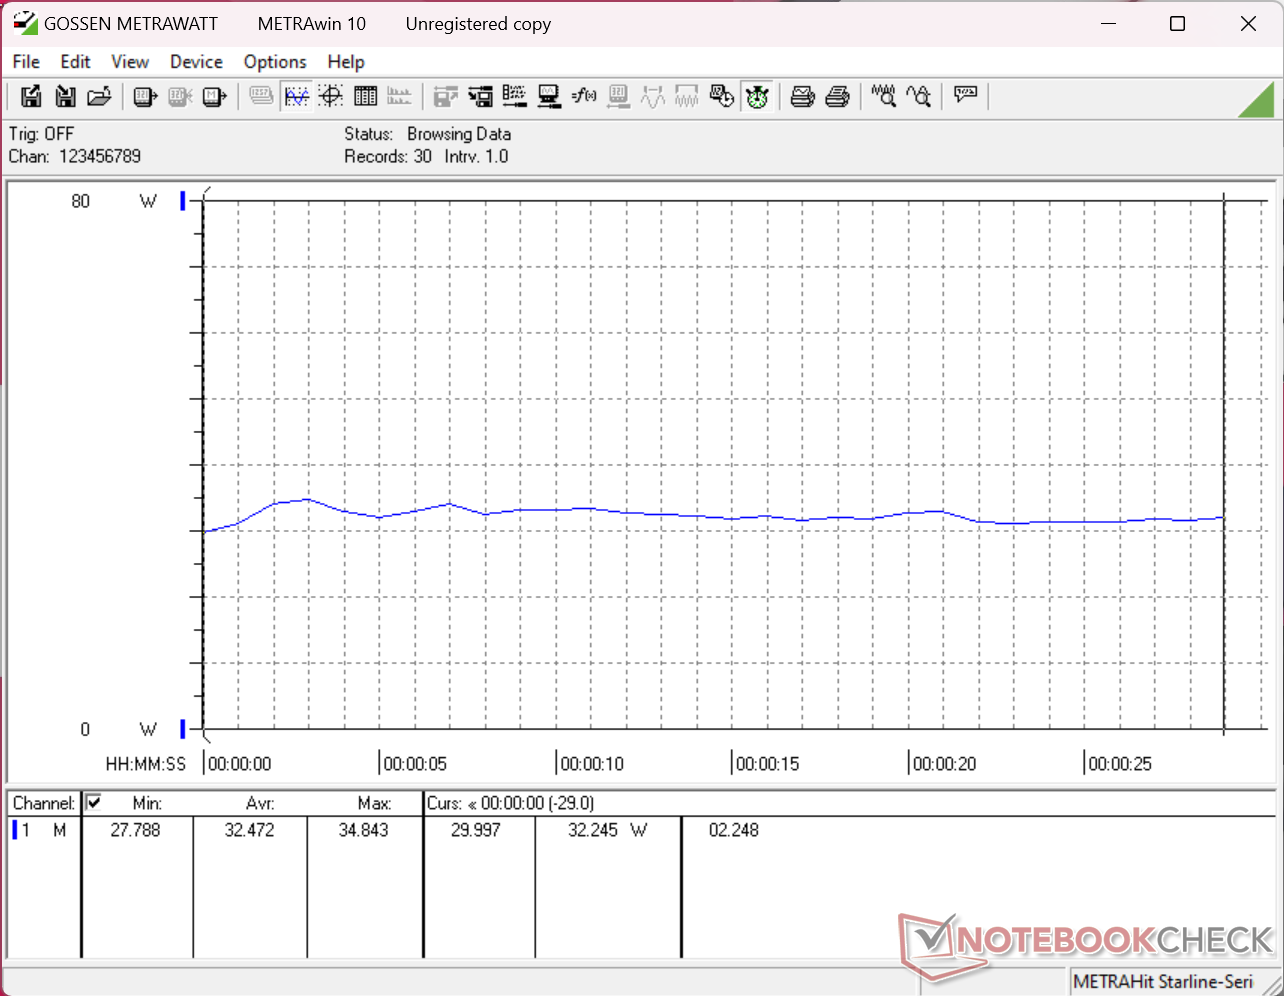
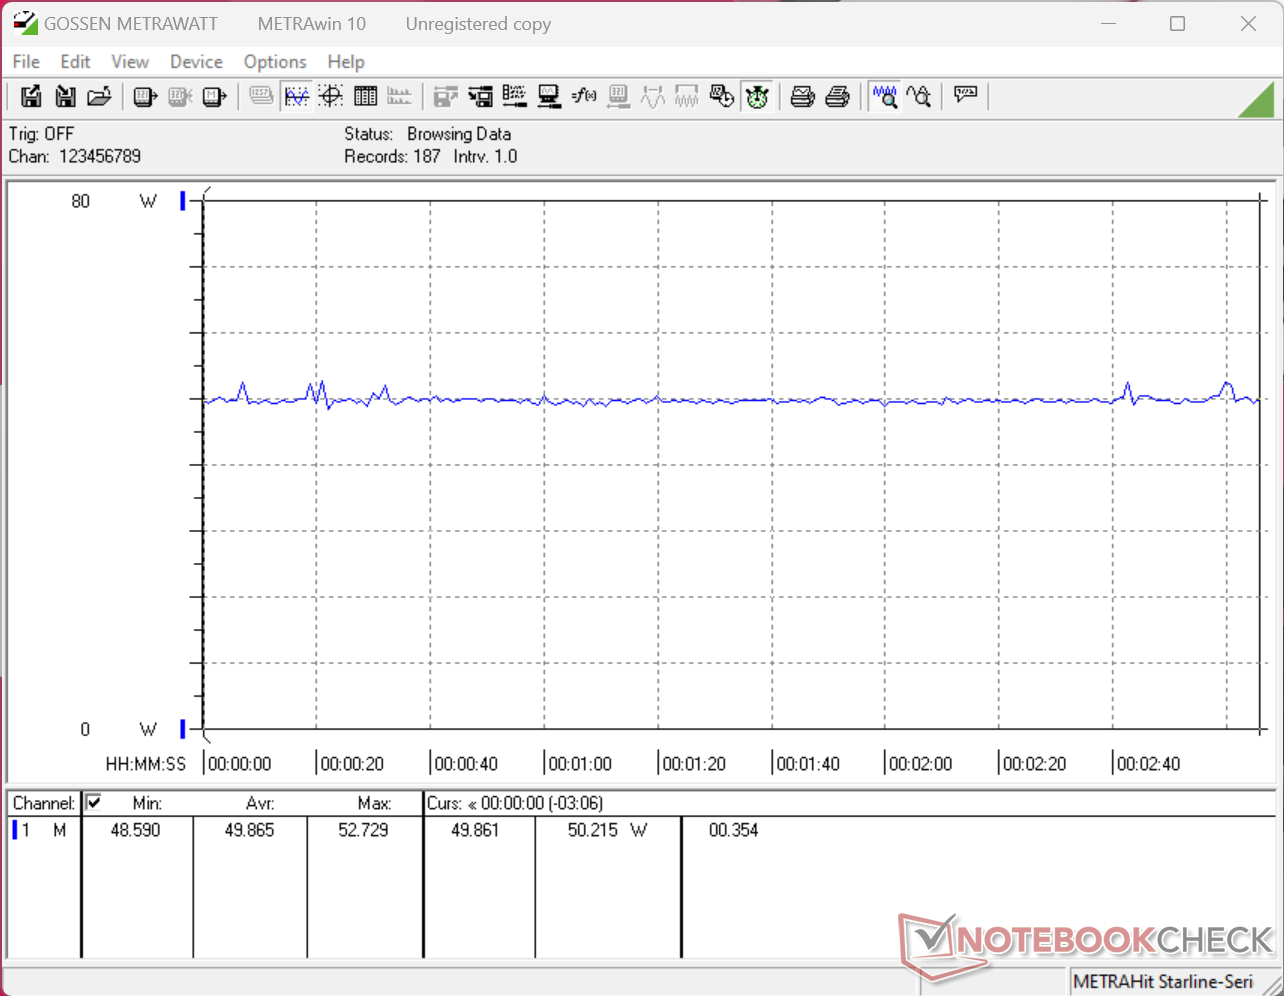
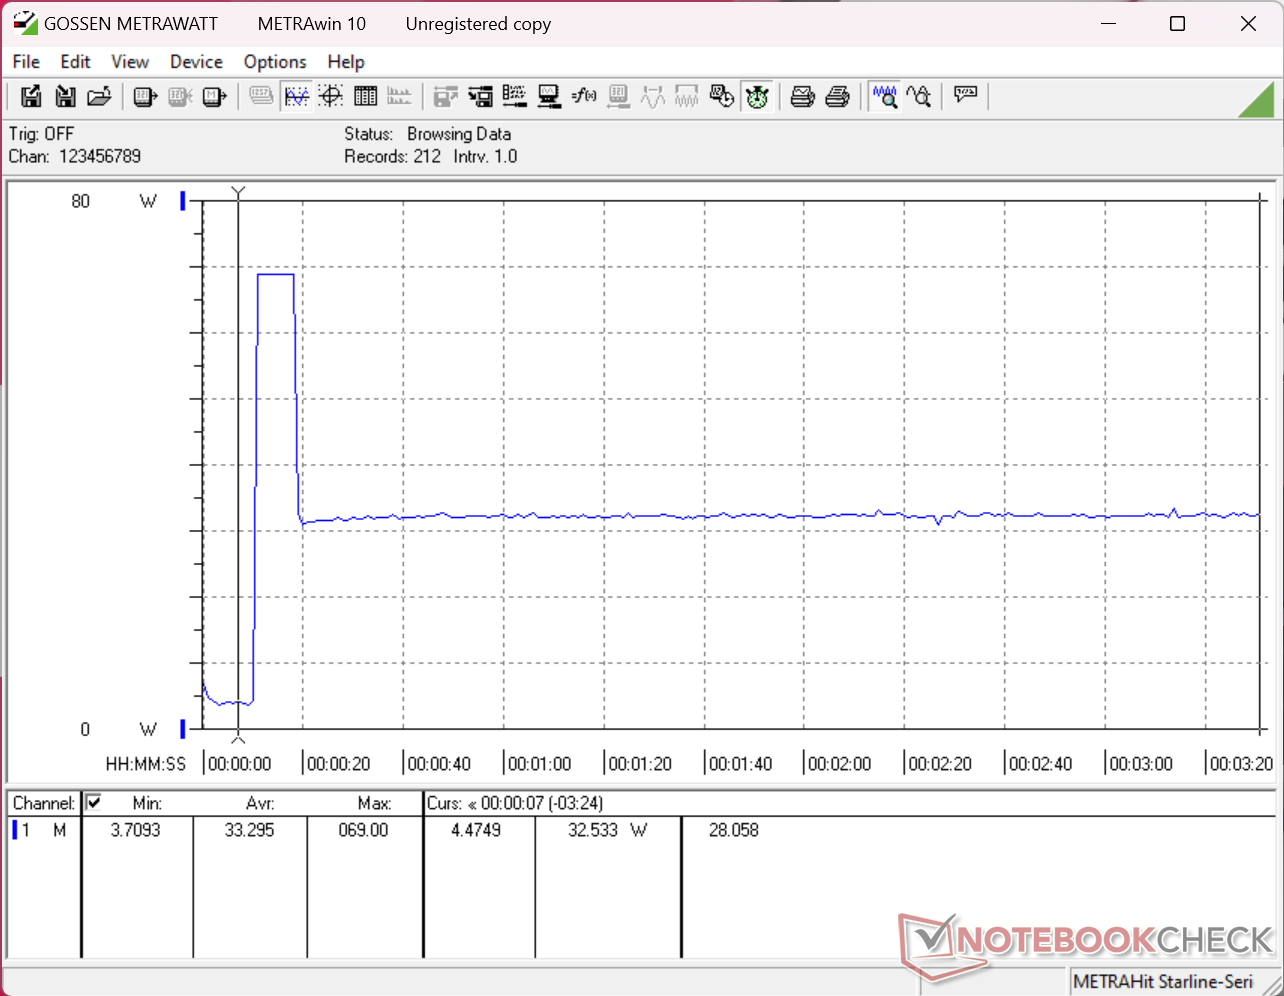
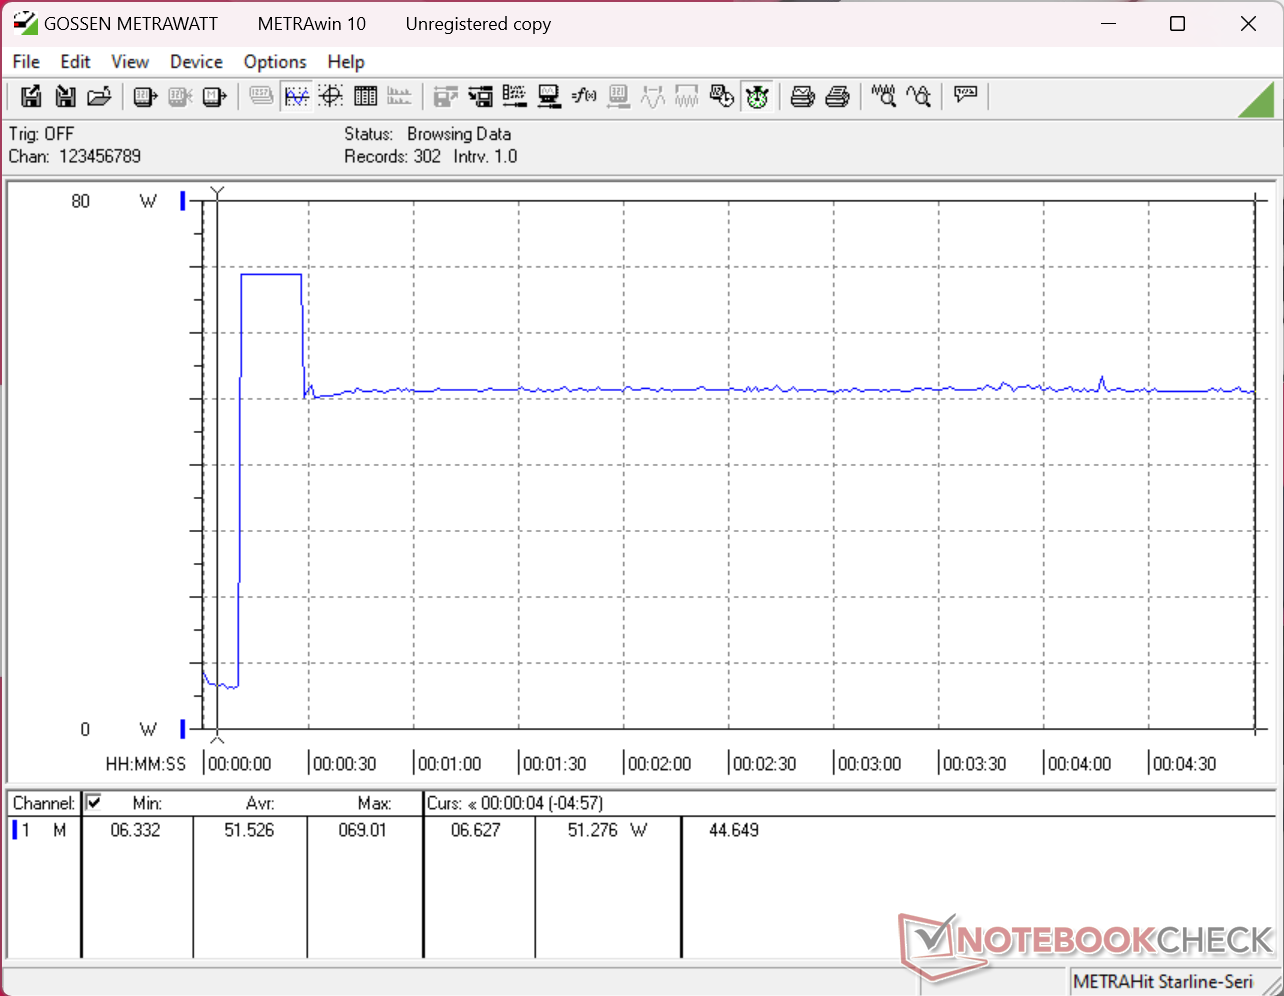
| Aus / Standby | 0.12 / 0.48 Watt |
| Idle | 1.4 / 4.3 / 4.6 Watt |
| Last |
32.5 / 69 Watt |
   
| |
Legende:
min: ,
med: ,
max: Metrahit Energy | |
| Dell Pro 7 14 P714260 Ultra 7 366H, Intel Graphics 4 Xe3 PTL, SK hynix PCB01 HFS001TFM9X186N, IPS, 1920x1200, 14" | Dell Pro 7 14 P714265 Ryzen AI 9 HX PRO 470, Radeon 890M, , IPS, 1920x1200, 14" | HP EliteBook 8 G2a 14 Ryzen AI 7 450, Radeon 860M, Western Digital PC SN5000S SDEPNSJ-1T00-1006, IPS, 1920x1200, 14" | Lenovo ThinkPad T14s Gen 7 21YW0022GE Ryzen AI 7 PRO 450, Radeon 860M, Micron 2650 MTFDKBA512TGW, IPS, 1920x1200, 14" | Asus ExpertBook Ultra B9406CAA Ultra X7 358H, Arc B390 Panther Lake iGPU, Samsung PM9E1 MZVLC2T0HBLD, OLED, 2880x1800, 14" | Acer TravelMate P6 TMP614-54-TCO-553Z Core Ultra 5 226V, Arc 130V, WDC PC SN810 512GB, IPS, 1920x1200, 14" | |
|---|---|---|---|---|---|---|
| Stromverbrauch | -34% | -28% | -35% | -34% | -39% | |
| Idle min * (Watt) | 1.4 | 2.8 -100% | 2.7 -93% | 2.7 -93% | 3.5 -150% | 4.21 -201% |
| Idle avg * (Watt) | 4.3 | 6 -40% | 5.8 -35% | 5.5 -28% | 4 7% | 5.365 -25% |
| Idle max * (Watt) | 4.6 | 7.4 -61% | 6.1 -33% | 6.8 -48% | 5.3 -15% | 6.7 -46% |
| Last avg * (Watt) | 32.5 | 47.9 -47% | 48.1 -48% | 60.5 -86% | 43.7 -34% | |
| Cyberpunk 2077 ultra * (Watt) | 49.9 | 47.9 4% | 55.1 -10% | 49.7 -0% | 61.3 -23% | 40.5 19% |
| Cyberpunk 2077 ultra external monitor * (Watt) | 47.4 | 45.3 4% | 38.4 19% | 44.1 7% | 61.4 -30% | 46 3% |
| Last max * (Watt) | 69 | 67 3% | 67.2 3% | 64.8 6% | 63.4 8% | 57 17% |
* ... kleinere Werte sind besser
Stromverbrauch Cyberpunk / Stresstest
Stromverbrauch eines externen Monitors
Akkulaufzeit
| Dell Pro 7 14 P714260 Ultra 7 366H, Intel Graphics 4 Xe3 PTL, 70 Wh | Dell Pro 7 14 P714265 Ryzen AI 9 HX PRO 470, Radeon 890M, 70 Wh | HP EliteBook 8 G2a 14 Ryzen AI 7 450, Radeon 860M, 68 Wh | Lenovo ThinkPad T14s Gen 7 21YW0022GE Ryzen AI 7 PRO 450, Radeon 860M, 58 Wh | Asus ExpertBook Ultra B9406CAA Ultra X7 358H, Arc B390 Panther Lake iGPU, 70 Wh | Acer TravelMate P6 TMP614-54-TCO-553Z Core Ultra 5 226V, Arc 130V, 65 Wh | |
|---|---|---|---|---|---|---|
| Akkulaufzeit | ||||||
| WLAN (h) | 23.5 | 15.7 -33% | 19.3 -18% | 17.4 -26% | 16.1 -31% | 22.1 -6% |
Notebookcheck-Bewertung
Im Vergleich zum AMD-basierten Dell Pro 7 14 verfügt die Intel-Version über Thunderbolt 4, eine etwas schnellere Grafikleistung und eine verbesserte Energieeffizienz für eine längere Akkulaufzeit, wenn auch auf Kosten einer etwas langsameren Prozessorleistung.
Dell Pro 7 14 P714260
- 07.09.2026 v8
Allen Ngo
 Total Sustainability Score:
 Mögliche Mitbewerber im Vergleich
Bild | Modell / Test | Preis ab | Gewicht | Dicke | Display |
|---|---|---|---|---|---|
1. 84.5%  | Dell Pro 7 14 P714260 Intel Core Ultra 7 366H ⎘ Intel Graphics 4 Xe3 Panther Lake iGPU ⎘ 64 GB RAM, SSD | Amazon: 799,00 € Geizhals Suche | 1.4 kg | 14.73 mm | 14.00" 1920x1200 162 PPI IPS |
2. 84.7%  | Dell Pro 7 14 P714265 AMD Ryzen AI 9 HX PRO 470 ⎘ AMD Radeon 890M ⎘ 64 GB RAM | Amazon: 799,00 € Listenpreis: 4900 USD | 1.3 kg | 16.45 mm | 14.00" 1920x1200 162 PPI IPS |
3. 87.4%  | HP EliteBook 8 G2a 14 AMD Ryzen AI 7 450 ⎘ AMD Radeon 860M ⎘ 32 GB RAM, 1000 GB SSD | Amazon: 1. 1.777,52 € HP EliteBook 8 G1a Notebook ... 2. 2.007,79 € HP EliteBook 8 G2a Notebook ... 3. 2.668,00 € HP EliteBook 8 G2a Notebook ... Bestpreis 2475€ CNW IT-Systeme 2. 2477€ MetaComp 3. 2532.34€ Klarsicht IT | 1.5 kg | 15.5 mm | 14.00" 1920x1200 162 PPI IPS |
4. 89.7%  | Lenovo ThinkPad T14s Gen 7 21YW0022GE AMD Ryzen AI 7 PRO 450 ⎘ AMD Radeon 860M ⎘ 64 GB RAM, 512 GB SSD | Amazon: 1. 2.352,00 € Lenovo ThinkPad T14s Gen 7 2... 2. 2.132,08 € Lenovo ThinkPad T14s Gen 6 2... 3. 2.343,21 € Lenovo ThinkPad T14s Gen 6 2... | 1.2 kg | 15.9 mm | 14.00" 1920x1200 162 PPI IPS |
5. 87.6%  | Asus ExpertBook Ultra B9406CAA Intel Core Ultra X7 358H ⎘ Intel Arc B390 12 Xe3 Panther Lake iGPU ⎘ 32 GB RAM, 2048 GB SSD | Amazon: 1.613,57 € Bestpreis 3432.29€ computeruniverse.net 2. 3432.29€ Cyberport.de 3. 3461.14€ computeruniverse.at | 1.1 kg | 15.9 mm | 14.00" 2880x1800 243 PPI OLED |
6. 85.7%  | Acer TravelMate P6 TMP614-54-TCO-553Z Intel Core Ultra 5 226V ⎘ Intel Arc Graphics 130V ⎘ 16 GB RAM, 512 GB SSD | Amazon: 1.249,23 € Bestpreis 1191.89€ playox.de 2. 1191.9€ office-partner.de 3. 1201.91€ playox (AT) | 1 kg | 17 mm | 14.00" 1920x1200 162 PPI IPS |
Transparenz
Die Auswahl der zu testenden Geräte erfolgt innerhalb der Redaktion. Das vorliegende Testmuster wurde dem Autor vom Hersteller oder einem Shop zu Testzwecken leihweise zur Verfügung gestellt. Eine Einflussnahme des Leihstellers auf den Testbericht gab es nicht, der Hersteller erhielt keine Version des Reviews vor der Veröffentlichung. Es bestand keine Verpflichtung zur Publikation. Als eigenständiges, unabhängiges Unternehmen unterliegt Notebookcheck keiner Diktion von Herstellern, Shops und Verlagen.
So testet Notebookcheck
Pro Jahr werden von Notebookcheck hunderte Laptops und Smartphones unabhängig in von uns standardisierten technischen Verfahren getestet, um eine Vergleichbarkeit aller Testergebnisse zu gewährleisten. Seit rund 20 Jahren entwickeln wir diese Testmethoden kontinuierlich weiter und setzen damit Branchenstandards. In unseren Testlaboren kommt ausschließlich hochwertiges Messequipment in die Hände erfahrener Techniker und Redakteure. Die Tests unterliegen einer mehrstufigen Kontrolle. Unsere komplexe Gesamtbewertung basiert auf hunderten fundierten Messergebnissen und Benchmarks, womit Ihnen Objektivität garantiert ist. Weitere Informationen zu unseren Testmethoden gibt es hier.
 Als bevorzugte Quelle auf Google hinzufügen


