

Notebookcheck Logo
Teaser

Dell 14S DS14260 im Test: XPS-Feeling zum kleineren Preis?

Rundumerneuerung.

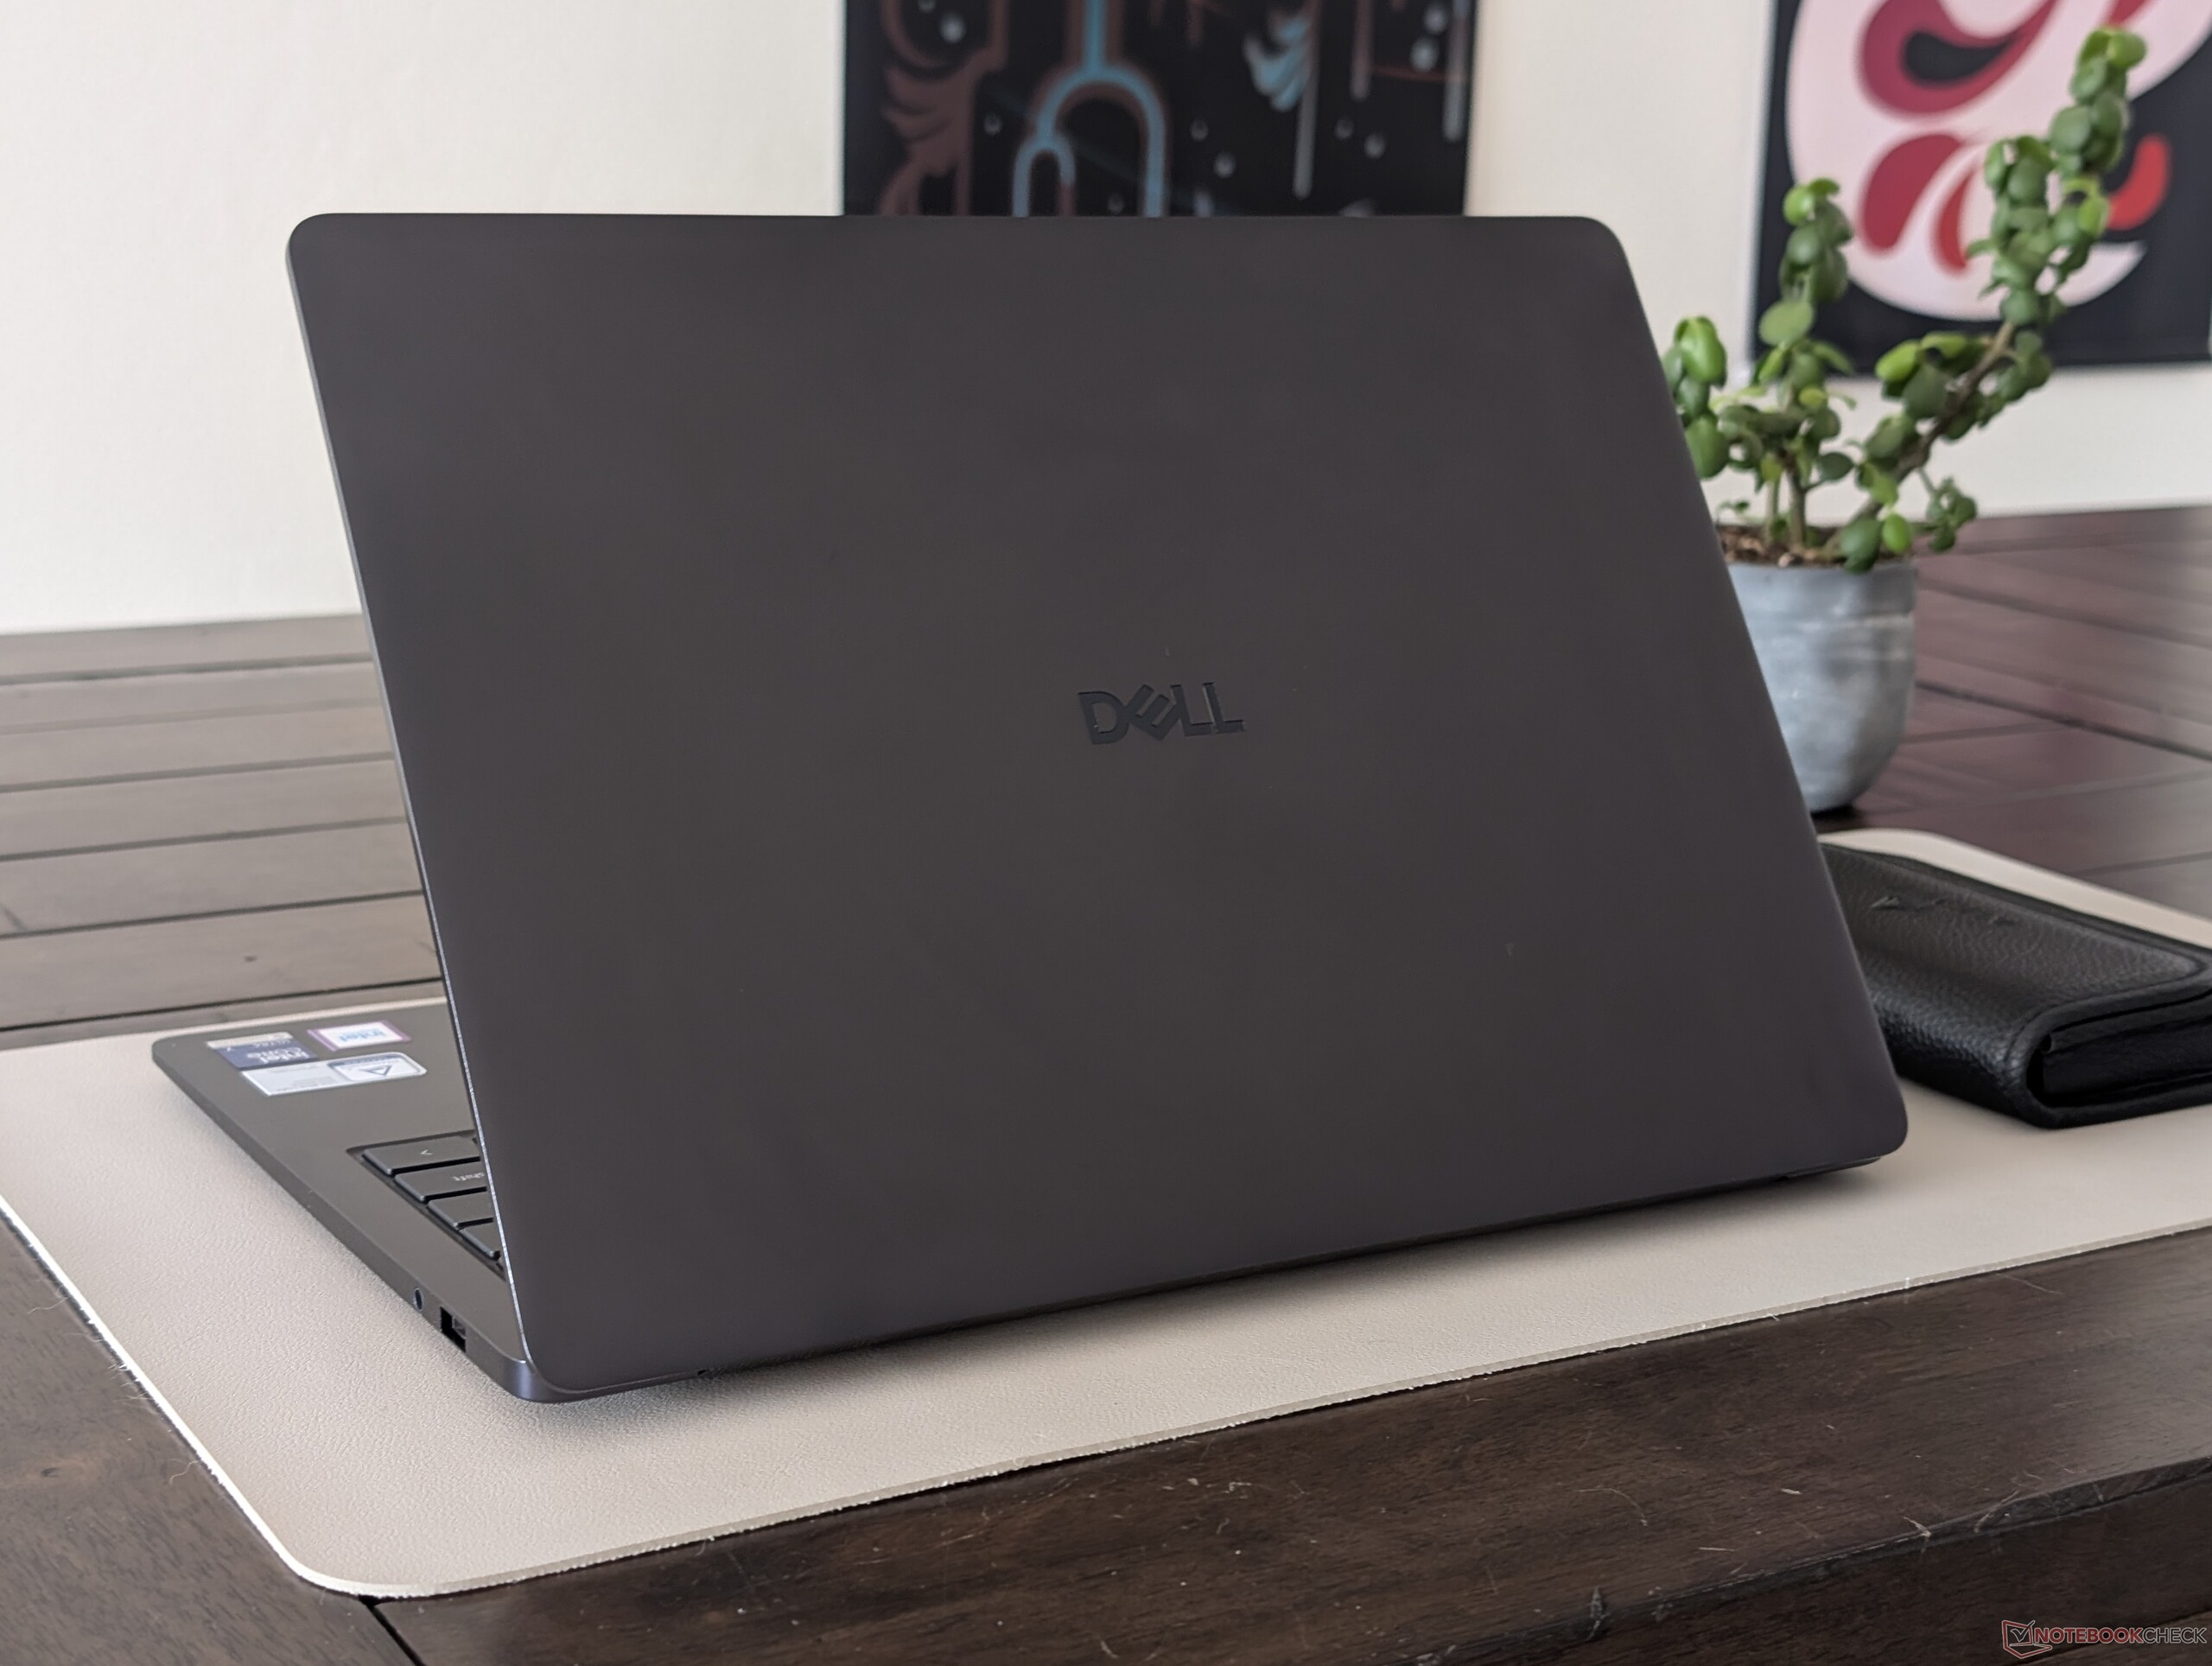
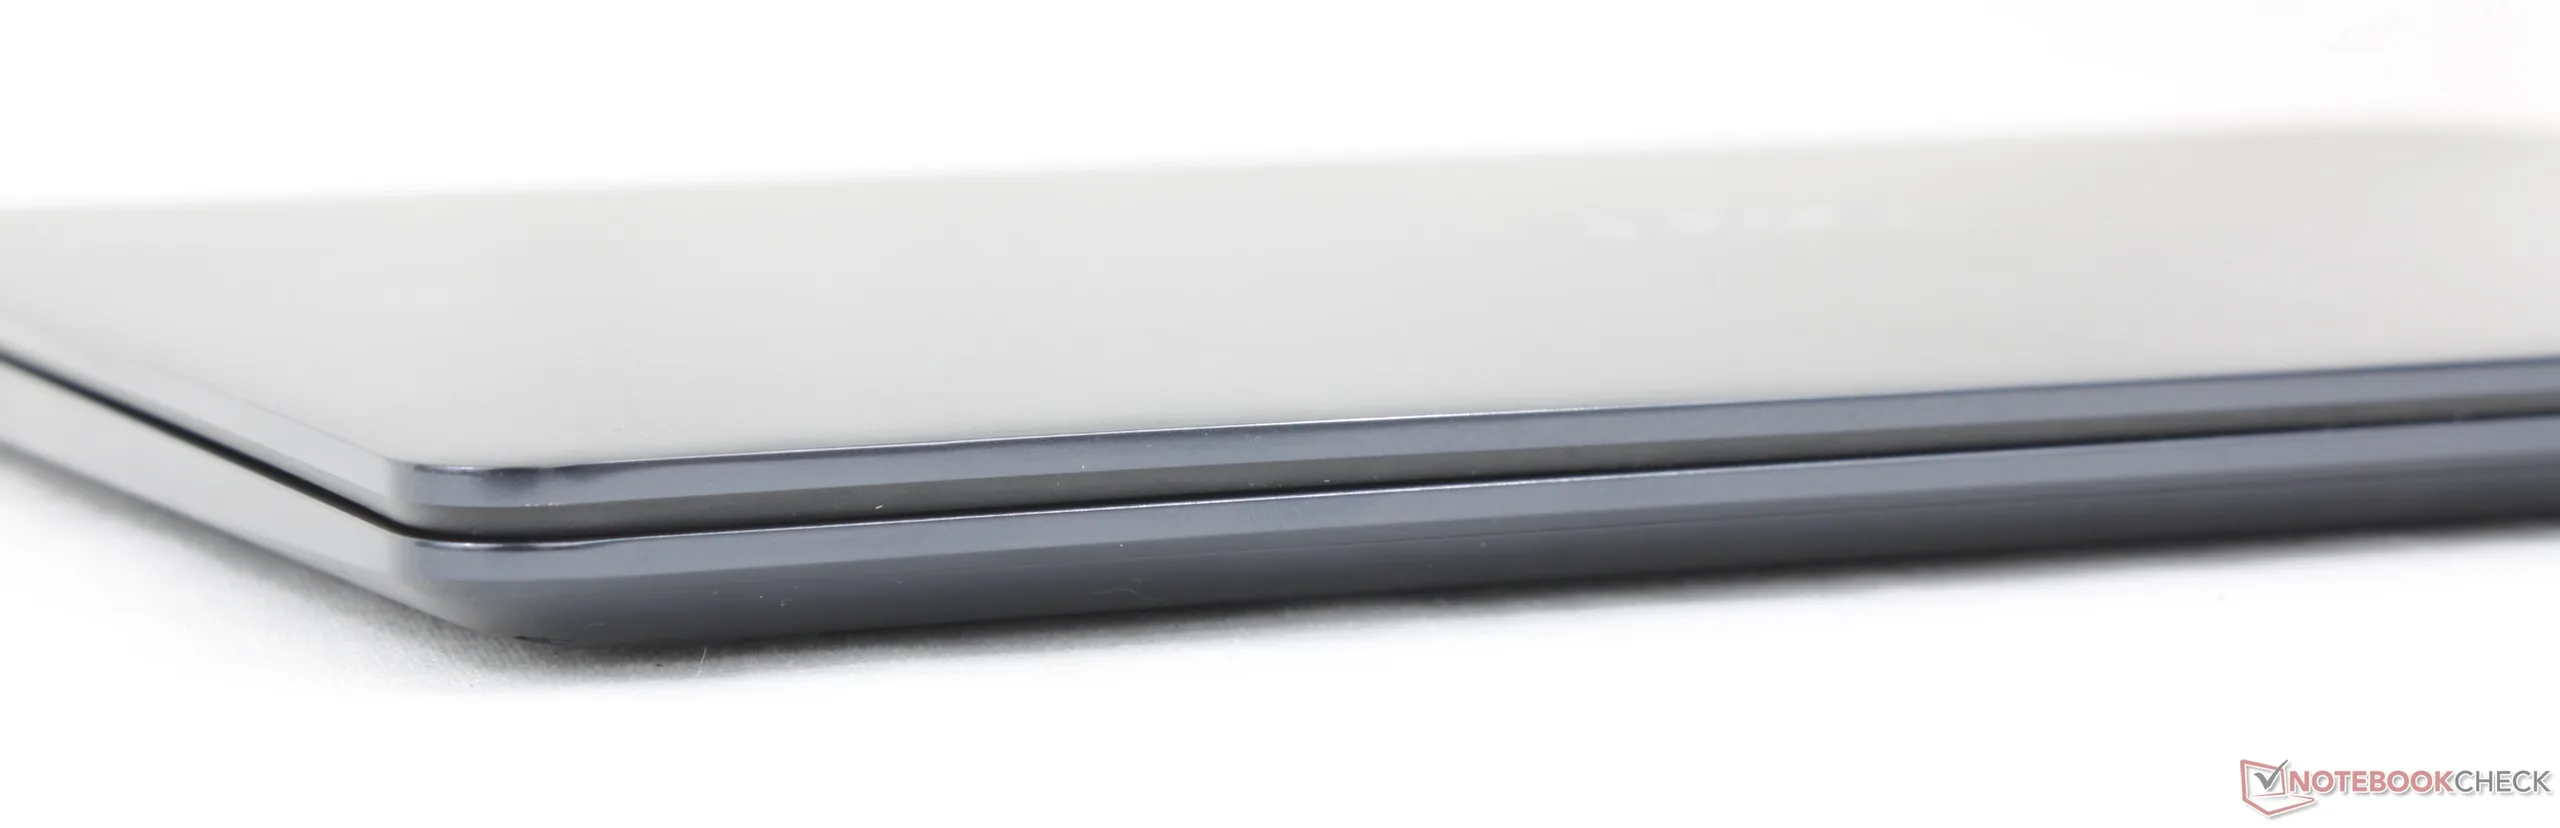
Das Dell 14S stellt insbesondere hinsichtlich des Gehäusedesigns und der Stabilität eine deutliche Verbesserung gegenüber dem Dell 14 Plus dar. Dennoch ist es selbst für einen 16-Zoller etwas schwerer, als uns lieb ist.
Allen Ngo, 👁 Allen Ngo, Andrea Grüblinger (übersetzt von DeepL / Ninh Duy) Veröffentlicht am 🇺🇸 🇳🇱 ...
Laptop / Notebook Panther Lake Ultrabook

Fazit – Sieht viel besser aus und fühlt sich viel besser an als zuvor

In unserem Test zum Dell 14 Plus lobten wir dessen Effizienz und sein Preis-Leistungs-Verhältnis dank Lunar Lake, kritisierten jedoch das veraltete Design, das seit den Inspiron-Tagen unverändert geblieben war. Beim Dell 14S hat der Hersteller das Gehäuse überarbeitet und mehr Metall verwendet. Das neuere Design ist wohl eines der wichtigsten Verkaufsargumente des Dell 14S, da die reine Leistung des Core Ultra 7 355 ansonsten dem Lunar-Lake-Core-Ultra-7-256V im Dell 14 Plus des letzten Jahres recht ähnlich ist. Nutzer, die sich mehr Leistung wünschen, sollten die Core-Ultra-X7-Konfigurationen in Betracht ziehen.

Um das Dell 14S besser von teureren Flaggschiff-Modellen wie dem XPS 14 abzugrenzen, ist es bestenfalls mit Display-Panels der Mittelklasse ausgestattet. So bietet beispielsweise die OLED-Option lediglich 60 Hz und ist nur halb so hell wie das OLED-Display des XPS 14 oder im Vergleich zum Asus ExpertBook Ultra 14 sogar noch dunkler. Zwar ist eine Bildwiederholfrequenz von 120 Hz verfügbar, doch ist diese Option an ein IPS-Display gebunden, was bedeutet, dass Nutzer zugunsten der flüssigeren Bildwiederholfrequenz Abstriche bei der Bildqualität in Kauf nehmen müssen. Zudem gehört das Modell zu den schwereren 14-Zoll-Laptops, da Konkurrenzmodelle wie das Lenovo Yoga Slim 7 Ultra 14IPH11 über 500 g leichter sind. Nutzer, denen HDR-Unterstützung und Tragbarkeit besonders wichtig sind, sollten sich daher nach solchen Alternativen umsehen.

Pro

+ robustes Gehäuse
+ angemessene Auswahl an integrierten Anschlüssen
+ Core Ultra X7-Optionen
+ lange Akkulaufzeit

Contra

- Mangelhafte HDR-Unterstützung, selbst bei Konfiguration mit OLED
- Die Kerntemperaturen erreichen unter Last ~90 °C
- Keinen Webcam-Shutter
- Relativ schwer

Preis und Verfügbarkeit

Direkt bei Dell erhalten Sie das 14S zu einem Preis ab 1.649 Euro für die Konfiguration mit Core 7 355.

Amazon Logo
1.599,00 €
Dell 14S Laptop - Intel Core Ultra 7 355, 16GB RAM, 512GB SSD

Das Dell 14S ist das neueste Mittelklasse-Notebook des Herstellers und der direkte Nachfolger des Dell 14 Plus aus dem letzten Jahr. Das Gehäuse wurde mit stabileren Metallmaterialien aufgewertet und verfügt zudem über einen größeren Lüfter sowie einen größeren Akku als zuvor.

Unser Testgerät ist eine mittlere Konfiguration mit der Core Ultra 7 355 Panther Lake-CPU und einem 1200p-OLED-Touchscreen mit 60 Hz für etwa 1.500 US-Dollar. Teurere Modelle sind mit IPS-Displays mit höherer Auflösung oder dem deutlich schnelleren Core Ultra X7 358H ausgestattet, während die Einstiegsvarianten mit dem Core Ultra 5 322 und einem 1200p-IPS-Display ohne Touchfunktion kommen.

Zu den Alternativen zum Dell 14S zählen andere Multimedia-Subnotebooks der Mittelklasse wie das Asus VivoBook S 14, die HP OmniBook 7-Serie oder die Lenovo IdeaPad Slim-Serie. Eine 16-Zoll-Version dieses Modells ist ebenfalls erhältlich und trägt die Bezeichnung Dell 16S.

Weitere Dell-Testberichte:

Technische Daten

Dell 14S DS14260
Prozessor
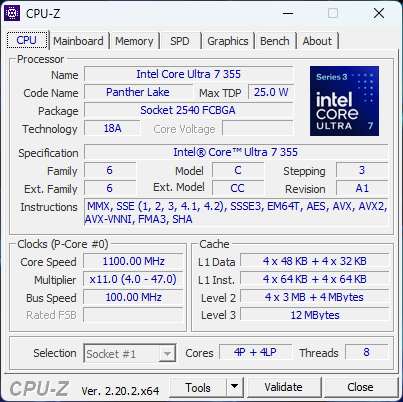
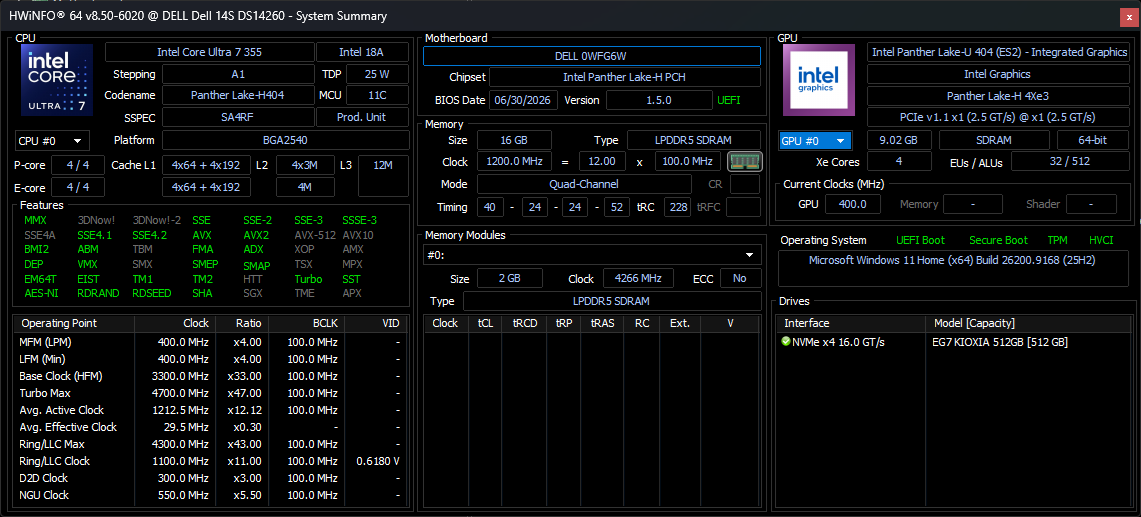
Intel Core Ultra 7 355 8c/8t, 4 x 4.7 GHz Intel Cougar Cove P-Core, 4 x 3.5 GHz Intel Darkmont LP E-Core, 56 W PL2 / Short Burst, 34 W PL1 / Sustained, Panther Lake
Grafikkarte
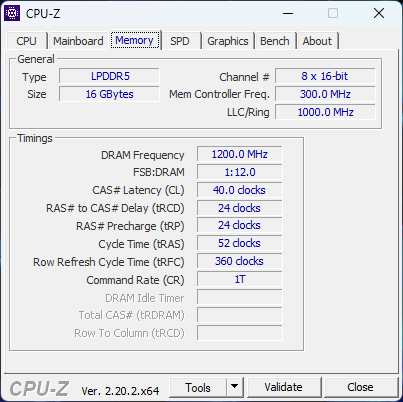
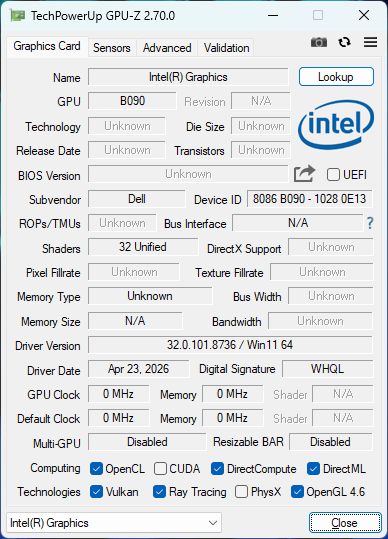
Intel Graphics 4 Xe3 Panther Lake iGPU, Kerntakt: 2500 MHz, LPDDR5x, 32.0.101.8736
RAM
16 GB 
, LPDDR5x-7467, Dual-Channel, Soldered
Bildschirm
14.00 Zoll 16:10, 1920 x 1200 Pixel 162 PPI, 10-point capacitive, Samsung 140KW04, OLED, Dell P/N: 0RV56, spiegelnd: ja, 60 Hz
Mainboard
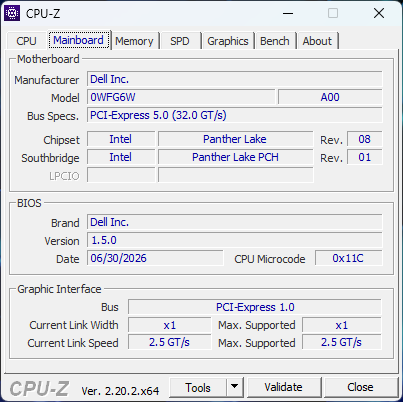
Intel Panther Lake-H PCH
Soundkarte
Intel Panther Lake-H PCH - High Definition Audio - AVS (Audio, Voice, Speech)
Anschlüsse
2 USB 3.0 / 3.1 Gen1, 2 Thunderbolt 4, USB-C Power Delivery (PD), 1 HDMI, 2 DisplayPort, Audio Anschlüsse: 3.5 mm combo
Netzwerk
Intel Wi-Fi 7 BE211 320MHz (a/b/g/n = Wi-Fi 4/ac = Wi-Fi 5/ax = Wi-Fi 6/ Wi-Fi 6E 6 GHz be = Wi-Fi 7), Bluetooth 6
Abmessungen
Höhe x Breite x Tiefe (in mm): 15.3 x 313.7 x 224
Akku
70 Wh Lithium-Polymer
Betriebssystem
Microsoft Windows 11 Home
Kamera
Webcam: 1080p30 w/ IR
Primary Camera: 2 MPix
Sonstiges
Lautsprecher: Stereo, Dolby Atmos Core, Tastatur: Chiclet, Tastatur-Beleuchtung: ja, Dell Optimizer, SupportAssist, 12 Monate Garantie
Gewicht
1.481 kg, Netzteil: 327 g
Preis
1500 USD
Hinweis: Der Hersteller kann abweichende Bauteile wie Bildschirme, Laufwerke und Speicherriegel mit ähnlichen Spezifikationen unter dem gleichen Modellnamen einsetzen.


Gehäuse

Größenvergleich

313.5 mm 224 mm 21 mm 1.4 kg314 mm 226.15 mm 18.9 mm 1.7 kg313.7 mm 224 mm 15.3 mm 1.5 kg311 mm 222 mm 15.9 mm 1.3 kg312.6 mm 213.8 mm 13.9 mm 978 g311.1 mm 215.6 mm 10.7 mm 1.3 kg297 mm 210 mm 1 mm 5.7 g

Konnektivität

Vorderseite: Keine Anschlüsse
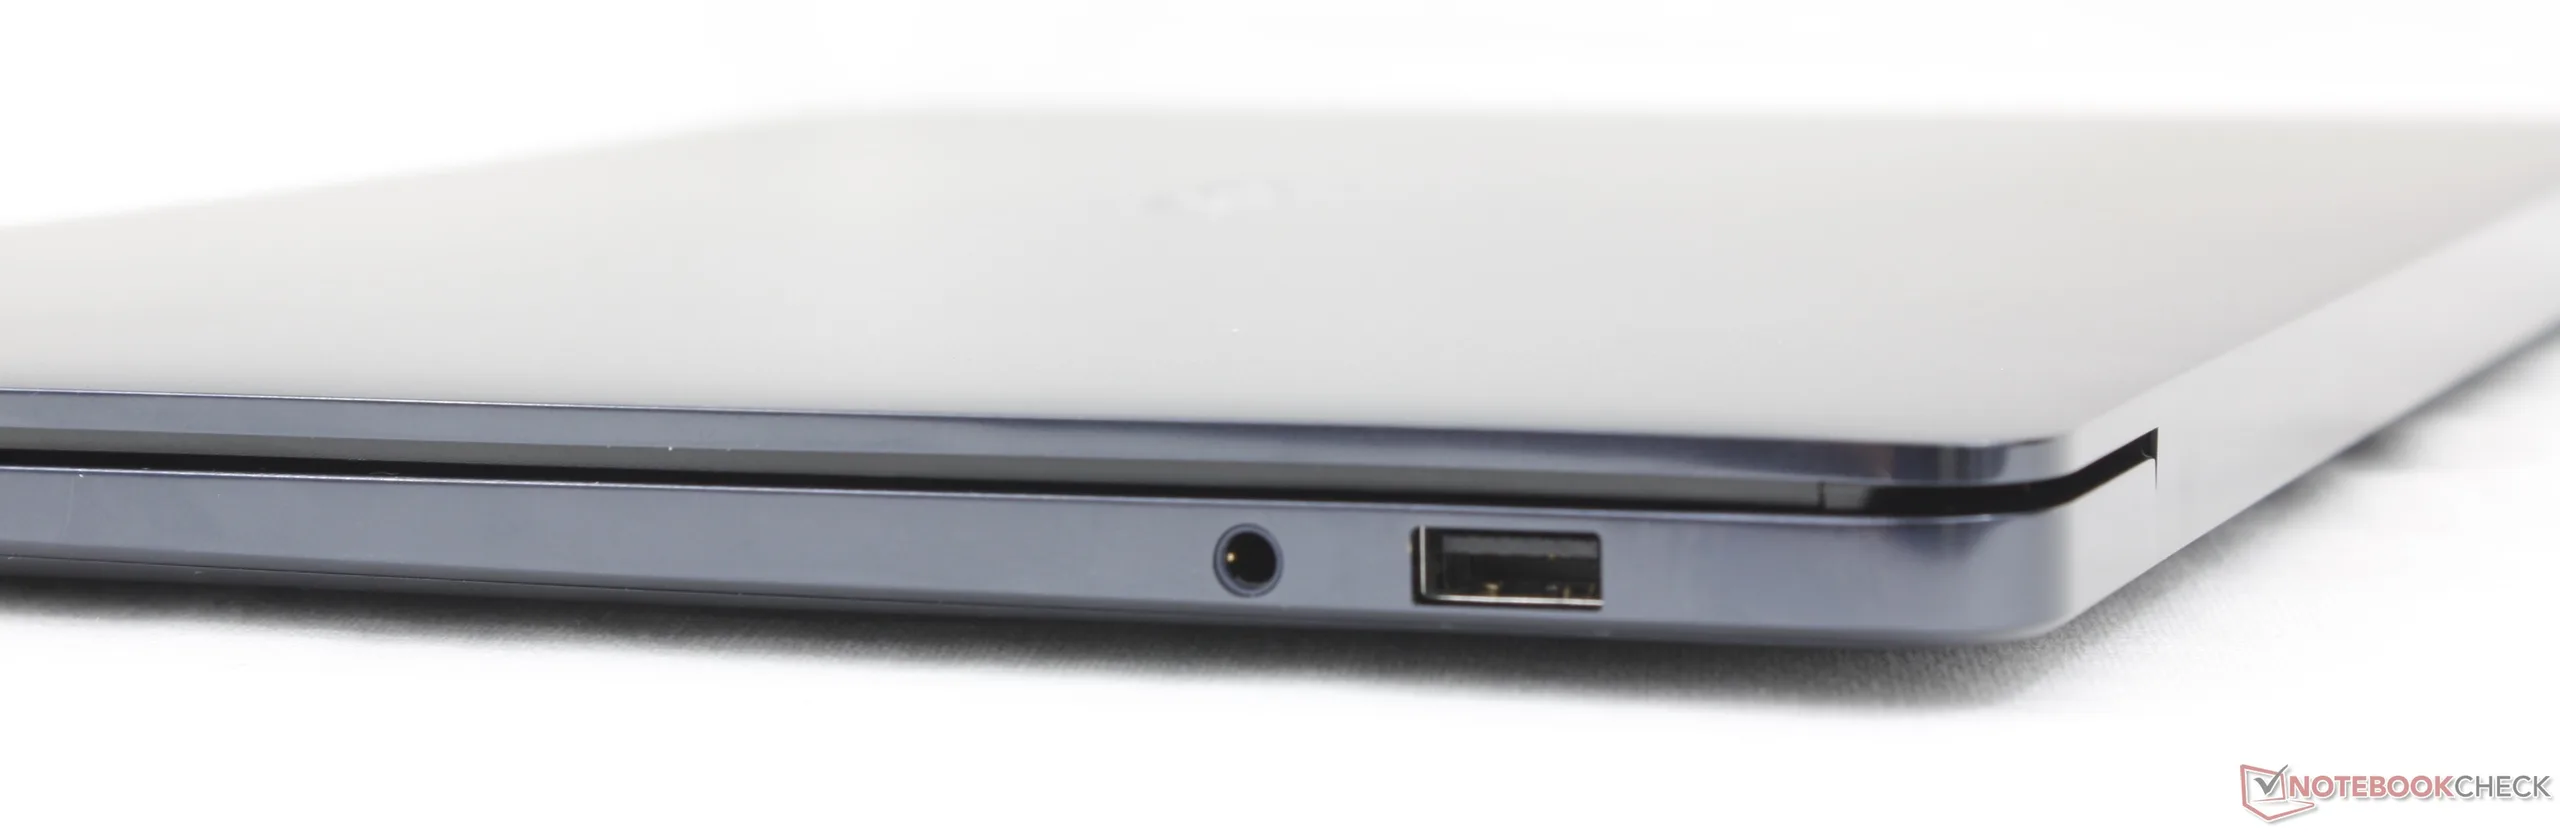
Rechts: 3,5-mm-Headset, USB-A 3.2 Gen. 1
Rückseite: Keine Anschlüsse
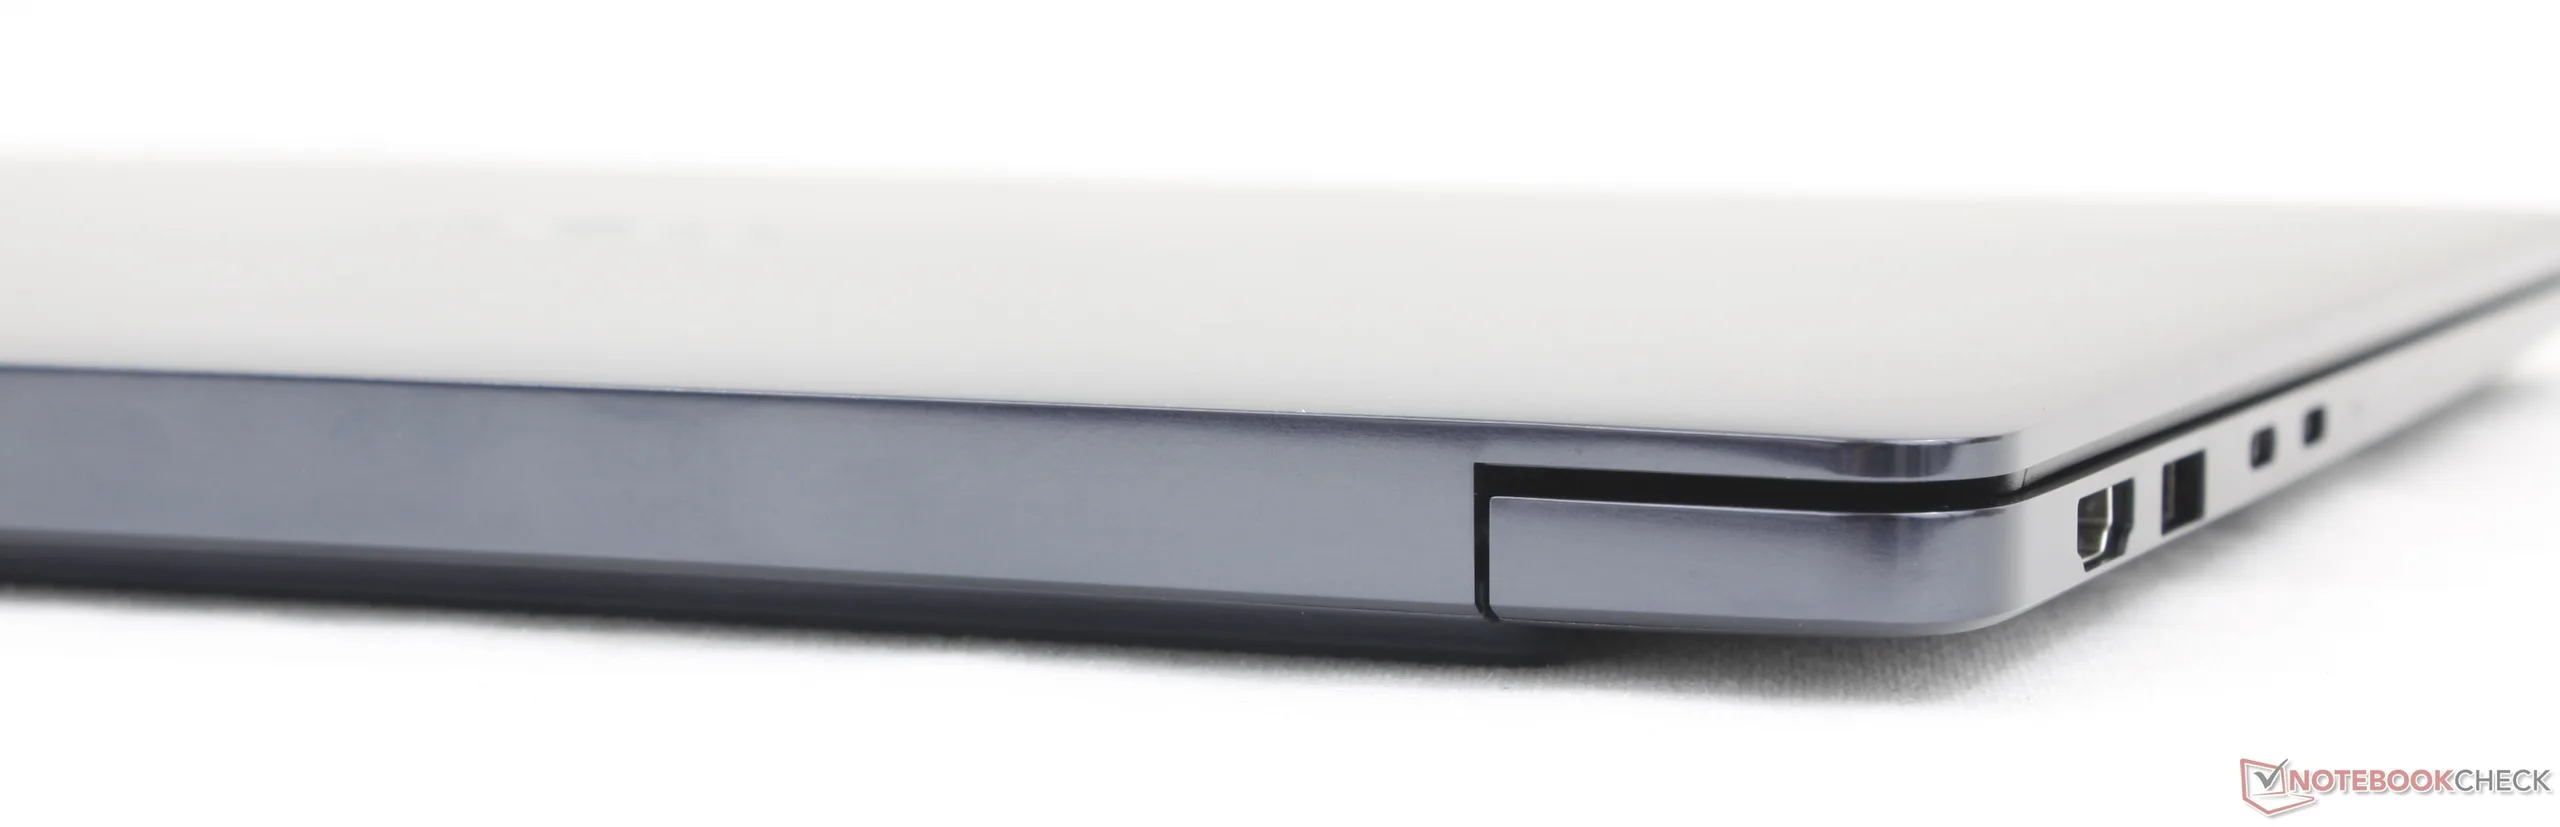
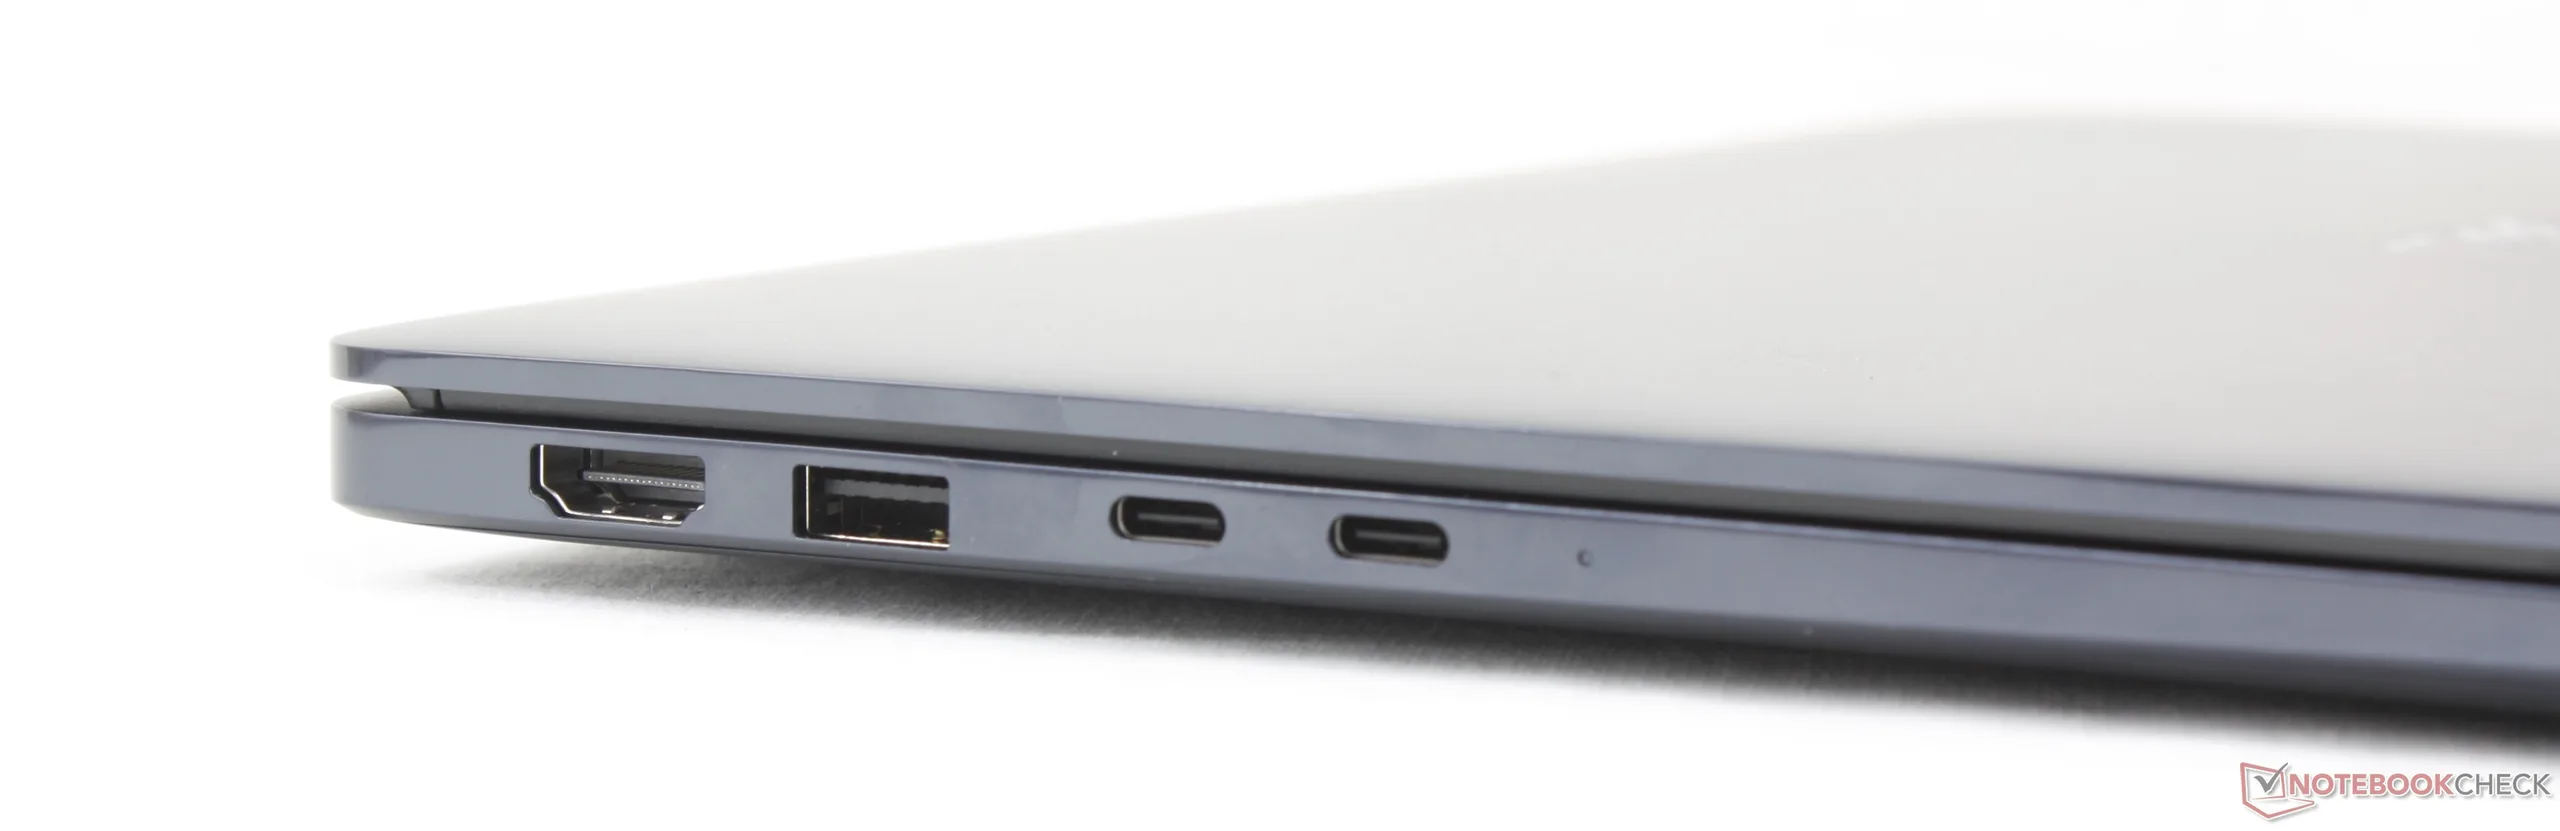
Links: HDMI 2.1, USB-A 3.2 Gen. 1, 2x USB-C Thunderbolt 4 mit DisplayPort 2.1 + Power Delivery

Kommunikation

Networking
iperf3 transmit Wi-Fi6/7 RT-BE96U
Lenovo ThinkBook 14 G9 IPL 21UX005PGE
Intel Wi-Fi 7 BE213 160MHz
2356 (1259min - 2607max) MBit/s
iperf3 receive Wi-Fi6/7 RT-BE96U
Lenovo ThinkBook 14 G9 IPL 21UX005PGE
Intel Wi-Fi 7 BE213 160MHz
1915 (1721min - 1966max) MBit/s
iperf3 receive AXE11000 6GHz
Dell XPS 14 Core Ultra X7 358H
Intel Wi-Fi 7 BE211 320MHz
1740 (1711min - 1757max) MBit/s +7%
HP OmniBook Ultra 14 Core Ultra X9
Intel Wi-Fi 7 BE211 320MHz
1702 (1671min - 1731max) MBit/s +4%
Dell 14S DS14260
Intel Wi-Fi 7 BE211 320MHz
1632 (1600min - 1654max) MBit/s
Dell Inspiron 14 7445 2-in-1
RealTek Semiconductor RTL8852CE WiFi 6E PCI-E NIC
824 (766min - 860max) MBit/s -50%
iperf3 transmit AXE11000 6GHz
Dell 14S DS14260
Intel Wi-Fi 7 BE211 320MHz
1654 (1516min - 1819max) MBit/s
HP OmniBook Ultra 14 Core Ultra X9
Intel Wi-Fi 7 BE211 320MHz
1626 (1572min - 1670max) MBit/s -2%
Dell XPS 14 Core Ultra X7 358H
Intel Wi-Fi 7 BE211 320MHz
1440 (1053min - 1526max) MBit/s -13%
Dell Inspiron 14 7445 2-in-1
RealTek Semiconductor RTL8852CE WiFi 6E PCI-E NIC
694 (653min - 873max) MBit/s -58%
0100200300400500600700800900100011001200130014001500160017001800Tooltip
Dell 14S DS14260; iperf3 receive AXE11000 6GHz; iperf 3.1.3: Ø1631 (1600-1654) MBit/s
Dell 14S DS14260; iperf3 transmit AXE11000 6GHz; iperf 3.1.3: Ø1654 (1516-1819) MBit/s

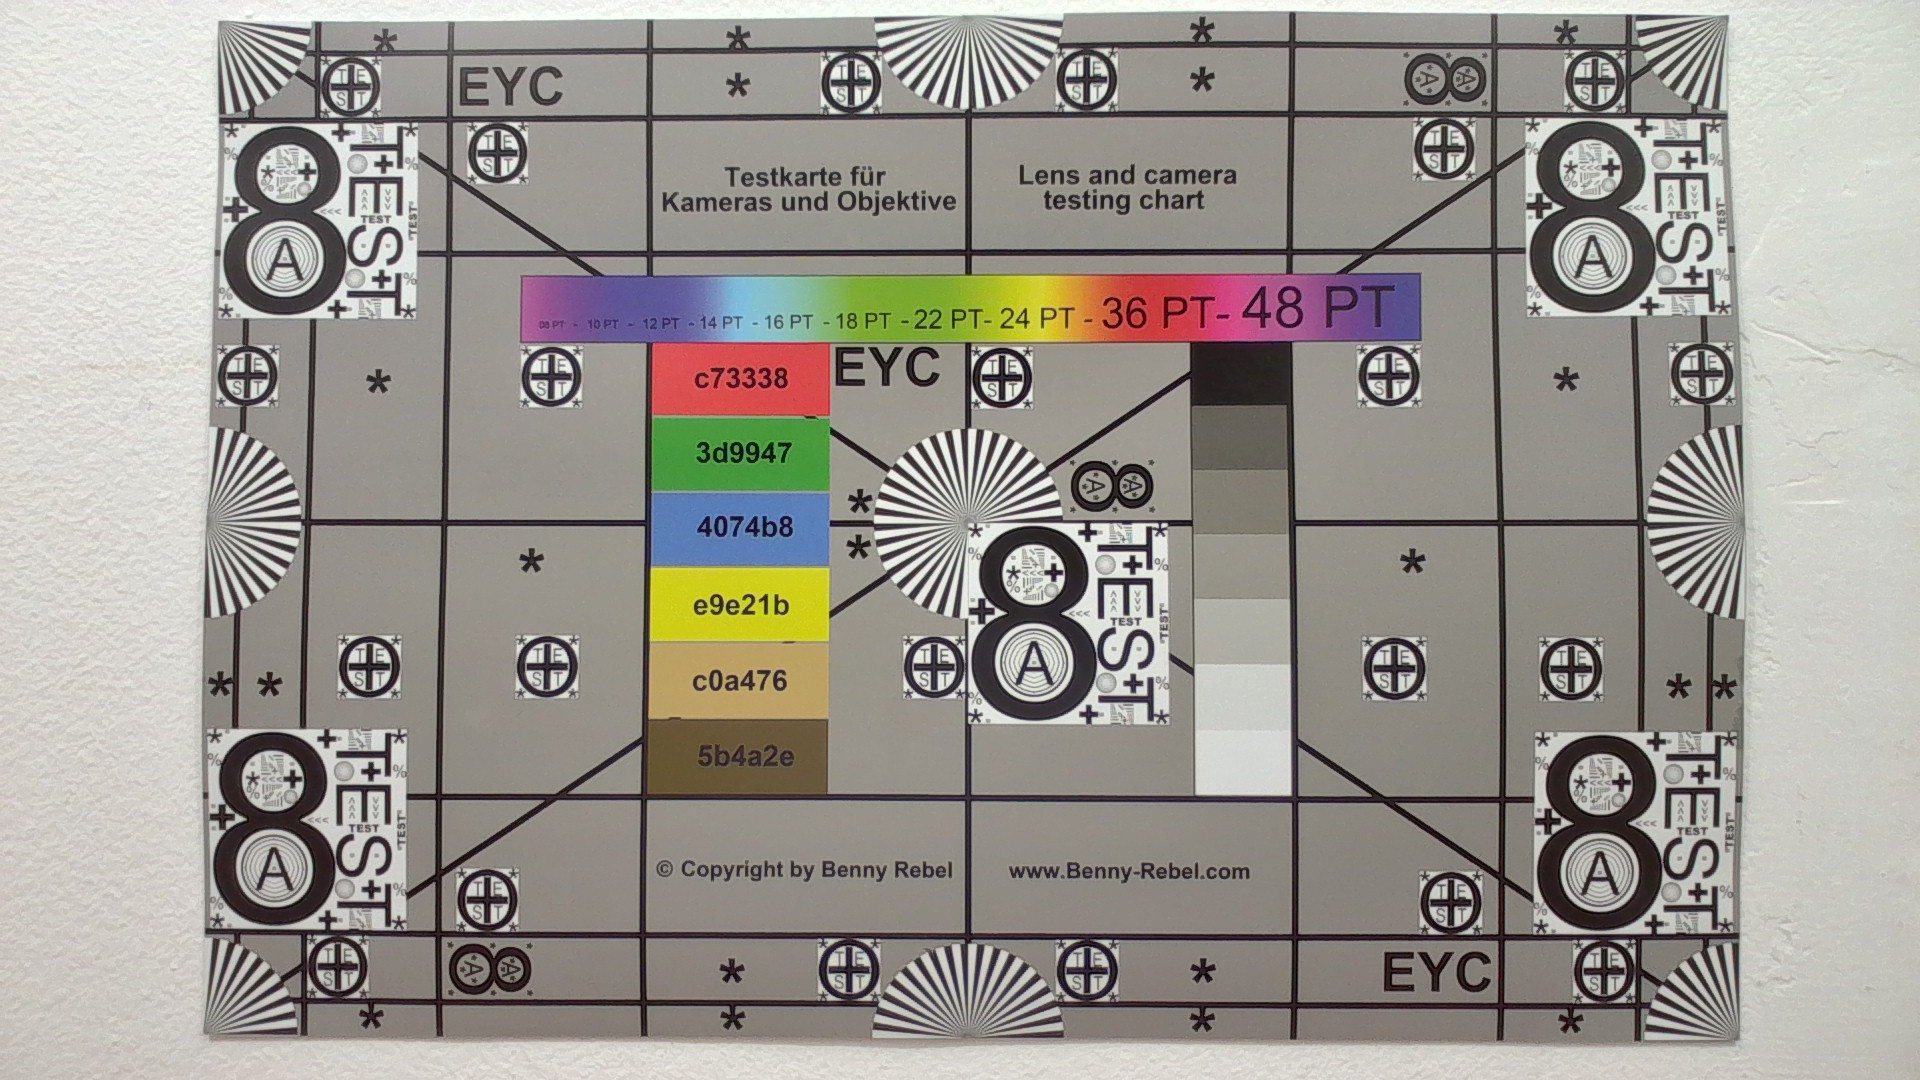
Webcam

ColorChecker
5.1 ∆E
8.7 ∆E
14.3 ∆E
13.4 ∆E
14.6 ∆E
12.5 ∆E
9.6 ∆E
8.9 ∆E
14 ∆E
9.8 ∆E
9.9 ∆E
8.3 ∆E
4 ∆E
14 ∆E
19.3 ∆E
11.2 ∆E
14.6 ∆E
14.1 ∆E
5.5 ∆E
11.5 ∆E
13.5 ∆E
14 ∆E
13.9 ∆E
10.6 ∆E
ColorChecker Dell 14S DS14260: 11.47 ∆E min: 4.04 - max: 19.34 ∆E

Wartung

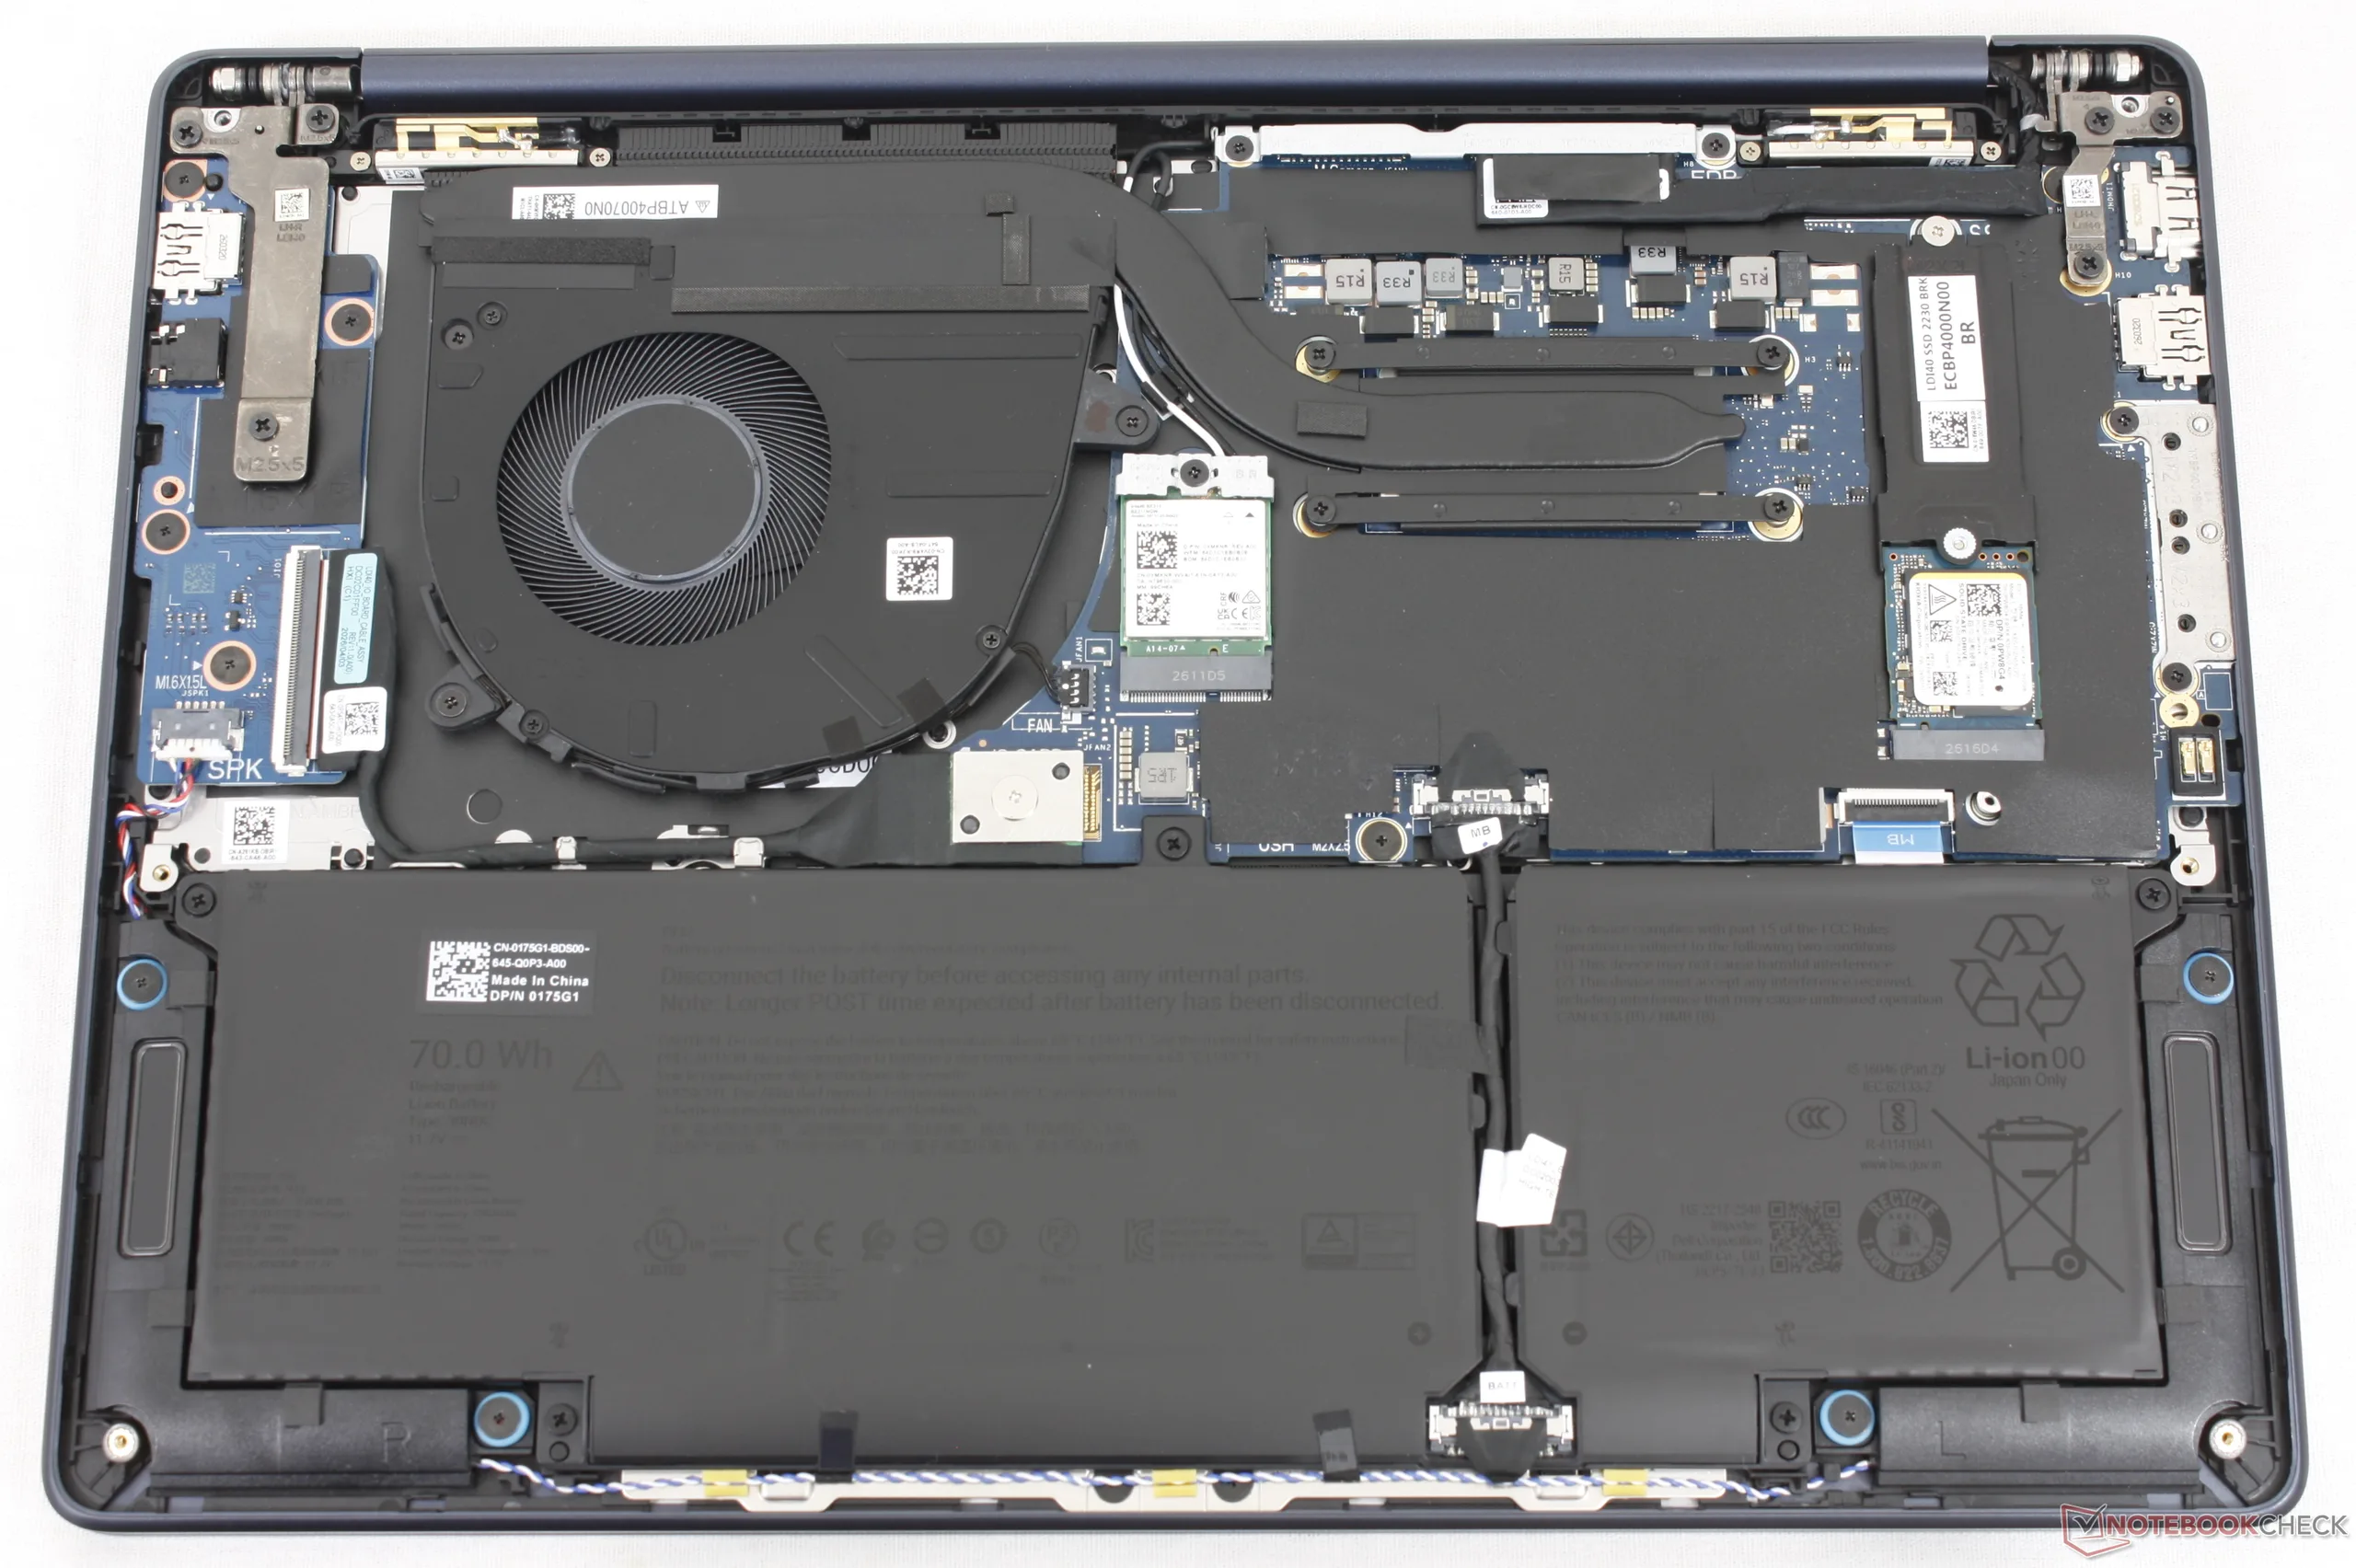
Dell 14S-Hauptplatine
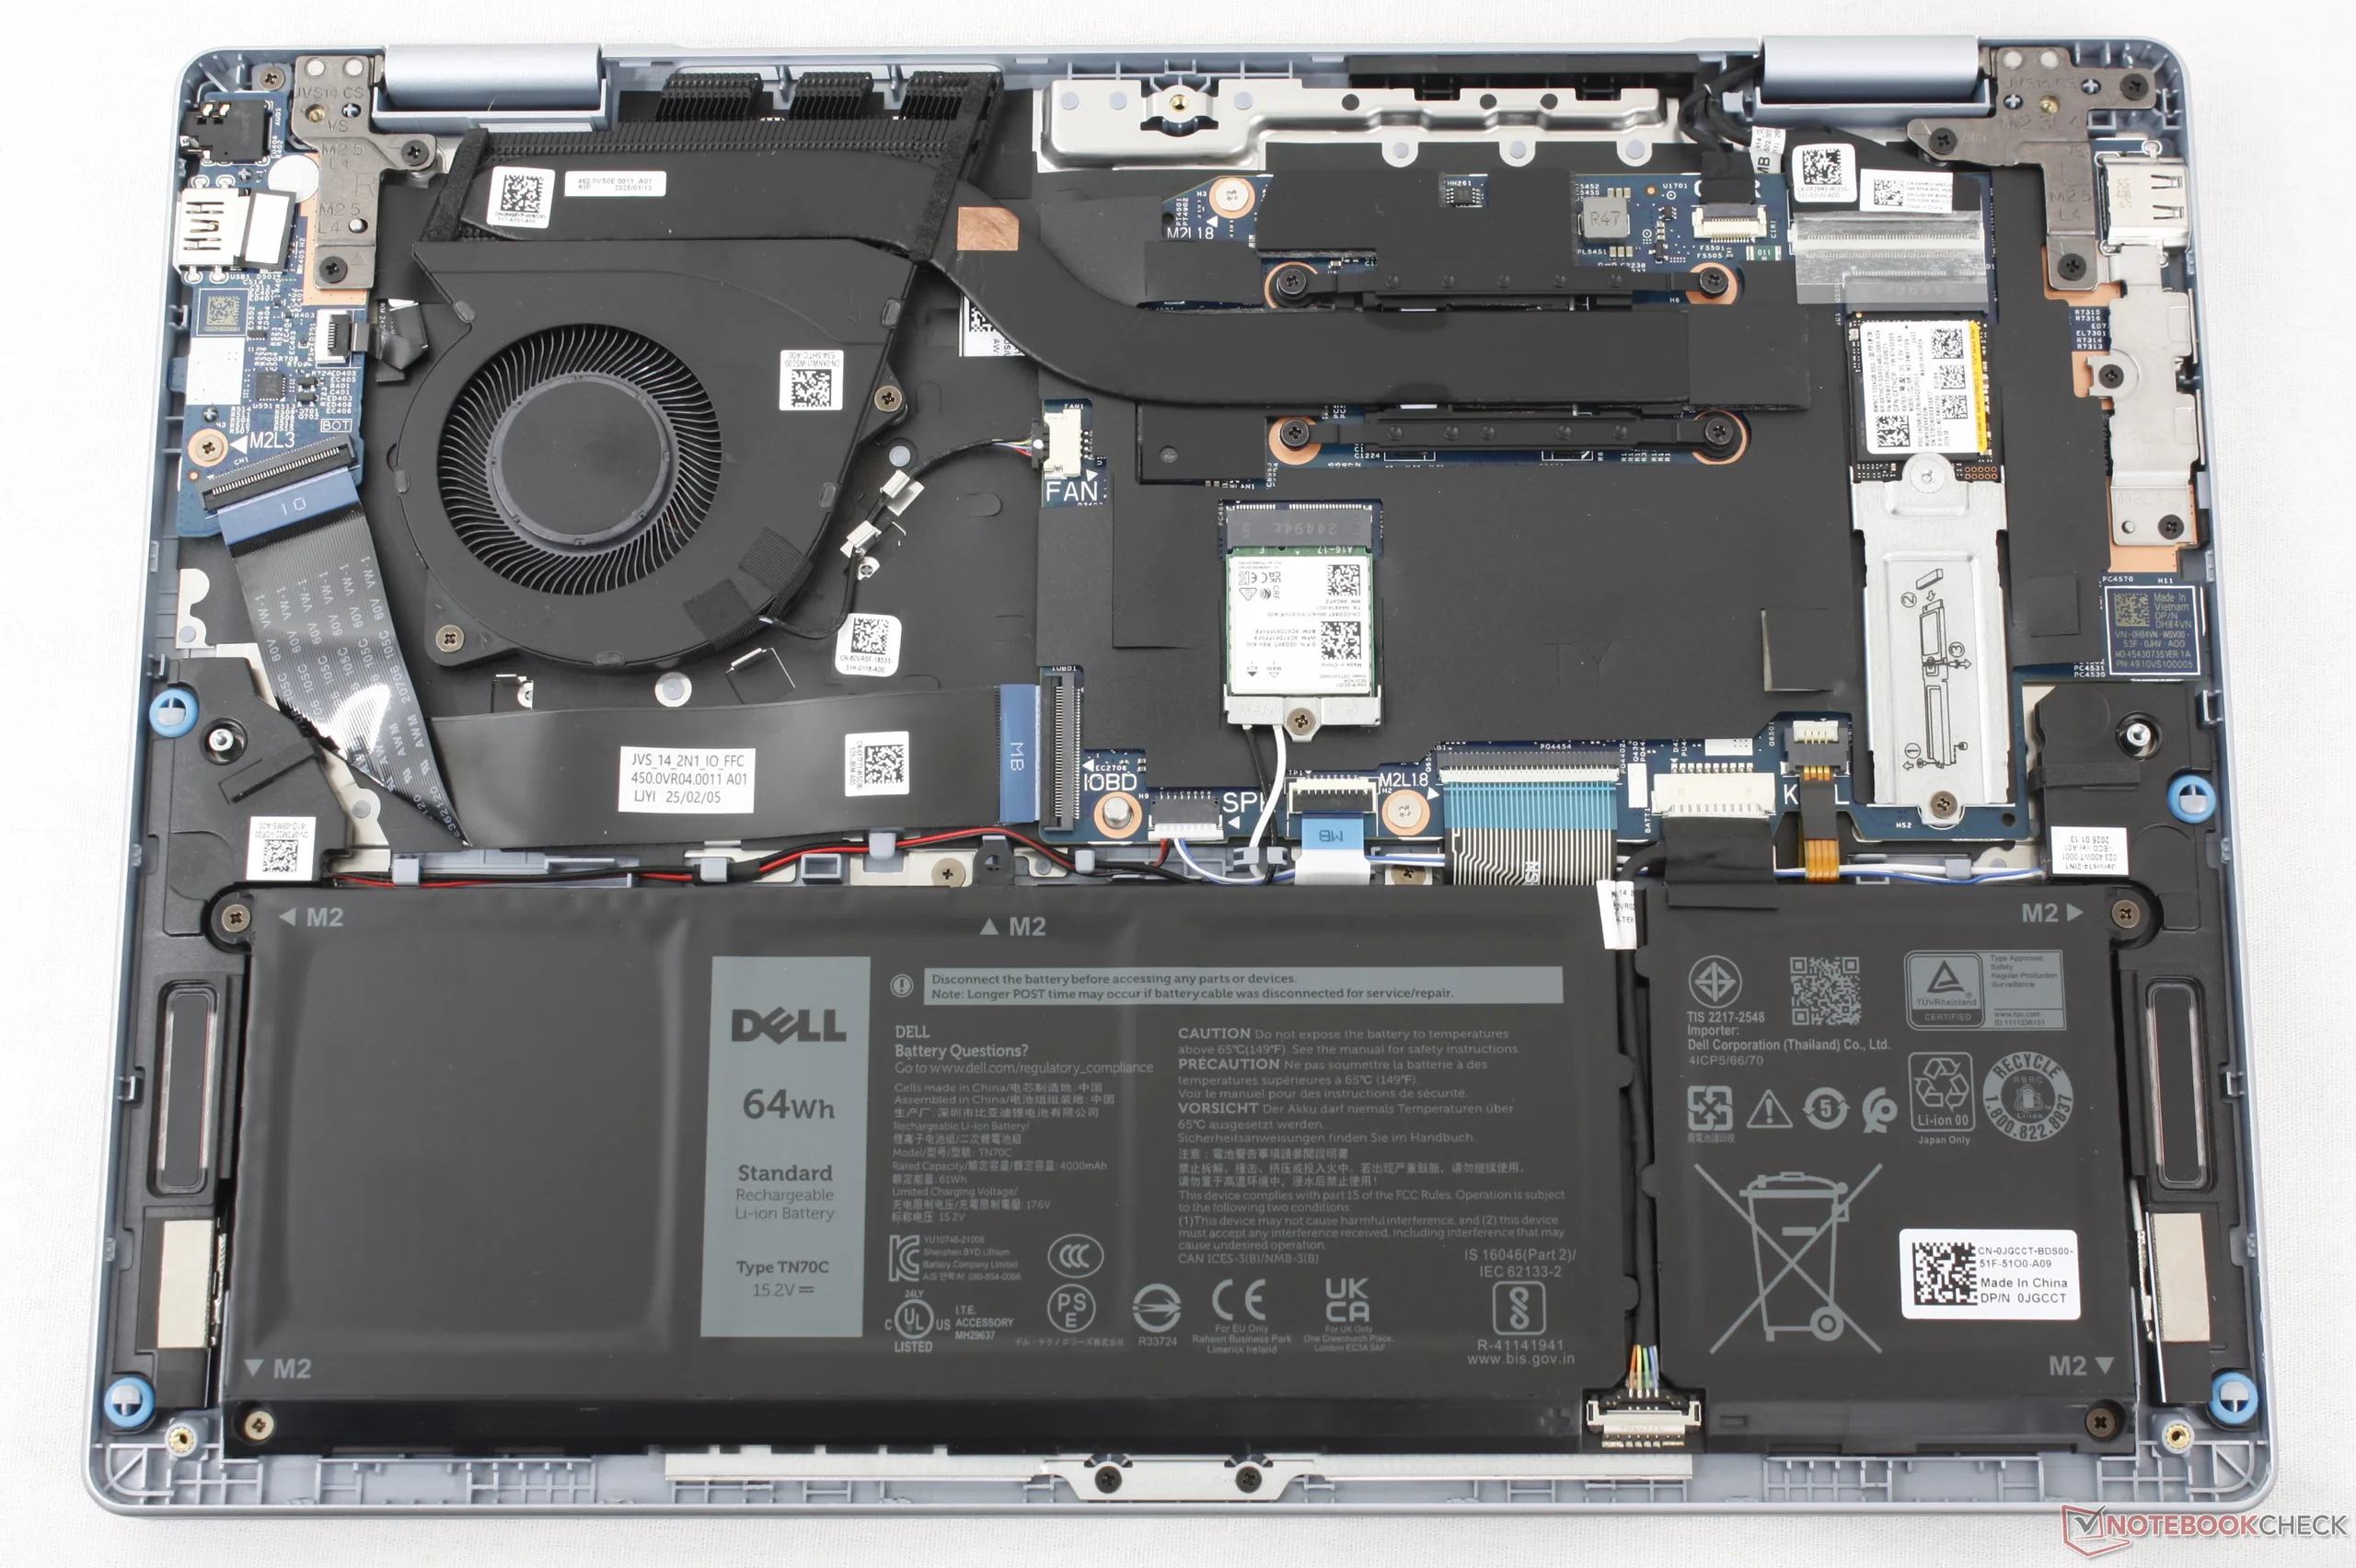
Dell 14 Plus-Hauptplatine zum Vergleich

Nachhaltigkeit

Für das Gehäuse, die Blende und die Lautsprecher werden bis zu 50 Prozent PCC-Kunststoff verwendet, während für die Außenhülle, die Handballenauflagen, die Tastaturhalterungen und den Akku jeweils bis zu 50 Prozent recyceltes Aluminium, Stahl und Kobalt zum Einsatz kommen. Die Verpackung ist kunststofffrei.

Eingabegeräte
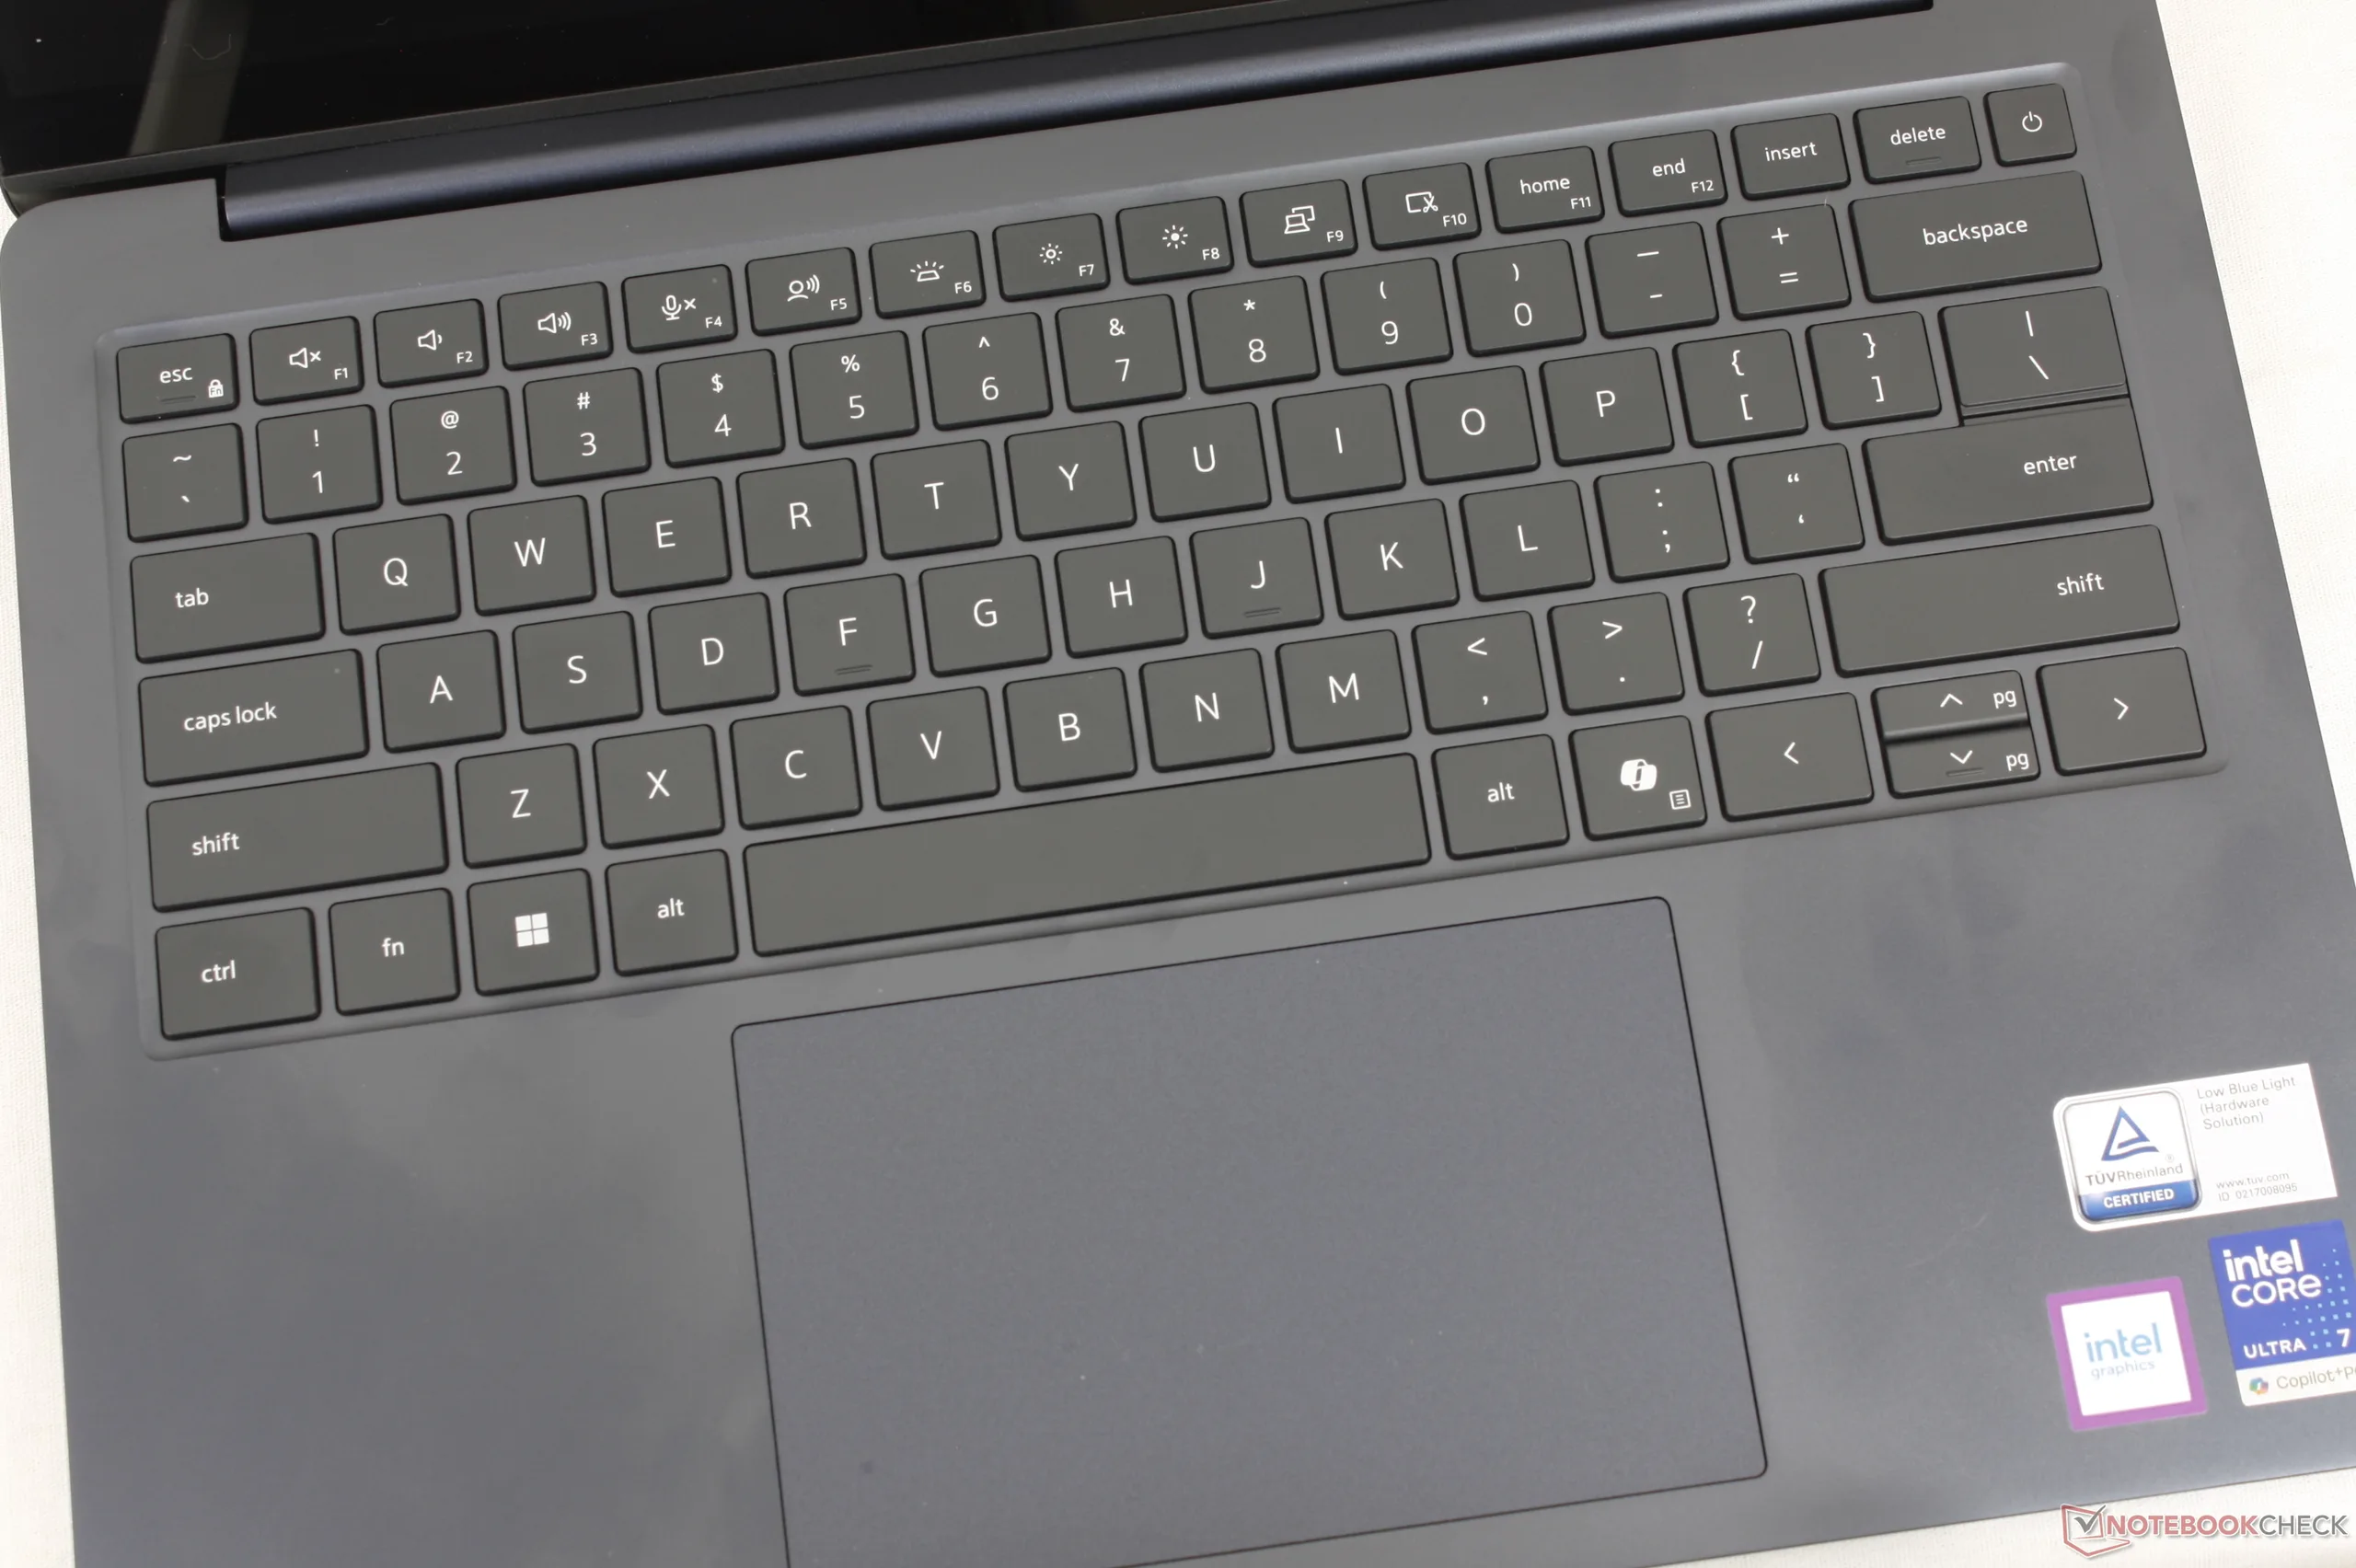
Im Vergleich zum letztjährigen Dell 14 Plus gibt es nur geringfügige Änderungen bei der Größe von Tastatur und Clickpad (12,8 x 7,8 cm gegenüber 12,5 x 8 cm).

Display

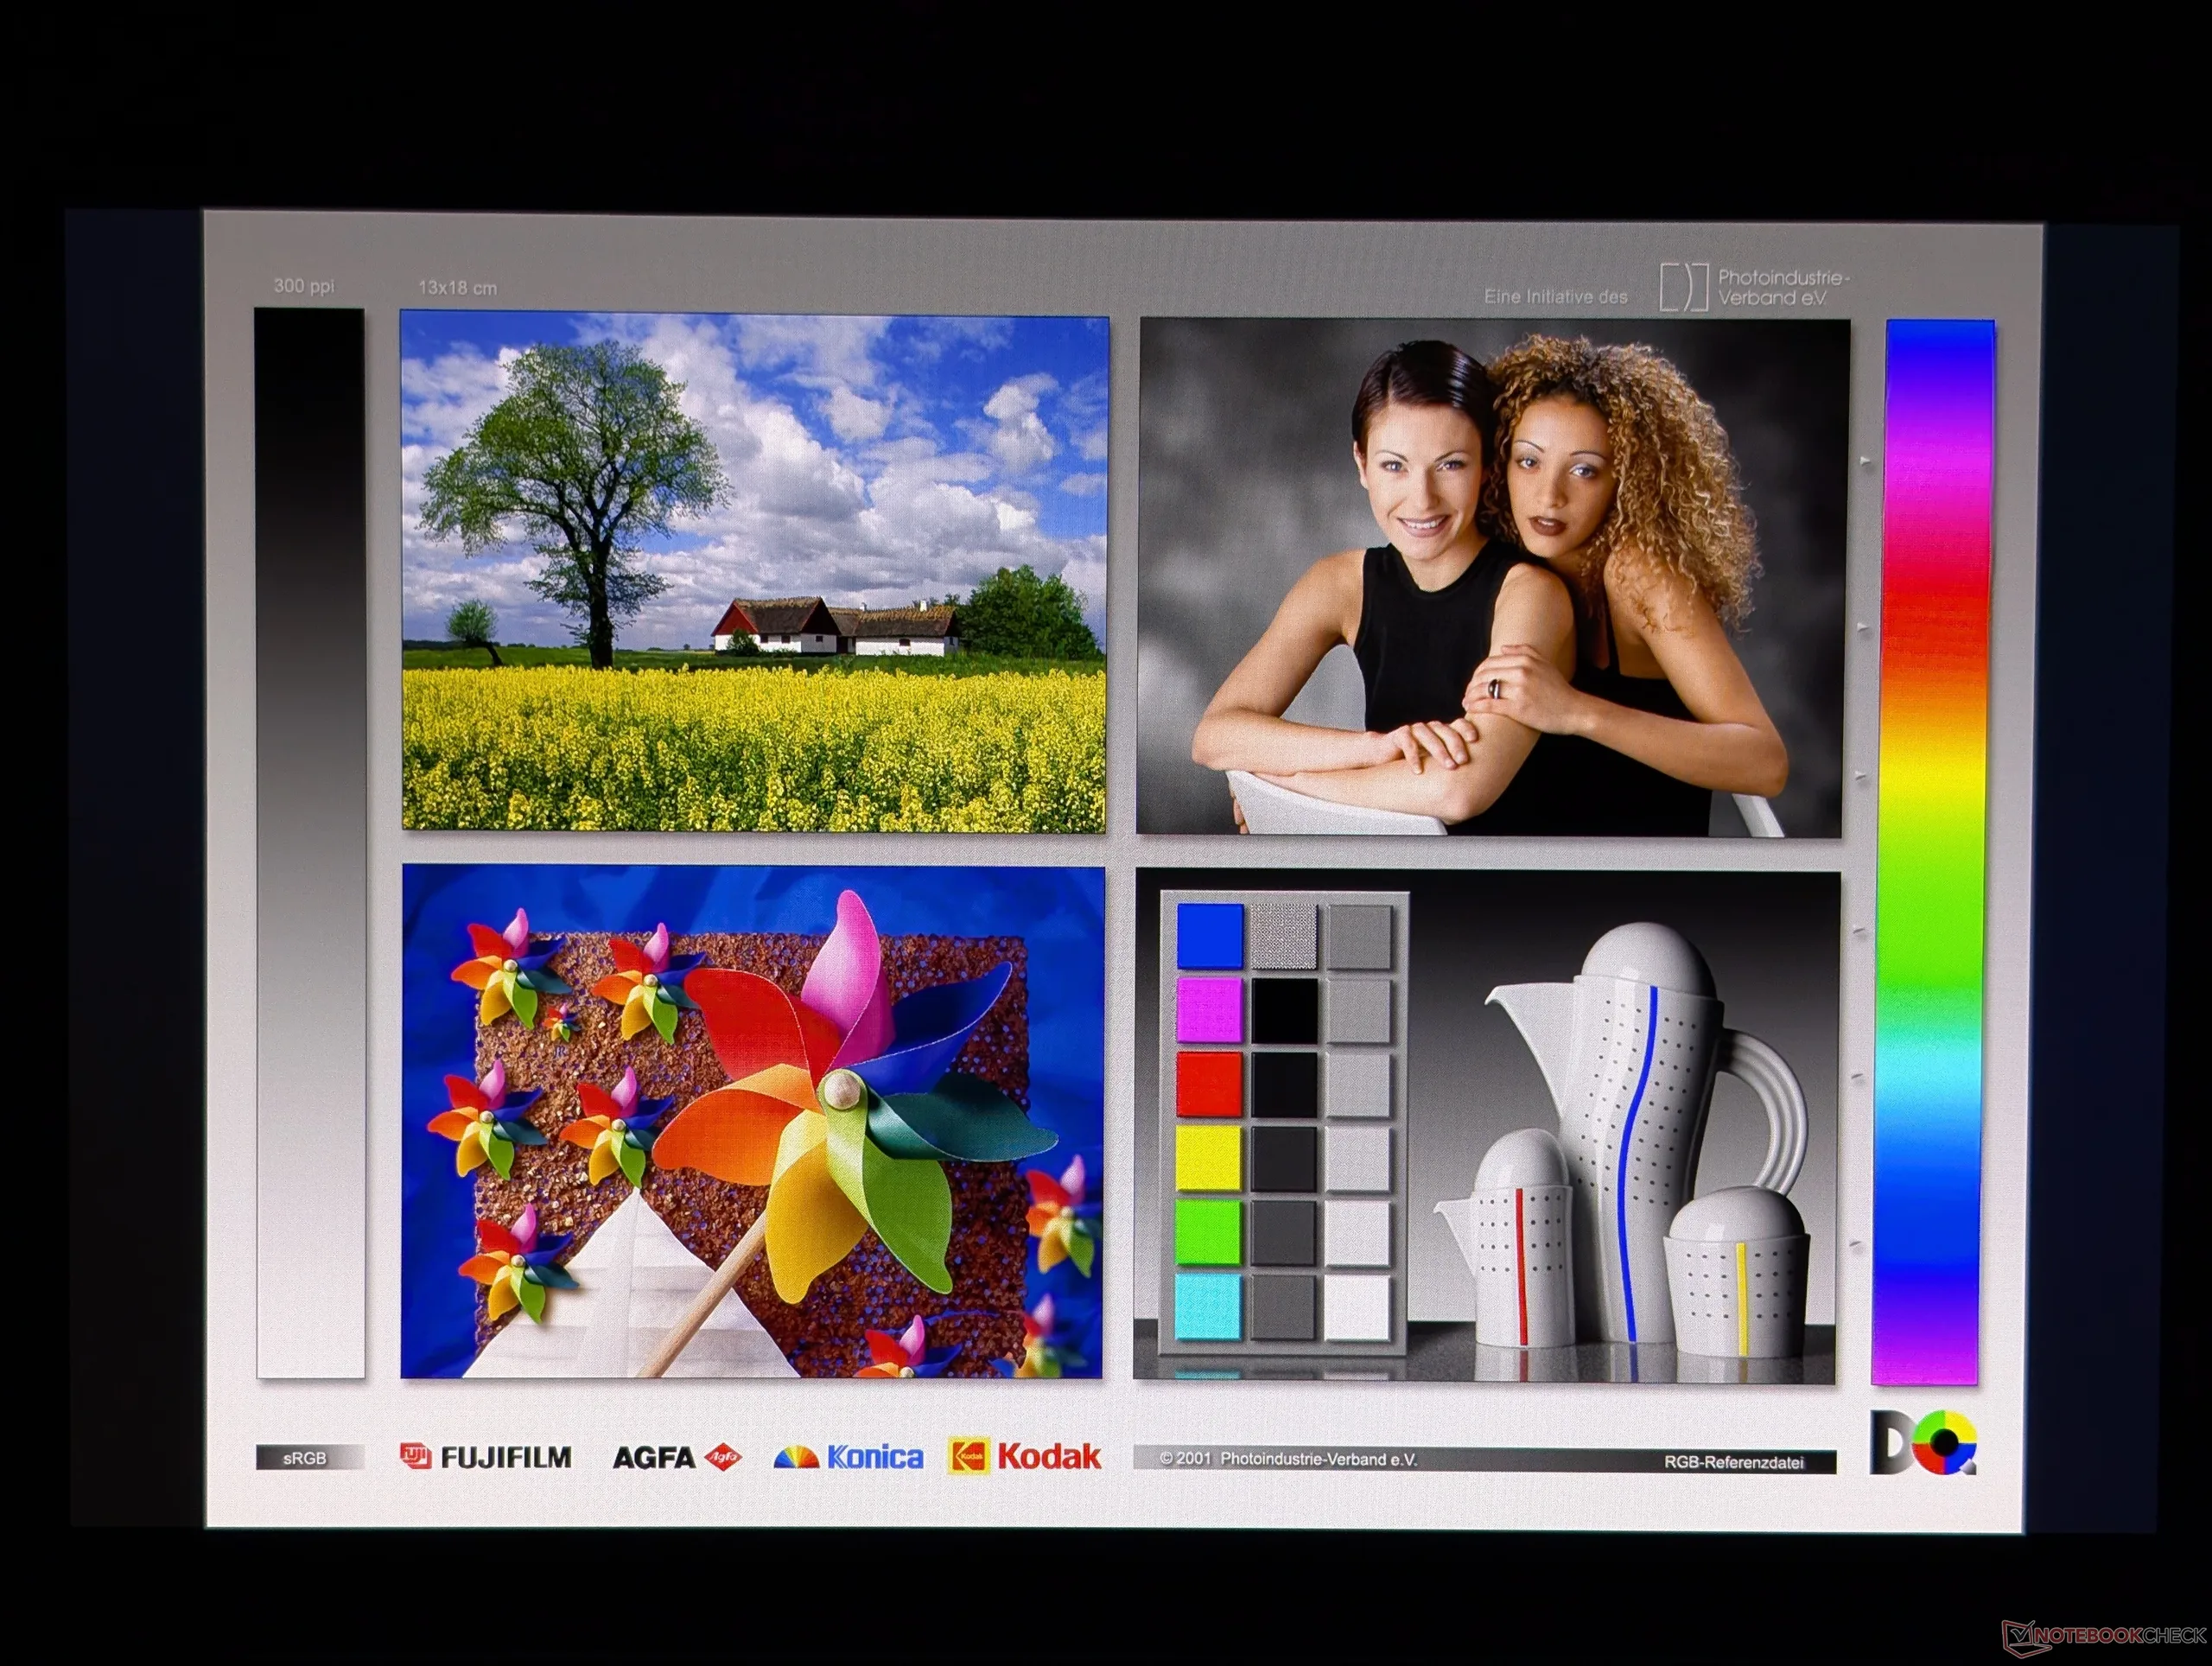
RGB-OLED-Subpixel
RGB-OLED-Subpixel

Es gibt folgende fünf Optionen:

  • 1920 x 1200, 60 Hz, ohne Touchfunktion, ~60 % sRGB, matt, IPS, 400 Nits
  • 1920 x 1200, 60 Hz, Touchscreen, ~60 % sRGB, glänzend, IPS, 400 Nits
  • 2560 x 1600, 120 Hz, ohne Touchscreen, 100 % sRGB, matt, IPS, 500 Nits
  • 1920 x 1200, 60 Hz, ohne Touchfunktion, 100 % DCI-P3, glänzend, OLED, 300 Nits
  • 1920 x 1200, 60 Hz, Touchscreen, 100 % DCI-P3, glänzend, OLED, 300 Nits

Unser Testgerät wurde mit der fettgedruckten Option konfiguriert.

278.5
cd/m²
282.5
cd/m²
284.7
cd/m²
280.5
cd/m²
282.4
cd/m²
281.6
cd/m²
281.6
cd/m²
282.1
cd/m²
279.5
cd/m²
Ausleuchtung des Bildschirms
Samsung 140KW04 getestet mit X-Rite i1Pro 3
Maximal: 284.7 cd/m² (Nits) Durchschnitt: 281.5 cd/m² Minimum: 3.64 cd/m²
Ausleuchtung: 98 %
Helligkeit Akku: 282.4 cd/m²
Kontrast: ∞:1 (Schwarzwert: 0 cd/m²)
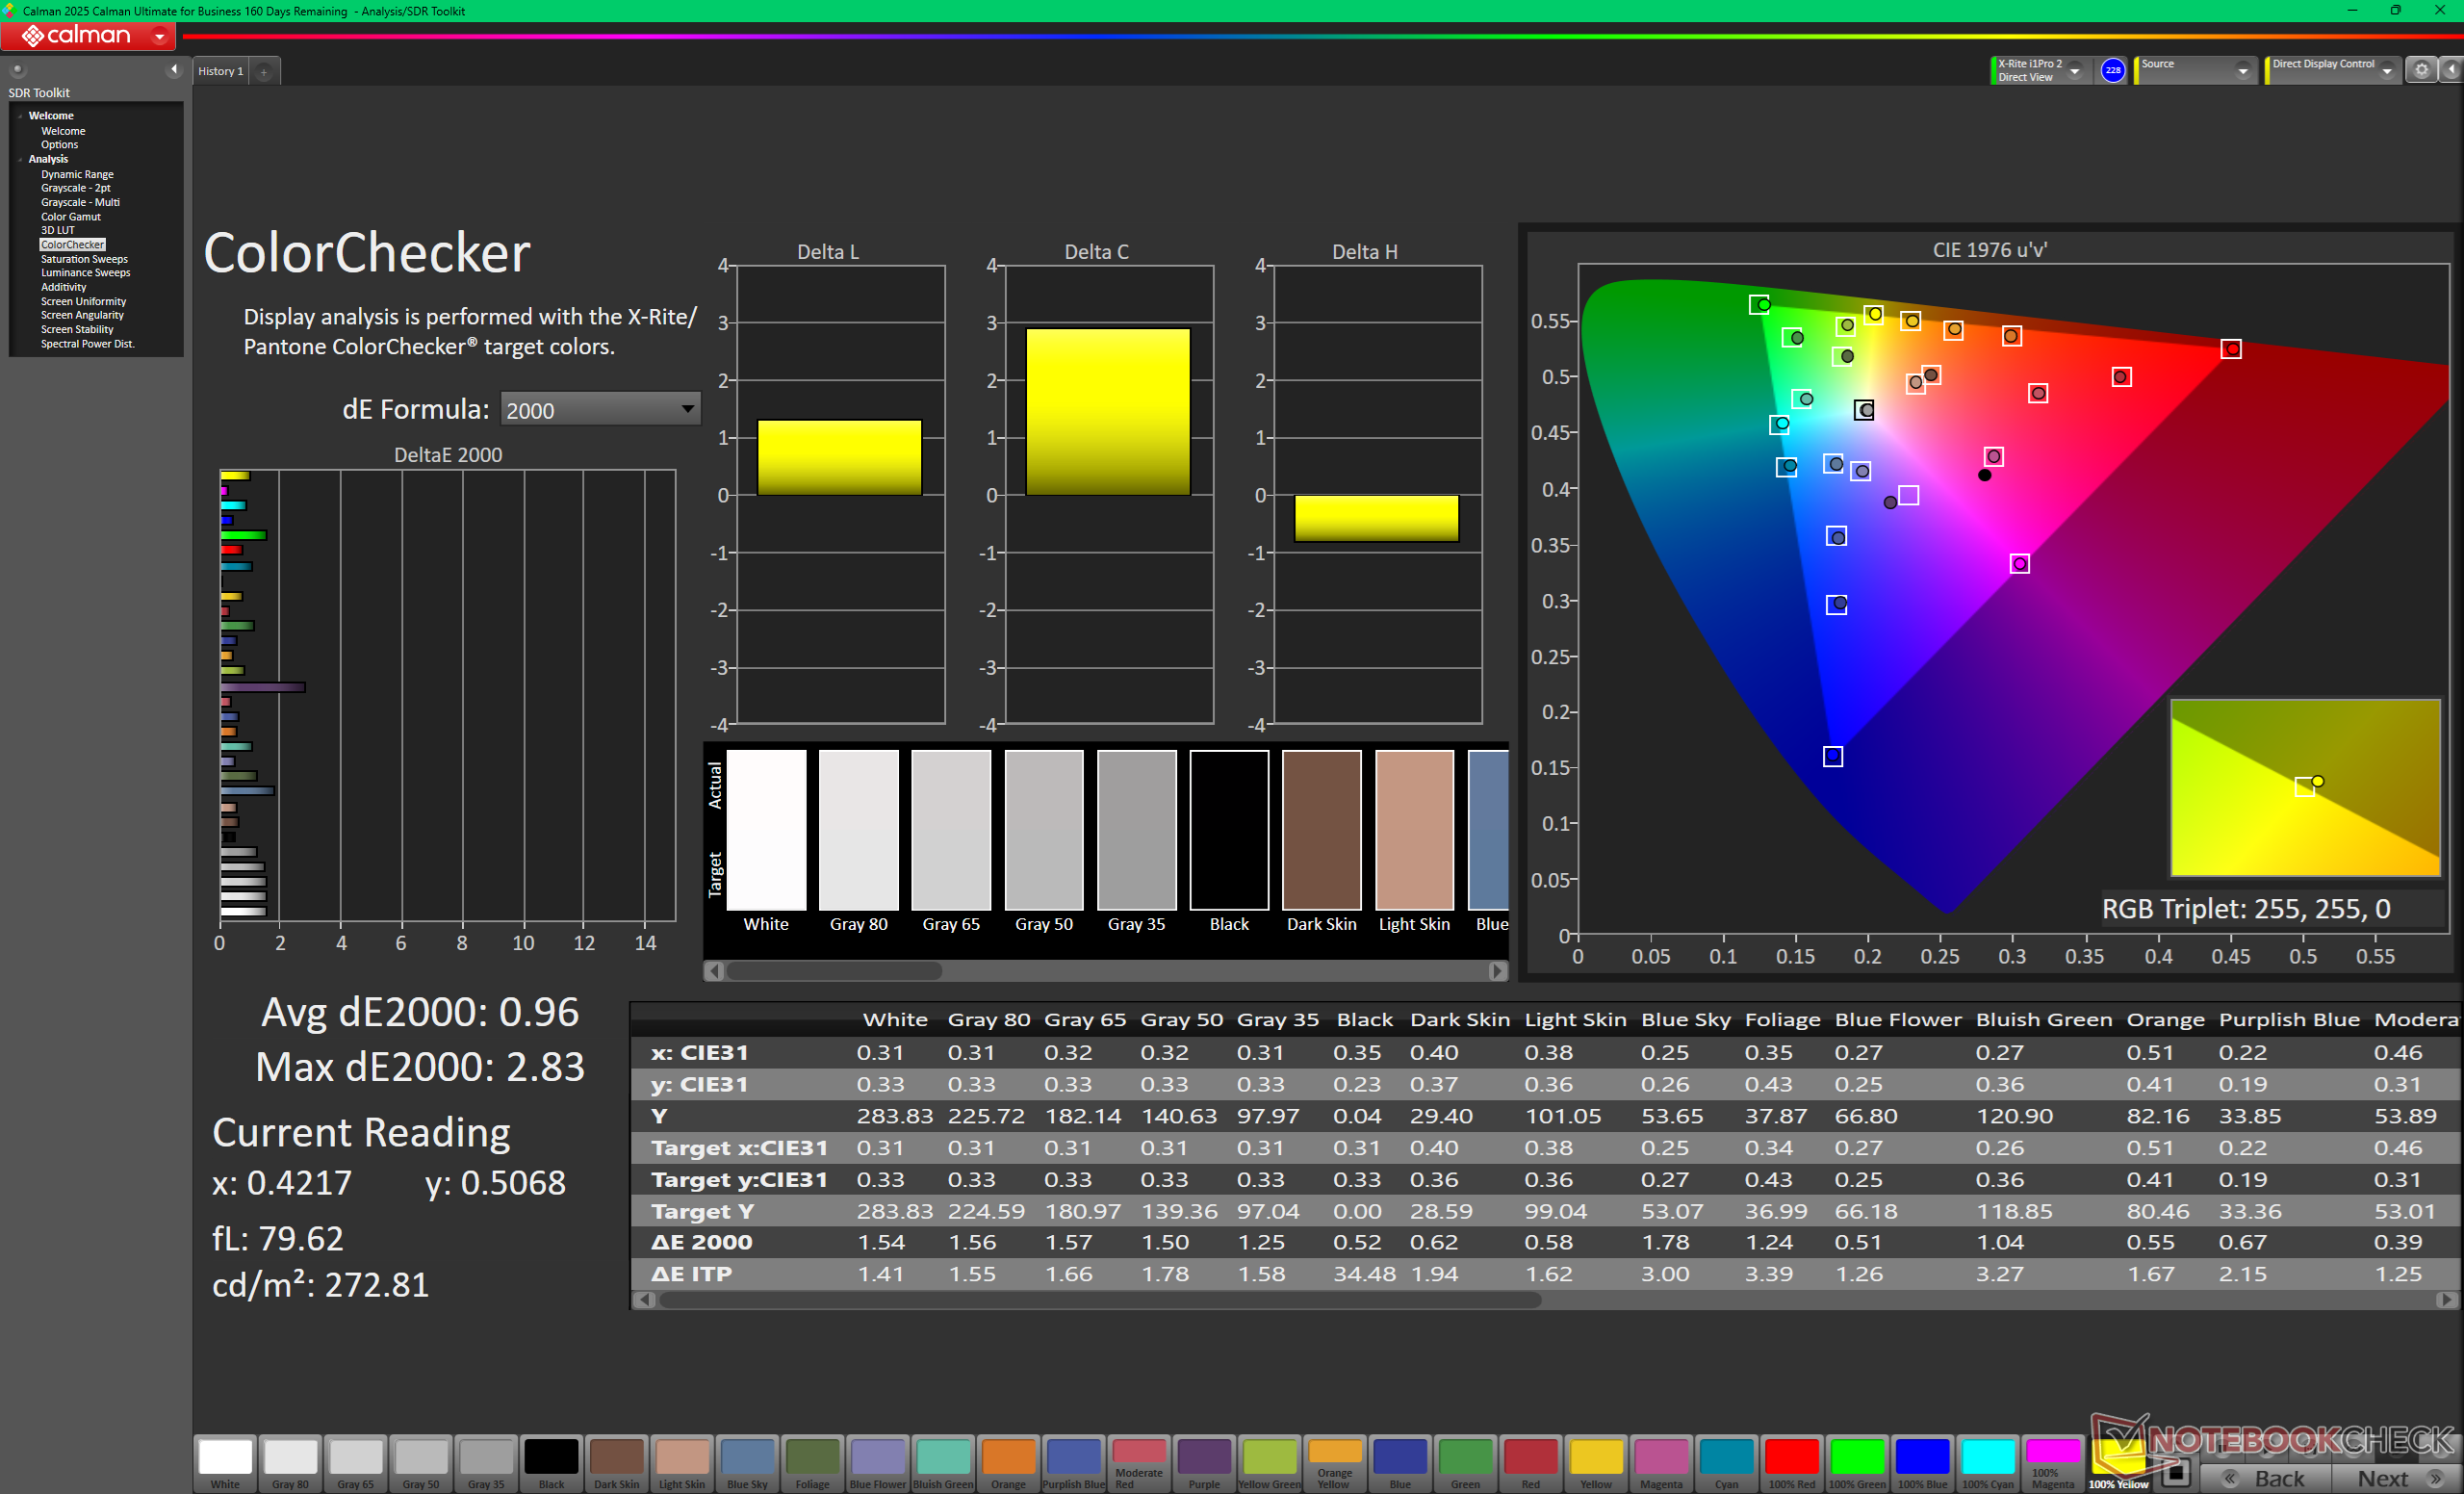
ΔE ColorChecker Calman: 0.96 | ∀{0.5-29.43 Ø4.71}
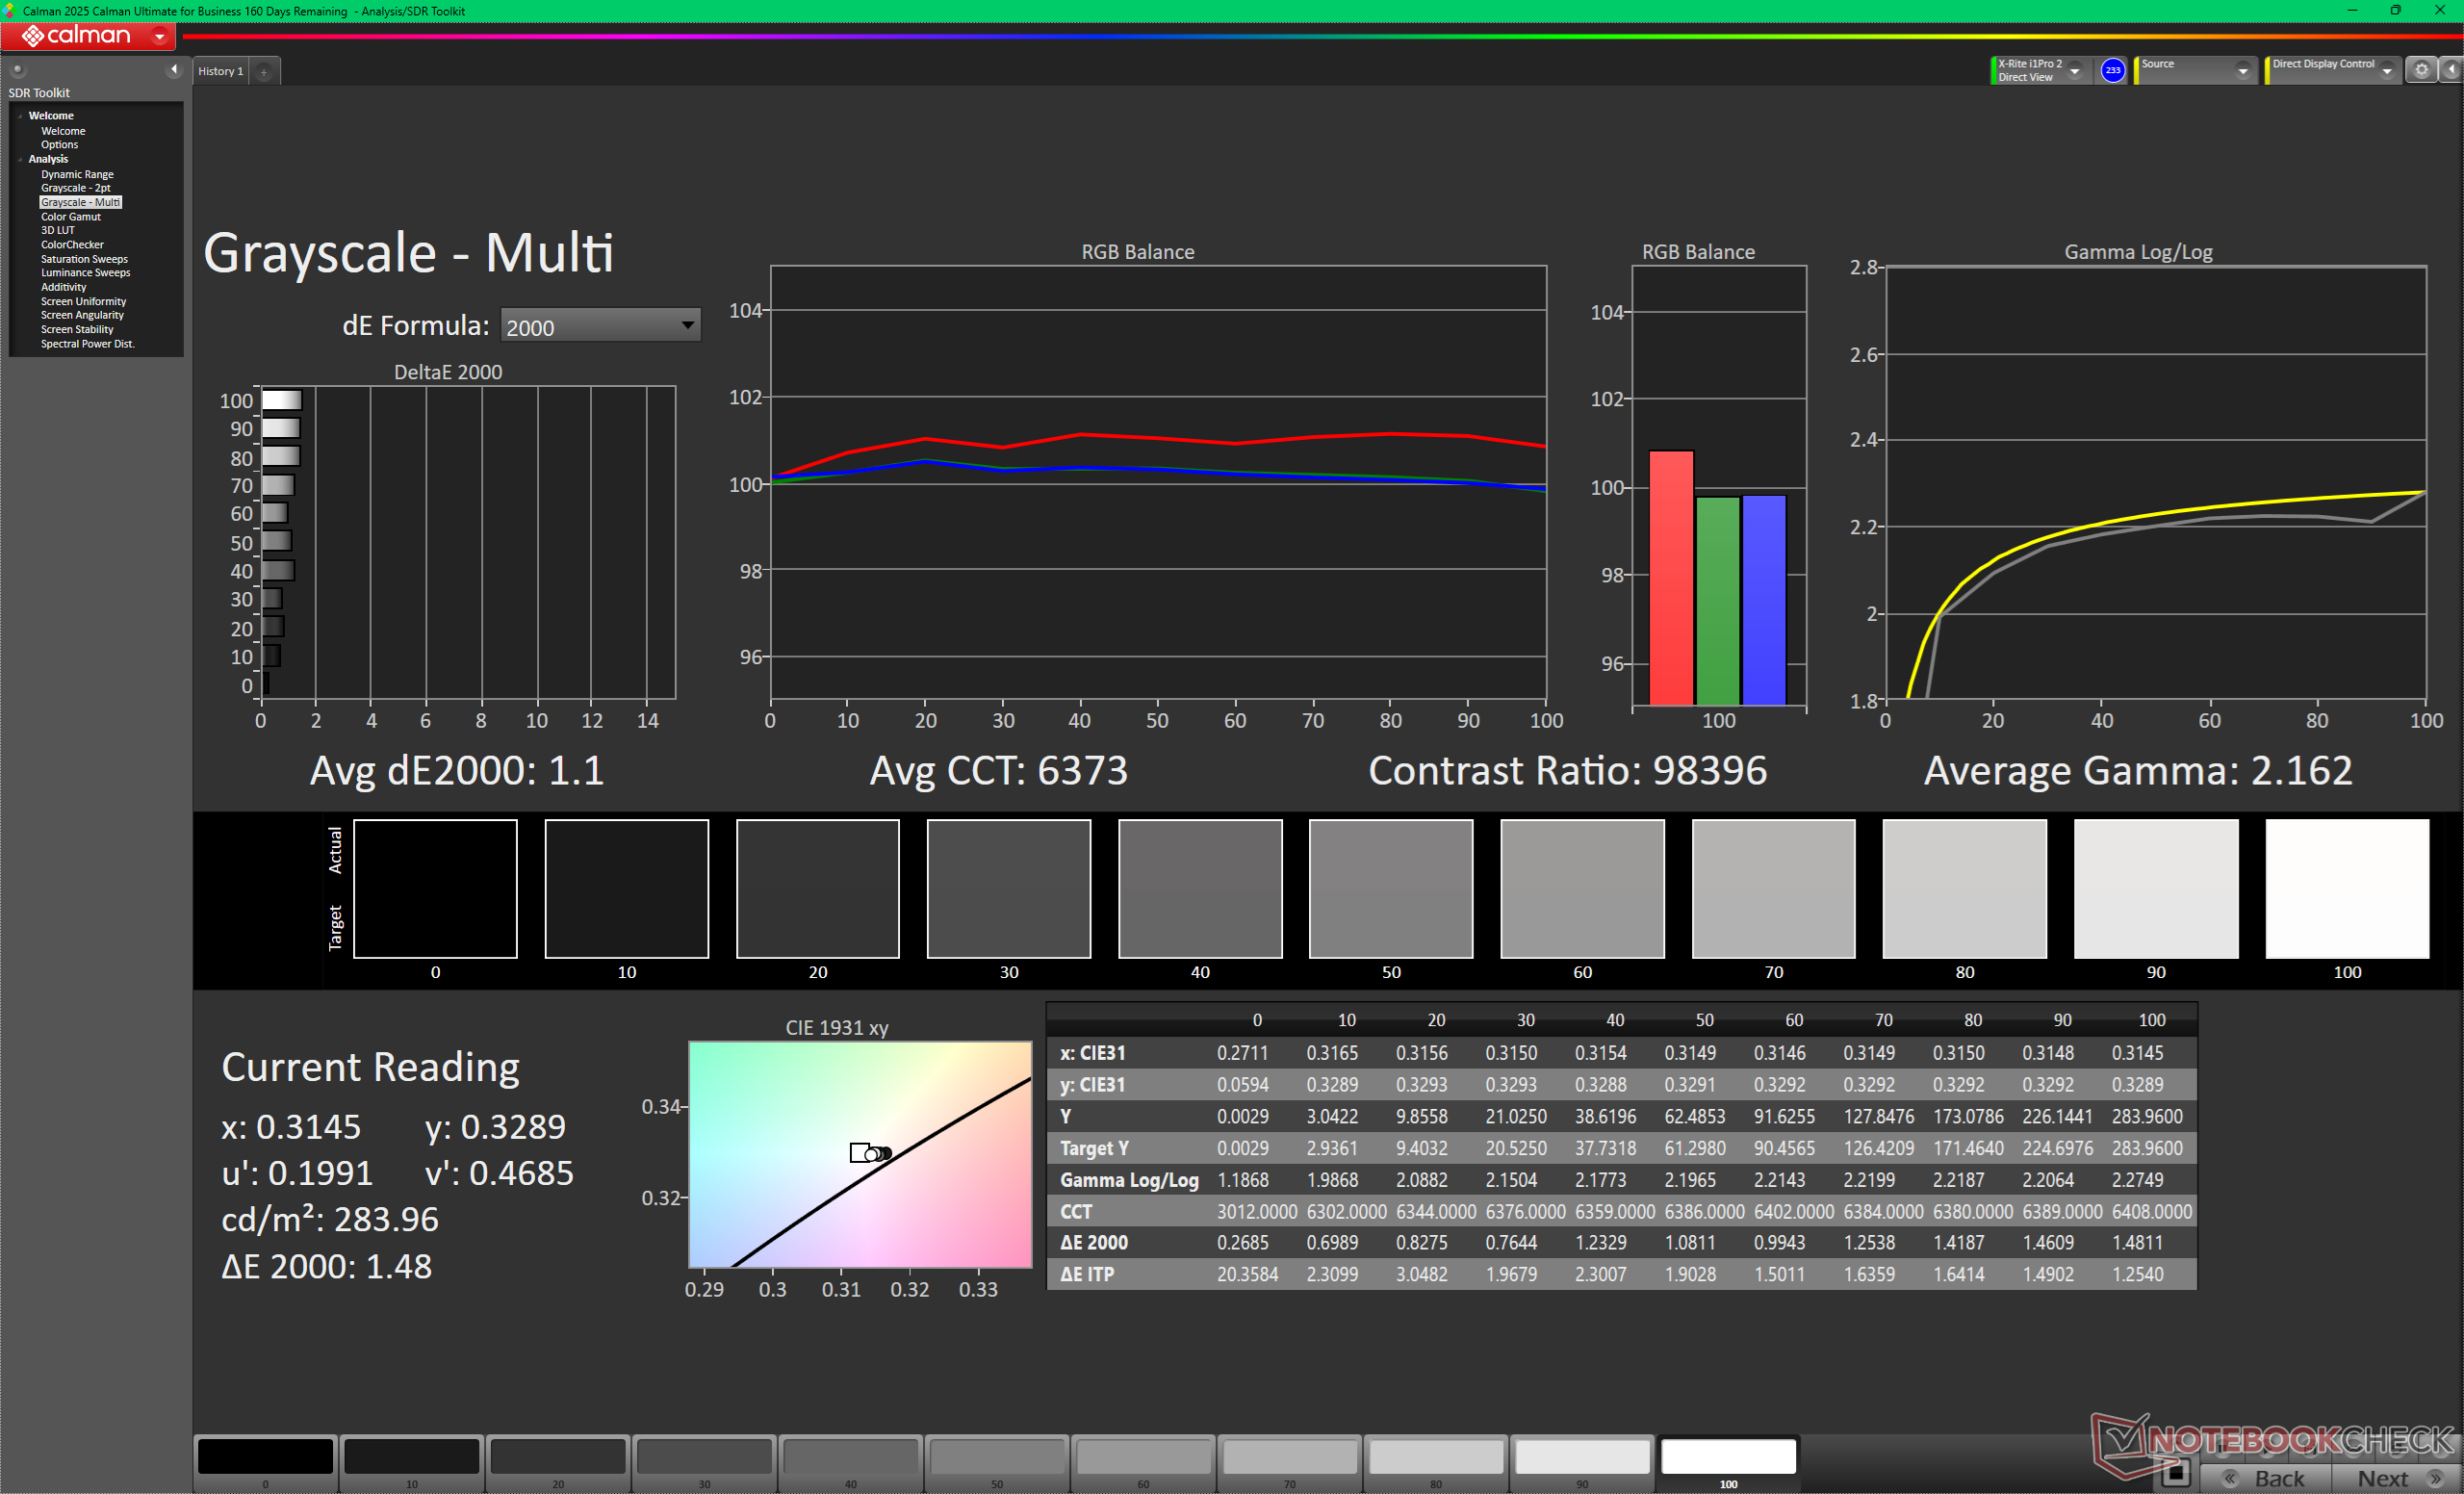
ΔE Greyscale Calman: 1.1 | ∀{0.09-98 Ø4.96}
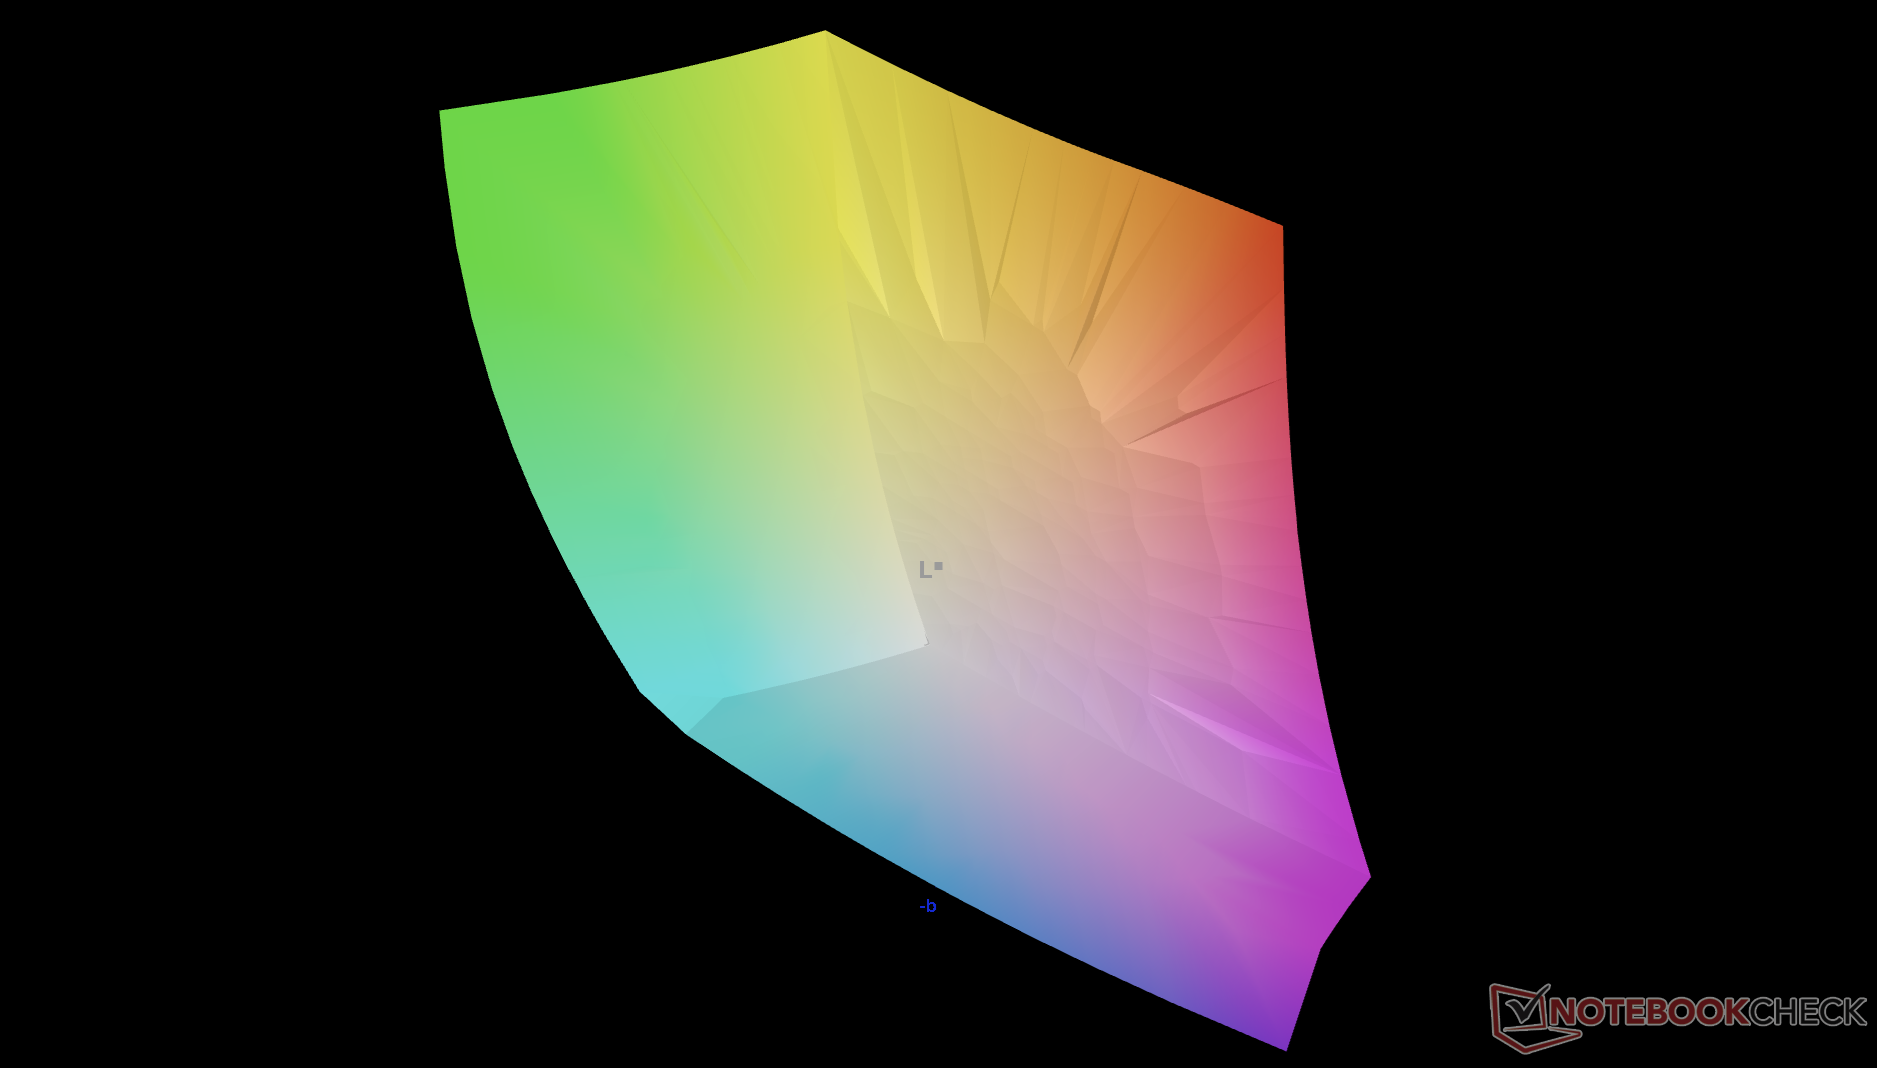
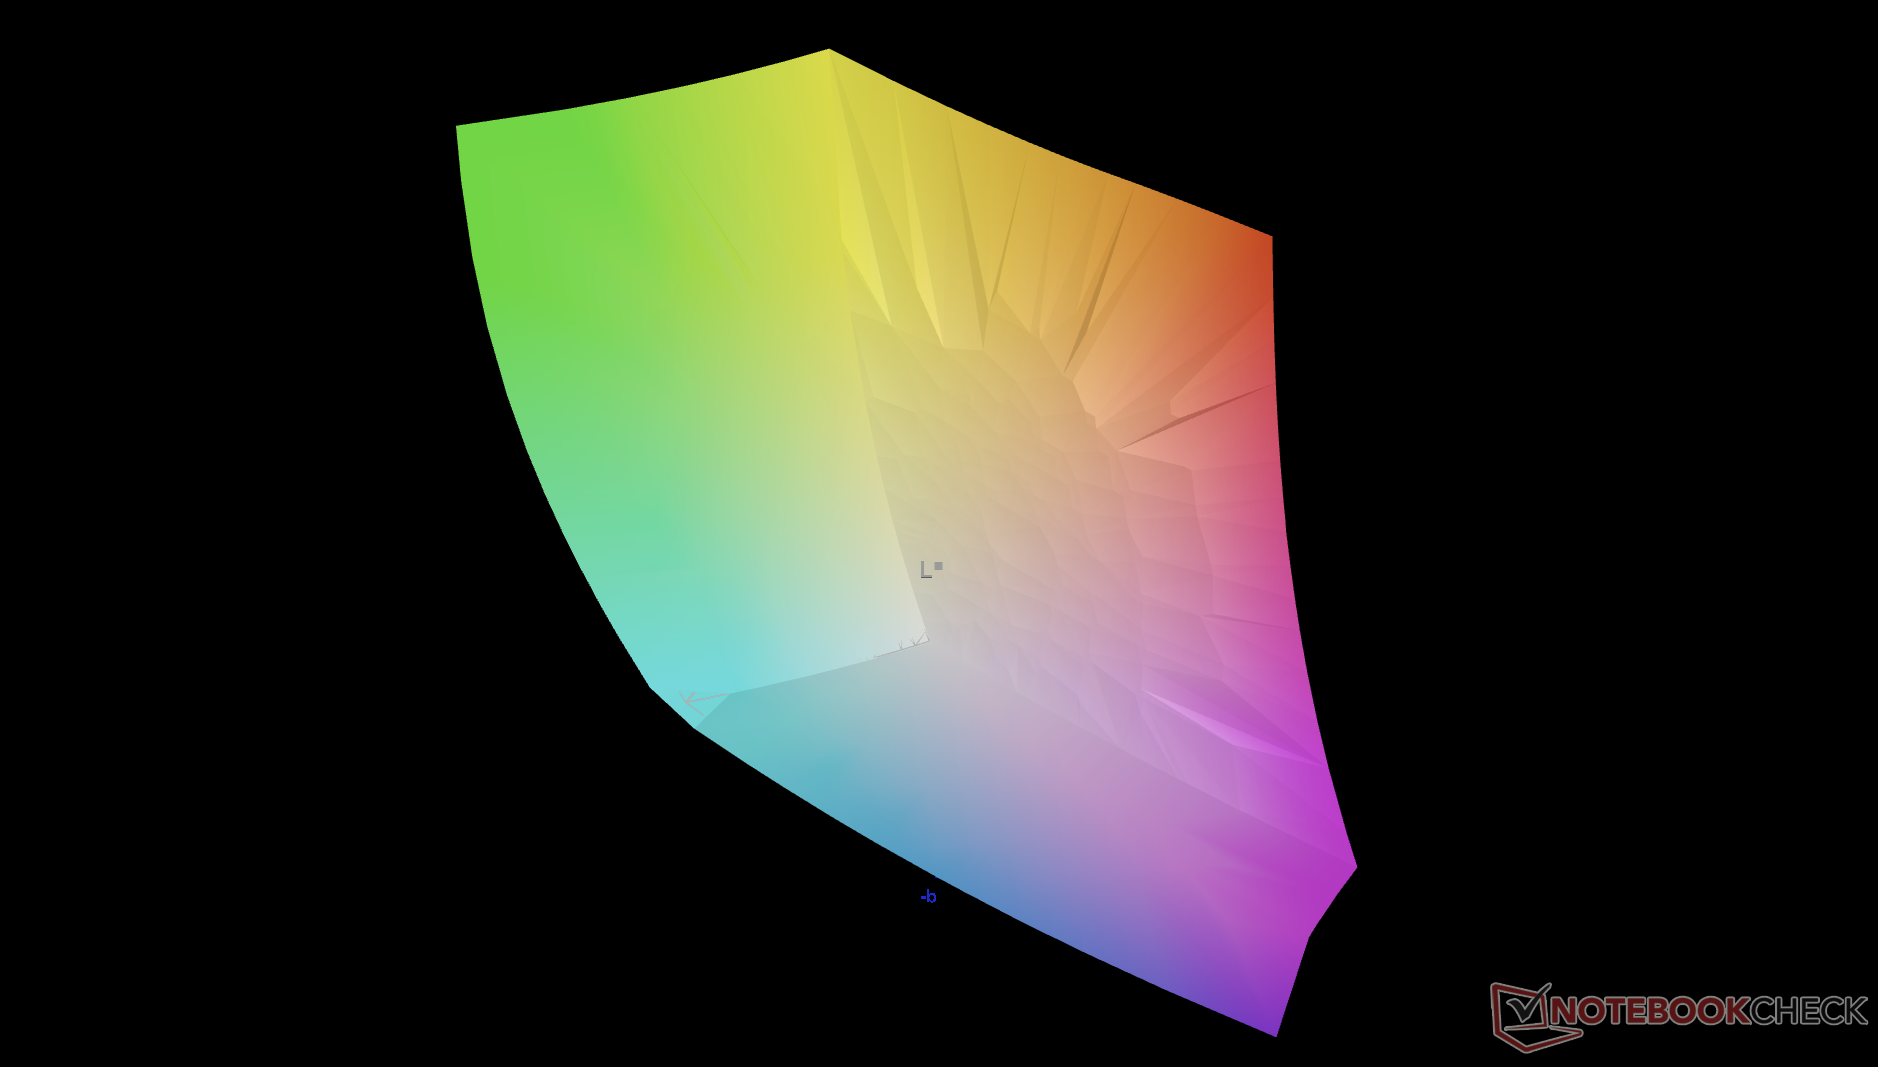
92.3% AdobeRGB 1998 (Argyll 3D)
100% sRGB (Argyll 3D)
100% Display P3 (Argyll 3D)
Gamma: 2.16
CCT: 6373 K
Dell 14S DS14260
Samsung 140KW04, OLED, 1920x1200, 14", 60 Hz
Lenovo ThinkBook 14 G9 IPL 21UX005PGE
LEN140WUXGA, IPS LED, 1920x1200, 14", 60 Hz
Dell XPS 14 Core Ultra X7 358H
LG Philips 140WT2, OLED, 2880x1800, 14", 120 Hz
HP OmniBook Ultra 14 Core Ultra X9
Samsung SDC4215, OLED, 2880x1800, 14", 120 Hz
Dell Inspiron 14 7445 2-in-1
AU Optronics B14UAT, IPS, 1920x1200, 14", 60 Hz
Asus VivoBook S 14 OLED M5406WA
ATNA40CT02-0 (SDC41A0), OLED, 1920x1200, 14", 60 Hz
Display
-53%
2%
0%
-57%
2%
Display P3 Coverage (%)
100
39.3
-61%
99.7
0%
99.9
0%
35.7
-64%
99.9
0%
sRGB Coverage (%)
100
59
-41%
100
0%
100
0%
53.6
-46%
100
0%
AdobeRGB 1998 Coverage (%)
92.3
40.7
-56%
98.2
6%
92.3
0%
36.9
-60%
97.2
5%
Response Times
-901%
15%
29%
-1009%
29%
Response Time Grey 50% / Grey 80% * (ms)
1.71 ?(0.88, 0.83)
19.2 ?(9.2, 10)
-1023%
0.75 ?(0.43, 0.32)
56%
0.58 ?(0.3, 0.28)
66%
23 ?(10.7, 12.3)
-1245%
1.3 ?(0.7, 0.6)
24%
Response Time Black / White * (ms)
1.81 ?(0.87, 0.94)
15.9 ?(8.3, 7.6)
-778%
1.03 ?(0.53, 0.5)
43%
0.87 ?(0.4, 0.47)
52%
15.8 ?(9.1, 6.7)
-773%
1.2 ?(0.6, 0.6)
34%
PWM Frequency (Hz)
463.67 ?(100)
240.62 ?(100)
927.13 ?(100)
240 ?(86)
PWM Amplitude * (%)
19
29
-53%
25
-32%
Bildschirm
-163%
-10%
-15%
-170%
-7%
Helligkeit Bildmitte (cd/m²)
282.4
403
43%
393.8
39%
446
58%
267.6
-5%
385
36%
Brightness (cd/m²)
281
386
37%
389
38%
447
59%
240
-15%
382
36%
Brightness Distribution (%)
98
89
-9%
96
-2%
99
1%
84
-14%
95
-3%
Schwarzwert * (cd/m²)
0.4
0.31
0.03
Delta E Colorchecker *
0.96
4.5
-369%
1.27
-32%
1.76
-83%
4.67
-386%
1.99
-107%
Colorchecker dE 2000 max. *
2.83
18
-536%
3.35
-18%
3.29
-16%
17.52
-519%
3.69
-30%
Delta E Graustufen *
1.1
2.7
-145%
2
-82%
2.3
-109%
2
-82%
0.8
27%
Gamma
2.16 102%
2.22 99%
2.19 100%
2.25 98%
2.15 102%
2.204 100%
CCT
6373 102%
6832 95%
6379 102%
6470 100%
6585 99%
6474 100%
Kontrast (:1)
1008
863
12833
Colorchecker dE 2000 calibrated *
4.1
0.71
1.18
2.49
1.79
Durchschnitt gesamt (Programm / Settings)
-372% / -267%
2% / -0%
5% / -0%
-412% / -292%
8% / 2%

* ... kleinere Werte sind besser

vs. sRGB
vs. sRGB
vs. P3
vs. P3
Graustufen (im Vergleich zu sRGB)
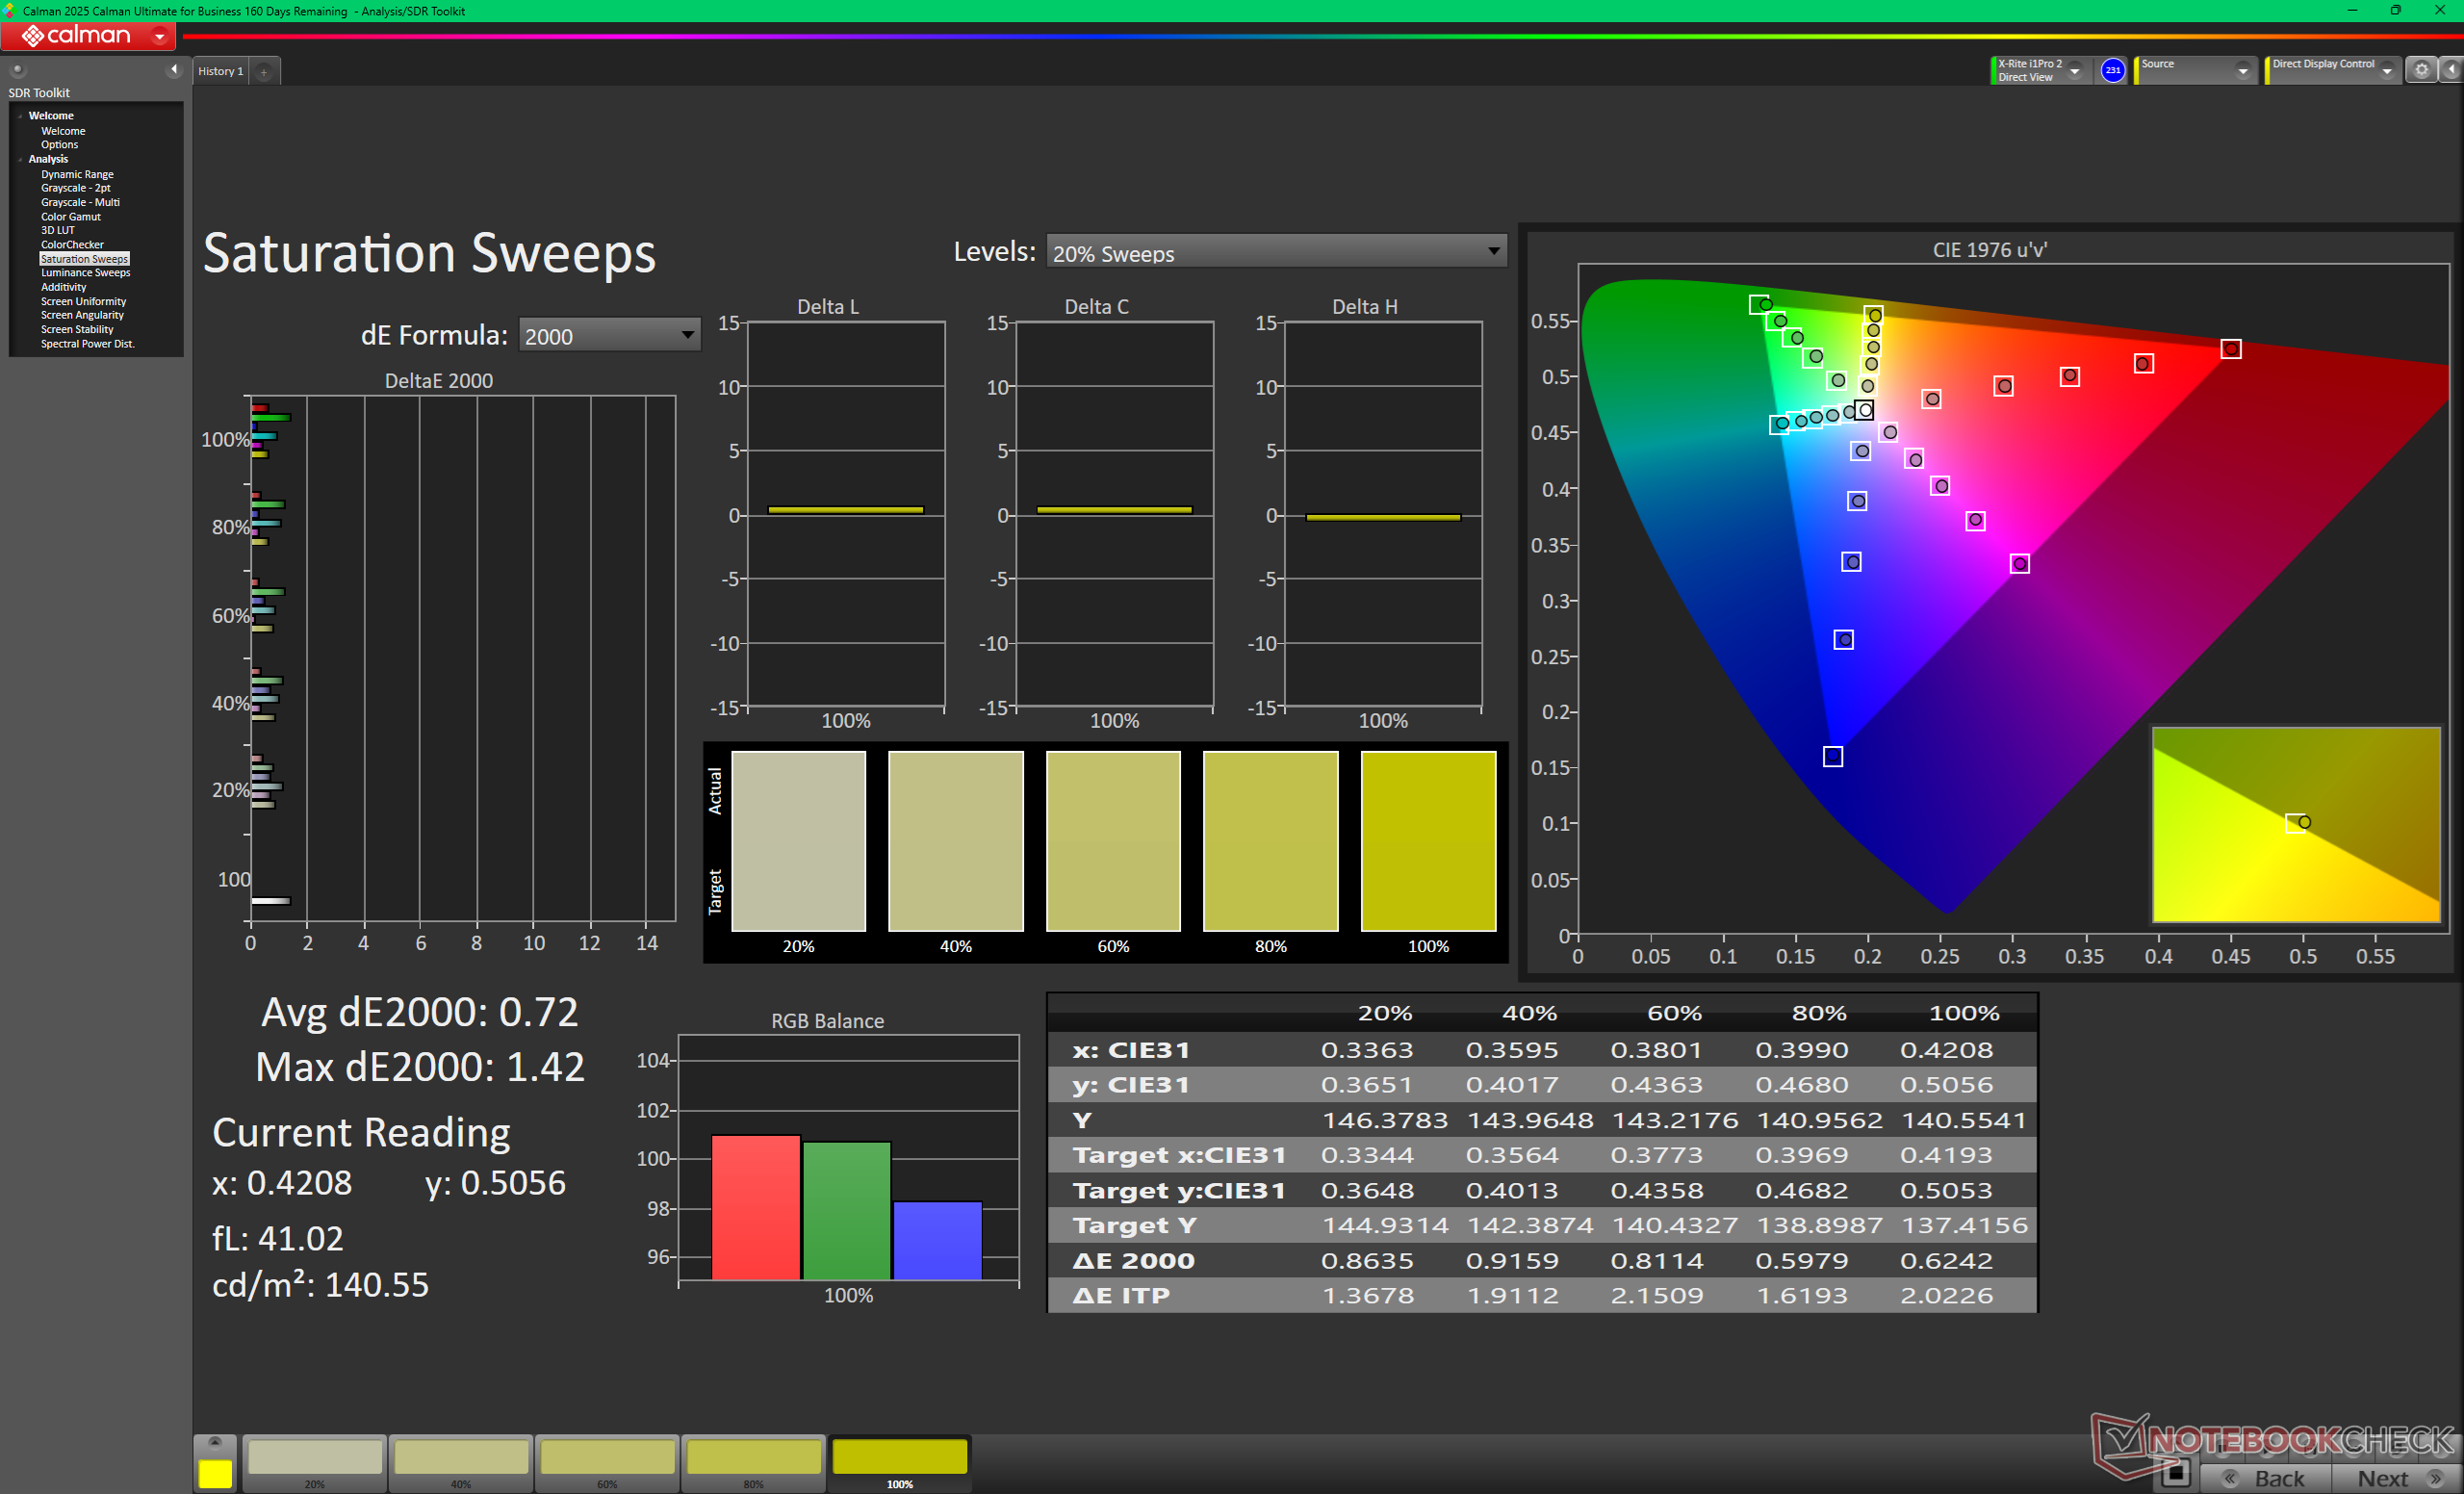
Sättigung (im Vergleich zu sRGB)
ColorChecker (im Vergleich zu sRGB)

Reaktionszeiten (Response Times) des Displays

Die Reaktionszeiten (Response Times) beschreiben wie schnell zwischen zwei Farben eines Pixels umgeschaltet werden kann. Langsame Response Times können zu einer verschwommenen Darstellung, Schlieren und Geisterbilder führen. Besonders bei schnellen 3D-Spielen sind kurze Umschaltzeiten wichtig.
       Reaktionszeiten Schwarz zu Weiß
1.81 ms ... steigend ↗ und fallend ↘ kombiniert↗ 0.87 ms steigend
↘ 0.94 ms fallend
Die gemessenen Reaktionszeiten sind sehr kurz, wodurch sich der Bildschirm auch für schnelle 3D Spiele eignen sollte.
Im Vergleich rangierten die bei uns getesteten Geräte von 0.1 (Minimum) zu 240 (Maximum) ms. » 11 % aller Screens waren schneller als der getestete.
Daher sind die gemessenen Reaktionszeiten besser als der Durchschnitt aller vermessenen Geräte (19.7 ms).
       Reaktionszeiten 50% Grau zu 80% Grau
1.71 ms ... steigend ↗ und fallend ↘ kombiniert↗ 0.88 ms steigend
↘ 0.83 ms fallend
Die gemessenen Reaktionszeiten sind sehr kurz, wodurch sich der Bildschirm auch für schnelle 3D Spiele eignen sollte.
Im Vergleich rangierten die bei uns getesteten Geräte von 0.13 (Minimum) zu 636 (Maximum) ms. » 9 % aller Screens waren schneller als der getestete.
Daher sind die gemessenen Reaktionszeiten besser als der Durchschnitt aller vermessenen Geräte (30.9 ms).

Bildschirm-Flackern / PWM (Pulse-Width Modulation)

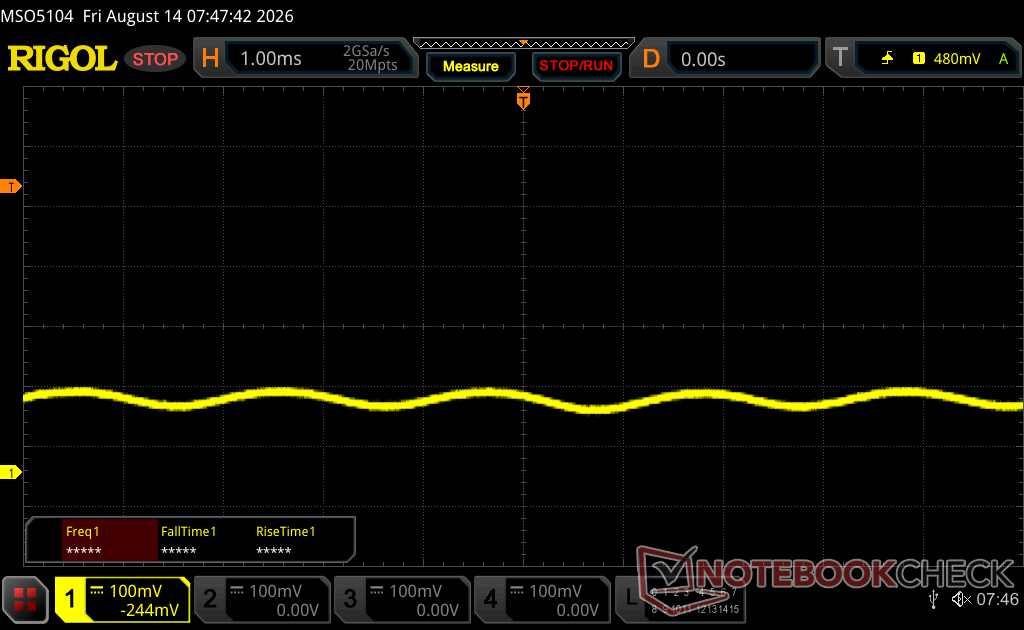
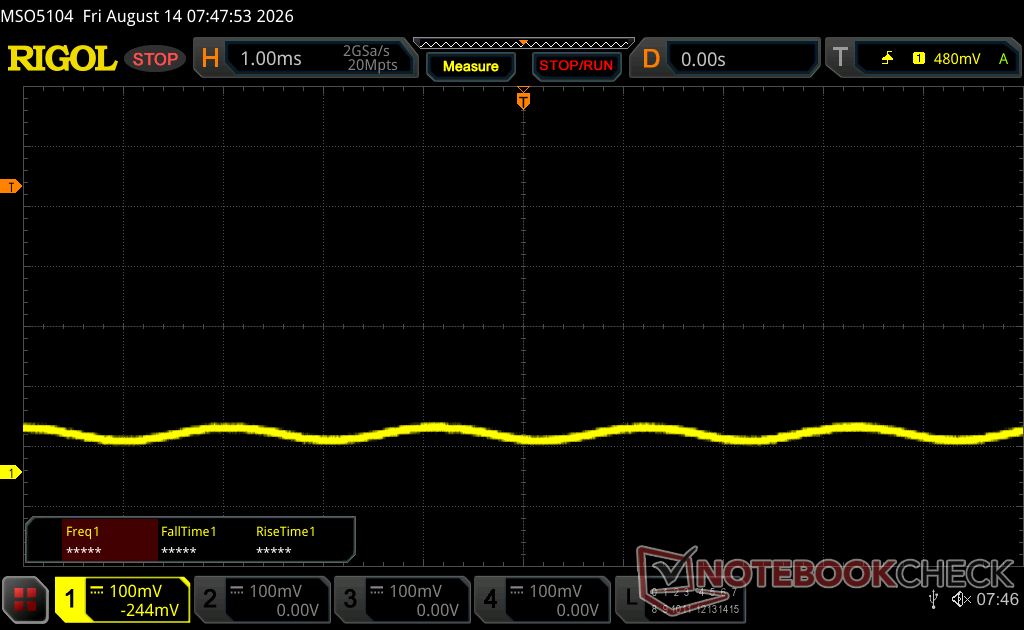
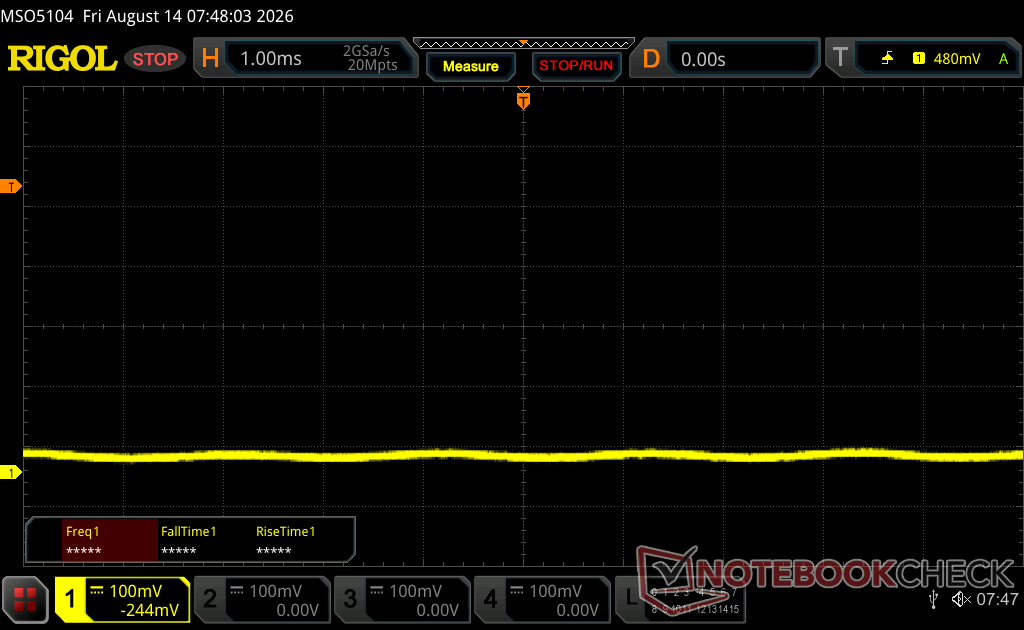
Eine günstige Methode um die Helligkeit eines Bildschirms zu steuern, ist die Beleuchtung periodisch ein- und auszuschalten. Dies nennt sich PWM (Pulsweitenmodulation) Diese Umschaltung sollte mit einer hohen Frequenz stattfinden damit das menschliche Auge kein Flimmern wahrnimmt. Wenn die Frequenz zu niedrig ist, kann dies zu Ermüdungserscheinungen, Augenbrennen, Kopfweh und auch sichtbaren Flackern führen.
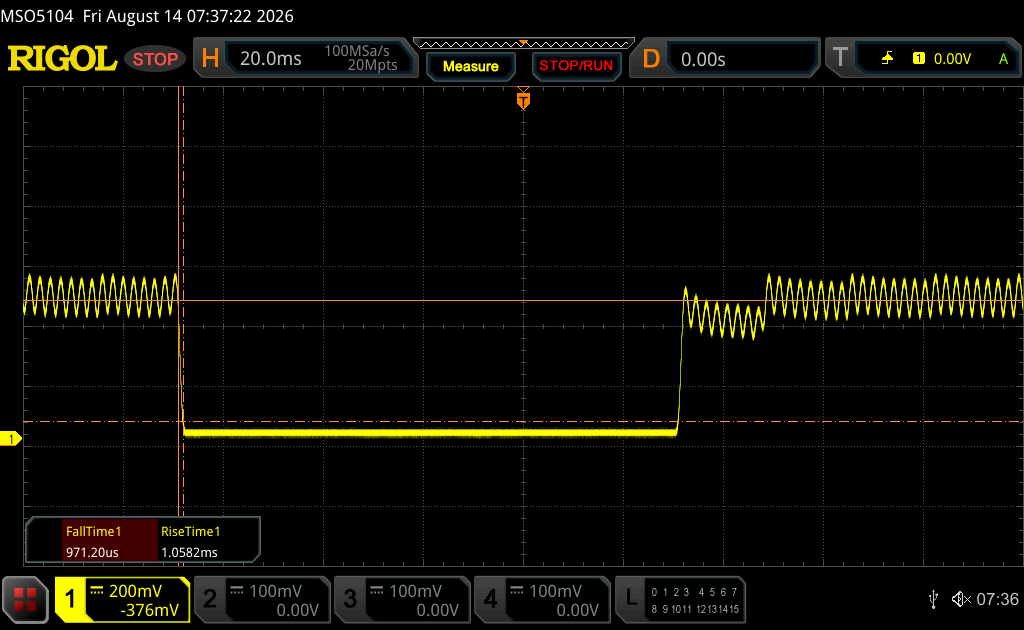
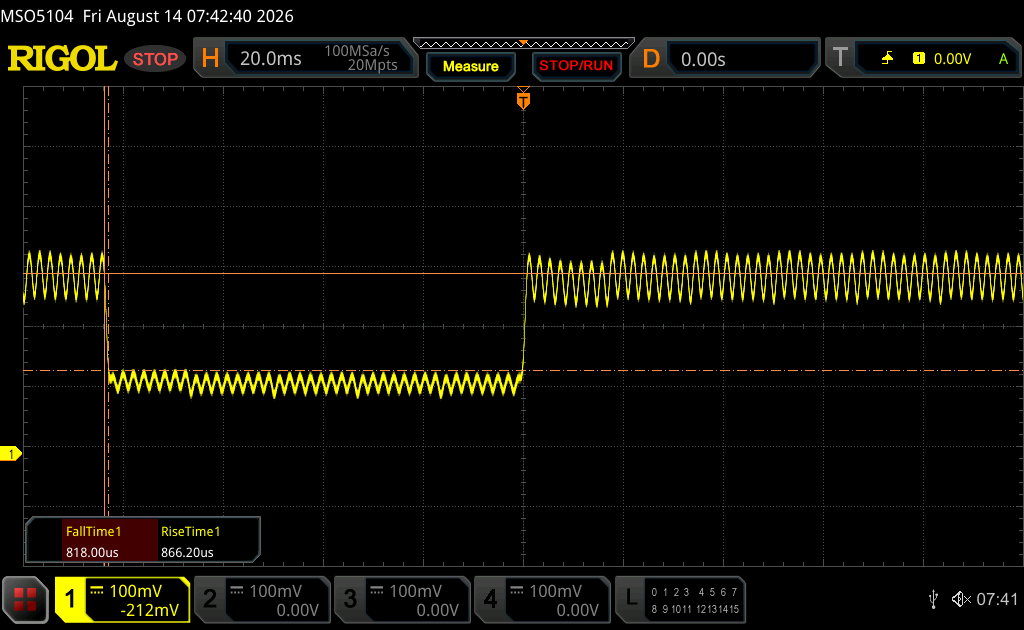
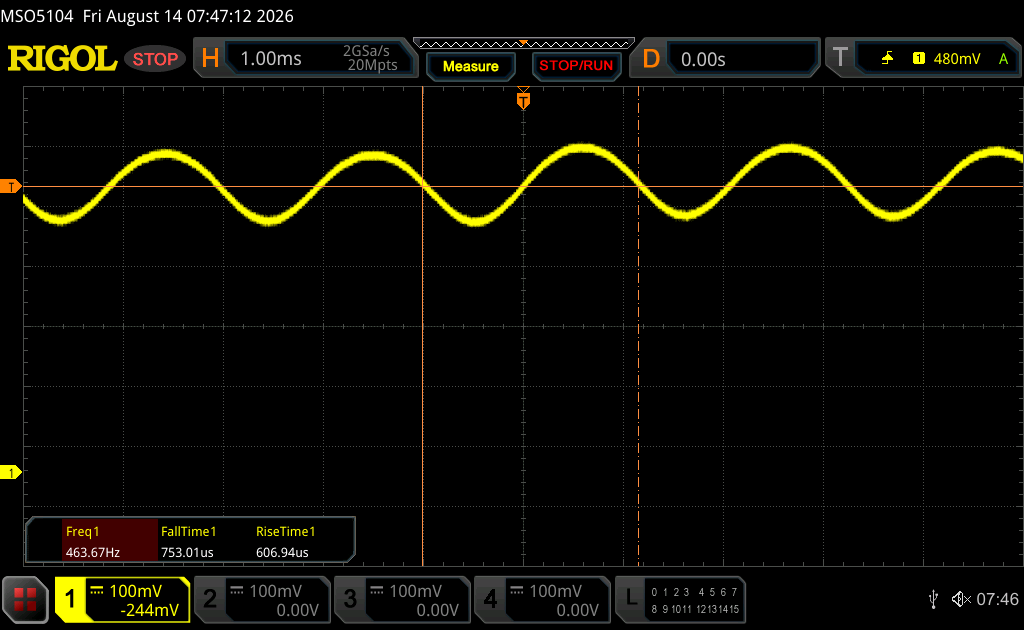
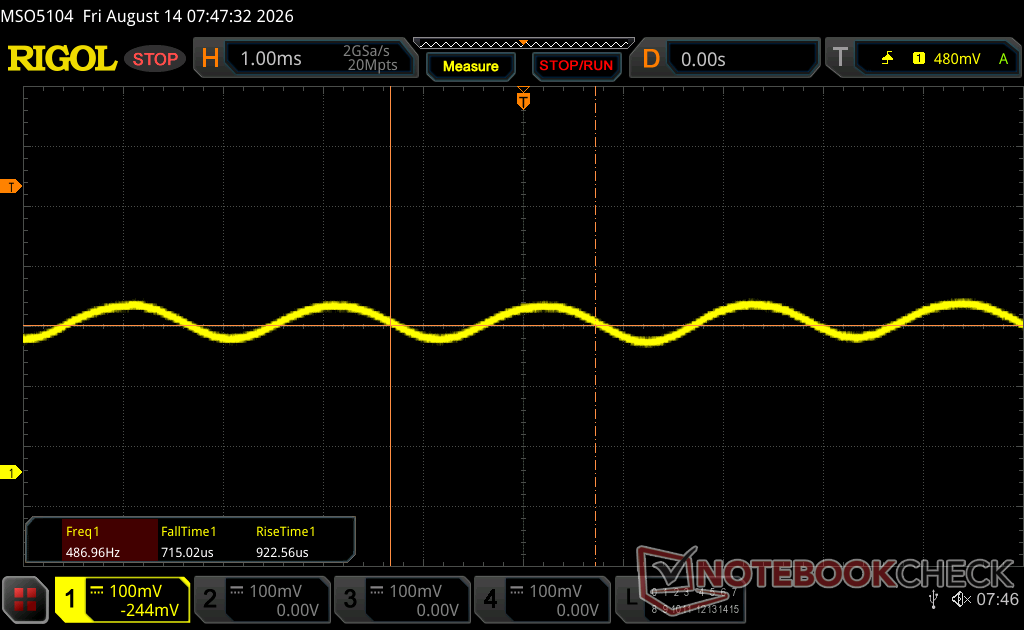
Flackern / PWM festgestellt 463.67 Hz
Amplitude: 19 %
≤ 100 % Helligkeit

Das Display flackert mit 463.67 Hz (im schlimmsten Fall, eventuell durch Pulsweitenmodulation PWM) bei einer eingestellten Helligkeit von 100 % und darunter. Darüber sollte es zu keinem Flackern kommen.

Die Frequenz von 463.67 Hz ist relativ hoch und sollte daher auch bei den meisten Personen zu keinen Problemen führen. Empfindliche User sollen laut Berichten aber sogar noch bei 500 Hz und darüber ein Flackern wahrnehmen.

Im Vergleich: 52 % aller getesteten Geräte nutzten kein PWM um die Helligkeit zu reduzieren. Wenn PWM eingesetzt wurde, dann bei einer Frequenz von durchschnittlich 7710 (Minimum 5, Maximum 343500) Hz.

100 Prozent Helligkeit
75 Prozent Helligkeit
50 Prozent Helligkeit
25 Prozent Helligkeit
0 Prozent Helligkeit
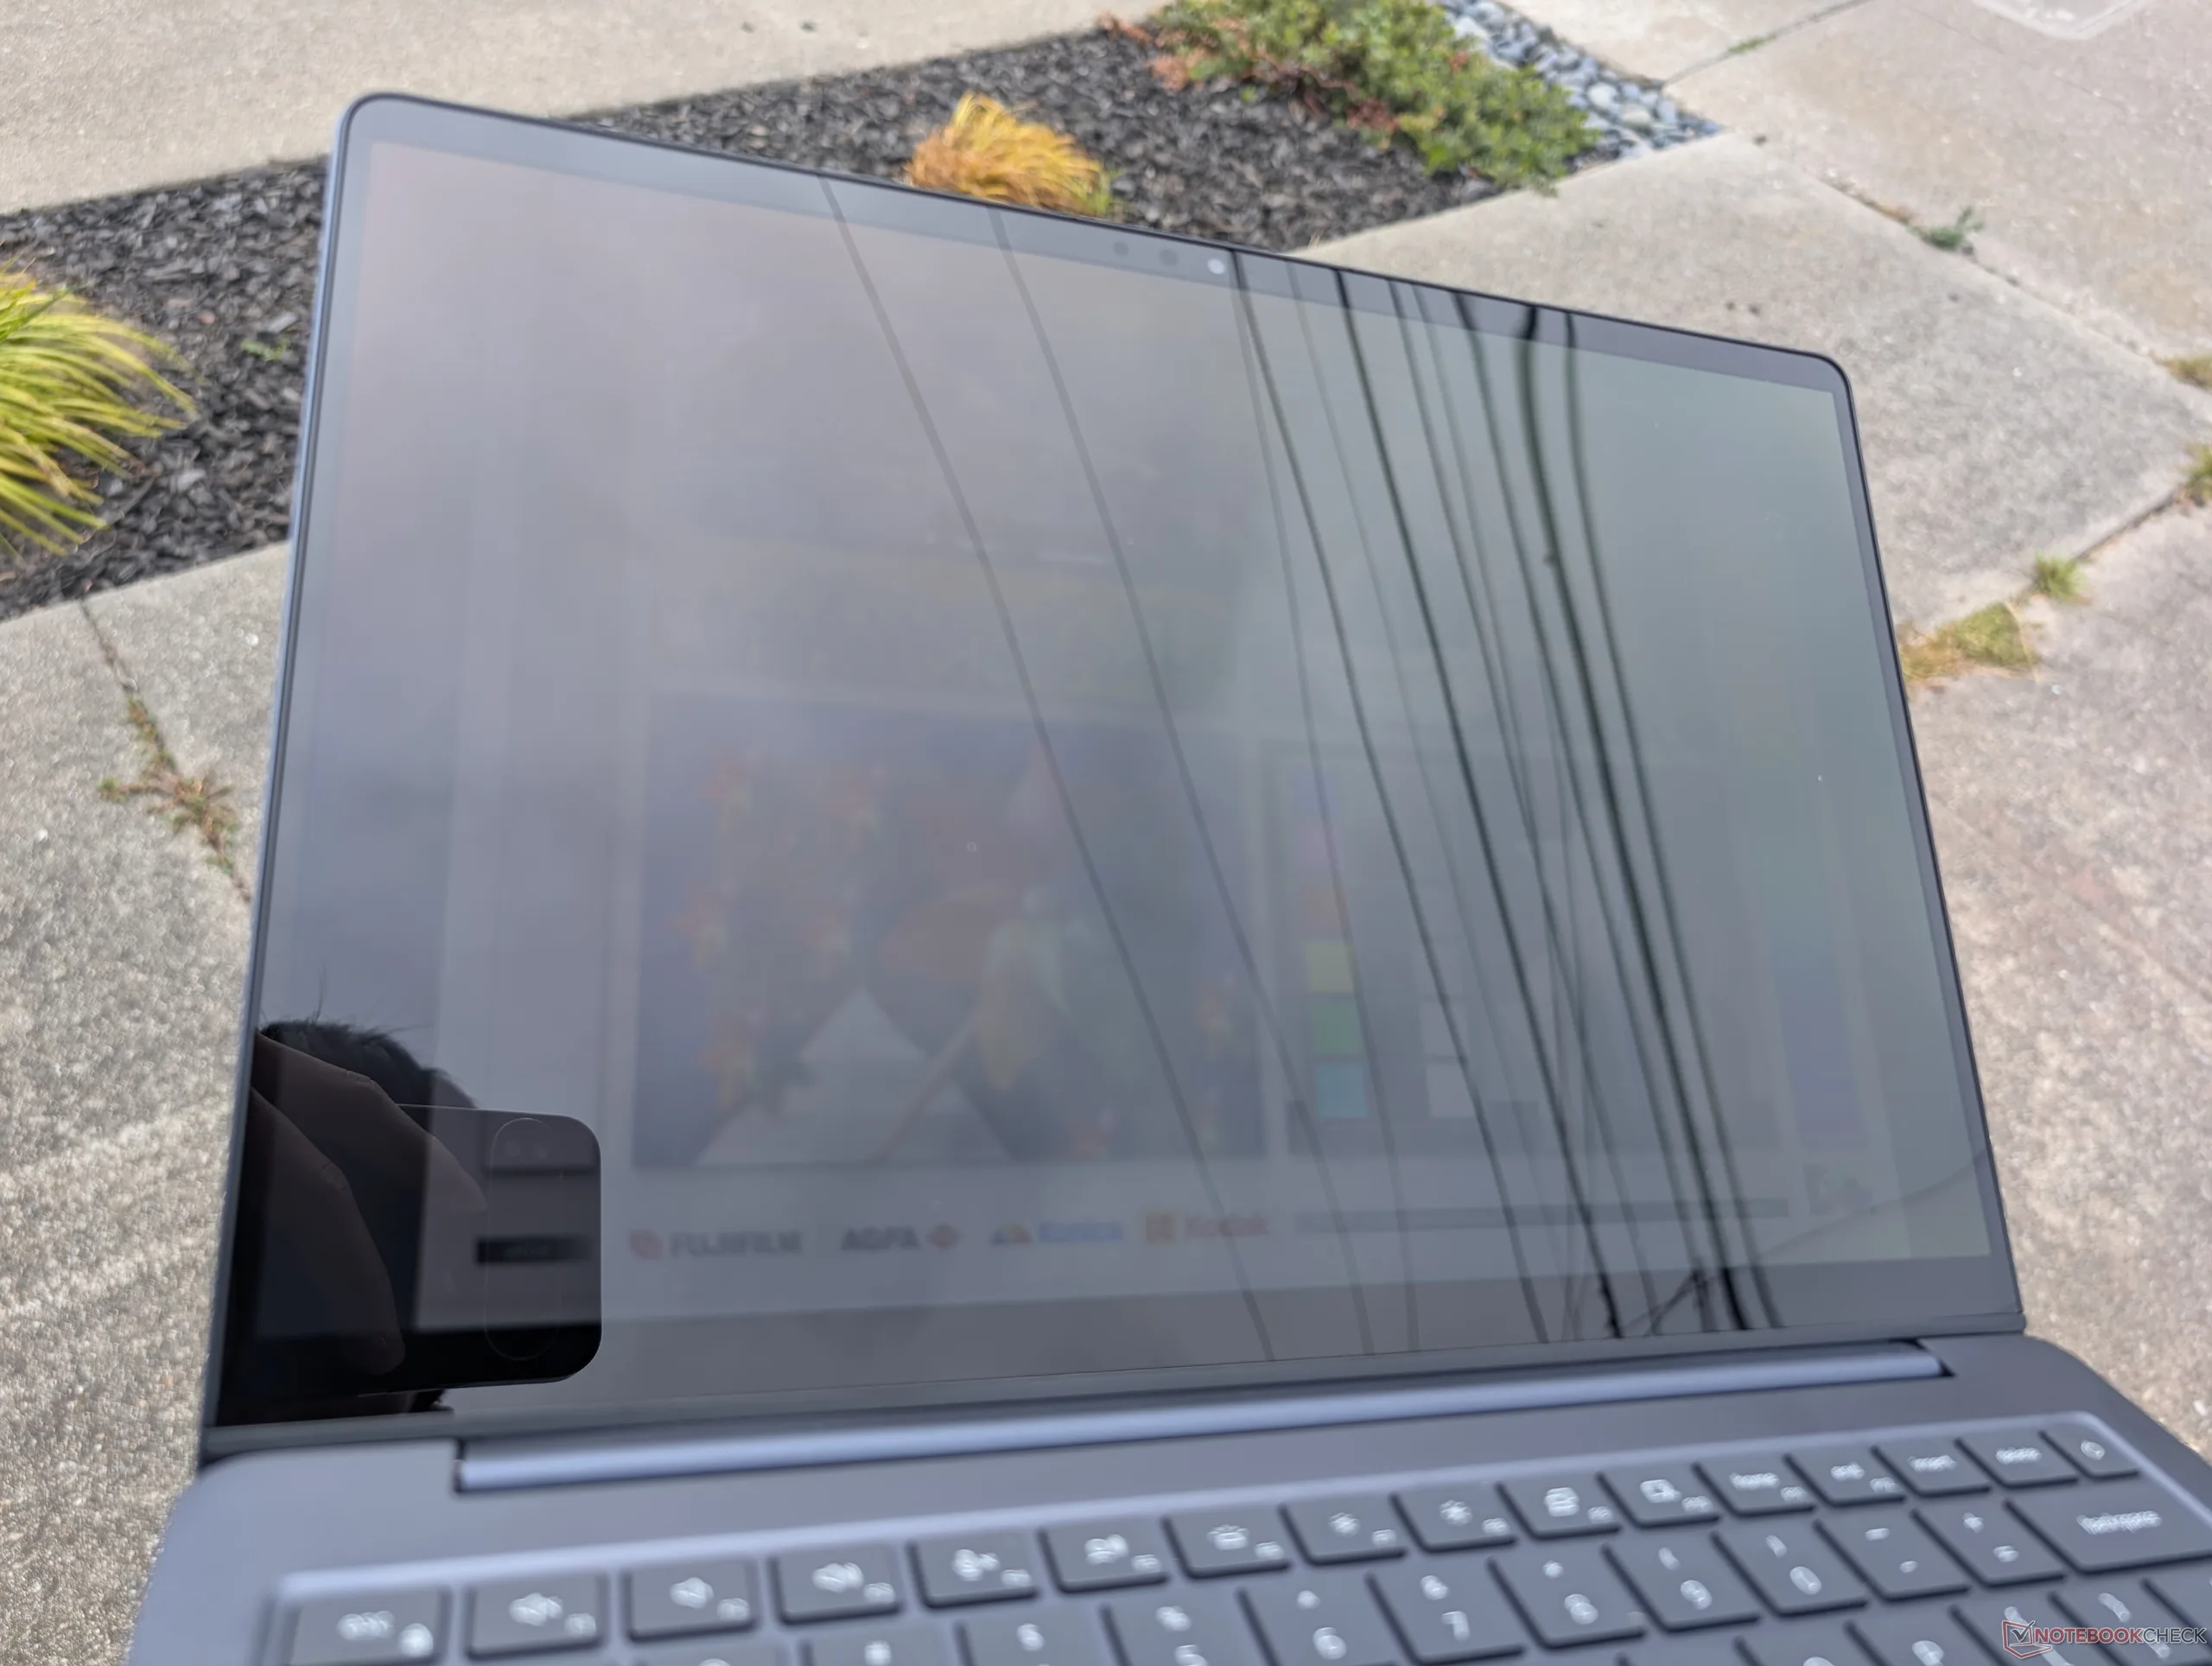
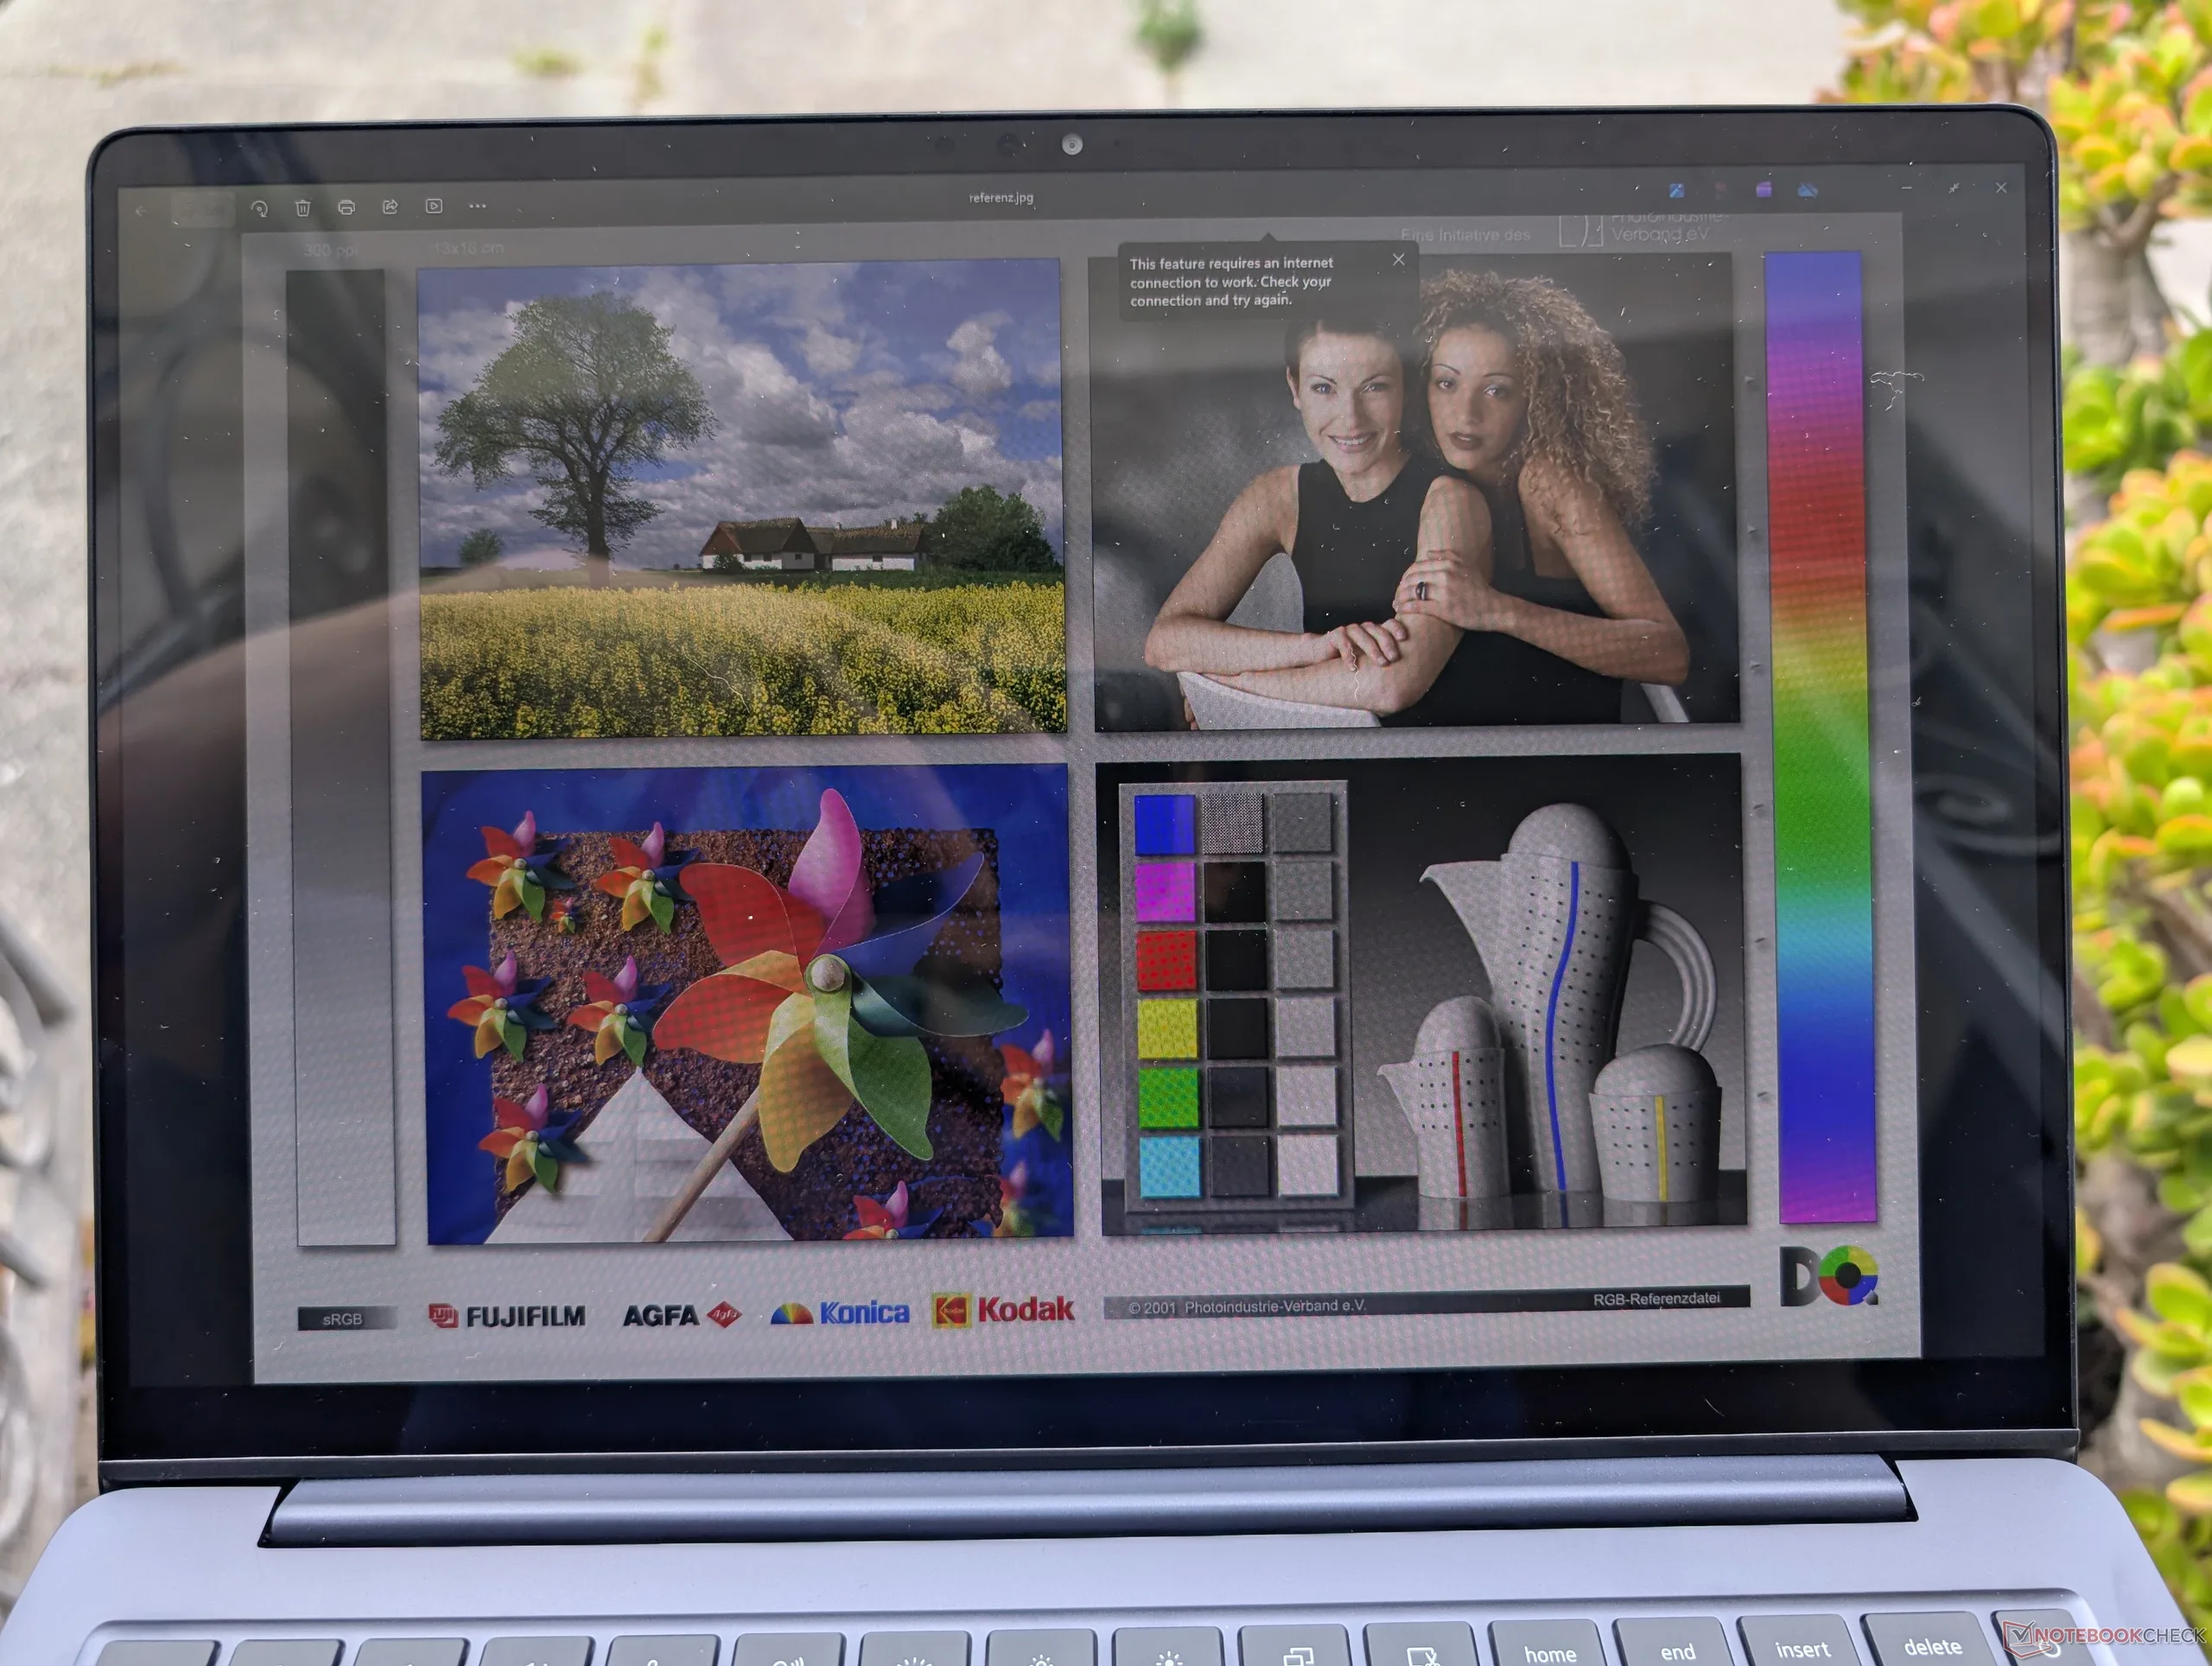
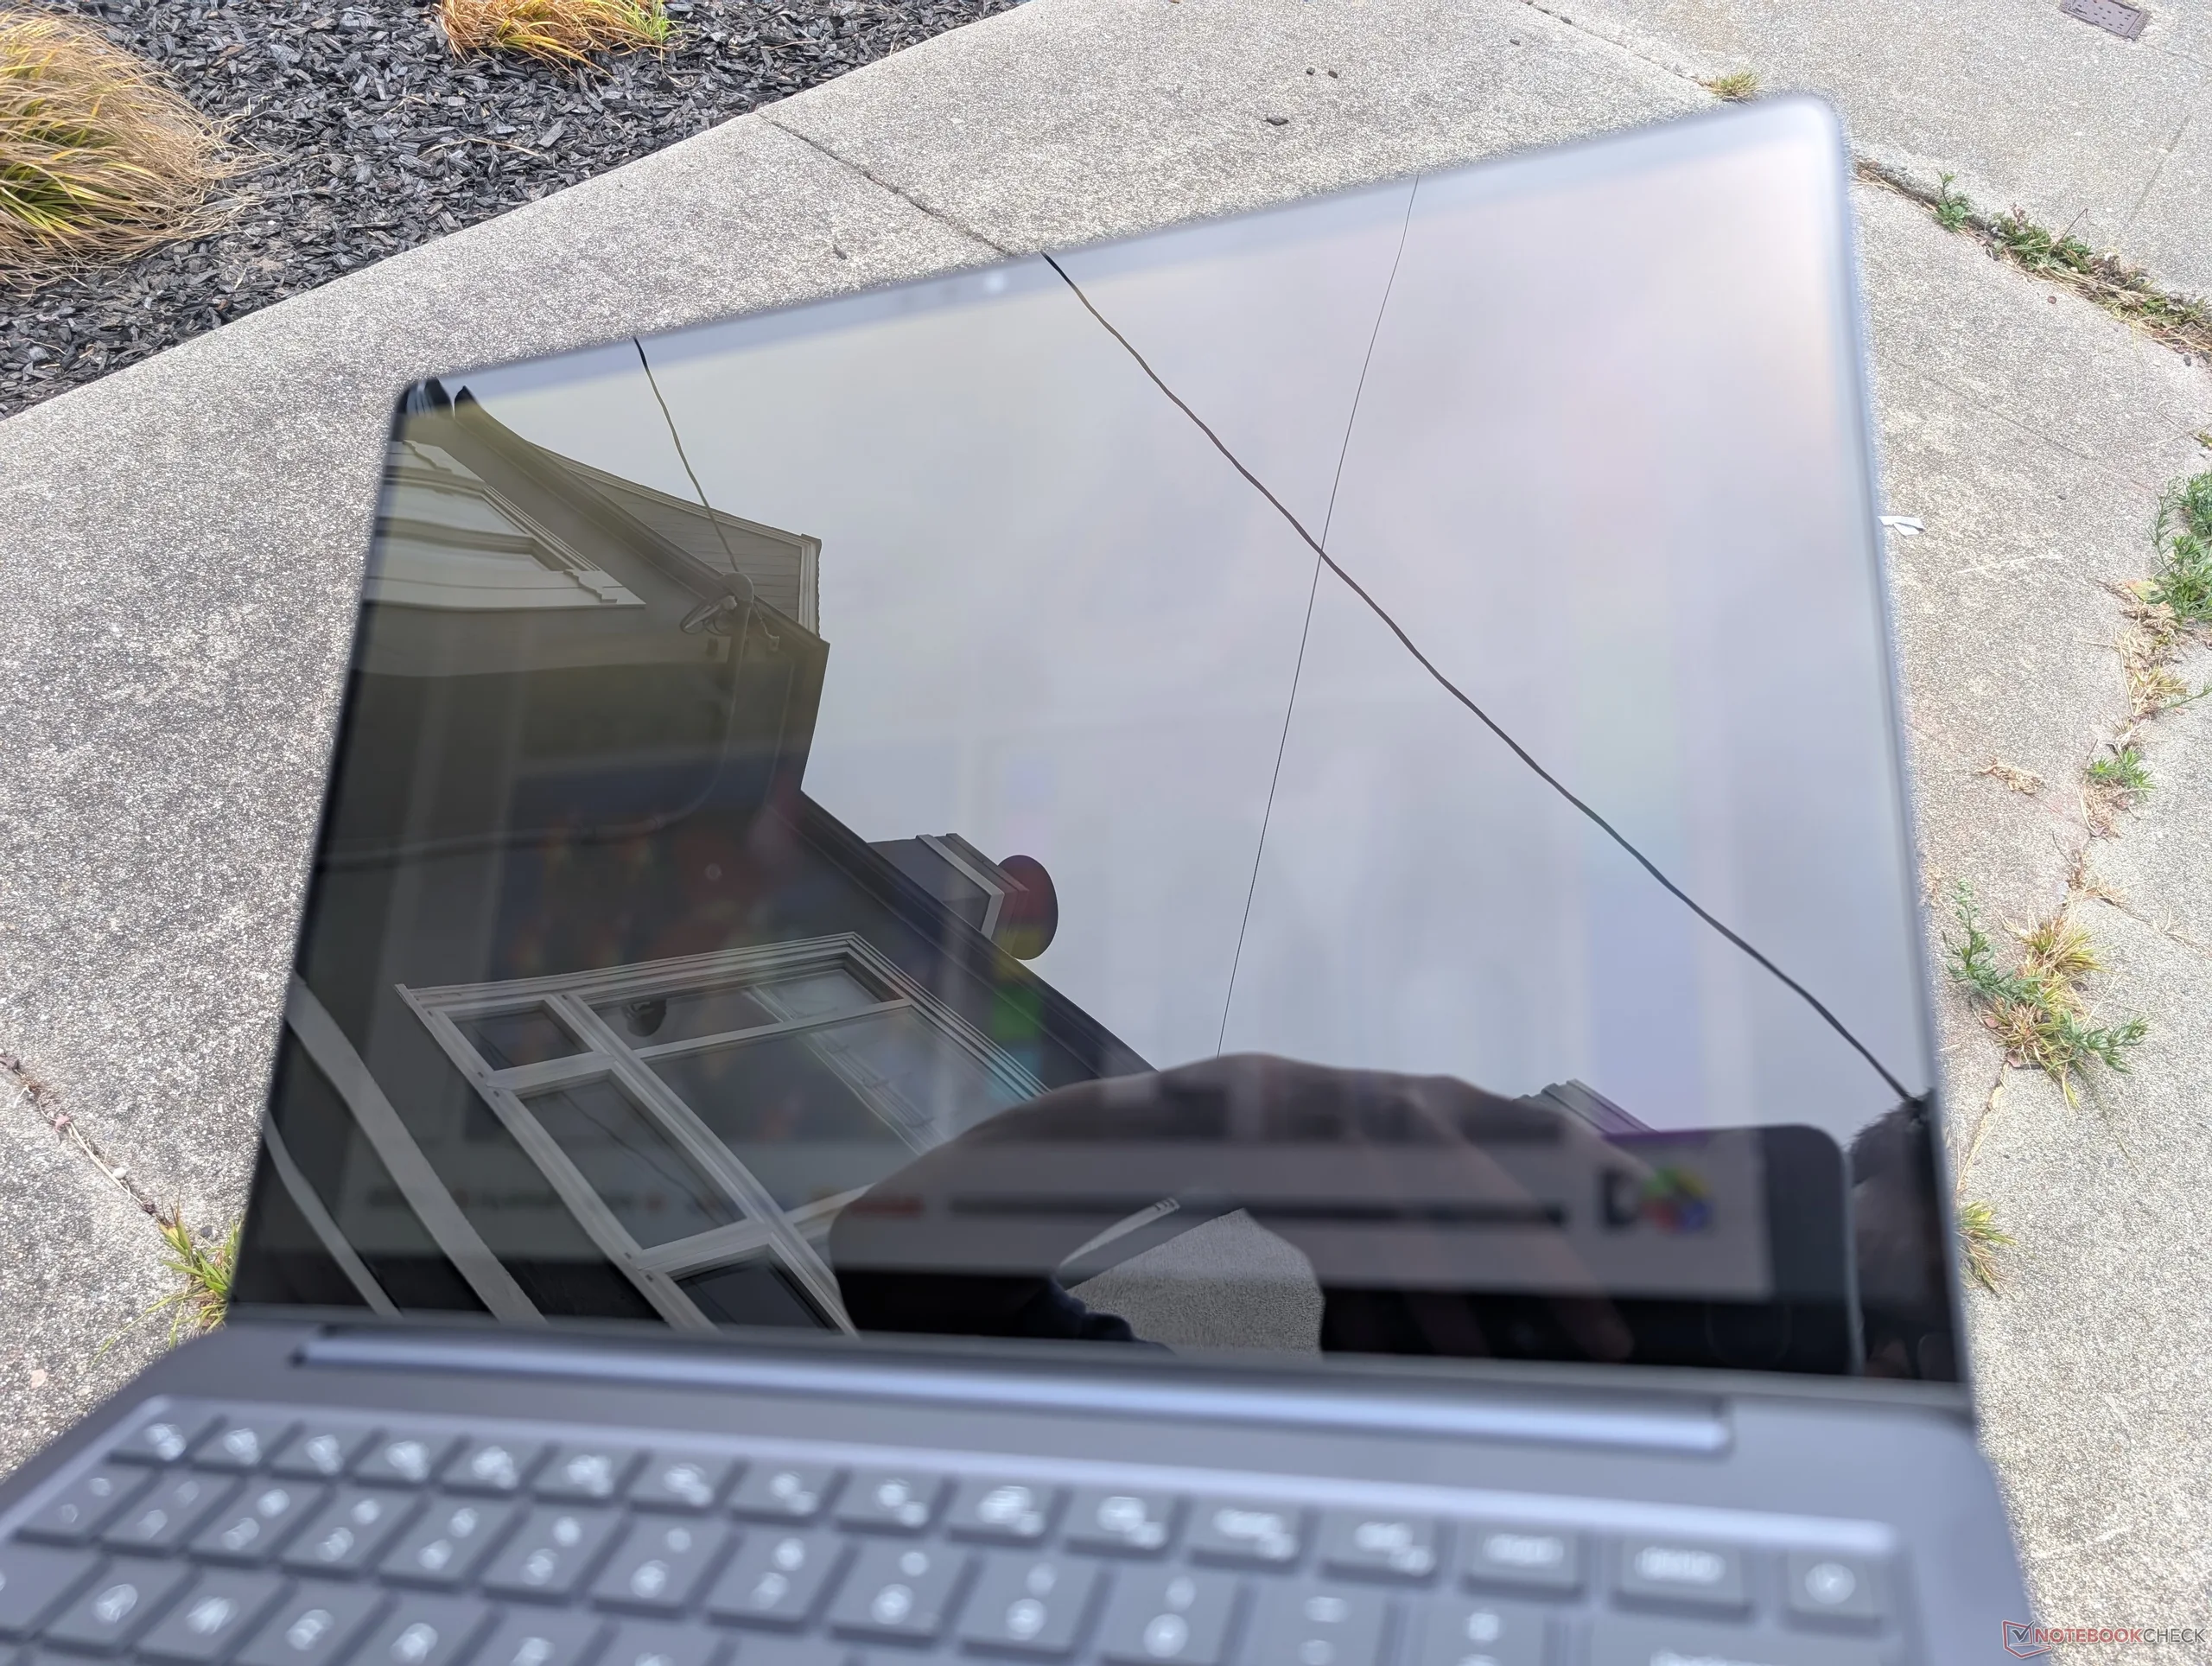
Im Freien bei bewölktem Himmel
Im Freien im Schatten
Im Freien bei bewölktem Himmel
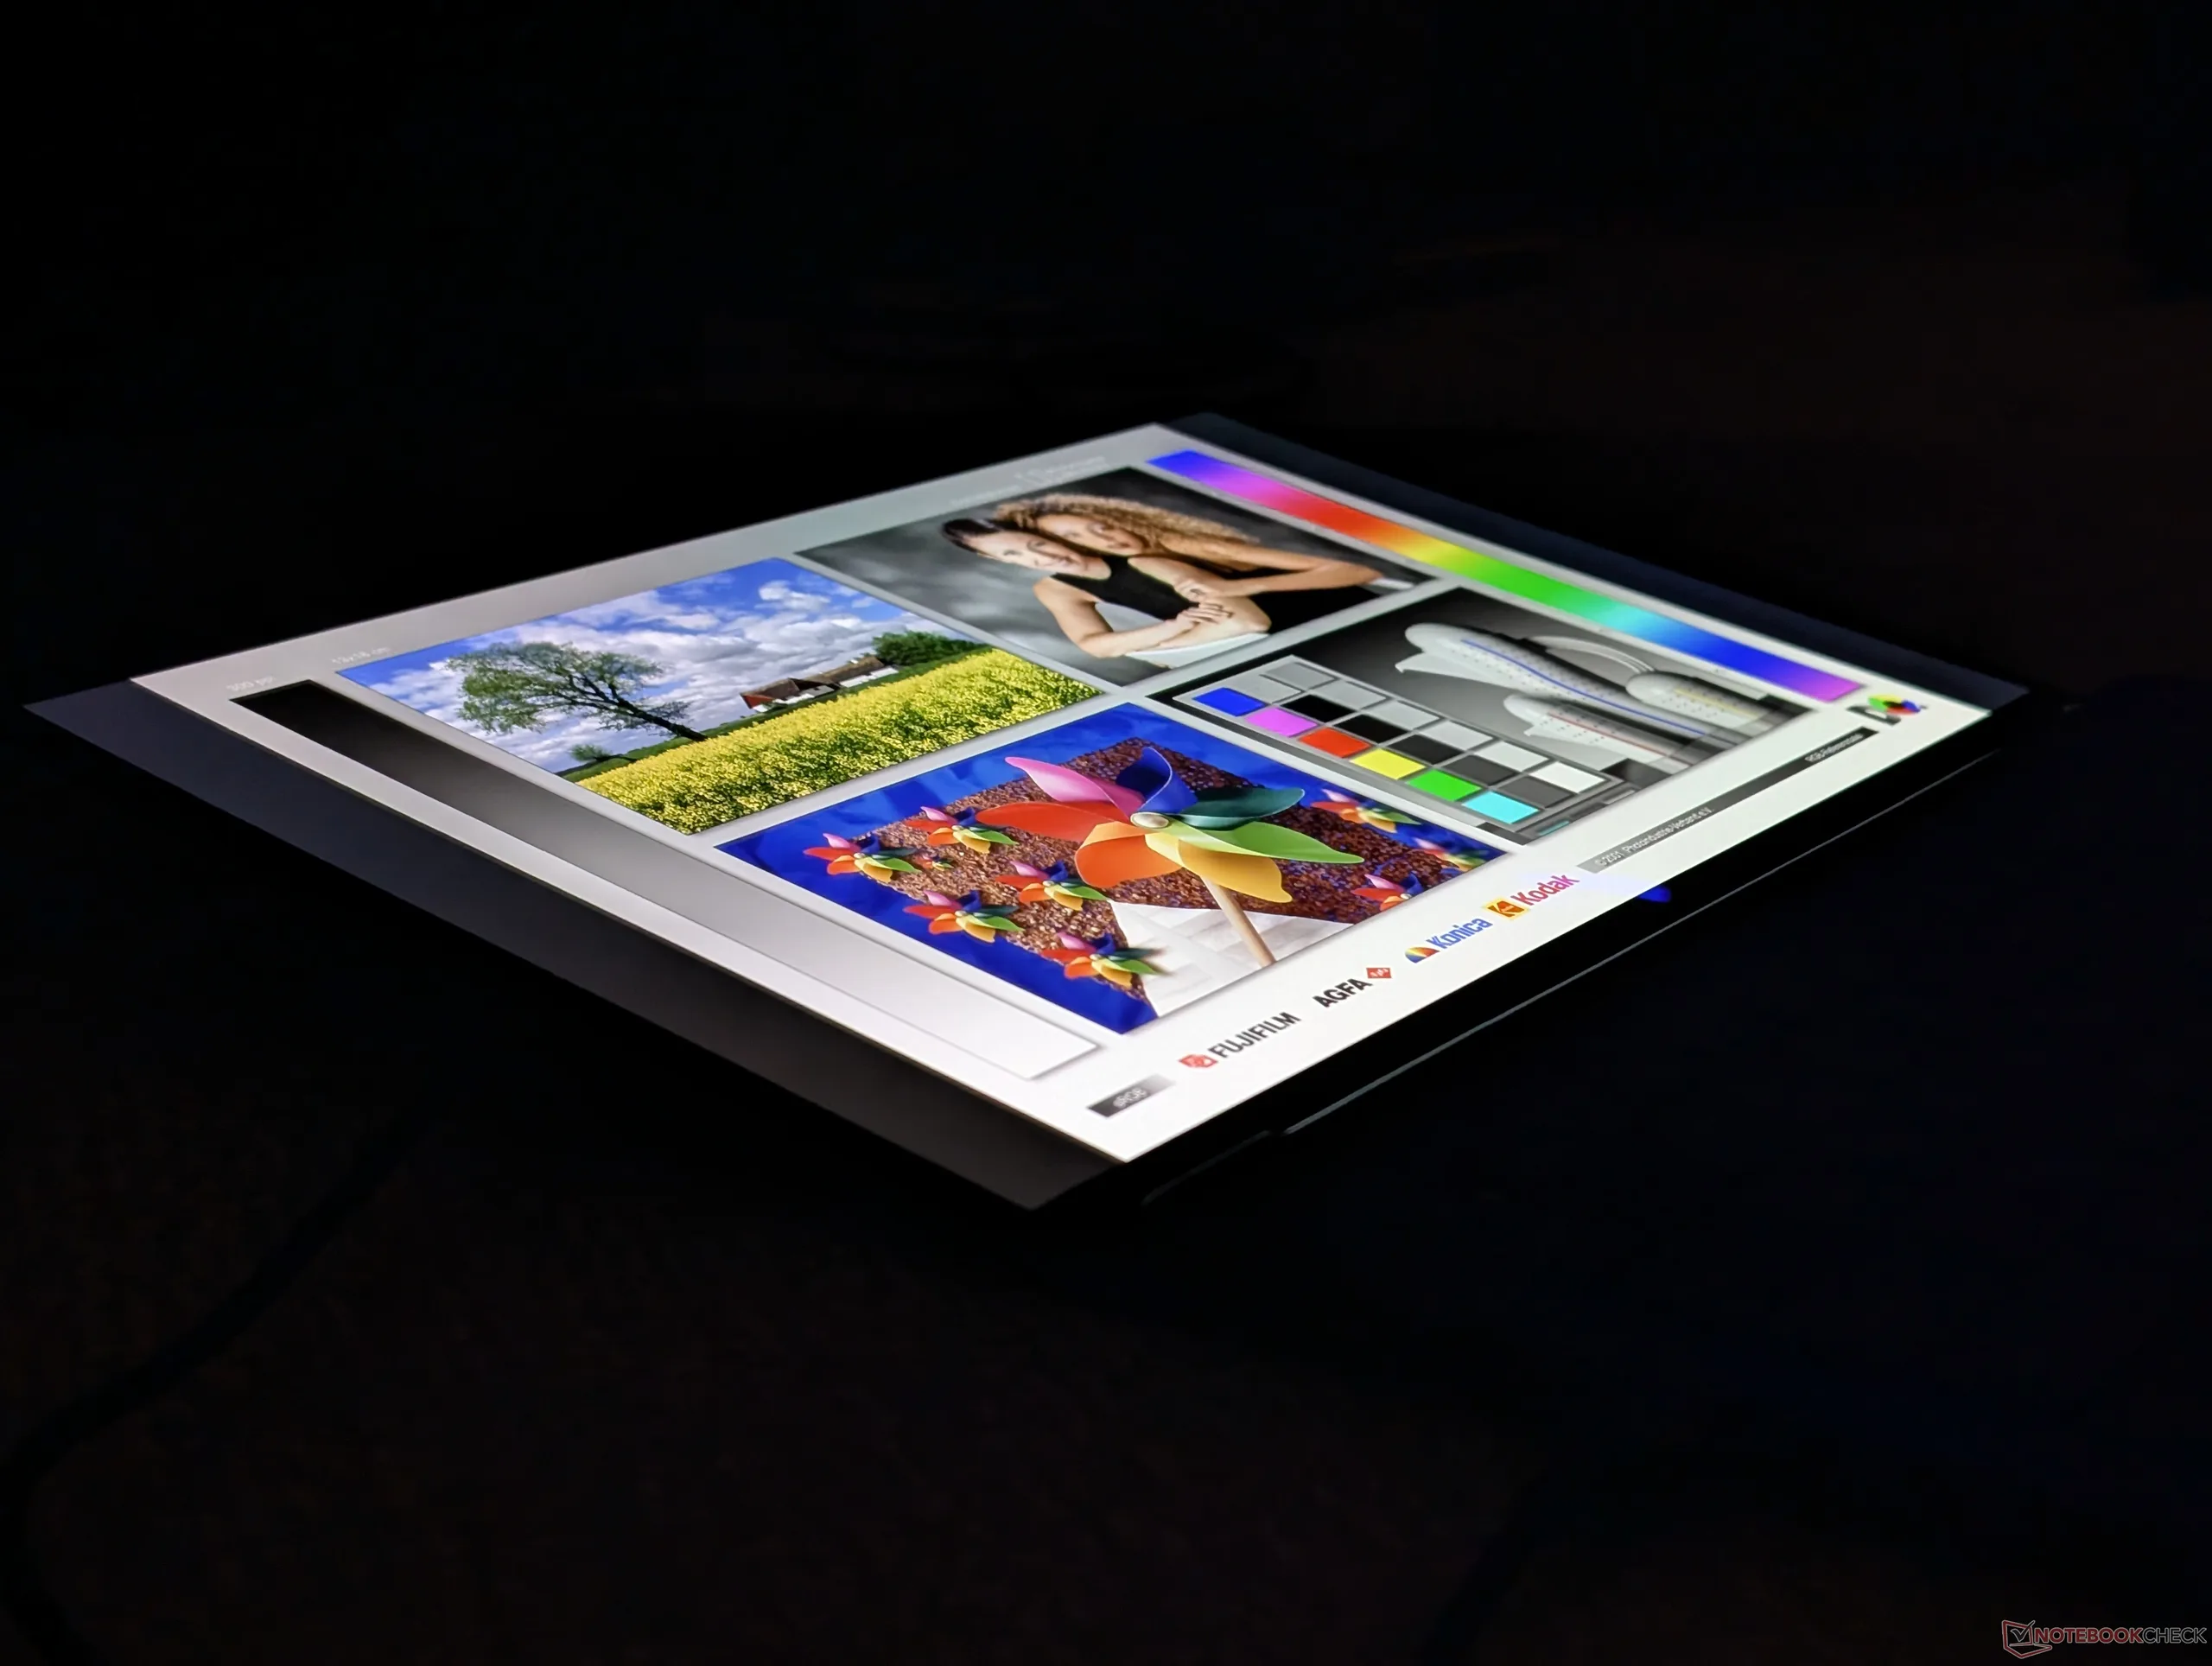
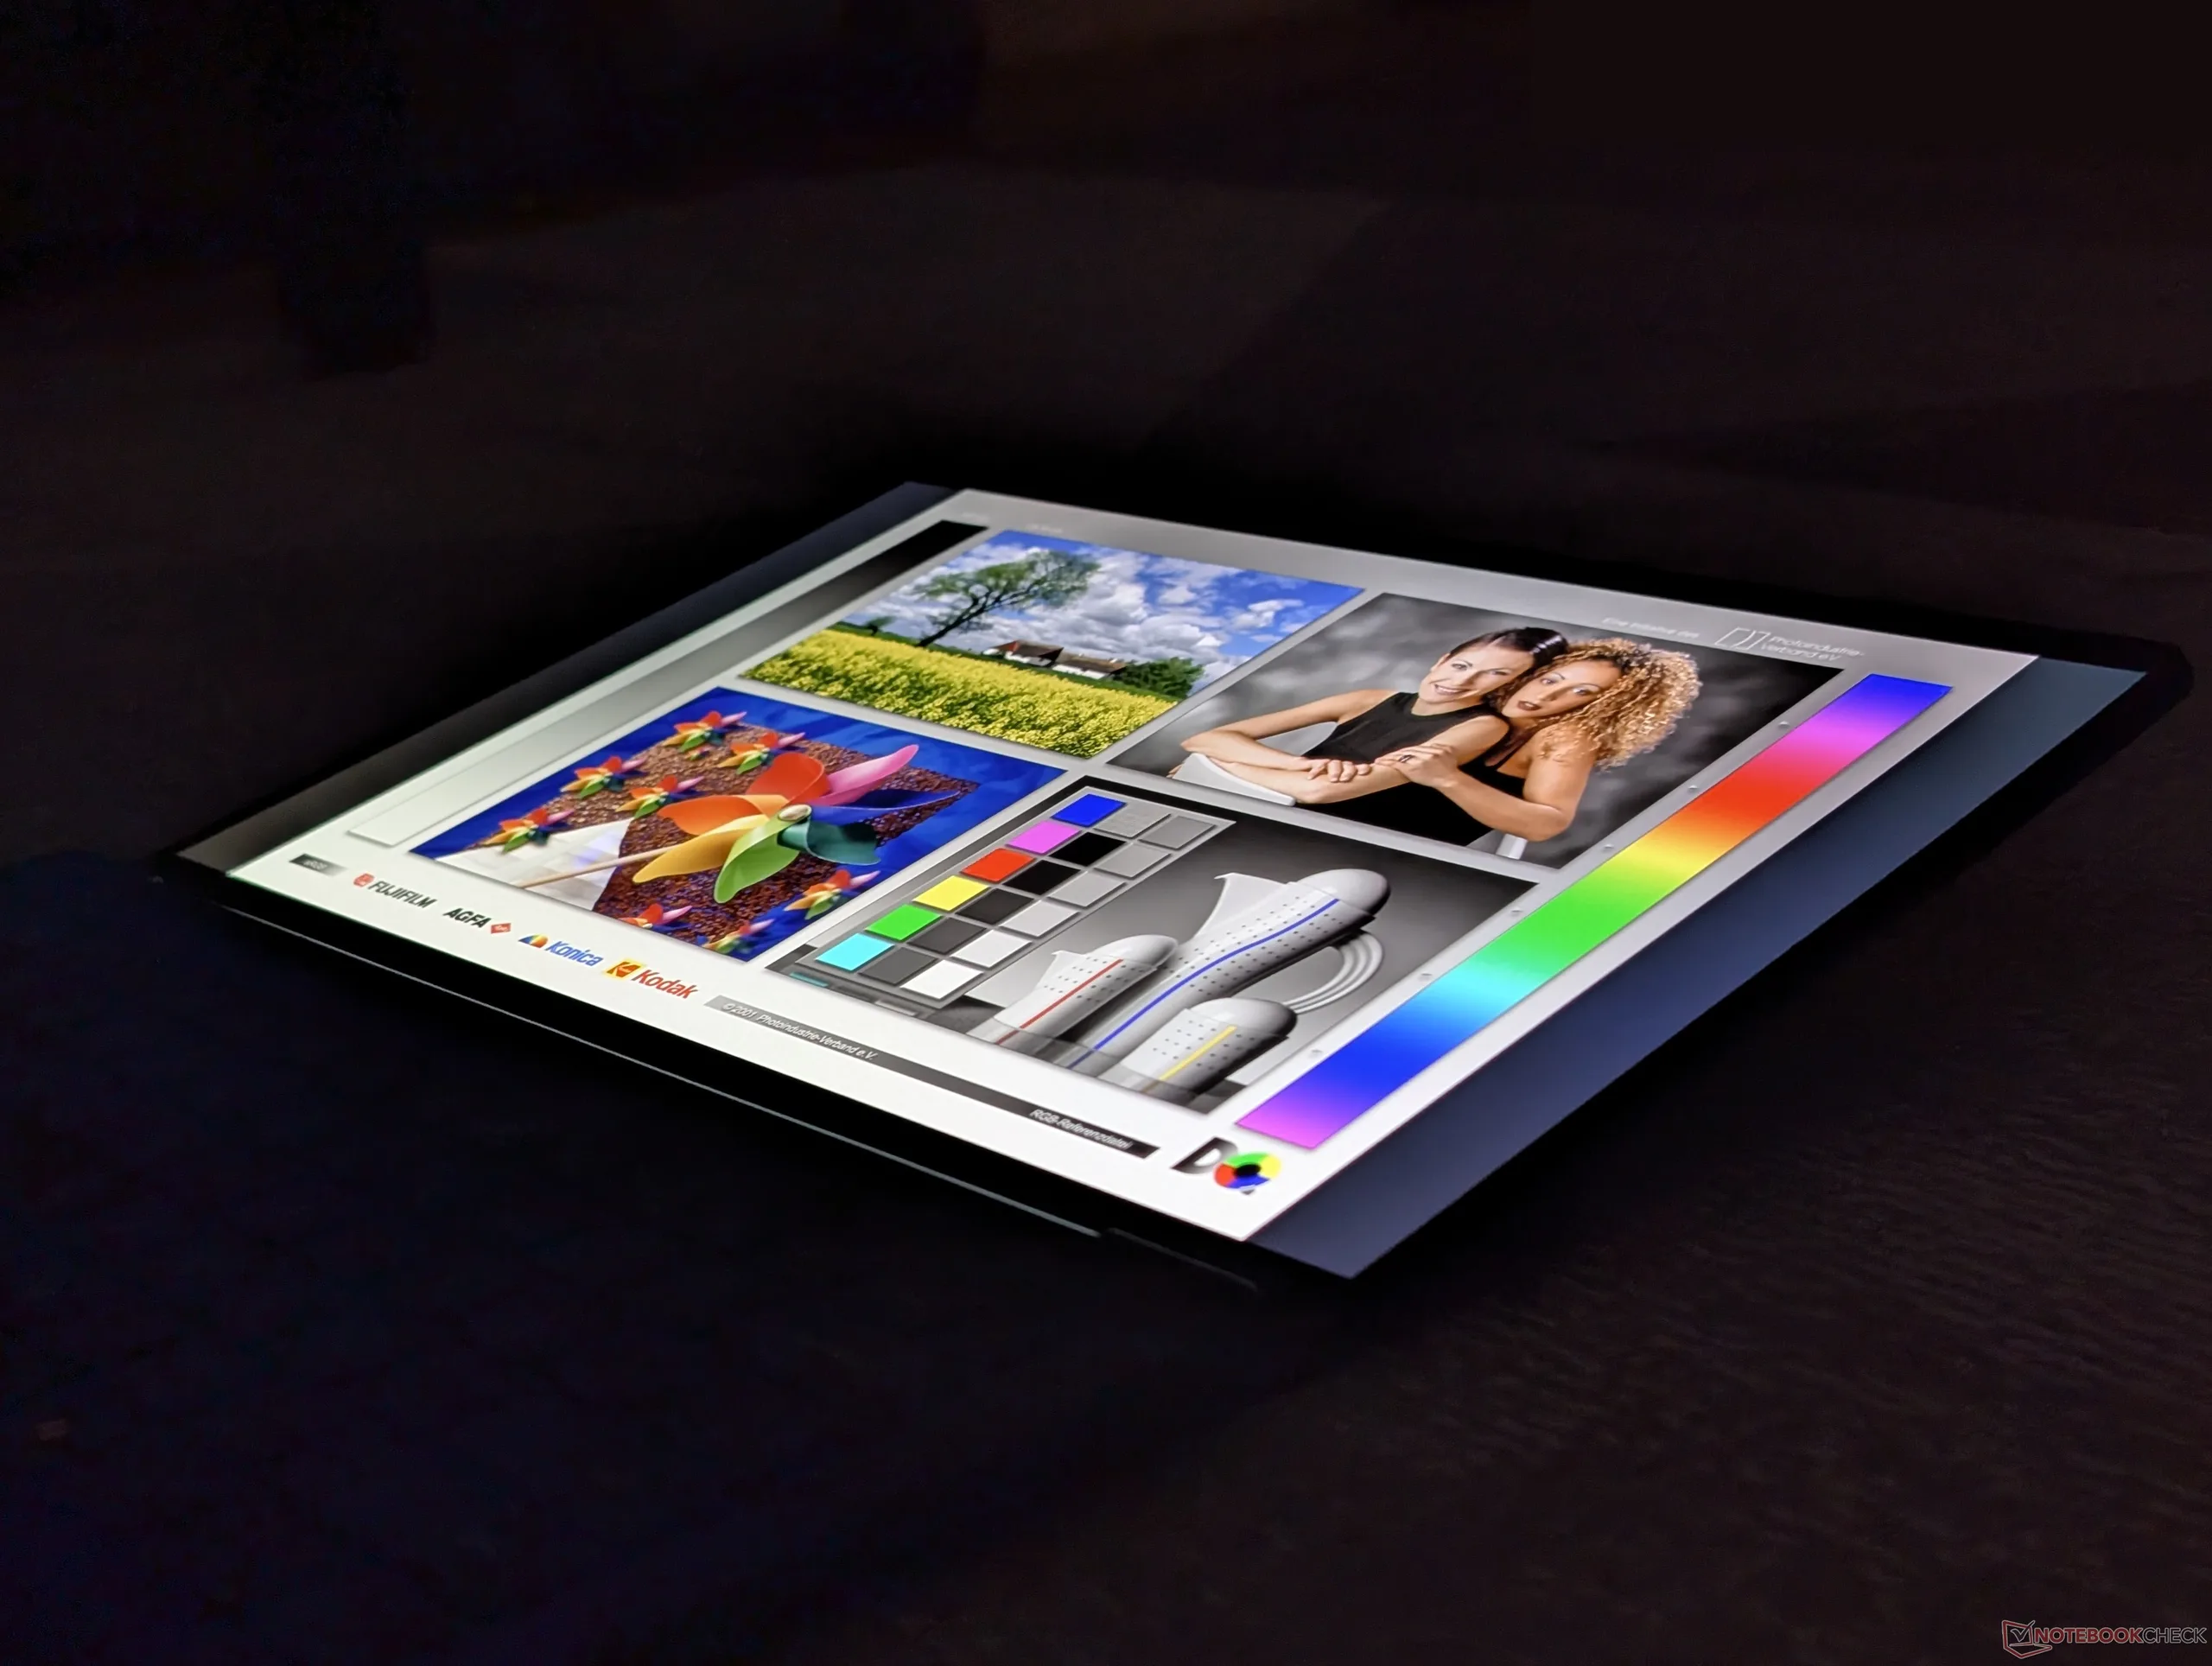
Große Betrachtungswinkel bei OLED-Displays

Leistung

Testbedingungen

Wir haben Windows vor der Durchführung der folgenden Benchmarks in den Leistungsmodus versetzt.

Prozessorleistung

Cinebench R15 Multi Loop

070140210280350420490560630700770840910980105011201190126013301400147015401610168017501820189019602030210021702240231023802450252025902660273028002870294030103080315032203290Tooltip
Dell 14S DS14260 Intel Core Ultra 7 355: Ø1561 (1476.23-1666.04) Points
Lenovo ThinkBook 14 G9 IPL 21UX005PGE Intel Core Ultra 5 325: Ø1548 (1444.41-1609.46) Points
Dell XPS 14 Core Ultra X7 358H Intel Core Ultra X7 358H: Ø2340 (2099.85-3134.55) Points
HP OmniBook Ultra 14 Core Ultra X9 Intel Core Ultra X9 388H: Ø2466 (2420.72-2711.68) Points
Dell Inspiron 14 7445 2-in-1 AMD Ryzen 7 8840HS: Ø1718 (1669.1-1933.67) Points
Asus VivoBook S 14 OLED M5406WA AMD Ryzen AI 9 HX 370: Ø2944 (2602.98-3345.04) Points
CPU Performance Rating: Percent
Cinebench R23: Multi Core | Single Core
Cinebench R20: CPU (Multi Core) | CPU (Single Core)
Cinebench R15: CPU Multi 64Bit | CPU Single 64Bit
Blender: v2.79 BMW27 CPU
7-Zip 18.03: 7z b 4 | 7z b 4 -mmt1
Geekbench 6.7: Multi-Core | Single-Core
Geekbench 5.5: Multi-Core | Single-Core
HWBOT x265 Benchmark v2.2: 4k Preset
LibreOffice : 20 Documents To PDF
R Benchmark 2.5: Overall mean
CPU Performance Rating
Dell XPS 14 Core Ultra X7 358H
Intel Core Ultra X7 358H
82.6 pt
Asus VivoBook S 14 OLED M5406WA
AMD Ryzen AI 9 HX 370
82.5 pt
HP OmniBook Ultra 14 Core Ultra X9
Intel Core Ultra X9 388H
81.7 pt
Lenovo IdeaPad Pro 5 14AGP11
AMD Ryzen AI 7 450
77 pt
Honor MagicBook Pro 14 2026
Intel Core Ultra 5 338H
75.3 pt
Dell Inspiron 14 7445 2-in-1
AMD Ryzen 7 8840HS
65 pt
Durchschnittliche Intel Core Ultra 7 355
 
62.4 pt
Dell 14S DS14260
Intel Core Ultra 7 355
62.3 pt
Lenovo ThinkBook 14 G9 IPL 21UX005PGE
Intel Core Ultra 5 325
60 pt
Dell 14 Plus
Intel Core Ultra 7 256V
57.1 pt
Lenovo ThinkPad E14 Gen 7 21U2002QGE
Intel Core Ultra 5 228V
53.2 pt
Lenovo Yoga Slim 6 14APU8
AMD Ryzen 5 7540U
52.6 pt
Cinebench R23 / Multi Core
Asus VivoBook S 14 OLED M5406WA
AMD Ryzen AI 9 HX 370
21058 Points +92%
Dell XPS 14 Core Ultra X7 358H
Intel Core Ultra X7 358H
18932 (14811.1min - 18932.2max) Points +73%
Lenovo IdeaPad Pro 5 14AGP11
AMD Ryzen AI 7 450
18316 Points +67%
HP OmniBook Ultra 14 Core Ultra X9
Intel Core Ultra X9 388H
17663 (16042.7min - 17663.2max) Points +61%
Honor MagicBook Pro 14 2026
Intel Core Ultra 5 338H
16331 Points +49%
Dell Inspiron 14 7445 2-in-1
AMD Ryzen 7 8840HS
12720 (10900.4min - 12720.4max) Points +16%
Durchschnittliche Intel Core Ultra 7 355
  (10966 - 11504, n=5)
11261 Points +3%
Lenovo ThinkBook 14 G9 IPL 21UX005PGE
Intel Core Ultra 5 325
11015 Points 0%
Dell 14S DS14260
Intel Core Ultra 7 355
10966 (10330.8min - 10966.4max) Points
Lenovo Yoga Slim 6 14APU8
AMD Ryzen 5 7540U
10383 Points -5%
Lenovo ThinkPad E14 Gen 7 21U2002QGE
Intel Core Ultra 5 228V
10077 Points -8%
Dell 14 Plus
Intel Core Ultra 7 256V
9992 (8467.37min - 9991.62max) Points -9%
Cinebench R23 / Single Core
HP OmniBook Ultra 14 Core Ultra X9
Intel Core Ultra X9 388H
2213 Points +13%
Dell XPS 14 Core Ultra X7 358H
Intel Core Ultra X7 358H
2086 Points +6%
Honor MagicBook Pro 14 2026
Intel Core Ultra 5 338H
2044 Points +4%
Lenovo IdeaPad Pro 5 14AGP11
AMD Ryzen AI 7 450
2038 Points +4%
Asus VivoBook S 14 OLED M5406WA
AMD Ryzen AI 9 HX 370
2001 Points +2%
Dell 14S DS14260
Intel Core Ultra 7 355
1964 Points
Durchschnittliche Intel Core Ultra 7 355
  (1931 - 1984, n=5)
1958 Points 0%
Lenovo ThinkBook 14 G9 IPL 21UX005PGE
Intel Core Ultra 5 325
1911 Points -3%
Dell 14 Plus
Intel Core Ultra 7 256V
1804 Points -8%
Lenovo ThinkPad E14 Gen 7 21U2002QGE
Intel Core Ultra 5 228V
1761 Points -10%
Dell Inspiron 14 7445 2-in-1
AMD Ryzen 7 8840HS
1737 Points -12%
Lenovo Yoga Slim 6 14APU8
AMD Ryzen 5 7540U
1699 Points -13%
Cinebench R20 / CPU (Multi Core)
Asus VivoBook S 14 OLED M5406WA
AMD Ryzen AI 9 HX 370
8233 Points +92%
Dell XPS 14 Core Ultra X7 358H
Intel Core Ultra X7 358H
7437 Points +74%
Lenovo IdeaPad Pro 5 14AGP11
AMD Ryzen AI 7 450
7161 Points +67%
HP OmniBook Ultra 14 Core Ultra X9
Intel Core Ultra X9 388H
7008 Points +64%
Honor MagicBook Pro 14 2026
Intel Core Ultra 5 338H
6370 Points +49%
Dell Inspiron 14 7445 2-in-1
AMD Ryzen 7 8840HS
4854 Points +13%
Durchschnittliche Intel Core Ultra 7 355
  (4282 - 4381, n=5)
4347 Points +2%
Dell 14S DS14260
Intel Core Ultra 7 355
4282 Points
Lenovo ThinkBook 14 G9 IPL 21UX005PGE
Intel Core Ultra 5 325
4254 Points -1%
Lenovo Yoga Slim 6 14APU8
AMD Ryzen 5 7540U
4036 Points -6%
Lenovo ThinkPad E14 Gen 7 21U2002QGE
Intel Core Ultra 5 228V
3927 Points -8%
Dell 14 Plus
Intel Core Ultra 7 256V
3893 Points -9%
Cinebench R20 / CPU (Single Core)
HP OmniBook Ultra 14 Core Ultra X9
Intel Core Ultra X9 388H
832 Points +11%
Lenovo IdeaPad Pro 5 14AGP11
AMD Ryzen AI 7 450
802 Points +7%
Dell XPS 14 Core Ultra X7 358H
Intel Core Ultra X7 358H
792 Points +6%
Asus VivoBook S 14 OLED M5406WA
AMD Ryzen AI 9 HX 370
790 Points +5%
Honor MagicBook Pro 14 2026
Intel Core Ultra 5 338H
774 Points +3%
Dell 14S DS14260
Intel Core Ultra 7 355
749 Points
Durchschnittliche Intel Core Ultra 7 355
  (730 - 749, n=5)
740 Points -1%
Lenovo ThinkBook 14 G9 IPL 21UX005PGE
Intel Core Ultra 5 325
723 Points -3%
Dell 14 Plus
Intel Core Ultra 7 256V
702 Points -6%
Dell Inspiron 14 7445 2-in-1
AMD Ryzen 7 8840HS
681 Points -9%
Lenovo ThinkPad E14 Gen 7 21U2002QGE
Intel Core Ultra 5 228V
678 Points -9%
Lenovo Yoga Slim 6 14APU8
AMD Ryzen 5 7540U
657 Points -12%
Cinebench R15 / CPU Multi 64Bit
Asus VivoBook S 14 OLED M5406WA
AMD Ryzen AI 9 HX 370
3345 (2602.98min - 3345.04max) Points +101%
Dell XPS 14 Core Ultra X7 358H
Intel Core Ultra X7 358H
3135 (2099.85min - 3134.55max) Points +88%
Lenovo IdeaPad Pro 5 14AGP11
AMD Ryzen AI 7 450
2713 (2666.13min - 2713.15max) Points +63%
HP OmniBook Ultra 14 Core Ultra X9
Intel Core Ultra X9 388H
2712 (2420.72min - 2711.68max) Points +63%
Honor MagicBook Pro 14 2026
Intel Core Ultra 5 338H
2504 (2424.98min - 2504.07max) Points +50%
Dell Inspiron 14 7445 2-in-1
AMD Ryzen 7 8840HS
1934 (1669.1min - 1933.67max) Points +16%
Durchschnittliche Intel Core Ultra 7 355
  (1654 - 1707, n=5)
1683 Points +1%
Lenovo Yoga Slim 6 14APU8
AMD Ryzen 5 7540U
1676 (1424.1min - 1675.6max) Points +1%
Dell 14S DS14260
Intel Core Ultra 7 355
1666 (1476.23min - 1666.04max) Points
Lenovo ThinkBook 14 G9 IPL 21UX005PGE
Intel Core Ultra 5 325
1609 (1444.41min - 1609.46max) Points -3%
Lenovo ThinkPad E14 Gen 7 21U2002QGE
Intel Core Ultra 5 228V
1535 (1389.95min - 1535.1max) Points -8%
Dell 14 Plus
Intel Core Ultra 7 256V
1500 (1111.88min - 1500.09max) Points -10%
Cinebench R15 / CPU Single 64Bit
HP OmniBook Ultra 14 Core Ultra X9
Intel Core Ultra X9 388H
313 Points +7%
Dell XPS 14 Core Ultra X7 358H
Intel Core Ultra X7 358H
312 Points +7%
Asus VivoBook S 14 OLED M5406WA
AMD Ryzen AI 9 HX 370
307 Points +5%
Honor MagicBook Pro 14 2026
Intel Core Ultra 5 338H
305 Points +4%
Dell 14S DS14260
Intel Core Ultra 7 355
292 Points
Durchschnittliche Intel Core Ultra 7 355
  (288 - 292, n=5)
290 Points -1%
Lenovo ThinkBook 14 G9 IPL 21UX005PGE
Intel Core Ultra 5 325
280 Points -4%
Dell 14 Plus
Intel Core Ultra 7 256V
276 Points -5%
Lenovo ThinkPad E14 Gen 7 21U2002QGE
Intel Core Ultra 5 228V
273 Points -7%
Dell Inspiron 14 7445 2-in-1
AMD Ryzen 7 8840HS
270 Points -8%
Lenovo Yoga Slim 6 14APU8
AMD Ryzen 5 7540U
264 Points -10%
Lenovo IdeaPad Pro 5 14AGP11
AMD Ryzen AI 7 450
215 Points -26%
Blender / v2.79 BMW27 CPU
Lenovo ThinkPad E14 Gen 7 21U2002QGE
Intel Core Ultra 5 228V
416 Seconds * -34%
Lenovo Yoga Slim 6 14APU8
AMD Ryzen 5 7540U
413 Seconds * -33%
Dell 14 Plus
Intel Core Ultra 7 256V
373 Seconds * -20%
Lenovo ThinkBook 14 G9 IPL 21UX005PGE
Intel Core Ultra 5 325
319 Seconds * -3%
Dell 14S DS14260
Intel Core Ultra 7 355
310 Seconds *
Durchschnittliche Intel Core Ultra 7 355
  (299 - 310, n=5)
306 Seconds * +1%
Dell Inspiron 14 7445 2-in-1
AMD Ryzen 7 8840HS
232 Seconds * +25%
Honor MagicBook Pro 14 2026
Intel Core Ultra 5 338H
209 Seconds * +33%
HP OmniBook Ultra 14 Core Ultra X9
Intel Core Ultra X9 388H
198 Seconds * +36%
Dell XPS 14 Core Ultra X7 358H
Intel Core Ultra X7 358H
196 Seconds * +37%
Lenovo IdeaPad Pro 5 14AGP11
AMD Ryzen AI 7 450
182 Seconds * +41%
Asus VivoBook S 14 OLED M5406WA
AMD Ryzen AI 9 HX 370
163 Seconds * +47%
7-Zip 18.03 / 7z b 4
Asus VivoBook S 14 OLED M5406WA
AMD Ryzen AI 9 HX 370
75402 MIPS +109%
Lenovo IdeaPad Pro 5 14AGP11
AMD Ryzen AI 7 450
65714 MIPS +82%
Dell XPS 14 Core Ultra X7 358H
Intel Core Ultra X7 358H
64255 MIPS +78%
HP OmniBook Ultra 14 Core Ultra X9
Intel Core Ultra X9 388H
62372 MIPS +73%
Dell Inspiron 14 7445 2-in-1
AMD Ryzen 7 8840HS
60670 MIPS +68%
Honor MagicBook Pro 14 2026
Intel Core Ultra 5 338H
54556 MIPS +51%
Durchschnittliche Intel Core Ultra 7 355
  (36122 - 38450, n=5)
37509 MIPS +4%
Dell 14S DS14260
Intel Core Ultra 7 355
36122 MIPS
Lenovo ThinkBook 14 G9 IPL 21UX005PGE
Intel Core Ultra 5 325
35424 MIPS -2%
Lenovo Yoga Slim 6 14APU8
AMD Ryzen 5 7540U
35368 MIPS -2%
Dell 14 Plus
Intel Core Ultra 7 256V
35100 MIPS -3%
Lenovo ThinkPad E14 Gen 7 21U2002QGE
Intel Core Ultra 5 228V
28714 MIPS -21%
7-Zip 18.03 / 7z b 4 -mmt1
HP OmniBook Ultra 14 Core Ultra X9
Intel Core Ultra X9 388H
6699 MIPS +15%
Dell XPS 14 Core Ultra X7 358H
Intel Core Ultra X7 358H
6526 MIPS +12%
Dell Inspiron 14 7445 2-in-1
AMD Ryzen 7 8840HS
6493 MIPS +11%
Lenovo IdeaPad Pro 5 14AGP11
AMD Ryzen AI 7 450
6338 MIPS +9%
Honor MagicBook Pro 14 2026
Intel Core Ultra 5 338H
6316 MIPS +8%
Asus VivoBook S 14 OLED M5406WA
AMD Ryzen AI 9 HX 370
6077 MIPS +4%
Lenovo Yoga Slim 6 14APU8
AMD Ryzen 5 7540U
6039 MIPS +4%
Dell 14S DS14260
Intel Core Ultra 7 355
5831 MIPS
Durchschnittliche Intel Core Ultra 7 355
  (5734 - 5831, n=5)
5781 MIPS -1%
Dell 14 Plus
Intel Core Ultra 7 256V
5563 MIPS -5%
Lenovo ThinkBook 14 G9 IPL 21UX005PGE
Intel Core Ultra 5 325
5466 MIPS -6%
Lenovo ThinkPad E14 Gen 7 21U2002QGE
Intel Core Ultra 5 228V
5326 MIPS -9%
Geekbench 6.7 / Multi-Core
Dell XPS 14 Core Ultra X7 358H
Intel Core Ultra X7 358H
17121 Points +52%
HP OmniBook Ultra 14 Core Ultra X9
Intel Core Ultra X9 388H
16568 Points +48%
Asus VivoBook S 14 OLED M5406WA
AMD Ryzen AI 9 HX 370
15059 Points +34%
Lenovo IdeaPad Pro 5 14AGP11
AMD Ryzen AI 7 450
14624 Points +30%
Honor MagicBook Pro 14 2026
Intel Core Ultra 5 338H
14499 Points +29%
Durchschnittliche Intel Core Ultra 7 355
  (11036 - 11702, n=5)
11367 Points +1%
Dell Inspiron 14 7445 2-in-1
AMD Ryzen 7 8840HS
11327 Points +1%
Dell 14S DS14260
Intel Core Ultra 7 355
11227 Points
Dell 14 Plus
Intel Core Ultra 7 256V
11085 Points -1%
Lenovo ThinkBook 14 G9 IPL 21UX005PGE
Intel Core Ultra 5 325
10907 Points -3%
Lenovo ThinkPad E14 Gen 7 21U2002QGE
Intel Core Ultra 5 228V
10353 Points -8%
Lenovo Yoga Slim 6 14APU8
AMD Ryzen 5 7540U
8971 Points -20%
Geekbench 6.7 / Single-Core
HP OmniBook Ultra 14 Core Ultra X9
Intel Core Ultra X9 388H
3027 Points +11%
Lenovo IdeaPad Pro 5 14AGP11
AMD Ryzen AI 7 450
2928 Points +8%
Dell XPS 14 Core Ultra X7 358H
Intel Core Ultra X7 358H
2927 Points +8%
Asus VivoBook S 14 OLED M5406WA
AMD Ryzen AI 9 HX 370
2884 Points +6%
Honor MagicBook Pro 14 2026
Intel Core Ultra 5 338H
2840 Points +5%
Dell 14 Plus
Intel Core Ultra 7 256V
2728 Points 0%
Durchschnittliche Intel Core Ultra 7 355
  (2701 - 2769, n=5)
2725 Points 0%
Dell 14S DS14260
Intel Core Ultra 7 355
2716 Points
Lenovo ThinkPad E14 Gen 7 21U2002QGE
Intel Core Ultra 5 228V
2605 Points -4%
Dell Inspiron 14 7445 2-in-1
AMD Ryzen 7 8840HS
2592 Points -5%
Lenovo ThinkBook 14 G9 IPL 21UX005PGE
Intel Core Ultra 5 325
2571 Points -5%
Lenovo Yoga Slim 6 14APU8
AMD Ryzen 5 7540U
2519 Points -7%
Geekbench 5.5 / Multi-Core
Dell XPS 14 Core Ultra X7 358H
Intel Core Ultra X7 358H
17028 Points +70%
HP OmniBook Ultra 14 Core Ultra X9
Intel Core Ultra X9 388H
15933 Points +59%
Asus VivoBook S 14 OLED M5406WA
AMD Ryzen AI 9 HX 370
14608 Points +46%
Honor MagicBook Pro 14 2026
Intel Core Ultra 5 338H
13521 Points +35%
Lenovo IdeaPad Pro 5 14AGP11
AMD Ryzen AI 7 450
12776 Points +28%
Durchschnittliche Intel Core Ultra 7 355
  (10000 - 10284, n=5)
10128 Points +1%
Dell 14S DS14260
Intel Core Ultra 7 355
10000 Points
Dell Inspiron 14 7445 2-in-1
AMD Ryzen 7 8840HS
9779 Points -2%
Dell 14 Plus
Intel Core Ultra 7 256V
9715 Points -3%
Lenovo ThinkBook 14 G9 IPL 21UX005PGE
Intel Core Ultra 5 325
9514 Points -5%
Lenovo ThinkPad E14 Gen 7 21U2002QGE
Intel Core Ultra 5 228V
9169 Points -8%
Lenovo Yoga Slim 6 14APU8
AMD Ryzen 5 7540U
8296 Points -17%
Geekbench 5.5 / Single-Core
HP OmniBook Ultra 14 Core Ultra X9
Intel Core Ultra X9 388H
2224 Points +10%
Lenovo IdeaPad Pro 5 14AGP11
AMD Ryzen AI 7 450
2191 Points +9%
Dell XPS 14 Core Ultra X7 358H
Intel Core Ultra X7 358H
2142 Points +6%
Asus VivoBook S 14 OLED M5406WA
AMD Ryzen AI 9 HX 370
2108 Points +5%
Honor MagicBook Pro 14 2026
Intel Core Ultra 5 338H
2083 Points +3%
Durchschnittliche Intel Core Ultra 7 355
  (1999 - 2034, n=5)
2018 Points 0%
Dell 14S DS14260
Intel Core Ultra 7 355
2014 Points
Dell 14 Plus
Intel Core Ultra 7 256V
1987 Points -1%
Dell Inspiron 14 7445 2-in-1
AMD Ryzen 7 8840HS
1946 Points -3%
Lenovo ThinkBook 14 G9 IPL 21UX005PGE
Intel Core Ultra 5 325
1934 Points -4%
Lenovo ThinkPad E14 Gen 7 21U2002QGE
Intel Core Ultra 5 228V
1905 Points -5%
Lenovo Yoga Slim 6 14APU8
AMD Ryzen 5 7540U
1866 Points -7%
HWBOT x265 Benchmark v2.2 / 4k Preset
Lenovo IdeaPad Pro 5 14AGP11
AMD Ryzen AI 7 450
23.3 fps +62%
Asus VivoBook S 14 OLED M5406WA
AMD Ryzen AI 9 HX 370
21.3 fps +48%
Dell XPS 14 Core Ultra X7 358H
Intel Core Ultra X7 358H
20.7 fps +44%
HP OmniBook Ultra 14 Core Ultra X9
Intel Core Ultra X9 388H
20.6 fps +43%
Honor MagicBook Pro 14 2026
Intel Core Ultra 5 338H
20.5 fps +42%
Dell Inspiron 14 7445 2-in-1
AMD Ryzen 7 8840HS
14.6 fps +1%
Durchschnittliche Intel Core Ultra 7 355
  (14.2 - 14.8, n=5)
14.5 fps +1%
Dell 14S DS14260
Intel Core Ultra 7 355
14.4 fps
Lenovo ThinkBook 14 G9 IPL 21UX005PGE
Intel Core Ultra 5 325
14 fps -3%
Dell 14 Plus
Intel Core Ultra 7 256V
12.4 fps -14%
Lenovo ThinkPad E14 Gen 7 21U2002QGE
Intel Core Ultra 5 228V
10.6 fps -26%
Lenovo Yoga Slim 6 14APU8
AMD Ryzen 5 7540U
9.56 fps -34%
LibreOffice / 20 Documents To PDF
Lenovo Yoga Slim 6 14APU8
AMD Ryzen 5 7540U
61.6 s * -49%
Lenovo IdeaPad Pro 5 14AGP11
AMD Ryzen AI 7 450
57.1 s * -38%
Lenovo ThinkPad E14 Gen 7 21U2002QGE
Intel Core Ultra 5 228V
54 s * -30%
Asus VivoBook S 14 OLED M5406WA
AMD Ryzen AI 9 HX 370
53.1 s * -28%
Dell 14 Plus
Intel Core Ultra 7 256V
50.8 s * -23%
Honor MagicBook Pro 14 2026
Intel Core Ultra 5 338H
47.3 s * -14%
Dell Inspiron 14 7445 2-in-1
AMD Ryzen 7 8840HS
46.7 s * -13%
Dell XPS 14 Core Ultra X7 358H
Intel Core Ultra X7 358H
45.9 s * -11%
HP OmniBook Ultra 14 Core Ultra X9
Intel Core Ultra X9 388H
45.9 s * -11%
Durchschnittliche Intel Core Ultra 7 355
  (40.8 - 47.3, n=5)
43.4 s * -5%
Dell 14S DS14260
Intel Core Ultra 7 355
41.4 s *
Lenovo ThinkBook 14 G9 IPL 21UX005PGE
Intel Core Ultra 5 325
39.9 s * +4%
R Benchmark 2.5 / Overall mean
Lenovo ThinkPad E14 Gen 7 21U2002QGE
Intel Core Ultra 5 228V
0.492 sec * -13%
Lenovo Yoga Slim 6 14APU8
AMD Ryzen 5 7540U
0.4607 sec * -6%
Lenovo ThinkBook 14 G9 IPL 21UX005PGE
Intel Core Ultra 5 325
0.457 sec * -5%
Dell 14 Plus
Intel Core Ultra 7 256V
0.4551 sec * -4%
Dell Inspiron 14 7445 2-in-1
AMD Ryzen 7 8840HS
0.439 sec * -1%
Durchschnittliche Intel Core Ultra 7 355
  (0.4258 - 0.4438, n=5)
0.4376 sec * -0%
Dell 14S DS14260
Intel Core Ultra 7 355
0.4363 sec *
Honor MagicBook Pro 14 2026
Intel Core Ultra 5 338H
0.4249 sec * +3%
Asus VivoBook S 14 OLED M5406WA
AMD Ryzen AI 9 HX 370
0.413 sec * +5%
Dell XPS 14 Core Ultra X7 358H
Intel Core Ultra X7 358H
0.4127 sec * +5%
HP OmniBook Ultra 14 Core Ultra X9
Intel Core Ultra X9 388H
0.4045 sec * +7%
Lenovo IdeaPad Pro 5 14AGP11
AMD Ryzen AI 7 450
0.4024 sec * +8%

* ... kleinere Werte sind besser

Cinebench R15 CPU Multi 64Bit
1666 Points
Cinebench R15 OpenGL 64Bit
183.6 fps
Cinebench R15 Ref. Match 64Bit
97.8 %
Cinebench R15 CPU Single 64Bit
292 Points
Cinebench R20 CPU (Multi Core)
4282 Points
Cinebench R20 CPU (Single Core)
749 Points
Cinebench R23 Single Core
1964 Points
Cinebench R23 Multi Core
10966 Points
Cinebench 2024 CPU Multi Core
645 Points
Cinebench 2024 CPU Single Core
118.2 Points
Cinebench 2026 CPU Multi
2585 Points
Cinebench 2026 CPU Single Thread
468 Points
Hilfe
Performance Rating
Asus VivoBook S 14 OLED M5406WA -1!
AMD Ryzen AI 9 HX 370, Radeon 890M
94.2 pt
Dell Inspiron 14 7445 2-in-1 -1!
AMD Ryzen 7 8840HS, Radeon 780M
70.5 pt
HP OmniBook Ultra 14 Core Ultra X9 -1!
Intel Core Ultra X9 388H, Arc B390 Panther Lake iGPU
68.6 pt
Dell XPS 14 Core Ultra X7 358H
Intel Core Ultra X7 358H, Arc B390 Panther Lake iGPU
68.1 pt
Dell 14S DS14260 -1!
Intel Core Ultra 7 355, Intel Graphics 4 Xe3 PTL
47.5 pt
Durchschnittliche Intel Core Ultra 7 355
 
46.9 pt
Lenovo ThinkBook 14 G9 IPL 21UX005PGE -1!
Intel Core Ultra 5 325, Intel Graphics 4 Xe3 PTL
46 pt
AIDA64 / FP32 Ray-Trace
Asus VivoBook S 14 OLED M5406WA
AMD Ryzen AI 9 HX 370, Radeon 890M (v6.92.6600)
32888 KRay/s +172%
Dell Inspiron 14 7445 2-in-1
AMD Ryzen 7 8840HS, Radeon 780M (v6.92.6600)
21489 KRay/s +78%
HP OmniBook Ultra 14 Core Ultra X9
Intel Core Ultra X9 388H, Arc B390 Panther Lake iGPU (v8.20.8100)
15651 KRay/s +29%
Dell XPS 14 Core Ultra X7 358H
Intel Core Ultra X7 358H, Arc B390 Panther Lake iGPU (v8.20.8100)
14318 KRay/s +18%
Durchschnittliche Intel Core Ultra 7 355
  (12088 - 12838, n=5)
12313 KRay/s +2%
Dell 14S DS14260
Intel Core Ultra 7 355, Intel Graphics 4 Xe3 PTL (v8.20.8100)
12088 KRay/s
Lenovo ThinkBook 14 G9 IPL 21UX005PGE
Intel Core Ultra 5 325, Intel Graphics 4 Xe3 PTL (v8.20.8100)
12008 KRay/s -1%
AIDA64 / FPU Julia
Asus VivoBook S 14 OLED M5406WA
AMD Ryzen AI 9 HX 370, Radeon 890M (v6.92.6600)
123315 Points +97%
Dell Inspiron 14 7445 2-in-1
AMD Ryzen 7 8840HS, Radeon 780M (v6.92.6600)
90007 Points +44%
HP OmniBook Ultra 14 Core Ultra X9
Intel Core Ultra X9 388H, Arc B390 Panther Lake iGPU (v8.20.8100)
82749 Points +32%
Dell XPS 14 Core Ultra X7 358H
Intel Core Ultra X7 358H, Arc B390 Panther Lake iGPU (v8.20.8100)
77086 Points +23%
Durchschnittliche Intel Core Ultra 7 355
  (60741 - 65963, n=5)
63070 Points +1%
Dell 14S DS14260
Intel Core Ultra 7 355, Intel Graphics 4 Xe3 PTL (v8.20.8100)
62696 Points
Lenovo ThinkBook 14 G9 IPL 21UX005PGE
Intel Core Ultra 5 325, Intel Graphics 4 Xe3 PTL (v8.20.8100)
62311 Points -1%
AIDA64 / CPU SHA3
Asus VivoBook S 14 OLED M5406WA
AMD Ryzen AI 9 HX 370, Radeon 890M (v6.92.6600)
5287 MB/s +89%
HP OmniBook Ultra 14 Core Ultra X9
Intel Core Ultra X9 388H, Arc B390 Panther Lake iGPU (v8.20.8100)
4178 MB/s +49%
Dell XPS 14 Core Ultra X7 358H
Intel Core Ultra X7 358H, Arc B390 Panther Lake iGPU (v8.20.8100)
4033 MB/s +44%
Dell Inspiron 14 7445 2-in-1
AMD Ryzen 7 8840HS, Radeon 780M (v6.92.6600)
3999 MB/s +43%
Durchschnittliche Intel Core Ultra 7 355
  (2763 - 2845, n=5)
2813 MB/s 0%
Dell 14S DS14260
Intel Core Ultra 7 355, Intel Graphics 4 Xe3 PTL (v8.20.8100)
2803 MB/s
Lenovo ThinkBook 14 G9 IPL 21UX005PGE
Intel Core Ultra 5 325, Intel Graphics 4 Xe3 PTL (v8.20.8100)
2720 MB/s -3%
AIDA64 / CPU Queen
Dell Inspiron 14 7445 2-in-1
AMD Ryzen 7 8840HS, Radeon 780M (v6.92.6600)
103719 Points
Asus VivoBook S 14 OLED M5406WA
AMD Ryzen AI 9 HX 370, Radeon 890M (v6.92.6600)
89020 Points
Dell XPS 14 Core Ultra X7 358H
Intel Core Ultra X7 358H, Arc B390 Panther Lake iGPU (v6.92.6600)
63827 Points
Durchschnittliche Intel Core Ultra 7 355
  (n=1)
36043 Points
AIDA64 / FPU SinJulia
Asus VivoBook S 14 OLED M5406WA
AMD Ryzen AI 9 HX 370, Radeon 890M (v6.92.6600)
18418 Points +301%
Dell Inspiron 14 7445 2-in-1
AMD Ryzen 7 8840HS, Radeon 780M (v6.92.6600)
13441 Points +193%
HP OmniBook Ultra 14 Core Ultra X9
Intel Core Ultra X9 388H, Arc B390 Panther Lake iGPU (v8.20.8100)
7015 Points +53%
Dell XPS 14 Core Ultra X7 358H
Intel Core Ultra X7 358H, Arc B390 Panther Lake iGPU (v8.20.8100)
6919 Points +51%
Durchschnittliche Intel Core Ultra 7 355
  (4585 - 4601, n=5)
4595 Points 0%
Dell 14S DS14260
Intel Core Ultra 7 355, Intel Graphics 4 Xe3 PTL (v8.20.8100)
4591 Points
Lenovo ThinkBook 14 G9 IPL 21UX005PGE
Intel Core Ultra 5 325, Intel Graphics 4 Xe3 PTL (v8.20.8100)
4409 Points -4%
AIDA64 / FPU Mandel
Asus VivoBook S 14 OLED M5406WA
AMD Ryzen AI 9 HX 370, Radeon 890M (v6.92.6600)
65433 Points +101%
Dell Inspiron 14 7445 2-in-1
AMD Ryzen 7 8840HS, Radeon 780M (v6.92.6600)
48197 Points +48%
HP OmniBook Ultra 14 Core Ultra X9
Intel Core Ultra X9 388H, Arc B390 Panther Lake iGPU (v8.20.8100)
44749 Points +38%
Dell XPS 14 Core Ultra X7 358H
Intel Core Ultra X7 358H, Arc B390 Panther Lake iGPU (v8.20.8100)
40542 Points +25%
Durchschnittliche Intel Core Ultra 7 355
  (32404 - 35293, n=5)
33418 Points +3%
Lenovo ThinkBook 14 G9 IPL 21UX005PGE
Intel Core Ultra 5 325, Intel Graphics 4 Xe3 PTL (v8.20.8100)
33009 Points +2%
Dell 14S DS14260
Intel Core Ultra 7 355, Intel Graphics 4 Xe3 PTL (v8.20.8100)
32516 Points
AIDA64 / CPU AES
Asus VivoBook S 14 OLED M5406WA
AMD Ryzen AI 9 HX 370, Radeon 890M (v6.92.6600)
77257 MB/s +98%
Dell XPS 14 Core Ultra X7 358H
Intel Core Ultra X7 358H, Arc B390 Panther Lake iGPU (v8.20.8100)
63775 MB/s +63%
HP OmniBook Ultra 14 Core Ultra X9
Intel Core Ultra X9 388H, Arc B390 Panther Lake iGPU (v8.20.8100)
61890 MB/s +58%
Dell Inspiron 14 7445 2-in-1
AMD Ryzen 7 8840HS, Radeon 780M (v6.92.6600)
60328 MB/s +54%
Durchschnittliche Intel Core Ultra 7 355
  (38981 - 39424, n=5)
39197 MB/s 0%
Dell 14S DS14260
Intel Core Ultra 7 355, Intel Graphics 4 Xe3 PTL (v8.20.8100)
39116 MB/s
Lenovo ThinkBook 14 G9 IPL 21UX005PGE
Intel Core Ultra 5 325, Intel Graphics 4 Xe3 PTL (v8.20.8100)
37899 MB/s -3%
AIDA64 / CPU ZLib
Asus VivoBook S 14 OLED M5406WA
AMD Ryzen AI 9 HX 370, Radeon 890M (v6.92.6600)
1379 MB/s +116%
Dell XPS 14 Core Ultra X7 358H
Intel Core Ultra X7 358H, Arc B390 Panther Lake iGPU (v8.20.8100)
1103 MB/s +73%
HP OmniBook Ultra 14 Core Ultra X9
Intel Core Ultra X9 388H, Arc B390 Panther Lake iGPU (v8.20.8100)
984 MB/s +54%
Dell Inspiron 14 7445 2-in-1
AMD Ryzen 7 8840HS, Radeon 780M (v6.92.6600)
892 MB/s +40%
Durchschnittliche Intel Core Ultra 7 355
  (635 - 646, n=5)
640 MB/s 0%
Dell 14S DS14260
Intel Core Ultra 7 355, Intel Graphics 4 Xe3 PTL (v8.20.8100)
637 MB/s
Lenovo ThinkBook 14 G9 IPL 21UX005PGE
Intel Core Ultra 5 325, Intel Graphics 4 Xe3 PTL (v8.20.8100)
626 MB/s -2%
AIDA64 / FP64 Ray-Trace
Asus VivoBook S 14 OLED M5406WA
AMD Ryzen AI 9 HX 370, Radeon 890M (v6.92.6600)
17495 KRay/s +185%
Dell Inspiron 14 7445 2-in-1
AMD Ryzen 7 8840HS, Radeon 780M (v6.92.6600)
11203 KRay/s +83%
HP OmniBook Ultra 14 Core Ultra X9
Intel Core Ultra X9 388H, Arc B390 Panther Lake iGPU (v8.20.8100)
8317 KRay/s +36%
Dell XPS 14 Core Ultra X7 358H
Intel Core Ultra X7 358H, Arc B390 Panther Lake iGPU (v8.20.8100)
7603 KRay/s +24%
Lenovo ThinkBook 14 G9 IPL 21UX005PGE
Intel Core Ultra 5 325, Intel Graphics 4 Xe3 PTL (v8.20.8100)
6452 KRay/s +5%
Durchschnittliche Intel Core Ultra 7 355
  (6138 - 6833, n=5)
6375 KRay/s +4%
Dell 14S DS14260
Intel Core Ultra 7 355, Intel Graphics 4 Xe3 PTL (v8.20.8100)
6138 KRay/s
AIDA64 / CPU PhotoWorxx
Dell XPS 14 Core Ultra X7 358H
Intel Core Ultra X7 358H, Arc B390 Panther Lake iGPU (v8.20.8100)
88086 MPixel/s +50%
HP OmniBook Ultra 14 Core Ultra X9
Intel Core Ultra X9 388H, Arc B390 Panther Lake iGPU (v8.20.8100)
85600 MPixel/s +46%
Durchschnittliche Intel Core Ultra 7 355
  (57998 - 60440, n=5)
59247 MPixel/s +1%
Dell 14S DS14260
Intel Core Ultra 7 355, Intel Graphics 4 Xe3 PTL (v8.20.8100)
58664 MPixel/s
Lenovo ThinkBook 14 G9 IPL 21UX005PGE
Intel Core Ultra 5 325, Intel Graphics 4 Xe3 PTL (v8.20.8100)
49816 MPixel/s -15%
Asus VivoBook S 14 OLED M5406WA
AMD Ryzen AI 9 HX 370, Radeon 890M (v6.92.6600)
49402 MPixel/s -16%
Dell Inspiron 14 7445 2-in-1
AMD Ryzen 7 8840HS, Radeon 780M (v6.92.6600)
33411 MPixel/s -43%
AIDA64 / CPU CheckMate
Dell XPS 14 Core Ultra X7 358H
Intel Core Ultra X7 358H, Arc B390 Panther Lake iGPU (v8.20.8100)
4475 MP/s +62%
HP OmniBook Ultra 14 Core Ultra X9
Intel Core Ultra X9 388H, Arc B390 Panther Lake iGPU (v8.20.8100)
4009 MP/s +45%
Durchschnittliche Intel Core Ultra 7 355
  (2747 - 2813, n=5)
2783 MP/s +1%
Dell 14S DS14260
Intel Core Ultra 7 355, Intel Graphics 4 Xe3 PTL (v8.20.8100)
2762 MP/s
Lenovo ThinkBook 14 G9 IPL 21UX005PGE
Intel Core Ultra 5 325, Intel Graphics 4 Xe3 PTL (v8.20.8100)
2632 MP/s -5%

System Performance

PCMark 10 Standard
PCMark 10 Standard
Performance Rating: Percent
PCMark 10: Score | Essentials | Productivity | Digital Content Creation
CrossMark: Overall | Productivity | Creativity | Responsiveness
WebXPRT 3: Overall
WebXPRT 4: Overall
Mozilla Kraken 1.1: Total
Performance Rating
HP OmniBook Ultra 14 Core Ultra X9
Arc B390 Panther Lake iGPU, Ultra X9 388H
92.4 pt
Dell XPS 14 Core Ultra X7 358H
Arc B390 Panther Lake iGPU, Ultra X7 358H, Samsung PM9C1b MZVL81T0HFLB-00BH1
89 pt
Dell 14S DS14260
Intel Graphics 4 Xe3 PTL, Ultra 7 355
79.9 pt
Durchschnittliche Intel Core Ultra 7 355, Intel Graphics 4 Xe3 Panther Lake iGPU
 
78.4 pt
Dell Inspiron 14 7445 2-in-1
Radeon 780M, R7 8840HS, Micron 2400 MTFDKBK1T0QFM
70.6 pt
Lenovo ThinkBook 14 G9 IPL 21UX005PGE -4!
Intel Graphics 4 Xe3 PTL, Ultra 5 325, YMTC PC42Q512GBG4Q
69.7 pt
Asus VivoBook S 14 OLED M5406WA -5!
Radeon 890M, Ryzen AI 9 HX 370, Micron 2400 MTFDKBA1T0QFM
68.2 pt
PCMark 10 / Score
HP OmniBook Ultra 14 Core Ultra X9
Arc B390 Panther Lake iGPU, Ultra X9 388H
9939 Points +23%
Dell XPS 14 Core Ultra X7 358H
Arc B390 Panther Lake iGPU, Ultra X7 358H, Samsung PM9C1b MZVL81T0HFLB-00BH1
9880 Points +23%
Durchschnittliche Intel Core Ultra 7 355, Intel Graphics 4 Xe3 Panther Lake iGPU
  (7884 - 8201, n=5)
8076 Points 0%
Dell 14S DS14260
Intel Graphics 4 Xe3 PTL, Ultra 7 355
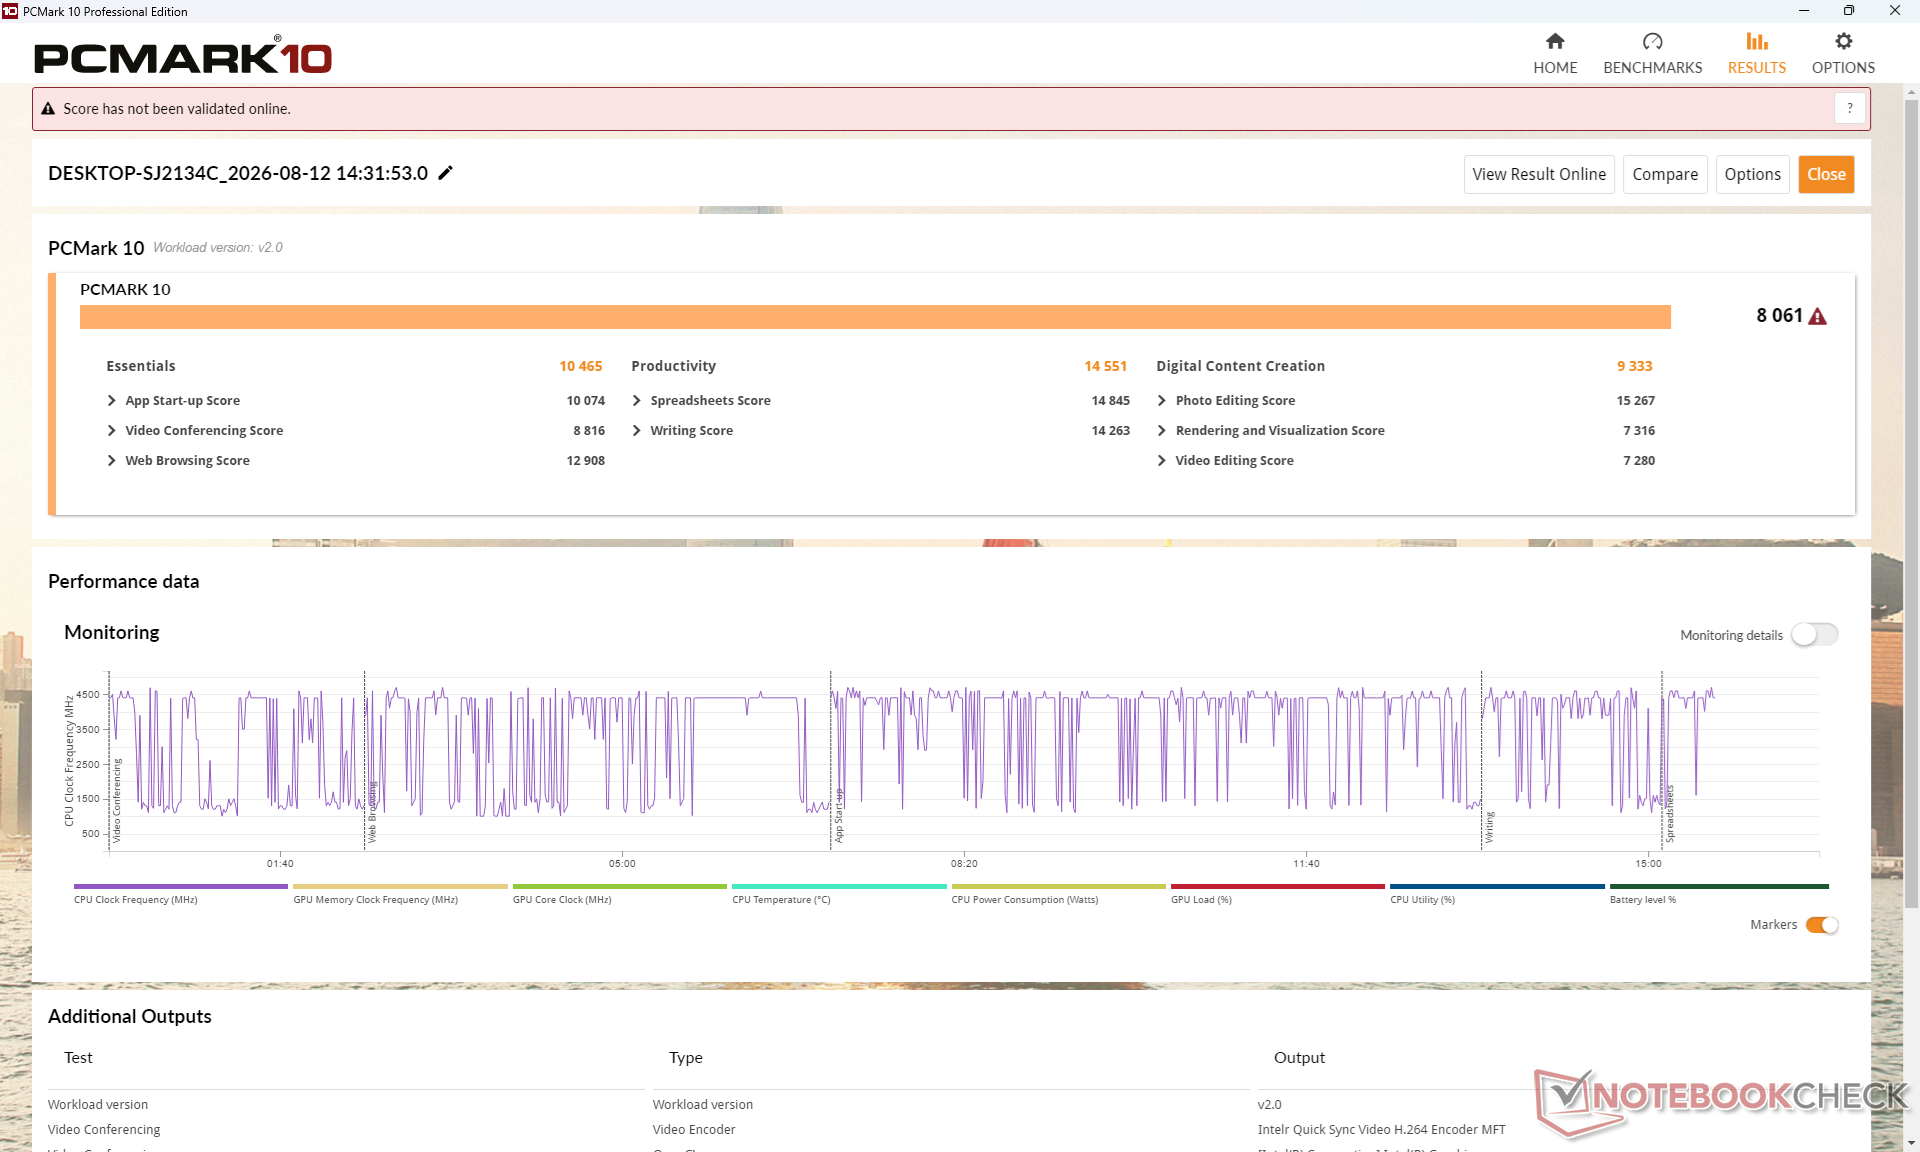
8061 Points
Lenovo ThinkBook 14 G9 IPL 21UX005PGE
Intel Graphics 4 Xe3 PTL, Ultra 5 325, YMTC PC42Q512GBG4Q
7656 Points -5%
Asus VivoBook S 14 OLED M5406WA
Radeon 890M, Ryzen AI 9 HX 370, Micron 2400 MTFDKBA1T0QFM
7646 Points -5%
Dell Inspiron 14 7445 2-in-1
Radeon 780M, R7 8840HS, Micron 2400 MTFDKBK1T0QFM
7024 Points -13%
PCMark 10 / Essentials
HP OmniBook Ultra 14 Core Ultra X9
Arc B390 Panther Lake iGPU, Ultra X9 388H
11646 Points +11%
Dell XPS 14 Core Ultra X7 358H
Arc B390 Panther Lake iGPU, Ultra X7 358H, Samsung PM9C1b MZVL81T0HFLB-00BH1
11263 Points +8%
Dell Inspiron 14 7445 2-in-1
Radeon 780M, R7 8840HS, Micron 2400 MTFDKBK1T0QFM
10692 Points +2%
Asus VivoBook S 14 OLED M5406WA
Radeon 890M, Ryzen AI 9 HX 370, Micron 2400 MTFDKBA1T0QFM
10678 Points +2%
Durchschnittliche Intel Core Ultra 7 355, Intel Graphics 4 Xe3 Panther Lake iGPU
  (10356 - 10820, n=5)
10578 Points +1%
Dell 14S DS14260
Intel Graphics 4 Xe3 PTL, Ultra 7 355
10465 Points
Lenovo ThinkBook 14 G9 IPL 21UX005PGE
Intel Graphics 4 Xe3 PTL, Ultra 5 325, YMTC PC42Q512GBG4Q
10337 Points -1%
PCMark 10 / Productivity
Dell XPS 14 Core Ultra X7 358H
Arc B390 Panther Lake iGPU, Ultra X7 358H, Samsung PM9C1b MZVL81T0HFLB-00BH1
16780 Points +15%
HP OmniBook Ultra 14 Core Ultra X9
Arc B390 Panther Lake iGPU, Ultra X9 388H
16606 Points +14%
Dell 14S DS14260
Intel Graphics 4 Xe3 PTL, Ultra 7 355
14551 Points
Durchschnittliche Intel Core Ultra 7 355, Intel Graphics 4 Xe3 Panther Lake iGPU
  (13871 - 14955, n=5)
14512 Points 0%
Lenovo ThinkBook 14 G9 IPL 21UX005PGE
Intel Graphics 4 Xe3 PTL, Ultra 5 325, YMTC PC42Q512GBG4Q
12897 Points -11%
Asus VivoBook S 14 OLED M5406WA
Radeon 890M, Ryzen AI 9 HX 370, Micron 2400 MTFDKBA1T0QFM
10345 Points -29%
Dell Inspiron 14 7445 2-in-1
Radeon 780M, R7 8840HS, Micron 2400 MTFDKBK1T0QFM
9957 Points -32%
PCMark 10 / Digital Content Creation
Dell XPS 14 Core Ultra X7 358H
Arc B390 Panther Lake iGPU, Ultra X7 358H, Samsung PM9C1b MZVL81T0HFLB-00BH1
13847 Points +48%
HP OmniBook Ultra 14 Core Ultra X9
Arc B390 Panther Lake iGPU, Ultra X9 388H
13779 Points +48%
Asus VivoBook S 14 OLED M5406WA
Radeon 890M, Ryzen AI 9 HX 370, Micron 2400 MTFDKBA1T0QFM
10983 Points +18%
Dell 14S DS14260
Intel Graphics 4 Xe3 PTL, Ultra 7 355
9333 Points
Durchschnittliche Intel Core Ultra 7 355, Intel Graphics 4 Xe3 Panther Lake iGPU
  (9258 - 9368, n=5)
9312 Points 0%
Lenovo ThinkBook 14 G9 IPL 21UX005PGE
Intel Graphics 4 Xe3 PTL, Ultra 5 325, YMTC PC42Q512GBG4Q
9133 Points -2%
Dell Inspiron 14 7445 2-in-1
Radeon 780M, R7 8840HS, Micron 2400 MTFDKBK1T0QFM
8833 Points -5%
CrossMark / Overall
HP OmniBook Ultra 14 Core Ultra X9
Arc B390 Panther Lake iGPU, Ultra X9 388H
2048 Points +8%
Dell XPS 14 Core Ultra X7 358H
Arc B390 Panther Lake iGPU, Ultra X7 358H, Samsung PM9C1b MZVL81T0HFLB-00BH1
1955 Points +4%
Dell 14S DS14260
Intel Graphics 4 Xe3 PTL, Ultra 7 355
1888 Points
Durchschnittliche Intel Core Ultra 7 355, Intel Graphics 4 Xe3 Panther Lake iGPU
  (1627 - 1892, n=5)
1808 Points -4%
Dell Inspiron 14 7445 2-in-1
Radeon 780M, R7 8840HS, Micron 2400 MTFDKBK1T0QFM
1681 Points -11%
CrossMark / Productivity
HP OmniBook Ultra 14 Core Ultra X9
Arc B390 Panther Lake iGPU, Ultra X9 388H
1834 Points 0%
Dell 14S DS14260
Intel Graphics 4 Xe3 PTL, Ultra 7 355
1826 Points
Durchschnittliche Intel Core Ultra 7 355, Intel Graphics 4 Xe3 Panther Lake iGPU
  (1561 - 1826, n=5)
1737 Points -5%
Dell XPS 14 Core Ultra X7 358H
Arc B390 Panther Lake iGPU, Ultra X7 358H, Samsung PM9C1b MZVL81T0HFLB-00BH1
1719 Points -6%
Dell Inspiron 14 7445 2-in-1
Radeon 780M, R7 8840HS, Micron 2400 MTFDKBK1T0QFM
1638 Points -10%
CrossMark / Creativity
Dell XPS 14 Core Ultra X7 358H
Arc B390 Panther Lake iGPU, Ultra X7 358H, Samsung PM9C1b MZVL81T0HFLB-00BH1
2398 Points +18%
HP OmniBook Ultra 14 Core Ultra X9
Arc B390 Panther Lake iGPU, Ultra X9 388H
2390 Points +17%
Dell 14S DS14260
Intel Graphics 4 Xe3 PTL, Ultra 7 355
2038 Points
Durchschnittliche Intel Core Ultra 7 355, Intel Graphics 4 Xe3 Panther Lake iGPU
  (1761 - 2052, n=5)
1977 Points -3%
Dell Inspiron 14 7445 2-in-1
Radeon 780M, R7 8840HS, Micron 2400 MTFDKBK1T0QFM
1863 Points -9%
CrossMark / Responsiveness
HP OmniBook Ultra 14 Core Ultra X9
Arc B390 Panther Lake iGPU, Ultra X9 388H
1797 Points +8%
Dell 14S DS14260
Intel Graphics 4 Xe3 PTL, Ultra 7 355
1661 Points
Dell XPS 14 Core Ultra X7 358H
Arc B390 Panther Lake iGPU, Ultra X7 358H, Samsung PM9C1b MZVL81T0HFLB-00BH1
1560 Points -6%
Durchschnittliche Intel Core Ultra 7 355, Intel Graphics 4 Xe3 Panther Lake iGPU
  (1458 - 1671, n=5)
1560 Points -6%
Dell Inspiron 14 7445 2-in-1
Radeon 780M, R7 8840HS, Micron 2400 MTFDKBK1T0QFM
1334 Points -20%
WebXPRT 3 / Overall
HP OmniBook Ultra 14 Core Ultra X9
Arc B390 Panther Lake iGPU, Ultra X9 388H
354 Points +18%
Dell XPS 14 Core Ultra X7 358H
Arc B390 Panther Lake iGPU, Ultra X7 358H, Samsung PM9C1b MZVL81T0HFLB-00BH1
338 Points +13%
Lenovo ThinkBook 14 G9 IPL 21UX005PGE
Intel Graphics 4 Xe3 PTL, Ultra 5 325, YMTC PC42Q512GBG4Q
312 Points +4%
Dell Inspiron 14 7445 2-in-1
Radeon 780M, R7 8840HS, Micron 2400 MTFDKBK1T0QFM
308 Points +3%
Durchschnittliche Intel Core Ultra 7 355, Intel Graphics 4 Xe3 Panther Lake iGPU
  (300 - 303, n=5)
302 Points +1%
Dell 14S DS14260
Intel Graphics 4 Xe3 PTL, Ultra 7 355
300 Points
WebXPRT 4 / Overall
HP OmniBook Ultra 14 Core Ultra X9
Arc B390 Panther Lake iGPU, Ultra X9 388H
318 Points +12%
Dell XPS 14 Core Ultra X7 358H
Arc B390 Panther Lake iGPU, Ultra X7 358H, Samsung PM9C1b MZVL81T0HFLB-00BH1
305 Points +7%
Dell 14S DS14260
Intel Graphics 4 Xe3 PTL, Ultra 7 355
284 Points
Durchschnittliche Intel Core Ultra 7 355, Intel Graphics 4 Xe3 Panther Lake iGPU
  (279 - 284, n=5)
282 Points -1%
Lenovo ThinkBook 14 G9 IPL 21UX005PGE
Intel Graphics 4 Xe3 PTL, Ultra 5 325, YMTC PC42Q512GBG4Q
272 Points -4%
Asus VivoBook S 14 OLED M5406WA
Radeon 890M, Ryzen AI 9 HX 370, Micron 2400 MTFDKBA1T0QFM
259 Points -9%
Dell Inspiron 14 7445 2-in-1
Radeon 780M, R7 8840HS, Micron 2400 MTFDKBK1T0QFM
257 Points -10%
Mozilla Kraken 1.1 / Total
Dell Inspiron 14 7445 2-in-1
Radeon 780M, R7 8840HS, Micron 2400 MTFDKBK1T0QFM
528 ms * -12%
Lenovo ThinkBook 14 G9 IPL 21UX005PGE
Intel Graphics 4 Xe3 PTL, Ultra 5 325, YMTC PC42Q512GBG4Q
500 ms * -6%
Durchschnittliche Intel Core Ultra 7 355, Intel Graphics 4 Xe3 Panther Lake iGPU
  (470 - 487, n=5)
476 ms * -1%
Dell 14S DS14260
Intel Graphics 4 Xe3 PTL, Ultra 7 355
470 ms *
Dell XPS 14 Core Ultra X7 358H
Arc B390 Panther Lake iGPU, Ultra X7 358H, Samsung PM9C1b MZVL81T0HFLB-00BH1
445 ms * +5%
Asus VivoBook S 14 OLED M5406WA
Radeon 890M, Ryzen AI 9 HX 370, Micron 2400 MTFDKBA1T0QFM
433 ms * +8%
Asus VivoBook S 14 OLED M5406WA
Radeon 890M, Ryzen AI 9 HX 370, Micron 2400 MTFDKBA1T0QFM
433 ms * +8%
HP OmniBook Ultra 14 Core Ultra X9
Arc B390 Panther Lake iGPU, Ultra X9 388H
431 ms * +8%

* ... kleinere Werte sind besser

PCMark 10 Score
8061 Punkte
Hilfe
AIDA64 / Memory Copy
Dell XPS 14 Core Ultra X7 358H
Intel Core Ultra X7 358H, Arc B390 Panther Lake iGPU
131796 MB/s +32%
HP OmniBook Ultra 14 Core Ultra X9
Intel Core Ultra X9 388H, Arc B390 Panther Lake iGPU
131023 MB/s +31%
Durchschnittliche Intel Core Ultra 7 355
  (97301 - 105135, n=5)
101458 MB/s +2%
Dell 14S DS14260
Intel Core Ultra 7 355, Intel Graphics 4 Xe3 PTL
99824 MB/s
Asus VivoBook S 14 OLED M5406WA
AMD Ryzen AI 9 HX 370, Radeon 890M
89348 MB/s -10%
Lenovo ThinkBook 14 G9 IPL 21UX005PGE
Intel Core Ultra 5 325, Intel Graphics 4 Xe3 PTL
77379 MB/s -22%
Dell Inspiron 14 7445 2-in-1
AMD Ryzen 7 8840HS, Radeon 780M
63403 MB/s -36%
AIDA64 / Memory Read
HP OmniBook Ultra 14 Core Ultra X9
Intel Core Ultra X9 388H, Arc B390 Panther Lake iGPU
120487 MB/s +41%
Dell XPS 14 Core Ultra X7 358H
Intel Core Ultra X7 358H, Arc B390 Panther Lake iGPU
114349 MB/s +34%
Asus VivoBook S 14 OLED M5406WA
AMD Ryzen AI 9 HX 370, Radeon 890M
100293 MB/s +17%
Dell 14S DS14260
Intel Core Ultra 7 355, Intel Graphics 4 Xe3 PTL
85558 MB/s
Durchschnittliche Intel Core Ultra 7 355
  (79551 - 85807, n=5)
84036 MB/s -2%
Lenovo ThinkBook 14 G9 IPL 21UX005PGE
Intel Core Ultra 5 325, Intel Graphics 4 Xe3 PTL
68508 MB/s -20%
Dell Inspiron 14 7445 2-in-1
AMD Ryzen 7 8840HS, Radeon 780M
61739 MB/s -28%
AIDA64 / Memory Write
HP OmniBook Ultra 14 Core Ultra X9
Intel Core Ultra X9 388H, Arc B390 Panther Lake iGPU
135141 MB/s +25%
Dell XPS 14 Core Ultra X7 358H
Intel Core Ultra X7 358H, Arc B390 Panther Lake iGPU
134916 MB/s +24%
Dell 14S DS14260
Intel Core Ultra 7 355, Intel Graphics 4 Xe3 PTL
108380 MB/s
Durchschnittliche Intel Core Ultra 7 355
  (103056 - 108621, n=5)
107406 MB/s -1%
Asus VivoBook S 14 OLED M5406WA
AMD Ryzen AI 9 HX 370, Radeon 890M
98648 MB/s -9%
Dell Inspiron 14 7445 2-in-1
AMD Ryzen 7 8840HS, Radeon 780M
78347 MB/s -28%
Lenovo ThinkBook 14 G9 IPL 21UX005PGE
Intel Core Ultra 5 325, Intel Graphics 4 Xe3 PTL
77837 MB/s -28%
AIDA64 / Memory Latency
Asus VivoBook S 14 OLED M5406WA
AMD Ryzen AI 9 HX 370, Radeon 890M
116.1 ns * -14%
Lenovo ThinkBook 14 G9 IPL 21UX005PGE
Intel Core Ultra 5 325, Intel Graphics 4 Xe3 PTL
114.1 ns * -12%
Durchschnittliche Intel Core Ultra 7 355
  (99.7 - 105.8, n=5)
102.5 ns * -1%
Dell 14S DS14260
Intel Core Ultra 7 355, Intel Graphics 4 Xe3 PTL
101.5 ns *
Dell Inspiron 14 7445 2-in-1
AMD Ryzen 7 8840HS, Radeon 780M
92.2 ns * +9%
Dell XPS 14 Core Ultra X7 358H
Intel Core Ultra X7 358H, Arc B390 Panther Lake iGPU
87.8 ns * +13%
HP OmniBook Ultra 14 Core Ultra X9
Intel Core Ultra X9 388H, Arc B390 Panther Lake iGPU
85 ns * +16%

* ... kleinere Werte sind besser

DPC-Latenz
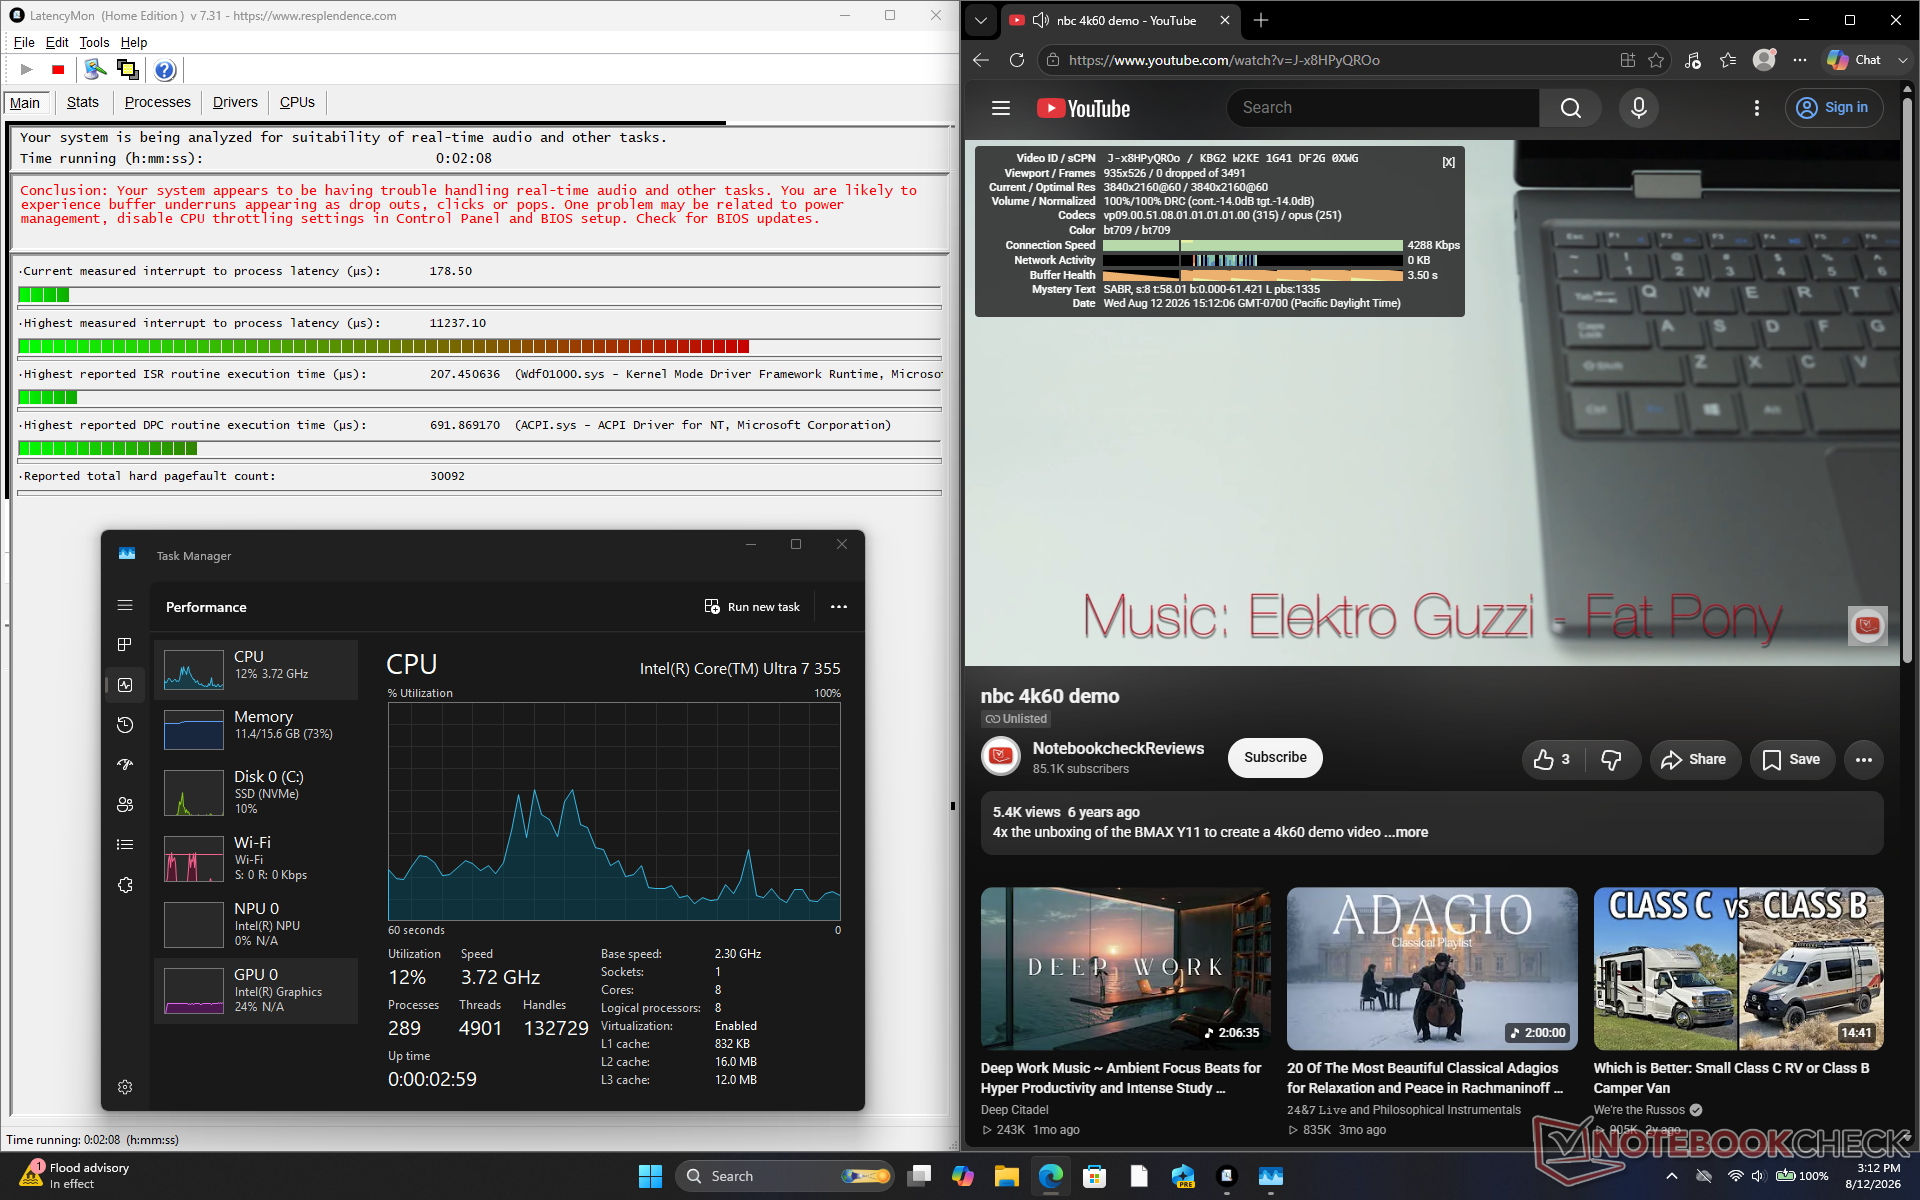
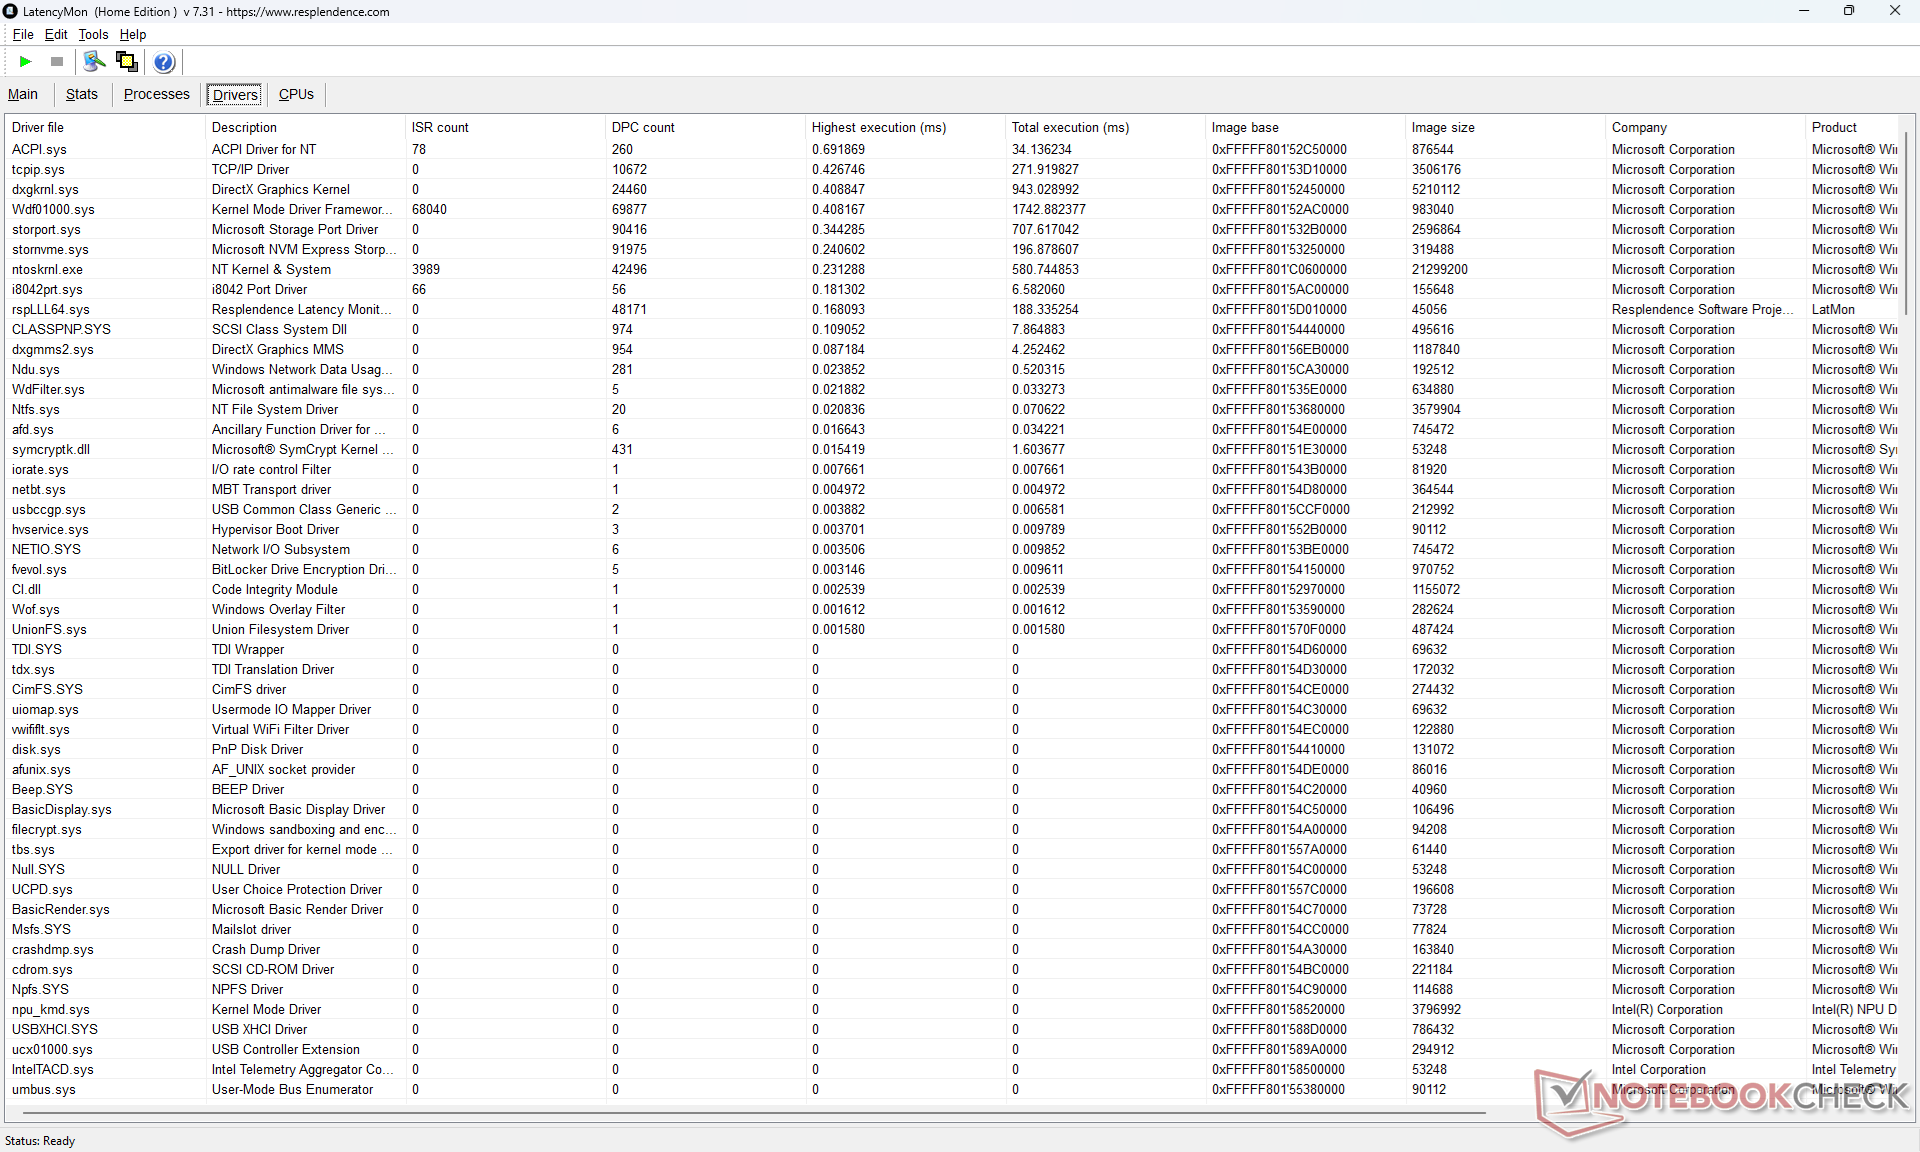
LatencyMon zeigt DPC-Probleme an, jedoch treten ansonsten keine Bildausfälle bei der Wiedergabe von 4K60-Videos auf
Treiberliste
Treiberliste
DPC Latencies / LatencyMon - interrupt to process latency (max), Web, Youtube, Prime95
Dell 14S DS14260
Intel Graphics 4 Xe3 PTL, Ultra 7 355
11237.1 μs *
HP OmniBook Ultra 14 Core Ultra X9
Arc B390 Panther Lake iGPU, Ultra X9 388H
5654.9 μs * +50%
Dell XPS 14 Core Ultra X7 358H
Arc B390 Panther Lake iGPU, Ultra X7 358H, Samsung PM9C1b MZVL81T0HFLB-00BH1
872.4 μs * +92%
Dell Inspiron 14 7445 2-in-1
Radeon 780M, R7 8840HS, Micron 2400 MTFDKBK1T0QFM
731.1 μs * +93%
Asus VivoBook S 14 OLED M5406WA
Radeon 890M, Ryzen AI 9 HX 370, Micron 2400 MTFDKBA1T0QFM
558.9 μs * +95%
Lenovo ThinkBook 14 G9 IPL 21UX005PGE
Intel Graphics 4 Xe3 PTL, Ultra 5 325, YMTC PC42Q512GBG4Q
396 μs * +96%

* ... kleinere Werte sind besser

Speichergeräte
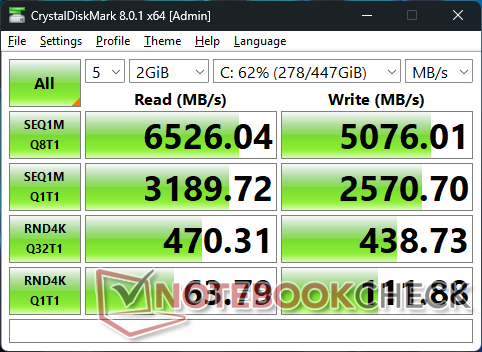
CDM 8
CDM 8
AS SSD
AS SSD
CDM 5/6 Read Seq Q32T1: 6552 MB/s
CDM 5/6 Write Seq Q32T1: 5205 MB/s
CDM 5/6 Read 4K Q32T1: 478.6 MB/s
CDM 5/6 Write 4K Q32T1: 432 MB/s
CDM 5 Read Seq: 2576 MB/s
CDM 5 Write Seq: 2478 MB/s
CDM 5/6 Read 4K: 24.7 MB/s
CDM 5/6 Write 4K: 109.7 MB/s
Drive Performance Rating - Percent
HP OmniBook Ultra 14 Core Ultra X9
 
97.1 pt
Dell XPS 14 Core Ultra X7 358H
Samsung PM9C1b MZVL81T0HFLB-00BH1
76.6 pt
Dell 14S DS14260
 
63.1 pt
Lenovo ThinkBook 14 G9 IPL 21UX005PGE
YMTC PC42Q512GBG4Q
60.5 pt
Asus VivoBook S 14 OLED M5406WA
Micron 2400 MTFDKBA1T0QFM
57.8 pt
Dell Inspiron 14 7445 2-in-1
Micron 2400 MTFDKBK1T0QFM
44.7 pt
DiskSpd
seq read
HP OmniBook Ultra 14 Core Ultra X9
 
4309 (3909.03min - 4308.81max) MB/s +28%
Dell 14S DS14260
 
3378 (3294.29min - 3377.67max) MB/s
Lenovo ThinkBook 14 G9 IPL 21UX005PGE
YMTC PC42Q512GBG4Q
3228 (3193.03min - 3227.52max) MB/s -4%
Dell XPS 14 Core Ultra X7 358H
Samsung PM9C1b MZVL81T0HFLB-00BH1
2967 (2659.4min - 2966.9max) MB/s -12%
Asus VivoBook S 14 OLED M5406WA
Micron 2400 MTFDKBA1T0QFM
2399 (2379.43min - 2398.54max) MB/s -29%
Dell Inspiron 14 7445 2-in-1
Micron 2400 MTFDKBK1T0QFM
2044 (2024.17min - 2044.09max) MB/s -39%
seq write
HP OmniBook Ultra 14 Core Ultra X9
 
4651 (4040.05min - 4650.57max) MB/s +30%
Dell 14S DS14260
 
3584 (3373.65min - 3583.61max) MB/s
Lenovo ThinkBook 14 G9 IPL 21UX005PGE
YMTC PC42Q512GBG4Q
3106 (2718.75min - 3105.54max) MB/s -13%
Asus VivoBook S 14 OLED M5406WA
Micron 2400 MTFDKBA1T0QFM
2717 (2647.81min - 2717.09max) MB/s -24%
Dell Inspiron 14 7445 2-in-1
Micron 2400 MTFDKBK1T0QFM
2631 (2464.99min - 2630.67max) MB/s -27%
Dell XPS 14 Core Ultra X7 358H
Samsung PM9C1b MZVL81T0HFLB-00BH1
2327 (2217.14min - 2327max) MB/s -35%
seq q8 t1 read
HP OmniBook Ultra 14 Core Ultra X9
 
10314 (8944.92min - 10313.9max) MB/s +55%
Dell XPS 14 Core Ultra X7 358H
Samsung PM9C1b MZVL81T0HFLB-00BH1
7037 (5759.83min - 7037.41max) MB/s +6%
Dell 14S DS14260
 
6635 (5920.47min - 6634.91max) MB/s
Asus VivoBook S 14 OLED M5406WA
Micron 2400 MTFDKBA1T0QFM
5046 (4376.97min - 5045.96max) MB/s -24%
Lenovo ThinkBook 14 G9 IPL 21UX005PGE
YMTC PC42Q512GBG4Q
4987 (3896.3min - 4986.82max) MB/s -25%
Dell Inspiron 14 7445 2-in-1
Micron 2400 MTFDKBK1T0QFM
4852 (4230.58min - 4852.03max) MB/s -27%
seq q8 t1 write
HP OmniBook Ultra 14 Core Ultra X9
 
8967 (8867.27min - 8966.79max) MB/s +76%
Dell XPS 14 Core Ultra X7 358H
Samsung PM9C1b MZVL81T0HFLB-00BH1
5595 (5550.94min - 5595.34max) MB/s +10%
Dell 14S DS14260
 
5093 (5018.28min - 5092.93max) MB/s
Lenovo ThinkBook 14 G9 IPL 21UX005PGE
YMTC PC42Q512GBG4Q
4594 (4085.68min - 4593.64max) MB/s -10%
Asus VivoBook S 14 OLED M5406WA
Micron 2400 MTFDKBA1T0QFM
3580 (3459.88min - 3579.6max) MB/s -30%
Dell Inspiron 14 7445 2-in-1
Micron 2400 MTFDKBK1T0QFM
3439 (2844.97min - 3438.66max) MB/s -32%
4k q1 t1 read
HP OmniBook Ultra 14 Core Ultra X9
 
81.6 (80.13min - 81.55max) MB/s +31%
Dell 14S DS14260
 
62.3 (61.44min - 62.29max) MB/s
Dell XPS 14 Core Ultra X7 358H
Samsung PM9C1b MZVL81T0HFLB-00BH1
61.8 (59.95min - 61.82max) MB/s -1%
Lenovo ThinkBook 14 G9 IPL 21UX005PGE
YMTC PC42Q512GBG4Q
41.6 (39.42min - 41.61max) MB/s -33%
Asus VivoBook S 14 OLED M5406WA
Micron 2400 MTFDKBA1T0QFM
32.6 (32.32min - 32.63max) MB/s -48%
Dell Inspiron 14 7445 2-in-1
Micron 2400 MTFDKBK1T0QFM
31.1 (30.82min - 31.09max) MB/s -50%
4k q1 t1 write
HP OmniBook Ultra 14 Core Ultra X9
 
191.6 (187.96min - 191.62max) MB/s +11%
Lenovo ThinkBook 14 G9 IPL 21UX005PGE
YMTC PC42Q512GBG4Q
181.5 (143.28min - 181.47max) MB/s +5%
Dell 14S DS14260
 
173.2 (137.33min - 173.19max) MB/s
Asus VivoBook S 14 OLED M5406WA
Micron 2400 MTFDKBA1T0QFM
144.1 (135.56min - 144.07max) MB/s -17%
Dell XPS 14 Core Ultra X7 358H
Samsung PM9C1b MZVL81T0HFLB-00BH1
139.7 (138.86min - 139.67max) MB/s -19%
Dell Inspiron 14 7445 2-in-1
Micron 2400 MTFDKBK1T0QFM
120.5 (119.19min - 120.53max) MB/s -30%
4k q32 t16 read
HP OmniBook Ultra 14 Core Ultra X9
 
932 (924.12min - 932.49max) MB/s +27%
Dell Inspiron 14 7445 2-in-1
Micron 2400 MTFDKBK1T0QFM
781 (742.63min - 781.21max) MB/s +6%
Dell 14S DS14260
 
736 (667.91min - 735.75max) MB/s
Dell XPS 14 Core Ultra X7 358H
Samsung PM9C1b MZVL81T0HFLB-00BH1
711 (562.02min - 711.38max) MB/s -3%
Lenovo ThinkBook 14 G9 IPL 21UX005PGE
YMTC PC42Q512GBG4Q
610 (596.83min - 610.37max) MB/s -17%
Asus VivoBook S 14 OLED M5406WA
Micron 2400 MTFDKBA1T0QFM
535 (521.87min - 535.44max) MB/s -27%
4k q32 t16 write
Dell 14S DS14260
 
510 (455.91min - 510.25max) MB/s
Lenovo ThinkBook 14 G9 IPL 21UX005PGE
YMTC PC42Q512GBG4Q
489 (391.1min - 488.69max) MB/s -4%
HP OmniBook Ultra 14 Core Ultra X9
 
464 (436.89min - 463.53max) MB/s -9%
Dell XPS 14 Core Ultra X7 358H
Samsung PM9C1b MZVL81T0HFLB-00BH1
432 (319.99min - 432.49max) MB/s -15%
Dell Inspiron 14 7445 2-in-1
Micron 2400 MTFDKBK1T0QFM
314 (299.4min - 314.29max) MB/s -38%
Asus VivoBook S 14 OLED M5406WA
Micron 2400 MTFDKBA1T0QFM
312 (290.34min - 311.75max) MB/s -39%
AS SSD
Score Total
HP OmniBook Ultra 14 Core Ultra X9
 
6029 Points +87%
Dell XPS 14 Core Ultra X7 358H
Samsung PM9C1b MZVL81T0HFLB-00BH1
5466 Points +70%
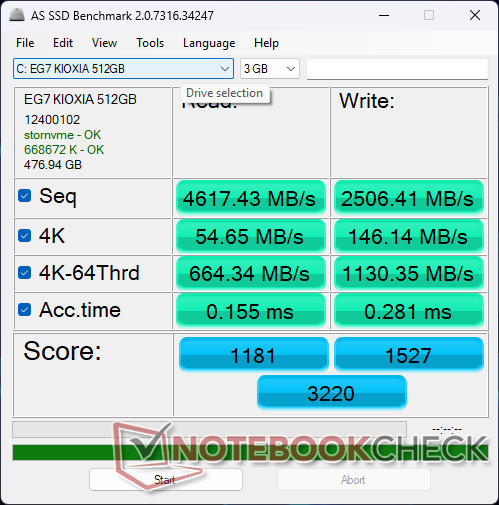
Dell 14S DS14260
 
3220 Points
Asus VivoBook S 14 OLED M5406WA
Micron 2400 MTFDKBA1T0QFM
3137 Points -3%
Lenovo ThinkBook 14 G9 IPL 21UX005PGE
YMTC PC42Q512GBG4Q
2909 Points -10%
Dell Inspiron 14 7445 2-in-1
Micron 2400 MTFDKBK1T0QFM
2248 Points -30%
Score Read
HP OmniBook Ultra 14 Core Ultra X9
 
1687 Points +43%
Dell XPS 14 Core Ultra X7 358H
Samsung PM9C1b MZVL81T0HFLB-00BH1
1402 Points +19%
Dell 14S DS14260
 
1181 Points
Lenovo ThinkBook 14 G9 IPL 21UX005PGE
YMTC PC42Q512GBG4Q
1008 Points -15%
Asus VivoBook S 14 OLED M5406WA
Micron 2400 MTFDKBA1T0QFM
958 Points -19%
Dell Inspiron 14 7445 2-in-1
Micron 2400 MTFDKBK1T0QFM
889 Points -25%
Score Write
HP OmniBook Ultra 14 Core Ultra X9
 
3565 Points +133%
Dell XPS 14 Core Ultra X7 358H
Samsung PM9C1b MZVL81T0HFLB-00BH1
3375 Points +121%
Asus VivoBook S 14 OLED M5406WA
Micron 2400 MTFDKBA1T0QFM
1741 Points +14%
Dell 14S DS14260
 
1527 Points
Lenovo ThinkBook 14 G9 IPL 21UX005PGE
YMTC PC42Q512GBG4Q
1446 Points -5%
Dell Inspiron 14 7445 2-in-1
Micron 2400 MTFDKBK1T0QFM
971 Points -36%
Seq Read
HP OmniBook Ultra 14 Core Ultra X9
 
6737.66 MB/s +46%
Dell 14S DS14260
 
4617.43 MB/s
Dell XPS 14 Core Ultra X7 358H
Samsung PM9C1b MZVL81T0HFLB-00BH1
4161.24 MB/s -10%
Lenovo ThinkBook 14 G9 IPL 21UX005PGE
YMTC PC42Q512GBG4Q
3950 MB/s -14%
Asus VivoBook S 14 OLED M5406WA
Micron 2400 MTFDKBA1T0QFM
3851.62 MB/s -17%
Dell Inspiron 14 7445 2-in-1
Micron 2400 MTFDKBK1T0QFM
2968.79 MB/s -36%
Seq Write
HP OmniBook Ultra 14 Core Ultra X9
 
4758.23 MB/s +90%
Dell XPS 14 Core Ultra X7 358H
Samsung PM9C1b MZVL81T0HFLB-00BH1
3356.2 MB/s +34%
Asus VivoBook S 14 OLED M5406WA
Micron 2400 MTFDKBA1T0QFM
2548.02 MB/s +2%
Lenovo ThinkBook 14 G9 IPL 21UX005PGE
YMTC PC42Q512GBG4Q
2514 MB/s 0%
Dell 14S DS14260
 
2506.41 MB/s
Dell Inspiron 14 7445 2-in-1
Micron 2400 MTFDKBK1T0QFM
1562.89 MB/s -38%
4K Read
HP OmniBook Ultra 14 Core Ultra X9
 
63.24 MB/s +16%
Dell XPS 14 Core Ultra X7 358H
Samsung PM9C1b MZVL81T0HFLB-00BH1
57.94 MB/s +6%
Dell 14S DS14260
 
54.65 MB/s
Asus VivoBook S 14 OLED M5406WA
Micron 2400 MTFDKBA1T0QFM
48.65 MB/s -11%
Lenovo ThinkBook 14 G9 IPL 21UX005PGE
YMTC PC42Q512GBG4Q
44.7 MB/s -18%
Dell Inspiron 14 7445 2-in-1
Micron 2400 MTFDKBK1T0QFM
28.07 MB/s -49%
4K Write
HP OmniBook Ultra 14 Core Ultra X9
 
188.94 MB/s +29%
Asus VivoBook S 14 OLED M5406WA
Micron 2400 MTFDKBA1T0QFM
185.83 MB/s +27%
Dell XPS 14 Core Ultra X7 358H
Samsung PM9C1b MZVL81T0HFLB-00BH1
183.04 MB/s +25%
Dell 14S DS14260
 
146.14 MB/s
Lenovo ThinkBook 14 G9 IPL 21UX005PGE
YMTC PC42Q512GBG4Q
119.6 MB/s -18%
Dell Inspiron 14 7445 2-in-1
Micron 2400 MTFDKBK1T0QFM
114.15 MB/s -22%
4K-64 Read
HP OmniBook Ultra 14 Core Ultra X9
 
950.03 MB/s +43%
Dell XPS 14 Core Ultra X7 358H
Samsung PM9C1b MZVL81T0HFLB-00BH1
927.71 MB/s +40%
Dell 14S DS14260
 
664.34 MB/s
Dell Inspiron 14 7445 2-in-1
Micron 2400 MTFDKBK1T0QFM
654.43 MB/s -1%
Lenovo ThinkBook 14 G9 IPL 21UX005PGE
YMTC PC42Q512GBG4Q
569 MB/s -14%
Asus VivoBook S 14 OLED M5406WA
Micron 2400 MTFDKBA1T0QFM
523.78 MB/s -21%
4K-64 Write
HP OmniBook Ultra 14 Core Ultra X9
 
2900.72 MB/s +157%
Dell XPS 14 Core Ultra X7 358H
Samsung PM9C1b MZVL81T0HFLB-00BH1
2856.06 MB/s +153%
Asus VivoBook S 14 OLED M5406WA
Micron 2400 MTFDKBA1T0QFM
1300.79 MB/s +15%
Dell 14S DS14260
 
1130.35 MB/s
Lenovo ThinkBook 14 G9 IPL 21UX005PGE
YMTC PC42Q512GBG4Q
1075 MB/s -5%
Dell Inspiron 14 7445 2-in-1
Micron 2400 MTFDKBK1T0QFM
700.07 MB/s -38%
Access Time Read
Dell 14S DS14260
 
0.155 ms *
Dell Inspiron 14 7445 2-in-1
Micron 2400 MTFDKBK1T0QFM
0.122 ms * +21%
Dell XPS 14 Core Ultra X7 358H
Samsung PM9C1b MZVL81T0HFLB-00BH1
0.103 ms * +34%
Lenovo ThinkBook 14 G9 IPL 21UX005PGE
YMTC PC42Q512GBG4Q
0.099 ms * +36%
Asus VivoBook S 14 OLED M5406WA
Micron 2400 MTFDKBA1T0QFM
0.08 ms * +48%
HP OmniBook Ultra 14 Core Ultra X9
 
0.042 ms * +73%
Access Time Write
Dell Inspiron 14 7445 2-in-1
Micron 2400 MTFDKBK1T0QFM
0.333 ms * -19%
Dell 14S DS14260
 
0.281 ms *
Asus VivoBook S 14 OLED M5406WA
Micron 2400 MTFDKBA1T0QFM
0.1 ms * +64%
Lenovo ThinkBook 14 G9 IPL 21UX005PGE
YMTC PC42Q512GBG4Q
0.086 ms * +69%
Dell XPS 14 Core Ultra X7 358H
Samsung PM9C1b MZVL81T0HFLB-00BH1
0.077 ms * +73%
HP OmniBook Ultra 14 Core Ultra X9
 
0.061 ms * +78%

* ... kleinere Werte sind besser

Festplattendrosselung: DiskSpd-Lese-Schleife, Warteschlangentiefe 8

0145290435580725870101511601305145015951740188520302175232024652610275529003045319033353480362537703915406042054350449546404785493050755220536555105655580059456090623563806525667068156960Tooltip
Dell 14S DS14260  ; diskspd 2.0.17 f: Ø6412 (5703.96-6488.82) MB/s
Dell XPS 14 Core Ultra X7 358H Samsung PM9C1b MZVL81T0HFLB-00BH1; diskspd 2.0.17 f: Ø7012 (6080.06-7044.75) MB/s

GPU-Leistung

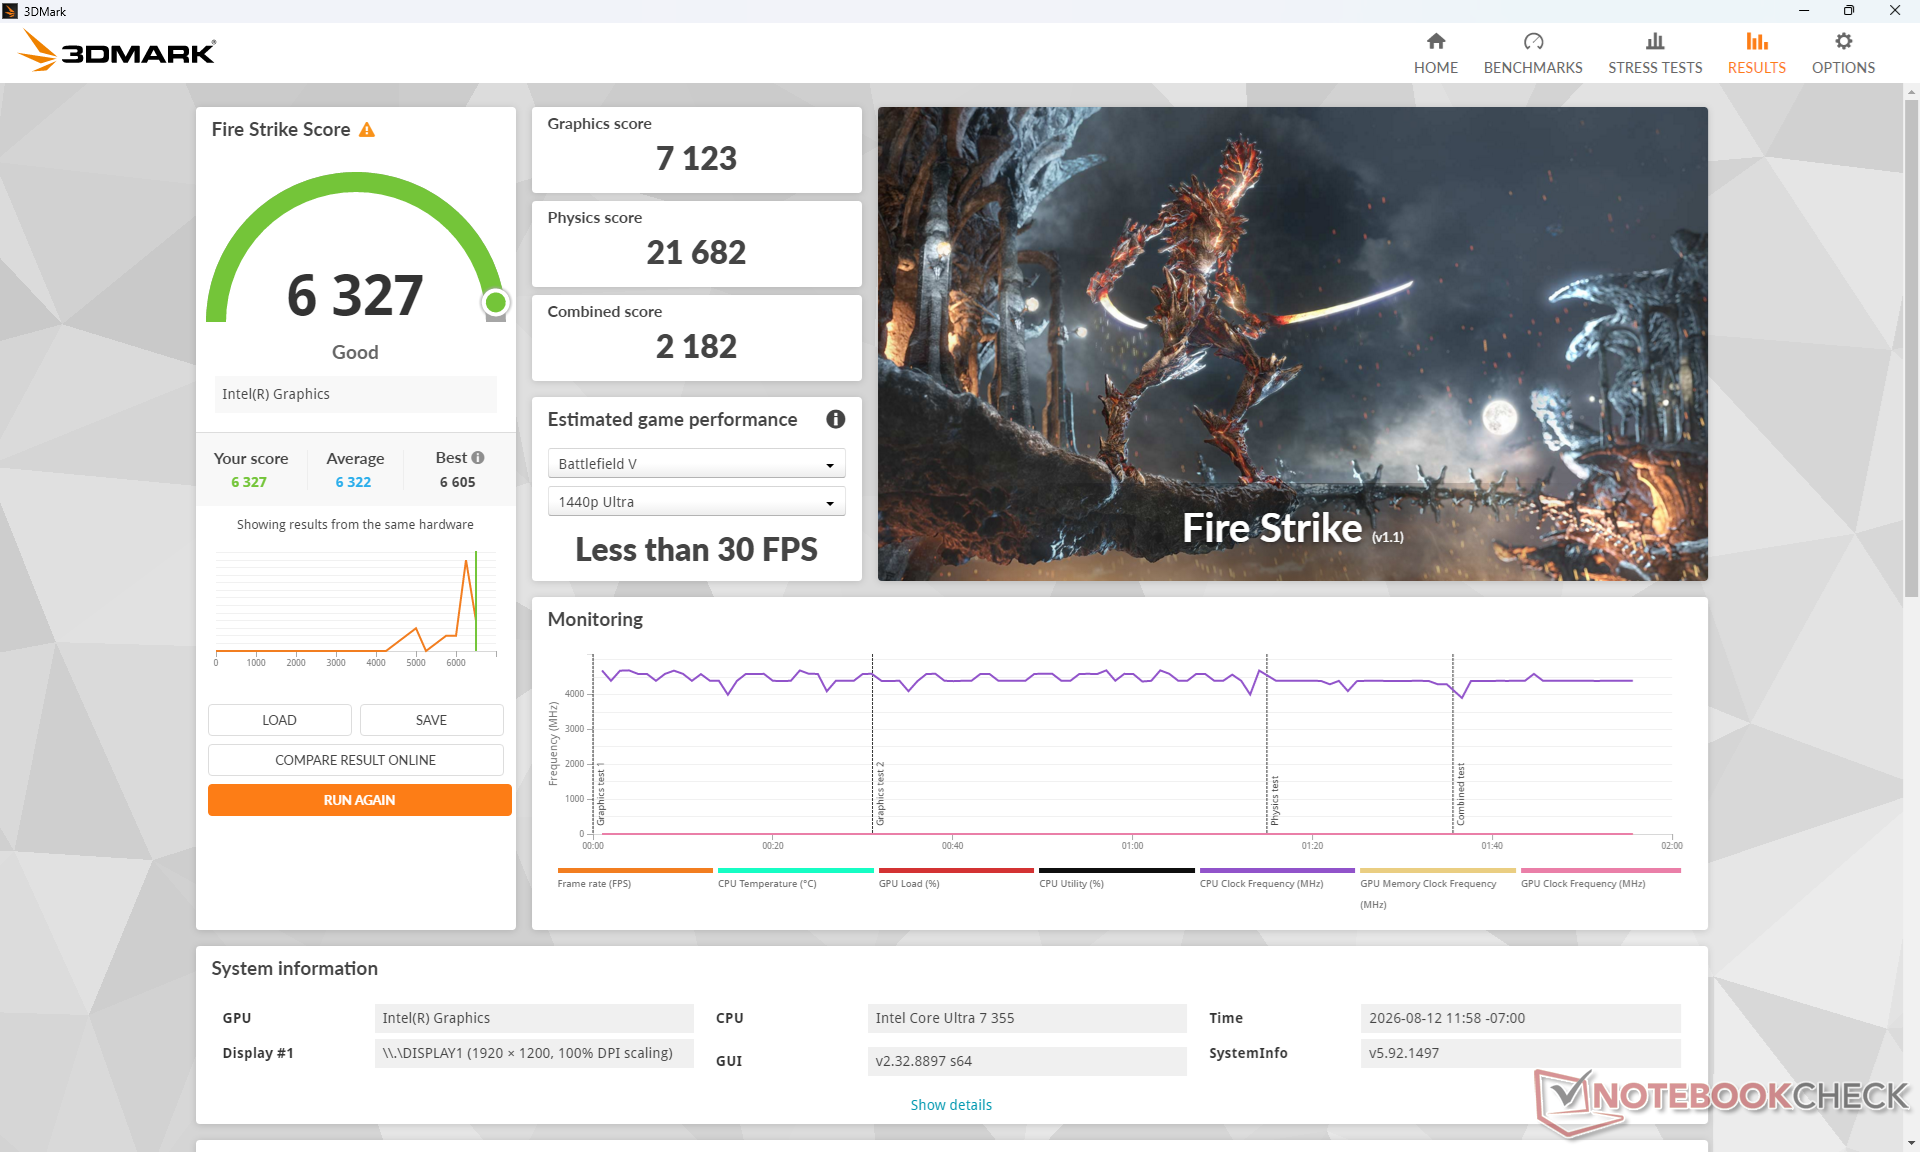
LeistungsprofilFire Strike-Grafik-ErgebnisPhysik-ErgebnisKombinierte Punktzahl
Leistungsmodus712321.6822182
Battery Power6.996 (-2 %)17.440 (-20 %)2.156
3DMark 11
3DMark 11
Cloud Gate
Cloud Gate
Fire Strike
Fire Strike
Time Spy
Time Spy
3DMark Performance Rating - Percent
Dell XPS 14 Core Ultra X7 358H
Intel Arc B390 12 Xe3 Panther Lake iGPU, Intel Core Ultra X7 358H
100 pt
Honor MagicBook Pro 14 2026 -1!
Intel Arc B370 10 Xe3 Panther Lake iGPU, Intel Core Ultra 5 338H
87 pt
HP OmniBook Ultra 14 Core Ultra X9
Intel Arc B390 12 Xe3 Panther Lake iGPU, Intel Core Ultra X9 388H
86.3 pt
Asus VivoBook S 14 OLED M5406WA
AMD Radeon 890M, AMD Ryzen AI 9 HX 370
66.1 pt
Lenovo ThinkPad E14 Gen 7 21U2002QGE -1!
Intel Arc Graphics 130V, Intel Core Ultra 5 228V
51.5 pt
Dell 14 Plus -1!
Intel Arc Graphics 140V, Intel Core Ultra 7 256V
49.5 pt
Dell Inspiron 14 7445 2-in-1
AMD Radeon 780M, AMD Ryzen 7 8840HS
47 pt
Dell 14S DS14260
Intel Graphics 4 Xe3 Panther Lake iGPU, Intel Core Ultra 7 355
43.4 pt
Lenovo IdeaPad Pro 5 14AGP11 -1!
AMD Radeon 860M, AMD Ryzen AI 7 450
42.4 pt
Durchschnittliche Intel Graphics 4 Xe3 Panther Lake iGPU
 
41.7 pt
Lenovo ThinkBook 14 G9 IPL 21UX005PGE -1!
Intel Graphics 4 Xe3 Panther Lake iGPU, Intel Core Ultra 5 325
38 pt
Lenovo Yoga Slim 6 14APU8
AMD Radeon 740M, AMD Ryzen 5 7540U
32.6 pt
3DMark 11 - 1280x720 Performance GPU
Dell XPS 14 Core Ultra X7 358H
Intel Arc B390 12 Xe3 Panther Lake iGPU, Intel Core Ultra X7 358H
18743 Points +148%
HP OmniBook Ultra 14 Core Ultra X9
Intel Arc B390 12 Xe3 Panther Lake iGPU, Intel Core Ultra X9 388H
18489 Points +144%
Asus VivoBook S 14 OLED M5406WA
AMD Radeon 890M, AMD Ryzen AI 9 HX 370
16296 Points +115%
Honor MagicBook Pro 14 2026
Intel Arc B370 10 Xe3 Panther Lake iGPU, Intel Core Ultra 5 338H
16289 Points +115%
Dell Inspiron 14 7445 2-in-1
AMD Radeon 780M, AMD Ryzen 7 8840HS
11659 Points +54%
Dell 14 Plus
Intel Arc Graphics 140V, Intel Core Ultra 7 256V
10775 Points +42%
Lenovo ThinkPad E14 Gen 7 21U2002QGE
Intel Arc Graphics 130V, Intel Core Ultra 5 228V
10079 Points +33%
Dell 14S DS14260
Intel Graphics 4 Xe3 Panther Lake iGPU, Intel Core Ultra 7 355
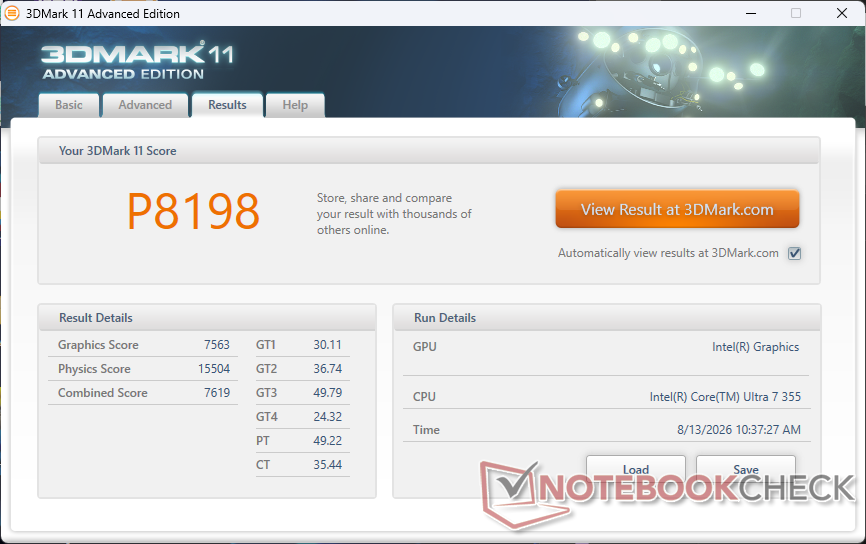
7563 Points
Lenovo Yoga Slim 6 14APU8
AMD Radeon 740M, AMD Ryzen 5 7540U
7490 Points -1%
Durchschnittliche Intel Graphics 4 Xe3 Panther Lake iGPU
  (6268 - 7678, n=13)
7124 Points -6%
Lenovo ThinkBook 14 G9 IPL 21UX005PGE
Intel Graphics 4 Xe3 Panther Lake iGPU, Intel Core Ultra 5 325
6519 Points -14%
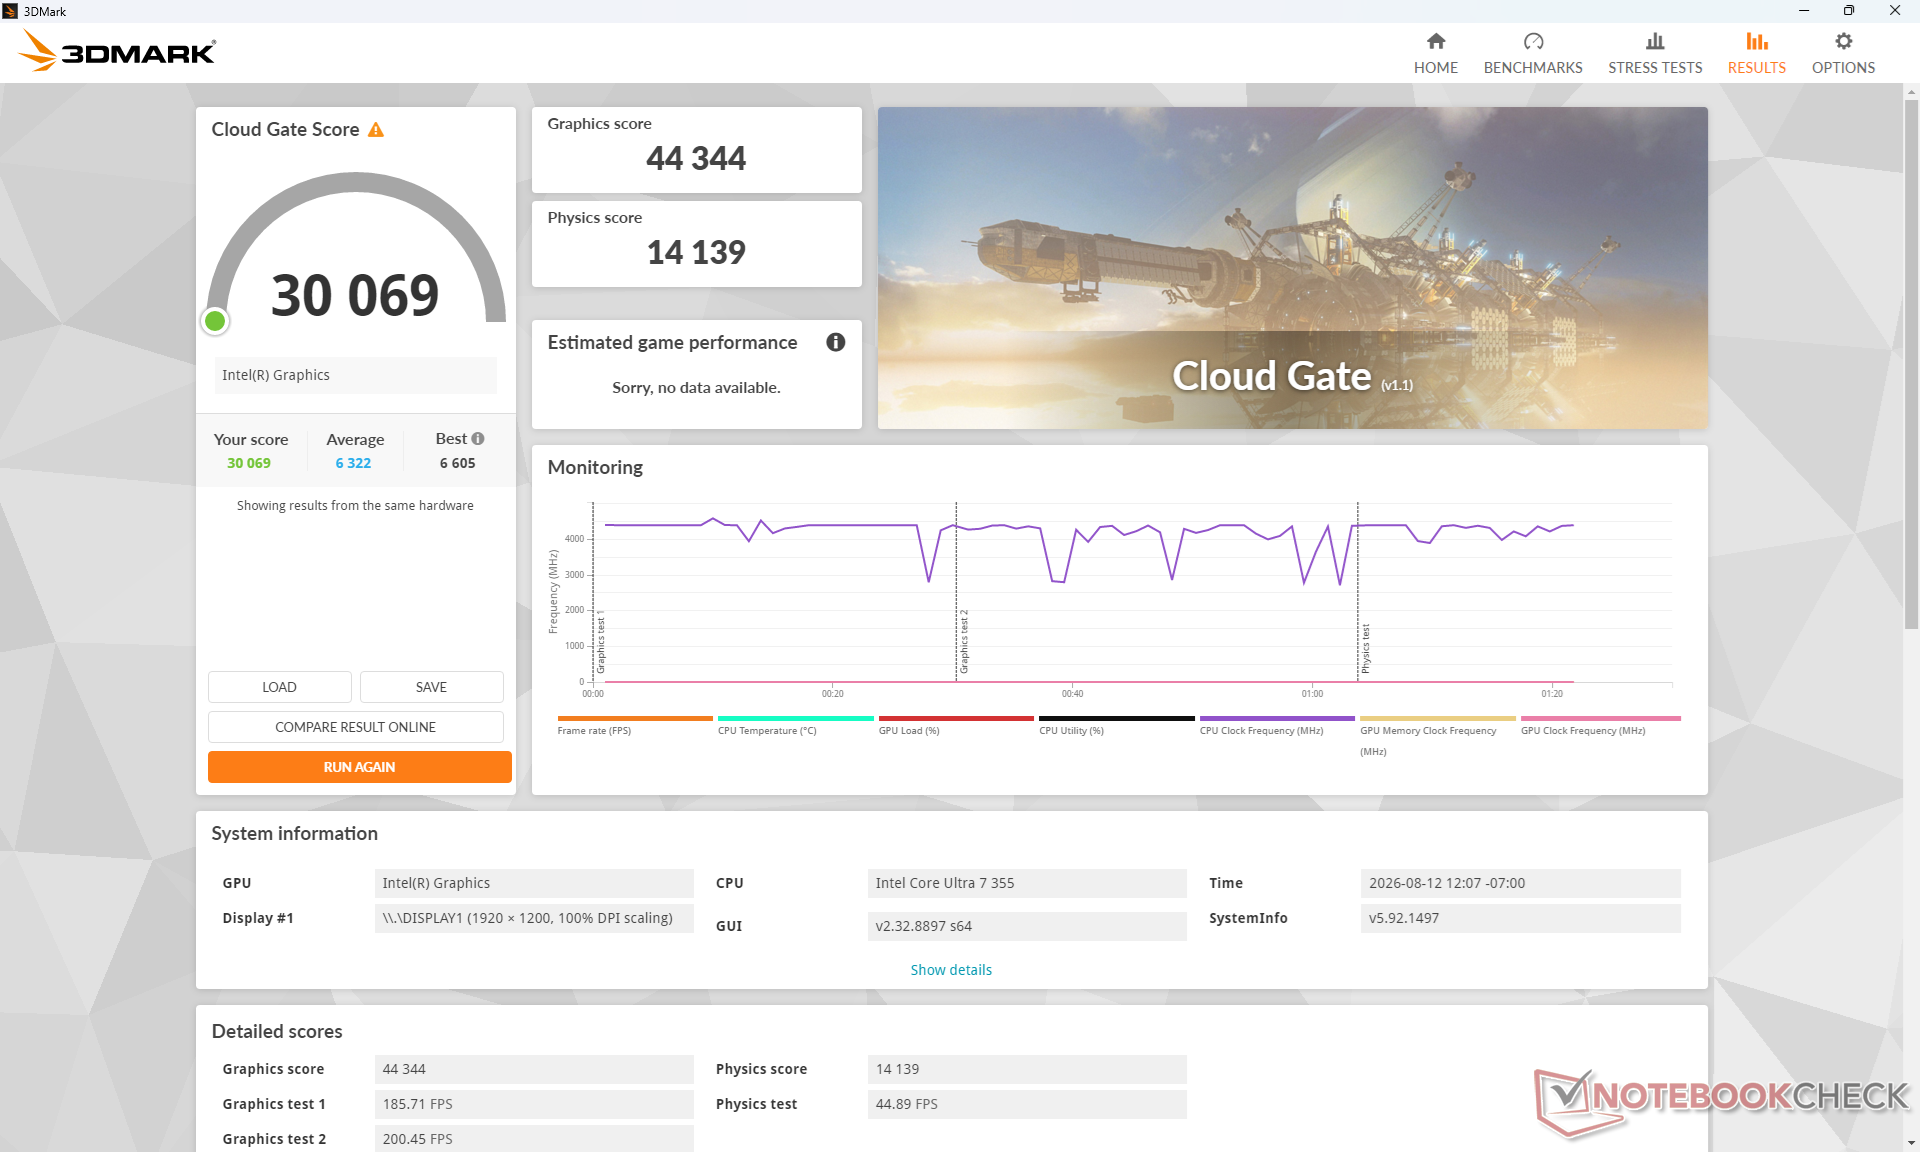
3DMark
1280x720 Cloud Gate Standard Graphics
Dell XPS 14 Core Ultra X7 358H
Intel Arc B390 12 Xe3 Panther Lake iGPU, Intel Core Ultra X7 358H
82808 Points +87%
Asus VivoBook S 14 OLED M5406WA
AMD Radeon 890M, AMD Ryzen AI 9 HX 370
58319 Points +32%
HP OmniBook Ultra 14 Core Ultra X9
Intel Arc B390 12 Xe3 Panther Lake iGPU, Intel Core Ultra X9 388H
52256 Points +18%
Lenovo IdeaPad Pro 5 14AGP11
AMD Radeon 860M, AMD Ryzen AI 7 450
46356 Points +5%
Dell Inspiron 14 7445 2-in-1
AMD Radeon 780M, AMD Ryzen 7 8840HS
45584 Points +3%
Dell 14S DS14260
Intel Graphics 4 Xe3 Panther Lake iGPU, Intel Core Ultra 7 355
44344 Points
Durchschnittliche Intel Graphics 4 Xe3 Panther Lake iGPU
  (30345 - 44501, n=8)
40024 Points -10%
Lenovo Yoga Slim 6 14APU8
AMD Radeon 740M, AMD Ryzen 5 7540U
30354 Points -32%
1920x1080 Fire Strike Graphics
Dell XPS 14 Core Ultra X7 358H
Intel Arc B390 12 Xe3 Panther Lake iGPU, Intel Core Ultra X7 358H
17324 Points +143%
HP OmniBook Ultra 14 Core Ultra X9
Intel Arc B390 12 Xe3 Panther Lake iGPU, Intel Core Ultra X9 388H
16347 Points +129%
Honor MagicBook Pro 14 2026
Intel Arc B370 10 Xe3 Panther Lake iGPU, Intel Core Ultra 5 338H
14966 Points +110%
Asus VivoBook S 14 OLED M5406WA
AMD Radeon 890M, AMD Ryzen AI 9 HX 370
9524 Points +34%
Lenovo ThinkPad E14 Gen 7 21U2002QGE
Intel Arc Graphics 130V, Intel Core Ultra 5 228V
8755 Points +23%
Dell 14 Plus
Intel Arc Graphics 140V, Intel Core Ultra 7 256V
7706 Points +8%
Dell 14S DS14260
Intel Graphics 4 Xe3 Panther Lake iGPU, Intel Core Ultra 7 355
7123 Points
Durchschnittliche Intel Graphics 4 Xe3 Panther Lake iGPU
  (5688 - 7227, n=14)
6874 Points -3%
Dell Inspiron 14 7445 2-in-1
AMD Radeon 780M, AMD Ryzen 7 8840HS
6722 Points -6%
Lenovo ThinkBook 14 G9 IPL 21UX005PGE
Intel Graphics 4 Xe3 Panther Lake iGPU, Intel Core Ultra 5 325
6678 Points -6%
Lenovo IdeaPad Pro 5 14AGP11
AMD Radeon 860M, AMD Ryzen AI 7 450
6496 Points -9%
Lenovo Yoga Slim 6 14APU8
AMD Radeon 740M, AMD Ryzen 5 7540U
5135 Points -28%
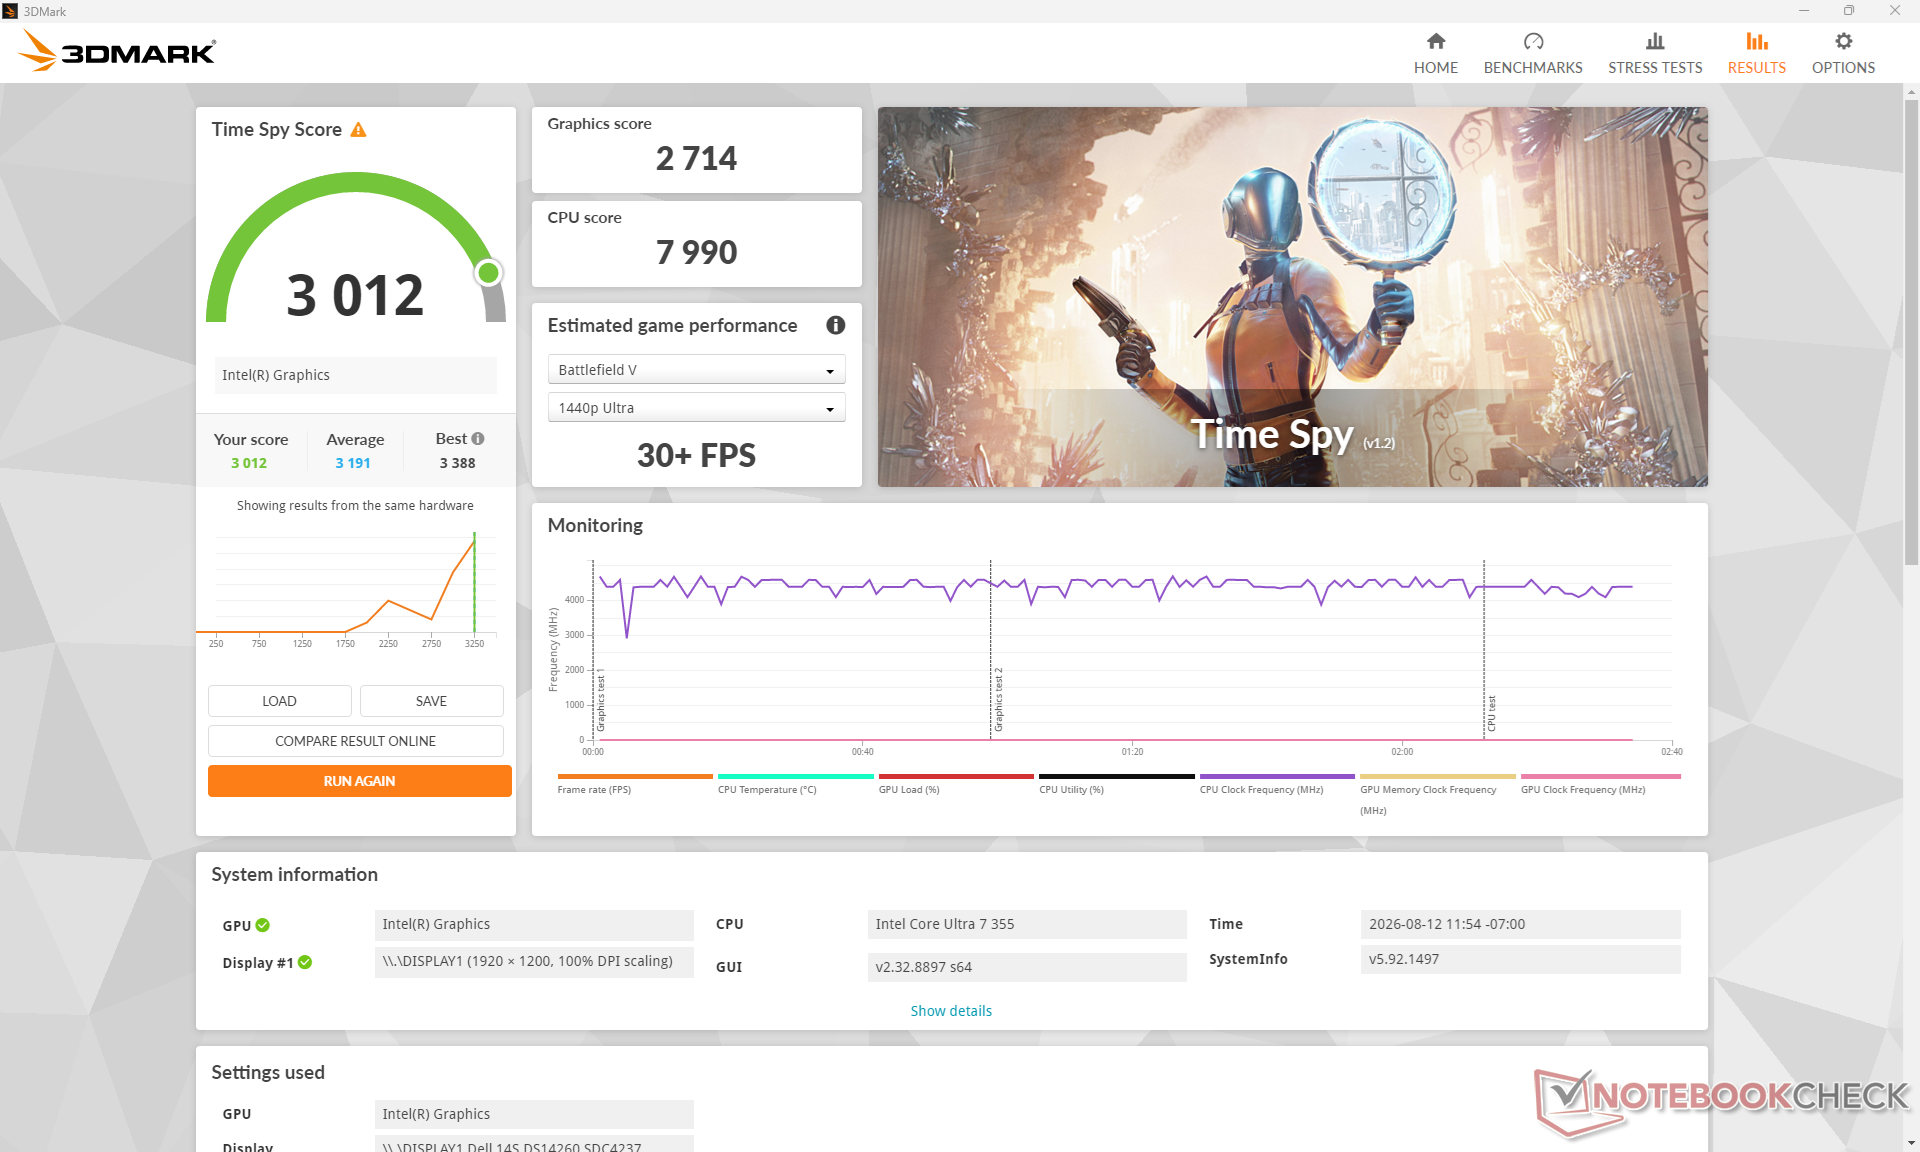
2560x1440 Time Spy Graphics
Dell XPS 14 Core Ultra X7 358H
Intel Arc B390 12 Xe3 Panther Lake iGPU, Intel Core Ultra X7 358H
7043 Points +160%
HP OmniBook Ultra 14 Core Ultra X9
Intel Arc B390 12 Xe3 Panther Lake iGPU, Intel Core Ultra X9 388H
6288 Points +132%
Honor MagicBook Pro 14 2026
Intel Arc B370 10 Xe3 Panther Lake iGPU, Intel Core Ultra 5 338H
6167 Points +127%
Asus VivoBook S 14 OLED M5406WA
AMD Radeon 890M, AMD Ryzen AI 9 HX 370
3676 Points +35%
Lenovo ThinkPad E14 Gen 7 21U2002QGE
Intel Arc Graphics 130V, Intel Core Ultra 5 228V
3538 Points +30%
Dell 14 Plus
Intel Arc Graphics 140V, Intel Core Ultra 7 256V
3275 Points +21%
Durchschnittliche Intel Graphics 4 Xe3 Panther Lake iGPU
  (2391 - 3044, n=14)
2864 Points +6%
Lenovo ThinkBook 14 G9 IPL 21UX005PGE
Intel Graphics 4 Xe3 Panther Lake iGPU, Intel Core Ultra 5 325
2856 Points +5%
Dell 14S DS14260
Intel Graphics 4 Xe3 Panther Lake iGPU, Intel Core Ultra 7 355
2714 Points
Lenovo IdeaPad Pro 5 14AGP11
AMD Radeon 860M, AMD Ryzen AI 7 450
2365 Points -13%
Dell Inspiron 14 7445 2-in-1
AMD Radeon 780M, AMD Ryzen 7 8840HS
2252 Points -17%
Lenovo Yoga Slim 6 14APU8
AMD Radeon 740M, AMD Ryzen 5 7540U
1699 Points -37%
3DMark 11 Performance
8198 Punkte
3DMark Cloud Gate Standard Score
30069 Punkte
3DMark Fire Strike Score
6327 Punkte
3DMark Time Spy Score
3012 Punkte
Hilfe
Blender
v3.3 Classroom CPU
Lenovo Yoga Slim 6 14APU8
AMD Radeon 740M, AMD Ryzen 5 7540U
687 Seconds * -37%
Lenovo ThinkPad E14 Gen 7 21U2002QGE
Intel Arc Graphics 130V, Intel Core Ultra 5 228V
676 Seconds * -34%
Dell 14 Plus
Intel Arc Graphics 140V, Intel Core Ultra 7 256V
616 Seconds * -22%
Lenovo ThinkBook 14 G9 IPL 21UX005PGE
Intel Graphics 4 Xe3 Panther Lake iGPU, Intel Core Ultra 5 325
526 Seconds * -5%
Dell 14S DS14260
Intel Graphics 4 Xe3 Panther Lake iGPU, Intel Core Ultra 7 355
503 Seconds *
Durchschnittliche Intel Graphics 4 Xe3 Panther Lake iGPU
  (309 - 569, n=14)
461 Seconds * +8%
Dell Inspiron 14 7445 2-in-1
AMD Radeon 780M, AMD Ryzen 7 8840HS
404 Seconds * +20%
Honor MagicBook Pro 14 2026
Intel Arc B370 10 Xe3 Panther Lake iGPU, Intel Core Ultra 5 338H
341 Seconds * +32%
Dell XPS 14 Core Ultra X7 358H
Intel Arc B390 12 Xe3 Panther Lake iGPU, Intel Core Ultra X7 358H
335 Seconds * +33%
HP OmniBook Ultra 14 Core Ultra X9
Intel Arc B390 12 Xe3 Panther Lake iGPU, Intel Core Ultra X9 388H
326 Seconds * +35%
Lenovo IdeaPad Pro 5 14AGP11
AMD Radeon 860M, AMD Ryzen AI 7 450
280 Seconds * +44%
Asus VivoBook S 14 OLED M5406WA
AMD Radeon 890M, AMD Ryzen AI 9 HX 370
256 Seconds * +49%
v4.3 Barbershop oneAPI
Dell 14S DS14260
Intel Graphics 4 Xe3 Panther Lake iGPU, Intel Core Ultra 7 355
956 Seconds *
Dell 14 Plus
Intel Arc Graphics 140V, Intel Core Ultra 7 256V
942 Seconds * +1%
Durchschnittliche Intel Graphics 4 Xe3 Panther Lake iGPU
  (823 - 1015, n=7)
922 Seconds * +4%
HP OmniBook Ultra 14 Core Ultra X9
Intel Arc B390 12 Xe3 Panther Lake iGPU, Intel Core Ultra X9 388H
371 Seconds * +61%
Dell XPS 14 Core Ultra X7 358H
Intel Arc B390 12 Xe3 Panther Lake iGPU, Intel Core Ultra X7 358H
369 Seconds * +61%
v4.3 Barbershop CPU
Dell 14 Plus
Intel Arc Graphics 140V, Intel Core Ultra 7 256V
3319 Seconds * -22%
Dell 14S DS14260
Intel Graphics 4 Xe3 Panther Lake iGPU, Intel Core Ultra 7 355
2714 Seconds *
Durchschnittliche Intel Graphics 4 Xe3 Panther Lake iGPU
  (1709 - 2769, n=7)
2518 Seconds * +7%
Dell XPS 14 Core Ultra X7 358H
Intel Arc B390 12 Xe3 Panther Lake iGPU, Intel Core Ultra X7 358H
1711 Seconds * +37%
HP OmniBook Ultra 14 Core Ultra X9
Intel Arc B390 12 Xe3 Panther Lake iGPU, Intel Core Ultra X9 388H
1609 Seconds * +41%

* ... kleinere Werte sind besser

Performance Rating - Percent
HP OmniBook Ultra 14 Core Ultra X9
Intel Core Ultra X9 388H, Intel Arc B390 12 Xe3 Panther Lake iGPU
97.6 pt
Dell XPS 14 Core Ultra X7 358H
Intel Core Ultra X7 358H, Intel Arc B390 12 Xe3 Panther Lake iGPU
94.2 pt
Asus VivoBook S 14 OLED M5406WA
AMD Ryzen AI 9 HX 370, AMD Radeon 890M
60.9 pt
Dell 14S DS14260
Intel Core Ultra 7 355, Intel Graphics 4 Xe3 Panther Lake iGPU
51.8 pt
Dell Inspiron 14 7445 2-in-1 -1!
AMD Ryzen 7 8840HS, AMD Radeon 780M
51 pt
Lenovo ThinkBook 14 G9 IPL 21UX005PGE -1!
Intel Core Ultra 5 325, Intel Graphics 4 Xe3 Panther Lake iGPU
50.5 pt
Cyberpunk 2077 - 1920x1080 Ultra Preset (FSR off)
HP OmniBook Ultra 14 Core Ultra X9
Intel Core Ultra X9 388H, Intel Arc B390 12 Xe3 Panther Lake iGPU
44.9 (36.5min, 35.1P1) fps +167%
Dell XPS 14 Core Ultra X7 358H
Intel Core Ultra X7 358H, Intel Arc B390 12 Xe3 Panther Lake iGPU
40.9 (33.3min, 30.6P1) fps +143%
Asus VivoBook S 14 OLED M5406WA
AMD Ryzen AI 9 HX 370, AMD Radeon 890M
25.4 (21min) fps +51%
Lenovo ThinkBook 14 G9 IPL 21UX005PGE
Intel Core Ultra 5 325, Intel Graphics 4 Xe3 Panther Lake iGPU
20.2 (17.1min, 16.2P1) fps +20%
Dell Inspiron 14 7445 2-in-1
AMD Ryzen 7 8840HS, AMD Radeon 780M
19.1 (15.8min) fps +14%
Dell 14S DS14260
Intel Core Ultra 7 355, Intel Graphics 4 Xe3 Panther Lake iGPU
16.8 (14min, 13.1P1) fps
Baldur's Gate 3 - 1920x1080 Ultra Preset AA:T
HP OmniBook Ultra 14 Core Ultra X9
Intel Core Ultra X9 388H, Intel Arc B390 12 Xe3 Panther Lake iGPU
53.5 (48.4min, 49.1P0.1, 50.4P1) fps +179%
Dell XPS 14 Core Ultra X7 358H
Intel Core Ultra X7 358H, Intel Arc B390 12 Xe3 Panther Lake iGPU
48.7 (43.1min, 44.3P0.1, 45.5P1) fps +154%
Asus VivoBook S 14 OLED M5406WA
AMD Ryzen AI 9 HX 370, AMD Radeon 890M
28.4 (19.8min, 22.1P0.1, 23.8P1) fps +48%
Lenovo ThinkBook 14 G9 IPL 21UX005PGE
Intel Core Ultra 5 325, Intel Graphics 4 Xe3 Panther Lake iGPU
21.4 (19min, 19.1P0.1, 19.3P1) fps +11%
Dell Inspiron 14 7445 2-in-1
AMD Ryzen 7 8840HS, AMD Radeon 780M
21.2 fps +10%
Dell 14S DS14260
Intel Core Ultra 7 355, Intel Graphics 4 Xe3 Panther Lake iGPU
19.2 (16.3min, 16.3P0.1, 17.9P1) fps
GTA V - 1920x1080 Highest AA:4xMSAA + FX AF:16x
HP OmniBook Ultra 14 Core Ultra X9
Intel Core Ultra X9 388H, Intel Arc B390 12 Xe3 Panther Lake iGPU
43.7 (6.57min, 29.4P1) fps +108%
Dell XPS 14 Core Ultra X7 358H
Intel Core Ultra X7 358H, Intel Arc B390 12 Xe3 Panther Lake iGPU
43.3 (6.46min, 33.3P1) fps +106%
Asus VivoBook S 14 OLED M5406WA
AMD Ryzen AI 9 HX 370, AMD Radeon 890M
32.4 (3.71min, 23.8P1) fps +54%
Dell 14S DS14260
Intel Core Ultra 7 355, Intel Graphics 4 Xe3 Panther Lake iGPU
21 (4.83min, 16.1P1) fps
Lenovo ThinkBook 14 G9 IPL 21UX005PGE
Intel Core Ultra 5 325, Intel Graphics 4 Xe3 Panther Lake iGPU
18 (6.43min, 13.9P1) fps -14%
Final Fantasy XV Benchmark - 1920x1080 High Quality
HP OmniBook Ultra 14 Core Ultra X9
Intel Core Ultra X9 388H, Intel Arc B390 12 Xe3 Panther Lake iGPU
54.5 fps +110%
Dell XPS 14 Core Ultra X7 358H
Intel Core Ultra X7 358H, Intel Arc B390 12 Xe3 Panther Lake iGPU
52.8 fps +103%
Asus VivoBook S 14 OLED M5406WA
AMD Ryzen AI 9 HX 370, AMD Radeon 890M
31.2 fps +20%
Dell 14S DS14260
Intel Core Ultra 7 355, Intel Graphics 4 Xe3 Panther Lake iGPU
26 fps
Dell Inspiron 14 7445 2-in-1
AMD Ryzen 7 8840HS, AMD Radeon 780M
23.7 fps -9%
Lenovo ThinkBook 14 G9 IPL 21UX005PGE
Intel Core Ultra 5 325, Intel Graphics 4 Xe3 Panther Lake iGPU
22.5 fps -13%
Strange Brigade - 1920x1080 ultra AA:ultra AF:16
HP OmniBook Ultra 14 Core Ultra X9
Intel Core Ultra X9 388H, Intel Arc B390 12 Xe3 Panther Lake iGPU
101.3 (43.7min, 74.5P1) fps +111%
Dell XPS 14 Core Ultra X7 358H
Intel Core Ultra X7 358H, Intel Arc B390 12 Xe3 Panther Lake iGPU
95.1 (51.4min, 79.8P1) fps +98%
Asus VivoBook S 14 OLED M5406WA
AMD Ryzen AI 9 HX 370, AMD Radeon 890M
54.2 (16.1min, 20.1P1) fps +13%
Dell 14S DS14260
Intel Core Ultra 7 355, Intel Graphics 4 Xe3 Panther Lake iGPU
48 (16.5min, 25.9P1) fps
Dell Inspiron 14 7445 2-in-1
AMD Ryzen 7 8840HS, AMD Radeon 780M
39.9 (6.9min, 8.65P1) fps -17%
Dota 2 Reborn - 1920x1080 ultra (3/3) best looking
Dell XPS 14 Core Ultra X7 358H
Intel Core Ultra X7 358H, Intel Arc B390 12 Xe3 Panther Lake iGPU
105.4 (70.1min) fps +16%
HP OmniBook Ultra 14 Core Ultra X9
Intel Core Ultra X9 388H, Intel Arc B390 12 Xe3 Panther Lake iGPU
97 (51.8min) fps +7%
Dell 14S DS14260
Intel Core Ultra 7 355, Intel Graphics 4 Xe3 Panther Lake iGPU
90.7 (54.5min) fps
Lenovo ThinkBook 14 G9 IPL 21UX005PGE
Intel Core Ultra 5 325, Intel Graphics 4 Xe3 Panther Lake iGPU
80.3 (53.8min) fps -11%
Dell Inspiron 14 7445 2-in-1
AMD Ryzen 7 8840HS, AMD Radeon 780M
66.7 (56.4min) fps -26%
Asus VivoBook S 14 OLED M5406WA
AMD Ryzen AI 9 HX 370, AMD Radeon 890M
33.6 (17.1min) fps -63%
X-Plane 11.11 - 1920x1080 high (fps_test=3)
Asus VivoBook S 14 OLED M5406WA
AMD Ryzen AI 9 HX 370, AMD Radeon 890M
46.2 fps +66%
HP OmniBook Ultra 14 Core Ultra X9
Intel Core Ultra X9 388H, Intel Arc B390 12 Xe3 Panther Lake iGPU
42.2 fps +52%
Dell XPS 14 Core Ultra X7 358H
Intel Core Ultra X7 358H, Intel Arc B390 12 Xe3 Panther Lake iGPU
40.3 fps +45%
Dell Inspiron 14 7445 2-in-1
AMD Ryzen 7 8840HS, AMD Radeon 780M
35.9 fps +29%
Dell 14S DS14260
Intel Core Ultra 7 355, Intel Graphics 4 Xe3 Panther Lake iGPU
27.8 fps
Lenovo ThinkBook 14 G9 IPL 21UX005PGE
Intel Core Ultra 5 325, Intel Graphics 4 Xe3 Panther Lake iGPU
27.3 fps -2%
Baldur's Gate 3
1920x1080 Medium Preset AA:T
HP OmniBook Ultra 14 Core Ultra X9
Intel Core Ultra X9 388H, Intel Arc B390 12 Xe3 Panther Lake iGPU
61.3 (54.8min, 56P0.1, 57.7P1) fps +168%
Dell XPS 14 Core Ultra X7 358H
Intel Core Ultra X7 358H, Intel Arc B390 12 Xe3 Panther Lake iGPU
55.4 (49.6min, 49.9P0.1, 51P1) fps +142%
Honor MagicBook Pro 14 2026
Intel Core Ultra 5 338H, Intel Arc B370 10 Xe3 Panther Lake iGPU
47.3 (41.7min, 42.4P0.1, 43.5P1) fps +107%
Asus VivoBook S 14 OLED M5406WA
AMD Ryzen AI 9 HX 370, AMD Radeon 890M
35.4 (26.6min, 26.6P0.1, 30P1) fps +55%
Dell 14 Plus
Intel Core Ultra 7 256V, Intel Arc Graphics 140V
32.1 fps +40%
Lenovo IdeaPad Pro 5 14AGP11
AMD Ryzen AI 7 450, AMD Radeon 860M
31.4 (22min) fps +37%
Lenovo ThinkPad E14 Gen 7 21U2002QGE
Intel Core Ultra 5 228V, Intel Arc Graphics 130V
29.6 (25.1min, 25.3P0.1, 26.5P1) fps +29%
Dell Inspiron 14 7445 2-in-1
AMD Ryzen 7 8840HS, AMD Radeon 780M
26.3 fps +15%
Lenovo ThinkBook 14 G9 IPL 21UX005PGE
Intel Core Ultra 5 325, Intel Graphics 4 Xe3 Panther Lake iGPU
25.1 (22.3min, 22.5P0.1, 22.7P1) fps +10%
Durchschnittliche Intel Graphics 4 Xe3 Panther Lake iGPU
  (21 - 27.1, n=13)
24.6 fps +7%
Dell 14S DS14260
Intel Core Ultra 7 355, Intel Graphics 4 Xe3 Panther Lake iGPU
22.9 (20.6min, 20.6P0.1, 20.8P1) fps
Lenovo Yoga Slim 6 14APU8
AMD Ryzen 5 7540U, AMD Radeon 740M
16.4 (11.6min, 12.2P0.1, 13.5P1) fps -28%
1920x1080 High Preset AA:T
HP OmniBook Ultra 14 Core Ultra X9
Intel Core Ultra X9 388H, Intel Arc B390 12 Xe3 Panther Lake iGPU
54 (47.6min, 48.5P0.1, 49.7P1) fps +178%
Dell XPS 14 Core Ultra X7 358H
Intel Core Ultra X7 358H, Intel Arc B390 12 Xe3 Panther Lake iGPU
49 (44.2min, 44.5P0.1, 46.3P1) fps +153%
Honor MagicBook Pro 14 2026
Intel Core Ultra 5 338H, Intel Arc B370 10 Xe3 Panther Lake iGPU
41.8 (36.7min, 37.1P0.1, 38.5P1) fps +115%
Asus VivoBook S 14 OLED M5406WA
AMD Ryzen AI 9 HX 370, AMD Radeon 890M
28.9 (21.9min, 23.1P0.1, 24.6P1) fps +49%
Dell 14 Plus
Intel Core Ultra 7 256V, Intel Arc Graphics 140V
27.9 fps +44%
Lenovo ThinkPad E14 Gen 7 21U2002QGE
Intel Core Ultra 5 228V, Intel Arc Graphics 130V
25.9 (21.9min, 22.2P0.1, 23P1) fps +34%
Lenovo IdeaPad Pro 5 14AGP11
AMD Ryzen AI 7 450, AMD Radeon 860M
23.3 (20min) fps +20%
Dell Inspiron 14 7445 2-in-1
AMD Ryzen 7 8840HS, AMD Radeon 780M
22.2 fps +14%
Lenovo ThinkBook 14 G9 IPL 21UX005PGE
Intel Core Ultra 5 325, Intel Graphics 4 Xe3 Panther Lake iGPU
21.9 (19.6min, 19.7P0.1, 19.9P1) fps +13%
Durchschnittliche Intel Graphics 4 Xe3 Panther Lake iGPU
  (18 - 23.7, n=13)
21.2 fps +9%
Dell 14S DS14260
Intel Core Ultra 7 355, Intel Graphics 4 Xe3 Panther Lake iGPU
19.4 (17.5min, 17.7P0.1, 18.2P1) fps
Lenovo Yoga Slim 6 14APU8
AMD Ryzen 5 7540U, AMD Radeon 740M
13.5 (10.5min, 10.6P0.1, 11.1P1) fps -30%
1920x1080 Ultra Preset AA:T
HP OmniBook Ultra 14 Core Ultra X9
Intel Core Ultra X9 388H, Intel Arc B390 12 Xe3 Panther Lake iGPU
53.5 (48.4min, 49.1P0.1, 50.4P1) fps +179%
Dell XPS 14 Core Ultra X7 358H
Intel Core Ultra X7 358H, Intel Arc B390 12 Xe3 Panther Lake iGPU
48.7 (43.1min, 44.3P0.1, 45.5P1) fps +154%
Honor MagicBook Pro 14 2026
Intel Core Ultra 5 338H, Intel Arc B370 10 Xe3 Panther Lake iGPU
40.6 (36.1min, 36.4P0.1, 36.9P1) fps +111%
Asus VivoBook S 14 OLED M5406WA
AMD Ryzen AI 9 HX 370, AMD Radeon 890M
28.4 (19.8min, 22.1P0.1, 23.8P1) fps +48%
Dell 14 Plus
Intel Core Ultra 7 256V, Intel Arc Graphics 140V
27.4 fps +43%
Lenovo ThinkPad E14 Gen 7 21U2002QGE
Intel Core Ultra 5 228V, Intel Arc Graphics 130V
24.9 (21.2min, 21.3P0.1, 21.7P1) fps +30%
Lenovo IdeaPad Pro 5 14AGP11
AMD Ryzen AI 7 450, AMD Radeon 860M
21.9 (16min) fps +14%
Lenovo ThinkBook 14 G9 IPL 21UX005PGE
Intel Core Ultra 5 325, Intel Graphics 4 Xe3 Panther Lake iGPU
21.4 (19min, 19.1P0.1, 19.3P1) fps +11%
Dell Inspiron 14 7445 2-in-1
AMD Ryzen 7 8840HS, AMD Radeon 780M
21.2 fps +10%
Durchschnittliche Intel Graphics 4 Xe3 Panther Lake iGPU
  (17.7 - 23.1, n=13)
20.8 fps +8%
Dell 14S DS14260
Intel Core Ultra 7 355, Intel Graphics 4 Xe3 Panther Lake iGPU
19.2 (16.3min, 16.3P0.1, 17.9P1) fps
Lenovo Yoga Slim 6 14APU8
AMD Ryzen 5 7540U, AMD Radeon 740M
12.8 (10.9min, 11P0.1, 11.4P1) fps -33%
Dota 2 Reborn
1920x1080 high (2/3)
Dell XPS 14 Core Ultra X7 358H
Intel Core Ultra X7 358H, Intel Arc B390 12 Xe3 Panther Lake iGPU
107.6 (68.3min) fps +31%
Honor MagicBook Pro 14 2026
Intel Core Ultra 5 338H, Intel Arc B370 10 Xe3 Panther Lake iGPU
103.7 (68.4min) fps +27%
Lenovo IdeaPad Pro 5 14AGP11
AMD Ryzen AI 7 450, AMD Radeon 860M
100.4 (89.7min) fps +23%
HP OmniBook Ultra 14 Core Ultra X9
Intel Core Ultra X9 388H, Intel Arc B390 12 Xe3 Panther Lake iGPU
99 (51.9min) fps +21%
Lenovo ThinkBook 14 G9 IPL 21UX005PGE
Intel Core Ultra 5 325, Intel Graphics 4 Xe3 Panther Lake iGPU
85.8 (56.7min) fps +5%
Dell 14S DS14260
Intel Core Ultra 7 355, Intel Graphics 4 Xe3 Panther Lake iGPU
81.9 (26.2min) fps
Durchschnittliche Intel Graphics 4 Xe3 Panther Lake iGPU
  (72.6 - 94, n=14)
81.5 fps 0%
Dell Inspiron 14 7445 2-in-1
AMD Ryzen 7 8840HS, AMD Radeon 780M
74.5 (62.6min) fps -9%
Dell 14 Plus
Intel Core Ultra 7 256V, Intel Arc Graphics 140V
74.5 (27.8min) fps -9%
Lenovo Yoga Slim 6 14APU8
AMD Ryzen 5 7540U, AMD Radeon 740M
68.2 (59.4min) fps -17%
Lenovo ThinkPad E14 Gen 7 21U2002QGE
Intel Core Ultra 5 228V, Intel Arc Graphics 130V
58 (34.2min) fps -29%
Asus VivoBook S 14 OLED M5406WA
AMD Ryzen AI 9 HX 370, AMD Radeon 890M
35.8 (16.9min) fps -56%
1920x1080 ultra (3/3) best looking
Dell XPS 14 Core Ultra X7 358H
Intel Core Ultra X7 358H, Intel Arc B390 12 Xe3 Panther Lake iGPU
105.4 (70.1min) fps +16%
Honor MagicBook Pro 14 2026
Intel Core Ultra 5 338H, Intel Arc B370 10 Xe3 Panther Lake iGPU
104.8 (73.3min) fps +16%
HP OmniBook Ultra 14 Core Ultra X9
Intel Core Ultra X9 388H, Intel Arc B390 12 Xe3 Panther Lake iGPU
97 (51.8min) fps +7%
Dell 14S DS14260
Intel Core Ultra 7 355, Intel Graphics 4 Xe3 Panther Lake iGPU
90.7 (54.5min) fps
Lenovo IdeaPad Pro 5 14AGP11
AMD Ryzen AI 7 450, AMD Radeon 860M
89.4 (79.8min) fps -1%
Lenovo ThinkBook 14 G9 IPL 21UX005PGE
Intel Core Ultra 5 325, Intel Graphics 4 Xe3 Panther Lake iGPU
80.3 (53.8min) fps -11%
Durchschnittliche Intel Graphics 4 Xe3 Panther Lake iGPU
  (68.4 - 90.7, n=14)
78.9 fps -13%
Dell 14 Plus
Intel Core Ultra 7 256V, Intel Arc Graphics 140V
69.1 (40.5min) fps -24%
Dell Inspiron 14 7445 2-in-1
AMD Ryzen 7 8840HS, AMD Radeon 780M
66.7 (56.4min) fps -26%
Lenovo Yoga Slim 6 14APU8
AMD Ryzen 5 7540U, AMD Radeon 740M
58.9 (53min) fps -35%
Lenovo ThinkPad E14 Gen 7 21U2002QGE
Intel Core Ultra 5 228V, Intel Arc Graphics 130V
52.2 (30.3min) fps -42%
Asus VivoBook S 14 OLED M5406WA
AMD Ryzen AI 9 HX 370, AMD Radeon 890M
33.6 (17.1min) fps -63%
Final Fantasy XV Benchmark
1280x720 Lite Quality
HP OmniBook Ultra 14 Core Ultra X9
Intel Core Ultra X9 388H, Intel Arc B390 12 Xe3 Panther Lake iGPU
129.8 fps +94%
Honor MagicBook Pro 14 2026
Intel Core Ultra 5 338H, Intel Arc B370 10 Xe3 Panther Lake iGPU
125.5 fps +88%
Dell XPS 14 Core Ultra X7 358H
Intel Core Ultra X7 358H, Intel Arc B390 12 Xe3 Panther Lake iGPU
123.5 fps +85%
Lenovo ThinkPad E14 Gen 7 21U2002QGE
Intel Core Ultra 5 228V, Intel Arc Graphics 130V
85.6 fps +28%
Asus VivoBook S 14 OLED M5406WA
AMD Ryzen AI 9 HX 370, AMD Radeon 890M
78.9 fps +18%
Dell 14 Plus
Intel Core Ultra 7 256V, Intel Arc Graphics 140V
76.9 fps +15%
Durchschnittliche Intel Graphics 4 Xe3 Panther Lake iGPU
  (58 - 76.4, n=13)
68.3 fps +2%
Dell 14S DS14260
Intel Core Ultra 7 355, Intel Graphics 4 Xe3 Panther Lake iGPU
66.9 fps
Lenovo ThinkBook 14 G9 IPL 21UX005PGE
Intel Core Ultra 5 325, Intel Graphics 4 Xe3 Panther Lake iGPU
64.5 fps -4%
Dell Inspiron 14 7445 2-in-1
AMD Ryzen 7 8840HS, AMD Radeon 780M
60.5 fps -10%
Lenovo Yoga Slim 6 14APU8
AMD Ryzen 5 7540U, AMD Radeon 740M
50.7 fps -24%
1920x1080 Standard Quality
HP OmniBook Ultra 14 Core Ultra X9
Intel Core Ultra X9 388H, Intel Arc B390 12 Xe3 Panther Lake iGPU
75.2 fps +108%
Dell XPS 14 Core Ultra X7 358H
Intel Core Ultra X7 358H, Intel Arc B390 12 Xe3 Panther Lake iGPU
73.7 fps +104%
Honor MagicBook Pro 14 2026
Intel Core Ultra 5 338H, Intel Arc B370 10 Xe3 Panther Lake iGPU
69.3 fps +91%
Asus VivoBook S 14 OLED M5406WA
AMD Ryzen AI 9 HX 370, AMD Radeon 890M
44 fps +22%
Lenovo ThinkPad E14 Gen 7 21U2002QGE
Intel Core Ultra 5 228V, Intel Arc Graphics 130V
44 fps +22%
Dell 14 Plus
Intel Core Ultra 7 256V, Intel Arc Graphics 140V
42.8 fps +18%
Dell 14S DS14260
Intel Core Ultra 7 355, Intel Graphics 4 Xe3 Panther Lake iGPU
36.2 fps
Durchschnittliche Intel Graphics 4 Xe3 Panther Lake iGPU
  (31.5 - 39.5, n=13)
36 fps -1%
Dell Inspiron 14 7445 2-in-1
AMD Ryzen 7 8840HS, AMD Radeon 780M
32.3 fps -11%
Lenovo ThinkBook 14 G9 IPL 21UX005PGE
Intel Core Ultra 5 325, Intel Graphics 4 Xe3 Panther Lake iGPU
31.5 fps -13%
Lenovo Yoga Slim 6 14APU8
AMD Ryzen 5 7540U, AMD Radeon 740M
23.5 fps -35%
1920x1080 High Quality
HP OmniBook Ultra 14 Core Ultra X9
Intel Core Ultra X9 388H, Intel Arc B390 12 Xe3 Panther Lake iGPU
54.5 fps +110%
Dell XPS 14 Core Ultra X7 358H
Intel Core Ultra X7 358H, Intel Arc B390 12 Xe3 Panther Lake iGPU
52.8 fps +103%
Honor MagicBook Pro 14 2026
Intel Core Ultra 5 338H, Intel Arc B370 10 Xe3 Panther Lake iGPU
48.5 fps +87%
Dell 14 Plus
Intel Core Ultra 7 256V, Intel Arc Graphics 140V
32.3 fps +24%
Asus VivoBook S 14 OLED M5406WA
AMD Ryzen AI 9 HX 370, AMD Radeon 890M
31.2 fps +20%
Lenovo ThinkPad E14 Gen 7 21U2002QGE
Intel Core Ultra 5 228V, Intel Arc Graphics 130V
31 fps +19%
Dell 14S DS14260
Intel Core Ultra 7 355, Intel Graphics 4 Xe3 Panther Lake iGPU
26 fps
Durchschnittliche Intel Graphics 4 Xe3 Panther Lake iGPU
  (22.5 - 27.2, n=13)
25.7 fps -1%
Dell Inspiron 14 7445 2-in-1
AMD Ryzen 7 8840HS, AMD Radeon 780M
23.7 fps -9%
Lenovo ThinkBook 14 G9 IPL 21UX005PGE
Intel Core Ultra 5 325, Intel Graphics 4 Xe3 Panther Lake iGPU
22.5 fps -13%
Lenovo Yoga Slim 6 14APU8
AMD Ryzen 5 7540U, AMD Radeon 740M
17.6 fps -32%
X-Plane 11.11 - 1920x1080 high (fps_test=3)
Lenovo IdeaPad Pro 5 14AGP11
AMD Ryzen AI 7 450, AMD Radeon 860M
50.5 fps +82%
Asus VivoBook S 14 OLED M5406WA
AMD Ryzen AI 9 HX 370, AMD Radeon 890M
46.2 fps +66%
Honor MagicBook Pro 14 2026
Intel Core Ultra 5 338H, Intel Arc B370 10 Xe3 Panther Lake iGPU
45.1 fps +62%
HP OmniBook Ultra 14 Core Ultra X9
Intel Core Ultra X9 388H, Intel Arc B390 12 Xe3 Panther Lake iGPU
42.2 fps +52%
Dell XPS 14 Core Ultra X7 358H
Intel Core Ultra X7 358H, Intel Arc B390 12 Xe3 Panther Lake iGPU
40.3 fps +45%
Dell 14 Plus
Intel Core Ultra 7 256V, Intel Arc Graphics 140V
36 fps +29%
Dell Inspiron 14 7445 2-in-1
AMD Ryzen 7 8840HS, AMD Radeon 780M
35.9 fps +29%
Lenovo ThinkPad E14 Gen 7 21U2002QGE
Intel Core Ultra 5 228V, Intel Arc Graphics 130V
29.2 fps +5%
Durchschnittliche Intel Graphics 4 Xe3 Panther Lake iGPU
  (22.9 - 33.2, n=14)
28.5 fps +3%
Dell 14S DS14260
Intel Core Ultra 7 355, Intel Graphics 4 Xe3 Panther Lake iGPU
27.8 fps
Lenovo ThinkBook 14 G9 IPL 21UX005PGE
Intel Core Ultra 5 325, Intel Graphics 4 Xe3 Panther Lake iGPU
27.3 fps -2%
Lenovo Yoga Slim 6 14APU8
AMD Ryzen 5 7540U, AMD Radeon 740M
20.7 fps -26%
Strange Brigade
1920x1080 high AA:high AF:8
HP OmniBook Ultra 14 Core Ultra X9
Intel Core Ultra X9 388H, Intel Arc B390 12 Xe3 Panther Lake iGPU
114.9 (46min, 91.6P1) fps +103%
Honor MagicBook Pro 14 2026
Intel Core Ultra 5 338H, Intel Arc B370 10 Xe3 Panther Lake iGPU
105.8 (34min, 82.5P1) fps +87%
Dell XPS 14 Core Ultra X7 358H
Intel Core Ultra X7 358H, Intel Arc B390 12 Xe3 Panther Lake iGPU
103.3 (57.4min, 80.8P1) fps +82%
Asus VivoBook S 14 OLED M5406WA
AMD Ryzen AI 9 HX 370, AMD Radeon 890M
63.8 (36.4min, 46.9P1) fps +13%
Lenovo ThinkPad E14 Gen 7 21U2002QGE
Intel Core Ultra 5 228V, Intel Arc Graphics 130V
58.4 (37.5min, 45.9P1) fps +3%
Durchschnittliche Intel Graphics 4 Xe3 Panther Lake iGPU
  (35.9 - 64.1, n=10)
57.3 fps +1%
Dell 14S DS14260
Intel Core Ultra 7 355, Intel Graphics 4 Xe3 Panther Lake iGPU
56.7 (35.1min, 42.5P1) fps
Dell 14 Plus
Intel Core Ultra 7 256V, Intel Arc Graphics 140V
52.6 (16.7min, 33.6P1) fps -7%
Dell Inspiron 14 7445 2-in-1
AMD Ryzen 7 8840HS, AMD Radeon 780M
47 (7.7min, 15.4P1) fps -17%
Lenovo Yoga Slim 6 14APU8
AMD Ryzen 5 7540U, AMD Radeon 740M
36.9 (12.2min, 23.7P1) fps -35%
1920x1080 ultra AA:ultra AF:16
HP OmniBook Ultra 14 Core Ultra X9
Intel Core Ultra X9 388H, Intel Arc B390 12 Xe3 Panther Lake iGPU
101.3 (43.7min, 74.5P1) fps +111%
Dell XPS 14 Core Ultra X7 358H
Intel Core Ultra X7 358H, Intel Arc B390 12 Xe3 Panther Lake iGPU
95.1 (51.4min, 79.8P1) fps +98%
Honor MagicBook Pro 14 2026
Intel Core Ultra 5 338H, Intel Arc B370 10 Xe3 Panther Lake iGPU
92.6 (60.3min, 72P1) fps +93%
Asus VivoBook S 14 OLED M5406WA
AMD Ryzen AI 9 HX 370, AMD Radeon 890M
54.2 (16.1min, 20.1P1) fps +13%
Lenovo ThinkPad E14 Gen 7 21U2002QGE
Intel Core Ultra 5 228V, Intel Arc Graphics 130V
51.4 (23min, 38P1) fps +7%
Durchschnittliche Intel Graphics 4 Xe3 Panther Lake iGPU
  (43.3 - 54.6, n=10)
50.1 fps +4%
Dell 14 Plus
Intel Core Ultra 7 256V, Intel Arc Graphics 140V
48.8 (12.7min, 19.2P1) fps +2%
Dell 14S DS14260
Intel Core Ultra 7 355, Intel Graphics 4 Xe3 Panther Lake iGPU
48 (16.5min, 25.9P1) fps
Dell Inspiron 14 7445 2-in-1
AMD Ryzen 7 8840HS, AMD Radeon 780M
39.9 (6.9min, 8.65P1) fps -17%
Lenovo Yoga Slim 6 14APU8
AMD Ryzen 5 7540U, AMD Radeon 740M
30.3 (6.5min, 10.5P1) fps -37%
F1 24
1920x1080 High Preset AA:T AF:16x
HP OmniBook Ultra 14 Core Ultra X9
Intel Core Ultra X9 388H, Intel Arc B390 12 Xe3 Panther Lake iGPU
101.4 (80min, 70P1) fps +139%
Dell XPS 14 Core Ultra X7 358H
Intel Core Ultra X7 358H, Intel Arc B390 12 Xe3 Panther Lake iGPU
100.7 (92min, 71P1) fps +138%
Honor MagicBook Pro 14 2026
Intel Core Ultra 5 338H, Intel Arc B370 10 Xe3 Panther Lake iGPU
97.6 (84min, 75P1) fps +130%
Lenovo ThinkPad E14 Gen 7 21U2002QGE
Intel Core Ultra 5 228V, Intel Arc Graphics 130V
55.2 (46min, 46P1) fps +30%
Dell 14 Plus
Intel Core Ultra 7 256V, Intel Arc Graphics 140V
45.9 (20P1) fps +8%
Durchschnittliche Intel Graphics 4 Xe3 Panther Lake iGPU
  (40.8 - 48, n=9)
44.5 fps +5%
Dell 14S DS14260
Intel Core Ultra 7 355, Intel Graphics 4 Xe3 Panther Lake iGPU
42.4 (22min, 36P1) fps
Lenovo Yoga Slim 6 14APU8
AMD Ryzen 5 7540U, AMD Radeon 740M
24 (11min) fps -43%
Asus VivoBook S 14 OLED M5406WA
AMD Ryzen AI 9 HX 370, AMD Radeon 890M
fps -100%
1920x1080 Ultra High Preset AA:T AF:16x
Dell XPS 14 Core Ultra X7 358H
Intel Core Ultra X7 358H, Intel Arc B390 12 Xe3 Panther Lake iGPU
36.2 (30min, 28P1) fps +155%
HP OmniBook Ultra 14 Core Ultra X9
Intel Core Ultra X9 388H, Intel Arc B390 12 Xe3 Panther Lake iGPU
35.6 (25min, 26P1) fps +151%
Honor MagicBook Pro 14 2026
Intel Core Ultra 5 338H, Intel Arc B370 10 Xe3 Panther Lake iGPU
33.6 (27min, 26P1) fps +137%
Lenovo ThinkPad E14 Gen 7 21U2002QGE
Intel Core Ultra 5 228V, Intel Arc Graphics 130V
18.1 (15min, 15P1) fps +27%
Dell 14 Plus
Intel Core Ultra 7 256V, Intel Arc Graphics 140V
16.5 (9min, 10P1) fps +16%
Durchschnittliche Intel Graphics 4 Xe3 Panther Lake iGPU
  (13.2 - 15.1, n=9)
14.3 fps +1%
Dell 14S DS14260
Intel Core Ultra 7 355, Intel Graphics 4 Xe3 Panther Lake iGPU
14.2 (7min, 11P1) fps
Lenovo Yoga Slim 6 14APU8
AMD Ryzen 5 7540U, AMD Radeon 740M
2 (1min) fps -86%
Asus VivoBook S 14 OLED M5406WA
AMD Ryzen AI 9 HX 370, AMD Radeon 890M
fps -100%
Cyberpunk 2077
1280x720 Low Preset (FSR off)
HP OmniBook Ultra 14 Core Ultra X9
Intel Core Ultra X9 388H, Intel Arc B390 12 Xe3 Panther Lake iGPU
102.2 (85.5min, 79.9P1) fps +67%
Dell XPS 14 Core Ultra X7 358H
Intel Core Ultra X7 358H, Intel Arc B390 12 Xe3 Panther Lake iGPU
94.4 (78.1min, 71P1) fps +54%
Durchschnittliche Intel Graphics 4 Xe3 Panther Lake iGPU
  (58.7 - 66.2, n=7)
62 fps +1%
Dell 14S DS14260
Intel Core Ultra 7 355, Intel Graphics 4 Xe3 Panther Lake iGPU
61.3 (49.9min, 46.9P1) fps
Dell Inspiron 14 7445 2-in-1
AMD Ryzen 7 8840HS, AMD Radeon 780M
60.6 (50.3min) fps -1%
Dell 14 Plus
Intel Core Ultra 7 256V, Intel Arc Graphics 140V
60.2 (45.2min, 37.5P1) fps -2%
1920x1080 Low Preset (FSR off)
HP OmniBook Ultra 14 Core Ultra X9
Intel Core Ultra X9 388H, Intel Arc B390 12 Xe3 Panther Lake iGPU
74.2 (62.8min, 58.4P1) fps +99%
Honor MagicBook Pro 14 2026
Intel Core Ultra 5 338H, Intel Arc B370 10 Xe3 Panther Lake iGPU
72.7 (61.2min) fps +95%
Dell XPS 14 Core Ultra X7 358H
Intel Core Ultra X7 358H, Intel Arc B390 12 Xe3 Panther Lake iGPU
68.6 (57.3min, 52.9P1) fps +84%
Asus VivoBook S 14 OLED M5406WA
AMD Ryzen AI 9 HX 370, AMD Radeon 890M
46 (38min) fps +23%
Dell 14 Plus
Intel Core Ultra 7 256V, Intel Arc Graphics 140V
43.5 (36.7min, 34.9P1) fps +17%
Lenovo IdeaPad Pro 5 14AGP11
AMD Ryzen AI 7 450, AMD Radeon 860M
43.4 (36min) fps +16%
Lenovo ThinkPad E14 Gen 7 21U2002QGE
Intel Core Ultra 5 228V, Intel Arc Graphics 130V
43 (35.7min) fps +15%
Dell 14S DS14260
Intel Core Ultra 7 355, Intel Graphics 4 Xe3 Panther Lake iGPU
37.3 (31.5min, 30.1P1) fps
Durchschnittliche Intel Graphics 4 Xe3 Panther Lake iGPU
  (32.7 - 39.4, n=14)
37 fps -1%
Lenovo ThinkBook 14 G9 IPL 21UX005PGE
Intel Core Ultra 5 325, Intel Graphics 4 Xe3 Panther Lake iGPU
35.3 (30.2min, 29.3P1) fps -5%
Dell Inspiron 14 7445 2-in-1
AMD Ryzen 7 8840HS, AMD Radeon 780M
34.3 (29min) fps -8%
Lenovo Yoga Slim 6 14APU8
AMD Ryzen 5 7540U, AMD Radeon 740M
20.5 (17min) fps -45%
1920x1080 Medium Preset (FSR off)
HP OmniBook Ultra 14 Core Ultra X9
Intel Core Ultra X9 388H, Intel Arc B390 12 Xe3 Panther Lake iGPU
60.1 (51.4min, 48.1P1) fps +128%
Honor MagicBook Pro 14 2026
Intel Core Ultra 5 338H, Intel Arc B370 10 Xe3 Panther Lake iGPU
57.7 (49.3min) fps +119%
Dell XPS 14 Core Ultra X7 358H
Intel Core Ultra X7 358H, Intel Arc B390 12 Xe3 Panther Lake iGPU
56.2 (48.2min, 44.5P1) fps +113%
Asus VivoBook S 14 OLED M5406WA
AMD Ryzen AI 9 HX 370, AMD Radeon 890M
36.3 (30min) fps +38%
Dell 14 Plus
Intel Core Ultra 7 256V, Intel Arc Graphics 140V
35.1 (30.1min, 28.9P1) fps +33%
Lenovo IdeaPad Pro 5 14AGP11
AMD Ryzen AI 7 450, AMD Radeon 860M
33.7 (29min) fps +28%
Lenovo ThinkPad E14 Gen 7 21U2002QGE
Intel Core Ultra 5 228V, Intel Arc Graphics 130V
33 (28.5min) fps +25%
Durchschnittliche Intel Graphics 4 Xe3 Panther Lake iGPU
  (26 - 29.8, n=14)
28 fps +6%
Dell Inspiron 14 7445 2-in-1
AMD Ryzen 7 8840HS, AMD Radeon 780M
26.5 (22.9min) fps 0%
Dell 14S DS14260
Intel Core Ultra 7 355, Intel Graphics 4 Xe3 Panther Lake iGPU
26.4 (23.2min, 22.3P1) fps
Lenovo ThinkBook 14 G9 IPL 21UX005PGE
Intel Core Ultra 5 325, Intel Graphics 4 Xe3 Panther Lake iGPU
26 (22.6min, 22.1P1) fps -2%
Lenovo Yoga Slim 6 14APU8
AMD Ryzen 5 7540U, AMD Radeon 740M
16 (14min) fps -39%
1920x1080 High Preset (FSR off)
HP OmniBook Ultra 14 Core Ultra X9
Intel Core Ultra X9 388H, Intel Arc B390 12 Xe3 Panther Lake iGPU
51.9 (44.1min, 41.3P1) fps +145%
Honor MagicBook Pro 14 2026
Intel Core Ultra 5 338H, Intel Arc B370 10 Xe3 Panther Lake iGPU
49.6 (41.9min) fps +134%
Dell XPS 14 Core Ultra X7 358H
Intel Core Ultra X7 358H, Intel Arc B390 12 Xe3 Panther Lake iGPU
46.9 (39.2min, 36.5P1) fps +121%
Asus VivoBook S 14 OLED M5406WA
AMD Ryzen AI 9 HX 370, AMD Radeon 890M
29.3 (24min) fps +38%
Lenovo ThinkPad E14 Gen 7 21U2002QGE
Intel Core Ultra 5 228V, Intel Arc Graphics 130V
29.2 (24.5min) fps +38%
Dell 14 Plus
Intel Core Ultra 7 256V, Intel Arc Graphics 140V
26 (21.2min, 20.3P1) fps +23%
Lenovo IdeaPad Pro 5 14AGP11
AMD Ryzen AI 7 450, AMD Radeon 860M
25.8 (22min) fps +22%
Durchschnittliche Intel Graphics 4 Xe3 Panther Lake iGPU
  (20.7 - 26.1, n=14)
23.6 fps +11%
Dell Inspiron 14 7445 2-in-1
AMD Ryzen 7 8840HS, AMD Radeon 780M
21.5 (18.4min) fps +1%
Dell 14S DS14260
Intel Core Ultra 7 355, Intel Graphics 4 Xe3 Panther Lake iGPU
21.2 (18.5min, 17.5P1) fps
Lenovo ThinkBook 14 G9 IPL 21UX005PGE
Intel Core Ultra 5 325, Intel Graphics 4 Xe3 Panther Lake iGPU
21.1 (17.8min, 17.1P1) fps 0%
Lenovo Yoga Slim 6 14APU8
AMD Ryzen 5 7540U, AMD Radeon 740M
13.3 (11min) fps -37%
1920x1080 Ultra Preset (FSR off)
HP OmniBook Ultra 14 Core Ultra X9
Intel Core Ultra X9 388H, Intel Arc B390 12 Xe3 Panther Lake iGPU
44.9 (36.5min, 35.1P1) fps +167%
Honor MagicBook Pro 14 2026
Intel Core Ultra 5 338H, Intel Arc B370 10 Xe3 Panther Lake iGPU
43.5 (35.8min) fps +159%
Dell XPS 14 Core Ultra X7 358H
Intel Core Ultra X7 358H, Intel Arc B390 12 Xe3 Panther Lake iGPU
40.9 (33.3min, 30.6P1) fps +143%
Asus VivoBook S 14 OLED M5406WA
AMD Ryzen AI 9 HX 370, AMD Radeon 890M
25.4 (21min) fps +51%
Lenovo ThinkPad E14 Gen 7 21U2002QGE
Intel Core Ultra 5 228V, Intel Arc Graphics 130V
25.4 (21.1min) fps +51%
Dell 14 Plus
Intel Core Ultra 7 256V, Intel Arc Graphics 140V
24.2 (20.8min, 19.9P1) fps +44%
Lenovo ThinkBook 14 G9 IPL 21UX005PGE
Intel Core Ultra 5 325, Intel Graphics 4 Xe3 Panther Lake iGPU
20.2 (17.1min, 16.2P1) fps +20%
Durchschnittliche Intel Graphics 4 Xe3 Panther Lake iGPU
  (16.8 - 21.8, n=14)
20 fps +19%
Lenovo IdeaPad Pro 5 14AGP11
AMD Ryzen AI 7 450, AMD Radeon 860M
19.2 (16min) fps +14%
Dell Inspiron 14 7445 2-in-1
AMD Ryzen 7 8840HS, AMD Radeon 780M
19.1 (15.8min) fps +14%
Dell 14S DS14260
Intel Core Ultra 7 355, Intel Graphics 4 Xe3 Panther Lake iGPU
16.8 (14min, 13.1P1) fps
Lenovo Yoga Slim 6 14APU8
AMD Ryzen 5 7540U, AMD Radeon 740M
10.4 (9min) fps -38%
GTA V
1920x1080 High/On (Advanced Graphics Off) AA:2xMSAA + FX AF:8x
Honor MagicBook Pro 14 2026
Intel Core Ultra 5 338H, Intel Arc B370 10 Xe3 Panther Lake iGPU
101.7 (18.1min, 76.9P1) fps +101%
HP OmniBook Ultra 14 Core Ultra X9
Intel Core Ultra X9 388H, Intel Arc B390 12 Xe3 Panther Lake iGPU
99.6 (7.57min, 62.5P1) fps +97%
Dell XPS 14 Core Ultra X7 358H
Intel Core Ultra X7 358H, Intel Arc B390 12 Xe3 Panther Lake iGPU
98.2 (6.53min, 66.7P1) fps +94%
Lenovo IdeaPad Pro 5 14AGP11
AMD Ryzen AI 7 450, AMD Radeon 860M
80.3 (12.5min, 55.6P1) fps +59%
Asus VivoBook S 14 OLED M5406WA
AMD Ryzen AI 9 HX 370, AMD Radeon 890M
79.1 (3.03min, 52.6P1) fps +56%
Lenovo ThinkPad E14 Gen 7 21U2002QGE
Intel Core Ultra 5 228V, Intel Arc Graphics 130V
65.8 (7.58min, 50P1) fps +30%
Durchschnittliche Intel Graphics 4 Xe3 Panther Lake iGPU
  (46.6 - 58.2, n=13)
52.5 fps +4%
Dell 14S DS14260
Intel Core Ultra 7 355, Intel Graphics 4 Xe3 Panther Lake iGPU
50.6 (7.67min, 38.5P1) fps
Lenovo ThinkBook 14 G9 IPL 21UX005PGE
Intel Core Ultra 5 325, Intel Graphics 4 Xe3 Panther Lake iGPU
46.6 (7.82min, 34.5P1) fps -8%
Lenovo Yoga Slim 6 14APU8
AMD Ryzen 5 7540U, AMD Radeon 740M
44.8 (2.22min, 29.4P1) fps -11%
1920x1080 Highest AA:4xMSAA + FX AF:16x
HP OmniBook Ultra 14 Core Ultra X9
Intel Core Ultra X9 388H, Intel Arc B390 12 Xe3 Panther Lake iGPU
43.7 (6.57min, 29.4P1) fps +108%
Dell XPS 14 Core Ultra X7 358H
Intel Core Ultra X7 358H, Intel Arc B390 12 Xe3 Panther Lake iGPU
43.3 (6.46min, 33.3P1) fps +106%
Honor MagicBook Pro 14 2026
Intel Core Ultra 5 338H, Intel Arc B370 10 Xe3 Panther Lake iGPU
40.6 (9.03min, 31.3P1) fps +93%
Lenovo IdeaPad Pro 5 14AGP11
AMD Ryzen AI 7 450, AMD Radeon 860M
32.8 (8.32min, 23.3P1) fps +56%
Asus VivoBook S 14 OLED M5406WA
AMD Ryzen AI 9 HX 370, AMD Radeon 890M
32.4 (3.71min, 23.8P1) fps +54%
Lenovo ThinkPad E14 Gen 7 21U2002QGE
Intel Core Ultra 5 228V, Intel Arc Graphics 130V
25.6 (8.2min, 20.8P1) fps +22%
Durchschnittliche Intel Graphics 4 Xe3 Panther Lake iGPU
  (18 - 23.8, n=13)
21.1 fps 0%
Dell 14S DS14260
Intel Core Ultra 7 355, Intel Graphics 4 Xe3 Panther Lake iGPU
21 (4.83min, 16.1P1) fps
Lenovo Yoga Slim 6 14APU8
AMD Ryzen 5 7540U, AMD Radeon 740M
18.5 (0.913min, 12.7P1) fps -12%
Lenovo ThinkBook 14 G9 IPL 21UX005PGE
Intel Core Ultra 5 325, Intel Graphics 4 Xe3 Panther Lake iGPU
18 (6.43min, 13.9P1) fps -14%

Cyberpunk 2077 – Ultra-FPS-Diagramm

0510152025303540Tooltip
Dell 14S DS14260 Ultra 7 355, Intel Graphics 4 Xe3 PTL: Ø17.6 (16.6-17.9) fps
Dell XPS 14 Core Ultra X7 358H Ultra X7 358H, Arc B390 Panther Lake iGPU: Ø40.6 (36.6-42.9) fps
min.mittelhochmax.
GTA V (2015) 167.7 156.4 50.6 21
Dota 2 Reborn (2015) 107.1 96.1 81.9 90.7
Final Fantasy XV Benchmark (2018) 66.9 36.2 26
X-Plane 11.11 (2018) 34.8 29.2 27.8
Strange Brigade (2018) 187.5 70.4 56.7 48
Baldur's Gate 3 (2023) 28.1 22.9 19.4 19.2
Cyberpunk 2077 (2023) 37.3 26.4 21.2 16.8
F1 24 (2024) 64.1 57 42.4 14.2

Emissionen

Systemgeräusche

Geräuschprofil des Lüfters (Weiß: Hintergrund, Rot: System im Leerlauf, Blau: 3DMark 06, Orange: Cyberpunk 2077 Stress, Grün: Prime95 Stress)

Lautstärkediagramm

Idle
23.4 / 23.4 / 23.4 dB(A)
Last
30.3 / 47.4 dB(A)
  red to green bar
 
 
30 dB
leise
40 dB(A)
deutlich hörbar
50 dB(A)
störend
 
min: dark, med: mid, max: light   Earthworks M23R, Arta (aus 15 cm gemessen)   Umgebungsgeräusche: 23.3 dB(A)
dB(A) 0102030405060708090Deep BassMiddle BassHigh BassLower RangeMidsHigher MidsLower HighsMid HighsUpper HighsSuper Highs2037.834.131.331.831.12525.724.725.724.5253126.525.622.620.425.64021.520.620.218.820.55020.330.831.530.6206320.321.722.121.220.2801818.719.619.319.410017.216.819.31820.21251613.915.313.819.216018.613.513.713.523.320021.111.611.511.725.525025.811.812.512.32731522.313.614.514.729.740024.311.211.812.131.250026.311.311.31133.763024.410.810.310.132.480025.41110.310.533.2100025.79.810.19.833.5125026.59.9109.734.9160026.29.99.99.734.4200028.410.6109.936.2250028.410.710.410.536.6315027.211.210.710.836.1400029.713.111.811.738500030.612.712.211.938.3630025.413.712.412.135.7800019.91312.412.333.5100001713.112.612.430.31250014.713.312.212.427.51600012.313.311.711.820.7SPL39.123.923.423.347.4N30.50.50.55.9median 25.4median 11.8median 11.8median 11.8median 33.2Delta4.21.31.61.54.7hearing rangehide median Fan NoiseDell 14S DS14260
Dell 14S DS14260
Ultra 7 355, Intel Graphics 4 Xe3 PTL
Lenovo ThinkBook 14 G9 IPL 21UX005PGE
Ultra 5 325, Intel Graphics 4 Xe3 PTL
Dell XPS 14 Core Ultra X7 358H
Ultra X7 358H, Arc B390 Panther Lake iGPU
HP OmniBook Ultra 14 Core Ultra X9
Ultra X9 388H, Arc B390 Panther Lake iGPU
Dell Inspiron 14 7445 2-in-1
R7 8840HS, Radeon 780M
Asus VivoBook S 14 OLED M5406WA
Ryzen AI 9 HX 370, Radeon 890M
Geräuschentwicklung
-15%
-2%
-7%
-3%
-6%
aus / Umgebung * (dB)
23.3
24.8
-6%
22.9
2%
23.3
-0%
23.6
-1%
24
-3%
Idle min * (dB)
23.4
24.8
-6%
23.3
-0%
23.3
-0%
24.3
-4%
24
-3%
Idle avg * (dB)
23.4
24.8
-6%
23.3
-0%
23.3
-0%
24.3
-4%
25
-7%
Idle max * (dB)
23.4
24.8
-6%
23.3
-0%
23.3
-0%
24.8
-6%
27
-15%
Last avg * (dB)
30.3
46.1
-52%
34
-12%
42.9
-42%
33.5
-11%
40
-32%
Cyberpunk 2077 ultra * (dB)
39.1
49.7
-27%
43.5
-11%
44.4
-14%
39
-0%
Last max * (dB)
47.4
48.2
-2%
45.7
4%
44.1
7%
43.8
8%
40
16%
Witcher 3 ultra * (dB)
43.8

* ... kleinere Werte sind besser

Temperatur
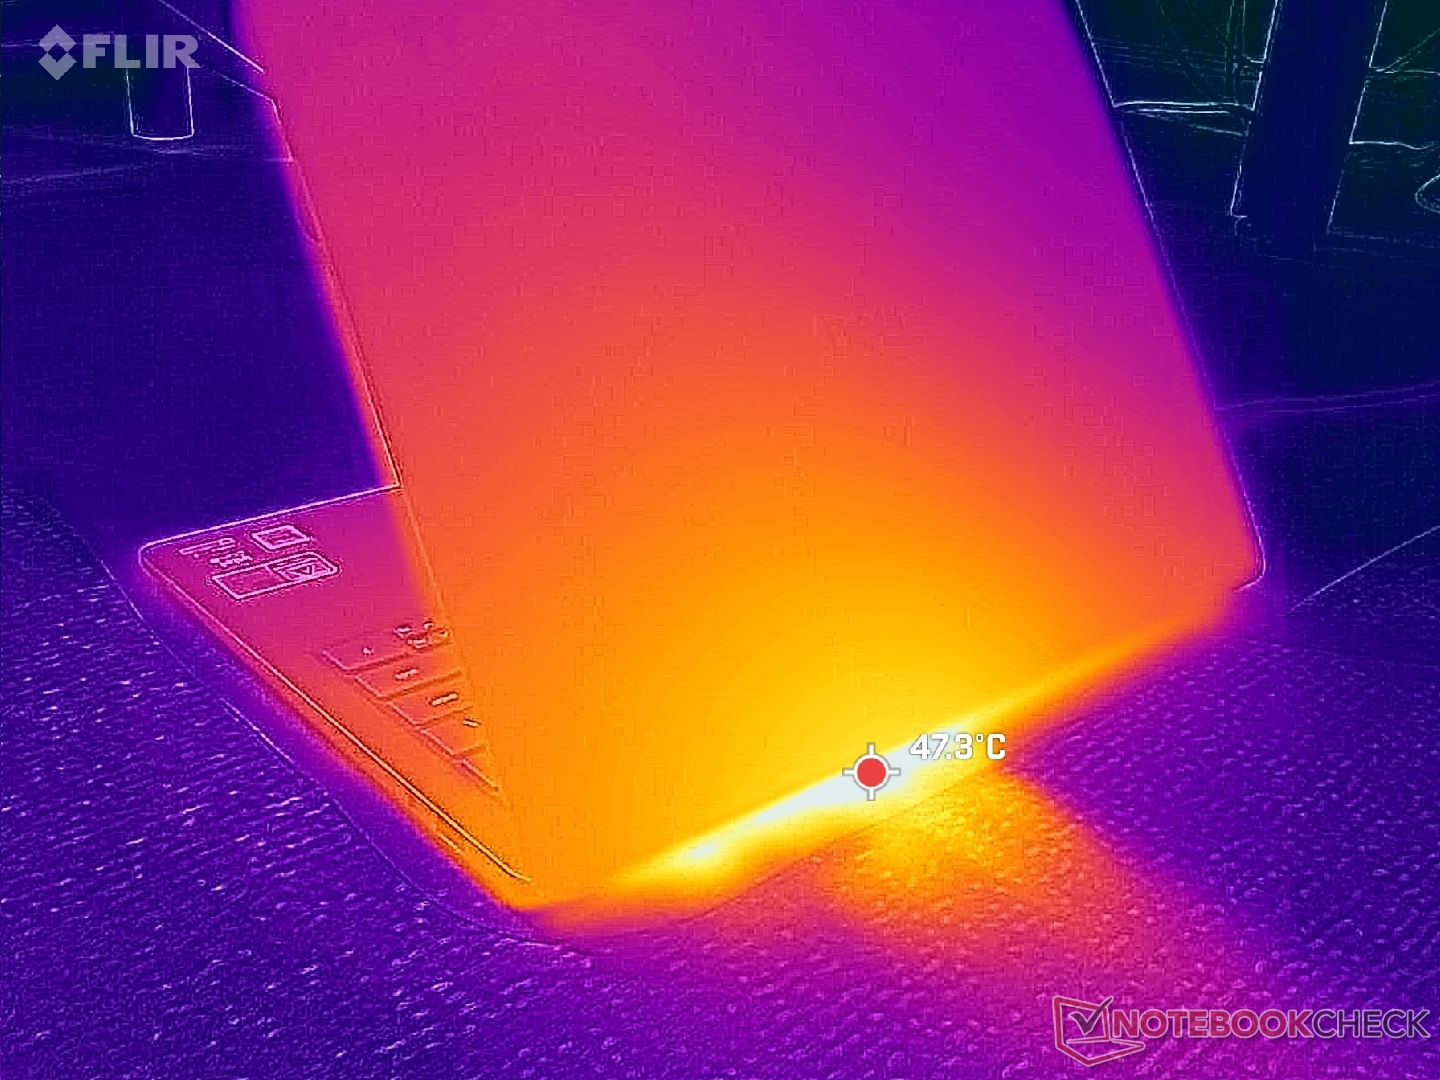
Hinterer Luftauslass
Das Netzteil erreicht bei hoher Auslastung Temperaturen von über 45 °C.
Max. Last
 41.4 °C43.2 °C38.6 °C 
 41 °C44.4 °C33 °C 
 33 °C29.8 °C27 °C 
Maximal: 44.4 °C
Durchschnitt: 36.8 °C
31.8 °C40.6 °C41 °C
29.8 °C37.8 °C38.8 °C
29.6 °C32.4 °C34.4 °C
Maximal: 41 °C
Durchschnitt: 35.1 °C
Netzteil (max.)  44 °C | Raumtemperatur 20 °C | Fluke 62 Mini IR Thermometer
(±) Die Durchschnittstemperatur auf der Oberseite unter extremer Last ist 36.8 °C. Im Vergleich erhitzte sich der Durchschnitt der Geräteklasse Subnotebook auf 30.8 °C.
(±) Die maximale Temperatur auf der Oberseite ist 44.4 °C. Im Vergleich liegt der Klassendurchschnitt bei 35.9 °C (von 21.4 bis 59 °C für die Klasse Subnotebook).
(±) Auf der Unterseite messen wir eine maximalen Wert von 41 °C (im Vergleich zum Durchschnitt von 39.2 °C).
(+) Ohne Last messen wir eine durchschnittliche Temperatur von 25.6 °C auf der Oberseite. Der Klassendurchschnitt erreicht 30.8 °C.
(+) Die Handballen und der Touchpad-Bereich erreichen maximal 33 °C und damit die typische Hauttemperatur und fühlen sich daher nicht heiß an.
(-) Die durchschnittliche Handballen-Temperatur anderer getesteter Geräte war 28.2 °C (-4.8 °C).
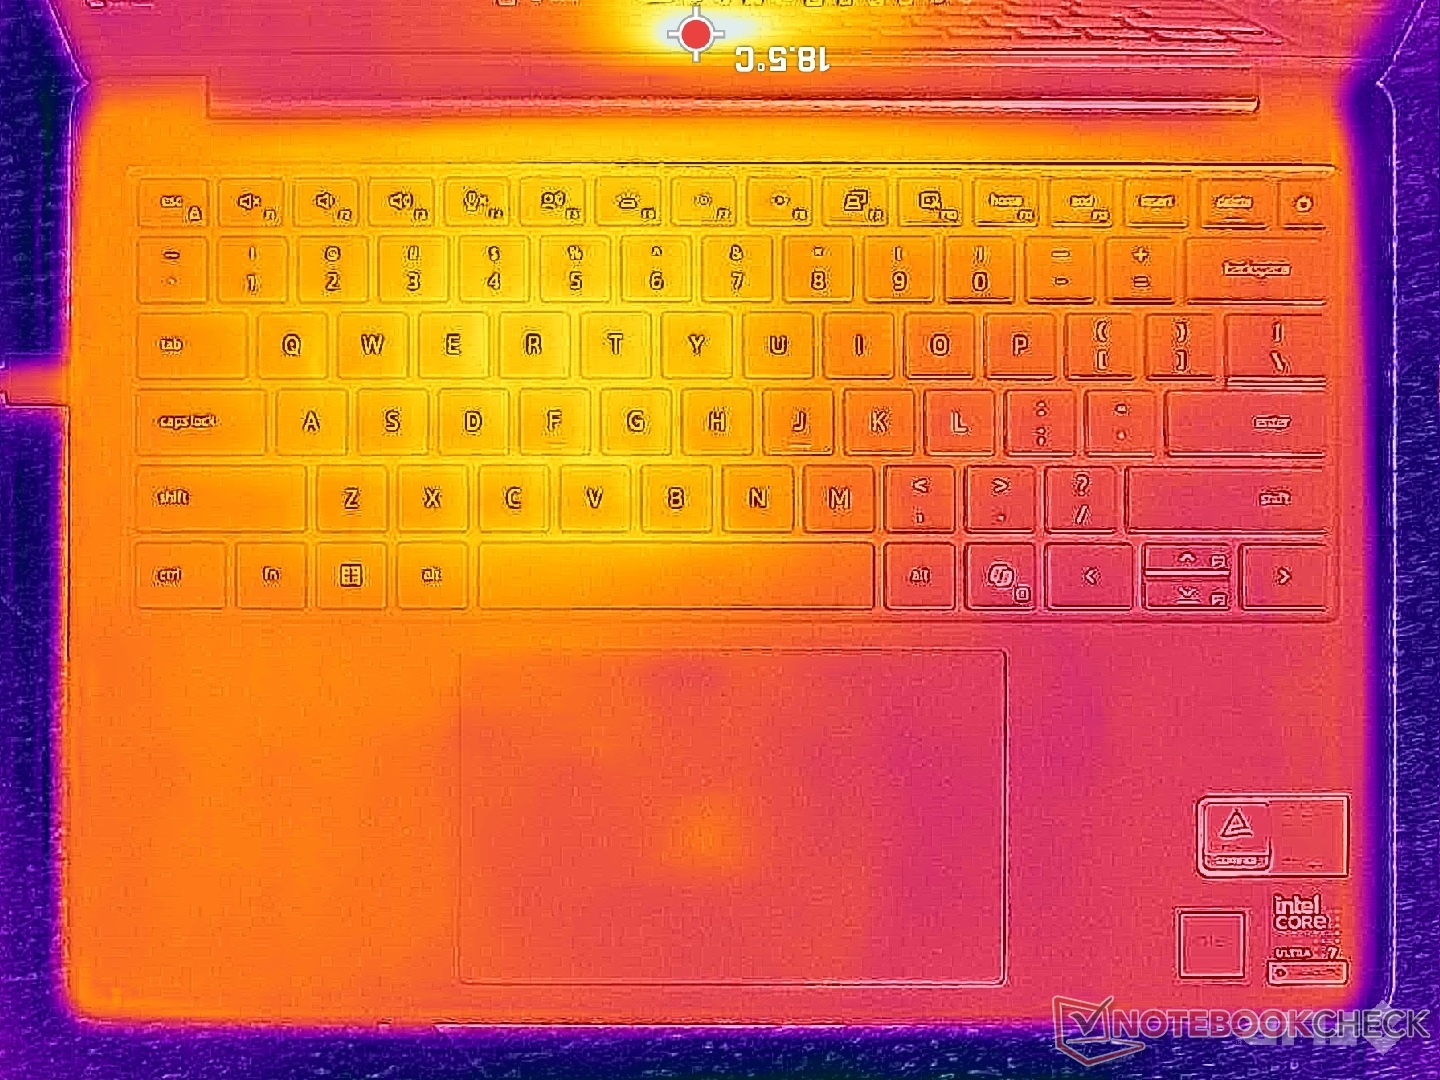
System im Leerlauf (C-Cover)
System im Leerlauf (D-Cover)
Prime95+FurMark-Belastungstest (C-Cover)
Prime95+FurMark-Belastungstest (D-Cover)
Dell 14S DS14260
Ultra 7 355, Intel Graphics 4 Xe3 PTL
Lenovo ThinkBook 14 G9 IPL 21UX005PGE
Ultra 5 325, Intel Graphics 4 Xe3 PTL
Dell XPS 14 Core Ultra X7 358H
Ultra X7 358H, Arc B390 Panther Lake iGPU
HP OmniBook Ultra 14 Core Ultra X9
Ultra X9 388H, Arc B390 Panther Lake iGPU
Dell Inspiron 14 7445 2-in-1
R7 8840HS, Radeon 780M
Asus VivoBook S 14 OLED M5406WA
Ryzen AI 9 HX 370, Radeon 890M
Hitze
-12%
11%
8%
-13%
-16%
Last oben max * (°C)
44.4
43.5
2%
34
23%
40.2
9%
41.2
7%
49
-10%
Last unten max * (°C)
41
42.5
-4%
35.8
13%
44.2
-8%
48.4
-18%
59
-44%
Idle oben max * (°C)
26.6
33.6
-26%
25.6
4%
22.8
14%
29.4
-11%
28
-5%
Idle unten max * (°C)
27.4
32.8
-20%
26.4
4%
23.4
15%
35.2
-28%
29
-6%

* ... kleinere Werte sind besser

Stresstest
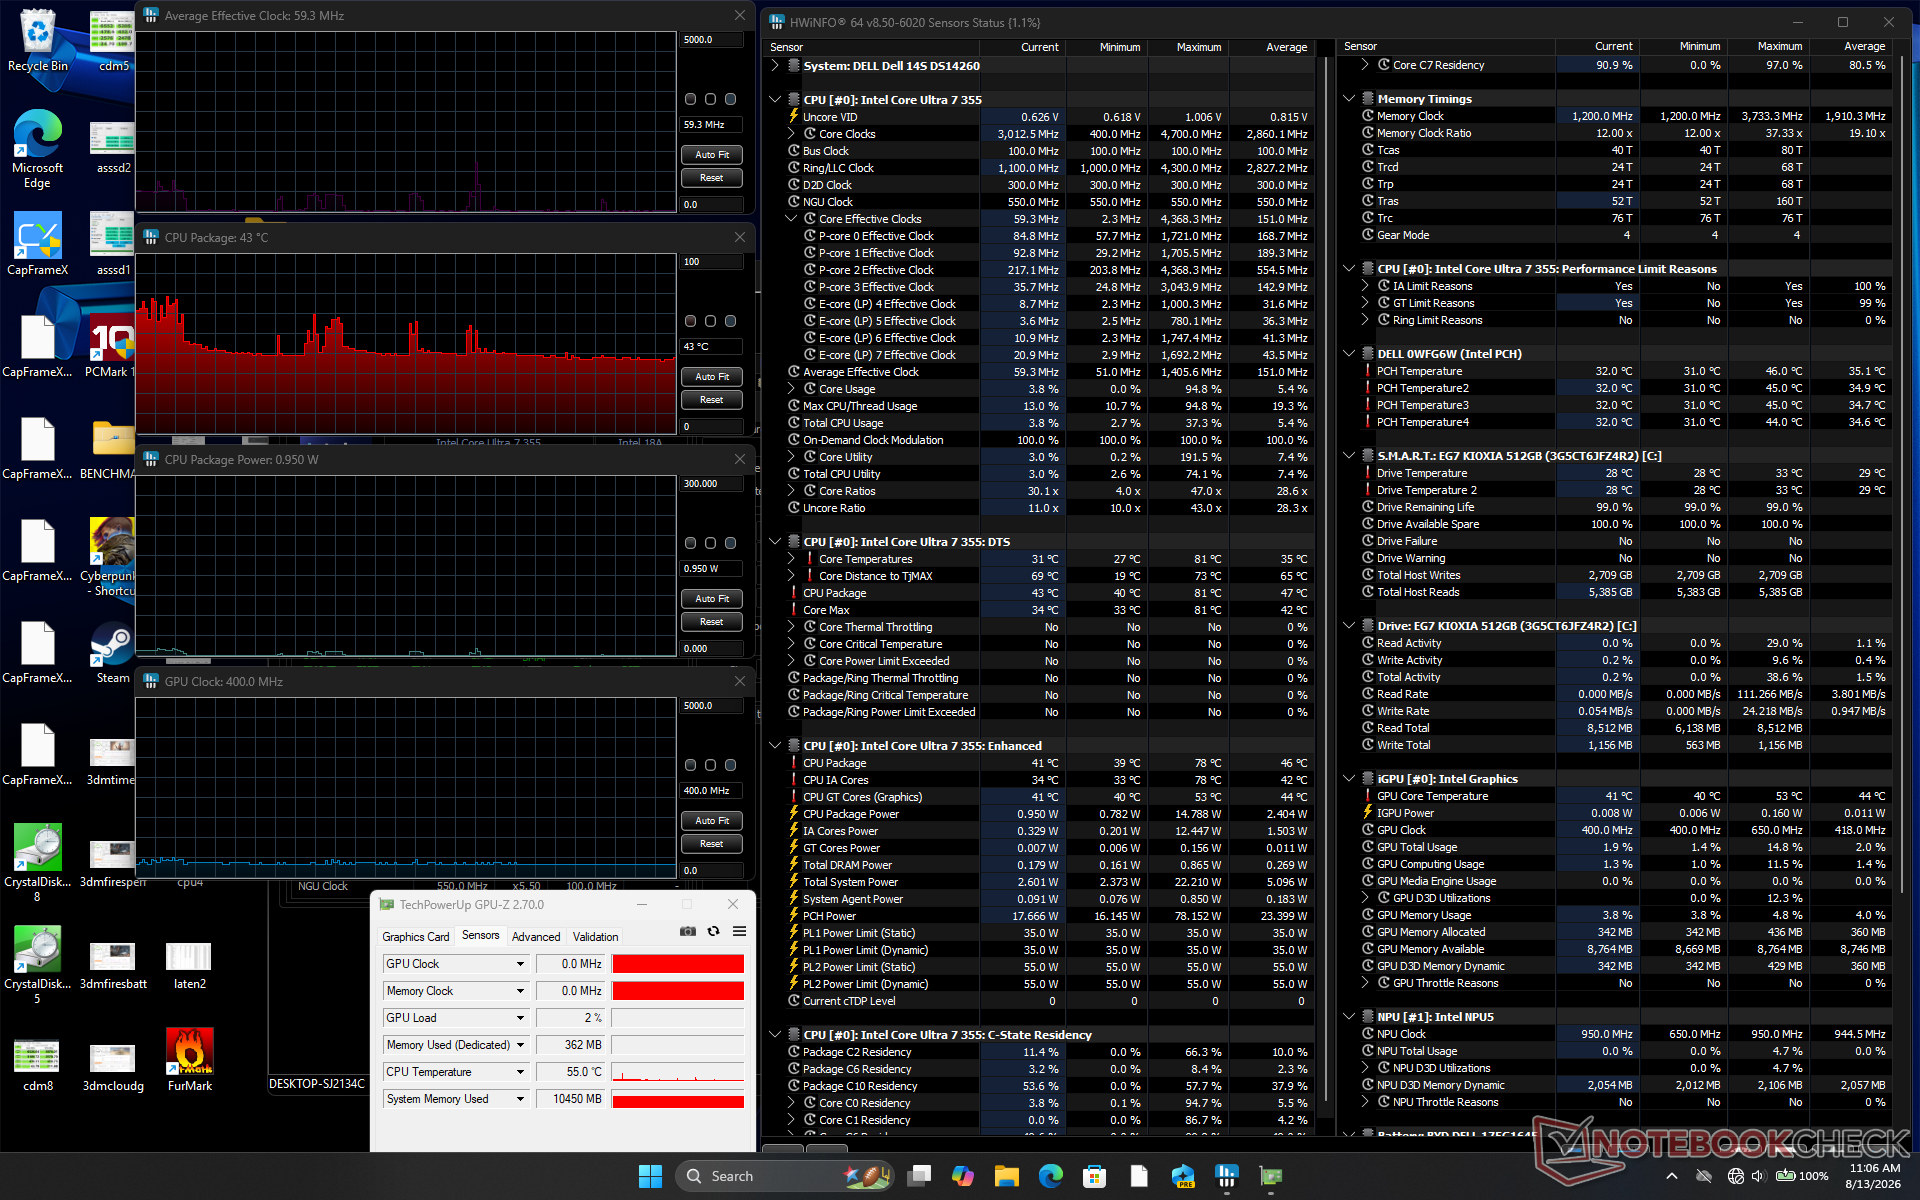
System im Leerlauf
System im Leerlauf
Cyberpunk 2077–Stresstest
Prime95-Stresstest
Prime95-Stresstest
Prime95+FurMark-Stresstest
Durchschnittliche CPU-Taktfrequenz (GHz) GPU-Taktfrequenz (MHz) Durchschnittliche CPU-Temperatur (°C) System im Leerlauf
--
400
43
Prime95-Belastungstest
3,1
--
87
Prime95 + FurMark-Belastungstest
1,4
2200
87
Cyberpunk 2077-Belastungstest
1,5
2500
91

Lautsprecher

Pink Noise weist bei den 2-W-Stereolautsprechern eine relativ hohe maximale Lautstärke und einen großen Dynamikbereich auf
dB(A) 0102030405060708090Deep BassMiddle BassHigh BassLower RangeMidsHigher MidsLower HighsMid HighsUpper HighsSuper Highs2031.332.82525.723.63122.620.24020.2225031.525.86322.121.88019.64110019.34812515.352.416013.759.420011.56225012.564.731514.566.140011.867.350011.369.863010.368.180010.371.8100010.176.812501074.316009.972.720001074.4250010.470.8315010.768400011.864.3500012.263.7630012.464800012.4651000012.665.61250012.261.71600011.754.4SPL23.483.1N0.556.5median 11.8median 65.6Delta1.64.326.325.821.422.12624.925.127.622.532.523.448.72655.818.860.922.167.2267019.372.317.674.217.774.319.575.31571.711.871.311.27410.574.21072.710.17210.67210.97511.374.811.671.71269.71269.612.371.112.669.61270.111.269.824.784.70.666.6median 12median 71.73.42.2hearing rangehide median Pink NoiseDell 14S DS14260Apple MacBook Pro 16 2021 M1 Pro
Frequenzdiagramm (für Vergleiche die Checkboxen oben an-/abwählen)
Dell 14S DS14260 Audio Analyse

(+) | Die Lautsprecher können relativ laut spielen (83.1 dB)
Bass 100 - 315 Hz
(±) | abgesenkter Bass - 7% geringer als der Median
(±) | durchschnittlich lineare Bass-Wiedergabe (7.8% Delta zum Vorgänger)
Mitteltöne 400 - 2000 Hz
(±) | zu hohe Mitten, vom Median 6.3% abweichend
(+) | lineare Mitten (4.6% Delta zum Vorgänger)
Hochtöne 2 - 16 kHz
(+) | ausgeglichene Hochtöne, vom Median nur 1.9% abweichend
(+) | sehr lineare Hochtöne (3.3% Delta zum Vorgänger)
Gesamt im hörbaren Bereich 100 - 16.000 Hz
(+) | hörbarer Bereich ist sehr linear (10.9% Abstand zum Median
Im Vergleich zu allen Geräten derselben Klasse
» 10% aller getesteten Geräte dieser Klasse waren besser, 3% vergleichbar, 87% schlechter
» Das beste Gerät hat einen Delta-Wert von 5%, durchschnittlich ist 18%, das schlechteste Gerät hat 53%
Im Vergleich zu allen Geräten im Test
» 6% aller getesteten Geräte waren besser, 2% vergleichbar, 92% schlechter
» Das beste Gerät hat einen Delta-Wert von 4%, durchschnittlich ist 23%, das schlechteste Gerät hat 134%

Apple MacBook Pro 16 2021 M1 Pro Audio Analyse

(+) | Die Lautsprecher können relativ laut spielen (84.7 dB)
Bass 100 - 315 Hz
(+) | guter Bass - nur 3.8% Abweichung vom Median
(+) | lineare Bass-Wiedergabe (5.2% Delta zum Vorgänger)
Mitteltöne 400 - 2000 Hz
(+) | ausgeglichene Mitten, vom Median nur 1.3% abweichend
(+) | lineare Mitten (2.1% Delta zum Vorgänger)
Hochtöne 2 - 16 kHz
(+) | ausgeglichene Hochtöne, vom Median nur 1.9% abweichend
(+) | sehr lineare Hochtöne (2.7% Delta zum Vorgänger)
Gesamt im hörbaren Bereich 100 - 16.000 Hz
(+) | hörbarer Bereich ist sehr linear (4.6% Abstand zum Median
Im Vergleich zu allen Geräten derselben Klasse
» 0% aller getesteten Geräte dieser Klasse waren besser, 0% vergleichbar, 100% schlechter
» Das beste Gerät hat einen Delta-Wert von 5%, durchschnittlich ist 17%, das schlechteste Gerät hat 45%
Im Vergleich zu allen Geräten im Test
» 0% aller getesteten Geräte waren besser, 0% vergleichbar, 100% schlechter
» Das beste Gerät hat einen Delta-Wert von 4%, durchschnittlich ist 23%, das schlechteste Gerät hat 134%

Energiemanagement

Stromverbrauch

3DMark 11 – Energieverbrauch
Cyberpunk 2077 – 1080p Ultra – Ressourcenverbrauch
Der Stromverbrauch steigt beim Starten des Prime95-Stresstests kurzzeitig auf 71 W an, bevor er rasch auf 53 W zurückfällt, was das begrenzte Turbo-Boost-Potenzial verdeutlicht.
Der Prime95+FurMark-Stresstest wurde nach 10 Sekunden gestartet
Stromverbrauch
Aus / Standbydarklight 0.15 / 0.56 Watt
Idledarkmidlight 1.8 / 6.6 / 11.4 Watt
Last midlight 30.7 / 71 Watt
 color bar
Legende: min: dark, med: mid, max: light        Metrahit Energy
Dell 14S DS14260
Ultra 7 355, Intel Graphics 4 Xe3 PTL, , OLED, 1920x1200, 14"
Lenovo ThinkBook 14 G9 IPL 21UX005PGE
Ultra 5 325, Intel Graphics 4 Xe3 PTL, YMTC PC42Q512GBG4Q, IPS LED, 1920x1200, 14"
Dell XPS 14 Core Ultra X7 358H
Ultra X7 358H, Arc B390 Panther Lake iGPU, Samsung PM9C1b MZVL81T0HFLB-00BH1, OLED, 2880x1800, 14"
HP OmniBook Ultra 14 Core Ultra X9
Ultra X9 388H, Arc B390 Panther Lake iGPU, , OLED, 2880x1800, 14"
Dell Inspiron 14 7445 2-in-1
R7 8840HS, Radeon 780M, Micron 2400 MTFDKBK1T0QFM, IPS, 1920x1200, 14"
Asus VivoBook S 14 OLED M5406WA
Ryzen AI 9 HX 370, Radeon 890M, Micron 2400 MTFDKBA1T0QFM, OLED, 1920x1200, 14"
Stromverbrauch
-5%
-14%
-8%
-42%
-73%
Idle min * (Watt)
1.8
2.4
-33%
3.1
-72%
2.5
-39%
4.5
-150%
6
-233%
Idle avg * (Watt)
6.6
6.9
-5%
3.6
45%
5.1
23%
8.4
-27%
8
-21%
Idle max * (Watt)
11.4
7.9
31%
10
12%
5.8
49%
8.9
22%
14
-23%
Last avg * (Watt)
30.7
41.5
-35%
39.2
-28%
49.8
-62%
50.7
-65%
76
-148%
Cyberpunk 2077 ultra external monitor * (Watt)
47.6
48.3
-1%
51.2
-8%
55.1
-16%
61.9
-30%
Cyberpunk 2077 ultra * (Watt)
48
48
-0%
51.4
-7%
55
-15%
58.6
-22%
Last max * (Watt)
71
66.9
6%
101.4
-43%
68
4%
62.4
12%
94
-32%
Witcher 3 ultra * (Watt)
50.8

* ... kleinere Werte sind besser

Stromverbrauch Cyberpunk / Stresstest

0510152025303540455055606570Tooltip
Dell 14S DS14260 Ultra 7 355, Intel Graphics 4 Xe3 PTL; 1280x720 Prime95 28.10 and Furmark 1.25: Ø58.8 (54.9-70.3) Watt
Dell Inspiron 14 7445 2-in-1 R7 8840HS, Radeon 780M; 1280x720 Prime95 28.10 and Furmark 1.25: Ø50.3 (38-62.4) Watt
Dell 14S DS14260 Ultra 7 355, Intel Graphics 4 Xe3 PTL; Idle 150cd/m2: Ø1.986 (1.787-5.59) Watt
Dell Inspiron 14 7445 2-in-1 R7 8840HS, Radeon 780M; Idle 150cd/m2: Ø7.5 (6.5-12.9) Watt
Dell 14S DS14260 Ultra 7 355, Intel Graphics 4 Xe3 PTL; Cyberpunk 2077 FHD ultra no FSR 150cd: Ø48 (44.8-55) Watt

Stromverbrauch des externen Monitors

0510152025303540455055606570Tooltip
Dell 14S DS14260 Ultra 7 355, Intel Graphics 4 Xe3 PTL; Prime95 V2810 Stress (external Monitor): Ø54.8 (49.1-70.5) Watt
Dell Inspiron 14 7445 2-in-1 R7 8840HS, Radeon 780M; Prime95 V2810 Stress (external Monitor): Ø39.5 (34.7-60.2) Watt
Dell 14S DS14260 Ultra 7 355, Intel Graphics 4 Xe3 PTL; Cinebench R15 Multi (external Monitor): Ø61.9 (56.3-68.9) Watt
Dell Inspiron 14 7445 2-in-1 R7 8840HS, Radeon 780M; Cinebench R15 Multi (external Monitor): Ø22.3 (21.9-23.1) Watt
Dell 14S DS14260 Ultra 7 355, Intel Graphics 4 Xe3 PTL; Cinebench R23 Multi (external Monitor): Ø56 (50.3-65.8) Watt
Dell 14S DS14260 Ultra 7 355, Intel Graphics 4 Xe3 PTL; 1280x720 FurMark 1.19 GPU Stress Test (external Monitor): Ø45.5 (44.4-51.4) Watt
Dell Inspiron 14 7445 2-in-1 R7 8840HS, Radeon 780M; 1280x720 FurMark 1.19 GPU Stress Test (external Monitor): Ø34.8 (28.1-53.8) Watt
Dell 14S DS14260 Ultra 7 355, Intel Graphics 4 Xe3 PTL; Idle 1min (external Monitor): Ø1.922 (1.677-5.65) Watt
Dell Inspiron 14 7445 2-in-1 R7 8840HS, Radeon 780M; Idle 1min (external Monitor): Ø5.77 (4.73-10) Watt
Dell 14S DS14260 Ultra 7 355, Intel Graphics 4 Xe3 PTL; Cyberpunk 2077 FHD ultra no FSR (external Monitor): Ø47.6 (45.4-55.6) Watt

Akkulaufzeit

Akkulaufzeit
WiFi Websurfing
19h 07min
Dell 14S DS14260
Ultra 7 355, Intel Graphics 4 Xe3 PTL, 70 Wh
Lenovo ThinkBook 14 G9 IPL 21UX005PGE
Ultra 5 325, Intel Graphics 4 Xe3 PTL, 48 Wh
Dell XPS 14 Core Ultra X7 358H
Ultra X7 358H, Arc B390 Panther Lake iGPU, 70 Wh
HP OmniBook Ultra 14 Core Ultra X9
Ultra X9 388H, Arc B390 Panther Lake iGPU, 70 Wh
Dell Inspiron 14 7445 2-in-1
R7 8840HS, Radeon 780M, 54 Wh
Asus VivoBook S 14 OLED M5406WA
Ryzen AI 9 HX 370, Radeon 890M, 75 Wh
Akkulaufzeit
-54%
-12%
-34%
-31%
-14%
WLAN (h)
19.1
8.7
-54%
16.8
-12%
12.6
-34%
13.1
-31%
16.5
-14%
Last (h)
1.4
2.2
2.8
Idle (h)
22.2
31.7

Notebookcheck-Bewertung

Der "wahre" Nachfolger der Inspiron-14-Serie mit neuem Design und Panther-Lake-CPU-Optionen.

Dell 14S DS14260 - 17.08.2026 v8
Allen Ngo

Gehäuse
86 / 98 → 88%
Tastatur
83%
Pointing Device
78%
Konnektivität
67 / 74 → 91%
Gewicht
69 / 20-77 → 86%
Akkulaufzeit
92%
Display
83%
Leistung Spiele
45 / 75 → 60%
Leistung Anwendungen
85 / 92 → 92%
AI Performance
89%
Temperatur
90%
Lautstärke
85%
Audio
82 / 91 → 90%
Kamera
36 / 75 → 47%
Durchschnitt
68%
82%
Subnotebook - gewichteter Durchschnitt
Weitere Informationen über unsere Bewertung finden Sie hier.
CO2 Emissions
No Data
Materials
50%
Packaging
100%
Power Use
91.2%
Repairability
50%
Software Updates
22.3%
Recycle Logo Total Sustainability Score: 52.3%

Mögliche Mitbewerber im Vergleich

Bild
Modell / Test
Preis ab
Gewicht
Dicke
Display
1.
81.9%
Dell 14S DS14260
Dell 14S DS14260
Intel Core Ultra 7 355 ⎘
Intel Graphics 4 Xe3 Panther Lake iGPU ⎘
16 GB RAM
Amazon: 1.599,00 €
Geizhals Suche
1.5 kg15.3 mm14.00"
1920x1200
162 PPI
OLED
2.
84.2%
Lenovo ThinkBook 14 G9 IPL 21UX005PGE
Intel Core Ultra 5 325 ⎘
Intel Graphics 4 Xe3 Panther Lake iGPU ⎘
32 GB RAM, 512 GB SSD
Amazon: 1.425,08 €
Bestpreis 999€ galaxus
2. 1245€ TechnikDeals24
3. 1245€ HEINZSOFT
1.4 kg21 mm14.00"
1920x1200
162 PPI
IPS LED
3.
87.4%
Dell XPS 14 Core Ultra X7 358H
Intel Core Ultra X7 358H ⎘
Intel Arc B390 12 Xe3 Panther Lake iGPU ⎘
32 GB RAM, 1000 GB SSD
Amazon:
1. 3.145,37 €
ASUS ExpertBook Ultra 14 Zol...
2. 1.221,67 €
Dell Pro 14 Plus PB14250 - I...
3. 3.599,00 €
Dell XPS 16 9640 Laptop 16.3...
Geizhals Suche
1.4 kg14.62 mm14.00"
2880x1800
243 PPI
OLED
4.
87.9%
HP OmniBook Ultra 14 Core Ultra X9
Intel Core Ultra X9 388H ⎘
Intel Arc B390 12 Xe3 Panther Lake iGPU ⎘
32 GB RAM
Amazon:
Bestpreis 1899€ nullprozentshop.de
2. 1899€ notebooksbilliger.de
3. 1914.96€ notebooksbilliger.at
1.3 kg10.7 mm14.00"
2880x1800
243 PPI
OLED
5.
80.1%
Dell Inspiron 14 7445 2-in-1
AMD Ryzen 7 8840HS ⎘
AMD Radeon 780M ⎘
16 GB RAM, 1024 GB SSD
Amazon:
1. 729,00 €
Dell Inspiron 14 Plus Laptop...
2. 2.105,80 €
Dell Inspiron 14 7445 7440 2...
3. 799,00 €
Dell Inspiron 14 (5441) Copi...
Geizhals Suche
1.7 kg18.9 mm14.00"
1920x1200
162 PPI
IPS
6.
84.9%
Asus VivoBook S 14 OLED M5406WA
AMD Ryzen AI 9 HX 370 ⎘
AMD Radeon 890M ⎘
24 GB RAM, 1024 GB SSD
Amazon: 1.688,35 €
Bestpreis 2199.99€ AS-Warenhandel
1.3 kg15.9 mm14.00"
1920x1200
162 PPI
OLED

Transparenz

Die Auswahl der zu testenden Geräte erfolgt innerhalb der Redaktion. Das vorliegende Testmuster wurde dem Autor vom Hersteller oder einem Shop zu Testzwecken leihweise zur Verfügung gestellt. Eine Einflussnahme des Leihstellers auf den Testbericht gab es nicht, der Hersteller erhielt keine Version des Reviews vor der Veröffentlichung. Es bestand keine Verpflichtung zur Publikation. Als eigenständiges, unabhängiges Unternehmen unterliegt Notebookcheck keiner Diktion von Herstellern, Shops und Verlagen.

So testet Notebookcheck

Pro Jahr werden von Notebookcheck hunderte Laptops und Smartphones unabhängig in von uns standardisierten technischen Verfahren getestet, um eine Vergleichbarkeit aller Testergebnisse zu gewährleisten. Seit rund 20 Jahren entwickeln wir diese Testmethoden kontinuierlich weiter und setzen damit Branchenstandards. In unseren Testlaboren kommt ausschließlich hochwertiges Messequipment in die Hände erfahrener Techniker und Redakteure. Die Tests unterliegen einer mehrstufigen Kontrolle. Unsere komplexe Gesamtbewertung basiert auf hunderten fundierten Messergebnissen und Benchmarks, womit Ihnen Objektivität garantiert ist. Weitere Informationen zu unseren Testmethoden gibt es hier.

Google LogoAls bevorzugte Quelle auf Google hinzufügen
Mail Logo

Keine Kommentare zum Artikel

Fragen, Anregungen, zusätzliche Informationen zu diesem Artikel? - Uns interessiert Deine Meinung (auch ohne Anmeldung möglich)!
Keine Kommentare zum Artikel / Antworten

static version load dynamic
> Notebook Test, Laptop Test und News > Tests > Notebook Testberichte > Dell 14S DS14260 im Test: XPS-Feeling zum kleineren Preis?
Autor: Allen Ngo, 18.08.2026 (Update: 18.08.2026)