




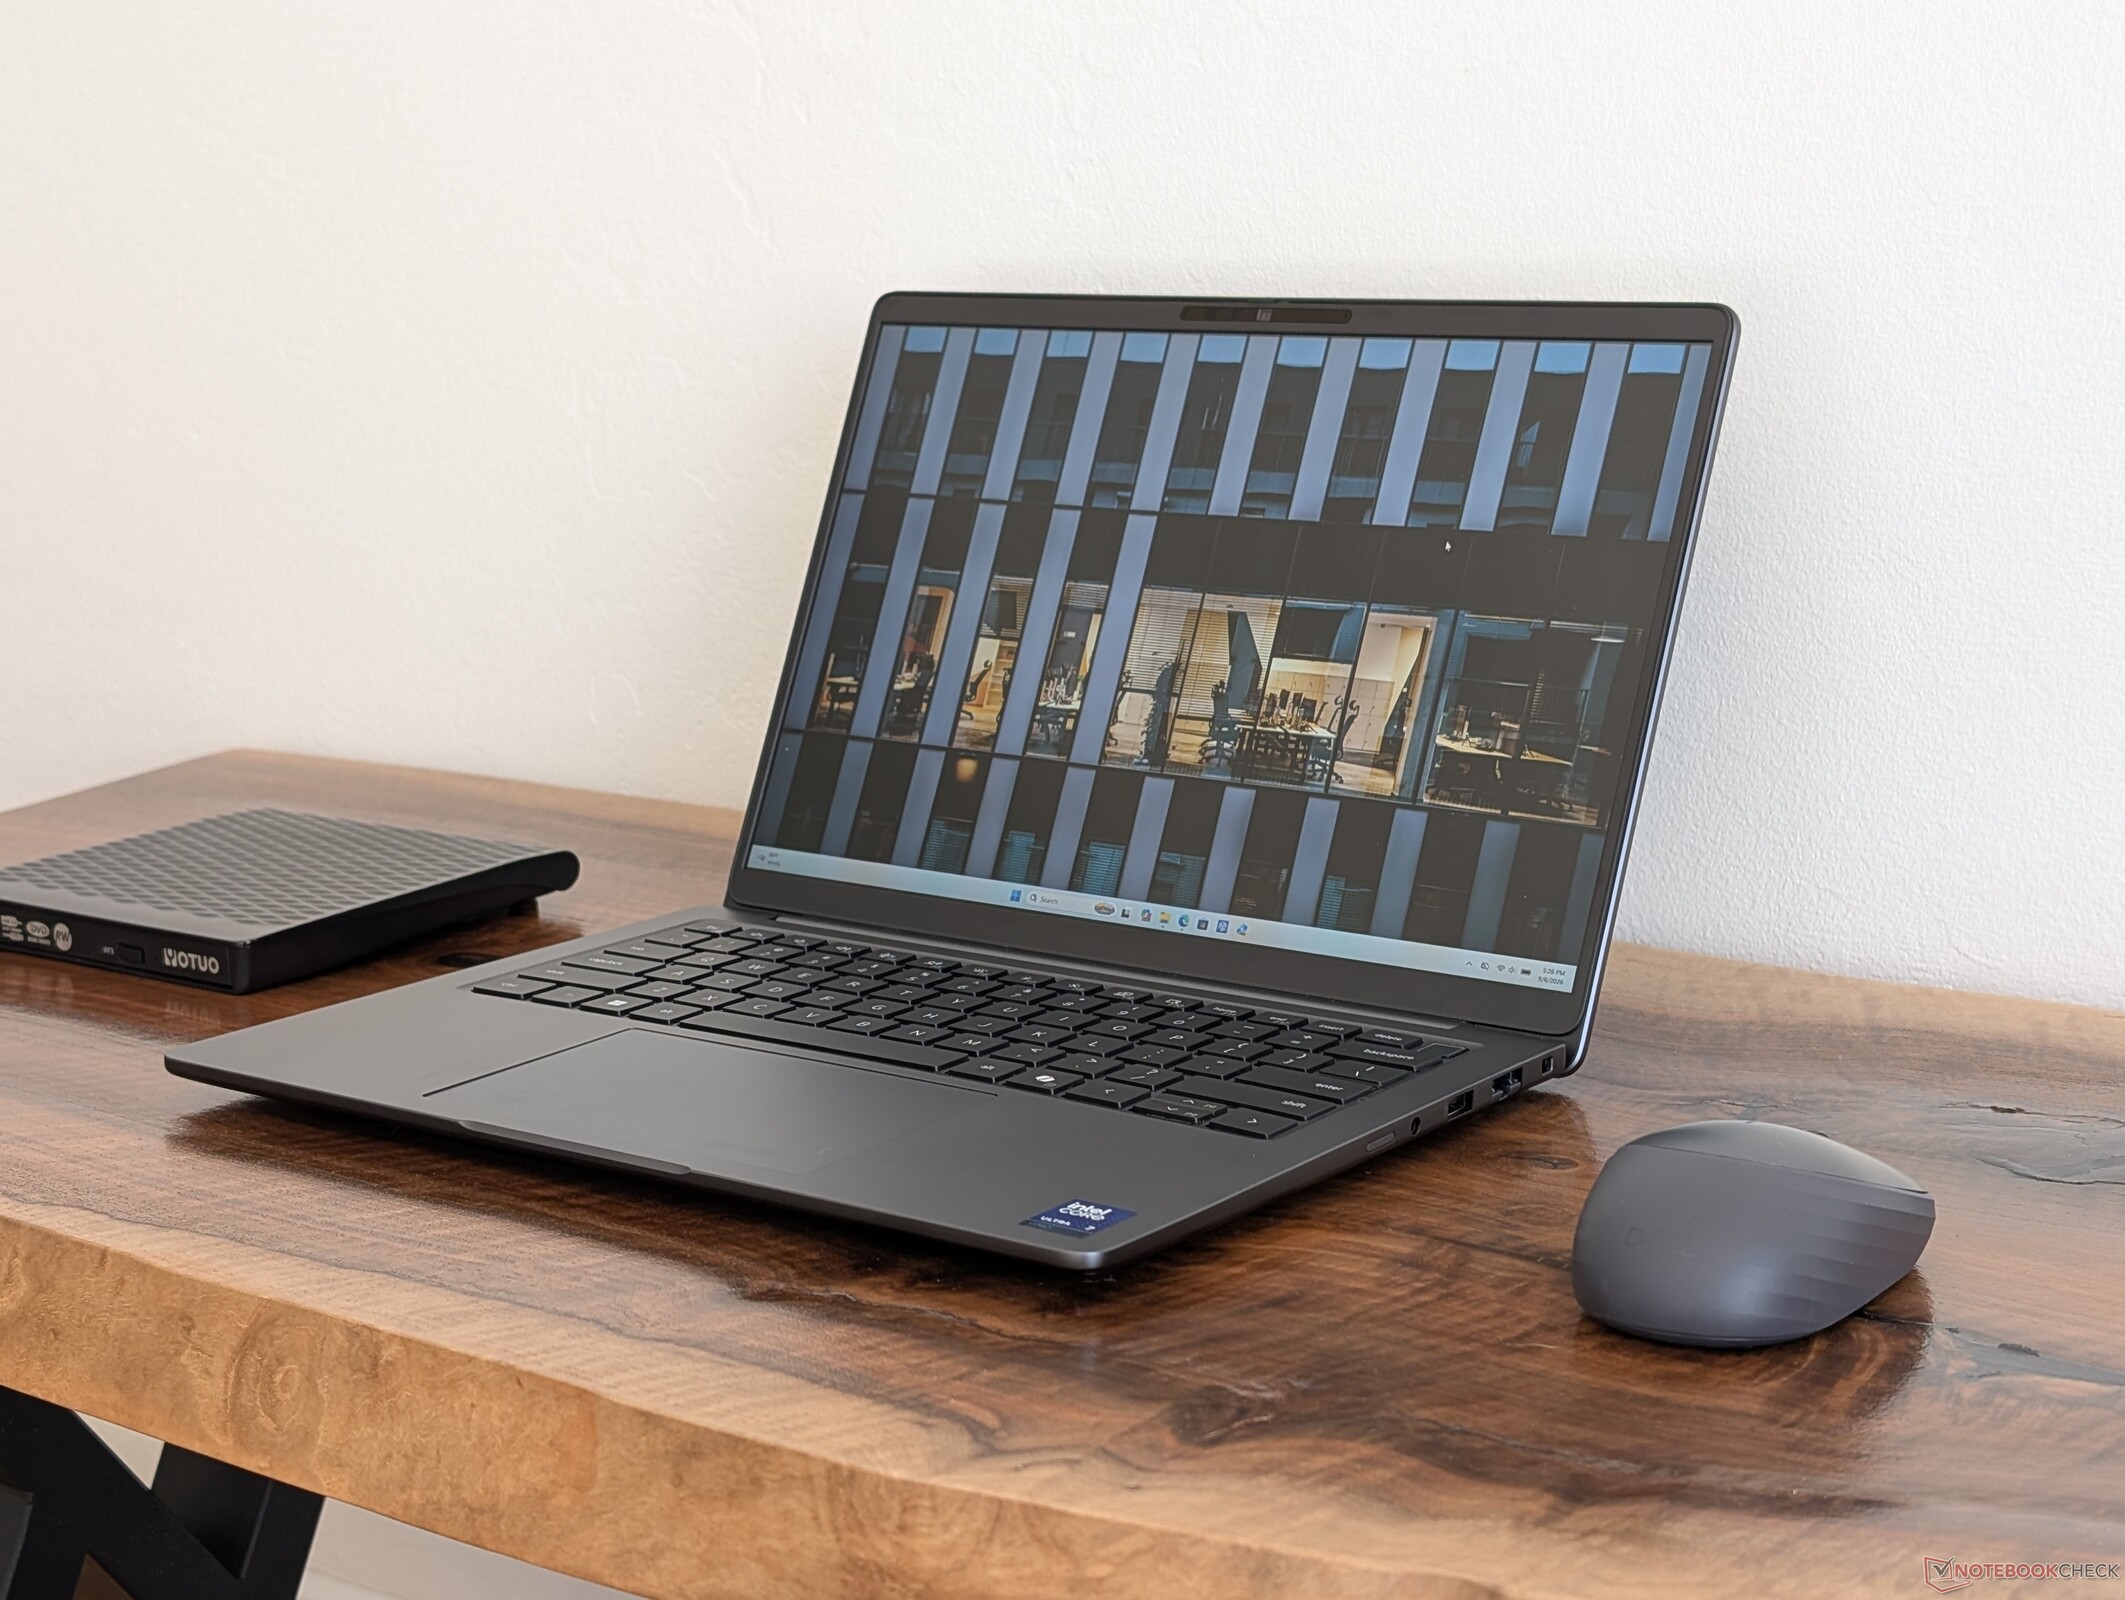
Fazit – In mancherlei Hinsicht besser als das Dell Pro 7 14
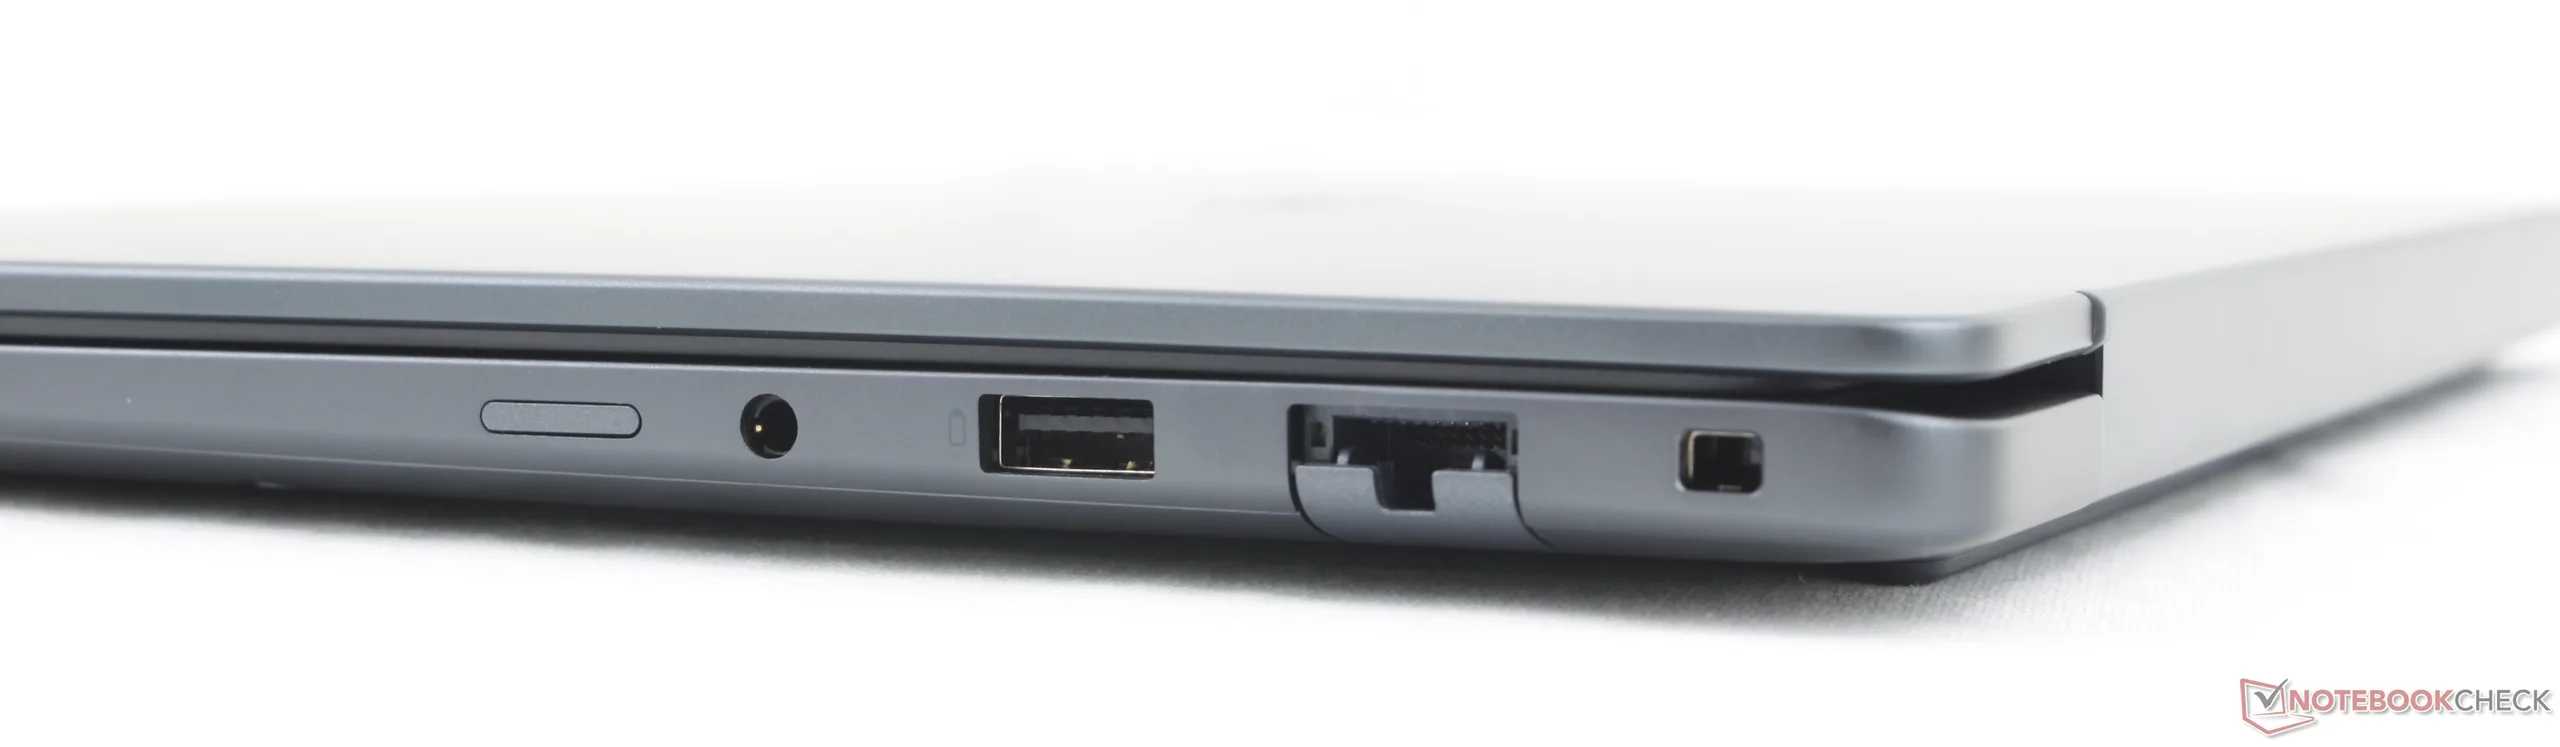
Obwohl das Dell Pro 5 14 günstiger ist als das Dell Pro 7 14, verfügt es über ähnliche Gehäuseeigenschaften sowie die gleichen Eingabegeräte, Akkukapazitäten, Webcam und Displayoptionen, was zu einem nahezu identischen Benutzererlebnis führt. Tatsächlich verfügt das Dell Pro 5 14 über einige Funktionen, die das Dell Pro 7 14 nicht aufweist, darunter einen RJ-45-Anschluss, optionales LPCAMM2 sowie Panther-Lake-X7-Prozessoren, wobei Letztere die Grafikleistung für diejenigen, die dies benötigen, erheblich steigern.
Als das preisgünstigere Modell ist das Dell Pro 5 14 jedoch etwas dicker und schwerer als sein teureres Schwestermodell, sodass die zusätzlichen Funktionen auf Kosten von Größe und Gewicht gehen. Konkurrenten wie das leichtere Lenovo ThinkPad T14s sind bei ähnlicher Bildschirmgröße und ähnlichen Hardware-Optionen reisetauglicher.
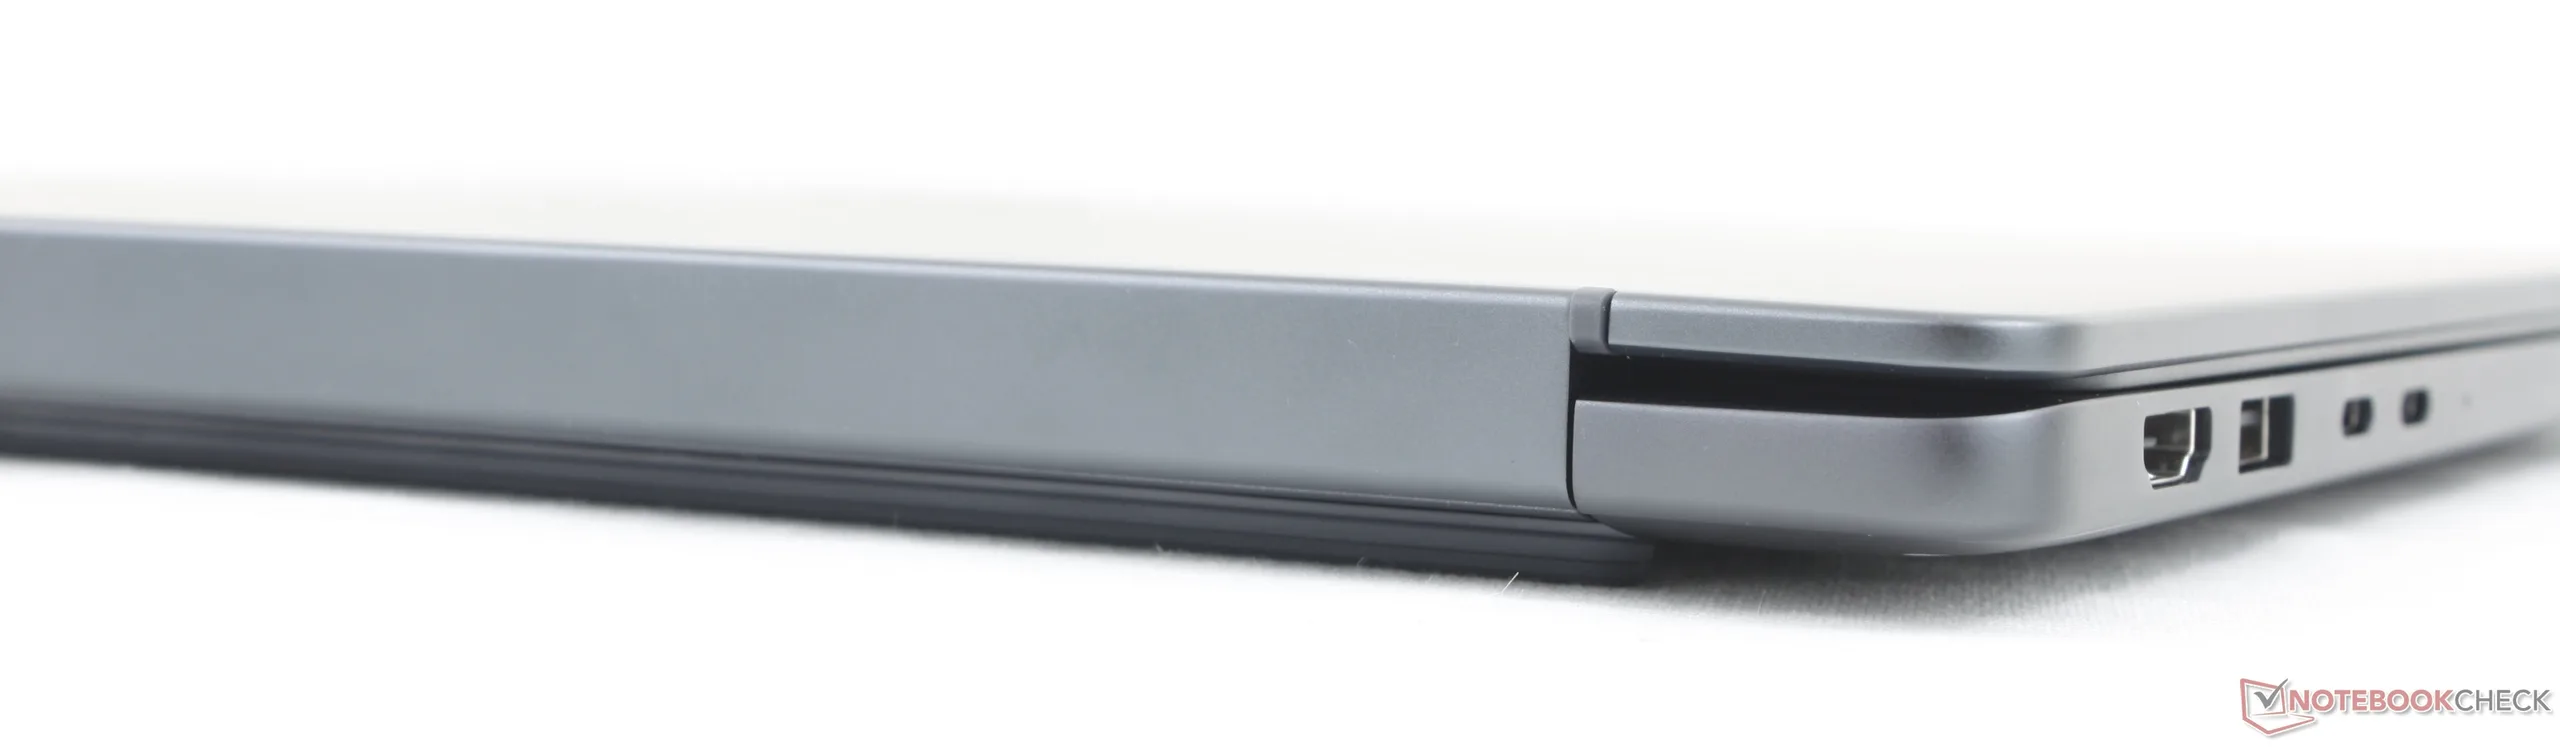
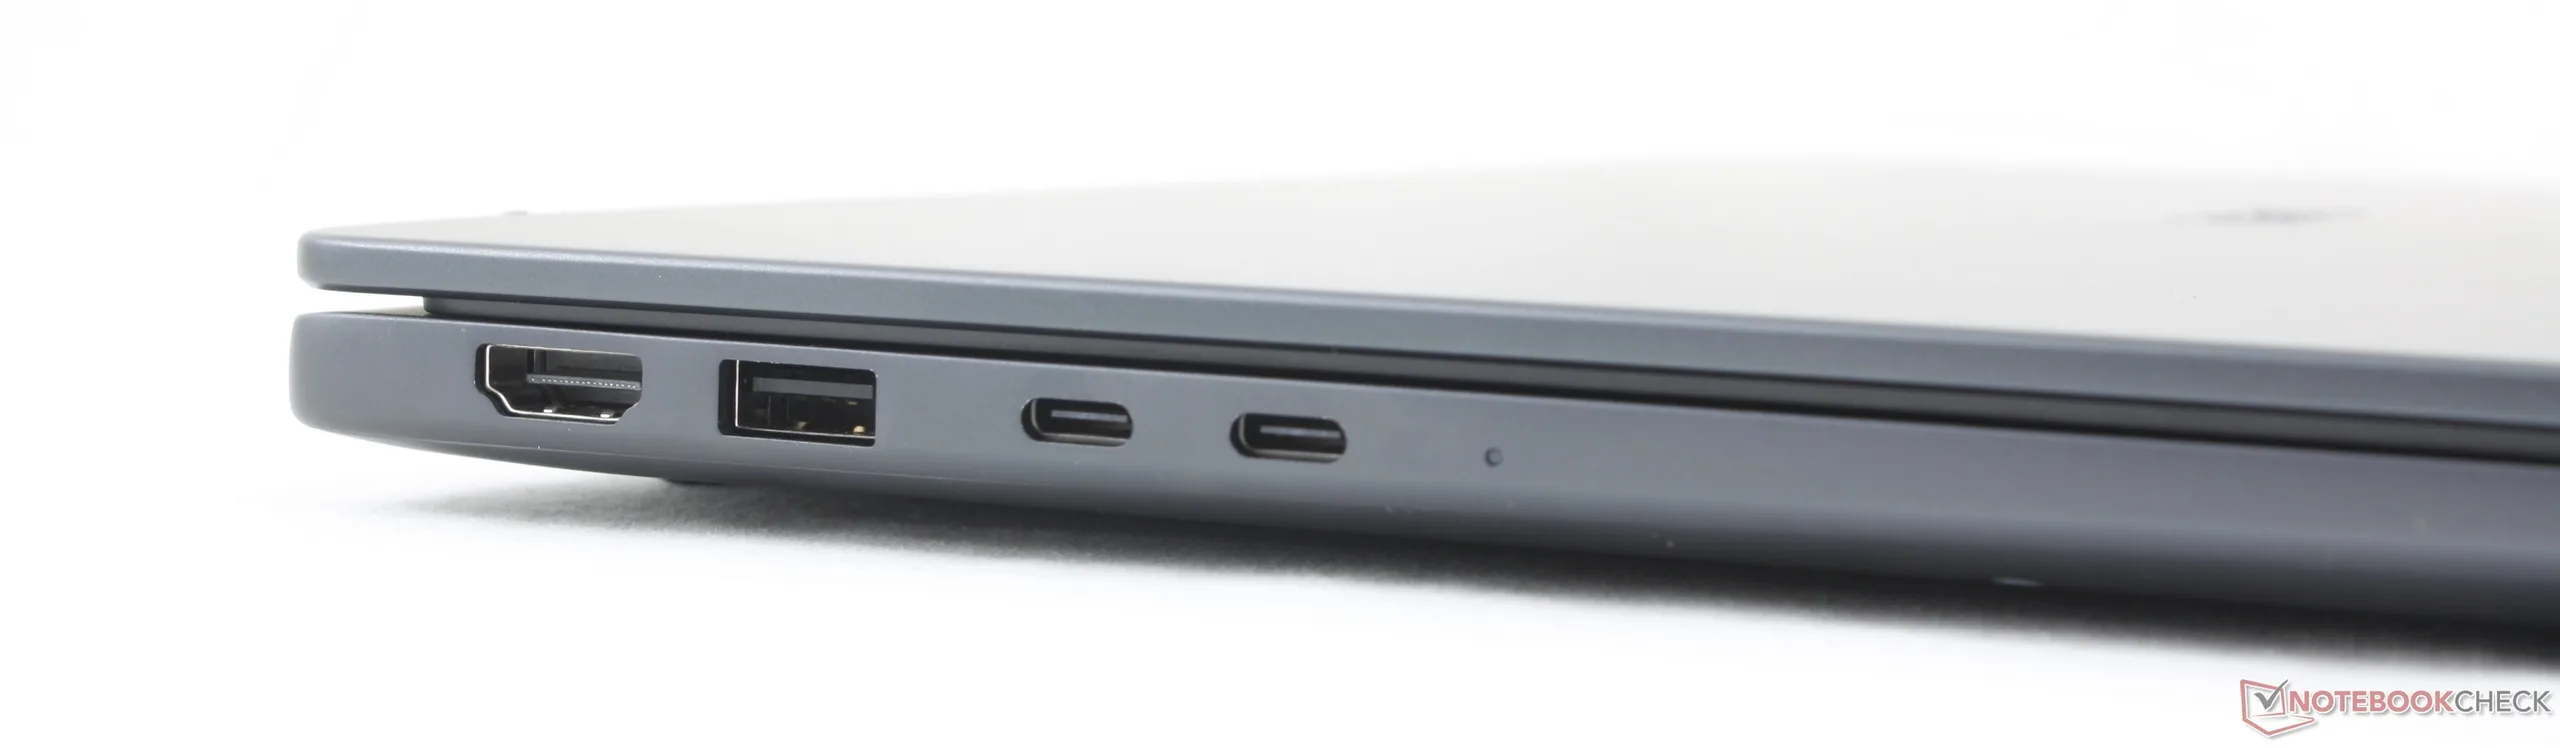
Zu den weiteren kleineren Kritikpunkten gehört das Fehlen von USB-C-Anschlüssen an der rechten Seite, wodurch das Aufladen ausschließlich über die linke Seite des Geräts möglich ist. Zudem neigen die SSD und die iGPU dazu, nach einigen Minuten unter Last etwas an Leistung zu verlieren, anders als wir es beim teureren Dell Pro 7 14 erlebt haben. In der Praxis sind diese leichten Leistungseinbußen jedoch in den allermeisten Anwendungsfällen vernachlässigbar.
Pro
Contra
Preis und Verfügbarkeit
Die Preise im Online-Shop von Dell beginnen bei 2.438 Euro für die Basisausstattung „Core Ultra 5“ und reichen bis zu 3.092 Euro oder mehr für die „Core Ultra X7“-Ausstattung.

Ähnlich wie die High-End-Serie Dell Pro 7 14 die ältere Latitude-7400-Serie ablöst, ersetzt das neue Mittelklasse-Modell Dell Pro 5 14 die ältere Latitude-5400-Serie. Dennoch weist das Modell in mehreren wesentlichen Punkten auffallende Ähnlichkeiten mit dem teureren Dell Pro 7 14 auf.
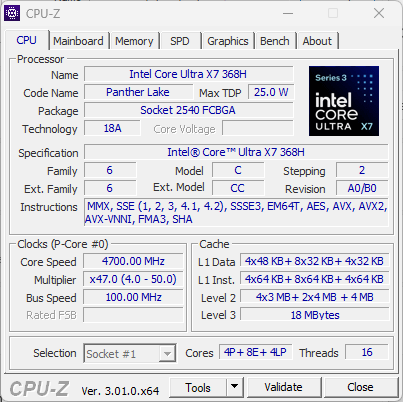
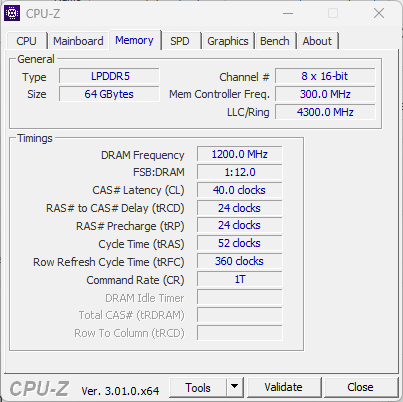
Unser konkretes Testgerät ist eine High-End-Konfiguration mit der Core Ultra X7 368H vPro Panther-Lake-CPU, 64 GB austauschbarem LPCAMM2-Speicher und einem 1.200p-IPS-Display mit 120 Hz für etwa 4.000 US-Dollar. Günstigere Modelle sind bereits zur Hälfte dieses Preises erhältlich, beispielsweise mit der Core-Ultra-5-CPU oder standardmäßigen SODIMM-RAM-Modulen.
Zu den Alternativen zählen andere geschäftsorientierte Laptops wie das Lenovo ThinkPad T14s oder die HP-EliteBook-14-Serie.
Weitere Dell Testberichte:
Spezifikationen
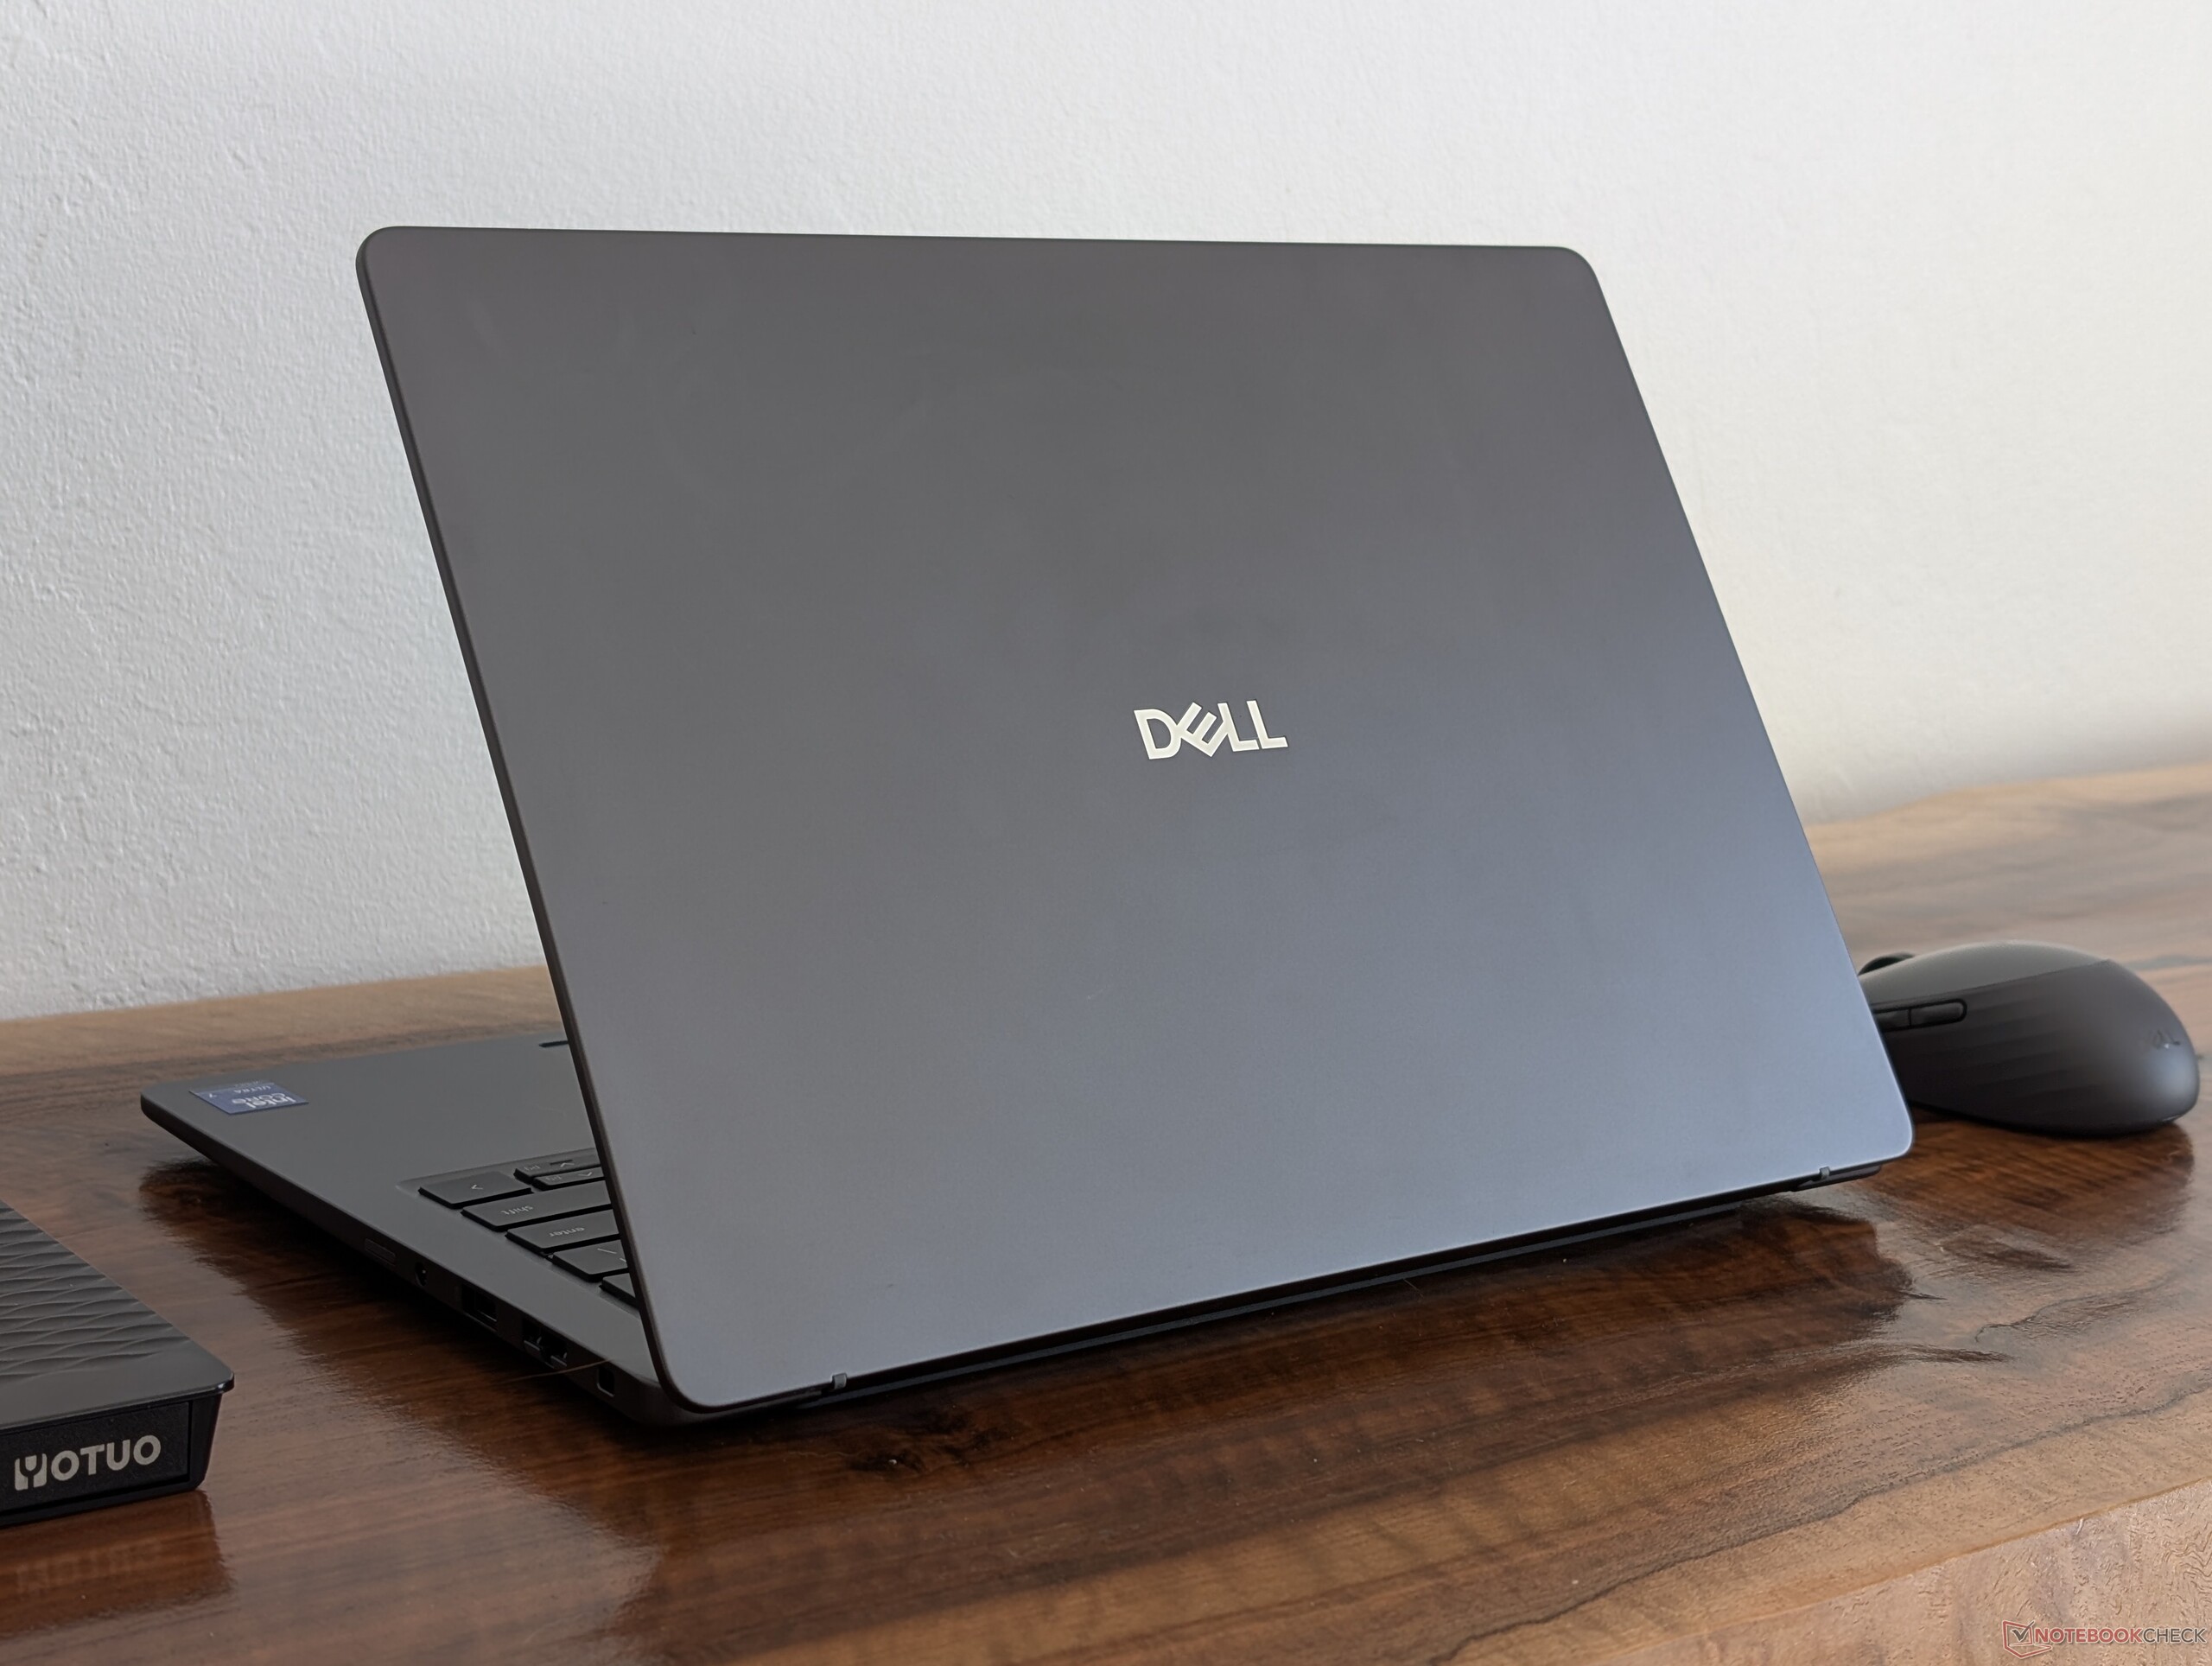
Gehäuse
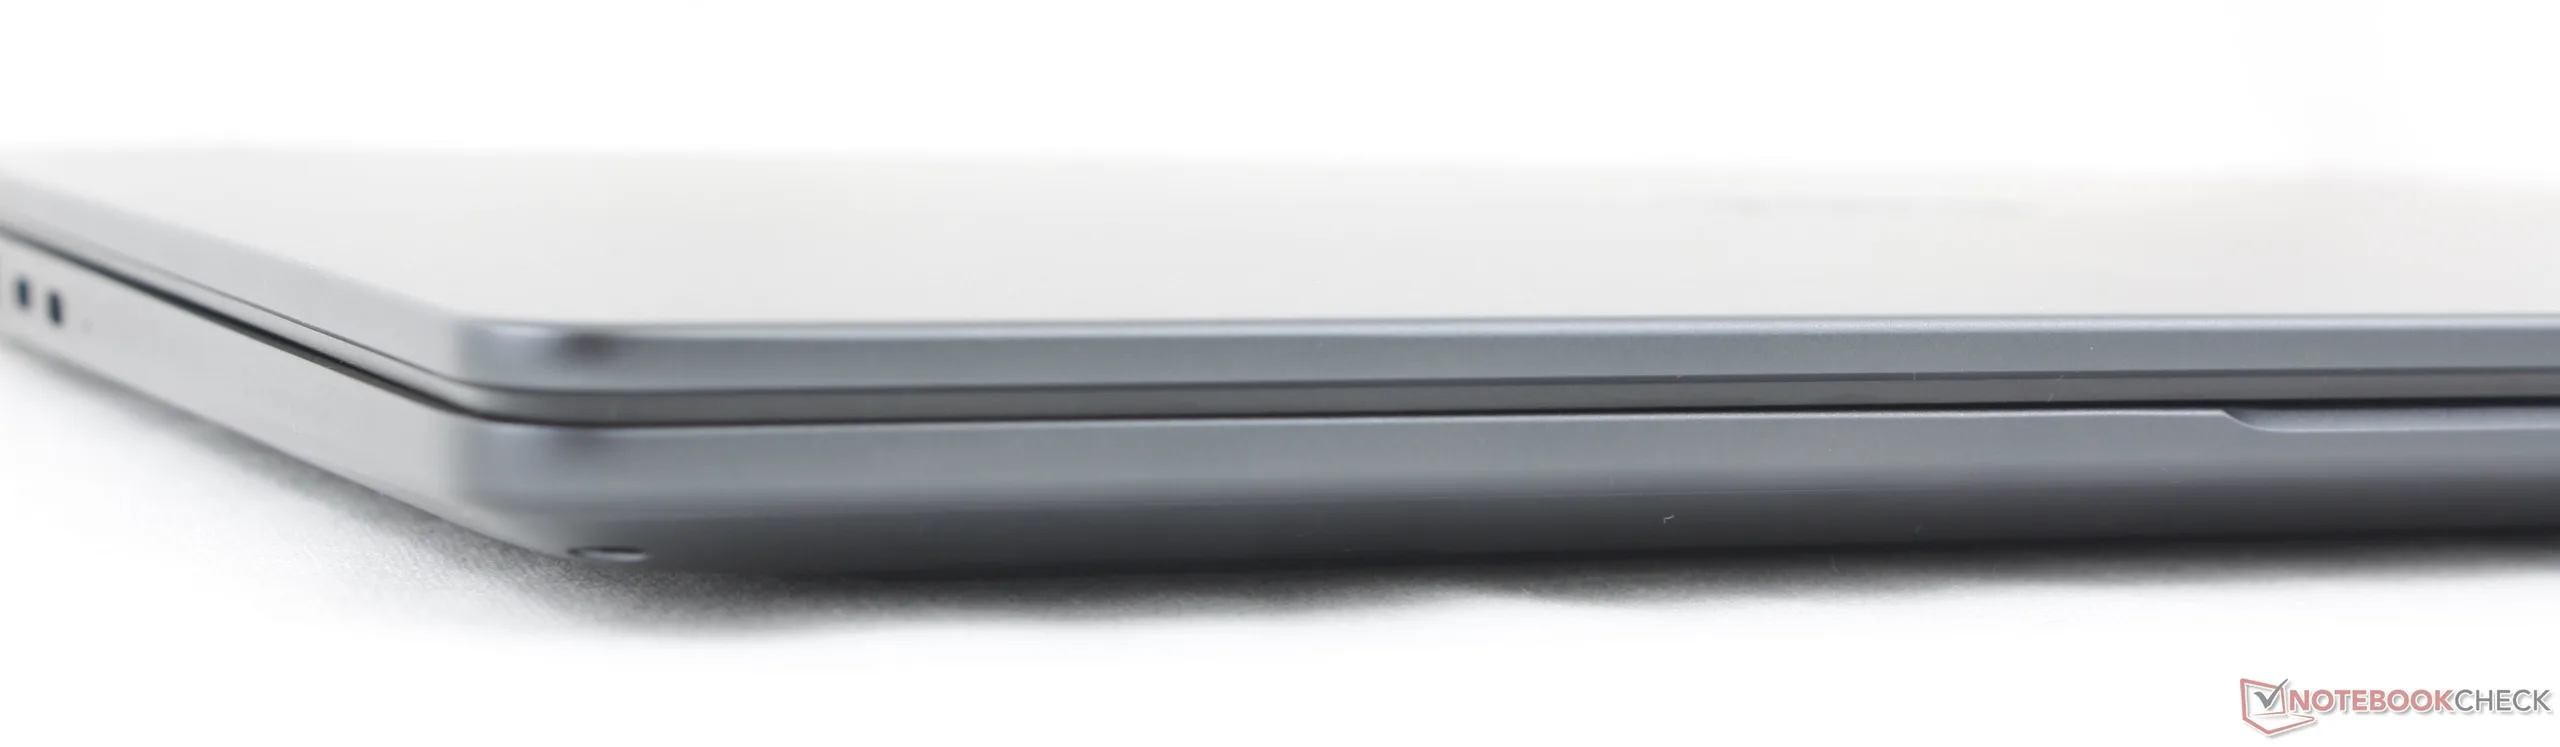
Das Gehäuse ist hinsichtlich Material, Oberflächenstruktur, Größe und ersten Eindrücken nahezu identisch mit denen des Dell Pro 7 14. Die Unterseite des Dell Pro 5 14 kann jedoch wahlweise mit eloxiertem Aluminium oder Glasfaserverbundwerkstoff konfiguriert werden, wobei Letzterer geringfügig dicker ist (18,65 mm gegenüber 18,1 mm). Wir empfehlen eloxiertes Aluminium, da das schlankere Profil deutlicher ins Auge fällt als die sehr geringe Gewichtsersparnis (~10 g), die der Glasfaserverbundwerkstoff mit sich bringt.
Konnektivität
Kommunikation
| Networking | |
| iperf3 transmit Wi-Fi6/7 RT-BE96U | |
| Lenovo ThinkPad T14s Gen 7 21YW0022GE | |
| iperf3 receive Wi-Fi6/7 RT-BE96U | |
| Lenovo ThinkPad T14s Gen 7 21YW0022GE | |
| iperf3 receive AXE11000 6GHz | |
| HP OmniBook Ultra 14 Core Ultra X9 | |
| Dell Pro 5 14 P514260 | |
| Asus ExpertBook Ultra B9406CAA | |
| Dell Pro 7 14 P714260 | |
| iperf3 transmit AXE11000 6GHz | |
| Dell Pro 5 14 P514260 | |
| Dell Pro 7 14 P714260 | |
| HP OmniBook Ultra 14 Core Ultra X9 | |
| Asus ExpertBook Ultra B9406CAA | |
Webcam

Wartung
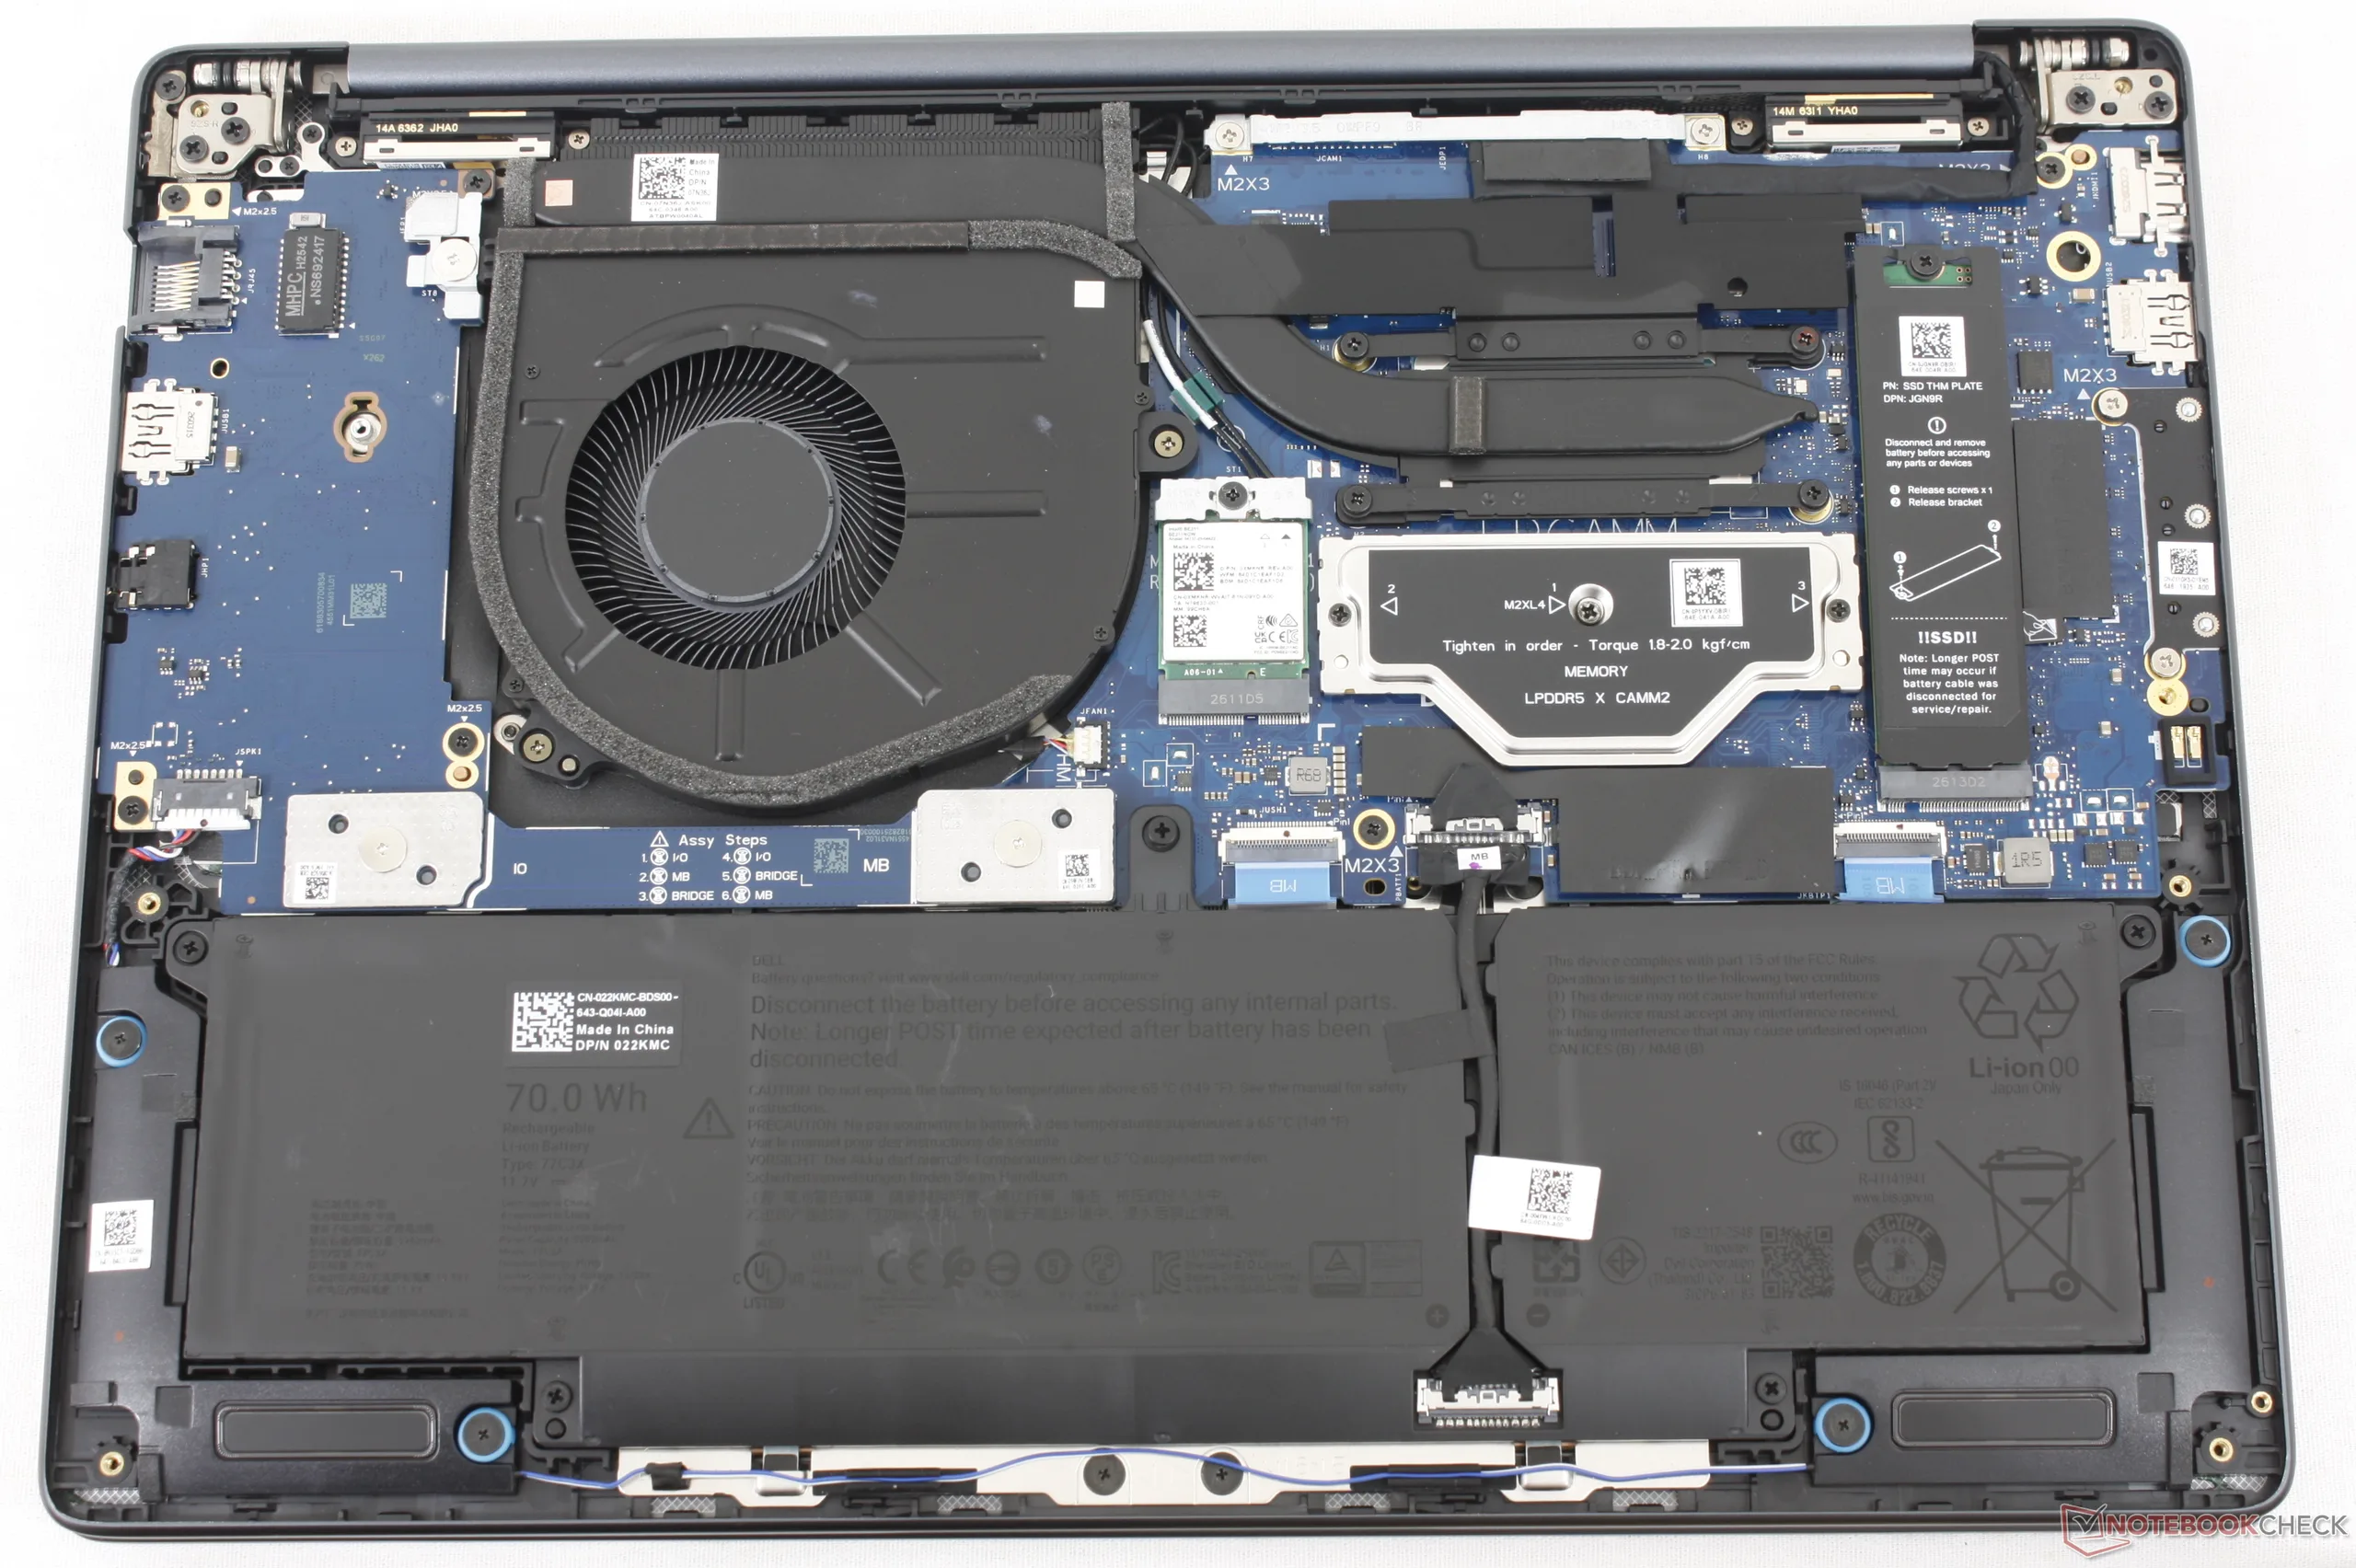
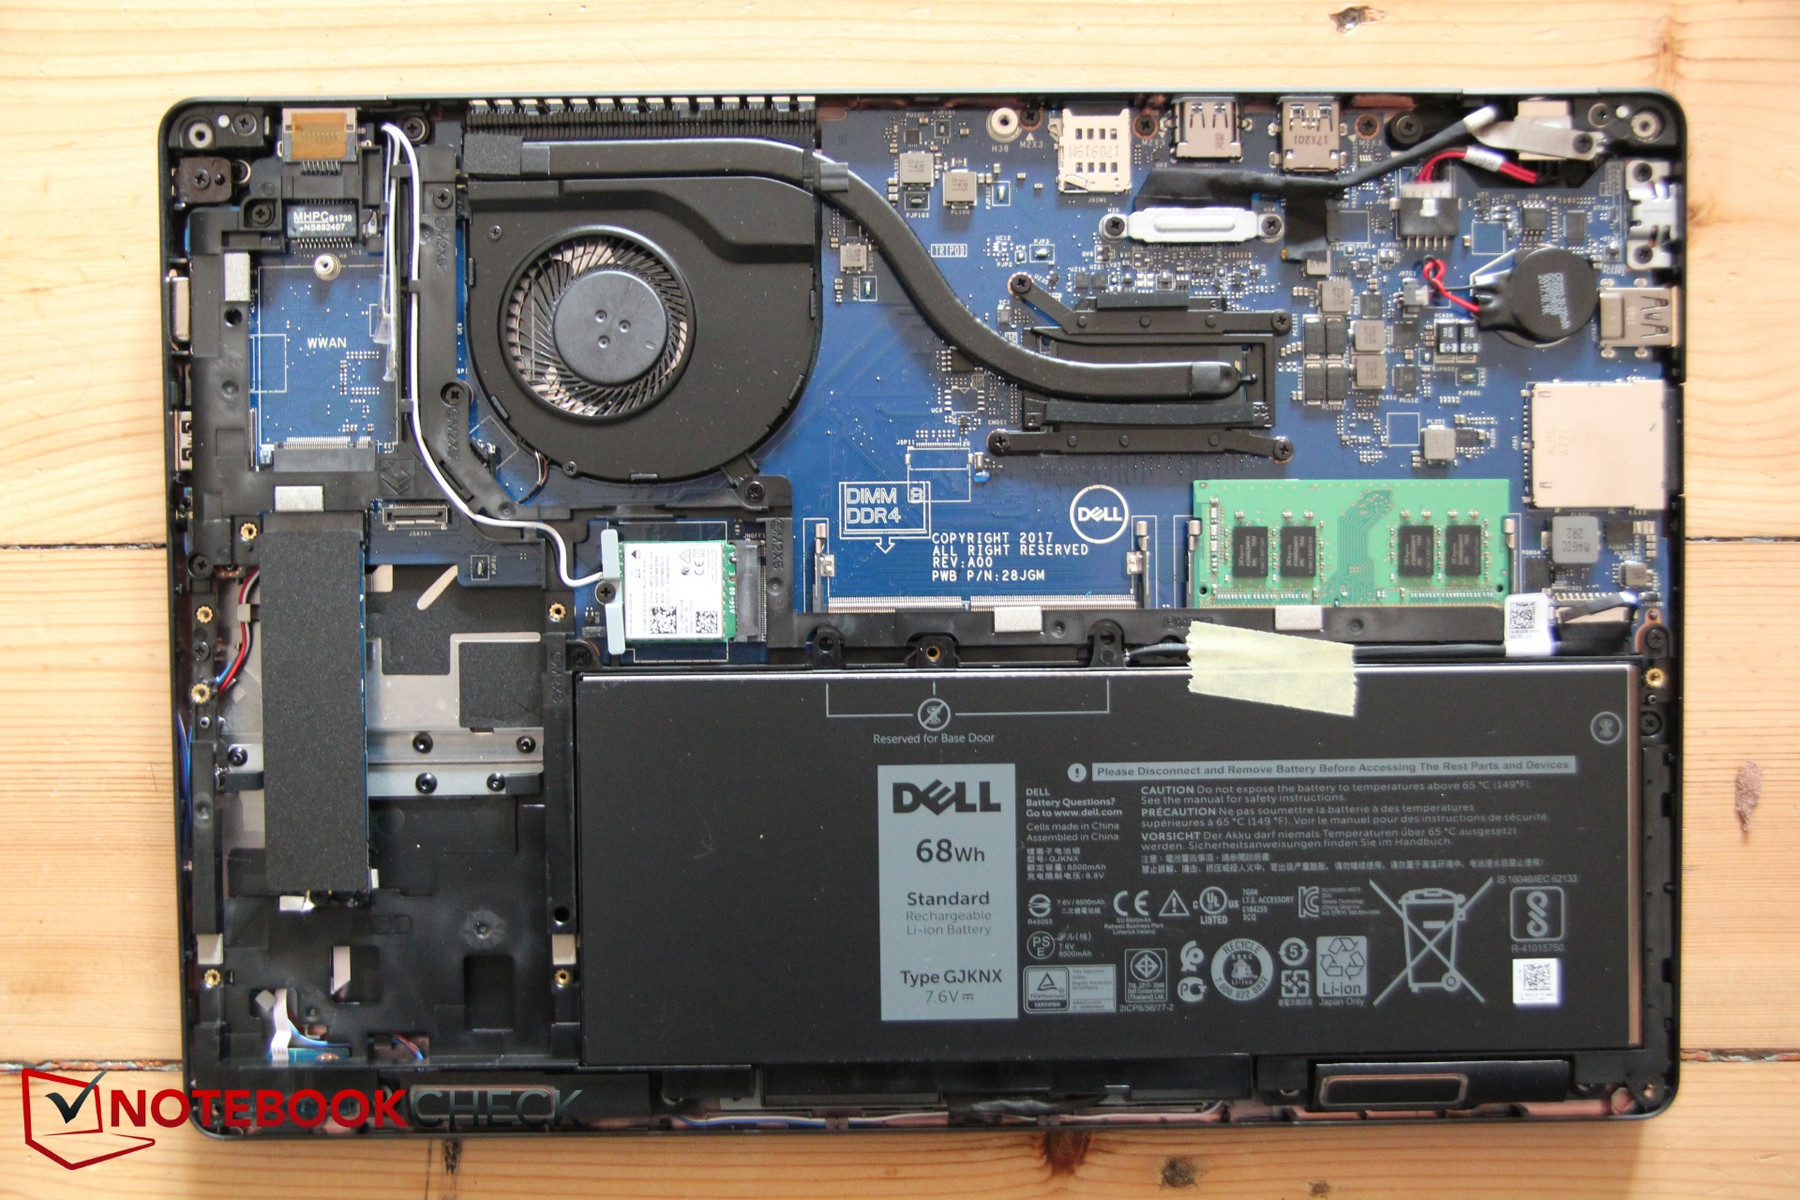
Nachhaltigkeit
Das Modell besteht in unterschiedlichen Anteilen aus recyceltem Stahl, Kobalt, aus dem Meer geborgenem Kunststoff und Aluminium für den äußeren Deckel, die Handballenauflagen und die Bodenabdeckung. Die Verpackung ist kunststofffrei und vollständig recycelbar.
Eingabegeräte
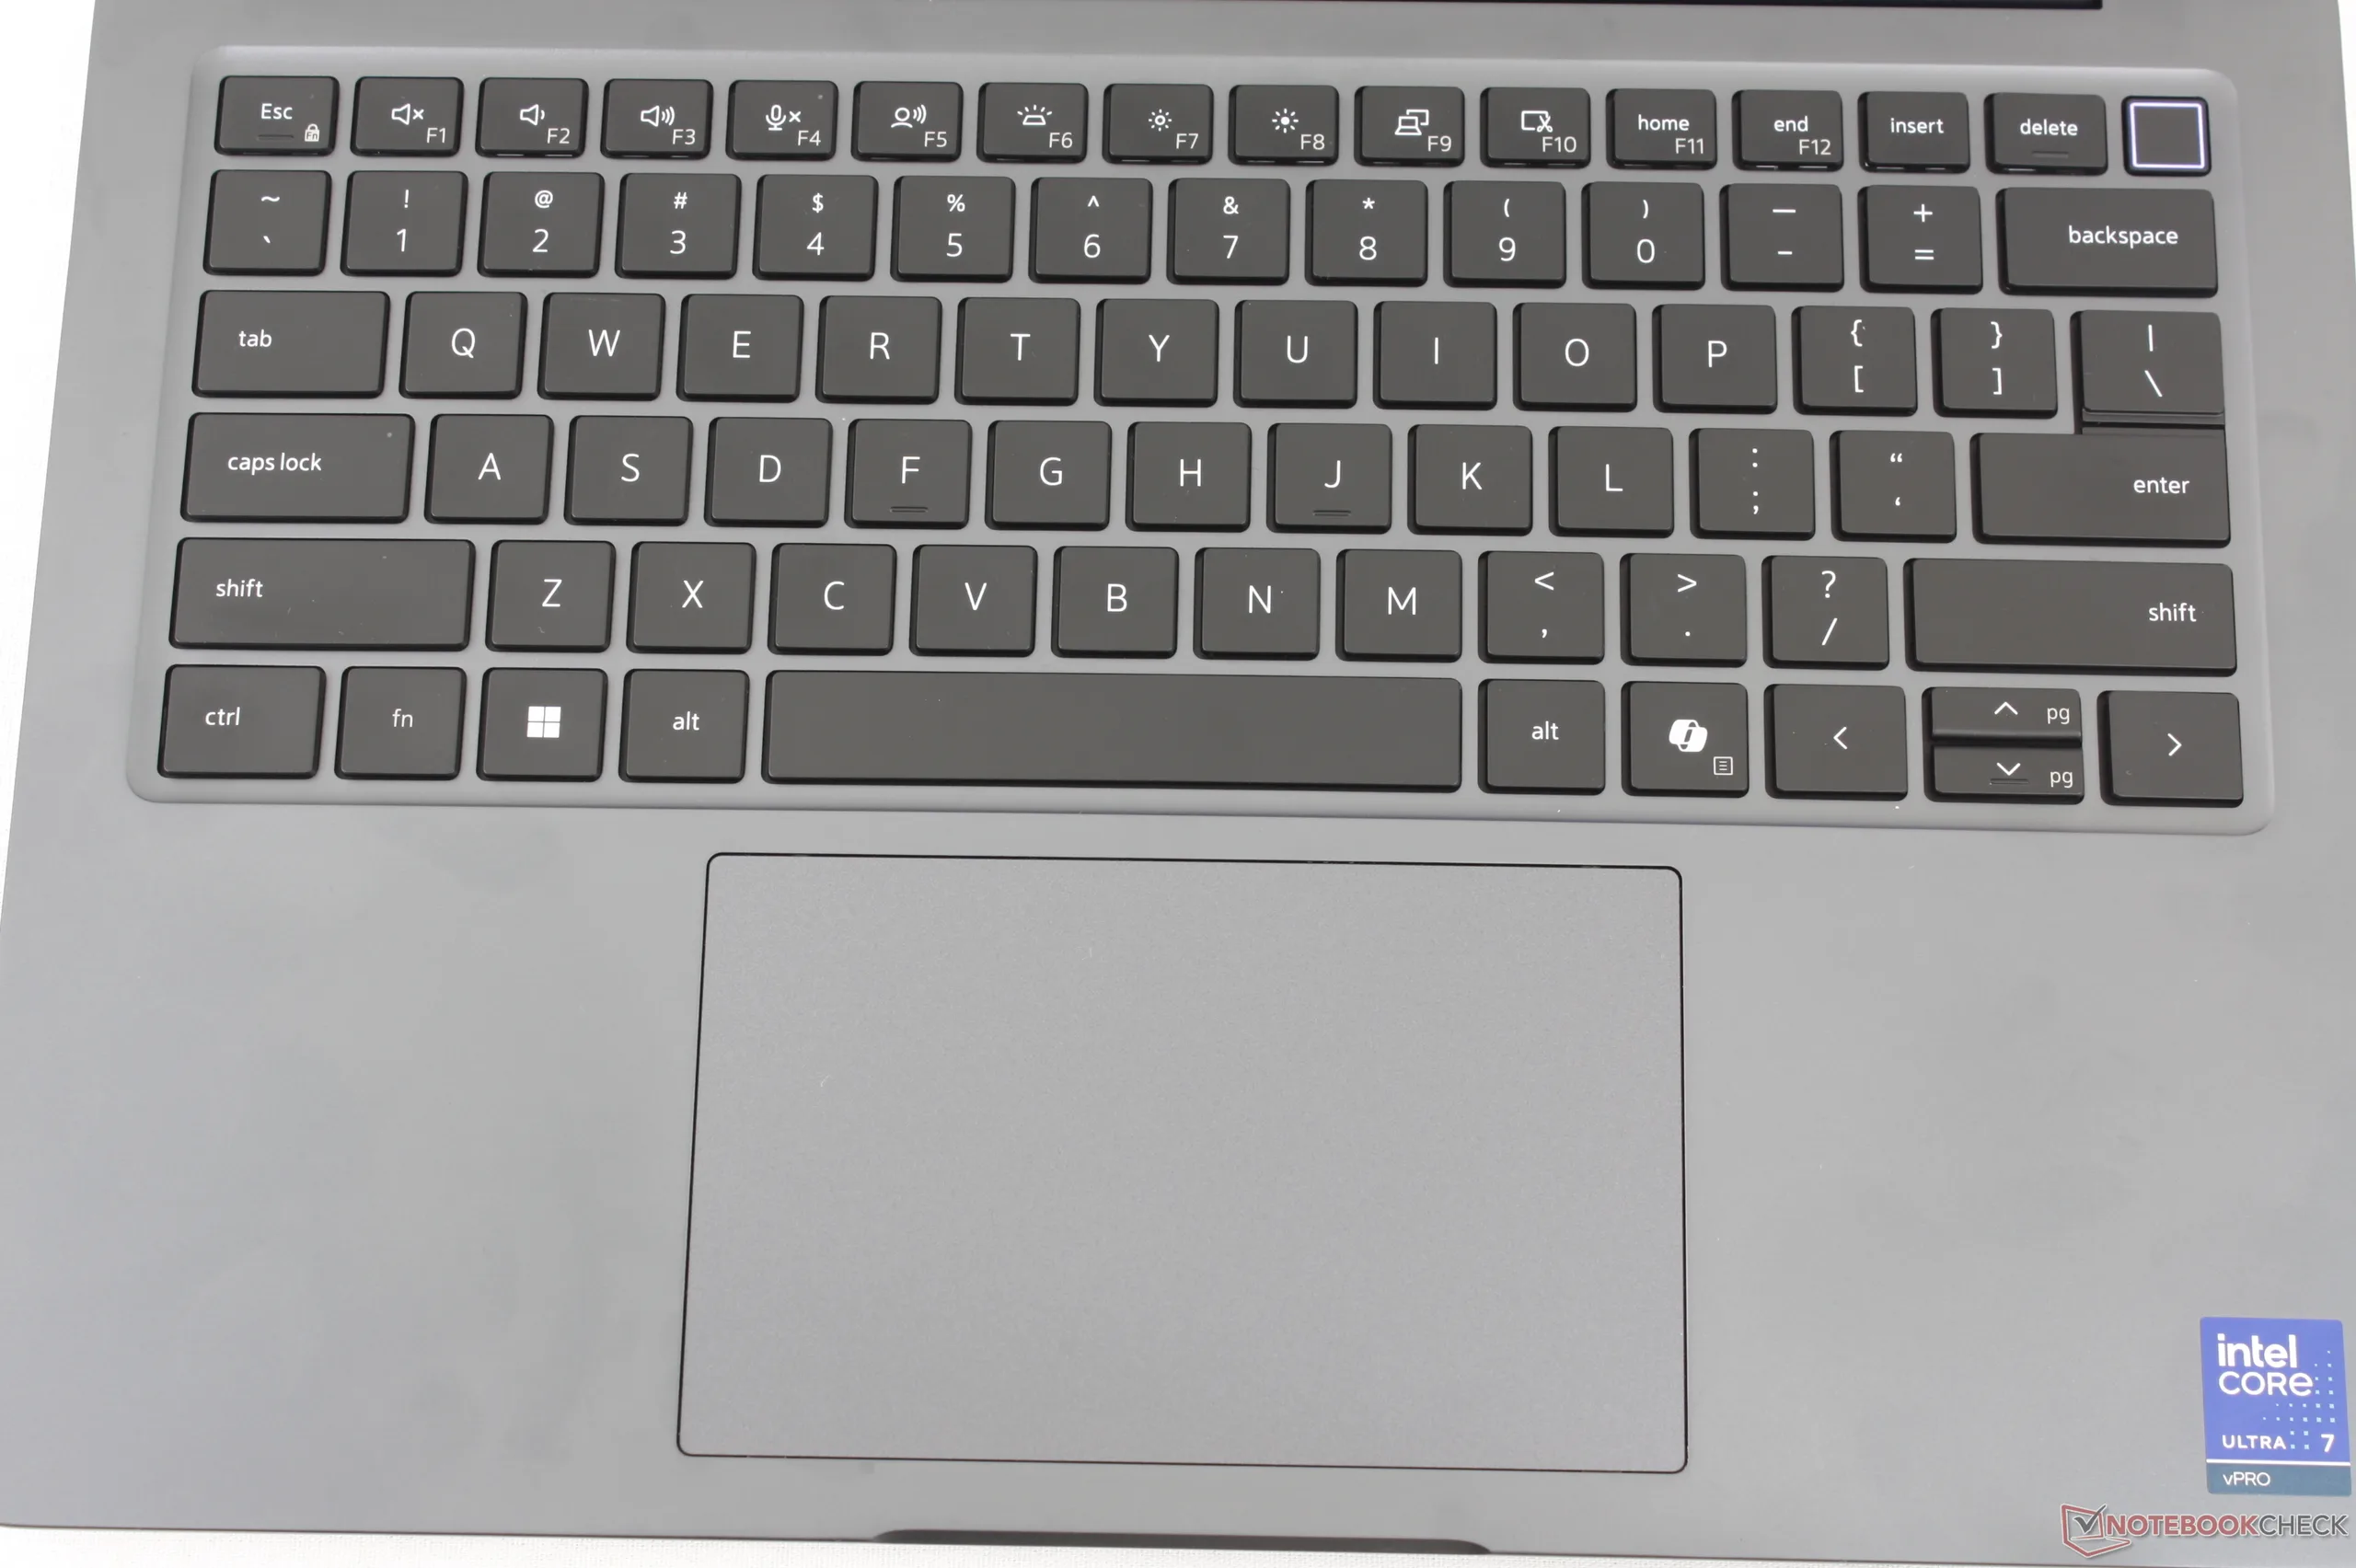
Display
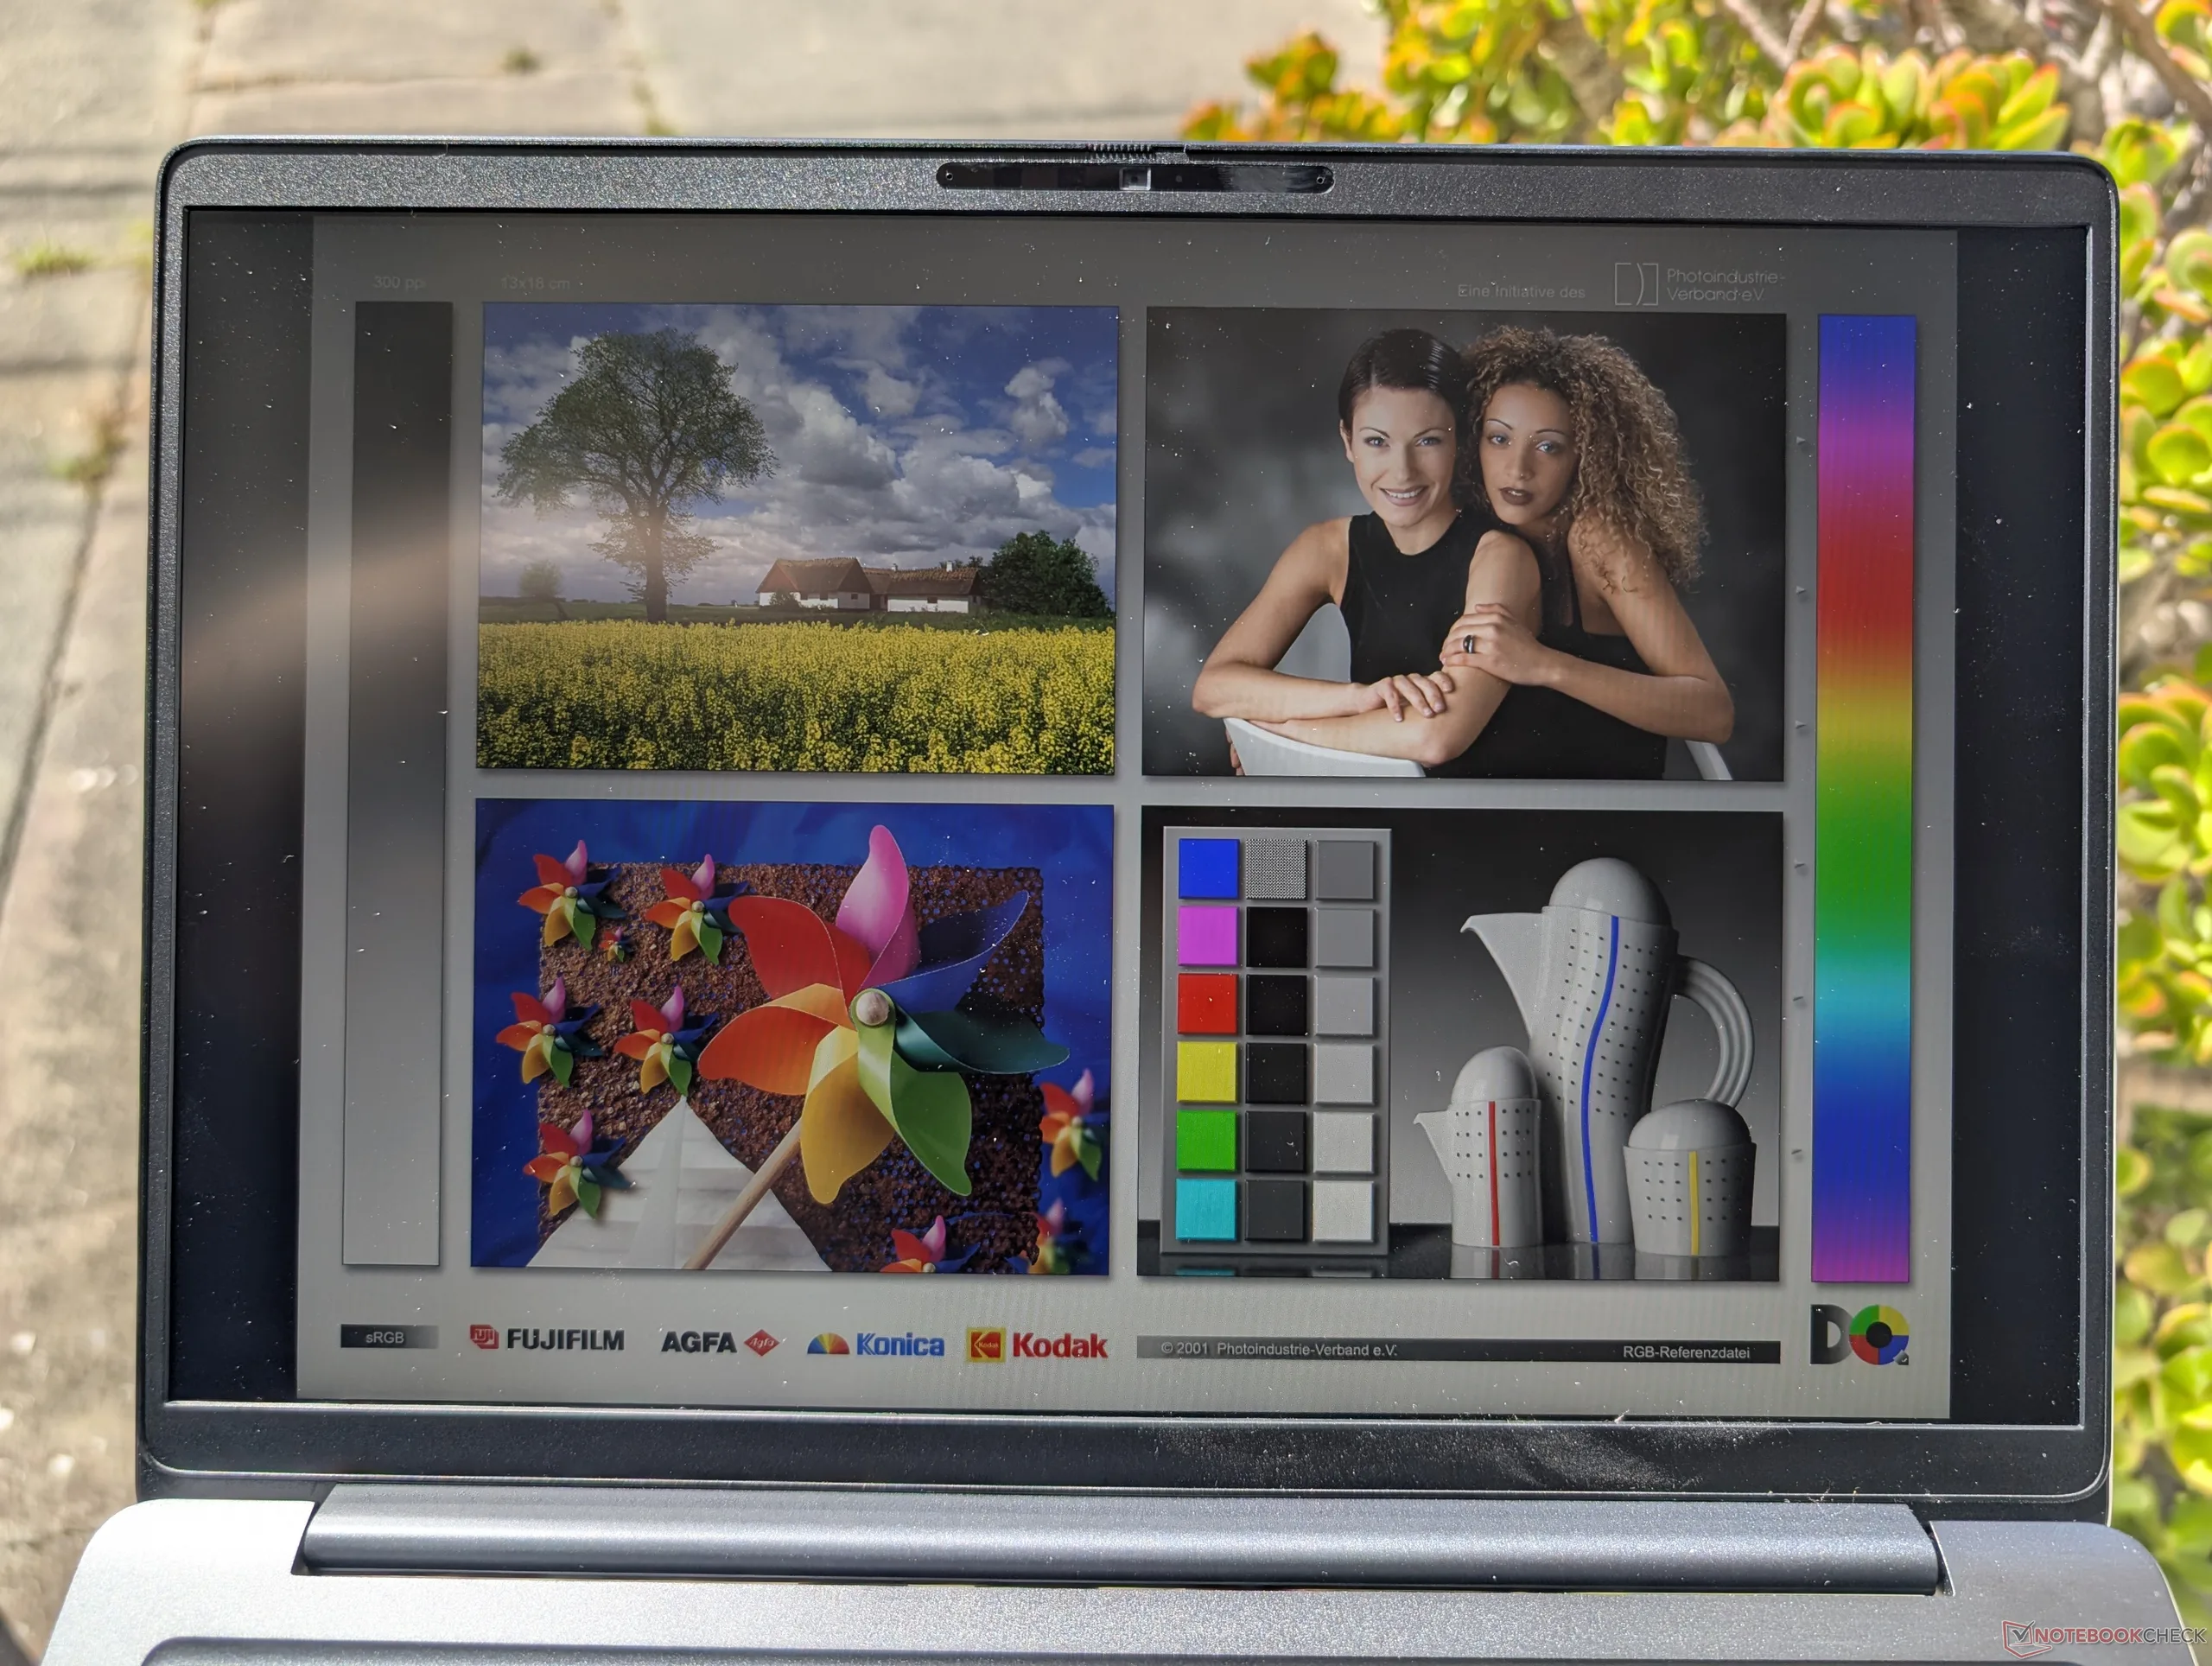
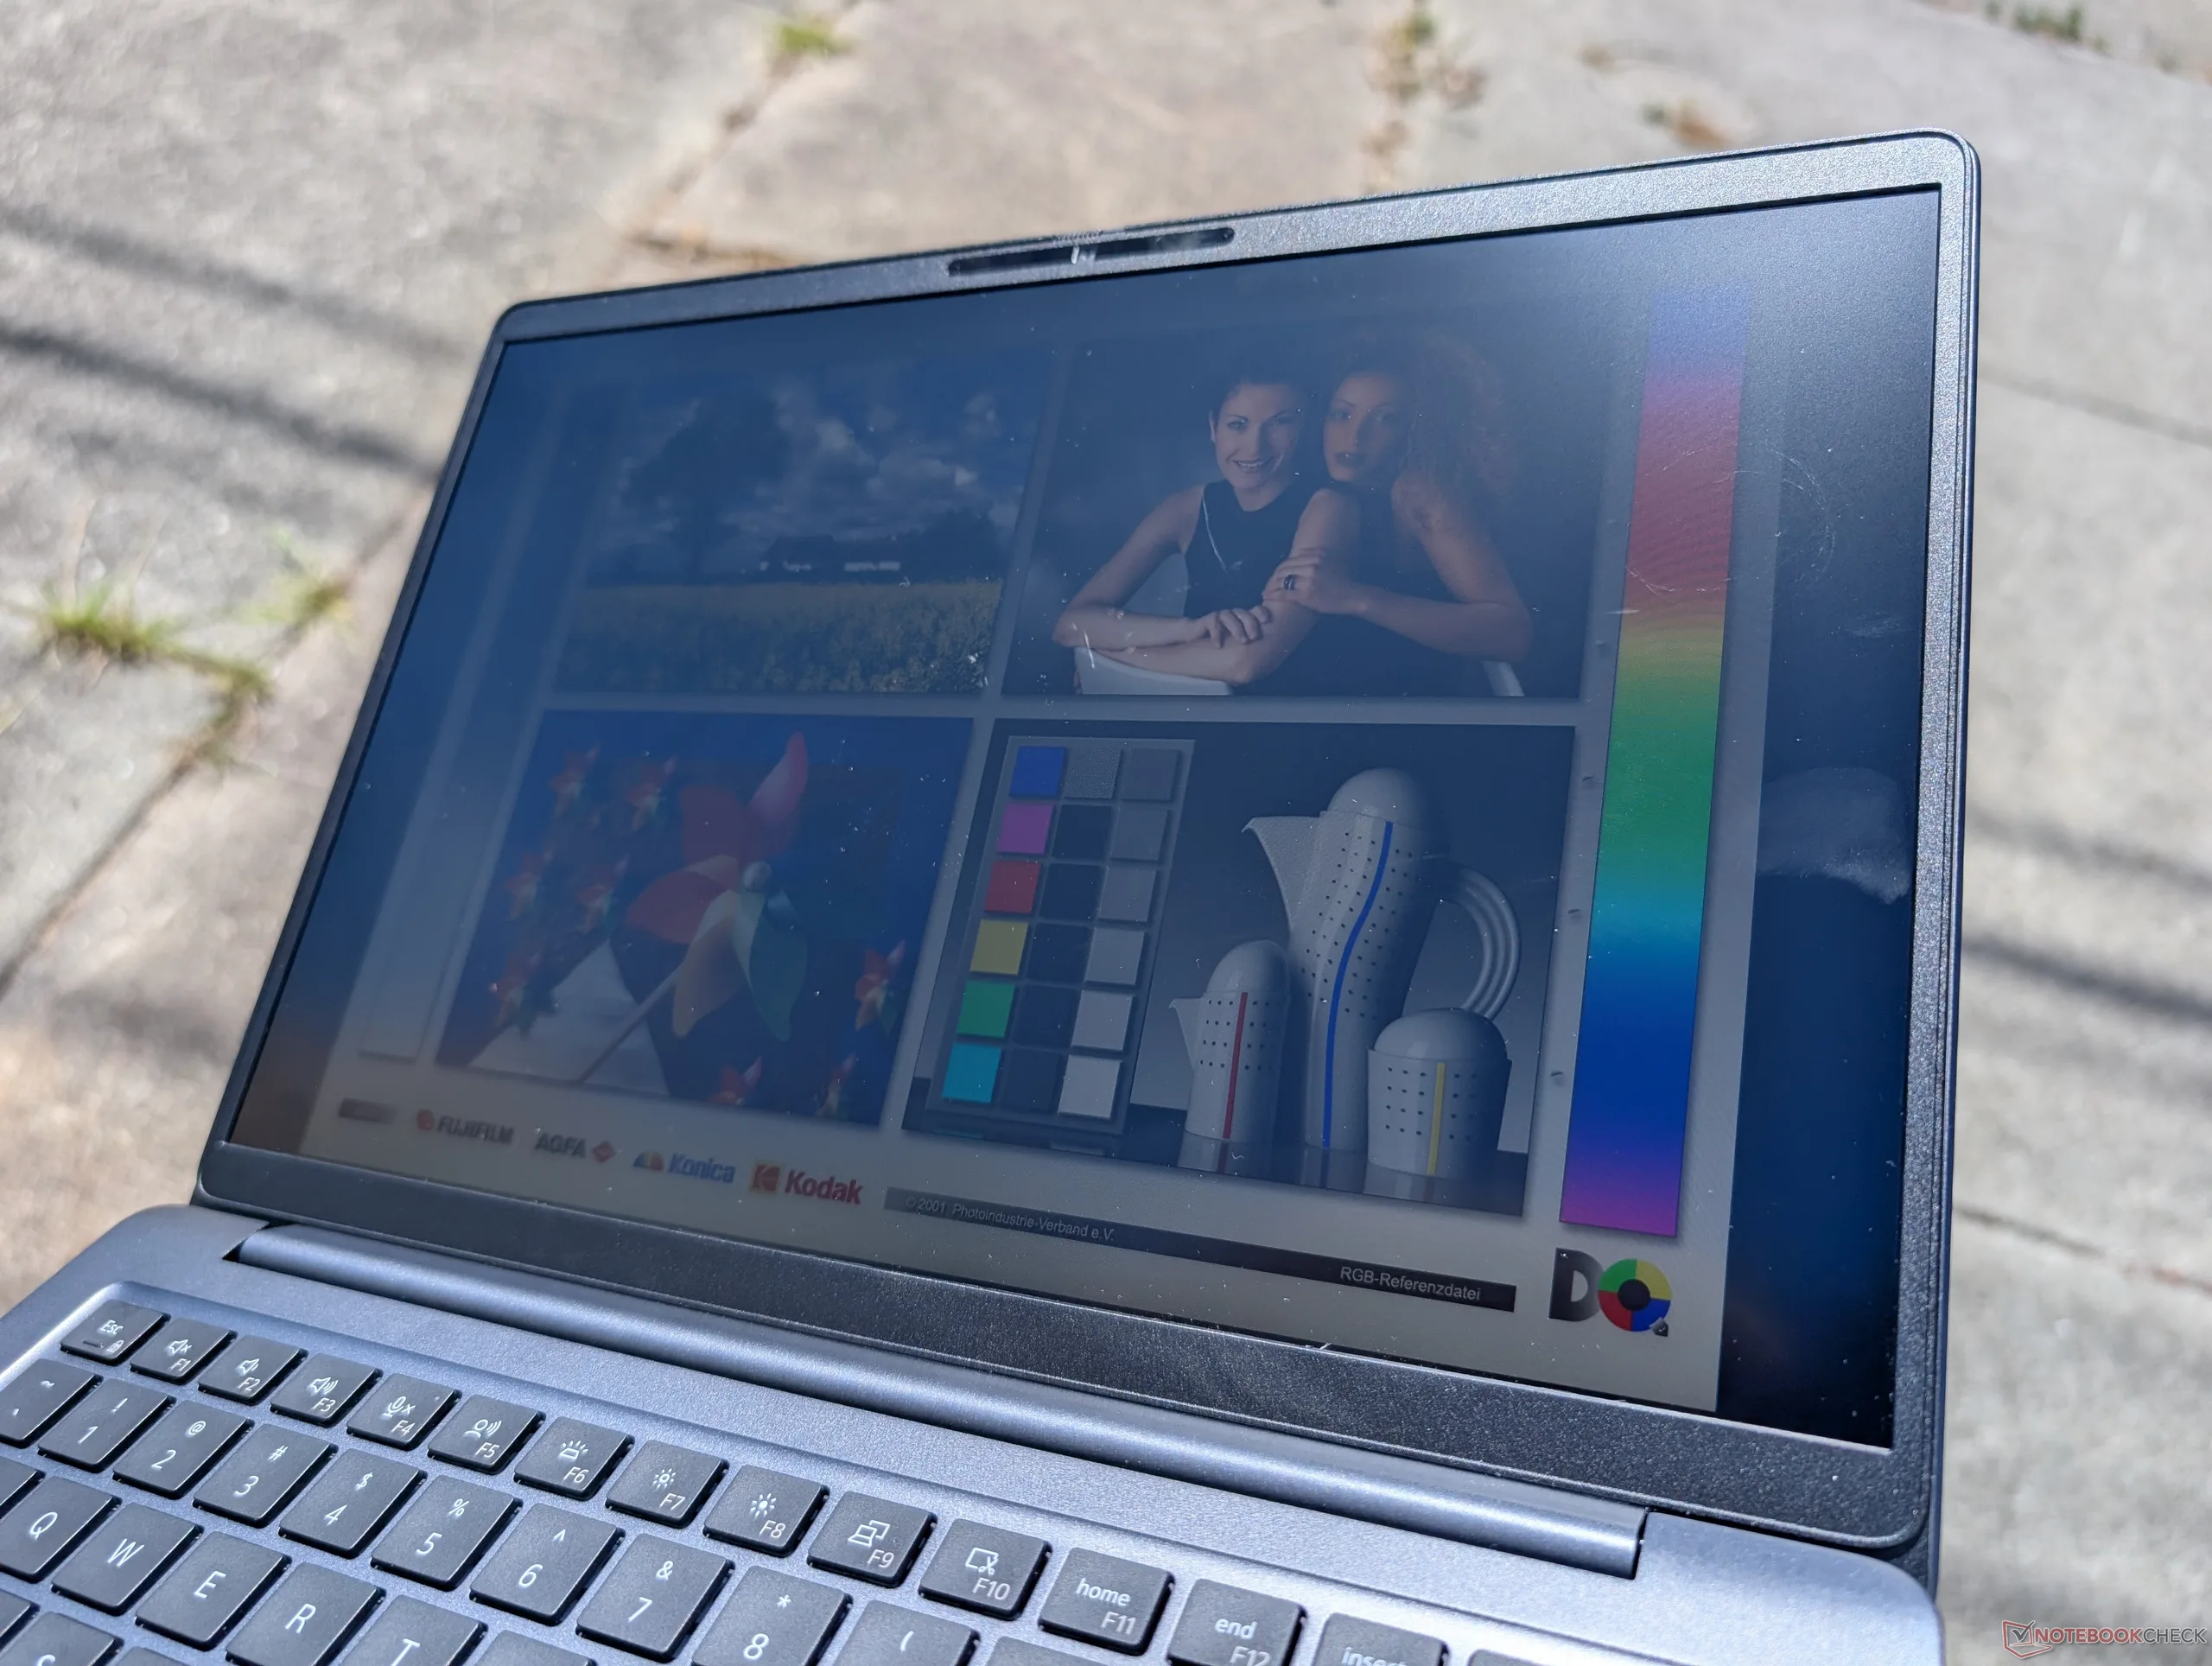
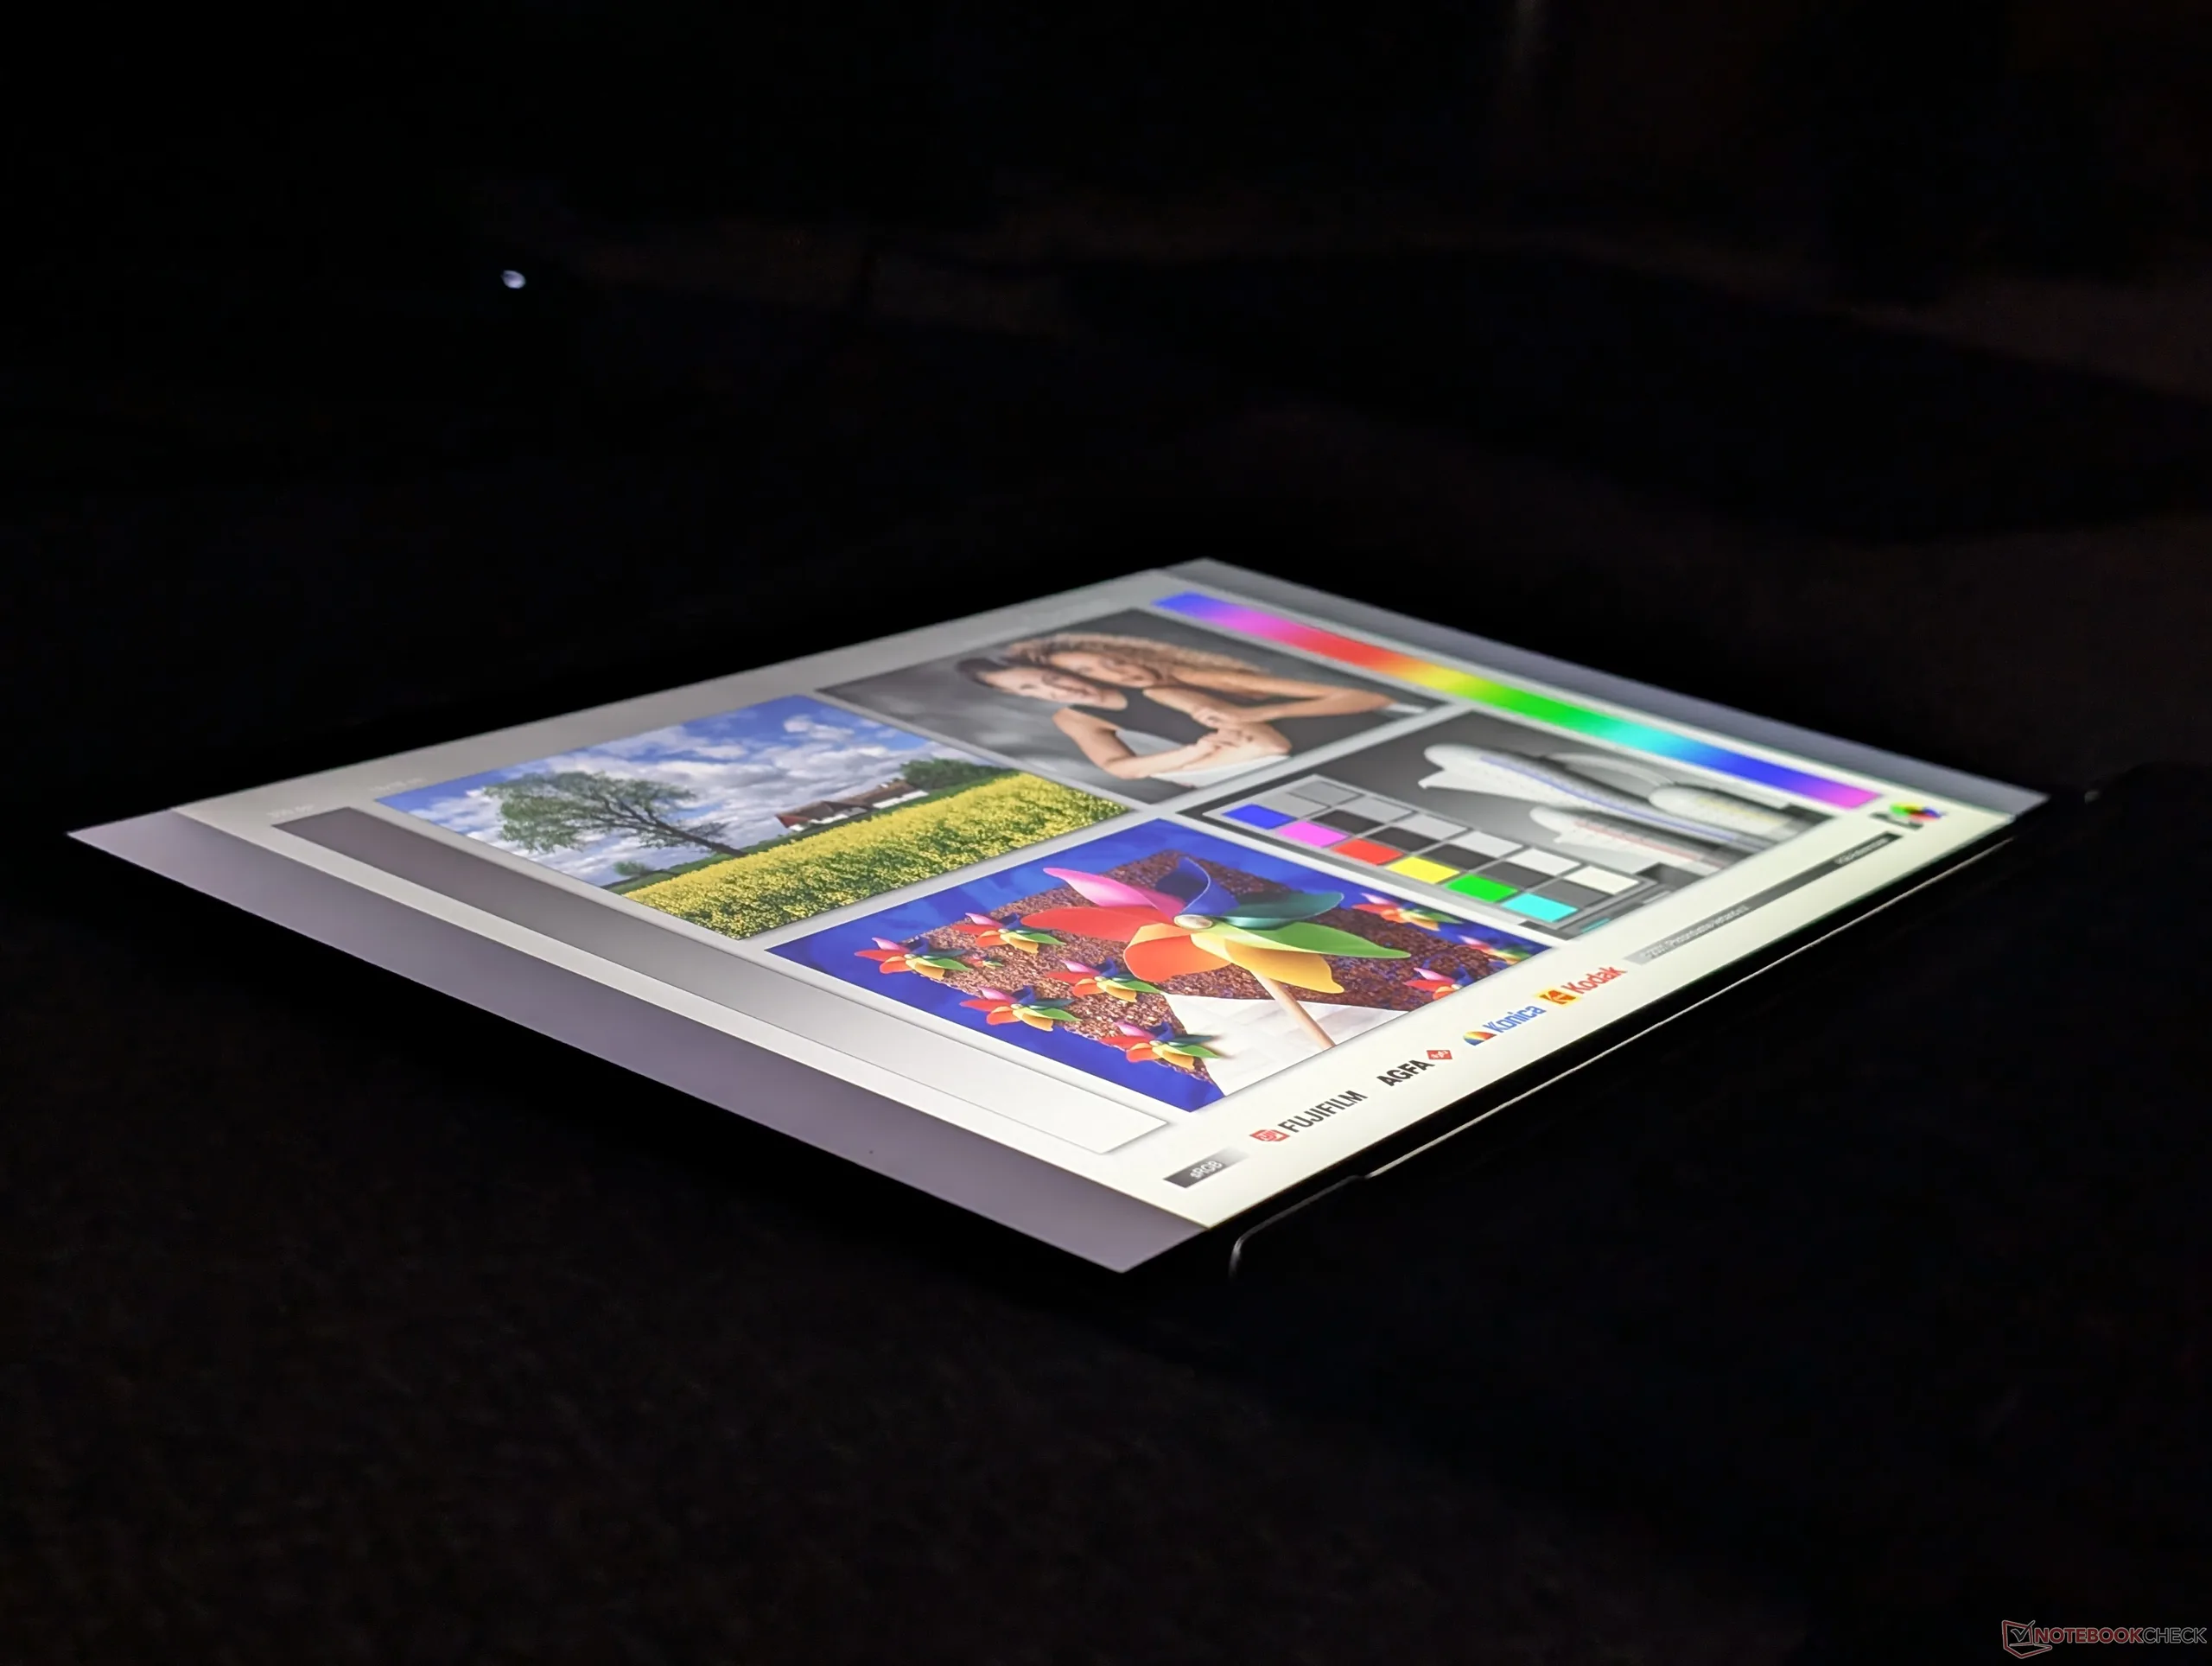
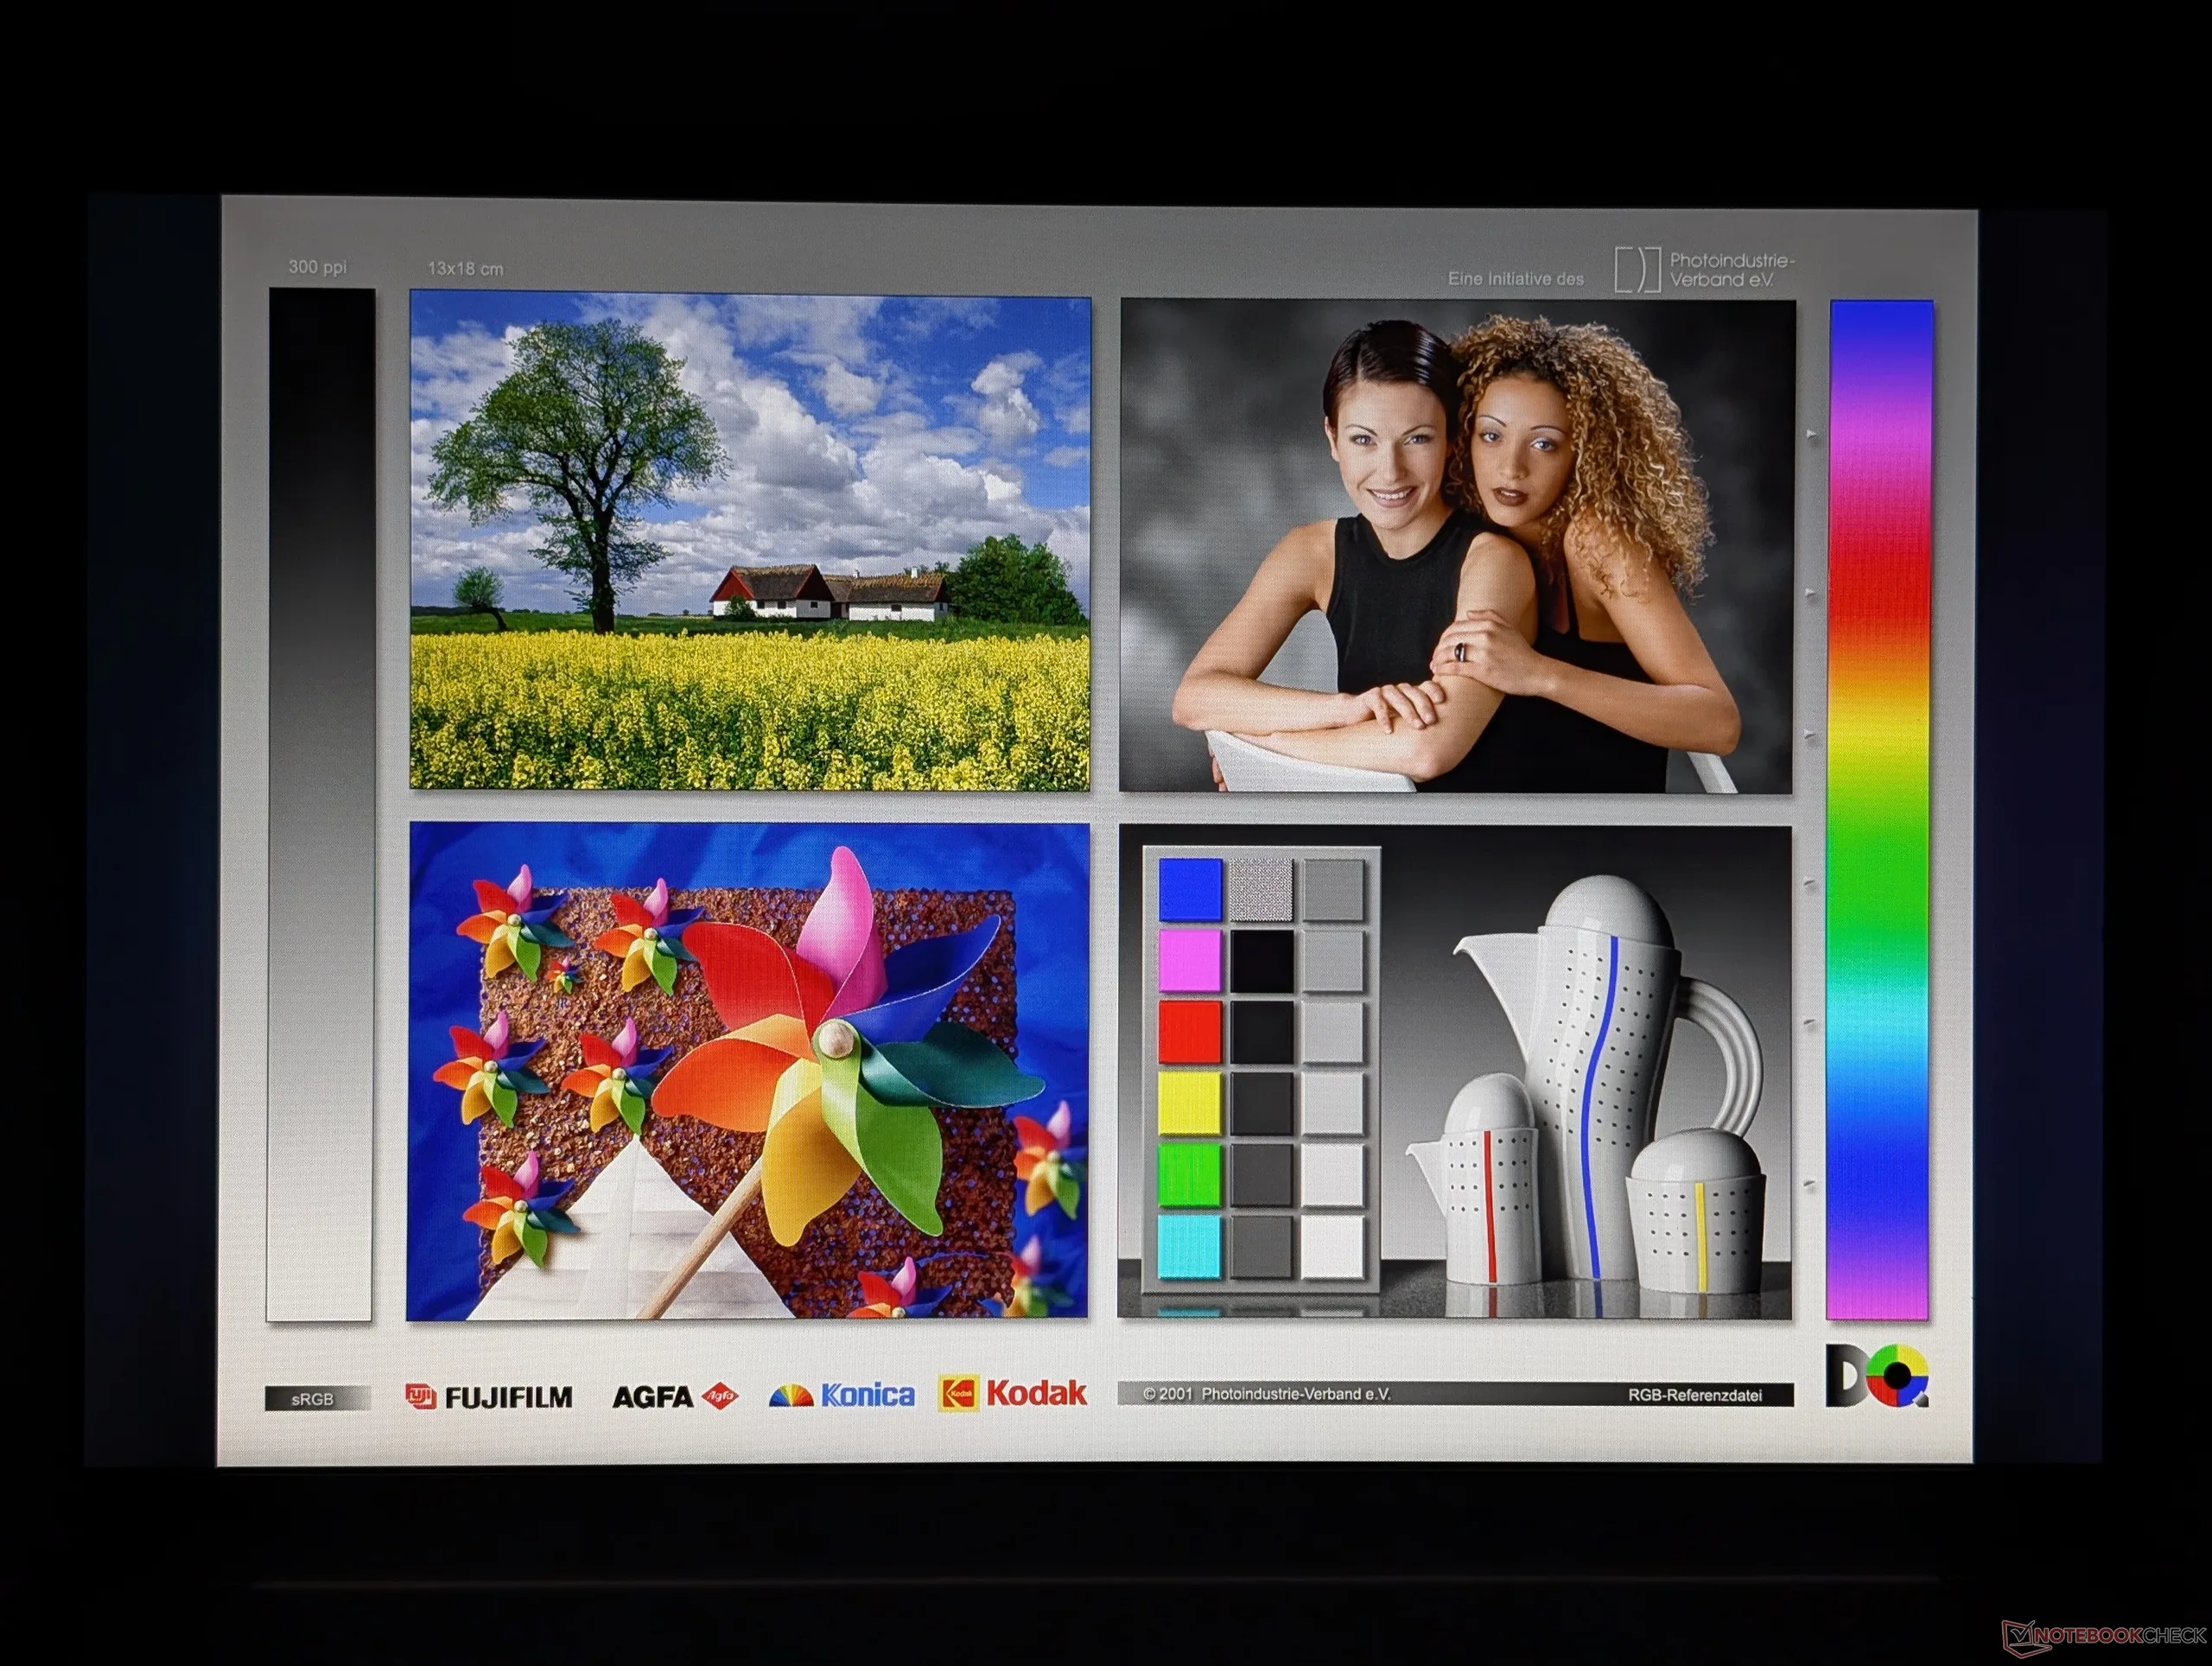
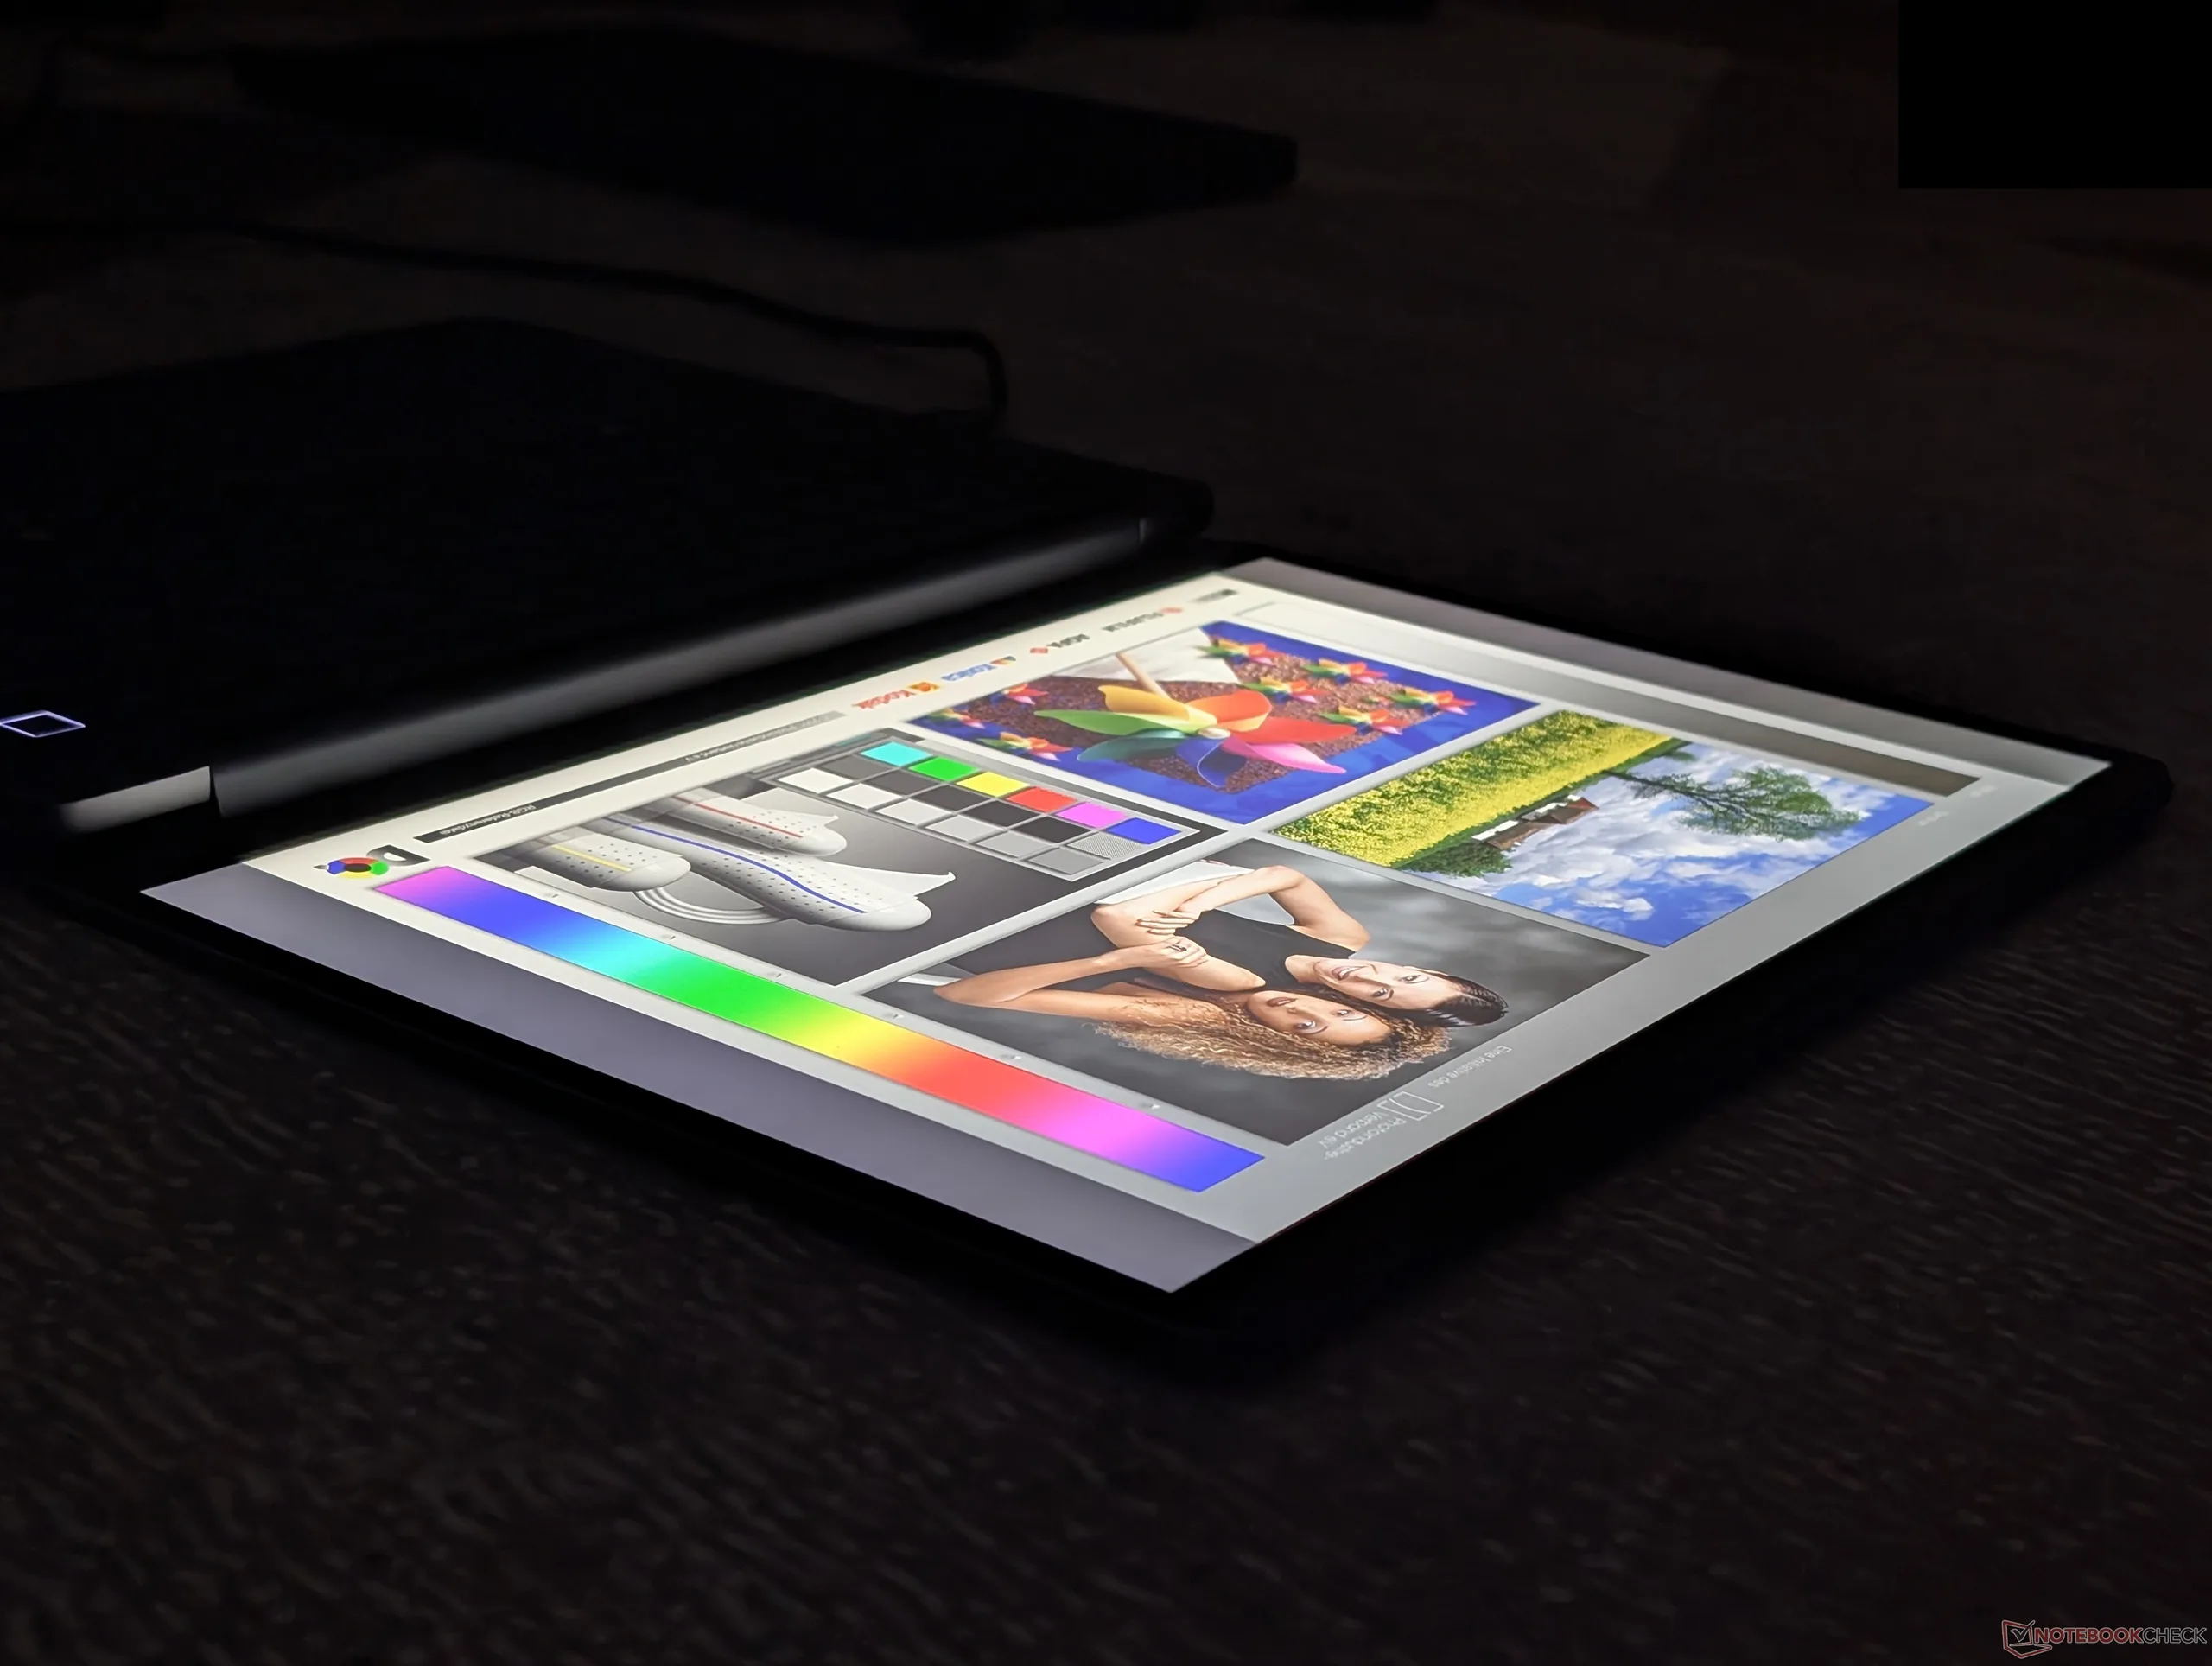
Insgesamt stehen sieben Display-Optionen zur Verfügung, bei denen es sich mit Ausnahme einer einzigen FHD-OLED-Option ausschließlich um IPS-Displays handelt. Es gibt keine Touchscreen- oder HDR-Optionen, was für viele geschäftsorientierte Clamshell-Notebooks typisch ist.
Nur eine der Optionen unterstützt eine Bildwiederholfrequenz von 1 Hz zur zusätzlichen Energieeinsparung, da alle anderen eine Mindestfrequenz von nur 60 oder 48 Hz aufweisen.

| |||||||||||||||||||||||||
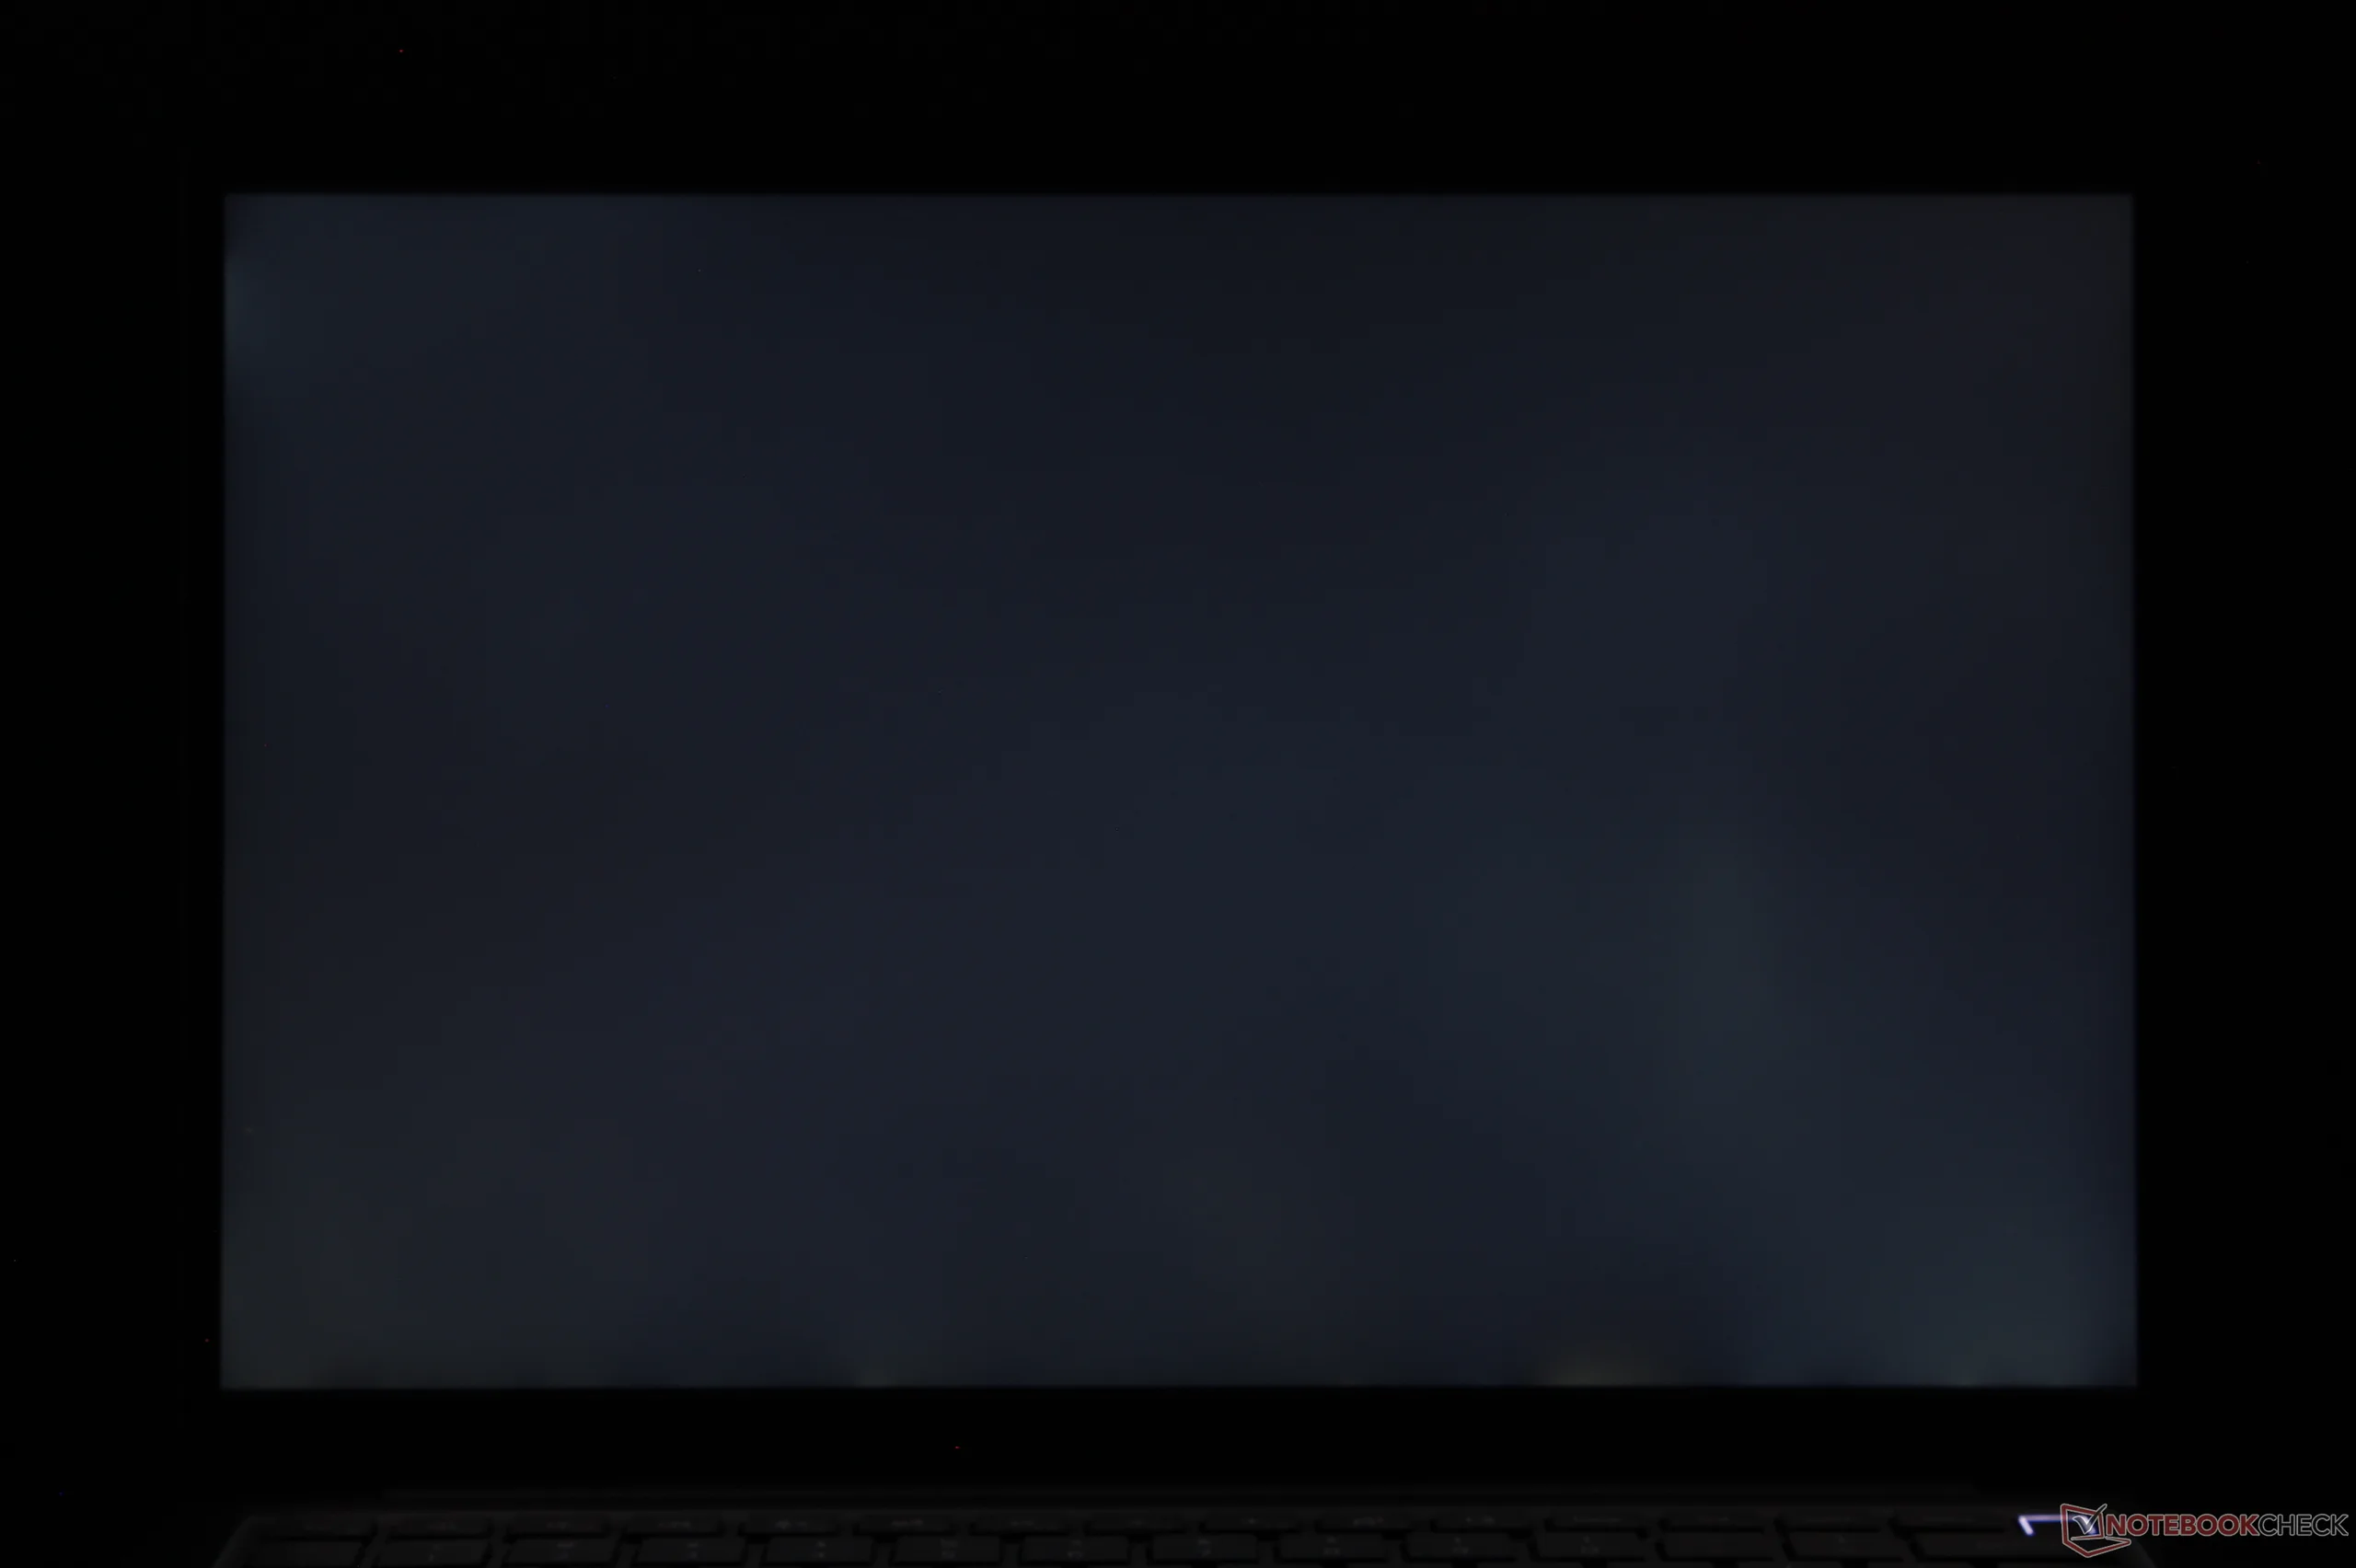
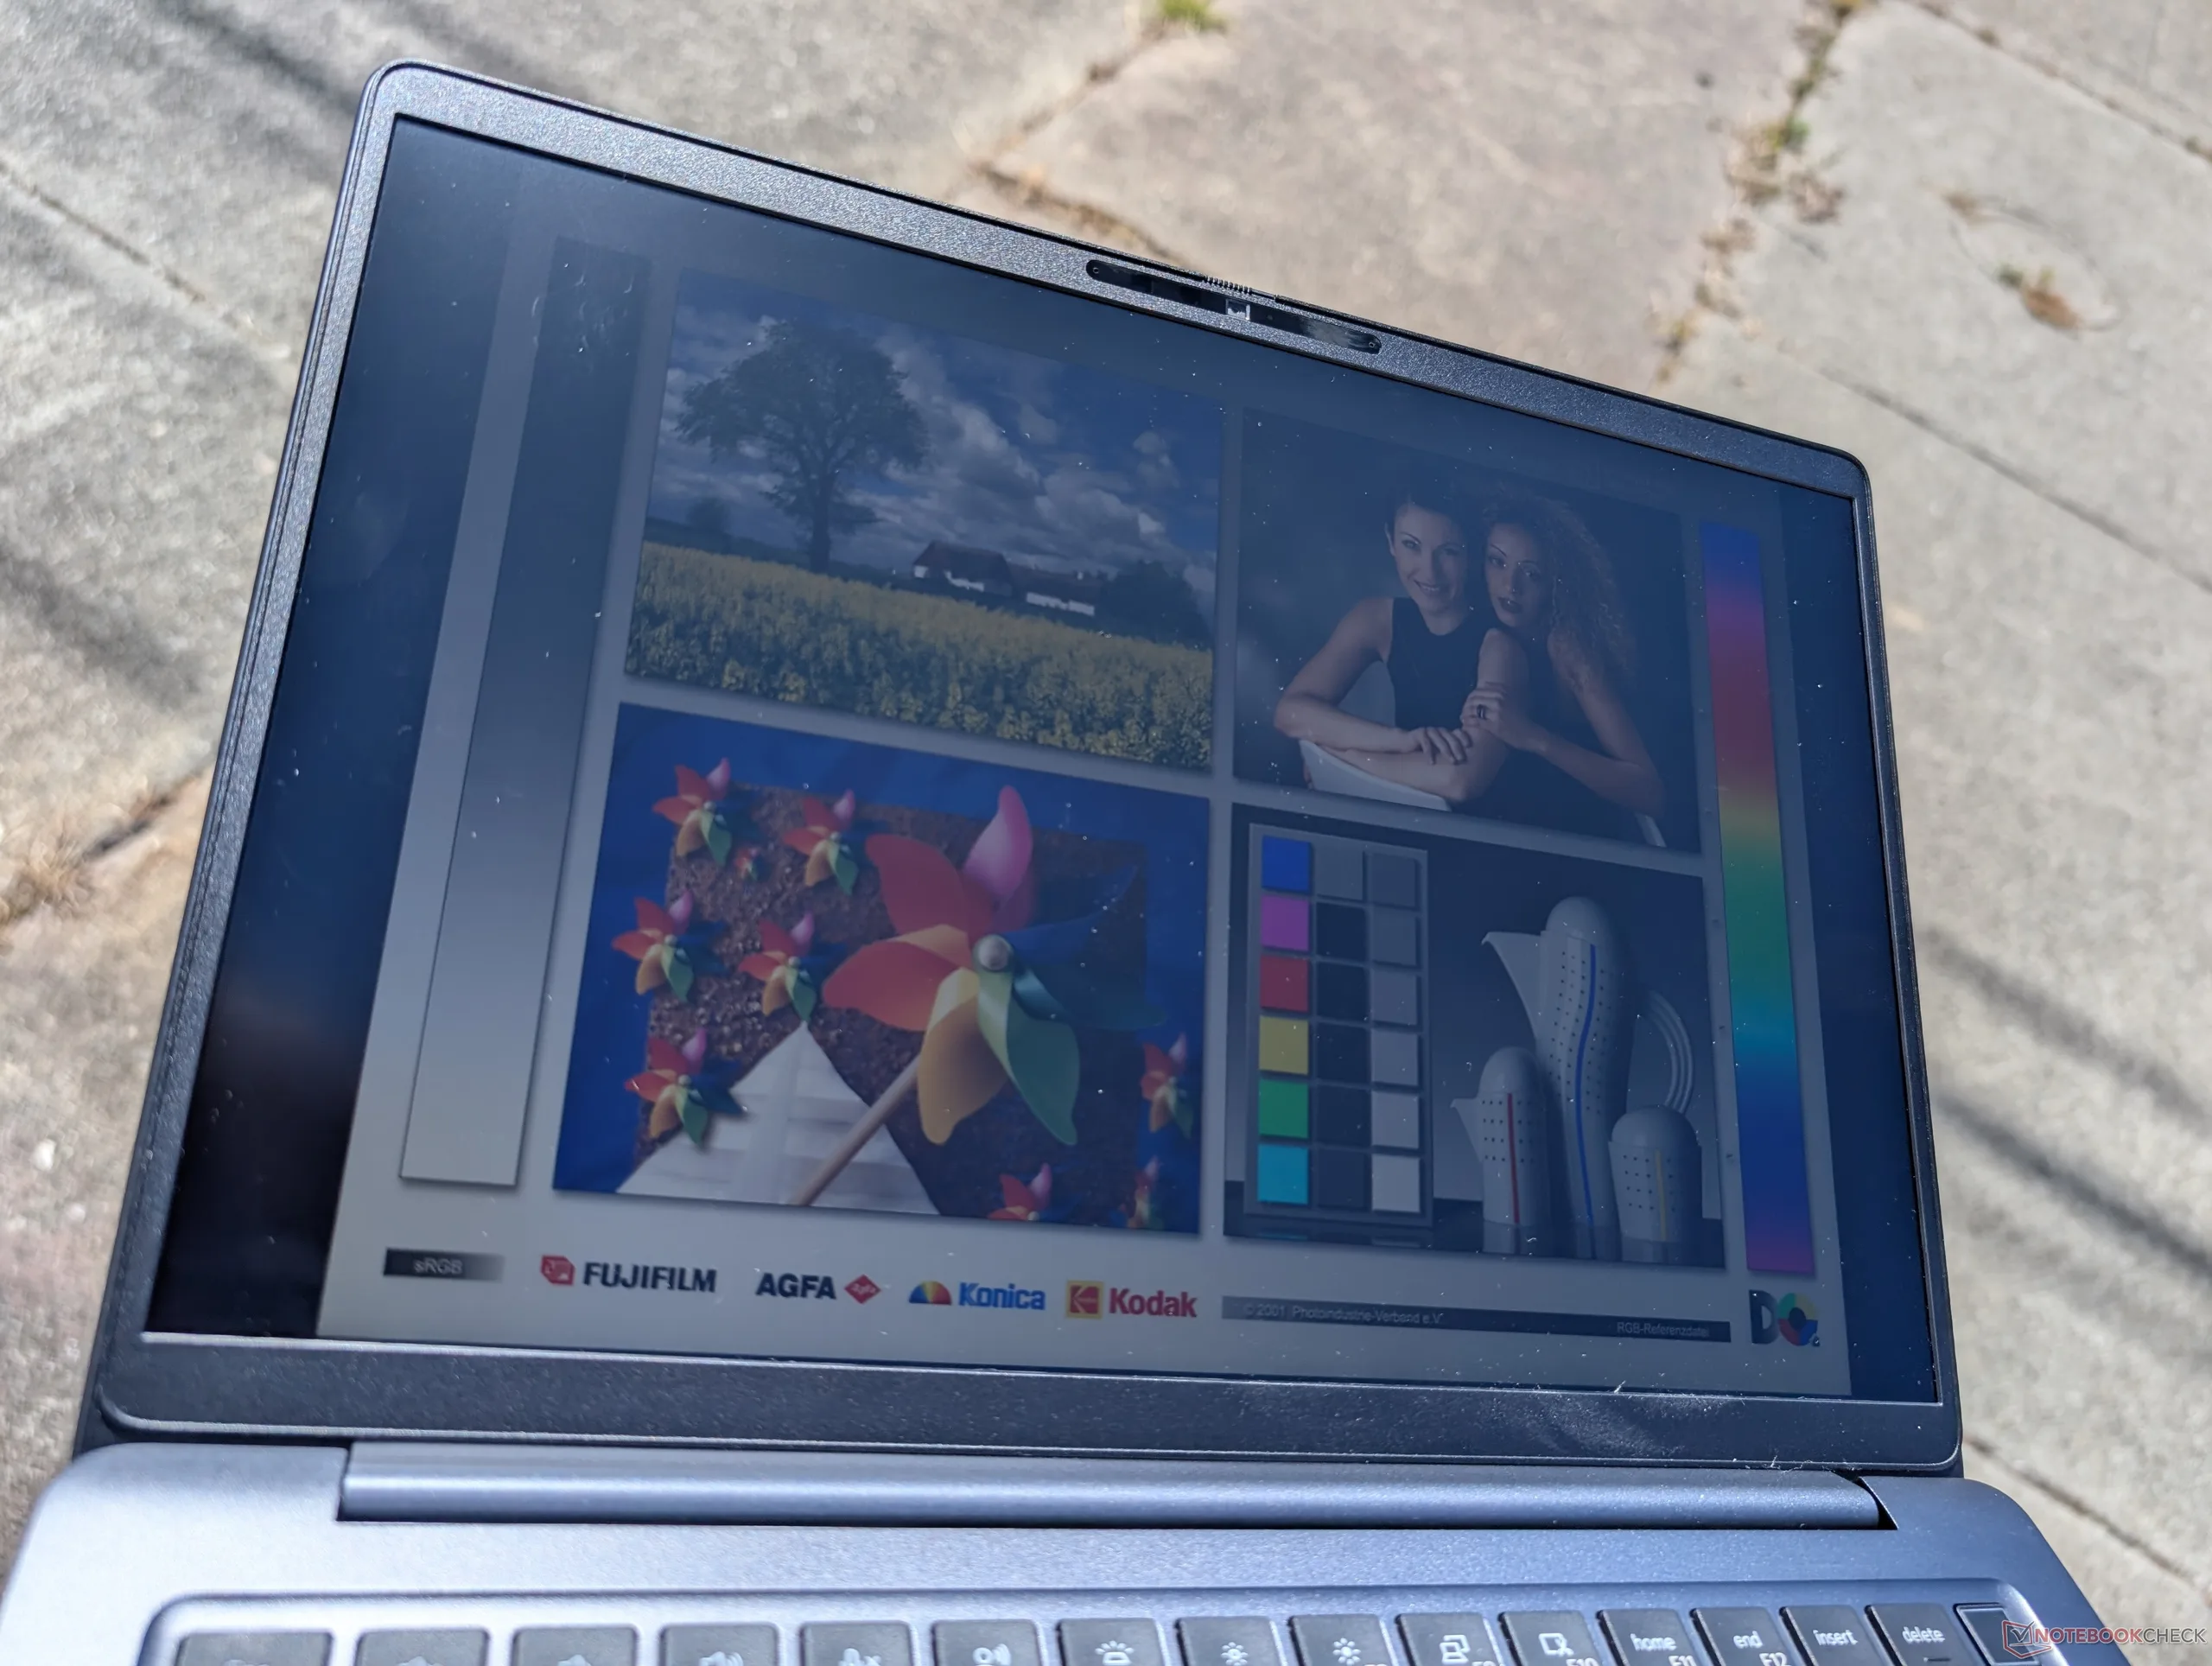
Ausleuchtung: 80 %
Helligkeit Akku: 559.9 cd/m²
Kontrast: 2333:1 (Schwarzwert: 0.24 cd/m²)
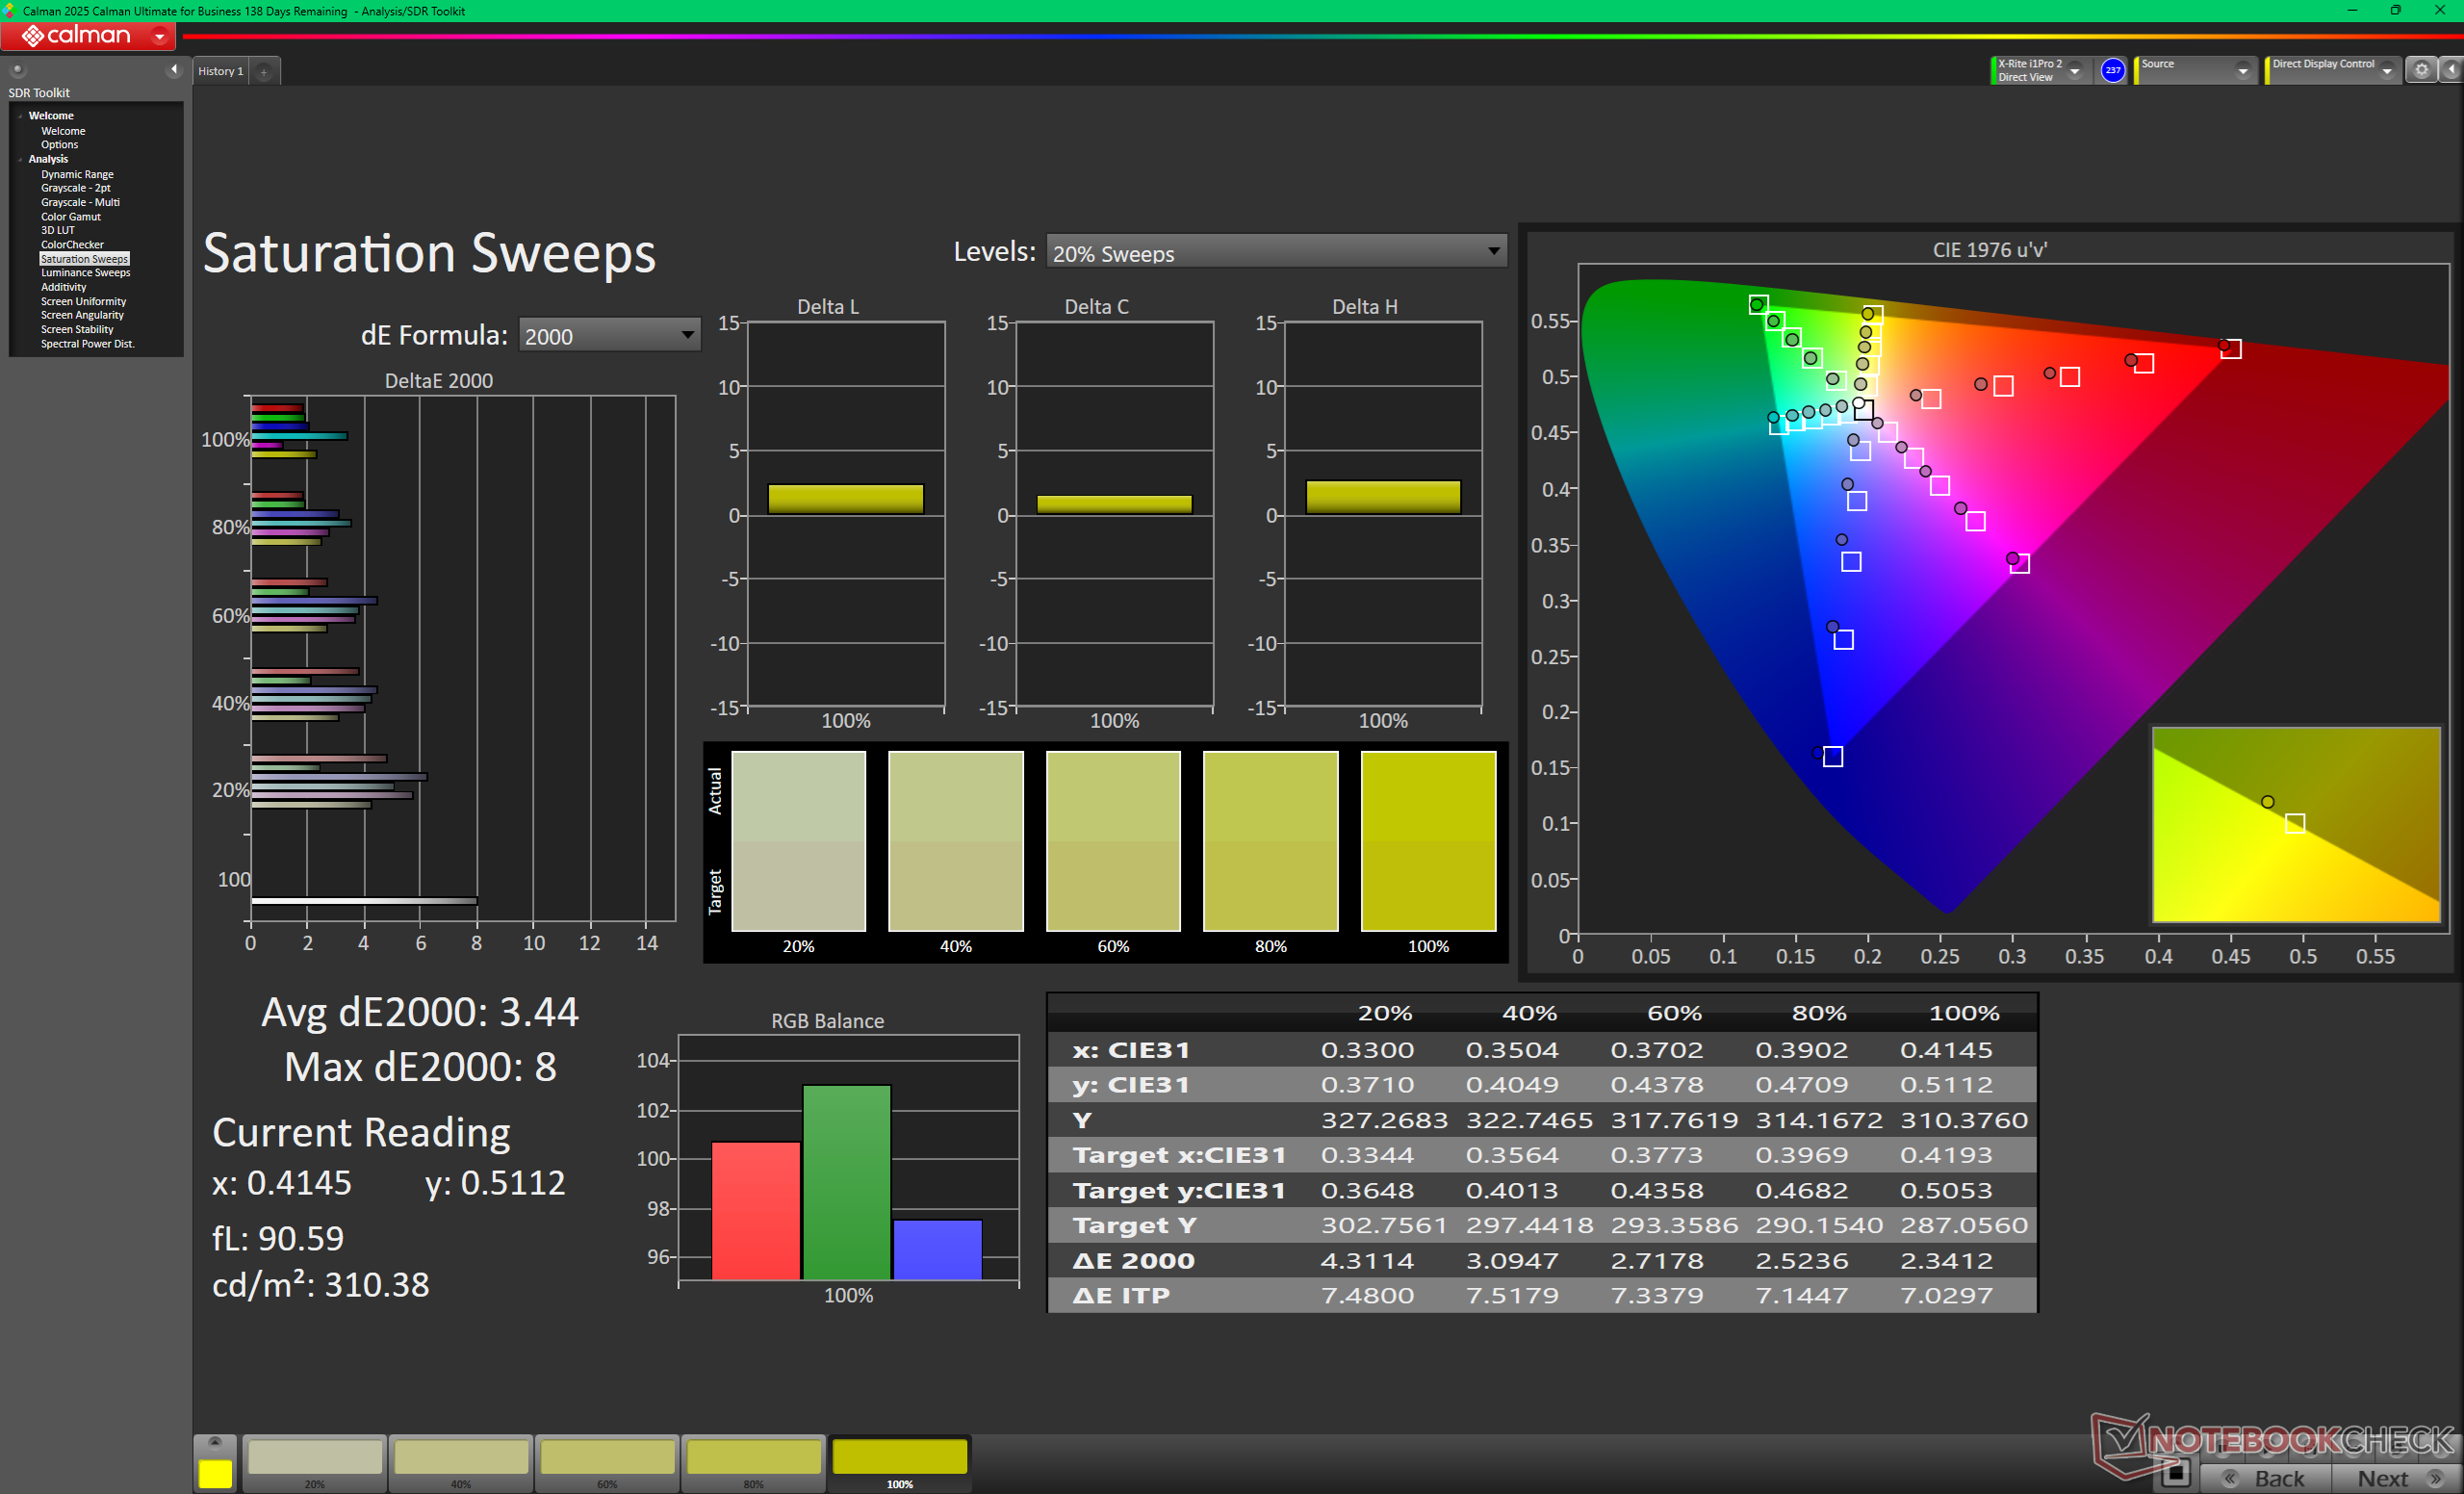
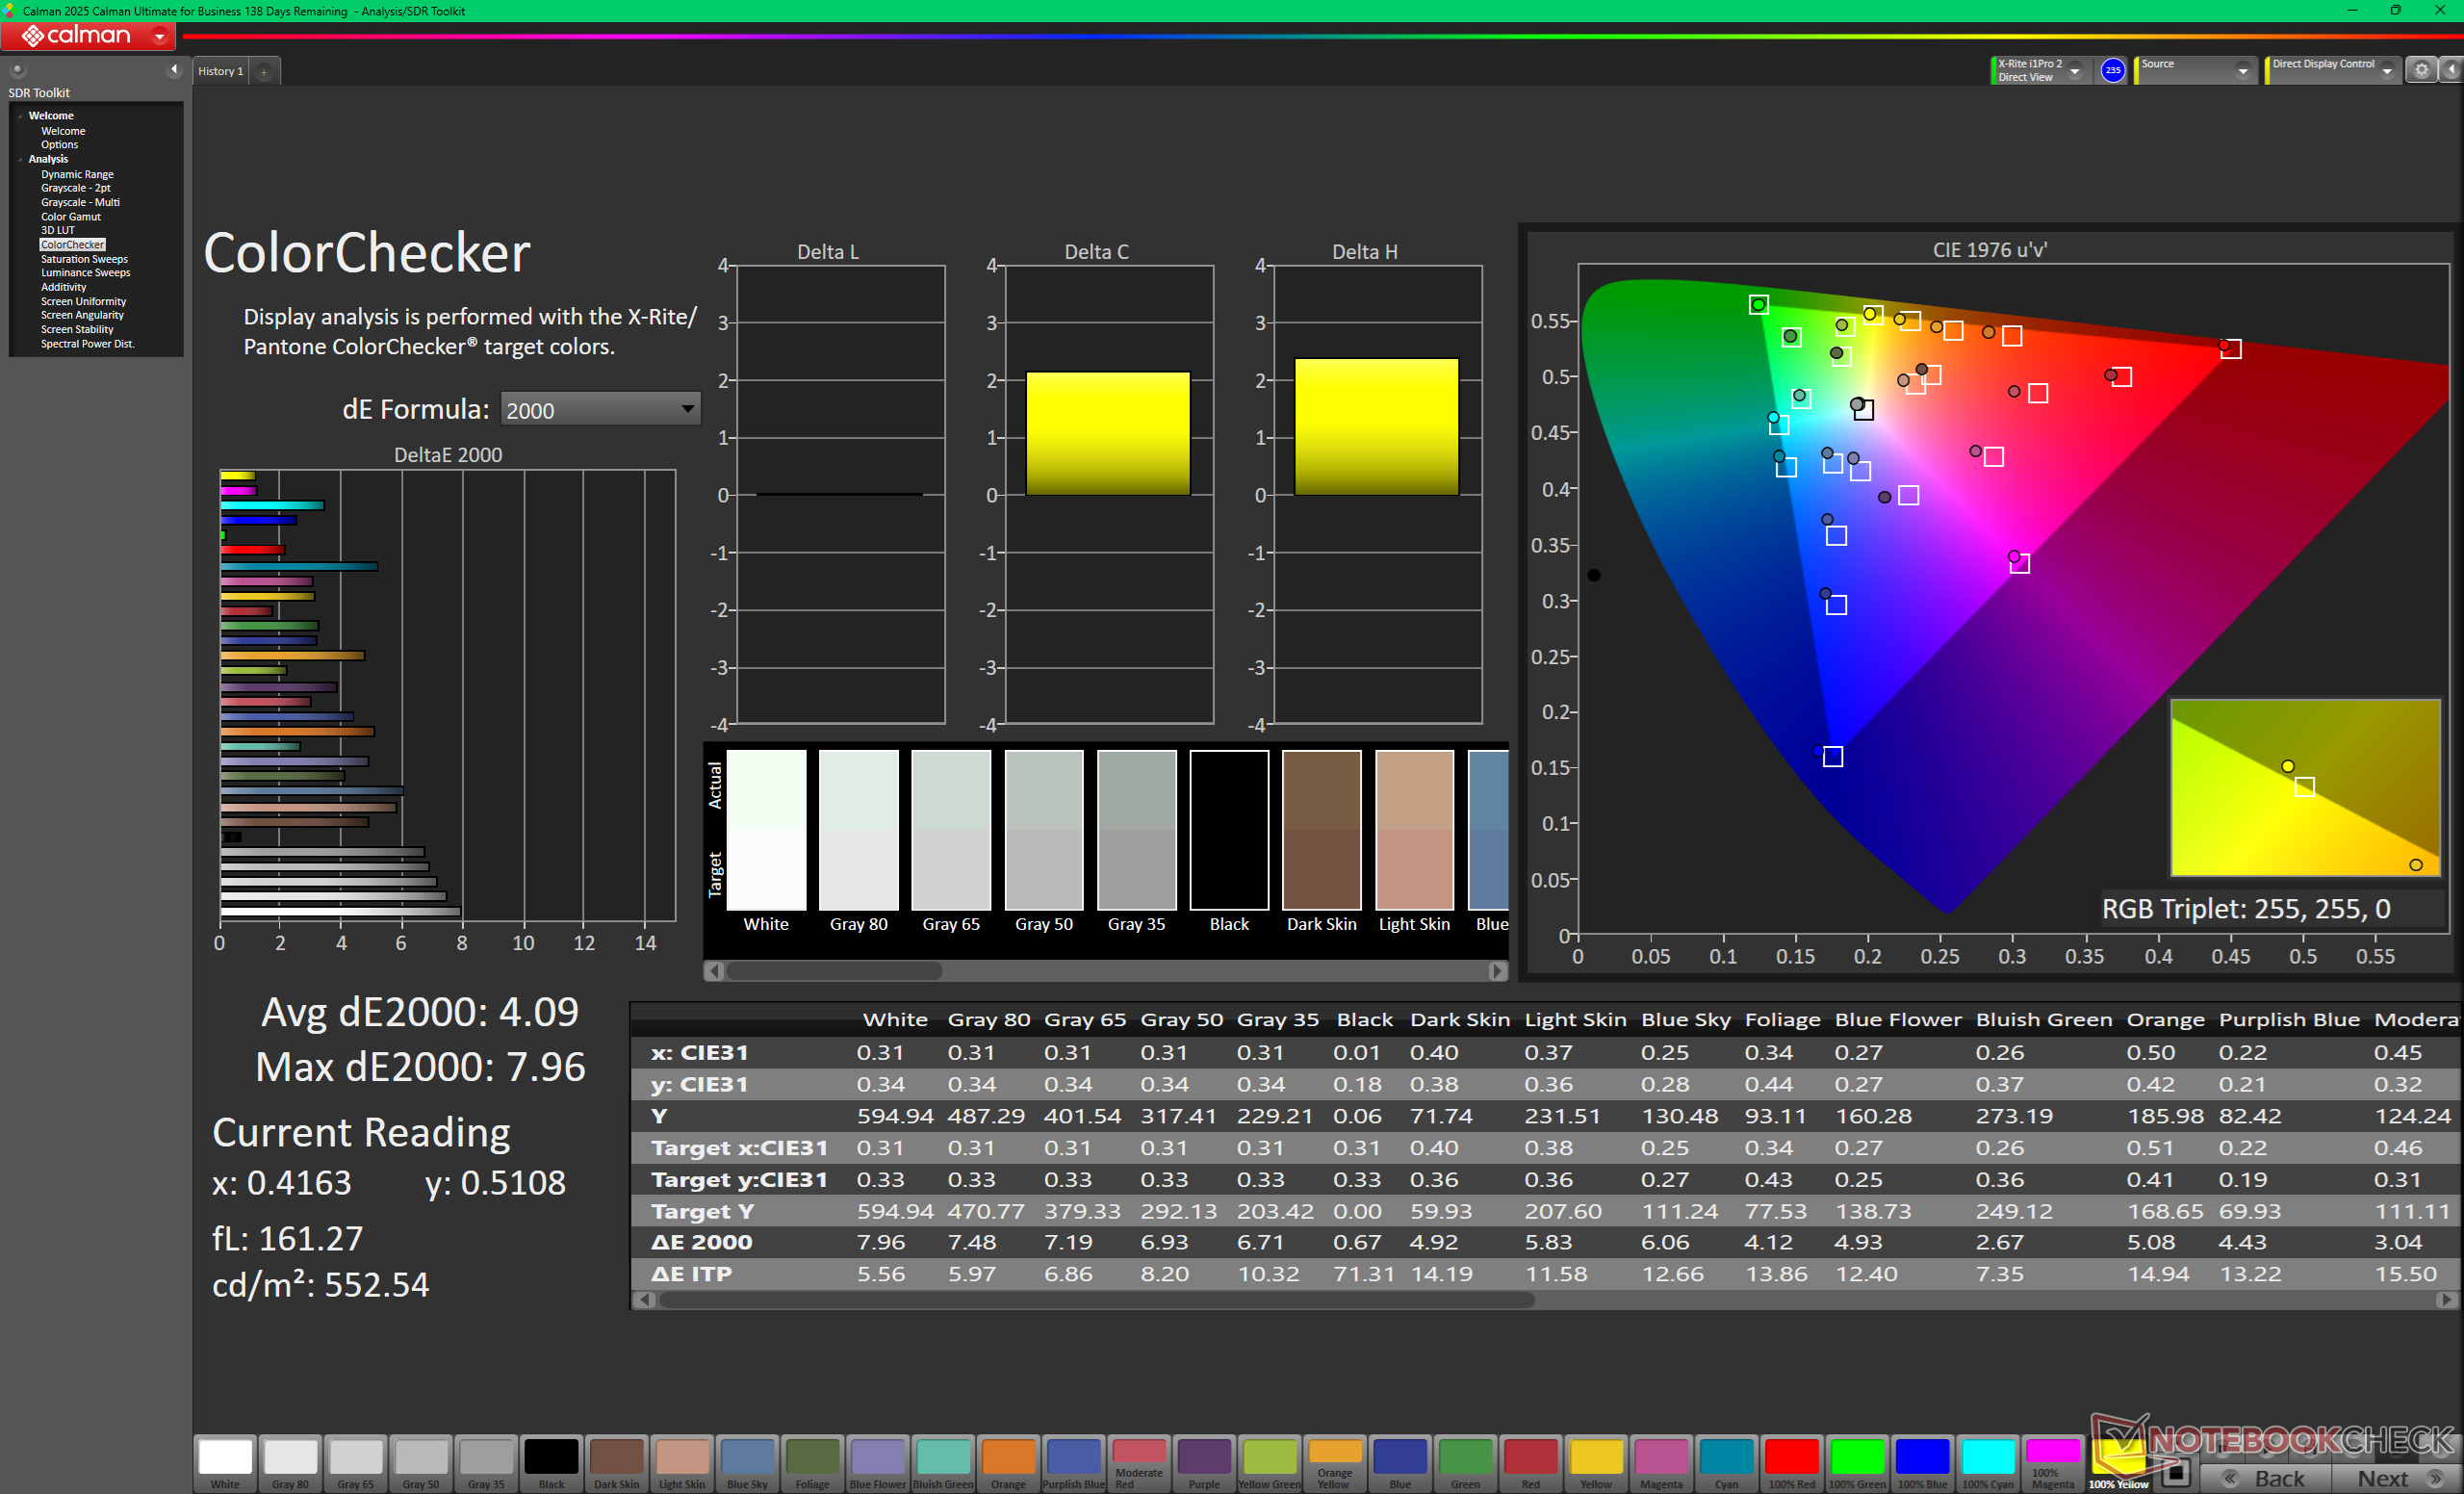
ΔE ColorChecker Calman: 4.09 | ∀{0.5-29.43 Ø4.68}
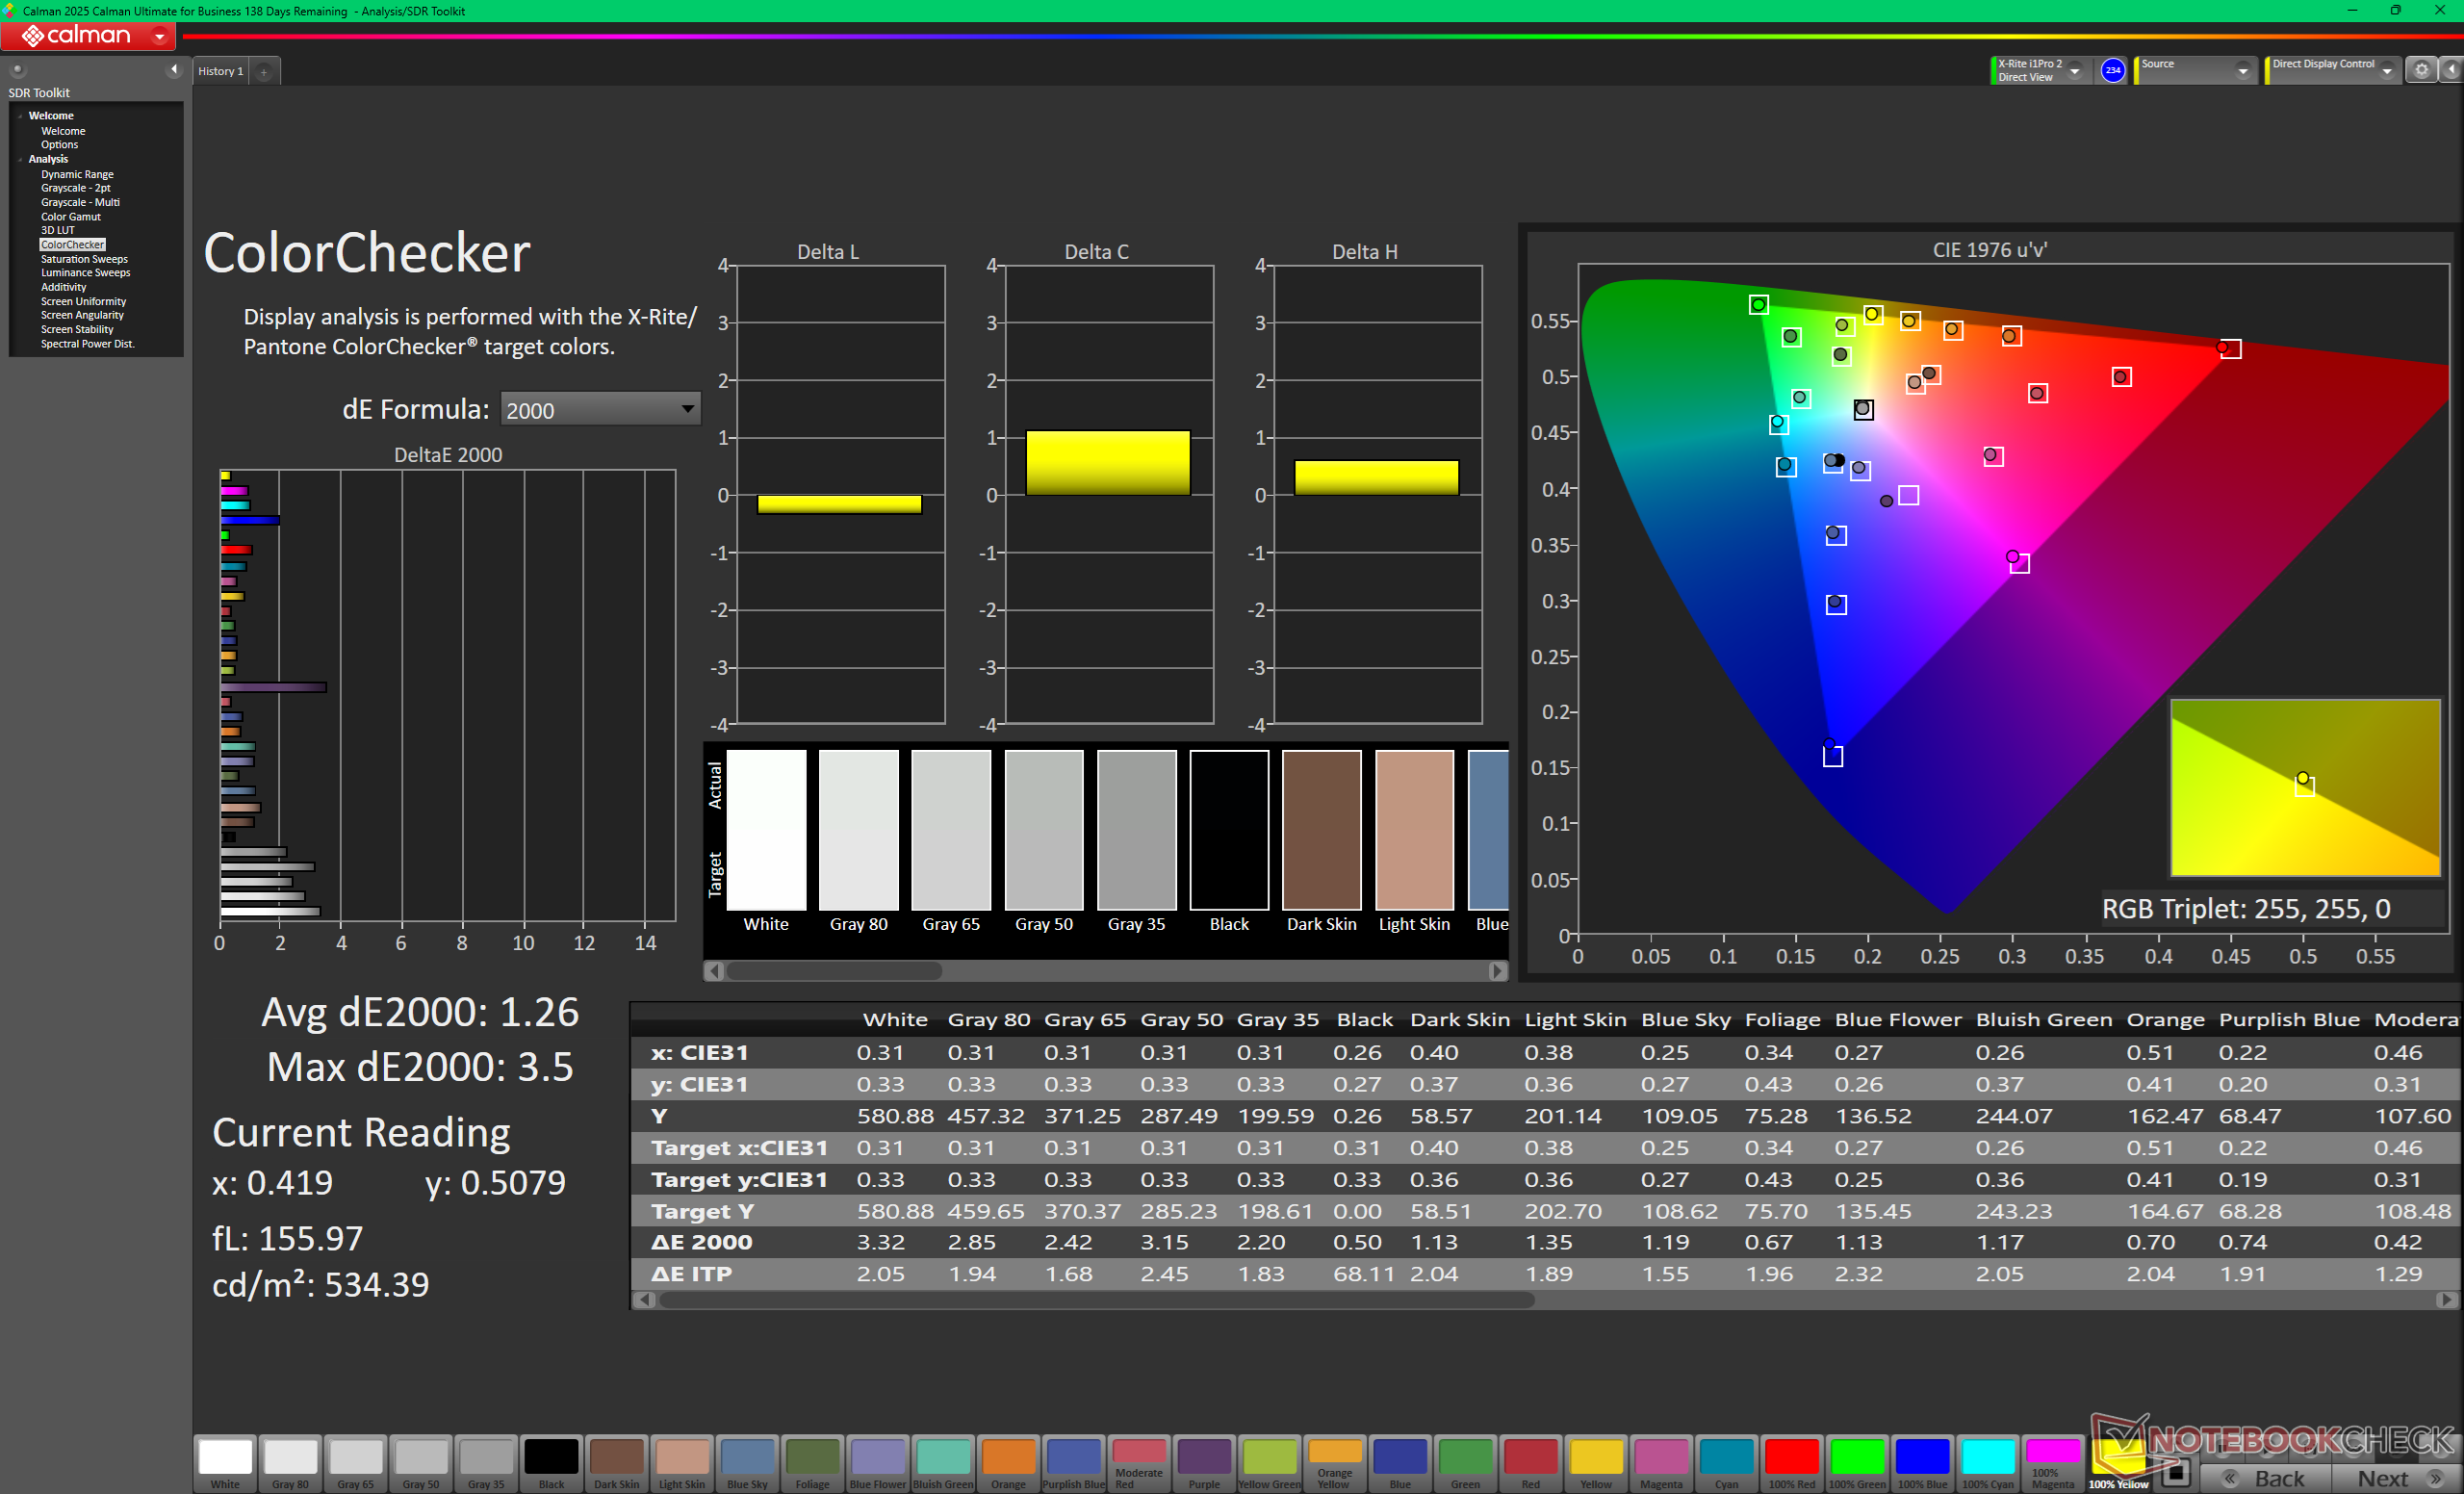
calibrated: 1.26
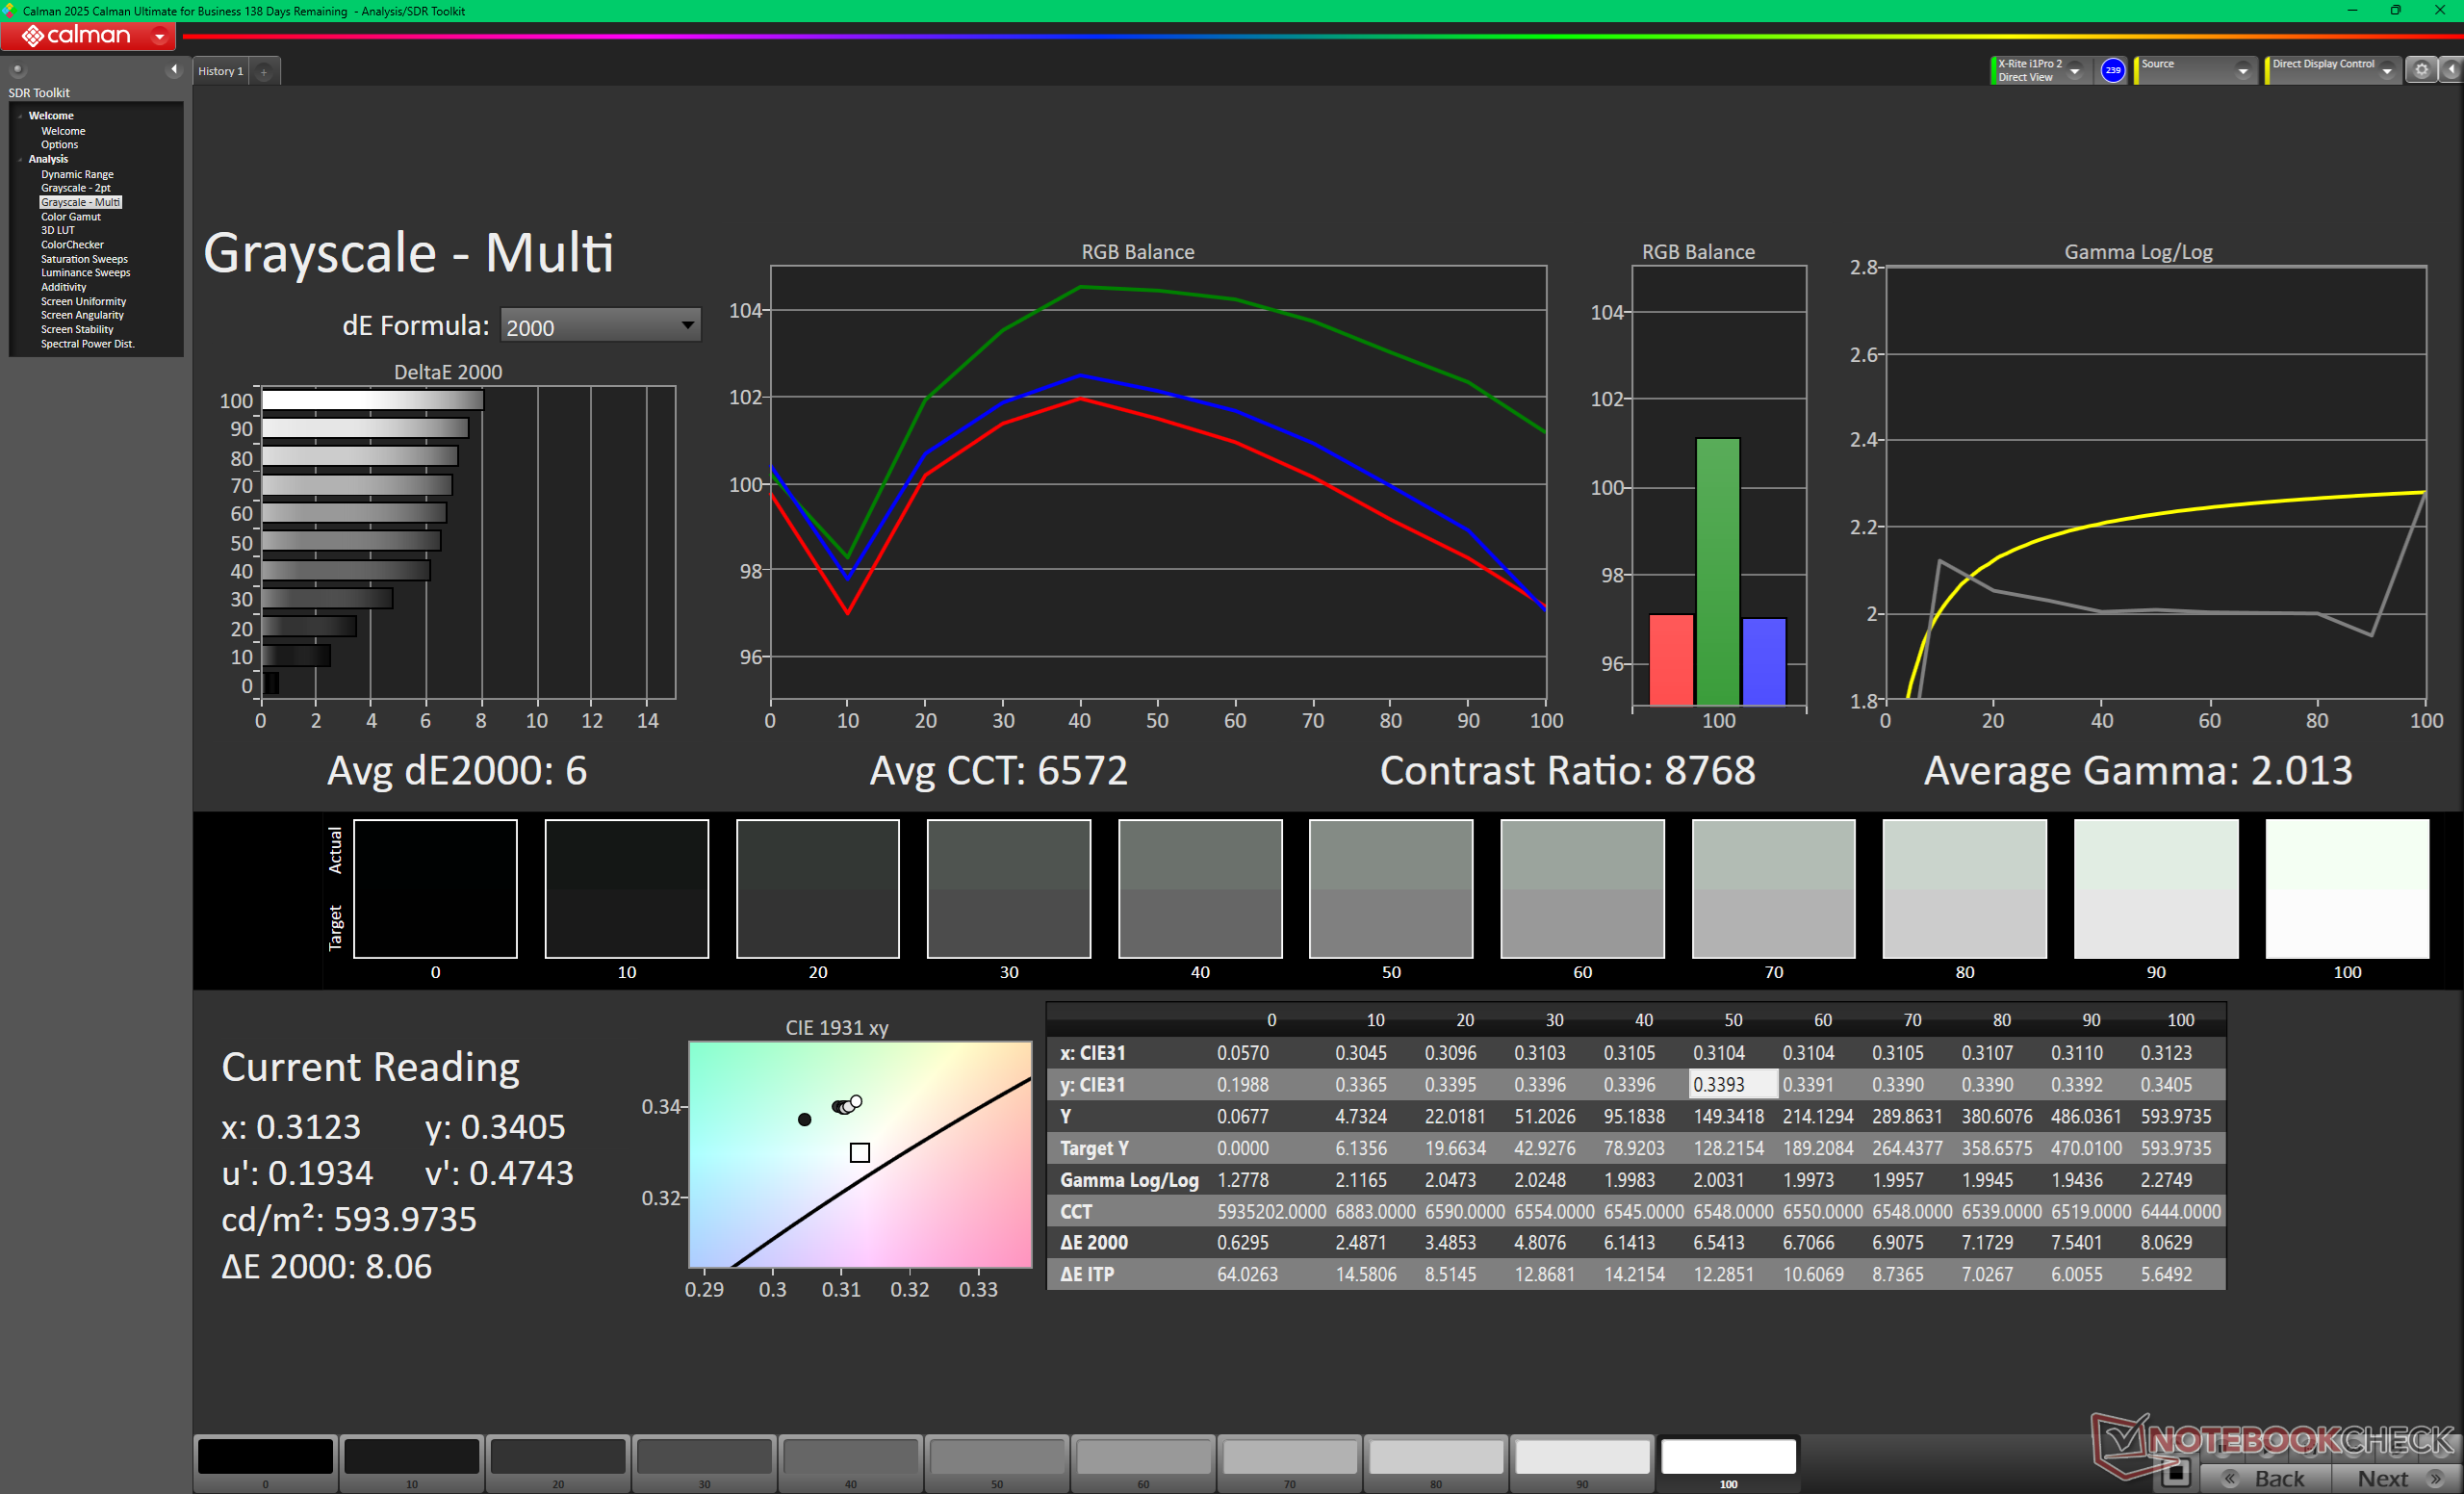
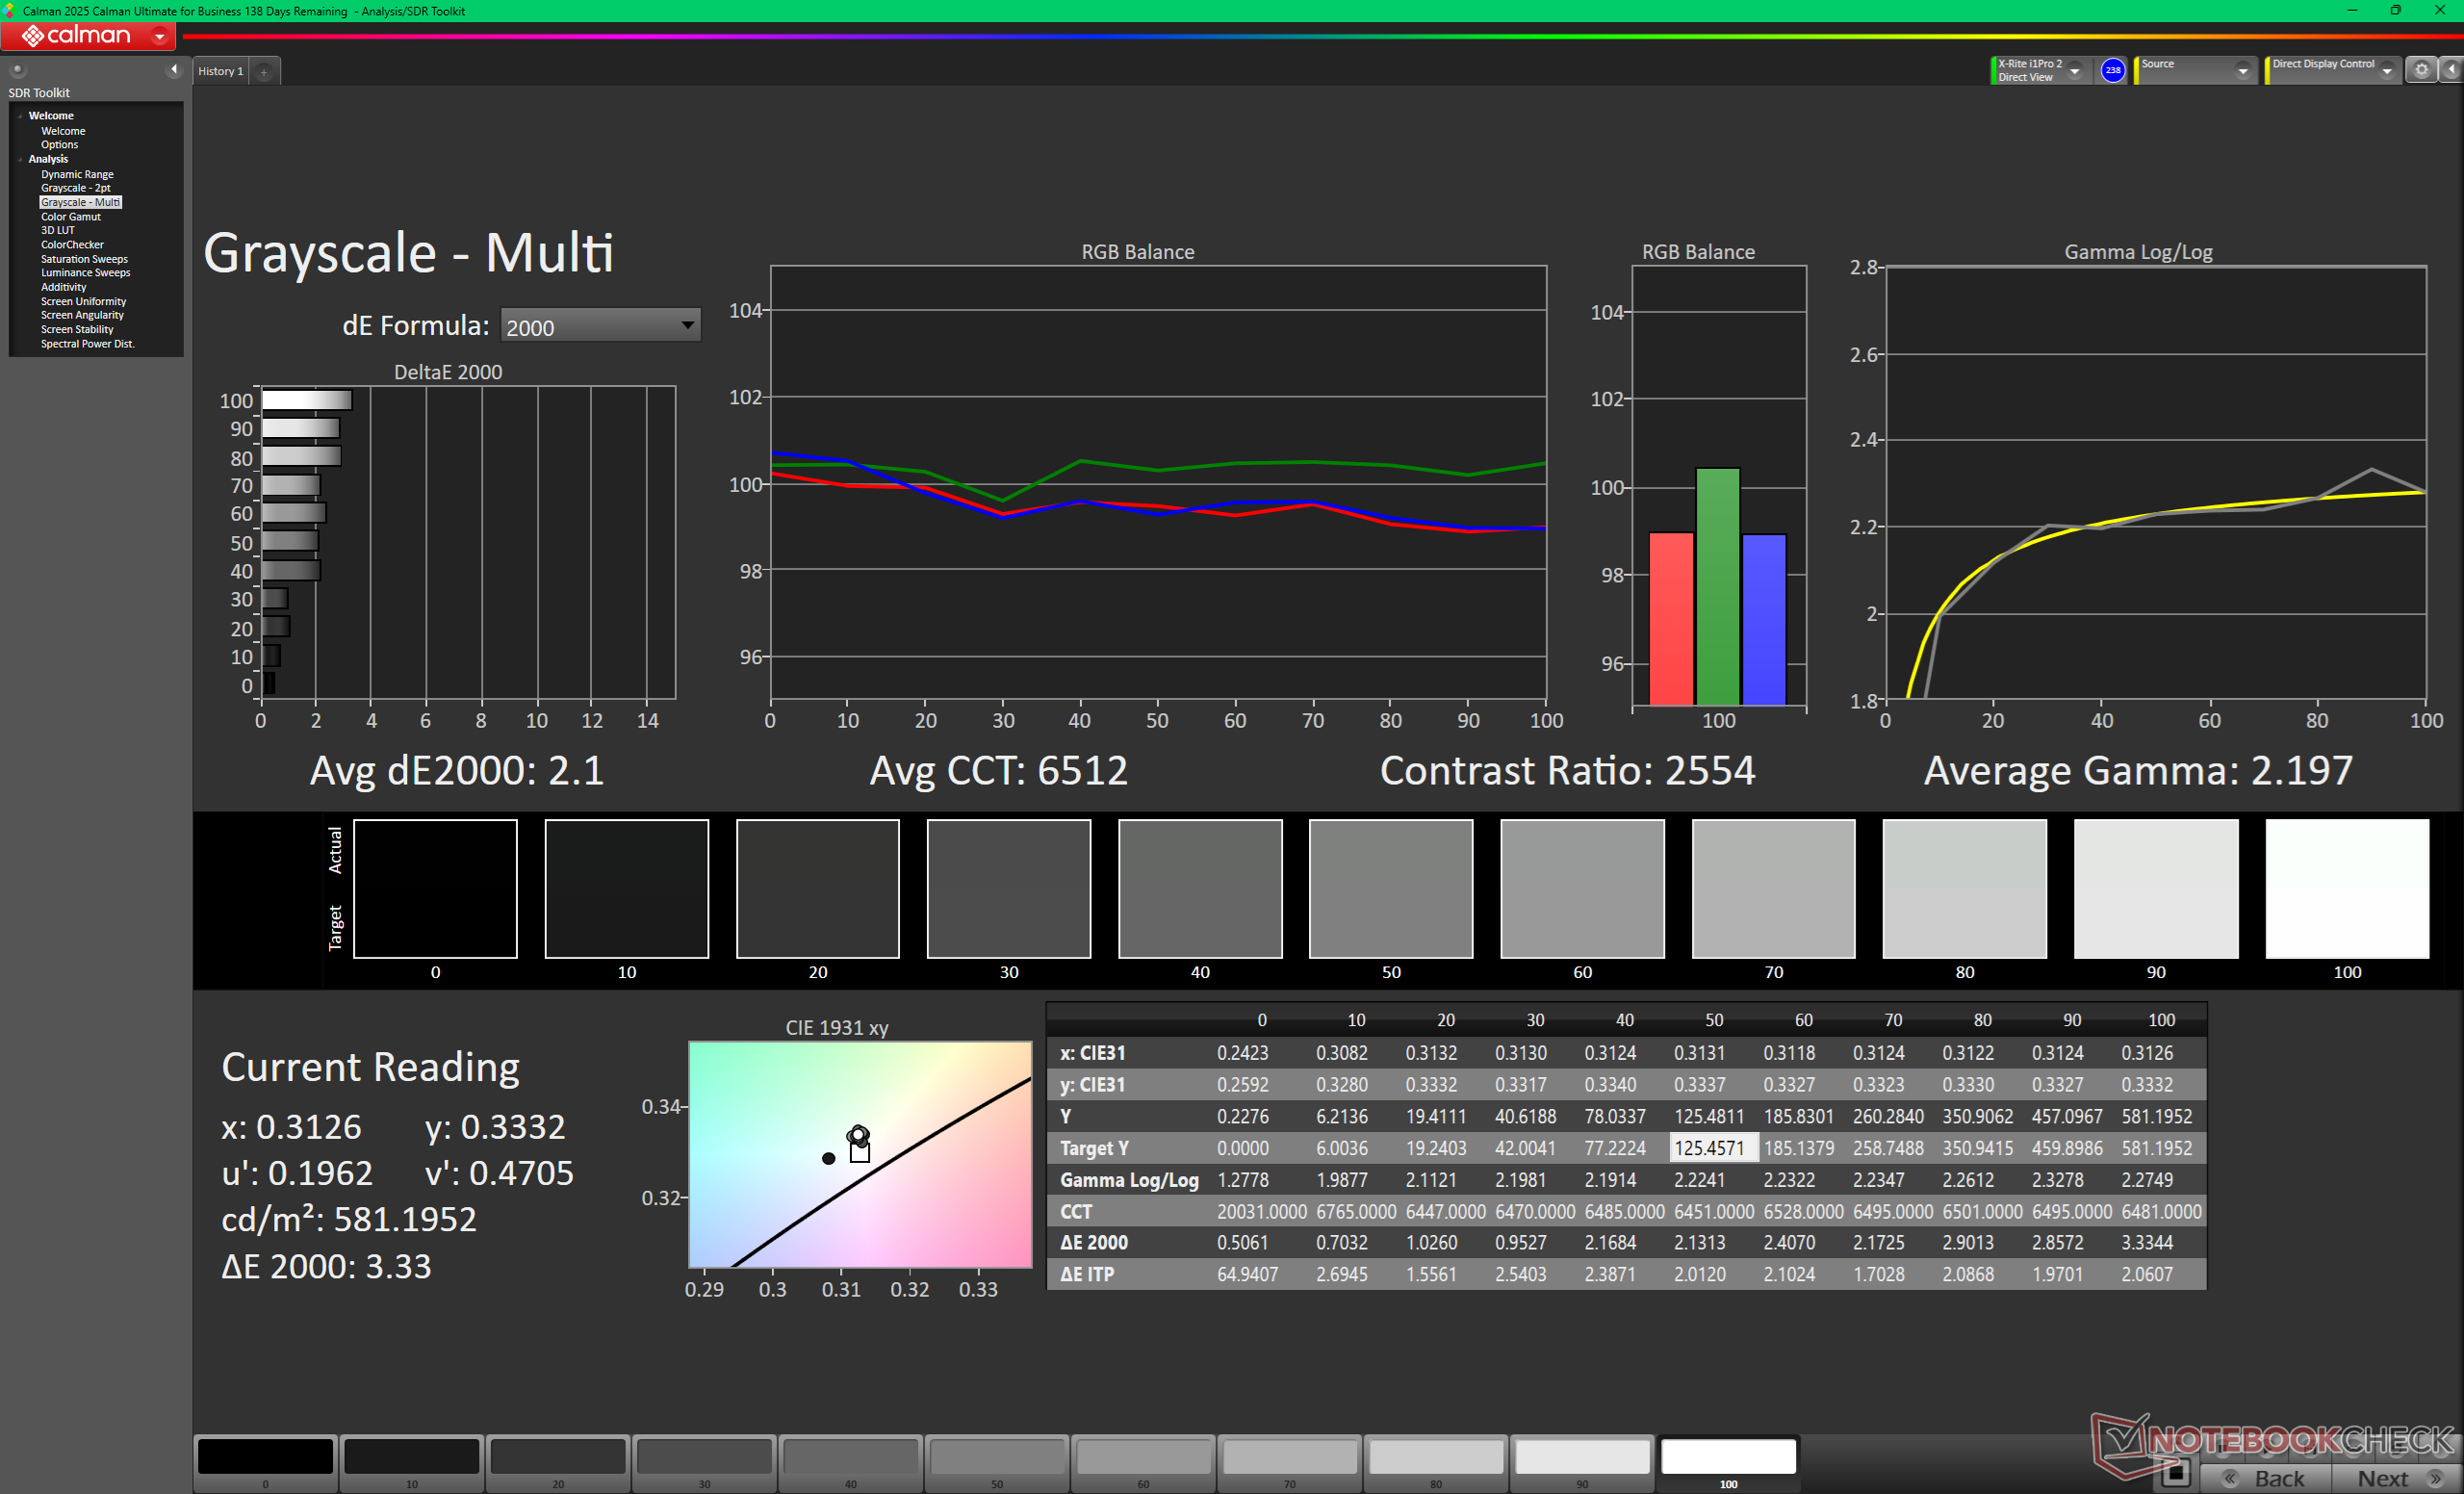
ΔE Greyscale Calman: 6 | ∀{0.09-98 Ø4.93}
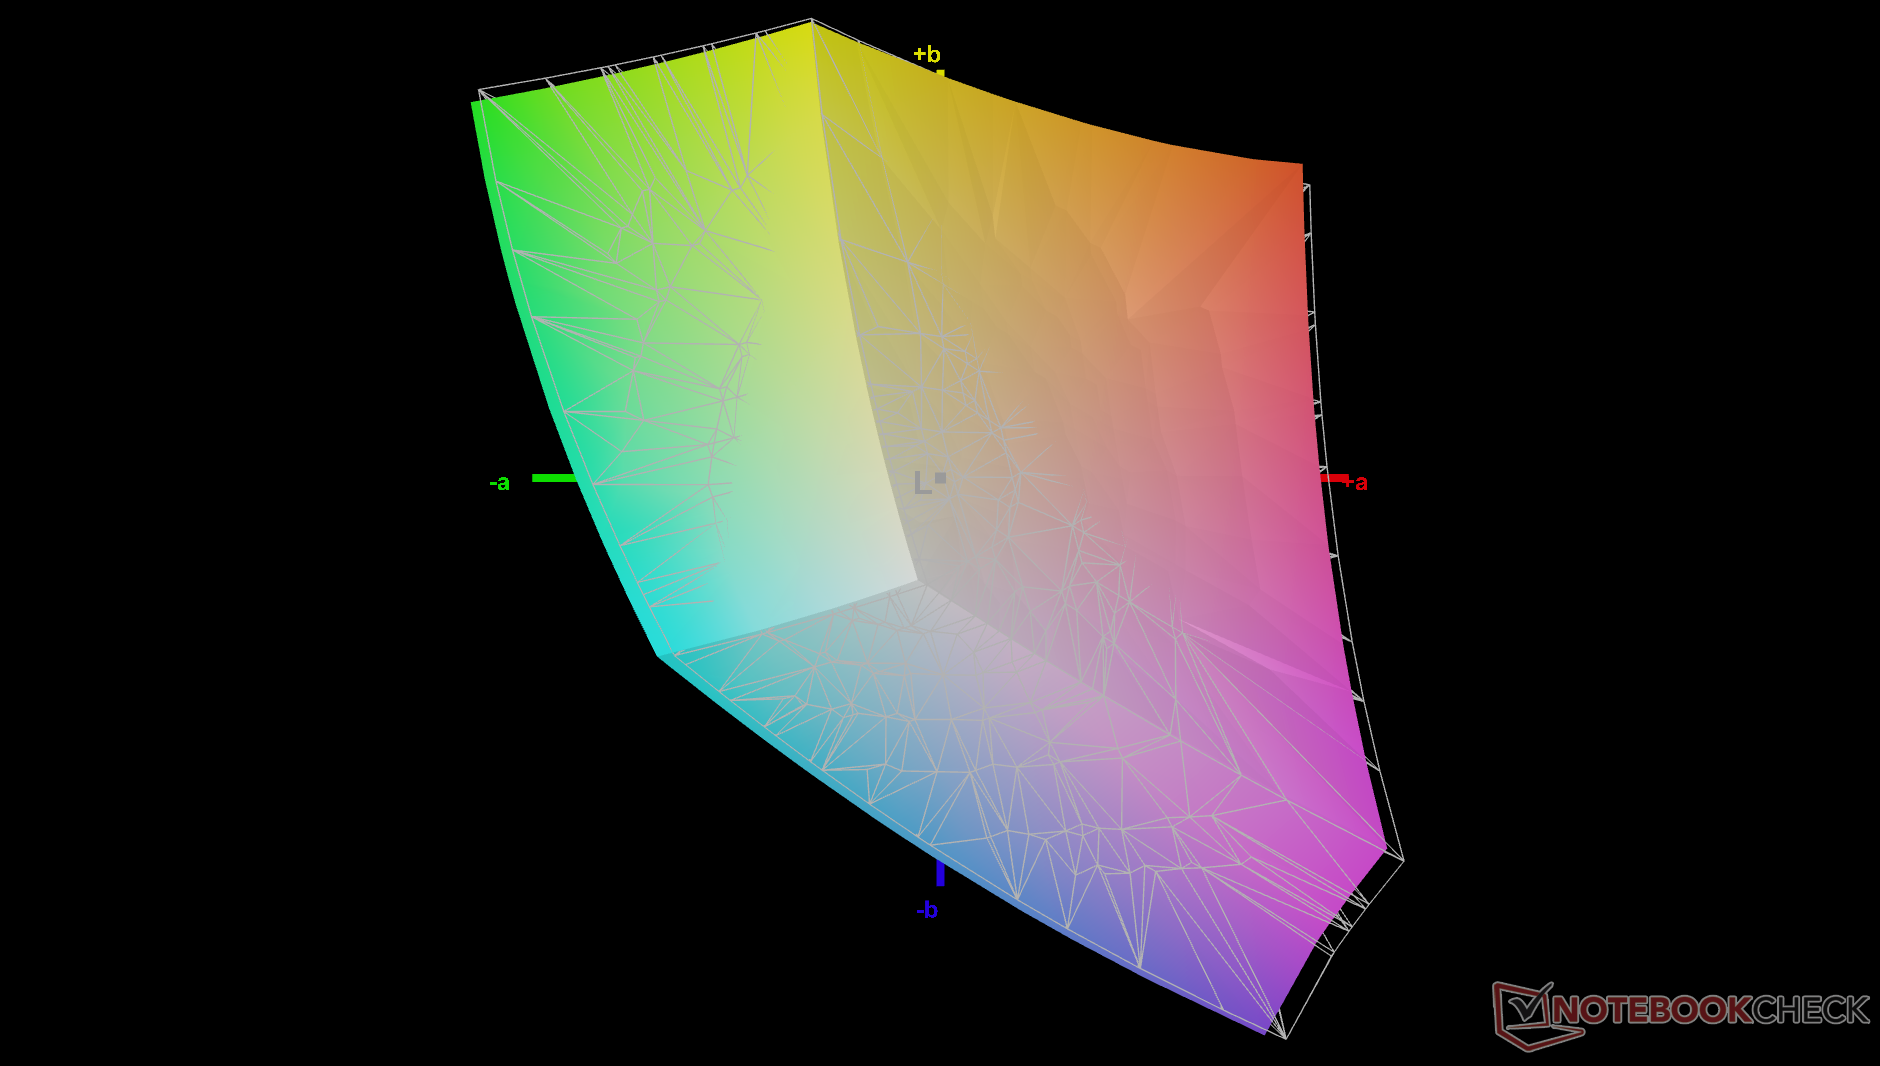
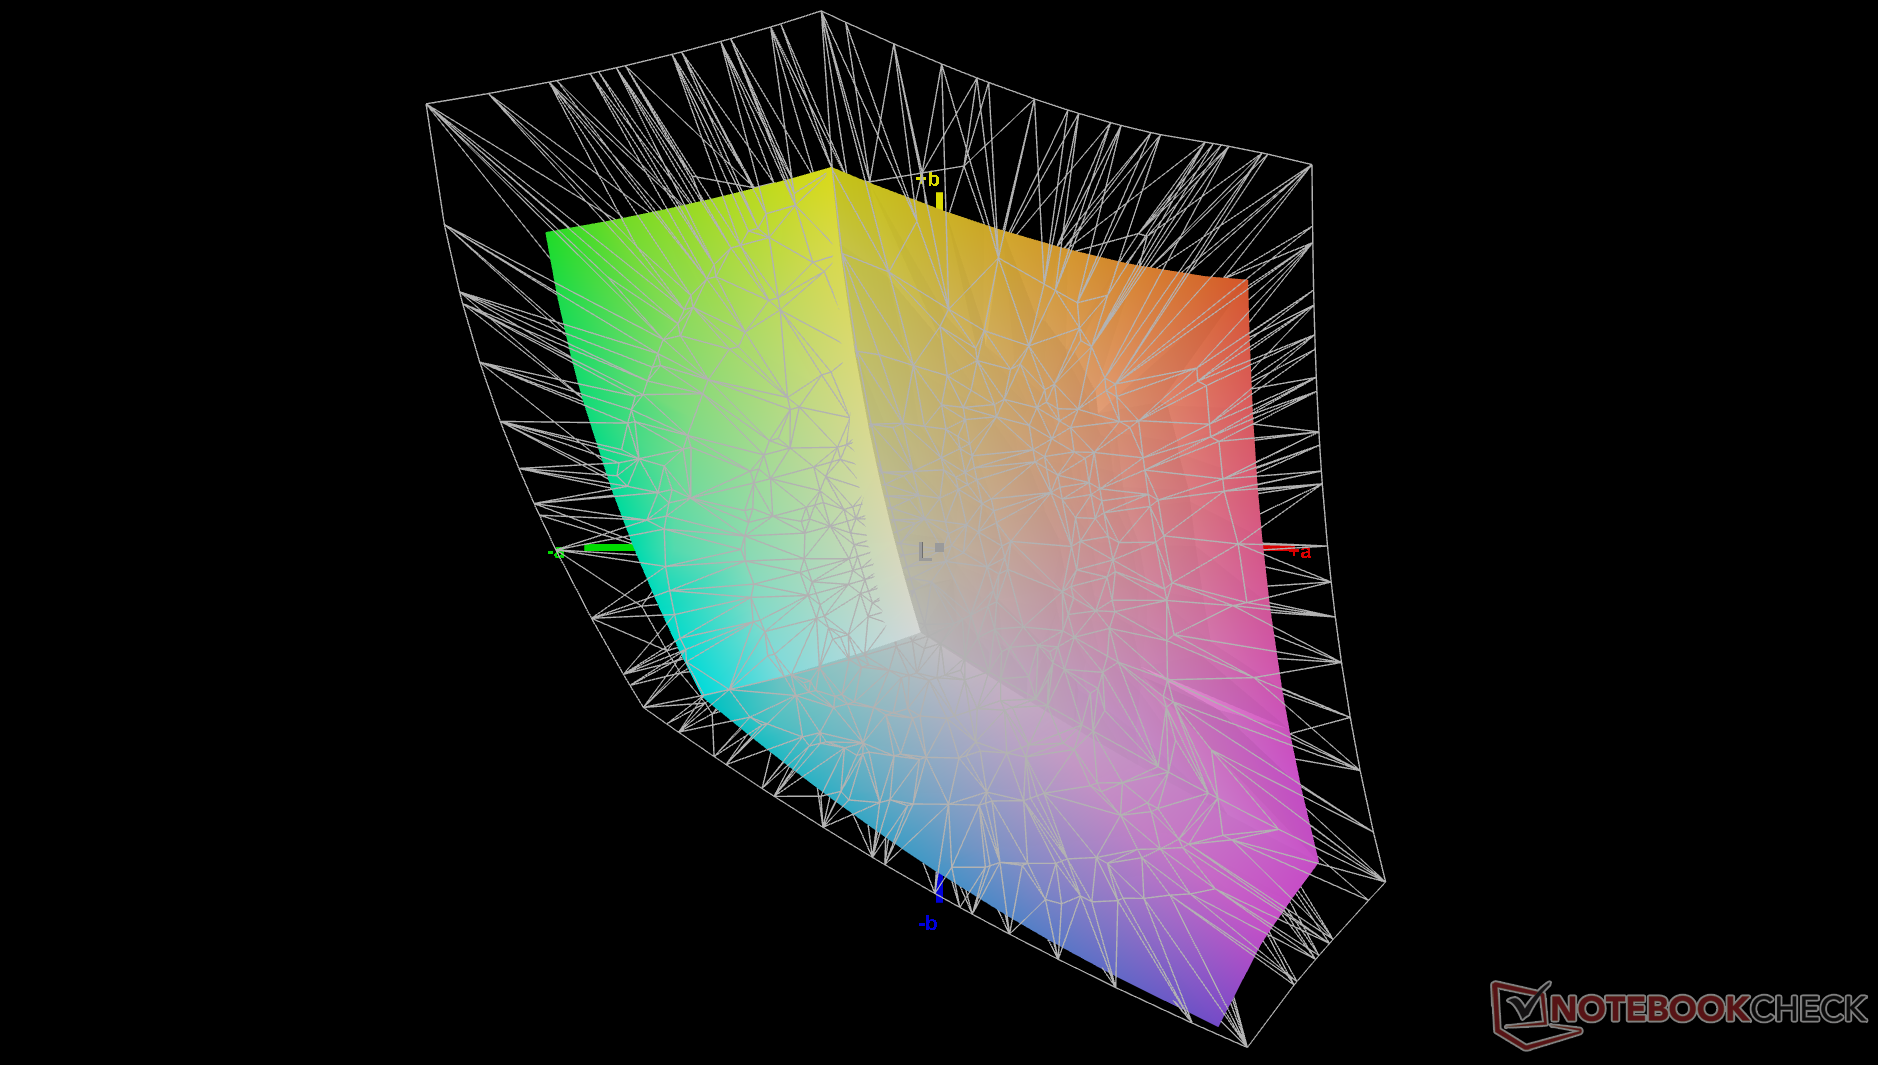
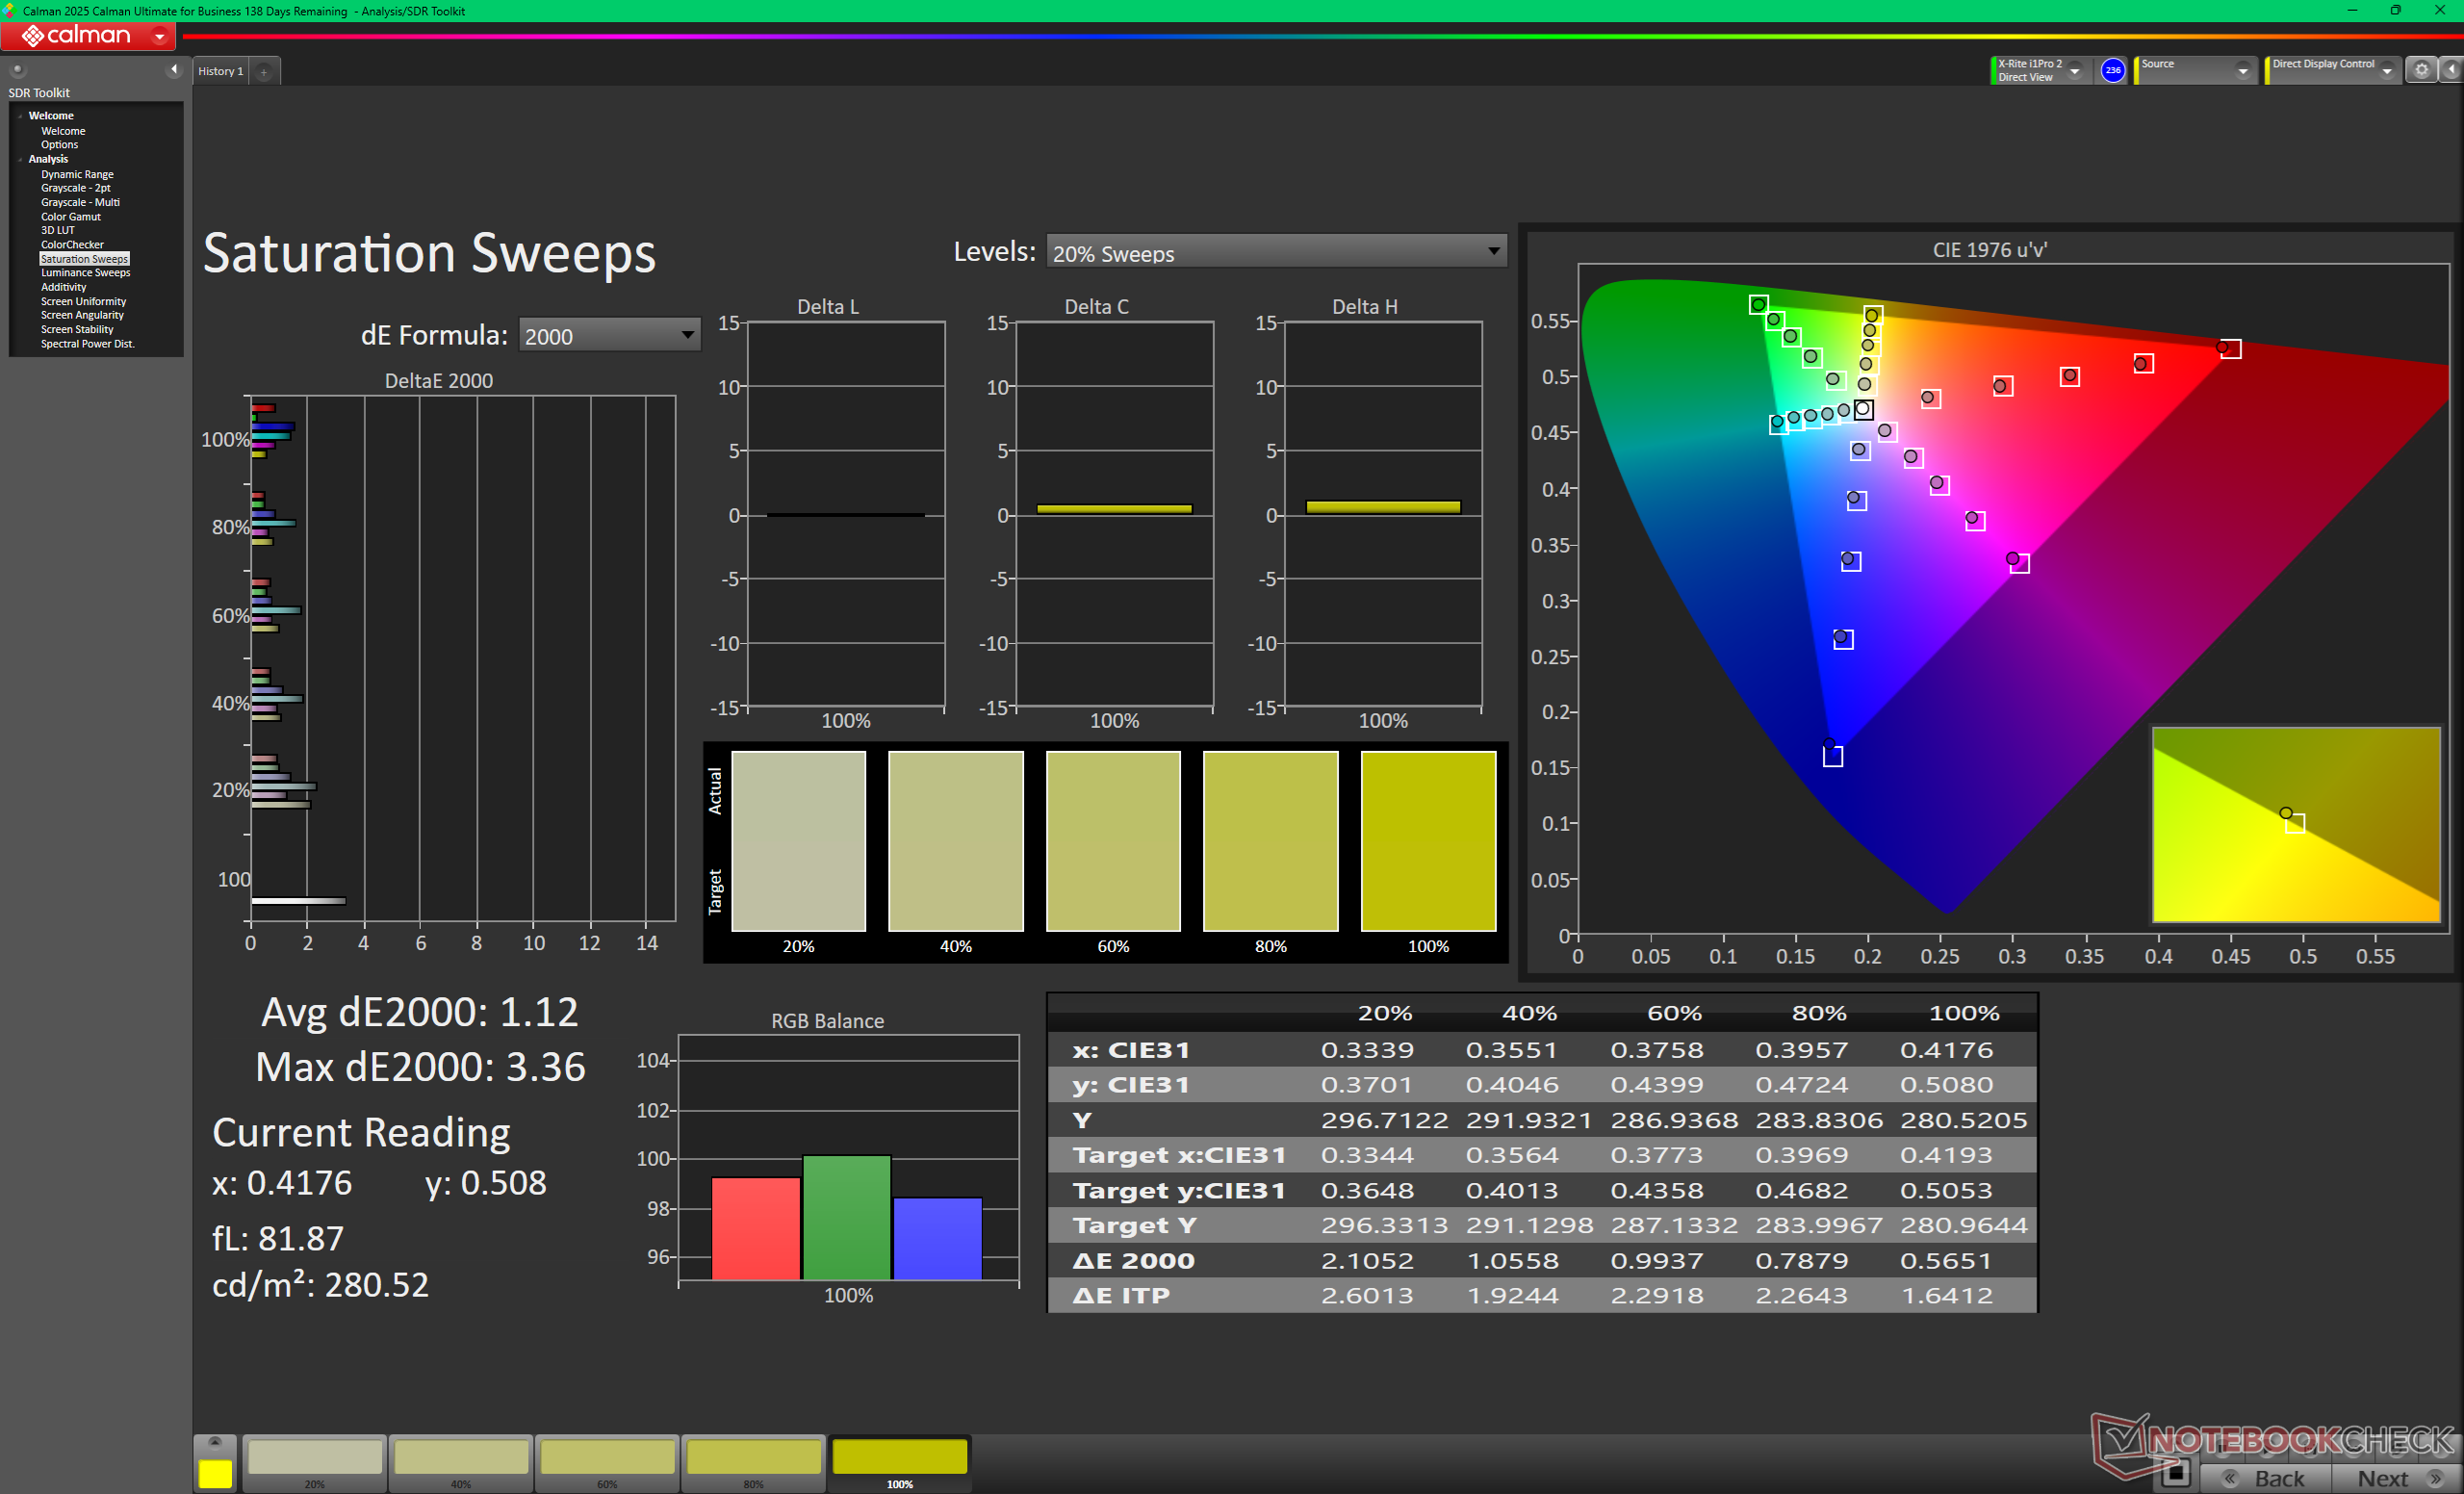
68.7% AdobeRGB 1998 (Argyll 3D)
96.9% sRGB (Argyll 3D)
66.5% Display P3 (Argyll 3D)
Gamma: 2.01
CCT: 8768 K
| Dell Pro 5 14 P514260 LG Philips LP140WU, IPS, 1920x1200, 14", 120 Hz | Dell Pro 7 14 P714260 LG Philips LP140WU, IPS, 1920x1200, 14", 120 Hz | Lenovo ThinkPad T14s Gen 7 21YW0022GE MNE007QB1-1, IPS, 1920x1200, 14", 60 Hz | HP OmniBook Ultra 14 Core Ultra X9 Samsung SDC4215, OLED, 2880x1800, 14", 120 Hz | Samsung Galaxy Book5 Pro 14 940XHA ATNA40CU07-0, OLED, 2880x1800, 14", 120 Hz | Asus ExpertBook Ultra B9406CAA Samsung ATNA40LE01-0, OLED, 2880x1800, 14", 120 Hz | |
|---|---|---|---|---|---|---|
| Display | -2% | 4% | 29% | 31% | 25% | |
| Display P3 Coverage (%) | 66.5 | 65.4 -2% | 71.6 8% | 99.9 50% | 99.9 50% | 96.2 45% |
| sRGB Coverage (%) | 96.9 | 96.2 -1% | 97.4 1% | 100 3% | 100 3% | 100 3% |
| AdobeRGB 1998 Coverage (%) | 68.7 | 67.6 -2% | 70.4 2% | 92.3 34% | 95.7 39% | 86.7 26% |
| Response Times | -14% | 38% | 98% | 98% | 98% | |
| Response Time Grey 50% / Grey 80% * (ms) | 36.9 ? | 43.8 ? -19% | 27.8 ? 25% | 0.58 ? 98% | 0.83 ? 98% | 0.71 ? 98% |
| Response Time Black / White * (ms) | 28.6 ? | 31.3 ? -9% | 14 ? 51% | 0.87 ? 97% | 0.69 ? 98% | 0.94 ? 97% |
| PWM Frequency (Hz) | 927.13 ? | 240 ? | 968.8 ? | |||
| PWM Amplitude * (%) | 25 | 66 | 20 | |||
| Bildschirm | -2% | 14% | 24% | 16% | 41% | |
| Helligkeit Bildmitte (cd/m²) | 559.9 | 575.7 3% | 574 3% | 446 -20% | 400 -29% | 600.5 7% |
| Brightness (cd/m²) | 560 | 532 -5% | 530 -5% | 447 -20% | 402 -28% | 612 9% |
| Brightness Distribution (%) | 80 | 82 2% | 87 9% | 99 24% | 99 24% | 96 20% |
| Schwarzwert * (cd/m²) | 0.24 | 0.32 -33% | 0.32 -33% | |||
| Kontrast (:1) | 2333 | 1799 -23% | 1794 -23% | |||
| Delta E Colorchecker * | 4.09 | 3.88 5% | 2 51% | 1.76 57% | 2.1 49% | 1.18 71% |
| Colorchecker dE 2000 max. * | 7.96 | 7.53 5% | 3.7 54% | 3.29 59% | 3.3 59% | 3.4 57% |
| Colorchecker dE 2000 calibrated * | 1.26 | 0.96 24% | 1.1 13% | 1.18 6% | 1.6 -27% | 0.73 42% |
| Delta E Graustufen * | 6 | 5.6 7% | 2.6 57% | 2.3 62% | 2.3 62% | 1 83% |
| Gamma | 2.01 109% | 2.01 109% | 2.27 97% | 2.25 98% | 2.26 97% | 2.27 97% |
| CCT | 8768 74% | 6541 99% | 6910 94% | 6470 100% | 6795 96% | 6567 99% |
| Durchschnitt gesamt (Programm / Settings) | -6% /
-3% | 19% /
15% | 50% /
38% | 48% /
33% | 55% /
47% |
* ... kleinere Werte sind besser
Reaktionszeiten (Response Times) des Displays
| ↔ Reaktionszeiten Schwarz zu Weiß | ||
|---|---|---|
| 28.6 ms ... steigend ↗ und fallend ↘ kombiniert | ↗ 11.9 ms steigend | 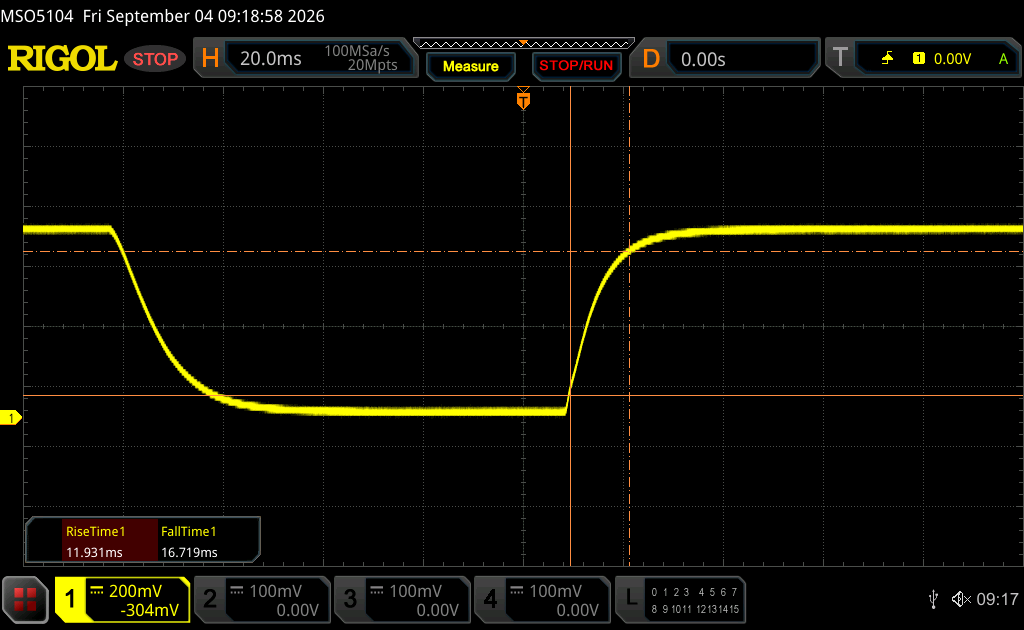 |
| ↘ 16.7 ms fallend | ||
| Die gemessenen Reaktionszeiten sind mittelmäßig und dadurch für Spieler eventuell zu langsam. Im Vergleich rangierten die bei uns getesteten Geräte von 0.1 (Minimum) zu 240 (Maximum) ms. » 76 % aller Screens waren schneller als der getestete. Daher sind die gemessenen Reaktionszeiten schlechter als der Durchschnitt aller vermessenen Geräte (19.6 ms). | ||
| ↔ Reaktionszeiten 50% Grau zu 80% Grau | ||
| 36.9 ms ... steigend ↗ und fallend ↘ kombiniert | ↗ 17.2 ms steigend | 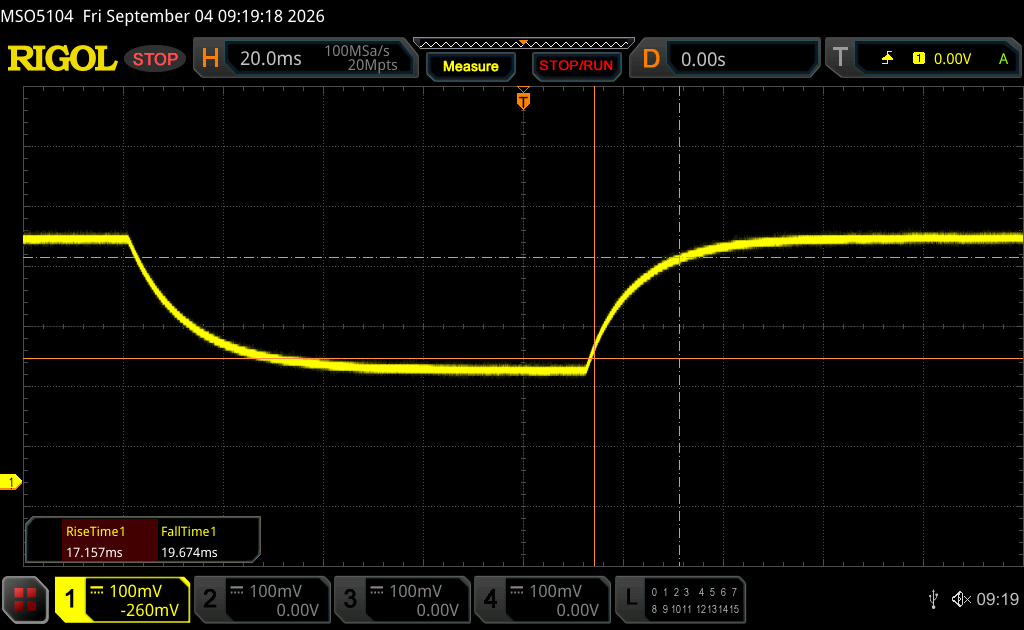 |
| ↘ 19.7 ms fallend | ||
| Die gemessenen Reaktionszeiten sind langsam und dadurch für viele Spieler wahrscheinlich zu langsam. Im Vergleich rangierten die bei uns getesteten Geräte von 0.13 (Minimum) zu 636 (Maximum) ms. » 54 % aller Screens waren schneller als der getestete. Daher sind die gemessenen Reaktionszeiten schlechter als der Durchschnitt aller vermessenen Geräte (30.7 ms). | ||
Bildschirm-Flackern / PWM (Pulse-Width Modulation)
| Flackern / PWM nicht festgestellt | 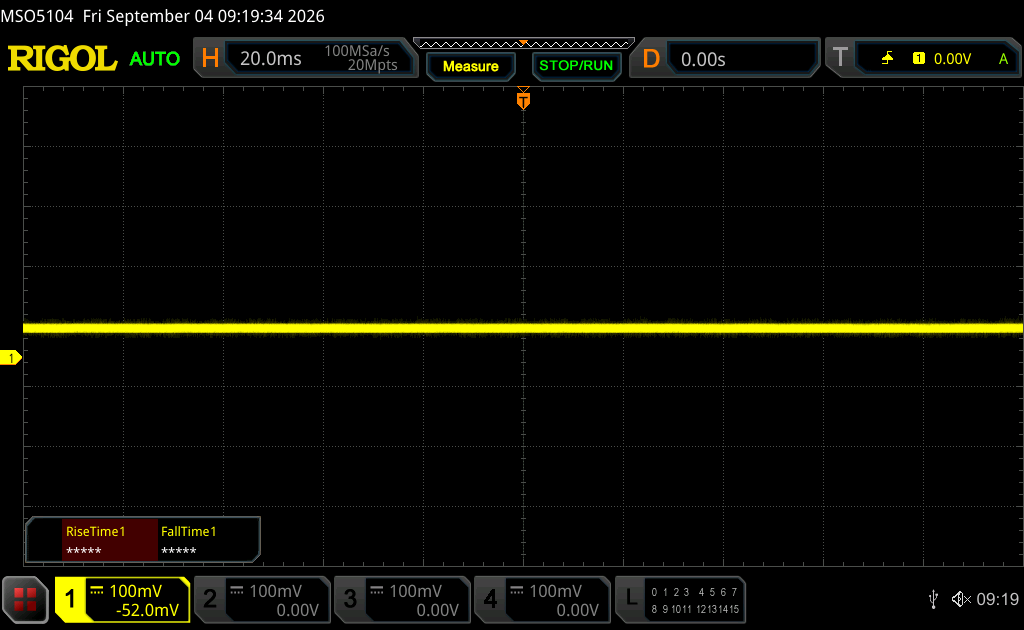 | ||
Im Vergleich: 52 % aller getesteten Geräte nutzten kein PWM um die Helligkeit zu reduzieren. Wenn PWM eingesetzt wurde, dann bei einer Frequenz von durchschnittlich 7572 (Minimum 5, Maximum 343500) Hz. | |||
Leistung
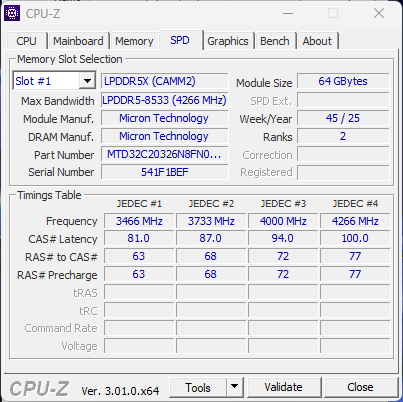
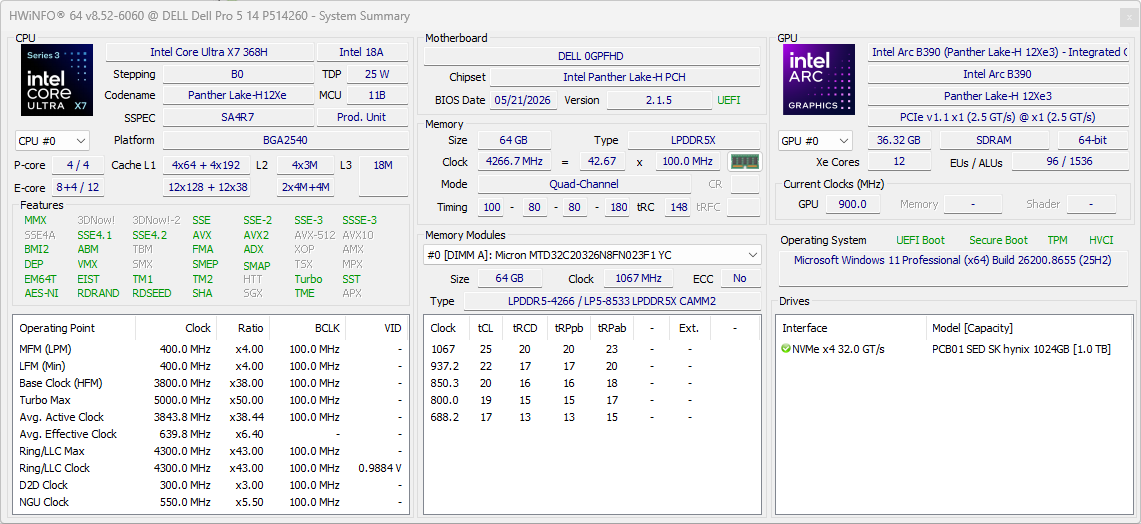
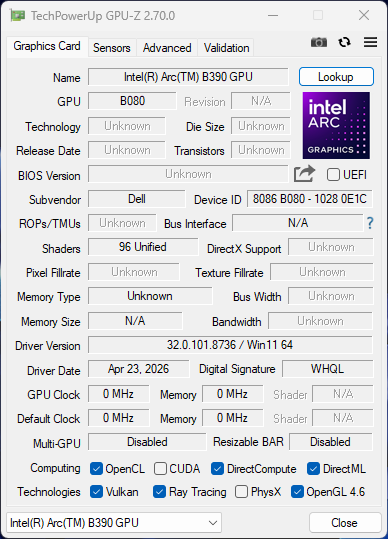
Testbedingungen
Wir haben Windows und den Dell Optimizer vor der Durchführung der nachstehenden Benchmarks auf den Leistungsmodus eingestellt.
Prozessorleistung
Cinebench R15 Multi Loop
Cinebench 2026: CPU Multi | CPU Single Thread
Cinebench R23: Multi Core | Single Core
Cinebench R20: CPU (Multi Core) | CPU (Single Core)
Cinebench R15: CPU Multi 64Bit | CPU Single 64Bit
Blender: v2.79 BMW27 CPU
7-Zip 18.03: 7z b 4 | 7z b 4 -mmt1
Geekbench 6.7: Multi-Core | Single-Core
Geekbench 5.5: Multi-Core | Single-Core
HWBOT x265 Benchmark v2.2: 4k Preset
LibreOffice : 20 Documents To PDF
R Benchmark 2.5: Overall mean
| CPU Performance Rating | |
| Asus ExpertBook Ultra B9406CAA | |
| HP OmniBook Ultra 14 Core Ultra X9 | |
| Dell Pro 7 14 P714265 | |
| Durchschnittliche Intel Core Ultra X7 368H | |
| Dell Pro 7 14 P714260 | |
| Dell Pro 5 14 P514260 | |
| HP EliteBook 8 G2a 14 -4! | |
| Lenovo ThinkPad T14s Gen 7 21YW0022GE -2! | |
| HP ZBook Ultra G1a 14 B30FBES -4! | |
| Lenovo Yoga 9 14 2in1 G10 -2! | |
| Lenovo ThinkPad E14 G8-21Y2006XGE | |
| Samsung Galaxy Book5 Pro 14 940XHA -2! | |
| Cinebench 2026 / CPU Multi | |
| Asus ExpertBook Ultra B9406CAA | |
| Dell Pro 5 14 P514260 | |
| Durchschnittliche Intel Core Ultra X7 368H (n=1) | |
| Dell Pro 7 14 P714265 | |
| HP OmniBook Ultra 14 Core Ultra X9 | |
| Dell Pro 7 14 P714260 | |
| Lenovo ThinkPad E14 G8-21Y2006XGE | |
| Cinebench 2026 / CPU Single Thread | |
| HP OmniBook Ultra 14 Core Ultra X9 | |
| Dell Pro 5 14 P514260 | |
| Durchschnittliche Intel Core Ultra X7 368H (n=1) | |
| Dell Pro 7 14 P714260 | |
| Asus ExpertBook Ultra B9406CAA | |
| Dell Pro 7 14 P714265 | |
| Lenovo ThinkPad E14 G8-21Y2006XGE | |
| Geekbench 5.5 / Multi-Core | |
| Asus ExpertBook Ultra B9406CAA | |
| Dell Pro 7 14 P714260 | |
| HP OmniBook Ultra 14 Core Ultra X9 | |
| Dell Pro 7 14 P714265 | |
| Lenovo ThinkPad T14s Gen 7 21YW0022GE | |
| Dell Pro 5 14 P514260 | |
| Durchschnittliche Intel Core Ultra X7 368H (n=1) | |
| Lenovo Yoga 9 14 2in1 G10 | |
| Samsung Galaxy Book5 Pro 14 940XHA | |
| Lenovo ThinkPad E14 G8-21Y2006XGE | |
| Geekbench 5.5 / Single-Core | |
| HP OmniBook Ultra 14 Core Ultra X9 | |
| Dell Pro 5 14 P514260 | |
| Durchschnittliche Intel Core Ultra X7 368H (n=1) | |
| Lenovo ThinkPad T14s Gen 7 21YW0022GE | |
| Dell Pro 7 14 P714265 | |
| Dell Pro 7 14 P714260 | |
| Asus ExpertBook Ultra B9406CAA | |
| Lenovo Yoga 9 14 2in1 G10 | |
| Samsung Galaxy Book5 Pro 14 940XHA | |
| Lenovo ThinkPad E14 G8-21Y2006XGE | |
| HWBOT x265 Benchmark v2.2 / 4k Preset | |
| Asus ExpertBook Ultra B9406CAA | |
| Dell Pro 7 14 P714265 | |
| HP EliteBook 8 G2a 14 | |
| HP OmniBook Ultra 14 Core Ultra X9 | |
| Lenovo ThinkPad T14s Gen 7 21YW0022GE | |
| Dell Pro 7 14 P714260 | |
| HP ZBook Ultra G1a 14 B30FBES | |
| Durchschnittliche Intel Core Ultra X7 368H (14.1 - 18.7, n=2) | |
| Lenovo ThinkPad E14 G8-21Y2006XGE | |
| Dell Pro 5 14 P514260 | |
| Lenovo Yoga 9 14 2in1 G10 | |
| Samsung Galaxy Book5 Pro 14 940XHA | |
* ... kleinere Werte sind besser
AIDA64: FP32 Ray-Trace | FPU Julia | CPU SHA3 | CPU Queen | FPU SinJulia | FPU Mandel | CPU AES | CPU ZLib | FP64 Ray-Trace | CPU PhotoWorxx | CPU CheckMate
| Performance Rating | |
| Lenovo ThinkPad T14s Gen 7 21YW0022GE -1! | |
| Dell Pro 5 14 P514260 -1! | |
| Durchschnittliche Intel Core Ultra X7 368H -1! | |
| HP OmniBook Ultra 14 Core Ultra X9 -1! | |
| Dell Pro 7 14 P714260 -1! | |
| Asus ExpertBook Ultra B9406CAA -1! | |
| Samsung Galaxy Book5 Pro 14 940XHA -1! | |
| AIDA64 / FP32 Ray-Trace | |
| Lenovo ThinkPad T14s Gen 7 21YW0022GE (v8.20.8100) | |
| Dell Pro 5 14 P514260 (v8.20.8100) | |
| Durchschnittliche Intel Core Ultra X7 368H (15419 - 17245, n=2) | |
| HP OmniBook Ultra 14 Core Ultra X9 (v8.20.8100) | |
| Dell Pro 7 14 P714260 (v8.20.8100) | |
| Asus ExpertBook Ultra B9406CAA (v6.92.6600) | |
| Samsung Galaxy Book5 Pro 14 940XHA (v6.92.6600) | |
| AIDA64 / FPU Julia | |
| Lenovo ThinkPad T14s Gen 7 21YW0022GE (v8.20.8100) | |
| Dell Pro 5 14 P514260 (v8.20.8100) | |
| Durchschnittliche Intel Core Ultra X7 368H (84167 - 90689, n=2) | |
| HP OmniBook Ultra 14 Core Ultra X9 (v8.20.8100) | |
| Dell Pro 7 14 P714260 (v8.20.8100) | |
| Samsung Galaxy Book5 Pro 14 940XHA (v6.92.6600) | |
| Asus ExpertBook Ultra B9406CAA (v6.92.6600) | |
| AIDA64 / CPU SHA3 | |
| Asus ExpertBook Ultra B9406CAA (v6.92.6600) | |
| Dell Pro 5 14 P514260 (v8.20.8100) | |
| Durchschnittliche Intel Core Ultra X7 368H (4052 - 4537, n=2) | |
| HP OmniBook Ultra 14 Core Ultra X9 (v8.20.8100) | |
| Lenovo ThinkPad T14s Gen 7 21YW0022GE (v8.20.8100) | |
| Dell Pro 7 14 P714260 (v8.20.8100) | |
| Samsung Galaxy Book5 Pro 14 940XHA (v6.92.6600) | |
| AIDA64 / CPU Queen | |
| Asus ExpertBook Ultra B9406CAA (v6.92.6600) | |
| Samsung Galaxy Book5 Pro 14 940XHA (v6.92.6600) | |
| AIDA64 / FPU SinJulia | |
| Lenovo ThinkPad T14s Gen 7 21YW0022GE (v8.20.8100) | |
| Dell Pro 5 14 P514260 (v8.20.8100) | |
| Durchschnittliche Intel Core Ultra X7 368H (6765 - 7511, n=2) | |
| HP OmniBook Ultra 14 Core Ultra X9 (v8.20.8100) | |
| Dell Pro 7 14 P714260 (v8.20.8100) | |
| Asus ExpertBook Ultra B9406CAA (v6.92.6600) | |
| Samsung Galaxy Book5 Pro 14 940XHA (v6.92.6600) | |
| AIDA64 / FPU Mandel | |
| Lenovo ThinkPad T14s Gen 7 21YW0022GE (v8.20.8100) | |
| Dell Pro 5 14 P514260 (v8.20.8100) | |
| Durchschnittliche Intel Core Ultra X7 368H (44784 - 48562, n=2) | |
| HP OmniBook Ultra 14 Core Ultra X9 (v8.20.8100) | |
| Dell Pro 7 14 P714260 (v8.20.8100) | |
| Samsung Galaxy Book5 Pro 14 940XHA (v6.92.6600) | |
| Asus ExpertBook Ultra B9406CAA (v6.92.6600) | |
| AIDA64 / CPU AES | |
| Lenovo ThinkPad T14s Gen 7 21YW0022GE (v8.20.8100) | |
| Dell Pro 5 14 P514260 (v8.20.8100) | |
| Durchschnittliche Intel Core Ultra X7 368H (58572 - 68180, n=2) | |
| HP OmniBook Ultra 14 Core Ultra X9 (v8.20.8100) | |
| Dell Pro 7 14 P714260 (v8.20.8100) | |
| Samsung Galaxy Book5 Pro 14 940XHA (v6.92.6600) | |
| Asus ExpertBook Ultra B9406CAA (v6.92.6600) | |
| AIDA64 / CPU ZLib | |
| Asus ExpertBook Ultra B9406CAA (v6.92.6600) | |
| Dell Pro 5 14 P514260 (v8.20.8100) | |
| Lenovo ThinkPad T14s Gen 7 21YW0022GE (v8.20.8100) | |
| HP OmniBook Ultra 14 Core Ultra X9 (v8.20.8100) | |
| Durchschnittliche Intel Core Ultra X7 368H (803 - 1130, n=2) | |
| Dell Pro 7 14 P714260 (v8.20.8100) | |
| Samsung Galaxy Book5 Pro 14 940XHA (v6.92.6600) | |
| AIDA64 / FP64 Ray-Trace | |
| Lenovo ThinkPad T14s Gen 7 21YW0022GE (v8.20.8100) | |
| Dell Pro 5 14 P514260 (v8.20.8100) | |
| Durchschnittliche Intel Core Ultra X7 368H (8151 - 9131, n=2) | |
| HP OmniBook Ultra 14 Core Ultra X9 (v8.20.8100) | |
| Dell Pro 7 14 P714260 (v8.20.8100) | |
| Asus ExpertBook Ultra B9406CAA (v6.92.6600) | |
| Samsung Galaxy Book5 Pro 14 940XHA (v6.92.6600) | |
| AIDA64 / CPU PhotoWorxx | |
| HP OmniBook Ultra 14 Core Ultra X9 (v8.20.8100) | |
| Dell Pro 5 14 P514260 (v8.20.8100) | |
| Dell Pro 7 14 P714260 (v8.20.8100) | |
| Durchschnittliche Intel Core Ultra X7 368H (75761 - 84065, n=2) | |
| Samsung Galaxy Book5 Pro 14 940XHA (v6.92.6600) | |
| Lenovo ThinkPad T14s Gen 7 21YW0022GE (v8.20.8100) | |
| Asus ExpertBook Ultra B9406CAA (v6.92.6600) | |
| AIDA64 / CPU CheckMate | |
| Lenovo ThinkPad T14s Gen 7 21YW0022GE (v8.20.8100) | |
| Dell Pro 5 14 P514260 (v8.20.8100) | |
| Durchschnittliche Intel Core Ultra X7 368H (4328 - 4613, n=2) | |
| Dell Pro 7 14 P714260 (v8.20.8100) | |
| HP OmniBook Ultra 14 Core Ultra X9 (v8.20.8100) | |
Systemleistung
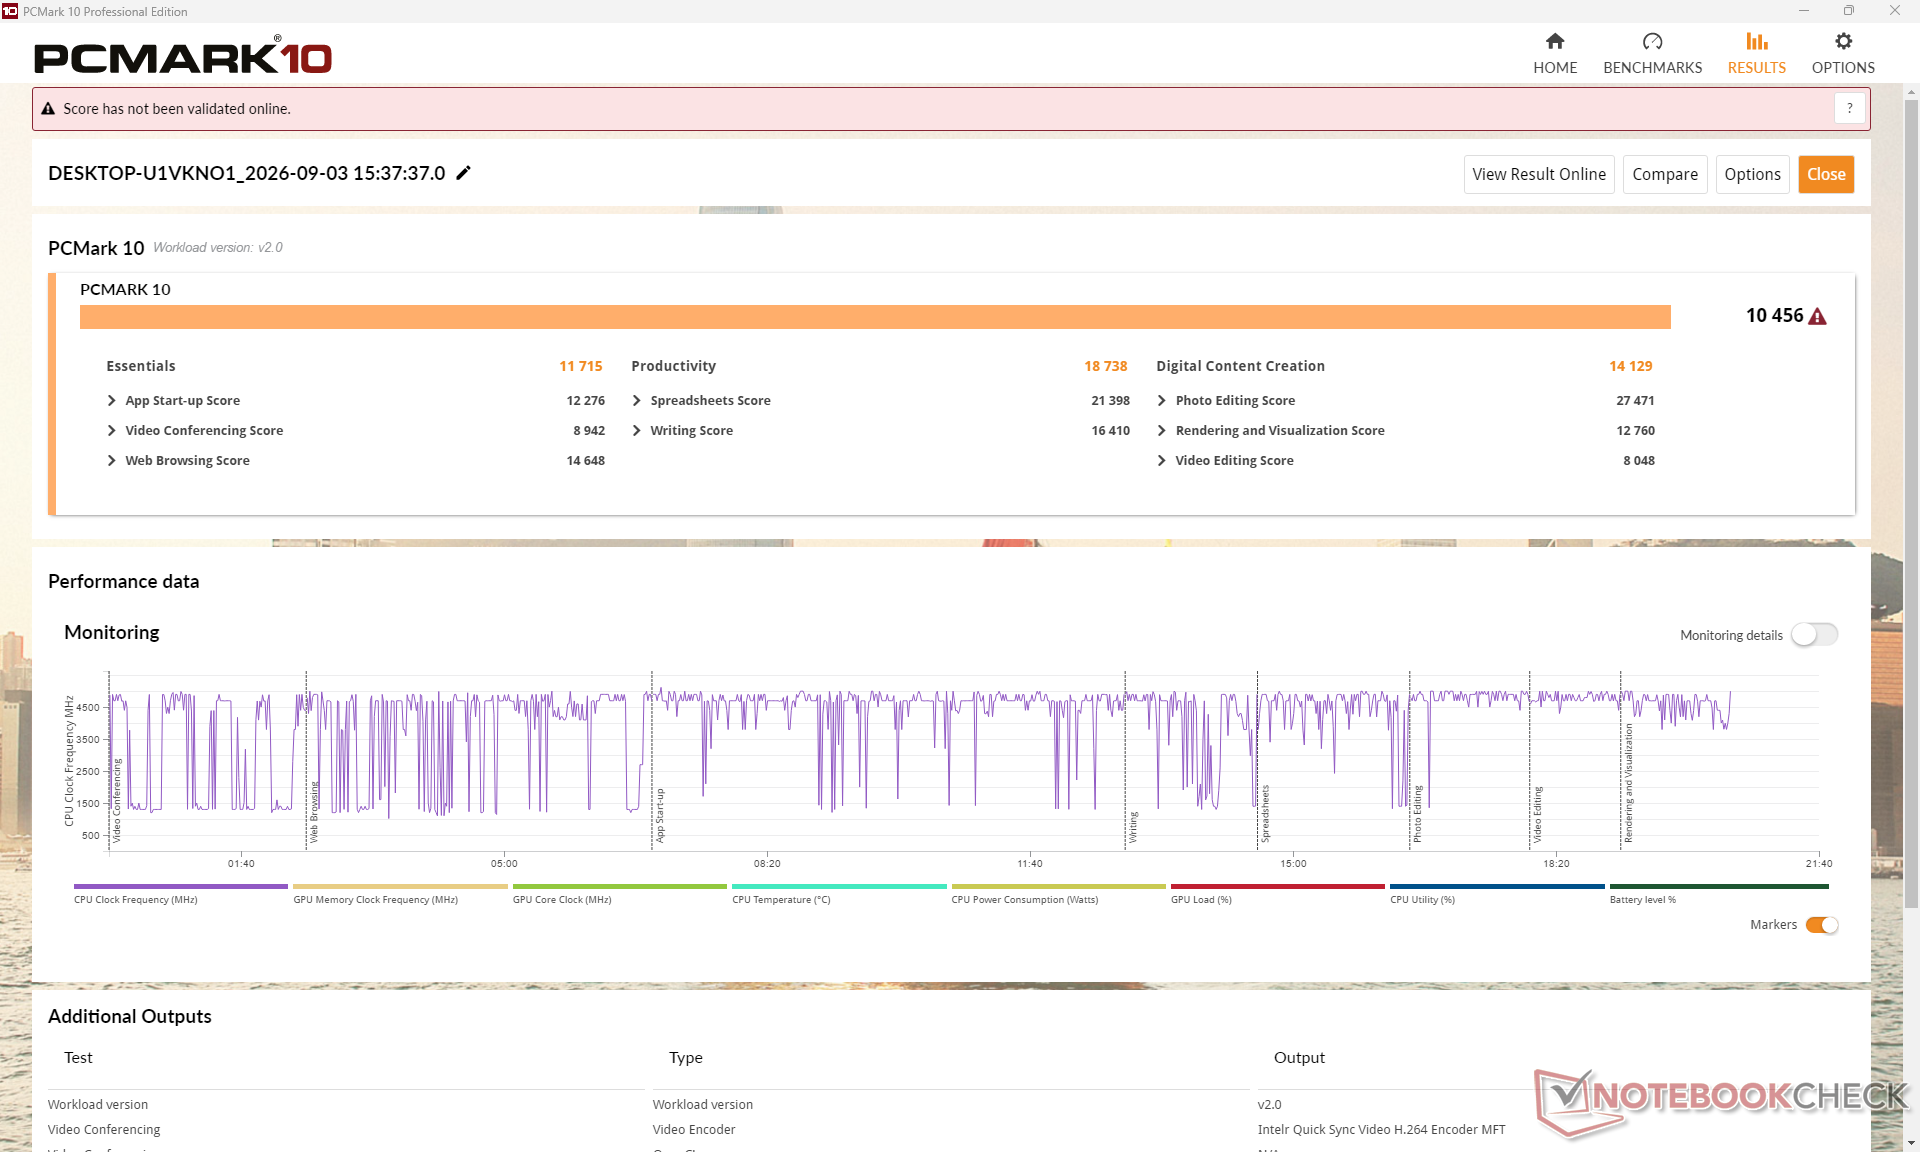
PCMark 10: Score | Essentials | Productivity | Digital Content Creation
CrossMark: Overall | Productivity | Creativity | Responsiveness
WebXPRT 3: Overall
WebXPRT 4: Overall
Mozilla Kraken 1.1: Total
Geekbench AI: Single Precision GPU 1.7 | Half Precision GPU 1.7 | Quantized GPU 1.7
| Performance Rating | |
| Durchschnittliche Intel Core Ultra X7 368H, Intel Arc B390 12 Xe3 Panther Lake iGPU | |
| HP OmniBook Ultra 14 Core Ultra X9 | |
| Dell Pro 5 14 P514260 | |
| Asus ExpertBook Ultra B9406CAA | |
| Dell Pro 7 14 P714260 | |
| Lenovo ThinkPad T14s Gen 7 21YW0022GE | |
| Samsung Galaxy Book5 Pro 14 940XHA | |
| PCMark 10 / Score | |
| Dell Pro 5 14 P514260 | |
| Durchschnittliche Intel Core Ultra X7 368H, Intel Arc B390 12 Xe3 Panther Lake iGPU (9923 - 10456, n=2) | |
| HP OmniBook Ultra 14 Core Ultra X9 | |
| Dell Pro 7 14 P714260 | |
| Asus ExpertBook Ultra B9406CAA | |
| Lenovo ThinkPad T14s Gen 7 21YW0022GE | |
| Samsung Galaxy Book5 Pro 14 940XHA | |
| PCMark 10 / Essentials | |
| Dell Pro 5 14 P514260 | |
| Dell Pro 7 14 P714260 | |
| HP OmniBook Ultra 14 Core Ultra X9 | |
| Durchschnittliche Intel Core Ultra X7 368H, Intel Arc B390 12 Xe3 Panther Lake iGPU (11288 - 11715, n=2) | |
| Lenovo ThinkPad T14s Gen 7 21YW0022GE | |
| Asus ExpertBook Ultra B9406CAA | |
| Samsung Galaxy Book5 Pro 14 940XHA | |
| PCMark 10 / Productivity | |
| Dell Pro 5 14 P514260 | |
| Durchschnittliche Intel Core Ultra X7 368H, Intel Arc B390 12 Xe3 Panther Lake iGPU (17463 - 18738, n=2) | |
| Dell Pro 7 14 P714260 | |
| HP OmniBook Ultra 14 Core Ultra X9 | |
| Asus ExpertBook Ultra B9406CAA | |
| Lenovo ThinkPad T14s Gen 7 21YW0022GE | |
| Samsung Galaxy Book5 Pro 14 940XHA | |
| PCMark 10 / Digital Content Creation | |
| Dell Pro 5 14 P514260 | |
| Durchschnittliche Intel Core Ultra X7 368H, Intel Arc B390 12 Xe3 Panther Lake iGPU (13454 - 14129, n=2) | |
| HP OmniBook Ultra 14 Core Ultra X9 | |
| Asus ExpertBook Ultra B9406CAA | |
| Dell Pro 7 14 P714260 | |
| Lenovo ThinkPad T14s Gen 7 21YW0022GE | |
| Samsung Galaxy Book5 Pro 14 940XHA | |
| CrossMark / Overall | |
| Dell Pro 7 14 P714260 | |
| Durchschnittliche Intel Core Ultra X7 368H, Intel Arc B390 12 Xe3 Panther Lake iGPU (2032 - 2182, n=2) | |
| HP OmniBook Ultra 14 Core Ultra X9 | |
| Dell Pro 5 14 P514260 | |
| Asus ExpertBook Ultra B9406CAA | |
| Lenovo ThinkPad T14s Gen 7 21YW0022GE | |
| Samsung Galaxy Book5 Pro 14 940XHA | |
| CrossMark / Productivity | |
| Dell Pro 7 14 P714260 | |
| Durchschnittliche Intel Core Ultra X7 368H, Intel Arc B390 12 Xe3 Panther Lake iGPU (1916 - 1995, n=2) | |
| Dell Pro 5 14 P514260 | |
| HP OmniBook Ultra 14 Core Ultra X9 | |
| Lenovo ThinkPad T14s Gen 7 21YW0022GE | |
| Asus ExpertBook Ultra B9406CAA | |
| Samsung Galaxy Book5 Pro 14 940XHA | |
| CrossMark / Creativity | |
| Dell Pro 7 14 P714260 | |
| HP OmniBook Ultra 14 Core Ultra X9 | |
| Durchschnittliche Intel Core Ultra X7 368H, Intel Arc B390 12 Xe3 Panther Lake iGPU (2241 - 2530, n=2) | |
| Asus ExpertBook Ultra B9406CAA | |
| Dell Pro 5 14 P514260 | |
| Lenovo ThinkPad T14s Gen 7 21YW0022GE | |
| Samsung Galaxy Book5 Pro 14 940XHA | |
| CrossMark / Responsiveness | |
| Dell Pro 7 14 P714260 | |
| Lenovo ThinkPad T14s Gen 7 21YW0022GE | |
| Durchschnittliche Intel Core Ultra X7 368H, Intel Arc B390 12 Xe3 Panther Lake iGPU (1808 - 1832, n=2) | |
| Dell Pro 5 14 P514260 | |
| HP OmniBook Ultra 14 Core Ultra X9 | |
| Asus ExpertBook Ultra B9406CAA | |
| Samsung Galaxy Book5 Pro 14 940XHA | |
| WebXPRT 3 / Overall | |
| HP OmniBook Ultra 14 Core Ultra X9 | |
| Dell Pro 5 14 P514260 | |
| Durchschnittliche Intel Core Ultra X7 368H, Intel Arc B390 12 Xe3 Panther Lake iGPU (338 - 342, n=2) | |
| Dell Pro 7 14 P714260 | |
| Lenovo ThinkPad T14s Gen 7 21YW0022GE | |
| Asus ExpertBook Ultra B9406CAA | |
| Samsung Galaxy Book5 Pro 14 940XHA | |
| WebXPRT 4 / Overall | |
| HP OmniBook Ultra 14 Core Ultra X9 | |
| Durchschnittliche Intel Core Ultra X7 368H, Intel Arc B390 12 Xe3 Panther Lake iGPU (304 - 314, n=2) | |
| Dell Pro 7 14 P714260 | |
| Dell Pro 5 14 P514260 | |
| Asus ExpertBook Ultra B9406CAA | |
| Lenovo ThinkPad T14s Gen 7 21YW0022GE | |
| Samsung Galaxy Book5 Pro 14 940XHA | |
| Mozilla Kraken 1.1 / Total | |
| Samsung Galaxy Book5 Pro 14 940XHA | |
| Asus ExpertBook Ultra B9406CAA | |
| Dell Pro 7 14 P714260 | |
| Lenovo ThinkPad T14s Gen 7 21YW0022GE | |
| Dell Pro 5 14 P514260 | |
| Durchschnittliche Intel Core Ultra X7 368H, Intel Arc B390 12 Xe3 Panther Lake iGPU (429 - 437, n=2) | |
| HP OmniBook Ultra 14 Core Ultra X9 | |
| Geekbench AI / Single Precision GPU 1.7 | |
| Asus ExpertBook Ultra B9406CAA | |
| HP OmniBook Ultra 14 Core Ultra X9 | |
| Dell Pro 5 14 P514260 | |
| Durchschnittliche Intel Core Ultra X7 368H, Intel Arc B390 12 Xe3 Panther Lake iGPU (7039 - 10200, n=2) | |
| Lenovo ThinkPad T14s Gen 7 21YW0022GE | |
| Samsung Galaxy Book5 Pro 14 940XHA | |
| Dell Pro 7 14 P714260 | |
| Geekbench AI / Half Precision GPU 1.7 | |
| Asus ExpertBook Ultra B9406CAA | |
| Dell Pro 5 14 P514260 | |
| Durchschnittliche Intel Core Ultra X7 368H, Intel Arc B390 12 Xe3 Panther Lake iGPU (18546 - 20294, n=2) | |
| HP OmniBook Ultra 14 Core Ultra X9 | |
| Samsung Galaxy Book5 Pro 14 940XHA | |
| Dell Pro 7 14 P714260 | |
| Lenovo ThinkPad T14s Gen 7 21YW0022GE | |
| Geekbench AI / Quantized GPU 1.7 | |
| Durchschnittliche Intel Core Ultra X7 368H, Intel Arc B390 12 Xe3 Panther Lake iGPU (6761 - 11082, n=2) | |
| Asus ExpertBook Ultra B9406CAA | |
| HP OmniBook Ultra 14 Core Ultra X9 | |
| Dell Pro 5 14 P514260 | |
| Lenovo ThinkPad T14s Gen 7 21YW0022GE | |
| Samsung Galaxy Book5 Pro 14 940XHA | |
| Dell Pro 7 14 P714260 | |
* ... kleinere Werte sind besser
| PCMark 10 Score | 10456 Punkte | |
Hilfe | ||
| AIDA64 / Memory Copy | |
| HP OmniBook Ultra 14 Core Ultra X9 | |
| Dell Pro 7 14 P714260 | |
| Dell Pro 5 14 P514260 | |
| Samsung Galaxy Book5 Pro 14 940XHA | |
| Lenovo ThinkPad T14s Gen 7 21YW0022GE | |
| AIDA64 / Memory Read | |
| HP OmniBook Ultra 14 Core Ultra X9 | |
| Asus ExpertBook Ultra B9406CAA | |
| Dell Pro 7 14 P714260 | |
| Dell Pro 5 14 P514260 | |
| Samsung Galaxy Book5 Pro 14 940XHA | |
| Lenovo ThinkPad T14s Gen 7 21YW0022GE | |
| AIDA64 / Memory Write | |
| HP OmniBook Ultra 14 Core Ultra X9 | |
| Dell Pro 7 14 P714260 | |
| Dell Pro 5 14 P514260 | |
| Asus ExpertBook Ultra B9406CAA | |
| Samsung Galaxy Book5 Pro 14 940XHA | |
| Lenovo ThinkPad T14s Gen 7 21YW0022GE | |
| AIDA64 / Memory Latency | |
| Lenovo ThinkPad T14s Gen 7 21YW0022GE | |
| Samsung Galaxy Book5 Pro 14 940XHA | |
| Dell Pro 7 14 P714260 | |
| Dell Pro 5 14 P514260 | |
| HP OmniBook Ultra 14 Core Ultra X9 | |
* ... kleinere Werte sind besser
DPC-Latenz
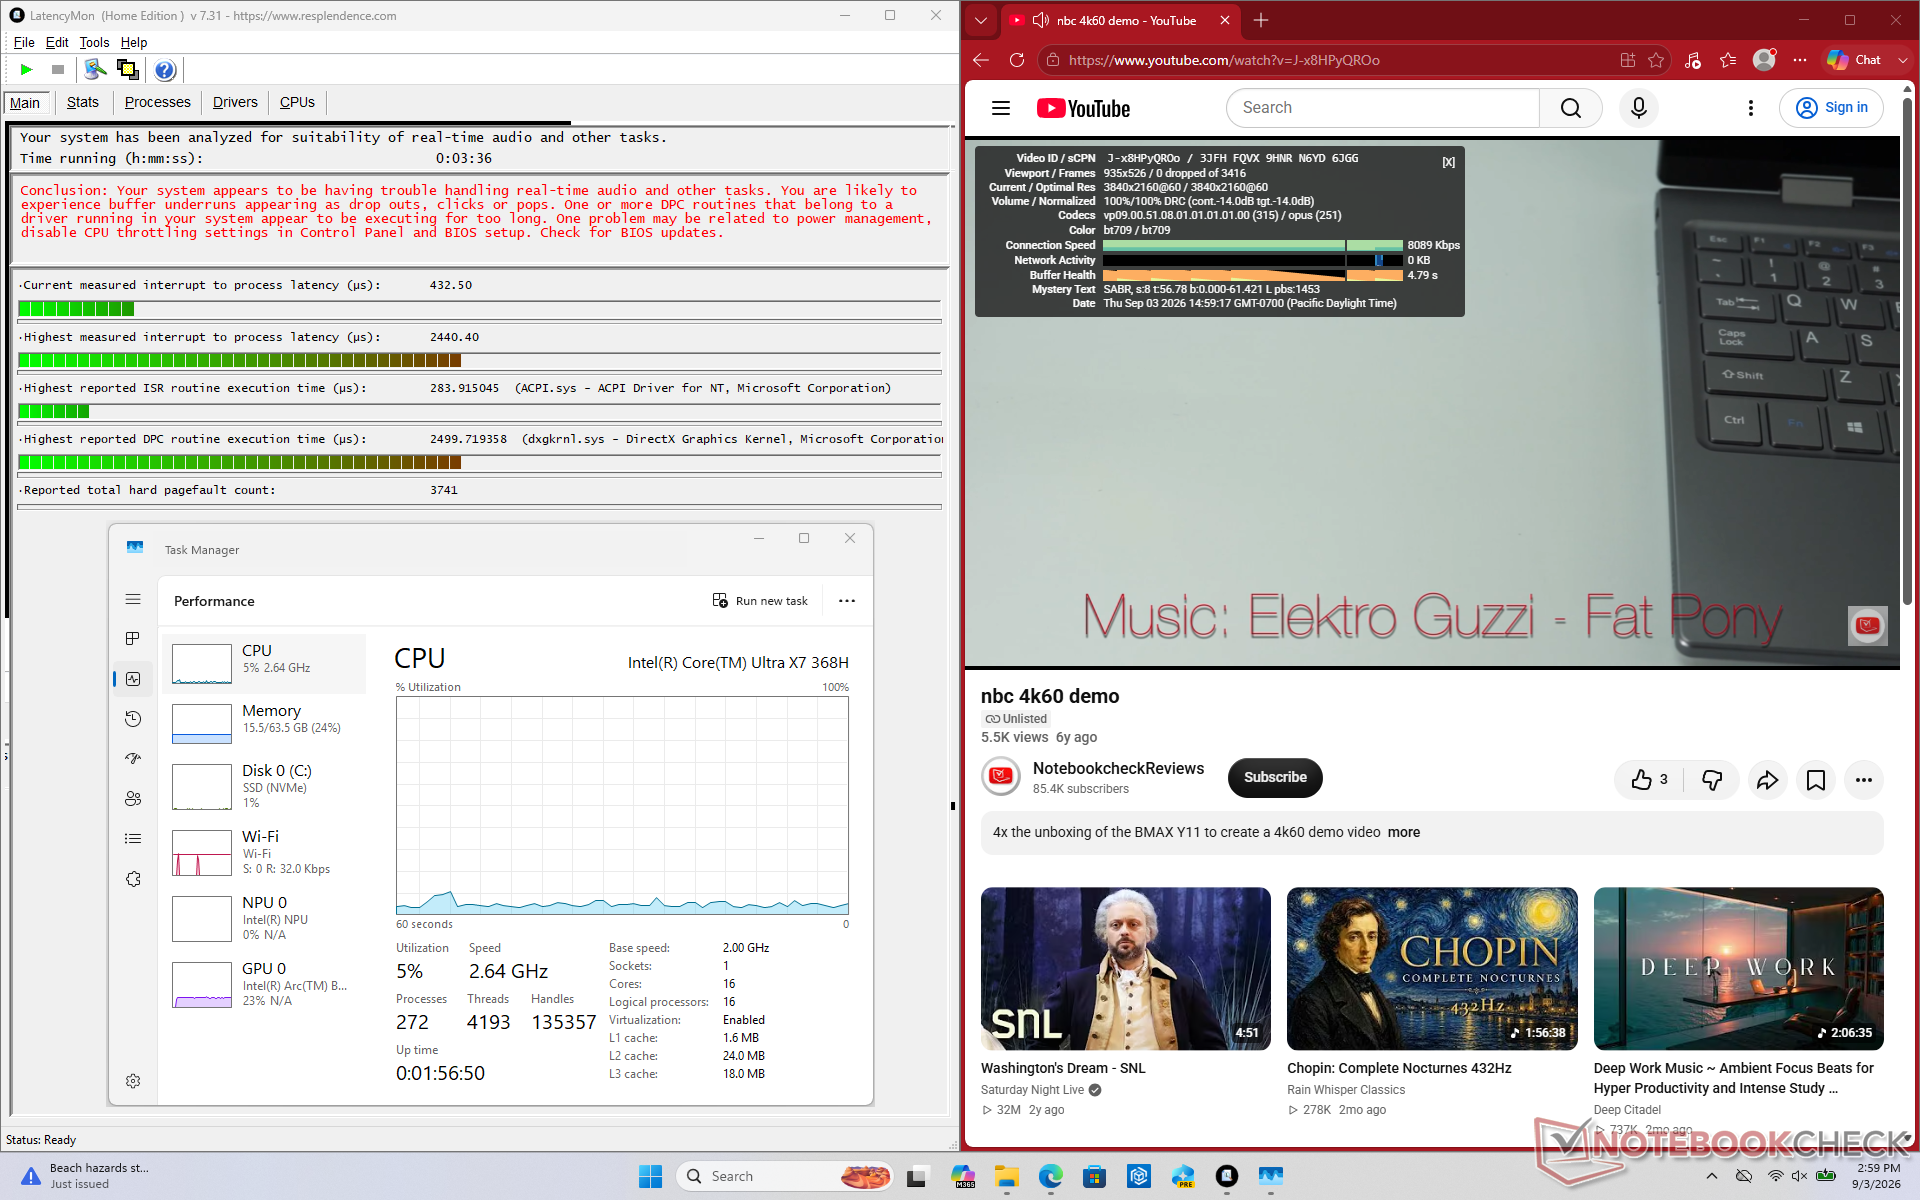
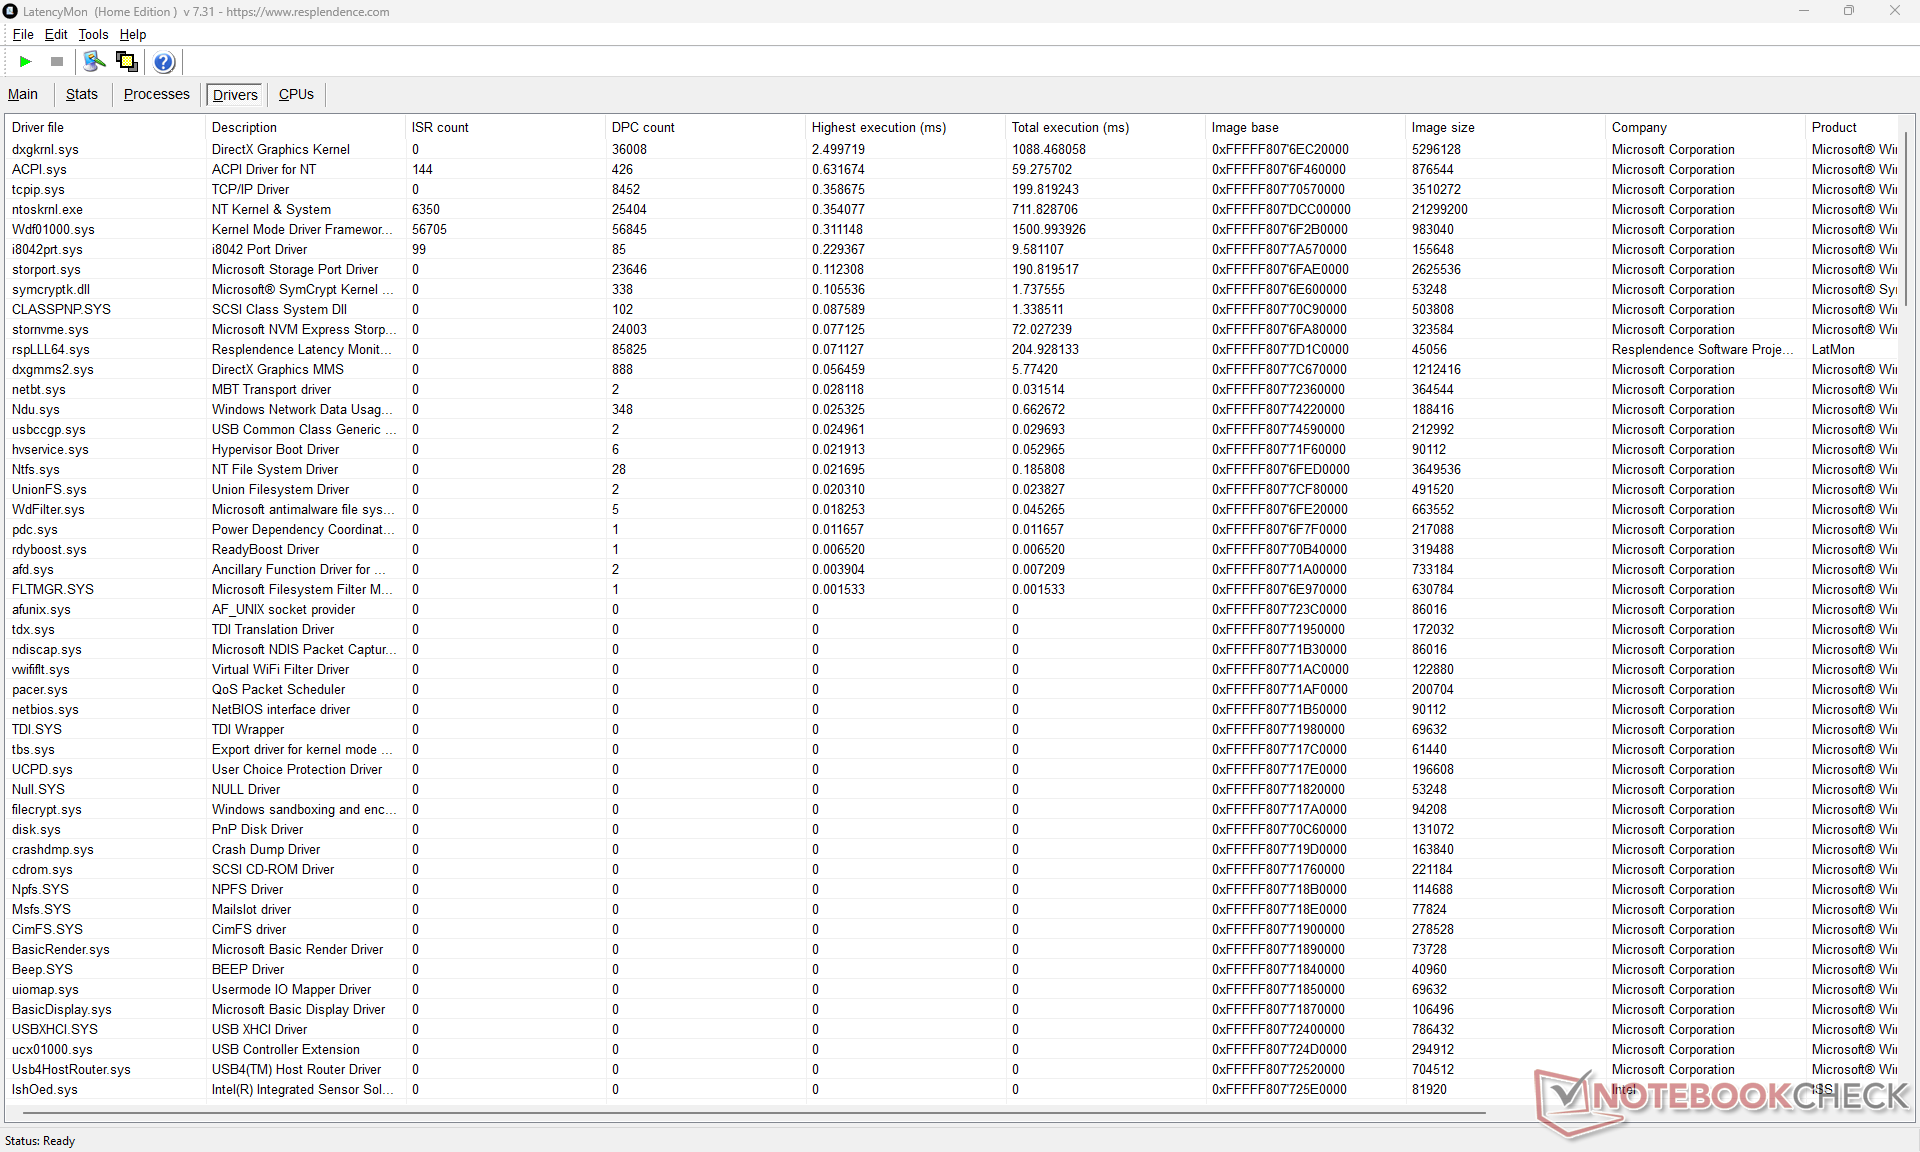
| DPC Latencies / LatencyMon - interrupt to process latency (max), Web, Youtube, Prime95 | |
| HP OmniBook Ultra 14 Core Ultra X9 | |
| Samsung Galaxy Book5 Pro 14 940XHA | |
| Lenovo ThinkPad T14s Gen 7 21YW0022GE | |
| Dell Pro 5 14 P514260 | |
| Dell Pro 7 14 P714260 | |
| Asus ExpertBook Ultra B9406CAA | |
* ... kleinere Werte sind besser
Speichergeräte
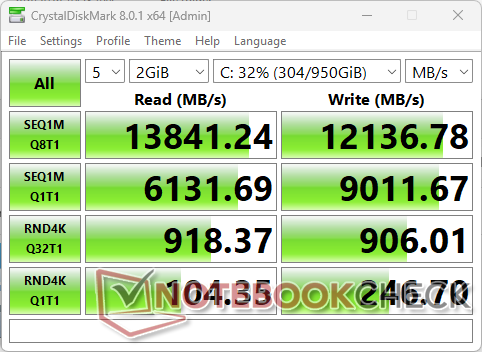
Da AS SSD nicht initialisiert werden konnte, sind die entsprechenden Ergebnisse im Folgenden nicht enthalten. Dennoch kam es bei der SK Hynix PCB01 PCIe5-SSD nach einigen Minuten unseres Stresstests zu einer leichten Drosselung von 14 auf 11 GB/s.
Zu beachten ist, dass das System M.2-2280-SSDs nur unterstützt, wenn es mit LPCAMM2 konfiguriert ist; andernfalls werden bei einer Konfiguration mit SODIMM nur M.2-230-SSDs unterstützt.

Festplatten-Drosselung: DiskSpd-Lese-Schleife, Warteschlangentiefe 8
GPU-Leistung
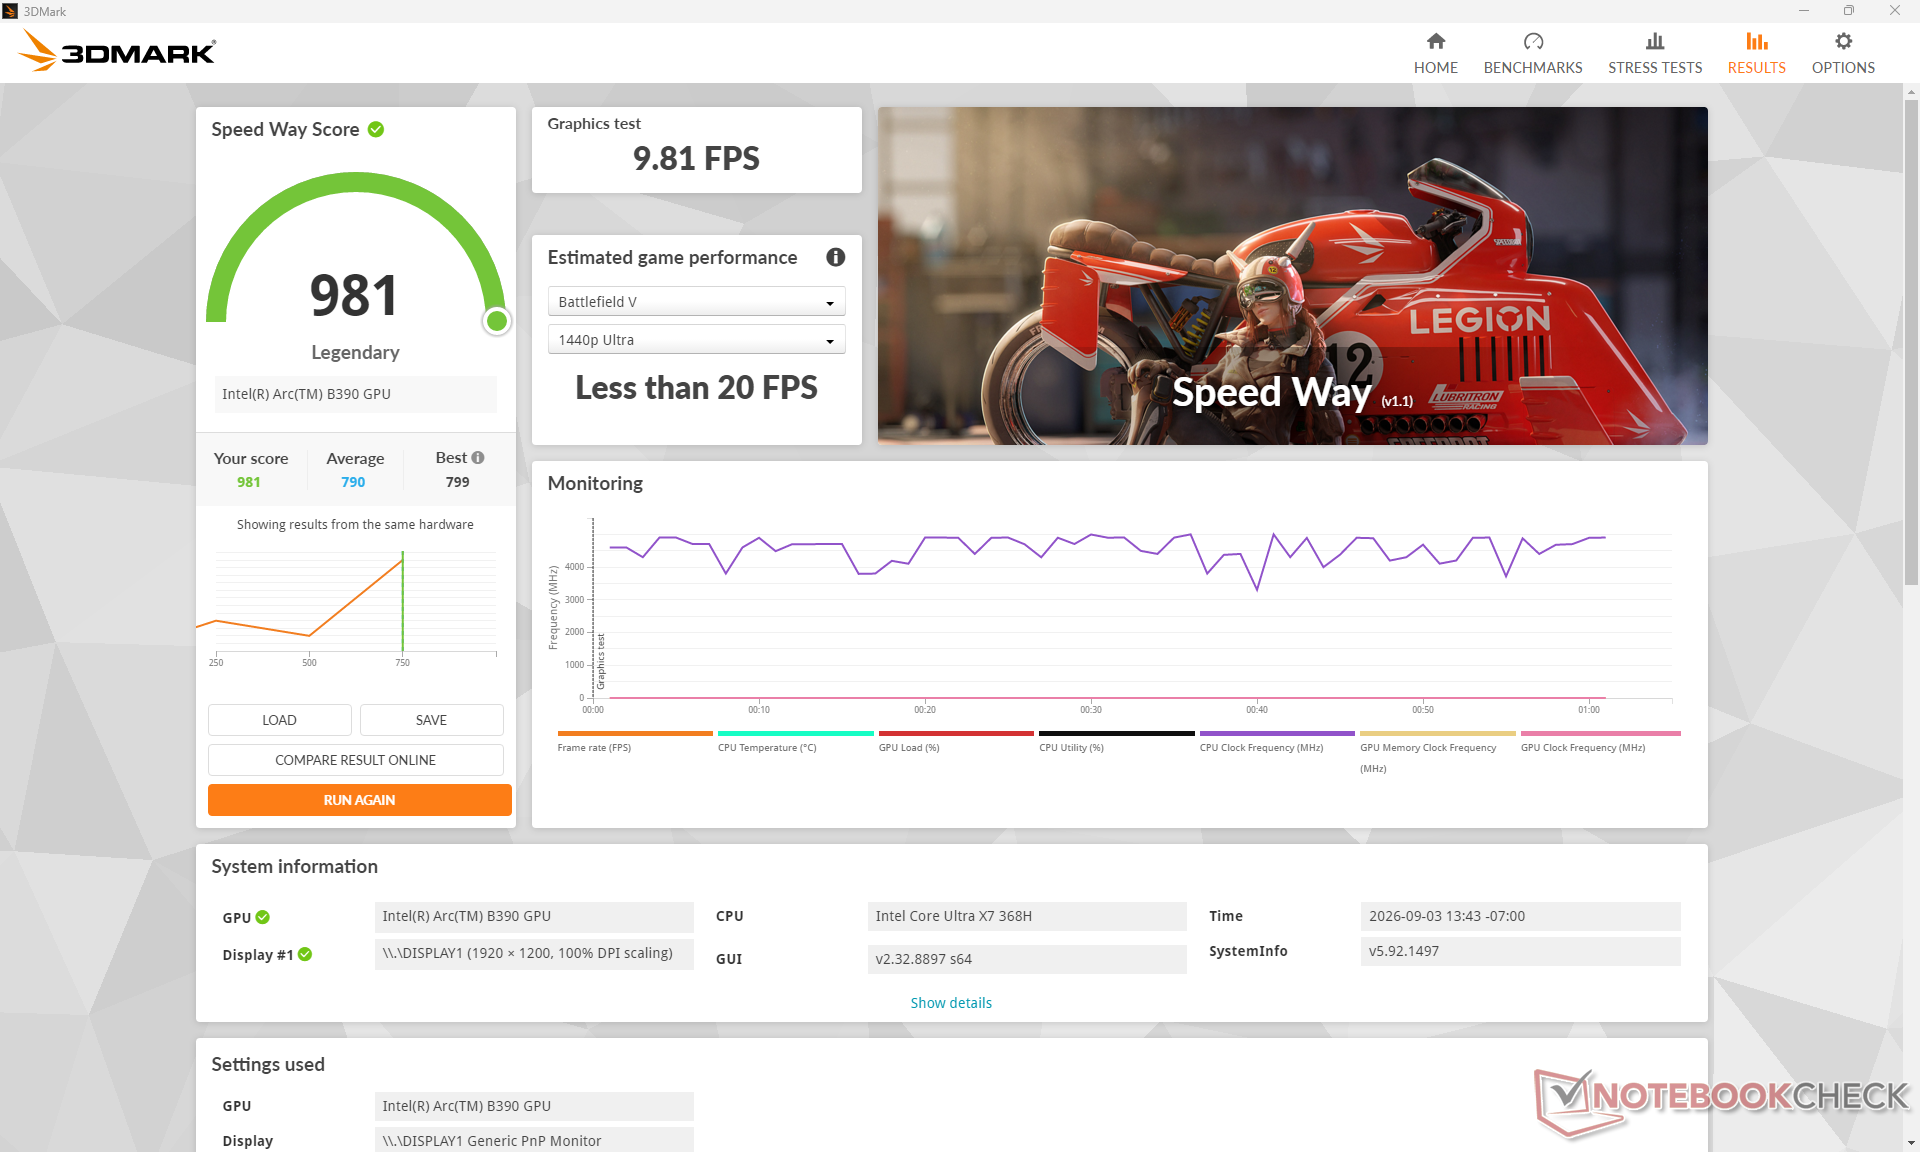
Die Grafikleistung ist für die Größe zwar beachtlich, neigt jedoch dazu, nach 10 Minuten unter hoher Belastung abzubremsen, wie unser untenstehender Cyberpunk-2077-Test zeigt, während das Asus ExpertBook Ultra über einen längeren Zeitraum hinweg konstantere Bildraten aufrechterhalten würde, obwohl beide Geräte mit derselben integrierten Arc-B390-GPU ausgestattet sind.
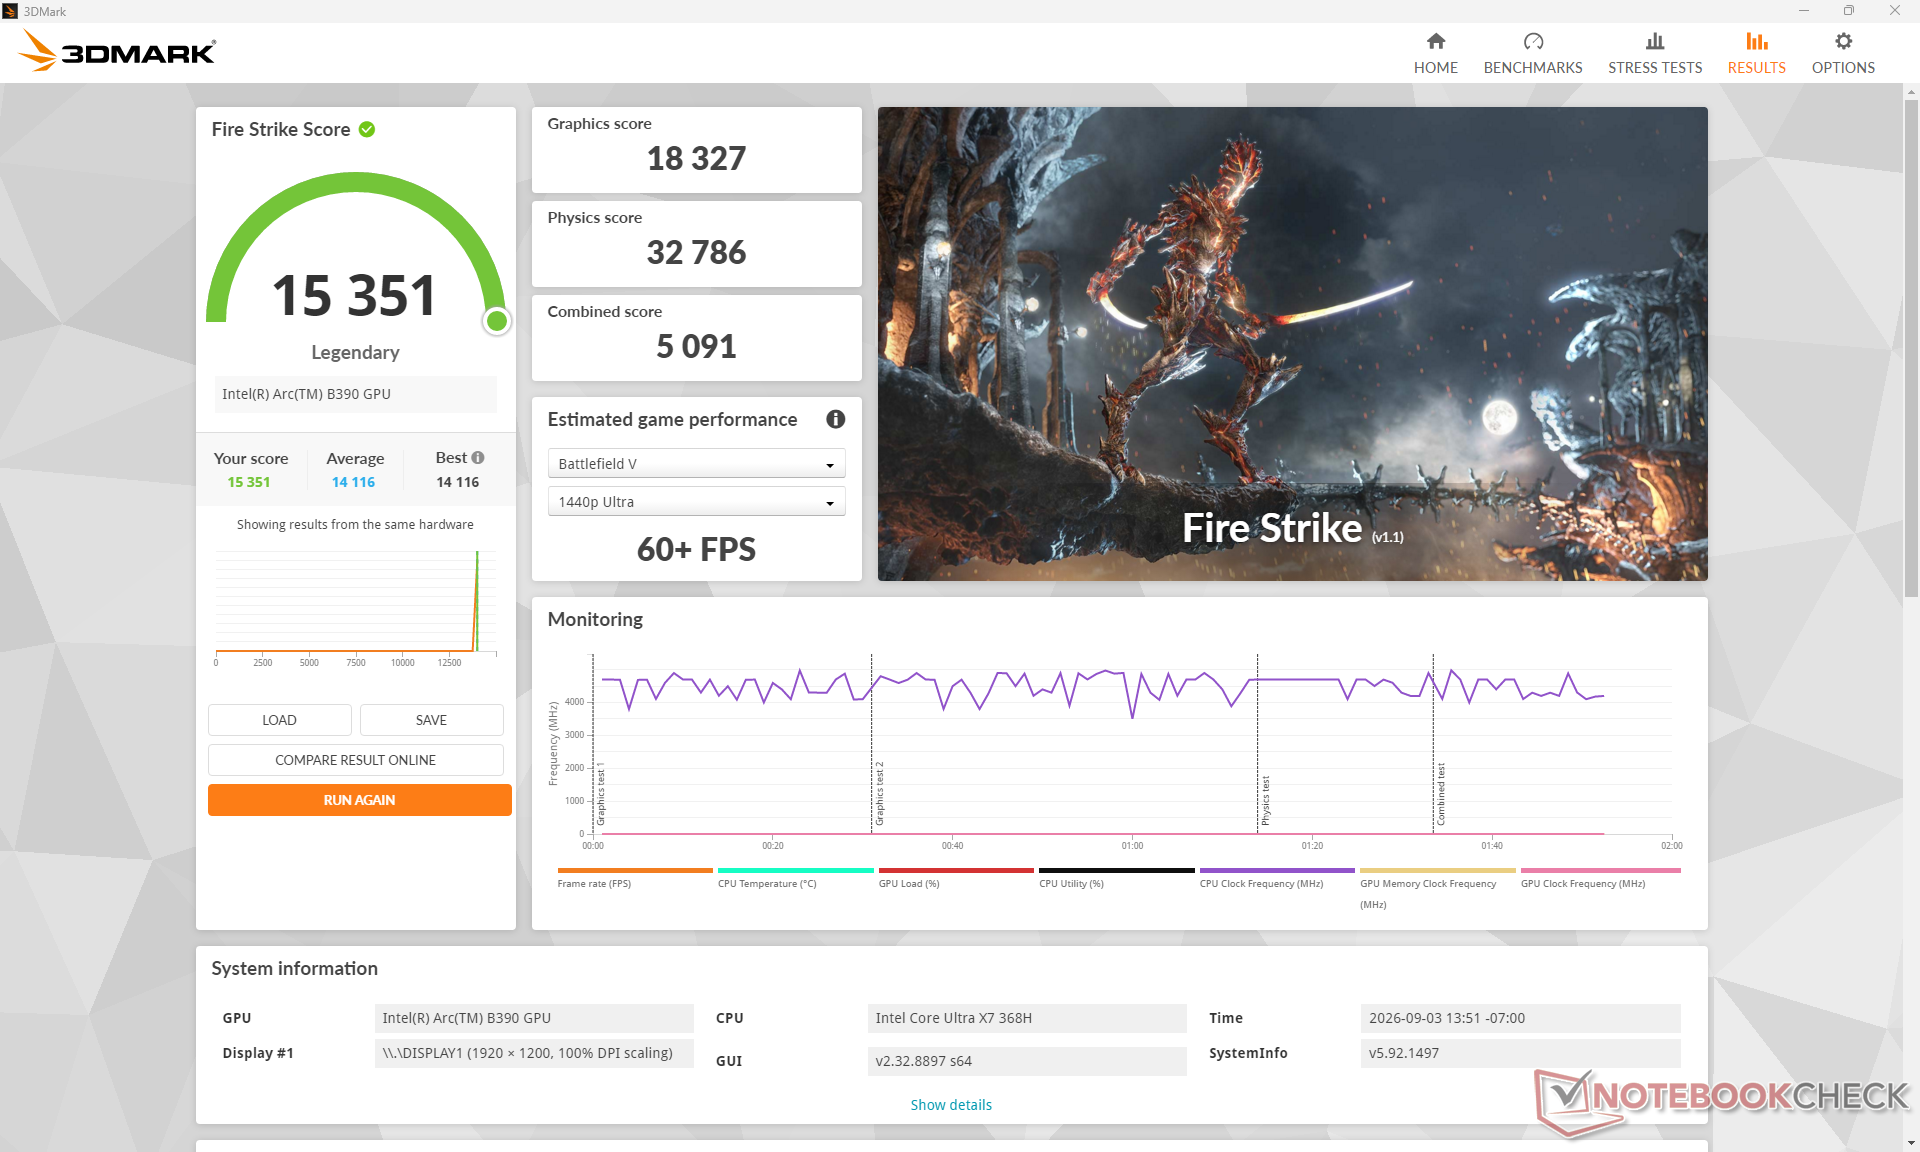
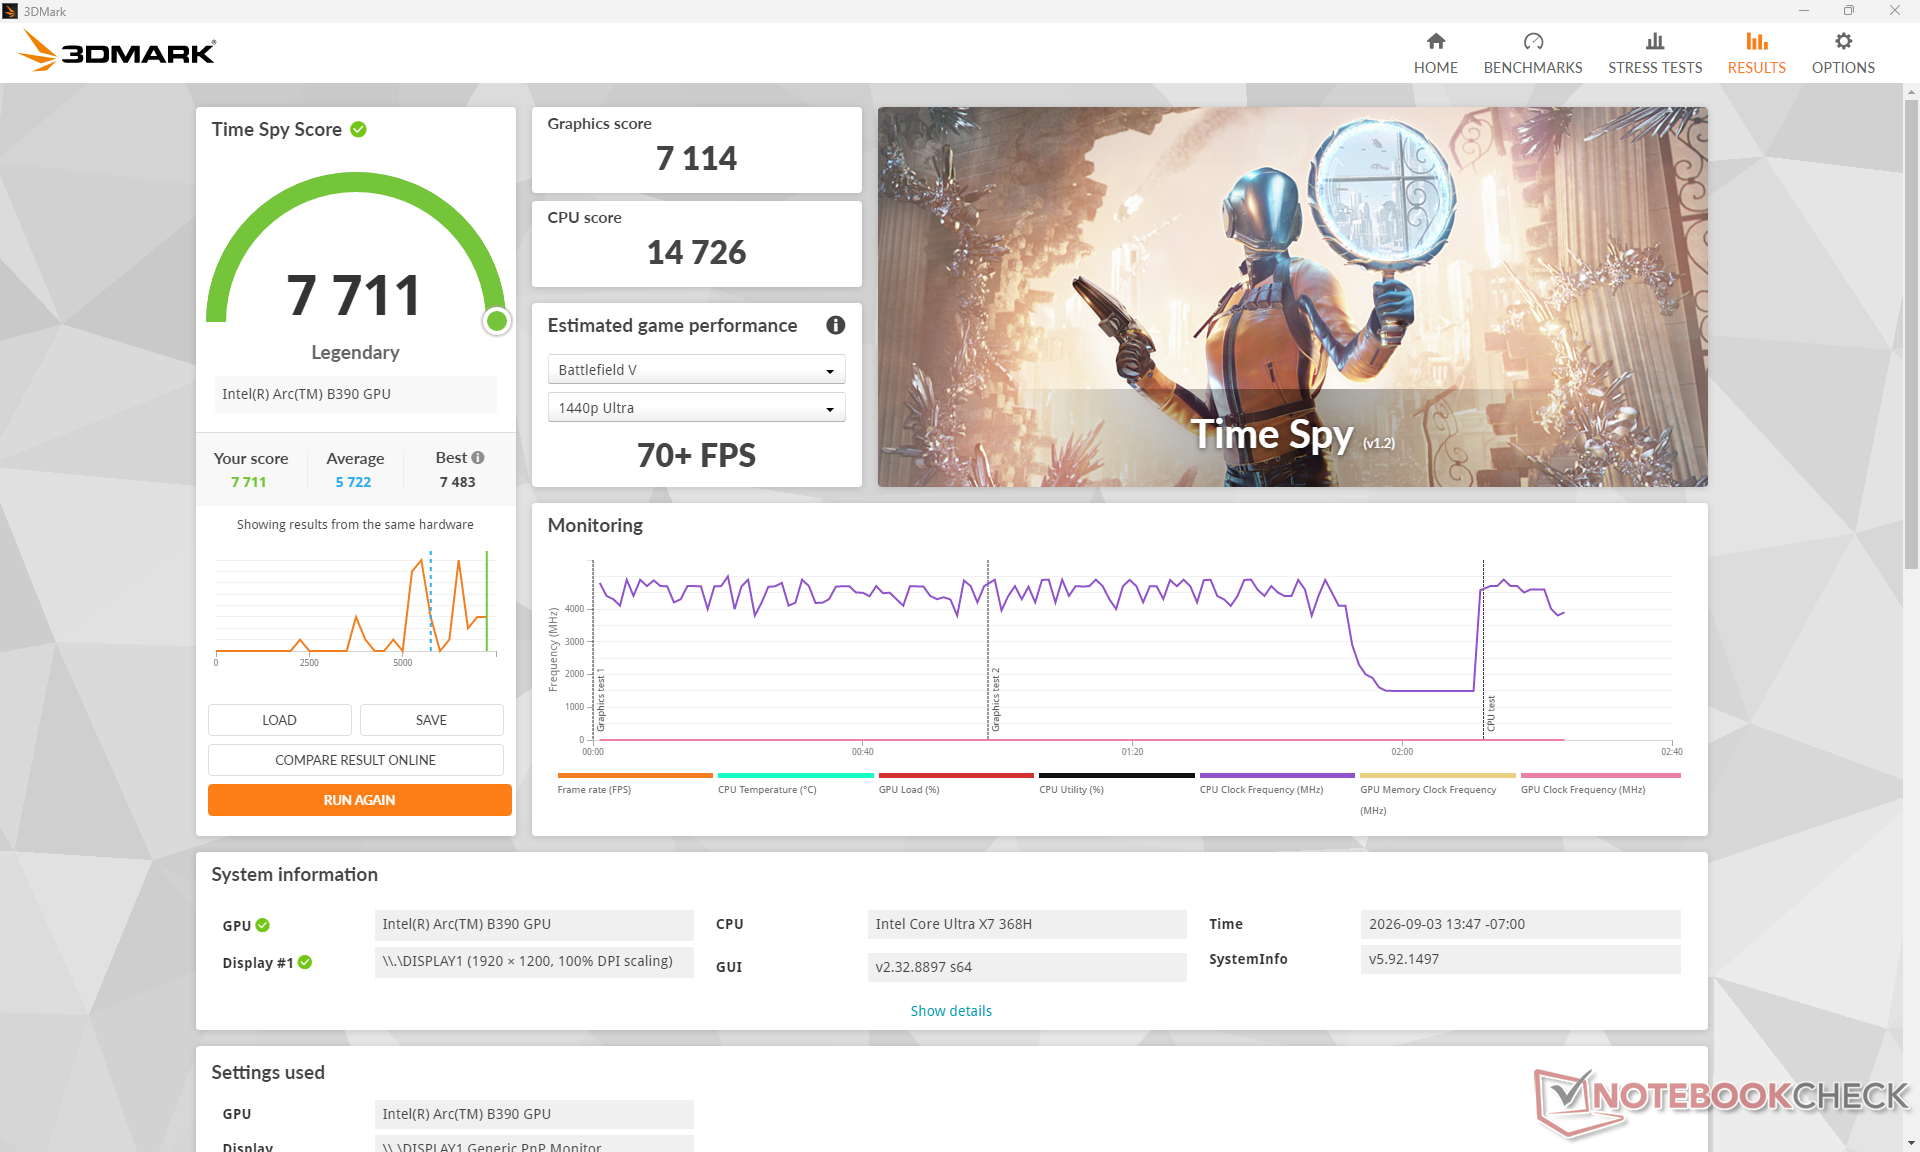
| Leistungsprofil | Grafics-Ergebnis | Physics-Ergebnis | Kombinierte Punktzahl |
| Leistungsmodus | 18.327 | 32.786 | 5.091 |
| Ausgewogener Modus | 18.194 (-0 %) | 32.616 (-0 %) | 4191 (-0 %) |
| Batteriestrom | 17.114 (-0 %) | 28.206 (-0 %) | 4.705 (-0 %) |
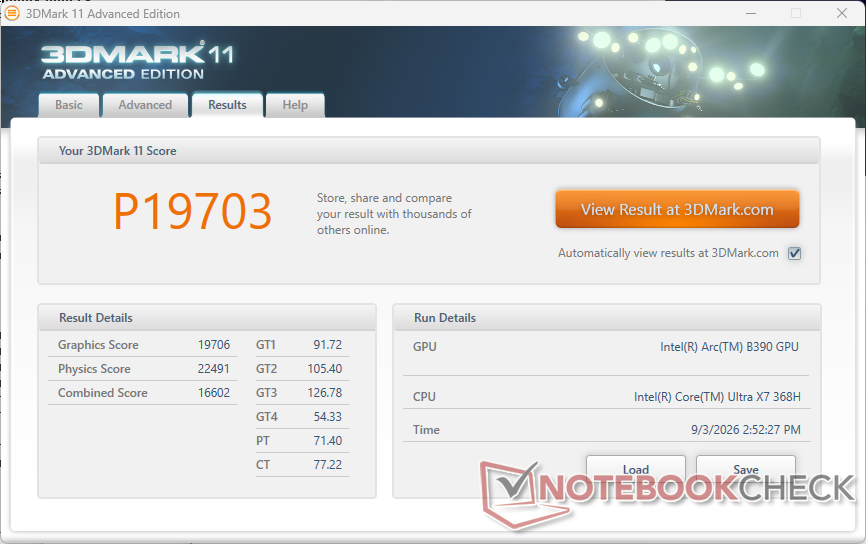
| 3DMark 11 Performance | 19703 Punkte | |
| 3DMark Cloud Gate Standard Score | 42701 Punkte | |
| 3DMark Fire Strike Score | 15351 Punkte | |
| 3DMark Time Spy Score | 7711 Punkte | |
Hilfe | ||
* ... kleinere Werte sind besser
| Cyberpunk 2077 - 1920x1080 Ultra Preset (FSR off) | |
| Dell Pro 5 14 P514260 | |
| Asus ExpertBook Ultra B9406CAA | |
| HP OmniBook Ultra 14 Core Ultra X9 | |
| Samsung Galaxy Book5 Pro 14 940XHA | |
| Dell Pro 7 14 P714260 | |
| Lenovo ThinkPad T14s Gen 7 21YW0022GE | |
| Baldur's Gate 3 - 1920x1080 Ultra Preset AA:T | |
| HP OmniBook Ultra 14 Core Ultra X9 | |
| Asus ExpertBook Ultra B9406CAA | |
| Dell Pro 5 14 P514260 | |
| Dell Pro 7 14 P714260 | |
| Samsung Galaxy Book5 Pro 14 940XHA | |
| Lenovo ThinkPad T14s Gen 7 21YW0022GE | |
| GTA V - 1920x1080 Highest AA:4xMSAA + FX AF:16x | |
| Asus ExpertBook Ultra B9406CAA | |
| HP OmniBook Ultra 14 Core Ultra X9 | |
| Dell Pro 5 14 P514260 | |
| Lenovo ThinkPad T14s Gen 7 21YW0022GE | |
| Dell Pro 7 14 P714260 | |
| Samsung Galaxy Book5 Pro 14 940XHA | |
| Final Fantasy XV Benchmark - 1920x1080 High Quality | |
| Asus ExpertBook Ultra B9406CAA | |
| HP OmniBook Ultra 14 Core Ultra X9 | |
| Dell Pro 5 14 P514260 | |
| Samsung Galaxy Book5 Pro 14 940XHA | |
| Dell Pro 7 14 P714260 | |
| Lenovo ThinkPad T14s Gen 7 21YW0022GE | |
| Strange Brigade - 1920x1080 ultra AA:ultra AF:16 | |
| HP OmniBook Ultra 14 Core Ultra X9 | |
| Asus ExpertBook Ultra B9406CAA | |
| Dell Pro 5 14 P514260 | |
| Dell Pro 7 14 P714260 | |
| Samsung Galaxy Book5 Pro 14 940XHA | |
| Lenovo ThinkPad T14s Gen 7 21YW0022GE | |
| Dota 2 Reborn - 1920x1080 ultra (3/3) best looking | |
| Asus ExpertBook Ultra B9406CAA | |
| HP OmniBook Ultra 14 Core Ultra X9 | |
| Dell Pro 5 14 P514260 | |
| Dell Pro 7 14 P714260 | |
| Lenovo ThinkPad T14s Gen 7 21YW0022GE | |
| Samsung Galaxy Book5 Pro 14 940XHA | |
Cyberpunk 2077 – Ultra-fps-Diagramm
| min. | mittel | hoch | max. | |
|---|---|---|---|---|
| GTA V (2015) | 180.6 | 174.4 | 94.7 | 41.4 |
| Dota 2 Reborn (2015) | 139.5 | 76.5 | 94.6 | 94.3 |
| Final Fantasy XV Benchmark (2018) | 83.6 | 48.9 | 35.5 | |
| X-Plane 11.11 (2018) | 63.8 | 50.2 | 43.4 | |
| Strange Brigade (2018) | 333 | 128.6 | 104.7 | 91.7 |
| Baldur's Gate 3 (2023) | 65.8 | 56.2 | 49.3 | 48.5 |
| Cyberpunk 2077 (2023) | 85.9 | 68.9 | 58.3 | 51 |
| F1 24 (2024) | 157.2 | 144.3 | 107.3 | 33.2 |
Emissionen
Systemgeräusche
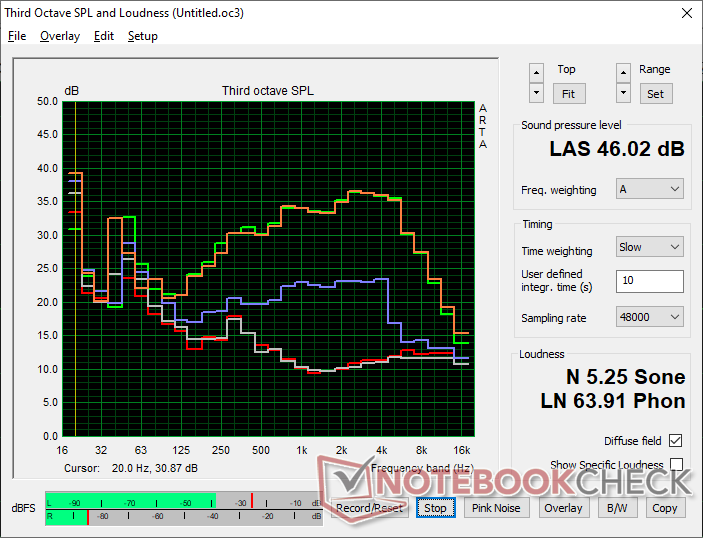
Lautstärkediagramm
| Idle |
| 23.9 / 23.9 / 28.9 dB(A) |
| Last |
| 33.5 / 46 dB(A) |
 | ||
30 dB leise 40 dB(A) deutlich hörbar 50 dB(A) störend |
||
min:  , med: , med:  , max: , max:  Earthworks M23R, Arta (aus 15 cm gemessen) Umgebungsgeräusche: 23.6 dB(A) Earthworks M23R, Arta (aus 15 cm gemessen) Umgebungsgeräusche: 23.6 dB(A) | ||
| Dell Pro 5 14 P514260 Ultra X7 368H, Arc B390 Panther Lake iGPU | Dell Pro 7 14 P714260 Ultra 7 366H, Intel Graphics 4 Xe3 PTL | Lenovo ThinkPad T14s Gen 7 21YW0022GE Ryzen AI 7 PRO 450, Radeon 860M | HP OmniBook Ultra 14 Core Ultra X9 Ultra X9 388H, Arc B390 Panther Lake iGPU | Samsung Galaxy Book5 Pro 14 940XHA Core Ultra 5 226V, Arc 130V | Asus ExpertBook Ultra B9406CAA Ultra X7 358H, Arc B390 Panther Lake iGPU | |
|---|---|---|---|---|---|---|
| Geräuschentwicklung | 3% | 2% | 1% | 8% | 7% | |
| aus / Umgebung * (dB) | 23.6 | 23.3 1% | 24.8 -5% | 23.3 1% | 25.1 -6% | 22.9 3% |
| Idle min * (dB) | 23.9 | 23.8 -0% | 24.8 -4% | 23.3 3% | 25.1 -5% | 23.4 2% |
| Idle avg * (dB) | 23.9 | 23.8 -0% | 24.8 -4% | 23.3 3% | 25.1 -5% | 23.4 2% |
| Idle max * (dB) | 28.9 | 23.8 18% | 24.8 14% | 23.3 19% | 25.1 13% | 23.4 19% |
| Last avg * (dB) | 33.5 | 31.9 5% | 36.7 -10% | 42.9 -28% | 29.3 13% | 28.6 15% |
| Cyberpunk 2077 ultra * (dB) | 46 | 46.1 -0% | 41.6 10% | 44.4 3% | 33.1 28% | 42.8 7% |
| Last max * (dB) | 46 | 46.3 -1% | 41.6 10% | 44.1 4% | 38.7 16% | 45.2 2% |
* ... kleinere Werte sind besser
Temperatur
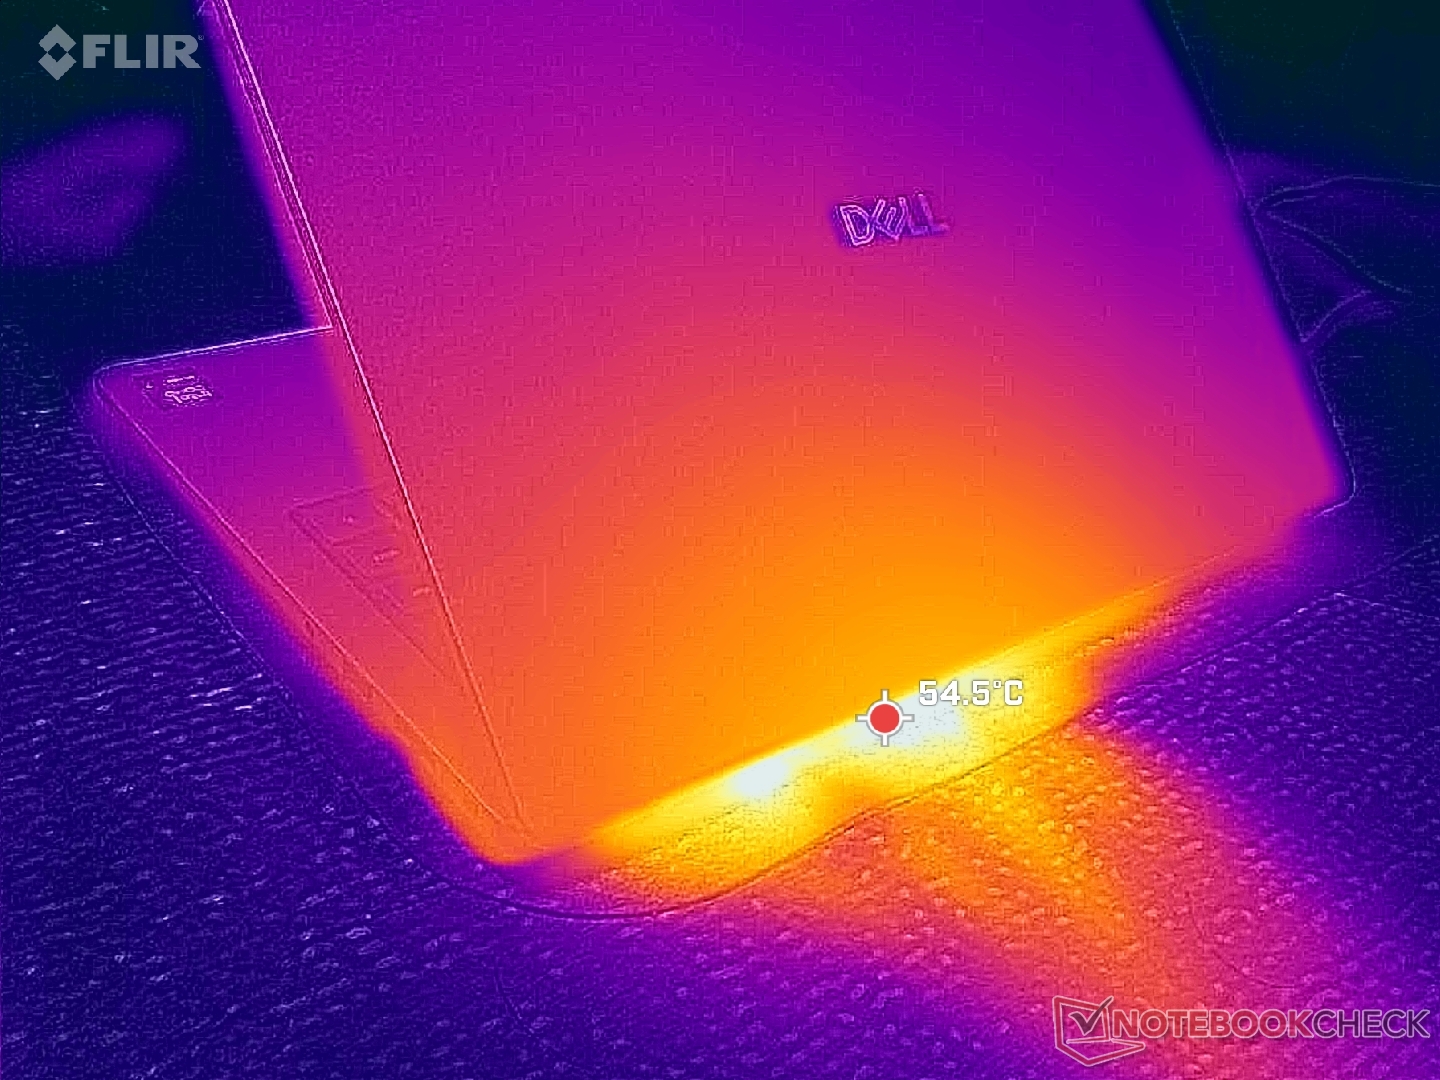
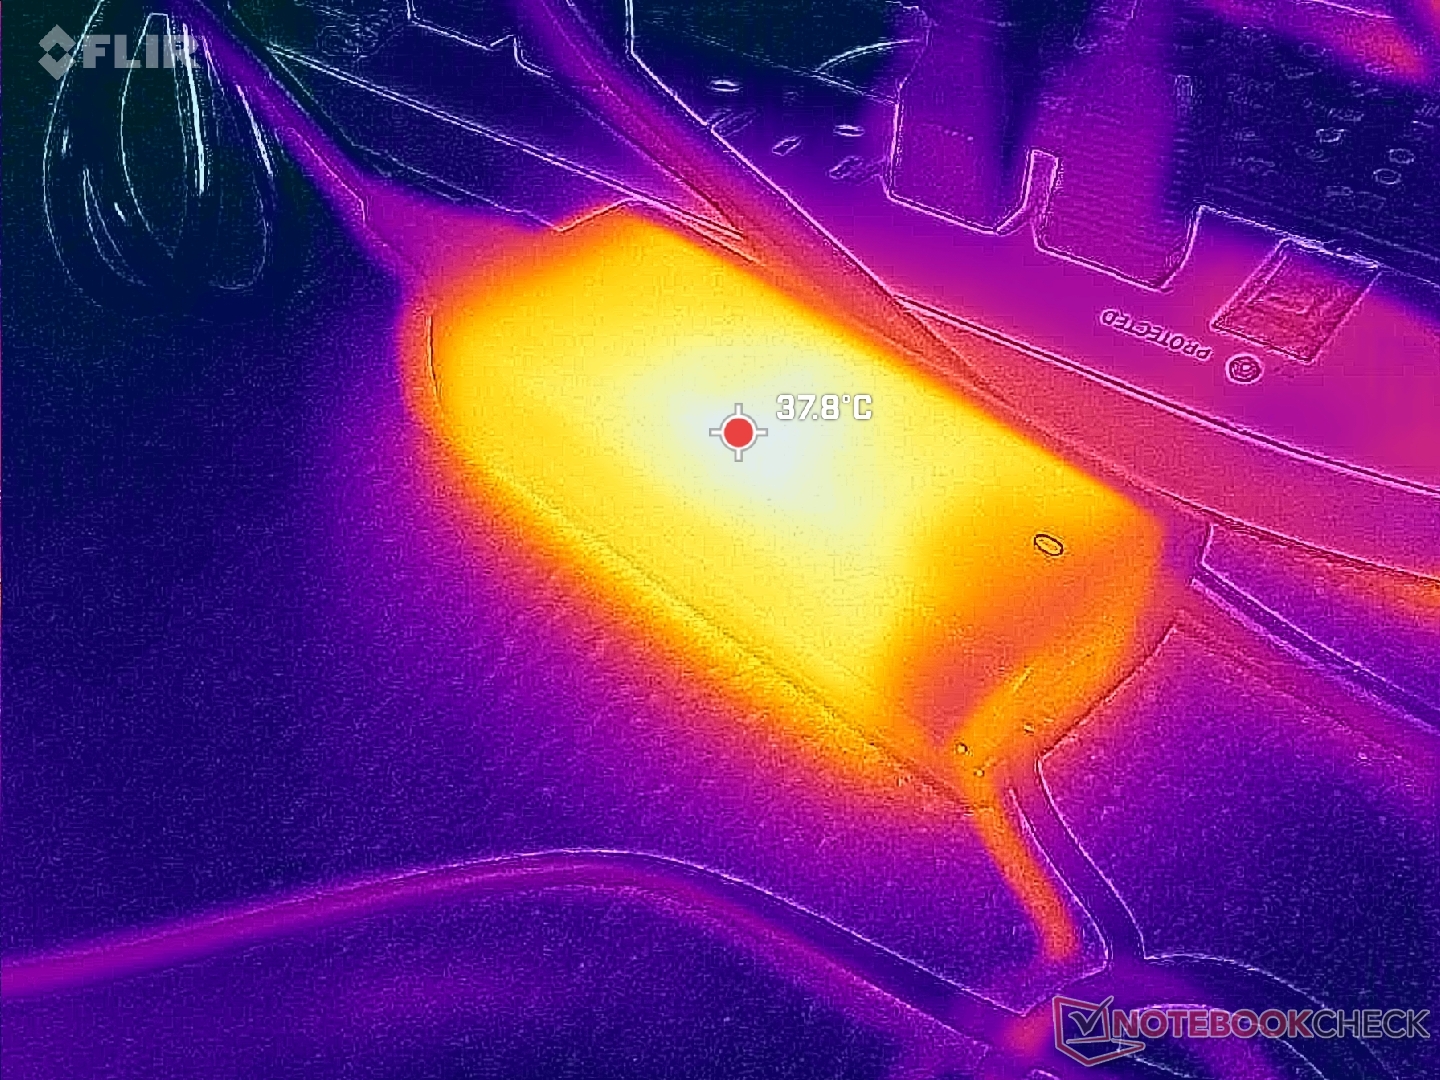
(±) Die maximale Temperatur auf der Oberseite ist 42.8 °C. Im Vergleich liegt der Klassendurchschnitt bei 34.4 °C (von 21.2 bis 62.5 °C für die Klasse Office).
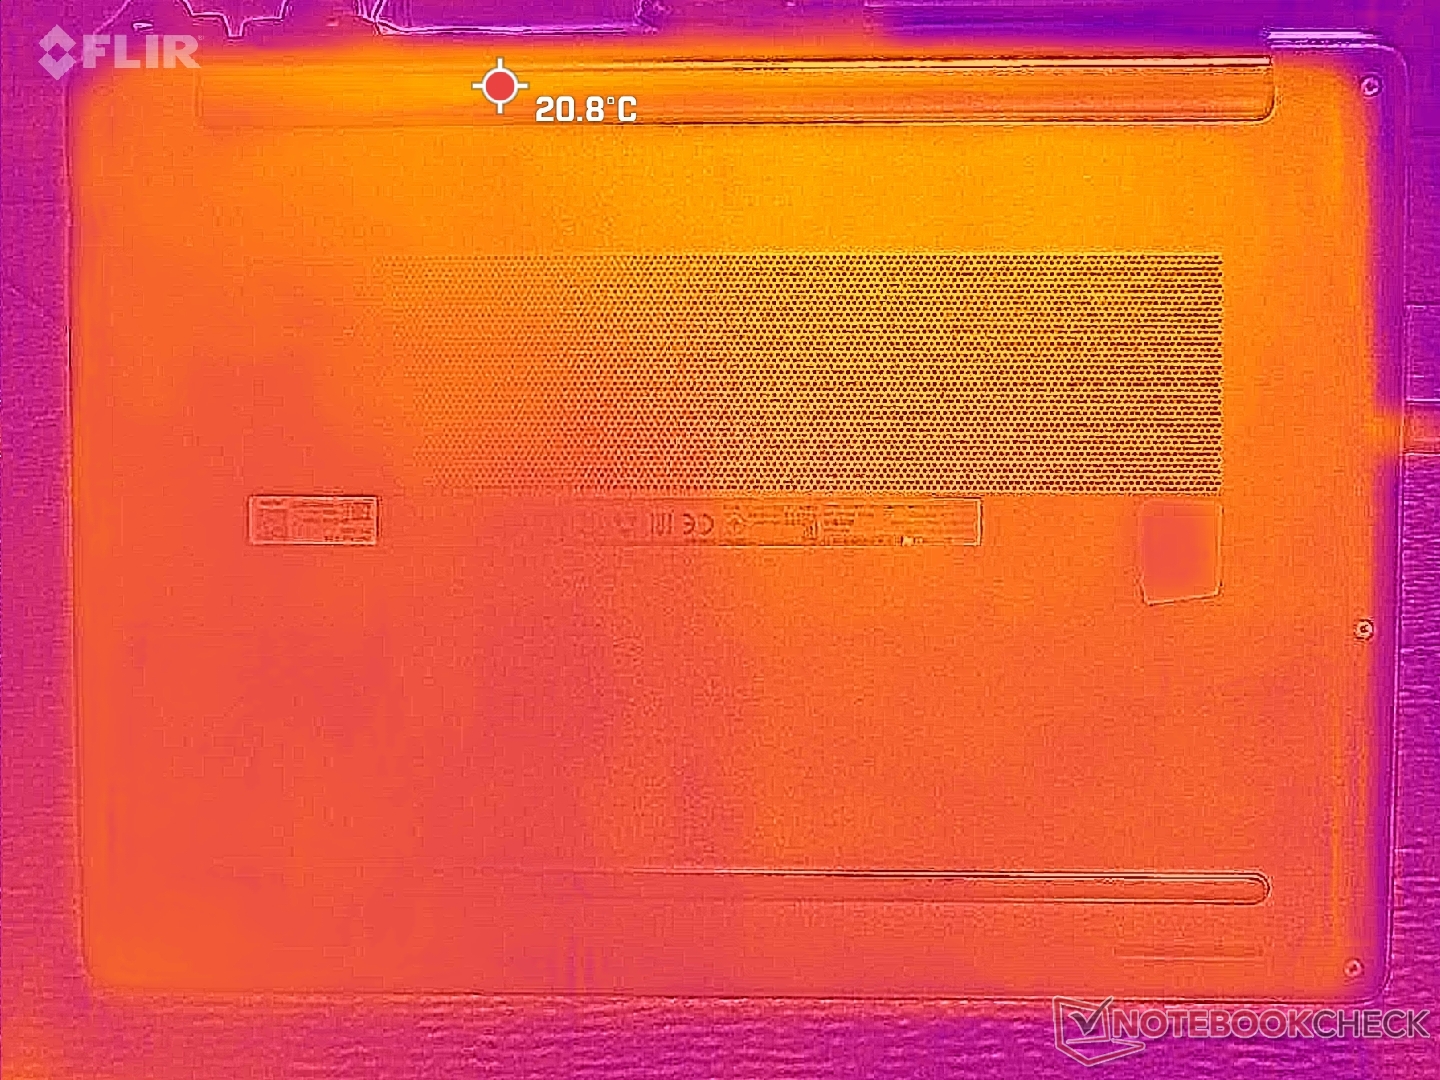
(±) Auf der Unterseite messen wir eine maximalen Wert von 43.6 °C (im Vergleich zum Durchschnitt von 36.8 °C).
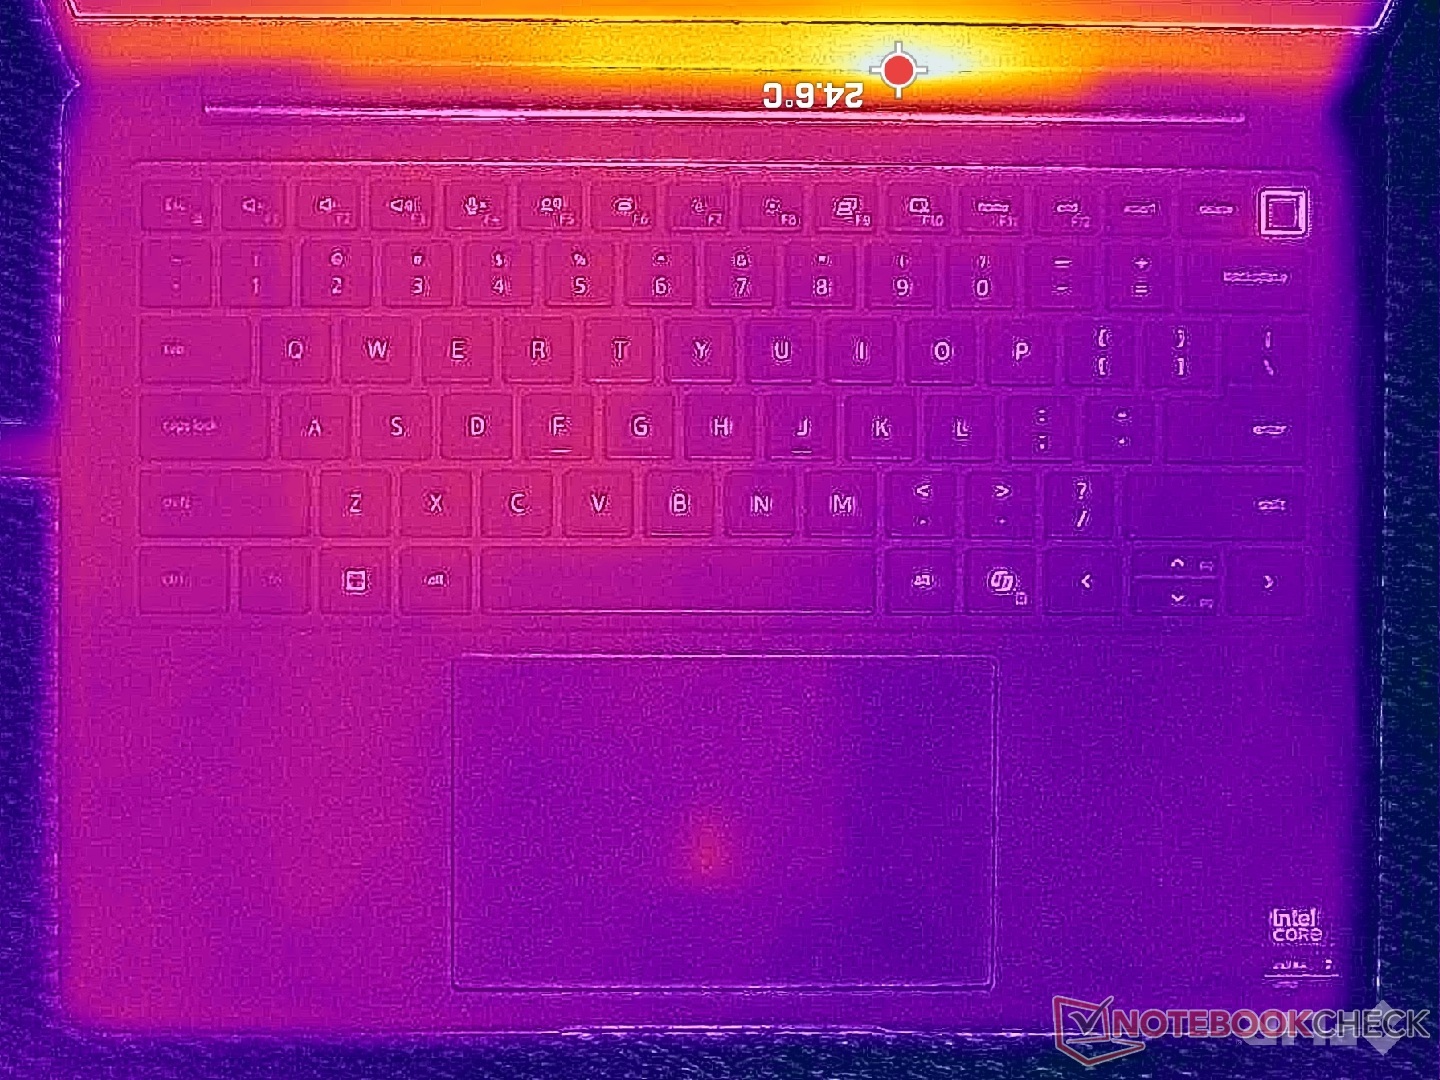
(+) Ohne Last messen wir eine durchschnittliche Temperatur von 25.2 °C auf der Oberseite. Der Klassendurchschnitt erreicht 29.5 °C.
(+) Die Handballen und der Touchpad-Bereich erreichen maximal 33.2 °C und damit die typische Hauttemperatur und fühlen sich daher nicht heiß an.
(-) Die durchschnittliche Handballen-Temperatur anderer getesteter Geräte war 27.6 °C (-5.6 °C).
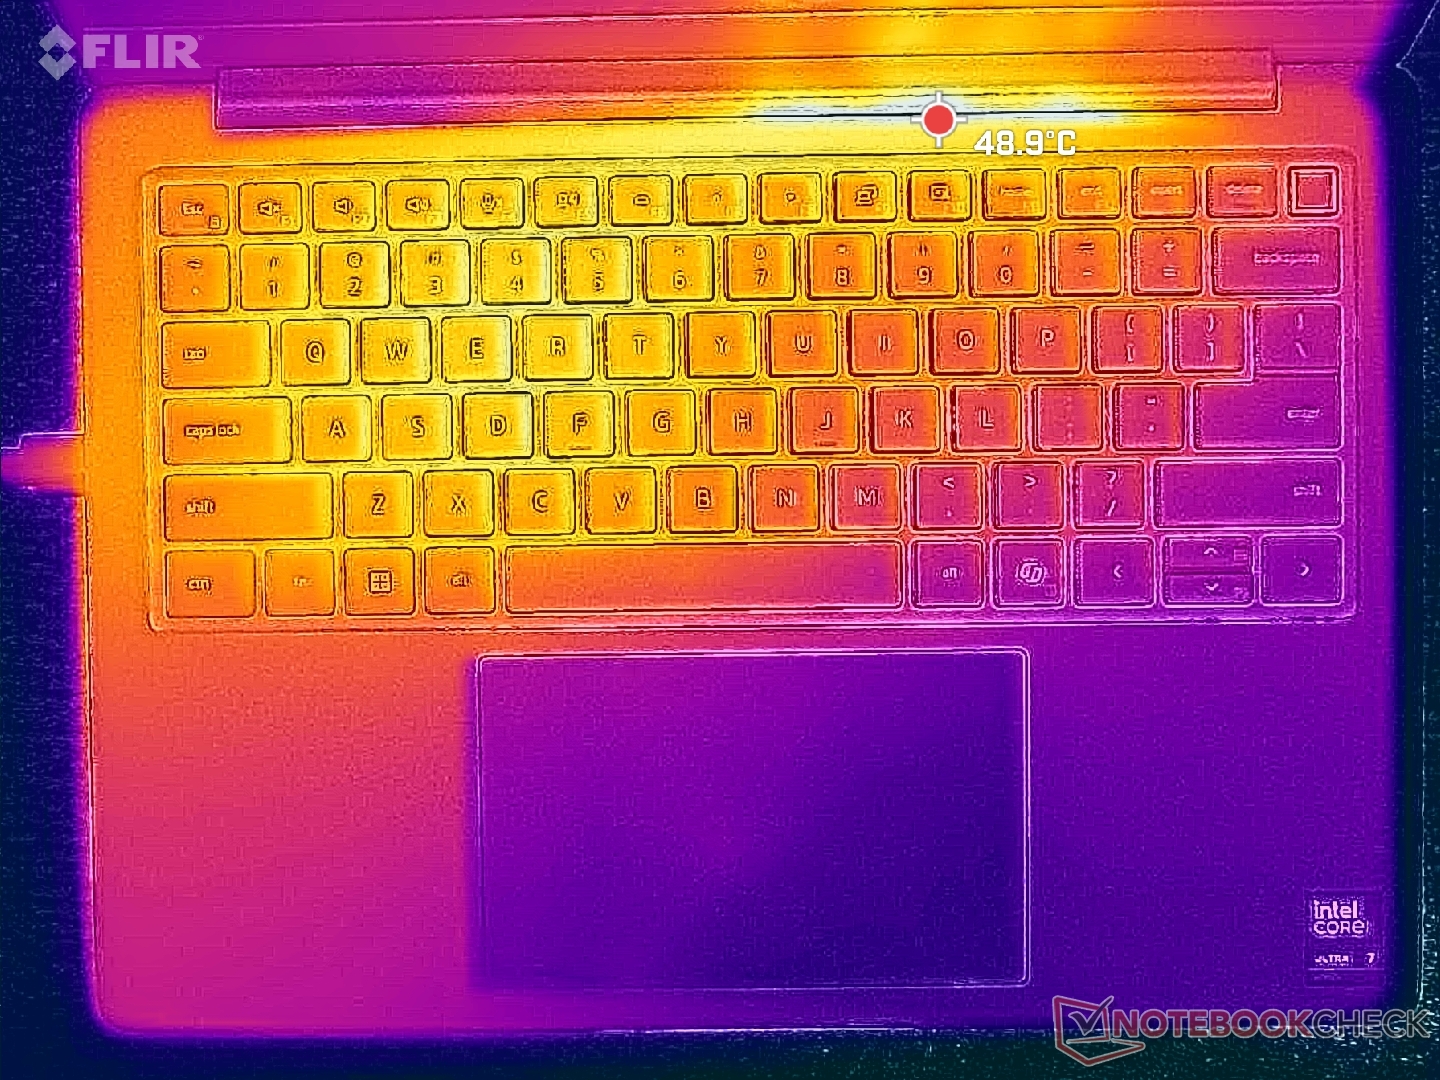
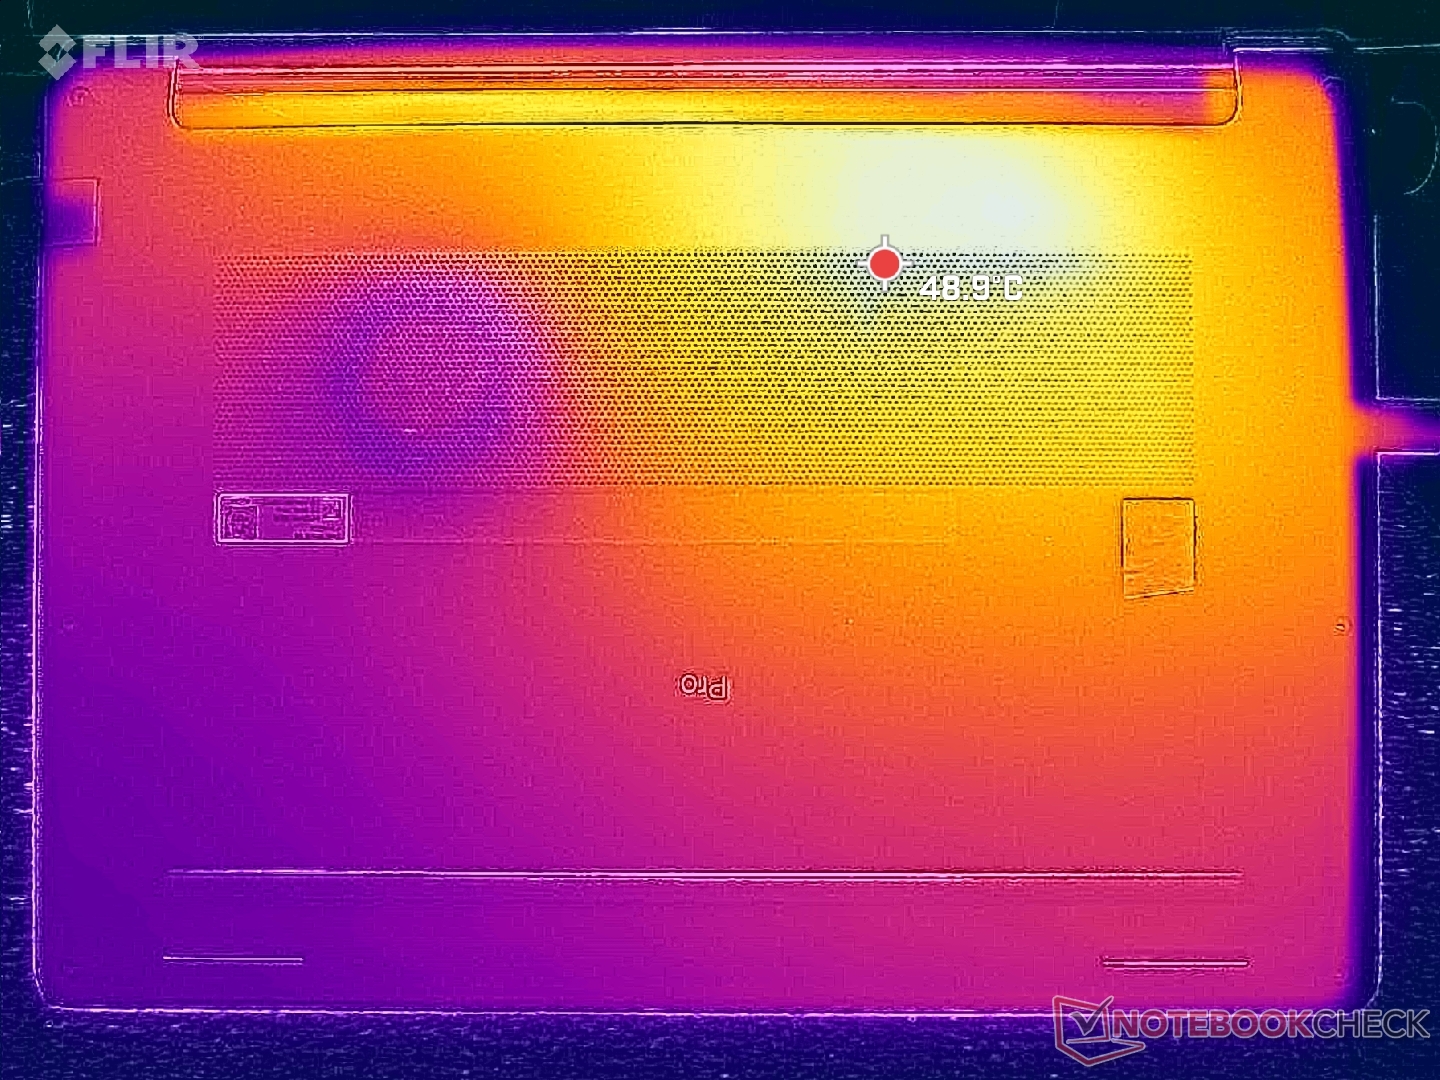
| Dell Pro 5 14 P514260 Ultra X7 368H, Arc B390 Panther Lake iGPU | Dell Pro 7 14 P714260 Ultra 7 366H, Intel Graphics 4 Xe3 PTL | Lenovo ThinkPad T14s Gen 7 21YW0022GE Ryzen AI 7 PRO 450, Radeon 860M | HP OmniBook Ultra 14 Core Ultra X9 Ultra X9 388H, Arc B390 Panther Lake iGPU | Samsung Galaxy Book5 Pro 14 940XHA Core Ultra 5 226V, Arc 130V | Asus ExpertBook Ultra B9406CAA Ultra X7 358H, Arc B390 Panther Lake iGPU | |
|---|---|---|---|---|---|---|
| Hitze | -4% | 1% | 7% | 1% | 7% | |
| Last oben max * (°C) | 42.8 | 43.4 -1% | 42.3 1% | 40.2 6% | 41.4 3% | 38.6 10% |
| Last unten max * (°C) | 43.6 | 44.6 -2% | 43.8 -0% | 44.2 -1% | 44.6 -2% | 38.4 12% |
| Idle oben max * (°C) | 25.8 | 27.2 -5% | 25.2 2% | 22.8 12% | 24.9 3% | 24.6 5% |
| Idle unten max * (°C) | 25.8 | 27.6 -7% | 25.5 1% | 23.4 9% | 25.5 1% | 26 -1% |
* ... kleinere Werte sind besser
Stresstest
Die CPU fährt auf 3,1 GHz und 66 W hoch, bis sie wenige Augenblicke später eine Temperatur von 96 °C erreicht. Die Leistung sinkt dann auf 2,4 GHz und 40 W, um eine besser kontrollierbare Kerntemperatur von 81 °C aufrechtzuerhalten.
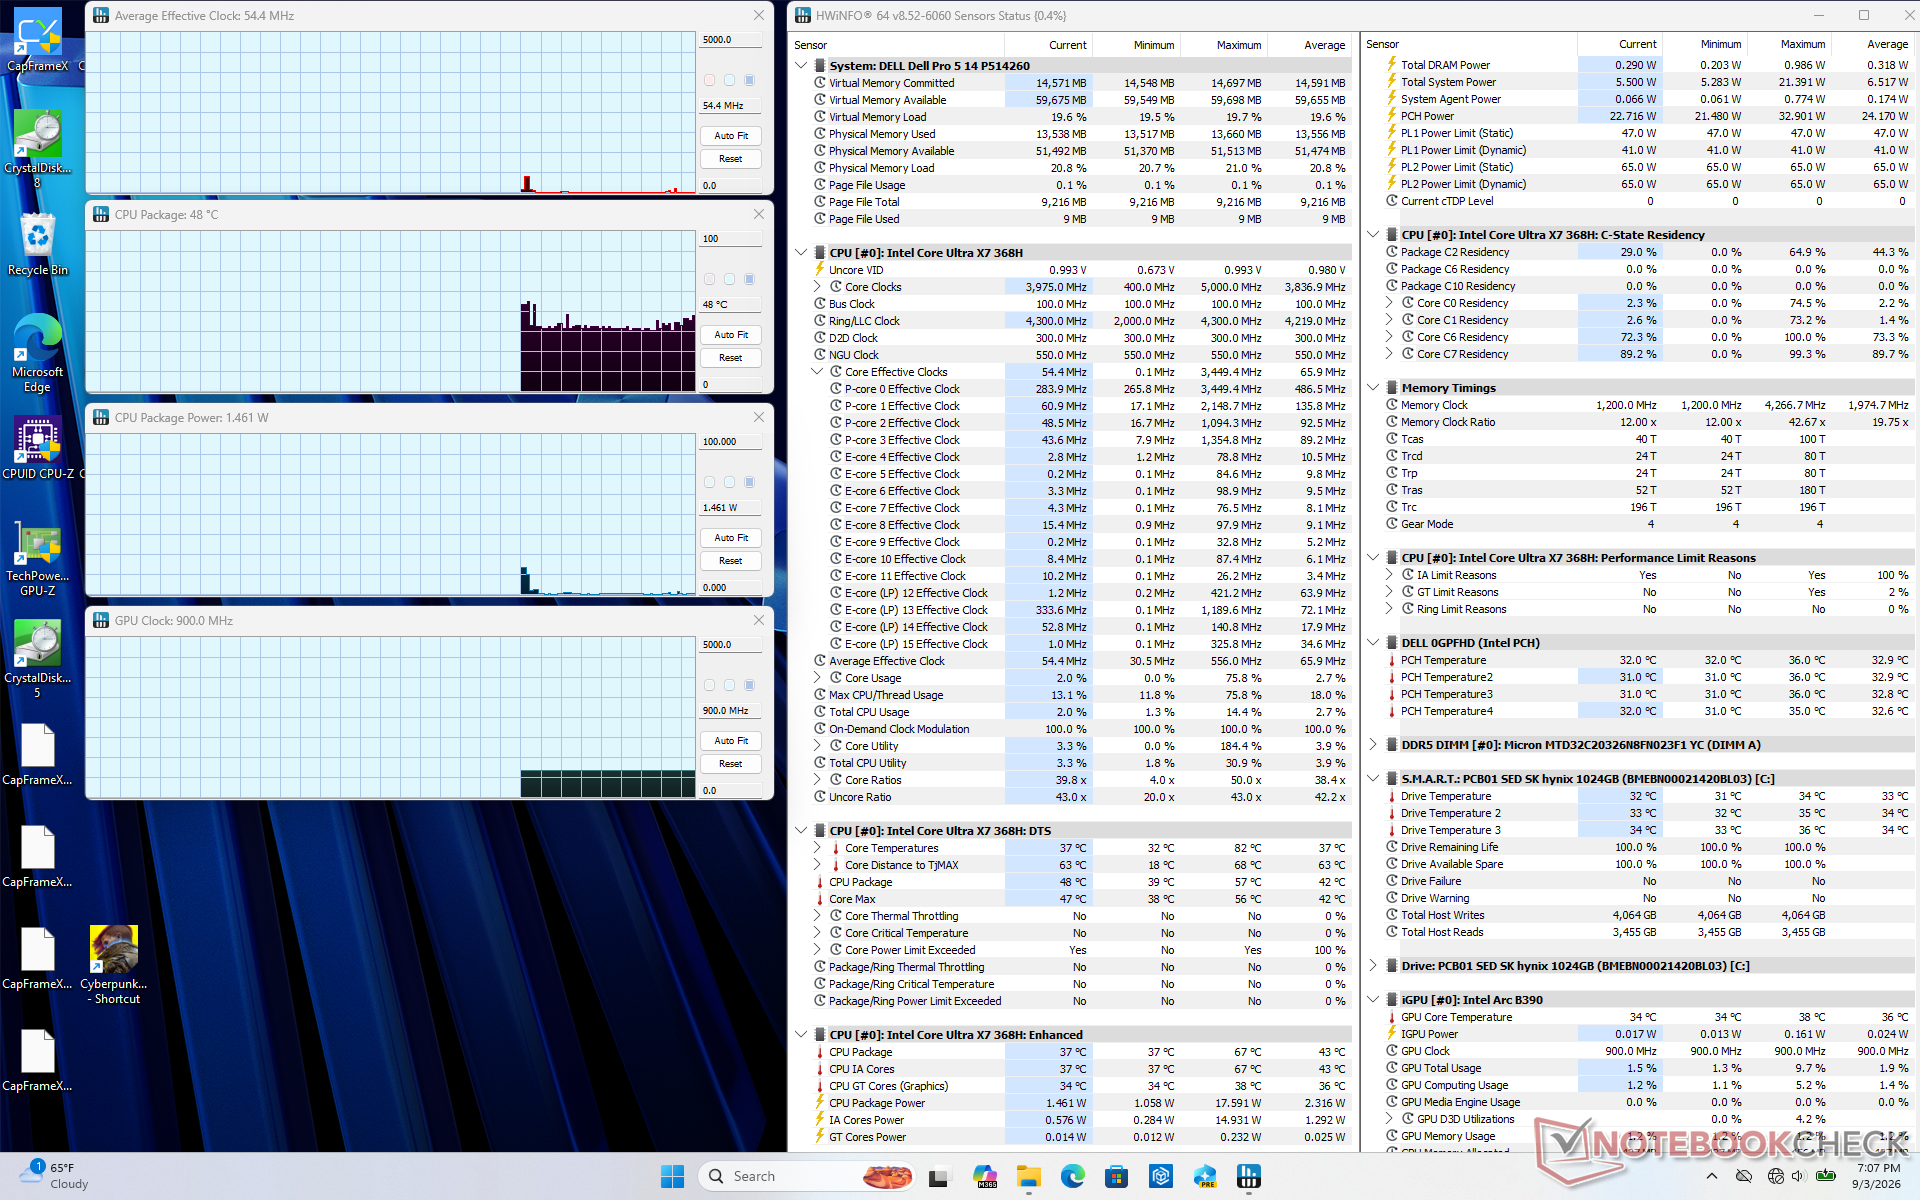
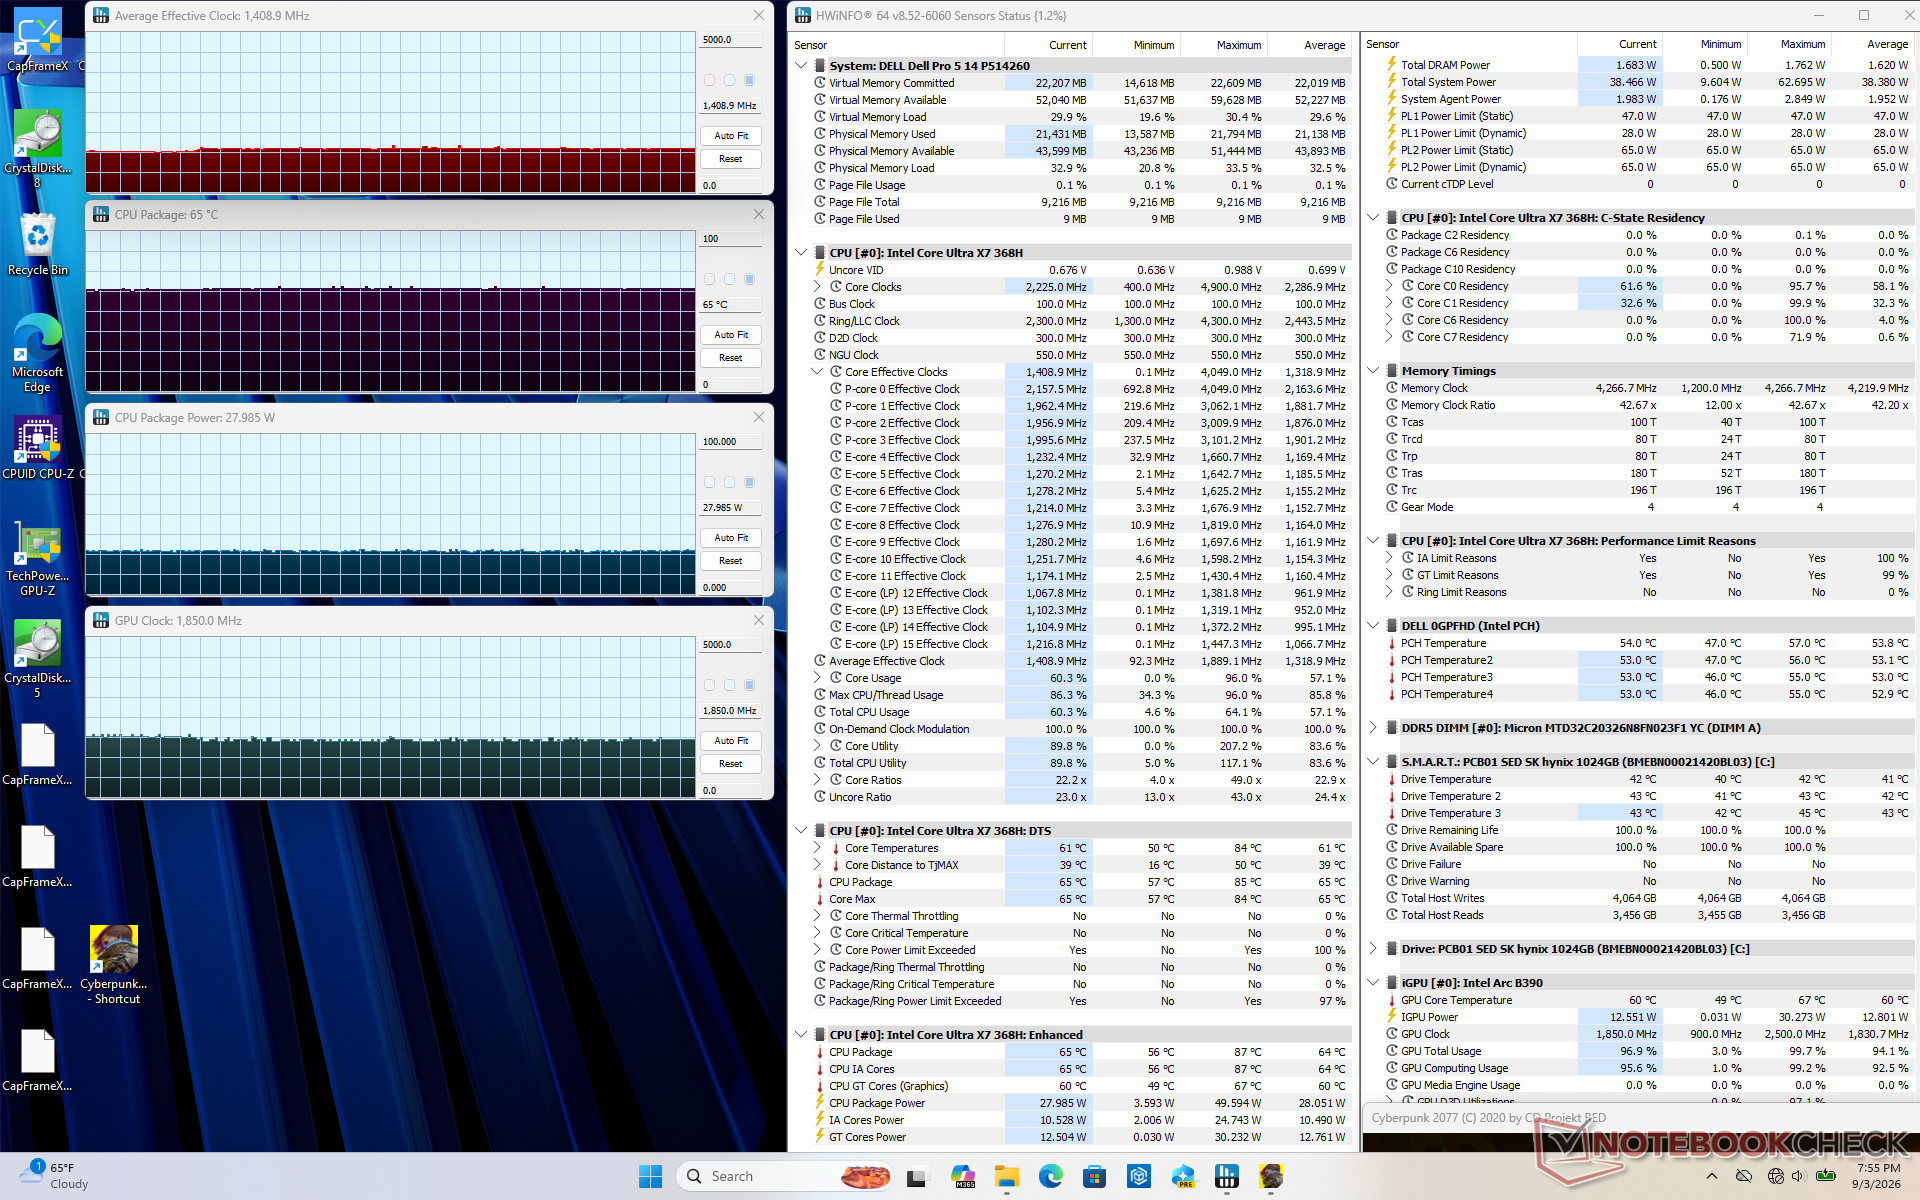
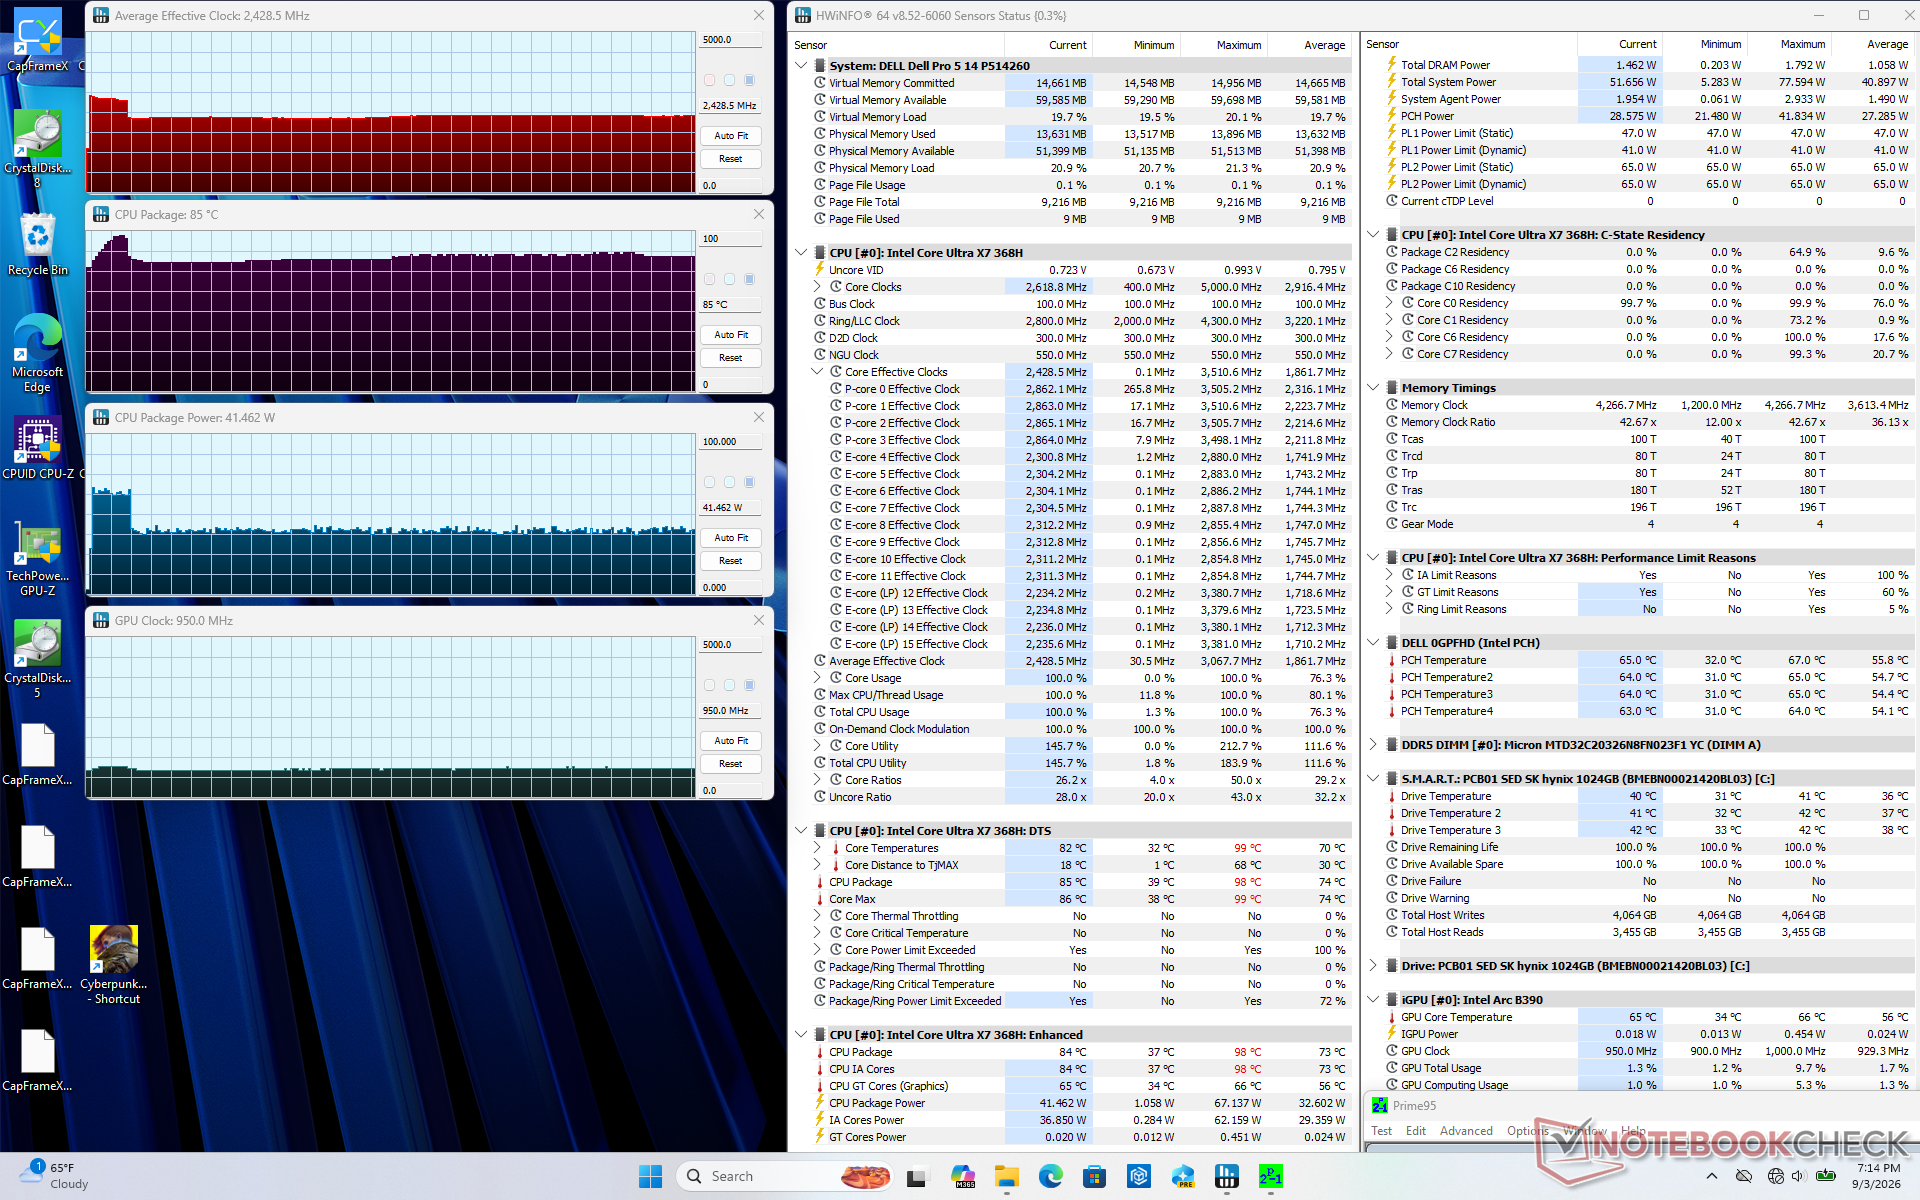
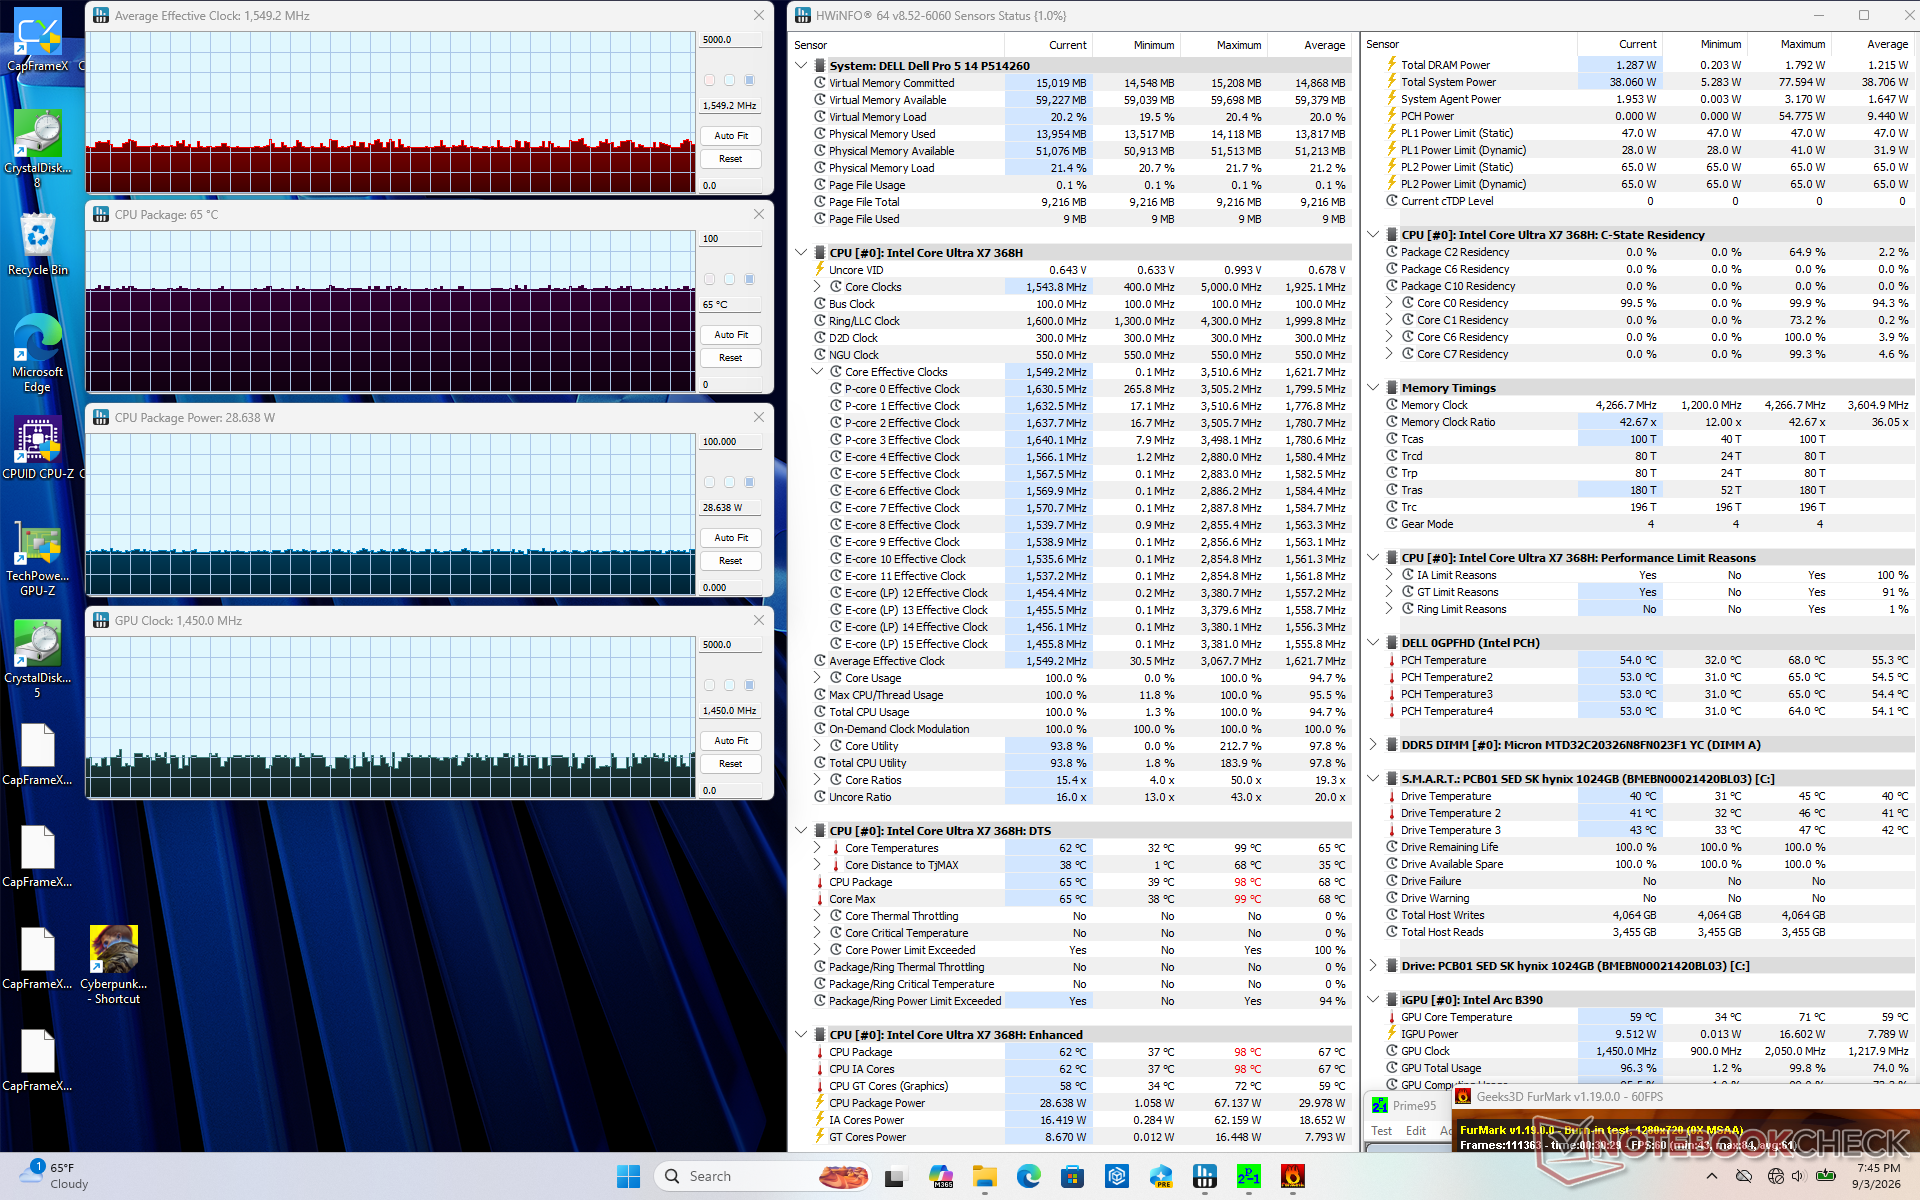
| durchschnittliche CPU-Taktfrequenz (GHz) | GPU-Taktfrequenz (MHz) | durchschnittliche CPU-Temperatur (°C) | |
| System im Leerlauf | -- | -- | 47 |
| Prime95-Stresstest | 2,4 | -- | 85 |
| Prime95 + FurMark-Belastungstest | 1,5 | 1.450 | 65 |
| Cyberpunk 2077 – Stress | 1,4 | 1.850 | 65 |
Lautsprecher
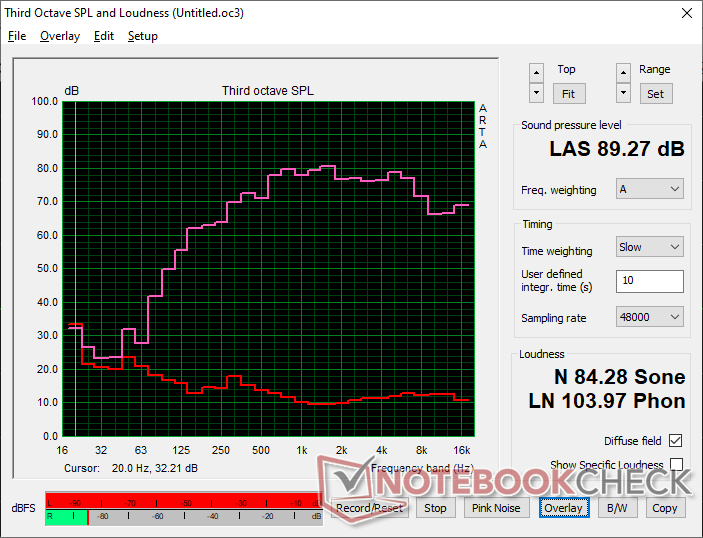
Dell Pro 5 14 P514260 Audio Analyse
(+) | Die Lautsprecher können relativ laut spielen (89.3 dB)
Bass 100 - 315 Hz
(-) | kaum Bass - 15.4% niedriger als der Median
(±) | durchschnittlich lineare Bass-Wiedergabe (7.4% Delta zum Vorgänger)
Mitteltöne 400 - 2000 Hz
(+) | ausgeglichene Mitten, vom Median nur 3% abweichend
(+) | lineare Mitten (4% Delta zum Vorgänger)
Hochtöne 2 - 16 kHz
(+) | ausgeglichene Hochtöne, vom Median nur 2.7% abweichend
(+) | sehr lineare Hochtöne (3.7% Delta zum Vorgänger)
Gesamt im hörbaren Bereich 100 - 16.000 Hz
(+) | hörbarer Bereich ist sehr linear (10.9% Abstand zum Median
Im Vergleich zu allen Geräten derselben Klasse
» 2% aller getesteten Geräte dieser Klasse waren besser, 2% vergleichbar, 96% schlechter
» Das beste Gerät hat einen Delta-Wert von 7%, durchschnittlich ist 21%, das schlechteste Gerät hat 53%
Im Vergleich zu allen Geräten im Test
» 7% aller getesteten Geräte waren besser, 2% vergleichbar, 92% schlechter
» Das beste Gerät hat einen Delta-Wert von 4%, durchschnittlich ist 23%, das schlechteste Gerät hat 136%
Apple MacBook Pro 16 2021 M1 Pro Audio Analyse
(+) | Die Lautsprecher können relativ laut spielen (84.7 dB)
Bass 100 - 315 Hz
(+) | guter Bass - nur 3.8% Abweichung vom Median
(+) | lineare Bass-Wiedergabe (5.2% Delta zum Vorgänger)
Mitteltöne 400 - 2000 Hz
(+) | ausgeglichene Mitten, vom Median nur 1.3% abweichend
(+) | lineare Mitten (2.1% Delta zum Vorgänger)
Hochtöne 2 - 16 kHz
(+) | ausgeglichene Hochtöne, vom Median nur 1.9% abweichend
(+) | sehr lineare Hochtöne (2.7% Delta zum Vorgänger)
Gesamt im hörbaren Bereich 100 - 16.000 Hz
(+) | hörbarer Bereich ist sehr linear (4.6% Abstand zum Median
Im Vergleich zu allen Geräten derselben Klasse
» 0% aller getesteten Geräte dieser Klasse waren besser, 0% vergleichbar, 100% schlechter
» Das beste Gerät hat einen Delta-Wert von 5%, durchschnittlich ist 17%, das schlechteste Gerät hat 45%
Im Vergleich zu allen Geräten im Test
» 0% aller getesteten Geräte waren besser, 0% vergleichbar, 100% schlechter
» Das beste Gerät hat einen Delta-Wert von 4%, durchschnittlich ist 23%, das schlechteste Gerät hat 136%
Energiemanagement
Stromverbrauch
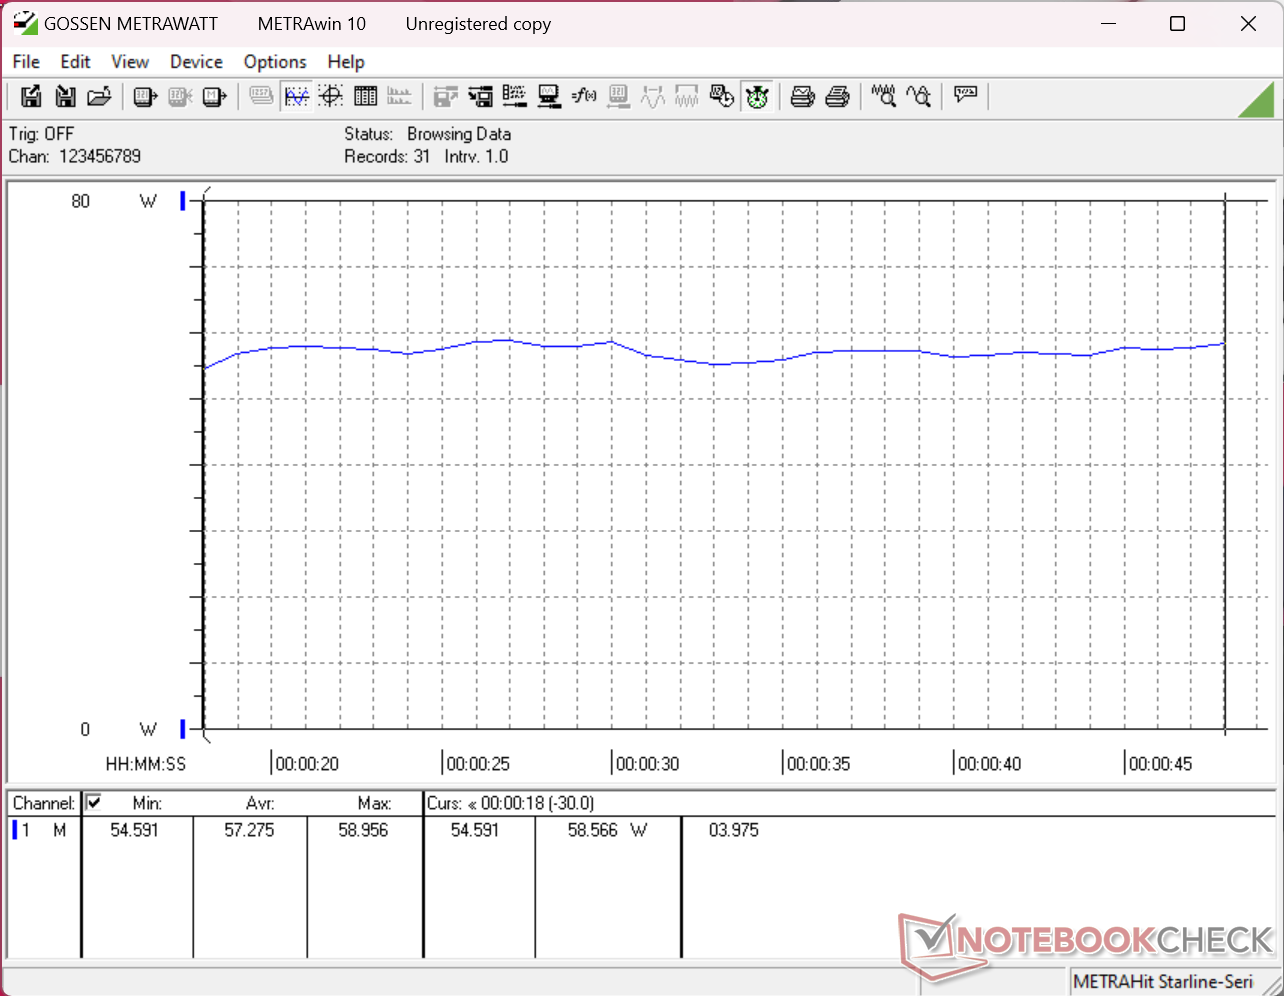
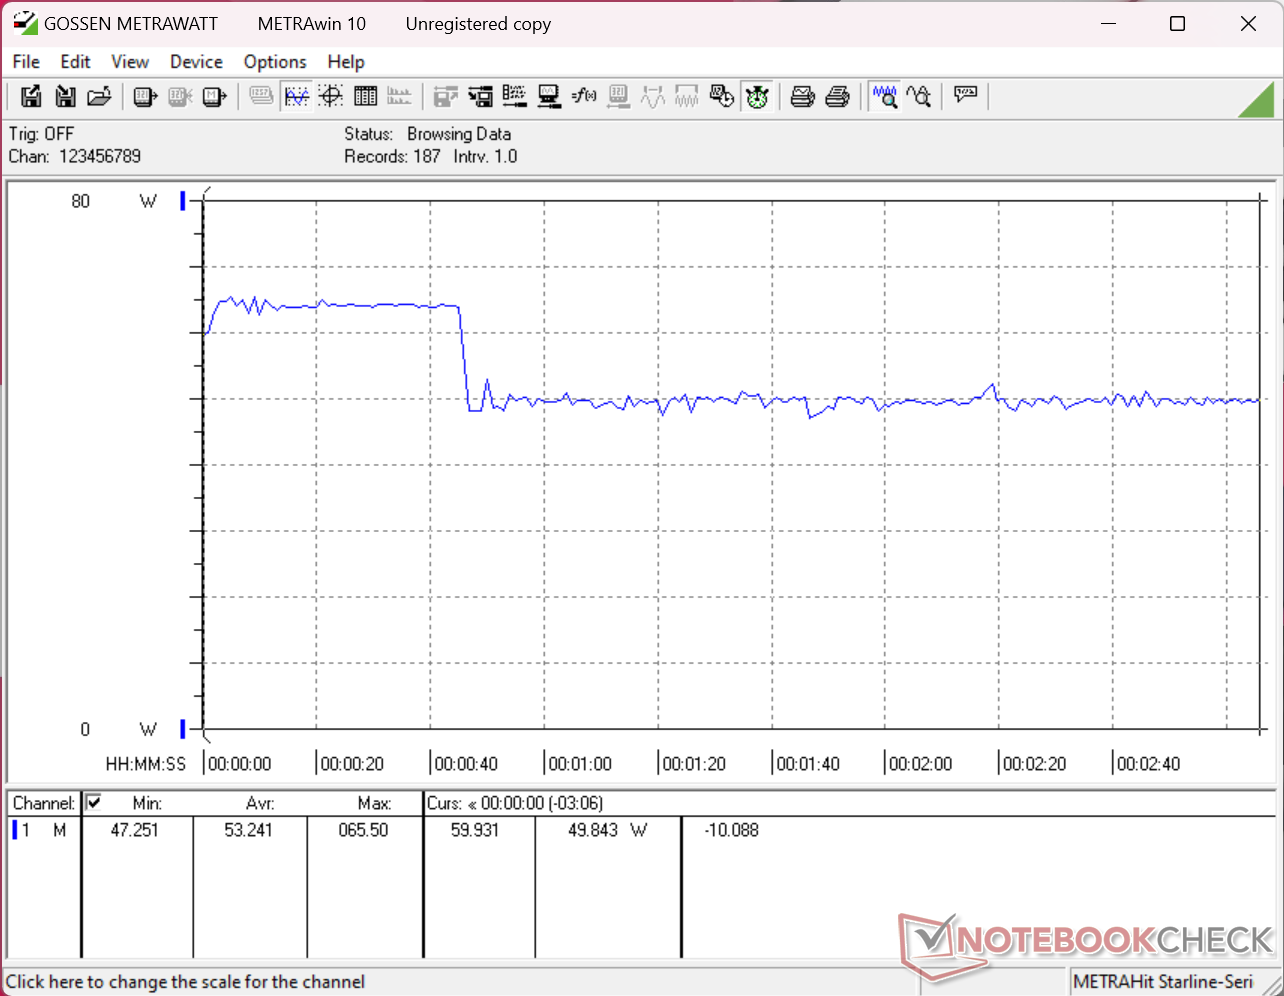
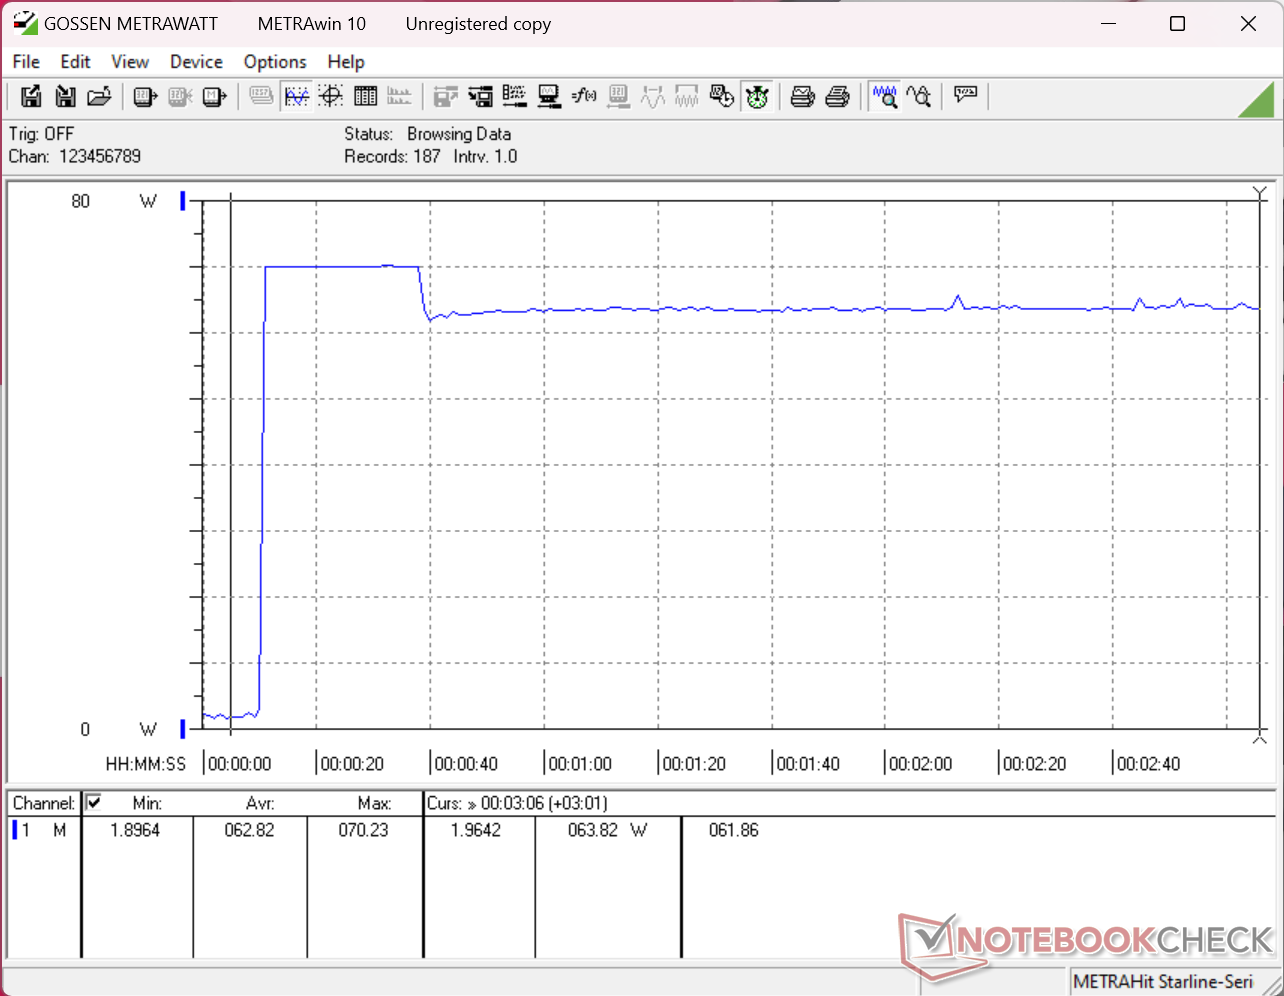
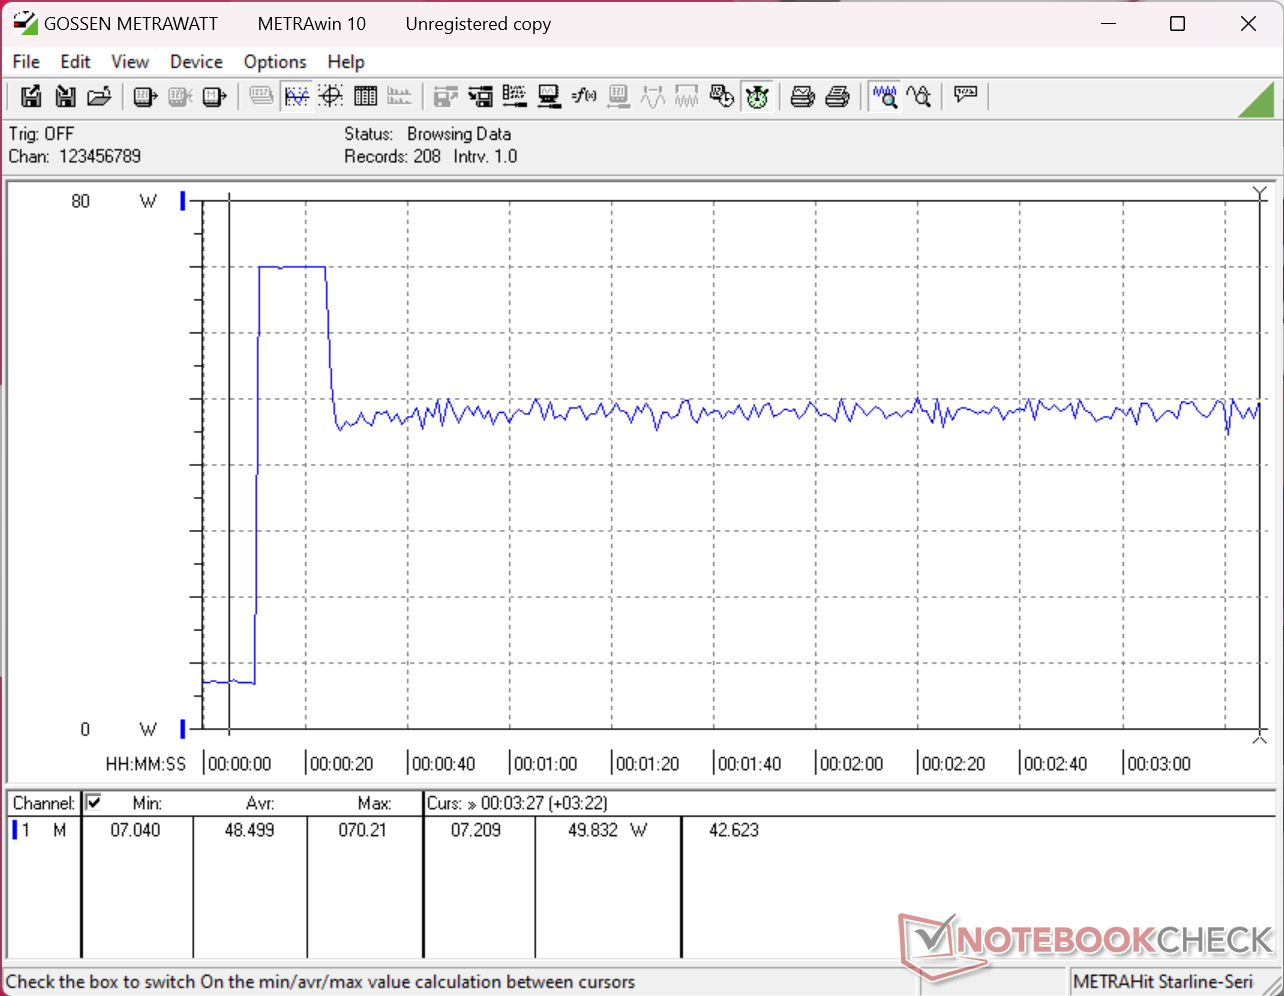
| Aus / Standby | 0.15 / 0.67 Watt |
| Idle | 1.5 / 4.5 / 4.7 Watt |
| Last |
57.3 / 70.2 Watt |
   
| |
Legende:
min: ,
med: ,
max: Metrahit Energy | |
| Dell Pro 5 14 P514260 Ultra X7 368H, Arc B390 Panther Lake iGPU, SK hynix PCB01 HFS001TFM9X186N, IPS, 1920x1200, 14" | Dell Pro 7 14 P714260 Ultra 7 366H, Intel Graphics 4 Xe3 PTL, SK hynix PCB01 HFS001TFM9X186N, IPS, 1920x1200, 14" | Lenovo ThinkPad T14s Gen 7 21YW0022GE Ryzen AI 7 PRO 450, Radeon 860M, Micron 2650 MTFDKBA512TGW, IPS, 1920x1200, 14" | HP OmniBook Ultra 14 Core Ultra X9 Ultra X9 388H, Arc B390 Panther Lake iGPU, , OLED, 2880x1800, 14" | Samsung Galaxy Book5 Pro 14 940XHA Core Ultra 5 226V, Arc 130V, Samsung PM9C1 MZVL8512HELU, OLED, 2880x1800, 14" | Asus ExpertBook Ultra B9406CAA Ultra X7 358H, Arc B390 Panther Lake iGPU, Samsung PM9E1 MZVLC2T0HBLD, OLED, 2880x1800, 14" | |
|---|---|---|---|---|---|---|
| Stromverbrauch | 10% | -18% | -15% | -13% | -20% | |
| Idle min * (Watt) | 1.5 | 1.4 7% | 2.7 -80% | 2.5 -67% | 3.7 -147% | 3.5 -133% |
| Idle avg * (Watt) | 4.5 | 4.3 4% | 5.5 -22% | 5.1 -13% | 5.2 -16% | 4 11% |
| Idle max * (Watt) | 4.7 | 4.6 2% | 6.8 -45% | 5.8 -23% | 5.4 -15% | 5.3 -13% |
| Last avg * (Watt) | 57.3 | 32.5 43% | 60.5 -6% | 49.8 13% | 26.2 54% | 43.7 24% |
| Cyberpunk 2077 ultra * (Watt) | 53.2 | 49.9 6% | 49.7 7% | 55 -3% | 47.4 11% | 61.3 -15% |
| Cyberpunk 2077 ultra external monitor * (Watt) | 48.7 | 47.4 3% | 44.1 9% | 55.1 -13% | 42.7 12% | 61.4 -26% |
| Last max * (Watt) | 70.2 | 69 2% | 64.8 8% | 68 3% | 63.5 10% | 63.4 10% |
* ... kleinere Werte sind besser
Stromverbrauch Cyberpunk / Stresstest
Stromverbrauch eines externen Monitors
Akkulaufzeit
| Dell Pro 5 14 P514260 Ultra X7 368H, Arc B390 Panther Lake iGPU, 70 Wh | Dell Pro 7 14 P714260 Ultra 7 366H, Intel Graphics 4 Xe3 PTL, 70 Wh | Lenovo ThinkPad T14s Gen 7 21YW0022GE Ryzen AI 7 PRO 450, Radeon 860M, 58 Wh | HP OmniBook Ultra 14 Core Ultra X9 Ultra X9 388H, Arc B390 Panther Lake iGPU, 70 Wh | Samsung Galaxy Book5 Pro 14 940XHA Core Ultra 5 226V, Arc 130V, 63 Wh | Asus ExpertBook Ultra B9406CAA Ultra X7 358H, Arc B390 Panther Lake iGPU, 70 Wh | |
|---|---|---|---|---|---|---|
| Akkulaufzeit | ||||||
| WLAN (h) | 21.3 | 23.5 10% | 17.4 -18% | 12.6 -41% | 10.1 -53% | 16.1 -24% |
Notebookcheck Bewertung
Das Dell Pro 5 14 sieht aus und fühlt sich an wie das teurere Dell Pro 7 14, ist jedoch preisgünstiger.
Dell Pro 5 14 P514260
- 09.09.2026 v8
Allen Ngo
 Total Sustainability Score:
 Mögliche Wettbewerber im Vergleich
Bild | Modell / Test | Preis ab | Gewicht | Dicke | Display |
|---|---|---|---|---|---|
1. 84%  | Dell Pro 5 14 P514260 Intel Core Ultra X7 368H ⎘ Intel Arc B390 12 Xe3 Panther Lake iGPU ⎘ 64 GB RAM, SSD | Amazon: 834,31 € Geizhals Suche | 1.5 kg | 18.1 mm | 14.00" 1920x1200 162 PPI IPS |
2. 84.5% 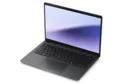 | Dell Pro 7 14 P714260 Intel Core Ultra 7 366H ⎘ Intel Graphics 4 Xe3 Panther Lake iGPU ⎘ 64 GB RAM, SSD | Amazon: 799,00 € Geizhals Suche | 1.4 kg | 14.73 mm | 14.00" 1920x1200 162 PPI IPS |
3. 89.7% 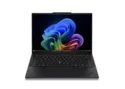 | Lenovo ThinkPad T14s Gen 7 21YW0022GE AMD Ryzen AI 7 PRO 450 ⎘ AMD Radeon 860M ⎘ 64 GB RAM, 512 GB SSD | Amazon: 1. 2.352,00 € Lenovo ThinkPad T14s Gen 7 2... 2. 1.868,00 € Lenovo ThinkPad T14s Gen 7 2... 3. 2.132,08 € Lenovo ThinkPad T14s Gen 6 2... | 1.2 kg | 15.9 mm | 14.00" 1920x1200 162 PPI IPS |
4. 87.9% 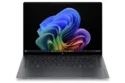 | HP OmniBook Ultra 14 Core Ultra X9 Intel Core Ultra X9 388H ⎘ Intel Arc B390 12 Xe3 Panther Lake iGPU ⎘ 32 GB RAM | Amazon: Bestpreis 1899€ notebooksbilliger.de 2. 1914.96€ notebooksbilliger.at 3. 1971.67€ galaxus | 1.3 kg | 10.7 mm | 14.00" 2880x1800 243 PPI OLED |
5. 86.9%  | Samsung Galaxy Book5 Pro 14 940XHA Intel Core Ultra 5 226V ⎘ Intel Arc Graphics 130V ⎘ 16 GB RAM, 512 GB SSD | Amazon: Bestpreis 1199€ Easynotebooks.de 2. 1199€ office-partner.de 3. 1199€ playox.de | 1.2 kg | 11.6 mm | 14.00" 2880x1800 243 PPI OLED |
6. 87.6%  | Asus ExpertBook Ultra B9406CAA Intel Core Ultra X7 358H ⎘ Intel Arc B390 12 Xe3 Panther Lake iGPU ⎘ 32 GB RAM, 2048 GB SSD | Amazon: 1.613,57 € Bestpreis 3432.29€ computeruniverse.net 2. 3432.29€ Cyberport.de 3. 3461.14€ computeruniverse.at | 1.1 kg | 15.9 mm | 14.00" 2880x1800 243 PPI OLED |
Transparenz
Die Auswahl der zu testenden Geräte erfolgt innerhalb der Redaktion. Das vorliegende Testmuster wurde dem Autor vom Hersteller oder einem Shop zu Testzwecken leihweise zur Verfügung gestellt. Eine Einflussnahme des Leihstellers auf den Testbericht gab es nicht, der Hersteller erhielt keine Version des Reviews vor der Veröffentlichung. Es bestand keine Verpflichtung zur Publikation. Als eigenständiges, unabhängiges Unternehmen unterliegt Notebookcheck keiner Diktion von Herstellern, Shops und Verlagen.
So testet Notebookcheck
Pro Jahr werden von Notebookcheck hunderte Laptops und Smartphones unabhängig in von uns standardisierten technischen Verfahren getestet, um eine Vergleichbarkeit aller Testergebnisse zu gewährleisten. Seit rund 20 Jahren entwickeln wir diese Testmethoden kontinuierlich weiter und setzen damit Branchenstandards. In unseren Testlaboren kommt ausschließlich hochwertiges Messequipment in die Hände erfahrener Techniker und Redakteure. Die Tests unterliegen einer mehrstufigen Kontrolle. Unsere komplexe Gesamtbewertung basiert auf hunderten fundierten Messergebnissen und Benchmarks, womit Ihnen Objektivität garantiert ist. Weitere Informationen zu unseren Testmethoden gibt es hier.
 Als bevorzugte Quelle auf Google hinzufügen


