

Notebookcheck Logo
Teaser

Testbericht zum Asus ZenBook S14 2026 – Helleres OLED-Display, aber eine langsame Panther-Lake-iGPU

Verbessert, aber auch schlechter als zuvor.

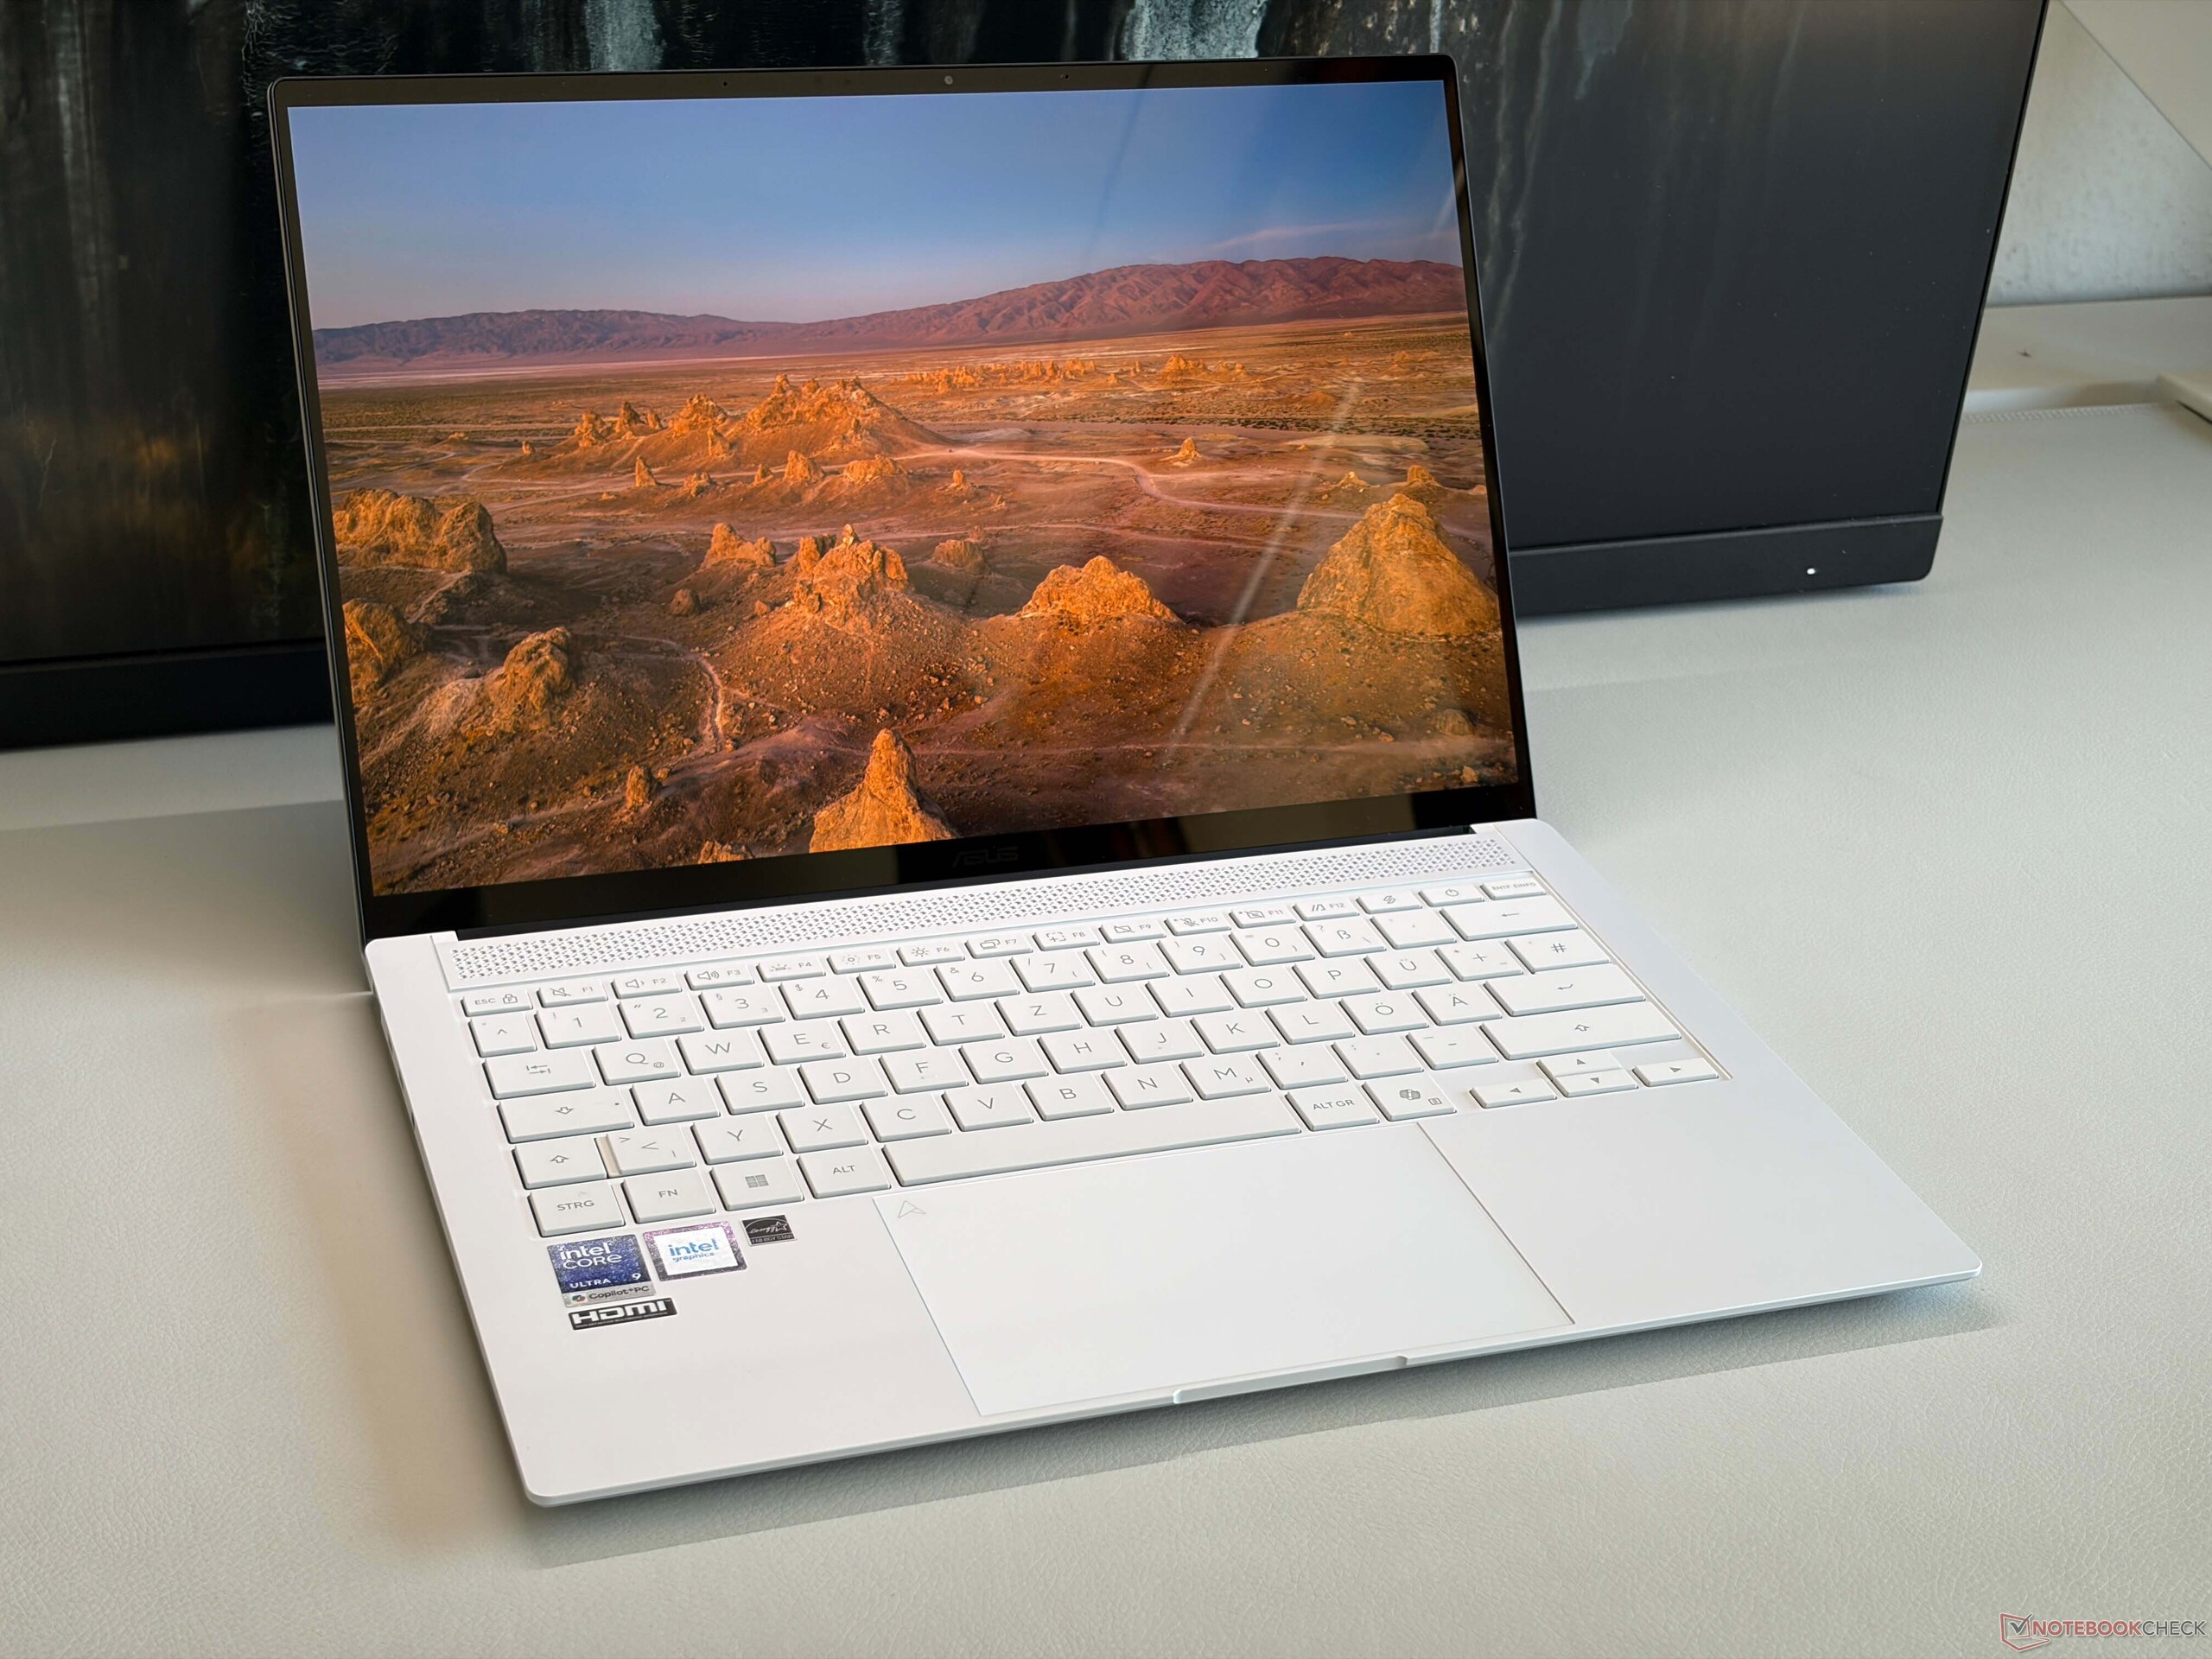
Asus hat sein High-End-Modell Zenbook S14 mit einem neuen Panther-Lake-Prozessor von Intel, einem etwas größeren Akku sowie einem helleren OLED-Bildschirm aktualisiert. Während die CPU-Leistung gestiegen ist, ist die GPU-Leistung geringer als zuvor.
Andreas Osthoff, 👁 Andreas Osthoff, Stefanie Voigt (übersetzt von DeepL / Ninh Duy) Veröffentlicht am 🇺🇸 🇳🇱 ...
AI Arc Laptop / Notebook Intel Panther Lake Thunderbolt Touchscreen Wi-Fi 7 Windows

Fazit – Das Zenbook S14 2026 ist gleichzeitig besser und schlechter

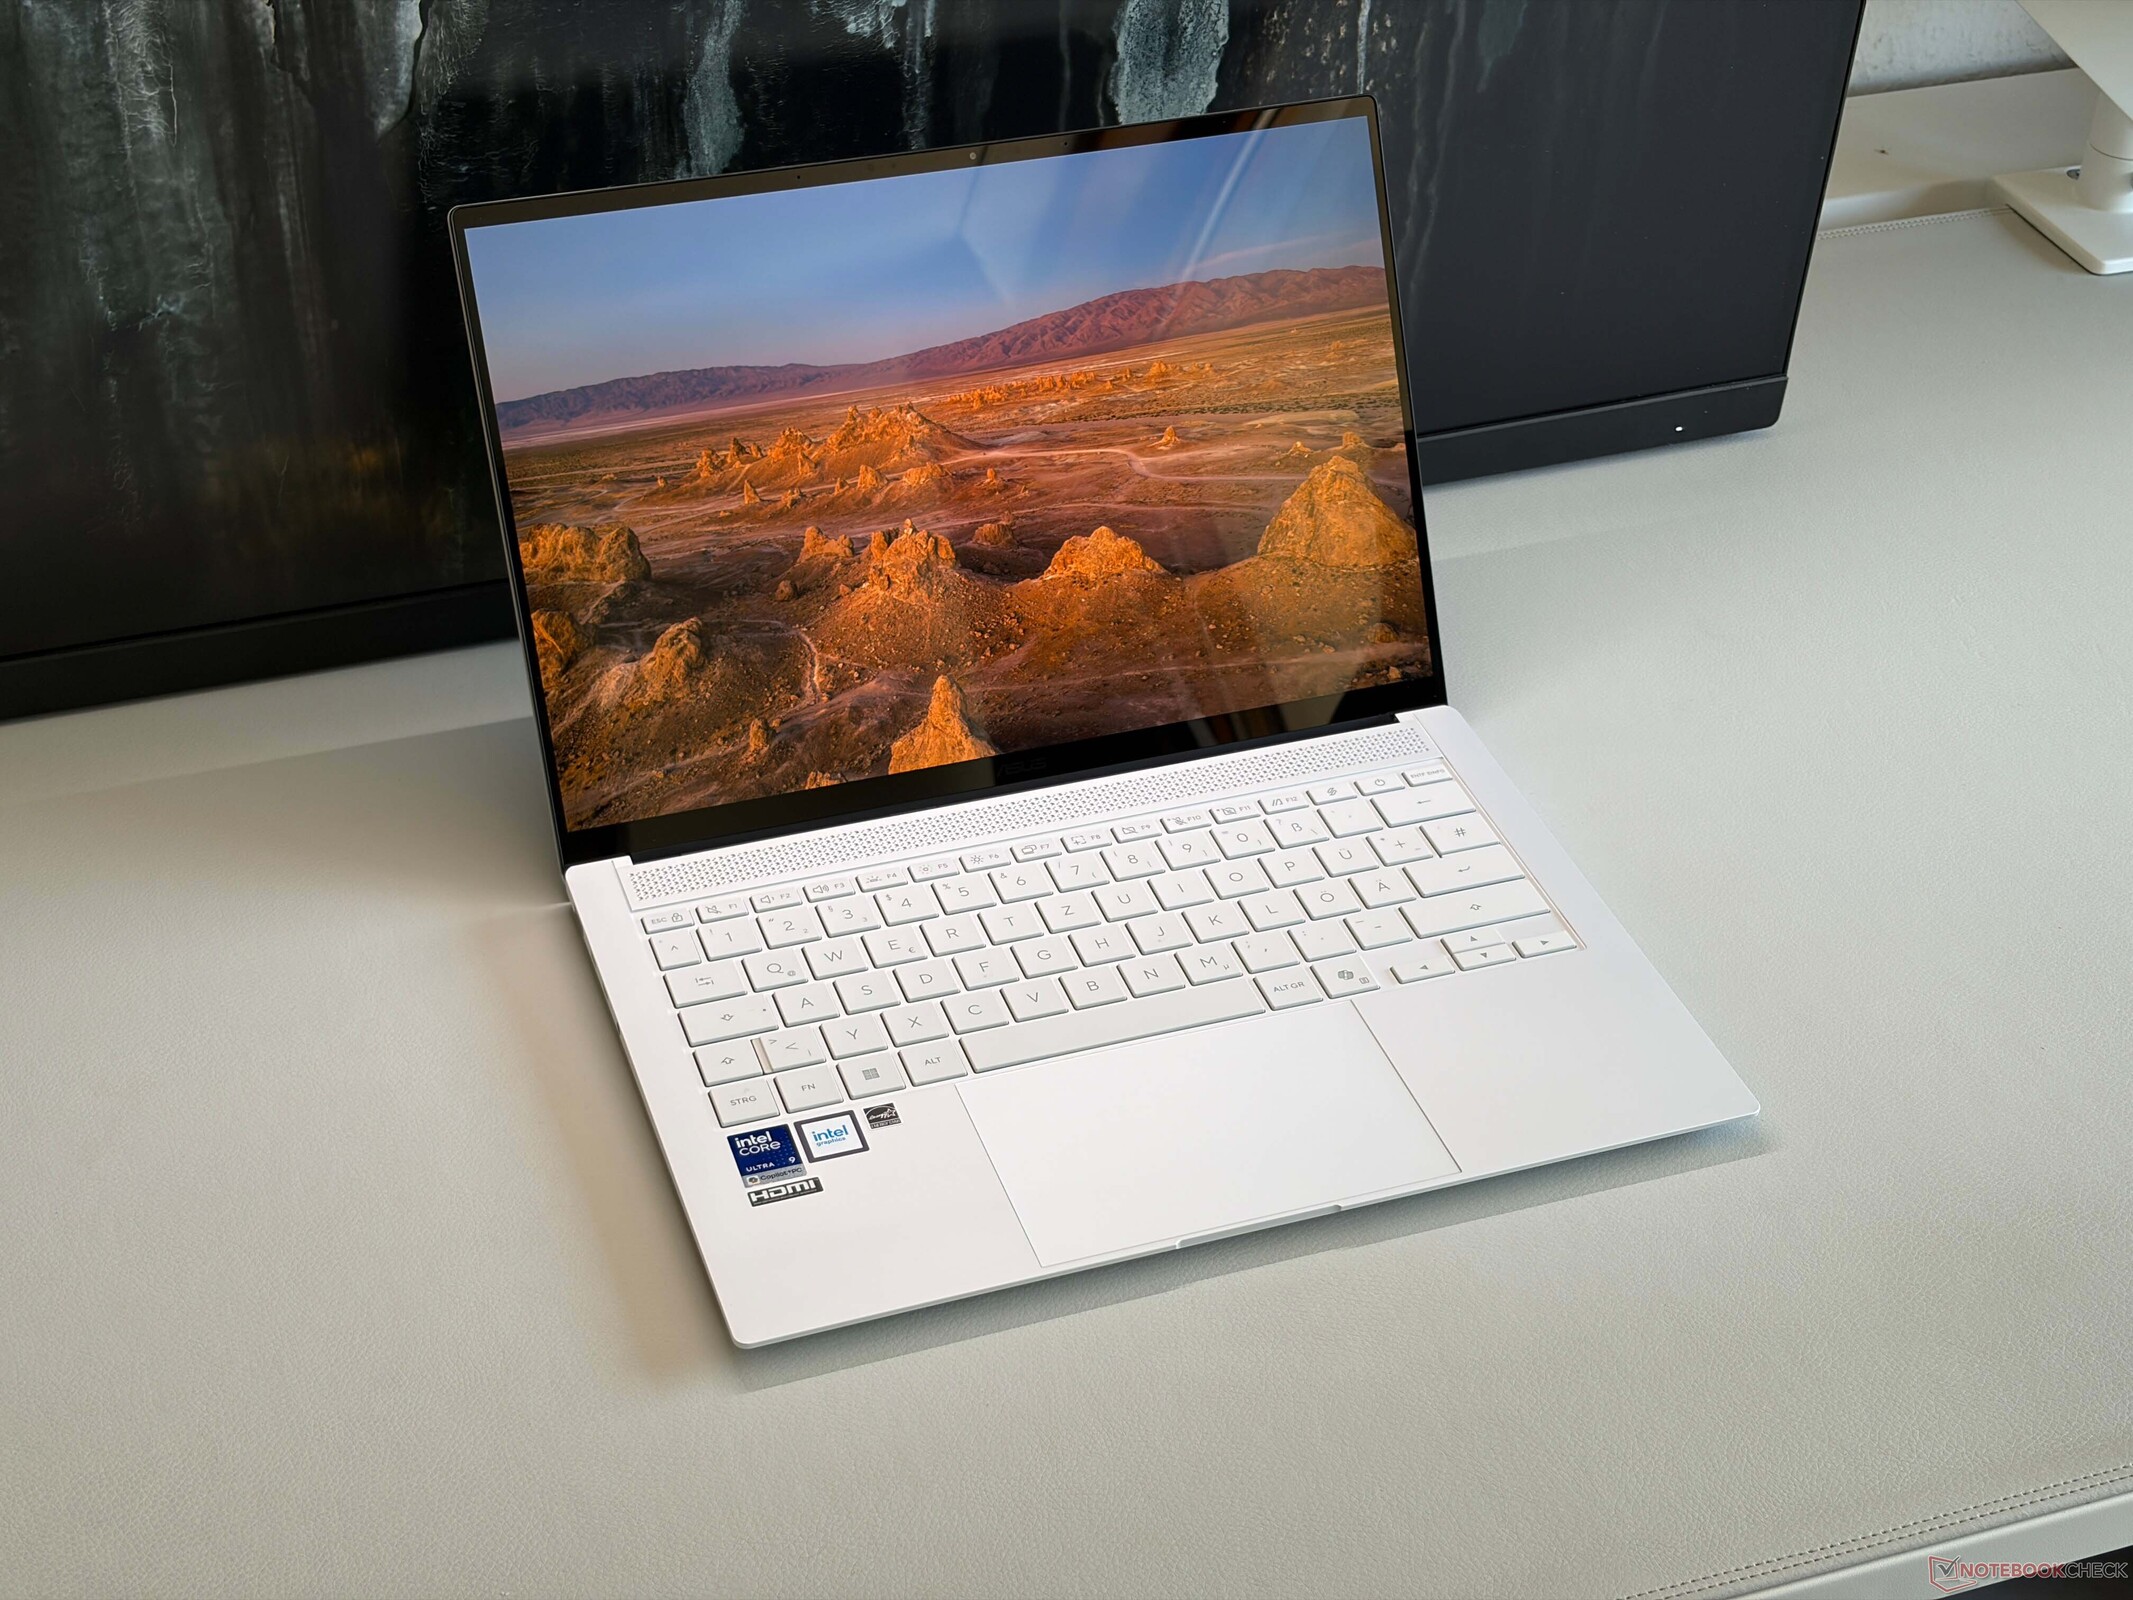
Das Update 2026 des Asus Zenbook S14 ist eine interessante Neuerung, doch nicht alle Änderungen sind positiv. Es handelt sich nach wie vor um einen sehr schlanken und leichten 14-Zoll-Laptop mit großartigem Design, guter Konnektivität, komfortablen Eingabegeräten sowie einem hervorragenden Soundsystem. Durch den Wechsel zu den neuen Panther-Lake-CPUs verdoppelt sich die CPU-Leistung im Vergleich zum alten Lunar-Lake-Chip nahezu, und die Akkulaufzeiten sind etwas länger, doch die Grafikleistung ist tatsächlich etwas schlechter. Dies ist eine Enttäuschung, und wir hatten erwartet, dass ein Premium-System wie das Zenbook S14 mit den neuesten Core-Ultra-X-CPUs und der schnellen Arc-B390-Grafikkarte ausgestattet sein würde; stattdessen erhält man nur den Core Ultra 386H mit der langsamen iGPU.

Download der lizensierten Bewertungsgrafik als SVG / PNG

Die neuen Panther-Lake-Chips weisen zudem höhere Leistungsgrenzen auf, und das allgemeine Lüftergeräusch ist deutlich lauter als zuvor. Ja, der Whisper“-Modus ist nach wie vor durchgehend angenehm leise, doch fast 50 dB(A) bei voller CPU-Auslastung sind ziemlich laut. Ein weiteres Problem ist das neue OLED-Display: Es ist nun deutlich heller (insbesondere im HDR-Modus) und bietet weiterhin 120 Hz bei sehr präziser Farbwiedergabe, doch das Bild wirkt auf hellen Oberflächen aufgrund der Touchscreen-Schicht etwas körnig. Dies ist ein häufiges Problem bei OLED-Touchscreen-Panels, doch bei einigen Herstellern tritt es nicht auf (darunter auch bei Samsungs eigenen Geräten, obwohl Asus ebenfalls ein Samsung Panel verwendet). Der festgelötete Arbeitsspeicher stellt ein weiteres Problem dar, auch wenn 32 GB RAM für die meisten Nutzer ausreichend sein dürften.

Angesichts der aktuellen Preissteigerungen bei Laptops und der Ausstattung mit 32 GB RAM sowie einer 1-TB-SSD ist der Listenpreis von 1.899 US-Dollar für das neue Zenbook S14 angesichts der gebotenen Leistung und im Vergleich zu seinen Konkurrenten tatsächlich recht angemessen. Wenn die Grafikleistung nicht wichtig ist, könnte das neue Zenbook S14 die richtige Wahl sein; wenn man jedoch bereits jetzt die beste Panther-Lake-iGPU wünscht, muss man sich für eines der Konkurrenzmodelle entscheiden.

Pro

+ schlankes und stabiles Gehäuse
+ verbesserte CPU-Leistung
+ präziser 120-Hz-OLED-Touchscreen
+ sehr gute Systemleistung
+ Thunderbolt 4, USB-A und Wi-Fi 7
+ komfortable Tastatur
+ gutes Soundsystem
+ verbesserte Akkulaufzeit

Contra

- Unter Last deutlich lauter als zuvor
- PWM-Flackern und leicht körniges Bild
- aufgelöteter Arbeitsspeicher
- geringere GPU-Leistung als zuvor

Preis und Verfügbarkeit

Das neue Asus Zenbook S14 2026 ist bei Cyberport für 1.899 Euro und bei Amazon für 1.974 Euro erhältlich.

Amazon Logo
  • 1.974,00 €
    ASUS Zenbook S14 UX5406AA Copilot+ PC | 14" 2,8K WQXGA+ 120Hz 16:10 OLED Display | Intel Core Ultra 9 386H | 32GB RAM | 1TB SSD | Intel Graphics | Win11 Home | QWERTZ | Antrim Gray
  • 1.961,99 €
    ASUS Zenbook S14 UX5406AA Copilot+ PC | 14" 2,8K WQXGA+ 120Hz 16:10 OLED Display | Intel Core Ultra 9 386H | 32GB RAM | 1TB SSD | Intel Graphics | Win11 Home | QWERTZ | Scandinavian White
  • 1.799,00 €
    ASUS Zenbook S14 | 14" WQXGA+ | Ultra 7 258V | RAM: 32GB | SSD: 1TB
Bestpreis 1840 € TechnikLaden
ASUS ZenBook S14 UX5406AA-SU236W, Scandinavian White, Core Ultra 9 386H, 32GB RAM, 1TB SSD, DE (90NB16Q4-M00BZ0)
2. 1851.34 € haym.infotec
3. 1879.89 € voelkner.de
4. 1898.99 € Easynotebooks.de

Spezifikationen

Asus ZenBook S14 UX5406AA (ZenBook S (2026) Serie)
Prozessor
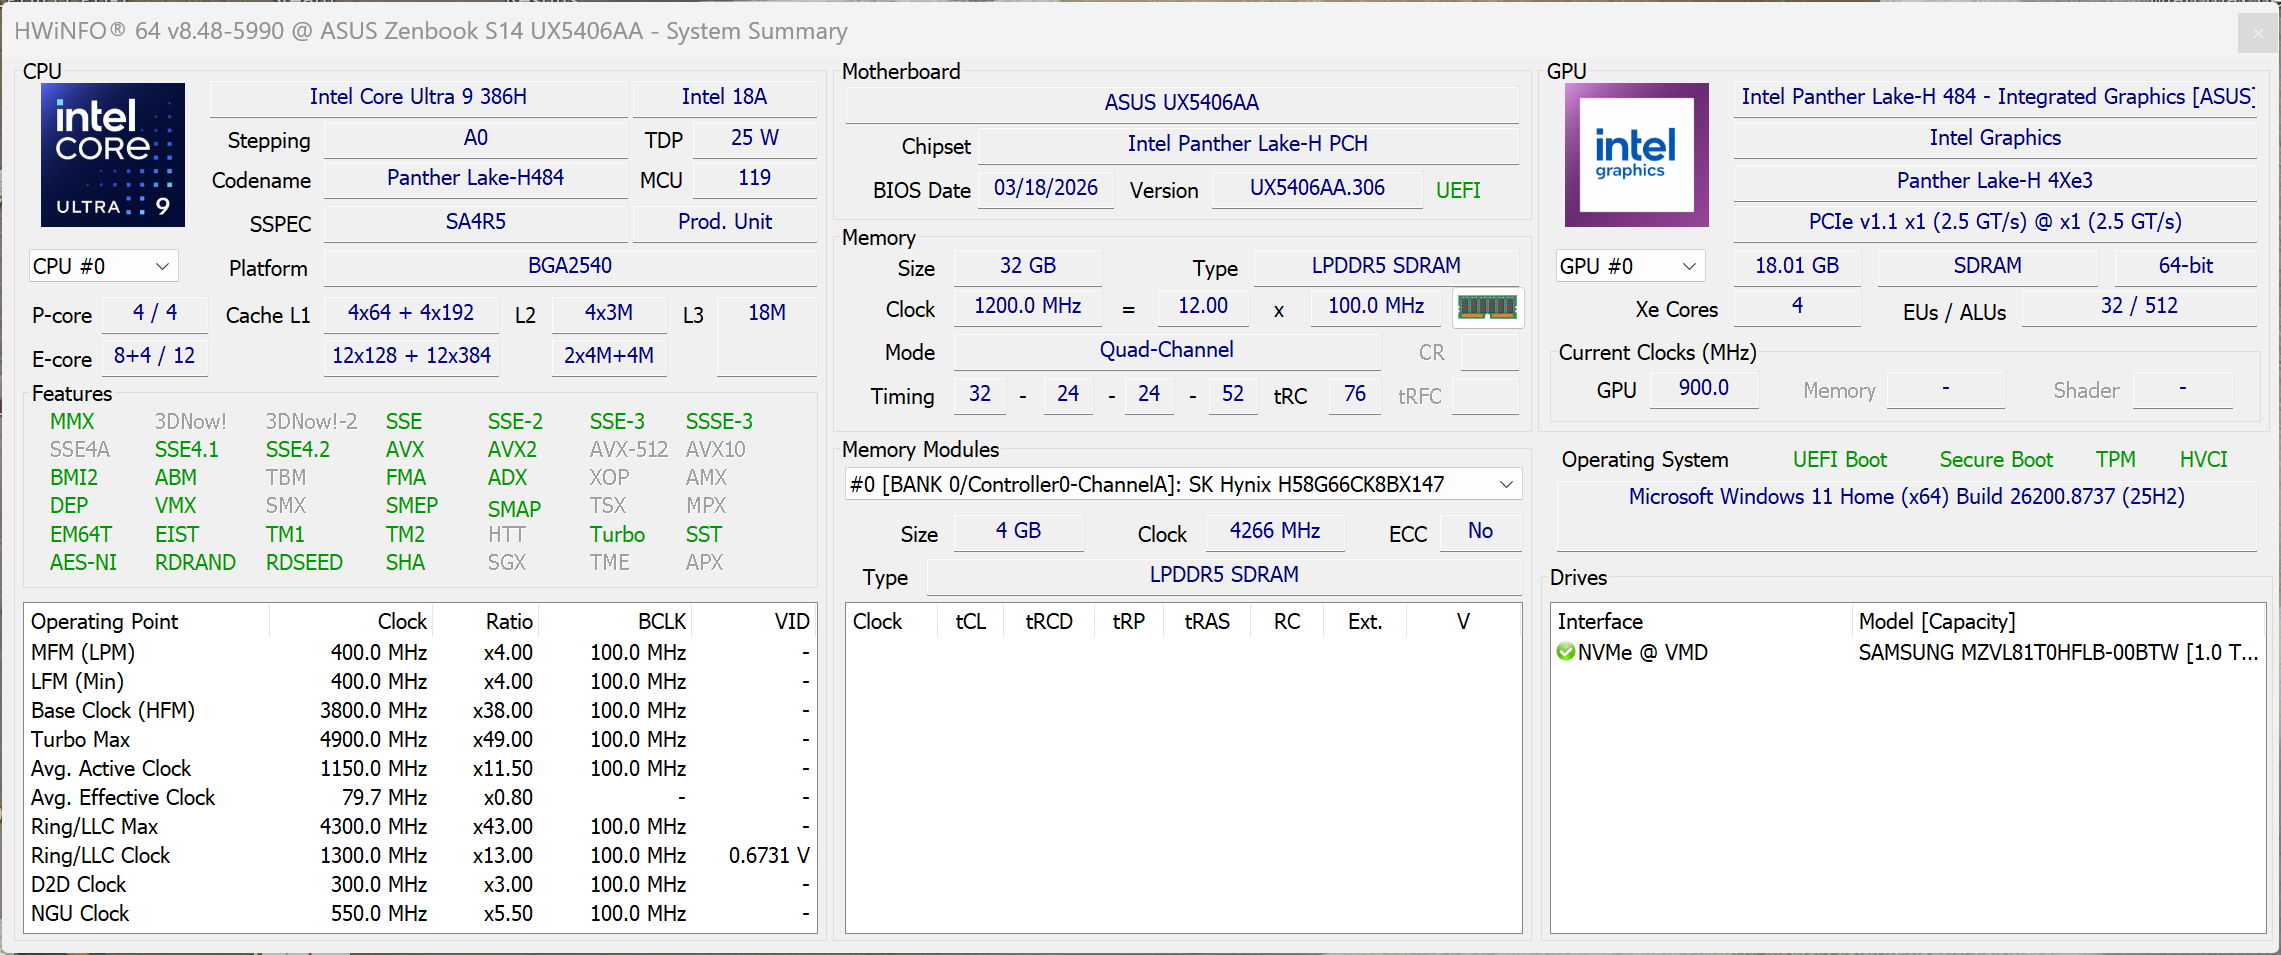
Intel Core Ultra 9 386H 16c/16t, 4 x 4.9 GHz Intel Cougar Cove P-Core, 8 x 3.9 GHz Intel Darkmont E-Core, 4 x 3.5 GHz Intel Darkmont LP E-Core, 57 W PL2 / Short Burst, 28 W PL1 / Sustained, Panther Lake
Grafikkarte
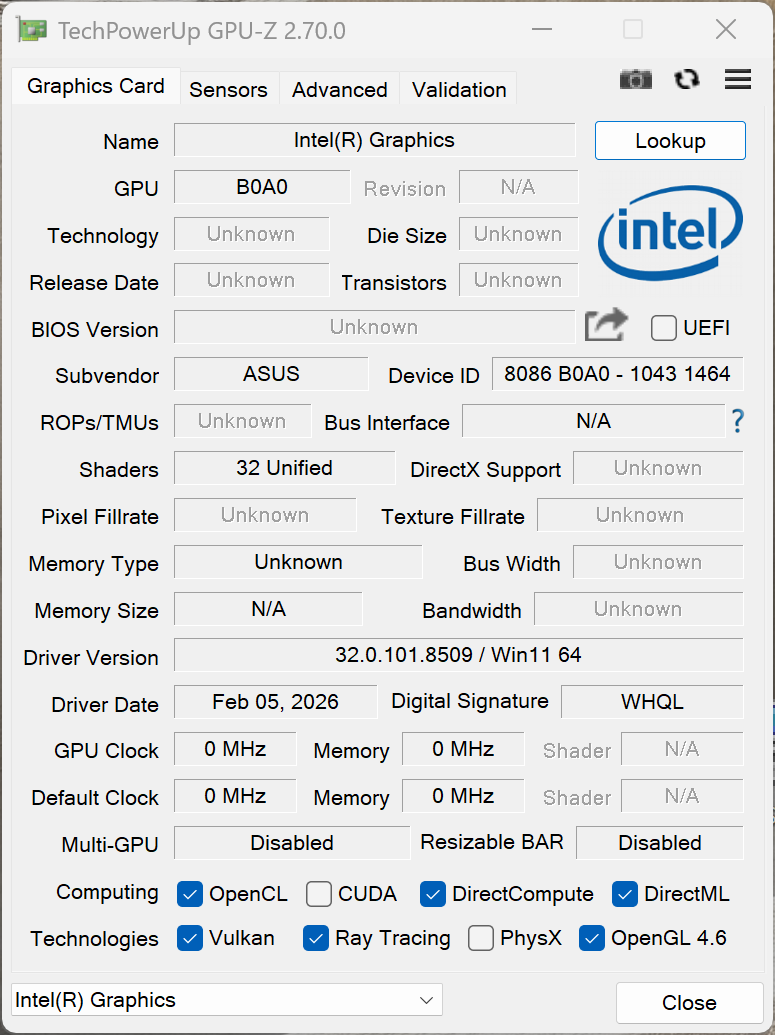
Intel Graphics 4 Xe3 Panther Lake iGPU, Kerntakt: 2500 MHz, 32.0.101.8509
RAM
32 GB 
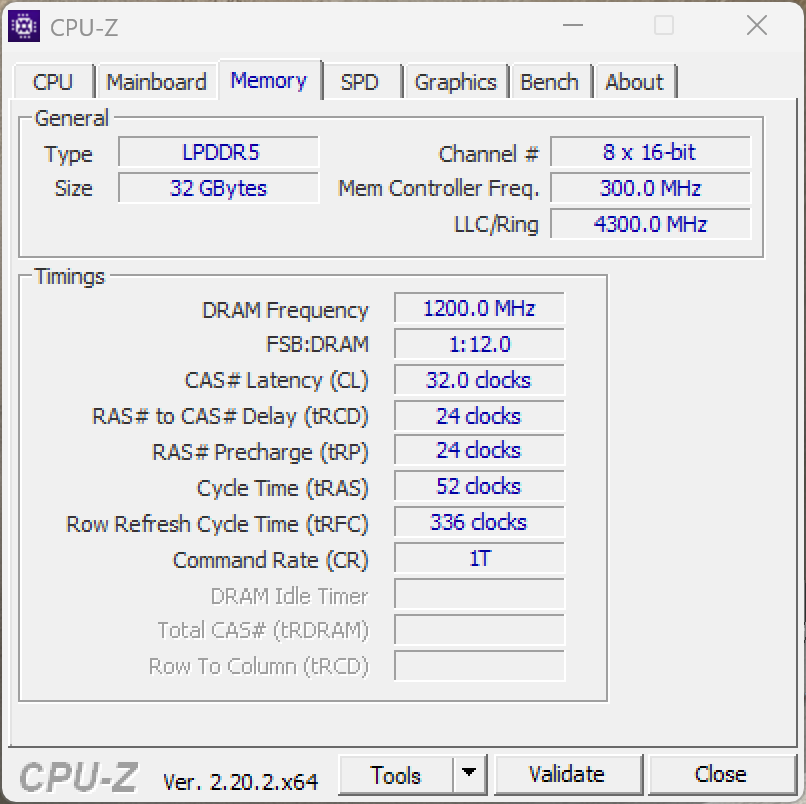
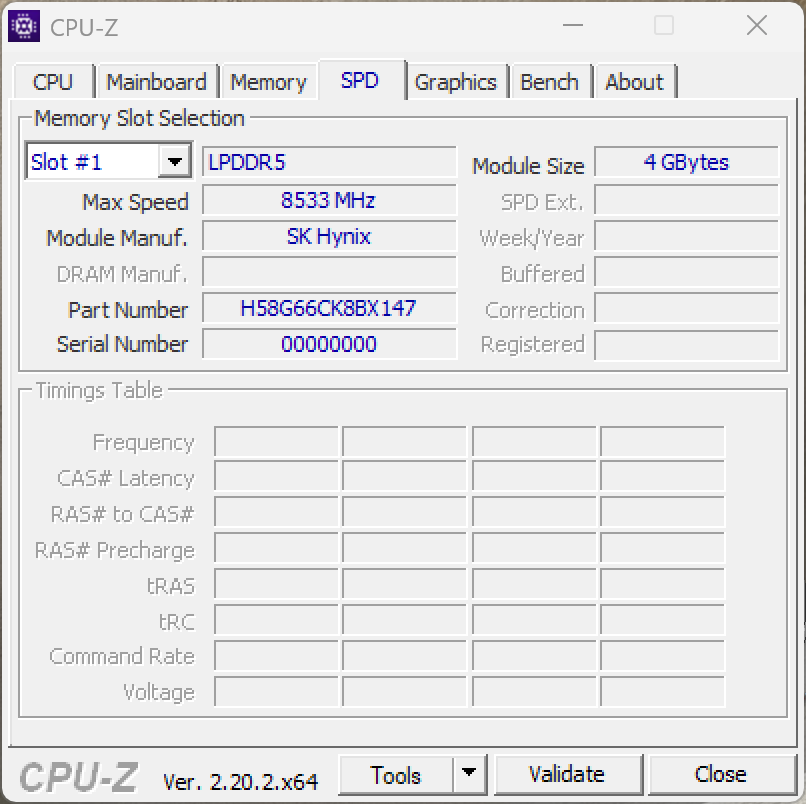
, LPDDR5x-8533, Dual-Channel, soldered
Bildschirm
14.00 Zoll 16:10, 2880 x 1800 Pixel 243 PPI, capacitive, ATNA40HQ05-0, OLED, spiegelnd: ja, HDR, 120 Hz
Mainboard
Intel Panther Lake-H PCH
Massenspeicher
Samsung PM9C1b MZVL81T0HFLB-00BTW, 1000 GB 
, 865 GB verfügbar
Soundkarte
Intel Panther Lake-H PCH - High Definition Audio - AVS (Audio, Voice, Speech)
Anschlüsse
1 USB 3.1 Gen2, 2 USB4 40 Gbps, 2 Thunderbolt 4, USB-C Power Delivery (PD), 1 HDMI, 2 DisplayPort, 1 Docking Station Anschluss, Audio Anschlüsse: 3.5 mm, Helligkeitssensor
Netzwerk
Intel Wi-Fi 7 BE211 320MHz (a/b/g/n = Wi-Fi 4/ac = Wi-Fi 5/ax = Wi-Fi 6/ Wi-Fi 6E 6 GHz be = Wi-Fi 7), Bluetooth 6.0
Abmessungen
Höhe x Breite x Tiefe (in mm): 12.9 x 310.3 x 214.7
Akku
77 Wh, 4950 mAh Lithium-Polymer, 4-cell
Betriebssystem
Microsoft Windows 11 Home
Kamera
Webcam: 1080p + IR
Primary Camera: 2 MPix
Sonstiges
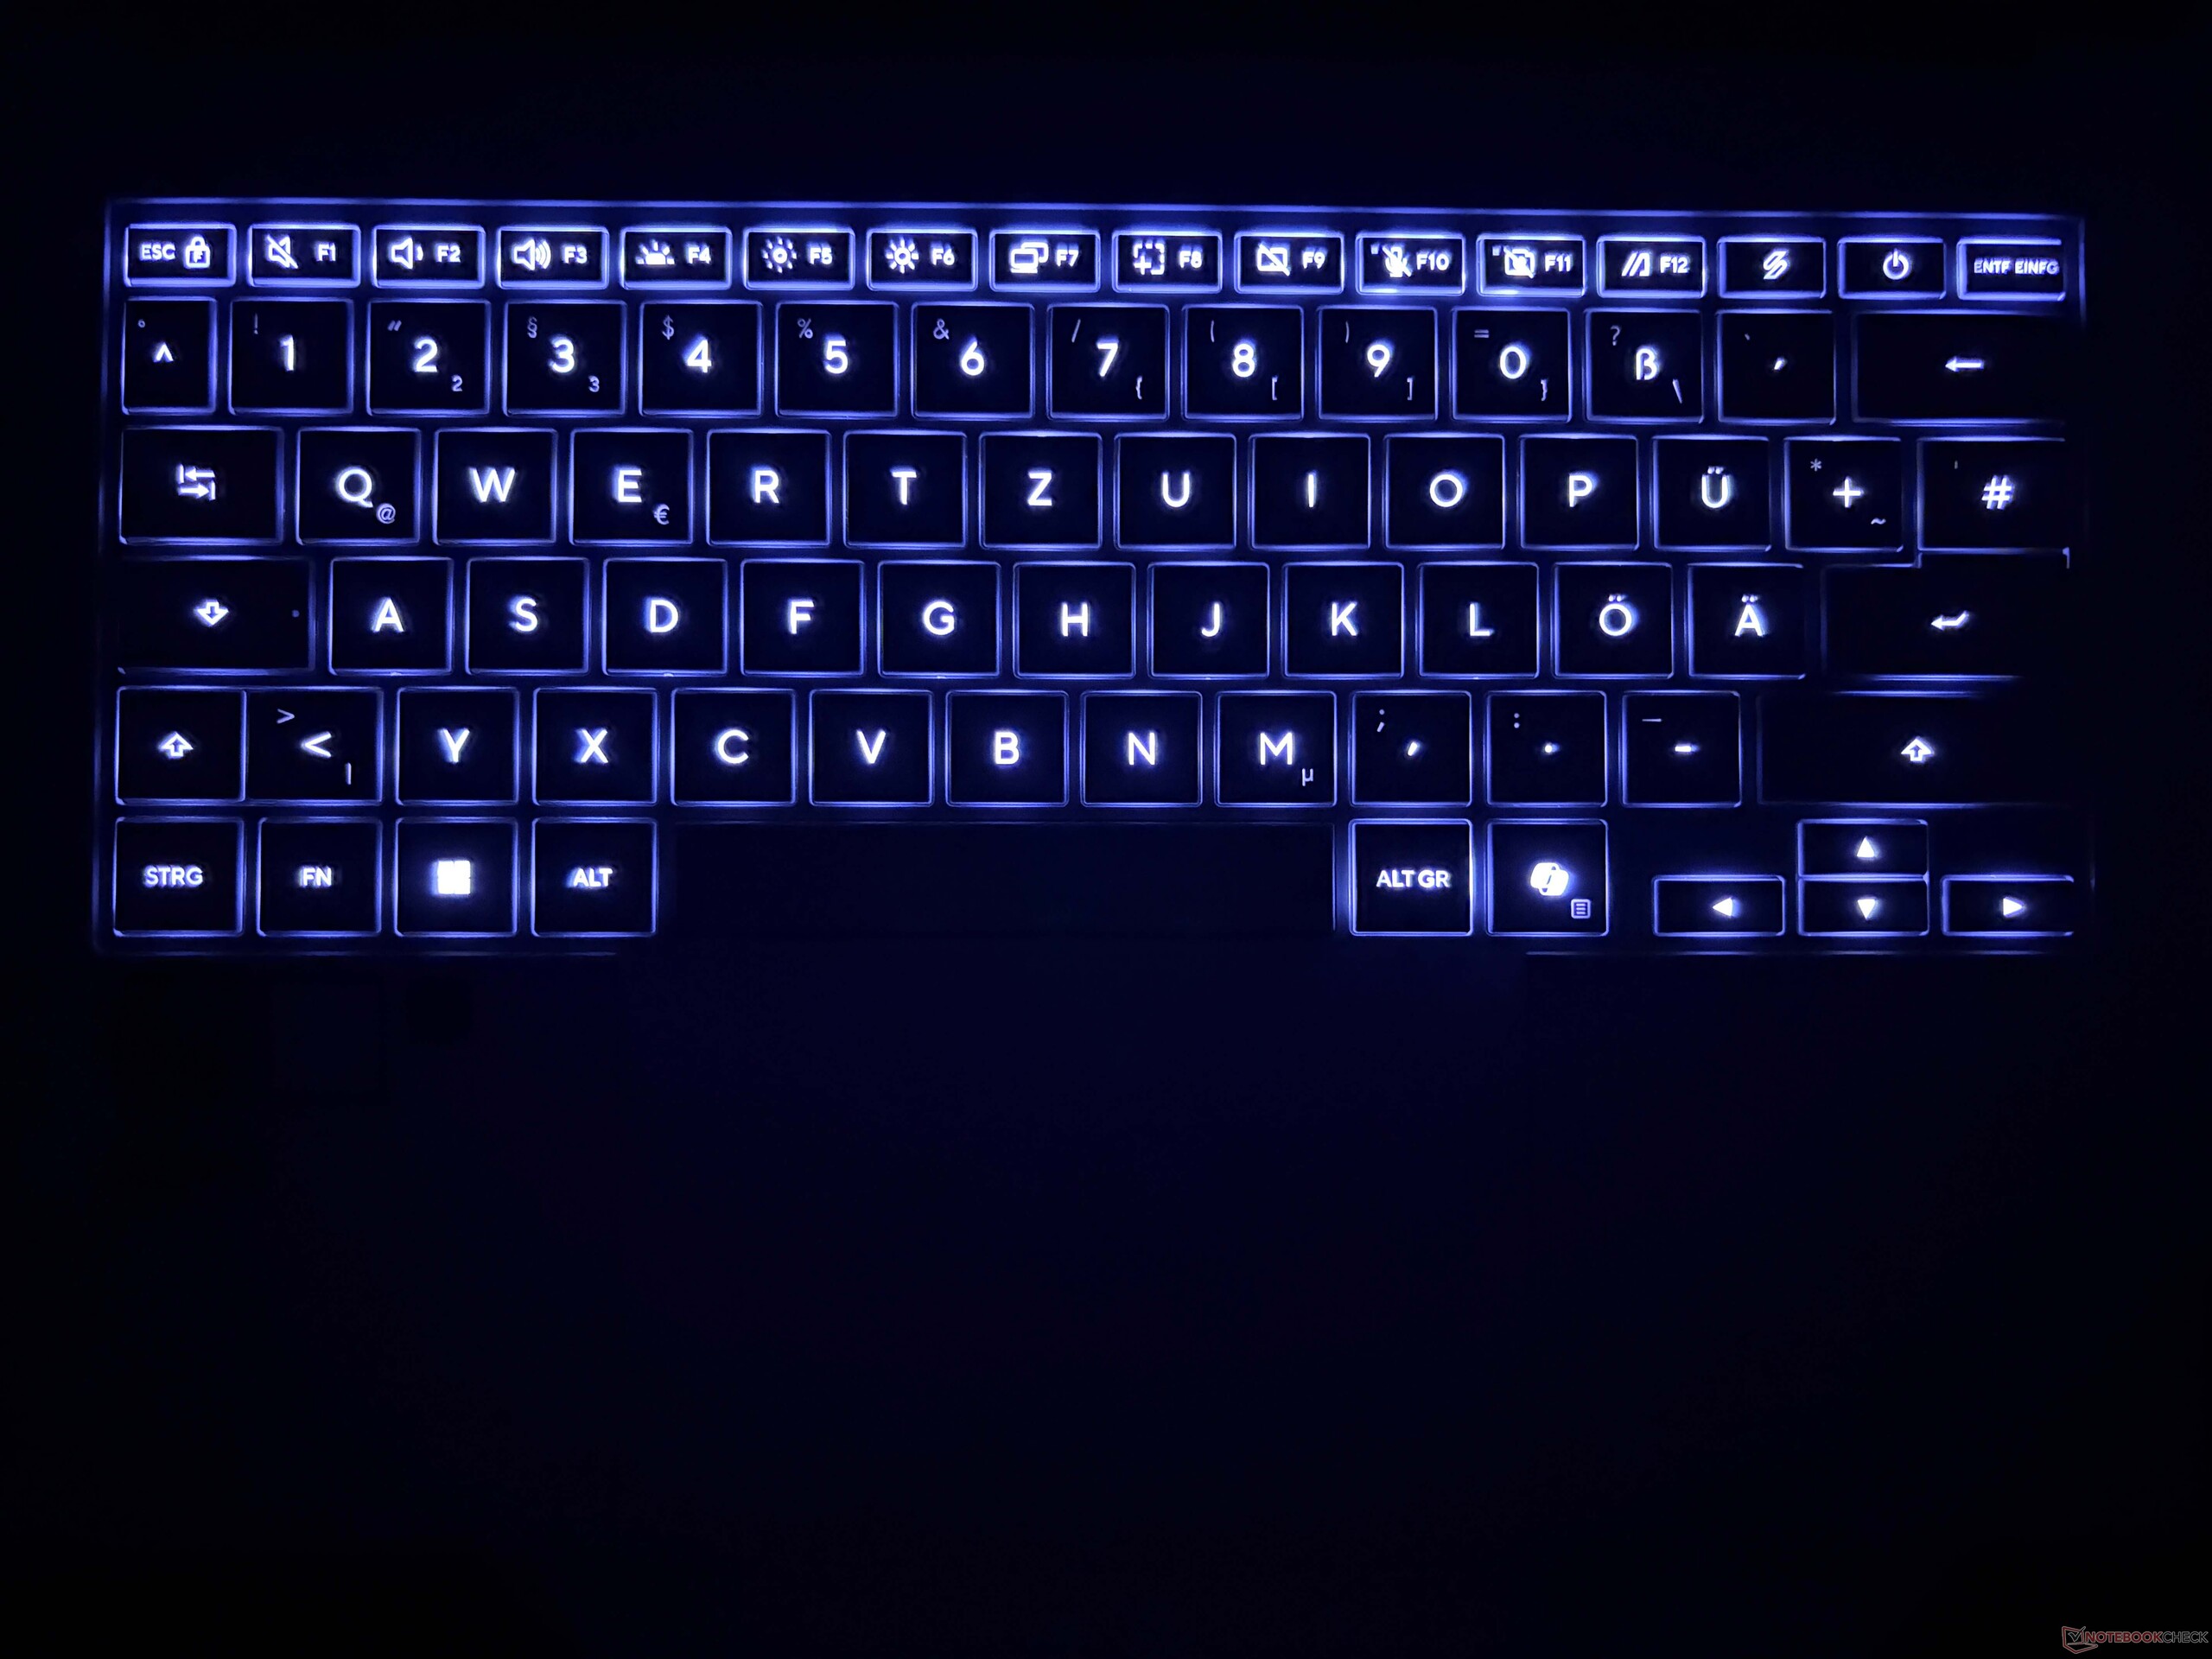
Lautsprecher: Stereo, Tastatur: Chiclet, Tastatur-Beleuchtung: ja, Xbox PC Game Pass (2-month), 24 Monate Garantie
Gewicht
1.205 kg
Preis
1899 Euro
Geizhals
Preisvergleich
Geizhals Bestpreis 1840€ (Historischer Bestpreis: 1716€)
ASUS ZenBook S14 UX5406AA-SU236W, Scandinavian White, Core Ultra 9 386H, 32GB RAM, 1TB SSD, DE (90NB16Q4-M00BZ0)
Hinweis: Der Hersteller kann abweichende Bauteile wie Bildschirme, Laufwerke und Speicherriegel mit ähnlichen Spezifikationen unter dem gleichen Modellnamen einsetzen.


Gehäuse, Konnektivität und Eingabegeräte

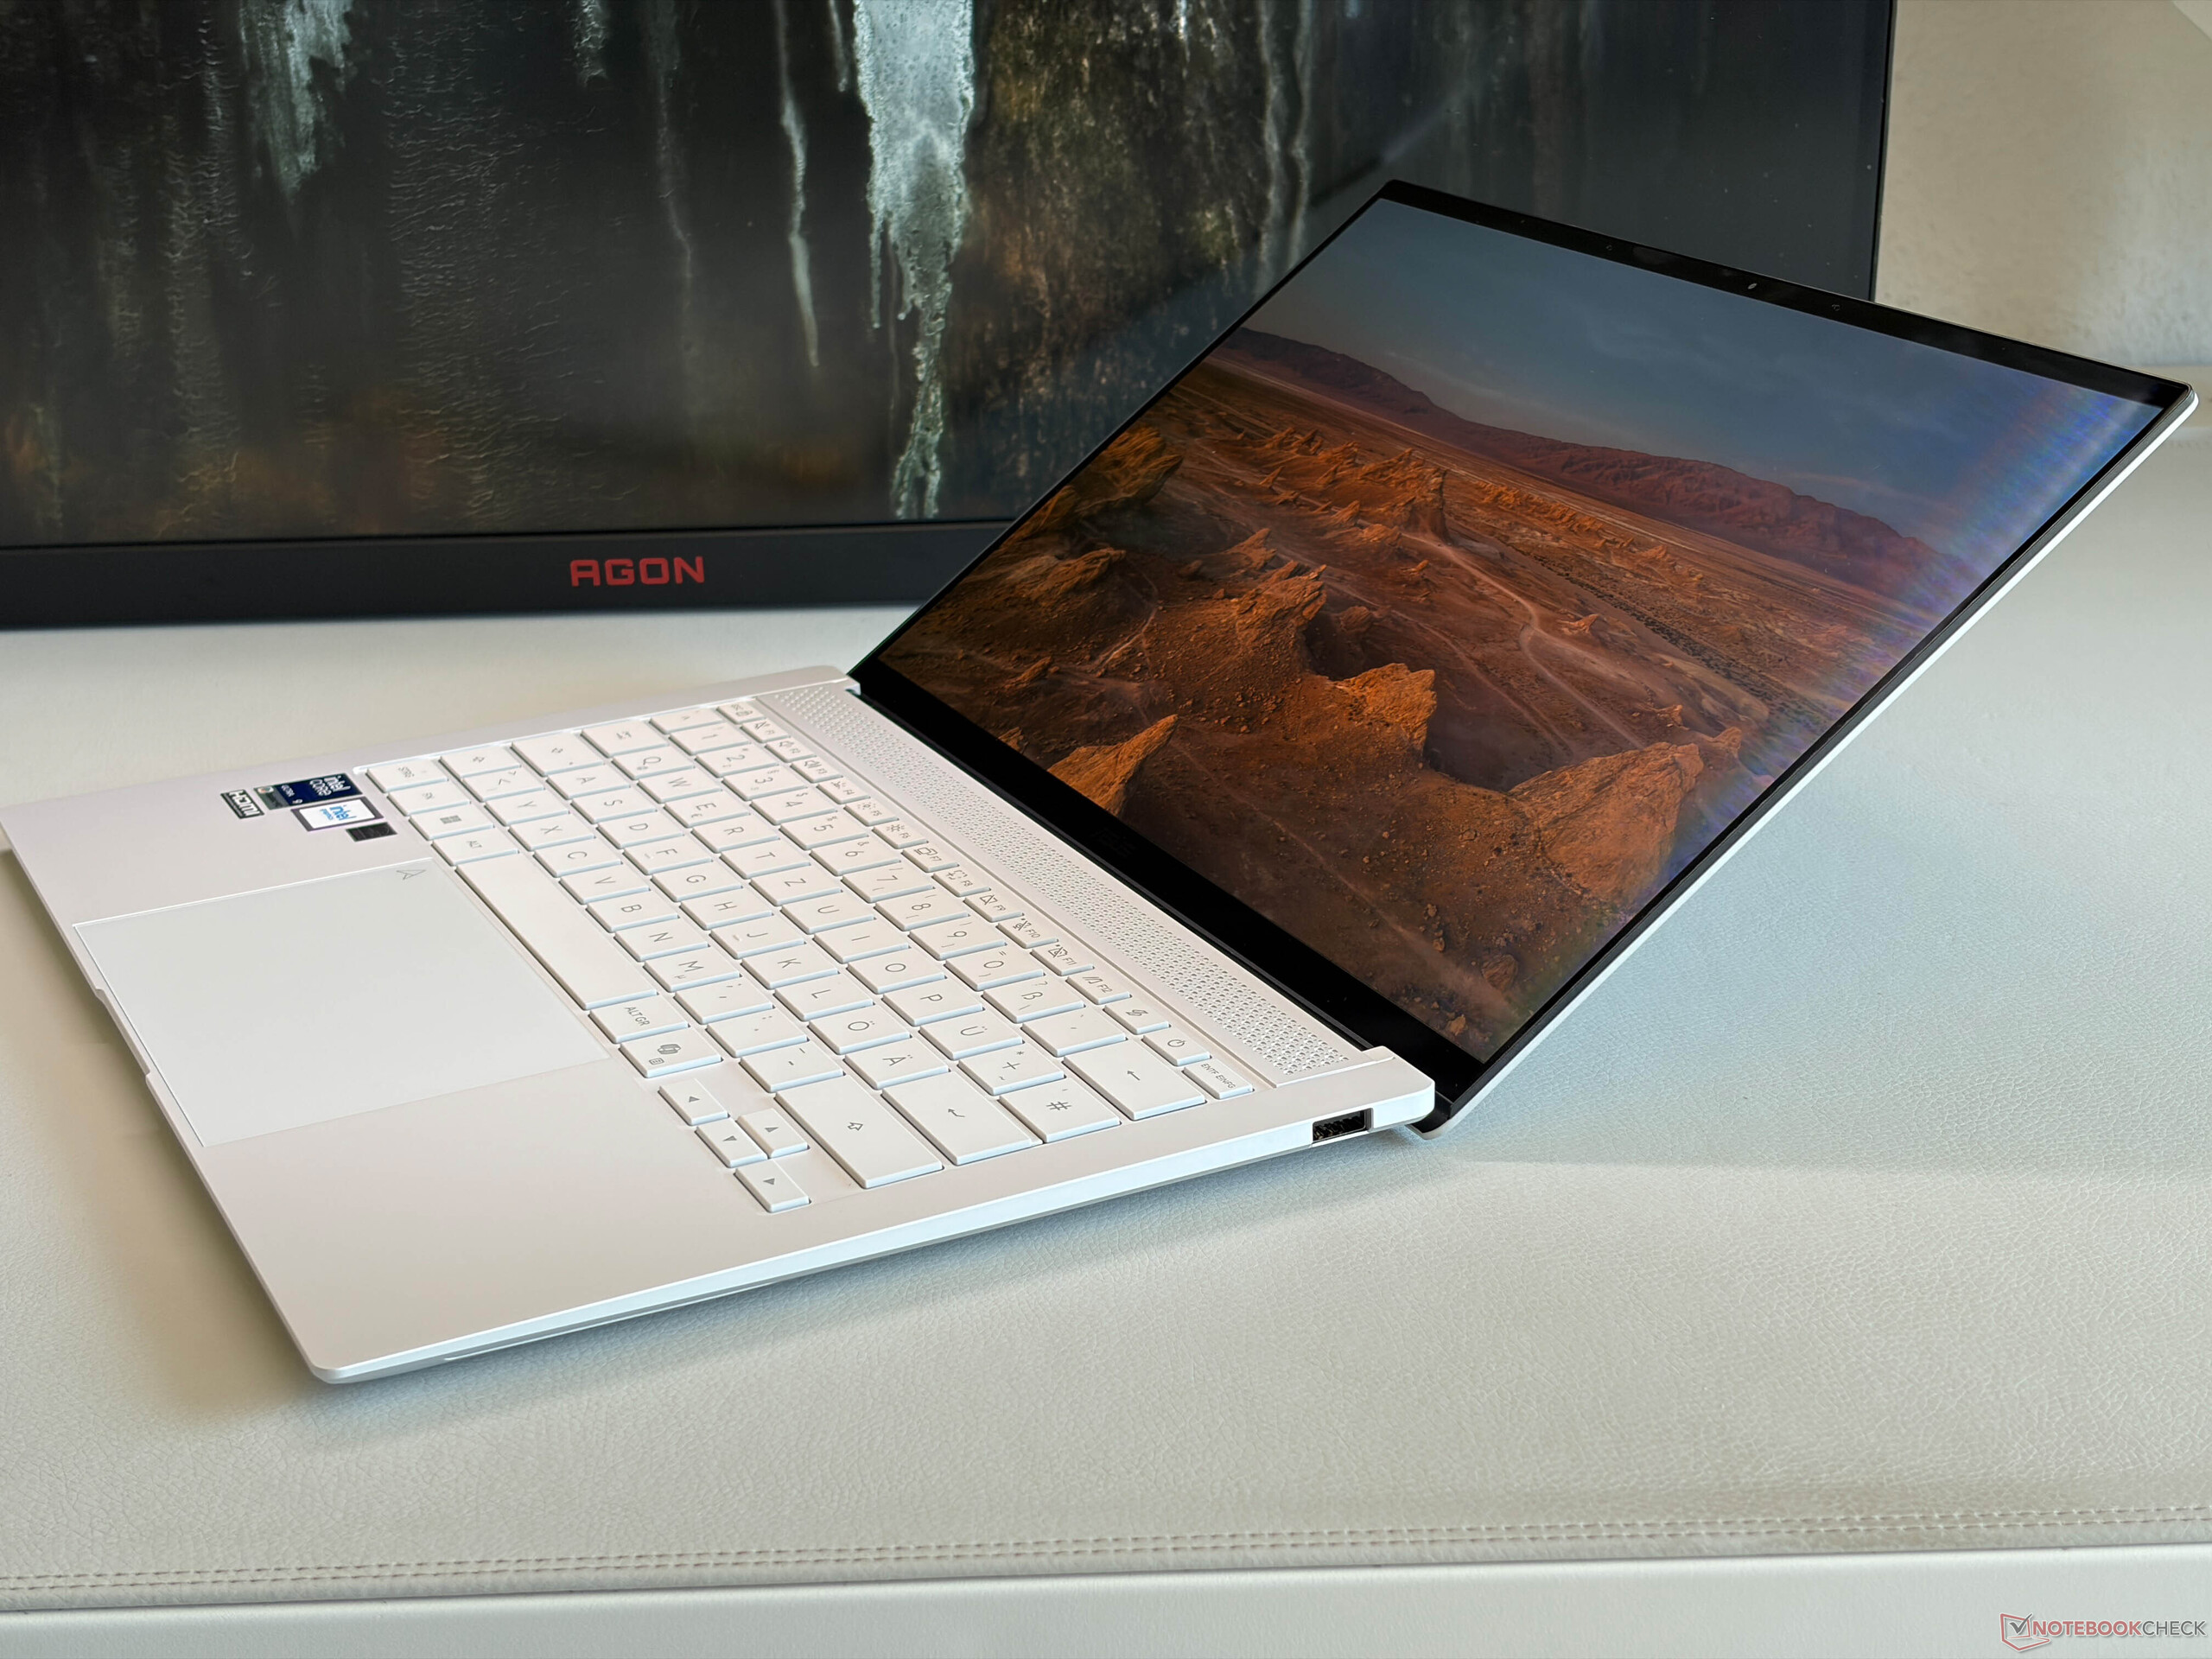
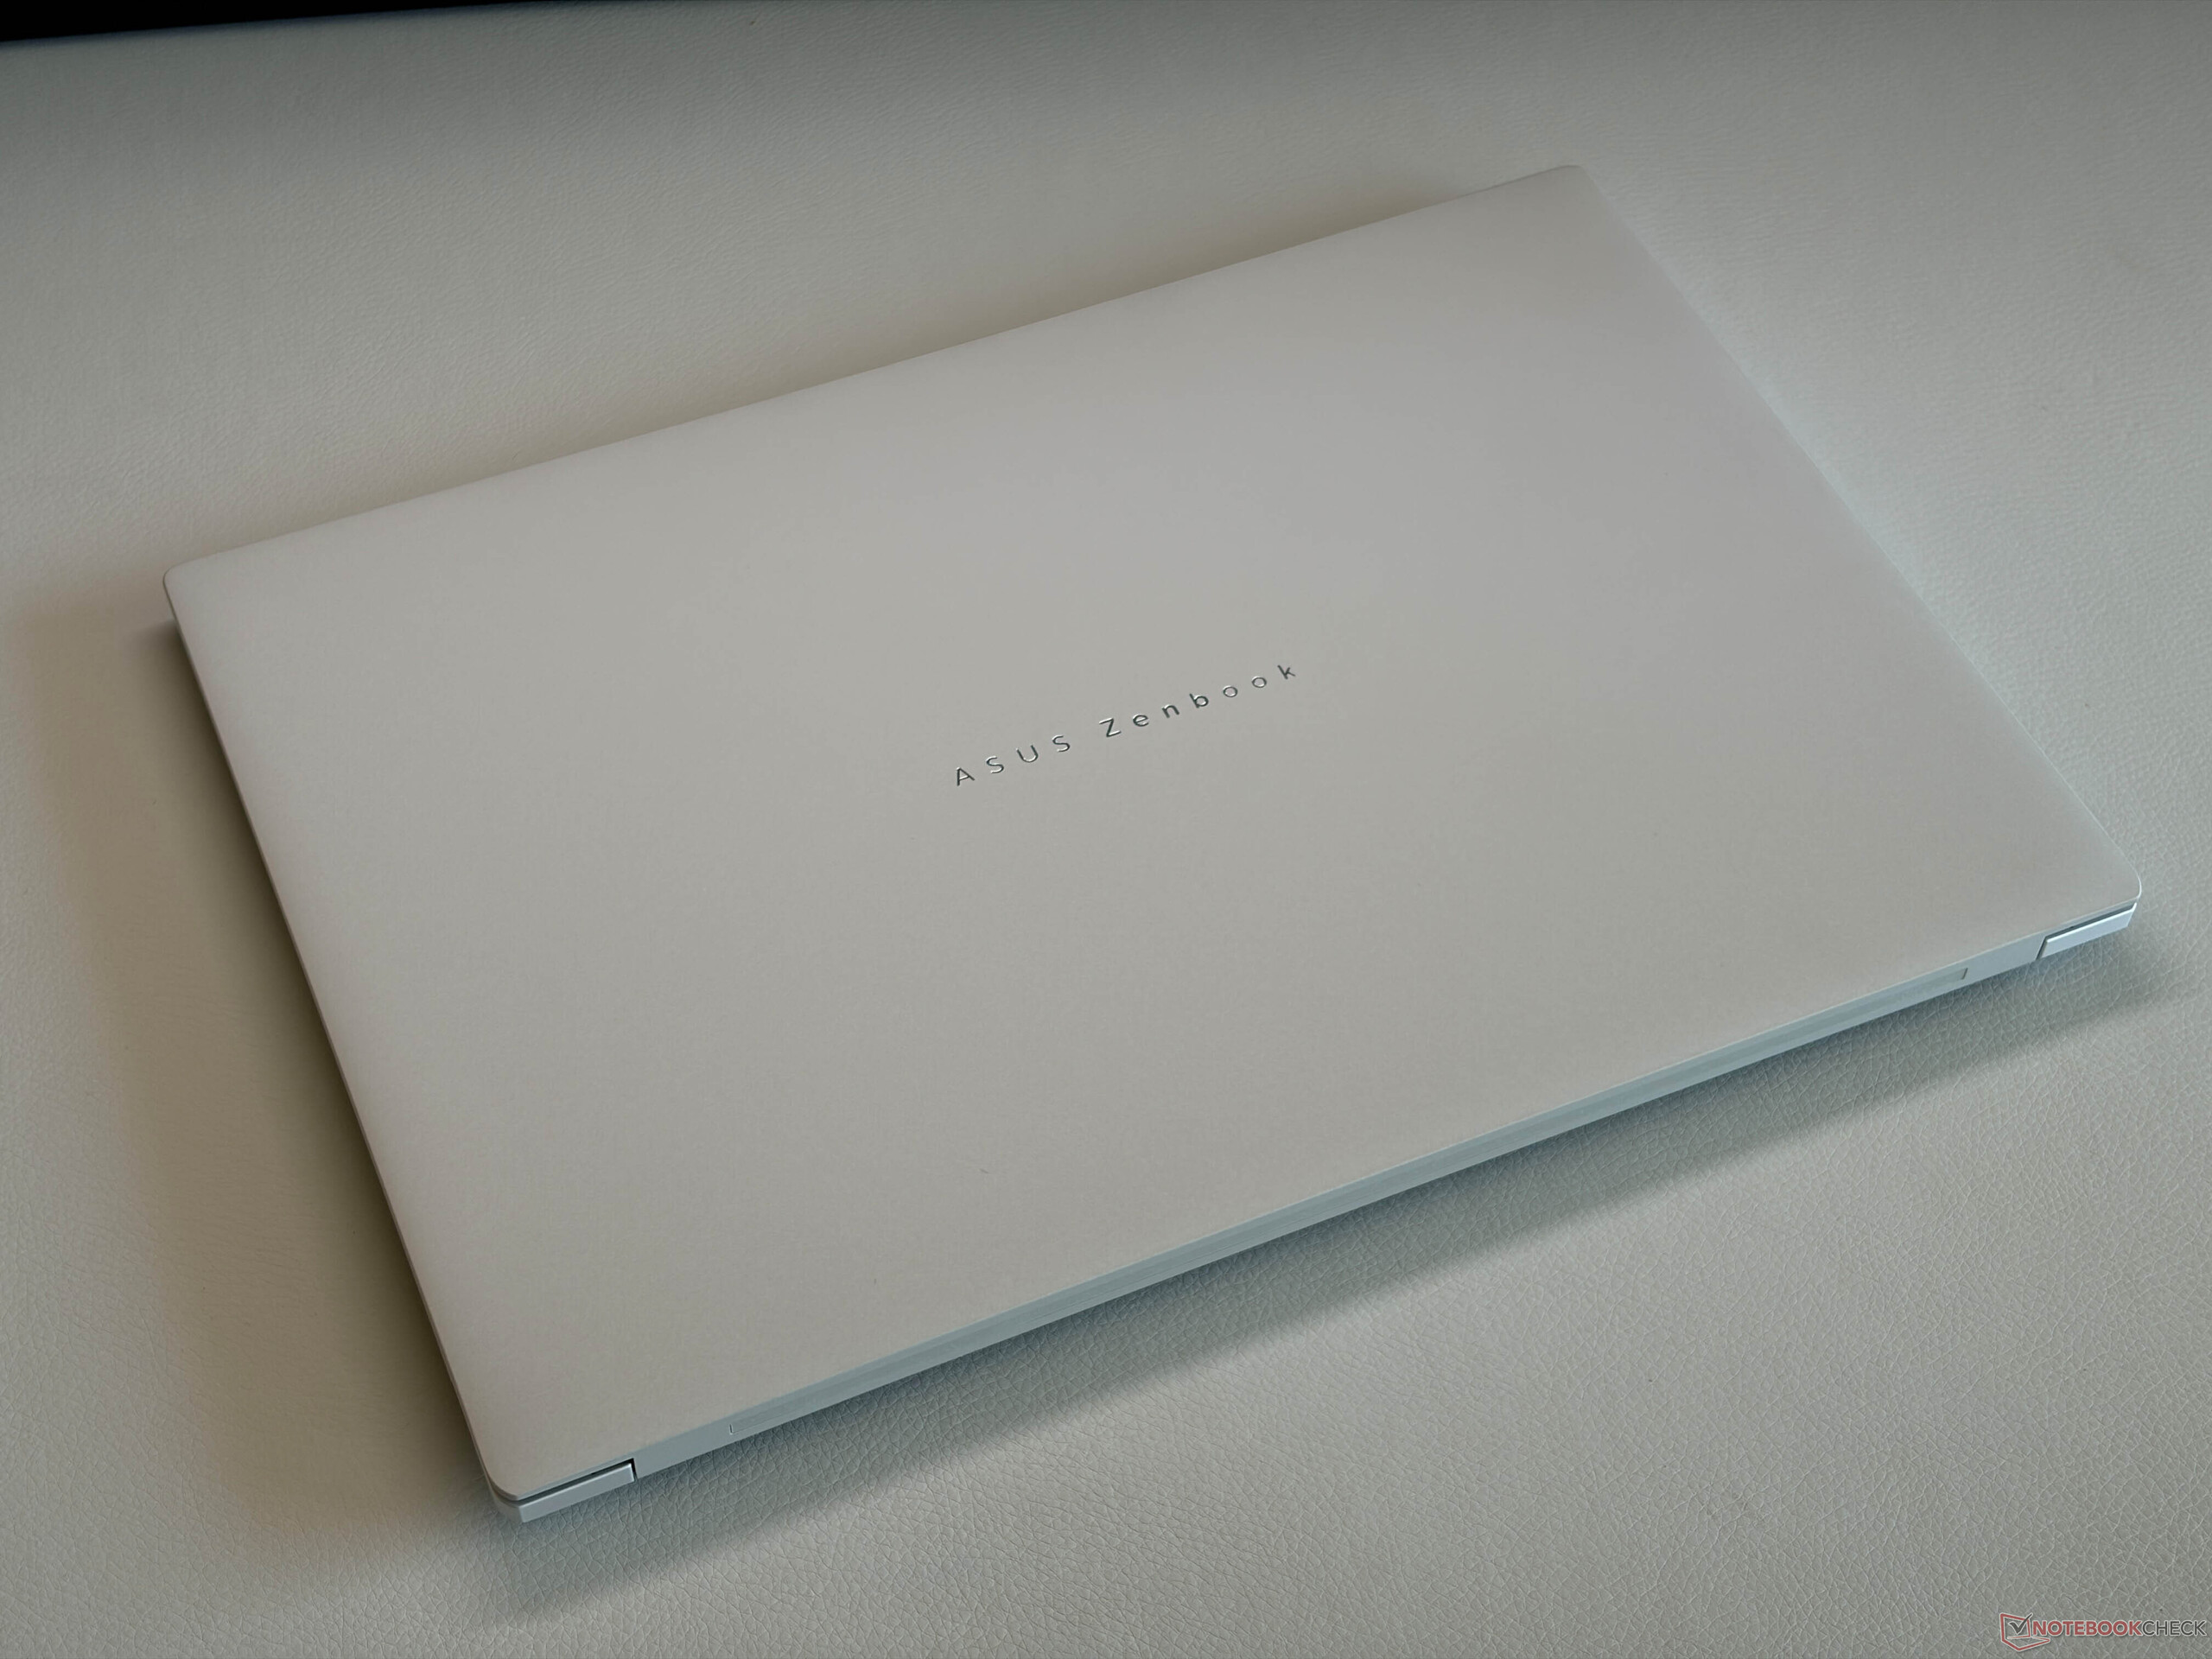
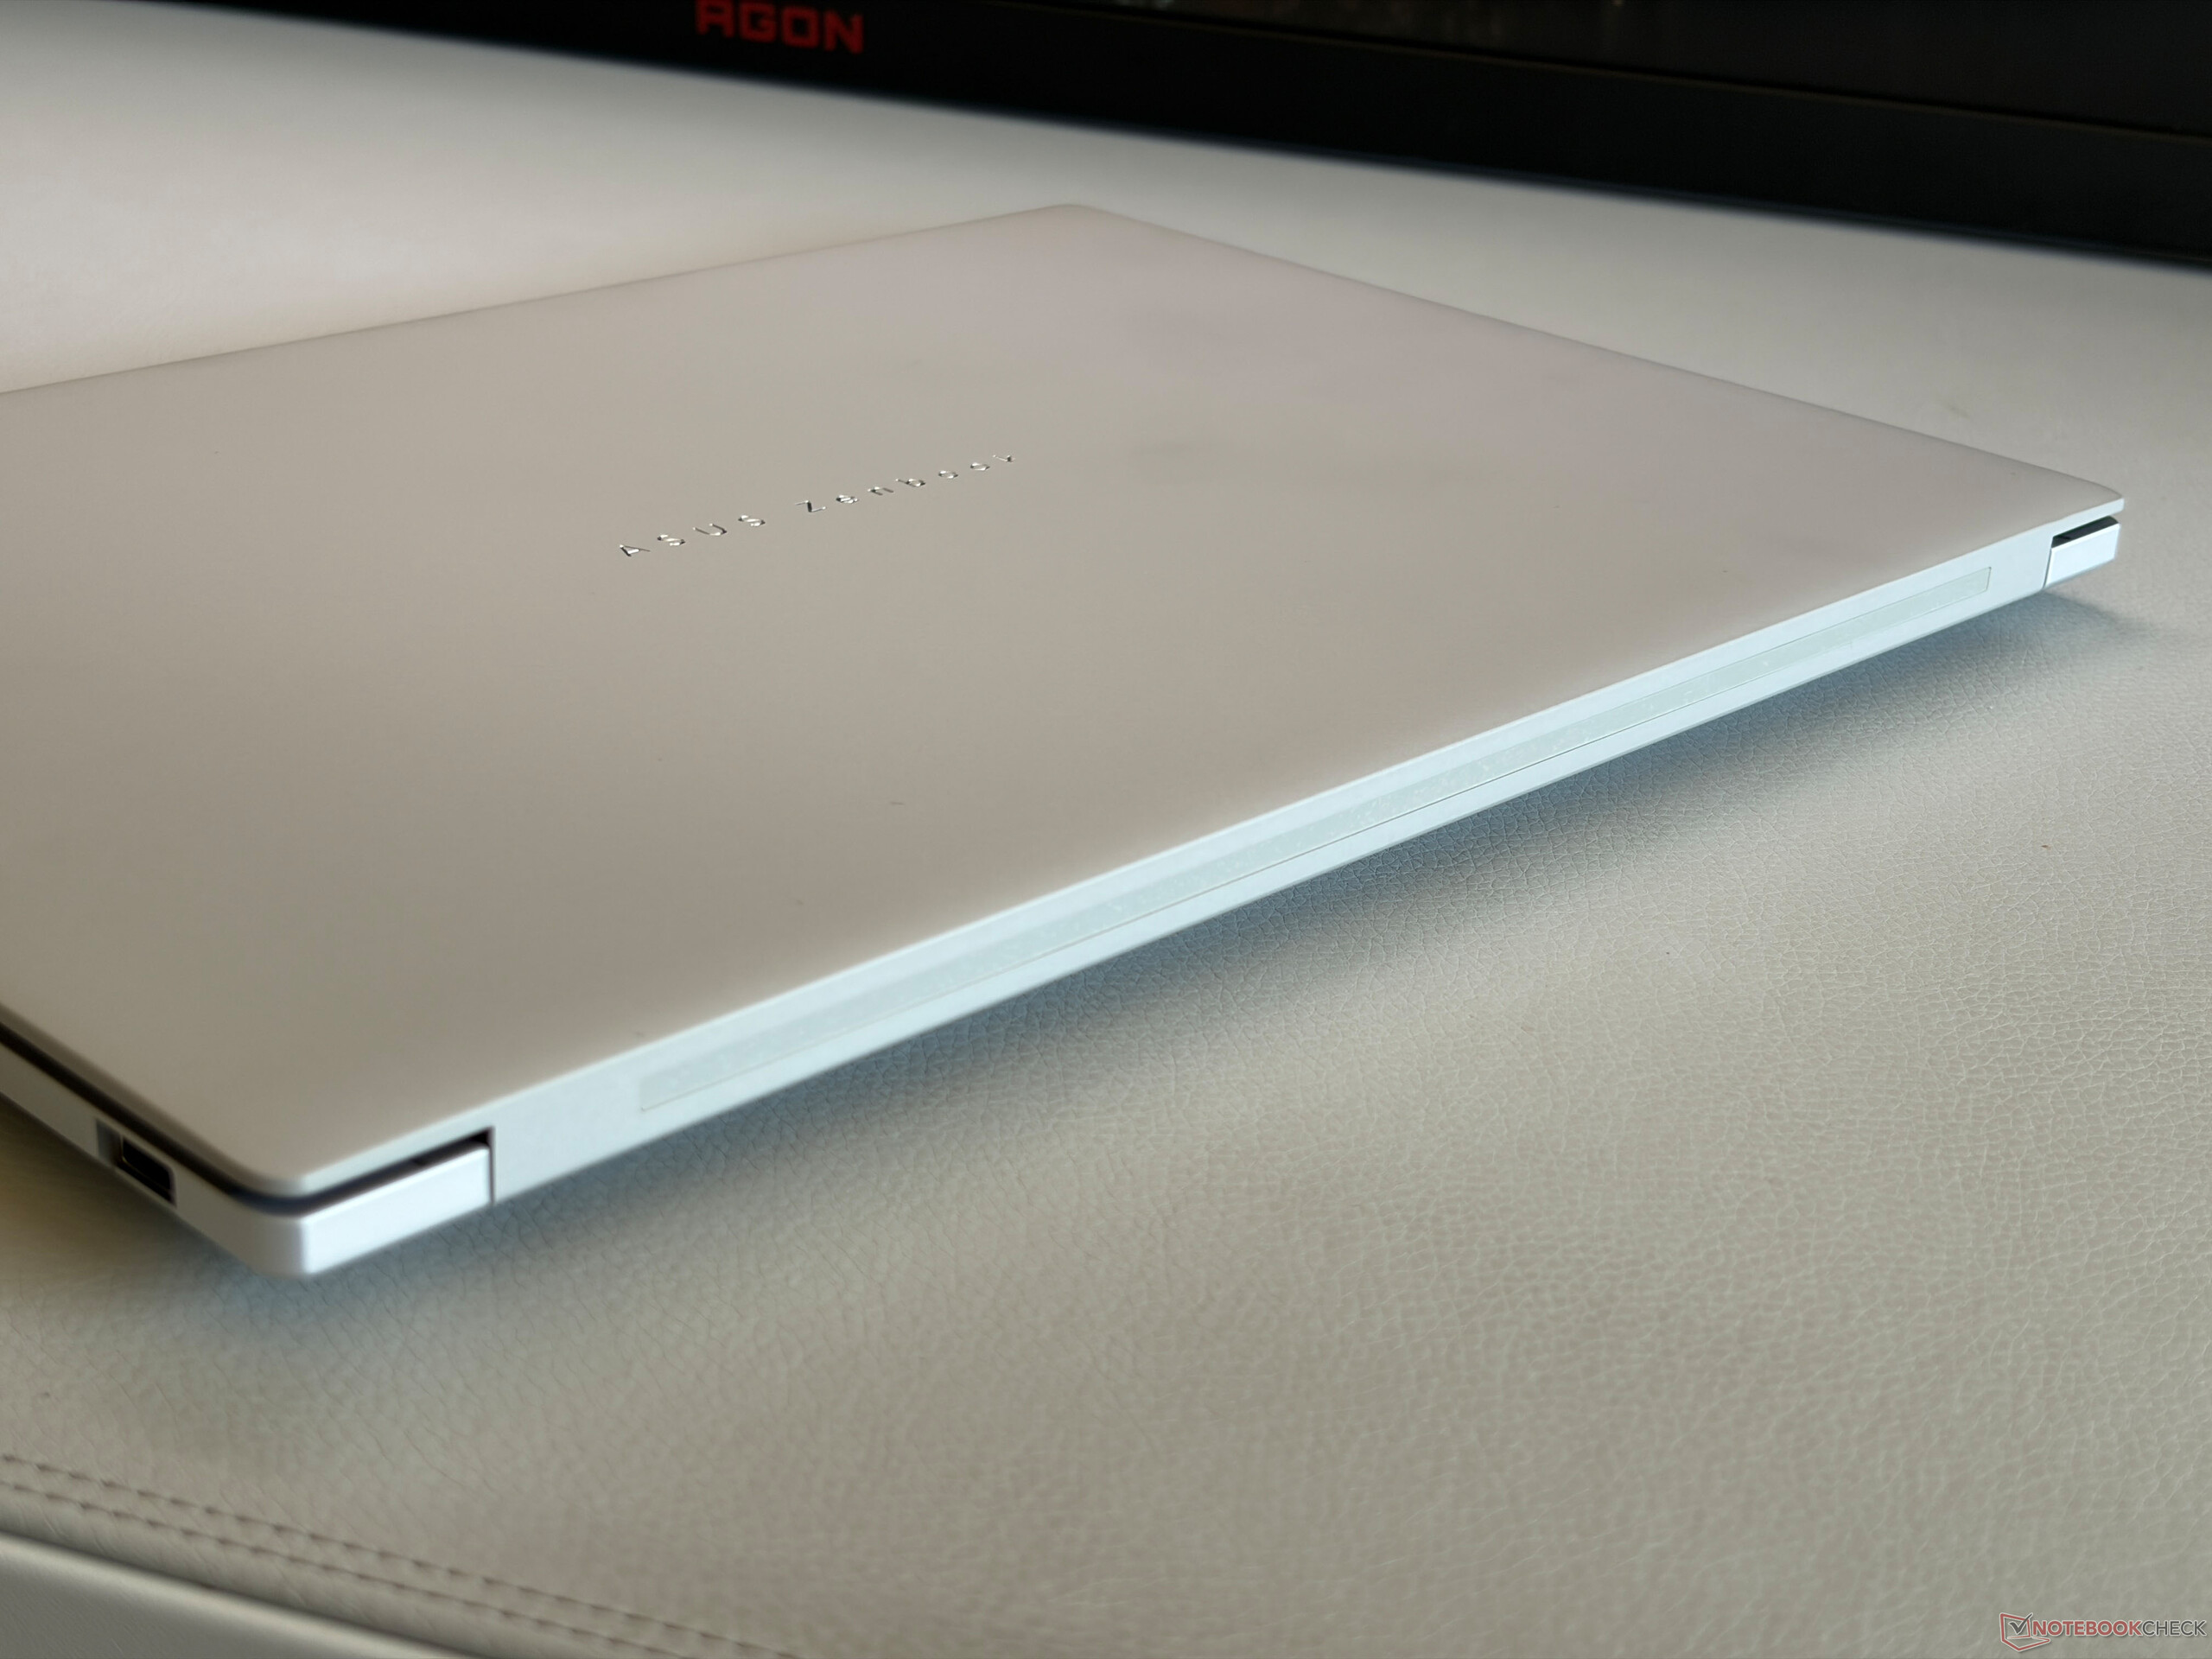
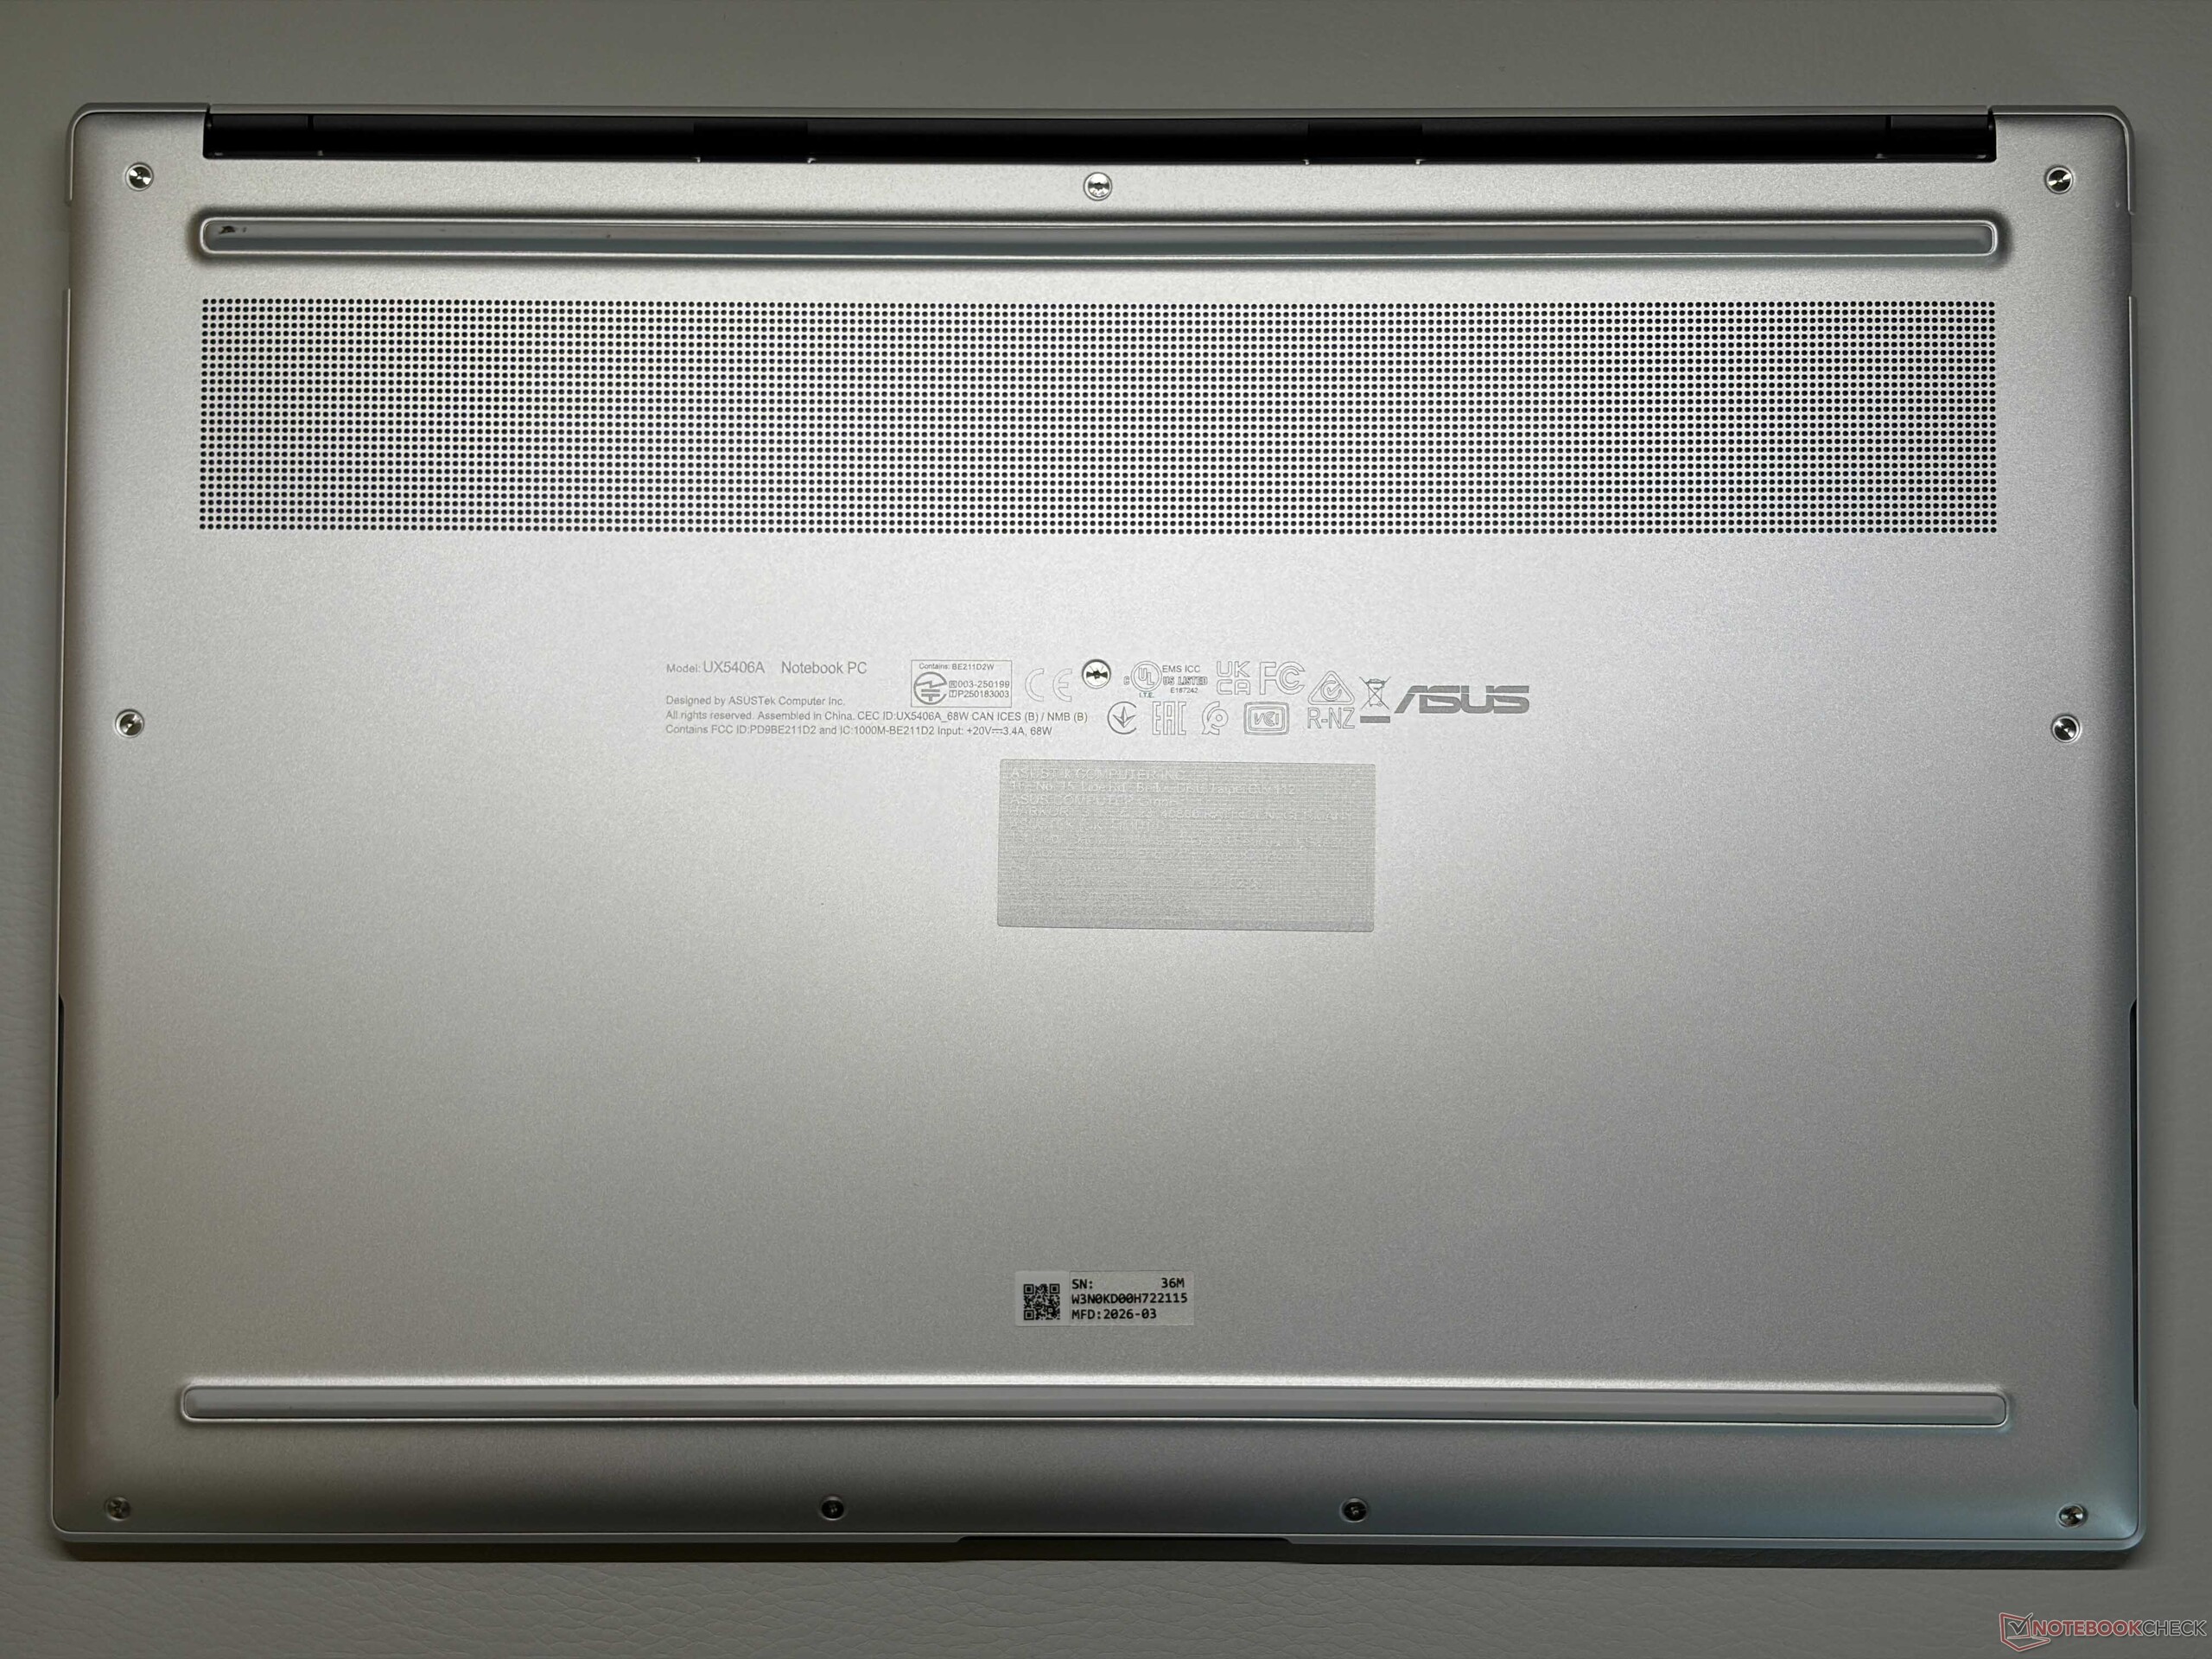
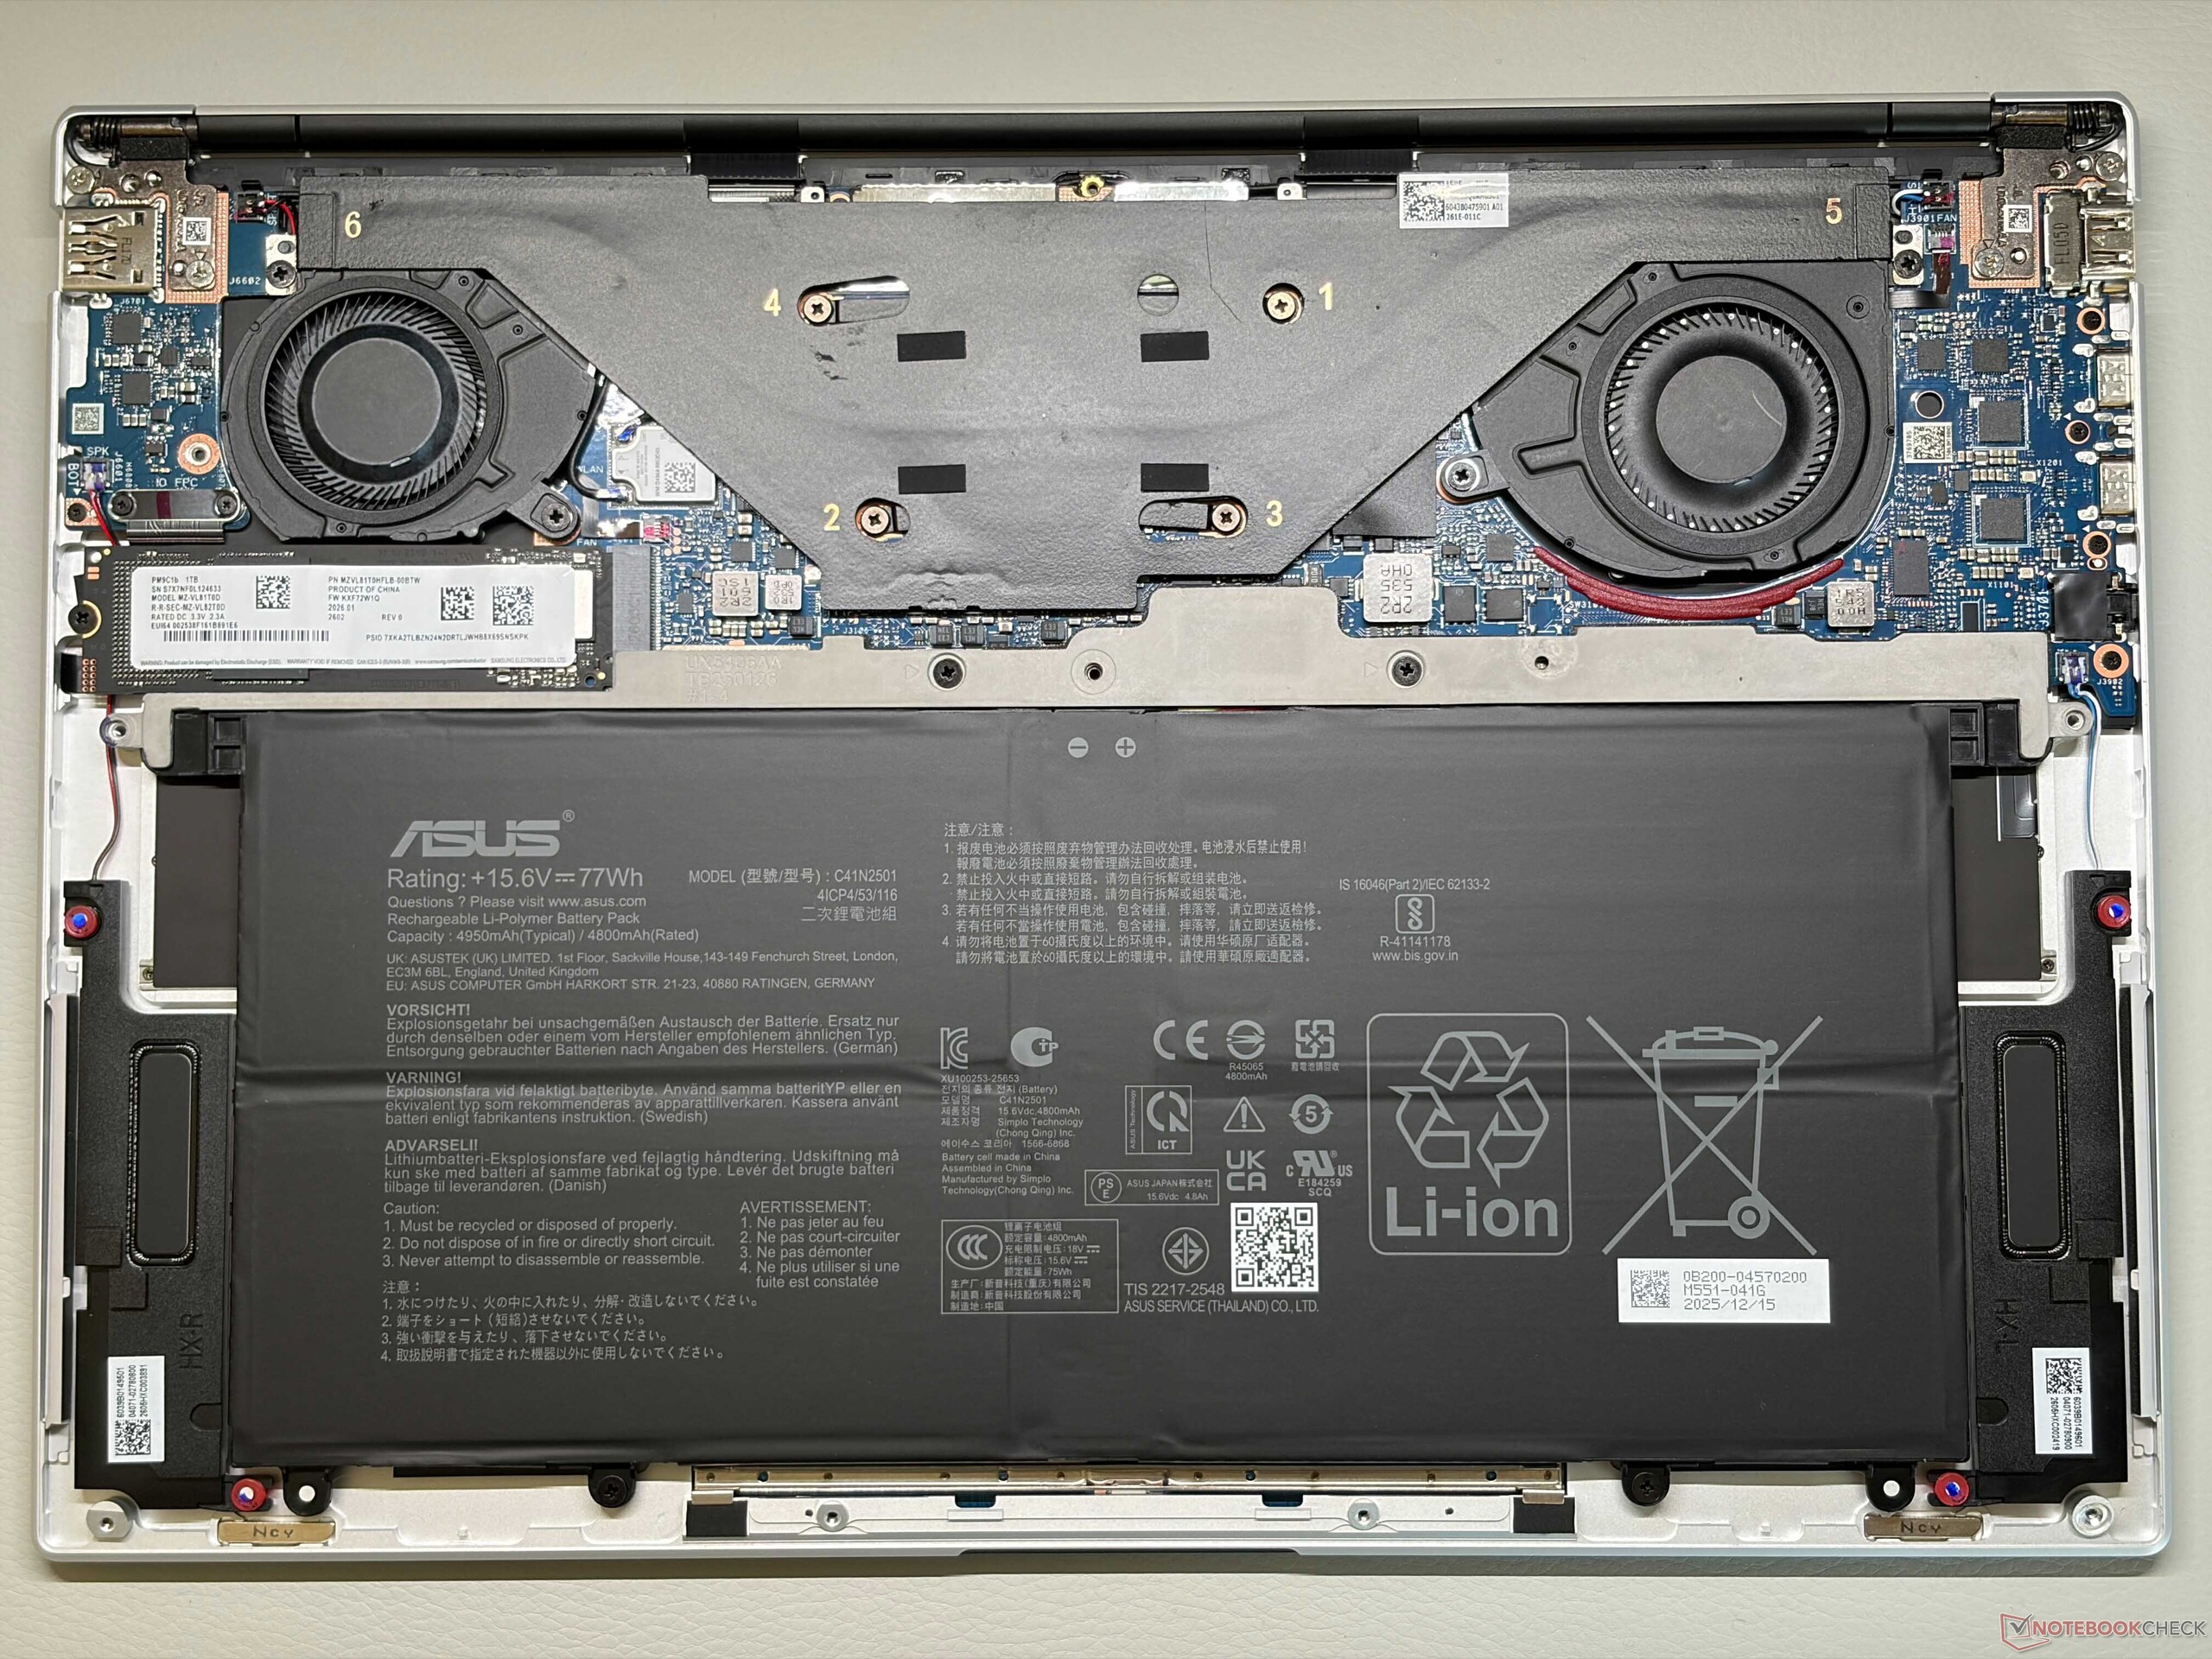
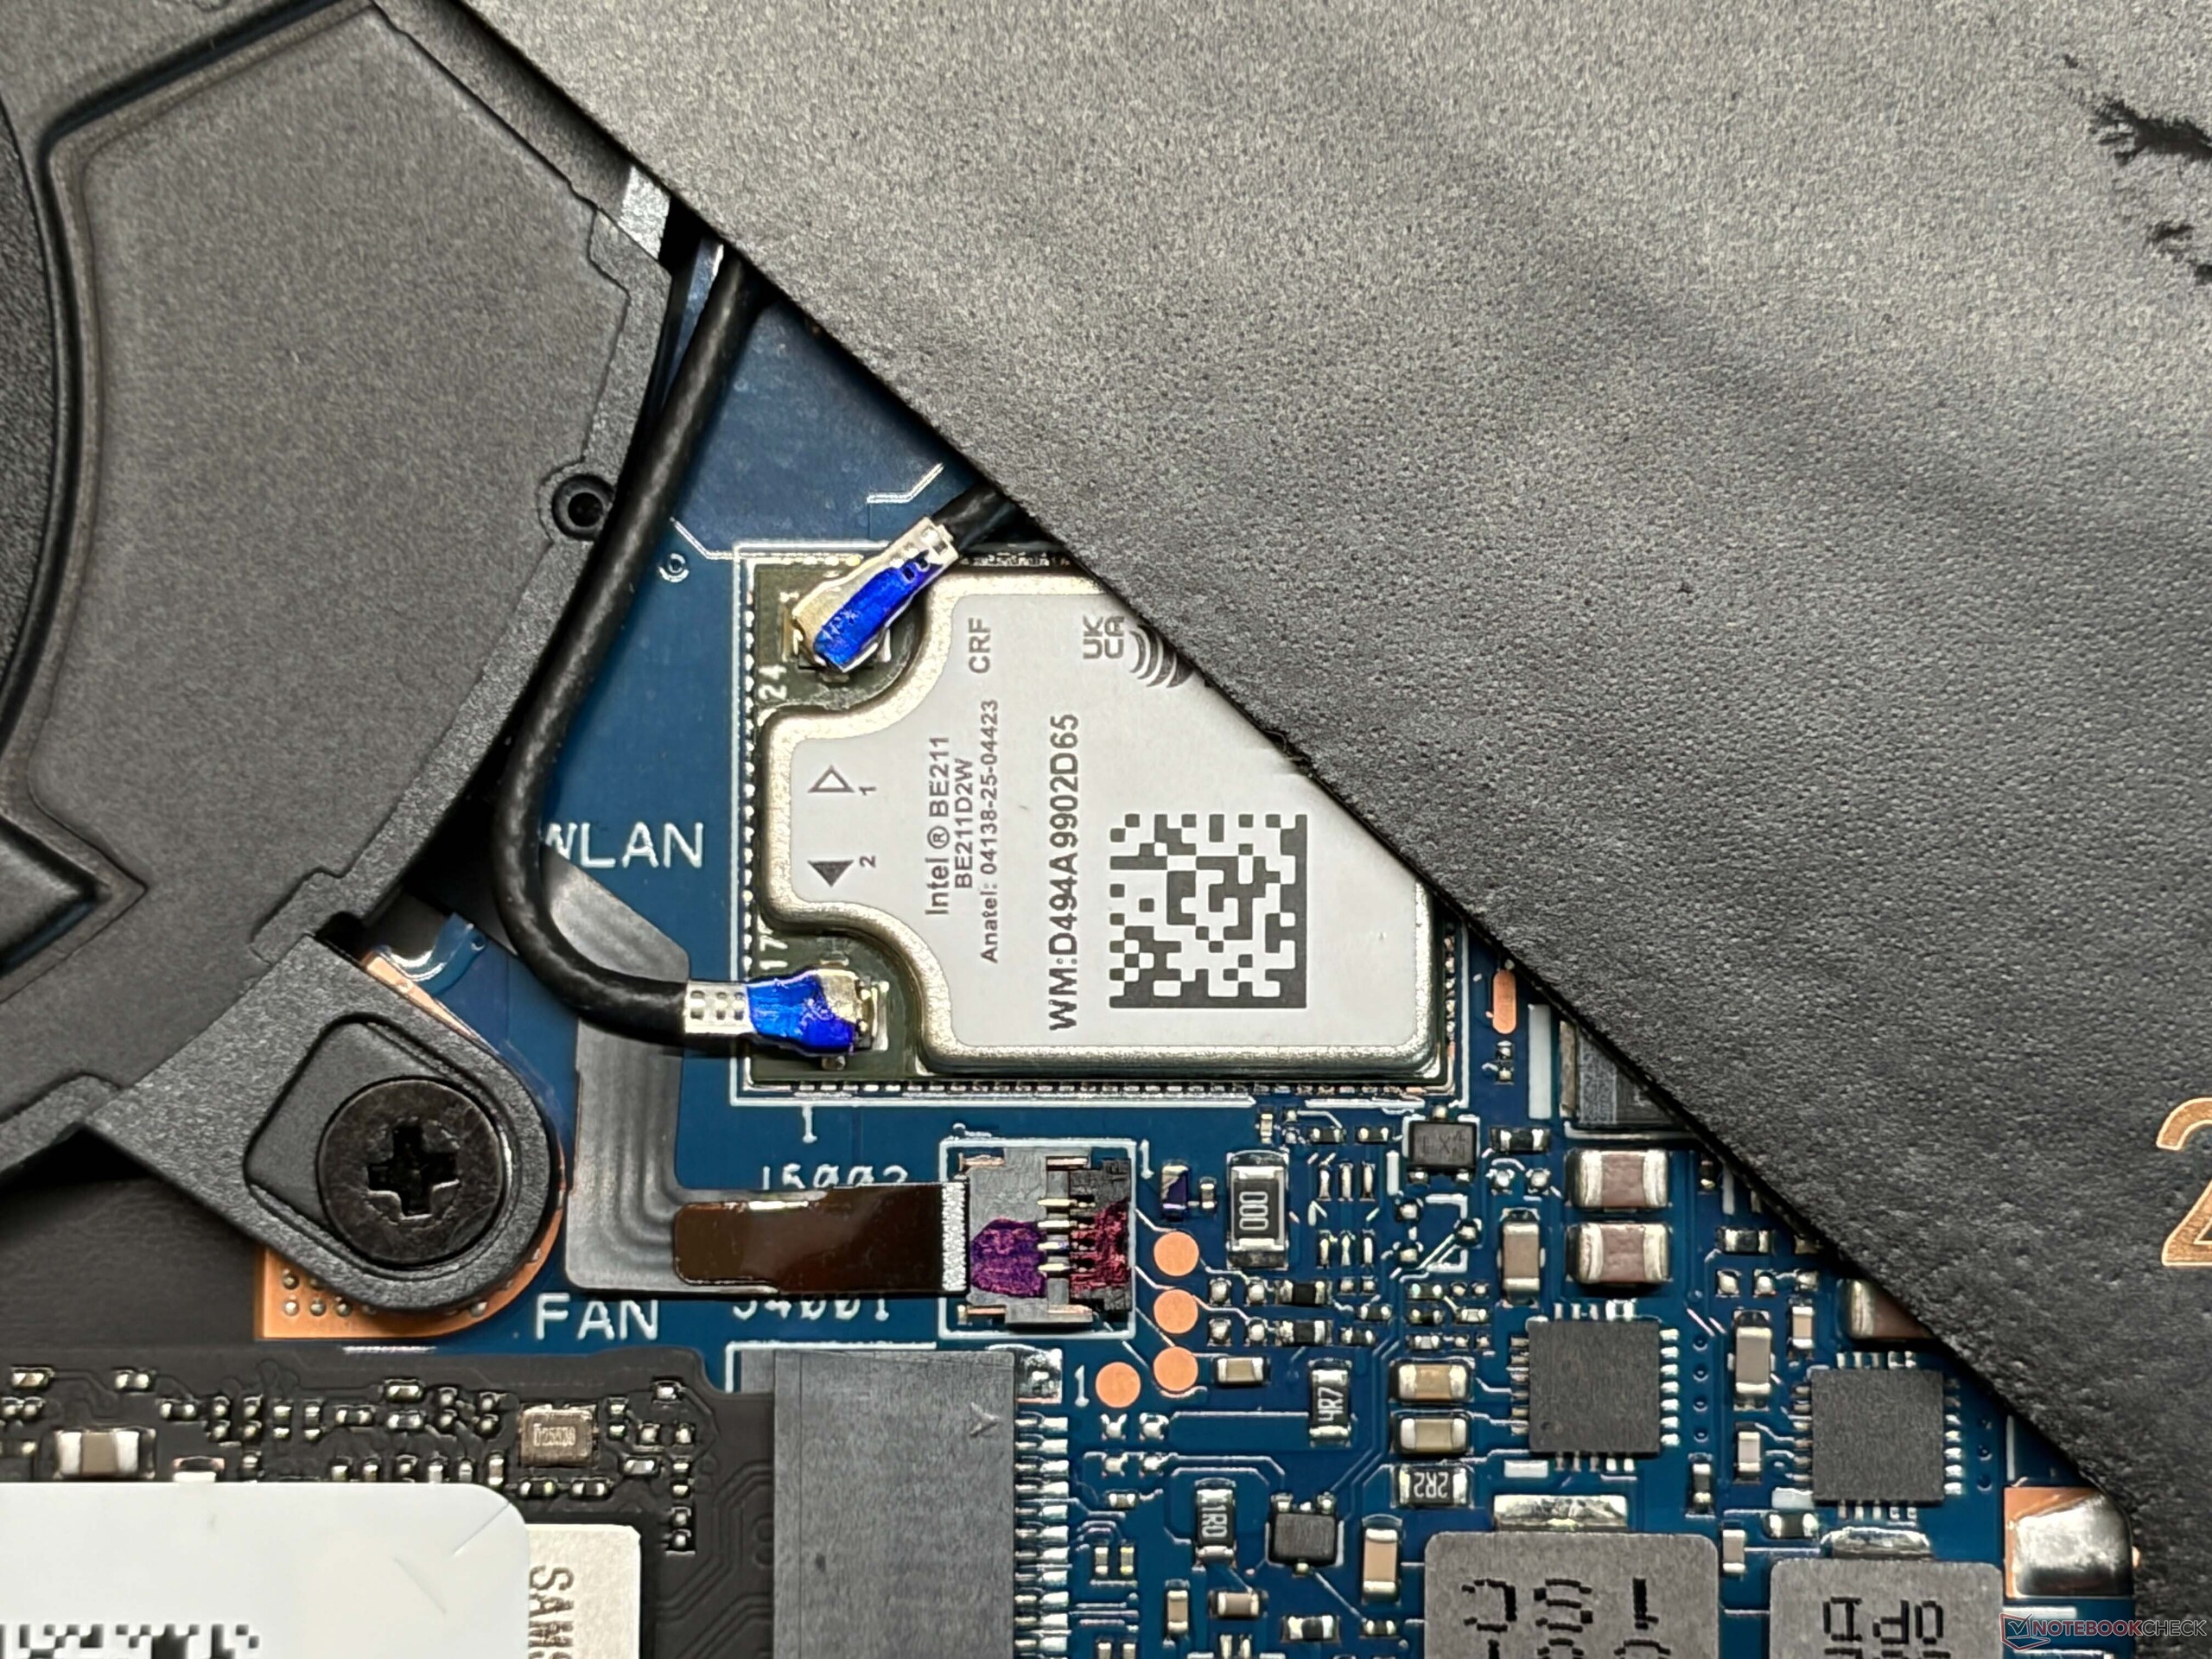
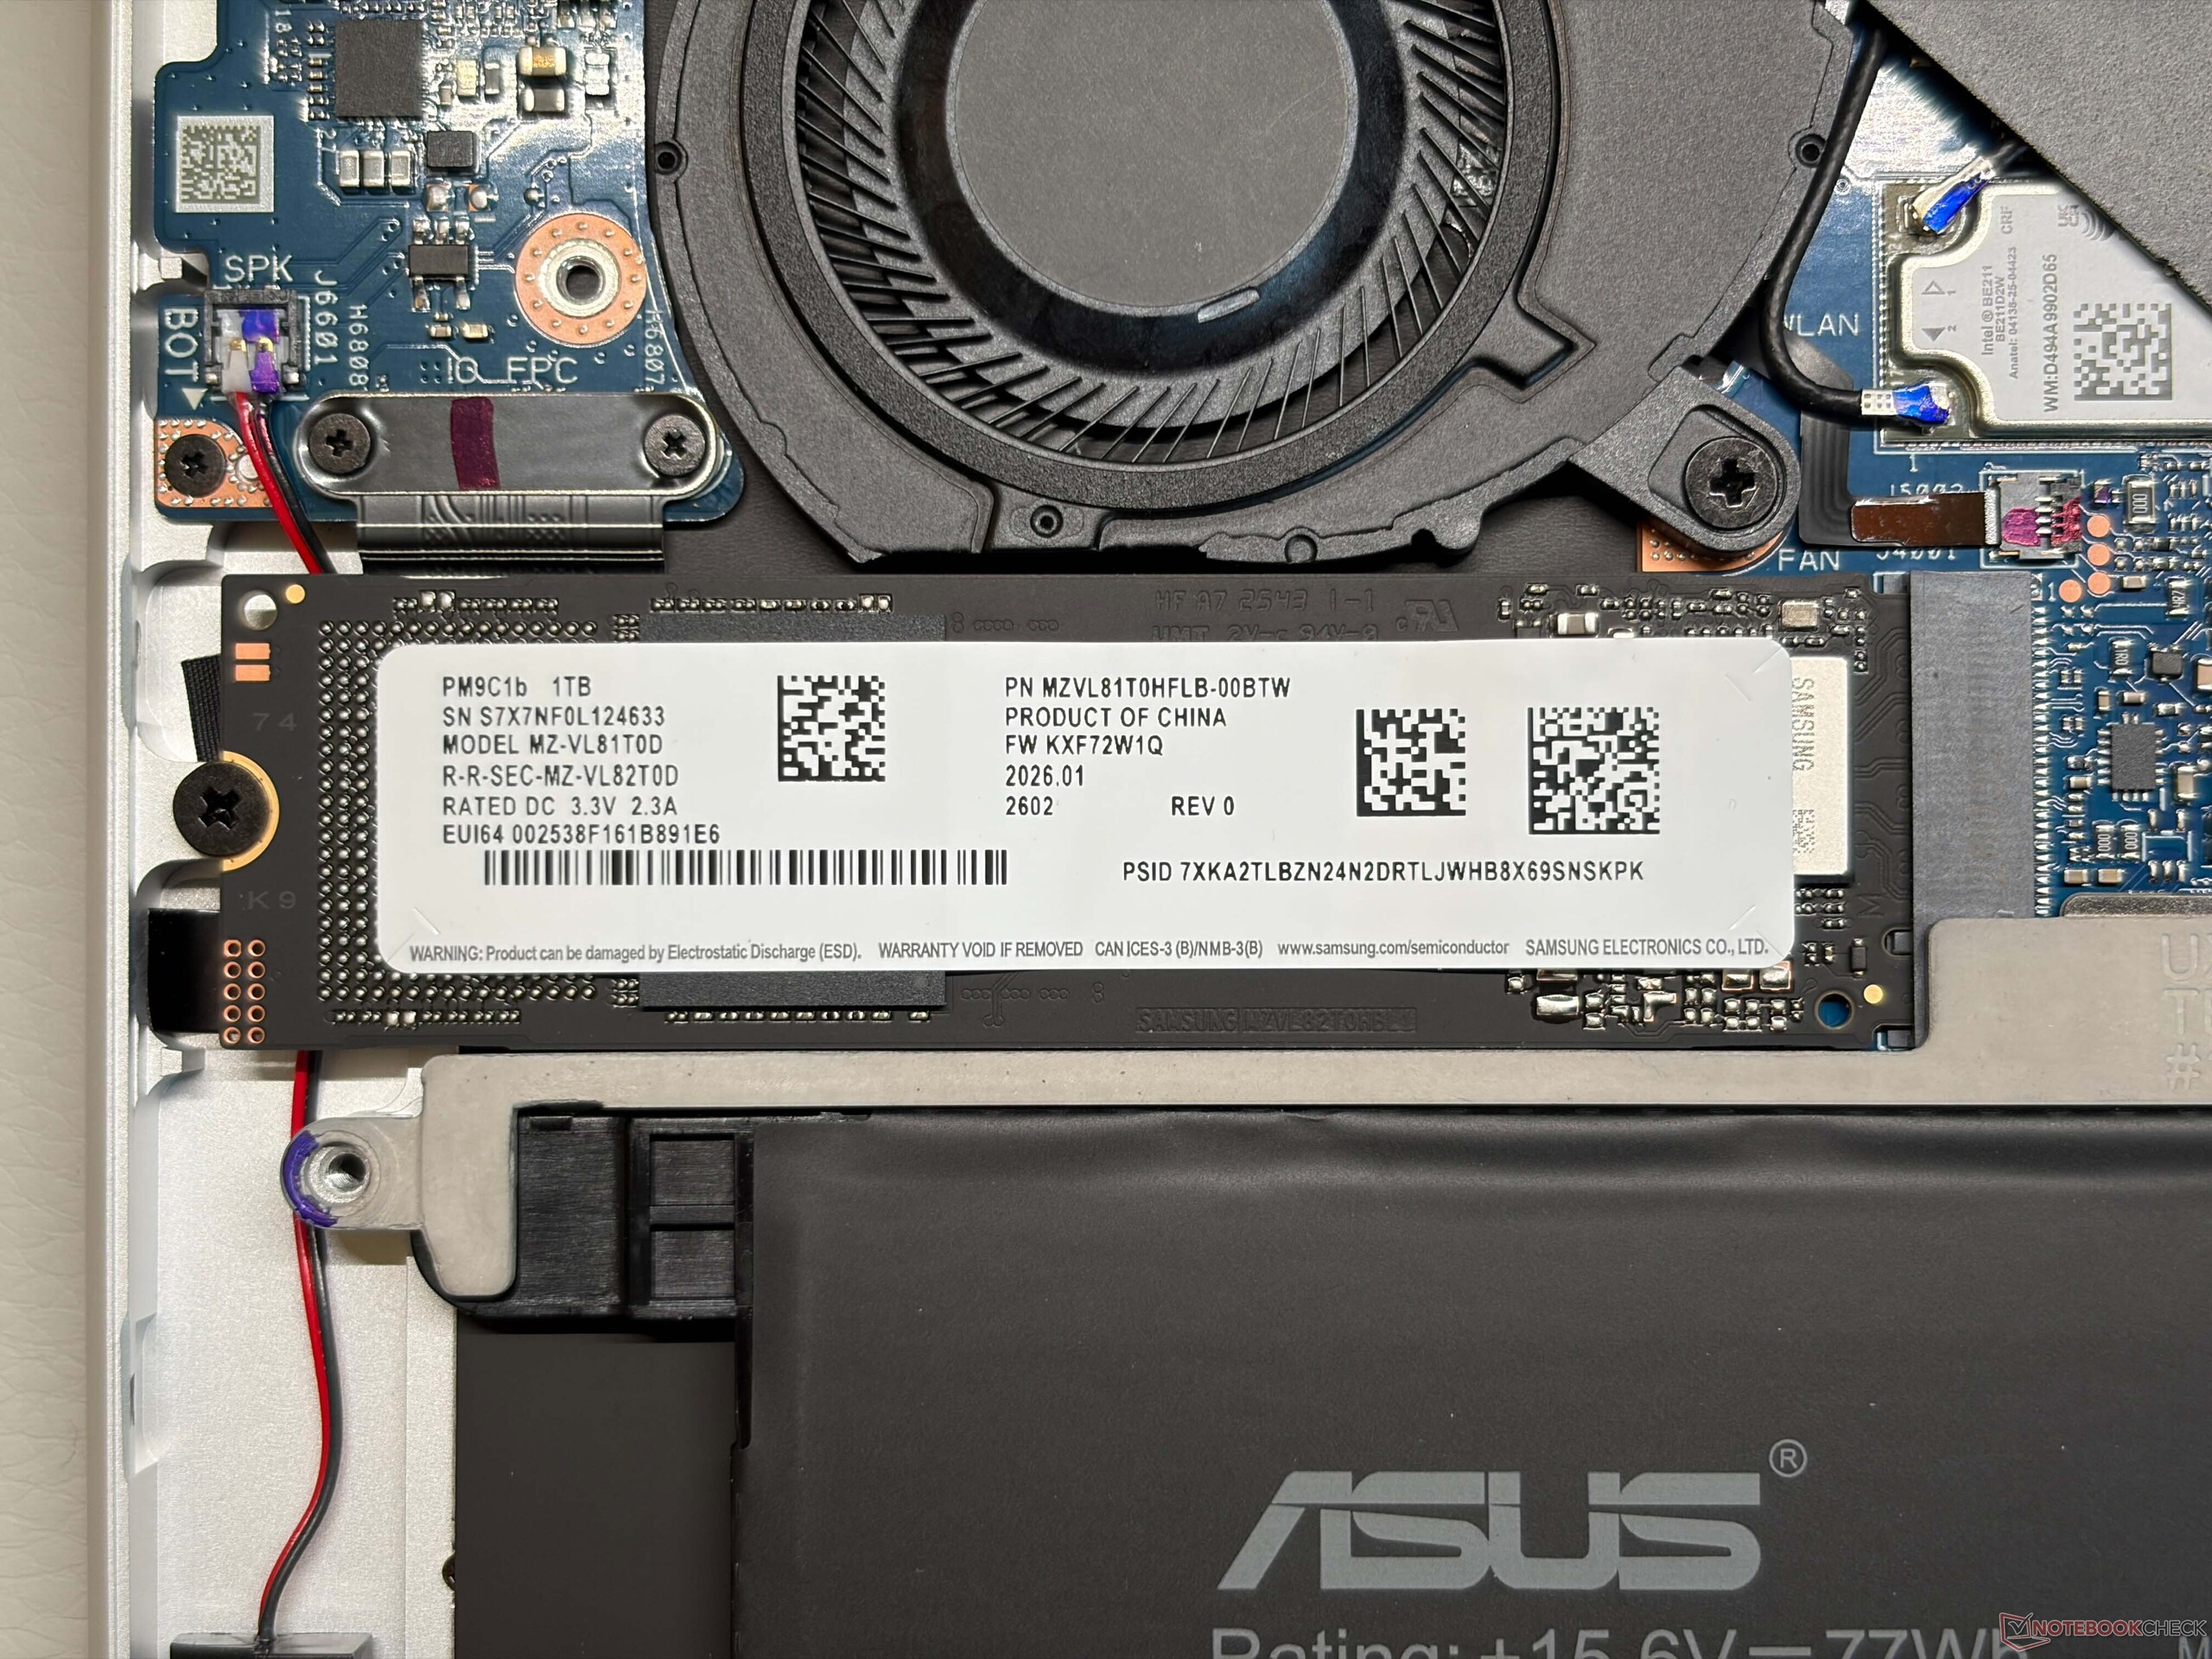
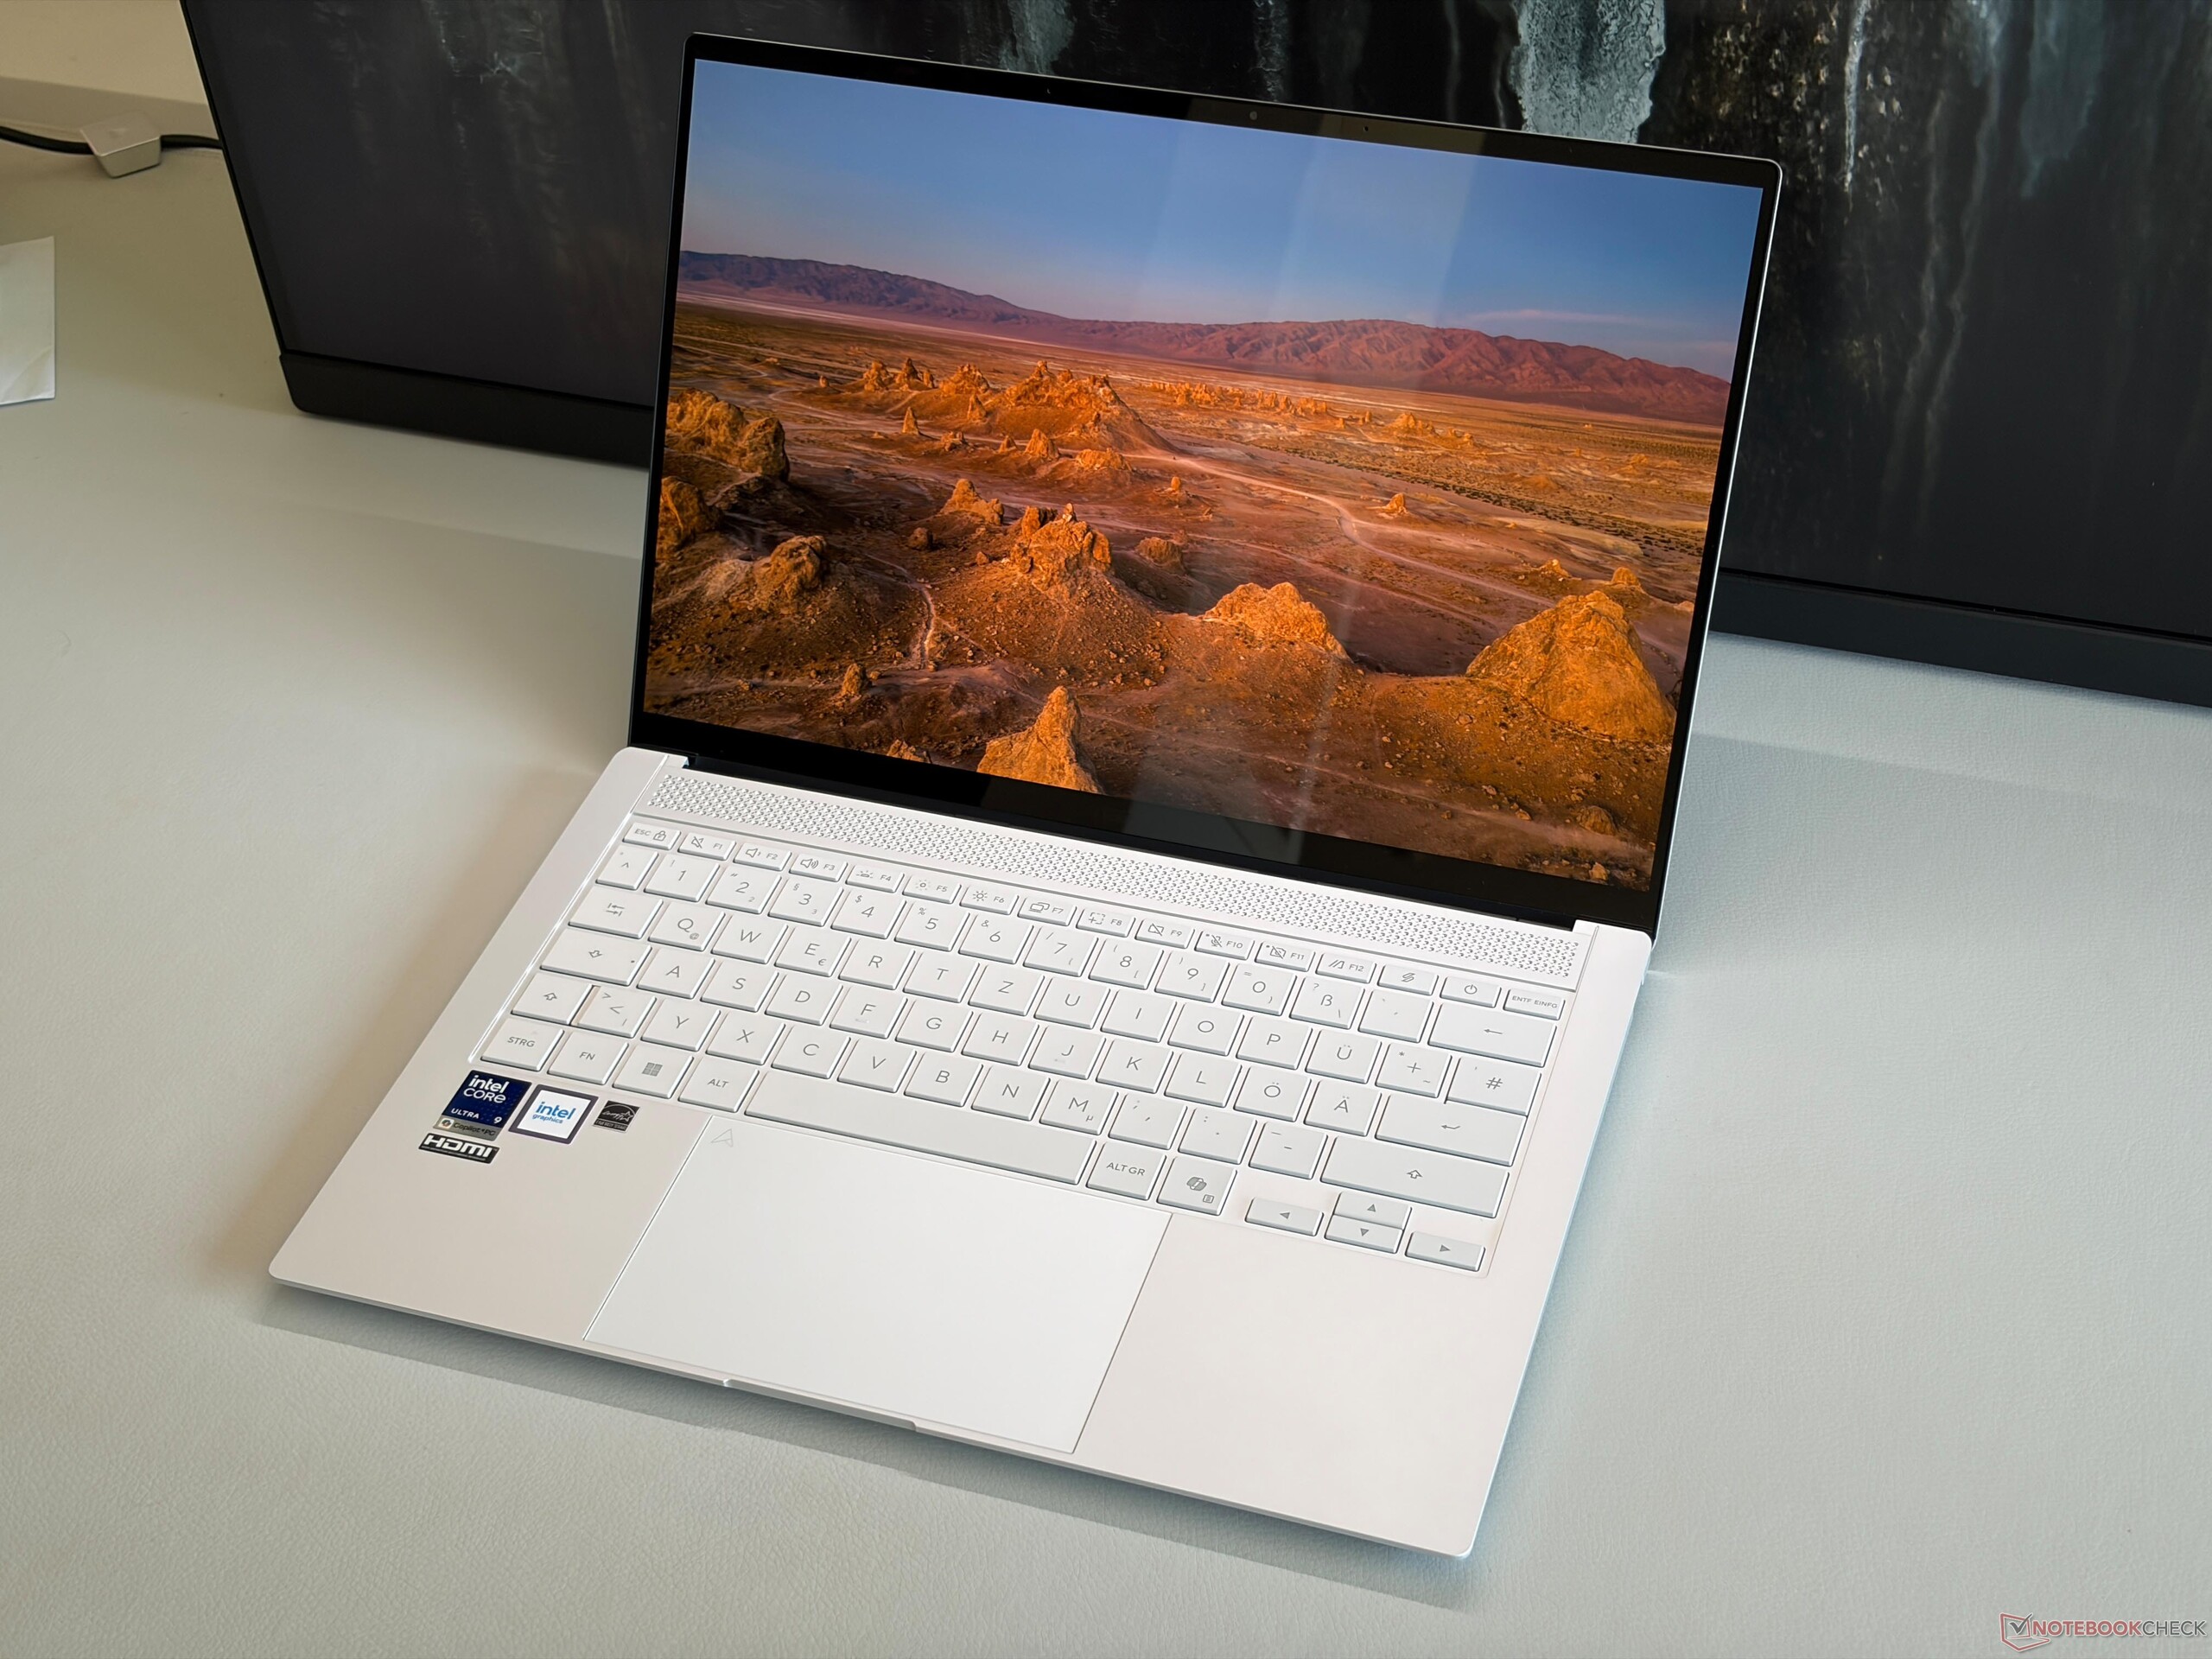
Asus hat das Design des neuen Zenbook S14 leicht verändert: Während der Deckel des Vorgängermodells noch mit einem großen ProArt-Logo und einem etwas anderen Oberflächenmuster versehen war, verfügt das neue Modell über einen Deckel mit einem kleinen Zenbook Logo, dessen Farbe nun mit der des Gehäuses identisch ist. Die Verarbeitungsqualität des Gehäuses aus Ceraluminium ist erneut hervorragend, und das Zenbook S14 ist nach wie vor ein sehr schlankes und leichtes (1,2 kg) Gerät, das problemlos in jede Tasche passt. Der interne Aufbau ist trotz dem größeren Akku weitgehend unverändert geblieben, und die M.2-2280-SSD lässt sich austauschen; sowohl der Arbeitsspeicher als auch das WLAN-Modul sind jedoch fest verlötet.

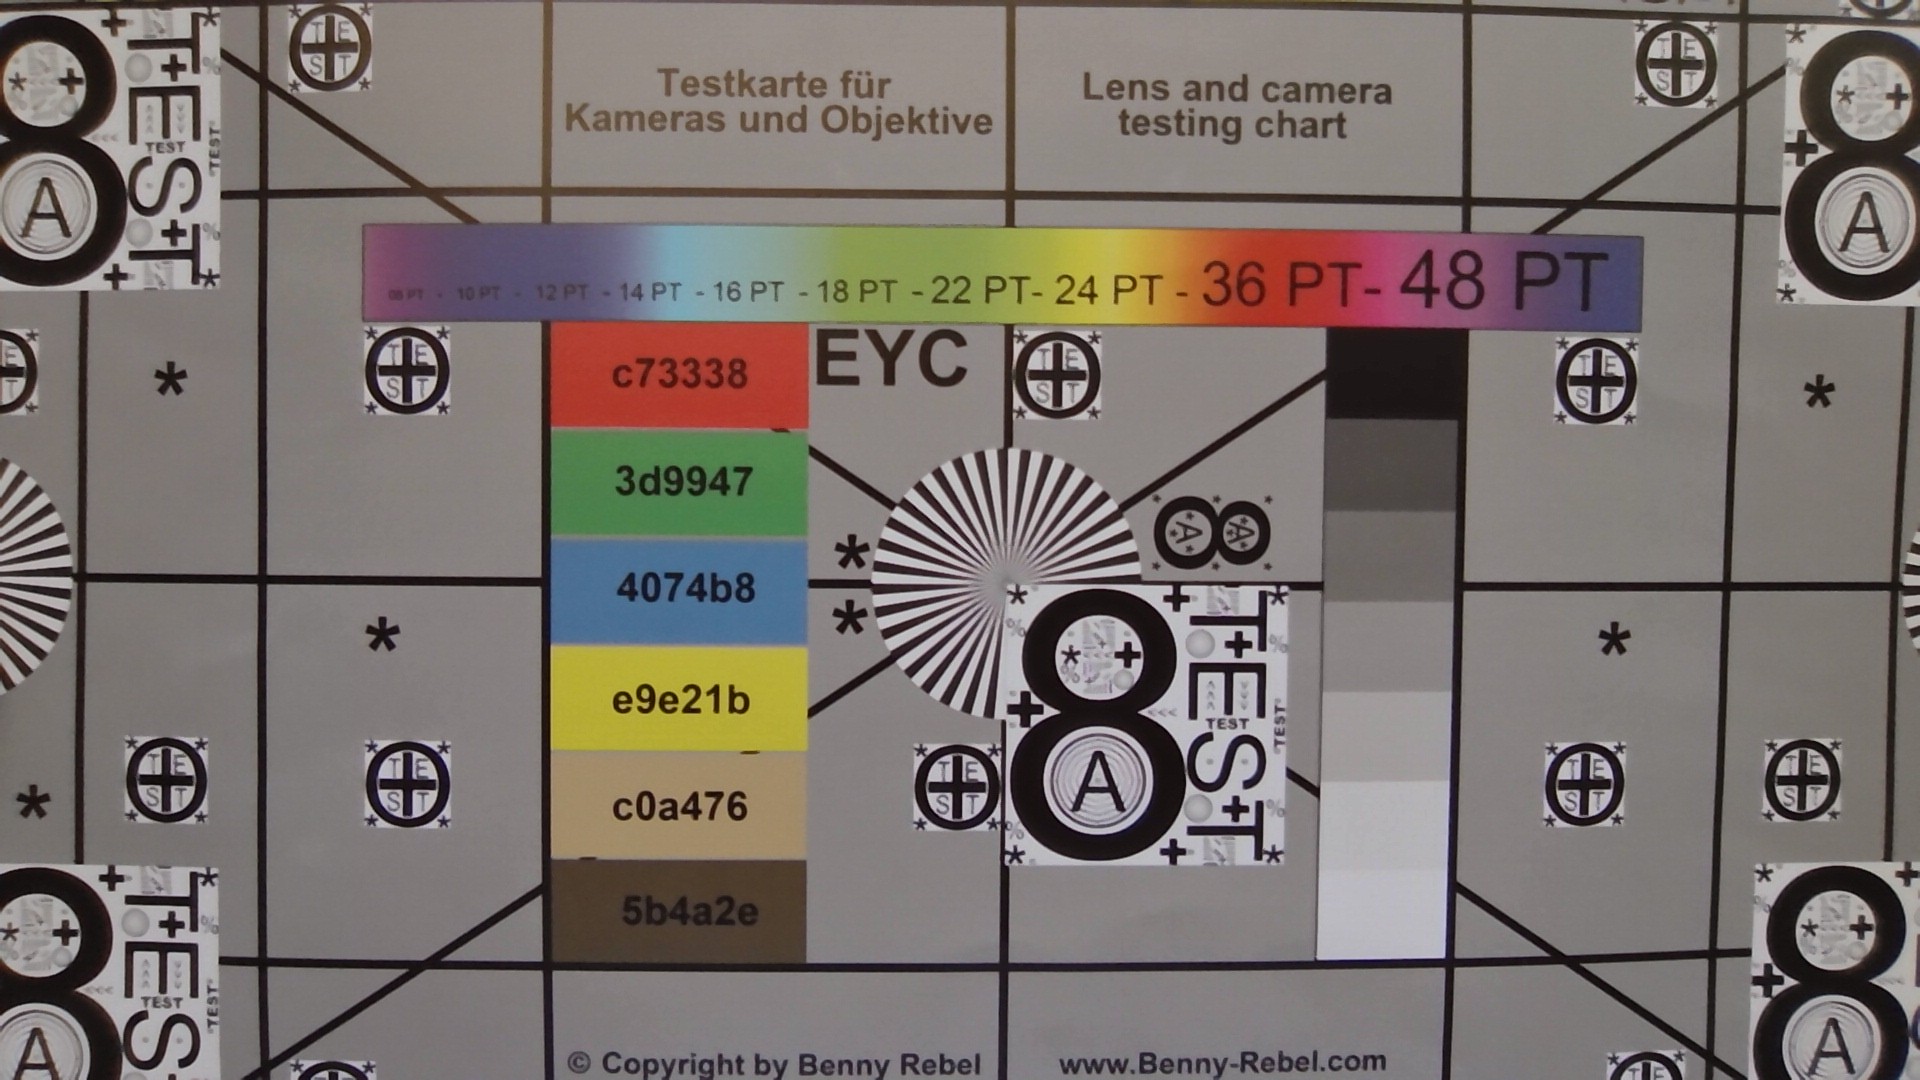
Die Anschlussmöglichkeiten sind unverändert geblieben und umfassen zwei Thunderbolt-4-Anschlüsse, einen regulären USB-A-Anschluss sowie HDMI. Das Wi-Fi-7-Modul von Intel erreicht mit einem entsprechenden Router hervorragende Übertragungsraten von über 4 Gbit/s; die Bildqualität der 1.080p-Webcam ist bei guten Lichtverhältnissen nach wie vor ordentlich.

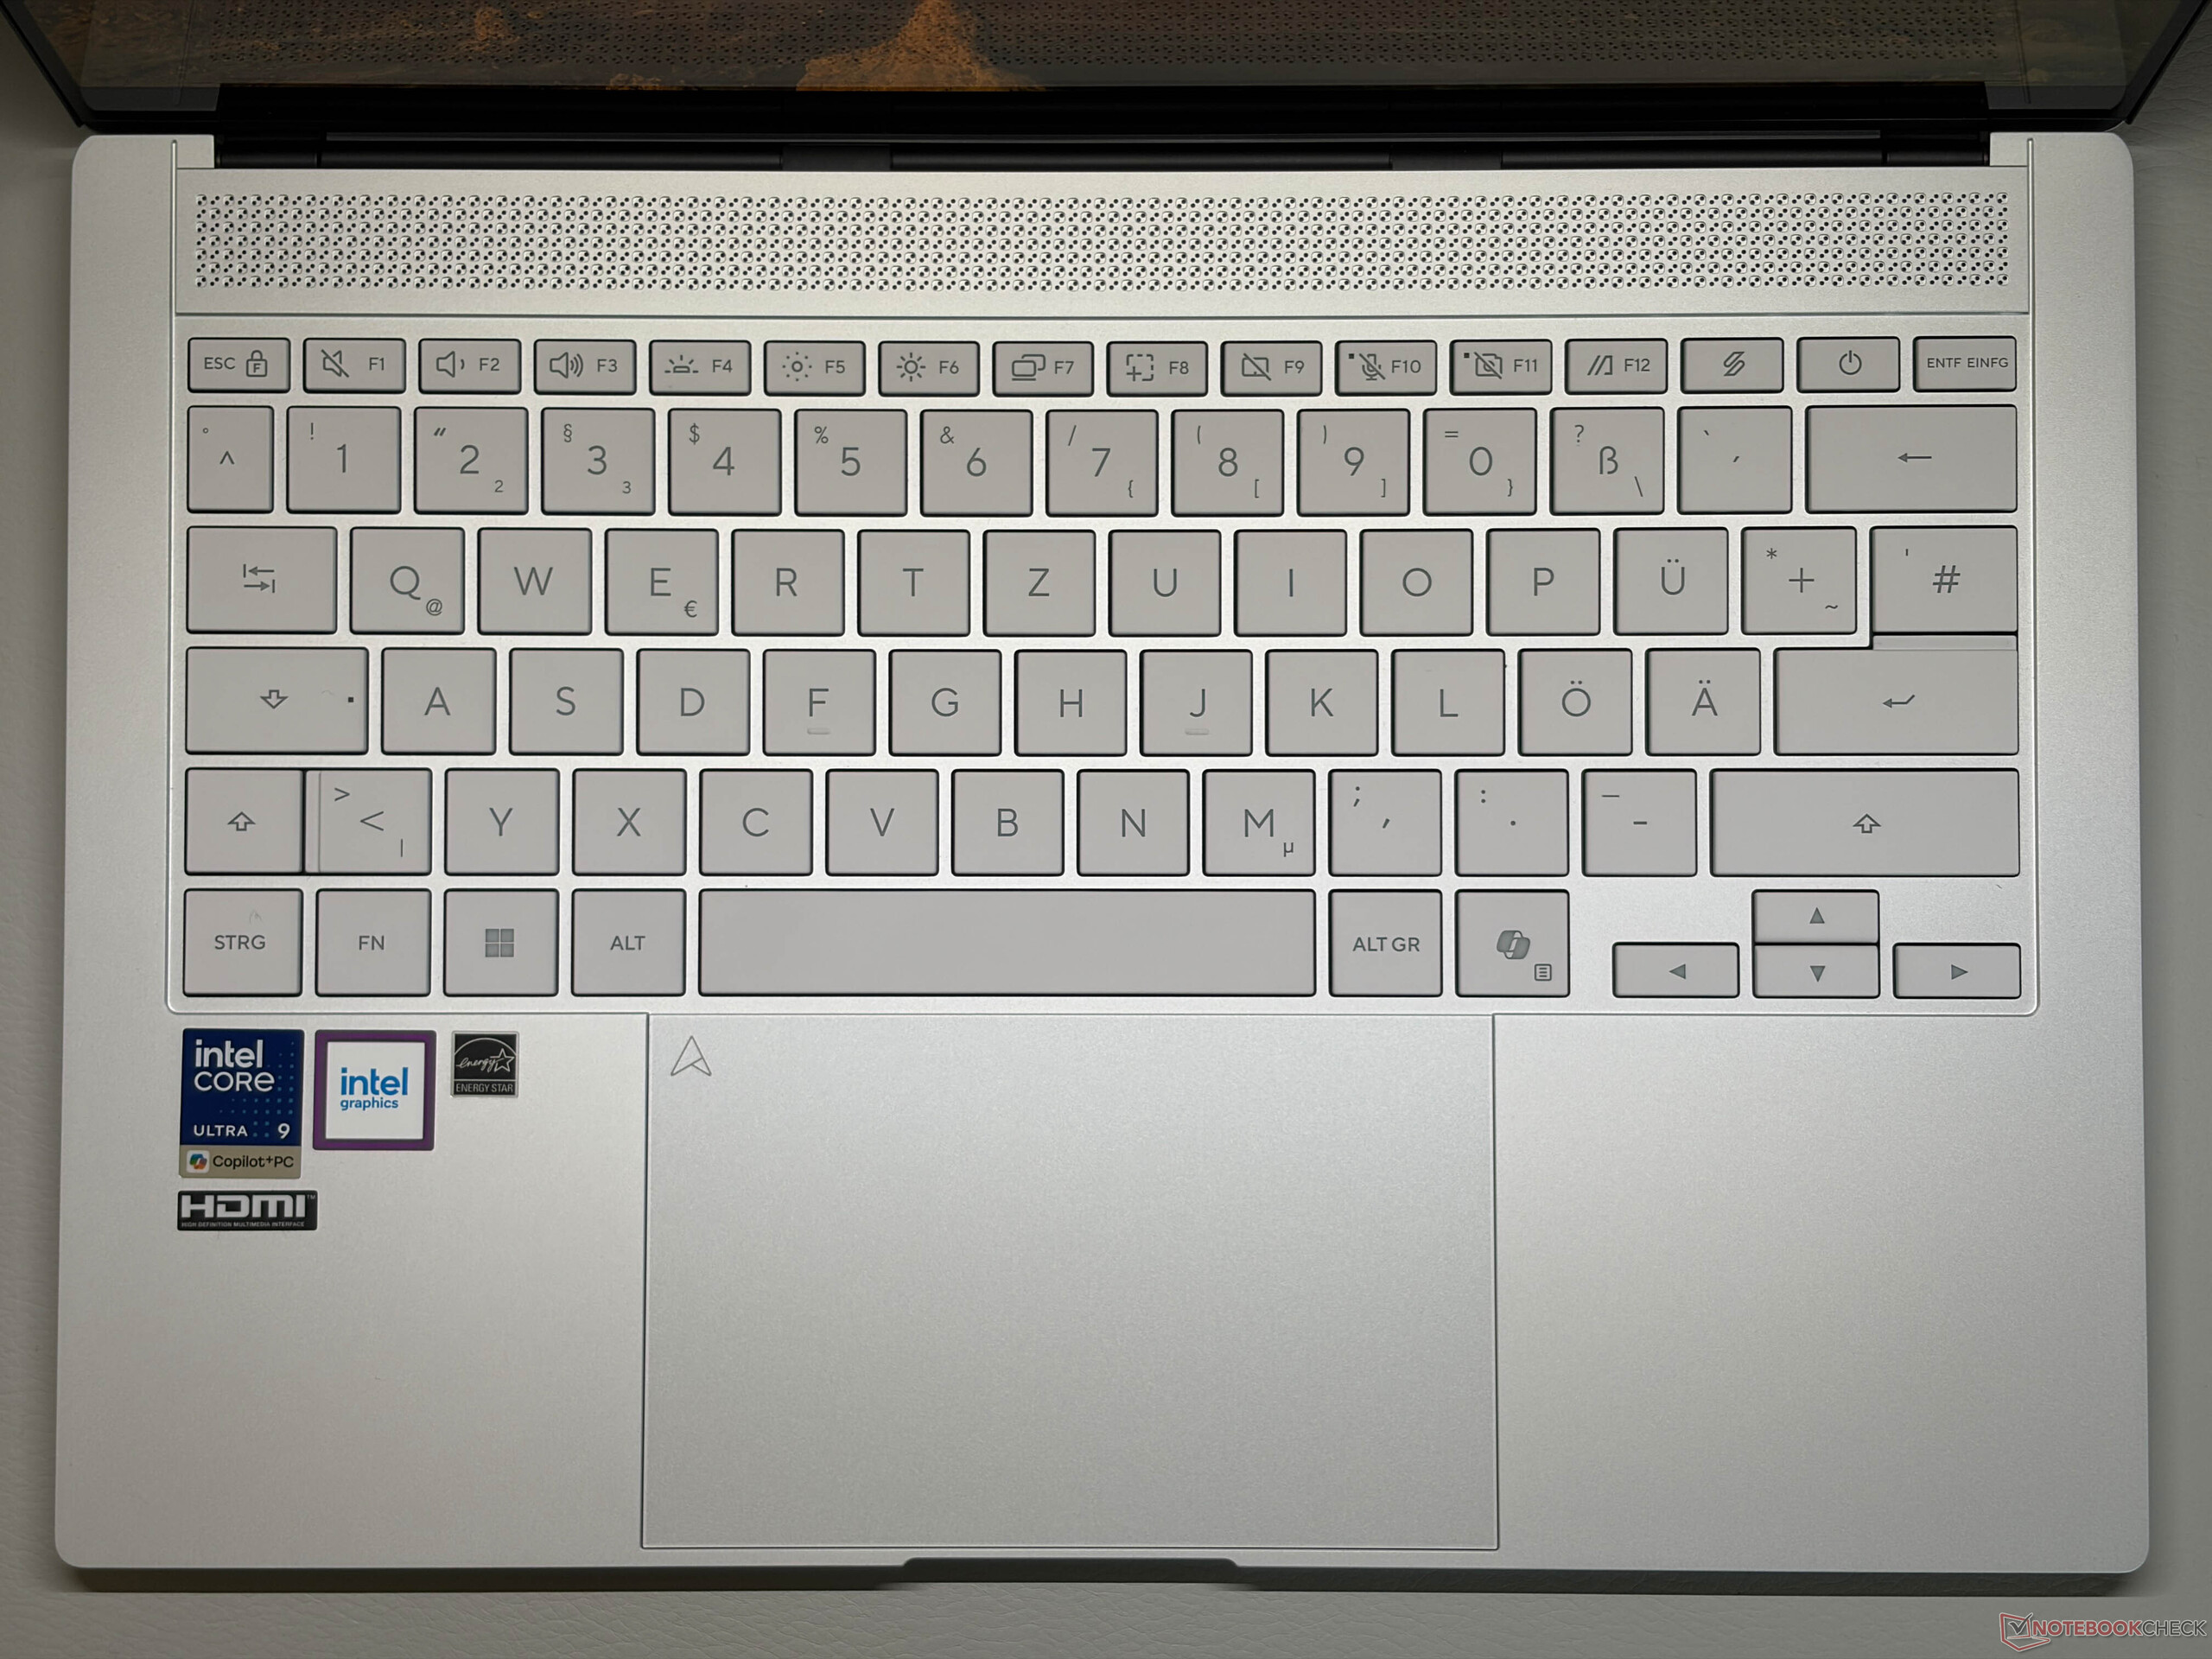
Die Eingabegeräte gefallen uns nach wie vor gut. Der Tastenhub ist zwar auf nur 1,1 mm begrenzt, doch das Feedback ist dennoch sehr präzise und das Tipperlebnis insgesamt sehr angenehm. Das mechanische Clickpad funktioniert weiterhin sehr gut, auch wenn die mechanischen Klicks etwas laut sind. 
Größenvergleich

319.8 mm 231.8 mm 15.9 mm 1.4 kg310.7 mm 213.9 mm 15.9 mm 992 g312.6 mm 213.8 mm 13.9 mm 978 g309.52 mm 209.71 mm 15.2 mm 1.5 kg312.3 mm 223.8 mm 11.6 mm 1.2 kg310.3 mm 214.7 mm 12.9 mm 1.2 kg310 mm 215 mm 13 mm 1.2 kg311.1 mm 215.6 mm 10.7 mm 1.3 kg304.1 mm 215 mm 11.3 mm 1.2 kg297 mm 210 mm 1 mm 5.7 g
Links: HDMI 2.1 TDMS, 2x USB-C 4.0 mit Thunderbolt 4 (40 Gbit/s, DisplayPort-ALT-Modus, Power Delivery)
Rechts: USB-A 3.2 Gen 2 (10 Gbit/s)
Networking
Asus ZenBook S14 UX5406AA
Intel Wi-Fi 7 BE211 320MHz
iperf3 transmit Wi-Fi6/7 RT-BE96U
4549 (min: 4294) MBit/s ∼100%
iperf3 receive Wi-Fi6/7 RT-BE96U
3060 (min: 2986) MBit/s ∼100%
Asus Zenbook S 14 UX5406
 
iperf3 receive AXE11000
1737 (min: 1714) MBit/s ∼100%
iperf3 transmit AXE11000
1670 (min: 1553) MBit/s ∼100%
HP OmniBook Ultra 14 Core Ultra X9
Intel Wi-Fi 7 BE211 320MHz
iperf3 receive AXE11000 6GHz
1702 (min: 1671) MBit/s ∼98%
iperf3 transmit AXE11000 6GHz
1626 (min: 1572) MBit/s ∼99%
iperf3 receive AXE11000
801 (min: 660) MBit/s ∼46%
iperf3 transmit AXE11000
889 (min: 448) MBit/s ∼53%
Samsung Galaxy Book5 Pro 14 940XHA
Intel BE201 320MHz
iperf3 receive AXE11000
1561 (min: 1509) MBit/s ∼90%
iperf3 transmit AXE11000
1653 (min: 1515) MBit/s ∼99%
Lenovo Yoga Slim 7 Ultra 14IPH11
Intel Wi-Fi 7 BE211 320MHz
iperf3 receive AXE11000 6GHz
1743 (min: 1722) MBit/s ∼100%
iperf3 transmit AXE11000 6GHz
1638 (min: 1446) MBit/s ∼100%
iperf3 receive AXE11000
1160 (min: 757) MBit/s ∼67%
iperf3 transmit AXE11000
1395 (min: 1074) MBit/s ∼84%
Honor MagicBook Pro 14 2026
Intel Wi-Fi 6E AX211
iperf3 receive AXE11000
1548 (min: 1528) MBit/s ∼89%
iperf3 transmit AXE11000
1642 (min: 1596) MBit/s ∼98%
Dell XPS 14 Core Ultra 7 355
Intel Wi-Fi 7 BE211 320MHz
iperf3 receive AXE11000 6GHz
1709 (min: 1665) MBit/s ∼98%
iperf3 transmit AXE11000 6GHz
1464 (min: 727) MBit/s ∼89%
iperf3 receive AXE11000
821 (min: 714) MBit/s ∼47%
iperf3 transmit AXE11000
720 (min: 352) MBit/s ∼43%
Apple MacBook Air 13 M5
Wi-Fi 7
iperf3 receive AXE11000
1551 (min: 1406) MBit/s ∼89%
iperf3 transmit AXE11000
1540 (min: 1405) MBit/s ∼92%
010020030040050060070080090010001100120013001400150016001700180019002000210022002300240025002600270028002900300031003200330034003500360037003800390040004100420043004400450046004700Tooltip
Asus ZenBook S14 UX5406AA; iperf3 transmit Wi-Fi6/7 RT-BE96U; iperf 3.1.3: Ø4549 (4294-4713) MBit/s
Asus ZenBook S14 UX5406AA; iperf3 receive Wi-Fi6/7 RT-BE96U; iperf 3.1.3: Ø3059 (2986-3117) MBit/s
ColorChecker
4.4 ∆E
3.9 ∆E
13.9 ∆E
11 ∆E
12.1 ∆E
6.2 ∆E
5.6 ∆E
9.8 ∆E
8.3 ∆E
7.2 ∆E
5.2 ∆E
3.9 ∆E
4.5 ∆E
10.1 ∆E
8.5 ∆E
3.1 ∆E
5.9 ∆E
13.4 ∆E
6.8 ∆E
2.4 ∆E
3.4 ∆E
5.1 ∆E
2.2 ∆E
6.1 ∆E
ColorChecker Asus ZenBook S14 UX5406AA: 6.79 ∆E min: 2.23 - max: 13.92 ∆E

Anzeige

Subpixel-Array
Subpixel-Array

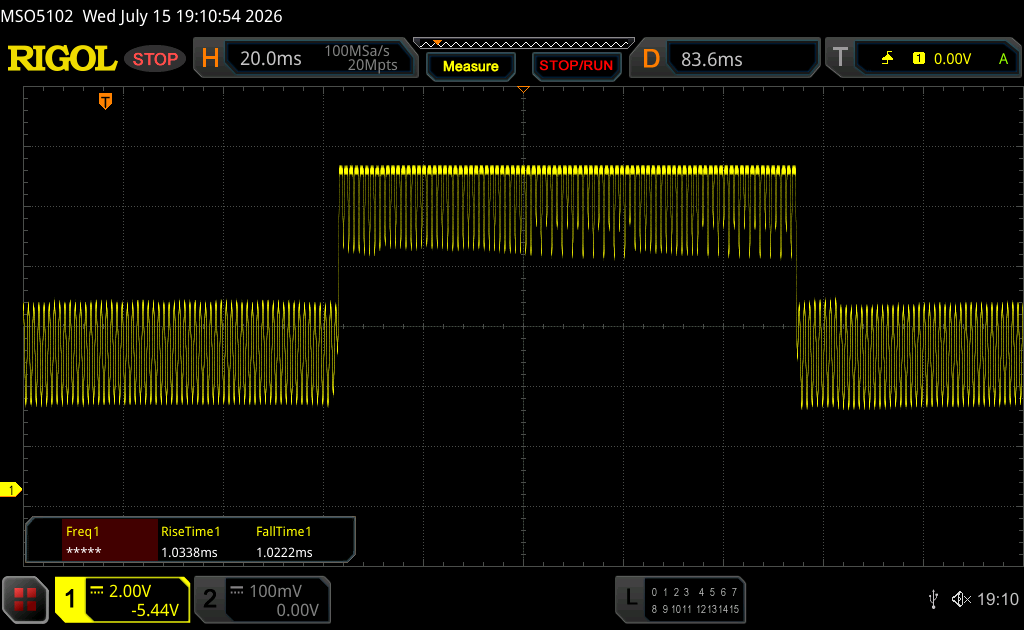
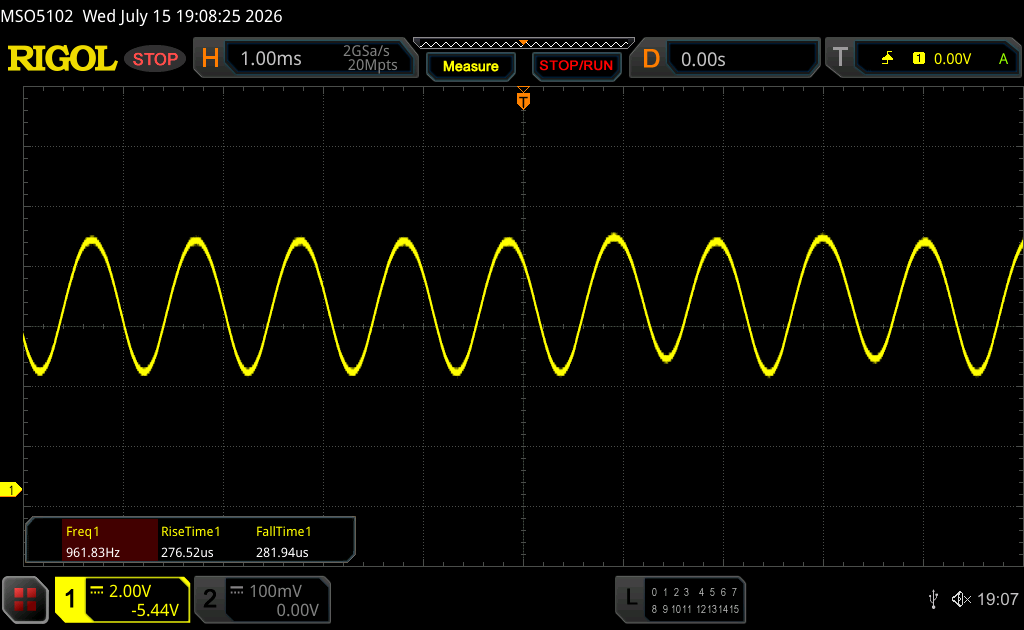
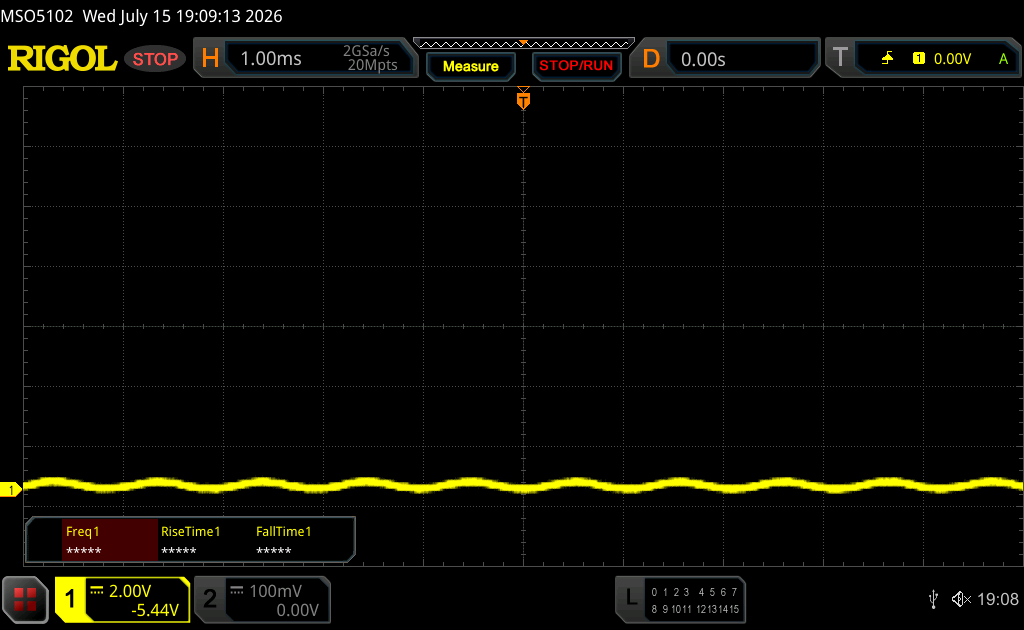
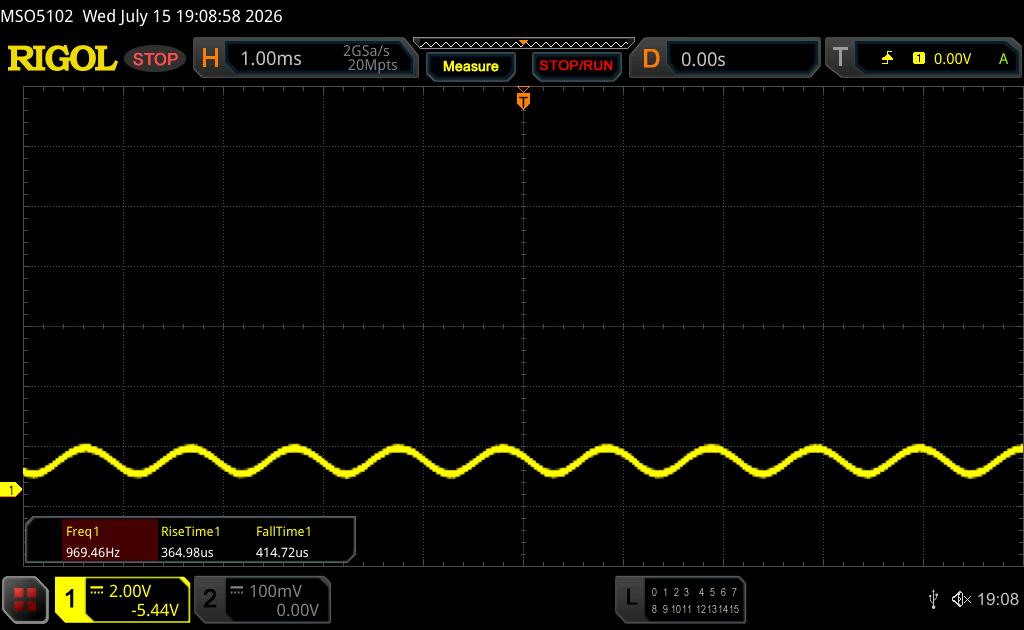
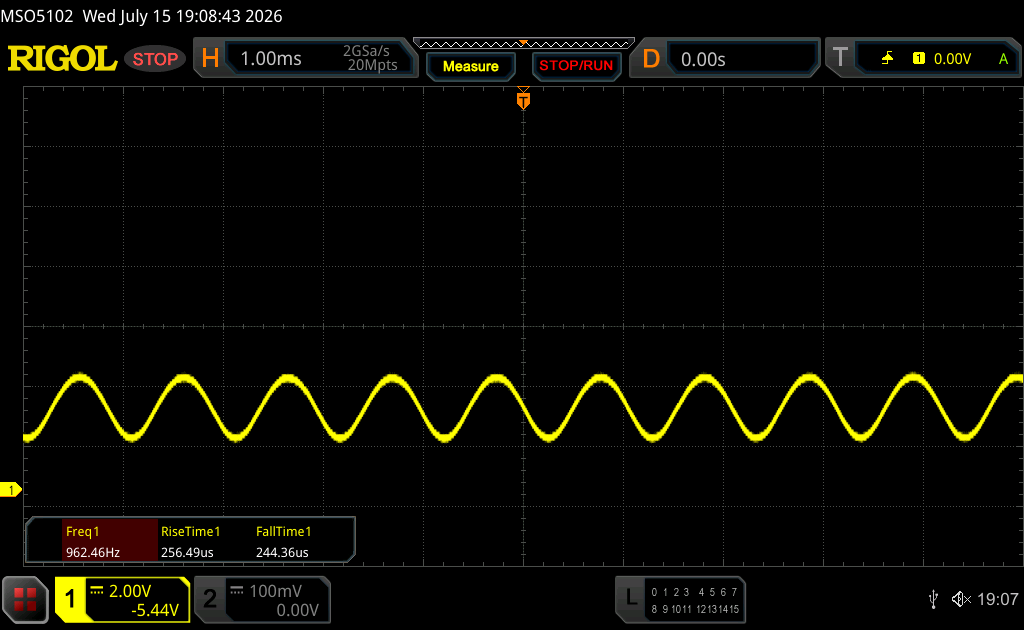
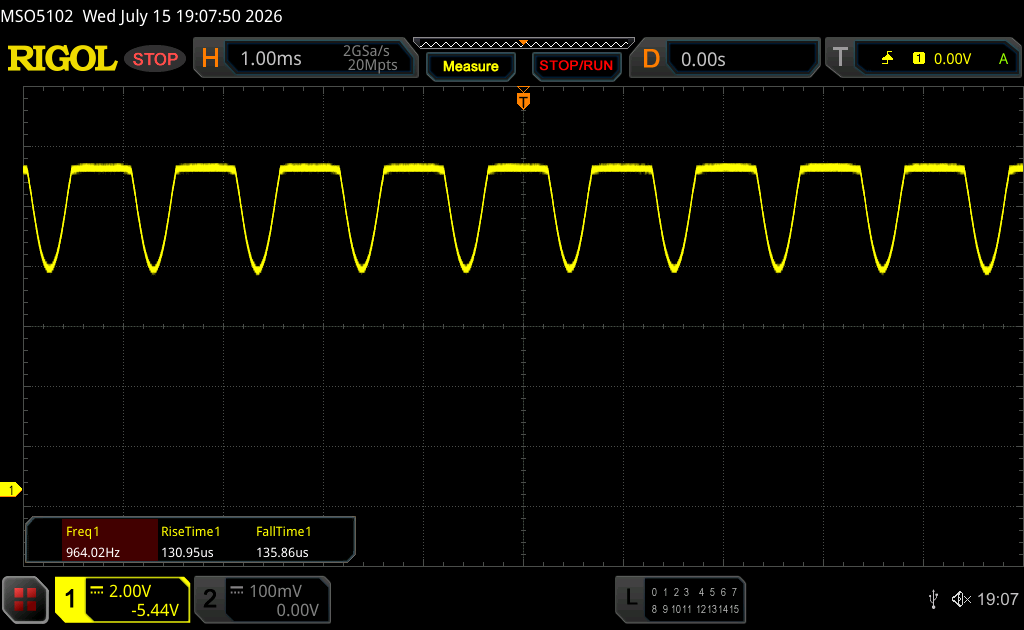
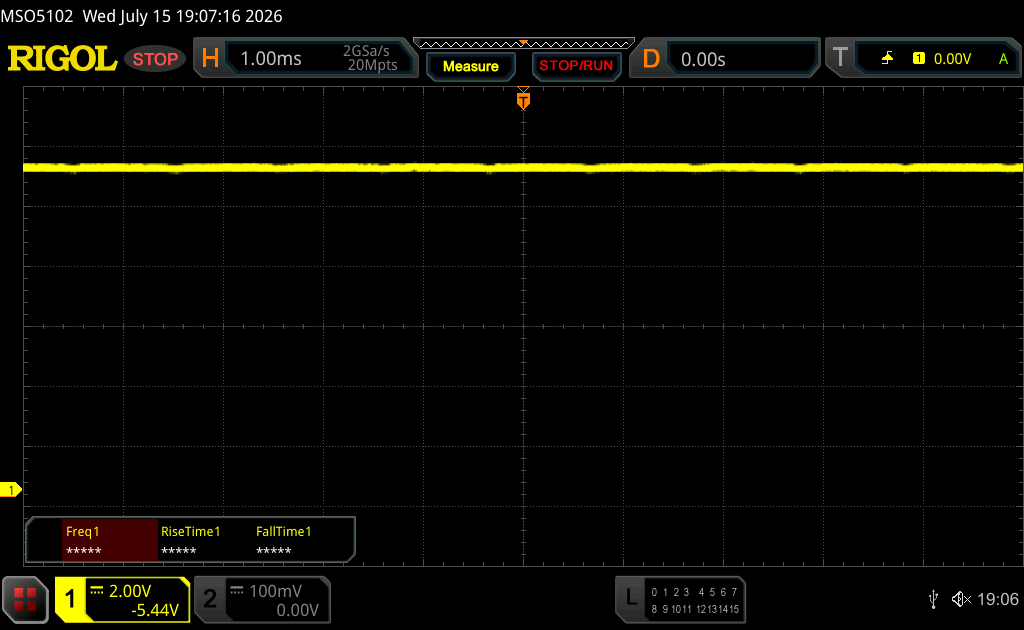
Asus hat den OLED-Touchscreen verbessert. Er verfügt weiterhin über eine Auflösung von 2,8K und eine Bildwiederholfrequenz von 120 Hz, doch die Helligkeit ist nun deutlich höher als zuvor. Während die maximale SDR-Helligkeit nun bei 450 statt bei 370 Nits liegt, beträgt die maximale HDR-Helligkeit nun 1.050 statt 615 Nits. Der Schwarzwert und das Kontrastverhältnis sind ausgezeichnet, ebenso wie die Reaktionszeiten. Die Bildqualität ist insgesamt sehr gut, allerdings kann das Bild bei hellen Motiven aufgrund der Touch-Schicht etwas körnig wirken. Wir haben zudem ein PWM-Flimmern bei 960 Hz festgestellt. Sowohl die Helligkeit als auch die Farbtemperatur lassen sich über einen Sensor steuern.

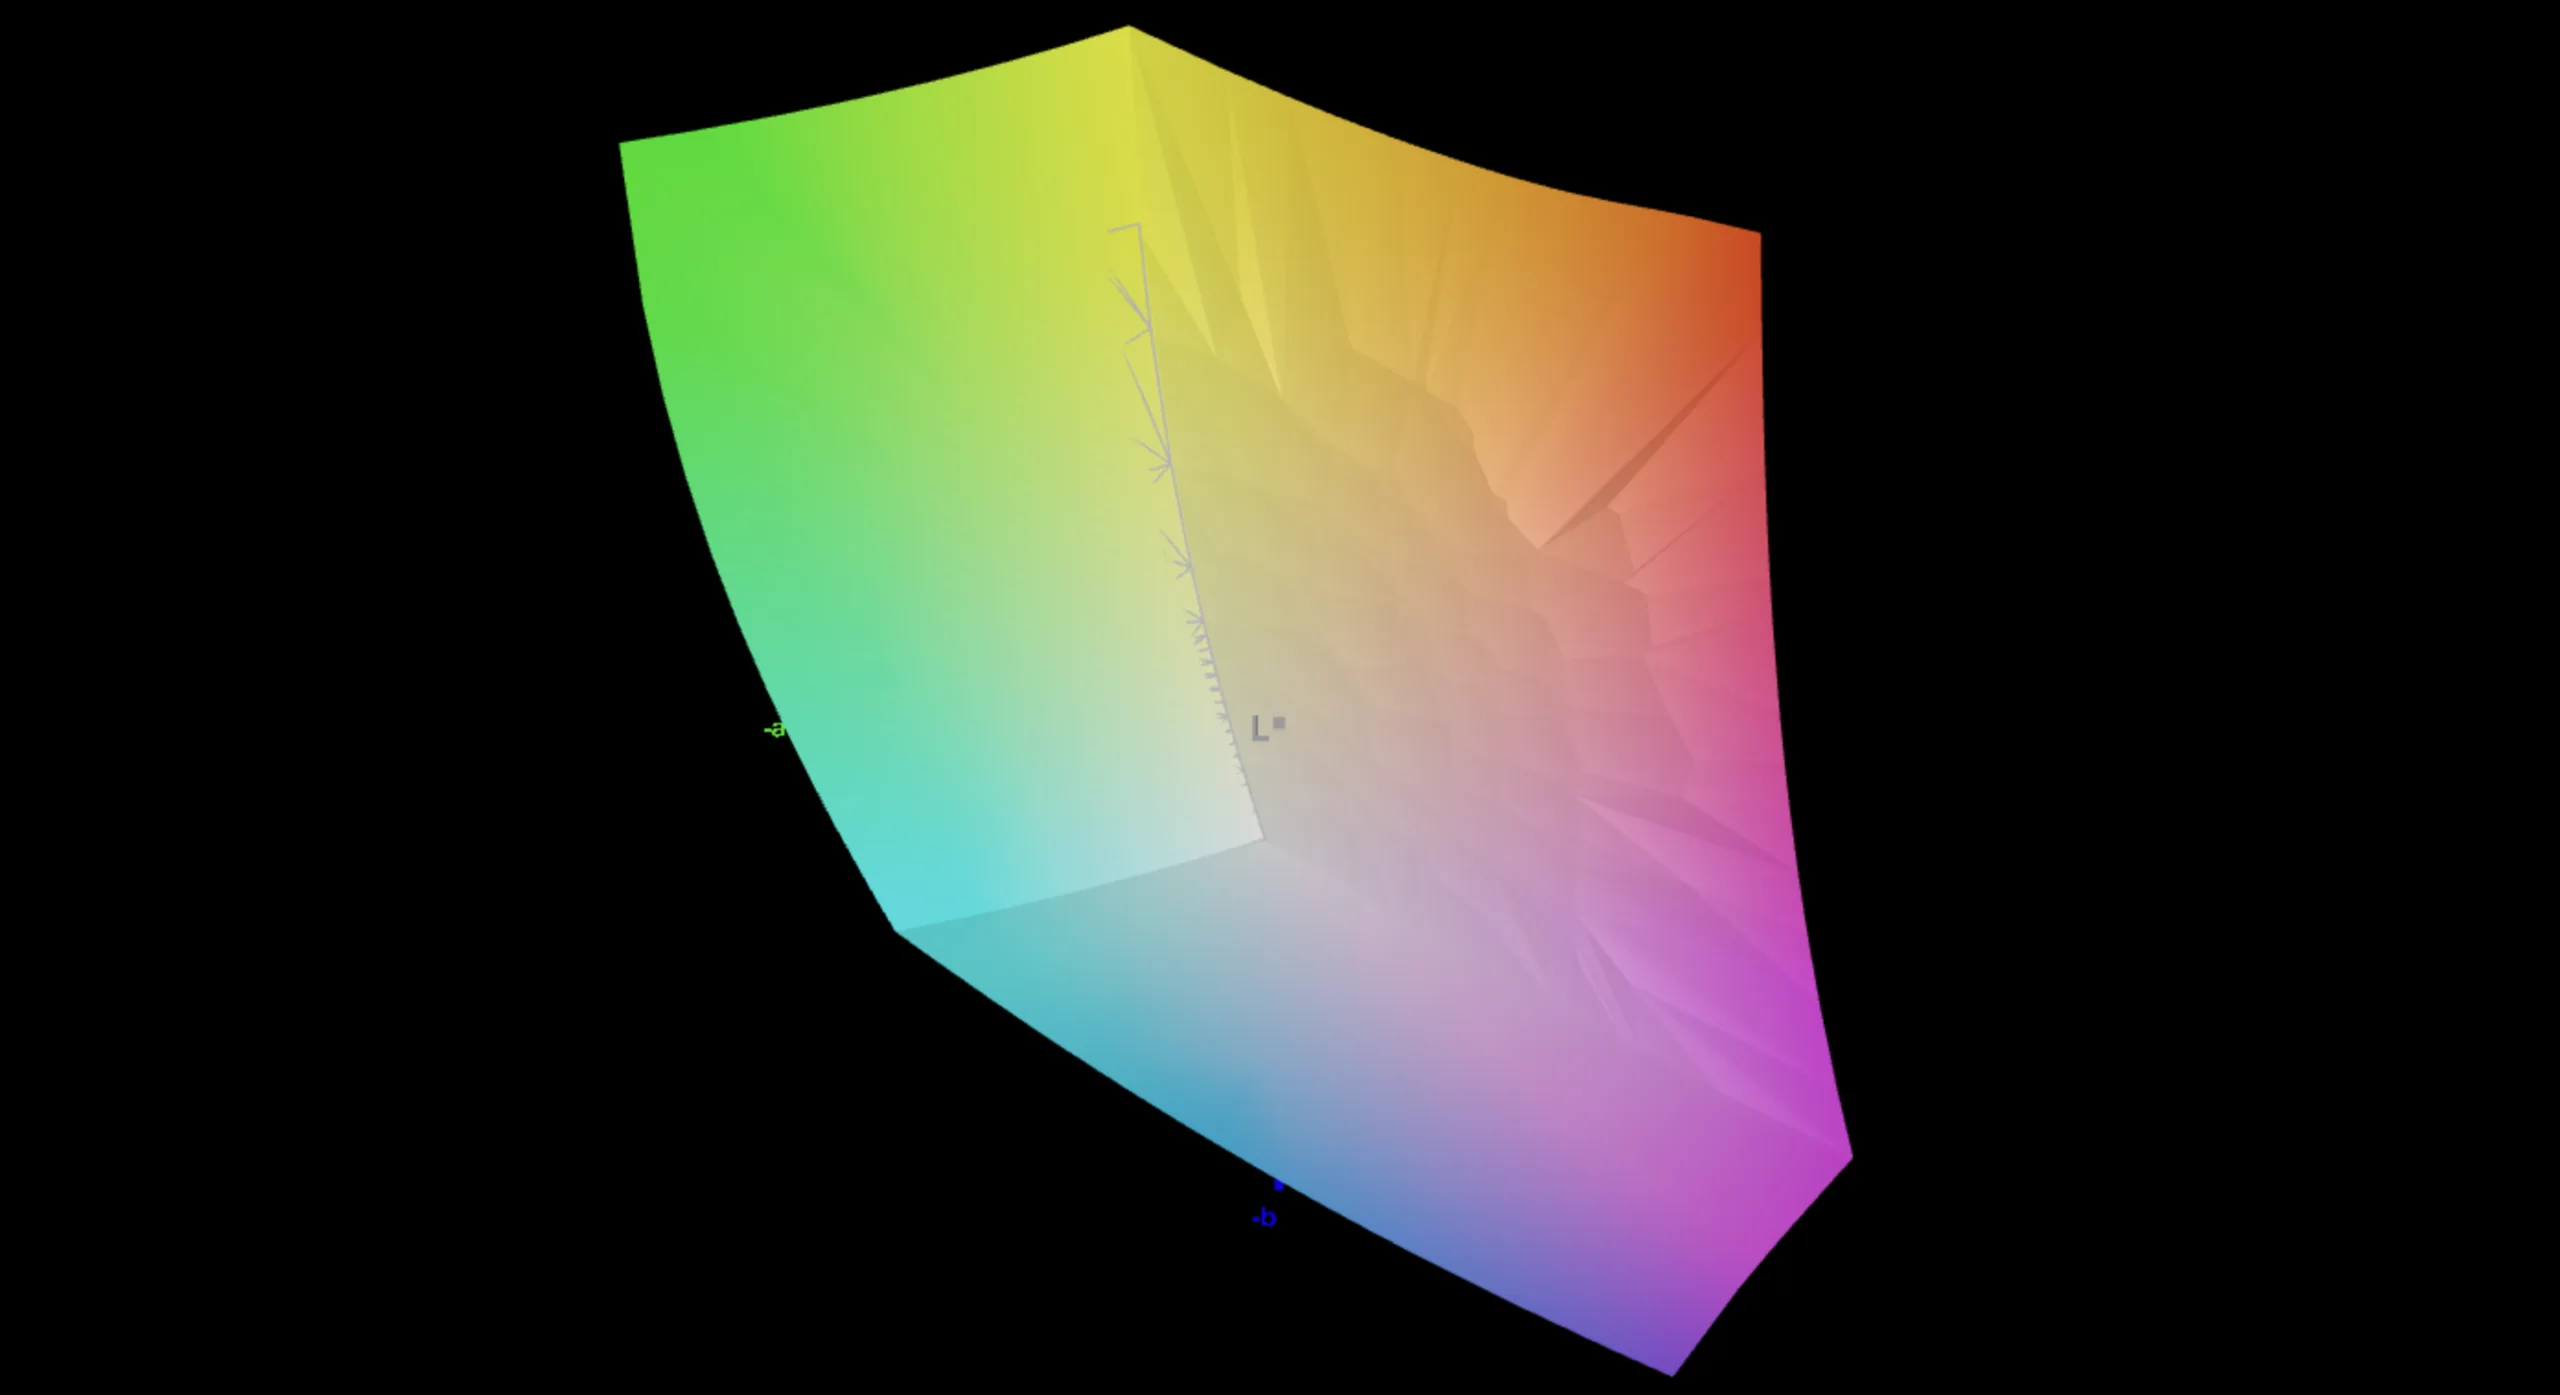
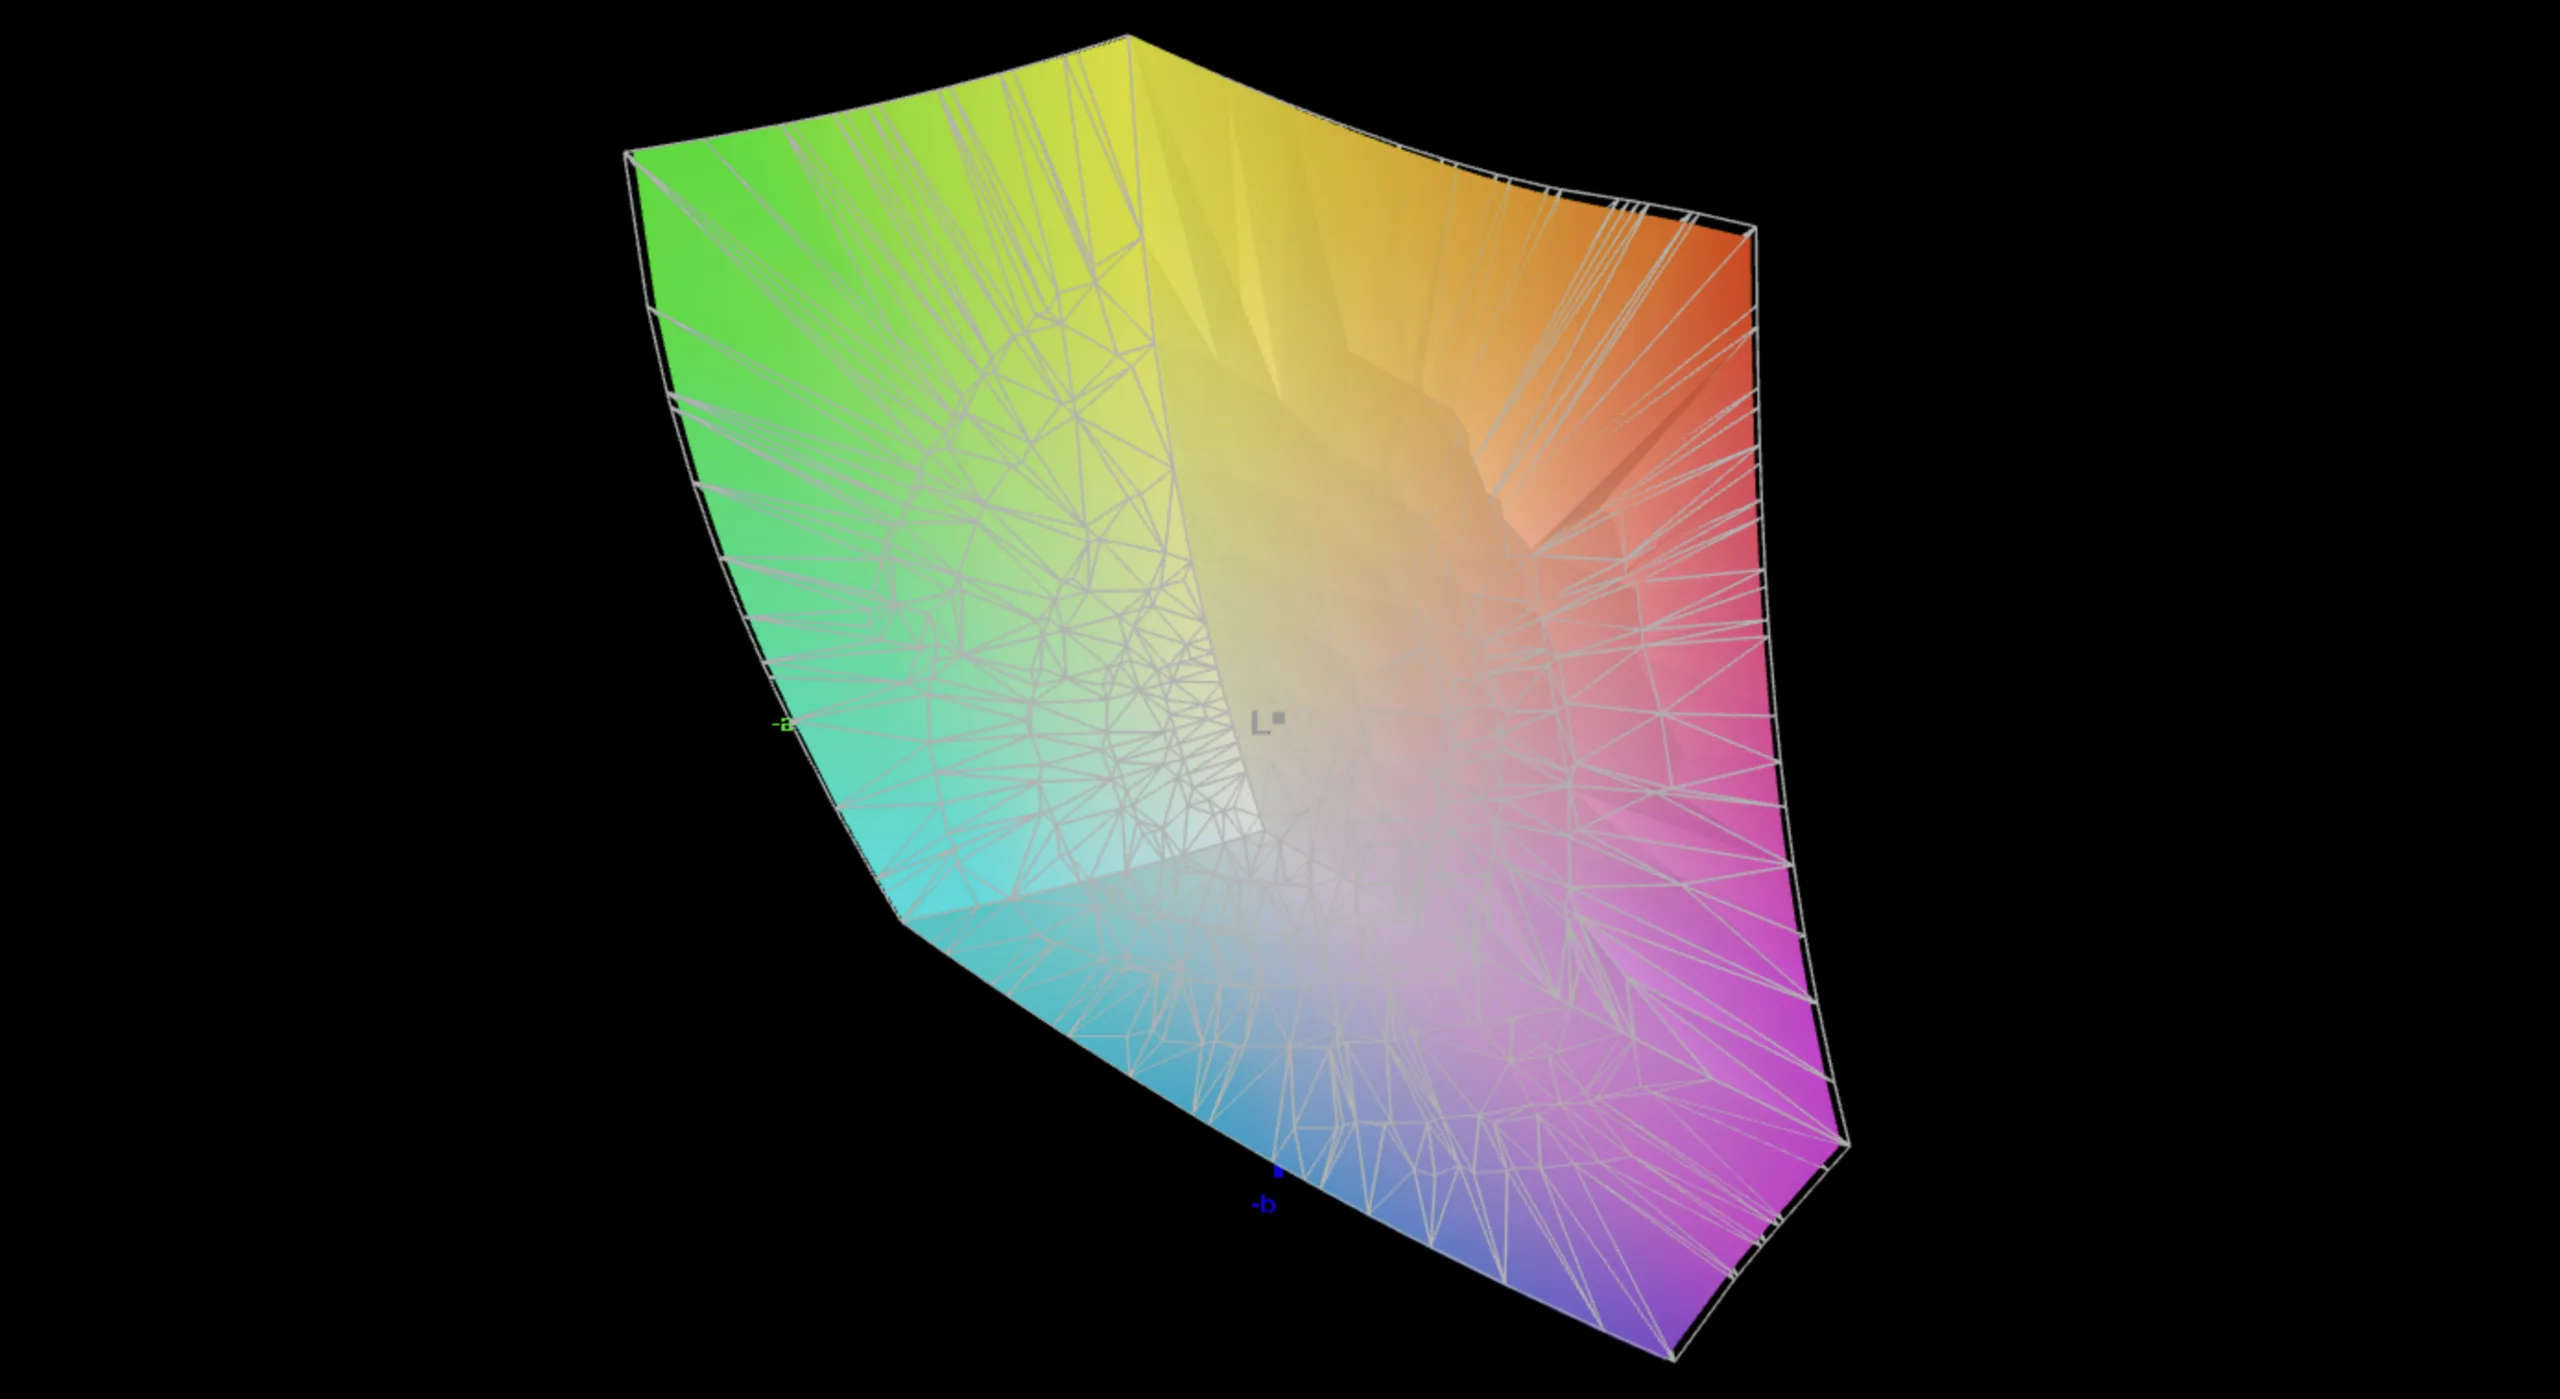
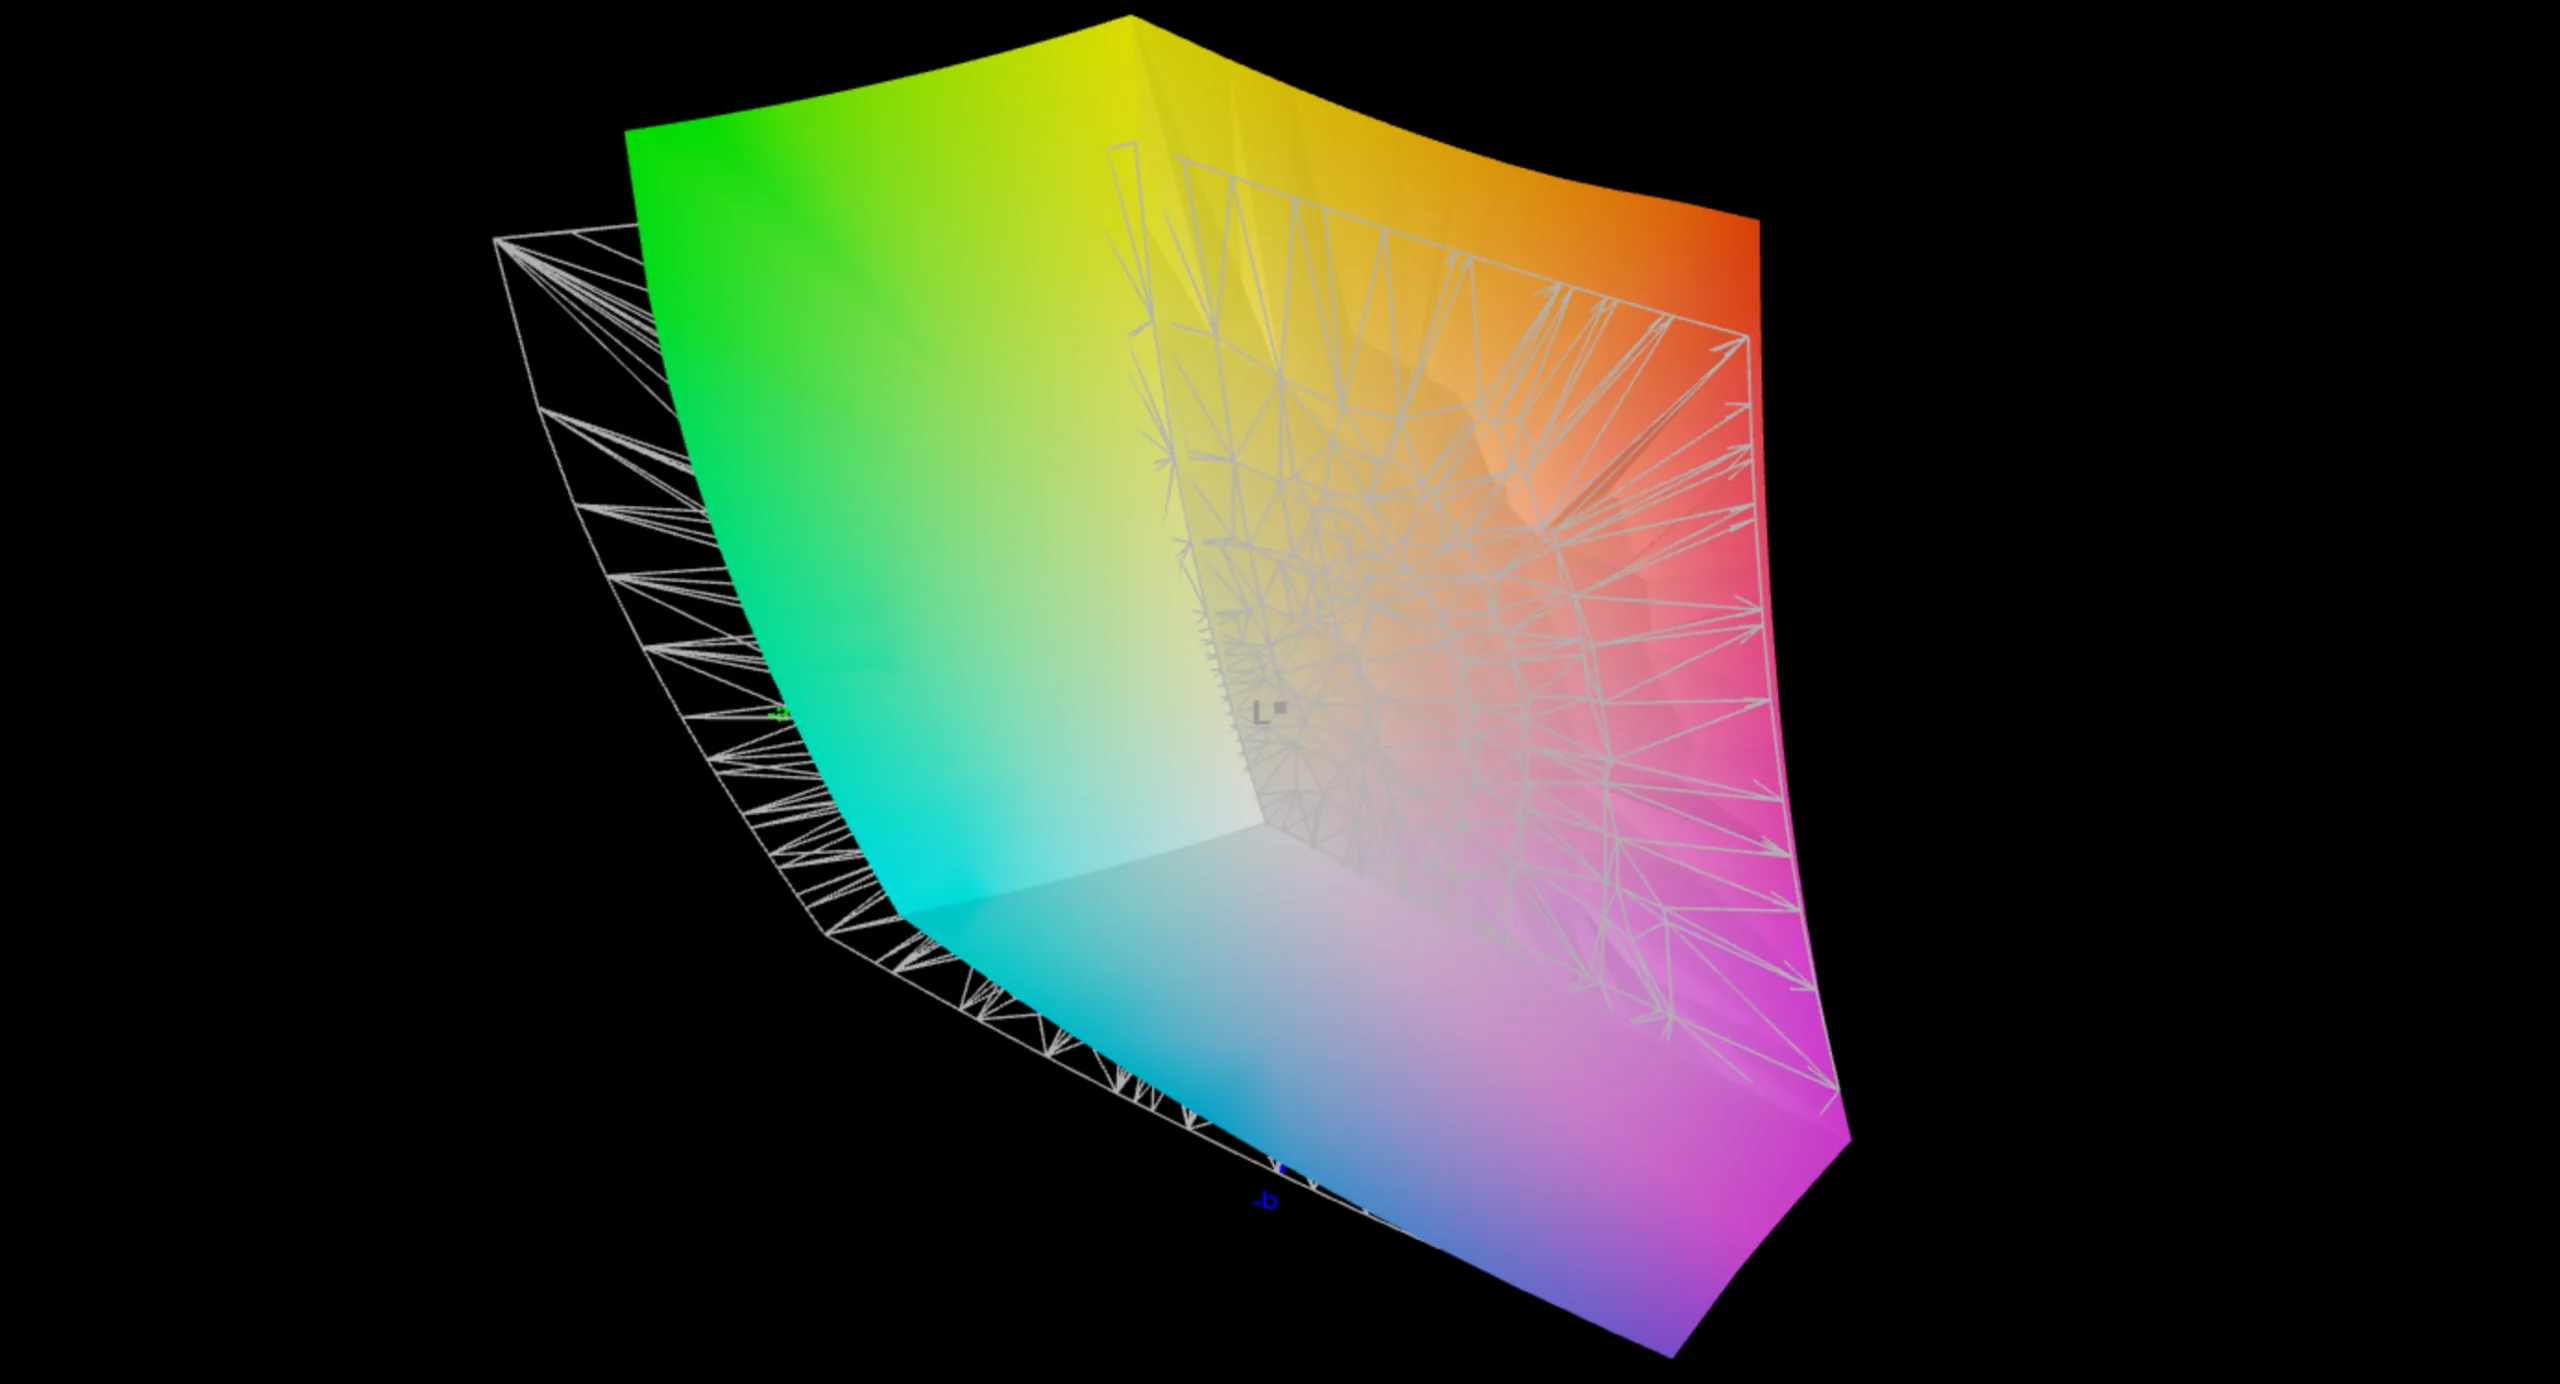
Es stehen verschiedene Farbprofile von Asus zur Verfügung, und unsere Kalibrierung mit der professionellen CalMAN-Software ergibt eine sehr präzise Farb- und Graustufenwiedergabe, sodass die Bildbearbeitung direkt nach dem Auspacken problemlos möglich ist. Sowohl der sRGB- als auch der P3-Farbraum werden vollständig abgedeckt. Mit unserer eigenen Kalibrierung konnten wir die Farbgenauigkeit nicht weiter verbessern.

459
cd/m²
452
cd/m²
459
cd/m²
457
cd/m²
458
cd/m²
458
cd/m²
458
cd/m²
452
cd/m²
459
cd/m²
Ausleuchtung des Bildschirms
ATNA40HQ05-0 getestet mit X-Rite i1Pro 3
Maximal: 459 cd/m² (Nits) Durchschnitt: 456.9 cd/m² Minimum: 4.1 cd/m²
Ausleuchtung: 98 %
Helligkeit Akku: 454 cd/m²
Kontrast: ∞:1 (Schwarzwert: 0 cd/m²)
ΔE ColorChecker Calman: 1 | ∀{0.5-29.43 Ø4.72}
ΔE Greyscale Calman: 1.8 | ∀{0.09-98 Ø4.97}
86.7% AdobeRGB 1998 (Argyll 3D)
99.9% sRGB (Argyll 3D)
98.3% Display P3 (Argyll 3D)
Gamma: 2.16
CCT: 6550 K
Asus ZenBook S14 UX5406AA
ATNA40HQ05-0, OLED, 2880x1800, 14", 120 Hz
Asus Zenbook A14 UX3704NA
ATNA40CT06-0, OLED, 1920x1200, 14", 60 Hz
Asus Zenbook S 14 UX5406
ATNA40CU09-0, OLED, 2880x1800, 14", 120 Hz
HP OmniBook Ultra 14 Core Ultra X9
Samsung SDC4215, OLED, 2880x1800, 14", 120 Hz
Samsung Galaxy Book5 Pro 14 940XHA
ATNA40CU07-0, OLED, 2880x1800, 14", 120 Hz
Lenovo Yoga Slim 7 Ultra 14IPH11
LEN140WQ+, OLED, 2880x1800, 14", 120 Hz
Honor MagicBook Pro 14 2026
EDO14.55, OLED, 3120x2080, 14.6", 120 Hz
Dell XPS 14 Core Ultra 7 355
LG Philips 140WUX, IPS, 1920x1200, 14", 120 Hz
Apple MacBook Air 13 M5
IPS, 2560x1664, 13.6", 60 Hz
Display
1%
1%
3%
4%
1%
-1%
-21%
-0%
HDR Peak Brightness (cd/m²)
1050
Display P3 Coverage (%)
98.3
99.5
1%
99
1%
99.9
2%
99.9
2%
99.3
1%
96.3
-2%
64
-35%
98.1
0%
sRGB Coverage (%)
99.9
98.8
-1%
100
0%
100
0%
100
0%
100
0%
99.9
0%
95.3
-5%
98.6
-1%
AdobeRGB 1998 Coverage (%)
86.7
88.9
3%
89.2
3%
92.3
6%
95.7
10%
87.7
1%
85
-2%
66.2
-24%
86.8
0%
Response Times
-12%
22%
15%
-12%
-11%
49%
-5003%
-1895%
Response Time Grey 50% / Grey 80% * (ms)
2 ?(1, 1)
1.22 ?(0.66, 0.56)
39%
0.7 ?(0.38, 0.32)
65%
0.58 ?(0.3, 0.28)
71%
0.83 ?(0.43, 0.4)
58%
0.64 ?(0.34, 0.3)
68%
0.55 ?(0.29, 0.26)
72%
57.7 ?(26.4, 31.3)
-2785%
24.3 ?(11.5, 12.8)
-1115%
Response Time Black / White * (ms)
0.53 ?(0.28, 0.25)
1.26 ?(0.69, 0.57)
-138%
0.71 ?(0.4, 0.31)
-34%
0.87 ?(0.4, 0.47)
-64%
0.69 ?(0.38, 0.31)
-30%
0.94 ?(0.45, 0.49)
-77%
0.51 ?(0.27, 0.24)
4%
38.8 ?(17, 21.8)
-7221%
14.7 ?(5.1, 9.6)
-2674%
PWM Frequency (Hz)
960 ?(100)
480 ?(83)
480 ?(100)
927.13 ?(100)
240 ?(100)
479.46 ?(100)
120 ?(85)
PWM Amplitude * (%)
40
15
62%
26
35%
25
37%
66
-65%
50
-25%
11
72%
Bildschirm
-11%
3%
-23%
-32%
-24%
4%
-33%
-37%
Helligkeit Bildmitte (cd/m²)
458
404
-12%
374
-18%
446
-3%
400
-13%
470.7
3%
519
13%
561.2
23%
546
19%
Brightness (cd/m²)
457
408
-11%
379
-17%
447
-2%
402
-12%
488
7%
526
15%
505
11%
519
14%
Brightness Distribution (%)
98
98
0%
98
0%
99
1%
99
1%
94
-4%
89
-9%
85
-13%
90
-8%
Schwarzwert * (cd/m²)
0.01
0.22
0.38
Delta E Colorchecker *
1
1.1
-10%
1
-0%
1.76
-76%
2.1
-110%
2.21
-121%
1.1
-10%
2.09
-109%
2.1
-110%
Colorchecker dE 2000 max. *
2.6
3.3
-27%
2.2
15%
3.29
-27%
3.3
-27%
5.02
-93%
2.2
15%
4.37
-68%
4
-54%
Delta E Graustufen *
1.8
1.9
-6%
1.1
39%
2.3
-28%
2.3
-28%
0.6
67%
1.8
-0%
2.5
-39%
3.3
-83%
Gamma
2.16 102%
2.17 101%
2.15 102%
2.25 98%
2.26 97%
2.2 100%
2.23 99%
2.19 100%
2.22 99%
CCT
6550 99%
6547 99%
6549 99%
6470 100%
6795 96%
6472 100%
6496 100%
6760 96%
7127 91%
Colorchecker dE 2000 calibrated *
1.18
1.6
0.82
0.7
1.09
0.9
Kontrast (:1)
51900
2551
1437
Durchschnitt gesamt (Programm / Settings)
-7% / -8%
9% / 7%
-2% / -7%
-13% / -18%
-11% / -14%
17% / 14%
-1686% / -933%
-644% / -365%

* ... kleinere Werte sind besser

CalMAN-Graustufen
CalMAN-Graustufen
CalMAN-Sättigung
CalMAN-Sättigung
CalMAN ColorChecker
CalMAN ColorChecker
vs. sRGB
vs. sRGB
vs. P3
vs. P3
vs. AdobeRGB
vs. AdobeRGB

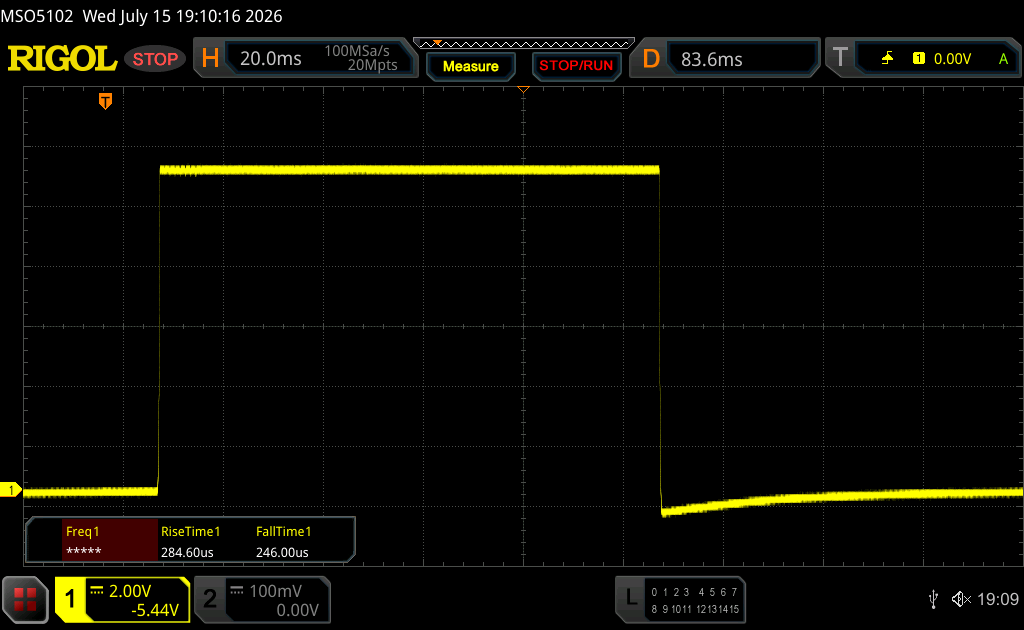
Reaktionszeiten (Response Times) des Displays

Die Reaktionszeiten (Response Times) beschreiben wie schnell zwischen zwei Farben eines Pixels umgeschaltet werden kann. Langsame Response Times können zu einer verschwommenen Darstellung, Schlieren und Geisterbilder führen. Besonders bei schnellen 3D-Spielen sind kurze Umschaltzeiten wichtig.
       Reaktionszeiten Schwarz zu Weiß
0.53 ms ... steigend ↗ und fallend ↘ kombiniert↗ 0.28 ms steigend
↘ 0.25 ms fallend
Die gemessenen Reaktionszeiten sind sehr kurz, wodurch sich der Bildschirm auch für schnelle 3D Spiele eignen sollte.
Im Vergleich rangierten die bei uns getesteten Geräte von 0.1 (Minimum) zu 240 (Maximum) ms. » 1 % aller Screens waren schneller als der getestete.
Daher sind die gemessenen Reaktionszeiten besser als der Durchschnitt aller vermessenen Geräte (19.8 ms).
       Reaktionszeiten 50% Grau zu 80% Grau
2 ms ... steigend ↗ und fallend ↘ kombiniert↗ 1 ms steigend
↘ 1 ms fallend
Die gemessenen Reaktionszeiten sind sehr kurz, wodurch sich der Bildschirm auch für schnelle 3D Spiele eignen sollte.
Im Vergleich rangierten die bei uns getesteten Geräte von 0.165 (Minimum) zu 636 (Maximum) ms. » 10 % aller Screens waren schneller als der getestete.
Daher sind die gemessenen Reaktionszeiten besser als der Durchschnitt aller vermessenen Geräte (31 ms).

Bildschirm-Flackern / PWM (Pulse-Width Modulation)

Eine günstige Methode um die Helligkeit eines Bildschirms zu steuern, ist die Beleuchtung periodisch ein- und auszuschalten. Dies nennt sich PWM (Pulsweitenmodulation) Diese Umschaltung sollte mit einer hohen Frequenz stattfinden damit das menschliche Auge kein Flimmern wahrnimmt. Wenn die Frequenz zu niedrig ist, kann dies zu Ermüdungserscheinungen, Augenbrennen, Kopfweh und auch sichtbaren Flackern führen.
Flackern / PWM festgestellt 960 Hz
Amplitude: 40 %
≤ 100 % Helligkeit

Das Display flackert mit 960 Hz (im schlimmsten Fall, eventuell durch Pulsweitenmodulation PWM) bei einer eingestellten Helligkeit von 100 % und darunter. Darüber sollte es zu keinem Flackern kommen.

Die Frequenz von 960 Hz ist sehr hoch und sollte daher auch bei empfindlichen Personen zu keinen Problemen führen.

Im Vergleich: 52 % aller getesteten Geräte nutzten kein PWM um die Helligkeit zu reduzieren. Wenn PWM eingesetzt wurde, dann bei einer Frequenz von durchschnittlich 7747 (Minimum 5, Maximum 343500) Hz.

PWM (0 % Helligkeit)
PWM (20 % Helligkeit)
PWM (40 % Helligkeit)
PWM (60 % Helligkeit)
PWM (80 % Helligkeit)
PWM (100 % Helligkeit)
In der Sonne
In der Sonne
Im Freien (heller Tag, keine direkte Sonneneinstrahlung)
Betrachtungswinkel
Betrachtungswinkel

Leistung

Asus ist auf Intels Panther-Lake-CPUs umgestiegen, allerdings gibt es derzeit keine Modelle mit Core-Ultra-X-SoCs und Arc-B390-iGPUs.
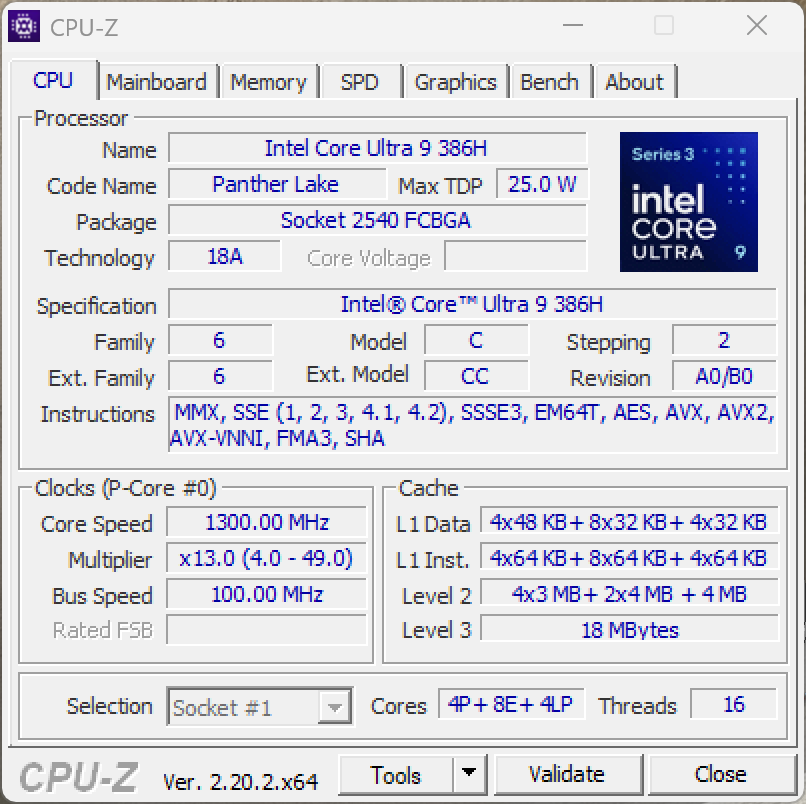
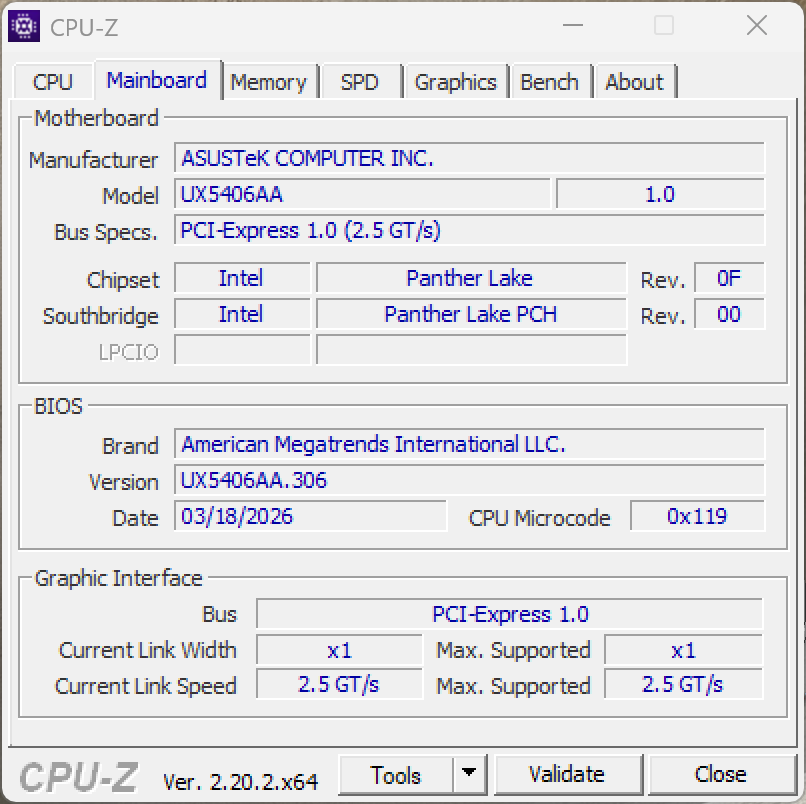
Testbedingungen

Asus bietet die üblichen Energieprofile an, die zudem mit den Windows Einstellungen synchronisiert werden. Für leichte Alltagsaufgaben empfehlen wir den Whisper-Modus, damit die Lüfter die meiste Zeit deaktiviert sind. Für unsere Benchmarks und Messungen haben wir den Performance-Modus verwendet.

Profil TDP CB2024 Multi Time Spy Graphics max. Lüftergeräusch
Whisper 35/12 Watt 476 Punkte 1.991 Punkte 29 dB(A)
Standard 57/17 Watt 666 Punkte 2.745 Punkte 38,5 dB(A)
Performance 57/28 Watt 969 Punkte 3.048 Punkte 49,1 dB(A)
Akku 57/28 Watt 936 Punkte 2.998 Punkte 49,1 dB(A)

Prozessorleistung

Asus setzt den neuen Intel Core Ultra 9 386H (Panther Lake) mit 4 Performance-Kernen und insgesamt 12 Effizienz-Kernen ein. Die CPU kann bis zu 57 Watt verbrauchen und pendelt sich bei anhaltender Auslastung schnell bei 28 Watt ein. Die Single-Core-Leistung ist im Vergleich zu den alten Lunar-Lake-Modellen etwas besser, doch der größte Vorteil liegt in der Multi-Core-Leistung, die sich im Grunde verdoppelt hat. Die Ergebnisse sind für einen Alltags-Laptop gut, aber auch nichts Besonderes, da sie den Zen-5-Chips von AMD nur geringfügig überlegen sind und insgesamt immer noch schlechter abschneiden als Apples lüfterloser M5-SoC und vom Snapdragon X2 Elite von Qualcomm im Zenbook A14 mühelos übertroffen werden.

Cinebench R15 Multi-Loop

0651301952603253904555205856507157808459109751040110511701235130013651430149515601625169017551820188519502015208021452210227523402405247025352600266527302795286029252990305531203185Tooltip
Asus ZenBook S14 UX5406AA Intel Core Ultra 9 386H: Ø2436 (2356.68-2972.43) Points
Asus Zenbook A14 UX3704NA Qualcomm Snapdragon X2 Elite X2E-88-100: Ø2812 (2709.84-3196.16) Points
Asus Zenbook S 14 UX5406 Intel Core Ultra 7 258V: Ø1155 (1108.49-1550.27) Points
HP OmniBook Ultra 14 Core Ultra X9 Intel Core Ultra X9 388H: Ø2466 (2420.72-2711.68) Points
Samsung Galaxy Book5 Pro 14 940XHA Intel Core Ultra 5 226V: Ø1380 (1248.24-1530.87) Points
Lenovo Yoga Slim 7 Ultra 14IPH11 Intel Core Ultra 7 355: Ø1608 (1599.3-1707.14) Points
Honor MagicBook Pro 14 2026 Intel Core Ultra 5 338H: Ø2455 (2424.98-2504.07) Points
Dell XPS 14 Core Ultra 7 355 Intel Core Ultra 7 355: Ø1536 (1489.92-1654.26) Points
CPU Performance Rating: Percent
Cinebench 2024: CPU Multi Core | CPU Single Core
Cinebench R23: Multi Core | Single Core
Cinebench R20: CPU (Multi Core) | CPU (Single Core)
Cinebench R15: CPU Multi 64Bit | CPU Single 64Bit
Blender: v2.79 BMW27 CPU
7-Zip 18.03: 7z b 4 | 7z b 4 -mmt1
Geekbench 6.7: Multi-Core | Single-Core
Geekbench 5.5: Multi-Core | Single-Core
HWBOT x265 Benchmark v2.2: 4k Preset
LibreOffice : 20 Documents To PDF
R Benchmark 2.5: Overall mean
CPU Performance Rating
Apple MacBook Air 13 M5 -14!
Apple M5 10-Core
87.3 pt
Durchschnittliche Intel Core Ultra 9 386H
 
80.1 pt
HP OmniBook Ultra 14 Core Ultra X9
Intel Core Ultra X9 388H
80 pt
Asus ZenBook S14 UX5406AA
Intel Core Ultra 9 386H
79.1 pt
Honor MagicBook Pro 14 2026
Intel Core Ultra 5 338H
74 pt
Asus Zenbook A14 UX3704NA -3!
Qualcomm Snapdragon X2 Elite X2E-88-100
73.6 pt
Lenovo Yoga Slim 7 Ultra 14IPH11
Intel Core Ultra 7 355
61 pt
Dell XPS 14 Core Ultra 7 355
Intel Core Ultra 7 355
60.4 pt
Durchschnitt der Klasse Subnotebook
 
58.1 pt
Samsung Galaxy Book5 Pro 14 940XHA
Intel Core Ultra 5 226V
54.4 pt
Asus Zenbook S 14 UX5406
Intel Core Ultra 7 258V
51.9 pt
Cinebench 2024 / CPU Multi Core
Asus Zenbook A14 UX3704NA
Qualcomm Snapdragon X2 Elite X2E-88-100
1471 Points +52%
Durchschnittliche Intel Core Ultra 9 386H
  (873 - 1271, n=8)
1115 Points +15%
HP OmniBook Ultra 14 Core Ultra X9
Intel Core Ultra X9 388H
1002 Points +3%
Asus ZenBook S14 UX5406AA
Intel Core Ultra 9 386H
969 Points
Honor MagicBook Pro 14 2026
Intel Core Ultra 5 338H
968 Points 0%
Apple MacBook Air 13 M5
Apple M5 10-Core
957 Points -1%
Durchschnitt der Klasse Subnotebook
  (148 - 1471, n=66, der letzten 2 Jahre)
729 Points -25%
Lenovo Yoga Slim 7 Ultra 14IPH11
Intel Core Ultra 7 355
655 Points -32%
Dell XPS 14 Core Ultra 7 355
Intel Core Ultra 7 355
636 Points -34%
Samsung Galaxy Book5 Pro 14 940XHA
Intel Core Ultra 5 226V
539 Points -44%
Asus Zenbook S 14 UX5406
Intel Core Ultra 7 258V
497 Points -49%
Cinebench 2024 / CPU Single Core
Apple MacBook Air 13 M5
Apple M5 10-Core
200 Points +62%
Asus Zenbook A14 UX3704NA
Qualcomm Snapdragon X2 Elite X2E-88-100
149 Points +21%
HP OmniBook Ultra 14 Core Ultra X9
Intel Core Ultra X9 388H
129 Points +5%
Asus ZenBook S14 UX5406AA
Intel Core Ultra 9 386H
123.1 Points
Durchschnittliche Intel Core Ultra 9 386H
  (118.1 - 126.8, n=8)
122.8 Points 0%
Honor MagicBook Pro 14 2026
Intel Core Ultra 5 338H
122.3 Points -1%
Asus Zenbook S 14 UX5406
Intel Core Ultra 7 258V
120 Points -3%
Durchschnitt der Klasse Subnotebook
  (35 - 200, n=55, der letzten 2 Jahre)
119.7 Points -3%
Lenovo Yoga Slim 7 Ultra 14IPH11
Intel Core Ultra 7 355
119.1 Points -3%
Dell XPS 14 Core Ultra 7 355
Intel Core Ultra 7 355
117.1 Points -5%
Samsung Galaxy Book5 Pro 14 940XHA
Intel Core Ultra 5 226V
114.1 Points -7%
Cinebench R23 / Multi Core
Durchschnittliche Intel Core Ultra 9 386H
  (12144 - 21186, n=8)
18992 Points +2%
Asus ZenBook S14 UX5406AA
Intel Core Ultra 9 386H
18553 Points
HP OmniBook Ultra 14 Core Ultra X9
Intel Core Ultra X9 388H
17663 (16042.7min - 17663.2max) Points -5%
Asus Zenbook A14 UX3704NA
Qualcomm Snapdragon X2 Elite X2E-88-100
16808 Points -9%
Honor MagicBook Pro 14 2026
Intel Core Ultra 5 338H
16331 Points -12%
Durchschnitt der Klasse Subnotebook
  (1555 - 21812, n=60, der letzten 2 Jahre)
12235 Points -34%
Dell XPS 14 Core Ultra 7 355
Intel Core Ultra 7 355
11348 (10188.4min - 11347.5max) Points -39%
Lenovo Yoga Slim 7 Ultra 14IPH11
Intel Core Ultra 7 355
11221 (10770.3min - 11221.4max) Points -40%
Samsung Galaxy Book5 Pro 14 940XHA
Intel Core Ultra 5 226V
9896 Points -47%
Asus Zenbook S 14 UX5406
Intel Core Ultra 7 258V
9114 Points -51%
Cinebench R23 / Single Core
HP OmniBook Ultra 14 Core Ultra X9
Intel Core Ultra X9 388H
2213 Points +7%
Asus ZenBook S14 UX5406AA
Intel Core Ultra 9 386H
2066 Points
Durchschnittliche Intel Core Ultra 9 386H
  (2010 - 2101, n=8)
2062 Points 0%
Honor MagicBook Pro 14 2026
Intel Core Ultra 5 338H
2044 Points -1%
Dell XPS 14 Core Ultra 7 355
Intel Core Ultra 7 355
1940 Points -6%
Lenovo Yoga Slim 7 Ultra 14IPH11
Intel Core Ultra 7 355
1931 Points -7%
Asus Zenbook S 14 UX5406
Intel Core Ultra 7 258V
1865 Points -10%
Samsung Galaxy Book5 Pro 14 940XHA
Intel Core Ultra 5 226V
1821 Points -12%
Durchschnitt der Klasse Subnotebook
  (358 - 2213, n=61, der letzten 2 Jahre)
1740 Points -16%
Asus Zenbook A14 UX3704NA
Qualcomm Snapdragon X2 Elite X2E-88-100
1629 Points -21%
Cinebench R20 / CPU (Multi Core)
Durchschnittliche Intel Core Ultra 9 386H
  (4757 - 8405, n=8)
7460 Points +4%
Asus ZenBook S14 UX5406AA
Intel Core Ultra 9 386H
7175 Points
HP OmniBook Ultra 14 Core Ultra X9
Intel Core Ultra X9 388H
7008 Points -2%
Honor MagicBook Pro 14 2026
Intel Core Ultra 5 338H
6370 Points -11%
Asus Zenbook A14 UX3704NA
Qualcomm Snapdragon X2 Elite X2E-88-100
6338 Points -12%
Durchschnitt der Klasse Subnotebook
  (579 - 8541, n=57, der letzten 2 Jahre)
4752 Points -34%
Dell XPS 14 Core Ultra 7 355
Intel Core Ultra 7 355
4359 Points -39%
Lenovo Yoga Slim 7 Ultra 14IPH11
Intel Core Ultra 7 355
4346 Points -39%
Samsung Galaxy Book5 Pro 14 940XHA
Intel Core Ultra 5 226V
3889 Points -46%
Asus Zenbook S 14 UX5406
Intel Core Ultra 7 258V
3530 Points -51%
Cinebench R20 / CPU (Single Core)
HP OmniBook Ultra 14 Core Ultra X9
Intel Core Ultra X9 388H
832 Points +5%
Asus ZenBook S14 UX5406AA
Intel Core Ultra 9 386H
789 Points
Durchschnittliche Intel Core Ultra 9 386H
  (762 - 796, n=8)
785 Points -1%
Honor MagicBook Pro 14 2026
Intel Core Ultra 5 338H
774 Points -2%
Dell XPS 14 Core Ultra 7 355
Intel Core Ultra 7 355
733 Points -7%
Lenovo Yoga Slim 7 Ultra 14IPH11
Intel Core Ultra 7 355
730 Points -7%
Samsung Galaxy Book5 Pro 14 940XHA
Intel Core Ultra 5 226V
703 Points -11%
Durchschnitt der Klasse Subnotebook
  (128 - 832, n=57, der letzten 2 Jahre)
661 Points -16%
Asus Zenbook S 14 UX5406
Intel Core Ultra 7 258V
643 Points -19%
Asus Zenbook A14 UX3704NA
Qualcomm Snapdragon X2 Elite X2E-88-100
621 Points -21%
Cinebench R15 / CPU Multi 64Bit
Asus Zenbook A14 UX3704NA
Qualcomm Snapdragon X2 Elite X2E-88-100
3196 (2709.84min - 3196.16max) Points +8%
Durchschnittliche Intel Core Ultra 9 386H
  (2197 - 3347, n=8)
3042 Points +2%
Asus ZenBook S14 UX5406AA
Intel Core Ultra 9 386H
2972 (2356.68min - 2972.43max) Points
HP OmniBook Ultra 14 Core Ultra X9
Intel Core Ultra X9 388H
2712 (2420.72min - 2711.68max) Points -9%
Honor MagicBook Pro 14 2026
Intel Core Ultra 5 338H
2504 (2424.98min - 2504.07max) Points -16%
Durchschnitt der Klasse Subnotebook
  (327 - 3345, n=57, der letzten 2 Jahre)
2000 Points -33%
Lenovo Yoga Slim 7 Ultra 14IPH11
Intel Core Ultra 7 355
1707 (1599.3min - 1707.14max) Points -43%
Dell XPS 14 Core Ultra 7 355
Intel Core Ultra 7 355
1654 (1489.92min - 1654.26max) Points -44%
Asus Zenbook S 14 UX5406
Intel Core Ultra 7 258V
1550 (1108.49min - 1550.27max) Points -48%
Samsung Galaxy Book5 Pro 14 940XHA
Intel Core Ultra 5 226V
1531 (1248.24min - 1530.87max) Points -48%
Cinebench R15 / CPU Single 64Bit
HP OmniBook Ultra 14 Core Ultra X9
Intel Core Ultra X9 388H
313 Points +3%
Honor MagicBook Pro 14 2026
Intel Core Ultra 5 338H
305 Points +1%
Asus ZenBook S14 UX5406AA
Intel Core Ultra 9 386H
303 Points
Asus Zenbook A14 UX3704NA
Qualcomm Snapdragon X2 Elite X2E-88-100
296 Points -2%
Durchschnittliche Intel Core Ultra 9 386H
  (249 - 314, n=8)
296 Points -2%
Lenovo Yoga Slim 7 Ultra 14IPH11
Intel Core Ultra 7 355
291 Points -4%
Dell XPS 14 Core Ultra 7 355
Intel Core Ultra 7 355
288 Points -5%
Samsung Galaxy Book5 Pro 14 940XHA
Intel Core Ultra 5 226V
278 Points -8%
Durchschnitt der Klasse Subnotebook
  (72.4 - 322, n=57, der letzten 2 Jahre)
264 Points -13%
Asus Zenbook S 14 UX5406
Intel Core Ultra 7 258V
258 Points -15%
Blender / v2.79 BMW27 CPU
Asus Zenbook S 14 UX5406
Intel Core Ultra 7 258V
414 Seconds * -105%
Durchschnitt der Klasse Subnotebook
  (159 - 2271, n=58, der letzten 2 Jahre)
374 Seconds * -85%
Samsung Galaxy Book5 Pro 14 940XHA
Intel Core Ultra 5 226V
357 Seconds * -77%
Lenovo Yoga Slim 7 Ultra 14IPH11
Intel Core Ultra 7 355
310 Seconds * -53%
Dell XPS 14 Core Ultra 7 355
Intel Core Ultra 7 355
307 Seconds * -52%
Asus Zenbook A14 UX3704NA
Qualcomm Snapdragon X2 Elite X2E-88-100
210 Seconds * -4%
Honor MagicBook Pro 14 2026
Intel Core Ultra 5 338H
209 Seconds * -3%
Asus ZenBook S14 UX5406AA
Intel Core Ultra 9 386H
202 Seconds *
HP OmniBook Ultra 14 Core Ultra X9
Intel Core Ultra X9 388H
198 Seconds * +2%
Durchschnittliche Intel Core Ultra 9 386H
  (156 - 299, n=8)
189.6 Seconds * +6%
7-Zip 18.03 / 7z b 4
Durchschnittliche Intel Core Ultra 9 386H
  (44980 - 72882, n=8)
65902 MIPS +4%
Asus ZenBook S14 UX5406AA
Intel Core Ultra 9 386H
63455 MIPS
HP OmniBook Ultra 14 Core Ultra X9
Intel Core Ultra X9 388H
62372 MIPS -2%
Honor MagicBook Pro 14 2026
Intel Core Ultra 5 338H
54556 MIPS -14%
Durchschnitt der Klasse Subnotebook
  (11668 - 77867, n=57, der letzten 2 Jahre)
44119 MIPS -30%
Lenovo Yoga Slim 7 Ultra 14IPH11
Intel Core Ultra 7 355
38450 MIPS -39%
Dell XPS 14 Core Ultra 7 355
Intel Core Ultra 7 355
37123 MIPS -41%
Samsung Galaxy Book5 Pro 14 940XHA
Intel Core Ultra 5 226V
33446 MIPS -47%
Asus Zenbook S 14 UX5406
Intel Core Ultra 7 258V
32198 MIPS -49%
7-Zip 18.03 / 7z b 4 -mmt1
HP OmniBook Ultra 14 Core Ultra X9
Intel Core Ultra X9 388H
6699 MIPS +4%
Asus ZenBook S14 UX5406AA
Intel Core Ultra 9 386H
6458 MIPS
Asus Zenbook A14 UX3704NA
Qualcomm Snapdragon X2 Elite X2E-88-100
6442 MIPS 0%
Honor MagicBook Pro 14 2026
Intel Core Ultra 5 338H
6316 MIPS -2%
Durchschnittliche Intel Core Ultra 9 386H
  (5488 - 6493, n=8)
6211 MIPS -4%
Lenovo Yoga Slim 7 Ultra 14IPH11
Intel Core Ultra 7 355
5772 MIPS -11%
Dell XPS 14 Core Ultra 7 355
Intel Core Ultra 7 355
5764 MIPS -11%
Durchschnitt der Klasse Subnotebook
  (2643 - 6699, n=59, der letzten 2 Jahre)
5552 MIPS -14%
Asus Zenbook S 14 UX5406
Intel Core Ultra 7 258V
5551 MIPS -14%
Samsung Galaxy Book5 Pro 14 940XHA
Intel Core Ultra 5 226V
5341 MIPS -17%
Geekbench 6.7 / Multi-Core
Asus Zenbook A14 UX3704NA
Qualcomm Snapdragon X2 Elite X2E-88-100
20325 Points +20%
Apple MacBook Air 13 M5
Apple M5 10-Core
17072 Points +1%
Asus ZenBook S14 UX5406AA
Intel Core Ultra 9 386H
16882 Points
HP OmniBook Ultra 14 Core Ultra X9
Intel Core Ultra X9 388H
16568 Points -2%
Durchschnittliche Intel Core Ultra 9 386H
  (13776 - 17405, n=10)
16196 Points -4%
Honor MagicBook Pro 14 2026
Intel Core Ultra 5 338H
14499 Points -14%
Durchschnitt der Klasse Subnotebook
  (2244 - 20325, n=63, der letzten 2 Jahre)
12492 Points -26%
Lenovo Yoga Slim 7 Ultra 14IPH11
Intel Core Ultra 7 355
11702 Points -31%
Dell XPS 14 Core Ultra 7 355
Intel Core Ultra 7 355
11394 Points -33%
Asus Zenbook S 14 UX5406
Intel Core Ultra 7 258V
10730 Points -36%
Samsung Galaxy Book5 Pro 14 940XHA
Intel Core Ultra 5 226V
10114 Points -40%
Geekbench 6.7 / Single-Core
Apple MacBook Air 13 M5
Apple M5 10-Core
4185 Points +44%
Asus Zenbook A14 UX3704NA
Qualcomm Snapdragon X2 Elite X2E-88-100
3814 Points +32%
HP OmniBook Ultra 14 Core Ultra X9
Intel Core Ultra X9 388H
3027 Points +4%
Asus ZenBook S14 UX5406AA
Intel Core Ultra 9 386H
2899 Points
Durchschnittliche Intel Core Ultra 9 386H
  (2778 - 2919, n=10)
2869 Points -1%
Honor MagicBook Pro 14 2026
Intel Core Ultra 5 338H
2840 Points -2%
Durchschnitt der Klasse Subnotebook
  (960 - 4195, n=62, der letzten 2 Jahre)
2781 Points -4%
Lenovo Yoga Slim 7 Ultra 14IPH11
Intel Core Ultra 7 355
2769 Points -4%
Dell XPS 14 Core Ultra 7 355
Intel Core Ultra 7 355
2701 Points -7%
Asus Zenbook S 14 UX5406
Intel Core Ultra 7 258V
2679 Points -8%
Samsung Galaxy Book5 Pro 14 940XHA
Intel Core Ultra 5 226V
2627 Points -9%
Geekbench 5.5 / Multi-Core
Asus ZenBook S14 UX5406AA
Intel Core Ultra 9 386H
16599 Points
Durchschnittliche Intel Core Ultra 9 386H
  (13098 - 17557, n=8)
16275 Points -2%
HP OmniBook Ultra 14 Core Ultra X9
Intel Core Ultra X9 388H
15933 Points -4%
Honor MagicBook Pro 14 2026
Intel Core Ultra 5 338H
13521 Points -19%
Durchschnitt der Klasse Subnotebook
  (2557 - 17218, n=48, der letzten 2 Jahre)
10642 Points -36%
Lenovo Yoga Slim 7 Ultra 14IPH11
Intel Core Ultra 7 355
10284 Points -38%
Dell XPS 14 Core Ultra 7 355
Intel Core Ultra 7 355
10011 Points -40%
Asus Zenbook S 14 UX5406
Intel Core Ultra 7 258V
9330 Points -44%
Samsung Galaxy Book5 Pro 14 940XHA
Intel Core Ultra 5 226V
8941 Points -46%
Geekbench 5.5 / Single-Core
HP OmniBook Ultra 14 Core Ultra X9
Intel Core Ultra X9 388H
2224 Points +6%
Asus ZenBook S14 UX5406AA
Intel Core Ultra 9 386H
2108 Points
Durchschnittliche Intel Core Ultra 9 386H
  (1992 - 2162, n=8)
2102 Points 0%
Honor MagicBook Pro 14 2026
Intel Core Ultra 5 338H
2083 Points -1%
Lenovo Yoga Slim 7 Ultra 14IPH11
Intel Core Ultra 7 355
2034 Points -4%
Dell XPS 14 Core Ultra 7 355
Intel Core Ultra 7 355
1999 Points -5%
Asus Zenbook S 14 UX5406
Intel Core Ultra 7 258V
1956 Points -7%
Durchschnitt der Klasse Subnotebook
  (726 - 2224, n=48, der letzten 2 Jahre)
1919 Points -9%
Samsung Galaxy Book5 Pro 14 940XHA
Intel Core Ultra 5 226V
1912 Points -9%
HWBOT x265 Benchmark v2.2 / 4k Preset
Durchschnittliche Intel Core Ultra 9 386H
  (13.2 - 25.1, n=8)
22.2 fps +4%
Asus ZenBook S14 UX5406AA
Intel Core Ultra 9 386H
21.3 fps
HP OmniBook Ultra 14 Core Ultra X9
Intel Core Ultra X9 388H
20.6 fps -3%
Honor MagicBook Pro 14 2026
Intel Core Ultra 5 338H
20.5 fps -4%
Dell XPS 14 Core Ultra 7 355
Intel Core Ultra 7 355
14.6 fps -31%
Lenovo Yoga Slim 7 Ultra 14IPH11
Intel Core Ultra 7 355
14.3 fps -33%
Durchschnitt der Klasse Subnotebook
  (0.97 - 25.1, n=57, der letzten 2 Jahre)
13.3 fps -38%
Samsung Galaxy Book5 Pro 14 940XHA
Intel Core Ultra 5 226V
12.2 fps -43%
Asus Zenbook A14 UX3704NA
Qualcomm Snapdragon X2 Elite X2E-88-100
11.1 fps -48%
Asus Zenbook S 14 UX5406
Intel Core Ultra 7 258V
10.5 fps -51%
LibreOffice / 20 Documents To PDF
Asus Zenbook S 14 UX5406
Intel Core Ultra 7 258V
59.3 s * -23%
Durchschnitt der Klasse Subnotebook
  (39.9 - 220, n=56, der letzten 2 Jahre)
56.5 s * -17%
Samsung Galaxy Book5 Pro 14 940XHA
Intel Core Ultra 5 226V
49.7 s * -3%
Asus ZenBook S14 UX5406AA
Intel Core Ultra 9 386H
48.2 s *
Honor MagicBook Pro 14 2026
Intel Core Ultra 5 338H
47.3 s * +2%
Durchschnittliche Intel Core Ultra 9 386H
  (38.5 - 56.1, n=8)
46.9 s * +3%
HP OmniBook Ultra 14 Core Ultra X9
Intel Core Ultra X9 388H
45.9 s * +5%
Lenovo Yoga Slim 7 Ultra 14IPH11
Intel Core Ultra 7 355
44.5 s * +8%
Asus Zenbook A14 UX3704NA
Qualcomm Snapdragon X2 Elite X2E-88-100
44 s * +9%
Dell XPS 14 Core Ultra 7 355
Intel Core Ultra 7 355
43.1 s * +11%
R Benchmark 2.5 / Overall mean
Durchschnitt der Klasse Subnotebook
  (0.4024 - 1.456, n=58, der letzten 2 Jahre)
0.526 sec * -23%
Asus Zenbook A14 UX3704NA
Qualcomm Snapdragon X2 Elite X2E-88-100
0.524 sec * -23%
Samsung Galaxy Book5 Pro 14 940XHA
Intel Core Ultra 5 226V
0.4719 sec * -11%
Asus Zenbook S 14 UX5406
Intel Core Ultra 7 258V
0.4593 sec * -8%
Dell XPS 14 Core Ultra 7 355
Intel Core Ultra 7 355
0.4435 sec * -4%
Asus ZenBook S14 UX5406AA
Intel Core Ultra 9 386H
0.4265 sec *
Durchschnittliche Intel Core Ultra 9 386H
  (0.4055 - 0.4384, n=8)
0.426 sec * -0%
Lenovo Yoga Slim 7 Ultra 14IPH11
Intel Core Ultra 7 355
0.4258 sec * -0%
Honor MagicBook Pro 14 2026
Intel Core Ultra 5 338H
0.4249 sec * -0%
HP OmniBook Ultra 14 Core Ultra X9
Intel Core Ultra X9 388H
0.4045 sec * +5%

* ... kleinere Werte sind besser

Cinebench R15 CPU Multi 64Bit
2972 Points
Cinebench R15 OpenGL 64Bit
213 fps
Cinebench R15 Ref. Match 64Bit
97.8 %
Cinebench R15 CPU Single 64Bit
303 Points
Cinebench R20 CPU (Multi Core)
7175 Points
Cinebench R20 CPU (Single Core)
789 Points
Cinebench R23 Single Core
2066 Points
Cinebench R23 Multi Core
18553 Points
Cinebench 2024 CPU Single Core
123.1 Points
Cinebench 2024 CPU Multi Core
969 Points
Hilfe
Performance Rating
Durchschnittliche Intel Core Ultra 9 386H -1!
 
96.1 pt
HP OmniBook Ultra 14 Core Ultra X9 -1!
Intel Core Ultra X9 388H, Arc B390 Panther Lake iGPU
88.1 pt
Asus ZenBook S14 UX5406AA -1!
Intel Core Ultra 9 386H, Intel Graphics 4 Xe3 PTL
85.7 pt
Honor MagicBook Pro 14 2026 -1!
Intel Core Ultra 5 338H, Arc B370 Panther Lake iGPU
85.4 pt
Durchschnitt der Klasse Subnotebook
 
72 pt
Asus Zenbook A14 UX3704NA -1!
Qualcomm Snapdragon X2 Elite X2E-88-100, X2-90
62.9 pt
Dell XPS 14 Core Ultra 7 355
Intel Core Ultra 7 355, Intel Graphics 4 Xe3 PTL
62.1 pt
Lenovo Yoga Slim 7 Ultra 14IPH11 -1!
Intel Core Ultra 7 355, Intel Graphics 4 Xe3 PTL
61.9 pt
Samsung Galaxy Book5 Pro 14 940XHA -1!
Intel Core Ultra 5 226V, Arc 130V
58.1 pt
Asus Zenbook S 14 UX5406 -1!
Intel Core Ultra 7 258V, Arc 140V
54.3 pt
AIDA64 / FP32 Ray-Trace
Durchschnittliche Intel Core Ultra 9 386H
  (10001 - 21727, n=8)
18048 KRay/s +23%
Honor MagicBook Pro 14 2026
Intel Core Ultra 5 338H, Arc B370 Panther Lake iGPU (v8.20.8100)
16812 KRay/s +15%
HP OmniBook Ultra 14 Core Ultra X9
Intel Core Ultra X9 388H, Arc B390 Panther Lake iGPU (v8.20.8100)
15651 KRay/s +7%
Asus ZenBook S14 UX5406AA
Intel Core Ultra 9 386H, Intel Graphics 4 Xe3 PTL (v8.20.8100)
14680 KRay/s
Durchschnitt der Klasse Subnotebook
  (1135 - 32888, n=58, der letzten 2 Jahre)
13874 KRay/s -5%
Lenovo Yoga Slim 7 Ultra 14IPH11
Intel Core Ultra 7 355, Intel Graphics 4 Xe3 PTL (v8.20.8100)
12305 KRay/s -16%
Dell XPS 14 Core Ultra 7 355
Intel Core Ultra 7 355, Intel Graphics 4 Xe3 PTL (v8.20.8100)
12228 KRay/s -17%
Samsung Galaxy Book5 Pro 14 940XHA
Intel Core Ultra 5 226V, Arc 130V (v6.92.6600)
11876 KRay/s -19%
Asus Zenbook A14 UX3704NA
Qualcomm Snapdragon X2 Elite X2E-88-100, X2-90 (v8.20.8100)
9452 KRay/s -36%
Asus Zenbook S 14 UX5406
Intel Core Ultra 7 258V, Arc 140V (v6.92.6600)
9215 KRay/s -37%
AIDA64 / FPU Julia
Durchschnittliche Intel Core Ultra 9 386H
  (53370 - 113595, n=8)
95456 Points +20%
Honor MagicBook Pro 14 2026
Intel Core Ultra 5 338H, Arc B370 Panther Lake iGPU (v8.20.8100)
88248 Points +11%
HP OmniBook Ultra 14 Core Ultra X9
Intel Core Ultra X9 388H, Arc B390 Panther Lake iGPU (v8.20.8100)
82749 Points +4%
Asus ZenBook S14 UX5406AA
Intel Core Ultra 9 386H, Intel Graphics 4 Xe3 PTL (v8.20.8100)
79533 Points
Dell XPS 14 Core Ultra 7 355
Intel Core Ultra 7 355, Intel Graphics 4 Xe3 PTL (v8.20.8100)
63504 Points -20%
Durchschnitt der Klasse Subnotebook
  (5218 - 123315, n=58, der letzten 2 Jahre)
62101 Points -22%
Lenovo Yoga Slim 7 Ultra 14IPH11
Intel Core Ultra 7 355, Intel Graphics 4 Xe3 PTL (v8.20.8100)
60741 Points -24%
Samsung Galaxy Book5 Pro 14 940XHA
Intel Core Ultra 5 226V, Arc 130V (v6.92.6600)
56296 Points -29%
Asus Zenbook S 14 UX5406
Intel Core Ultra 7 258V, Arc 140V (v6.92.6600)
48758 Points -39%
Asus Zenbook A14 UX3704NA
Qualcomm Snapdragon X2 Elite X2E-88-100, X2-90 (v8.20.8100)
41889 Points -47%
AIDA64 / CPU SHA3
Durchschnittliche Intel Core Ultra 9 386H
  (2776 - 5604, n=8)
4771 MB/s +17%
Asus Zenbook A14 UX3704NA
Qualcomm Snapdragon X2 Elite X2E-88-100, X2-90 (v8.20.8100)
4670 MB/s +14%
HP OmniBook Ultra 14 Core Ultra X9
Intel Core Ultra X9 388H, Arc B390 Panther Lake iGPU (v8.20.8100)
4178 MB/s +2%
Honor MagicBook Pro 14 2026
Intel Core Ultra 5 338H, Arc B370 Panther Lake iGPU (v8.20.8100)
4089 MB/s 0%
Asus ZenBook S14 UX5406AA
Intel Core Ultra 9 386H, Intel Graphics 4 Xe3 PTL (v8.20.8100)
4082 MB/s
Durchschnitt der Klasse Subnotebook
  (444 - 5287, n=58, der letzten 2 Jahre)
3089 MB/s -24%
Lenovo Yoga Slim 7 Ultra 14IPH11
Intel Core Ultra 7 355, Intel Graphics 4 Xe3 PTL (v8.20.8100)
2841 MB/s -30%
Dell XPS 14 Core Ultra 7 355
Intel Core Ultra 7 355, Intel Graphics 4 Xe3 PTL (v8.20.8100)
2763 MB/s -32%
Samsung Galaxy Book5 Pro 14 940XHA
Intel Core Ultra 5 226V, Arc 130V (v6.92.6600)
2566 MB/s -37%
Asus Zenbook S 14 UX5406
Intel Core Ultra 7 258V, Arc 140V (v6.92.6600)
2271 MB/s -44%
AIDA64 / CPU Queen
Durchschnitt der Klasse Subnotebook
  (10579 - 95002, n=49, der letzten 2 Jahre)
60572 Points
Asus Zenbook S 14 UX5406
Intel Core Ultra 7 258V, Arc 140V (v6.92.6600)
49763 Points
Samsung Galaxy Book5 Pro 14 940XHA
Intel Core Ultra 5 226V, Arc 130V (v6.92.6600)
47041 Points
Dell XPS 14 Core Ultra 7 355
Intel Core Ultra 7 355, Intel Graphics 4 Xe3 PTL (v6.92.6600)
36043 Points
AIDA64 / FPU SinJulia
HP OmniBook Ultra 14 Core Ultra X9
Intel Core Ultra X9 388H, Arc B390 Panther Lake iGPU (v8.20.8100)
7015 Points +6%
Durchschnittliche Intel Core Ultra 9 386H
  (5314 - 7332, n=8)
6852 Points +3%
Asus ZenBook S14 UX5406AA
Intel Core Ultra 9 386H, Intel Graphics 4 Xe3 PTL (v8.20.8100)
6648 Points
Durchschnitt der Klasse Subnotebook
  (744 - 18418, n=58, der letzten 2 Jahre)
6626 Points 0%
Honor MagicBook Pro 14 2026
Intel Core Ultra 5 338H, Arc B370 Panther Lake iGPU (v8.20.8100)
5779 Points -13%
Lenovo Yoga Slim 7 Ultra 14IPH11
Intel Core Ultra 7 355, Intel Graphics 4 Xe3 PTL (v8.20.8100)
4600 Points -31%
Dell XPS 14 Core Ultra 7 355
Intel Core Ultra 7 355, Intel Graphics 4 Xe3 PTL (v8.20.8100)
4597 Points -31%
Asus Zenbook S 14 UX5406
Intel Core Ultra 7 258V, Arc 140V (v6.92.6600)
4319 Points -35%
Samsung Galaxy Book5 Pro 14 940XHA
Intel Core Ultra 5 226V, Arc 130V (v6.92.6600)
3916 Points -41%
Asus Zenbook A14 UX3704NA
Qualcomm Snapdragon X2 Elite X2E-88-100, X2-90 (v8.20.8100)
3487 Points -48%
AIDA64 / FPU Mandel
Durchschnittliche Intel Core Ultra 9 386H
  (28414 - 61578, n=8)
50807 Points +21%
Honor MagicBook Pro 14 2026
Intel Core Ultra 5 338H, Arc B370 Panther Lake iGPU (v8.20.8100)
46608 Points +11%
HP OmniBook Ultra 14 Core Ultra X9
Intel Core Ultra X9 388H, Arc B390 Panther Lake iGPU (v8.20.8100)
44749 Points +6%
Asus ZenBook S14 UX5406AA
Intel Core Ultra 9 386H, Intel Graphics 4 Xe3 PTL (v8.20.8100)
42018 Points
Dell XPS 14 Core Ultra 7 355
Intel Core Ultra 7 355, Intel Graphics 4 Xe3 PTL (v8.20.8100)
34150 Points -19%
Durchschnitt der Klasse Subnotebook
  (3341 - 65433, n=58, der letzten 2 Jahre)
32706 Points -22%
Lenovo Yoga Slim 7 Ultra 14IPH11
Intel Core Ultra 7 355, Intel Graphics 4 Xe3 PTL (v8.20.8100)
32404 Points -23%
Samsung Galaxy Book5 Pro 14 940XHA
Intel Core Ultra 5 226V, Arc 130V (v6.92.6600)
28485 Points -32%
Asus Zenbook S 14 UX5406
Intel Core Ultra 7 258V, Arc 140V (v6.92.6600)
25361 Points -40%
Asus Zenbook A14 UX3704NA
Qualcomm Snapdragon X2 Elite X2E-88-100, X2-90 (v8.20.8100)
20738 Points -51%
AIDA64 / CPU AES
Asus Zenbook A14 UX3704NA
Qualcomm Snapdragon X2 Elite X2E-88-100, X2-90 (v8.20.8100)
86944 MB/s +42%
Durchschnittliche Intel Core Ultra 9 386H
  (46362 - 72112, n=8)
64877 MB/s +6%
HP OmniBook Ultra 14 Core Ultra X9
Intel Core Ultra X9 388H, Arc B390 Panther Lake iGPU (v8.20.8100)
61890 MB/s +1%
Asus ZenBook S14 UX5406AA
Intel Core Ultra 9 386H, Intel Graphics 4 Xe3 PTL (v8.20.8100)
61072 MB/s
Durchschnitt der Klasse Subnotebook
  (638 - 96917, n=58, der letzten 2 Jahre)
53040 MB/s -13%
Honor MagicBook Pro 14 2026
Intel Core Ultra 5 338H, Arc B370 Panther Lake iGPU (v8.20.8100)
52769 MB/s -14%
Lenovo Yoga Slim 7 Ultra 14IPH11
Intel Core Ultra 7 355, Intel Graphics 4 Xe3 PTL (v8.20.8100)
39424 MB/s -35%
Dell XPS 14 Core Ultra 7 355
Intel Core Ultra 7 355, Intel Graphics 4 Xe3 PTL (v8.20.8100)
39050 MB/s -36%
Asus Zenbook S 14 UX5406
Intel Core Ultra 7 258V, Arc 140V (v6.92.6600)
38049 MB/s -38%
Samsung Galaxy Book5 Pro 14 940XHA
Intel Core Ultra 5 226V, Arc 130V (v6.92.6600)
36115 MB/s -41%
AIDA64 / CPU ZLib
Asus Zenbook A14 UX3704NA
Qualcomm Snapdragon X2 Elite X2E-88-100, X2-90 (v8.20.8100)
1150 MB/s +16%
Durchschnittliche Intel Core Ultra 9 386H
  (669 - 1271, n=8)
1123 MB/s +14%
Asus ZenBook S14 UX5406AA
Intel Core Ultra 9 386H, Intel Graphics 4 Xe3 PTL (v8.20.8100)
988 MB/s
HP OmniBook Ultra 14 Core Ultra X9
Intel Core Ultra X9 388H, Arc B390 Panther Lake iGPU (v8.20.8100)
984 MB/s 0%
Honor MagicBook Pro 14 2026
Intel Core Ultra 5 338H, Arc B370 Panther Lake iGPU (v8.20.8100)
932 MB/s -6%
Durchschnitt der Klasse Subnotebook
  (164.9 - 1379, n=58, der letzten 2 Jahre)
748 MB/s -24%
Lenovo Yoga Slim 7 Ultra 14IPH11
Intel Core Ultra 7 355, Intel Graphics 4 Xe3 PTL (v8.20.8100)
646 MB/s -35%
Dell XPS 14 Core Ultra 7 355
Intel Core Ultra 7 355, Intel Graphics 4 Xe3 PTL (v8.20.8100)
635 MB/s -36%
Samsung Galaxy Book5 Pro 14 940XHA
Intel Core Ultra 5 226V, Arc 130V (v6.92.6600)
548 MB/s -45%
Asus Zenbook S 14 UX5406
Intel Core Ultra 7 258V, Arc 140V (v6.92.6600)
499 MB/s -49%
AIDA64 / FP64 Ray-Trace
Durchschnittliche Intel Core Ultra 9 386H
  (5138 - 11627, n=8)
9380 KRay/s +20%
Honor MagicBook Pro 14 2026
Intel Core Ultra 5 338H, Arc B370 Panther Lake iGPU (v8.20.8100)
9051 KRay/s +15%
HP OmniBook Ultra 14 Core Ultra X9
Intel Core Ultra X9 388H, Arc B390 Panther Lake iGPU (v8.20.8100)
8317 KRay/s +6%
Asus ZenBook S14 UX5406AA
Intel Core Ultra 9 386H, Intel Graphics 4 Xe3 PTL (v8.20.8100)
7845 KRay/s
Durchschnitt der Klasse Subnotebook
  (610 - 17495, n=58, der letzten 2 Jahre)
7413 KRay/s -6%
Dell XPS 14 Core Ultra 7 355
Intel Core Ultra 7 355, Intel Graphics 4 Xe3 PTL (v8.20.8100)
6594 KRay/s -16%
Lenovo Yoga Slim 7 Ultra 14IPH11
Intel Core Ultra 7 355, Intel Graphics 4 Xe3 PTL (v8.20.8100)
6147 KRay/s -22%
Samsung Galaxy Book5 Pro 14 940XHA
Intel Core Ultra 5 226V, Arc 130V (v6.92.6600)
6098 KRay/s -22%
Asus Zenbook A14 UX3704NA
Qualcomm Snapdragon X2 Elite X2E-88-100, X2-90 (v8.20.8100)
5170 KRay/s -34%
Asus Zenbook S 14 UX5406
Intel Core Ultra 7 258V, Arc 140V (v6.92.6600)
4891 KRay/s -38%
AIDA64 / CPU PhotoWorxx
HP OmniBook Ultra 14 Core Ultra X9
Intel Core Ultra X9 388H, Arc B390 Panther Lake iGPU (v8.20.8100)
85600 MPixel/s +3%
Asus ZenBook S14 UX5406AA
Intel Core Ultra 9 386H, Intel Graphics 4 Xe3 PTL (v8.20.8100)
83144 MPixel/s
Durchschnittliche Intel Core Ultra 9 386H
  (54042 - 89891, n=8)
77827 MPixel/s -6%
Honor MagicBook Pro 14 2026
Intel Core Ultra 5 338H, Arc B370 Panther Lake iGPU (v8.20.8100)
75915 MPixel/s -9%
Lenovo Yoga Slim 7 Ultra 14IPH11
Intel Core Ultra 7 355, Intel Graphics 4 Xe3 PTL (v8.20.8100)
60240 MPixel/s -28%
Dell XPS 14 Core Ultra 7 355
Intel Core Ultra 7 355, Intel Graphics 4 Xe3 PTL (v8.20.8100)
57998 MPixel/s -30%
Asus Zenbook S 14 UX5406
Intel Core Ultra 7 258V, Arc 140V (v6.92.6600)
51458 MPixel/s -38%
Asus Zenbook A14 UX3704NA
Qualcomm Snapdragon X2 Elite X2E-88-100, X2-90 (v8.20.8100)
51129 MPixel/s -39%
Samsung Galaxy Book5 Pro 14 940XHA
Intel Core Ultra 5 226V, Arc 130V (v6.92.6600)
50115 MPixel/s -40%
Durchschnitt der Klasse Subnotebook
  (6569 - 85600, n=58, der letzten 2 Jahre)
47867 MPixel/s -42%
AIDA64 / CPU CheckMate
Durchschnittliche Intel Core Ultra 9 386H
  (4051 - 4858, n=7)
4608 MP/s +8%
Asus ZenBook S14 UX5406AA
Intel Core Ultra 9 386H, Intel Graphics 4 Xe3 PTL (v8.20.8100)
4280 MP/s
HP OmniBook Ultra 14 Core Ultra X9
Intel Core Ultra X9 388H, Arc B390 Panther Lake iGPU (v8.20.8100)
4009 MP/s -6%
Honor MagicBook Pro 14 2026
Intel Core Ultra 5 338H, Arc B370 Panther Lake iGPU (v8.20.8100)
3776 MP/s -12%
Durchschnitt der Klasse Subnotebook
  (756 - 5939, n=8, der letzten 2 Jahre)
3029 MP/s -29%
Lenovo Yoga Slim 7 Ultra 14IPH11
Intel Core Ultra 7 355, Intel Graphics 4 Xe3 PTL (v8.20.8100)
2802 MP/s -35%
Dell XPS 14 Core Ultra 7 355
Intel Core Ultra 7 355, Intel Graphics 4 Xe3 PTL (v8.20.8100)
2790 MP/s -35%
Asus Zenbook A14 UX3704NA
Qualcomm Snapdragon X2 Elite X2E-88-100, X2-90 (v8.20.8100)
1353 MP/s -68%

System- und Speichergeräte

Die Systemleistung ist sehr gut, das Zenbook S14 arbeitet äußerst flüssig, und es traten keinerlei Stabilitätsprobleme auf. Die PCIe-4.0-SSD von Samsung (1 TB, 865 GB frei) bietet hohe und stabile Übertragungsraten.

Performance Rating: Percent
PCMark 10: Score | Essentials | Productivity | Digital Content Creation
CrossMark: Overall | Productivity | Creativity | Responsiveness
WebXPRT 3: Overall
WebXPRT 4: Overall
Mozilla Kraken 1.1: Total
Performance Rating
Apple MacBook Air 13 M5 -4!
M5 8-Core GPU, M5 10-Core, Apple SSD AP0512Z
92.3 pt
HP OmniBook Ultra 14 Core Ultra X9
Arc B390 Panther Lake iGPU, Ultra X9 388H
84.7 pt
Asus Zenbook A14 UX3704NA -4!
X2-90, X2E-88-100, Micron 2600 1TB MTFDKBA1T0QHK
84.5 pt
Asus ZenBook S14 UX5406AA
Intel Graphics 4 Xe3 PTL, Ultra 9 386H, Samsung PM9C1b MZVL81T0HFLB-00BTW
80.2 pt
Honor MagicBook Pro 14 2026
Arc B370 Panther Lake iGPU, Ultra 5 338H, YMTC PC411-1TB
77.5 pt
Durchschnittliche Intel Core Ultra 9 386H, Intel Graphics 4 Xe3 Panther Lake iGPU
 
76.7 pt
Lenovo Yoga Slim 7 Ultra 14IPH11
Intel Graphics 4 Xe3 PTL, Ultra 7 355, SK hynix PVC10 HFS001TEM4X182N
71.3 pt
Dell XPS 14 Core Ultra 7 355
Intel Graphics 4 Xe3 PTL, Ultra 7 355, WD PC SN7100S SDFPMSL-512G-1101
69.2 pt
Durchschnitt der Klasse Subnotebook
 
65.9 pt
Samsung Galaxy Book5 Pro 14 940XHA
Arc 130V, Core Ultra 5 226V, Samsung PM9C1 MZVL8512HELU
61.7 pt
Asus Zenbook S 14 UX5406
Arc 140V, Core Ultra 7 258V, WD PC SN560 SDDPNQE-1T00
61.5 pt
PCMark 10 / Score
HP OmniBook Ultra 14 Core Ultra X9
Arc B390 Panther Lake iGPU, Ultra X9 388H
9939 Points +15%
Honor MagicBook Pro 14 2026
Arc B370 Panther Lake iGPU, Ultra 5 338H, YMTC PC411-1TB
9297 Points +8%
Asus ZenBook S14 UX5406AA
Intel Graphics 4 Xe3 PTL, Ultra 9 386H, Samsung PM9C1b MZVL81T0HFLB-00BTW
8639 Points
Durchschnittliche Intel Core Ultra 9 386H, Intel Graphics 4 Xe3 Panther Lake iGPU
  (7679 - 8639, n=3)
8214 Points -5%
Dell XPS 14 Core Ultra 7 355
Intel Graphics 4 Xe3 PTL, Ultra 7 355, WD PC SN7100S SDFPMSL-512G-1101
8185 Points -5%
Lenovo Yoga Slim 7 Ultra 14IPH11
Intel Graphics 4 Xe3 PTL, Ultra 7 355, SK hynix PVC10 HFS001TEM4X182N
8047 Points -7%
Durchschnitt der Klasse Subnotebook
  (4920 - 9939, n=45, der letzten 2 Jahre)
7064 Points -18%
Asus Zenbook S 14 UX5406
Arc 140V, Core Ultra 7 258V, WD PC SN560 SDDPNQE-1T00
6868 Points -21%
Samsung Galaxy Book5 Pro 14 940XHA
Arc 130V, Core Ultra 5 226V, Samsung PM9C1 MZVL8512HELU
6547 Points -24%
PCMark 10 / Essentials
HP OmniBook Ultra 14 Core Ultra X9
Arc B390 Panther Lake iGPU, Ultra X9 388H
11646 Points +7%
Asus ZenBook S14 UX5406AA
Intel Graphics 4 Xe3 PTL, Ultra 9 386H, Samsung PM9C1b MZVL81T0HFLB-00BTW
10934 Points
Dell XPS 14 Core Ultra 7 355
Intel Graphics 4 Xe3 PTL, Ultra 7 355, WD PC SN7100S SDFPMSL-512G-1101
10820 Points -1%
Durchschnittliche Intel Core Ultra 9 386H, Intel Graphics 4 Xe3 Panther Lake iGPU
  (10375 - 10934, n=3)
10734 Points -2%
Honor MagicBook Pro 14 2026
Arc B370 Panther Lake iGPU, Ultra 5 338H, YMTC PC411-1TB
10720 Points -2%
Lenovo Yoga Slim 7 Ultra 14IPH11
Intel Graphics 4 Xe3 PTL, Ultra 7 355, SK hynix PVC10 HFS001TEM4X182N
10505 Points -4%
Durchschnitt der Klasse Subnotebook
  (8552 - 11646, n=45, der letzten 2 Jahre)
10407 Points -5%
Asus Zenbook S 14 UX5406
Arc 140V, Core Ultra 7 258V, WD PC SN560 SDDPNQE-1T00
9729 Points -11%
Samsung Galaxy Book5 Pro 14 940XHA
Arc 130V, Core Ultra 5 226V, Samsung PM9C1 MZVL8512HELU
9640 Points -12%
PCMark 10 / Productivity
HP OmniBook Ultra 14 Core Ultra X9
Arc B390 Panther Lake iGPU, Ultra X9 388H
16606 Points +10%
Honor MagicBook Pro 14 2026
Arc B370 Panther Lake iGPU, Ultra 5 338H, YMTC PC411-1TB
16122 Points +6%
Asus ZenBook S14 UX5406AA
Intel Graphics 4 Xe3 PTL, Ultra 9 386H, Samsung PM9C1b MZVL81T0HFLB-00BTW
15148 Points
Dell XPS 14 Core Ultra 7 355
Intel Graphics 4 Xe3 PTL, Ultra 7 355, WD PC SN7100S SDFPMSL-512G-1101
14685 Points -3%
Lenovo Yoga Slim 7 Ultra 14IPH11
Intel Graphics 4 Xe3 PTL, Ultra 7 355, SK hynix PVC10 HFS001TEM4X182N
14500 Points -4%
Durchschnittliche Intel Core Ultra 9 386H, Intel Graphics 4 Xe3 Panther Lake iGPU
  (12295 - 15282, n=3)
14242 Points -6%
Durchschnitt der Klasse Subnotebook
  (5435 - 16606, n=45, der letzten 2 Jahre)
9752 Points -36%
Asus Zenbook S 14 UX5406
Arc 140V, Core Ultra 7 258V, WD PC SN560 SDDPNQE-1T00
9287 Points -39%
Samsung Galaxy Book5 Pro 14 940XHA
Arc 130V, Core Ultra 5 226V, Samsung PM9C1 MZVL8512HELU
8591 Points -43%
PCMark 10 / Digital Content Creation
HP OmniBook Ultra 14 Core Ultra X9
Arc B390 Panther Lake iGPU, Ultra X9 388H
13779 Points +30%
Honor MagicBook Pro 14 2026
Arc B370 Panther Lake iGPU, Ultra 5 338H, YMTC PC411-1TB
12618 Points +19%
Asus ZenBook S14 UX5406AA
Intel Graphics 4 Xe3 PTL, Ultra 9 386H, Samsung PM9C1b MZVL81T0HFLB-00BTW
10562 Points
Durchschnittliche Intel Core Ultra 9 386H, Intel Graphics 4 Xe3 Panther Lake iGPU
  (9175 - 10562, n=3)
9870 Points -7%
Asus Zenbook S 14 UX5406
Arc 140V, Core Ultra 7 258V, WD PC SN560 SDDPNQE-1T00
9728 Points -8%
Durchschnitt der Klasse Subnotebook
  (5722 - 13779, n=45, der letzten 2 Jahre)
9573 Points -9%
Dell XPS 14 Core Ultra 7 355
Intel Graphics 4 Xe3 PTL, Ultra 7 355, WD PC SN7100S SDFPMSL-512G-1101
9368 Points -11%
Lenovo Yoga Slim 7 Ultra 14IPH11
Intel Graphics 4 Xe3 PTL, Ultra 7 355, SK hynix PVC10 HFS001TEM4X182N
9285 Points -12%
Samsung Galaxy Book5 Pro 14 940XHA
Arc 130V, Core Ultra 5 226V, Samsung PM9C1 MZVL8512HELU
9197 Points -13%
CrossMark / Overall
Apple MacBook Air 13 M5
M5 8-Core GPU, M5 10-Core, Apple SSD AP0512Z
2314 Points +8%
Asus ZenBook S14 UX5406AA
Intel Graphics 4 Xe3 PTL, Ultra 9 386H, Samsung PM9C1b MZVL81T0HFLB-00BTW
2143 Points
HP OmniBook Ultra 14 Core Ultra X9
Arc B390 Panther Lake iGPU, Ultra X9 388H
2048 Points -4%
Durchschnittliche Intel Core Ultra 9 386H, Intel Graphics 4 Xe3 Panther Lake iGPU
  (1975 - 2143, n=3)
2032 Points -5%
Asus Zenbook A14 UX3704NA
X2-90, X2E-88-100, Micron 2600 1TB MTFDKBA1T0QHK
1926 Points -10%
Honor MagicBook Pro 14 2026
Arc B370 Panther Lake iGPU, Ultra 5 338H, YMTC PC411-1TB
1884 Points -12%
Lenovo Yoga Slim 7 Ultra 14IPH11
Intel Graphics 4 Xe3 PTL, Ultra 7 355, SK hynix PVC10 HFS001TEM4X182N
1814 Points -15%
Durchschnitt der Klasse Subnotebook
  (365 - 2356, n=60, der letzten 2 Jahre)
1657 Points -23%
Asus Zenbook S 14 UX5406
Arc 140V, Core Ultra 7 258V, WD PC SN560 SDDPNQE-1T00
1654 Points -23%
Dell XPS 14 Core Ultra 7 355
Intel Graphics 4 Xe3 PTL, Ultra 7 355, WD PC SN7100S SDFPMSL-512G-1101
1627 Points -24%
Samsung Galaxy Book5 Pro 14 940XHA
Arc 130V, Core Ultra 5 226V, Samsung PM9C1 MZVL8512HELU
1620 Points -24%
CrossMark / Productivity
Apple MacBook Air 13 M5
M5 8-Core GPU, M5 10-Core, Apple SSD AP0512Z
2253 Points +15%
Asus ZenBook S14 UX5406AA
Intel Graphics 4 Xe3 PTL, Ultra 9 386H, Samsung PM9C1b MZVL81T0HFLB-00BTW
1955 Points
Durchschnittliche Intel Core Ultra 9 386H, Intel Graphics 4 Xe3 Panther Lake iGPU
  (1842 - 1955, n=3)
1894 Points -3%
HP OmniBook Ultra 14 Core Ultra X9
Arc B390 Panther Lake iGPU, Ultra X9 388H
1834 Points -6%
Asus Zenbook A14 UX3704NA
X2-90, X2E-88-100, Micron 2600 1TB MTFDKBA1T0QHK
1750 Points -10%
Honor MagicBook Pro 14 2026
Arc B370 Panther Lake iGPU, Ultra 5 338H, YMTC PC411-1TB
1743 Points -11%
Lenovo Yoga Slim 7 Ultra 14IPH11
Intel Graphics 4 Xe3 PTL, Ultra 7 355, SK hynix PVC10 HFS001TEM4X182N
1726 Points -12%
Asus Zenbook S 14 UX5406
Arc 140V, Core Ultra 7 258V, WD PC SN560 SDDPNQE-1T00
1590 Points -19%
Samsung Galaxy Book5 Pro 14 940XHA
Arc 130V, Core Ultra 5 226V, Samsung PM9C1 MZVL8512HELU
1575 Points -19%
Durchschnitt der Klasse Subnotebook
  (364 - 2277, n=60, der letzten 2 Jahre)
1573 Points -20%
Dell XPS 14 Core Ultra 7 355
Intel Graphics 4 Xe3 PTL, Ultra 7 355, WD PC SN7100S SDFPMSL-512G-1101
1561 Points -20%
CrossMark / Creativity
Apple MacBook Air 13 M5
M5 8-Core GPU, M5 10-Core, Apple SSD AP0512Z
2664 Points +8%
Asus ZenBook S14 UX5406AA
Intel Graphics 4 Xe3 PTL, Ultra 9 386H, Samsung PM9C1b MZVL81T0HFLB-00BTW
2477 Points
HP OmniBook Ultra 14 Core Ultra X9
Arc B390 Panther Lake iGPU, Ultra X9 388H
2390 Points -4%
Durchschnittliche Intel Core Ultra 9 386H, Intel Graphics 4 Xe3 Panther Lake iGPU
  (2169 - 2477, n=3)
2295 Points -7%
Asus Zenbook A14 UX3704NA
X2-90, X2E-88-100, Micron 2600 1TB MTFDKBA1T0QHK
2147 Points -13%
Honor MagicBook Pro 14 2026
Arc B370 Panther Lake iGPU, Ultra 5 338H, YMTC PC411-1TB
2119 Points -14%
Lenovo Yoga Slim 7 Ultra 14IPH11
Intel Graphics 4 Xe3 PTL, Ultra 7 355, SK hynix PVC10 HFS001TEM4X182N
2045 Points -17%
Asus Zenbook S 14 UX5406
Arc 140V, Core Ultra 7 258V, WD PC SN560 SDDPNQE-1T00
1882 Points -24%
Durchschnitt der Klasse Subnotebook
  (372 - 2743, n=60, der letzten 2 Jahre)
1870 Points -25%
Dell XPS 14 Core Ultra 7 355
Intel Graphics 4 Xe3 PTL, Ultra 7 355, WD PC SN7100S SDFPMSL-512G-1101
1761 Points -29%
Samsung Galaxy Book5 Pro 14 940XHA
Arc 130V, Core Ultra 5 226V, Samsung PM9C1 MZVL8512HELU
1746 Points -30%
CrossMark / Responsiveness
Asus Zenbook A14 UX3704NA
X2-90, X2E-88-100, Micron 2600 1TB MTFDKBA1T0QHK
1854 Points +1%
Asus ZenBook S14 UX5406AA
Intel Graphics 4 Xe3 PTL, Ultra 9 386H, Samsung PM9C1b MZVL81T0HFLB-00BTW
1831 Points
HP OmniBook Ultra 14 Core Ultra X9
Arc B390 Panther Lake iGPU, Ultra X9 388H
1797 Points -2%
Durchschnittliche Intel Core Ultra 9 386H, Intel Graphics 4 Xe3 Panther Lake iGPU
  (1667 - 1831, n=3)
1744 Points -5%
Honor MagicBook Pro 14 2026
Arc B370 Panther Lake iGPU, Ultra 5 338H, YMTC PC411-1TB
1672 Points -9%
Apple MacBook Air 13 M5
M5 8-Core GPU, M5 10-Core, Apple SSD AP0512Z
1643 Points -10%
Lenovo Yoga Slim 7 Ultra 14IPH11
Intel Graphics 4 Xe3 PTL, Ultra 7 355, SK hynix PVC10 HFS001TEM4X182N
1467 Points -20%
Dell XPS 14 Core Ultra 7 355
Intel Graphics 4 Xe3 PTL, Ultra 7 355, WD PC SN7100S SDFPMSL-512G-1101
1458 Points -20%
Samsung Galaxy Book5 Pro 14 940XHA
Arc 130V, Core Ultra 5 226V, Samsung PM9C1 MZVL8512HELU
1408 Points -23%
Durchschnitt der Klasse Subnotebook
  (312 - 1854, n=60, der letzten 2 Jahre)
1360 Points -26%
Asus Zenbook S 14 UX5406
Arc 140V, Core Ultra 7 258V, WD PC SN560 SDDPNQE-1T00
1263 Points -31%
WebXPRT 3 / Overall
Apple MacBook Air 13 M5
M5 8-Core GPU, M5 10-Core, Apple SSD AP0512Z
525 Points +64%
Asus Zenbook A14 UX3704NA
X2-90, X2E-88-100, Micron 2600 1TB MTFDKBA1T0QHK
509 Points +59%
HP OmniBook Ultra 14 Core Ultra X9
Arc B390 Panther Lake iGPU, Ultra X9 388H
354 Points +11%
Durchschnitt der Klasse Subnotebook
  (156 - 530, n=56, der letzten 2 Jahre)
332 Points +4%
Asus ZenBook S14 UX5406AA
Intel Graphics 4 Xe3 PTL, Ultra 9 386H, Samsung PM9C1b MZVL81T0HFLB-00BTW
320 Points
Durchschnittliche Intel Core Ultra 9 386H, Intel Graphics 4 Xe3 Panther Lake iGPU
  (302 - 323, n=3)
315 Points -2%
Dell XPS 14 Core Ultra 7 355
Intel Graphics 4 Xe3 PTL, Ultra 7 355, WD PC SN7100S SDFPMSL-512G-1101
302 Points -6%
Lenovo Yoga Slim 7 Ultra 14IPH11
Intel Graphics 4 Xe3 PTL, Ultra 7 355, SK hynix PVC10 HFS001TEM4X182N
302 Points -6%
Honor MagicBook Pro 14 2026
Arc B370 Panther Lake iGPU, Ultra 5 338H, YMTC PC411-1TB
283 Points -12%
Samsung Galaxy Book5 Pro 14 940XHA
Arc 130V, Core Ultra 5 226V, Samsung PM9C1 MZVL8512HELU
281 Points -12%
Asus Zenbook S 14 UX5406
Arc 140V, Core Ultra 7 258V, WD PC SN560 SDDPNQE-1T00
260 Points -19%
WebXPRT 4 / Overall
Asus Zenbook A14 UX3704NA
X2-90, X2E-88-100, Micron 2600 1TB MTFDKBA1T0QHK
375 Points +23%
Apple MacBook Air 13 M5
M5 8-Core GPU, M5 10-Core, Apple SSD AP0512Z
374 Points +22%
HP OmniBook Ultra 14 Core Ultra X9
Arc B390 Panther Lake iGPU, Ultra X9 388H
318 Points +4%
Asus ZenBook S14 UX5406AA
Intel Graphics 4 Xe3 PTL, Ultra 9 386H, Samsung PM9C1b MZVL81T0HFLB-00BTW
306 Points
Durchschnittliche Intel Core Ultra 9 386H, Intel Graphics 4 Xe3 Panther Lake iGPU
  (282 - 309, n=3)
299 Points -2%
Honor MagicBook Pro 14 2026
Arc B370 Panther Lake iGPU, Ultra 5 338H, YMTC PC411-1TB
292 Points -5%
Dell XPS 14 Core Ultra 7 355
Intel Graphics 4 Xe3 PTL, Ultra 7 355, WD PC SN7100S SDFPMSL-512G-1101
279 Points -9%
Lenovo Yoga Slim 7 Ultra 14IPH11
Intel Graphics 4 Xe3 PTL, Ultra 7 355, SK hynix PVC10 HFS001TEM4X182N
279 Points -9%
Durchschnitt der Klasse Subnotebook
  (132 - 378, n=61, der letzten 2 Jahre)
275 Points -10%
Asus Zenbook S 14 UX5406
Arc 140V, Core Ultra 7 258V, WD PC SN560 SDDPNQE-1T00
251 Points -18%
Samsung Galaxy Book5 Pro 14 940XHA
Arc 130V, Core Ultra 5 226V, Samsung PM9C1 MZVL8512HELU
248 Points -19%
Mozilla Kraken 1.1 / Total
Asus Zenbook S 14 UX5406
Arc 140V, Core Ultra 7 258V, WD PC SN560 SDDPNQE-1T00
559 ms * -24%
Samsung Galaxy Book5 Pro 14 940XHA
Arc 130V, Core Ultra 5 226V, Samsung PM9C1 MZVL8512HELU
503 ms * -12%
Dell XPS 14 Core Ultra 7 355
Intel Graphics 4 Xe3 PTL, Ultra 7 355, WD PC SN7100S SDFPMSL-512G-1101
487 ms * -8%
Durchschnitt der Klasse Subnotebook
  (234 - 1104, n=61, der letzten 2 Jahre)
475 ms * -5%
Lenovo Yoga Slim 7 Ultra 14IPH11
Intel Graphics 4 Xe3 PTL, Ultra 7 355, SK hynix PVC10 HFS001TEM4X182N
474 ms * -5%
Honor MagicBook Pro 14 2026
Arc B370 Panther Lake iGPU, Ultra 5 338H, YMTC PC411-1TB
458 ms * -2%
Asus ZenBook S14 UX5406AA
Intel Graphics 4 Xe3 PTL, Ultra 9 386H, Samsung PM9C1b MZVL81T0HFLB-00BTW
451 ms *
Durchschnittliche Intel Core Ultra 9 386H, Intel Graphics 4 Xe3 Panther Lake iGPU
  (447 - 456, n=3)
451 ms * -0%
HP OmniBook Ultra 14 Core Ultra X9
Arc B390 Panther Lake iGPU, Ultra X9 388H
431 ms * +4%
Asus Zenbook A14 UX3704NA
X2-90, X2E-88-100, Micron 2600 1TB MTFDKBA1T0QHK
261.7 ms * +42%
Apple MacBook Air 13 M5
M5 8-Core GPU, M5 10-Core, Apple SSD AP0512Z
234.4 ms * +48%

* ... kleinere Werte sind besser

PCMark 10 Score
8639 Punkte
Hilfe
AIDA64 / Memory Copy
HP OmniBook Ultra 14 Core Ultra X9
Intel Core Ultra X9 388H, Arc B390 Panther Lake iGPU
131023 MB/s +12%
Asus ZenBook S14 UX5406AA
Intel Core Ultra 9 386H, Intel Graphics 4 Xe3 PTL
117423 MB/s
Honor MagicBook Pro 14 2026
Intel Core Ultra 5 338H, Arc B370 Panther Lake iGPU
114117 MB/s -3%
Durchschnittliche Intel Core Ultra 9 386H
  (75437 - 129946, n=8)
111660 MB/s -5%
Asus Zenbook S 14 UX5406
Intel Core Ultra 7 258V, Arc 140V
108756 MB/s -7%
Lenovo Yoga Slim 7 Ultra 14IPH11
Intel Core Ultra 7 355, Intel Graphics 4 Xe3 PTL
105135 MB/s -10%
Samsung Galaxy Book5 Pro 14 940XHA
Intel Core Ultra 5 226V, Arc 130V
99848 MB/s -15%
Dell XPS 14 Core Ultra 7 355
Intel Core Ultra 7 355, Intel Graphics 4 Xe3 PTL
97301 MB/s -17%
Durchschnitt der Klasse Subnotebook
  (14554 - 131023, n=58, der letzten 2 Jahre)
87849 MB/s -25%
Asus Zenbook A14 UX3704NA
Qualcomm Snapdragon X2 Elite X2E-88-100, X2-90
71573 MB/s -39%
AIDA64 / Memory Read
Asus Zenbook A14 UX3704NA
Qualcomm Snapdragon X2 Elite X2E-88-100, X2-90
122889 MB/s +11%
HP OmniBook Ultra 14 Core Ultra X9
Intel Core Ultra X9 388H, Arc B390 Panther Lake iGPU
120487 MB/s +9%
Asus ZenBook S14 UX5406AA
Intel Core Ultra 9 386H, Intel Graphics 4 Xe3 PTL
110626 MB/s
Durchschnittliche Intel Core Ultra 9 386H
  (81021 - 118858, n=8)
105248 MB/s -5%
Honor MagicBook Pro 14 2026
Intel Core Ultra 5 338H, Arc B370 Panther Lake iGPU
102294 MB/s -8%
Lenovo Yoga Slim 7 Ultra 14IPH11
Intel Core Ultra 7 355, Intel Graphics 4 Xe3 PTL
85021 MB/s -23%
Samsung Galaxy Book5 Pro 14 940XHA
Intel Core Ultra 5 226V, Arc 130V
84606 MB/s -24%
Durchschnitt der Klasse Subnotebook
  (15948 - 127174, n=58, der letzten 2 Jahre)
84046 MB/s -24%
Asus Zenbook S 14 UX5406
Intel Core Ultra 7 258V, Arc 140V
82846 MB/s -25%
Dell XPS 14 Core Ultra 7 355
Intel Core Ultra 7 355, Intel Graphics 4 Xe3 PTL
79551 MB/s -28%
AIDA64 / Memory Write
HP OmniBook Ultra 14 Core Ultra X9
Intel Core Ultra X9 388H, Arc B390 Panther Lake iGPU
135141 MB/s +12%
Asus ZenBook S14 UX5406AA
Intel Core Ultra 9 386H, Intel Graphics 4 Xe3 PTL
120995 MB/s
Honor MagicBook Pro 14 2026
Intel Core Ultra 5 338H, Arc B370 Panther Lake iGPU
120457 MB/s 0%
Durchschnittliche Intel Core Ultra 9 386H
  (75959 - 135096, n=8)
113435 MB/s -6%
Asus Zenbook S 14 UX5406
Intel Core Ultra 7 258V, Arc 140V
112837 MB/s -7%
Samsung Galaxy Book5 Pro 14 940XHA
Intel Core Ultra 5 226V, Arc 130V
111533 MB/s -8%
Lenovo Yoga Slim 7 Ultra 14IPH11
Intel Core Ultra 7 355, Intel Graphics 4 Xe3 PTL
108621 MB/s -10%
Dell XPS 14 Core Ultra 7 355
Intel Core Ultra 7 355, Intel Graphics 4 Xe3 PTL
103056 MB/s -15%
Durchschnitt der Klasse Subnotebook
  (15709 - 135141, n=58, der letzten 2 Jahre)
90037 MB/s -26%
Asus Zenbook A14 UX3704NA
Qualcomm Snapdragon X2 Elite X2E-88-100, X2-90
53663 MB/s -56%
AIDA64 / Memory Latency
Dell XPS 14 Core Ultra 7 355
Intel Core Ultra 7 355, Intel Graphics 4 Xe3 PTL
105.8 ns * -21%
Lenovo Yoga Slim 7 Ultra 14IPH11
Intel Core Ultra 7 355, Intel Graphics 4 Xe3 PTL
99.7 ns * -14%
Asus Zenbook S 14 UX5406
Intel Core Ultra 7 258V, Arc 140V
98.1 ns * -12%
Durchschnittliche Intel Core Ultra 9 386H
  (87.2 - 116.9, n=8)
96.7 ns * -10%
Durchschnitt der Klasse Subnotebook
  (6.1 - 159.9, n=56, der letzten 2 Jahre)
96.3 ns * -10%
Samsung Galaxy Book5 Pro 14 940XHA
Intel Core Ultra 5 226V, Arc 130V
90.5 ns * -3%
Honor MagicBook Pro 14 2026
Intel Core Ultra 5 338H, Arc B370 Panther Lake iGPU
90 ns * -3%
Asus ZenBook S14 UX5406AA
Intel Core Ultra 9 386H, Intel Graphics 4 Xe3 PTL
87.7 ns *
HP OmniBook Ultra 14 Core Ultra X9
Intel Core Ultra X9 388H, Arc B390 Panther Lake iGPU
85 ns * +3%

* ... kleinere Werte sind besser

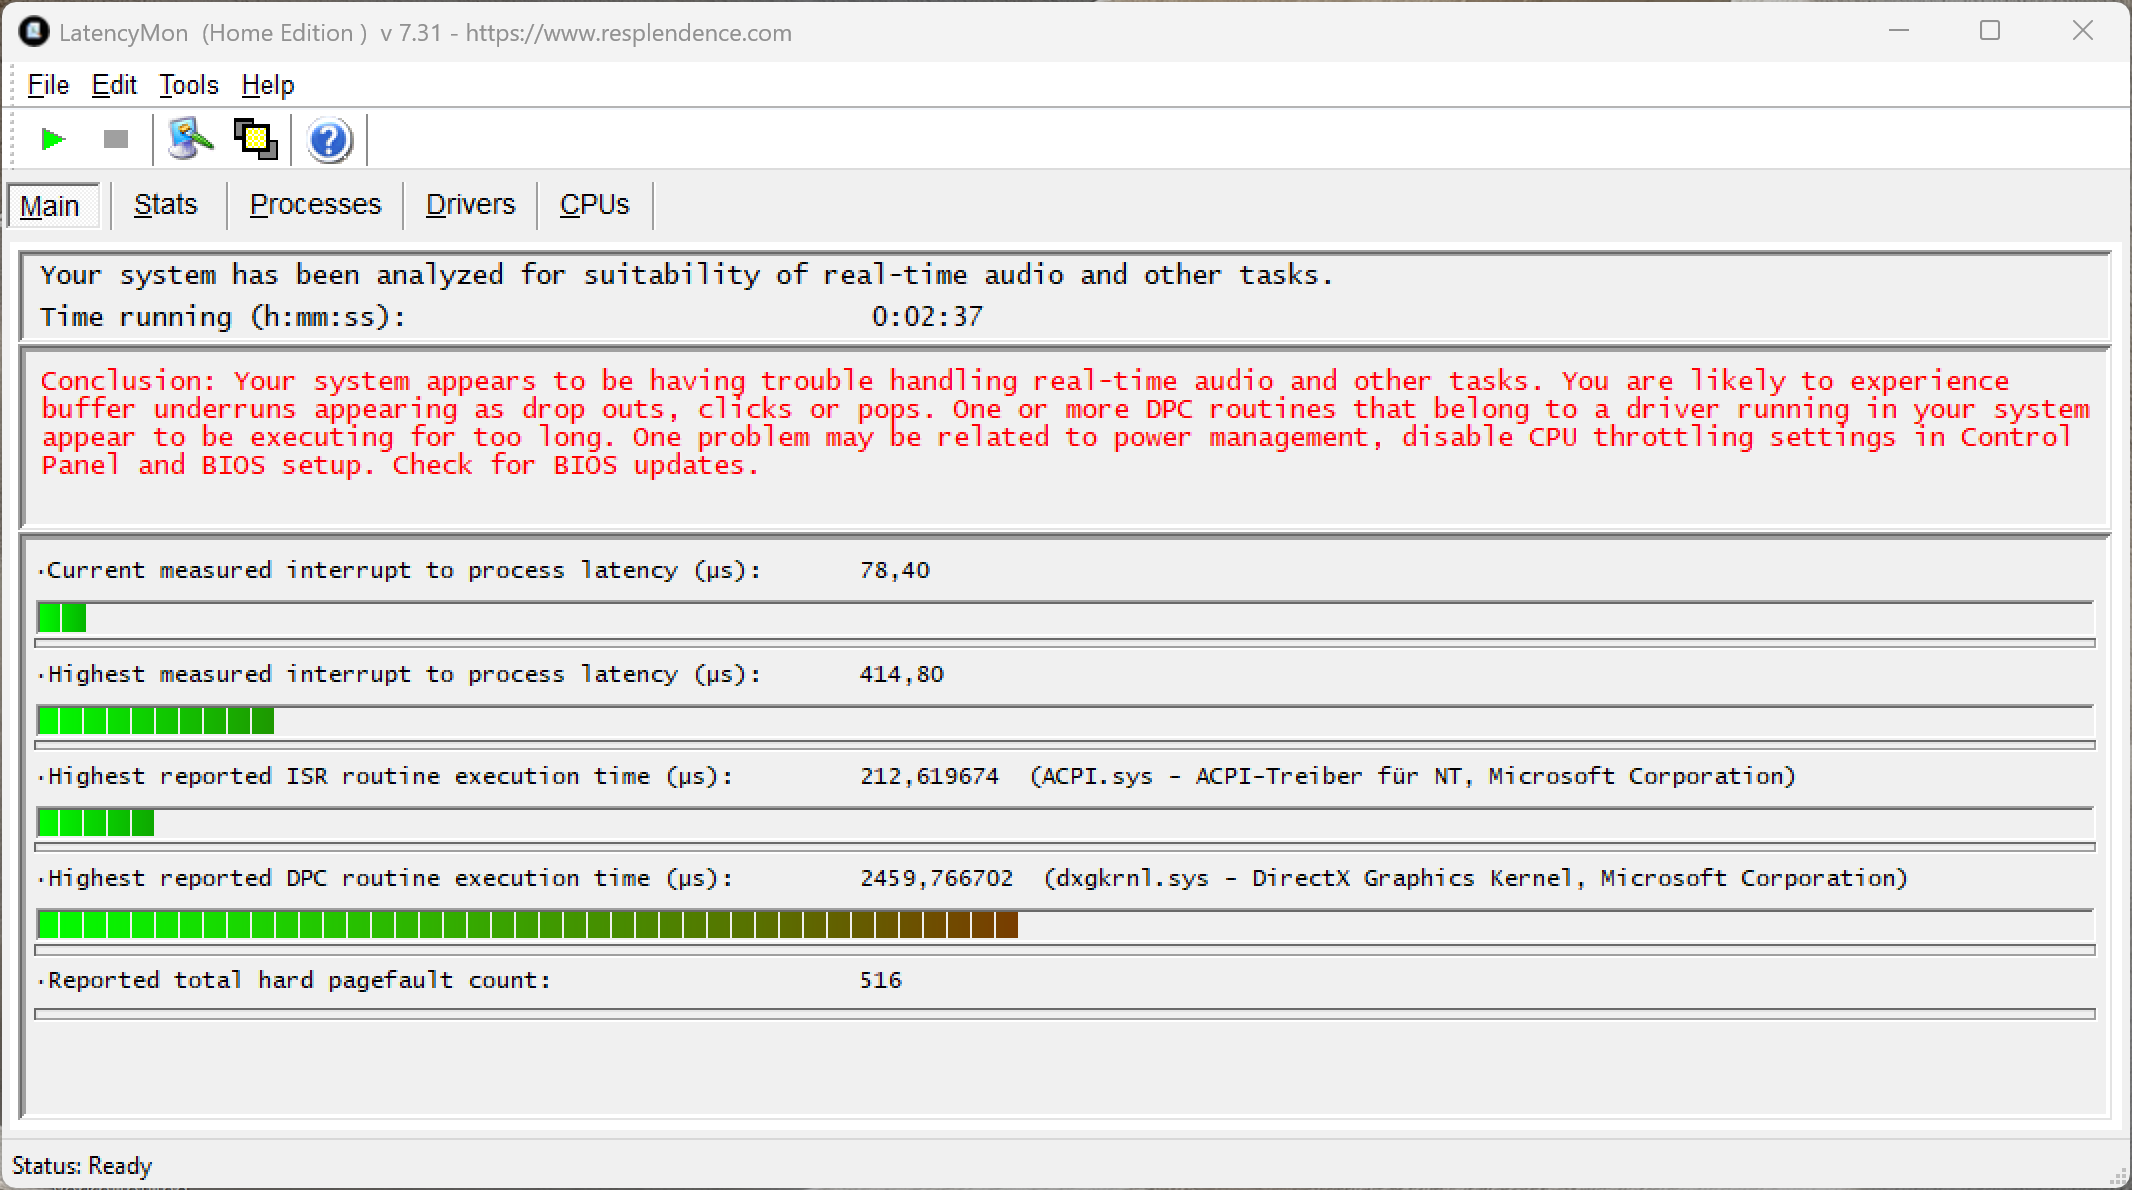
LatencyMon – Überblick
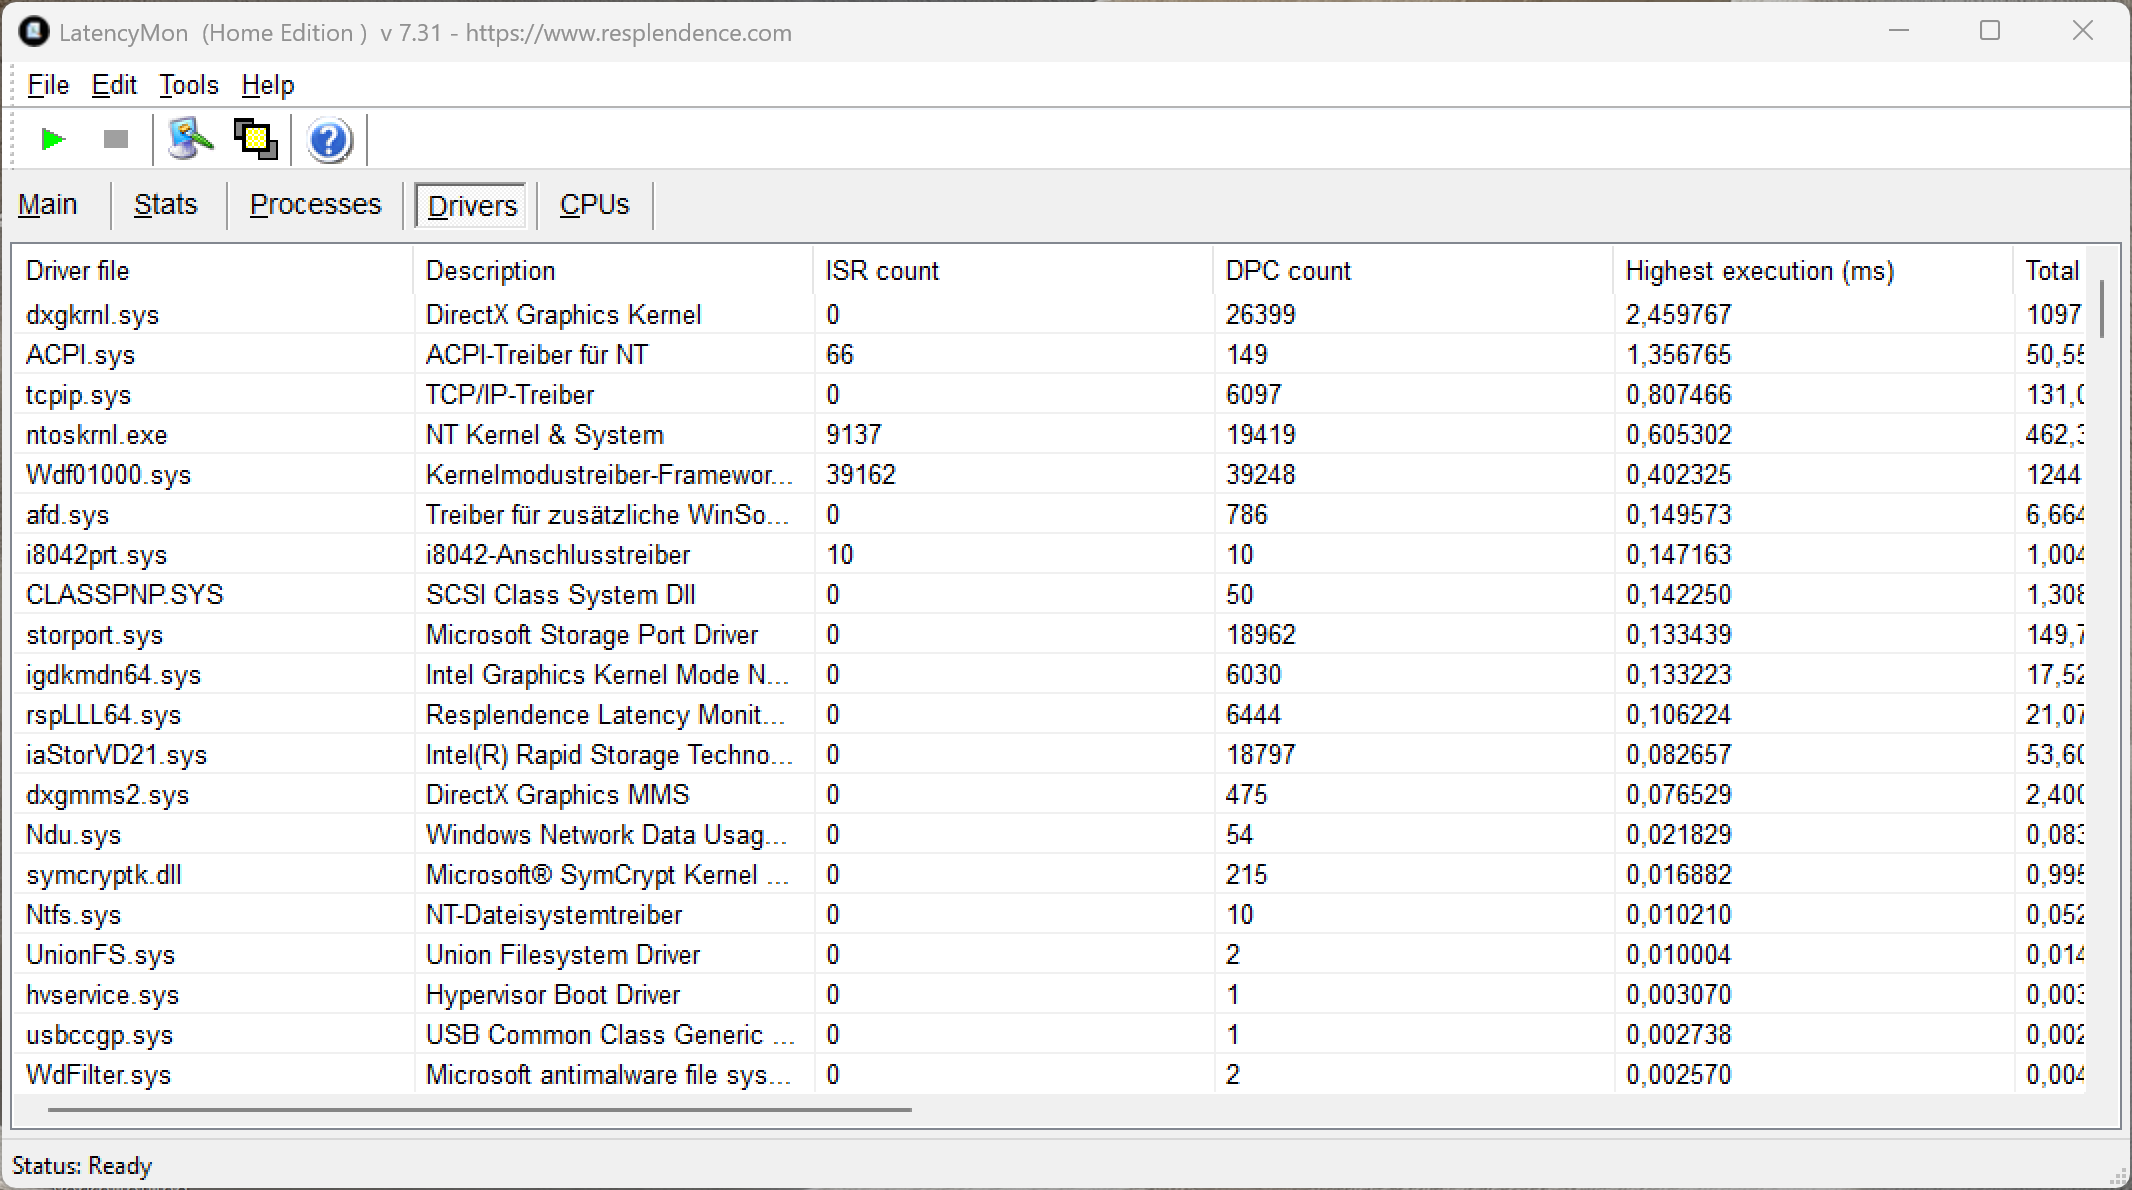
LatencyMon – Treiber
DPC Latencies / LatencyMon - interrupt to process latency (max), Web, Youtube, Prime95
HP OmniBook Ultra 14 Core Ultra X9
Arc B390 Panther Lake iGPU, Ultra X9 388H
5654.9 μs * -1263%
Lenovo Yoga Slim 7 Ultra 14IPH11
Intel Graphics 4 Xe3 PTL, Ultra 7 355, SK hynix PVC10 HFS001TEM4X182N
4322.1 μs * -942%
Samsung Galaxy Book5 Pro 14 940XHA
Arc 130V, Core Ultra 5 226V, Samsung PM9C1 MZVL8512HELU
3862.9 μs * -831%
Asus Zenbook S 14 UX5406
Arc 140V, Core Ultra 7 258V, WD PC SN560 SDDPNQE-1T00
1614.8 μs * -289%
Durchschnitt der Klasse Subnotebook
  (316 - 8148, n=40, der letzten 2 Jahre)
1468 μs * -254%
Honor MagicBook Pro 14 2026
Arc B370 Panther Lake iGPU, Ultra 5 338H, YMTC PC411-1TB
838.2 μs * -102%
Dell XPS 14 Core Ultra 7 355
Intel Graphics 4 Xe3 PTL, Ultra 7 355, WD PC SN7100S SDFPMSL-512G-1101
438.5 μs * -6%
Asus ZenBook S14 UX5406AA
Intel Graphics 4 Xe3 PTL, Ultra 9 386H, Samsung PM9C1b MZVL81T0HFLB-00BTW
414.8 μs *

* ... kleinere Werte sind besser

Samsung PM9C1b MZVL81T0HFLB-00BTW
CDM 5/6 Read Seq Q32T1: 7071 MB/s
CDM 5/6 Write Seq Q32T1: 5705 MB/s
CDM 5/6 Read 4K Q32T1: 486 MB/s
CDM 5/6 Write 4K Q32T1: 486 MB/s
CDM 5/6 Read 4K: 65 MB/s
CDM 5/6 Write 4K: 156.3 MB/s
CDM 6 Write 4K Q8T8: 533 MB/s
CDM 6 Read 4K Q8T8: 1007 MB/s
Drive Performance Rating - Percent
Honor MagicBook Pro 14 2026
YMTC PC411-1TB
81.3 pt
HP OmniBook Ultra 14 Core Ultra X9
 
77.1 pt
Durchschnittliche Samsung PM9C1b MZVL81T0HFLB-00BTW
 
72.1 pt
Asus Zenbook A14 UX3704NA
Micron 2600 1TB MTFDKBA1T0QHK
63.5 pt
Asus ZenBook S14 UX5406AA
Samsung PM9C1b MZVL81T0HFLB-00BTW
63.4 pt
Samsung Galaxy Book5 Pro 14 940XHA
Samsung PM9C1 MZVL8512HELU
56.1 pt
Durchschnitt der Klasse Subnotebook
 
55.3 pt
Lenovo Yoga Slim 7 Ultra 14IPH11
SK hynix PVC10 HFS001TEM4X182N
52.3 pt
Dell XPS 14 Core Ultra 7 355
WD PC SN7100S SDFPMSL-512G-1101
50.6 pt
Asus Zenbook S 14 UX5406
WD PC SN560 SDDPNQE-1T00
49.4 pt
DiskSpd
seq read
HP OmniBook Ultra 14 Core Ultra X9
 
4309 (3909.03min - 4308.81max) MB/s +80%
Honor MagicBook Pro 14 2026
YMTC PC411-1TB
4282 (4267.28min - 4282max) MB/s +79%
Asus Zenbook S 14 UX5406
WD PC SN560 SDDPNQE-1T00
3956 (3911.61min - 3955.65max) MB/s +65%
Lenovo Yoga Slim 7 Ultra 14IPH11
SK hynix PVC10 HFS001TEM4X182N
3721 (3612.13min - 3721.19max) MB/s +55%
Asus Zenbook A14 UX3704NA
Micron 2600 1TB MTFDKBA1T0QHK
3608 (3562.44min - 3608.27max) MB/s +51%
Durchschnittliche Samsung PM9C1b MZVL81T0HFLB-00BTW
  (2395 - 3686, n=3)
3112 MB/s +30%
Durchschnitt der Klasse Subnotebook
  (688 - 4852, n=57, der letzten 2 Jahre)
3011 MB/s +26%
Samsung Galaxy Book5 Pro 14 940XHA
Samsung PM9C1 MZVL8512HELU
2738 (2622.07min - 2738.46max) MB/s +14%
Asus ZenBook S14 UX5406AA
Samsung PM9C1b MZVL81T0HFLB-00BTW
2395 (1723.23min - 2395.4max) MB/s
Dell XPS 14 Core Ultra 7 355
WD PC SN7100S SDFPMSL-512G-1101
1981 (1834.07min - 1981.41max) MB/s -17%
seq write
Honor MagicBook Pro 14 2026
YMTC PC411-1TB
4761 (1570.35min - 4761.16max) MB/s +45%
HP OmniBook Ultra 14 Core Ultra X9
 
4651 (4040.05min - 4650.57max) MB/s +42%
Asus Zenbook A14 UX3704NA
Micron 2600 1TB MTFDKBA1T0QHK
3995 (3714.27min - 3995.31max) MB/s +22%
Durchschnittliche Samsung PM9C1b MZVL81T0HFLB-00BTW
  (3282 - 4939, n=3)
3955 MB/s +21%
Asus ZenBook S14 UX5406AA
Samsung PM9C1b MZVL81T0HFLB-00BTW
3282 (2221.3min - 3282.04max) MB/s
Durchschnitt der Klasse Subnotebook
  (102.8 - 5392, n=57, der letzten 2 Jahre)
2962 MB/s -10%
Samsung Galaxy Book5 Pro 14 940XHA
Samsung PM9C1 MZVL8512HELU
2887 (2771.18min - 2887.15max) MB/s -12%
Dell XPS 14 Core Ultra 7 355
WD PC SN7100S SDFPMSL-512G-1101
2541 (984.32min - 2540.86max) MB/s -23%
Asus Zenbook S 14 UX5406
WD PC SN560 SDDPNQE-1T00
2428 (2247.52min - 2427.66max) MB/s -26%
Lenovo Yoga Slim 7 Ultra 14IPH11
SK hynix PVC10 HFS001TEM4X182N
2412 (1944.8min - 2412.36max) MB/s -27%
seq q8 t1 read
HP OmniBook Ultra 14 Core Ultra X9
 
10314 (8944.92min - 10313.9max) MB/s +48%
Asus Zenbook A14 UX3704NA
Micron 2600 1TB MTFDKBA1T0QHK
7018 (5583.3min - 7017.51max) MB/s +1%
Durchschnittliche Samsung PM9C1b MZVL81T0HFLB-00BTW
  (6940 - 7013, n=3)
6966 MB/s 0%
Asus ZenBook S14 UX5406AA
Samsung PM9C1b MZVL81T0HFLB-00BTW
6946 (6079.44min - 6946.4max) MB/s
Honor MagicBook Pro 14 2026
YMTC PC411-1TB
6927 (5783.35min - 6926.91max) MB/s 0%
Dell XPS 14 Core Ultra 7 355
WD PC SN7100S SDFPMSL-512G-1101
6851 (5650.54min - 6850.91max) MB/s -1%
Lenovo Yoga Slim 7 Ultra 14IPH11
SK hynix PVC10 HFS001TEM4X182N
6602 (4923.47min - 6602.04max) MB/s -5%
Durchschnitt der Klasse Subnotebook
  (694 - 13544, n=57, der letzten 2 Jahre)
5861 MB/s -16%
Asus Zenbook S 14 UX5406
WD PC SN560 SDDPNQE-1T00
5021 (4293.08min - 5020.56max) MB/s -28%
Samsung Galaxy Book5 Pro 14 940XHA
Samsung PM9C1 MZVL8512HELU
5008 (4528.17min - 5007.63max) MB/s -28%
seq q8 t1 write
HP OmniBook Ultra 14 Core Ultra X9
 
8967 (8867.27min - 8966.79max) MB/s +63%
Honor MagicBook Pro 14 2026
YMTC PC411-1TB
6307 (6196.46min - 6306.97max) MB/s +15%
Lenovo Yoga Slim 7 Ultra 14IPH11
SK hynix PVC10 HFS001TEM4X182N
5795 (5683.11min - 5795.06max) MB/s +5%
Asus Zenbook A14 UX3704NA
Micron 2600 1TB MTFDKBA1T0QHK
5756 (5681.39min - 5756.49max) MB/s +5%
Asus ZenBook S14 UX5406AA
Samsung PM9C1b MZVL81T0HFLB-00BTW
5499 (1771.7min - 5499.27max) MB/s
Durchschnittliche Samsung PM9C1b MZVL81T0HFLB-00BTW
  (4986 - 5771, n=3)
5419 MB/s -1%
Dell XPS 14 Core Ultra 7 355
WD PC SN7100S SDFPMSL-512G-1101
5290 (1086.67min - 5289.65max) MB/s -4%
Durchschnitt der Klasse Subnotebook
  (107 - 9702, n=57, der letzten 2 Jahre)
4510 MB/s -18%
Asus Zenbook S 14 UX5406
WD PC SN560 SDDPNQE-1T00
3256 (3210.53min - 3255.62max) MB/s -41%
Samsung Galaxy Book5 Pro 14 940XHA
Samsung PM9C1 MZVL8512HELU
2873 (2752.51min - 2872.55max) MB/s -48%
4k q1 t1 read
HP OmniBook Ultra 14 Core Ultra X9
 
81.6 (80.13min - 81.55max) MB/s +38%
Asus Zenbook A14 UX3704NA
Micron 2600 1TB MTFDKBA1T0QHK
80.8 (78.68min - 80.78max) MB/s +36%
Dell XPS 14 Core Ultra 7 355
WD PC SN7100S SDFPMSL-512G-1101
70.1 (69.53min - 70.06max) MB/s +18%
Lenovo Yoga Slim 7 Ultra 14IPH11
SK hynix PVC10 HFS001TEM4X182N
67.9 (67.24min - 67.94max) MB/s +15%
Samsung Galaxy Book5 Pro 14 940XHA
Samsung PM9C1 MZVL8512HELU
61.9 (58.67min - 61.86max) MB/s +4%
Durchschnittliche Samsung PM9C1b MZVL81T0HFLB-00BTW
  (45.1 - 81.4, n=3)
61.9 MB/s +4%
Durchschnitt der Klasse Subnotebook
  (19.9 - 95.2, n=57, der letzten 2 Jahre)
59.5 MB/s 0%
Asus ZenBook S14 UX5406AA
Samsung PM9C1b MZVL81T0HFLB-00BTW
59.3 (58.83min - 59.32max) MB/s
Honor MagicBook Pro 14 2026
YMTC PC411-1TB
51.6 (48.94min - 51.55max) MB/s -13%
Asus Zenbook S 14 UX5406
WD PC SN560 SDDPNQE-1T00
48.4 (45.76min - 48.41max) MB/s -18%
4k q1 t1 write
Asus Zenbook A14 UX3704NA
Micron 2600 1TB MTFDKBA1T0QHK
278 (277.09min - 278.31max) MB/s +44%
Durchschnittliche Samsung PM9C1b MZVL81T0HFLB-00BTW
  (193 - 253, n=3)
232 MB/s +20%
Honor MagicBook Pro 14 2026
YMTC PC411-1TB
224 (169.94min - 224.41max) MB/s +16%
Asus ZenBook S14 UX5406AA
Samsung PM9C1b MZVL81T0HFLB-00BTW
193 (151.69min - 192.98max) MB/s
HP OmniBook Ultra 14 Core Ultra X9
 
191.6 (187.96min - 191.62max) MB/s -1%
Samsung Galaxy Book5 Pro 14 940XHA
Samsung PM9C1 MZVL8512HELU
170.2 (159.17min - 170.23max) MB/s -12%
Durchschnitt der Klasse Subnotebook
  (44.6 - 278, n=57, der letzten 2 Jahre)
154.1 MB/s -20%
Dell XPS 14 Core Ultra 7 355
WD PC SN7100S SDFPMSL-512G-1101
132.1 (130.77min - 132.13max) MB/s -32%
Lenovo Yoga Slim 7 Ultra 14IPH11
SK hynix PVC10 HFS001TEM4X182N
128 (119.77min - 128max) MB/s -34%
Asus Zenbook S 14 UX5406
WD PC SN560 SDDPNQE-1T00
119.2 (115.9min - 119.18max) MB/s -38%
4k q32 t16 read
Honor MagicBook Pro 14 2026
YMTC PC411-1TB
3332 (3316.22min - 3331.68max) MB/s +371%
Samsung Galaxy Book5 Pro 14 940XHA
Samsung PM9C1 MZVL8512HELU
1751 (1747.14min - 1750.91max) MB/s +147%
Durchschnittliche Samsung PM9C1b MZVL81T0HFLB-00BTW
  (708 - 2986, n=3)
1626 MB/s +130%
Asus Zenbook A14 UX3704NA
Micron 2600 1TB MTFDKBA1T0QHK
1210 (1149.44min - 1210.21max) MB/s +71%
Durchschnitt der Klasse Subnotebook
  (207 - 4203, n=57, der letzten 2 Jahre)
1100 MB/s +55%
HP OmniBook Ultra 14 Core Ultra X9
 
932 (924.12min - 932.49max) MB/s +32%
Dell XPS 14 Core Ultra 7 355
WD PC SN7100S SDFPMSL-512G-1101
755 (635.73min - 755.13max) MB/s +7%
Asus Zenbook S 14 UX5406
WD PC SN560 SDDPNQE-1T00
730 (676.47min - 730.15max) MB/s +3%
Asus ZenBook S14 UX5406AA
Samsung PM9C1b MZVL81T0HFLB-00BTW
708 (681.96min - 708.32max) MB/s
Lenovo Yoga Slim 7 Ultra 14IPH11
SK hynix PVC10 HFS001TEM4X182N
654 (648.37min - 654.06max) MB/s -8%
4k q32 t16 write
Honor MagicBook Pro 14 2026
YMTC PC411-1TB
2675 (1736.42min - 2674.78max) MB/s +430%
Samsung Galaxy Book5 Pro 14 940XHA
Samsung PM9C1 MZVL8512HELU
1626 (1615.92min - 1626.34max) MB/s +222%
Durchschnittliche Samsung PM9C1b MZVL81T0HFLB-00BTW
  (505 - 1761, n=3)
1024 MB/s +103%
Durchschnitt der Klasse Subnotebook
  (115.9 - 5007, n=57, der letzten 2 Jahre)
786 MB/s +56%
Asus Zenbook A14 UX3704NA
Micron 2600 1TB MTFDKBA1T0QHK
677 (665.02min - 677.09max) MB/s +34%
Asus ZenBook S14 UX5406AA
Samsung PM9C1b MZVL81T0HFLB-00BTW
505 (445.89min - 505.42max) MB/s
HP OmniBook Ultra 14 Core Ultra X9
 
464 (436.89min - 463.53max) MB/s -8%
Dell XPS 14 Core Ultra 7 355
WD PC SN7100S SDFPMSL-512G-1101
437 (331.11min - 436.83max) MB/s -13%
Lenovo Yoga Slim 7 Ultra 14IPH11
SK hynix PVC10 HFS001TEM4X182N
431 (398.98min - 431.3max) MB/s -15%
Asus Zenbook S 14 UX5406
WD PC SN560 SDDPNQE-1T00
381 (308.99min - 381.11max) MB/s -25%
AS SSD
Score Total
Honor MagicBook Pro 14 2026
YMTC PC411-1TB
6839 Points +31%
Durchschnittliche Samsung PM9C1b MZVL81T0HFLB-00BTW
  (5124 - 8229, n=3)
6197 Points +18%
HP OmniBook Ultra 14 Core Ultra X9
 
6029 Points +15%
Asus ZenBook S14 UX5406AA
Samsung PM9C1b MZVL81T0HFLB-00BTW
5238 Points
Asus Zenbook A14 UX3704NA
Micron 2600 1TB MTFDKBA1T0QHK
4349 Points -17%
Durchschnitt der Klasse Subnotebook
  (515 - 9875, n=56, der letzten 2 Jahre)
4146 Points -21%
Samsung Galaxy Book5 Pro 14 940XHA
Samsung PM9C1 MZVL8512HELU
3775 Points -28%
Lenovo Yoga Slim 7 Ultra 14IPH11
SK hynix PVC10 HFS001TEM4X182N
3727 Points -29%
Dell XPS 14 Core Ultra 7 355
WD PC SN7100S SDFPMSL-512G-1101
3542 Points -32%
Asus Zenbook S 14 UX5406
WD PC SN560 SDDPNQE-1T00
3064 Points -42%
Score Read
Honor MagicBook Pro 14 2026
YMTC PC411-1TB
2787 Points +98%
Durchschnittliche Samsung PM9C1b MZVL81T0HFLB-00BTW
  (1188 - 3317, n=3)
1971 Points +40%
HP OmniBook Ultra 14 Core Ultra X9
 
1687 Points +20%
Samsung Galaxy Book5 Pro 14 940XHA
Samsung PM9C1 MZVL8512HELU
1479 Points +5%
Asus ZenBook S14 UX5406AA
Samsung PM9C1b MZVL81T0HFLB-00BTW
1409 Points
Durchschnitt der Klasse Subnotebook
  (246 - 4048, n=56, der letzten 2 Jahre)
1360 Points -3%
Dell XPS 14 Core Ultra 7 355
WD PC SN7100S SDFPMSL-512G-1101
1283 Points -9%
Lenovo Yoga Slim 7 Ultra 14IPH11
SK hynix PVC10 HFS001TEM4X182N
1259 Points -11%
Asus Zenbook A14 UX3704NA
Micron 2600 1TB MTFDKBA1T0QHK
1192 Points -15%
Asus Zenbook S 14 UX5406
WD PC SN560 SDDPNQE-1T00
1096 Points -22%
Score Write
HP OmniBook Ultra 14 Core Ultra X9
 
3565 Points +11%
Durchschnittliche Samsung PM9C1b MZVL81T0HFLB-00BTW
  (3208 - 3402, n=3)
3294 Points +3%
Asus ZenBook S14 UX5406AA
Samsung PM9C1b MZVL81T0HFLB-00BTW
3208 Points
Asus Zenbook A14 UX3704NA
Micron 2600 1TB MTFDKBA1T0QHK
2724 Points -15%
Honor MagicBook Pro 14 2026
YMTC PC411-1TB
2642 Points -18%
Durchschnitt der Klasse Subnotebook
  (153 - 4148, n=56, der letzten 2 Jahre)
2153 Points -33%
Lenovo Yoga Slim 7 Ultra 14IPH11
SK hynix PVC10 HFS001TEM4X182N
1889 Points -41%
Dell XPS 14 Core Ultra 7 355
WD PC SN7100S SDFPMSL-512G-1101
1716 Points -47%
Samsung Galaxy Book5 Pro 14 940XHA
Samsung PM9C1 MZVL8512HELU
1608 Points -50%
Asus Zenbook S 14 UX5406
WD PC SN560 SDDPNQE-1T00
1474 Points -54%
Seq Read
HP OmniBook Ultra 14 Core Ultra X9
 
6737.66 MB/s +36%
Asus Zenbook A14 UX3704NA
Micron 2600 1TB MTFDKBA1T0QHK
5527 MB/s +12%
Durchschnittliche Samsung PM9C1b MZVL81T0HFLB-00BTW
  (4948 - 5626, n=3)
5322 MB/s +8%
Honor MagicBook Pro 14 2026
YMTC PC411-1TB
5171.68 MB/s +5%
Lenovo Yoga Slim 7 Ultra 14IPH11
SK hynix PVC10 HFS001TEM4X182N
5167.4 MB/s +4%
Dell XPS 14 Core Ultra 7 355
WD PC SN7100S SDFPMSL-512G-1101
5156.88 MB/s +4%
Asus ZenBook S14 UX5406AA
Samsung PM9C1b MZVL81T0HFLB-00BTW
4948 MB/s
Durchschnitt der Klasse Subnotebook
  (448 - 8075, n=56, der letzten 2 Jahre)
4491 MB/s -9%
Asus Zenbook S 14 UX5406
WD PC SN560 SDDPNQE-1T00
3936 MB/s -20%
Samsung Galaxy Book5 Pro 14 940XHA
Samsung PM9C1 MZVL8512HELU
3935 MB/s -20%
Seq Write
Honor MagicBook Pro 14 2026
YMTC PC411-1TB
4835.53 MB/s +88%
HP OmniBook Ultra 14 Core Ultra X9
 
4758.23 MB/s +85%
Durchschnittliche Samsung PM9C1b MZVL81T0HFLB-00BTW
  (2567 - 4528, n=3)
3541 MB/s +38%
Lenovo Yoga Slim 7 Ultra 14IPH11
SK hynix PVC10 HFS001TEM4X182N
3485.6 MB/s +36%
Durchschnitt der Klasse Subnotebook
  (99 - 5481, n=56, der letzten 2 Jahre)
2933 MB/s +14%
Asus ZenBook S14 UX5406AA
Samsung PM9C1b MZVL81T0HFLB-00BTW
2567 MB/s
Dell XPS 14 Core Ultra 7 355
WD PC SN7100S SDFPMSL-512G-1101
2538.17 MB/s -1%
Samsung Galaxy Book5 Pro 14 940XHA
Samsung PM9C1 MZVL8512HELU
2410 MB/s -6%
Asus Zenbook S 14 UX5406
WD PC SN560 SDDPNQE-1T00
2387 MB/s -7%
Asus Zenbook A14 UX3704NA
Micron 2600 1TB MTFDKBA1T0QHK
1794 MB/s -30%
4K Read
Durchschnittliche Samsung PM9C1b MZVL81T0HFLB-00BTW
  (65.7 - 74.7, n=3)
70 MB/s +1%
Asus ZenBook S14 UX5406AA
Samsung PM9C1b MZVL81T0HFLB-00BTW
69.6 MB/s
Lenovo Yoga Slim 7 Ultra 14IPH11
SK hynix PVC10 HFS001TEM4X182N
67.45 MB/s -3%
Dell XPS 14 Core Ultra 7 355
WD PC SN7100S SDFPMSL-512G-1101
67.29 MB/s -3%
Honor MagicBook Pro 14 2026
YMTC PC411-1TB
66.22 MB/s -5%
HP OmniBook Ultra 14 Core Ultra X9
 
63.24 MB/s -9%
Durchschnitt der Klasse Subnotebook
  (19.8 - 96.3, n=56, der letzten 2 Jahre)
59 MB/s -15%
Samsung Galaxy Book5 Pro 14 940XHA
Samsung PM9C1 MZVL8512HELU
50 MB/s -28%
Asus Zenbook A14 UX3704NA
Micron 2600 1TB MTFDKBA1T0QHK
47.4 MB/s -32%
Asus Zenbook S 14 UX5406
WD PC SN560 SDDPNQE-1T00
47 MB/s -32%
4K Write
Durchschnittliche Samsung PM9C1b MZVL81T0HFLB-00BTW
  (153.1 - 225, n=3)
200 MB/s +31%
Honor MagicBook Pro 14 2026
YMTC PC411-1TB
190.41 MB/s +24%
HP OmniBook Ultra 14 Core Ultra X9
 
188.94 MB/s +23%
Dell XPS 14 Core Ultra 7 355
WD PC SN7100S SDFPMSL-512G-1101
176.81 MB/s +15%
Lenovo Yoga Slim 7 Ultra 14IPH11
SK hynix PVC10 HFS001TEM4X182N
167.72 MB/s +10%
Durchschnitt der Klasse Subnotebook
  (37.4 - 265, n=56, der letzten 2 Jahre)
165.1 MB/s +8%
Samsung Galaxy Book5 Pro 14 940XHA
Samsung PM9C1 MZVL8512HELU
153.7 MB/s 0%
Asus ZenBook S14 UX5406AA
Samsung PM9C1b MZVL81T0HFLB-00BTW
153.1 MB/s
Asus Zenbook S 14 UX5406
WD PC SN560 SDDPNQE-1T00
138.5 MB/s -10%
Asus Zenbook A14 UX3704NA
Micron 2600 1TB MTFDKBA1T0QHK
110 MB/s -28%
4K-64 Read
Honor MagicBook Pro 14 2026
YMTC PC411-1TB
2203.55 MB/s +161%
Durchschnittliche Samsung PM9C1b MZVL81T0HFLB-00BTW
  (583 - 2680, n=3)
1369 MB/s +62%
Samsung Galaxy Book5 Pro 14 940XHA
Samsung PM9C1 MZVL8512HELU
1036 MB/s +23%
HP OmniBook Ultra 14 Core Ultra X9
 
950.03 MB/s +12%
Durchschnitt der Klasse Subnotebook
  (168.4 - 3417, n=56, der letzten 2 Jahre)
854 MB/s +1%
Asus ZenBook S14 UX5406AA
Samsung PM9C1b MZVL81T0HFLB-00BTW
845 MB/s
Dell XPS 14 Core Ultra 7 355
WD PC SN7100S SDFPMSL-512G-1101
699.72 MB/s -17%
Lenovo Yoga Slim 7 Ultra 14IPH11
SK hynix PVC10 HFS001TEM4X182N
674.97 MB/s -20%
Asus Zenbook S 14 UX5406
WD PC SN560 SDDPNQE-1T00
655 MB/s -22%
Asus Zenbook A14 UX3704NA
Micron 2600 1TB MTFDKBA1T0QHK
592 MB/s -30%
4K-64 Write
HP OmniBook Ultra 14 Core Ultra X9
 
2900.72 MB/s +4%
Asus ZenBook S14 UX5406AA
Samsung PM9C1b MZVL81T0HFLB-00BTW
2799 MB/s
Durchschnittliche Samsung PM9C1b MZVL81T0HFLB-00BTW
  (2596 - 2825, n=3)
2740 MB/s -2%
Asus Zenbook A14 UX3704NA
Micron 2600 1TB MTFDKBA1T0QHK
2435 MB/s -13%
Honor MagicBook Pro 14 2026
YMTC PC411-1TB
1968.07 MB/s -30%
Durchschnitt der Klasse Subnotebook
  (105.9 - 3386, n=56, der letzten 2 Jahre)
1694 MB/s -39%
Lenovo Yoga Slim 7 Ultra 14IPH11
SK hynix PVC10 HFS001TEM4X182N
1372.53 MB/s -51%
Dell XPS 14 Core Ultra 7 355
WD PC SN7100S SDFPMSL-512G-1101
1284.98 MB/s -54%
Samsung Galaxy Book5 Pro 14 940XHA
Samsung PM9C1 MZVL8512HELU
1213 MB/s -57%
Asus Zenbook S 14 UX5406
WD PC SN560 SDDPNQE-1T00
1097 MB/s -61%
Access Time Read
Dell XPS 14 Core Ultra 7 355
WD PC SN7100S SDFPMSL-512G-1101
0.083 ms * -77%
Durchschnittliche Samsung PM9C1b MZVL81T0HFLB-00BTW
  (0.047 - 0.121, n=3)
0.081 ms * -72%
Lenovo Yoga Slim 7 Ultra 14IPH11
SK hynix PVC10 HFS001TEM4X182N
0.08 ms * -70%
Durchschnitt der Klasse Subnotebook
  (0.02 - 0.172, n=56, der letzten 2 Jahre)
0.06636 ms * -41%
Honor MagicBook Pro 14 2026
YMTC PC411-1TB
0.053 ms * -13%
Samsung Galaxy Book5 Pro 14 940XHA
Samsung PM9C1 MZVL8512HELU
0.051 ms * -9%
Asus ZenBook S14 UX5406AA
Samsung PM9C1b MZVL81T0HFLB-00BTW
0.047 ms *
Asus Zenbook A14 UX3704NA
Micron 2600 1TB MTFDKBA1T0QHK
0.044 ms * +6%
HP OmniBook Ultra 14 Core Ultra X9
 
0.042 ms * +11%
Asus Zenbook S 14 UX5406
WD PC SN560 SDDPNQE-1T00
0.032 ms * +32%
Access Time Write
Lenovo Yoga Slim 7 Ultra 14IPH11
SK hynix PVC10 HFS001TEM4X182N
0.085 ms * -240%
Honor MagicBook Pro 14 2026
YMTC PC411-1TB
0.069 ms * -176%
HP OmniBook Ultra 14 Core Ultra X9
 
0.061 ms * -144%
Dell XPS 14 Core Ultra 7 355
WD PC SN7100S SDFPMSL-512G-1101
0.06 ms * -140%
Durchschnitt der Klasse Subnotebook
  (0.017 - 0.158, n=56, der letzten 2 Jahre)
0.05079 ms * -103%
Asus Zenbook A14 UX3704NA
Micron 2600 1TB MTFDKBA1T0QHK
0.031 ms * -24%
Asus ZenBook S14 UX5406AA
Samsung PM9C1b MZVL81T0HFLB-00BTW
0.025 ms *
Asus Zenbook S 14 UX5406
WD PC SN560 SDDPNQE-1T00
0.023 ms * +8%
Samsung Galaxy Book5 Pro 14 940XHA
Samsung PM9C1 MZVL8512HELU
0.023 ms * +8%
Durchschnittliche Samsung PM9C1b MZVL81T0HFLB-00BTW
  (0.017 - 0.025, n=3)
0.02033 ms * +19%

* ... kleinere Werte sind besser

Festplattendrosselung: DiskSpd-Lese-Schleife, Warteschlangentiefe 8

0145290435580725870101511601305145015951740188520302175232024652610275529003045319033353480362537703915406042054350449546404785493050755220536555105655580059456090623563806525667068156960Tooltip
Asus ZenBook S14 UX5406AA; diskspd 2.0.17 f: Ø6997 (6381.84-7056.02) MB/s

GPU- und Gaming-Leistung

Der Core Ultra 9 386H ist lediglich mit der Intel Graphics-iGPU mit 4 Xe-Kernen ausgestattet, die deutlich langsamer ist als die High-End-iGPUs Arc B390 oder B370. Tatsächlich ist sie sogar langsamer als die alte Lunar-Lake-Arc-Grafikkarte 140V aus dem Vorgängermodell Zenbook S14, was bedeutet, dass auch die Spieleleistung bei modernen Titeln etwas schlechter ausfällt. Die iGPU reicht für gängige Aufgaben wie die Videowiedergabe natürlich aus, doch wenn man gerne spielt, empfehlen wir die Entscheidung für eines der Konkurrenzmodelle mit schnelleren GPU-Optionen.

3DMark Performance Rating - Percent
HP OmniBook Ultra 14 Core Ultra X9 -2!
Intel Arc B390 12 Xe3 Panther Lake iGPU, Intel Core Ultra X9 388H
100 pt
Honor MagicBook Pro 14 2026
Intel Arc B370 10 Xe3 Panther Lake iGPU, Intel Core Ultra 5 338H
95.5 pt
Apple MacBook Air 13 M5 -3!
Apple M5 8-Core GPU, Apple M5 10-Core
74.6 pt
Asus Zenbook A14 UX3704NA
Qualcomm Adreno X2-90, Qualcomm Snapdragon X2 Elite X2E-88-100
70.4 pt
Asus Zenbook S 14 UX5406
Intel Arc Graphics 140V, Intel Core Ultra 7 258V
59.7 pt
Samsung Galaxy Book5 Pro 14 940XHA -2!
Intel Arc Graphics 130V, Intel Core Ultra 5 226V
54.5 pt
Durchschnitt der Klasse Subnotebook
 
48.2 pt
Asus ZenBook S14 UX5406AA
Intel Graphics 4 Xe3 Panther Lake iGPU, Intel Core Ultra 9 386H
44.1 pt
Dell XPS 14 Core Ultra 7 355 -2!
Intel Graphics 4 Xe3 Panther Lake iGPU, Intel Core Ultra 7 355
43.2 pt
Durchschnittliche Intel Graphics 4 Xe3 Panther Lake iGPU
 
43.1 pt
Lenovo Yoga Slim 7 Ultra 14IPH11 -2!
Intel Graphics 4 Xe3 Panther Lake iGPU, Intel Core Ultra 7 355
42.3 pt
3DMark 11 - 1280x720 Performance GPU
HP OmniBook Ultra 14 Core Ultra X9
Intel Arc B390 12 Xe3 Panther Lake iGPU, Intel Core Ultra X9 388H
18489 Points +152%
Honor MagicBook Pro 14 2026
Intel Arc B370 10 Xe3 Panther Lake iGPU, Intel Core Ultra 5 338H
16289 Points +122%
Asus Zenbook A14 UX3704NA
Qualcomm Adreno X2-90, Qualcomm Snapdragon X2 Elite X2E-88-100
11821 Points +61%
Asus Zenbook S 14 UX5406
Intel Arc Graphics 140V, Intel Core Ultra 7 258V
10722 Points +46%
Samsung Galaxy Book5 Pro 14 940XHA
Intel Arc Graphics 130V, Intel Core Ultra 5 226V
10042 Points +37%
Durchschnitt der Klasse Subnotebook
  (995 - 18489, n=55, der letzten 2 Jahre)
9658 Points +32%
Asus ZenBook S14 UX5406AA
Intel Graphics 4 Xe3 Panther Lake iGPU, Intel Core Ultra 9 386H
7334 Points
Dell XPS 14 Core Ultra 7 355
Intel Graphics 4 Xe3 Panther Lake iGPU, Intel Core Ultra 7 355
7317 Points 0%
Lenovo Yoga Slim 7 Ultra 14IPH11
Intel Graphics 4 Xe3 Panther Lake iGPU, Intel Core Ultra 7 355
7291 Points -1%
Durchschnittliche Intel Graphics 4 Xe3 Panther Lake iGPU
  (6268 - 7678, n=10)
7019 Points -4%
3DMark
Steel Nomad Score
Honor MagicBook Pro 14 2026
Intel Arc B370 10 Xe3 Panther Lake iGPU, Intel Core Ultra 5 338H
1393 Points +127%
Asus Zenbook A14 UX3704NA
Qualcomm Adreno X2-90, Qualcomm Snapdragon X2 Elite X2E-88-100
1095 Points +79%
Apple MacBook Air 13 M5
Apple M5 8-Core GPU, Apple M5 10-Core
941 Points +54%
Asus Zenbook S 14 UX5406
Intel Arc Graphics 140V, Intel Core Ultra 7 258V
883 Points +44%
Durchschnittliche Intel Graphics 4 Xe3 Panther Lake iGPU
  (613 - 622, n=2)
618 Points +1%
Asus ZenBook S14 UX5406AA
Intel Graphics 4 Xe3 Panther Lake iGPU, Intel Core Ultra 9 386H
613 Points
Durchschnitt der Klasse Subnotebook
  (184 - 1095, n=31, der letzten 2 Jahre)
572 Points -7%
Steel Nomad Light Score
Honor MagicBook Pro 14 2026
Intel Arc B370 10 Xe3 Panther Lake iGPU, Intel Core Ultra 5 338H
5398 Points +119%
Asus Zenbook A14 UX3704NA
Qualcomm Adreno X2-90, Qualcomm Snapdragon X2 Elite X2E-88-100
4877 Points +98%
Apple MacBook Air 13 M5
Apple M5 8-Core GPU, Apple M5 10-Core
4405 Points +79%
Asus Zenbook S 14 UX5406
Intel Arc Graphics 140V, Intel Core Ultra 7 258V
3299 Points +34%
Durchschnitt der Klasse Subnotebook
  (1034 - 5084, n=27, der letzten 2 Jahre)
2801 Points +14%
Durchschnittliche Intel Graphics 4 Xe3 Panther Lake iGPU
  (2466 - 2501, n=2)
2484 Points +1%
Asus ZenBook S14 UX5406AA
Intel Graphics 4 Xe3 Panther Lake iGPU, Intel Core Ultra 9 386H
2466 Points
1920x1080 Fire Strike Graphics
HP OmniBook Ultra 14 Core Ultra X9
Intel Arc B390 12 Xe3 Panther Lake iGPU, Intel Core Ultra X9 388H
16347 Points +134%
Honor MagicBook Pro 14 2026
Intel Arc B370 10 Xe3 Panther Lake iGPU, Intel Core Ultra 5 338H
14966 Points +114%
Asus Zenbook A14 UX3704NA
Qualcomm Adreno X2-90, Qualcomm Snapdragon X2 Elite X2E-88-100
9974 Points +43%
Asus Zenbook S 14 UX5406
Intel Arc Graphics 140V, Intel Core Ultra 7 258V
9414 Points +35%
Samsung Galaxy Book5 Pro 14 940XHA
Intel Arc Graphics 130V, Intel Core Ultra 5 226V
8648 Points +24%
Durchschnitt der Klasse Subnotebook
  (832 - 16347, n=56, der letzten 2 Jahre)
7576 Points +9%
Dell XPS 14 Core Ultra 7 355
Intel Graphics 4 Xe3 Panther Lake iGPU, Intel Core Ultra 7 355
7025 Points +1%
Asus ZenBook S14 UX5406AA
Intel Graphics 4 Xe3 Panther Lake iGPU, Intel Core Ultra 9 386H
6981 Points
Lenovo Yoga Slim 7 Ultra 14IPH11
Intel Graphics 4 Xe3 Panther Lake iGPU, Intel Core Ultra 7 355
6837 Points -2%
Durchschnittliche Intel Graphics 4 Xe3 Panther Lake iGPU
  (5688 - 7227, n=10)
6782 Points -3%
2560x1440 Time Spy Graphics
HP OmniBook Ultra 14 Core Ultra X9
Intel Arc B390 12 Xe3 Panther Lake iGPU, Intel Core Ultra X9 388H
6288 Points +107%
Honor MagicBook Pro 14 2026
Intel Arc B370 10 Xe3 Panther Lake iGPU, Intel Core Ultra 5 338H
6167 Points +103%
Asus Zenbook S 14 UX5406
Intel Arc Graphics 140V, Intel Core Ultra 7 258V
3669 Points +21%
Asus Zenbook A14 UX3704NA
Qualcomm Adreno X2-90, Qualcomm Snapdragon X2 Elite X2E-88-100
3666 Points +20%
Samsung Galaxy Book5 Pro 14 940XHA
Intel Arc Graphics 130V, Intel Core Ultra 5 226V
3532 Points +16%
Durchschnitt der Klasse Subnotebook
  (804 - 6288, n=55, der letzten 2 Jahre)
3096 Points +2%
Asus ZenBook S14 UX5406AA
Intel Graphics 4 Xe3 Panther Lake iGPU, Intel Core Ultra 9 386H
3044 Points
Dell XPS 14 Core Ultra 7 355
Intel Graphics 4 Xe3 Panther Lake iGPU, Intel Core Ultra 7 355
2951 Points -3%
Durchschnittliche Intel Graphics 4 Xe3 Panther Lake iGPU
  (2391 - 3044, n=10)
2866 Points -6%
Lenovo Yoga Slim 7 Ultra 14IPH11
Intel Graphics 4 Xe3 Panther Lake iGPU, Intel Core Ultra 7 355
2861 Points -6%
3DMark 11 Performance
8245 Punkte
3DMark Fire Strike Score
6412 Punkte
3DMark Time Spy Score
3458 Punkte
3DMark Steel Nomad Score
613 Punkte
3DMark Steel Nomad Light Score
2466 Punkte
Hilfe
Blender / v3.3 Classroom METAL
Durchschnitt der Klasse Subnotebook
  (76.3 - 227, n=5, der letzten 2 Jahre)
121.9 Seconds *
Apple MacBook Air 13 M5
Apple M5 8-Core GPU, Apple M5 10-Core
93 Seconds *
Blender / v3.3 Classroom CPU
Asus Zenbook S 14 UX5406
Intel Arc Graphics 140V, Intel Core Ultra 7 258V
700 Seconds * -108%
Samsung Galaxy Book5 Pro 14 940XHA
Intel Arc Graphics 130V, Intel Core Ultra 5 226V
593 Seconds * -76%
Durchschnitt der Klasse Subnotebook
  (241 - 861, n=60, der letzten 2 Jahre)
519 Seconds * -54%
Dell XPS 14 Core Ultra 7 355
Intel Graphics 4 Xe3 Panther Lake iGPU, Intel Core Ultra 7 355
512 Seconds * -52%
Lenovo Yoga Slim 7 Ultra 14IPH11
Intel Graphics 4 Xe3 Panther Lake iGPU, Intel Core Ultra 7 355
500 Seconds * -49%
Durchschnittliche Intel Graphics 4 Xe3 Panther Lake iGPU
  (332 - 569, n=10)
463 Seconds * -38%
Asus Zenbook A14 UX3704NA
Qualcomm Adreno X2-90, Qualcomm Snapdragon X2 Elite X2E-88-100
405 Seconds * -21%
Apple MacBook Air 13 M5
Apple M5 8-Core GPU, Apple M5 10-Core
359 Seconds * -7%
Honor MagicBook Pro 14 2026
Intel Arc B370 10 Xe3 Panther Lake iGPU, Intel Core Ultra 5 338H
341 Seconds * -1%
Asus ZenBook S14 UX5406AA
Intel Graphics 4 Xe3 Panther Lake iGPU, Intel Core Ultra 9 386H
336 Seconds *
HP OmniBook Ultra 14 Core Ultra X9
Intel Arc B390 12 Xe3 Panther Lake iGPU, Intel Core Ultra X9 388H
326 Seconds * +3%
Blender / v3.3 Classroom oneAPI/Intel
Dell XPS 14 Core Ultra 7 355
Intel Graphics 4 Xe3 Panther Lake iGPU, Intel Core Ultra 7 355
257 Seconds *
Durchschnittliche Intel Graphics 4 Xe3 Panther Lake iGPU
  (235 - 257, n=5)
245 Seconds *
Lenovo Yoga Slim 7 Ultra 14IPH11
Intel Graphics 4 Xe3 Panther Lake iGPU, Intel Core Ultra 7 355
237 Seconds *
Durchschnitt der Klasse Subnotebook
  (105 - 396, n=11, der letzten 2 Jahre)
232 Seconds *
HP OmniBook Ultra 14 Core Ultra X9
Intel Arc B390 12 Xe3 Panther Lake iGPU, Intel Core Ultra X9 388H
105 Seconds *

* ... kleinere Werte sind besser

Performance Rating - Percent
HP OmniBook Ultra 14 Core Ultra X9
Intel Core Ultra X9 388H, Intel Arc B390 12 Xe3 Panther Lake iGPU
98 pt
Honor MagicBook Pro 14 2026
Intel Core Ultra 5 338H, Intel Arc B370 10 Xe3 Panther Lake iGPU
92.3 pt
Asus Zenbook A14 UX3704NA
Qualcomm Snapdragon X2 Elite X2E-88-100, Qualcomm Adreno X2-90
70.7 pt
Samsung Galaxy Book5 Pro 14 940XHA
Intel Core Ultra 5 226V, Intel Arc Graphics 130V
56.8 pt
Durchschnitt der Klasse Subnotebook
 
55.6 pt
Asus ZenBook S14 UX5406AA
Intel Core Ultra 9 386H, Intel Graphics 4 Xe3 Panther Lake iGPU
55.5 pt
Asus Zenbook S 14 UX5406
Intel Core Ultra 7 258V, Intel Arc Graphics 140V
55 pt
Lenovo Yoga Slim 7 Ultra 14IPH11
Intel Core Ultra 7 355, Intel Graphics 4 Xe3 Panther Lake iGPU
54.2 pt
Dell XPS 14 Core Ultra 7 355
Intel Core Ultra 7 355, Intel Graphics 4 Xe3 Panther Lake iGPU
50.6 pt
Apple MacBook Air 13 M5 -5!
Apple M5 10-Core, Apple M5 8-Core GPU
48.4 pt
Cyberpunk 2077 - 1920x1080 Ultra Preset (FSR off)
HP OmniBook Ultra 14 Core Ultra X9
Intel Core Ultra X9 388H, Intel Arc B390 12 Xe3 Panther Lake iGPU
44.9 (36.5min, 35.1P1) fps +112%
Honor MagicBook Pro 14 2026
Intel Core Ultra 5 338H, Intel Arc B370 10 Xe3 Panther Lake iGPU
43.5 (35.8min) fps +105%
Asus Zenbook A14 UX3704NA
Qualcomm Snapdragon X2 Elite X2E-88-100, Qualcomm Adreno X2-90
30.8 (25.3min) fps +45%
Samsung Galaxy Book5 Pro 14 940XHA
Intel Core Ultra 5 226V, Intel Arc Graphics 130V
24.9 (20.8min) fps +17%
Asus Zenbook S 14 UX5406
Intel Core Ultra 7 258V, Intel Arc Graphics 140V
24.3 (19.9min) fps +15%
Lenovo Yoga Slim 7 Ultra 14IPH11
Intel Core Ultra 7 355, Intel Graphics 4 Xe3 Panther Lake iGPU
21.5 (18.3min, 17.4P1) fps +1%
Asus ZenBook S14 UX5406AA
Intel Core Ultra 9 386H, Intel Graphics 4 Xe3 Panther Lake iGPU
21.2 (17.8min) fps
Durchschnitt der Klasse Subnotebook
  (5.6 - 44.9, n=63, der letzten 2 Jahre)
20.9 fps -1%
Apple MacBook Air 13 M5
Apple M5 10-Core, Apple M5 8-Core GPU
19.5 fps -8%
Dell XPS 14 Core Ultra 7 355
Intel Core Ultra 7 355, Intel Graphics 4 Xe3 Panther Lake iGPU
17.7 (15.1min, 14.4P1) fps -17%
Baldur's Gate 3 - 1920x1080 Ultra Preset AA:T
HP OmniBook Ultra 14 Core Ultra X9
Intel Core Ultra X9 388H, Intel Arc B390 12 Xe3 Panther Lake iGPU
53.5 (48.4min, 49.1P0.1, 50.4P1) fps +152%
Honor MagicBook Pro 14 2026
Intel Core Ultra 5 338H, Intel Arc B370 10 Xe3 Panther Lake iGPU
40.6 (36.1min, 36.4P0.1, 36.9P1) fps +92%
Asus Zenbook A14 UX3704NA
Qualcomm Snapdragon X2 Elite X2E-88-100, Qualcomm Adreno X2-90
34.8 (23.1min, 23.9P0.1, 29.6P1) fps +64%
Apple MacBook Air 13 M5
Apple M5 10-Core, Apple M5 8-Core GPU
28.5 fps +34%
Durchschnitt der Klasse Subnotebook
  (10.2 - 53.5, n=55, der letzten 2 Jahre)
23.9 fps +13%
Asus Zenbook S 14 UX5406
Intel Core Ultra 7 258V, Intel Arc Graphics 140V
23 fps +8%
Lenovo Yoga Slim 7 Ultra 14IPH11
Intel Core Ultra 7 355, Intel Graphics 4 Xe3 Panther Lake iGPU
23 (21.2min, 21.2P0.1, 21.5P1) fps +8%
Samsung Galaxy Book5 Pro 14 940XHA
Intel Core Ultra 5 226V, Intel Arc Graphics 130V
22.8 fps +8%
Asus ZenBook S14 UX5406AA
Intel Core Ultra 9 386H, Intel Graphics 4 Xe3 Panther Lake iGPU
21.2 (19min, 19.1P0.1, 19.4P1) fps
Dell XPS 14 Core Ultra 7 355
Intel Core Ultra 7 355, Intel Graphics 4 Xe3 Panther Lake iGPU
19.5 (18.1min, 18.1P0.1, 18.3P1) fps -8%
GTA V - 1920x1080 Highest AA:4xMSAA + FX AF:16x
HP OmniBook Ultra 14 Core Ultra X9
Intel Core Ultra X9 388H, Intel Arc B390 12 Xe3 Panther Lake iGPU
43.7 (6.57min, 29.4P1) fps +100%
Honor MagicBook Pro 14 2026
Intel Core Ultra 5 338H, Intel Arc B370 10 Xe3 Panther Lake iGPU
40.6 (9.03min, 31.3P1) fps +86%
Asus Zenbook A14 UX3704NA
Qualcomm Snapdragon X2 Elite X2E-88-100, Qualcomm Adreno X2-90
33.1 (4.41min, 22.7P1) fps +52%
Durchschnitt der Klasse Subnotebook
  (10.7 - 43.7, n=56, der letzten 2 Jahre)
23.7 fps +9%
Asus Zenbook S 14 UX5406
Intel Core Ultra 7 258V, Intel Arc Graphics 140V
23.4 (2.44min, 13.3P1) fps +7%
Asus ZenBook S14 UX5406AA
Intel Core Ultra 9 386H, Intel Graphics 4 Xe3 Panther Lake iGPU
21.8 (7.03min, 16.9P1) fps
Lenovo Yoga Slim 7 Ultra 14IPH11
Intel Core Ultra 7 355, Intel Graphics 4 Xe3 Panther Lake iGPU
21.6 (5.04min, 17.2P1) fps -1%
Dell XPS 14 Core Ultra 7 355
Intel Core Ultra 7 355, Intel Graphics 4 Xe3 Panther Lake iGPU
20.9 (5.74min, 15.9P1) fps -4%
Samsung Galaxy Book5 Pro 14 940XHA
Intel Core Ultra 5 226V, Intel Arc Graphics 130V
20.8 (7.23min, 16.4P1) fps -5%
Final Fantasy XV Benchmark - 1920x1080 High Quality
HP OmniBook Ultra 14 Core Ultra X9
Intel Core Ultra X9 388H, Intel Arc B390 12 Xe3 Panther Lake iGPU
54.5 fps +100%
Honor MagicBook Pro 14 2026
Intel Core Ultra 5 338H, Intel Arc B370 10 Xe3 Panther Lake iGPU
48.5 fps +78%
Asus Zenbook A14 UX3704NA
Qualcomm Snapdragon X2 Elite X2E-88-100, Qualcomm Adreno X2-90
31 fps +14%
Samsung Galaxy Book5 Pro 14 940XHA
Intel Core Ultra 5 226V, Intel Arc Graphics 130V
30.3 fps +11%
Asus Zenbook S 14 UX5406
Intel Core Ultra 7 258V, Intel Arc Graphics 140V
30 fps +10%
Durchschnitt der Klasse Subnotebook
  (11.6 - 54.5, n=54, der letzten 2 Jahre)
27.4 fps +1%
Asus ZenBook S14 UX5406AA
Intel Core Ultra 9 386H, Intel Graphics 4 Xe3 Panther Lake iGPU
27.2 fps
Lenovo Yoga Slim 7 Ultra 14IPH11
Intel Core Ultra 7 355, Intel Graphics 4 Xe3 Panther Lake iGPU
26.2 fps -4%
Dell XPS 14 Core Ultra 7 355
Intel Core Ultra 7 355, Intel Graphics 4 Xe3 Panther Lake iGPU
25.4 fps -7%
Strange Brigade - 1920x1080 ultra AA:ultra AF:16
HP OmniBook Ultra 14 Core Ultra X9
Intel Core Ultra X9 388H, Intel Arc B390 12 Xe3 Panther Lake iGPU
101.3 (43.7min, 74.5P1) fps +86%
Honor MagicBook Pro 14 2026
Intel Core Ultra 5 338H, Intel Arc B370 10 Xe3 Panther Lake iGPU
92.6 (60.3min, 72P1) fps +70%
Asus Zenbook A14 UX3704NA
Qualcomm Snapdragon X2 Elite X2E-88-100, Qualcomm Adreno X2-90
68.9 (14.9min, 22.6P1) fps +26%
Asus ZenBook S14 UX5406AA
Intel Core Ultra 9 386H, Intel Graphics 4 Xe3 Panther Lake iGPU
54.6 (31min, 40.7P1) fps
Asus Zenbook S 14 UX5406
Intel Core Ultra 7 258V, Intel Arc Graphics 140V
54 (32min, 42.8P1) fps -1%
Lenovo Yoga Slim 7 Ultra 14IPH11
Intel Core Ultra 7 355, Intel Graphics 4 Xe3 Panther Lake iGPU
52.1 (29.2min, 39.9P1) fps -5%
Samsung Galaxy Book5 Pro 14 940XHA
Intel Core Ultra 5 226V, Intel Arc Graphics 130V
51.3 (21.7min, 28.6P1) fps -6%
Dell XPS 14 Core Ultra 7 355
Intel Core Ultra 7 355, Intel Graphics 4 Xe3 Panther Lake iGPU
50.6 (19.6min, 26P1) fps -7%
Durchschnitt der Klasse Subnotebook
  (19 - 101.3, n=50, der letzten 2 Jahre)
48.9 fps -10%
Dota 2 Reborn - 1920x1080 ultra (3/3) best looking
Honor MagicBook Pro 14 2026
Intel Core Ultra 5 338H, Intel Arc B370 10 Xe3 Panther Lake iGPU
104.8 (73.3min) fps +35%
HP OmniBook Ultra 14 Core Ultra X9
Intel Core Ultra X9 388H, Intel Arc B390 12 Xe3 Panther Lake iGPU
97 (51.8min) fps +25%
Samsung Galaxy Book5 Pro 14 940XHA
Intel Core Ultra 5 226V, Intel Arc Graphics 130V
79.5 (53.1min) fps +2%
Asus ZenBook S14 UX5406AA
Intel Core Ultra 9 386H, Intel Graphics 4 Xe3 Panther Lake iGPU
77.8 (42.6min) fps
Lenovo Yoga Slim 7 Ultra 14IPH11
Intel Core Ultra 7 355, Intel Graphics 4 Xe3 Panther Lake iGPU
74.2 (38.8min) fps -5%
Dell XPS 14 Core Ultra 7 355
Intel Core Ultra 7 355, Intel Graphics 4 Xe3 Panther Lake iGPU
69.4 (33.2min) fps -11%
Asus Zenbook A14 UX3704NA
Qualcomm Snapdragon X2 Elite X2E-88-100, Qualcomm Adreno X2-90
69.4 (53min) fps -11%
Durchschnitt der Klasse Subnotebook
  (13 - 97, n=61, der letzten 2 Jahre)
68.4 fps -12%
Asus Zenbook S 14 UX5406
Intel Core Ultra 7 258V, Intel Arc Graphics 140V
62.9 fps -19%
X-Plane 11.11 - 1920x1080 high (fps_test=3)
Honor MagicBook Pro 14 2026
Intel Core Ultra 5 338H, Intel Arc B370 10 Xe3 Panther Lake iGPU
45.1 fps +36%
Asus Zenbook A14 UX3704NA
Qualcomm Snapdragon X2 Elite X2E-88-100, Qualcomm Adreno X2-90
42.5 fps +28%
HP OmniBook Ultra 14 Core Ultra X9
Intel Core Ultra X9 388H, Intel Arc B390 12 Xe3 Panther Lake iGPU
42.2 fps +27%
Durchschnitt der Klasse Subnotebook
  (20.7 - 50.5, n=53, der letzten 2 Jahre)
36 fps +8%
Asus ZenBook S14 UX5406AA
Intel Core Ultra 9 386H, Intel Graphics 4 Xe3 Panther Lake iGPU
33.2 fps
Samsung Galaxy Book5 Pro 14 940XHA
Intel Core Ultra 5 226V, Intel Arc Graphics 130V
31.5 fps -5%
Lenovo Yoga Slim 7 Ultra 14IPH11
Intel Core Ultra 7 355, Intel Graphics 4 Xe3 Panther Lake iGPU
31.1 fps -6%
Dell XPS 14 Core Ultra 7 355
Intel Core Ultra 7 355, Intel Graphics 4 Xe3 Panther Lake iGPU
30.5 fps -8%
Asus Zenbook S 14 UX5406
Intel Core Ultra 7 258V, Intel Arc Graphics 140V
29.8 fps -10%

Cyberpunk 2077 – Ultra-fps-Diagramm

0510152025303540Tooltip
Asus ZenBook S14 UX5406AA Ultra 9 386H, Intel Graphics 4 Xe3 PTL: Ø19.1 (18-19.5) fps
Asus Zenbook A14 UX3704NA X2E-88-100, X2-90: Ø26.4 (25.4-28.5) fps
Asus Zenbook S 14 UX5406 Core Ultra 7 258V, Arc 140V: Ø19.9 (18.8-22.2) fps
HP OmniBook Ultra 14 Core Ultra X9 Ultra X9 388H, Arc B390 Panther Lake iGPU: Ø42.3 (36.6-44.1) fps
Samsung Galaxy Book5 Pro 14 940XHA Core Ultra 5 226V, Arc 130V: Ø19.4 (16.5-20.4) fps
Lenovo Yoga Slim 7 Ultra 14IPH11 Ultra 7 355, Intel Graphics 4 Xe3 PTL: Ø20.8 (19.5-21.6) fps
Honor MagicBook Pro 14 2026 Ultra 5 338H, Arc B370 Panther Lake iGPU: Ø40.6 (37.6-41.6) fps
Dell XPS 14 Core Ultra 7 355 Ultra 7 355, Intel Graphics 4 Xe3 PTL: Ø18.1 (16.8-19.1) fps
min.mittelhochmax.
GTA V (2015) 172 158.4 55.2 21.8
Dota 2 Reborn (2015) 133.5 72.4 85.4 77.8
Final Fantasy XV Benchmark (2018) 74.1 37.6 27.2
X-Plane 11.11 (2018) 45.6 35.4 33.2
Strange Brigade (2018) 198.1 72.5 64.1 54.6
Baldur's Gate 3 (2023) 34.3 25.6 22.1 21.2
Cyberpunk 2077 (2023) 38.7 29.2 25.1 21.2
F1 24 (2024) 69.3 64.1 48 15.1

Emissionen und Stromverbrauch

Systemgeräusche

Kühlaggregat
Kühlaggregat

Das Lüftergeräusch hängt vom gewählten Leistungsprofil ab, und die Lüfter drehen im Standard- oder Leistungsmodus recht schnell hoch; daher empfehlen wir, den Flüstermodus zu verwenden, es sei denn, man benötigt wirklich die volle Leistung. Im Whisper-Modus beträgt die maximale Lüftergeräuschpegel nur 28 dB(A), was kaum hörbar ist, während es im Performance-Modus mit bis zu 49 dB(A) sehr laut ist. Das bedeutet, dass das neue Zenbook S14 im Vergleich zum alten Lunar-Lake-Modell auch deutlich geräuschvoller ist. Wir haben keine weiteren elektronischen Geräusche wahrgenommen.

Lautstärkediagramm

Idle
24.1 / 24.1 / 24.1 dB(A)
Last
45.4 / 49.1 dB(A)
  red to green bar
 
 
30 dB
leise
40 dB(A)
deutlich hörbar
50 dB(A)
störend
 
min: dark, med: mid, max: light   Earthworks M23R, Arta (aus 15 cm gemessen)   Umgebungsgeräusche: 24.1 dB(A)
dB(A) 0102030405060708090Deep BassMiddle BassHigh BassLower RangeMidsHigher MidsLower HighsMid HighsUpper HighsSuper Highs2044.637.439.437.835.835.32529.926.73030.829.1293126.325.52827.426.827.14026.328.927.536.827.626.55026.224.32627.326.523.86323.122.923.924.124.622.8802021.622.520.420.618.310019.719.124.223.818.917.712517.317.525.722.716.41716015.918.520.818.91414.420016.918.723.22115.415.425019.220.424.123.218.919.531517.3182421.614.41640015.418.624.921.912.414.350014.820.527.424.51113.863014.621.329.129.311.112.580016.124.832.23010.413.8100019.728.436.133.110.416.2125020.229.639.235.110.816.316002028.639.835.110.716.4200019.33039.3371115250017.330.339.736.611.913.9315014.125.436.934.312.112.6400013.424.839341212.4500012.82136.231.812.612.7630012.717.836.130.112.812.9800012.715.332.626.312.712.71000012.713.527.221.312.612.71250012.612.922.817.512.612.61600011.912.218.114.111.912SPL2938.549.145.424.126.4N12.56.14.60.50.8median 15.9median 20.4median 29.1median 26.3median 12.4median 13.9Delta3.33.86.261.91.4hearing rangehide median Fan NoiseAsus ZenBook S14 UX5406AA
Asus ZenBook S14 UX5406AA
Ultra 9 386H, Intel Graphics 4 Xe3 PTL
Asus Zenbook A14 UX3704NA
X2E-88-100, X2-90
Asus Zenbook S 14 UX5406
Core Ultra 7 258V, Arc 140V
HP OmniBook Ultra 14 Core Ultra X9
Ultra X9 388H, Arc B390 Panther Lake iGPU
Samsung Galaxy Book5 Pro 14 940XHA
Core Ultra 5 226V, Arc 130V
Lenovo Yoga Slim 7 Ultra 14IPH11
Ultra 7 355, Intel Graphics 4 Xe3 PTL
Honor MagicBook Pro 14 2026
Ultra 5 338H, Arc B370 Panther Lake iGPU
Dell XPS 14 Core Ultra 7 355
Ultra 7 355, Intel Graphics 4 Xe3 PTL
Apple MacBook Air 13 M5
M5 10-Core, M5 8-Core GPU
Geräuschentwicklung
3%
16%
5%
10%
1%
5%
12%
aus / Umgebung * (dB)
24.1
24.2
-0%
23.7
2%
23.3
3%
25.1
-4%
23.1
4%
25.7
-7%
23
5%
Idle min * (dB)
24.1
24.2
-0%
23.7
2%
23.3
3%
25.1
-4%
25.4
-5%
25.7
-7%
23
5%
Idle avg * (dB)
24.1
24.2
-0%
23.7
2%
23.3
3%
25.1
-4%
25.5
-6%
25.7
-7%
23
5%
Idle max * (dB)
24.1
24.2
-0%
23.7
2%
23.3
3%
25.1
-4%
25.5
-6%
25.7
-7%
23.1
4%
Last avg * (dB)
45.4
41.3
9%
30.5
33%
42.9
6%
29.3
35%
44.4
2%
30.2
33%
30.8
32%
Cyberpunk 2077 ultra * (dB)
49.1
41.3
16%
31.1
37%
44.4
10%
33.1
33%
43.4
12%
39.4
20%
35.4
28%
Last max * (dB)
49.1
51.7
-5%
33.6
32%
44.1
10%
38.7
21%
45.5
7%
42.9
13%
45.9
7%

* ... kleinere Werte sind besser

Temperatur

Im Performance-Modus wird das Zenbook S14 unter Volllast mit bis zu 47 °C recht warm, doch an dieser Stelle kommt es in der Regel nicht zu Hautkontakt, sodass Sie es weiterhin auf dem Schoß verwenden und ohne Einschränkungen tippen können. Während des Stresstests verbraucht die CPU bis zu 57 Watt und pendelt sich schnell bei 28 Watt ein.
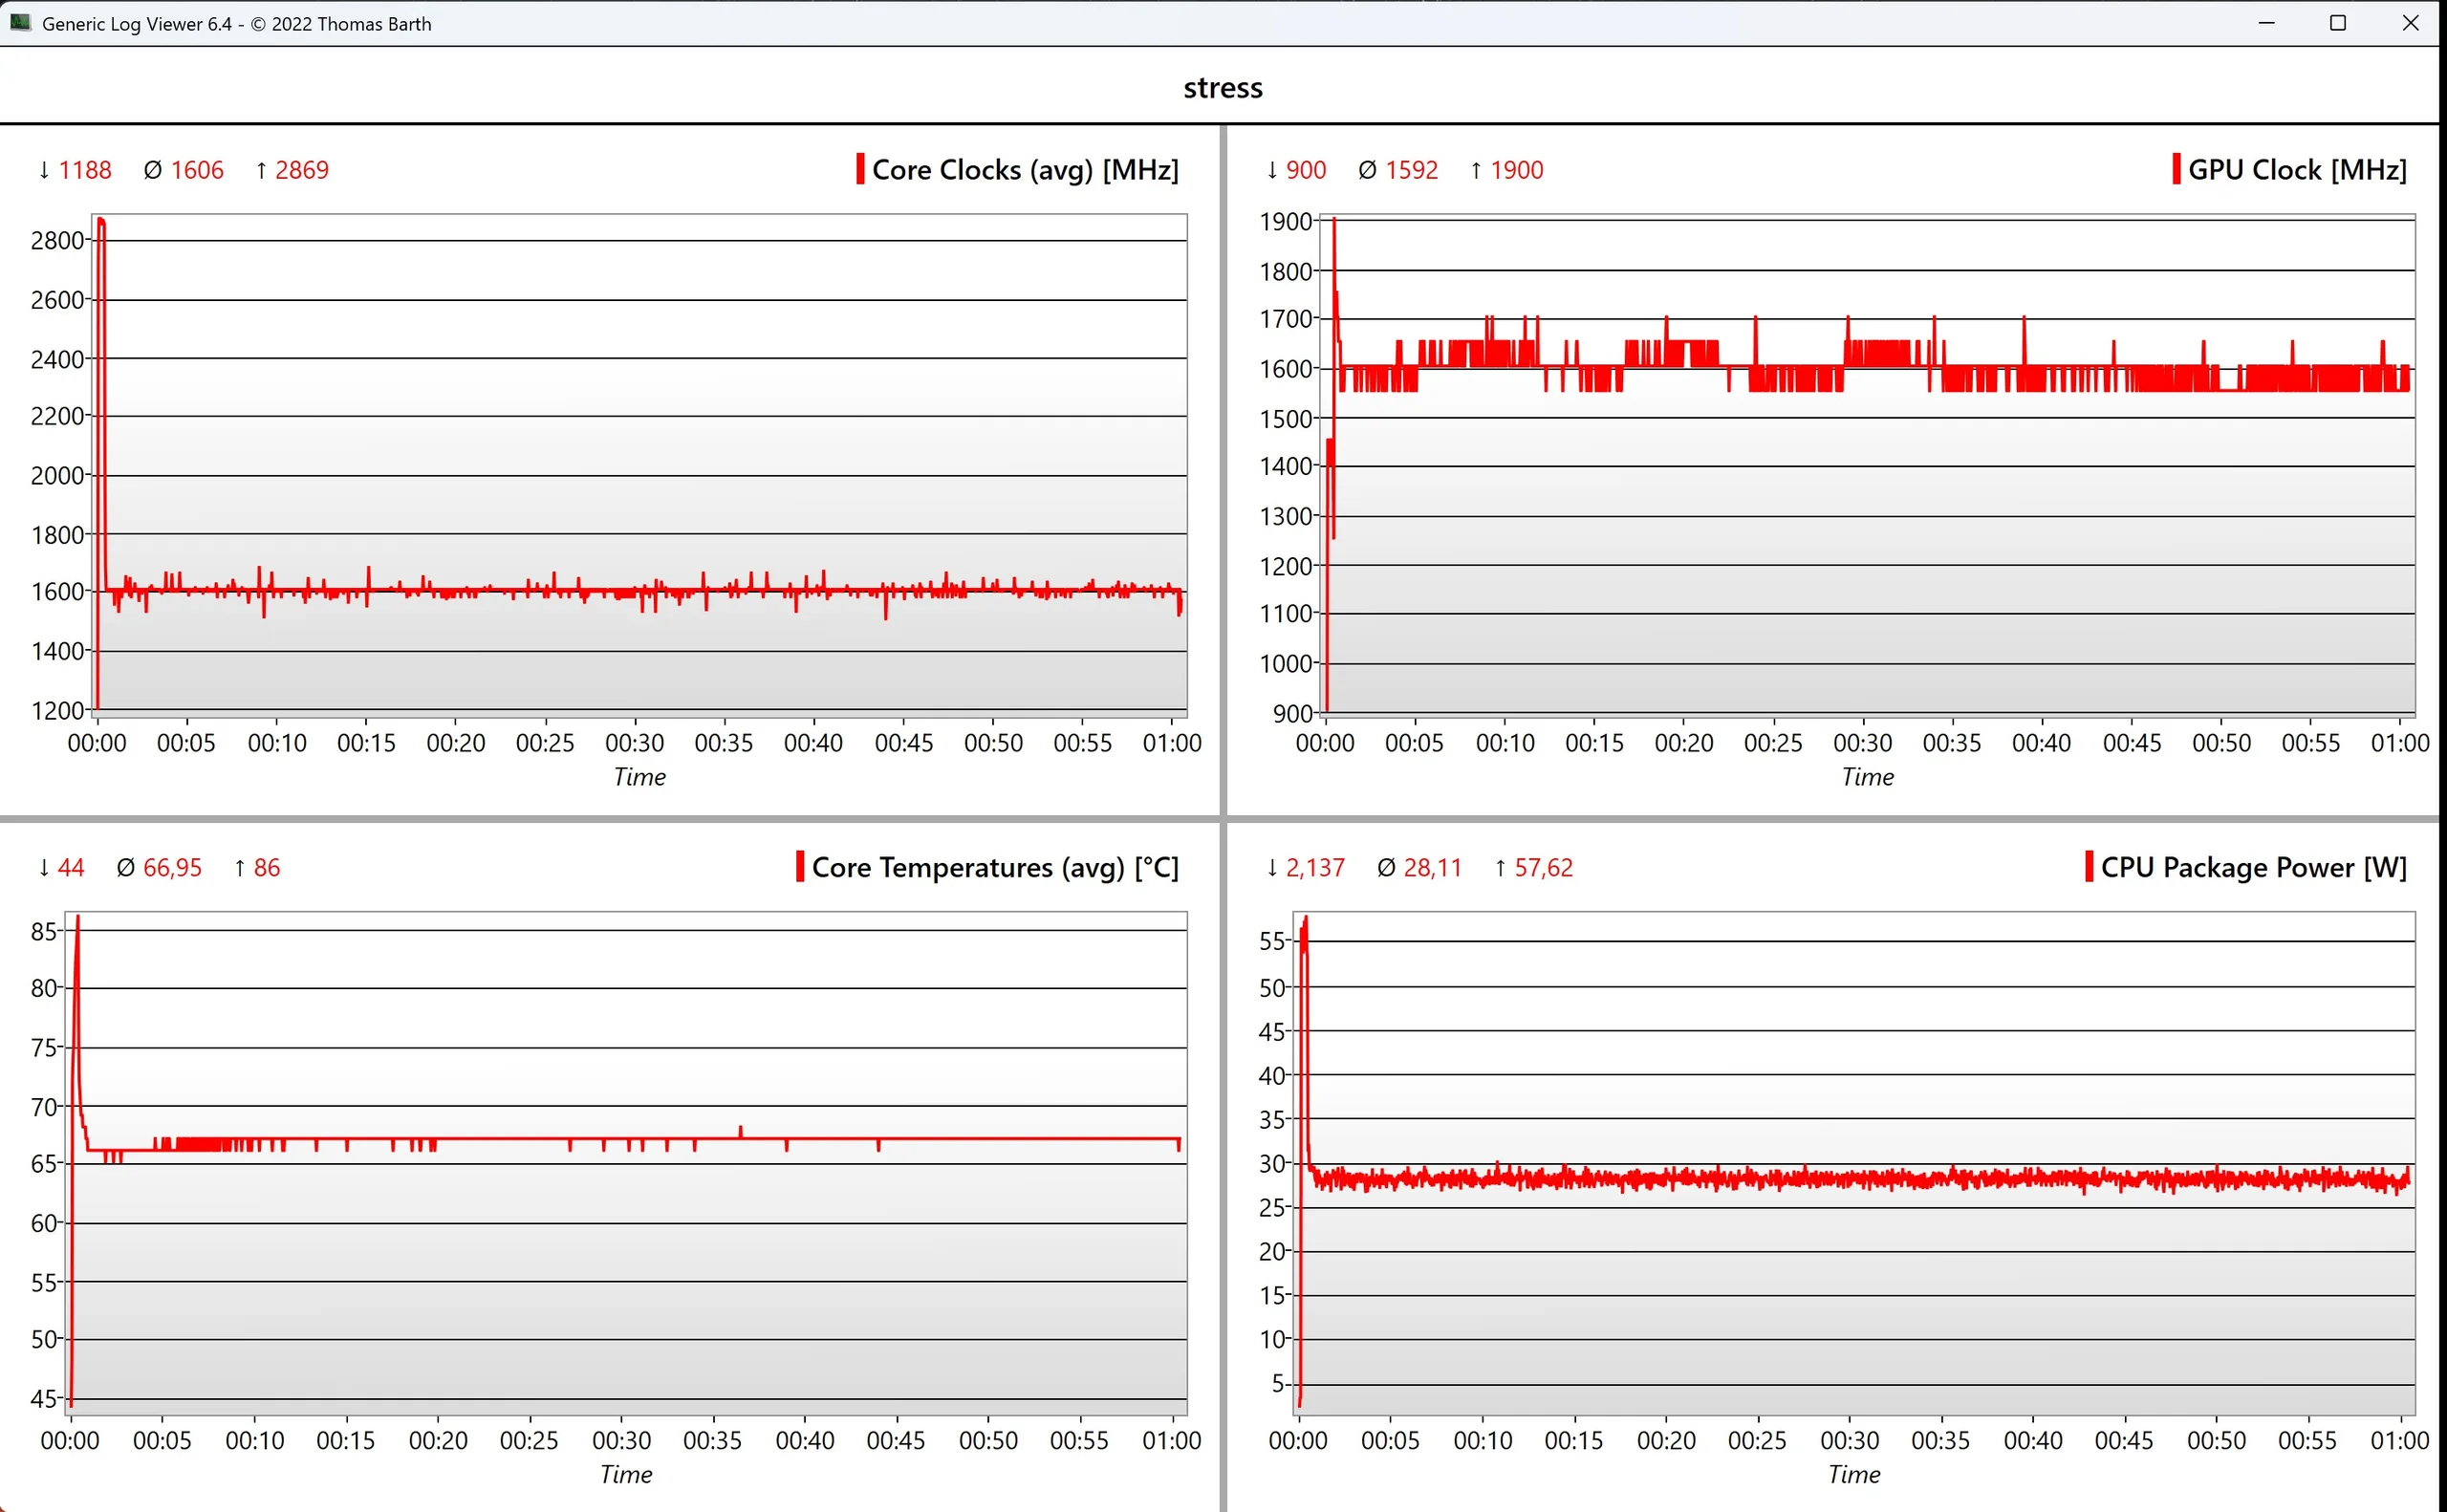
CPU-/iGPU-Daten Stresstest
Max. Last
 41.3 °C43.5 °C41.9 °C 
 37.2 °C41.1 °C38.5 °C 
 29.5 °C29.3 °C30 °C 
Maximal: 43.5 °C
Durchschnitt: 36.9 °C
44.5 °C47.1 °C43.8 °C
39.6 °C43.2 °C37 °C
30.8 °C31.4 °C31.4 °C
Maximal: 47.1 °C
Durchschnitt: 38.8 °C
Raumtemperatur 22.2 °C | Fluke t3000FC (calibrated), Voltcraft IR-900
(±) Die Durchschnittstemperatur auf der Oberseite unter extremer Last ist 36.9 °C. Im Vergleich erhitzte sich der Durchschnitt der Geräteklasse Subnotebook auf 30.8 °C.
(±) Die maximale Temperatur auf der Oberseite ist 43.5 °C. Im Vergleich liegt der Klassendurchschnitt bei 35.9 °C (von 21.4 bis 59 °C für die Klasse Subnotebook).
(-) Auf der Unterseite messen wir eine maximalen Wert von 47.1 °C (im Vergleich zum Durchschnitt von 39.2 °C).
(+) Ohne Last messen wir eine durchschnittliche Temperatur von 25.1 °C auf der Oberseite. Der Klassendurchschnitt erreicht 30.8 °C.
(±) 3: The average temperature for the upper side is 36 °C / 97 F, compared to the average of 30.8 °C / 87 F for the class Subnotebook.
(+) Die Handballen und der Touchpad-Bereich sind mit gemessenen 30 °C kühler als die typische Hauttemperatur und fühlen sich dadurch kühl an.
(±) Die durchschnittliche Handballen-Temperatur anderer getesteter Geräte war 28.2 °C (-1.8 °C).
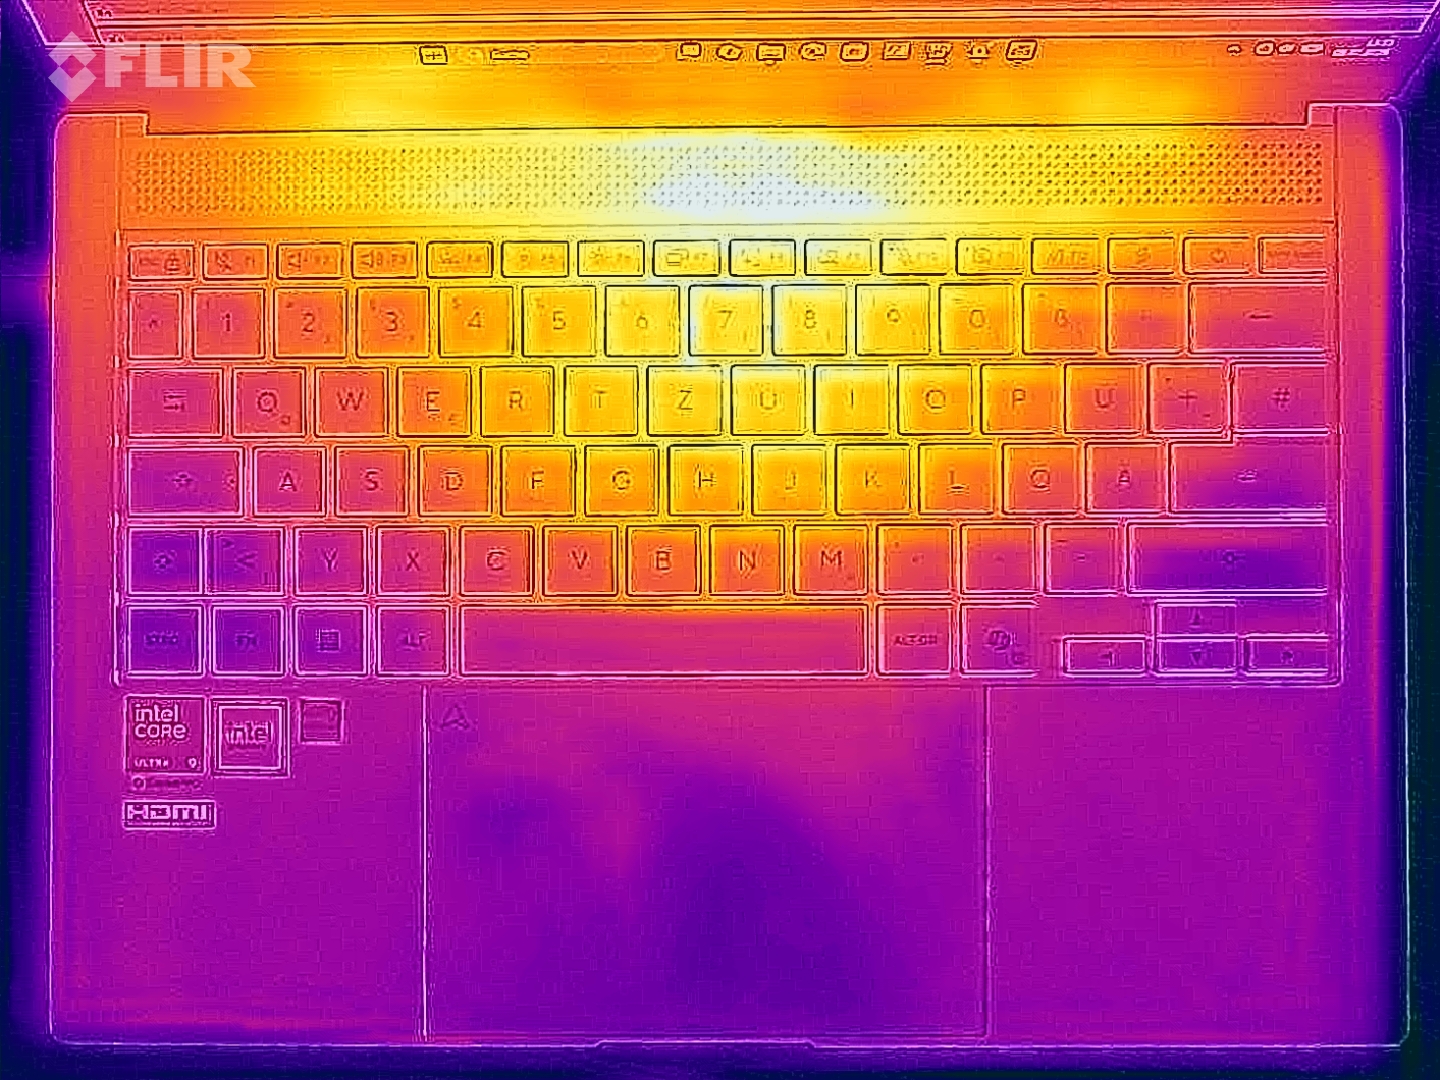
Heatmap-Belastung (oben)
Heatmap-Belastung (unten)
Asus ZenBook S14 UX5406AA
Ultra 9 386H, Intel Graphics 4 Xe3 PTL
Asus Zenbook A14 UX3704NA
X2E-88-100, X2-90
Asus Zenbook S 14 UX5406
Core Ultra 7 258V, Arc 140V
HP OmniBook Ultra 14 Core Ultra X9
Ultra X9 388H, Arc B390 Panther Lake iGPU
Samsung Galaxy Book5 Pro 14 940XHA
Core Ultra 5 226V, Arc 130V
Lenovo Yoga Slim 7 Ultra 14IPH11
Ultra 7 355, Intel Graphics 4 Xe3 PTL
Honor MagicBook Pro 14 2026
Ultra 5 338H, Arc B370 Panther Lake iGPU
Dell XPS 14 Core Ultra 7 355
Ultra 7 355, Intel Graphics 4 Xe3 PTL
Apple MacBook Air 13 M5
M5 10-Core, M5 8-Core GPU
Hitze
4%
-1%
9%
3%
17%
10%
16%
6%
Last oben max * (°C)
43.5
40.9
6%
43.7
-0%
40.2
8%
41.4
5%
33.6
23%
39.1
10%
37.8
13%
44.1
-1%
Last unten max * (°C)
47.1
47.2
-0%
46.9
-0%
44.2
6%
44.6
5%
28.8
39%
35.7
24%
38.6
18%
42.4
10%
Idle oben max * (°C)
25.5
24.5
4%
25.8
-1%
22.8
11%
24.9
2%
25.2
1%
25.2
1%
21.2
17%
23.7
7%
Idle unten max * (°C)
25.6
24
6%
26.3
-3%
23.4
9%
25.5
-0%
24.6
4%
24.9
3%
21.4
16%
23.8
7%

* ... kleinere Werte sind besser

Lautsprecher

Das Soundsystem des Zenbook S14 bleibt unverändert und bietet nach wie vor eine hervorragende Klangqualität.

dB(A) 0102030405060708090Deep BassMiddle BassHigh BassLower RangeMidsHigher MidsLower HighsMid HighsUpper HighsSuper Highs2035.835.62529.128.53126.825.74027.628.85026.528.36324.630.68020.638.910018.945.812516.451.71601455.120015.463.425018.964.331514.468.140012.467.9500116763011.167.780010.472.8100010.471.7125010.869.1160010.765.720001163.4250011.965.3315012.166.940001268.7500012.666.9630012.867.5800012.765.71000012.662.81250012.660.91600011.957.1SPL24.179.8N0.550.7median 12.4median 65.7Delta1.93.738.544.729.63225.928.931.333.628.231.425.130.820.633.820.54218.149.717.250.820.759.12260.316.465.113.66511.365.611.269.31076.11174.210.769.110.369.710.572.510.977.311.570.711.771.51270.812.171.712.27312.172.512.262.811.357.324.284.50.663.1median 12median 69.32.15.535.434.329.833.828.735.128.53724.836.92436.619.144.818.954.117.55617.855.716.465.518.669.81472.612.273.810.67210.269.910.375.610.375.910.275.410.473.610.770.210.867.711.265.911.66312.165.312.365.212.367.912.368.712.267.713.456.923.783.40.560.1median 12.2median 67.92.44.626.732.221.82319.624.918.220.418.12921.626.617.631.216.744.714.453.612.863.314.767.714.270.916.573.214.874.712.672.211.869.911.175.19.777.19.374.69.672.91074.210.374.810.572.311.171.711.570.211.571.611.672.211.668.61269.411.368.823.385.30.570.1median 11.6median 71.71.72.353.545.345.638.739.530.346.533.439.233.631.831.226.527.622.731.321.939.920.745.123.152.624.35517.462.314.362.212.663.811.667.310.971.211.473.610.872.310.37110.568.91170.111.267.111.462.711.958.712.162.31261.812.264.612.261.512.656.425.180.70.747.5median 12.1median 62.336.32828.222.22220.11915.419.420.420.722.822.921.536.917.649.415.655.81462.414.162.114.264.915.466.214.868.511.165.310.366.410.374.29.476.69.171.79.670.59.967.810.170.110.469.811.169.611.866.911.566.211.663.711.662.911.768.312.568.325.482.30.556.3median 11.6median 66.923.142.146.133.837.630.535.332.935.230.63231.529.523.63424.540.119.54819.853.920.85821.758.117.162.314.361.713.466.212.870.612.473.112.771.612.473.912.56912.670.312.865.313.366.513.466.313.467.413.468.113.464.813.668.113.361.112.759.425.781.20.752.8median 13.4median 66.22.3527.232.222.224.119.822.718.820.122.222.621.130.521.651.817.958.717.460.114.866.315.769.115.670.315.869.814.775.611.879.41177.510.773.79.274.6977.99.277.89.674.810.274.210.366.410.768.511.167.211.466.411.46711.770.711.771.311.267.423.186.20.571median 11.4median 70.72.43.844.34834.937.435.236.833.54027.336.934.733.125.132.72243.518.251.918.153.520.458.122.260.71765.314.565.213.364.413.36612.263.81264.611.767.411.769.911.570.41268.512.36812.370.112.771.612.774.512.872.612.972.512.873.212.759.425.282.10.754.6median 12.8median 6625.4hearing rangehide median Pink NoiseAsus ZenBook S14 UX5406AAAsus Zenbook A14 UX3704NAAsus Zenbook S 14 UX5406HP OmniBook Ultra 14 Core Ultra X9Samsung Galaxy Book5 Pro 14 940XHALenovo Yoga Slim 7 Ultra 14IPH11Honor MagicBook Pro 14 2026Dell XPS 14 Core Ultra 7 355Apple MacBook Air 13 M5
Frequenzdiagramm (für Vergleiche die Checkboxen oben an-/abwählen)
Asus ZenBook S14 UX5406AA Audio Analyse

(±) | Mittelmäßig laut spielende Lautsprecher (79.8 dB)
Bass 100 - 315 Hz
(±) | abgesenkter Bass - 8.5% geringer als der Median
(±) | durchschnittlich lineare Bass-Wiedergabe (9.1% Delta zum Vorgänger)
Mitteltöne 400 - 2000 Hz
(+) | ausgeglichene Mitten, vom Median nur 3% abweichend
(+) | lineare Mitten (3.8% Delta zum Vorgänger)
Hochtöne 2 - 16 kHz
(+) | ausgeglichene Hochtöne, vom Median nur 1.5% abweichend
(+) | sehr lineare Hochtöne (3.3% Delta zum Vorgänger)
Gesamt im hörbaren Bereich 100 - 16.000 Hz
(+) | hörbarer Bereich ist sehr linear (9.6% Abstand zum Median
Im Vergleich zu allen Geräten derselben Klasse
» 5% aller getesteten Geräte dieser Klasse waren besser, 2% vergleichbar, 93% schlechter
» Das beste Gerät hat einen Delta-Wert von 5%, durchschnittlich ist 18%, das schlechteste Gerät hat 53%
Im Vergleich zu allen Geräten im Test
» 4% aller getesteten Geräte waren besser, 1% vergleichbar, 95% schlechter
» Das beste Gerät hat einen Delta-Wert von 4%, durchschnittlich ist 23%, das schlechteste Gerät hat 134%

Asus Zenbook A14 UX3704NA Audio Analyse

(+) | Die Lautsprecher können relativ laut spielen (84.5 dB)
Bass 100 - 315 Hz
(±) | abgesenkter Bass - 14.8% geringer als der Median
(±) | durchschnittlich lineare Bass-Wiedergabe (9.1% Delta zum Vorgänger)
Mitteltöne 400 - 2000 Hz
(+) | ausgeglichene Mitten, vom Median nur 2.9% abweichend
(+) | lineare Mitten (4.7% Delta zum Vorgänger)
Hochtöne 2 - 16 kHz
(+) | ausgeglichene Hochtöne, vom Median nur 3.2% abweichend
(+) | sehr lineare Hochtöne (3.9% Delta zum Vorgänger)
Gesamt im hörbaren Bereich 100 - 16.000 Hz
(+) | hörbarer Bereich ist sehr linear (12.2% Abstand zum Median
Im Vergleich zu allen Geräten derselben Klasse
» 15% aller getesteten Geräte dieser Klasse waren besser, 5% vergleichbar, 80% schlechter
» Das beste Gerät hat einen Delta-Wert von 5%, durchschnittlich ist 18%, das schlechteste Gerät hat 53%
Im Vergleich zu allen Geräten im Test
» 10% aller getesteten Geräte waren besser, 2% vergleichbar, 88% schlechter
» Das beste Gerät hat einen Delta-Wert von 4%, durchschnittlich ist 23%, das schlechteste Gerät hat 134%

Asus Zenbook S 14 UX5406 Audio Analyse

(+) | Die Lautsprecher können relativ laut spielen (83.4 dB)
Bass 100 - 315 Hz
(±) | abgesenkter Bass - 7.8% geringer als der Median
(±) | durchschnittlich lineare Bass-Wiedergabe (8.5% Delta zum Vorgänger)
Mitteltöne 400 - 2000 Hz
(±) | zu hohe Mitten, vom Median 5.4% abweichend
(+) | lineare Mitten (3.7% Delta zum Vorgänger)
Hochtöne 2 - 16 kHz
(+) | ausgeglichene Hochtöne, vom Median nur 1.9% abweichend
(+) | sehr lineare Hochtöne (3.3% Delta zum Vorgänger)
Gesamt im hörbaren Bereich 100 - 16.000 Hz
(+) | hörbarer Bereich ist sehr linear (9.9% Abstand zum Median
Im Vergleich zu allen Geräten derselben Klasse
» 7% aller getesteten Geräte dieser Klasse waren besser, 1% vergleichbar, 92% schlechter
» Das beste Gerät hat einen Delta-Wert von 5%, durchschnittlich ist 18%, das schlechteste Gerät hat 53%
Im Vergleich zu allen Geräten im Test
» 4% aller getesteten Geräte waren besser, 1% vergleichbar, 95% schlechter
» Das beste Gerät hat einen Delta-Wert von 4%, durchschnittlich ist 23%, das schlechteste Gerät hat 134%

HP OmniBook Ultra 14 Core Ultra X9 Audio Analyse

(+) | Die Lautsprecher können relativ laut spielen (85.3 dB)
Bass 100 - 315 Hz
(±) | abgesenkter Bass - 10% geringer als der Median
(±) | durchschnittlich lineare Bass-Wiedergabe (11.6% Delta zum Vorgänger)
Mitteltöne 400 - 2000 Hz
(+) | ausgeglichene Mitten, vom Median nur 2.6% abweichend
(+) | lineare Mitten (4% Delta zum Vorgänger)
Hochtöne 2 - 16 kHz
(+) | ausgeglichene Hochtöne, vom Median nur 1.3% abweichend
(+) | sehr lineare Hochtöne (2.6% Delta zum Vorgänger)
Gesamt im hörbaren Bereich 100 - 16.000 Hz
(+) | hörbarer Bereich ist sehr linear (7.3% Abstand zum Median
Im Vergleich zu allen Geräten derselben Klasse
» 1% aller getesteten Geräte dieser Klasse waren besser, 1% vergleichbar, 98% schlechter
» Das beste Gerät hat einen Delta-Wert von 5%, durchschnittlich ist 18%, das schlechteste Gerät hat 53%
Im Vergleich zu allen Geräten im Test
» 1% aller getesteten Geräte waren besser, 0% vergleichbar, 99% schlechter
» Das beste Gerät hat einen Delta-Wert von 4%, durchschnittlich ist 23%, das schlechteste Gerät hat 134%

Samsung Galaxy Book5 Pro 14 940XHA Audio Analyse

(±) | Mittelmäßig laut spielende Lautsprecher (80.7 dB)
Bass 100 - 315 Hz
(±) | abgesenkter Bass - 14.6% geringer als der Median
(±) | durchschnittlich lineare Bass-Wiedergabe (11.5% Delta zum Vorgänger)
Mitteltöne 400 - 2000 Hz
(±) | zu hohe Mitten, vom Median 6.5% abweichend
(+) | lineare Mitten (4% Delta zum Vorgänger)
Hochtöne 2 - 16 kHz
(+) | ausgeglichene Hochtöne, vom Median nur 2.8% abweichend
(+) | sehr lineare Hochtöne (5.5% Delta zum Vorgänger)
Gesamt im hörbaren Bereich 100 - 16.000 Hz
(±) | hörbarer Bereich ist durchschnittlich linear (15.8% Abstand zum Median)
Im Vergleich zu allen Geräten derselben Klasse
» 37% aller getesteten Geräte dieser Klasse waren besser, 6% vergleichbar, 57% schlechter
» Das beste Gerät hat einen Delta-Wert von 5%, durchschnittlich ist 18%, das schlechteste Gerät hat 53%
Im Vergleich zu allen Geräten im Test
» 24% aller getesteten Geräte waren besser, 5% vergleichbar, 70% schlechter
» Das beste Gerät hat einen Delta-Wert von 4%, durchschnittlich ist 23%, das schlechteste Gerät hat 134%

Lenovo Yoga Slim 7 Ultra 14IPH11 Audio Analyse

(+) | Die Lautsprecher können relativ laut spielen (82.3 dB)
Bass 100 - 315 Hz
(±) | abgesenkter Bass - 6.7% geringer als der Median
(±) | durchschnittlich lineare Bass-Wiedergabe (9% Delta zum Vorgänger)
Mitteltöne 400 - 2000 Hz
(+) | ausgeglichene Mitten, vom Median nur 3.7% abweichend
(+) | lineare Mitten (5.8% Delta zum Vorgänger)
Hochtöne 2 - 16 kHz
(+) | ausgeglichene Hochtöne, vom Median nur 2.4% abweichend
(+) | sehr lineare Hochtöne (2.4% Delta zum Vorgänger)
Gesamt im hörbaren Bereich 100 - 16.000 Hz
(+) | hörbarer Bereich ist sehr linear (8.4% Abstand zum Median
Im Vergleich zu allen Geräten derselben Klasse
» 9% aller getesteten Geräte dieser Klasse waren besser, 2% vergleichbar, 89% schlechter
» Das beste Gerät hat einen Delta-Wert von 5%, durchschnittlich ist 17%, das schlechteste Gerät hat 45%
Im Vergleich zu allen Geräten im Test
» 2% aller getesteten Geräte waren besser, 1% vergleichbar, 97% schlechter
» Das beste Gerät hat einen Delta-Wert von 4%, durchschnittlich ist 23%, das schlechteste Gerät hat 134%

Honor MagicBook Pro 14 2026 Audio Analyse

(±) | Mittelmäßig laut spielende Lautsprecher (81.2 dB)
Bass 100 - 315 Hz
(±) | abgesenkter Bass - 12.8% geringer als der Median
(±) | durchschnittlich lineare Bass-Wiedergabe (8.9% Delta zum Vorgänger)
Mitteltöne 400 - 2000 Hz
(+) | ausgeglichene Mitten, vom Median nur 4.5% abweichend
(+) | lineare Mitten (5.2% Delta zum Vorgänger)
Hochtöne 2 - 16 kHz
(+) | ausgeglichene Hochtöne, vom Median nur 1.1% abweichend
(+) | sehr lineare Hochtöne (3.9% Delta zum Vorgänger)
Gesamt im hörbaren Bereich 100 - 16.000 Hz
(+) | hörbarer Bereich ist sehr linear (12.1% Abstand zum Median
Im Vergleich zu allen Geräten derselben Klasse
» 22% aller getesteten Geräte dieser Klasse waren besser, 3% vergleichbar, 76% schlechter
» Das beste Gerät hat einen Delta-Wert von 5%, durchschnittlich ist 17%, das schlechteste Gerät hat 45%
Im Vergleich zu allen Geräten im Test
» 10% aller getesteten Geräte waren besser, 2% vergleichbar, 88% schlechter
» Das beste Gerät hat einen Delta-Wert von 4%, durchschnittlich ist 23%, das schlechteste Gerät hat 134%

Dell XPS 14 Core Ultra 7 355 Audio Analyse

(+) | Die Lautsprecher können relativ laut spielen (86.2 dB)
Bass 100 - 315 Hz
(±) | abgesenkter Bass - 5% geringer als der Median
(+) | lineare Bass-Wiedergabe (5.3% Delta zum Vorgänger)
Mitteltöne 400 - 2000 Hz
(±) | zu hohe Mitten, vom Median 5.7% abweichend
(+) | lineare Mitten (4.7% Delta zum Vorgänger)
Hochtöne 2 - 16 kHz
(+) | ausgeglichene Hochtöne, vom Median nur 3.1% abweichend
(+) | sehr lineare Hochtöne (4.1% Delta zum Vorgänger)
Gesamt im hörbaren Bereich 100 - 16.000 Hz
(+) | hörbarer Bereich ist sehr linear (7.9% Abstand zum Median
Im Vergleich zu allen Geräten derselben Klasse
» 7% aller getesteten Geräte dieser Klasse waren besser, 2% vergleichbar, 91% schlechter
» Das beste Gerät hat einen Delta-Wert von 5%, durchschnittlich ist 17%, das schlechteste Gerät hat 45%
Im Vergleich zu allen Geräten im Test
» 2% aller getesteten Geräte waren besser, 1% vergleichbar, 98% schlechter
» Das beste Gerät hat einen Delta-Wert von 4%, durchschnittlich ist 23%, das schlechteste Gerät hat 134%

Apple MacBook Air 13 M5 Audio Analyse

(+) | Die Lautsprecher können relativ laut spielen (82.1 dB)
Bass 100 - 315 Hz
(±) | abgesenkter Bass - 10.5% geringer als der Median
(±) | durchschnittlich lineare Bass-Wiedergabe (10.2% Delta zum Vorgänger)
Mitteltöne 400 - 2000 Hz
(+) | ausgeglichene Mitten, vom Median nur 2% abweichend
(+) | lineare Mitten (2.7% Delta zum Vorgänger)
Hochtöne 2 - 16 kHz
(±) | zu hohe Hochtöne, vom Median nur 5.1% abweichend
(+) | sehr lineare Hochtöne (3% Delta zum Vorgänger)
Gesamt im hörbaren Bereich 100 - 16.000 Hz
(+) | hörbarer Bereich ist sehr linear (11.7% Abstand zum Median
Im Vergleich zu allen Geräten derselben Klasse
» 13% aller getesteten Geräte dieser Klasse waren besser, 3% vergleichbar, 83% schlechter
» Das beste Gerät hat einen Delta-Wert von 5%, durchschnittlich ist 18%, das schlechteste Gerät hat 53%
Im Vergleich zu allen Geräten im Test
» 8% aller getesteten Geräte waren besser, 3% vergleichbar, 89% schlechter
» Das beste Gerät hat einen Delta-Wert von 4%, durchschnittlich ist 23%, das schlechteste Gerät hat 134%

Stromverbrauch und Akkulaufzeit

Das neue Zenbook S14 ist im Leerlauf trotz dem helleren OLED-Bildschirm noch effizienter als sein Vorgänger mit Lunar-Lake-Prozessor. Bei maximaler Auslastung messen wir bis zu 87 Watt, wobei sich der Verbrauch schnell auf etwa 48 Watt einpendelt. Unserem deutschen Testgerät lag kein Netzteil bei, doch Modelle außerhalb Europas werden mit einem 68-W-Netzteil ausgeliefert, was nicht ausreicht. Aufgrund der hohen Leistungsgrenze der CPU wird der Verbrauch in Spitzenlastszenarien stets die Kapazität des Netzteils übersteigen, sodass der Akku entladen wird. Dies ist nicht ideal.

Die Akkulaufzeit profitiert sowohl vom geringeren Stromverbrauch als auch vom größeren 77-Wh-Akku (zuvor 72 Wh). Bei 150 Nits läuft unser WLAN-Test mehr als 16 Stunden und damit etwa 2 Stunden länger als zuvor. Bei maximaler Helligkeit ist die Laufzeit mit rund zehn Stunden nahezu identisch.

Stromverbrauch
Aus / Standbydarklight 0.29 / 0.56 Watt
Idledarkmidlight 2.3 / 4.6 / 5 Watt
Last midlight 45.9 / 87 Watt
 color bar
Legende: min: dark, med: mid, max: light        Metrahit Energy
Asus ZenBook S14 UX5406AA
Ultra 9 386H, Intel Graphics 4 Xe3 PTL, Samsung PM9C1b MZVL81T0HFLB-00BTW, OLED, 2880x1800, 14"
Asus Zenbook A14 UX3704NA
X2E-88-100, X2-90, Micron 2600 1TB MTFDKBA1T0QHK, OLED, 1920x1200, 14"
Asus Zenbook S 14 UX5406
Core Ultra 7 258V, Arc 140V, WD PC SN560 SDDPNQE-1T00, OLED, 2880x1800, 14"
HP OmniBook Ultra 14 Core Ultra X9
Ultra X9 388H, Arc B390 Panther Lake iGPU, , OLED, 2880x1800, 14"
Samsung Galaxy Book5 Pro 14 940XHA
Core Ultra 5 226V, Arc 130V, Samsung PM9C1 MZVL8512HELU, OLED, 2880x1800, 14"
Lenovo Yoga Slim 7 Ultra 14IPH11
Ultra 7 355, Intel Graphics 4 Xe3 PTL, SK hynix PVC10 HFS001TEM4X182N, OLED, 2880x1800, 14"
Honor MagicBook Pro 14 2026
Ultra 5 338H, Arc B370 Panther Lake iGPU, YMTC PC411-1TB, OLED, 3120x2080, 14.6"
Dell XPS 14 Core Ultra 7 355
Ultra 7 355, Intel Graphics 4 Xe3 PTL, WD PC SN7100S SDFPMSL-512G-1101, IPS, 1920x1200, 14"
Apple MacBook Air 13 M5
M5 10-Core, M5 8-Core GPU, Apple SSD AP0512Z, IPS, 2560x1664, 13.6"
Durchschnittliche Intel Graphics 4 Xe3 Panther Lake iGPU
 
Durchschnitt der Klasse Subnotebook
 
Stromverbrauch
-30%
-11%
-8%
-1%
-21%
-63%
13%
8%
-6%
-26%
Idle min * (Watt)
2.3
4.7
-104%
5.1
-122%
2.5
-9%
3.7
-61%
3.2
-39%
6.8
-196%
1.6
30%
1.8
22%
2.75 ?(1.3 - 6.2, n=10)
-20%
Idle avg * (Watt)
4.6
7.1
-54%
6.2
-35%
5.1
-11%
5.2
-13%
3.9
15%
8.2
-78%
3.7
20%
9.3
-102%
5.03 ?(3.7 - 7.9, n=10)
-9%
Idle max * (Watt)
5
7.4
-48%
6.9
-38%
5.8
-16%
5.4
-8%
12.3
-146%
9.1
-82%
3.9
22%
9.4
-88%
6.51 ?(3.9 - 12.3, n=10)
-30%
Last avg * (Watt)
45.9
39.6
14%
38.7
16%
49.8
-8%
26.2
43%
36.5
20%
40.4
12%
36
22%
29.4
36%
40.6 ?(36 - 45.9, n=10)
12%
Cyberpunk 2077 ultra external monitor * (Watt)
46.1
31.4
32%
28.6
38%
55.1
-20%
42.7
7%
50.6
-10%
66
-43%
47.7
-3%
17.7
62%
Cyberpunk 2077 ultra * (Watt)
48.1
65.3
-36%
33.1
31%
55
-14%
47.4
1%
51.1
-6%
66.1
-37%
50.9
-6%
18.9
61%
Last max * (Watt)
87
101.8
-17%
60
31%
68
22%
63.5
27%
69
21%
100.2
-15%
80
8%
30.4
65%
73.7 ?(54 - 98, n=10)
15%

* ... kleinere Werte sind besser

Stromverbrauch Cyberpunk/Stresstest

0510152025303540455055606570758085Tooltip
Asus ZenBook S14 UX5406AA; 1280x720 Prime95 28.10 and Furmark 1.25: Ø52.1 (47.9-87) Watt
Asus ZenBook S14 UX5406AA; Idle 150cd/m2: Ø3.52 (3.32-4.58) Watt
Asus ZenBook S14 UX5406AA; Cyberpunk 2077 FHD ultra no FSR 150cd: Ø48.1 (45.1-56.1) Watt

Stromverbrauch eines externen Monitors

05101520253035404550556065707580Tooltip
Asus ZenBook S14 UX5406AA; Prime95 V2810 Stress (external Monitor): Ø49.2 (43.4-81.3) Watt
Asus ZenBook S14 UX5406AA; Cinebench R23 Single (external Monitor): Ø23.8 (22.8-30.9) Watt
Asus ZenBook S14 UX5406AA; Cinebench R23 Multi (external Monitor): Ø67.7 (49.5-79.4) Watt
Asus ZenBook S14 UX5406AA; 1280x720 FurMark 1.19 GPU Stress Test (external Monitor): Ø48.4 (46-54.8) Watt
Asus ZenBook S14 UX5406AA; Idle 1min (external Monitor): Ø4.73 (4.53-5.55) Watt
Asus ZenBook S14 UX5406AA; Cyberpunk 2077 FHD ultra no FSR (external Monitor): Ø46.1 (44.6-49.3) Watt
Asus ZenBook S14 UX5406AA; Cinebench 2024 Single Power (external Monitor): Ø25.4 (20.2-38.2) Watt
Asus ZenBook S14 UX5406AA; Cinebench 2024 Multi Power (external Monitor): Ø48.5 (43.5-84) Watt

Akkulaufzeit

Akkulaufzeit
WiFi Websurfing
16h 11min
WiFi Websurfing max. Brightness
10h 14min
Battery Runtime
WiFi Websurfing
Asus ZenBook S14 UX5406AA
Ultra 9 386H, Intel Graphics 4 Xe3 PTL, 77 Wh
16.2 h
Apple MacBook Air 13 M5
M5 10-Core, M5 8-Core GPU, 53.8 Wh
16.2 h 0%
Asus Zenbook A14 UX3704NA
X2E-88-100, X2-90, 70 Wh
16.1 h -1%
Honor MagicBook Pro 14 2026
Ultra 5 338H, Arc B370 Panther Lake iGPU, 92 Wh
14.9 h -8%
Dell XPS 14 Core Ultra 7 355
Ultra 7 355, Intel Graphics 4 Xe3 PTL, 70 Wh
14.5 h -10%
Asus Zenbook S 14 UX5406
Core Ultra 7 258V, Arc 140V, 72 Wh
14.3 h -12%
Durchschnitt der Klasse Subnotebook
  (7.25 - 26.4, n=60, der letzten 2 Jahre)
14 h -14%
HP OmniBook Ultra 14 Core Ultra X9
Ultra X9 388H, Arc B390 Panther Lake iGPU, 70 Wh
12.6 h -22%
Lenovo Yoga Slim 7 Ultra 14IPH11
Ultra 7 355, Intel Graphics 4 Xe3 PTL, 75 Wh
10.6 h -35%
Samsung Galaxy Book5 Pro 14 940XHA
Core Ultra 5 226V, Arc 130V, 63 Wh
10.1 h -38%
WiFi Websurfing max. Brightness
Asus Zenbook A14 UX3704NA
X2E-88-100, X2-90, 70 Wh
10.9 h +7%
Asus ZenBook S14 UX5406AA
Ultra 9 386H, Intel Graphics 4 Xe3 PTL, 77 Wh
10.2 h
Asus Zenbook S 14 UX5406
Core Ultra 7 258V, Arc 140V, 72 Wh
10 h -2%
Honor MagicBook Pro 14 2026
Ultra 5 338H, Arc B370 Panther Lake iGPU, 92 Wh
8.8 h -14%
Durchschnitt der Klasse Subnotebook
  (4.82 - 15.8, n=34, der letzten 2 Jahre)
8.6 h -16%
Samsung Galaxy Book5 Pro 14 940XHA
Core Ultra 5 226V, Arc 130V, 63 Wh
8.3 h -19%
Apple MacBook Air 13 M5
M5 10-Core, M5 8-Core GPU, 53.8 Wh
6.7 h -34%

Notebookcheck Bewertung

Asus ZenBook S14 UX5406AA - 18.07.2026 v8
Andreas Osthoff

Gehäuse
89 / 98 → 91%
Tastatur
87%
Pointing Device
93%
Konnektivität
71 / 74 → 96%
Gewicht
73 / 20-77 → 92%
Akkulaufzeit
91%
Display
85%
Leistung Spiele
50 / 75 → 66%
Leistung Anwendungen
88 / 92 → 95%
AI Performance
89%
Temperatur
90%
Lautstärke
80%
Audio
87 / 91 → 95%
Kamera
34 / 75 → 45%
Durchschnitt
68%
88%
Subnotebook - gewichteter Durchschnitt
Weitere Informationen über unsere Bewertung finden Sie hier.
CO2 Emissions
Materials
50%
Packaging
50%
Power Use
87.5%
Repairability
40%
Software Updates
22.3%
Recycle Logo Total Sustainability Score: 0%

Mögliche Wettbewerber im Vergleich

Bild
Modell / Test
Preis ab
Gewicht
Dicke
Display
1.
88%
Asus ZenBook S14 UX5406AA
Intel Core Ultra 9 386H ⎘
Intel Graphics 4 Xe3 Panther Lake iGPU ⎘
32 GB RAM, 1000 GB SSD
Amazon:
1. 1.974,00 €
ASUS Zenbook S14 UX5406AA Co...
2. 1.961,99 €
ASUS Zenbook S14 UX5406AA Co...
3. 1.799,00 €
ASUS Zenbook S14 | 14" WQXGA...
Bestpreis 1840€ TechnikLaden
2. 1851.34€ haym.infotec
3. 1879.89€ voelkner.de
1.2 kg12.9 mm14.00"
2880x1800
243 PPI
OLED
2.
87.5%
Asus Zenbook A14 UX3704NA
Qualcomm Snapdragon X2 Elite X2E-88-100 ⎘
Qualcomm Adreno X2-90 ⎘
32 GB RAM, 1024 GB SSD
Amazon:
1. 1.499,00 €
ASUS Zenbook A14 UX3407NA Co...
2. 1.008,80 €
ASUS Zenbook A14 UX3407RA-QD...
3. 825,75 €
ASUS Zenbook A14 OLED UX3407...
Bestpreis 1460€ TechnikLaden
2. 1461.38€ haym.infotec
3. 1494.78€ voelkner.de
992 g15.9 mm14.00"
1920x1200
162 PPI
OLED
3.
88.1%
Asus Zenbook S 14 UX5406
Intel Core Ultra 7 258V ⎘
Intel Arc Graphics 140V ⎘
32 GB RAM, 1024 GB SSD
Amazon: Bestpreis 1632.05€ Morelenet
2. 1647.61€ Morelenet
1.2 kg13 mm14.00"
2880x1800
243 PPI
OLED
4.
87.9%
HP OmniBook Ultra 14 Core Ultra X9
Intel Core Ultra X9 388H ⎘
Intel Arc B390 12 Xe3 Panther Lake iGPU ⎘
32 GB RAM
Amazon:
Bestpreis 1899€ nullprozentshop.de
2. 1899€ notebooksbilliger.de
3. 1914.96€ notebooksbilliger.at
1.3 kg10.7 mm14.00"
2880x1800
243 PPI
OLED
5.
86.9%
Samsung Galaxy Book5 Pro 14 940XHA
Intel Core Ultra 5 226V ⎘
Intel Arc Graphics 130V ⎘
16 GB RAM, 512 GB SSD
Amazon: Bestpreis 1229€ Easynotebooks.de
2. 1229.01€ Notebook.de
3. 1239.33€ Easynotebooks.de (AT)
1.2 kg11.6 mm14.00"
2880x1800
243 PPI
OLED
6.
84.4%
Lenovo Yoga Slim 7 Ultra 14IPH11
Intel Core Ultra 7 355 ⎘
Intel Graphics 4 Xe3 Panther Lake iGPU ⎘
32 GB RAM, 1024 GB SSD
Amazon: 949,00 €
Geizhals Suche
978 g13.9 mm14.00"
2880x1800
243 PPI
OLED
7.
88.9%
Honor MagicBook Pro 14 2026
Intel Core Ultra 5 338H ⎘
Intel Arc B370 10 Xe3 Panther Lake iGPU ⎘
32 GB RAM, 1024 GB SSD
Amazon:
1. 699,94 €
HUAWEI MateBook 14 Laptop,14...
2. 1.377,13 €
HUAWEI MateBook X Pro Core U...
3. 586,72 €
HUAWEI MateBook D 14 Laptop,...
1.4 kg15.9 mm14.60"
3120x2080
257 PPI
OLED
8.
84.8%
Dell XPS 14 Core Ultra 7 355
Intel Core Ultra 7 355 ⎘
Intel Graphics 4 Xe3 Panther Lake iGPU ⎘
16 GB RAM, 512 GB SSD
Amazon:
1. 1.699,00 €
Dell XPS 14 9440 Laptop 14.5...
2. 1.482,34 €
Dell Pro 14 Plus PB14250 - I...
3. 1.605,61 €
Dell XPS 13 (9350) Laptop Co...
Geizhals Suche
1.5 kg15.2 mm14.00"
1920x1200
162 PPI
IPS
9.
91.6%
Apple MacBook Air 13 M5
Apple M5 10-Core ⎘
Apple M5 8-Core GPU ⎘
16 GB RAM, 512 GB SSD
Amazon: 1.211,53 €
Bestpreis 1248.99€ Mindfactory
2. 1249€ Media Markt.at
3. 1249€ nullprozentshop.de
1.2 kg11.3 mm13.60"
2560x1664
225 PPI
IPS

Transparenz

Die Auswahl der zu testenden Geräte erfolgt innerhalb der Redaktion. Das vorliegende Testmuster wurde dem Autor vom Hersteller oder einem Shop zu Testzwecken leihweise zur Verfügung gestellt. Eine Einflussnahme des Leihstellers auf den Testbericht gab es nicht, der Hersteller erhielt keine Version des Reviews vor der Veröffentlichung. Es bestand keine Verpflichtung zur Publikation. Als eigenständiges, unabhängiges Unternehmen unterliegt Notebookcheck keiner Diktion von Herstellern, Shops und Verlagen.

So testet Notebookcheck

Pro Jahr werden von Notebookcheck hunderte Laptops und Smartphones unabhängig in von uns standardisierten technischen Verfahren getestet, um eine Vergleichbarkeit aller Testergebnisse zu gewährleisten. Seit rund 20 Jahren entwickeln wir diese Testmethoden kontinuierlich weiter und setzen damit Branchenstandards. In unseren Testlaboren kommt ausschließlich hochwertiges Messequipment in die Hände erfahrener Techniker und Redakteure. Die Tests unterliegen einer mehrstufigen Kontrolle. Unsere komplexe Gesamtbewertung basiert auf hunderten fundierten Messergebnissen und Benchmarks, womit Ihnen Objektivität garantiert ist. Weitere Informationen zu unseren Testmethoden gibt es hier.

Google LogoAls bevorzugte Quelle auf Google hinzufügen
Mail Logo
static version load dynamic
Loading Comments
Diesen Artikel kommentieren / Antworten
> Notebook Test, Laptop Test und News > Tests > Notebook Testberichte > Testbericht zum Asus ZenBook S14 2026 – Helleres OLED-Display, aber eine langsame Panther-Lake-iGPU
Autor: Andreas Osthoff, 18.07.2026 (Update: 18.07.2026)