Notebookcheck Logo
Teaser

Einer der besten Gaming-Laptops endlich mit G-Sync - XMG Neo 16 (M26) im Test

Maximale Leistung, top Display.

Das XMG Neo 16 ist eines der schnellsten Gaming-Laptops auf dem Markt und für das aktuelle Modelljahr bekommt das sehr gute Mini-LED-Panel mit 300 Hz endlich G-Sync-Unterstützung. Optional steht erstmals zudem ein OLED-Bildschirm zur Verfügung.
Andreas Osthoff 👁 Veröffentlicht am
Blackwell RTX 5000 Gaming Geforce Intel Laptop / Notebook Thunderbolt Wi-Fi 7 Windows

Fazit - Ein hervorragendes Gaming/Creator-Notebook

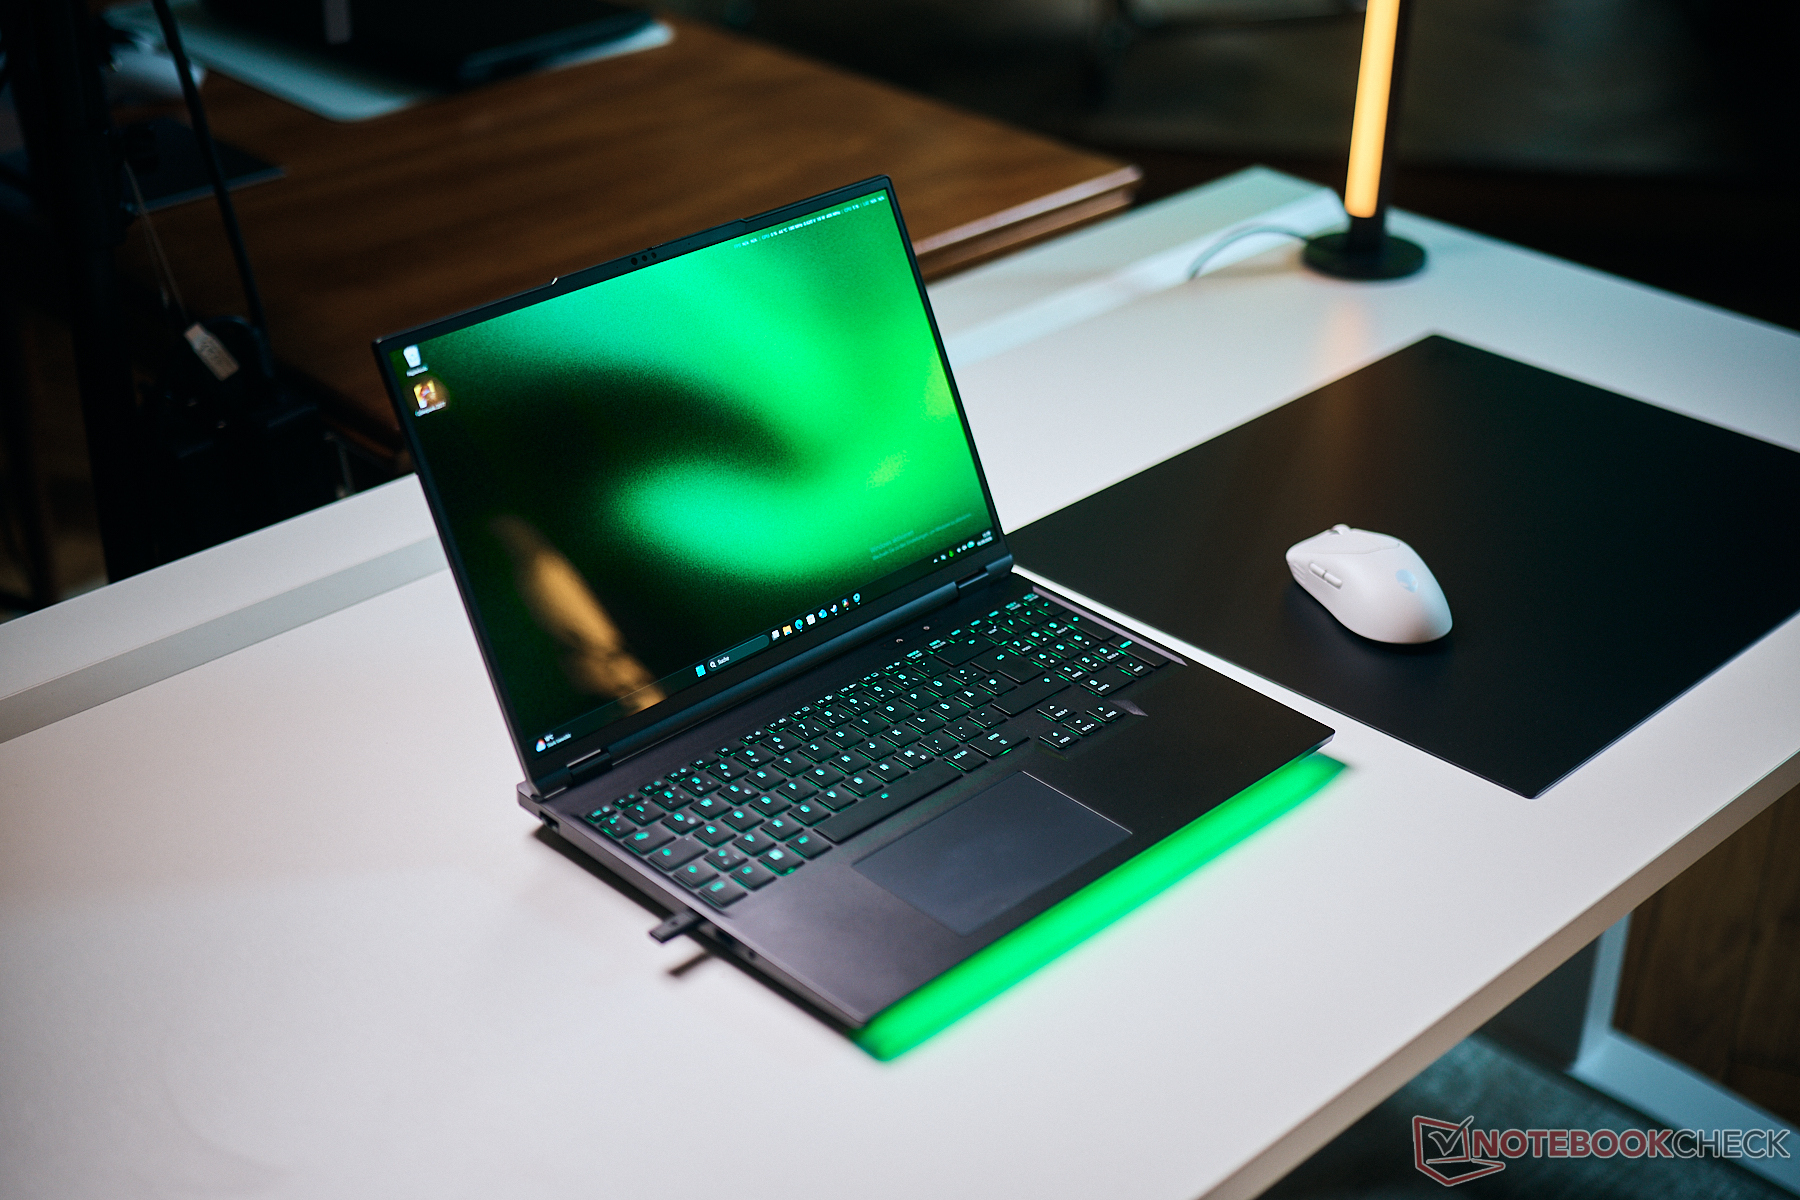
Das XMG Neo 16 bleibt auch im Modelljahr 2026 ein hervorragendes Gaming-Notebook. Die Leistung ist sehr hoch und optional ist natürlich weiterhin der Betrieb mit der Oasis-Wasserkühlung möglich, wo die CPU-Leistung noch einmal besser wird. Das sehr gute Mini-LED-Panel bietet erneut eine sehr gute Bildqualität und unterstützt nun endlich G-Sync, womit ein Kritikpunkt des Vorgängers nun ausgemerzt wurde. Zudem ist die Handhabung des Mini-LED-Panels vorbildlich, da sich das Local Dimming problemlos aktivieren bzw. deaktivieren lässt, was beispielsweise bei der Bildbearbeitung ein Vorteil ist. Optional steht nun zudem ein spiegelnder OLED-Bildschirm zur Auswahl, wenn man einen etwas plastischeren Bildeindruck bevorzugt. Dank dem unauffälligen Gehäuse lässt sich das Neo 16 auch problemlos in professionellen Umfeldern verwenden.

Download der lizensierten Bewertungsgrafik als SVG / PNG

Auch die Kühlung kann überzeugen, denn mit den Energieprofilen kann man problemlos zwischen einem vergleichsweise leisen Gamer (unter 40 dB(A)) und maximaler Leistung wählen, was dann aber mit lauten Lüftern quittiert wird. Aber selbst im leisesten Modus ist die Gaming-Leistung immer noch hervorragend (TGP 150 Watt), hier lohnt es sich also, die verschiedenen Profile auszuprobieren.

Für Schwachpunkte muss man schon sehr genau suchen. Auf Thunderbolt 5 muss man verzichten, die Lautsprecher könnten noch etwas besser sein und eine umfangreiche Beleuchtung gibt es auch nicht, wobei dieser Punkt sicherlich Geschmackssache ist. Wie alle Laptops in 2026 ist zudem der Preis sehr hoch, dafür bekommt man aber auch eines der besten Gaming/Creator-Notebooks auf dem Markt, optional sogar als baugleiche Linux-Variante von Tuxedo (Stellaris 16).

Pro

+ sehr hohe Leistung (CPU & GPU)
+ PCIe 5.0 und viele Anschlüsse
+ enorm helles und mattes Mini-LED-Panel
+ sehr gute Bildqualität & 300 Hz
+ stabiles und hochwertiges Gehäuse
+ komfortable Tastatur
+ gute Wartungsmöglichkeiten & bis zu 128 GB RAM
+ verbesserte Akkulaufzeit
+ schneller SD-Express-Kartenleser
+ optionale Wasserkühlung

Contra

- kein Thunderbolt 5
- laute Lüfter beim Spielen (abhängig vom Energieprofil)
- kurzes Netzteilkabel
- Werksprofile für P3 sind nicht optimal

Preis und Verfügbarkeit

Spezifikationen

Schenker XMG Neo 16 M26 Mini-LED (XMG Neo 16 Serie)
Prozessor
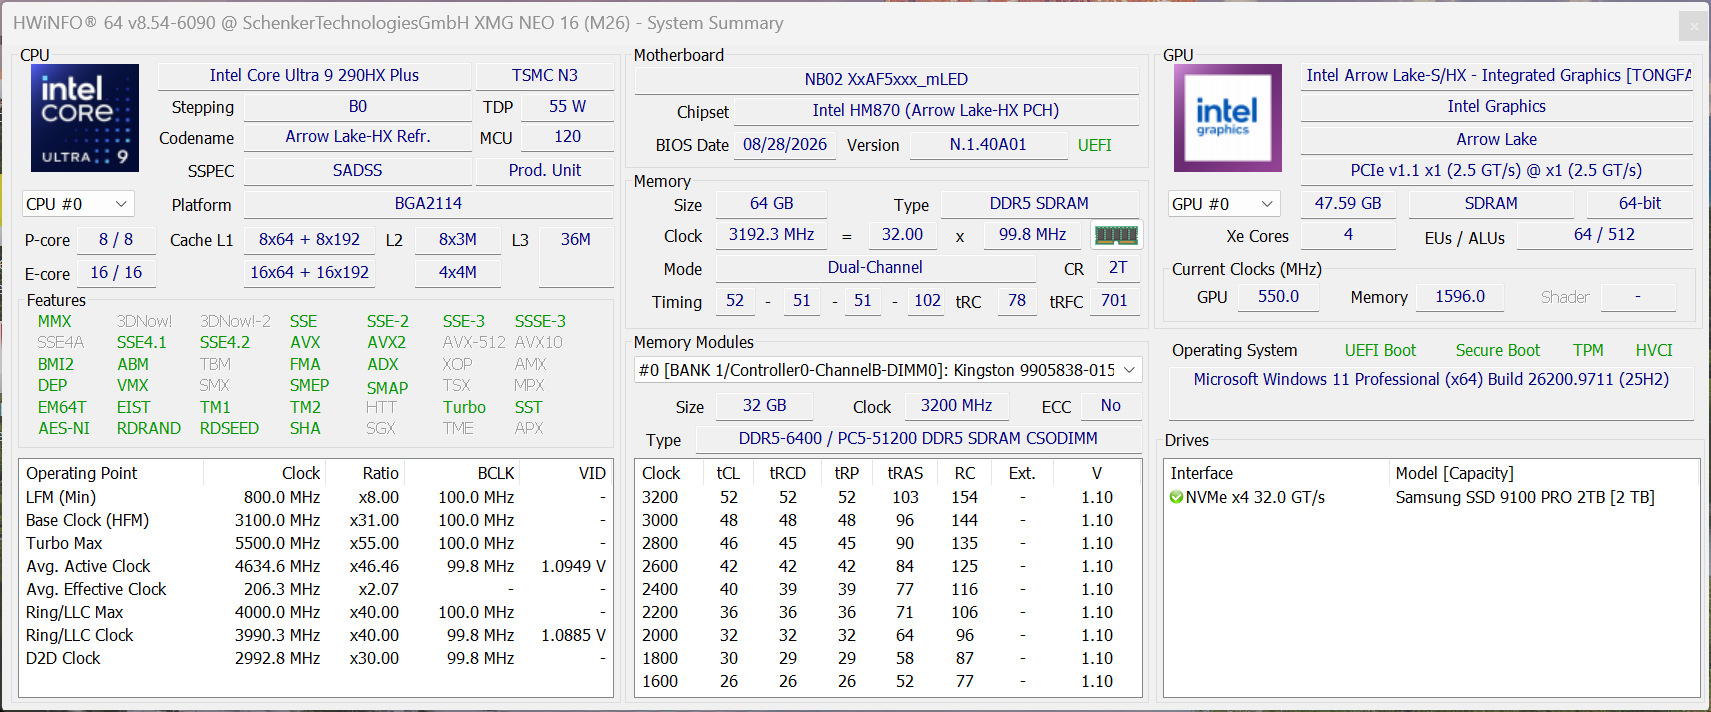
Intel Core Ultra 9 290HX Plus 24c/24t, 8 x 5.5 GHz Intel Lion Cove P-Core, 16 x 4.7 GHz Intel Skymont E-Core, 200 W PL2 / Short Burst, 185 W PL1 / Sustained, Arrow Lake-HX
Grafikkarte
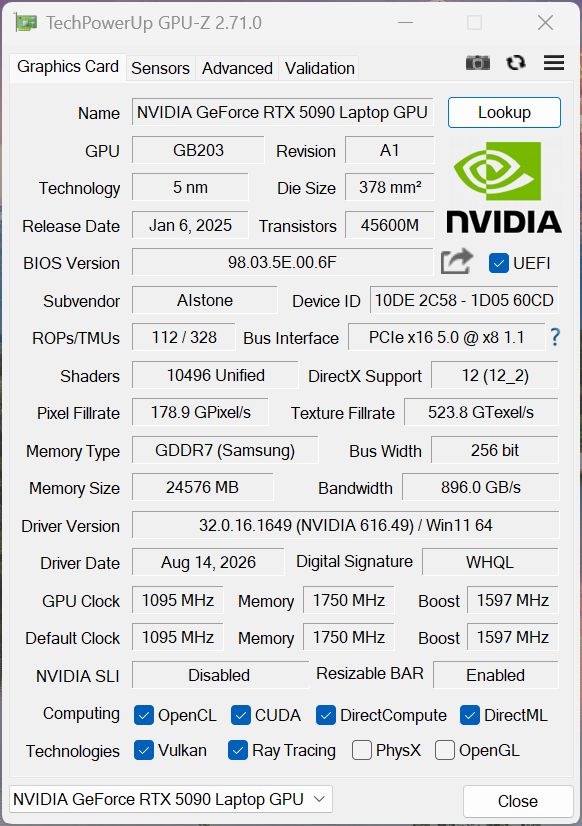
NVIDIA GeForce RTX 5090 Laptop - 24 GB VRAM, Kerntakt: 1845 MHz, Speichertakt: 1750 MHz, 175 W TDP ( beinhaltet 25 W Dynamic Boost), GDDR7, 616.49, Advanced Optimus
RAM
64 GB 
, DDR5-6400, Dual-Channel, 2 slots in use, max. 128 GB
Bildschirm
16.00 Zoll 16:10, 2560 x 1600 Pixel 189 PPI, NE160QDM-NM9, Mini-LED, G-Sync, spiegelnd: nein, HDR, 300 Hz, Adaptive Sync
Mainboard
Intel HM870 (Arrow Lake-HX PCH)
Massenspeicher
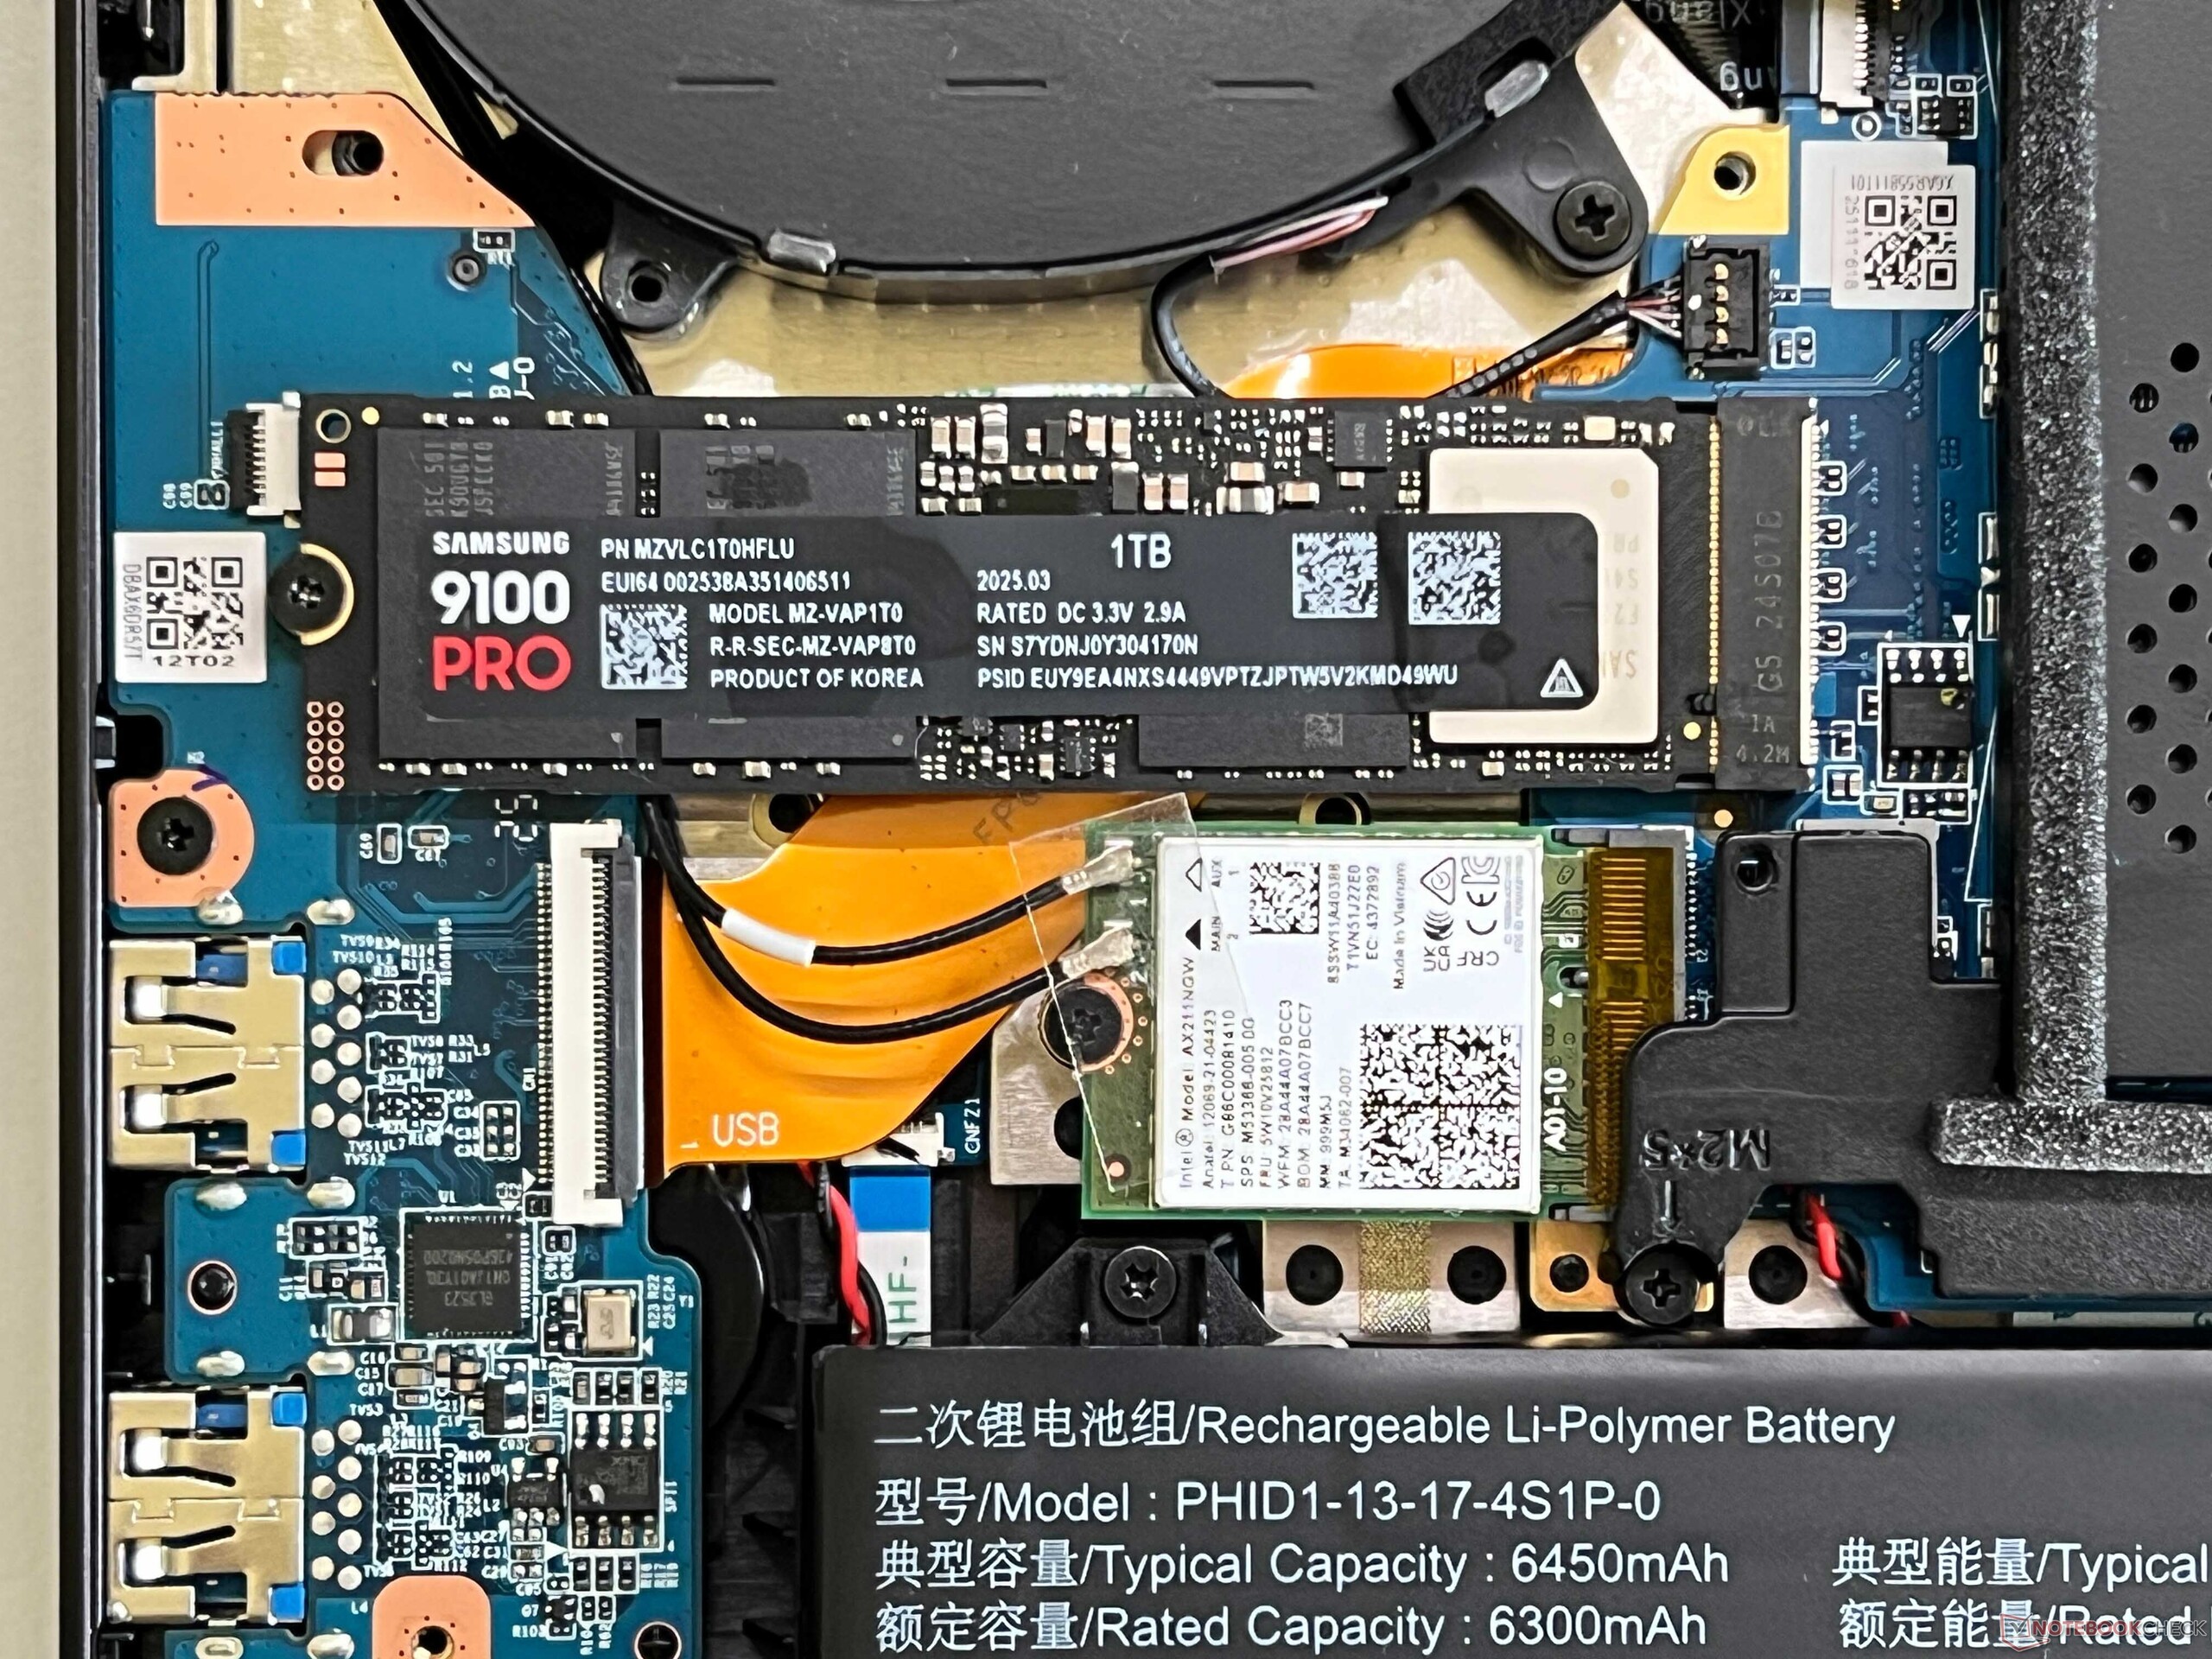
Samsung 9100 Pro 2 TB, 2048 GB 
, 1782 GB verfügbar
Soundkarte
Intel Arrow Lake-S PCH - ACE (Audio Context Engine)
Anschlüsse
3 USB 3.0 / 3.1 Gen1, 1 USB 3.1 Gen2, 1 Thunderbolt 4, USB-C Power Delivery (PD), 1 HDMI, 3 DisplayPort, 1 Kensington Lock, 1 Docking Station Anschluss, Audio Anschlüsse: 3.5 mm stereo, Card Reader: SD Express
Netzwerk
Realtek RTL8125 2.5GBe Family Ethernet Controller (10/100/1000/2500MBit/s), Intel Wi-Fi 7 BE200 320MHz (a/b/g/n = Wi-Fi 4/ac = Wi-Fi 5/ax = Wi-Fi 6/ Wi-Fi 6E 6 GHz be = Wi-Fi 7), Bluetooth 5.4
Abmessungen
Höhe x Breite x Tiefe (in mm): 27.9 x 356.7 x 259.9
Akku
99.8 Wh, 6450 mAh Lithium-Polymer
Betriebssystem
Microsoft Windows 11 Home
Kamera
Webcam: 1080p w/ mechanical shutter + IR
Primary Camera: 2 MPix
Sonstiges
Lautsprecher: Stereo, Tastatur: Chiclet, Tastatur-Beleuchtung: ja, 420W PSU, 24 Monate Garantie
Gewicht
2.837 kg, Netzteil: 835 g
Preis
5800 Euro
Hinweis: Der Hersteller kann abweichende Bauteile wie Bildschirme, Laufwerke und Speicherriegel mit ähnlichen Spezifikationen unter dem gleichen Modellnamen einsetzen.


Gehäuse, Ausstattung und Eingabegeräte

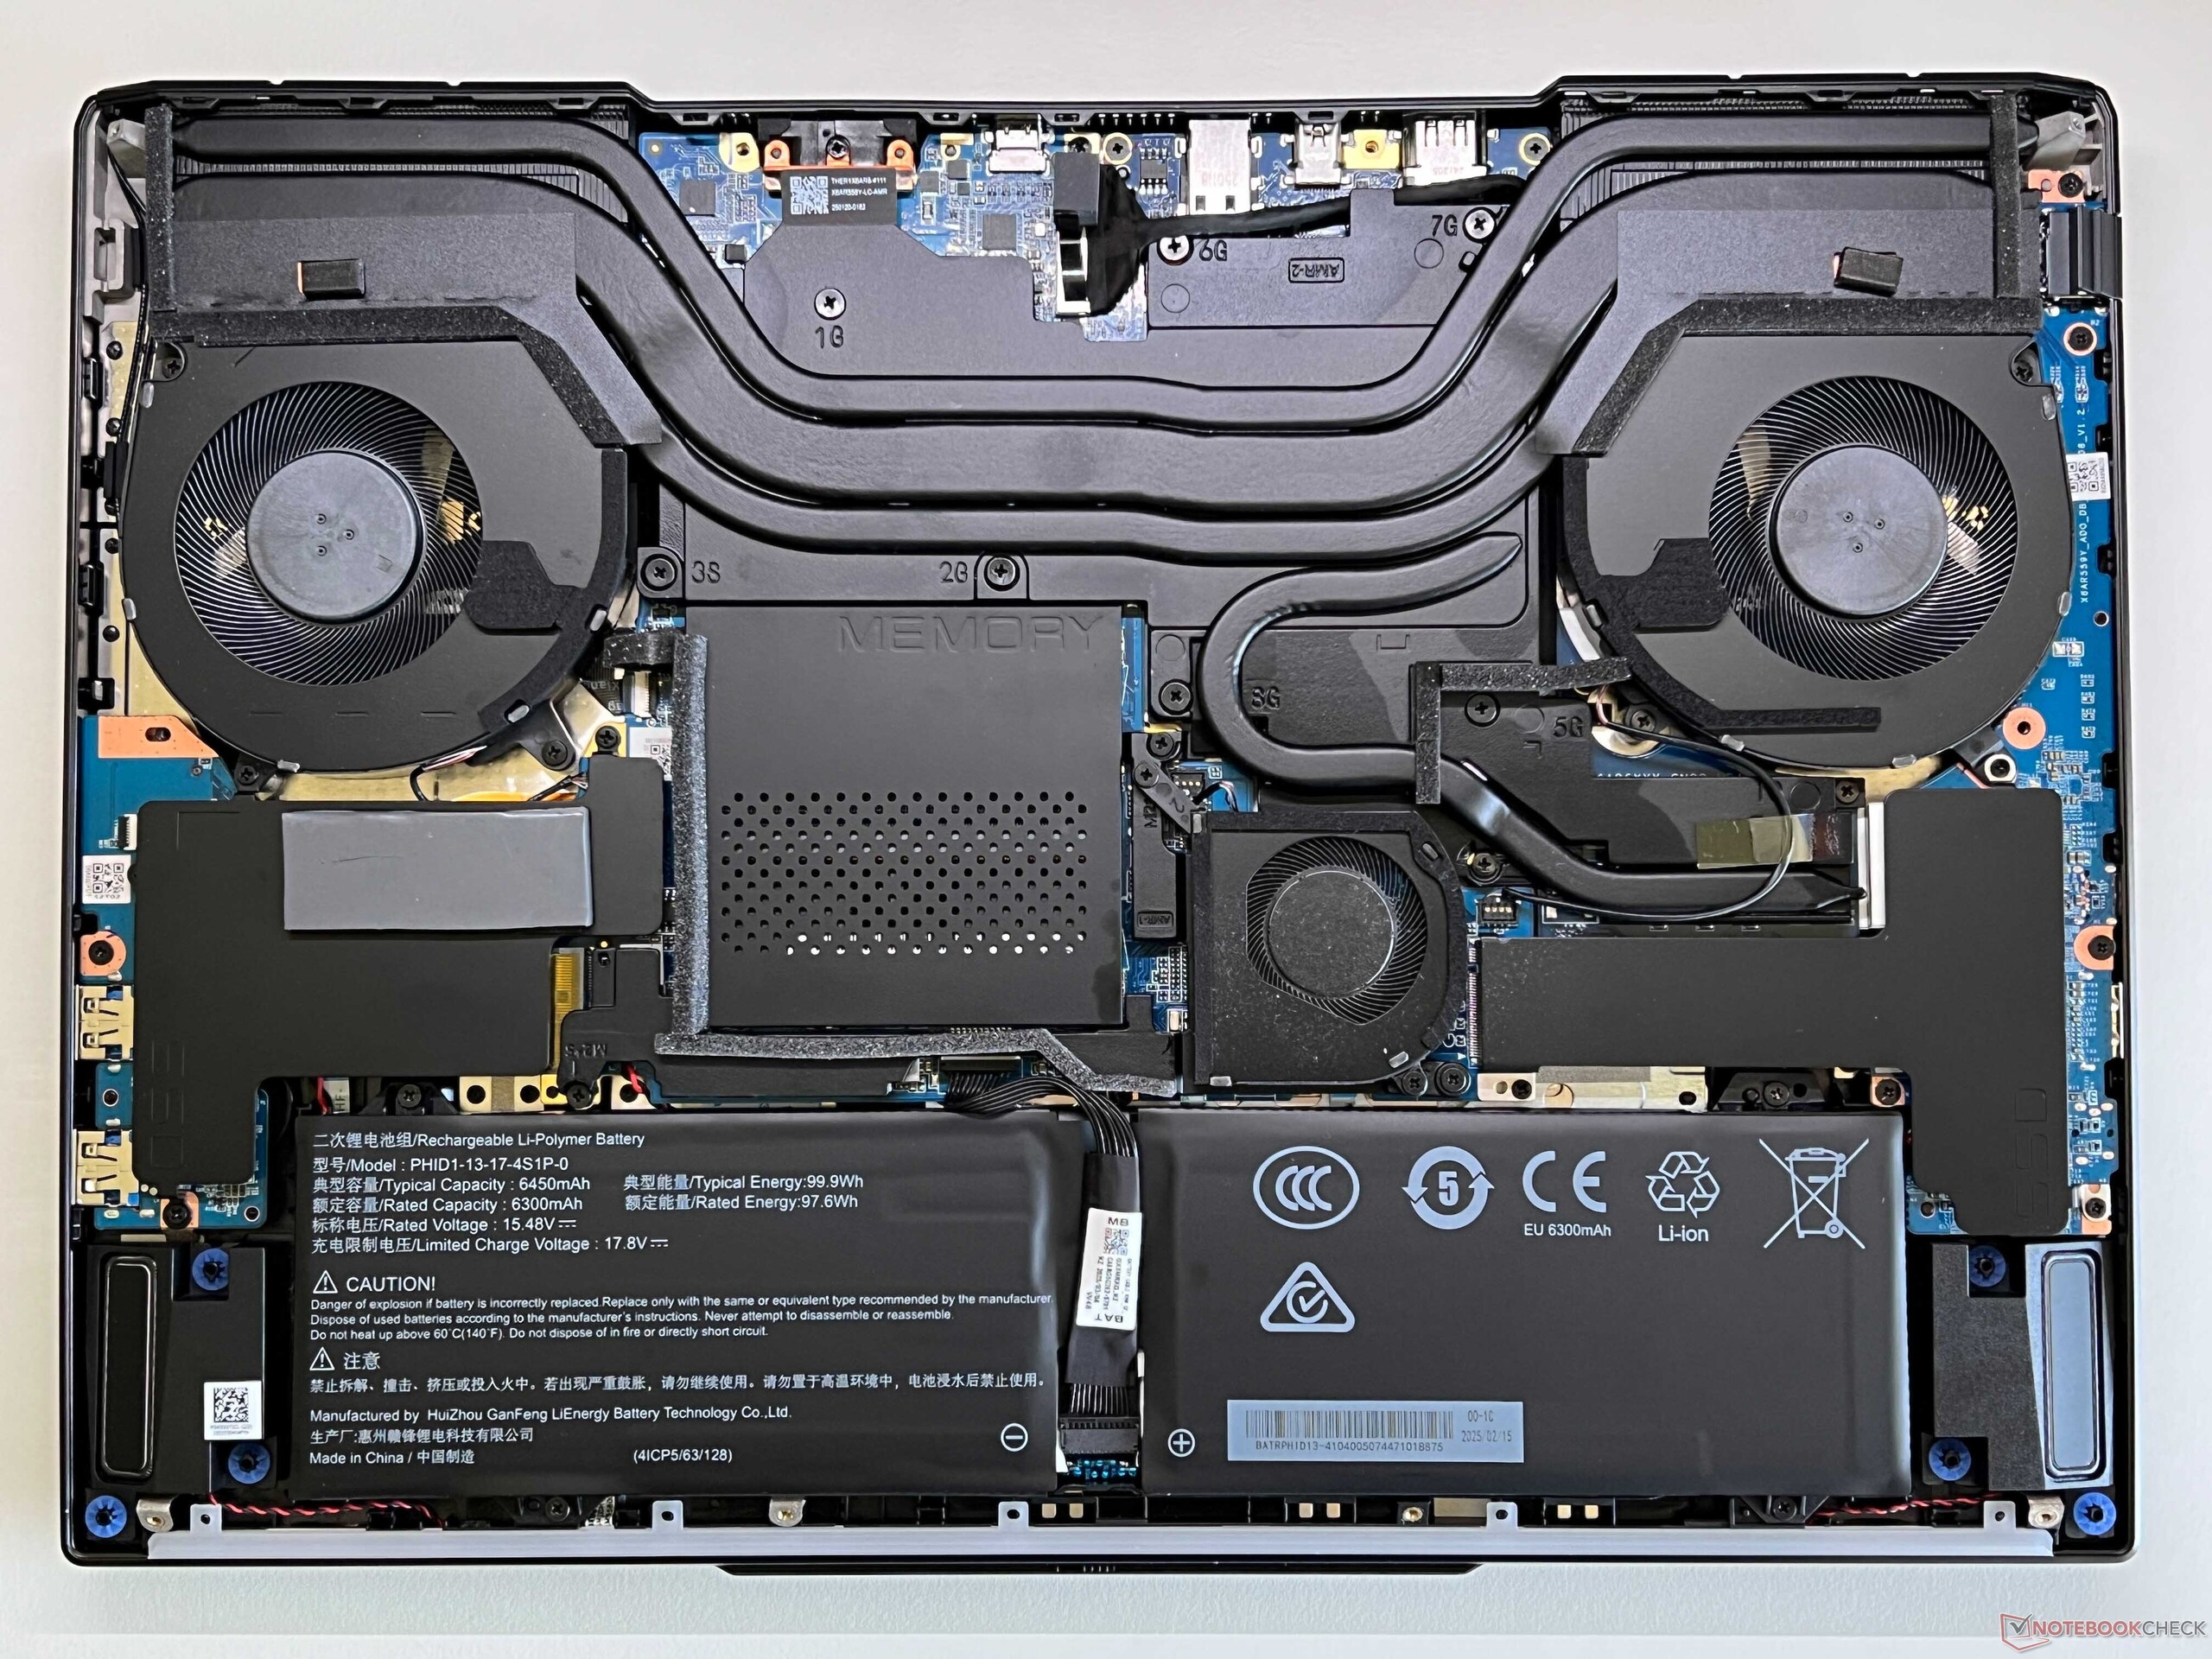
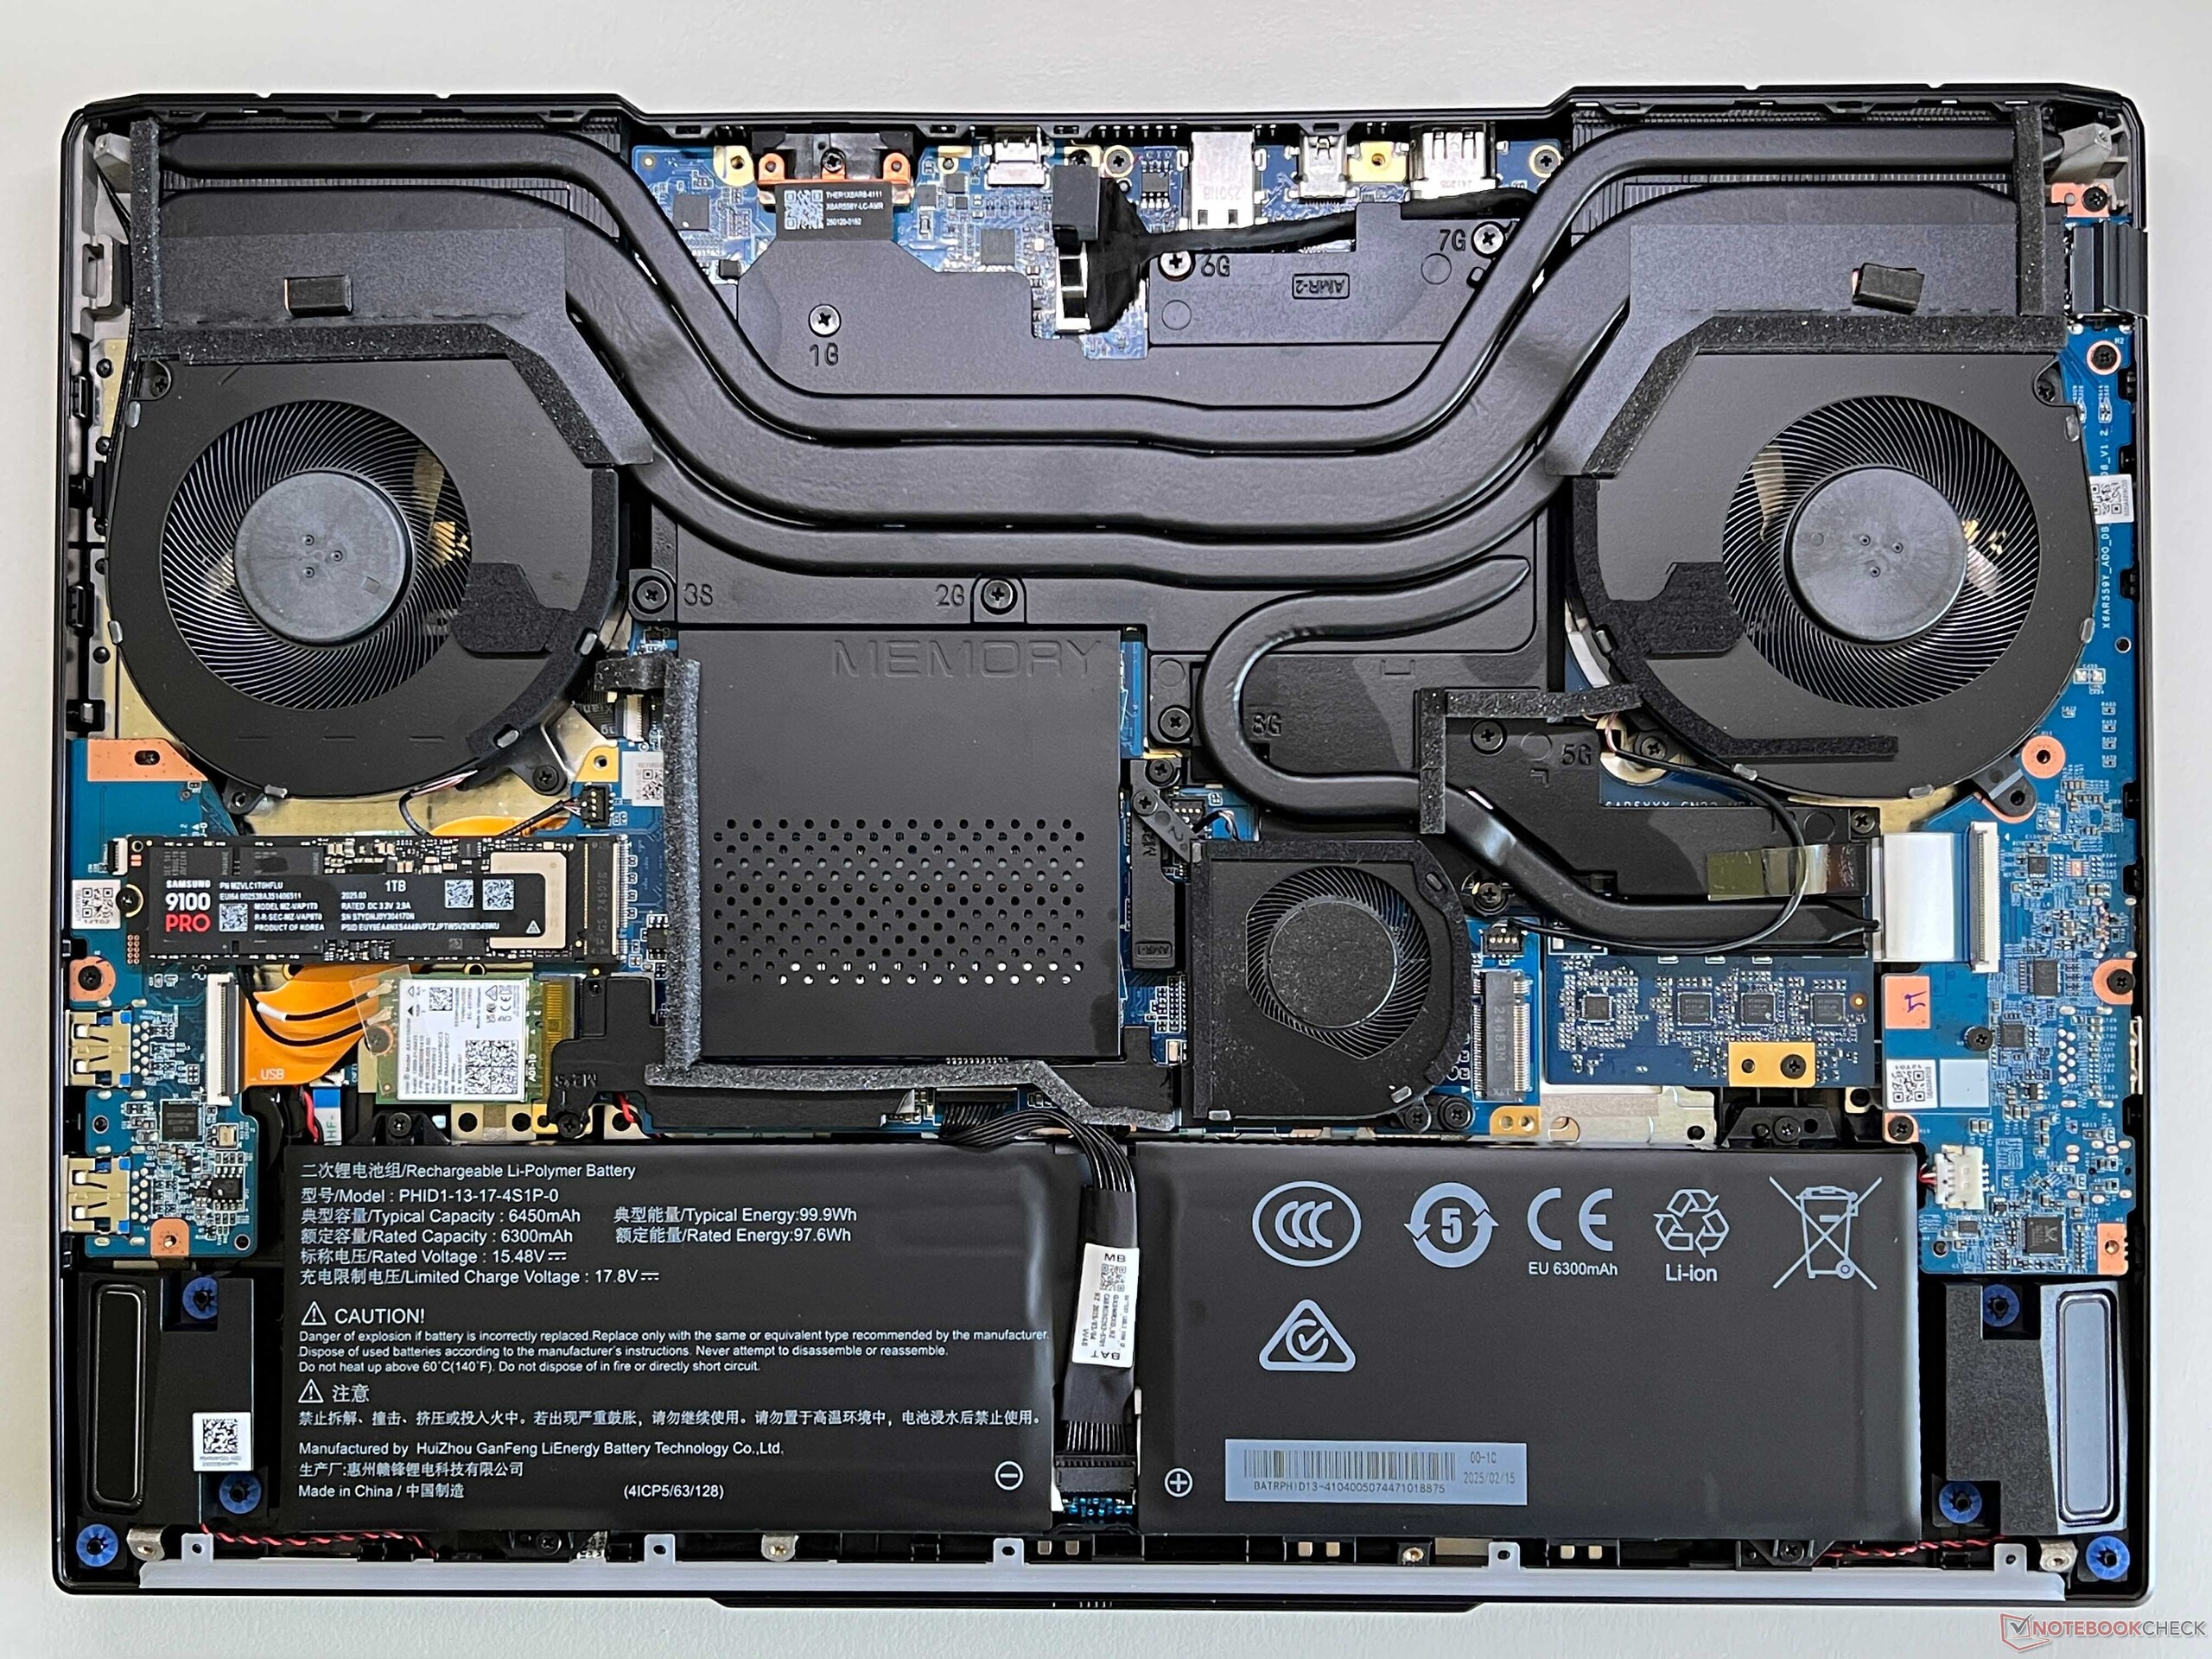
Am Gehäuse gab es keinerlei Veränderungen, weshalb wir hier auf unseren ausführlichen Testbericht des Vorgängers verweisen. Das Neo 16 bietet weiterhin ein hochwertiges Metallgehäuse, gute Wartungsmöglichkeiten und alle modernen Features (inklusive Wi-Fi 7 und Thunderbolt). Zudem lässt sich auch weiterhin die externe Wasserkühlung von XMG anschließen.

Größenvergleich

❌
365 mm 290 mm 28.5 mm 3.3 kg363 mm 269.7 mm 28.9 mm 2.7 kg356.5 mm 269 mm 28.7 mm 2.9 kg356.7 mm 259.9 mm 27.9 mm 2.8 kg356.7 mm 259.9 mm 27.9 mm 2.9 kg357 mm 255 mm 24.5 mm 2.3 kg297 mm 210 mm 1 mm 5.7 g
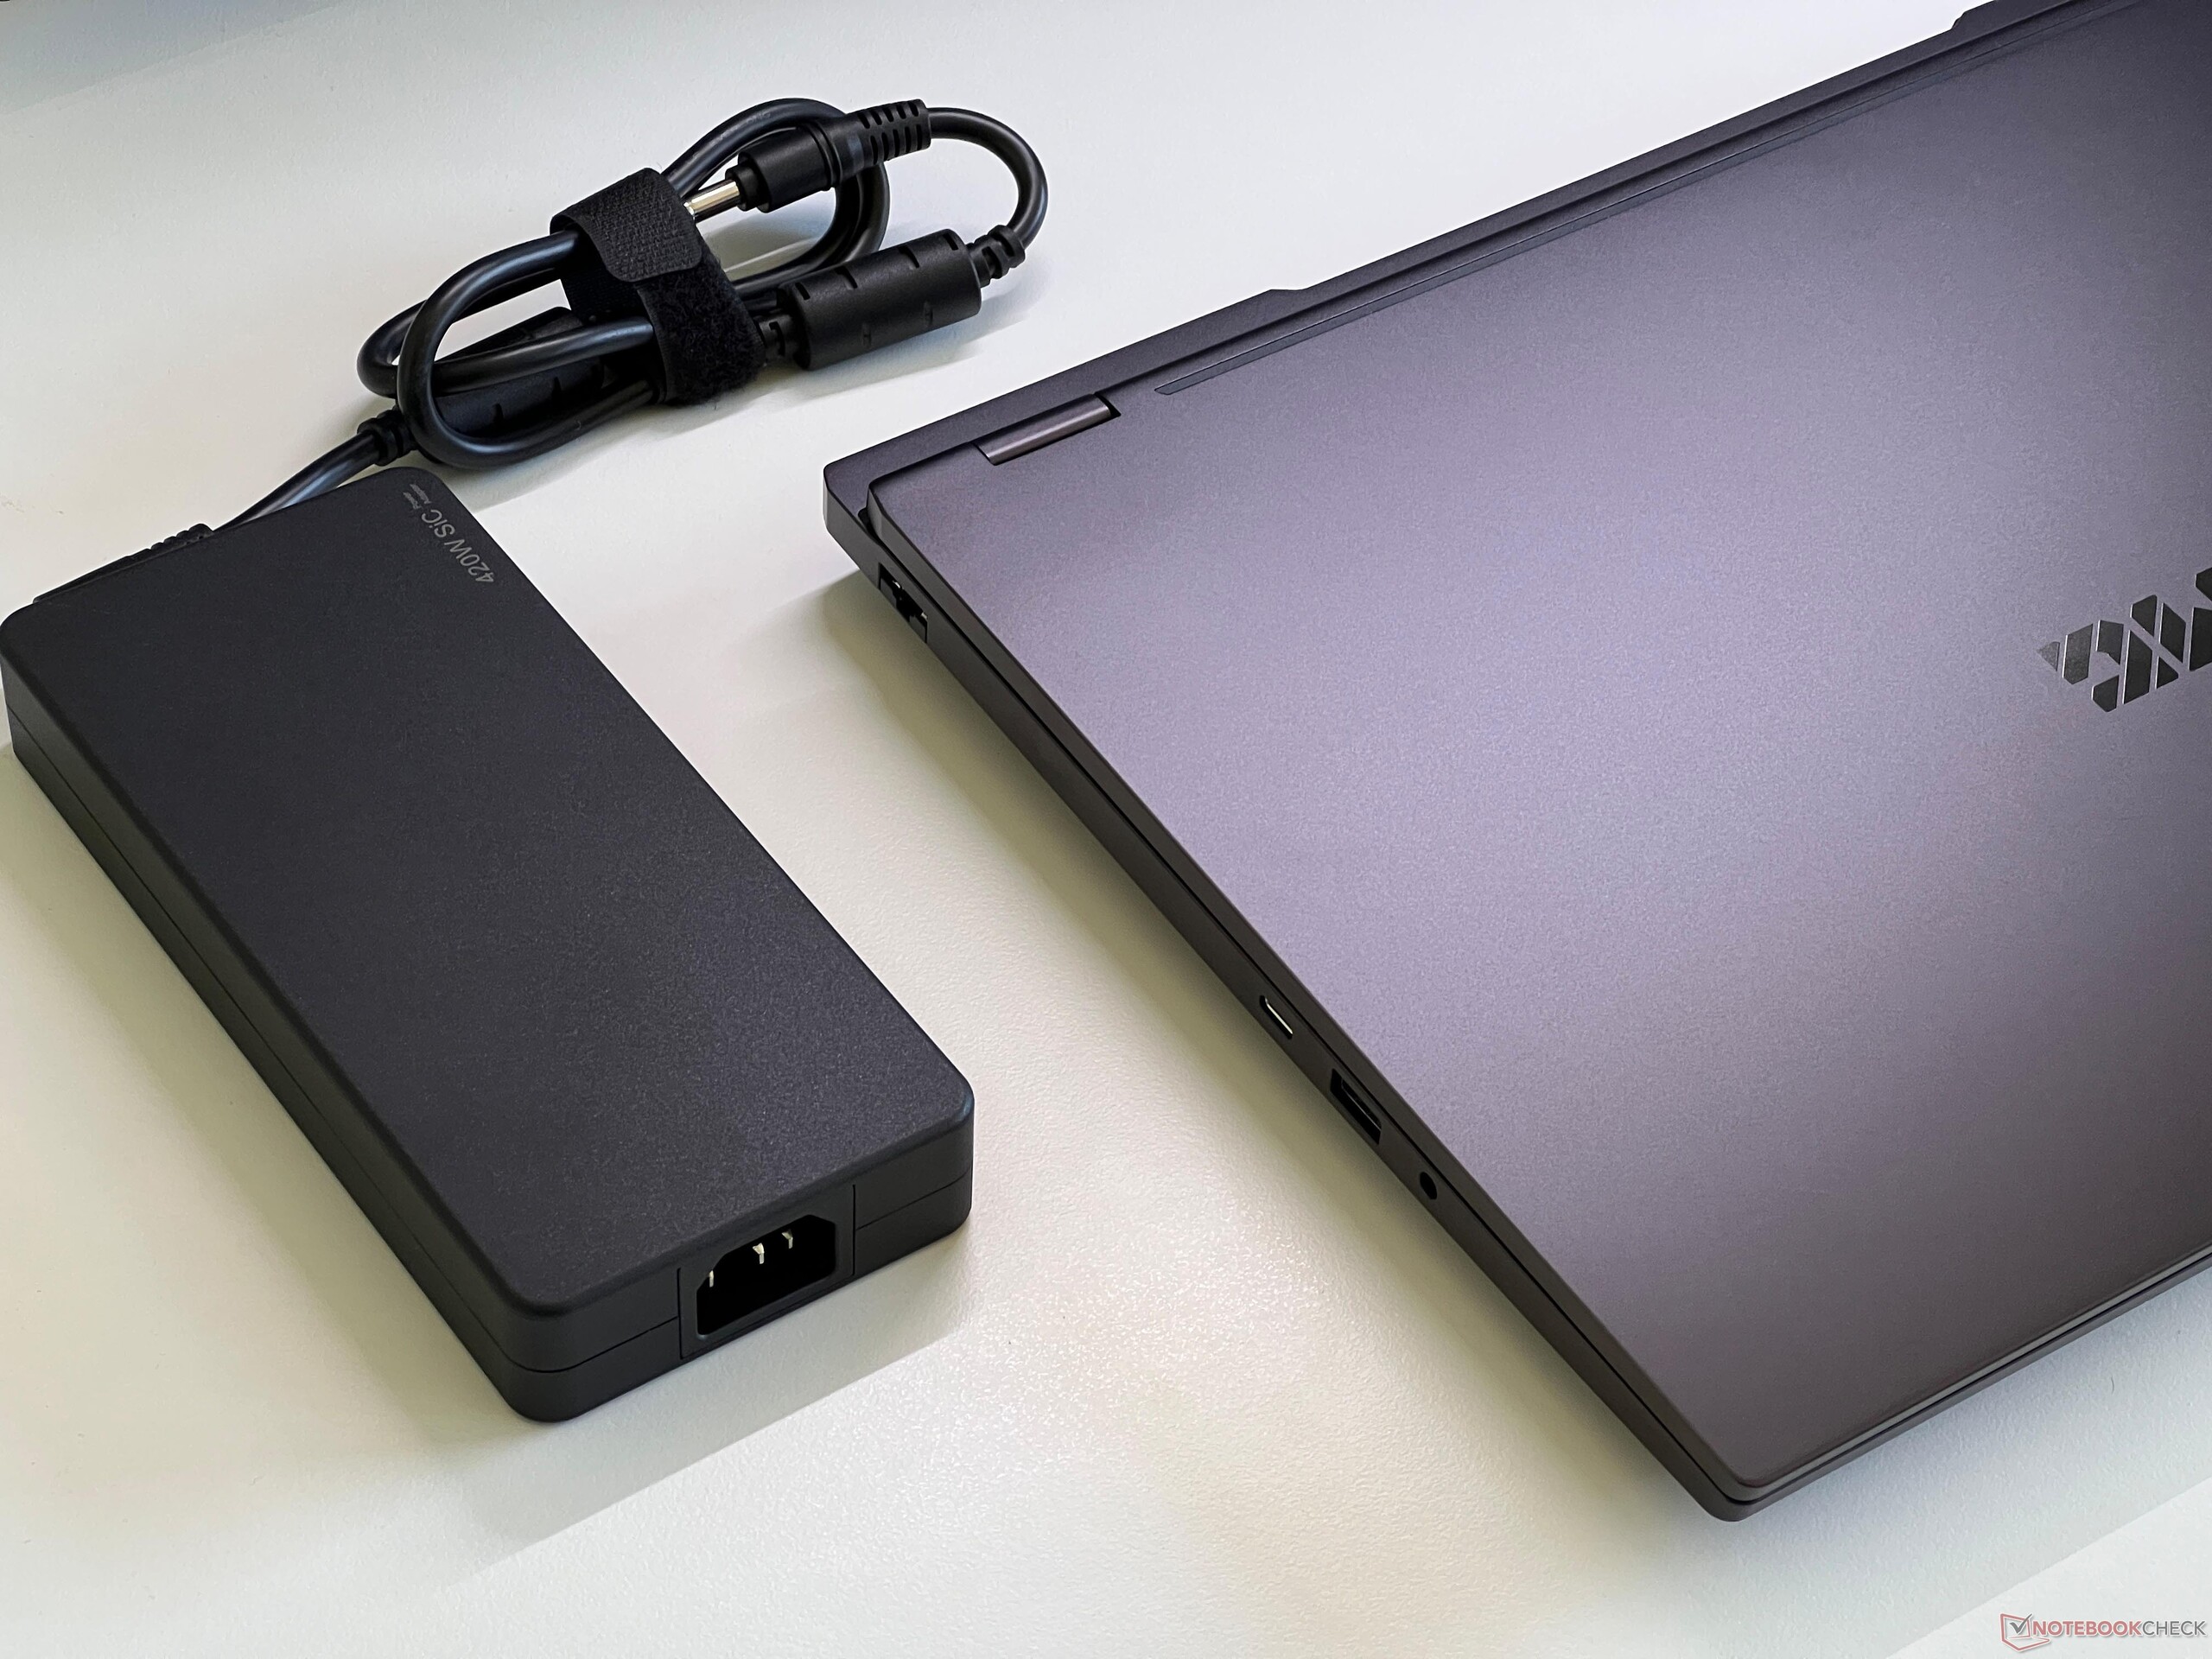
Rückseite: Anschluss für Oasis-Wasserkühlung, USB-C 4.0 mit Thunderbolt 4 (40 GBit/s, DisplayPort-ALT-Modus 2.1, 140 Watt Power Delivery), Netzteil, Mini-DisplayPort 2.1, HDMI 2.1
Links: Ethernet (2,5 GBit/s), USB-C 3.2 Gen.2 (10 GBit/s, DisplayPort 1.4a, 100 Watt Power Delivery), USB-A 3.2 Gen.1 (5 GBit/s), 3,5-mm-Audio
Rechts: 2x USB-A 3.2 Gen.1 (5 GBit/s), SD-Kartenleser, Kensington NanoSaver Lock
Networking
Schenker XMG Neo 16 M26 Mini-LED
Intel Wi-Fi 7 BE200 320MHz
iperf3 transmit Wi-Fi6/7 RT-BE96U
2391 (min: 2257) MBit/s ∼66%
iperf3 receive Wi-Fi6/7 RT-BE96U
1913 (min: 1794) MBit/s ∼64%
HP Omen Max 16-ah1932nr
Intel Wi-Fi 7 BE200 320MHz
iperf3 transmit Wi-Fi6/7 RT-BE96U
3607 (min: 2208) MBit/s ∼100%
iperf3 receive Wi-Fi6/7 RT-BE96U
2989 (min: 2778) MBit/s ∼100%
MSI Raider 16 Max HX B2WJ
Intel Killer Wi-Fi 7 BE1750x BE200NGW
iperf3 receive AXE11000 6GHz
1730 (min: 1708) MBit/s ∼100%
iperf3 transmit AXE11000 6GHz
1585 (min: 1204) MBit/s ∼98%
iperf3 receive AXE11000
1424 (min: 1293) MBit/s ∼83%
iperf3 transmit AXE11000
1244 (min: 915) MBit/s ∼74%
Aorus Master 16 AM6J
Realtek 8922AE WiFi 7 PCI-E NIC
iperf3 transmit Wi-Fi6/7 RT-BE96U
718 (min: 672) MBit/s ∼20%
iperf3 receive Wi-Fi6/7 RT-BE96U
1642 (min: 1406) MBit/s ∼55%
Alienware 16 Area-51 Core Ultra 9 290HX Plus
Intel Killer Wi-Fi 7 BE1750W 320 MHz (BE200NGW)
iperf3 receive AXE11000 6GHz
1681 (min: 1662) MBit/s ∼97%
iperf3 transmit AXE11000 6GHz
1610 (min: 1324) MBit/s ∼100%
iperf3 receive AXE11000
1333 (min: 1076) MBit/s ∼78%
iperf3 transmit AXE11000
1457 (min: 1280) MBit/s ∼87%
Schenker XMG Neo 16 A25 5090
Intel Wi-Fi 6E AX210
iperf3 receive AXE11000
1717 (min: 1648) MBit/s ∼100%
iperf3 transmit AXE11000
1681 (min: 1637) MBit/s ∼100%
01002003004005006007008009001000110012001300140015001600170018001900200021002200230024002500Tooltip
Schenker XMG Neo 16 M26 Mini-LED; iperf3 transmit Wi-Fi6/7 RT-BE96U; iperf 3.1.3: Ø2391 (2257-2564) MBit/s
Schenker XMG Neo 16 M26 Mini-LED; iperf3 receive Wi-Fi6/7 RT-BE96U; iperf 3.1.3: Ø1913 (1794-1954) MBit/s
ColorChecker
9.1 ∆E
11.7 ∆E
14 ∆E
12.4 ∆E
12.8 ∆E
11.7 ∆E
11.1 ∆E
11.4 ∆E
11.9 ∆E
8.6 ∆E
10 ∆E
6.6 ∆E
4.7 ∆E
11.1 ∆E
13.2 ∆E
4.3 ∆E
10.1 ∆E
17.1 ∆E
2.7 ∆E
8.1 ∆E
9.2 ∆E
6.1 ∆E
3.5 ∆E
9.4 ∆E
ColorChecker Schenker XMG Neo 16 M26 Mini-LED: 9.62 ∆E min: 2.75 - max: 17.06 ∆E

Display - 300 Hz Mini-LED mit G-Sync
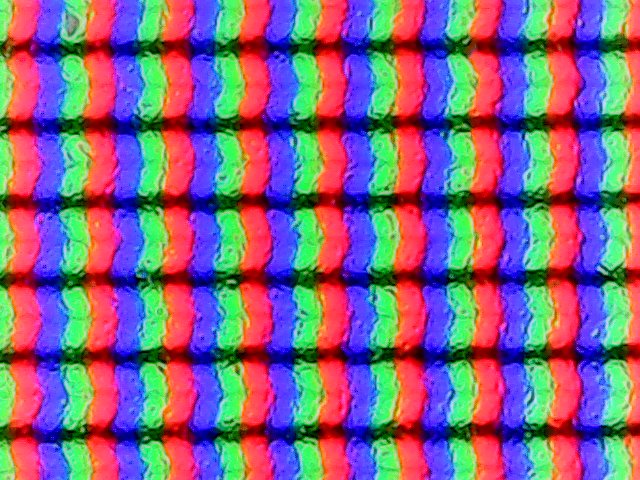
Subpixel-Anordnung
Subpixel-Anordnung

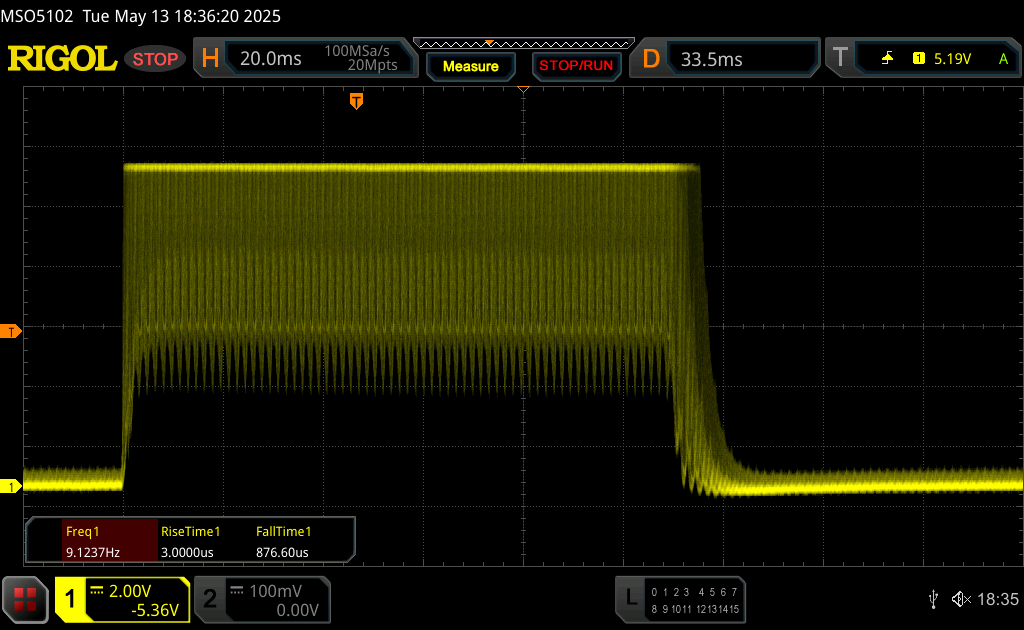
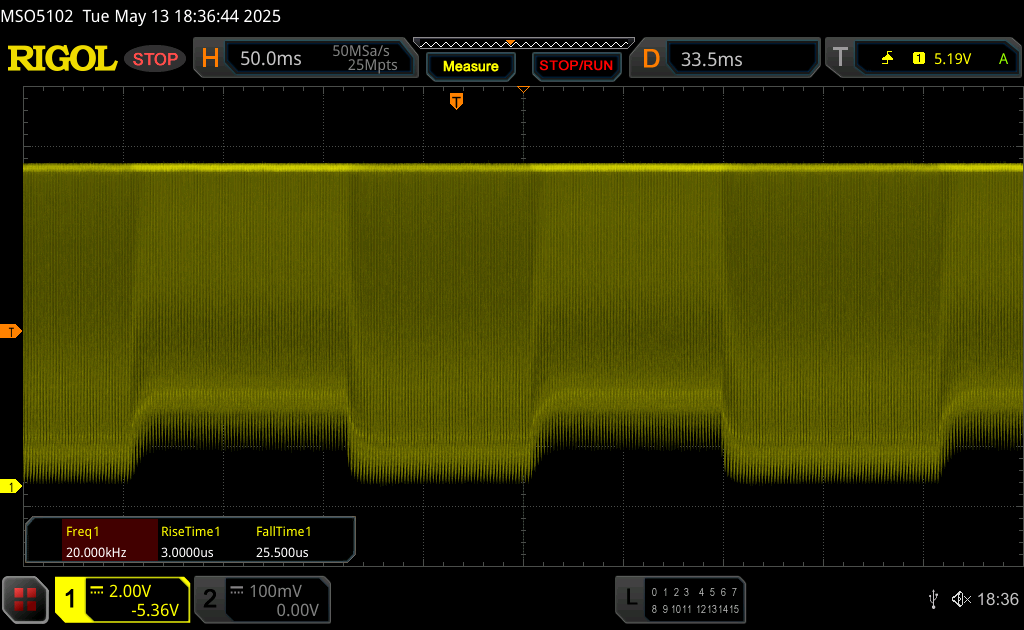
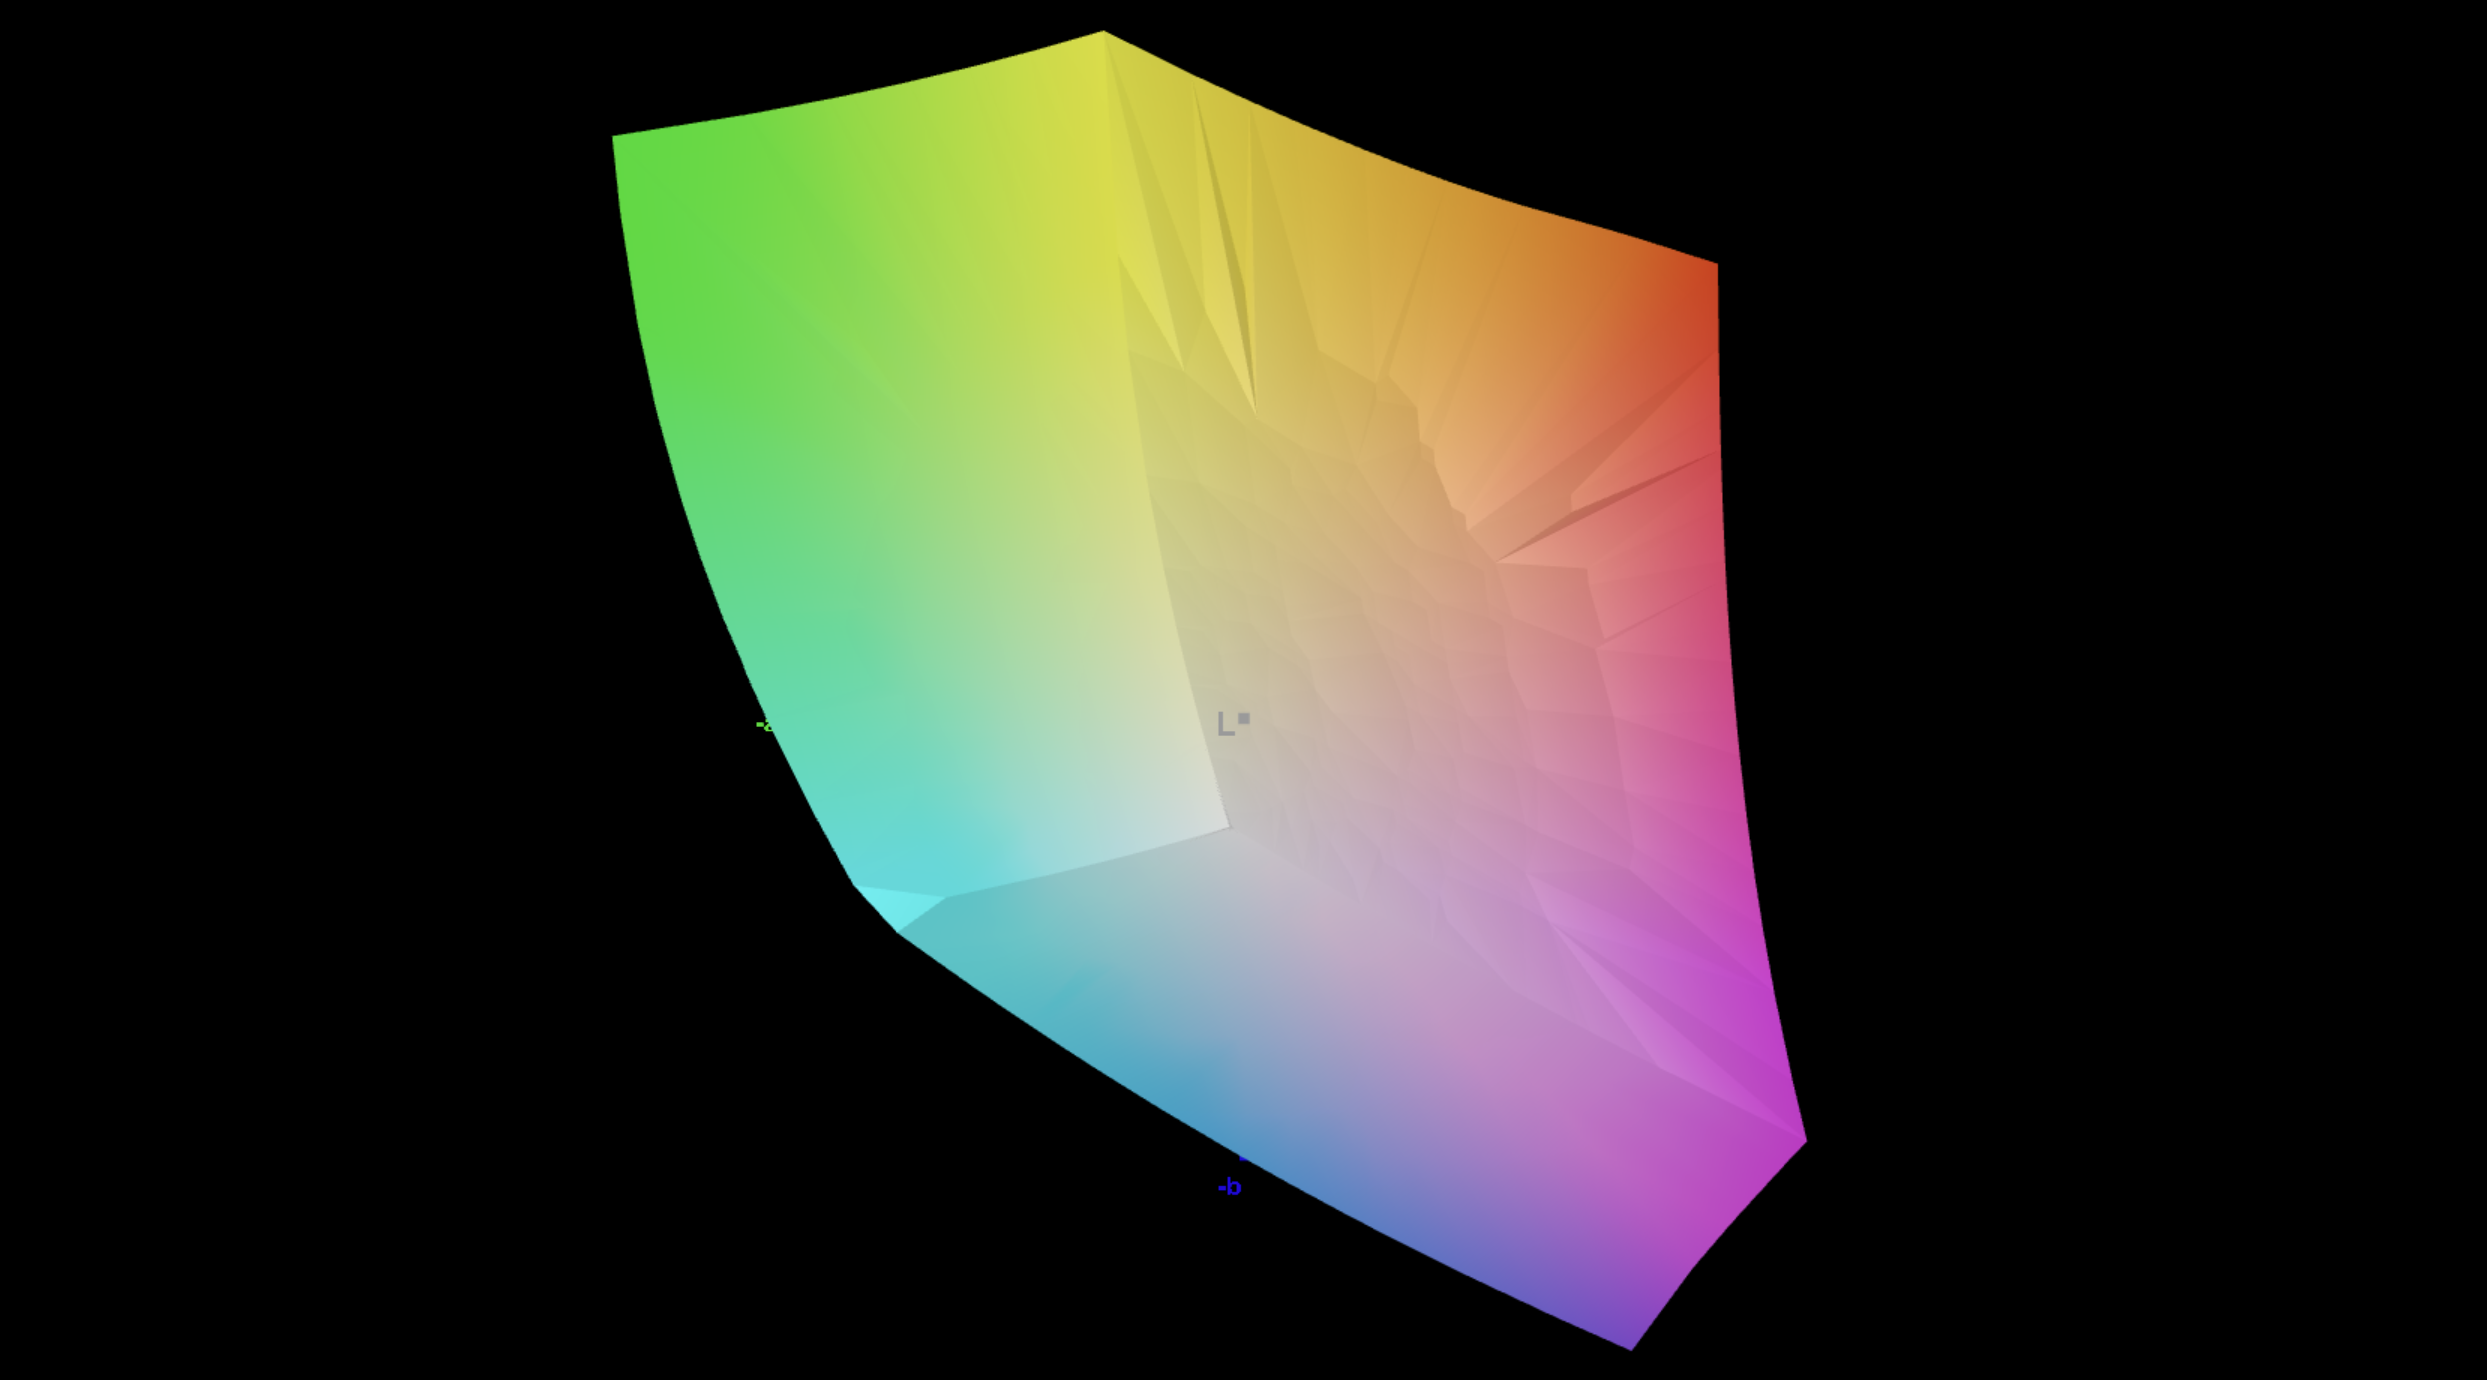
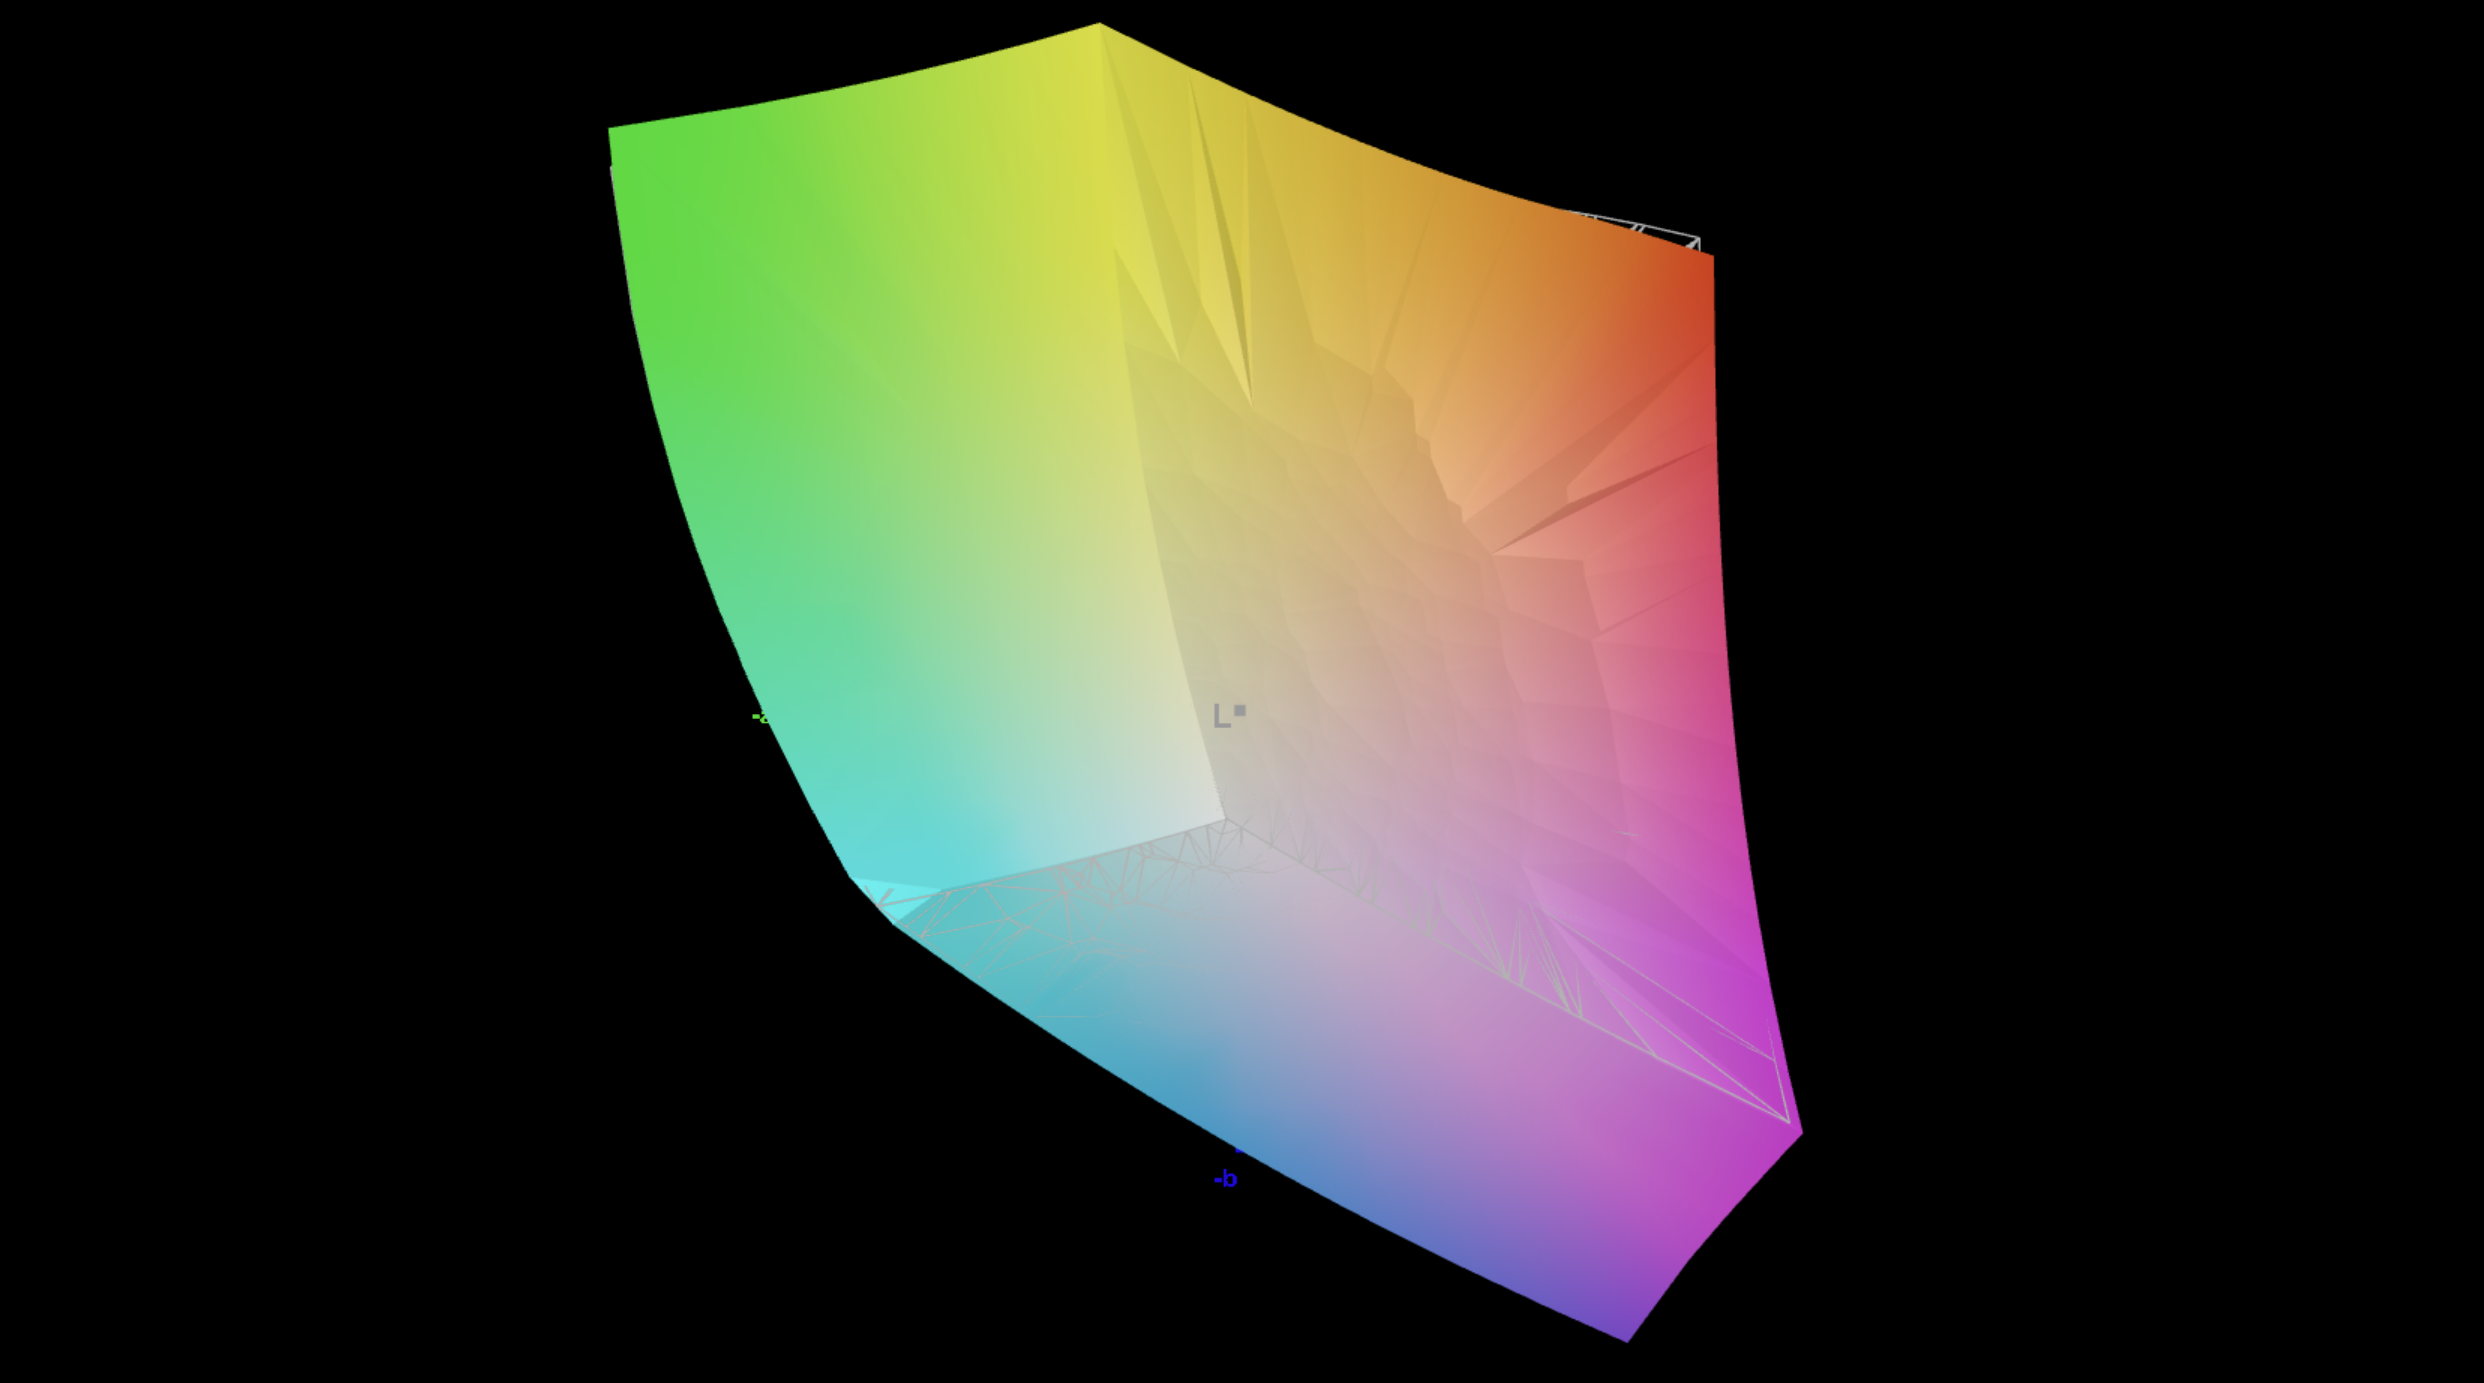
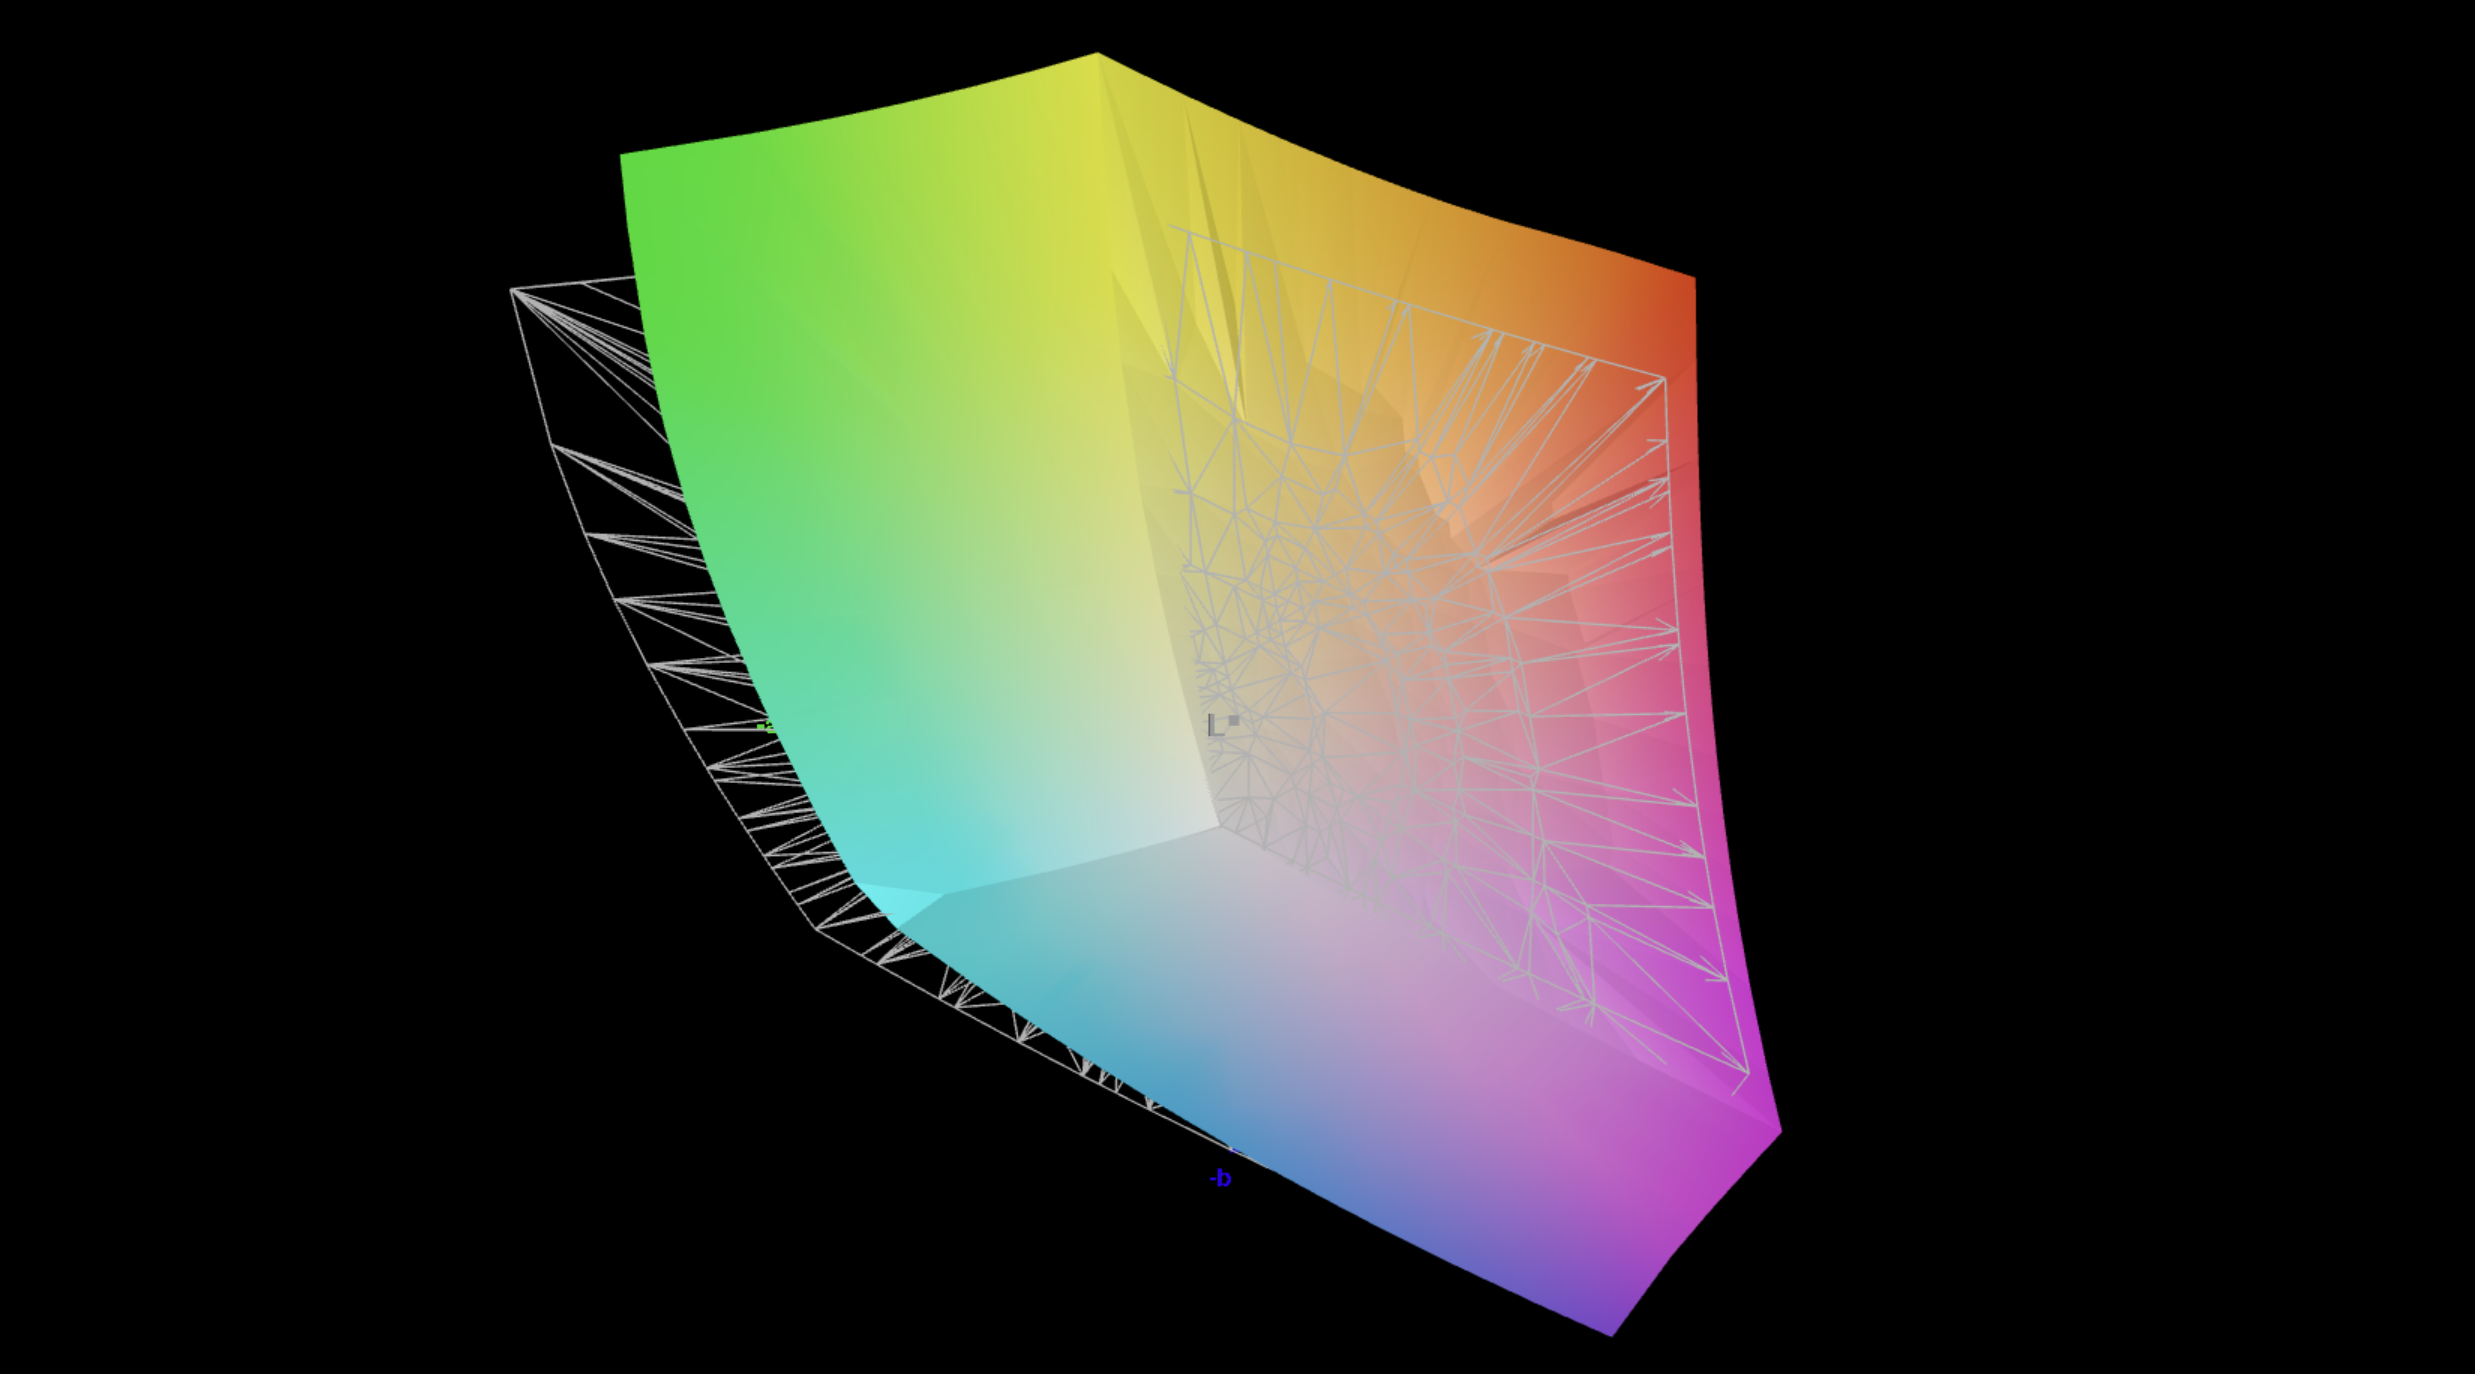
Neben dem IPS-Display kann man jetzt zwischen einem OLED-Panel und einem Mini-LED-Panel auswählen. Unser Testgerät ist erneut mit dem matten 300 Hz Mini-LED-Panel ausgestattet, das nun endlich G-Sync unterstützt. Die Bildqualität ist weiterhin sehr gut und in unserer Analyse mit der professionellen CalMAN-Software ermitteln wir sehr hohe Helligkeitswerte (765 cd/m² SDR, max. 1.473 cd/m² HDR) und ein akkurates sRGB-Profil, das P3-Profil ist jedoch nicht optimal. Mit unserer eigenen Kalibrierung (Profil steht in der Box kostenlos zur Verfügung) konnten wir die Farbgenauigkeit deutlich verbessern. Die Mini-LED-Beleuchtung flackert dauerhaft, allerdings mit einer sehr hohen Frequenz von mehr als 20 kHz. Dieses Flackern erschwert auch die genaue Ermittlung der Reaktionszeiten, aber es handelt sich um ein sehr schnelles IPS-Panel, das sich auch für sehr schnelle Shooter eignet. Die Messwerte für das neue OLED-Panel werden wir in Kürze ergänzen.

772
cd/m²
763
cd/m²
763
cd/m²
760
cd/m²
766
cd/m²
762
cd/m²
759
cd/m²
777
cd/m²
760
cd/m²
Ausleuchtung des Bildschirms
NE160QDM-NM9 getestet mit X-Rite i1Pro 3
Maximal: 777 cd/m² (Nits) Durchschnitt: 764.7 cd/m² Minimum: 35.8 cd/m²
Ausleuchtung: 98 %
Helligkeit Akku: 766 cd/m²
Kontrast: ∞:1 (Schwarzwert: 0 cd/m²)
ΔE ColorChecker Calman: 2.8 | ∀{0.5-29.43 Ø4.68}
calibrated: 1.1
ΔE Greyscale Calman: 3.5 | ∀{0.09-98 Ø4.92}
88.2% AdobeRGB 1998 (Argyll 3D)
100% sRGB (Argyll 3D)
99.8% Display P3 (Argyll 3D)
Gamma: 2.47
CCT: 6501 K
Schenker XMG Neo 16 M26 Mini-LED
NE160QDM-NM9, Mini-LED, 2560x1600, 16", 300 Hz
HP Omen Max 16-ah1932nr
Samsung SDC4234, OLED, 2560x1600, 16", 240 Hz
MSI Raider 16 Max HX B2WJ
Samsung ATNA60HU01-0, OLED, 2560x1600, 16", 240 Hz
Aorus Master 16 AM6J
Samsung ATNA60HU02-0, OLED, 2560x1600, 16", 240 Hz
Alienware 16 Area-51 Core Ultra 9 290HX Plus
Samsung 160HU05, OLED, 2560x1600, 16", 240 Hz
Schenker XMG Neo 16 A25 5090
NE160QDM-NM9, Mini-LED, 2560x1600, 16", 300 Hz
Display
2%
-1%
-1%
3%
0%
Display P3 Coverage (%)
99.8
99.9
0%
99.3
-1%
95.9
-4%
99.6
0%
99.9
0%
sRGB Coverage (%)
100
100
0%
99.9
0%
100
0%
100
0%
100
0%
AdobeRGB 1998 Coverage (%)
88.2
93.5
6%
87.5
-1%
88.2
0%
95.6
8%
88.5
0%
Response Times
85%
83%
81%
85%
0%
Response Time Grey 50% / Grey 80% * (ms)
17.4 ?(8.4, 9)
0.28 ?(0.14, 0.14)
98%
0.28 ?(0.14, 0.14)
98%
0.371 ?(0.289, 0.082)
98%
0.29 ?(0.15, 0.14)
98%
17.4 ?(8.4, 9)
-0%
Response Time Black / White * (ms)
13 ?(4.6, 8.4)
0.39 ?(0.19, 0.2)
97%
0.39 ?(0.21, 0.18)
97%
0.206 ?(0.112, 0.094)
98%
0.41 ?(0.2, 0.21)
97%
13 ?(4.6, 8.4)
-0%
PWM Frequency (Hz)
20253
1439.8 ?(100)
1440 ?(100)
1158 ?(99)
1440 ?(100)
20253
PWM Amplitude * (%)
75
29
61%
35
53%
40
47%
30
60%
75
-0%
Bildschirm
-0%
19%
-33%
19%
-11%
Helligkeit Bildmitte (cd/m²)
766
482.7
-37%
478.6
-38%
468
-39%
383.3
-50%
888
16%
Brightness (cd/m²)
765
487
-36%
481
-37%
467
-39%
387
-49%
859
12%
Brightness Distribution (%)
98
98
0%
98
0%
96
-2%
97
-1%
94
-4%
Schwarzwert * (cd/m²)
0.03
Delta E Colorchecker *
2.8
3.02
-8%
0.62
78%
4
-43%
0.87
69%
3.3
-18%
Colorchecker dE 2000 max. *
4
6.01
-50%
2.87
28%
6.59
-65%
2.23
44%
5.5
-38%
Colorchecker dE 2000 calibrated *
1.1
0.49
55%
0.61
45%
1.5
-36%
Delta E Graustufen *
3.5
0.9
74%
0.7
80%
3.8
-9%
0.8
77%
3.8
-9%
Gamma
2.47 89%
2.23 99%
2.16 102%
2.597 85%
2.19 100%
2.46 89%
CCT
6501 100%
6432 101%
6535 99%
6626 98%
6395 102%
6267 104%
Kontrast (:1)
15600
Durchschnitt gesamt (Programm / Settings)
29% / 20%
34% / 30%
16% / 4%
36% / 31%
-4% / -6%

* ... kleinere Werte sind besser
CalMAN Graustufen
CalMAN Graustufen
CalMAN Sättigung
CalMAN Sättigung
CalMAN ColorChecker
CalMAN ColorChecker
CalMAN Graustufen kalibriert
CalMAN Sättigung kalibriert
CalMAN ColorChecker kalibriert
vs. sRGB
vs. sRGB
vs. P3
vs. P3
vs. AdobeRGB
vs. AdobeRGB
In der Sonne
In der Sonne

Reaktionszeiten (Response Times) des Displays

ℹ
Die Reaktionszeiten (Response Times) beschreiben wie schnell zwischen zwei Farben eines Pixels umgeschaltet werden kann. Langsame Response Times können zu einer verschwommenen Darstellung, Schlieren und Geisterbilder führen. Besonders bei schnellen 3D-Spielen sind kurze Umschaltzeiten wichtig.
   ↔    Reaktionszeiten Schwarz zu Weiß
13 ms ... steigend ↗ und fallend ↘ kombiniert↗ 4.6 ms steigend
↘ 8.4 ms fallend
Die gemessenen Reaktionszeiten sind gut, für anspruchsvolle Spieler könnten der Bildschirm jedoch zu langsam sein.
Im Vergleich rangierten die bei uns getesteten Geräte von 0.1 (Minimum) zu 240 (Maximum) ms. » 34 % aller Screens waren schneller als der getestete.
Daher sind die gemessenen Reaktionszeiten besser als der Durchschnitt aller vermessenen Geräte (19.6 ms).
   ↔    Reaktionszeiten 50% Grau zu 80% Grau
17.4 ms ... steigend ↗ und fallend ↘ kombiniert↗ 8.4 ms steigend
↘ 9 ms fallend
Die gemessenen Reaktionszeiten sind gut, für anspruchsvolle Spieler könnten der Bildschirm jedoch zu langsam sein.
Im Vergleich rangierten die bei uns getesteten Geräte von 0.13 (Minimum) zu 636 (Maximum) ms. » 32 % aller Screens waren schneller als der getestete.
Daher sind die gemessenen Reaktionszeiten besser als der Durchschnitt aller vermessenen Geräte (30.6 ms).

Bildschirm-Flackern / PWM (Pulse-Width Modulation)

ℹ
Eine günstige Methode um die Helligkeit eines Bildschirms zu steuern, ist die Beleuchtung periodisch ein- und auszuschalten. Dies nennt sich PWM (Pulsweitenmodulation) Diese Umschaltung sollte mit einer hohen Frequenz stattfinden damit das menschliche Auge kein Flimmern wahrnimmt. Wenn die Frequenz zu niedrig ist, kann dies zu Ermüdungserscheinungen, Augenbrennen, Kopfweh und auch sichtbaren Flackern führen.
Flackern / PWM festgestellt 20253 Hz
Amplitude: 75 %

Das Display flackert mit 20253 Hz (im schlimmsten Fall, eventuell durch Pulsweitenmodulation PWM) .

Die Frequenz von 20253 Hz ist sehr hoch und sollte daher auch bei empfindlichen Personen zu keinen Problemen führen.

Im Vergleich: 52 % aller getesteten Geräte nutzten kein PWM um die Helligkeit zu reduzieren. Wenn PWM eingesetzt wurde, dann bei einer Frequenz von durchschnittlich 7547 (Minimum 5, Maximum 343500) Hz.

Leistung - Bis zu 128 GB RAM

Testbedingungen

Wir haben die Benchmarks im Modus Overboost Extreme durchgeführt, um die maximale Leistung zu erhalten. Beim Spielen sollte man aber auch die anderen Modi testen, da die Lüfter dort deutlich leiser bleiben.

Energieprofil CPU TDP CB 2024 Multi GPU TGP Time Spy Graphics CP 2077 QHD Ultra max. Lüfterlautstärke
Ausbalanciert 45 Watt 1.373 Punkte 150 Watt 22.434 Punkte 103,8 fps 39,3 dB(A)
Enthusiast 85/75 Watt 1.848 Punkte 150 Watt 22.514 Punkte 107.2 fps 47,6 dB(A)
Overboost Normal 180/165 Watt 2.136 Punkte 175 Watt 24.831 Punkte 116,9 fps 52 dB(A)
Overboost Extreme 190/170 Watt 2.234 Punkte 175 Watt 24.894 Punkte 117,4 fps 55,9 dB(A)
Akku (Enthusiast) 40/35 Watt 1.135 Punkte 45 Watt 7.206 Punkte 34,8 fps 36 dB(A)

Prozessor Leistung

Das aktuelle Neo 16 ist mit dem Intel Core Ultra 9 290HX Plus ausgestattet, bei dem es sich jedoch nur ein minimales Update gegenüber dem alten 275HX handelt. Die Leistung ist dementsprechend erneut sehr hoch, aber insgesamt auf dem gleichen Niveau.

Cinebench R15 Multi Dauertest

013026039052065078091010401170130014301560169018201950208022102340247026002730286029903120325033803510364037703900403041604290442045504680481049405070520053305460559057205850598061106240Tooltip
Schenker XMG Neo 16 M26 Mini-LED Intel Core Ultra 9 290HX Plus: Ø6023 (5899.71-6204.44) Points
HP Omen Max 16-ah1932nr Intel Core Ultra 9 290HX Plus: Ø5402 (5175.31-5628.25) Points
MSI Raider 16 Max HX B2WJ Intel Core Ultra 9 290HX Plus: Ø6112 (6002.4-6162.38) Points
Aorus Master 16 AM6J AMD Ryzen 9 9955HX3D: Ø5951 (5802.15-6067.96) Points
Alienware 16 Area-51 Core Ultra 9 290HX Plus Intel Core Ultra 9 290HX Plus: Ø5863 (5365.53-5919.79) Points
Schenker XMG Neo 16 A25 5090 AMD Ryzen 9 9955HX3D: Ø5974 (5932.08-6044.12) Points
Schenker XMG Neo 16 E25 RTX 5090 Laptop Intel Core Ultra 9 275HX: Ø6151 (6038.65-6270.58) Points
CPU Performance Rating: Percent
Cinebench 2024: CPU Multi Core | CPU Single Core
Cinebench R23: Multi Core | Single Core
Cinebench R20: CPU (Multi Core) | CPU (Single Core)
Cinebench R15: CPU Multi 64Bit | CPU Single 64Bit
Blender: v2.79 BMW27 CPU
7-Zip 18.03: 7z b 4 | 7z b 4 -mmt1
Geekbench 7: Multi-Core | Single-Core
Geekbench 6.7: Multi-Core | Single-Core
HWBOT x265 Benchmark v2.2: 4k Preset
LibreOffice : 20 Documents To PDF
R Benchmark 2.5: Overall mean
CPU Performance Rating
Schenker XMG Neo 16 M26 Mini-LED
Intel Core Ultra 9 290HX Plus
87.2 pt
Durchschnittliche Intel Core Ultra 9 290HX Plus
 
84.9 pt
Schenker XMG Neo 16 E25 RTX 5090 Laptop -2!
Intel Core Ultra 9 275HX
84.8 pt
MSI Raider 16 Max HX B2WJ -2!
Intel Core Ultra 9 290HX Plus
84.6 pt
Schenker XMG Neo 16 A25 5090 -2!
AMD Ryzen 9 9955HX3D
84.3 pt
Alienware 16 Area-51 Core Ultra 9 290HX Plus -2!
Intel Core Ultra 9 290HX Plus
82.9 pt
Aorus Master 16 AM6J -2!
AMD Ryzen 9 9955HX3D
80.9 pt
HP Omen Max 16-ah1932nr -2!
Intel Core Ultra 9 290HX Plus
79.3 pt
Durchschnitt der Klasse Gaming
 
67.4 pt
Cinebench 2024 / CPU Multi Core
Schenker XMG Neo 16 E25 RTX 5090 Laptop
Intel Core Ultra 9 275HX
2254 Points +1%
Schenker XMG Neo 16 M26 Mini-LED
Intel Core Ultra 9 290HX Plus
2234 Points
MSI Raider 16 Max HX B2WJ
Intel Core Ultra 9 290HX Plus
2215 Points -1%
Alienware 16 Area-51 Core Ultra 9 290HX Plus
Intel Core Ultra 9 290HX Plus
2195 Points -2%
Durchschnittliche Intel Core Ultra 9 290HX Plus
  (1954 - 2327, n=9)
2162 Points -3%
Schenker XMG Neo 16 A25 5090
AMD Ryzen 9 9955HX3D
2120 Points -5%
HP Omen Max 16-ah1932nr
Intel Core Ultra 9 290HX Plus
2096 Points -6%
Aorus Master 16 AM6J
AMD Ryzen 9 9955HX3D
2090 Points -6%
Durchschnitt der Klasse Gaming
  (486 - 2327, n=94, der letzten 2 Jahre)
1504 Points -33%
Cinebench 2024 / CPU Single Core
Schenker XMG Neo 16 E25 RTX 5090 Laptop
Intel Core Ultra 9 275HX
138.2 Points +1%
Durchschnittliche Intel Core Ultra 9 290HX Plus
  (135.9 - 141, n=9)
138.1 Points +1%
HP Omen Max 16-ah1932nr
Intel Core Ultra 9 290HX Plus
137.5 Points 0%
MSI Raider 16 Max HX B2WJ
Intel Core Ultra 9 290HX Plus
137.2 Points 0%
Schenker XMG Neo 16 M26 Mini-LED
Intel Core Ultra 9 290HX Plus
137.2 Points
Alienware 16 Area-51 Core Ultra 9 290HX Plus
Intel Core Ultra 9 290HX Plus
135.9 Points -1%
Schenker XMG Neo 16 A25 5090
AMD Ryzen 9 9955HX3D
130 Points -5%
Aorus Master 16 AM6J
AMD Ryzen 9 9955HX3D
130 Points -5%
Durchschnitt der Klasse Gaming
  (95 - 141, n=94, der letzten 2 Jahre)
122.9 Points -10%
Cinebench R23 / Multi Core
Schenker XMG Neo 16 E25 RTX 5090 Laptop
Intel Core Ultra 9 275HX
40951 Points 0%
Schenker XMG Neo 16 M26 Mini-LED
Intel Core Ultra 9 290HX Plus
40835 Points
MSI Raider 16 Max HX B2WJ
Intel Core Ultra 9 290HX Plus
40560 (38371.5min - 40559.8max) Points -1%
Durchschnittliche Intel Core Ultra 9 290HX Plus
  (37038 - 42661, n=8)
39873 Points -2%
Alienware 16 Area-51 Core Ultra 9 290HX Plus
Intel Core Ultra 9 290HX Plus
39514 (38155.7min - 39513.8max) Points -3%
Schenker XMG Neo 16 A25 5090
AMD Ryzen 9 9955HX3D
39266 Points -4%
HP Omen Max 16-ah1932nr
Intel Core Ultra 9 290HX Plus
38242 (36217.9min - 38242.1max) Points -6%
Aorus Master 16 AM6J
AMD Ryzen 9 9955HX3D
37459 Points -8%
Durchschnitt der Klasse Gaming
  (10488 - 42661, n=108, der letzten 2 Jahre)
27273 Points -33%
Cinebench R23 / Single Core
Schenker XMG Neo 16 M26 Mini-LED
Intel Core Ultra 9 290HX Plus
2396 Points
Durchschnittliche Intel Core Ultra 9 290HX Plus
  (2231 - 2418, n=8)
2357 Points -2%
MSI Raider 16 Max HX B2WJ
Intel Core Ultra 9 290HX Plus
2356 Points -2%
Alienware 16 Area-51 Core Ultra 9 290HX Plus
Intel Core Ultra 9 290HX Plus
2319 Points -3%
Schenker XMG Neo 16 E25 RTX 5090 Laptop
Intel Core Ultra 9 275HX
2260 Points -6%
HP Omen Max 16-ah1932nr
Intel Core Ultra 9 290HX Plus
2231 Points -7%
Schenker XMG Neo 16 A25 5090
AMD Ryzen 9 9955HX3D
2179 Points -9%
Aorus Master 16 AM6J
AMD Ryzen 9 9955HX3D
2150 Points -10%
Durchschnitt der Klasse Gaming
  (1601 - 2418, n=108, der letzten 2 Jahre)
2041 Points -15%
Cinebench R20 / CPU (Multi Core)
Schenker XMG Neo 16 M26 Mini-LED
Intel Core Ultra 9 290HX Plus
15923 Points
Schenker XMG Neo 16 E25 RTX 5090 Laptop
Intel Core Ultra 9 275HX
15881 Points 0%
MSI Raider 16 Max HX B2WJ
Intel Core Ultra 9 290HX Plus
15732 Points -1%
Durchschnittliche Intel Core Ultra 9 290HX Plus
  (14397 - 16433, n=8)
15447 Points -3%
Alienware 16 Area-51 Core Ultra 9 290HX Plus
Intel Core Ultra 9 290HX Plus
15299 Points -4%
Schenker XMG Neo 16 A25 5090
AMD Ryzen 9 9955HX3D
15177 Points -5%
Aorus Master 16 AM6J
AMD Ryzen 9 9955HX3D
14793 Points -7%
HP Omen Max 16-ah1932nr
Intel Core Ultra 9 290HX Plus
14722 Points -8%
Durchschnitt der Klasse Gaming
  (4029 - 16433, n=107, der letzten 2 Jahre)
10603 Points -33%
Cinebench R20 / CPU (Single Core)
MSI Raider 16 Max HX B2WJ
Intel Core Ultra 9 290HX Plus
895 Points +1%
Schenker XMG Neo 16 M26 Mini-LED
Intel Core Ultra 9 290HX Plus
890 Points
Durchschnittliche Intel Core Ultra 9 290HX Plus
  (840 - 916, n=8)
888 Points 0%
Alienware 16 Area-51 Core Ultra 9 290HX Plus
Intel Core Ultra 9 290HX Plus
878 Points -1%
Schenker XMG Neo 16 E25 RTX 5090 Laptop
Intel Core Ultra 9 275HX
869 Points -2%
Schenker XMG Neo 16 A25 5090
AMD Ryzen 9 9955HX3D
847 Points -5%
HP Omen Max 16-ah1932nr
Intel Core Ultra 9 290HX Plus
840 Points -6%
Aorus Master 16 AM6J
AMD Ryzen 9 9955HX3D
790 Points -11%
Durchschnitt der Klasse Gaming
  (622 - 916, n=107, der letzten 2 Jahre)
789 Points -11%
Cinebench R15 / CPU Multi 64Bit
Schenker XMG Neo 16 E25 RTX 5090 Laptop
Intel Core Ultra 9 275HX
6271 (6038.65min - 6270.58max) Points +1%
Schenker XMG Neo 16 M26 Mini-LED
Intel Core Ultra 9 290HX Plus
6204 (5899.71min - 6204.44max) Points
MSI Raider 16 Max HX B2WJ
Intel Core Ultra 9 290HX Plus
6162 (6002.4min - 6162.38max) Points -1%
Aorus Master 16 AM6J
AMD Ryzen 9 9955HX3D
6068 (5802.15min - 6067.96max) Points -2%
Schenker XMG Neo 16 A25 5090
AMD Ryzen 9 9955HX3D
6044 (5932.08min - 6044.12max) Points -3%
Durchschnittliche Intel Core Ultra 9 290HX Plus
  (5617 - 6330, n=8)
5985 Points -4%
Alienware 16 Area-51 Core Ultra 9 290HX Plus
Intel Core Ultra 9 290HX Plus
5920 (5365.53min - 5919.79max) Points -5%
HP Omen Max 16-ah1932nr
Intel Core Ultra 9 290HX Plus
5628 (5175.31min - 5628.25max) Points -9%
Durchschnitt der Klasse Gaming
  (1578 - 6330, n=106, der letzten 2 Jahre)
4216 Points -32%
Cinebench R15 / CPU Single 64Bit
Schenker XMG Neo 16 E25 RTX 5090 Laptop
Intel Core Ultra 9 275HX
340 Points +1%
MSI Raider 16 Max HX B2WJ
Intel Core Ultra 9 290HX Plus
338 Points 0%
Schenker XMG Neo 16 M26 Mini-LED
Intel Core Ultra 9 290HX Plus
338 Points
Durchschnittliche Intel Core Ultra 9 290HX Plus
  (303 - 350, n=8)
336 Points -1%
Schenker XMG Neo 16 A25 5090
AMD Ryzen 9 9955HX3D
333 Points -1%
Aorus Master 16 AM6J
AMD Ryzen 9 9955HX3D
331 Points -2%
Alienware 16 Area-51 Core Ultra 9 290HX Plus
Intel Core Ultra 9 290HX Plus
324 Points -4%
HP Omen Max 16-ah1932nr
Intel Core Ultra 9 290HX Plus
303 Points -10%
Durchschnitt der Klasse Gaming
  (188.8 - 350, n=107, der letzten 2 Jahre)
300 Points -11%
Blender / v2.79 BMW27 CPU
Durchschnitt der Klasse Gaming
  (79 - 330, n=105, der letzten 2 Jahre)
144.2 Seconds * -72%
HP Omen Max 16-ah1932nr
Intel Core Ultra 9 290HX Plus
92 Seconds * -10%
Alienware 16 Area-51 Core Ultra 9 290HX Plus
Intel Core Ultra 9 290HX Plus
88 Seconds * -5%
Durchschnittliche Intel Core Ultra 9 290HX Plus
  (79 - 94, n=8)
86.3 Seconds * -3%
MSI Raider 16 Max HX B2WJ
Intel Core Ultra 9 290HX Plus
84 Seconds * -0%
Schenker XMG Neo 16 M26 Mini-LED
Intel Core Ultra 9 290HX Plus
84 Seconds *
Schenker XMG Neo 16 E25 RTX 5090 Laptop
Intel Core Ultra 9 275HX
83 Seconds * +1%
Aorus Master 16 AM6J
AMD Ryzen 9 9955HX3D
82 Seconds * +2%
Schenker XMG Neo 16 A25 5090
AMD Ryzen 9 9955HX3D
80 Seconds * +5%
7-Zip 18.03 / 7z b 4
Schenker XMG Neo 16 A25 5090
AMD Ryzen 9 9955HX3D
148086 MIPS +20%
Aorus Master 16 AM6J
AMD Ryzen 9 9955HX3D
145000 MIPS +17%
Schenker XMG Neo 16 E25 RTX 5090 Laptop
Intel Core Ultra 9 275HX
124155 MIPS 0%
Schenker XMG Neo 16 M26 Mini-LED
Intel Core Ultra 9 290HX Plus
123747 MIPS
MSI Raider 16 Max HX B2WJ
Intel Core Ultra 9 290HX Plus
121987 MIPS -1%
Durchschnittliche Intel Core Ultra 9 290HX Plus
  (103072 - 131933, n=8)
118462 MIPS -4%
Alienware 16 Area-51 Core Ultra 9 290HX Plus
Intel Core Ultra 9 290HX Plus
116793 MIPS -6%
HP Omen Max 16-ah1932nr
Intel Core Ultra 9 290HX Plus
103072 MIPS -17%
Durchschnitt der Klasse Gaming
  (33491 - 148086, n=105, der letzten 2 Jahre)
92867 MIPS -25%
7-Zip 18.03 / 7z b 4 -mmt1
Aorus Master 16 AM6J
AMD Ryzen 9 9955HX3D
7382 MIPS +4%
Schenker XMG Neo 16 A25 5090
AMD Ryzen 9 9955HX3D
7300 MIPS +3%
Schenker XMG Neo 16 E25 RTX 5090 Laptop
Intel Core Ultra 9 275HX
7114 MIPS 0%
Schenker XMG Neo 16 M26 Mini-LED
Intel Core Ultra 9 290HX Plus
7085 MIPS
Durchschnittliche Intel Core Ultra 9 290HX Plus
  (6562 - 7263, n=8)
6925 MIPS -2%
HP Omen Max 16-ah1932nr
Intel Core Ultra 9 290HX Plus
6802 MIPS -4%
MSI Raider 16 Max HX B2WJ
Intel Core Ultra 9 290HX Plus
6748 MIPS -5%
Alienware 16 Area-51 Core Ultra 9 290HX Plus
Intel Core Ultra 9 290HX Plus
6685 MIPS -6%
Durchschnitt der Klasse Gaming
  (4824 - 7436, n=106, der letzten 2 Jahre)
6483 MIPS -8%
Geekbench 7 / Multi-Core
Schenker XMG Neo 16 M26 Mini-LED
Intel Core Ultra 9 290HX Plus
24976 Points
Durchschnittliche Intel Core Ultra 9 290HX Plus
  (21559 - 24976, n=3)
23830 Points -5%
Durchschnitt der Klasse Gaming
  (12092 - 24976, n=5, der letzten 2 Jahre)
21128 Points -15%
Geekbench 7 / Single-Core
Schenker XMG Neo 16 M26 Mini-LED
Intel Core Ultra 9 290HX Plus
2873 Points
Durchschnittliche Intel Core Ultra 9 290HX Plus
  (2724 - 2912, n=3)
2836 Points -1%
Durchschnitt der Klasse Gaming
  (2234 - 2912, n=5, der letzten 2 Jahre)
2697 Points -6%
Geekbench 6.7 / Multi-Core
Durchschnittliche Intel Core Ultra 9 290HX Plus
  (19855 - 22850, n=9)
21039 Points +1%
Alienware 16 Area-51 Core Ultra 9 290HX Plus
Intel Core Ultra 9 290HX Plus
20920 Points +1%
Schenker XMG Neo 16 E25 RTX 5090 Laptop
Intel Core Ultra 9 275HX
20890 Points +1%
Schenker XMG Neo 16 M26 Mini-LED
Intel Core Ultra 9 290HX Plus
20786 Points
MSI Raider 16 Max HX B2WJ
Intel Core Ultra 9 290HX Plus
20699 Points 0%
HP Omen Max 16-ah1932nr
Intel Core Ultra 9 290HX Plus
20585 Points -1%
Schenker XMG Neo 16 A25 5090
AMD Ryzen 9 9955HX3D
20540 Points -1%
Aorus Master 16 AM6J
AMD Ryzen 9 9955HX3D
20023 Points -4%
Durchschnitt der Klasse Gaming
  (6625 - 22850, n=106, der letzten 2 Jahre)
16416 Points -21%
Geekbench 6.7 / Single-Core
Schenker XMG Neo 16 A25 5090
AMD Ryzen 9 9955HX3D
3214 Points +1%
Aorus Master 16 AM6J
AMD Ryzen 9 9955HX3D
3203 Points +1%
Durchschnittliche Intel Core Ultra 9 290HX Plus
  (3100 - 3228, n=9)
3180 Points 0%
Schenker XMG Neo 16 M26 Mini-LED
Intel Core Ultra 9 290HX Plus
3179 Points
Alienware 16 Area-51 Core Ultra 9 290HX Plus
Intel Core Ultra 9 290HX Plus
3170 Points 0%
MSI Raider 16 Max HX B2WJ
Intel Core Ultra 9 290HX Plus
3149 Points -1%
Schenker XMG Neo 16 E25 RTX 5090 Laptop
Intel Core Ultra 9 275HX
3109 Points -2%
HP Omen Max 16-ah1932nr
Intel Core Ultra 9 290HX Plus
3100 Points -2%
Durchschnitt der Klasse Gaming
  (1982 - 3259, n=106, der letzten 2 Jahre)
2885 Points -9%
HWBOT x265 Benchmark v2.2 / 4k Preset
Schenker XMG Neo 16 E25 RTX 5090 Laptop
Intel Core Ultra 9 275HX
43.2 fps +1%
Aorus Master 16 AM6J
AMD Ryzen 9 9955HX3D
43 fps +1%
Schenker XMG Neo 16 M26 Mini-LED
Intel Core Ultra 9 290HX Plus
42.6 fps
Schenker XMG Neo 16 A25 5090
AMD Ryzen 9 9955HX3D
42.3 fps -1%
MSI Raider 16 Max HX B2WJ
Intel Core Ultra 9 290HX Plus
42.3 fps -1%
Alienware 16 Area-51 Core Ultra 9 290HX Plus
Intel Core Ultra 9 290HX Plus
40.9 fps -4%
Durchschnittliche Intel Core Ultra 9 290HX Plus
  (32.6 - 44.4, n=8)
40.6 fps -5%
HP Omen Max 16-ah1932nr
Intel Core Ultra 9 290HX Plus
32.6 fps -23%
Durchschnitt der Klasse Gaming
  (11.5 - 44.4, n=106, der letzten 2 Jahre)
29.7 fps -30%
LibreOffice / 20 Documents To PDF
Aorus Master 16 AM6J
AMD Ryzen 9 9955HX3D
71.8 s * -98%
Durchschnitt der Klasse Gaming
  (33.2 - 88.8, n=107, der letzten 2 Jahre)
50.6 s * -40%
Schenker XMG Neo 16 A25 5090
AMD Ryzen 9 9955HX3D
46.6 s * -29%
Durchschnittliche Intel Core Ultra 9 290HX Plus
  (36.2 - 68.2, n=8)
45.2 s * -25%
Schenker XMG Neo 16 E25 RTX 5090 Laptop
Intel Core Ultra 9 275HX
40.7 s * -12%
MSI Raider 16 Max HX B2WJ
Intel Core Ultra 9 290HX Plus
39.5 s * -9%
Alienware 16 Area-51 Core Ultra 9 290HX Plus
Intel Core Ultra 9 290HX Plus
38.9 s * -7%
HP Omen Max 16-ah1932nr
Intel Core Ultra 9 290HX Plus
37 s * -2%
Schenker XMG Neo 16 M26 Mini-LED
Intel Core Ultra 9 290HX Plus
36.2 s *
R Benchmark 2.5 / Overall mean
Durchschnitt der Klasse Gaming
  (0.3439 - 0.59, n=106, der letzten 2 Jahre)
0.4231 sec * -7%
Schenker XMG Neo 16 E25 RTX 5090 Laptop
Intel Core Ultra 9 275HX
0.4053 sec * -3%
Alienware 16 Area-51 Core Ultra 9 290HX Plus
Intel Core Ultra 9 290HX Plus
0.3951 sec * -0%
Schenker XMG Neo 16 M26 Mini-LED
Intel Core Ultra 9 290HX Plus
0.3937 sec *
HP Omen Max 16-ah1932nr
Intel Core Ultra 9 290HX Plus
0.3899 sec * +1%
MSI Raider 16 Max HX B2WJ
Intel Core Ultra 9 290HX Plus
0.3889 sec * +1%
Durchschnittliche Intel Core Ultra 9 290HX Plus
  (0.3769 - 0.3951, n=8)
0.388 sec * +1%
Aorus Master 16 AM6J
AMD Ryzen 9 9955HX3D
0.3566 sec * +9%
Schenker XMG Neo 16 A25 5090
AMD Ryzen 9 9955HX3D
0.3552 sec * +10%

* ... kleinere Werte sind besser
Cinebench R15 CPU Multi 64Bit
6204 Points
Cinebench R15 OpenGL 64Bit
318 fps
Cinebench R15 Ref. Match 64Bit
99.6 %
Cinebench R15 CPU Single 64Bit
338 Points
Cinebench R20 CPU (Multi Core)
15923 Points
Cinebench R20 CPU (Single Core)
890 Points
Cinebench R23 Single Core
2396 Points
Cinebench R23 Multi Core
40835 Points
Cinebench 2024 CPU Single Core
137.2 Points
Cinebench 2024 CPU Multi Core
2234 Points
Hilfe
Performance Rating
Aorus Master 16 AM6J -1!
AMD Ryzen 9 9955HX3D, GeForce RTX 5080 Laptop
96.9 pt
Schenker XMG Neo 16 A25 5090
AMD Ryzen 9 9955HX3D, GeForce RTX 5090 Laptop
89.8 pt
Schenker XMG Neo 16 E25 RTX 5090 Laptop
Intel Core Ultra 9 275HX, GeForce RTX 5090 Laptop
69.8 pt
Durchschnittliche Intel Core Ultra 9 290HX Plus
 
69 pt
MSI Raider 16 Max HX B2WJ -1!
Intel Core Ultra 9 290HX Plus, GeForce RTX 5090 Laptop
68.9 pt
Schenker XMG Neo 16 M26 Mini-LED -1!
Intel Core Ultra 9 290HX Plus, GeForce RTX 5090 Laptop
68.2 pt
Alienware 16 Area-51 Core Ultra 9 290HX Plus -1!
Intel Core Ultra 9 290HX Plus, GeForce RTX 5080 Laptop
68.1 pt
HP Omen Max 16-ah1932nr -1!
Intel Core Ultra 9 290HX Plus, GeForce RTX 5090 Laptop
56.4 pt
Durchschnitt der Klasse Gaming
 
55.7 pt
AIDA64 / FP32 Ray-Trace
Aorus Master 16 AM6J
AMD Ryzen 9 9955HX3D, GeForce RTX 5080 Laptop (v8.20.8100)
81070 KRay/s +107%
Schenker XMG Neo 16 A25 5090
AMD Ryzen 9 9955HX3D, GeForce RTX 5090 Laptop (v6.92.6600)
80619 KRay/s +106%
MSI Raider 16 Max HX B2WJ
Intel Core Ultra 9 290HX Plus, GeForce RTX 5090 Laptop (v8.20.8100)
40761 KRay/s +4%
Schenker XMG Neo 16 E25 RTX 5090 Laptop
Intel Core Ultra 9 275HX, GeForce RTX 5090 Laptop (v6.92.6600)
39895 KRay/s +2%
Alienware 16 Area-51 Core Ultra 9 290HX Plus
Intel Core Ultra 9 290HX Plus, GeForce RTX 5080 Laptop (v8.20.8100)
39607 KRay/s +1%
Schenker XMG Neo 16 M26 Mini-LED
Intel Core Ultra 9 290HX Plus, GeForce RTX 5090 Laptop (v8.20.8100)
39194 KRay/s
Durchschnittliche Intel Core Ultra 9 290HX Plus
  (29285 - 43239, n=9)
37741 KRay/s -4%
Durchschnitt der Klasse Gaming
  (10227 - 85542, n=106, der letzten 2 Jahre)
33771 KRay/s -14%
HP Omen Max 16-ah1932nr
Intel Core Ultra 9 290HX Plus, GeForce RTX 5090 Laptop (v8.20.8100)
29285 KRay/s -25%
AIDA64 / FPU Julia
Aorus Master 16 AM6J
AMD Ryzen 9 9955HX3D, GeForce RTX 5080 Laptop (v8.20.8100)
372155 Points +87%
Schenker XMG Neo 16 A25 5090
AMD Ryzen 9 9955HX3D, GeForce RTX 5090 Laptop (v6.92.6600)
230738 Points +16%
MSI Raider 16 Max HX B2WJ
Intel Core Ultra 9 290HX Plus, GeForce RTX 5090 Laptop (v8.20.8100)
208083 Points +4%
Alienware 16 Area-51 Core Ultra 9 290HX Plus
Intel Core Ultra 9 290HX Plus, GeForce RTX 5080 Laptop (v8.20.8100)
204103 Points +2%
Schenker XMG Neo 16 M26 Mini-LED
Intel Core Ultra 9 290HX Plus, GeForce RTX 5090 Laptop (v8.20.8100)
199207 Points
Schenker XMG Neo 16 E25 RTX 5090 Laptop
Intel Core Ultra 9 275HX, GeForce RTX 5090 Laptop (v6.92.6600)
198802 Points 0%
Durchschnittliche Intel Core Ultra 9 290HX Plus
  (152663 - 218895, n=9)
198375 Points 0%
HP Omen Max 16-ah1932nr
Intel Core Ultra 9 290HX Plus, GeForce RTX 5090 Laptop (v8.20.8100)
152663 Points -23%
Durchschnitt der Klasse Gaming
  (51376 - 372155, n=106, der letzten 2 Jahre)
148087 Points -26%
AIDA64 / CPU SHA3
MSI Raider 16 Max HX B2WJ
Intel Core Ultra 9 290HX Plus, GeForce RTX 5090 Laptop (v8.20.8100)
9784 MB/s +1%
Schenker XMG Neo 16 E25 RTX 5090 Laptop
Intel Core Ultra 9 275HX, GeForce RTX 5090 Laptop (v6.92.6600)
9734 MB/s +1%
Schenker XMG Neo 16 A25 5090
AMD Ryzen 9 9955HX3D, GeForce RTX 5090 Laptop (v6.92.6600)
9656 MB/s 0%
Schenker XMG Neo 16 M26 Mini-LED
Intel Core Ultra 9 290HX Plus, GeForce RTX 5090 Laptop (v8.20.8100)
9649 MB/s
Aorus Master 16 AM6J
AMD Ryzen 9 9955HX3D, GeForce RTX 5080 Laptop (v8.20.8100)
9630 MB/s 0%
Alienware 16 Area-51 Core Ultra 9 290HX Plus
Intel Core Ultra 9 290HX Plus, GeForce RTX 5080 Laptop (v8.20.8100)
9516 MB/s -1%
Durchschnittliche Intel Core Ultra 9 290HX Plus
  (7331 - 10115, n=9)
9334 MB/s -3%
HP Omen Max 16-ah1932nr
Intel Core Ultra 9 290HX Plus, GeForce RTX 5090 Laptop (v8.20.8100)
7331 MB/s -24%
Durchschnitt der Klasse Gaming
  (2180 - 10115, n=106, der letzten 2 Jahre)
6609 MB/s -32%
AIDA64 / CPU Queen
Schenker XMG Neo 16 A25 5090
AMD Ryzen 9 9955HX3D, GeForce RTX 5090 Laptop (v6.92.6600)
173351 Points
Durchschnittliche Intel Core Ultra 9 290HX Plus
  (n=1)
141622 Points
Schenker XMG Neo 16 E25 RTX 5090 Laptop
Intel Core Ultra 9 275HX, GeForce RTX 5090 Laptop (v6.92.6600)
140695 Points
Durchschnitt der Klasse Gaming
  (49785 - 173351, n=79, der letzten 2 Jahre)
118606 Points
AIDA64 / FPU SinJulia
Schenker XMG Neo 16 A25 5090
AMD Ryzen 9 9955HX3D, GeForce RTX 5090 Laptop (v6.92.6600)
32989 Points +129%
Aorus Master 16 AM6J
AMD Ryzen 9 9955HX3D, GeForce RTX 5080 Laptop (v8.20.8100)
32252 Points +124%
Durchschnitt der Klasse Gaming
  (4424 - 33636, n=106, der letzten 2 Jahre)
14837 Points +3%
MSI Raider 16 Max HX B2WJ
Intel Core Ultra 9 290HX Plus, GeForce RTX 5090 Laptop (v8.20.8100)
14461 Points 0%
Schenker XMG Neo 16 M26 Mini-LED
Intel Core Ultra 9 290HX Plus, GeForce RTX 5090 Laptop (v8.20.8100)
14393 Points
Schenker XMG Neo 16 E25 RTX 5090 Laptop
Intel Core Ultra 9 275HX, GeForce RTX 5090 Laptop (v6.92.6600)
14382 Points 0%
Durchschnittliche Intel Core Ultra 9 290HX Plus
  (13019 - 14874, n=9)
14147 Points -2%
Alienware 16 Area-51 Core Ultra 9 290HX Plus
Intel Core Ultra 9 290HX Plus, GeForce RTX 5080 Laptop (v8.20.8100)
13612 Points -5%
HP Omen Max 16-ah1932nr
Intel Core Ultra 9 290HX Plus, GeForce RTX 5090 Laptop (v8.20.8100)
13019 Points -10%
AIDA64 / FPU Mandel
Aorus Master 16 AM6J
AMD Ryzen 9 9955HX3D, GeForce RTX 5080 Laptop (v8.20.8100)
196829 Points +90%
Schenker XMG Neo 16 A25 5090
AMD Ryzen 9 9955HX3D, GeForce RTX 5090 Laptop (v6.92.6600)
122088 Points +18%
MSI Raider 16 Max HX B2WJ
Intel Core Ultra 9 290HX Plus, GeForce RTX 5090 Laptop (v8.20.8100)
108275 Points +4%
Alienware 16 Area-51 Core Ultra 9 290HX Plus
Intel Core Ultra 9 290HX Plus, GeForce RTX 5080 Laptop (v8.20.8100)
106285 Points +2%
Schenker XMG Neo 16 M26 Mini-LED
Intel Core Ultra 9 290HX Plus, GeForce RTX 5090 Laptop (v8.20.8100)
103810 Points
Durchschnittliche Intel Core Ultra 9 290HX Plus
  (81013 - 115371, n=9)
103799 Points 0%
Schenker XMG Neo 16 E25 RTX 5090 Laptop
Intel Core Ultra 9 275HX, GeForce RTX 5090 Laptop (v6.92.6600)
102544 Points -1%
HP Omen Max 16-ah1932nr
Intel Core Ultra 9 290HX Plus, GeForce RTX 5090 Laptop (v8.20.8100)
81013 Points -22%
Durchschnitt der Klasse Gaming
  (25115 - 196829, n=106, der letzten 2 Jahre)
77921 Points -25%
AIDA64 / CPU AES
Schenker XMG Neo 16 A25 5090
AMD Ryzen 9 9955HX3D, GeForce RTX 5090 Laptop (v6.92.6600)
161913 MB/s +19%
Aorus Master 16 AM6J
AMD Ryzen 9 9955HX3D, GeForce RTX 5080 Laptop (v8.20.8100)
160619 MB/s +18%
Schenker XMG Neo 16 E25 RTX 5090 Laptop
Intel Core Ultra 9 275HX, GeForce RTX 5090 Laptop (v6.92.6600)
136847 MB/s +1%
MSI Raider 16 Max HX B2WJ
Intel Core Ultra 9 290HX Plus, GeForce RTX 5090 Laptop (v8.20.8100)
136781 MB/s +1%
Schenker XMG Neo 16 M26 Mini-LED
Intel Core Ultra 9 290HX Plus, GeForce RTX 5090 Laptop (v8.20.8100)
135888 MB/s
Durchschnittliche Intel Core Ultra 9 290HX Plus
  (119656 - 143205, n=9)
134404 MB/s -1%
Alienware 16 Area-51 Core Ultra 9 290HX Plus
Intel Core Ultra 9 290HX Plus, GeForce RTX 5080 Laptop (v8.20.8100)
130696 MB/s -4%
HP Omen Max 16-ah1932nr
Intel Core Ultra 9 290HX Plus, GeForce RTX 5090 Laptop (v8.20.8100)
119656 MB/s -12%
Durchschnitt der Klasse Gaming
  (39258 - 247074, n=106, der letzten 2 Jahre)
108018 MB/s -21%
AIDA64 / CPU ZLib
Schenker XMG Neo 16 A25 5090
AMD Ryzen 9 9955HX3D, GeForce RTX 5090 Laptop (v6.92.6600)
2497 MB/s +12%
Aorus Master 16 AM6J
AMD Ryzen 9 9955HX3D, GeForce RTX 5080 Laptop (v8.20.8100)
2436 MB/s +9%
Schenker XMG Neo 16 E25 RTX 5090 Laptop
Intel Core Ultra 9 275HX, GeForce RTX 5090 Laptop (v6.92.6600)
2263 MB/s +2%
Schenker XMG Neo 16 M26 Mini-LED
Intel Core Ultra 9 290HX Plus, GeForce RTX 5090 Laptop (v8.20.8100)
2225 MB/s
MSI Raider 16 Max HX B2WJ
Intel Core Ultra 9 290HX Plus, GeForce RTX 5090 Laptop (v8.20.8100)
2206 MB/s -1%
Alienware 16 Area-51 Core Ultra 9 290HX Plus
Intel Core Ultra 9 290HX Plus, GeForce RTX 5080 Laptop (v8.20.8100)
2162 MB/s -3%
Durchschnittliche Intel Core Ultra 9 290HX Plus
  (1622 - 2340, n=9)
2141 MB/s -4%
HP Omen Max 16-ah1932nr
Intel Core Ultra 9 290HX Plus, GeForce RTX 5090 Laptop (v8.20.8100)
1622 MB/s -27%
Durchschnitt der Klasse Gaming
  (574 - 2531, n=106, der letzten 2 Jahre)
1608 MB/s -28%
AIDA64 / FP64 Ray-Trace
Aorus Master 16 AM6J
AMD Ryzen 9 9955HX3D, GeForce RTX 5080 Laptop (v8.20.8100)
43081 KRay/s +106%
Schenker XMG Neo 16 A25 5090
AMD Ryzen 9 9955HX3D, GeForce RTX 5090 Laptop (v6.92.6600)
42676 KRay/s +104%
MSI Raider 16 Max HX B2WJ
Intel Core Ultra 9 290HX Plus, GeForce RTX 5090 Laptop (v8.20.8100)
21949 KRay/s +5%
Alienware 16 Area-51 Core Ultra 9 290HX Plus
Intel Core Ultra 9 290HX Plus, GeForce RTX 5080 Laptop (v8.20.8100)
21472 KRay/s +3%
Durchschnittliche Intel Core Ultra 9 290HX Plus
  (15810 - 23843, n=9)
21054 KRay/s +1%
Schenker XMG Neo 16 E25 RTX 5090 Laptop
Intel Core Ultra 9 275HX, GeForce RTX 5090 Laptop (v6.92.6600)
20910 KRay/s 0%
Schenker XMG Neo 16 M26 Mini-LED
Intel Core Ultra 9 290HX Plus, GeForce RTX 5090 Laptop (v8.20.8100)
20909 KRay/s
Durchschnitt der Klasse Gaming
  (5509 - 45446, n=106, der letzten 2 Jahre)
18135 KRay/s -13%
HP Omen Max 16-ah1932nr
Intel Core Ultra 9 290HX Plus, GeForce RTX 5090 Laptop (v8.20.8100)
15810 KRay/s -24%
AIDA64 / CPU PhotoWorxx
Durchschnittliche Intel Core Ultra 9 290HX Plus
  (51134 - 65272, n=9)
56076 MPixel/s +5%
HP Omen Max 16-ah1932nr
Intel Core Ultra 9 290HX Plus, GeForce RTX 5090 Laptop (v8.20.8100)
55846 MPixel/s +4%
Alienware 16 Area-51 Core Ultra 9 290HX Plus
Intel Core Ultra 9 290HX Plus, GeForce RTX 5080 Laptop (v8.20.8100)
55731 MPixel/s +4%
Schenker XMG Neo 16 E25 RTX 5090 Laptop
Intel Core Ultra 9 275HX, GeForce RTX 5090 Laptop (v6.92.6600)
53630 MPixel/s 0%
Schenker XMG Neo 16 M26 Mini-LED
Intel Core Ultra 9 290HX Plus, GeForce RTX 5090 Laptop (v8.20.8100)
53536 MPixel/s
MSI Raider 16 Max HX B2WJ
Intel Core Ultra 9 290HX Plus, GeForce RTX 5090 Laptop (v8.20.8100)
51134 MPixel/s -4%
Durchschnitt der Klasse Gaming
  (12271 - 89891, n=106, der letzten 2 Jahre)
45724 MPixel/s -15%
Aorus Master 16 AM6J
AMD Ryzen 9 9955HX3D, GeForce RTX 5080 Laptop (v8.20.8100)
44266 MPixel/s -17%
Schenker XMG Neo 16 A25 5090
AMD Ryzen 9 9955HX3D, GeForce RTX 5090 Laptop (v6.92.6600)
43032 MPixel/s -20%

System und Speicherleistung

Die Systemleistung ist hervorragend und es gab keinerlei Stabilitätsprobleme. Das Neo 16 bietet einen schnellen PCIe-5.0-Anschluss (plus einen weiteren PCIe-4.0-Anschluss) für die SSD und die Samsung 9100 Pro (2 TB) in unserem Testgerät erreicht sehr hohe sowie stabile Transferraten.

Performance Rating: Percent
PCMark 10: Score | Essentials | Productivity | Digital Content Creation
CrossMark: Overall | Productivity | Creativity | Responsiveness
WebXPRT 4: Overall
WebXPRT 5: Overall
Mozilla Kraken 1.1: Total
Performance Rating
Alienware 16 Area-51 Core Ultra 9 290HX Plus
GeForce RTX 5080 Laptop, Ultra 9 290HX Plus, SK hynix PCB01 HFS001TFM9X186N
89.7 pt
Schenker XMG Neo 16 M26 Mini-LED
GeForce RTX 5090 Laptop, Ultra 9 290HX Plus, Samsung 9100 Pro 2 TB
87.8 pt
Durchschnittliche Intel Core Ultra 9 290HX Plus, NVIDIA GeForce RTX 5090 Laptop
 
86.9 pt
MSI Raider 16 Max HX B2WJ
GeForce RTX 5090 Laptop, Ultra 9 290HX Plus, Micron 2500 1TB MTFDKBA1T0QGN
86.8 pt
HP Omen Max 16-ah1932nr
GeForce RTX 5090 Laptop, Ultra 9 290HX Plus
86.1 pt
Aorus Master 16 AM6J -1!
GeForce RTX 5080 Laptop, R9 9955HX3D, Samsung PM9C1b MZVL81T0HFLB-00BTW
78.4 pt
Schenker XMG Neo 16 A25 5090 -1!
GeForce RTX 5090 Laptop, R9 9955HX3D, Kingston Fury Renegade SFYRS1000G
77.9 pt
Schenker XMG Neo 16 E25 RTX 5090 Laptop -1!
GeForce RTX 5090 Laptop, Ultra 9 275HX, Samsung 9100 Pro 1 TB
77.5 pt
Durchschnitt der Klasse Gaming
 
71.1 pt
PCMark 10 / Score
HP Omen Max 16-ah1932nr
GeForce RTX 5090 Laptop, Ultra 9 290HX Plus
12093 Points +3%
Durchschnittliche Intel Core Ultra 9 290HX Plus, NVIDIA GeForce RTX 5090 Laptop
  (11015 - 12414, n=5)
11788 Points +1%
Schenker XMG Neo 16 M26 Mini-LED
GeForce RTX 5090 Laptop, Ultra 9 290HX Plus, Samsung 9100 Pro 2 TB
11687 Points
Alienware 16 Area-51 Core Ultra 9 290HX Plus
GeForce RTX 5080 Laptop, Ultra 9 290HX Plus, SK hynix PCB01 HFS001TFM9X186N
11574 Points -1%
MSI Raider 16 Max HX B2WJ
GeForce RTX 5090 Laptop, Ultra 9 290HX Plus, Micron 2500 1TB MTFDKBA1T0QGN
11015 Points -6%
Aorus Master 16 AM6J
GeForce RTX 5080 Laptop, R9 9955HX3D, Samsung PM9C1b MZVL81T0HFLB-00BTW
10636 Points -9%
Schenker XMG Neo 16 A25 5090
GeForce RTX 5090 Laptop, R9 9955HX3D, Kingston Fury Renegade SFYRS1000G
9647 Points -17%
Schenker XMG Neo 16 E25 RTX 5090 Laptop
GeForce RTX 5090 Laptop, Ultra 9 275HX, Samsung 9100 Pro 1 TB
9032 Points -23%
Durchschnitt der Klasse Gaming
  (5828 - 12414, n=96, der letzten 2 Jahre)
8749 Points -25%
PCMark 10 / Essentials
HP Omen Max 16-ah1932nr
GeForce RTX 5090 Laptop, Ultra 9 290HX Plus
12187 Points +7%
Alienware 16 Area-51 Core Ultra 9 290HX Plus
GeForce RTX 5080 Laptop, Ultra 9 290HX Plus, SK hynix PCB01 HFS001TFM9X186N
11887 Points +4%
Schenker XMG Neo 16 A25 5090
GeForce RTX 5090 Laptop, R9 9955HX3D, Kingston Fury Renegade SFYRS1000G
11728 Points +3%
Durchschnittliche Intel Core Ultra 9 290HX Plus, NVIDIA GeForce RTX 5090 Laptop
  (11316 - 12187, n=5)
11595 Points +2%
Aorus Master 16 AM6J
GeForce RTX 5080 Laptop, R9 9955HX3D, Samsung PM9C1b MZVL81T0HFLB-00BTW
11564 Points +2%
Schenker XMG Neo 16 M26 Mini-LED
GeForce RTX 5090 Laptop, Ultra 9 290HX Plus, Samsung 9100 Pro 2 TB
11386 Points
MSI Raider 16 Max HX B2WJ
GeForce RTX 5090 Laptop, Ultra 9 290HX Plus, Micron 2500 1TB MTFDKBA1T0QGN
11316 Points -1%
Schenker XMG Neo 16 E25 RTX 5090 Laptop
GeForce RTX 5090 Laptop, Ultra 9 275HX, Samsung 9100 Pro 1 TB
11162 Points -2%
Durchschnitt der Klasse Gaming
  (8810 - 12187, n=100, der letzten 2 Jahre)
10704 Points -6%
PCMark 10 / Productivity
HP Omen Max 16-ah1932nr
GeForce RTX 5090 Laptop, Ultra 9 290HX Plus
22488 Points +15%
Durchschnittliche Intel Core Ultra 9 290HX Plus, NVIDIA GeForce RTX 5090 Laptop
  (16305 - 25323, n=5)
20569 Points +5%
Aorus Master 16 AM6J
GeForce RTX 5080 Laptop, R9 9955HX3D, Samsung PM9C1b MZVL81T0HFLB-00BTW
19653 Points 0%
Schenker XMG Neo 16 M26 Mini-LED
GeForce RTX 5090 Laptop, Ultra 9 290HX Plus, Samsung 9100 Pro 2 TB
19617 Points
Alienware 16 Area-51 Core Ultra 9 290HX Plus
GeForce RTX 5080 Laptop, Ultra 9 290HX Plus, SK hynix PCB01 HFS001TFM9X186N
18766 Points -4%
MSI Raider 16 Max HX B2WJ
GeForce RTX 5090 Laptop, Ultra 9 290HX Plus, Micron 2500 1TB MTFDKBA1T0QGN
16305 Points -17%
Durchschnitt der Klasse Gaming
  (6845 - 25323, n=98, der letzten 2 Jahre)
12214 Points -38%
Schenker XMG Neo 16 A25 5090
GeForce RTX 5090 Laptop, R9 9955HX3D, Kingston Fury Renegade SFYRS1000G
11003 Points -44%
Schenker XMG Neo 16 E25 RTX 5090 Laptop
GeForce RTX 5090 Laptop, Ultra 9 275HX, Samsung 9100 Pro 1 TB
9317 Points -53%
PCMark 10 / Digital Content Creation
MSI Raider 16 Max HX B2WJ
GeForce RTX 5090 Laptop, Ultra 9 290HX Plus, Micron 2500 1TB MTFDKBA1T0QGN
19657 Points +1%
Schenker XMG Neo 16 M26 Mini-LED
GeForce RTX 5090 Laptop, Ultra 9 290HX Plus, Samsung 9100 Pro 2 TB
19396 Points
Schenker XMG Neo 16 E25 RTX 5090 Laptop
GeForce RTX 5090 Laptop, Ultra 9 275HX, Samsung 9100 Pro 1 TB
19227 Points -1%
Schenker XMG Neo 16 A25 5090
GeForce RTX 5090 Laptop, R9 9955HX3D, Kingston Fury Renegade SFYRS1000G
18879 Points -3%
Alienware 16 Area-51 Core Ultra 9 290HX Plus
GeForce RTX 5080 Laptop, Ultra 9 290HX Plus, SK hynix PCB01 HFS001TFM9X186N
18861 Points -3%
Durchschnittliche Intel Core Ultra 9 290HX Plus, NVIDIA GeForce RTX 5090 Laptop
  (17503 - 19954, n=5)
18835 Points -3%
HP Omen Max 16-ah1932nr
GeForce RTX 5090 Laptop, Ultra 9 290HX Plus
17503 Points -10%
Aorus Master 16 AM6J
GeForce RTX 5080 Laptop, R9 9955HX3D, Samsung PM9C1b MZVL81T0HFLB-00BTW
14368 Points -26%
Durchschnitt der Klasse Gaming
  (7602 - 19954, n=98, der letzten 2 Jahre)
14277 Points -26%
CrossMark / Overall
Alienware 16 Area-51 Core Ultra 9 290HX Plus
GeForce RTX 5080 Laptop, Ultra 9 290HX Plus, SK hynix PCB01 HFS001TFM9X186N
2409 Points +2%
MSI Raider 16 Max HX B2WJ
GeForce RTX 5090 Laptop, Ultra 9 290HX Plus, Micron 2500 1TB MTFDKBA1T0QGN
2401 Points +2%
Schenker XMG Neo 16 M26 Mini-LED
GeForce RTX 5090 Laptop, Ultra 9 290HX Plus, Samsung 9100 Pro 2 TB
2364 Points
Durchschnittliche Intel Core Ultra 9 290HX Plus, NVIDIA GeForce RTX 5090 Laptop
  (2177 - 2401, n=5)
2307 Points -2%
Schenker XMG Neo 16 E25 RTX 5090 Laptop
GeForce RTX 5090 Laptop, Ultra 9 275HX, Samsung 9100 Pro 1 TB
2249 Points -5%
HP Omen Max 16-ah1932nr
GeForce RTX 5090 Laptop, Ultra 9 290HX Plus
2249 Points -5%
Schenker XMG Neo 16 A25 5090
GeForce RTX 5090 Laptop, R9 9955HX3D, Kingston Fury Renegade SFYRS1000G
2199 Points -7%
Aorus Master 16 AM6J
GeForce RTX 5080 Laptop, R9 9955HX3D, Samsung PM9C1b MZVL81T0HFLB-00BTW
2126 Points -10%
Durchschnitt der Klasse Gaming
  (1366 - 2409, n=99, der letzten 2 Jahre)
2000 Points -15%
CrossMark / Productivity
Alienware 16 Area-51 Core Ultra 9 290HX Plus
GeForce RTX 5080 Laptop, Ultra 9 290HX Plus, SK hynix PCB01 HFS001TFM9X186N
2216 Points 0%
MSI Raider 16 Max HX B2WJ
GeForce RTX 5090 Laptop, Ultra 9 290HX Plus, Micron 2500 1TB MTFDKBA1T0QGN
2213 Points 0%
Schenker XMG Neo 16 M26 Mini-LED
GeForce RTX 5090 Laptop, Ultra 9 290HX Plus, Samsung 9100 Pro 2 TB
2213 Points
Durchschnittliche Intel Core Ultra 9 290HX Plus, NVIDIA GeForce RTX 5090 Laptop
  (1994 - 2213, n=5)
2124 Points -4%
HP Omen Max 16-ah1932nr
GeForce RTX 5090 Laptop, Ultra 9 290HX Plus
2092 Points -5%
Schenker XMG Neo 16 E25 RTX 5090 Laptop
GeForce RTX 5090 Laptop, Ultra 9 275HX, Samsung 9100 Pro 1 TB
2062 Points -7%
Schenker XMG Neo 16 A25 5090
GeForce RTX 5090 Laptop, R9 9955HX3D, Kingston Fury Renegade SFYRS1000G
1958 Points -12%
Aorus Master 16 AM6J
GeForce RTX 5080 Laptop, R9 9955HX3D, Samsung PM9C1b MZVL81T0HFLB-00BTW
1914 Points -14%
Durchschnitt der Klasse Gaming
  (1386 - 2254, n=99, der letzten 2 Jahre)
1866 Points -16%
CrossMark / Creativity
MSI Raider 16 Max HX B2WJ
GeForce RTX 5090 Laptop, Ultra 9 290HX Plus, Micron 2500 1TB MTFDKBA1T0QGN
2661 Points +2%
Schenker XMG Neo 16 A25 5090
GeForce RTX 5090 Laptop, R9 9955HX3D, Kingston Fury Renegade SFYRS1000G
2651 Points +1%
Alienware 16 Area-51 Core Ultra 9 290HX Plus
GeForce RTX 5080 Laptop, Ultra 9 290HX Plus, SK hynix PCB01 HFS001TFM9X186N
2648 Points +1%
Durchschnittliche Intel Core Ultra 9 290HX Plus, NVIDIA GeForce RTX 5090 Laptop
  (2490 - 2786, n=5)
2621 Points 0%
Schenker XMG Neo 16 M26 Mini-LED
GeForce RTX 5090 Laptop, Ultra 9 290HX Plus, Samsung 9100 Pro 2 TB
2620 Points
Schenker XMG Neo 16 E25 RTX 5090 Laptop
GeForce RTX 5090 Laptop, Ultra 9 275HX, Samsung 9100 Pro 1 TB
2612 Points 0%
Aorus Master 16 AM6J
GeForce RTX 5080 Laptop, R9 9955HX3D, Samsung PM9C1b MZVL81T0HFLB-00BTW
2547 Points -3%
HP Omen Max 16-ah1932nr
GeForce RTX 5090 Laptop, Ultra 9 290HX Plus
2490 Points -5%
Durchschnitt der Klasse Gaming
  (1343 - 2786, n=99, der letzten 2 Jahre)
2261 Points -14%
CrossMark / Responsiveness
Alienware 16 Area-51 Core Ultra 9 290HX Plus
GeForce RTX 5080 Laptop, Ultra 9 290HX Plus, SK hynix PCB01 HFS001TFM9X186N
2334 Points +10%
MSI Raider 16 Max HX B2WJ
GeForce RTX 5090 Laptop, Ultra 9 290HX Plus, Micron 2500 1TB MTFDKBA1T0QGN
2249 Points +6%
Schenker XMG Neo 16 M26 Mini-LED
GeForce RTX 5090 Laptop, Ultra 9 290HX Plus, Samsung 9100 Pro 2 TB
2113 Points
HP Omen Max 16-ah1932nr
GeForce RTX 5090 Laptop, Ultra 9 290HX Plus
2058 Points -3%
Durchschnittliche Intel Core Ultra 9 290HX Plus, NVIDIA GeForce RTX 5090 Laptop
  (1766 - 2249, n=5)
2022 Points -4%
Schenker XMG Neo 16 E25 RTX 5090 Laptop
GeForce RTX 5090 Laptop, Ultra 9 275HX, Samsung 9100 Pro 1 TB
1864 Points -12%
Schenker XMG Neo 16 A25 5090
GeForce RTX 5090 Laptop, R9 9955HX3D, Kingston Fury Renegade SFYRS1000G
1776 Points -16%
Durchschnitt der Klasse Gaming
  (1241 - 2334, n=99, der letzten 2 Jahre)
1715 Points -19%
Aorus Master 16 AM6J
GeForce RTX 5080 Laptop, R9 9955HX3D, Samsung PM9C1b MZVL81T0HFLB-00BTW
1691 Points -20%
WebXPRT 4 / Overall
Alienware 16 Area-51 Core Ultra 9 290HX Plus
GeForce RTX 5080 Laptop, Ultra 9 290HX Plus, SK hynix PCB01 HFS001TFM9X186N
354 Points +6%
MSI Raider 16 Max HX B2WJ
GeForce RTX 5090 Laptop, Ultra 9 290HX Plus, Micron 2500 1TB MTFDKBA1T0QGN
336 Points 0%
Schenker XMG Neo 16 M26 Mini-LED
GeForce RTX 5090 Laptop, Ultra 9 290HX Plus, Samsung 9100 Pro 2 TB
335 Points
Schenker XMG Neo 16 E25 RTX 5090 Laptop
GeForce RTX 5090 Laptop, Ultra 9 275HX, Samsung 9100 Pro 1 TB
333 Points -1%
Durchschnittliche Intel Core Ultra 9 290HX Plus, NVIDIA GeForce RTX 5090 Laptop
  (310 - 336, n=5)
327 Points -2%
Schenker XMG Neo 16 A25 5090
GeForce RTX 5090 Laptop, R9 9955HX3D, Kingston Fury Renegade SFYRS1000G
320 Points -4%
HP Omen Max 16-ah1932nr
GeForce RTX 5090 Laptop, Ultra 9 290HX Plus
320 Points -4%
Aorus Master 16 AM6J
GeForce RTX 5080 Laptop, R9 9955HX3D, Samsung PM9C1b MZVL81T0HFLB-00BTW
309 Points -8%
Durchschnitt der Klasse Gaming
  (165 - 354, n=102, der letzten 2 Jahre)
288 Points -14%
WebXPRT 5 / Overall
Alienware 16 Area-51 Core Ultra 9 290HX Plus
GeForce RTX 5080 Laptop, Ultra 9 290HX Plus, SK hynix PCB01 HFS001TFM9X186N
142 Points +2%
Schenker XMG Neo 16 M26 Mini-LED
GeForce RTX 5090 Laptop, Ultra 9 290HX Plus, Samsung 9100 Pro 2 TB
139 Points
Durchschnittliche Intel Core Ultra 9 290HX Plus, NVIDIA GeForce RTX 5090 Laptop
  (129 - 141, n=4)
136 Points -2%
MSI Raider 16 Max HX B2WJ
GeForce RTX 5090 Laptop, Ultra 9 290HX Plus, Micron 2500 1TB MTFDKBA1T0QGN
135 Points -3%
HP Omen Max 16-ah1932nr
GeForce RTX 5090 Laptop, Ultra 9 290HX Plus
129 Points -7%
Durchschnitt der Klasse Gaming
  (97 - 142, n=19, der letzten 2 Jahre)
124.5 Points -10%
Mozilla Kraken 1.1 / Total
Durchschnitt der Klasse Gaming
  (391 - 590, n=106, der letzten 2 Jahre)
455 ms * -12%
HP Omen Max 16-ah1932nr
GeForce RTX 5090 Laptop, Ultra 9 290HX Plus
421 ms * -3%
Schenker XMG Neo 16 M26 Mini-LED
GeForce RTX 5090 Laptop, Ultra 9 290HX Plus, Samsung 9100 Pro 2 TB
408 ms *
Aorus Master 16 AM6J
GeForce RTX 5080 Laptop, R9 9955HX3D, Samsung PM9C1b MZVL81T0HFLB-00BTW
405 ms * +1%
Schenker XMG Neo 16 E25 RTX 5090 Laptop
GeForce RTX 5090 Laptop, Ultra 9 275HX, Samsung 9100 Pro 1 TB
404 ms * +1%
Durchschnittliche Intel Core Ultra 9 290HX Plus, NVIDIA GeForce RTX 5090 Laptop
  (393 - 421, n=5)
403 ms * +1%
MSI Raider 16 Max HX B2WJ
GeForce RTX 5090 Laptop, Ultra 9 290HX Plus, Micron 2500 1TB MTFDKBA1T0QGN
399 ms * +2%
Schenker XMG Neo 16 A25 5090
GeForce RTX 5090 Laptop, R9 9955HX3D, Kingston Fury Renegade SFYRS1000G
397 ms * +3%
Alienware 16 Area-51 Core Ultra 9 290HX Plus
GeForce RTX 5080 Laptop, Ultra 9 290HX Plus, SK hynix PCB01 HFS001TFM9X186N
391 ms * +4%

* ... kleinere Werte sind besser
PCMark 10 Score
11687 Punkte
Hilfe
AIDA64 / Memory Copy
Schenker XMG Neo 16 E25 RTX 5090 Laptop
Intel Core Ultra 9 275HX, GeForce RTX 5090 Laptop
86978 MB/s +4%
Alienware 16 Area-51 Core Ultra 9 290HX Plus
Intel Core Ultra 9 290HX Plus, GeForce RTX 5080 Laptop
85698 MB/s +2%
HP Omen Max 16-ah1932nr
Intel Core Ultra 9 290HX Plus, GeForce RTX 5090 Laptop
85698 MB/s +2%
Durchschnittliche Intel Core Ultra 9 290HX Plus
  (76912 - 93930, n=9)
85619 MB/s +2%
Schenker XMG Neo 16 M26 Mini-LED
Intel Core Ultra 9 290HX Plus, GeForce RTX 5090 Laptop
83625 MB/s
MSI Raider 16 Max HX B2WJ
Intel Core Ultra 9 290HX Plus, GeForce RTX 5090 Laptop
79127 MB/s -5%
Durchschnitt der Klasse Gaming
  (21750 - 129946, n=106, der letzten 2 Jahre)
72859 MB/s -13%
Aorus Master 16 AM6J
AMD Ryzen 9 9955HX3D, GeForce RTX 5080 Laptop
63173 MB/s -24%
Schenker XMG Neo 16 A25 5090
AMD Ryzen 9 9955HX3D, GeForce RTX 5090 Laptop
61533 MB/s -26%
AIDA64 / Memory Read
Schenker XMG Neo 16 E25 RTX 5090 Laptop
Intel Core Ultra 9 275HX, GeForce RTX 5090 Laptop
97151 MB/s +3%
HP Omen Max 16-ah1932nr
Intel Core Ultra 9 290HX Plus, GeForce RTX 5090 Laptop
96458 MB/s +2%
Schenker XMG Neo 16 M26 Mini-LED
Intel Core Ultra 9 290HX Plus, GeForce RTX 5090 Laptop
94249 MB/s
Alienware 16 Area-51 Core Ultra 9 290HX Plus
Intel Core Ultra 9 290HX Plus, GeForce RTX 5080 Laptop
93496 MB/s -1%
Durchschnittliche Intel Core Ultra 9 290HX Plus
  (84638 - 98574, n=9)
93480 MB/s -1%
MSI Raider 16 Max HX B2WJ
Intel Core Ultra 9 290HX Plus, GeForce RTX 5090 Laptop
85730 MB/s -9%
Durchschnitt der Klasse Gaming
  (22956 - 118858, n=106, der letzten 2 Jahre)
75522 MB/s -20%
Aorus Master 16 AM6J
AMD Ryzen 9 9955HX3D, GeForce RTX 5080 Laptop
66539 MB/s -29%
Schenker XMG Neo 16 A25 5090
AMD Ryzen 9 9955HX3D, GeForce RTX 5090 Laptop
65369 MB/s -31%
AIDA64 / Memory Write
Schenker XMG Neo 16 E25 RTX 5090 Laptop
Intel Core Ultra 9 275HX, GeForce RTX 5090 Laptop
85648 MB/s +4%
HP Omen Max 16-ah1932nr
Intel Core Ultra 9 290HX Plus, GeForce RTX 5090 Laptop
84559 MB/s +3%
Durchschnittliche Intel Core Ultra 9 290HX Plus
  (76094 - 100988, n=9)
84455 MB/s +2%
Schenker XMG Neo 16 M26 Mini-LED
Intel Core Ultra 9 290HX Plus, GeForce RTX 5090 Laptop
82465 MB/s
Alienware 16 Area-51 Core Ultra 9 290HX Plus
Intel Core Ultra 9 290HX Plus, GeForce RTX 5080 Laptop
81688 MB/s -1%
MSI Raider 16 Max HX B2WJ
Intel Core Ultra 9 290HX Plus, GeForce RTX 5090 Laptop
77650 MB/s -6%
Durchschnitt der Klasse Gaming
  (22297 - 135096, n=106, der letzten 2 Jahre)
77085 MB/s -7%
Schenker XMG Neo 16 A25 5090
AMD Ryzen 9 9955HX3D, GeForce RTX 5090 Laptop
72898 MB/s -12%
Aorus Master 16 AM6J
AMD Ryzen 9 9955HX3D, GeForce RTX 5080 Laptop
69431 MB/s -16%
AIDA64 / Memory Latency
Schenker XMG Neo 16 E25 RTX 5090 Laptop
Intel Core Ultra 9 275HX, GeForce RTX 5090 Laptop
107.7 ns * -2%
Schenker XMG Neo 16 M26 Mini-LED
Intel Core Ultra 9 290HX Plus, GeForce RTX 5090 Laptop
106.1 ns *
Alienware 16 Area-51 Core Ultra 9 290HX Plus
Intel Core Ultra 9 290HX Plus, GeForce RTX 5080 Laptop
105.5 ns * +1%
MSI Raider 16 Max HX B2WJ
Intel Core Ultra 9 290HX Plus, GeForce RTX 5090 Laptop
105.3 ns * +1%
Durchschnittliche Intel Core Ultra 9 290HX Plus
  (100.7 - 108.4, n=9)
105.2 ns * +1%
HP Omen Max 16-ah1932nr
Intel Core Ultra 9 290HX Plus, GeForce RTX 5090 Laptop
105 ns * +1%
Durchschnitt der Klasse Gaming
  (75.3 - 151.7, n=106, der letzten 2 Jahre)
103.7 ns * +2%
Schenker XMG Neo 16 A25 5090
AMD Ryzen 9 9955HX3D, GeForce RTX 5090 Laptop
103.6 ns * +2%
Aorus Master 16 AM6J
AMD Ryzen 9 9955HX3D, GeForce RTX 5080 Laptop
100.4 ns * +5%

* ... kleinere Werte sind besser

Samsung 9100 Pro 2 TB
CDM 5/6 Read Seq Q32T1: 13962 MB/s
CDM 5/6 Write Seq Q32T1: 13163 MB/s
CDM 5/6 Read 4K Q32T1: 563 MB/s
CDM 5/6 Write 4K Q32T1: 801 MB/s
CDM 5/6 Read 4K: 87.4 MB/s
CDM 5/6 Write 4K: 218 MB/s
CDM 6 Write 4K Q8T8: 3474 MB/s
CDM 6 Read 4K Q8T8: 2834 MB/s
Drive Performance Rating - Percent
Alienware 16 Area-51 Core Ultra 9 290HX Plus
SK hynix PCB01 HFS001TFM9X186N
91.8 pt
Schenker XMG Neo 16 M26 Mini-LED
Samsung 9100 Pro 2 TB
78.4 pt
HP Omen Max 16-ah1932nr
 
72.9 pt
Durchschnittliche Samsung 9100 Pro 2 TB
 
72.4 pt
Schenker XMG Neo 16 A25 5090
Kingston Fury Renegade SFYRS1000G
62.3 pt
Schenker XMG Neo 16 E25 RTX 5090 Laptop
Samsung 9100 Pro 1 TB
59.2 pt
Aorus Master 16 AM6J
Samsung PM9C1b MZVL81T0HFLB-00BTW
54.4 pt
Durchschnitt der Klasse Gaming
 
46.4 pt
MSI Raider 16 Max HX B2WJ
Micron 2500 1TB MTFDKBA1T0QGN
45.6 pt
DiskSpd
seq read
Alienware 16 Area-51 Core Ultra 9 290HX Plus
SK hynix PCB01 HFS001TFM9X186N
9494 (9407.46min - 9494.44max) MB/s +50%
Schenker XMG Neo 16 A25 5090
Kingston Fury Renegade SFYRS1000G
7029 (6966.86min - 7029.44max) MB/s +11%
Schenker XMG Neo 16 M26 Mini-LED
Samsung 9100 Pro 2 TB
6344 (4311.09min - 6344.2max) MB/s
Durchschnittliche Samsung 9100 Pro 2 TB
  (4645 - 7811, n=6)
6282 MB/s -1%
Schenker XMG Neo 16 E25 RTX 5090 Laptop
Samsung 9100 Pro 1 TB
5861 (5825.98min - 5861.12max) MB/s -8%
HP Omen Max 16-ah1932nr
 
5553 (5407.18min - 5553.05max) MB/s -12%
Durchschnitt der Klasse Gaming
  (281 - 9494, n=104, der letzten 2 Jahre)
3520 MB/s -45%
Aorus Master 16 AM6J
Samsung PM9C1b MZVL81T0HFLB-00BTW
3378 (3230.45min - 3378.26max) MB/s -47%
MSI Raider 16 Max HX B2WJ
Micron 2500 1TB MTFDKBA1T0QGN
3373 (3352.51min - 3373.06max) MB/s -47%
seq write
Alienware 16 Area-51 Core Ultra 9 290HX Plus
SK hynix PCB01 HFS001TFM9X186N
9832 (9798.01min - 9832.34max) MB/s +368%
Durchschnittliche Samsung 9100 Pro 2 TB
  (2074 - 9952, n=6)
5634 MB/s +168%
Schenker XMG Neo 16 A25 5090
Kingston Fury Renegade SFYRS1000G
5592 (5439.62min - 5591.78max) MB/s +166%
Schenker XMG Neo 16 E25 RTX 5090 Laptop
Samsung 9100 Pro 1 TB
4387 (4285.53min - 4387.28max) MB/s +109%
MSI Raider 16 Max HX B2WJ
Micron 2500 1TB MTFDKBA1T0QGN
3884 (3823.64min - 3884.13max) MB/s +85%
Durchschnitt der Klasse Gaming
  (1057 - 9832, n=104, der letzten 2 Jahre)
3779 MB/s +80%
Aorus Master 16 AM6J
Samsung PM9C1b MZVL81T0HFLB-00BTW
3491 (3110.85min - 3490.71max) MB/s +66%
HP Omen Max 16-ah1932nr
 
2333 (1784.67min - 2332.87max) MB/s +11%
Schenker XMG Neo 16 M26 Mini-LED
Samsung 9100 Pro 2 TB
2101 (1700.79min - 2100.5max) MB/s
seq q8 t1 read
Schenker XMG Neo 16 A25 5090
Kingston Fury Renegade SFYRS1000G
14313 (12003.9min - 14312.6max) MB/s +1%
Schenker XMG Neo 16 M26 Mini-LED
Samsung 9100 Pro 2 TB
14109 (12148.2min - 14109.2max) MB/s
Alienware 16 Area-51 Core Ultra 9 290HX Plus
SK hynix PCB01 HFS001TFM9X186N
13867 (12274.8min - 13866.7max) MB/s -2%
Durchschnittliche Samsung 9100 Pro 2 TB
  (12481 - 14592, n=6)
13704 MB/s -3%
Schenker XMG Neo 16 E25 RTX 5090 Laptop
Samsung 9100 Pro 1 TB
13091 (10532.2min - 13090.8max) MB/s -7%
HP Omen Max 16-ah1932nr
 
12314 (9848.44min - 12313.8max) MB/s -13%
Durchschnitt der Klasse Gaming
  (3772 - 17459, n=104, der letzten 2 Jahre)
7694 MB/s -45%
MSI Raider 16 Max HX B2WJ
Micron 2500 1TB MTFDKBA1T0QGN
6943 (5690.83min - 6942.79max) MB/s -51%
Aorus Master 16 AM6J
Samsung PM9C1b MZVL81T0HFLB-00BTW
5597 (4952.59min - 5597.43max) MB/s -60%
seq q8 t1 write
Schenker XMG Neo 16 M26 Mini-LED
Samsung 9100 Pro 2 TB
13355 (13324min - 13355max) MB/s
Alienware 16 Area-51 Core Ultra 9 290HX Plus
SK hynix PCB01 HFS001TFM9X186N
12690 (12611.6min - 12689.7max) MB/s -5%
HP Omen Max 16-ah1932nr
 
12100 (11778.2min - 12099.9max) MB/s -9%
Durchschnittliche Samsung 9100 Pro 2 TB
  (7918 - 13523, n=6)
11924 MB/s -11%
Schenker XMG Neo 16 A25 5090
Kingston Fury Renegade SFYRS1000G
10800 (10111.1min - 10799.7max) MB/s -19%
Schenker XMG Neo 16 E25 RTX 5090 Laptop
Samsung 9100 Pro 1 TB
7264 (5656.44min - 7264.06max) MB/s -46%
Durchschnitt der Klasse Gaming
  (1218 - 13519, n=104, der letzten 2 Jahre)
6101 MB/s -54%
MSI Raider 16 Max HX B2WJ
Micron 2500 1TB MTFDKBA1T0QGN
6051 (6018.41min - 6050.97max) MB/s -55%
Aorus Master 16 AM6J
Samsung PM9C1b MZVL81T0HFLB-00BTW
3705 (3255.83min - 3704.62max) MB/s -72%
4k q1 t1 read
Alienware 16 Area-51 Core Ultra 9 290HX Plus
SK hynix PCB01 HFS001TFM9X186N
111.2 (110.81min - 111.23max) MB/s +27%
HP Omen Max 16-ah1932nr
 
93.1 (92.38min - 93.11max) MB/s +6%
Schenker XMG Neo 16 M26 Mini-LED
Samsung 9100 Pro 2 TB
87.9 (81.19min - 87.91max) MB/s
Durchschnittliche Samsung 9100 Pro 2 TB
  (66.1 - 93.6, n=6)
83 MB/s -6%
MSI Raider 16 Max HX B2WJ
Micron 2500 1TB MTFDKBA1T0QGN
81.2 (80.72min - 81.24max) MB/s -8%
Schenker XMG Neo 16 E25 RTX 5090 Laptop
Samsung 9100 Pro 1 TB
77.4 (77.02min - 77.43max) MB/s -12%
Aorus Master 16 AM6J
Samsung PM9C1b MZVL81T0HFLB-00BTW
77.4 (74.48min - 77.41max) MB/s -12%
Durchschnitt der Klasse Gaming
  (32.2 - 111.2, n=104, der letzten 2 Jahre)
70.4 MB/s -20%
Schenker XMG Neo 16 A25 5090
Kingston Fury Renegade SFYRS1000G
69.8 (69.45min - 69.83max) MB/s -21%
4k q1 t1 write
Alienware 16 Area-51 Core Ultra 9 290HX Plus
SK hynix PCB01 HFS001TFM9X186N
334 (326.58min - 333.71max) MB/s +55%
MSI Raider 16 Max HX B2WJ
Micron 2500 1TB MTFDKBA1T0QGN
276 (265.07min - 275.53max) MB/s +28%
Aorus Master 16 AM6J
Samsung PM9C1b MZVL81T0HFLB-00BTW
226 (220.4min - 226.16max) MB/s +5%
Schenker XMG Neo 16 M26 Mini-LED
Samsung 9100 Pro 2 TB
215 (211.12min - 214.71max) MB/s
HP Omen Max 16-ah1932nr
 
211 (208.1min - 210.69max) MB/s -2%
Durchschnittliche Samsung 9100 Pro 2 TB
  (160.7 - 246, n=6)
208 MB/s -3%
Durchschnitt der Klasse Gaming
  (96.7 - 345, n=104, der letzten 2 Jahre)
193.1 MB/s -10%
Schenker XMG Neo 16 A25 5090
Kingston Fury Renegade SFYRS1000G
170.3 (168.43min - 170.32max) MB/s -21%
Schenker XMG Neo 16 E25 RTX 5090 Laptop
Samsung 9100 Pro 1 TB
157 (155.82min - 156.95max) MB/s -27%
4k q32 t16 read
Alienware 16 Area-51 Core Ultra 9 290HX Plus
SK hynix PCB01 HFS001TFM9X186N
7357 (7227.79min - 7356.85max) MB/s +24%
Schenker XMG Neo 16 M26 Mini-LED
Samsung 9100 Pro 2 TB
5956 (5913.8min - 5956.11max) MB/s
HP Omen Max 16-ah1932nr
 
4564 (3818.08min - 4563.78max) MB/s -23%
Aorus Master 16 AM6J
Samsung PM9C1b MZVL81T0HFLB-00BTW
4063 (4026.11min - 4063.09max) MB/s -32%
Durchschnittliche Samsung 9100 Pro 2 TB
  (964 - 5962, n=6)
4050 MB/s -32%
Durchschnitt der Klasse Gaming
  (539 - 8067, n=104, der letzten 2 Jahre)
2340 MB/s -61%
Schenker XMG Neo 16 A25 5090
Kingston Fury Renegade SFYRS1000G
1112 (1085.98min - 1112.27max) MB/s -81%
Schenker XMG Neo 16 E25 RTX 5090 Laptop
Samsung 9100 Pro 1 TB
961 (945.93min - 961.25max) MB/s -84%
MSI Raider 16 Max HX B2WJ
Micron 2500 1TB MTFDKBA1T0QGN
814 (789.35min - 814.41max) MB/s -86%
4k q32 t16 write
Schenker XMG Neo 16 M26 Mini-LED
Samsung 9100 Pro 2 TB
4817 (4762.59min - 4816.59max) MB/s
Alienware 16 Area-51 Core Ultra 9 290HX Plus
SK hynix PCB01 HFS001TFM9X186N
4595 (4538.14min - 4594.84max) MB/s -5%
HP Omen Max 16-ah1932nr
 
4435 (4416.36min - 4434.67max) MB/s -8%
Durchschnittliche Samsung 9100 Pro 2 TB
  (546 - 4821, n=6)
2812 MB/s -42%
Aorus Master 16 AM6J
Samsung PM9C1b MZVL81T0HFLB-00BTW
2590 (2147.15min - 2589.9max) MB/s -46%
Durchschnitt der Klasse Gaming
  (284 - 5653, n=104, der letzten 2 Jahre)
1888 MB/s -61%
Schenker XMG Neo 16 A25 5090
Kingston Fury Renegade SFYRS1000G
618 (609.25min - 617.87max) MB/s -87%
Schenker XMG Neo 16 E25 RTX 5090 Laptop
Samsung 9100 Pro 1 TB
544 (523.14min - 543.91max) MB/s -89%
MSI Raider 16 Max HX B2WJ
Micron 2500 1TB MTFDKBA1T0QGN
514 (510.53min - 514.33max) MB/s -89%
AS SSD
Score Total
Alienware 16 Area-51 Core Ultra 9 290HX Plus
SK hynix PCB01 HFS001TFM9X186N
14159 Points +15%
Schenker XMG Neo 16 M26 Mini-LED
Samsung 9100 Pro 2 TB
12263 Points
HP Omen Max 16-ah1932nr
 
12210 Points 0%
Durchschnittliche Samsung 9100 Pro 2 TB
  (8053 - 12475, n=5)
10294 Points -16%
Aorus Master 16 AM6J
Samsung PM9C1b MZVL81T0HFLB-00BTW
9344 Points -24%
Schenker XMG Neo 16 E25 RTX 5090 Laptop
Samsung 9100 Pro 1 TB
8857 Points -28%
Schenker XMG Neo 16 A25 5090
Kingston Fury Renegade SFYRS1000G
8146 Points -34%
MSI Raider 16 Max HX B2WJ
Micron 2500 1TB MTFDKBA1T0QGN
7364 Points -40%
Durchschnitt der Klasse Gaming
  (2660 - 14159, n=102, der letzten 2 Jahre)
6909 Points -44%
Score Read
Alienware 16 Area-51 Core Ultra 9 290HX Plus
SK hynix PCB01 HFS001TFM9X186N
5082 Points +14%
HP Omen Max 16-ah1932nr
 
4625 Points +4%
Schenker XMG Neo 16 M26 Mini-LED
Samsung 9100 Pro 2 TB
4450 Points
Aorus Master 16 AM6J
Samsung PM9C1b MZVL81T0HFLB-00BTW
3427 Points -23%
Durchschnittliche Samsung 9100 Pro 2 TB
  (2009 - 4450, n=5)
3423 Points -23%
Durchschnitt der Klasse Gaming
  (953 - 5082, n=102, der letzten 2 Jahre)
2299 Points -48%
Schenker XMG Neo 16 E25 RTX 5090 Laptop
Samsung 9100 Pro 1 TB
2056 Points -54%
Schenker XMG Neo 16 A25 5090
Kingston Fury Renegade SFYRS1000G
1869 Points -58%
MSI Raider 16 Max HX B2WJ
Micron 2500 1TB MTFDKBA1T0QGN
1668 Points -63%
Score Write
Alienware 16 Area-51 Core Ultra 9 290HX Plus
SK hynix PCB01 HFS001TFM9X186N
6457 Points +12%
Schenker XMG Neo 16 E25 RTX 5090 Laptop
Samsung 9100 Pro 1 TB
5936 Points +3%
Schenker XMG Neo 16 M26 Mini-LED
Samsung 9100 Pro 2 TB
5789 Points
Schenker XMG Neo 16 A25 5090
Kingston Fury Renegade SFYRS1000G
5482 Points -5%
HP Omen Max 16-ah1932nr
 
5404 Points -7%
Durchschnittliche Samsung 9100 Pro 2 TB
  (4404 - 6045, n=5)
5312 Points -8%
MSI Raider 16 Max HX B2WJ
Micron 2500 1TB MTFDKBA1T0QGN
4919 Points -15%
Aorus Master 16 AM6J
Samsung PM9C1b MZVL81T0HFLB-00BTW
4249 Points -27%
Durchschnitt der Klasse Gaming
  (460 - 6457, n=102, der letzten 2 Jahre)
3517 Points -39%
Seq Read
Schenker XMG Neo 16 M26 Mini-LED
Samsung 9100 Pro 2 TB
10367 MB/s
Durchschnittliche Samsung 9100 Pro 2 TB
  (9538 - 10494, n=5)
10136 MB/s -2%
Alienware 16 Area-51 Core Ultra 9 290HX Plus
SK hynix PCB01 HFS001TFM9X186N
10090.72 MB/s -3%
Schenker XMG Neo 16 E25 RTX 5090 Laptop
Samsung 9100 Pro 1 TB
9653 MB/s -7%
Schenker XMG Neo 16 A25 5090
Kingston Fury Renegade SFYRS1000G
9484 MB/s -9%
HP Omen Max 16-ah1932nr
 
9008.39 MB/s -13%
Aorus Master 16 AM6J
Samsung PM9C1b MZVL81T0HFLB-00BTW
5721.12 MB/s -45%
Durchschnitt der Klasse Gaming
  (2346 - 10367, n=102, der letzten 2 Jahre)
5694 MB/s -45%
MSI Raider 16 Max HX B2WJ
Micron 2500 1TB MTFDKBA1T0QGN
5350.7 MB/s -48%
Seq Write
Alienware 16 Area-51 Core Ultra 9 290HX Plus
SK hynix PCB01 HFS001TFM9X186N
10725.9 MB/s +93%
Durchschnittliche Samsung 9100 Pro 2 TB
  (5382 - 9495, n=5)
6328 MB/s +14%
Schenker XMG Neo 16 A25 5090
Kingston Fury Renegade SFYRS1000G
6039 MB/s +9%
Schenker XMG Neo 16 M26 Mini-LED
Samsung 9100 Pro 2 TB
5565 MB/s
Schenker XMG Neo 16 E25 RTX 5090 Laptop
Samsung 9100 Pro 1 TB
5562 MB/s 0%
HP Omen Max 16-ah1932nr
 
5491.08 MB/s -1%
Aorus Master 16 AM6J
Samsung PM9C1b MZVL81T0HFLB-00BTW
4108.74 MB/s -26%
Durchschnitt der Klasse Gaming
  (114.5 - 10726, n=102, der letzten 2 Jahre)
3894 MB/s -30%
MSI Raider 16 Max HX B2WJ
Micron 2500 1TB MTFDKBA1T0QGN
3554.54 MB/s -36%
4K Read
Alienware 16 Area-51 Core Ultra 9 290HX Plus
SK hynix PCB01 HFS001TFM9X186N
95.48 MB/s +23%
HP Omen Max 16-ah1932nr
 
86.96 MB/s +12%
Schenker XMG Neo 16 E25 RTX 5090 Laptop
Samsung 9100 Pro 1 TB
81.6 MB/s +5%
Schenker XMG Neo 16 M26 Mini-LED
Samsung 9100 Pro 2 TB
77.9 MB/s
Durchschnittliche Samsung 9100 Pro 2 TB
  (66.6 - 80.9, n=5)
76.5 MB/s -2%
Aorus Master 16 AM6J
Samsung PM9C1b MZVL81T0HFLB-00BTW
70.8 MB/s -9%
Durchschnitt der Klasse Gaming
  (36.4 - 108.4, n=102, der letzten 2 Jahre)
70.5 MB/s -9%
Schenker XMG Neo 16 A25 5090
Kingston Fury Renegade SFYRS1000G
66.4 MB/s -15%
MSI Raider 16 Max HX B2WJ
Micron 2500 1TB MTFDKBA1T0QGN
66.05 MB/s -15%
4K Write
Alienware 16 Area-51 Core Ultra 9 290HX Plus
SK hynix PCB01 HFS001TFM9X186N
244.41 MB/s +8%
Schenker XMG Neo 16 E25 RTX 5090 Laptop
Samsung 9100 Pro 1 TB
226 MB/s 0%
Schenker XMG Neo 16 M26 Mini-LED
Samsung 9100 Pro 2 TB
226 MB/s
Schenker XMG Neo 16 A25 5090
Kingston Fury Renegade SFYRS1000G
225 MB/s 0%
Durchschnittliche Samsung 9100 Pro 2 TB
  (197.5 - 230, n=5)
216 MB/s -4%
MSI Raider 16 Max HX B2WJ
Micron 2500 1TB MTFDKBA1T0QGN
215.95 MB/s -4%
HP Omen Max 16-ah1932nr
 
214.67 MB/s -5%
Durchschnitt der Klasse Gaming
  (75.6 - 307, n=102, der letzten 2 Jahre)
213 MB/s -6%
Aorus Master 16 AM6J
Samsung PM9C1b MZVL81T0HFLB-00BTW
206.42 MB/s -9%
4K-64 Read
Alienware 16 Area-51 Core Ultra 9 290HX Plus
SK hynix PCB01 HFS001TFM9X186N
3977.11 MB/s +19%
HP Omen Max 16-ah1932nr
 
3637.5 MB/s +9%
Schenker XMG Neo 16 M26 Mini-LED
Samsung 9100 Pro 2 TB
3335 MB/s
Aorus Master 16 AM6J
Samsung PM9C1b MZVL81T0HFLB-00BTW
2784.09 MB/s -17%
Durchschnittliche Samsung 9100 Pro 2 TB
  (975 - 3335, n=5)
2333 MB/s -30%
Durchschnitt der Klasse Gaming
  (517 - 3977, n=102, der letzten 2 Jahre)
1659 MB/s -50%
MSI Raider 16 Max HX B2WJ
Micron 2500 1TB MTFDKBA1T0QGN
1066.55 MB/s -68%
Schenker XMG Neo 16 E25 RTX 5090 Laptop
Samsung 9100 Pro 1 TB
1010 MB/s -70%
Schenker XMG Neo 16 A25 5090
Kingston Fury Renegade SFYRS1000G
854 MB/s -74%
4K-64 Write
Schenker XMG Neo 16 E25 RTX 5090 Laptop
Samsung 9100 Pro 1 TB
5155 MB/s +3%
Alienware 16 Area-51 Core Ultra 9 290HX Plus
SK hynix PCB01 HFS001TFM9X186N
5139.71 MB/s +3%
Schenker XMG Neo 16 M26 Mini-LED
Samsung 9100 Pro 2 TB
5006 MB/s
Schenker XMG Neo 16 A25 5090
Kingston Fury Renegade SFYRS1000G
4653 MB/s -7%
HP Omen Max 16-ah1932nr
 
4640.51 MB/s -7%
Durchschnittliche Samsung 9100 Pro 2 TB
  (3256 - 5260, n=5)
4463 MB/s -11%
MSI Raider 16 Max HX B2WJ
Micron 2500 1TB MTFDKBA1T0QGN
4347.83 MB/s -13%
Aorus Master 16 AM6J
Samsung PM9C1b MZVL81T0HFLB-00BTW
3631.52 MB/s -27%
Durchschnitt der Klasse Gaming
  (90.2 - 5356, n=102, der letzten 2 Jahre)
2915 MB/s -42%
Access Time Read
Aorus Master 16 AM6J
Samsung PM9C1b MZVL81T0HFLB-00BTW
0.068 ms * -79%
Durchschnitt der Klasse Gaming
  (0.017 - 0.623, n=102, der letzten 2 Jahre)
0.06763 ms * -78%
MSI Raider 16 Max HX B2WJ
Micron 2500 1TB MTFDKBA1T0QGN
0.065 ms * -71%
Schenker XMG Neo 16 E25 RTX 5090 Laptop
Samsung 9100 Pro 1 TB
0.052 ms * -37%
Schenker XMG Neo 16 M26 Mini-LED
Samsung 9100 Pro 2 TB
0.038 ms *
Alienware 16 Area-51 Core Ultra 9 290HX Plus
SK hynix PCB01 HFS001TFM9X186N
0.032 ms * +16%
Durchschnittliche Samsung 9100 Pro 2 TB
  (0.017 - 0.041, n=5)
0.0268 ms * +29%
Schenker XMG Neo 16 A25 5090
Kingston Fury Renegade SFYRS1000G
0.024 ms * +37%
HP Omen Max 16-ah1932nr
 
0.023 ms * +39%
Access Time Write
HP Omen Max 16-ah1932nr
 
0.049 ms * -172%
MSI Raider 16 Max HX B2WJ
Micron 2500 1TB MTFDKBA1T0QGN
0.048 ms * -167%
Alienware 16 Area-51 Core Ultra 9 290HX Plus
SK hynix PCB01 HFS001TFM9X186N
0.046 ms * -156%
Durchschnitt der Klasse Gaming
  (0.012 - 0.277, n=102, der letzten 2 Jahre)
0.04195 ms * -133%
Aorus Master 16 AM6J
Samsung PM9C1b MZVL81T0HFLB-00BTW
0.021 ms * -17%
Schenker XMG Neo 16 M26 Mini-LED
Samsung 9100 Pro 2 TB
0.018 ms *
Durchschnittliche Samsung 9100 Pro 2 TB
  (0.017 - 0.019, n=5)
0.018 ms * -0%
Schenker XMG Neo 16 E25 RTX 5090 Laptop
Samsung 9100 Pro 1 TB
0.017 ms * +6%
Schenker XMG Neo 16 A25 5090
Kingston Fury Renegade SFYRS1000G
0.017 ms * +6%

* ... kleinere Werte sind besser

Dauerleistung Lesen: DiskSpd Read Loop, Queue Depth 8

02905808701160145017402030232026102900319034803770406043504640493052205510580060906380667069607250754078308120841087008990928095709860101501044010730110201131011600118901218012470127601305013340136301392014210Tooltip
Schenker XMG Neo 16 M26 Mini-LED Samsung 9100 Pro 2 TB; diskspd 2.0.17 f: Ø14178 (11023.65-14237.56) MB/s
HP Omen Max 16-ah1932nr  ; diskspd 2.0.17 f: Ø12217 (7555.2-12331.76) MB/s
MSI Raider 16 Max HX B2WJ Micron 2500 1TB MTFDKBA1T0QGN; diskspd 2.0.17 f: Ø6919 (5755.42-6966.11) MB/s
Aorus Master 16 AM6J Samsung PM9C1b MZVL81T0HFLB-00BTW; diskspd 2.0.17 f: Ø5357 (5165.5-5625.19) MB/s
Alienware 16 Area-51 Core Ultra 9 290HX Plus SK hynix PCB01 HFS001TFM9X186N; diskspd 2.0.17 f: Ø13749 (11803.28-13797.67) MB/s
Schenker XMG Neo 16 A25 5090 Kingston Fury Renegade SFYRS1000G; diskspd 2.0.17 f: Ø14274 (12676.44-14430.92) MB/s

GPU und Gaming Performance

Als Grafikkarte steht nach wie vor maximal die GeForce RTX 5090 mit 24 GB VRAM zur Verfügung, die auch in unserem Testgerät verbaut ist. Da sich die maximale TGP von 175 Watt nicht verändert hat, ist die Leistung insgesamt auch gleichgeblieben. Die Leistungsunterschiede der Vergleichsgeräte sind eher auf die verschiedenen Treiberversionen zum jeweiligen Testzeitpunkt zurückzuführen, insgesamt ist das Leistungsniveau bei den High-End-Gamern sehr vergleichbar.

3DMark Performance Rating - Percent
Schenker XMG Neo 16 E25 RTX 5090 Laptop
NVIDIA GeForce RTX 5090 Laptop, Intel Core Ultra 9 275HX
94.8 pt
Schenker XMG Neo 16 M26 Mini-LED
NVIDIA GeForce RTX 5090 Laptop, Intel Core Ultra 9 290HX Plus
94.6 pt
Schenker XMG Neo 16 A25 5090 -1!
NVIDIA GeForce RTX 5090 Laptop, AMD Ryzen 9 9955HX3D
94.5 pt
MSI Raider 16 Max HX B2WJ -1!
NVIDIA GeForce RTX 5090 Laptop, Intel Core Ultra 9 290HX Plus
90.2 pt
Durchschnittliche NVIDIA GeForce RTX 5090 Laptop
 
89.4 pt
HP Omen Max 16-ah1932nr -1!
NVIDIA GeForce RTX 5090 Laptop, Intel Core Ultra 9 290HX Plus
79.6 pt
Aorus Master 16 AM6J -2!
NVIDIA GeForce RTX 5080 Laptop, AMD Ryzen 9 9955HX3D
76.7 pt
Alienware 16 Area-51 Core Ultra 9 290HX Plus -1!
NVIDIA GeForce RTX 5080 Laptop, Intel Core Ultra 9 290HX Plus
69.6 pt
Durchschnitt der Klasse Gaming
 
66.4 pt
3DMark 11 - 1280x720 Performance GPU
Schenker XMG Neo 16 M26 Mini-LED
NVIDIA GeForce RTX 5090 Laptop, Intel Core Ultra 9 290HX Plus
77047 Points
MSI Raider 16 Max HX B2WJ
NVIDIA GeForce RTX 5090 Laptop, Intel Core Ultra 9 290HX Plus
75158 Points -2%
Schenker XMG Neo 16 E25 RTX 5090 Laptop
NVIDIA GeForce RTX 5090 Laptop, Intel Core Ultra 9 275HX
73596 Points -4%
Schenker XMG Neo 16 A25 5090
NVIDIA GeForce RTX 5090 Laptop, AMD Ryzen 9 9955HX3D
69089 Points -10%
Durchschnittliche NVIDIA GeForce RTX 5090 Laptop
  (26378 - 80022, n=26)
65457 Points -15%
Aorus Master 16 AM6J
NVIDIA GeForce RTX 5080 Laptop, AMD Ryzen 9 9955HX3D
61571 Points -20%
Durchschnitt der Klasse Gaming
  (21841 - 80022, n=107, der letzten 2 Jahre)
50413 Points -35%
HP Omen Max 16-ah1932nr
NVIDIA GeForce RTX 5090 Laptop, Intel Core Ultra 9 290HX Plus
27814 Points -64%
Alienware 16 Area-51 Core Ultra 9 290HX Plus
NVIDIA GeForce RTX 5080 Laptop, Intel Core Ultra 9 290HX Plus
26017 Points -66%
3DMark
1920x1080 Fire Strike Graphics
Schenker XMG Neo 16 A25 5090
NVIDIA GeForce RTX 5090 Laptop, AMD Ryzen 9 9955HX3D
62849 Points +25%
Schenker XMG Neo 16 E25 RTX 5090 Laptop
NVIDIA GeForce RTX 5090 Laptop, Intel Core Ultra 9 275HX
54791 Points +9%
Durchschnittliche NVIDIA GeForce RTX 5090 Laptop
  (42175 - 62849, n=32)
51748 Points +3%
HP Omen Max 16-ah1932nr
NVIDIA GeForce RTX 5090 Laptop, Intel Core Ultra 9 290HX Plus
51707 Points +3%
MSI Raider 16 Max HX B2WJ
NVIDIA GeForce RTX 5090 Laptop, Intel Core Ultra 9 290HX Plus
51545 Points +3%
Schenker XMG Neo 16 M26 Mini-LED
NVIDIA GeForce RTX 5090 Laptop, Intel Core Ultra 9 290HX Plus
50099 Points
Alienware 16 Area-51 Core Ultra 9 290HX Plus
NVIDIA GeForce RTX 5080 Laptop, Intel Core Ultra 9 290HX Plus
48214 Points -4%
Aorus Master 16 AM6J
NVIDIA GeForce RTX 5080 Laptop, AMD Ryzen 9 9955HX3D
46816 Points -7%
Durchschnitt der Klasse Gaming
  (18629 - 62849, n=115, der letzten 2 Jahre)
39953 Points -20%
2560x1440 Time Spy Graphics
HP Omen Max 16-ah1932nr
NVIDIA GeForce RTX 5090 Laptop, Intel Core Ultra 9 290HX Plus
25953 Points +4%
Schenker XMG Neo 16 E25 RTX 5090 Laptop
NVIDIA GeForce RTX 5090 Laptop, Intel Core Ultra 9 275HX
25040 Points +1%
Schenker XMG Neo 16 M26 Mini-LED
NVIDIA GeForce RTX 5090 Laptop, Intel Core Ultra 9 290HX Plus
24894 Points
Schenker XMG Neo 16 A25 5090
NVIDIA GeForce RTX 5090 Laptop, AMD Ryzen 9 9955HX3D
24483 Points -2%
Durchschnittliche NVIDIA GeForce RTX 5090 Laptop
  (19216 - 26212, n=30)
23952 Points -4%
MSI Raider 16 Max HX B2WJ
NVIDIA GeForce RTX 5090 Laptop, Intel Core Ultra 9 290HX Plus
23905 Points -4%
Alienware 16 Area-51 Core Ultra 9 290HX Plus
NVIDIA GeForce RTX 5080 Laptop, Intel Core Ultra 9 290HX Plus
22247 Points -11%
Aorus Master 16 AM6J
NVIDIA GeForce RTX 5080 Laptop, AMD Ryzen 9 9955HX3D
19673 Points -21%
Durchschnitt der Klasse Gaming
  (6387 - 26212, n=115, der letzten 2 Jahre)
16297 Points -35%
Steel Nomad Score
HP Omen Max 16-ah1932nr
NVIDIA GeForce RTX 5090 Laptop, Intel Core Ultra 9 290HX Plus
6413 Points +3%
Schenker XMG Neo 16 M26 Mini-LED
NVIDIA GeForce RTX 5090 Laptop, Intel Core Ultra 9 290HX Plus
6250 Points
Schenker XMG Neo 16 E25 RTX 5090 Laptop
NVIDIA GeForce RTX 5090 Laptop, Intel Core Ultra 9 275HX
6151 Points -2%
Schenker XMG Neo 16 A25 5090
NVIDIA GeForce RTX 5090 Laptop, AMD Ryzen 9 9955HX3D
6029 Points -4%
Durchschnittliche NVIDIA GeForce RTX 5090 Laptop
  (4791 - 6500, n=27)
6001 Points -4%
MSI Raider 16 Max HX B2WJ
NVIDIA GeForce RTX 5090 Laptop, Intel Core Ultra 9 290HX Plus
5710 Points -9%
Alienware 16 Area-51 Core Ultra 9 290HX Plus
NVIDIA GeForce RTX 5080 Laptop, Intel Core Ultra 9 290HX Plus
5265 Points -16%
Durchschnitt der Klasse Gaming
  (2176 - 6500, n=65, der letzten 2 Jahre)
4421 Points -29%
Steel Nomad Light Score
Schenker XMG Neo 16 M26 Mini-LED
NVIDIA GeForce RTX 5090 Laptop, Intel Core Ultra 9 290HX Plus
26276 Points
Schenker XMG Neo 16 E25 RTX 5090 Laptop
NVIDIA GeForce RTX 5090 Laptop, Intel Core Ultra 9 275HX
25981 Points -1%
Durchschnittliche NVIDIA GeForce RTX 5090 Laptop
  (18624 - 27244, n=12)
24621 Points -6%
Durchschnitt der Klasse Gaming
  (11847 - 27227, n=29, der letzten 2 Jahre)
18699 Points -29%
3DMark 11 Performance
54162 Punkte
3DMark Fire Strike Score
39963 Punkte
3DMark Time Spy Score
23362 Punkte
3DMark Steel Nomad Score
6250 Punkte
3DMark Steel Nomad Light Score
26276 Punkte
Hilfe
Blender / v3.3 Classroom OPTIX/RTX
Durchschnitt der Klasse Gaming
  (9 - 32, n=106, der letzten 2 Jahre)
17.8 Seconds * -78%
Aorus Master 16 AM6J
NVIDIA GeForce RTX 5080 Laptop, AMD Ryzen 9 9955HX3D
14 Seconds * -40%
Durchschnittliche NVIDIA GeForce RTX 5090 Laptop
  (9 - 18, n=25)
11.7 Seconds * -17%
Schenker XMG Neo 16 E25 RTX 5090 Laptop
NVIDIA GeForce RTX 5090 Laptop, Intel Core Ultra 9 275HX
11.47 Seconds * -15%
Alienware 16 Area-51 Core Ultra 9 290HX Plus
NVIDIA GeForce RTX 5080 Laptop, Intel Core Ultra 9 290HX Plus
11 Seconds * -10%
HP Omen Max 16-ah1932nr
NVIDIA GeForce RTX 5090 Laptop, Intel Core Ultra 9 290HX Plus
11 Seconds * -10%
MSI Raider 16 Max HX B2WJ
NVIDIA GeForce RTX 5090 Laptop, Intel Core Ultra 9 290HX Plus
10 Seconds * -0%
Schenker XMG Neo 16 M26 Mini-LED
NVIDIA GeForce RTX 5090 Laptop, Intel Core Ultra 9 290HX Plus
10 Seconds *
Schenker XMG Neo 16 A25 5090
NVIDIA GeForce RTX 5090 Laptop, AMD Ryzen 9 9955HX3D
9 Seconds * +10%
Blender / v3.3 Classroom CUDA
Durchschnitt der Klasse Gaming
  (15 - 228, n=107, der letzten 2 Jahre)
31.5 Seconds * -110%
Aorus Master 16 AM6J
NVIDIA GeForce RTX 5080 Laptop, AMD Ryzen 9 9955HX3D
22 Seconds * -47%
Alienware 16 Area-51 Core Ultra 9 290HX Plus
NVIDIA GeForce RTX 5080 Laptop, Intel Core Ultra 9 290HX Plus
19 Seconds * -27%
Durchschnittliche NVIDIA GeForce RTX 5090 Laptop
  (15 - 37, n=24)
17.4 Seconds * -16%
MSI Raider 16 Max HX B2WJ
NVIDIA GeForce RTX 5090 Laptop, Intel Core Ultra 9 290HX Plus
17 Seconds * -13%
Schenker XMG Neo 16 E25 RTX 5090 Laptop
NVIDIA GeForce RTX 5090 Laptop, Intel Core Ultra 9 275HX
16.04 Seconds * -7%
HP Omen Max 16-ah1932nr
NVIDIA GeForce RTX 5090 Laptop, Intel Core Ultra 9 290HX Plus
16 Seconds * -7%
Schenker XMG Neo 16 A25 5090
NVIDIA GeForce RTX 5090 Laptop, AMD Ryzen 9 9955HX3D
15 Seconds * -0%
Schenker XMG Neo 16 M26 Mini-LED
NVIDIA GeForce RTX 5090 Laptop, Intel Core Ultra 9 290HX Plus
15 Seconds *
Blender / v3.3 Classroom CPU
Durchschnitt der Klasse Gaming
  (122 - 565, n=103, der letzten 2 Jahre)
235 Seconds * -77%
Durchschnittliche NVIDIA GeForce RTX 5090 Laptop
  (123 - 282, n=25)
162.4 Seconds * -22%
HP Omen Max 16-ah1932nr
NVIDIA GeForce RTX 5090 Laptop, Intel Core Ultra 9 290HX Plus
147 Seconds * -11%
Alienware 16 Area-51 Core Ultra 9 290HX Plus
NVIDIA GeForce RTX 5080 Laptop, Intel Core Ultra 9 290HX Plus
137 Seconds * -3%
Schenker XMG Neo 16 E25 RTX 5090 Laptop
NVIDIA GeForce RTX 5090 Laptop, Intel Core Ultra 9 275HX
134 Seconds * -1%
MSI Raider 16 Max HX B2WJ
NVIDIA GeForce RTX 5090 Laptop, Intel Core Ultra 9 290HX Plus
134 Seconds * -1%
Schenker XMG Neo 16 M26 Mini-LED
NVIDIA GeForce RTX 5090 Laptop, Intel Core Ultra 9 290HX Plus
133 Seconds *
Aorus Master 16 AM6J
NVIDIA GeForce RTX 5080 Laptop, AMD Ryzen 9 9955HX3D
124 Seconds * +7%
Schenker XMG Neo 16 A25 5090
NVIDIA GeForce RTX 5090 Laptop, AMD Ryzen 9 9955HX3D
123 Seconds * +8%

* ... kleinere Werte sind besser

Performance Rating - Percent
Schenker XMG Neo 16 A25 5090
AMD Ryzen 9 9955HX3D, NVIDIA GeForce RTX 5090 Laptop
97.1 pt
HP Omen Max 16-ah1932nr
Intel Core Ultra 9 290HX Plus, NVIDIA GeForce RTX 5090 Laptop
90.9 pt
Aorus Master 16 AM6J -3!
AMD Ryzen 9 9955HX3D, NVIDIA GeForce RTX 5080 Laptop
90.5 pt
Schenker XMG Neo 16 M26 Mini-LED
Intel Core Ultra 9 290HX Plus, NVIDIA GeForce RTX 5090 Laptop
89.1 pt
Schenker XMG Neo 16 E25 RTX 5090 Laptop
Intel Core Ultra 9 275HX, NVIDIA GeForce RTX 5090 Laptop
87.7 pt
MSI Raider 16 Max HX B2WJ
Intel Core Ultra 9 290HX Plus, NVIDIA GeForce RTX 5090 Laptop
87.6 pt
Alienware 16 Area-51 Core Ultra 9 290HX Plus -1!
Intel Core Ultra 9 290HX Plus, NVIDIA GeForce RTX 5080 Laptop
87.3 pt
Durchschnitt der Klasse Gaming
 
67.4 pt
Cyberpunk 2077 - 1920x1080 Ultra Preset (FSR off)
HP Omen Max 16-ah1932nr
Intel Core Ultra 9 290HX Plus, NVIDIA GeForce RTX 5090 Laptop
166.3 (124.6min, 113.6P1) fps +4%
Schenker XMG Neo 16 A25 5090
AMD Ryzen 9 9955HX3D, NVIDIA GeForce RTX 5090 Laptop
164 (130.9min) fps +3%
MSI Raider 16 Max HX B2WJ
Intel Core Ultra 9 290HX Plus, NVIDIA GeForce RTX 5090 Laptop
161.7 (129.1min, 117.6P1) fps +1%
Schenker XMG Neo 16 M26 Mini-LED
Intel Core Ultra 9 290HX Plus, NVIDIA GeForce RTX 5090 Laptop
159.8 (125.5min) fps
Schenker XMG Neo 16 E25 RTX 5090 Laptop
Intel Core Ultra 9 275HX, NVIDIA GeForce RTX 5090 Laptop
154.8 (123.7min) fps -3%
Alienware 16 Area-51 Core Ultra 9 290HX Plus
Intel Core Ultra 9 290HX Plus, NVIDIA GeForce RTX 5080 Laptop
153.3 (121.2min, 109.6P1) fps -4%
Aorus Master 16 AM6J
AMD Ryzen 9 9955HX3D, NVIDIA GeForce RTX 5080 Laptop
144.5 (116min) fps -10%
Durchschnitt der Klasse Gaming
  (47.3 - 169.9, n=115, der letzten 2 Jahre)
112.9 fps -29%
Baldur's Gate 3 - 1920x1080 Ultra Preset AA:T
HP Omen Max 16-ah1932nr
Intel Core Ultra 9 290HX Plus, NVIDIA GeForce RTX 5090 Laptop
233 (109.5min, 153.7P0.1, 194.5P1) fps +7%
Schenker XMG Neo 16 A25 5090
AMD Ryzen 9 9955HX3D, NVIDIA GeForce RTX 5090 Laptop
218.8 fps +1%
Schenker XMG Neo 16 M26 Mini-LED
Intel Core Ultra 9 290HX Plus, NVIDIA GeForce RTX 5090 Laptop
217 (65.6min, 155.9P0.1, 180.2P1) fps
MSI Raider 16 Max HX B2WJ
Intel Core Ultra 9 290HX Plus, NVIDIA GeForce RTX 5090 Laptop
207 (162.3min, 172.9P0.1, 177.2P1) fps -5%
Schenker XMG Neo 16 E25 RTX 5090 Laptop
Intel Core Ultra 9 275HX, NVIDIA GeForce RTX 5090 Laptop
201 fps -7%
Aorus Master 16 AM6J
AMD Ryzen 9 9955HX3D, NVIDIA GeForce RTX 5080 Laptop
175 (65min) fps -19%
Durchschnitt der Klasse Gaming
  (59.4 - 246, n=111, der letzten 2 Jahre)
142.9 fps -34%
GTA V - 1920x1080 Highest AA:4xMSAA + FX AF:16x
Schenker XMG Neo 16 A25 5090
AMD Ryzen 9 9955HX3D, NVIDIA GeForce RTX 5090 Laptop
186.9 (2.62min, 166.7P1) fps +12%
Alienware 16 Area-51 Core Ultra 9 290HX Plus
Intel Core Ultra 9 290HX Plus, NVIDIA GeForce RTX 5080 Laptop
168.1 (3.31min, 111.1P1) fps +1%
Schenker XMG Neo 16 M26 Mini-LED
Intel Core Ultra 9 290HX Plus, NVIDIA GeForce RTX 5090 Laptop
166.5 (3.69min, 111.1P1) fps
MSI Raider 16 Max HX B2WJ
Intel Core Ultra 9 290HX Plus, NVIDIA GeForce RTX 5090 Laptop
165.2 (5.71min, 125P1) fps -1%
Schenker XMG Neo 16 E25 RTX 5090 Laptop
Intel Core Ultra 9 275HX, NVIDIA GeForce RTX 5090 Laptop
164.1 (3.7min, 100P1) fps -1%
HP Omen Max 16-ah1932nr
Intel Core Ultra 9 290HX Plus, NVIDIA GeForce RTX 5090 Laptop
162.6 (2.43min, 125P1) fps -2%
Durchschnitt der Klasse Gaming
  (67.1 - 186.9, n=92, der letzten 2 Jahre)
136.5 fps -18%
Final Fantasy XV Benchmark - 1920x1080 High Quality
HP Omen Max 16-ah1932nr
Intel Core Ultra 9 290HX Plus, NVIDIA GeForce RTX 5090 Laptop
210 fps +8%
Schenker XMG Neo 16 A25 5090
AMD Ryzen 9 9955HX3D, NVIDIA GeForce RTX 5090 Laptop
208 fps +7%
MSI Raider 16 Max HX B2WJ
Intel Core Ultra 9 290HX Plus, NVIDIA GeForce RTX 5090 Laptop
205 fps +6%
Schenker XMG Neo 16 E25 RTX 5090 Laptop
Intel Core Ultra 9 275HX, NVIDIA GeForce RTX 5090 Laptop
203 fps +5%
Alienware 16 Area-51 Core Ultra 9 290HX Plus
Intel Core Ultra 9 290HX Plus, NVIDIA GeForce RTX 5080 Laptop
201 fps +4%
Schenker XMG Neo 16 M26 Mini-LED
Intel Core Ultra 9 290HX Plus, NVIDIA GeForce RTX 5090 Laptop
193.8 fps
Durchschnitt der Klasse Gaming
  (64.2 - 215, n=93, der letzten 2 Jahre)
155.1 fps -20%
Strange Brigade - 1920x1080 ultra AA:ultra AF:16
Schenker XMG Neo 16 A25 5090
AMD Ryzen 9 9955HX3D, NVIDIA GeForce RTX 5090 Laptop
453.1 fps +4%
HP Omen Max 16-ah1932nr
Intel Core Ultra 9 290HX Plus, NVIDIA GeForce RTX 5090 Laptop
447 (84.9min, 322P1) fps +3%
Schenker XMG Neo 16 E25 RTX 5090 Laptop
Intel Core Ultra 9 275HX, NVIDIA GeForce RTX 5090 Laptop
434 (79.1min, 306P1) fps 0%
Schenker XMG Neo 16 M26 Mini-LED
Intel Core Ultra 9 290HX Plus, NVIDIA GeForce RTX 5090 Laptop
434 fps
MSI Raider 16 Max HX B2WJ
Intel Core Ultra 9 290HX Plus, NVIDIA GeForce RTX 5090 Laptop
433 (198.8min, 313P1) fps 0%
Alienware 16 Area-51 Core Ultra 9 290HX Plus
Intel Core Ultra 9 290HX Plus, NVIDIA GeForce RTX 5080 Laptop
413 (96.6min, 299P1) fps -5%
Durchschnitt der Klasse Gaming
  (113.6 - 458, n=85, der letzten 2 Jahre)
301 fps -31%
Dota 2 Reborn - 1920x1080 ultra (3/3) best looking
Aorus Master 16 AM6J
AMD Ryzen 9 9955HX3D, NVIDIA GeForce RTX 5080 Laptop
252 (201.5min) fps +35%
Schenker XMG Neo 16 A25 5090
AMD Ryzen 9 9955HX3D, NVIDIA GeForce RTX 5090 Laptop
248 (195.9min) fps +32%
Schenker XMG Neo 16 M26 Mini-LED
Intel Core Ultra 9 290HX Plus, NVIDIA GeForce RTX 5090 Laptop
187.2 (158.4min) fps
HP Omen Max 16-ah1932nr
Intel Core Ultra 9 290HX Plus, NVIDIA GeForce RTX 5090 Laptop
186.9 (155.8min) fps 0%
Schenker XMG Neo 16 E25 RTX 5090 Laptop
Intel Core Ultra 9 275HX, NVIDIA GeForce RTX 5090 Laptop
185.6 (154.7min) fps -1%
MSI Raider 16 Max HX B2WJ
Intel Core Ultra 9 290HX Plus, NVIDIA GeForce RTX 5090 Laptop
176.1 (149.9min) fps -6%
Alienware 16 Area-51 Core Ultra 9 290HX Plus
Intel Core Ultra 9 290HX Plus, NVIDIA GeForce RTX 5080 Laptop
170.9 (144.5min) fps -9%
Durchschnitt der Klasse Gaming
  (84.8 - 252, n=108, der letzten 2 Jahre)
157.2 fps -16%
X-Plane 11.11 - 1920x1080 high (fps_test=3)
Aorus Master 16 AM6J
AMD Ryzen 9 9955HX3D, NVIDIA GeForce RTX 5080 Laptop
148.5 fps +21%
Schenker XMG Neo 16 A25 5090
AMD Ryzen 9 9955HX3D, NVIDIA GeForce RTX 5090 Laptop
133.6 fps +9%
Alienware 16 Area-51 Core Ultra 9 290HX Plus
Intel Core Ultra 9 290HX Plus, NVIDIA GeForce RTX 5080 Laptop
129.5 fps +5%
Schenker XMG Neo 16 M26 Mini-LED
Intel Core Ultra 9 290HX Plus, NVIDIA GeForce RTX 5090 Laptop
123 fps
Schenker XMG Neo 16 E25 RTX 5090 Laptop
Intel Core Ultra 9 275HX, NVIDIA GeForce RTX 5090 Laptop
119.5 fps -3%
HP Omen Max 16-ah1932nr
Intel Core Ultra 9 290HX Plus, NVIDIA GeForce RTX 5090 Laptop
113.9 fps -7%
MSI Raider 16 Max HX B2WJ
Intel Core Ultra 9 290HX Plus, NVIDIA GeForce RTX 5090 Laptop
112.6 fps -8%
Durchschnitt der Klasse Gaming
  (55.5 - 148.5, n=110, der letzten 2 Jahre)
99.7 fps -19%
Cyberpunk 2077
2560x1440 Ultra Preset (FSR off)
HP Omen Max 16-ah1932nr
Intel Core Ultra 9 290HX Plus, NVIDIA GeForce RTX 5090 Laptop
119.7 (100.3min, 95P1) fps +2%
Schenker XMG Neo 16 M26 Mini-LED
Intel Core Ultra 9 290HX Plus, NVIDIA GeForce RTX 5090 Laptop
117.4 (96.8min) fps
Schenker XMG Neo 16 A25 5090
AMD Ryzen 9 9955HX3D, NVIDIA GeForce RTX 5090 Laptop
111.2 (91.6min) fps -5%
MSI Raider 16 Max HX B2WJ
Intel Core Ultra 9 290HX Plus, NVIDIA GeForce RTX 5090 Laptop
111.2 (92.2min, 88.8P1) fps -5%
Durchschnittliche NVIDIA GeForce RTX 5090 Laptop
  (83.2 - 122.8, n=31)
109.5 fps -7%
Schenker XMG Neo 16 E25 RTX 5090 Laptop
Intel Core Ultra 9 275HX, NVIDIA GeForce RTX 5090 Laptop
108.3 (91.2min) fps -8%
Alienware 16 Area-51 Core Ultra 9 290HX Plus
Intel Core Ultra 9 290HX Plus, NVIDIA GeForce RTX 5080 Laptop
101.7 (84.5min, 81.3P1) fps -13%
Aorus Master 16 AM6J
AMD Ryzen 9 9955HX3D, NVIDIA GeForce RTX 5080 Laptop
99.8 (84min) fps -15%
Durchschnitt der Klasse Gaming
  (42.3 - 122.8, n=92, der letzten 2 Jahre)
82.9 fps -29%
2560x1440 Ultra Preset DLSS4 quality no FG
HP Omen Max 16-ah1932nr
Intel Core Ultra 9 290HX Plus, NVIDIA GeForce RTX 5090 Laptop
134.6 (114.6min, 108.2P1) fps +3%
Schenker XMG Neo 16 M26 Mini-LED
Intel Core Ultra 9 290HX Plus, NVIDIA GeForce RTX 5090 Laptop
130.5 (112.3min) fps
MSI Raider 16 Max HX B2WJ
Intel Core Ultra 9 290HX Plus, NVIDIA GeForce RTX 5090 Laptop
122.7 (106.2min, 100.8P1) fps -6%
Durchschnittliche NVIDIA GeForce RTX 5090 Laptop
  (94.1 - 136.6, n=20)
121.6 fps -7%
Alienware 16 Area-51 Core Ultra 9 290HX Plus
Intel Core Ultra 9 290HX Plus, NVIDIA GeForce RTX 5080 Laptop
119.1 (102.2min, 97.5P1) fps -9%
Schenker XMG Neo 16 E25 RTX 5090 Laptop
Intel Core Ultra 9 275HX, NVIDIA GeForce RTX 5090 Laptop
119 (103.4min) fps -9%
Durchschnitt der Klasse Gaming
  (65 - 136.6, n=62, der letzten 2 Jahre)
95.3 fps -27%
Baldur's Gate 3 - 2560x1440 Ultra Preset AA:T
HP Omen Max 16-ah1932nr
Intel Core Ultra 9 290HX Plus, NVIDIA GeForce RTX 5090 Laptop
168.2 (141.3min, 147P0.1, 150.5P1) fps +3%
Schenker XMG Neo 16 M26 Mini-LED
Intel Core Ultra 9 290HX Plus, NVIDIA GeForce RTX 5090 Laptop
163.5 (142min, 146.4P0.1, 148.5P1) fps
Schenker XMG Neo 16 A25 5090
AMD Ryzen 9 9955HX3D, NVIDIA GeForce RTX 5090 Laptop
156.9 fps -4%
Durchschnittliche NVIDIA GeForce RTX 5090 Laptop
  (103.1 - 174.8, n=29)
148.7 fps -9%
MSI Raider 16 Max HX B2WJ
Intel Core Ultra 9 290HX Plus, NVIDIA GeForce RTX 5090 Laptop
147.7 (106.6min, 130.5P0.1, 135.4P1) fps -10%
Schenker XMG Neo 16 E25 RTX 5090 Laptop
Intel Core Ultra 9 275HX, NVIDIA GeForce RTX 5090 Laptop
146 fps -11%
Aorus Master 16 AM6J
AMD Ryzen 9 9955HX3D, NVIDIA GeForce RTX 5080 Laptop
123 (79min) fps -25%
Durchschnitt der Klasse Gaming
  (60 - 175.5, n=90, der letzten 2 Jahre)
112 fps -31%
F1 25
2560x1440 Ultra Max Preset AA:T AF:16x
Schenker XMG Neo 16 M26 Mini-LED
Intel Core Ultra 9 290HX Plus, NVIDIA GeForce RTX 5090 Laptop
39.9 (22min, 24P1) fps
Schenker XMG Neo 16 A25 5090
AMD Ryzen 9 9955HX3D, NVIDIA GeForce RTX 5090 Laptop
36.8 (21min, 22P1) fps -8%
Durchschnittliche NVIDIA GeForce RTX 5090 Laptop
  (30.2 - 39.9, n=11)
35.3 fps -12%
Durchschnitt der Klasse Gaming
  (5 - 39.9, n=28, der letzten 2 Jahre)
22.8 fps -43%
2560x1440 Ultra Max Preset + DLSS Quality AA:DLSS AF:16x
Schenker XMG Neo 16 M26 Mini-LED
Intel Core Ultra 9 290HX Plus, NVIDIA GeForce RTX 5090 Laptop
70.7 (41min, 48P1) fps
Durchschnittliche NVIDIA GeForce RTX 5090 Laptop
  (51.8 - 70.7, n=8)
61 fps -14%
Durchschnitt der Klasse Gaming
  (9 - 70.7, n=25, der letzten 2 Jahre)
41.1 fps -42%
F1 24
2560x1440 Ultra High Preset AA:T AF:16x
HP Omen Max 16-ah1932nr
Intel Core Ultra 9 290HX Plus, NVIDIA GeForce RTX 5090 Laptop
110.5 (83min, 88P1) fps +1%
Schenker XMG Neo 16 M26 Mini-LED
Intel Core Ultra 9 290HX Plus, NVIDIA GeForce RTX 5090 Laptop
109 (77min, 85P1) fps
Schenker XMG Neo 16 E25 RTX 5090 Laptop
Intel Core Ultra 9 275HX, NVIDIA GeForce RTX 5090 Laptop
103.3 (73min, 80P1) fps -5%
Schenker XMG Neo 16 A25 5090
AMD Ryzen 9 9955HX3D, NVIDIA GeForce RTX 5090 Laptop
101.2 (76min, 81P1) fps -7%
MSI Raider 16 Max HX B2WJ
Intel Core Ultra 9 290HX Plus, NVIDIA GeForce RTX 5090 Laptop
99.8 (81min, 81P1) fps -8%
Durchschnittliche NVIDIA GeForce RTX 5090 Laptop
  (72.5 - 110.5, n=26)
98.5 fps -10%
Alienware 16 Area-51 Core Ultra 9 290HX Plus
Intel Core Ultra 9 290HX Plus, NVIDIA GeForce RTX 5080 Laptop
89.2 (71min, 72P1) fps -18%
Durchschnitt der Klasse Gaming
  (39 - 110.5, n=63, der letzten 2 Jahre)
75.3 fps -31%
2560x1440 Ultra High Preset + Quality DLSS AF:16x
HP Omen Max 16-ah1932nr
Intel Core Ultra 9 290HX Plus, NVIDIA GeForce RTX 5090 Laptop
166.7 (92min, 105P1) fps +2%
Schenker XMG Neo 16 M26 Mini-LED
Intel Core Ultra 9 290HX Plus, NVIDIA GeForce RTX 5090 Laptop
163.3 (73min, 92P1) fps
MSI Raider 16 Max HX B2WJ
Intel Core Ultra 9 290HX Plus, NVIDIA GeForce RTX 5090 Laptop
154.1 (87min, 103P1) fps -6%
Alienware 16 Area-51 Core Ultra 9 290HX Plus
Intel Core Ultra 9 290HX Plus, NVIDIA GeForce RTX 5080 Laptop
141.2 (79min, 90P1) fps -14%
Durchschnittliche NVIDIA GeForce RTX 5090 Laptop
  (105.5 - 166.7, n=19)
140.9 fps -14%
Durchschnitt der Klasse Gaming
  (14.3 - 166.7, n=53, der letzten 2 Jahre)
109.5 fps -33%
GTA V - 2560x1440 Highest AA:4xMSAA + FX AF:16x
Schenker XMG Neo 16 A25 5090
AMD Ryzen 9 9955HX3D, NVIDIA GeForce RTX 5090 Laptop
183.9 (1.777min, 125P1) fps +14%
Alienware 16 Area-51 Core Ultra 9 290HX Plus
Intel Core Ultra 9 290HX Plus, NVIDIA GeForce RTX 5080 Laptop
167.2 (2.85min, 125P1) fps +3%
Schenker XMG Neo 16 E25 RTX 5090 Laptop
Intel Core Ultra 9 275HX, NVIDIA GeForce RTX 5090 Laptop
163.1 (3.22min, 111.1P1) fps +1%
MSI Raider 16 Max HX B2WJ
Intel Core Ultra 9 290HX Plus, NVIDIA GeForce RTX 5090 Laptop
162.3 (3.8min, 125P1) fps 0%
Schenker XMG Neo 16 M26 Mini-LED
Intel Core Ultra 9 290HX Plus, NVIDIA GeForce RTX 5090 Laptop
161.6 (3.05min, 125P1) fps
HP Omen Max 16-ah1932nr
Intel Core Ultra 9 290HX Plus, NVIDIA GeForce RTX 5090 Laptop
160.9 (3.12min, 125P1) fps 0%
Durchschnittliche NVIDIA GeForce RTX 5090 Laptop
  (62.7 - 183.9, n=21)
146.9 fps -9%
Durchschnitt der Klasse Gaming
  (62.7 - 183.9, n=70, der letzten 2 Jahre)
132.1 fps -18%
Final Fantasy XV Benchmark - 2560x1440 High Quality
HP Omen Max 16-ah1932nr
Intel Core Ultra 9 290HX Plus, NVIDIA GeForce RTX 5090 Laptop
181.5 fps +10%
Schenker XMG Neo 16 A25 5090
AMD Ryzen 9 9955HX3D, NVIDIA GeForce RTX 5090 Laptop
173.5 fps +5%
MSI Raider 16 Max HX B2WJ
Intel Core Ultra 9 290HX Plus, NVIDIA GeForce RTX 5090 Laptop
171.3 fps +4%
Schenker XMG Neo 16 E25 RTX 5090 Laptop
Intel Core Ultra 9 275HX, NVIDIA GeForce RTX 5090 Laptop
170.7 fps +3%
Durchschnittliche NVIDIA GeForce RTX 5090 Laptop
  (123.4 - 184.3, n=28)
165.6 fps 0%
Schenker XMG Neo 16 M26 Mini-LED
Intel Core Ultra 9 290HX Plus, NVIDIA GeForce RTX 5090 Laptop
165.4 fps
Alienware 16 Area-51 Core Ultra 9 290HX Plus
Intel Core Ultra 9 290HX Plus, NVIDIA GeForce RTX 5080 Laptop
157.5 fps -5%
Durchschnitt der Klasse Gaming
  (73.6 - 184.3, n=84, der letzten 2 Jahre)
129.7 fps -22%

Cyberpunk 2077 ultra FPS-Diagramm

05101520253035404550556065707580859095100105110115120125130135140145150155160165Tooltip
Schenker XMG Neo 16 M26 Mini-LED Ultra 9 290HX Plus, GeForce RTX 5090 Laptop: Ø156.1 (148-162.5) fps
HP Omen Max 16-ah1932nr Ultra 9 290HX Plus, GeForce RTX 5090 Laptop: Ø164 (146.7-166.7) fps
MSI Raider 16 Max HX B2WJ Ultra 9 290HX Plus, GeForce RTX 5090 Laptop: Ø156 (146-158.1) fps
Aorus Master 16 AM6J R9 9955HX3D, GeForce RTX 5080 Laptop: Ø131.8 (127.2-134.8) fps
Alienware 16 Area-51 Core Ultra 9 290HX Plus Ultra 9 290HX Plus, GeForce RTX 5080 Laptop: Ø133.3 (125.9-140.4) fps
Schenker XMG Neo 16 A25 5090 R9 9955HX3D, GeForce RTX 5090 Laptop: Ø152.6 (146-156) fps
min.mittelhochmax.QHD DLSSQHD
GTA V (2015) 166.5 161.6
Dota 2 Reborn (2015) 242 210 200 187.2
Final Fantasy XV Benchmark (2018) 234 232 193.8 165.4
X-Plane 11.11 (2018) 168.9 144 123
Strange Brigade (2018) 434 354
Baldur's Gate 3 (2023) 217 163.5
Cyberpunk 2077 (2023) 193.6 190.7 175.6 159.8 130.5 117.4
F1 24 (2024) 371 328 164.4 163.3 109
F1 25 (2025) 279 270 256 65.4 70.7 39.9

Emissionen & Energie

Geräuschemissionen

Die Lüftergeräusche hängen maßgeblich vom ausgewählten Energieprofil ab, doch selbst im Overboost-Modus bleibt das Neo 16 im Leerlauf und ohne GPU-Last insgesamt sehr ruhig. Beim Spielen schwankt die Lautstärke je nach Modus zwischen angenehmen 40 dB(A) und sehr lauten 55,9 dB(A), wo man definitiv Kopfhörer verwenden sollte. Sonstige elektronische Geräusche gab es nicht.

Lautstärkediagramm

Idle
25.3 / 26.4 / 26.4 dB(A)
Last
52.6 / 55.9 dB(A)
  red to green bar
 
 
30 dB
leise
40 dB(A)
deutlich hörbar
50 dB(A)
störend
 
min: dark, med: mid, max: light   Earthworks M23R, Arta (aus 15 cm gemessen)   Umgebungsgeräusche: 25.3 dB(A)
dB(A) 0102030405060708090Deep BassMiddle BassHigh BassLower RangeMidsHigher MidsLower HighsMid HighsUpper HighsSuper Highs2035.834.835.538.839.936.435.641.12531.327.225.332.228.827.829.336.53134.531.231.434.437.633.931.739.54035.136.53334.336.138.235.137.45033.132.532.830.93233.233.132.76330.928.526.329.62727.627.229.88030.131.526.426.624.223.422.928.910030.530.326.526.925.923.224.927.91253132.826.124.624.621.120.426.316031.133.126.525.82623.123.125.2200323528.326.425.223.223.527.425032.535.52927.225.425.423.927.631534.738.230.225.423.521.118.526.540036.539.130.326.121.217.815.226.450037.140.431.726.820.315.612.726.563040.341.832.828.920.114.711.828.480041.244.134.429.920.214.111.730.5100040.443.533.12717.512.811.127.8125040.743.932.526.417.812.910.726.7160040.844.531.925.915.912.310.924.8200040.244.731.825.61612.311.324.2250040.744.831.324.916.412.611.623.7315040.144.730.424.415.112.412.123400042.146.533.22714.312.912.423.9500039.944.131.523.113.61312.621630038.242.427.217.513.512.912.716.7800039.443.323.815.713.312.912.614.91000034.540.219.514.413.41313.113.81250031.236.91713.813.413.412.913.51600027.933.215.213.513.213.412.613.1SPL5255.943.437.629.426.425.337N8.510.94.52.81.30.80.72.6median 38.2median 41.8median 30.3median 25.8median 17.5median 13.4median 12.6median 25.2Delta4.44.53.83.94.53.23.44.4hearing rangehide median Fan NoiseSchenker XMG Neo 16 M26 Mini-LED
Schenker XMG Neo 16 M26 Mini-LED
Ultra 9 290HX Plus, GeForce RTX 5090 Laptop
HP Omen Max 16-ah1932nr
Ultra 9 290HX Plus, GeForce RTX 5090 Laptop
MSI Raider 16 Max HX B2WJ
Ultra 9 290HX Plus, GeForce RTX 5090 Laptop
Aorus Master 16 AM6J
R9 9955HX3D, GeForce RTX 5080 Laptop
Alienware 16 Area-51 Core Ultra 9 290HX Plus
Ultra 9 290HX Plus, GeForce RTX 5080 Laptop
Schenker XMG Neo 16 A25 5090
R9 9955HX3D, GeForce RTX 5090 Laptop
Schenker XMG Neo 16 E25 RTX 5090 Laptop
Ultra 9 275HX, GeForce RTX 5090 Laptop
Geräuschentwicklung
2%
5%
-11%
8%
3%
1%
aus / Umgebung * (dB)
25.3
23.8
6%
23.1
9%
25
1%
23.1
9%
24.1
5%
24
5%
Idle min * (dB)
25.3
23.8
6%
26.6
-5%
28
-11%
23.2
8%
25.6
-1%
26
-3%
Idle avg * (dB)
26.4
25.7
3%
26.7
-1%
29
-10%
28.2
-7%
25.6
3%
26
2%
Idle max * (dB)
26.4
30.6
-16%
26.9
-2%
35
-33%
28.3
-7%
25.6
3%
26
2%
Last avg * (dB)
52.6
39
26%
36
32%
58
-10%
28.8
45%
47.2
10%
52.4
-0%
Cyberpunk 2077 ultra * (dB)
55.9
54.4
3%
51.1
9%
59
-6%
49
12%
55.5
1%
55.4
1%
Last max * (dB)
55.9
61.8
-11%
60.2
-8%
60
-7%
57.1
-2%
55.5
1%
55.4
1%

* ... kleinere Werte sind besser

Temperatur

Unter Last erwärmen sich einige Stellen zwar auf rund 45 °C, was man zwar merkt, doch kritisch sind diese Werte auf keinen Fall. Im Stresstest bleibt die RTX 5090 stabil bei den vollen 175 Watt (also inkl. Dynamic Boost) und die CPU pendelt sich bei 65 Watt ein. 

CPU/GPU-Daten Stresstest
Max. Last
44.6 °C45.7 °C40.9 °C
46.1 °C45.8 °C36.8 °C
33.2 °C32.6 °C32.1 °C
Maximal: 46.1 °C
Durchschnitt: 39.8 °C
41.2 °C44.6 °C42.9 °C
36.4 °C40.4 °C43.6 °C
33.3 °C33 °C34.5 °C
Maximal: 44.6 °C
Durchschnitt: 38.9 °C
Netzteil (max.)  56.4 °C | Raumtemperatur 21 °C | Fluke t3000FC (calibrated), Voltcraft IR-900
(-) Die Durchschnittstemperatur auf der Oberseite unter extremer Last ist 39.8 °C. Im Vergleich erhitzte sich der Durchschnitt der Geräteklasse Gaming auf 33.9 °C.
(-) Die maximale Temperatur auf der Oberseite ist 46.1 °C. Im Vergleich liegt der Klassendurchschnitt bei 40.4 °C (von 21.2 bis 68.8 °C für die Klasse Gaming).
(±) Auf der Unterseite messen wir eine maximalen Wert von 44.6 °C (im Vergleich zum Durchschnitt von 43.2 °C).
(+) Ohne Last messen wir eine durchschnittliche Temperatur von 26.3 °C auf der Oberseite. Der Klassendurchschnitt erreicht 33.9 °C.
(+) Die Handballen und der Touchpad-Bereich erreichen maximal 33.2 °C und damit die typische Hauttemperatur und fühlen sich daher nicht heiß an.
(-) Die durchschnittliche Handballen-Temperatur anderer getesteter Geräte war 28.8 °C (-4.4 °C).
Oberflächentemperaturen Stresstest (Oberseite)
Oberflächentemperaturen Stresstest (Unterseite)
Schenker XMG Neo 16 M26 Mini-LED
Ultra 9 290HX Plus, GeForce RTX 5090 Laptop
HP Omen Max 16-ah1932nr
Ultra 9 290HX Plus, GeForce RTX 5090 Laptop
MSI Raider 16 Max HX B2WJ
Ultra 9 290HX Plus, GeForce RTX 5090 Laptop
Aorus Master 16 AM6J
R9 9955HX3D, GeForce RTX 5080 Laptop
Alienware 16 Area-51 Core Ultra 9 290HX Plus
Ultra 9 290HX Plus, GeForce RTX 5080 Laptop
Schenker XMG Neo 16 A25 5090
R9 9955HX3D, GeForce RTX 5090 Laptop
Schenker XMG Neo 16 E25 RTX 5090 Laptop
Ultra 9 275HX, GeForce RTX 5090 Laptop
Hitze
-1%
-2%
-13%
-3%
-7%
-6%
Last oben max * (°C)
46.1
43.8
5%
43.2
6%
50
-8%
45.2
2%
46.3
-0%
47.8
-4%
Last unten max * (°C)
44.6
42.4
5%
45.6
-2%
52
-17%
37.4
16%
44.3
1%
46.7
-5%
Idle oben max * (°C)
26.9
28.6
-6%
27.8
-3%
31.6
-17%
30
-12%
28.4
-6%
Idle unten max * (°C)
26.8
28.6
-7%
29
-8%
30.2
-13%
31.1
-16%
28.9
-8%

* ... kleinere Werte sind besser

Lautsprecher

dB(A) 0102030405060708090Deep BassMiddle BassHigh BassLower RangeMidsHigher MidsLower HighsMid HighsUpper HighsSuper Highs2035.637.72529.330.33131.735.94035.1375033.135.26327.229.58022.93610024.94212520.447.916023.151.320023.555.625023.954.731518.55840015.257.350012.763.563011.871.980011.773.8100011.170.2125010.769.4160010.965.7200011.366.3250011.662.5315012.163.9400012.468.3500012.664.6630012.768.8800012.669.51000013.169.71250012.964.11600012.655.4SPL25.380.2N0.749.4median 12.6median 64.1Delta3.46.534.637.626.526.322.924.319.321.922.320.921.521.123.727.523.335.819.444.120.556.521.764.922.566.622.963.322.265.321.666.921.363.319.368.719.568.419.167.41866.417.966.719.662.919.562.817.563.415.364.114.765.11366.712.666.612.264.611.655.330.677.81.445.7median 19.4median 64.93.34.635.432.523.428.123.526.722.726.622.728.822.429.322.432.918.934.916.443.816.648.417.756.517.958.520.358.420.262.716.765.815.572.717.373.116.369.815.667.514.66615.863.514.667.31366.112.265.711.665.211.470.111.673.911.771.311.663.110.855.526.980.80.851.8median 15.6median 65.72.86.541.340.136.436.44641.531.233.240.340.422.736.118.339.916.346.615.253.616.855.720.658.515.463.613.871.112.675.611.776.412.477.511.974.911.671.911.872.611.472.611.371.71271.71367.71366.913.16413.265.713.359.612.955.812.753.812.751.424.983.50.659median 12.9median 66.91.1731.127.224.322.32422.823.123.62626.923.823.322.523.720.826.416.935.216.753.518.363.619.368.419.56921.271.620.268.418.674.217.977.918.172.817.571.717.371.416.371.816.171.613.572.911.974.612.174.612.173.413.166.612.568.612.26911.16428.384.9167.6median 16.9median 71.43.34.736.344.528.735.227.129.528.728.724.431.923.435.519.841.818.452.417.35717.955.418.362.117.963.715.96712.268.311.172.610.176.310.577.810.474.510.773.810.772.710.671.811.463.112.365.412.469.812.267.812.270.612.366.312.464.912.259.311.755.82483.80.561.3median 12.2median 672.35.6hearing rangehide median Pink NoiseSchenker XMG Neo 16 M26 Mini-LEDHP Omen Max 16-ah1932nrMSI Raider 16 Max HX B2WJAorus Master 16 AM6JAlienware 16 Area-51 Core Ultra 9 290HX PlusSchenker XMG Neo 16 A25 5090
Frequenzdiagramm (für Vergleiche die Checkboxen oben an-/abwählen)
Schenker XMG Neo 16 M26 Mini-LED Audio Analyse

(±) | Mittelmäßig laut spielende Lautsprecher (80.2 dB)
Bass 100 - 315 Hz
(±) | abgesenkter Bass - 12.5% geringer als der Median
(±) | durchschnittlich lineare Bass-Wiedergabe (7.7% Delta zum Vorgänger)
Mitteltöne 400 - 2000 Hz
(±) | zu hohe Mitten, vom Median 5% abweichend
(+) | lineare Mitten (6.3% Delta zum Vorgänger)
Hochtöne 2 - 16 kHz
(+) | ausgeglichene Hochtöne, vom Median nur 3.2% abweichend
(+) | sehr lineare Hochtöne (5.1% Delta zum Vorgänger)
Gesamt im hörbaren Bereich 100 - 16.000 Hz
(+) | hörbarer Bereich ist sehr linear (13.8% Abstand zum Median
Im Vergleich zu allen Geräten derselben Klasse
» 22% aller getesteten Geräte dieser Klasse waren besser, 7% vergleichbar, 71% schlechter
» Das beste Gerät hat einen Delta-Wert von 6%, durchschnittlich ist 18%, das schlechteste Gerät hat 132%
Im Vergleich zu allen Geräten im Test
» 16% aller getesteten Geräte waren besser, 4% vergleichbar, 80% schlechter
» Das beste Gerät hat einen Delta-Wert von 4%, durchschnittlich ist 23%, das schlechteste Gerät hat 136%

HP Omen Max 16-ah1932nr Audio Analyse

(±) | Mittelmäßig laut spielende Lautsprecher (77.8 dB)
Bass 100 - 315 Hz
(±) | abgesenkter Bass - 10.2% geringer als der Median
(-) | keine lineare Bass-Wiedergabe (15.5% Delta zum Vorgänger)
Mitteltöne 400 - 2000 Hz
(+) | ausgeglichene Mitten, vom Median nur 2.2% abweichend
(+) | lineare Mitten (4.1% Delta zum Vorgänger)
Hochtöne 2 - 16 kHz
(+) | ausgeglichene Hochtöne, vom Median nur 1.4% abweichend
(+) | sehr lineare Hochtöne (2.4% Delta zum Vorgänger)
Gesamt im hörbaren Bereich 100 - 16.000 Hz
(+) | hörbarer Bereich ist sehr linear (11.5% Abstand zum Median
Im Vergleich zu allen Geräten derselben Klasse
» 10% aller getesteten Geräte dieser Klasse waren besser, 3% vergleichbar, 87% schlechter
» Das beste Gerät hat einen Delta-Wert von 6%, durchschnittlich ist 18%, das schlechteste Gerät hat 132%
Im Vergleich zu allen Geräten im Test
» 8% aller getesteten Geräte waren besser, 2% vergleichbar, 90% schlechter
» Das beste Gerät hat einen Delta-Wert von 4%, durchschnittlich ist 23%, das schlechteste Gerät hat 136%

MSI Raider 16 Max HX B2WJ Audio Analyse

(±) | Mittelmäßig laut spielende Lautsprecher (80.8 dB)
Bass 100 - 315 Hz
(-) | kaum Bass - 15.7% niedriger als der Median
(±) | durchschnittlich lineare Bass-Wiedergabe (8.6% Delta zum Vorgänger)
Mitteltöne 400 - 2000 Hz
(+) | ausgeglichene Mitten, vom Median nur 3.2% abweichend
(+) | lineare Mitten (6.1% Delta zum Vorgänger)
Hochtöne 2 - 16 kHz
(+) | ausgeglichene Hochtöne, vom Median nur 2.9% abweichend
(+) | sehr lineare Hochtöne (4.9% Delta zum Vorgänger)
Gesamt im hörbaren Bereich 100 - 16.000 Hz
(+) | hörbarer Bereich ist sehr linear (14.5% Abstand zum Median
Im Vergleich zu allen Geräten derselben Klasse
» 28% aller getesteten Geräte dieser Klasse waren besser, 7% vergleichbar, 65% schlechter
» Das beste Gerät hat einen Delta-Wert von 6%, durchschnittlich ist 18%, das schlechteste Gerät hat 132%
Im Vergleich zu allen Geräten im Test
» 19% aller getesteten Geräte waren besser, 4% vergleichbar, 77% schlechter
» Das beste Gerät hat einen Delta-Wert von 4%, durchschnittlich ist 23%, das schlechteste Gerät hat 136%

Aorus Master 16 AM6J Audio Analyse

(+) | Die Lautsprecher können relativ laut spielen (84 dB)
Bass 100 - 315 Hz
(±) | abgesenkter Bass - 10.1% geringer als der Median
(±) | durchschnittlich lineare Bass-Wiedergabe (9.6% Delta zum Vorgänger)
Mitteltöne 400 - 2000 Hz
(±) | zu hohe Mitten, vom Median 7.2% abweichend
(+) | lineare Mitten (3.2% Delta zum Vorgänger)
Hochtöne 2 - 16 kHz
(+) | ausgeglichene Hochtöne, vom Median nur 4% abweichend
(+) | sehr lineare Hochtöne (5.1% Delta zum Vorgänger)
Gesamt im hörbaren Bereich 100 - 16.000 Hz
(+) | hörbarer Bereich ist sehr linear (14.8% Abstand zum Median
Im Vergleich zu allen Geräten derselben Klasse
» 30% aller getesteten Geräte dieser Klasse waren besser, 7% vergleichbar, 63% schlechter
» Das beste Gerät hat einen Delta-Wert von 6%, durchschnittlich ist 18%, das schlechteste Gerät hat 132%
Im Vergleich zu allen Geräten im Test
» 20% aller getesteten Geräte waren besser, 4% vergleichbar, 75% schlechter
» Das beste Gerät hat einen Delta-Wert von 4%, durchschnittlich ist 23%, das schlechteste Gerät hat 136%

Alienware 16 Area-51 Core Ultra 9 290HX Plus Audio Analyse

(+) | Die Lautsprecher können relativ laut spielen (84.9 dB)
Bass 100 - 315 Hz
(-) | kaum Bass - 18.7% niedriger als der Median
(±) | durchschnittlich lineare Bass-Wiedergabe (13.9% Delta zum Vorgänger)
Mitteltöne 400 - 2000 Hz
(+) | ausgeglichene Mitten, vom Median nur 1.8% abweichend
(+) | lineare Mitten (5.1% Delta zum Vorgänger)
Hochtöne 2 - 16 kHz
(+) | ausgeglichene Hochtöne, vom Median nur 2.5% abweichend
(+) | sehr lineare Hochtöne (3.4% Delta zum Vorgänger)
Gesamt im hörbaren Bereich 100 - 16.000 Hz
(+) | hörbarer Bereich ist sehr linear (12.6% Abstand zum Median
Im Vergleich zu allen Geräten derselben Klasse
» 16% aller getesteten Geräte dieser Klasse waren besser, 4% vergleichbar, 81% schlechter
» Das beste Gerät hat einen Delta-Wert von 6%, durchschnittlich ist 18%, das schlechteste Gerät hat 132%
Im Vergleich zu allen Geräten im Test
» 12% aller getesteten Geräte waren besser, 3% vergleichbar, 85% schlechter
» Das beste Gerät hat einen Delta-Wert von 4%, durchschnittlich ist 23%, das schlechteste Gerät hat 136%

Schenker XMG Neo 16 A25 5090 Audio Analyse

(+) | Die Lautsprecher können relativ laut spielen (83.8 dB)
Bass 100 - 315 Hz
(±) | abgesenkter Bass - 7.3% geringer als der Median
(±) | durchschnittlich lineare Bass-Wiedergabe (8.6% Delta zum Vorgänger)
Mitteltöne 400 - 2000 Hz
(±) | zu hohe Mitten, vom Median 6.5% abweichend
(+) | lineare Mitten (3.8% Delta zum Vorgänger)
Hochtöne 2 - 16 kHz
(+) | ausgeglichene Hochtöne, vom Median nur 2.2% abweichend
(+) | sehr lineare Hochtöne (6.8% Delta zum Vorgänger)
Gesamt im hörbaren Bereich 100 - 16.000 Hz
(+) | hörbarer Bereich ist sehr linear (11.2% Abstand zum Median
Im Vergleich zu allen Geräten derselben Klasse
» 8% aller getesteten Geräte dieser Klasse waren besser, 4% vergleichbar, 88% schlechter
» Das beste Gerät hat einen Delta-Wert von 6%, durchschnittlich ist 18%, das schlechteste Gerät hat 132%
Im Vergleich zu allen Geräten im Test
» 7% aller getesteten Geräte waren besser, 2% vergleichbar, 91% schlechter
» Das beste Gerät hat einen Delta-Wert von 4%, durchschnittlich ist 23%, das schlechteste Gerät hat 136%

Energieaufnahme und Akkulaufzeit

Beim Spielen benötigt das Neo 16 rund 300 Watt, weshalb das 420-Watt-Netzteil vollkommen ausreichend dimensioniert ist. Bei wenig Last ist der Verbrauch aber gar nicht so hoch für einen 16-Zoll-Laptop, weshalb auch die Akkulaufzeit in unserem WLAN-Test (150 cd/m²) mit 10 Stunden sehr gut ausfällt und die Konkurrenz damit deutlich hinter sich lässt. Bei voller SDR-Helligkeit ist allerdings schon nach ~5 Stunden Schluss.

Stromverbrauch
Aus / Standbydarklight 0.13 / 1.47 Watt
Idledarkmidlight 7.6 / 16.4 / 17.4 Watt
Last midlight 170.4 / 470 Watt
 color bar
Legende: min: dark, med: mid, max: light        Metrahit Energy
Schenker XMG Neo 16 M26 Mini-LED
Ultra 9 290HX Plus, GeForce RTX 5090 Laptop, Samsung 9100 Pro 2 TB, Mini-LED, 2560x1600, 16"
HP Omen Max 16-ah1932nr
Ultra 9 290HX Plus, GeForce RTX 5090 Laptop, , OLED, 2560x1600, 16"
MSI Raider 16 Max HX B2WJ
Ultra 9 290HX Plus, GeForce RTX 5090 Laptop, Micron 2500 1TB MTFDKBA1T0QGN, OLED, 2560x1600, 16"
Aorus Master 16 AM6J
R9 9955HX3D, GeForce RTX 5080 Laptop, Samsung PM9C1b MZVL81T0HFLB-00BTW, OLED, 2560x1600, 16"
Alienware 16 Area-51 Core Ultra 9 290HX Plus
Ultra 9 290HX Plus, GeForce RTX 5080 Laptop, SK hynix PCB01 HFS001TFM9X186N, OLED, 2560x1600, 16"
Schenker XMG Neo 16 A25 5090
R9 9955HX3D, GeForce RTX 5090 Laptop, Kingston Fury Renegade SFYRS1000G, Mini-LED, 2560x1600, 16"
Schenker XMG Neo 16 E25 RTX 5090 Laptop
Ultra 9 275HX, GeForce RTX 5090 Laptop, Samsung 9100 Pro 1 TB, Mini-LED, 2560x1600, 16"
Durchschnittliche NVIDIA GeForce RTX 5090 Laptop
 
Durchschnitt der Klasse Gaming
 
Stromverbrauch
-29%
-2%
-9%
-69%
-8%
-4%
-38%
-9%
Idle min * (Watt)
7.6
7.5
1%
7.2
5%
14.4
-89%
23.9
-214%
13.2
-74%
11.8
-55%
15.4 ?(4.4 - 38.4, n=24)
-103%
Idle avg * (Watt)
16.4
21
-28%
12
27%
16.8
-2%
25.2
-54%
16.8
-2%
15.1
8%
24.8 ?(7.6 - 45.6, n=24)
-51%
Idle max * (Watt)
17.4
44.4
-155%
32.8
-89%
19.3
-11%
49.6
-185%
17.1
2%
15.8
9%
31.1 ?(7.8 - 57.5, n=24)
-79%
Last avg * (Watt)
170.4
146.4
14%
133
22%
151
11%
141.2
17%
164.2
4%
165.3
3%
139.4 ?(88 - 190.1, n=24)
18%
Cyberpunk 2077 ultra * (Watt)
301
343
-14%
276
8%
272
10%
298
1%
284
6%
296
2%
Last max * (Watt)
470
420.9
10%
404.5
14%
338
28%
372.8
21%
392.8
16%
415.5
12%
Cyberpunk 2077 ultra external monitor * (Watt)
341
275
297
282
289

* ... kleinere Werte sind besser

Akkulaufzeit
WiFi Websurfing
10h 02min
WiFi Websurfing max. Brightness
4h 50min
Battery Runtime
WiFi Websurfing
Schenker XMG Neo 16 M26 Mini-LED
Ultra 9 290HX Plus, GeForce RTX 5090 Laptop, 99.8 Wh
10 h
Schenker XMG Neo 16 E25 RTX 5090 Laptop
Ultra 9 275HX, GeForce RTX 5090 Laptop, 99.8 Wh
9.5 h -5%
MSI Raider 16 Max HX B2WJ
Ultra 9 290HX Plus, GeForce RTX 5090 Laptop, 91.8 Wh
7.9 h -21%
HP Omen Max 16-ah1932nr
Ultra 9 290HX Plus, GeForce RTX 5090 Laptop, 83 Wh
7.3 h -27%
Durchschnitt der Klasse Gaming
  (1.967 - 14.6, n=105, der letzten 2 Jahre)
7.25 h -27%
Schenker XMG Neo 16 A25 5090
R9 9955HX3D, GeForce RTX 5090 Laptop, 99.8 Wh
5.9 h -41%
Aorus Master 16 AM6J
R9 9955HX3D, GeForce RTX 5080 Laptop, 99 Wh
5.2 h -48%
Alienware 16 Area-51 Core Ultra 9 290HX Plus
Ultra 9 290HX Plus, GeForce RTX 5080 Laptop, 96 Wh
3.2 h -68%
WiFi Websurfing max. Brightness
Durchschnitt der Klasse Gaming
  (2.27 - 8.93, n=29, der letzten 2 Jahre)
5.42 h +13%
Schenker XMG Neo 16 M26 Mini-LED
Ultra 9 290HX Plus, GeForce RTX 5090 Laptop, 99.8 Wh
4.8 h
Schenker XMG Neo 16 E25 RTX 5090 Laptop
Ultra 9 275HX, GeForce RTX 5090 Laptop, 99.8 Wh
3.9 h -19%
Schenker XMG Neo 16 A25 5090
R9 9955HX3D, GeForce RTX 5090 Laptop, 99.8 Wh
3.3 h -31%
Akkulaufzeit
WLAN
Schenker XMG Neo 16 M26 Mini-LED
Ultra 9 290HX Plus, GeForce RTX 5090 Laptop, 99.8 Wh
10 h
HP Omen Max 16-ah1932nr
Ultra 9 290HX Plus, GeForce RTX 5090 Laptop, 83 Wh
7.3 h
MSI Raider 16 Max HX B2WJ
Ultra 9 290HX Plus, GeForce RTX 5090 Laptop, 91.8 Wh
7.9 h
Durchschnitt der Klasse Gaming
  (1.967 - 14.6, n=105, der letzten 2 Jahre)
7.25 h -27%
Aorus Master 16 AM6J
R9 9955HX3D, GeForce RTX 5080 Laptop, 99 Wh
5.2 h
Alienware 16 Area-51 Core Ultra 9 290HX Plus
Ultra 9 290HX Plus, GeForce RTX 5080 Laptop, 96 Wh
3.2 h
Schenker XMG Neo 16 A25 5090
R9 9955HX3D, GeForce RTX 5090 Laptop, 99.8 Wh
5.9 h
Schenker XMG Neo 16 E25 RTX 5090 Laptop
Ultra 9 275HX, GeForce RTX 5090 Laptop, 99.8 Wh
9.5 h
H.264
Durchschnitt der Klasse Gaming
  (2.13 - 15, n=16, der letzten 2 Jahre)
8.24 h
Schenker XMG Neo 16 E25 RTX 5090 Laptop
Ultra 9 275HX, GeForce RTX 5090 Laptop, 99.8 Wh
7.7 h
Last
Schenker XMG Neo 16 E25 RTX 5090 Laptop
Ultra 9 275HX, GeForce RTX 5090 Laptop, 99.8 Wh
2 h
Durchschnitt der Klasse Gaming
  (0.8 - 2.1, n=21, der letzten 2 Jahre)
1.479 h

Notebookcheck Gesamtbewertung

Schenker XMG Neo 16 M26 Mini-LED - 18.11.2026 v8
Andreas Osthoff

Gehäuse
88 / 98 → 89%
Tastatur
89%
Pointing Device
86%
Konnektivität
80 / 80 → 100%
Gewicht
58 / 10-68 → 82%
Akkulaufzeit
83 / 95 → 88%
Display
93%
Leistung Spiele
96%
Leistung Anwendungen
97%
Temperatur
89 / 95 → 93%
Lautstärke
67 / 90 → 74%
Audio
81%
Kamera
37 / 75 → 49%
Durchschnitt
63%
91%
Gaming - gewichteter Durchschnitt
Weitere Informationen über unsere Bewertung finden Sie hier.
CO2 Emissions
No Data
Materials
0%
Packaging
50%
Power Use
78.8%
Repairability
40%
Software Updates
22.3%
Recycle Logo Total Sustainability Score: 31.9%

Mögliche Alternativen im Vergleich

Bild
Modell / Test
Preis ab
Gewicht
Dicke
Display
1.
90.5%
Schenker XMG Neo 16 M26 Mini-LED
Intel Core Ultra 9 290HX Plus ⎘
NVIDIA GeForce RTX 5090 Laptop ⎘
64 GB RAM, 2048 GB SSD
Listenpreis: 5800€2.8 kg27.9 mm16.00"
2560x1600
189 PPI
Mini-LED
2.
88%
HP Omen Max 16-ah1932nr
Intel Core Ultra 9 290HX Plus ⎘
NVIDIA GeForce RTX 5090 Laptop ⎘
32 GB RAM
Amazon:
Geizhals Suche
2.9 kg28.7 mm16.00"
2560x1600
189 PPI
OLED
3.
87.7%
MSI Raider 16 Max HX B2WJ
Intel Core Ultra 9 290HX Plus ⎘
NVIDIA GeForce RTX 5090 Laptop ⎘
32 GB RAM, 1024 GB SSD
Amazon:
Bestpreis 4665€ Conrad.de
2. 4689.88€ BA-Computer
3. 4689.9€ complIT EDV
2.7 kg28.9 mm16.00"
2560x1600
189 PPI
OLED
4.
83.5%
Aorus Master 16 AM6J
AMD Ryzen 9 9955HX3D ⎘
NVIDIA GeForce RTX 5080 Laptop ⎘
32 GB RAM, 1000 GB SSD
Amazon:
1. 4.550,77 €
GIGABYTE AORUS Master 16 - I...
2. 58,00 €
CPU-Lüfter für Gigabyte AO...
3. 58,00 €
GPU-Lüfter für Gigabyte AO...
Bestpreis 3299€ notebooksbilliger.de
2. 3326.72€ notebooksbilliger.at
3. 3399€ Alternate
2.3 kg24.5 mm16.00"
2560x1600
189 PPI
OLED
5.
88.2%
Alienware 16 Area-51 Core Ultra 9 290HX Plus
Intel Core Ultra 9 290HX Plus ⎘
NVIDIA GeForce RTX 5080 Laptop ⎘
32 GB RAM,  SSD
Amazon:
Geizhals Suche
3.3 kg28.5 mm16.00"
2560x1600
189 PPI
OLED
6.
89.4%
Schenker XMG Neo 16 A25 5090
AMD Ryzen 9 9955HX3D ⎘
NVIDIA GeForce RTX 5090 Laptop ⎘
32 GB RAM, 1024 GB NVMe
Listenpreis 4480€
Geizhals Suche
2.9 kg27.9 mm16.00"
2560x1600
189 PPI
Mini-LED

Transparenz

Die Auswahl der zu testenden Geräte erfolgt innerhalb der Redaktion. Das vorliegende Testmuster wurde dem Autor vom Hersteller oder einem Shop zu Testzwecken leihweise zur Verfügung gestellt. Eine Einflussnahme des Leihstellers auf den Testbericht gab es nicht, der Hersteller erhielt keine Version des Reviews vor der Veröffentlichung. Es bestand keine Verpflichtung zur Publikation. Als eigenständiges, unabhängiges Unternehmen unterliegt Notebookcheck keiner Diktion von Herstellern, Shops und Verlagen.

So testet Notebookcheck

Pro Jahr werden von Notebookcheck hunderte Laptops und Smartphones unabhängig in von uns standardisierten technischen Verfahren getestet, um eine Vergleichbarkeit aller Testergebnisse zu gewährleisten. Seit rund 20 Jahren entwickeln wir diese Testmethoden kontinuierlich weiter und setzen damit Branchenstandards. In unseren Testlaboren kommt ausschließlich hochwertiges Messequipment in die Hände erfahrener Techniker und Redakteure. Die Tests unterliegen einer mehrstufigen Kontrolle. Unsere komplexe Gesamtbewertung basiert auf hunderten fundierten Messergebnissen und Benchmarks, womit Ihnen Objektivität garantiert ist. Weitere Informationen zu unseren Testmethoden gibt es hier.

Google LogoAls bevorzugte Quelle auf Google hinzufügen
Mail Logo
Could not open connection to Notebookchat
static version load dynamic
> Notebook Test, Laptop Test und News > Tests > Notebook Testberichte > Einer der besten Gaming-Laptops endlich mit G-Sync - XMG Neo 16 (M26) im Test
Autor: Andreas Osthoff, 18.11.2026 (Update: 18.11.2026)