Fazit - Leistung eines 18-Zoll-Gaming-Notebooks in der Größe eines 16-Zoll-Displays
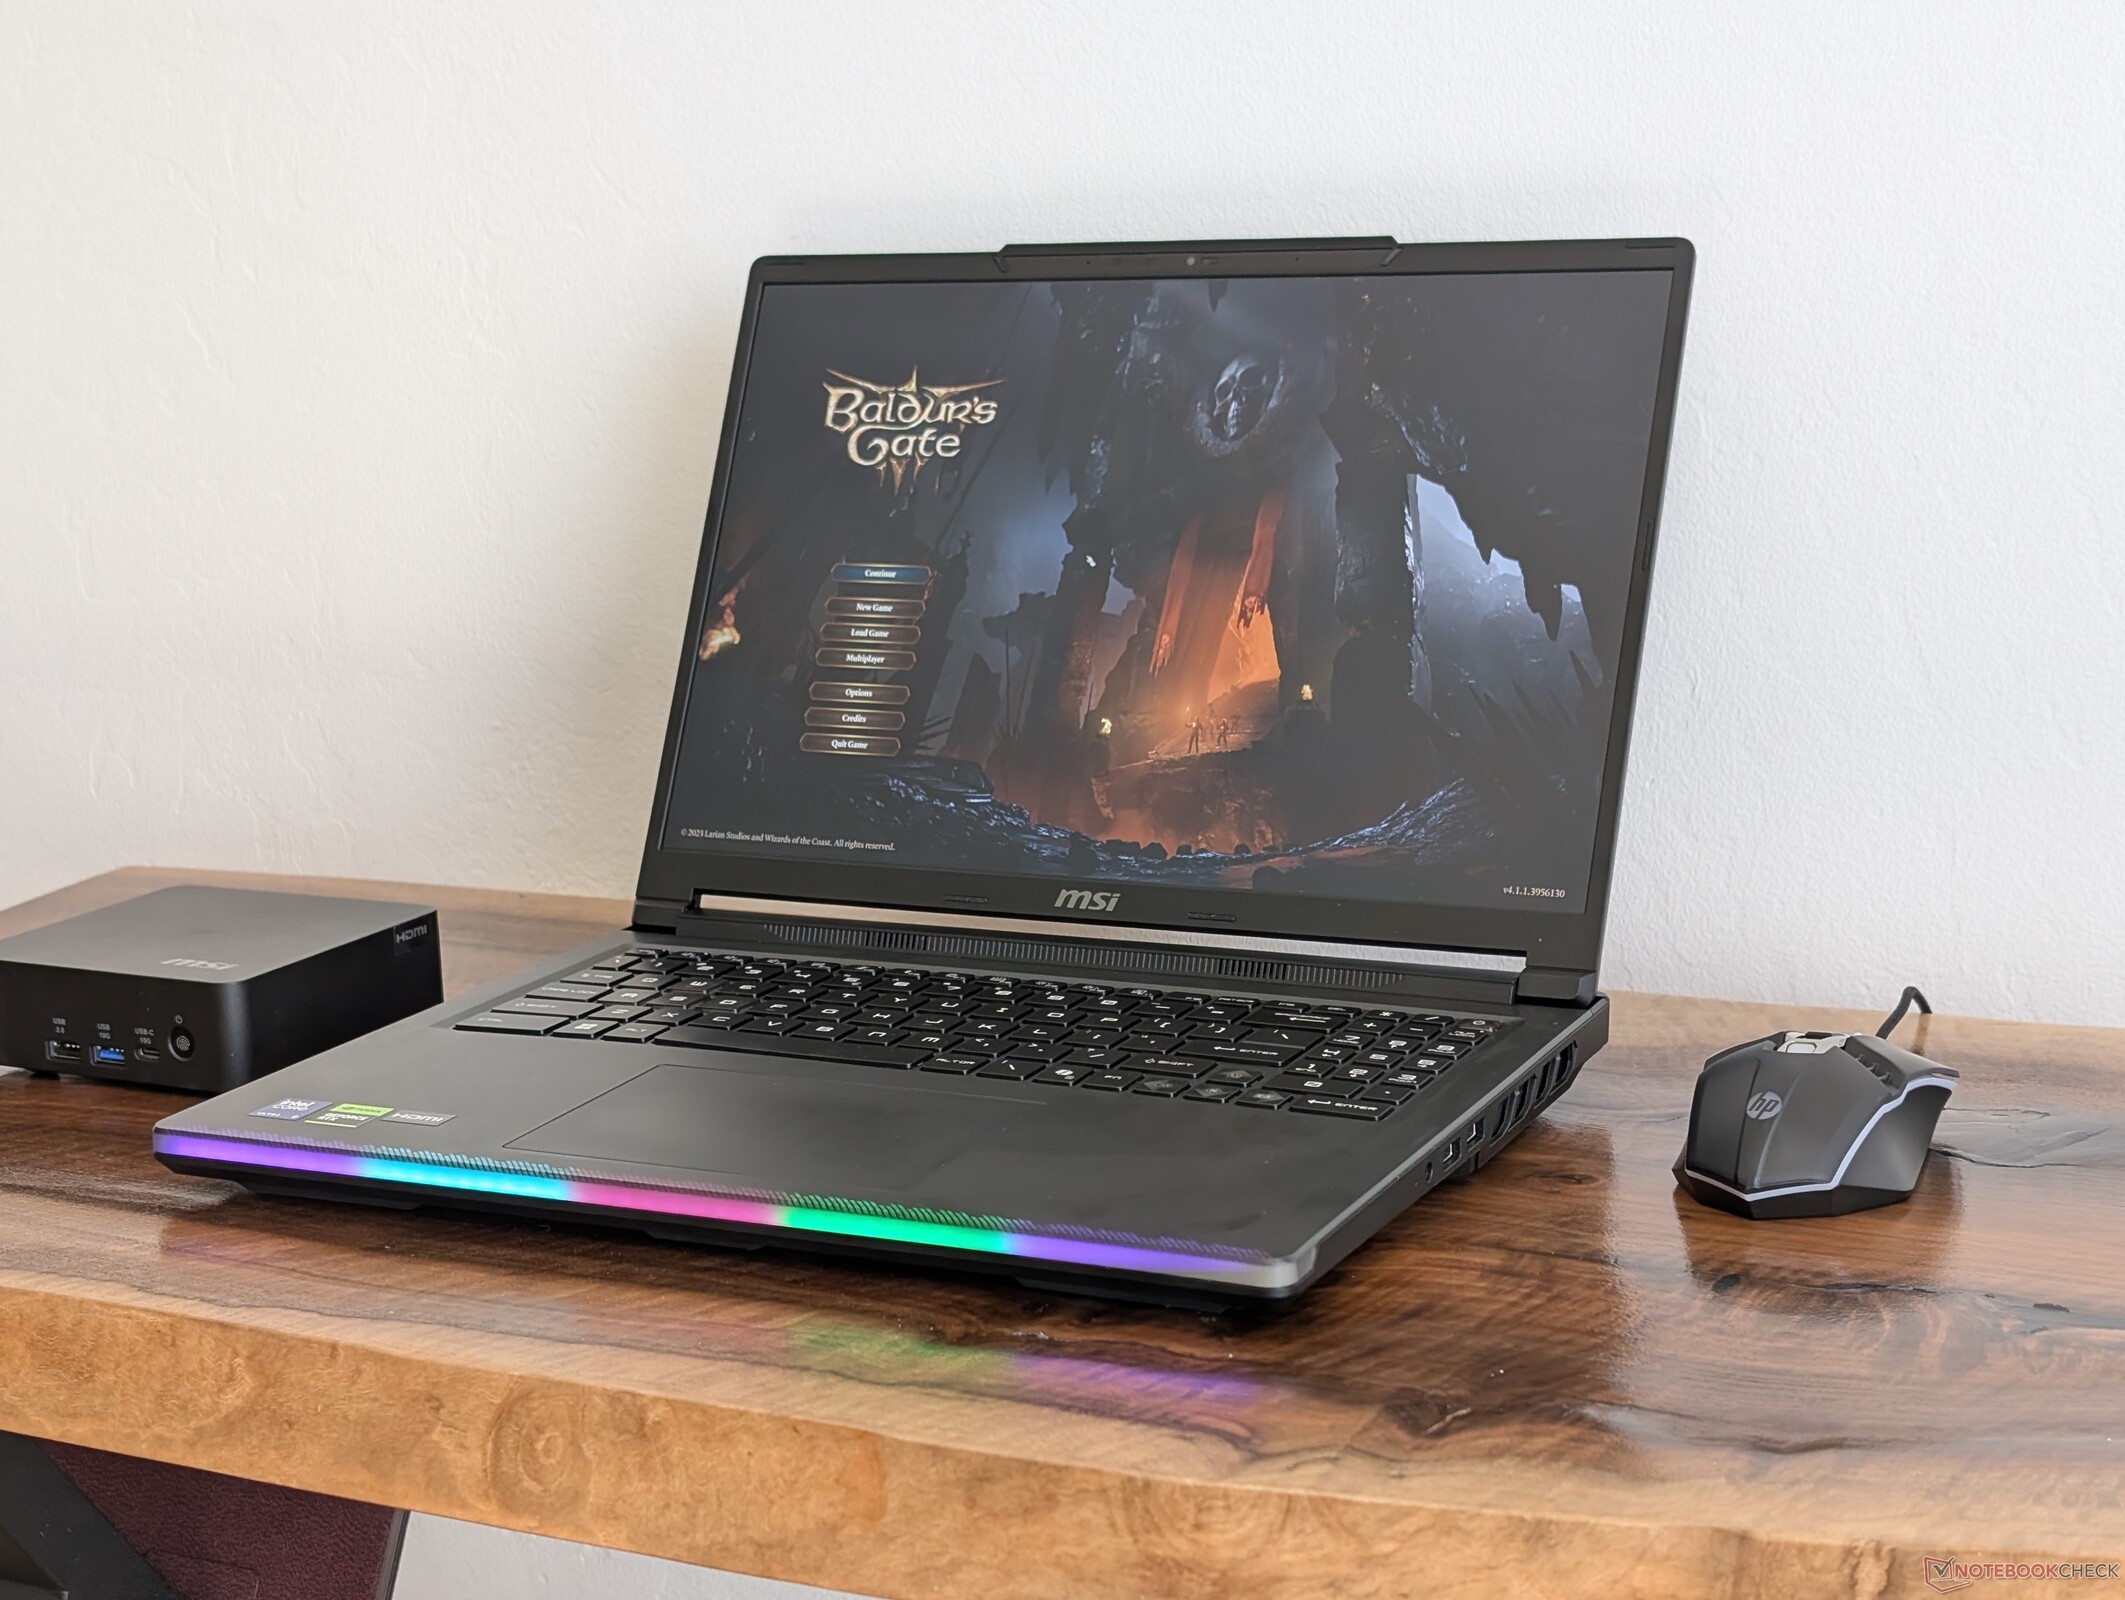
Das Raider 16 Max HX mag kleiner sein als das massive Raider 18 oder Titan 18, aber es stellt die Leistung immer noch über alles andere. Die Arrow Lake-HX-CPU und die 175-W-GPU gehören zu den schnellsten Optionen, die unabhängig von der Größe des Laptops verfügbar sind und machen das Raider 16 Max HX zu einer der schnellsten Lösungen für Spiele auf dem Markt. Das glänzende OLED-Display ist ebenso beeindruckend, wenn man die unvermeidlichen Blendeffekte abmildern kann, während das Subpanel ein praktisches Feature ist, das wir in Zukunft gerne bei allen MSI Gaming-Laptops sehen würden.
Die extreme Leistung ist mit Kosten verbunden. Vor allem ist das Raider 16 Max HX klobiger und schwerer als viele andere 16-Zoll-Gaming-Laptops, darunter das bereits große Alienware 16X Aurora. Das Kunststoffgehäuse fühlt sich nicht so luxuriös an wie das des Alienware 16 Area-51, obwohl sie ungefähr gleich viel kosten, und das Fehlen von G-Sync und Advanced Optimus ist in dieser Preisklasse schwer zu verzeihen. Nutzer, die gerne reisen und unterwegs spielen, finden vielleicht mehr Wert in leichteren und tragbareren 16-Zoll-Lösungen wie dem MSI Stealth 16 oder dem Razer Blade 16, die mit einer ähnlichen RTX-5090-Grafik ausgestattet sind und etwas weniger Leistung bieten.
Pro
Contra
Preis und Verfügbarkeit
Das MSI Raider 16 Max HX mit RTX 5090 wird aktuell für 4.349 Euro bei notebooksbilliger.de angeboten. In der Variante mit RTX 5080 kostet es 4.299 Euro bei Alternate.
Das MSI Raider 16 Max HX wurde auf der CES 2026 als das erste 16-Zoll-Notebook der Raider Serie vorgestellt. Es ist außerdem eines der ersten MSI-Gaming-Notebooks mit einem OLED-Display anstelle des üblichen IPS- oder Mini-LED-Displays. Ähnlich wie bei der Raider-18-Serie ist das Raider 16 Max HX eines der schnellsten Notebooks, die MSI zu bieten hat.
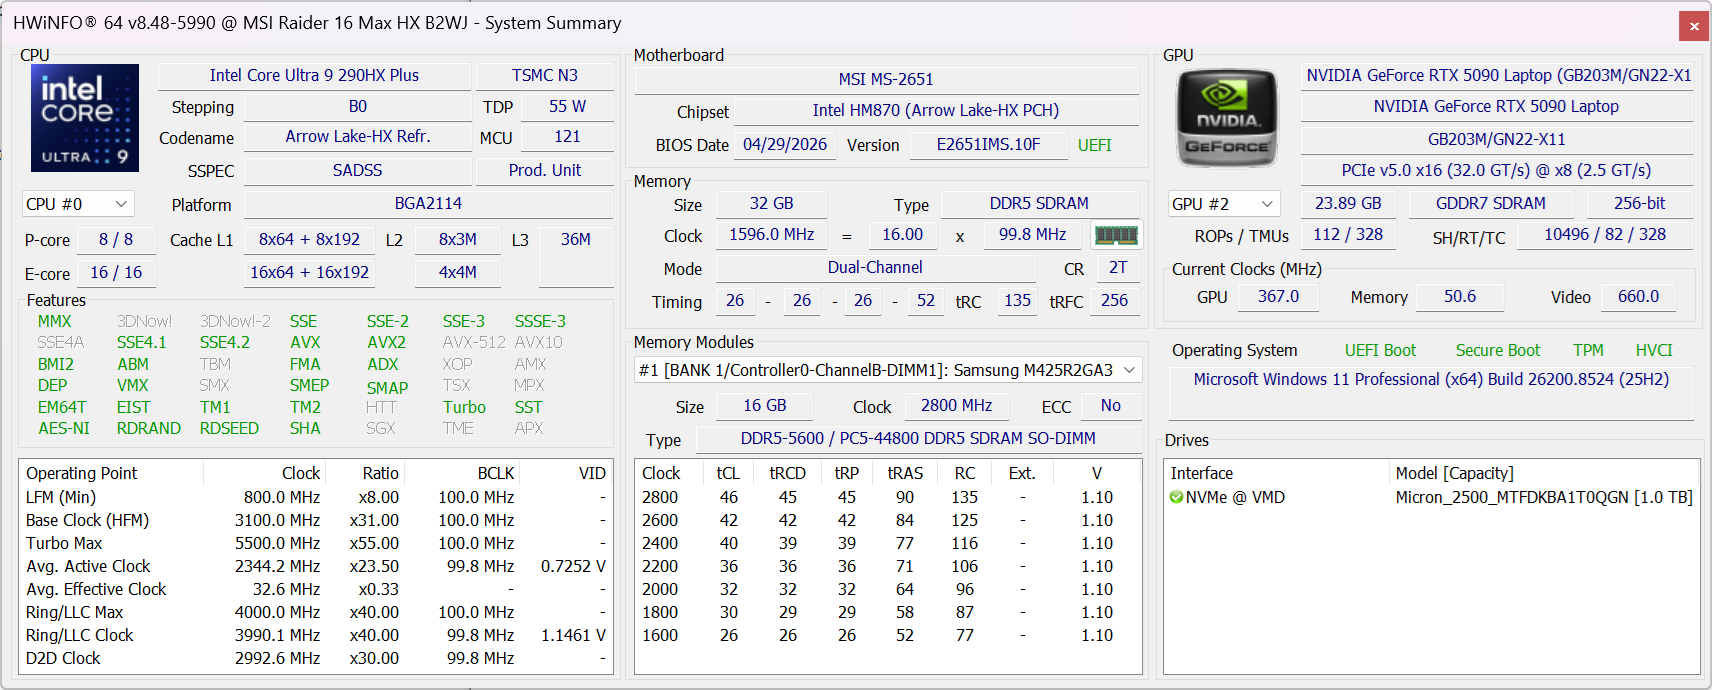
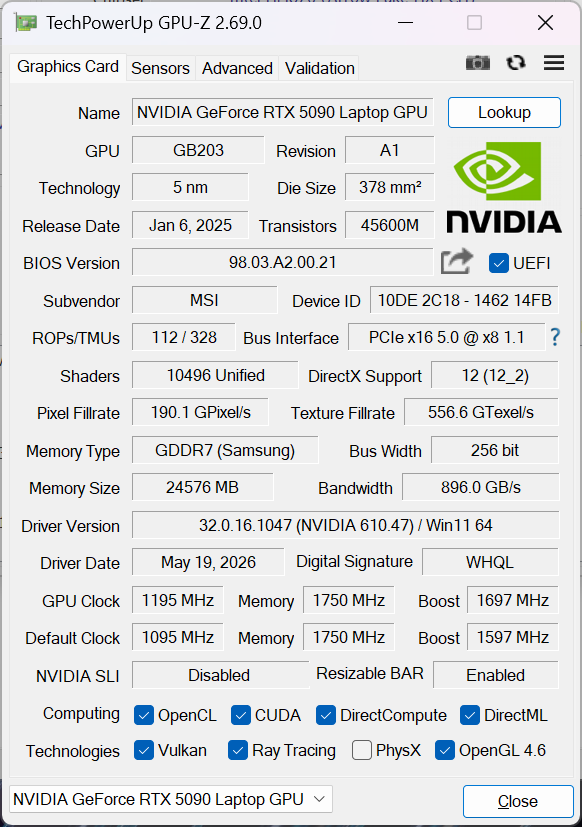
Bei unserem Testgerät handelt es sich um die High-End-Konfiguration mit der Arrow Lake Core Ultra 9 290HX Plus CPU und 175-W-GeForce-RTX-5090 GPU für ca. 4.400 US-Dollar. Alle SKUs werden derzeit mit der gleichen CPU und einem QHD+-240-Hz-OLED-Hochglanzdisplay ausgeliefert, können aber stattdessen mit der GeForce RTX 5070 Ti starten.
Zu den Konkurrenten gehören andere High-End- oder Flaggschiff-Gaming-Laptops im 16-Zoll-Format wie das Dell Alienware 16 Area-51, Asus Zephyrus Duo oder Razer Blade 16.
Weitere MSI Bewertungen:
Spezifikationen
Preisvergleich
Gehäuse
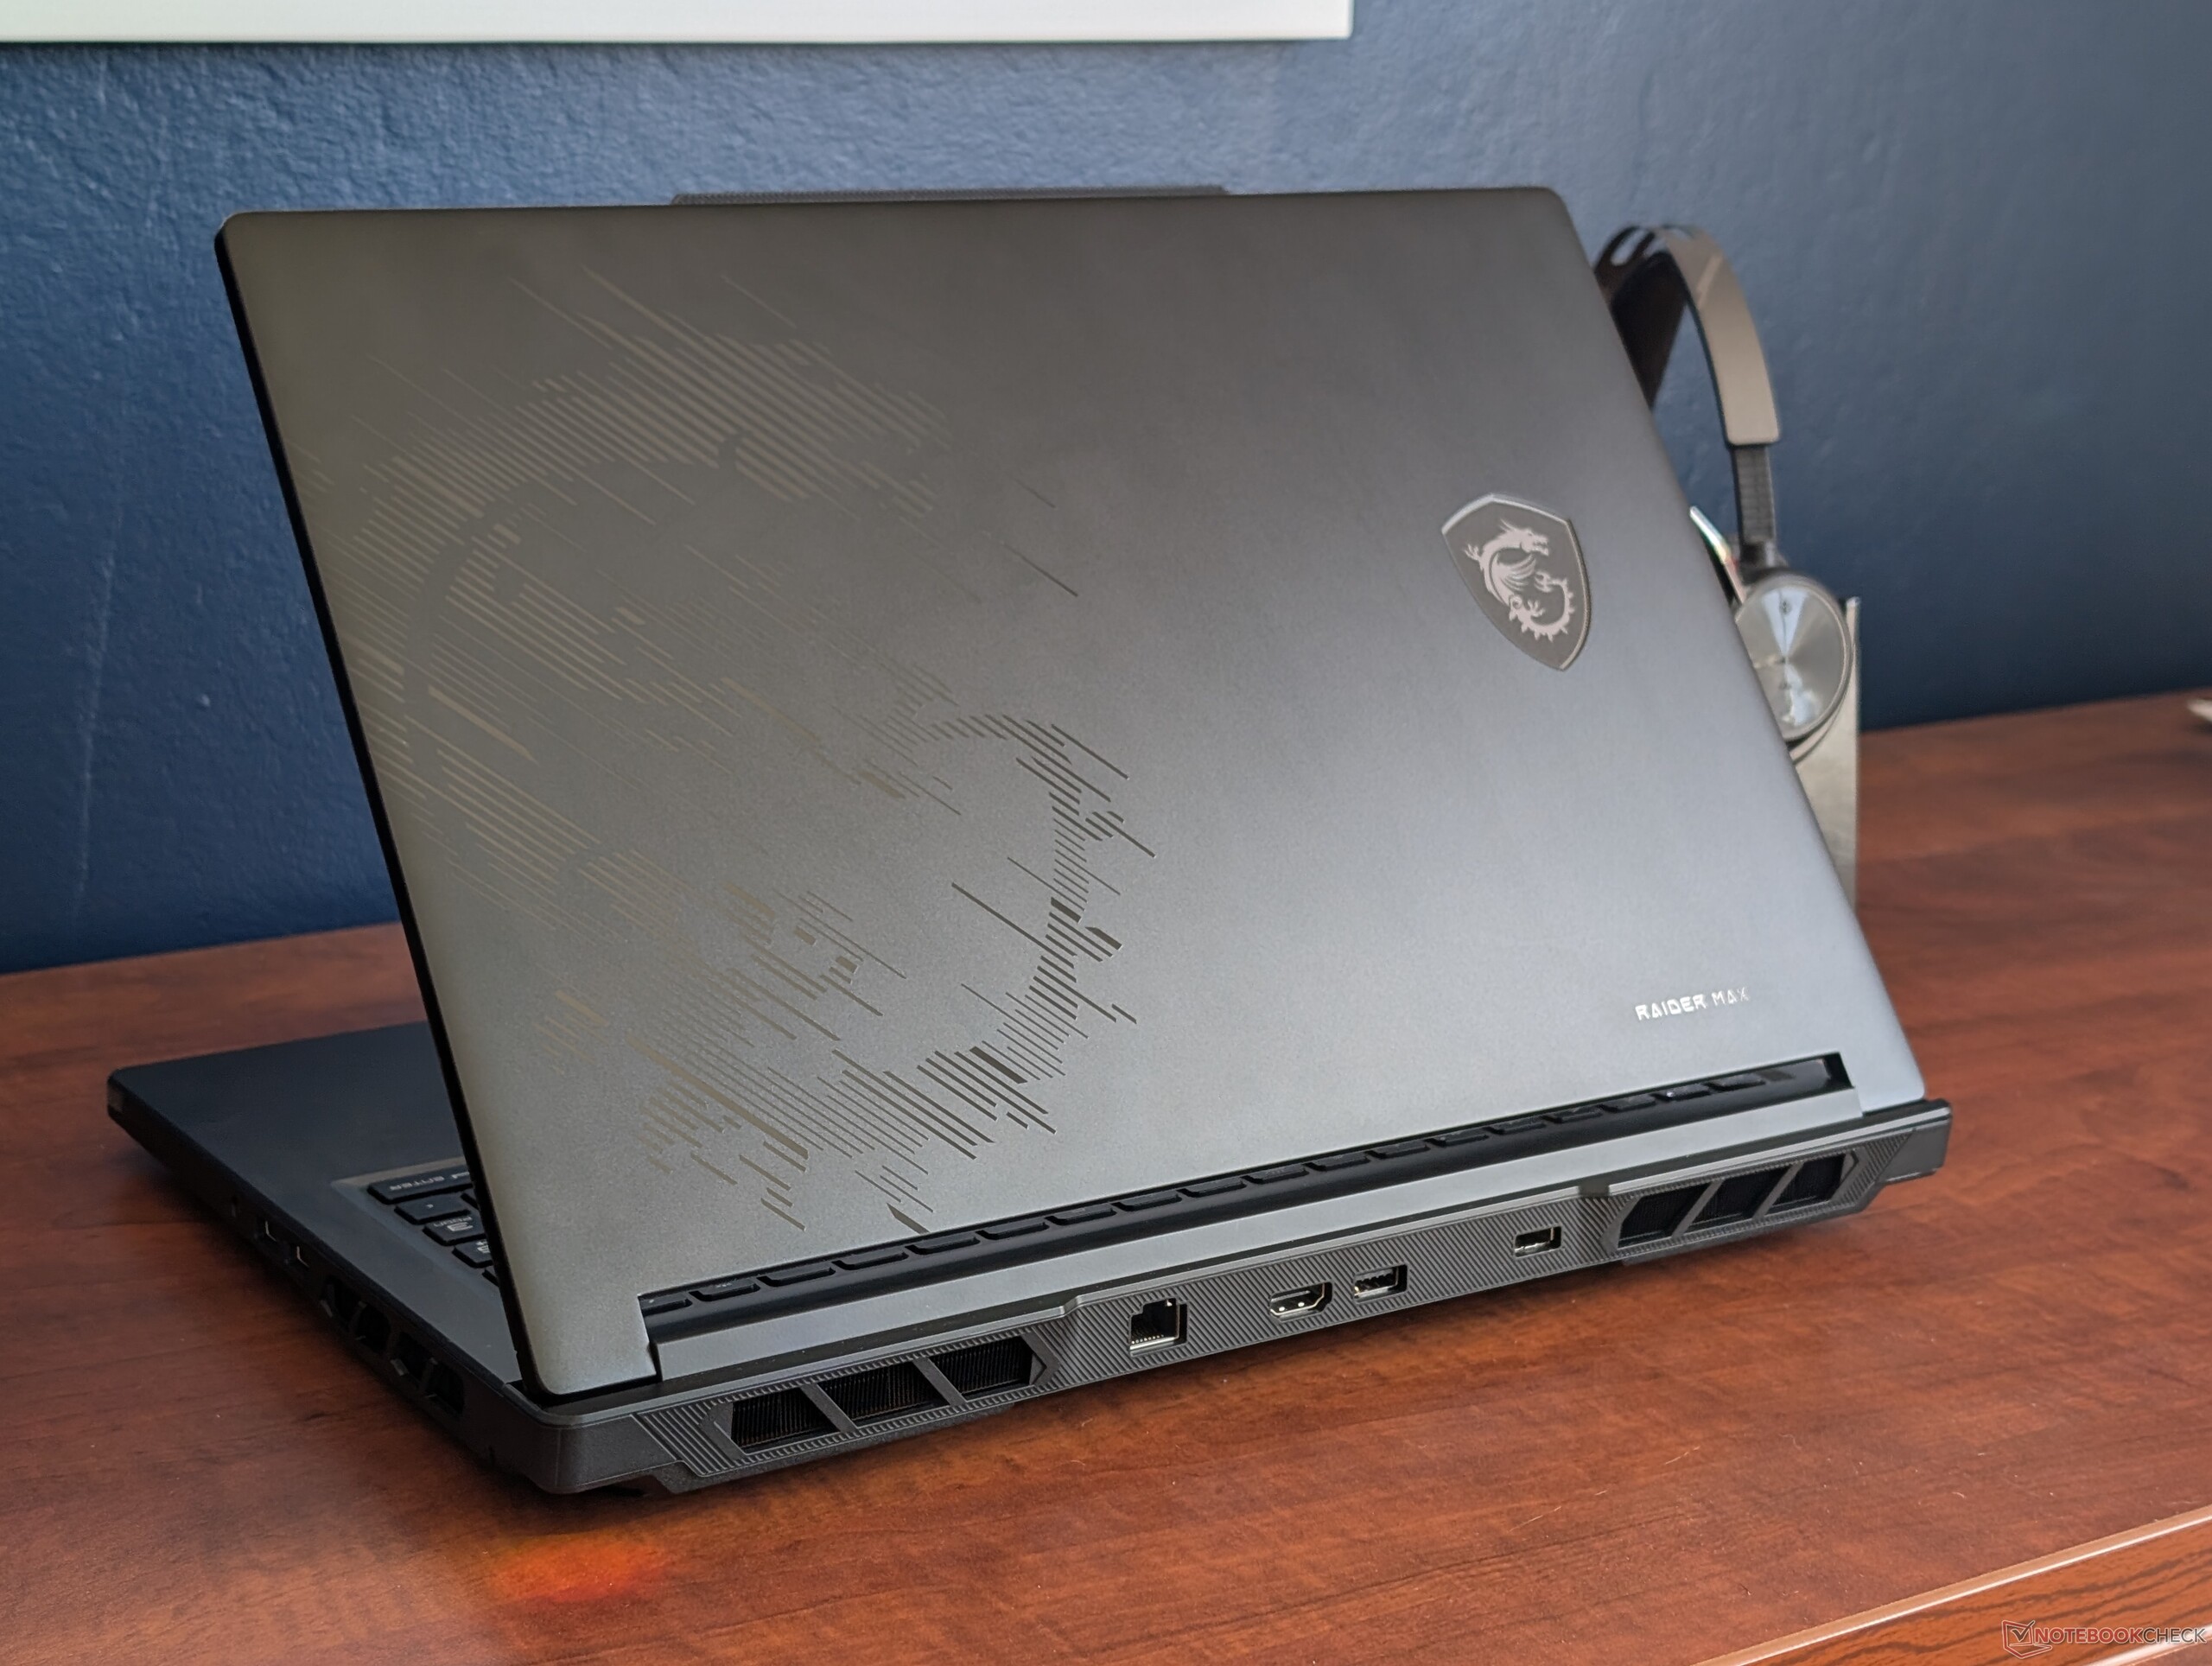
Der äußere Deckel ist aus glattem, mattem Metall, während die Basis größtenteils aus Kunststoff besteht. Das ist zwar keineswegs schlimm, aber die Oberflächen sind biegsam und fühlen sich nicht so stabil an wie bei Konkurrenzmodellen wie dem Alienware 16 Area-51 oder dem Razer Blade 16. In Anbetracht des hohen Preises haben wir ein stabileres oder hochwertigeres Gehäuse-Design erwartet.
Anschlussausstattung
Die Anschlussmöglichkeiten sind identisch mit denen des Raider 18 HX, wenn auch in anderer Anordnung.


SD-Kartenleser
| SD Card Reader | |
| average JPG Copy Test (av. of 3 runs) | |
| MSI Raider 16 Max HX B2WJ (Toshiba Exceria Pro SDXC 64 GB UHS-II) | |
| Razer Blade 16 Core Ultra 9 386H (Toshiba Exceria Pro SDXC 64 GB UHS-II) | |
| Lenovo Legion 7 16IAX10 (Toshiba Exceria Pro SDXC 64 GB UHS-II) | |
| maximum AS SSD Seq Read Test (1GB) | |
| Lenovo Legion 7 16IAX10 (Toshiba Exceria Pro SDXC 64 GB UHS-II) | |
| Razer Blade 16 Core Ultra 9 386H (Toshiba Exceria Pro SDXC 64 GB UHS-II) | |
| MSI Raider 16 Max HX B2WJ (Toshiba Exceria Pro SDXC 64 GB UHS-II) | |
Kommunikation
Webcam
Die 2 MP-Webcam mit standardmäßig mit IR und physischem Auslöser im Lieferumfang enthalten.


Wartung
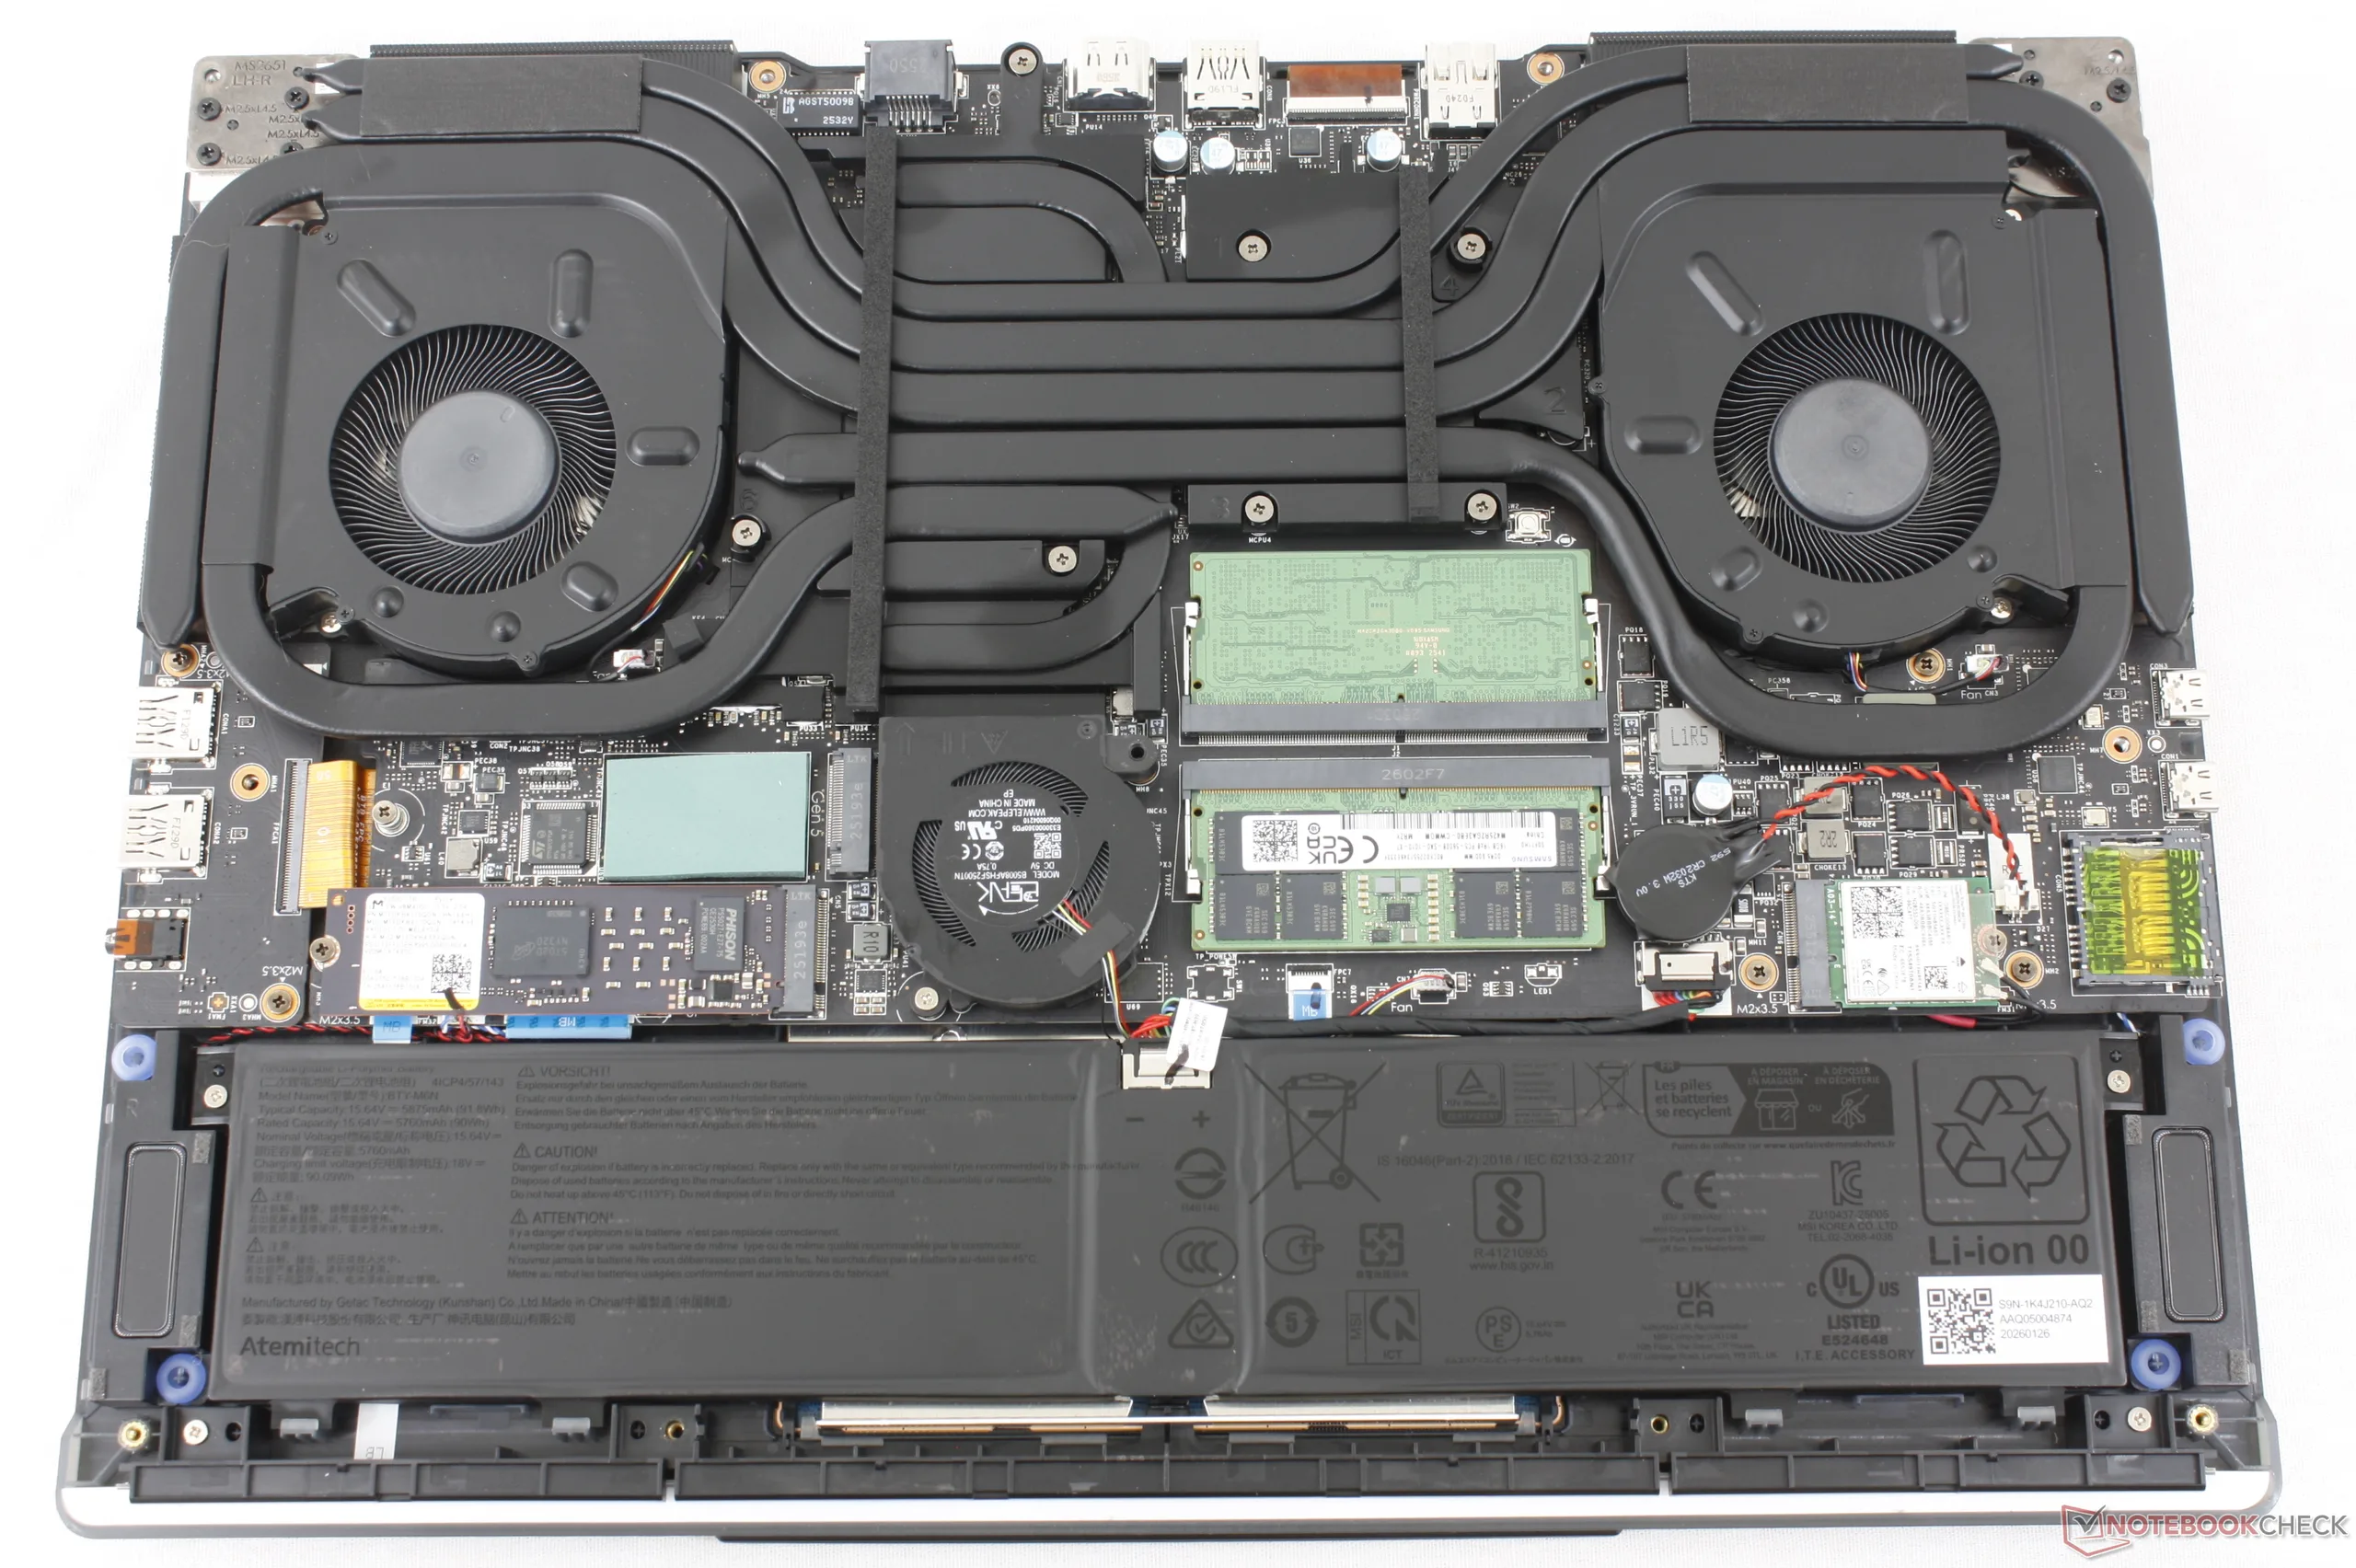
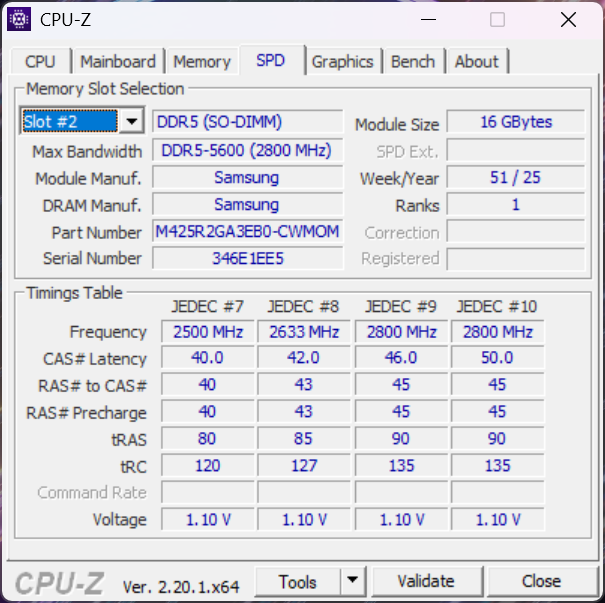
Die Bodenplatte enthält ein Subpanel für einen leichteren Zugang zu den beiden M.2-2280-SSD-Steckplätzen (ein PCIe5- und ein PCIe4-Steckplatz) und zwei DDR5-SODIMM-Steckplätzen. Ansonsten lässt sich die gesamte Bodenplatte mit einem Standard-Phillips-Schraubendreher relativ einfach entfernen.
Nachhaltigkeit
MSI erwähnt nicht, dass bei der Herstellung des Raider 16 Max HX recycelte Materialien verwendet wurden. Die Verpackung ist plastikfrei.
Zubehör und Garantie
In der Verpackung befinden sich außer dem Netzadapter und den Unterlagen keine weiteren Extras. Wenn man das Gerät in den USA kauft, gilt die übliche einjährige Herstellergarantie.
Eingabegeräte
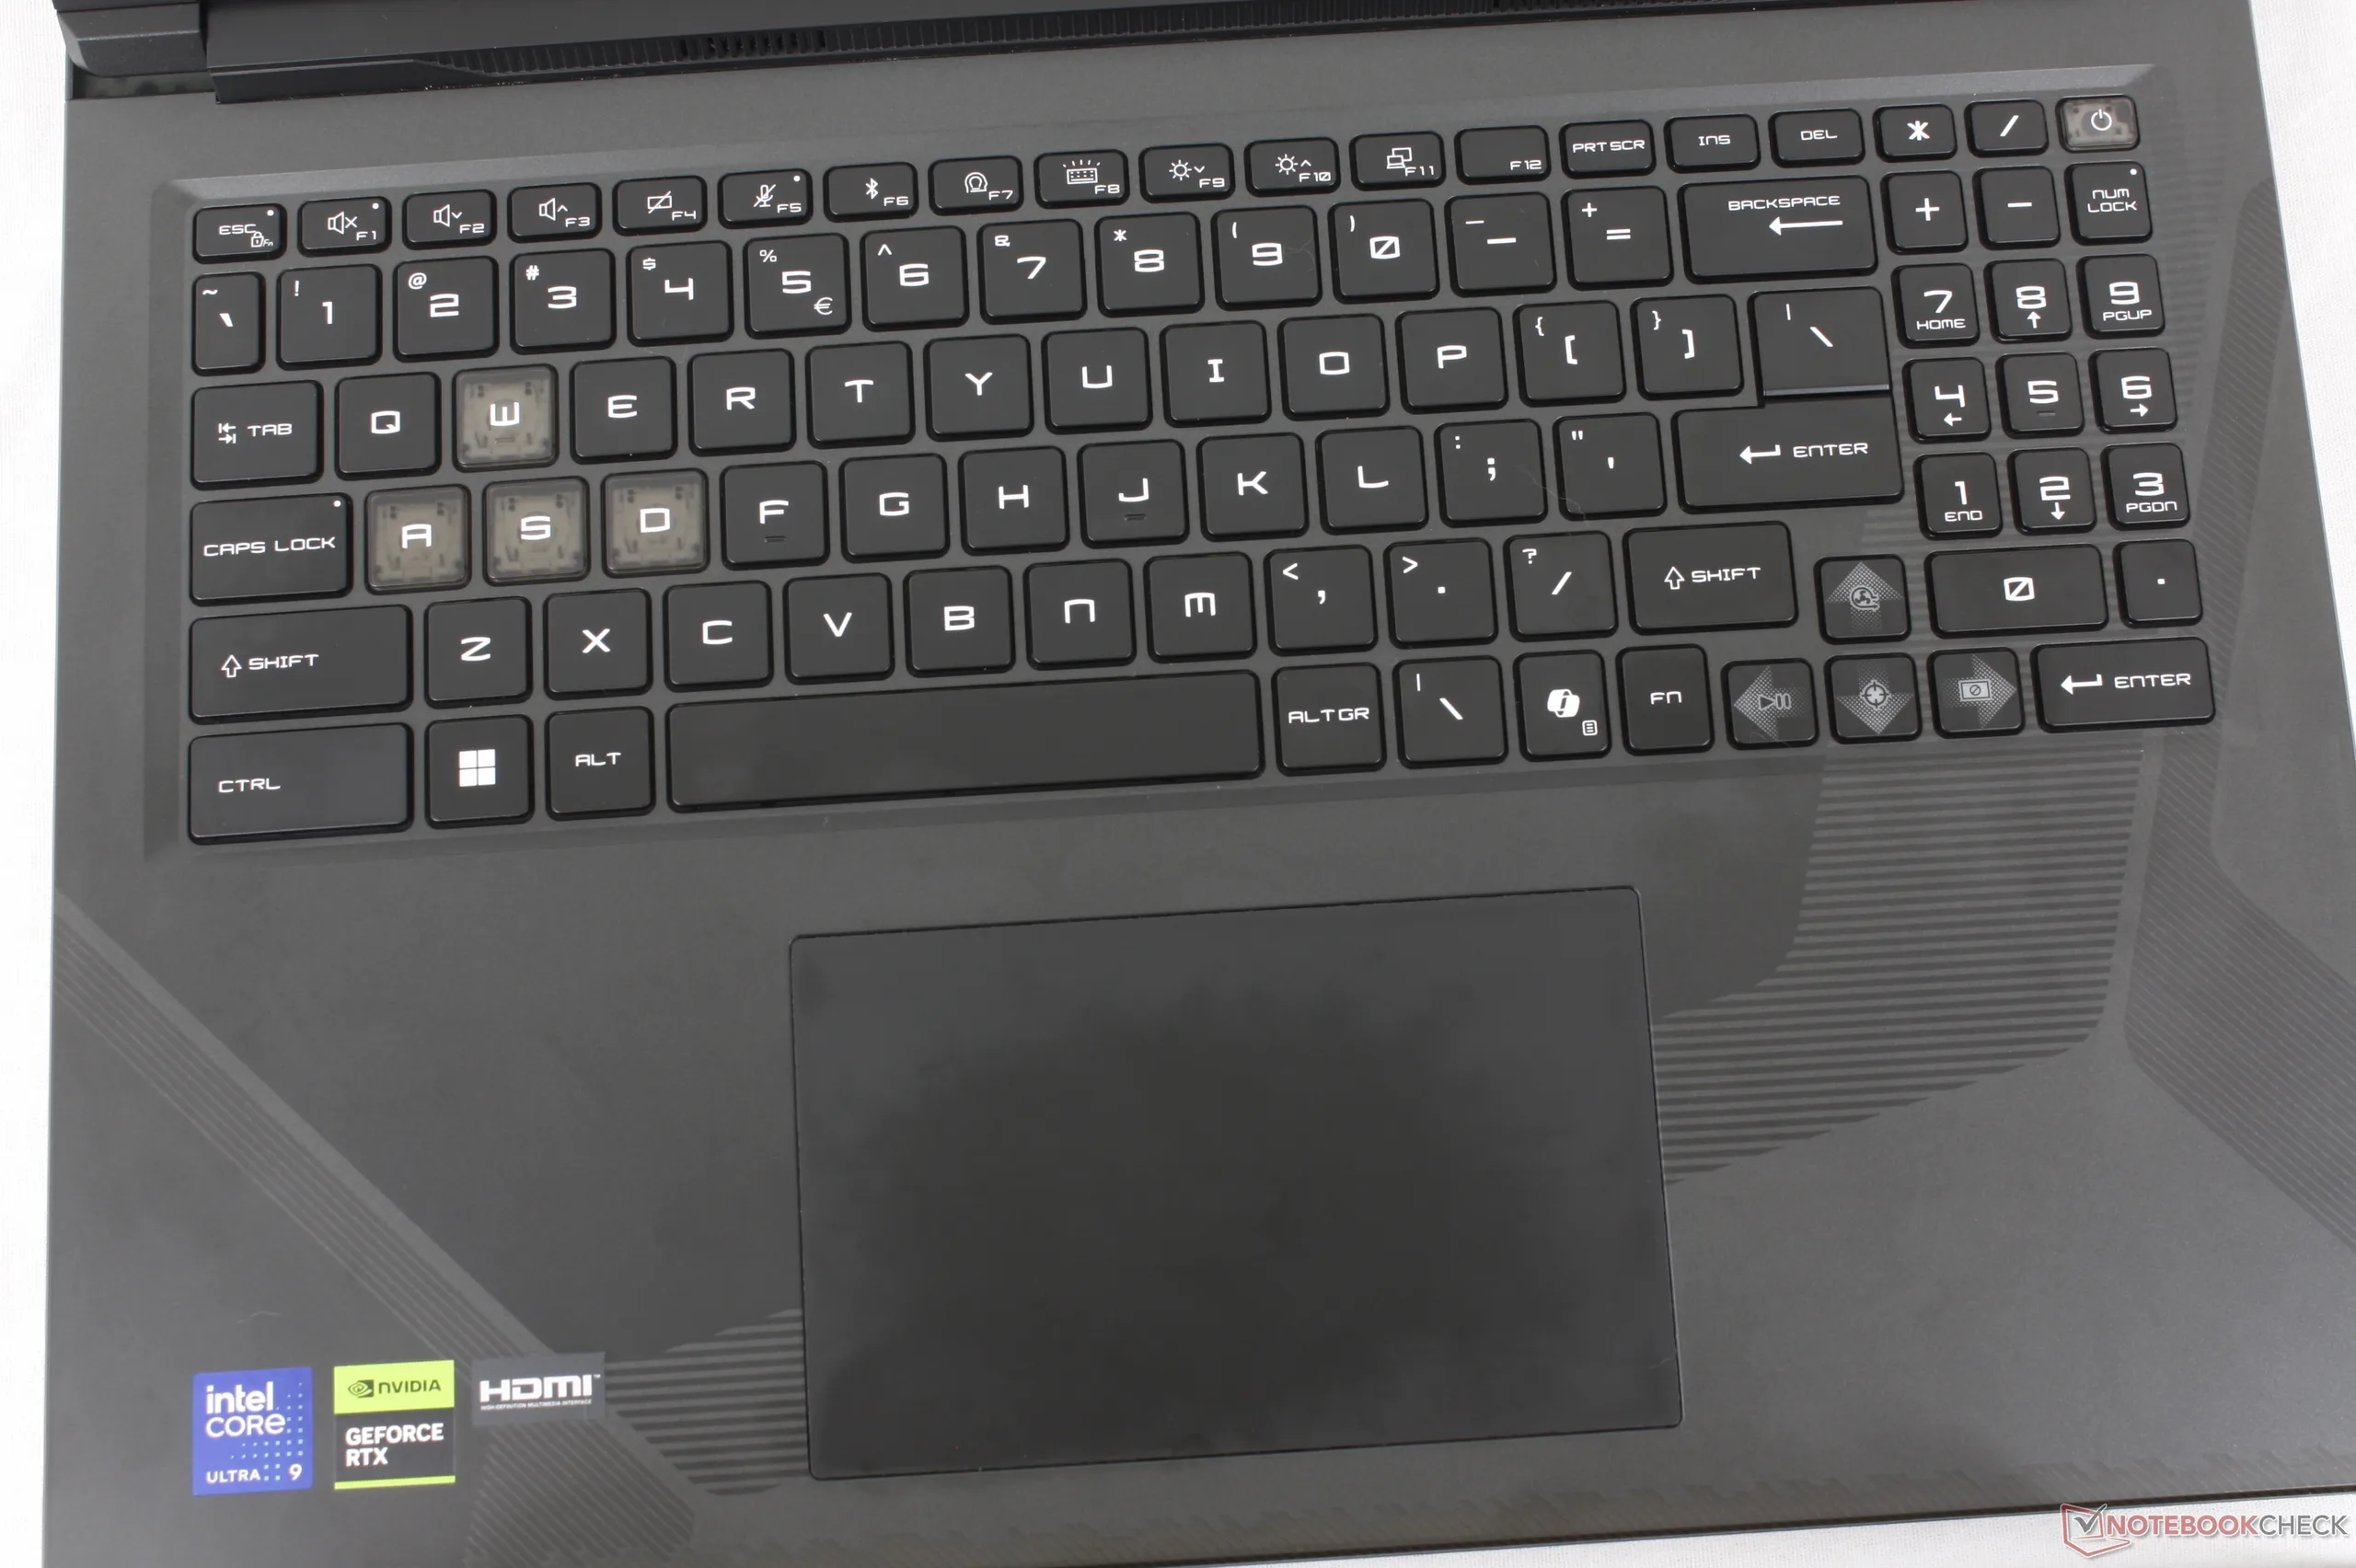
Die Tastatur und das Clickpad des Raider 16 Max HX sind identisch mit denen des Crosshair 16 HX, obwohl es sich bei Letzterem um ein günstigeres Gaming-Modell von MSI handelt. Beim Raider sind die Tasten jedoch mit einer RGB-Beleuchtung pro Taste ausgestattet, so dass der Benutzer sie besser anpassen kann, während das Crosshair über weniger RGB-Zonen verfügt.
Display

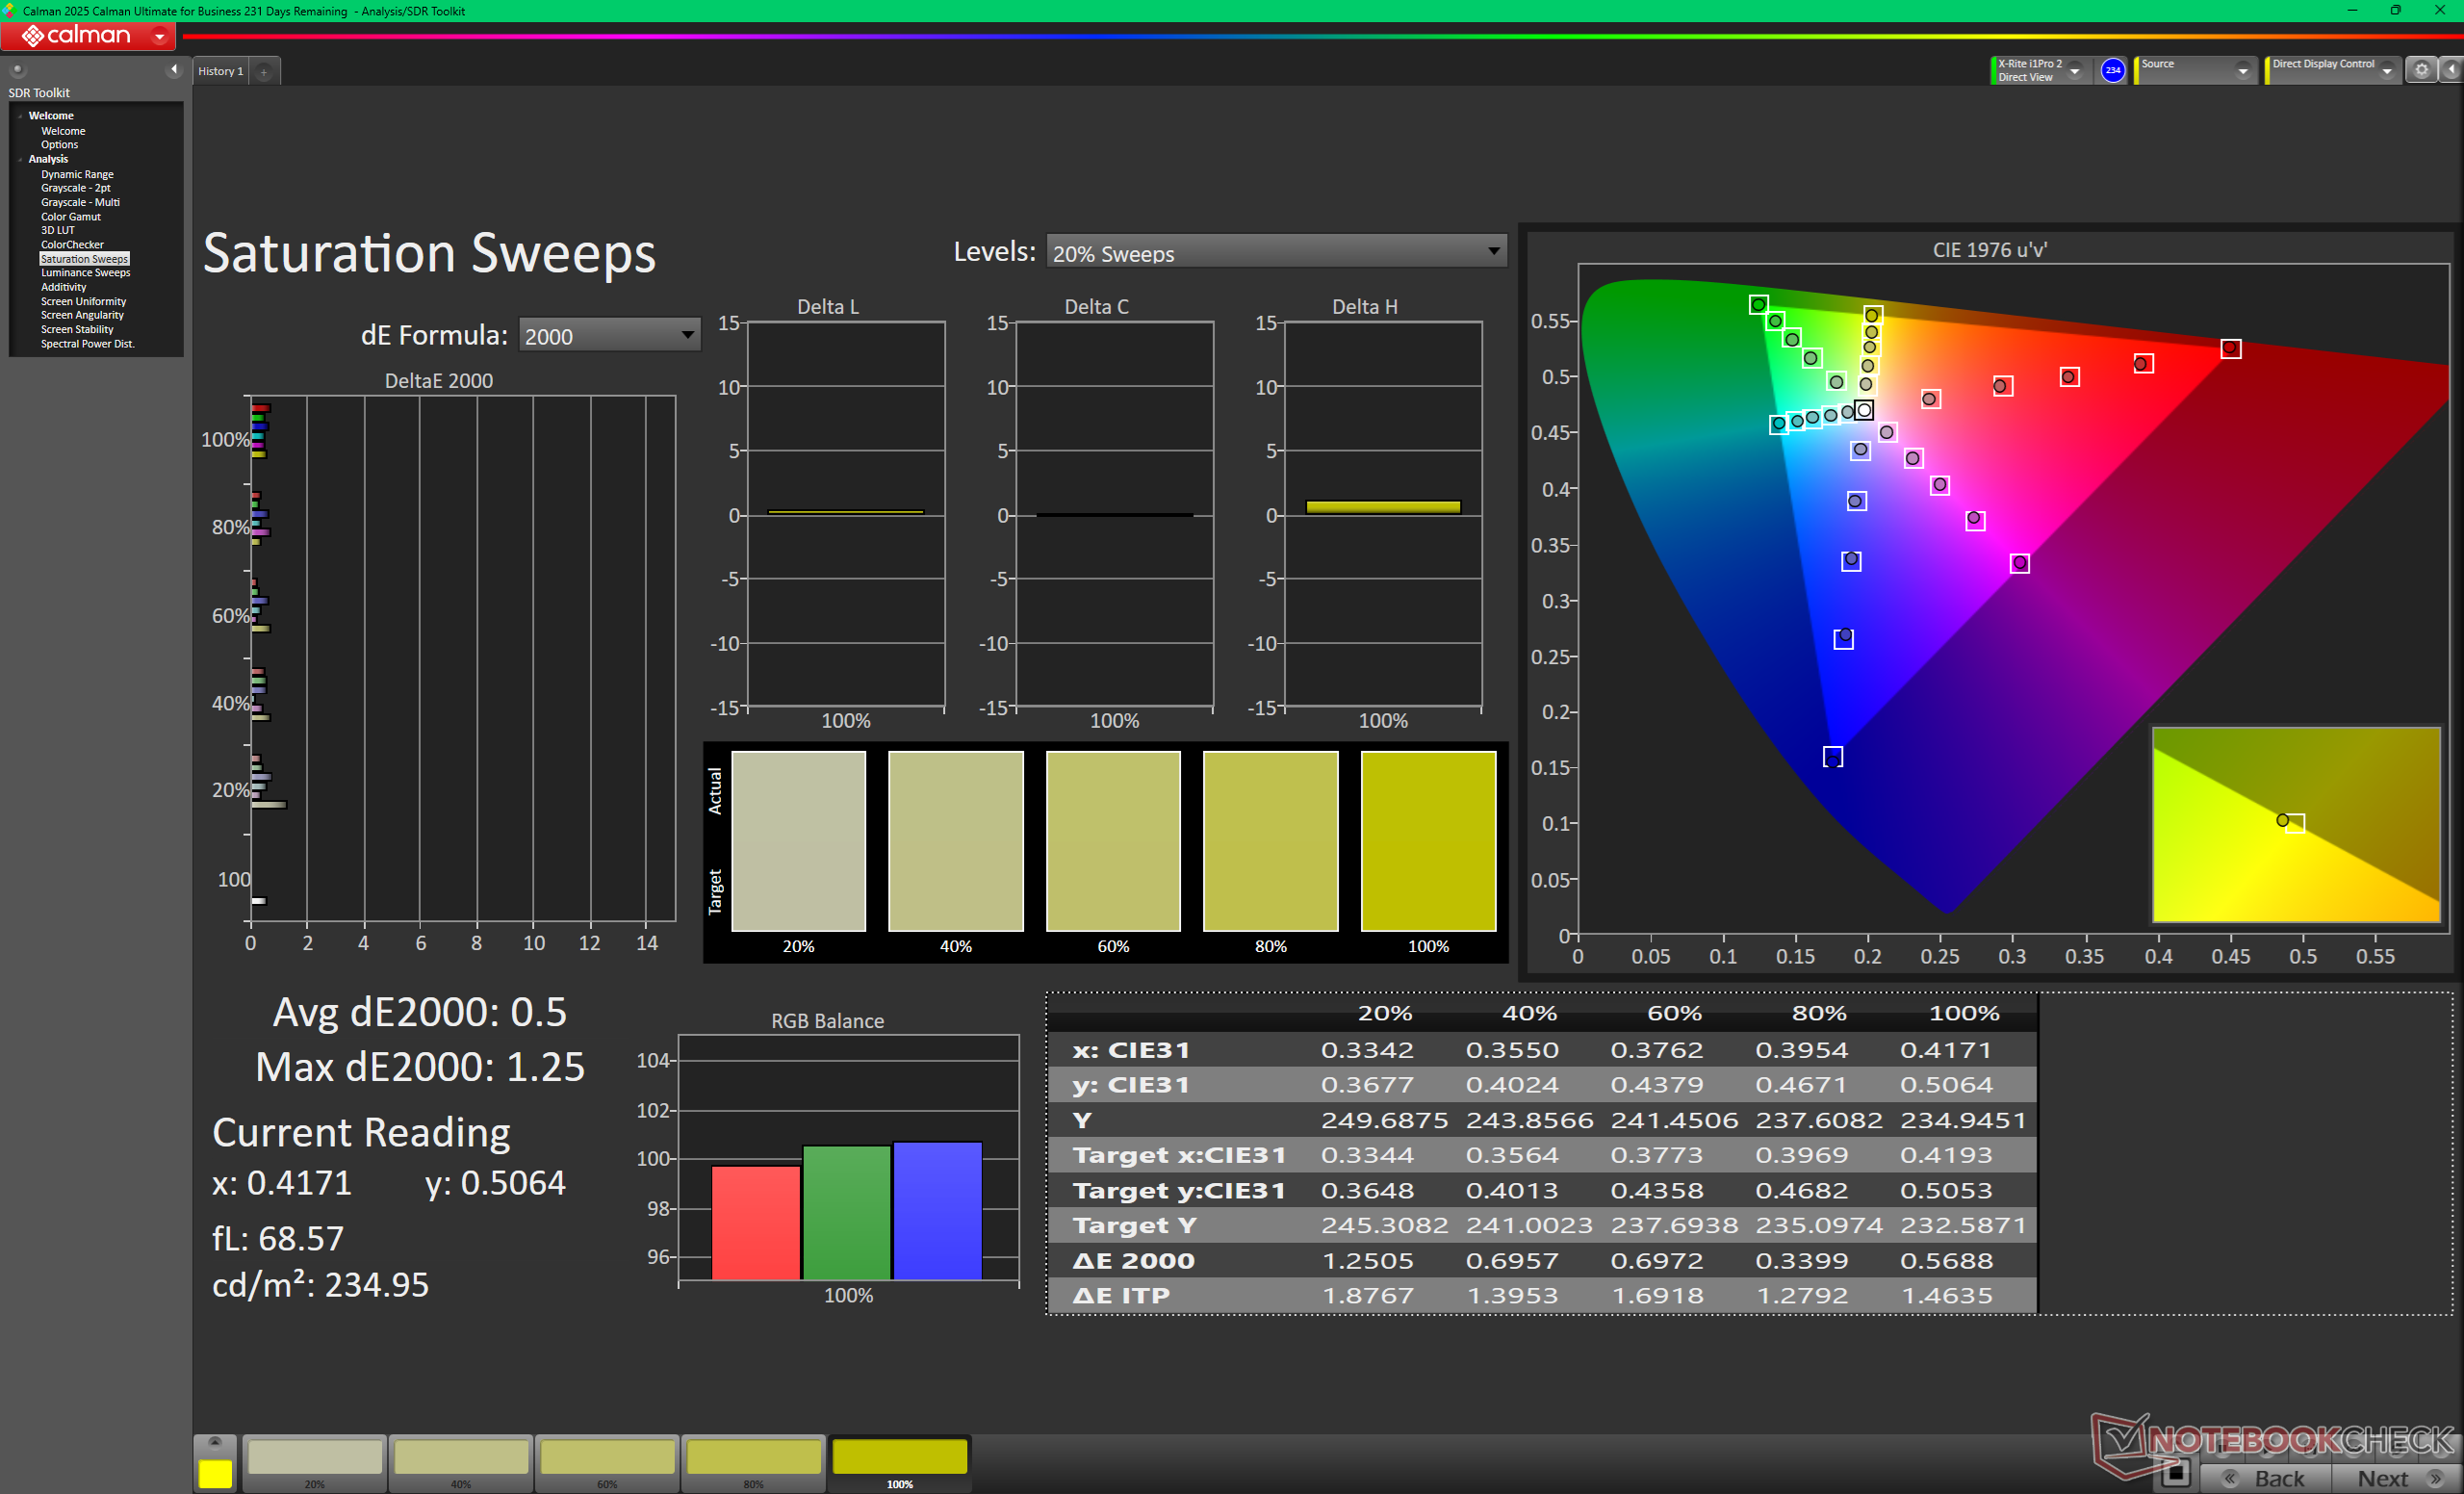
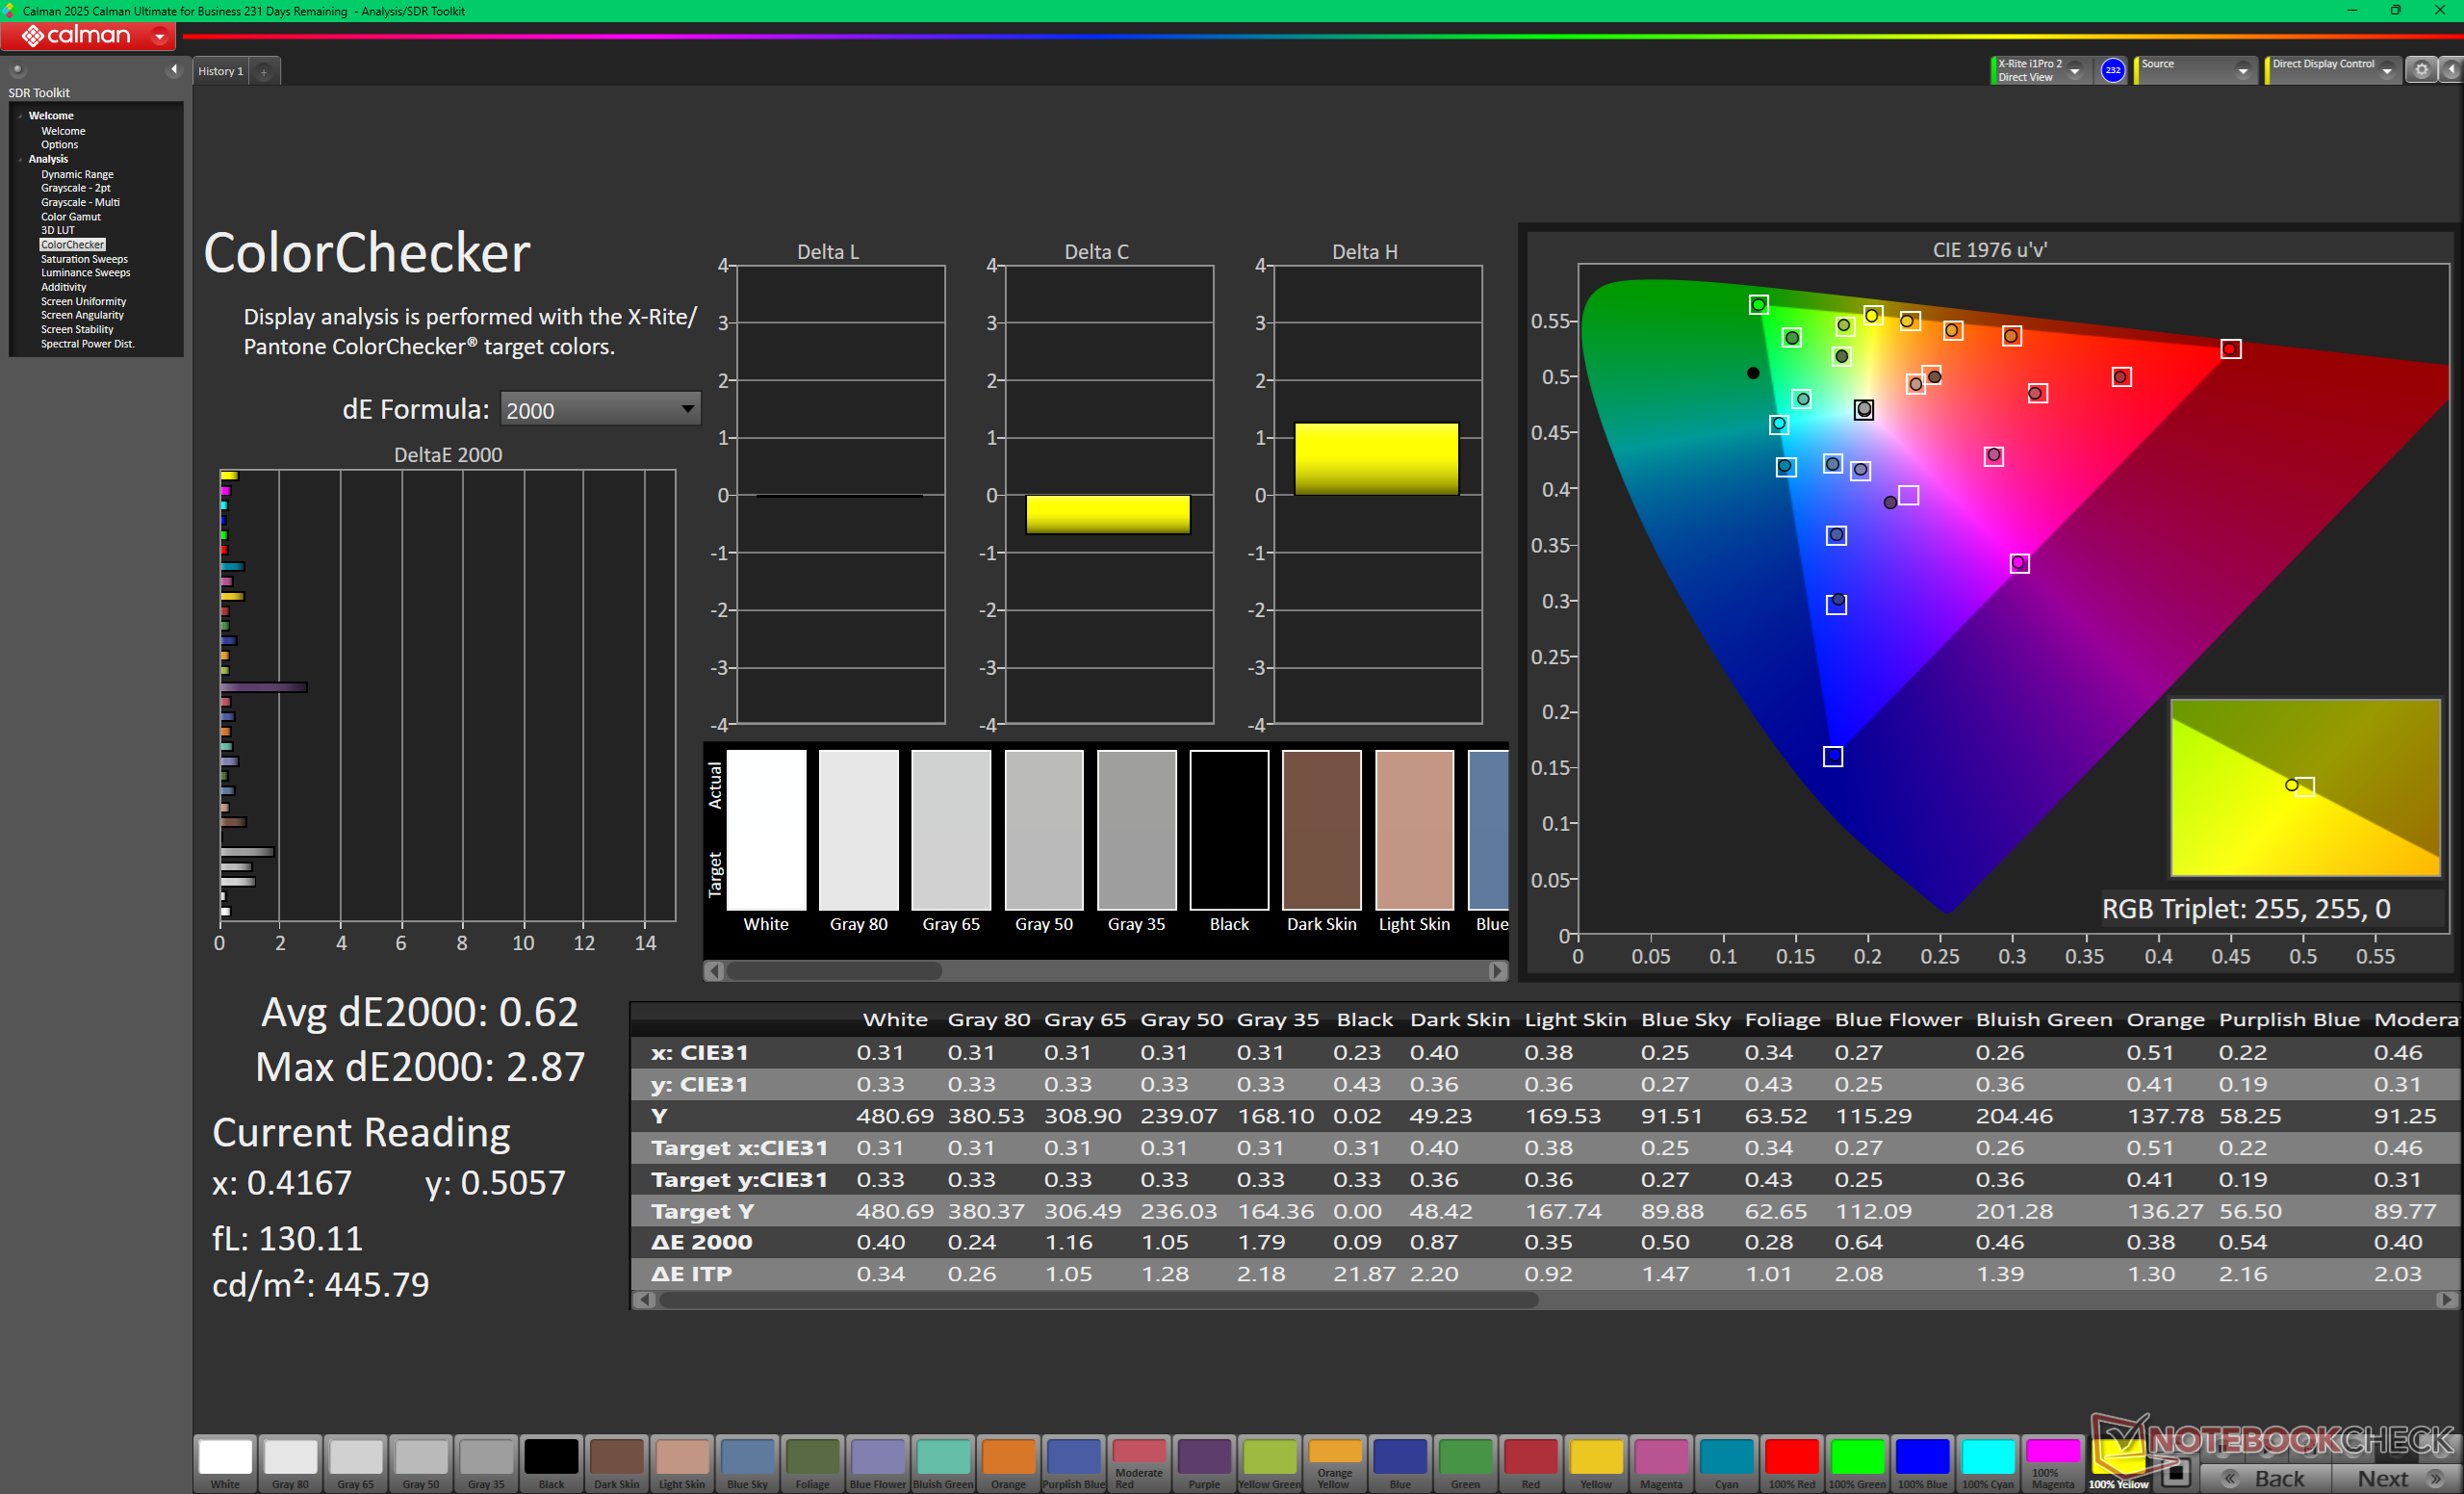
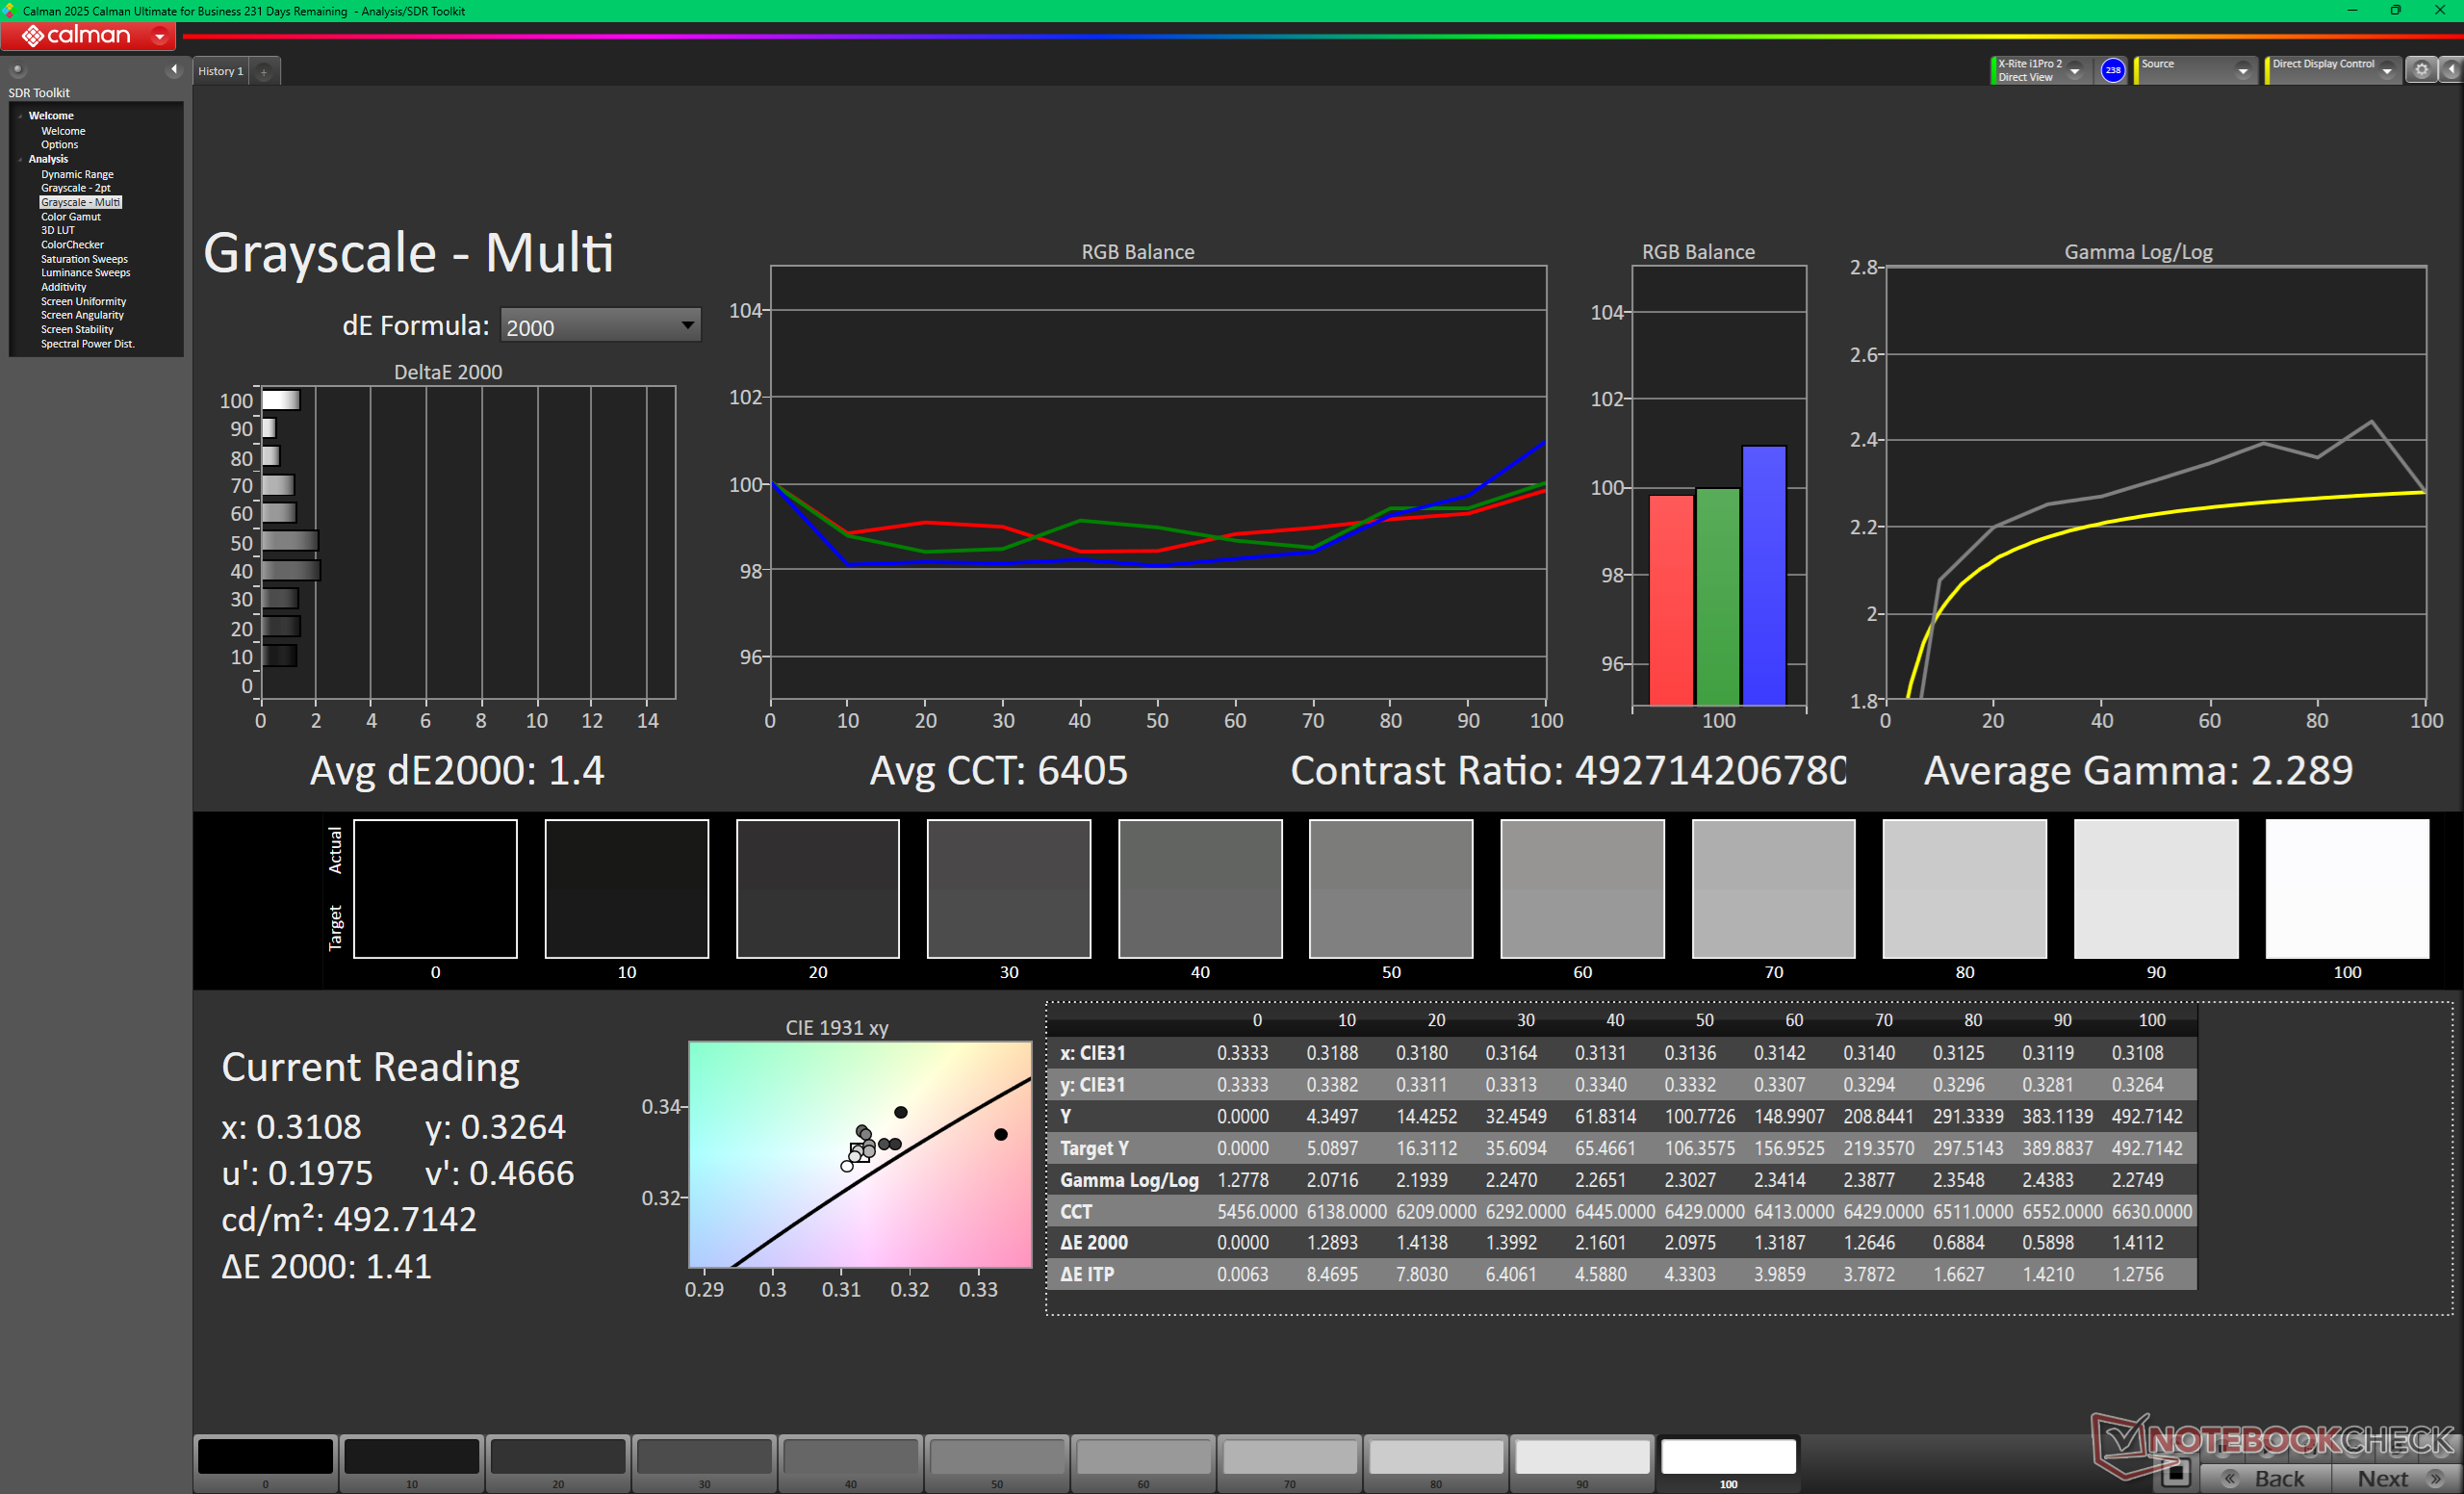
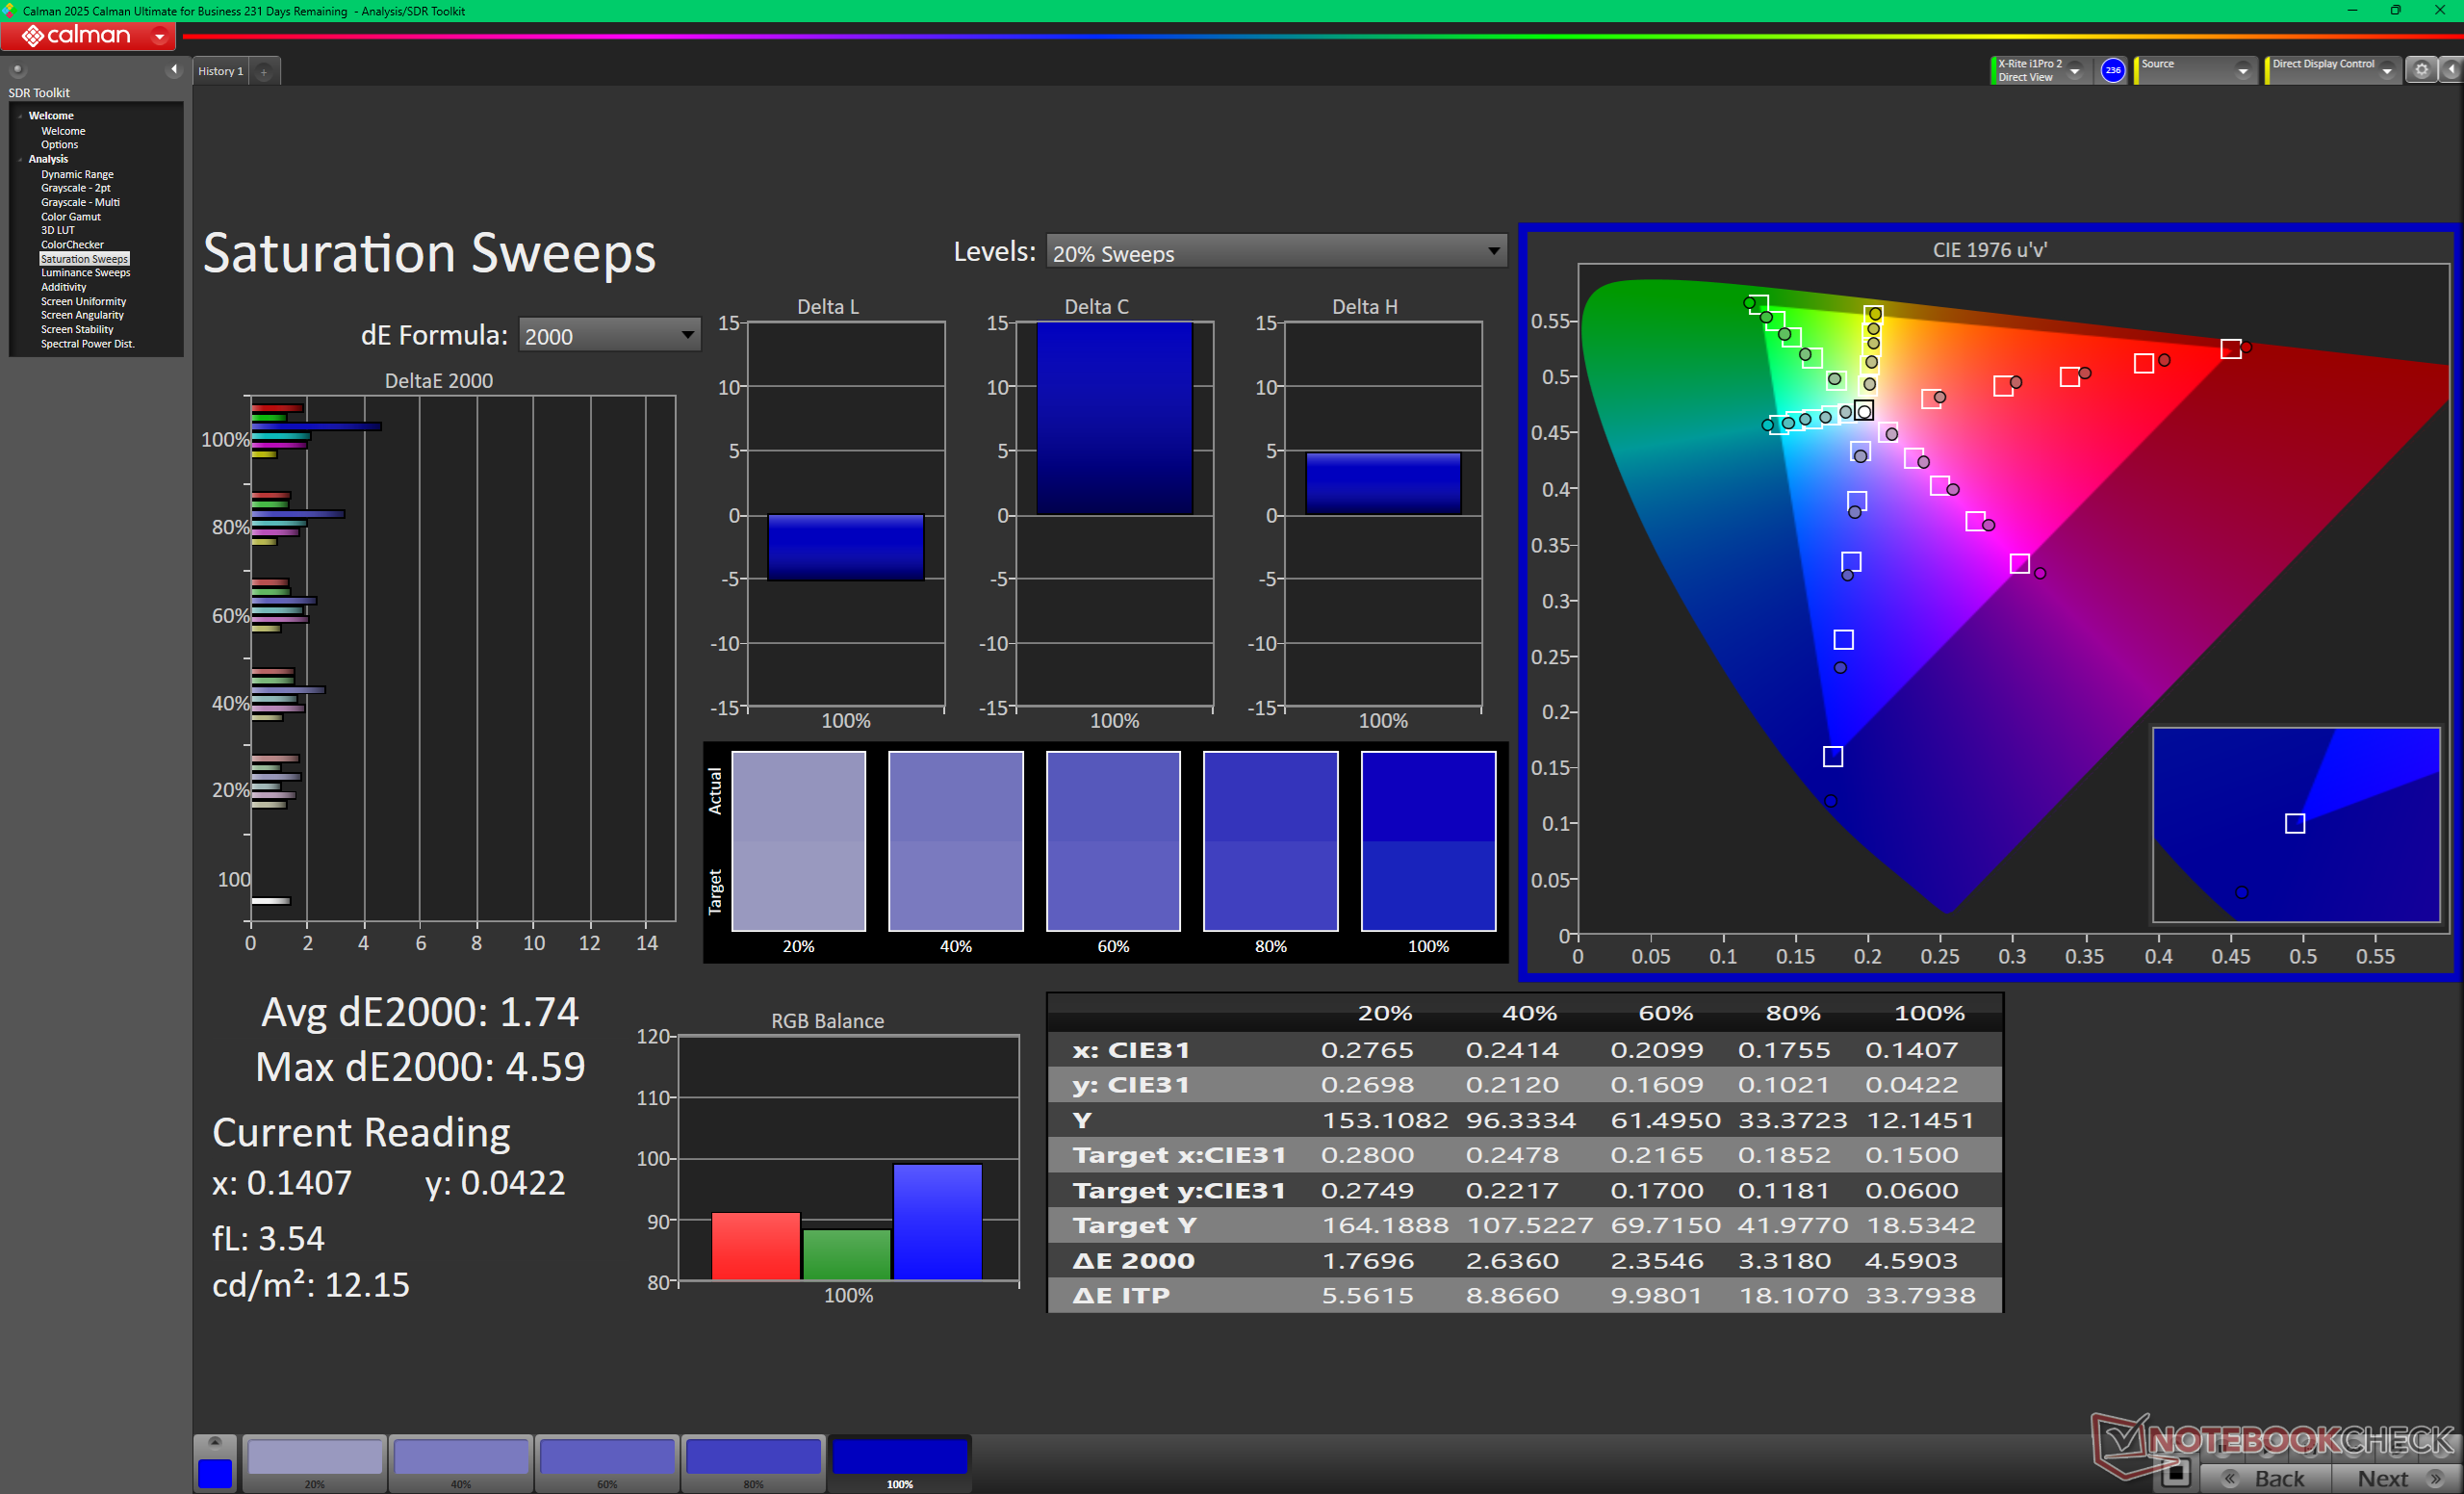
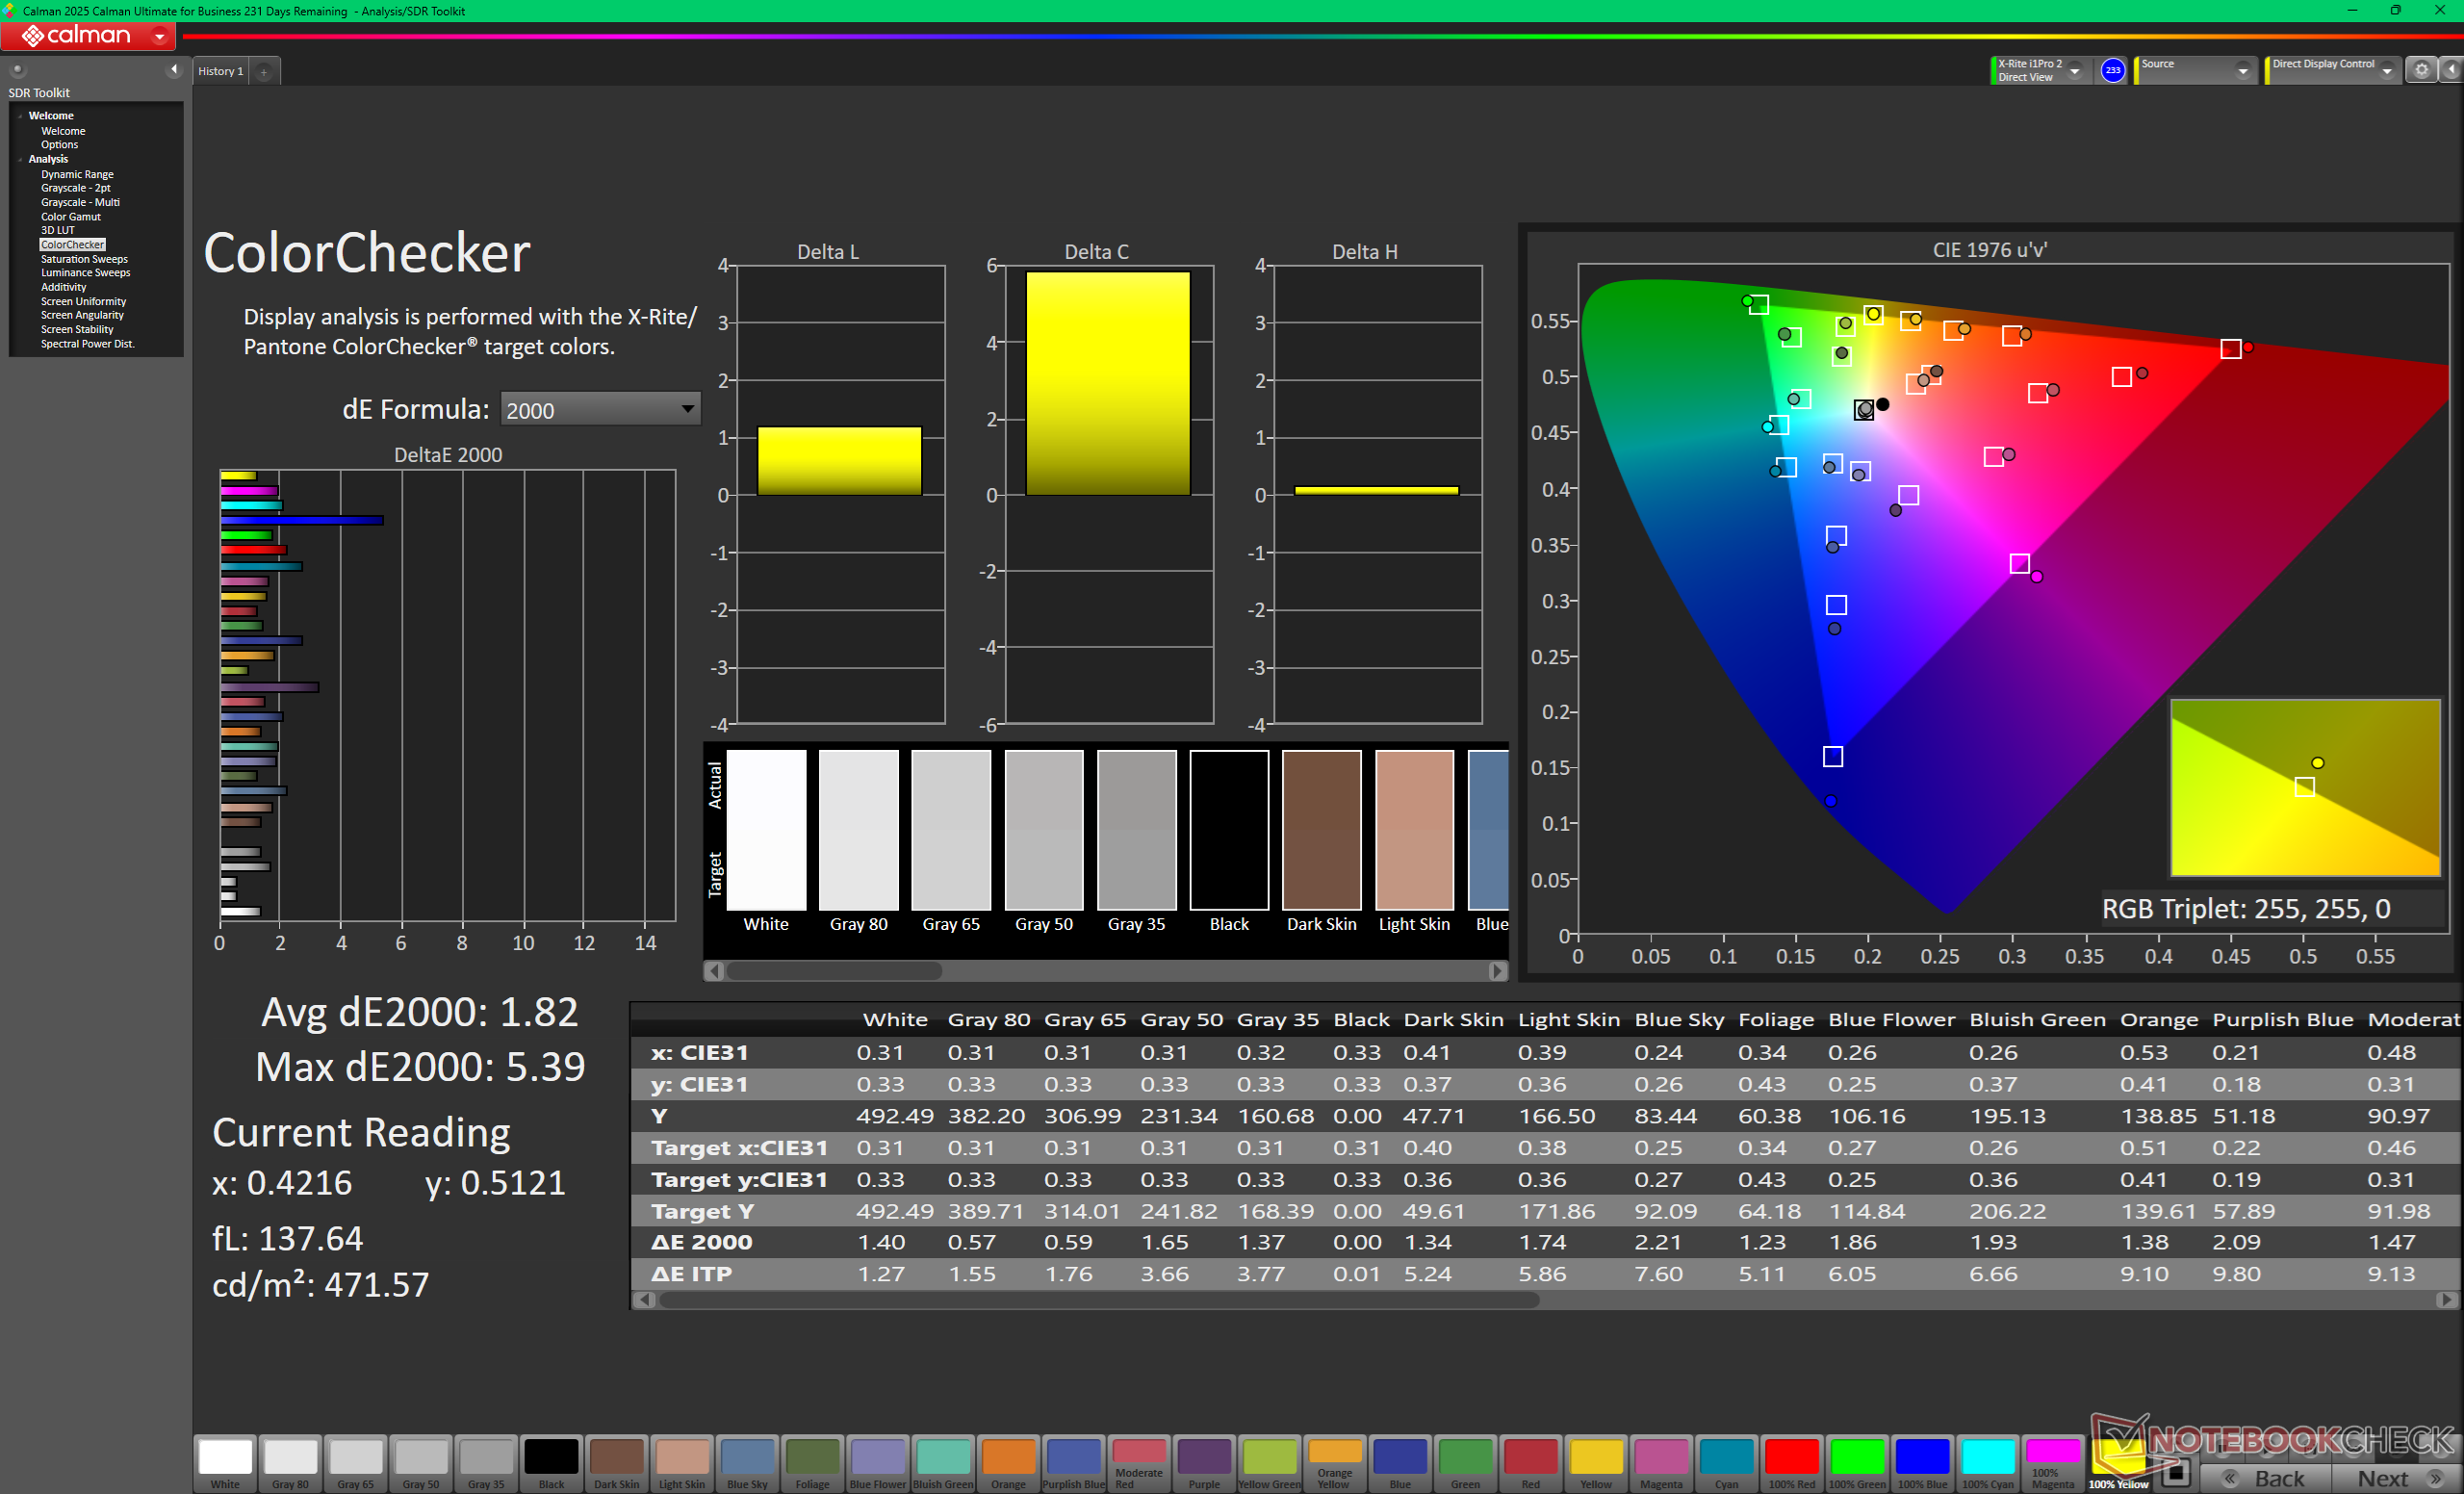
MSI setzt bei vielen seiner Gaming-Notebooks zunehmend auf OLED anstelle von IPS oder Mini-LED. Beim Raider 16 Max HX ist das 240-Hz-QHD+-OLED-Panel gestochen scharf, mit perfektem Schwarzwert, akkuraten P3-Farben, DisplayHDR1000-Unterstützung und ohne den "Halo"-Effekt, der bei konkurrierenden Mini-LED-Optionen häufig auftritt.
Die beiden größten Nachteile des Displays sind das sehr glänzende Overlay und die fehlende G-Sync-Unterstützung im Gegensatz zu den meisten älteren MSI Gaming-Laptops, bei denen matte Panels verwendet wurden. Man sollte sich darauf einstellen, dass man beim Spielen in hellen Innenräumen geblendet wird.
| |||||||||||||||||||||||||
Ausleuchtung: 98 %
Helligkeit Akku: 478.6 cd/m²
Kontrast: ∞:1 (Schwarzwert: 0 cd/m²)
ΔE ColorChecker Calman: 0.62 | ∀{0.5-29.43 Ø4.71}
ΔE Greyscale Calman: 0.7 | ∀{0.09-98 Ø4.96}
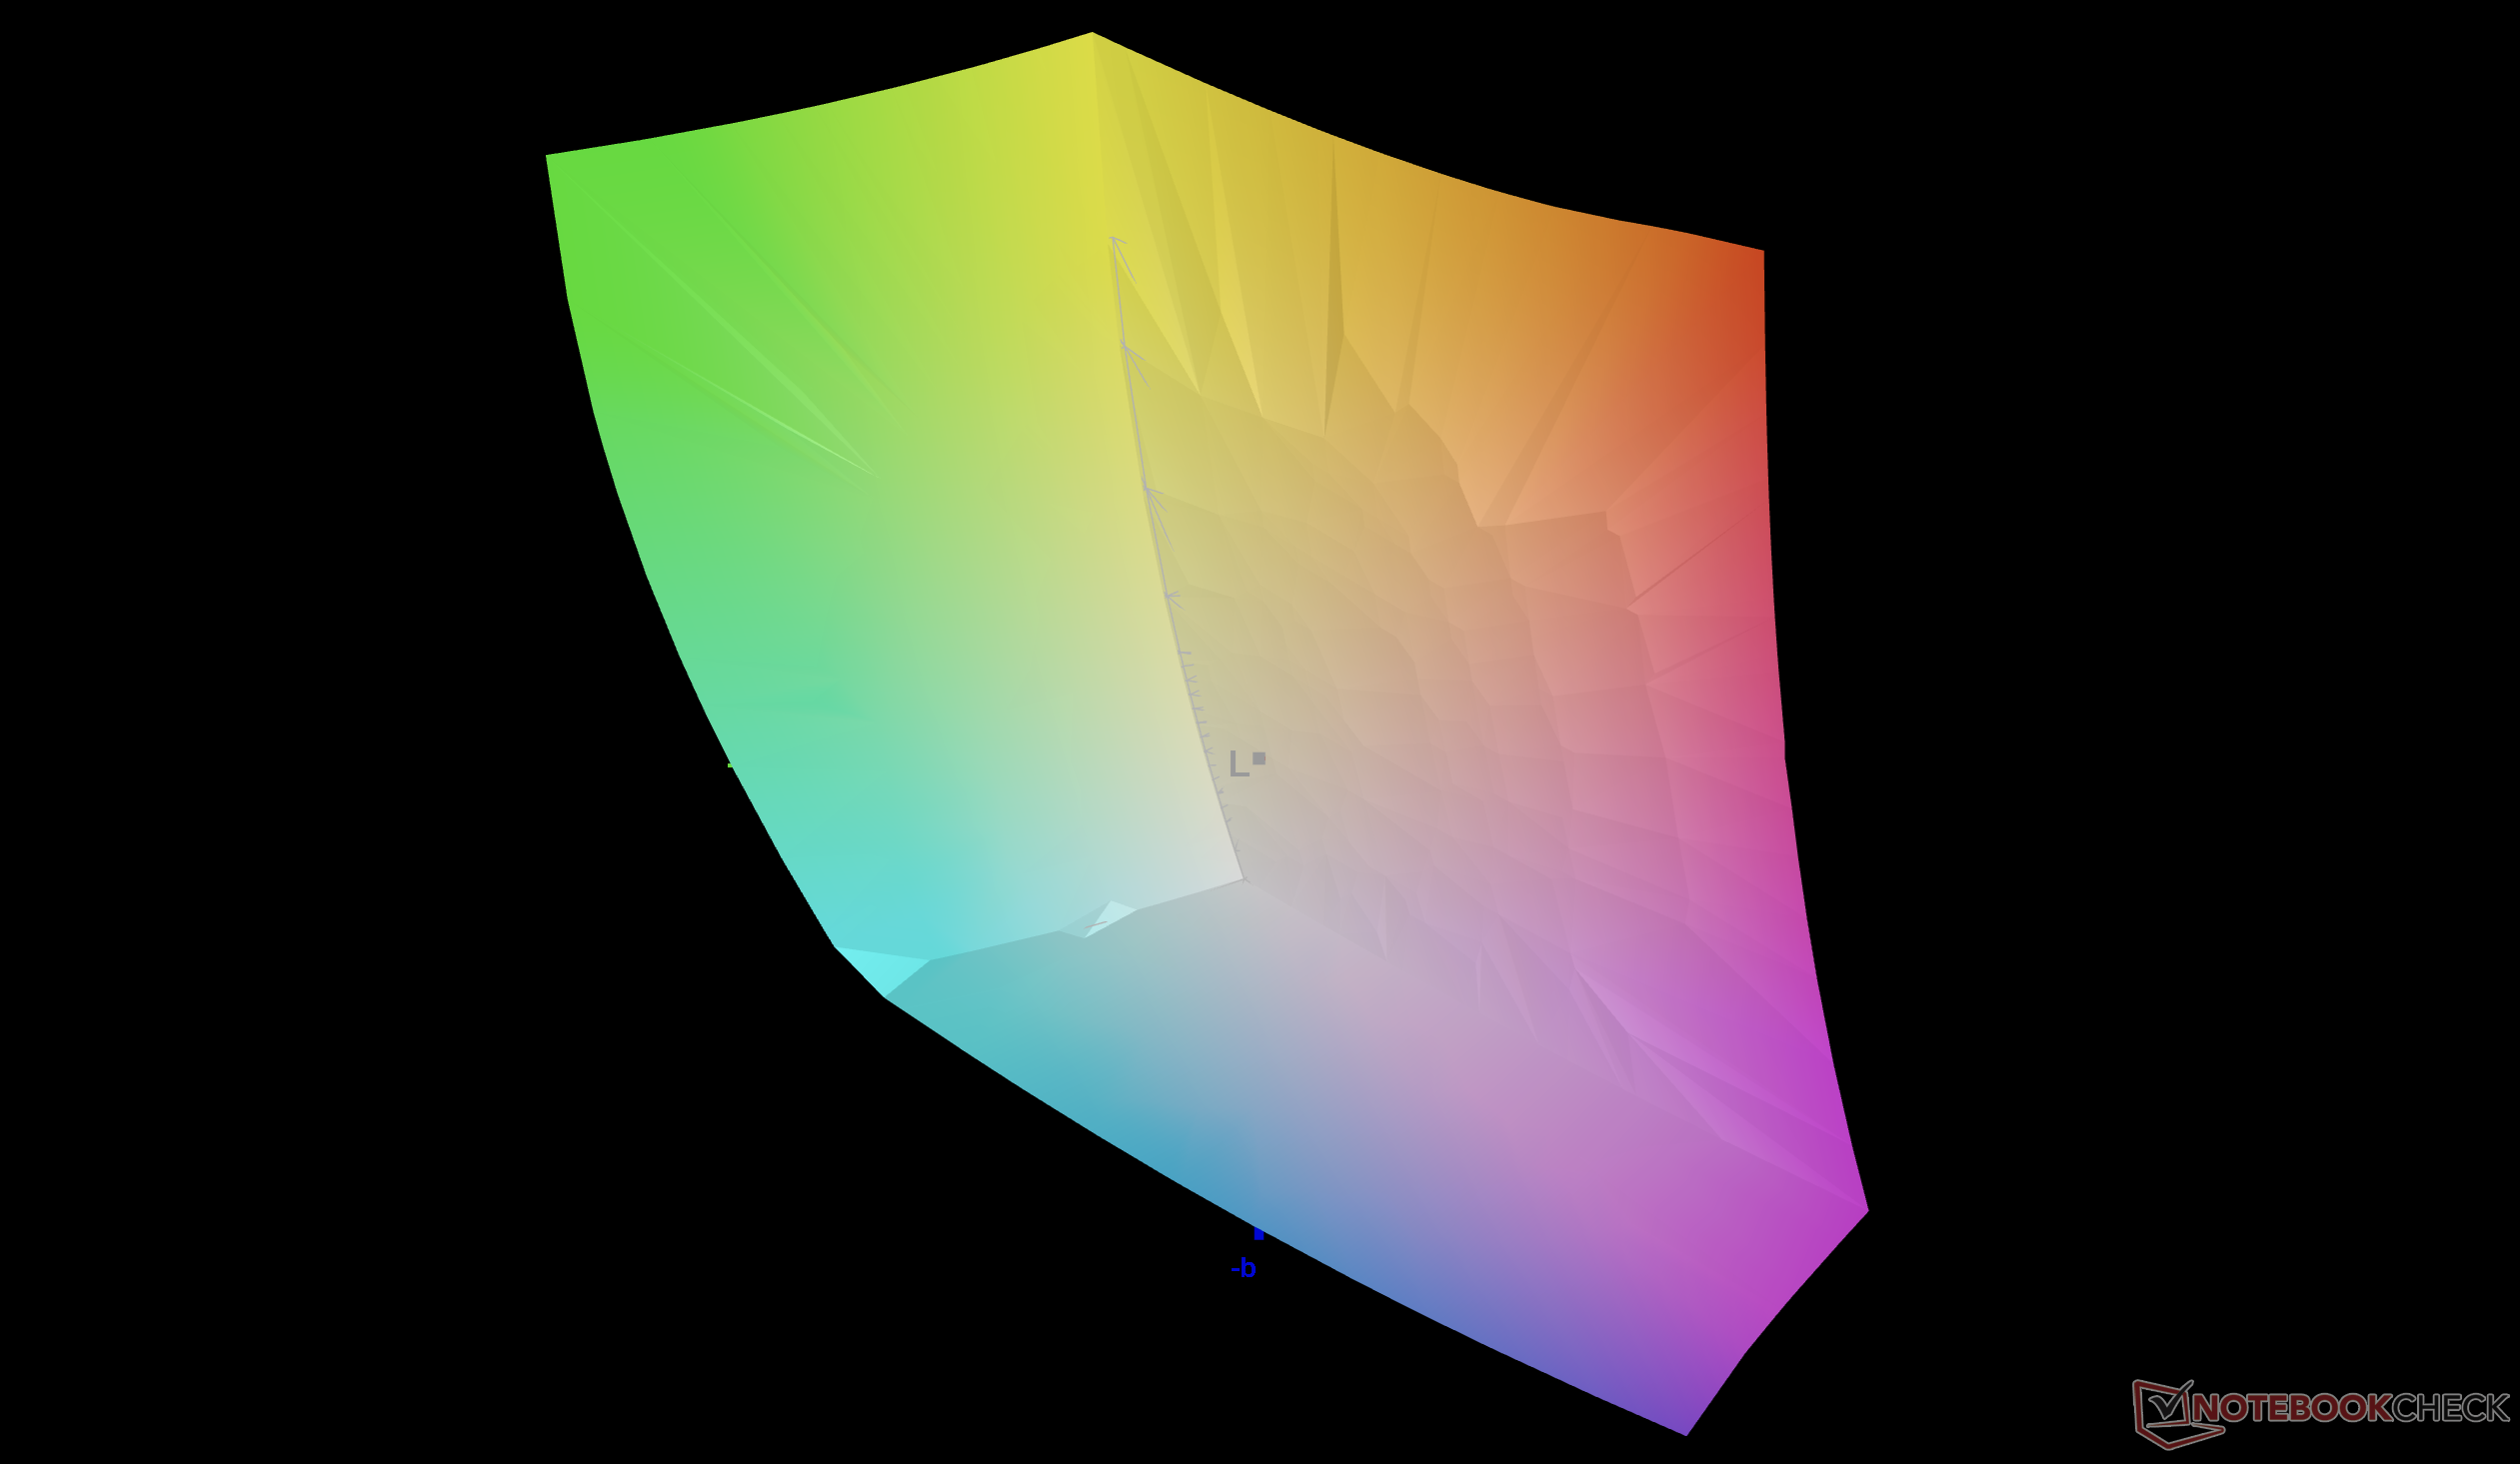
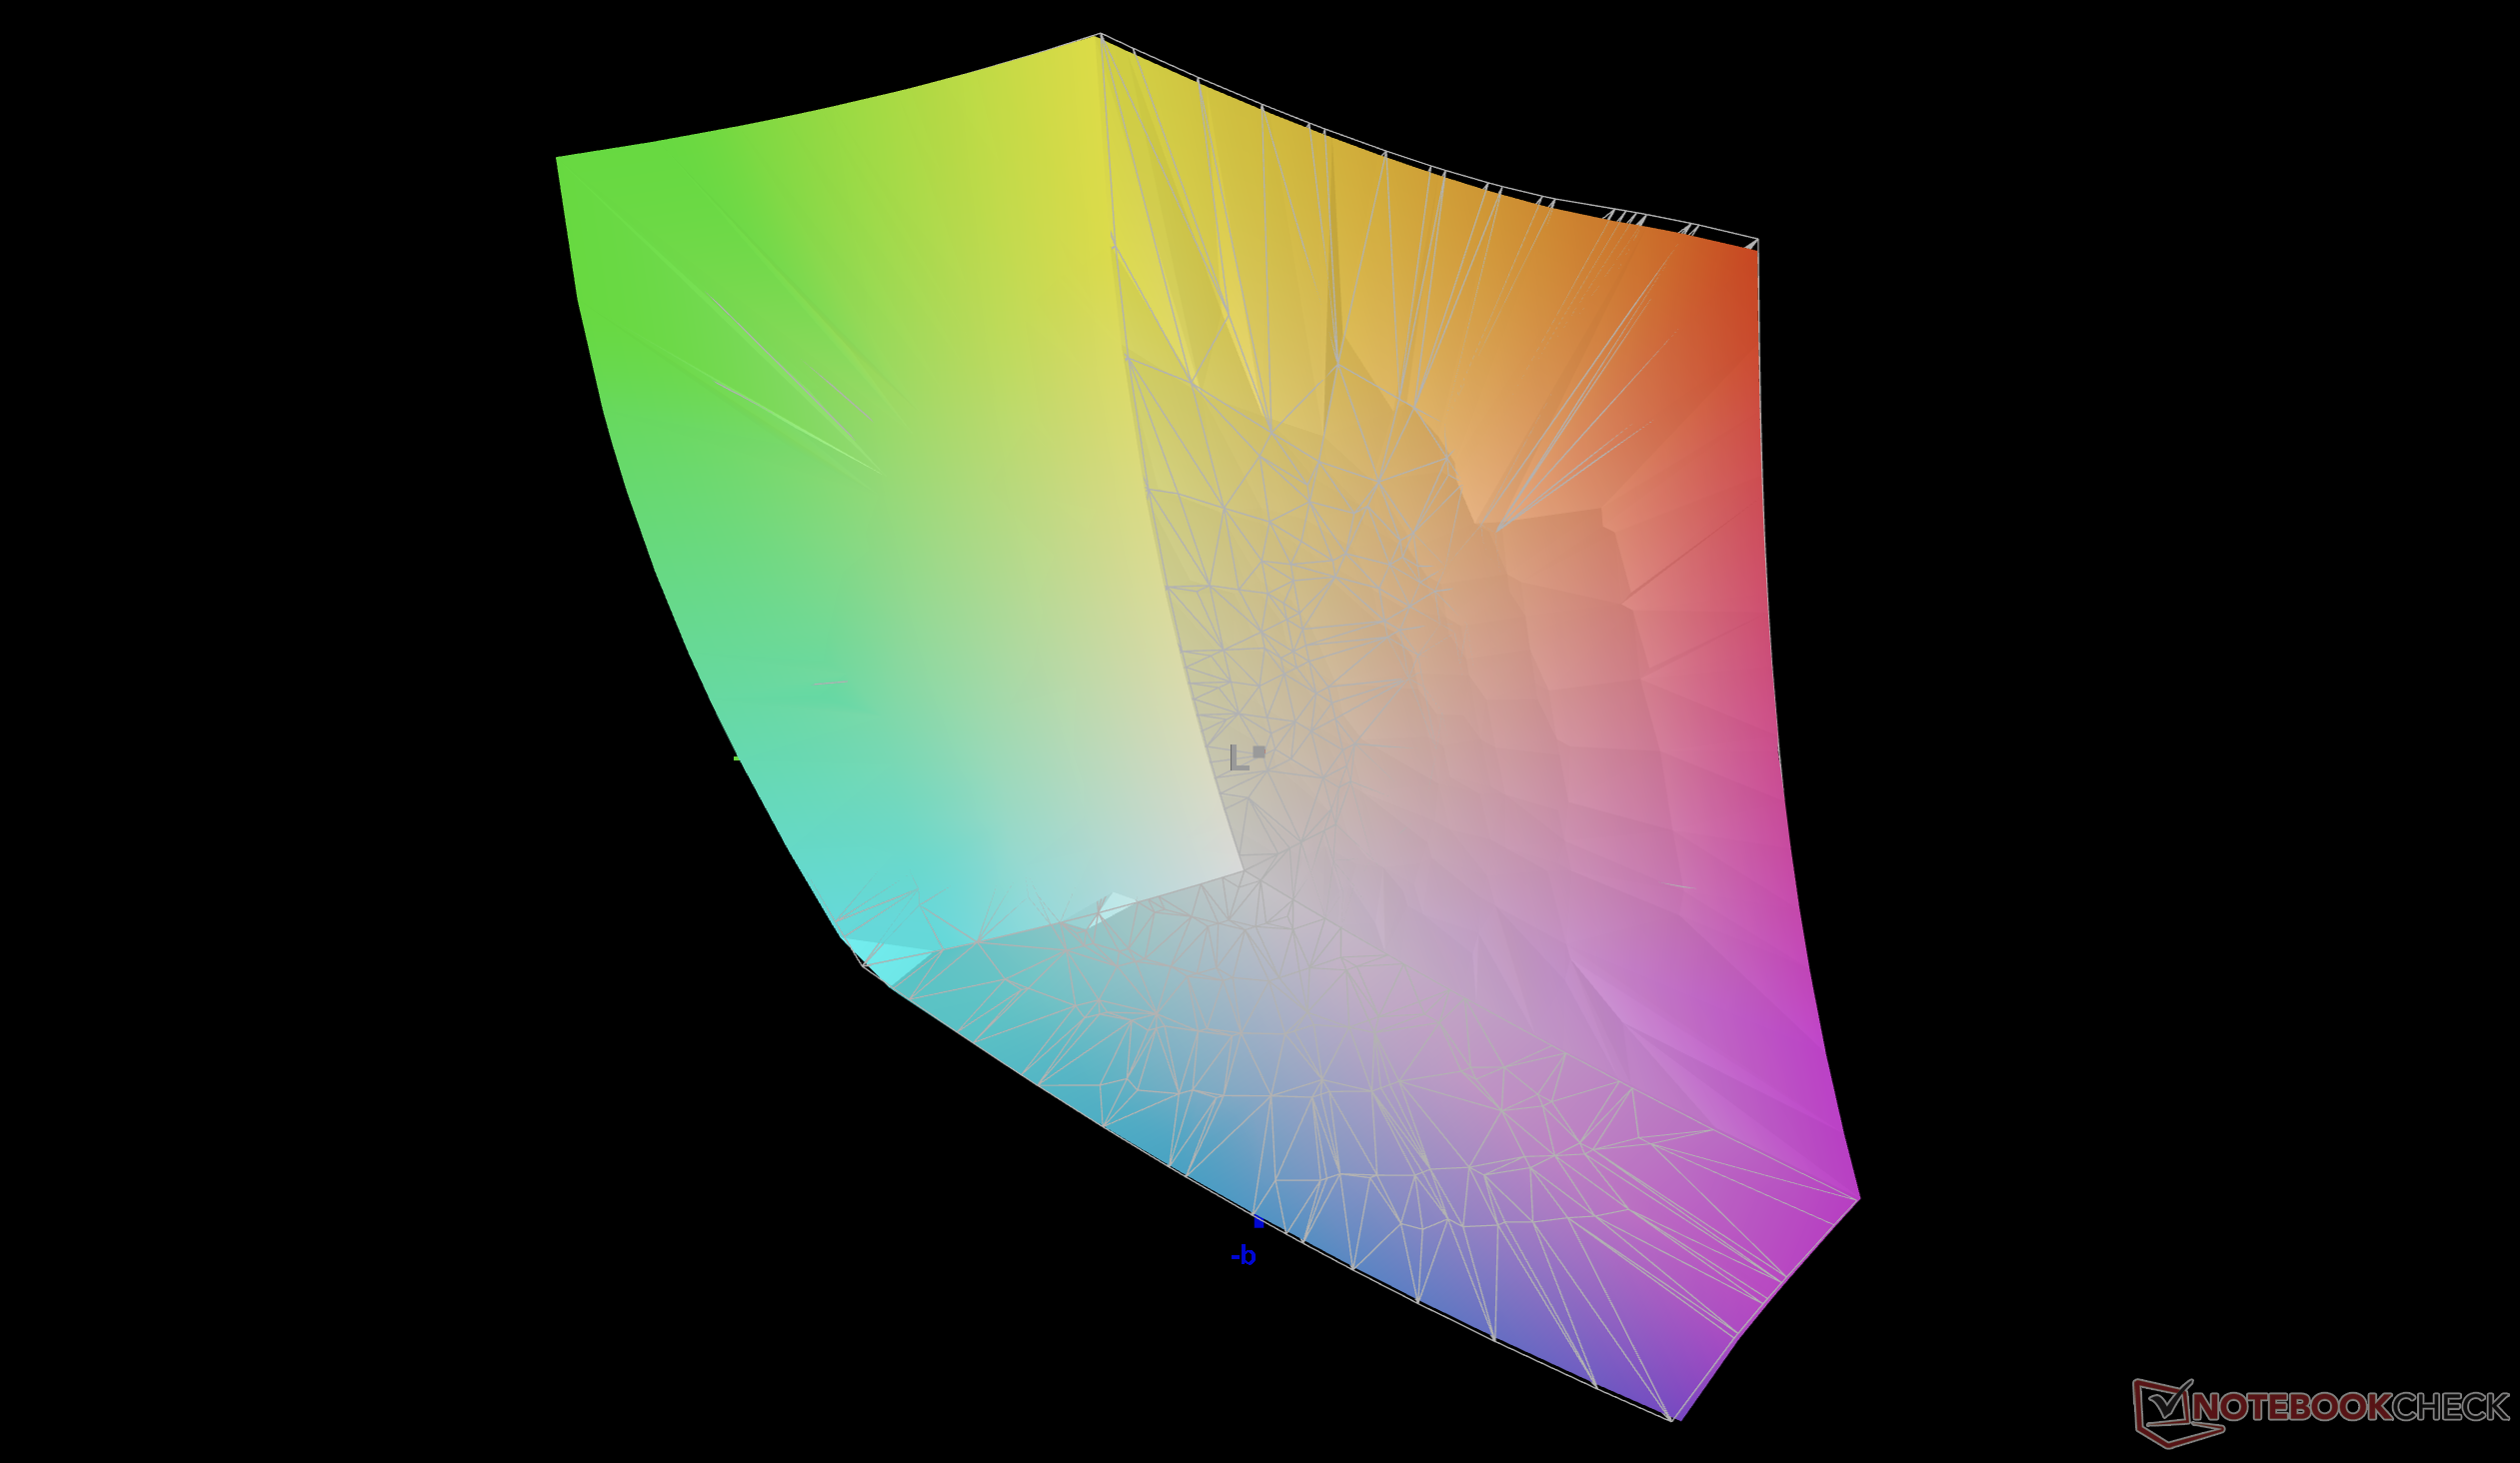
87.5% AdobeRGB 1998 (Argyll 3D)
99.9% sRGB (Argyll 3D)
99.3% Display P3 (Argyll 3D)
Gamma: 2.16
CCT: 6535 K
| MSI Raider 16 Max HX B2WJ Samsung ATNA60HU01-0, OLED, 2560x1600, 16", 240 Hz | MSI Crosshair 16 HX AI D2XWGKG AUO B160QAN02.3, IPS, 2560x1600, 16", 240 Hz | Razer Blade 16 Core Ultra 9 386H Samsung ATNA60HU06-0, OLED, 2560x1600, 16", 240 Hz | Alienware 16X Aurora Core Ultra 9 290HX Plus Samsung 160HU05, OLED, 2560x1600, 16", 240 Hz | Asus TUF Gaming A16 FA608UP MNG007DA5-3, IPS, 2560x1600, 16", 165 Hz | Lenovo Legion 7 16IAX10 Samsung ATNA60HS01-0, OLED, 2560x1600, 16", 165 Hz | |
|---|---|---|---|---|---|---|
| Display | -3% | 2% | 2% | -17% | 2% | |
| Display P3 Coverage (%) | 99.3 | 95.5 -4% | 99.7 0% | 99.6 0% | 69.4 -30% | 99.6 0% |
| sRGB Coverage (%) | 99.9 | 99.7 0% | 100 0% | 100 0% | 97.2 -3% | 100 0% |
| AdobeRGB 1998 Coverage (%) | 87.5 | 83.9 -4% | 93.5 7% | 93.9 7% | 71.9 -18% | 93.5 7% |
| Response Times | -1450% | 2% | -1% | -1641% | -62% | |
| Response Time Grey 50% / Grey 80% * (ms) | 0.28 ? | 3.59 ? -1182% | 0.28 ? -0% | 0.29 ? -4% | 6.3 ? -2150% | 0.6 ? -114% |
| Response Time Black / White * (ms) | 0.39 ? | 7.09 ? -1718% | 0.4 ? -3% | 0.45 ? -15% | 4.8 ? -1131% | 0.8 ? -105% |
| PWM Frequency (Hz) | 1440 ? | 1441 | 1439.8 ? | 1317 ? | ||
| PWM Amplitude * (%) | 35 | 32 9% | 29 17% | 23 34% | ||
| Bildschirm | -326% | -81% | -105% | -33% | -91% | |
| Helligkeit Bildmitte (cd/m²) | 478.6 | 472 -1% | 462.2 -3% | 380.5 -20% | 480 0% | 477.6 0% |
| Brightness (cd/m²) | 481 | 438 -9% | 465 -3% | 384 -20% | 456 -5% | 483 0% |
| Brightness Distribution (%) | 98 | 88 -10% | 97 -1% | 98 0% | 91 -7% | 95 -3% |
| Schwarzwert * (cd/m²) | 0.4 | 0.32 | ||||
| Delta E Colorchecker * | 0.62 | 6.07 -879% | 3.03 -389% | 3.27 -427% | 1.4 -126% | 3.11 -402% |
| Colorchecker dE 2000 max. * | 2.87 | 9.76 -240% | 5.84 -103% | 6.31 -120% | 2.5 13% | 5.99 -109% |
| Delta E Graustufen * | 0.7 | 6.4 -814% | 0.6 14% | 1 -43% | 1.2 -71% | 0.9 -29% |
| Gamma | 2.16 102% | 2.52 87% | 2.2 100% | 2.23 99% | 2.16 102% | 2.18 101% |
| CCT | 6535 99% | 7987 81% | 6452 101% | 6410 101% | 6620 98% | 6405 101% |
| Kontrast (:1) | 1180 | 1500 | ||||
| Colorchecker dE 2000 calibrated * | 2.25 | 0.6 | 1.1 | 1.3 | 0.79 | |
| Durchschnitt gesamt (Programm / Settings) | -593% /
-442% | -26% /
-39% | -35% /
-52% | -564% /
-321% | -50% /
-60% |
* ... kleinere Werte sind besser

Reaktionszeiten (Response Times) des Displays
| ↔ Reaktionszeiten Schwarz zu Weiß | ||
|---|---|---|
| 0.39 ms ... steigend ↗ und fallend ↘ kombiniert | ↗ 0.21 ms steigend | 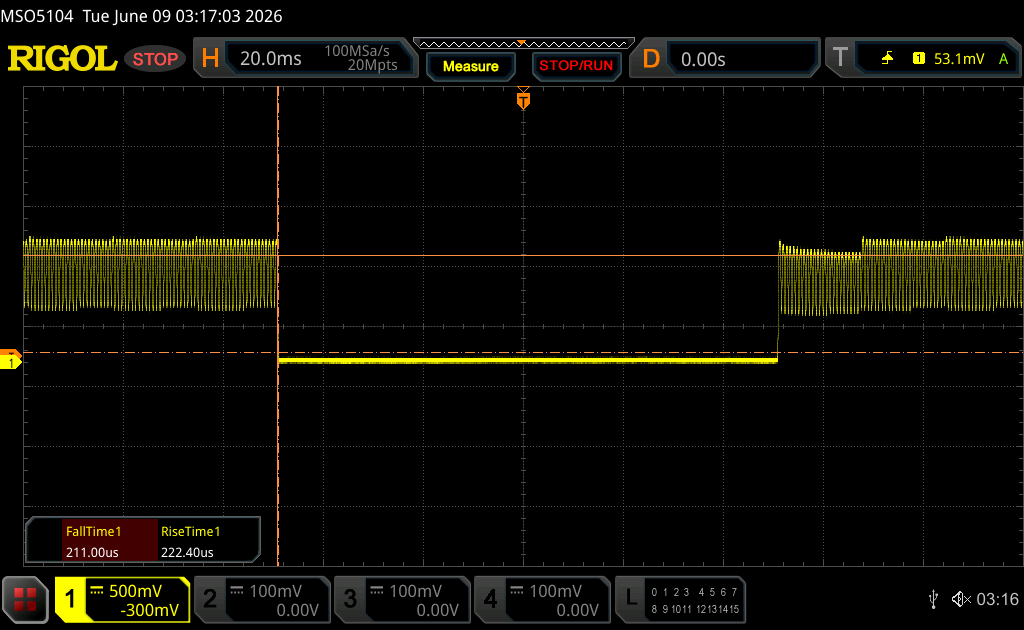 |
| ↘ 0.18 ms fallend | ||
| Die gemessenen Reaktionszeiten sind sehr kurz, wodurch sich der Bildschirm auch für schnelle 3D Spiele eignen sollte. Im Vergleich rangierten die bei uns getesteten Geräte von 0.1 (Minimum) zu 240 (Maximum) ms. » 0 % aller Screens waren schneller als der getestete. Daher sind die gemessenen Reaktionszeiten besser als der Durchschnitt aller vermessenen Geräte (19.8 ms). | ||
| ↔ Reaktionszeiten 50% Grau zu 80% Grau | ||
| 0.28 ms ... steigend ↗ und fallend ↘ kombiniert | ↗ 0.14 ms steigend | 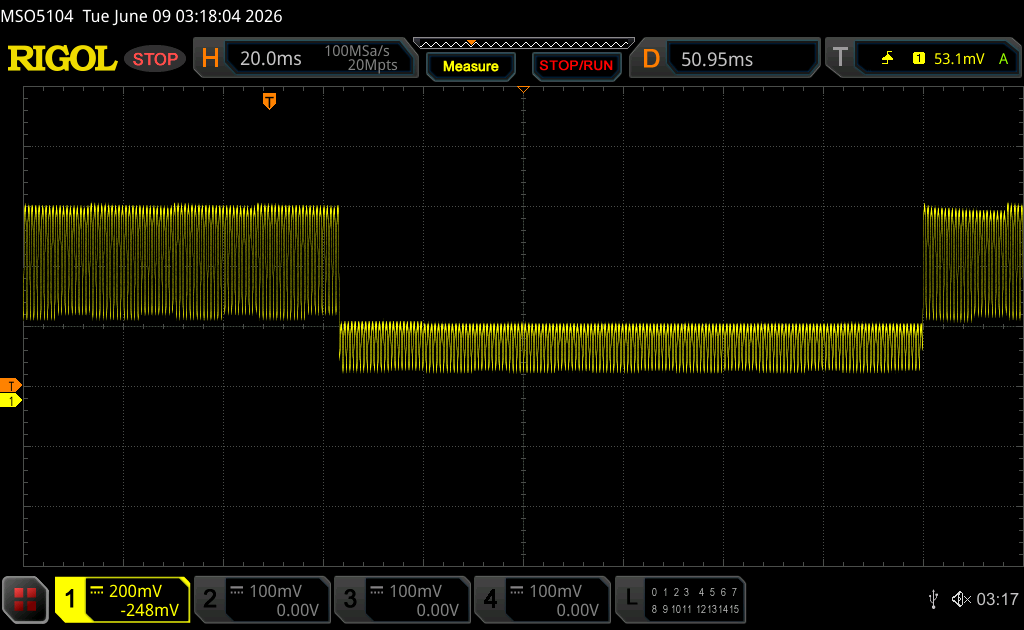 |
| ↘ 0.14 ms fallend | ||
| Die gemessenen Reaktionszeiten sind sehr kurz, wodurch sich der Bildschirm auch für schnelle 3D Spiele eignen sollte. Im Vergleich rangierten die bei uns getesteten Geräte von 0.165 (Minimum) zu 636 (Maximum) ms. » 0 % aller Screens waren schneller als der getestete. Daher sind die gemessenen Reaktionszeiten besser als der Durchschnitt aller vermessenen Geräte (31 ms). | ||
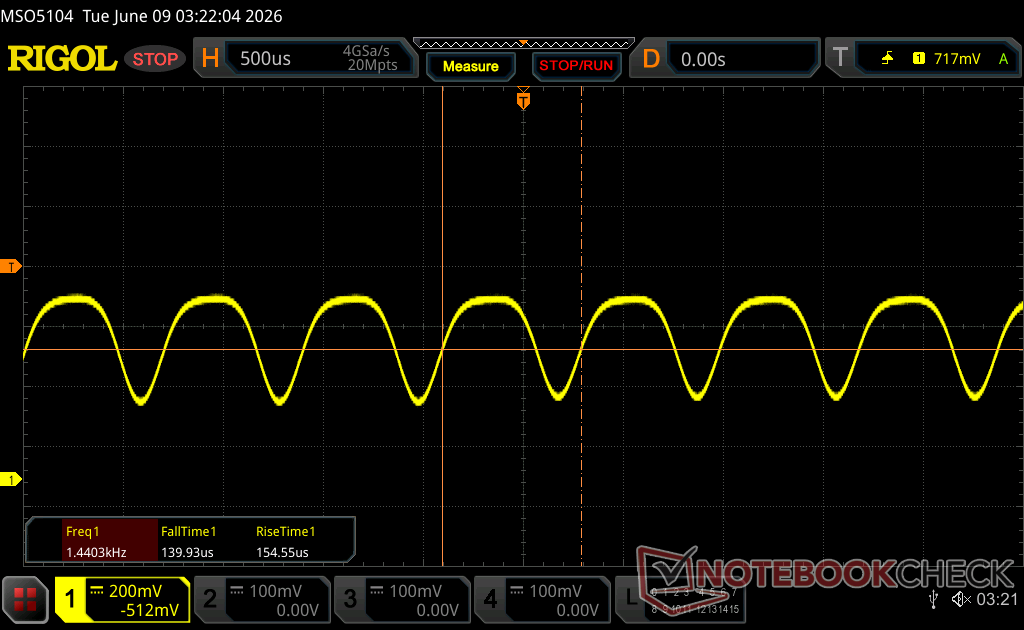
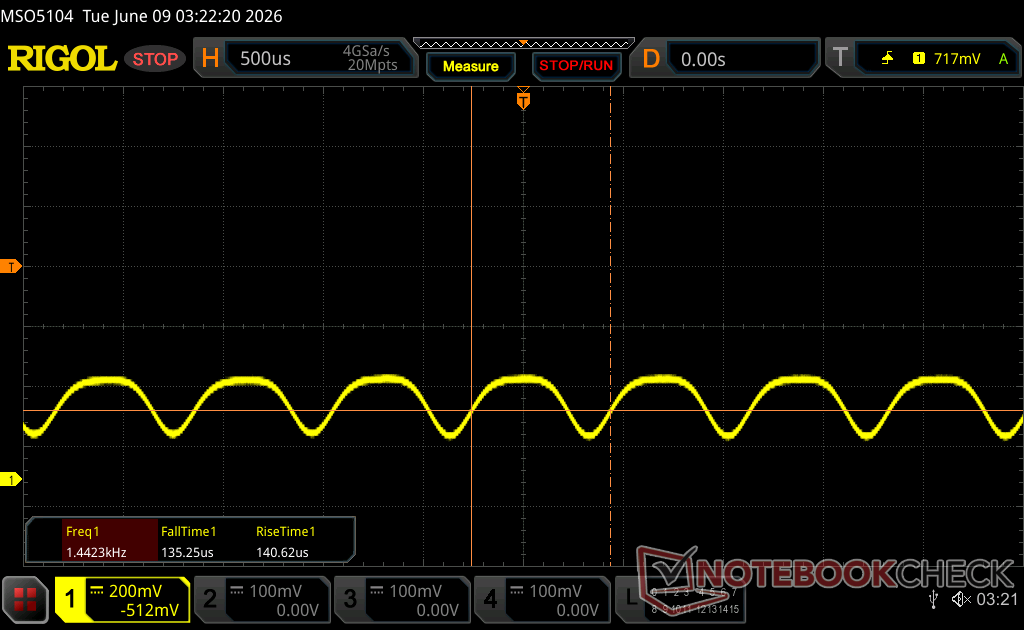
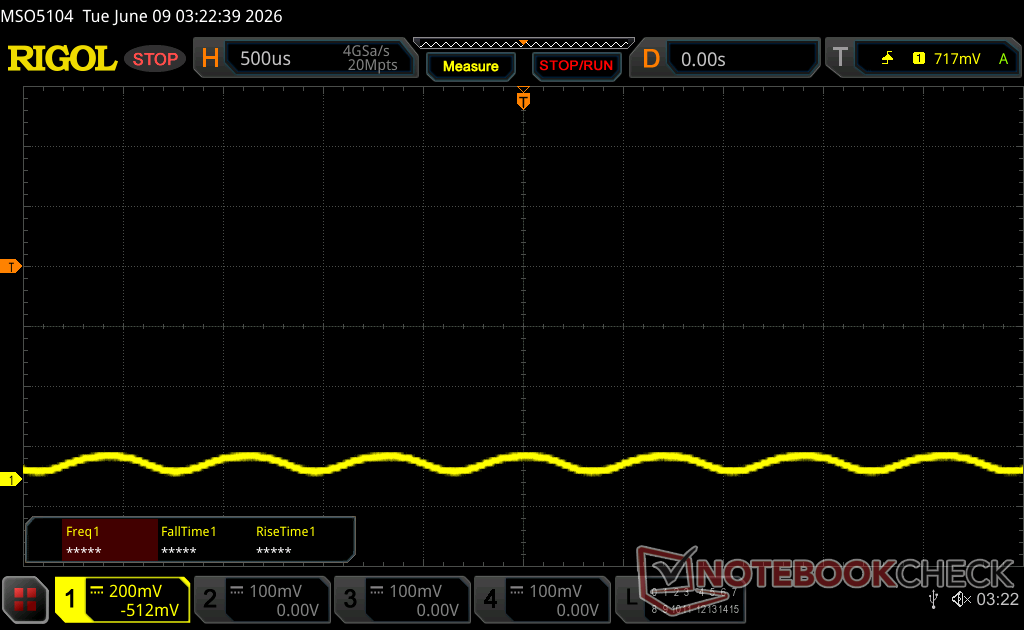
Bildschirm-Flackern / PWM (Pulse-Width Modulation)
| Flackern / PWM festgestellt | 1440 Hz Amplitude: 35 % | ≤ 100 % Helligkeit | 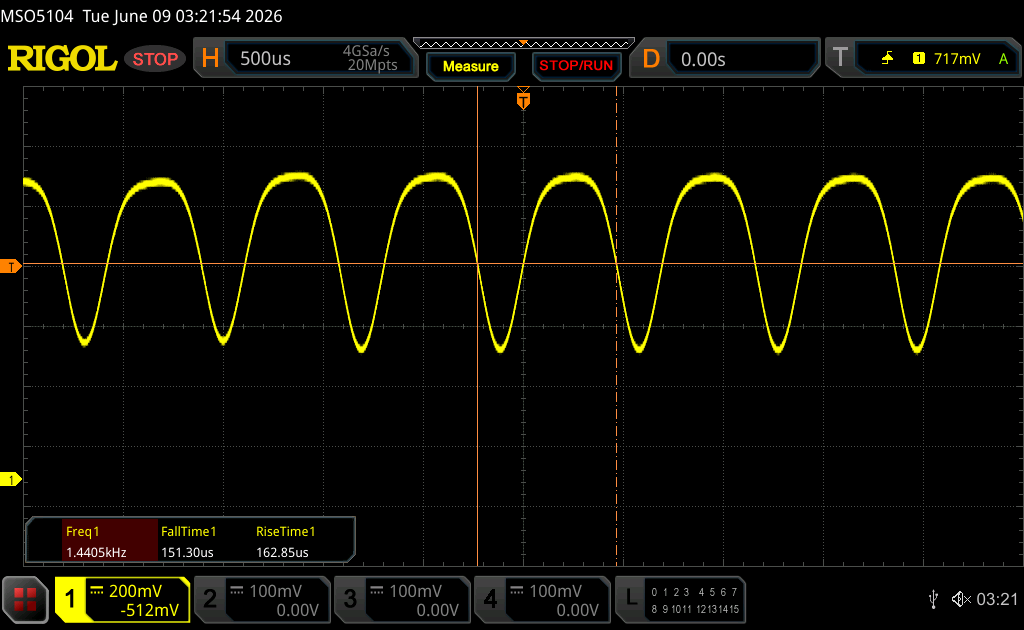 |
Das Display flackert mit 1440 Hz (im schlimmsten Fall, eventuell durch Pulsweitenmodulation PWM) bei einer eingestellten Helligkeit von 100 % und darunter. Darüber sollte es zu keinem Flackern kommen. Die Frequenz von 1440 Hz ist sehr hoch und sollte daher auch bei empfindlichen Personen zu keinen Problemen führen. Im Vergleich: 52 % aller getesteten Geräte nutzten kein PWM um die Helligkeit zu reduzieren. Wenn PWM eingesetzt wurde, dann bei einer Frequenz von durchschnittlich 7757 (Minimum 5, Maximum 343500) Hz. | |||


Leistung
Testbedingungen
Wir haben das MSI Center auf den Modus Extreme Performance und den diskreten Grafikmodus eingestellt, bevor wir die folgenden Benchmarks durchgeführt haben.
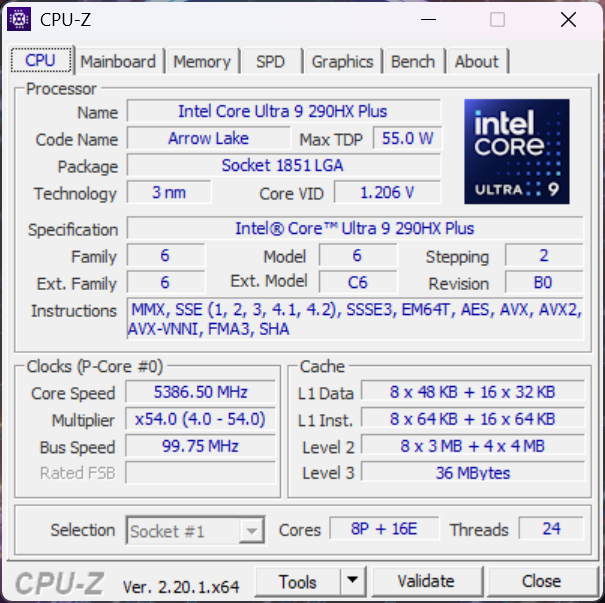
Prozessor
Der Core Ultra 9 290HX Plus ist im Wesentlichen ein übertakteter Core Ultra 9 275HX mit genau den gleichen Cache-Größen und der gleichen Anzahl von Kernen. Im Vergleich zum MSI Crosshair 16 HX kann man eine etwa 15 Prozent schnellere CPU-Leistung erwarten. Noch interessanter ist, dass unser MSI bis zu zehn Prozent schneller läuft als das Dell Alienware 16X Aurora mit dem exakt gleichen Core-Ultra-9-290HX-Plus-Prozessor, wie die Vergleichstabellen unten zeigen.
Cinebench R15 Mehrfachschleife
Cinebench R23: Multi Core | Single Core
Cinebench R20: CPU (Multi Core) | CPU (Single Core)
Cinebench R15: CPU Multi 64Bit | CPU Single 64Bit
Blender: v2.79 BMW27 CPU
7-Zip 18.03: 7z b 4 | 7z b 4 -mmt1
Geekbench 6.7: Multi-Core | Single-Core
Geekbench 5.5: Multi-Core | Single-Core
HWBOT x265 Benchmark v2.2: 4k Preset
LibreOffice : 20 Documents To PDF
R Benchmark 2.5: Overall mean
| Geekbench 6.7 / Multi-Core | |
| Durchschnittliche Intel Core Ultra 9 290HX Plus (19855 - 22850, n=6) | |
| MSI Raider 16 Max HX B2WJ | |
| Schenker XMG Neo 16 A25 5090 | |
| Alienware 16X Aurora Core Ultra 9 290HX Plus | |
| Schenker XMG APEX 16 MAX | |
| MSI Crosshair 16 HX AI D2XWGKG | |
| MSI Raider GE68HX 13VF | |
| Lenovo Legion 7 16IAX10 | |
| Razer Blade 16 Core Ultra 9 386H | |
| Lenovo Legion 7 16 AGP11 | |
| Asus TUF Gaming A16 FA608UP | |
| Geekbench 6.7 / Single-Core | |
| Schenker XMG APEX 16 MAX | |
| Schenker XMG Neo 16 A25 5090 | |
| Durchschnittliche Intel Core Ultra 9 290HX Plus (3147 - 3228, n=6) | |
| MSI Raider 16 Max HX B2WJ | |
| Alienware 16X Aurora Core Ultra 9 290HX Plus | |
| MSI Crosshair 16 HX AI D2XWGKG | |
| Lenovo Legion 7 16 AGP11 | |
| Lenovo Legion 7 16IAX10 | |
| MSI Raider GE68HX 13VF | |
| Razer Blade 16 Core Ultra 9 386H | |
| Asus TUF Gaming A16 FA608UP | |
Cinebench R23: Multi Core | Single Core
Cinebench R20: CPU (Multi Core) | CPU (Single Core)
Cinebench R15: CPU Multi 64Bit | CPU Single 64Bit
Blender: v2.79 BMW27 CPU
7-Zip 18.03: 7z b 4 | 7z b 4 -mmt1
Geekbench 6.7: Multi-Core | Single-Core
Geekbench 5.5: Multi-Core | Single-Core
HWBOT x265 Benchmark v2.2: 4k Preset
LibreOffice : 20 Documents To PDF
R Benchmark 2.5: Overall mean
* ... kleinere Werte sind besser
AIDA64: FP32 Ray-Trace | FPU Julia | CPU SHA3 | CPU Queen | FPU SinJulia | FPU Mandel | CPU AES | CPU ZLib | FP64 Ray-Trace | CPU PhotoWorxx | CPU CheckMate
| Performance Rating | |
| Durchschnittliche Intel Core Ultra 9 290HX Plus | |
| MSI Raider 16 Max HX B2WJ -1! | |
| Alienware 16X Aurora Core Ultra 9 290HX Plus -1! | |
| MSI Crosshair 16 HX AI D2XWGKG -1! | |
| Lenovo Legion 7 16IAX10 -1! | |
| Asus TUF Gaming A16 FA608UP -1! | |
| Razer Blade 16 Core Ultra 9 386H -1! | |
| AIDA64 / FP32 Ray-Trace | |
| MSI Raider 16 Max HX B2WJ (v8.20.8100) | |
| Durchschnittliche Intel Core Ultra 9 290HX Plus (34761 - 43239, n=6) | |
| MSI Crosshair 16 HX AI D2XWGKG (v6.92.6600) | |
| Alienware 16X Aurora Core Ultra 9 290HX Plus (v8.20.8100) | |
| Lenovo Legion 7 16IAX10 (v6.92.6600) | |
| Asus TUF Gaming A16 FA608UP (v6.92.6600) | |
| Razer Blade 16 Core Ultra 9 386H (v8.20.8100) | |
| AIDA64 / FPU Julia | |
| MSI Raider 16 Max HX B2WJ (v8.20.8100) | |
| Durchschnittliche Intel Core Ultra 9 290HX Plus (174665 - 218895, n=6) | |
| MSI Crosshair 16 HX AI D2XWGKG (v6.92.6600) | |
| Alienware 16X Aurora Core Ultra 9 290HX Plus (v8.20.8100) | |
| Lenovo Legion 7 16IAX10 (v6.92.6600) | |
| Asus TUF Gaming A16 FA608UP (v6.92.6600) | |
| Razer Blade 16 Core Ultra 9 386H (v8.20.8100) | |
| AIDA64 / CPU SHA3 | |
| MSI Raider 16 Max HX B2WJ (v8.20.8100) | |
| Durchschnittliche Intel Core Ultra 9 290HX Plus (8352 - 10115, n=6) | |
| MSI Crosshair 16 HX AI D2XWGKG (v6.92.6600) | |
| Alienware 16X Aurora Core Ultra 9 290HX Plus (v8.20.8100) | |
| Lenovo Legion 7 16IAX10 (v6.92.6600) | |
| Razer Blade 16 Core Ultra 9 386H (v8.20.8100) | |
| Asus TUF Gaming A16 FA608UP (v6.92.6600) | |
| AIDA64 / CPU Queen | |
| Durchschnittliche Intel Core Ultra 9 290HX Plus (n=1) | |
| Lenovo Legion 7 16IAX10 (v6.92.6600) | |
| MSI Crosshair 16 HX AI D2XWGKG (v6.92.6600) | |
| Asus TUF Gaming A16 FA608UP (v6.92.6600) | |
| AIDA64 / FPU SinJulia | |
| Asus TUF Gaming A16 FA608UP (v6.92.6600) | |
| MSI Raider 16 Max HX B2WJ (v8.20.8100) | |
| Durchschnittliche Intel Core Ultra 9 290HX Plus (13612 - 14874, n=6) | |
| Alienware 16X Aurora Core Ultra 9 290HX Plus (v8.20.8100) | |
| MSI Crosshair 16 HX AI D2XWGKG (v6.92.6600) | |
| Lenovo Legion 7 16IAX10 (v6.92.6600) | |
| Razer Blade 16 Core Ultra 9 386H (v8.20.8100) | |
| AIDA64 / FPU Mandel | |
| MSI Raider 16 Max HX B2WJ (v8.20.8100) | |
| Durchschnittliche Intel Core Ultra 9 290HX Plus (91215 - 115371, n=6) | |
| MSI Crosshair 16 HX AI D2XWGKG (v6.92.6600) | |
| Alienware 16X Aurora Core Ultra 9 290HX Plus (v8.20.8100) | |
| Lenovo Legion 7 16IAX10 (v6.92.6600) | |
| Asus TUF Gaming A16 FA608UP (v6.92.6600) | |
| Razer Blade 16 Core Ultra 9 386H (v8.20.8100) | |
| AIDA64 / CPU AES | |
| MSI Raider 16 Max HX B2WJ (v8.20.8100) | |
| Durchschnittliche Intel Core Ultra 9 290HX Plus (127585 - 143205, n=6) | |
| Alienware 16X Aurora Core Ultra 9 290HX Plus (v8.20.8100) | |
| MSI Crosshair 16 HX AI D2XWGKG (v6.92.6600) | |
| Lenovo Legion 7 16IAX10 (v6.92.6600) | |
| Asus TUF Gaming A16 FA608UP (v6.92.6600) | |
| Razer Blade 16 Core Ultra 9 386H (v8.20.8100) | |
| AIDA64 / CPU ZLib | |
| MSI Raider 16 Max HX B2WJ (v8.20.8100) | |
| Durchschnittliche Intel Core Ultra 9 290HX Plus (1967 - 2340, n=6) | |
| MSI Crosshair 16 HX AI D2XWGKG (v6.92.6600) | |
| Alienware 16X Aurora Core Ultra 9 290HX Plus (v8.20.8100) | |
| Lenovo Legion 7 16IAX10 (v6.92.6600) | |
| Razer Blade 16 Core Ultra 9 386H (v8.20.8100) | |
| Asus TUF Gaming A16 FA608UP (v6.92.6600) | |
| AIDA64 / FP64 Ray-Trace | |
| MSI Raider 16 Max HX B2WJ (v8.20.8100) | |
| Durchschnittliche Intel Core Ultra 9 290HX Plus (18611 - 23843, n=6) | |
| MSI Crosshair 16 HX AI D2XWGKG (v6.92.6600) | |
| Alienware 16X Aurora Core Ultra 9 290HX Plus (v8.20.8100) | |
| Lenovo Legion 7 16IAX10 (v6.92.6600) | |
| Asus TUF Gaming A16 FA608UP (v6.92.6600) | |
| Razer Blade 16 Core Ultra 9 386H (v8.20.8100) | |
| AIDA64 / CPU PhotoWorxx | |
| Razer Blade 16 Core Ultra 9 386H (v8.20.8100) | |
| Durchschnittliche Intel Core Ultra 9 290HX Plus (51134 - 65272, n=6) | |
| Alienware 16X Aurora Core Ultra 9 290HX Plus (v8.20.8100) | |
| MSI Raider 16 Max HX B2WJ (v8.20.8100) | |
| Lenovo Legion 7 16IAX10 (v6.92.6600) | |
| Asus TUF Gaming A16 FA608UP (v6.92.6600) | |
| MSI Crosshair 16 HX AI D2XWGKG (v6.92.6600) | |
| AIDA64 / CPU CheckMate | |
| MSI Raider 16 Max HX B2WJ (v8.20.8100) | |
| Durchschnittliche Intel Core Ultra 9 290HX Plus (7624 - 8765, n=5) | |
| Alienware 16X Aurora Core Ultra 9 290HX Plus (v8.20.8100) | |
| Razer Blade 16 Core Ultra 9 386H (v8.20.8100) | |
Systemleistung
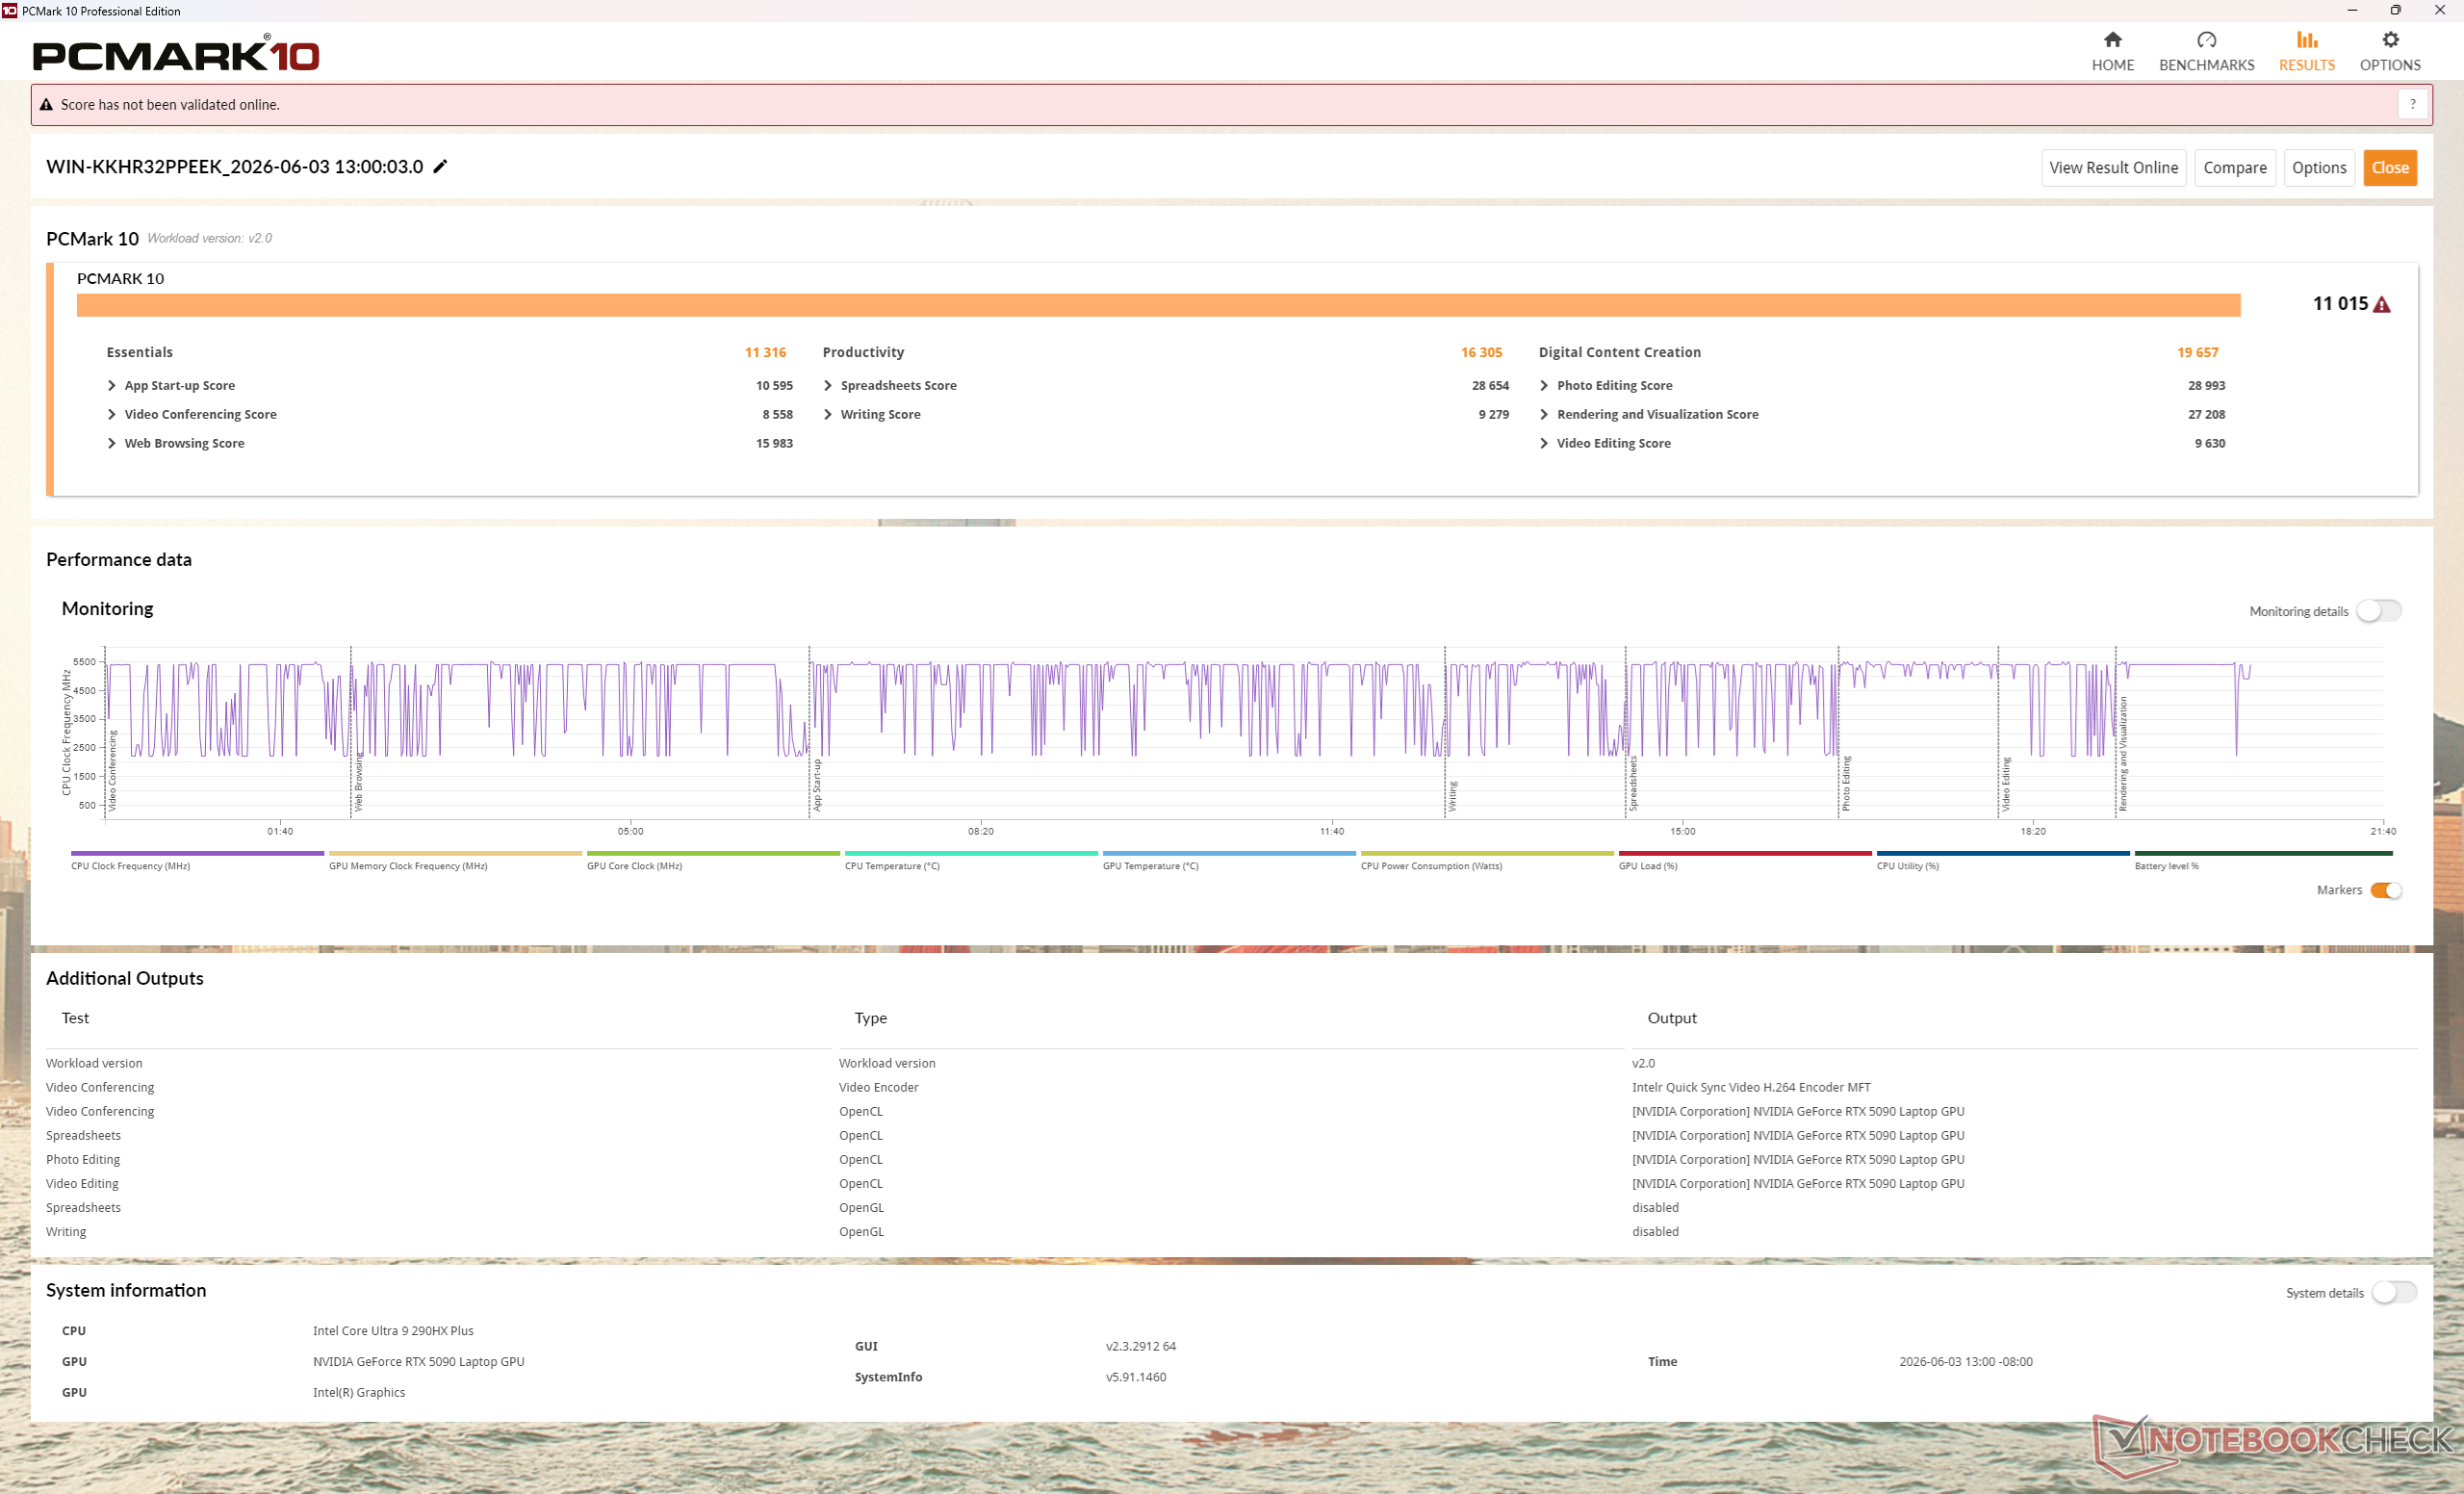
PCMark 10: Score | Essentials | Productivity | Digital Content Creation
CrossMark: Overall | Productivity | Creativity | Responsiveness
WebXPRT 3: Overall
WebXPRT 4: Overall
Mozilla Kraken 1.1: Total
Geekbench AI: Quantized GPU 1.7 | Half Precision GPU 1.7 | Single Precision GPU 1.7
| Performance Rating | |
| Durchschnittliche Intel Core Ultra 9 290HX Plus, NVIDIA GeForce RTX 5090 Laptop | |
| MSI Raider 16 Max HX B2WJ | |
| Alienware 16X Aurora Core Ultra 9 290HX Plus | |
| Razer Blade 16 Core Ultra 9 386H | |
| MSI Crosshair 16 HX AI D2XWGKG | |
| Lenovo Legion 7 16IAX10 | |
| Asus TUF Gaming A16 FA608UP -4! | |
| PCMark 10 / Score | |
| Durchschnittliche Intel Core Ultra 9 290HX Plus, NVIDIA GeForce RTX 5090 Laptop (11015 - 12414, n=3) | |
| MSI Raider 16 Max HX B2WJ | |
| Alienware 16X Aurora Core Ultra 9 290HX Plus | |
| Razer Blade 16 Core Ultra 9 386H | |
| MSI Crosshair 16 HX AI D2XWGKG | |
| Lenovo Legion 7 16IAX10 | |
| PCMark 10 / Essentials | |
| Alienware 16X Aurora Core Ultra 9 290HX Plus | |
| Lenovo Legion 7 16IAX10 | |
| Durchschnittliche Intel Core Ultra 9 290HX Plus, NVIDIA GeForce RTX 5090 Laptop (11316 - 11604, n=3) | |
| MSI Raider 16 Max HX B2WJ | |
| Razer Blade 16 Core Ultra 9 386H | |
| MSI Crosshair 16 HX AI D2XWGKG | |
| PCMark 10 / Productivity | |
| Durchschnittliche Intel Core Ultra 9 290HX Plus, NVIDIA GeForce RTX 5090 Laptop (16305 - 25323, n=3) | |
| Alienware 16X Aurora Core Ultra 9 290HX Plus | |
| MSI Raider 16 Max HX B2WJ | |
| Razer Blade 16 Core Ultra 9 386H | |
| Lenovo Legion 7 16IAX10 | |
| MSI Crosshair 16 HX AI D2XWGKG | |
| PCMark 10 / Digital Content Creation | |
| MSI Raider 16 Max HX B2WJ | |
| Durchschnittliche Intel Core Ultra 9 290HX Plus, NVIDIA GeForce RTX 5090 Laptop (17665 - 19954, n=3) | |
| Alienware 16X Aurora Core Ultra 9 290HX Plus | |
| MSI Crosshair 16 HX AI D2XWGKG | |
| Razer Blade 16 Core Ultra 9 386H | |
| Lenovo Legion 7 16IAX10 | |
| CrossMark / Overall | |
| MSI Raider 16 Max HX B2WJ | |
| Alienware 16X Aurora Core Ultra 9 290HX Plus | |
| Durchschnittliche Intel Core Ultra 9 290HX Plus, NVIDIA GeForce RTX 5090 Laptop (2177 - 2401, n=3) | |
| Razer Blade 16 Core Ultra 9 386H | |
| MSI Crosshair 16 HX AI D2XWGKG | |
| Lenovo Legion 7 16IAX10 | |
| Asus TUF Gaming A16 FA608UP | |
| CrossMark / Productivity | |
| Alienware 16X Aurora Core Ultra 9 290HX Plus | |
| MSI Raider 16 Max HX B2WJ | |
| Durchschnittliche Intel Core Ultra 9 290HX Plus, NVIDIA GeForce RTX 5090 Laptop (1994 - 2213, n=3) | |
| Razer Blade 16 Core Ultra 9 386H | |
| MSI Crosshair 16 HX AI D2XWGKG | |
| Lenovo Legion 7 16IAX10 | |
| Asus TUF Gaming A16 FA608UP | |
| CrossMark / Creativity | |
| Durchschnittliche Intel Core Ultra 9 290HX Plus, NVIDIA GeForce RTX 5090 Laptop (2548 - 2786, n=3) | |
| MSI Raider 16 Max HX B2WJ | |
| Alienware 16X Aurora Core Ultra 9 290HX Plus | |
| Razer Blade 16 Core Ultra 9 386H | |
| MSI Crosshair 16 HX AI D2XWGKG | |
| Lenovo Legion 7 16IAX10 | |
| Asus TUF Gaming A16 FA608UP | |
| CrossMark / Responsiveness | |
| Alienware 16X Aurora Core Ultra 9 290HX Plus | |
| MSI Raider 16 Max HX B2WJ | |
| Durchschnittliche Intel Core Ultra 9 290HX Plus, NVIDIA GeForce RTX 5090 Laptop (1766 - 2249, n=3) | |
| Razer Blade 16 Core Ultra 9 386H | |
| MSI Crosshair 16 HX AI D2XWGKG | |
| Lenovo Legion 7 16IAX10 | |
| Asus TUF Gaming A16 FA608UP | |
| WebXPRT 3 / Overall | |
| Alienware 16X Aurora Core Ultra 9 290HX Plus | |
| MSI Raider 16 Max HX B2WJ | |
| Durchschnittliche Intel Core Ultra 9 290HX Plus, NVIDIA GeForce RTX 5090 Laptop (354 - 369, n=3) | |
| Lenovo Legion 7 16IAX10 | |
| MSI Crosshair 16 HX AI D2XWGKG | |
| Razer Blade 16 Core Ultra 9 386H | |
| Asus TUF Gaming A16 FA608UP | |
| WebXPRT 4 / Overall | |
| Alienware 16X Aurora Core Ultra 9 290HX Plus | |
| MSI Raider 16 Max HX B2WJ | |
| Durchschnittliche Intel Core Ultra 9 290HX Plus, NVIDIA GeForce RTX 5090 Laptop (310 - 336, n=3) | |
| Lenovo Legion 7 16IAX10 | |
| MSI Crosshair 16 HX AI D2XWGKG | |
| Razer Blade 16 Core Ultra 9 386H | |
| Asus TUF Gaming A16 FA608UP | |
| Mozilla Kraken 1.1 / Total | |
| Asus TUF Gaming A16 FA608UP | |
| Razer Blade 16 Core Ultra 9 386H | |
| Lenovo Legion 7 16IAX10 | |
| MSI Crosshair 16 HX AI D2XWGKG | |
| MSI Raider 16 Max HX B2WJ | |
| Durchschnittliche Intel Core Ultra 9 290HX Plus, NVIDIA GeForce RTX 5090 Laptop (393 - 399, n=3) | |
| Alienware 16X Aurora Core Ultra 9 290HX Plus | |
| Geekbench AI / Quantized GPU 1.7 | |
| Durchschnittliche Intel Core Ultra 9 290HX Plus, NVIDIA GeForce RTX 5090 Laptop (25151 - 25211, n=2) | |
| MSI Raider 16 Max HX B2WJ | |
| Razer Blade 16 Core Ultra 9 386H | |
| Alienware 16X Aurora Core Ultra 9 290HX Plus | |
| MSI Crosshair 16 HX AI D2XWGKG | |
| Asus TUF Gaming A16 FA608UP | |
| Lenovo Legion 7 16IAX10 | |
| Geekbench AI / Half Precision GPU 1.7 | |
| Durchschnittliche Intel Core Ultra 9 290HX Plus, NVIDIA GeForce RTX 5090 Laptop (55223 - 56393, n=2) | |
| MSI Raider 16 Max HX B2WJ | |
| Alienware 16X Aurora Core Ultra 9 290HX Plus | |
| Razer Blade 16 Core Ultra 9 386H | |
| MSI Crosshair 16 HX AI D2XWGKG | |
| Asus TUF Gaming A16 FA608UP | |
| Lenovo Legion 7 16IAX10 | |
| Geekbench AI / Single Precision GPU 1.7 | |
| Durchschnittliche Intel Core Ultra 9 290HX Plus, NVIDIA GeForce RTX 5090 Laptop (31828 - 32576, n=2) | |
| MSI Raider 16 Max HX B2WJ | |
| Razer Blade 16 Core Ultra 9 386H | |
| Alienware 16X Aurora Core Ultra 9 290HX Plus | |
| MSI Crosshair 16 HX AI D2XWGKG | |
| Asus TUF Gaming A16 FA608UP | |
| Lenovo Legion 7 16IAX10 | |
* ... kleinere Werte sind besser
| PCMark 10 Score | 11015 Punkte | |
Hilfe | ||
| AIDA64 / Memory Copy | |
| Razer Blade 16 Core Ultra 9 386H | |
| Lenovo Legion 7 16IAX10 | |
| Durchschnittliche Intel Core Ultra 9 290HX Plus (76912 - 93930, n=6) | |
| MSI Raider 16 Max HX B2WJ | |
| Alienware 16X Aurora Core Ultra 9 290HX Plus | |
| MSI Crosshair 16 HX AI D2XWGKG | |
| Asus TUF Gaming A16 FA608UP | |
| AIDA64 / Memory Read | |
| Razer Blade 16 Core Ultra 9 386H | |
| Durchschnittliche Intel Core Ultra 9 290HX Plus (84638 - 98574, n=6) | |
| MSI Raider 16 Max HX B2WJ | |
| Lenovo Legion 7 16IAX10 | |
| Alienware 16X Aurora Core Ultra 9 290HX Plus | |
| MSI Crosshair 16 HX AI D2XWGKG | |
| Asus TUF Gaming A16 FA608UP | |
| AIDA64 / Memory Write | |
| Razer Blade 16 Core Ultra 9 386H | |
| Asus TUF Gaming A16 FA608UP | |
| Durchschnittliche Intel Core Ultra 9 290HX Plus (76094 - 100988, n=6) | |
| MSI Raider 16 Max HX B2WJ | |
| Lenovo Legion 7 16IAX10 | |
| Alienware 16X Aurora Core Ultra 9 290HX Plus | |
| MSI Crosshair 16 HX AI D2XWGKG | |
| AIDA64 / Memory Latency | |
| MSI Crosshair 16 HX AI D2XWGKG | |
| Alienware 16X Aurora Core Ultra 9 290HX Plus | |
| Lenovo Legion 7 16IAX10 | |
| MSI Raider 16 Max HX B2WJ | |
| Durchschnittliche Intel Core Ultra 9 290HX Plus (100.7 - 108.4, n=6) | |
| Asus TUF Gaming A16 FA608UP | |
| Razer Blade 16 Core Ultra 9 386H | |
* ... kleinere Werte sind besser
DPC-Latenzzeit
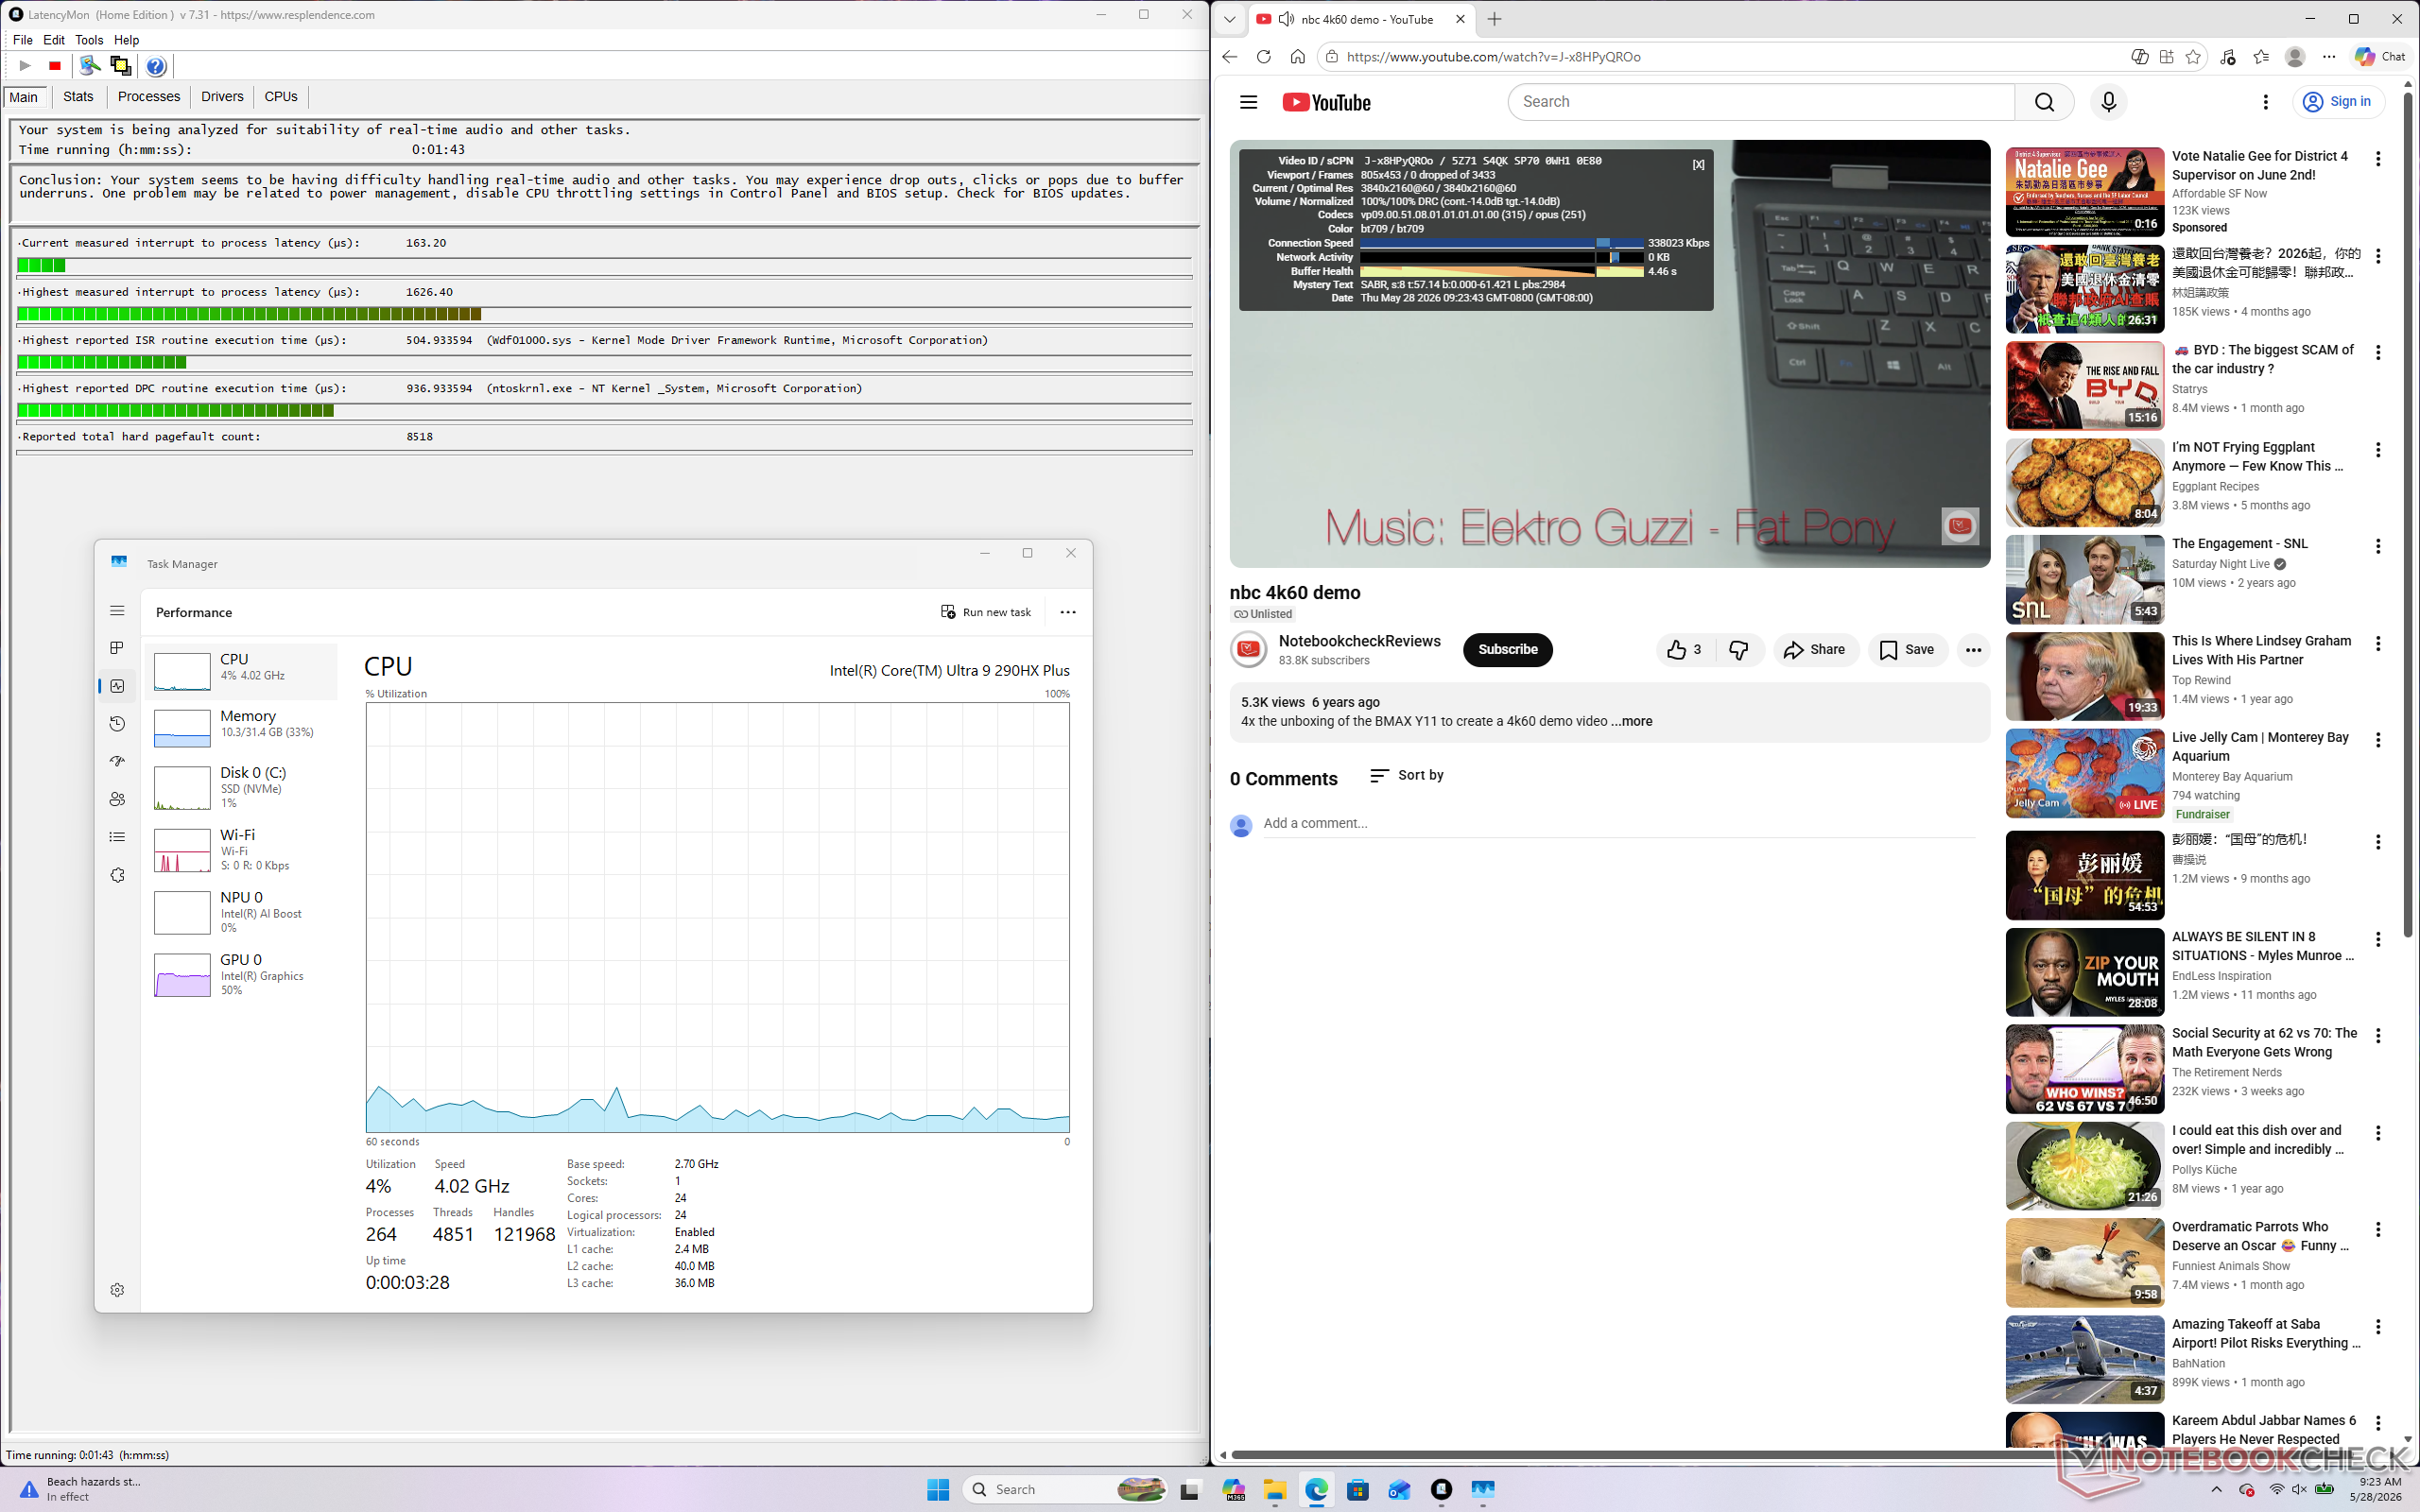
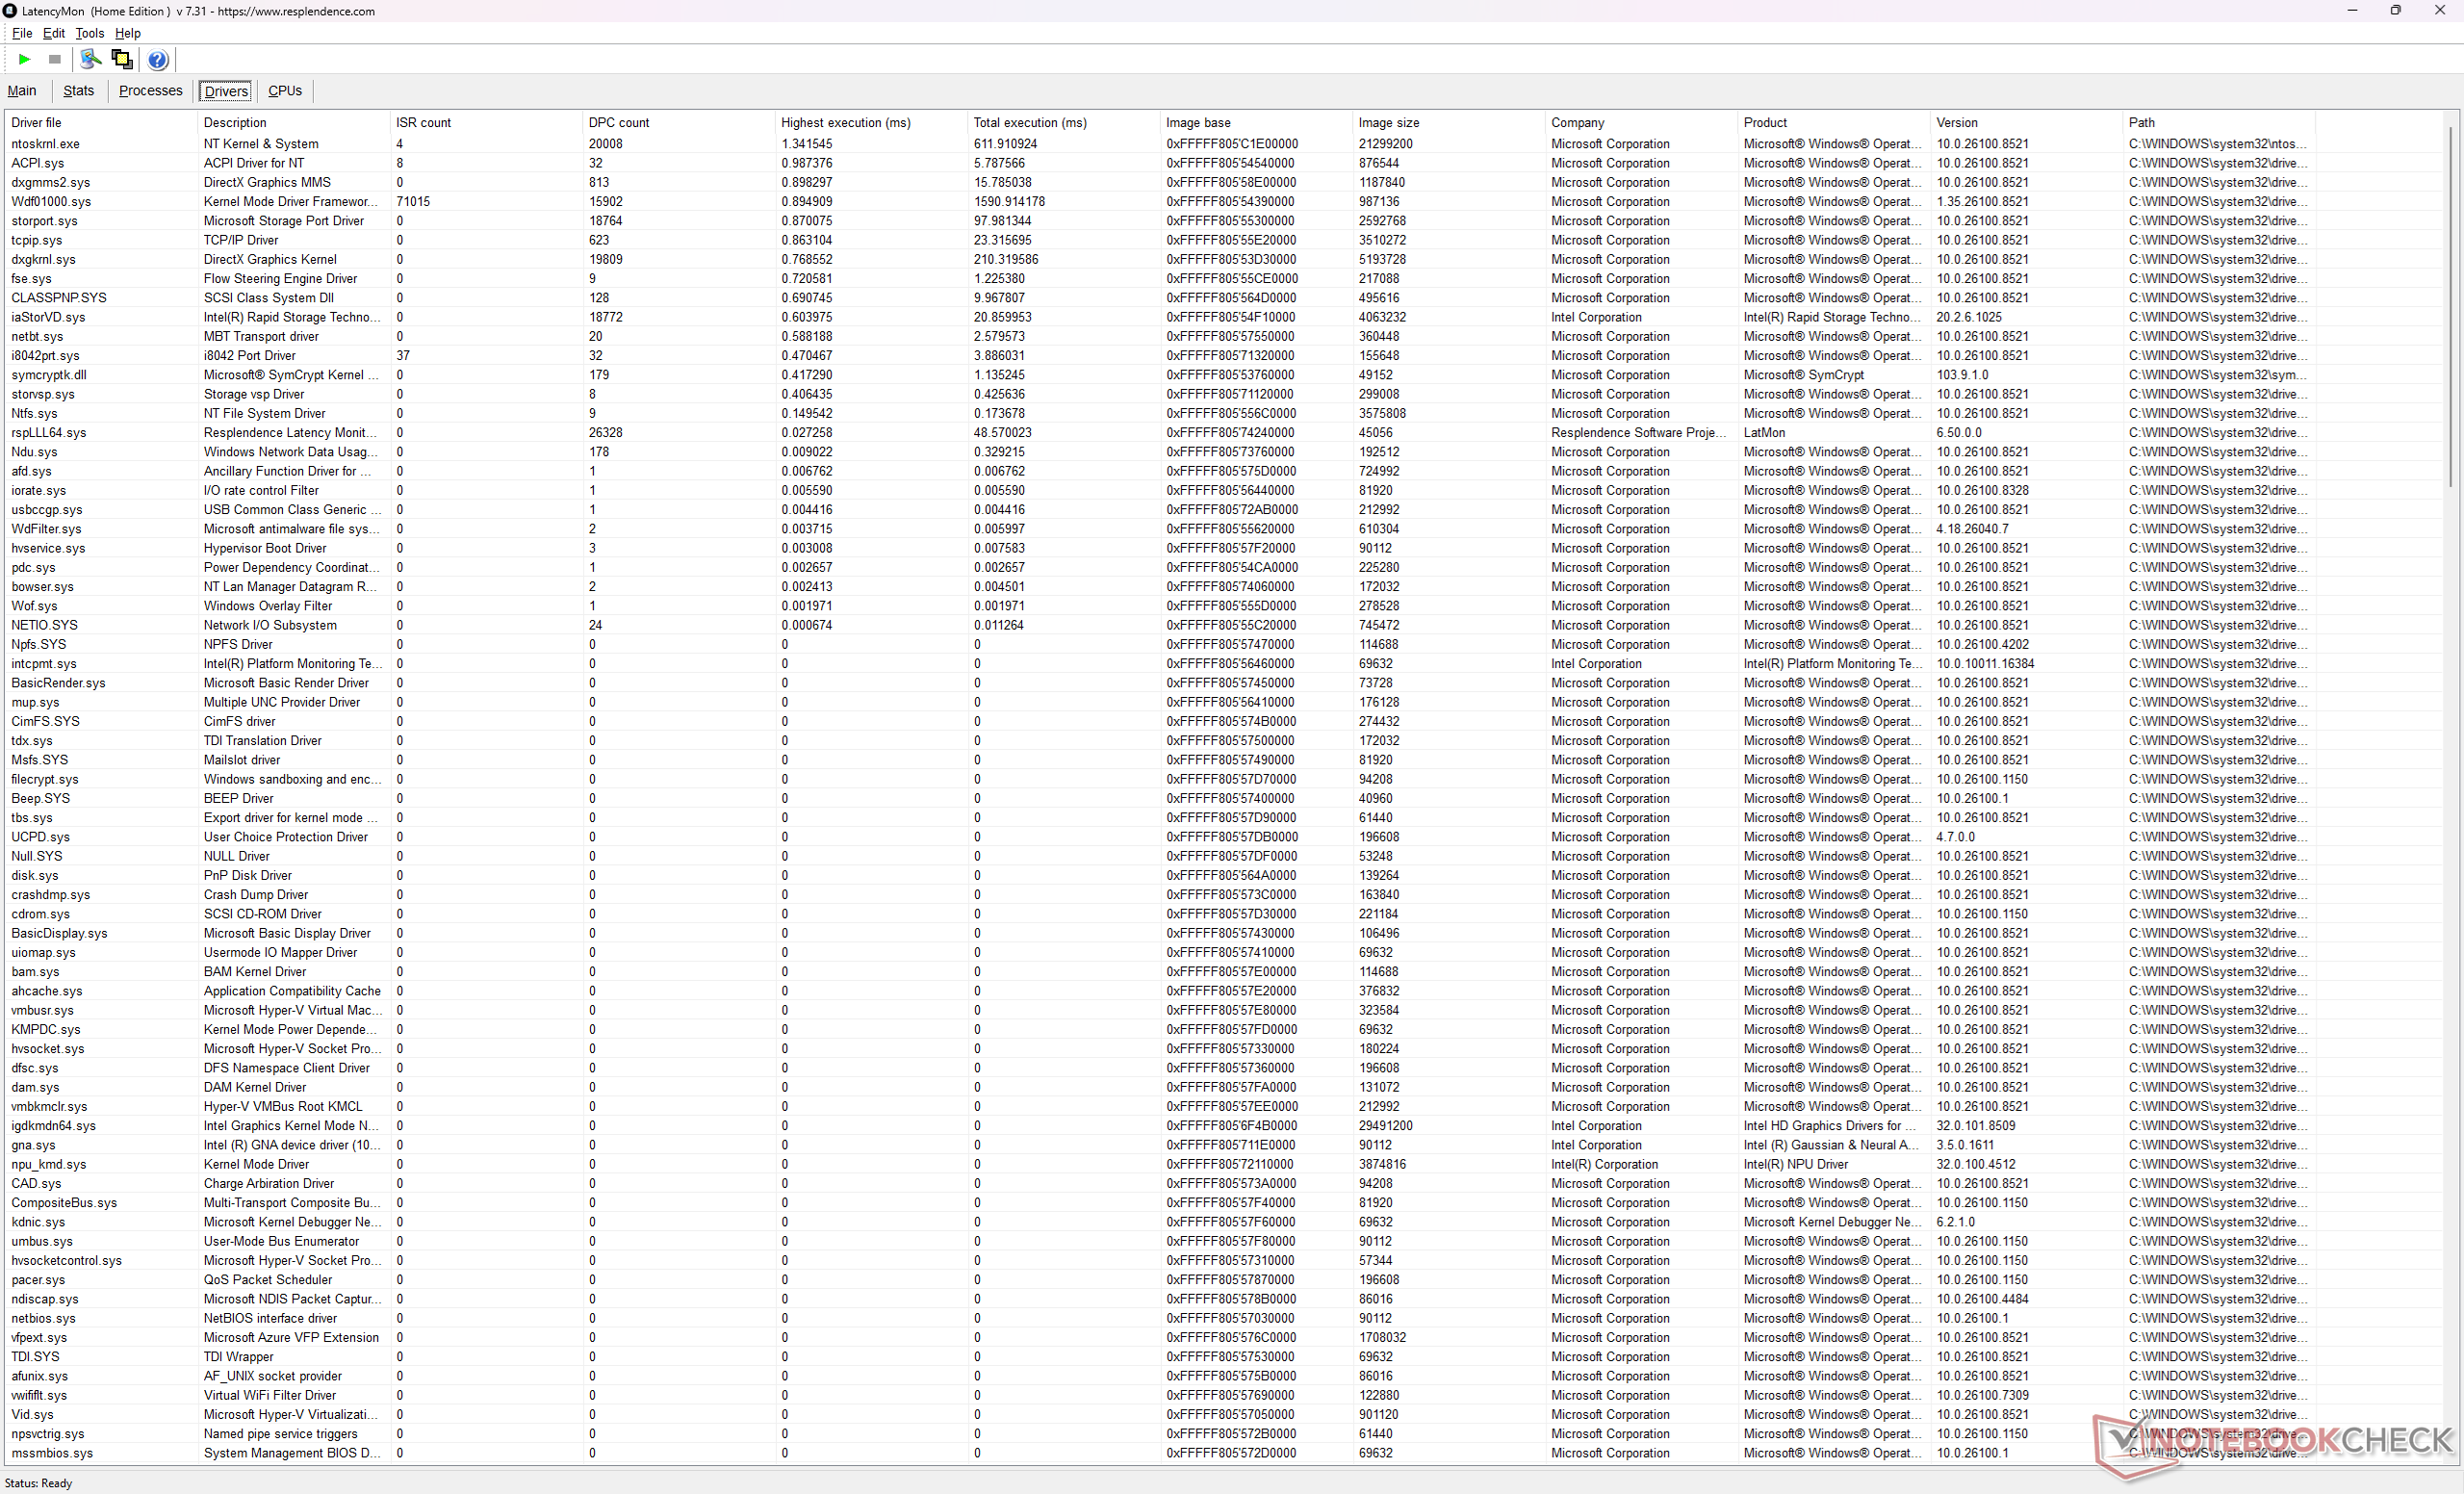
| DPC Latencies / LatencyMon - interrupt to process latency (max), Web, Youtube, Prime95 | |
| Alienware 16X Aurora Core Ultra 9 290HX Plus | |
| Razer Blade 16 Core Ultra 9 386H | |
| MSI Raider 16 Max HX B2WJ | |
| MSI Crosshair 16 HX AI D2XWGKG | |
| Lenovo Legion 7 16IAX10 | |
| Asus TUF Gaming A16 FA608UP | |
* ... kleinere Werte sind besser
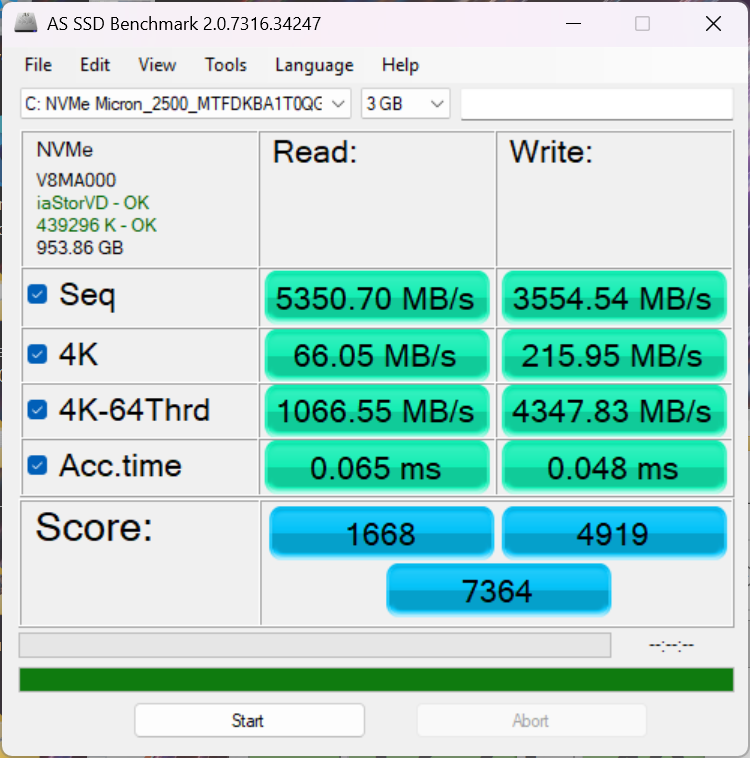
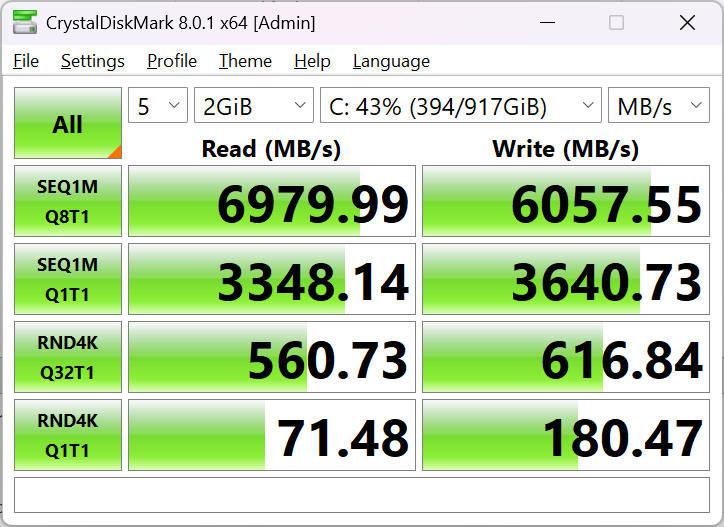
Speichergeräte
Unser Testgerät wird mit derselben Micron 2500 PCIe4 x4 NVMe SSD ausgestattet, die sie auch im Crosshair 16 HX zu finden ist.

* ... kleinere Werte sind besser
Drosselung der FDisk Throttling: DiskSpd Read Loop, Queue Depth 8
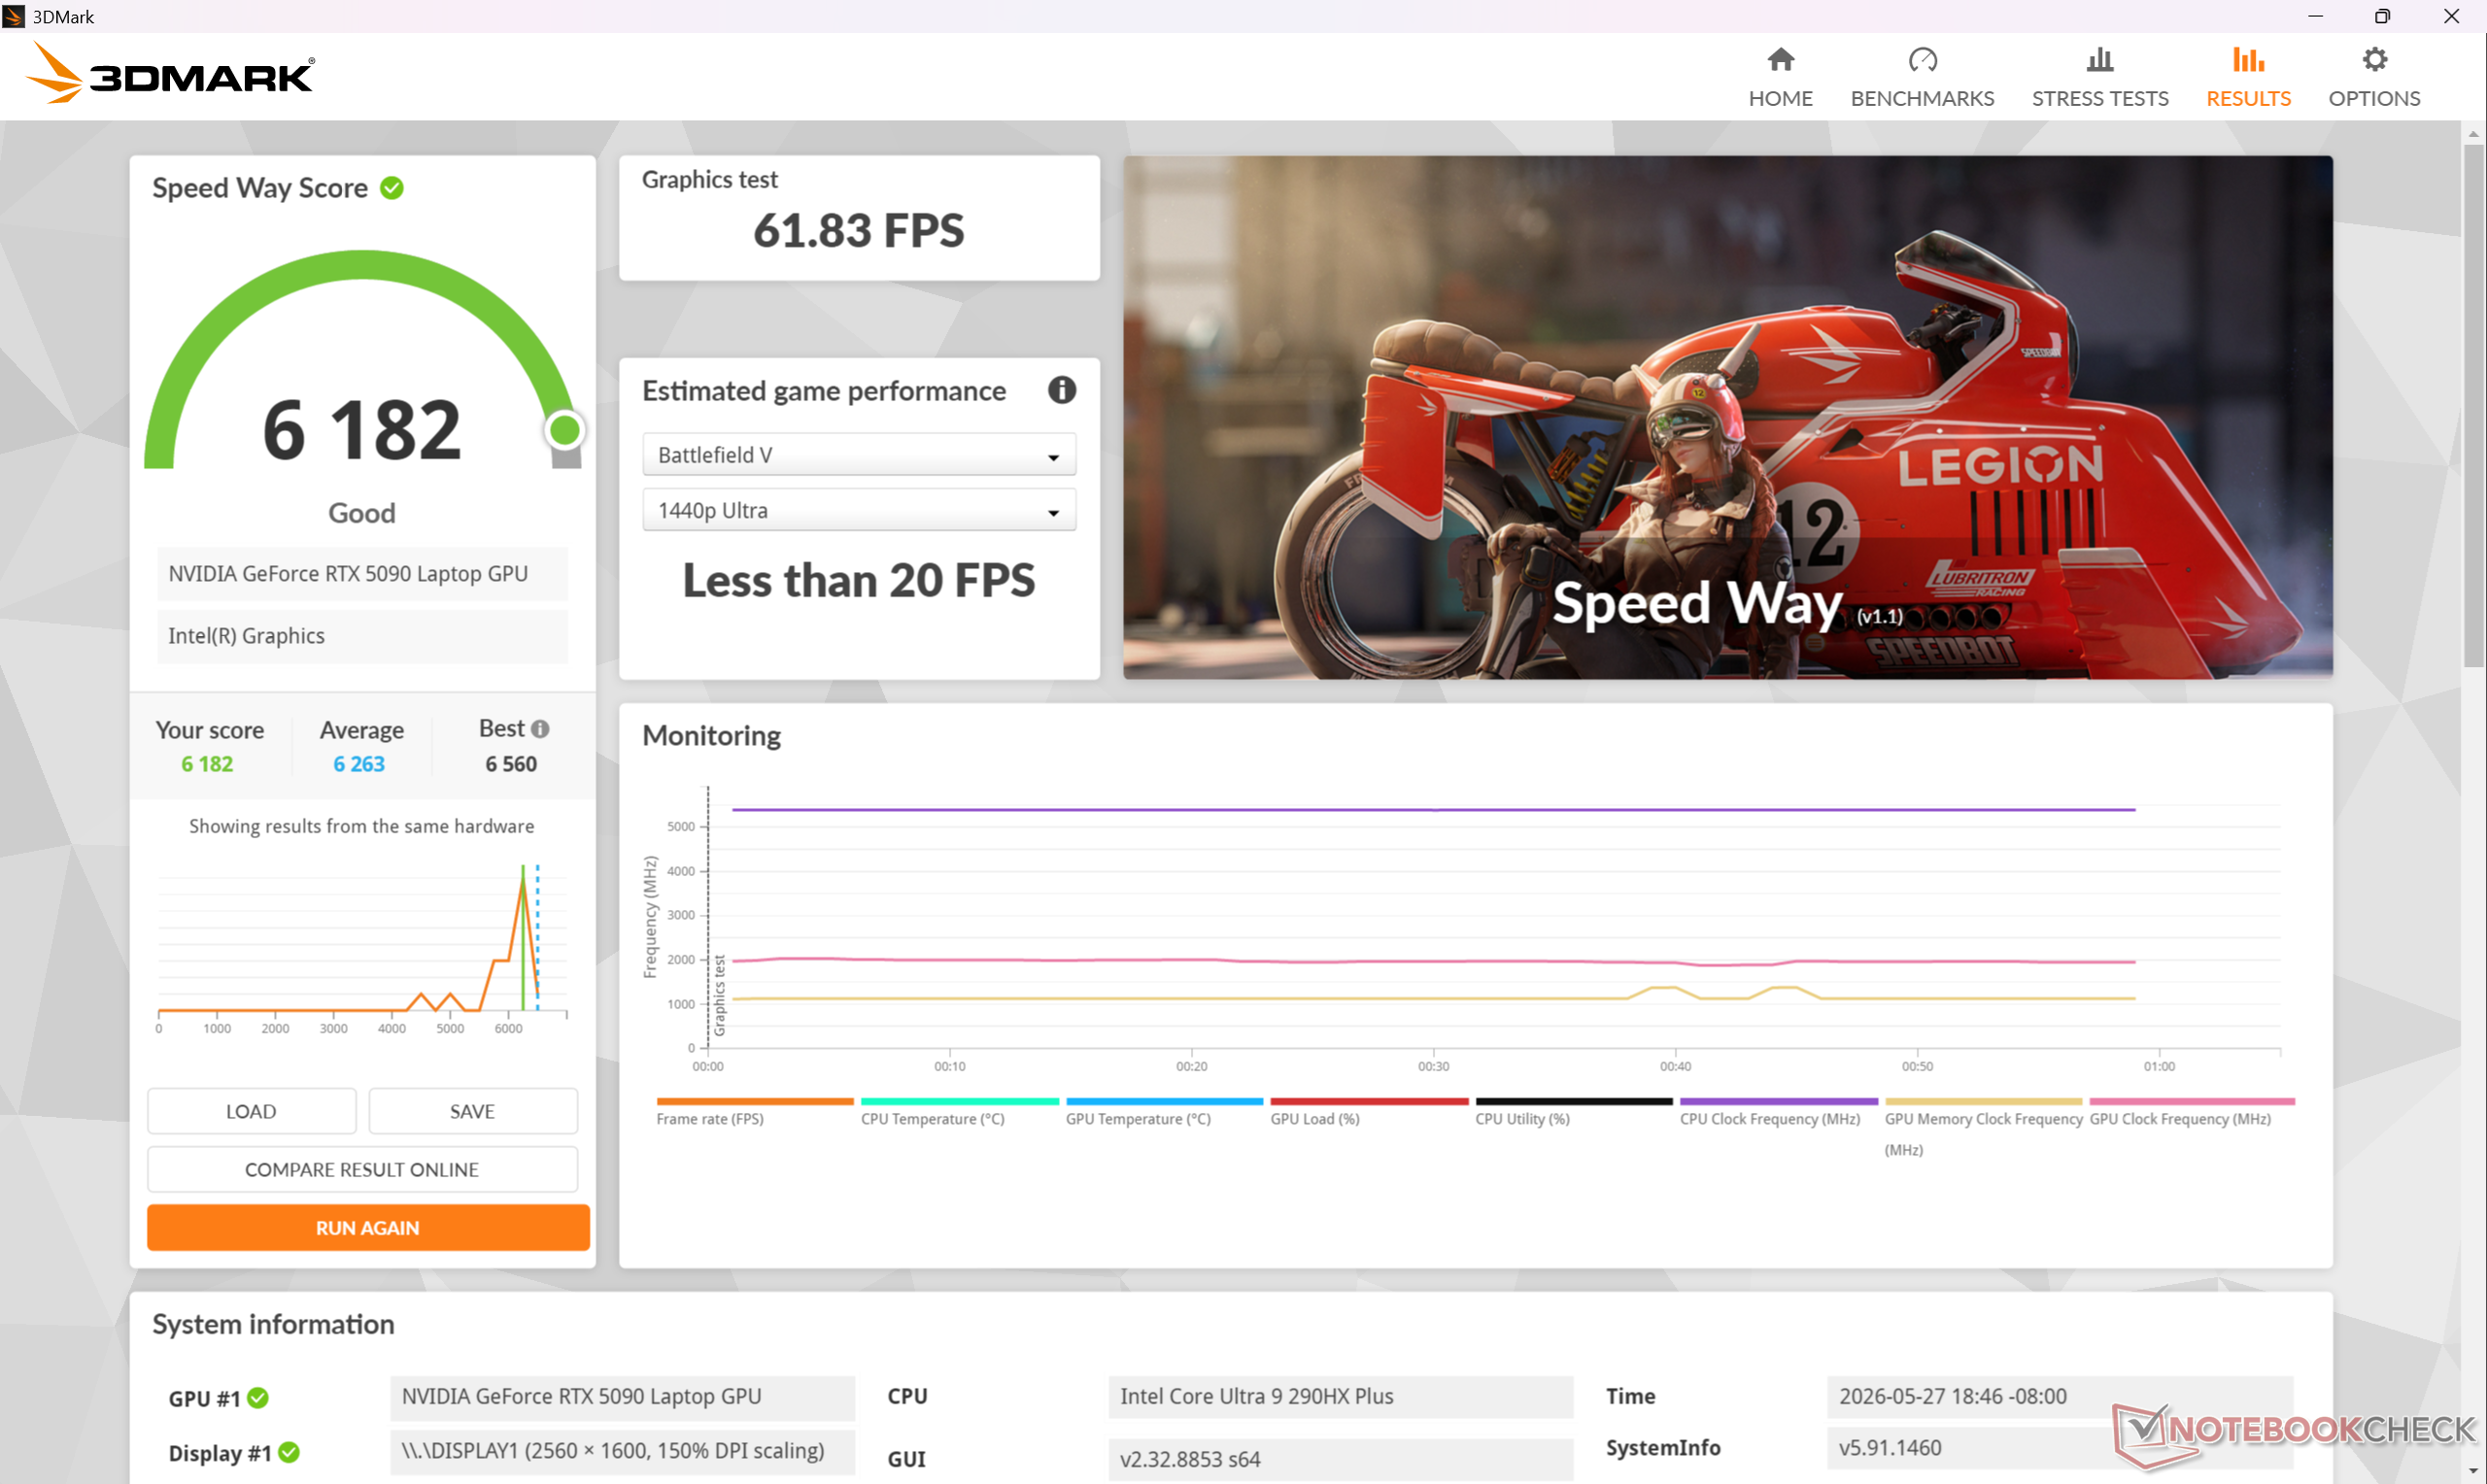
GPU-Leistung
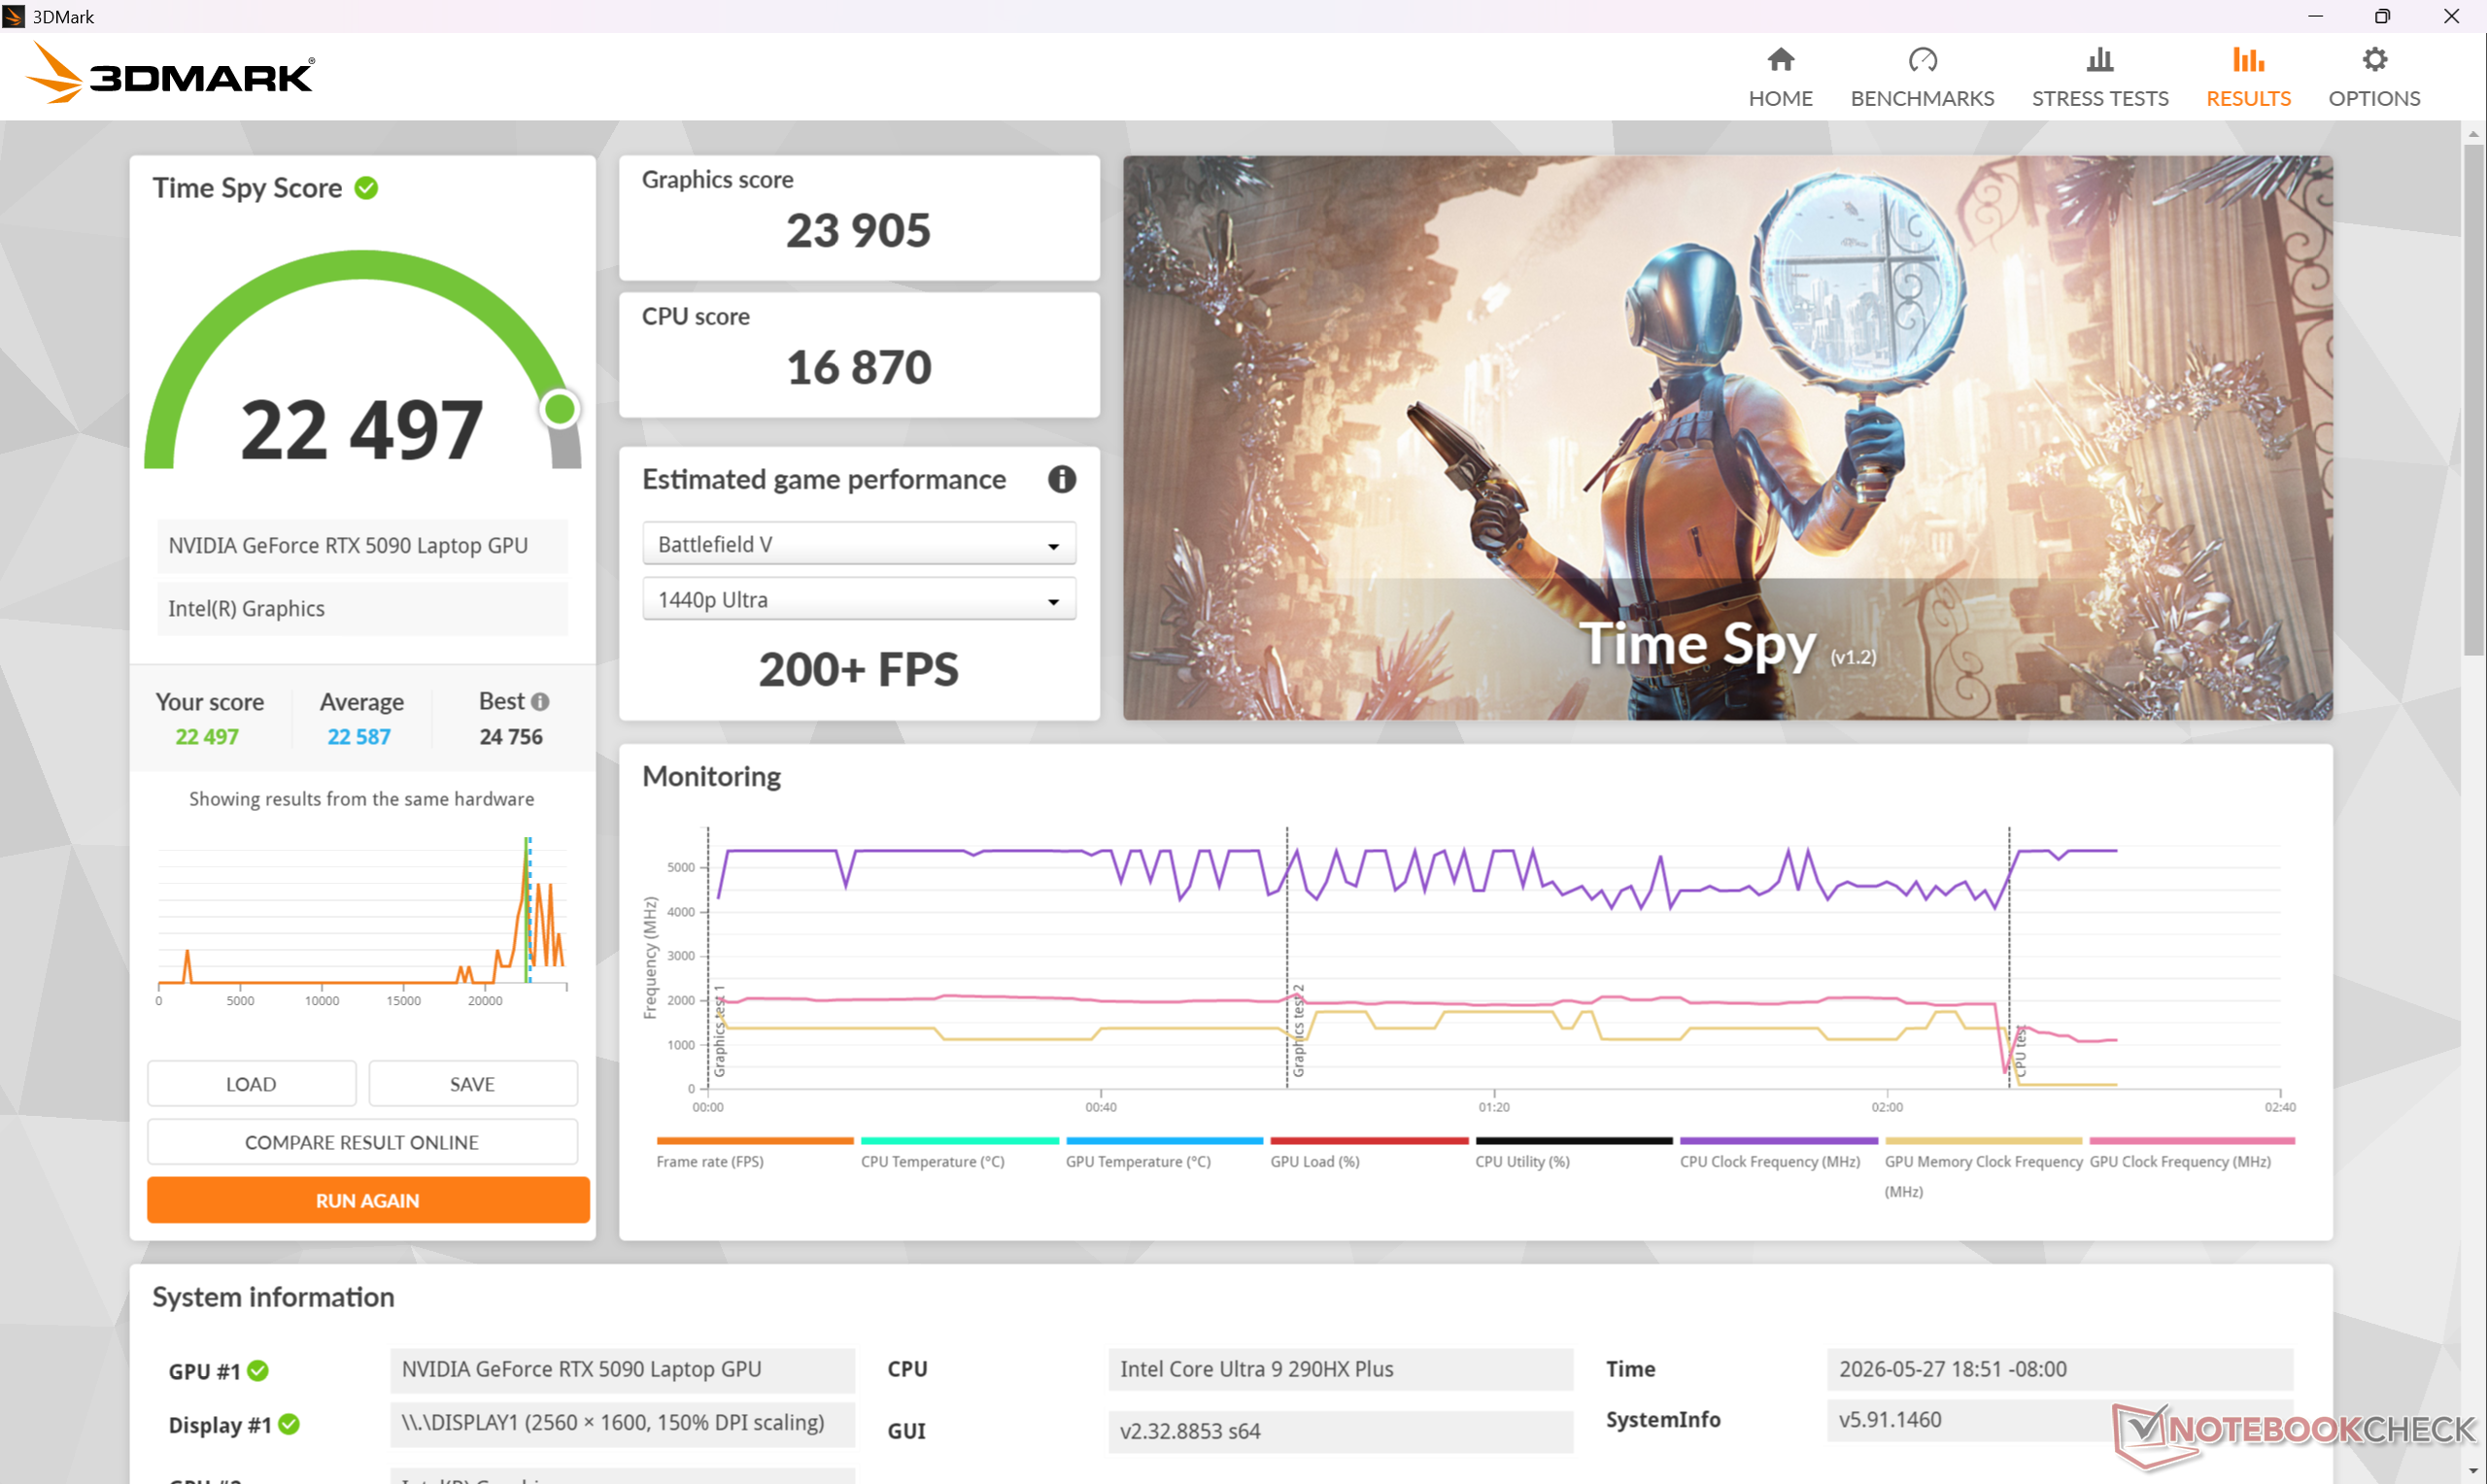
Wenn man das System im Apex- oder Cooler-Boost-Modus (d. h. im Modus mit maximalem Lüftergeräusch) betreibt, ist das die einzige Möglichkeit, die maximale Verarbeitungsleistung von CPU und GeForce RTX 5090 GPU zu erhalten, wie unsere Time-Spy-Ergebnistabelle unten zeigt. Geht man auf den leiseren Modus Balanced zurück, verringert sich die Gesamtleistung um etwa zehn Prozent.
| Leistungsprofil | Graphics-Punktzahl | Physics-Punktzahl | Kombinierte Punktzahl |
| Cooler-Boost-Modus | 26.009 | 16.635 | 23.981 |
| Apex-Modus | 25.594 (-2 %) | 16.938 (-2 %) | 23.771 (-1 %) |
| Extrem-Performance-Modus | 23.905 (-8 %) | 16.870 (-1 %) | 22.497 (-6 %) |
| Balanced-Modus | 23.572 (-9 %) | 14.462 (-13 %) | 21.536 (-10 %) |
| Energiesparen | 18.192 (-30 %) | 13.786 (-17 %) | 17.912 (-25 %) |
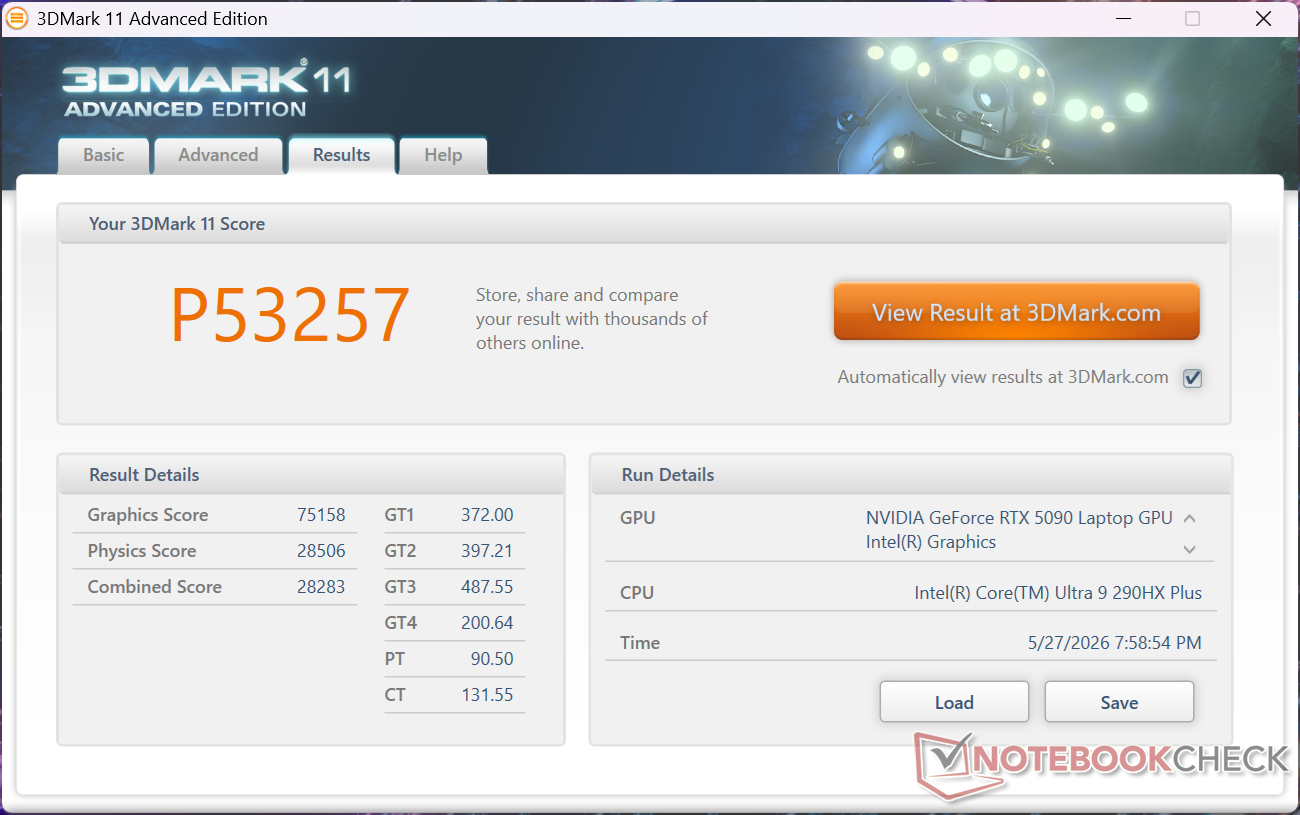
| 3DMark 11 Performance | 53257 Punkte | |
| 3DMark Cloud Gate Standard Score | 77700 Punkte | |
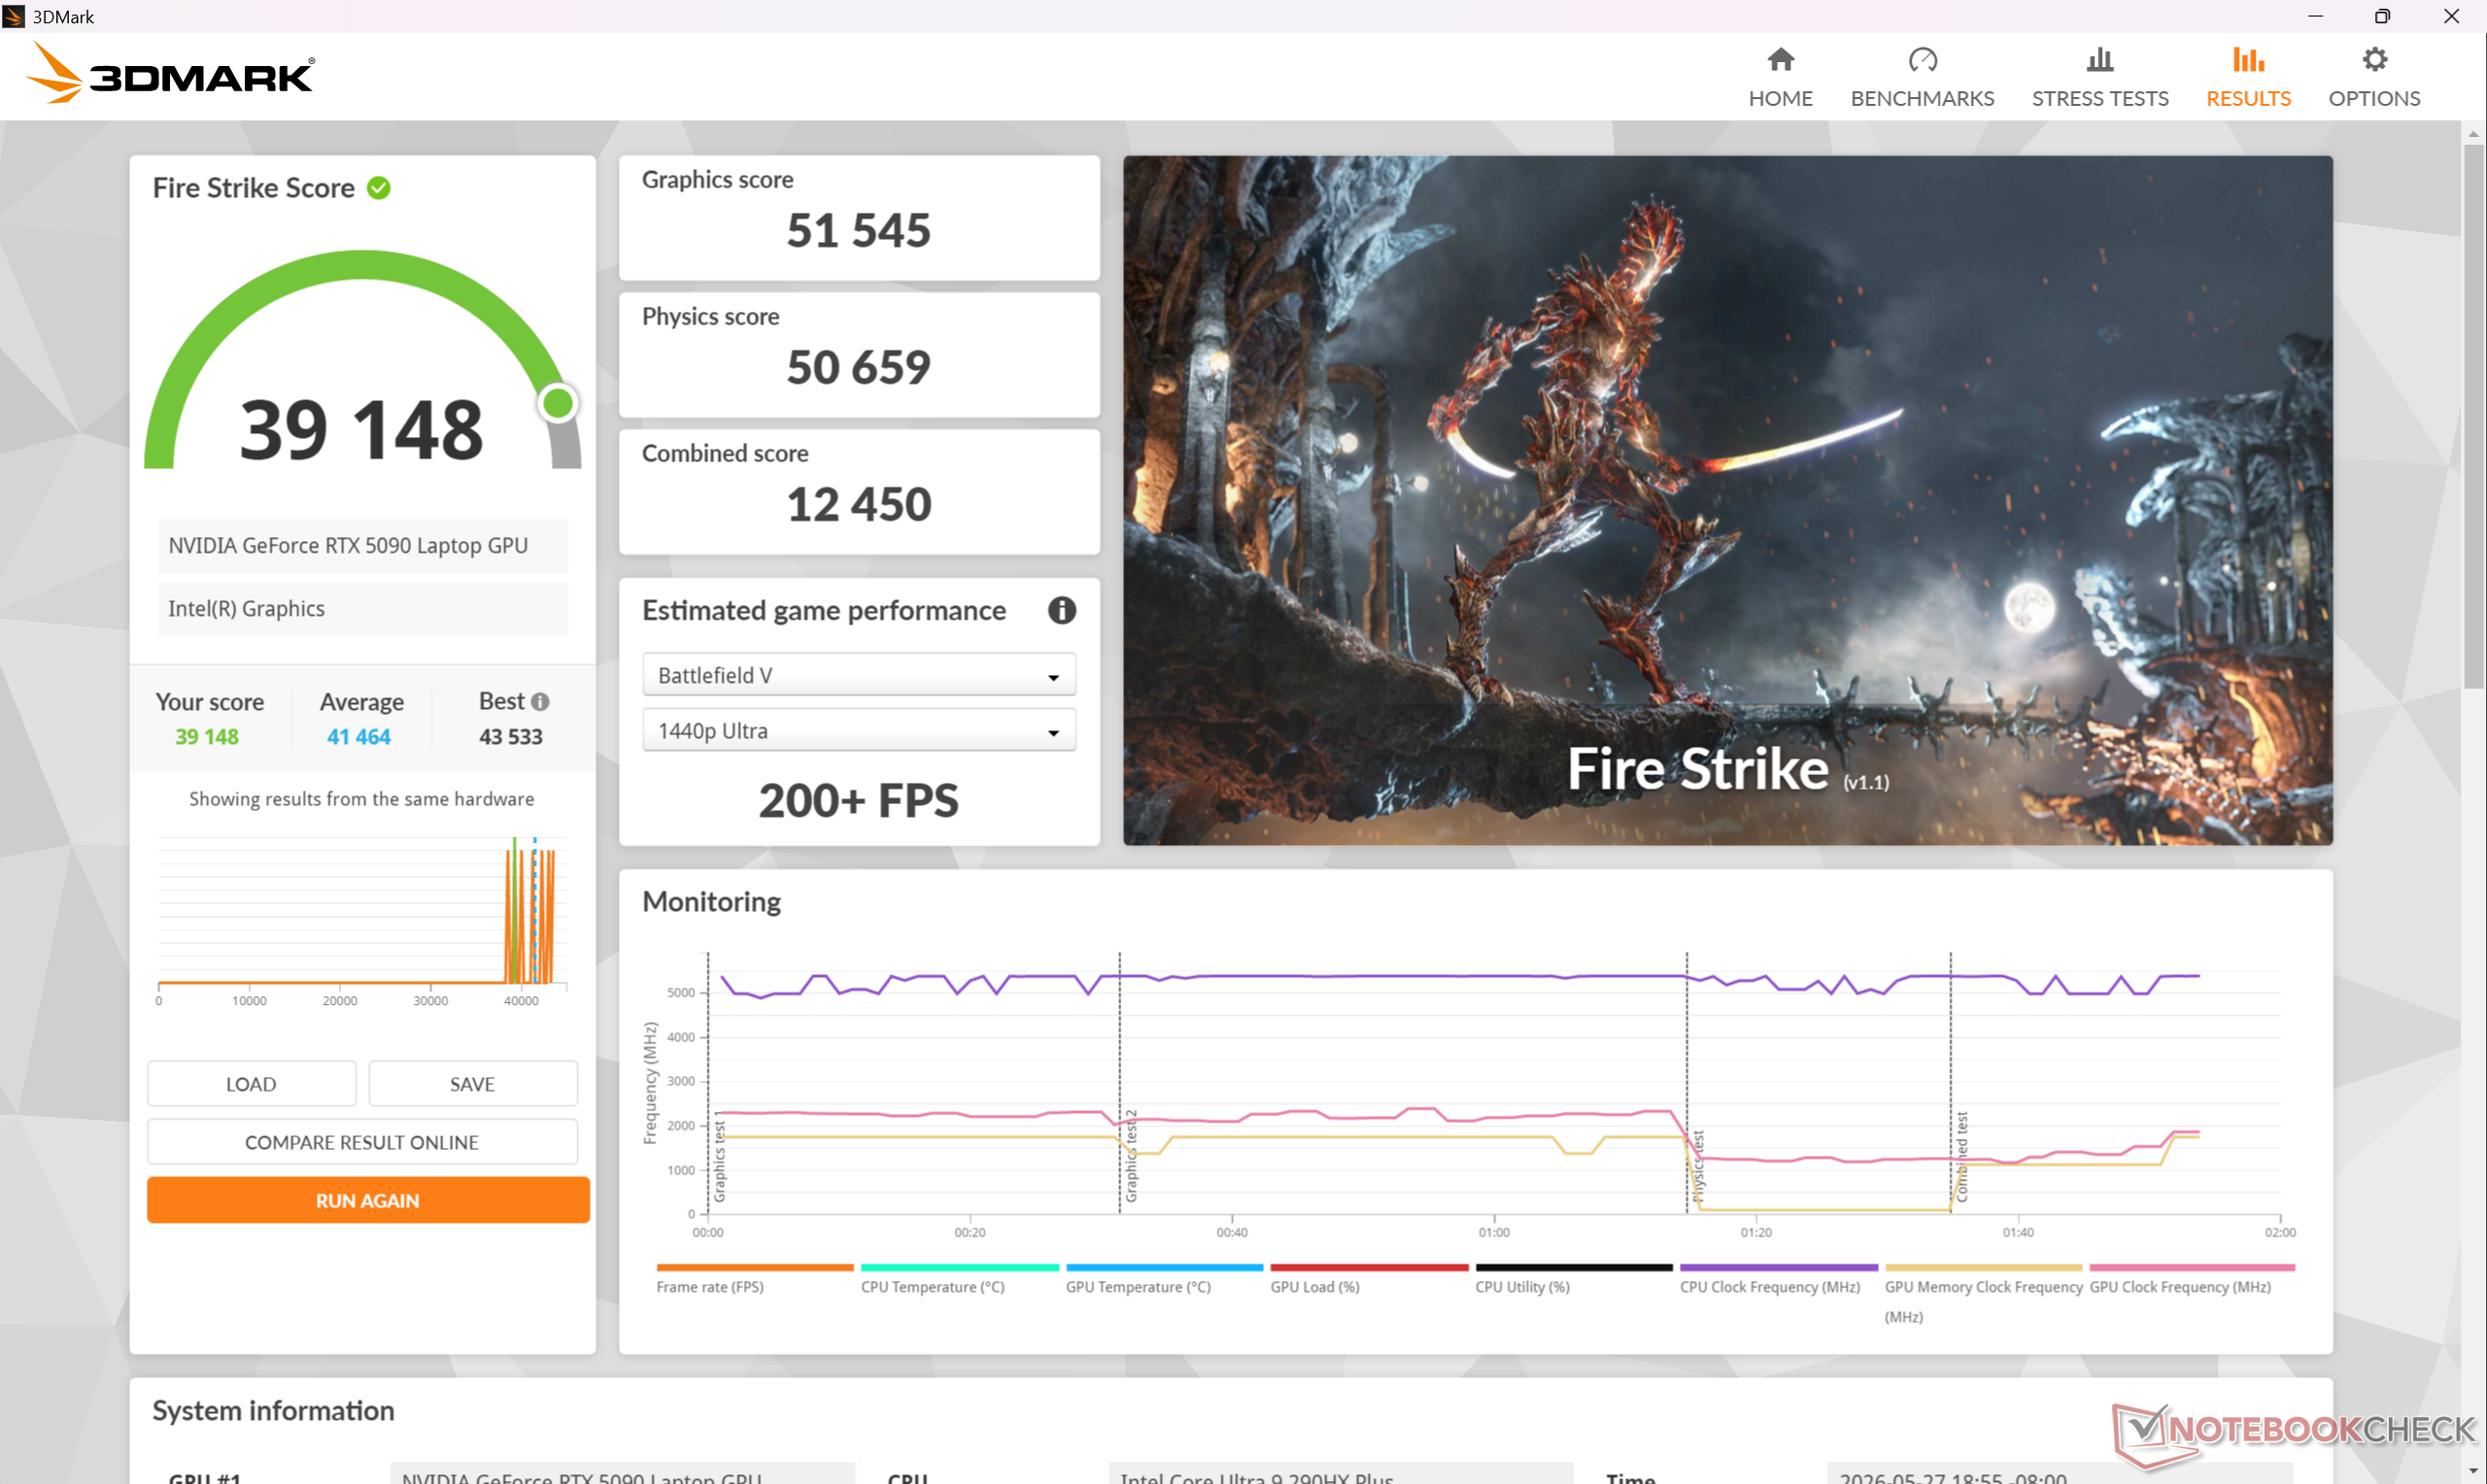
| 3DMark Fire Strike Score | 39148 Punkte | |
| 3DMark Time Spy Score | 22497 Punkte | |
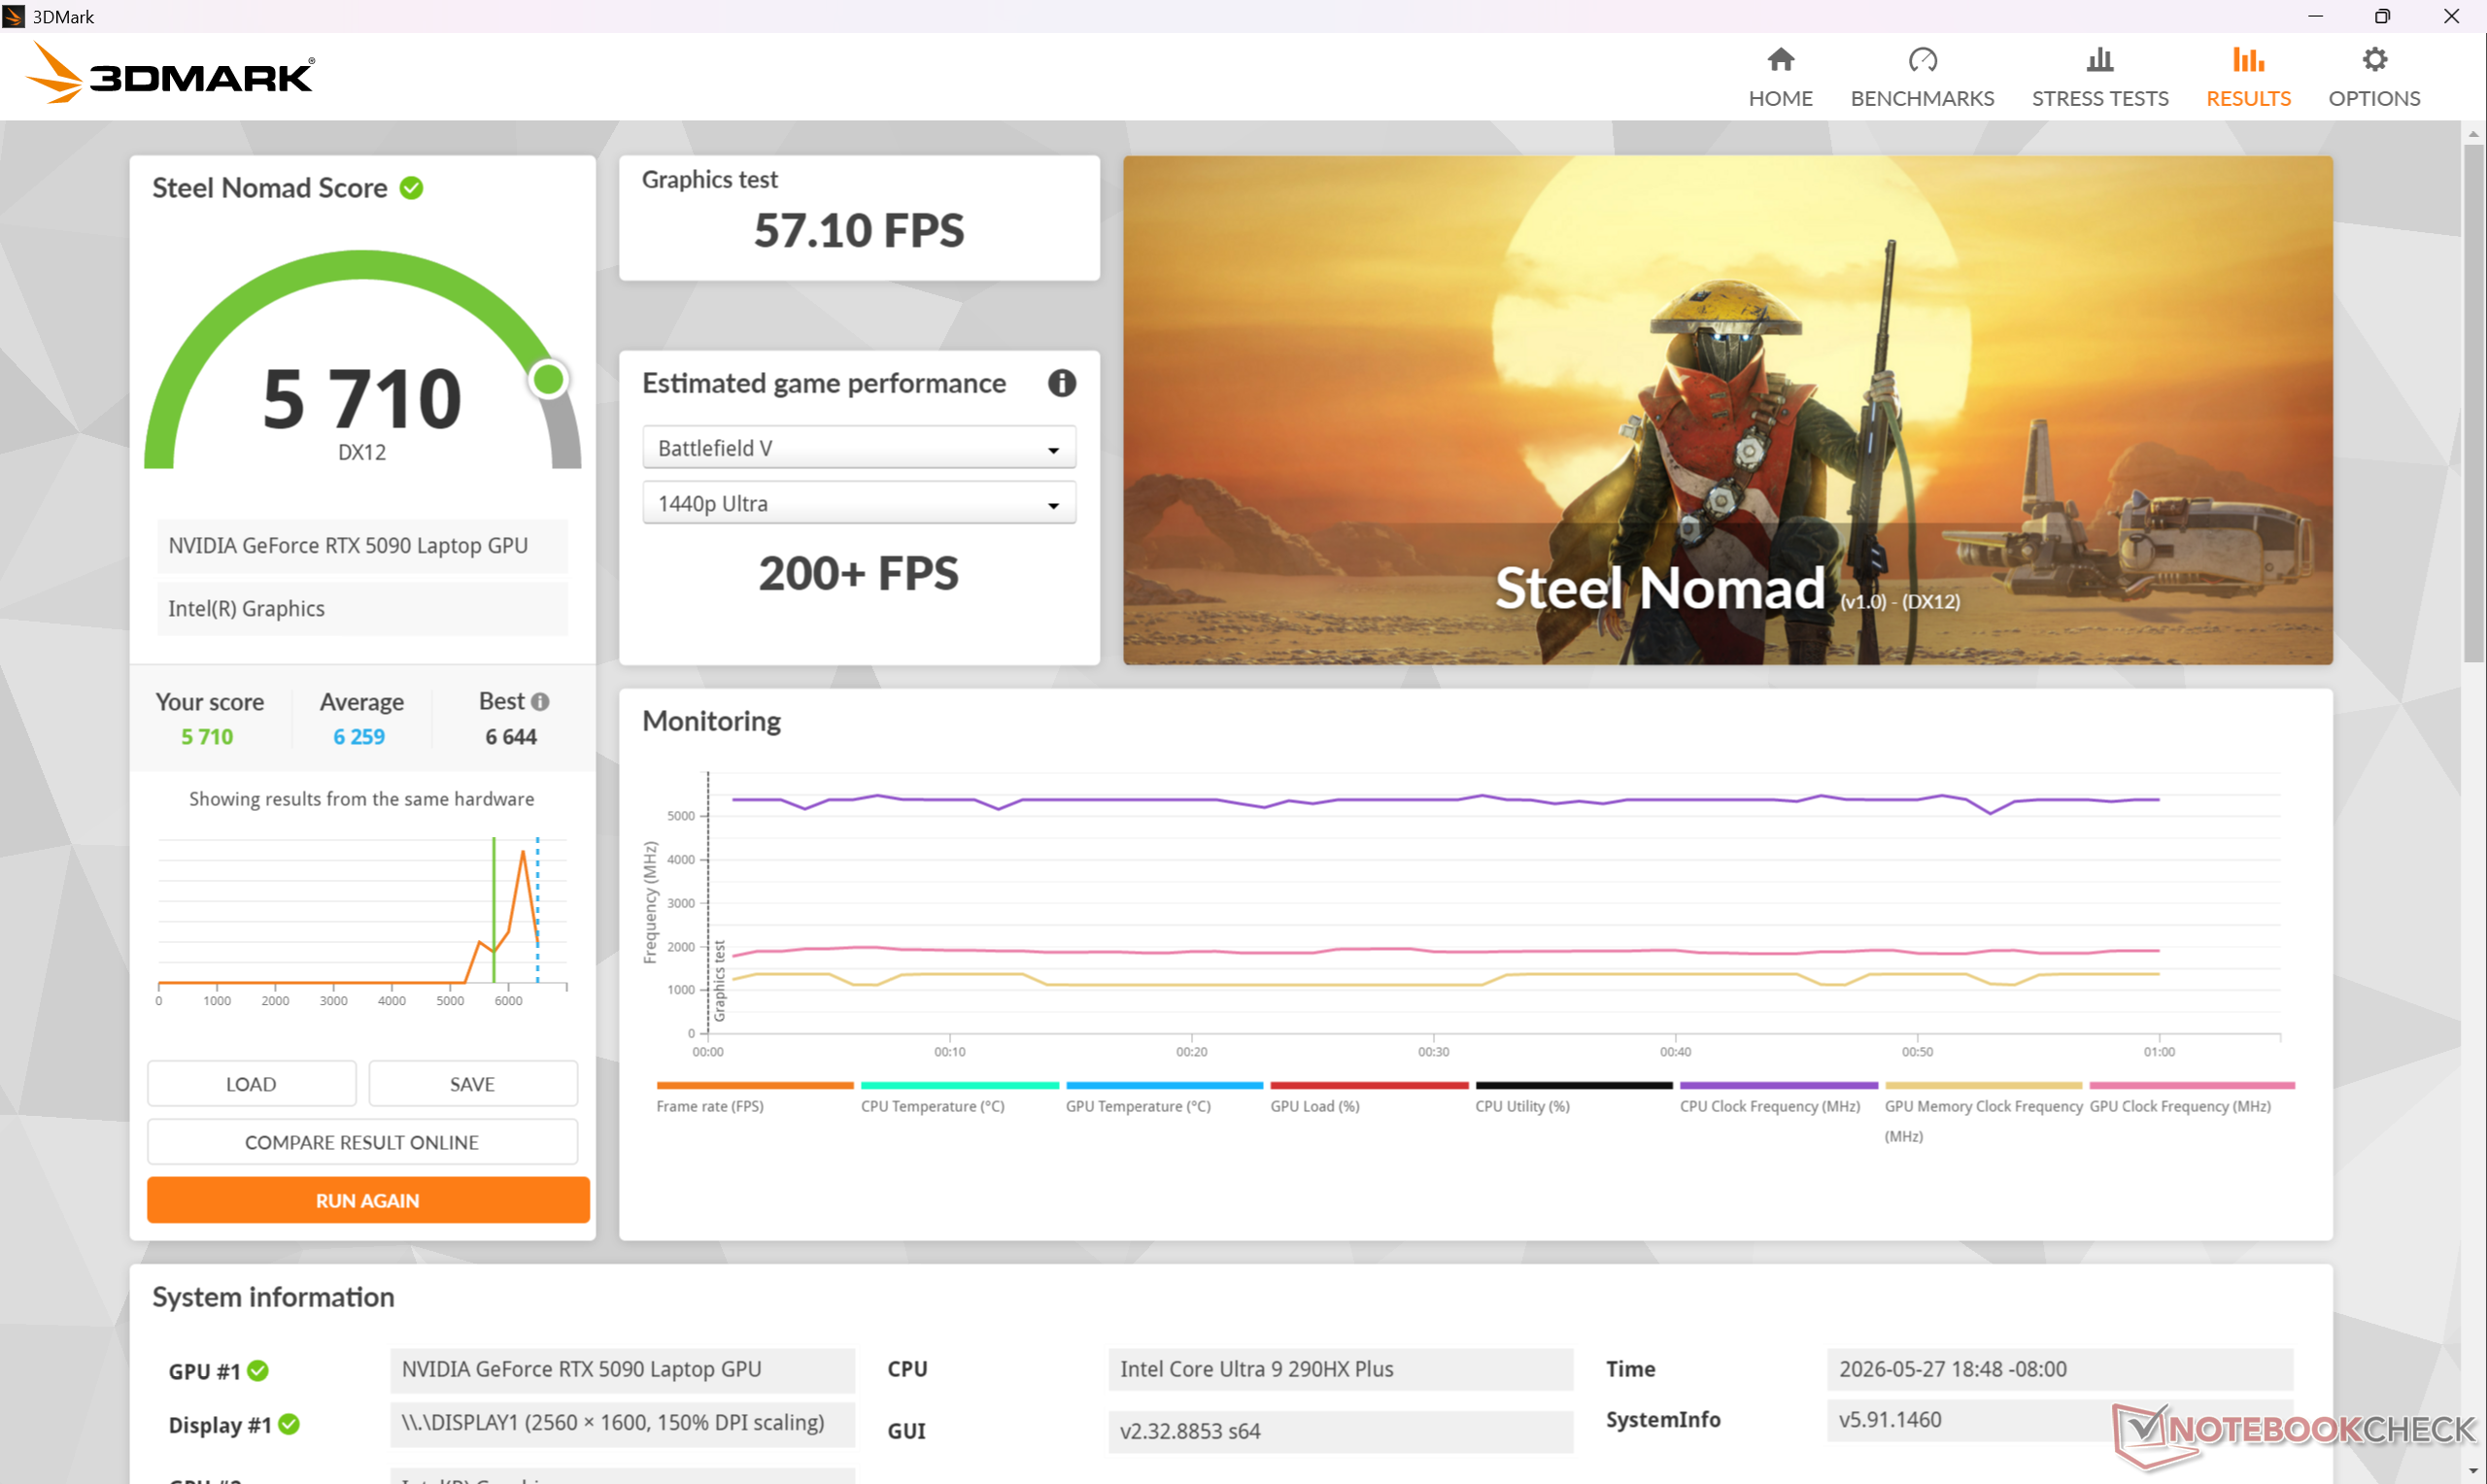
| 3DMark Steel Nomad Score | 5710 Punkte | |
Hilfe | ||
* ... kleinere Werte sind besser
Spieleleistung
Die mobile GeForce RTX 5090 passt wohl besser zu einem nativen 1.600p-Display als zu 4K, wenn man bedenkt, dass die Desktop-Version zweimal so leistungsfähig sein kann. Zu beachten ist, dass das System auf den Apex-Modus oder den Cooler-Boost-Modus eingestellt sein muss, um die beworbenen 175 W TGP voll auszuschöpfen.
| Cyberpunk 2077 - 1920x1080 Ultra Preset (FSR off) | |
| MSI Raider 16 Max HX B2WJ | |
| Razer Blade 16 Core Ultra 9 386H | |
| Alienware 16X Aurora Core Ultra 9 290HX Plus | |
| Asus TUF Gaming A16 FA608UP | |
| MSI Crosshair 16 HX AI D2XWGKG | |
| Lenovo Legion 7 16IAX10 | |
| Baldur's Gate 3 - 1920x1080 Ultra Preset AA:T | |
| MSI Raider 16 Max HX B2WJ | |
| Razer Blade 16 Core Ultra 9 386H | |
| Alienware 16X Aurora Core Ultra 9 290HX Plus | |
| MSI Crosshair 16 HX AI D2XWGKG | |
| Asus TUF Gaming A16 FA608UP | |
| Lenovo Legion 7 16IAX10 | |
| GTA V - 1920x1080 Highest AA:4xMSAA + FX AF:16x | |
| MSI Raider 16 Max HX B2WJ | |
| Alienware 16X Aurora Core Ultra 9 290HX Plus | |
| Lenovo Legion 7 16IAX10 | |
| MSI Crosshair 16 HX AI D2XWGKG | |
| Asus TUF Gaming A16 FA608UP | |
| Razer Blade 16 Core Ultra 9 386H | |
| Final Fantasy XV Benchmark - 1920x1080 High Quality | |
| MSI Raider 16 Max HX B2WJ | |
| Razer Blade 16 Core Ultra 9 386H | |
| Alienware 16X Aurora Core Ultra 9 290HX Plus | |
| Asus TUF Gaming A16 FA608UP | |
| MSI Crosshair 16 HX AI D2XWGKG | |
| Lenovo Legion 7 16IAX10 | |
| Strange Brigade - 1920x1080 ultra AA:ultra AF:16 | |
| MSI Raider 16 Max HX B2WJ | |
| Razer Blade 16 Core Ultra 9 386H | |
| Alienware 16X Aurora Core Ultra 9 290HX Plus | |
| MSI Crosshair 16 HX AI D2XWGKG | |
| Lenovo Legion 7 16IAX10 | |
| Asus TUF Gaming A16 FA608UP | |
| Dota 2 Reborn - 1920x1080 ultra (3/3) best looking | |
| Alienware 16X Aurora Core Ultra 9 290HX Plus | |
| MSI Raider 16 Max HX B2WJ | |
| MSI Crosshair 16 HX AI D2XWGKG | |
| Lenovo Legion 7 16IAX10 | |
| Razer Blade 16 Core Ultra 9 386H | |
| Asus TUF Gaming A16 FA608UP | |
Cyberpunk 2077 ultra FPS Grafik
| min. | mittel | hoch | max. | QHD DLSS | QHD | 4K DLSS | 4K | |
|---|---|---|---|---|---|---|---|---|
| GTA V (2015) | 191.4 | 190.9 | 187.5 | 165.2 | 162.3 | 181.5 | ||
| Dota 2 Reborn (2015) | 225 | 206 | 189.6 | 176.1 | 160 | |||
| Final Fantasy XV Benchmark (2018) | 234 | 236 | 205 | 171.3 | 96.3 | |||
| X-Plane 11.11 (2018) | 154.8 | 138 | 112.6 | 93.8 | ||||
| Strange Brigade (2018) | 639 | 503 | 471 | 433 | 329 | 179.6 | ||
| Baldur's Gate 3 (2023) | 287 | 242 | 211 | 207 | 202 | 147.7 | 125.9 | 83.1 |
| Cyberpunk 2077 (2023) | 199.4 | 196.6 | 177.3 | 161.7 | 122.7 | 111.2 | 61 | 50.4 |
| F1 24 (2024) | 353 | 379 | 364 | 153.8 | 154.1 | 99.8 | 85.3 | 50.5 |
| Black Myth: Wukong (2024) | 122 | 97 | 58 | 65 | 45 | 46 | 27 | |
| Assassin's Creed Shadows (2025) | 102 | 89 | 69 | 70 | 59 | 56 | 43 |
Emissionen
Systemgeräusche
Das Lüftergeräusch ist eng mit den fünf Leistungsprofil-Einstellungen verbunden, und zwar in der Reihenfolge von der niedrigsten bis zur höchsten Leistung: Eco, Balanced, Extreme Performance, Apex und Cooler Boost. Wenn Cyberpunk 2077 mit diesen Profilen läuft, stabilisiert sich das Lüftergeräusch bei 36,2 dB(A), 47,5 dB(A), 51,1 dB(A), 57 dB(A) bzw. 60,2 dB(A). Das Pulsverhalten ist im Allgemeinen minimal, wenn der Modus Balanced oder niedriger eingestellt ist. Dennoch sind 51,1 dB(A) beim Spielen im Extreme-Performance-Modus etwas leiser als bei Konkurrenzmodellen wie dem Lenovo Legion 7 16IAX10 oder Razer Blade 16.
Lautstärkediagramm
| Idle |
| 26.6 / 26.7 / 26.9 dB(A) |
| Last |
| 36 / 60.2 dB(A) |
 | ||
30 dB leise 40 dB(A) deutlich hörbar 50 dB(A) störend |
||
min: | ||
| MSI Raider 16 Max HX B2WJ Ultra 9 290HX Plus, GeForce RTX 5090 Laptop | MSI Crosshair 16 HX AI D2XWGKG Ultra 9 275HX, GeForce RTX 5070 Laptop | Razer Blade 16 Core Ultra 9 386H Ultra 9 386H, GeForce RTX 5090 Laptop | Alienware 16X Aurora Core Ultra 9 290HX Plus Ultra 9 290HX Plus, GeForce RTX 5070 Ti Laptop | Asus TUF Gaming A16 FA608UP R7 260, GeForce RTX 5070 Laptop | Lenovo Legion 7 16IAX10 Ultra 7 255HX, GeForce RTX 5060 Laptop | |
|---|---|---|---|---|---|---|
| Geräuschentwicklung | -11% | -1% | -4% | -11% | 1% | |
| aus / Umgebung * (dB) | 23.1 | 25.56 -11% | 23.1 -0% | 23.4 -1% | 25.1 -9% | 23.9 -3% |
| Idle min * (dB) | 26.6 | 28.3 -6% | 23.4 12% | 23.8 11% | 32.2 -21% | 24 10% |
| Idle avg * (dB) | 26.7 | 28.3 -6% | 25.4 5% | 23.8 11% | 32.2 -21% | 26 3% |
| Idle max * (dB) | 26.9 | 28.3 -5% | 29.3 -9% | 31.4 -17% | 32.2 -20% | 29.4 -9% |
| Last avg * (dB) | 36 | 50.26 -40% | 42.6 -18% | 48.7 -35% | 38.1 -6% | 35.4 2% |
| Cyberpunk 2077 ultra * (dB) | 51.1 | 57.8 -13% | 53.6 -5% | 51.5 -1% | 53.9 -5% | 54.6 -7% |
| Last max * (dB) | 60.2 | 57.95 4% | 53.7 11% | 59.8 1% | 57.1 5% | 54.7 9% |
* ... kleinere Werte sind besser
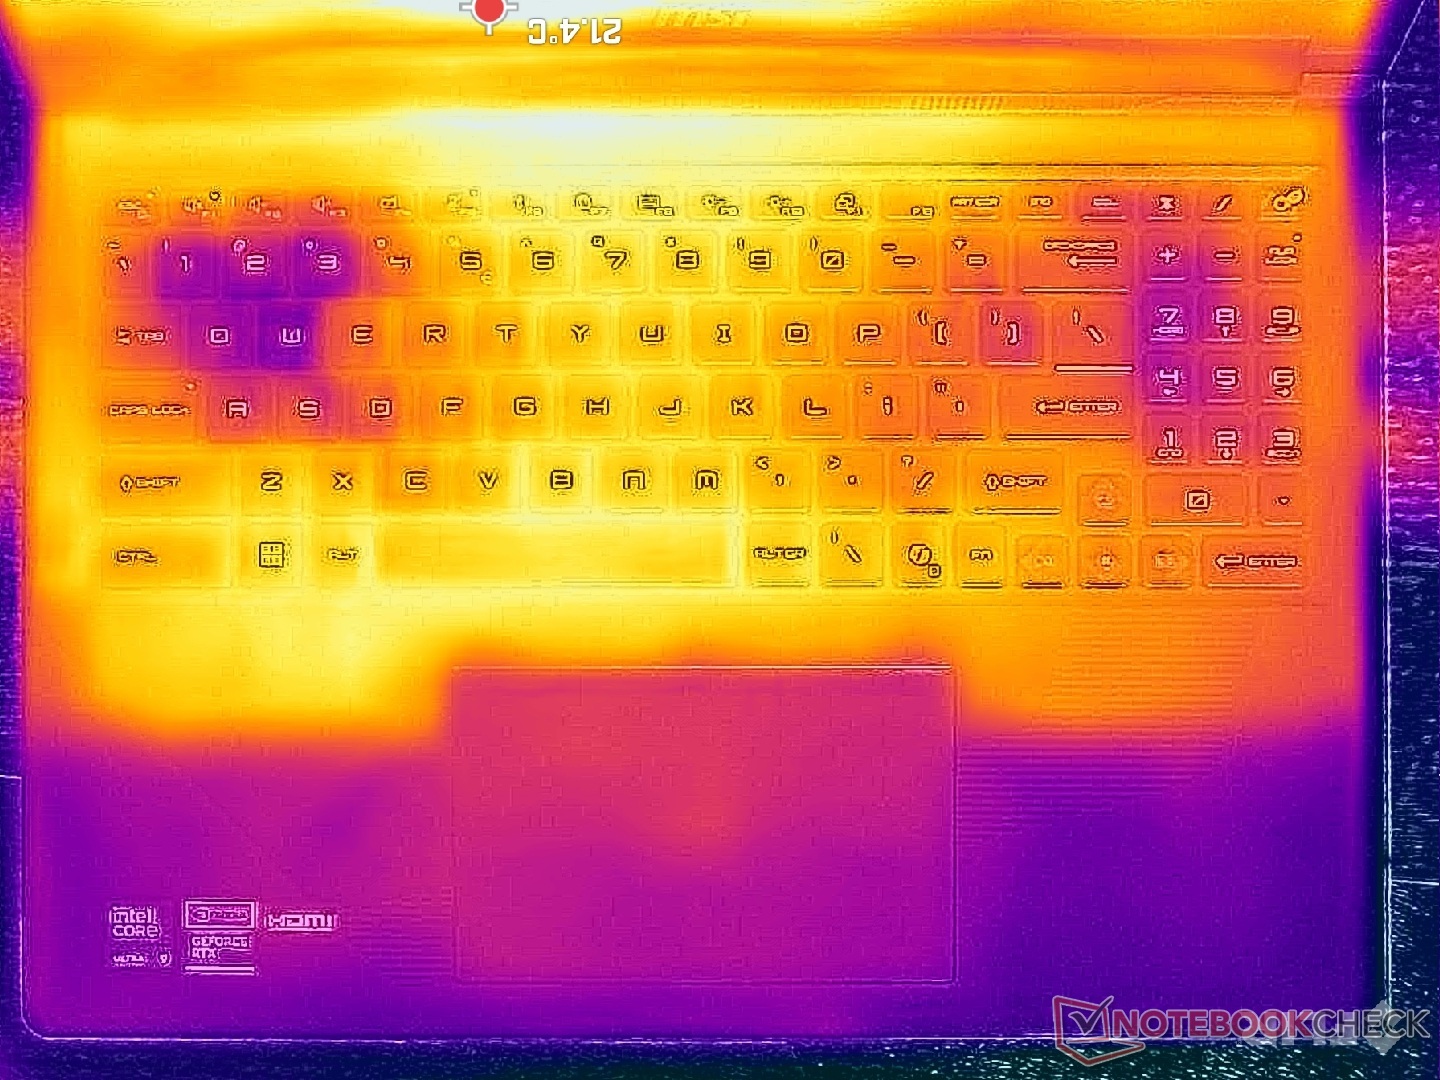
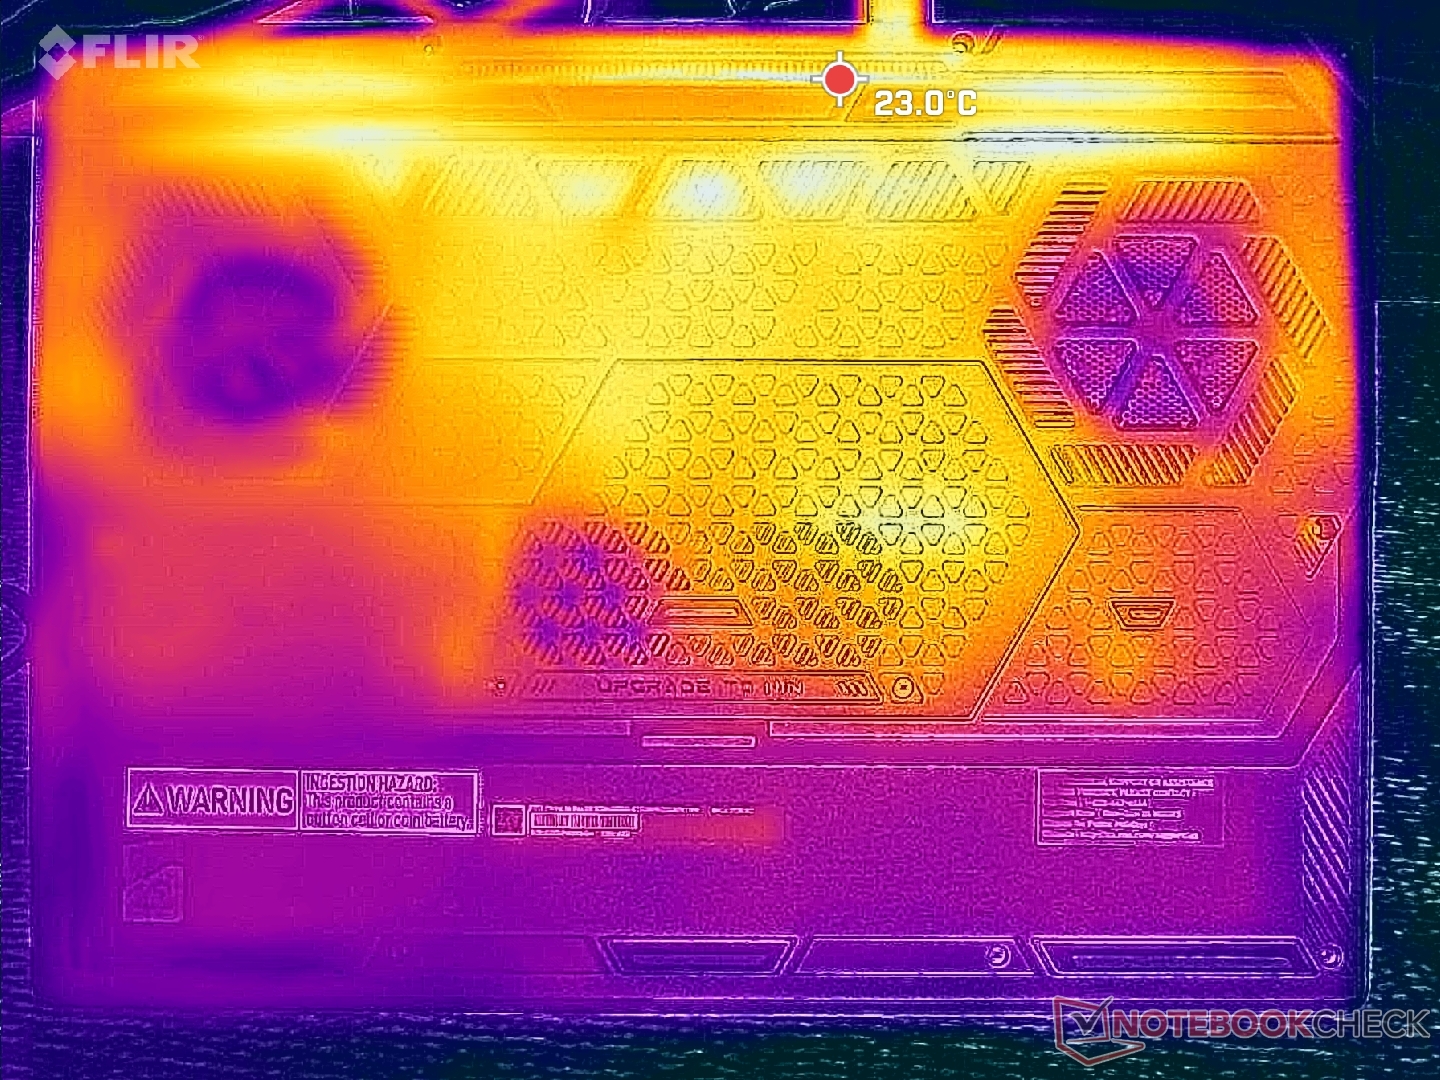
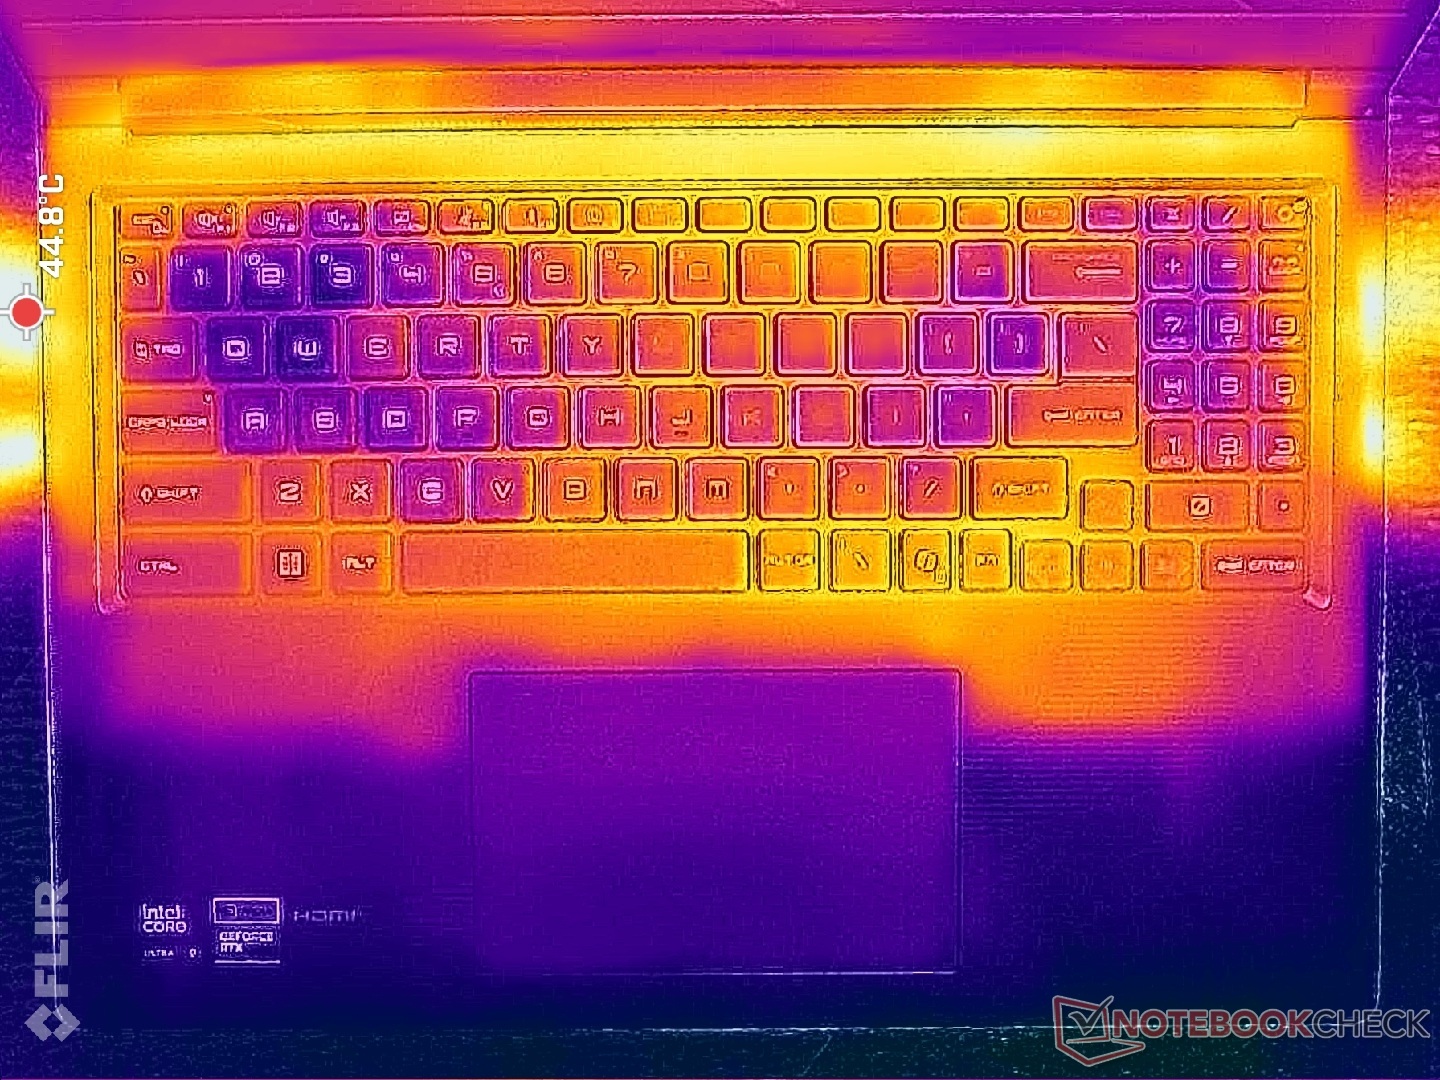
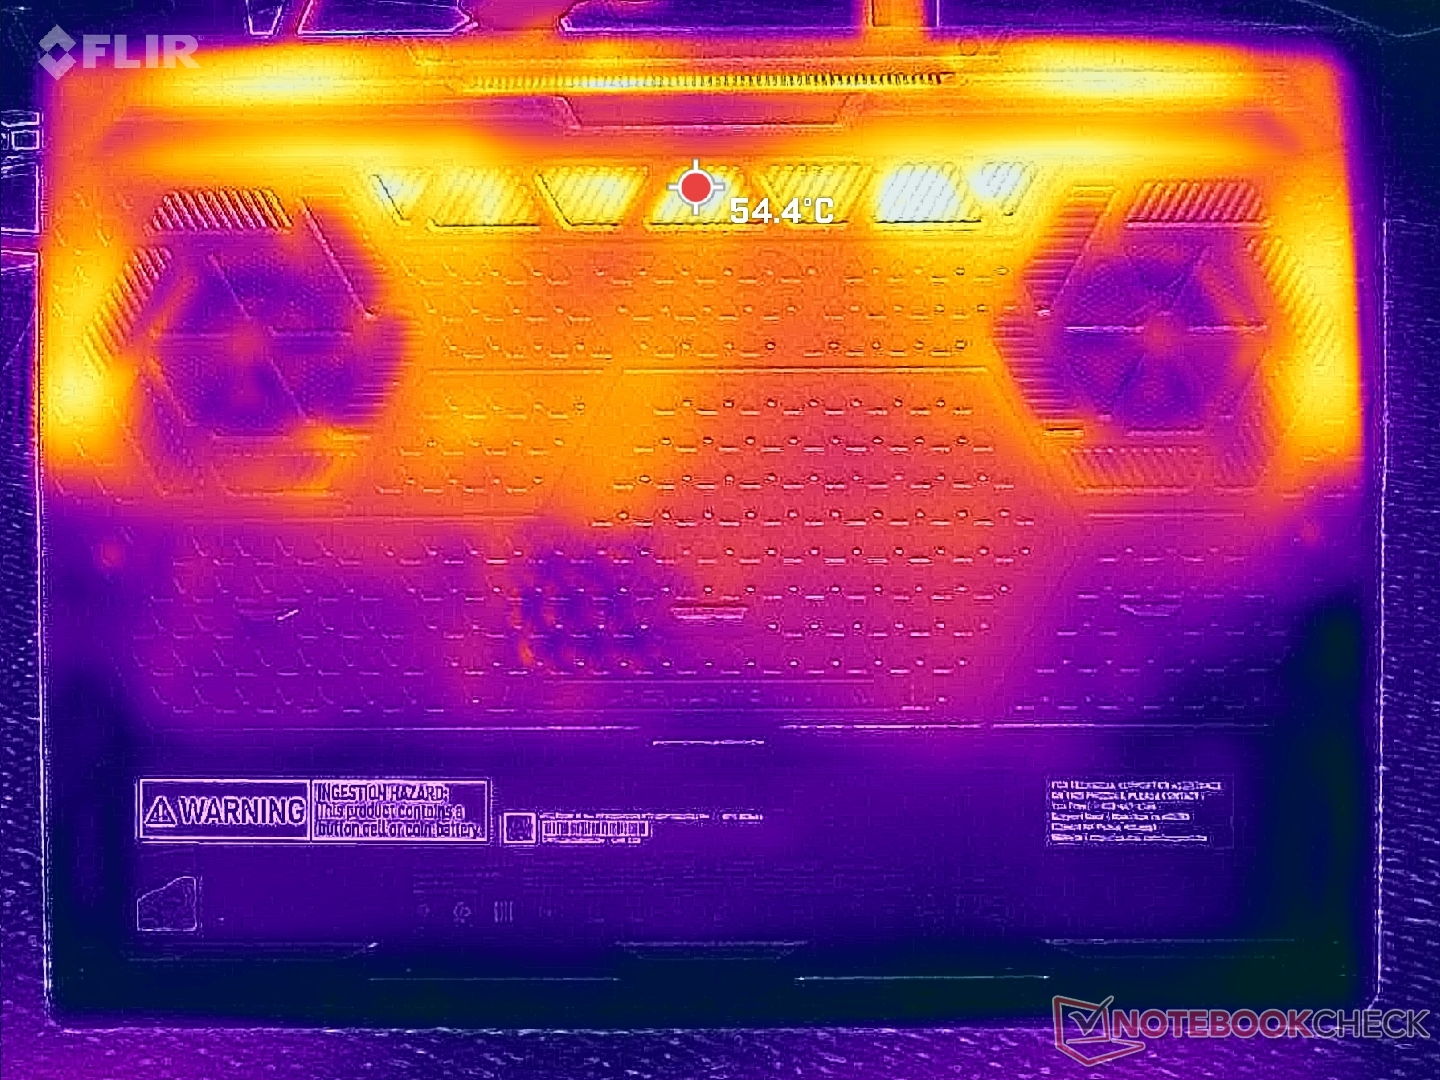
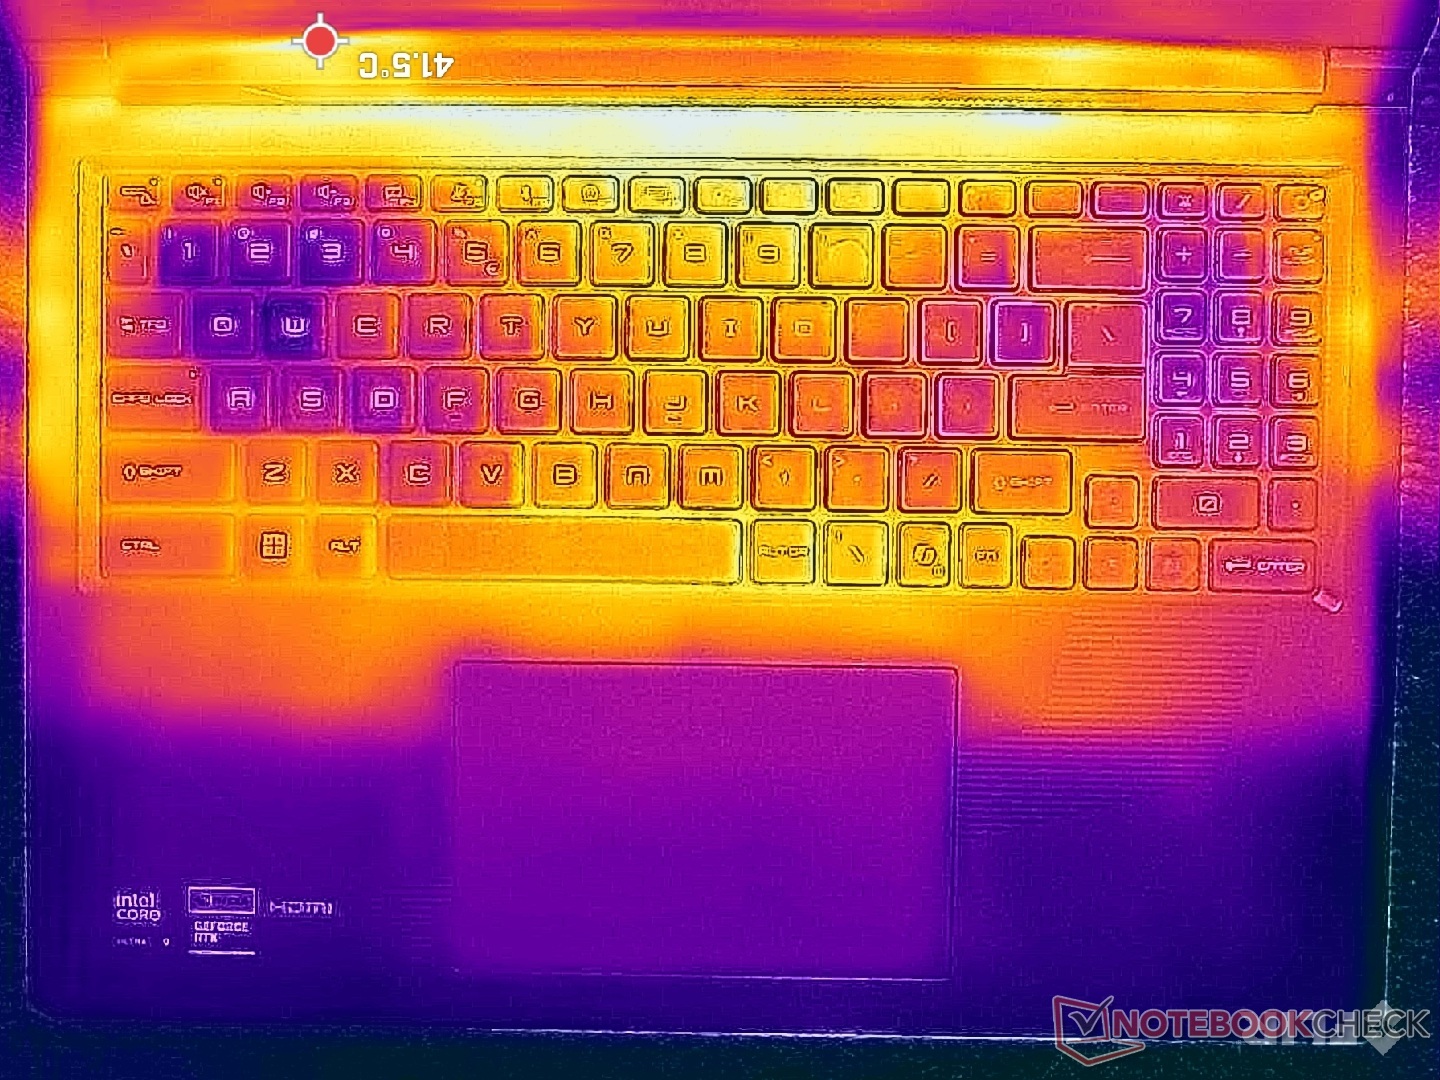
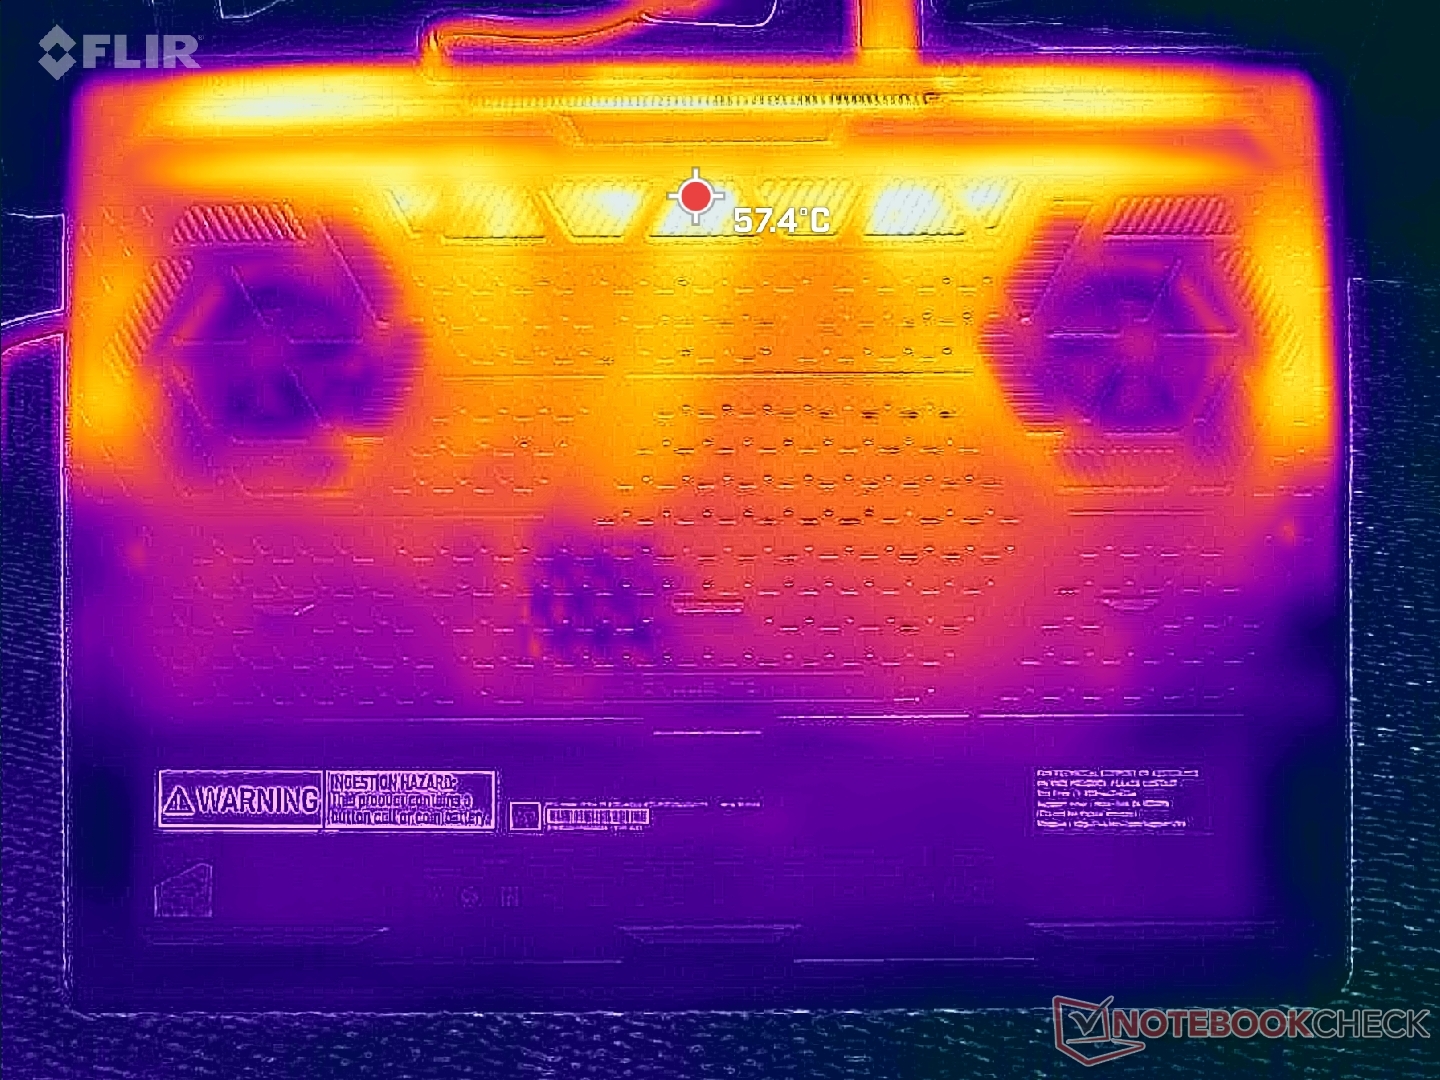
Temperatur
Die Hotspots der Oberflächentemperaturen erreichen 44 und 46 °C auf dem Tastaturdeck bzw. der Unterseite, was ein paar Grad °C kühler ist als das, was wir beim dünneren Razer Blade 16 beobachtet haben.
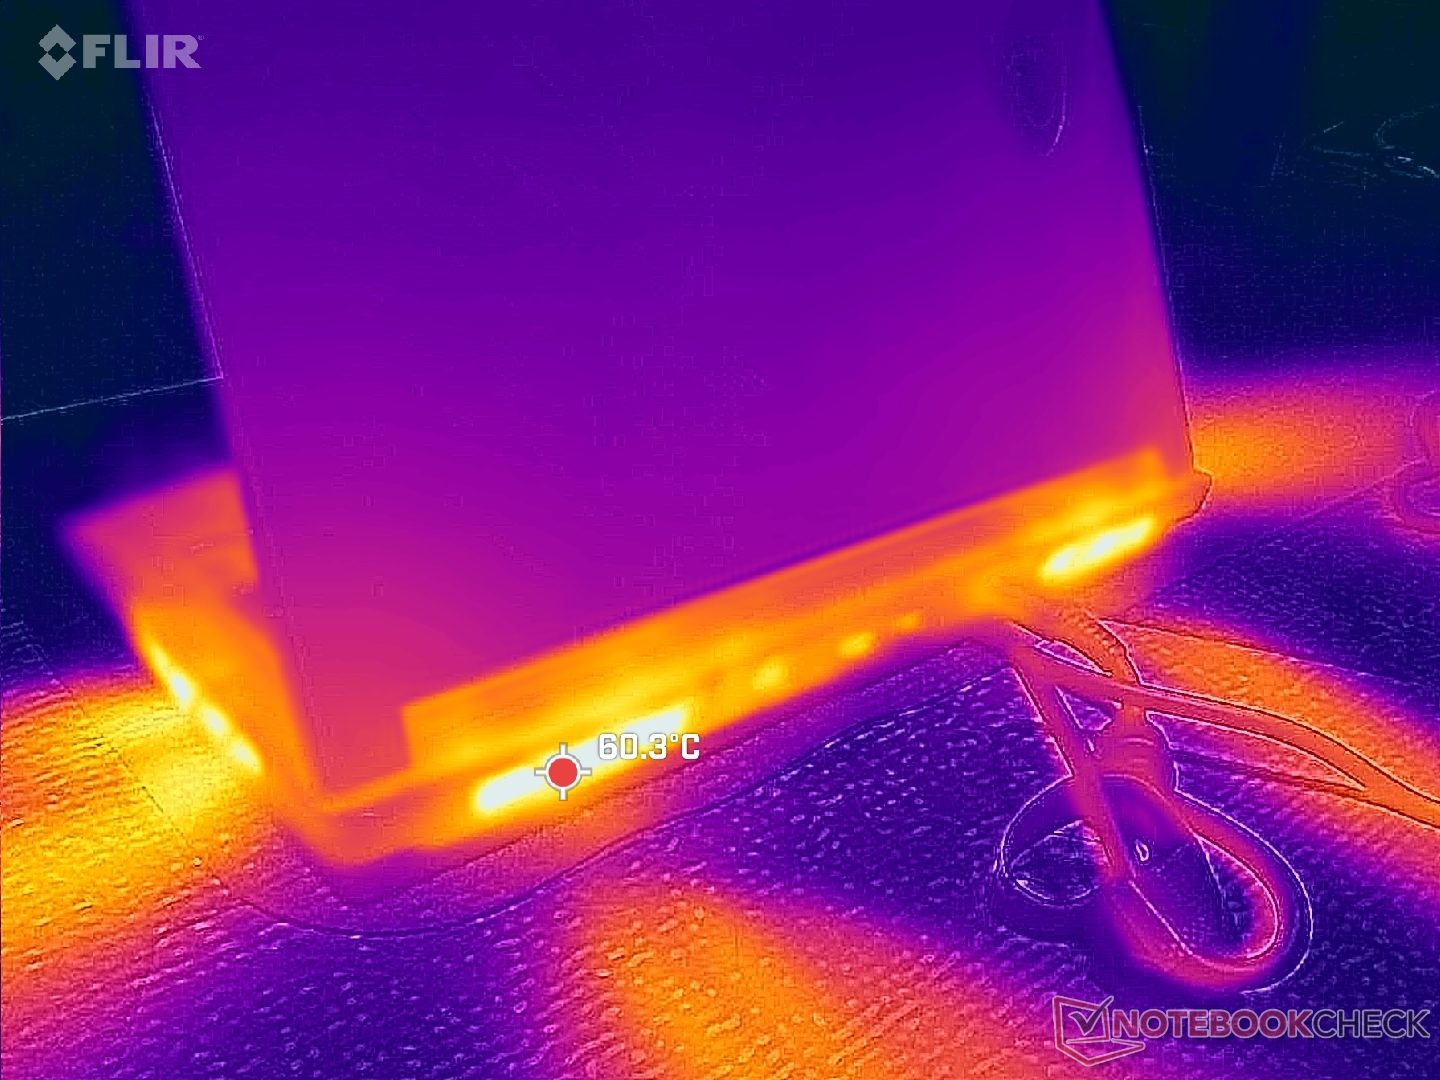
(±) Die maximale Temperatur auf der Oberseite ist 43.2 °C. Im Vergleich liegt der Klassendurchschnitt bei 40.4 °C (von 21.2 bis 68.8 °C für die Klasse Gaming).
(-) Auf der Unterseite messen wir eine maximalen Wert von 45.6 °C (im Vergleich zum Durchschnitt von 43.2 °C).
(+) Ohne Last messen wir eine durchschnittliche Temperatur von 26.1 °C auf der Oberseite. Der Klassendurchschnitt erreicht 33.9 °C.
(±) 3: The average temperature for the upper side is 34.1 °C / 93 F, compared to the average of 33.9 °C / 93 F for the class Gaming.
(+) Die Handballen und der Touchpad-Bereich erreichen maximal 33.6 °C und damit die typische Hauttemperatur und fühlen sich daher nicht heiß an.
(-) Die durchschnittliche Handballen-Temperatur anderer getesteter Geräte war 28.8 °C (-4.8 °C).
| MSI Raider 16 Max HX B2WJ Ultra 9 290HX Plus, GeForce RTX 5090 Laptop | MSI Crosshair 16 HX AI D2XWGKG Ultra 9 275HX, GeForce RTX 5070 Laptop | Razer Blade 16 Core Ultra 9 386H Ultra 9 386H, GeForce RTX 5090 Laptop | Alienware 16X Aurora Core Ultra 9 290HX Plus Ultra 9 290HX Plus, GeForce RTX 5070 Ti Laptop | Asus TUF Gaming A16 FA608UP R7 260, GeForce RTX 5070 Laptop | Lenovo Legion 7 16IAX10 Ultra 7 255HX, GeForce RTX 5060 Laptop | |
|---|---|---|---|---|---|---|
| Hitze | -3% | -17% | 2% | 8% | -14% | |
| Last oben max * (°C) | 43.2 | 44.8 -4% | 45.6 -6% | 48.2 -12% | 39.5 9% | 47 -9% |
| Last unten max * (°C) | 45.6 | 43.4 5% | 47 -3% | 41 10% | 45.1 1% | 44 4% |
| Idle oben max * (°C) | 27.8 | 31.2 -12% | 35.2 -27% | 28.2 -1% | 25.7 8% | 35.6 -28% |
| Idle unten max * (°C) | 29 | 28.8 1% | 37.6 -30% | 26.2 10% | 25.5 12% | 35.2 -21% |
* ... kleinere Werte sind besser
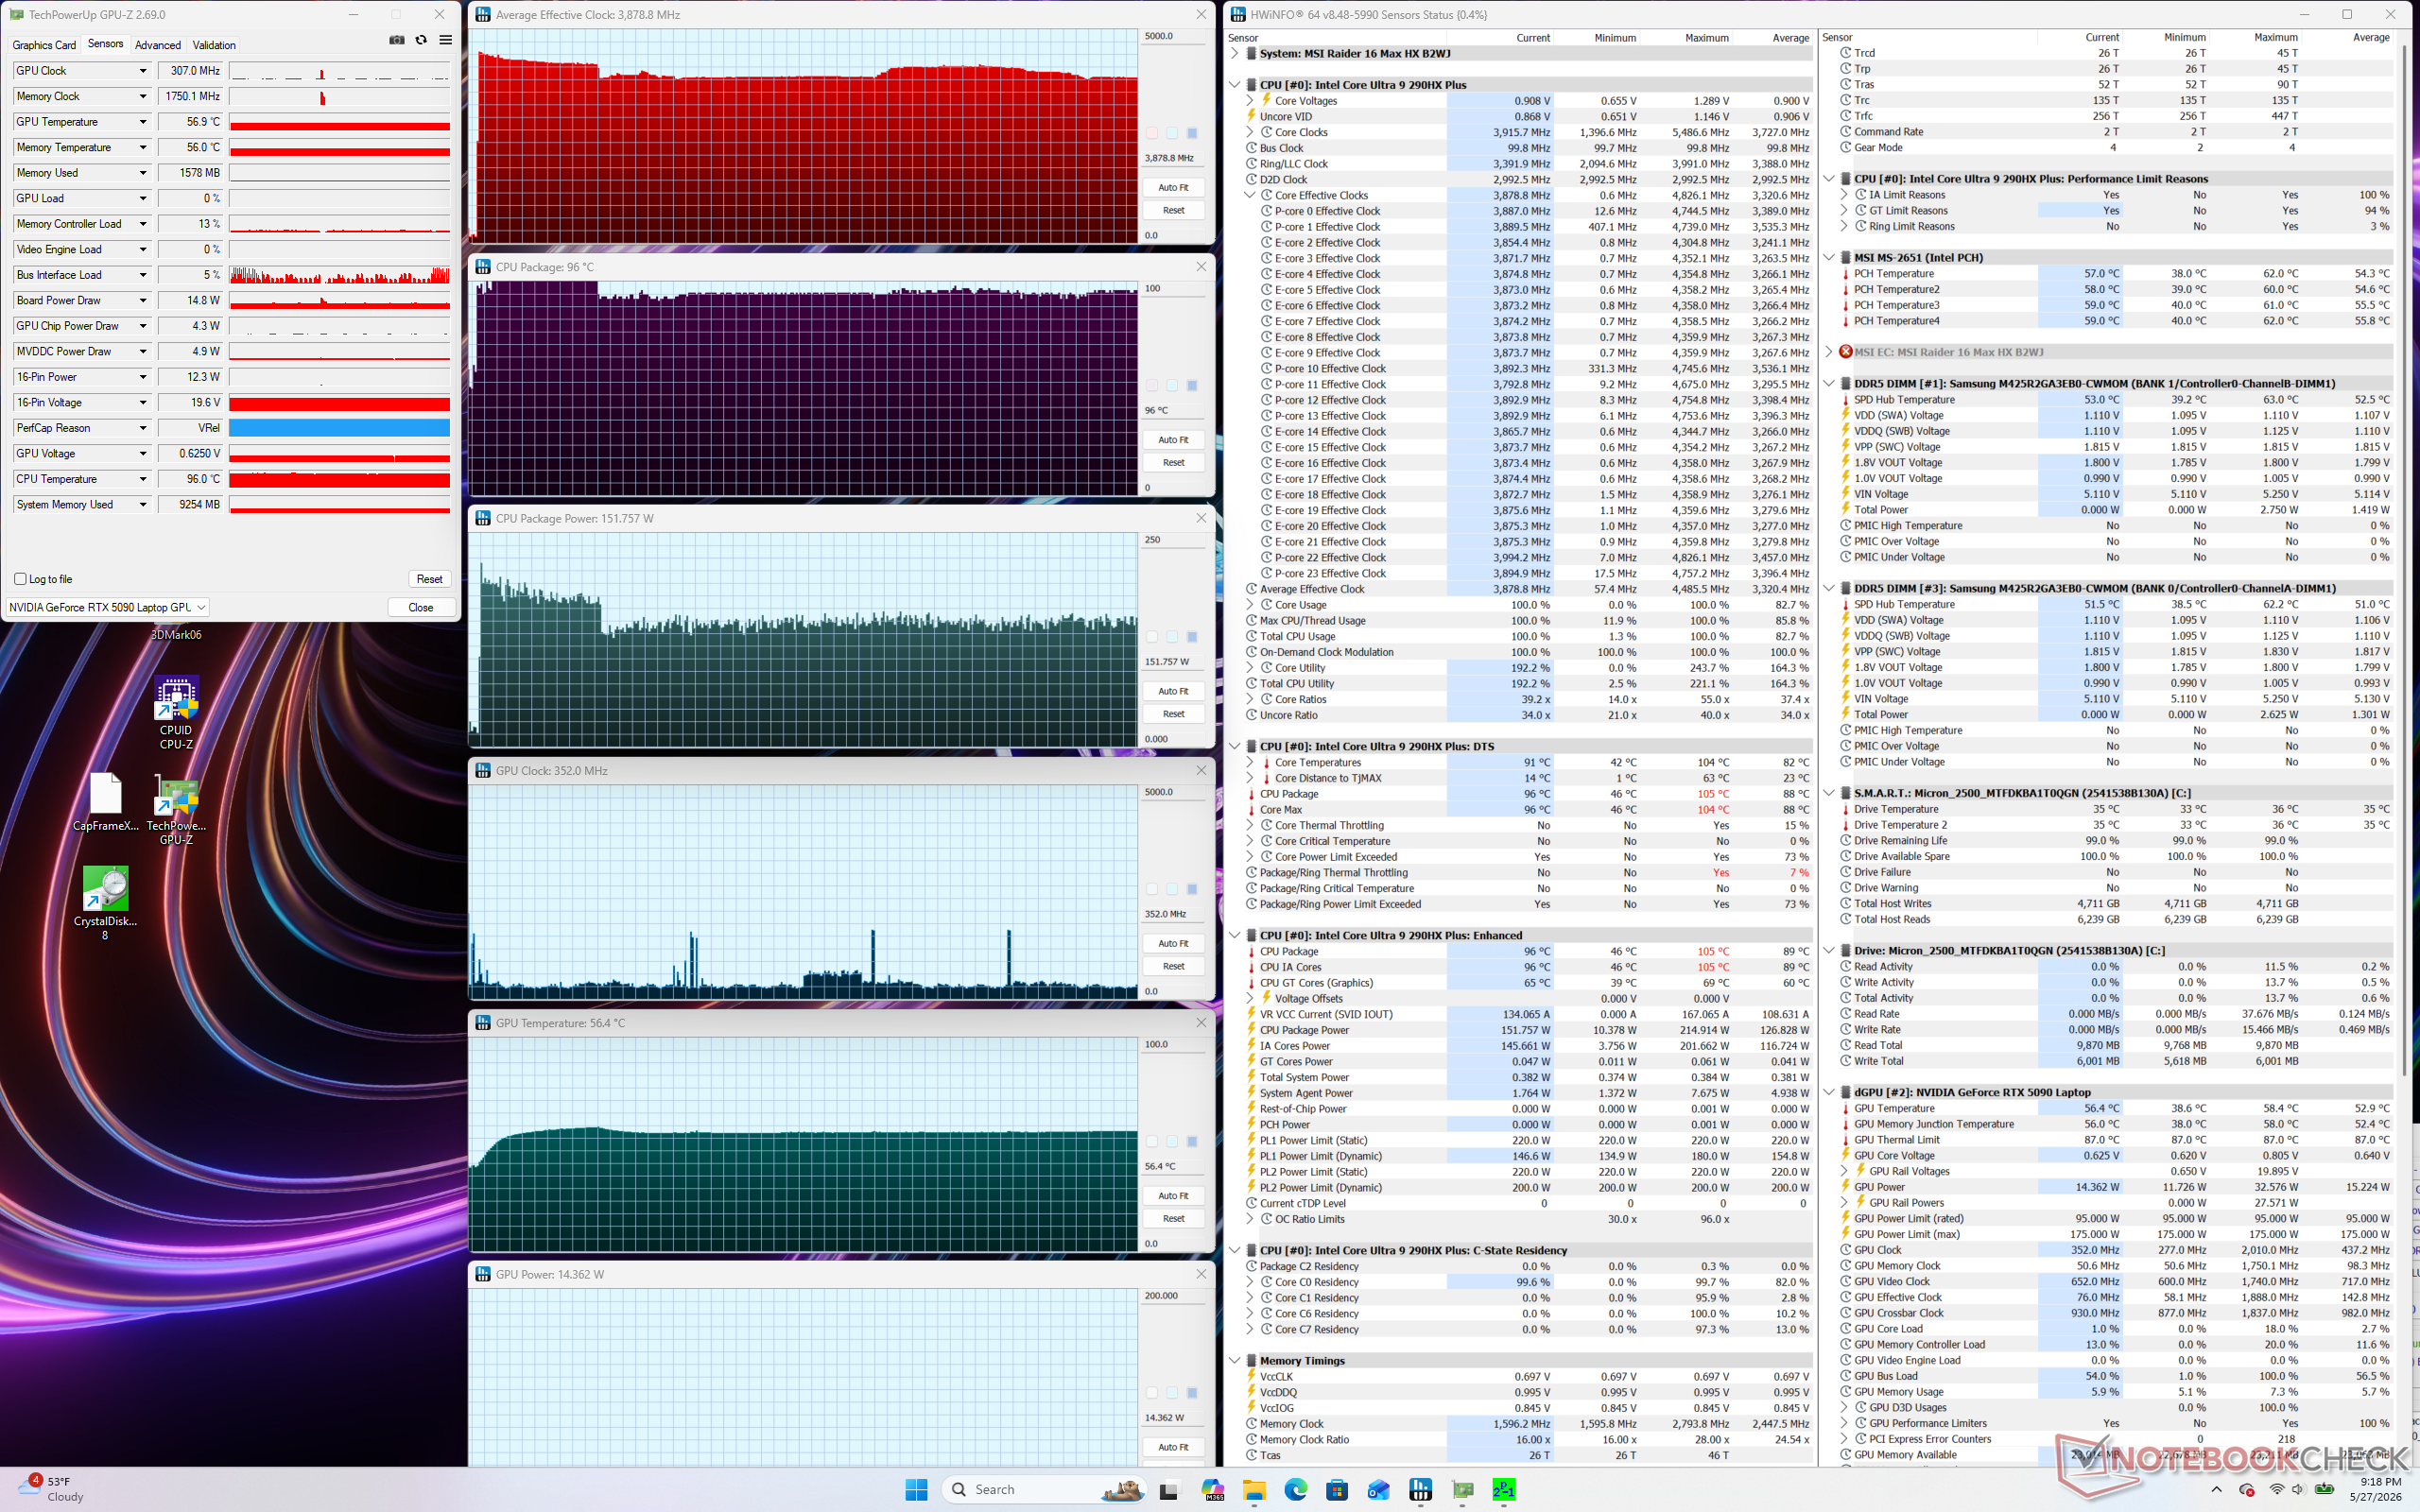
Stresstest
Die CPU wurde nach dem Start von Prime95 Stress für etwa eine Minute auf 4,5 GHz, 215 W und 105 °C hochgefahren. Danach sinkt sie auf 3,9 GHz und ~152 W, um eine kontrollierbarere Kerntemperatur von 96 °C zu halten. Das Alienware 16 Area-51, das mit genau der gleichen CPU wie unser MSI ausgeliefert wird, stabilisiert sich unter ähnlichen Bedingungen ebenfalls im hohen 90-°C-Bereich, was darauf hindeutet, dass der Core Ultra 9 290HX Plus eine der wärmsten mobilen CPUs auf dem Markt ist.
Man beachte die stetig steigenden durchschnittlichen GPU-Taktraten beim Wechsel zu schnelleren Energieprofilen, wie die Screenshots und die Tabelle unten zeigen.
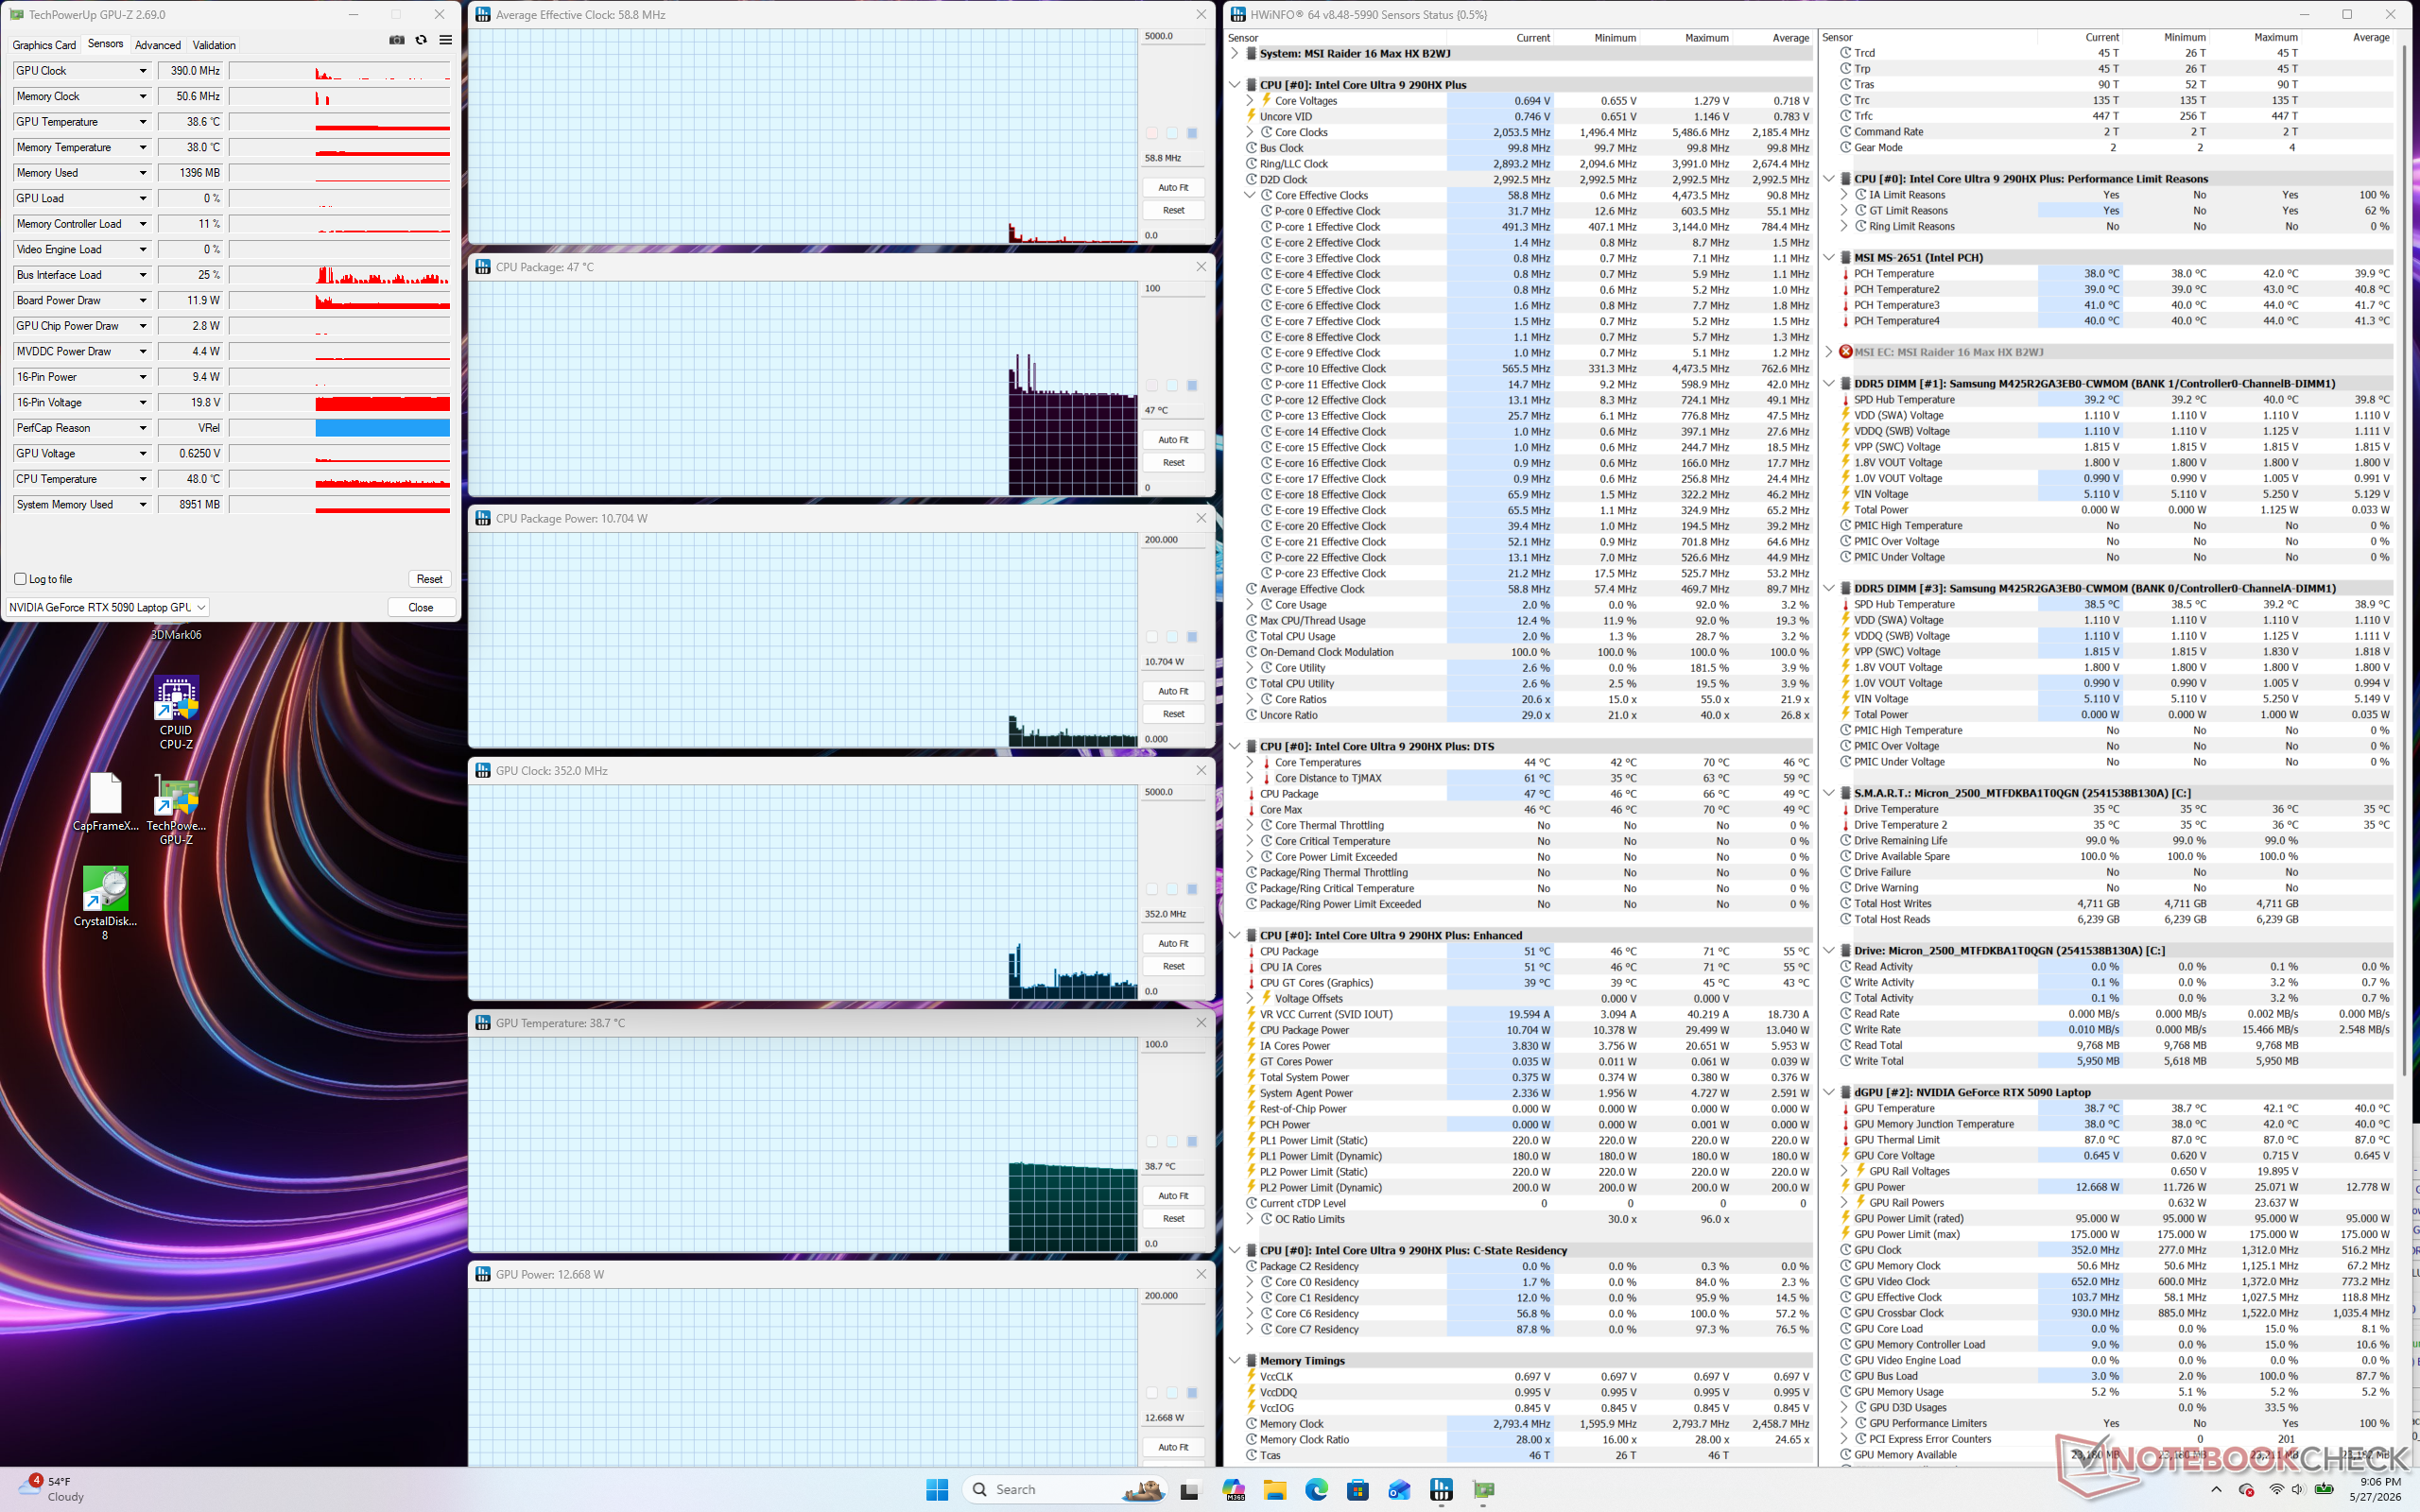
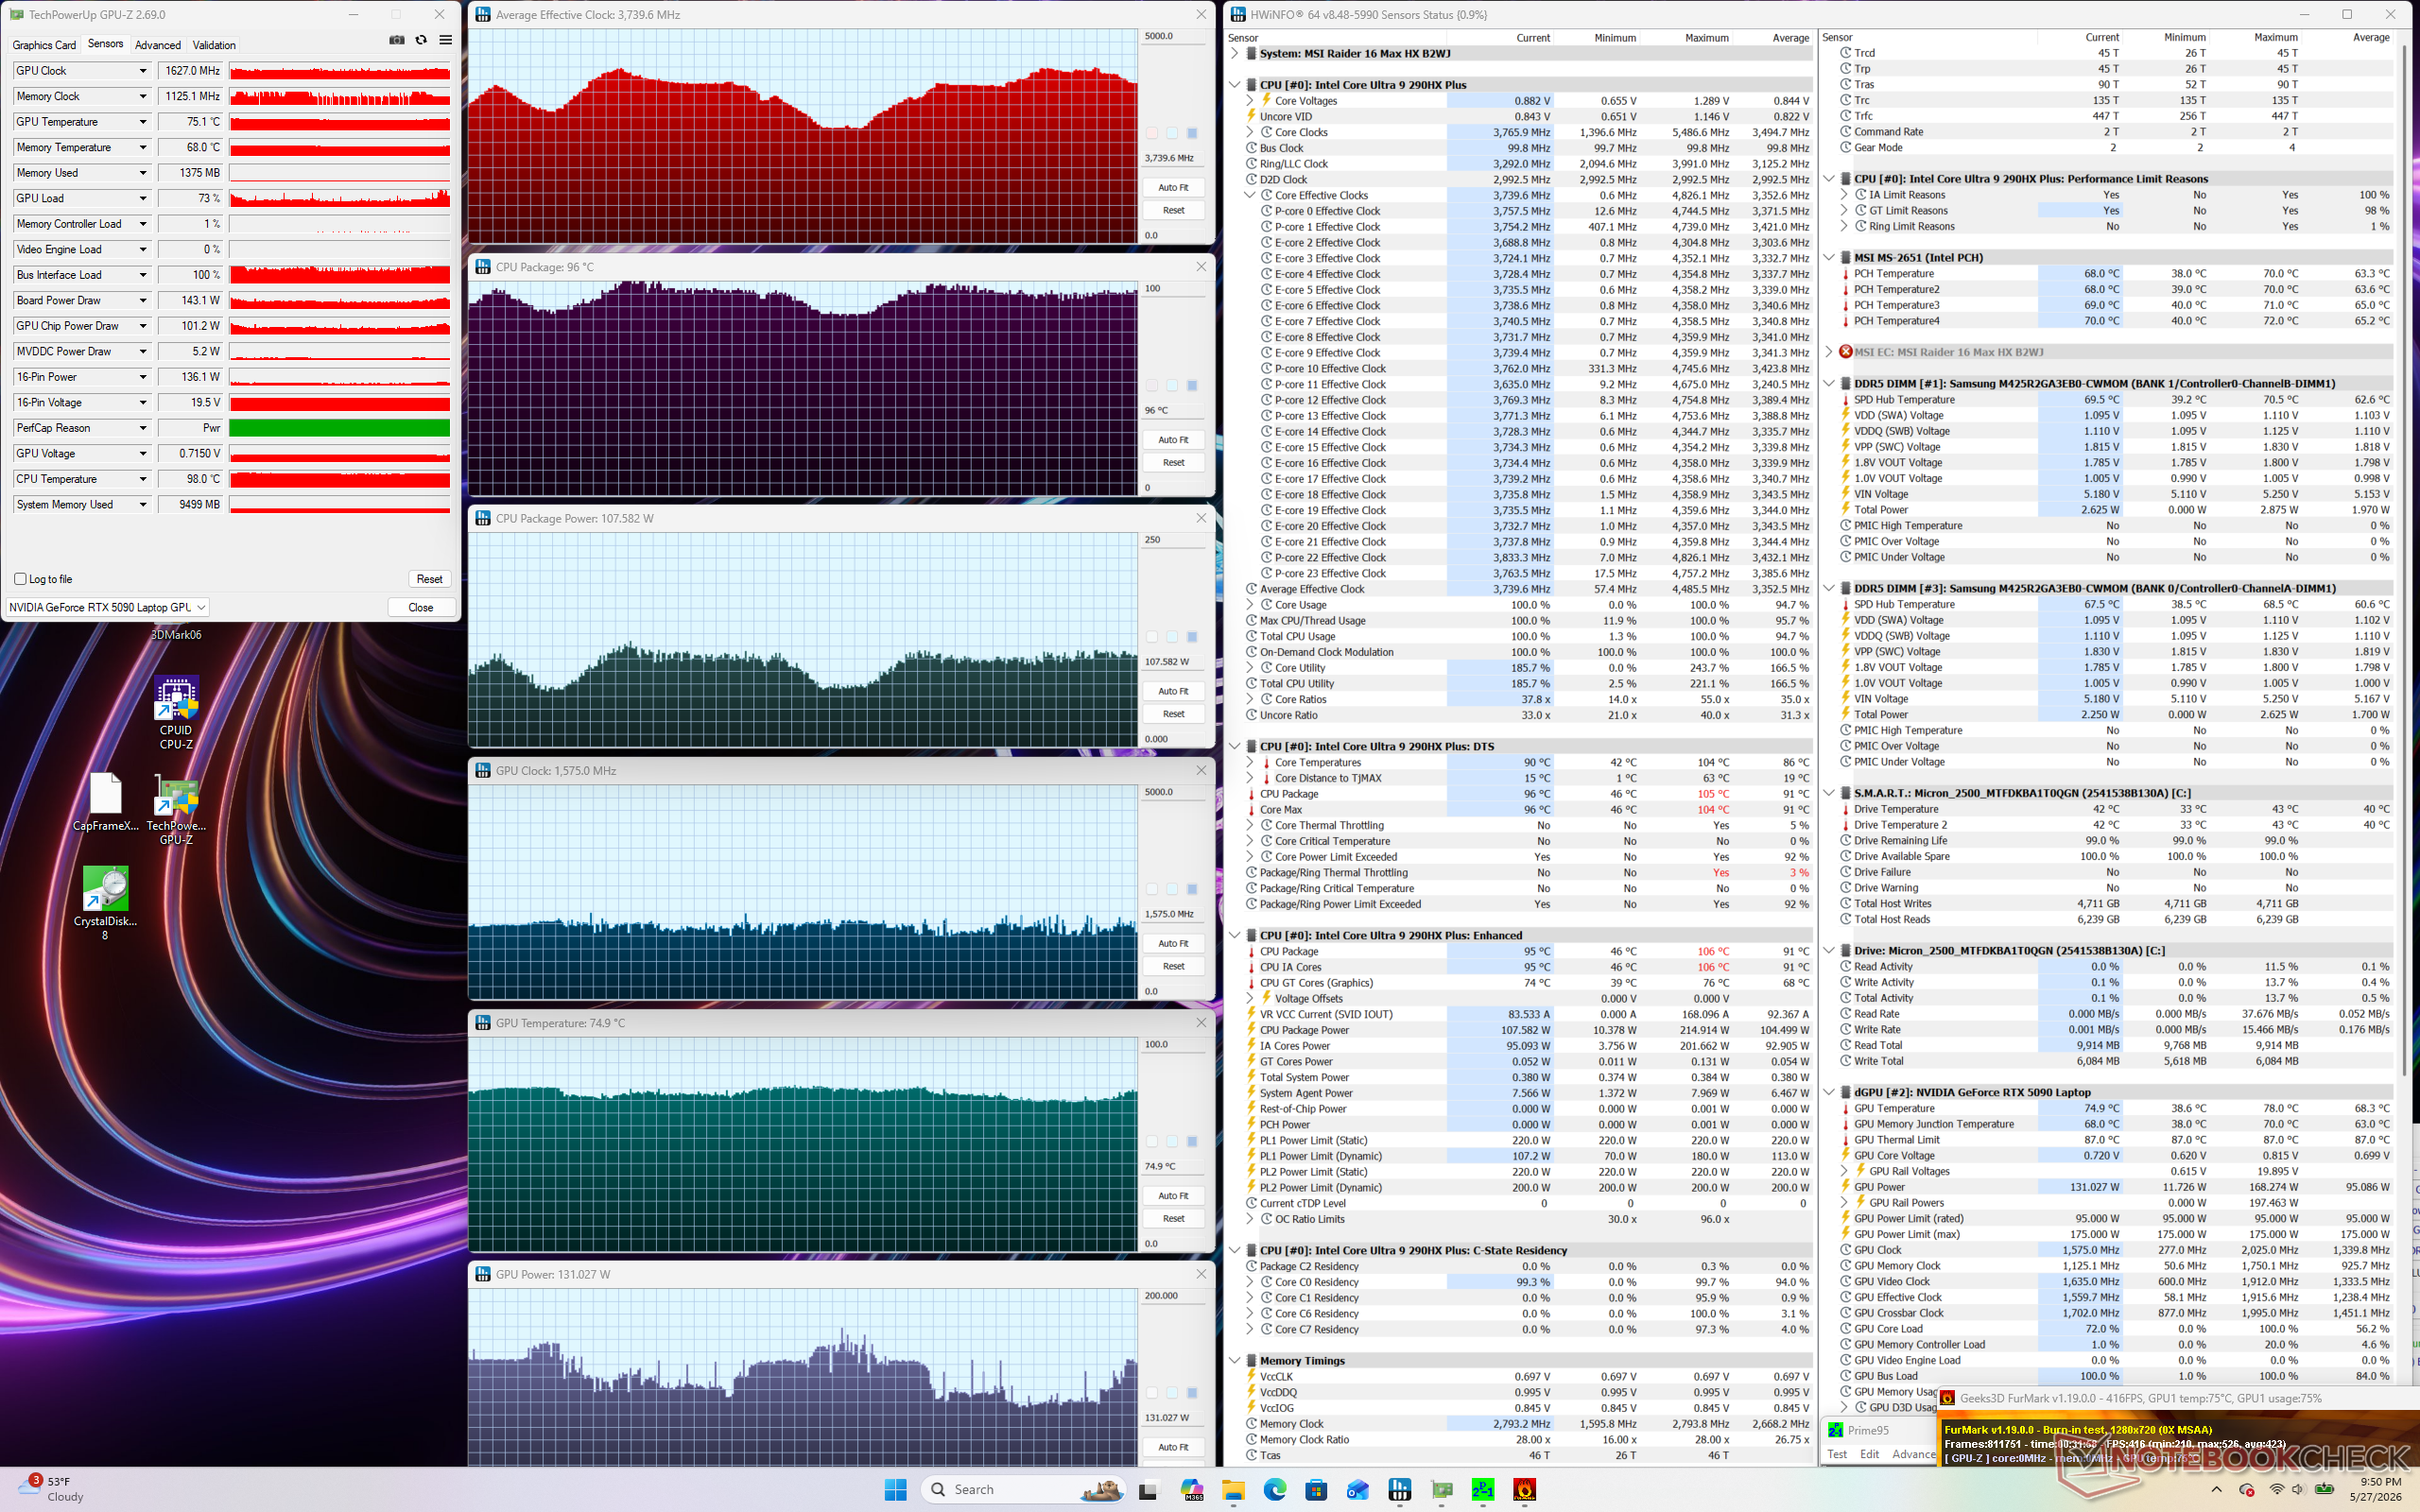
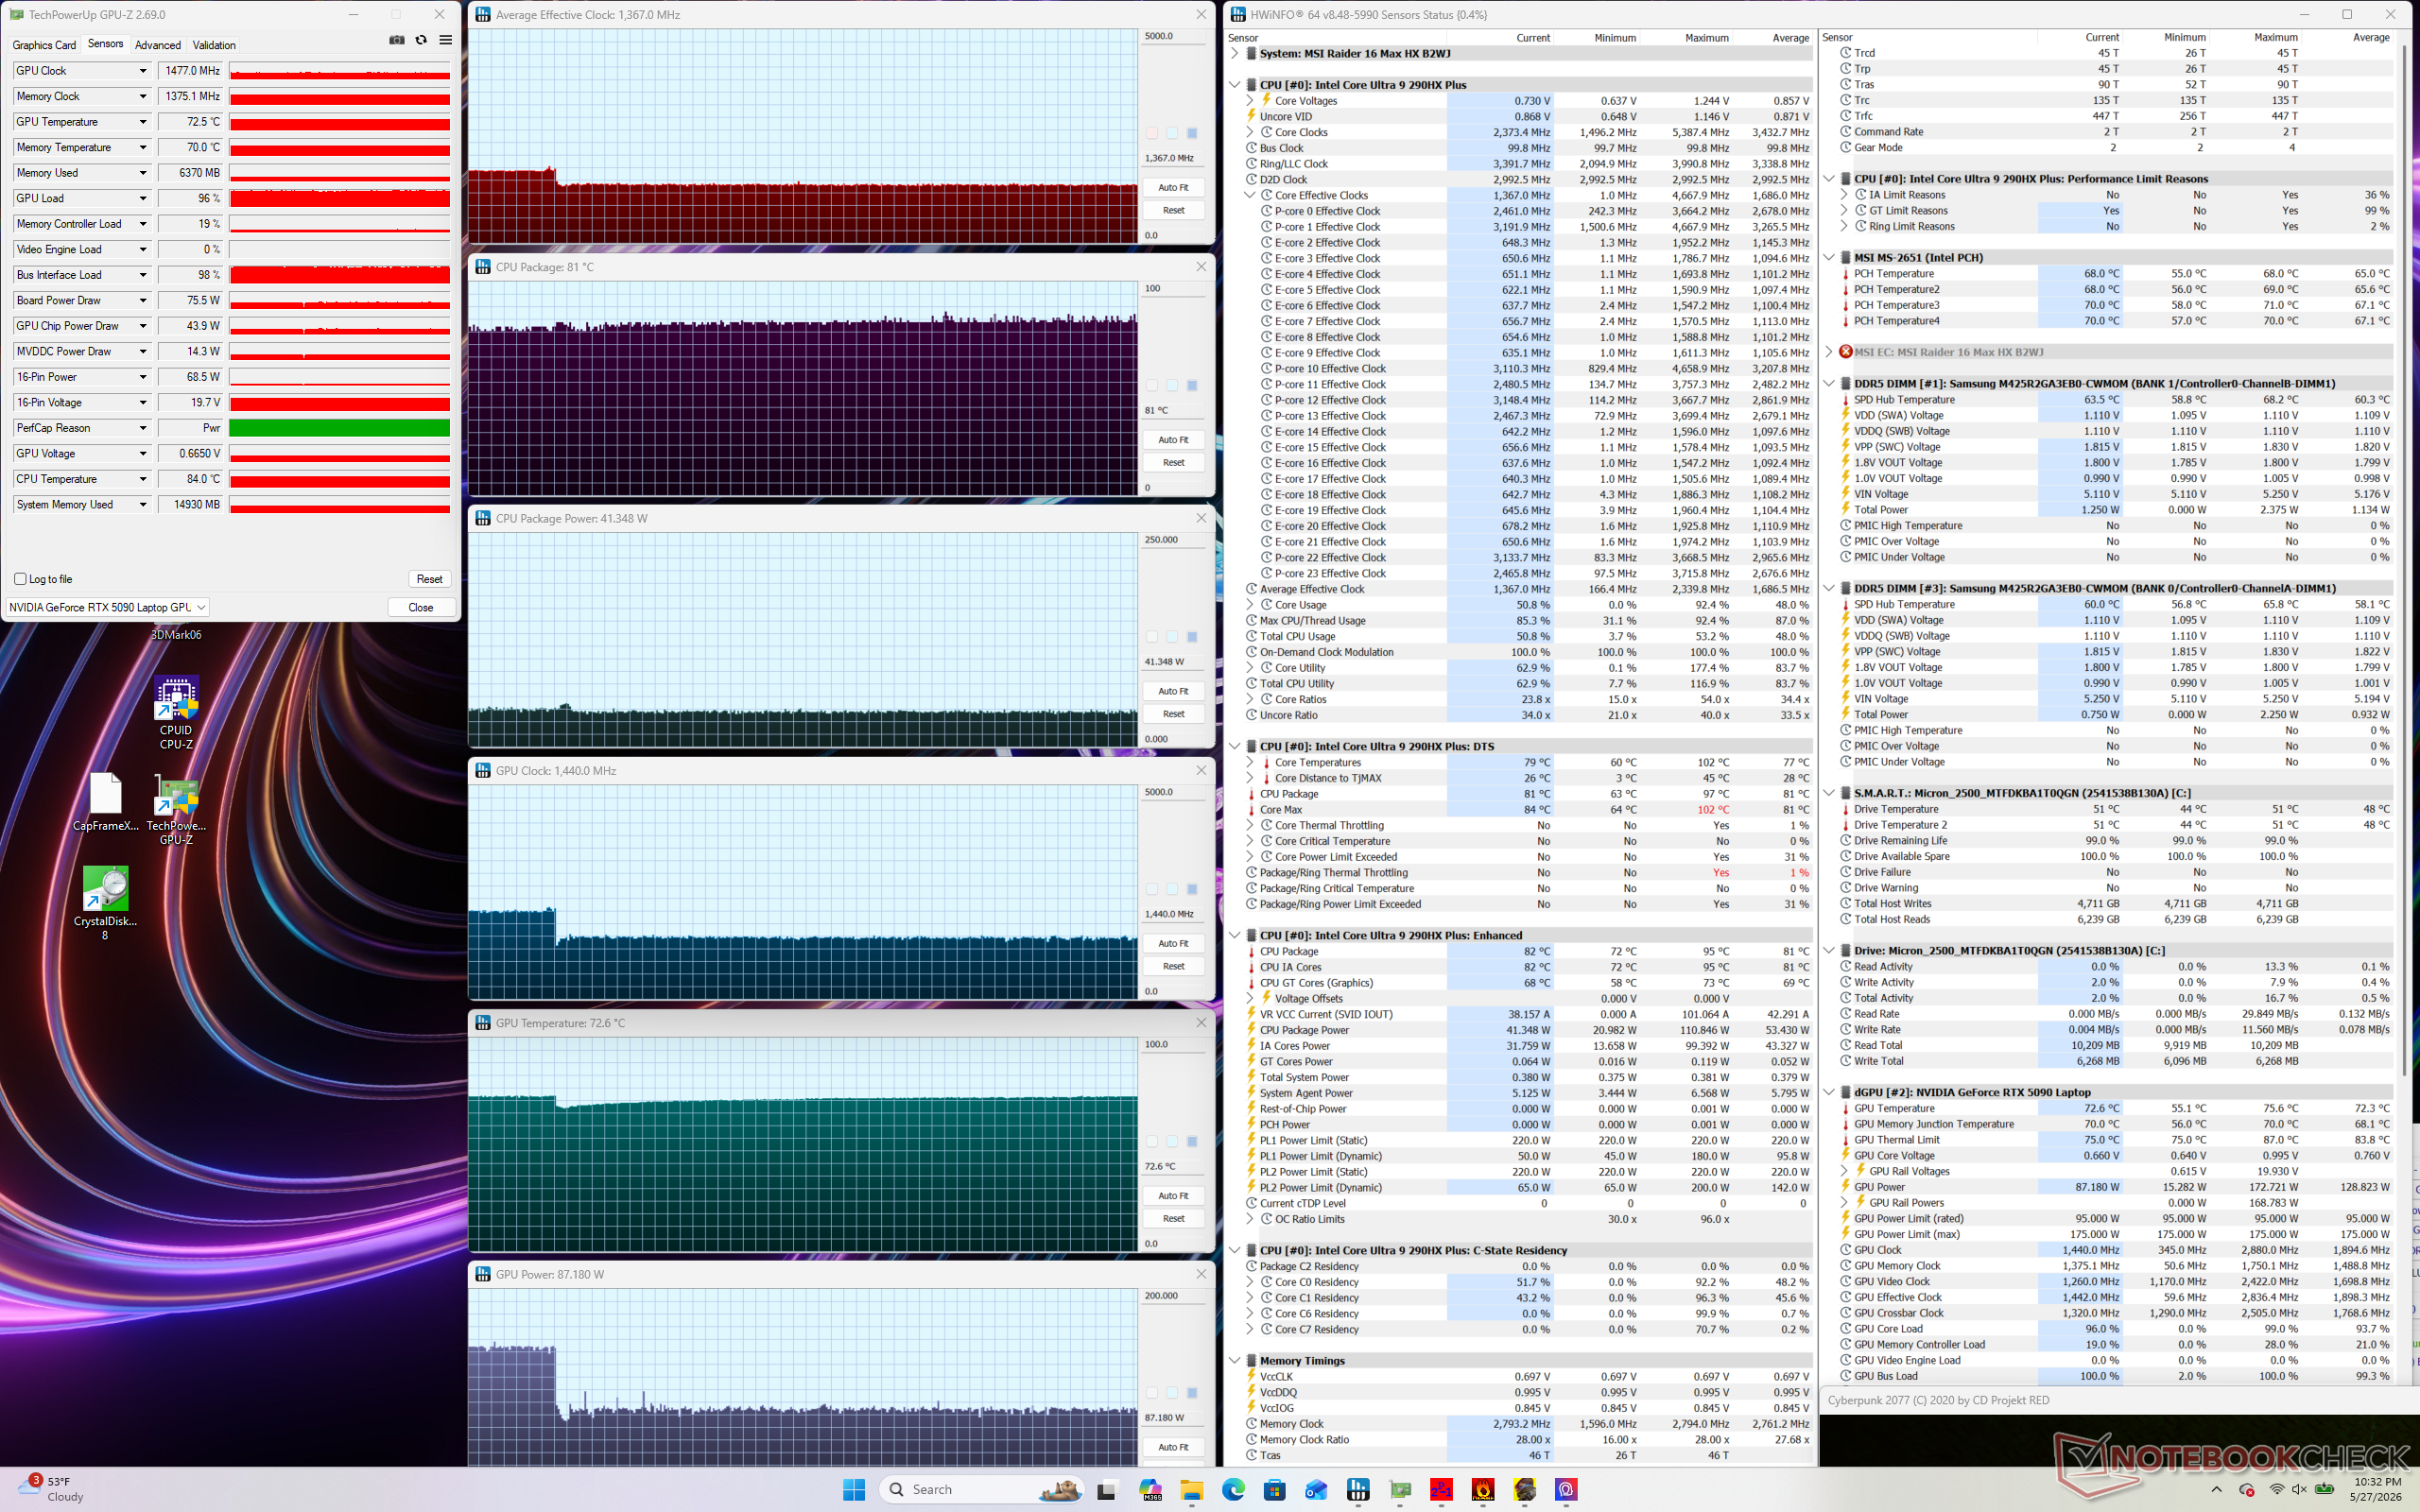
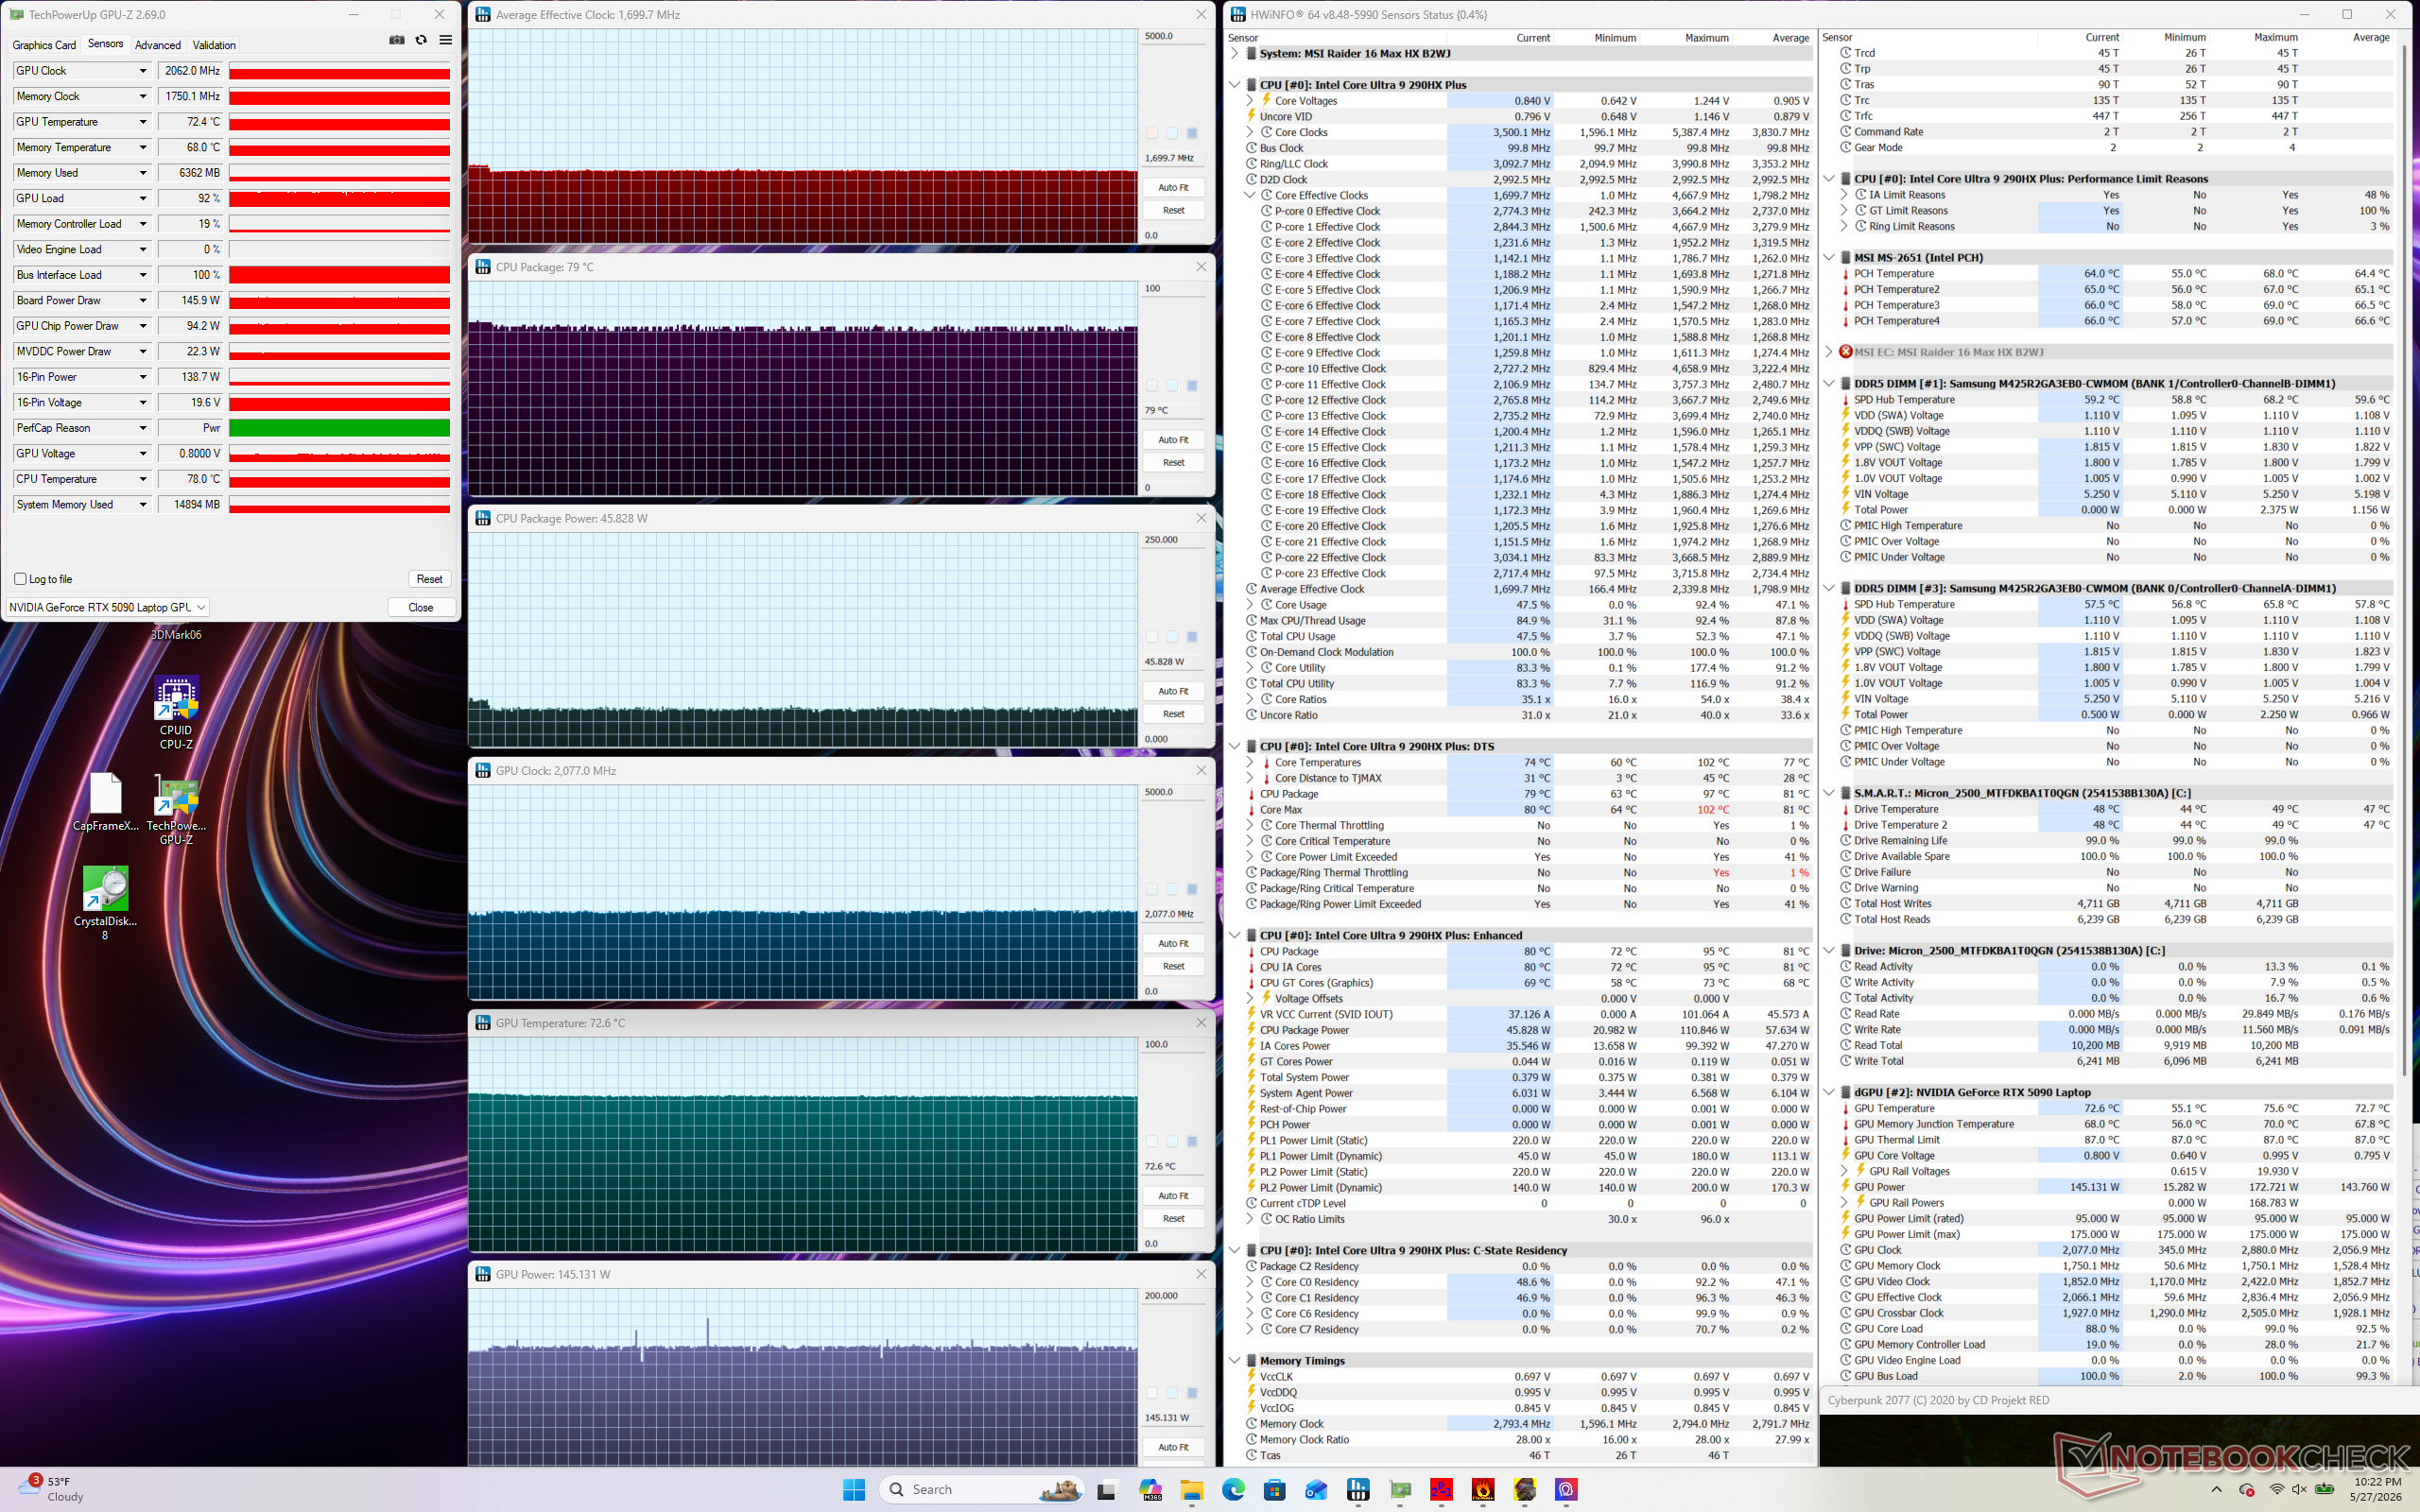
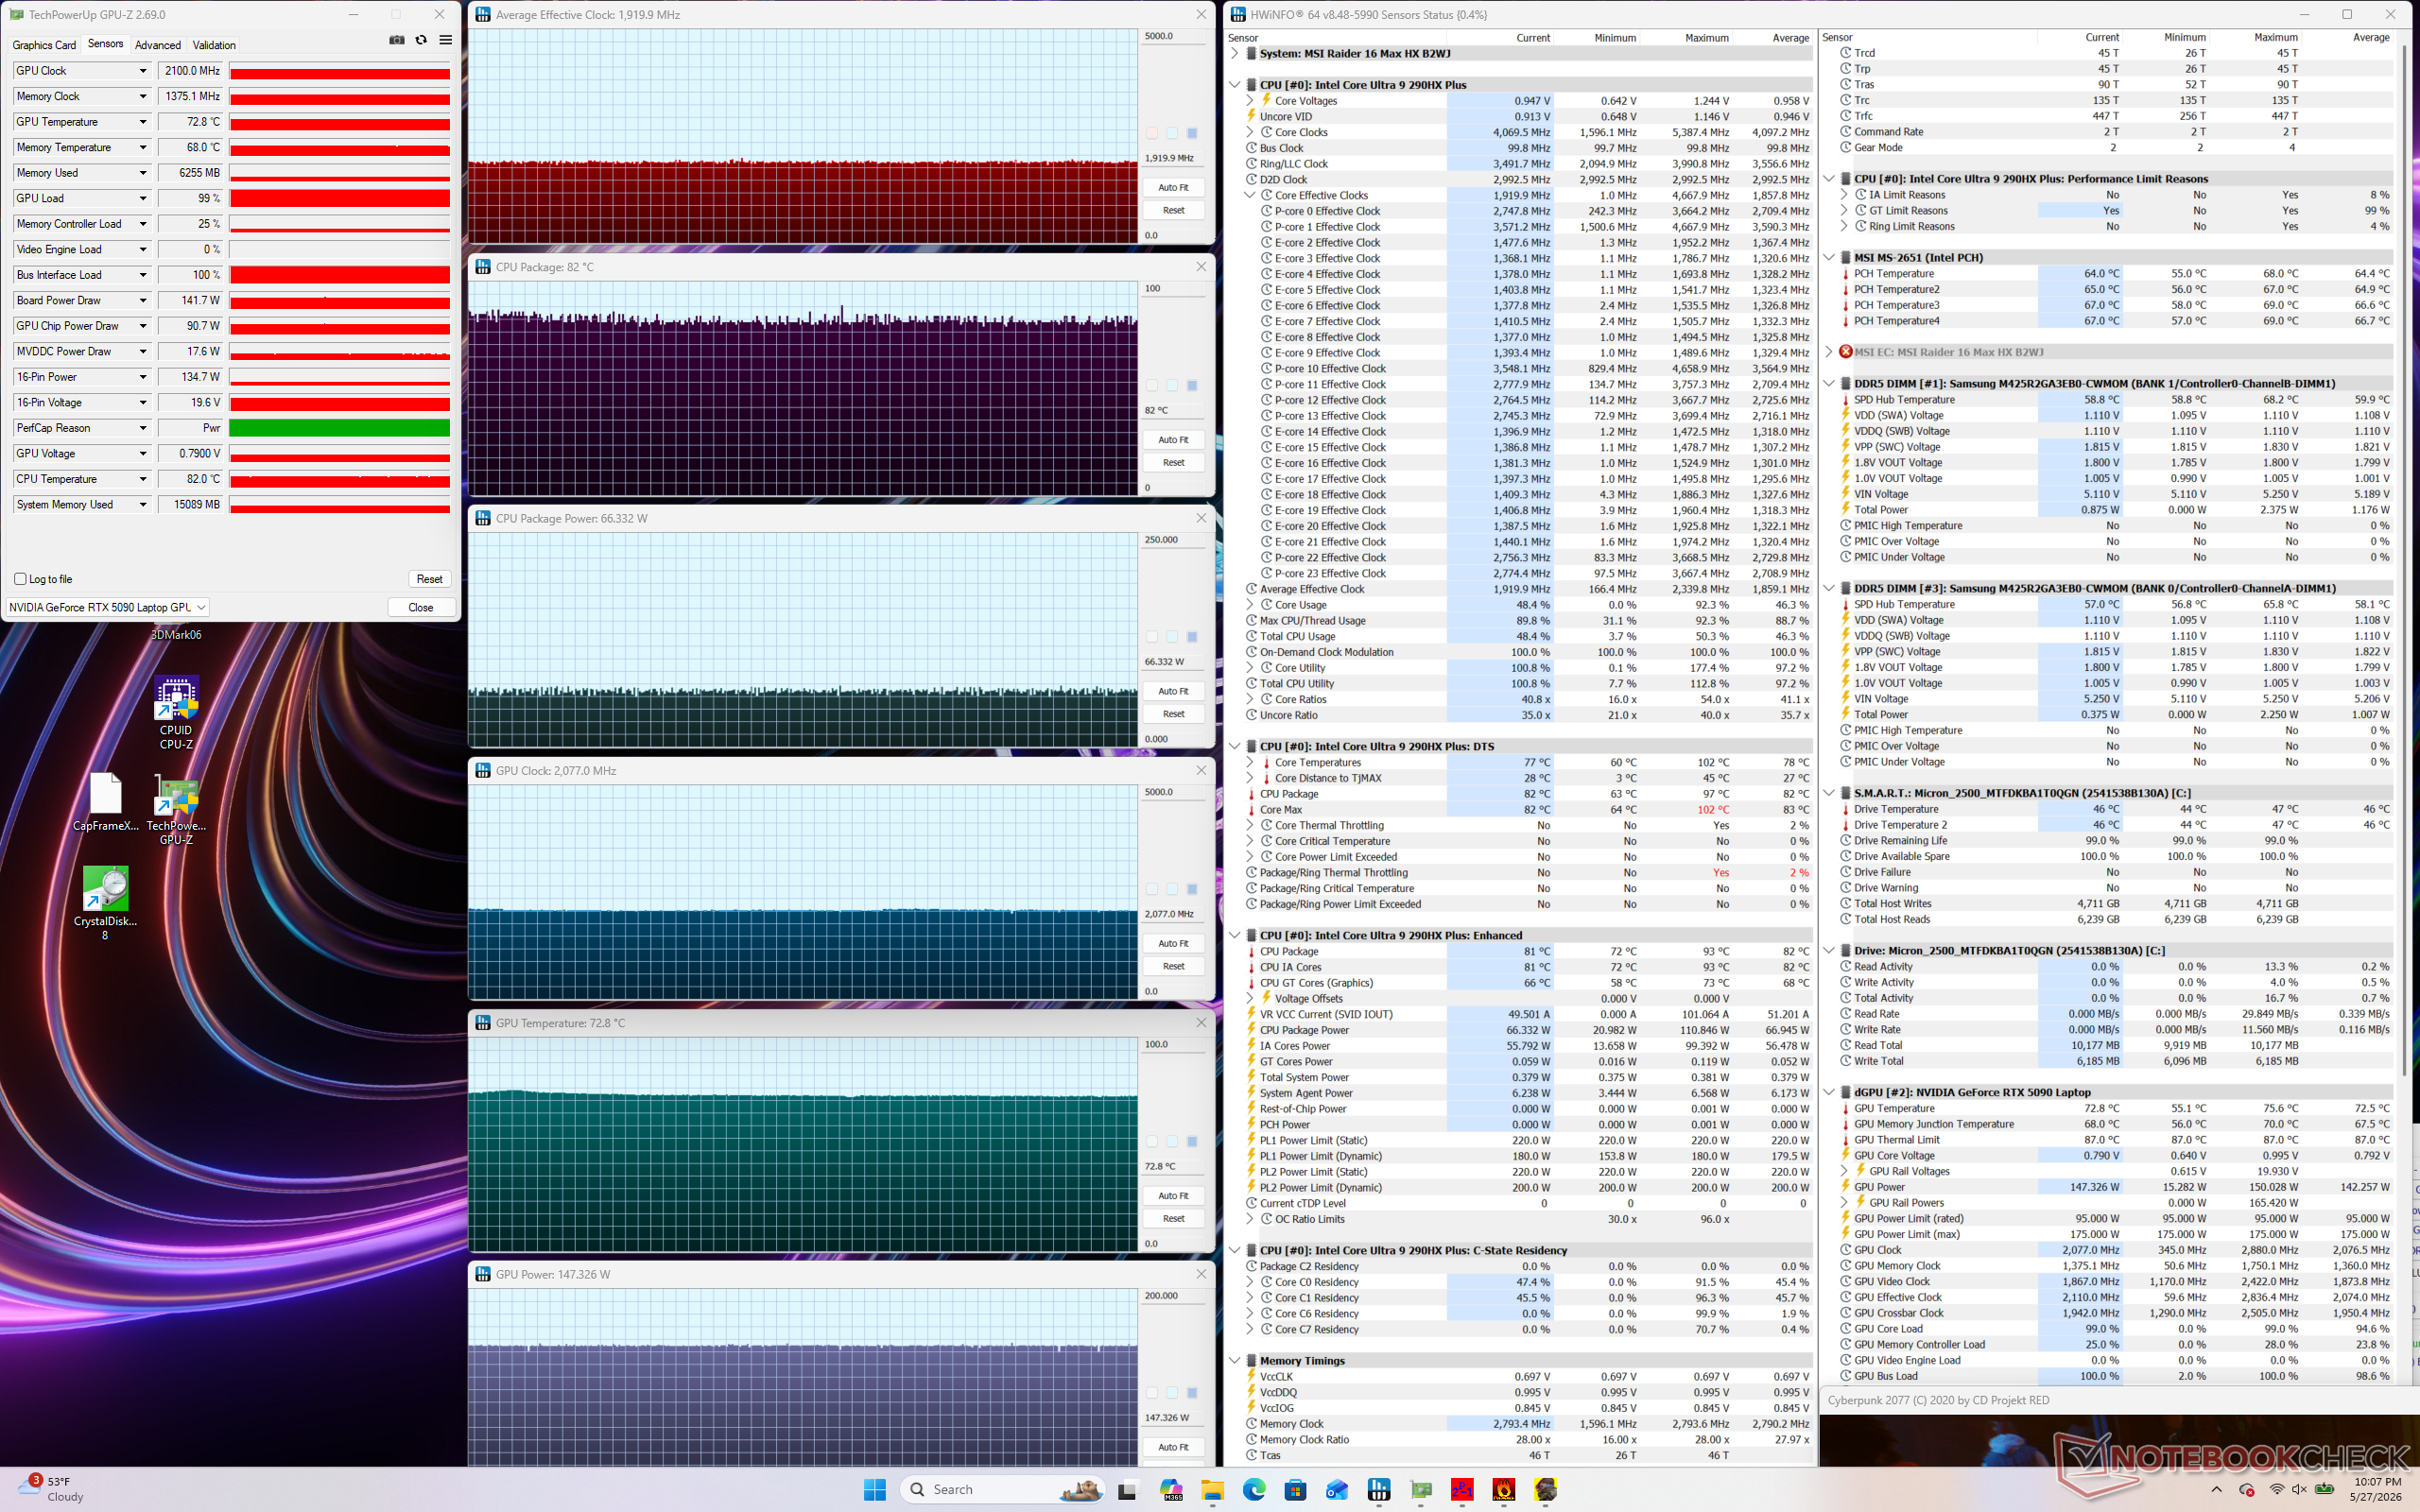
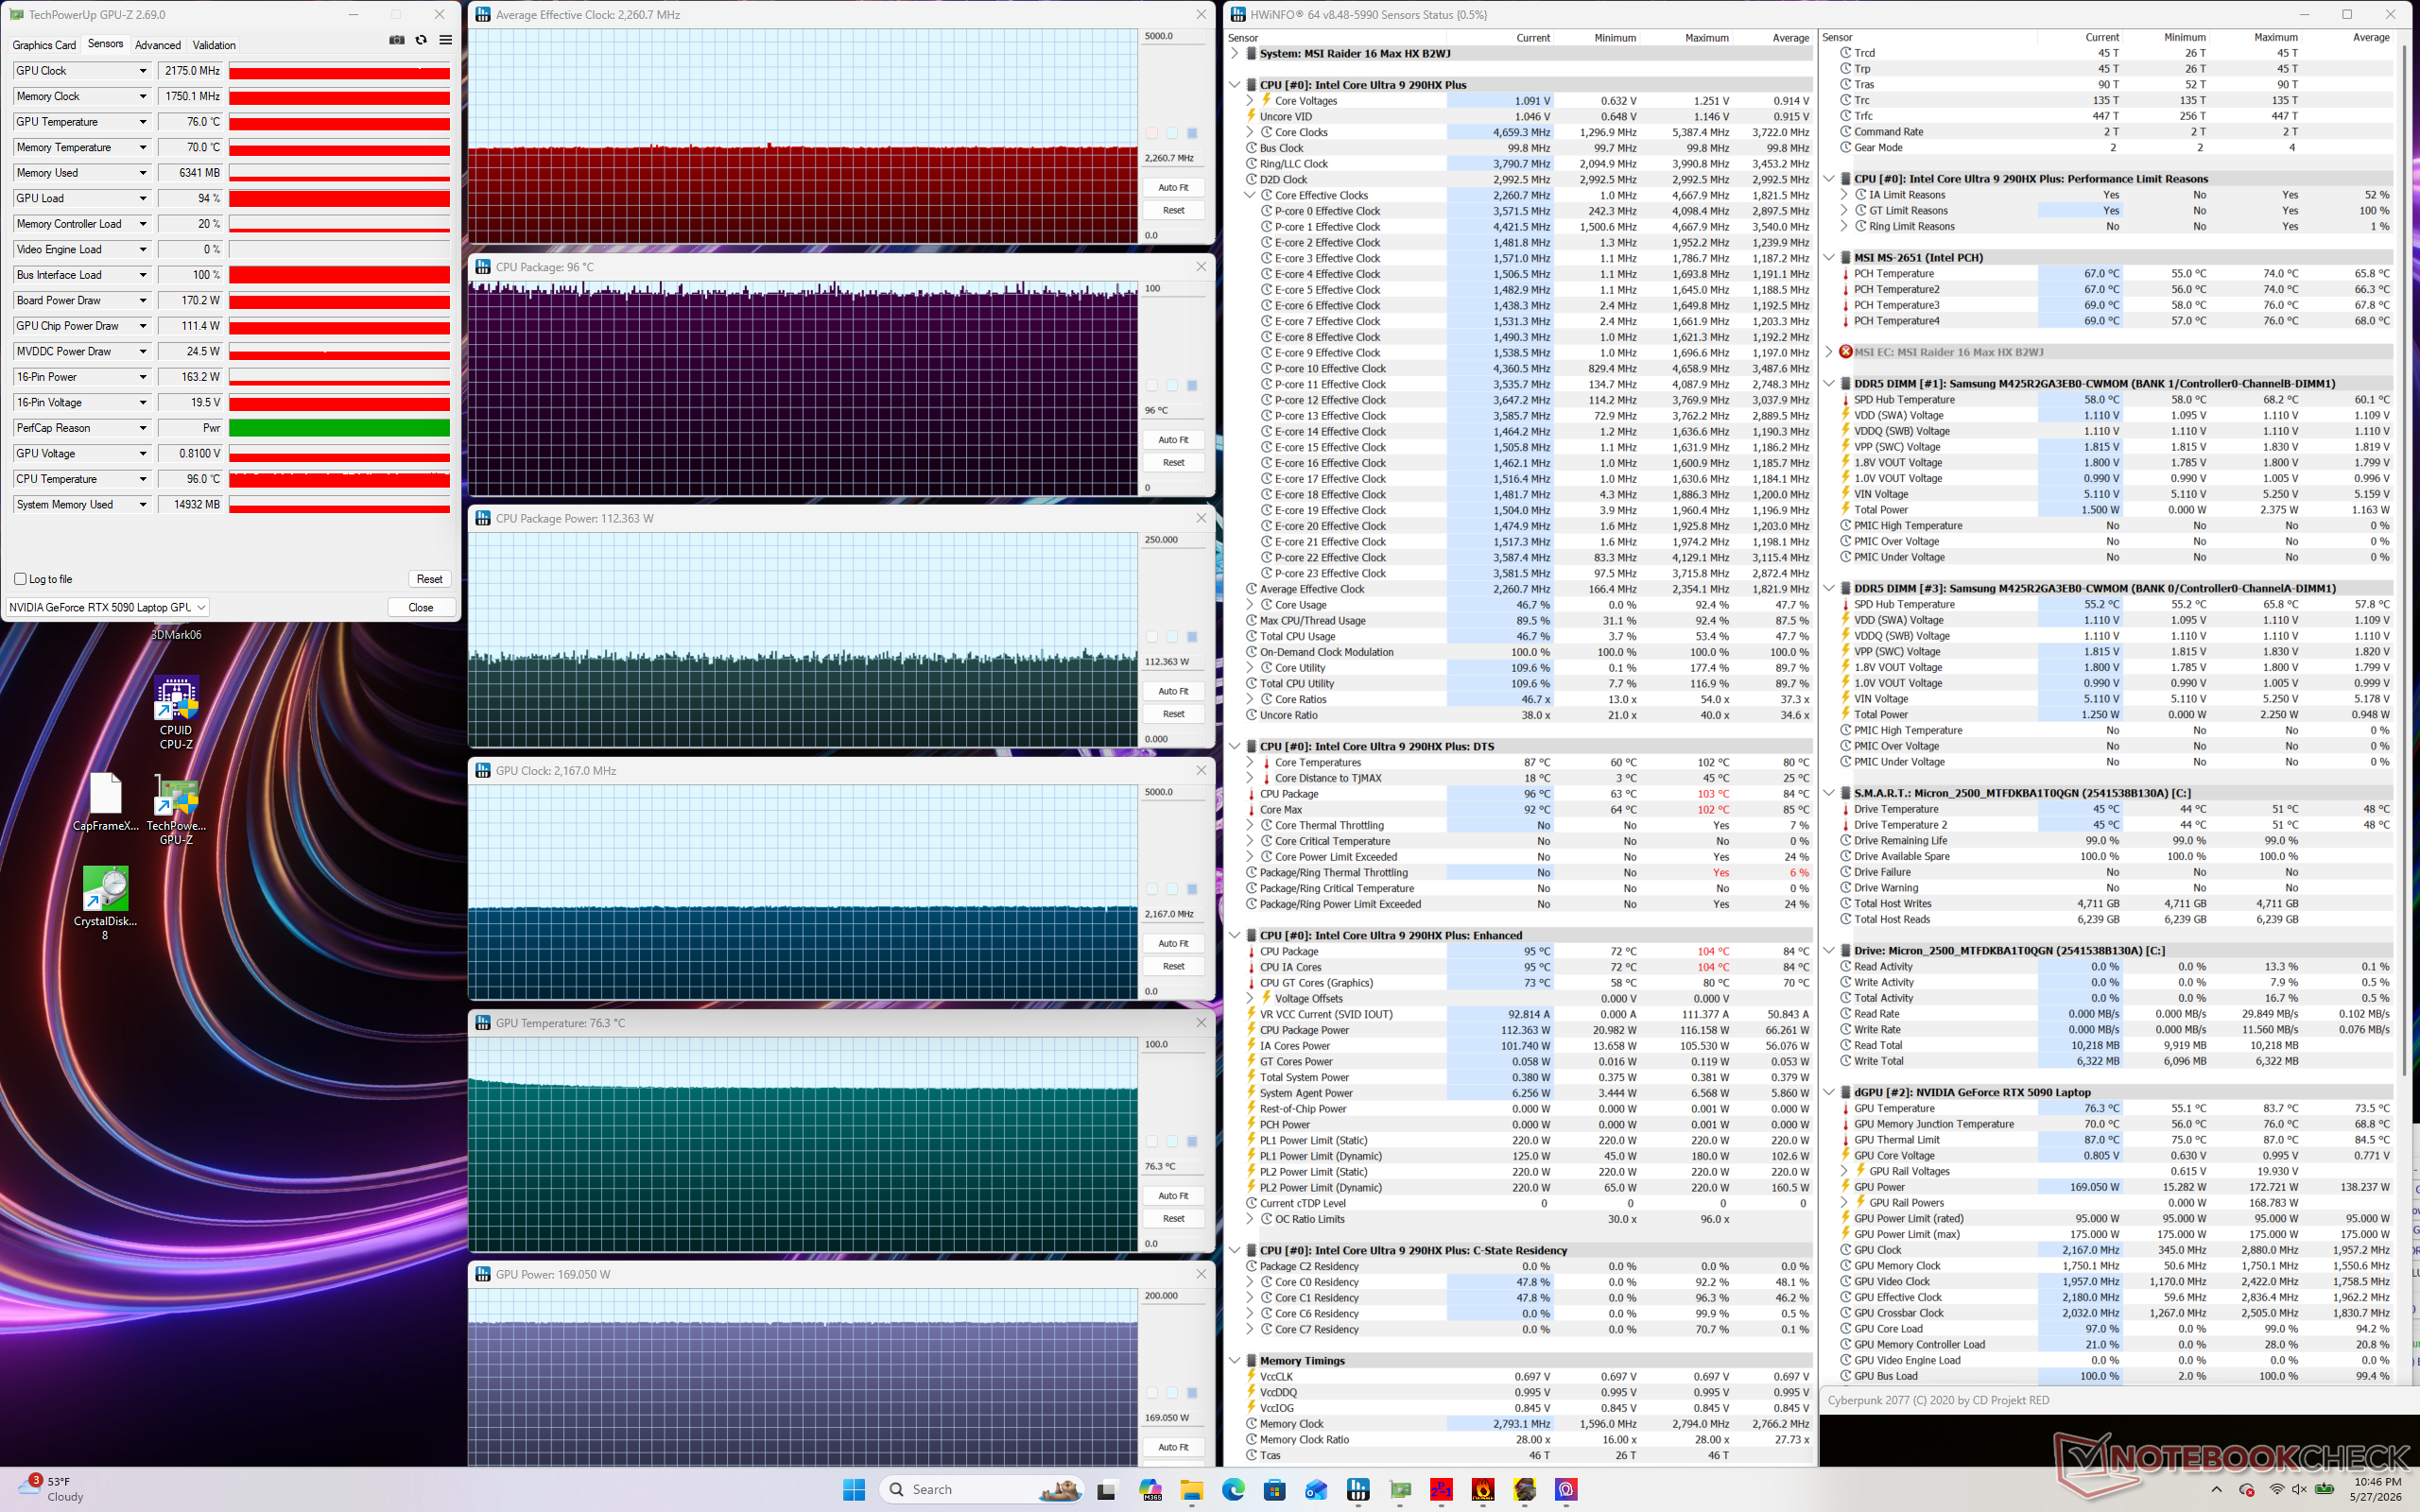

| durchschnittlicher CPU-Takt (GHz) | GPU-Takt (MHz) | durchschnittliche CPU-Temperatur (°C) | durchschnittliche GPU-Temperatur (°C) | |
| System Leerlauf | -- | -- | 47 | 39 |
| Prime95 Stress | 3,9 | -- | 96 | 56 |
| Prime95 + FurMark Stress | 2,7-3,9 | ~1.600 | 96 | 75 |
| Cyberpunk 2077 Stress (Leiser Modus) | 1,4 | 1.440 | 81 | 73 |
| Cyberpunk 2077 Stress (Balanced-Modus) | 1,7 | 2.062 | 79 | 73 |
| Cyberpunk 2077 Stress (Extreme-Performance-Modus) | 1,9 | 2.100 | 82 | 73 |
| Cyberpunk 2077 Stress (Apex Modus) | 2,3 | 2.175 | 96 | 76 |
| Cyberpunk 2077 Stress (Cooler-Boost-Modus) | 2,2 | 2.295 | 87 | 72 |
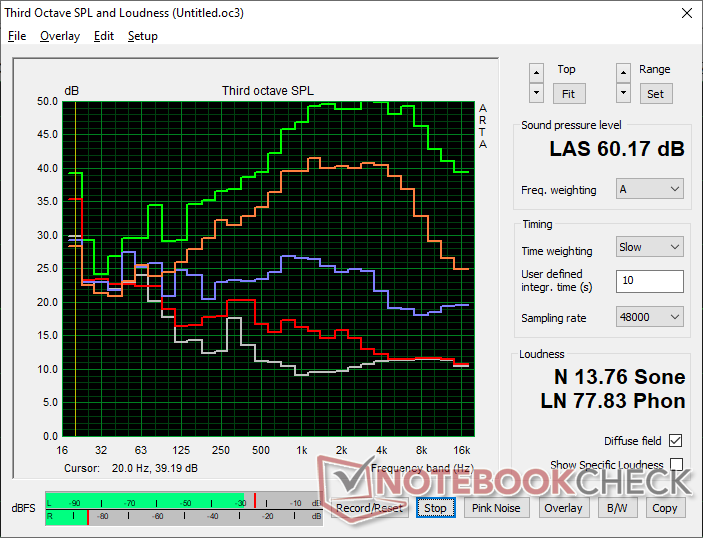
Lautsprecher
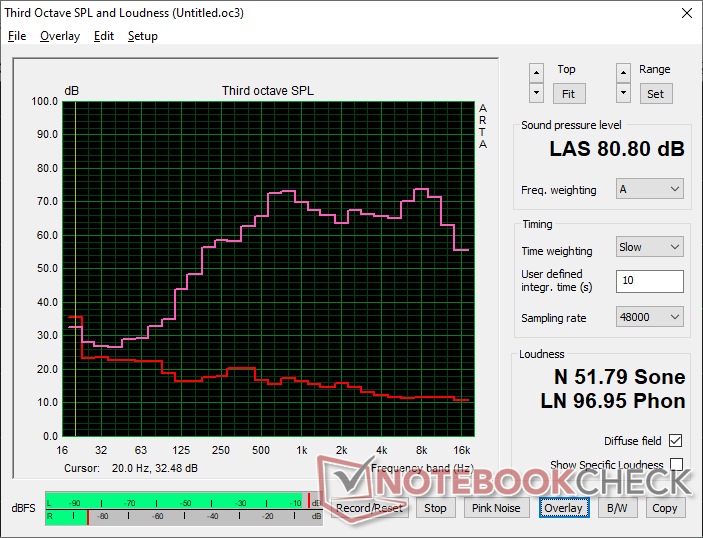
MSI Raider 16 Max HX B2WJ Audio Analyse
(±) | Mittelmäßig laut spielende Lautsprecher (80.8 dB)
Bass 100 - 315 Hz
(-) | kaum Bass - 15.7% niedriger als der Median
(±) | durchschnittlich lineare Bass-Wiedergabe (8.6% Delta zum Vorgänger)
Mitteltöne 400 - 2000 Hz
(+) | ausgeglichene Mitten, vom Median nur 3.2% abweichend
(+) | lineare Mitten (6.1% Delta zum Vorgänger)
Hochtöne 2 - 16 kHz
(+) | ausgeglichene Hochtöne, vom Median nur 2.9% abweichend
(+) | sehr lineare Hochtöne (4.9% Delta zum Vorgänger)
Gesamt im hörbaren Bereich 100 - 16.000 Hz
(+) | hörbarer Bereich ist sehr linear (14.5% Abstand zum Median
Im Vergleich zu allen Geräten derselben Klasse
» 27% aller getesteten Geräte dieser Klasse waren besser, 7% vergleichbar, 66% schlechter
» Das beste Gerät hat einen Delta-Wert von 6%, durchschnittlich ist 18%, das schlechteste Gerät hat 132%
Im Vergleich zu allen Geräten im Test
» 18% aller getesteten Geräte waren besser, 4% vergleichbar, 77% schlechter
» Das beste Gerät hat einen Delta-Wert von 4%, durchschnittlich ist 23%, das schlechteste Gerät hat 134%
Apple MacBook Pro 16 2021 M1 Pro Audio Analyse
(+) | Die Lautsprecher können relativ laut spielen (84.7 dB)
Bass 100 - 315 Hz
(+) | guter Bass - nur 3.8% Abweichung vom Median
(+) | lineare Bass-Wiedergabe (5.2% Delta zum Vorgänger)
Mitteltöne 400 - 2000 Hz
(+) | ausgeglichene Mitten, vom Median nur 1.3% abweichend
(+) | lineare Mitten (2.1% Delta zum Vorgänger)
Hochtöne 2 - 16 kHz
(+) | ausgeglichene Hochtöne, vom Median nur 1.9% abweichend
(+) | sehr lineare Hochtöne (2.7% Delta zum Vorgänger)
Gesamt im hörbaren Bereich 100 - 16.000 Hz
(+) | hörbarer Bereich ist sehr linear (4.6% Abstand zum Median
Im Vergleich zu allen Geräten derselben Klasse
» 0% aller getesteten Geräte dieser Klasse waren besser, 0% vergleichbar, 100% schlechter
» Das beste Gerät hat einen Delta-Wert von 5%, durchschnittlich ist 17%, das schlechteste Gerät hat 45%
Im Vergleich zu allen Geräten im Test
» 0% aller getesteten Geräte waren besser, 0% vergleichbar, 100% schlechter
» Das beste Gerät hat einen Delta-Wert von 4%, durchschnittlich ist 23%, das schlechteste Gerät hat 134%
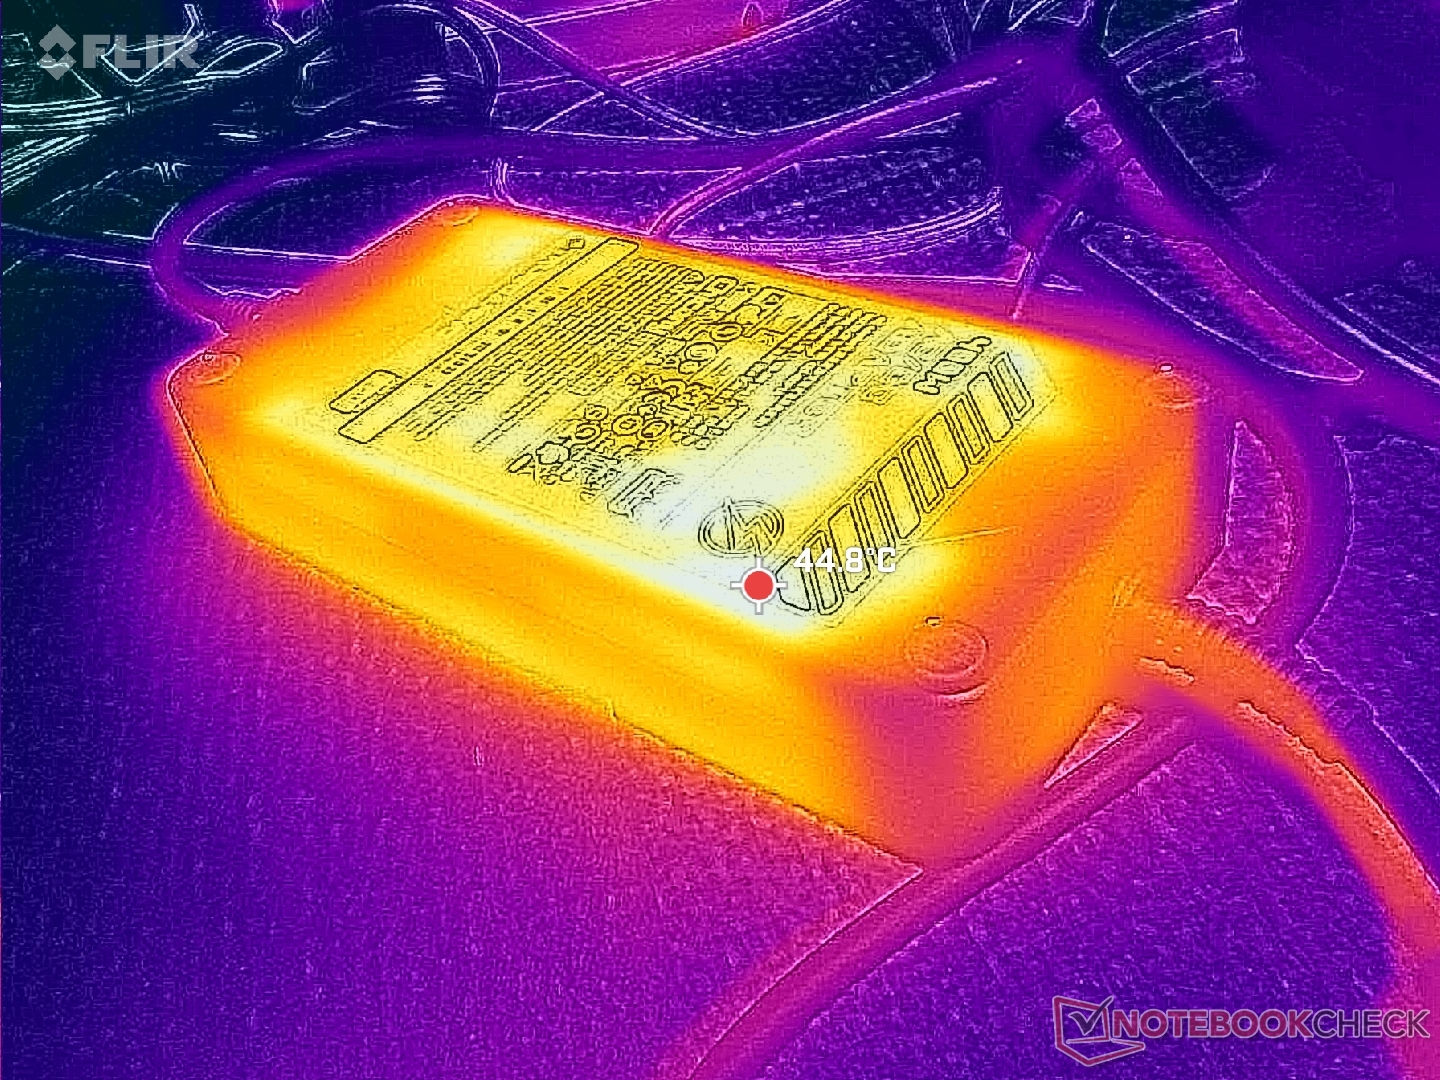
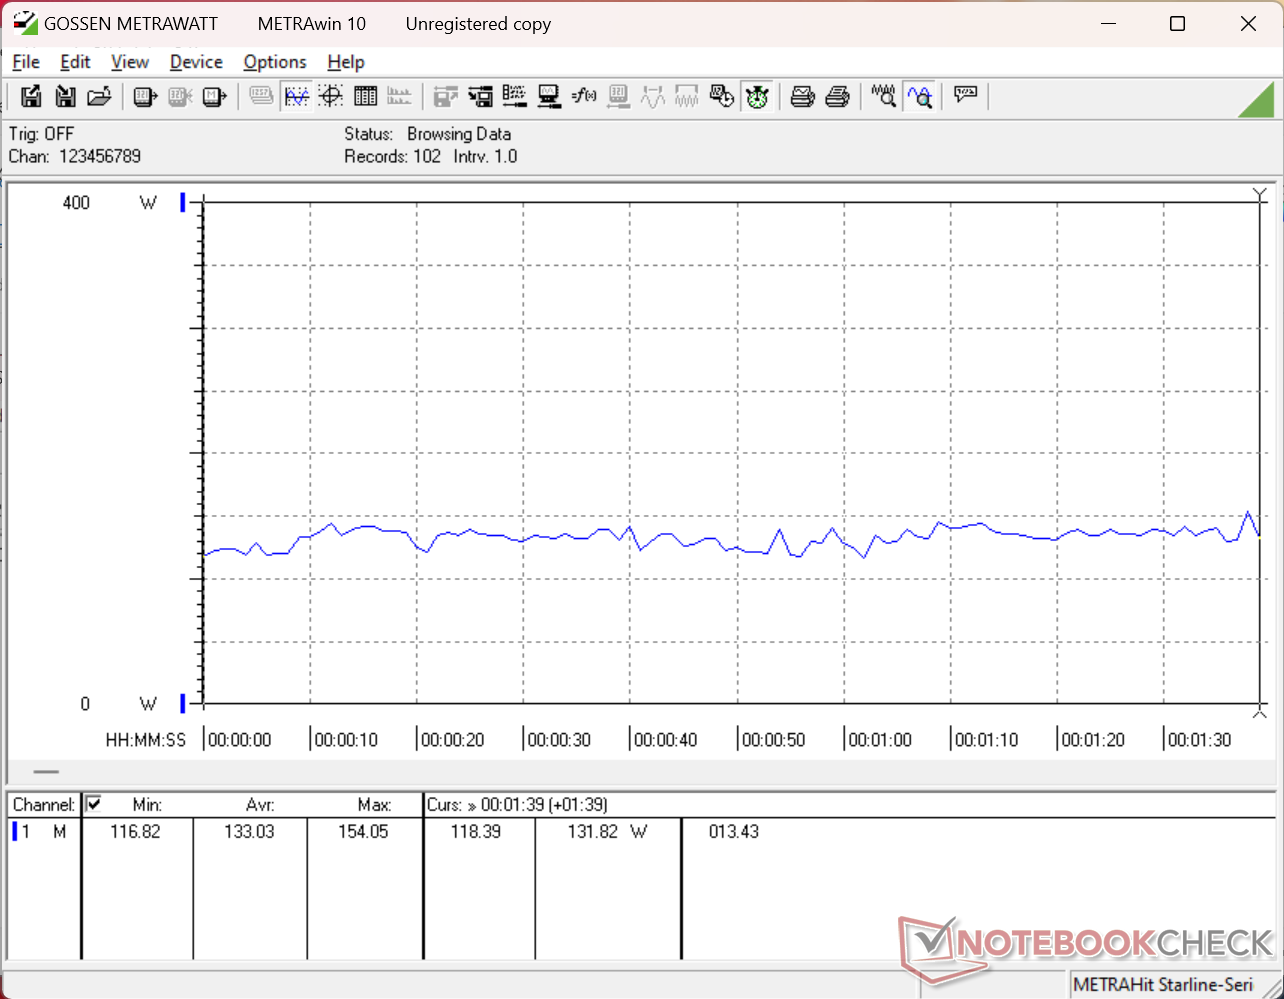
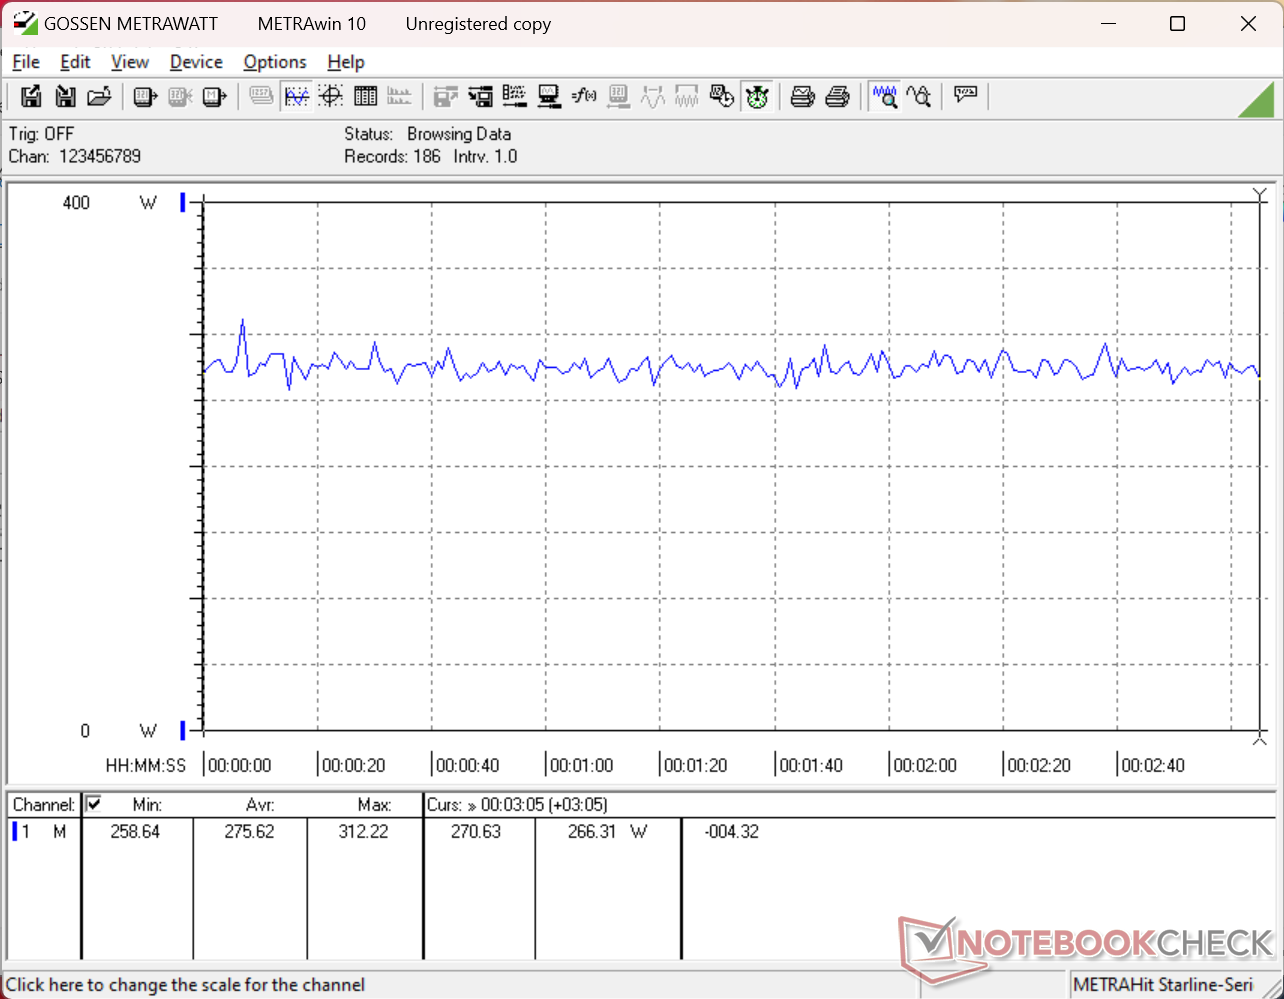
Energieverwaltung
Stromverbrauch
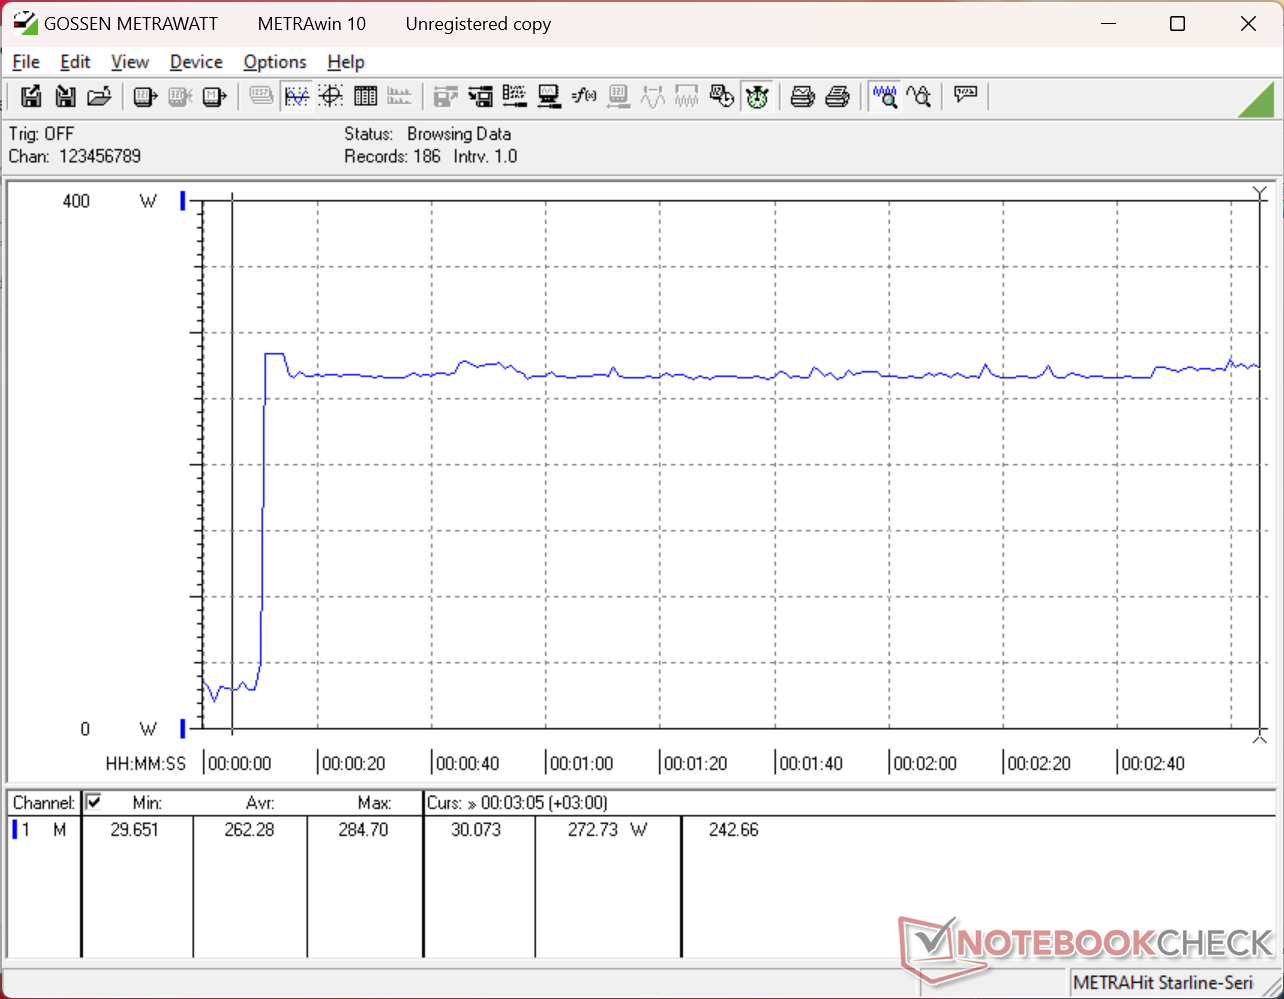
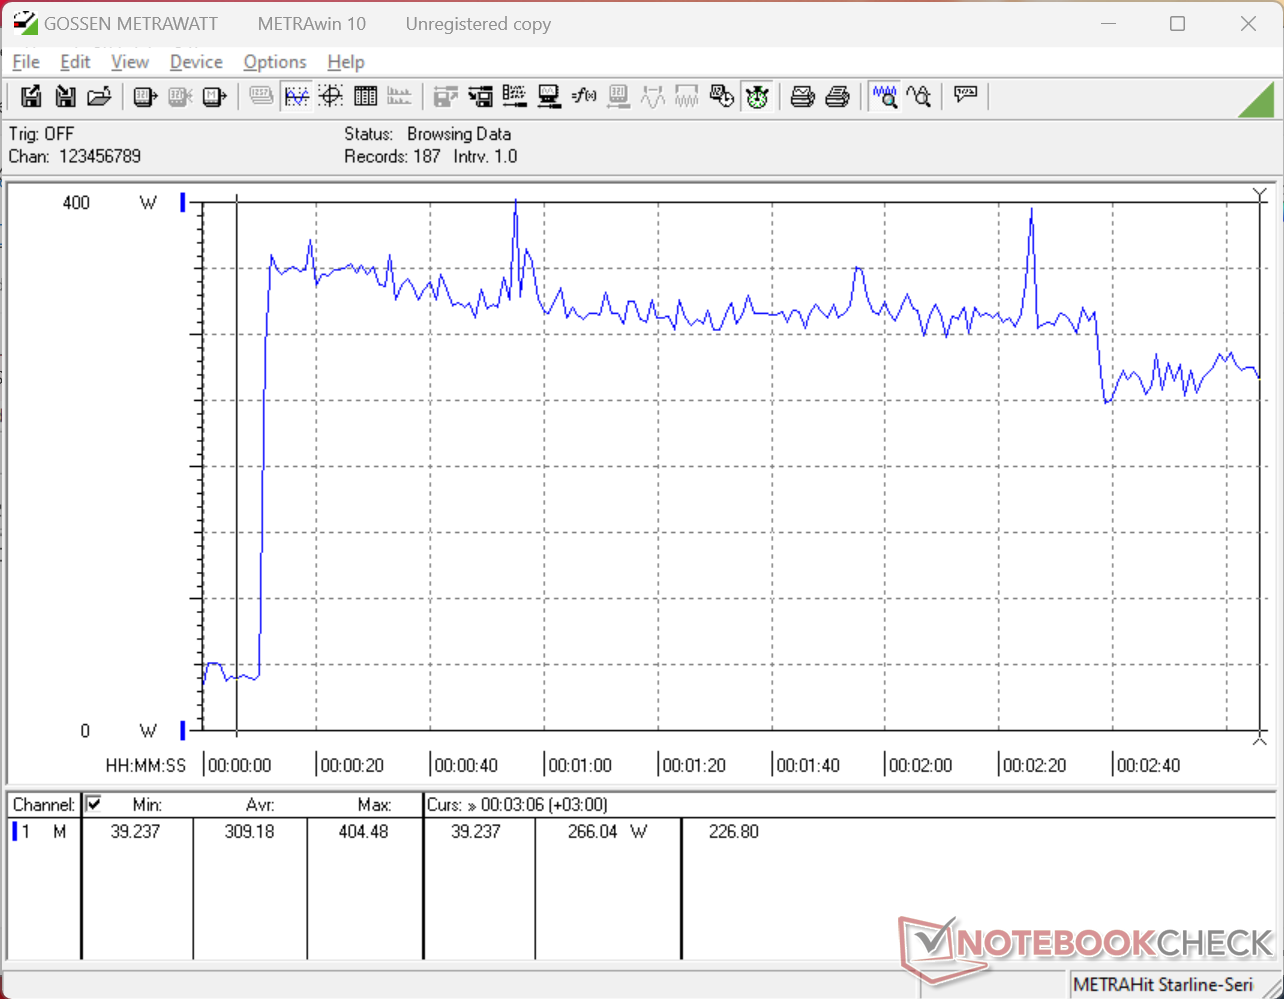
Der Stromverbrauch ist in Anbetracht der beteiligten Hardware vorhersehbar sehr hoch. Die Ausführung von Cyberpunk 2077 im Modus Extreme Performance ist etwa 28 Prozent anspruchsvoller als die des Razer Blade 16, obwohl Letzteres mit der gleichen RTX-5090-GPU ausgestattet ist. Die große Diskrepanz kann auf die Arrow-Lake-HX-CPU im Vergleich zur langsameren, aber viel effizienteren Panther-Lake-H Serie zurückgeführt werden.
Mit dem großen (~18,8 x 8,8 x 3,4 cm) 400-Watt-Netzteil konnten wir eine vorübergehende maximale Leistungsaufnahme von 405 W verzeichnen.
| Aus / Standby | |
| Idle | |
| Last |
|
Legende:
min: | |
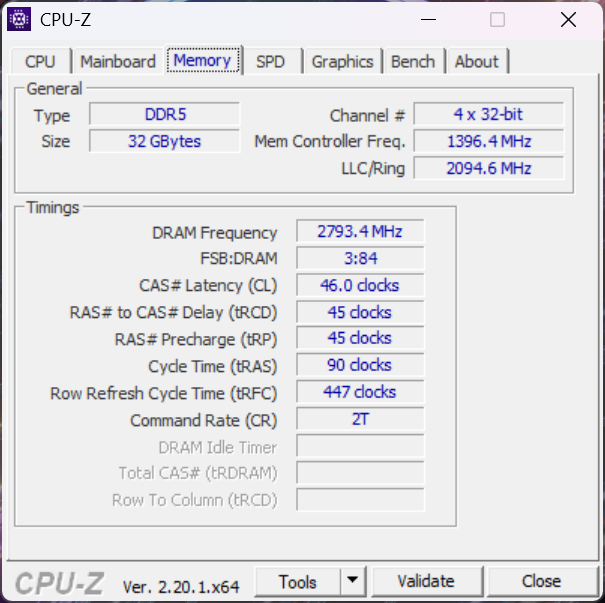
| MSI Raider 16 Max HX B2WJ Ultra 9 290HX Plus, GeForce RTX 5090 Laptop, Micron 2500 1TB MTFDKBA1T0QGN, OLED, 2560x1600, 16" | MSI Crosshair 16 HX AI D2XWGKG Ultra 9 275HX, GeForce RTX 5070 Laptop, Micron 2500 1TB MTFDKBA1T0QGN, IPS, 2560x1600, 16" | Razer Blade 16 Core Ultra 9 386H Ultra 9 386H, GeForce RTX 5090 Laptop, Lexar NM790 2TB, OLED, 2560x1600, 16" | Alienware 16X Aurora Core Ultra 9 290HX Plus Ultra 9 290HX Plus, GeForce RTX 5070 Ti Laptop, , OLED, 2560x1600, 16" | Asus TUF Gaming A16 FA608UP R7 260, GeForce RTX 5070 Laptop, Western Digital PC SN5000S SDEQNSJ-1T00, IPS, 2560x1600, 16" | Lenovo Legion 7 16IAX10 Ultra 7 255HX, GeForce RTX 5060 Laptop, WD PC SN7100S SDFPMSL-1T00-1101, OLED, 2560x1600, 16" | |
|---|---|---|---|---|---|---|
| Stromverbrauch | -53% | 8% | 19% | 38% | 13% | |
| Idle min * (Watt) | 7.2 | 26.2 -264% | 4.4 39% | 6.9 4% | 4.6 36% | 9.4 -31% |
| Idle avg * (Watt) | 12 | 33.8 -182% | 22.3 -86% | 8.1 32% | 9.8 18% | 10.6 12% |
| Idle max * (Watt) | 32.8 | 34 -4% | 30.4 7% | 31 5% | 10.2 69% | 36.4 -11% |
| Last avg * (Watt) | 133 | 112 16% | 110.7 17% | 131.6 1% | 76.1 43% | 107.7 19% |
| Cyberpunk 2077 ultra external monitor * (Watt) | 275 | 220 20% | 216 21% | 172.1 37% | 198.1 28% | 187.5 32% |
| Cyberpunk 2077 ultra * (Watt) | 276 | 224 19% | 216 22% | 198.3 28% | 198.9 28% | 188 32% |
| Last max * (Watt) | 404.5 | 315 22% | 251.3 38% | 300.1 26% | 235.2 42% | 247 39% |
* ... kleinere Werte sind besser
Stromverbrauch Cyberpunk / Stress Test
Stromverbrauch externer Monitor
Akkulaufzeit
Die Laufzeiten sind anständig, aber kürzer als bei vielen Modellen der vorherigen Generation, was teilweise auf den Wechsel von IPS zu OLED zurückzuführen ist.
| MSI Raider 16 Max HX B2WJ Ultra 9 290HX Plus, GeForce RTX 5090 Laptop, 91.8 Wh | MSI Crosshair 16 HX AI D2XWGKG Ultra 9 275HX, GeForce RTX 5070 Laptop, 90 Wh | Razer Blade 16 Core Ultra 9 386H Ultra 9 386H, GeForce RTX 5090 Laptop, 90 Wh | Alienware 16X Aurora Core Ultra 9 290HX Plus Ultra 9 290HX Plus, GeForce RTX 5070 Ti Laptop, 96 Wh | Asus TUF Gaming A16 FA608UP R7 260, GeForce RTX 5070 Laptop, 90 Wh | Lenovo Legion 7 16IAX10 Ultra 7 255HX, GeForce RTX 5060 Laptop, 84 Wh | |
|---|---|---|---|---|---|---|
| Akkulaufzeit | 41% | 48% | -6% | 65% | -41% | |
| WLAN (h) | 7.9 | 11.1 41% | 11.7 48% | 7.4 -6% | 13 65% | 4.7 -41% |
| H.264 (h) | 14.2 |
Notebookcheck Bewertung
Das Raider 16 Max HX ist schwerer und größer als viele andere 16-Zoll-Gaming-Notebooks, aber dafür kann es mehr Leistung aus CPU und GPU herausholen.
MSI Raider 16 Max HX B2WJ
- 09.06.2026 v8
Allen Ngo
 Total Sustainability Score:
 Potenzielle Wettbewerber im Vergleich
Bild | Modell / Test | Preis ab | Gewicht | Dicke | Display |
|---|---|---|---|---|---|
1. 87.7%  | MSI Raider 16 Max HX B2WJ Intel Core Ultra 9 290HX Plus ⎘ NVIDIA GeForce RTX 5090 Laptop ⎘ 32 GB RAM, 1024 GB SSD | Amazon: Bestpreis 4349€ nullprozentshop.de 2. 4349€ notebooksbilliger.de 3. 4357.99€ galaxus | 2.7 kg | 28.9 mm | 16.00" 2560x1600 189 PPI OLED |
2. 81.9%  | MSI Crosshair 16 HX AI D2XWGKG Intel Core Ultra 9 275HX ⎘ NVIDIA GeForce RTX 5070 Laptop ⎘ 16 GB RAM, 1024 GB SSD | Amazon: Bestpreis 2269€ galaxus | 2.5 kg | 27.9 mm | 16.00" 2560x1600 189 PPI IPS |
3. 87.7%  | Razer Blade 16 Core Ultra 9 386H Intel Core Ultra 9 386H ⎘ NVIDIA GeForce RTX 5090 Laptop ⎘ 32 GB RAM, 2048 GB SSD | Amazon: 1. 3.719,63 € Razer Blade 16 (2026) Gaming... 2. 5.325,03 € Razer Blade 18 (2026) - 18 Z... 3. 5.701,46 € Razer Blade 18 (2026) - 18 Z... Bestpreis 5399€ Alternate 2. 5399€ nullprozentshop.de 3. 5399€ notebooksbilliger.de | 2.1 kg | 17.4 mm | 16.00" 2560x1600 189 PPI OLED |
4. 85.9%  | Alienware 16X Aurora Core Ultra 9 290HX Plus Intel Core Ultra 9 290HX Plus ⎘ NVIDIA GeForce RTX 5070 Ti Laptop ⎘ 32 GB RAM | Amazon: 2.199,00 € Bestpreis 2199€ Alternate 2. 2268.02€ galaxus 3. 2359.53€ galaxus.at | 2.6 kg | 23.4 mm | 16.00" 2560x1600 189 PPI OLED |
5. 83.8%  | Asus TUF Gaming A16 FA608UP AMD Ryzen 7 260 ⎘ NVIDIA GeForce RTX 5070 Laptop ⎘ 32 GB RAM, 1024 GB SSD | Amazon: Bestpreis 2299€ ONE.de | 2.2 kg | 25.7 mm | 16.00" 2560x1600 189 PPI IPS |
6. 86.6%  | Lenovo Legion 7 16IAX10 Intel Core Ultra 7 255HX ⎘ NVIDIA GeForce RTX 5060 Laptop ⎘ 32 GB RAM, 1024 GB SSD | Amazon: 1.947,57 € Geizhals Suche | 2 kg | 17.9 mm | 16.00" 2560x1600 189 PPI OLED |
Transparenz
Die Auswahl der zu testenden Geräte erfolgt innerhalb der Redaktion. Das vorliegende Testmuster wurde dem Autor vom Hersteller oder einem Shop zu Testzwecken leihweise zur Verfügung gestellt. Eine Einflussnahme des Leihstellers auf den Testbericht gab es nicht, der Hersteller erhielt keine Version des Reviews vor der Veröffentlichung. Es bestand keine Verpflichtung zur Publikation. Als eigenständiges, unabhängiges Unternehmen unterliegt Notebookcheck keiner Diktion von Herstellern, Shops und Verlagen.
So testet Notebookcheck
Pro Jahr werden von Notebookcheck hunderte Laptops und Smartphones unabhängig in von uns standardisierten technischen Verfahren getestet, um eine Vergleichbarkeit aller Testergebnisse zu gewährleisten. Seit rund 20 Jahren entwickeln wir diese Testmethoden kontinuierlich weiter und setzen damit Branchenstandards. In unseren Testlaboren kommt ausschließlich hochwertiges Messequipment in die Hände erfahrener Techniker und Redakteure. Die Tests unterliegen einer mehrstufigen Kontrolle. Unsere komplexe Gesamtbewertung basiert auf hunderten fundierten Messergebnissen und Benchmarks, womit Ihnen Objektivität garantiert ist. Weitere Informationen zu unseren Testmethoden gibt es hier.

