Fazit — rohe Leistung mit nur minimalem Luxus
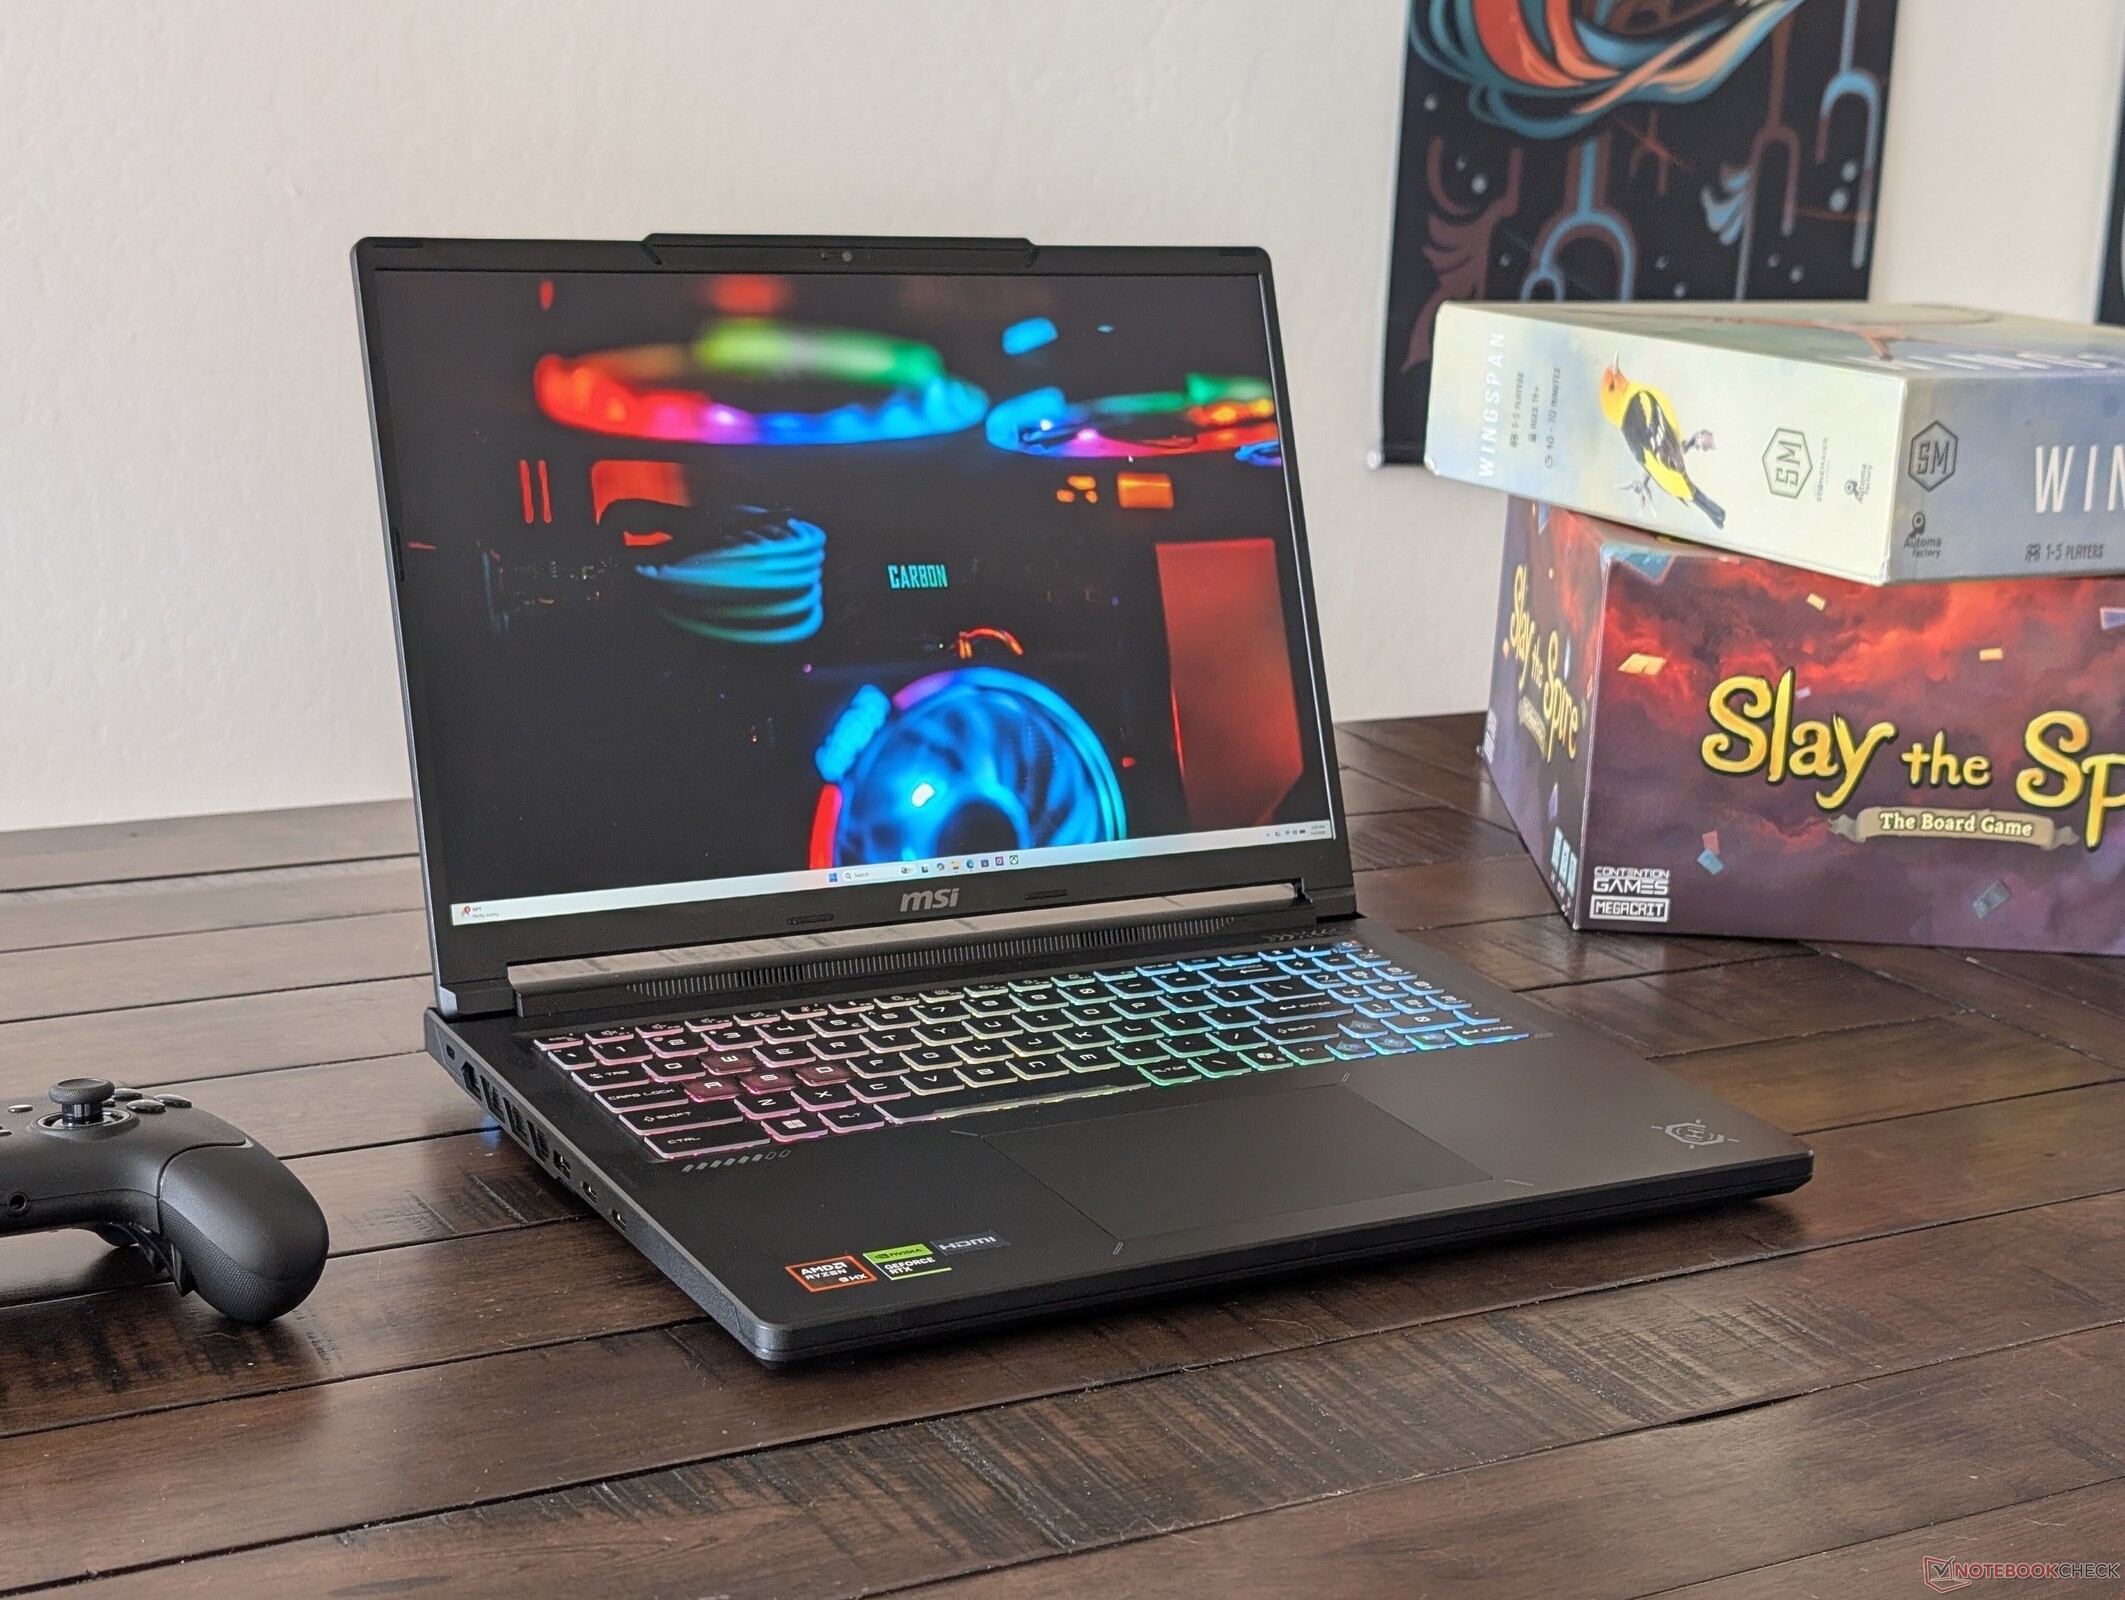
Das Crosshair A16 HX überzeugt durch seine Leistung, insbesondere für einen Gaming-Laptop der Mittelklasse mit AMD- oder Nvidia Grafikkarte. Trotz der älteren Zen-4-Plattform übertrifft die CPU Ryzen 9 8940HX die neuere Ryzen AI 9 470 mit Zen 5 und liegt dabei nur etwa 5 bis 10 Prozent hinter dem teureren Intel Core Ultra 9 275HX. Auch die baulichen Neuerungen am Gehäuse sind ein Schritt in die richtige Richtung, da das System mehr Ports, ein größeres Clickpad sowie ein etwas dünneres und leichteres Design bietet als das Intel basierte Crosshair 16 HX und somit einen leichteren Transport ermöglicht.
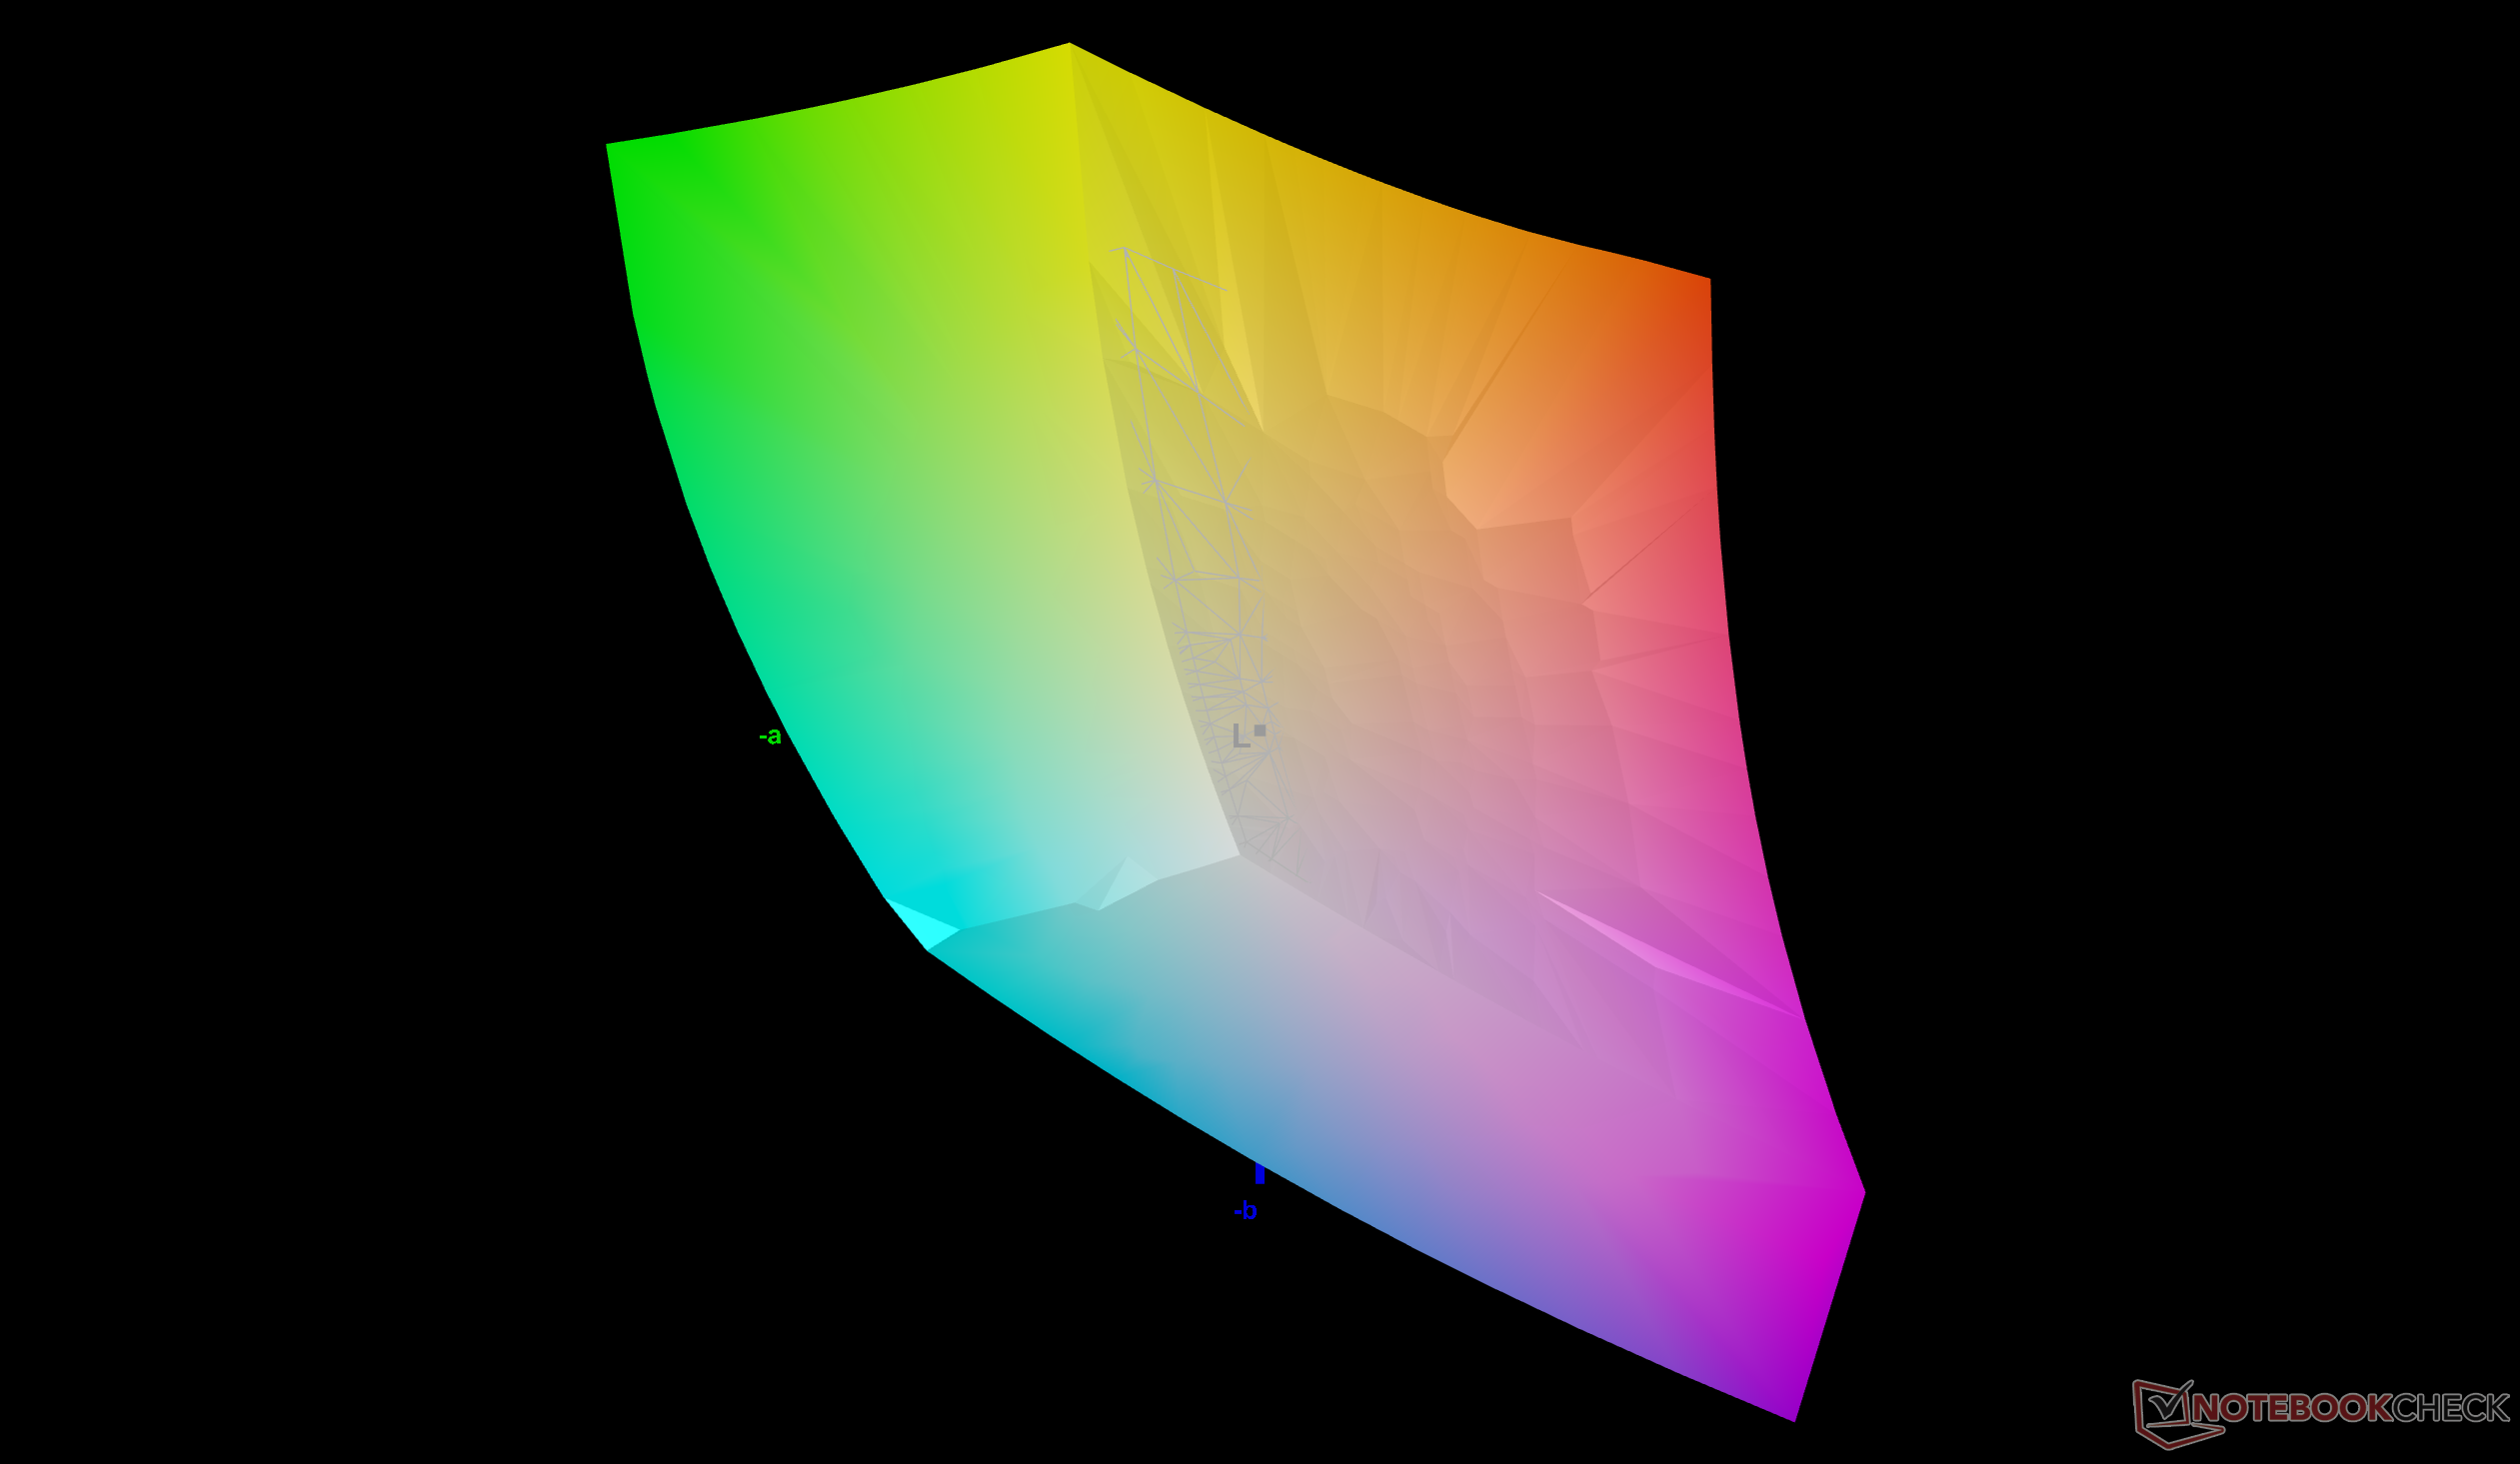
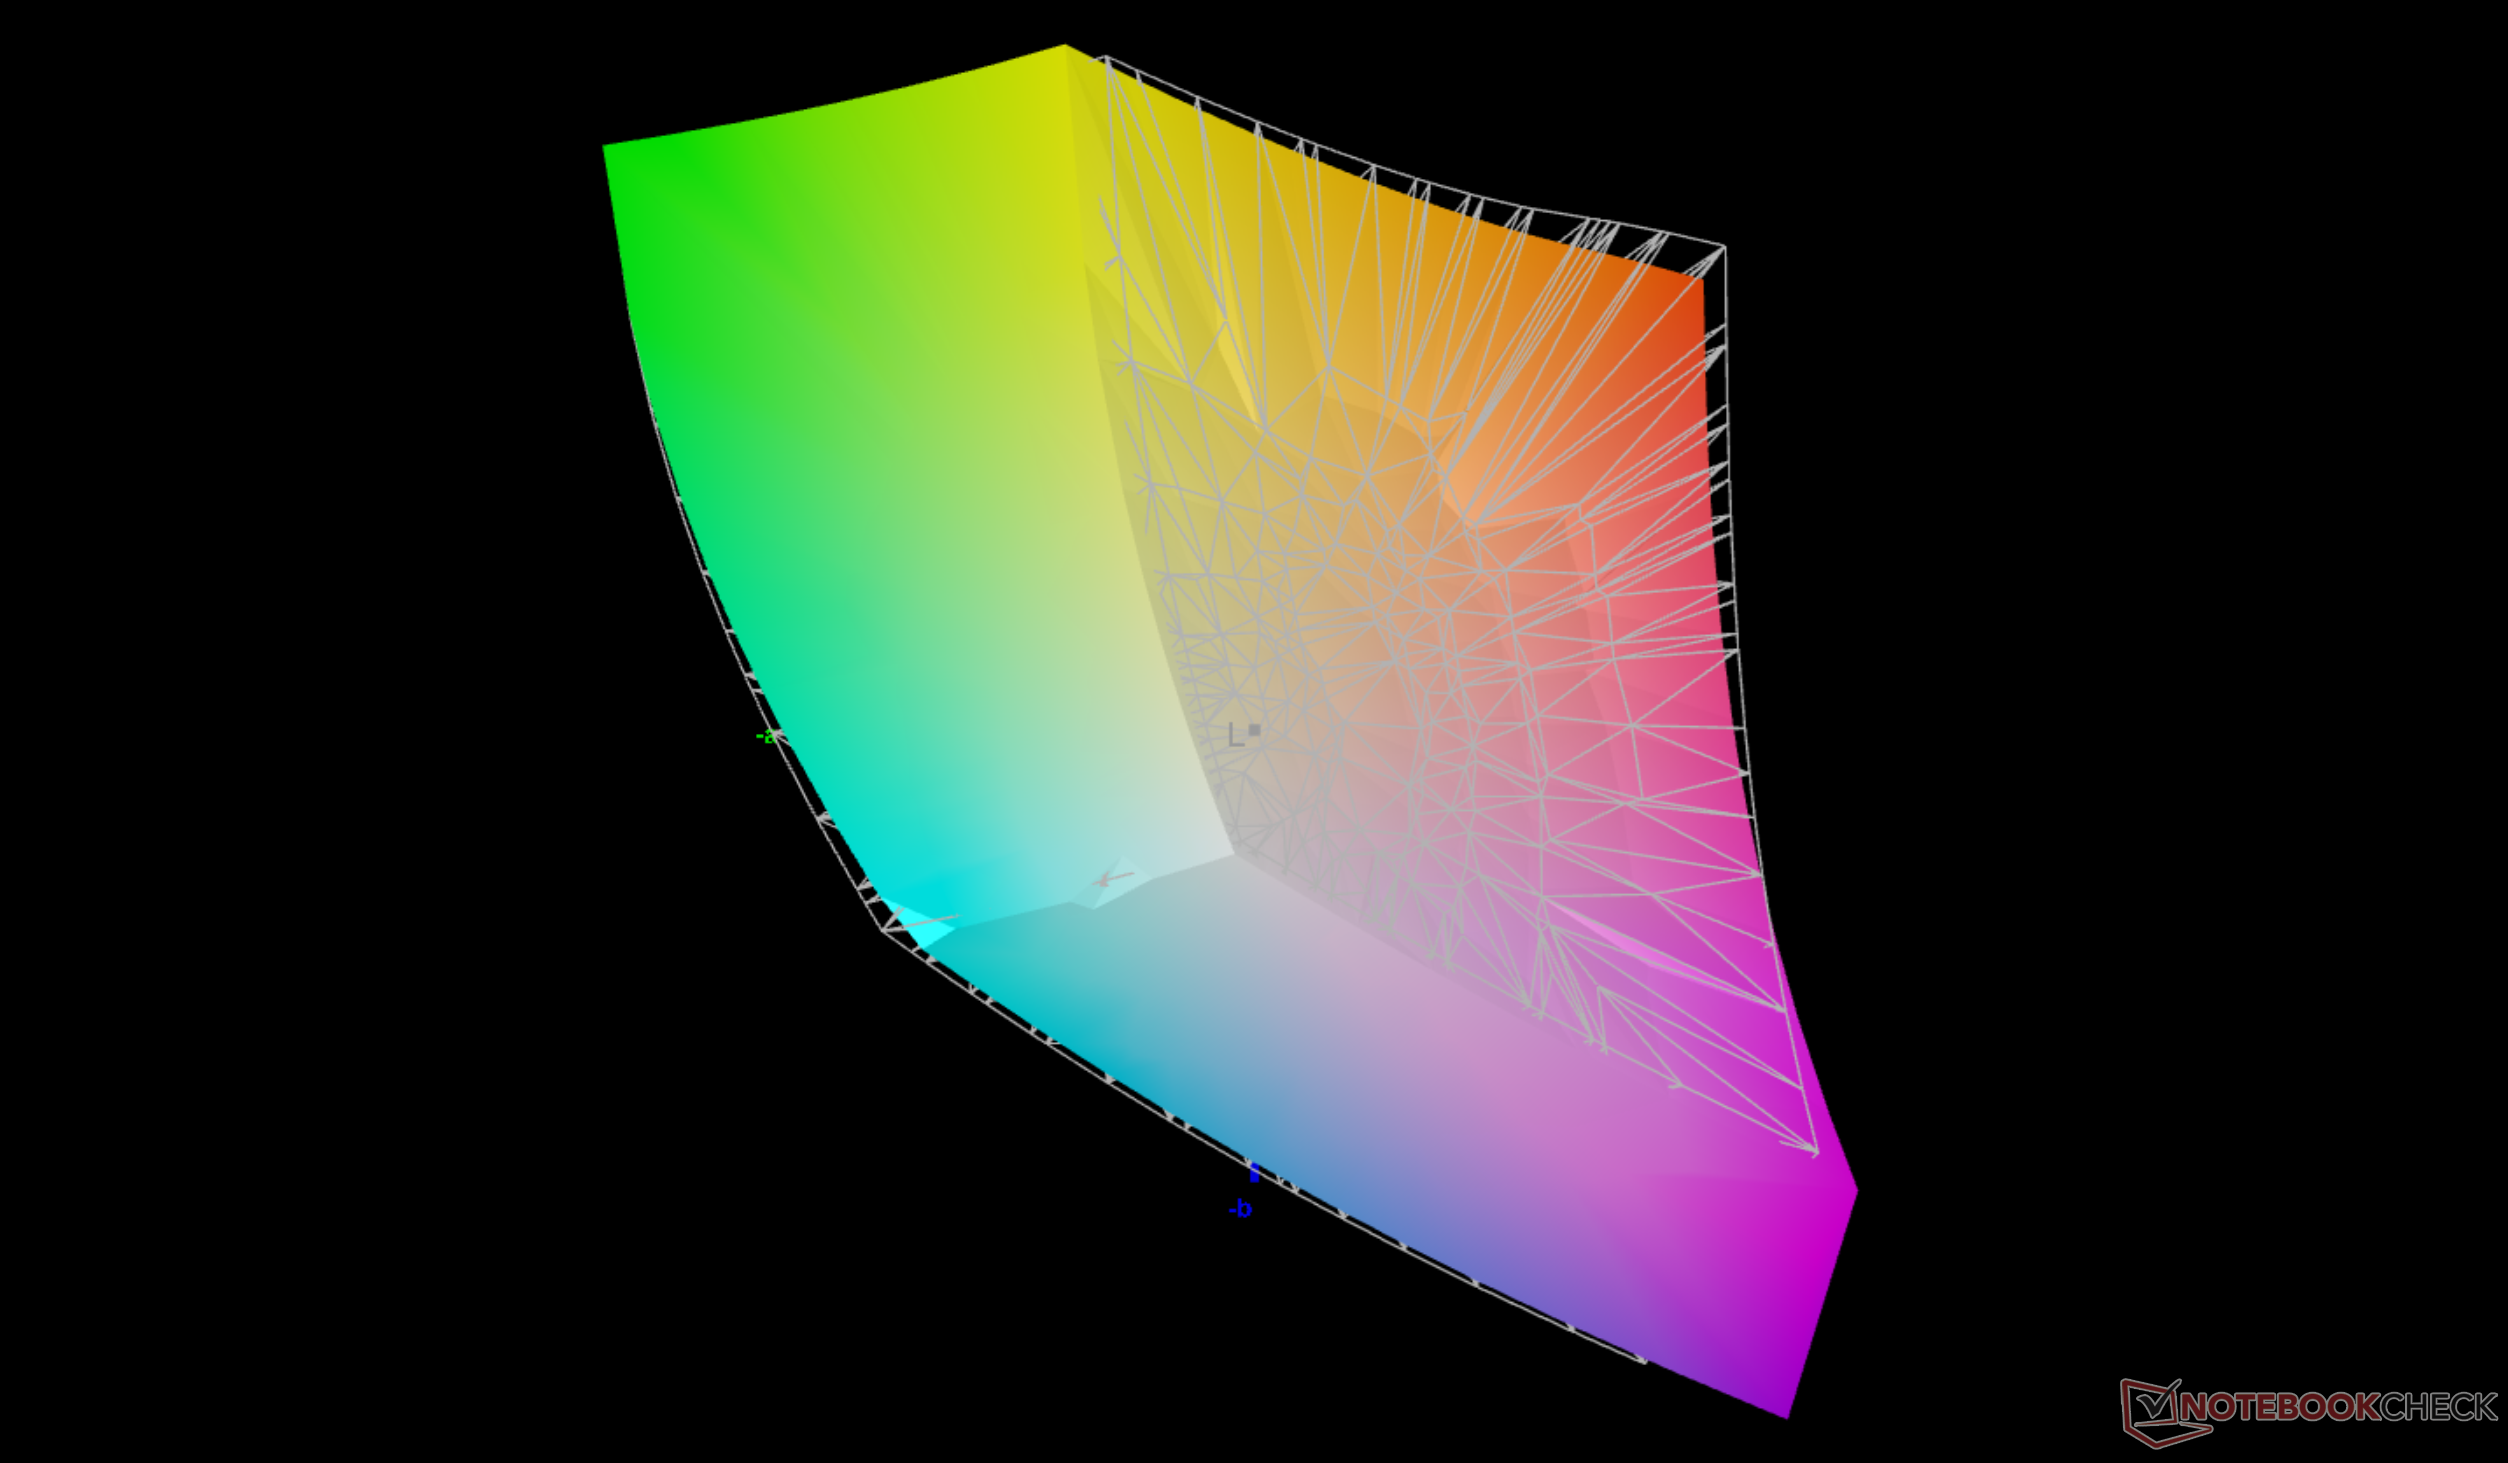
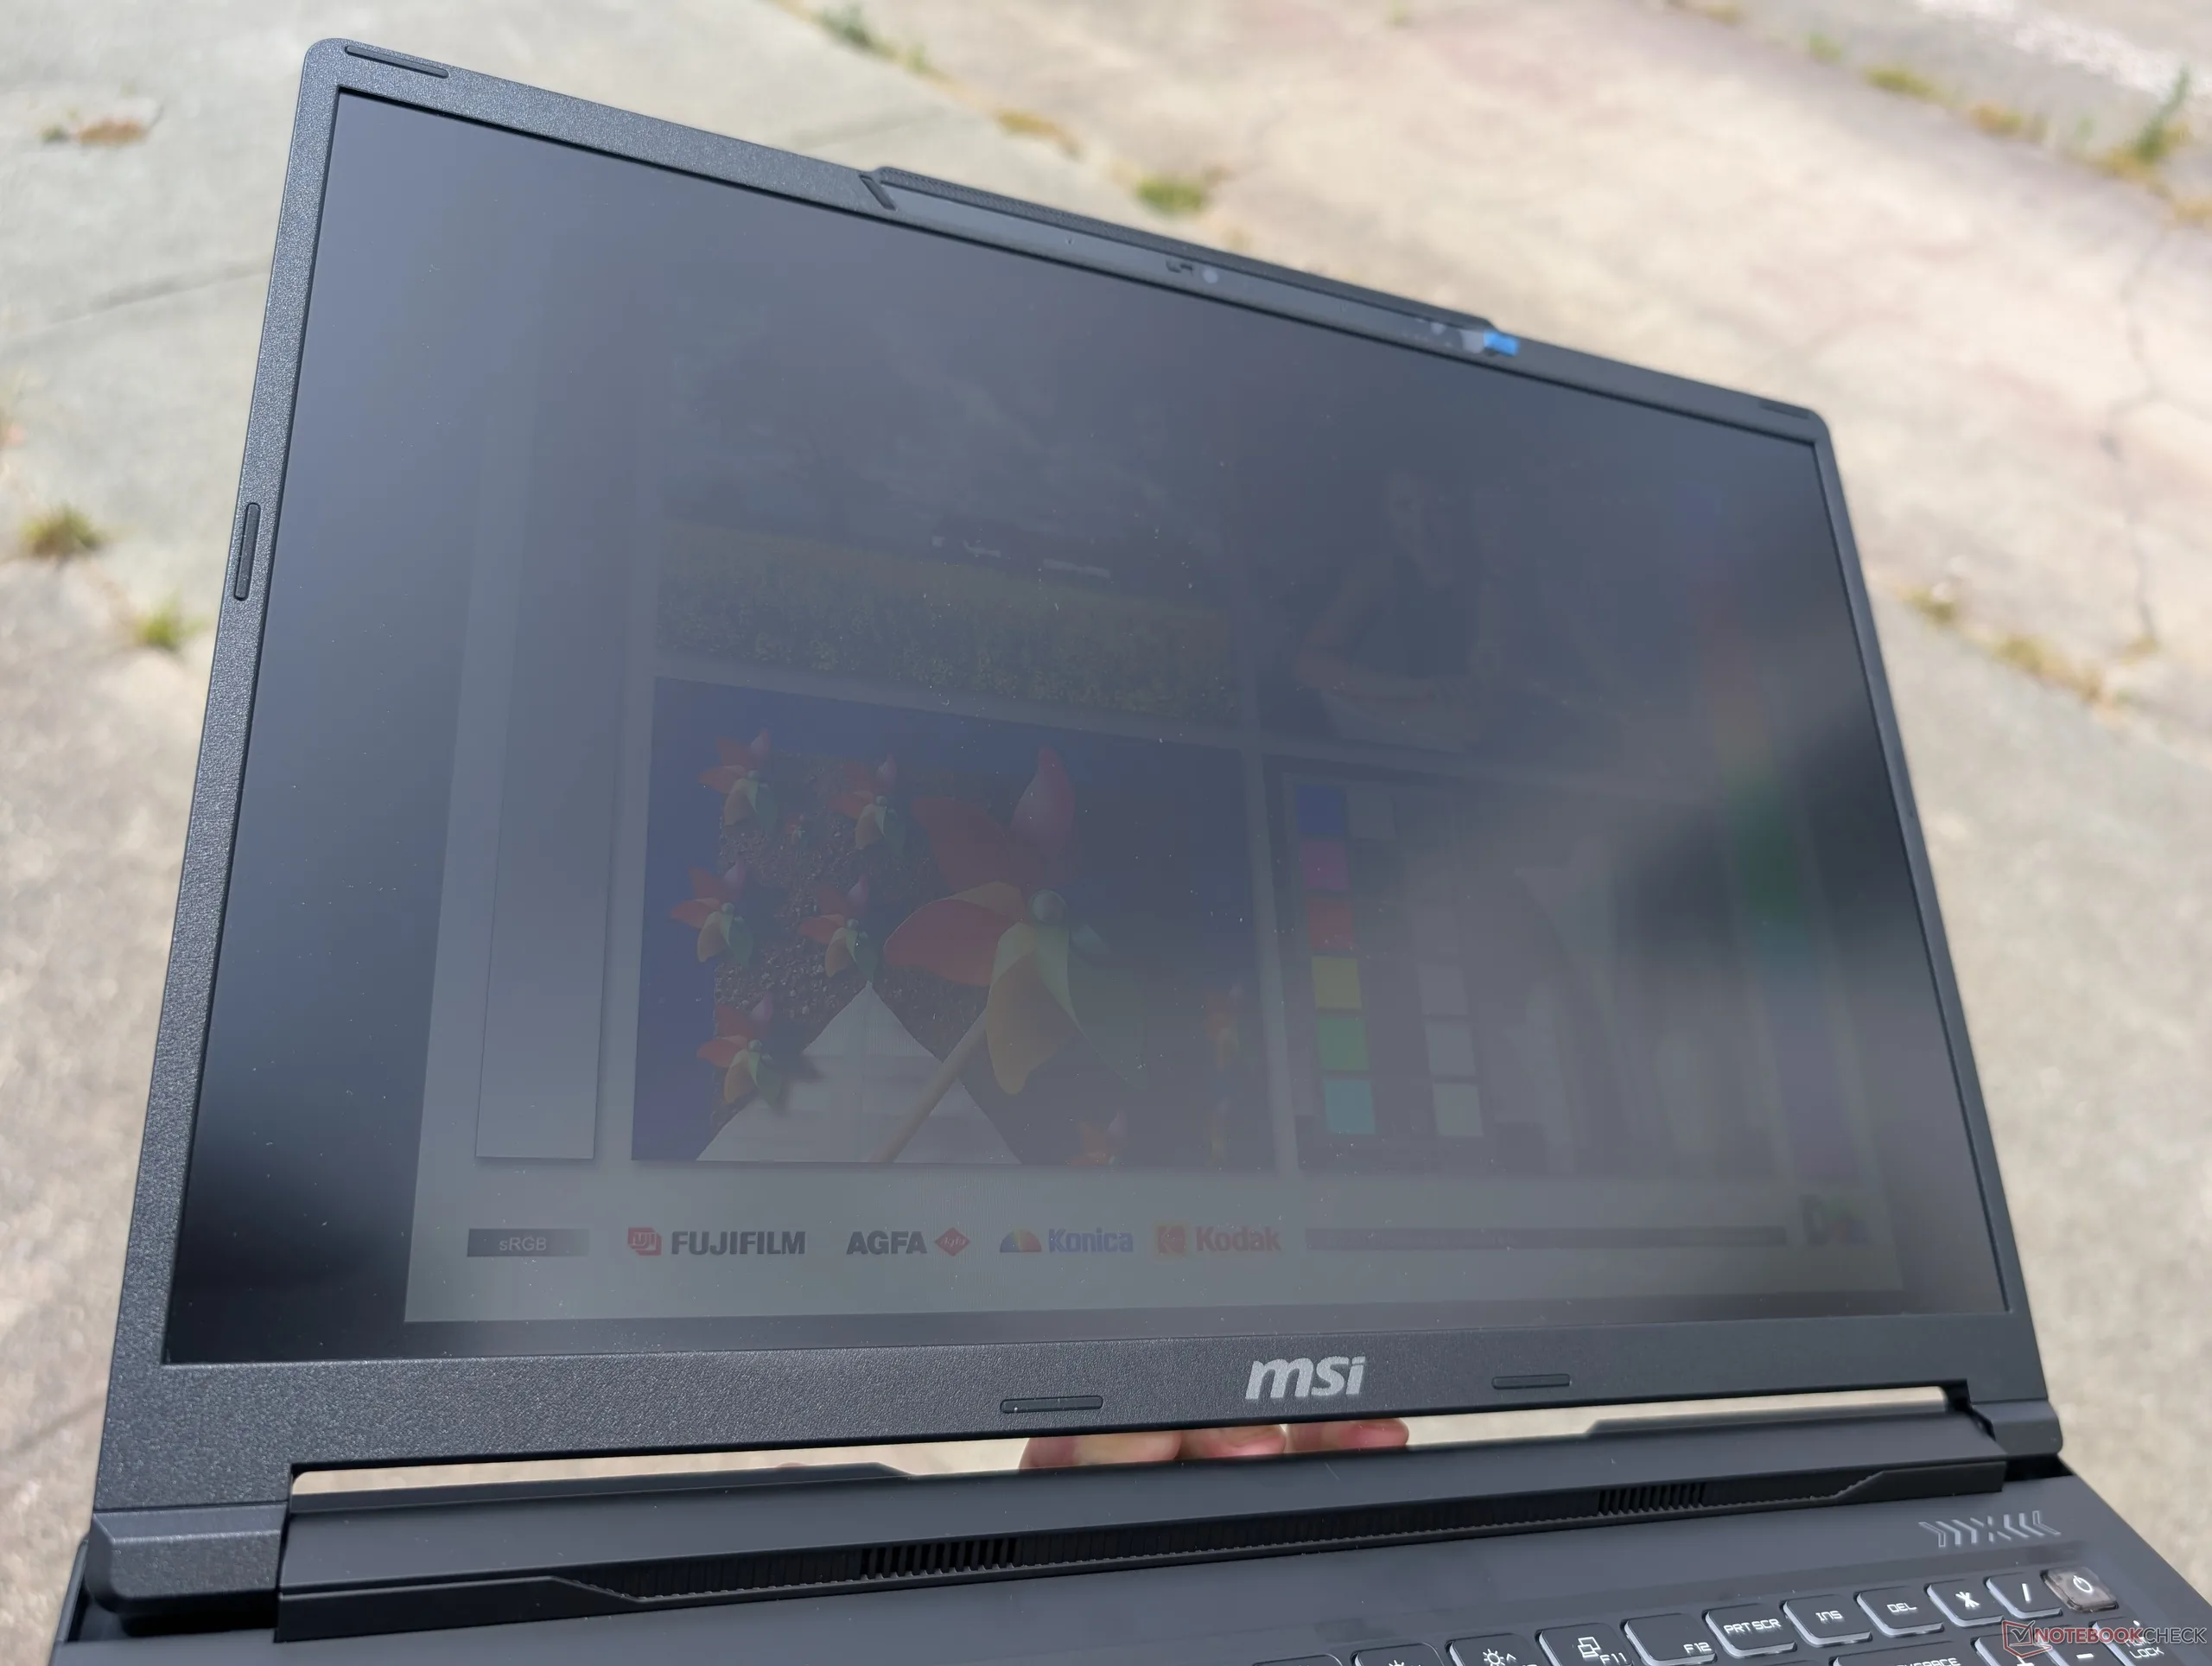
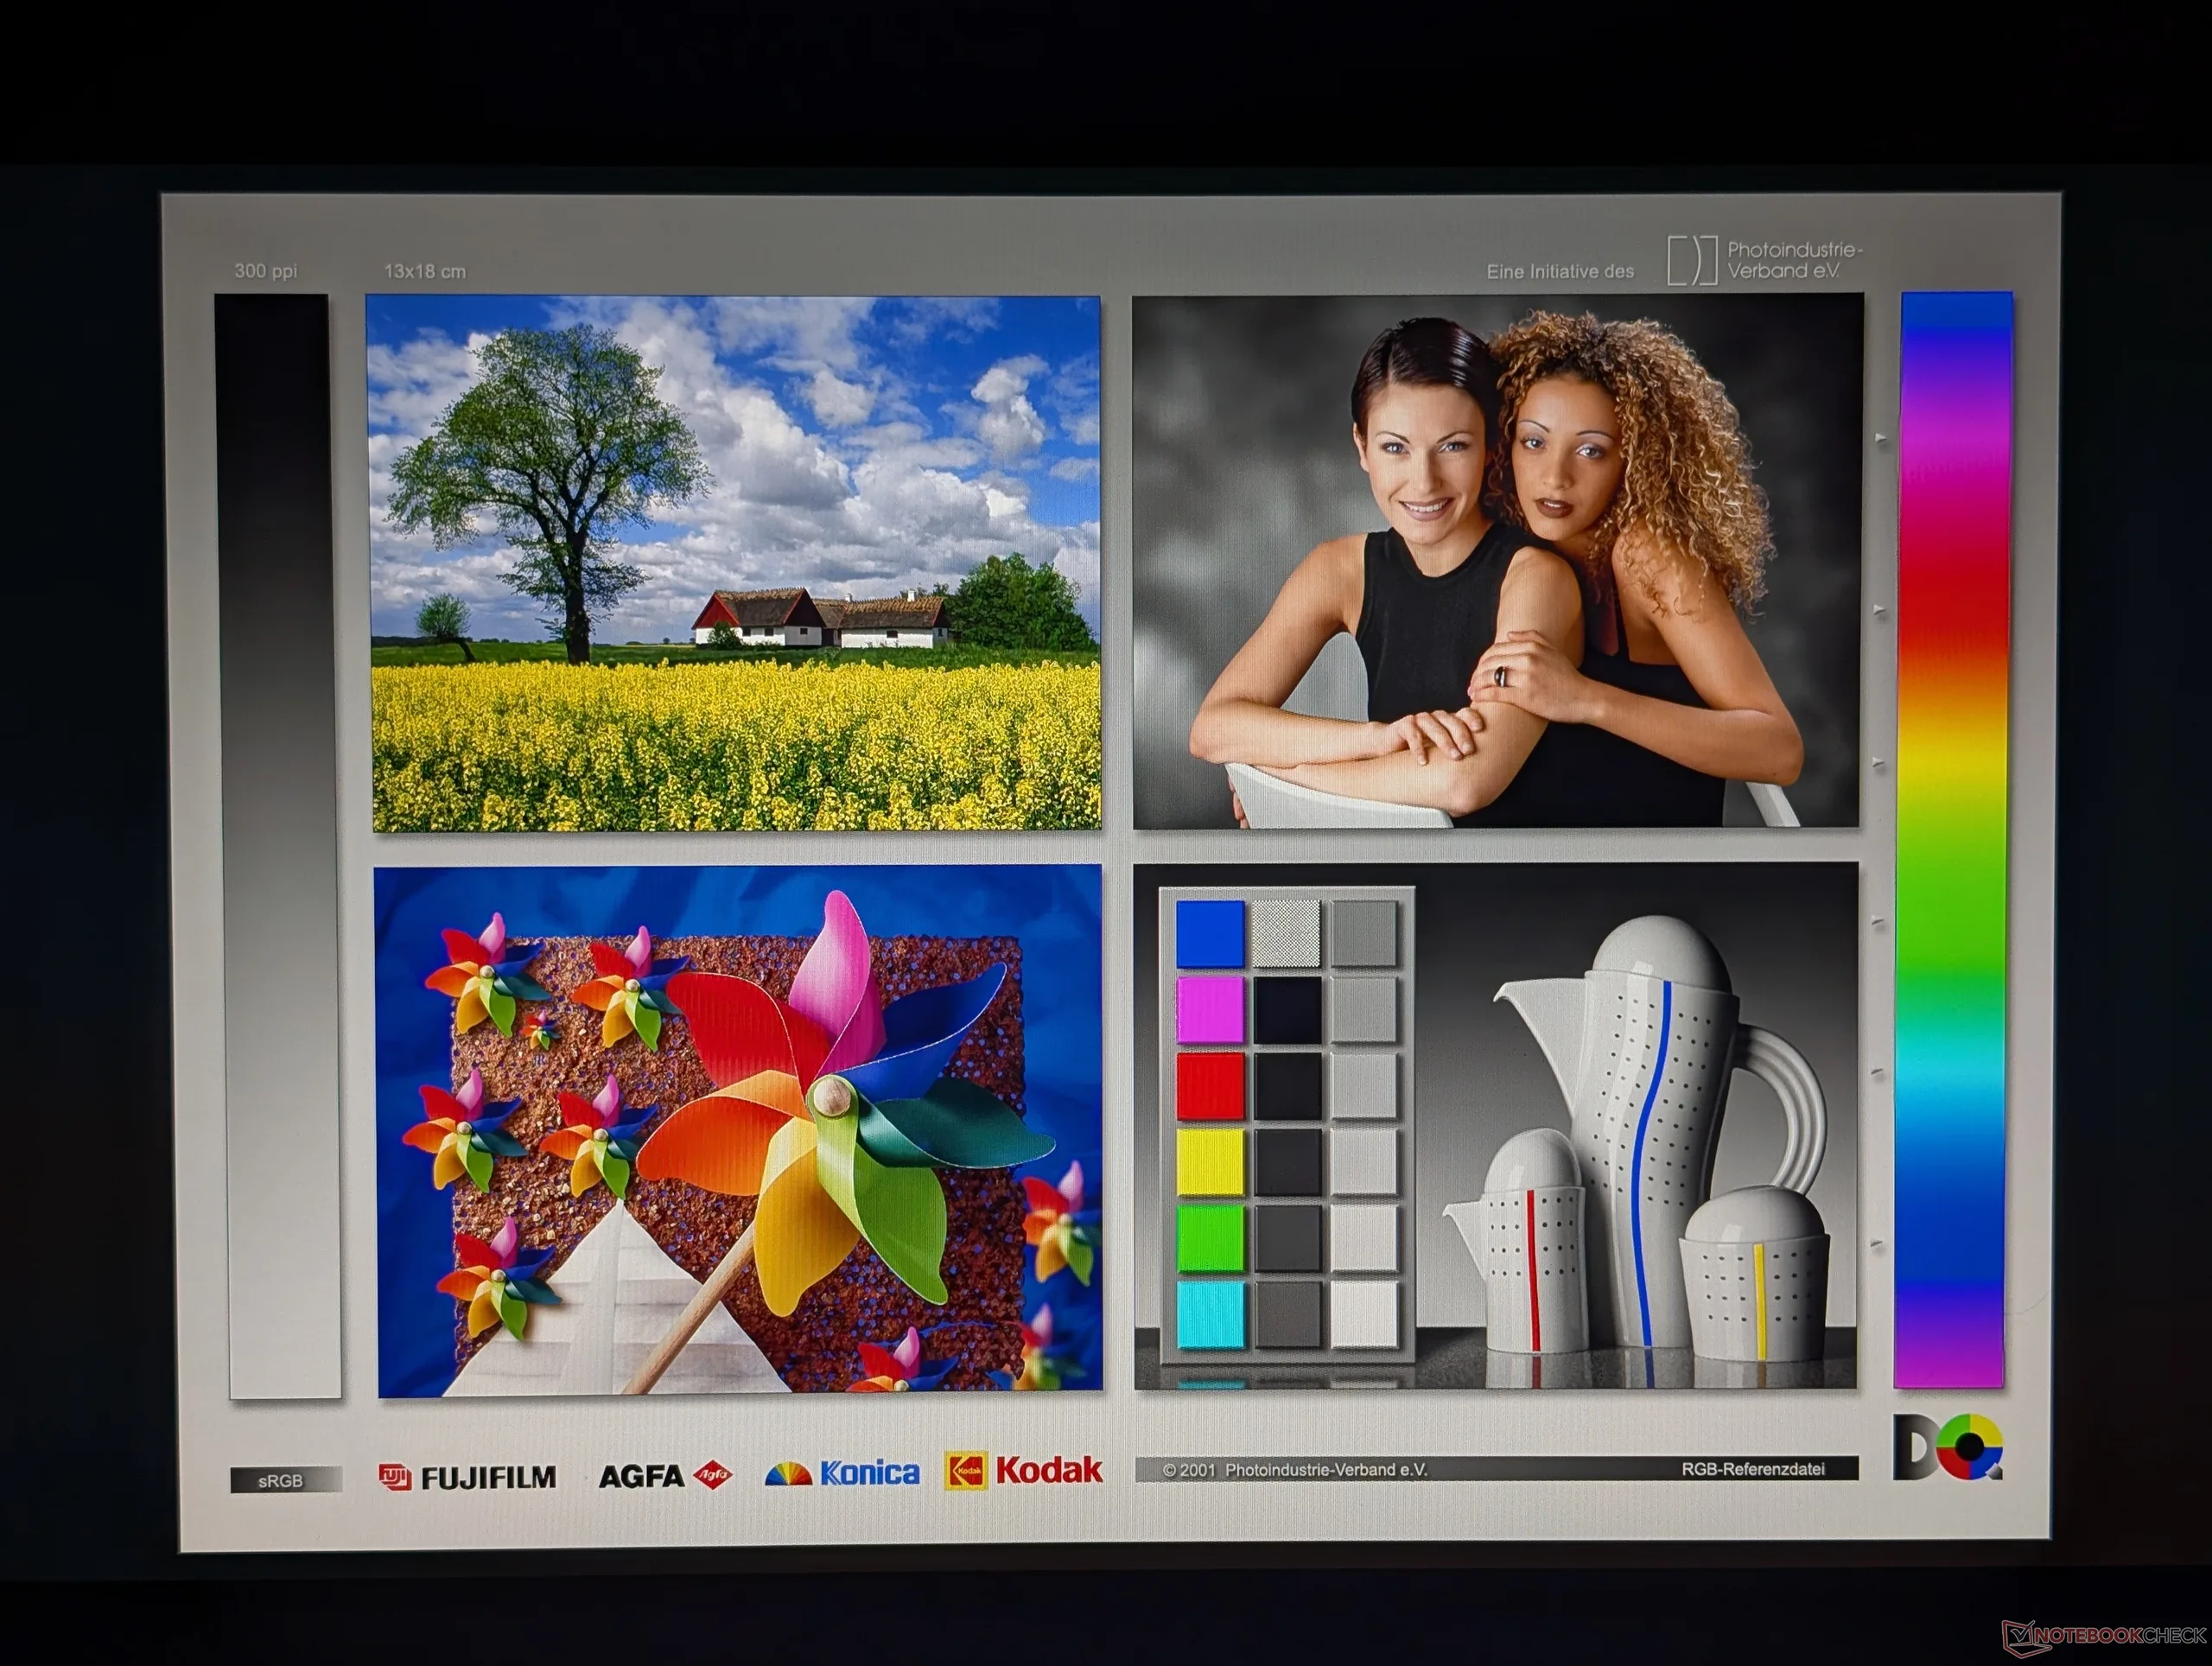
Erwähnenswert ist auch das 1.600p240-IPS-Display mit einer P3-Farbraumabdeckung von 95 %. Wir begrüßen, dass alle aktuellen Konfigurationen mit dem gleichen hochwertigen Panel ausgeliefert werden – einschließlich der Basisvariante mit RTX 5060 –, sodass Käufer sich keine Sorgen um Modelle mit einer geringen NTSC-Abdeckung von nur 45 % machen müssen.
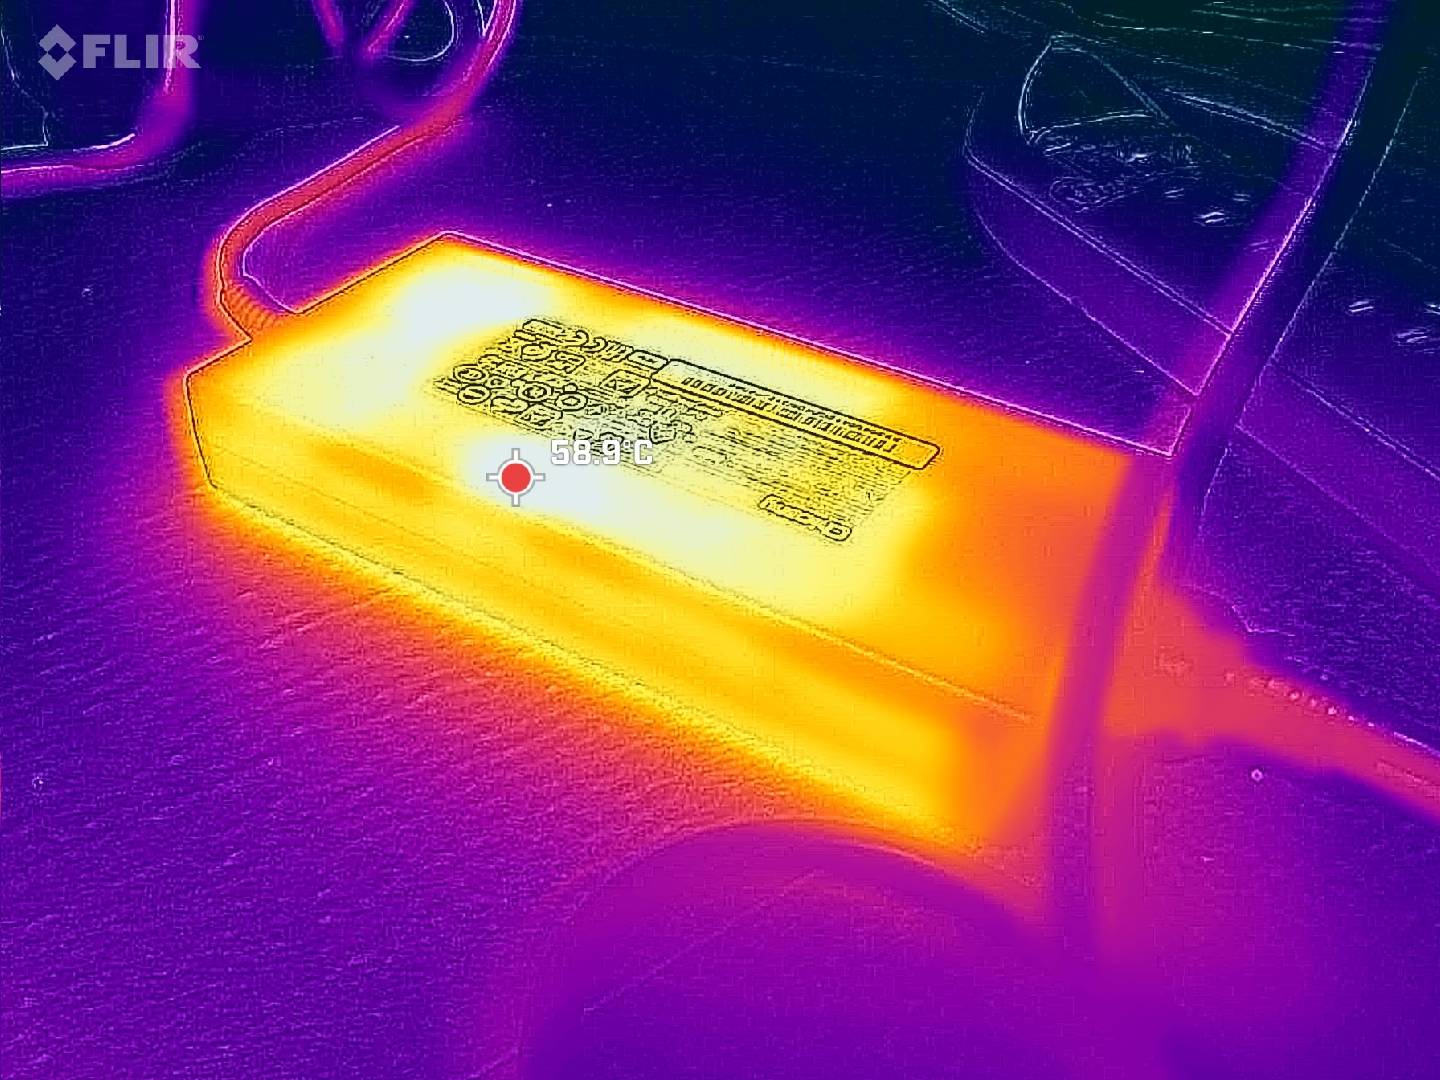
Zwar sind die Leistungs- und Gehäuse-Updates hervorragend, doch das Crosshair A16 HX ist nach wie vor ein preisgünstiges Modell, sodass die Einsparungen deutlich spürbar sind. Insbesondere das matte Kunststoffgehäuse ist sehr anfällig für Fingerabdrücke, während die mangelhaften Lautsprecher, das Fehlen von G-Sync, Advanced Optimus, HDR sowie einer RGB-Beleuchtung pro Taste das gesamte Spielerlebnis beeinträchtigen. Das 240-W-Netzteil wirkt etwas zu klein, da der leistungshungrige Laptop beim Gaming bereits durchschnittlich fast 250 W verbraucht, was zu sehr hohen Temperaturen am Netzteil und einer generell kürzeren Akkulaufzeit führt.
Pro
Contra
Preis und Verfügbarkeit
Das MSI Crosshair A16 HX wie im Test beschrieben, ist auf dem deutschsprachigen Markt aktuell noch nicht verfügbar. Das MSI Crosshair 16 HX mit Intel Core Ultra 9 275HX und RTX 5070 gibt es bei Amazon für 2.882 Euro.
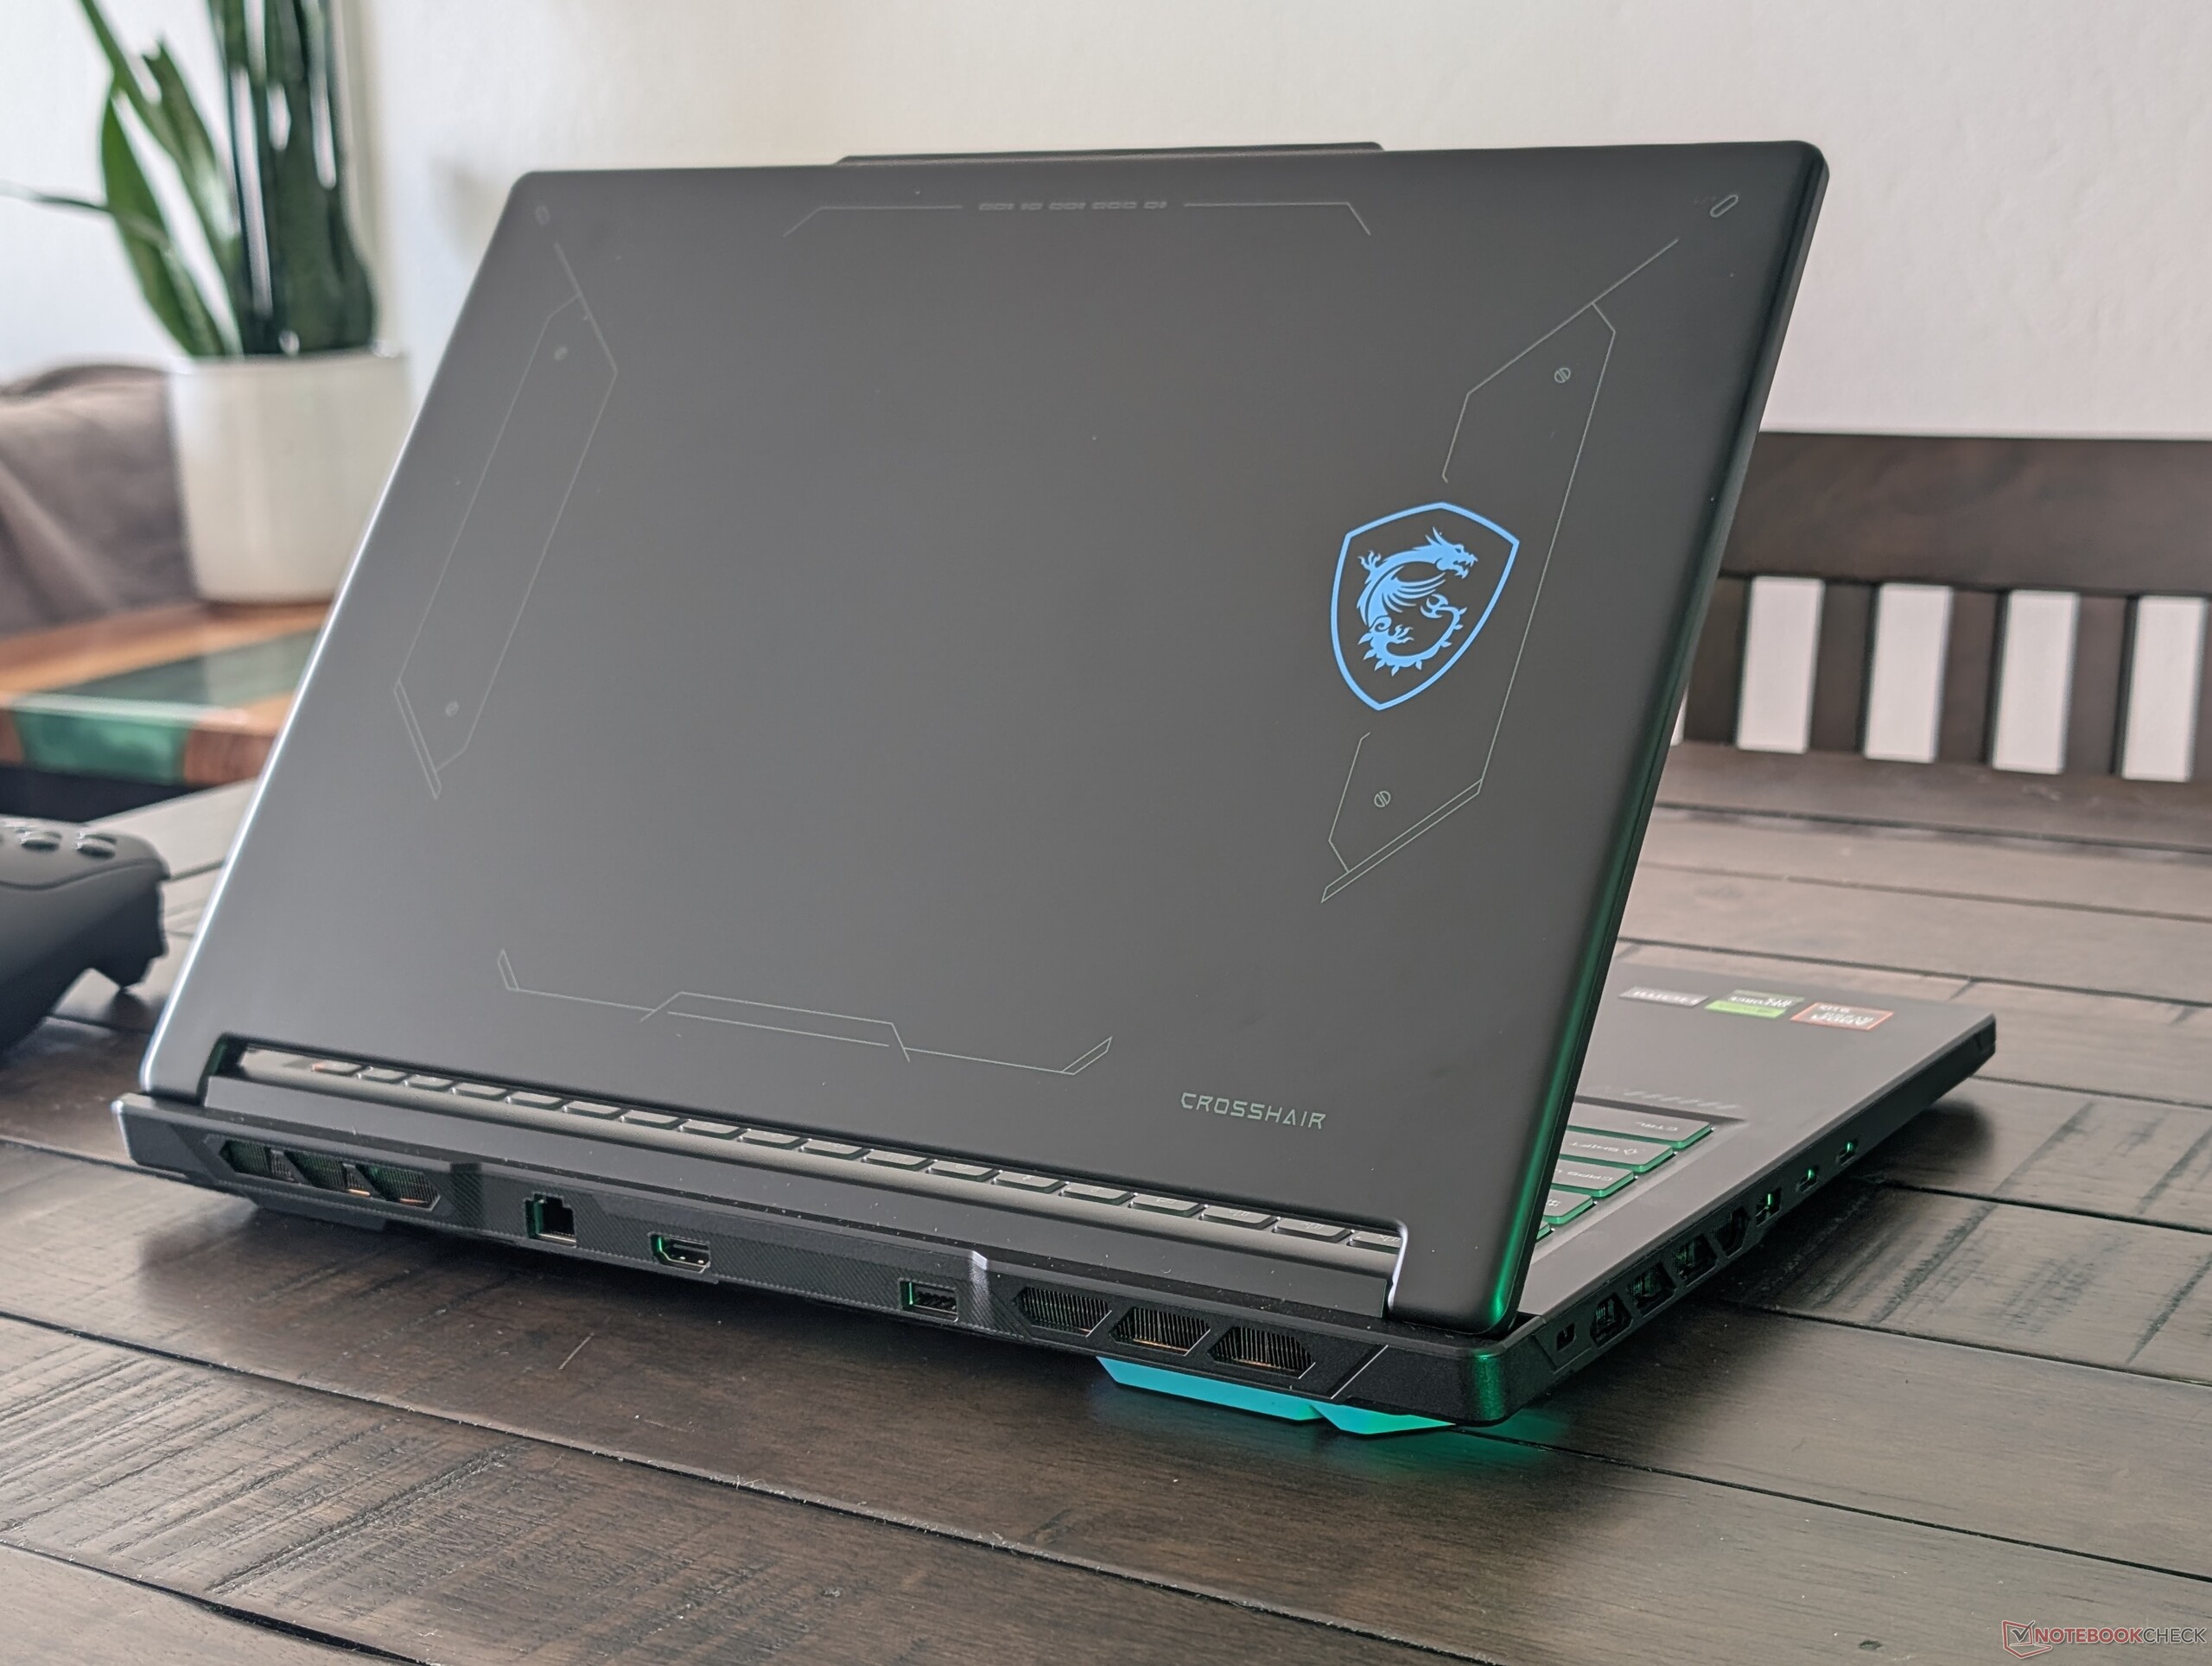
Das Crosshair A16 HX ist die AMD Version des Intel basierten Crosshair 16 HX. Dennoch gibt es zwischen den Modellen sowohl äußerlich als auch technisch einige Unterschiede. Die Crosshair Serie umfasst einige der preisgünstigeren Gaming-Laptops von MSI, im Gegensatz zu den teureren Raider- oder Titan-Serien.
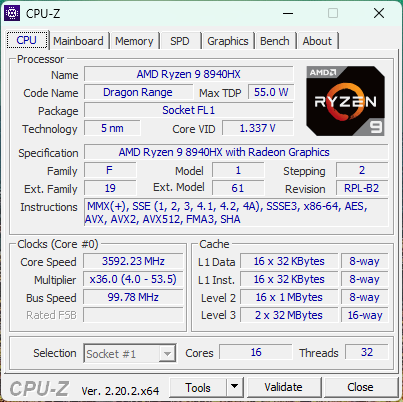
Unser Testgerät ist eine High-End-Konfiguration mit der Ryzen 9 8940HX Zen 4-CPU, einer GeForce-RTX-5070-GPU mit 115 W und einem 1.600p-IPS-Display zum Preis von etwa 2.700 US-Dollar. Günstigere Modelle sind stattdessen mit der RTX 5060 ausgestattet, doch alle Konfigurationen verfügen über dasselbe IPS-Display.
Zu den Alternativen zählen weitere preisgünstige bis mittelpreisige Gaming-Laptops wie die Asus TUF-Serie, Alienware 16 Aurora oder das Acer Nitro V 16.
Weitere MSI Testberichte:
Technische Daten
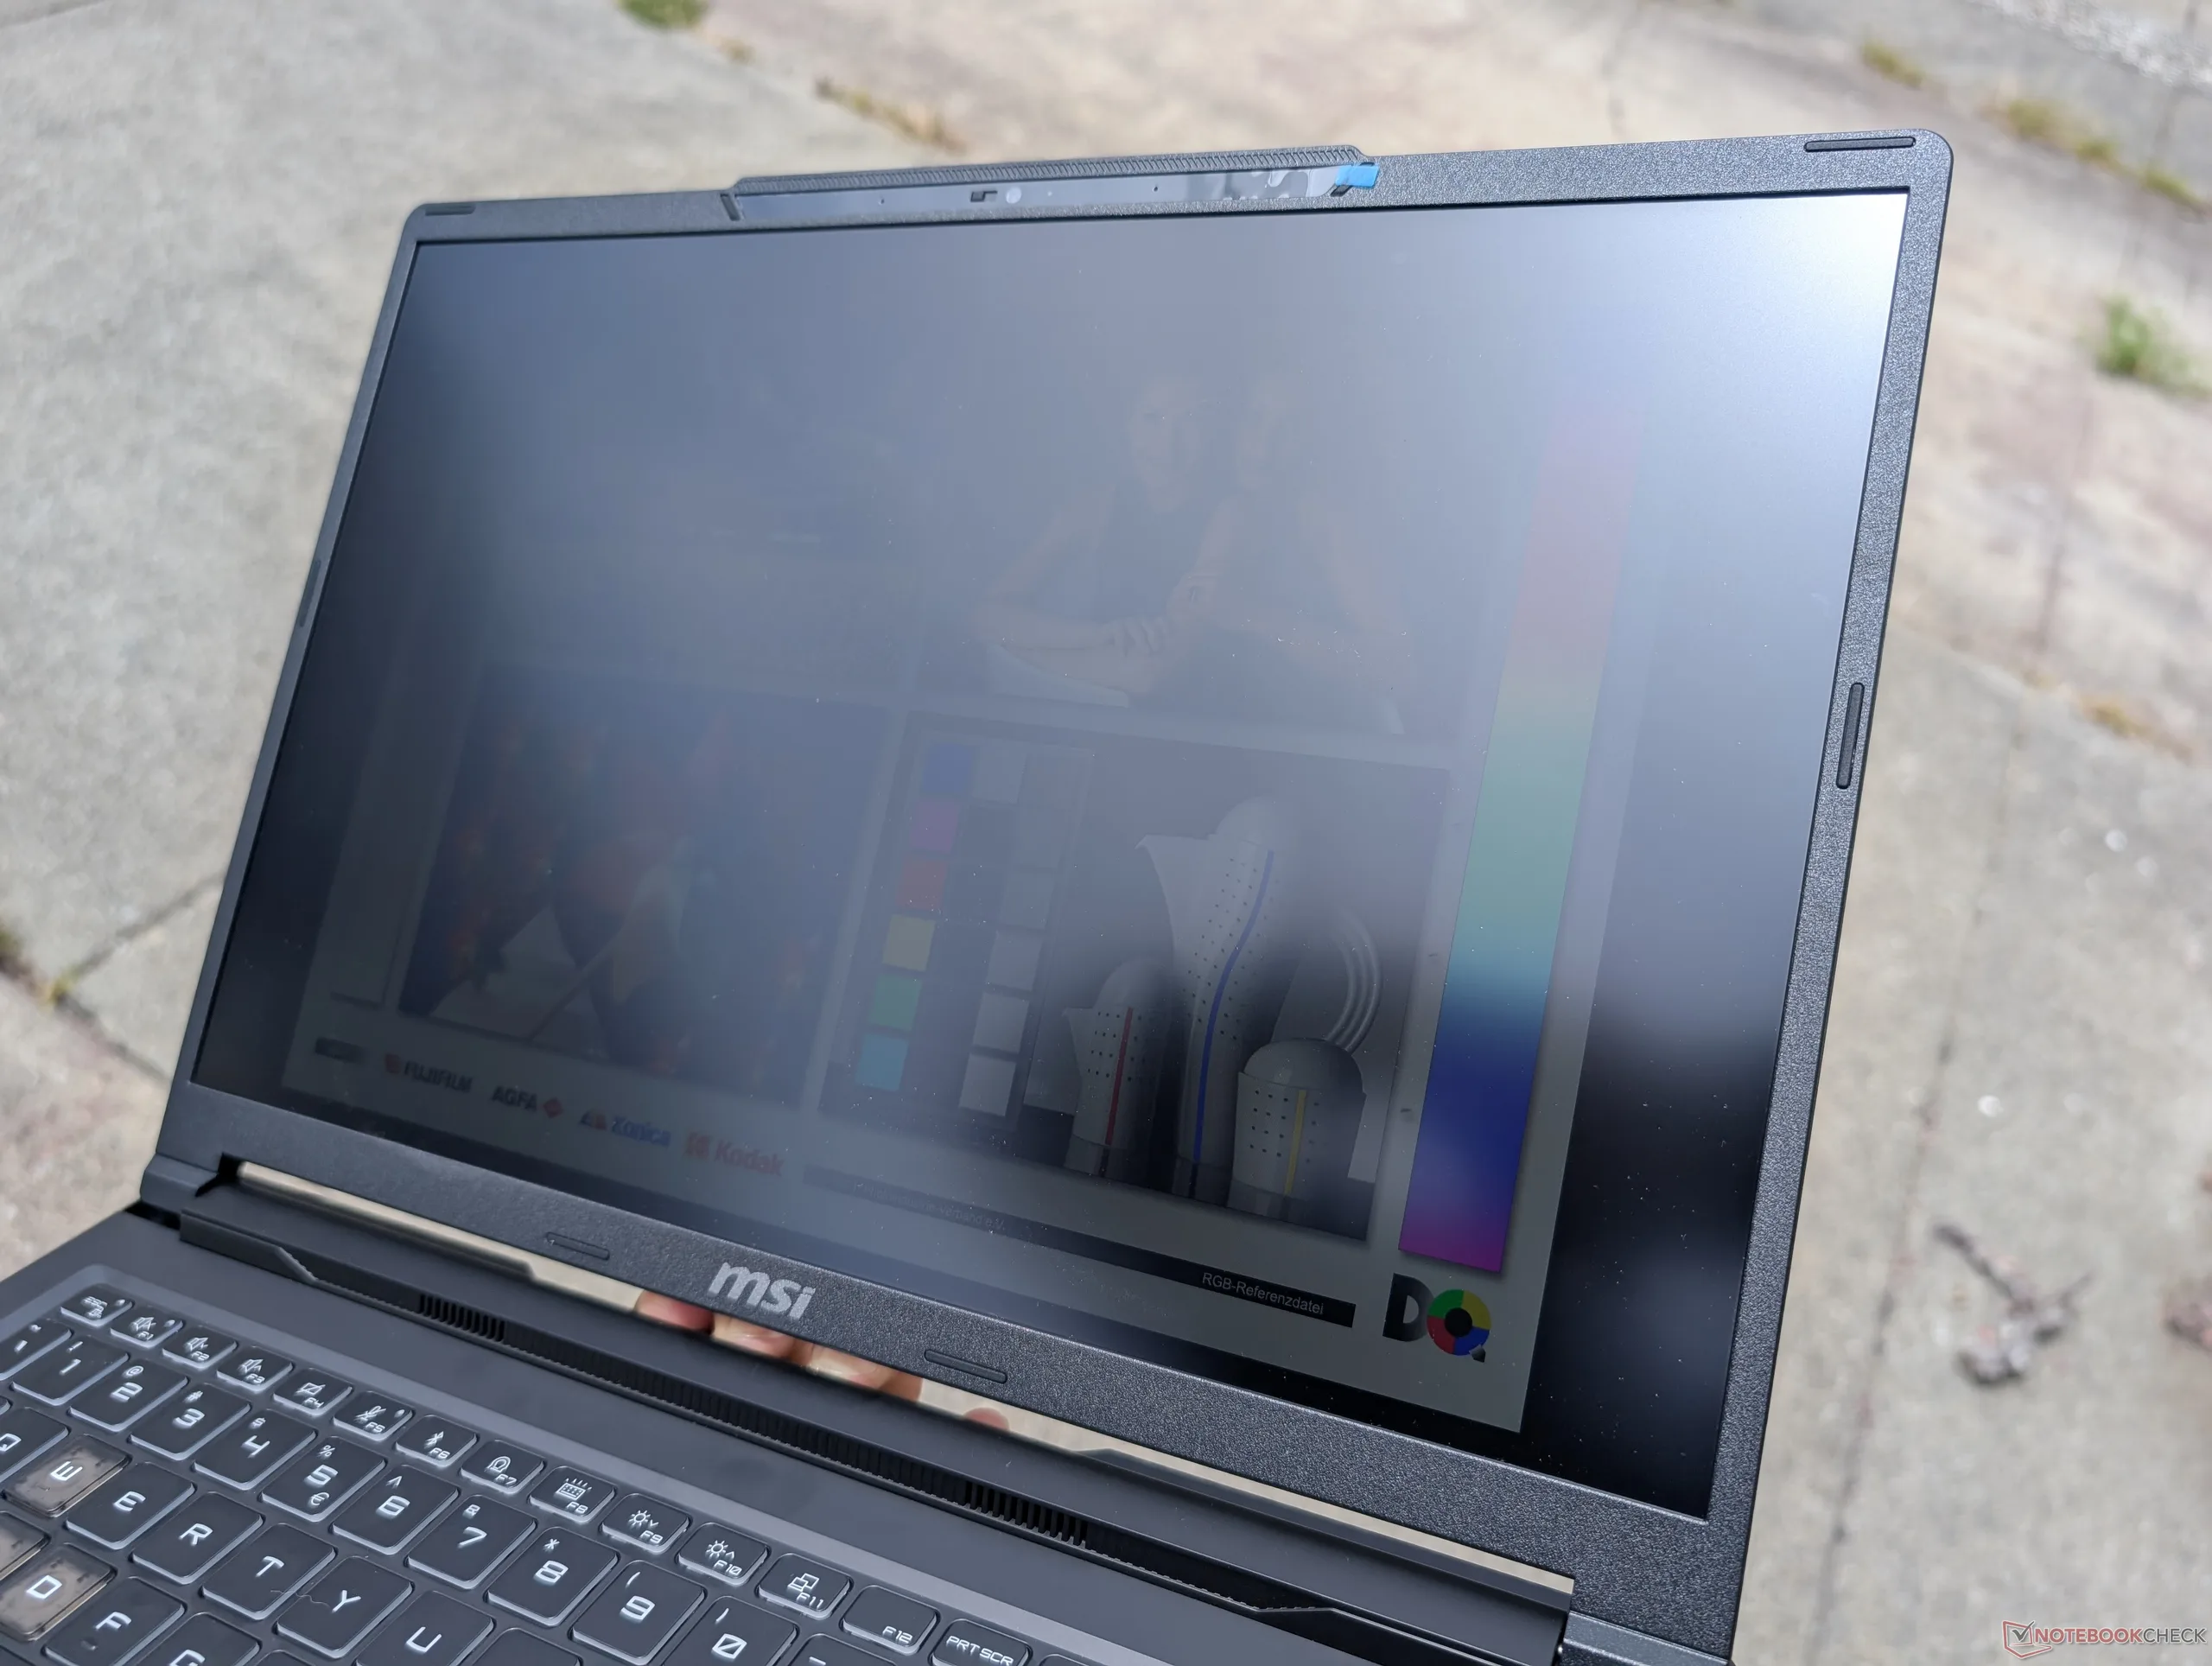
Gehäuse
Der Gehäuse besteht größtenteils aus mattschwarzem Kunststoff und verzichtet aus Kostengründen auf überflüssige RGB-Beleuchtung. Das Display lässt sich um maximal etwa 150 Grad aufklappen.
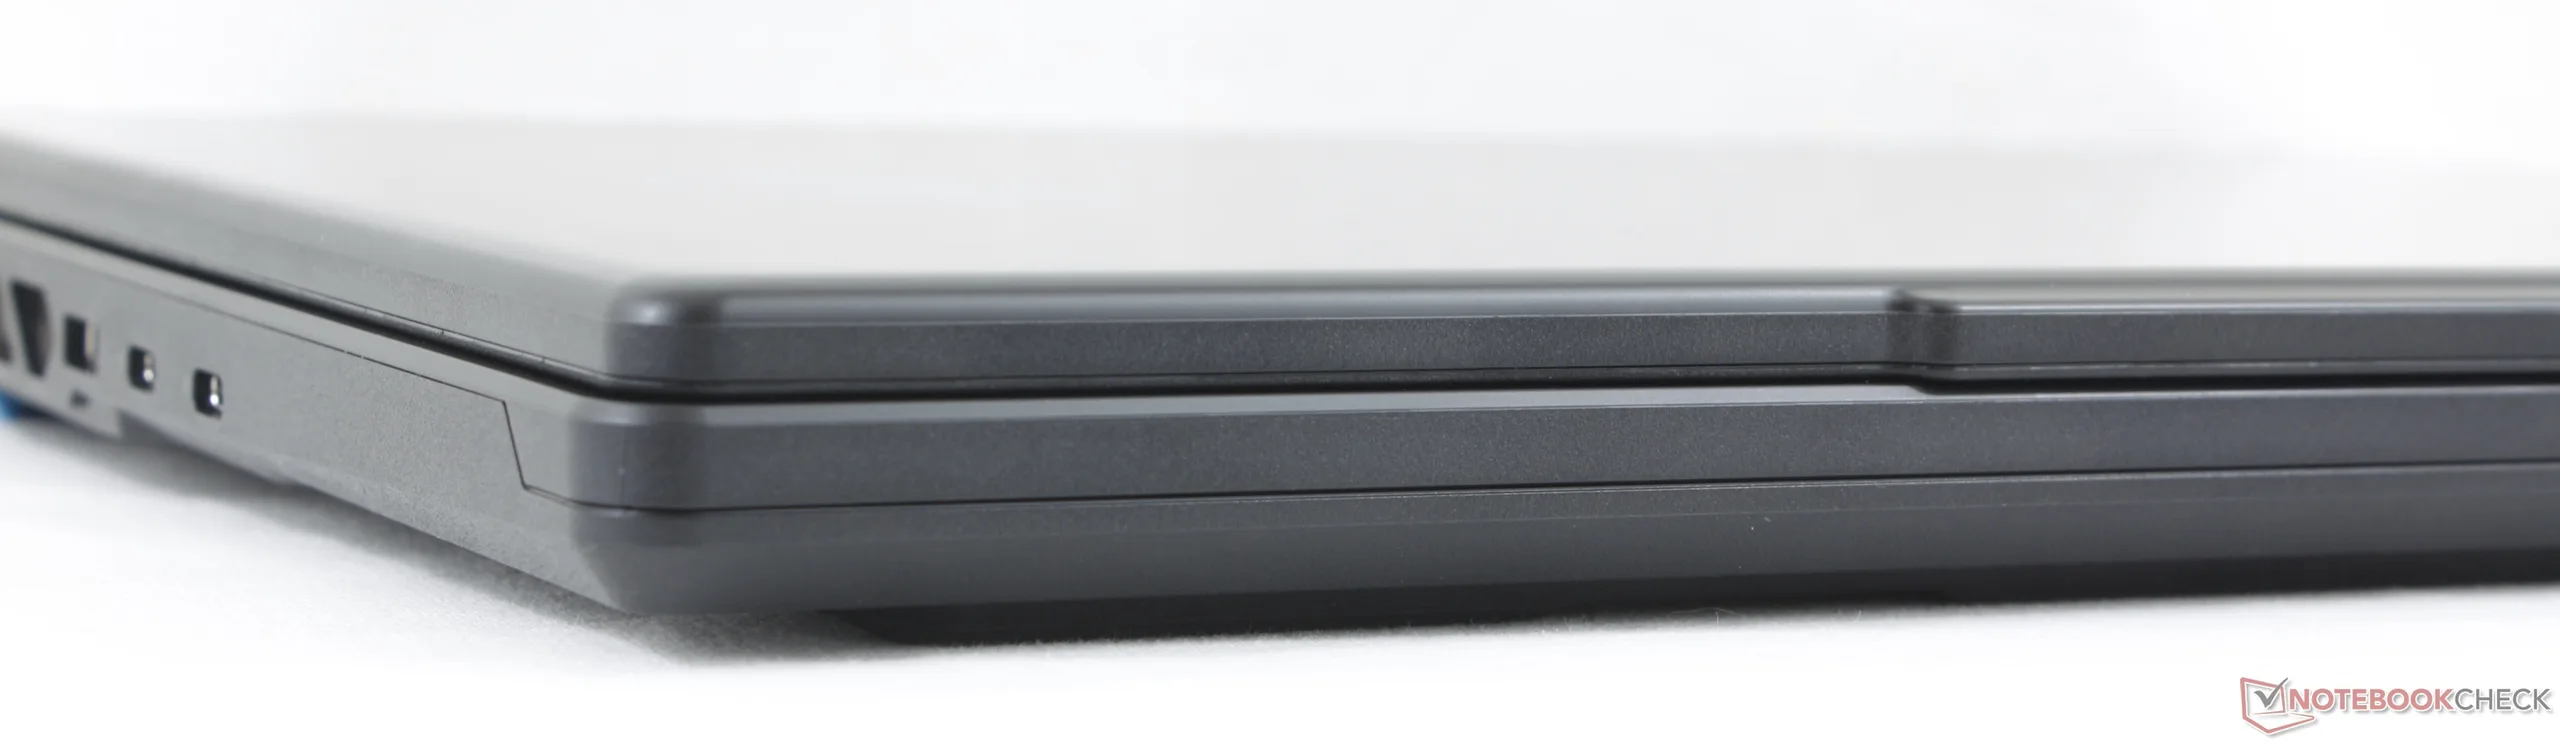
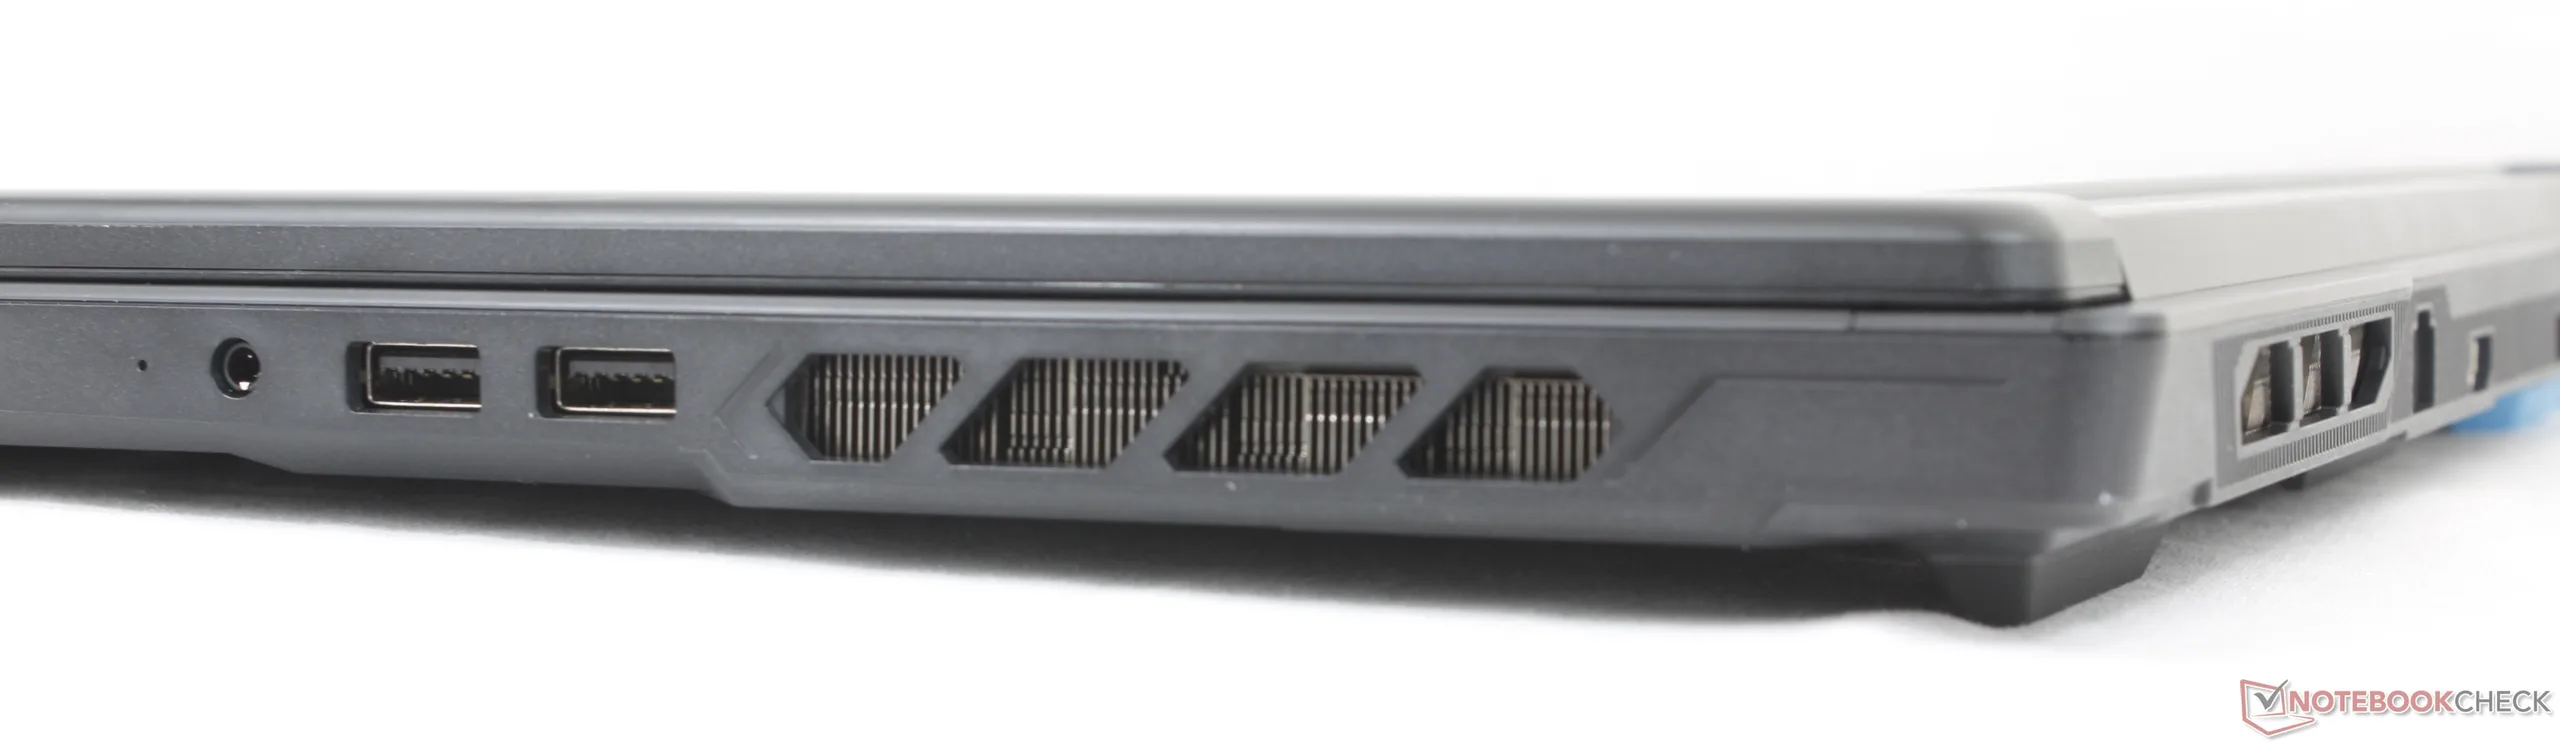
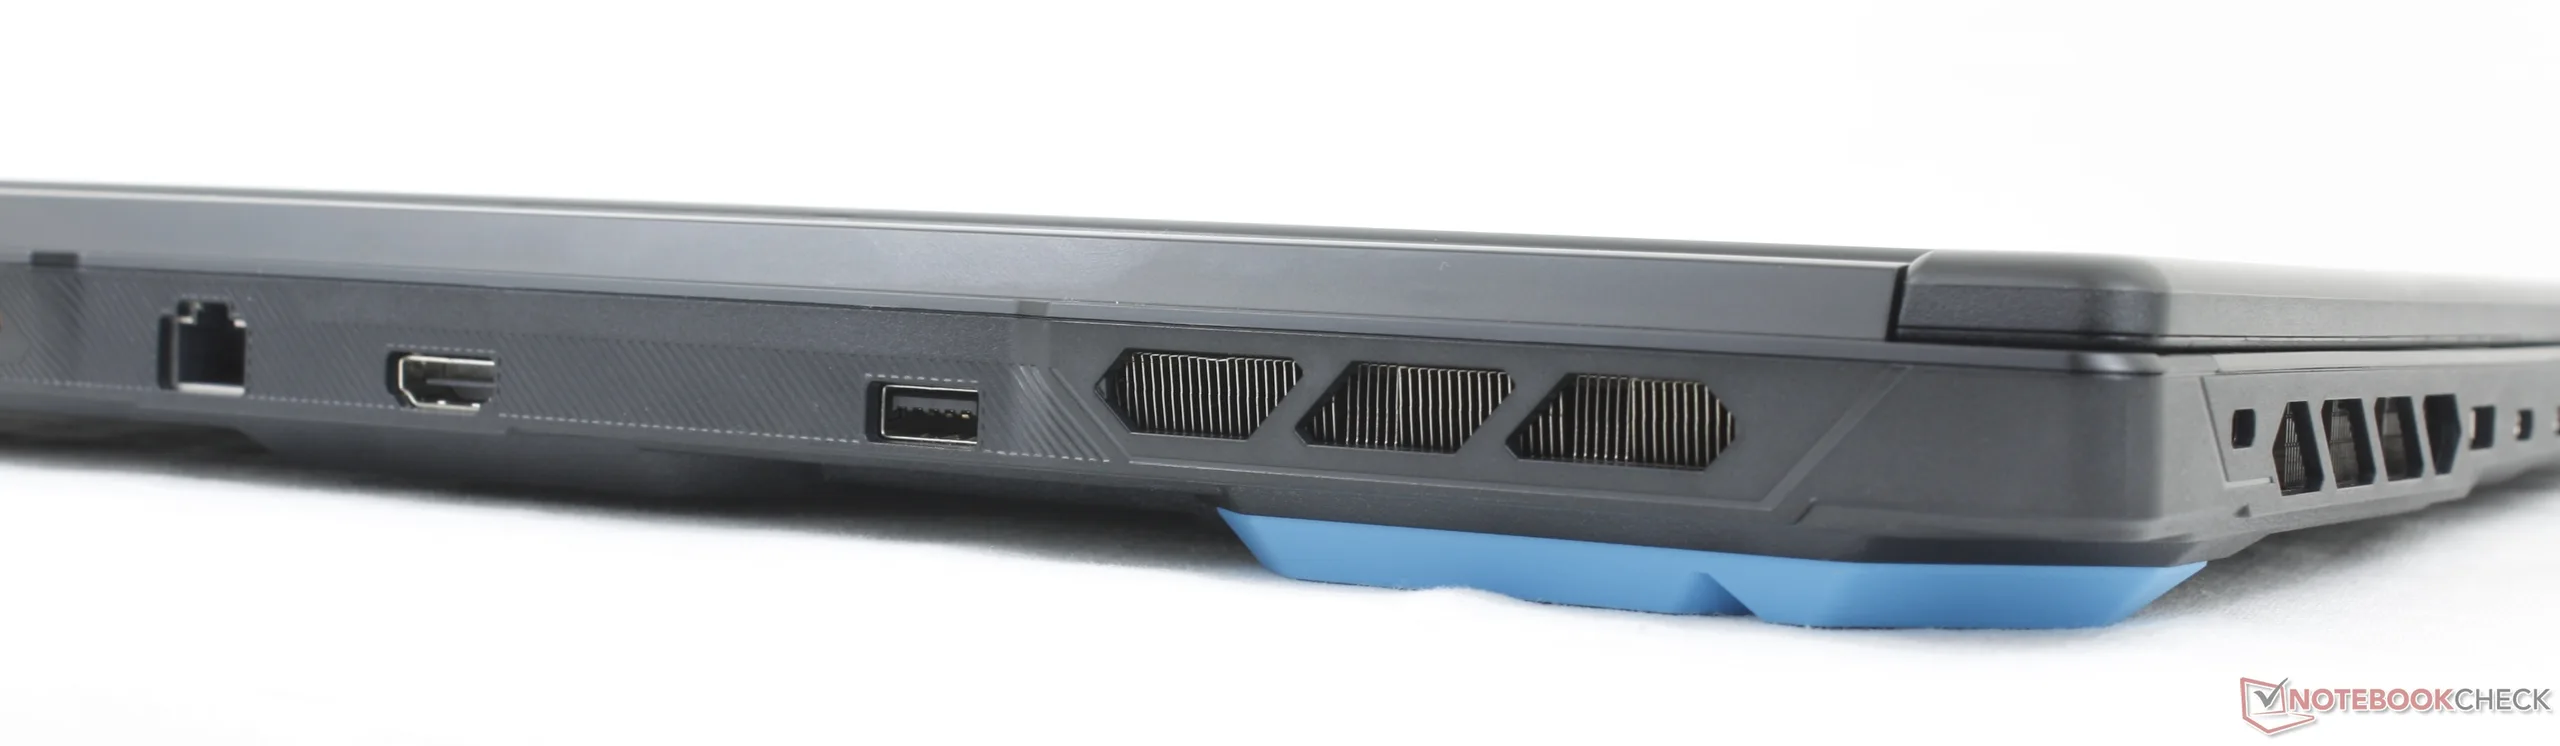
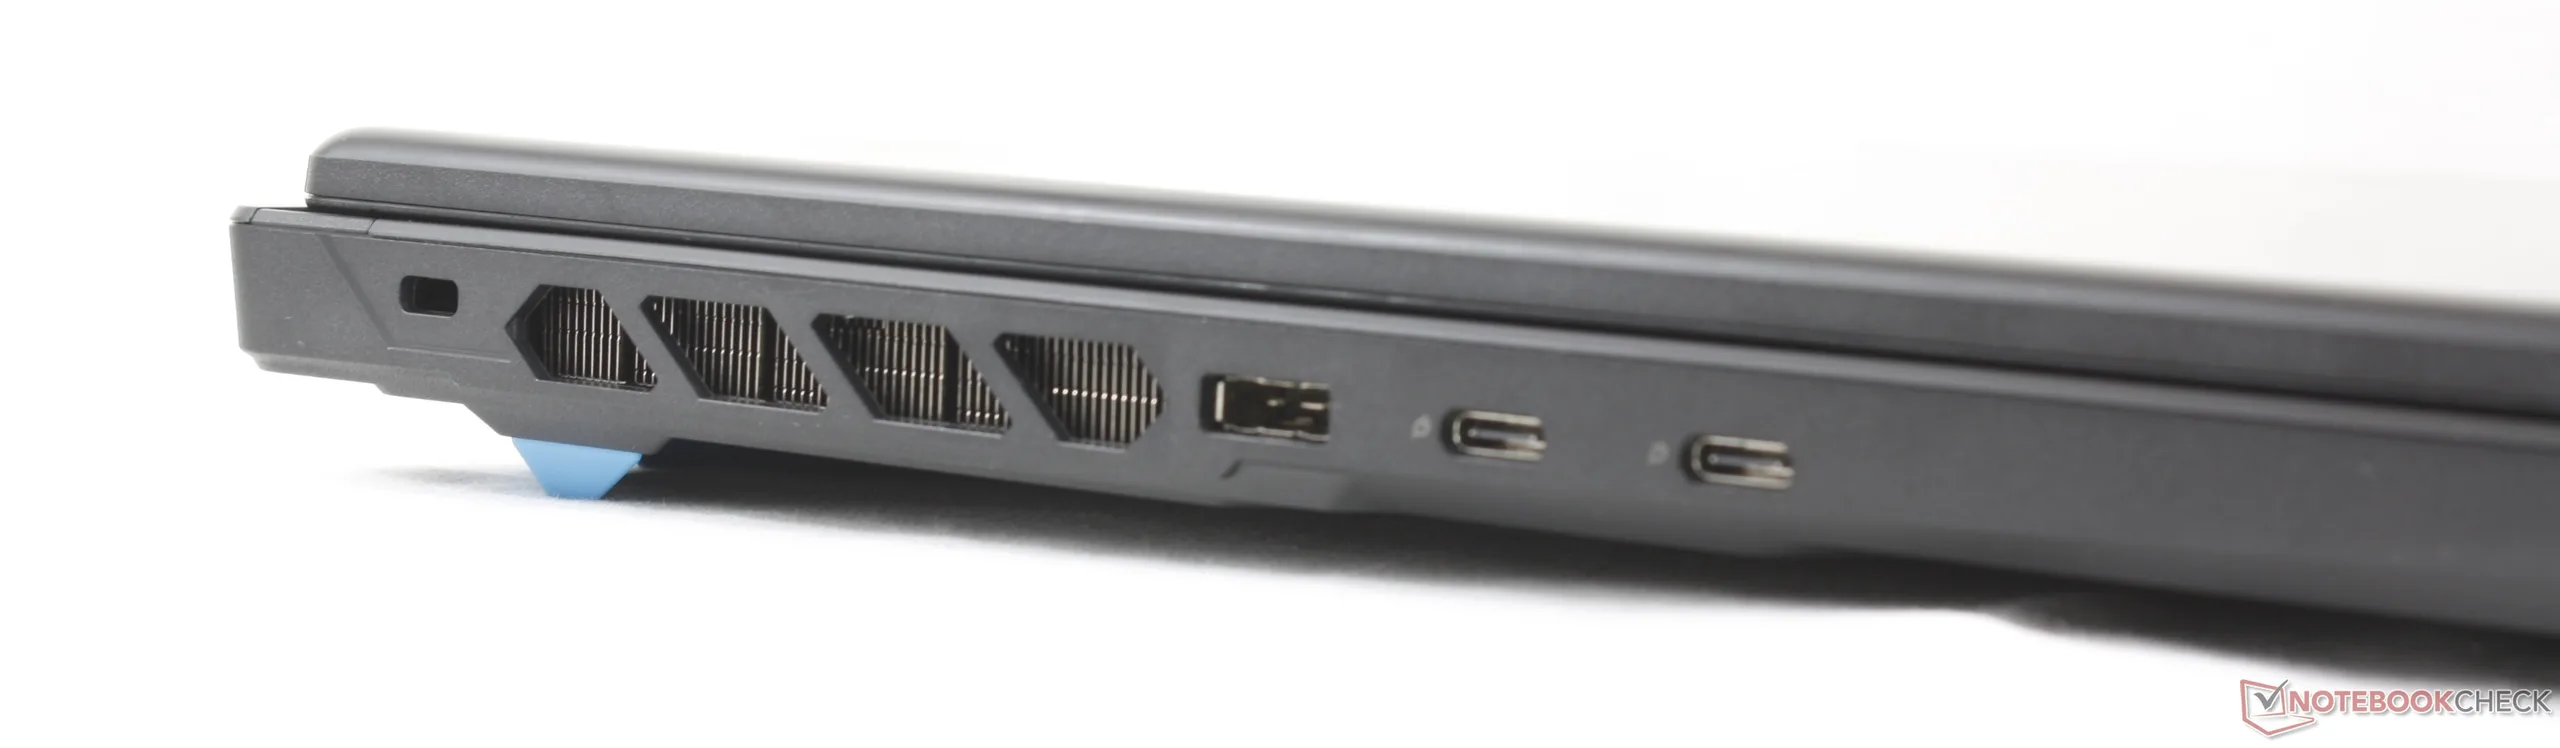
Anschlussausstattung
Kommunikation
Webcam


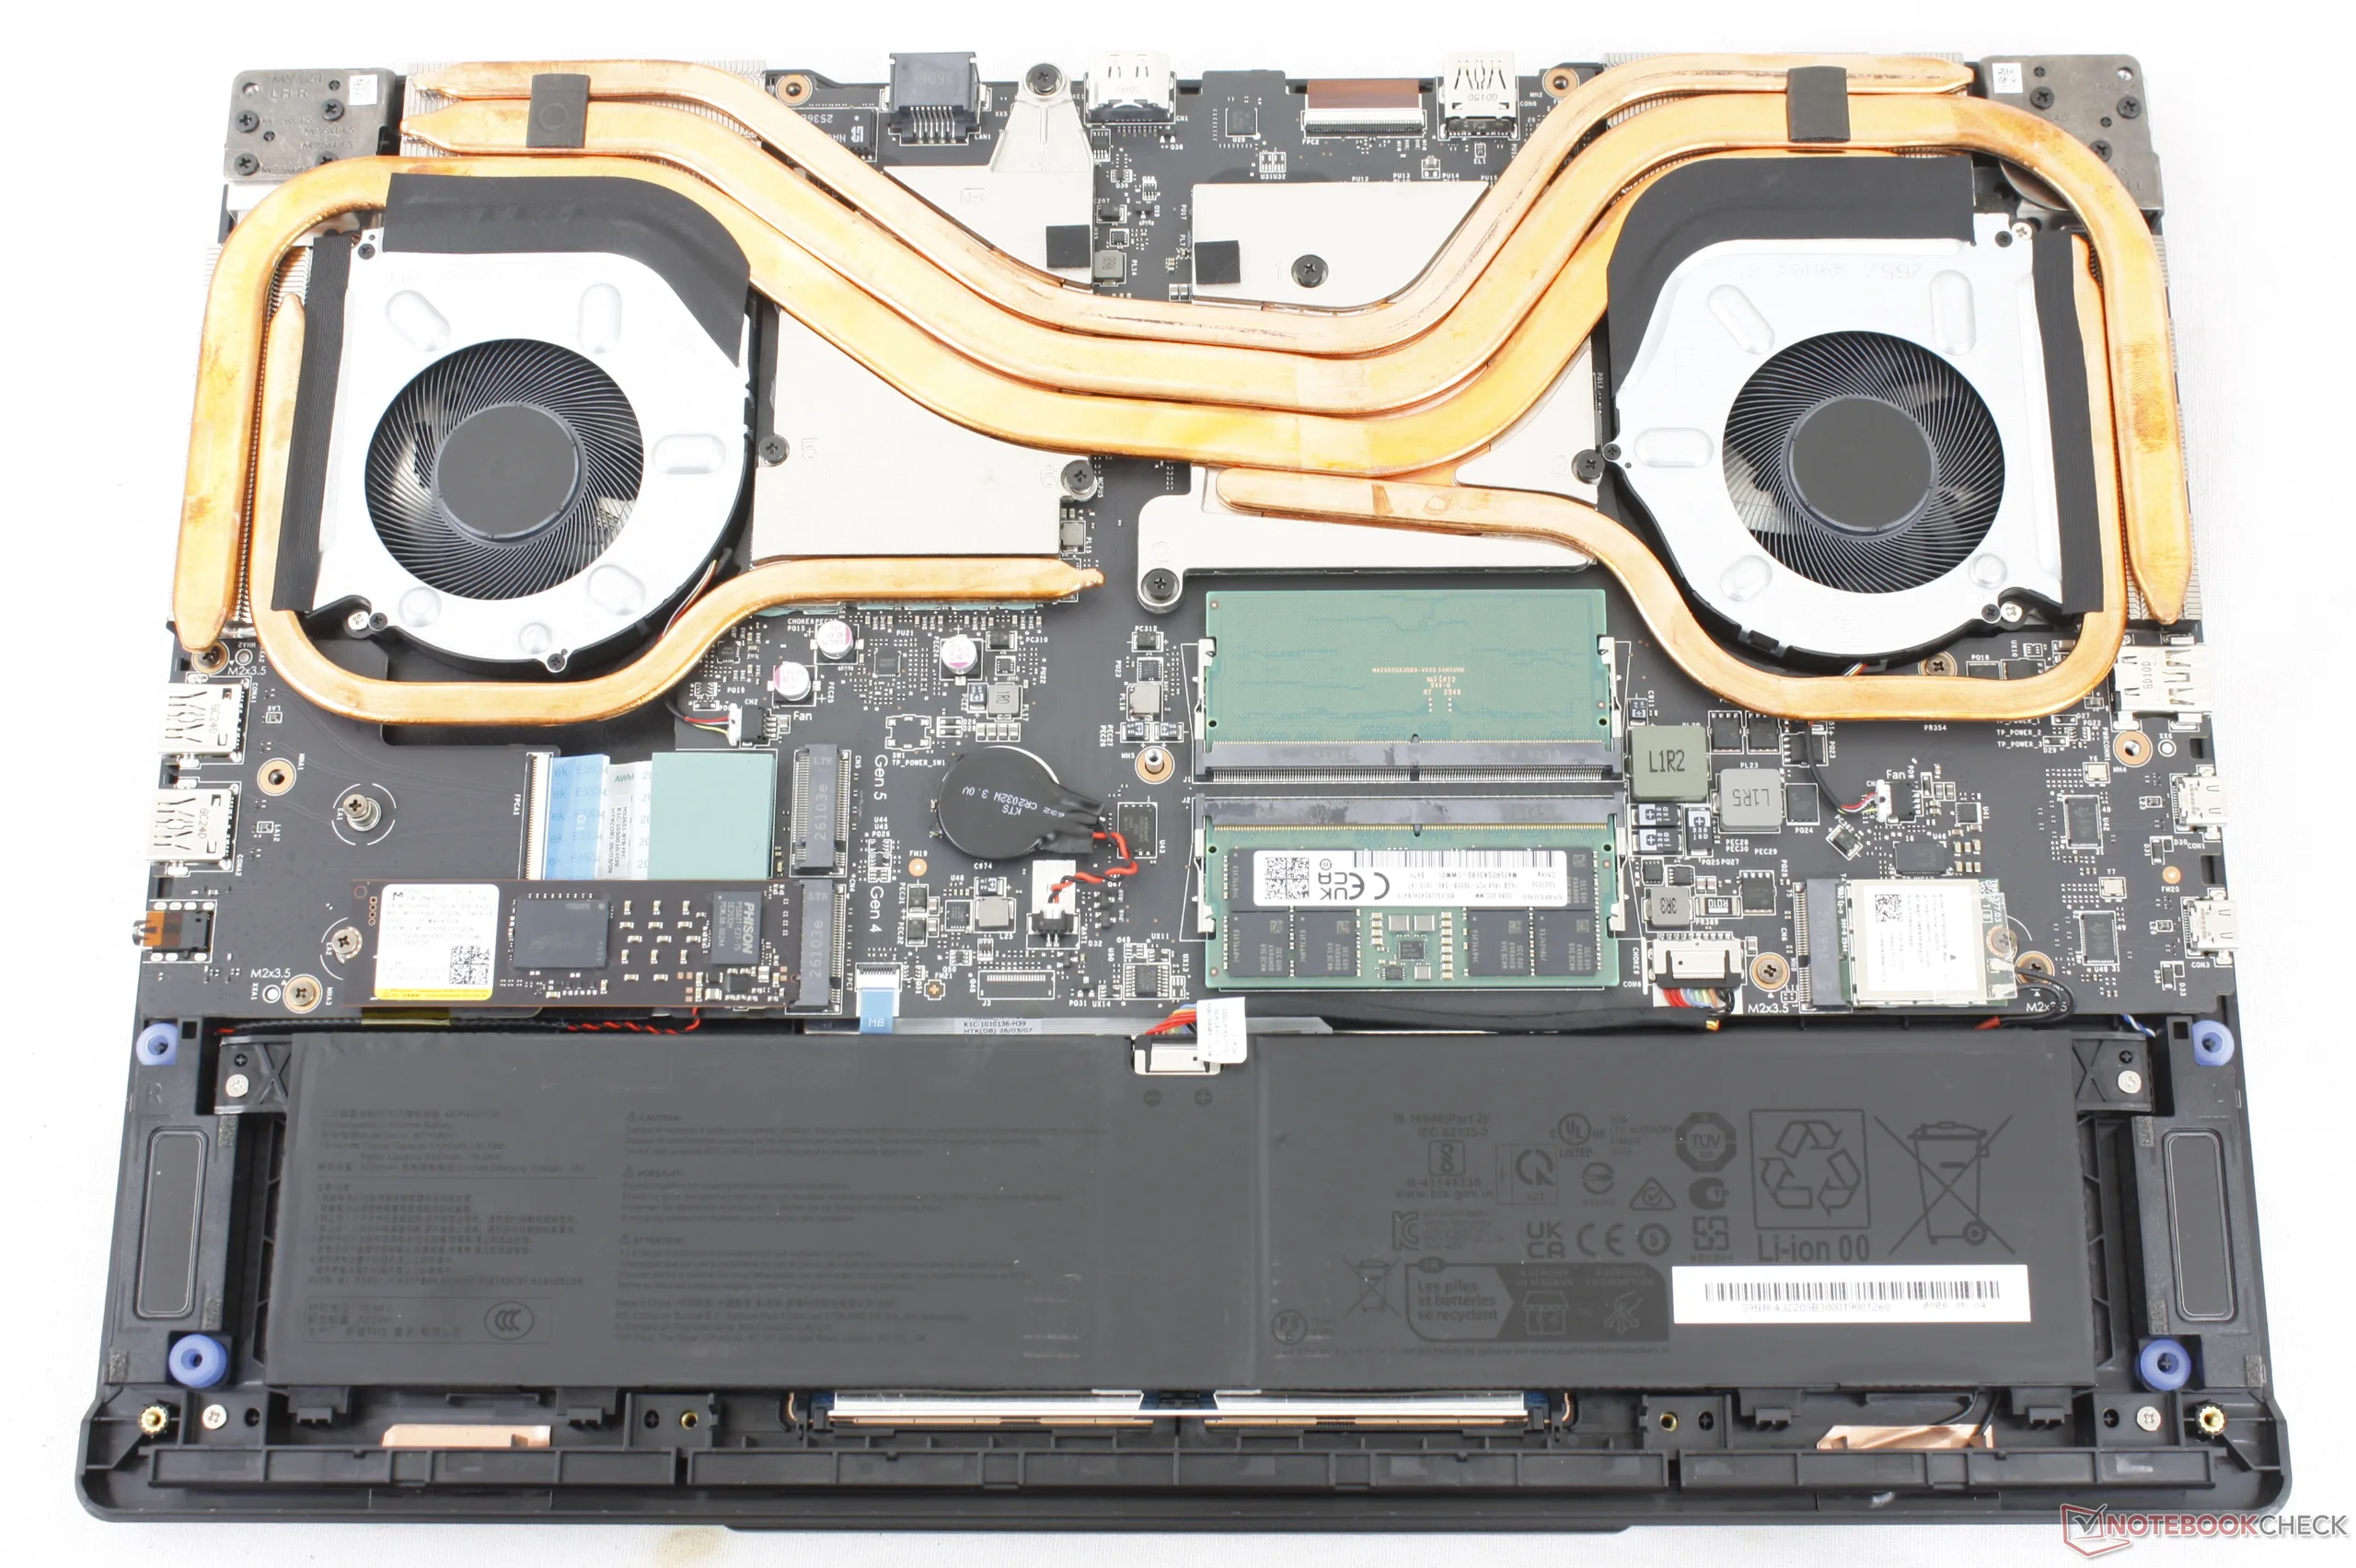
Wartung

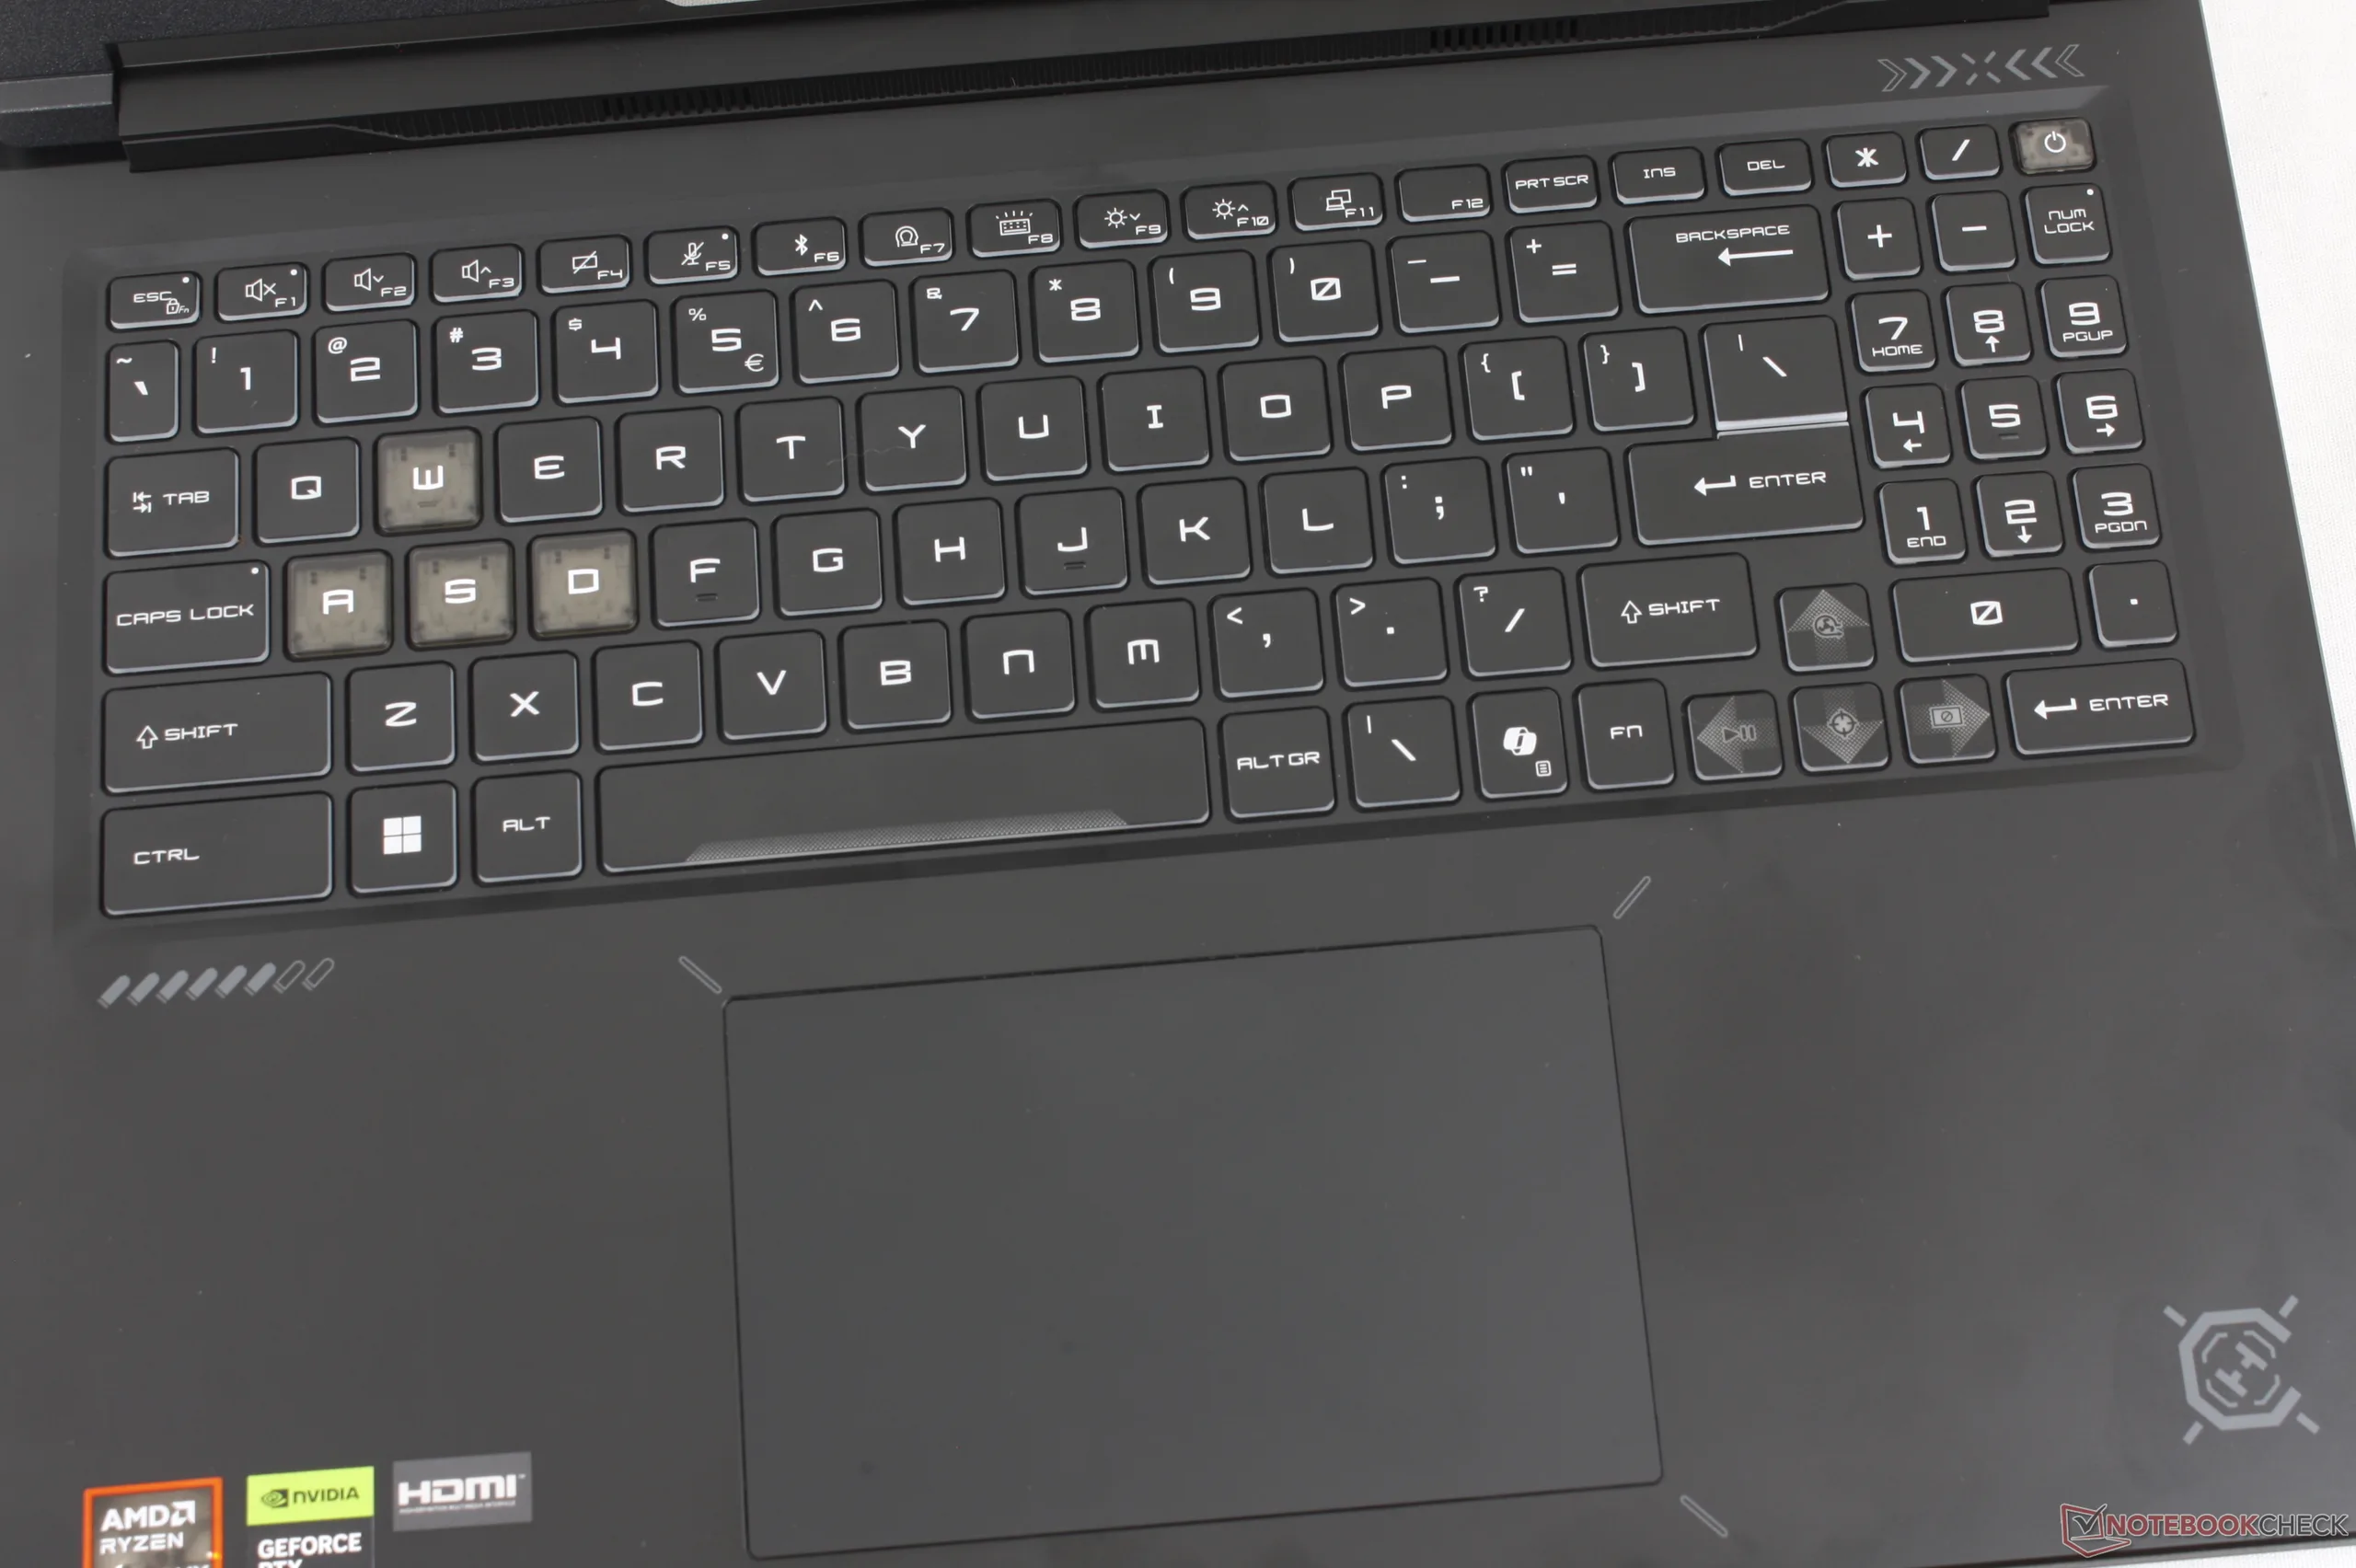
Eingabegeräte
Display
Das Modell verfügt über dasselbe IPS-Panel vom Typ B160QAN02.3 von AU Optronics, das auch beim Intel basierten Crosshair 16 HX AI zum Einsatz kommt.


| |||||||||||||||||||||||||
Ausleuchtung: 89 %
Helligkeit Akku: 512.4 cd/m²
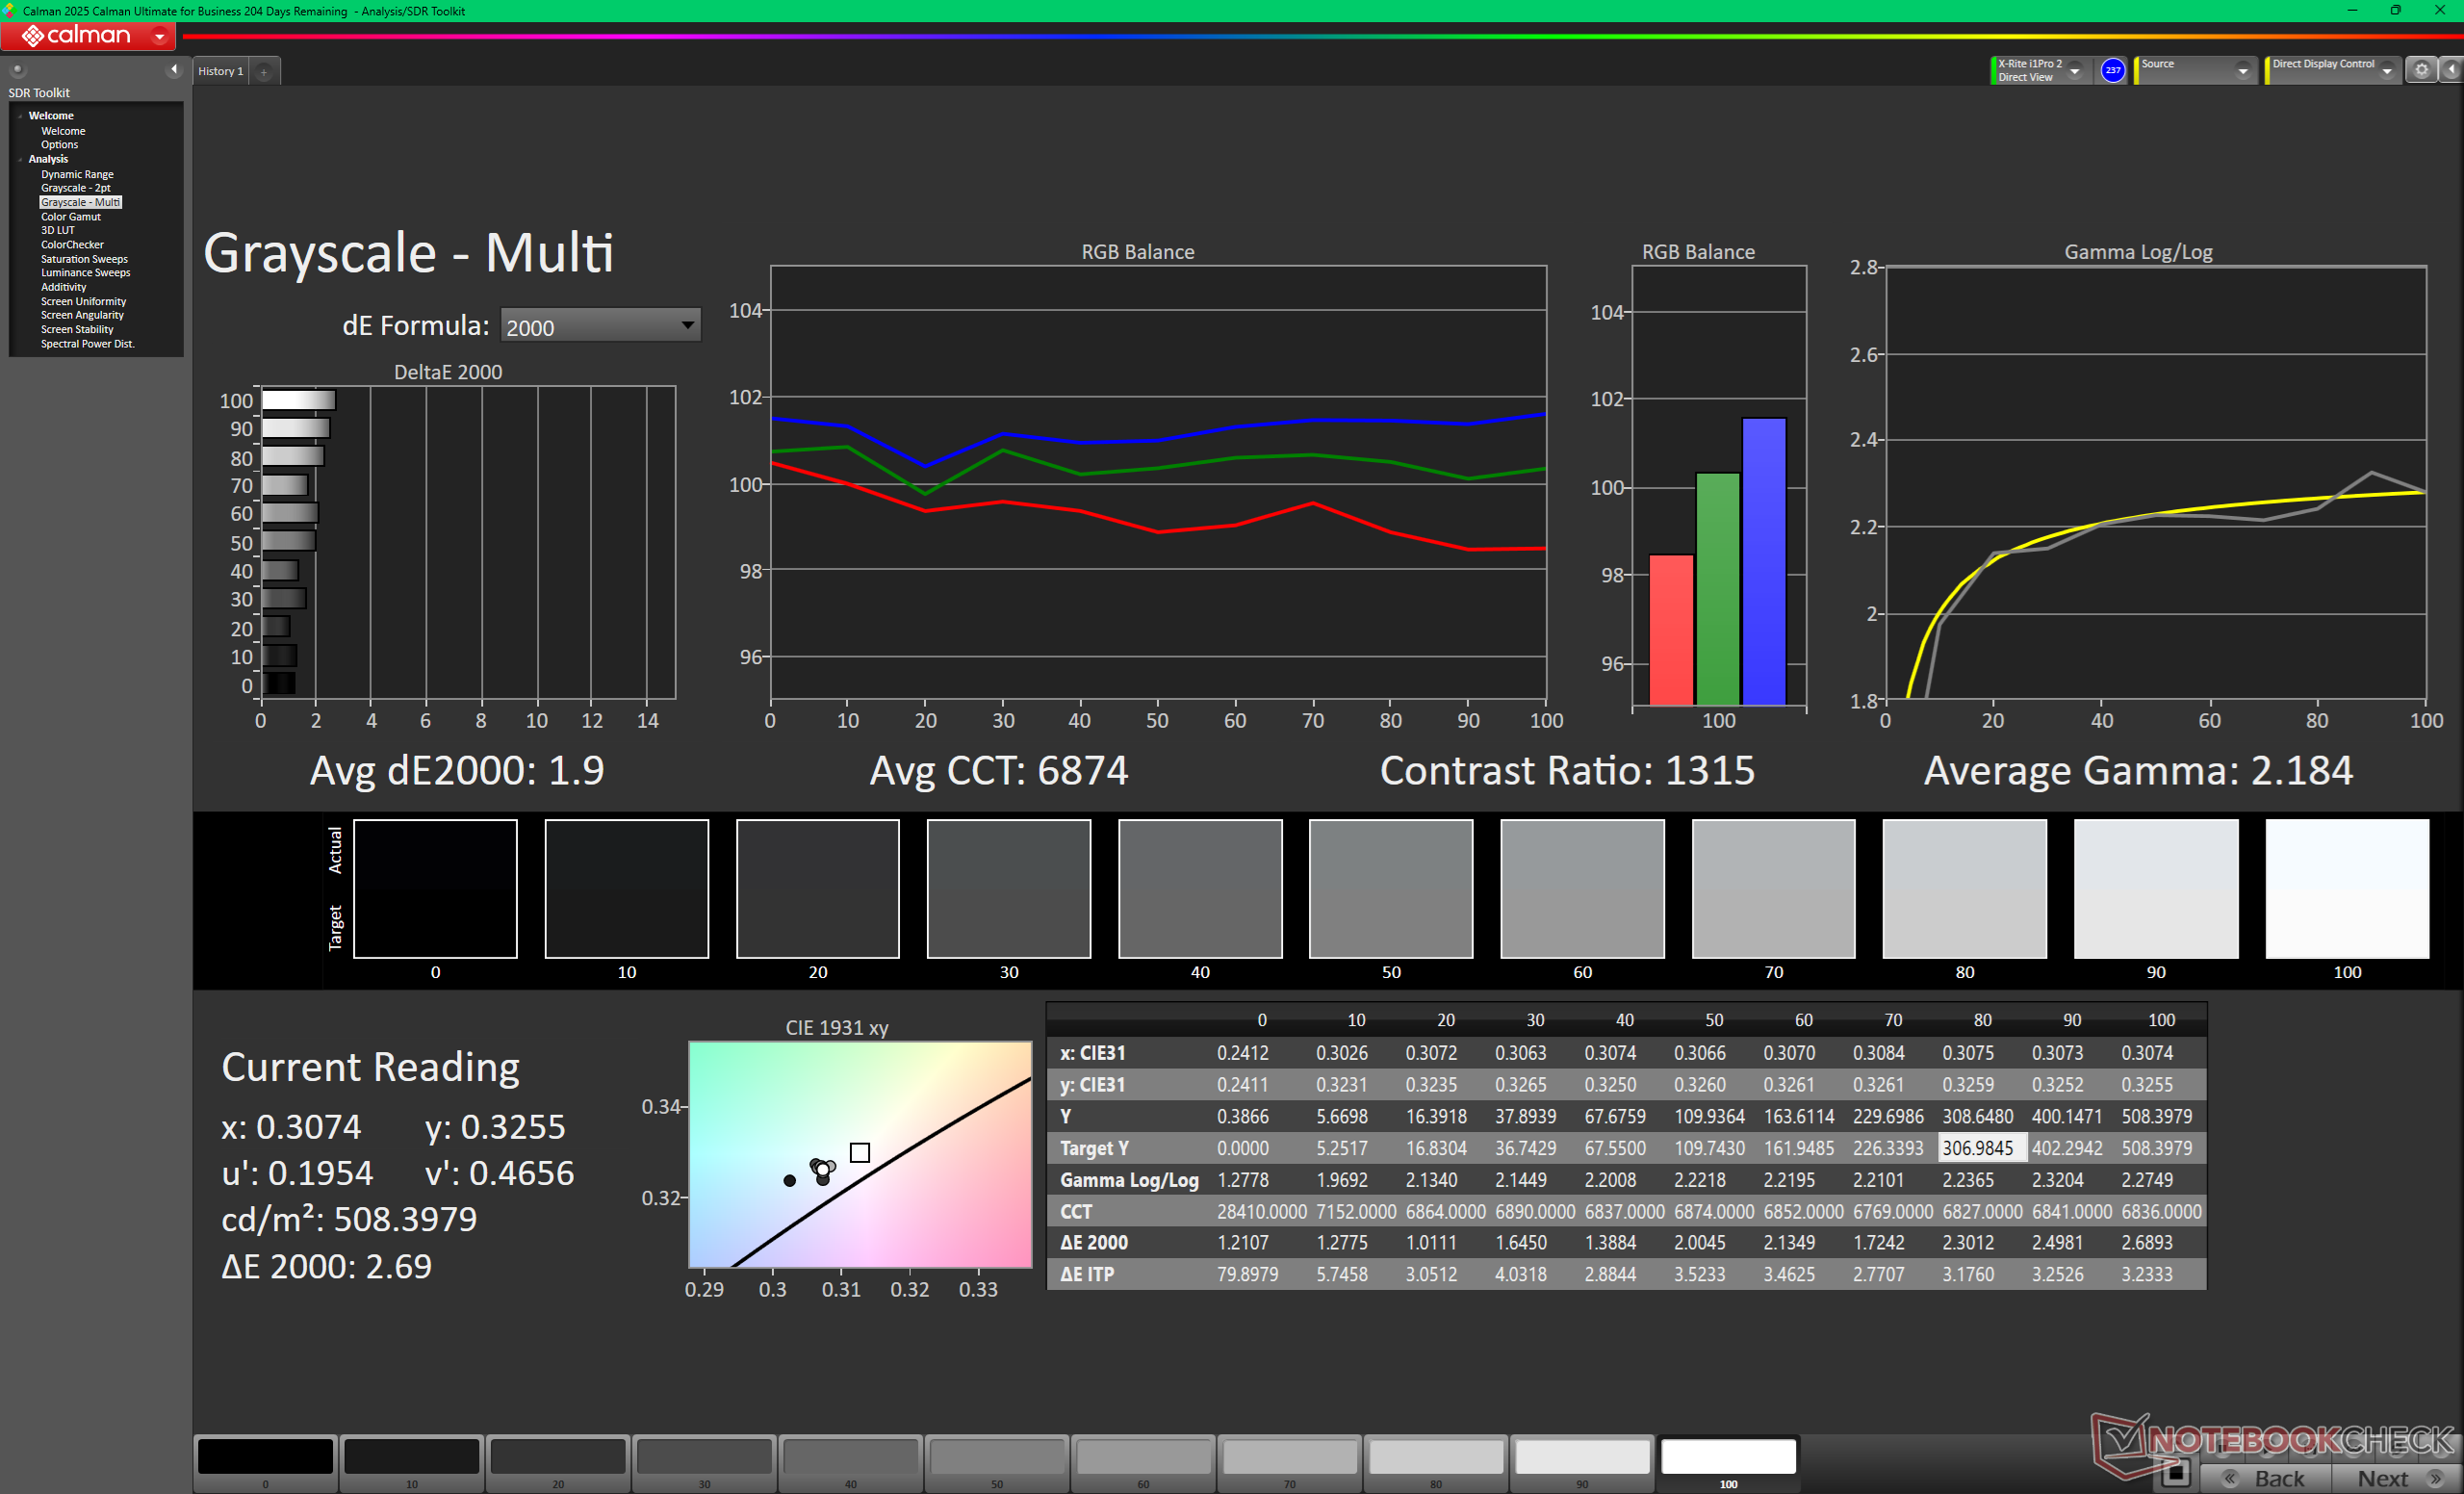
Kontrast: 1314:1 (Schwarzwert: 0.39 cd/m²)
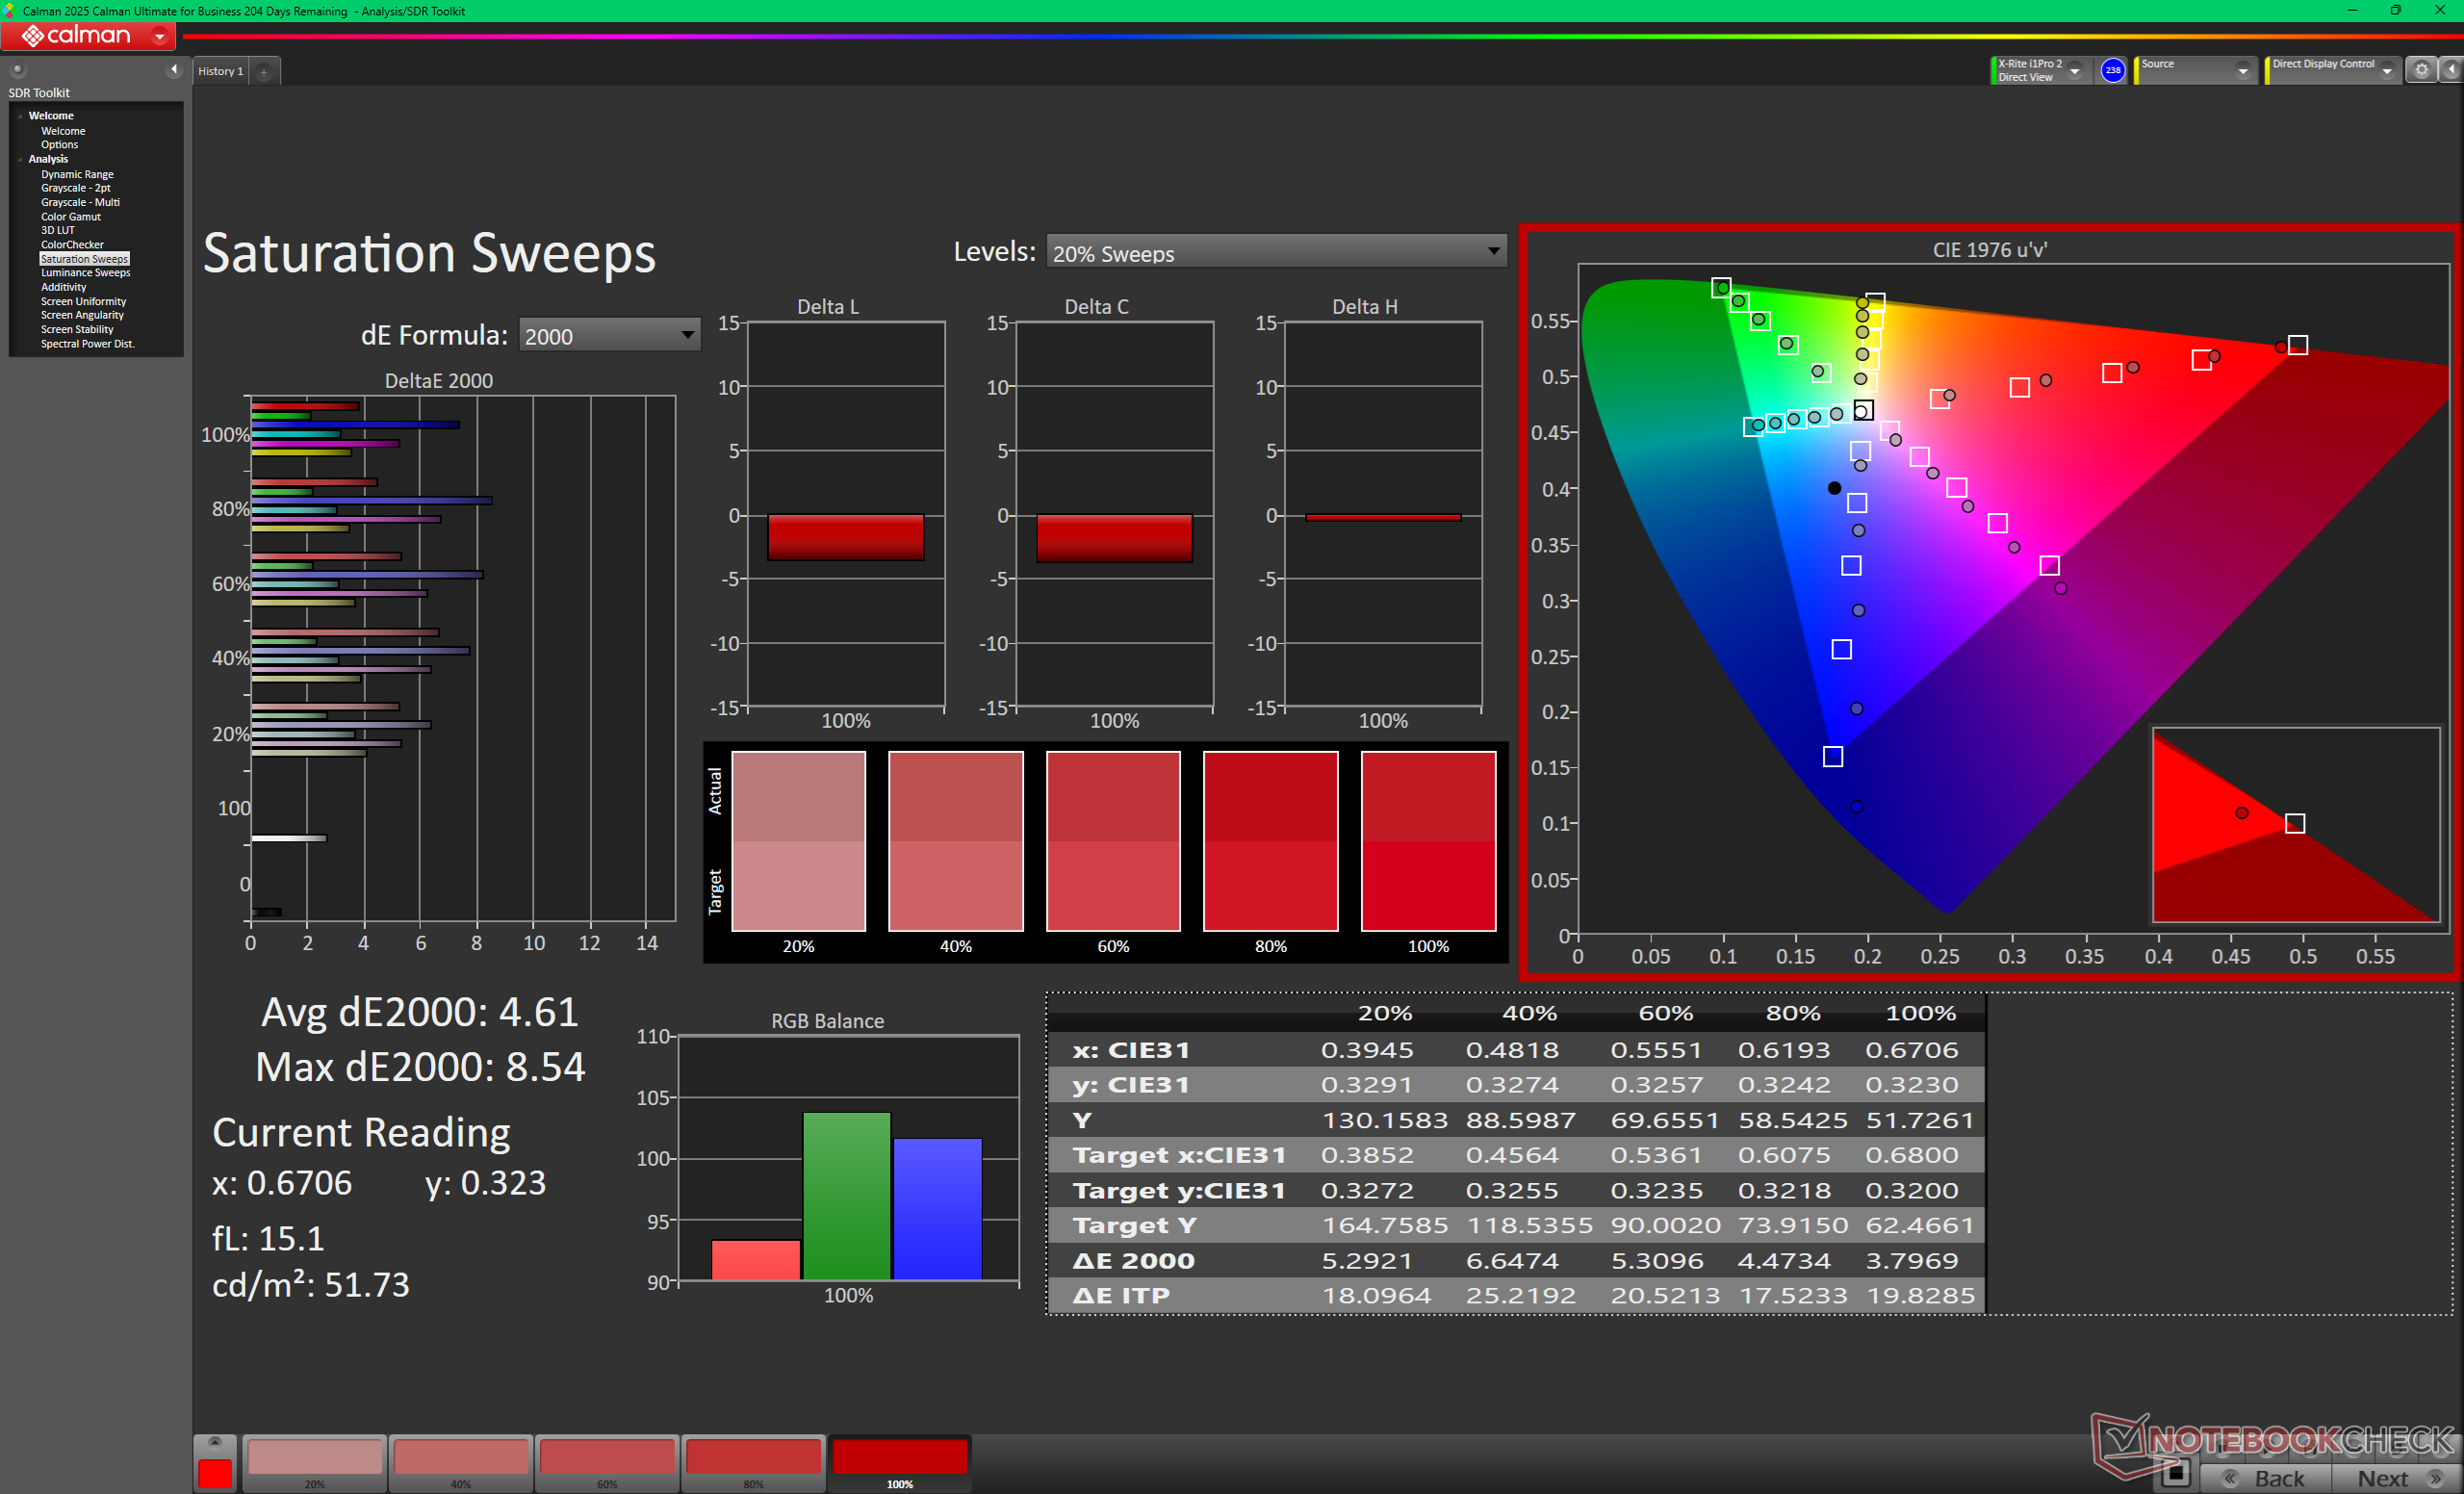
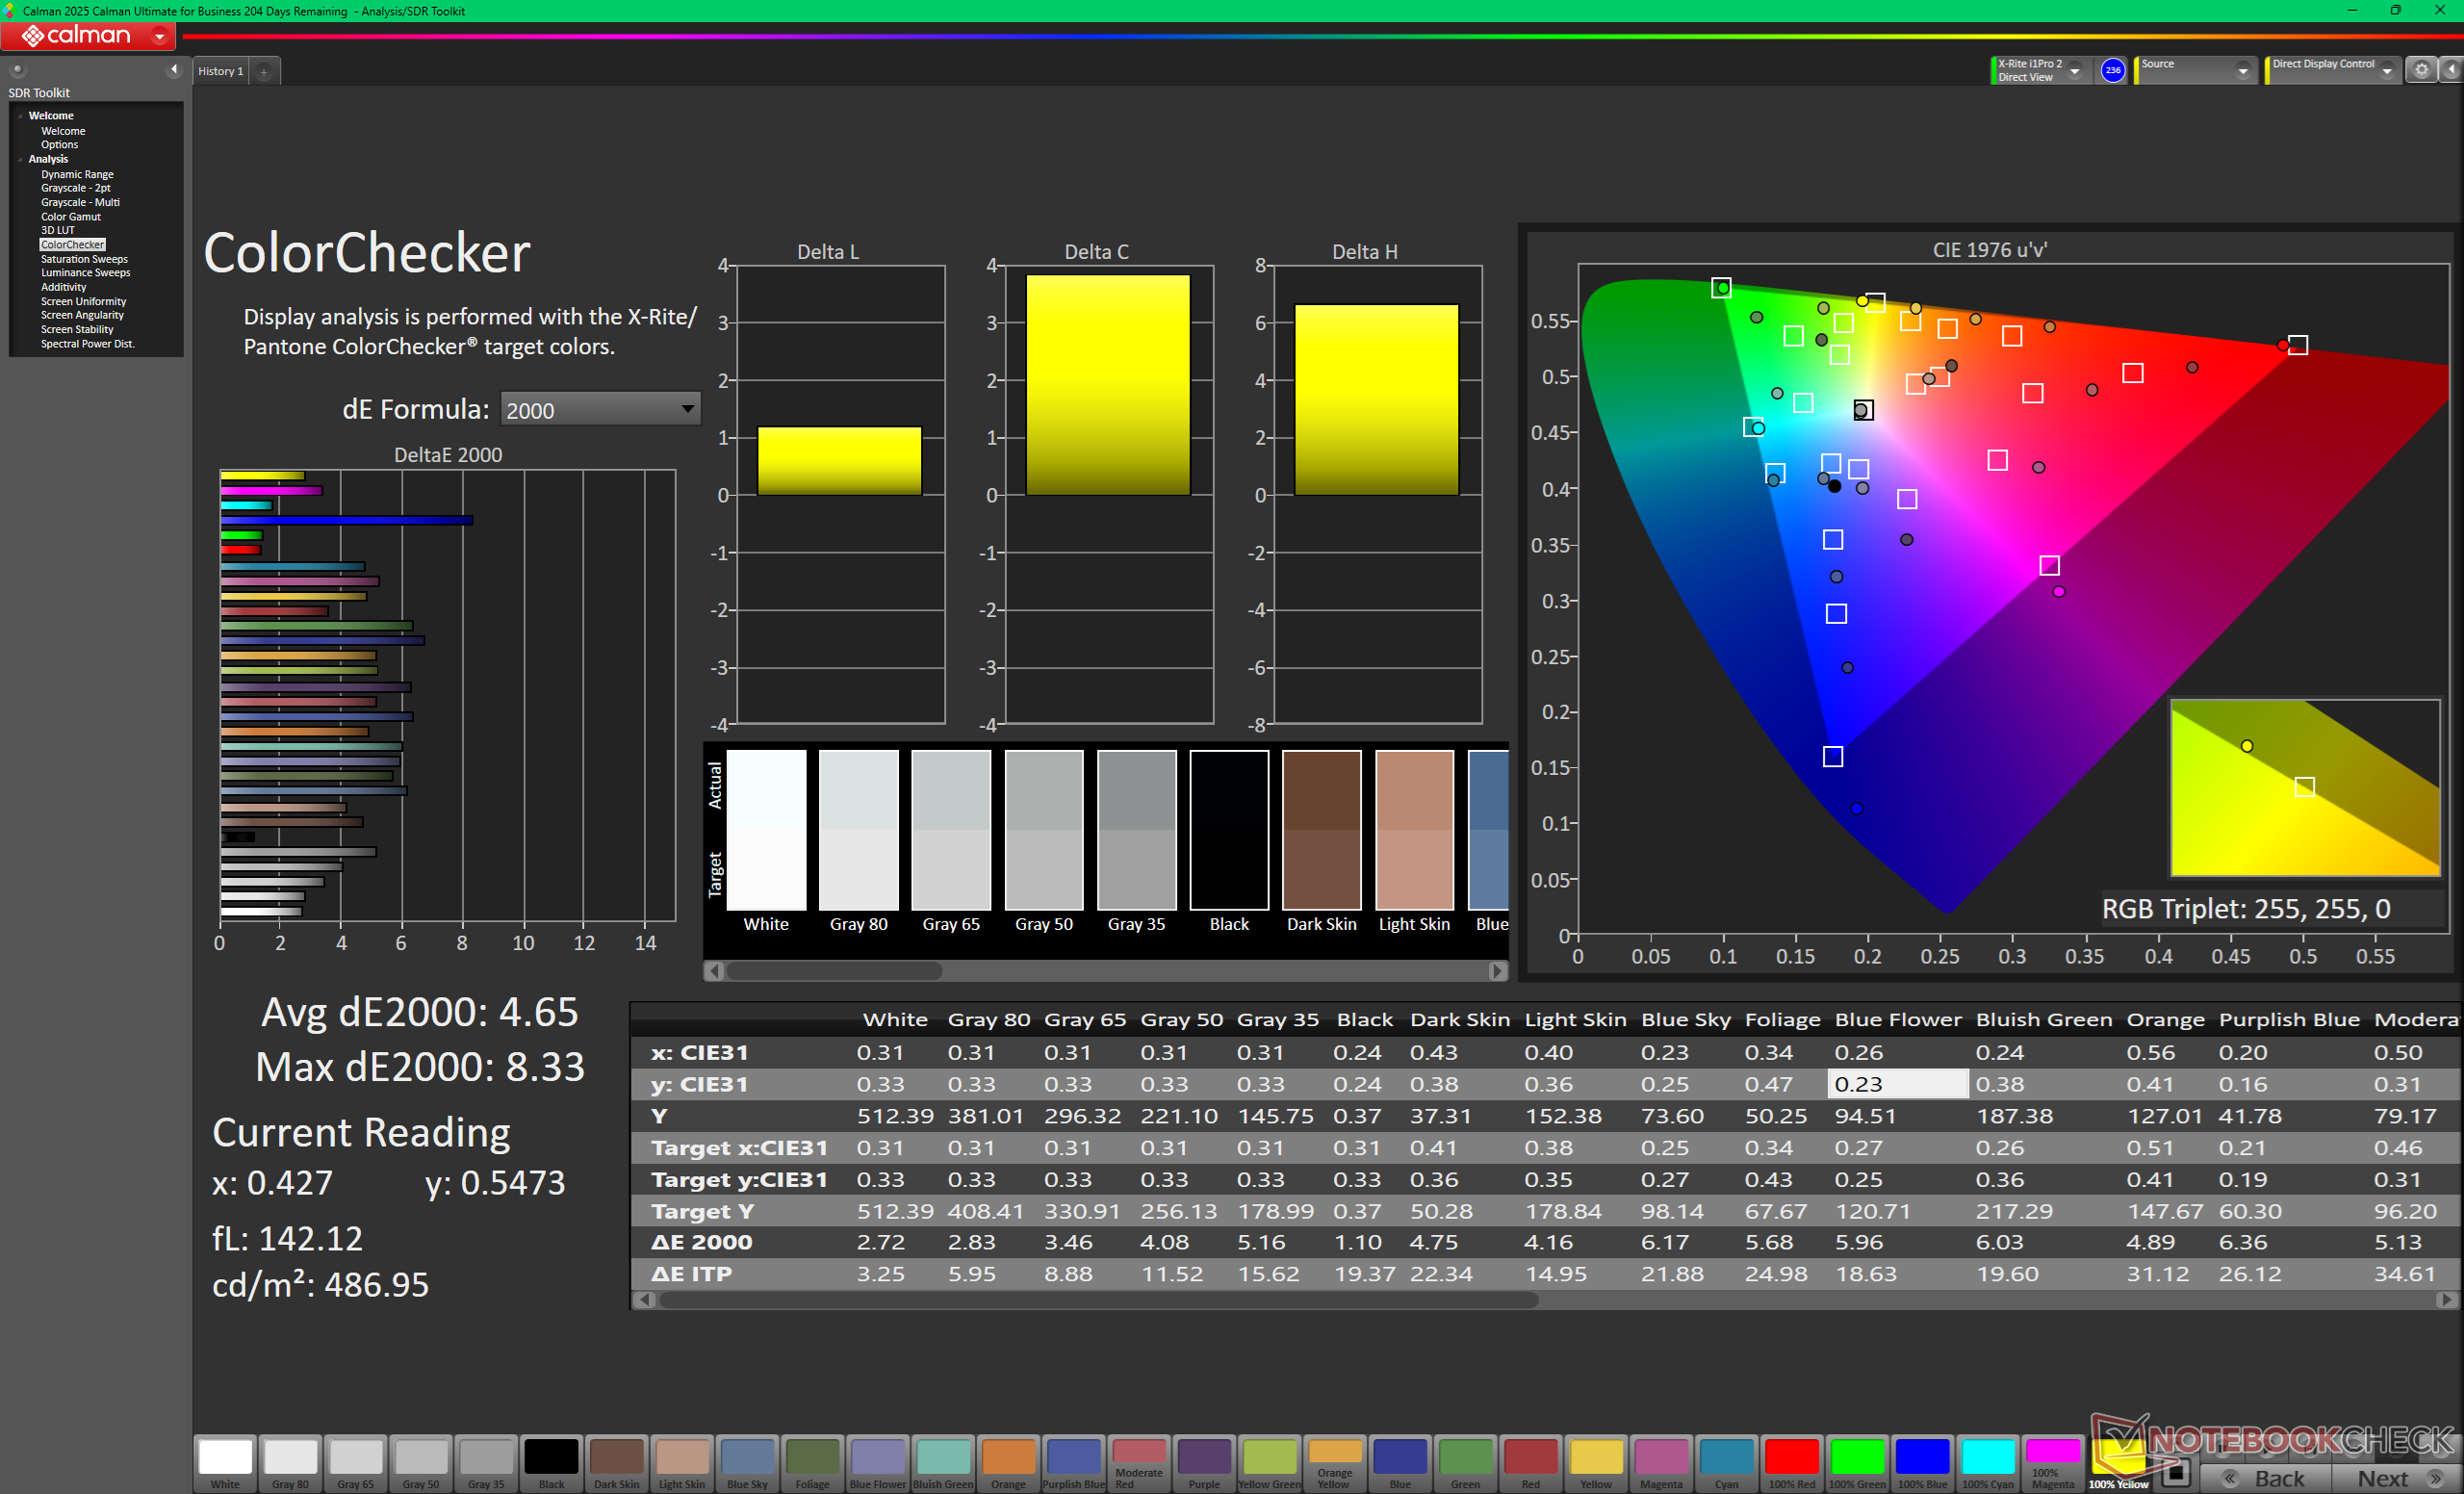
ΔE ColorChecker Calman: 4.65 | ∀{0.5-29.43 Ø4.72}
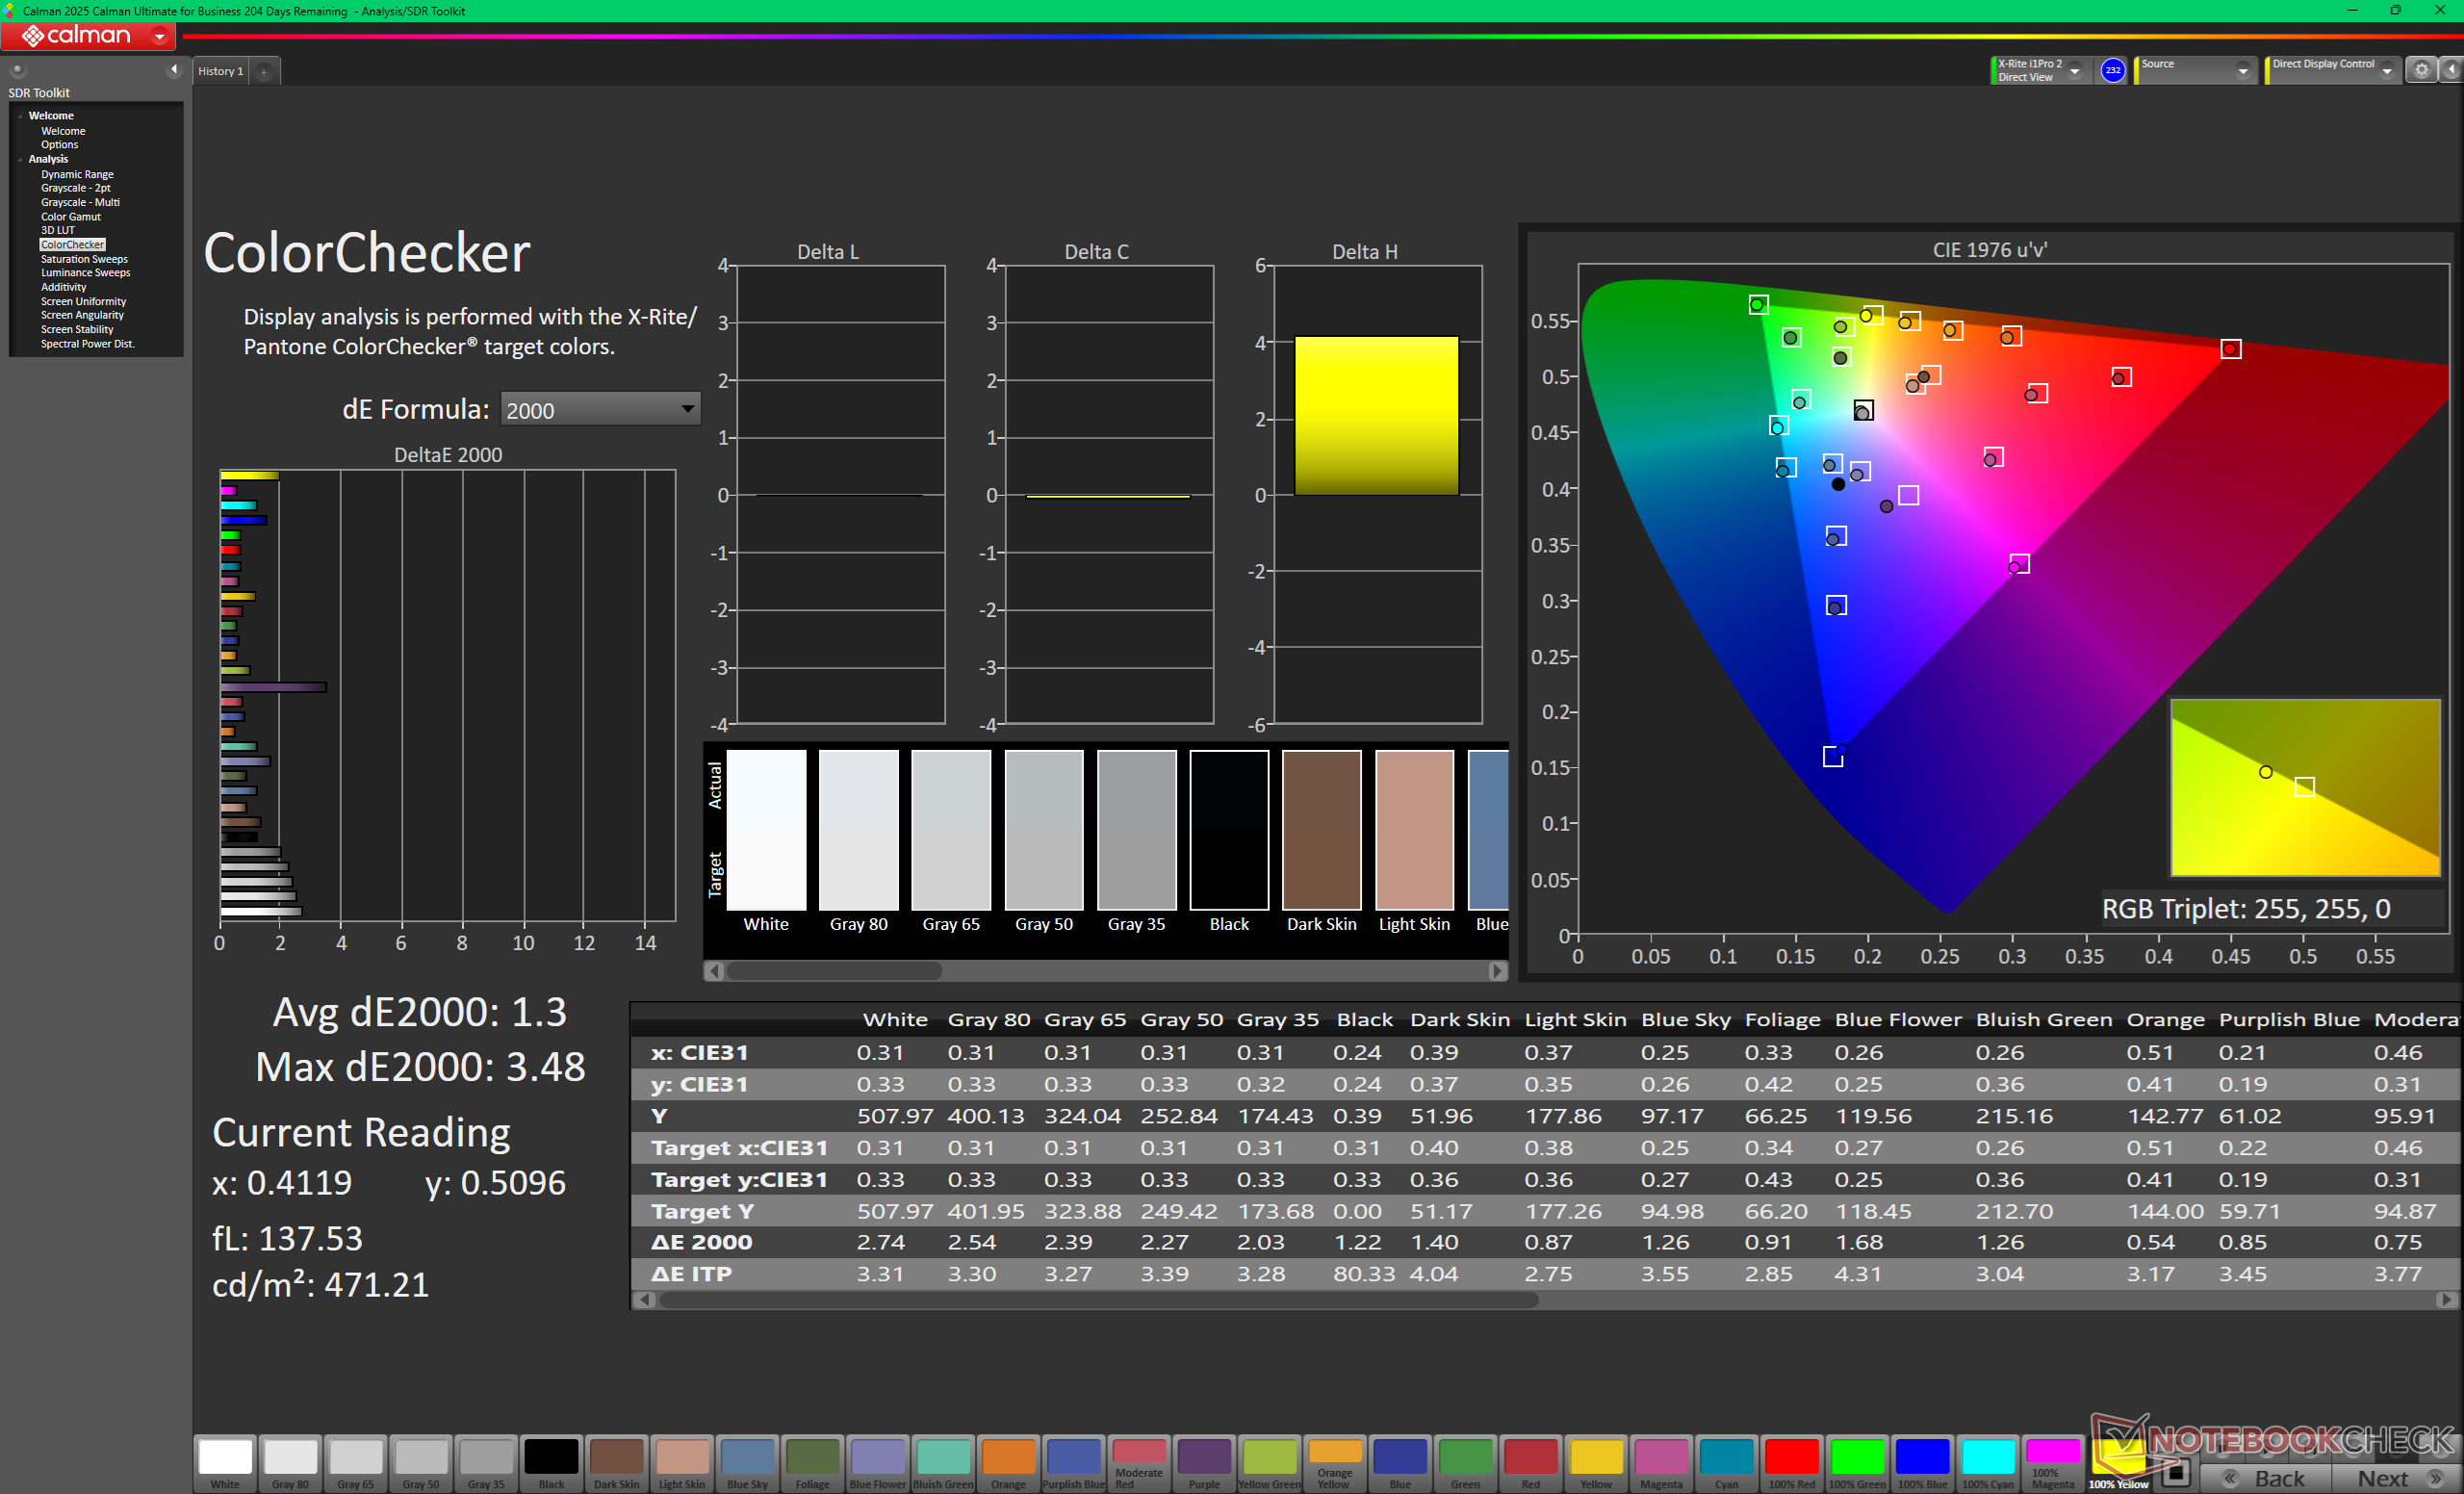
calibrated: 1.3
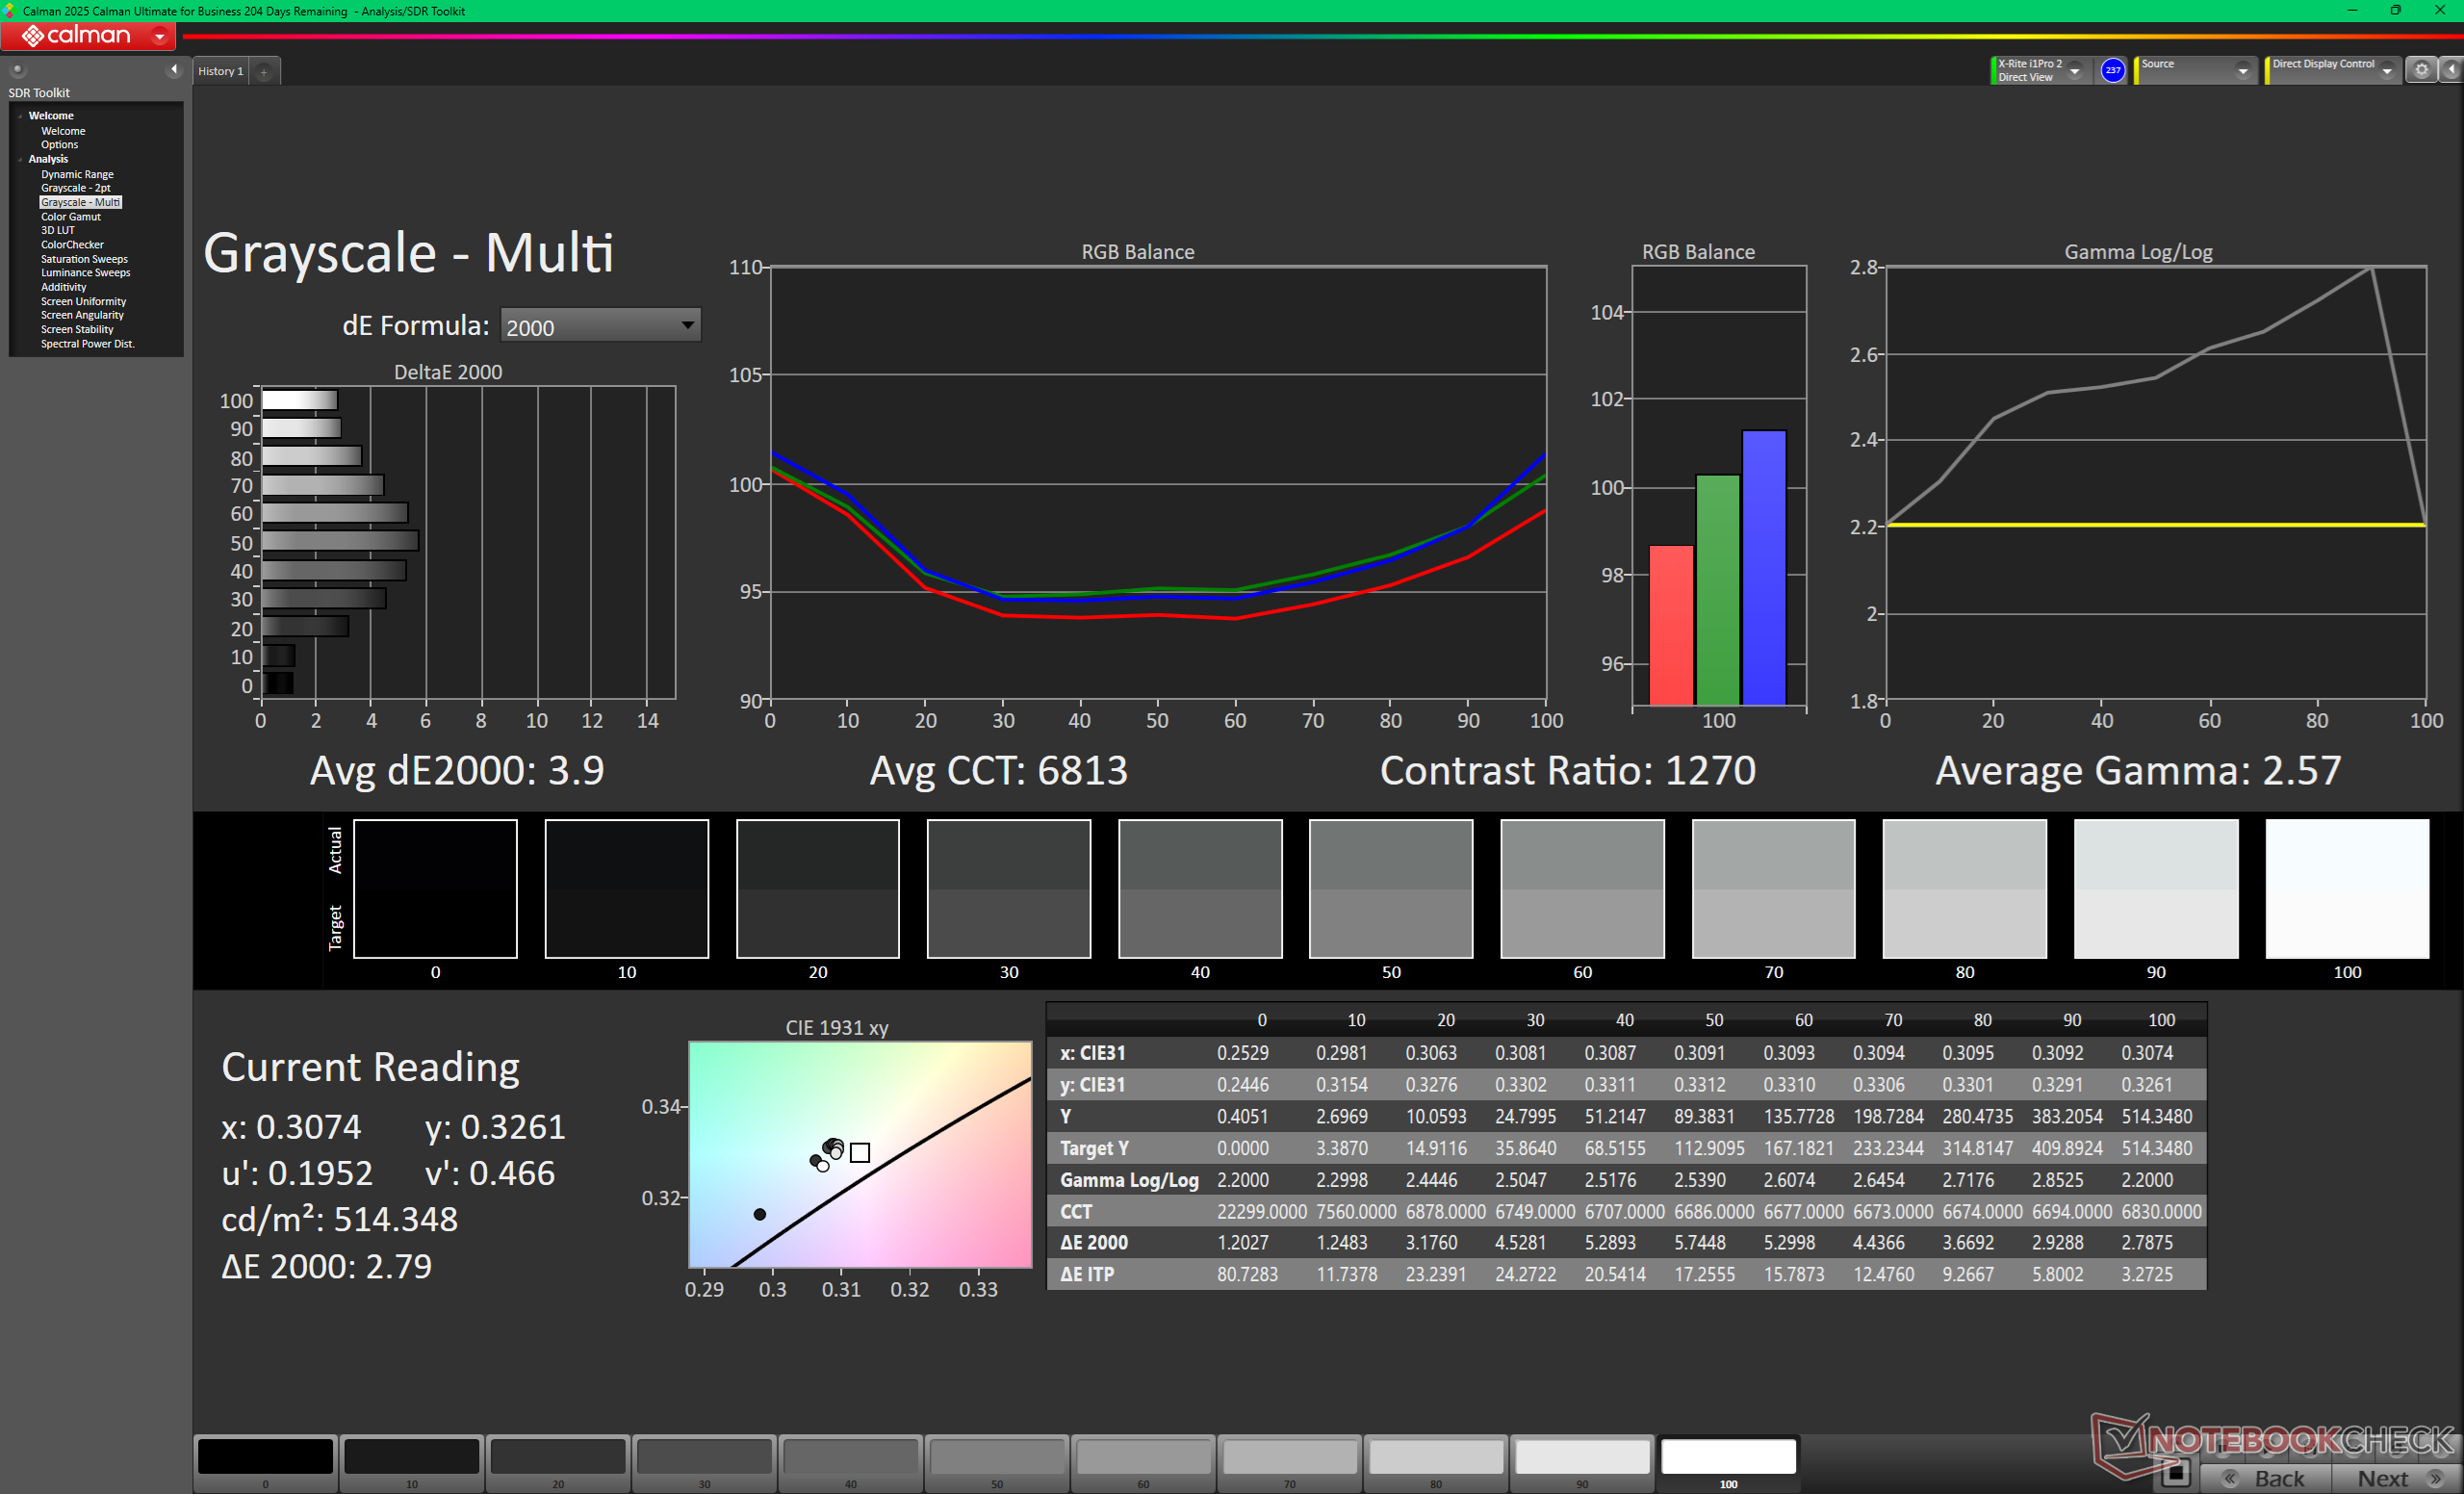
ΔE Greyscale Calman: 3.9 | ∀{0.09-98 Ø4.97}
83.1% AdobeRGB 1998 (Argyll 3D)
99.6% sRGB (Argyll 3D)
94.9% Display P3 (Argyll 3D)
Gamma: 2.57
CCT: 6813 K
| MSI Crosshair A16 HX E8WGK AU Optronics B160QAN02.3, IPS, 2560x1600, 16", 240 Hz | MSI Crosshair 16 HX AI D2XWGKG AUO B160QAN02.3, IPS, 2560x1600, 16", 240 Hz | Alienware 16X Aurora Core Ultra 9 290HX Plus Samsung 160HU05, OLED, 2560x1600, 16", 240 Hz | Lenovo Legion 7 16 AGP11 ATNA60HU02-0, OLED, 2560x1600, 16", 240 Hz | Gigabyte Gaming A16 Pro GA6DH (Core 7 240H, RTX 5070 Ti) BOE0D86 (NS160QDM-NY3), IPS, 2560x1600, 16", 165 Hz | Acer Predator Helios Neo 16S AI PHN16S-71-94L9 Samsung ATNA60DL03-0, OLED, 2560x1600, 16", 240 Hz | |
|---|---|---|---|---|---|---|
| Display | 1% | 6% | 5% | -13% | 7% | |
| Display P3 Coverage (%) | 94.9 | 95.5 1% | 99.6 5% | 99.2 5% | 72.5 -24% | 99.9 5% |
| sRGB Coverage (%) | 99.6 | 99.7 0% | 100 0% | 100 0% | 99.3 0% | 100 0% |
| AdobeRGB 1998 Coverage (%) | 83.1 | 83.9 1% | 93.9 13% | 90.2 9% | 70.4 -15% | 96.5 16% |
| Response Times | 19% | 94% | 82% | -7% | 96% | |
| Response Time Grey 50% / Grey 80% * (ms) | 4.2 ? | 3.59 ? 15% | 0.29 ? 93% | 1.41 ? 66% | 6.8 ? -62% | 0.2 ? 95% |
| Response Time Black / White * (ms) | 9.2 ? | 7.09 ? 23% | 0.45 ? 95% | 0.25 ? 97% | 4.8 ? 48% | 0.25 ? 97% |
| PWM Frequency (Hz) | 1439.8 ? | 1440 ? | 960 | |||
| PWM Amplitude * (%) | 29 | 44 | 50 | |||
| Bildschirm | -24% | 15% | 242% | 18% | 97% | |
| Helligkeit Bildmitte (cd/m²) | 512.4 | 472 -8% | 380.5 -26% | 499 -3% | 517 1% | 390 -24% |
| Brightness (cd/m²) | 476 | 438 -8% | 384 -19% | 502 5% | 490 3% | 394 -17% |
| Brightness Distribution (%) | 89 | 88 -1% | 98 10% | 98 10% | 92 3% | 98 10% |
| Schwarzwert * (cd/m²) | 0.39 | 0.4 -3% | 0.02 95% | 0.39 -0% | 0.04 90% | |
| Kontrast (:1) | 1314 | 1180 -10% | 24950 1799% | 1326 1% | 9750 642% | |
| Delta E Colorchecker * | 4.65 | 6.07 -31% | 3.27 30% | 2.5 46% | 1.62 65% | 1.61 65% |
| Colorchecker dE 2000 max. * | 8.33 | 9.76 -17% | 6.31 24% | 7.8 6% | 3.52 58% | 3.49 58% |
| Colorchecker dE 2000 calibrated * | 1.3 | 2.25 -73% | 1.1 15% | 1.62 -25% | 1.59 -22% | |
| Delta E Graustufen * | 3.9 | 6.4 -64% | 1 74% | 4.7 -21% | 1.85 53% | 1.2 69% |
| Gamma | 2.57 86% | 2.52 87% | 2.23 99% | 2.21 100% | 2.36 93% | 2.235 98% |
| CCT | 6813 95% | 7987 81% | 6410 101% | 6715 97% | 6596 99% | 6580 99% |
| Durchschnitt gesamt (Programm / Settings) | -1% /
-13% | 38% /
26% | 110% /
163% | -1% /
8% | 67% /
77% |
* ... kleinere Werte sind besser
Reaktionszeiten (Response Times) des Displays
| ↔ Reaktionszeiten Schwarz zu Weiß | ||
|---|---|---|
| 9.2 ms ... steigend ↗ und fallend ↘ kombiniert | ↗ 4.9 ms steigend | 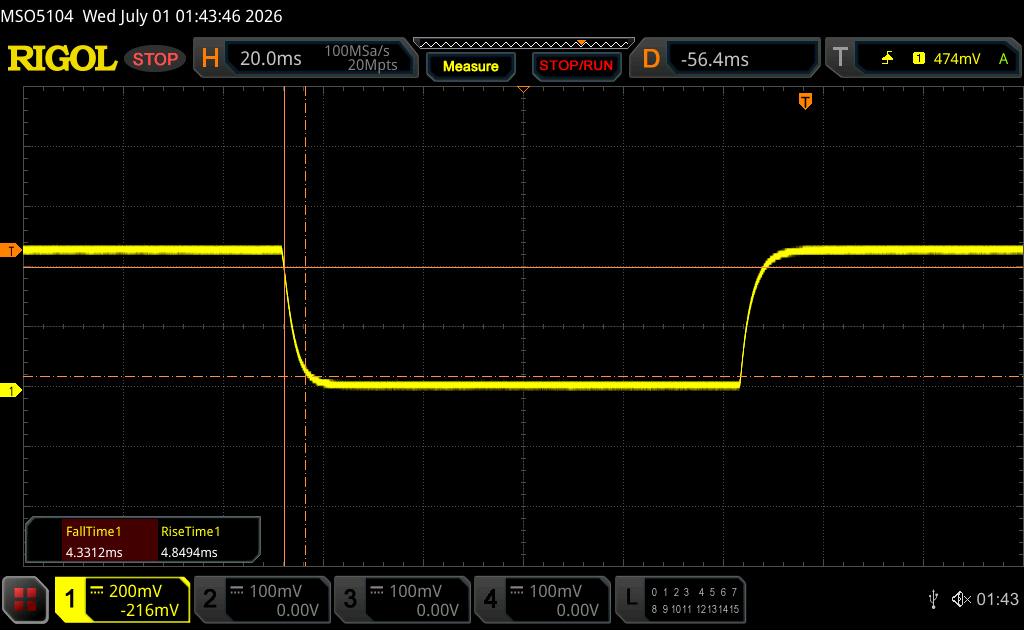 |
| ↘ 4.3 ms fallend | ||
| Die gemessenen Reaktionszeiten sind kurz wodurch sich der Bildschirm auch für Spiele gut eignen sollte. Im Vergleich rangierten die bei uns getesteten Geräte von 0.1 (Minimum) zu 240 (Maximum) ms. » 26 % aller Screens waren schneller als der getestete. Daher sind die gemessenen Reaktionszeiten besser als der Durchschnitt aller vermessenen Geräte (19.8 ms). | ||
| ↔ Reaktionszeiten 50% Grau zu 80% Grau | ||
| 4.2 ms ... steigend ↗ und fallend ↘ kombiniert | ↗ 1.8 ms steigend | 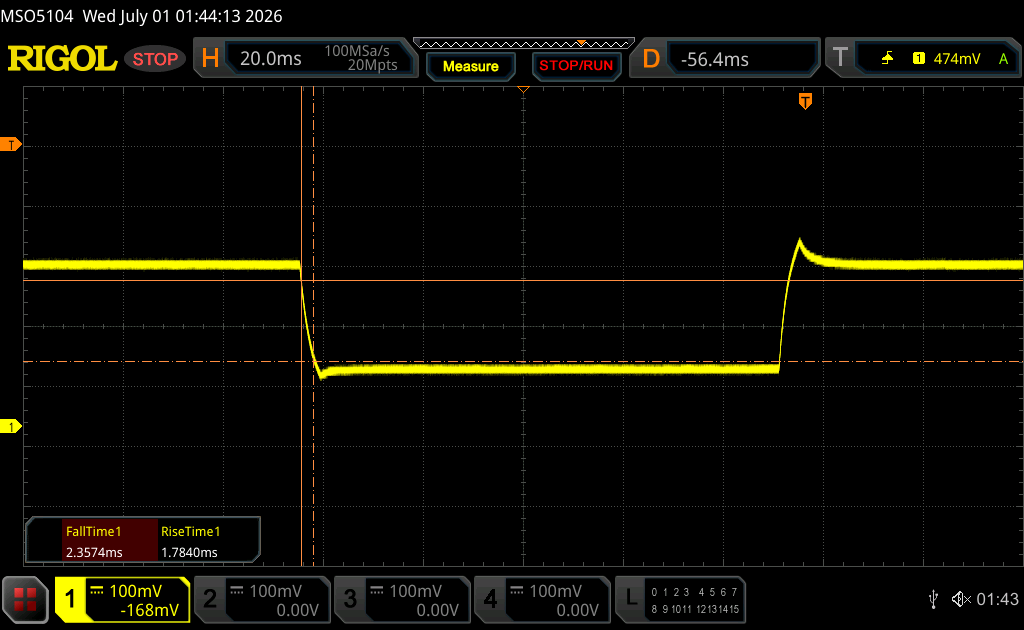 |
| ↘ 2.4 ms fallend | ||
| Die gemessenen Reaktionszeiten sind sehr kurz, wodurch sich der Bildschirm auch für schnelle 3D Spiele eignen sollte. Im Vergleich rangierten die bei uns getesteten Geräte von 0.165 (Minimum) zu 636 (Maximum) ms. » 16 % aller Screens waren schneller als der getestete. Daher sind die gemessenen Reaktionszeiten besser als der Durchschnitt aller vermessenen Geräte (31 ms). | ||
Bildschirm-Flackern / PWM (Pulse-Width Modulation)
| Flackern / PWM nicht festgestellt | 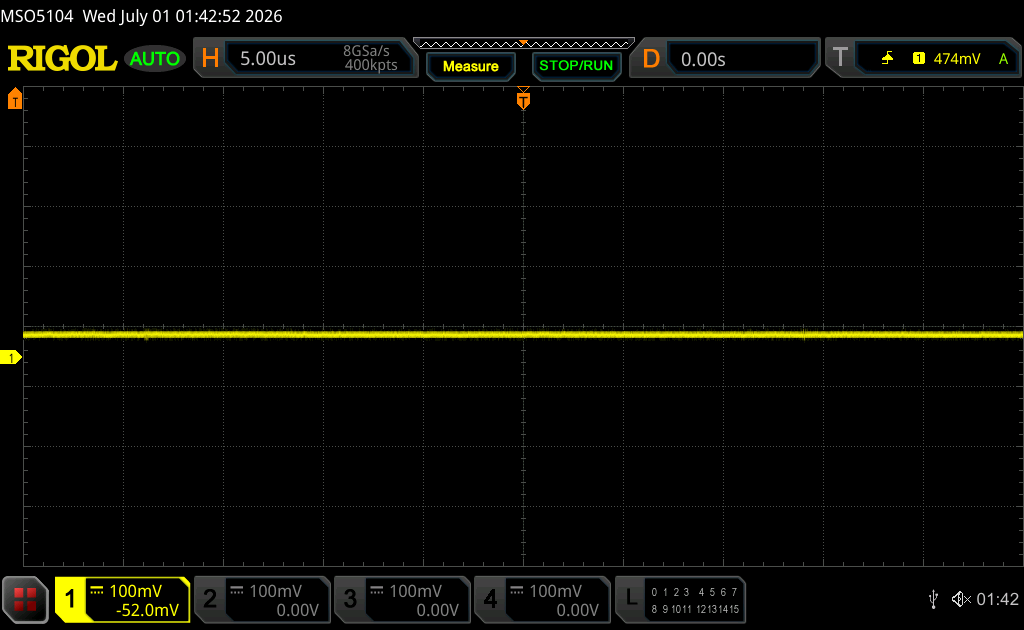 | ||
Im Vergleich: 52 % aller getesteten Geräte nutzten kein PWM um die Helligkeit zu reduzieren. Wenn PWM eingesetzt wurde, dann bei einer Frequenz von durchschnittlich 7769 (Minimum 5, Maximum 343500) Hz. | |||


Performance
Testbedingungen
Das System ist werkseitig auf den Modus Performance voreingestellt, wobei der Apex-Modus aktiviert ist. Außerdem haben wir das System vor der Durchführung der nachstehenden Benchmarks auf den dGPU-Modus umgestellt.
Prozessorleistung
Cinebench R15 Multi-Loop
Cinebench R23: Multi Core | Single Core
Cinebench R20: CPU (Multi Core) | CPU (Single Core)
Cinebench R15: CPU Multi 64Bit | CPU Single 64Bit
Blender: v2.79 BMW27 CPU
7-Zip 18.03: 7z b 4 | 7z b 4 -mmt1
Geekbench 6.7: Multi-Core | Single-Core
Geekbench 5.5: Multi-Core | Single-Core
HWBOT x265 Benchmark v2.2: 4k Preset
LibreOffice : 20 Documents To PDF
R Benchmark 2.5: Overall mean
* ... kleinere Werte sind besser
AIDA64: FP32 Ray-Trace | FPU Julia | CPU SHA3 | CPU Queen | FPU SinJulia | FPU Mandel | CPU AES | CPU ZLib | FP64 Ray-Trace | CPU PhotoWorxx | CPU CheckMate
| Performance Rating | |
| MSI Crosshair A16 HX E8WGK -1! | |
| Durchschnittliche AMD Ryzen 9 8940HX | |
| Alienware 16X Aurora Core Ultra 9 290HX Plus -1! | |
| MSI Crosshair 16 HX AI D2XWGKG -1! | |
| Lenovo Legion 7 16 AGP11 -1! | |
| Acer Predator Helios Neo 16S AI PHN16S-71-94L9 -1! | |
| Gigabyte Gaming A16 Pro GA6DH (Core 7 240H, RTX 5070 Ti) -1! | |
| AIDA64 / FP32 Ray-Trace | |
| MSI Crosshair A16 HX E8WGK (v8.20.8100) | |
| Durchschnittliche AMD Ryzen 9 8940HX (43311 - 53747, n=3) | |
| Lenovo Legion 7 16 AGP11 (v8.20.8100) | |
| MSI Crosshair 16 HX AI D2XWGKG (v6.92.6600) | |
| Alienware 16X Aurora Core Ultra 9 290HX Plus (v8.20.8100) | |
| Acer Predator Helios Neo 16S AI PHN16S-71-94L9 (v6.92.6600) | |
| Gigabyte Gaming A16 Pro GA6DH (Core 7 240H, RTX 5070 Ti) (v8.20.8100) | |
| AIDA64 / FPU Julia | |
| MSI Crosshair A16 HX E8WGK (v8.20.8100) | |
| Durchschnittliche AMD Ryzen 9 8940HX (171374 - 218716, n=3) | |
| MSI Crosshair 16 HX AI D2XWGKG (v6.92.6600) | |
| Alienware 16X Aurora Core Ultra 9 290HX Plus (v8.20.8100) | |
| Lenovo Legion 7 16 AGP11 (v8.20.8100) | |
| Acer Predator Helios Neo 16S AI PHN16S-71-94L9 (v6.92.6600) | |
| Gigabyte Gaming A16 Pro GA6DH (Core 7 240H, RTX 5070 Ti) (v8.20.8100) | |
| AIDA64 / CPU SHA3 | |
| MSI Crosshair A16 HX E8WGK (v8.20.8100) | |
| Durchschnittliche AMD Ryzen 9 8940HX (7988 - 9427, n=3) | |
| MSI Crosshair 16 HX AI D2XWGKG (v6.92.6600) | |
| Alienware 16X Aurora Core Ultra 9 290HX Plus (v8.20.8100) | |
| Acer Predator Helios Neo 16S AI PHN16S-71-94L9 (v6.92.6600) | |
| Lenovo Legion 7 16 AGP11 (v8.20.8100) | |
| Gigabyte Gaming A16 Pro GA6DH (Core 7 240H, RTX 5070 Ti) (v8.20.8100) | |
| AIDA64 / CPU Queen | |
| Durchschnittliche AMD Ryzen 9 8940HX (169334 - 172010, n=2) | |
| MSI Crosshair 16 HX AI D2XWGKG (v6.92.6600) | |
| Acer Predator Helios Neo 16S AI PHN16S-71-94L9 (v6.92.6600) | |
| AIDA64 / FPU SinJulia | |
| MSI Crosshair A16 HX E8WGK (v8.20.8100) | |
| Durchschnittliche AMD Ryzen 9 8940HX (26855 - 29886, n=3) | |
| Lenovo Legion 7 16 AGP11 (v8.20.8100) | |
| Alienware 16X Aurora Core Ultra 9 290HX Plus (v8.20.8100) | |
| MSI Crosshair 16 HX AI D2XWGKG (v6.92.6600) | |
| Acer Predator Helios Neo 16S AI PHN16S-71-94L9 (v6.92.6600) | |
| Gigabyte Gaming A16 Pro GA6DH (Core 7 240H, RTX 5070 Ti) (v8.20.8100) | |
| AIDA64 / FPU Mandel | |
| MSI Crosshair A16 HX E8WGK (v8.20.8100) | |
| Durchschnittliche AMD Ryzen 9 8940HX (90684 - 117231, n=3) | |
| MSI Crosshair 16 HX AI D2XWGKG (v6.92.6600) | |
| Alienware 16X Aurora Core Ultra 9 290HX Plus (v8.20.8100) | |
| Lenovo Legion 7 16 AGP11 (v8.20.8100) | |
| Acer Predator Helios Neo 16S AI PHN16S-71-94L9 (v6.92.6600) | |
| Gigabyte Gaming A16 Pro GA6DH (Core 7 240H, RTX 5070 Ti) (v8.20.8100) | |
| AIDA64 / CPU AES | |
| MSI Crosshair A16 HX E8WGK (v8.20.8100) | |
| Durchschnittliche AMD Ryzen 9 8940HX (150768 - 175214, n=3) | |
| Alienware 16X Aurora Core Ultra 9 290HX Plus (v8.20.8100) | |
| MSI Crosshair 16 HX AI D2XWGKG (v6.92.6600) | |
| Lenovo Legion 7 16 AGP11 (v8.20.8100) | |
| Acer Predator Helios Neo 16S AI PHN16S-71-94L9 (v6.92.6600) | |
| Gigabyte Gaming A16 Pro GA6DH (Core 7 240H, RTX 5070 Ti) (v8.20.8100) | |
| AIDA64 / CPU ZLib | |
| MSI Crosshair A16 HX E8WGK (v8.20.8100) | |
| Durchschnittliche AMD Ryzen 9 8940HX (1784 - 2122, n=3) | |
| MSI Crosshair 16 HX AI D2XWGKG (v6.92.6600) | |
| Alienware 16X Aurora Core Ultra 9 290HX Plus (v8.20.8100) | |
| Acer Predator Helios Neo 16S AI PHN16S-71-94L9 (v6.92.6600) | |
| Lenovo Legion 7 16 AGP11 (v8.20.8100) | |
| Gigabyte Gaming A16 Pro GA6DH (Core 7 240H, RTX 5070 Ti) (v8.20.8100) | |
| AIDA64 / FP64 Ray-Trace | |
| MSI Crosshair A16 HX E8WGK (v8.20.8100) | |
| Durchschnittliche AMD Ryzen 9 8940HX (23193 - 28773, n=3) | |
| Lenovo Legion 7 16 AGP11 (v8.20.8100) | |
| MSI Crosshair 16 HX AI D2XWGKG (v6.92.6600) | |
| Alienware 16X Aurora Core Ultra 9 290HX Plus (v8.20.8100) | |
| Acer Predator Helios Neo 16S AI PHN16S-71-94L9 (v6.92.6600) | |
| Gigabyte Gaming A16 Pro GA6DH (Core 7 240H, RTX 5070 Ti) (v8.20.8100) | |
| AIDA64 / CPU PhotoWorxx | |
| Lenovo Legion 7 16 AGP11 (v8.20.8100) | |
| Acer Predator Helios Neo 16S AI PHN16S-71-94L9 (v6.92.6600) | |
| Alienware 16X Aurora Core Ultra 9 290HX Plus (v8.20.8100) | |
| Gigabyte Gaming A16 Pro GA6DH (Core 7 240H, RTX 5070 Ti) (v8.20.8100) | |
| MSI Crosshair 16 HX AI D2XWGKG (v6.92.6600) | |
| MSI Crosshair A16 HX E8WGK (v8.20.8100) | |
| Durchschnittliche AMD Ryzen 9 8940HX (18283 - 35274, n=3) | |
| AIDA64 / CPU CheckMate | |
| MSI Crosshair A16 HX E8WGK (v8.20.8100) | |
| Durchschnittliche AMD Ryzen 9 8940HX (n=1) | |
| Lenovo Legion 7 16 AGP11 (v8.20.8100) | |
| Alienware 16X Aurora Core Ultra 9 290HX Plus (v8.20.8100) | |
| Gigabyte Gaming A16 Pro GA6DH (Core 7 240H, RTX 5070 Ti) (v8.20.8100) | |
Systemleistung
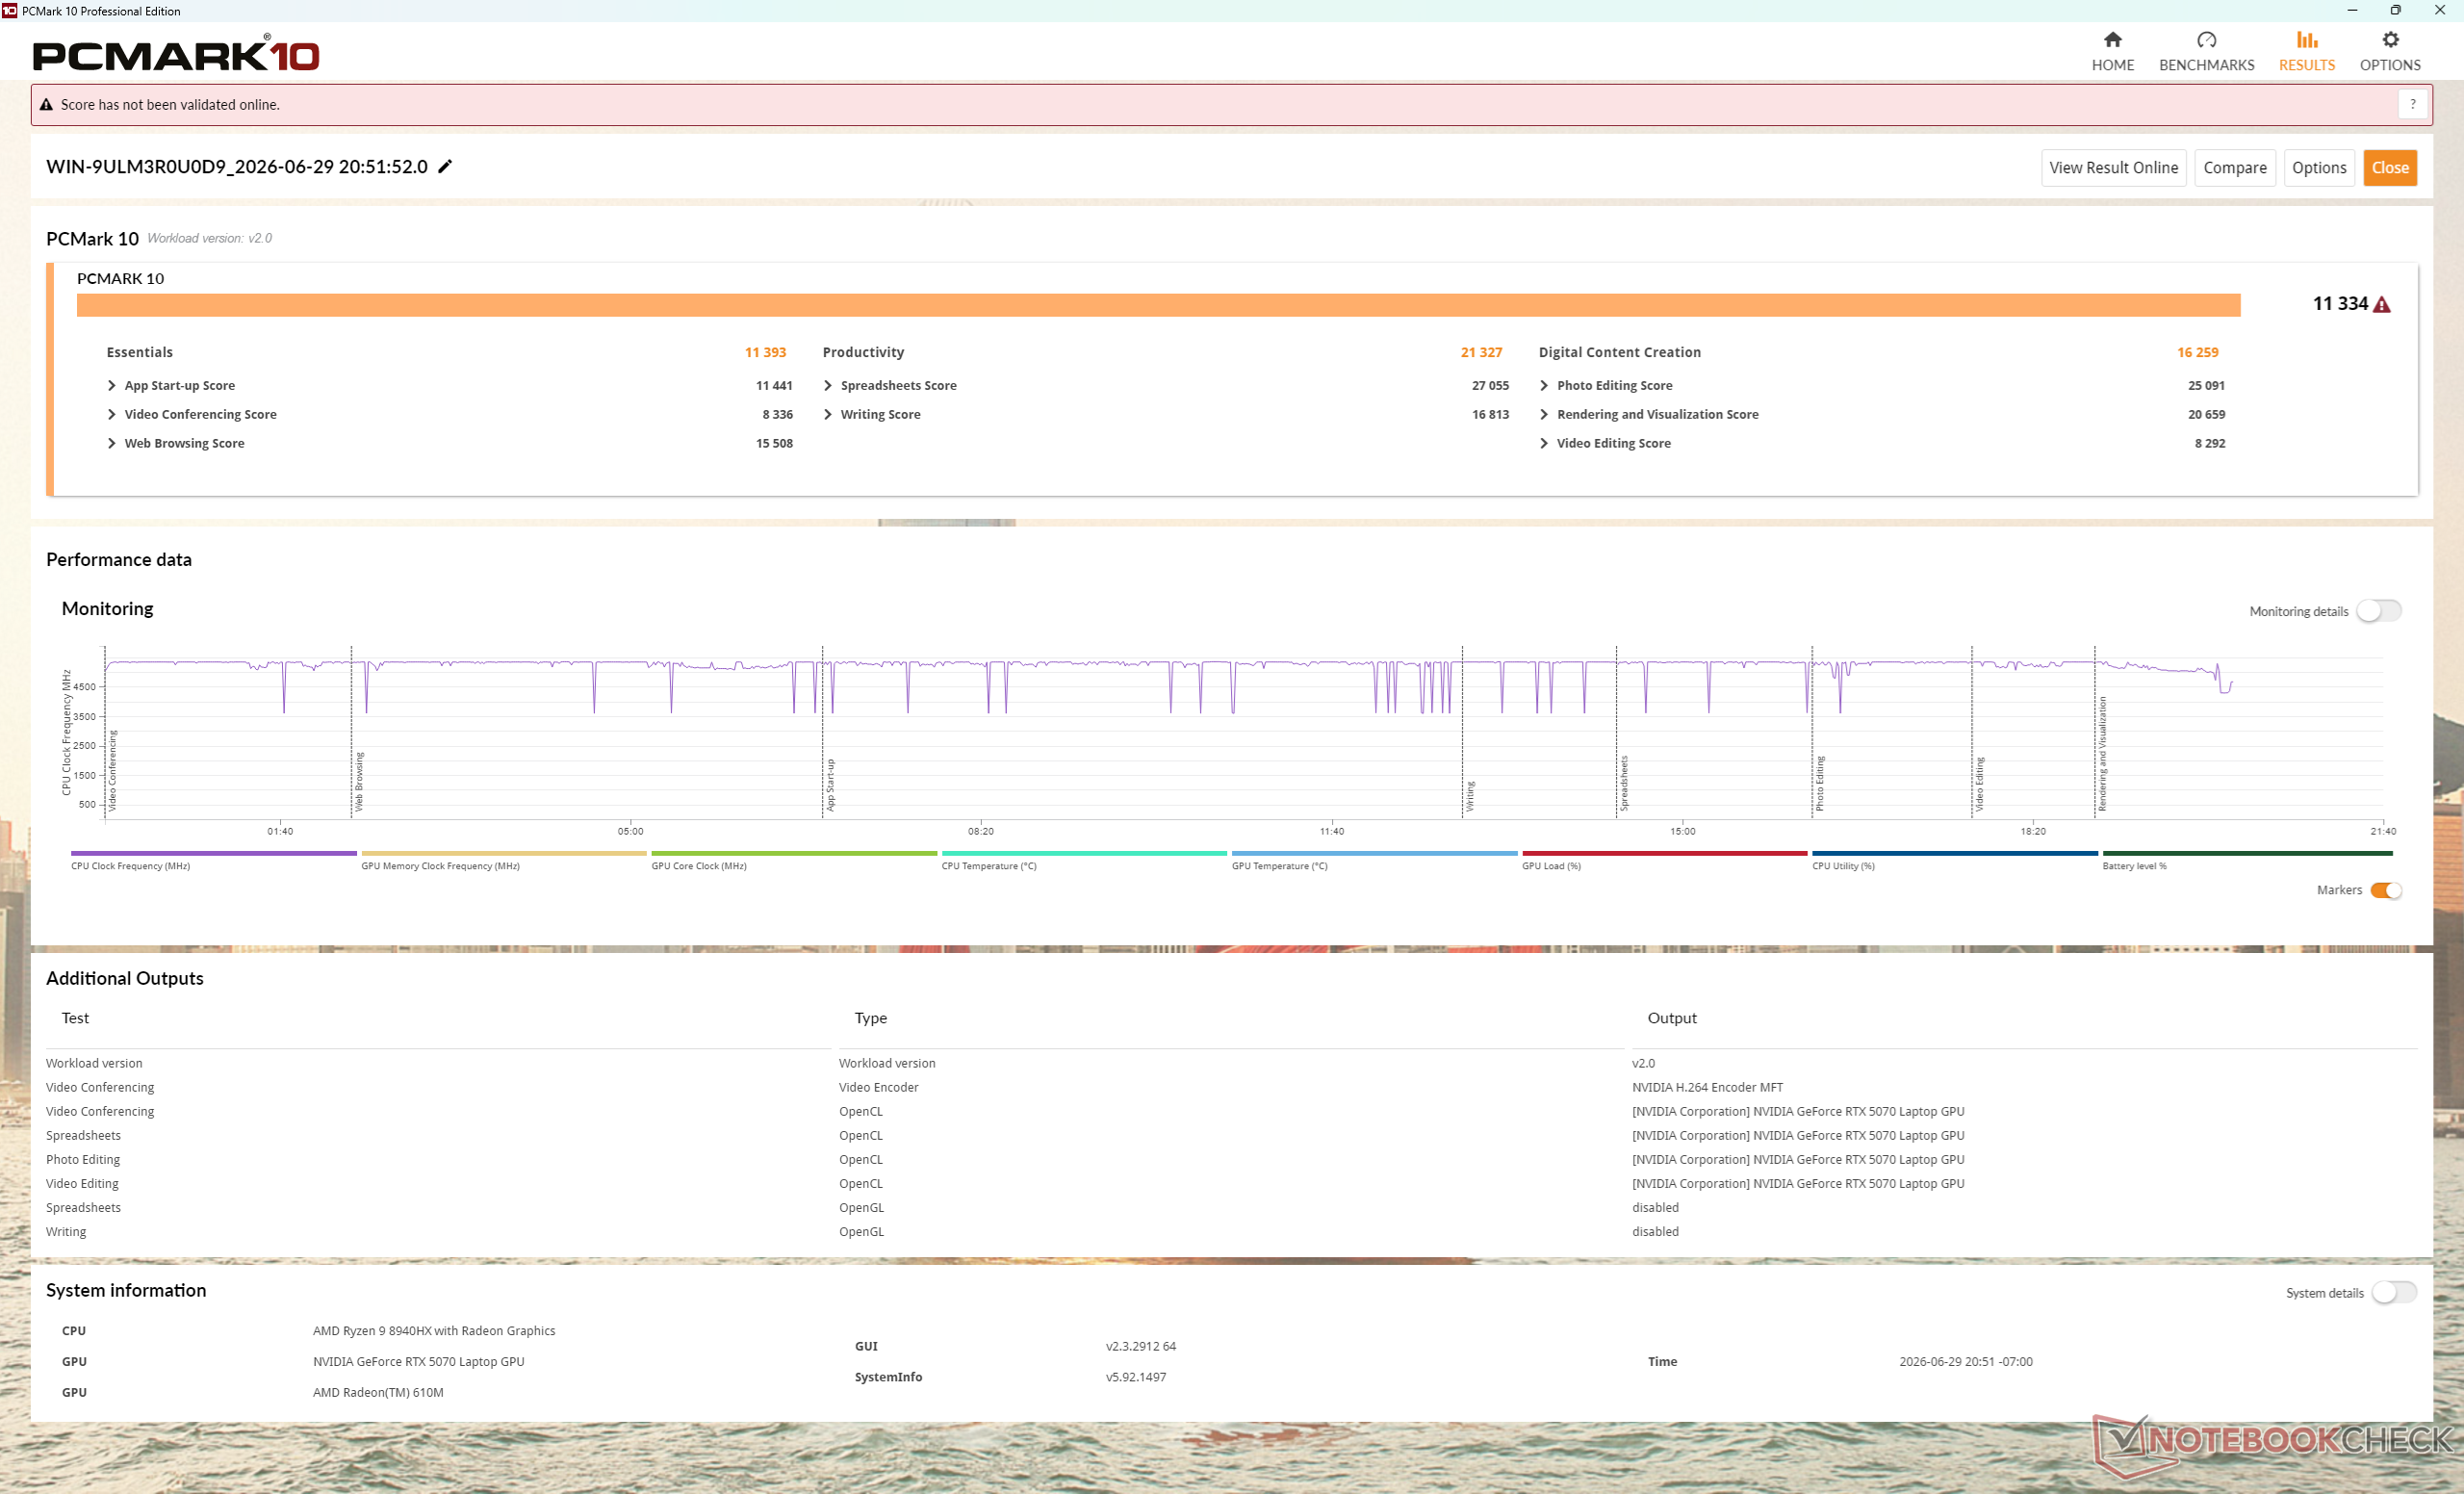
PCMark 10: Score | Essentials | Productivity | Digital Content Creation
CrossMark: Overall | Productivity | Creativity | Responsiveness
WebXPRT 3: Overall
WebXPRT 4: Overall
Mozilla Kraken 1.1: Total
Geekbench AI: Quantized GPU 1.7 | Half Precision GPU 1.7 | Single Precision GPU 1.7
| Performance Rating | |
| Alienware 16X Aurora Core Ultra 9 290HX Plus | |
| MSI Crosshair A16 HX E8WGK | |
| Durchschnittliche AMD Ryzen 9 8940HX, NVIDIA GeForce RTX 5070 Laptop | |
| MSI Crosshair 16 HX AI D2XWGKG | |
| Acer Predator Helios Neo 16S AI PHN16S-71-94L9 -3! | |
| Lenovo Legion 7 16 AGP11 -3! | |
| Gigabyte Gaming A16 Pro GA6DH (Core 7 240H, RTX 5070 Ti) | |
| PCMark 10 / Score | |
| MSI Crosshair A16 HX E8WGK | |
| Alienware 16X Aurora Core Ultra 9 290HX Plus | |
| Durchschnittliche AMD Ryzen 9 8940HX, NVIDIA GeForce RTX 5070 Laptop (8106 - 11334, n=2) | |
| Lenovo Legion 7 16 AGP11 | |
| Gigabyte Gaming A16 Pro GA6DH (Core 7 240H, RTX 5070 Ti) | |
| Acer Predator Helios Neo 16S AI PHN16S-71-94L9 | |
| MSI Crosshair 16 HX AI D2XWGKG | |
| PCMark 10 / Essentials | |
| Alienware 16X Aurora Core Ultra 9 290HX Plus | |
| MSI Crosshair A16 HX E8WGK | |
| Durchschnittliche AMD Ryzen 9 8940HX, NVIDIA GeForce RTX 5070 Laptop (11371 - 11393, n=2) | |
| Acer Predator Helios Neo 16S AI PHN16S-71-94L9 | |
| MSI Crosshair 16 HX AI D2XWGKG | |
| Lenovo Legion 7 16 AGP11 | |
| Gigabyte Gaming A16 Pro GA6DH (Core 7 240H, RTX 5070 Ti) | |
| PCMark 10 / Productivity | |
| MSI Crosshair A16 HX E8WGK | |
| Alienware 16X Aurora Core Ultra 9 290HX Plus | |
| Lenovo Legion 7 16 AGP11 | |
| Durchschnittliche AMD Ryzen 9 8940HX, NVIDIA GeForce RTX 5070 Laptop (9492 - 21327, n=2) | |
| Gigabyte Gaming A16 Pro GA6DH (Core 7 240H, RTX 5070 Ti) | |
| Acer Predator Helios Neo 16S AI PHN16S-71-94L9 | |
| MSI Crosshair 16 HX AI D2XWGKG | |
| PCMark 10 / Digital Content Creation | |
| Alienware 16X Aurora Core Ultra 9 290HX Plus | |
| MSI Crosshair 16 HX AI D2XWGKG | |
| MSI Crosshair A16 HX E8WGK | |
| Durchschnittliche AMD Ryzen 9 8940HX, NVIDIA GeForce RTX 5070 Laptop (13392 - 16259, n=2) | |
| Acer Predator Helios Neo 16S AI PHN16S-71-94L9 | |
| Lenovo Legion 7 16 AGP11 | |
| Gigabyte Gaming A16 Pro GA6DH (Core 7 240H, RTX 5070 Ti) | |
| CrossMark / Overall | |
| Alienware 16X Aurora Core Ultra 9 290HX Plus | |
| Acer Predator Helios Neo 16S AI PHN16S-71-94L9 | |
| MSI Crosshair 16 HX AI D2XWGKG | |
| MSI Crosshair A16 HX E8WGK | |
| Durchschnittliche AMD Ryzen 9 8940HX, NVIDIA GeForce RTX 5070 Laptop (1977 - 2011, n=2) | |
| Gigabyte Gaming A16 Pro GA6DH (Core 7 240H, RTX 5070 Ti) | |
| Lenovo Legion 7 16 AGP11 | |
| CrossMark / Productivity | |
| Alienware 16X Aurora Core Ultra 9 290HX Plus | |
| MSI Crosshair 16 HX AI D2XWGKG | |
| Acer Predator Helios Neo 16S AI PHN16S-71-94L9 | |
| MSI Crosshair A16 HX E8WGK | |
| Durchschnittliche AMD Ryzen 9 8940HX, NVIDIA GeForce RTX 5070 Laptop (1844 - 1869, n=2) | |
| Gigabyte Gaming A16 Pro GA6DH (Core 7 240H, RTX 5070 Ti) | |
| Lenovo Legion 7 16 AGP11 | |
| CrossMark / Creativity | |
| Alienware 16X Aurora Core Ultra 9 290HX Plus | |
| Acer Predator Helios Neo 16S AI PHN16S-71-94L9 | |
| MSI Crosshair 16 HX AI D2XWGKG | |
| MSI Crosshair A16 HX E8WGK | |
| Durchschnittliche AMD Ryzen 9 8940HX, NVIDIA GeForce RTX 5070 Laptop (2225 - 2298, n=2) | |
| Gigabyte Gaming A16 Pro GA6DH (Core 7 240H, RTX 5070 Ti) | |
| Lenovo Legion 7 16 AGP11 | |
| CrossMark / Responsiveness | |
| Alienware 16X Aurora Core Ultra 9 290HX Plus | |
| MSI Crosshair 16 HX AI D2XWGKG | |
| Acer Predator Helios Neo 16S AI PHN16S-71-94L9 | |
| Durchschnittliche AMD Ryzen 9 8940HX, NVIDIA GeForce RTX 5070 Laptop (1680 - 1709, n=2) | |
| MSI Crosshair A16 HX E8WGK | |
| Gigabyte Gaming A16 Pro GA6DH (Core 7 240H, RTX 5070 Ti) | |
| Lenovo Legion 7 16 AGP11 | |
| WebXPRT 3 / Overall | |
| Alienware 16X Aurora Core Ultra 9 290HX Plus | |
| MSI Crosshair 16 HX AI D2XWGKG | |
| Lenovo Legion 7 16 AGP11 | |
| Acer Predator Helios Neo 16S AI PHN16S-71-94L9 | |
| MSI Crosshair A16 HX E8WGK | |
| Durchschnittliche AMD Ryzen 9 8940HX, NVIDIA GeForce RTX 5070 Laptop (274 - 322, n=2) | |
| Gigabyte Gaming A16 Pro GA6DH (Core 7 240H, RTX 5070 Ti) | |
| WebXPRT 4 / Overall | |
| Alienware 16X Aurora Core Ultra 9 290HX Plus | |
| MSI Crosshair 16 HX AI D2XWGKG | |
| Acer Predator Helios Neo 16S AI PHN16S-71-94L9 | |
| MSI Crosshair A16 HX E8WGK | |
| Lenovo Legion 7 16 AGP11 | |
| Durchschnittliche AMD Ryzen 9 8940HX, NVIDIA GeForce RTX 5070 Laptop (230 - 283, n=2) | |
| Gigabyte Gaming A16 Pro GA6DH (Core 7 240H, RTX 5070 Ti) | |
| Mozilla Kraken 1.1 / Total | |
| Gigabyte Gaming A16 Pro GA6DH (Core 7 240H, RTX 5070 Ti) | |
| Durchschnittliche AMD Ryzen 9 8940HX, NVIDIA GeForce RTX 5070 Laptop (474 - 507, n=2) | |
| MSI Crosshair A16 HX E8WGK | |
| Lenovo Legion 7 16 AGP11 | |
| Acer Predator Helios Neo 16S AI PHN16S-71-94L9 | |
| MSI Crosshair 16 HX AI D2XWGKG | |
| Alienware 16X Aurora Core Ultra 9 290HX Plus | |
| Geekbench AI / Quantized GPU 1.7 | |
| Alienware 16X Aurora Core Ultra 9 290HX Plus | |
| MSI Crosshair A16 HX E8WGK | |
| Durchschnittliche AMD Ryzen 9 8940HX, NVIDIA GeForce RTX 5070 Laptop (n=1) | |
| MSI Crosshair 16 HX AI D2XWGKG | |
| Gigabyte Gaming A16 Pro GA6DH (Core 7 240H, RTX 5070 Ti) | |
| Geekbench AI / Half Precision GPU 1.7 | |
| MSI Crosshair A16 HX E8WGK | |
| Durchschnittliche AMD Ryzen 9 8940HX, NVIDIA GeForce RTX 5070 Laptop (n=1) | |
| Alienware 16X Aurora Core Ultra 9 290HX Plus | |
| MSI Crosshair 16 HX AI D2XWGKG | |
| Gigabyte Gaming A16 Pro GA6DH (Core 7 240H, RTX 5070 Ti) | |
| Geekbench AI / Single Precision GPU 1.7 | |
| Alienware 16X Aurora Core Ultra 9 290HX Plus | |
| MSI Crosshair A16 HX E8WGK | |
| Durchschnittliche AMD Ryzen 9 8940HX, NVIDIA GeForce RTX 5070 Laptop (n=1) | |
| MSI Crosshair 16 HX AI D2XWGKG | |
| Gigabyte Gaming A16 Pro GA6DH (Core 7 240H, RTX 5070 Ti) | |
* ... kleinere Werte sind besser
| PCMark 10 Score | 11334 Punkte | |
Hilfe | ||
| AIDA64 / Memory Write | |
| Lenovo Legion 7 16 AGP11 | |
| Acer Predator Helios Neo 16S AI PHN16S-71-94L9 | |
| Gigabyte Gaming A16 Pro GA6DH (Core 7 240H, RTX 5070 Ti) | |
| Alienware 16X Aurora Core Ultra 9 290HX Plus | |
| MSI Crosshair 16 HX AI D2XWGKG | |
| MSI Crosshair A16 HX E8WGK | |
| Durchschnittliche AMD Ryzen 9 8940HX (32239 - 61929, n=3) | |
| AIDA64 / Memory Latency | |
| MSI Crosshair 16 HX AI D2XWGKG | |
| Acer Predator Helios Neo 16S AI PHN16S-71-94L9 | |
| Alienware 16X Aurora Core Ultra 9 290HX Plus | |
| Lenovo Legion 7 16 AGP11 | |
| Gigabyte Gaming A16 Pro GA6DH (Core 7 240H, RTX 5070 Ti) | |
| MSI Crosshair A16 HX E8WGK | |
| Durchschnittliche AMD Ryzen 9 8940HX (83.5 - 87.1, n=3) | |
* ... kleinere Werte sind besser
DPC-Latenz
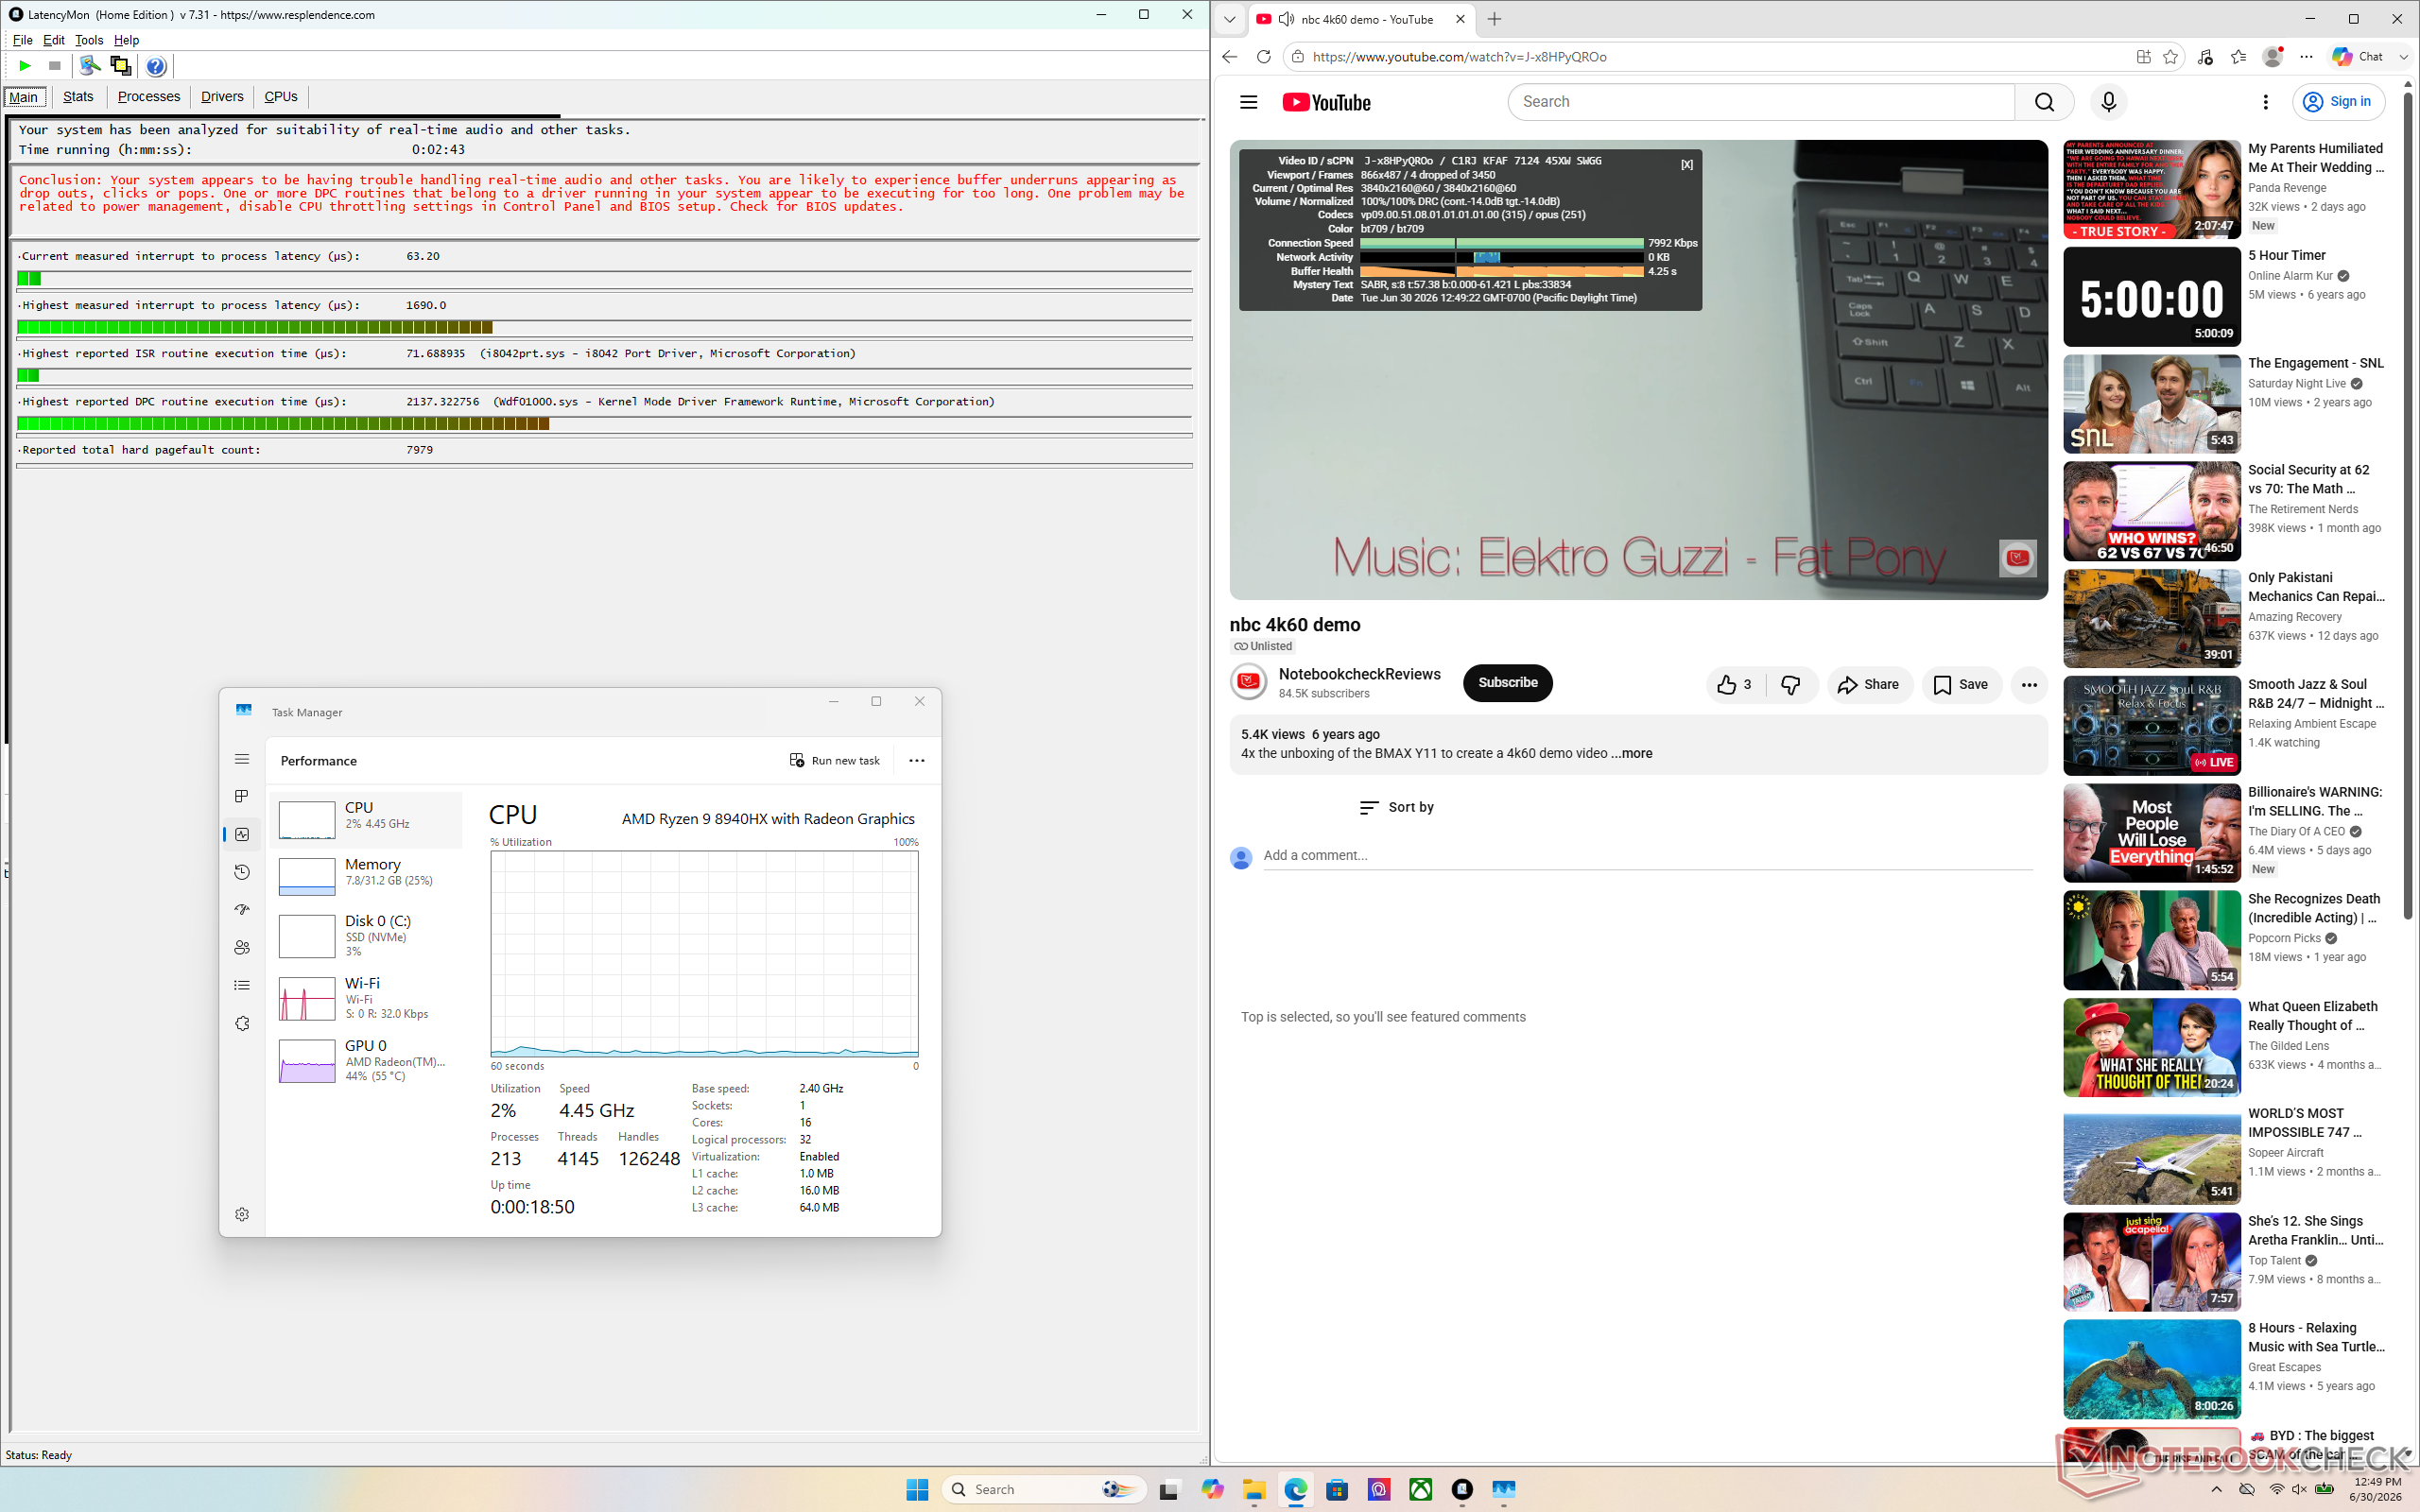
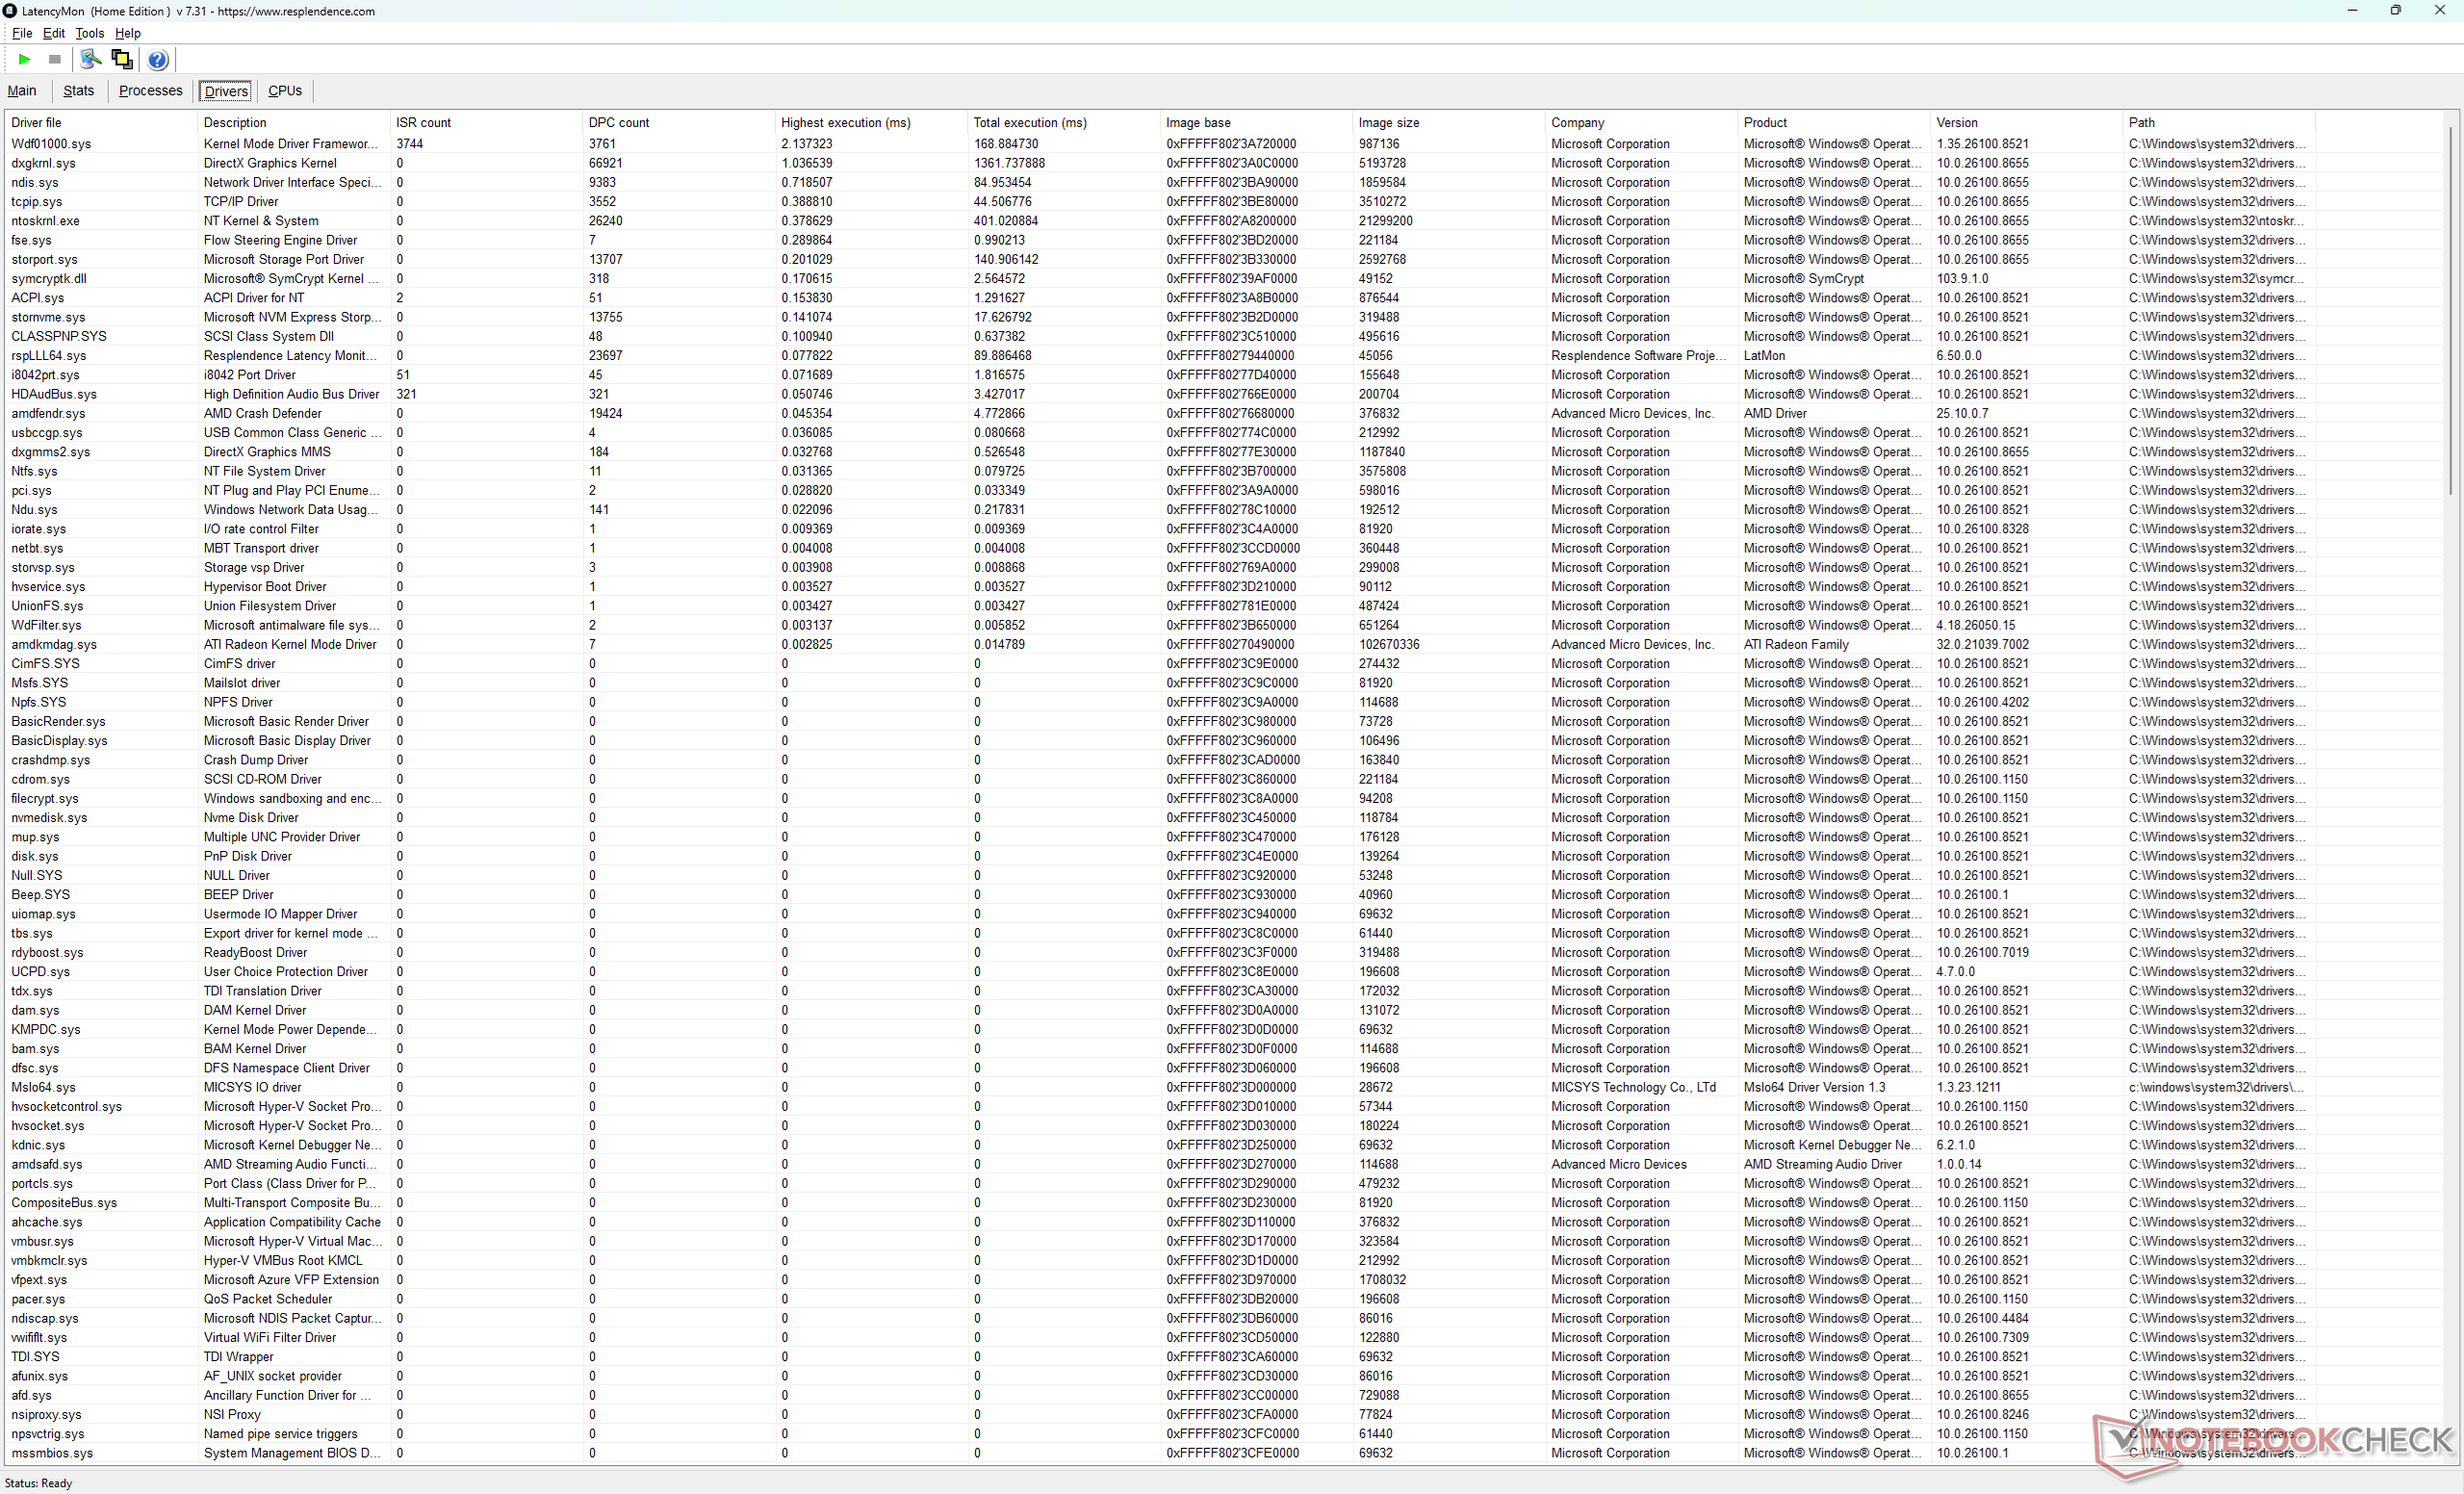
| DPC Latencies / LatencyMon - interrupt to process latency (max), Web, Youtube, Prime95 | |
| Lenovo Legion 7 16 AGP11 | |
| Gigabyte Gaming A16 Pro GA6DH (Core 7 240H, RTX 5070 Ti) | |
| Alienware 16X Aurora Core Ultra 9 290HX Plus | |
| Acer Predator Helios Neo 16S AI PHN16S-71-94L9 | |
| MSI Crosshair A16 HX E8WGK | |
| MSI Crosshair 16 HX AI D2XWGKG | |
* ... kleinere Werte sind besser
Speichergeräte
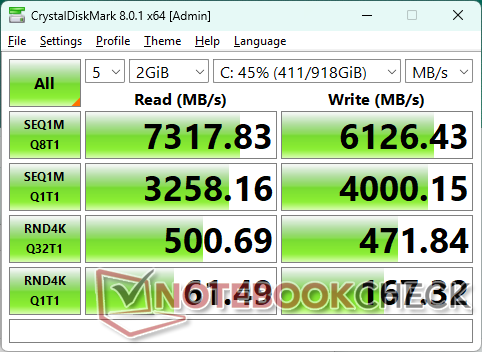
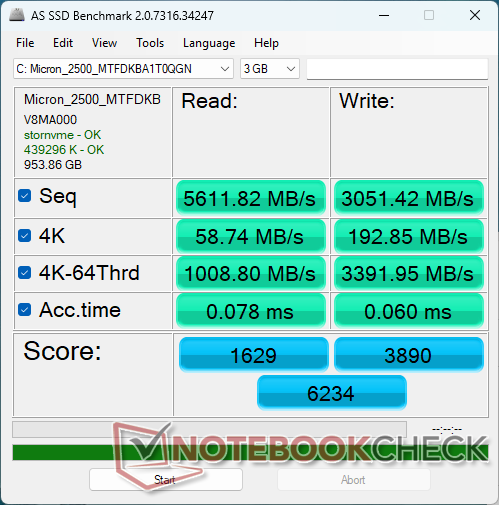

* ... kleinere Werte sind besser
Festplatten-Drosselung: „DiskSpd“-Lese-Schleife, Warteschlangentiefe 8
GPU Performance
| Leistungsprofil | Grafics-Ergebnis | Physics-Ergebnis | Gesamtwert |
| Performance-Modus, „Cooler Boost“ aktiviert, Apex ein | 14.087 | 13.104 | 13.930 |
| Performance-Modus, „Cooler Boost“ aus, Apex ein | 14.118 (-0 %) | 13.154 (-0 %) | 13.964 (-0 %) |
| Performance-Modus, Cooler Boost aus, Apex aus | 13.991 (-1 %) | 13.109 (-0 %) | 13.851 (-0 %) |
| Ausgewogener Modus | 13.451 (-5 %) | 12.174 (-7 %) | 13.242 (-5 %) |
| Batteriebetrieb | 4.400 (-69 %) | 6.518 (-50 %) | 4.625 (-67 %) |
| 3DMark 11 Performance | 37786 Punkte | |
| 3DMark Cloud Gate Standard Score | 71413 Punkte | |
| 3DMark Fire Strike Score | 35205 Punkte | |
| 3DMark Time Spy Score | 13964 Punkte | |
| 3DMark Steel Nomad Score | 3087 Punkte | |
Hilfe | ||
* ... kleinere Werte sind besser
| Final Fantasy XV Benchmark - 1920x1080 High Quality | |
| Alienware 16X Aurora Core Ultra 9 290HX Plus | |
| MSI Crosshair 16 HX AI D2XWGKG | |
| MSI Crosshair A16 HX E8WGK | |
| Lenovo Legion 7 16 AGP11 | |
| Gigabyte Gaming A16 Pro GA6DH (Core 7 240H, RTX 5070 Ti) | |
| Strange Brigade - 1920x1080 ultra AA:ultra AF:16 | |
| Alienware 16X Aurora Core Ultra 9 290HX Plus | |
| Gigabyte Gaming A16 Pro GA6DH (Core 7 240H, RTX 5070 Ti) | |
| MSI Crosshair 16 HX AI D2XWGKG | |
| MSI Crosshair A16 HX E8WGK | |
| Lenovo Legion 7 16 AGP11 | |
Cyberpunk 2077 – Ultra-fps-Diagramm
| min. | mittel | hoch | max. | QHD DLSS | QHD | |
|---|---|---|---|---|---|---|
| GTA V (2015) | 187.6 | 186.6 | 184.6 | 152.6 | 129.7 | |
| Dota 2 Reborn (2015) | 240 | 208 | 199.1 | 183.3 | ||
| Final Fantasy XV Benchmark (2018) | 229 | 187.8 | 140 | 102 | ||
| X-Plane 11.11 (2018) | 141.9 | 131.5 | 104.8 | |||
| Strange Brigade (2018) | 502 | 369 | 305 | 258 | 170.4 | |
| Baldur's Gate 3 (2023) | 239 | 183.9 | 154.6 | 133.2 | 129.6 | 90.3 |
| Cyberpunk 2077 (2023) | 173.8 | 149 | 124.8 | 112.1 | 81.9 | 68.8 |
| F1 24 (2024) | 345 | 336 | 269 | 94.7 | 93.1 | 59.3 |
Emissionen
Systemgeräusche
Lautstärkediagramm
| Idle |
| 29.1 / 29.1 / 29.1 dB(A) |
| Last |
| 41.7 / 59 dB(A) |
 | ||
30 dB leise 40 dB(A) deutlich hörbar 50 dB(A) störend |
||
min: | ||
| MSI Crosshair A16 HX E8WGK R9 8940HX, GeForce RTX 5070 Laptop | MSI Crosshair 16 HX AI D2XWGKG Ultra 9 275HX, GeForce RTX 5070 Laptop | Alienware 16X Aurora Core Ultra 9 290HX Plus Ultra 9 290HX Plus, GeForce RTX 5070 Ti Laptop | Lenovo Legion 7 16 AGP11 Ryzen AI 9 HX 470, GeForce RTX 5060 Laptop | Gigabyte Gaming A16 Pro GA6DH (Core 7 240H, RTX 5070 Ti) Core 7 240H, GeForce RTX 5070 Ti Laptop | Acer Predator Helios Neo 16S AI PHN16S-71-94L9 Ultra 9 275HX, GeForce RTX 5070 Ti Laptop | |
|---|---|---|---|---|---|---|
| Geräuschentwicklung | -2% | 3% | 10% | 11% | -2% | |
| aus / Umgebung * (dB) | 23.4 | 25.56 -9% | 23.4 -0% | 24.5 -5% | 23 2% | 24 -3% |
| Idle min * (dB) | 29.1 | 28.3 3% | 23.8 18% | 24.5 16% | 23 21% | 24 18% |
| Idle avg * (dB) | 29.1 | 28.3 3% | 23.8 18% | 24.5 16% | 24.35 16% | 30 -3% |
| Idle max * (dB) | 29.1 | 28.3 3% | 31.4 -8% | 27.1 7% | 24.35 16% | 35 -20% |
| Last avg * (dB) | 41.7 | 50.26 -21% | 48.7 -17% | 34.6 17% | 34.77 17% | 53 -27% |
| Cyberpunk 2077 ultra * (dB) | 58.7 | 57.8 2% | 51.5 12% | 53 10% | 56.18 4% | 52 11% |
| Last max * (dB) | 59 | 57.95 2% | 59.8 -1% | 53 10% | 56.43 4% | 54 8% |
* ... kleinere Werte sind besser
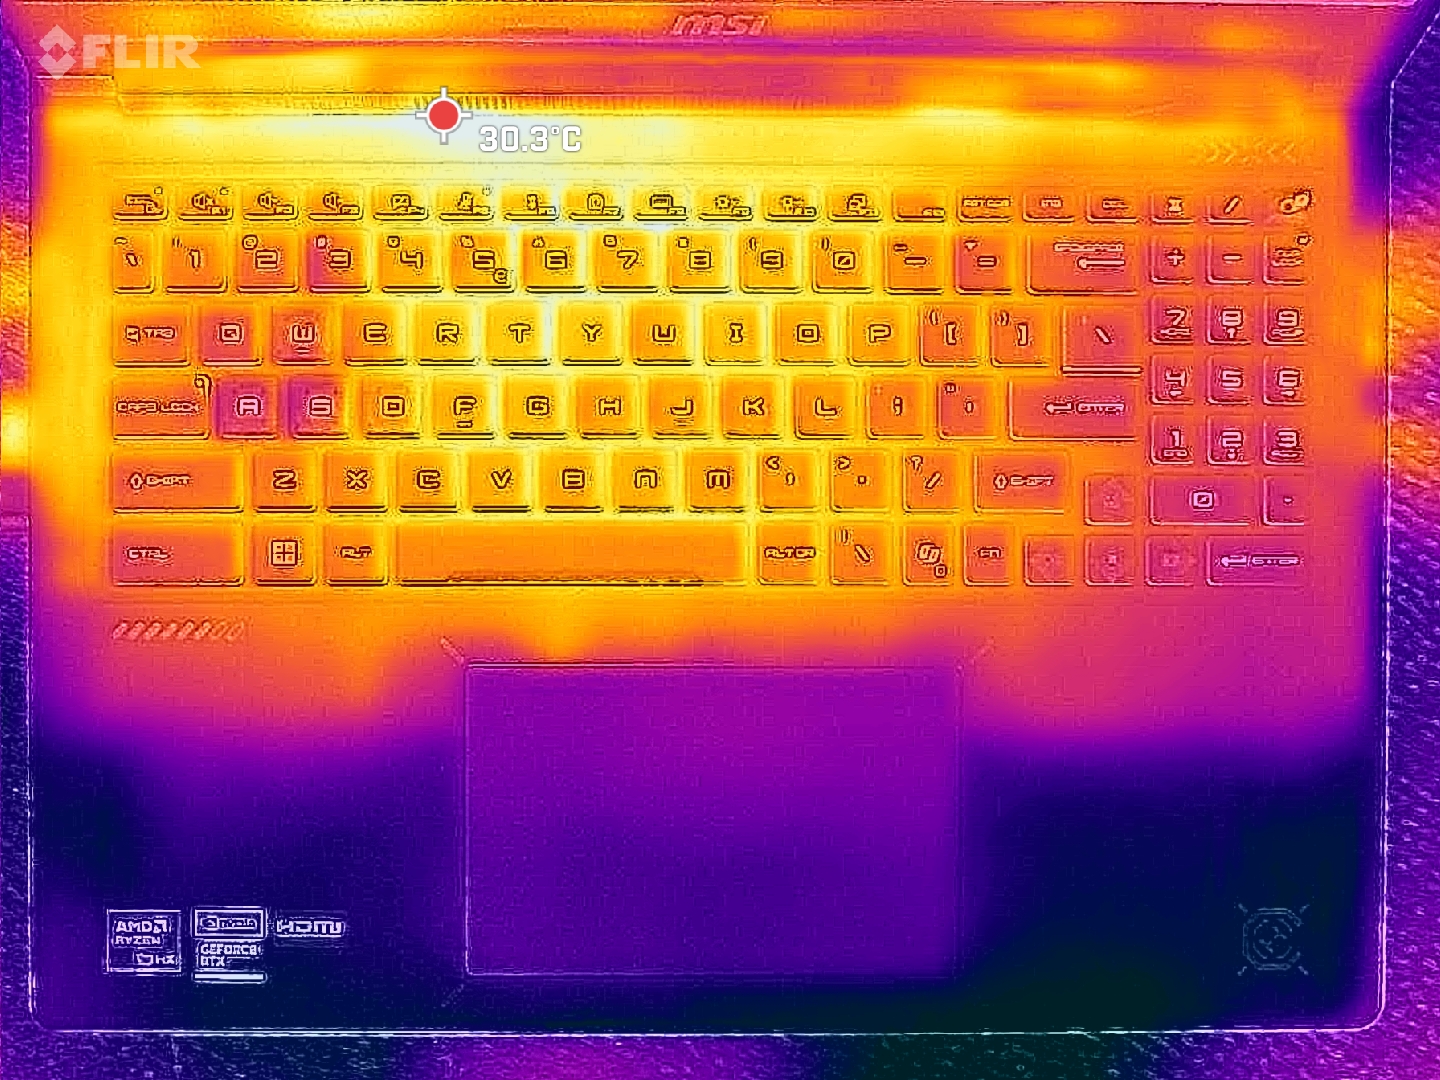
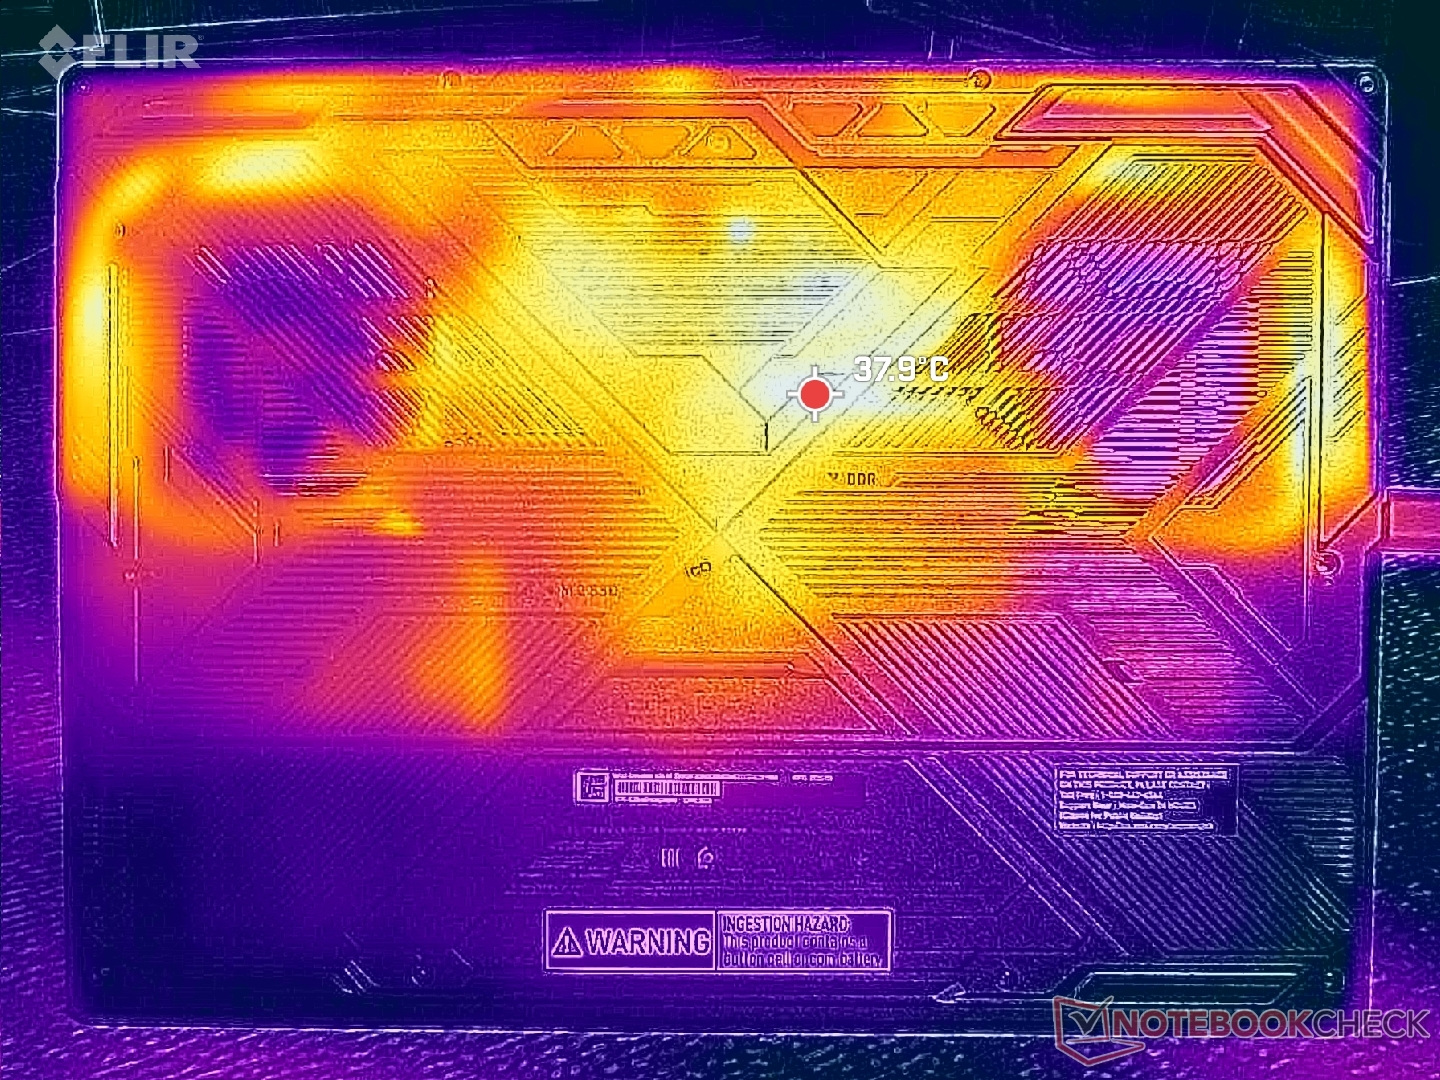
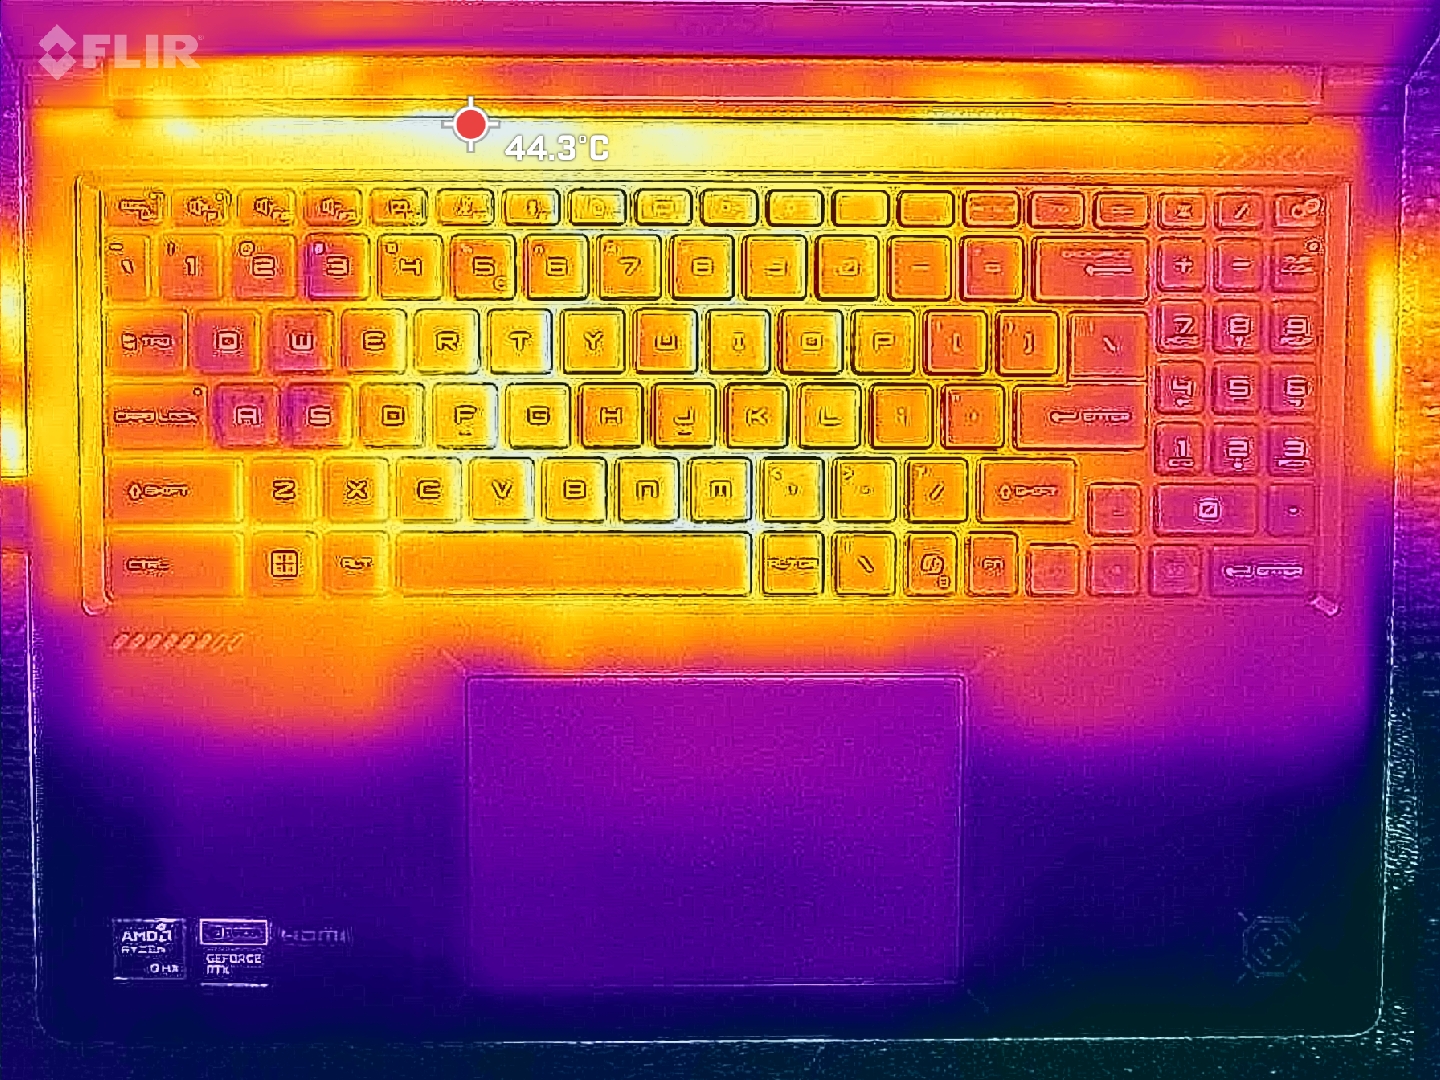
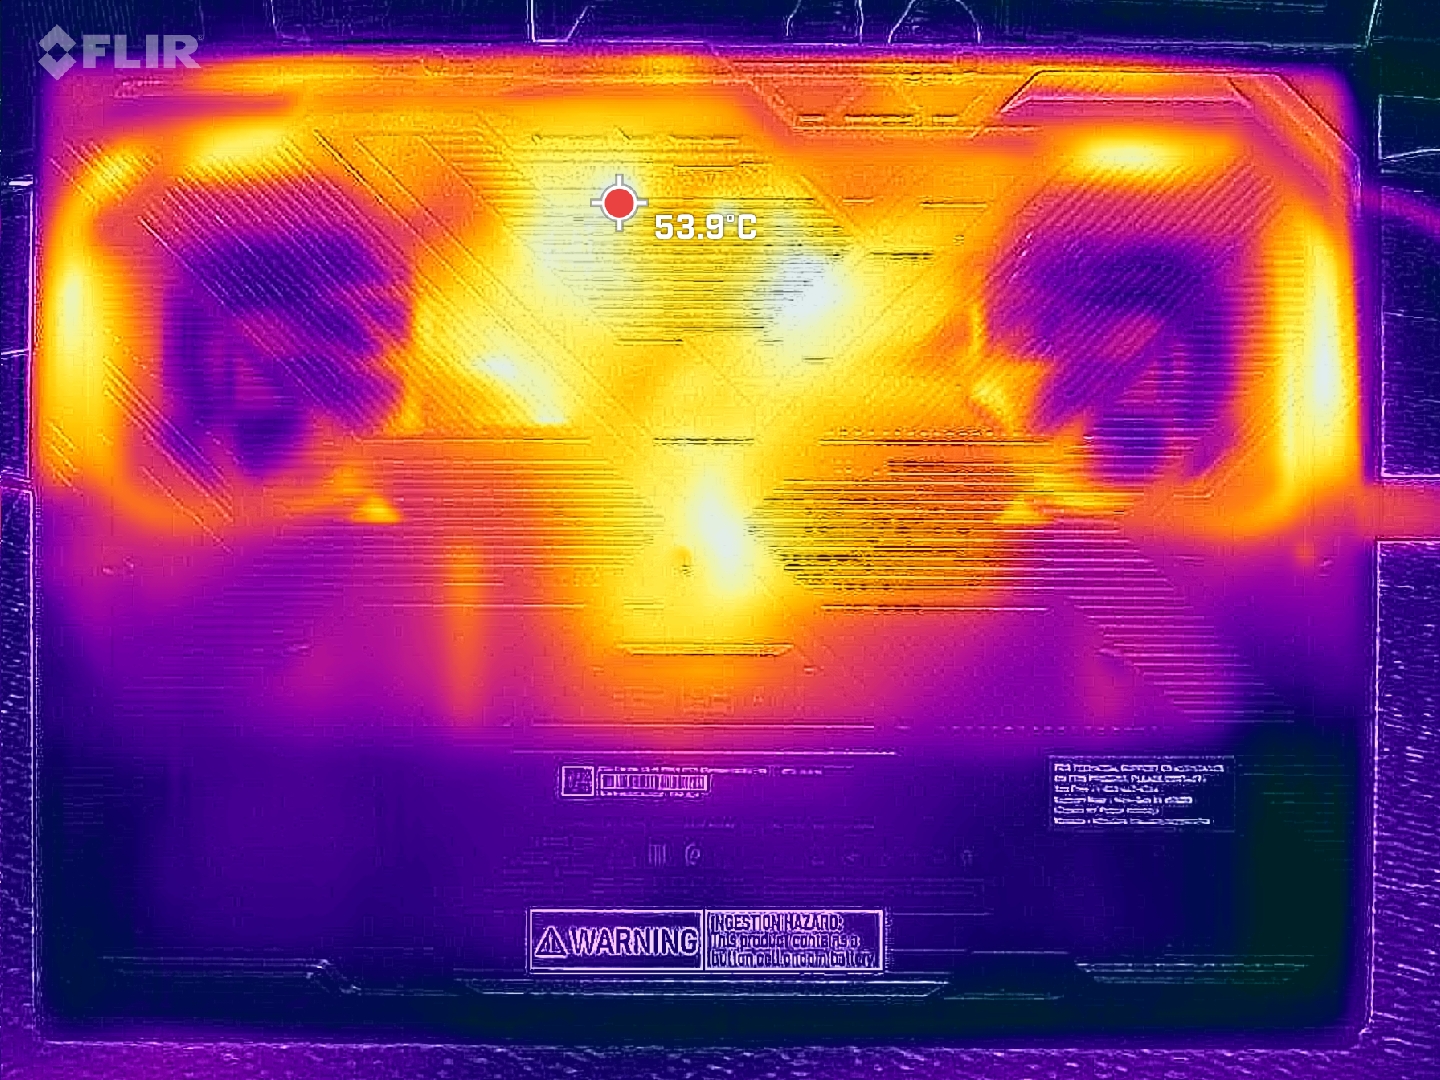
Temperatur
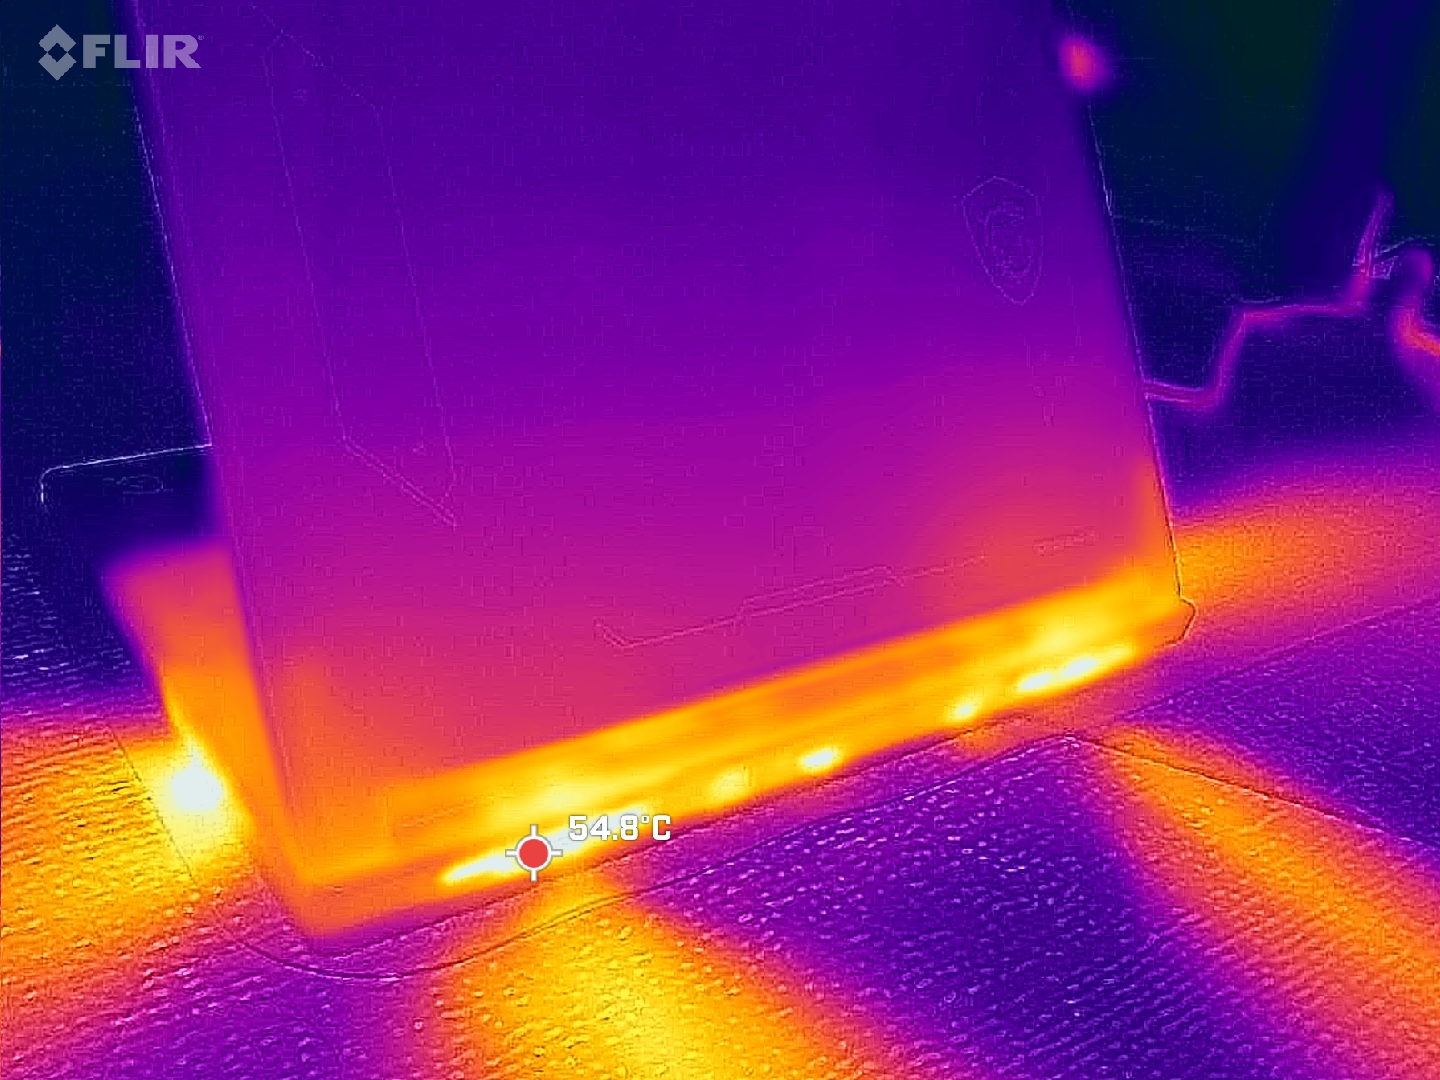
(±) Die maximale Temperatur auf der Oberseite ist 41.8 °C. Im Vergleich liegt der Klassendurchschnitt bei 40.4 °C (von 21.2 bis 68.8 °C für die Klasse Gaming).
(-) Auf der Unterseite messen wir eine maximalen Wert von 50.6 °C (im Vergleich zum Durchschnitt von 43.2 °C).
(+) Ohne Last messen wir eine durchschnittliche Temperatur von 26.2 °C auf der Oberseite. Der Klassendurchschnitt erreicht 33.9 °C.
(+) Die Handballen und der Touchpad-Bereich sind mit gemessenen 31.6 °C kühler als die typische Hauttemperatur und fühlen sich dadurch kühl an.
(-) Die durchschnittliche Handballen-Temperatur anderer getesteter Geräte war 28.8 °C (-2.8 °C).
| MSI Crosshair A16 HX E8WGK R9 8940HX, GeForce RTX 5070 Laptop | MSI Crosshair 16 HX AI D2XWGKG Ultra 9 275HX, GeForce RTX 5070 Laptop | Alienware 16X Aurora Core Ultra 9 290HX Plus Ultra 9 290HX Plus, GeForce RTX 5070 Ti Laptop | Lenovo Legion 7 16 AGP11 Ryzen AI 9 HX 470, GeForce RTX 5060 Laptop | Gigabyte Gaming A16 Pro GA6DH (Core 7 240H, RTX 5070 Ti) Core 7 240H, GeForce RTX 5070 Ti Laptop | Acer Predator Helios Neo 16S AI PHN16S-71-94L9 Ultra 9 275HX, GeForce RTX 5070 Ti Laptop | |
|---|---|---|---|---|---|---|
| Hitze | 7% | 10% | 7% | -2% | 2% | |
| Last oben max * (°C) | 41.8 | 44.8 -7% | 48.2 -15% | 44.9 -7% | 42 -0% | 47 -12% |
| Last unten max * (°C) | 50.6 | 43.4 14% | 41 19% | 50.5 -0% | 49 3% | 55 -9% |
| Idle oben max * (°C) | 30.8 | 31.2 -1% | 28.2 8% | 27.3 11% | 34 -10% | 28 9% |
| Idle unten max * (°C) | 36 | 28.8 20% | 26.2 27% | 27.5 24% | 36 -0% | 29 19% |
* ... kleinere Werte sind besser
Stresstest
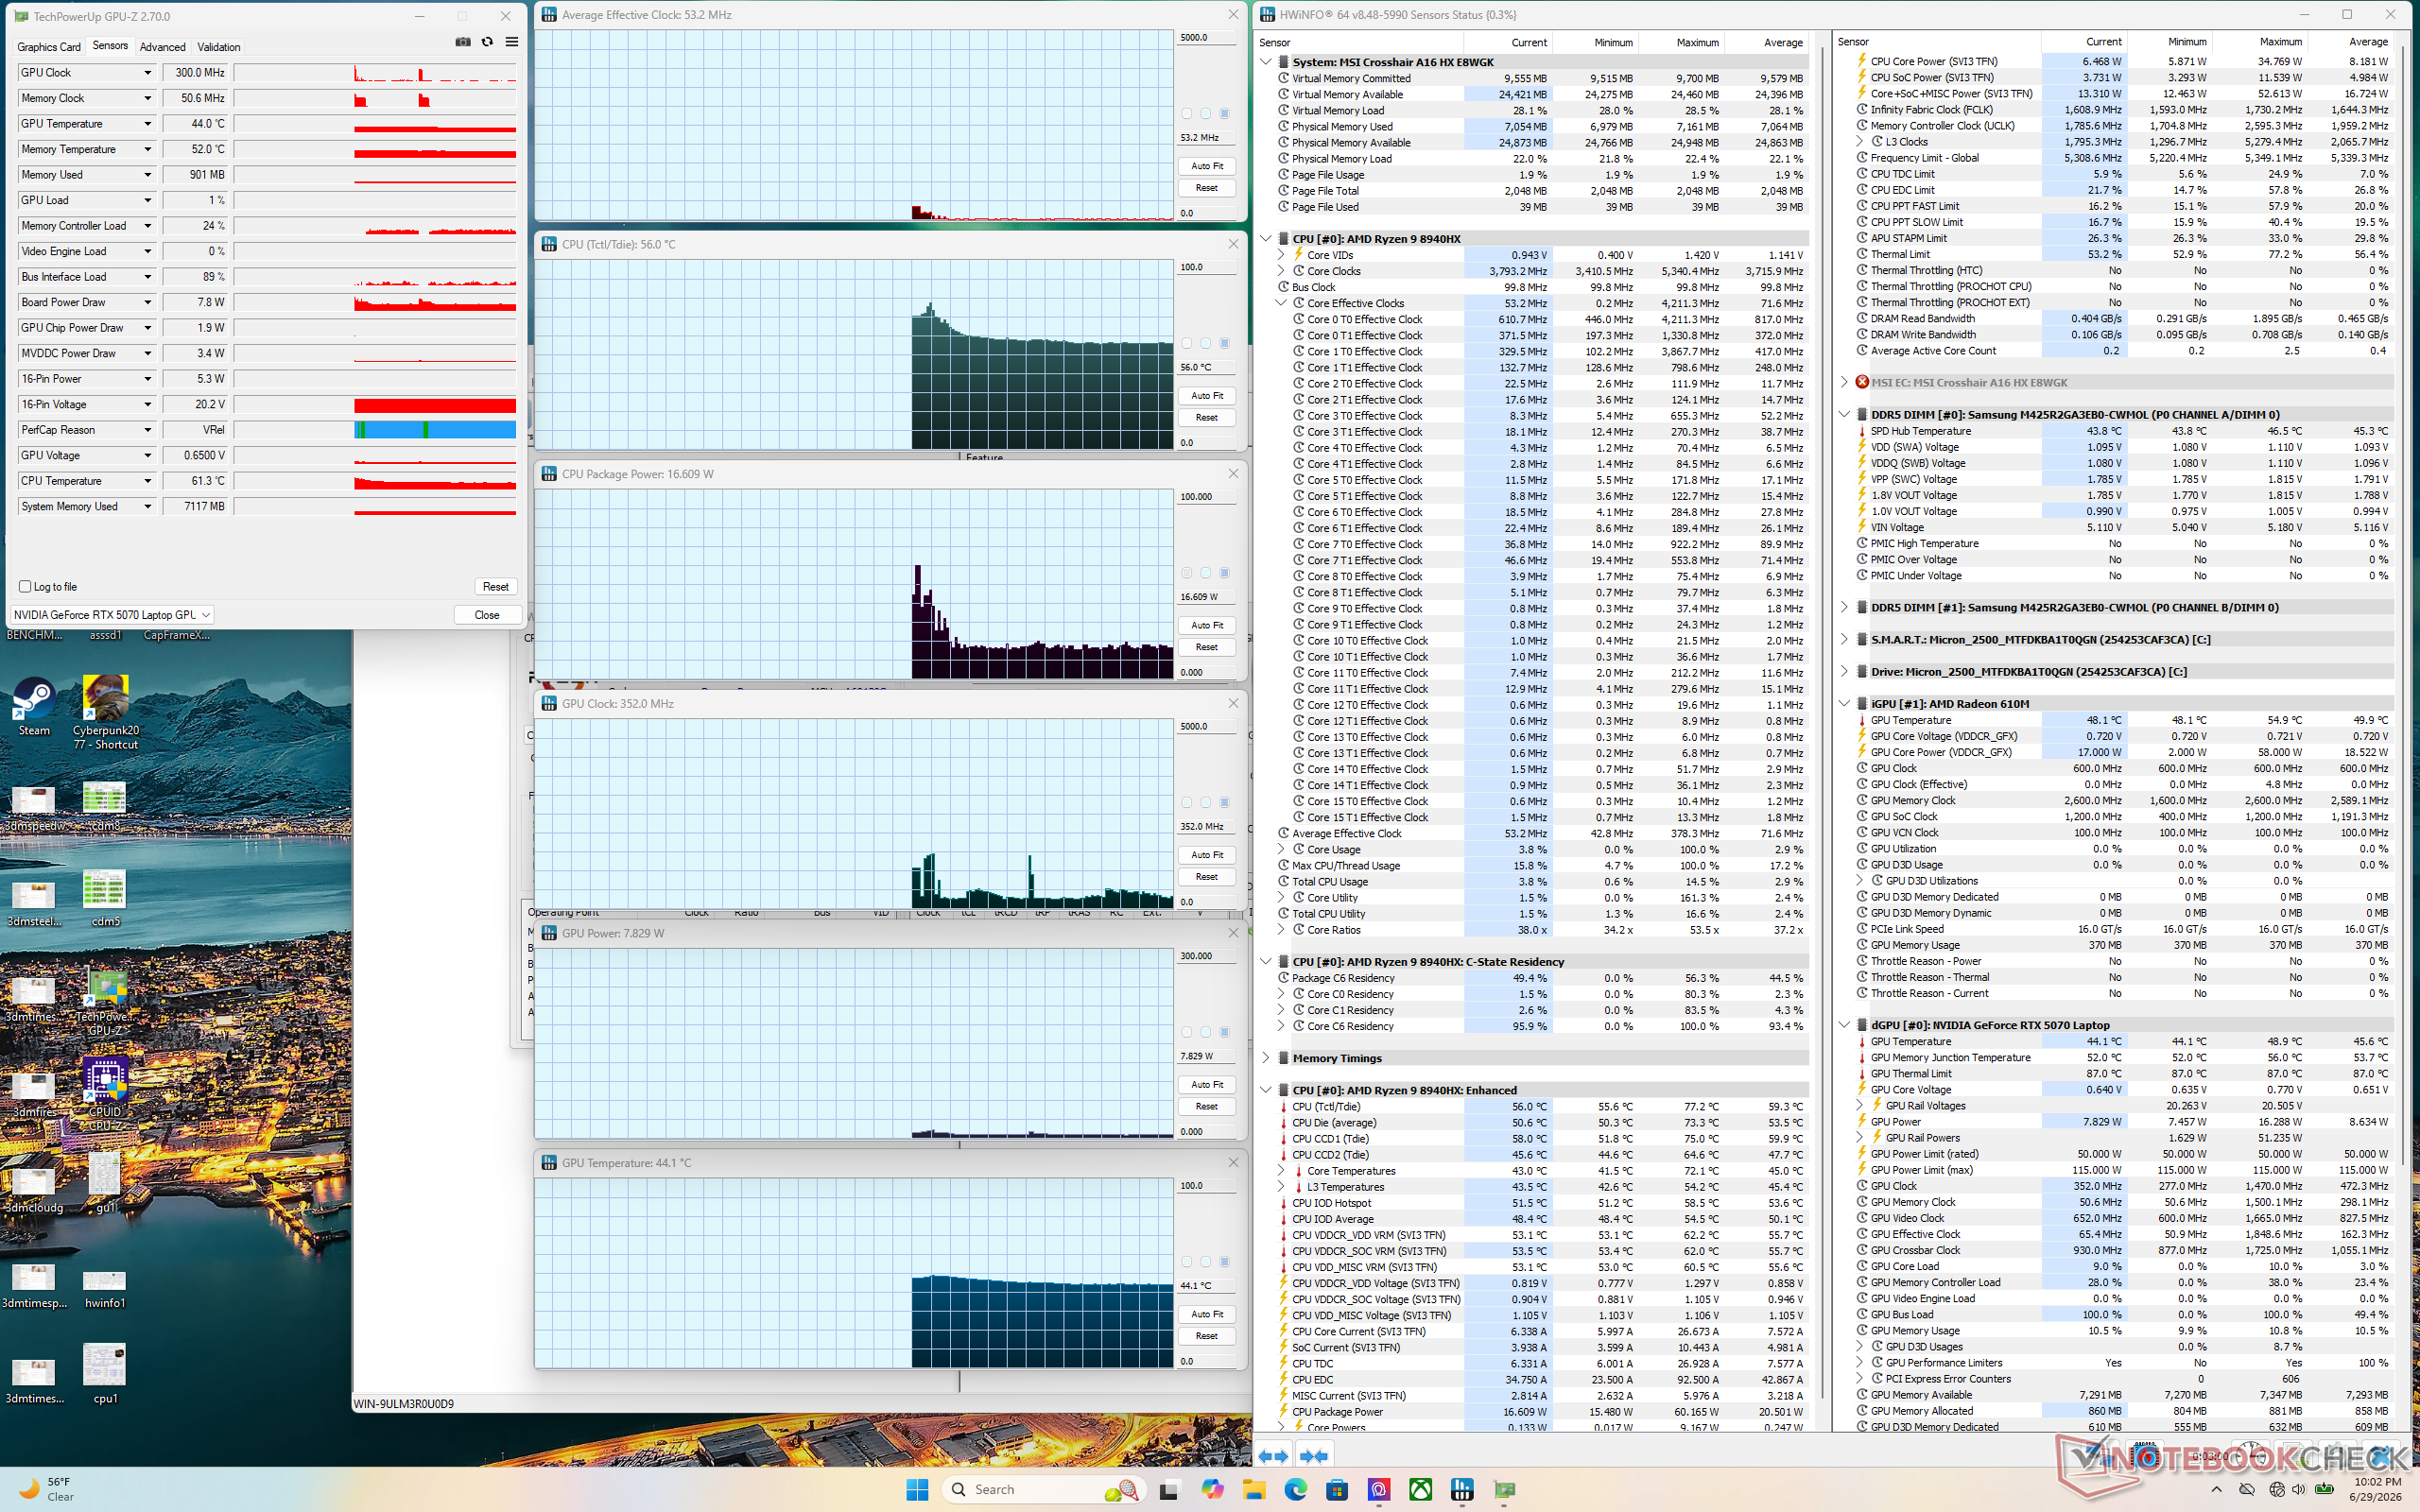
Die CPU- und GPU-Temperaturen beim Spielen im Modus Performance lagen im Durchschnitt bei Werten in der Mitte bzw. am unteren Ende der 80er. Die Kerntemperaturen waren im Ausgeglichenen Modus um einige Grad Celsius niedriger, allerdings sank die durchschnittliche TGP von 113 auf 99 W, was zu einer geringeren Grafikleistung führte.
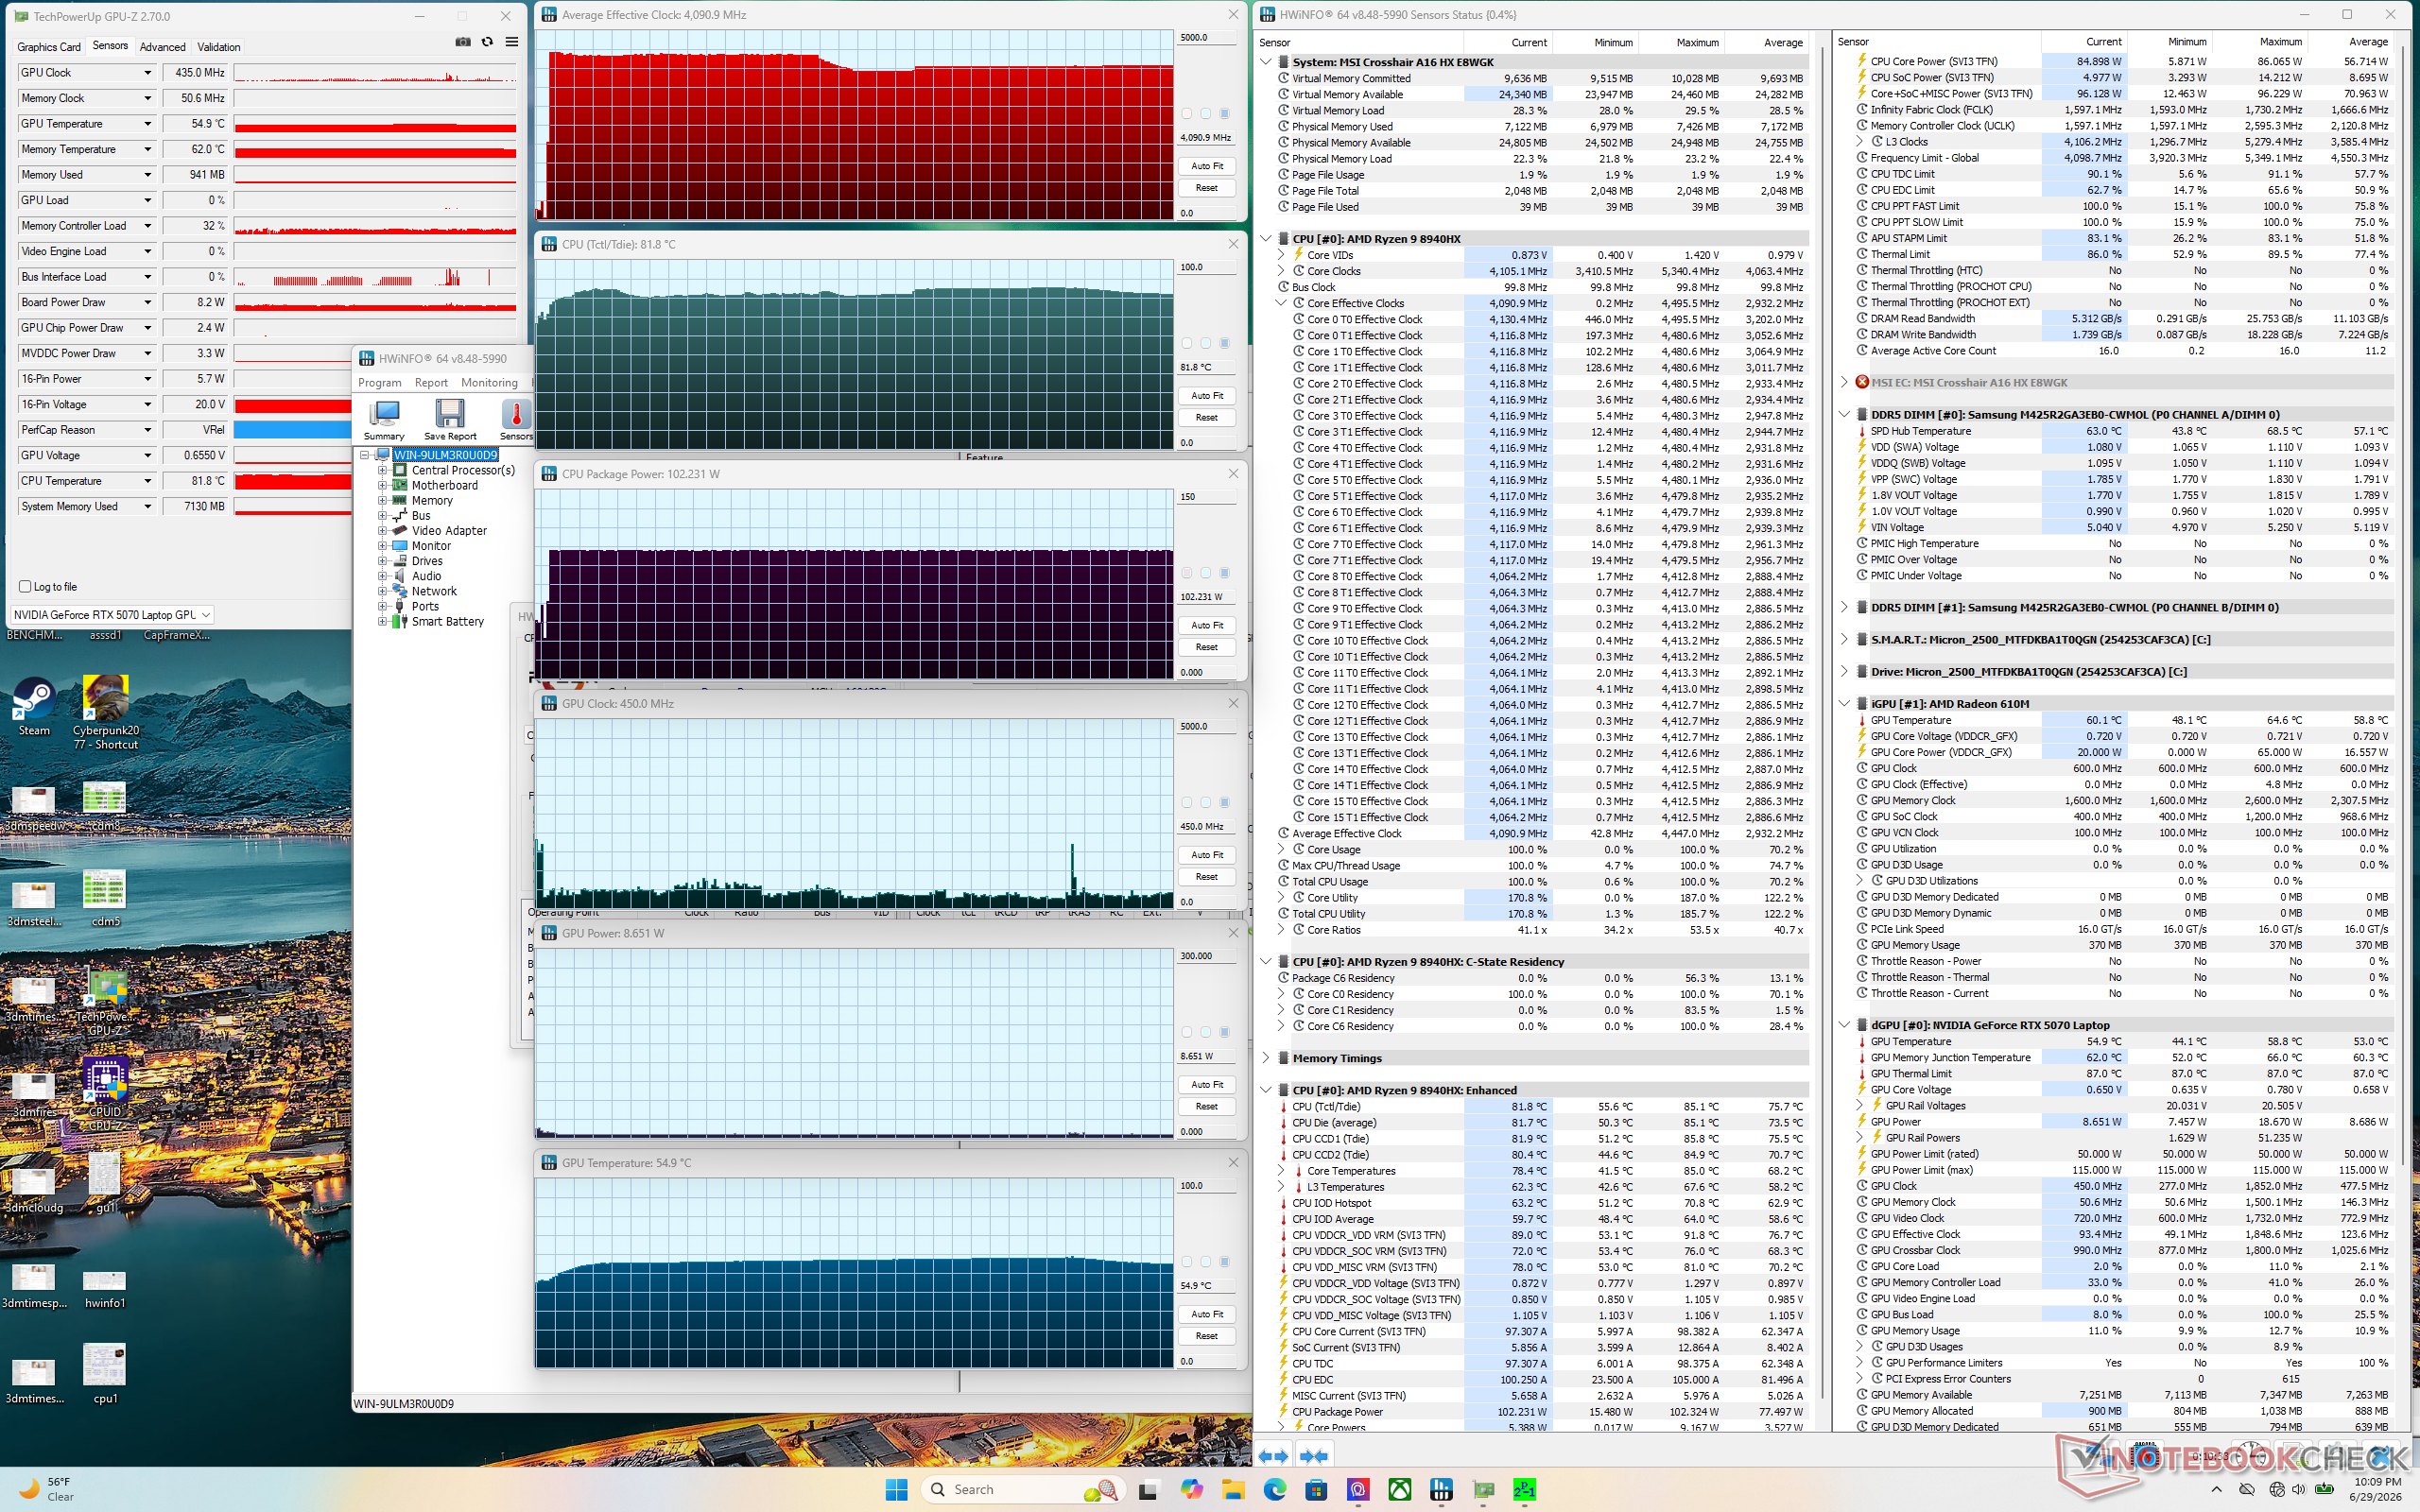
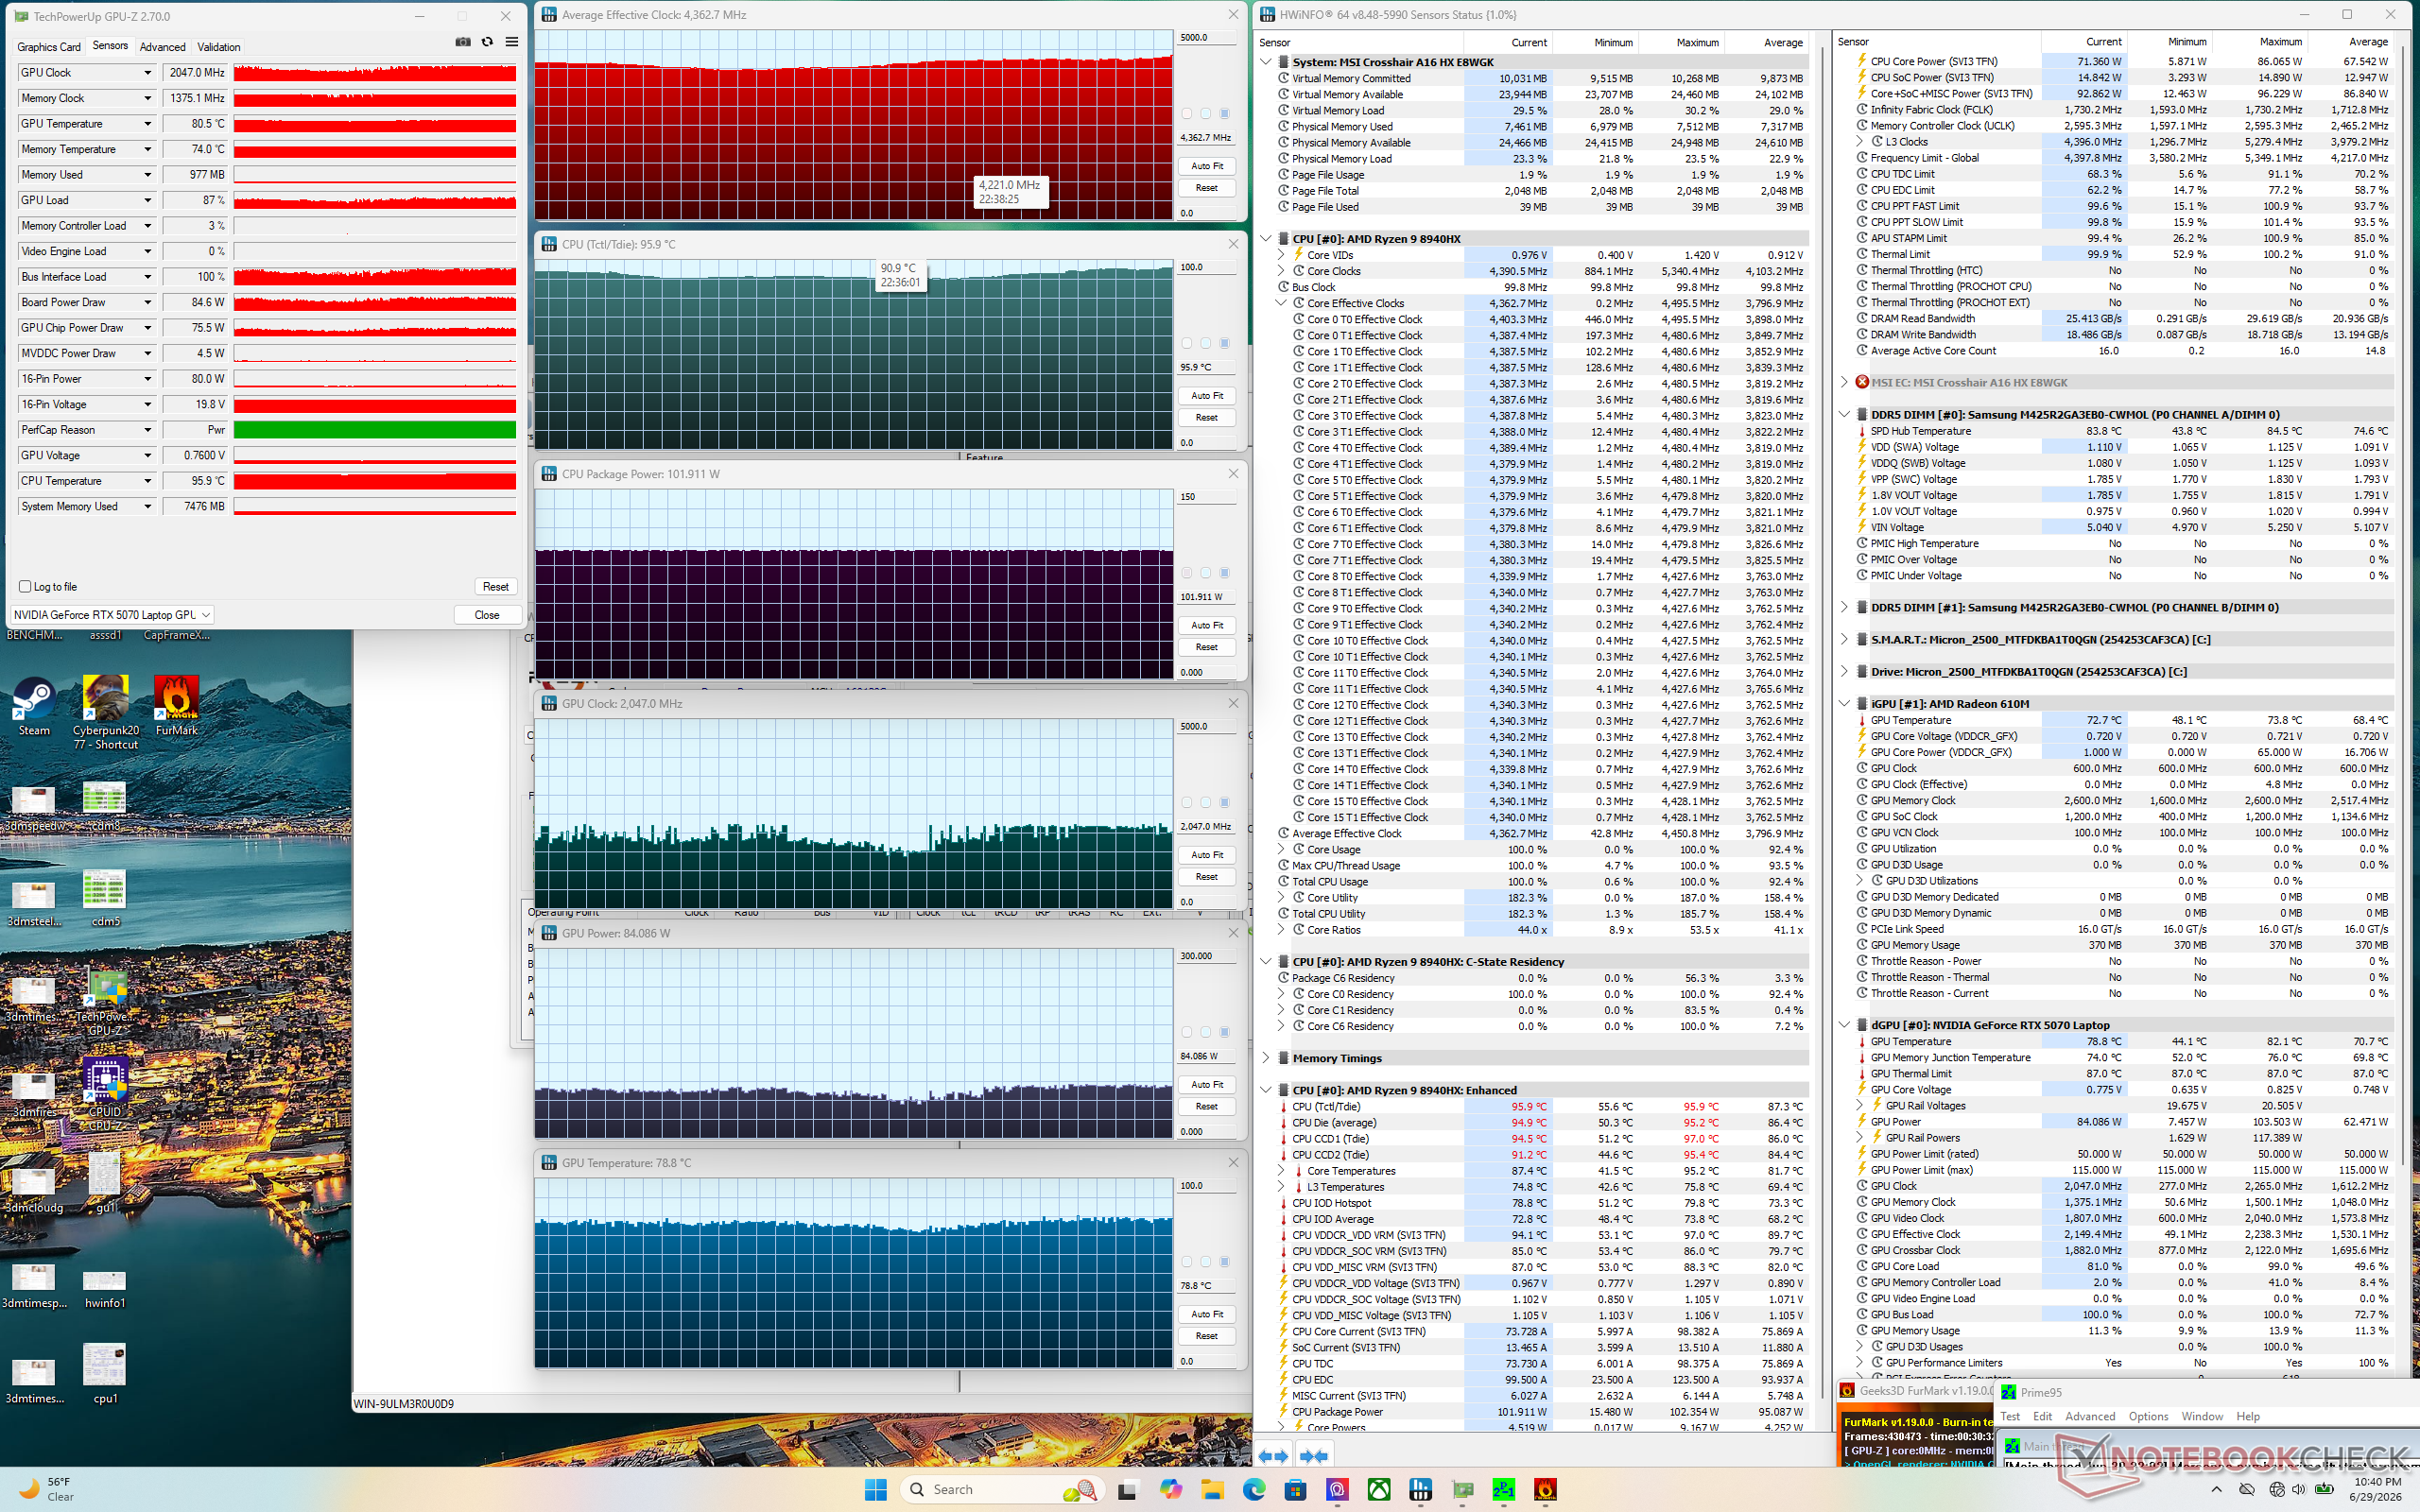
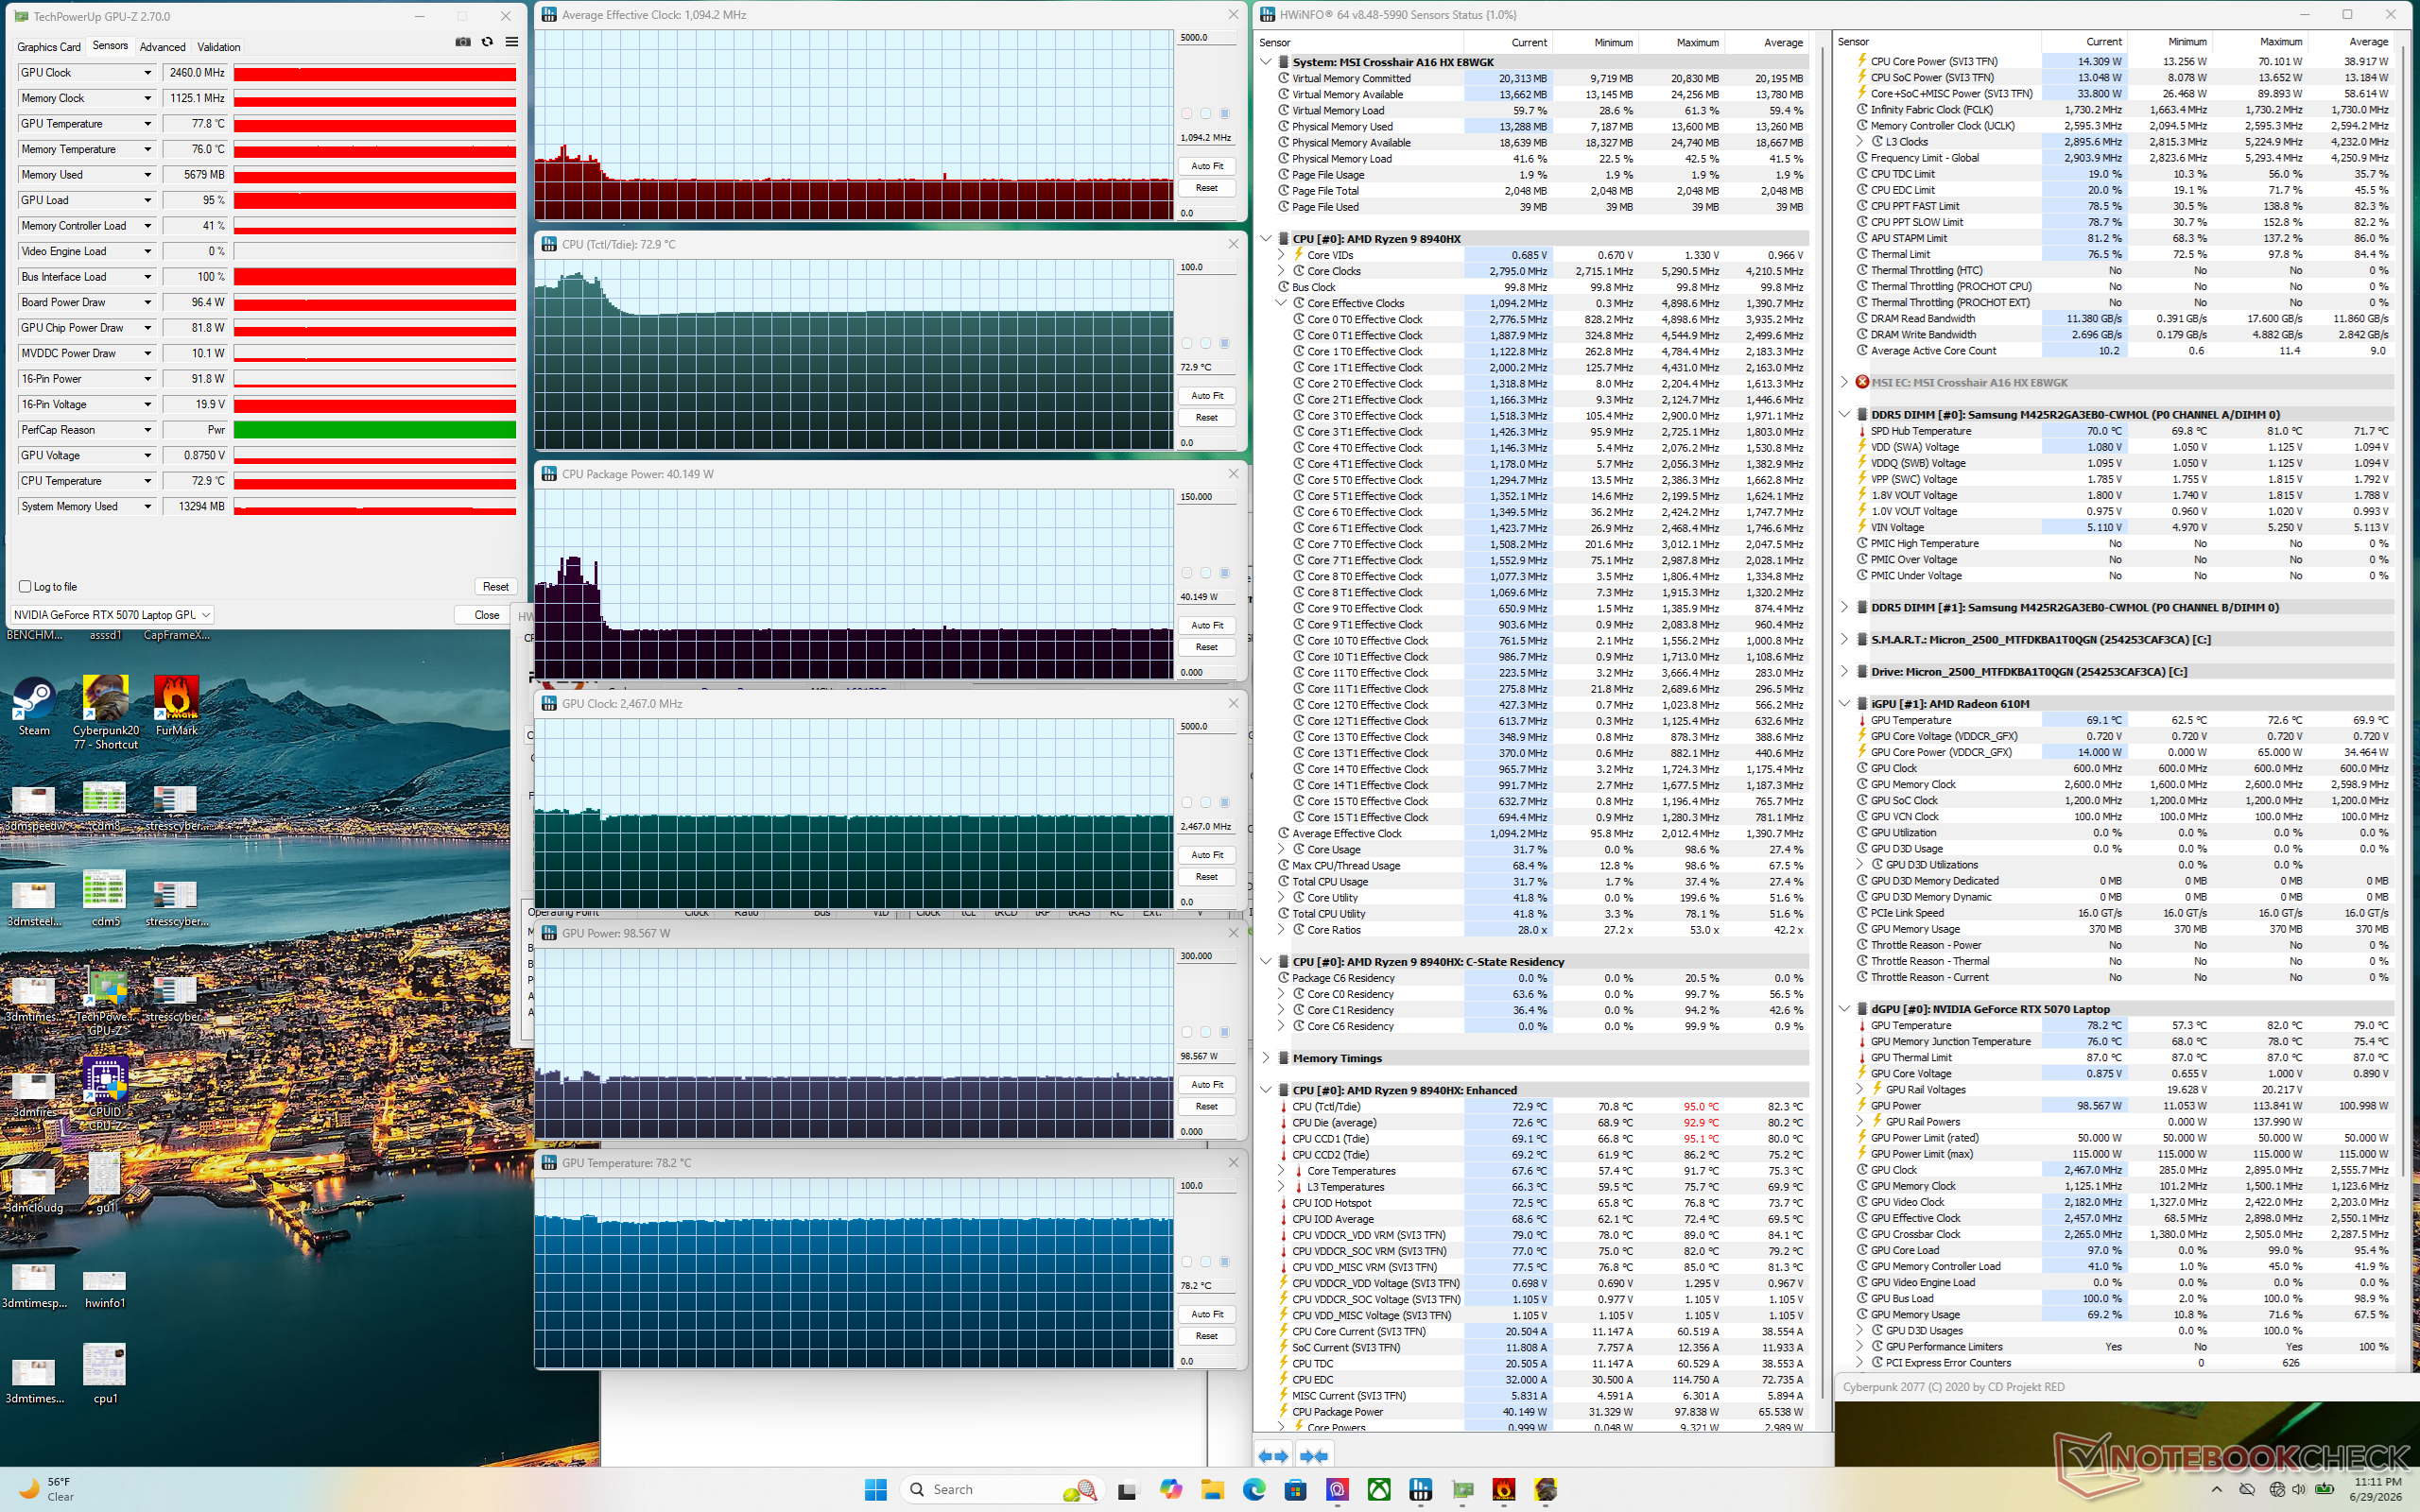
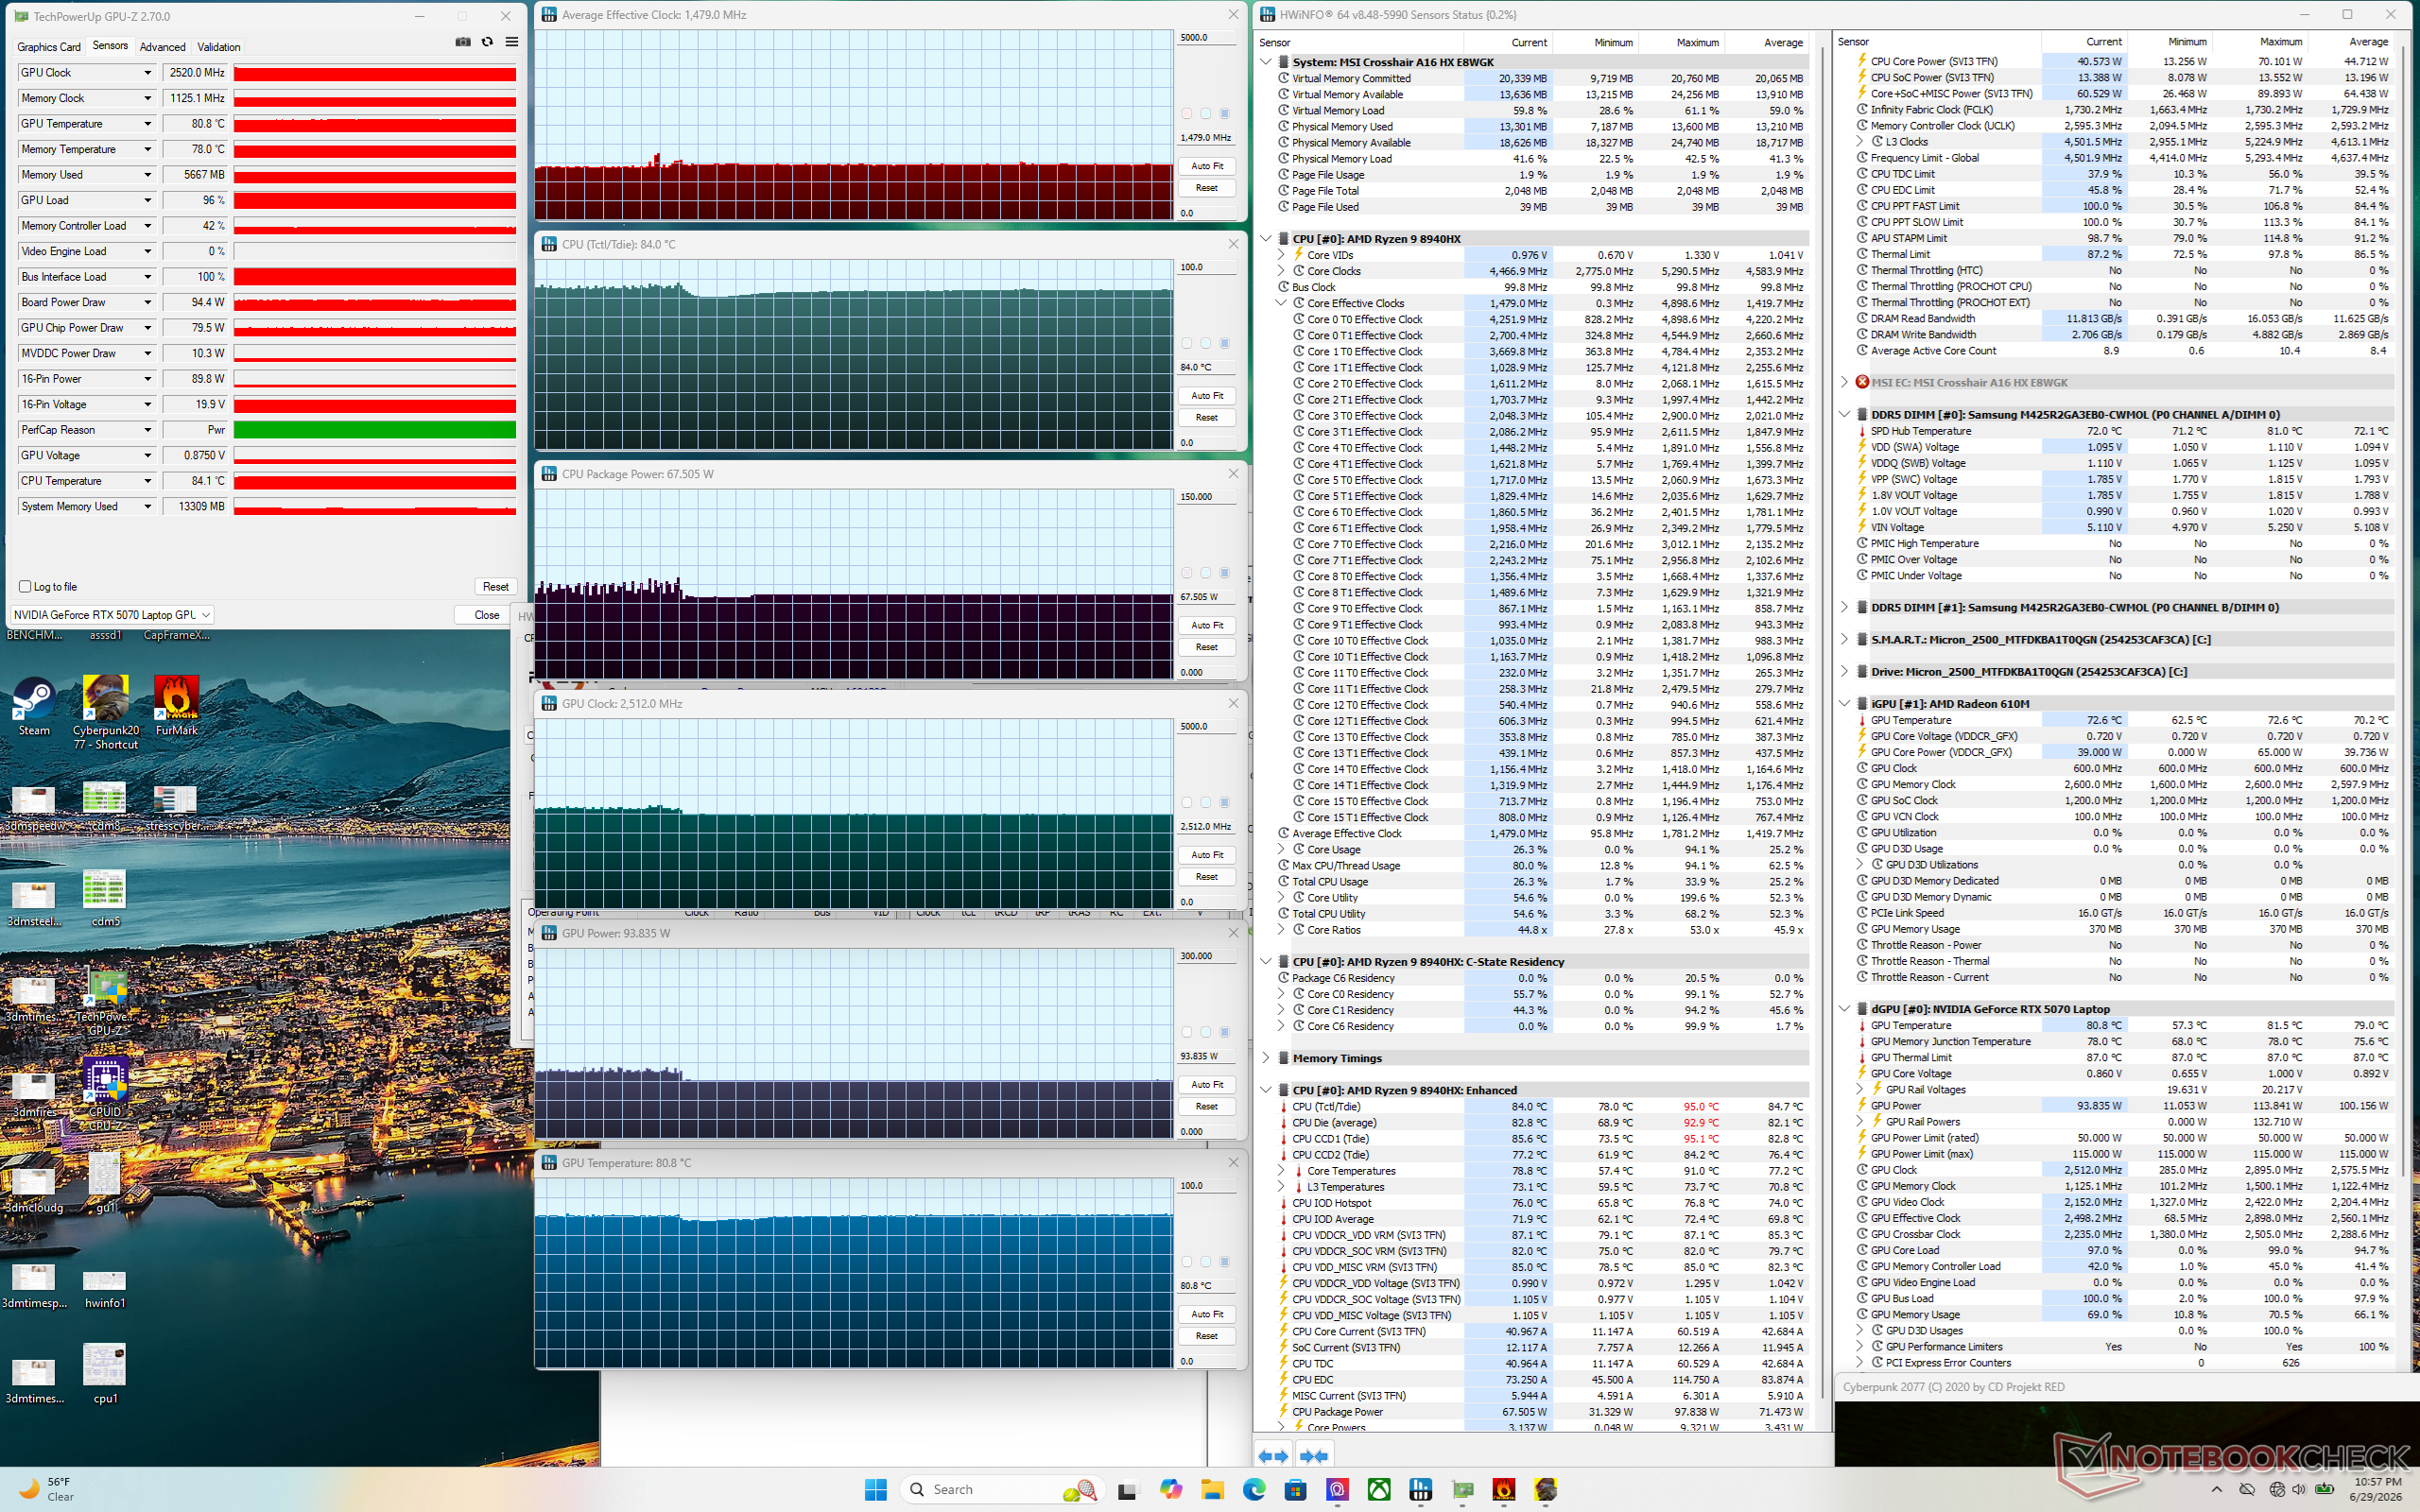
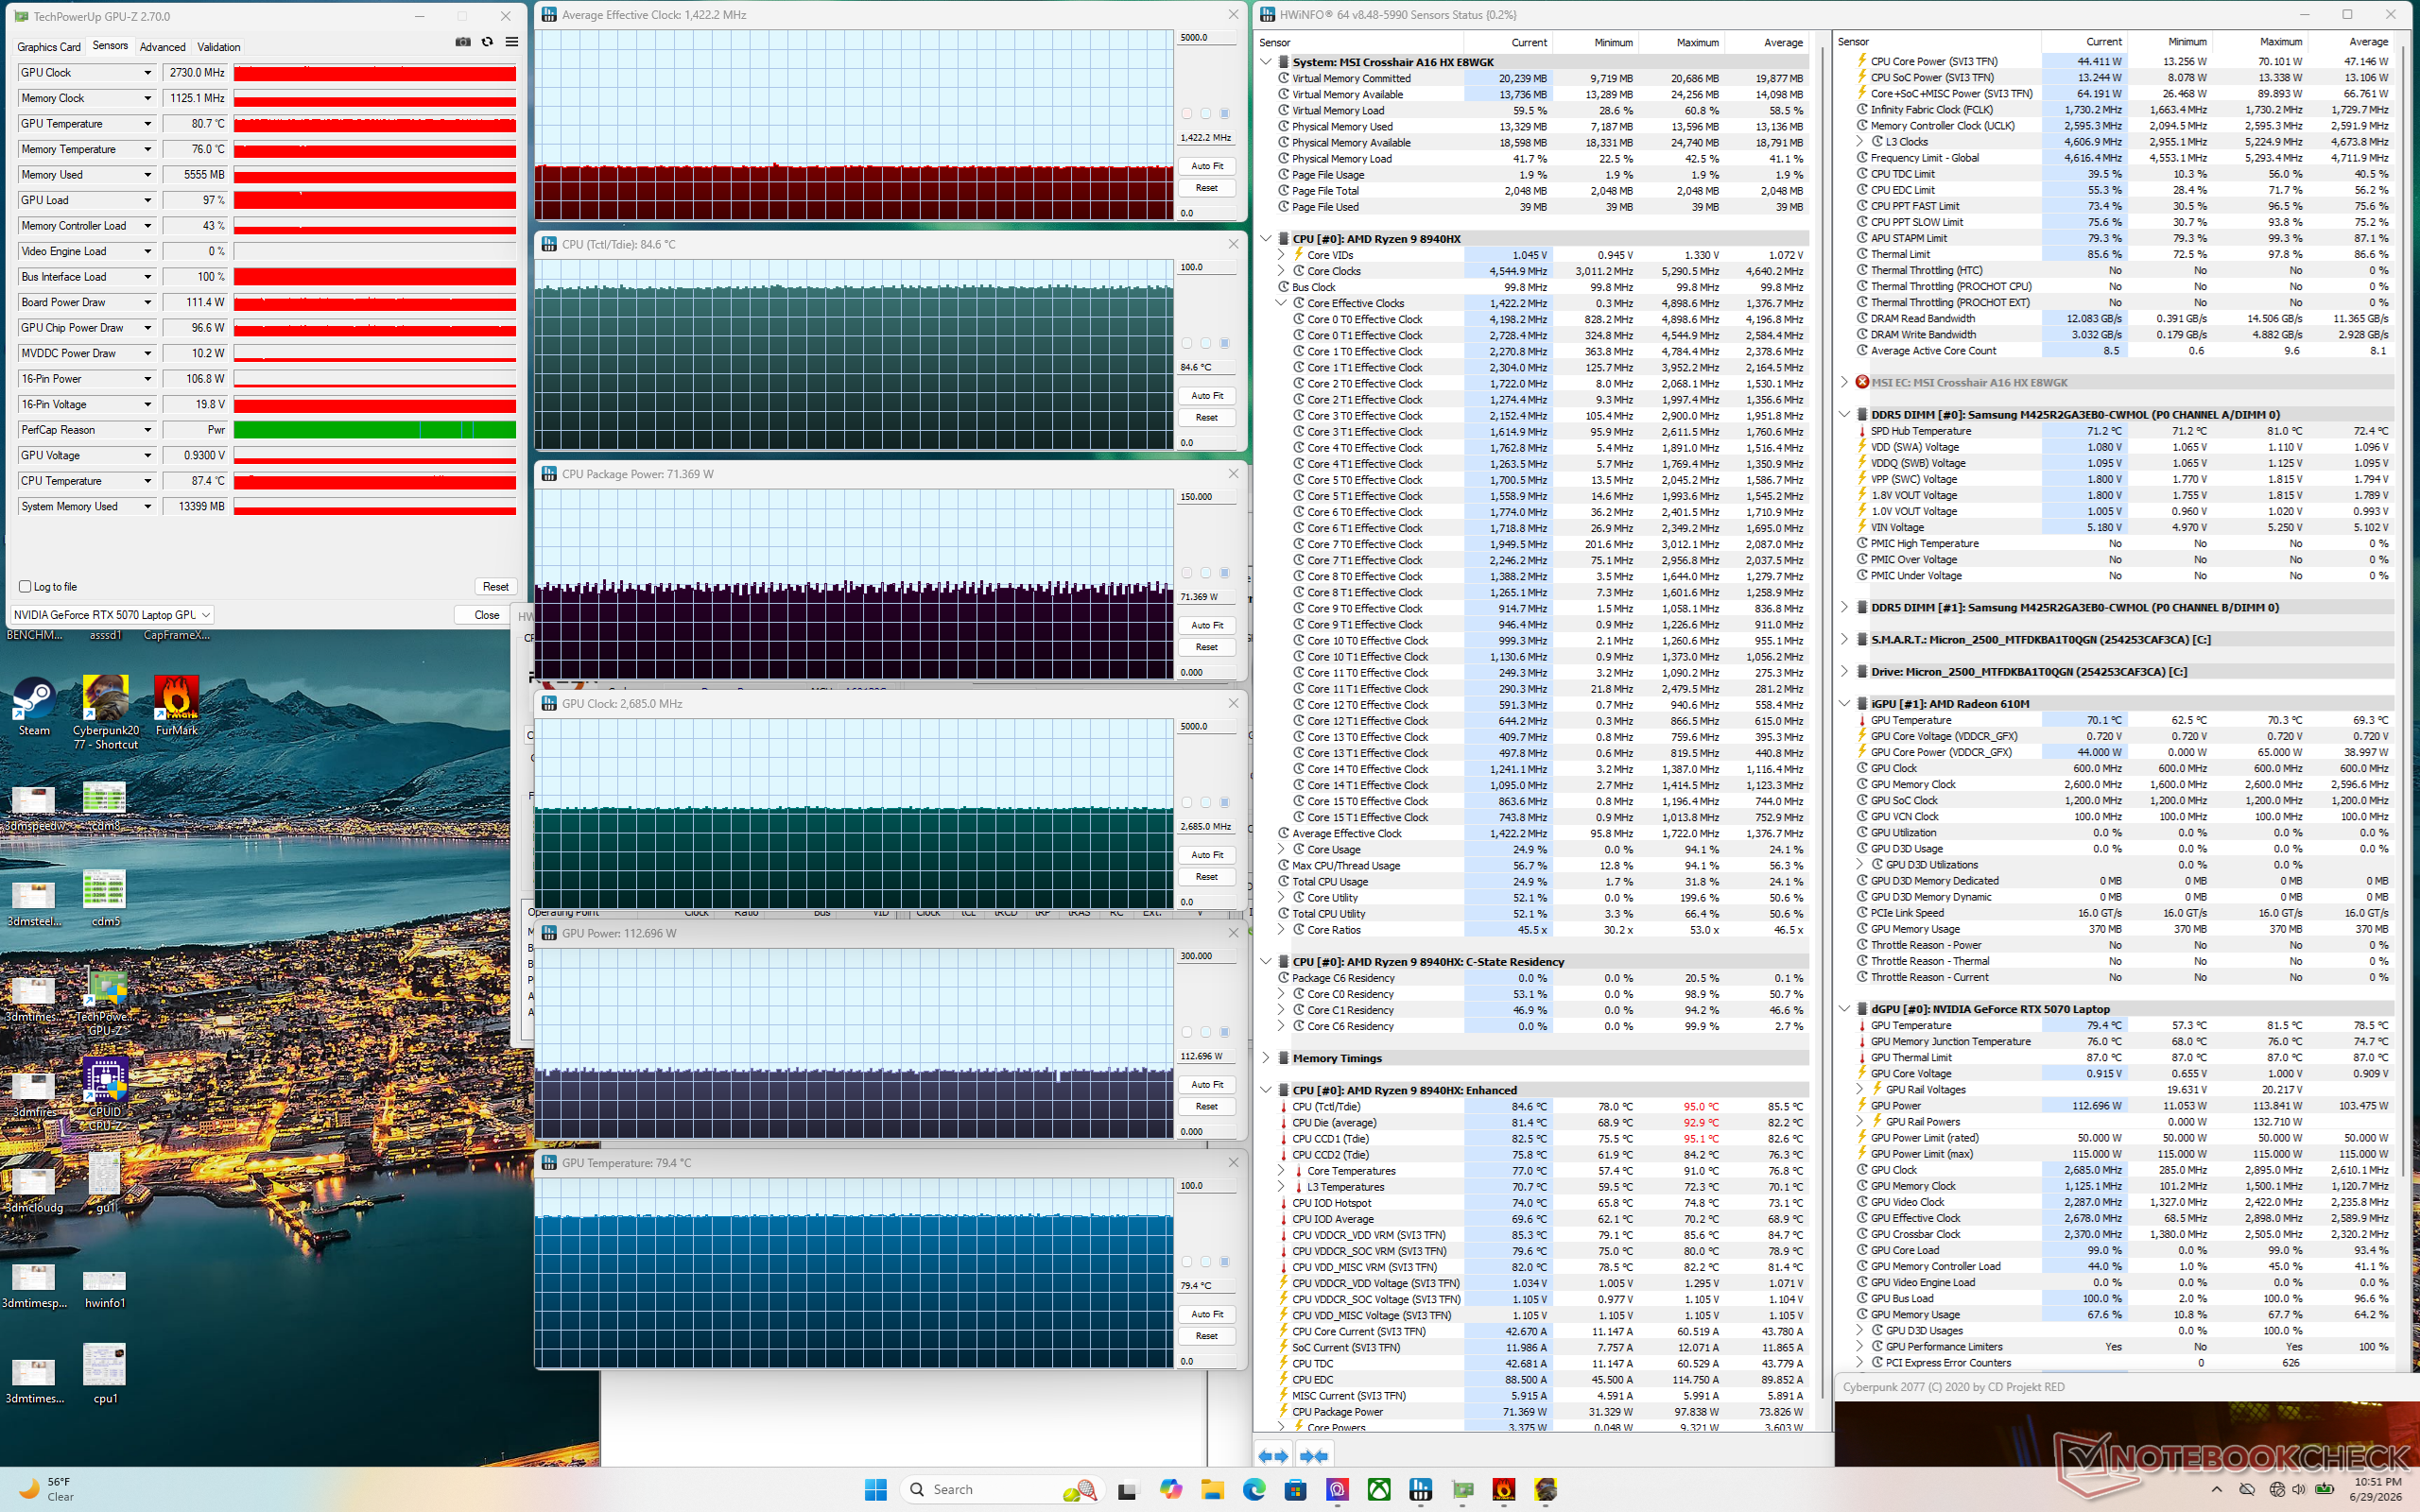

| durchschnittliche CPU-Taktfrequenz (GHz) | GPU-Taktfrequenz (MHz) | durchschnittliche CPU-Temperatur (°C) | durchschnittliche GPU-Temperatur (°C) | |
| System im Leerlauf | -- | -- | 56 | 44 |
| Prime95 Stress | 4,1 | -- | 82 | 55 |
| Prime95 + FurMark Stress | 4,4 | ~2.047 | 96 | 79 |
| Cyberpunk 2077 Stress (ausgewogener Modus) | 1,1 | 2.467 | 73 | 78 |
| Cyberpunk 2077 Stress (Apex deaktiviert, Performance-Modus) | 1,5 | 2.512 | 84 | 81 |
| Cyberpunk 2077 Stress (Apex aktiviert, Performance-Modus) | 1,4 | 2.685 | 85 | 79 |
| Cyberpunk 2077 Stress (Apex aktiviert, Cooler-Boost-Modus) | 1,6 | 2.625 | 85 | 80 |
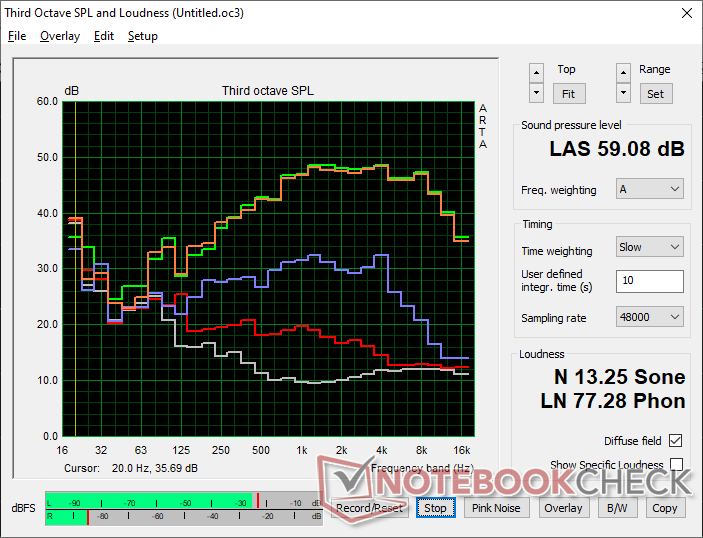
Lautsprecher
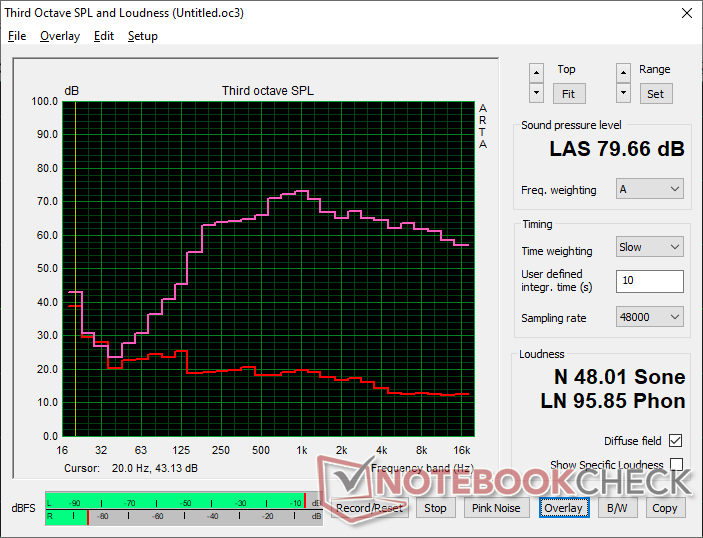
MSI Crosshair A16 HX E8WGK Audio Analyse
(±) | Mittelmäßig laut spielende Lautsprecher (79.7 dB)
Bass 100 - 315 Hz
(±) | abgesenkter Bass - 8.8% geringer als der Median
(±) | durchschnittlich lineare Bass-Wiedergabe (10% Delta zum Vorgänger)
Mitteltöne 400 - 2000 Hz
(+) | ausgeglichene Mitten, vom Median nur 4.5% abweichend
(+) | lineare Mitten (4.6% Delta zum Vorgänger)
Hochtöne 2 - 16 kHz
(+) | ausgeglichene Hochtöne, vom Median nur 1.7% abweichend
(+) | sehr lineare Hochtöne (3.6% Delta zum Vorgänger)
Gesamt im hörbaren Bereich 100 - 16.000 Hz
(+) | hörbarer Bereich ist sehr linear (12.7% Abstand zum Median
Im Vergleich zu allen Geräten derselben Klasse
» 16% aller getesteten Geräte dieser Klasse waren besser, 4% vergleichbar, 80% schlechter
» Das beste Gerät hat einen Delta-Wert von 6%, durchschnittlich ist 18%, das schlechteste Gerät hat 132%
Im Vergleich zu allen Geräten im Test
» 12% aller getesteten Geräte waren besser, 3% vergleichbar, 86% schlechter
» Das beste Gerät hat einen Delta-Wert von 4%, durchschnittlich ist 24%, das schlechteste Gerät hat 134%
Apple MacBook Pro 16 2021 M1 Pro Audio Analyse
(+) | Die Lautsprecher können relativ laut spielen (84.7 dB)
Bass 100 - 315 Hz
(+) | guter Bass - nur 3.8% Abweichung vom Median
(+) | lineare Bass-Wiedergabe (5.2% Delta zum Vorgänger)
Mitteltöne 400 - 2000 Hz
(+) | ausgeglichene Mitten, vom Median nur 1.3% abweichend
(+) | lineare Mitten (2.1% Delta zum Vorgänger)
Hochtöne 2 - 16 kHz
(+) | ausgeglichene Hochtöne, vom Median nur 1.9% abweichend
(+) | sehr lineare Hochtöne (2.7% Delta zum Vorgänger)
Gesamt im hörbaren Bereich 100 - 16.000 Hz
(+) | hörbarer Bereich ist sehr linear (4.6% Abstand zum Median
Im Vergleich zu allen Geräten derselben Klasse
» 0% aller getesteten Geräte dieser Klasse waren besser, 0% vergleichbar, 100% schlechter
» Das beste Gerät hat einen Delta-Wert von 5%, durchschnittlich ist 17%, das schlechteste Gerät hat 45%
Im Vergleich zu allen Geräten im Test
» 0% aller getesteten Geräte waren besser, 0% vergleichbar, 100% schlechter
» Das beste Gerät hat einen Delta-Wert von 4%, durchschnittlich ist 24%, das schlechteste Gerät hat 134%
Energieverwaltung
Stromverbrauch
| Aus / Standby | |
| Idle | |
| Last |
|
Legende:
min: | |
| MSI Crosshair A16 HX E8WGK R9 8940HX, GeForce RTX 5070 Laptop, Micron 2500 1TB MTFDKBA1T0QGN, IPS, 2560x1600, 16" | MSI Crosshair 16 HX AI D2XWGKG Ultra 9 275HX, GeForce RTX 5070 Laptop, Micron 2500 1TB MTFDKBA1T0QGN, IPS, 2560x1600, 16" | Alienware 16X Aurora Core Ultra 9 290HX Plus Ultra 9 290HX Plus, GeForce RTX 5070 Ti Laptop, , OLED, 2560x1600, 16" | Lenovo Legion 7 16 AGP11 Ryzen AI 9 HX 470, GeForce RTX 5060 Laptop, Lenovo UMIS AM541 1TB, OLED, 2560x1600, 16" | Gigabyte Gaming A16 Pro GA6DH (Core 7 240H, RTX 5070 Ti) Core 7 240H, GeForce RTX 5070 Ti Laptop, Samsung PM9C1b MZVL81T0HFLB-00BTW, IPS, 2560x1600, 16" | Acer Predator Helios Neo 16S AI PHN16S-71-94L9 Ultra 9 275HX, GeForce RTX 5070 Ti Laptop, Micron 3500 1TB MTFDKBA1T0TGD, OLED, 2560x1600, 16" | |
|---|---|---|---|---|---|---|
| Stromverbrauch | -25% | 22% | 42% | 3% | 37% | |
| Idle min * (Watt) | 12.3 | 26.2 -113% | 6.9 44% | 5.7 54% | 21.5 -75% | 3.9 68% |
| Idle avg * (Watt) | 17.1 | 33.8 -98% | 8.1 53% | 8.7 49% | 28.3 -65% | 11 36% |
| Idle max * (Watt) | 42.4 | 34 20% | 31 27% | 9.1 79% | 26.3 38% | 16.9 60% |
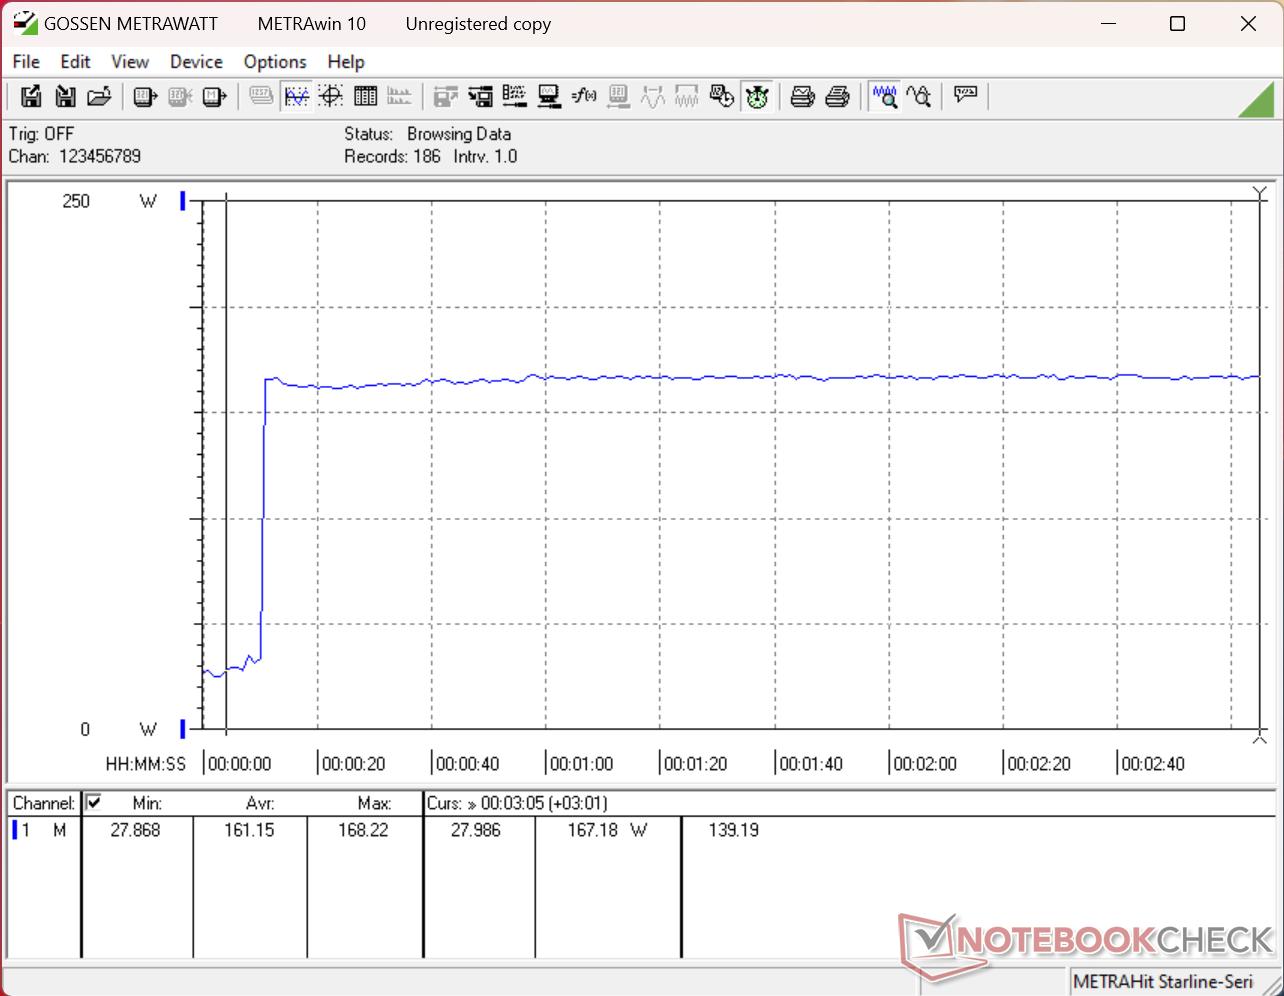
| Last avg * (Watt) | 130.2 | 112 14% | 131.6 -1% | 88.7 32% | 92.5 29% | 123 6% |
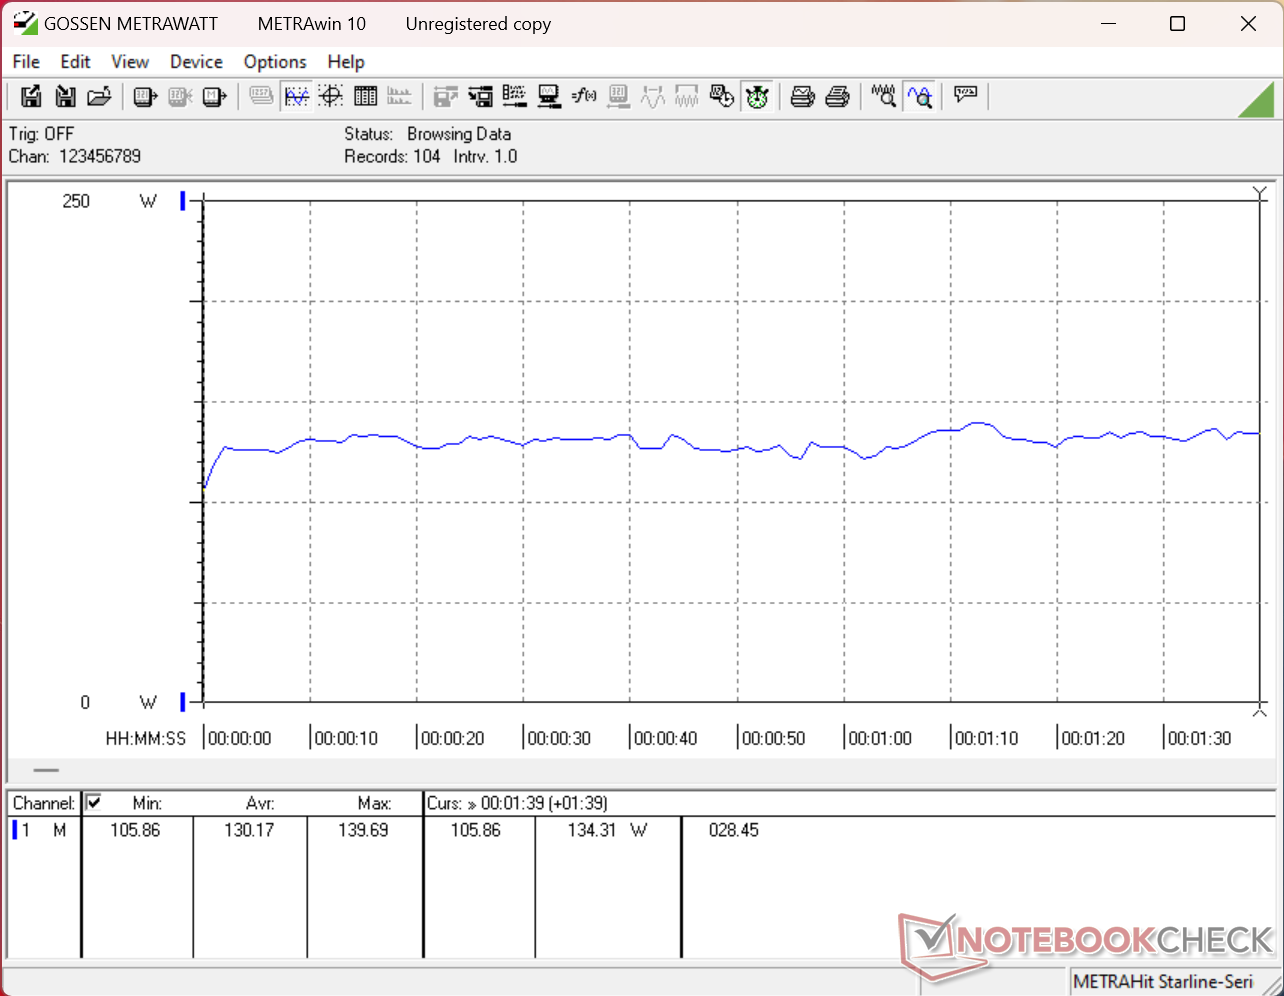
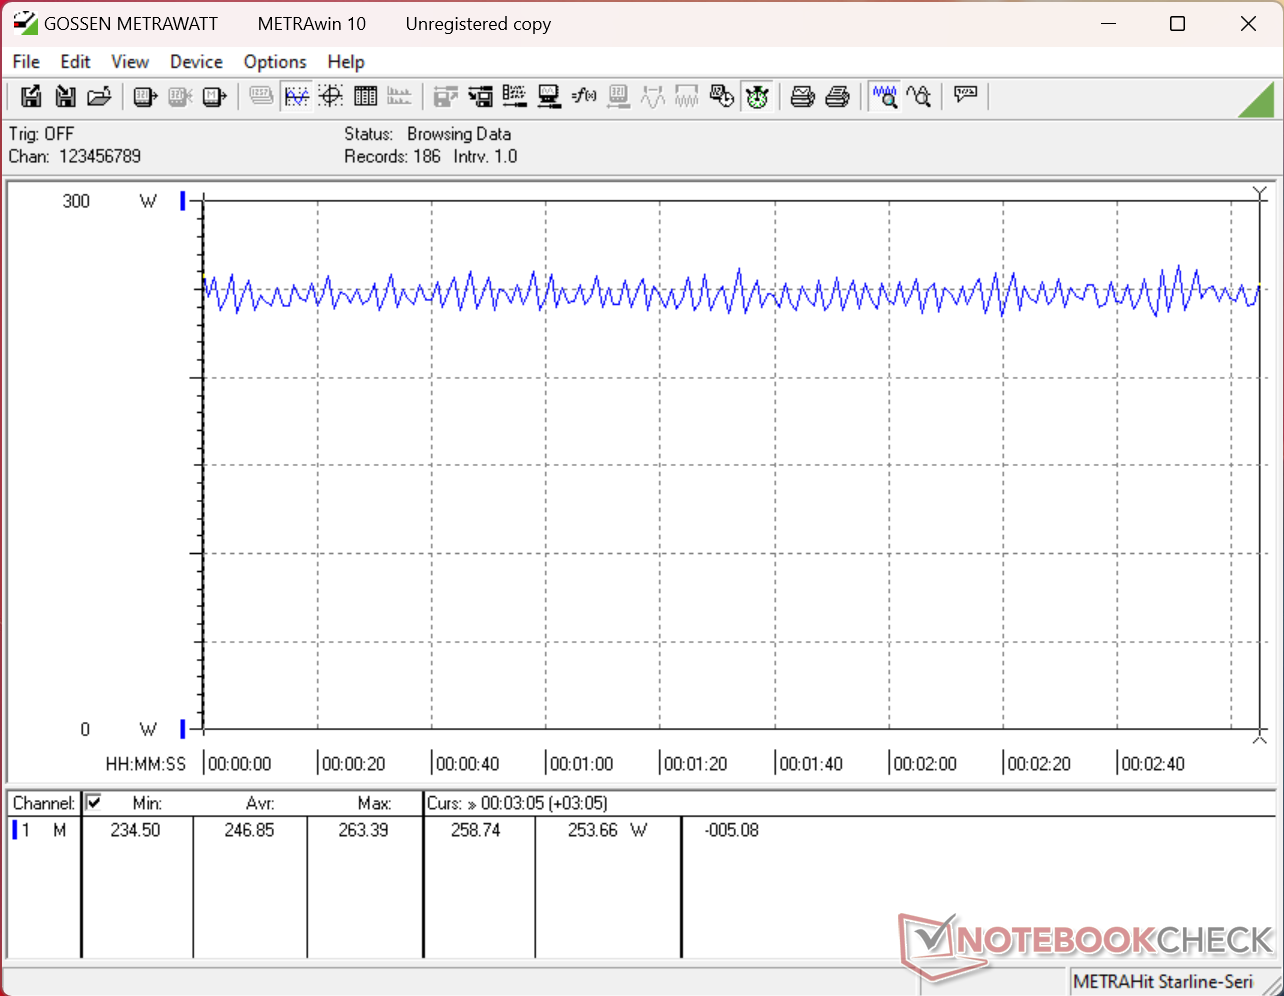
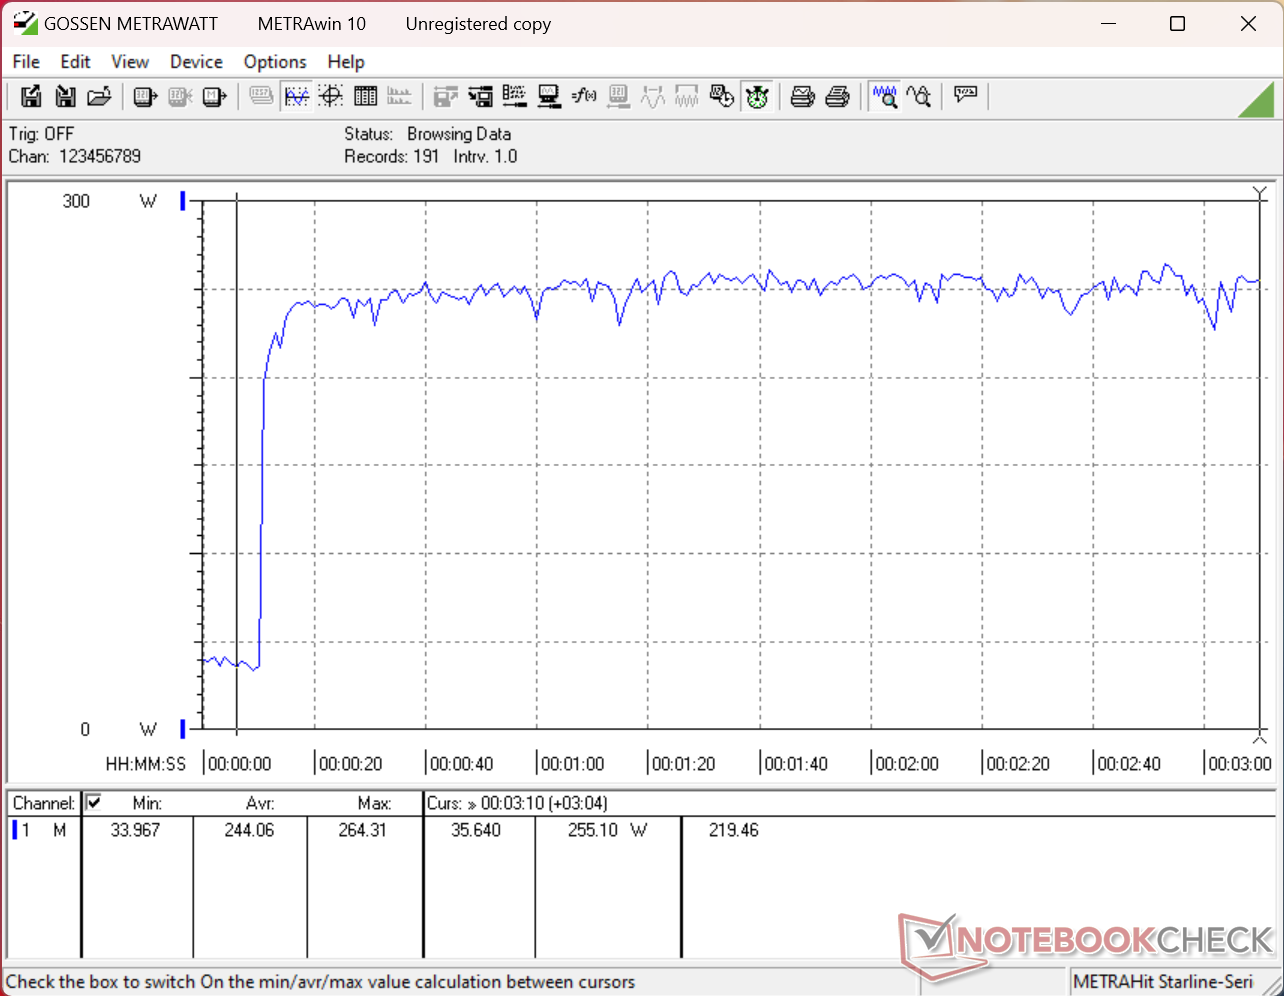
| Cyberpunk 2077 ultra * (Watt) | 246 | 224 9% | 198.3 19% | 160.3 35% | 165 33% | 152.7 38% |
| Cyberpunk 2077 ultra external monitor * (Watt) | 242 | 220 9% | 172.1 29% | 156.9 35% | 158 35% | 144.9 40% |
| Last max * (Watt) | 264.3 | 315 -19% | 300.1 -14% | 234.9 11% | 195 26% | 229 13% |
* ... kleinere Werte sind besser
Stromverbrauch Cyberpunk/Stresstest
Stromverbrauch des externen Monitors
Akkulaufzeit
| MSI Crosshair A16 HX E8WGK R9 8940HX, GeForce RTX 5070 Laptop, 80 Wh | MSI Crosshair 16 HX AI D2XWGKG Ultra 9 275HX, GeForce RTX 5070 Laptop, 90 Wh | Alienware 16X Aurora Core Ultra 9 290HX Plus Ultra 9 290HX Plus, GeForce RTX 5070 Ti Laptop, 96 Wh | Lenovo Legion 7 16 AGP11 Ryzen AI 9 HX 470, GeForce RTX 5060 Laptop, 84 Wh | Gigabyte Gaming A16 Pro GA6DH (Core 7 240H, RTX 5070 Ti) Core 7 240H, GeForce RTX 5070 Ti Laptop, 76 Wh | Acer Predator Helios Neo 16S AI PHN16S-71-94L9 Ultra 9 275HX, GeForce RTX 5070 Ti Laptop, 76 Wh | |
|---|---|---|---|---|---|---|
| Akkulaufzeit | 102% | 35% | 67% | 51% | -9% | |
| WLAN (h) | 5.5 | 11.1 102% | 7.4 35% | 9.2 67% | 8.3 51% | 5 -9% |
| H.264 (h) | 14.2 |
Notebookcheck Bewertung
Das Crosshair A16 gehört zu den preisgünstigeren Gaming-Notebooks von MSI, bei denen Leistung und Bildschirmqualität Vorrang haben vor Zusatzfunktionen oder luxuriösen Ausstattungsmerkmalen, um Kosten zu sparen.
MSI Crosshair A16 HX E8WGK
- 03.07.2026 v8
Allen Ngo
 Total Sustainability Score:
 Potenzielle Wettbewerber im Vergleich
Bild | Modell / Test | Preis ab | Gewicht | Dicke | Display |
|---|---|---|---|---|---|
1. 82.5%  | MSI Crosshair A16 HX E8WGK AMD Ryzen 9 8940HX ⎘ NVIDIA GeForce RTX 5070 Laptop ⎘ 32 GB RAM, 1024 GB SSD | Amazon: 6.349,02 € Listenpreis: 2700 USD | 2.3 kg | 25.55 mm | 16.00" 2560x1600 189 PPI IPS |
2. 81.9%  | MSI Crosshair 16 HX AI D2XWGKG Intel Core Ultra 9 275HX ⎘ NVIDIA GeForce RTX 5070 Laptop ⎘ 16 GB RAM, 1024 GB SSD | Amazon: 2.882,43 € Geizhals Suche | 2.5 kg | 27.9 mm | 16.00" 2560x1600 189 PPI IPS |
3. 85.9%  | Alienware 16X Aurora Core Ultra 9 290HX Plus Intel Core Ultra 9 290HX Plus ⎘ NVIDIA GeForce RTX 5070 Ti Laptop ⎘ 32 GB RAM | Amazon: 2.539,79 € Bestpreis 2199€ Alternate 2. 2268.02€ galaxus 3. 2392.79€ Easynotebooks.de | 2.6 kg | 23.4 mm | 16.00" 2560x1600 189 PPI OLED |
4. 86.4%  | Lenovo Legion 7 16 AGP11 AMD Ryzen AI 9 HX 470 ⎘ NVIDIA GeForce RTX 5060 Laptop ⎘ 32 GB RAM, 1024 GB SSD | Amazon: 2.014,77 € Bestpreis 2400.04€ Cyberport.de 2. 2400.04€ computeruniverse.net 3. 2420.21€ computeruniverse.at | 1.8 kg | 16.9 mm | 16.00" 2560x1600 189 PPI OLED |
5. 81%  | Gigabyte Gaming A16 Pro GA6DH (Core 7 240H, RTX 5070 Ti) Intel Core 7 240H ⎘ NVIDIA GeForce RTX 5070 Ti Laptop ⎘ 32 GB RAM, 1000 GB SSD | Amazon: 2.690,55 € Bestpreis 1910.99€ Cyberport.de 2. 1910.99€ computeruniverse.net 3. 1917.98€ galaxus | 2.4 kg | 22.99 mm | 16.00" 2560x1600 189 PPI IPS |
6. 82%  | Acer Predator Helios Neo 16S AI PHN16S-71-94L9 Intel Core Ultra 9 275HX ⎘ NVIDIA GeForce RTX 5070 Ti Laptop ⎘ 32 GB RAM, 1024 GB SSD | Amazon: Bestpreis 2687€ AO-Projekt 2. 2741€ ao-projekt 3. 2753€ A&O Projekt | 2.2 kg | 19.9 mm | 16.00" 2560x1600 189 PPI OLED |
Transparenz
Die Auswahl der zu testenden Geräte erfolgt innerhalb der Redaktion. Das vorliegende Testmuster wurde dem Autor vom Hersteller oder einem Shop zu Testzwecken leihweise zur Verfügung gestellt. Eine Einflussnahme des Leihstellers auf den Testbericht gab es nicht, der Hersteller erhielt keine Version des Reviews vor der Veröffentlichung. Es bestand keine Verpflichtung zur Publikation. Als eigenständiges, unabhängiges Unternehmen unterliegt Notebookcheck keiner Diktion von Herstellern, Shops und Verlagen.
So testet Notebookcheck
Pro Jahr werden von Notebookcheck hunderte Laptops und Smartphones unabhängig in von uns standardisierten technischen Verfahren getestet, um eine Vergleichbarkeit aller Testergebnisse zu gewährleisten. Seit rund 20 Jahren entwickeln wir diese Testmethoden kontinuierlich weiter und setzen damit Branchenstandards. In unseren Testlaboren kommt ausschließlich hochwertiges Messequipment in die Hände erfahrener Techniker und Redakteure. Die Tests unterliegen einer mehrstufigen Kontrolle. Unsere komplexe Gesamtbewertung basiert auf hunderten fundierten Messergebnissen und Benchmarks, womit Ihnen Objektivität garantiert ist. Weitere Informationen zu unseren Testmethoden gibt es hier.
Keine Kommentare zum Artikel

