Fazit - Mehr Features für mehr Geld
Einer unserer größten Kritikpunkte am 2025 Alienware 16X Aurora war das Fehlen von OLED, HDR-Unterstützung und GeForce RTX 5070 Ti Optionen. Jetzt, ein Jahr später, kann das 16X Aurora 2026 mit diesen Funktionen plus dem brandneuen Core Ultra 9 290HX Plus als CPU-Option statt dem bisherigen Core Ultra 9 275HX konfiguriert werden.
Die neue CPU bringt speziell für Gamer nur sehr wenig und ist daher wohl kein Grund, sich für das 2026er 16X Aurora gegenüber dem 2025er Modell zu entscheiden. Die neue RTX 5070 Ti Option ist da schon eher Verkaufsargument, da sie deutlich schneller läuft als die RTX 5070 des letzten Jahres.
Zudem ist das matte OLED-Panel einzigartig in der Branche, die meisten anderen sind glänzend. Die Bildqualität ist noch besser als bei der bereits großartigen IPS-Option, aber leider immer noch ein bisschen körnig. Auch die Helligkeit ist für ein OLED nur durchschnittlich; das konkurrierende Lenovo Legion Pro 5 mit seinem glänzenden OLED-Panel strahlt heller.
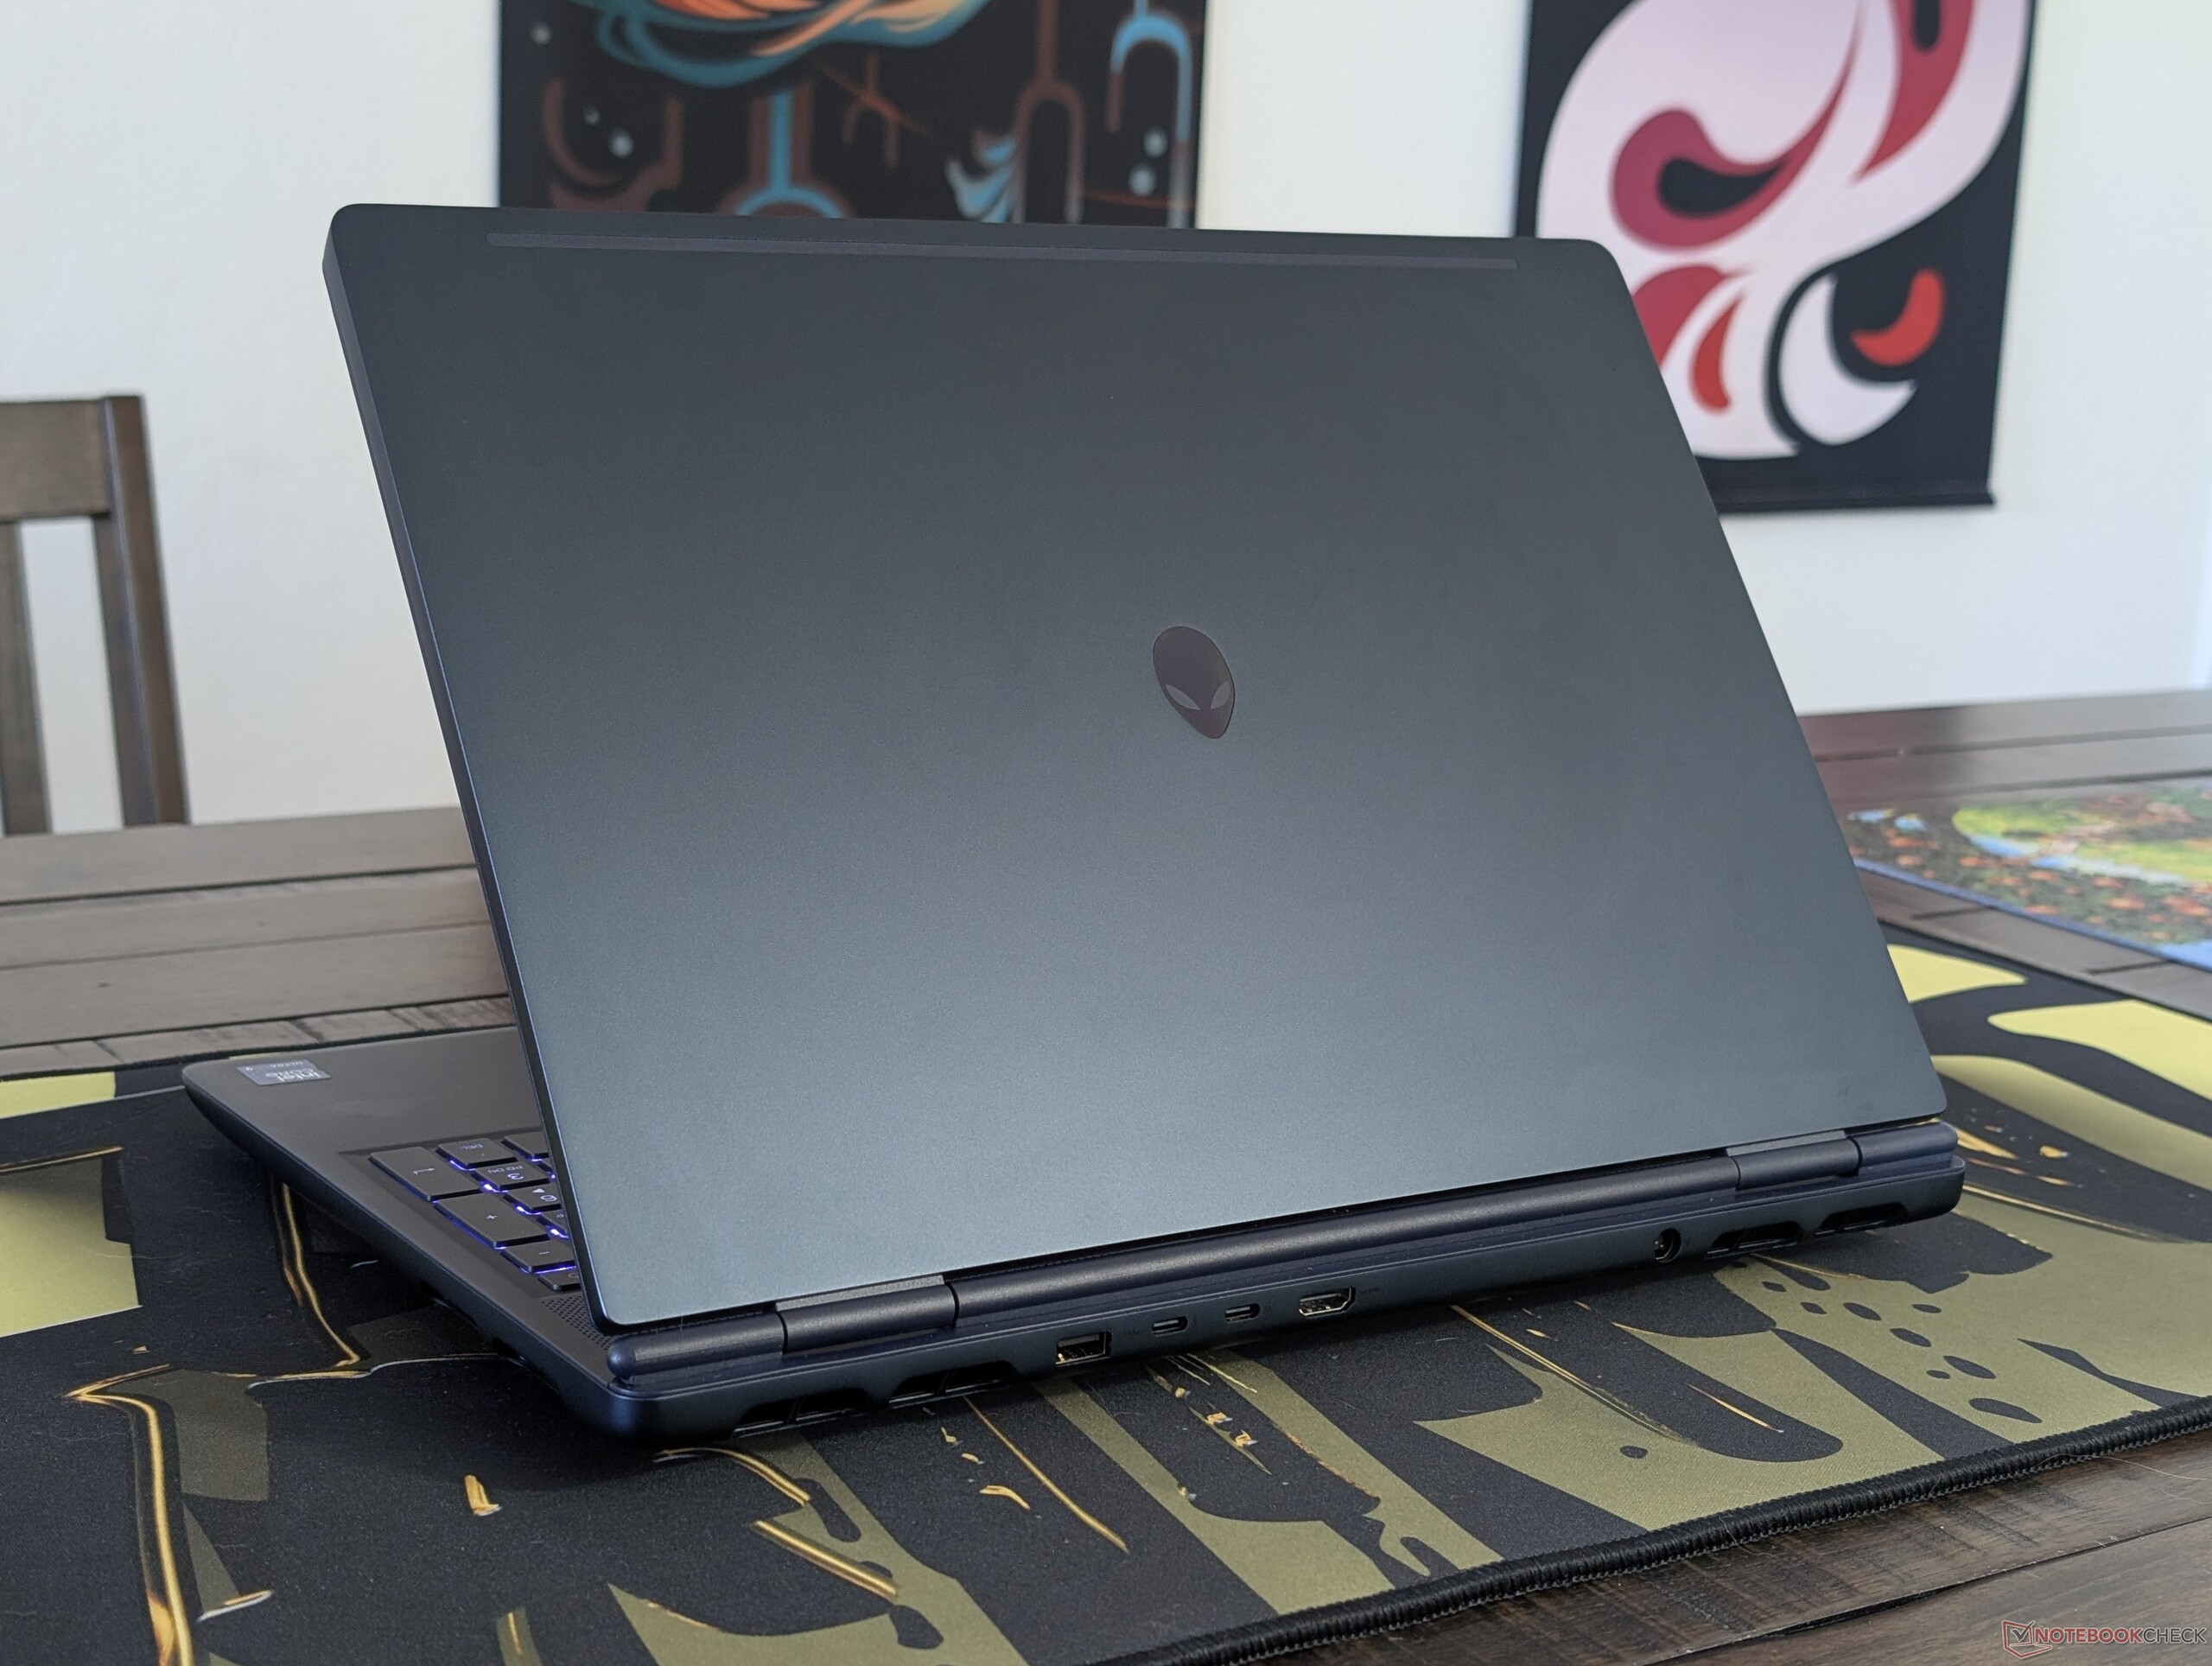
Sonst ändert sich zum Vorjahresgerät nur wenig. Das Dell-Notebook ist schwerer als die meisten Konkurrenten, dafür aber sehr stabil und gut erweiterbar. Der vielleicht ärgerlichste Aspekt des aktualisierten Modells ist, dass die neue RTX 5070 Ti-Option an den Core Ultra 9 290HX Plus gebunden ist, obwohl die CPU das Spielerlebnis im Vergleich zum bestehenden Core Ultra 9 275HX kaum verbessert.
Pro
Contra
Preis und Verfügbarkeit
Die Konfiguration des Dell Alienware 16X Aurora AC16251 mit Core Ultra 9 275HX, 32GB RAM, 2TB SSD und GeForce RTX 5070 Ti kostet direkt beim Hersteller 3.800 Euro.
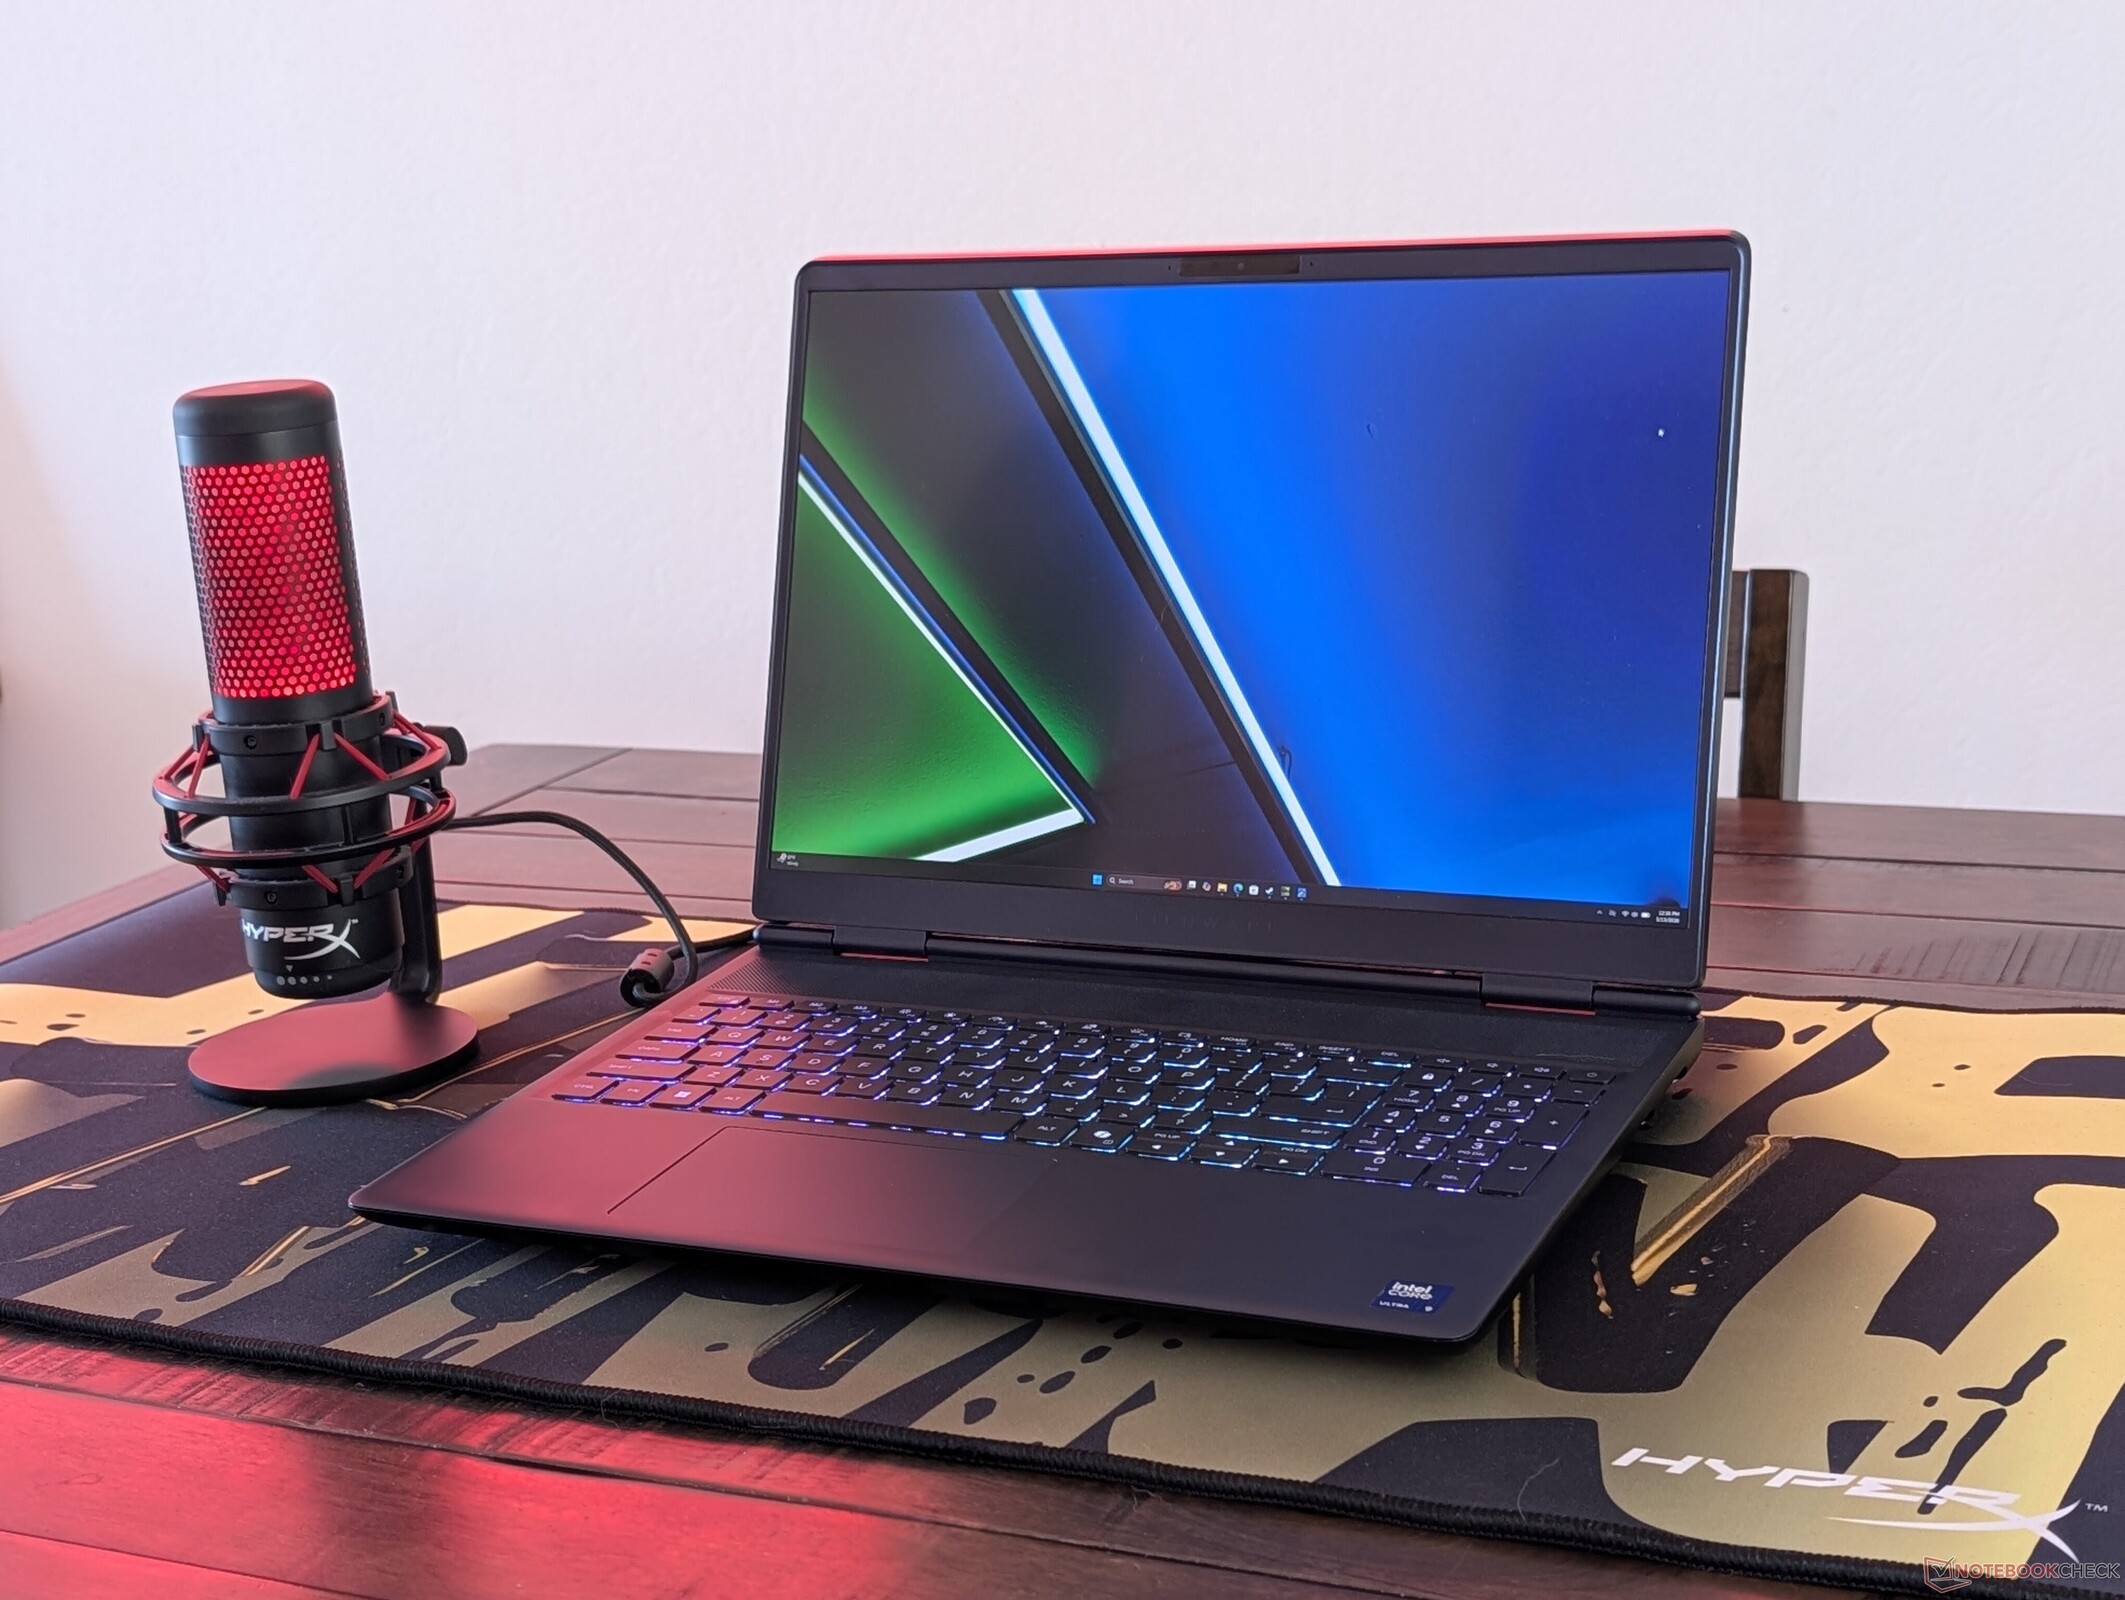
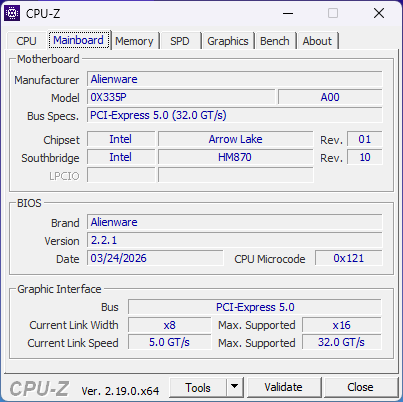
Das Alienware 16X Aurora ist in diesem Jahr mit neuen CPU-, GPU- und Display-Optionen zurück, die die bestehenden Optionen des Modells von 2025 ergänzen. Die Gehäuse beider Modelle sind ansonsten optisch ident (Details in unserem Test des 2025er Modells).
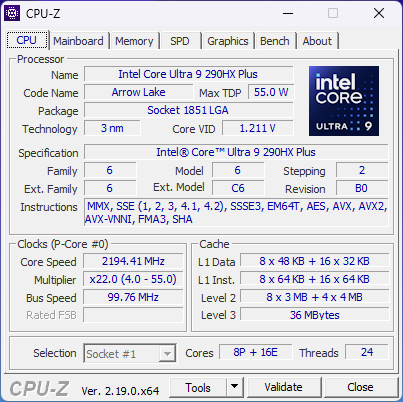
Bei unserem heutigen amerikanischen Testgerät handelt es sich um die Konfiguration mit Arrow Lake Core Ultra 9 290HX Plus, GeForce RTX 5070 Ti und 1600p OLED-Display für ca. 3.000 Dollar. Bisher war das 16X Aurora auf den Core Ultra 9 275HX, die RTX 5070 und ein 1600p IPS-Display beschränkt.
Zu den Konkurrenten in diesem Bereich gehören andere 16-Zoll-Gaming-Laptops der oberen Mittelklasse wie das Asus ROG Zephyrus G16, das Acer Predator Helios Neo oder das MSI Vector 16 HX.
Weitere Alienware-Tests:
Spezifikationen
Preisvergleich
Gehäuse
Anschlussausstattung


Kommunikation
Webcam


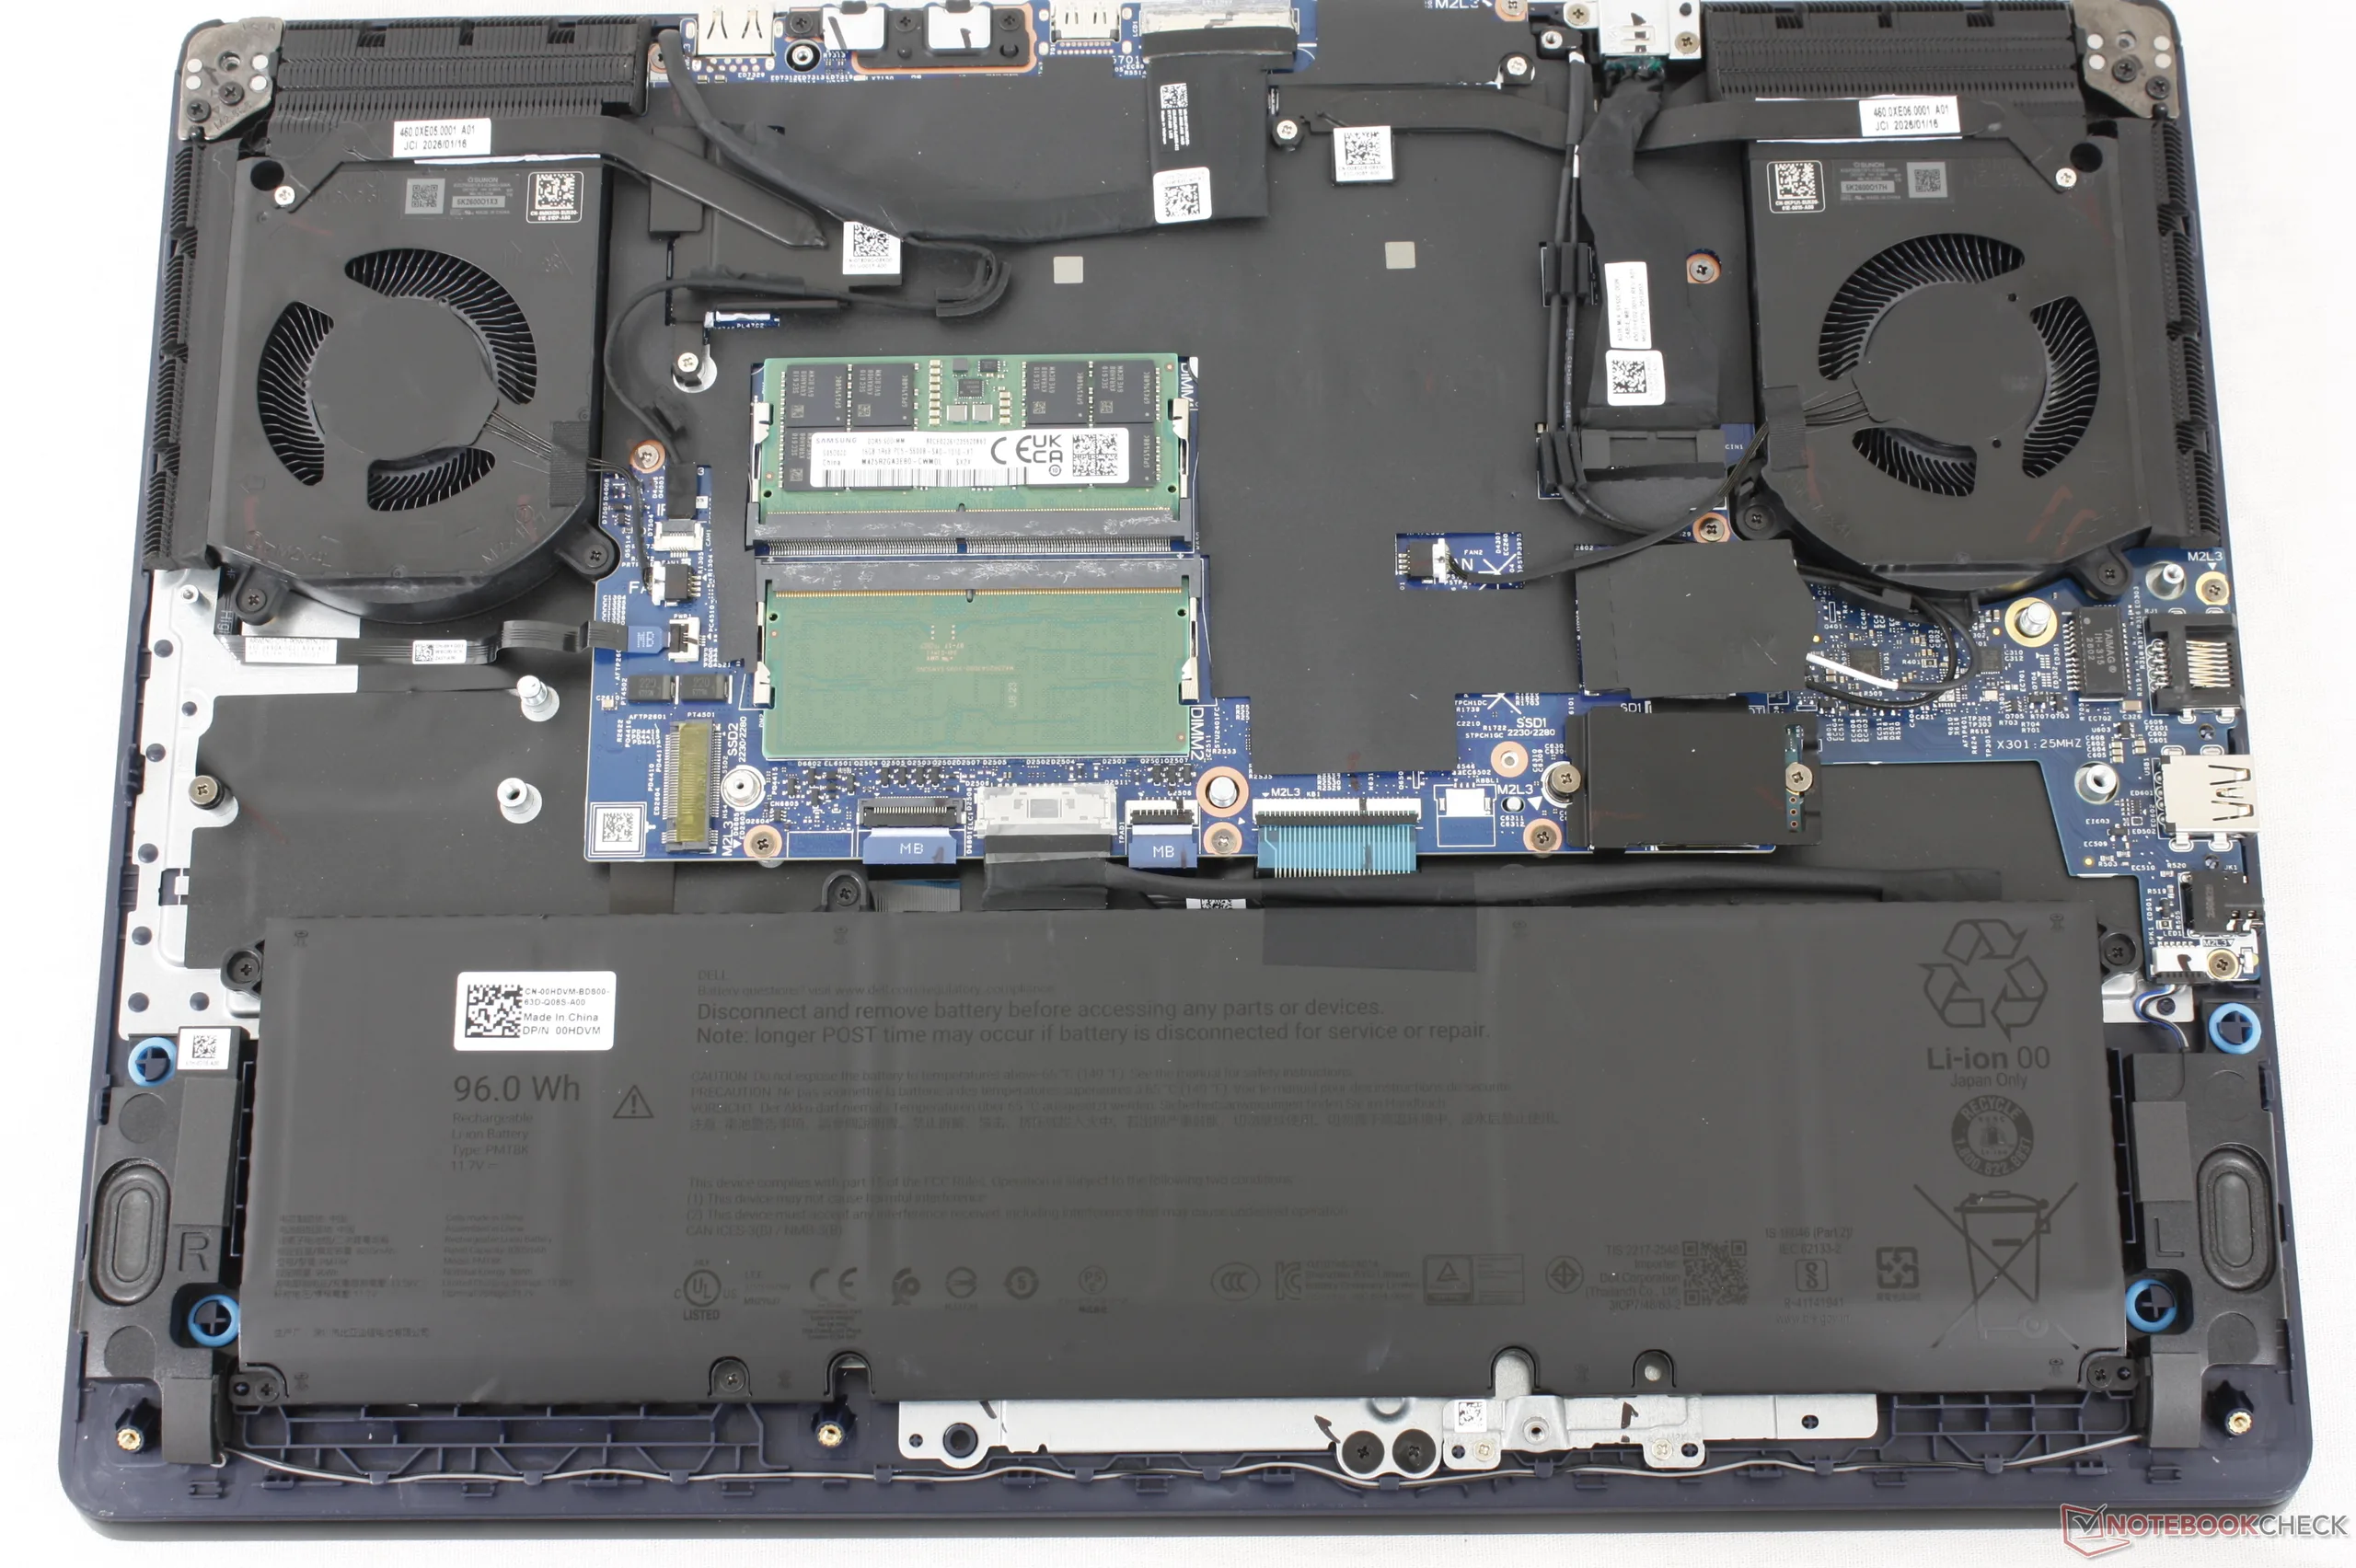
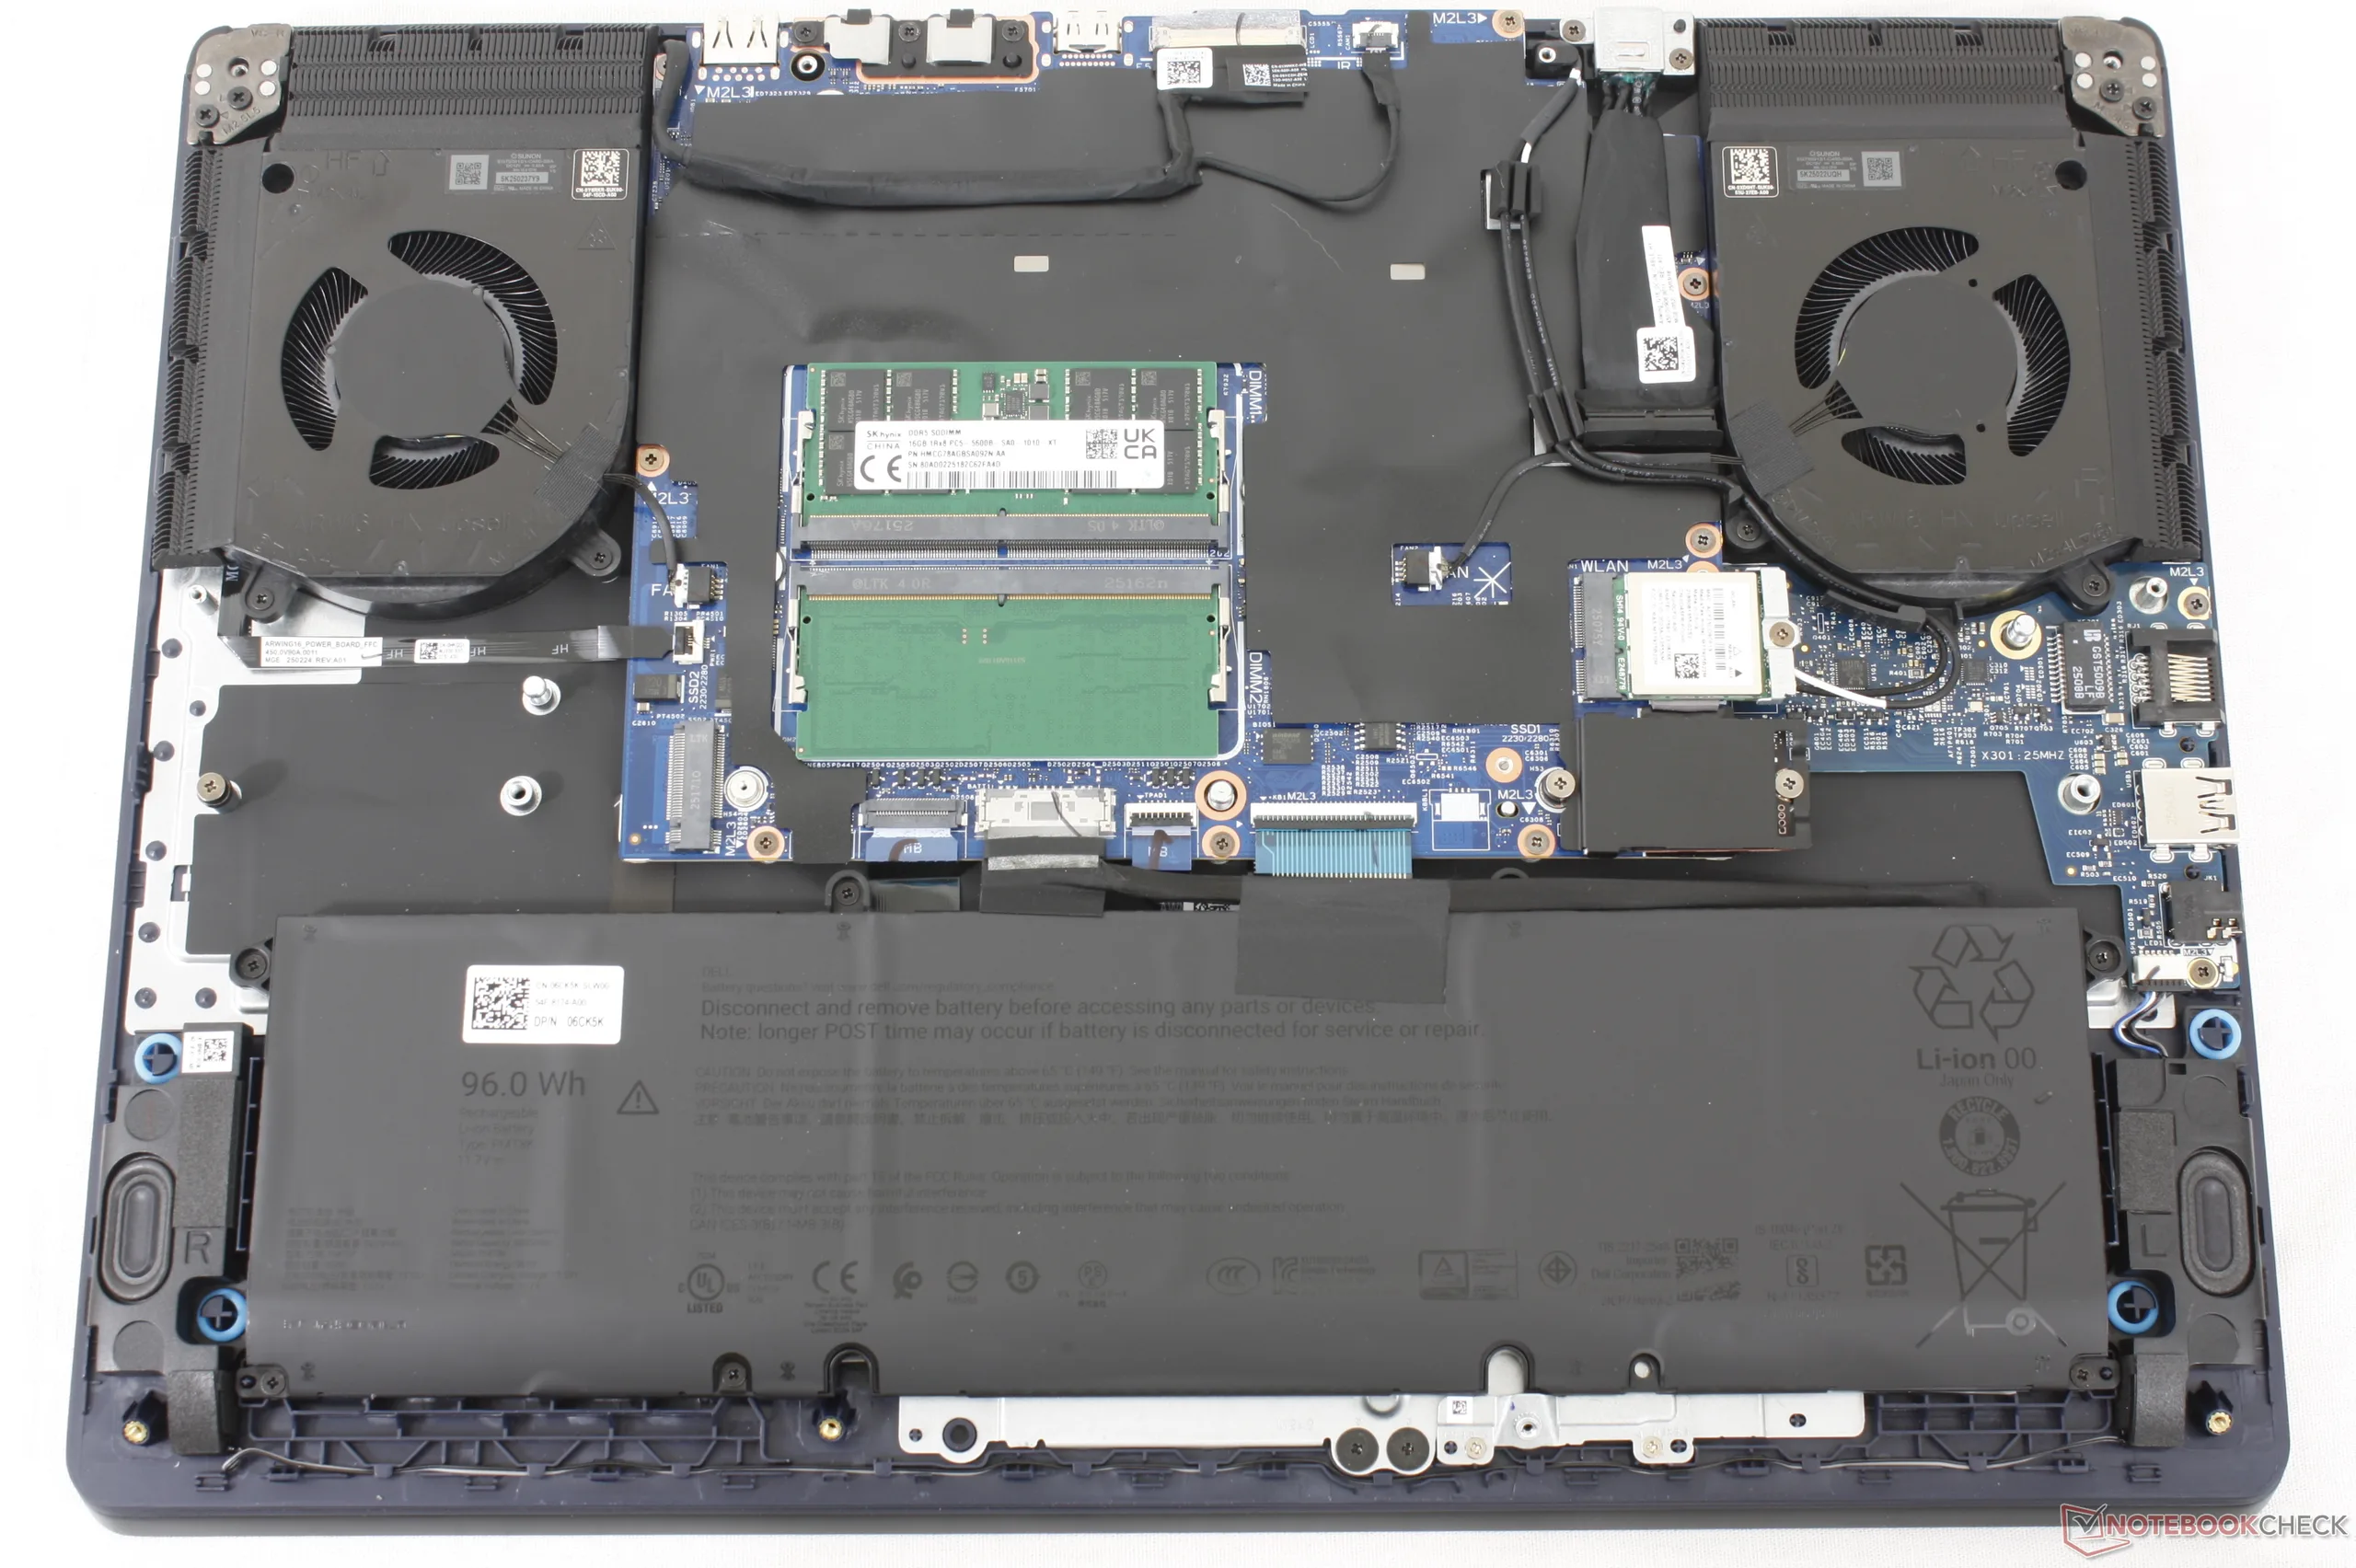
Wartung
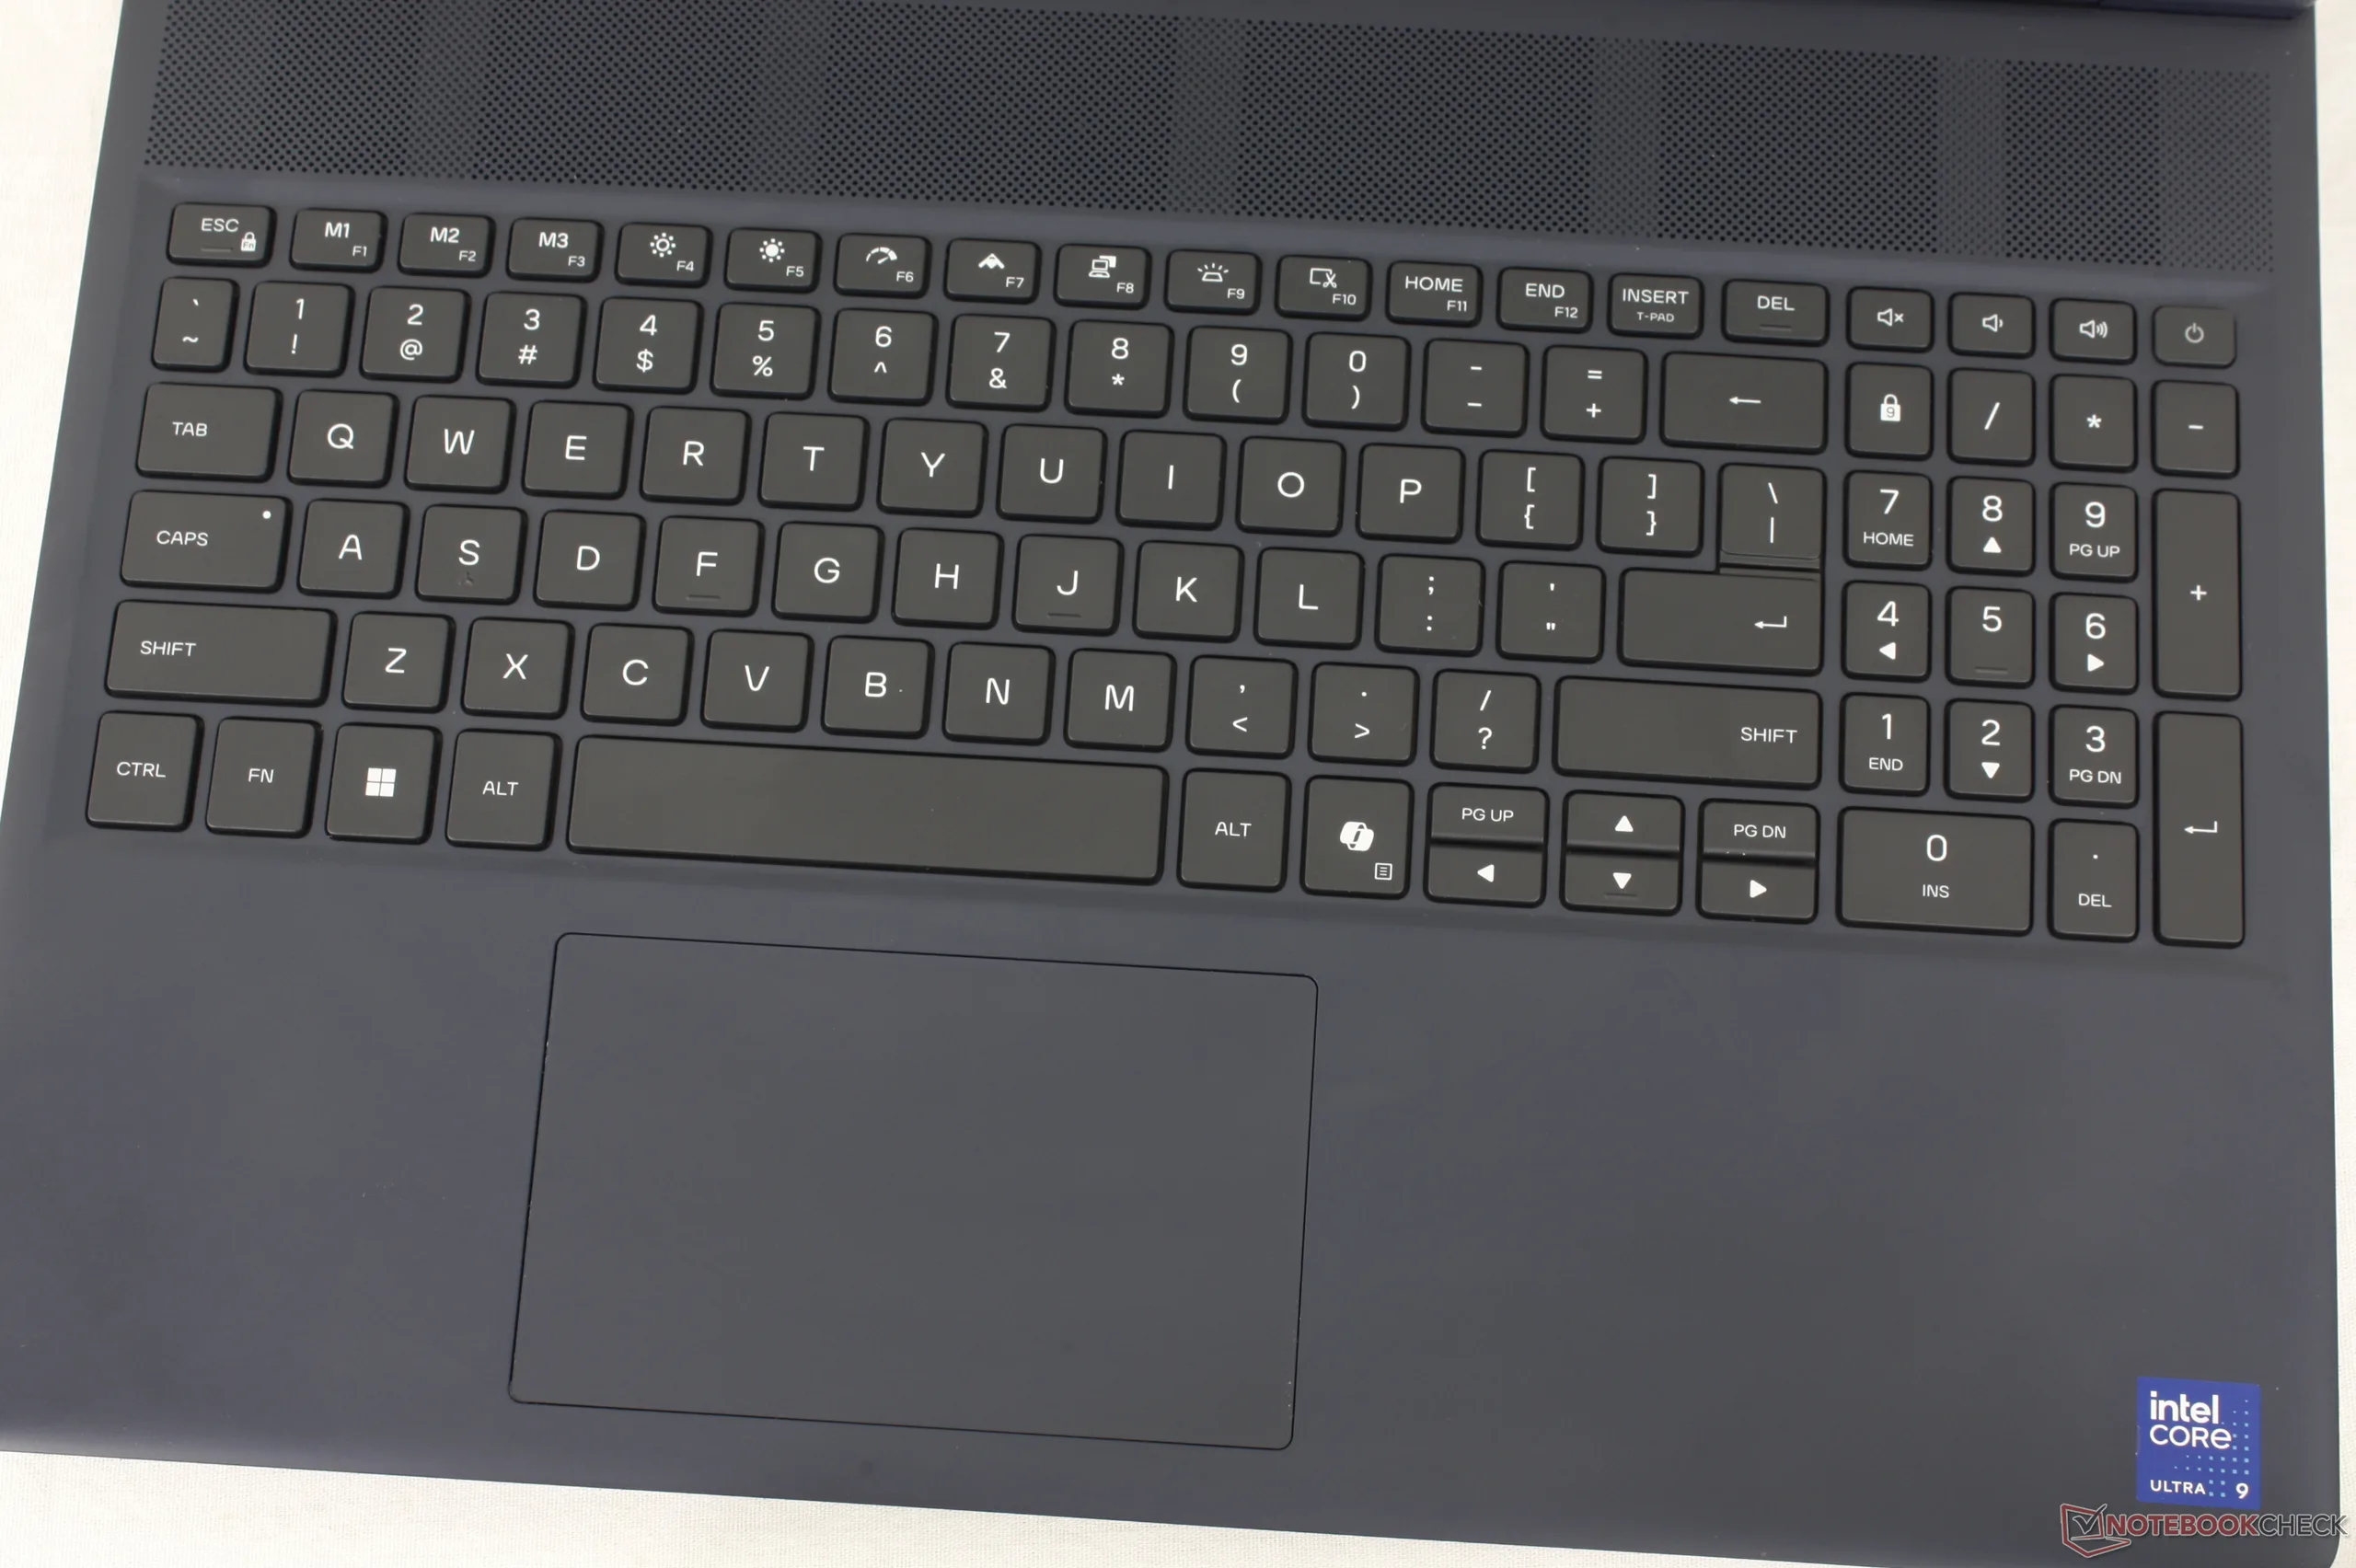
Eingabegeräte
Display

Neu in diesem Jahr in der Aurora 16X-Serie ist das matte OLED-Panel, das die gleiche native Bildwiederholfrequenz von 240 Hz, die gleiche Auflösung von 2560 x 1600 und die gleiche G-Sync-Unterstützung bietet wie die bestehende IPS-Option, aber mit allen Vorteilen von OLED, einschließlich schnellerer Reaktionszeiten, tieferen Schwarzwerten und HDR-Unterstützung.
Ein Nachteil des OLED-Panels ist, dass es im SDR-Modus um etwa 100 nits schwächer ist als das IPS-Panel, wie unsere Vergleichstabelle unten zeigt. Die maximale Helligkeit erreicht 390 nits im SDR-Modus bzw. bis zu 621 nits im HDR-Modus, was der Herstellerangabe von 620 nits entspricht.
Leider weist das matte OLED-Panel immer noch ein ähnliches Maß an Körnigkeit auf, wie wir es beim IPS-Panel des letzten Jahres festgestellt haben. Es ist zwar nicht besonders störend, aber eben nicht so scharf oder sauber wie das glänzende OLED-Panel des neuen XPS 16.
| |||||||||||||||||||||||||
Ausleuchtung: 98 %
Helligkeit Akku: 380.5 cd/m²
Kontrast: ∞:1 (Schwarzwert: 0 cd/m²)
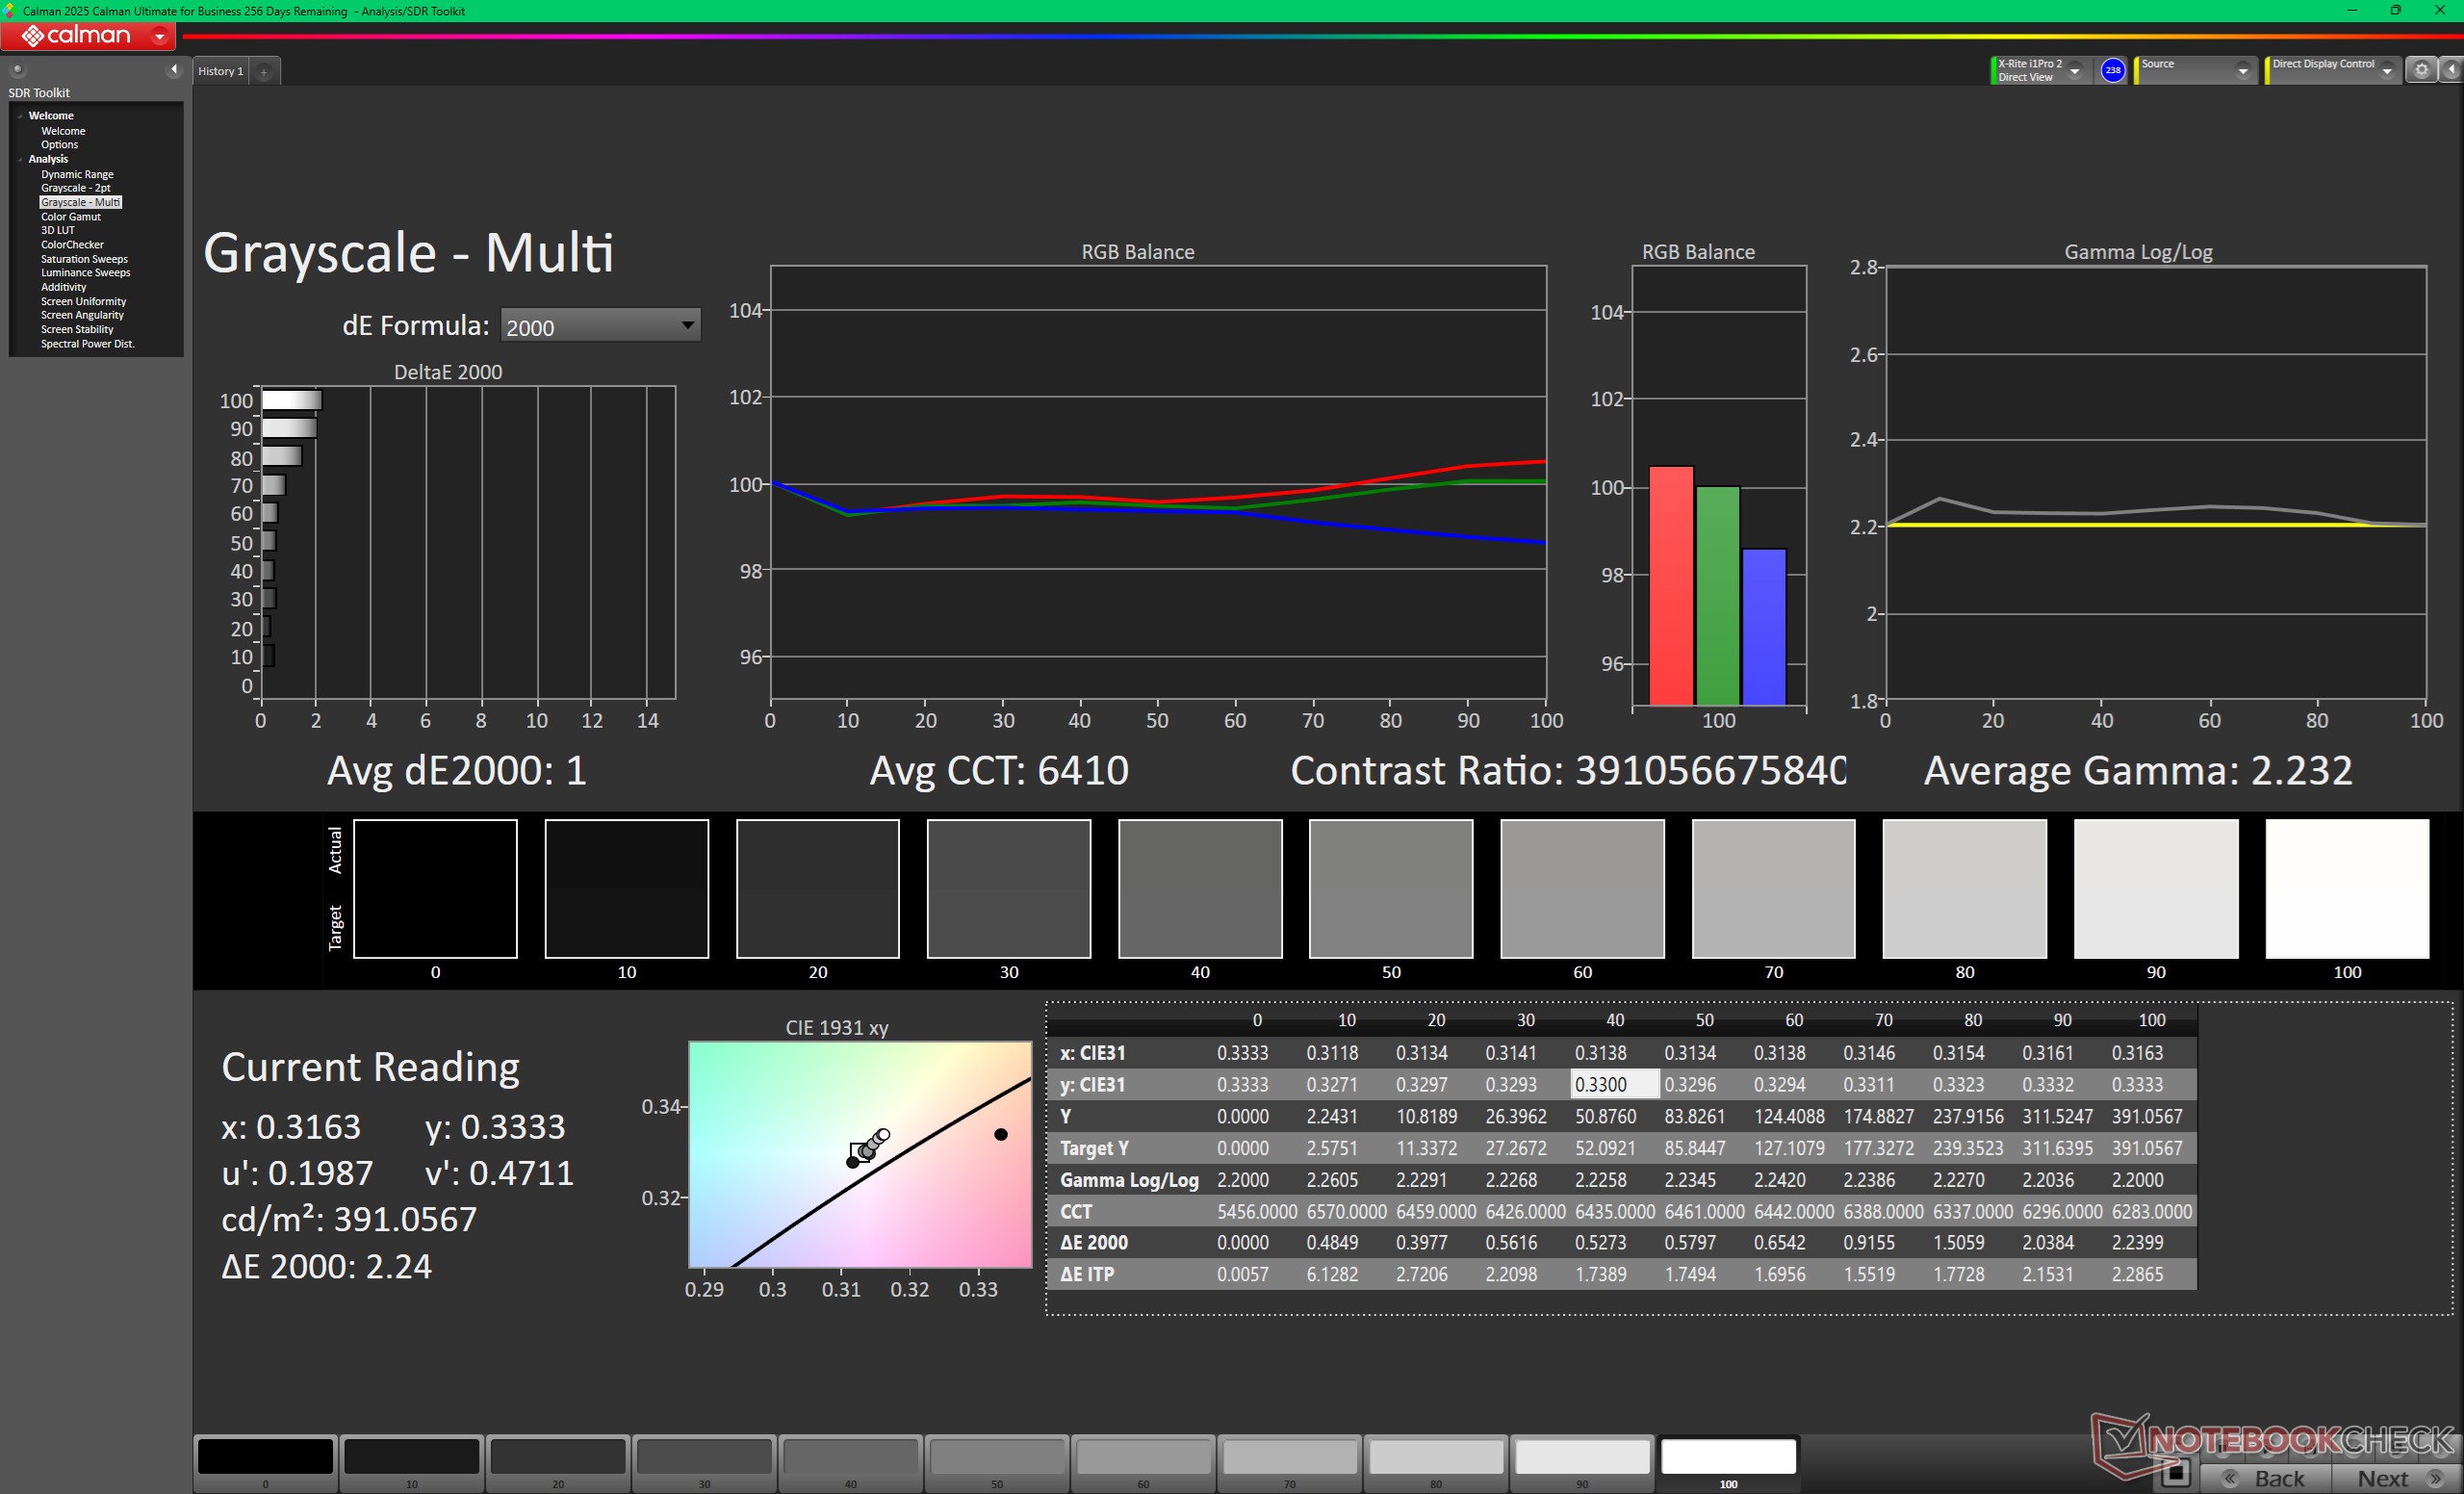
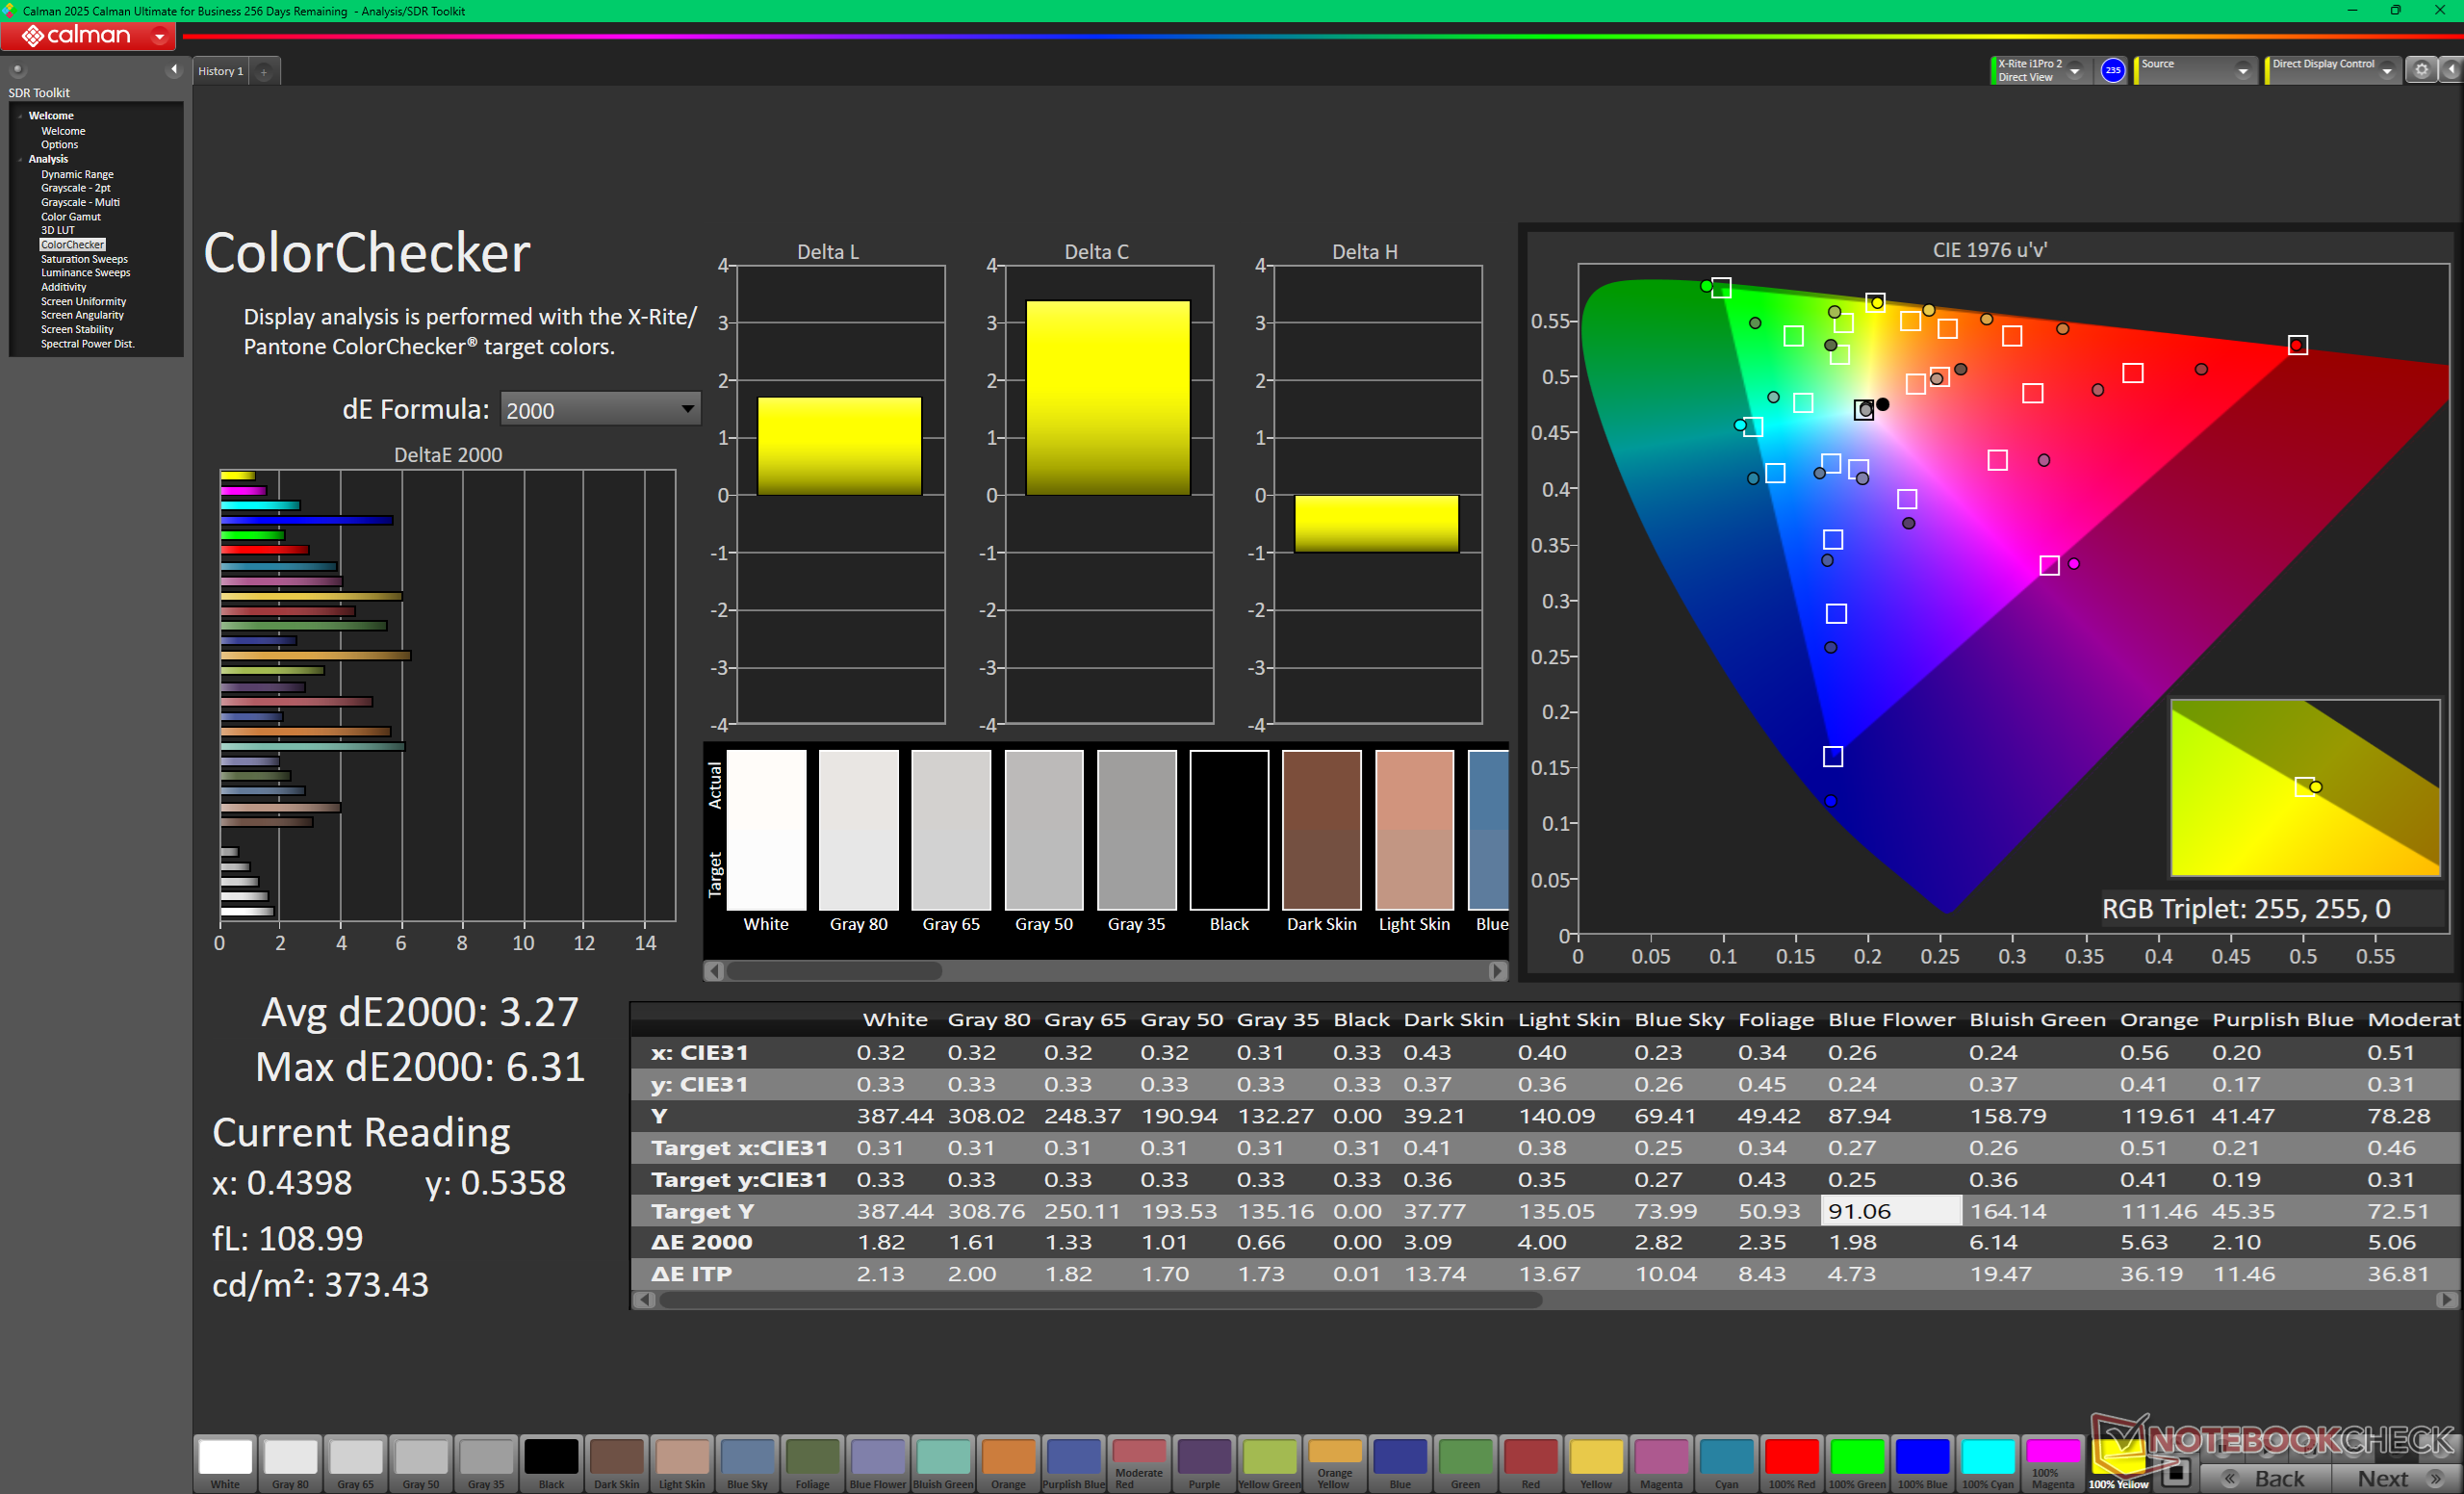
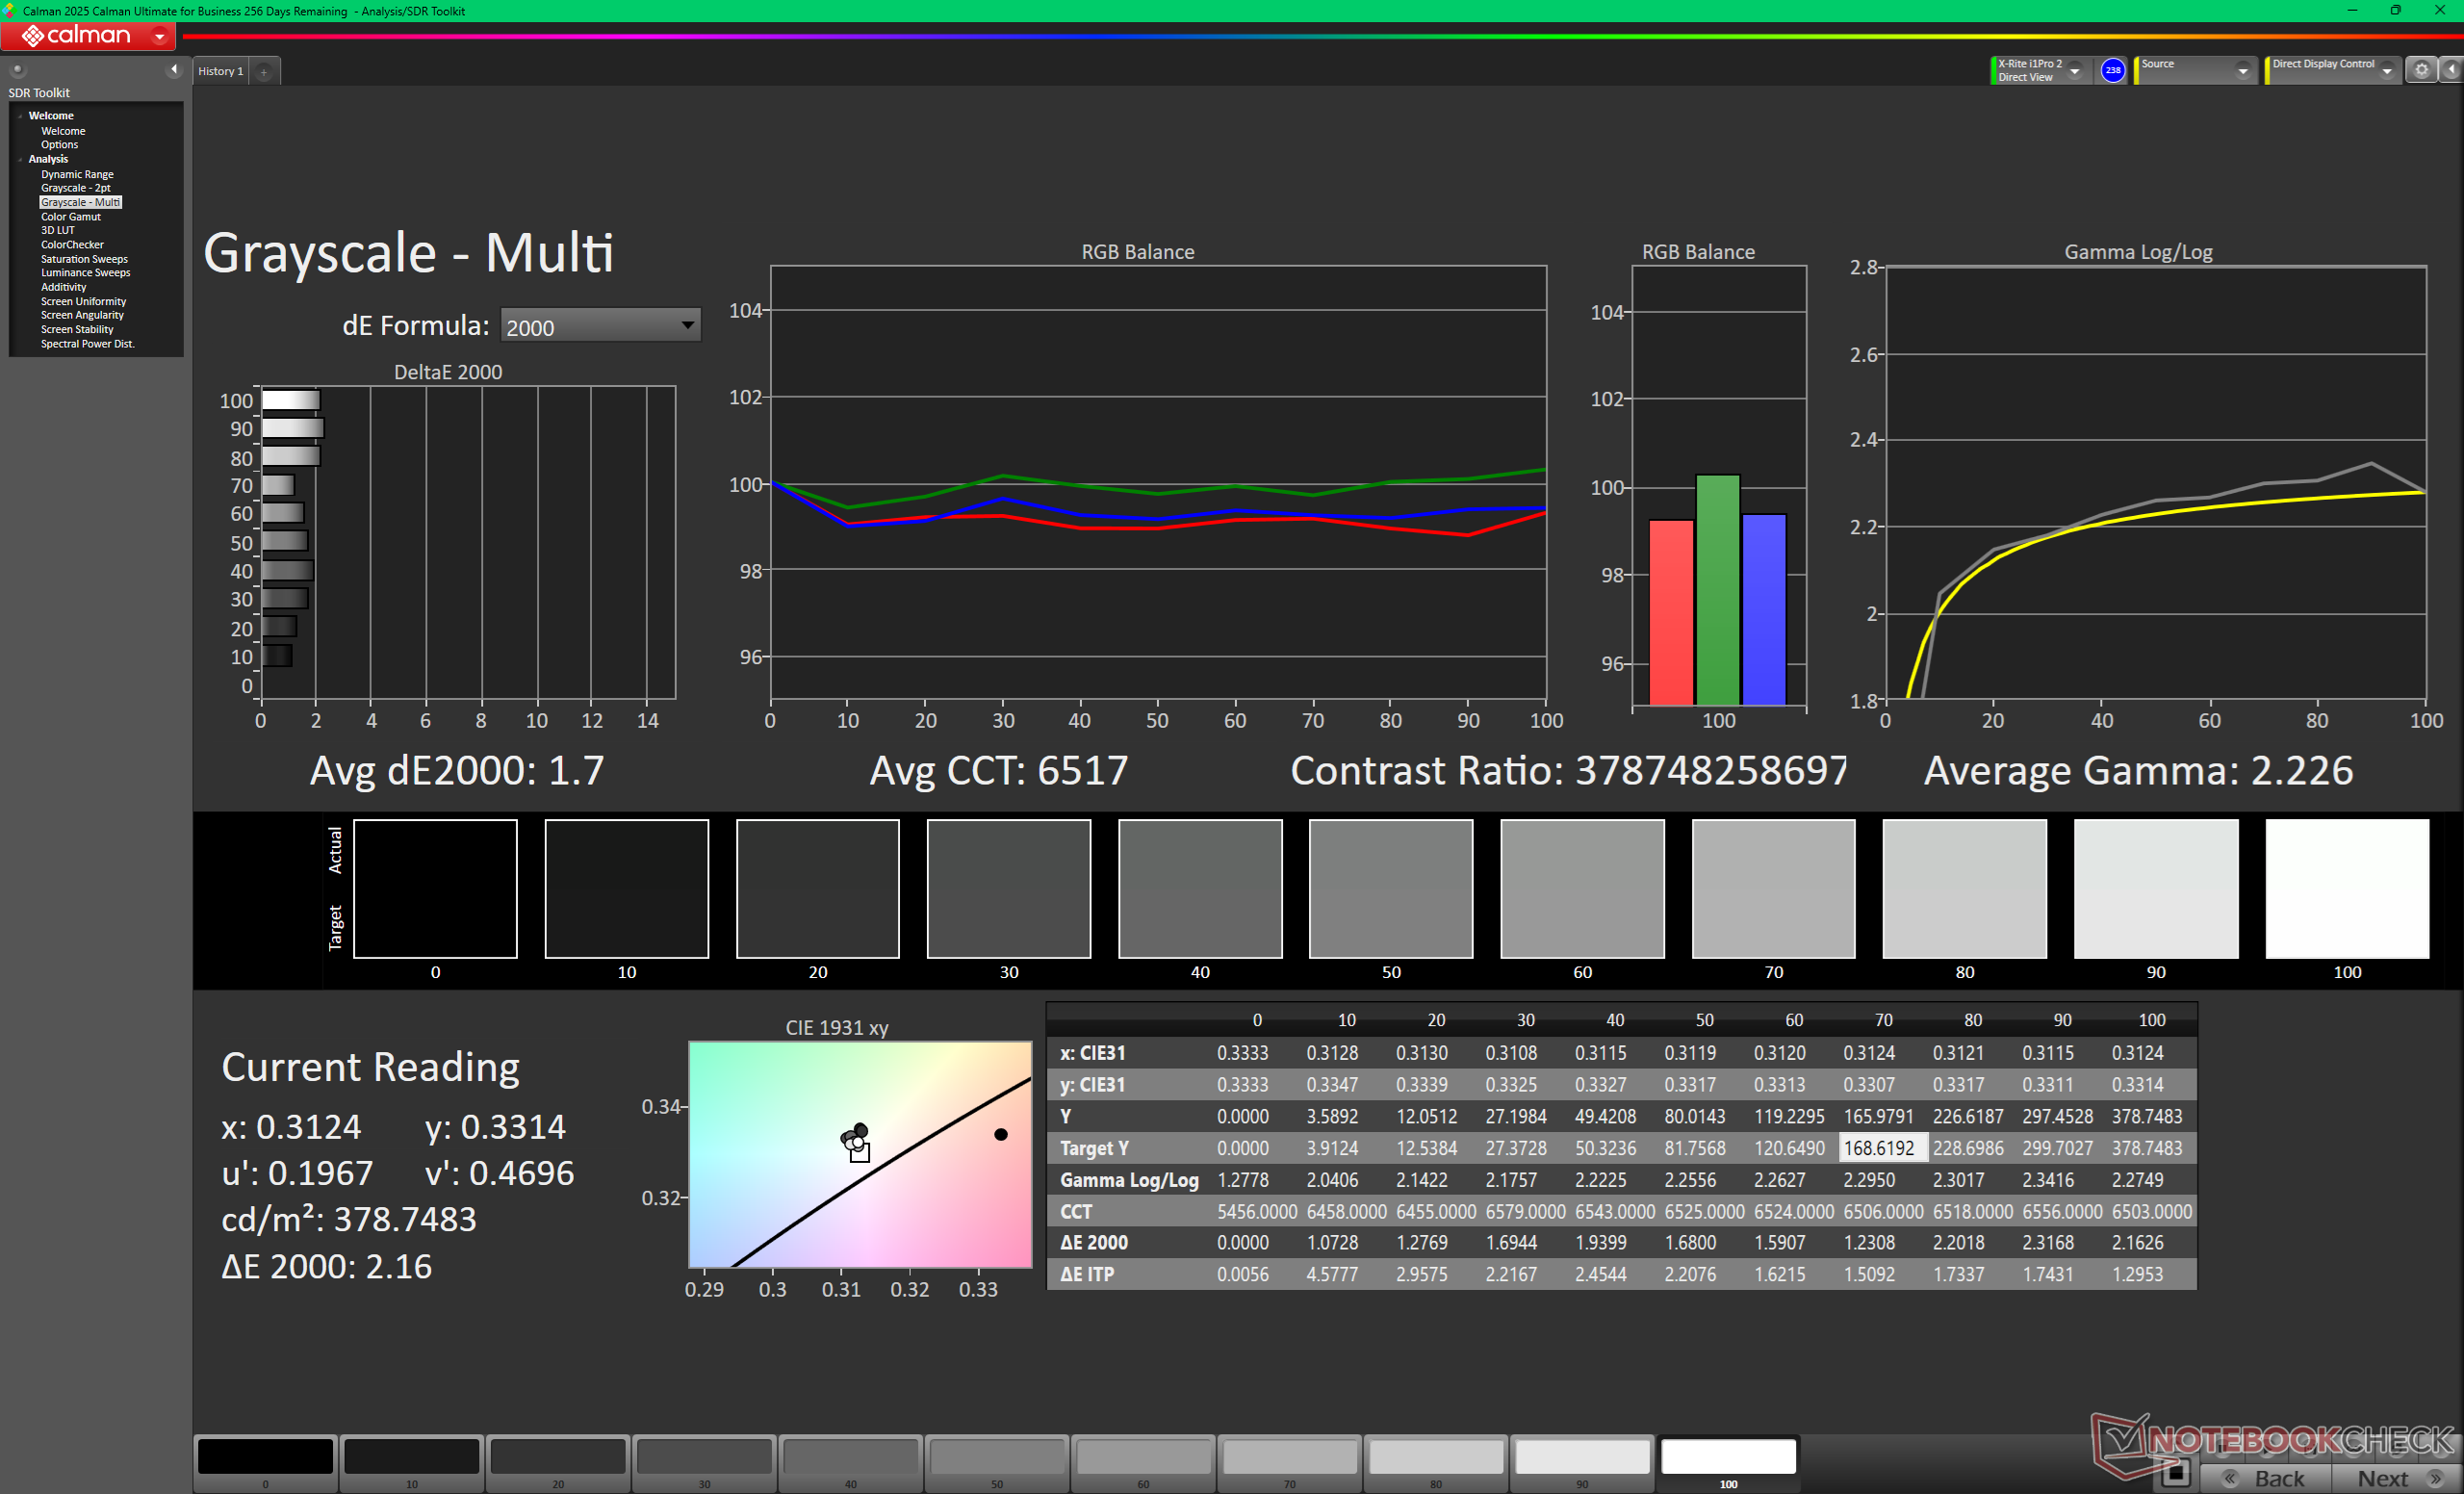
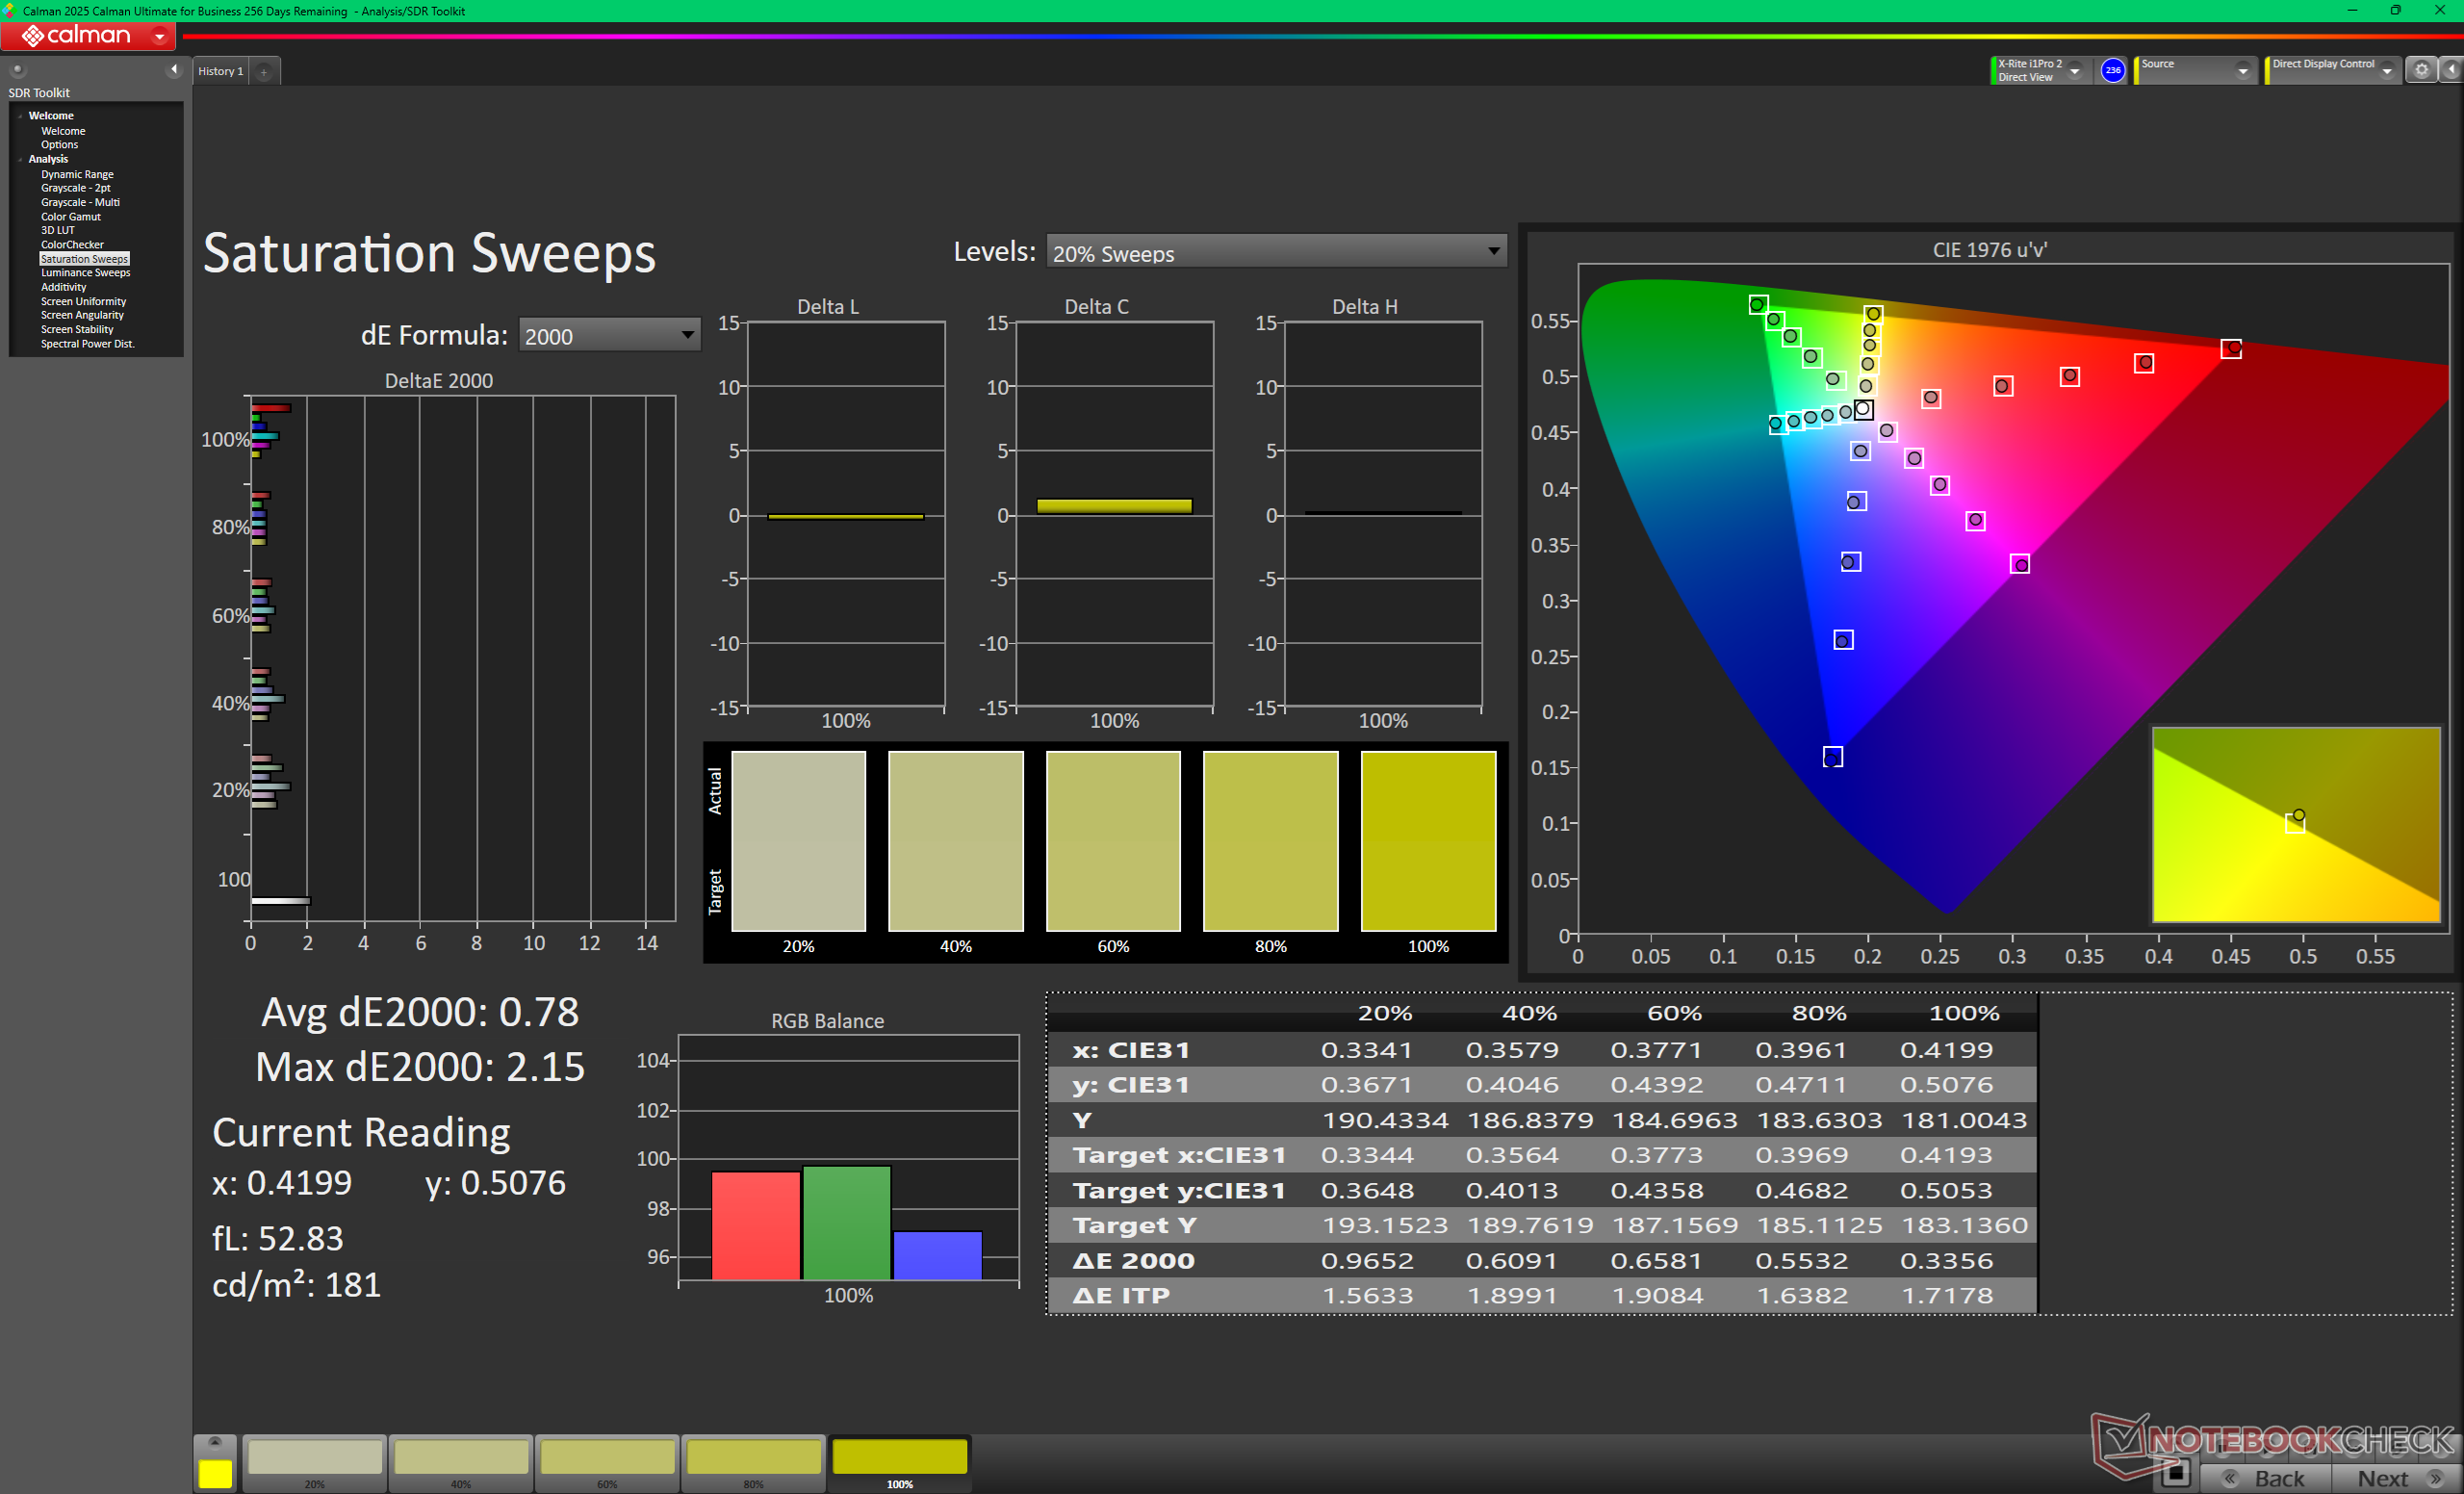
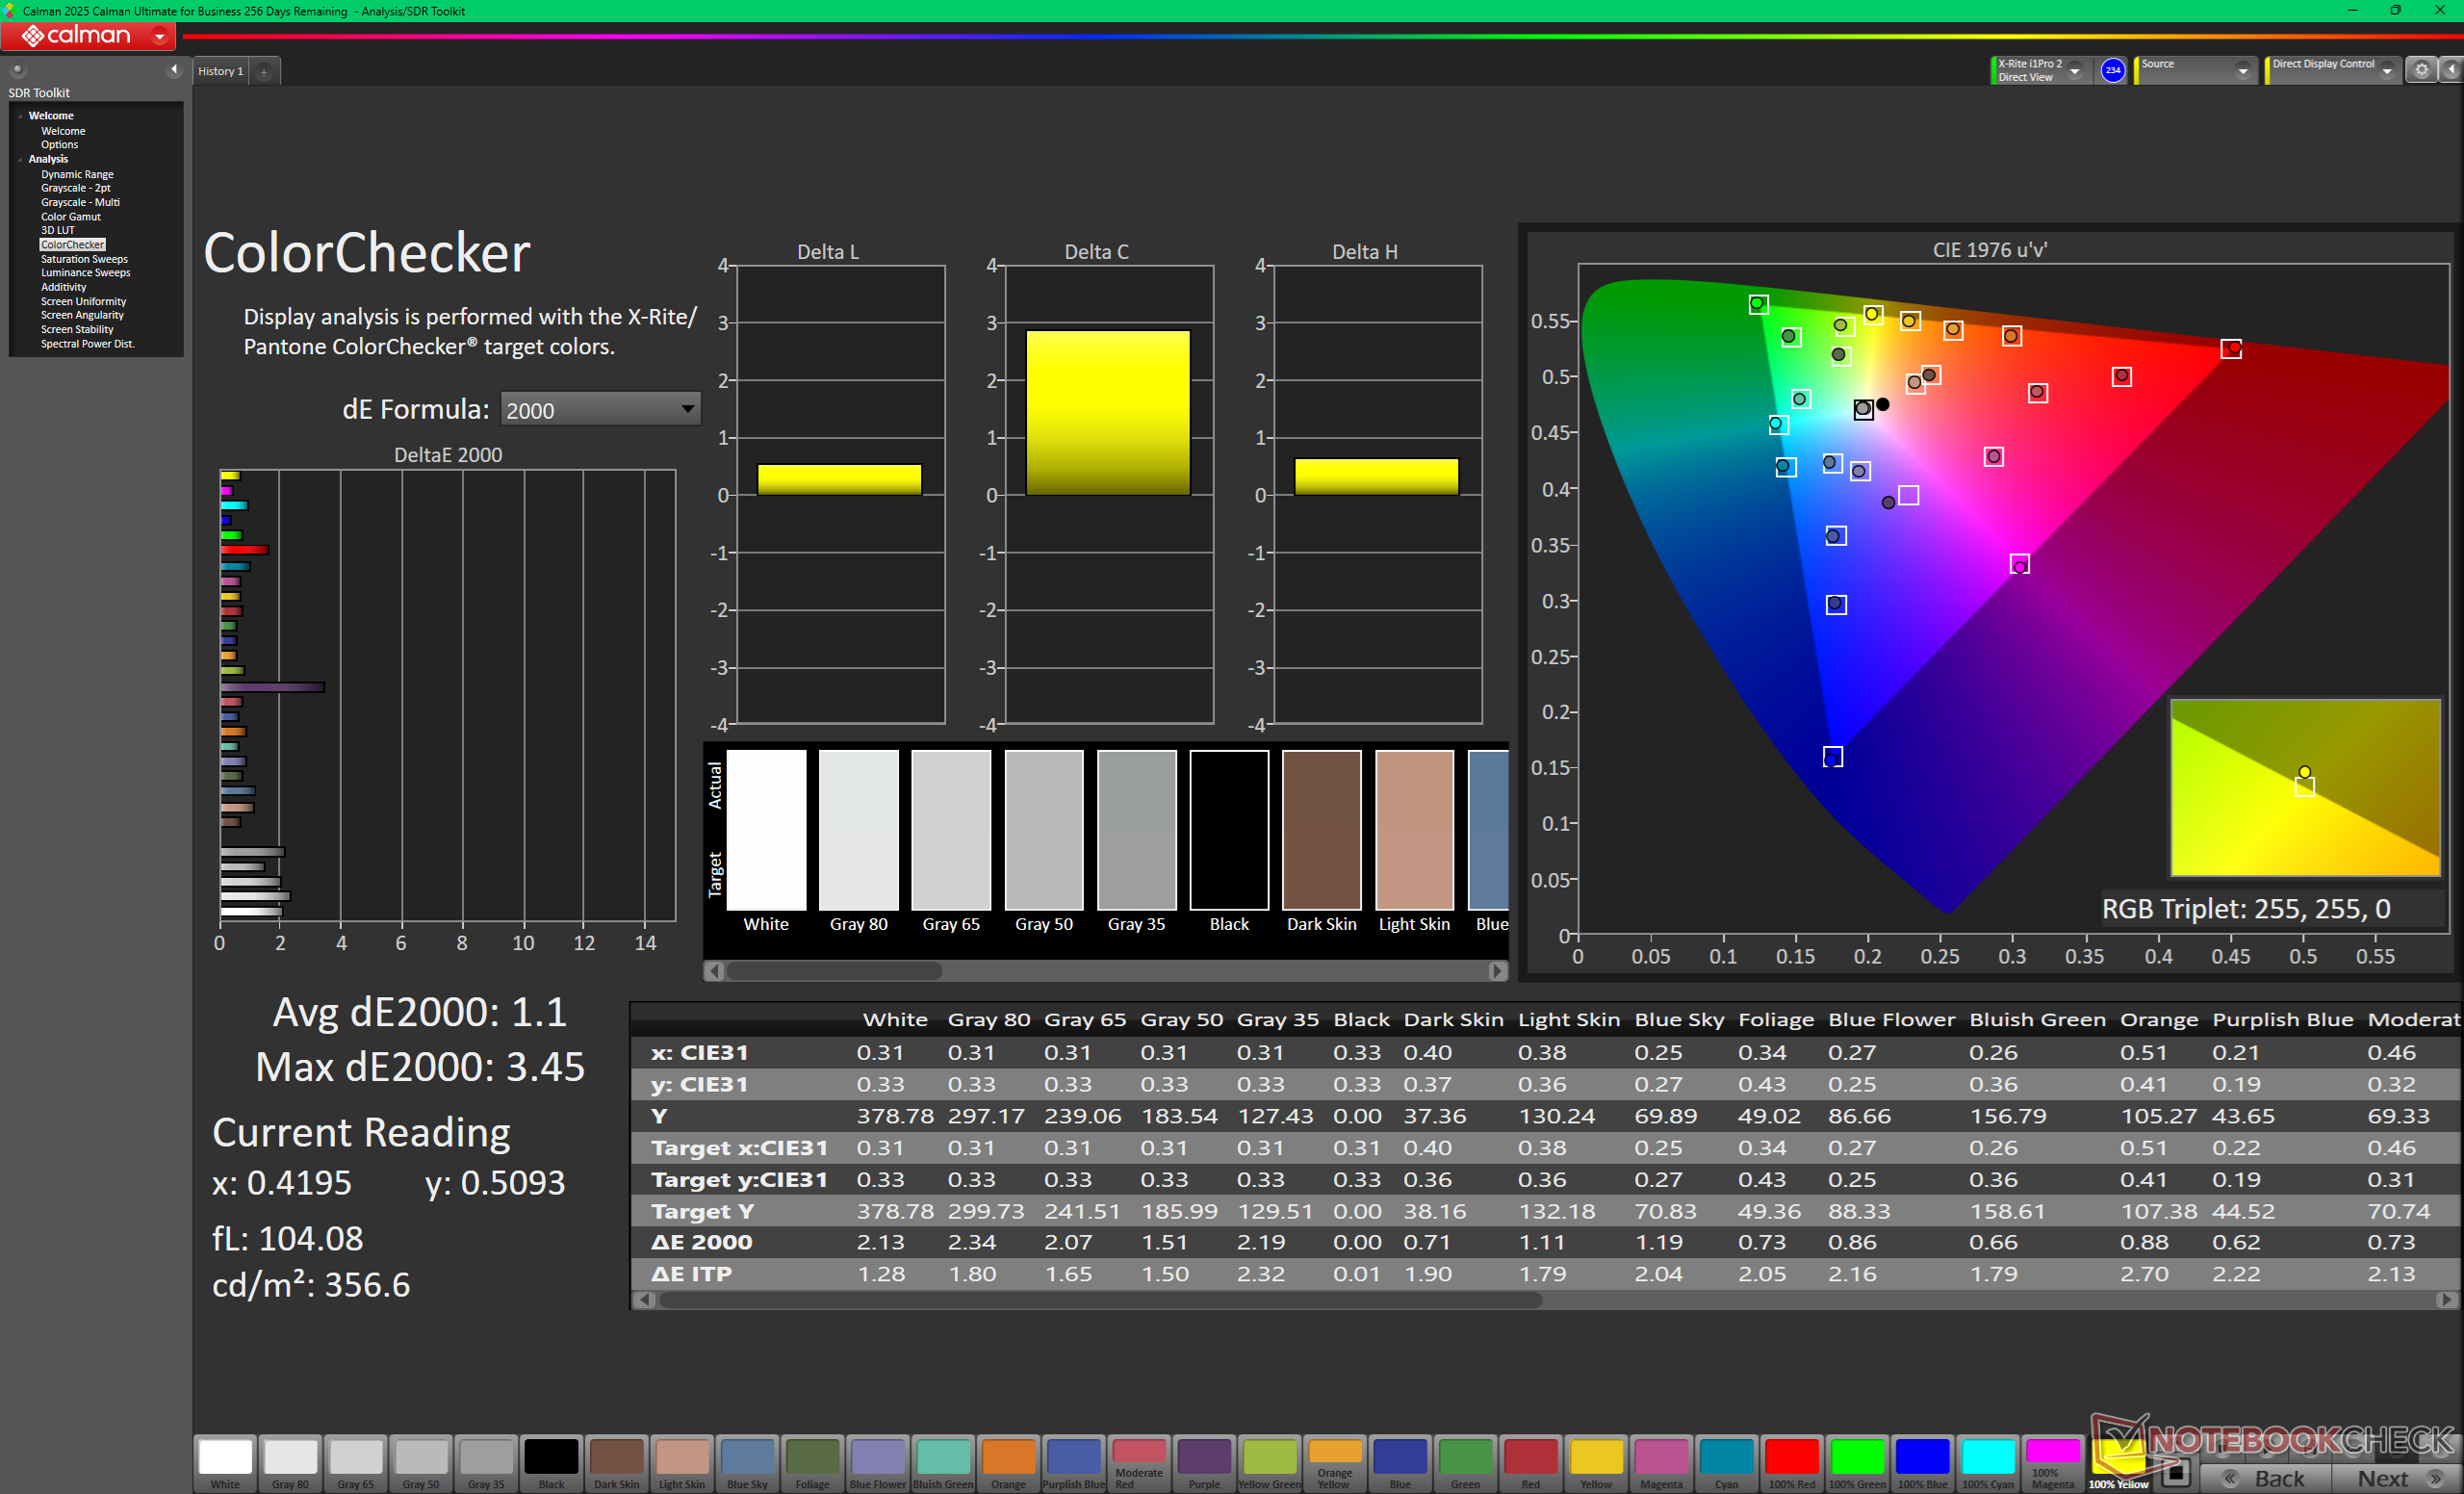
ΔE ColorChecker Calman: 3.27 | ∀{0.5-29.43 Ø4.73}
calibrated: 1.1
ΔE Greyscale Calman: 1 | ∀{0.09-98 Ø4.97}
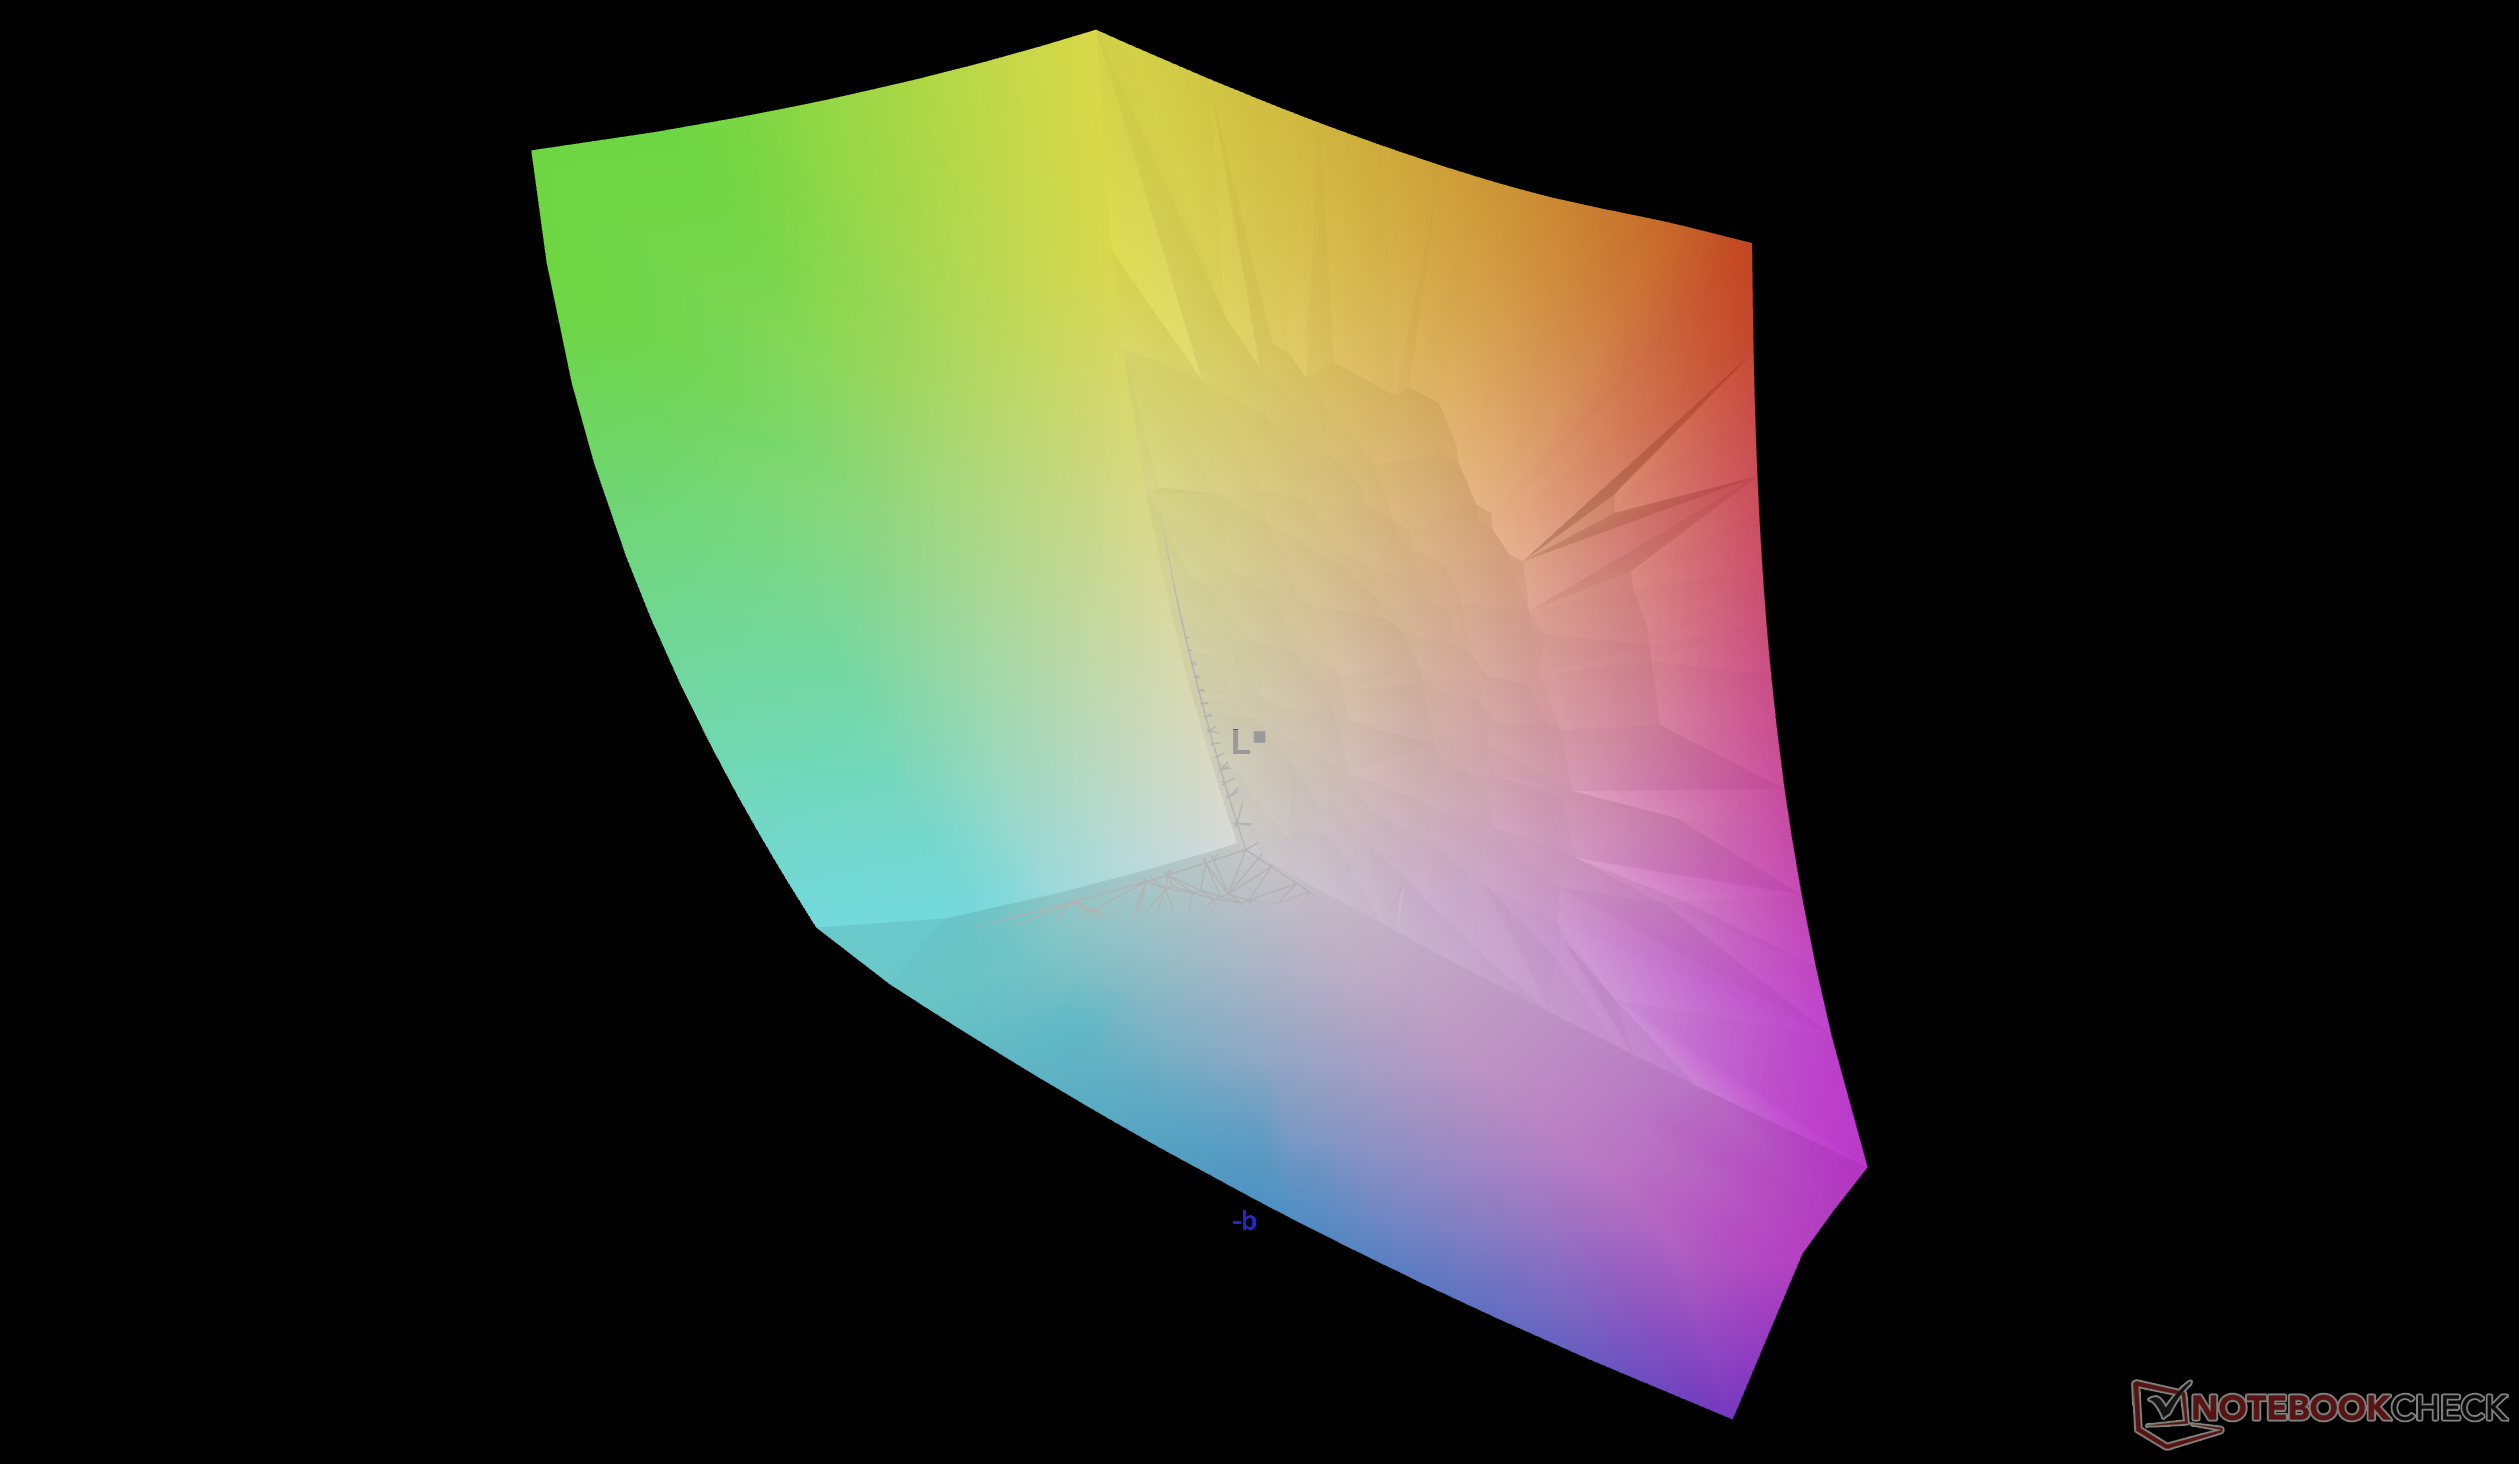
93.9% AdobeRGB 1998 (Argyll 3D)
100% sRGB (Argyll 3D)
99.6% Display P3 (Argyll 3D)
Gamma: 2.23
CCT: 6410 K
| Alienware 16X Aurora Core Ultra 9 290HX Plus Samsung 160HU05, OLED, 2560x1600, 16", 240 Hz | Alienware 16X Aurora, RTX 5070 LG Philips 160WQG, IPS, 2560x1600, 16", 240 Hz | Acer Predator Helios Neo 16S AI PHN16S-71-94L9 Samsung ATNA60DL03-0, OLED, 2560x1600, 16", 240 Hz | Lenovo Legion Pro 5 16IAX10, RTX 5070 ATNA60HS01-0 (Samsung SDC420A), OLED, 2650x1600, 16", 165 Hz | MSI Vector 16 HX AI A2XWHG B160QAN02.3 (AUO7DB2), IPS, 2560x1600, 16", 240 Hz | Asus ROG Zephyrus G16 GU605CW Samsung ATNA60DL01-0, OLED, 2560x1600, 16", 240 Hz | |
|---|---|---|---|---|---|---|
| Display | -2% | 1% | 0% | -4% | -1% | |
| APL18 Peak Brightness (cd/m²) | 609 | |||||
| HDR Peak Brightness (cd/m²) | 609 | |||||
| Display P3 Coverage (%) | 99.6 | 96.9 -3% | 99.9 0% | 99.3 0% | 96.6 -3% | 96.5 -3% |
| sRGB Coverage (%) | 100 | 99.8 0% | 100 0% | 100 0% | 99.8 0% | 99.2 -1% |
| AdobeRGB 1998 Coverage (%) | 93.9 | 89.7 -4% | 96.5 3% | 93.9 0% | 84.4 -10% | 94.5 1% |
| Response Times | -1608% | 1% | -253% | -1308% | -404% | |
| Response Time Grey 50% / Grey 80% * (ms) | 0.29 ? | 4.3 ? -1383% | 0.2 ? 31% | 2 ? -590% | 4.3 ? -1383% | 0.32 ? -10% |
| Response Time Black / White * (ms) | 0.45 ? | 8.7 ? -1833% | 0.25 ? 44% | 1.4 ? -211% | 6 ? -1233% | 6 ? -1233% |
| PWM Frequency (Hz) | 1439.8 ? | 960 | 1300 | 960 | ||
| PWM Amplitude * (%) | 29 | 50 -72% | 16.7 42% | 20 31% | ||
| Bildschirm | -29% | 5% | -32% | -33% | -14% | |
| Helligkeit Bildmitte (cd/m²) | 380.5 | 493.2 30% | 390 2% | 521 37% | 473 24% | 394 4% |
| Brightness (cd/m²) | 384 | 477 24% | 394 3% | 519 35% | 426 11% | 398 4% |
| Brightness Distribution (%) | 98 | 93 -5% | 98 0% | 98 0% | 85 -13% | 98 0% |
| Schwarzwert * (cd/m²) | 0.5 | 0.04 | 0.075 | 0.42 | 0.0084 | |
| Delta E Colorchecker * | 3.27 | 3.57 -9% | 1.61 51% | 2.5 24% | 3.47 -6% | 2.41 26% |
| Colorchecker dE 2000 max. * | 6.31 | 7.03 -11% | 3.49 45% | 4.85 23% | 7.24 -15% | 3.82 39% |
| Colorchecker dE 2000 calibrated * | 1.1 | 0.68 38% | 1.59 -45% | 2.5 -127% | 1.36 -24% | 1.41 -28% |
| Delta E Graustufen * | 1 | 3.7 -270% | 1.2 -20% | 3.17 -217% | 3.1 -210% | 2.4 -140% |
| Gamma | 2.23 99% | 2.16 102% | 2.235 98% | 2.35 94% | 2.486 88% | 2.16 102% |
| CCT | 6410 101% | 5876 111% | 6580 99% | 6454 101% | 6832 95% | 6544 99% |
| Kontrast (:1) | 986 | 9750 | 6947 | 1126 | 46905 | |
| Durchschnitt gesamt (Programm / Settings) | -546% /
-286% | 2% /
3% | -95% /
-76% | -448% /
-239% | -140% /
-101% |
* ... kleinere Werte sind besser


Reaktionszeiten (Response Times) des Displays
| ↔ Reaktionszeiten Schwarz zu Weiß | ||
|---|---|---|
| 0.45 ms ... steigend ↗ und fallend ↘ kombiniert | ↗ 0.23 ms steigend | 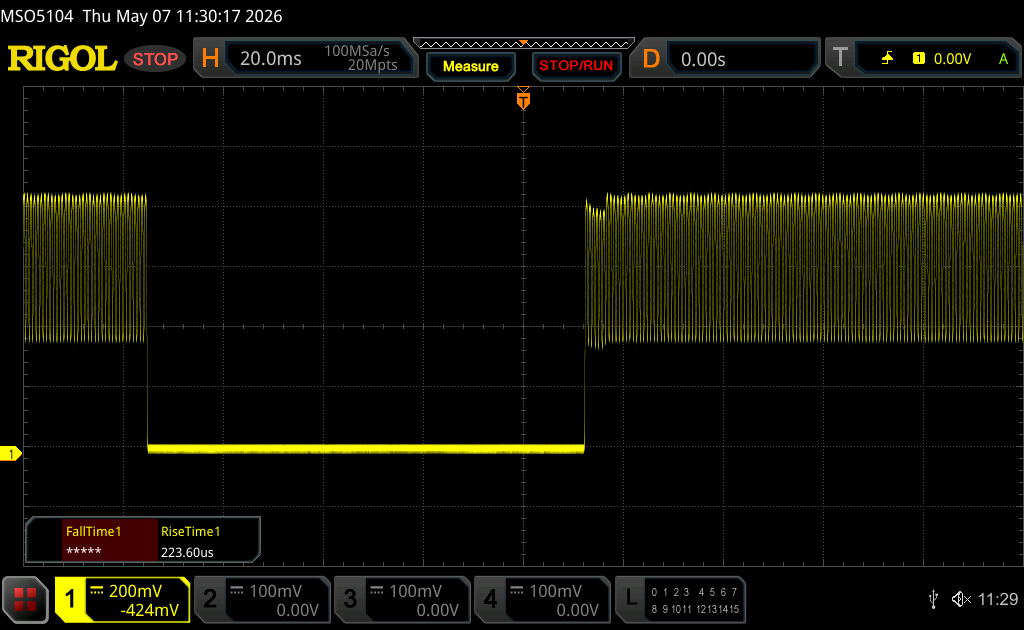 |
| ↘ 0.22 ms fallend | ||
| Die gemessenen Reaktionszeiten sind sehr kurz, wodurch sich der Bildschirm auch für schnelle 3D Spiele eignen sollte. Im Vergleich rangierten die bei uns getesteten Geräte von 0.1 (Minimum) zu 240 (Maximum) ms. » 1 % aller Screens waren schneller als der getestete. Daher sind die gemessenen Reaktionszeiten besser als der Durchschnitt aller vermessenen Geräte (19.9 ms). | ||
| ↔ Reaktionszeiten 50% Grau zu 80% Grau | ||
| 0.29 ms ... steigend ↗ und fallend ↘ kombiniert | ↗ 0.15 ms steigend | 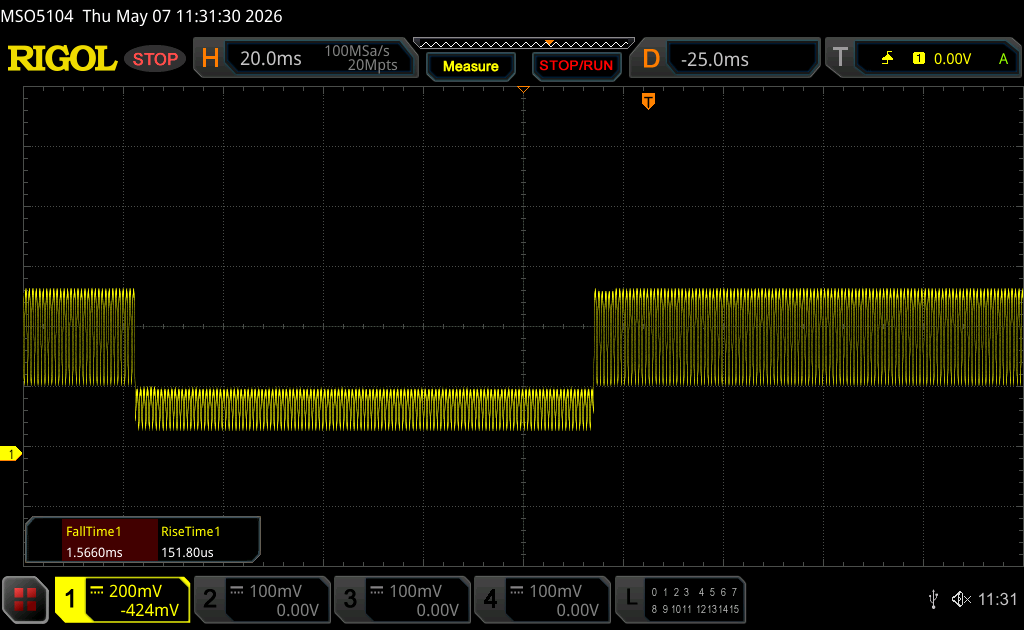 |
| ↘ 0.14 ms fallend | ||
| Die gemessenen Reaktionszeiten sind sehr kurz, wodurch sich der Bildschirm auch für schnelle 3D Spiele eignen sollte. Im Vergleich rangierten die bei uns getesteten Geräte von 0.165 (Minimum) zu 636 (Maximum) ms. » 0 % aller Screens waren schneller als der getestete. Daher sind die gemessenen Reaktionszeiten besser als der Durchschnitt aller vermessenen Geräte (31.1 ms). | ||
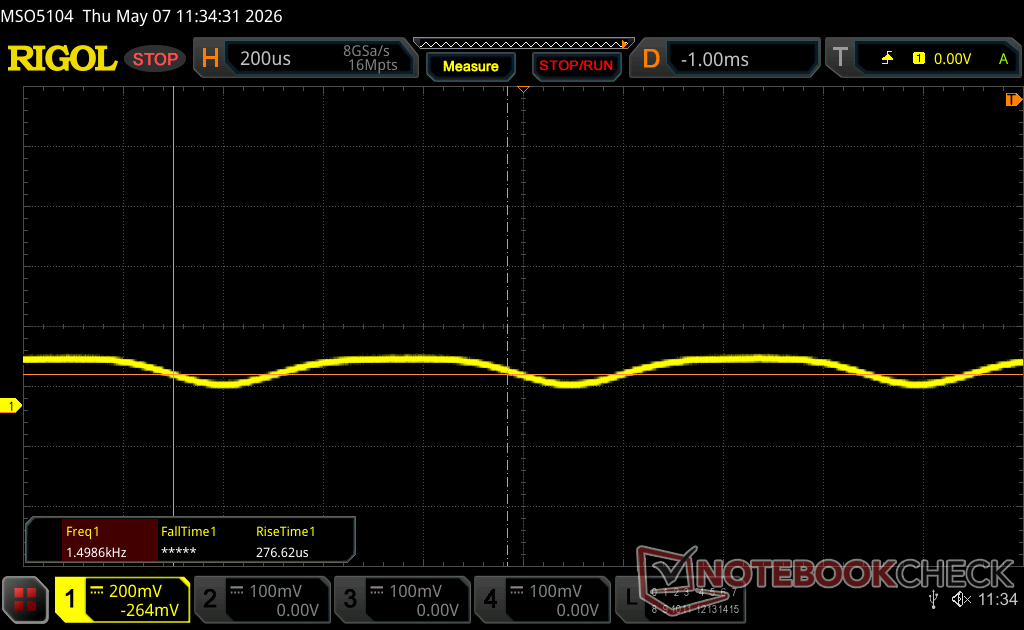
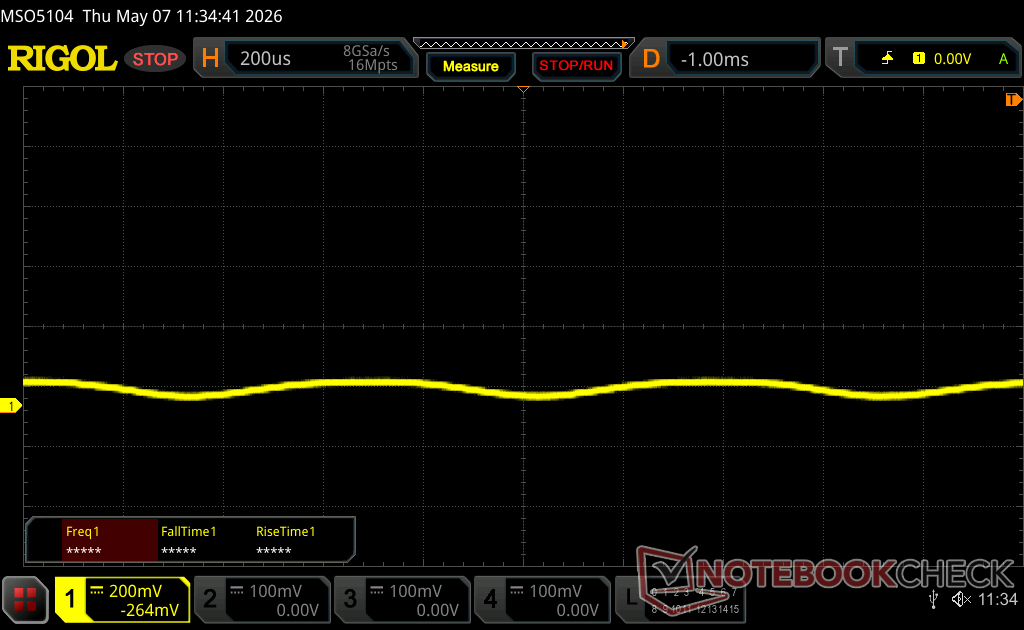
Bildschirm-Flackern / PWM (Pulse-Width Modulation)
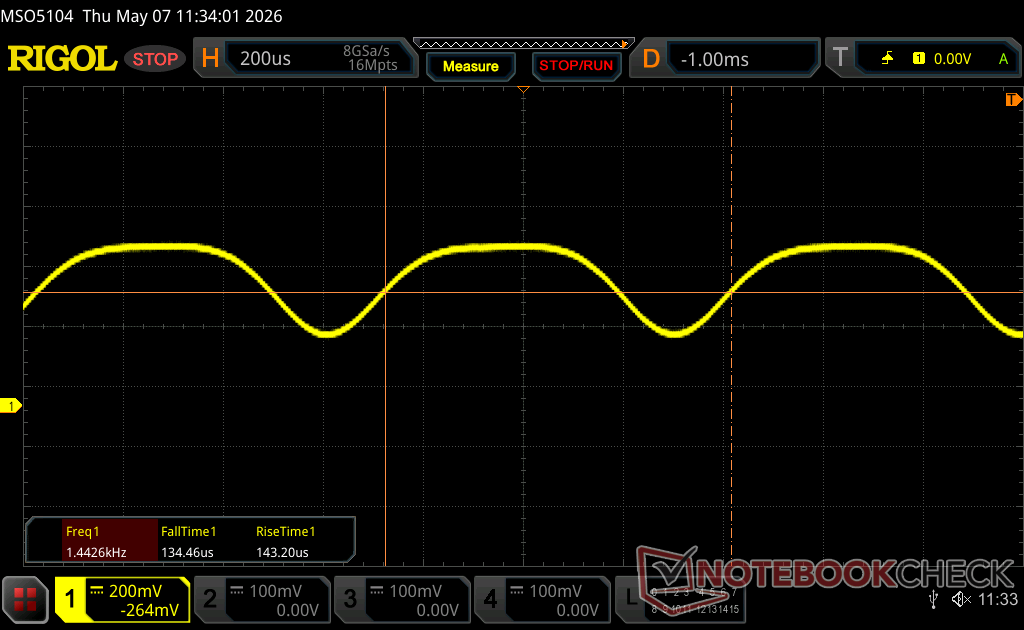
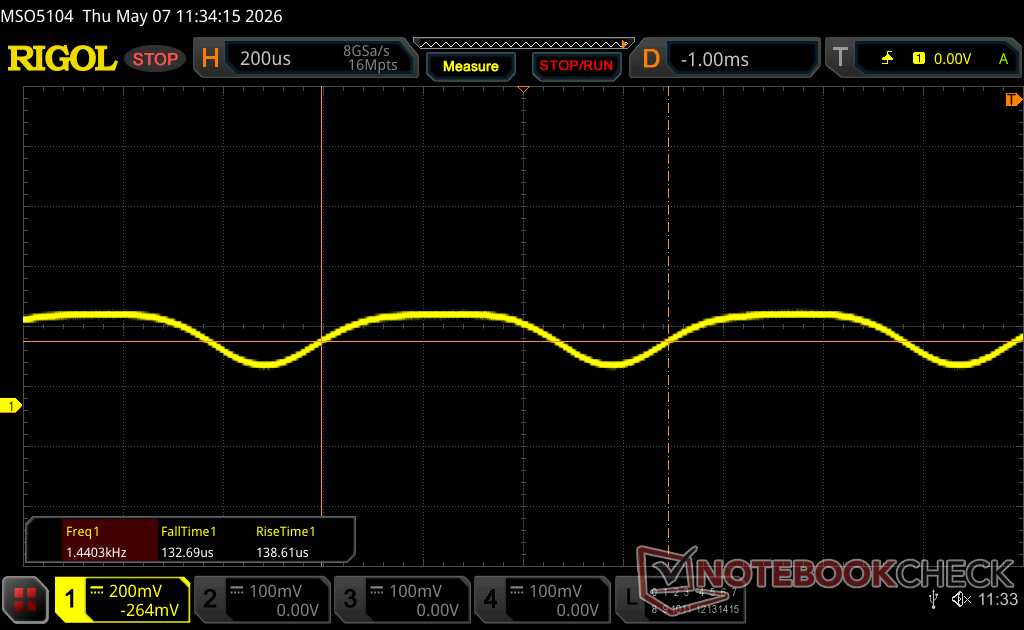
| Flackern / PWM festgestellt | 1439.8 Hz Amplitude: 29 % | ≤ 100 % Helligkeit | 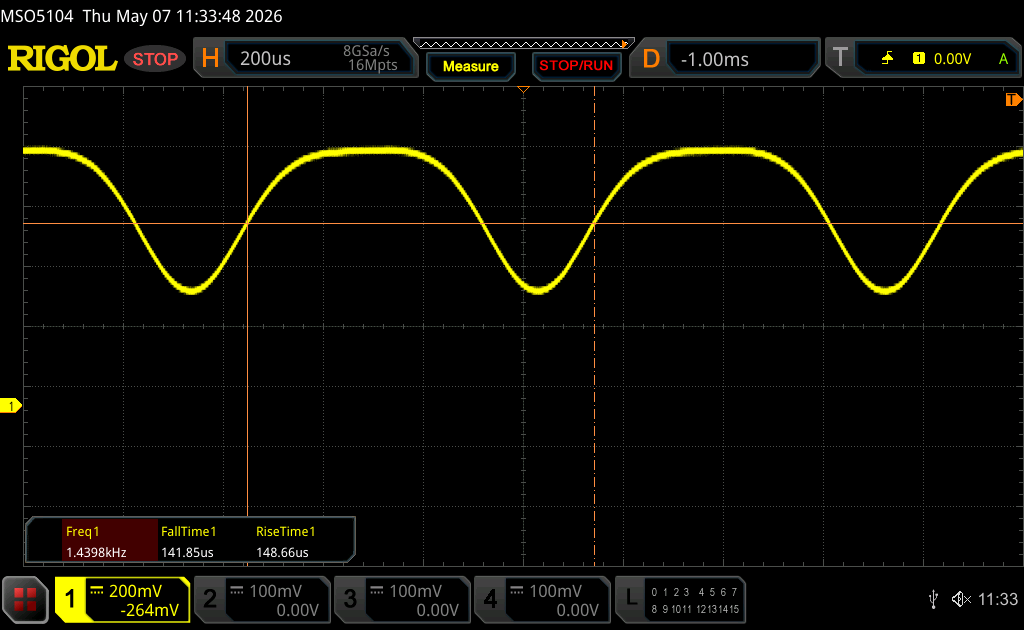 |
Das Display flackert mit 1439.8 Hz (im schlimmsten Fall, eventuell durch Pulsweitenmodulation PWM) bei einer eingestellten Helligkeit von 100 % und darunter. Darüber sollte es zu keinem Flackern kommen. Die Frequenz von 1439.8 Hz ist sehr hoch und sollte daher auch bei empfindlichen Personen zu keinen Problemen führen. Im Vergleich: 52 % aller getesteten Geräte nutzten kein PWM um die Helligkeit zu reduzieren. Wenn PWM eingesetzt wurde, dann bei einer Frequenz von durchschnittlich 7794 (Minimum 5, Maximum 343500) Hz. | |||


Performance
Testbedingungen
Wir haben das Alienware im Command Center auf den Modus Performance eingestellt, bevor wir die folgenden Benchmarks durchgeführt haben. Es ist auch ein "Overdrive-Modus" verfügbar, der die Lüfterdrehzahl auf das Maximum erhöht, aber die Leistungsvorteile gegenüber dem Performance Modus sind nur gering.
Prozessor
Der Core Ultra 9 290HX Plus ist nur bis zu 5 Prozentpunkte schneller als der Core Ultra 9 275HX des letztjährigen Modells. Die Ausführung im Overdrive-Modus hat die Ergebnisse nicht mehr signifikant verbessert.
Cinebench R15 Mehrfachschleife
Cinebench R23: Multi Core | Single Core
Cinebench R20: CPU (Multi Core) | CPU (Single Core)
Cinebench R15: CPU Multi 64Bit | CPU Single 64Bit
Blender: v2.79 BMW27 CPU
7-Zip 18.03: 7z b 4 | 7z b 4 -mmt1
Geekbench 6.7: Multi-Core | Single-Core
Geekbench 5.5: Multi-Core | Single-Core
HWBOT x265 Benchmark v2.2: 4k Preset
LibreOffice : 20 Documents To PDF
R Benchmark 2.5: Overall mean
| Geekbench 6.7 / Single-Core | |
| Schenker XMG Neo 16 A25 5090 | |
| Durchschnittliche Intel Core Ultra 9 290HX Plus (3147 - 3198, n=4) | |
| Alienware 16X Aurora Core Ultra 9 290HX Plus | |
| Alienware 16X Aurora, RTX 5070 | |
| Lenovo Legion Pro 5 16IAX10, RTX 5070 | |
| Lenovo Legion 7 16 IRX G9 | |
| Lenovo Legion 7 16 AGP11 | |
| Asus ROG Zephyrus G16 GA605WV | |
| Asus ROG Zephyrus G16 GU605CW | |
| Asus TUF Gaming A16 FA608UP | |
| Alienware 16 Aurora | |
| HWBOT x265 Benchmark v2.2 / 4k Preset | |
| Schenker XMG Neo 16 A25 5090 | |
| Durchschnittliche Intel Core Ultra 9 290HX Plus (38.2 - 42.3, n=3) | |
| Alienware 16X Aurora Core Ultra 9 290HX Plus | |
| Alienware 16X Aurora, RTX 5070 | |
| Lenovo Legion Pro 5 16IAX10, RTX 5070 | |
| Lenovo Legion 7 16 IRX G9 | |
| Lenovo Legion 7 16 AGP11 | |
| Asus ROG Zephyrus G16 GA605WV | |
| Asus TUF Gaming A16 FA608UP | |
| HP Omen 16-b1090ng | |
| Alienware 16 Aurora | |
| Asus ROG Zephyrus G16 GU605CW | |
| HP Omen 16-c0077ng | |
Cinebench R23: Multi Core | Single Core
Cinebench R20: CPU (Multi Core) | CPU (Single Core)
Cinebench R15: CPU Multi 64Bit | CPU Single 64Bit
Blender: v2.79 BMW27 CPU
7-Zip 18.03: 7z b 4 | 7z b 4 -mmt1
Geekbench 6.7: Multi-Core | Single-Core
Geekbench 5.5: Multi-Core | Single-Core
HWBOT x265 Benchmark v2.2: 4k Preset
LibreOffice : 20 Documents To PDF
R Benchmark 2.5: Overall mean
* ... kleinere Werte sind besser
AIDA64: FP32 Ray-Trace | FPU Julia | CPU SHA3 | CPU Queen | FPU SinJulia | FPU Mandel | CPU AES | CPU ZLib | FP64 Ray-Trace | CPU PhotoWorxx | CPU CheckMate
| Performance Rating | |
| Durchschnittliche Intel Core Ultra 9 290HX Plus -1! | |
| Alienware 16X Aurora Core Ultra 9 290HX Plus -1! | |
| Lenovo Legion Pro 5 16IAX10, RTX 5070 -1! | |
| Alienware 16X Aurora, RTX 5070 -1! | |
| Acer Predator Helios Neo 16S AI PHN16S-71-94L9 -1! | |
| MSI Vector 16 HX AI A2XWHG -1! | |
| Asus ROG Zephyrus G16 GU605CW -1! | |
| AIDA64 / FP32 Ray-Trace | |
| Durchschnittliche Intel Core Ultra 9 290HX Plus (34761 - 40761, n=3) | |
| Alienware 16X Aurora Core Ultra 9 290HX Plus (v8.20.8100) | |
| Lenovo Legion Pro 5 16IAX10, RTX 5070 (v6.92.6600) | |
| Alienware 16X Aurora, RTX 5070 (v6.92.6600) | |
| Acer Predator Helios Neo 16S AI PHN16S-71-94L9 (v6.92.6600) | |
| MSI Vector 16 HX AI A2XWHG (v6.92.6600) | |
| Asus ROG Zephyrus G16 GU605CW (v6.92.6600) | |
| AIDA64 / FPU Julia | |
| Durchschnittliche Intel Core Ultra 9 290HX Plus (174665 - 208083, n=3) | |
| Alienware 16X Aurora Core Ultra 9 290HX Plus (v8.20.8100) | |
| Lenovo Legion Pro 5 16IAX10, RTX 5070 (v6.92.6600) | |
| Alienware 16X Aurora, RTX 5070 (v6.92.6600) | |
| Acer Predator Helios Neo 16S AI PHN16S-71-94L9 (v6.92.6600) | |
| MSI Vector 16 HX AI A2XWHG (v6.92.6600) | |
| Asus ROG Zephyrus G16 GU605CW (v6.92.6600) | |
| AIDA64 / CPU SHA3 | |
| Durchschnittliche Intel Core Ultra 9 290HX Plus (8352 - 9784, n=3) | |
| Alienware 16X Aurora Core Ultra 9 290HX Plus (v8.20.8100) | |
| Alienware 16X Aurora, RTX 5070 (v6.92.6600) | |
| Lenovo Legion Pro 5 16IAX10, RTX 5070 (v6.92.6600) | |
| Acer Predator Helios Neo 16S AI PHN16S-71-94L9 (v6.92.6600) | |
| MSI Vector 16 HX AI A2XWHG (v6.92.6600) | |
| Asus ROG Zephyrus G16 GU605CW (v6.92.6600) | |
| AIDA64 / CPU Queen | |
| Lenovo Legion Pro 5 16IAX10, RTX 5070 (v6.92.6600) | |
| Alienware 16X Aurora, RTX 5070 (v6.92.6600) | |
| Acer Predator Helios Neo 16S AI PHN16S-71-94L9 (v6.92.6600) | |
| MSI Vector 16 HX AI A2XWHG (v6.92.6600) | |
| Asus ROG Zephyrus G16 GU605CW (v6.92.6600) | |
| AIDA64 / FPU SinJulia | |
| Durchschnittliche Intel Core Ultra 9 290HX Plus (13612 - 14461, n=3) | |
| Alienware 16X Aurora Core Ultra 9 290HX Plus (v8.20.8100) | |
| Alienware 16X Aurora, RTX 5070 (v6.92.6600) | |
| Lenovo Legion Pro 5 16IAX10, RTX 5070 (v6.92.6600) | |
| Acer Predator Helios Neo 16S AI PHN16S-71-94L9 (v6.92.6600) | |
| MSI Vector 16 HX AI A2XWHG (v6.92.6600) | |
| Asus ROG Zephyrus G16 GU605CW (v6.92.6600) | |
| AIDA64 / FPU Mandel | |
| Durchschnittliche Intel Core Ultra 9 290HX Plus (91215 - 108275, n=3) | |
| Alienware 16X Aurora Core Ultra 9 290HX Plus (v8.20.8100) | |
| Lenovo Legion Pro 5 16IAX10, RTX 5070 (v6.92.6600) | |
| Alienware 16X Aurora, RTX 5070 (v6.92.6600) | |
| Acer Predator Helios Neo 16S AI PHN16S-71-94L9 (v6.92.6600) | |
| MSI Vector 16 HX AI A2XWHG (v6.92.6600) | |
| Asus ROG Zephyrus G16 GU605CW (v6.92.6600) | |
| AIDA64 / CPU AES | |
| Durchschnittliche Intel Core Ultra 9 290HX Plus (127585 - 136781, n=3) | |
| Alienware 16X Aurora Core Ultra 9 290HX Plus (v8.20.8100) | |
| Alienware 16X Aurora, RTX 5070 (v6.92.6600) | |
| Lenovo Legion Pro 5 16IAX10, RTX 5070 (v6.92.6600) | |
| Acer Predator Helios Neo 16S AI PHN16S-71-94L9 (v6.92.6600) | |
| MSI Vector 16 HX AI A2XWHG (v6.92.6600) | |
| Asus ROG Zephyrus G16 GU605CW (v6.92.6600) | |
| AIDA64 / CPU ZLib | |
| Durchschnittliche Intel Core Ultra 9 290HX Plus (1967 - 2206, n=3) | |
| Alienware 16X Aurora Core Ultra 9 290HX Plus (v8.20.8100) | |
| Alienware 16X Aurora, RTX 5070 (v6.92.6600) | |
| Lenovo Legion Pro 5 16IAX10, RTX 5070 (v6.92.6600) | |
| Acer Predator Helios Neo 16S AI PHN16S-71-94L9 (v6.92.6600) | |
| MSI Vector 16 HX AI A2XWHG (v6.92.6600) | |
| Asus ROG Zephyrus G16 GU605CW (v6.92.6600) | |
| AIDA64 / FP64 Ray-Trace | |
| Durchschnittliche Intel Core Ultra 9 290HX Plus (18611 - 21949, n=3) | |
| Alienware 16X Aurora Core Ultra 9 290HX Plus (v8.20.8100) | |
| Lenovo Legion Pro 5 16IAX10, RTX 5070 (v6.92.6600) | |
| Alienware 16X Aurora, RTX 5070 (v6.92.6600) | |
| Acer Predator Helios Neo 16S AI PHN16S-71-94L9 (v6.92.6600) | |
| MSI Vector 16 HX AI A2XWHG (v6.92.6600) | |
| Asus ROG Zephyrus G16 GU605CW (v6.92.6600) | |
| AIDA64 / CPU PhotoWorxx | |
| Asus ROG Zephyrus G16 GU605CW (v6.92.6600) | |
| Lenovo Legion Pro 5 16IAX10, RTX 5070 (v6.92.6600) | |
| Acer Predator Helios Neo 16S AI PHN16S-71-94L9 (v6.92.6600) | |
| Durchschnittliche Intel Core Ultra 9 290HX Plus (51134 - 55731, n=3) | |
| Alienware 16X Aurora Core Ultra 9 290HX Plus (v8.20.8100) | |
| Alienware 16X Aurora, RTX 5070 (v6.92.6600) | |
| MSI Vector 16 HX AI A2XWHG (v6.92.6600) | |
| AIDA64 / CPU CheckMate | |
| Durchschnittliche Intel Core Ultra 9 290HX Plus (7624 - 8322, n=3) | |
| Alienware 16X Aurora Core Ultra 9 290HX Plus (v8.20.8100) | |
System Performance
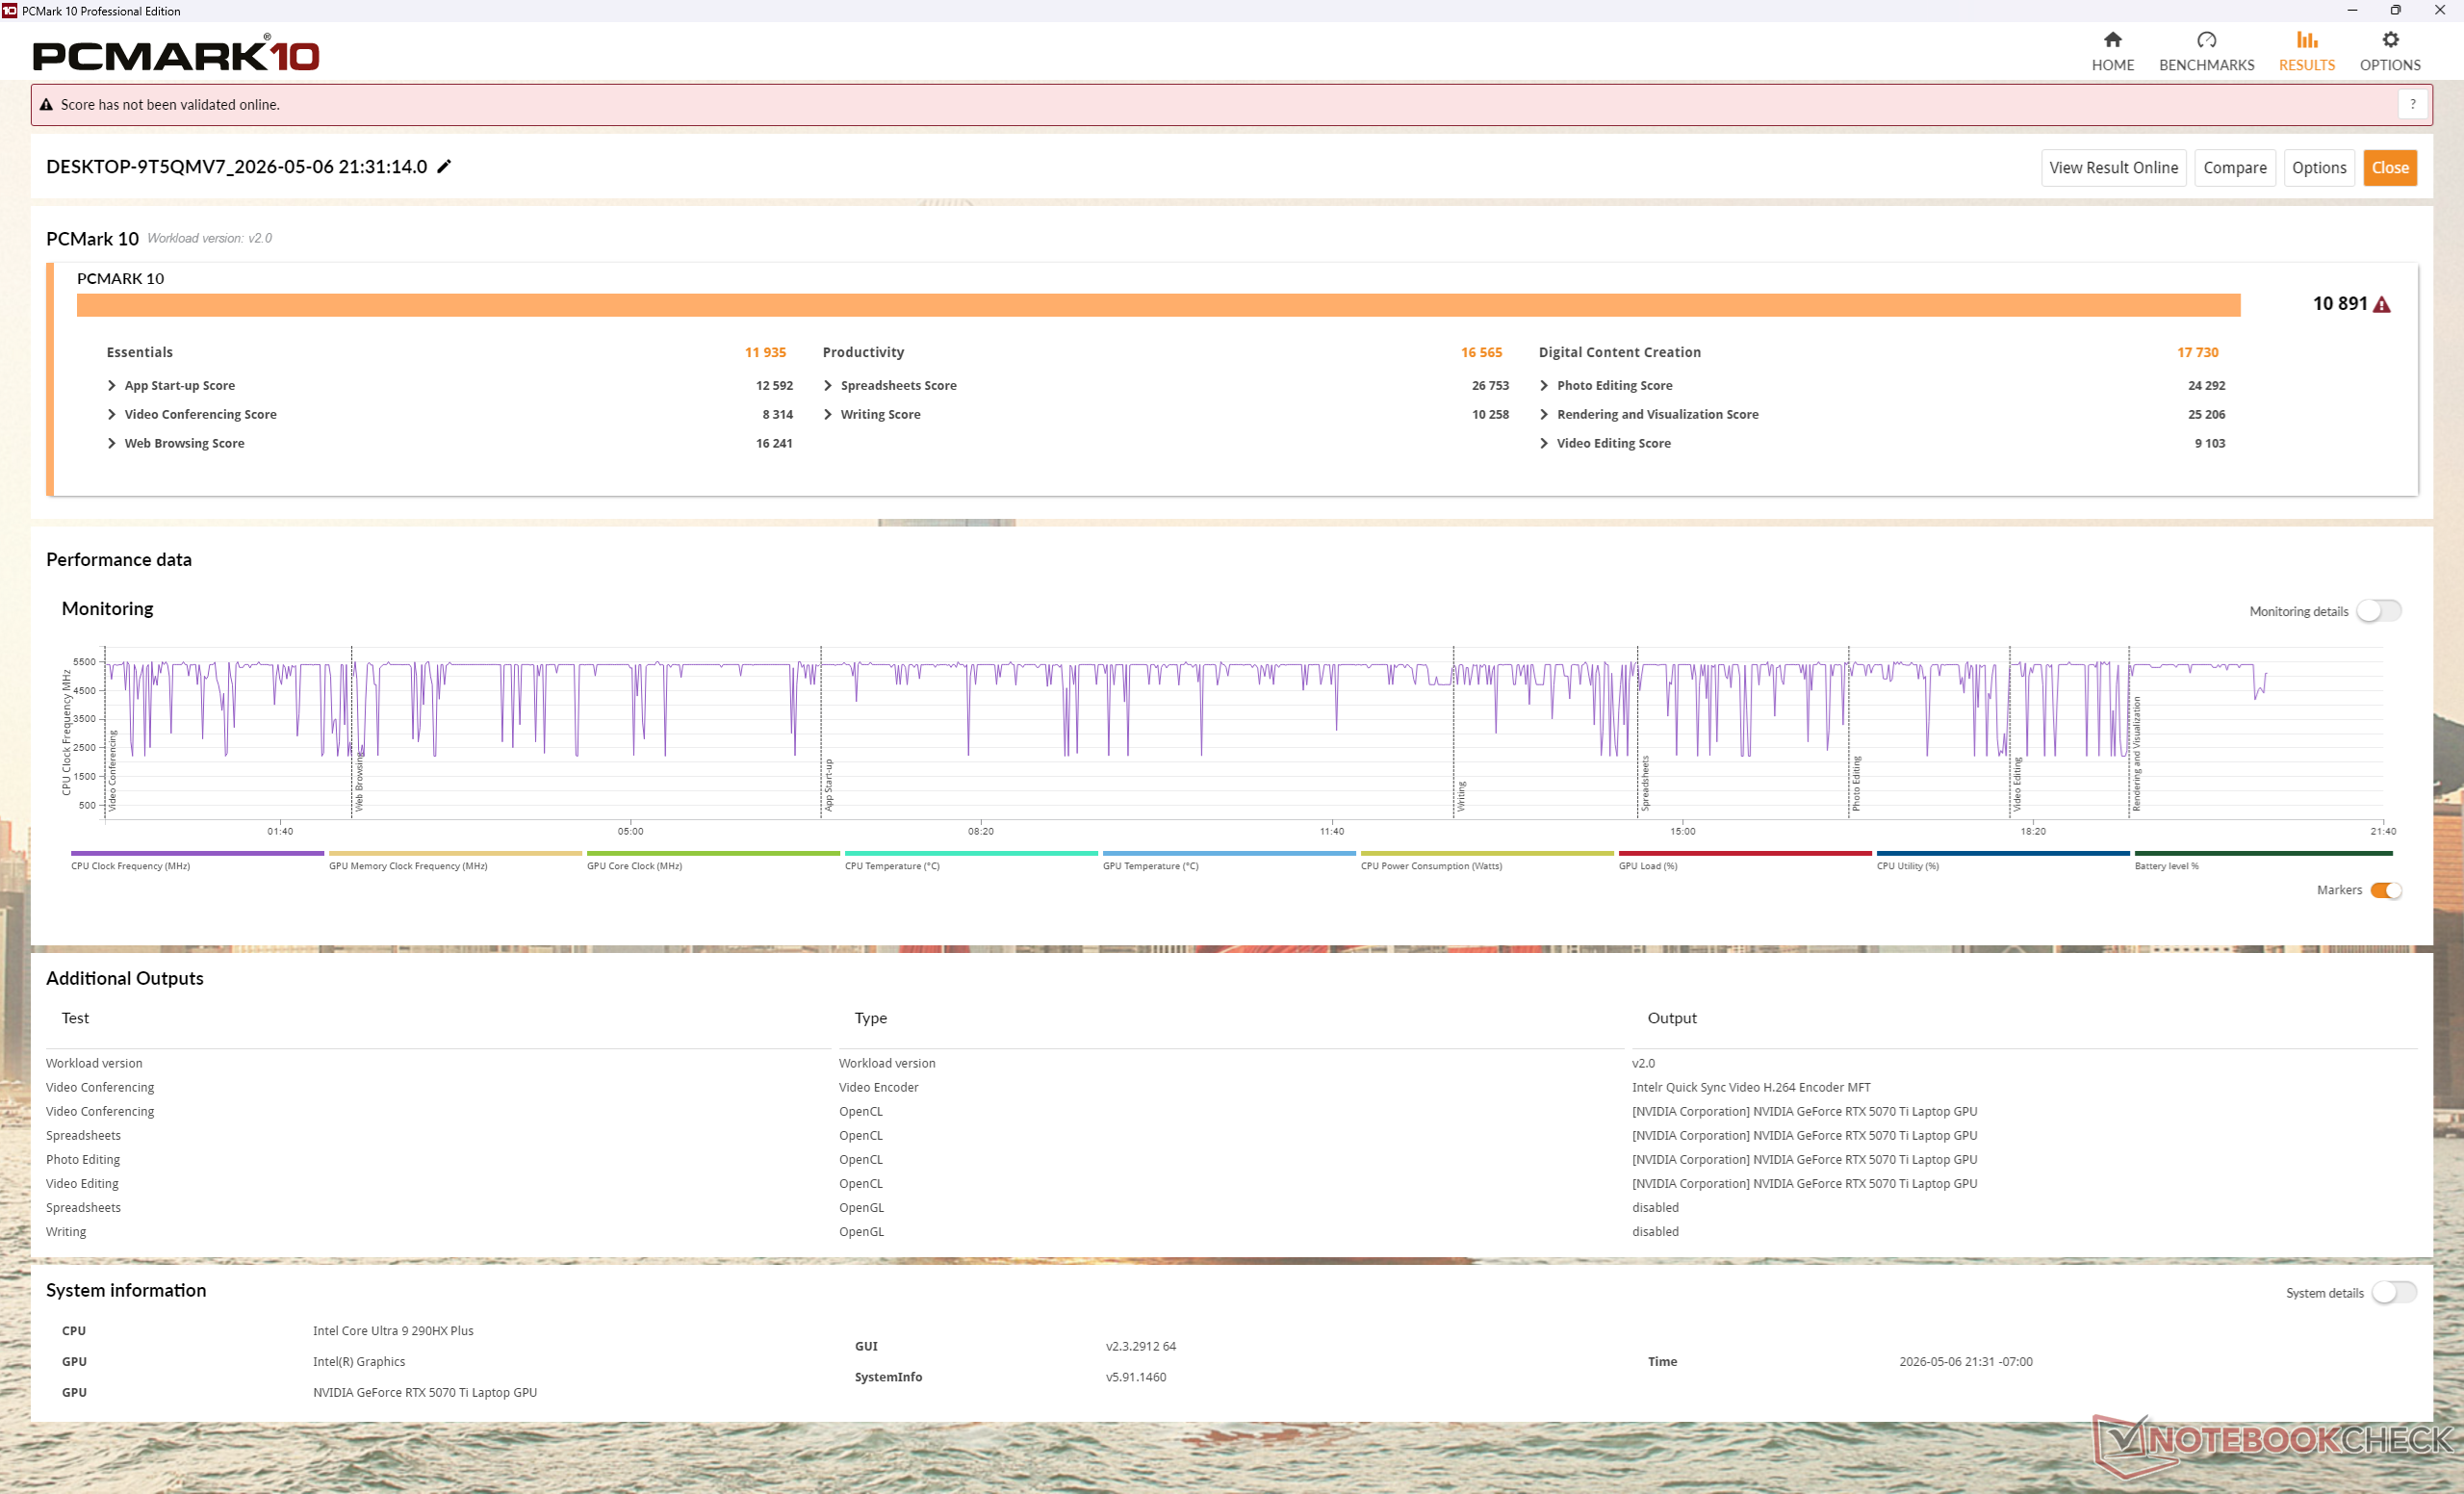
PCMark 10: Score | Essentials | Productivity | Digital Content Creation
CrossMark: Overall | Productivity | Creativity | Responsiveness
WebXPRT 3: Overall
WebXPRT 4: Overall
Mozilla Kraken 1.1: Total
Geekbench AI: Quantized GPU 1.7 | Half Precision GPU 1.7 | Single Precision GPU 1.7
| Performance Rating | |
| Alienware 16X Aurora Core Ultra 9 290HX Plus | |
| Durchschnittliche Intel Core Ultra 9 290HX Plus, NVIDIA GeForce RTX 5070 Ti Laptop | |
| Alienware 16X Aurora, RTX 5070 -4! | |
| Lenovo Legion Pro 5 16IAX10, RTX 5070 | |
| Acer Predator Helios Neo 16S AI PHN16S-71-94L9 -3! | |
| MSI Vector 16 HX AI A2XWHG -3! | |
| Asus ROG Zephyrus G16 GU605CW -3! | |
| PCMark 10 / Score | |
| Alienware 16X Aurora Core Ultra 9 290HX Plus | |
| Durchschnittliche Intel Core Ultra 9 290HX Plus, NVIDIA GeForce RTX 5070 Ti Laptop (n=1) | |
| Lenovo Legion Pro 5 16IAX10, RTX 5070 | |
| Acer Predator Helios Neo 16S AI PHN16S-71-94L9 | |
| MSI Vector 16 HX AI A2XWHG | |
| Asus ROG Zephyrus G16 GU605CW | |
| PCMark 10 / Essentials | |
| Alienware 16X Aurora Core Ultra 9 290HX Plus | |
| Durchschnittliche Intel Core Ultra 9 290HX Plus, NVIDIA GeForce RTX 5070 Ti Laptop (n=1) | |
| Lenovo Legion Pro 5 16IAX10, RTX 5070 | |
| Acer Predator Helios Neo 16S AI PHN16S-71-94L9 | |
| MSI Vector 16 HX AI A2XWHG | |
| Asus ROG Zephyrus G16 GU605CW | |
| PCMark 10 / Productivity | |
| Alienware 16X Aurora Core Ultra 9 290HX Plus | |
| Durchschnittliche Intel Core Ultra 9 290HX Plus, NVIDIA GeForce RTX 5070 Ti Laptop (n=1) | |
| Lenovo Legion Pro 5 16IAX10, RTX 5070 | |
| Acer Predator Helios Neo 16S AI PHN16S-71-94L9 | |
| MSI Vector 16 HX AI A2XWHG | |
| Asus ROG Zephyrus G16 GU605CW | |
| PCMark 10 / Digital Content Creation | |
| Alienware 16X Aurora Core Ultra 9 290HX Plus | |
| Durchschnittliche Intel Core Ultra 9 290HX Plus, NVIDIA GeForce RTX 5070 Ti Laptop (n=1) | |
| Lenovo Legion Pro 5 16IAX10, RTX 5070 | |
| Acer Predator Helios Neo 16S AI PHN16S-71-94L9 | |
| Asus ROG Zephyrus G16 GU605CW | |
| MSI Vector 16 HX AI A2XWHG | |
| CrossMark / Overall | |
| Alienware 16X Aurora Core Ultra 9 290HX Plus | |
| Durchschnittliche Intel Core Ultra 9 290HX Plus, NVIDIA GeForce RTX 5070 Ti Laptop (n=1) | |
| Alienware 16X Aurora, RTX 5070 | |
| Acer Predator Helios Neo 16S AI PHN16S-71-94L9 | |
| Lenovo Legion Pro 5 16IAX10, RTX 5070 | |
| MSI Vector 16 HX AI A2XWHG | |
| Asus ROG Zephyrus G16 GU605CW | |
| CrossMark / Productivity | |
| Alienware 16X Aurora Core Ultra 9 290HX Plus | |
| Durchschnittliche Intel Core Ultra 9 290HX Plus, NVIDIA GeForce RTX 5070 Ti Laptop (n=1) | |
| Alienware 16X Aurora, RTX 5070 | |
| Acer Predator Helios Neo 16S AI PHN16S-71-94L9 | |
| Lenovo Legion Pro 5 16IAX10, RTX 5070 | |
| MSI Vector 16 HX AI A2XWHG | |
| Asus ROG Zephyrus G16 GU605CW | |
| CrossMark / Creativity | |
| Alienware 16X Aurora Core Ultra 9 290HX Plus | |
| Durchschnittliche Intel Core Ultra 9 290HX Plus, NVIDIA GeForce RTX 5070 Ti Laptop (n=1) | |
| Acer Predator Helios Neo 16S AI PHN16S-71-94L9 | |
| Alienware 16X Aurora, RTX 5070 | |
| Lenovo Legion Pro 5 16IAX10, RTX 5070 | |
| MSI Vector 16 HX AI A2XWHG | |
| Asus ROG Zephyrus G16 GU605CW | |
| CrossMark / Responsiveness | |
| Alienware 16X Aurora Core Ultra 9 290HX Plus | |
| Durchschnittliche Intel Core Ultra 9 290HX Plus, NVIDIA GeForce RTX 5070 Ti Laptop (n=1) | |
| Alienware 16X Aurora, RTX 5070 | |
| Lenovo Legion Pro 5 16IAX10, RTX 5070 | |
| Acer Predator Helios Neo 16S AI PHN16S-71-94L9 | |
| MSI Vector 16 HX AI A2XWHG | |
| Asus ROG Zephyrus G16 GU605CW | |
| WebXPRT 3 / Overall | |
| Alienware 16X Aurora Core Ultra 9 290HX Plus | |
| Durchschnittliche Intel Core Ultra 9 290HX Plus, NVIDIA GeForce RTX 5070 Ti Laptop (n=1) | |
| Alienware 16X Aurora, RTX 5070 | |
| Lenovo Legion Pro 5 16IAX10, RTX 5070 | |
| Acer Predator Helios Neo 16S AI PHN16S-71-94L9 | |
| MSI Vector 16 HX AI A2XWHG | |
| Asus ROG Zephyrus G16 GU605CW | |
| WebXPRT 4 / Overall | |
| Alienware 16X Aurora Core Ultra 9 290HX Plus | |
| Durchschnittliche Intel Core Ultra 9 290HX Plus, NVIDIA GeForce RTX 5070 Ti Laptop (n=1) | |
| Alienware 16X Aurora, RTX 5070 | |
| Lenovo Legion Pro 5 16IAX10, RTX 5070 | |
| Acer Predator Helios Neo 16S AI PHN16S-71-94L9 | |
| MSI Vector 16 HX AI A2XWHG | |
| Asus ROG Zephyrus G16 GU605CW | |
| Mozilla Kraken 1.1 / Total | |
| Asus ROG Zephyrus G16 GU605CW | |
| Lenovo Legion Pro 5 16IAX10, RTX 5070 | |
| MSI Vector 16 HX AI A2XWHG | |
| Alienware 16X Aurora, RTX 5070 | |
| Acer Predator Helios Neo 16S AI PHN16S-71-94L9 | |
| Alienware 16X Aurora Core Ultra 9 290HX Plus | |
| Durchschnittliche Intel Core Ultra 9 290HX Plus, NVIDIA GeForce RTX 5070 Ti Laptop (n=1) | |
| Geekbench AI / Quantized GPU 1.7 | |
| Alienware 16X Aurora Core Ultra 9 290HX Plus | |
| Durchschnittliche Intel Core Ultra 9 290HX Plus, NVIDIA GeForce RTX 5070 Ti Laptop (n=1) | |
| Alienware 16X Aurora, RTX 5070 | |
| Lenovo Legion Pro 5 16IAX10, RTX 5070 | |
| Geekbench AI / Half Precision GPU 1.7 | |
| Alienware 16X Aurora Core Ultra 9 290HX Plus | |
| Durchschnittliche Intel Core Ultra 9 290HX Plus, NVIDIA GeForce RTX 5070 Ti Laptop (n=1) | |
| Alienware 16X Aurora, RTX 5070 | |
| Lenovo Legion Pro 5 16IAX10, RTX 5070 | |
| Geekbench AI / Single Precision GPU 1.7 | |
| Alienware 16X Aurora Core Ultra 9 290HX Plus | |
| Durchschnittliche Intel Core Ultra 9 290HX Plus, NVIDIA GeForce RTX 5070 Ti Laptop (n=1) | |
| Alienware 16X Aurora, RTX 5070 | |
| Lenovo Legion Pro 5 16IAX10, RTX 5070 | |
* ... kleinere Werte sind besser
| PCMark 10 Score | 10891 Punkte | |
Hilfe | ||
| AIDA64 / Memory Copy | |
| Asus ROG Zephyrus G16 GU605CW | |
| Acer Predator Helios Neo 16S AI PHN16S-71-94L9 | |
| Lenovo Legion Pro 5 16IAX10, RTX 5070 | |
| Durchschnittliche Intel Core Ultra 9 290HX Plus (76912 - 85698, n=3) | |
| Alienware 16X Aurora, RTX 5070 | |
| Alienware 16X Aurora Core Ultra 9 290HX Plus | |
| MSI Vector 16 HX AI A2XWHG | |
| AIDA64 / Memory Read | |
| Acer Predator Helios Neo 16S AI PHN16S-71-94L9 | |
| Lenovo Legion Pro 5 16IAX10, RTX 5070 | |
| Durchschnittliche Intel Core Ultra 9 290HX Plus (84638 - 93496, n=3) | |
| Alienware 16X Aurora, RTX 5070 | |
| Alienware 16X Aurora Core Ultra 9 290HX Plus | |
| MSI Vector 16 HX AI A2XWHG | |
| Asus ROG Zephyrus G16 GU605CW | |
| AIDA64 / Memory Write | |
| Acer Predator Helios Neo 16S AI PHN16S-71-94L9 | |
| Lenovo Legion Pro 5 16IAX10, RTX 5070 | |
| Alienware 16X Aurora, RTX 5070 | |
| Durchschnittliche Intel Core Ultra 9 290HX Plus (76094 - 81688, n=3) | |
| Alienware 16X Aurora Core Ultra 9 290HX Plus | |
| Asus ROG Zephyrus G16 GU605CW | |
| MSI Vector 16 HX AI A2XWHG | |
| AIDA64 / Memory Latency | |
| Asus ROG Zephyrus G16 GU605CW | |
| Alienware 16X Aurora, RTX 5070 | |
| Acer Predator Helios Neo 16S AI PHN16S-71-94L9 | |
| Alienware 16X Aurora Core Ultra 9 290HX Plus | |
| MSI Vector 16 HX AI A2XWHG | |
| Durchschnittliche Intel Core Ultra 9 290HX Plus (105.3 - 108.4, n=3) | |
| Lenovo Legion Pro 5 16IAX10, RTX 5070 | |
* ... kleinere Werte sind besser
DPC-Latenzzeit
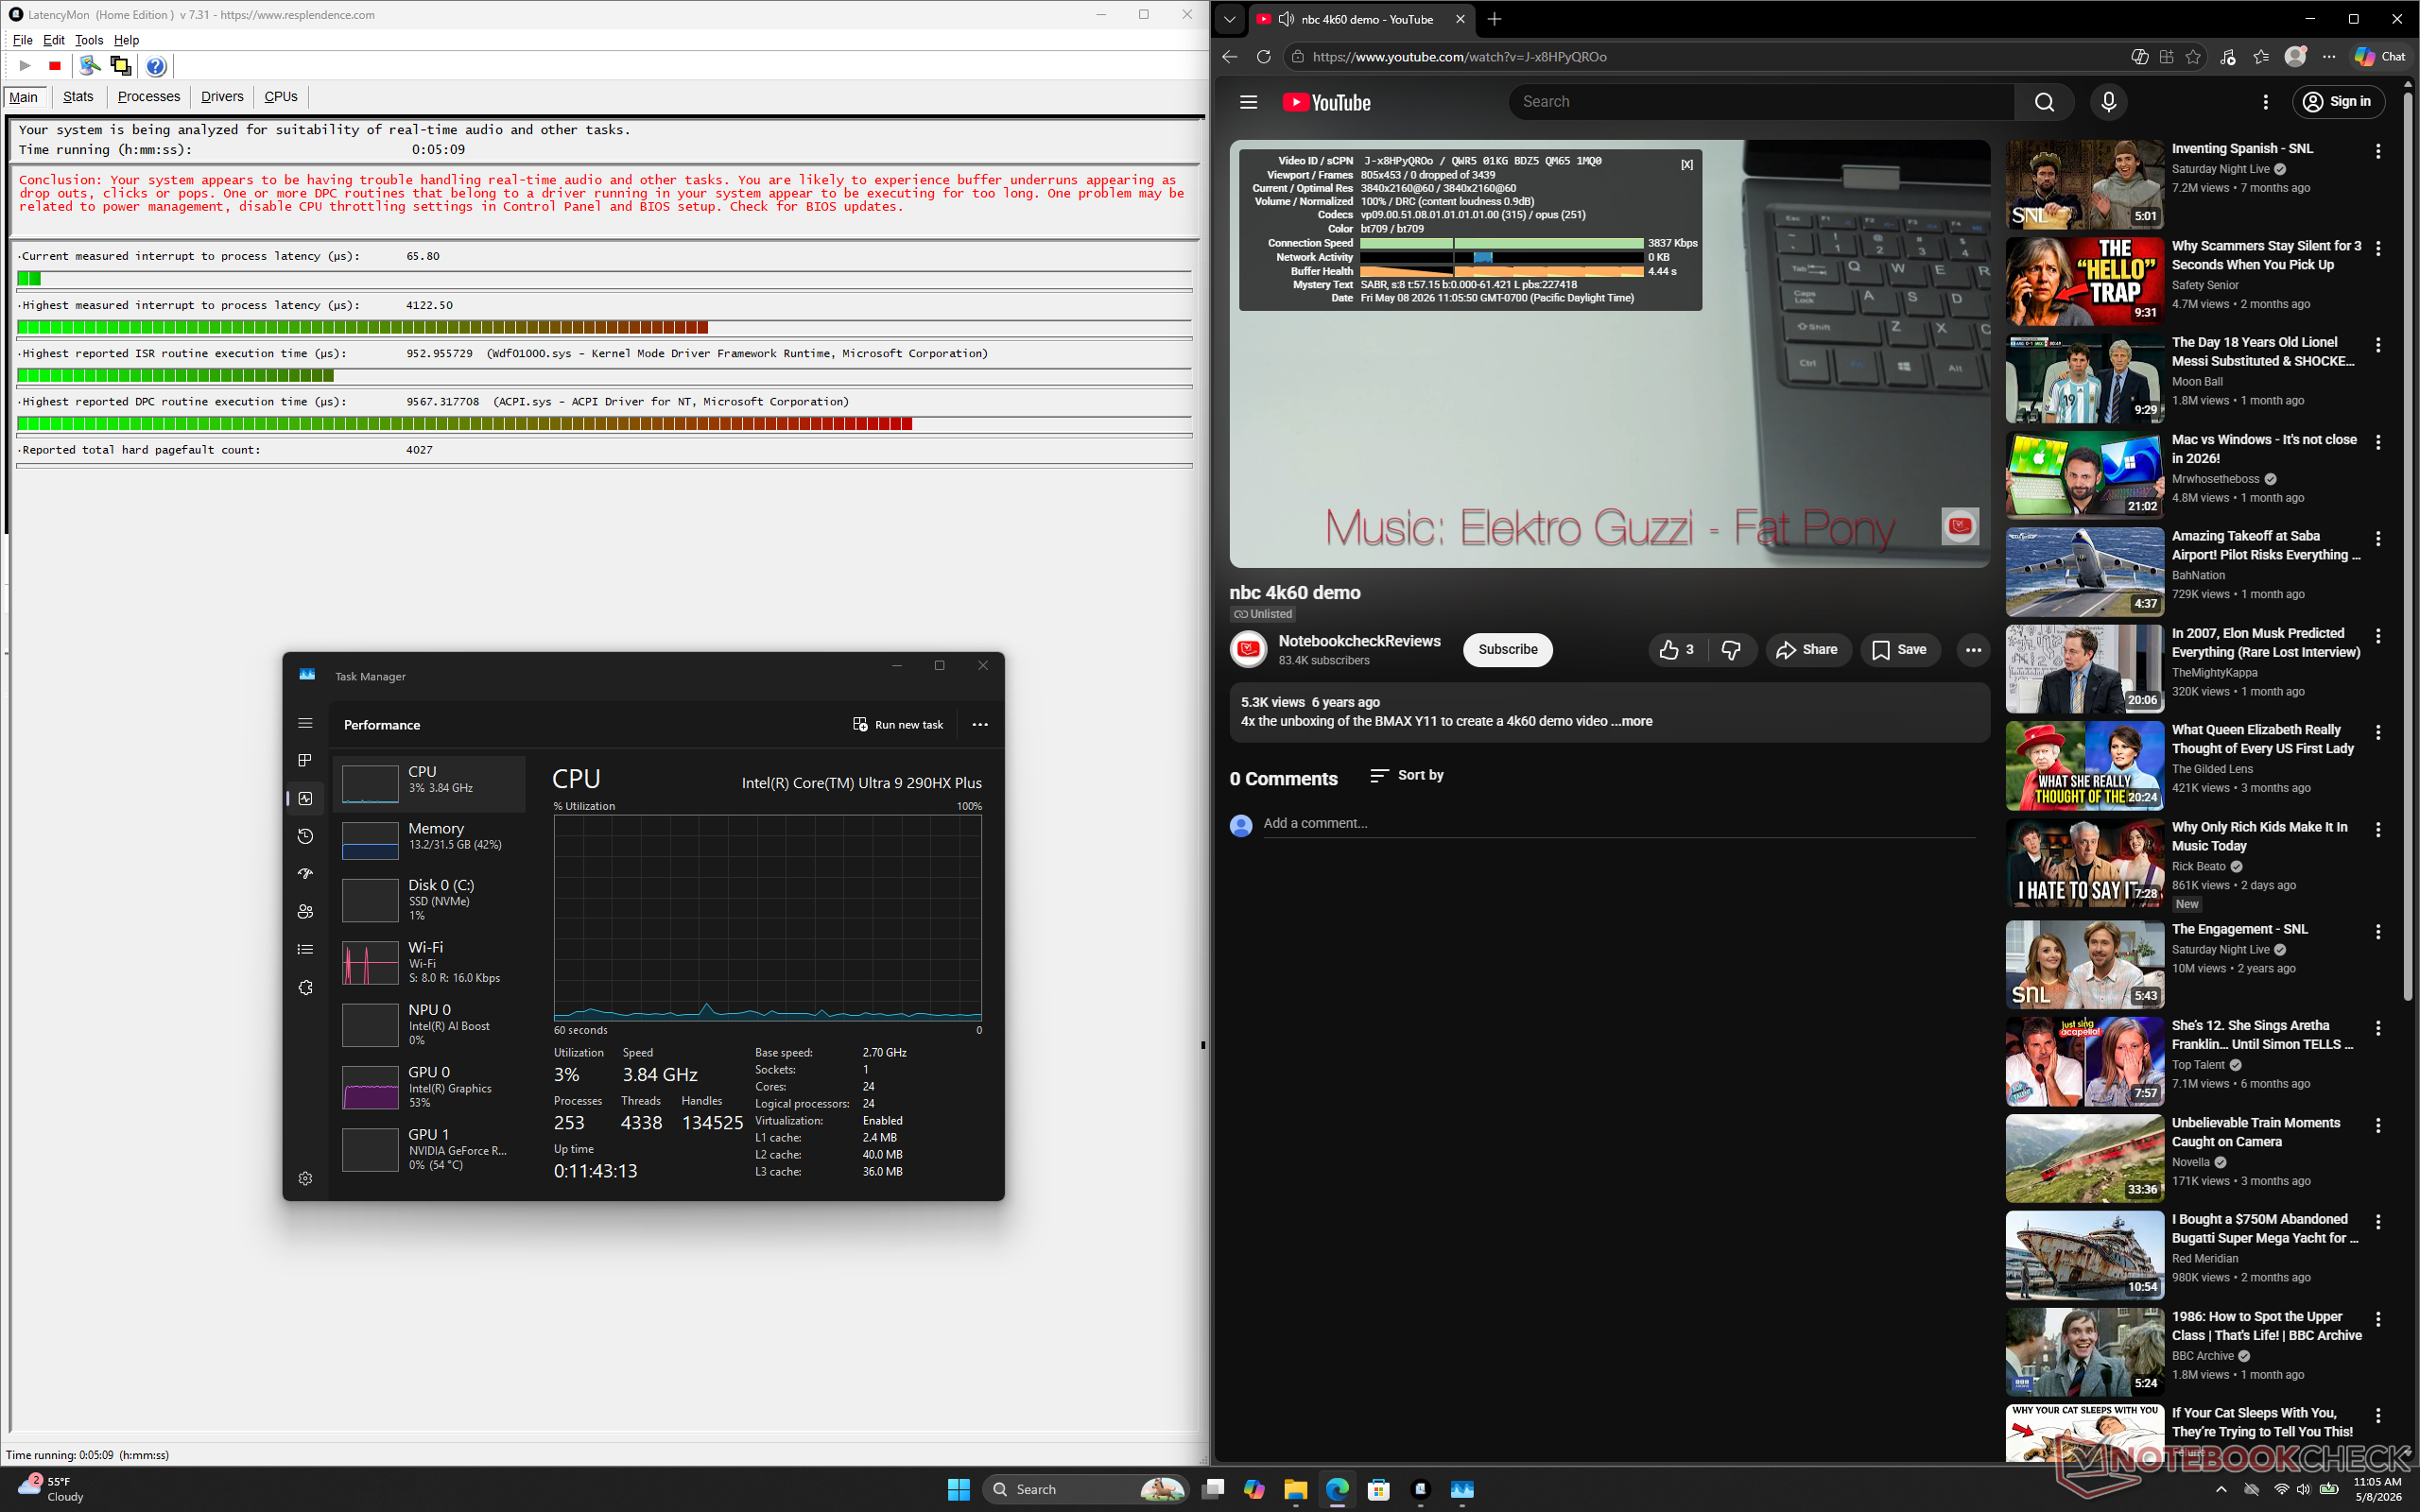
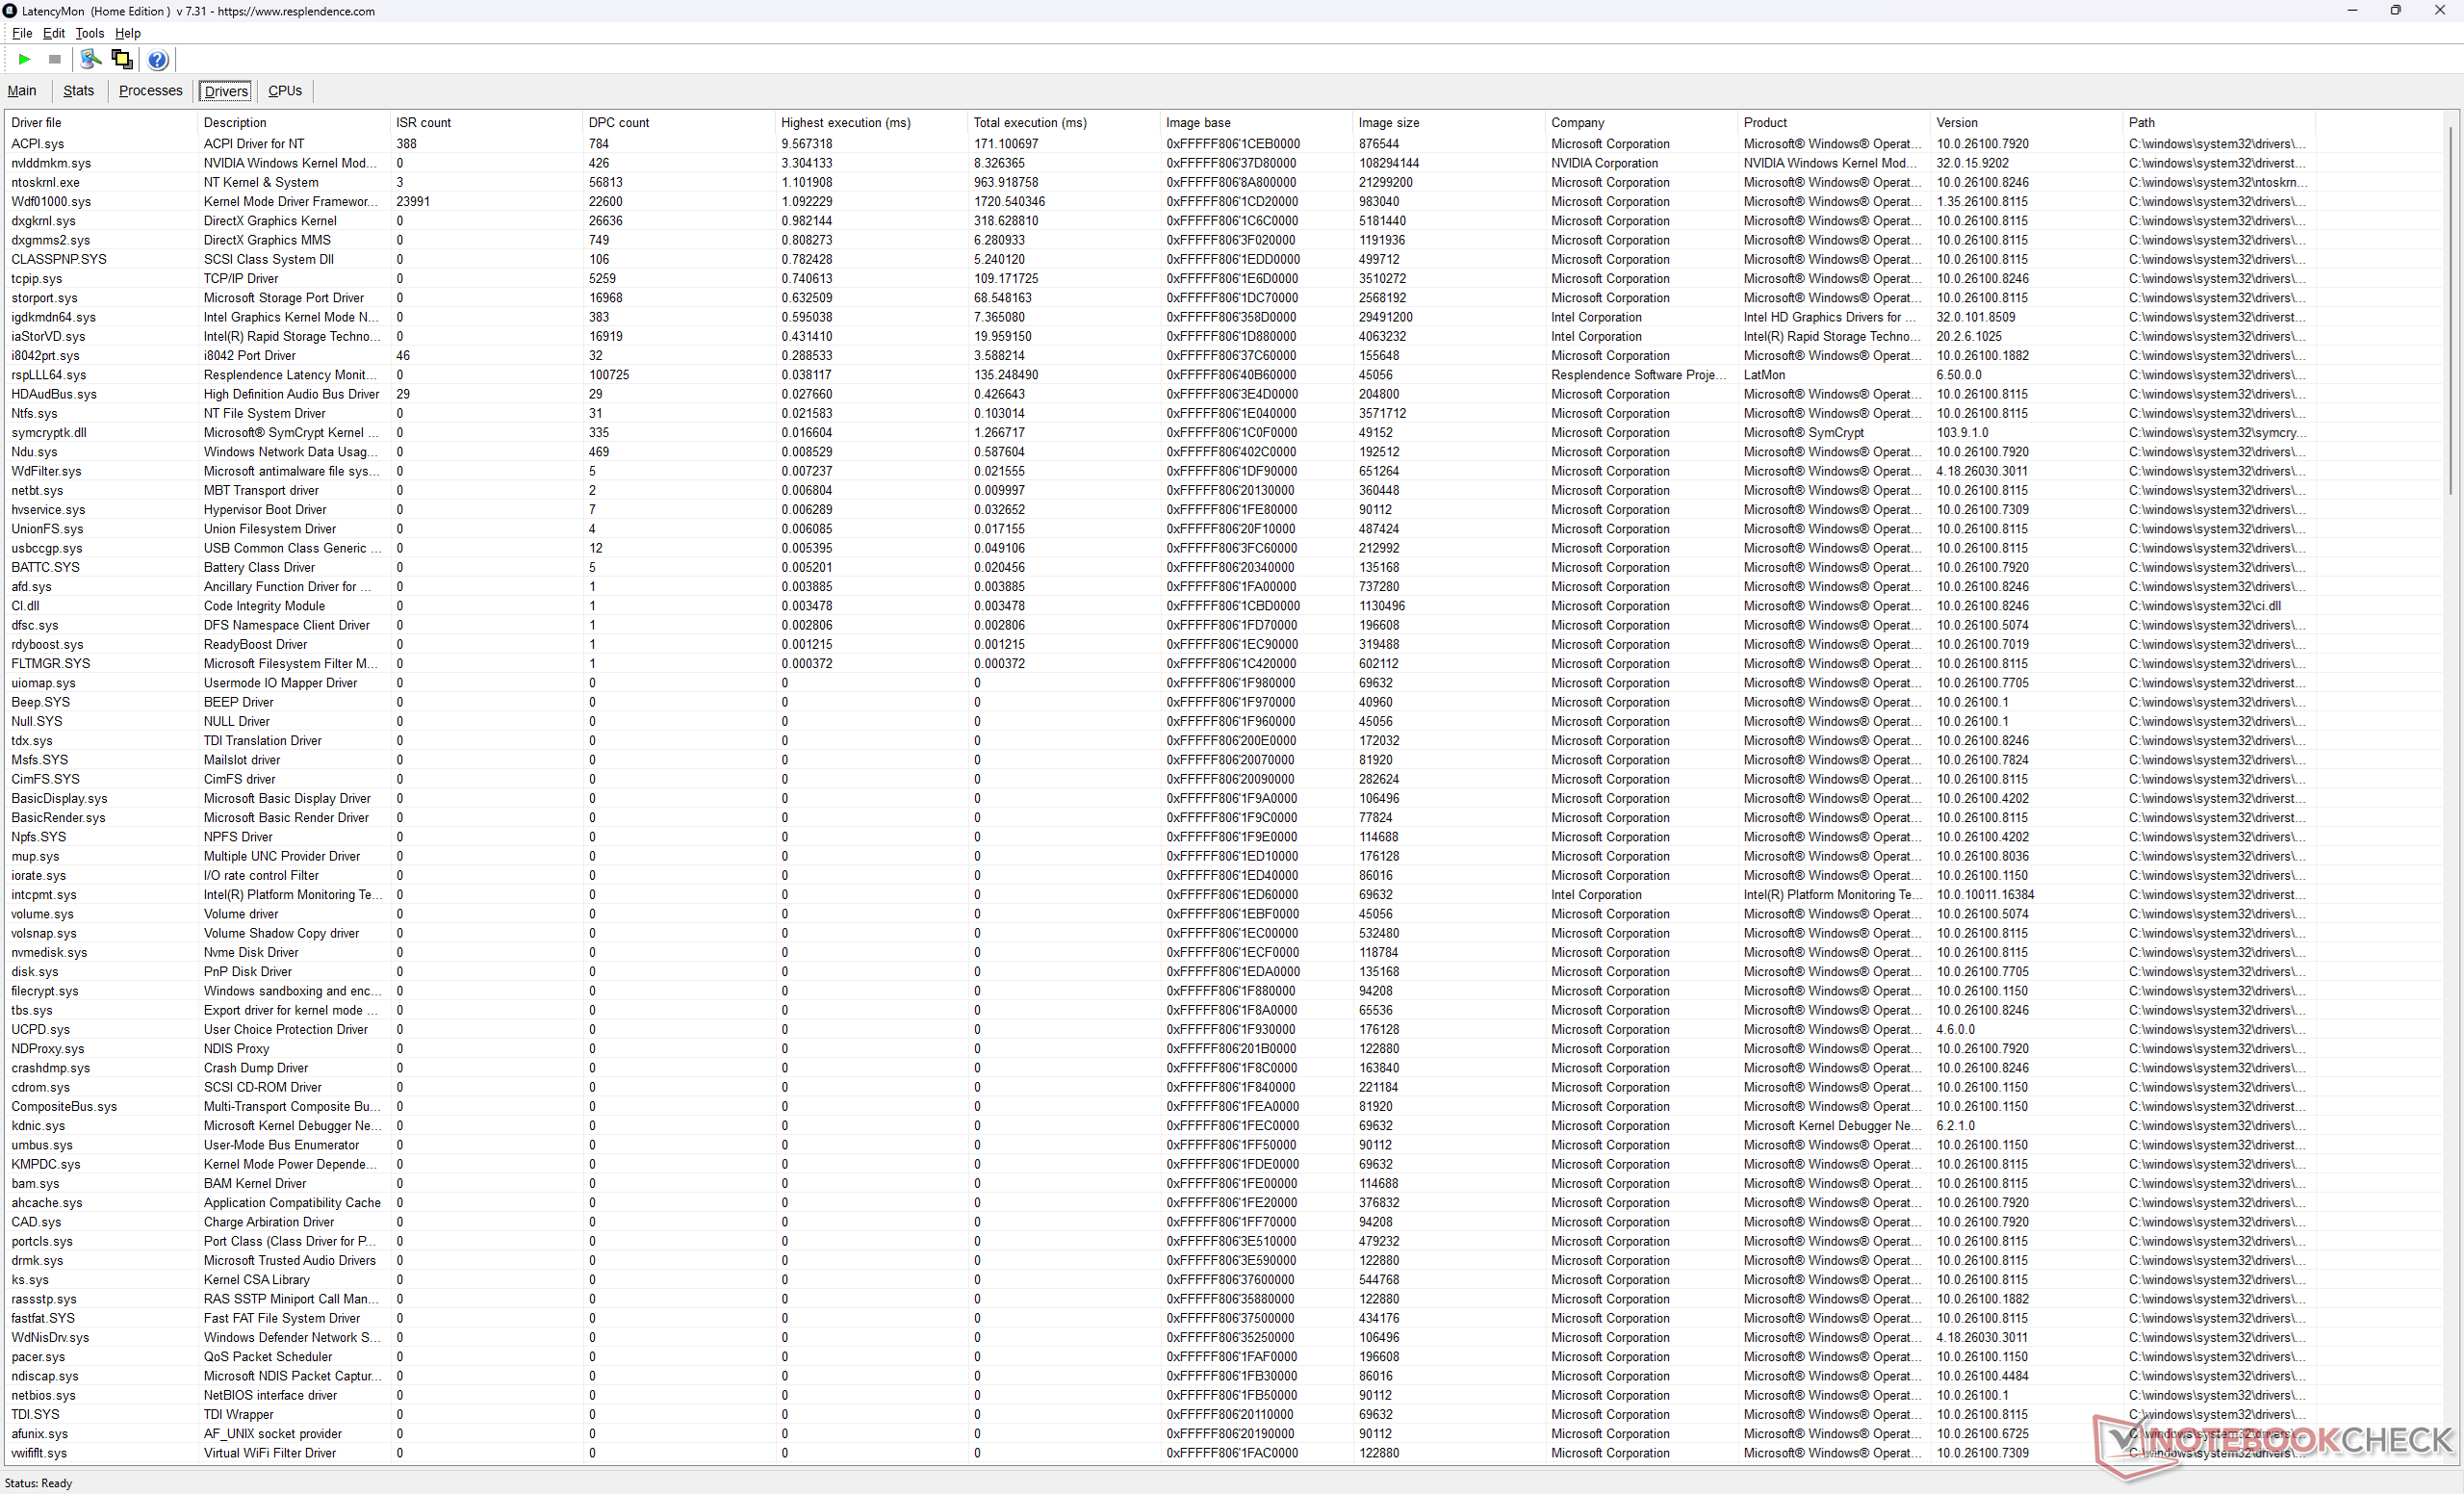
| DPC Latencies / LatencyMon - interrupt to process latency (max), Web, Youtube, Prime95 | |
| MSI Vector 16 HX AI A2XWHG | |
| Alienware 16X Aurora Core Ultra 9 290HX Plus | |
| Acer Predator Helios Neo 16S AI PHN16S-71-94L9 | |
| Alienware 16X Aurora, RTX 5070 | |
| Asus ROG Zephyrus G16 GU605CW | |
| Lenovo Legion Pro 5 16IAX10, RTX 5070 | |
* ... kleinere Werte sind besser
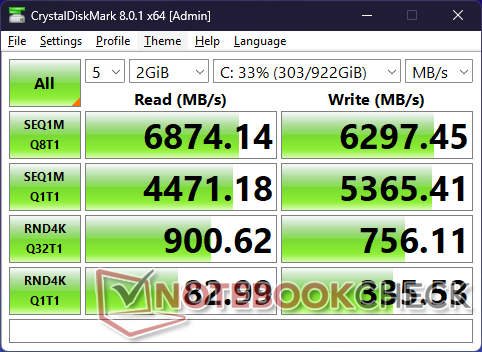
Speichergeräte
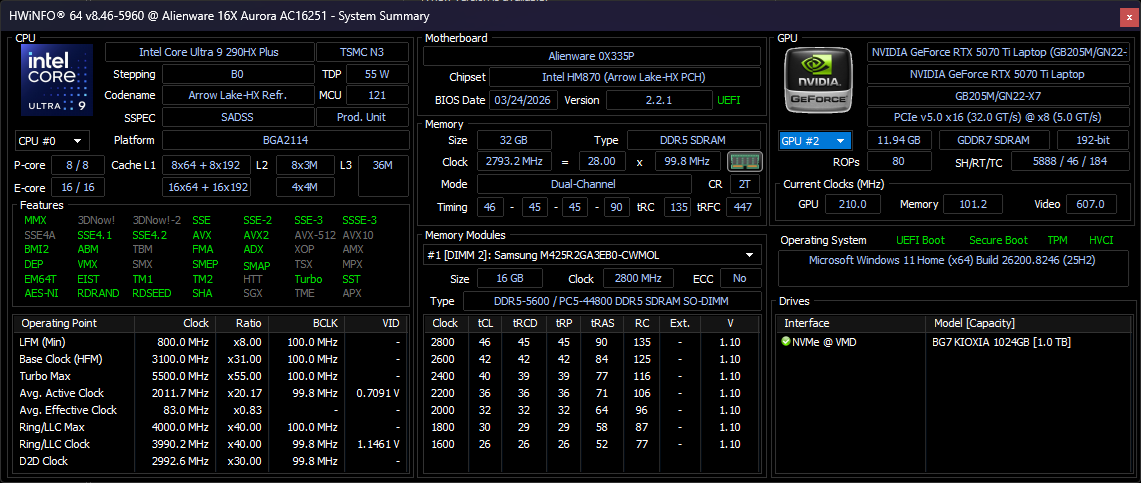
Während das letztjährige Modell mit einem Micron 2650 ausgeliefert wurde, kommt unser 2026er Modell mit dem Kioxia BG7. Diese M.2 2242 PCIe4 x4 NVMe SSD bietet stabile Übertragungsraten von ~7000 MB/s ohne Drosselungsprobleme und ist damit eine Verbesserung gegenüber dem Micron.
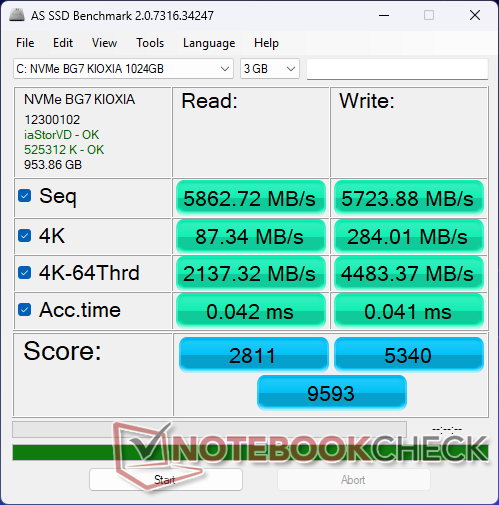

* ... kleinere Werte sind besser
Drosselung der Festplatte: DiskSpd-Leseschleife, Warteschlangentiefe 8
GPU Performance
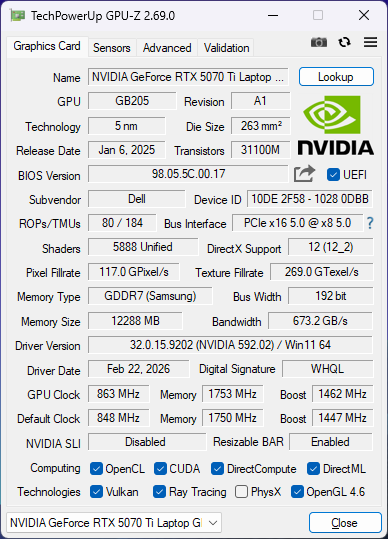
Die mobile GeForce RTX 5070 Ti ist etwa 20 Prozent schneller als die mobile RTX 5070 im 16X Aurora vom letzten Jahr. Vor allem bietet die mobile RTX 5070 Ti mehr VRAM.
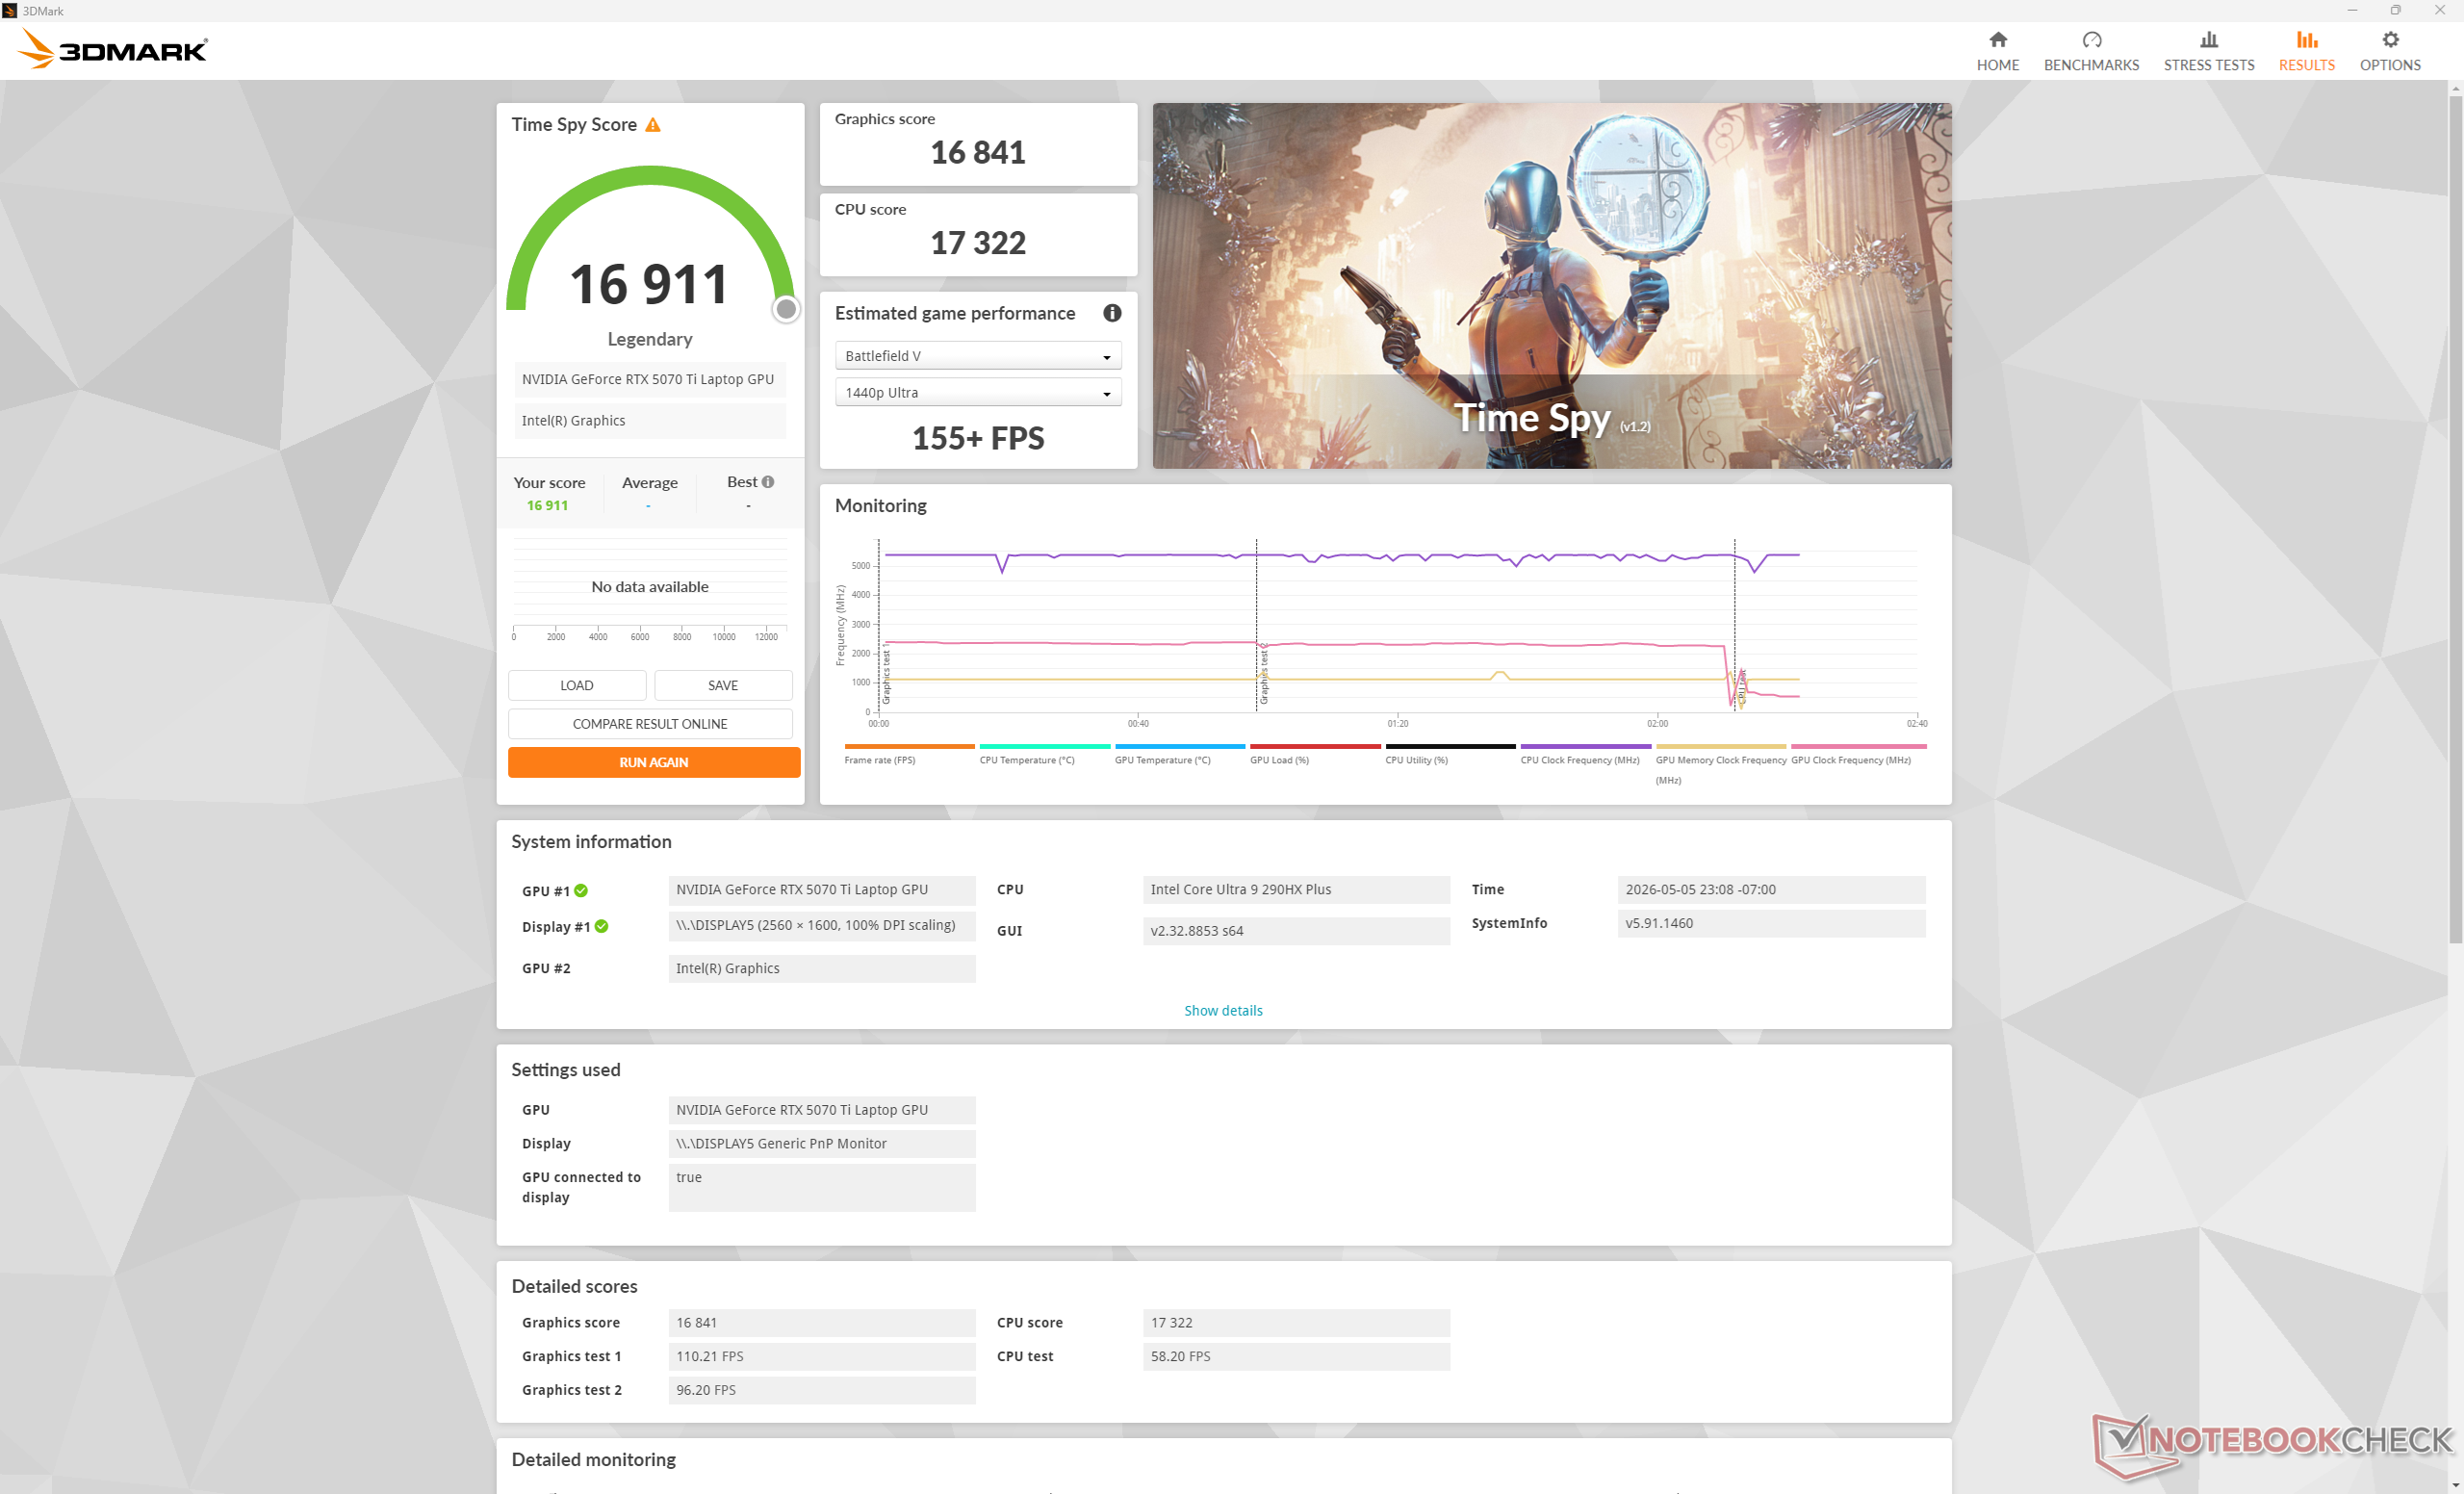
Der Performance Modus anstelle des Overdrive Modus hat kaum Auswirkungen auf die Leistung, wie unsere Time Spy Ergebnisse unten zeigen. Erst im Balanced Modus zeigt sich eine Beeinträchtigung der Gaming Performance.
| Leistungsprofil | Grafik Ergebnis | Physik-Wertung | Kombinierte Wertung |
| Overdrive-Modus | 16841 | 17322 | 16911 |
| Performance Modus | 16458 (-2%) | 17318 (-0%) | 16581 (-2%) |
| Ausgeglichener Modus | 15234 (-10%) | 17079 (-1%) | 15484 (-8%) |
| Akku-Betrieb | 11934 (-29%) | 14833 (-14%) | 12294 (-27%) |
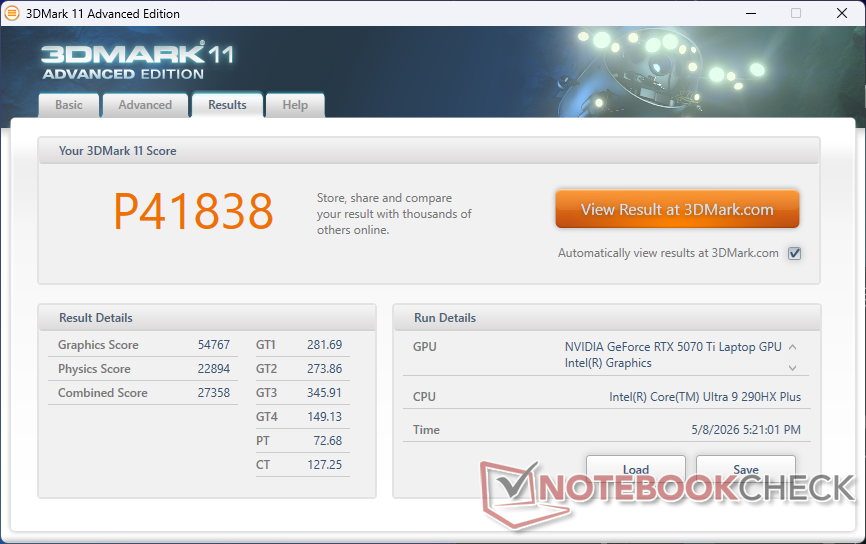
| 3DMark 11 Performance | 41838 Punkte | |
| 3DMark Cloud Gate Standard Score | 72346 Punkte | |
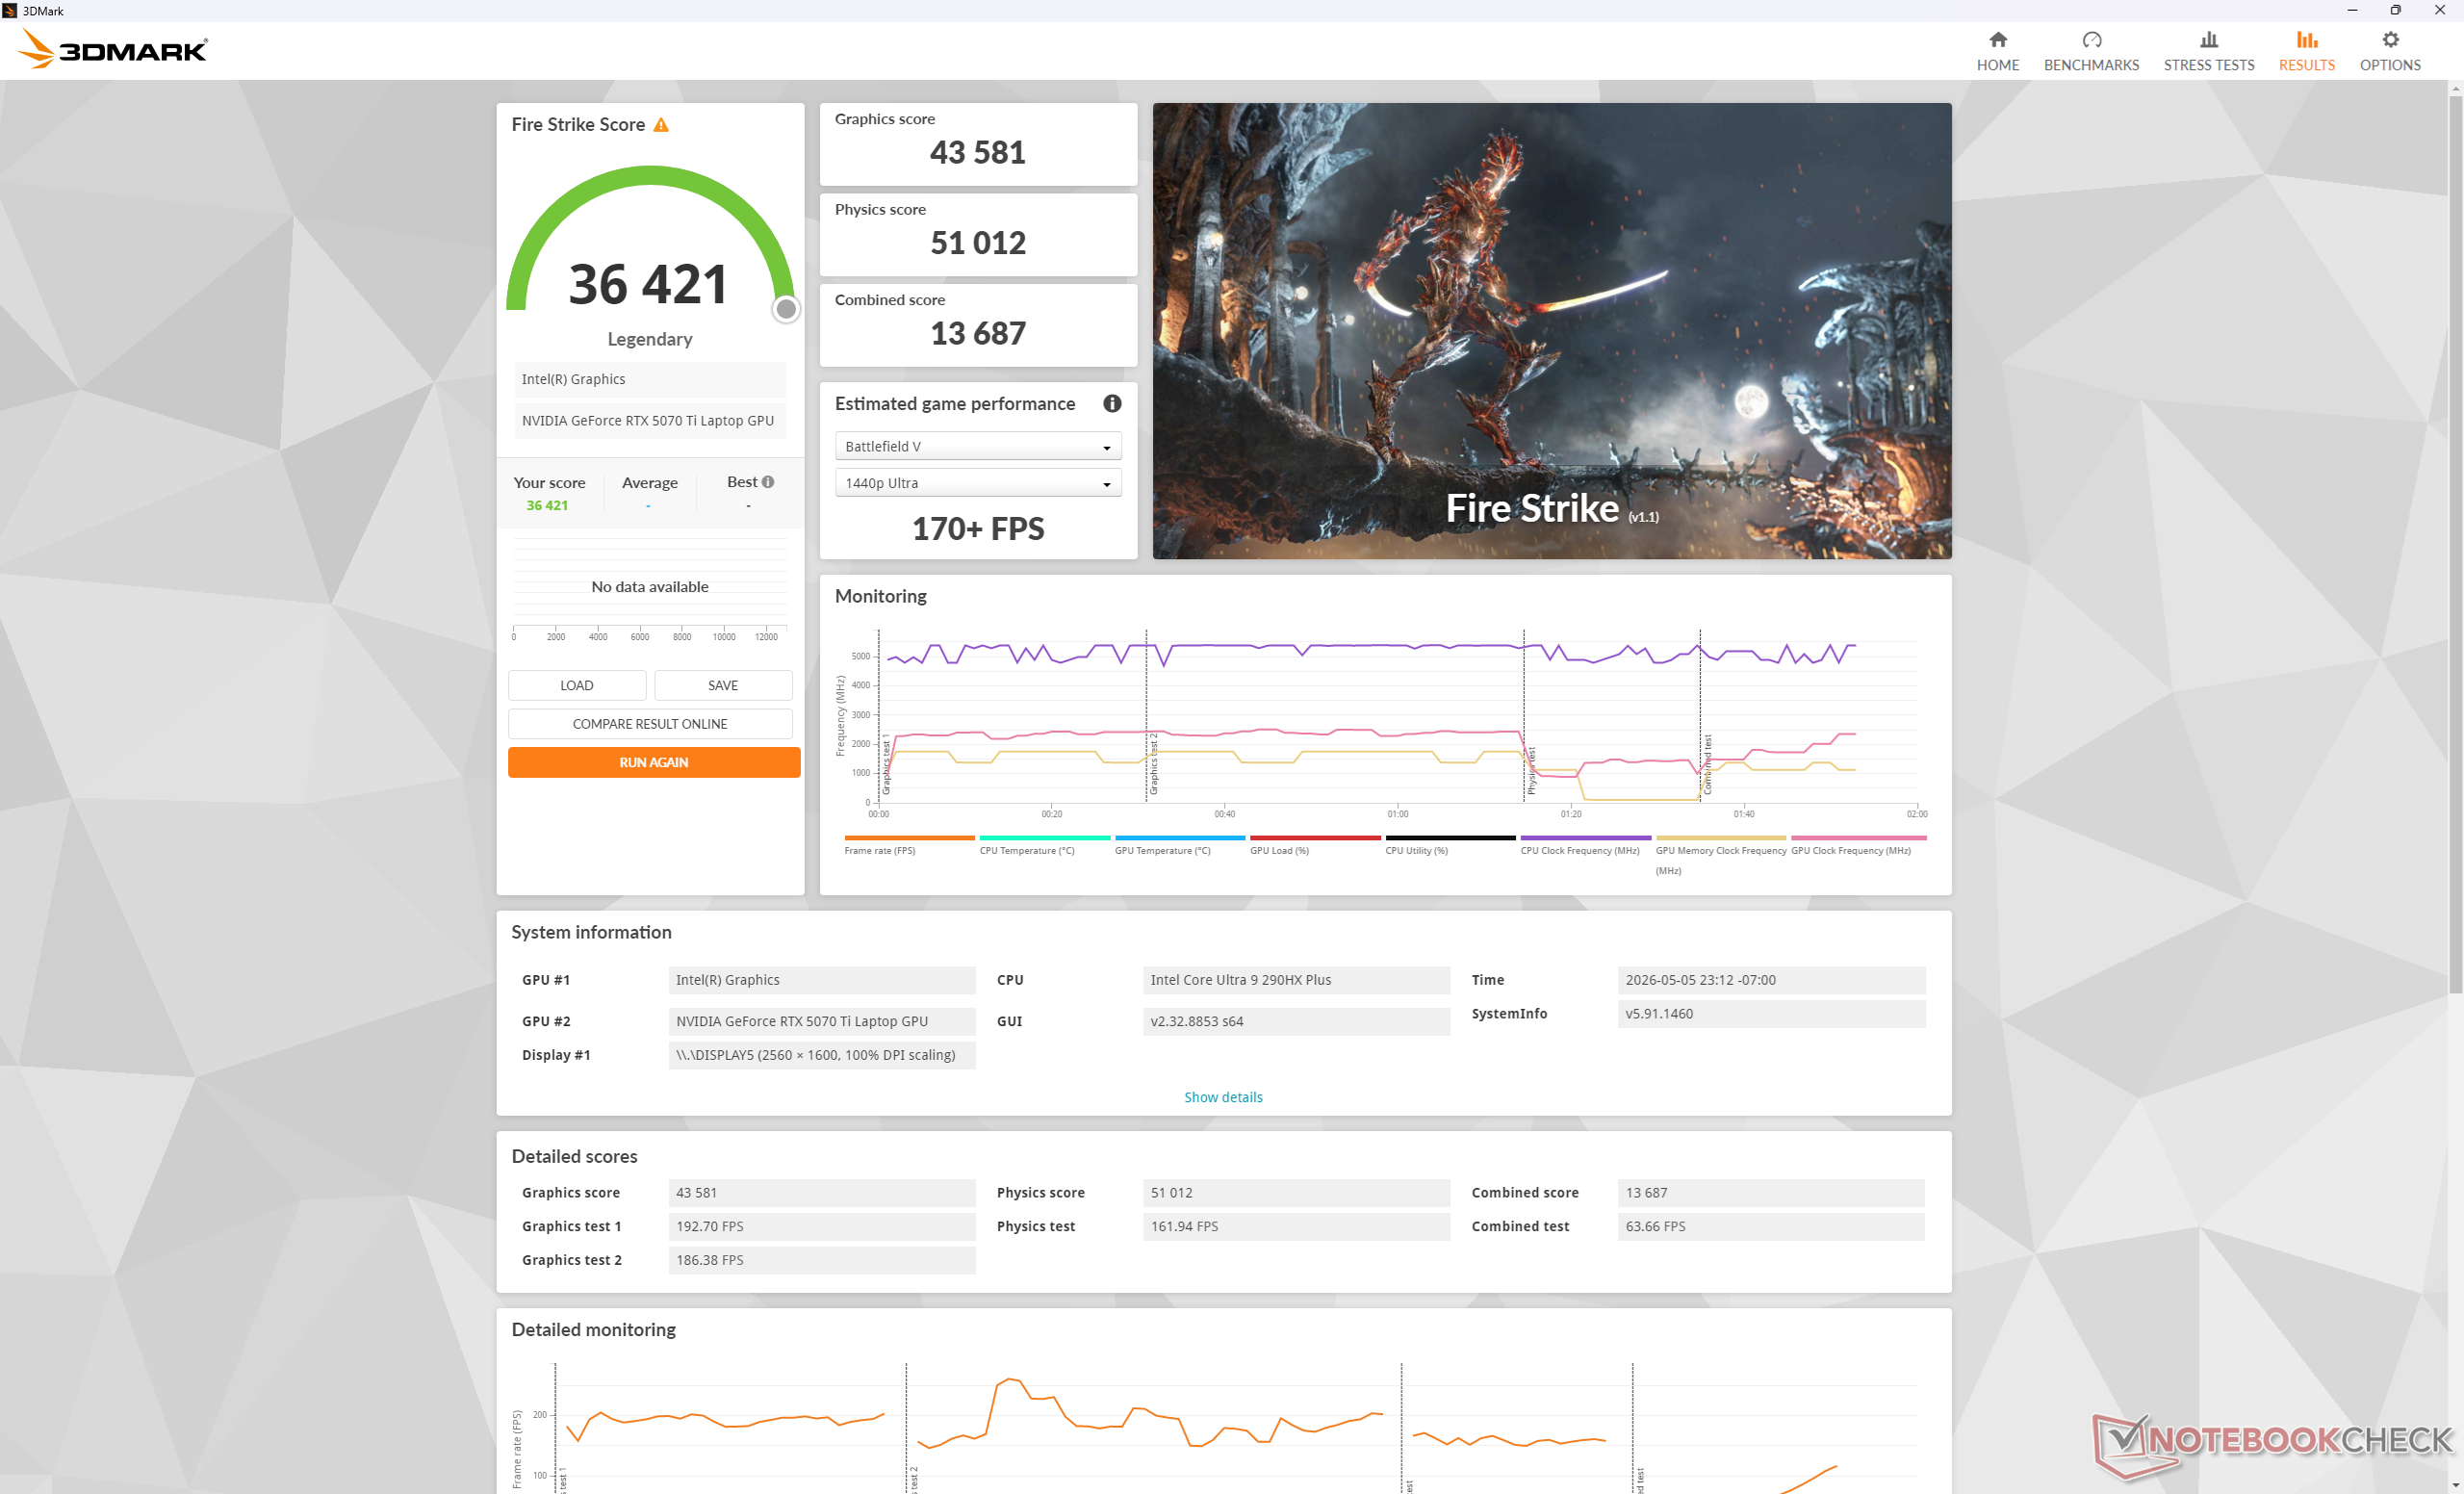
| 3DMark Fire Strike Score | 36421 Punkte | |
| 3DMark Time Spy Score | 16581 Punkte | |
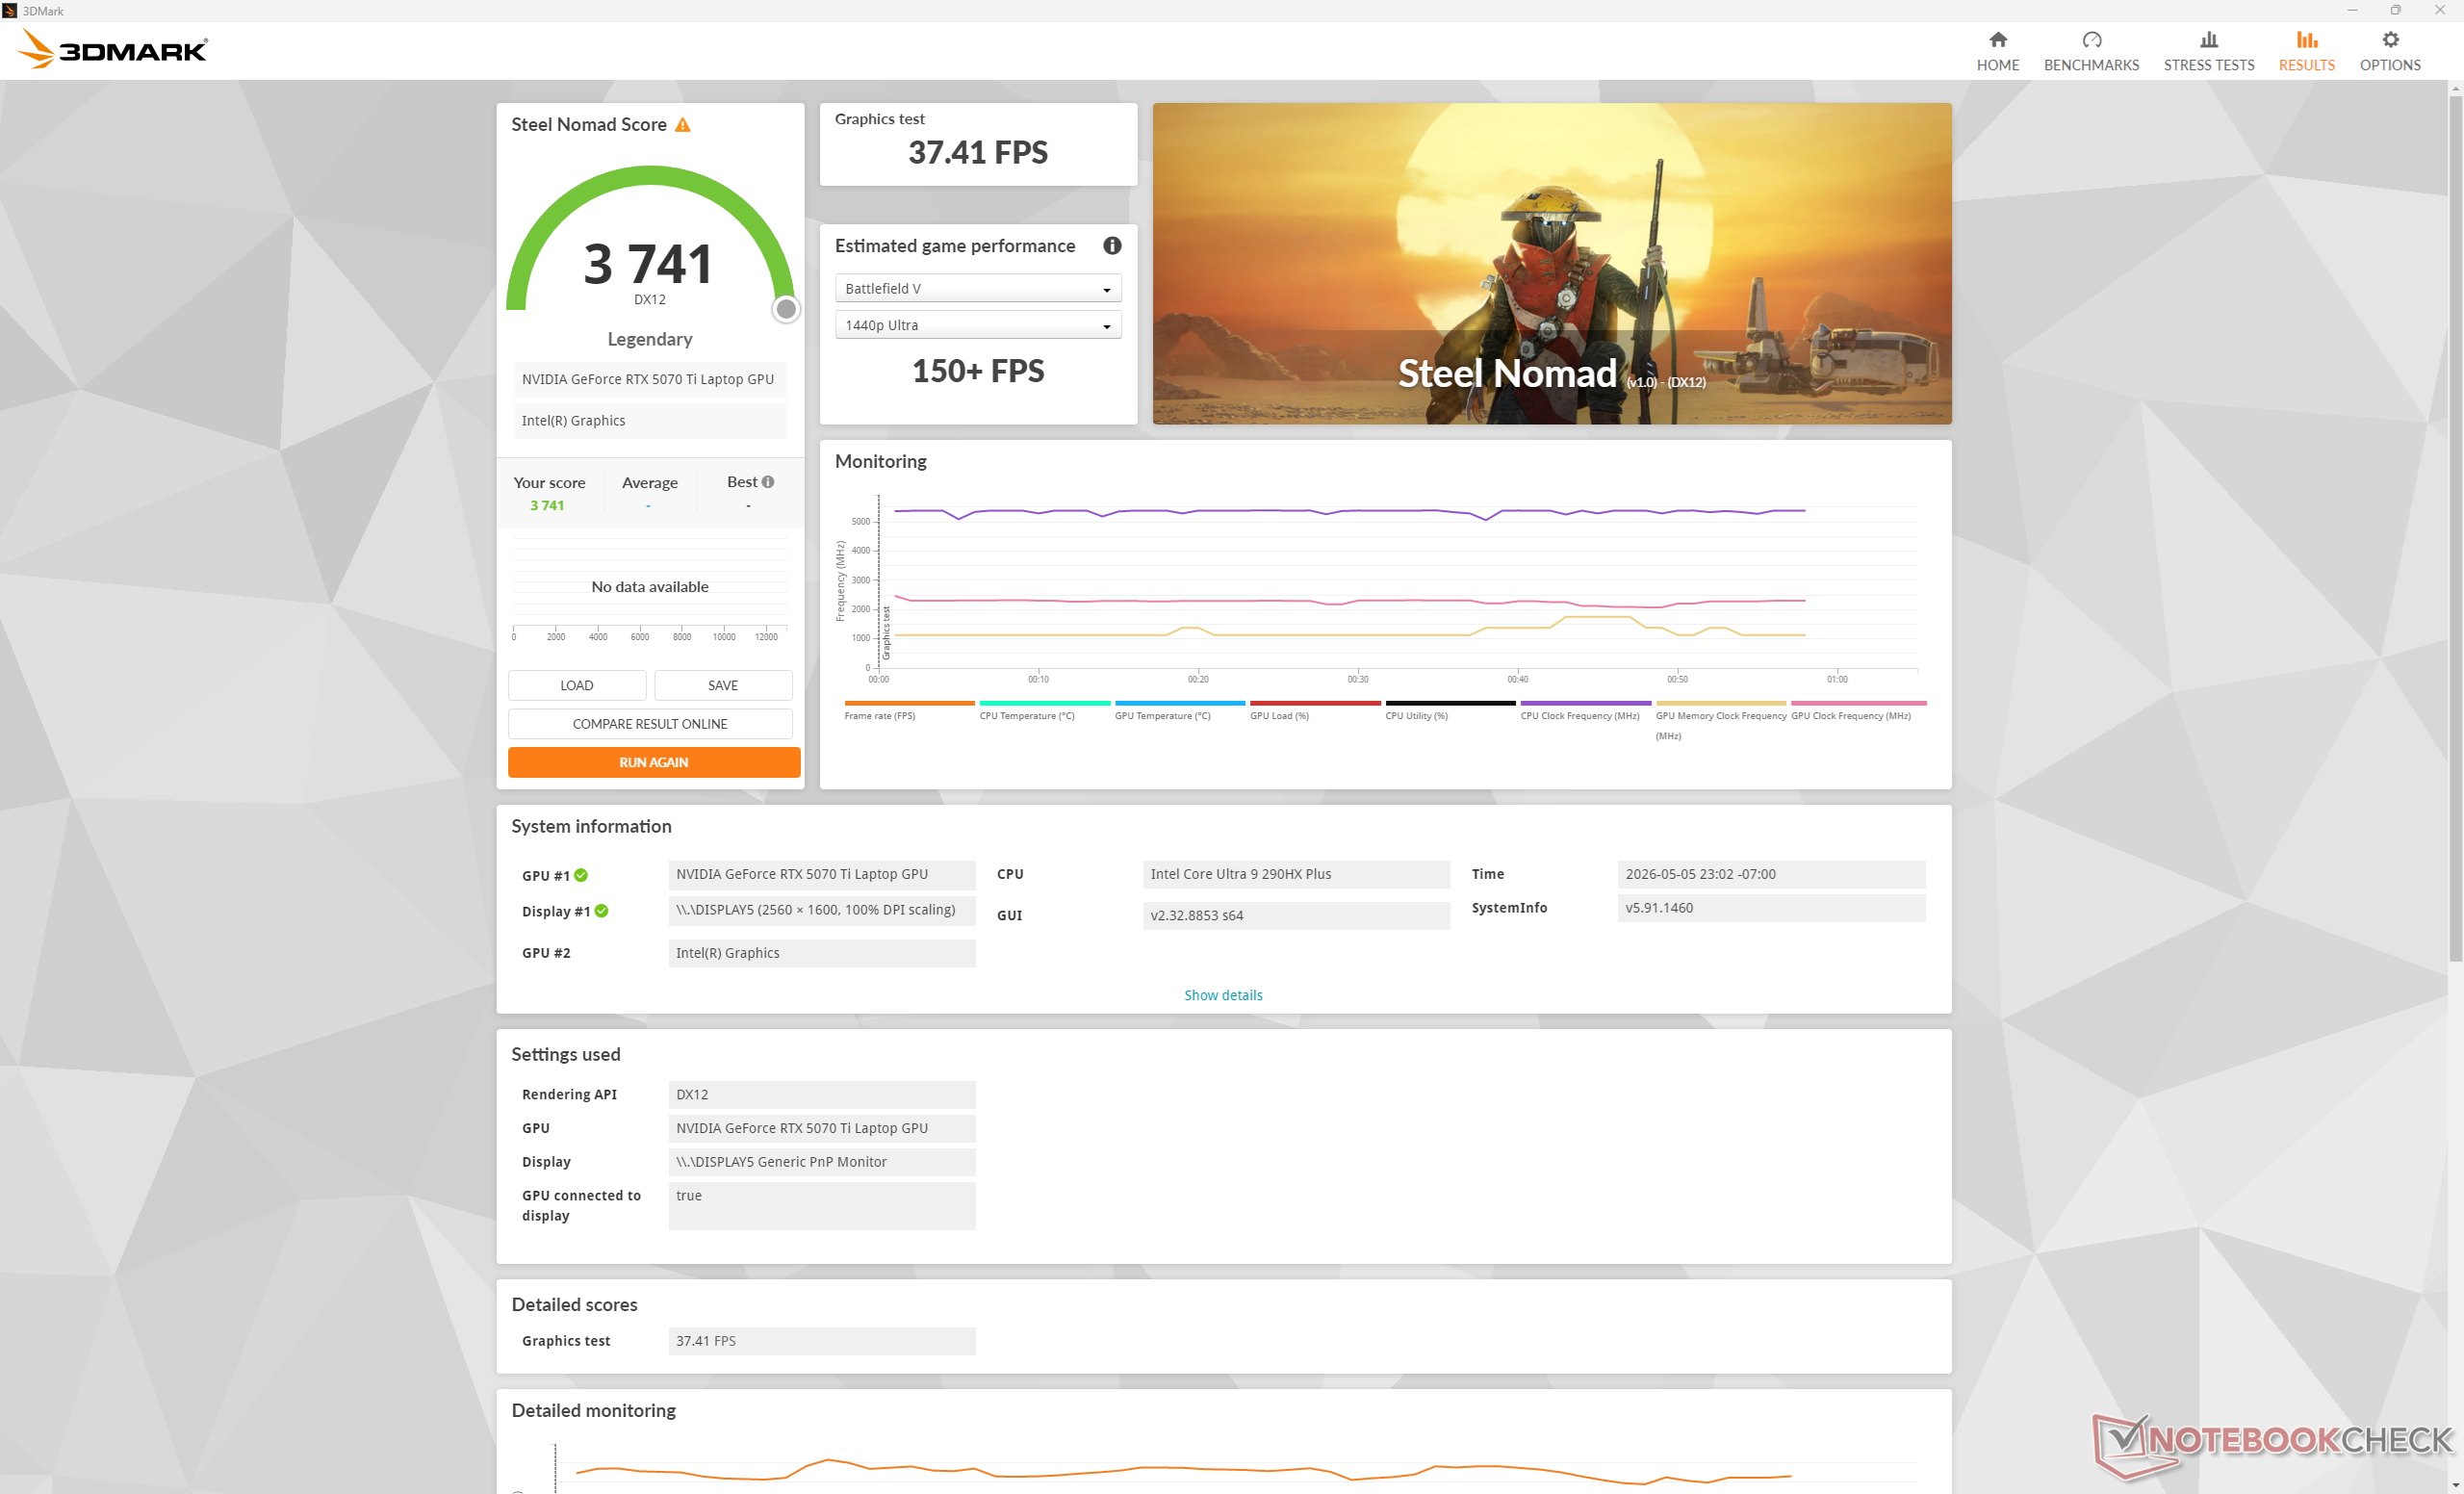
| 3DMark Steel Nomad Score | 3741 Punkte | |
Hilfe | ||
* ... kleinere Werte sind besser
Gaming Performance
Die Leistung beim Gaming ist im Durchschnitt etwa 15 Prozent höher als beim 2025er 16X Aurora mit der GeForce RTX 5070.
| GTA V - 1920x1080 Highest AA:4xMSAA + FX AF:16x | |
| Alienware 16X Aurora Core Ultra 9 290HX Plus | |
| Alienware 16X Aurora, RTX 5070 | |
| Lenovo Legion Pro 5 16IAX10, RTX 5070 | |
| Acer Predator Helios Neo 16S AI PHN16S-71-94L9 | |
| MSI Vector 16 HX AI A2XWHG | |
| Final Fantasy XV Benchmark - 1920x1080 High Quality | |
| MSI Vector 16 HX AI A2XWHG | |
| Alienware 16X Aurora Core Ultra 9 290HX Plus | |
| Alienware 16X Aurora, RTX 5070 | |
| Lenovo Legion Pro 5 16IAX10, RTX 5070 | |
| Asus ROG Zephyrus G16 2025 5070 Ti | |
| Strange Brigade - 1920x1080 ultra AA:ultra AF:16 | |
| Alienware 16X Aurora Core Ultra 9 290HX Plus | |
| Asus ROG Zephyrus G16 2025 5070 Ti | |
| Alienware 16X Aurora, RTX 5070 | |
| Lenovo Legion Pro 5 16IAX10, RTX 5070 | |
Cyberpunk 2077 ultra FPS Grafik
| min. | mittel | hoch | max. | QHD DLSS | QHD | |
|---|---|---|---|---|---|---|
| GTA V (2015) | 187.6 | 187.2 | 184.9 | 159.2 | 134.4 | |
| Dota 2 Reborn (2015) | 236 | 207 | 199.9 | 184.7 | ||
| Final Fantasy XV Benchmark (2018) | 233 | 209 | 161.1 | 120.3 | ||
| X-Plane 11.11 (2018) | 154.1 | 137.3 | 110.4 | |||
| Strange Brigade (2018) | 572 | 337 | 281 | 314 | 210 | |
| Baldur's Gate 3 (2023) | 181.6 | 162.4 | 159.3 | 157.7 | 109.5 | |
| Cyberpunk 2077 (2023) | 171.3 | 146.5 | 126.1 | 114.9 | 86.9 | 75.1 |
| F1 24 (2024) | 324 | 318 | 268 | 97.7 | 99 | 62.8 |
| Black Myth: Wukong (2024) | 126 | 94 | 73 | 42 | 47 | 31 |
| Assassin's Creed Shadows (2025) | 89 | 83 | 71 | 52 | 54 | 44 |
Emissionen
Geräuschemissionen
Die Lüfterdrehzahl ändert sich schnell und abrupt, wenn höhere Lasten eingeführt werden, selbst wenn Optimus und das Leistungsprofil "Ausgeglichen" eingestellt sind. Die Höchstwerte für das Lüftergeräusch sind ansonsten fast identisch mit denen des 2025er Modells, so dass das 2026er Modell beim Spielen weder lauter noch leiser ist.
Das Lüftergeräusch bei Cyberpunk 2077 in den Modi Balanced, Performance und Overdrive stabilisiert sich bei etwa 48,7 dB(A), 51,5 dB(A) bzw. 59,8 dB(A). Da die Leistungssteigerung beim Spielen im Overdrive-Modus so gering ist, empfehlen wir Ihnen, stattdessen im Performance Modus zu spielen, da die Lüfter dann deutlich leiser sind.
Lautstärkediagramm
| Idle |
| 23.8 / 23.8 / 31.4 dB(A) |
| Last |
| 48.7 / 59.8 dB(A) |
 | ||
30 dB leise 40 dB(A) deutlich hörbar 50 dB(A) störend |
||
min: | ||
| Alienware 16X Aurora Core Ultra 9 290HX Plus Ultra 9 290HX Plus, GeForce RTX 5070 Ti Laptop | Alienware 16X Aurora, RTX 5070 Ultra 9 275HX, GeForce RTX 5070 Laptop | Acer Predator Helios Neo 16S AI PHN16S-71-94L9 Ultra 9 275HX, GeForce RTX 5070 Ti Laptop | Lenovo Legion Pro 5 16IAX10, RTX 5070 Ultra 7 255HX, GeForce RTX 5070 Laptop | MSI Vector 16 HX AI A2XWHG Ultra 7 255HX, GeForce RTX 5070 Ti Laptop | Asus ROG Zephyrus G16 GU605CW Ultra 9 285H, GeForce RTX 5080 Laptop | |
|---|---|---|---|---|---|---|
| Geräuschentwicklung | 9% | -6% | 8% | -11% | -9% | |
| aus / Umgebung * (dB) | 23.4 | 23.7 -1% | 24 -3% | 23 2% | 25 -7% | 25.56 -9% |
| Idle min * (dB) | 23.8 | 23.9 -0% | 24 -1% | 23 3% | 33 -39% | 30 -26% |
| Idle avg * (dB) | 23.8 | 23.9 -0% | 30 -26% | 23 3% | 34 -43% | 30 -26% |
| Idle max * (dB) | 31.4 | 26.1 17% | 35 -11% | 23 27% | 38 -21% | 30 4% |
| Last avg * (dB) | 48.7 | 26.8 45% | 53 -9% | 43.85 10% | 46 6% | 53.55 -10% |
| Cyberpunk 2077 ultra * (dB) | 51.5 | 51.8 -1% | 52 -1% | 50.27 2% | 47 9% | 53.5 -4% |
| Last max * (dB) | 59.8 | 58 3% | 54 10% | 52.9 12% | 49 18% | 54.02 10% |
* ... kleinere Werte sind besser
Temperatur
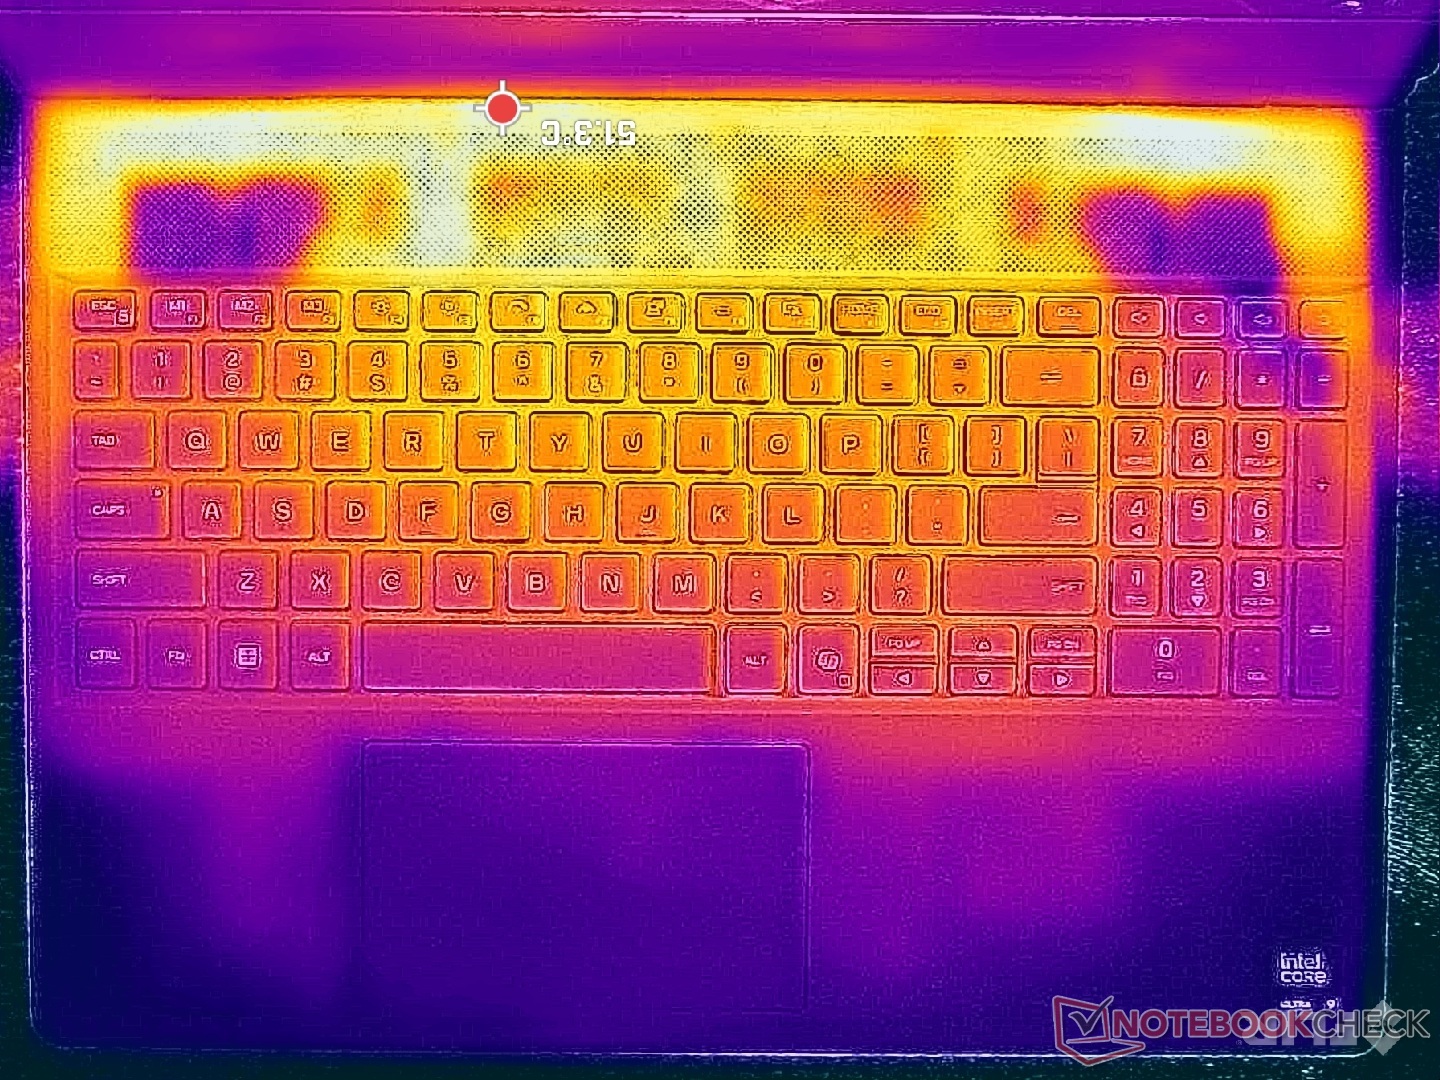
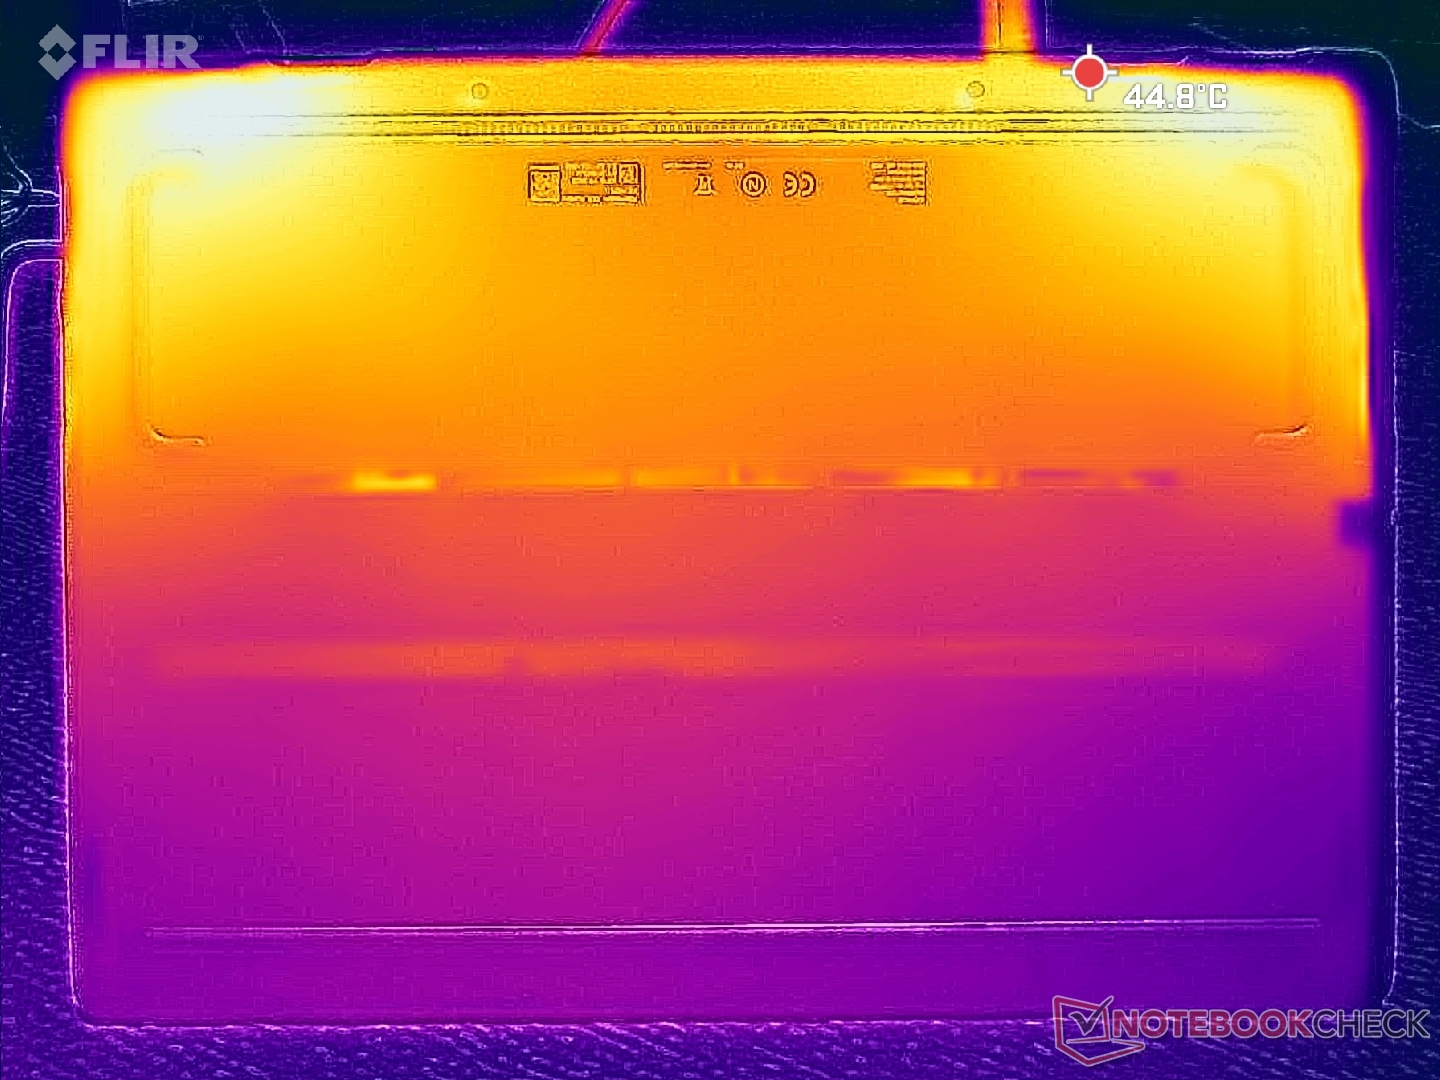
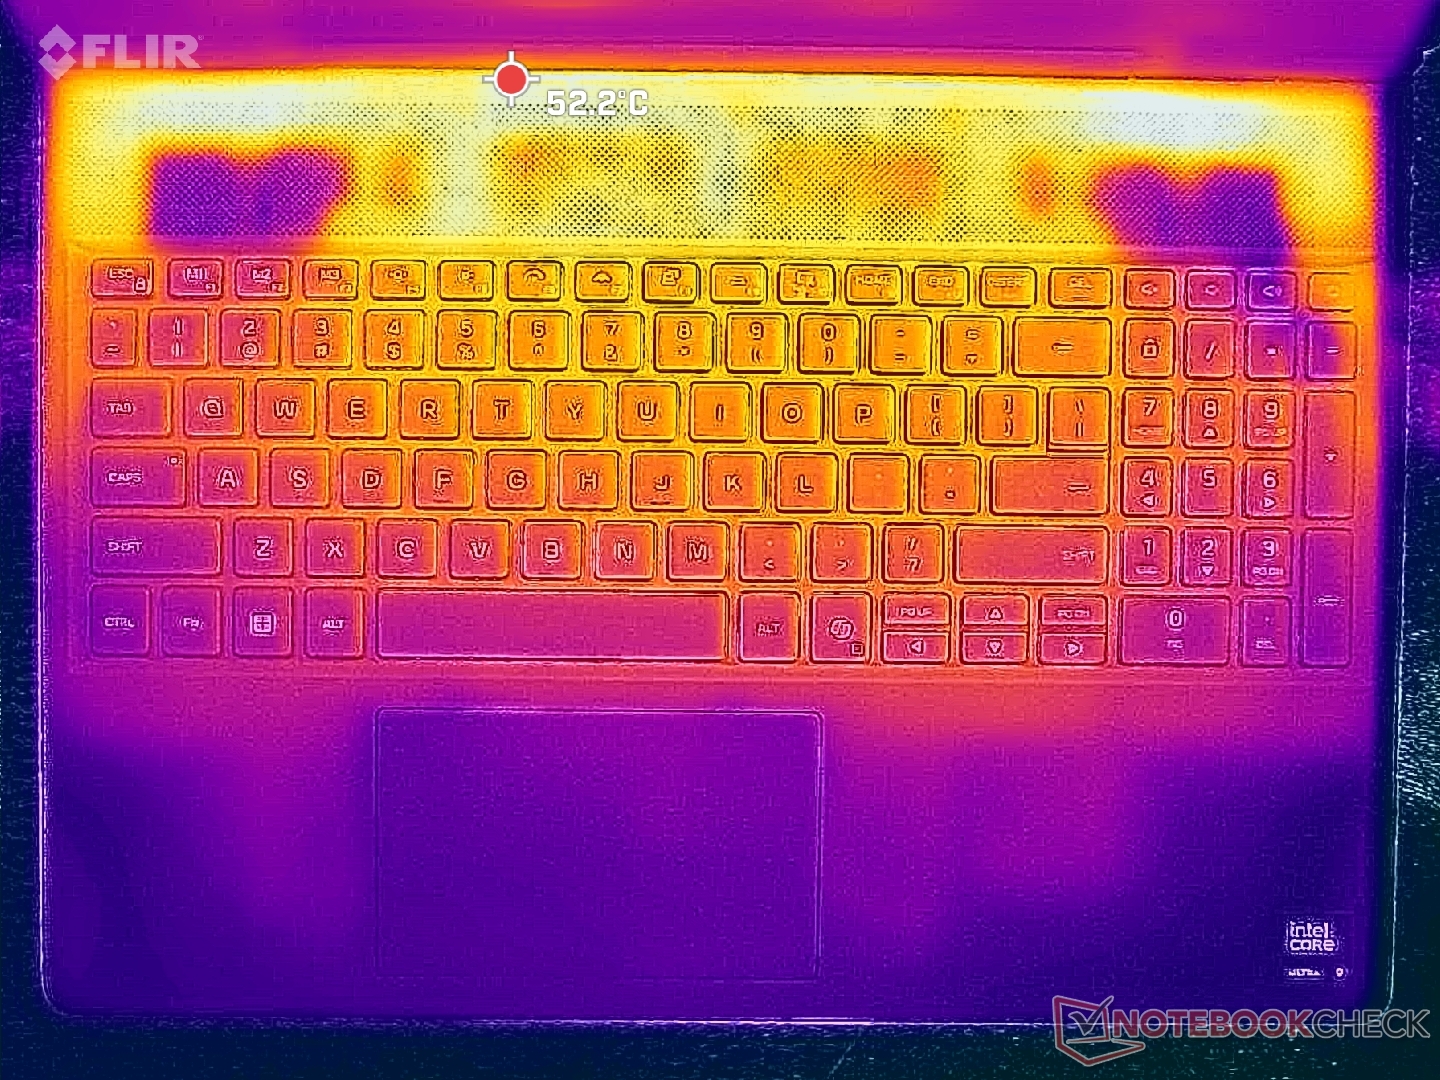
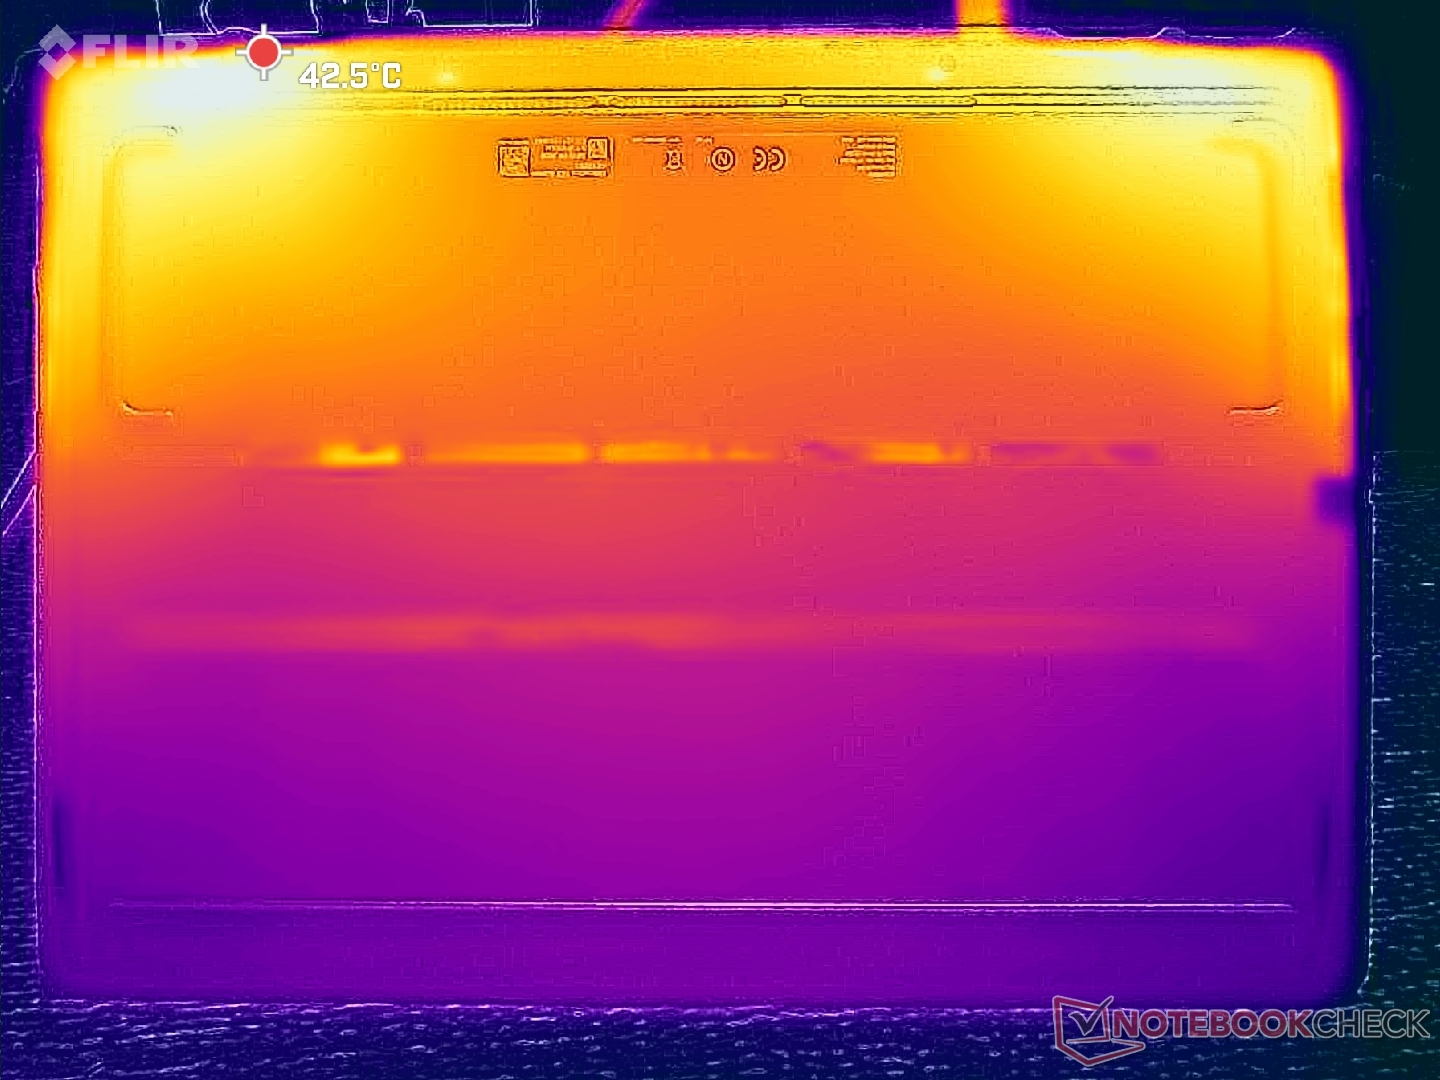
Die Oberflächentemperaturen sind im Durchschnitt ein paar Grad kühler als die, die wir bei der letztjährigen Konfiguration gemessen haben. Die Ergebnisse korrelieren mit unseren Analysen im Abschnitt Stress-Test unten.
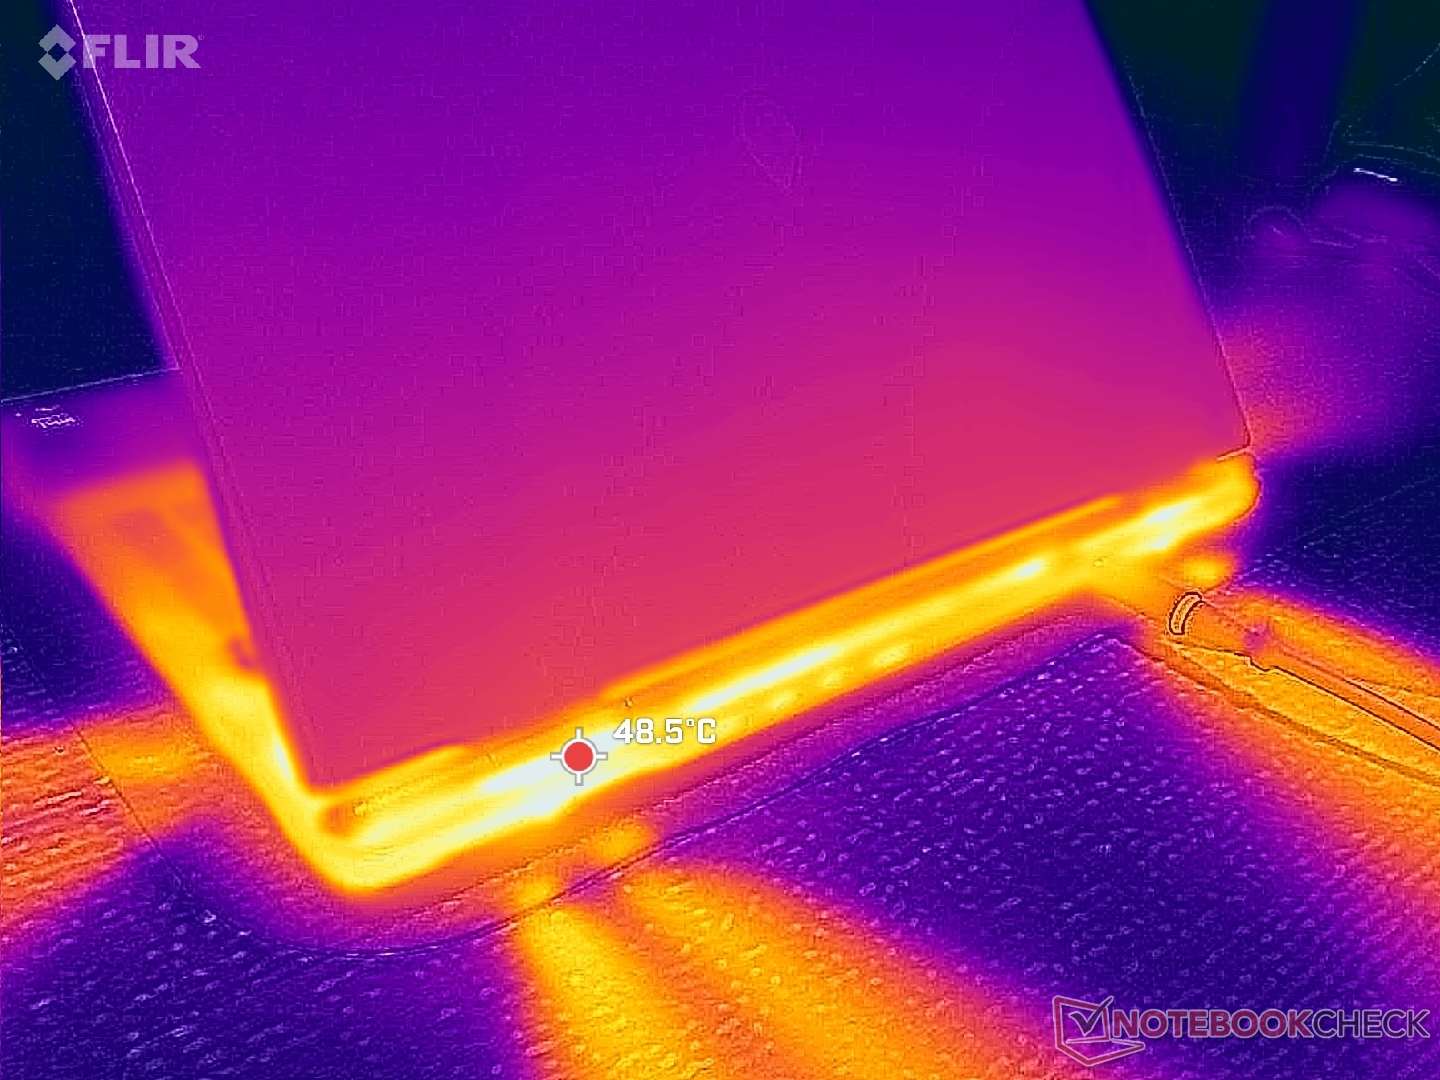
(-) Die maximale Temperatur auf der Oberseite ist 48.2 °C. Im Vergleich liegt der Klassendurchschnitt bei 40.4 °C (von 21.2 bis 68.8 °C für die Klasse Gaming).
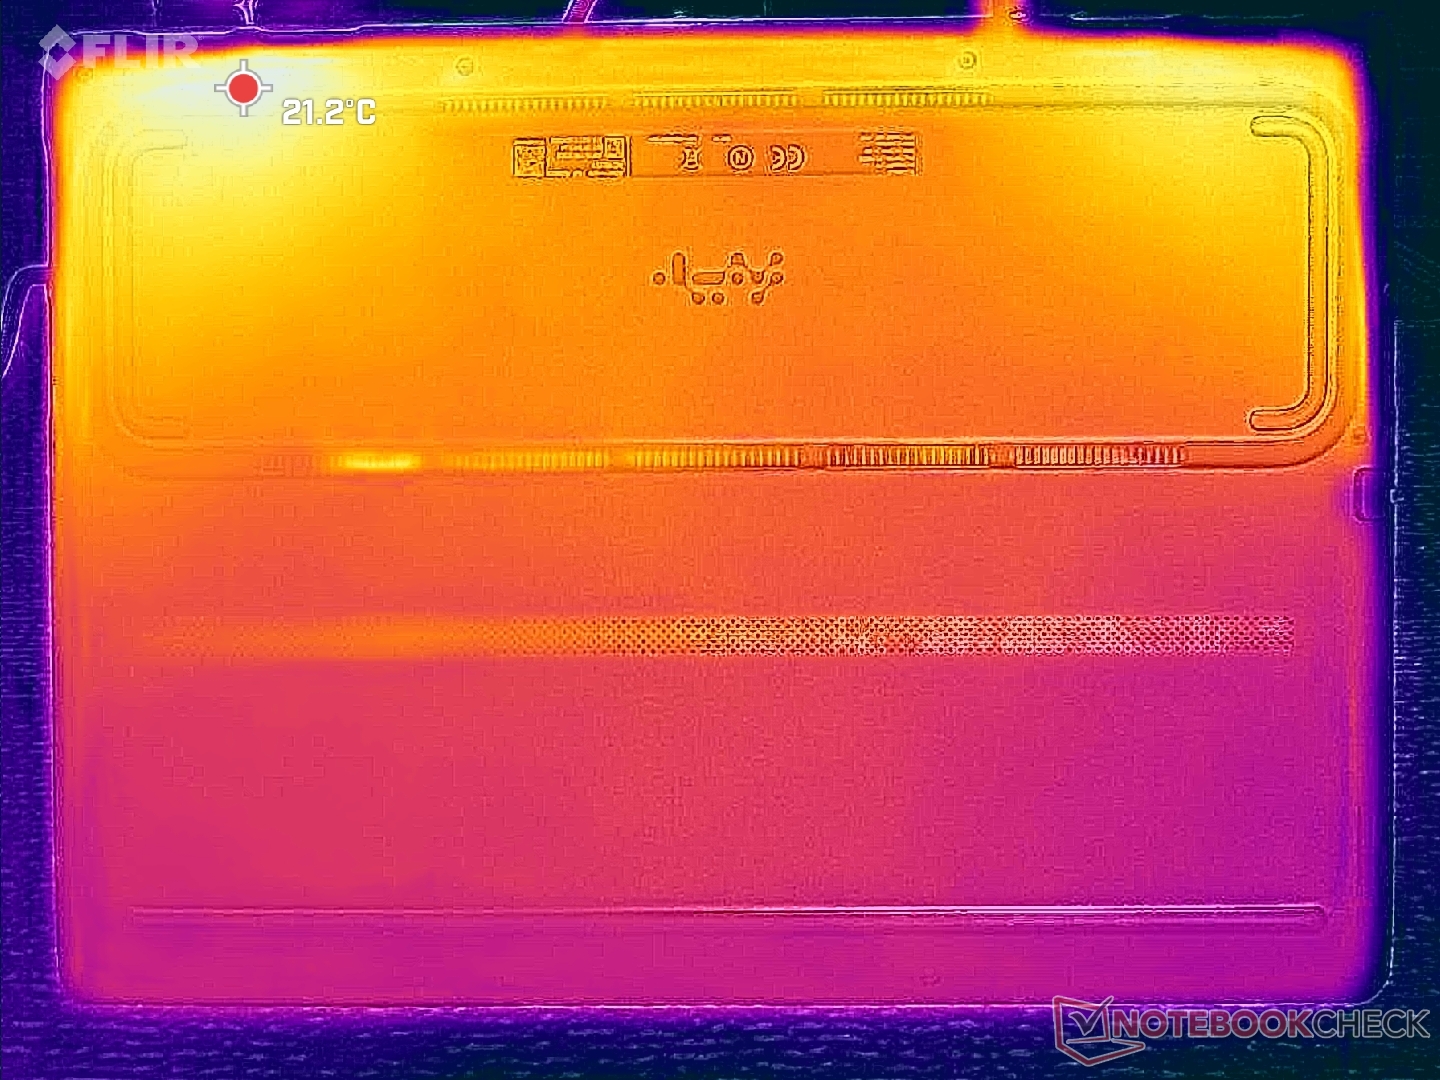
(±) Auf der Unterseite messen wir eine maximalen Wert von 41 °C (im Vergleich zum Durchschnitt von 43.2 °C).
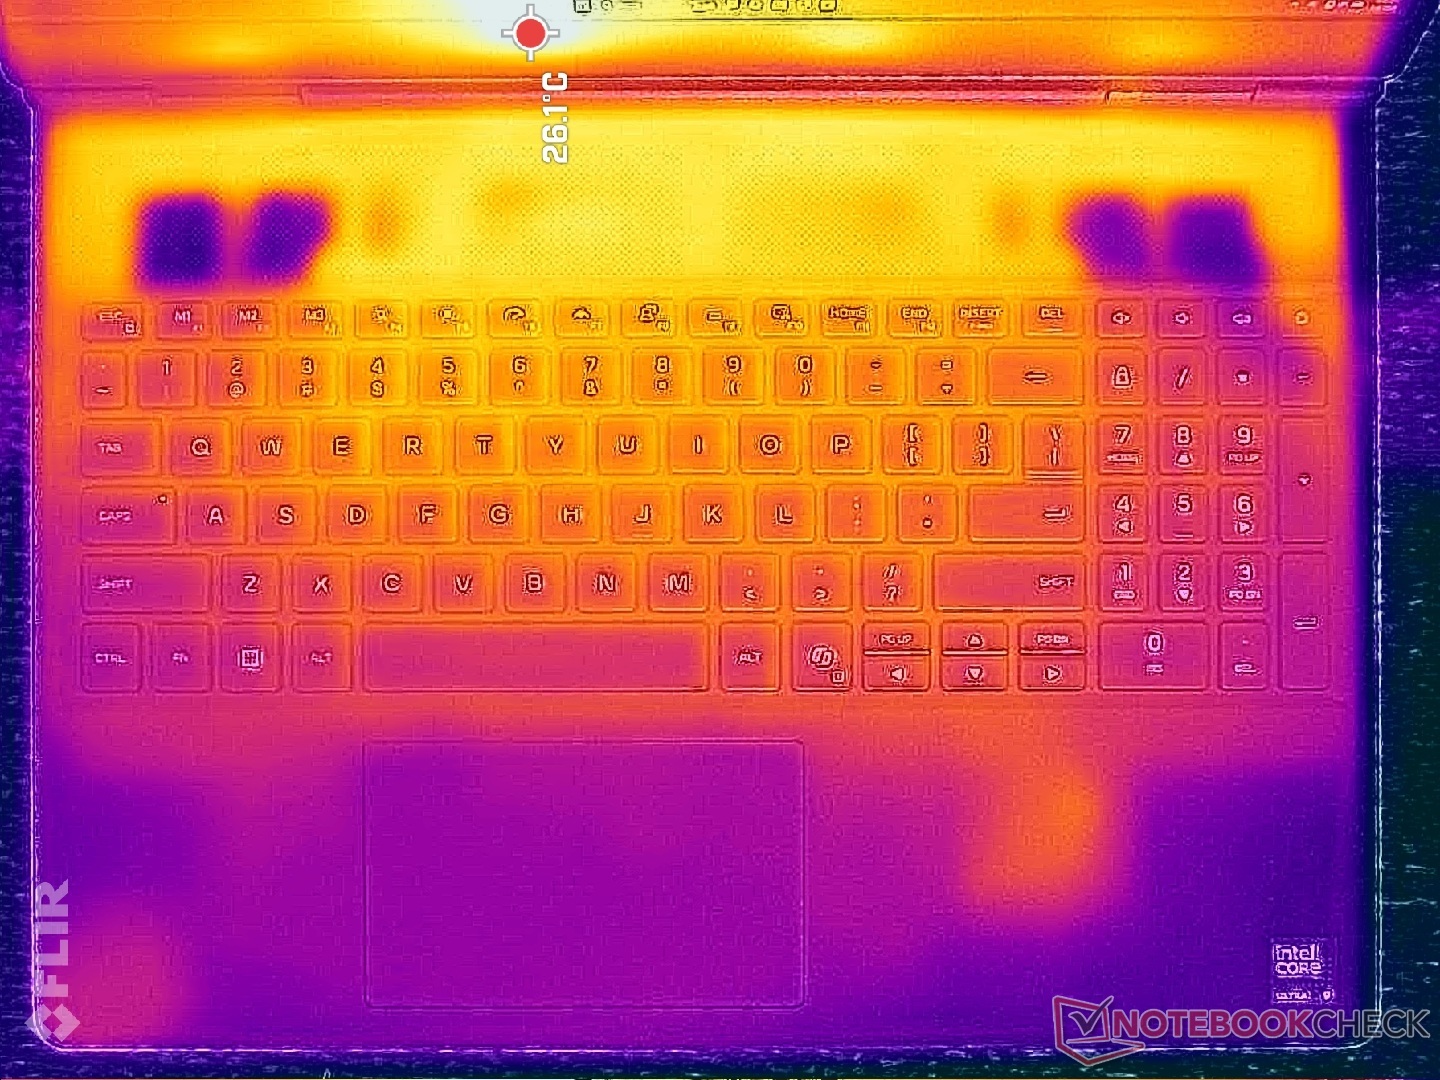
(+) Ohne Last messen wir eine durchschnittliche Temperatur von 26 °C auf der Oberseite. Der Klassendurchschnitt erreicht 33.9 °C.
(-) 3: The average temperature for the upper side is 39.4 °C / 103 F, compared to the average of 33.9 °C / 93 F for the class Gaming.
(+) Die Handballen und der Touchpad-Bereich sind mit gemessenen 31 °C kühler als die typische Hauttemperatur und fühlen sich dadurch kühl an.
(-) Die durchschnittliche Handballen-Temperatur anderer getesteter Geräte war 28.8 °C (-2.2 °C).
| Alienware 16X Aurora Core Ultra 9 290HX Plus Ultra 9 290HX Plus, GeForce RTX 5070 Ti Laptop | Alienware 16X Aurora, RTX 5070 Ultra 9 275HX, GeForce RTX 5070 Laptop | Acer Predator Helios Neo 16S AI PHN16S-71-94L9 Ultra 9 275HX, GeForce RTX 5070 Ti Laptop | Lenovo Legion Pro 5 16IAX10, RTX 5070 Ultra 7 255HX, GeForce RTX 5070 Laptop | MSI Vector 16 HX AI A2XWHG Ultra 7 255HX, GeForce RTX 5070 Ti Laptop | Asus ROG Zephyrus G16 GU605CW Ultra 9 285H, GeForce RTX 5080 Laptop | |
|---|---|---|---|---|---|---|
| Hitze | -7% | -11% | -10% | -16% | -25% | |
| Last oben max * (°C) | 48.2 | 51 -6% | 47 2% | 42 13% | 53 -10% | 49.2 -2% |
| Last unten max * (°C) | 41 | 45.6 -11% | 55 -34% | 44 -7% | 52 -27% | 50.2 -22% |
| Idle oben max * (°C) | 28.2 | 29.8 -6% | 28 1% | 33 -17% | 33 -17% | 37.2 -32% |
| Idle unten max * (°C) | 26.2 | 27.4 -5% | 29 -11% | 34 -30% | 29 -11% | 37.4 -43% |
* ... kleinere Werte sind besser
Stress-Test
Die Kerntemperatur beim Ausführen von Prime95 auf dem letztjährigen 16X Aurora erreichte fast 100 °C. Der Core Ultra 9 290HX Plus im 16X Aurora 2026 zielt auf noch höhere Taktraten ab, die – wenig überraschend – beim Ausführen von Prime95 ebenfalls fast 100 °C erreichen. Die CPU hätte wahrscheinlich eine bessere Leistung erbringen können, wenn die Kühlung des Laptops effektiver wäre. So fuhr die CPU für ein oder zwei Sekunden auf 4,3 GHz und 163 W hoch, bevor sie auf 3,4 GHz und 97 W abfiel, was auf ein begrenztes Turbo-Boost-Potenzial hindeutet.
Die Kerntemperaturen beim Gaming sind beim diesjährigen Modell im Vergleich zum Vorjahr aufgrund der unterschiedlichen Konfigurationen ansonsten niedriger. Genauer gesagt zielt die RTX 5070 Ti auf niedrigere Taktraten als die RTX 5070 ab, um Betriebstemperaturen zu erreichen, die durchweg einige Grad niedriger sind. Die GPU-Leistungsaufnahme im Overdrive-Modus, im Performance-Modus und im Balanced-Modus pendelten sich bei 114 W, 97 W bzw. 84 W ein.
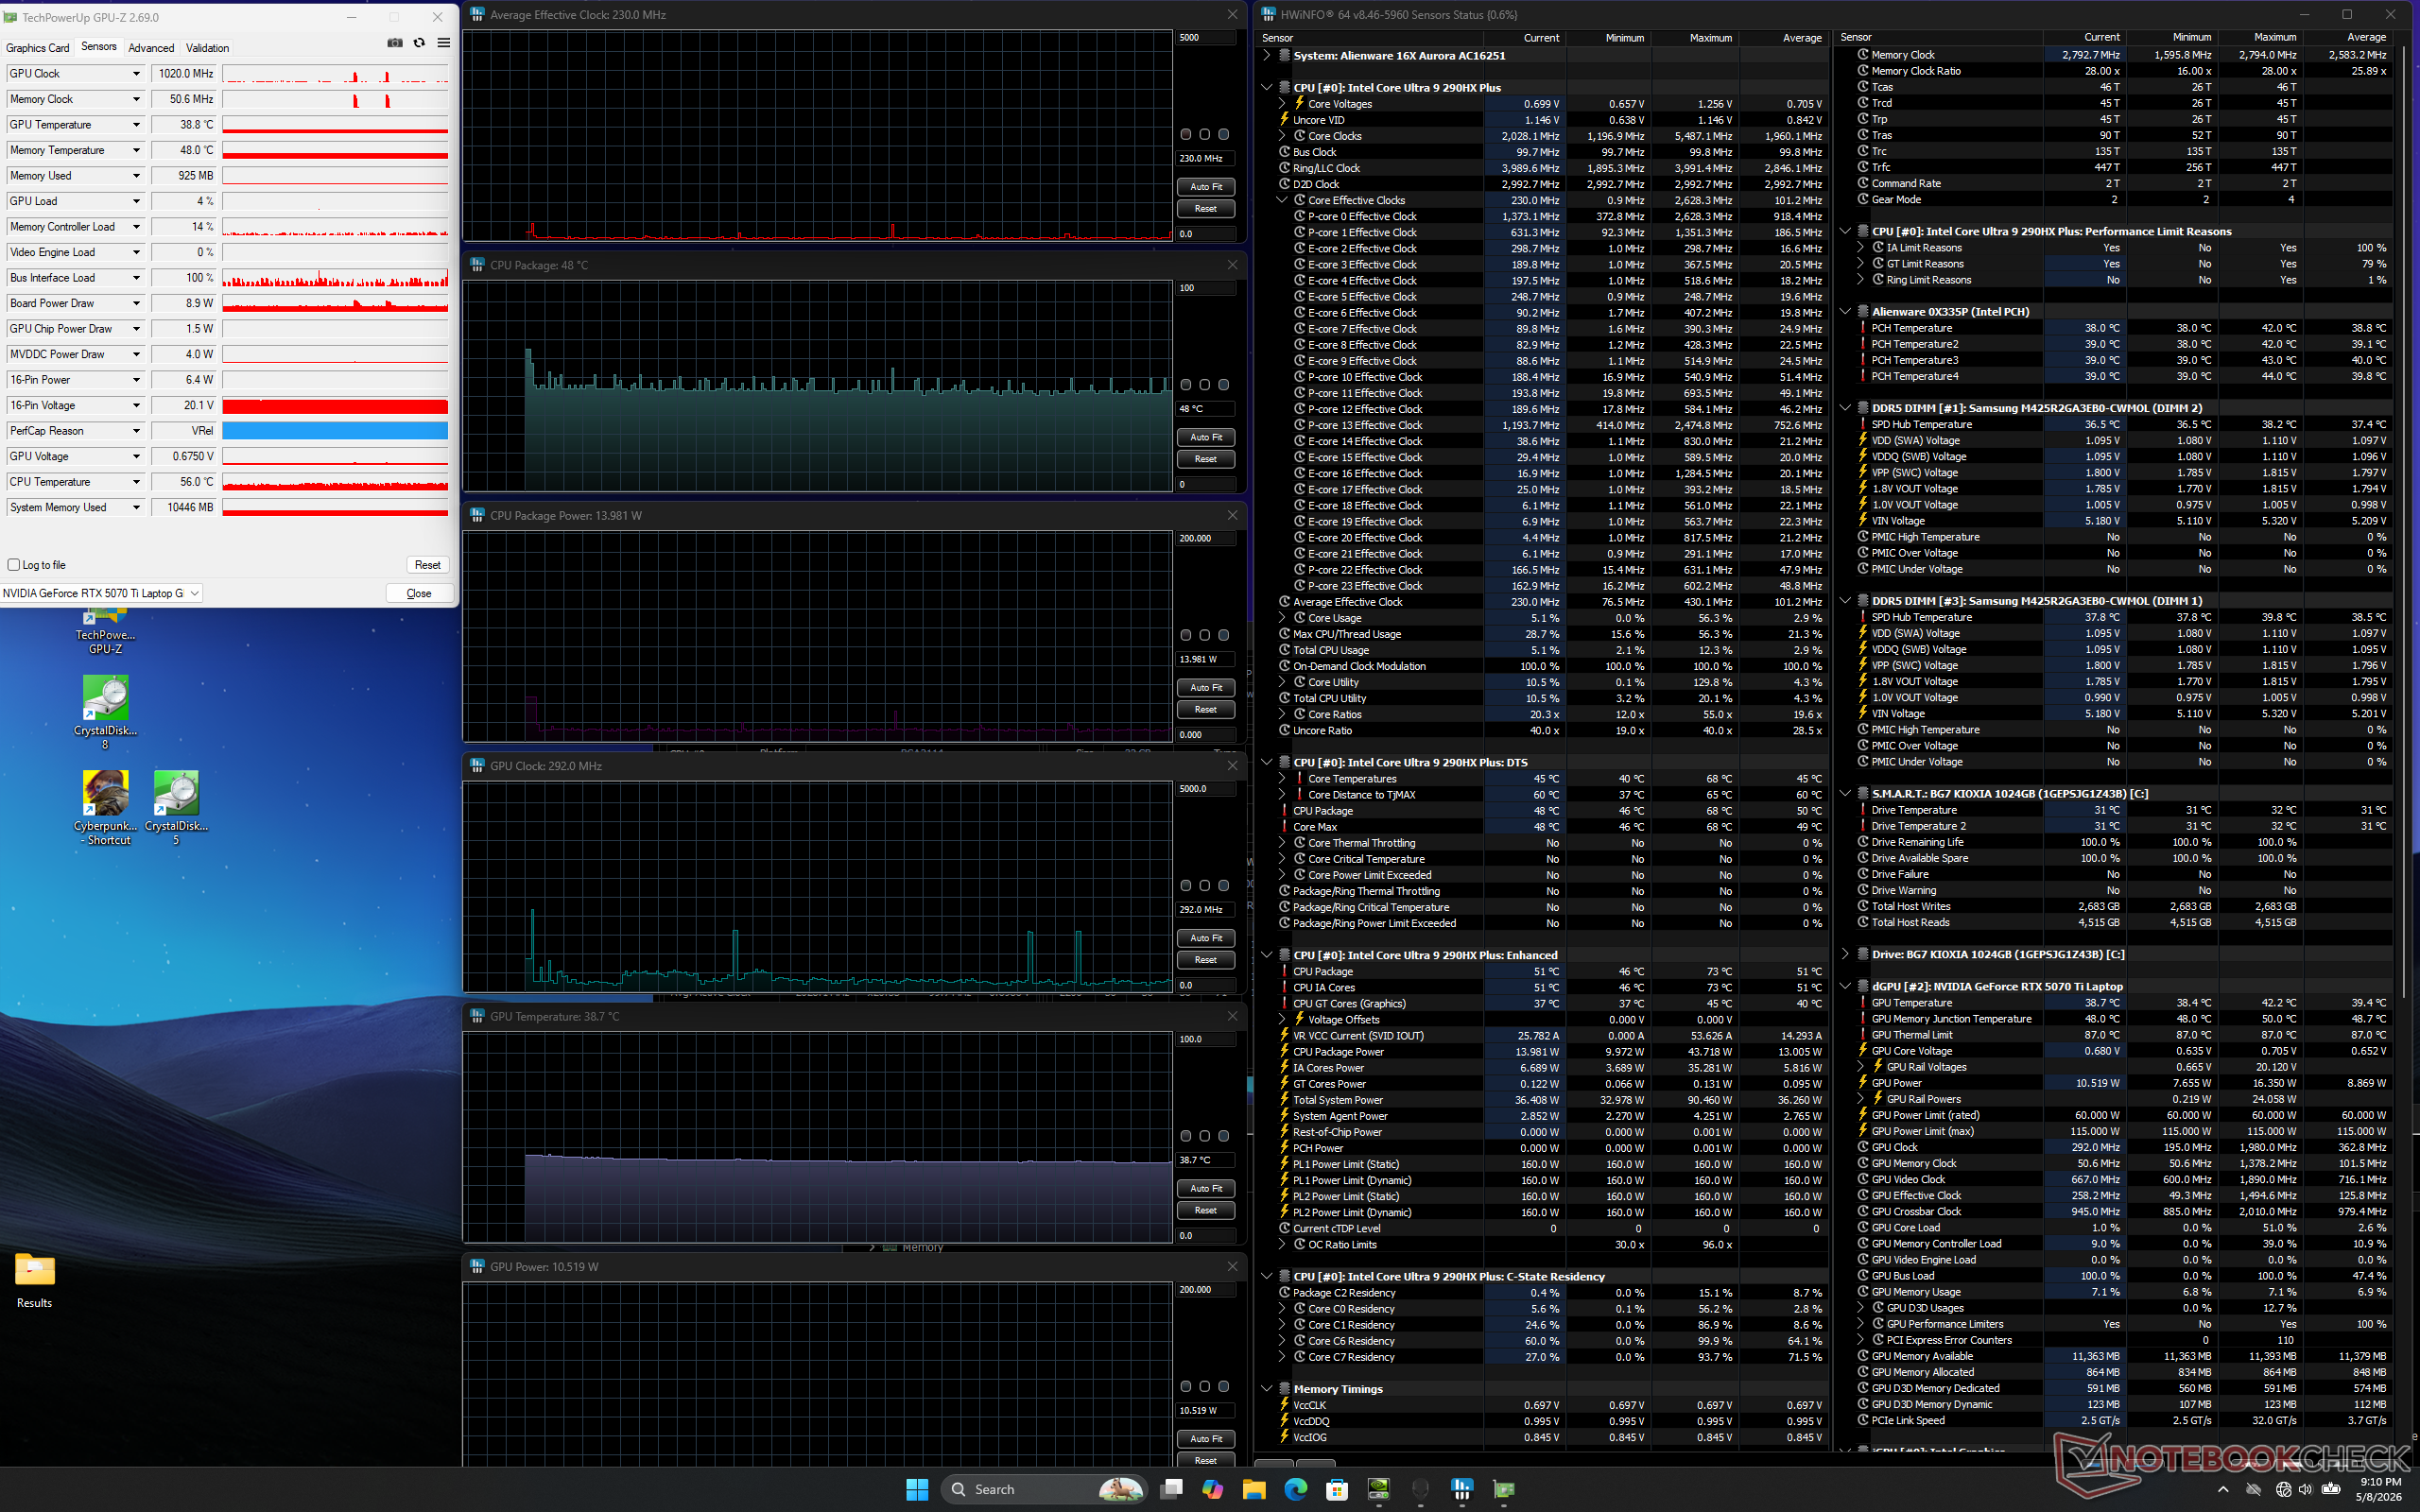
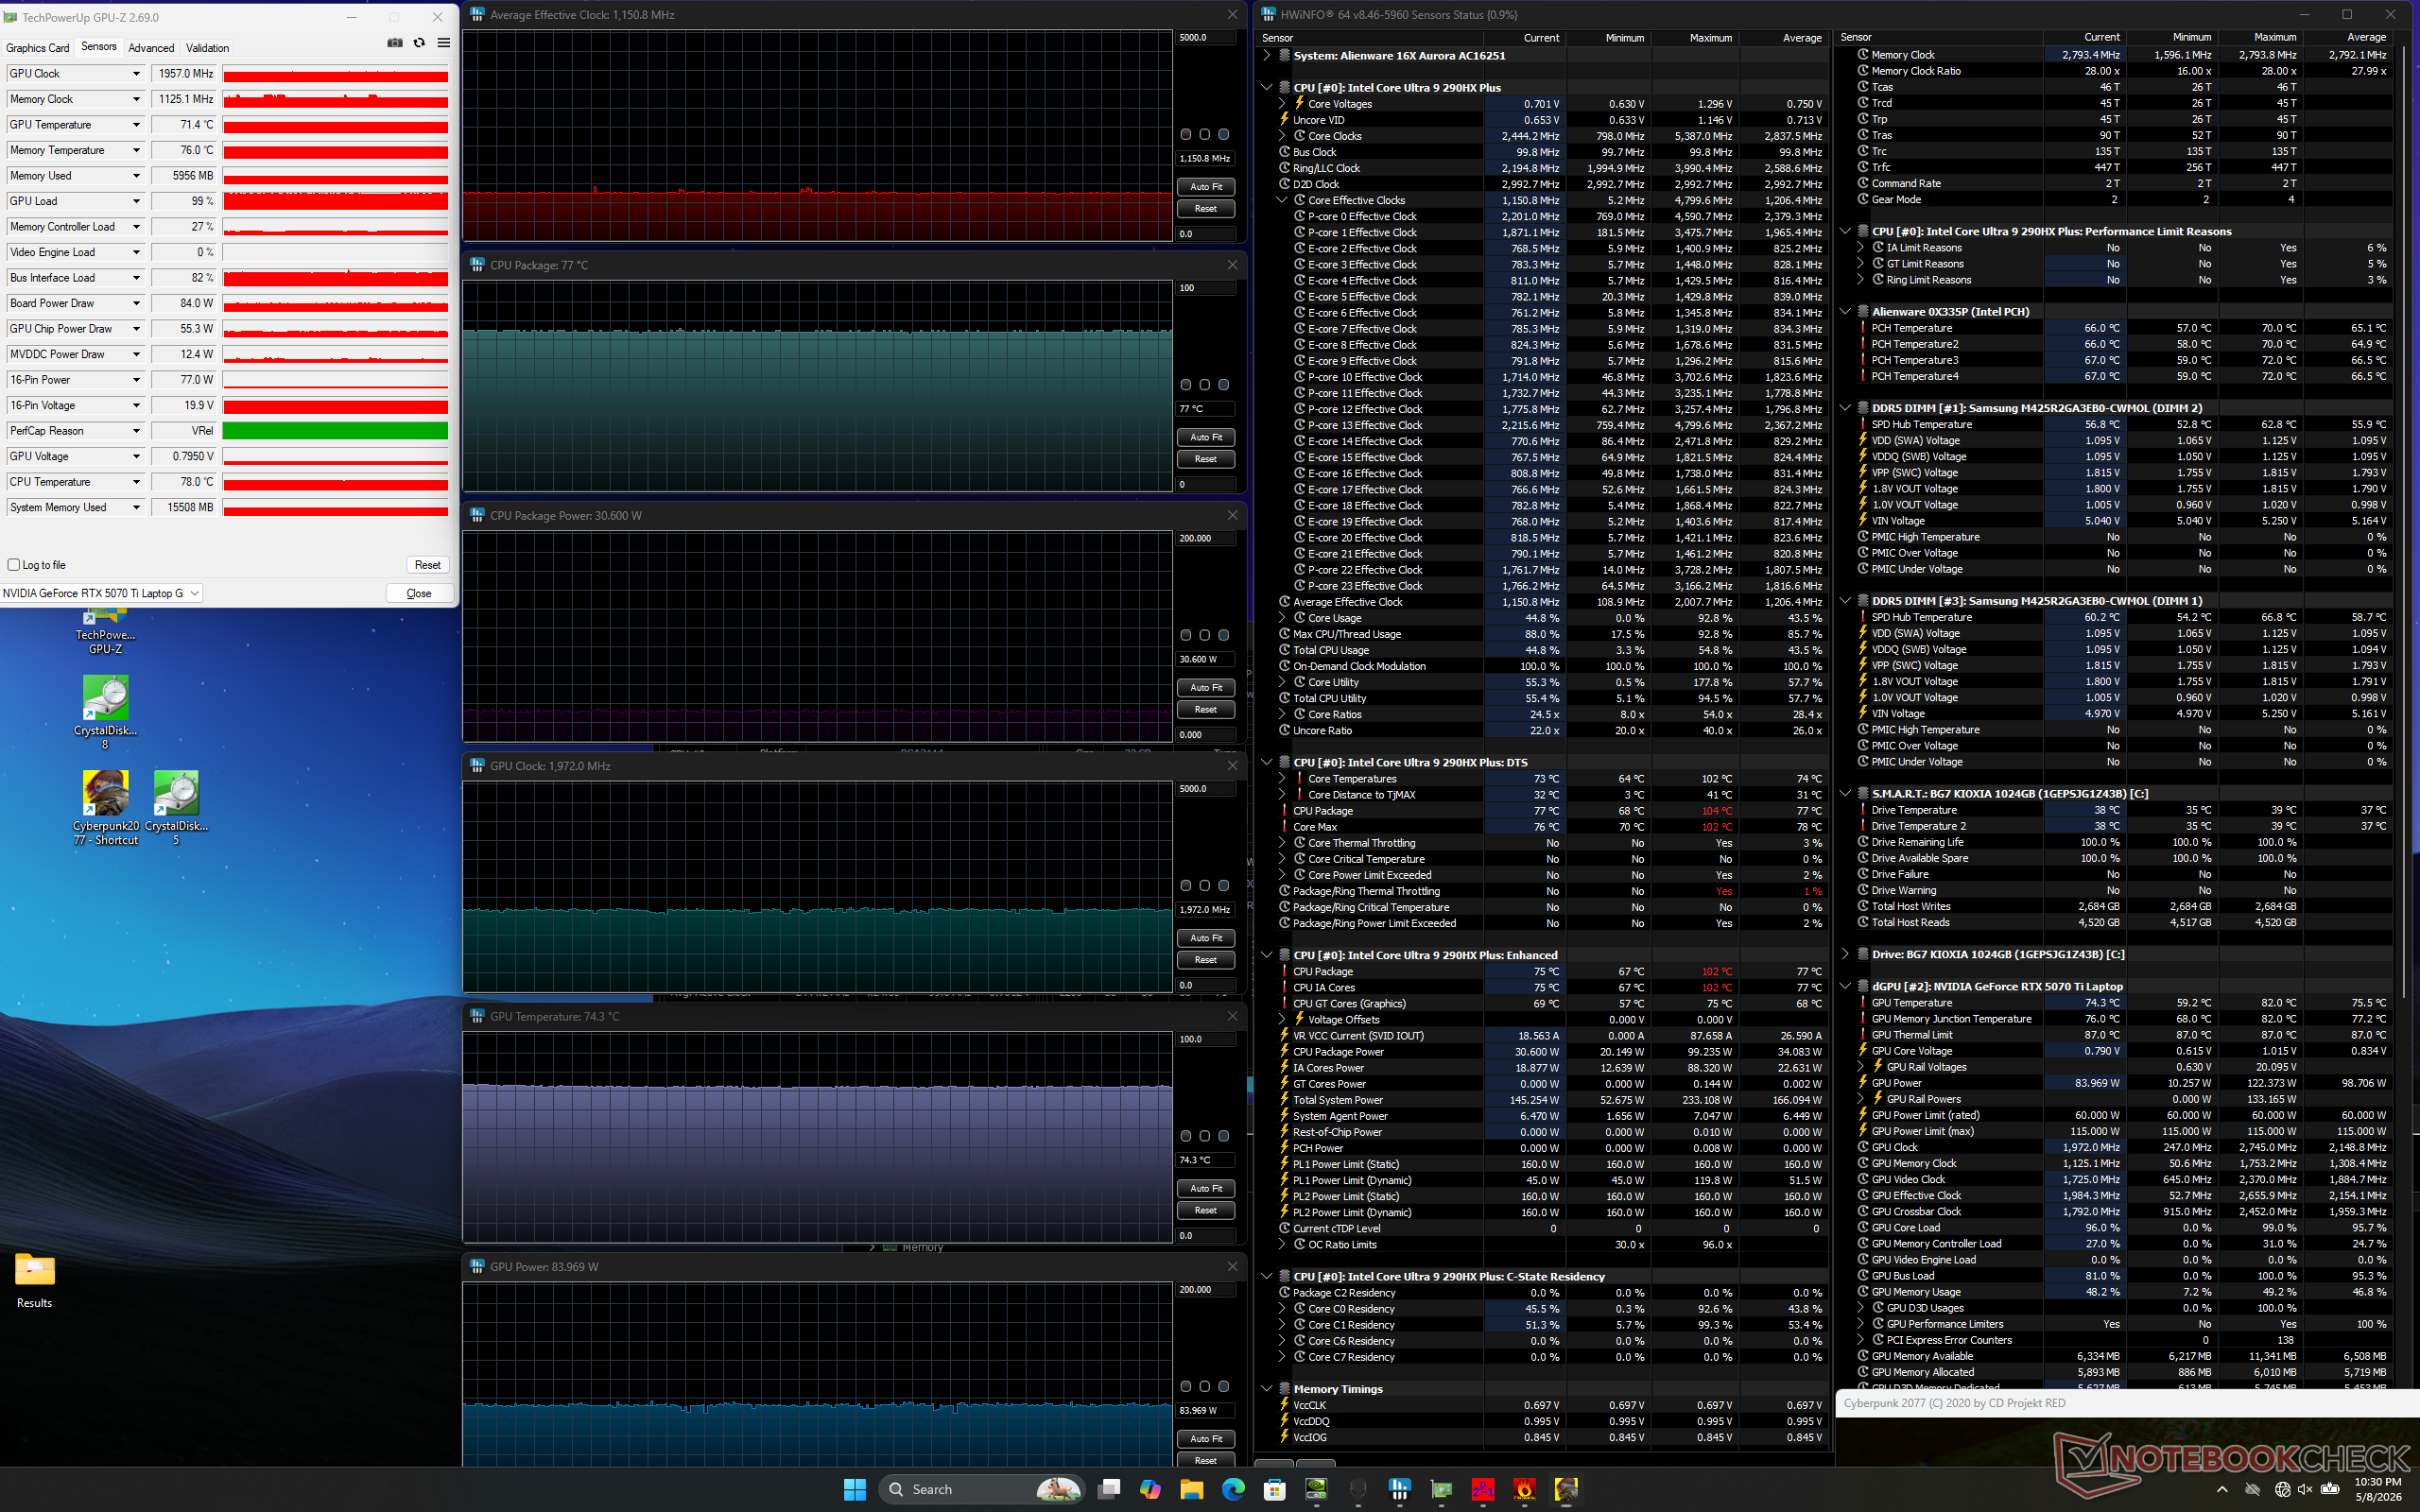
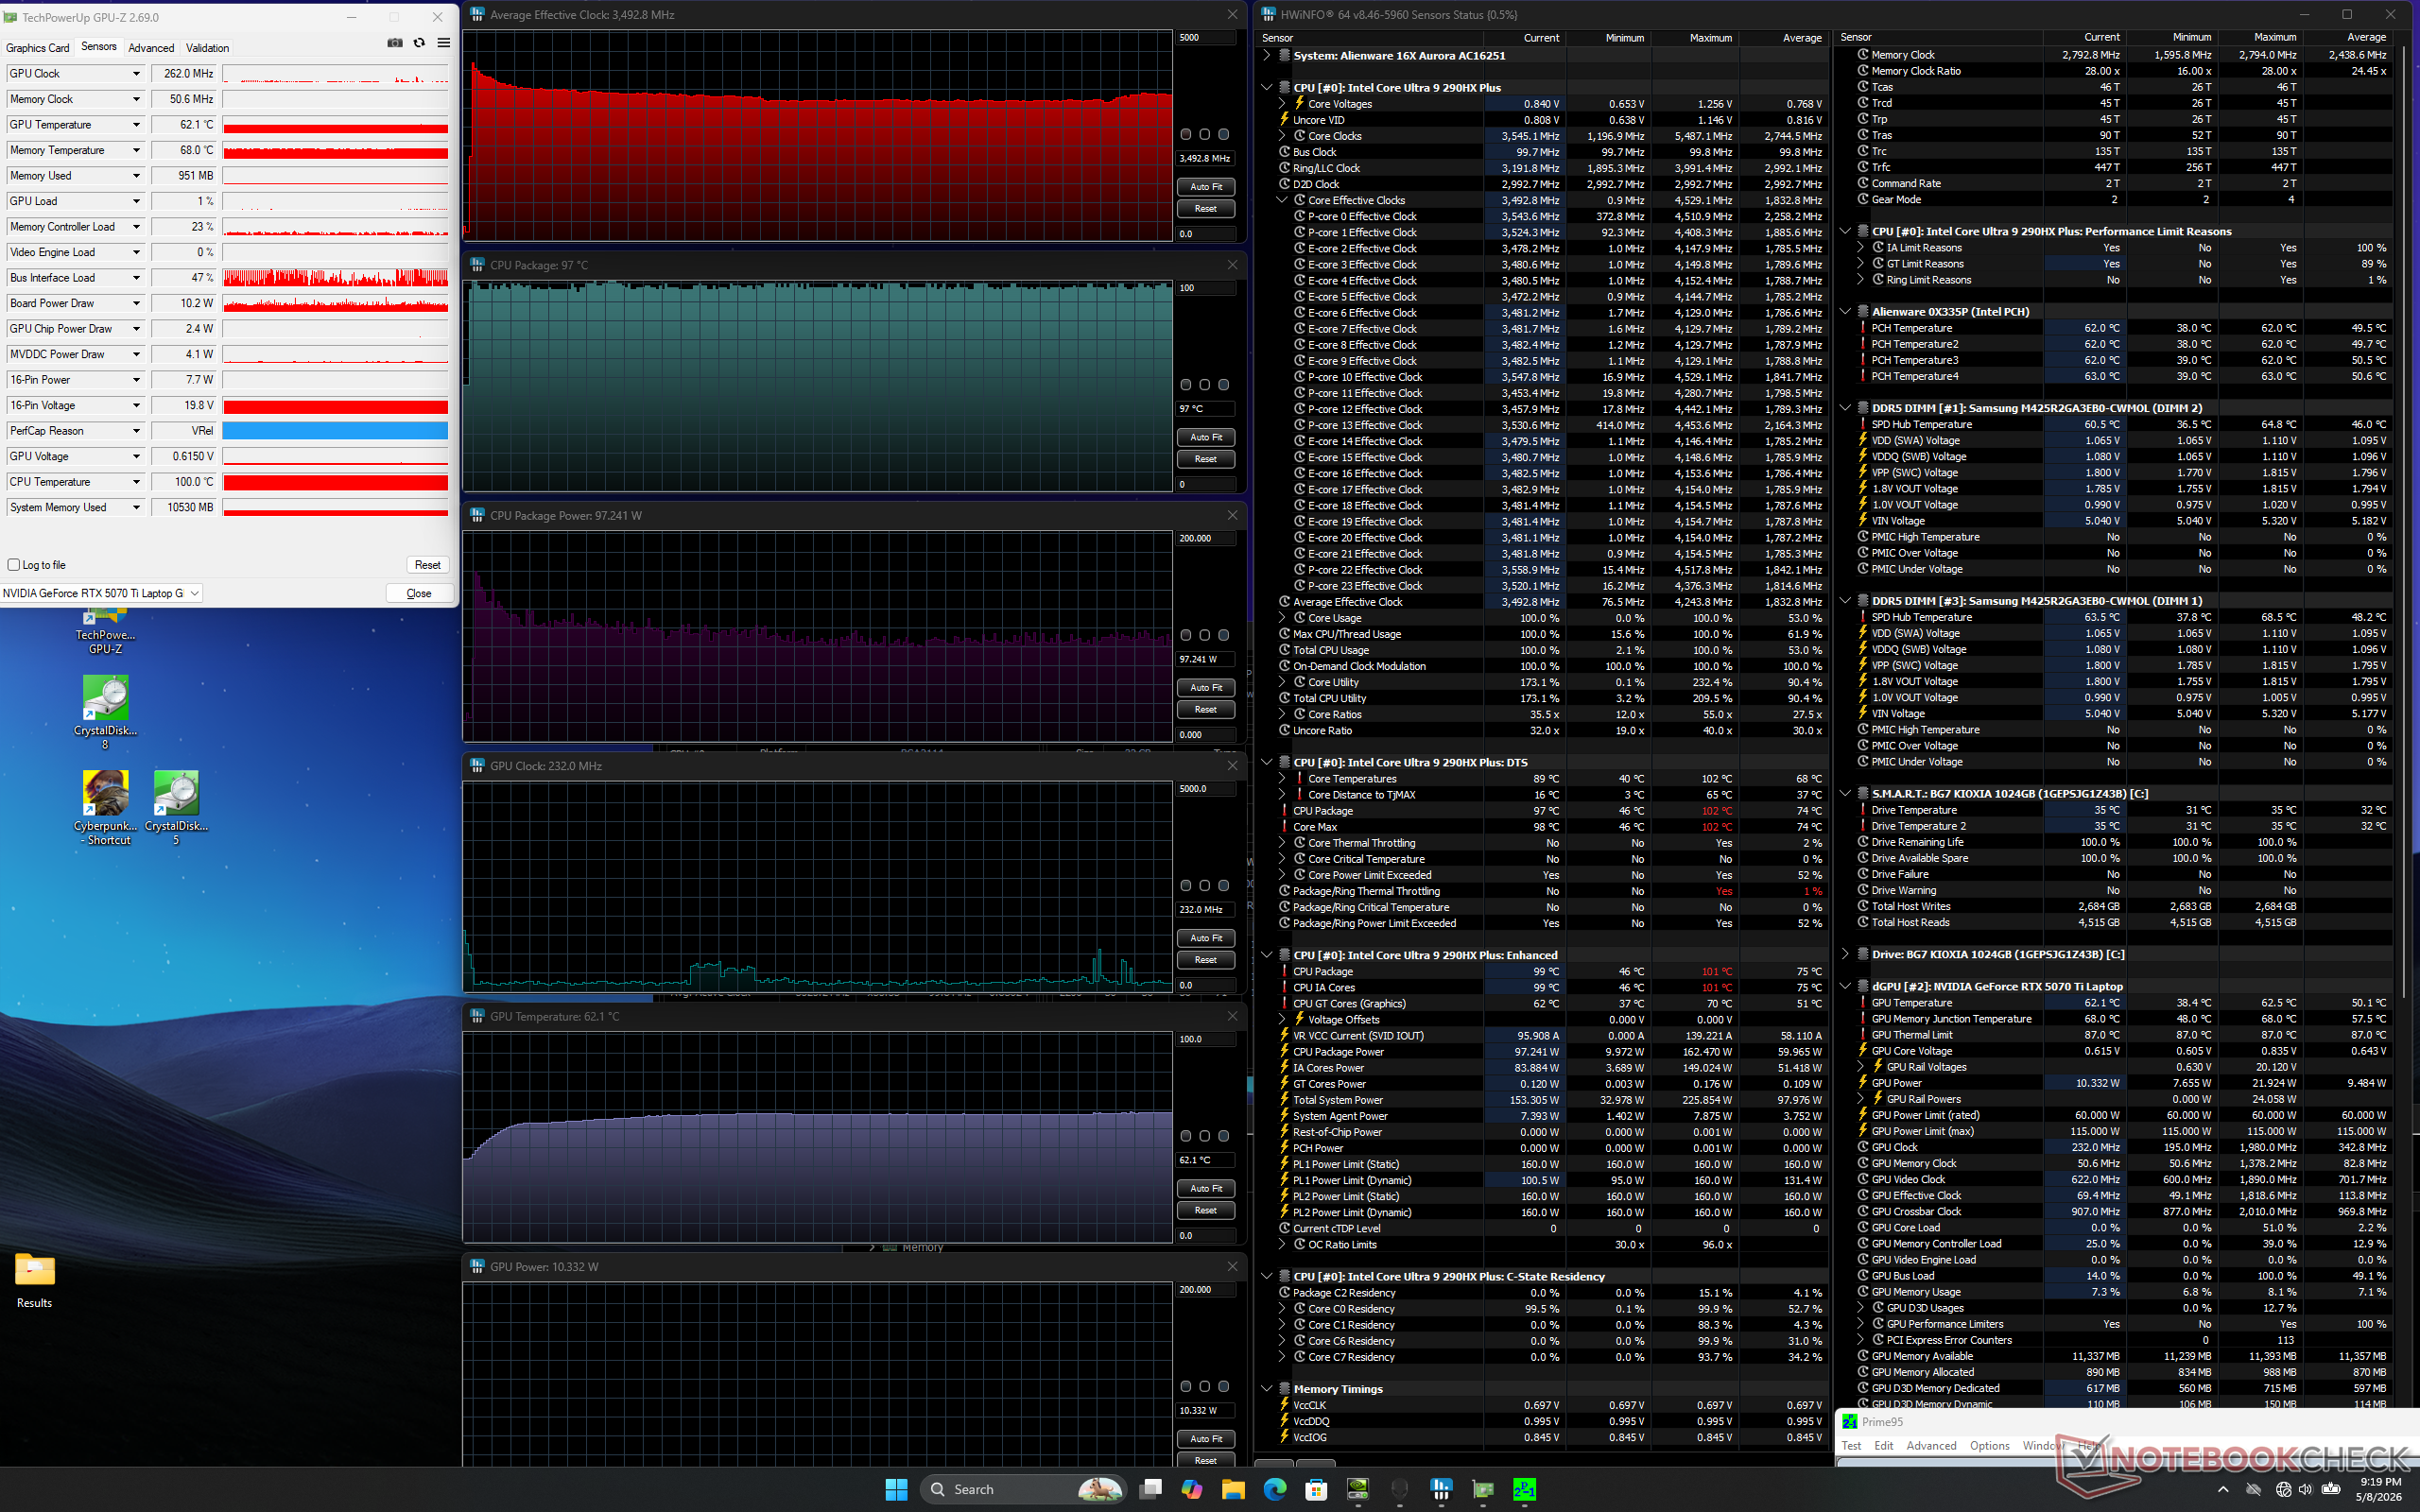
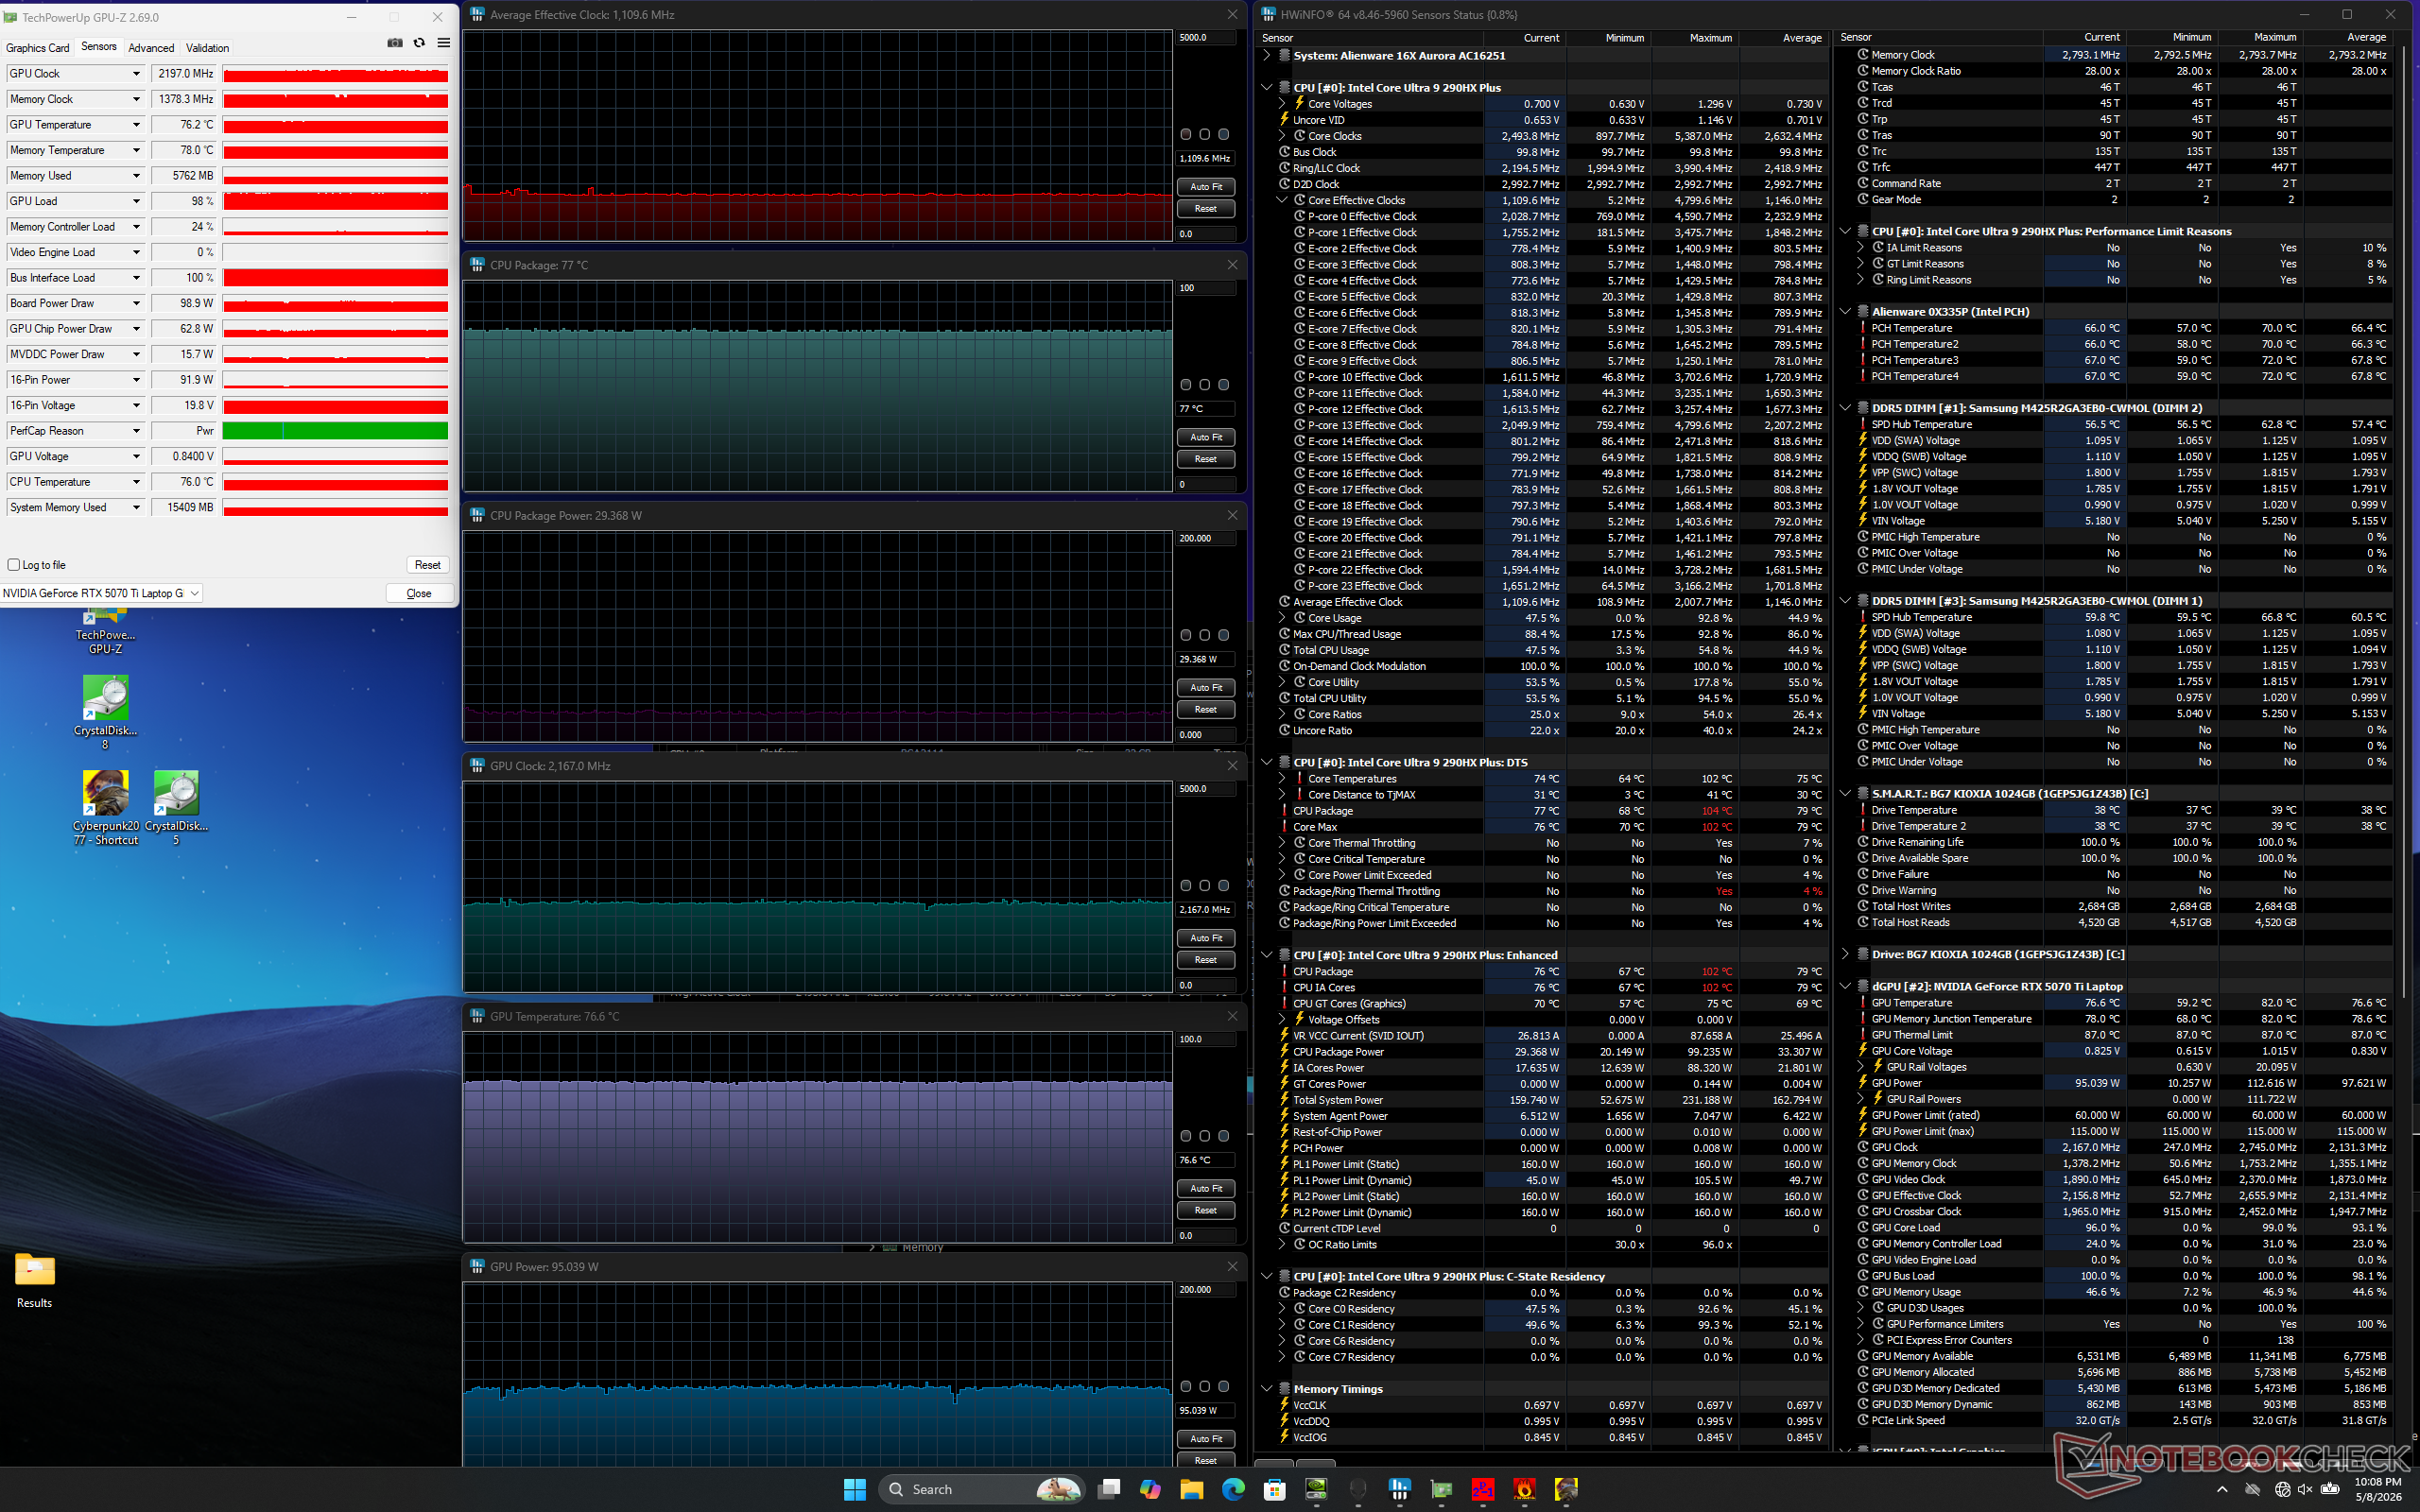
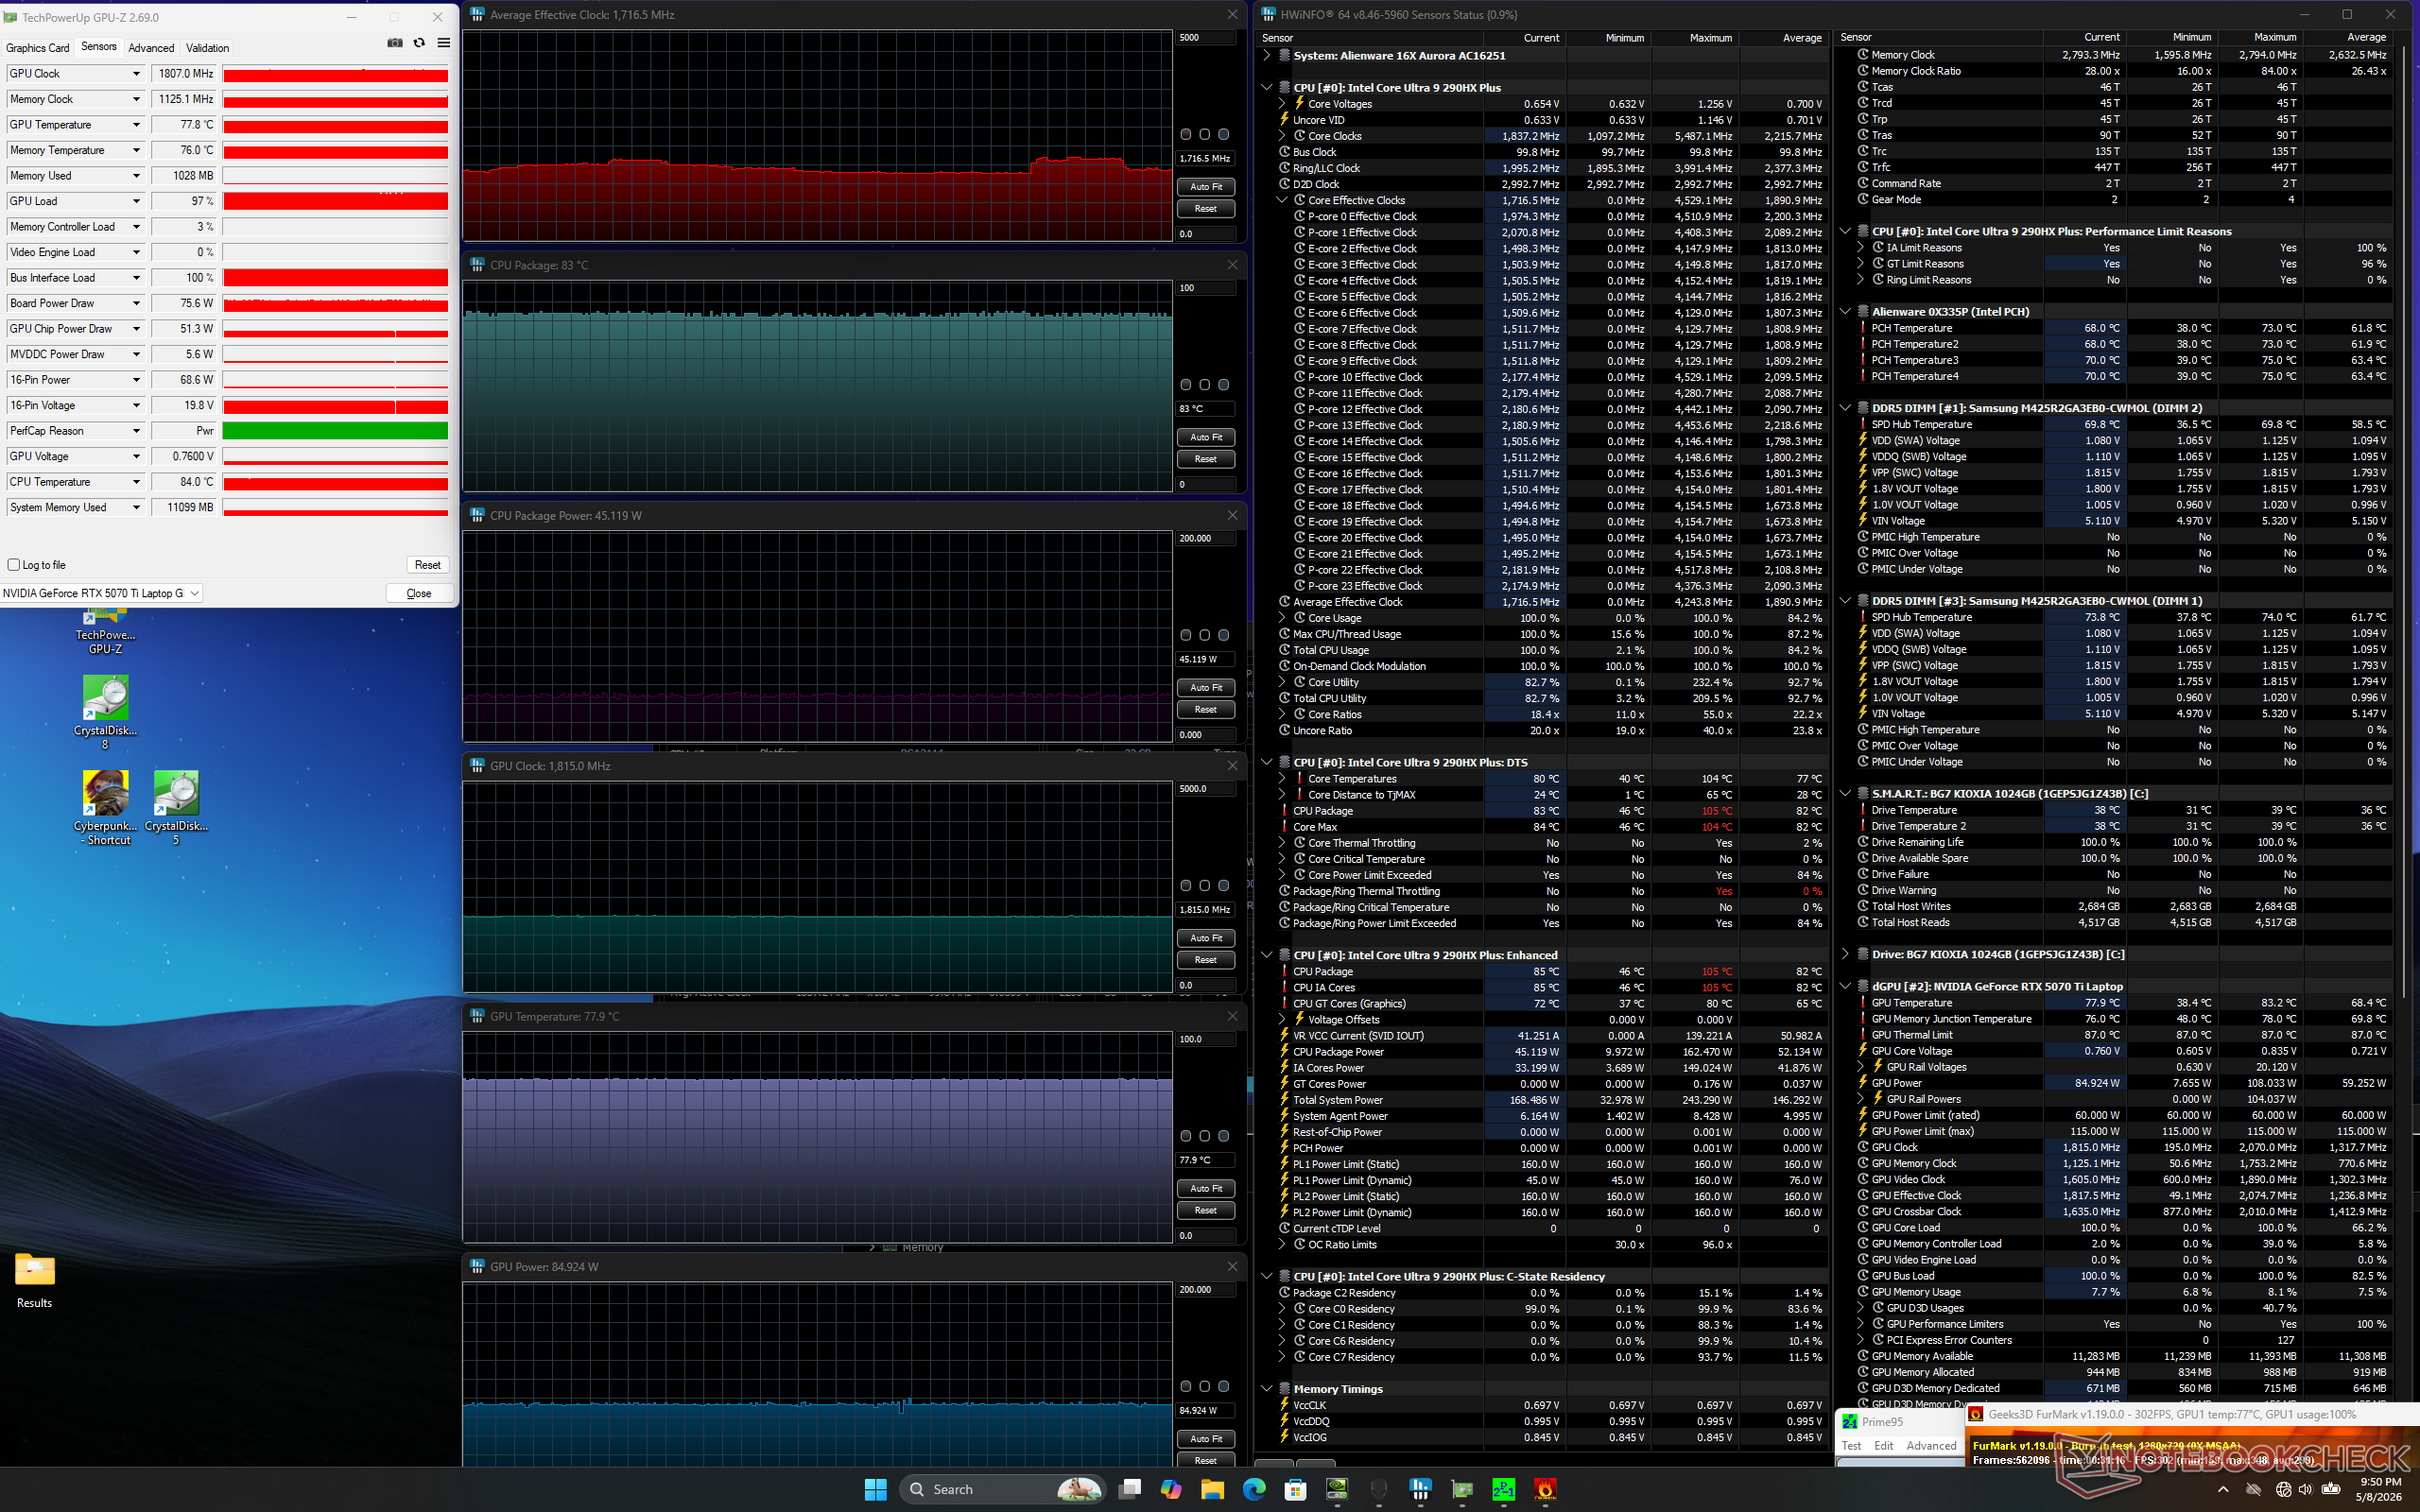
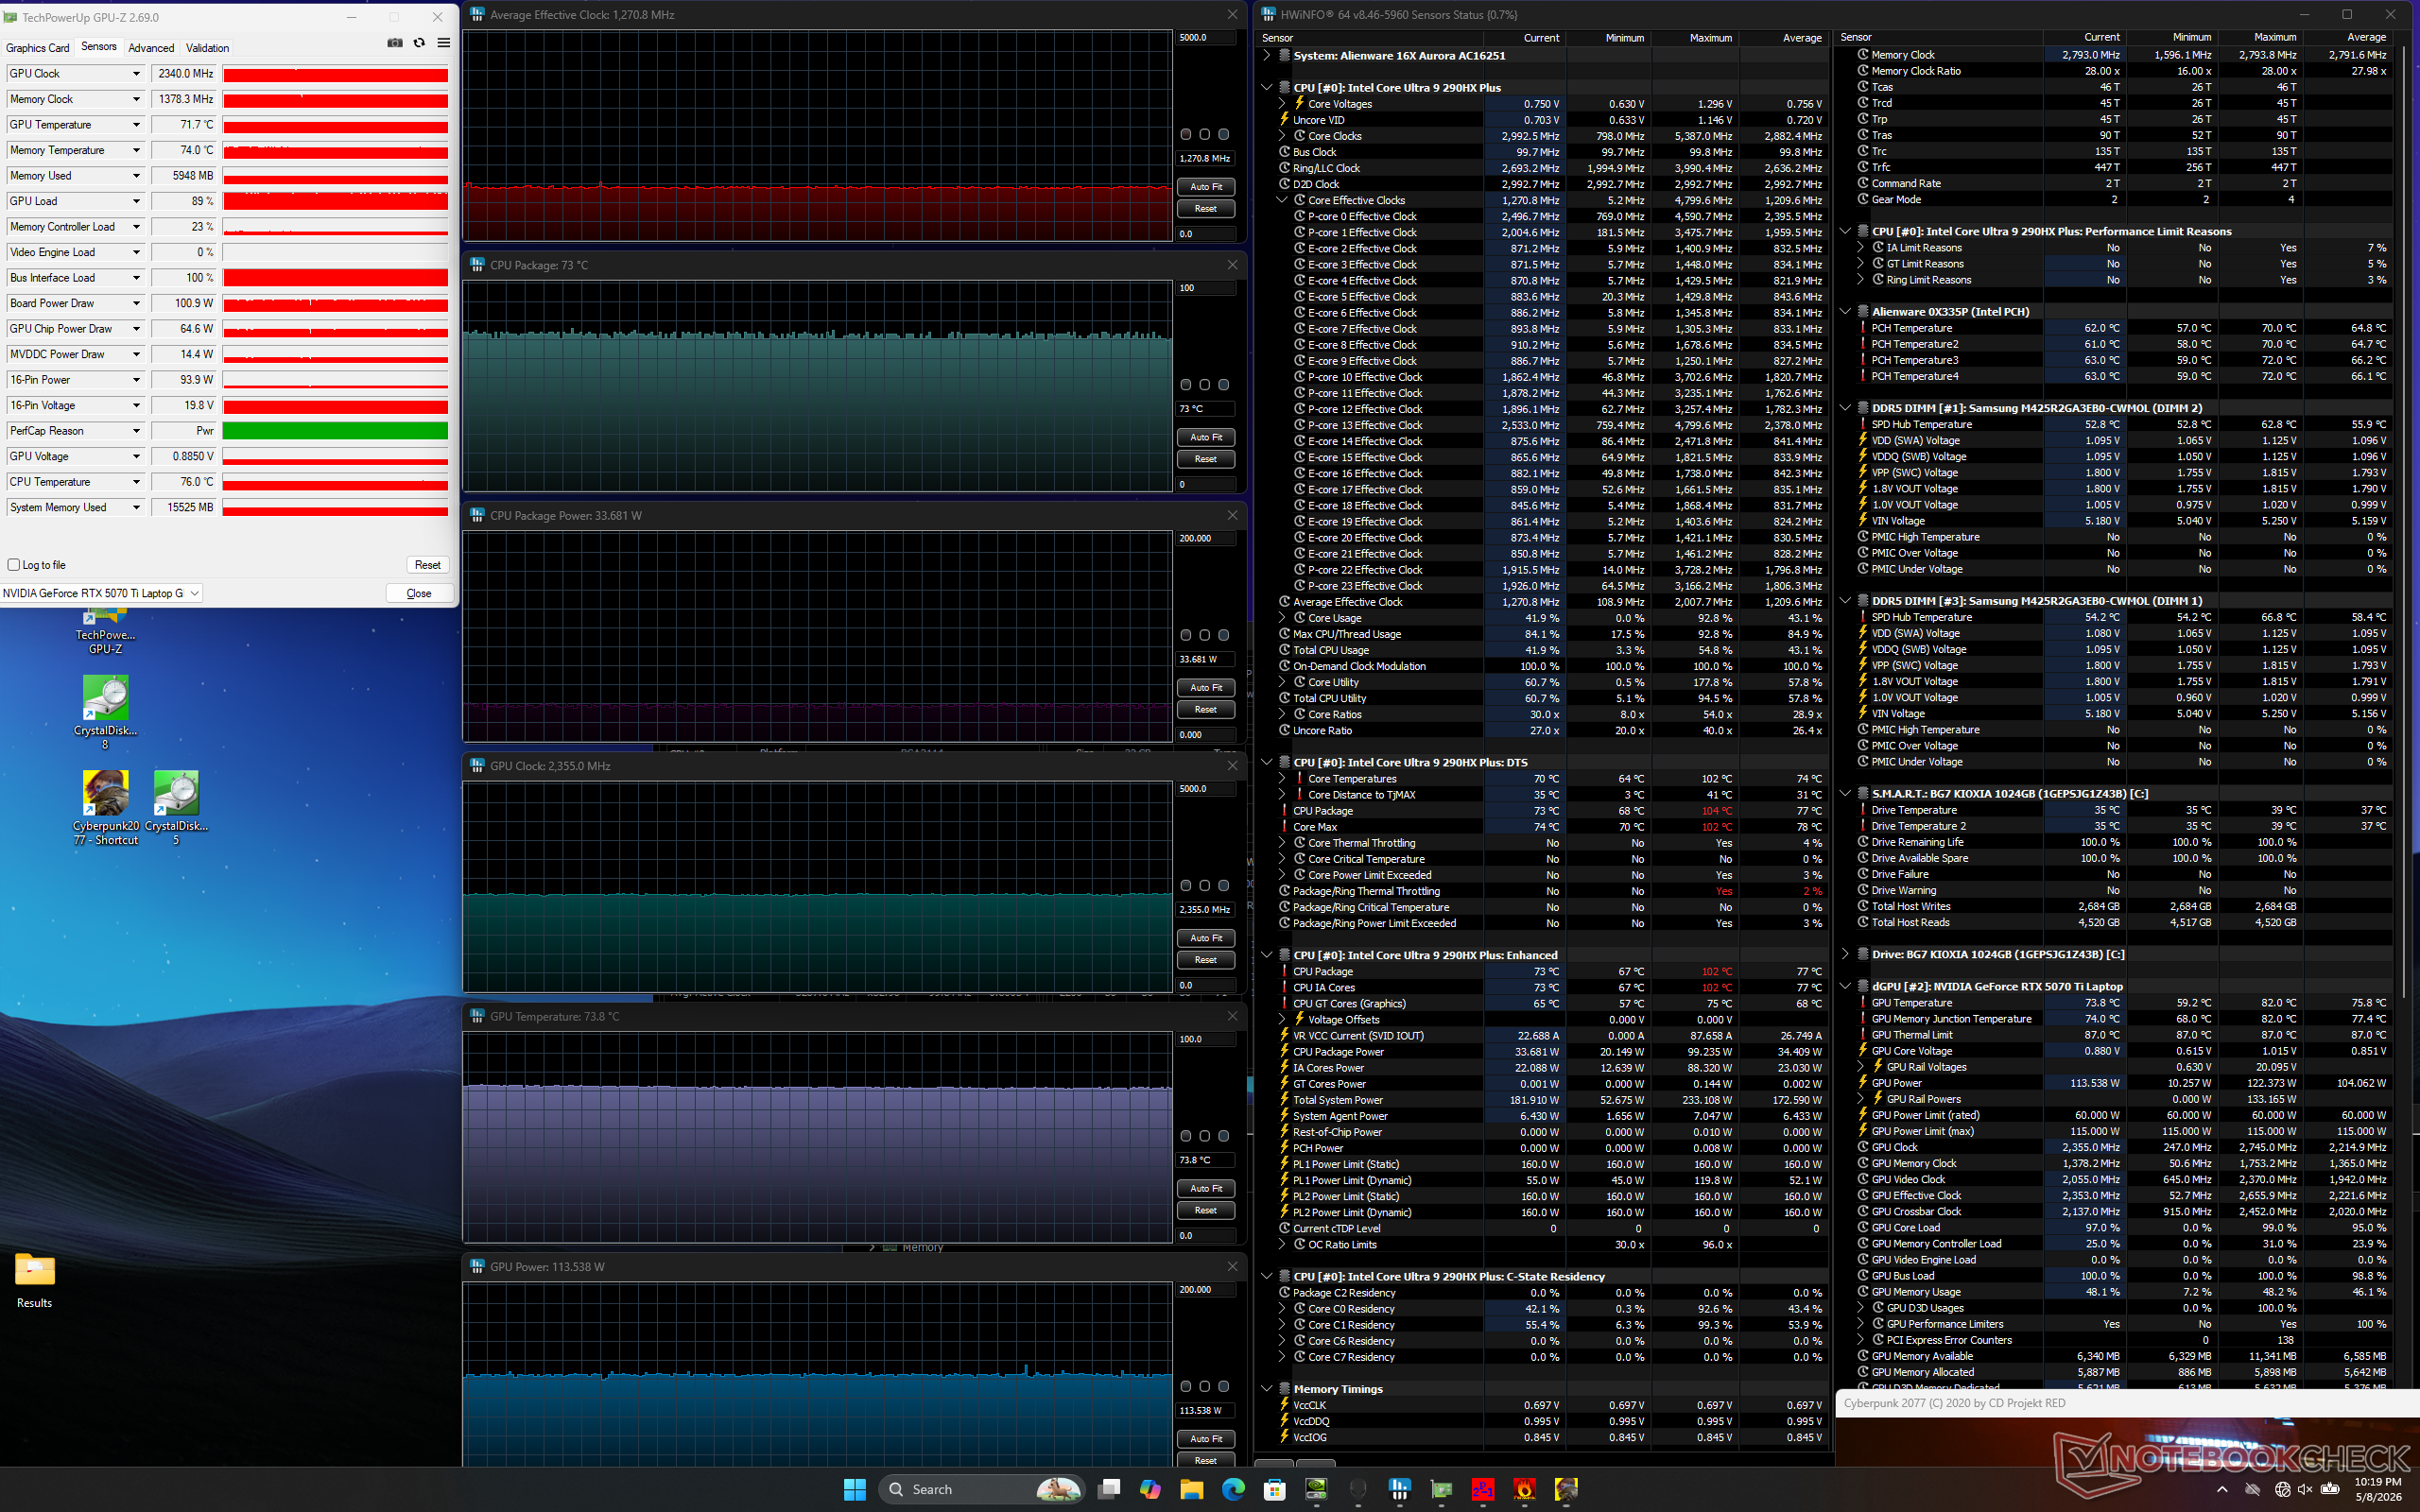
| Durchschnittlicher CPU-Takt (GHz) | GPU-Takt (MHz) | Durchschnittliche CPU-Temperatur (°C) | Durchschnittliche GPU-Temperatur (°C) | |
| System Leerlauf | -- | -- | 48 | 39 |
| Prime95 Stress | 3.5 | -- | 97 | 62 |
| Prime95 + FurMark Stress | 1.7 | 1815 | 83 | 78 |
| Cyberpunk 2077 Stress (Ausgewogener Modus) | 1.2 | 1972 | 77 | 74 |
| Cyberpunk 2077 Stress (Performance Modus) | 1.1 | 2167 | 77 | 77 |
| Cyberpunk 2077 Stress (Overdrive-Modus) | 1.3 | 2355 | 73 | 74 |
Lautsprecher
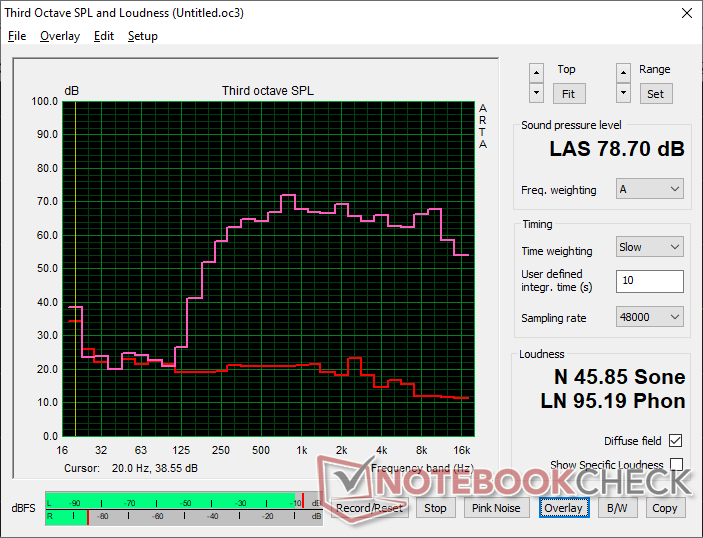
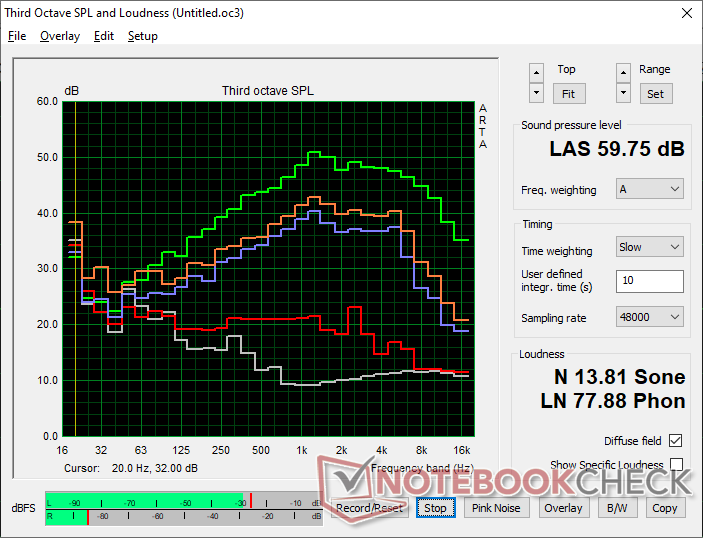
Alienware 16X Aurora Core Ultra 9 290HX Plus Audio Analyse
(±) | Mittelmäßig laut spielende Lautsprecher (78.7 dB)
Bass 100 - 315 Hz
(-) | kaum Bass - 20.8% niedriger als der Median
(-) | keine lineare Bass-Wiedergabe (16% Delta zum Vorgänger)
Mitteltöne 400 - 2000 Hz
(+) | ausgeglichene Mitten, vom Median nur 3% abweichend
(+) | lineare Mitten (5.1% Delta zum Vorgänger)
Hochtöne 2 - 16 kHz
(+) | ausgeglichene Hochtöne, vom Median nur 1.7% abweichend
(+) | sehr lineare Hochtöne (4.9% Delta zum Vorgänger)
Gesamt im hörbaren Bereich 100 - 16.000 Hz
(±) | hörbarer Bereich ist durchschnittlich linear (18.5% Abstand zum Median)
Im Vergleich zu allen Geräten derselben Klasse
» 60% aller getesteten Geräte dieser Klasse waren besser, 8% vergleichbar, 32% schlechter
» Das beste Gerät hat einen Delta-Wert von 6%, durchschnittlich ist 18%, das schlechteste Gerät hat 132%
Im Vergleich zu allen Geräten im Test
» 41% aller getesteten Geräte waren besser, 8% vergleichbar, 51% schlechter
» Das beste Gerät hat einen Delta-Wert von 4%, durchschnittlich ist 24%, das schlechteste Gerät hat 134%
Apple MacBook Pro 16 2021 M1 Pro Audio Analyse
(+) | Die Lautsprecher können relativ laut spielen (84.7 dB)
Bass 100 - 315 Hz
(+) | guter Bass - nur 3.8% Abweichung vom Median
(+) | lineare Bass-Wiedergabe (5.2% Delta zum Vorgänger)
Mitteltöne 400 - 2000 Hz
(+) | ausgeglichene Mitten, vom Median nur 1.3% abweichend
(+) | lineare Mitten (2.1% Delta zum Vorgänger)
Hochtöne 2 - 16 kHz
(+) | ausgeglichene Hochtöne, vom Median nur 1.9% abweichend
(+) | sehr lineare Hochtöne (2.7% Delta zum Vorgänger)
Gesamt im hörbaren Bereich 100 - 16.000 Hz
(+) | hörbarer Bereich ist sehr linear (4.6% Abstand zum Median
Im Vergleich zu allen Geräten derselben Klasse
» 0% aller getesteten Geräte dieser Klasse waren besser, 0% vergleichbar, 100% schlechter
» Das beste Gerät hat einen Delta-Wert von 5%, durchschnittlich ist 17%, das schlechteste Gerät hat 45%
Im Vergleich zu allen Geräten im Test
» 0% aller getesteten Geräte waren besser, 0% vergleichbar, 100% schlechter
» Das beste Gerät hat einen Delta-Wert von 4%, durchschnittlich ist 24%, das schlechteste Gerät hat 134%
Energieverwaltung
Stromverbrauch
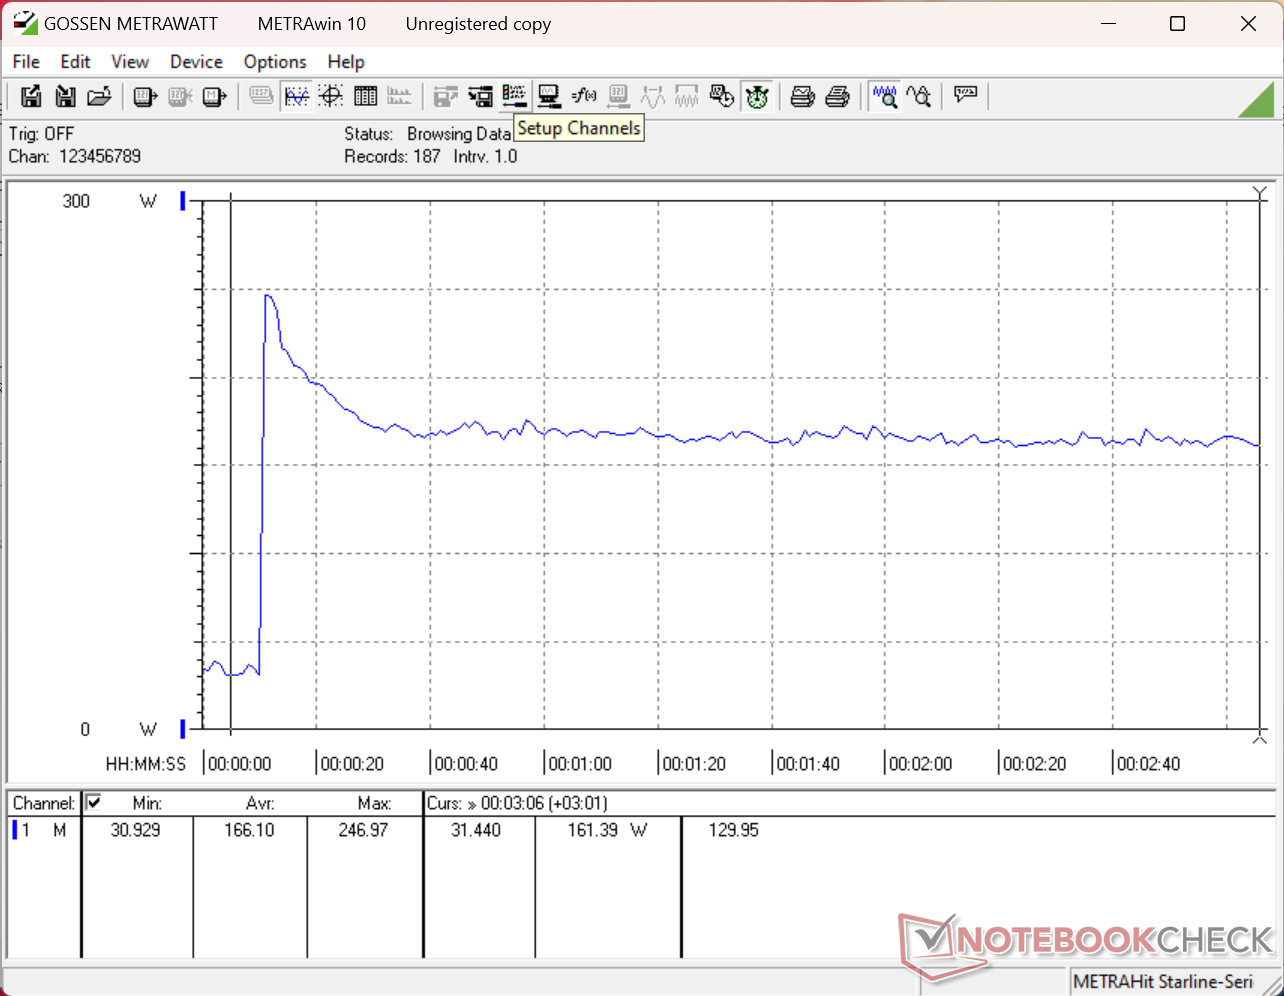
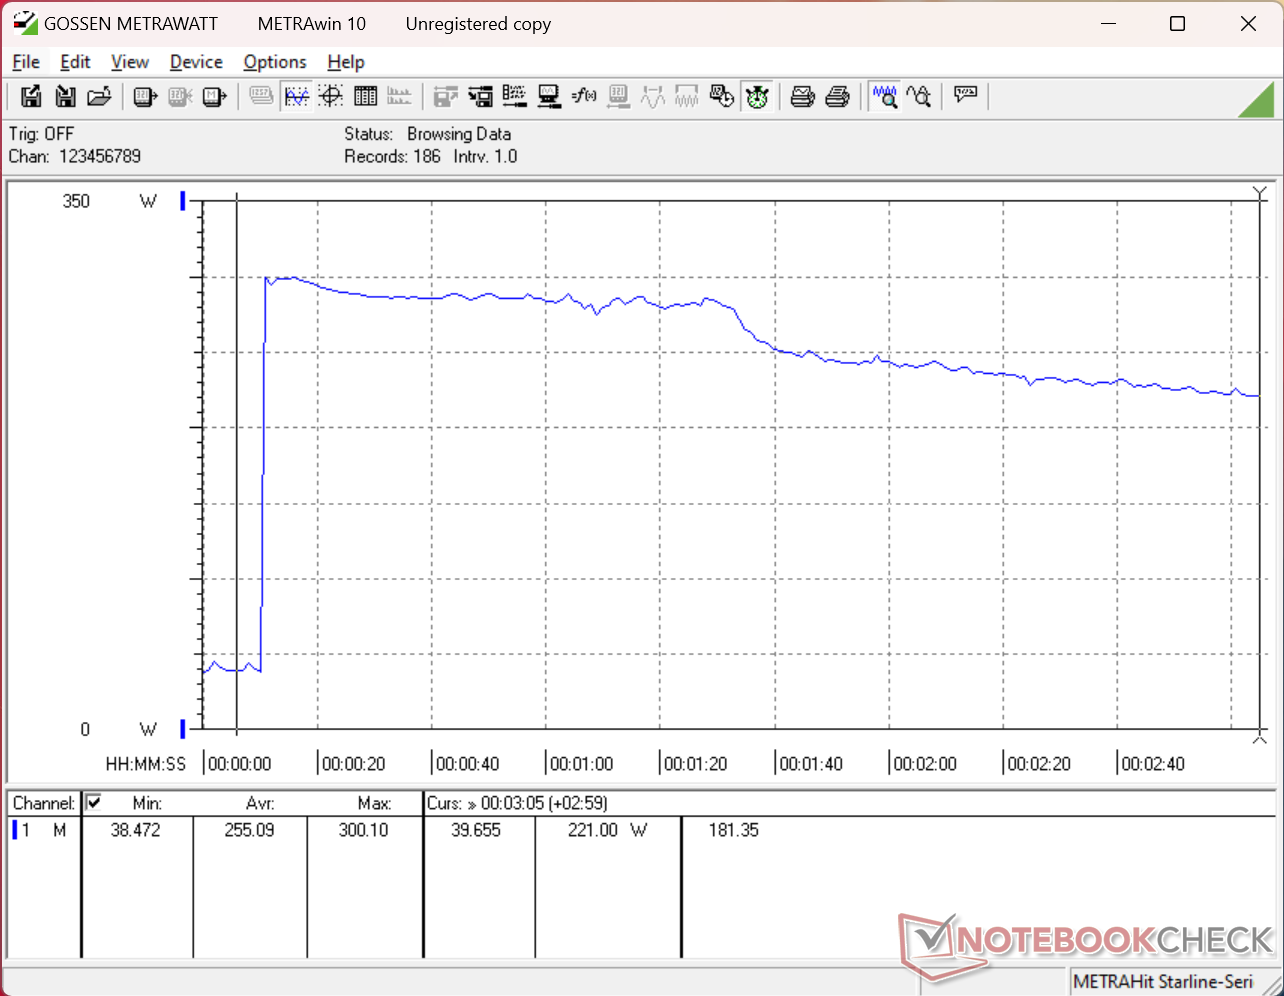
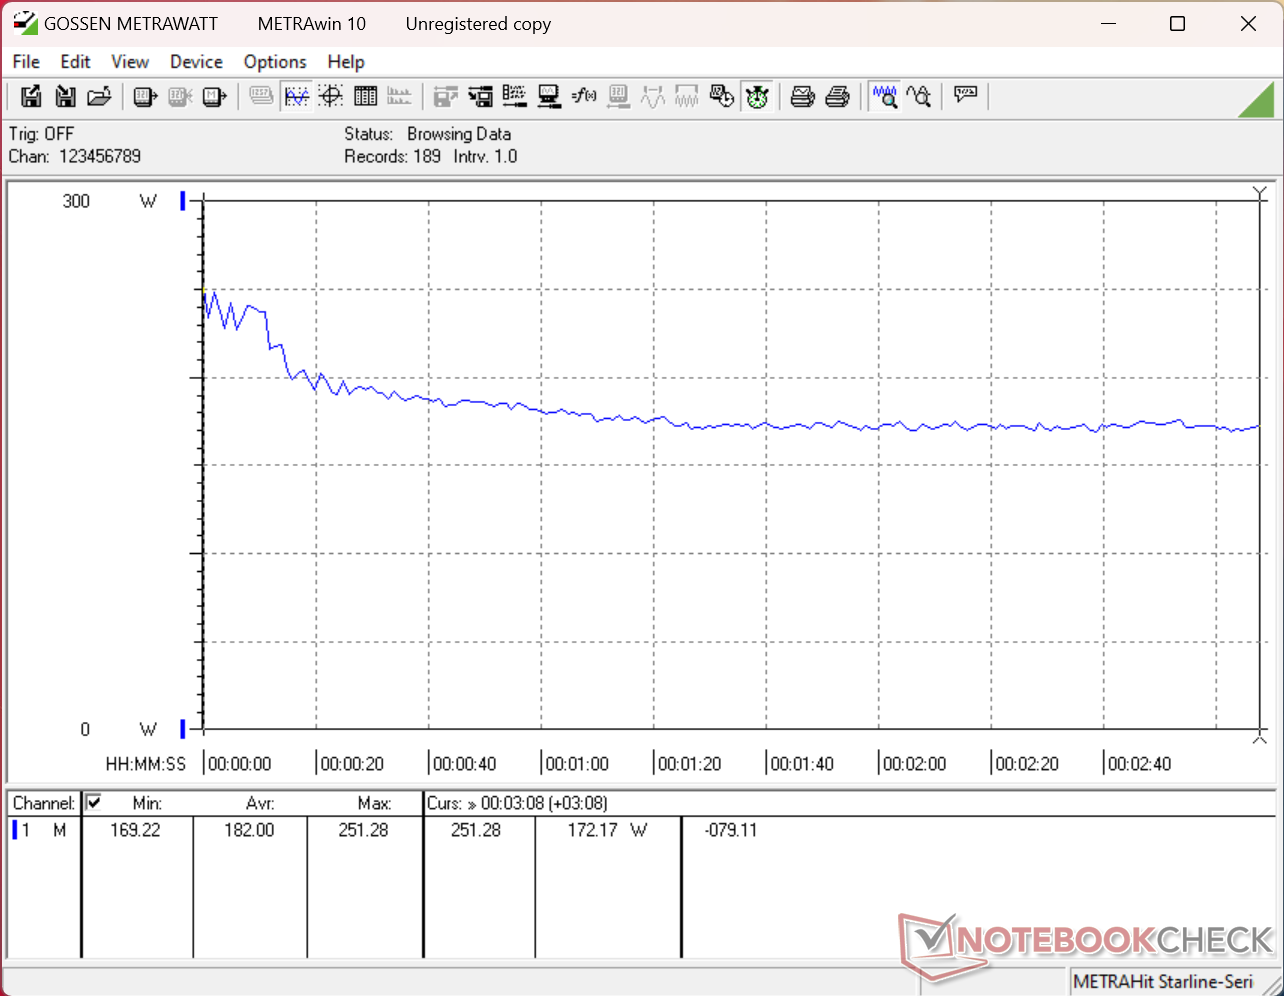
Der Verbrauch im Leerlauf kann im einstelligen Bereich liegen, was viel niedriger ist als das, was wir mit dem 2025er Modell gemessen haben. Ansonsten sind die Ergebnisse zwischen den beiden Modellen nahezu identisch, wenn höhere Lasten durchgeführt werden, einschließlich der Spitzenwerte und der allmählichen Abnahme bei Prime95 und/oder FurMark.
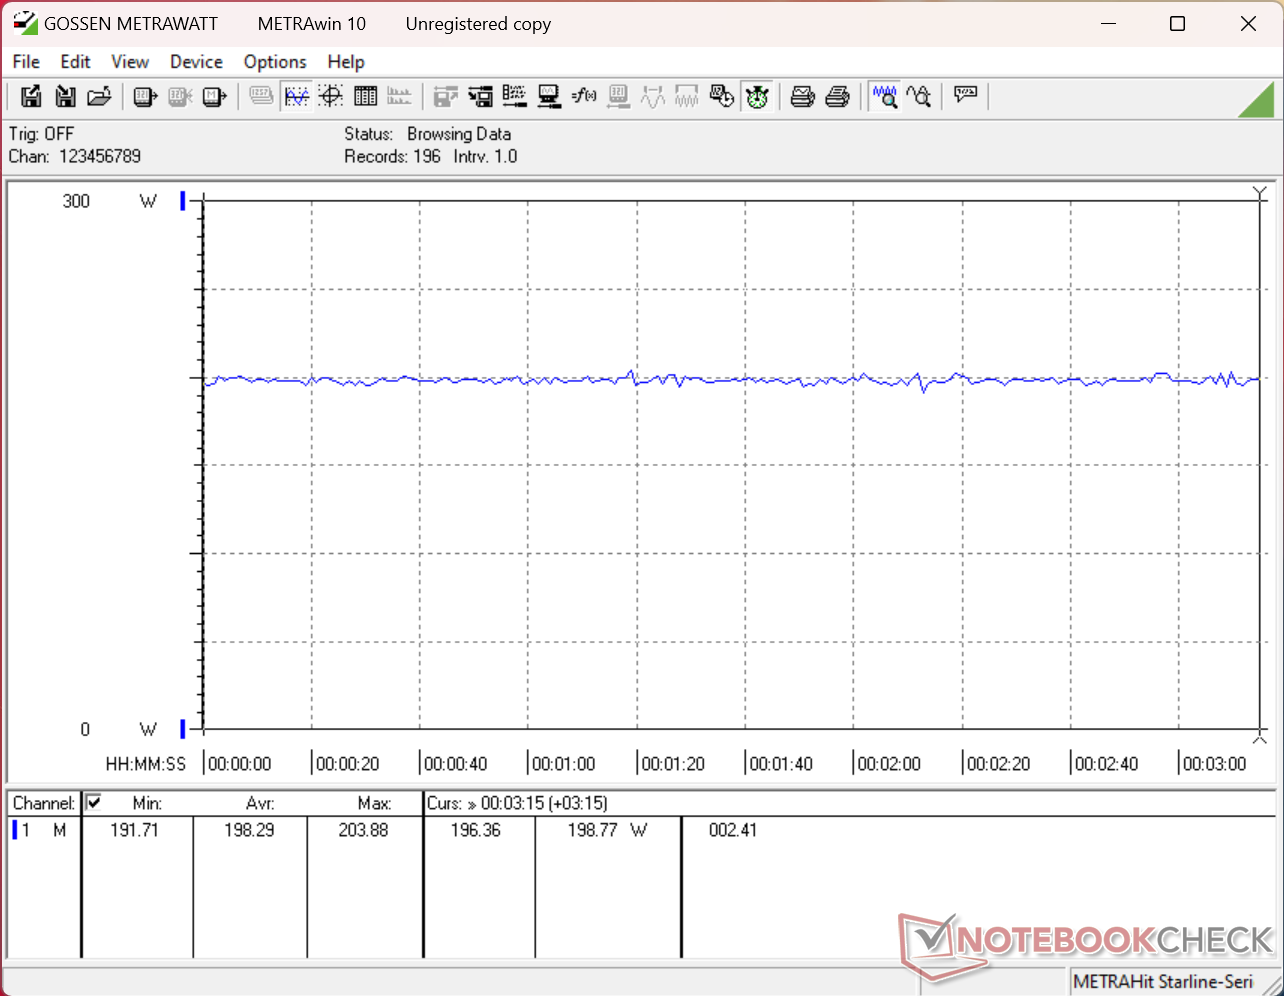
Der Verbrauch bei der Ausführung von Cyberpunk 2077 liegt im Durchschnitt bei 172 W und 199 W im Modus Performance bzw. im Modus Overdrive, was ein paar Watt mehr ist als das, was wir beim letztjährigen Modell gemessen haben. Der geringe Anstieg des Verbrauchs um 4 Prozent ist jedoch die um 20 Prozent höheren Bildraten wohl wert.
| Aus / Standby | |
| Idle | |
| Last |
|
Legende:
min: | |
| Alienware 16X Aurora Core Ultra 9 290HX Plus Ultra 9 290HX Plus, GeForce RTX 5070 Ti Laptop, , OLED, 2560x1600, 16" | Alienware 16X Aurora, RTX 5070 Ultra 9 275HX, GeForce RTX 5070 Laptop, , IPS, 2560x1600, 16" | Acer Predator Helios Neo 16S AI PHN16S-71-94L9 Ultra 9 275HX, GeForce RTX 5070 Ti Laptop, Micron 3500 1TB MTFDKBA1T0TGD, OLED, 2560x1600, 16" | Lenovo Legion Pro 5 16IAX10, RTX 5070 Ultra 7 255HX, GeForce RTX 5070 Laptop, SK Hynix HFS001TEJ9X115N, OLED, 2650x1600, 16" | MSI Vector 16 HX AI A2XWHG Ultra 7 255HX, GeForce RTX 5070 Ti Laptop, Micron 2400 MTFDKBA512QFM, IPS, 2560x1600, 16" | Asus ROG Zephyrus G16 GU605CW Ultra 9 285H, GeForce RTX 5080 Laptop, Micron 2500 2TB MTFDKBA2T0QGN-1BN1AABGA, OLED, 2560x1600, 16" | |
|---|---|---|---|---|---|---|
| Stromverbrauch | -62% | 17% | -11% | -20% | -3% | |
| Idle min * (Watt) | 6.9 | 20.1 -191% | 3.9 43% | 10.6 -54% | 7.1 -3% | 12.6 -83% |
| Idle avg * (Watt) | 8.1 | 27.6 -241% | 11 -36% | 12.3 -52% | 15.9 -96% | 13.4 -65% |
| Idle max * (Watt) | 31 | 31.8 -3% | 16.9 45% | 18.6 40% | 29.5 5% | 15.1 51% |
| Last avg * (Watt) | 131.6 | 102.7 22% | 123 7% | 104 21% | 124 6% | 116.3 12% |
| Cyberpunk 2077 ultra * (Watt) | 198.3 | 217 -9% | 152.7 23% | 231 -16% | 222 -12% | 156.4 21% |
| Cyberpunk 2077 ultra external monitor * (Watt) | 172.1 | 192.3 -12% | 144.9 16% | 227 -32% | 217 -26% | 157.9 8% |
| Last max * (Watt) | 300.1 | 292 3% | 229 24% | 248 17% | 336 -12% | 199 34% |
* ... kleinere Werte sind besser
Stromverbrauch Cyberpunk / Stress Test
Stromverbrauch externer Monitor
Akkulaufzeit
Der oben erwähnte geringere Verbrauch im Leerlauf führt zu längeren Akkulaufzeiten trotz des Wechsels von IPS zu OLED. Achten Sie jedoch darauf, die GPU auf "Automatisch", das Display auf 60 Hz und das Energieprofil auf "Ausbalanciert" oder niedriger einstellen, um WLAN-Laufzeiten von über 7 Stunden zu erreichen.
| Alienware 16X Aurora Core Ultra 9 290HX Plus Ultra 9 290HX Plus, GeForce RTX 5070 Ti Laptop, 96 Wh | Alienware 16X Aurora, RTX 5070 Ultra 9 275HX, GeForce RTX 5070 Laptop, 96 Wh | Acer Predator Helios Neo 16S AI PHN16S-71-94L9 Ultra 9 275HX, GeForce RTX 5070 Ti Laptop, 76 Wh | Lenovo Legion Pro 5 16IAX10, RTX 5070 Ultra 7 255HX, GeForce RTX 5070 Laptop, 80 Wh | MSI Vector 16 HX AI A2XWHG Ultra 7 255HX, GeForce RTX 5070 Ti Laptop, 90 Wh | Asus ROG Zephyrus G16 GA605WV Ryzen AI 9 HX 370, GeForce RTX 4060 Laptop GPU, 90 Wh | |
|---|---|---|---|---|---|---|
| Akkulaufzeit | -42% | -32% | -16% | -5% | 8% | |
| WLAN (h) | 7.4 | 4.3 -42% | 5 -32% | 6.2 -16% | 7 -5% | 8 8% |
| H.264 (h) | 6.1 | 13.7 | ||||
| Last (h) | 1.8 | 1.7 |
Notebookcheck Bewertung
Das 2026 Alienware 16X Aurora bietet mehr fortschrittliche Konfigurationen als das Vorjahr, aber bestimmte Optionen sind leider an andere gebunden oder zu überhöhten Preisen gebündelt.
Alienware 16X Aurora Core Ultra 9 290HX Plus
- 14.05.2026 v8
Allen Ngo
 Total Sustainability Score:
 Potenzielle Mitbewerber im Vergleich
Bild | Modell / Test | Preis ab | Gewicht | Dicke | Display |
|---|---|---|---|---|---|
1. 85.9%  | Alienware 16X Aurora Core Ultra 9 290HX Plus Intel Core Ultra 9 290HX Plus ⎘ NVIDIA GeForce RTX 5070 Ti Laptop ⎘ 32 GB RAM | Amazon: 2.489,69 € Bestpreis 2199€ Alternate 2. 2199€ Alternate.at 3. 2268.02€ galaxus | 2.6 kg | 23.4 mm | 16.00" 2560x1600 189 PPI OLED |
2. 84.9%  | Alienware 16X Aurora, RTX 5070 Intel Core Ultra 9 275HX ⎘ NVIDIA GeForce RTX 5070 Laptop ⎘ 32 GB RAM | Amazon: Geizhals Suche | 2.5 kg | 23.4 mm | 16.00" 2560x1600 189 PPI IPS |
3. 82%  | Acer Predator Helios Neo 16S AI PHN16S-71-94L9 Intel Core Ultra 9 275HX ⎘ NVIDIA GeForce RTX 5070 Ti Laptop ⎘ 32 GB RAM, 1024 GB SSD | Amazon: 2.013,75 € Bestpreis 2638€ ao-projekt 2. 2687€ AO-Projekt 3. 2753€ AO-Projekt | 2.2 kg | 19.9 mm | 16.00" 2560x1600 189 PPI OLED |
4. 86.2%  | Lenovo Legion Pro 5 16IAX10, RTX 5070 Intel Core Ultra 7 255HX ⎘ NVIDIA GeForce RTX 5070 Laptop ⎘ 32 GB RAM, 1024 GB SSD | Amazon: Geizhals Suche | 2.3 kg | 25.95 mm | 16.00" 2650x1600 189 PPI OLED |
5. 84%  | MSI Vector 16 HX AI A2XWHG Intel Core Ultra 7 255HX ⎘ NVIDIA GeForce RTX 5070 Ti Laptop ⎘ 16 GB RAM, 512 GB SSD | Amazon: 2.029,00 € Bestpreis 1898.99€ playox.de 2. 1899€ office-partner.de 3. 1914.95€ playox (AT) | 2.6 kg | 28.6 mm | 16.00" 2560x1600 189 PPI IPS |
6.  | Asus ROG Zephyrus G16 GU605CW Intel Core Ultra 9 285H ⎘ NVIDIA GeForce RTX 5080 Laptop ⎘ 32 GB RAM, 2048 GB SSD | Amazon: Geizhals Suche | 2 kg | 14.9 mm | 16.00" 2560x1600 189 PPI OLED |
Transparenz
Die Auswahl der zu testenden Geräte erfolgt innerhalb der Redaktion. Das vorliegende Testmuster wurde dem Autor vom Hersteller oder einem Shop zu Testzwecken leihweise zur Verfügung gestellt. Eine Einflussnahme des Leihstellers auf den Testbericht gab es nicht, der Hersteller erhielt keine Version des Reviews vor der Veröffentlichung. Es bestand keine Verpflichtung zur Publikation. Als eigenständiges, unabhängiges Unternehmen unterliegt Notebookcheck keiner Diktion von Herstellern, Shops und Verlagen.
So testet Notebookcheck
Pro Jahr werden von Notebookcheck hunderte Laptops und Smartphones unabhängig in von uns standardisierten technischen Verfahren getestet, um eine Vergleichbarkeit aller Testergebnisse zu gewährleisten. Seit rund 20 Jahren entwickeln wir diese Testmethoden kontinuierlich weiter und setzen damit Branchenstandards. In unseren Testlaboren kommt ausschließlich hochwertiges Messequipment in die Hände erfahrener Techniker und Redakteure. Die Tests unterliegen einer mehrstufigen Kontrolle. Unsere komplexe Gesamtbewertung basiert auf hunderten fundierten Messergebnissen und Benchmarks, womit Ihnen Objektivität garantiert ist. Weitere Informationen zu unseren Testmethoden gibt es hier.

