Notebookcheck Logo

Gigabyte GeForce RTX 4070 Super Gaming OC 12G im Test: Für einen Aufpreis von 50 US-Dollar gegenüber der Founders' Edition schlägt sie die RTX 3090 und RX 7800 XT

AD104 genau richtig gemacht. Die Gigabyte GeForce RTX 4070 Super Gaming OC verfügt über einen schnelleren AD104 Chip und eine bessere Kühlung, die sie vollständig von der Founders'-Edition-Karte unterscheidet. Die RTX 4070 Super Gaming OC bietet spürbare Vorteile gegenüber der RTX 3090 und der AMD Radeon RX 7800 XT. Unser Test prüft, ob sie die 50 US-Dollar mehr wert ist als die RTX 4070 Super Founders' Edition.
Gigabyte GeForce RTX 4070 Super Gaming OC 12G im Test

Wir haben kürzlich die Nvidia GeForce RTX 4070 Super Founders' Edition getestet und festgestellt, dass sie eine Leistung bietet, die mit der RTX 3090 vergleichbar ist. Neben der Founders' Edition (FE) haben Nvidias Add-in-Board-Partner (AiB) ihre eigene Version der neuen AD104 GPU mit 7.168 CUDA-Kernen.

Ein solches Angebot ist die neue Gigabyte GeForce RTX 4070 Super Gaming OC 12G.

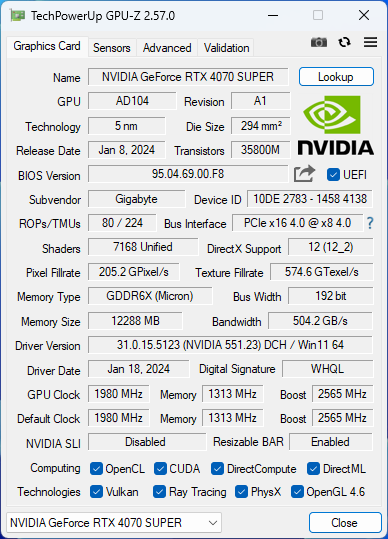
Abgesehen von den offensichtlichen Designänderungen gegenüber der Founders' Edition bietet die Gigabyte GeForce RTX 4070 Super Gaming OC 12G auch einen erhöhten Boost-Takt von 2.565 MHz im Gegensatz zum Referenztakt von 2.475 MHz.

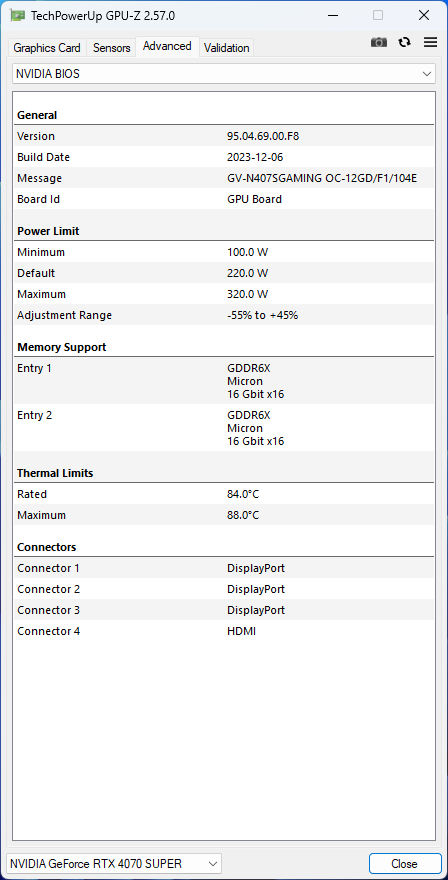
Darüber hinaus verfügt die Karte von Gigabyte über einen höheren Leistungsspielraum mit der Fähigkeit, bis zu 320 W zu pushen, verglichen mit den 240 W TGP der RTX 4070 Super FE.

Die Gigabyte GeForce RTX 4070 Super Gaming OC 12G kostet 62.490 Rupien in Indien bzw. 650 US-Dollar in den USA. Die Karte wird standardmäßig mit einer dreijährigen Herstellergarantie geliefert, die bei Produktregistrierung um ein weiteres Jahr verlängert werden kann.

In diesem Test sehen wir, wie gut sich der Aufpreis von 50 US-Dollar für die RTX 4070 Super Gaming OC 12G gegenüber der Founders' Edition (UVP: 599 US-Dollar) in der Praxis auswirkt.

Vergleich der Gigabyte GeForce RTX 4070 Super Gaming OC 12G mit anderen Nvidia GPUs

Spezifikation RTX 4090 FE RTX 4080 Super FE RTX 4080 FE Asus TUF RTX 4070 Ti Gigabyte RTX 4070 Super Gaming OC ZotacRTX 4070 AMP Airo KFA2RTX 4060 Ti EX RTX 3090 Ti FE RTX 3090 FE RTX 3080 Ti FE RTX 3070 FE Titan RTX
Chip AD102 AD103 AD103 AD104 AD104 AD104 AD106 GA102 GA102 GA102 GA104 TU102
FinFET-Prozess Custom 4N Custom 4N Custom 4N Custom 4N Custom 4N Custom 4N Custom 4N 8 nm 8 nm 8 nm 8 nm 12 nm
CUDA Kerne 16.384 10.240 9.728 7.680 7.168 5.888 4.352 10.752 10.496 10.240 5.888 4.608
Textureinheiten 512 320 304 240 224 184 136 336 328 320 184 288
Tensor Cores 512 4th Gen. 320 4th Gen. 304 4th Gen. 240 4th Gen. 224 4th Gen. 184 4th Gen. 136 4th Gen. 336 3rd Gen. 328 3rd Gen. 320 3rd Gen. 184 3rd Gen. 576 2nd Gen.
RT Cores 128 3. Gen. 80 3. Gen. 76 3. Gen. 60 3. Gen. 56 3. Gen. 46 3. Gen. 34 3. Gen. 84 2. Gen. 82 2. Gen. 80 2. Gen. 46 2. Gen. 72
GPU Base Clock 2.235 MHz 2.295 MHz 2.205 MHz 2.310 MHz 1.980 MHz 1.920 MHz 2.310 MHz 1.560 MHz 1.395 MHz 1.365 MHz 1.500 MHz 1.350 MHz
GPU Boost Clock 2.520 MHz 2.550 MHz 2.505 MHz 2.760 MHz 2.565 MHz 2.535 MHz 2.535 MHz 1.860 MHz 1.695 MHz 1.665 MHz 1.750 MHz 1.770 MHz
Speicherbus 384-bit 256-bit 256-bit 192-bit 192-bit 192-bit 128-bit 384-bit 384-bit 384-bit 256-bit 384-bit
Speicherbandbreite 1.008 GB/s 736,3 GB/s 716,8 GB/s 504 GB/s 504 GB/s 504 GB/s 288 GB/s 1.008 GB/s 936 GB/s 912 GB/s 448 GB/s 672 GB/s
Videospeicher 24 GB GDDR6X 16 GB GDDR6X 16 GB GDDR6X 12 GB GDDR6X 12 GB GDDR6X 12 GB GDDR6X 8 GB GDDR6 24 GB GDDR6X 24 GB GDDR6X 12 GB GDDR6X 8 GB GDDR6 24 GB GDDR6
Leistungsaufnahme 450 W 320 W 320 W 285 W 220 W 215 W 160 W 450 W 350 W 350 W 220 W 280 W

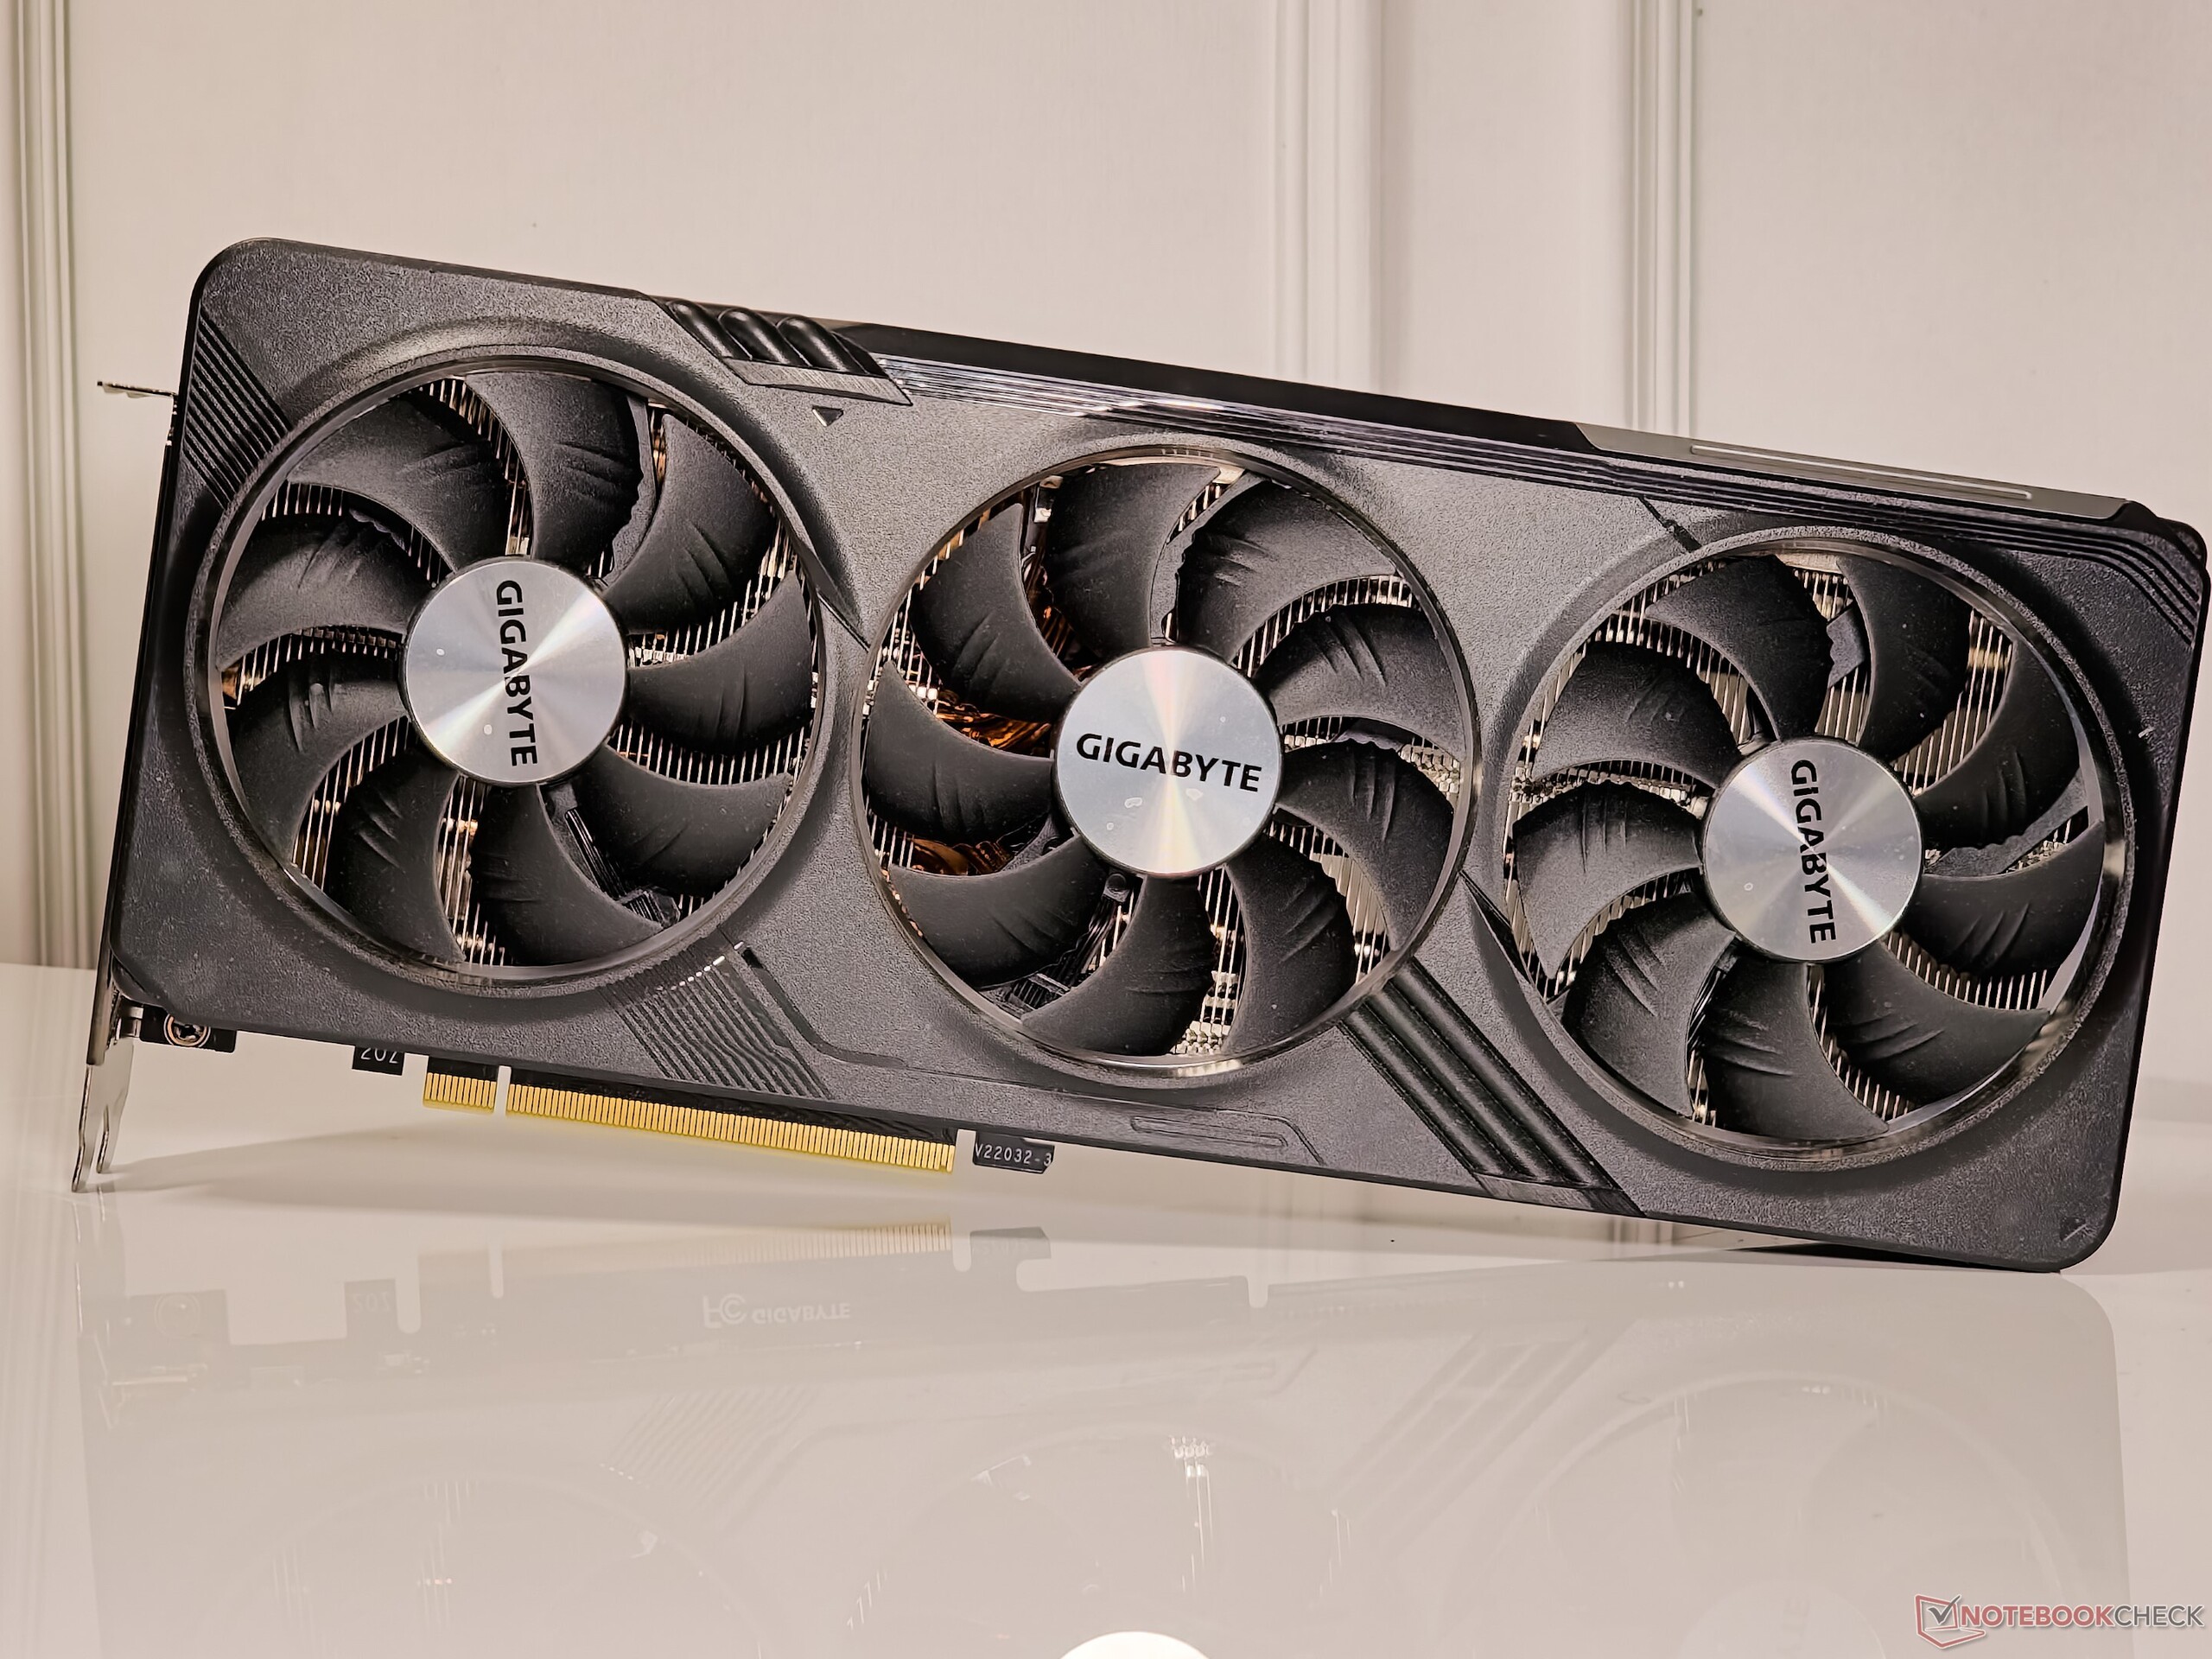
Ein Blick auf die Gigabyte GeForce RTX 4070 Super Gaming OC 12G

Die Gigabyte GeForce RTX 4070 Super Gaming OC 12G sieht genau gleich aus wie ihr RTX-4070-Vorgänger. Die Änderungen sind also intern und haben mit dem neuen AD104 Kern selbst zu tun.

Mit den Maßen 300 x 130 x 57,6 mm passt die RTX 4070 Super Gaming OC problemlos in die meisten ATX-Gehäuse. Angesichts des relativ geringen Gewichts der Karte von 1,26 kg liefert Gigabyte keine Anti-Sag-Halterung im Karton mit.

Die vordere Abdeckung der Karte ist aus Kunststoff, aber die Rückplatte ist aus hochwertigem Metall gefertigt und bietet ausreichend Platz für die Abluft, was das Unternehmen als "Bildschirmkühlung" bezeichnet.

Gigabyte GeForce RTX 4070 Super Gaming OC 12G: Vorderseite
Gigabyte GeForce RTX 4070 Super Gaming OC 12G: Rückseite
Gigabyte GeForce RTX 4070 Super Gaming OC 12G

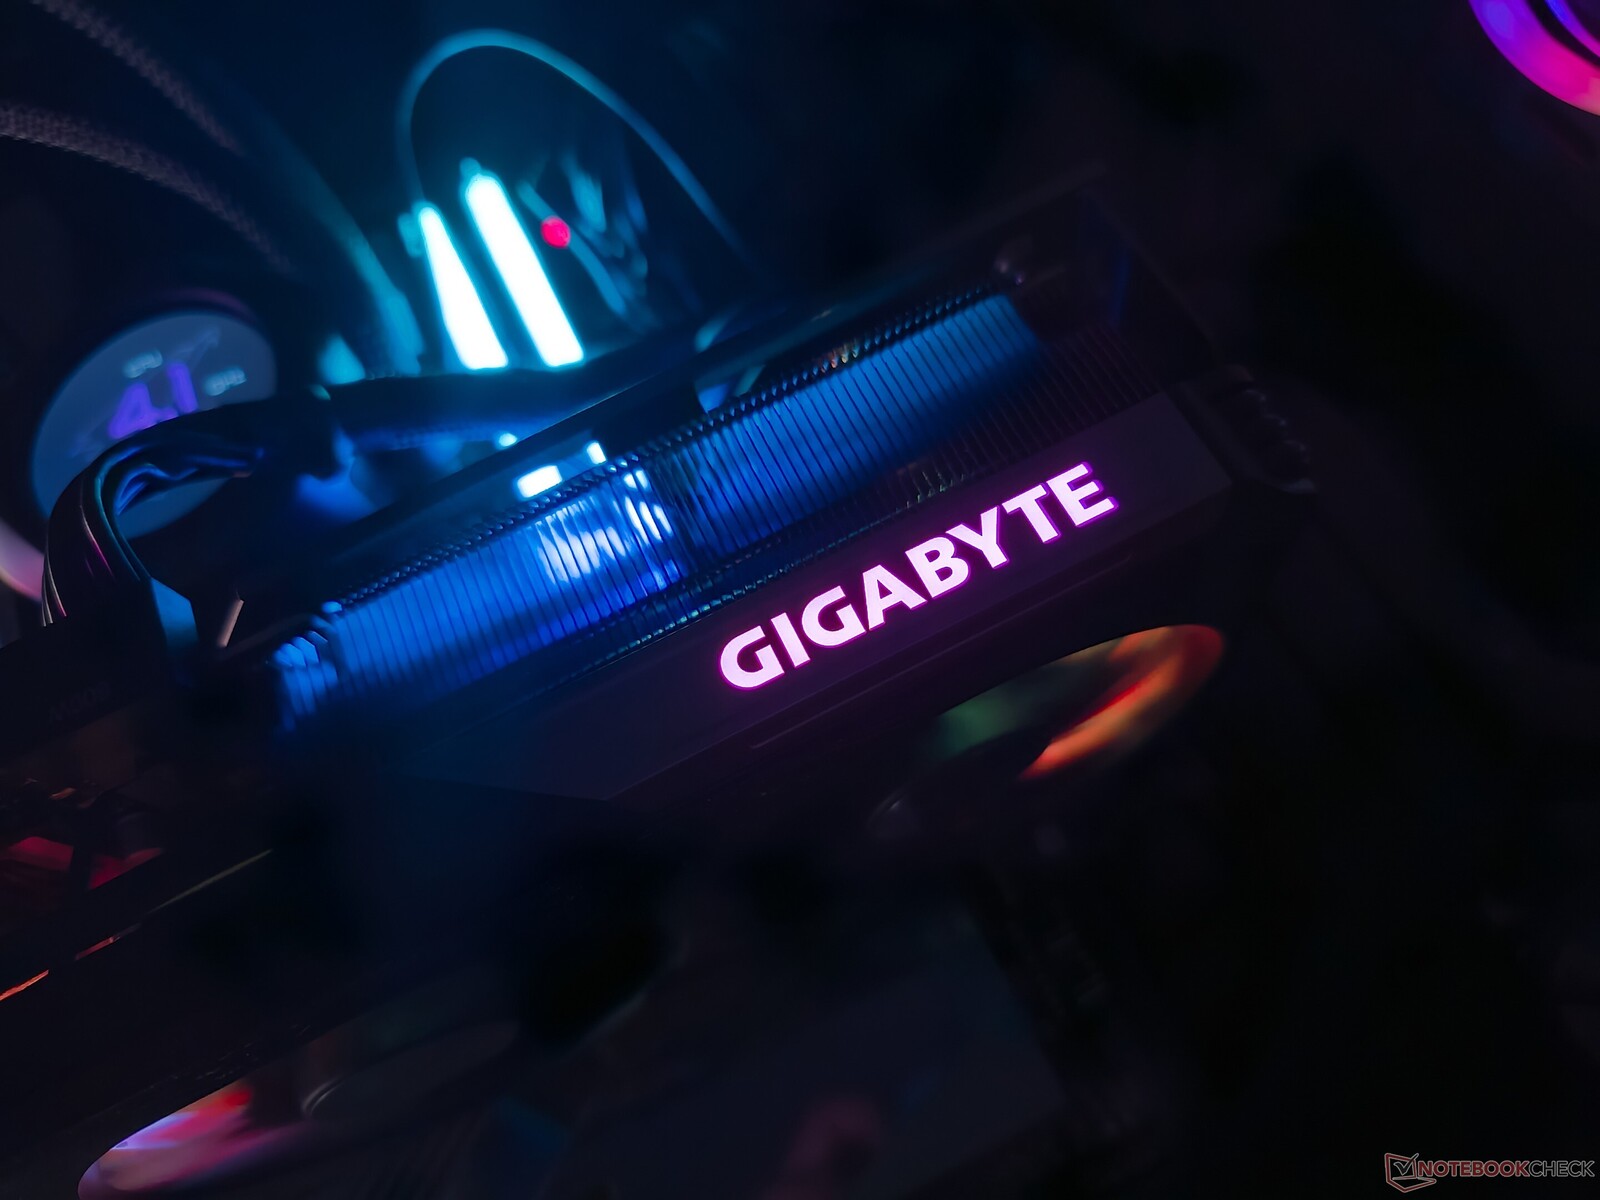
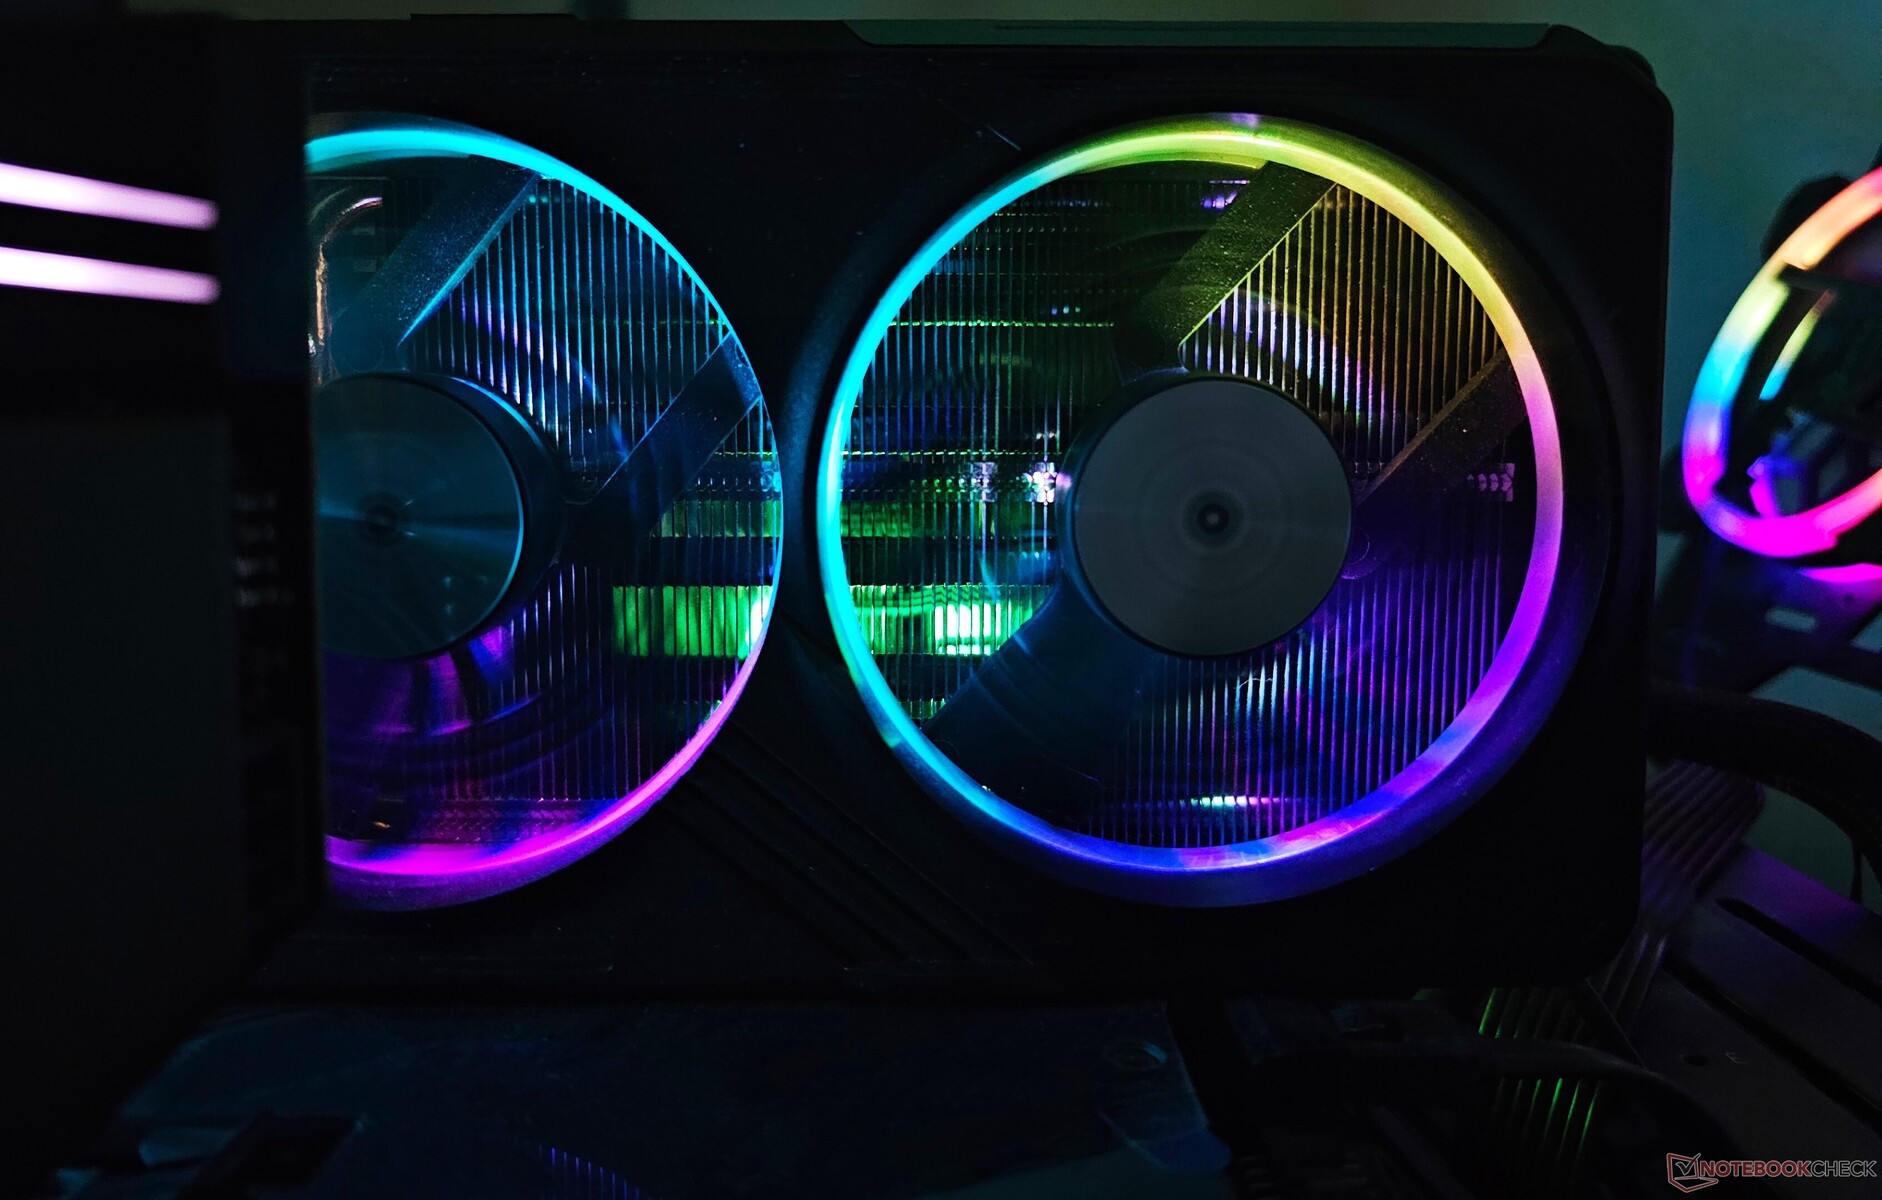
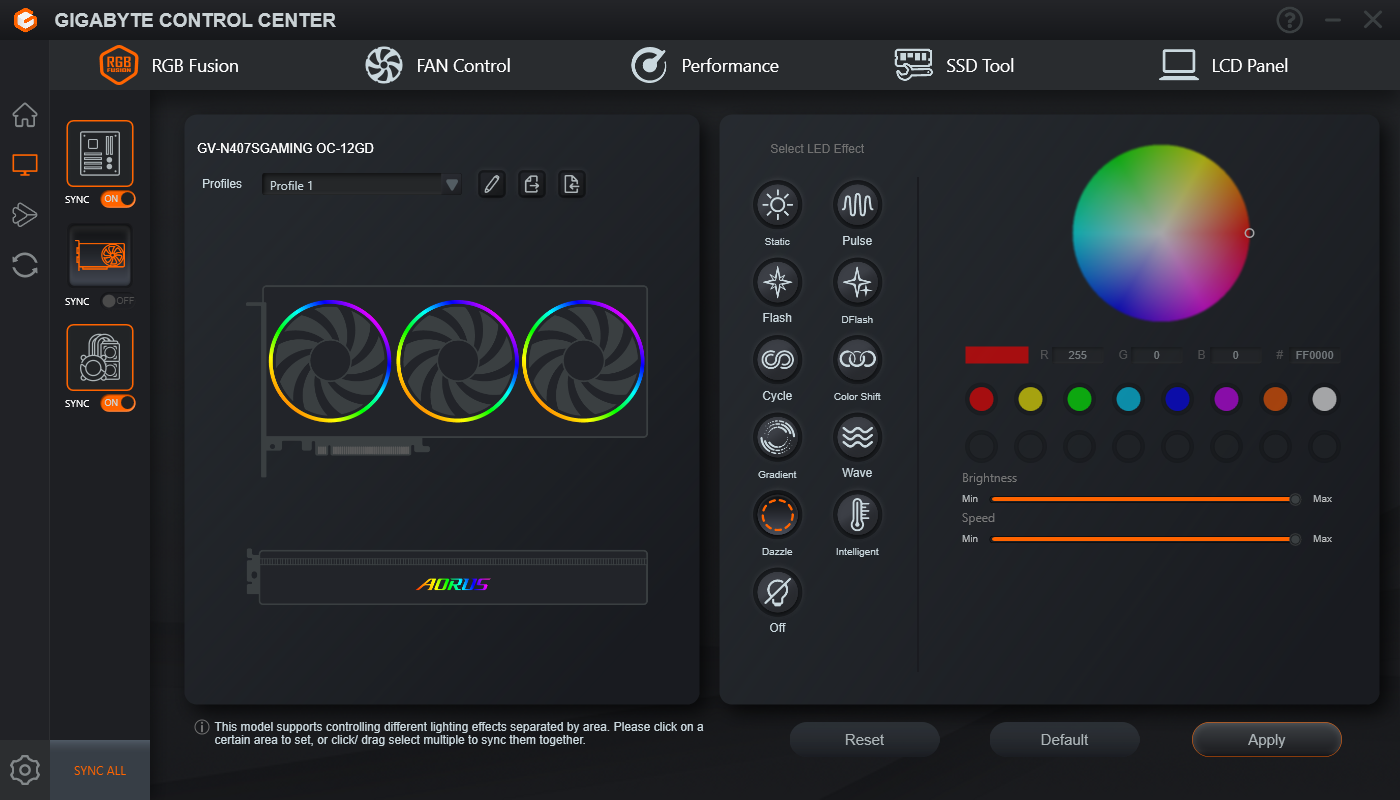
Gigabyte-Karten haben eine etwas andere RGB-Ästhetik als ihre Aorus Gegenstücke. Während Aorus GPUs, wie die RTX 4070 Ti Master, über ein unzusammenhängendes Beleuchtungssystem mit einzelnen LEDs an jeder Lüfterrippe verfügen, sind die Gigabyte-Karten mit einem konventionellen RGB-Ring ausgestattet.

Was besser aussieht, ist eine Frage der Vorliebe, aber die RGB-Implementierung bei den Aorus Karten ist auf jeden Fall auffälliger und sticht hervor.

Die RTX 4070 Super Gaming OC versucht auch, ihr Aorus Gegenstück zu imitieren, indem sie ein LCD-ähnliches Panel auf der Oberseite bietet. Dabei handelt es sich jedoch nicht um ein programmierbares LCD-Display, sondern nur um ein schickes Gigabyte Logo. Zum Glück leuchtet es mit anpassbarer Beleuchtung.

Es ist zwar verständlich, dass OEMs ihr Markenzeichen durchscheinen lassen wollen, aber die Benutzer wären eher daran interessiert, das GeForce-RTX-Logo auch in RGB zu zeigen. Leider ist das bei vielen OEM-Karten nicht der Fall.

Gigabyte-RGB-Logo auf der Oberseite
RGB-Effekte auf den Ventilatoren

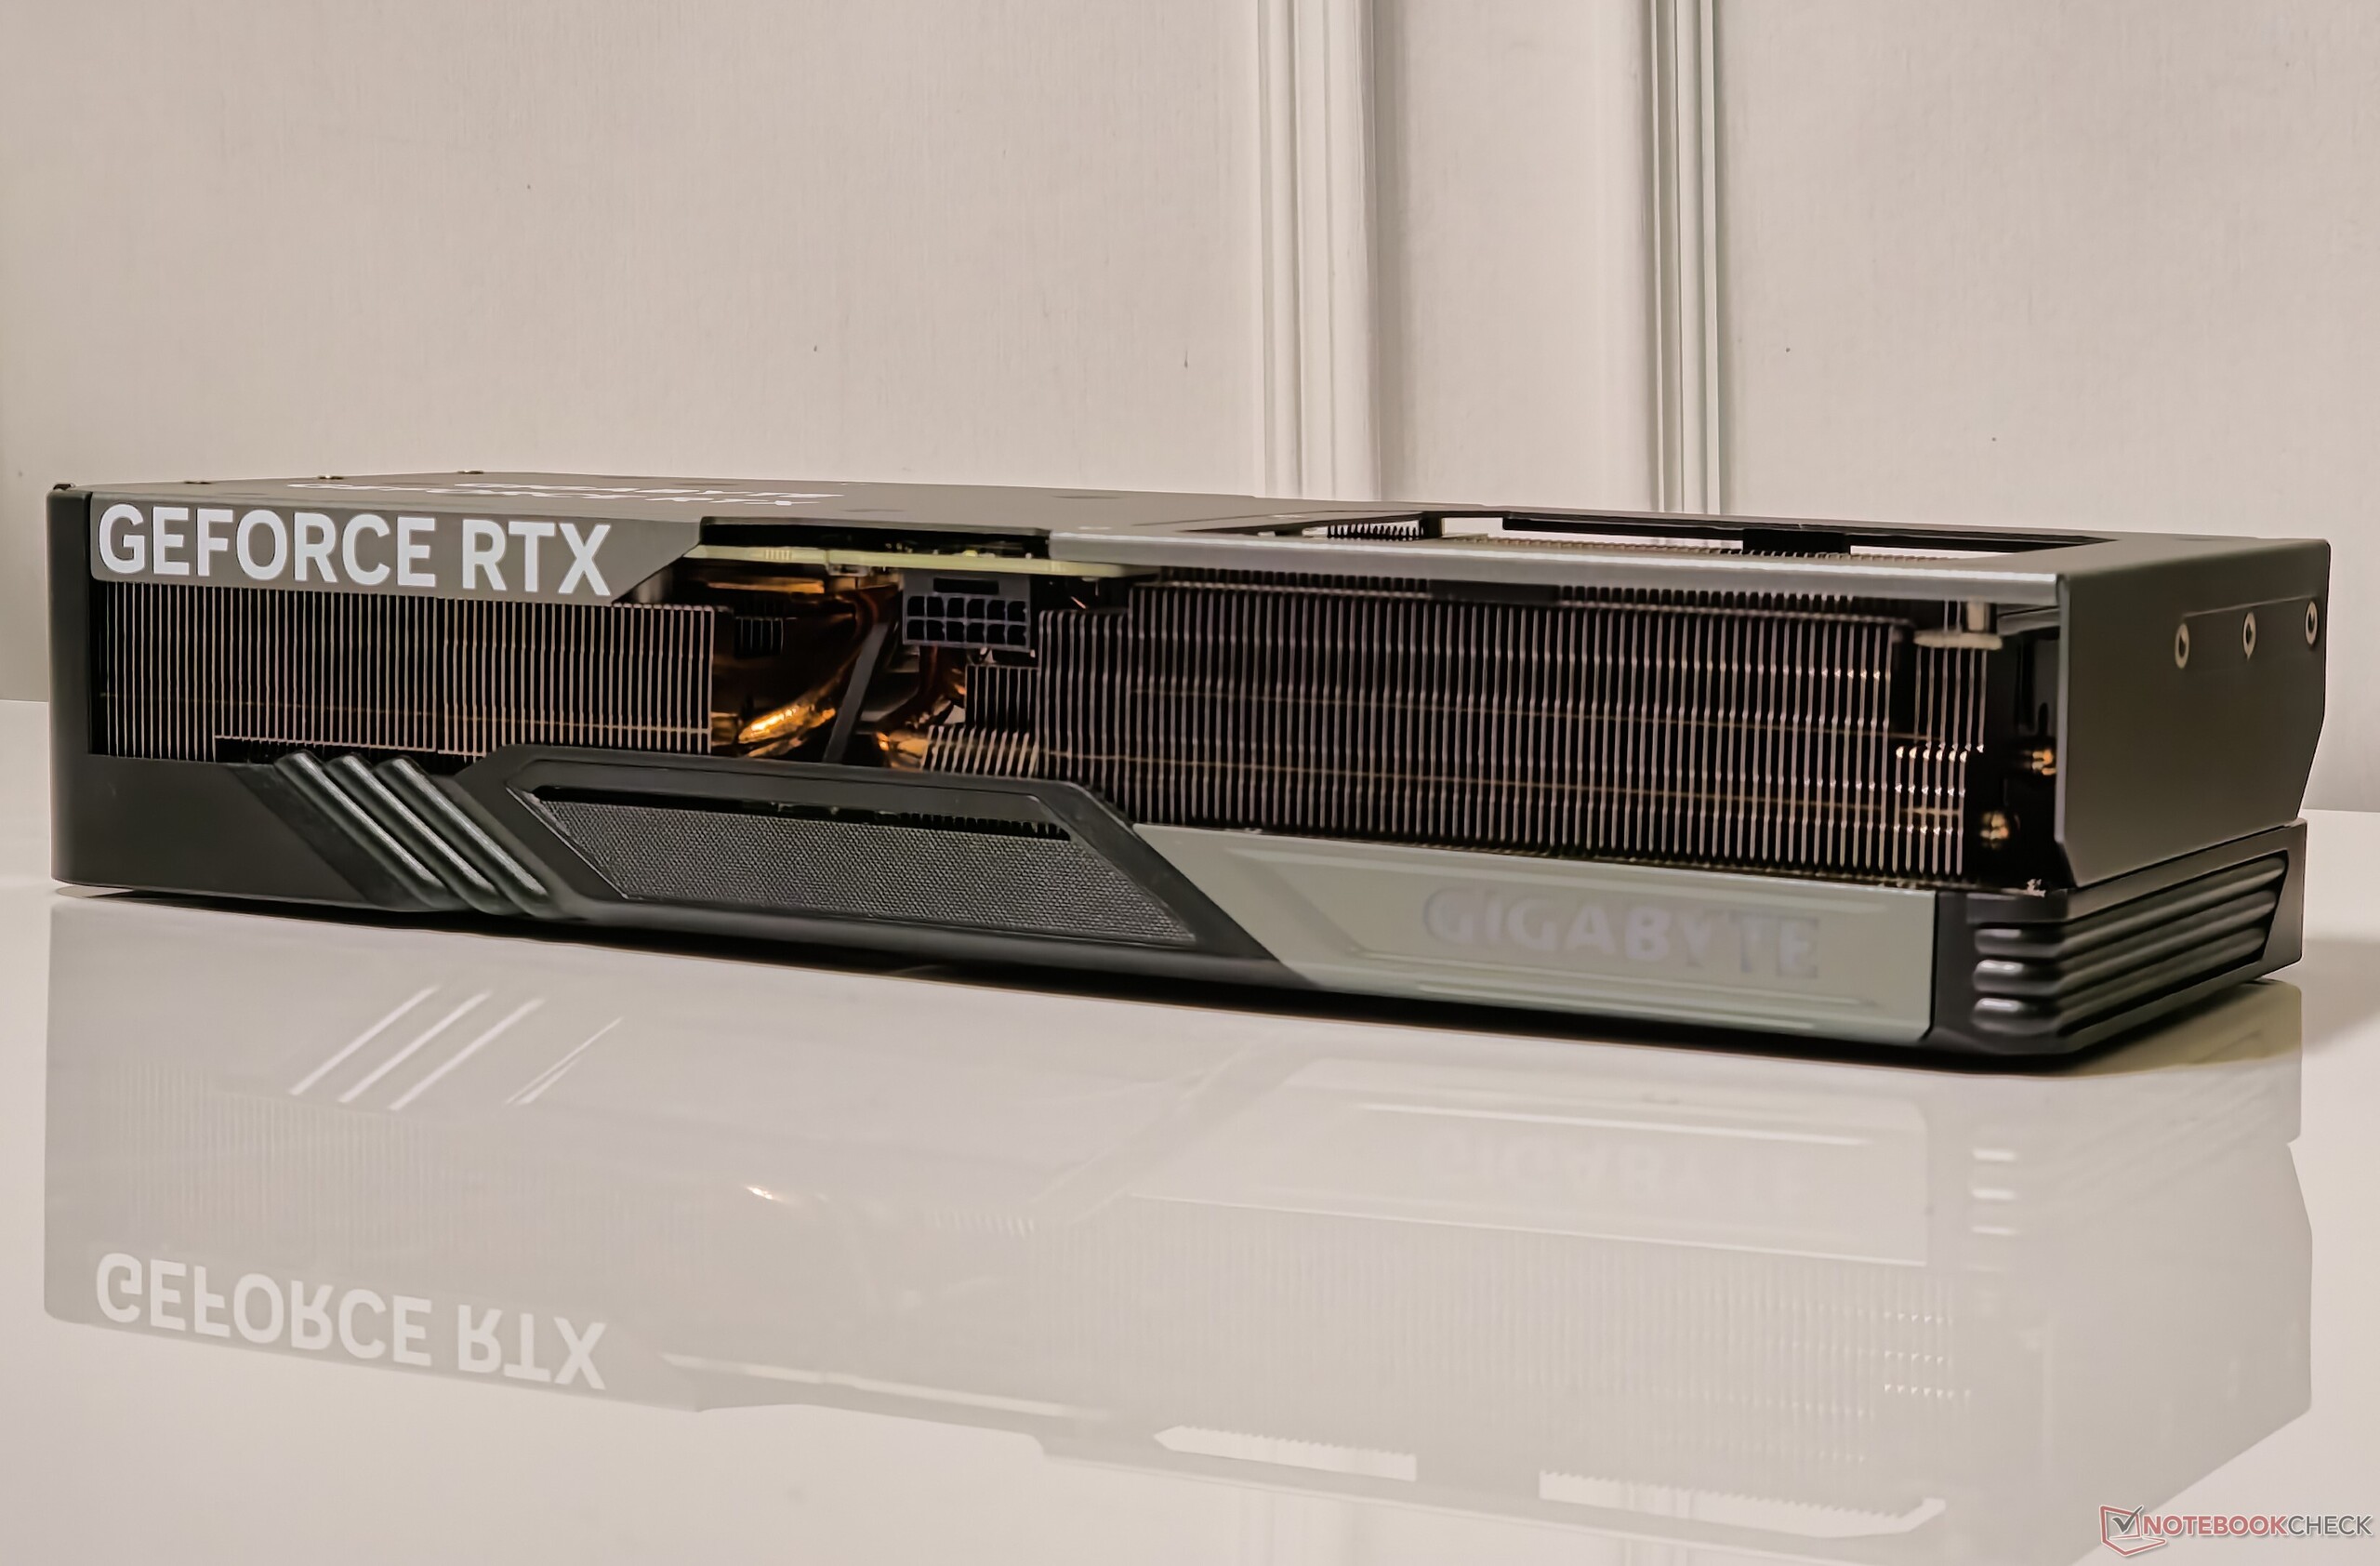
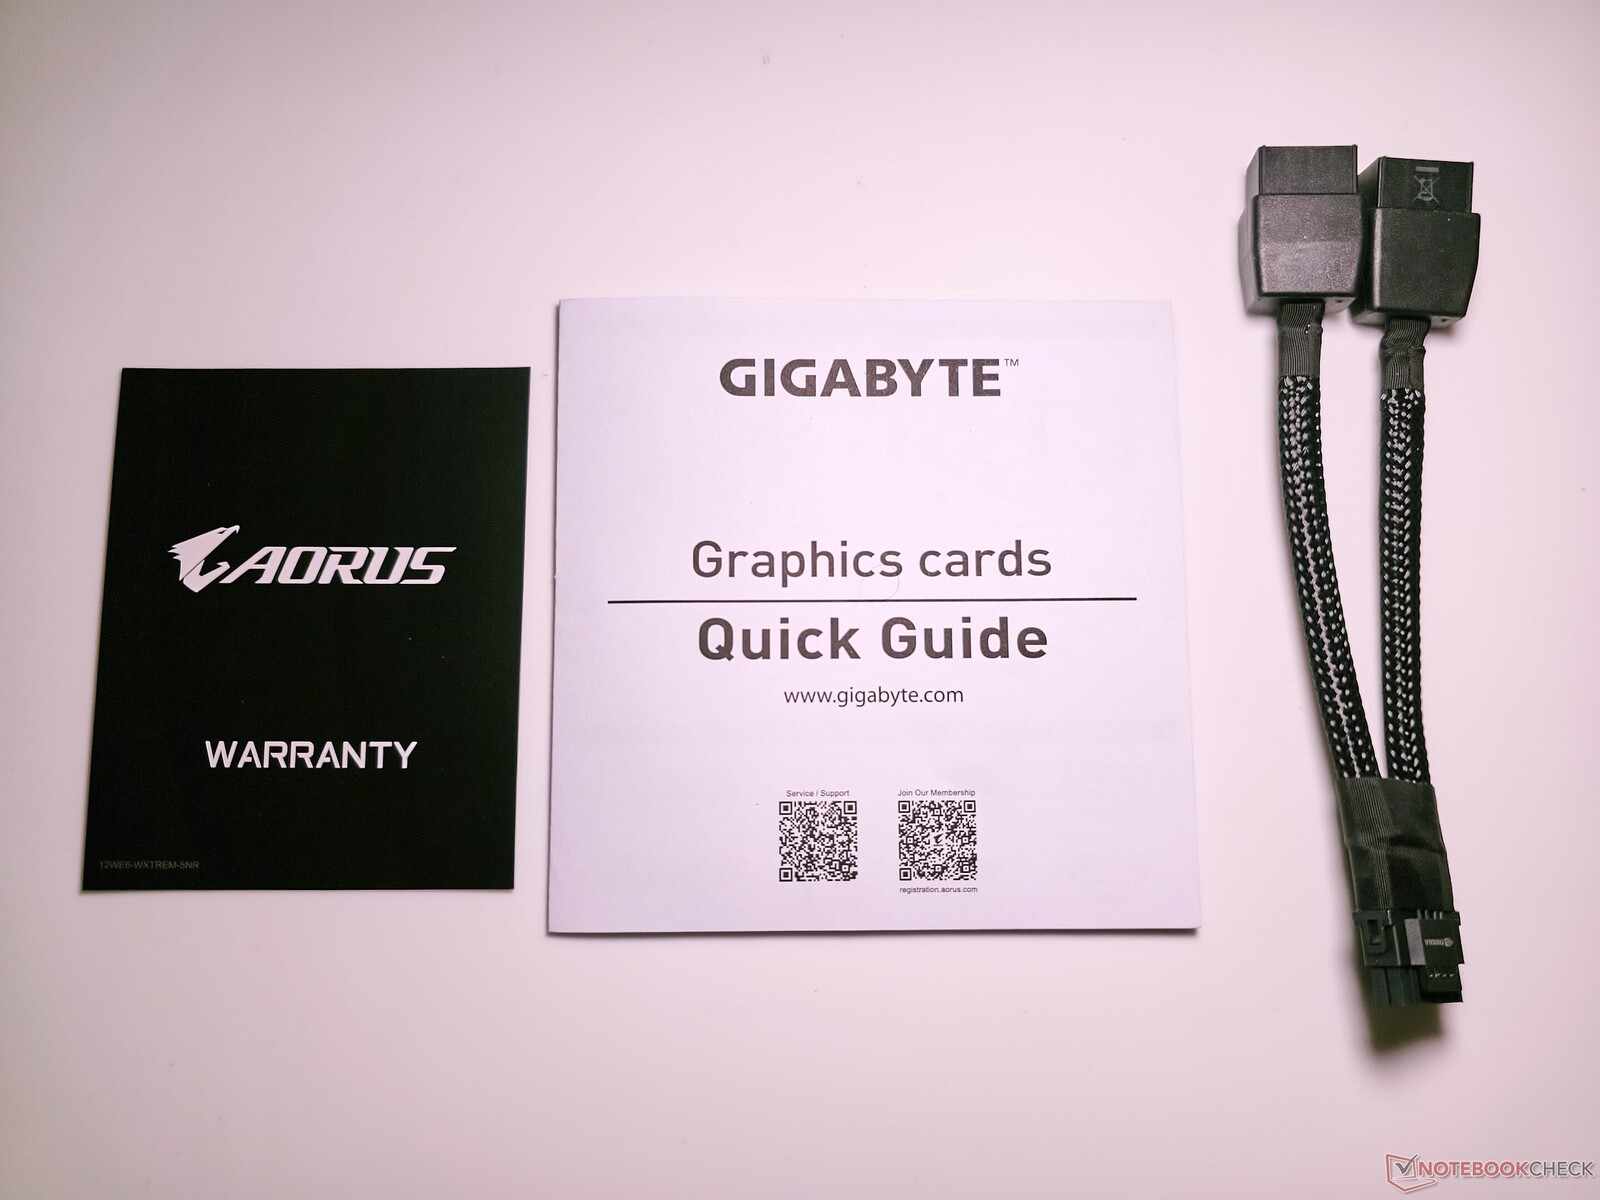
In der Verpackung finden Sie eine Garantiekarte, eine Schnellstartanleitung und einen 12VHPWR-auf-2x-8-poligen Stromanschluss.

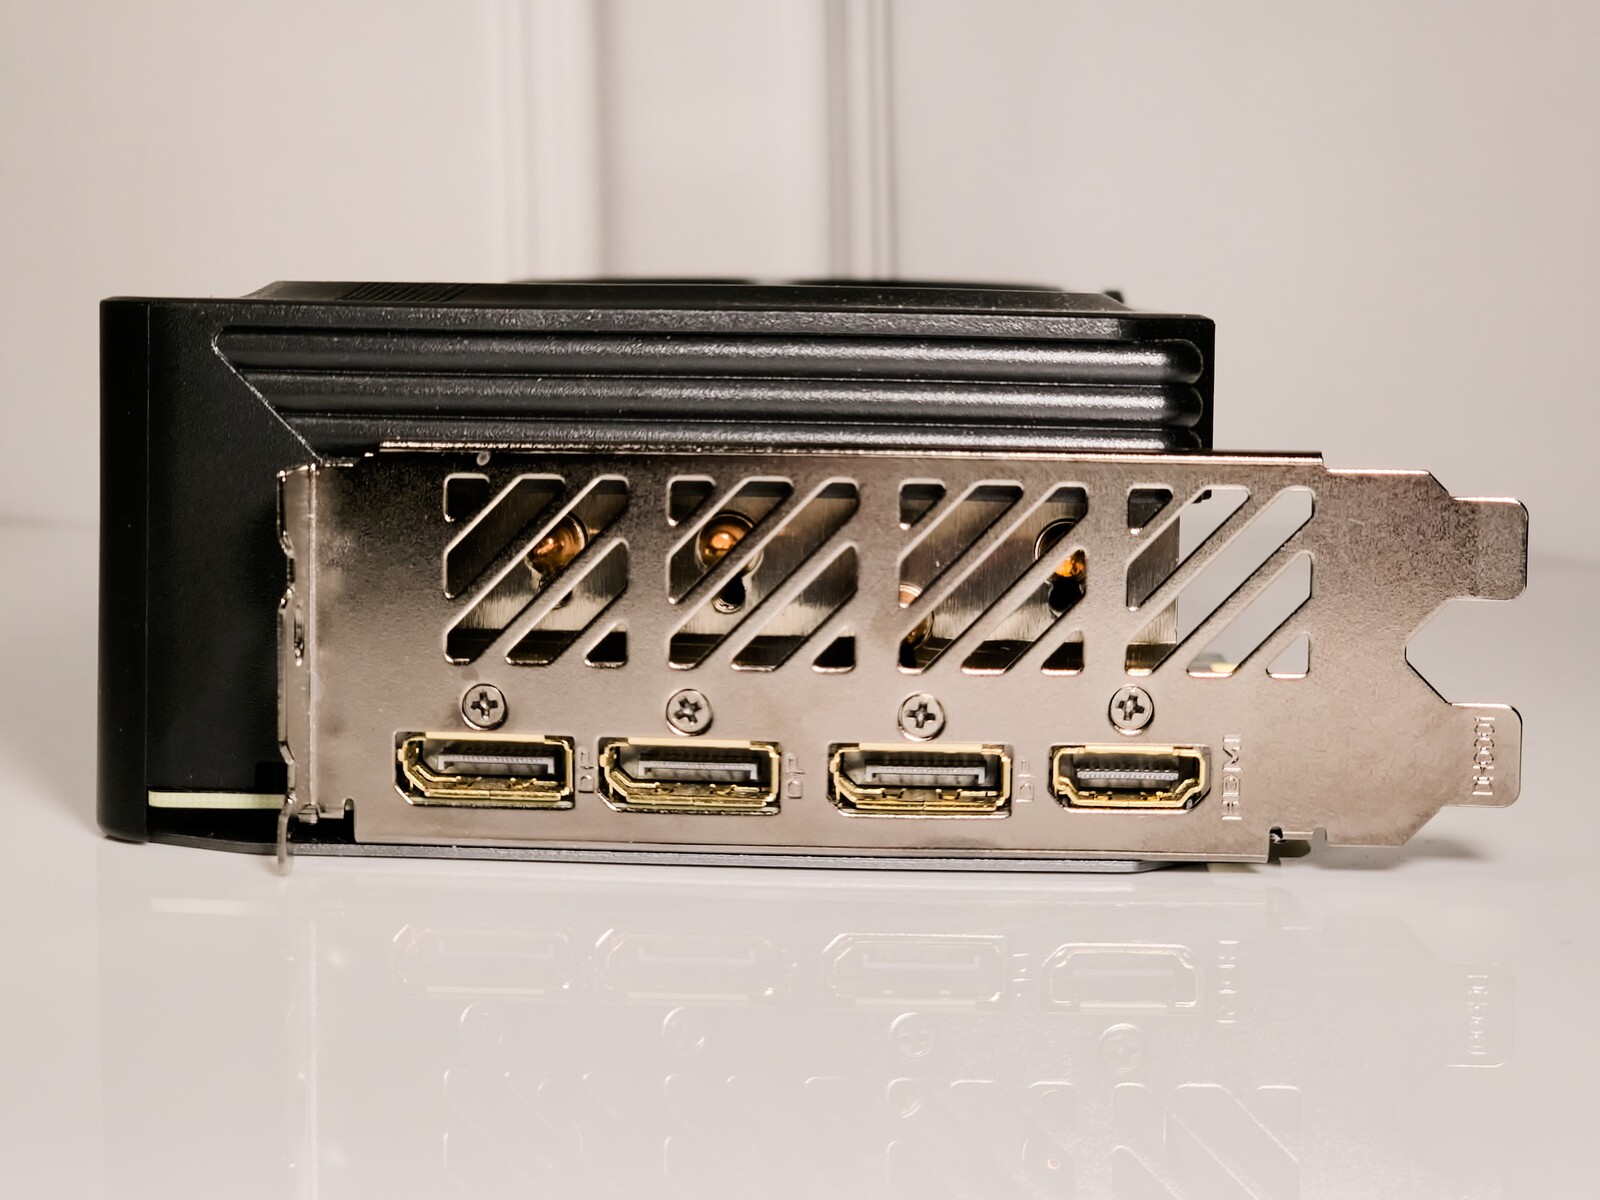
Die RTX 4070 Super Gaming OC bietet den Standardsatz an Anschlüssen einschließlich 3x DisplayPort-1.4-Ausgang und 1x HDMI-2.1-Ausgang.

Außerdem ist ein Dual-BIOS-Schalter vorhanden, mit dem Sie zwischen den BIOS-Modi OC und Silent umschalten können. Der 12VHPWR-Anschluss lässt sich mit einem zufriedenstellenden Klick an das mitgelieferte Kabel anschließen. Neben dem Anschluss befindet sich eine LED, die anzeigt, ob es ein Problem mit der Stromverbindung gibt.

12VHPWR-Anschluss
12VHPWR-Anschluss
3x DisplayPort-1.4-Ausgang, 1x HDMI-2.1a-Ausgang
Garantiekarte, Schnellstartanleitung und 12VHPWR-auf-2x-8-poliges Stromkabel

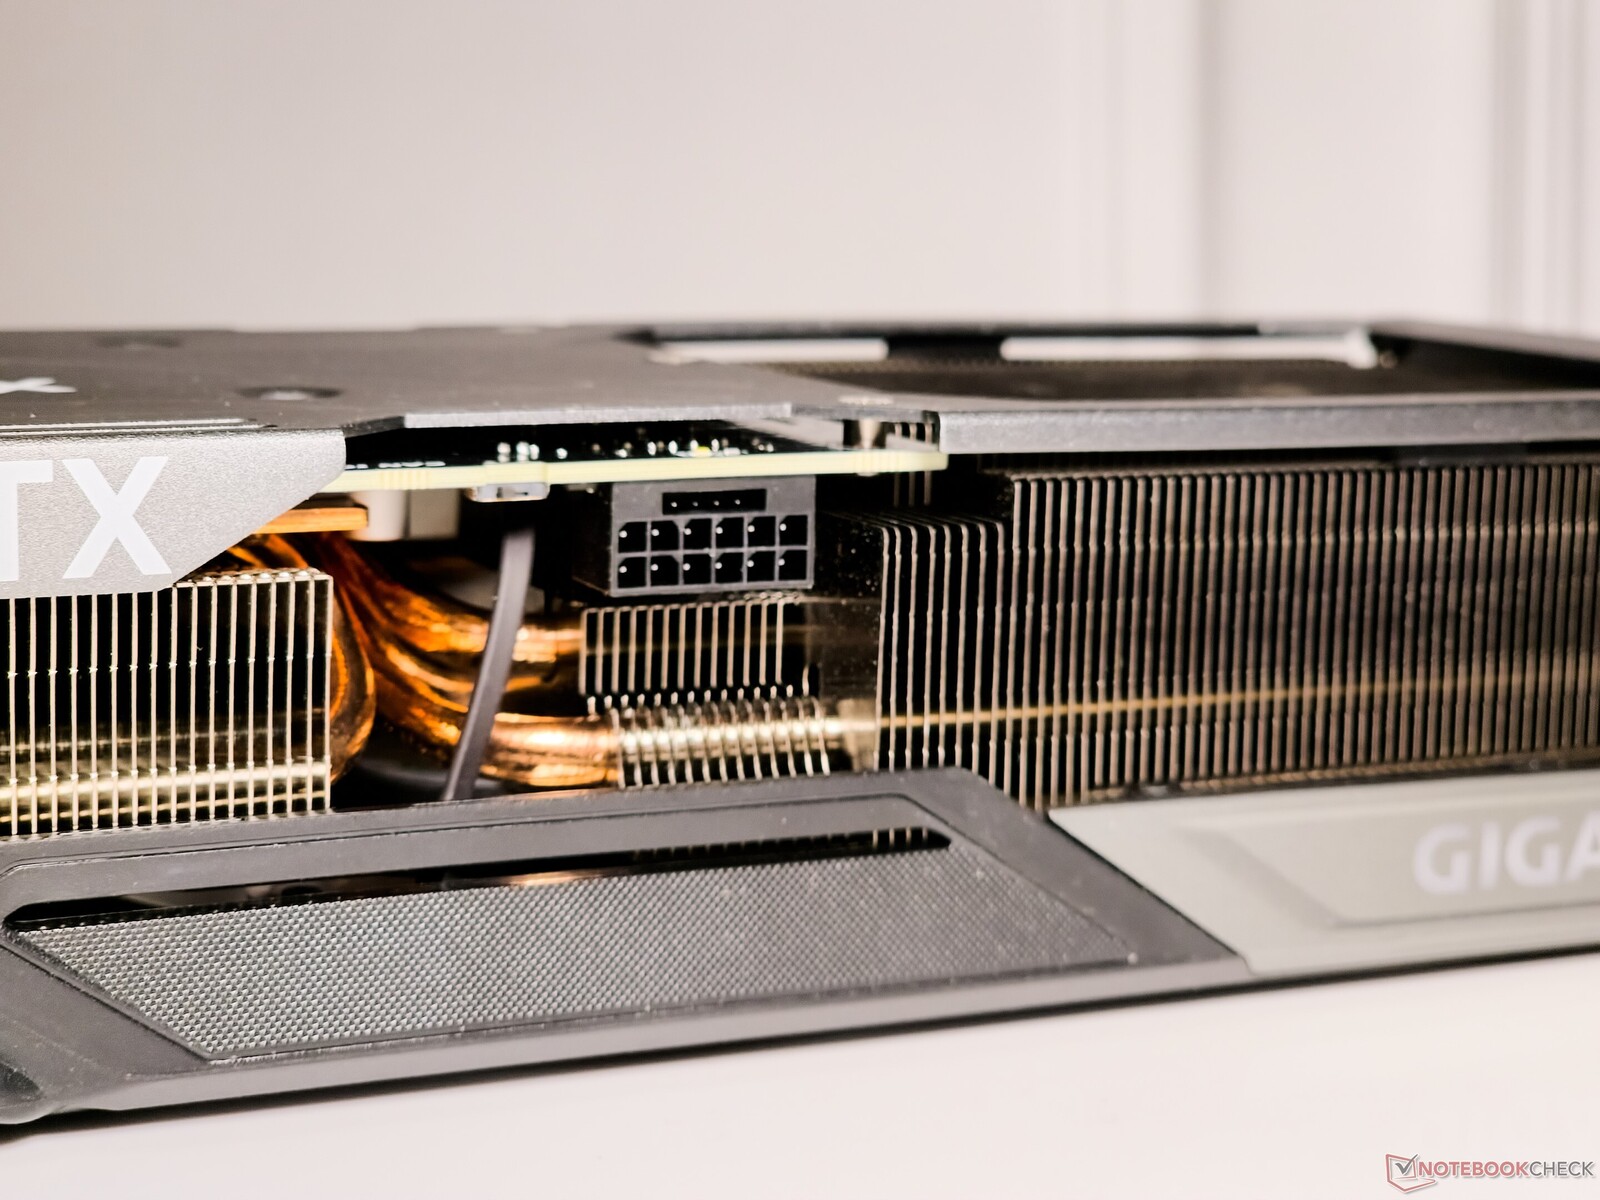
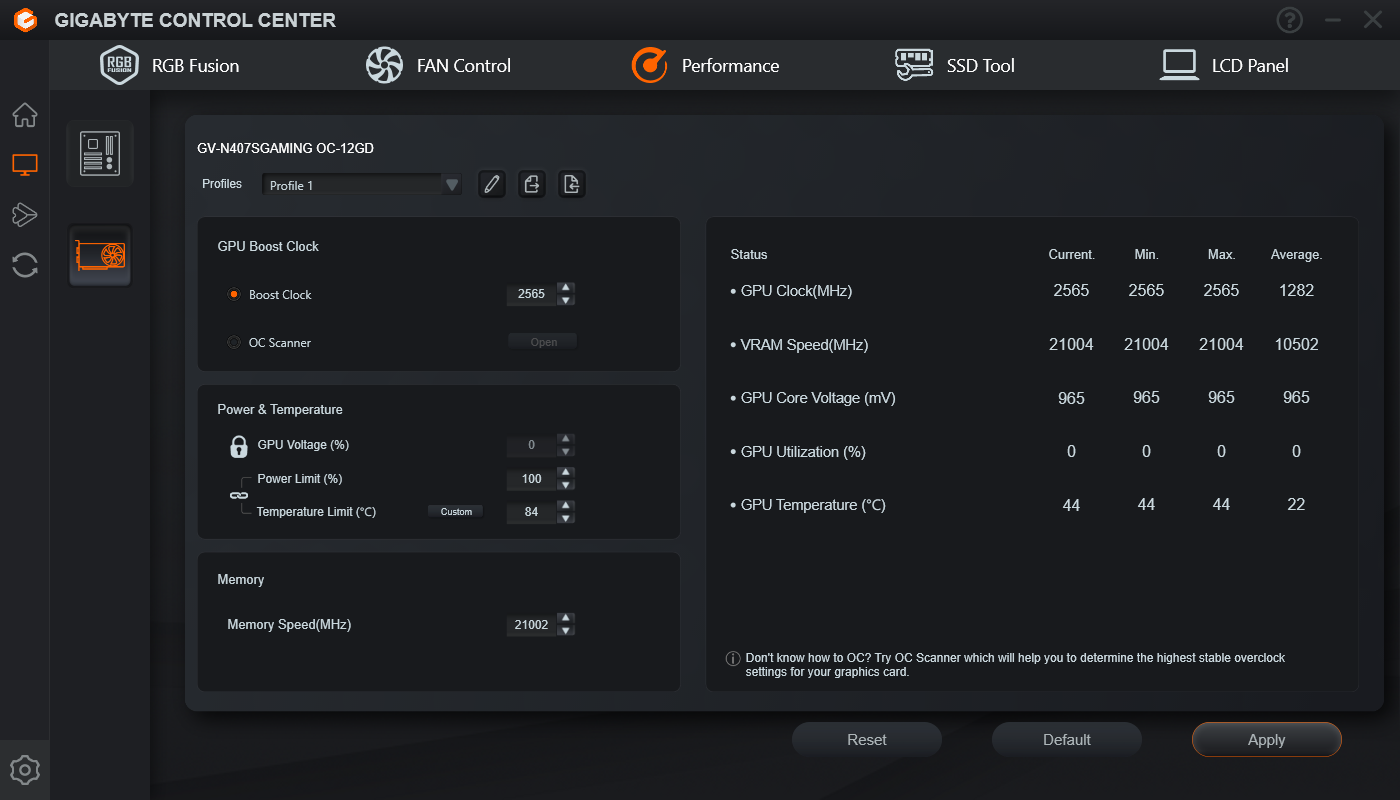
Die Gigabyte GeForce RTX 4070 Super Gaming OC 12G kann mit bis zu 2.565 MHz boosten und hat einen um 45% höheren TGP-Headroom von bis zu 320 W.

GPU-Z: Gigabyte GeForce RTX 4070 Super Gaming OC 12G

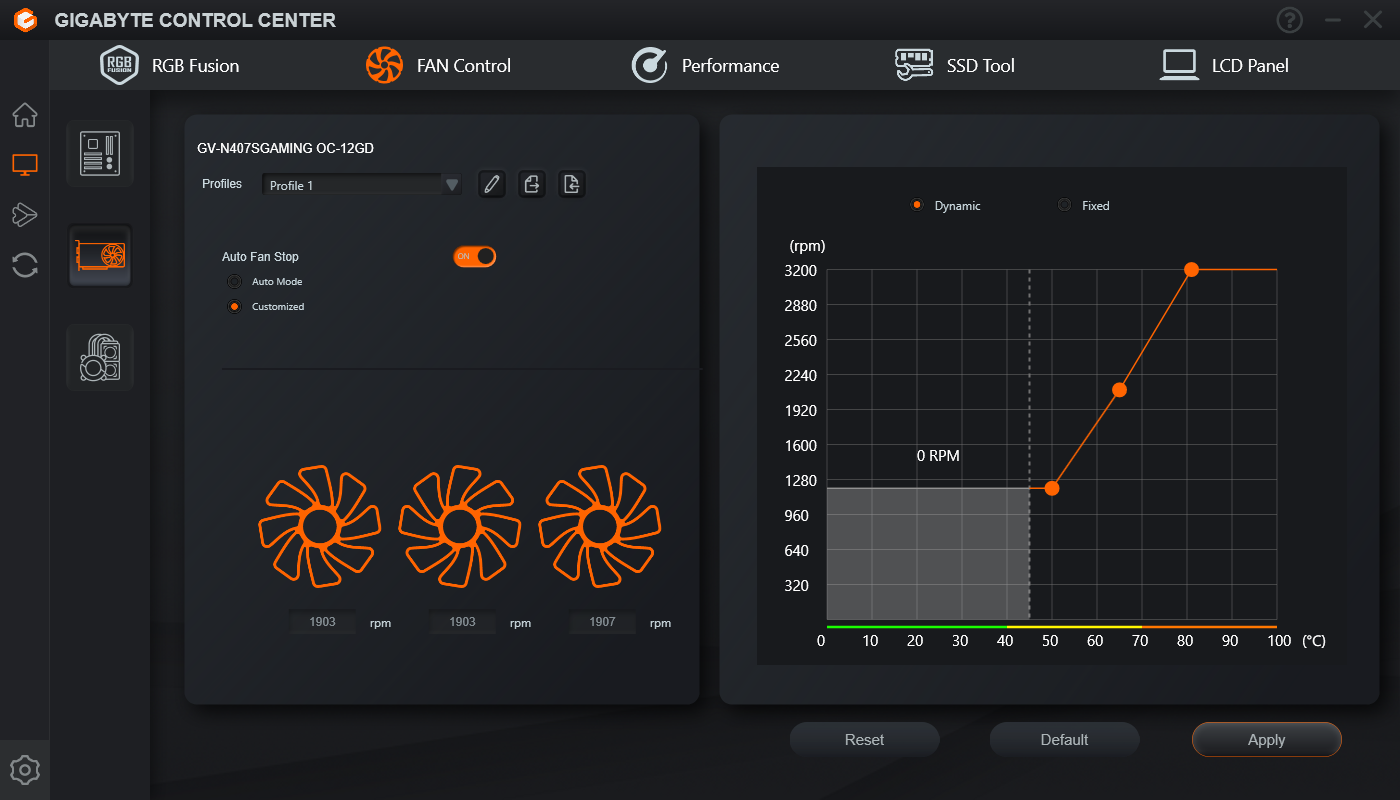
Das Gigabyte Control Center (GCC) hilft bei der Steuerung verschiedener Aspekte der RTX 4070 Super Gaming OC. Die Software hat harte Tage hinter sich, aber sie hat seit unserem Test der Aorus RTX 4070 Ti Master einen langen Weg in Sachen Stabilität zurückgelegt.

Während unseres Testzeitraumes der GPU sind wir auf keine auffälligen Bugs gestoßen. Nichtsdestotrotz muss GCC noch weiter optimiert werden, bevor man sich zu 100 % auf ihn verlassen kann.

Einstellung der Ventilatorkurve
GPU-Übertaktungseinstellungen
RGB-Steuerung
RGB-Steuerung

Der Prüfstand: RTX 4070 Super Gaming OC begrüßt den Intel Core i9-13900K

Wie bei vielen unserer GPU-Tests in letzter Zeit üblich, basiert unser Testsystem auf dem Intel Core i9-13900K und der Z790-Plattform, um sicherzustellen, dass die Karten nicht in einen CPU-Engpass geraten.

  • Cooler MasterFrame 700 Prüfstand
  • Intel Core i9-13900K mit PL1=PL2
  • Gigabyte Z790 Aorus Master Hauptplatine
  • Gigabyte Aorus Gen4 2 TB NVMe SSD
  • Sabrent Rocket 4 Plus Gen4 2 TB NVMe SSD
  • 2x 16 GB Kingston Fury Renegade DDR5-6400 RAM mit Timings 32-39-39-80 bei 1,40 V
  • Gigabyte M28U 4K 144 Hz Bildschirm
  • Gigabyte Aorus Waterforce X II 360 AiO-Kühler
  • Cooler Master MVE Gold V2 1250 ATX 3.0 vollmodulares Netzteil

Es wurde Windows 11 23H2 mit den neuesten Patches zusammen mit dem Nvidia Game Ready Driver Version 551.23 verwendet.

Basierend auf unseren eigenen Tests sind die Leistungswerte dieser Konfiguration ziemlich genau vergleichbar mit denen eines AMD Ryzen 9 7950X und einer X670E-Konfiguration.

Wir bedanken uns bei Cooler Master für die Bereitstellung des Prüfstands und des Netzteils, bei Gigabyte für das Mainboard, die CPU, die SSD, den AiO-Kühler und den Monitor, bei Sabrent für die SSD und bei Kingston für den Speicher.

Synthetische Benchmarks: Führt die RTX 4070 Super FE um Haaresbreite an

Zu Beginn schneiden die RTX 4070 Super Gaming OC und die Founders Edition ähnlich ab. Wir sehen, dass die GPU von Gigabyte in einzelnen Tests leicht vor der FE-Karte liegt, was angesichts der etwas höheren Boosts der RTX 4070 Super Gaming OC auch zu erwarten war.

Allerdings sind die Zuwächse nicht wirklich nennenswert, und das Leistungsdelta liegt sehr wohl im Bereich der Schwankungen von Lauf zu Lauf.

Nichtsdestotrotz setzt die RTX 4070 Super Gaming OC 12G ihre Dominanz gegenüber der AMD Radeon RX 7800 XT fort, indem sie in synthetischen Tests einen kumulativen Vorsprung von 9 % erzielt, während sie die Leistung der RTX 3090 erreicht.

Performance Rating
NVIDIA GeForce RTX 4090 Founders Edition
Intel Core i9-13900K, NVIDIA GeForce RTX 4090
99.8 pt
AMD Radeon RX 7900 XTX
AMD Ryzen 9 7950X, AMD Radeon RX 7900 XTX
83 pt
NVIDIA GeForce RTX 4080 Founders Edition
Intel Core i9-13900K, NVIDIA GeForce RTX 4080
81.4 pt
AMD Radeon RX 7900 XT
AMD Ryzen 9 7950X, AMD Radeon RX 7900 XT
73.4 pt
Gigabyte Aorus GeForce RTX 4070 Ti Master
Intel Core i9-13900K, NVIDIA GeForce RTX 4070 Ti
68 pt
Asus TUF Gaming GeForce RTX 4070 Ti
Intel Core i9-13900K, NVIDIA GeForce RTX 4070 Ti
67.9 pt
Durchschnittliche NVIDIA GeForce RTX 4070 Ti
 
67.2 pt
Zotac Gaming GeForce RTX 3090 Ti AMP Extreme Holo
AMD Ryzen 7 5800X3D, NVIDIA GeForce RTX 3090 Ti
66.5 pt
Sapphire AMD Radeon RX 6950 XT Nitro+ Pure
AMD Ryzen 9 5900X, AMD Radeon RX 6950 XT
62.8 pt
Gigabyte GeForce RTX 4070 Super Gaming OC 12G
Intel Core i9-13900K, NVIDIA GeForce RTX 4070 SUPER
62.7 pt
Durchschnittliche NVIDIA GeForce RTX 3080 Ti
 
62.1 pt
NVIDIA GeForce RTX 4070 Super Founders Edition
Intel Core i9-13900K, NVIDIA GeForce RTX 4070 SUPER
61.9 pt
Durchschnittliche NVIDIA GeForce RTX 3090
 
61.9 pt
AMD Radeon RX 7800 XT
AMD Ryzen 9 7950X, AMD Radeon RX 7800 XT
57.7 pt
AMD Radeon RX 6900 XT
AMD Ryzen 9 5950X, AMD Radeon RX 6900 XT
56.5 pt
Zotac Gaming GeForce RTX 4070 AMP Airo
Intel Core i9-13900K, NVIDIA GeForce RTX 4070
55 pt
AMD Radeon RX 6800 XT
AMD Ryzen 9 5950X, AMD Radeon RX 6800 XT
53.5 pt
Durchschnittliche NVIDIA GeForce RTX 3080
 
51.7 pt
Sapphire Pulse Radeon RX 7700 XT
AMD Ryzen 9 7950X, AMD Radeon RX 7700 XT
49.5 pt
Durchschnitt der Klasse Desktop
 
49.2 pt
Durchschnittliche NVIDIA Titan RTX
 
48.4 pt
Durchschnittliche NVIDIA GeForce RTX 3070
 
42.2 pt
Durchschnittliche NVIDIA GeForce RTX 4060 Ti 8G
 
41.6 pt
KFA2 GeForce RTX 4060 Ti EX, 16GB GDDR6
AMD Ryzen 9 7950X, NVIDIA GeForce RTX 4060 Ti 16G
40.1 pt
XFX Speedster QICK 308 Radeon RX 7600 Black Edition
AMD Ryzen 9 7950X, AMD Radeon RX 7600
36.4 pt
KFA2 GeForce RTX 4060 1-Click-OC 2X
AMD Ryzen 9 7950X, NVIDIA GeForce RTX 4060
35.4 pt
3DMark 11 / Performance GPU
NVIDIA GeForce RTX 4090 Founders Edition
Intel Core i9-13900K, NVIDIA GeForce RTX 4090
99834 Points +45%
NVIDIA GeForce RTX 4080 Founders Edition
Intel Core i9-13900K, NVIDIA GeForce RTX 4080
86838 Points +26%
AMD Radeon RX 7900 XTX
AMD Ryzen 9 7950X, AMD Radeon RX 7900 XTX
83322 Points +21%
AMD Radeon RX 7900 XT
AMD Ryzen 9 7950X, AMD Radeon RX 7900 XT
77784 Points +13%
Gigabyte Aorus GeForce RTX 4070 Ti Master
Intel Core i9-13900K, NVIDIA GeForce RTX 4070 Ti
76483 Points +11%
Asus TUF Gaming GeForce RTX 4070 Ti
Intel Core i9-13900K, NVIDIA GeForce RTX 4070 Ti
75990 Points +10%
Asus TUF Gaming GeForce RTX 4070 Ti
Intel Core i9-13900K, NVIDIA GeForce RTX 4070 Ti (Quiet BIOS)
75612 Points +10%
Durchschnittliche NVIDIA GeForce RTX 4070 Ti
  (74228 - 76483, n=5)
75509 Points +10%
Sapphire AMD Radeon RX 6950 XT Nitro+ Pure
AMD Ryzen 9 5900X, AMD Radeon RX 6950 XT
70480 Points +2%
Zotac Gaming GeForce RTX 3090 Ti AMP Extreme Holo
AMD Ryzen 7 5800X3D, NVIDIA GeForce RTX 3090 Ti
69481 Points +1%
Gigabyte GeForce RTX 4070 Super Gaming OC 12G
Intel Core i9-13900K, NVIDIA GeForce RTX 4070 SUPER
68894 Points
NVIDIA GeForce RTX 4070 Super Founders Edition
Intel Core i9-13900K, NVIDIA GeForce RTX 4070 SUPER
67852 Points -2%
AMD Radeon RX 7800 XT
AMD Ryzen 9 7950X, AMD Radeon RX 7800 XT
63292 Points -8%
Durchschnittliche NVIDIA GeForce RTX 3080 Ti
  (59799 - 62189, n=4)
60987 Points -11%
Durchschnittliche NVIDIA GeForce RTX 3090
  (55144 - 66934, n=17)
60853 Points -12%
Zotac Gaming GeForce RTX 4070 AMP Airo
Intel Core i9-13900K, NVIDIA GeForce RTX 4070
59510 Points -14%
AMD Radeon RX 6900 XT
AMD Ryzen 9 5950X, AMD Radeon RX 6900 XT
59119 Points -14%
Sapphire Pulse Radeon RX 7700 XT
AMD Ryzen 9 7950X, AMD Radeon RX 7700 XT
57340 Points -17%
Durchschnittliche NVIDIA GeForce RTX 3080
  (47287 - 57662, n=4)
53094 Points -23%
AMD Radeon RX 6800 XT
AMD Ryzen 9 5950X, AMD Radeon RX 6800 XT
52046 Points -24%
Durchschnitt der Klasse Desktop
  (650 - 104464, n=36, der letzten 2 Jahre)
49254 Points -29%
Durchschnittliche NVIDIA Titan RTX
  (43461 - 51863, n=30)
49062 Points -29%
Durchschnittliche NVIDIA GeForce RTX 4060 Ti 8G
  (47481 - 48363, n=3)
47882 Points -30%
XFX Speedster QICK 308 Radeon RX 7600 Black Edition
AMD Ryzen 9 7950X, AMD Radeon RX 7600
43430 Points -37%
KFA2 GeForce RTX 4060 Ti EX, 16GB GDDR6
AMD Ryzen 9 7950X, NVIDIA GeForce RTX 4060 Ti 16G
43112 Points -37%
Durchschnittliche NVIDIA GeForce RTX 3070
  (26812 - 46878, n=9)
40835 Points -41%
KFA2 GeForce RTX 4060 1-Click-OC 2X
AMD Ryzen 9 7950X, NVIDIA GeForce RTX 4060
38191 Points -45%
3DMark / Fire Strike Graphics
AMD Radeon RX 7900 XTX
AMD Ryzen 9 7950X, AMD Radeon RX 7900 XTX
66967 Points +35%
NVIDIA GeForce RTX 4090 Founders Edition
Intel Core i9-13900K, NVIDIA GeForce RTX 4090
65879 Points +33%
AMD Radeon RX 7900 XT
AMD Ryzen 9 7950X, AMD Radeon RX 7900 XT
63712 Points +28%
Sapphire AMD Radeon RX 6950 XT Nitro+ Pure
AMD Ryzen 9 5900X, AMD Radeon RX 6950 XT
60092 Points +21%
NVIDIA GeForce RTX 4080 Founders Edition
Intel Core i9-13900K, NVIDIA GeForce RTX 4080
58893 Points +18%
Asus TUF Gaming GeForce RTX 4070 Ti
Intel Core i9-13900K, NVIDIA GeForce RTX 4070 Ti
53729 Points +8%
Asus TUF Gaming GeForce RTX 4070 Ti
Intel Core i9-13900K, NVIDIA GeForce RTX 4070 Ti (Quiet BIOS)
52903 Points +6%
Durchschnittliche NVIDIA GeForce RTX 4070 Ti
  (52769 - 53736, n=5)
53299 Points +7%
Zotac Gaming GeForce RTX 3090 Ti AMP Extreme Holo
AMD Ryzen 7 5800X3D, NVIDIA GeForce RTX 3090 Ti
53110 Points +7%
Gigabyte Aorus GeForce RTX 4070 Ti Master
Intel Core i9-13900K, NVIDIA GeForce RTX 4070 Ti
52769 Points +6%
AMD Radeon RX 6900 XT
AMD Ryzen 9 5950X, AMD Radeon RX 6900 XT
50587 Points +2%
AMD Radeon RX 7800 XT
AMD Ryzen 9 7950X, AMD Radeon RX 7800 XT
50181 Points +1%
AMD Radeon RX 6800 XT
AMD Ryzen 9 5950X, AMD Radeon RX 6800 XT
49735 Points 0%
Gigabyte GeForce RTX 4070 Super Gaming OC 12G
Intel Core i9-13900K, NVIDIA GeForce RTX 4070 SUPER
49709 Points
NVIDIA GeForce RTX 4070 Super Founders Edition
Intel Core i9-13900K, NVIDIA GeForce RTX 4070 SUPER
48043 Points -3%
Durchschnittliche NVIDIA GeForce RTX 3080 Ti
  (45785 - 48709, n=4)
47180 Points -5%
Durchschnittliche NVIDIA GeForce RTX 3090
  (41298 - 49282, n=17)
46856 Points -6%
Zotac Gaming GeForce RTX 4070 AMP Airo
Intel Core i9-13900K, NVIDIA GeForce RTX 4070
43583 Points -12%
Sapphire Pulse Radeon RX 7700 XT
AMD Ryzen 9 7950X, AMD Radeon RX 7700 XT
42801 Points -14%
Durchschnittliche NVIDIA GeForce RTX 3080
  (37604 - 40910, n=2)
39257 Points -21%
Durchschnittliche NVIDIA Titan RTX
  (33377 - 40910, n=30)
36062 Points -27%
Durchschnittliche NVIDIA GeForce RTX 4060 Ti 8G
  (33762 - 34547, n=3)
34185 Points -31%
XFX Speedster QICK 308 Radeon RX 7600 Black Edition
AMD Ryzen 9 7950X, AMD Radeon RX 7600
32404 Points -35%
KFA2 GeForce RTX 4060 Ti EX, 16GB GDDR6
AMD Ryzen 9 7950X, NVIDIA GeForce RTX 4060 Ti 16G
32275 Points -35%
Durchschnitt der Klasse Desktop
  (523 - 70246, n=34, der letzten 2 Jahre)
31665 Points -36%
Durchschnittliche NVIDIA GeForce RTX 3070
  (20357 - 33270, n=7)
28949 Points -42%
KFA2 GeForce RTX 4060 1-Click-OC 2X
AMD Ryzen 9 7950X, NVIDIA GeForce RTX 4060
28111 Points -43%
3DMark / Fire Strike Ultra Graphics
NVIDIA GeForce RTX 4090 Founders Edition
Intel Core i9-13900K, NVIDIA GeForce RTX 4090
24276 Points +96%
AMD Radeon RX 7900 XTX
AMD Ryzen 9 7950X, AMD Radeon RX 7900 XTX
20214 Points +63%
NVIDIA GeForce RTX 4080 Founders Edition
Intel Core i9-13900K, NVIDIA GeForce RTX 4080
17122 Points +38%
AMD Radeon RX 7900 XT
AMD Ryzen 9 7950X, AMD Radeon RX 7900 XT
17078 Points +38%
Sapphire AMD Radeon RX 6950 XT Nitro+ Pure
AMD Ryzen 9 5900X, AMD Radeon RX 6950 XT
14978 Points +21%
Zotac Gaming GeForce RTX 3090 Ti AMP Extreme Holo
AMD Ryzen 7 5800X3D, NVIDIA GeForce RTX 3090 Ti
14026 Points +13%
Gigabyte Aorus GeForce RTX 4070 Ti Master
Intel Core i9-13900K, NVIDIA GeForce RTX 4070 Ti
13616 Points +10%
Asus TUF Gaming GeForce RTX 4070 Ti
Intel Core i9-13900K, NVIDIA GeForce RTX 4070 Ti
13546 Points +9%
Asus TUF Gaming GeForce RTX 4070 Ti
Intel Core i9-13900K, NVIDIA GeForce RTX 4070 Ti (Quiet BIOS)
13487 Points +9%
Durchschnittliche NVIDIA GeForce RTX 4070 Ti
  (13112 - 13616, n=5)
13390 Points +8%
AMD Radeon RX 6900 XT
AMD Ryzen 9 5950X, AMD Radeon RX 6900 XT
13370 Points +8%
AMD Radeon RX 6800 XT
AMD Ryzen 9 5950X, AMD Radeon RX 6800 XT
12626 Points +2%
AMD Radeon RX 7800 XT
AMD Ryzen 9 7950X, AMD Radeon RX 7800 XT
12529 Points +1%
Gigabyte GeForce RTX 4070 Super Gaming OC 12G
Intel Core i9-13900K, NVIDIA GeForce RTX 4070 SUPER
12389 Points
Durchschnittliche NVIDIA GeForce RTX 3090
  (11613 - 12587, n=14)
12289 Points -1%
Durchschnittliche NVIDIA GeForce RTX 3080 Ti
  (12050 - 12341, n=4)
12173 Points -2%
NVIDIA GeForce RTX 4070 Super Founders Edition
Intel Core i9-13900K, NVIDIA GeForce RTX 4070 SUPER
12086 Points -2%
Durchschnittliche NVIDIA GeForce RTX 3080
  (10645 - 10793, n=2)
10719 Points -13%
Sapphire Pulse Radeon RX 7700 XT
AMD Ryzen 9 7950X, AMD Radeon RX 7700 XT
10596 Points -14%
Durchschnitt der Klasse Desktop
  (141 - 24650, n=24, der letzten 2 Jahre)
10444 Points -16%
Zotac Gaming GeForce RTX 4070 AMP Airo
Intel Core i9-13900K, NVIDIA GeForce RTX 4070
10103 Points -18%
Durchschnittliche NVIDIA Titan RTX
  (8461 - 10793, n=29)
8868 Points -28%
Durchschnittliche NVIDIA GeForce RTX 3070
  (8043 - 8483, n=5)
8250 Points -33%
XFX Speedster QICK 308 Radeon RX 7600 Black Edition
AMD Ryzen 9 7950X, AMD Radeon RX 7600
7305 Points -41%
Durchschnittliche NVIDIA GeForce RTX 4060 Ti 8G
  (7152 - 7298, n=3)
7223 Points -42%
KFA2 GeForce RTX 4060 Ti EX, 16GB GDDR6
AMD Ryzen 9 7950X, NVIDIA GeForce RTX 4060 Ti 16G
7058 Points -43%
KFA2 GeForce RTX 4060 1-Click-OC 2X
AMD Ryzen 9 7950X, NVIDIA GeForce RTX 4060
5668 Points -54%
3DMark / Fire Strike Extreme Graphics
NVIDIA GeForce RTX 4090 Founders Edition
Intel Core i9-13900K, NVIDIA GeForce RTX 4090
44295 Points +78%
AMD Radeon RX 7900 XTX
AMD Ryzen 9 7950X, AMD Radeon RX 7900 XTX
39570 Points +59%
AMD Radeon RX 7900 XT
AMD Ryzen 9 7950X, AMD Radeon RX 7900 XT
33747 Points +36%
NVIDIA GeForce RTX 4080 Founders Edition
Intel Core i9-13900K, NVIDIA GeForce RTX 4080
33475 Points +35%
Sapphire AMD Radeon RX 6950 XT Nitro+ Pure
AMD Ryzen 9 5900X, AMD Radeon RX 6950 XT
29704 Points +19%
Gigabyte Aorus GeForce RTX 4070 Ti Master
Intel Core i9-13900K, NVIDIA GeForce RTX 4070 Ti
27167 Points +9%
Asus TUF Gaming GeForce RTX 4070 Ti
Intel Core i9-13900K, NVIDIA GeForce RTX 4070 Ti
26970 Points +8%
Asus TUF Gaming GeForce RTX 4070 Ti
Intel Core i9-13900K, NVIDIA GeForce RTX 4070 Ti (Quiet BIOS)
26925 Points +8%
Durchschnittliche NVIDIA GeForce RTX 4070 Ti
  (26470 - 27167, n=5)
26845 Points +8%
Zotac Gaming GeForce RTX 3090 Ti AMP Extreme Holo
AMD Ryzen 7 5800X3D, NVIDIA GeForce RTX 3090 Ti
26797 Points +8%
AMD Radeon RX 6900 XT
AMD Ryzen 9 5950X, AMD Radeon RX 6900 XT
26650 Points +7%
AMD Radeon RX 7800 XT
AMD Ryzen 9 7950X, AMD Radeon RX 7800 XT
25279 Points +2%
AMD Radeon RX 6800 XT
AMD Ryzen 9 5950X, AMD Radeon RX 6800 XT
25015 Points +1%
Gigabyte GeForce RTX 4070 Super Gaming OC 12G
Intel Core i9-13900K, NVIDIA GeForce RTX 4070 SUPER
24874 Points
NVIDIA GeForce RTX 4070 Super Founders Edition
Intel Core i9-13900K, NVIDIA GeForce RTX 4070 SUPER
24154 Points -3%
Durchschnittliche NVIDIA GeForce RTX 3090
  (22075 - 24730, n=14)
23806 Points -4%
Durchschnittliche NVIDIA GeForce RTX 3080 Ti
  (23127 - 24250, n=4)
23668 Points -5%
Zotac Gaming GeForce RTX 4070 AMP Airo
Intel Core i9-13900K, NVIDIA GeForce RTX 4070
21053 Points -15%
Sapphire Pulse Radeon RX 7700 XT
AMD Ryzen 9 7950X, AMD Radeon RX 7700 XT
21006 Points -16%
Durchschnittliche NVIDIA GeForce RTX 3080
  (20007 - 20861, n=2)
20434 Points -18%
Durchschnitt der Klasse Desktop
  (1053 - 44549, n=24, der letzten 2 Jahre)
20318 Points -18%
Durchschnittliche NVIDIA Titan RTX
  (16484 - 20861, n=29)
17649 Points -29%
Durchschnittliche NVIDIA GeForce RTX 4060 Ti 8G
  (15846 - 16250, n=3)
16051 Points -35%
Durchschnittliche NVIDIA GeForce RTX 3070
  (15503 - 16276, n=5)
15859 Points -36%
KFA2 GeForce RTX 4060 Ti EX, 16GB GDDR6
AMD Ryzen 9 7950X, NVIDIA GeForce RTX 4060 Ti 16G
15511 Points -38%
XFX Speedster QICK 308 Radeon RX 7600 Black Edition
AMD Ryzen 9 7950X, AMD Radeon RX 7600
14966 Points -40%
KFA2 GeForce RTX 4060 1-Click-OC 2X
AMD Ryzen 9 7950X, NVIDIA GeForce RTX 4060
13086 Points -47%
3DMark / Time Spy Graphics
NVIDIA GeForce RTX 4090 Founders Edition
Intel Core i9-13900K, NVIDIA GeForce RTX 4090
36101 Points +71%
AMD Radeon RX 7900 XTX
AMD Ryzen 9 7950X, AMD Radeon RX 7900 XTX
29699 Points +41%
NVIDIA GeForce RTX 4080 Founders Edition
Intel Core i9-13900K, NVIDIA GeForce RTX 4080
28133 Points +33%
AMD Radeon RX 7900 XT
AMD Ryzen 9 7950X, AMD Radeon RX 7900 XT
25874 Points +23%
Gigabyte Aorus GeForce RTX 4070 Ti Master
Intel Core i9-13900K, NVIDIA GeForce RTX 4070 Ti
23136 Points +10%
Asus TUF Gaming GeForce RTX 4070 Ti
Intel Core i9-13900K, NVIDIA GeForce RTX 4070 Ti
22982 Points +9%
Asus TUF Gaming GeForce RTX 4070 Ti
Intel Core i9-13900K, NVIDIA GeForce RTX 4070 Ti (Quiet BIOS)
22949 Points +9%
Durchschnittliche NVIDIA GeForce RTX 4070 Ti
  (22304 - 23136, n=5)
22791 Points +8%
Sapphire AMD Radeon RX 6950 XT Nitro+ Pure
AMD Ryzen 9 5900X, AMD Radeon RX 6950 XT
21719 Points +3%
Zotac Gaming GeForce RTX 3090 Ti AMP Extreme Holo
AMD Ryzen 7 5800X3D, NVIDIA GeForce RTX 3090 Ti
21645 Points +3%
Gigabyte GeForce RTX 4070 Super Gaming OC 12G
Intel Core i9-13900K, NVIDIA GeForce RTX 4070 SUPER
21117 Points
NVIDIA GeForce RTX 4070 Super Founders Edition
Intel Core i9-13900K, NVIDIA GeForce RTX 4070 SUPER
20867 Points -1%
AMD Radeon RX 7800 XT
AMD Ryzen 9 7950X, AMD Radeon RX 7800 XT
19369 Points -8%
Durchschnittliche NVIDIA GeForce RTX 3090
  (18685 - 20433, n=17)
19266 Points -9%
Durchschnittliche NVIDIA GeForce RTX 3080 Ti
  (19041 - 19460, n=4)
19237 Points -9%
AMD Radeon RX 6900 XT
AMD Ryzen 9 5950X, AMD Radeon RX 6900 XT
18210 Points -14%
Zotac Gaming GeForce RTX 4070 AMP Airo
Intel Core i9-13900K, NVIDIA GeForce RTX 4070
17847 Points -15%
AMD Radeon RX 6800 XT
AMD Ryzen 9 5950X, AMD Radeon RX 6800 XT
17603 Points -17%
Durchschnittliche NVIDIA GeForce RTX 3080
  (17467 - 17604, n=2)
17536 Points -17%
Durchschnitt der Klasse Desktop
  (173 - 37589, n=33, der letzten 2 Jahre)
17279 Points -18%
Sapphire Pulse Radeon RX 7700 XT
AMD Ryzen 9 7950X, AMD Radeon RX 7700 XT
16777 Points -21%
Durchschnittliche NVIDIA Titan RTX
  (14216 - 15283, n=29)
14884 Points -30%
Durchschnittliche NVIDIA GeForce RTX 4060 Ti 8G
  (13293 - 13549, n=3)
13423 Points -36%
KFA2 GeForce RTX 4060 Ti EX, 16GB GDDR6
AMD Ryzen 9 7950X, NVIDIA GeForce RTX 4060 Ti 16G
13359 Points -37%
Durchschnittliche NVIDIA GeForce RTX 3070
  (11043 - 13579, n=7)
12616 Points -40%
XFX Speedster QICK 308 Radeon RX 7600 Black Edition
AMD Ryzen 9 7950X, AMD Radeon RX 7600
11062 Points -48%
KFA2 GeForce RTX 4060 1-Click-OC 2X
AMD Ryzen 9 7950X, NVIDIA GeForce RTX 4060
10494 Points -50%
Unigine Heaven 4.0 / Extreme Preset DX11
NVIDIA GeForce RTX 4090 Founders Edition
Intel Core i9-13900K, NVIDIA GeForce RTX 4090
466 (11min - 1031max) fps +66%
NVIDIA GeForce RTX 4080 Founders Edition
Intel Core i9-13900K, NVIDIA GeForce RTX 4080
389.4 (11.3min - 813.1max) fps +39%
AMD Radeon RX 7900 XTX
AMD Ryzen 9 7950X, AMD Radeon RX 7900 XTX
357.6 fps +27%
AMD Radeon RX 7900 XT
AMD Ryzen 9 7950X, AMD Radeon RX 7900 XT
319.7 fps +14%
Gigabyte Aorus GeForce RTX 4070 Ti Master
Intel Core i9-13900K, NVIDIA GeForce RTX 4070 Ti
317.9 (52.3min - 701.6max) fps +13%
Asus TUF Gaming GeForce RTX 4070 Ti
Intel Core i9-13900K, NVIDIA GeForce RTX 4070 Ti
317.6 (57.8min - 692.1max) fps +13%
Durchschnittliche NVIDIA GeForce RTX 4070 Ti
  (312 - 319, n=4)
317 fps +13%
Zotac Gaming GeForce RTX 3090 Ti AMP Extreme Holo
AMD Ryzen 7 5800X3D, NVIDIA GeForce RTX 3090 Ti
308.5 (9.7min - 627.1max) fps +10%
Durchschnittliche NVIDIA GeForce RTX 3090
  (272 - 315, n=11)
300 fps +7%
Durchschnittliche NVIDIA GeForce RTX 3080 Ti
  (290 - 312, n=4)
300 fps +7%
Sapphire AMD Radeon RX 6950 XT Nitro+ Pure
AMD Ryzen 9 5900X, AMD Radeon RX 6950 XT
293.8 fps +5%
Gigabyte GeForce RTX 4070 Super Gaming OC 12G
Intel Core i9-13900K, NVIDIA GeForce RTX 4070 SUPER
280.8 (51.7min - 649.1max) fps
NVIDIA GeForce RTX 4070 Super Founders Edition
Intel Core i9-13900K, NVIDIA GeForce RTX 4070 SUPER
276.1 (50.9min - 603max) fps -2%
AMD Radeon RX 6900 XT
AMD Ryzen 9 5950X, AMD Radeon RX 6900 XT
259.5 (49.3min - 537.2max) fps -8%
Zotac Gaming GeForce RTX 4070 AMP Airo
Intel Core i9-13900K, NVIDIA GeForce RTX 4070
248 (11min - 572.3max) fps -12%
AMD Radeon RX 6800 XT
AMD Ryzen 9 5950X, AMD Radeon RX 6800 XT
247.9 fps -12%
Durchschnittliche NVIDIA GeForce RTX 3080
  (233 - 253, n=2)
243 fps -13%
AMD Radeon RX 7800 XT
AMD Ryzen 9 7950X, AMD Radeon RX 7800 XT
242.7 fps -14%
Durchschnittliche NVIDIA Titan RTX
  (207 - 248, n=12)
236 fps -16%
Durchschnitt der Klasse Desktop
  (4.5 - 472, n=24, der letzten 2 Jahre)
220 fps -22%
Sapphire Pulse Radeon RX 7700 XT
AMD Ryzen 9 7950X, AMD Radeon RX 7700 XT
211.7 fps -25%
Durchschnittliche NVIDIA GeForce RTX 3070
  (196.4 - 214, n=5)
206 fps -27%
Durchschnittliche NVIDIA GeForce RTX 4060 Ti 8G
  (178.9 - 181.6, n=3)
180.6 fps -36%
KFA2 GeForce RTX 4060 Ti EX, 16GB GDDR6
AMD Ryzen 9 7950X, NVIDIA GeForce RTX 4060 Ti 16G
174.8 fps -38%
KFA2 GeForce RTX 4060 1-Click-OC 2X
AMD Ryzen 9 7950X, NVIDIA GeForce RTX 4060
153.7 fps -45%
XFX Speedster QICK 308 Radeon RX 7600 Black Edition
AMD Ryzen 9 7950X, AMD Radeon RX 7600
148.1 fps -47%
Unigine Heaven 4.0 / Extreme Preset OpenGL
NVIDIA GeForce RTX 4090 Founders Edition
Intel Core i9-13900K, NVIDIA GeForce RTX 4090
443 (15min - 902max) fps +58%
AMD Radeon RX 7900 XTX
AMD Ryzen 9 7950X, AMD Radeon RX 7900 XTX
370.2 fps +32%
NVIDIA GeForce RTX 4080 Founders Edition
Intel Core i9-13900K, NVIDIA GeForce RTX 4080
364.2 (15min - 770.5max) fps +30%
AMD Radeon RX 7900 XT
AMD Ryzen 9 7950X, AMD Radeon RX 7900 XT
330.2 fps +18%
Gigabyte Aorus GeForce RTX 4070 Ti Master
Intel Core i9-13900K, NVIDIA GeForce RTX 4070 Ti
295.5 (50.3min - 602max) fps +6%
Durchschnittliche NVIDIA GeForce RTX 4070 Ti
  (291 - 297, n=4)
294 fps +5%
Asus TUF Gaming GeForce RTX 4070 Ti
Intel Core i9-13900K, NVIDIA GeForce RTX 4070 Ti
292.6 (15.2min - 600.3max) fps +5%
Zotac Gaming GeForce RTX 3090 Ti AMP Extreme Holo
AMD Ryzen 7 5800X3D, NVIDIA GeForce RTX 3090 Ti
292.5 (11.4min - 577.9max) fps +5%
Gigabyte GeForce RTX 4070 Super Gaming OC 12G
Intel Core i9-13900K, NVIDIA GeForce RTX 4070 SUPER
279.9 (14.2min - 655.5max) fps
NVIDIA GeForce RTX 4070 Super Founders Edition
Intel Core i9-13900K, NVIDIA GeForce RTX 4070 SUPER
276.1 (57.7min - 579max) fps -1%
Durchschnittliche NVIDIA GeForce RTX 3080 Ti
  (264 - 282, n=4)
274 fps -2%
Durchschnittliche NVIDIA GeForce RTX 3090
  (188.2 - 284, n=10)
270 fps -4%
AMD Radeon RX 7800 XT
AMD Ryzen 9 7950X, AMD Radeon RX 7800 XT
257.9 fps -8%
Durchschnittliche NVIDIA GeForce RTX 3080
  (232 - 243, n=2)
238 fps -15%
Zotac Gaming GeForce RTX 4070 AMP Airo
Intel Core i9-13900K, NVIDIA GeForce RTX 4070
230.2 (14.6min - 500.6max) fps -18%
Durchschnittliche NVIDIA Titan RTX
  (203 - 299, n=12)
223 fps -20%
Sapphire AMD Radeon RX 6950 XT Nitro+ Pure
AMD Ryzen 9 5900X, AMD Radeon RX 6950 XT
222.7 fps -20%
Sapphire Pulse Radeon RX 7700 XT
AMD Ryzen 9 7950X, AMD Radeon RX 7700 XT
213.2 fps -24%
Durchschnitt der Klasse Desktop
  (4 - 450, n=24, der letzten 2 Jahre)
209 fps -25%
AMD Radeon RX 6900 XT
AMD Ryzen 9 5950X, AMD Radeon RX 6900 XT
206.5 (8.2min - 453.7max) fps -26%
AMD Radeon RX 6800 XT
AMD Ryzen 9 5950X, AMD Radeon RX 6800 XT
204 fps -27%
Durchschnittliche NVIDIA GeForce RTX 3070
  (187.5 - 196.1, n=4)
192.5 fps -31%
Durchschnittliche NVIDIA GeForce RTX 4060 Ti 8G
  (173 - 176, n=3)
174.7 fps -38%
KFA2 GeForce RTX 4060 Ti EX, 16GB GDDR6
AMD Ryzen 9 7950X, NVIDIA GeForce RTX 4060 Ti 16G
170.3 fps -39%
XFX Speedster QICK 308 Radeon RX 7600 Black Edition
AMD Ryzen 9 7950X, AMD Radeon RX 7600
147.2 fps -47%
KFA2 GeForce RTX 4060 1-Click-OC 2X
AMD Ryzen 9 7950X, NVIDIA GeForce RTX 4060
147 fps -47%
Unigine Valley 1.0 / Extreme HD DirectX
NVIDIA GeForce RTX 4090 Founders Edition
Intel Core i9-13900K, NVIDIA GeForce RTX 4090
283 (80min - 527max) fps +31%
NVIDIA GeForce RTX 4080 Founders Edition
Intel Core i9-13900K, NVIDIA GeForce RTX 4080
277.5 (71.7min - 487.9max) fps +29%
AMD Radeon RX 7900 XTX
AMD Ryzen 9 7950X, AMD Radeon RX 7900 XTX
264.5 fps +23%
AMD Radeon RX 7900 XT
AMD Ryzen 9 7950X, AMD Radeon RX 7900 XT
243.3 fps +13%
Asus TUF Gaming GeForce RTX 4070 Ti
Intel Core i9-13900K, NVIDIA GeForce RTX 4070 Ti
230.3 (78.9min - 451.1max) fps +7%
Durchschnittliche NVIDIA GeForce RTX 3080 Ti
  (206 - 240, n=4)
228 fps +6%
Durchschnittliche NVIDIA GeForce RTX 3090
  (184.2 - 247, n=11)
225 fps +5%
Durchschnittliche NVIDIA GeForce RTX 4070 Ti
  (208 - 230, n=4)
218 fps +1%
Gigabyte GeForce RTX 4070 Super Gaming OC 12G
Intel Core i9-13900K, NVIDIA GeForce RTX 4070 SUPER
215.3 (73.3min - 409.2max) fps
NVIDIA GeForce RTX 4070 Super Founders Edition
Intel Core i9-13900K, NVIDIA GeForce RTX 4070 SUPER
213.8 (75min - 414.5max) fps -1%
Sapphire AMD Radeon RX 6950 XT Nitro+ Pure
AMD Ryzen 9 5900X, AMD Radeon RX 6950 XT
209.2 fps -3%
Gigabyte Aorus GeForce RTX 4070 Ti Master
Intel Core i9-13900K, NVIDIA GeForce RTX 4070 Ti
207.5 (75.3min - 371.2max) fps -4%
Zotac Gaming GeForce RTX 3090 Ti AMP Extreme Holo
AMD Ryzen 7 5800X3D, NVIDIA GeForce RTX 3090 Ti
201.7 (48.5min - 338.7max) fps -6%
AMD Radeon RX 6900 XT
AMD Ryzen 9 5950X, AMD Radeon RX 6900 XT
200.8 (53.4min - 359.1max) fps -7%
Zotac Gaming GeForce RTX 4070 AMP Airo
Intel Core i9-13900K, NVIDIA GeForce RTX 4070
195.2 (57.6min - 374.2max) fps -9%
AMD Radeon RX 7800 XT
AMD Ryzen 9 7950X, AMD Radeon RX 7800 XT
191.3 fps -11%
AMD Radeon RX 6800 XT
AMD Ryzen 9 5950X, AMD Radeon RX 6800 XT
190.6 fps -11%
Durchschnittliche NVIDIA GeForce RTX 3080
  (176.2 - 181.8, n=2)
179 fps -17%
Durchschnittliche NVIDIA Titan RTX
  (135 - 191.4, n=12)
173.3 fps -20%
Durchschnittliche NVIDIA GeForce RTX 3070
  (155.1 - 168.5, n=5)
161.2 fps -25%
Sapphire Pulse Radeon RX 7700 XT
AMD Ryzen 9 7950X, AMD Radeon RX 7700 XT
160.1 fps -26%
Durchschnitt der Klasse Desktop
  (3.7 - 292, n=24, der letzten 2 Jahre)
158.9 fps -26%
Durchschnittliche NVIDIA GeForce RTX 4060 Ti 8G
  (128.3 - 131.2, n=3)
129.8 fps -40%
KFA2 GeForce RTX 4060 Ti EX, 16GB GDDR6
AMD Ryzen 9 7950X, NVIDIA GeForce RTX 4060 Ti 16G
127.8 fps -41%
KFA2 GeForce RTX 4060 1-Click-OC 2X
AMD Ryzen 9 7950X, NVIDIA GeForce RTX 4060
115.3 fps -46%
XFX Speedster QICK 308 Radeon RX 7600 Black Edition
AMD Ryzen 9 7950X, AMD Radeon RX 7600
107.5 fps -50%
Unigine Valley 1.0 / Extreme HD Preset OpenGL
NVIDIA GeForce RTX 4090 Founders Edition
Intel Core i9-13900K, NVIDIA GeForce RTX 4090
315 (64min - 559max) fps +58%
NVIDIA GeForce RTX 4080 Founders Edition
Intel Core i9-13900K, NVIDIA GeForce RTX 4080
257 (79.3min - 462.8max) fps +29%
AMD Radeon RX 7900 XTX
AMD Ryzen 9 7950X, AMD Radeon RX 7900 XTX
254.2 fps +27%
Gigabyte Aorus GeForce RTX 4070 Ti Master
Intel Core i9-13900K, NVIDIA GeForce RTX 4070 Ti
230.9 (56.3min - 480.2max) fps +15%
AMD Radeon RX 7900 XT
AMD Ryzen 9 7950X, AMD Radeon RX 7900 XT
225.9 fps +13%
Zotac Gaming GeForce RTX 3090 Ti AMP Extreme Holo
AMD Ryzen 7 5800X3D, NVIDIA GeForce RTX 3090 Ti
208.4 (49.3min - 353max) fps +4%
Durchschnittliche NVIDIA GeForce RTX 4070 Ti
  (197.4 - 231, n=4)
208 fps +4%
Asus TUF Gaming GeForce RTX 4070 Ti
Intel Core i9-13900K, NVIDIA GeForce RTX 4070 Ti
206.8 (64.6min - 374.1max) fps +3%
Durchschnittliche NVIDIA GeForce RTX 3080 Ti
  (195.1 - 210, n=4)
204 fps +2%
Durchschnittliche NVIDIA GeForce RTX 3090
  (158.8 - 226, n=10)
203 fps +2%
NVIDIA GeForce RTX 4070 Super Founders Edition
Intel Core i9-13900K, NVIDIA GeForce RTX 4070 SUPER
200.4 (62.1min - 392.1max) fps 0%
Gigabyte GeForce RTX 4070 Super Gaming OC 12G
Intel Core i9-13900K, NVIDIA GeForce RTX 4070 SUPER
200 (63.6min - 393.8max) fps
AMD Radeon RX 7800 XT
AMD Ryzen 9 7950X, AMD Radeon RX 7800 XT
182 fps -9%
Sapphire AMD Radeon RX 6950 XT Nitro+ Pure
AMD Ryzen 9 5900X, AMD Radeon RX 6950 XT
176.9 fps -12%
Zotac Gaming GeForce RTX 4070 AMP Airo
Intel Core i9-13900K, NVIDIA GeForce RTX 4070
171.8 (61.5min - 301.3max) fps -14%
Durchschnittliche NVIDIA GeForce RTX 3080
  (163.8 - 172, n=2)
167.9 fps -16%
AMD Radeon RX 6900 XT
AMD Ryzen 9 5950X, AMD Radeon RX 6900 XT
167.4 (56.7min - 375.7max) fps -16%
AMD Radeon RX 6800 XT
AMD Ryzen 9 5950X, AMD Radeon RX 6800 XT
158.2 fps -21%
Durchschnittliche NVIDIA Titan RTX
  (139.2 - 181.2, n=12)
158.1 fps -21%
Durchschnitt der Klasse Desktop
  (3.4 - 315, n=24, der letzten 2 Jahre)
151.3 fps -24%
Sapphire Pulse Radeon RX 7700 XT
AMD Ryzen 9 7950X, AMD Radeon RX 7700 XT
143 fps -28%
Durchschnittliche NVIDIA GeForce RTX 3070
  (140.2 - 144.9, n=4)
142.7 fps -29%
Durchschnittliche NVIDIA GeForce RTX 4060 Ti 8G
  (116.5 - 118.8, n=3)
117.8 fps -41%
KFA2 GeForce RTX 4060 Ti EX, 16GB GDDR6
AMD Ryzen 9 7950X, NVIDIA GeForce RTX 4060 Ti 16G
114.9 fps -43%
KFA2 GeForce RTX 4060 1-Click-OC 2X
AMD Ryzen 9 7950X, NVIDIA GeForce RTX 4060
104.5 fps -48%
XFX Speedster QICK 308 Radeon RX 7600 Black Edition
AMD Ryzen 9 7950X, AMD Radeon RX 7600
94.8 fps -53%
Unigine Superposition / 720p Low
Asus TUF Gaming GeForce RTX 4070 Ti
Intel Core i9-13900K, NVIDIA GeForce RTX 4070 Ti
56132 Points +11%
NVIDIA GeForce RTX 4090 Founders Edition
Intel Core i9-13900K, NVIDIA GeForce RTX 4090
55915 Points +10%
NVIDIA GeForce RTX 4080 Founders Edition
Intel Core i9-13900K, NVIDIA GeForce RTX 4080
55670 Points +10%
Gigabyte Aorus GeForce RTX 4070 Ti Master
Intel Core i9-13900K, NVIDIA GeForce RTX 4070 Ti
55232 Points +9%
Durchschnittliche NVIDIA GeForce RTX 4070 Ti
  (48835 - 56396, n=4)
54149 Points +7%
Zotac Gaming GeForce RTX 4070 AMP Airo
Intel Core i9-13900K, NVIDIA GeForce RTX 4070
52713 Points +4%
NVIDIA GeForce RTX 4070 Super Founders Edition
Intel Core i9-13900K, NVIDIA GeForce RTX 4070 SUPER
50724 Points 0%
Gigabyte GeForce RTX 4070 Super Gaming OC 12G
Intel Core i9-13900K, NVIDIA GeForce RTX 4070 SUPER
50629 Points
Durchschnittliche NVIDIA GeForce RTX 3080 Ti
  (43163 - 50738, n=4)
47400 Points -6%
Durchschnittliche NVIDIA GeForce RTX 4060 Ti 8G
  (46504 - 47695, n=3)
47288 Points -7%
AMD Radeon RX 7900 XTX
AMD Ryzen 9 7950X, AMD Radeon RX 7900 XTX
47274 Points -7%
Durchschnittliche NVIDIA GeForce RTX 3090
  (33329 - 54879, n=10)
46049 Points -9%
AMD Radeon RX 7900 XT
AMD Ryzen 9 7950X, AMD Radeon RX 7900 XT
45904 Points -9%
KFA2 GeForce RTX 4060 1-Click-OC 2X
AMD Ryzen 9 7950X, NVIDIA GeForce RTX 4060
45864 Points -9%
AMD Radeon RX 7800 XT
AMD Ryzen 9 7950X, AMD Radeon RX 7800 XT
45745 Points -10%
Zotac Gaming GeForce RTX 3090 Ti AMP Extreme Holo
AMD Ryzen 7 5800X3D, NVIDIA GeForce RTX 3090 Ti
45444 Points -10%
Sapphire Pulse Radeon RX 7700 XT
AMD Ryzen 9 7950X, AMD Radeon RX 7700 XT
45299 Points -11%
KFA2 GeForce RTX 4060 Ti EX, 16GB GDDR6
AMD Ryzen 9 7950X, NVIDIA GeForce RTX 4060 Ti 16G
43851 Points -13%
XFX Speedster QICK 308 Radeon RX 7600 Black Edition
AMD Ryzen 9 7950X, AMD Radeon RX 7600
42477 Points -16%
Durchschnittliche NVIDIA Titan RTX
  (25622 - 50876, n=9)
40891 Points -19%
Durchschnitt der Klasse Desktop
  (2704 - 56132, n=22, der letzten 2 Jahre)
38418 Points -24%
AMD Radeon RX 6900 XT
AMD Ryzen 9 5950X, AMD Radeon RX 6900 XT
37023 Points -27%
AMD Radeon RX 6800 XT
AMD Ryzen 9 5950X, AMD Radeon RX 6800 XT
36452 Points -28%
Durchschnittliche NVIDIA GeForce RTX 3070
  (27330 - 40007, n=5)
34576 Points -32%
Sapphire AMD Radeon RX 6950 XT Nitro+ Pure
AMD Ryzen 9 5900X, AMD Radeon RX 6950 XT
33955 Points -33%
Durchschnittliche NVIDIA GeForce RTX 3080
  (30851 - 32183, n=2)
31517 Points -38%
Unigine Superposition / 1080p Extreme
NVIDIA GeForce RTX 4090 Founders Edition
Intel Core i9-13900K, NVIDIA GeForce RTX 4090
20729 Points +70%
AMD Radeon RX 7900 XTX
AMD Ryzen 9 7950X, AMD Radeon RX 7900 XTX
17264 Points +42%
NVIDIA GeForce RTX 4080 Founders Edition
Intel Core i9-13900K, NVIDIA GeForce RTX 4080
16623 Points +37%
AMD Radeon RX 7900 XT
AMD Ryzen 9 7950X, AMD Radeon RX 7900 XT
14181 Points +17%
Zotac Gaming GeForce RTX 3090 Ti AMP Extreme Holo
AMD Ryzen 7 5800X3D, NVIDIA GeForce RTX 3090 Ti
13803 Points +13%
Gigabyte Aorus GeForce RTX 4070 Ti Master
Intel Core i9-13900K, NVIDIA GeForce RTX 4070 Ti
13448 Points +11%
Asus TUF Gaming GeForce RTX 4070 Ti
Intel Core i9-13900K, NVIDIA GeForce RTX 4070 Ti
13266 Points +9%
Durchschnittliche NVIDIA GeForce RTX 4070 Ti
  (12837 - 13448, n=4)
13168 Points +8%
Durchschnittliche NVIDIA GeForce RTX 3090
  (11806 - 12694, n=11)
12209 Points 0%
Gigabyte GeForce RTX 4070 Super Gaming OC 12G
Intel Core i9-13900K, NVIDIA GeForce RTX 4070 SUPER
12163 Points
Durchschnittliche NVIDIA GeForce RTX 3080 Ti
  (12038 - 12347, n=4)
12139 Points 0%
Sapphire AMD Radeon RX 6950 XT Nitro+ Pure
AMD Ryzen 9 5900X, AMD Radeon RX 6950 XT
12079 Points -1%
NVIDIA GeForce RTX 4070 Super Founders Edition
Intel Core i9-13900K, NVIDIA GeForce RTX 4070 SUPER
12019 Points -1%
Durchschnittliche NVIDIA GeForce RTX 3080
  (10572 - 10822, n=2)
10697 Points -12%
AMD Radeon RX 6900 XT
AMD Ryzen 9 5950X, AMD Radeon RX 6900 XT
10683 Points -12%
AMD Radeon RX 7800 XT
AMD Ryzen 9 7950X, AMD Radeon RX 7800 XT
10145 Points -17%
Durchschnitt der Klasse Desktop
  (286 - 21332, n=22, der letzten 2 Jahre)
10122 Points -17%
AMD Radeon RX 6800 XT
AMD Ryzen 9 5950X, AMD Radeon RX 6800 XT
10046 Points -17%
Zotac Gaming GeForce RTX 4070 AMP Airo
Intel Core i9-13900K, NVIDIA GeForce RTX 4070
9764 Points -20%
Durchschnittliche NVIDIA Titan RTX
  (8916 - 9285, n=9)
9051 Points -26%
Sapphire Pulse Radeon RX 7700 XT
AMD Ryzen 9 7950X, AMD Radeon RX 7700 XT
8732 Points -28%
Durchschnittliche NVIDIA GeForce RTX 3070
  (8276 - 8507, n=5)
8354 Points -31%
KFA2 GeForce RTX 4060 Ti EX, 16GB GDDR6
AMD Ryzen 9 7950X, NVIDIA GeForce RTX 4060 Ti 16G
7712 Points -37%
Durchschnittliche NVIDIA GeForce RTX 4060 Ti 8G
  (7085 - 7833, n=3)
7438 Points -39%
XFX Speedster QICK 308 Radeon RX 7600 Black Edition
AMD Ryzen 9 7950X, AMD Radeon RX 7600
6419 Points -47%
KFA2 GeForce RTX 4060 1-Click-OC 2X
AMD Ryzen 9 7950X, NVIDIA GeForce RTX 4060
5974 Points -51%
Unigine Superposition / 4k Optimized
NVIDIA GeForce RTX 4090 Founders Edition
Intel Core i9-13900K, NVIDIA GeForce RTX 4090
32977 Points +107%
AMD Radeon RX 7900 XTX
AMD Ryzen 9 7950X, AMD Radeon RX 7900 XTX
23174 Points +46%
NVIDIA GeForce RTX 4080 Founders Edition
Intel Core i9-13900K, NVIDIA GeForce RTX 4080
22343 Points +40%
AMD Radeon RX 7900 XT
AMD Ryzen 9 7950X, AMD Radeon RX 7900 XT
18806 Points +18%
Zotac Gaming GeForce RTX 3090 Ti AMP Extreme Holo
AMD Ryzen 7 5800X3D, NVIDIA GeForce RTX 3090 Ti
18426 Points +16%
Sapphire AMD Radeon RX 6950 XT Nitro+ Pure
AMD Ryzen 9 5900X, AMD Radeon RX 6950 XT
17725 Points +11%
Gigabyte Aorus GeForce RTX 4070 Ti Master
Intel Core i9-13900K, NVIDIA GeForce RTX 4070 Ti
17290 Points +9%
Asus TUF Gaming GeForce RTX 4070 Ti
Intel Core i9-13900K, NVIDIA GeForce RTX 4070 Ti
17184 Points +8%
Durchschnittliche NVIDIA GeForce RTX 4070 Ti
  (16889 - 17290, n=4)
17118 Points +8%
Durchschnittliche NVIDIA GeForce RTX 3090
  (15794 - 16868, n=11)
16326 Points +3%
Durchschnittliche NVIDIA GeForce RTX 3080 Ti
  (16108 - 16412, n=4)
16199 Points +2%
Gigabyte GeForce RTX 4070 Super Gaming OC 12G
Intel Core i9-13900K, NVIDIA GeForce RTX 4070 SUPER
15913 Points
NVIDIA GeForce RTX 4070 Super Founders Edition
Intel Core i9-13900K, NVIDIA GeForce RTX 4070 SUPER
15803 Points -1%
AMD Radeon RX 6900 XT
AMD Ryzen 9 5950X, AMD Radeon RX 6900 XT
14955 Points -6%
Durchschnitt der Klasse Desktop
  (559 - 33488, n=21, der letzten 2 Jahre)
14724 Points -7%
Durchschnittliche NVIDIA GeForce RTX 3080
  (13984 - 14243, n=2)
14114 Points -11%
AMD Radeon RX 7800 XT
AMD Ryzen 9 7950X, AMD Radeon RX 7800 XT
13776 Points -13%
Zotac Gaming GeForce RTX 4070 AMP Airo
Intel Core i9-13900K, NVIDIA GeForce RTX 4070
13715 Points -14%
AMD Radeon RX 6800 XT
AMD Ryzen 9 5950X, AMD Radeon RX 6800 XT
13471 Points -15%
Durchschnittliche NVIDIA Titan RTX
  (11937 - 12644, n=9)
12203 Points -23%
Sapphire Pulse Radeon RX 7700 XT
AMD Ryzen 9 7950X, AMD Radeon RX 7700 XT
11256 Points -29%
Durchschnittliche NVIDIA GeForce RTX 3070
  (10544 - 10755, n=5)
10667 Points -33%
Durchschnittliche NVIDIA GeForce RTX 4060 Ti 8G
  (9579 - 9722, n=3)
9651 Points -39%
KFA2 GeForce RTX 4060 Ti EX, 16GB GDDR6
AMD Ryzen 9 7950X, NVIDIA GeForce RTX 4060 Ti 16G
9516 Points -40%
KFA2 GeForce RTX 4060 1-Click-OC 2X
AMD Ryzen 9 7950X, NVIDIA GeForce RTX 4060
7959 Points -50%
XFX Speedster QICK 308 Radeon RX 7600 Black Edition
AMD Ryzen 9 7950X, AMD Radeon RX 7600
7817 Points -51%
Unigine Superposition / 8k Optimized
NVIDIA GeForce RTX 4090 Founders Edition
Intel Core i9-13900K, NVIDIA GeForce RTX 4090
12826 Points +118%
AMD Radeon RX 7900 XTX
AMD Ryzen 9 7950X, AMD Radeon RX 7900 XTX
8751 Points +49%
NVIDIA GeForce RTX 4080 Founders Edition
Intel Core i9-13900K, NVIDIA GeForce RTX 4080
8556 Points +45%
Zotac Gaming GeForce RTX 3090 Ti AMP Extreme Holo
AMD Ryzen 7 5800X3D, NVIDIA GeForce RTX 3090 Ti
8213 Points +39%
Durchschnittliche NVIDIA GeForce RTX 3090
  (6969 - 7521, n=11)
7144 Points +21%
Durchschnittliche NVIDIA GeForce RTX 3080 Ti
  (6920 - 7161, n=4)
7070 Points +20%
AMD Radeon RX 7900 XT
AMD Ryzen 9 7950X, AMD Radeon RX 7900 XT
7034 Points +19%
Sapphire AMD Radeon RX 6950 XT Nitro+ Pure
AMD Ryzen 9 5900X, AMD Radeon RX 6950 XT
6645 Points +13%
Gigabyte Aorus GeForce RTX 4070 Ti Master
Intel Core i9-13900K, NVIDIA GeForce RTX 4070 Ti
6454 Points +10%
Asus TUF Gaming GeForce RTX 4070 Ti
Intel Core i9-13900K, NVIDIA GeForce RTX 4070 Ti
6427 Points +9%
Durchschnittliche NVIDIA GeForce RTX 4070 Ti
  (6380 - 6454, n=4)
6425 Points +9%
Durchschnittliche NVIDIA GeForce RTX 3080
  (6243 - 6346, n=2)
6295 Points +7%
Gigabyte GeForce RTX 4070 Super Gaming OC 12G
Intel Core i9-13900K, NVIDIA GeForce RTX 4070 SUPER
5892 Points
NVIDIA GeForce RTX 4070 Super Founders Edition
Intel Core i9-13900K, NVIDIA GeForce RTX 4070 SUPER
5844 Points -1%
Durchschnitt der Klasse Desktop
  (237 - 13008, n=21, der letzten 2 Jahre)
5826 Points -1%
AMD Radeon RX 6900 XT
AMD Ryzen 9 5950X, AMD Radeon RX 6900 XT
5764 Points -2%
Durchschnittliche NVIDIA Titan RTX
  (5255 - 5571, n=9)
5393 Points -8%
AMD Radeon RX 7800 XT
AMD Ryzen 9 7950X, AMD Radeon RX 7800 XT
5307 Points -10%
AMD Radeon RX 6800 XT
AMD Ryzen 9 5950X, AMD Radeon RX 6800 XT
5256 Points -11%
Zotac Gaming GeForce RTX 4070 AMP Airo
Intel Core i9-13900K, NVIDIA GeForce RTX 4070
5253 Points -11%
Durchschnittliche NVIDIA GeForce RTX 3070
  (4587 - 4695, n=5)
4624 Points -22%
Sapphire Pulse Radeon RX 7700 XT
AMD Ryzen 9 7950X, AMD Radeon RX 7700 XT
4085 Points -31%
Durchschnittliche NVIDIA GeForce RTX 4060 Ti 8G
  (3520 - 3571, n=3)
3546 Points -40%
KFA2 GeForce RTX 4060 Ti EX, 16GB GDDR6
AMD Ryzen 9 7950X, NVIDIA GeForce RTX 4060 Ti 16G
3517 Points -40%
KFA2 GeForce RTX 4060 1-Click-OC 2X
AMD Ryzen 9 7950X, NVIDIA GeForce RTX 4060
3066 Points -48%
XFX Speedster QICK 308 Radeon RX 7600 Black Edition
AMD Ryzen 9 7950X, AMD Radeon RX 7600
2964 Points -50%
3DMark 11 Performance
51572 Punkte
3DMark Ice Storm Standard Score
279979 Punkte
3DMark Cloud Gate Standard Score
81504 Punkte
3DMark Fire Strike Score
41178 Punkte
3DMark Fire Strike Extreme Score
24458 Punkte
3DMark Time Spy Score
21292 Punkte
Hilfe

Rechenleistung: Direkt auf den Fersen der RTX 4070 Ti

Die Rechenleistung ist praktisch nicht von der RTX 4070 Super FE zu unterscheiden. Die RTX 4070 Super Gaming OC ist in der Lage, die RTX 3090 Ti in V-Ray-GPU-Tests überzeugend zu schlagen, während sie 17 % und 21 % schneller ist als die Zotac GeForce Gaming RTX 4070 AMP Airo in Blender 3.3 Classroom CUDA und Classroom Optix Rendering.

Die RTX 4070 Super Gaming OC ist in Schlagdistanz zur Asus TUF Gaming GeForce RTX 4070 Ti und der Aorus RTX 4070 Ti Master im LuxMark Room. Die Sala-Tests bevorzugen traditionell ältere AMD GPUs, aber die RTX 4070 Super Gaming OC schafft dennoch einen Vorsprung von 27 % gegenüber der AMD Radeon RX 7900 XTX.

V-Ray 5 Benchmark / GPU CUDA
NVIDIA GeForce RTX 4090 Founders Edition
Intel Core i9-13900K, NVIDIA GeForce RTX 4090 (5.0.1)
4224 mpaths +87%
NVIDIA GeForce RTX 4080 Founders Edition
Intel Core i9-13900K, NVIDIA GeForce RTX 4080 (5.0.1)
3067 mpaths +36%
Gigabyte Aorus GeForce RTX 4070 Ti Master
Intel Core i9-13900K, NVIDIA GeForce RTX 4070 Ti (5.0.1)
2371 mpaths +5%
Asus TUF Gaming GeForce RTX 4070 Ti
Intel Core i9-13900K, NVIDIA GeForce RTX 4070 Ti (5.0.1)
2322 mpaths +3%
Durchschnittliche NVIDIA GeForce RTX 4070 Ti
  (2278 - 2371, n=4)
2318 mpaths +3%
Gigabyte GeForce RTX 4070 Super Gaming OC 12G
Intel Core i9-13900K, NVIDIA GeForce RTX 4070 SUPER (5.0.1)
2254 mpaths
NVIDIA GeForce RTX 4070 Super Founders Edition
Intel Core i9-13900K, NVIDIA GeForce RTX 4070 SUPER (5.0.1)
2238 mpaths -1%
Zotac Gaming GeForce RTX 3090 Ti AMP Extreme Holo
AMD Ryzen 7 5800X3D, NVIDIA GeForce RTX 3090 Ti (5.0.1)
2195 mpaths -3%
Durchschnittliche NVIDIA GeForce RTX 3080 Ti
  (2045 - 2070, n=3)
2057 mpaths -9%
Durchschnittliche NVIDIA GeForce RTX 3090
  (1616 - 2131, n=14)
2019 mpaths -10%
Zotac Gaming GeForce RTX 4070 AMP Airo
Intel Core i9-13900K, NVIDIA GeForce RTX 4070 (5.0.1)
1874 mpaths -17%
Durchschnitt der Klasse Desktop
  (13 - 4322, n=27, der letzten 2 Jahre)
1808 mpaths -20%
Durchschnittliche NVIDIA GeForce RTX 4060 Ti 8G
  (1375 - 1400, n=2)
1388 mpaths -38%
KFA2 GeForce RTX 4060 Ti EX, 16GB GDDR6
AMD Ryzen 9 7950X, NVIDIA GeForce RTX 4060 Ti 16G (5.0.1)
1387 mpaths -38%
Durchschnittliche NVIDIA GeForce RTX 3070
  (1109 - 1422, n=2)
1266 mpaths -44%
KFA2 GeForce RTX 4060 1-Click-OC 2X
AMD Ryzen 9 7950X, NVIDIA GeForce RTX 4060 (5.0.1)
1246 mpaths -45%
Durchschnittliche NVIDIA Titan RTX
  (668 - 1052, n=7)
910 mpaths -60%
AMD Radeon RX 7800 XT
AMD Ryzen 9 7950X, AMD Radeon RX 7800 XT (5.0.1)
666 mpaths -70%
Sapphire Pulse Radeon RX 7700 XT
AMD Ryzen 9 7950X, AMD Radeon RX 7700 XT (5.0.1)
663 mpaths -71%
XFX Speedster QICK 308 Radeon RX 7600 Black Edition
AMD Ryzen 9 7950X, AMD Radeon RX 7600 (5.0.1)
662 mpaths -71%
Sapphire AMD Radeon RX 6950 XT Nitro+ Pure
AMD Ryzen 9 5900X, AMD Radeon RX 6950 XT (5.0.1)
383 mpaths -83%
V-Ray 5 Benchmark / GPU RTX
NVIDIA GeForce RTX 4090 Founders Edition
Intel Core i9-13900K, NVIDIA GeForce RTX 4090 (5.0.1)
5935 mpaths +90%
NVIDIA GeForce RTX 4080 Founders Edition
Intel Core i9-13900K, NVIDIA GeForce RTX 4080 (5.0.1)
4193 mpaths +34%
Durchschnitt der Klasse Desktop
  (992 - 6019, n=18, der letzten 2 Jahre)
3574 mpaths +14%
Gigabyte Aorus GeForce RTX 4070 Ti Master
Intel Core i9-13900K, NVIDIA GeForce RTX 4070 Ti (5.0.1)
3221 mpaths +3%
Asus TUF Gaming GeForce RTX 4070 Ti
Intel Core i9-13900K, NVIDIA GeForce RTX 4070 Ti (5.0.1)
3180 mpaths +2%
Durchschnittliche NVIDIA GeForce RTX 4070 Ti
  (3054 - 3221, n=4)
3151 mpaths +1%
Gigabyte GeForce RTX 4070 Super Gaming OC 12G
Intel Core i9-13900K, NVIDIA GeForce RTX 4070 SUPER (5.0.1)
3122 mpaths
NVIDIA GeForce RTX 4070 Super Founders Edition
Intel Core i9-13900K, NVIDIA GeForce RTX 4070 SUPER (5.0.1)
3088 mpaths -1%
Zotac Gaming GeForce RTX 3090 Ti AMP Extreme Holo
AMD Ryzen 7 5800X3D, NVIDIA GeForce RTX 3090 Ti (5.0.1)
2880 mpaths -8%
Durchschnittliche NVIDIA GeForce RTX 3090
  (2551 - 2979, n=14)
2813 mpaths -10%
Durchschnittliche NVIDIA GeForce RTX 3080 Ti
  (2727 - 2883, n=3)
2784 mpaths -11%
Zotac Gaming GeForce RTX 4070 AMP Airo
Intel Core i9-13900K, NVIDIA GeForce RTX 4070 (5.0.1)
2660 mpaths -15%
AMD Radeon RX 7800 XT
AMD Ryzen 9 7950X, AMD Radeon RX 7800 XT (5.0.1)
2024 mpaths -35%
Durchschnittliche NVIDIA GeForce RTX 4060 Ti 8G
  (1974 - 2024, n=2)
1999 mpaths -36%
KFA2 GeForce RTX 4060 Ti EX, 16GB GDDR6
AMD Ryzen 9 7950X, NVIDIA GeForce RTX 4060 Ti 16G (5.0.1)
1967 mpaths -37%
Sapphire Pulse Radeon RX 7700 XT
AMD Ryzen 9 7950X, AMD Radeon RX 7700 XT (5.0.1)
1967 mpaths -37%
KFA2 GeForce RTX 4060 1-Click-OC 2X
AMD Ryzen 9 7950X, NVIDIA GeForce RTX 4060 (5.0.1)
1856 mpaths -41%
Durchschnittliche NVIDIA GeForce RTX 3070
  (1610 - 1756, n=2)
1683 mpaths -46%
Durchschnittliche NVIDIA Titan RTX
  (1246 - 1348, n=7)
1299 mpaths -58%
V-Ray Benchmark Next 4.10 / GPU
NVIDIA GeForce RTX 4090 Founders Edition
Intel Core i9-13900K, NVIDIA GeForce RTX 4090 (v4.10.07 )
1847 mpaths +72%
NVIDIA GeForce RTX 4080 Founders Edition
Intel Core i9-13900K, NVIDIA GeForce RTX 4080 (v4.10.07 )
1455 mpaths +35%
NVIDIA GeForce RTX 4070 Super Founders Edition
Intel Core i9-13900K, NVIDIA GeForce RTX 4070 SUPER (v4.10.07 )
1075 mpaths 0%
Gigabyte GeForce RTX 4070 Super Gaming OC 12G
Intel Core i9-13900K, NVIDIA GeForce RTX 4070 SUPER (v4.10.07 )
1075 mpaths
Durchschnittliche NVIDIA GeForce RTX 4070 Ti
  (1056 - 1076, n=3)
1064 mpaths -1%
Asus TUF Gaming GeForce RTX 4070 Ti
Intel Core i9-13900K, NVIDIA GeForce RTX 4070 Ti (v4.10.07 )
1060 mpaths -1%
Gigabyte Aorus GeForce RTX 4070 Ti Master
Intel Core i9-13900K, NVIDIA GeForce RTX 4070 Ti (v4.10.07 )
1056 mpaths -2%
Zotac Gaming GeForce RTX 4070 AMP Airo
Intel Core i9-13900K, NVIDIA GeForce RTX 4070 (v4.10.07 )
966 mpaths -10%
Zotac Gaming GeForce RTX 3090 Ti AMP Extreme Holo
AMD Ryzen 7 5800X3D, NVIDIA GeForce RTX 3090 Ti (v4.10.07 )
902 mpaths -16%
Durchschnittliche NVIDIA GeForce RTX 3090
  (781 - 877, n=16)
856 mpaths -20%
Durchschnittliche NVIDIA GeForce RTX 3080 Ti
  (854 - 855, n=3)
854 mpaths -21%
Durchschnitt der Klasse Desktop
  (4 - 1880, n=29, der letzten 2 Jahre)
792 mpaths -26%
Durchschnittliche NVIDIA GeForce RTX 3080
  (636 - 643, n=2)
640 mpaths -40%
Durchschnittliche NVIDIA GeForce RTX 4060 Ti 8G
  (626 - 649, n=2)
638 mpaths -41%
KFA2 GeForce RTX 4060 Ti EX, 16GB GDDR6
AMD Ryzen 9 7950X, NVIDIA GeForce RTX 4060 Ti 16G (v4.10.07 )
620 mpaths -42%
KFA2 GeForce RTX 4060 1-Click-OC 2X
AMD Ryzen 9 7950X, NVIDIA GeForce RTX 4060 (v4.10.07 )
601 mpaths -44%
Durchschnittliche NVIDIA GeForce RTX 3070
  (464 - 508, n=4)
478 mpaths -56%
Durchschnittliche NVIDIA Titan RTX
  (386 - 439, n=16)
400 mpaths -63%
XFX Speedster QICK 308 Radeon RX 7600 Black Edition
AMD Ryzen 9 7950X, AMD Radeon RX 7600 (v4.10.07 )
221 mpaths -79%
AMD Radeon RX 7800 XT
AMD Ryzen 9 7950X, AMD Radeon RX 7800 XT (v4.10.07 )
220 mpaths -80%
Sapphire Pulse Radeon RX 7700 XT
AMD Ryzen 9 7950X, AMD Radeon RX 7700 XT (v4.10.07 )
220 mpaths -80%
AMD Radeon RX 6800 XT
AMD Ryzen 9 5950X, AMD Radeon RX 6800 XT (v4.10.07 )
157 mpaths -85%
Sapphire AMD Radeon RX 6950 XT Nitro+ Pure
AMD Ryzen 9 5900X, AMD Radeon RX 6950 XT (v4.10.07 )
137 mpaths -87%
Blender / v3.3 Classroom CUDA
KFA2 GeForce RTX 4060 1-Click-OC 2X
AMD Ryzen 9 7950X, NVIDIA GeForce RTX 4060 (3.3.3)
40 Seconds * -111%
Durchschnittliche NVIDIA Titan RTX
  ()
31 Seconds * -63%
Zotac Gaming GeForce RTX 4070 AMP Airo
Intel Core i9-13900K, NVIDIA GeForce RTX 4070 (3.3.3)
23 Seconds * -21%
Durchschnittliche NVIDIA GeForce RTX 3080 Ti
  (21 - 22, n=2)
21.5 Seconds * -13%
Durchschnittliche NVIDIA GeForce RTX 3090
  (20 - 22, n=11)
21.4 Seconds * -13%
NVIDIA GeForce RTX 4070 Super Founders Edition
Intel Core i9-13900K, NVIDIA GeForce RTX 4070 SUPER (3.3.3)
19 Seconds * -0%
Gigabyte GeForce RTX 4070 Super Gaming OC 12G
Intel Core i9-13900K, NVIDIA GeForce RTX 4070 SUPER (3.3.3)
19 Seconds *
Durchschnittliche NVIDIA GeForce RTX 4070 Ti
  (18 - 19, n=2)
18.5 Seconds * +3%
Gigabyte Aorus GeForce RTX 4070 Ti Master
Intel Core i9-13900K, NVIDIA GeForce RTX 4070 Ti (3.3.2)
18 Seconds * +5%
Durchschnitt der Klasse Desktop
  (10 - 23, n=15, der letzten 2 Jahre)
16.2 Seconds * +15%
Blender / v3.3 Classroom OPTIX/RTX
KFA2 GeForce RTX 4060 1-Click-OC 2X
AMD Ryzen 9 7950X, NVIDIA GeForce RTX 4060 (3.3.3)
21 Seconds * -91%
Durchschnittliche NVIDIA Titan RTX
  ()
21 Seconds * -91%
KFA2 GeForce RTX 4060 Ti EX, 16GB GDDR6
AMD Ryzen 9 7950X, NVIDIA GeForce RTX 4060 Ti 16G (3.3.3)
18 Seconds * -64%
Durchschnittliche NVIDIA GeForce RTX 4060 Ti 8G
  (18 - 18, n=2)
18 Seconds * -64%
Durchschnittliche NVIDIA GeForce RTX 3080 Ti
  (14 - 15, n=2)
14.5 Seconds * -32%
Zotac Gaming GeForce RTX 4070 AMP Airo
Intel Core i9-13900K, NVIDIA GeForce RTX 4070 (3.3.3)
14 Seconds * -27%
Durchschnittliche NVIDIA GeForce RTX 3090
  (13 - 14, n=11)
13.4 Seconds * -22%
Asus TUF Gaming GeForce RTX 4070 Ti
Intel Core i9-13900K, NVIDIA GeForce RTX 4070 Ti (3.3.2)
12 Seconds * -9%
Durchschnittliche NVIDIA GeForce RTX 4070 Ti
  (11 - 12, n=4)
11.5 Seconds * -5%
Gigabyte Aorus GeForce RTX 4070 Ti Master
Intel Core i9-13900K, NVIDIA GeForce RTX 4070 Ti (3.3.2)
11 Seconds * -0%
NVIDIA GeForce RTX 4070 Super Founders Edition
Intel Core i9-13900K, NVIDIA GeForce RTX 4070 SUPER (3.3.3)
11 Seconds * -0%
Gigabyte GeForce RTX 4070 Super Gaming OC 12G
Intel Core i9-13900K, NVIDIA GeForce RTX 4070 SUPER (3.3.3)
11 Seconds *
Durchschnitt der Klasse Desktop
  (7 - 15, n=17, der letzten 2 Jahre)
10.6 Seconds * +4%
NVIDIA GeForce RTX 4080 Founders Edition
Intel Core i9-13900K, NVIDIA GeForce RTX 4080 (3.3.0)
10 Seconds * +9%
NVIDIA GeForce RTX 4090 Founders Edition
Intel Core i9-13900K, NVIDIA GeForce RTX 4090 (3.3.0)
8 Seconds * +27%
LuxMark v2.0 64Bit / Room GPUs-only
NVIDIA GeForce RTX 4090 Founders Edition
Intel Core i9-13900K, NVIDIA GeForce RTX 4090
12730 Samples/s +54%
NVIDIA GeForce RTX 4080 Founders Edition
Intel Core i9-13900K, NVIDIA GeForce RTX 4080
10491 Samples/s +27%
Gigabyte Aorus GeForce RTX 4070 Ti Master
Intel Core i9-13900K, NVIDIA GeForce RTX 4070 Ti
8436 Samples/s +2%
Asus TUF Gaming GeForce RTX 4070 Ti
Intel Core i9-13900K, NVIDIA GeForce RTX 4070 Ti
8413 Samples/s +2%
NVIDIA GeForce RTX 4070 Super Founders Edition
Intel Core i9-13900K, NVIDIA GeForce RTX 4070 SUPER
8262 Samples/s 0%
Gigabyte GeForce RTX 4070 Super Gaming OC 12G
Intel Core i9-13900K, NVIDIA GeForce RTX 4070 SUPER
8257 Samples/s
Durchschnittliche NVIDIA GeForce RTX 4070 Ti
  (7625 - 8436, n=4)
8065 Samples/s -2%
Zotac Gaming GeForce RTX 4070 AMP Airo
Intel Core i9-13900K, NVIDIA GeForce RTX 4070
7402 Samples/s -10%
Zotac Gaming GeForce RTX 3090 Ti AMP Extreme Holo
AMD Ryzen 7 5800X3D, NVIDIA GeForce RTX 3090 Ti
6221 Samples/s -25%
Durchschnittliche NVIDIA GeForce RTX 3080 Ti
  (5772 - 6464, n=4)
6138 Samples/s -26%
Durchschnittliche NVIDIA GeForce RTX 3090
  (5727 - 5985, n=9)
5893 Samples/s -29%
Durchschnitt der Klasse Desktop
  (81 - 12730, n=23, der letzten 2 Jahre)
5398 Samples/s -35%
AMD Radeon RX 7900 XTX
AMD Ryzen 9 7950X, AMD Radeon RX 7900 XTX
5161 Samples/s -37%
Durchschnittliche NVIDIA GeForce RTX 3080
  (5112 - 5198, n=2)
5155 Samples/s -38%
Sapphire AMD Radeon RX 6950 XT Nitro+ Pure
AMD Ryzen 9 5900X, AMD Radeon RX 6950 XT
5097 Samples/s -38%
AMD Radeon RX 6900 XT
AMD Ryzen 9 5950X, AMD Radeon RX 6900 XT
5084 Samples/s -38%
AMD Radeon RX 6800 XT
AMD Ryzen 9 5950X, AMD Radeon RX 6800 XT
5057 Samples/s -39%
Durchschnittliche NVIDIA Titan RTX
  (4643 - 4703, n=2)
4673 Samples/s -43%
Durchschnittliche NVIDIA GeForce RTX 4060 Ti 8G
  (4558 - 4790, n=3)
4641 Samples/s -44%
KFA2 GeForce RTX 4060 Ti EX, 16GB GDDR6
AMD Ryzen 9 7950X, NVIDIA GeForce RTX 4060 Ti 16G
4570 Samples/s -45%
AMD Radeon RX 7900 XT
AMD Ryzen 9 7950X, AMD Radeon RX 7900 XT
4451 Samples/s -46%
KFA2 GeForce RTX 4060 1-Click-OC 2X
AMD Ryzen 9 7950X, NVIDIA GeForce RTX 4060
4063 Samples/s -51%
Durchschnittliche NVIDIA GeForce RTX 3070
  (2187 - 4293, n=3)
3588 Samples/s -57%
AMD Radeon RX 7800 XT
AMD Ryzen 9 7950X, AMD Radeon RX 7800 XT
3446 Samples/s -58%
Sapphire Pulse Radeon RX 7700 XT
AMD Ryzen 9 7950X, AMD Radeon RX 7700 XT
3258 Samples/s -61%
XFX Speedster QICK 308 Radeon RX 7600 Black Edition
AMD Ryzen 9 7950X, AMD Radeon RX 7600
2227 Samples/s -73%
LuxMark v2.0 64Bit / Sala GPUs-only
Sapphire AMD Radeon RX 6950 XT Nitro+ Pure
AMD Ryzen 9 5900X, AMD Radeon RX 6950 XT
31954 Samples/s +67%
AMD Radeon RX 6900 XT
AMD Ryzen 9 5950X, AMD Radeon RX 6900 XT
31400 Samples/s +64%
AMD Radeon RX 6800 XT
AMD Ryzen 9 5950X, AMD Radeon RX 6800 XT
28023 Samples/s +46%
NVIDIA GeForce RTX 4090 Founders Edition
Intel Core i9-13900K, NVIDIA GeForce RTX 4090
27828 Samples/s +45%
NVIDIA GeForce RTX 4080 Founders Edition
Intel Core i9-13900K, NVIDIA GeForce RTX 4080
24835 Samples/s +30%
Gigabyte Aorus GeForce RTX 4070 Ti Master
Intel Core i9-13900K, NVIDIA GeForce RTX 4070 Ti
20305 Samples/s +6%
Asus TUF Gaming GeForce RTX 4070 Ti
Intel Core i9-13900K, NVIDIA GeForce RTX 4070 Ti
20171 Samples/s +5%
Durchschnittliche NVIDIA GeForce RTX 4070 Ti
  (17719 - 20305, n=4)
19151 Samples/s 0%
Gigabyte GeForce RTX 4070 Super Gaming OC 12G
Intel Core i9-13900K, NVIDIA GeForce RTX 4070 SUPER
19131 Samples/s
NVIDIA GeForce RTX 4070 Super Founders Edition
Intel Core i9-13900K, NVIDIA GeForce RTX 4070 SUPER
19072 Samples/s 0%
Zotac Gaming GeForce RTX 3090 Ti AMP Extreme Holo
AMD Ryzen 7 5800X3D, NVIDIA GeForce RTX 3090 Ti
16046 Samples/s -16%
Durchschnittliche NVIDIA GeForce RTX 3080 Ti
  (14871 - 16438, n=4)
15612 Samples/s -18%
Zotac Gaming GeForce RTX 4070 AMP Airo
Intel Core i9-13900K, NVIDIA GeForce RTX 4070
15100 Samples/s -21%
AMD Radeon RX 7900 XTX
AMD Ryzen 9 7950X, AMD Radeon RX 7900 XTX
15019 Samples/s -21%
Durchschnittliche NVIDIA GeForce RTX 3090
  (14590 - 15242, n=9)
14945 Samples/s -22%
AMD Radeon RX 7900 XT
AMD Ryzen 9 7950X, AMD Radeon RX 7900 XT
13489 Samples/s -29%
Durchschnittliche NVIDIA GeForce RTX 3080
  (12797 - 12980, n=2)
12889 Samples/s -33%
Durchschnitt der Klasse Desktop
  (147 - 27828, n=23, der letzten 2 Jahre)
12288 Samples/s -36%
Durchschnittliche NVIDIA GeForce RTX 4060 Ti 8G
  (11159 - 11281, n=3)
11235 Samples/s -41%
KFA2 GeForce RTX 4060 Ti EX, 16GB GDDR6
AMD Ryzen 9 7950X, NVIDIA GeForce RTX 4060 Ti 16G
11226 Samples/s -41%
Durchschnittliche NVIDIA Titan RTX
  (10799 - 10996, n=2)
10898 Samples/s -43%
AMD Radeon RX 7800 XT
AMD Ryzen 9 7950X, AMD Radeon RX 7800 XT
10158 Samples/s -47%
Durchschnittliche NVIDIA GeForce RTX 3070
  (10096 - 10115, n=3)
10107 Samples/s -47%
KFA2 GeForce RTX 4060 1-Click-OC 2X
AMD Ryzen 9 7950X, NVIDIA GeForce RTX 4060
8991 Samples/s -53%
Sapphire Pulse Radeon RX 7700 XT
AMD Ryzen 9 7950X, AMD Radeon RX 7700 XT
8614 Samples/s -55%
XFX Speedster QICK 308 Radeon RX 7600 Black Edition
AMD Ryzen 9 7950X, AMD Radeon RX 7600
5583 Samples/s -71%
ComputeMark v2.1 / Normal, Score
NVIDIA GeForce RTX 4090 Founders Edition
Intel Core i9-13900K, NVIDIA GeForce RTX 4090
86583 Points +80%
AMD Radeon RX 7900 XTX
AMD Ryzen 9 7950X, AMD Radeon RX 7900 XTX
62963 Points +31%
NVIDIA GeForce RTX 4080 Founders Edition
Intel Core i9-13900K, NVIDIA GeForce RTX 4080
62720 Points +30%
AMD Radeon RX 7900 XT
AMD Ryzen 9 7950X, AMD Radeon RX 7900 XT
57570 Points +20%
Zotac Gaming GeForce RTX 3090 Ti AMP Extreme Holo
AMD Ryzen 7 5800X3D, NVIDIA GeForce RTX 3090 Ti
52258 Points +9%
Gigabyte Aorus GeForce RTX 4070 Ti Master
Intel Core i9-13900K, NVIDIA GeForce RTX 4070 Ti
52251 Points +8%
Durchschnittliche NVIDIA GeForce RTX 4070 Ti
  (51287 - 52251, n=4)
51747 Points +7%
Asus TUF Gaming GeForce RTX 4070 Ti
Intel Core i9-13900K, NVIDIA GeForce RTX 4070 Ti
51616 Points +7%
Durchschnittliche NVIDIA GeForce RTX 3080 Ti
  (47377 - 48892, n=4)
48266 Points 0%
Gigabyte GeForce RTX 4070 Super Gaming OC 12G
Intel Core i9-13900K, NVIDIA GeForce RTX 4070 SUPER
48163 Points
NVIDIA GeForce RTX 4070 Super Founders Edition
Intel Core i9-13900K, NVIDIA GeForce RTX 4070 SUPER
47808 Points -1%
Durchschnittliche NVIDIA GeForce RTX 3090
  (44948 - 49118, n=9)
47804 Points -1%
Sapphire AMD Radeon RX 6950 XT Nitro+ Pure
AMD Ryzen 9 5900X, AMD Radeon RX 6950 XT
44959 Points -7%
AMD Radeon RX 7800 XT
AMD Ryzen 9 7950X, AMD Radeon RX 7800 XT
43852 Points -9%
Zotac Gaming GeForce RTX 4070 AMP Airo
Intel Core i9-13900K, NVIDIA GeForce RTX 4070
41933 Points -13%
AMD Radeon RX 6900 XT
AMD Ryzen 9 5950X, AMD Radeon RX 6900 XT
40857 Points -15%
Durchschnittliche NVIDIA GeForce RTX 3080
  (39924 - 41594, n=2)
40759 Points -15%
AMD Radeon RX 6800 XT
AMD Ryzen 9 5950X, AMD Radeon RX 6800 XT
38823 Points -19%
Sapphire Pulse Radeon RX 7700 XT
AMD Ryzen 9 7950X, AMD Radeon RX 7700 XT
38363 Points -20%
Durchschnitt der Klasse Desktop
  (476 - 90920, n=24, der letzten 2 Jahre)
35064 Points -27%
KFA2 GeForce RTX 4060 Ti EX, 16GB GDDR6
AMD Ryzen 9 7950X, NVIDIA GeForce RTX 4060 Ti 16G
32285 Points -33%
Durchschnittliche NVIDIA GeForce RTX 4060 Ti 8G
  (31884 - 32410, n=3)
32125 Points -33%
Durchschnittliche NVIDIA GeForce RTX 3070
  (29330 - 30581, n=3)
30004 Points -38%
Durchschnittliche NVIDIA Titan RTX
  (27907 - 29830, n=3)
28802 Points -40%
XFX Speedster QICK 308 Radeon RX 7600 Black Edition
AMD Ryzen 9 7950X, AMD Radeon RX 7600
25119 Points -48%
KFA2 GeForce RTX 4060 1-Click-OC 2X
AMD Ryzen 9 7950X, NVIDIA GeForce RTX 4060
23841 Points -50%
ComputeMark v2.1 / Normal, QJuliaRayTrace
NVIDIA GeForce RTX 4090 Founders Edition
Intel Core i9-13900K, NVIDIA GeForce RTX 4090
31780 Points +60%
NVIDIA GeForce RTX 4080 Founders Edition
Intel Core i9-13900K, NVIDIA GeForce RTX 4080
24307 Points +22%
Gigabyte Aorus GeForce RTX 4070 Ti Master
Intel Core i9-13900K, NVIDIA GeForce RTX 4070 Ti
21619 Points +9%
Durchschnittliche NVIDIA GeForce RTX 4070 Ti
  (21107 - 21619, n=4)
21333 Points +7%
Asus TUF Gaming GeForce RTX 4070 Ti
Intel Core i9-13900K, NVIDIA GeForce RTX 4070 Ti
21276 Points +7%
Gigabyte GeForce RTX 4070 Super Gaming OC 12G
Intel Core i9-13900K, NVIDIA GeForce RTX 4070 SUPER
19861 Points
NVIDIA GeForce RTX 4070 Super Founders Edition
Intel Core i9-13900K, NVIDIA GeForce RTX 4070 SUPER
19738 Points -1%
Zotac Gaming GeForce RTX 3090 Ti AMP Extreme Holo
AMD Ryzen 7 5800X3D, NVIDIA GeForce RTX 3090 Ti
18550 Points -7%
AMD Radeon RX 7900 XTX
AMD Ryzen 9 7950X, AMD Radeon RX 7900 XTX
17915 Points -10%
Durchschnittliche NVIDIA GeForce RTX 3080 Ti
  (17050 - 17749, n=4)
17475 Points -12%
Durchschnittliche NVIDIA GeForce RTX 3090
  (16403 - 18223, n=10)
17454 Points -12%
Zotac Gaming GeForce RTX 4070 AMP Airo
Intel Core i9-13900K, NVIDIA GeForce RTX 4070
17091 Points -14%
AMD Radeon RX 7900 XT
AMD Ryzen 9 7950X, AMD Radeon RX 7900 XT
16990 Points -14%
Durchschnittliche NVIDIA GeForce RTX 3080
  (14718 - 15508, n=2)
15113 Points -24%
KFA2 GeForce RTX 4060 Ti EX, 16GB GDDR6
AMD Ryzen 9 7950X, NVIDIA GeForce RTX 4060 Ti 16G
13856 Points -30%
Durchschnittliche NVIDIA GeForce RTX 4060 Ti 8G
  (13563 - 13822, n=3)
13702 Points -31%
Sapphire AMD Radeon RX 6950 XT Nitro+ Pure
AMD Ryzen 9 5900X, AMD Radeon RX 6950 XT
13580 Points -32%
AMD Radeon RX 7800 XT
AMD Ryzen 9 7950X, AMD Radeon RX 7800 XT
13454 Points -32%
Durchschnitt der Klasse Desktop
  (159 - 33698, n=24, der letzten 2 Jahre)
13343 Points -33%
Sapphire Pulse Radeon RX 7700 XT
AMD Ryzen 9 7950X, AMD Radeon RX 7700 XT
12925 Points -35%
AMD Radeon RX 6900 XT
AMD Ryzen 9 5950X, AMD Radeon RX 6900 XT
12255 Points -38%
Durchschnittliche NVIDIA GeForce RTX 3070
  (11510 - 11816, n=3)
11665 Points -41%
AMD Radeon RX 6800 XT
AMD Ryzen 9 5950X, AMD Radeon RX 6800 XT
11304 Points -43%
KFA2 GeForce RTX 4060 1-Click-OC 2X
AMD Ryzen 9 7950X, NVIDIA GeForce RTX 4060
9916 Points -50%
Durchschnittliche NVIDIA Titan RTX
  (9418 - 10129, n=3)
9748 Points -51%
XFX Speedster QICK 308 Radeon RX 7600 Black Edition
AMD Ryzen 9 7950X, AMD Radeon RX 7600
8897 Points -55%
ComputeMark v2.1 / Normal, Mandel Scalar
NVIDIA GeForce RTX 4090 Founders Edition
Intel Core i9-13900K, NVIDIA GeForce RTX 4090
21571 Points +91%
AMD Radeon RX 7900 XTX
AMD Ryzen 9 7950X, AMD Radeon RX 7900 XTX
15458 Points +37%
NVIDIA GeForce RTX 4080 Founders Edition
Intel Core i9-13900K, NVIDIA GeForce RTX 4080
14733 Points +30%
AMD Radeon RX 7900 XT
AMD Ryzen 9 7950X, AMD Radeon RX 7900 XT
13989 Points +24%
Gigabyte Aorus GeForce RTX 4070 Ti Master
Intel Core i9-13900K, NVIDIA GeForce RTX 4070 Ti
12449 Points +10%
Zotac Gaming GeForce RTX 3090 Ti AMP Extreme Holo
AMD Ryzen 7 5800X3D, NVIDIA GeForce RTX 3090 Ti
12406 Points +10%
Asus TUF Gaming GeForce RTX 4070 Ti
Intel Core i9-13900K, NVIDIA GeForce RTX 4070 Ti
12320 Points +9%
Durchschnittliche NVIDIA GeForce RTX 4070 Ti
  (12126 - 12449, n=4)
12302 Points +9%
Sapphire AMD Radeon RX 6950 XT Nitro+ Pure
AMD Ryzen 9 5900X, AMD Radeon RX 6950 XT
11854 Points +5%
Gigabyte GeForce RTX 4070 Super Gaming OC 12G
Intel Core i9-13900K, NVIDIA GeForce RTX 4070 SUPER
11317 Points
AMD Radeon RX 7800 XT
AMD Ryzen 9 7950X, AMD Radeon RX 7800 XT
11209 Points -1%
Durchschnittliche NVIDIA GeForce RTX 3080 Ti
  (11049 - 11318, n=4)
11196 Points -1%
Durchschnittliche NVIDIA GeForce RTX 3090
  (10650 - 11564, n=10)
11162 Points -1%
NVIDIA GeForce RTX 4070 Super Founders Edition
Intel Core i9-13900K, NVIDIA GeForce RTX 4070 SUPER
11149 Points -1%
AMD Radeon RX 6900 XT
AMD Ryzen 9 5950X, AMD Radeon RX 6900 XT
10834 Points -4%
Sapphire Pulse Radeon RX 7700 XT
AMD Ryzen 9 7950X, AMD Radeon RX 7700 XT
10601 Points -6%
AMD Radeon RX 6800 XT
AMD Ryzen 9 5950X, AMD Radeon RX 6800 XT
10018 Points -11%
Durchschnittliche NVIDIA GeForce RTX 3080
  (9554 - 9938, n=2)
9746 Points -14%
Zotac Gaming GeForce RTX 4070 AMP Airo
Intel Core i9-13900K, NVIDIA GeForce RTX 4070
9578 Points -15%
Durchschnitt der Klasse Desktop
  (75 - 22731, n=24, der letzten 2 Jahre)
8325 Points -26%
KFA2 GeForce RTX 4060 Ti EX, 16GB GDDR6
AMD Ryzen 9 7950X, NVIDIA GeForce RTX 4060 Ti 16G
7454 Points -34%
Durchschnittliche NVIDIA GeForce RTX 4060 Ti 8G
  (7374 - 7511, n=3)
7431 Points -34%
Durchschnittliche NVIDIA GeForce RTX 3070
  (7042 - 7314, n=3)
7169 Points -37%
XFX Speedster QICK 308 Radeon RX 7600 Black Edition
AMD Ryzen 9 7950X, AMD Radeon RX 7600
6746 Points -40%
Durchschnittliche NVIDIA Titan RTX
  (5977 - 6406, n=3)
6184 Points -45%
KFA2 GeForce RTX 4060 1-Click-OC 2X
AMD Ryzen 9 7950X, NVIDIA GeForce RTX 4060
5153 Points -54%
ComputeMark v2.1 / Normal, Mandel Vector
NVIDIA GeForce RTX 4090 Founders Edition
Intel Core i9-13900K, NVIDIA GeForce RTX 4090
16199 Points +66%
AMD Radeon RX 7900 XTX
AMD Ryzen 9 7950X, AMD Radeon RX 7900 XTX
13737 Points +41%
AMD Radeon RX 7900 XT
AMD Ryzen 9 7950X, AMD Radeon RX 7900 XT
13022 Points +34%
NVIDIA GeForce RTX 4080 Founders Edition
Intel Core i9-13900K, NVIDIA GeForce RTX 4080
11772 Points +21%
Gigabyte Aorus GeForce RTX 4070 Ti Master
Intel Core i9-13900K, NVIDIA GeForce RTX 4070 Ti
10888 Points +12%
Asus TUF Gaming GeForce RTX 4070 Ti
Intel Core i9-13900K, NVIDIA GeForce RTX 4070 Ti
10771 Points +10%
Durchschnittliche NVIDIA GeForce RTX 4070 Ti
  (10541 - 10888, n=4)
10728 Points +10%
Zotac Gaming GeForce RTX 3090 Ti AMP Extreme Holo
AMD Ryzen 7 5800X3D, NVIDIA GeForce RTX 3090 Ti
10652 Points +9%
AMD Radeon RX 7800 XT
AMD Ryzen 9 7950X, AMD Radeon RX 7800 XT
9963 Points +2%
Gigabyte GeForce RTX 4070 Super Gaming OC 12G
Intel Core i9-13900K, NVIDIA GeForce RTX 4070 SUPER
9748 Points
Durchschnittliche NVIDIA GeForce RTX 3080 Ti
  (9513 - 9860, n=4)
9730 Points 0%
NVIDIA GeForce RTX 4070 Super Founders Edition
Intel Core i9-13900K, NVIDIA GeForce RTX 4070 SUPER
9629 Points -1%
Sapphire Pulse Radeon RX 7700 XT
AMD Ryzen 9 7950X, AMD Radeon RX 7700 XT
9568 Points -2%
Sapphire AMD Radeon RX 6950 XT Nitro+ Pure
AMD Ryzen 9 5900X, AMD Radeon RX 6950 XT
9555 Points -2%
Durchschnittliche NVIDIA GeForce RTX 3090
  (8038 - 10097, n=10)
9467 Points -3%
AMD Radeon RX 6900 XT
AMD Ryzen 9 5950X, AMD Radeon RX 6900 XT
8690 Points -11%
Zotac Gaming GeForce RTX 4070 AMP Airo
Intel Core i9-13900K, NVIDIA GeForce RTX 4070
8421 Points -14%
AMD Radeon RX 6800 XT
AMD Ryzen 9 5950X, AMD Radeon RX 6800 XT
8399 Points -14%
Durchschnittliche NVIDIA GeForce RTX 3080
  (7148 - 7540, n=2)
7344 Points -25%
Durchschnitt der Klasse Desktop
  (97 - 16942, n=24, der letzten 2 Jahre)
6936 Points -29%
Durchschnittliche NVIDIA GeForce RTX 4060 Ti 8G
  (6815 - 6929, n=3)
6854 Points -30%
KFA2 GeForce RTX 4060 Ti EX, 16GB GDDR6
AMD Ryzen 9 7950X, NVIDIA GeForce RTX 4060 Ti 16G
6852 Points -30%
XFX Speedster QICK 308 Radeon RX 7600 Black Edition
AMD Ryzen 9 7950X, AMD Radeon RX 7600
5764 Points -41%
Durchschnittliche NVIDIA GeForce RTX 3070
  (5364 - 6266, n=3)
5707 Points -41%
Durchschnittliche NVIDIA Titan RTX
  (4944 - 5440, n=3)
5158 Points -47%
KFA2 GeForce RTX 4060 1-Click-OC 2X
AMD Ryzen 9 7950X, NVIDIA GeForce RTX 4060
4916 Points -50%
ComputeMark v2.1 / Normal, Fluid 2DTexArr
AMD Radeon RX 7900 XTX
AMD Ryzen 9 7950X, AMD Radeon RX 7900 XTX
7315 Points +103%
NVIDIA GeForce RTX 4090 Founders Edition
Intel Core i9-13900K, NVIDIA GeForce RTX 4090
6567 Points +82%
AMD Radeon RX 7900 XT
AMD Ryzen 9 7950X, AMD Radeon RX 7900 XT
6460 Points +79%
NVIDIA GeForce RTX 4080 Founders Edition
Intel Core i9-13900K, NVIDIA GeForce RTX 4080
5523 Points +53%
Zotac Gaming GeForce RTX 3090 Ti AMP Extreme Holo
AMD Ryzen 7 5800X3D, NVIDIA GeForce RTX 3090 Ti
4886 Points +36%
Durchschnittliche NVIDIA GeForce RTX 3080 Ti
  (4453 - 4546, n=4)
4498 Points +25%
Durchschnittliche NVIDIA GeForce RTX 3090
  (4344 - 4608, n=10)
4492 Points +25%
AMD Radeon RX 7800 XT
AMD Ryzen 9 7950X, AMD Radeon RX 7800 XT
4489 Points +25%
Sapphire AMD Radeon RX 6950 XT Nitro+ Pure
AMD Ryzen 9 5900X, AMD Radeon RX 6950 XT
4455 Points +24%
Durchschnittliche NVIDIA GeForce RTX 3080
  (4087 - 4159, n=2)
4123 Points +15%
AMD Radeon RX 6800 XT
AMD Ryzen 9 5950X, AMD Radeon RX 6800 XT
3947 Points +10%
AMD Radeon RX 6900 XT
AMD Ryzen 9 5950X, AMD Radeon RX 6900 XT
3924 Points +9%
Durchschnittliche NVIDIA Titan RTX
  (3691 - 3828, n=3)
3757 Points +4%
Durchschnittliche NVIDIA GeForce RTX 4070 Ti
  (3566 - 3724, n=4)
3647 Points +1%
Gigabyte GeForce RTX 4070 Super Gaming OC 12G
Intel Core i9-13900K, NVIDIA GeForce RTX 4070 SUPER
3599 Points
NVIDIA GeForce RTX 4070 Super Founders Edition
Intel Core i9-13900K, NVIDIA GeForce RTX 4070 SUPER
3592 Points 0%
Gigabyte Aorus GeForce RTX 4070 Ti Master
Intel Core i9-13900K, NVIDIA GeForce RTX 4070 Ti
3590 Points 0%
Asus TUF Gaming GeForce RTX 4070 Ti
Intel Core i9-13900K, NVIDIA GeForce RTX 4070 Ti
3566 Points -1%
Zotac Gaming GeForce RTX 4070 AMP Airo
Intel Core i9-13900K, NVIDIA GeForce RTX 4070
3404 Points -5%
Durchschnitt der Klasse Desktop
  (60 - 6800, n=24, der letzten 2 Jahre)
2929 Points -19%
Durchschnittliche NVIDIA GeForce RTX 3070
  (2666 - 2706, n=3)
2692 Points -25%
Sapphire Pulse Radeon RX 7700 XT
AMD Ryzen 9 7950X, AMD Radeon RX 7700 XT
2666 Points -26%
Durchschnittliche NVIDIA GeForce RTX 4060 Ti 8G
  (2044 - 2060, n=3)
2049 Points -43%
KFA2 GeForce RTX 4060 Ti EX, 16GB GDDR6
AMD Ryzen 9 7950X, NVIDIA GeForce RTX 4060 Ti 16G
2039 Points -43%
KFA2 GeForce RTX 4060 1-Click-OC 2X
AMD Ryzen 9 7950X, NVIDIA GeForce RTX 4060
1912 Points -47%
XFX Speedster QICK 308 Radeon RX 7600 Black Edition
AMD Ryzen 9 7950X, AMD Radeon RX 7600
1878 Points -48%
ComputeMark v2.1 / Normal, Fluid 3DTex
NVIDIA GeForce RTX 4090 Founders Edition
Intel Core i9-13900K, NVIDIA GeForce RTX 4090
10465 Points +188%
AMD Radeon RX 7900 XTX
AMD Ryzen 9 7950X, AMD Radeon RX 7900 XTX
8537 Points +135%
AMD Radeon RX 7900 XT
AMD Ryzen 9 7950X, AMD Radeon RX 7900 XT
7109 Points +95%
NVIDIA GeForce RTX 4080 Founders Edition
Intel Core i9-13900K, NVIDIA GeForce RTX 4080
6385 Points +76%
Zotac Gaming GeForce RTX 3090 Ti AMP Extreme Holo
AMD Ryzen 7 5800X3D, NVIDIA GeForce RTX 3090 Ti
5764 Points +58%
Sapphire AMD Radeon RX 6950 XT Nitro+ Pure
AMD Ryzen 9 5900X, AMD Radeon RX 6950 XT
5515 Points +52%
Durchschnittliche NVIDIA GeForce RTX 3090
  (5246 - 5520, n=10)
5448 Points +50%
Durchschnittliche NVIDIA GeForce RTX 3080 Ti
  (5312 - 5422, n=4)
5368 Points +48%
AMD Radeon RX 6800 XT
AMD Ryzen 9 5950X, AMD Radeon RX 6800 XT
5154 Points +42%
AMD Radeon RX 6900 XT
AMD Ryzen 9 5950X, AMD Radeon RX 6900 XT
5154 Points +42%
AMD Radeon RX 7800 XT
AMD Ryzen 9 7950X, AMD Radeon RX 7800 XT
4736 Points +30%
Durchschnittliche NVIDIA GeForce RTX 3080
  (4417 - 4450, n=2)
4434 Points +22%
Durchschnittliche NVIDIA Titan RTX
  (3877 - 4027, n=3)
3955 Points +9%
Durchschnittliche NVIDIA GeForce RTX 4070 Ti
  (3683 - 3789, n=4)
3738 Points +3%
Gigabyte Aorus GeForce RTX 4070 Ti Master
Intel Core i9-13900K, NVIDIA GeForce RTX 4070 Ti
3705 Points +2%
NVIDIA GeForce RTX 4070 Super Founders Edition
Intel Core i9-13900K, NVIDIA GeForce RTX 4070 SUPER
3701 Points +2%
Asus TUF Gaming GeForce RTX 4070 Ti
Intel Core i9-13900K, NVIDIA GeForce RTX 4070 Ti
3683 Points +1%
Gigabyte GeForce RTX 4070 Super Gaming OC 12G
Intel Core i9-13900K, NVIDIA GeForce RTX 4070 SUPER
3638 Points
Durchschnitt der Klasse Desktop
  (65 - 10749, n=24, der letzten 2 Jahre)
3532 Points -3%
Zotac Gaming GeForce RTX 4070 AMP Airo
Intel Core i9-13900K, NVIDIA GeForce RTX 4070
3438 Points -5%
Durchschnittliche NVIDIA GeForce RTX 3070
  (2749 - 2791, n=3)
2772 Points -24%
Sapphire Pulse Radeon RX 7700 XT
AMD Ryzen 9 7950X, AMD Radeon RX 7700 XT
2603 Points -28%
Durchschnittliche NVIDIA GeForce RTX 4060 Ti 8G
  (2088 - 2090, n=3)
2089 Points -43%
KFA2 GeForce RTX 4060 Ti EX, 16GB GDDR6
AMD Ryzen 9 7950X, NVIDIA GeForce RTX 4060 Ti 16G
2085 Points -43%
KFA2 GeForce RTX 4060 1-Click-OC 2X
AMD Ryzen 9 7950X, NVIDIA GeForce RTX 4060
1943 Points -47%
XFX Speedster QICK 308 Radeon RX 7600 Black Edition
AMD Ryzen 9 7950X, AMD Radeon RX 7600
1835 Points -50%

* ... kleinere Werte sind besser

Spielleistung: Erhöhte Boosts führen zu kleinen, aber willkommenen Verbesserungen gegenüber der RTX 4070 Super FE

Die Vorteile der erhöhten Boost-Taktraten werden beim Spielen deutlich, insbesondere bei Ultra-Einstellungen von 1.080p bis 4K.

Die höheren Takte scheinen der RTX 4070 Super Gaming OC einen kumulativen Leistungsvorteil von 5 % gegenüber der RTX 4070 Super FE zu verschaffen, was den Abstand zur RTX 3090 im Durchschnitt um 7 % vergrößert.

Bei individueller Betrachtung wurden die maximalen Gewinne gegenüber der RTX 4070 Super FE bei The Witcher 3 1.080p Ultra (+9 %) und Shadow of the Tomb Raider QHD Ultra (+14 %) festgestellt. Andere Spiele in diesem Vergleich zeigten relativ bescheidene Steigerungen der durchschnittlichen fps.

Performance Rating - Percent
NVIDIA GeForce RTX 4090 Founders Edition
Intel Core i9-13900K, NVIDIA GeForce RTX 4090
99.8 pt
NVIDIA GeForce RTX 4080 Founders Edition
Intel Core i9-13900K, NVIDIA GeForce RTX 4080
85.2 pt
AMD Radeon RX 7900 XTX -3!
AMD Ryzen 9 7950X, AMD Radeon RX 7900 XTX
83.8 pt
AMD Radeon RX 7900 XT -3!
AMD Ryzen 9 7950X, AMD Radeon RX 7900 XT
74.6 pt
Asus TUF Gaming GeForce RTX 4070 Ti
Intel Core i9-13900K, NVIDIA GeForce RTX 4070 Ti
71.4 pt
Gigabyte Aorus GeForce RTX 4070 Ti Master
Intel Core i9-13900K, NVIDIA GeForce RTX 4070 Ti
71.3 pt
Zotac Gaming GeForce RTX 3090 Ti AMP Extreme Holo
AMD Ryzen 7 5800X3D, NVIDIA GeForce RTX 3090 Ti
71.1 pt
Durchschnittliche NVIDIA GeForce RTX 4070 Ti
 
70.2 pt
Gigabyte GeForce RTX 4070 Super Gaming OC 12G
Intel Core i9-13900K, NVIDIA GeForce RTX 4070 SUPER
65.4 pt
Durchschnitt der Klasse Desktop
 
65.2 pt
Sapphire AMD Radeon RX 6950 XT Nitro+ Pure
AMD Ryzen 9 5900X, AMD Radeon RX 6950 XT
62.4 pt
NVIDIA GeForce RTX 4070 Super Founders Edition
Intel Core i9-13900K, NVIDIA GeForce RTX 4070 SUPER
62.4 pt
Durchschnittliche NVIDIA GeForce RTX 3080 Ti
 
61.8 pt
Durchschnittliche NVIDIA GeForce RTX 3090
 
61.3 pt
AMD Radeon RX 7800 XT -3!
AMD Ryzen 9 7950X, AMD Radeon RX 7800 XT
57.6 pt
Zotac Gaming GeForce RTX 4070 AMP Airo
Intel Core i9-13900K, NVIDIA GeForce RTX 4070
57.1 pt
AMD Radeon RX 6900 XT
AMD Ryzen 9 5950X, AMD Radeon RX 6900 XT
54.1 pt
Durchschnittliche NVIDIA GeForce RTX 3080
 
53 pt
AMD Radeon RX 6800 XT -1!
AMD Ryzen 9 5950X, AMD Radeon RX 6800 XT
50.7 pt
Sapphire Pulse Radeon RX 7700 XT -3!
AMD Ryzen 9 7950X, AMD Radeon RX 7700 XT
48.5 pt
Durchschnittliche NVIDIA Titan RTX
 
45 pt
Durchschnittliche NVIDIA GeForce RTX 4060 Ti 8G -3!
 
42.2 pt
KFA2 GeForce RTX 4060 Ti EX, 16GB GDDR6 -3!
AMD Ryzen 9 7950X, NVIDIA GeForce RTX 4060 Ti 16G
41.4 pt
Durchschnittliche NVIDIA GeForce RTX 3070
 
40.8 pt
XFX Speedster QICK 308 Radeon RX 7600 Black Edition -3!
AMD Ryzen 9 7950X, AMD Radeon RX 7600
33.9 pt
KFA2 GeForce RTX 4060 1-Click-OC 2X -3!
AMD Ryzen 9 7950X, NVIDIA GeForce RTX 4060
33.5 pt
The Witcher 3
3840x2160 Ultra Graphics & Postprocessing (HBAO+)
NVIDIA GeForce RTX 4090 Founders Edition
Intel Core i9-13900K, NVIDIA GeForce RTX 4090
170.7 (154min, 154.59P1) fps +92%
NVIDIA GeForce RTX 4080 Founders Edition
Intel Core i9-13900K, NVIDIA GeForce RTX 4080
128 (113min, 114.12P1) fps +44%
AMD Radeon RX 7900 XTX
AMD Ryzen 9 7950X, AMD Radeon RX 7900 XTX
125.8 (9.5min, 66.1P0.1, 94.8P1) fps +41%
Durchschnitt der Klasse Desktop
  (55.9 - 178.6, n=20, der letzten 2 Jahre)
114.9 fps +29%
AMD Radeon RX 7900 XT
AMD Ryzen 9 7950X, AMD Radeon RX 7900 XT
109.4 (57.5min, 60.1P0.1, 86.2P1) fps +23%
Zotac Gaming GeForce RTX 3090 Ti AMP Extreme Holo
AMD Ryzen 7 5800X3D, NVIDIA GeForce RTX 3090 Ti
107.5 (97min, 97.56P1) fps +21%
Asus TUF Gaming GeForce RTX 4070 Ti
Intel Core i9-13900K, NVIDIA GeForce RTX 4070 Ti
98.3 (88min, 88.56P1) fps +10%
Durchschnittliche NVIDIA GeForce RTX 4070 Ti
  (92.4 - 98.3, n=4)
95.2 fps +7%
Durchschnittliche NVIDIA GeForce RTX 3080 Ti
  (93.1 - 96.4, n=4)
94.7 fps +6%
Gigabyte Aorus GeForce RTX 4070 Ti Master
Intel Core i9-13900K, NVIDIA GeForce RTX 4070 Ti
94.4 (86min, 86.46P1) fps +6%
Durchschnittliche NVIDIA GeForce RTX 3090
  (85.4 - 98.5, n=8)
93.4 fps +5%
Sapphire AMD Radeon RX 6950 XT Nitro+ Pure
AMD Ryzen 9 5900X, AMD Radeon RX 6950 XT
92.3 (10.8min, 48.8P0.1, 54.2P1) fps +4%
Gigabyte GeForce RTX 4070 Super Gaming OC 12G
Intel Core i9-13900K, NVIDIA GeForce RTX 4070 SUPER
89.1 (81min, 81.6P1) fps
NVIDIA GeForce RTX 4070 Super Founders Edition
Intel Core i9-13900K, NVIDIA GeForce RTX 4070 SUPER
84.5 (77min, 77P1) fps -5%
Durchschnittliche NVIDIA GeForce RTX 3080
  (78 - 85.7, n=2)
81.9 fps -8%
AMD Radeon RX 7800 XT
AMD Ryzen 9 7950X, AMD Radeon RX 7800 XT
80.4 fps -10%
Zotac Gaming GeForce RTX 4070 AMP Airo
Intel Core i9-13900K, NVIDIA GeForce RTX 4070
77.1 (69min, 69P1) fps -13%
AMD Radeon RX 6900 XT
AMD Ryzen 9 5950X, AMD Radeon RX 6900 XT
76.6 (70min, 70P1) fps -14%
Durchschnittliche NVIDIA Titan RTX
  ()
71.8 fps -19%
Sapphire Pulse Radeon RX 7700 XT
AMD Ryzen 9 7950X, AMD Radeon RX 7700 XT
64.4 (33min, 33.3P0.1, 56.3P1) fps -28%
Durchschnittliche NVIDIA GeForce RTX 3070
  (59 - 60.3, n=2)
59.7 fps -33%
Durchschnittliche NVIDIA GeForce RTX 4060 Ti 8G
  (53.9 - 54.3, n=3)
54.1 fps -39%
KFA2 GeForce RTX 4060 Ti EX, 16GB GDDR6
AMD Ryzen 9 7950X, NVIDIA GeForce RTX 4060 Ti 16G
53.1 fps -40%
XFX Speedster QICK 308 Radeon RX 7600 Black Edition
AMD Ryzen 9 7950X, AMD Radeon RX 7600
43.9 fps -51%
KFA2 GeForce RTX 4060 1-Click-OC 2X
AMD Ryzen 9 7950X, NVIDIA GeForce RTX 4060
43.7 fps -51%
3840x2160 High Graphics & Postprocessing (Nvidia HairWorks Off)
NVIDIA GeForce RTX 4090 Founders Edition
Intel Core i9-13900K, NVIDIA GeForce RTX 4090
274 (243min, 244.12P1) fps +100%
NVIDIA GeForce RTX 4080 Founders Edition
Intel Core i9-13900K, NVIDIA GeForce RTX 4080
204 (183min, 183.55P1) fps +49%
Zotac Gaming GeForce RTX 3090 Ti AMP Extreme Holo
AMD Ryzen 7 5800X3D, NVIDIA GeForce RTX 3090 Ti
172.9 (152min, 152.57P1) fps +26%
AMD Radeon RX 7900 XTX
AMD Ryzen 9 7950X, AMD Radeon RX 7900 XTX
163.8 (49.6min, 112P0.1, 134.1P1) fps +20%
Durchschnitt der Klasse Desktop
  (16.1 - 282, n=23, der letzten 2 Jahre)
163.8 fps +20%
AMD Radeon RX 7900 XT
AMD Ryzen 9 7950X, AMD Radeon RX 7900 XT
158.5 (83.2min, 111.2P0.1, 122.8P1) fps +16%
Durchschnittliche NVIDIA GeForce RTX 3080 Ti
  (149 - 156.8, n=4)
152.4 fps +11%
Asus TUF Gaming GeForce RTX 4070 Ti
Intel Core i9-13900K, NVIDIA GeForce RTX 4070 Ti
151.9 (137min, 138.12P1) fps +11%
Durchschnittliche NVIDIA GeForce RTX 3090
  (128 - 160.2, n=12)
151.5 fps +11%
Gigabyte Aorus GeForce RTX 4070 Ti Master
Intel Core i9-13900K, NVIDIA GeForce RTX 4070 Ti
148.7 (130min, 130.59P1) fps +9%
Durchschnittliche NVIDIA GeForce RTX 4070 Ti
  (143 - 151.9, n=4)
148.2 fps +8%
Sapphire AMD Radeon RX 6950 XT Nitro+ Pure
AMD Ryzen 9 5900X, AMD Radeon RX 6950 XT
139.7 (10.4min, 105.6P0.1, 118.6P1) fps +2%
Gigabyte GeForce RTX 4070 Super Gaming OC 12G
Intel Core i9-13900K, NVIDIA GeForce RTX 4070 SUPER
136.7 (121min, 121.87P1) fps
NVIDIA GeForce RTX 4070 Super Founders Edition
Intel Core i9-13900K, NVIDIA GeForce RTX 4070 SUPER
129.4 (117min, 117.31P1) fps -5%
AMD Radeon RX 6900 XT
AMD Ryzen 9 5950X, AMD Radeon RX 6900 XT
122 (105min, 105P1) fps -11%
Zotac Gaming GeForce RTX 4070 AMP Airo
Intel Core i9-13900K, NVIDIA GeForce RTX 4070
116.9 (102min, 102P1) fps -14%
Durchschnittliche NVIDIA GeForce RTX 3080
  (114 - 115, n=2)
114.5 fps -16%
AMD Radeon RX 7800 XT
AMD Ryzen 9 7950X, AMD Radeon RX 7800 XT
112.9 fps -17%
AMD Radeon RX 6800 XT
AMD Ryzen 9 5950X, AMD Radeon RX 6800 XT
110 (97min) fps -20%
Durchschnittliche NVIDIA Titan RTX
  (94 - 107.1, n=28)
102.4 fps -25%
Durchschnittliche NVIDIA GeForce RTX 3070
  (84 - 93.9, n=5)
89.3 fps -35%
Sapphire Pulse Radeon RX 7700 XT
AMD Ryzen 9 7950X, AMD Radeon RX 7700 XT
88.7 (73.3min, 74.7P0.1, 79.4P1) fps -35%
Durchschnittliche NVIDIA GeForce RTX 4060 Ti 8G
  (78.5 - 80.4, n=3)
79.3 fps -42%
KFA2 GeForce RTX 4060 Ti EX, 16GB GDDR6
AMD Ryzen 9 7950X, NVIDIA GeForce RTX 4060 Ti 16G
78.5 fps -43%
KFA2 GeForce RTX 4060 1-Click-OC 2X
AMD Ryzen 9 7950X, NVIDIA GeForce RTX 4060
67.5 fps -51%
XFX Speedster QICK 308 Radeon RX 7600 Black Edition
AMD Ryzen 9 7950X, AMD Radeon RX 7600
58.7 fps -57%
1920x1080 Ultra Graphics & Postprocessing (HBAO+)
NVIDIA GeForce RTX 4090 Founders Edition
Intel Core i9-13900K, NVIDIA GeForce RTX 4090
297 (271min, 271P1) fps +41%
AMD Radeon RX 7900 XTX
AMD Ryzen 9 7950X, AMD Radeon RX 7900 XTX
297 (41.3min, 167.7P0.1, 245P1) fps +41%
AMD Radeon RX 7900 XT
AMD Ryzen 9 7950X, AMD Radeon RX 7900 XT
265 (104.1min, 151.5P0.1, 214P1) fps +26%
NVIDIA GeForce RTX 4080 Founders Edition
Intel Core i9-13900K, NVIDIA GeForce RTX 4080
254 (227min, 227P1) fps +21%
Asus TUF Gaming GeForce RTX 4070 Ti
Intel Core i9-13900K, NVIDIA GeForce RTX 4070 Ti
230 (207min, 208.68P1) fps +10%
Durchschnittliche NVIDIA GeForce RTX 4070 Ti
  (217 - 230, n=4)
223 fps +6%
Gigabyte Aorus GeForce RTX 4070 Ti Master
Intel Core i9-13900K, NVIDIA GeForce RTX 4070 Ti
220 (199min, 199.56P1) fps +5%
Gigabyte GeForce RTX 4070 Super Gaming OC 12G
Intel Core i9-13900K, NVIDIA GeForce RTX 4070 SUPER
210 (188min, 188.28P1) fps
Sapphire AMD Radeon RX 6950 XT Nitro+ Pure
AMD Ryzen 9 5900X, AMD Radeon RX 6950 XT
205 (10.2min, 109.8P0.1, 161.2P1) fps -2%
Zotac Gaming GeForce RTX 3090 Ti AMP Extreme Holo
AMD Ryzen 7 5800X3D, NVIDIA GeForce RTX 3090 Ti (110% PT)
196.3 (192min, 193P1) fps -7%
Zotac Gaming GeForce RTX 3090 Ti AMP Extreme Holo
AMD Ryzen 7 5800X3D, NVIDIA GeForce RTX 3090 Ti (100% PT)
193.4 (173min, 173.56P1) fps -8%
NVIDIA GeForce RTX 4070 Super Founders Edition
Intel Core i9-13900K, NVIDIA GeForce RTX 4070 SUPER
191.9 (175min, 175P1) fps -9%
AMD Radeon RX 7800 XT
AMD Ryzen 9 7950X, AMD Radeon RX 7800 XT
189.6 fps -10%
Durchschnittliche NVIDIA GeForce RTX 3080 Ti
  (174 - 184.6, n=4)
180.2 fps -14%
Durchschnittliche NVIDIA GeForce RTX 3090
  (160 - 192.6, n=16)
179.9 fps -14%
Zotac Gaming GeForce RTX 4070 AMP Airo
Intel Core i9-13900K, NVIDIA GeForce RTX 4070
168.6 (150min, 150.7P1) fps -20%
Durchschnitt der Klasse Desktop
  (3.9 - 314, n=31, der letzten 2 Jahre)
168.6 fps -20%
Sapphire Pulse Radeon RX 7700 XT
AMD Ryzen 9 7950X, AMD Radeon RX 7700 XT
168.3 (89min, 96.5P0.1, 143.7P1) fps -20%
AMD Radeon RX 6900 XT
AMD Ryzen 9 5950X, AMD Radeon RX 6900 XT
163.6 (139min) fps -22%
AMD Radeon RX 6800 XT
AMD Ryzen 9 5950X, AMD Radeon RX 6800 XT
160 (138min) fps -24%
Durchschnittliche NVIDIA GeForce RTX 3080
  (145 - 152, n=2)
148.5 fps -29%
Durchschnittliche NVIDIA GeForce RTX 4060 Ti 8G
  (136.2 - 140.6, n=3)
139.1 fps -34%
Durchschnittliche NVIDIA Titan RTX
  (124 - 150, n=28)
137.7 fps -34%
KFA2 GeForce RTX 4060 Ti EX, 16GB GDDR6
AMD Ryzen 9 7950X, NVIDIA GeForce RTX 4060 Ti 16G
132.3 fps -37%
XFX Speedster QICK 308 Radeon RX 7600 Black Edition
AMD Ryzen 9 7950X, AMD Radeon RX 7600
122.5 fps -42%
KFA2 GeForce RTX 4060 1-Click-OC 2X
AMD Ryzen 9 7950X, NVIDIA GeForce RTX 4060
111.6 fps -47%
Durchschnittliche NVIDIA GeForce RTX 3070
  (52.8 - 132.2, n=7)
106.1 fps -49%
Metro Exodus
3840x2160 Ultra Quality AF:16x
NVIDIA GeForce RTX 4090 Founders Edition
Intel Core i9-13900K, NVIDIA GeForce RTX 4090
135 (72.48min) fps +77%
NVIDIA GeForce RTX 4080 Founders Edition
Intel Core i9-13900K, NVIDIA GeForce RTX 4080
105.7 (67.17min) fps +39%
AMD Radeon RX 7900 XTX
AMD Ryzen 9 7950X, AMD Radeon RX 7900 XTX
103.5 (66.43min) fps +36%
AMD Radeon RX 7900 XT
AMD Ryzen 9 7950X, AMD Radeon RX 7900 XT
86.9 (56.86min) fps +14%
Gigabyte Aorus GeForce RTX 4070 Ti Master
Intel Core i9-13900K, NVIDIA GeForce RTX 4070 Ti
85 (54.63min) fps +12%
Asus TUF Gaming GeForce RTX 4070 Ti
Intel Core i9-13900K, NVIDIA GeForce RTX 4070 Ti
84.5 (55.02min) fps +11%
Zotac Gaming GeForce RTX 3090 Ti AMP Extreme Holo
AMD Ryzen 7 5800X3D, NVIDIA GeForce RTX 3090 Ti
84.3 (52.3min) fps +11%
Durchschnitt der Klasse Desktop
  (8.47 - 138.5, n=23, der letzten 2 Jahre)
83.6 fps +10%
Durchschnittliche NVIDIA GeForce RTX 4070 Ti
  (81.2 - 85, n=4)
83.4 fps +10%
Gigabyte GeForce RTX 4070 Super Gaming OC 12G
Intel Core i9-13900K, NVIDIA GeForce RTX 4070 SUPER
76.1 (49.56min) fps
Durchschnittliche NVIDIA GeForce RTX 3080 Ti
  (74.2 - 77.1, n=4)
75.7 fps -1%
Sapphire AMD Radeon RX 6950 XT Nitro+ Pure
AMD Ryzen 9 5900X, AMD Radeon RX 6950 XT
75 (50.07min) fps -1%
Durchschnittliche NVIDIA GeForce RTX 3090
  (70.6 - 77.3, n=12)
75 fps -1%
NVIDIA GeForce RTX 4070 Super Founders Edition
Intel Core i9-13900K, NVIDIA GeForce RTX 4070 SUPER
72.8 (46.78min) fps -4%
AMD Radeon RX 6900 XT
AMD Ryzen 9 5950X, AMD Radeon RX 6900 XT
66.7 (42.71min) fps -12%
AMD Radeon RX 7800 XT
AMD Ryzen 9 7950X, AMD Radeon RX 7800 XT
66.7 (43.89min) fps -12%
Zotac Gaming GeForce RTX 4070 AMP Airo
Intel Core i9-13900K, NVIDIA GeForce RTX 4070
65 (41.89min) fps -15%
Durchschnittliche NVIDIA GeForce RTX 3080
  (64.1 - 65.9, n=2)
65 fps -15%
Sapphire Pulse Radeon RX 7700 XT
AMD Ryzen 9 7950X, AMD Radeon RX 7700 XT
57 (38.42min) fps -25%
AMD Radeon RX 6800 XT
AMD Ryzen 9 5950X, AMD Radeon RX 6800 XT
56.3 (40.14min) fps -26%
Durchschnittliche NVIDIA Titan RTX
  (51.3 - 57.9, n=27)
54.9 fps -28%
Durchschnittliche NVIDIA GeForce RTX 3070
  (48.3 - 49.7, n=5)
48.9 fps -36%
Durchschnittliche NVIDIA GeForce RTX 4060 Ti 8G
  (48.4 - 49.3, n=3)
48.8 fps -36%
KFA2 GeForce RTX 4060 Ti EX, 16GB GDDR6
AMD Ryzen 9 7950X, NVIDIA GeForce RTX 4060 Ti 16G
48.1 (32min) fps -37%
KFA2 GeForce RTX 4060 1-Click-OC 2X
AMD Ryzen 9 7950X, NVIDIA GeForce RTX 4060
38.3 (25.16min) fps -50%
XFX Speedster QICK 308 Radeon RX 7600 Black Edition
AMD Ryzen 9 7950X, AMD Radeon RX 7600
38.1 (25.45min) fps -50%
2560x1440 Ultra Quality AF:16x
NVIDIA GeForce RTX 4090 Founders Edition
Intel Core i9-13900K, NVIDIA GeForce RTX 4090
176 (81.25min) fps +46%
NVIDIA GeForce RTX 4080 Founders Edition
Intel Core i9-13900K, NVIDIA GeForce RTX 4080
155.1 (77.58min) fps +28%
AMD Radeon RX 7900 XTX
AMD Ryzen 9 7950X, AMD Radeon RX 7900 XTX
154.5 (90.83min) fps +28%
AMD Radeon RX 7900 XT
AMD Ryzen 9 7950X, AMD Radeon RX 7900 XT
135 (79.57min) fps +12%
Gigabyte Aorus GeForce RTX 4070 Ti Master
Intel Core i9-13900K, NVIDIA GeForce RTX 4070 Ti
132.3 (73.1min) fps +10%
Asus TUF Gaming GeForce RTX 4070 Ti
Intel Core i9-13900K, NVIDIA GeForce RTX 4070 Ti
132.1 (72.92min) fps +9%
Durchschnittliche NVIDIA GeForce RTX 4070 Ti
  (126.7 - 132.3, n=4)
130 fps +8%
Zotac Gaming GeForce RTX 3090 Ti AMP Extreme Holo
AMD Ryzen 7 5800X3D, NVIDIA GeForce RTX 3090 Ti
125.3 (64.48min) fps +4%
Gigabyte GeForce RTX 4070 Super Gaming OC 12G
Intel Core i9-13900K, NVIDIA GeForce RTX 4070 SUPER
120.8 (68.31min) fps
Durchschnitt der Klasse Desktop
  (14.8 - 181.3, n=23, der letzten 2 Jahre)
120.8 fps 0%
NVIDIA GeForce RTX 4070 Super Founders Edition
Intel Core i9-13900K, NVIDIA GeForce RTX 4070 SUPER
116.1 (66.05min) fps -4%
Sapphire AMD Radeon RX 6950 XT Nitro+ Pure
AMD Ryzen 9 5900X, AMD Radeon RX 6950 XT
115.5 (70.52min) fps -4%
Durchschnittliche NVIDIA GeForce RTX 3080 Ti
  (110 - 118, n=4)
114 fps -6%
Durchschnittliche NVIDIA GeForce RTX 3090
  (102 - 118.2, n=12)
113.2 fps -6%
Zotac Gaming GeForce RTX 4070 AMP Airo
Intel Core i9-13900K, NVIDIA GeForce RTX 4070
103.8 (60.52min) fps -14%
AMD Radeon RX 7800 XT
AMD Ryzen 9 7950X, AMD Radeon RX 7800 XT
102.6 (62.24min) fps -15%
AMD Radeon RX 6900 XT
AMD Ryzen 9 5950X, AMD Radeon RX 6900 XT
102 (59.52min) fps -16%
Durchschnittliche NVIDIA GeForce RTX 3080
  (92.2 - 97.4, n=2)
94.8 fps -22%
AMD Radeon RX 6800 XT
AMD Ryzen 9 5950X, AMD Radeon RX 6800 XT
94.6 (55.44min) fps -22%
Sapphire Pulse Radeon RX 7700 XT
AMD Ryzen 9 7950X, AMD Radeon RX 7700 XT
89.6 (55.65min) fps -26%
Durchschnittliche NVIDIA Titan RTX
  (69 - 92.9, n=26)
84 fps -30%
Durchschnittliche NVIDIA GeForce RTX 4060 Ti 8G
  (78.9 - 80.1, n=3)
79.4 fps -34%
KFA2 GeForce RTX 4060 Ti EX, 16GB GDDR6
AMD Ryzen 9 7950X, NVIDIA GeForce RTX 4060 Ti 16G
78.6 (46.09min) fps -35%
Durchschnittliche NVIDIA GeForce RTX 3070
  (74.4 - 78.3, n=5)
75.8 fps -37%
XFX Speedster QICK 308 Radeon RX 7600 Black Edition
AMD Ryzen 9 7950X, AMD Radeon RX 7600
64.9 (40.24min) fps -46%
KFA2 GeForce RTX 4060 1-Click-OC 2X
AMD Ryzen 9 7950X, NVIDIA GeForce RTX 4060
62.9 (36.84min) fps -48%
1920x1080 Ultra Quality AF:16x
NVIDIA GeForce RTX 4090 Founders Edition
Intel Core i9-13900K, NVIDIA GeForce RTX 4090
191.2 (84.99min) fps +27%
AMD Radeon RX 7900 XTX
AMD Ryzen 9 7950X, AMD Radeon RX 7900 XTX
183.5 (102.51min) fps +22%
NVIDIA GeForce RTX 4080 Founders Edition
Intel Core i9-13900K, NVIDIA GeForce RTX 4080
180 (82.56min) fps +20%
AMD Radeon RX 7900 XT
AMD Ryzen 9 7950X, AMD Radeon RX 7900 XT
164.6 (92.11min) fps +9%
Asus TUF Gaming GeForce RTX 4070 Ti
Intel Core i9-13900K, NVIDIA GeForce RTX 4070 Ti
161.4 (78.05min) fps +7%
Gigabyte Aorus GeForce RTX 4070 Ti Master
Intel Core i9-13900K, NVIDIA GeForce RTX 4070 Ti
161.2 (77.88min) fps +7%
Durchschnittliche NVIDIA GeForce RTX 4070 Ti
  (155.6 - 161.4, n=4)
158.8 fps +5%
Gigabyte GeForce RTX 4070 Super Gaming OC 12G
Intel Core i9-13900K, NVIDIA GeForce RTX 4070 SUPER
150.6 (76.71min) fps
Zotac Gaming GeForce RTX 3090 Ti AMP Extreme Holo
AMD Ryzen 7 5800X3D, NVIDIA GeForce RTX 3090 Ti
145.9 (68.14min) fps -3%
NVIDIA GeForce RTX 4070 Super Founders Edition
Intel Core i9-13900K, NVIDIA GeForce RTX 4070 SUPER
144.8 (73.65min) fps -4%
Sapphire AMD Radeon RX 6950 XT Nitro+ Pure
AMD Ryzen 9 5900X, AMD Radeon RX 6950 XT
140 (81.08min) fps -7%
Durchschnittliche NVIDIA GeForce RTX 3080 Ti
  (131 - 144.2, n=5)
135.4 fps -10%
Durchschnittliche NVIDIA GeForce RTX 3090
  (108 - 145, n=12)
135.3 fps -10%
Zotac Gaming GeForce RTX 4070 AMP Airo
Intel Core i9-13900K, NVIDIA GeForce RTX 4070
129.4 (68.29min) fps -14%
AMD Radeon RX 7800 XT
AMD Ryzen 9 7950X, AMD Radeon RX 7800 XT
128.5 (73.66min) fps -15%
AMD Radeon RX 6900 XT
AMD Ryzen 9 5950X, AMD Radeon RX 6900 XT
123 (67.67min) fps -18%
Durchschnitt der Klasse Desktop
  (5.22 - 194.7, n=27, der letzten 2 Jahre)
121.2 fps -20%
AMD Radeon RX 6800 XT
AMD Ryzen 9 5950X, AMD Radeon RX 6800 XT
115 (64.52min) fps -24%
Sapphire Pulse Radeon RX 7700 XT
AMD Ryzen 9 7950X, AMD Radeon RX 7700 XT
113.9 (65.05min) fps -24%
Durchschnittliche NVIDIA GeForce RTX 3080
  (111 - 116, n=2)
113.5 fps -25%
Durchschnittliche NVIDIA Titan RTX
  (73 - 116, n=27)
102.2 fps -32%
Durchschnittliche NVIDIA GeForce RTX 4060 Ti 8G
  (100.6 - 101.8, n=3)
101.1 fps -33%
KFA2 GeForce RTX 4060 Ti EX, 16GB GDDR6
AMD Ryzen 9 7950X, NVIDIA GeForce RTX 4060 Ti 16G
100 (54.12min) fps -34%
Durchschnittliche NVIDIA GeForce RTX 3070
  (91.3 - 97.7, n=5)
93.9 fps -38%
XFX Speedster QICK 308 Radeon RX 7600 Black Edition
AMD Ryzen 9 7950X, AMD Radeon RX 7600
83.5 (48.41min) fps -45%
KFA2 GeForce RTX 4060 1-Click-OC 2X
AMD Ryzen 9 7950X, NVIDIA GeForce RTX 4060
80.2 (41.91min) fps -47%
Control
3840x2160 High Quality Preset (DX11)
NVIDIA GeForce RTX 4090 Founders Edition
Intel Core i9-13900K, NVIDIA GeForce RTX 4090
107.7 (83.4min, 85.3P0.1, 91.1P1) fps +85%
AMD Radeon RX 7900 XTX
AMD Ryzen 9 7950X, AMD Radeon RX 7900 XTX
89.4 (46.8min, 48.3P0.1, 52.1P1) fps +54%
NVIDIA GeForce RTX 4080 Founders Edition
Intel Core i9-13900K, NVIDIA GeForce RTX 4080
82.6 (15.4min, 68.7P0.1, 71.9P1) fps +42%
AMD Radeon RX 7900 XT
AMD Ryzen 9 7950X, AMD Radeon RX 7900 XT
75.8 (40.1min, 41.7P0.1, 43.6P1) fps +30%
Zotac Gaming GeForce RTX 3090 Ti AMP Extreme Holo
AMD Ryzen 7 5800X3D, NVIDIA GeForce RTX 3090 Ti
73.9 (46.2min, 53.2P0.1, 62.6P1) fps +27%
Durchschnitt der Klasse Desktop
  (30.3 - 114.4, n=15, der letzten 2 Jahre)
66.5 fps +14%
Durchschnittliche NVIDIA GeForce RTX 4070 Ti
  (63.8 - 66.2, n=4)
65 fps +12%
Asus TUF Gaming GeForce RTX 4070 Ti
Intel Core i9-13900K, NVIDIA GeForce RTX 4070 Ti
64.9 (50min, 51.9P0.1, 56.5P1) fps +12%
Gigabyte Aorus GeForce RTX 4070 Ti Master
Intel Core i9-13900K, NVIDIA GeForce RTX 4070 Ti
64.9 (26.4min, 32.6P0.1, 55.9P1) fps +12%
Sapphire AMD Radeon RX 6950 XT Nitro+ Pure
AMD Ryzen 9 5900X, AMD Radeon RX 6950 XT
64.8 (33.1min, 33.6P0.1, 36.3P1) fps +11%
Durchschnittliche NVIDIA GeForce RTX 3080 Ti
  (63.9 - 64.9, n=3)
64.3 fps +10%
Durchschnittliche NVIDIA GeForce RTX 3090
  (61.3 - 66, n=5)
62.9 fps +8%
AMD Radeon RX 7800 XT
AMD Ryzen 9 7950X, AMD Radeon RX 7800 XT
58.2 (30.4min, 30.9P0.1, 32.7P1) fps 0%
Gigabyte GeForce RTX 4070 Super Gaming OC 12G
Intel Core i9-13900K, NVIDIA GeForce RTX 4070 SUPER
58.2 (43.4min, 48.2P0.1, 50.4P1) fps
NVIDIA GeForce RTX 4070 Super Founders Edition
Intel Core i9-13900K, NVIDIA GeForce RTX 4070 SUPER
57.4 (47.8min, 47.9P0.1, 50.2P1) fps -1%
Durchschnittliche NVIDIA GeForce RTX 3080
  (56.2 - 56.7, n=2)
56.5 fps -3%
AMD Radeon RX 6900 XT
AMD Ryzen 9 5950X, AMD Radeon RX 6900 XT
54.7 (39.8min, 41.7P0.1, 44.9P1) fps -6%
AMD Radeon RX 6900 XT
AMD Ryzen 9 5950X, AMD Radeon RX 6900 XT (SAM ENABLED)
53.9 (36.6min, 41.7P0.1, 43.5P1) fps -7%
AMD Radeon RX 6800 XT
AMD Ryzen 9 5950X, AMD Radeon RX 6800 XT
51.6 (46min) fps -11%
Zotac Gaming GeForce RTX 4070 AMP Airo
Intel Core i9-13900K, NVIDIA GeForce RTX 4070
50.2 (29.1min, 30P0.1, 37.6P1) fps -14%
Durchschnittliche NVIDIA Titan RTX
  (45.2 - 47.3, n=3)
46.5 fps -20%
Sapphire Pulse Radeon RX 7700 XT
AMD Ryzen 9 7950X, AMD Radeon RX 7700 XT
46.4 (24.9min, 25.5P0.1, 26.2P1) fps -20%
Durchschnittliche NVIDIA GeForce RTX 3070
  (40.6 - 42.3, n=3)
41.3 fps -29%
KFA2 GeForce RTX 4060 Ti EX, 16GB GDDR6
AMD Ryzen 9 7950X, NVIDIA GeForce RTX 4060 Ti 16G
36 (19.1min, 24.7P0.1, 31.1P1) fps -38%
Durchschnittliche NVIDIA GeForce RTX 4060 Ti 8G
  (34.3 - 37.3, n=3)
35.7 fps -39%
XFX Speedster QICK 308 Radeon RX 7600 Black Edition
AMD Ryzen 9 7950X, AMD Radeon RX 7600
31.3 (17.1min, 17.1P0.1, 17.6P1) fps -46%
KFA2 GeForce RTX 4060 1-Click-OC 2X
AMD Ryzen 9 7950X, NVIDIA GeForce RTX 4060
28.4 (20.2min, 21.3P0.1, 24.9P1) fps -51%
2560x1440 High Quality Preset (DX11)
NVIDIA GeForce RTX 4090 Founders Edition
Intel Core i9-13900K, NVIDIA GeForce RTX 4090
201 (84.1min, 146.6P0.1, 159P1) fps +74%
AMD Radeon RX 7900 XTX
AMD Ryzen 9 7950X, AMD Radeon RX 7900 XTX
184.9 (66.6min, 105.1P0.1, 121.7P1) fps +60%
NVIDIA GeForce RTX 4080 Founders Edition
Intel Core i9-13900K, NVIDIA GeForce RTX 4080
164.2 (59.2min, 121.2P0.1, 135.5P1) fps +42%
AMD Radeon RX 7900 XT
AMD Ryzen 9 7950X, AMD Radeon RX 7900 XT
156.4 (53.3min, 89.4P0.1, 95.9P1) fps +35%
Zotac Gaming GeForce RTX 3090 Ti AMP Extreme Holo
AMD Ryzen 7 5800X3D, NVIDIA GeForce RTX 3090 Ti
142.5 (51.8min, 81.9P0.1, 115.5P1) fps +23%
Sapphire AMD Radeon RX 6950 XT Nitro+ Pure
AMD Ryzen 9 5900X, AMD Radeon RX 6950 XT
133.5 (73.5min, 75.3P0.1, 83.4P1) fps +16%
Asus TUF Gaming GeForce RTX 4070 Ti
Intel Core i9-13900K, NVIDIA GeForce RTX 4070 Ti
130.6 (59min, 74P0.1, 107.3P1) fps +13%
Gigabyte Aorus GeForce RTX 4070 Ti Master
Intel Core i9-13900K, NVIDIA GeForce RTX 4070 Ti
130.6 (24.9min, 47.8P0.1, 108.8P1) fps +13%
Durchschnitt der Klasse Desktop
  (60.9 - 232, n=15, der letzten 2 Jahre)
129.4 fps +12%
Durchschnittliche NVIDIA GeForce RTX 3080 Ti
  (122 - 125.5, n=3)
123.8 fps +7%
Durchschnittliche NVIDIA GeForce RTX 4070 Ti
  (100 - 130.6, n=4)
121.9 fps +6%
Durchschnittliche NVIDIA GeForce RTX 3090
  (115.8 - 123.7, n=5)
120.4 fps +4%
AMD Radeon RX 7800 XT
AMD Ryzen 9 7950X, AMD Radeon RX 7800 XT
120.3 (60.2min, 62.9P0.1, 68.1P1) fps +4%
Gigabyte GeForce RTX 4070 Super Gaming OC 12G
Intel Core i9-13900K, NVIDIA GeForce RTX 4070 SUPER
115.5 (64.7min, 91.1P0.1, 96.7P1) fps
AMD Radeon RX 6900 XT
AMD Ryzen 9 5950X, AMD Radeon RX 6900 XT
113 (71.5min, 73.2P0.1, 79.6P1) fps -2%
AMD Radeon RX 6900 XT
AMD Ryzen 9 5950X, AMD Radeon RX 6900 XT (SAM ENABLED)
113 (68min, 71.3P0.1, 81.1P1) fps -2%
NVIDIA GeForce RTX 4070 Super Founders Edition
Intel Core i9-13900K, NVIDIA GeForce RTX 4070 SUPER
112.6 (83.1min, 89.4P0.1, 94.5P1) fps -3%
AMD Radeon RX 6800 XT
AMD Ryzen 9 5950X, AMD Radeon RX 6800 XT
108 (93min) fps -6%
Durchschnittliche NVIDIA GeForce RTX 3080
  (105 - 106, n=2)
105.5 fps -9%
Zotac Gaming GeForce RTX 4070 AMP Airo
Intel Core i9-13900K, NVIDIA GeForce RTX 4070
101.8 (15.7min, 26.9P0.1, 84P1) fps -12%
Sapphire Pulse Radeon RX 7700 XT
AMD Ryzen 9 7950X, AMD Radeon RX 7700 XT
96.1 (51.5min, 52P0.1, 55P1) fps -17%
Durchschnittliche NVIDIA Titan RTX
  (89 - 93.6, n=3)
91.5 fps -21%
Durchschnittliche NVIDIA GeForce RTX 3070
  (79.8 - 82.5, n=3)
81.2 fps -30%
Durchschnittliche NVIDIA GeForce RTX 4060 Ti 8G
  (69.2 - 75.3, n=3)
73.2 fps -37%
KFA2 GeForce RTX 4060 Ti EX, 16GB GDDR6
AMD Ryzen 9 7950X, NVIDIA GeForce RTX 4060 Ti 16G
73.1 (43.1min, 53.6P0.1, 62.7P1) fps -37%
XFX Speedster QICK 308 Radeon RX 7600 Black Edition
AMD Ryzen 9 7950X, AMD Radeon RX 7600
63.6 (33.4min, 34.3P0.1, 36.6P1) fps -45%
KFA2 GeForce RTX 4060 1-Click-OC 2X
AMD Ryzen 9 7950X, NVIDIA GeForce RTX 4060
58.4 (38.3min, 43.3P0.1, 50.2P1) fps -49%
1920x1080 High Quality Preset (DX11)
AMD Radeon RX 7900 XTX
AMD Ryzen 9 7950X, AMD Radeon RX 7900 XTX
240 (18.1min, 136.2P0.1, 151.8P1) fps +33%
NVIDIA GeForce RTX 4090 Founders Edition
Intel Core i9-13900K, NVIDIA GeForce RTX 4090
238 (14.4min, 62.9P0.1, 153.8P1) fps +32%
NVIDIA GeForce RTX 4080 Founders Edition
Intel Core i9-13900K, NVIDIA GeForce RTX 4080
233 (7.49min, 27.2P0.1, 156.1P1) fps +29%
AMD Radeon RX 7900 XT
AMD Ryzen 9 7950X, AMD Radeon RX 7900 XT
233 (67.8min, 133.8P0.1, 152.6P1) fps +29%
Zotac Gaming GeForce RTX 3090 Ti AMP Extreme Holo
AMD Ryzen 7 5800X3D, NVIDIA GeForce RTX 3090 Ti
209 (55.6min, 119.8P0.1, 162.7P1) fps +16%
Sapphire AMD Radeon RX 6950 XT Nitro+ Pure
AMD Ryzen 9 5900X, AMD Radeon RX 6950 XT
205 (45.2min, 129.1P0.1, 150.8P1) fps +14%
Asus TUF Gaming GeForce RTX 4070 Ti
Intel Core i9-13900K, NVIDIA GeForce RTX 4070 Ti
202 (88min, 151.4P0.1, 165P1) fps +12%
Gigabyte Aorus GeForce RTX 4070 Ti Master
Intel Core i9-13900K, NVIDIA GeForce RTX 4070 Ti
201 (51.3min, 64.4P0.1, 157.9P1) fps +12%
Durchschnittliche NVIDIA GeForce RTX 4070 Ti
  (196.6 - 202, n=4)
199.9 fps +11%
AMD Radeon RX 7800 XT
AMD Ryzen 9 7950X, AMD Radeon RX 7800 XT
190.1 (56.5min, 107.1P0.1, 118.1P1) fps +6%
Durchschnittliche NVIDIA GeForce RTX 3080 Ti
  (181 - 190.7, n=3)
186.2 fps +3%
Durchschnitt der Klasse Desktop
  (93.7 - 238, n=15, der letzten 2 Jahre)
181.3 fps +1%
Gigabyte GeForce RTX 4070 Super Gaming OC 12G
Intel Core i9-13900K, NVIDIA GeForce RTX 4070 SUPER
180.1 (66.2min, 132.5P0.1, 143.9P1) fps
Durchschnittliche NVIDIA GeForce RTX 3090
  (172.2 - 189.2, n=5)
179.9 fps 0%
AMD Radeon RX 6900 XT
AMD Ryzen 9 5950X, AMD Radeon RX 6900 XT
175 (56.8min, 96P0.1, 112P1) fps -3%
AMD Radeon RX 6900 XT
AMD Ryzen 9 5950X, AMD Radeon RX 6900 XT (SAM ENABLED)
174 (54min, 99P0.1, 112P1) fps -3%
NVIDIA GeForce RTX 4070 Super Founders Edition
Intel Core i9-13900K, NVIDIA GeForce RTX 4070 SUPER
172.7 (52.1min, 129.1P0.1, 139.6P1) fps -4%
AMD Radeon RX 6800 XT
AMD Ryzen 9 5950X, AMD Radeon RX 6800 XT
168 (145min) fps -7%
Zotac Gaming GeForce RTX 4070 AMP Airo
Intel Core i9-13900K, NVIDIA GeForce RTX 4070
159.5 (24.5min, 120.5P0.1, 131P1) fps -11%
Sapphire Pulse Radeon RX 7700 XT
AMD Ryzen 9 7950X, AMD Radeon RX 7700 XT
156.1 (52.1min, 85.6P0.1, 89.5P1) fps -13%
Durchschnittliche NVIDIA GeForce RTX 3080
  (151 - 155, n=2)
153 fps -15%
Durchschnittliche NVIDIA Titan RTX
  (135 - 141.9, n=3)
137.3 fps -24%
Durchschnittliche NVIDIA GeForce RTX 3070
  (117 - 124.9, n=3)
121.3 fps -33%
Durchschnittliche NVIDIA GeForce RTX 4060 Ti 8G
  (115.7 - 120.2, n=3)
118.1 fps -34%
KFA2 GeForce RTX 4060 Ti EX, 16GB GDDR6
AMD Ryzen 9 7950X, NVIDIA GeForce RTX 4060 Ti 16G
113.3 (49.6min, 62.7P0.1, 94.3P1) fps -37%
XFX Speedster QICK 308 Radeon RX 7600 Black Edition
AMD Ryzen 9 7950X, AMD Radeon RX 7600
100.3 (52.4min, 55.2P0.1, 57.3P1) fps -44%
KFA2 GeForce RTX 4060 1-Click-OC 2X
AMD Ryzen 9 7950X, NVIDIA GeForce RTX 4060
92.6 (60min, 71.7P0.1, 78.5P1) fps -49%
Borderlands 3
3840x2160 Badass Overall Quality (DX11)
NVIDIA GeForce RTX 4090 Founders Edition
Intel Core i9-13900K, NVIDIA GeForce RTX 4090
133.4 fps +94%
NVIDIA GeForce RTX 4080 Founders Edition
Intel Core i9-13900K, NVIDIA GeForce RTX 4080
95.7 fps +39%
AMD Radeon RX 7900 XTX
AMD Ryzen 9 7950X, AMD Radeon RX 7900 XTX
88.4 fps +28%
Zotac Gaming GeForce RTX 3090 Ti AMP Extreme Holo
AMD Ryzen 7 5800X3D, NVIDIA GeForce RTX 3090 Ti
83.8 fps +22%
Gigabyte Aorus GeForce RTX 4070 Ti Master
Intel Core i9-13900K, NVIDIA GeForce RTX 4070 Ti
74.9 fps +9%
AMD Radeon RX 7900 XT
AMD Ryzen 9 7950X, AMD Radeon RX 7900 XT
74.6 fps +8%
Durchschnitt der Klasse Desktop
  (5.54 - 133.4, n=22, der letzten 2 Jahre)
74.4 fps +8%
Asus TUF Gaming GeForce RTX 4070 Ti
Intel Core i9-13900K, NVIDIA GeForce RTX 4070 Ti
74.1 fps +8%
Durchschnittliche NVIDIA GeForce RTX 4070 Ti
  (71.9 - 74.9, n=4)
73.4 fps +7%
Durchschnittliche NVIDIA GeForce RTX 3090
  (68 - 75.3, n=13)
72.8 fps +6%
Durchschnittliche NVIDIA GeForce RTX 3080 Ti
  (71.2 - 74, n=4)
72.8 fps +6%
Gigabyte GeForce RTX 4070 Super Gaming OC 12G
Intel Core i9-13900K, NVIDIA GeForce RTX 4070 SUPER
68.9 fps
NVIDIA GeForce RTX 4070 Super Founders Edition
Intel Core i9-13900K, NVIDIA GeForce RTX 4070 SUPER
66.2 fps -4%
Durchschnittliche NVIDIA GeForce RTX 3080
  (61.5 - 61.9, n=2)
61.7 fps -10%
Sapphire AMD Radeon RX 6950 XT Nitro+ Pure
AMD Ryzen 9 5900X, AMD Radeon RX 6950 XT
59.9 fps -13%
AMD Radeon RX 6900 XT
AMD Ryzen 9 5950X, AMD Radeon RX 6900 XT (SAM ENABLED)
59.8 fps -13%
AMD Radeon RX 6900 XT
AMD Ryzen 9 5950X, AMD Radeon RX 6900 XT
57.1 fps -17%
Zotac Gaming GeForce RTX 4070 AMP Airo
Intel Core i9-13900K, NVIDIA GeForce RTX 4070
58.8 fps -15%
AMD Radeon RX 7800 XT
AMD Ryzen 9 7950X, AMD Radeon RX 7800 XT
57.9 fps -16%
AMD Radeon RX 6800 XT
AMD Ryzen 9 5950X, AMD Radeon RX 6800 XT
53.6 fps -22%
Sapphire Pulse Radeon RX 7700 XT
AMD Ryzen 9 7950X, AMD Radeon RX 7700 XT
48 fps -30%
Durchschnittliche NVIDIA Titan RTX
  (46 - 52.8, n=29)
47.3 fps -31%
Durchschnittliche NVIDIA GeForce RTX 3070
  (42.7 - 46.3, n=5)
44.3 fps -36%
Durchschnittliche NVIDIA GeForce RTX 4060 Ti 8G
  (43.1 - 43.7, n=3)
43.5 fps -37%
KFA2 GeForce RTX 4060 Ti EX, 16GB GDDR6
AMD Ryzen 9 7950X, NVIDIA GeForce RTX 4060 Ti 16G
42.5 fps -38%
XFX Speedster QICK 308 Radeon RX 7600 Black Edition
AMD Ryzen 9 7950X, AMD Radeon RX 7600
34.5 fps -50%
KFA2 GeForce RTX 4060 1-Click-OC 2X
AMD Ryzen 9 7950X, NVIDIA GeForce RTX 4060
33.8 fps -51%
2560x1440 Badass Overall Quality (DX11)
NVIDIA GeForce RTX 4090 Founders Edition
Intel Core i9-13900K, NVIDIA GeForce RTX 4090
190 fps +45%
NVIDIA GeForce RTX 4080 Founders Edition
Intel Core i9-13900K, NVIDIA GeForce RTX 4080
170.5 fps +30%
AMD Radeon RX 7900 XTX
AMD Ryzen 9 7950X, AMD Radeon RX 7900 XTX
152.2 fps +16%
Zotac Gaming GeForce RTX 3090 Ti AMP Extreme Holo
AMD Ryzen 7 5800X3D, NVIDIA GeForce RTX 3090 Ti
143.1 fps +9%
Gigabyte Aorus GeForce RTX 4070 Ti Master
Intel Core i9-13900K, NVIDIA GeForce RTX 4070 Ti
142 fps +8%
Asus TUF Gaming GeForce RTX 4070 Ti
Intel Core i9-13900K, NVIDIA GeForce RTX 4070 Ti
140.6 fps +7%
Durchschnittliche NVIDIA GeForce RTX 4070 Ti
  (134.3 - 142, n=4)
138.3 fps +5%
AMD Radeon RX 7900 XT
AMD Ryzen 9 7950X, AMD Radeon RX 7900 XT
135.2 fps +3%
Gigabyte GeForce RTX 4070 Super Gaming OC 12G
Intel Core i9-13900K, NVIDIA GeForce RTX 4070 SUPER
131.2 fps
NVIDIA GeForce RTX 4070 Super Founders Edition
Intel Core i9-13900K, NVIDIA GeForce RTX 4070 SUPER
125.4 fps -4%
Durchschnittliche NVIDIA GeForce RTX 3080 Ti
  (114 - 130.2, n=4)
124.5 fps -5%
Durchschnittliche NVIDIA GeForce RTX 3090
  (105 - 131.6, n=13)
123.8 fps -6%
Durchschnitt der Klasse Desktop
  (13.4 - 190, n=23, der letzten 2 Jahre)
120.8 fps -8%
Zotac Gaming GeForce RTX 4070 AMP Airo
Intel Core i9-13900K, NVIDIA GeForce RTX 4070
110.8 fps -16%
Sapphire AMD Radeon RX 6950 XT Nitro+ Pure
AMD Ryzen 9 5900X, AMD Radeon RX 6950 XT
110 fps -16%
AMD Radeon RX 6900 XT
AMD Ryzen 9 5950X, AMD Radeon RX 6900 XT (SAM ENABLED)
107 fps -18%
AMD Radeon RX 6900 XT
AMD Ryzen 9 5950X, AMD Radeon RX 6900 XT
105 fps -20%
AMD Radeon RX 7800 XT
AMD Ryzen 9 7950X, AMD Radeon RX 7800 XT
105.5 fps -20%
Durchschnittliche NVIDIA GeForce RTX 3080
  (95.7 - 103, n=2)
99.4 fps -24%
AMD Radeon RX 6800 XT
AMD Ryzen 9 5950X, AMD Radeon RX 6800 XT
93.6 fps -29%
Sapphire Pulse Radeon RX 7700 XT
AMD Ryzen 9 7950X, AMD Radeon RX 7700 XT
89.4 fps -32%
Durchschnittliche NVIDIA Titan RTX
  (74 - 93.1, n=29)
84.7 fps -35%
Durchschnittliche NVIDIA GeForce RTX 4060 Ti 8G
  (83.9 - 85.2, n=3)
84.4 fps -36%
KFA2 GeForce RTX 4060 Ti EX, 16GB GDDR6
AMD Ryzen 9 7950X, NVIDIA GeForce RTX 4060 Ti 16G
81.7 fps -38%
Durchschnittliche NVIDIA GeForce RTX 3070
  (75.1 - 82.9, n=5)
77.7 fps -41%
XFX Speedster QICK 308 Radeon RX 7600 Black Edition
AMD Ryzen 9 7950X, AMD Radeon RX 7600
65.7 fps -50%
KFA2 GeForce RTX 4060 1-Click-OC 2X
AMD Ryzen 9 7950X, NVIDIA GeForce RTX 4060
64.8 fps -51%
1920x1080 Badass Overall Quality (DX11)
NVIDIA GeForce RTX 4090 Founders Edition
Intel Core i9-13900K, NVIDIA GeForce RTX 4090
201 fps +21%
NVIDIA GeForce RTX 4080 Founders Edition
Intel Core i9-13900K, NVIDIA GeForce RTX 4080
199.4 fps +20%
Asus TUF Gaming GeForce RTX 4070 Ti
Intel Core i9-13900K, NVIDIA GeForce RTX 4070 Ti
186.9 fps +12%
Gigabyte Aorus GeForce RTX 4070 Ti Master
Intel Core i9-13900K, NVIDIA GeForce RTX 4070 Ti
185.3 fps +11%
AMD Radeon RX 7900 XTX
AMD Ryzen 9 7950X, AMD Radeon RX 7900 XTX
180.2 fps +8%
Durchschnittliche NVIDIA GeForce RTX 4070 Ti
  (171.4 - 186.9, n=4)
178.9 fps +7%
Zotac Gaming GeForce RTX 3090 Ti AMP Extreme Holo
AMD Ryzen 7 5800X3D, NVIDIA GeForce RTX 3090 Ti
173.3 fps +4%
AMD Radeon RX 7900 XT
AMD Ryzen 9 7950X, AMD Radeon RX 7900 XT
169.4 fps +2%
Gigabyte GeForce RTX 4070 Super Gaming OC 12G
Intel Core i9-13900K, NVIDIA GeForce RTX 4070 SUPER
166.6 fps
NVIDIA GeForce RTX 4070 Super Founders Edition
Intel Core i9-13900K, NVIDIA GeForce RTX 4070 SUPER
163.4 fps -2%
Zotac Gaming GeForce RTX 4070 AMP Airo
Intel Core i9-13900K, NVIDIA GeForce RTX 4070
154.5 fps -7%
Durchschnittliche NVIDIA GeForce RTX 3080 Ti
  (129 - 164.9, n=4)
151.5 fps -9%
Durchschnittliche NVIDIA GeForce RTX 3090
  (117 - 170.1, n=13)
150.7 fps -10%
AMD Radeon RX 7800 XT
AMD Ryzen 9 7950X, AMD Radeon RX 7800 XT
141.8 fps -15%
AMD Radeon RX 6900 XT
AMD Ryzen 9 5950X, AMD Radeon RX 6900 XT (SAM ENABLED)
131 fps -21%
AMD Radeon RX 6900 XT
AMD Ryzen 9 5950X, AMD Radeon RX 6900 XT
130 fps -22%
Durchschnitt der Klasse Desktop
  (6.48 - 201, n=26, der letzten 2 Jahre)
129.9 fps -22%
Sapphire AMD Radeon RX 6950 XT Nitro+ Pure
AMD Ryzen 9 5900X, AMD Radeon RX 6950 XT
128.5 fps -23%
Sapphire Pulse Radeon RX 7700 XT
AMD Ryzen 9 7950X, AMD Radeon RX 7700 XT
126.4 fps -24%
Durchschnittliche NVIDIA GeForce RTX 3080
  (117 - 128, n=2)
122.5 fps -26%
Durchschnittliche NVIDIA GeForce RTX 4060 Ti 8G
  (121.5 - 123.5, n=3)
122.3 fps -27%
AMD Radeon RX 6800 XT
AMD Ryzen 9 5950X, AMD Radeon RX 6800 XT
120 fps -28%
KFA2 GeForce RTX 4060 Ti EX, 16GB GDDR6
AMD Ryzen 9 7950X, NVIDIA GeForce RTX 4060 Ti 16G
117.3 fps -30%
Durchschnittliche NVIDIA Titan RTX
  (77.2 - 128.7, n=29)
112 fps -33%
Durchschnittliche NVIDIA GeForce RTX 3070
  (95.3 - 108.9, n=5)
100.6 fps -40%
XFX Speedster QICK 308 Radeon RX 7600 Black Edition
AMD Ryzen 9 7950X, AMD Radeon RX 7600
96.2 fps -42%
KFA2 GeForce RTX 4060 1-Click-OC 2X
AMD Ryzen 9 7950X, NVIDIA GeForce RTX 4060
93.9 fps -44%
Shadow of the Tomb Raider
3840x2160 Highest Preset AA:T
NVIDIA GeForce RTX 4090 Founders Edition
Intel Core i9-13900K, NVIDIA GeForce RTX 4090
182 fps +88%
NVIDIA GeForce RTX 4080 Founders Edition
Intel Core i9-13900K, NVIDIA GeForce RTX 4080
134 fps +39%
AMD Radeon RX 7900 XTX
AMD Ryzen 9 7950X, AMD Radeon RX 7900 XTX
130.1 fps +35%
AMD Radeon RX 7900 XT
AMD Ryzen 9 7950X, AMD Radeon RX 7900 XT
109.6 fps +13%
Zotac Gaming GeForce RTX 3090 Ti AMP Extreme Holo
AMD Ryzen 7 5800X3D, NVIDIA GeForce RTX 3090 Ti
106 fps +10%
Gigabyte Aorus GeForce RTX 4070 Ti Master
Intel Core i9-13900K, NVIDIA GeForce RTX 4070 Ti
104.9 fps +8%
Asus TUF Gaming GeForce RTX 4070 Ti
Intel Core i9-13900K, NVIDIA GeForce RTX 4070 Ti
104.4 fps +8%
Durchschnittliche NVIDIA GeForce RTX 4070 Ti
  (102.7 - 104.9, n=4)
103.8 fps +7%
Durchschnitt der Klasse Desktop
  (33 - 186, n=20, der letzten 2 Jahre)
103.4 fps +7%
Sapphire AMD Radeon RX 6950 XT Nitro+ Pure
AMD Ryzen 9 5900X, AMD Radeon RX 6950 XT
97.4 fps +1%
Gigabyte GeForce RTX 4070 Super Gaming OC 12G
Intel Core i9-13900K, NVIDIA GeForce RTX 4070 SUPER
96.7 fps
Durchschnittliche NVIDIA GeForce RTX 3090
  (89.3 - 99.7, n=12)
96.4 fps 0%
Durchschnittliche NVIDIA GeForce RTX 3080 Ti
  (93 - 98.6, n=3)
95.1 fps -2%
NVIDIA GeForce RTX 4070 Super Founders Edition
Intel Core i9-13900K, NVIDIA GeForce RTX 4070 SUPER
91.5 fps -5%
AMD Radeon RX 6900 XT
AMD Ryzen 9 5950X, AMD Radeon RX 6900 XT (SAM ENABLED)
86 fps -11%
AMD Radeon RX 6900 XT
AMD Ryzen 9 5950X, AMD Radeon RX 6900 XT
84 fps -13%
Durchschnittliche NVIDIA GeForce RTX 3080
  (83.9 - 87.9, n=2)
85.9 fps -11%
Zotac Gaming GeForce RTX 4070 AMP Airo
Intel Core i9-13900K, NVIDIA GeForce RTX 4070
83.7 fps -13%
AMD Radeon RX 7800 XT
AMD Ryzen 9 7950X, AMD Radeon RX 7800 XT
82.7 fps -14%
AMD Radeon RX 6800 XT
AMD Ryzen 9 5950X, AMD Radeon RX 6800 XT
79.6 fps -18%
Durchschnittliche NVIDIA Titan RTX
  (59 - 71.1, n=24)
66.9 fps -31%
Sapphire Pulse Radeon RX 7700 XT
AMD Ryzen 9 7950X, AMD Radeon RX 7700 XT
65.5 fps -32%
Durchschnittliche NVIDIA GeForce RTX 3070
  (61 - 63.5, n=4)
62.3 fps -36%
KFA2 GeForce RTX 4060 Ti EX, 16GB GDDR6
AMD Ryzen 9 7950X, NVIDIA GeForce RTX 4060 Ti 16G
58.5 fps -40%
Durchschnittliche NVIDIA GeForce RTX 4060 Ti 8G
  (58.1 - 58.7, n=3)
58.5 fps -40%
KFA2 GeForce RTX 4060 1-Click-OC 2X
AMD Ryzen 9 7950X, NVIDIA GeForce RTX 4060
46.4 fps -52%
XFX Speedster QICK 308 Radeon RX 7600 Black Edition
AMD Ryzen 9 7950X, AMD Radeon RX 7600
41.6 fps -57%
2560x1440 Highest Preset AA:T
NVIDIA GeForce RTX 4090 Founders Edition
Intel Core i9-13900K, NVIDIA GeForce RTX 4090
282 fps +50%
NVIDIA GeForce RTX 4080 Founders Edition
Intel Core i9-13900K, NVIDIA GeForce RTX 4080
248 fps +32%
AMD Radeon RX 7900 XTX
AMD Ryzen 9 7950X, AMD Radeon RX 7900 XTX
230 fps +22%
Gigabyte Aorus GeForce RTX 4070 Ti Master
Intel Core i9-13900K, NVIDIA GeForce RTX 4070 Ti
204 fps +9%
AMD Radeon RX 7900 XT
AMD Ryzen 9 7950X, AMD Radeon RX 7900 XT
203 fps +8%
Asus TUF Gaming GeForce RTX 4070 Ti
Intel Core i9-13900K, NVIDIA GeForce RTX 4070 Ti
202 fps +7%
Durchschnittliche NVIDIA GeForce RTX 4070 Ti
  (195.9 - 204, n=4)
199.9 fps +6%
Gigabyte GeForce RTX 4070 Super Gaming OC 12G
Intel Core i9-13900K, NVIDIA GeForce RTX 4070 SUPER
188 fps
Zotac Gaming GeForce RTX 3090 Ti AMP Extreme Holo
AMD Ryzen 7 5800X3D, NVIDIA GeForce RTX 3090 Ti
184 fps -2%
Sapphire AMD Radeon RX 6950 XT Nitro+ Pure
AMD Ryzen 9 5900X, AMD Radeon RX 6950 XT
184 fps -2%
Durchschnitt der Klasse Desktop
  (61 - 282, n=21, der letzten 2 Jahre)
173.6 fps -8%
Durchschnittliche NVIDIA GeForce RTX 3090
  (137 - 172.3, n=12)
165.6 fps -12%
NVIDIA GeForce RTX 4070 Super Founders Edition
Intel Core i9-13900K, NVIDIA GeForce RTX 4070 SUPER
165.3 fps -12%
Durchschnittliche NVIDIA GeForce RTX 3080 Ti
  (157 - 173.3, n=3)
164.8 fps -12%
AMD Radeon RX 6900 XT
AMD Ryzen 9 5950X, AMD Radeon RX 6900 XT (SAM ENABLED)
163 fps -13%
AMD Radeon RX 6900 XT
AMD Ryzen 9 5950X, AMD Radeon RX 6900 XT
155 fps -18%
Zotac Gaming GeForce RTX 4070 AMP Airo
Intel Core i9-13900K, NVIDIA GeForce RTX 4070
162.6 fps -14%
AMD Radeon RX 7800 XT
AMD Ryzen 9 7950X, AMD Radeon RX 7800 XT
158.1 fps -16%
Durchschnittliche NVIDIA GeForce RTX 3080
  (147 - 152, n=2)
149.5 fps -20%
AMD Radeon RX 6800 XT
AMD Ryzen 9 5950X, AMD Radeon RX 6800 XT
148 fps -21%
Sapphire Pulse Radeon RX 7700 XT
AMD Ryzen 9 7950X, AMD Radeon RX 7700 XT
131.9 fps -30%
Durchschnittliche NVIDIA GeForce RTX 4060 Ti 8G
  (119.3 - 121.2, n=3)
120.3 fps -36%
KFA2 GeForce RTX 4060 Ti EX, 16GB GDDR6
AMD Ryzen 9 7950X, NVIDIA GeForce RTX 4060 Ti 16G
119.6 fps -36%
Durchschnittliche NVIDIA Titan RTX
  (98 - 128, n=23)
117.8 fps -37%
Durchschnittliche NVIDIA GeForce RTX 3070
  (108 - 116, n=4)
113.2 fps -40%
KFA2 GeForce RTX 4060 1-Click-OC 2X
AMD Ryzen 9 7950X, NVIDIA GeForce RTX 4060
96 fps -49%
XFX Speedster QICK 308 Radeon RX 7600 Black Edition
AMD Ryzen 9 7950X, AMD Radeon RX 7600
89.3 fps -52%
1920x1080 Highest Preset AA:T
NVIDIA GeForce RTX 4090 Founders Edition
Intel Core i9-13900K, NVIDIA GeForce RTX 4090
306 fps +20%
NVIDIA GeForce RTX 4080 Founders Edition
Intel Core i9-13900K, NVIDIA GeForce RTX 4080
303 fps +19%
AMD Radeon RX 7900 XTX
AMD Ryzen 9 7950X, AMD Radeon RX 7900 XTX
301 fps +18%
AMD Radeon RX 7900 XT
AMD Ryzen 9 7950X, AMD Radeon RX 7900 XT
282 fps +11%
Asus TUF Gaming GeForce RTX 4070 Ti
Intel Core i9-13900K, NVIDIA GeForce RTX 4070 Ti
280 fps +10%
Gigabyte Aorus GeForce RTX 4070 Ti Master
Intel Core i9-13900K, NVIDIA GeForce RTX 4070 Ti
280 fps +10%
Durchschnittliche NVIDIA GeForce RTX 4070 Ti
  (263 - 280, n=4)
272 fps +7%
Gigabyte GeForce RTX 4070 Super Gaming OC 12G
Intel Core i9-13900K, NVIDIA GeForce RTX 4070 SUPER
255 fps
Zotac Gaming GeForce RTX 3090 Ti AMP Extreme Holo
AMD Ryzen 7 5800X3D, NVIDIA GeForce RTX 3090 Ti
244 fps -4%
NVIDIA GeForce RTX 4070 Super Founders Edition
Intel Core i9-13900K, NVIDIA GeForce RTX 4070 SUPER
244 fps -4%
Zotac Gaming GeForce RTX 4070 AMP Airo
Intel Core i9-13900K, NVIDIA GeForce RTX 4070
239 fps -6%
Sapphire AMD Radeon RX 6950 XT Nitro+ Pure
AMD Ryzen 9 5900X, AMD Radeon RX 6950 XT
227 fps -11%
AMD Radeon RX 7800 XT
AMD Ryzen 9 7950X, AMD Radeon RX 7800 XT
221 fps -13%
Durchschnittliche NVIDIA GeForce RTX 3080 Ti
  (178 - 238, n=3)
209 fps -18%
Durchschnittliche NVIDIA GeForce RTX 3090
  (145 - 240, n=14)
204 fps -20%
AMD Radeon RX 6900 XT
AMD Ryzen 9 5950X, AMD Radeon RX 6900 XT
202 fps -21%
AMD Radeon RX 6900 XT
AMD Ryzen 9 5950X, AMD Radeon RX 6900 XT (SAM ENABLED)
199 fps -22%
Durchschnitt der Klasse Desktop
  (10.5 - 306, n=24, der letzten 2 Jahre)
194.9 fps -24%
Sapphire Pulse Radeon RX 7700 XT
AMD Ryzen 9 7950X, AMD Radeon RX 7700 XT
194.1 fps -24%
AMD Radeon RX 6800 XT
AMD Ryzen 9 5950X, AMD Radeon RX 6800 XT
194 fps -24%
KFA2 GeForce RTX 4060 Ti EX, 16GB GDDR6
AMD Ryzen 9 7950X, NVIDIA GeForce RTX 4060 Ti 16G
182.7 fps -28%
Durchschnittliche NVIDIA GeForce RTX 4060 Ti 8G
  (181.6 - 184, n=3)
182.7 fps -28%
Durchschnittliche NVIDIA GeForce RTX 3080
  (177 - 185, n=2)
181 fps -29%
Durchschnittliche NVIDIA GeForce RTX 3070
  (138 - 160, n=4)
151.3 fps -41%
Durchschnittliche NVIDIA Titan RTX
  (106 - 178.8, n=24)
149.5 fps -41%
KFA2 GeForce RTX 4060 1-Click-OC 2X
AMD Ryzen 9 7950X, NVIDIA GeForce RTX 4060
148.1 fps -42%
XFX Speedster QICK 308 Radeon RX 7600 Black Edition
AMD Ryzen 9 7950X, AMD Radeon RX 7600
142.2 fps -44%
Mafia Definitive Edition
3840x2160 High Preset
NVIDIA GeForce RTX 4090 Founders Edition
Intel Core i9-13900K, NVIDIA GeForce RTX 4090
160.2 (42.5min, 66.5P0.1, 122.8P1) fps +93%
NVIDIA GeForce RTX 4080 Founders Edition
Intel Core i9-13900K, NVIDIA GeForce RTX 4080
115.6 (34.7min, 70.3P0.1, 99.3P1) fps +39%
Durchschnitt der Klasse Desktop
  (72.3 - 160.2, n=11, der letzten 2 Jahre)
100.8 fps +21%
Zotac Gaming GeForce RTX 3090 Ti AMP Extreme Holo
AMD Ryzen 7 5800X3D, NVIDIA GeForce RTX 3090 Ti
99.2 (29.7min, 56P0.1, 77.1P1) fps +19%
Asus TUF Gaming GeForce RTX 4070 Ti
Intel Core i9-13900K, NVIDIA GeForce RTX 4070 Ti
88.9 (34.4min, 62P0.1, 77.4P1) fps +7%
Durchschnittliche NVIDIA GeForce RTX 4070 Ti
  (88.2 - 88.9, n=2)
88.6 fps +6%
Gigabyte Aorus GeForce RTX 4070 Ti Master
Intel Core i9-13900K, NVIDIA GeForce RTX 4070 Ti
88.2 (38min, 50P0.1, 75.9P1) fps +6%
Durchschnittliche NVIDIA GeForce RTX 3090
  (84.5 - 89.1, n=2)
86.8 fps +4%
Durchschnittliche NVIDIA GeForce RTX 3080 Ti
  ()
86.6 fps +4%
Gigabyte GeForce RTX 4070 Super Gaming OC 12G
Intel Core i9-13900K, NVIDIA GeForce RTX 4070 SUPER
83.2 (15.8min, 31.9P0.1, 71P1) fps
NVIDIA GeForce RTX 4070 Super Founders Edition
Intel Core i9-13900K, NVIDIA GeForce RTX 4070 SUPER
80.5 (17.6min, 28.5P0.1, 67.4P1) fps -3%
Sapphire AMD Radeon RX 6950 XT Nitro+ Pure
AMD Ryzen 9 5900X, AMD Radeon RX 6950 XT
80.4 (44.2min, 56.8P0.1, 70.5P1) fps -3%
Durchschnittliche NVIDIA GeForce RTX 3080
  (78.1 - 78.2, n=2)
78.2 fps -6%
Zotac Gaming GeForce RTX 4070 AMP Airo
Intel Core i9-13900K, NVIDIA GeForce RTX 4070
72.3 (32.3min, 50.2P0.1, 64.6P1) fps -13%
AMD Radeon RX 6900 XT
AMD Ryzen 9 5950X, AMD Radeon RX 6900 XT
67 (32.3min, 41.7P0.1, 44.7P1) fps -19%
Durchschnittliche NVIDIA Titan RTX
  ()
63.4 fps -24%
AMD Radeon RX 6800 XT
AMD Ryzen 9 5950X, AMD Radeon RX 6800 XT
62.6 (28min, 37.6P0.1, 49.2P1) fps -25%
Durchschnittliche NVIDIA GeForce RTX 3070
  (55.2 - 56.6, n=2)
55.9 fps -33%
2560x1440 High Preset
NVIDIA GeForce RTX 4090 Founders Edition
Intel Core i9-13900K, NVIDIA GeForce RTX 4090
238 (71.6min, 84.3P0.1, 162.7P1) fps +47%
NVIDIA GeForce RTX 4080 Founders Edition
Intel Core i9-13900K, NVIDIA GeForce RTX 4080
214 (100.6min, 149.1P0.1, 172.3P1) fps +33%
Durchschnitt der Klasse Desktop
  (141.1 - 238, n=11, der letzten 2 Jahre)
181.4 fps +12%
Gigabyte Aorus GeForce RTX 4070 Ti Master
Intel Core i9-13900K, NVIDIA GeForce RTX 4070 Ti
175.5 (51.6min, 61P0.1, 140.4P1) fps +9%
Zotac Gaming GeForce RTX 3090 Ti AMP Extreme Holo
AMD Ryzen 7 5800X3D, NVIDIA GeForce RTX 3090 Ti
173.9 (73.1min, 101.4P0.1, 134.6P1) fps +8%
Durchschnittliche NVIDIA GeForce RTX 4070 Ti
  (171.9 - 175.5, n=2)
173.7 fps +8%
Asus TUF Gaming GeForce RTX 4070 Ti
Intel Core i9-13900K, NVIDIA GeForce RTX 4070 Ti
171.9 (100min, 119.6P0.1, 144.6P1) fps +6%
Gigabyte GeForce RTX 4070 Super Gaming OC 12G
Intel Core i9-13900K, NVIDIA GeForce RTX 4070 SUPER
161.5 (49min, 72.2P0.1, 133.4P1) fps
NVIDIA GeForce RTX 4070 Super Founders Edition
Intel Core i9-13900K, NVIDIA GeForce RTX 4070 SUPER
156.8 (45.5min, 105.1P0.1, 131P1) fps -3%
Sapphire AMD Radeon RX 6950 XT Nitro+ Pure
AMD Ryzen 9 5900X, AMD Radeon RX 6950 XT
156.2 (30min, 87.3P0.1, 114P1) fps -3%
Durchschnittliche NVIDIA GeForce RTX 3090
  (142.3 - 149, n=2)
145.7 fps -10%
Durchschnittliche NVIDIA GeForce RTX 3080 Ti
  ()
142 fps -12%
Zotac Gaming GeForce RTX 4070 AMP Airo
Intel Core i9-13900K, NVIDIA GeForce RTX 4070
141.1 (38.7min, 98.7P0.1, 118.6P1) fps -13%
Durchschnittliche NVIDIA GeForce RTX 3080
  (127 - 137, n=2)
132 fps -18%
AMD Radeon RX 6900 XT
AMD Ryzen 9 5950X, AMD Radeon RX 6900 XT
120 (17.6min, 61.2P0.1, 83.1P1) fps -26%
AMD Radeon RX 6800 XT
AMD Ryzen 9 5950X, AMD Radeon RX 6800 XT
112 (23.5min, 64P0.1, 80.8P1) fps -31%
Durchschnittliche NVIDIA Titan RTX
  ()
109 fps -33%
Durchschnittliche NVIDIA GeForce RTX 3070
  (98.1 - 98.7, n=2)
98.4 fps -39%
1920x1080 High Preset
NVIDIA GeForce RTX 4080 Founders Edition
Intel Core i9-13900K, NVIDIA GeForce RTX 4080
260 (58.1min, 133.7P0.1, 187.5P1) fps +15%
NVIDIA GeForce RTX 4090 Founders Edition
Intel Core i9-13900K, NVIDIA GeForce RTX 4090
255 (80.7min, 89.2P0.1, 169.4P1) fps +13%
Gigabyte Aorus GeForce RTX 4070 Ti Master
Intel Core i9-13900K, NVIDIA GeForce RTX 4070 Ti
249 (29.7min, 62.5P0.1, 182.6P1) fps +10%
Durchschnittliche NVIDIA GeForce RTX 4070 Ti
  (241 - 249, n=2)
245 fps +8%
Asus TUF Gaming GeForce RTX 4070 Ti
Intel Core i9-13900K, NVIDIA GeForce RTX 4070 Ti
241 (107.5min, 136.3P0.1, 183.2P1) fps +7%
Durchschnitt der Klasse Desktop
  (207 - 260, n=11, der letzten 2 Jahre)
232 fps +3%
Zotac Gaming GeForce RTX 3090 Ti AMP Extreme Holo
AMD Ryzen 7 5800X3D, NVIDIA GeForce RTX 3090 Ti
231 (84.7min, 116.2P0.1, 160.4P1) fps +2%
Gigabyte GeForce RTX 4070 Super Gaming OC 12G
Intel Core i9-13900K, NVIDIA GeForce RTX 4070 SUPER
226 (46.9min, 116P0.1, 163.2P1) fps
NVIDIA GeForce RTX 4070 Super Founders Edition
Intel Core i9-13900K, NVIDIA GeForce RTX 4070 SUPER
216 (100.5min, 122.8P0.1, 159.4P1) fps -4%
Zotac Gaming GeForce RTX 4070 AMP Airo
Intel Core i9-13900K, NVIDIA GeForce RTX 4070
207 (53.5min, 121.4P0.1, 159.4P1) fps -8%
Sapphire AMD Radeon RX 6950 XT Nitro+ Pure
AMD Ryzen 9 5900X, AMD Radeon RX 6950 XT
175.5 (38.6min, 86.6P0.1, 117.6P1) fps -22%
Durchschnittliche NVIDIA GeForce RTX 3080 Ti
  ()
163 fps -28%
Durchschnittliche NVIDIA GeForce RTX 3090
  (157 - 158.8, n=2)
157.9 fps -30%
Durchschnittliche NVIDIA GeForce RTX 3080
  (144 - 169, n=2)
156.5 fps -31%
AMD Radeon RX 6900 XT
AMD Ryzen 9 5950X, AMD Radeon RX 6900 XT
138 (32.8min, 68.1P0.1, 90.2P1) fps -39%
Durchschnittliche NVIDIA GeForce RTX 3070
  (124 - 132, n=2)
128 fps -43%
Durchschnittliche NVIDIA Titan RTX
  ()
123.7 fps -45%
AMD Radeon RX 6800 XT
AMD Ryzen 9 5950X, AMD Radeon RX 6800 XT
121 (23.7min, 68P0.1, 83.3P1) fps -46%

Raytracing-Leistung

Diese wahrgenommenen Verbesserungen schlagen sich auch in der nativen Raytracing-Leistung nieder, obwohl die Steigerung mit 2-7 % je nach Spiel und Auflösung relativ gering ist.

Das Raytracing in Far Cry 6 1080p Ultra und Cyberpunk 2077 1.6 4K Ultra scheint im Vergleich zur RTX 4070 Super FE am meisten zu profitieren.

Metro Exodus - 1920x1080 Ultra Quality DXR AF:16x
AMD Radeon RX 7900 XTX
AMD Ryzen 9 7950X, AMD Radeon RX 7900 XTX
141.2 (89.03min) fps +12%
NVIDIA GeForce RTX 4080 Founders Edition
Intel Core i9-13900K, NVIDIA GeForce RTX 4080
137.2 (68.42min) fps +9%
NVIDIA GeForce RTX 4090 Founders Edition
Intel Core i9-13900K, NVIDIA GeForce RTX 4090
135 (73.53min) fps +7%
Durchschnittliche NVIDIA GeForce RTX 4070 Ti
  (128.8 - 133.3, n=4)
130.9 fps +4%
Gigabyte Aorus GeForce RTX 4070 Ti Master
Intel Core i9-13900K, NVIDIA GeForce RTX 4070 Ti
129 (64.57min) fps +2%
Asus TUF Gaming GeForce RTX 4070 Ti
Intel Core i9-13900K, NVIDIA GeForce RTX 4070 Ti
128.8 (62.96min) fps +2%
Zotac Gaming GeForce RTX 3090 Ti AMP Extreme Holo
AMD Ryzen 7 5800X3D, NVIDIA GeForce RTX 3090 Ti
128.5 (64.07min) fps +2%
Gigabyte GeForce RTX 4070 Super Gaming OC 12G
Intel Core i9-13900K, NVIDIA GeForce RTX 4070 SUPER
126.3 (69.94min) fps
AMD Radeon RX 7900 XT
AMD Ryzen 9 7950X, AMD Radeon RX 7900 XT
124.3 (78.88min) fps -2%
NVIDIA GeForce RTX 4070 Super Founders Edition
Intel Core i9-13900K, NVIDIA GeForce RTX 4070 SUPER
121.7 (67.66min) fps -4%
Durchschnitt der Klasse Desktop
  (62.8 - 163.7, n=22, der letzten 2 Jahre)
119.4 fps -5%
Durchschnittliche NVIDIA GeForce RTX 3080 Ti
  (110 - 121.2, n=4)
114.8 fps -9%
Durchschnittliche NVIDIA GeForce RTX 3090
  (68.6 - 122.2, n=12)
111.4 fps -12%
Zotac Gaming GeForce RTX 4070 AMP Airo
Intel Core i9-13900K, NVIDIA GeForce RTX 4070
107.1 (58.82min) fps -15%
AMD Radeon RX 7800 XT
AMD Ryzen 9 7950X, AMD Radeon RX 7800 XT
98.4 (61.39min) fps -22%
Durchschnittliche NVIDIA GeForce RTX 3080
  (91.5 - 102, n=2)
96.8 fps -23%
AMD Radeon RX 6900 XT
AMD Ryzen 9 5950X, AMD Radeon RX 6900 XT
90.5 (55.53min) fps -28%
Sapphire Pulse Radeon RX 7700 XT
AMD Ryzen 9 7950X, AMD Radeon RX 7700 XT
88.1 (56.03min) fps -30%
Durchschnittliche NVIDIA Titan RTX
  (69 - 95.5, n=23)
86.1 fps -32%
AMD Radeon RX 6800 XT
AMD Ryzen 9 5950X, AMD Radeon RX 6800 XT
85.5 (52.71min) fps -32%
Durchschnittliche NVIDIA GeForce RTX 4060 Ti 8G
  (84.6 - 86.1, n=3)
85.2 fps -33%
KFA2 GeForce RTX 4060 Ti EX, 16GB GDDR6
AMD Ryzen 9 7950X, NVIDIA GeForce RTX 4060 Ti 16G
84.5 (47.97min) fps -33%
Durchschnittliche NVIDIA GeForce RTX 3070
  (80.4 - 83, n=5)
81.6 fps -35%
KFA2 GeForce RTX 4060 1-Click-OC 2X
AMD Ryzen 9 7950X, NVIDIA GeForce RTX 4060
67.2 (36.94min) fps -47%
XFX Speedster QICK 308 Radeon RX 7600 Black Edition
AMD Ryzen 9 7950X, AMD Radeon RX 7600
62.9 (40.28min) fps -50%
Control - 1920x1080 High Quality Preset & High Ray Tracing Preset (DX12)
NVIDIA GeForce RTX 4090 Founders Edition
Intel Core i9-13900K, NVIDIA GeForce RTX 4090
185.1 (103.4min, 132.2P0.1, 140.8P1) fps +59%
NVIDIA GeForce RTX 4080 Founders Edition
Intel Core i9-13900K, NVIDIA GeForce RTX 4080
162.8 (28.9min, 60.8P0.1, 129.4P1) fps +40%
AMD Radeon RX 7900 XTX
AMD Ryzen 9 7950X, AMD Radeon RX 7900 XTX
133.7 (23.2min, 92.6P0.1, 104.6P1) fps +15%
Zotac Gaming GeForce RTX 3090 Ti AMP Extreme Holo
AMD Ryzen 7 5800X3D, NVIDIA GeForce RTX 3090 Ti
130.8 (62.6min, 107.5P0.1, 113.8P1) fps +12%
Gigabyte Aorus GeForce RTX 4070 Ti Master
Intel Core i9-13900K, NVIDIA GeForce RTX 4070 Ti
129.1 (38.7min, 49.1P0.1, 101.2P1) fps +11%
Asus TUF Gaming GeForce RTX 4070 Ti
Intel Core i9-13900K, NVIDIA GeForce RTX 4070 Ti
128.3 (6.22min, 61.8P0.1, 107P1) fps +10%
Durchschnittliche NVIDIA GeForce RTX 4070 Ti
  (123.5 - 129.1, n=4)
126.7 fps +9%
Gigabyte GeForce RTX 4070 Super Gaming OC 12G
Intel Core i9-13900K, NVIDIA GeForce RTX 4070 SUPER
116.7 (28.4min, 92.4P0.1, 101.1P1) fps
Durchschnitt der Klasse Desktop
  (58.6 - 185.1, n=15, der letzten 2 Jahre)
116.6 fps 0%
AMD Radeon RX 7900 XT
AMD Ryzen 9 7950X, AMD Radeon RX 7900 XT
116.1 (8.47min, 62.1P0.1, 91.4P1) fps -1%
Durchschnittliche NVIDIA GeForce RTX 3080 Ti
  (111 - 120.6, n=3)
115.2 fps -1%
NVIDIA GeForce RTX 4070 Super Founders Edition
Intel Core i9-13900K, NVIDIA GeForce RTX 4070 SUPER
113.8 (66.1min, 87.5P0.1, 97.9P1) fps -2%
Durchschnittliche NVIDIA GeForce RTX 3090
  (91.4 - 122.6, n=5)
111.1 fps -5%
Zotac Gaming GeForce RTX 4070 AMP Airo
Intel Core i9-13900K, NVIDIA GeForce RTX 4070
101.8 (30.1min, 42.5P0.1, 86.1P1) fps -13%
Durchschnittliche NVIDIA GeForce RTX 3080
  (98.1 - 103, n=2)
100.6 fps -14%
Sapphire AMD Radeon RX 6950 XT Nitro+ Pure
AMD Ryzen 9 5900X, AMD Radeon RX 6950 XT
97.7 (7.66min, 62.8P0.1, 73.5P1) fps -16%
AMD Radeon RX 7800 XT
AMD Ryzen 9 7950X, AMD Radeon RX 7800 XT
96.1 (18.2min, 69.2P0.1, 76.4P1) fps -18%
Durchschnittliche NVIDIA Titan RTX
  (63 - 120, n=3)
88.1 fps -25%
Sapphire Pulse Radeon RX 7700 XT
AMD Ryzen 9 7950X, AMD Radeon RX 7700 XT
79.9 (18.5min, 55.7P0.1, 65.6P1) fps -32%
AMD Radeon RX 6900 XT
AMD Ryzen 9 5950X, AMD Radeon RX 6900 XT (SAM ENABLED)
76.2 (38.7min, 43.3P0.1, 62.8P1) fps -35%
AMD Radeon RX 6900 XT
AMD Ryzen 9 5950X, AMD Radeon RX 6900 XT
73.1 (31.6min, 40.9P0.1, 62.6P1) fps -37%
KFA2 GeForce RTX 4060 Ti EX, 16GB GDDR6
AMD Ryzen 9 7950X, NVIDIA GeForce RTX 4060 Ti 16G
73 (15.8min, 59.4P0.1, 63.3P1) fps -37%
Durchschnittliche NVIDIA GeForce RTX 4060 Ti 8G
  (72.5 - 73.6, n=3)
73 fps -37%
Durchschnittliche NVIDIA GeForce RTX 3070
  (57.9 - 75.1, n=3)
68.5 fps -41%
AMD Radeon RX 6800 XT
AMD Ryzen 9 5950X, AMD Radeon RX 6800 XT
66.9 (60min) fps -43%
KFA2 GeForce RTX 4060 1-Click-OC 2X
AMD Ryzen 9 7950X, NVIDIA GeForce RTX 4060
57.5 (14.9min, 44.3P0.1, 50.6P1) fps -51%
XFX Speedster QICK 308 Radeon RX 7600 Black Edition
AMD Ryzen 9 7950X, AMD Radeon RX 7600
51.7 (6.96min, 38.6P0.1, 42P1) fps -56%
Watch Dogs Legion - 1920x1080 Ultra Preset + Ultra Ray Tracing (DX12)
NVIDIA GeForce RTX 4090 Founders Edition
Intel Core i9-13900K, NVIDIA GeForce RTX 4090
115.7 (18.56min, 92.59P1) fps +27%
NVIDIA GeForce RTX 4080 Founders Edition
Intel Core i9-13900K, NVIDIA GeForce RTX 4080
111.6 (76.88min, 90.46P1) fps +23%
Gigabyte Aorus GeForce RTX 4070 Ti Master
Intel Core i9-13900K, NVIDIA GeForce RTX 4070 Ti
99.4 (37.32min, 77.35P1) fps +9%
Durchschnittliche NVIDIA GeForce RTX 4070 Ti
  (98.9 - 99.4, n=2)
99.2 fps +9%
Asus TUF Gaming GeForce RTX 4070 Ti
Intel Core i9-13900K, NVIDIA GeForce RTX 4070 Ti
98.9 (72.06min, 82.17P1) fps +9%
Gigabyte GeForce RTX 4070 Super Gaming OC 12G
Intel Core i9-13900K, NVIDIA GeForce RTX 4070 SUPER
91.1 (18.45min, 75.38P1) fps
Zotac Gaming GeForce RTX 3090 Ti AMP Extreme Holo
AMD Ryzen 7 5800X3D, NVIDIA GeForce RTX 3090 Ti
88.7 (50.06min, 72.42P1) fps -3%
Durchschnittliche NVIDIA GeForce RTX 3090
  (75.7 - 110, n=3)
88 fps -3%
NVIDIA GeForce RTX 4070 Super Founders Edition
Intel Core i9-13900K, NVIDIA GeForce RTX 4070 SUPER
87.8 (19.1min, 71.63P1) fps -4%
Durchschnitt der Klasse Desktop
  (35 - 115.7, n=14, der letzten 2 Jahre)
83.7 fps -8%
Zotac Gaming GeForce RTX 4070 AMP Airo
Intel Core i9-13900K, NVIDIA GeForce RTX 4070
75.3 (15.28min, 63.07P1) fps -17%
Durchschnittliche NVIDIA GeForce RTX 3080 Ti
  ()
75.1 fps -18%
AMD Radeon RX 6800 XT
AMD Ryzen 9 5950X, AMD Radeon RX 6800 XT
71.4 (47.71min, 55.63P1) fps -22%
Durchschnittliche NVIDIA GeForce RTX 3080
  (70.9 - 71.3, n=2)
71.1 fps -22%
Sapphire AMD Radeon RX 6950 XT Nitro+ Pure
AMD Ryzen 9 5900X, AMD Radeon RX 6950 XT
69 fps -24%
AMD Radeon RX 6900 XT
AMD Ryzen 9 5950X, AMD Radeon RX 6900 XT
55.6 (35.81min, 41.86P1) fps -39%
AMD Radeon RX 6900 XT
AMD Ryzen 9 5950X, AMD Radeon RX 6900 XT (SAM ENABLED)
55.5 (36.48min, 43.27P1) fps -39%
Durchschnittliche NVIDIA Titan RTX
  ()
55.4 fps -39%
Durchschnittliche NVIDIA GeForce RTX 3070
  (51.7 - 61, n=4)
55.1 fps -40%
Far Cry 6 - 1920x1080 Ultra Graphics Quality + HD Textures + DXR AA:T
NVIDIA GeForce RTX 4080 Founders Edition
Intel Core i9-13900K, NVIDIA GeForce RTX 4080
154 (125min) fps +7%
AMD Radeon RX 7900 XTX
AMD Ryzen 9 7950X, AMD Radeon RX 7900 XTX
152.1 (75min) fps +6%
NVIDIA GeForce RTX 4090 Founders Edition
Intel Core i9-13900K, NVIDIA GeForce RTX 4090
147 (125min) fps +2%
Asus TUF Gaming GeForce RTX 4070 Ti
Intel Core i9-13900K, NVIDIA GeForce RTX 4070 Ti
146 (122min) fps +1%
Gigabyte GeForce RTX 4070 Super Gaming OC 12G
Intel Core i9-13900K, NVIDIA GeForce RTX 4070 SUPER
144 (99min) fps
AMD Radeon RX 7900 XT
AMD Ryzen 9 7950X, AMD Radeon RX 7900 XT
143.6 (46min) fps 0%
Gigabyte Aorus GeForce RTX 4070 Ti Master
Intel Core i9-13900K, NVIDIA GeForce RTX 4070 Ti
139.5 (114min) fps -3%
Durchschnittliche NVIDIA GeForce RTX 4070 Ti
  (133.4 - 146, n=4)
138.9 fps -4%
Zotac Gaming GeForce RTX 4070 AMP Airo
Intel Core i9-13900K, NVIDIA GeForce RTX 4070
138 (108min) fps -4%
NVIDIA GeForce RTX 4070 Super Founders Edition
Intel Core i9-13900K, NVIDIA GeForce RTX 4070 SUPER
134 (119min) fps -7%
AMD Radeon RX 7800 XT
AMD Ryzen 9 7950X, AMD Radeon RX 7800 XT
129.4 (36min) fps -10%
Durchschnitt der Klasse Desktop
  (19.1 - 154, n=17, der letzten 2 Jahre)
125 fps -13%
Zotac Gaming GeForce RTX 3090 Ti AMP Extreme Holo
AMD Ryzen 7 5800X3D, NVIDIA GeForce RTX 3090 Ti
122 (95min) fps -15%
Durchschnittliche NVIDIA GeForce RTX 3080 Ti
  (112 - 128.6, n=2)
120.3 fps -16%
Durchschnittliche NVIDIA GeForce RTX 3090
  (76 - 138.2, n=8)
112.6 fps -22%
KFA2 GeForce RTX 4060 Ti EX, 16GB GDDR6
AMD Ryzen 9 7950X, NVIDIA GeForce RTX 4060 Ti 16G
111.1 (100min) fps -23%
Sapphire Pulse Radeon RX 7700 XT
AMD Ryzen 9 7950X, AMD Radeon RX 7700 XT
104.1 (18min) fps -28%
Durchschnittliche NVIDIA Titan RTX
  (97 - 109.3, n=2)
103.2 fps -28%
Sapphire AMD Radeon RX 6950 XT Nitro+ Pure
AMD Ryzen 9 5900X, AMD Radeon RX 6950 XT
101.6 (24min) fps -29%
Durchschnittliche NVIDIA GeForce RTX 4060 Ti 8G
  (61.9 - 88, n=2)
75 fps -48%
Durchschnittliche NVIDIA GeForce RTX 3080
  ()
73 fps -49%
Durchschnittliche NVIDIA GeForce RTX 3070
  ()
71 fps -51%
XFX Speedster QICK 308 Radeon RX 7600 Black Edition
AMD Ryzen 9 7950X, AMD Radeon RX 7600
63.6 (31min) fps -56%
KFA2 GeForce RTX 4060 1-Click-OC 2X
AMD Ryzen 9 7950X, NVIDIA GeForce RTX 4060
34.8 (13min) fps -76%
Dying Light 2 - 1920x1080 High Quality Raytracing
NVIDIA GeForce RTX 4090 Founders Edition
Intel Core i9-13900K, NVIDIA GeForce RTX 4090
130 (49min, 97.7P0.1, 106.7P1) fps +80%
NVIDIA GeForce RTX 4080 Founders Edition
Intel Core i9-13900K, NVIDIA GeForce RTX 4080
98.7 (37.6min, 46.5P0.1, 74.3P1) fps +37%
Durchschnittliche NVIDIA GeForce RTX 3080 Ti
  ()
83.5 fps +16%
Durchschnitt der Klasse Desktop
  (59.4 - 130, n=11, der letzten 2 Jahre)
83.5 fps +16%
Asus TUF Gaming GeForce RTX 4070 Ti
Intel Core i9-13900K, NVIDIA GeForce RTX 4070 Ti
82.9 (36.6min, 45.4P0.1, 69.2P1) fps +15%
Durchschnittliche NVIDIA GeForce RTX 4070 Ti
  (82.8 - 82.9, n=2)
82.9 fps +15%
Gigabyte Aorus GeForce RTX 4070 Ti Master
Intel Core i9-13900K, NVIDIA GeForce RTX 4070 Ti
82.8 (27.4min, 39.9P0.1, 59.6P1) fps +15%
Durchschnittliche NVIDIA Titan RTX
  ()
80.1 fps +11%
Zotac Gaming GeForce RTX 3090 Ti AMP Extreme Holo
AMD Ryzen 7 5800X3D, NVIDIA GeForce RTX 3090 Ti
76.4 (33.4min, 57.9P0.1, 62.6P1) fps +6%
Durchschnittliche NVIDIA GeForce RTX 3090
  (67.9 - 80.2, n=2)
74.1 fps +3%
Gigabyte GeForce RTX 4070 Super Gaming OC 12G
Intel Core i9-13900K, NVIDIA GeForce RTX 4070 SUPER
72.1 (43.6min, 49.9P0.1, 61.6P1) fps
NVIDIA GeForce RTX 4070 Super Founders Edition
Intel Core i9-13900K, NVIDIA GeForce RTX 4070 SUPER
70.9 (37min, 44.8P0.1, 58.5P1) fps -2%
Durchschnittliche NVIDIA GeForce RTX 3080
  ()
59.7 fps -17%
Zotac Gaming GeForce RTX 4070 AMP Airo
Intel Core i9-13900K, NVIDIA GeForce RTX 4070
59.4 (17.2min, 20.2P0.1, 49P1) fps -18%
Durchschnittliche NVIDIA GeForce RTX 3070
  ()
42.2 fps -41%
Cyberpunk 2077 1.6
3840x2160 Ray Tracing Ultra Preset (DLSS off)
NVIDIA GeForce RTX 4090 Founders Edition
Intel Core i9-13900K, NVIDIA GeForce RTX 4090 (1.6)
42.6 (32min) fps +102%
NVIDIA GeForce RTX 4080 Founders Edition
Intel Core i9-13900K, NVIDIA GeForce RTX 4080 (1.6)
30.7 (23.5min) fps +45%
Durchschnitt der Klasse Desktop
  (1.4 - 43.8, n=19, der letzten 2 Jahre)
24.4 fps +16%
Zotac Gaming GeForce RTX 3090 Ti AMP Extreme Holo
AMD Ryzen 7 5800X3D, NVIDIA GeForce RTX 3090 Ti (1.52)
24.3 (16.3min) fps +15%
Gigabyte Aorus GeForce RTX 4070 Ti Master
Intel Core i9-13900K, NVIDIA GeForce RTX 4070 Ti (1.61)
23.9 (18min) fps +13%
Asus TUF Gaming GeForce RTX 4070 Ti
Intel Core i9-13900K, NVIDIA GeForce RTX 4070 Ti (1.61)
23.7 (18.1min) fps +12%
Durchschnittliche NVIDIA GeForce RTX 4070 Ti
  (21.6 - 23.9, n=4)
23.2 fps +10%
Gigabyte GeForce RTX 4070 Super Gaming OC 12G
Intel Core i9-13900K, NVIDIA GeForce RTX 4070 SUPER (1.63)
21.1 (2.68min) fps
Durchschnittliche NVIDIA GeForce RTX 3090
  (19.8 - 22.1, n=5)
21 fps 0%
AMD Radeon RX 7900 XTX
AMD Ryzen 9 7950X, AMD Radeon RX 7900 XTX (1.61)
20.7 (14.4min) fps -2%
NVIDIA GeForce RTX 4070 Super Founders Edition
Intel Core i9-13900K, NVIDIA GeForce RTX 4070 SUPER (1.63)
20 (9.7min) fps -5%
Durchschnittliche NVIDIA GeForce RTX 3080 Ti
  ()
18.6 fps -12%
AMD Radeon RX 7900 XT
AMD Ryzen 9 7950X, AMD Radeon RX 7900 XT (1.61)
17.6 (12min) fps -17%
Zotac Gaming GeForce RTX 4070 AMP Airo
Intel Core i9-13900K, NVIDIA GeForce RTX 4070 (1.62)
15.3 (11.7min) fps -27%
AMD Radeon RX 7800 XT
AMD Ryzen 9 7950X, AMD Radeon RX 7800 XT (1.6)
13.7 (10.2min) fps -35%
Durchschnittliche NVIDIA Titan RTX
  ()
13.4 fps -36%
KFA2 GeForce RTX 4060 Ti EX, 16GB GDDR6
AMD Ryzen 9 7950X, NVIDIA GeForce RTX 4060 Ti 16G (1.6)
13.2 (10min) fps -37%
Durchschnittliche NVIDIA GeForce RTX 3080
  ()
12.1 fps -43%
Sapphire Pulse Radeon RX 7700 XT
AMD Ryzen 9 7950X, AMD Radeon RX 7700 XT (1.6)
11.5 (7.84min) fps -45%
Sapphire Pulse Radeon RX 7700 XT
AMD Ryzen 9 7950X, AMD Radeon RX 7700 XT (1.6)
11.5 (7.84min) fps -45%
Durchschnittliche NVIDIA GeForce RTX 3070
  (5.4 - 6.6, n=2)
6 fps -72%
Durchschnittliche NVIDIA GeForce RTX 4060 Ti 8G
  (2.2 - 3.2, n=3)
2.6 fps -88%
KFA2 GeForce RTX 4060 1-Click-OC 2X
AMD Ryzen 9 7950X, NVIDIA GeForce RTX 4060 (1.6)
2.19 (1.635min) fps -90%
XFX Speedster QICK 308 Radeon RX 7600 Black Edition
AMD Ryzen 9 7950X, AMD Radeon RX 7600 (1.6)
2.05 (0.904min) fps -90%
1920x1080 Ray Tracing Ultra Preset (DLSS off)
NVIDIA GeForce RTX 4090 Founders Edition
Intel Core i9-13900K, NVIDIA GeForce RTX 4090 (1.6)
118.4 (92min) fps +66%
NVIDIA GeForce RTX 4080 Founders Edition
Intel Core i9-13900K, NVIDIA GeForce RTX 4080 (1.6)
100.1 (77.6min) fps +40%
Gigabyte Aorus GeForce RTX 4070 Ti Master
Intel Core i9-13900K, NVIDIA GeForce RTX 4070 Ti (1.61)
82.5 (32.1min) fps +15%
Asus TUF Gaming GeForce RTX 4070 Ti
Intel Core i9-13900K, NVIDIA GeForce RTX 4070 Ti (1.61)
81 (62.6min) fps +13%
Durchschnittliche NVIDIA GeForce RTX 4070 Ti
  (78.9 - 82.5, n=4)
81 fps +13%
Durchschnitt der Klasse Desktop
  (23.8 - 130.1, n=20, der letzten 2 Jahre)
77.1 fps +8%
Zotac Gaming GeForce RTX 3090 Ti AMP Extreme Holo
AMD Ryzen 7 5800X3D, NVIDIA GeForce RTX 3090 Ti (1.52)
74.7 (57.7min) fps +4%
Gigabyte GeForce RTX 4070 Super Gaming OC 12G
Intel Core i9-13900K, NVIDIA GeForce RTX 4070 SUPER (1.63)
71.5 (56.7min) fps
Durchschnittliche NVIDIA GeForce RTX 3080 Ti
  ()
69.1 fps -3%
NVIDIA GeForce RTX 4070 Super Founders Edition
Intel Core i9-13900K, NVIDIA GeForce RTX 4070 SUPER (1.63)
68.9 (54.4min) fps -4%
Durchschnittliche NVIDIA GeForce RTX 3090
  (61.3 - 68, n=5)
65.5 fps -8%
AMD Radeon RX 7900 XTX
AMD Ryzen 9 7950X, AMD Radeon RX 7900 XTX (1.61)
64.6 (49.1min) fps -10%
Durchschnittliche NVIDIA GeForce RTX 3080
  ()
61.1 fps -15%
Zotac Gaming GeForce RTX 4070 AMP Airo
Intel Core i9-13900K, NVIDIA GeForce RTX 4070 (1.62)
60 (47.6min) fps -16%
AMD Radeon RX 7900 XT
AMD Ryzen 9 7950X, AMD Radeon RX 7900 XT (1.61)
57.1 (41.7min) fps -20%
KFA2 GeForce RTX 4060 Ti EX, 16GB GDDR6
AMD Ryzen 9 7950X, NVIDIA GeForce RTX 4060 Ti 16G (1.6)
49 (37min) fps -31%
Durchschnittliche NVIDIA GeForce RTX 4060 Ti 8G
  (48 - 49.6, n=3)
48.9 fps -32%
AMD Radeon RX 7800 XT
AMD Ryzen 9 7950X, AMD Radeon RX 7800 XT (1.6)
46 (33.3min) fps -36%
Durchschnittliche NVIDIA Titan RTX
  ()
43.3 fps -39%
Durchschnittliche NVIDIA GeForce RTX 3070
  (41.6 - 43.9, n=2)
42.8 fps -40%
Sapphire Pulse Radeon RX 7700 XT
AMD Ryzen 9 7950X, AMD Radeon RX 7700 XT (1.6)
39.8 (30min) fps -44%
Sapphire Pulse Radeon RX 7700 XT
AMD Ryzen 9 7950X, AMD Radeon RX 7700 XT (1.6)
39.8 (30min) fps -44%
Sapphire Pulse Radeon RX 7700 XT
AMD Ryzen 9 7950X, AMD Radeon RX 7700 XT (1.6)
39.8 (30min) fps -44%
KFA2 GeForce RTX 4060 1-Click-OC 2X
AMD Ryzen 9 7950X, NVIDIA GeForce RTX 4060 (1.6)
37.1 (27.9min) fps -48%
XFX Speedster QICK 308 Radeon RX 7600 Black Edition
AMD Ryzen 9 7950X, AMD Radeon RX 7600 (1.6)
22.4 (13.9min) fps -69%
Ghostwire Tokyo - 1920x1080 Highest Settings + Maximum Ray Tracing
NVIDIA GeForce RTX 4090 Founders Edition
Intel Core i9-13900K, NVIDIA GeForce RTX 4090
193.7 (38.5min, 66.5P0.1, 142.5P1) fps +46%
NVIDIA GeForce RTX 4080 Founders Edition
Intel Core i9-13900K, NVIDIA GeForce RTX 4080
166.2 (30.4min, 60P0.1, 115.2P1) fps +25%
Asus TUF Gaming GeForce RTX 4070 Ti
Intel Core i9-13900K, NVIDIA GeForce RTX 4070 Ti
139.3 (31.3min, 53.2P0.1, 89.7P1) fps +5%
Gigabyte Aorus GeForce RTX 4070 Ti Master
Intel Core i9-13900K, NVIDIA GeForce RTX 4070 Ti
138.7 (38.5min, 54.6P0.1, 89.8P1) fps +4%
Durchschnittliche NVIDIA GeForce RTX 4070 Ti
  (130.7 - 139.3, n=4)
136.5 fps +3%
AMD Radeon RX 7900 XTX
AMD Ryzen 9 7950X, AMD Radeon RX 7900 XTX
136.3 (39.1min, 76.4P0.1, 95.8P1) fps +3%
Durchschnitt der Klasse Desktop
  (55.9 - 193.7, n=13, der letzten 2 Jahre)
136.3 fps +3%
Gigabyte GeForce RTX 4070 Super Gaming OC 12G
Intel Core i9-13900K, NVIDIA GeForce RTX 4070 SUPER
132.9 (13.7min, 19.3P0.1, 81.6P1) fps
NVIDIA GeForce RTX 4070 Super Founders Edition
Intel Core i9-13900K, NVIDIA GeForce RTX 4070 SUPER
128.3 (23.1min, 40.3P0.1, 80.7P1) fps -3%
Zotac Gaming GeForce RTX 3090 Ti AMP Extreme Holo
AMD Ryzen 7 5800X3D, NVIDIA GeForce RTX 3090 Ti
120.2 (33.8min, 55.2P0.1, 79.1P1) fps -10%
Durchschnittliche NVIDIA GeForce RTX 3080 Ti
  ()
119.9 fps -10%
AMD Radeon RX 7900 XT
AMD Ryzen 9 7950X, AMD Radeon RX 7900 XT
116.5 (30.3min, 71.6P0.1, 78.1P1) fps -12%
Zotac Gaming GeForce RTX 4070 AMP Airo
Intel Core i9-13900K, NVIDIA GeForce RTX 4070
112.2 (16.9min, 37.9P0.1, 67.5P1) fps -16%
Durchschnittliche NVIDIA GeForce RTX 3090
  (106 - 122, n=3)
111.6 fps -16%
Durchschnittliche NVIDIA GeForce RTX 3080
  ()
97.9 fps -26%
AMD Radeon RX 7800 XT
AMD Ryzen 9 7950X, AMD Radeon RX 7800 XT
95.3 (30.1min, 39.9P0.1, 57.5P1) fps -28%
KFA2 GeForce RTX 4060 Ti EX, 16GB GDDR6
AMD Ryzen 9 7950X, NVIDIA GeForce RTX 4060 Ti 16G
89.1 (34.3min, 49.2P0.1, 52.3P1) fps -33%
Durchschnittliche NVIDIA GeForce RTX 4060 Ti 8G
  (88 - 90.4, n=3)
89.1 fps -33%
Sapphire Pulse Radeon RX 7700 XT
AMD Ryzen 9 7950X, AMD Radeon RX 7700 XT
82.5 (20.2min, 38.6P0.1, 48.8P1) fps -38%
Durchschnittliche NVIDIA Titan RTX
  (74.5 - 79, n=2)
76.8 fps -42%
Durchschnittliche NVIDIA GeForce RTX 3070
  ()
76.3 fps -43%
KFA2 GeForce RTX 4060 1-Click-OC 2X
AMD Ryzen 9 7950X, NVIDIA GeForce RTX 4060
72.3 (38min, 39.5P0.1, 40.8P1) fps -46%
XFX Speedster QICK 308 Radeon RX 7600 Black Edition
AMD Ryzen 9 7950X, AMD Radeon RX 7600
52.8 (26.9min, 27.7P0.1, 28.6P1) fps -60%
The Callisto Protocol - 1920x1080 Ultra Preset (without FSR Upscaling) + Full Ray-Tracing
AMD Radeon RX 7800 XT
AMD Ryzen 9 7950X, AMD Radeon RX 7800 XT
99.3 fps +2%
AMD Radeon RX 7900 XTX
AMD Ryzen 9 7950X, AMD Radeon RX 7900 XTX
98 fps 0%
Gigabyte GeForce RTX 4070 Super Gaming OC 12G
Intel Core i9-13900K, NVIDIA GeForce RTX 4070 SUPER
97.64 fps
NVIDIA GeForce RTX 4070 Super Founders Edition
Intel Core i9-13900K, NVIDIA GeForce RTX 4070 SUPER
94.09 fps -4%
Sapphire Pulse Radeon RX 7700 XT
AMD Ryzen 9 7950X, AMD Radeon RX 7700 XT
92.4 fps -5%
AMD Radeon RX 7900 XT
AMD Ryzen 9 7950X, AMD Radeon RX 7900 XT
89 fps -9%
Durchschnittliche NVIDIA GeForce RTX 4070 Ti
  (82.1 - 97.5, n=4)
88.8 fps -9%
Asus TUF Gaming GeForce RTX 4070 Ti
Intel Core i9-13900K, NVIDIA GeForce RTX 4070 Ti
88.58 fps -9%
Gigabyte Aorus GeForce RTX 4070 Ti Master
Intel Core i9-13900K, NVIDIA GeForce RTX 4070 Ti
87 fps -11%
KFA2 GeForce RTX 4060 Ti EX, 16GB GDDR6
AMD Ryzen 9 7950X, NVIDIA GeForce RTX 4060 Ti 16G
86.6 fps -11%
Durchschnitt der Klasse Desktop
  (50.2 - 97.6, n=7, der letzten 2 Jahre)
86 fps -12%
Zotac Gaming GeForce RTX 4070 AMP Airo
Intel Core i9-13900K, NVIDIA GeForce RTX 4070
82 fps -16%
Durchschnittliche NVIDIA GeForce RTX 4060 Ti 8G
  (66.8 - 90.7, n=3)
81.1 fps -17%
Durchschnittliche NVIDIA GeForce RTX 3080 Ti
  ()
76 fps -22%
Durchschnittliche NVIDIA GeForce RTX 3080
  ()
71.3 fps -27%
XFX Speedster QICK 308 Radeon RX 7600 Black Edition
AMD Ryzen 9 7950X, AMD Radeon RX 7600
65.8 fps -33%
Durchschnittliche NVIDIA GeForce RTX 3070
  ()
61.8 fps -37%
Durchschnittliche NVIDIA Titan RTX
  ()
58.7 fps -40%
min. mittel hoch max.QHD4K DLSS4K
GTA V (2015) 188.3 187.9 186.9 158.8 147.2 166.6
The Witcher 3 (2015) 418 210 159.1 136.7
Dota 2 Reborn (2015) 250 228 221 209 202
Final Fantasy XV Benchmark (2018) 235 235 197.1 150.5 85.2
X-Plane 11.11 (2018) 233 196.4 152.4 129.1
Far Cry 5 (2018) 201 191 185 104
Strange Brigade (2018) 601 398 437 385 270 134.7
Shadow of the Tomb Raider (2018) 260 255 188 96.7
Metro Exodus (2019) 186.1 150.6 120.8 76.1
Control (2019) 180.1 115.5 69 58.2
Borderlands 3 (2019) 184.2 166.6 131.2 68.9
Mafia Definitive Edition (2020) 226 161.5 83.2
Watch Dogs Legion (2020) 142.3 109.2 63.4
Far Cry 6 (2021) 193.7 143.9 145.9 82.7
Dying Light 2 (2022) 157 108 54.5
Cyberpunk 2077 1.6 (2022) 161.8 146 92.8 44.9
Ghostwire Tokyo (2022) 284 291 194.8 92.7
F1 22 (2022) 381 403 340 136.3 88.8 44.6
The Callisto Protocol (2022) 216.05 155.69 123.75 78.04
F1 23 (2023) 380 406 357 125.9 81.2 69.7 40.7
Baldur's Gate 3 (2023) 203 203 142.7 119.7 71.7
Cyberpunk 2077 2.0 Phantom Liberty (2023) 162.1 141.9 89.6 38.9
Assassin's Creed Mirage (2023) 204 169 130 106 77
Alan Wake 2 (2023) 114.1 79.7 44.2 42.7
Call of Duty Modern Warfare 3 2023 (2023) 184 165 120 100 70
Avatar Frontiers of Pandora (2023) 129.9 101.2 67.6 60.5 34.6

Emissionen: Höheres Rauschen, aber niedrigere Temperaturen als RTX 4070 Super FE

Die RTX 4070 Super Gaming OC verfügt über acht Kupfer-Heatpipes

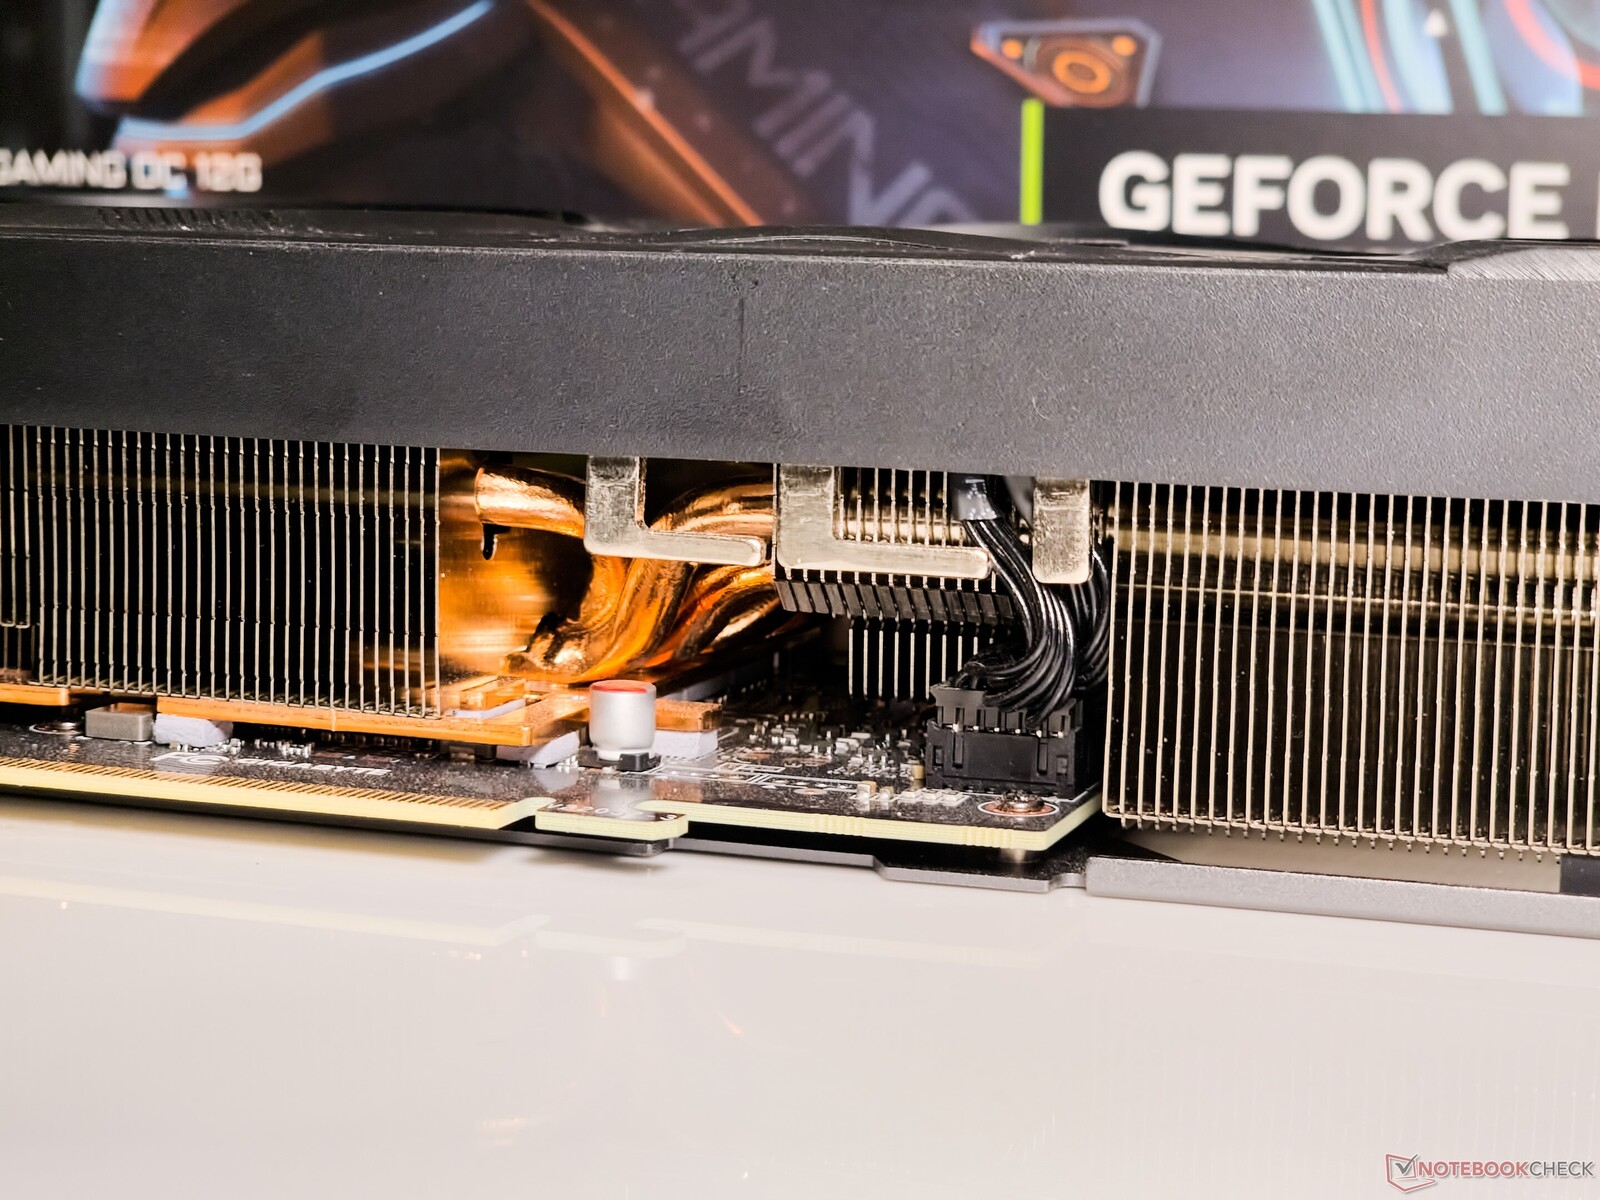
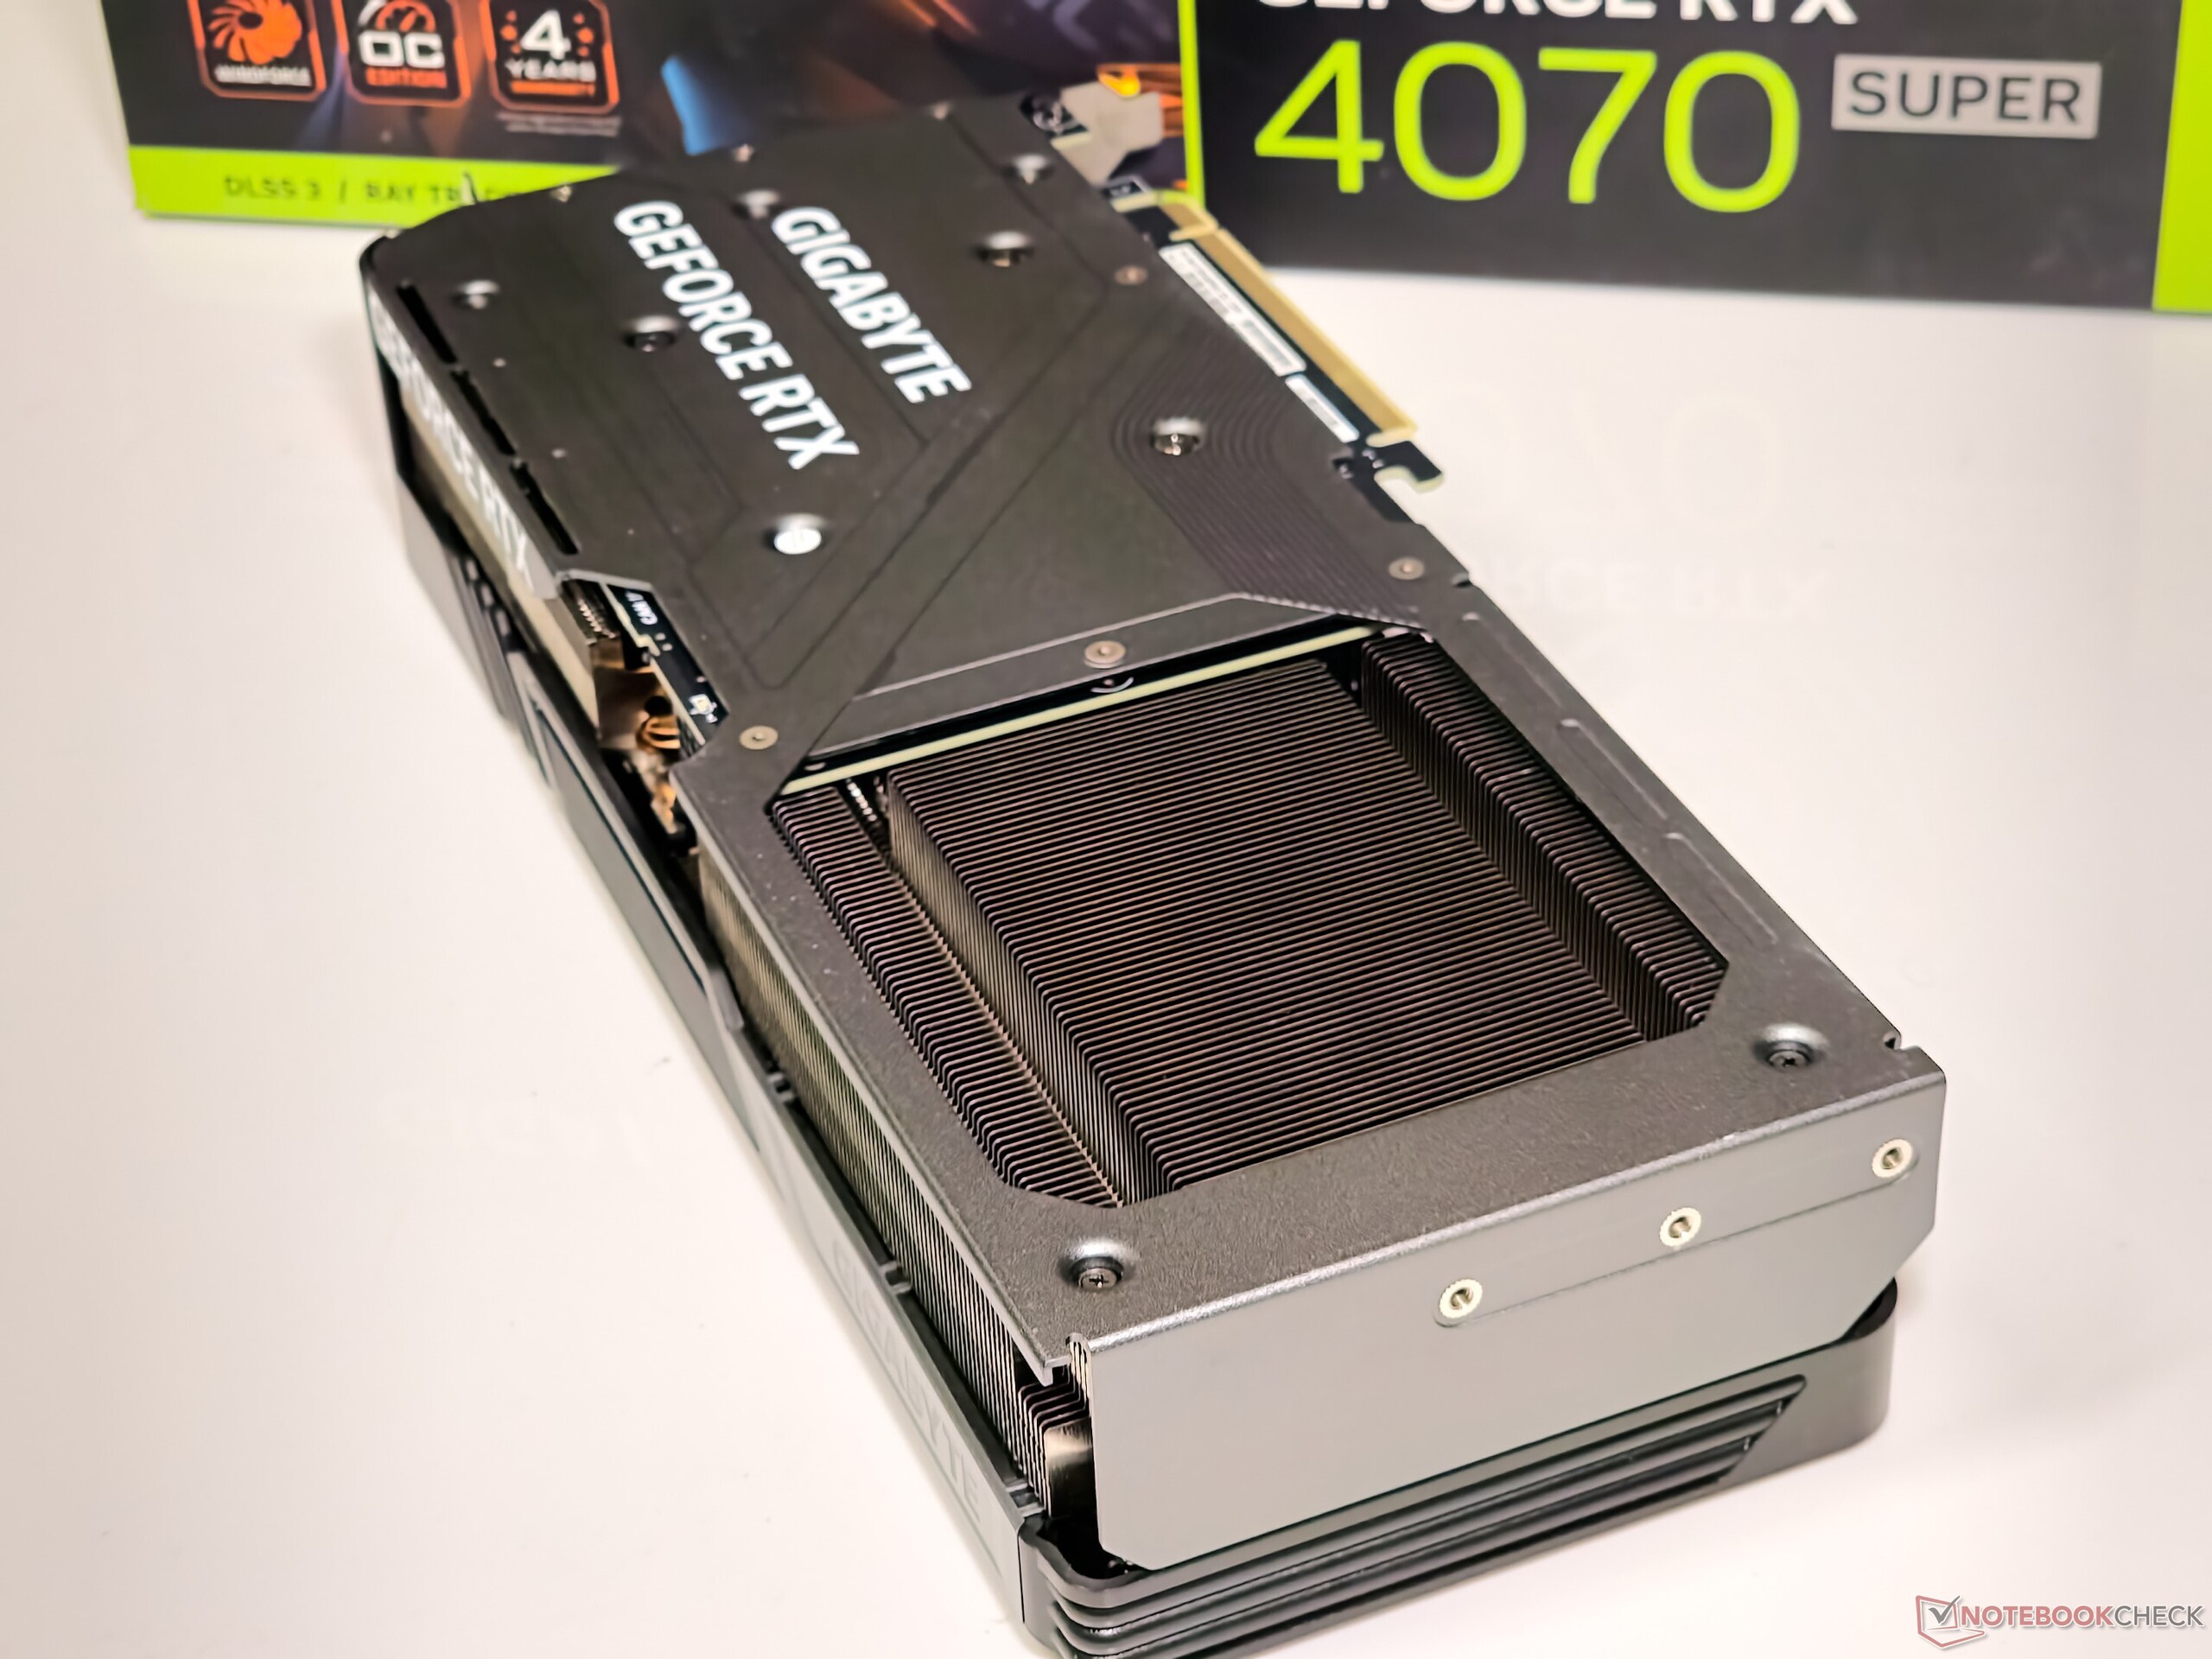
Die Gigabyte RTX 4070 Super Gaming OC verwendet das firmeneigene WindForce Kühlsystem mit drei 90-mm-Lüftern und insgesamt acht Kupfer-Heatpipes.

Zumindest bis zur Turing-Generation hatten die Founders-Edition-Karten von Nvidia in der Regel Mühe, im Vergleich zu ihren AiB-Pendants gute Wärme- und Geräuschemissionsprofile aufzuweisen.

Das hat sich mit Ampere geändert, und mit Ada haben wir gesehen, wie konsistent und effizient Nvidias neues thermisches Design ist. Die FE-Karten haben eine hohe Messlatte für AiB-Karten gesetzt, an der sie sich messen lassen müssen.

Stresstests

Da die RTX 4070 Super Gaming OC die verfügbare Leistung um 45 % auf bis zu 320 W erhöhen kann, haben wir die Karte sowohl bei 100 % als auch bei 145 % Power Targets (PTs) gestresst, um zu sehen, wie verschiedene GPU-Parameter beeinflusst werden.

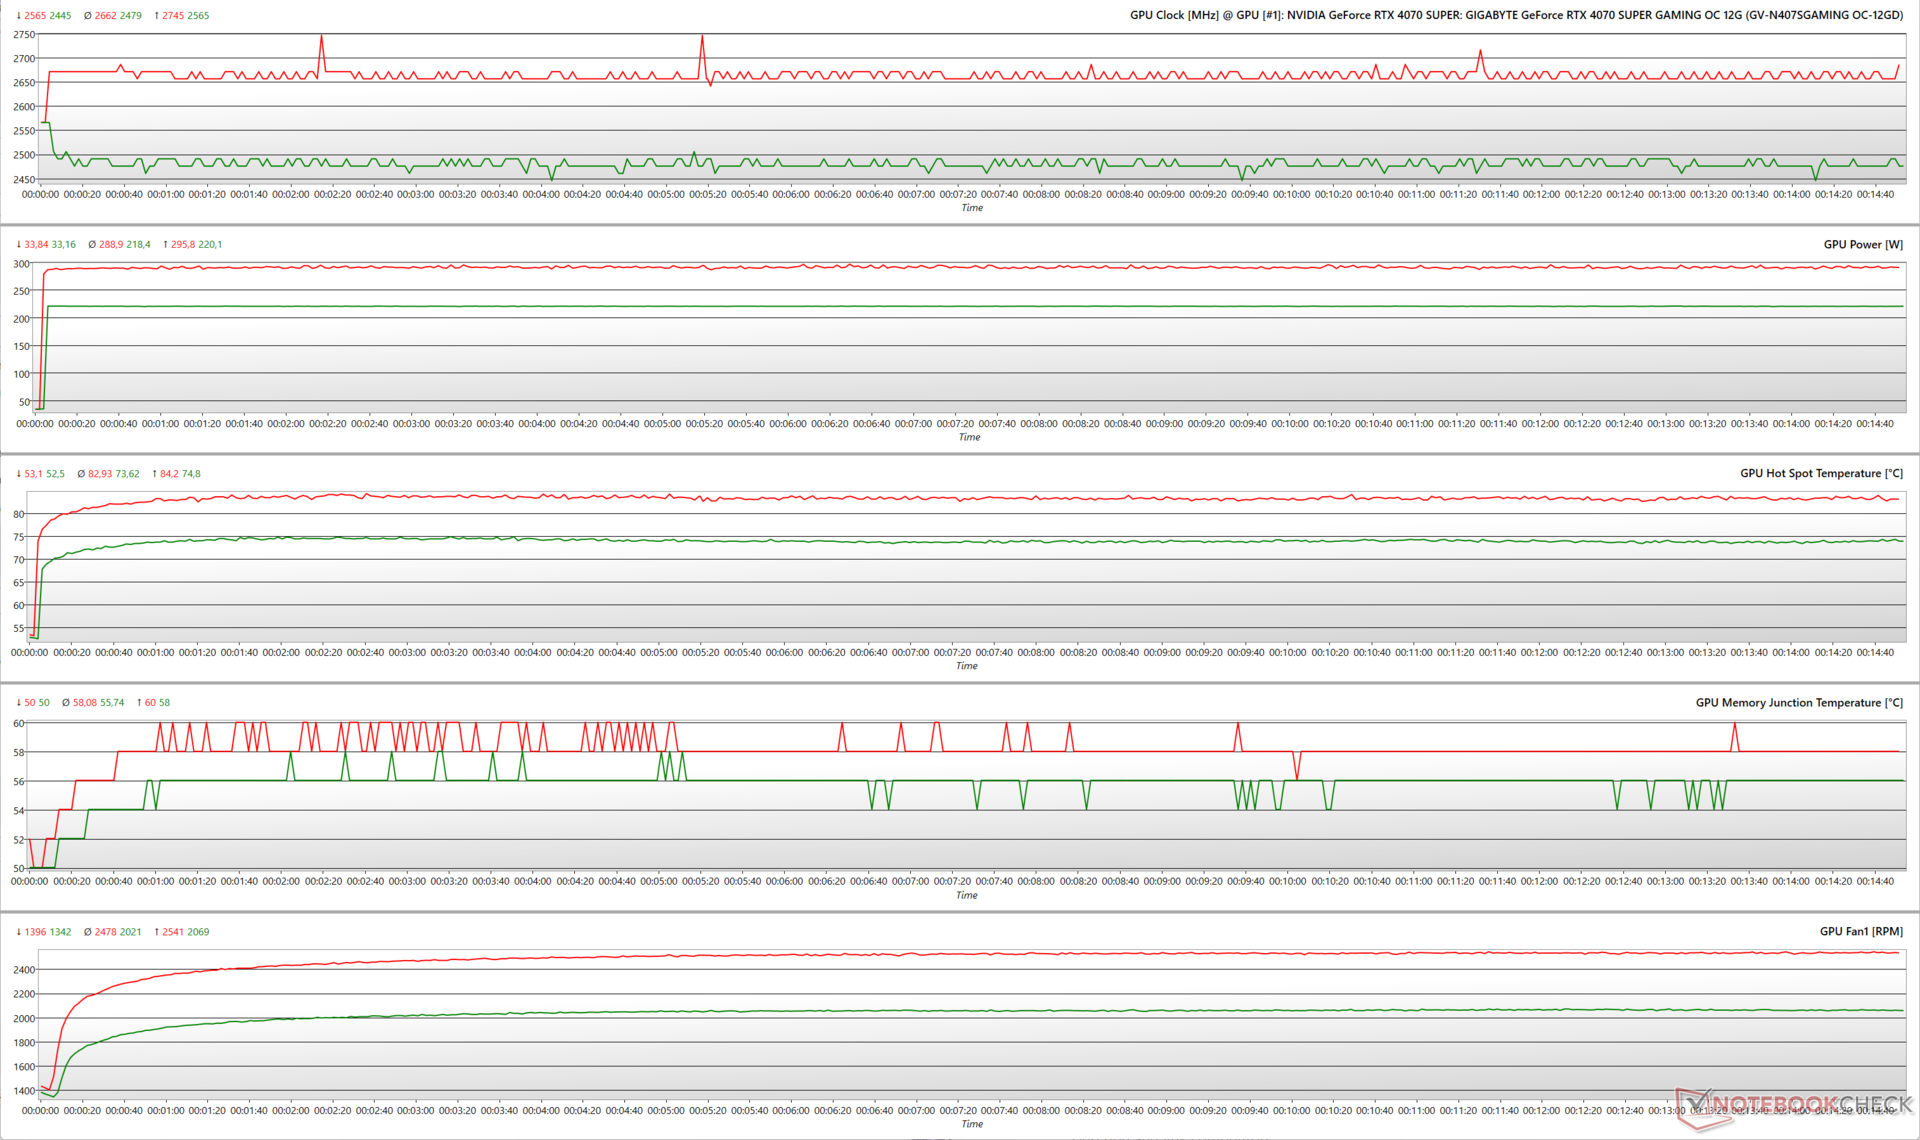
FurMark Stress bei 1.280 x 720 ohne AA zeigt, dass die RTX 4070 Super Gaming OC bei 100 % PT auf 2.565 MHz und bei 145 % PT auf 2.745 MHz ansteigt. Während die GPU in der Lage ist, die 220-W-TGP bei 100 % PT zu maximieren, kann sie bei 145 % nur 296 W nutzen, obwohl der theoretische Wert bis zu 320 W betragen kann.

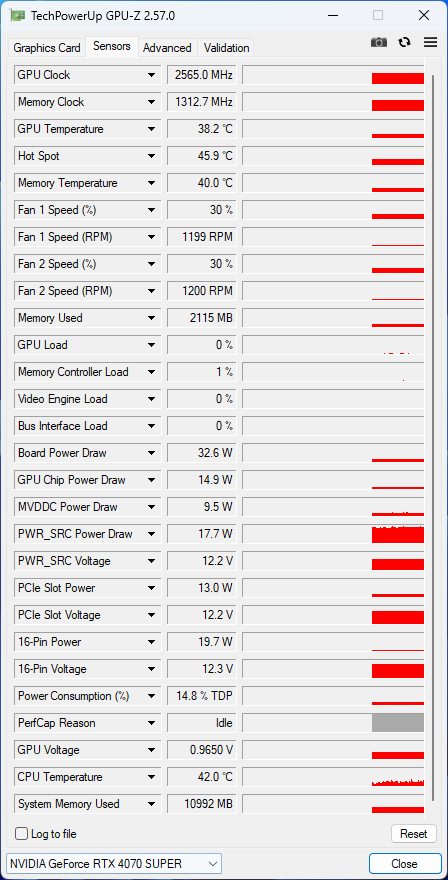
Natürlich wirkt sich die Erhöhung des Leistungsziels auch auf die Thermik aus. Die Hot-Spot-Temperaturen liegen bei 100 % PT im Durchschnitt bei 74 °C und steigen bei 145 % PT auf durchschnittlich 83 °C an.

Folglich klettern die Lüftergeschwindigkeiten um ~23 % von 100 % PT auf 145 % PT.

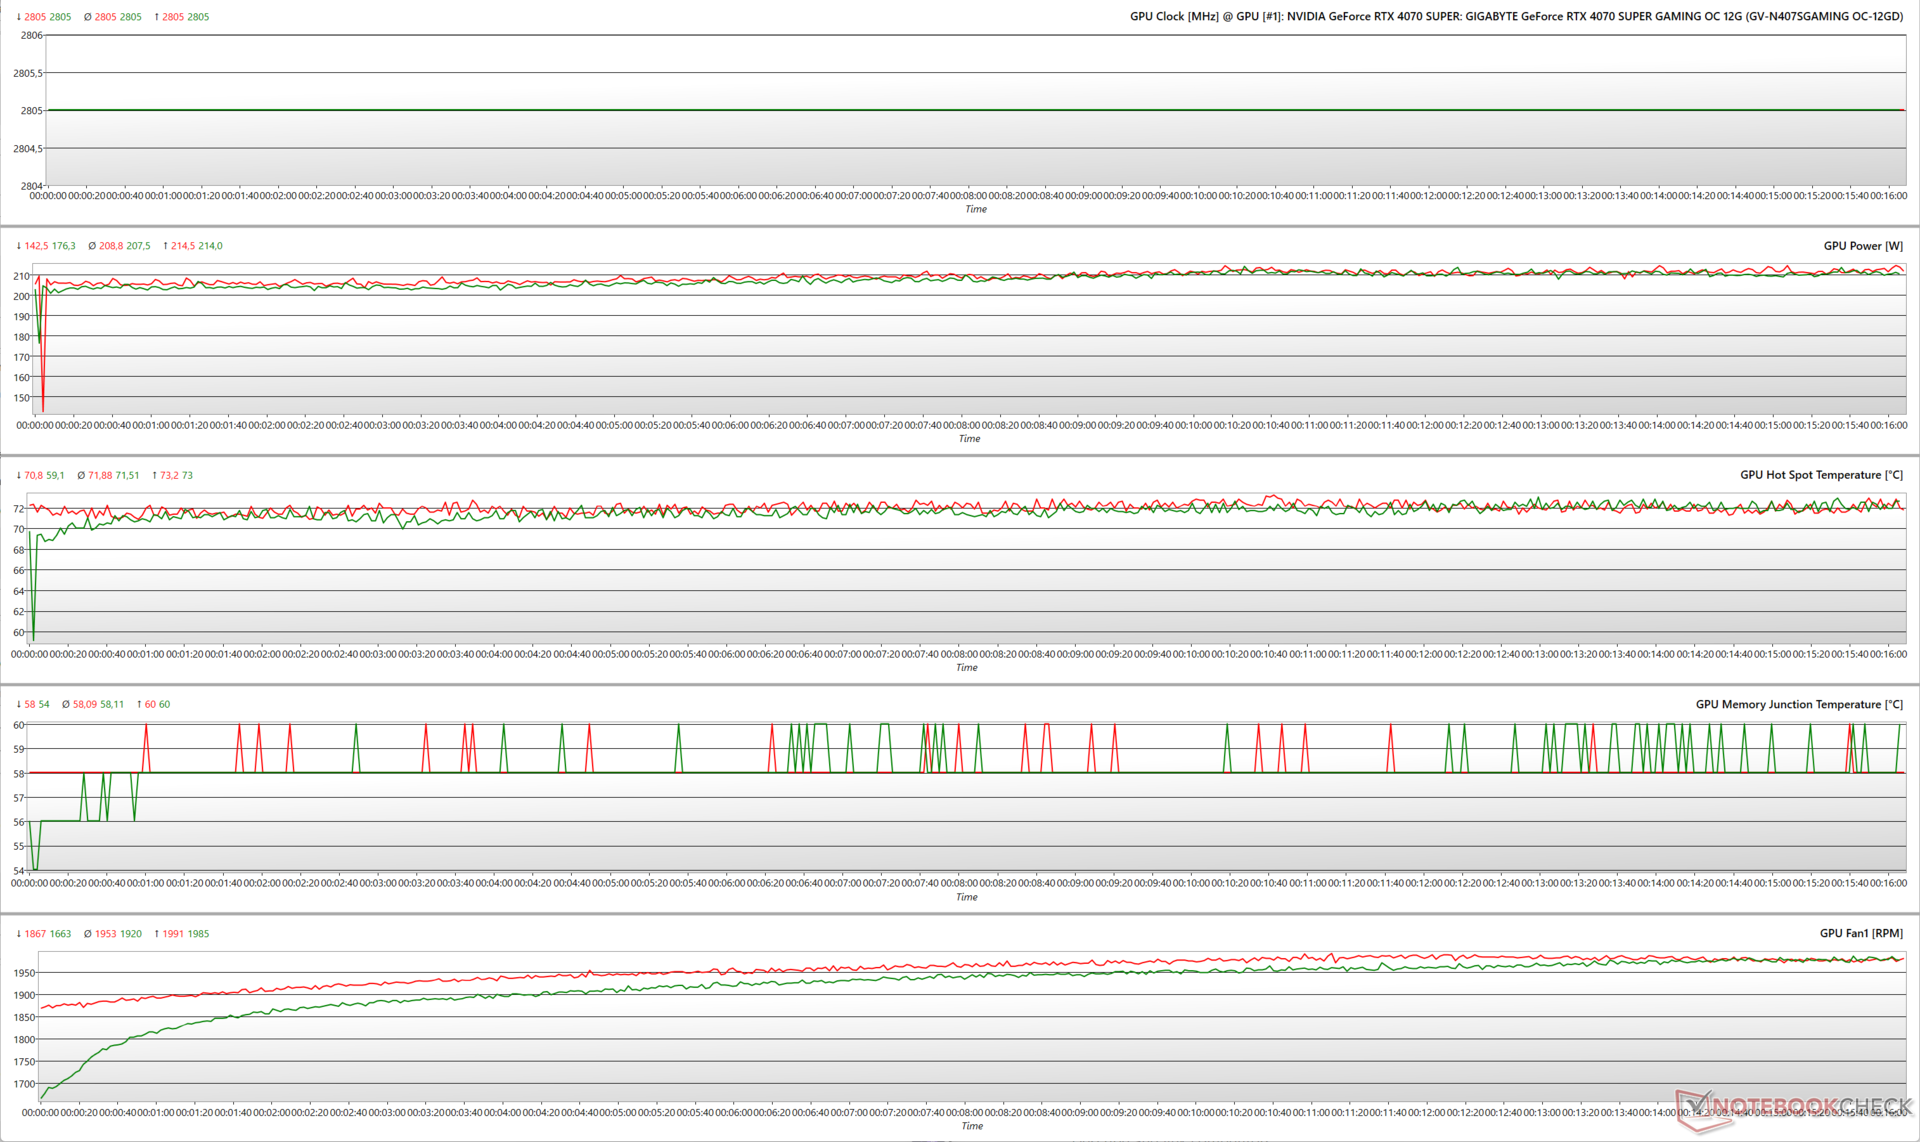
In einem realitätsnäheren Stress mit The Witcher 3 bei 1.080p Ultra sehen wir, dass eine Erhöhung des Energieziels keinerlei Einfluss auf die Taktraten hat. Unabhängig vom Leistungsziel hält die RTX 4070 Super Gaming OC einen stabilen Takt von 2.805 MHz und verbraucht dabei zwischen 208 und 214 W. Selbst die Hotspot-Temperaturen variieren zwischen diesen Leistungsprofilen kaum.

Diese Tests bestätigen einmal mehr, dass Ada nicht auf den TGP-Headroom angewiesen ist, um die Takte opportunistisch zu erhöhen. Tatsächlich ist der maximale Boost der RTX 4070 Super Gaming OC immer noch niedriger als der der RTX 4070 Super FE (2.820 MHz). Die Implementierung von Gigabyte führt jedoch zu einem etwas besseren durchschnittlichen Kerntakt (2.805 MHz) im Vergleich zu dem der Founders' Edition (2.776 MHz).

GPU-Parameter während FurMark Stress (Grün - 100 % PT; Rot - 145 % PT; OC BIOS)
GPU-Parameter während The Witcher 3 Stress bei 1.080p Ultra (Grün - 100 % PT; Rot - 145 % PT; OC BIOS)

The-Witcher-3-fps-Tabelle

Die Triple-Lüfter-Implementierung der RTX 4070 Super Gaming OC leistet gute Arbeit und sorgt für eine gleichbleibende Leistung, wie die konstanten Bildraten bei The Witcher 3 in 1.080p Ultra und 4K-Ultra-Einstellungen zeigen.

0153045607590105120135150165180195Tooltip
Gigabyte GeForce RTX 4070 Super Gaming OC 12G i9-13900K, NVIDIA GeForce RTX 4070 SUPER; 1920x1080 Ultra Graphics & Postprocessing (HBAO+): Ø198.9 (195-202)
Gigabyte GeForce RTX 4070 Super Gaming OC 12G i9-13900K, NVIDIA GeForce RTX 4070 SUPER; 3840x2160 Ultra Graphics & Postprocessing (HBAO+): Ø88.6 (86-90)

Oberflächentemperaturen

Bei einer Umgebungstemperatur von 22 °C bleibt die vordere Abdeckung mit 30 °C relativ kühl, während die Basis der Rückwand in der Nähe des PCIe-Anschlusses 44,5 °C erreicht. In der Nähe des 12VHPWR-Anschlusses haben wir 46,3 °C gemessen.

Insgesamt scheint das mitgelieferte Kühlsystem bei der Aufrechterhaltung erträglicher Oberflächentemperaturen unter Last einen guten Job zu machen.

Oberflächentemperaturen: vordere Abdeckhaube
Oberflächentemperaturen: Rückwand
Oberflächentemperaturen: 12VHPWR-Stromanschluss

Lärmpegel

Die dreifachen WindForce Lüfter erzeugen eine erträgliche Geräuschemissionen unter Last

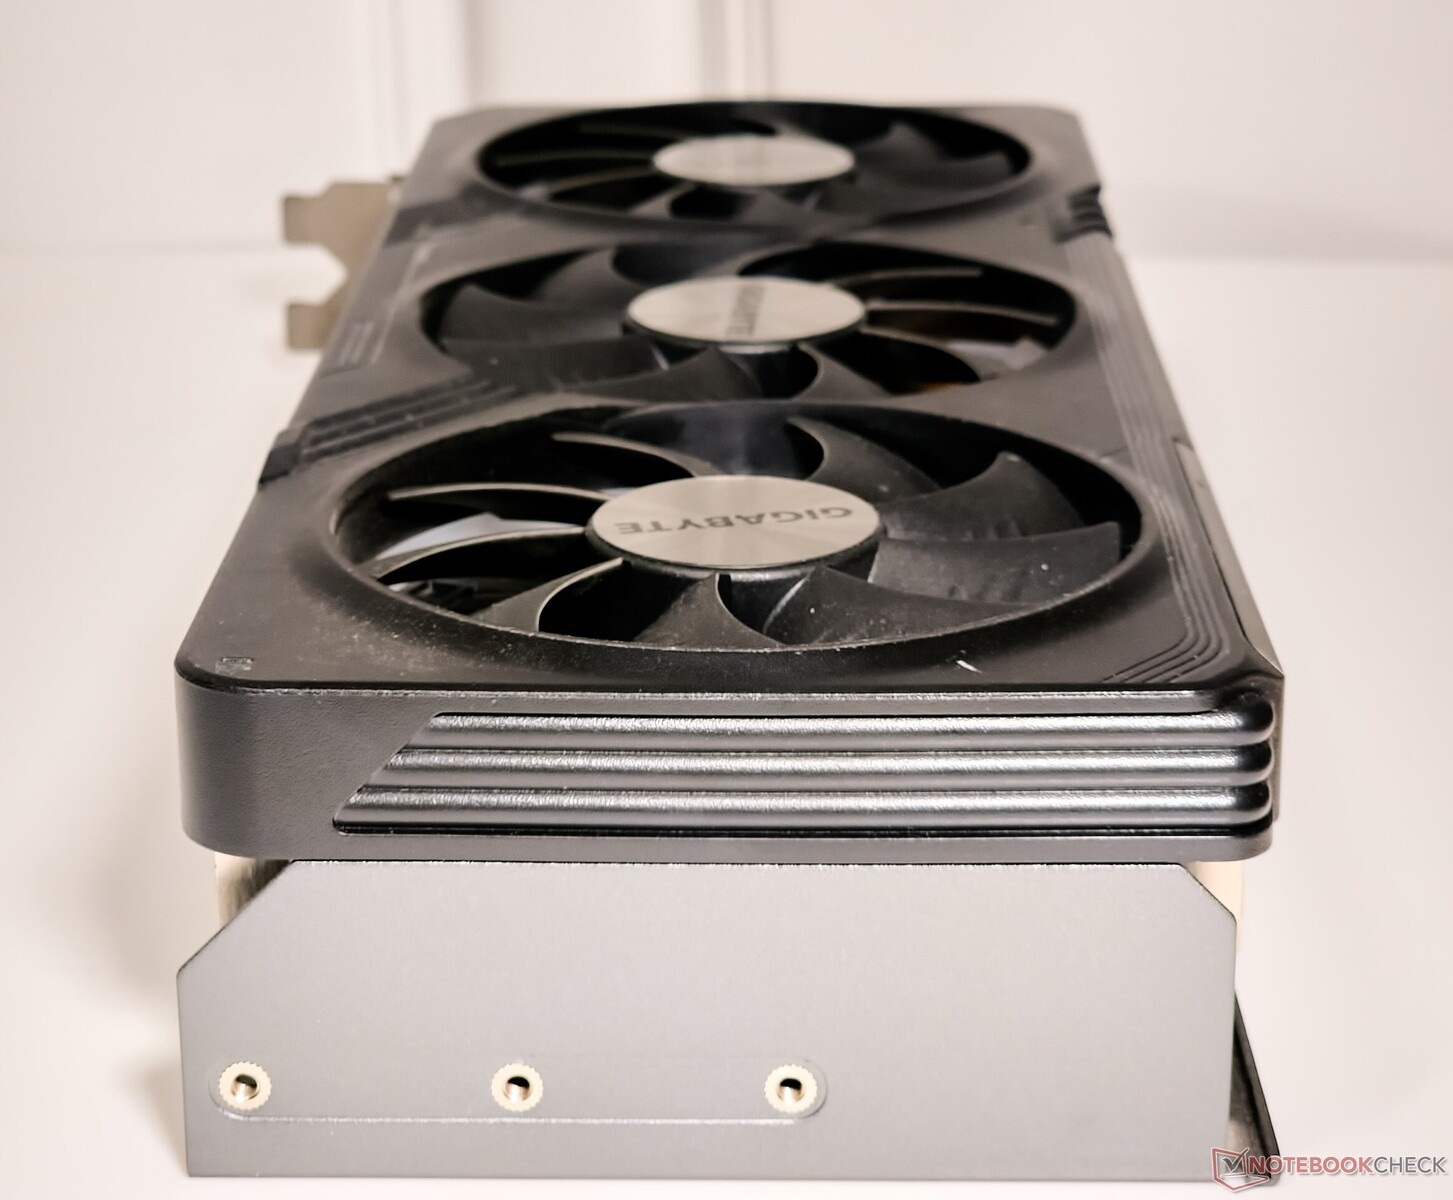
Von den drei Lüftern der RTX 4070 Super Gaming OC drehen sich der linke und der rechte gegen den Uhrzeigersinn, während sich der mittlere Lüfter im Uhrzeigersinn dreht, um ein gutes Gegengewicht zu schaffen.

Laut Gigabyte verwenden diese Lüfter ein Gleitlager mit Graphene-Nano-Schmiermittel, das angeblich eine Lebensdauer bietet, die der eines doppelten Kugellagers entspricht, allerdings ohne die Geräuschentwicklung.

Gigabyte implementiert einen kompletten Lüfterstopp im Leerlauf und bietet zwei VBIOS-Betriebsmodi - BIOS OC und Silent.

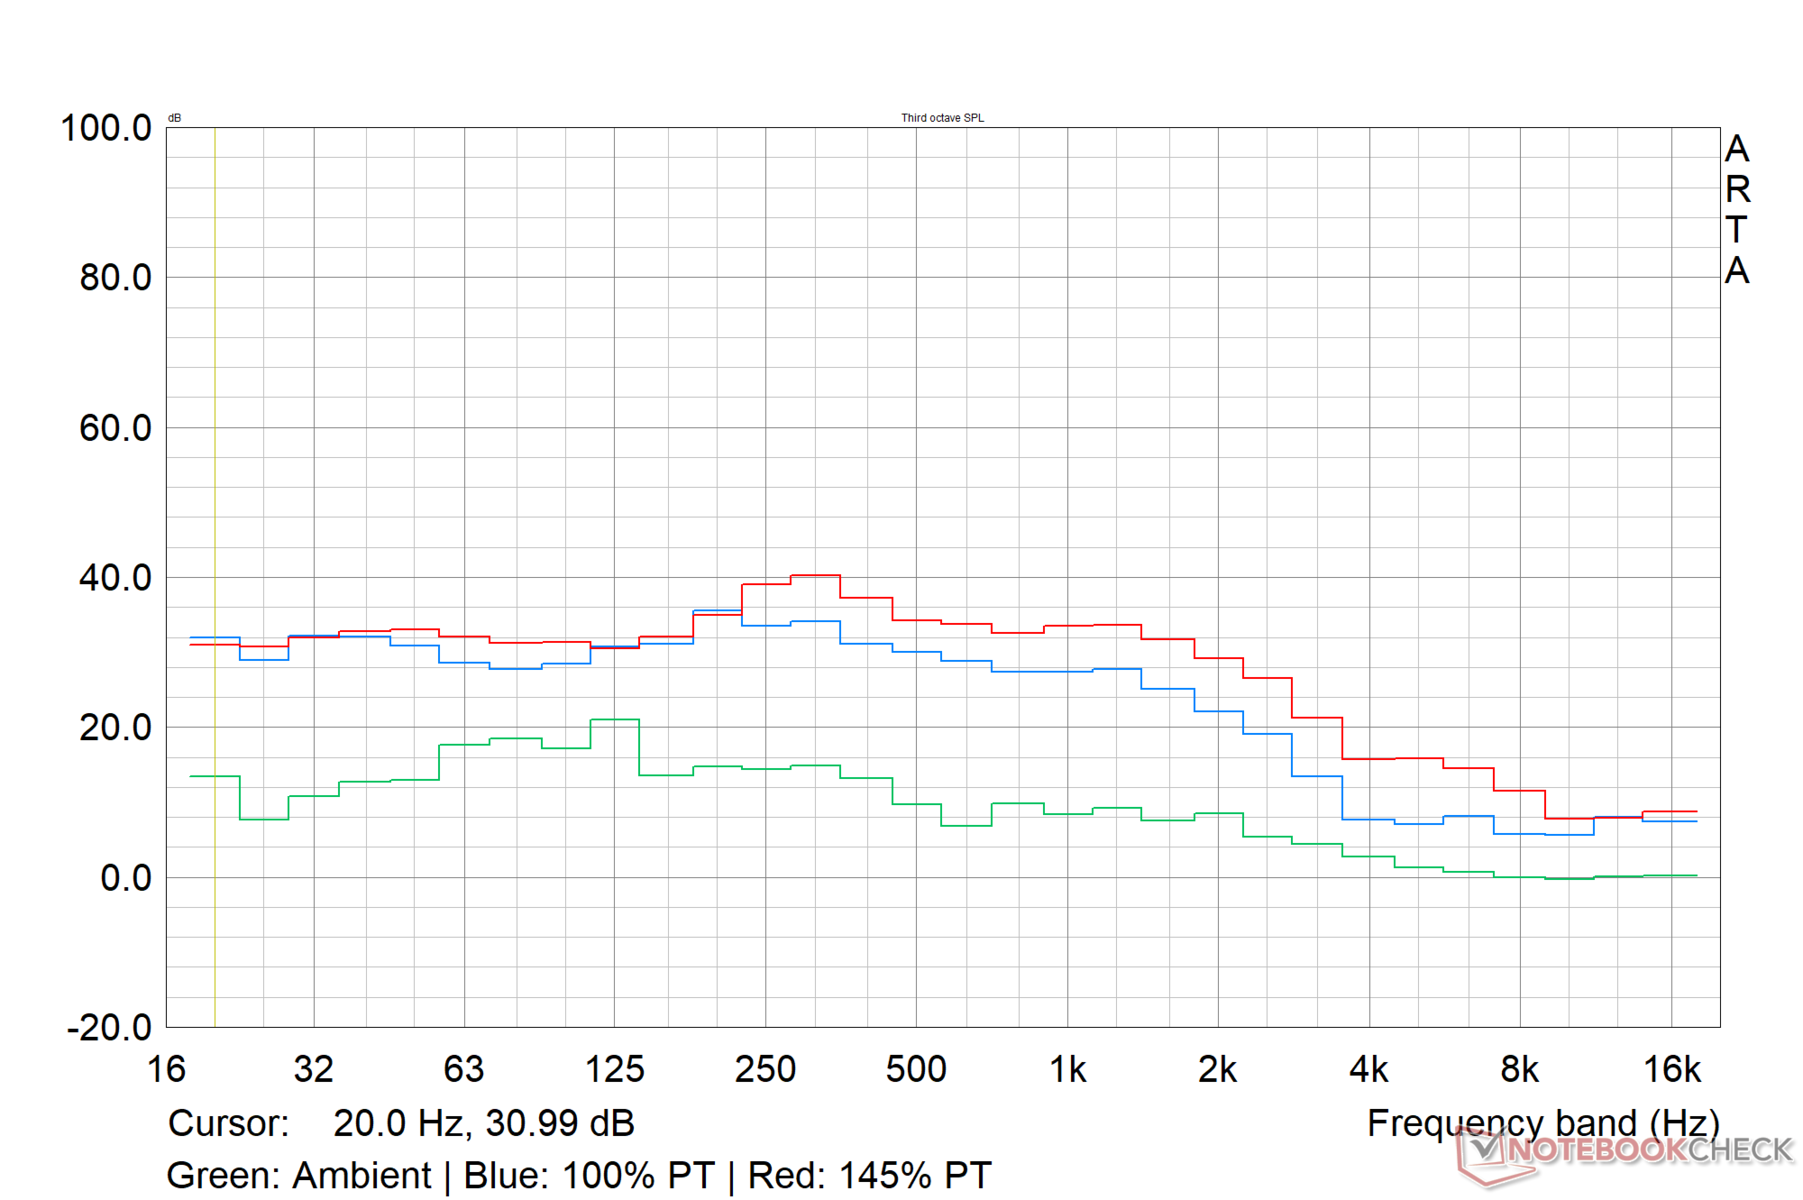
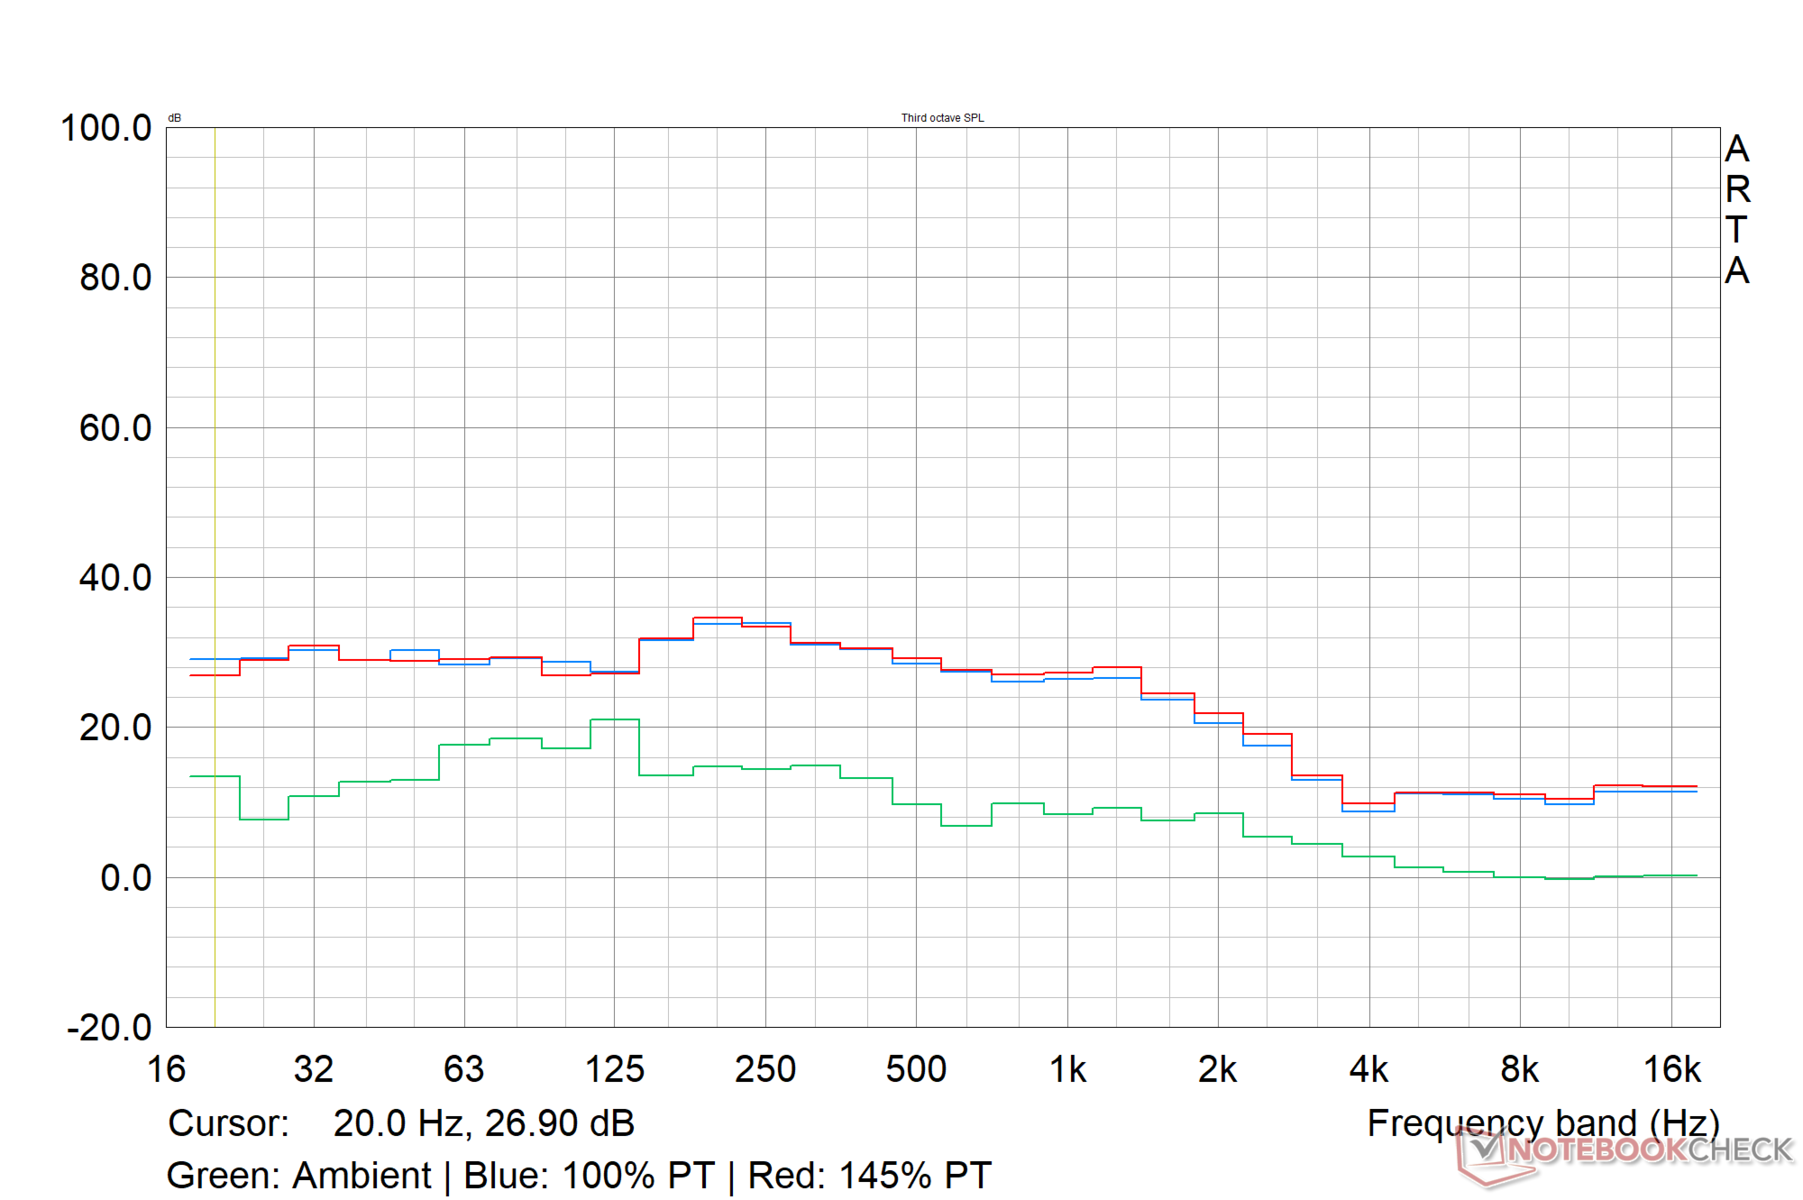
In der Praxis konnten wir bei den Stresstests mit 100 und 145 % Leistung in beiden VBIOS-Modi keine spürbaren Unterschiede bei den gemessenen Schalldruckpegeln (SPL) feststellen. 

Dennoch betrug der maximale SPL, den wir aufzeichnen konnten, 43,32 db(A) bei 2.541 RPM - verständlich, wenn man die Dreifach-Lüfterkonfiguration bedenkt.

Im Gegensatz dazu bleiben die Lüfter der RTX 4070 Super Founders' Edition immer unter 35 dB(A) SPL. Der Nachteil ist jedoch die um 10 °C höhere Hotspot-Temperatur und die um 14 °C höhere Sperrschichttemperatur des Speichers bei der FE-Karte im Vergleich zur RTX 4070 Super Gaming OC.

Ambient: 19.50 dB(A); System Idle: 24 dB(A)
Stresstest VBIOSModus / Power Target max. Lüfterdrehzahl (RPM) Lüftergeräusch dB(A)
FurMark 1.280 x 720, keine AA BIOS OC / 100 % 2.069 37,70
FurMark 1.280 x 720, ohne AA Silent BIOS / 100 % 1.930 37,11
FurMark 1.280 x 720, ohne AA BIOS OC / 145 % 2.541 43,32
FurMark 1.280 x 720, ohne AA Silent BIOS / 145 % 2.366 42,72
The Witcher 3 1.080p Ultra BIOS OC / 100 % 1.985 35,88
The Witcher 3 1.080p Ultra Silent BIOS / 100 % 1.842 35,72
The Witcher 3 1.080p Ultra BIOS OC / 145 % 1.991 36,54
The Witcher 3 1.080p Ultra Silent BIOS / 145 % 1.878 35,8
RTX 4070 Super Gaming OC Geräuschprofil während FuMark Stress (BIOS OC)
RTX 4070 Super Gaming OC Geräuschprofil während The Witcher 3 1.080p Ultra Stress (BIOS OC)

Energieverwaltung: Ausgezeichnete Energieeffizienz beim Spielen

Im Vergleich zur RTX 4070 Super FE weist die Gigabyte RTX 4070 Super Gaming OC in The Witcher 3 1.080p Ultra eine um 6 % verbesserte Energieeffizienz auf und liegt damit sogar vor der RTX 4090 Founders' Edition. Die Radeon RX 7900 XT führt die Effizienz-Charts immer noch an, aber nicht mehr ganz so weit.

Einmal mehr sehen wir, dass der durchschnittliche Stromverbrauch unverändert bleibt, selbst bei einem Leistungsziel von 145 %, während wir The Witcher 3 mit 1.080p Ultra anstrengen. Dies bestätigt unsere Beobachtungen aus dem Spiel-Stresstest, der keine TGP- oder Taktunterschiede bei beiden Energiezielen zeigt.

Power Consumption: External monitor

0255075100125150175200225250275300325350375400425Tooltip
Gigabyte GeForce RTX 4070 Super Gaming OC 12G; 1280x720 FurMark 1.19 GPU Stress Test (external Monitor); 145% PT, BIOS OC: Ø413 (403-440)
Gigabyte GeForce RTX 4070 Super Gaming OC 12G; 1280x720 FurMark 1.19 GPU Stress Test (external Monitor); 100% PT, BIOS OC: Ø335 (330-359)
Gigabyte GeForce RTX 4070 Super Gaming OC 12G; 1920x1080 The Witcher 3 ultra (external Monitor); 100% PT, BIOS OC: Ø388 (373-438)
Gigabyte GeForce RTX 4070 Super Gaming OC 12G; 1920x1080 The Witcher 3 ultra (external Monitor); 145% PT, BIOS OC: Ø388 (377-418)
Gigabyte GeForce RTX 4070 Super Gaming OC 12G; Idle 1min (external Monitor): Ø122.6 (114.8-153.4)
Power Consumption / FurMark 1.19 GPU Stress Test (external Monitor)
NVIDIA GeForce RTX 4090 Founders Edition
Intel Core i9-13900K, NVIDIA GeForce RTX 4090 (133% PT OC, Idle: 81.25 W)
704 (666min, 670P1 - 717max) Watt * -70%
NVIDIA GeForce RTX 4090 Founders Edition
Intel Core i9-13900K, NVIDIA GeForce RTX 4090 (100% PT, Idle: 81.25 W)
558 (551min, 553P1 - 566max) Watt * -35%
Zotac Gaming GeForce RTX 3090 Ti AMP Extreme Holo
AMD Ryzen 7 5800X3D, NVIDIA GeForce RTX 3090 Ti (110% PT, Idle: 102 W)
648 (629min, 637P1 - 658max) Watt * -57%
Zotac Gaming GeForce RTX 3090 Ti AMP Extreme Holo
AMD Ryzen 7 5800X3D, NVIDIA GeForce RTX 3090 Ti (100% PT; Quiet BIOS, Idle: 102 W)
599 (587min, 588P1 - 666max) Watt * -45%
Zotac Gaming GeForce RTX 3090 Ti AMP Extreme Holo
AMD Ryzen 7 5800X3D, NVIDIA GeForce RTX 3090 Ti (100% PT; Amplify BIOS, Idle: 102 W)
598 (584min, 595P1 - 608max) Watt * -45%
Sapphire AMD Radeon RX 6950 XT Nitro+ Pure
AMD Ryzen 9 5900X, AMD Radeon RX 6950 XT
564 (525min, 551P1 - 601max) Watt * -37%
AMD Radeon RX 7900 XTX
AMD Ryzen 9 7950X, AMD Radeon RX 7900 XTX (Idle: 86.5 W)
518 (501min, 502P1 - 525max) Watt * -25%
AMD Radeon RX 7900 XT
AMD Ryzen 9 7950X, AMD Radeon RX 7900 XT (Idle: 84.6 W)
513 (500min, 506P1 - 527max) Watt * -24%
Durchschnittliche NVIDIA GeForce RTX 3080
  (Idle: 492 - 505, n=2 W)
499 Watt * -21%
Durchschnittliche NVIDIA GeForce RTX 3090
  (Idle: 281 - 551, n=8 W)
469 Watt * -14%
NVIDIA GeForce RTX 4080 Founders Edition
Intel Core i9-13900K, NVIDIA GeForce RTX 4080 (110% PT, Idle: 78.45 W)
466 (461min, 462P1 - 488max) Watt * -13%
NVIDIA GeForce RTX 4080 Founders Edition
Intel Core i9-13900K, NVIDIA GeForce RTX 4080 (100% PT, Idle: 78.45 W)
429 (423min, 424P1 - 436max) Watt * -4%
Durchschnittliche NVIDIA GeForce RTX 3080 Ti
  (Idle: 427 - 513, n=3 W)
464 Watt * -12%
AMD Radeon RX 6900 XT
AMD Ryzen 9 5950X, AMD Radeon RX 6900 XT (Idle: 99.15 W)
456.8 (378.13min - 484.67max) Watt * -11%
AMD Radeon RX 6800 XT
AMD Ryzen 9 5950X, AMD Radeon RX 6800 XT (Idle: 99.5 W)
447.9 (413min - 484max) Watt * -8%
Gigabyte Aorus GeForce RTX 4070 Ti Master
Intel Core i9-13900K, NVIDIA GeForce RTX 4070 Ti (OC BIOS; 128% PT, Idle: 75.5 W)
446 (436min, 437P1 - 452max) Watt * -8%
Gigabyte Aorus GeForce RTX 4070 Ti Master
Intel Core i9-13900K, NVIDIA GeForce RTX 4070 Ti (OC BIOS; 100% PT, Idle: 75.5 W)
405 (397min, 398P1 - 416max) Watt * +2%
Gigabyte Aorus GeForce RTX 4070 Ti Master
Intel Core i9-13900K, NVIDIA GeForce RTX 4070 Ti (Silent BIOS; 100% PT, Idle: 75.5 W)
404 (396min, 398P1 - 417max) Watt * +2%
Asus TUF Gaming GeForce RTX 4070 Ti
Intel Core i9-13900K, NVIDIA GeForce RTX 4070 Ti (Perf BIOS / 110% PT, Idle: 75.4 W)
443 (440min, 440P1 - 465max) Watt * -7%
Asus TUF Gaming GeForce RTX 4070 Ti
Intel Core i9-13900K, NVIDIA GeForce RTX 4070 Ti (Quiet BIOS / 100% PT, Idle: 75.4 W)
410 (408min, 409P1 - 415max) Watt * +1%
Asus TUF Gaming GeForce RTX 4070 Ti
Intel Core i9-13900K, NVIDIA GeForce RTX 4070 Ti (Perf BIOS / 100% PT, Idle: 75.4 W)
406 (401min, 402P1 - 430max) Watt * +2%
Durchschnittliche NVIDIA GeForce RTX 4070 Ti
  (Idle: 404 - 451, n=8 W)
422 Watt * -2%
Durchschnittliche NVIDIA Titan RTX
  (Idle:  W)
419 Watt * -1%
Gigabyte GeForce RTX 4070 Super Gaming OC 12G
Intel Core i9-13900K, NVIDIA GeForce RTX 4070 SUPER (145% PT, BIOS OC, Idle: 122.6 W)
413 (403min, 404P1 - 440max) Watt *
Gigabyte GeForce RTX 4070 Super Gaming OC 12G
Intel Core i9-13900K, NVIDIA GeForce RTX 4070 SUPER (100% PT, BIOS OC, Idle: 122.6 W)
335 (330min, 330P1 - 359max) Watt * +19%
AMD Radeon RX 7800 XT
AMD Ryzen 9 7950X, AMD Radeon RX 7800 XT
408 (375min, 380P1 - 434max) Watt * +1%
Sapphire Pulse Radeon RX 7700 XT
AMD Ryzen 9 7950X, AMD Radeon RX 7700 XT
365 (359min, 360P1 - 373max) Watt * +12%
NVIDIA GeForce RTX 4070 Super Founders Edition
Intel Core i9-13900K, NVIDIA GeForce RTX 4070 SUPER (109% PT, Idle: 114.9 W)
355 (344min, 346P1 - 372max) Watt * +14%
NVIDIA GeForce RTX 4070 Super Founders Edition
Intel Core i9-13900K, NVIDIA GeForce RTX 4070 SUPER (100% PT, Idle: 114.9 W)
333 (321min, 323P1 - 351max) Watt * +19%
Zotac Gaming GeForce RTX 4070 AMP Airo
Intel Core i9-13900K, NVIDIA GeForce RTX 4070 (120% PT, Idle: 94.4 W)
351 (344min, 345P1 - 400max) Watt * +15%
Zotac Gaming GeForce RTX 4070 AMP Airo
Intel Core i9-13900K, NVIDIA GeForce RTX 4070 (100% PT, Idle: 94.4 W)
311 (307min, 307P1 - 371max) Watt * +25%
Durchschnittliche NVIDIA GeForce RTX 3070
  (Idle: 281 - 393, n=6 W)
348 Watt * +16%
XFX Speedster QICK 308 Radeon RX 7600 Black Edition
AMD Ryzen 9 7950X, AMD Radeon RX 7600
333 (323min, 325P1 - 352max) Watt * +19%
Durchschnitt der Klasse Desktop
  (Idle: 11.3 - 704, n=33, der letzten 2 Jahre W)
307 Watt * +26%
KFA2 GeForce RTX 4060 Ti EX, 16GB GDDR6
AMD Ryzen 9 7950X, NVIDIA GeForce RTX 4060 Ti 16G
304 (297min, 298P1 - 311max) Watt * +26%
KFA2 GeForce RTX 4060 1-Click-OC 2X
AMD Ryzen 9 7950X, NVIDIA GeForce RTX 4060
251 (244min, 245P1 - 259max) Watt * +39%
Power Consumption / The Witcher 3 ultra (external Monitor)
Sapphire AMD Radeon RX 6950 XT Nitro+ Pure
AMD Ryzen 9 5900X, AMD Radeon RX 6950 XT
589 (583min, 584P1 - 598max) Watt * -52%
Zotac Gaming GeForce RTX 3090 Ti AMP Extreme Holo
AMD Ryzen 7 5800X3D, NVIDIA GeForce RTX 3090 Ti (110% PT, Idle: 102 W)
569 (555min, 557P1 - 580max) Watt * -47%
Zotac Gaming GeForce RTX 3090 Ti AMP Extreme Holo
AMD Ryzen 7 5800X3D, NVIDIA GeForce RTX 3090 Ti (100% PT, Idle: 102 W)
561 (533min, 542P1 - 582max) Watt * -45%
NVIDIA GeForce RTX 4090 Founders Edition
Intel Core i9-13900K, NVIDIA GeForce RTX 4090 (133% PT OC, Idle: 81.25 W)
552 (541min, 545P1 - 569max) Watt * -42%
NVIDIA GeForce RTX 4090 Founders Edition
Intel Core i9-13900K, NVIDIA GeForce RTX 4090 (100% PT, Idle: 81.25 W)
499 (493min, 494P1 - 519max) Watt * -29%
AMD Radeon RX 7900 XTX
AMD Ryzen 9 7950X, AMD Radeon RX 7900 XTX (Idle: 86.5 W)
540 (527min, 530P1 - 564max) Watt * -39%
Durchschnittliche NVIDIA GeForce RTX 3090
  (Idle: 464 - 597, n=17 W)
524 Watt * -35%
Durchschnittliche NVIDIA GeForce RTX 3080 Ti
  (Idle: 490 - 528, n=3 W)
506 Watt * -30%
AMD Radeon RX 6800 XT
AMD Ryzen 9 5950X, AMD Radeon RX 6800 XT (Idle: 99.5 W)
505 (389min - 543max) Watt * -30%
Durchschnittliche NVIDIA GeForce RTX 3080
  (Idle: 498 - 505, n=2 W)
502 Watt * -29%
AMD Radeon RX 6900 XT
AMD Ryzen 9 5950X, AMD Radeon RX 6900 XT (Idle: 99.15 W)
488.3 (459.99min - 512.79max) Watt * -26%
NVIDIA GeForce RTX 4080 Founders Edition
Intel Core i9-13900K, NVIDIA GeForce RTX 4080 (110% PT, Idle: 78.45 W)
463 (451min, 453P1 - 481max) Watt * -19%
NVIDIA GeForce RTX 4080 Founders Edition
Intel Core i9-13900K, NVIDIA GeForce RTX 4080 (100% PT, Idle: 78.45 W)
420 (410min, 411P1 - 448max) Watt * -8%
AMD Radeon RX 7900 XT
AMD Ryzen 9 7950X, AMD Radeon RX 7900 XT (Idle: 84.6 W)
459 (451min, 453P1 - 488max) Watt * -18%
AMD Radeon RX 7800 XT
AMD Ryzen 9 7950X, AMD Radeon RX 7800 XT
425 (421min, 422P1 - 429max) Watt * -10%
Asus TUF Gaming GeForce RTX 4070 Ti
Intel Core i9-13900K, NVIDIA GeForce RTX 4070 Ti (Perf BIOS / 110% PT, Idle: 75.4 W)
422 (412min, 413P1 - 452max) Watt * -9%
Asus TUF Gaming GeForce RTX 4070 Ti
Intel Core i9-13900K, NVIDIA GeForce RTX 4070 Ti (Perf BIOS / 100% PT, Idle: 75.4 W)
419 (414min, 415P1 - 438max) Watt * -8%
Asus TUF Gaming GeForce RTX 4070 Ti
Intel Core i9-13900K, NVIDIA GeForce RTX 4070 Ti (Quiet BIOS / 100% PT, Idle: 75.4 W)
418 (411min, 412P1 - 433max) Watt * -8%
Durchschnittliche NVIDIA GeForce RTX 4070 Ti
  (Idle: 404 - 426, n=8 W)
415 Watt * -7%
Gigabyte Aorus GeForce RTX 4070 Ti Master
Intel Core i9-13900K, NVIDIA GeForce RTX 4070 Ti (Silent BIOS; 100% PT, Idle: 75.5 W)
414 (406min, 407P1 - 432max) Watt * -7%
Gigabyte Aorus GeForce RTX 4070 Ti Master
Intel Core i9-13900K, NVIDIA GeForce RTX 4070 Ti (OC BIOS; 128% PT, Idle: 75.5 W)
410 (401min, 403P1 - 435max) Watt * -6%
Gigabyte Aorus GeForce RTX 4070 Ti Master
Intel Core i9-13900K, NVIDIA GeForce RTX 4070 Ti (OC BIOS; 100% PT, Idle: 75.5 W)
404 (397min, 398P1 - 427max) Watt * -4%
Durchschnittliche NVIDIA Titan RTX
  (Idle: 371 - 463, n=27 W)
408 Watt * -5%
Durchschnittliche NVIDIA GeForce RTX 3070
  (Idle: 317 - 550, n=5 W)
401 Watt * -3%
Gigabyte GeForce RTX 4070 Super Gaming OC 12G
Intel Core i9-13900K, NVIDIA GeForce RTX 4070 SUPER (100% PT, BIOS OC, Idle: 122.6 W)
388 (373min, 375P1 - 438max) Watt *
Gigabyte GeForce RTX 4070 Super Gaming OC 12G
Intel Core i9-13900K, NVIDIA GeForce RTX 4070 SUPER (145% PT, BIOS OC, Idle: 122.6 W)
388 (377min, 377P1 - 418max) Watt * -0%
Sapphire Pulse Radeon RX 7700 XT
AMD Ryzen 9 7950X, AMD Radeon RX 7700 XT
384 (379min, 380P1 - 391max) Watt * +1%
NVIDIA GeForce RTX 4070 Super Founders Edition
Intel Core i9-13900K, NVIDIA GeForce RTX 4070 SUPER (109% PT, Idle: 114.9 W)
377 (365min, 366P1 - 407max) Watt * +3%
NVIDIA GeForce RTX 4070 Super Founders Edition
Intel Core i9-13900K, NVIDIA GeForce RTX 4070 SUPER (100% PT, Idle: 114.9 W)
372 (359min, 361P1 - 402max) Watt * +4%
Zotac Gaming GeForce RTX 4070 AMP Airo
Intel Core i9-13900K, NVIDIA GeForce RTX 4070 (120% PT, Idle: 94.4 W)
358 (348min, 350P1 - 400max) Watt * +8%
Zotac Gaming GeForce RTX 4070 AMP Airo
Intel Core i9-13900K, NVIDIA GeForce RTX 4070 (100% PT, Idle: 94.4 W)
353 (347min, 348P1 - 440max) Watt * +9%
Durchschnitt der Klasse Desktop
  (Idle: 19.1 - 569, n=37, der letzten 2 Jahre W)
354 Watt * +9%
XFX Speedster QICK 308 Radeon RX 7600 Black Edition
AMD Ryzen 9 7950X, AMD Radeon RX 7600
346 (340min, 341P1 - 351max) Watt * +11%
KFA2 GeForce RTX 4060 Ti EX, 16GB GDDR6
AMD Ryzen 9 7950X, NVIDIA GeForce RTX 4060 Ti 16G
310 (306min, 307P1 - 336max) Watt * +20%
KFA2 GeForce RTX 4060 1-Click-OC 2X
AMD Ryzen 9 7950X, NVIDIA GeForce RTX 4060
272 (264min, 266P1 - 297max) Watt * +30%
Power Consumption / Witcher 3 ultra Efficiency (external Monitor)
AMD Radeon RX 7900 XT
AMD Ryzen 9 7950X, AMD Radeon RX 7900 XT
0.577 fps per Watt +7%
AMD Radeon RX 7900 XTX
AMD Ryzen 9 7950X, AMD Radeon RX 7900 XTX
0.55 fps per Watt +2%
NVIDIA GeForce RTX 4080 Founders Edition
Intel Core i9-13900K, NVIDIA GeForce RTX 4080
0.549 fps per Watt +1%
Asus TUF Gaming GeForce RTX 4070 Ti
Intel Core i9-13900K, NVIDIA GeForce RTX 4070 Ti
0.545 fps per Watt +1%
Gigabyte GeForce RTX 4070 Super Gaming OC 12G
Intel Core i9-13900K, NVIDIA GeForce RTX 4070 SUPER
0.541 fps per Watt
NVIDIA GeForce RTX 4090 Founders Edition
Intel Core i9-13900K, NVIDIA GeForce RTX 4090
0.538 fps per Watt -1%
Durchschnittliche NVIDIA GeForce RTX 4070 Ti
  (0.509 - 0.548, n=4)
0.533 fps per Watt -1%
Gigabyte Aorus GeForce RTX 4070 Ti Master
Intel Core i9-13900K, NVIDIA GeForce RTX 4070 Ti
0.531 fps per Watt -2%
NVIDIA GeForce RTX 4070 Super Founders Edition
Intel Core i9-13900K, NVIDIA GeForce RTX 4070 SUPER
0.509 fps per Watt -6%
Zotac Gaming GeForce RTX 4070 AMP Airo
Intel Core i9-13900K, NVIDIA GeForce RTX 4070
0.4709 fps per Watt -13%
AMD Radeon RX 7800 XT
AMD Ryzen 9 7950X, AMD Radeon RX 7800 XT
0.4461 fps per Watt -18%
Sapphire Pulse Radeon RX 7700 XT
AMD Ryzen 9 7950X, AMD Radeon RX 7700 XT
0.4383 fps per Watt -19%
Durchschnitt der Klasse Desktop
  (0.1429 - 0.652, n=26, der letzten 2 Jahre)
0.437 fps per Watt -19%
KFA2 GeForce RTX 4060 Ti EX, 16GB GDDR6
AMD Ryzen 9 7950X, NVIDIA GeForce RTX 4060 Ti 16G
0.4268 fps per Watt -21%
KFA2 GeForce RTX 4060 1-Click-OC 2X
AMD Ryzen 9 7950X, NVIDIA GeForce RTX 4060
0.4103 fps per Watt -24%
Durchschnittliche NVIDIA GeForce RTX 3080 Ti
  (0.3496 - 0.3735, n=3)
0.3607 fps per Watt -33%
XFX Speedster QICK 308 Radeon RX 7600 Black Edition
AMD Ryzen 9 7950X, AMD Radeon RX 7600
0.354 fps per Watt -35%
Sapphire AMD Radeon RX 6950 XT Nitro+ Pure
AMD Ryzen 9 5900X, AMD Radeon RX 6950 XT
0.348 fps per Watt -36%
Zotac Gaming GeForce RTX 3090 Ti AMP Extreme Holo
AMD Ryzen 7 5800X3D, NVIDIA GeForce RTX 3090 Ti
0.345 fps per Watt -36%
Durchschnittliche NVIDIA GeForce RTX 3090
  (0.268 - 0.3954, n=14)
0.3429 fps per Watt -37%
Durchschnittliche NVIDIA Titan RTX
  (0.2926 - 0.385, n=26)
0.3382 fps per Watt -37%
AMD Radeon RX 6900 XT
AMD Ryzen 9 5950X, AMD Radeon RX 6900 XT
0.335 fps per Watt -38%
Durchschnittliche NVIDIA GeForce RTX 3070
  (0.22 - 0.3911, n=5)
0.3211 fps per Watt -41%
AMD Radeon RX 6800 XT
AMD Ryzen 9 5950X, AMD Radeon RX 6800 XT
0.3168 fps per Watt -41%
Durchschnittliche NVIDIA GeForce RTX 3080
  (0.291 - 0.301, n=2)
0.296 fps per Watt -45%
1280x720 FurMark 1.19 GPU Stress Test (external Monitor)
350.77
1920x1080 The Witcher 3 ultra (external Monitor)
357.59

* ... kleinere Werte sind besser

Pro

+ Gute Verarbeitungsqualität
+ Anständige RGB-Beleuchtungseffekte
+ Spürbare Verbesserungen beim Spielen gegenüber der RTX 3090 und Radeon RX 7800 XT im Vergleich zur Founders Edition
+ Leistungsfähiges WindForce Triple-Lüfter-Kühlsystem
+ Sehr energieeffizient bei Gaming-Workloads

Contra

- Das Gigabyte Control Center ist jetzt brauchbar, muss aber noch verbessert werden
- 12 GB 192-bit VRAM kann bei schweren Texturen einschränkend wirken
- Höhere Lüftergeräuschpegel
- Kein spürbarer Unterschied im Lüftergeräusch zwischen OC- und Silent-VBIOS-Modus
- Könnte sicherlich eine Preissenkung vertragen

Fazit: Der Aufschlag von 50 US-Dollar für die RTX 4070 Super Gaming OC bringt Vorteile

Gigabyte GeForce RTX 4070 Super Gaming OC 12G. Test Gerät mit freundlicher Genehmigung von Gigabyte Indien.

Die Nvidia GeForce RTX 4070 Super Founders' Edition(599 US-Dollar bei Best Buy) ist eine sehr leistungsfähige AD104-Karte. Aber Vielfalt ist die Würze des Lebens, und so haben Käufer auch eine gute Auswahl an AiB-Partnerkarten zur Auswahl.

Die Gigabyte GeForce RTX 4070 Super Gaming OC 12G setzt die gleiche Designsprache wie im letzten Jahr fort. Sie erhalten eine schöne Metall-Rückwand, eine robuste Triple-Fan-8-Heatpipe-Kühlung mit ausreichender Belüftung und ein anständiges RGB-Design.

Die RTX 4070 Super Gaming OC wird ab Werk mit 2.565 MHz übertaktet. Obwohl kumulative synthetische und Rechentests keinen greifbaren Vorteil erkennen lassen, übertrifft die OC die Karte beim Spielen deutlich den Durchschnitt der RTX 3090.

Spieler, die 1.440p Ultra bei hohen Bildraten anstreben, werden mit der RTX 4070 Super Gaming OC zufrieden sein. Gute Frame-Raten bei 4K Ultra sind kein Wunschtraum, aber moderne Titel werden eine helfende Hand von Upscalern benötigen.

Wenn Sie mit AD104 (und RGB) auf der Jagd nach Frames sind, könnte die Gigabyte GeForce RTX 4070 Super Gaming OC im Vergleich zur RTX 4070 Super Founders' Edition die bessere Wahl sein, solange Ihnen der Aufpreis von 50 US-Dollar für eine Leistungssteigerung von 3-5 % nichts ausmacht.

Das WindForce-Kühlsystem von Gigabyte erweist sich als recht effektiv, um die GPU kühl zu halten, ohne dass es zu Drosselungsproblemen kommt. Das Dreifach-Lüftersystem ist etwas lauter als das der Founders' Edition, aber es ist kein Düsentriebwerk und hilft dabei, die Hotspot- und Speichertemperaturen niedrig zu halten.

Technisch gesehen ist der VBIOS-Schalter überflüssig, da Sie sehr wohl mit den Lüfterkurven nach Ihrem Geschmack spielen können. Aber da er nun einmal da ist, würden wir uns weitere Verfeinerungen der VBIOS-Modi wünschen. Es gibt keinen wahrnehmbaren Unterschied im Lüftergeräusch zwischen diesen Modi. Benutzer, die sich mit benutzerdefinierten Lüfterkurven nicht sehr wohl fühlen, wären daher enttäuscht, wenn sie wüssten, dass der Silent-Modus ein ähnliches Geräuschprofil aufweist wie die standardmäßige BIOS-OC-Option.

Alles in allem ist Gigabyte mit der RTX 4070 Super Gaming OC die neueste AD104-GPU weitgehend gelungen. Die RTX 4070 Super Gaming OC vergrößert den Abstand zur AMD Radeon RX 7800 XT (ab 490 US-Dollar auf Amazon). Die AMD Karte bietet Ihnen mehr VRAM, aber die Waage neigt sich in Richtung Nvidia, wenn es um DLSS-Frame-Generierung und Ray-Rekonstruktions-Technologien geht, zusätzlich zu AMDs FSR und Intels XeSS-Upscaler.

Und wenn Sie schon dabei sind, sollten Sie die Ausverkäufe der RTX 4070 Ti im Auge behalten, die man zu Preisen nahe an oder sogar unter denen der RTX 4070 Super finden könnten.

Preis und Verfügbarkeit

Die Gigabyte GeForce RTX 4070 Super Gaming OC 12G ist derzeit auf dem deutschsprachigen Markt am günstigsten (673 Euro) über Mindfactory zu beziehen. Bei Amazon.de ist sie für 699 Euro gelistet.

Transparenz

Das vorliegende Testmuster wurde dem Autor vom Hersteller oder einem Shop zu Testzwecken leihweise zur Verfügung gestellt. Eine Einflussnahme des Leihstellers auf den Testbericht gab es nicht, der Hersteller hat keine Version des Reviews vor der Veröffentlichung erhalten. Es bestand keine Verpflichtung zur Veröffentlichung.

Preisvergleich

static version load dynamic
Loading Comments
Diesen Artikel kommentieren / Antworten
Teilen Sie diesen Artikel, um uns zu unterstützen. Jeder Link hilft!
> Notebook Test, Laptop Test und News > Tests > Notebook Testberichte > Gigabyte GeForce RTX 4070 Super Gaming OC 12G im Test: Für einen Aufpreis von 50 US-Dollar gegenüber der Founders' Edition schlägt sie die RTX 3090 und RX 7800 XT
Autor: Vaidyanathan Subramaniam, 24.02.2024 (Update: 25.02.2024)