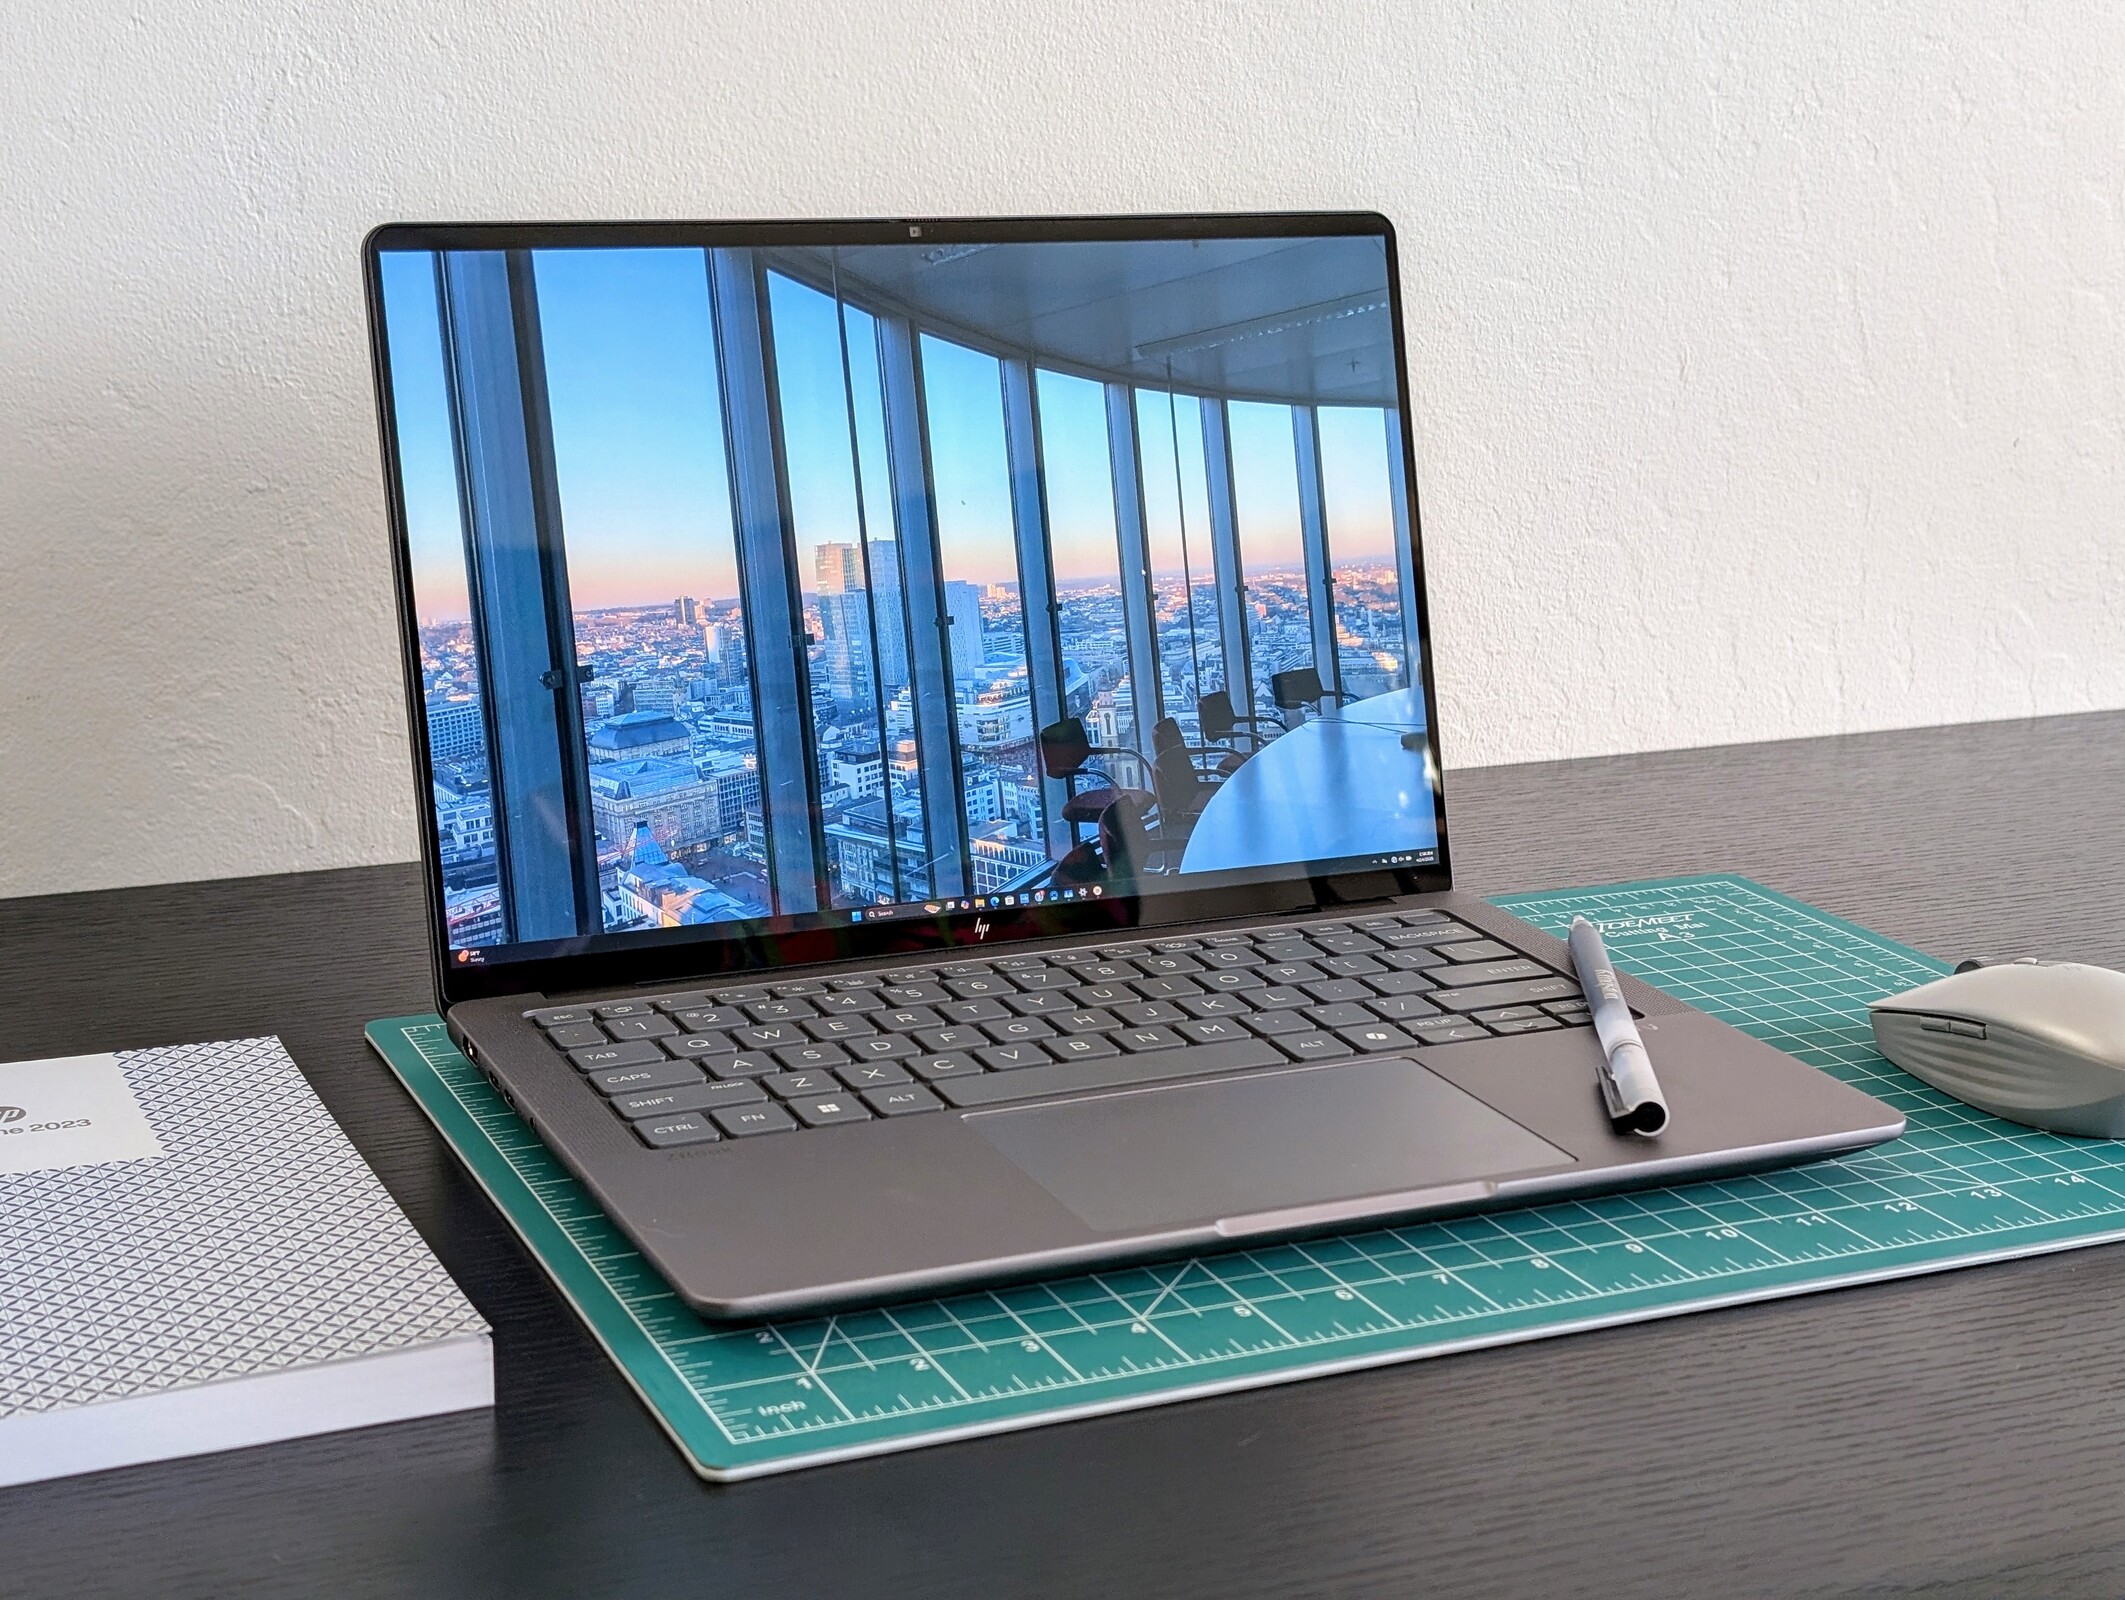
Leistungsstarke MacBook Pro Alternative: HP ZBook Ultra G1a 14 im Test
AMD Ryzen AI Max trumpft auf.
HP hat nicht übertrieben, als sie sagten, dass ihr neuestes ZBook der "schnellste 14-Zoll-Workstation-PC der Welt" sein würde. Mit dem Ryzen AI Max+ 395 schafft es beeindruckende Leistungen für einen dünnen und leichten 14-Zoller.Allen Ngo, 👁 Allen Ngo, ✓ Andrea Grüblinger (übersetzt von DeepL / Ninh Duy) Veröffentlicht am 🇺🇸 🇫🇷 ...
Fazit - AMD trägt das Seinige dazu bei
Das ZBook Ultra G1a 14 wird erst durch die einzigartige Ryzen AI Max Serie zu dem was es ist. Die spezialisierte Zen-5-CPU integriert eine Radeon 8060S-Grafik und bis zu 128 GB Arbeitsspeicher für ein sehr hohes Leistungsniveau in Anbetracht des 14-Zoll-Formfaktors. Die Leistung pro Volumen ist mit Abstand der stärkste Vorteil des Modells. Der beeindruckende 120-Hz-OLED-Touchscreen und das professionelle ZBook-Design runden das Paket gut ab.
So viel Leistung in einem so kleinen Paket zu vereinen hat seine Nachteile. Der Arbeitsspeicher ist fest verbaut und bietet keine ECC-Unterstützung, die Speicherkapazität ist auf ein einziges Laufwerk beschränkt und Akkulaufzeit ist für die Größenkategorie etwas kurz. Die Gesamtleistung wird im Akkubetrieb reduziert und das Netzteil ist aufgrund der anspruchsvollen internen Komponenten größer als erwartet.
Pro
Contra
Preis und Verfügbarkeit
Das HP ZBook Ultra G1a 14 gibt es etwa bei NBB zu einem Preis von 2.899 Euro. Die Variante mit 2-TB-SSD kommt auf 2.999 Euro. Auch HP selbst listet das Gerät in seinem Online-Store, allerdings ist es hier noch nicht erhältlich.
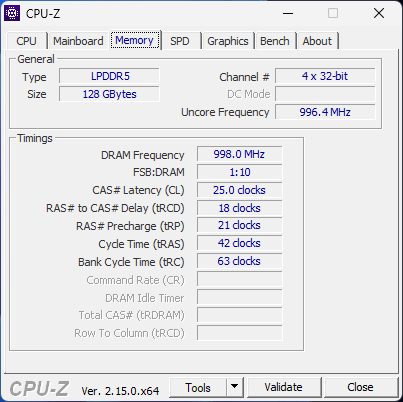
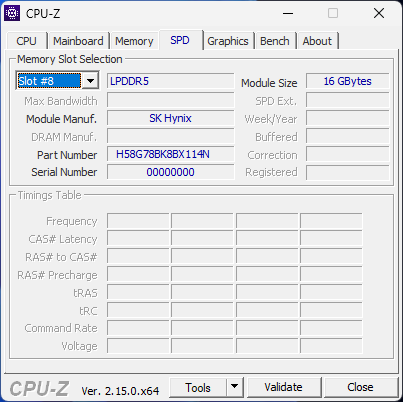
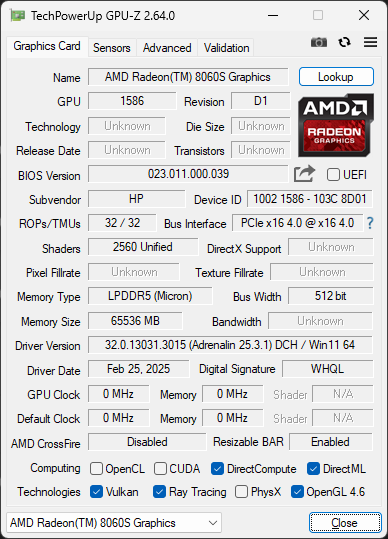
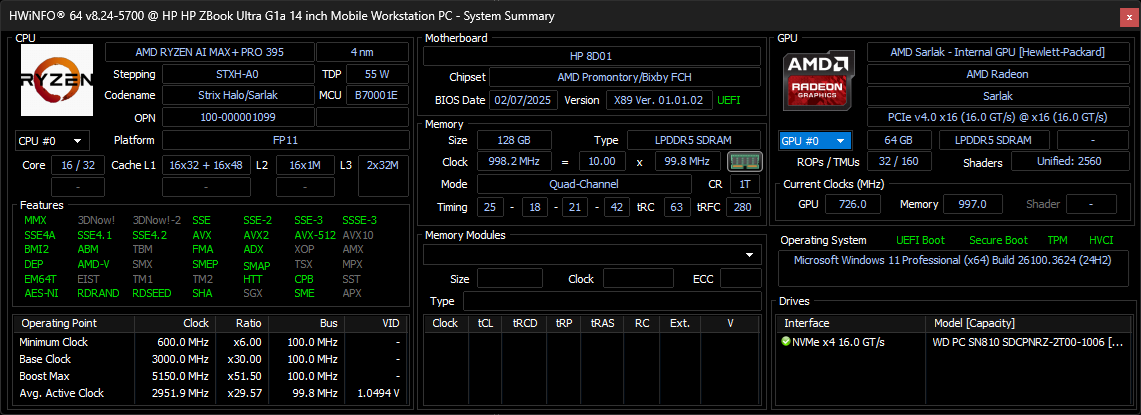
Nicht zu verwechseln mit dem EliteBook X G1a 14 ist das ZBook Ultra G1a 14 eines der ersten Notebooks mit AMDs Ryzen AI Max+ Pro 395 Prozessor mit integrierter Radeon 8060S Grafik. Bemerkenswert ist die Ausstattung mit 128 GB schnellem LPDDR5X-8533 RAM, was für eine 14-Zoll-Workstation ungewöhnlich ist. Das Modell unterscheidet sich vom ZBook Firefly 14 in Größe und bezüglich Intel- und Nvidia-Optionen.
Bei unserem Testgerät handelt es sich um eine High-End-Konfiguration mit Ryzen AI Max+ Pro 395 Prozessor, Radeon 8060S GPU und 2.8K OLED 120 Hz Touchscreen für etwa 4.000 Dollar. Kleinere SKUs können mit dem Ryzen AI Max 380 ohne Pro, der Radeon 8040S oder dem 1200p IPS-Display zu niedrigeren Einstiegspreisen erstanden werden.
Alternativen zum ZBook Ultra G1a 14 sind andere professionelle 14-Zoll-Notebooks wie das Dell Precision 5490, die ThinkPad P14-Serie oder das MacBook Pro 14.
Weitere HP-Testberichte:
Spezifikationen
Preisvergleich
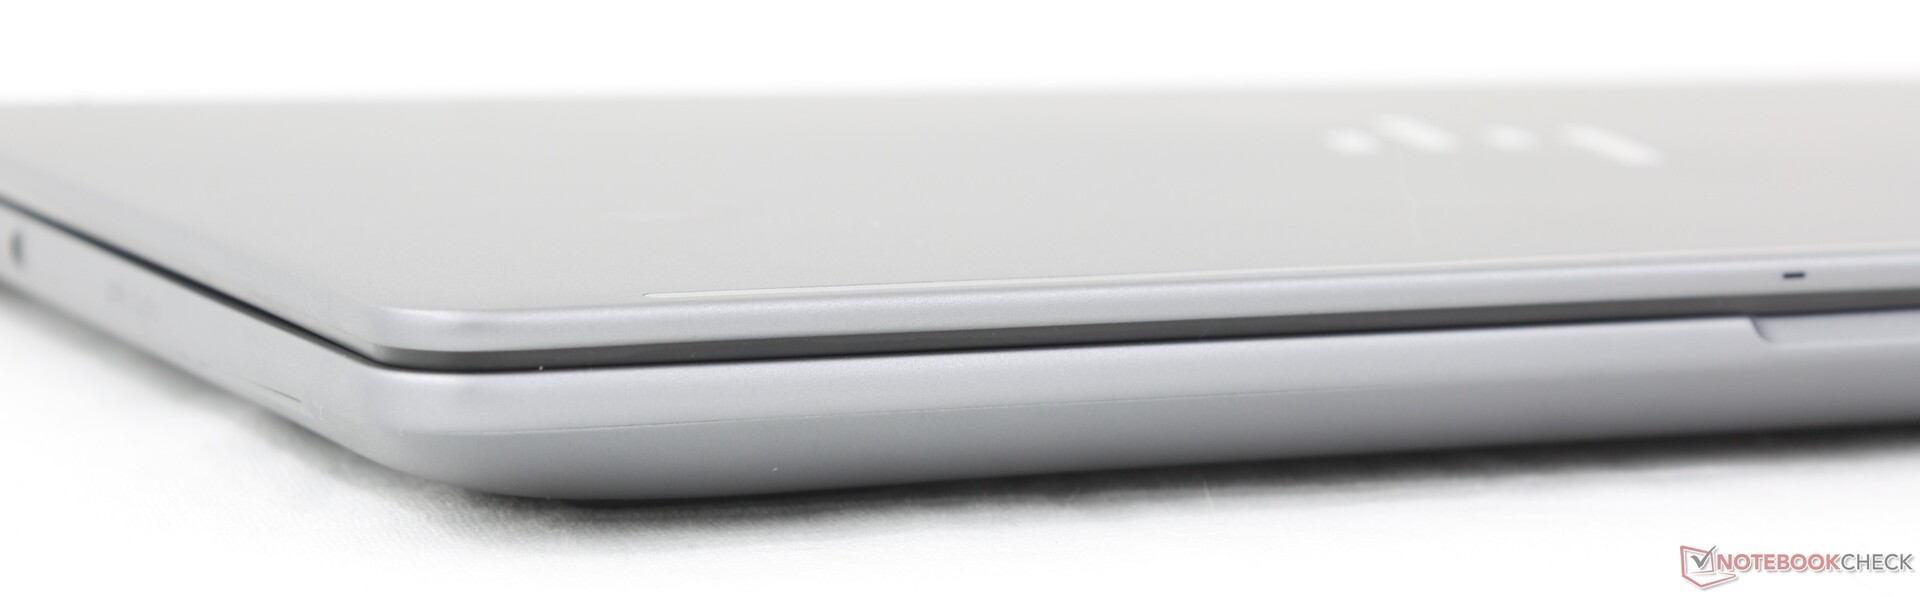
Gehäuse
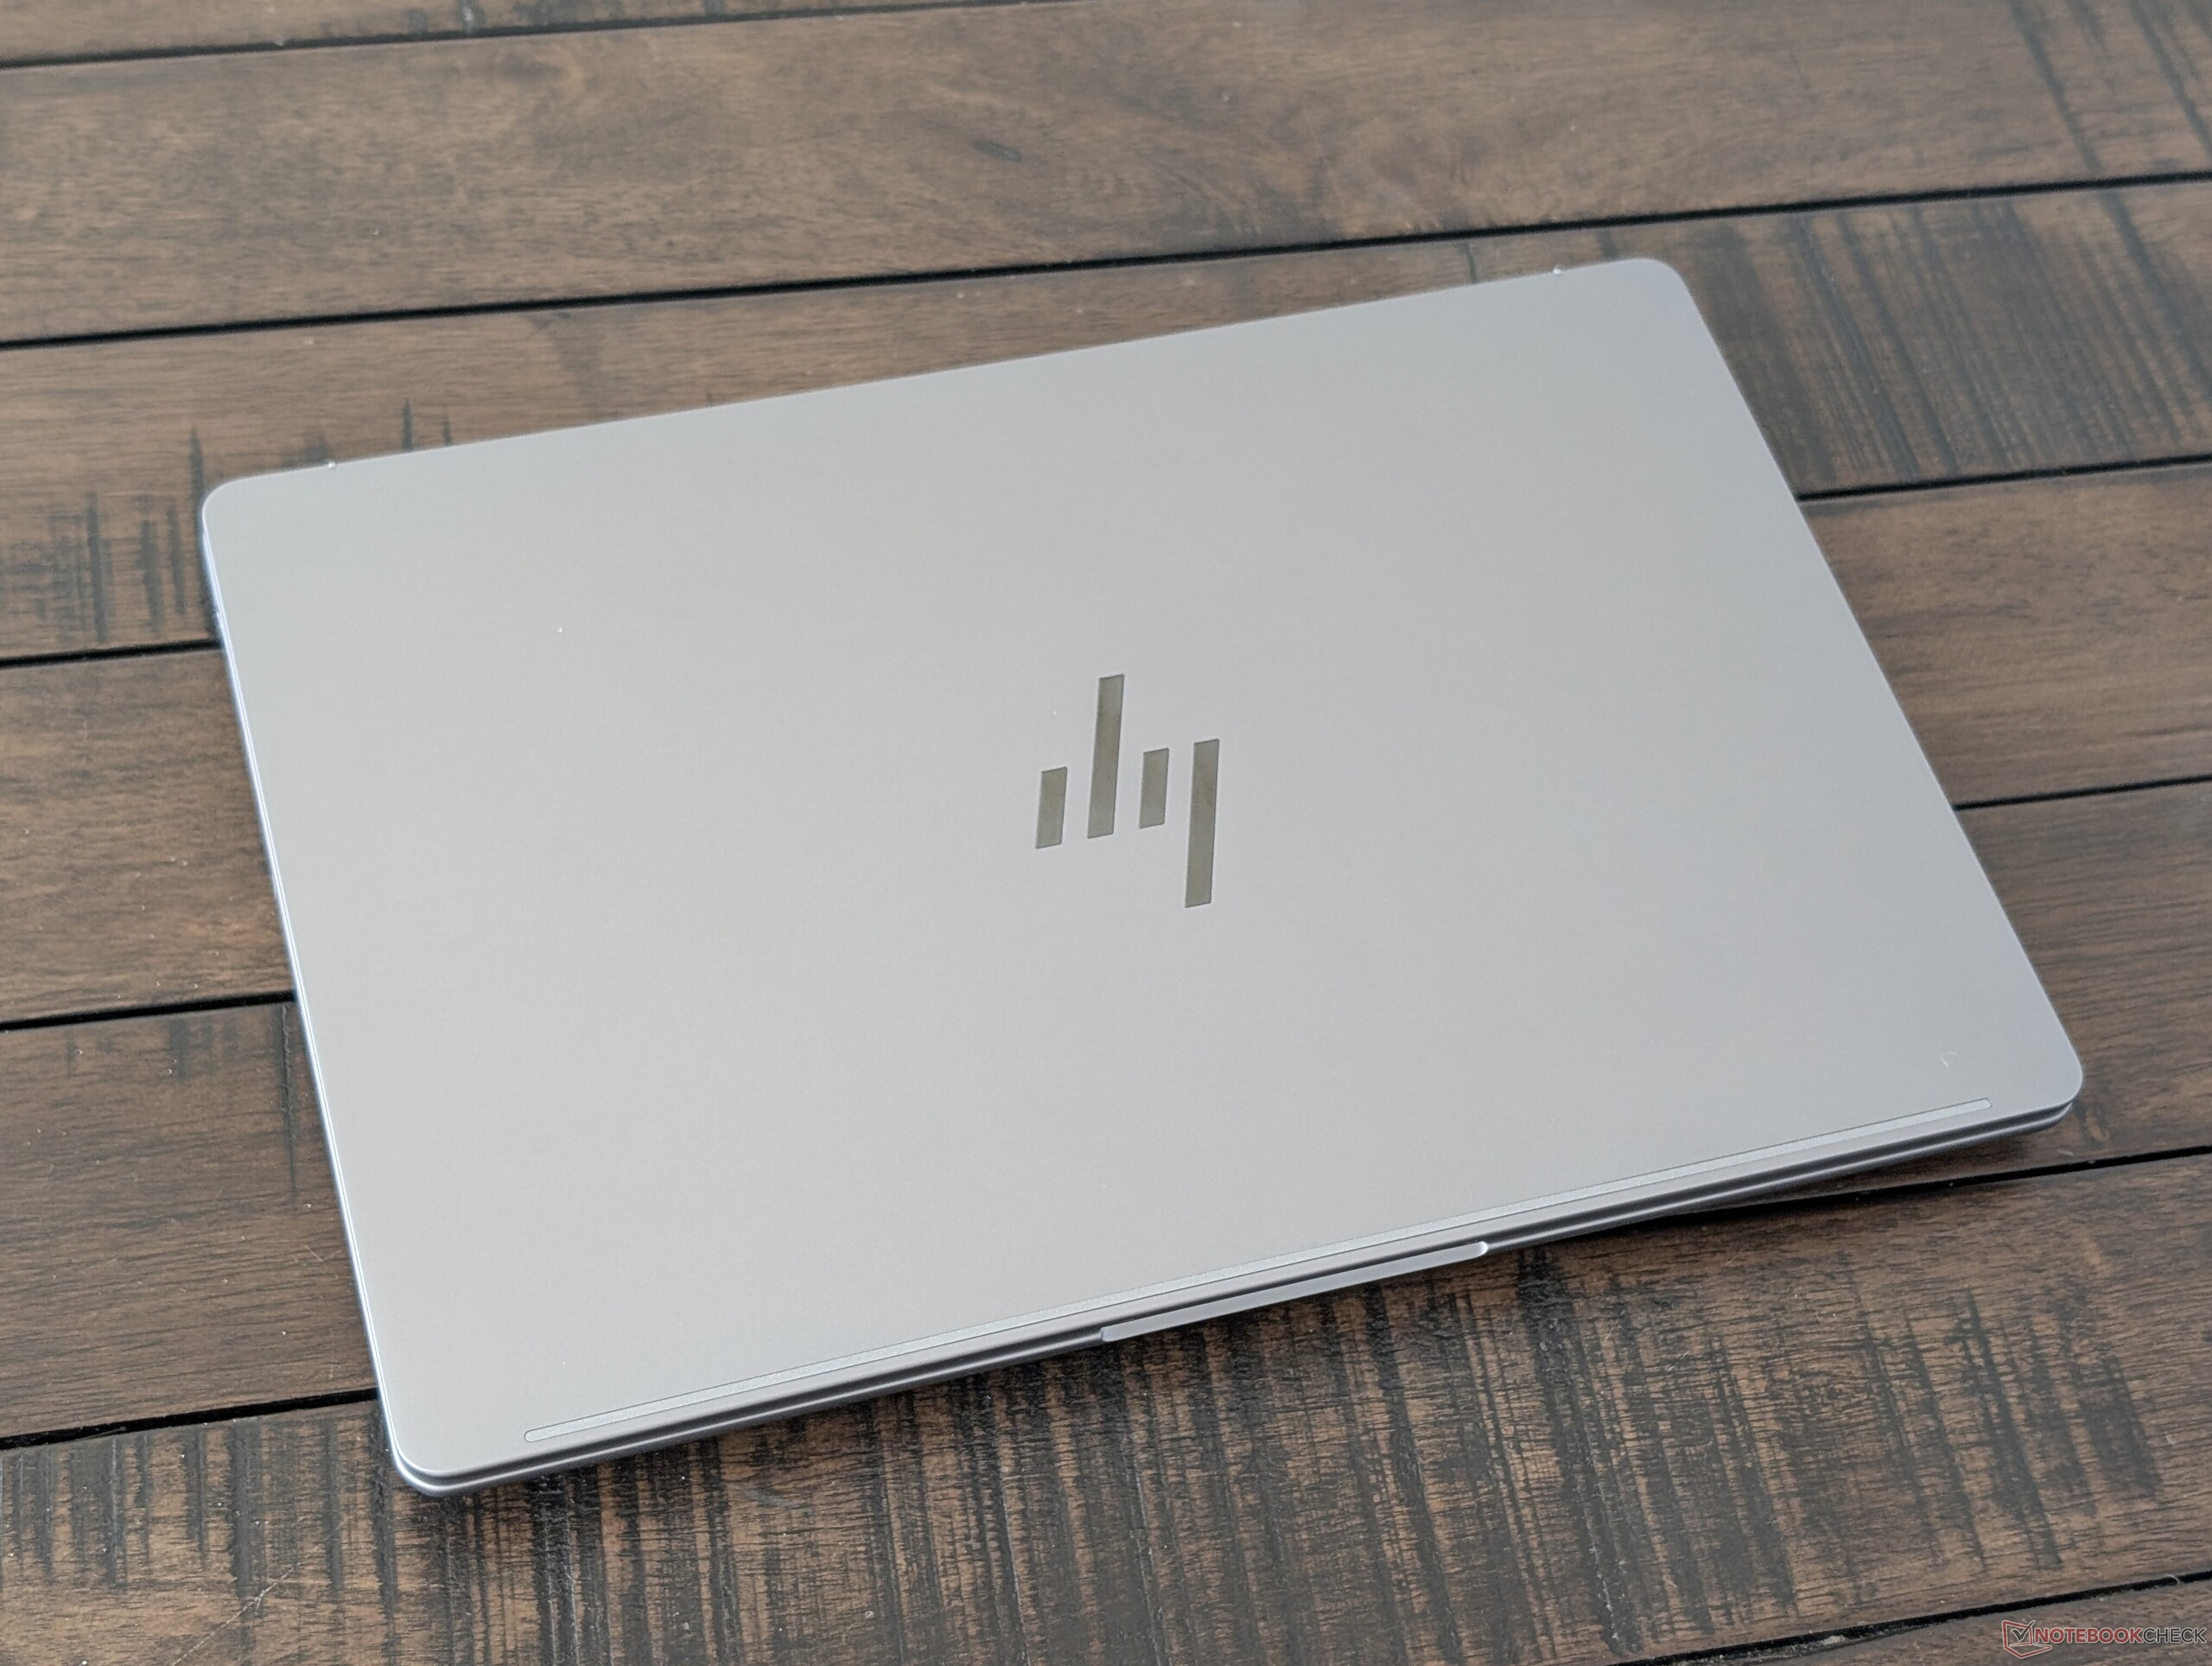
Äußere Merkmale und Abmessungen sind fast 1:1 mit denen des EliteBook X G1a 14. Beide Modelle haben sogar die gleiche Tastatur, Clickpad-Größe und Poly Studio Quad Lautsprecher. Der vielleicht einfachste Weg, das ZBook-Modell vom EliteBook-Modell zu unterscheiden, ist der dunklere Grauton des ZBooks.
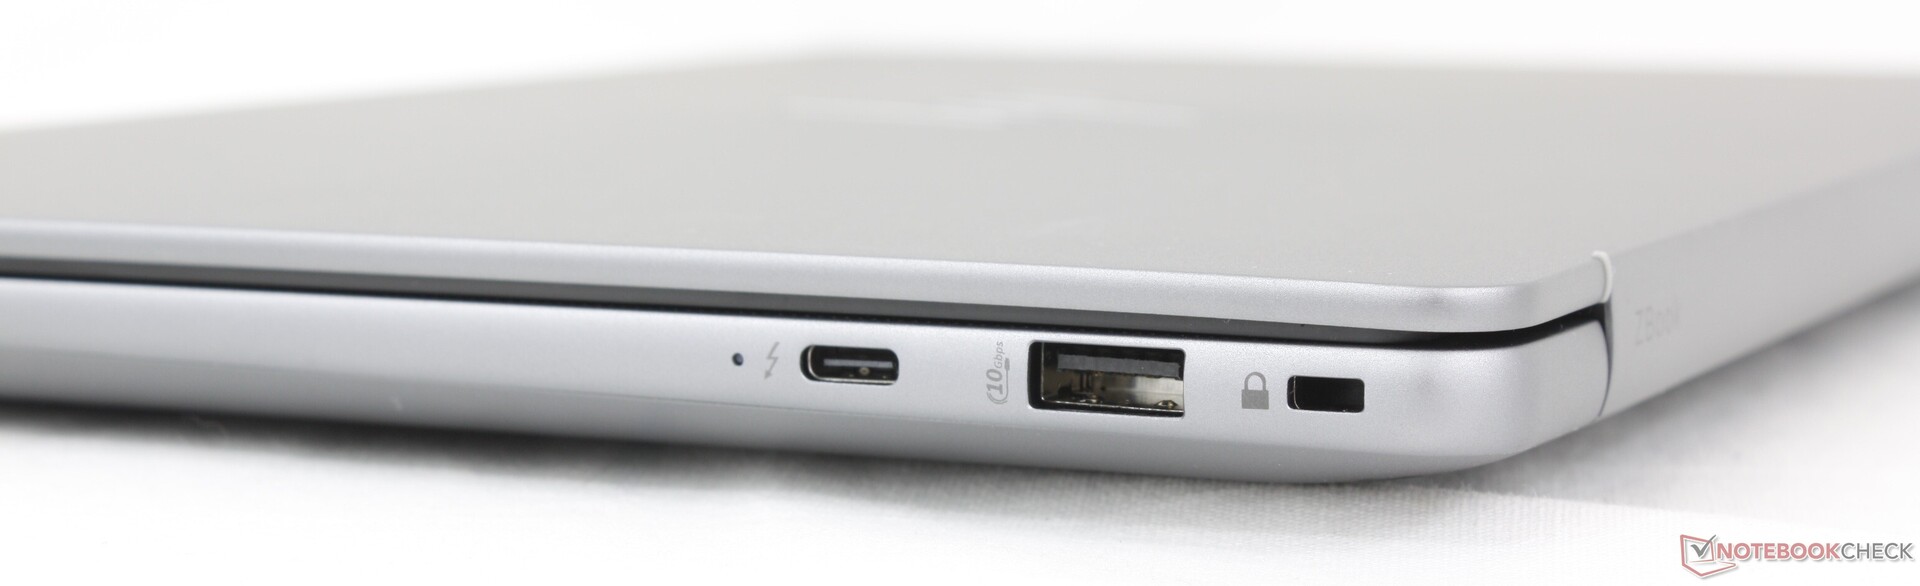
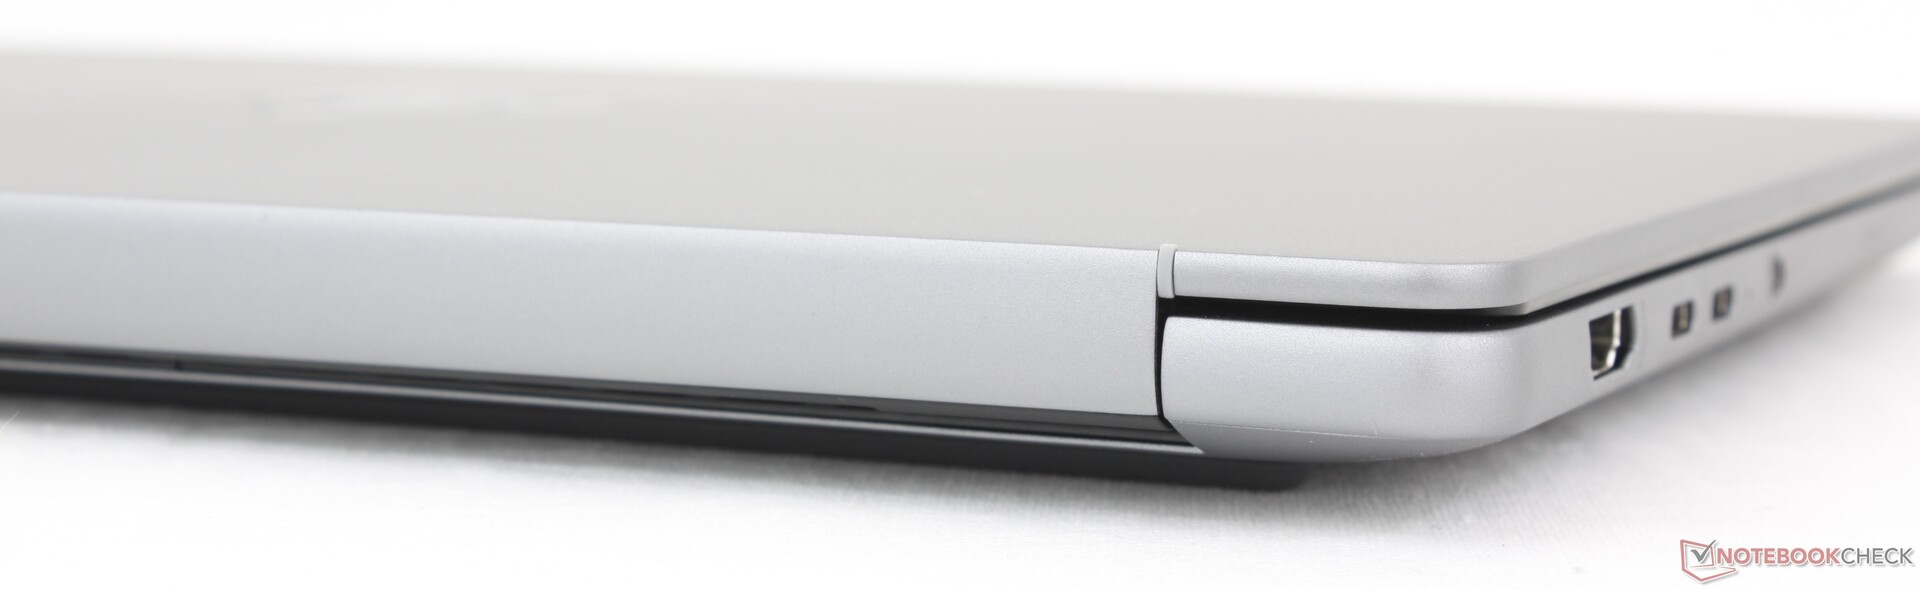
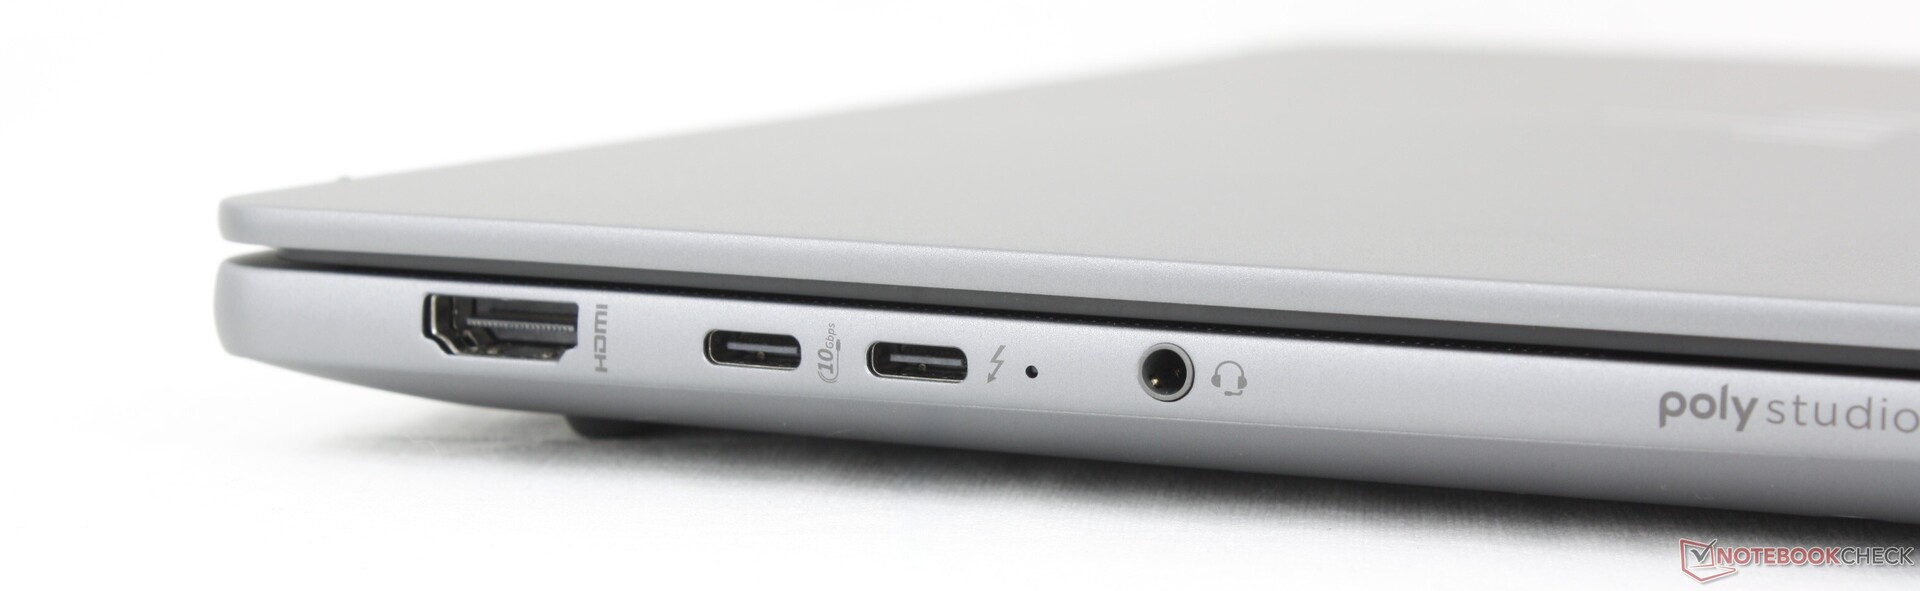
Anschlussausstattung
Kommunikation
Webcam
Eine 5-MP-Webcam mit IR und physischem Auslöser ist im Lieferumfang enthalten.


Wartung
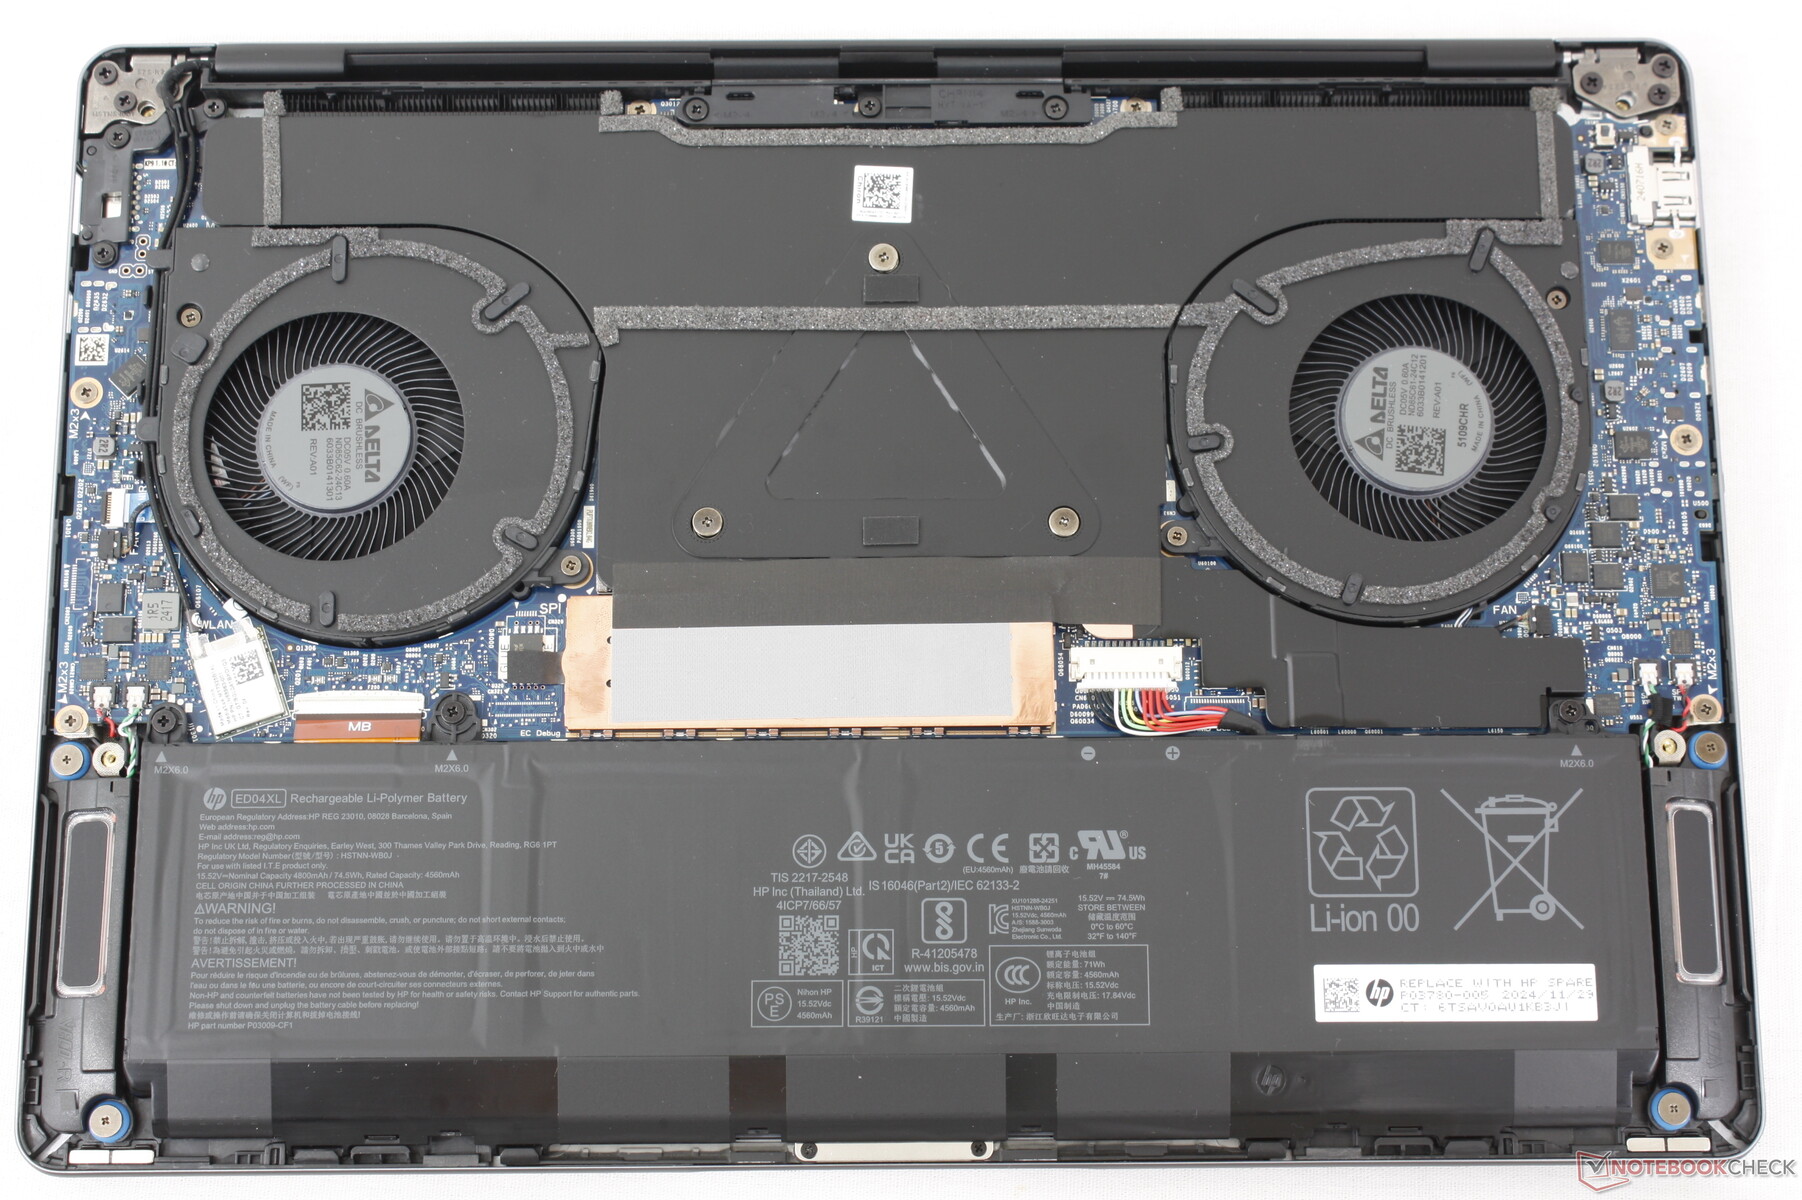
Für die Wartung müssen lediglich vier Schrauben an der Unterseite entfernt werden. Aufrüstungsmöglichkeiten sind ansonsten begrenzt, da der RAM und das WLAN fest verlötet sind. Es gibt keinen Platz für eine zweite SSD.
Nachhaltigkeit
HP verwendet bei der Herstellung verschiedener Komponenten des Modells 80 Prozent recyceltes Aluminium, 65 Prozent recyceltes Plastik, 30 Prozent ocean-bound-Plastik, 50 Prozent recyceltes Kupfer und 20 Prozent recyceltes Speiseöl. Auch die Verpackung stammt zu 100 Prozent aus nachhaltiger Produktion, lediglich das Netzteil ist mit ein wenig Plastik umwickelt.
Zubehör und Garantie
Neben dem Netzteil und dem Papierkram befinden sich keine weiteren Extras in der Verpackung. Eine standardmäßige Herstellergarantie ist bei einem High-End-ZBook-Modell zu erwarten.
Eingabegeräte
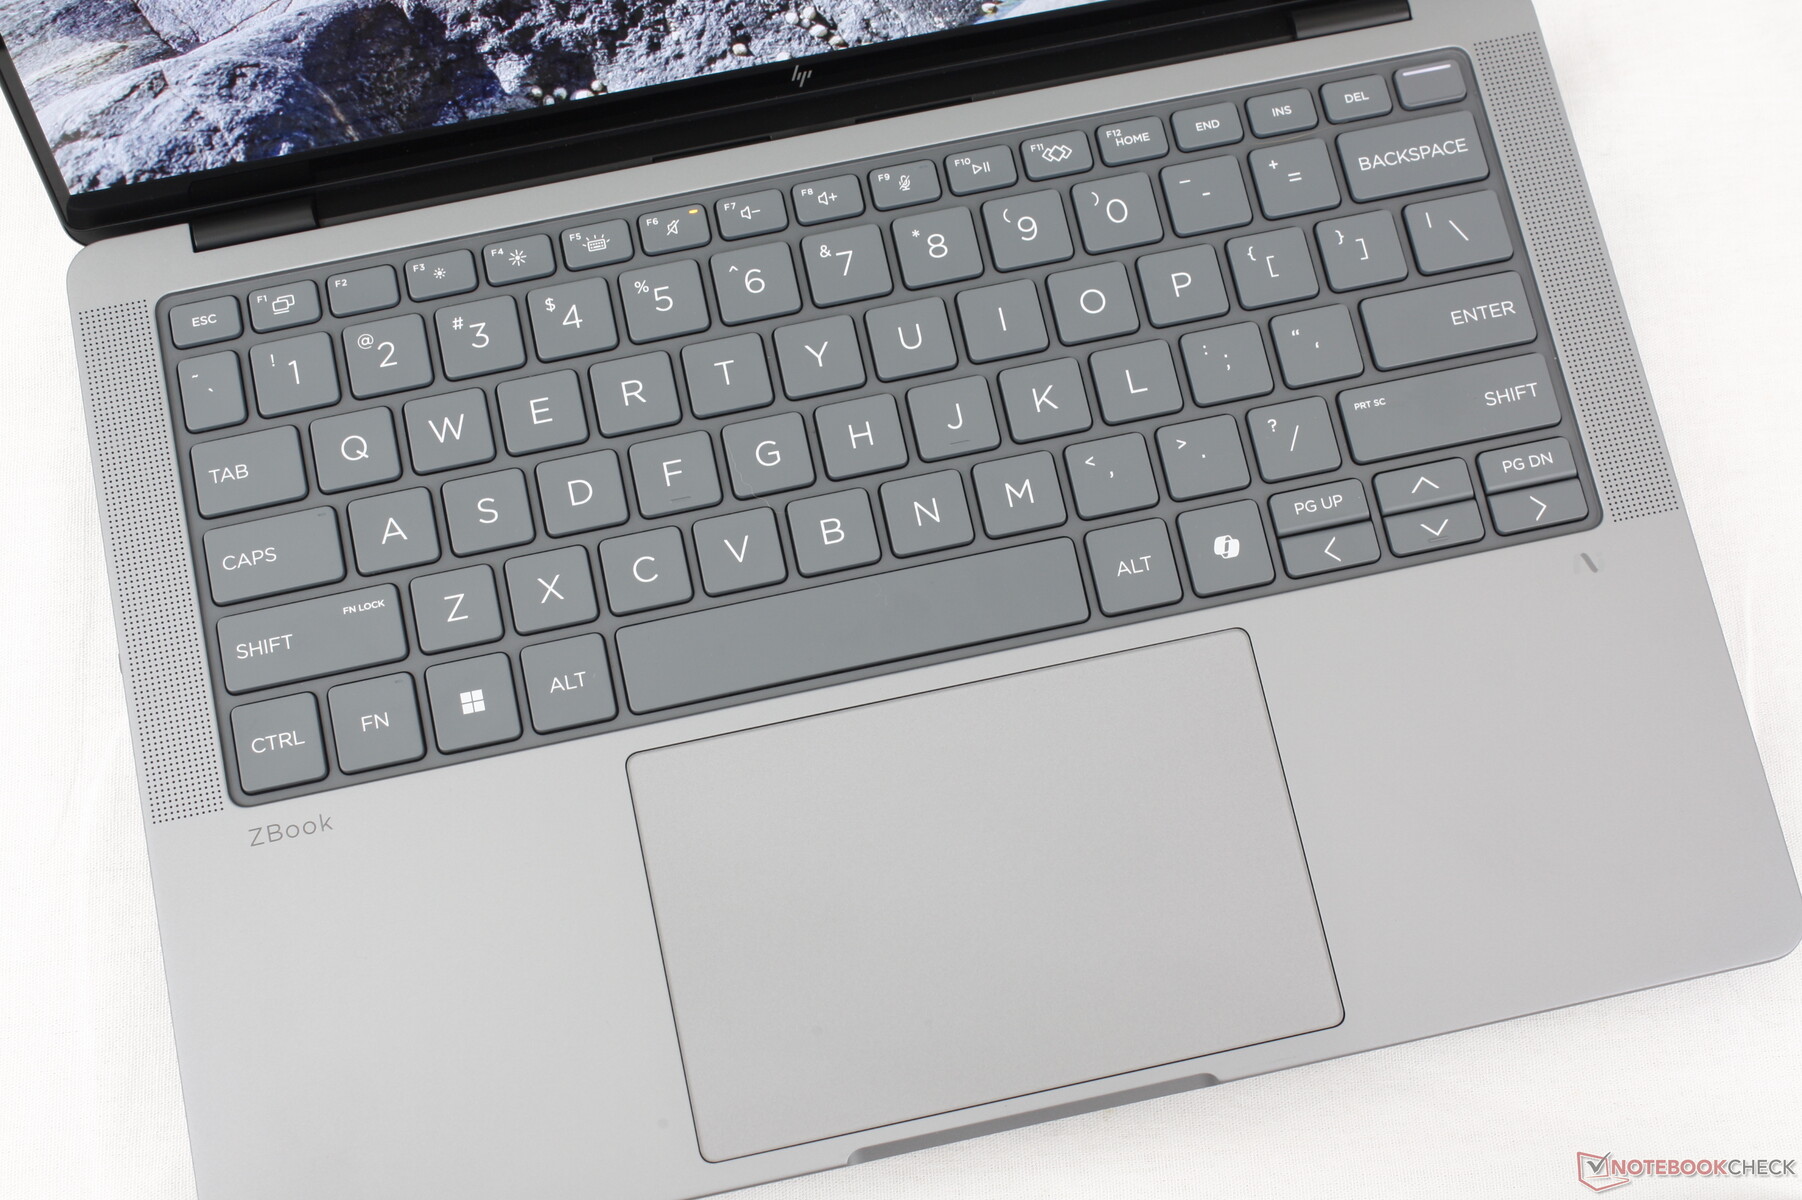
Tastatur und Touchpad
Das Tipperlebnis ist ähnlich wie beim EliteBook X G1a 14, was nicht schlecht ist, denn wir finden, dass die Tastaturen der HP Elite Modelle zu den besten aller professionellen Notebooks gehören. Die Leertaste fühlt sich jedoch seltsamerweise weicher und leiser an als der Rest der Tastatur und die Pfeiltasten sind immer noch so "eng" wie immer. Das sind kleine Nachteile bei einem ansonsten komfortablen Layout.
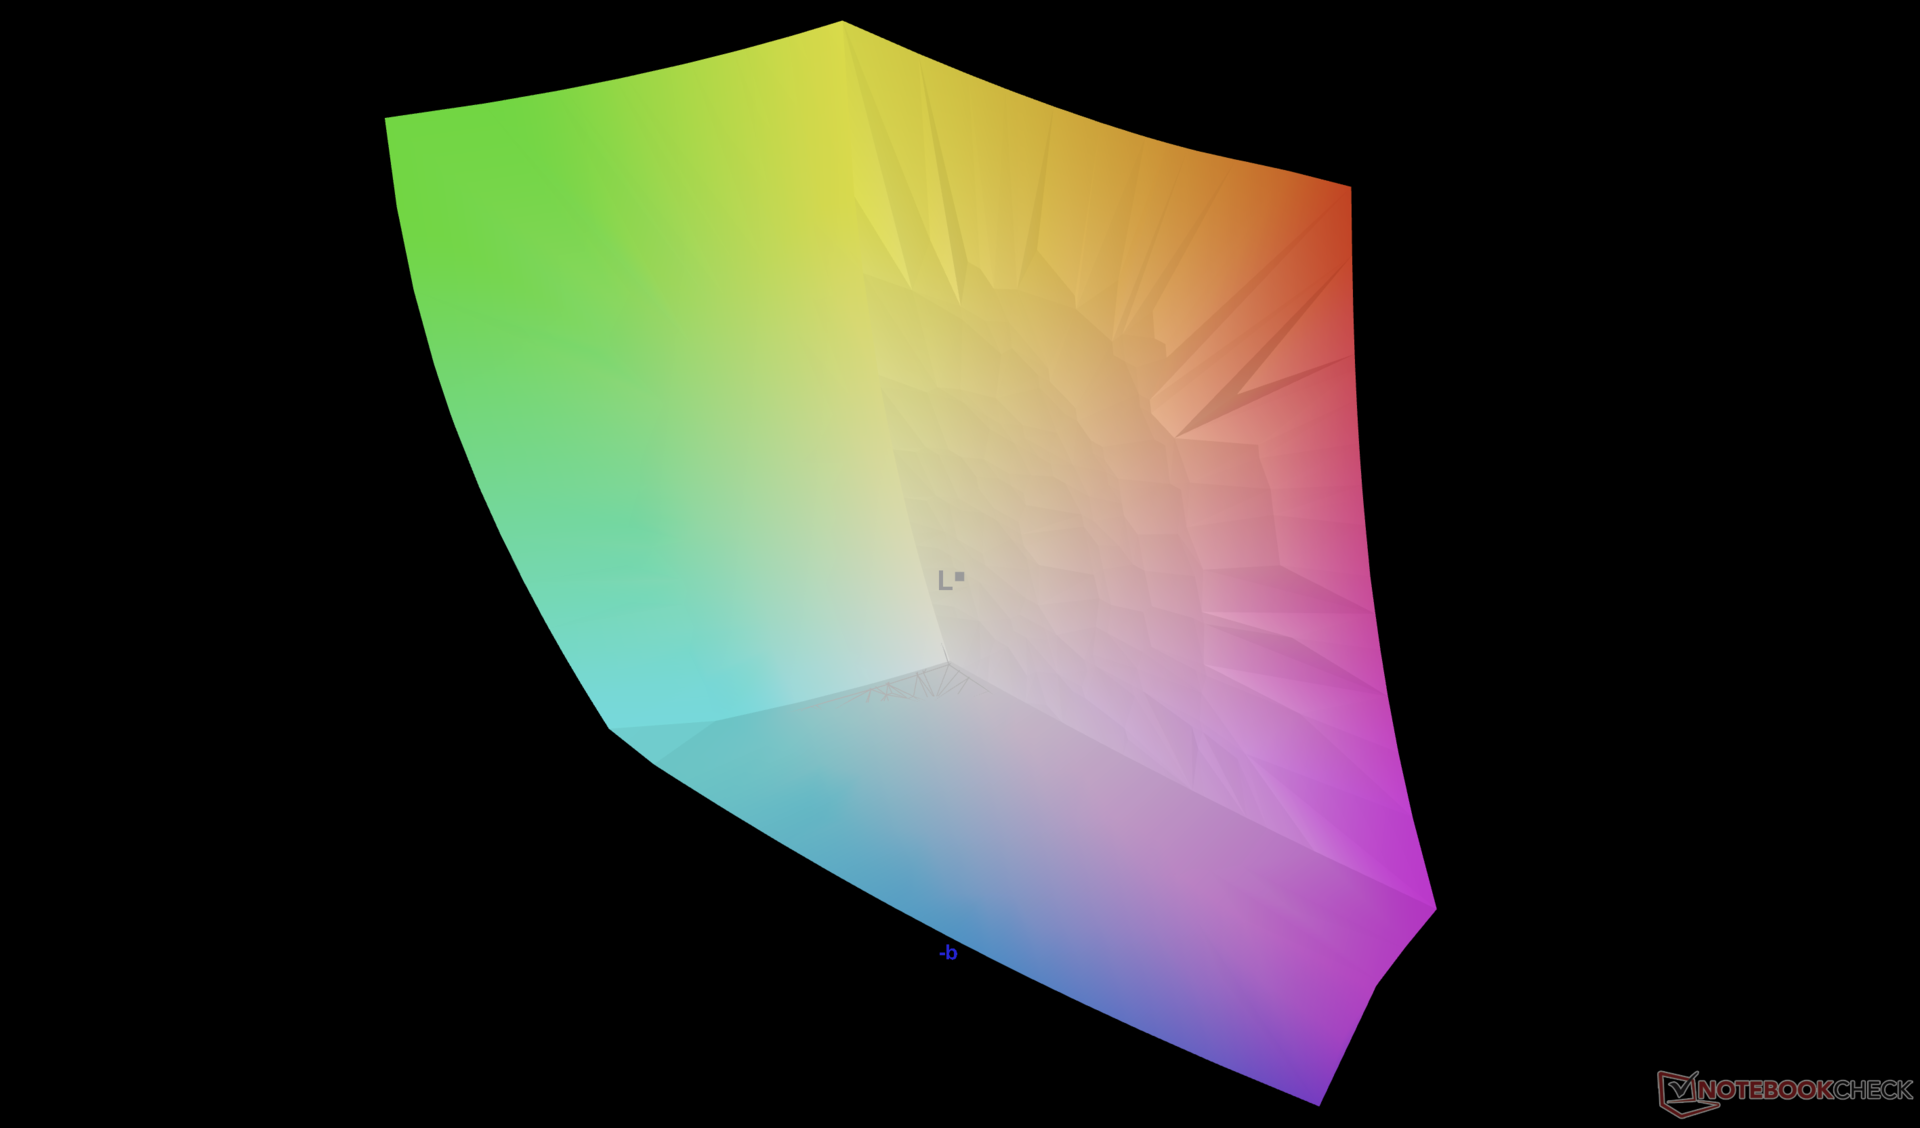
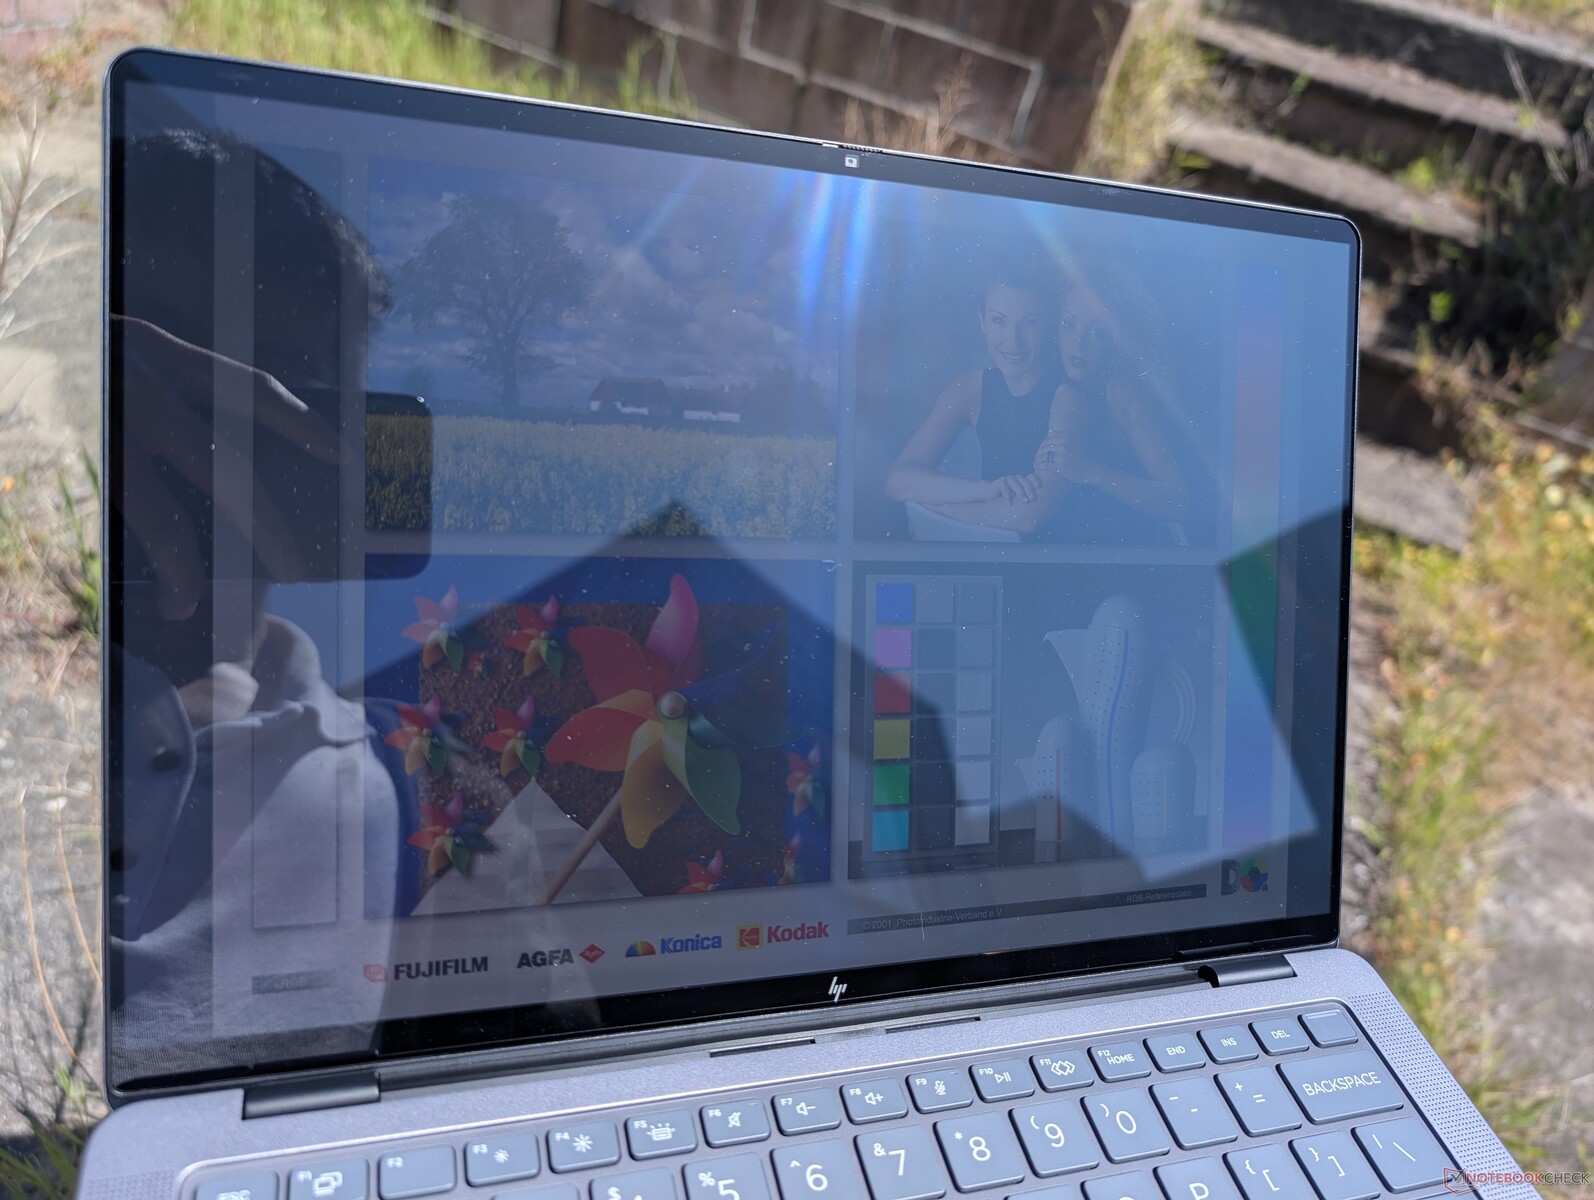
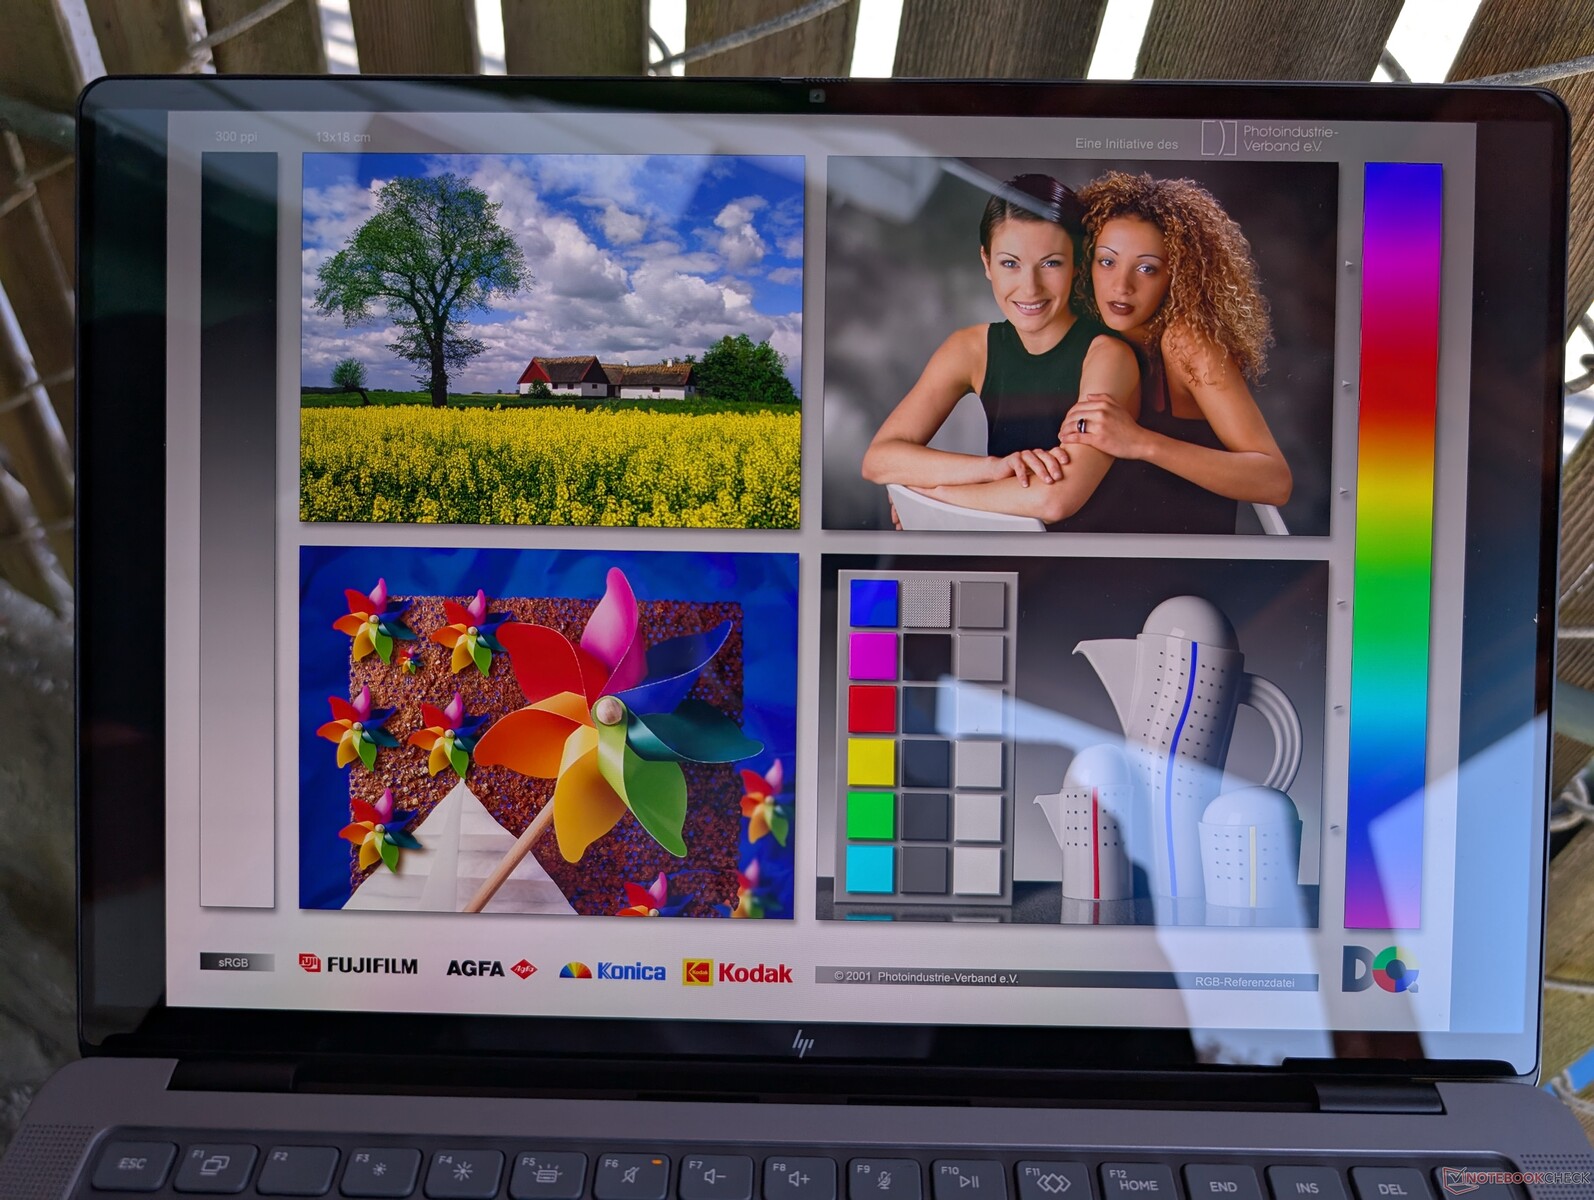
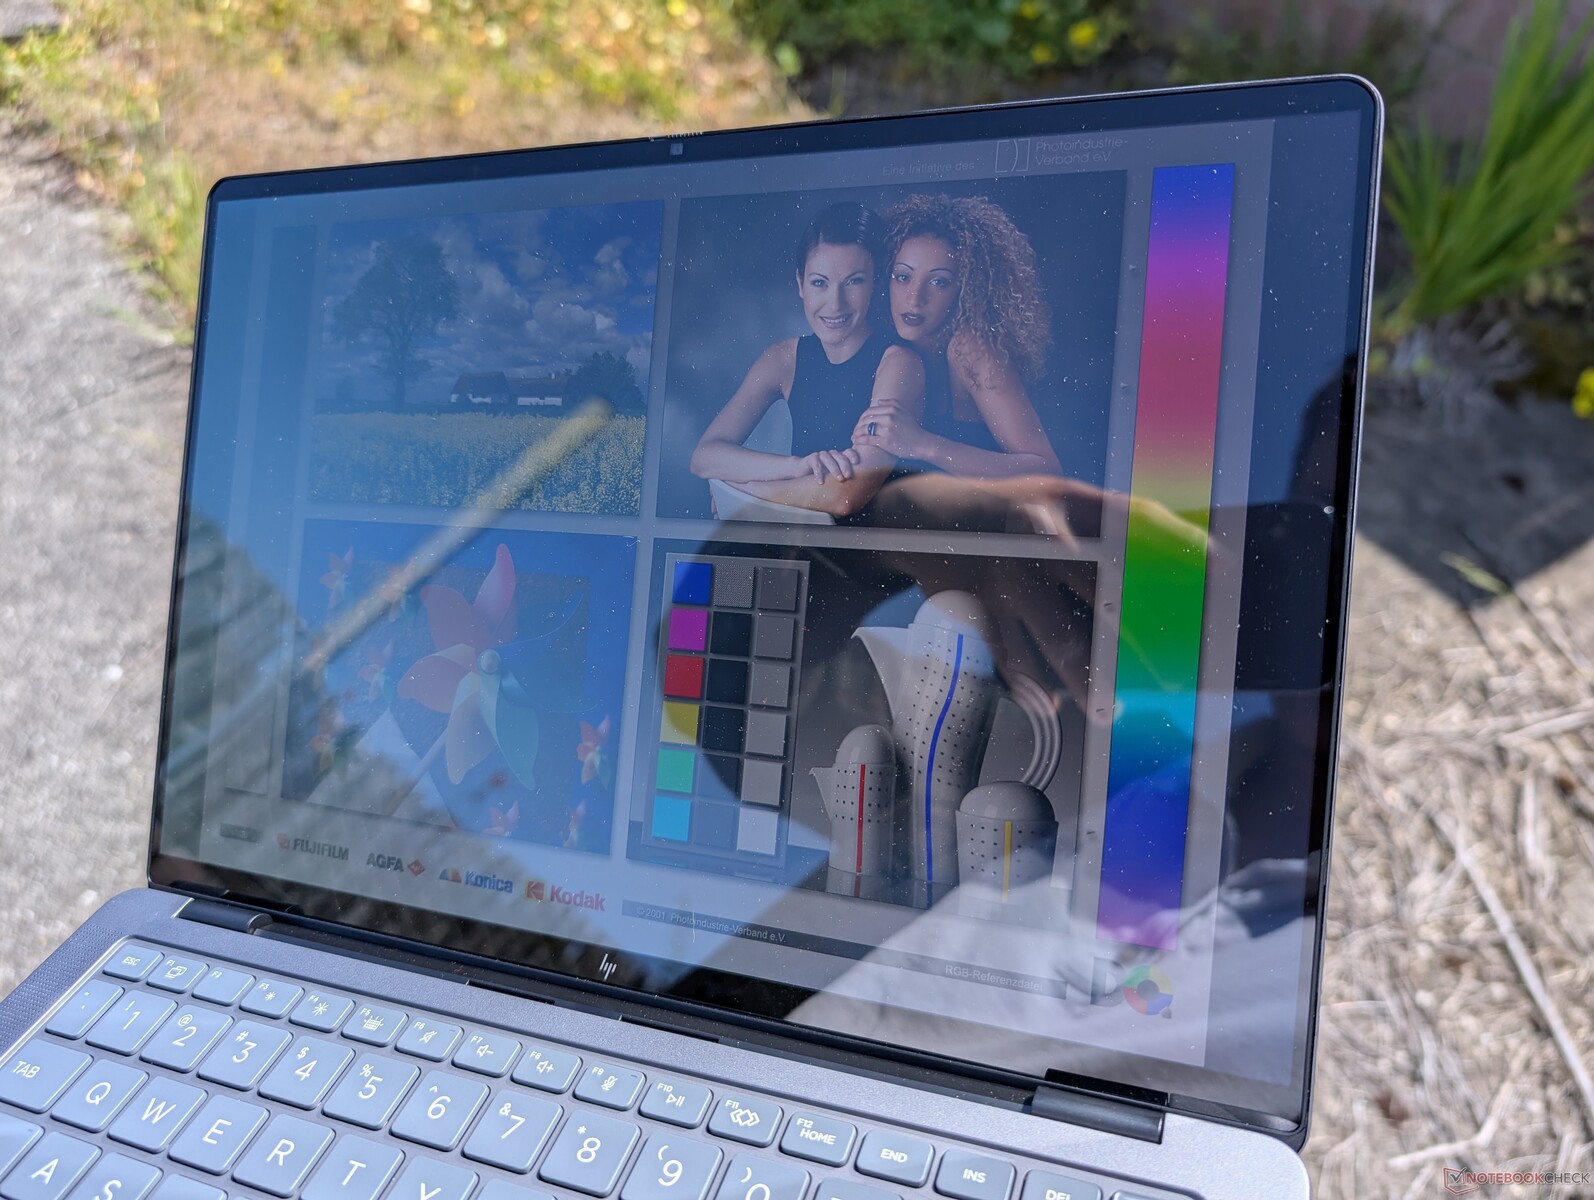
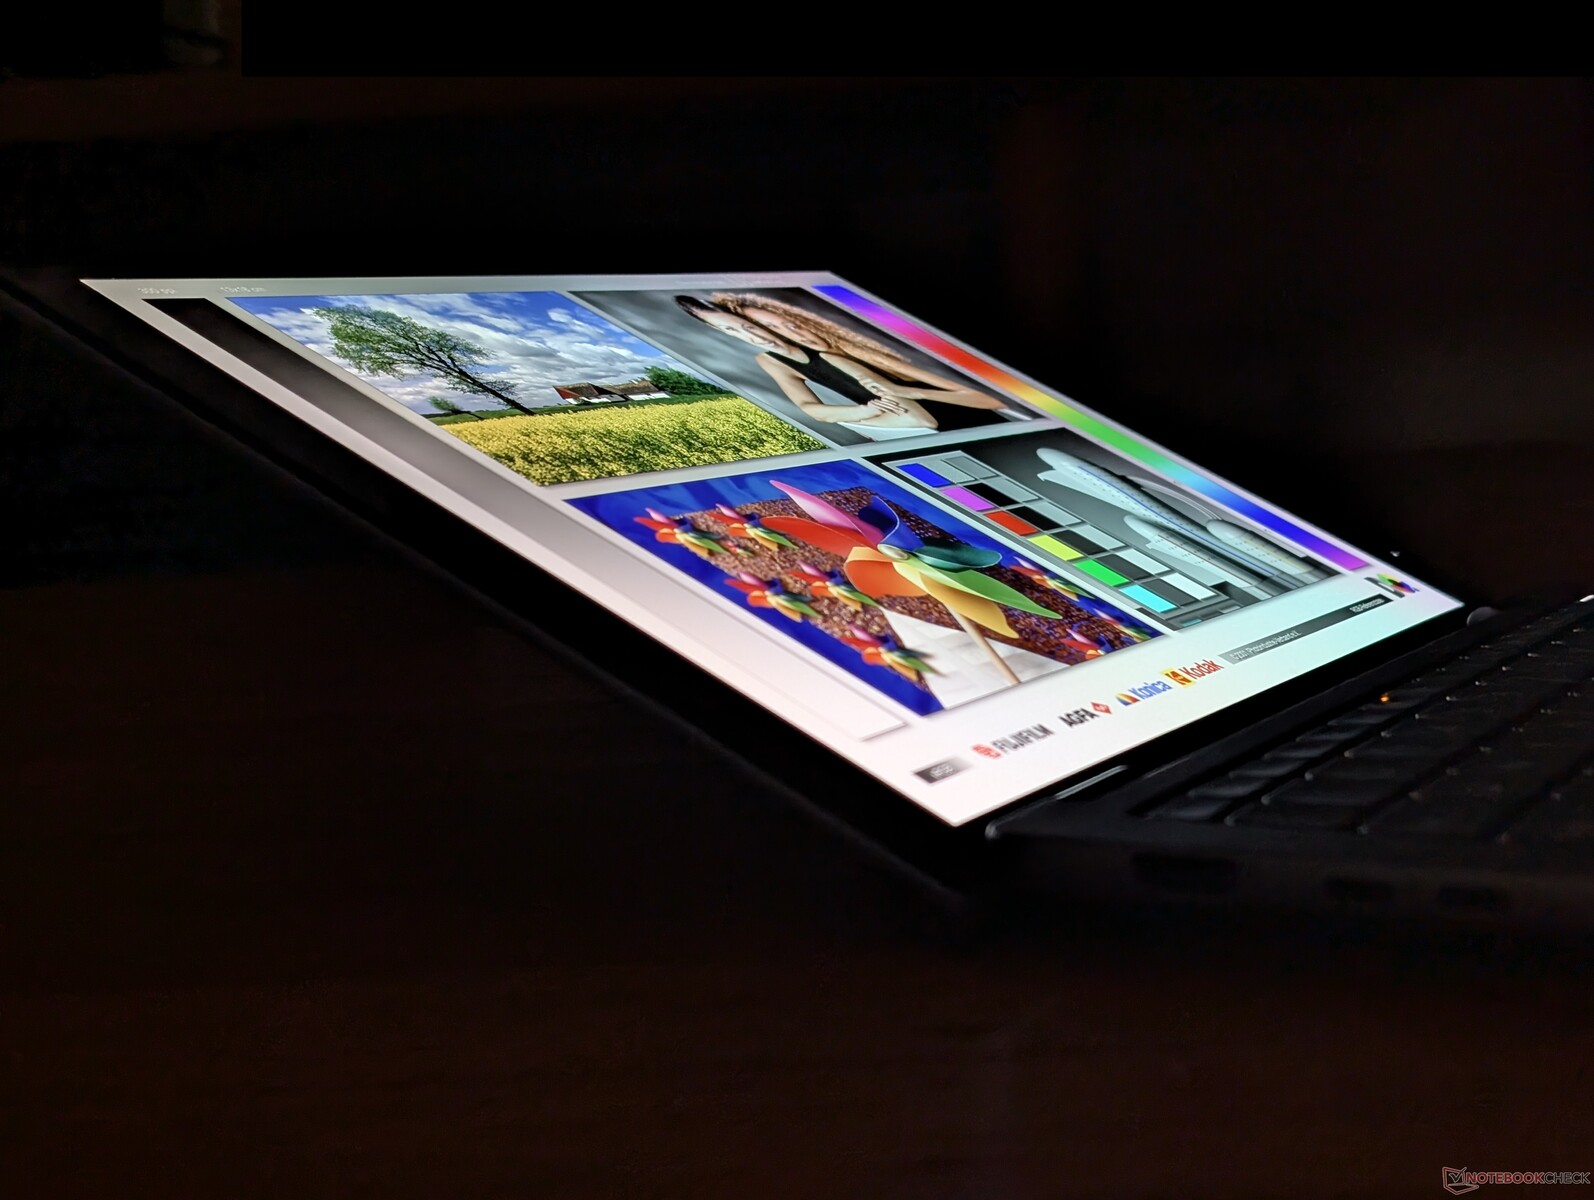
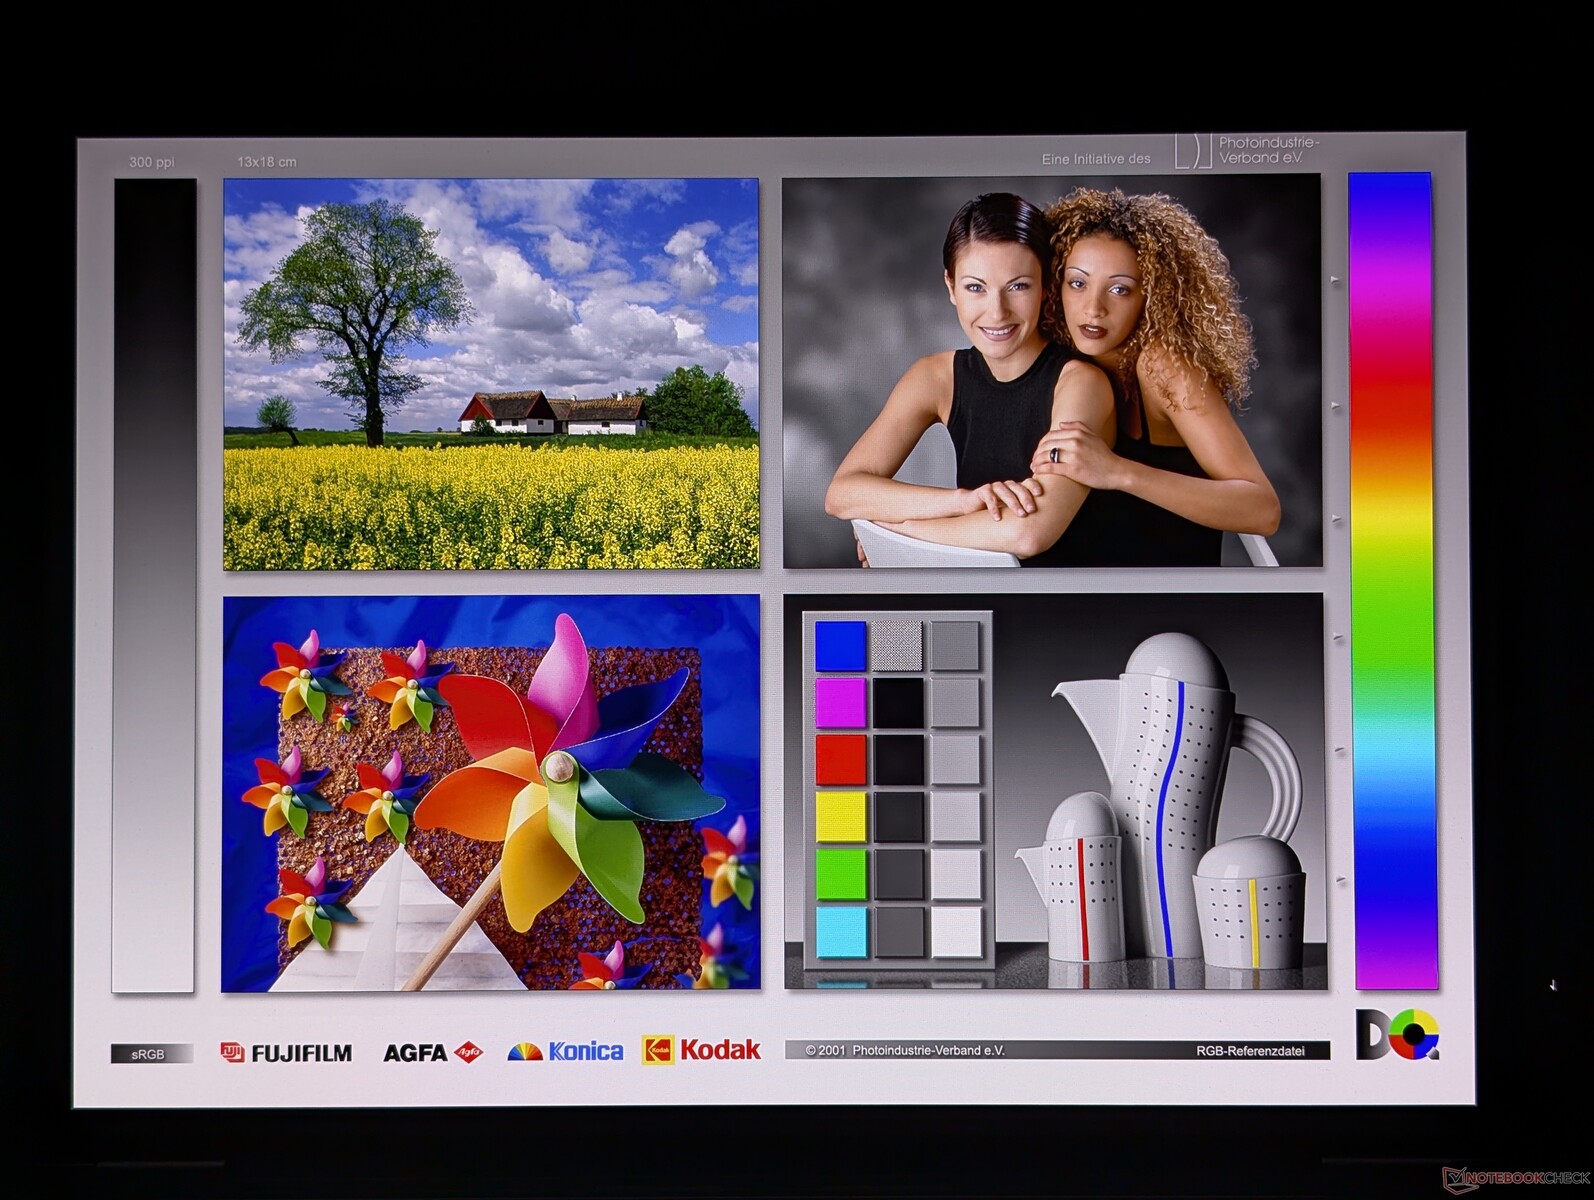
Display
Der OLED-Touchscreen unterstützt 120 Hz und ist gut auf den P3-Standard kalibriert. Allerdings ist er mit maximal 400 nits nicht besonders hell, verglichen mit über 600 nits oder 450 nits beim MacBook Pro 14 bzw. Book Firefly 14 G11.
HDR und adaptive Synchronisation werden nicht unterstützt.
| |||||||||||||||||||||||||
Ausleuchtung: 99 %
Helligkeit Akku: 384.7 cd/m²
Kontrast: ∞:1 (Schwarzwert: 0 cd/m²)
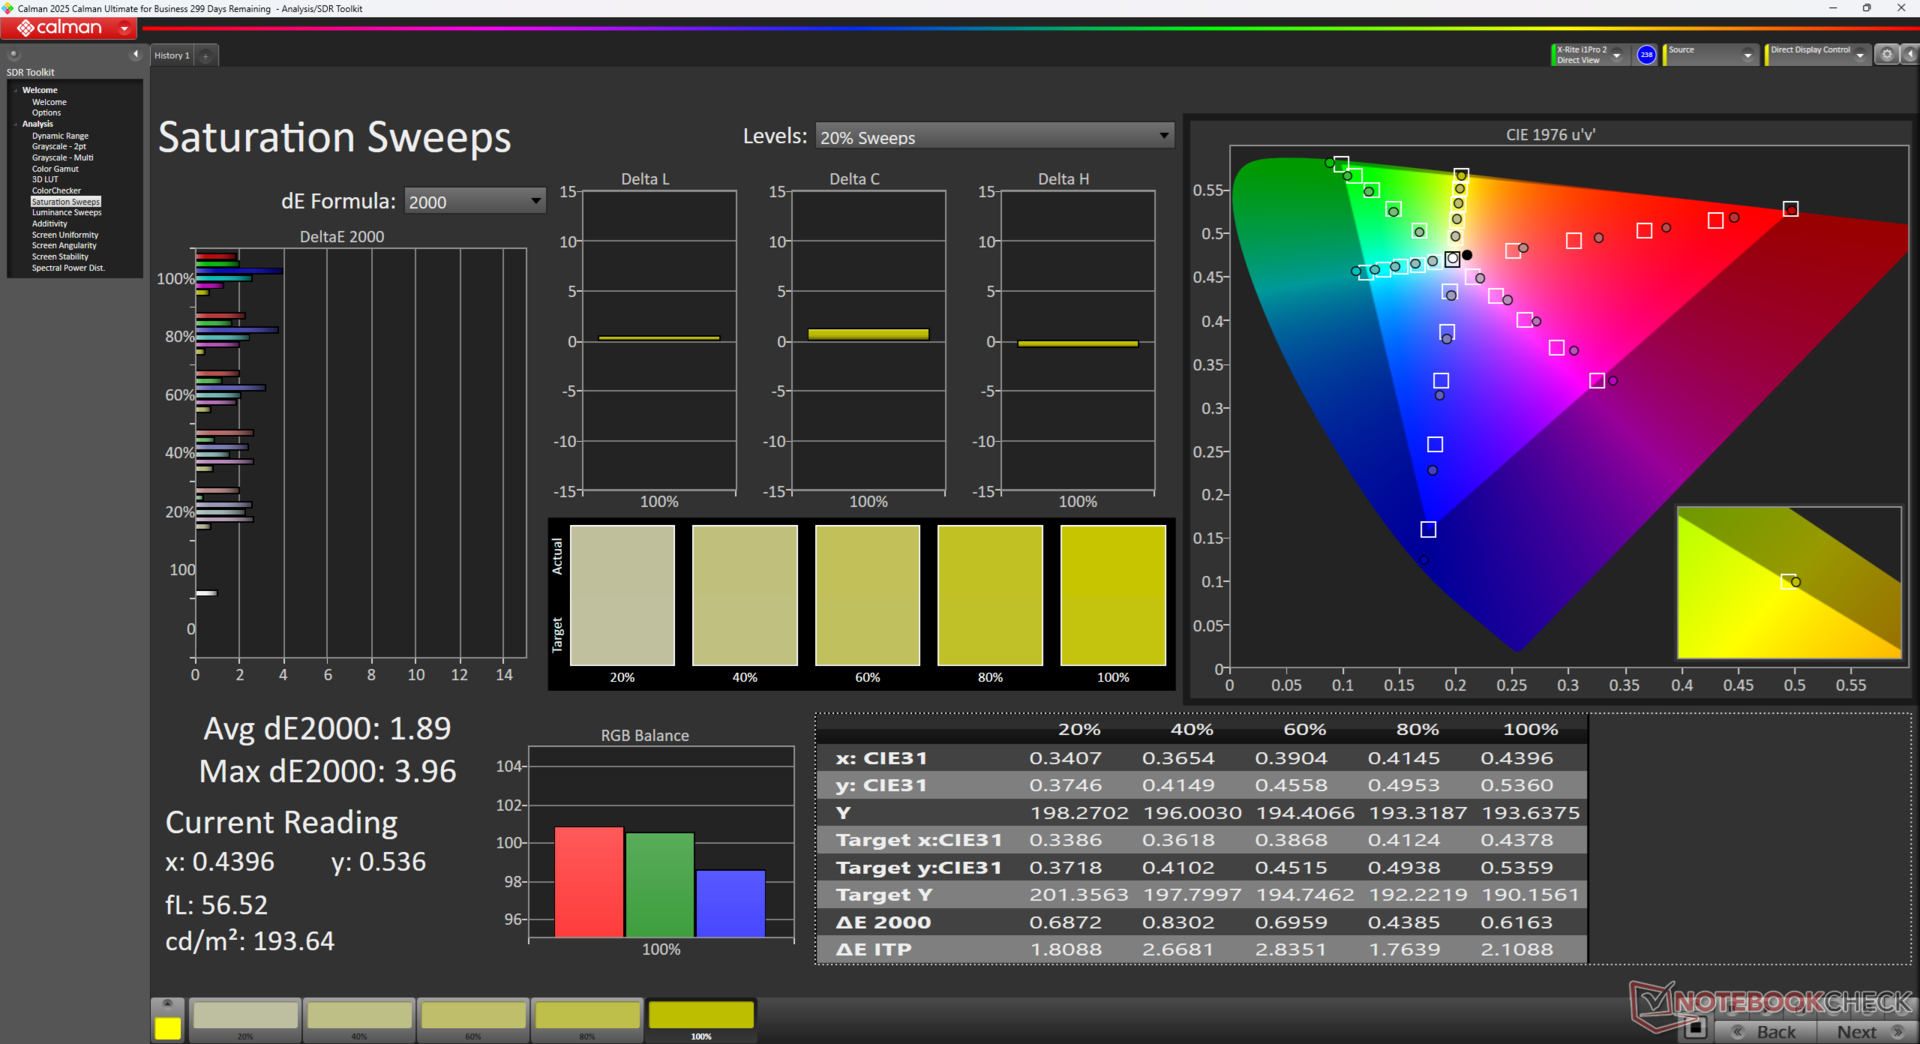
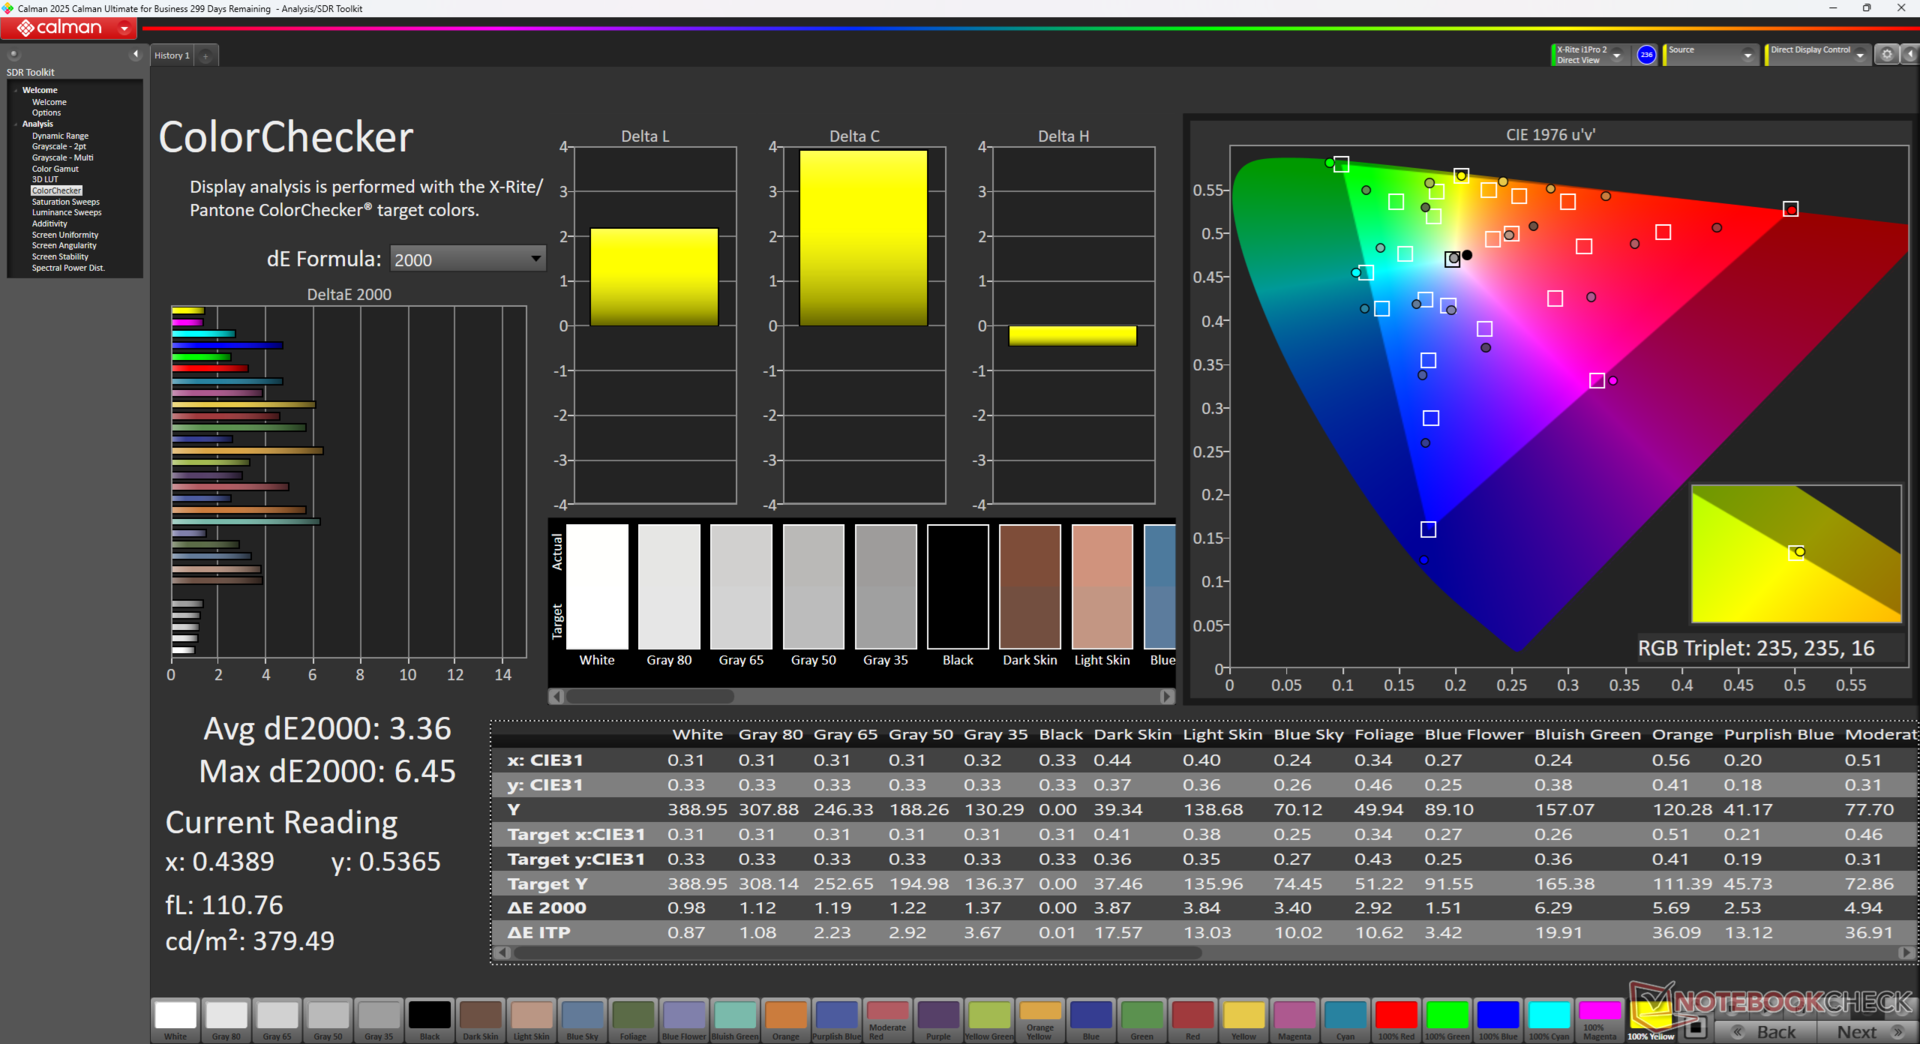
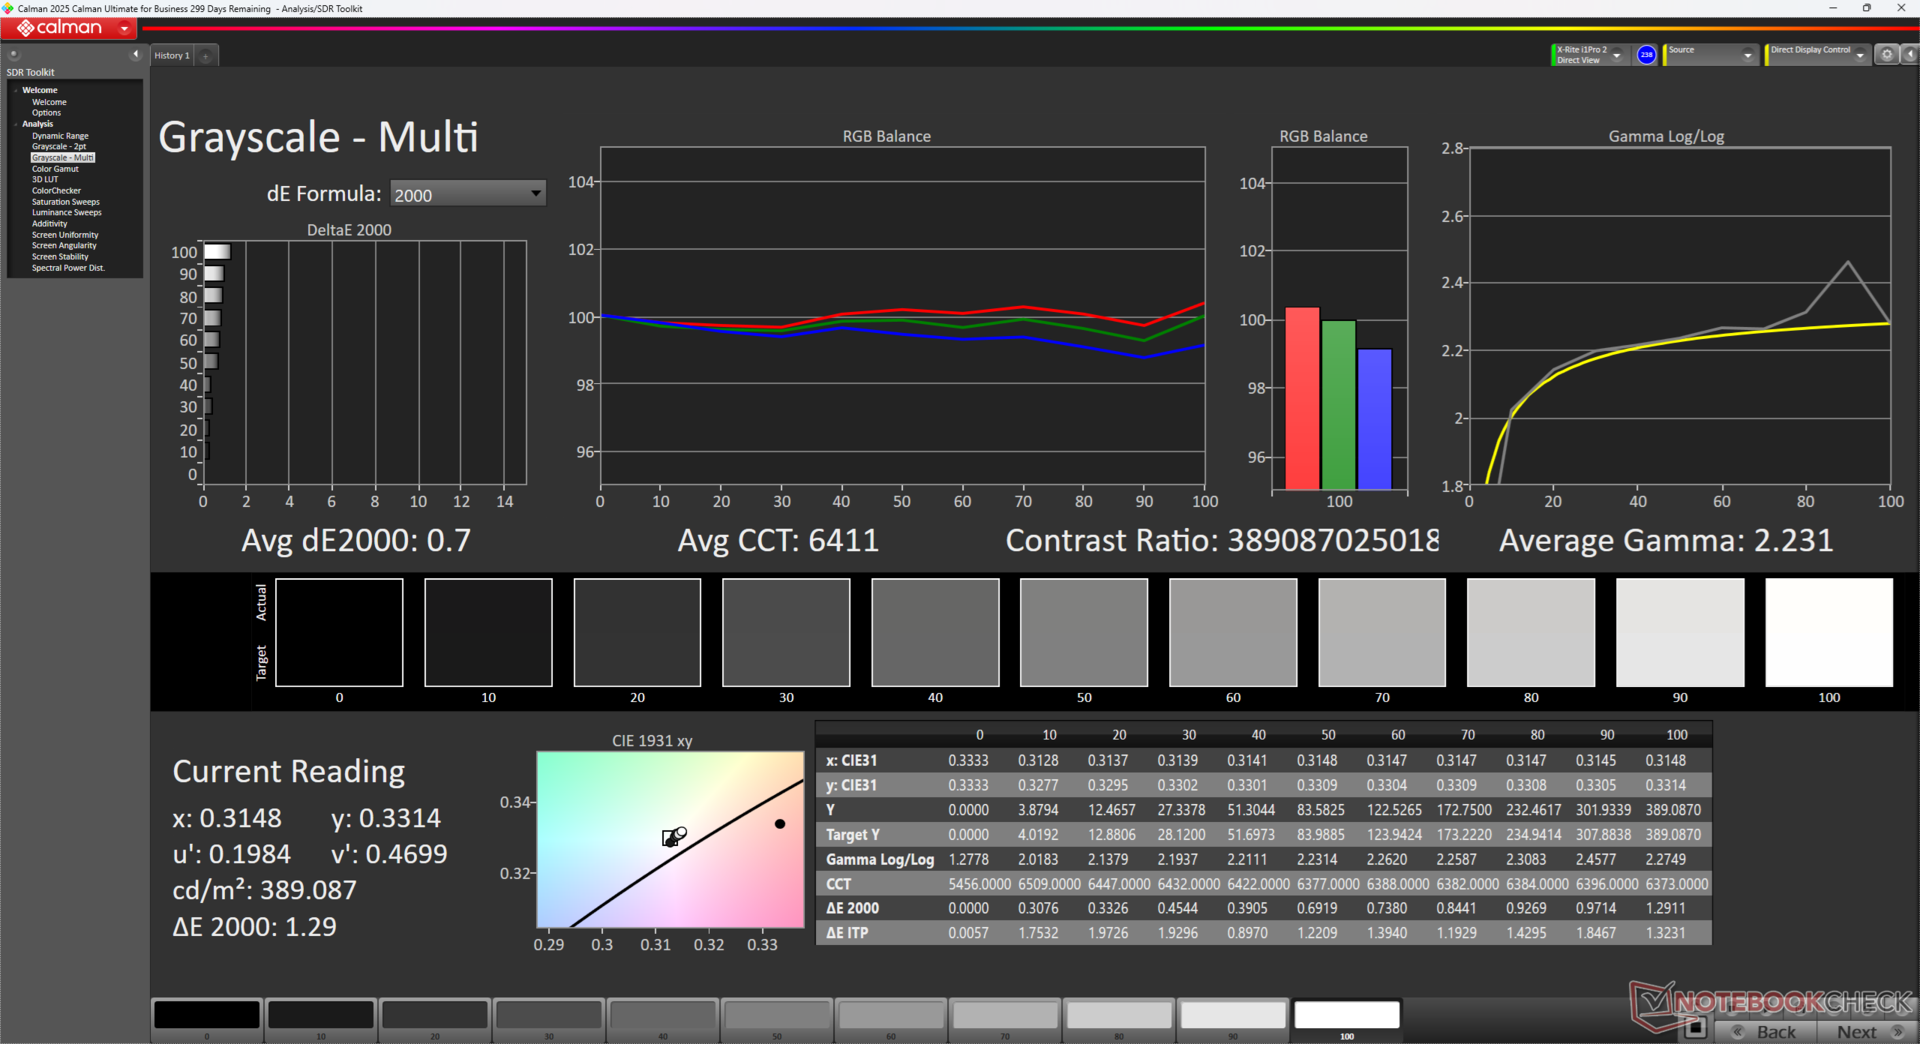
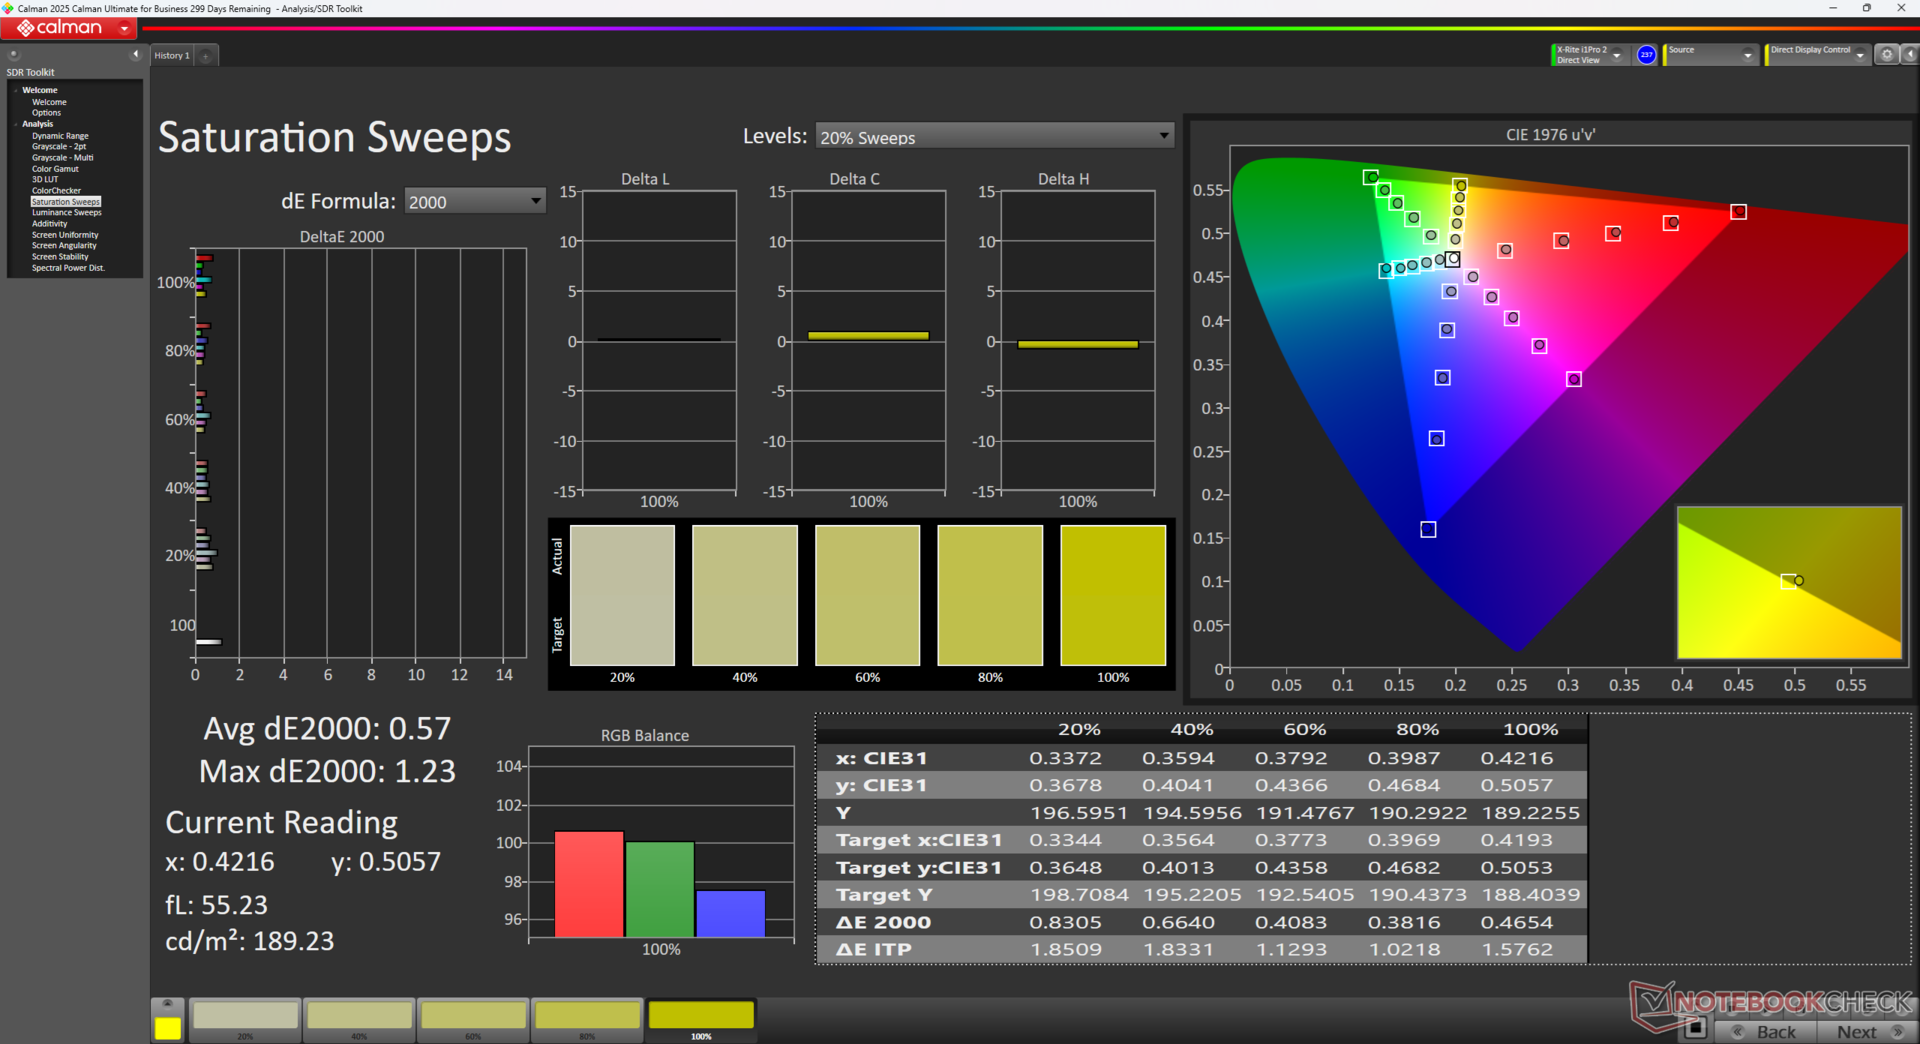
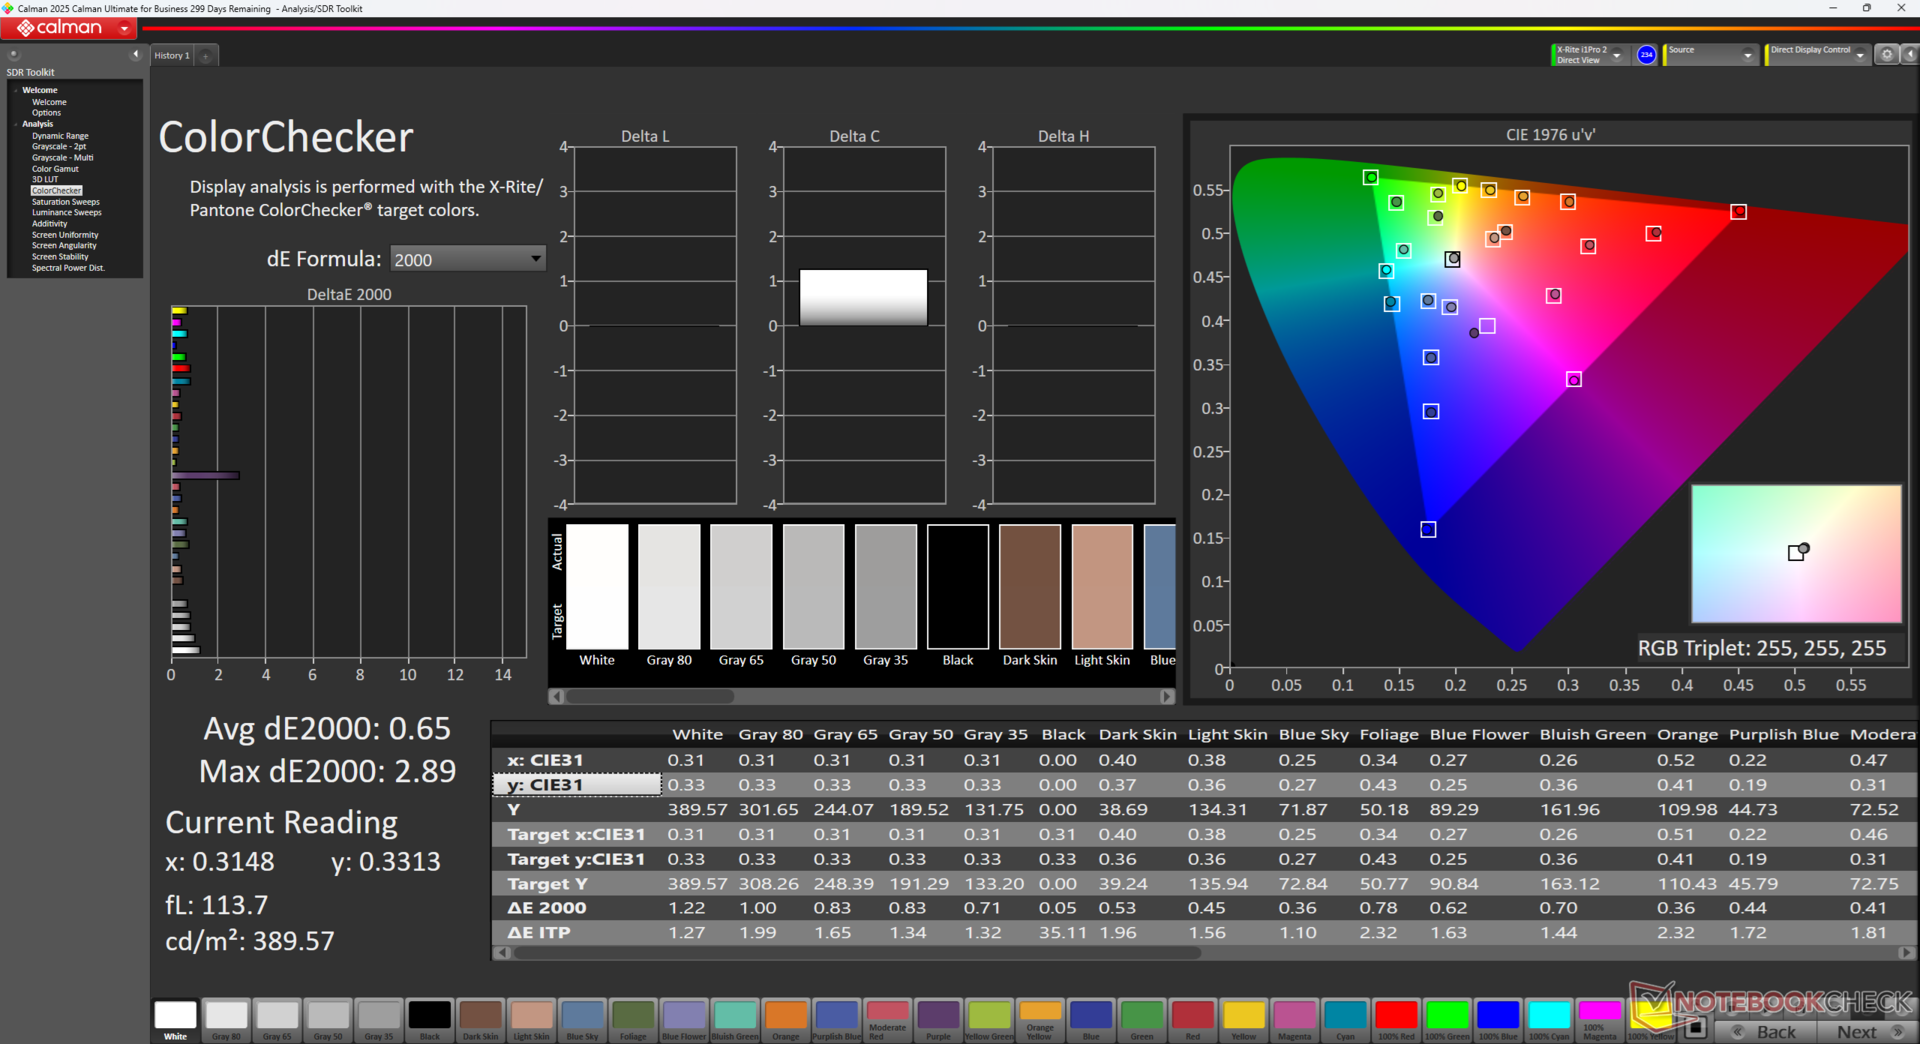
ΔE ColorChecker Calman: 3.36 | ∀{0.5-29.43 Ø4.72}
calibrated: 0.65
ΔE Greyscale Calman: 1 | ∀{0.09-98 Ø4.97}
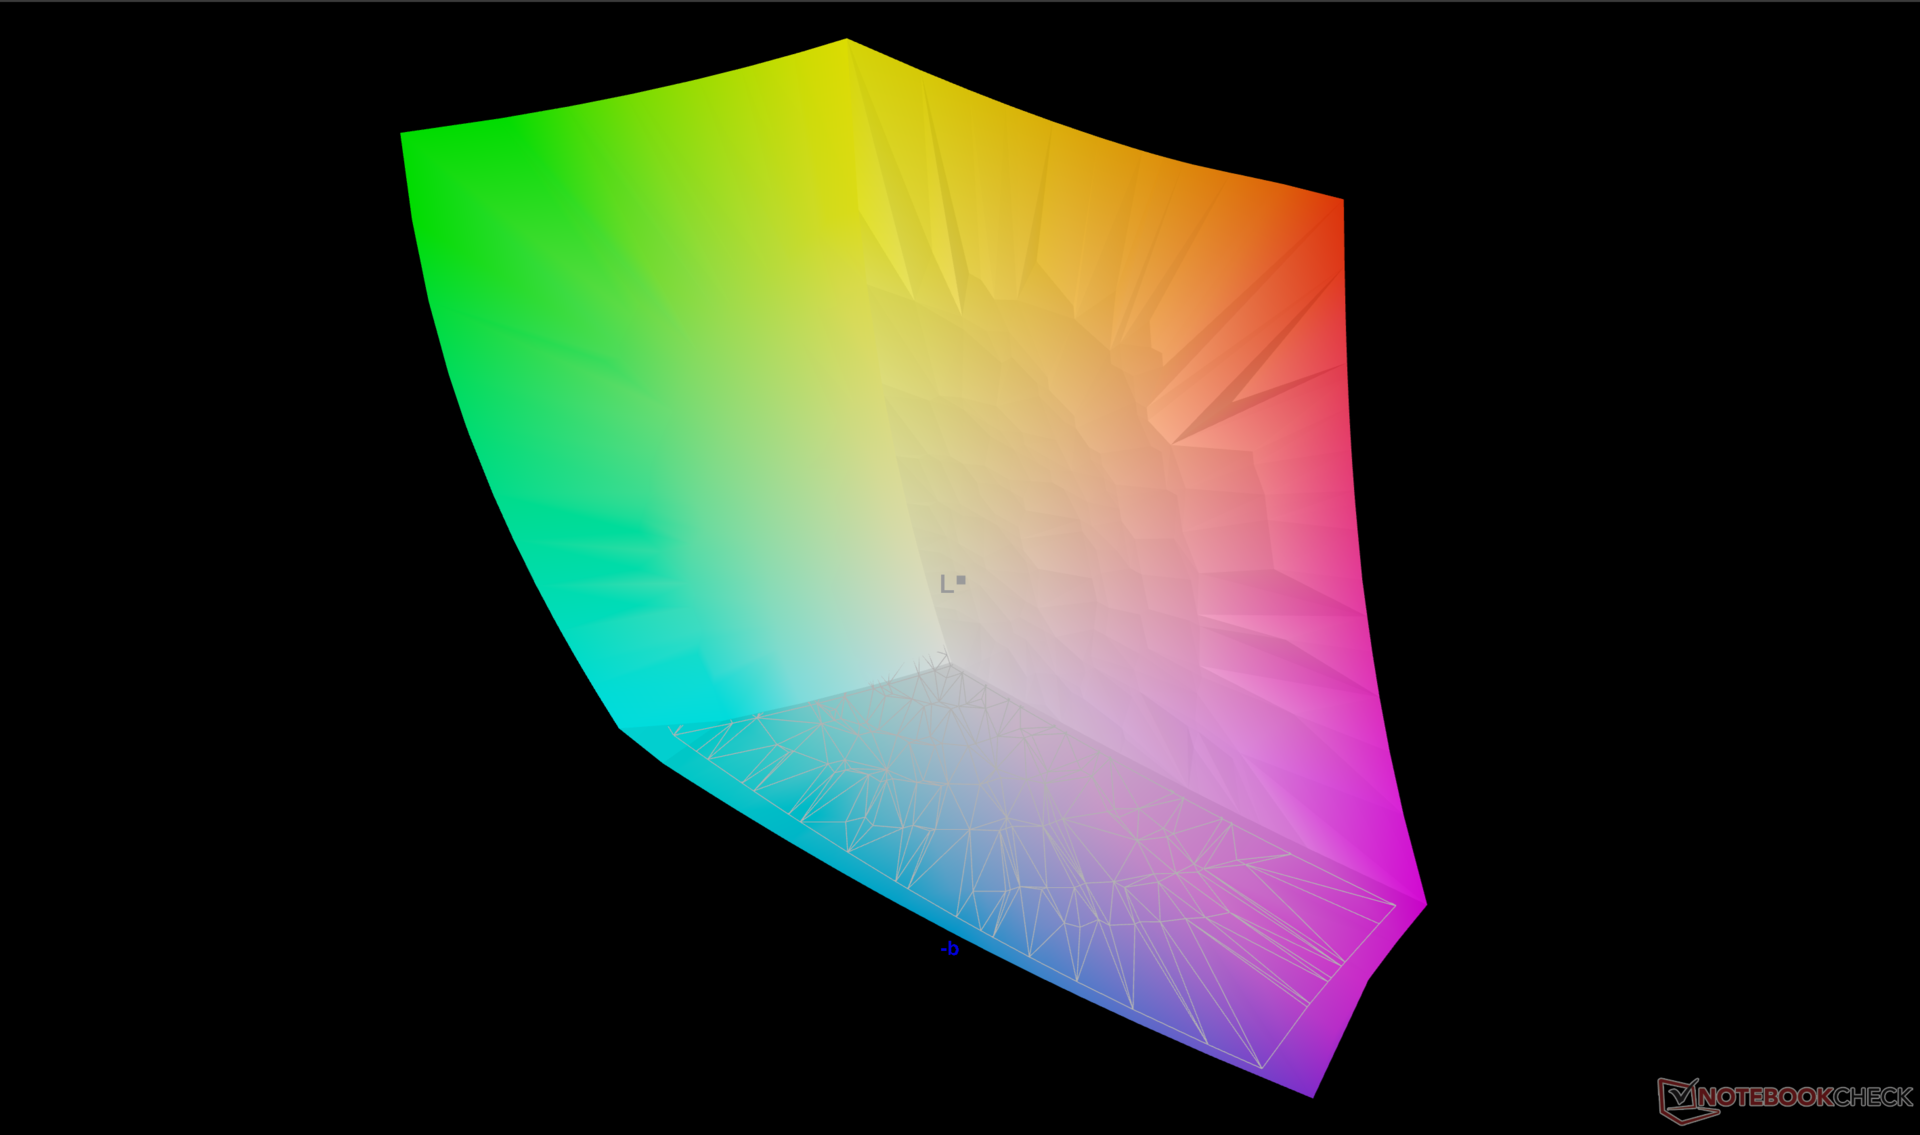
95.6% AdobeRGB 1998 (Argyll 3D)
100% sRGB (Argyll 3D)
99.7% Display P3 (Argyll 3D)
Gamma: 2.26
CCT: 6380 K
| HP ZBook Ultra G1a 14 Samsung SDC41B3, OLED, 2880x1800, 14", 120 Hz | HP ZBook Firefly 14 G11 AUO6DA8, IPS, 2560x1600, 14", 120 Hz | Lenovo ThinkPad X1 Carbon Gen 13 21NS0010GE ATNA40YK20-0, OLED, 2880x1800, 14", 120 Hz | Dell Precision 5000 5490 AU Optronics B140QAN, IPS, 2560x1600, 14", 60 Hz | Asus ExpertBook P5 P5405-NZ0102X NE140QDM-NX4, IPS LED, 2560x1600, 14", 144 Hz | Apple MacBook Pro 14 2024 M4 Pro MiniLED, 3024x1964, 14.2", 120 Hz | |
|---|---|---|---|---|---|---|
| Display | -3% | 1% | -12% | -19% | -2% | |
| Display P3 Coverage (%) | 99.7 | 98.9 -1% | 99.5 0% | 79.7 -20% | 70.8 -29% | 99.6 0% |
| sRGB Coverage (%) | 100 | 99.9 0% | 100 0% | 100 0% | 98 -2% | 100 0% |
| AdobeRGB 1998 Coverage (%) | 95.6 | 86.6 -9% | 97.1 2% | 79.5 -17% | 71.6 -25% | 89 -7% |
| Response Times | -966% | -73% | -4331% | -2990% | -5070% | |
| Response Time Grey 50% / Grey 80% * (ms) | 0.94 ? | 12.3 ? -1209% | 2.4 ? -155% | 52.3 ? -5464% | 36.3 ? -3762% | 77.2 ? -8113% |
| Response Time Black / White * (ms) | 1.01 ? | 8.3 ? -722% | 1.9 ? -88% | 33.3 ? -3197% | 23.4 ? -2217% | 71.6 ? -6989% |
| PWM Frequency (Hz) | 492.6 | 240 ? | 14880 ? | |||
| PWM Amplitude * (%) | 43 | 33 23% | 90 -109% | |||
| Bildschirm | 20% | -118% | -2% | -97% | 50% | |
| Helligkeit Bildmitte (cd/m²) | 384.7 | 554.1 44% | 407 6% | 485.1 26% | 457 19% | 638 66% |
| Brightness (cd/m²) | 387 | 540 40% | 410 6% | 471 22% | 457 18% | 621 60% |
| Brightness Distribution (%) | 99 | 93 -6% | 99 0% | 90 -9% | 95 -4% | 95 -4% |
| Schwarzwert * (cd/m²) | 0.58 | 0.38 | 0.12 | |||
| Delta E Colorchecker * | 3.36 | 2.54 24% | 4.9 -46% | 2.15 36% | 4.9 -46% | 0.6 82% |
| Colorchecker dE 2000 max. * | 6.45 | 4.99 23% | 9.1 -41% | 5.39 16% | 8.5 -32% | 1.4 78% |
| Colorchecker dE 2000 calibrated * | 0.65 | 0.56 14% | 4.7 -623% | 0.67 -3% | 1.7 -162% | |
| Delta E Graustufen * | 1 | 1 -0% | 2.3 -130% | 2 -100% | 5.7 -470% | 0.8 20% |
| Gamma | 2.26 97% | 2.3 96% | 2.26 97% | 2.3 96% | 2.25 98% | 2.22 99% |
| CCT | 6380 102% | 6556 99% | 6310 103% | 6826 95% | 7647 85% | 6430 101% |
| Kontrast (:1) | 955 | 1277 | 3808 | |||
| Durchschnitt gesamt (Programm / Settings) | -316% /
-150% | -63% /
-80% | -1448% /
-726% | -1035% /
-559% | -1674% /
-1243% |
* ... kleinere Werte sind besser

Reaktionszeiten (Response Times) des Displays
| ↔ Reaktionszeiten Schwarz zu Weiß | ||
|---|---|---|
| 1.01 ms ... steigend ↗ und fallend ↘ kombiniert | ↗ 0.46 ms steigend | 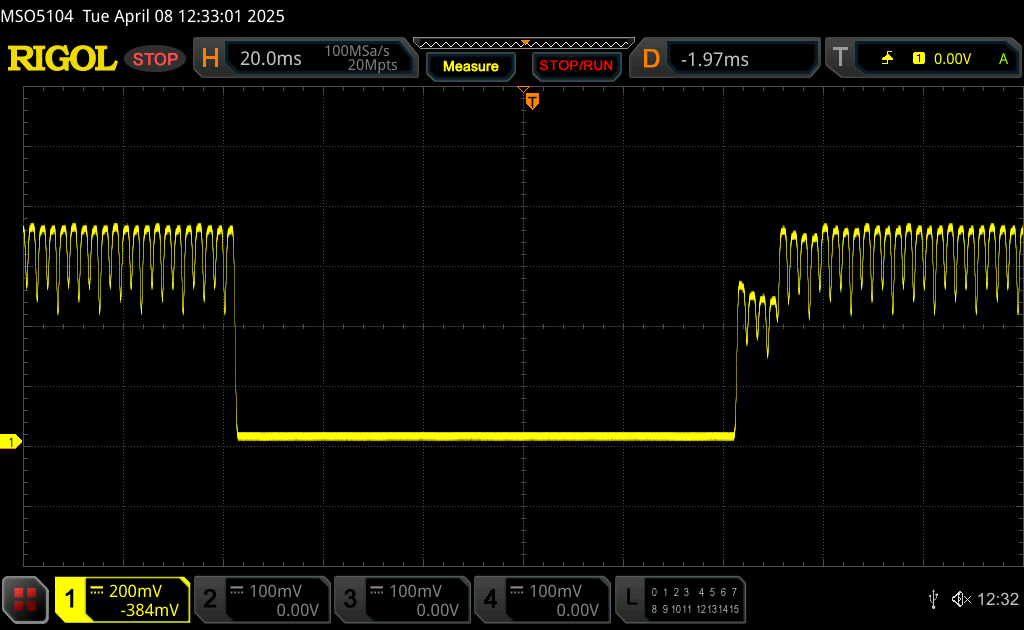 |
| ↘ 0.55 ms fallend | ||
| Die gemessenen Reaktionszeiten sind sehr kurz, wodurch sich der Bildschirm auch für schnelle 3D Spiele eignen sollte. Im Vergleich rangierten die bei uns getesteten Geräte von 0.1 (Minimum) zu 240 (Maximum) ms. » 4 % aller Screens waren schneller als der getestete. Daher sind die gemessenen Reaktionszeiten besser als der Durchschnitt aller vermessenen Geräte (19.8 ms). | ||
| ↔ Reaktionszeiten 50% Grau zu 80% Grau | ||
| 0.94 ms ... steigend ↗ und fallend ↘ kombiniert | ↗ 0.53 ms steigend | 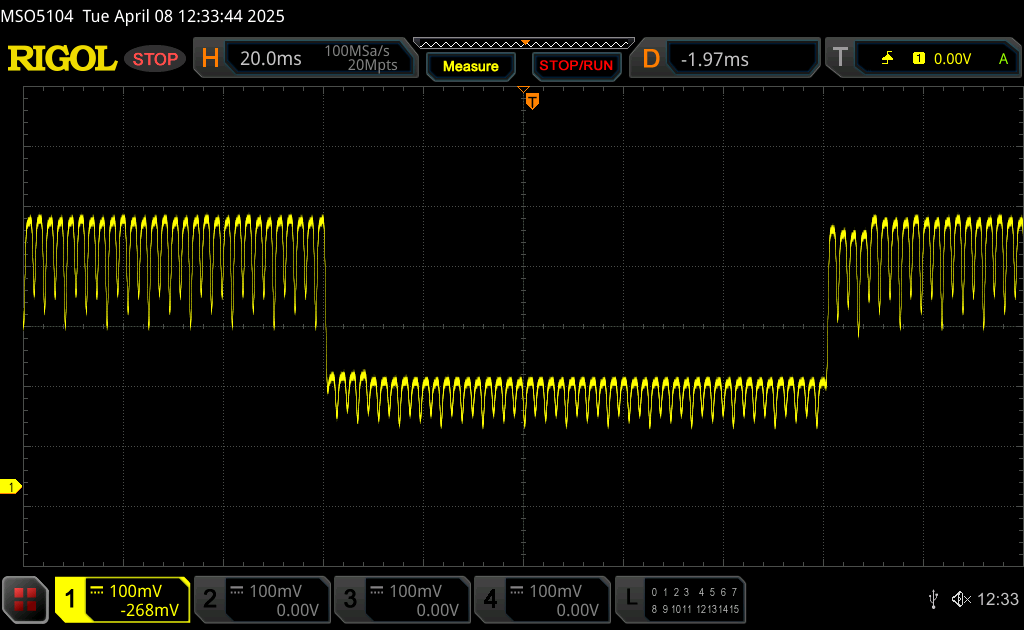 |
| ↘ 0.41 ms fallend | ||
| Die gemessenen Reaktionszeiten sind sehr kurz, wodurch sich der Bildschirm auch für schnelle 3D Spiele eignen sollte. Im Vergleich rangierten die bei uns getesteten Geräte von 0.165 (Minimum) zu 636 (Maximum) ms. » 3 % aller Screens waren schneller als der getestete. Daher sind die gemessenen Reaktionszeiten besser als der Durchschnitt aller vermessenen Geräte (31 ms). | ||
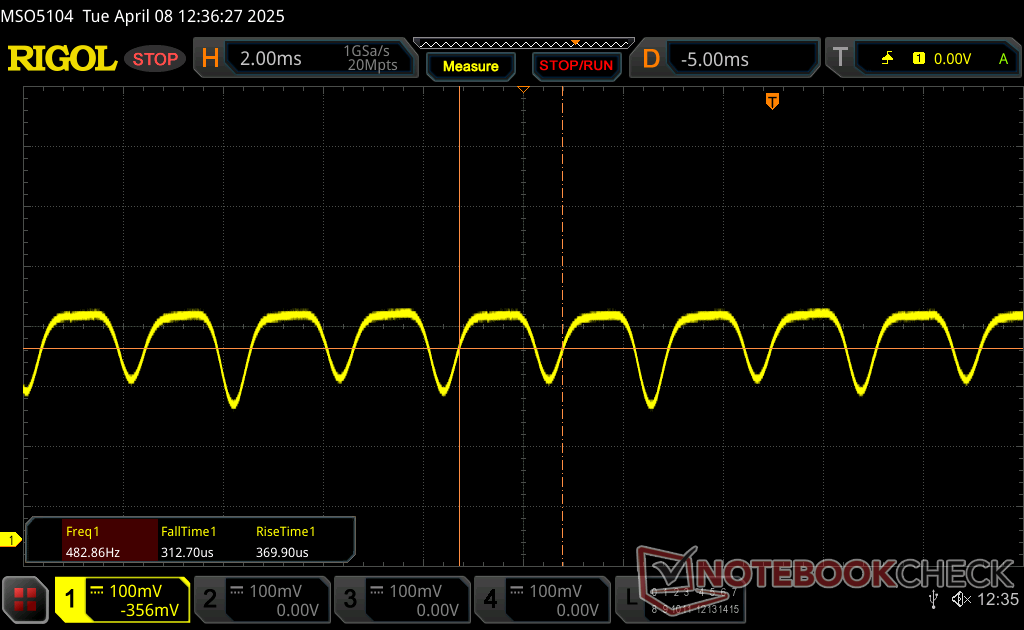
Bildschirm-Flackern / PWM (Pulse-Width Modulation)
| Flackern / PWM festgestellt | 492.6 Hz Amplitude: 43 % | 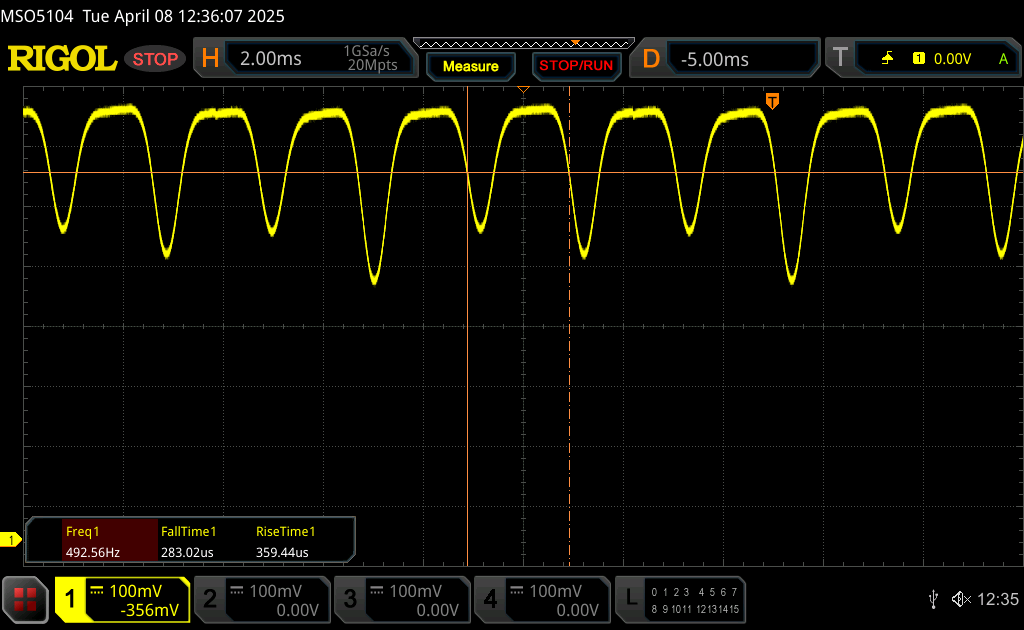 | |
Das Display flackert mit 492.6 Hz (im schlimmsten Fall, eventuell durch Pulsweitenmodulation PWM) . Die Frequenz von 492.6 Hz ist relativ hoch und sollte daher auch bei den meisten Personen zu keinen Problemen führen. Empfindliche User sollen laut Berichten aber sogar noch bei 500 Hz und darüber ein Flackern wahrnehmen. Im Vergleich: 52 % aller getesteten Geräte nutzten kein PWM um die Helligkeit zu reduzieren. Wenn PWM eingesetzt wurde, dann bei einer Frequenz von durchschnittlich 7769 (Minimum 5, Maximum 343500) Hz. | |||

Performance
Testbedingungen
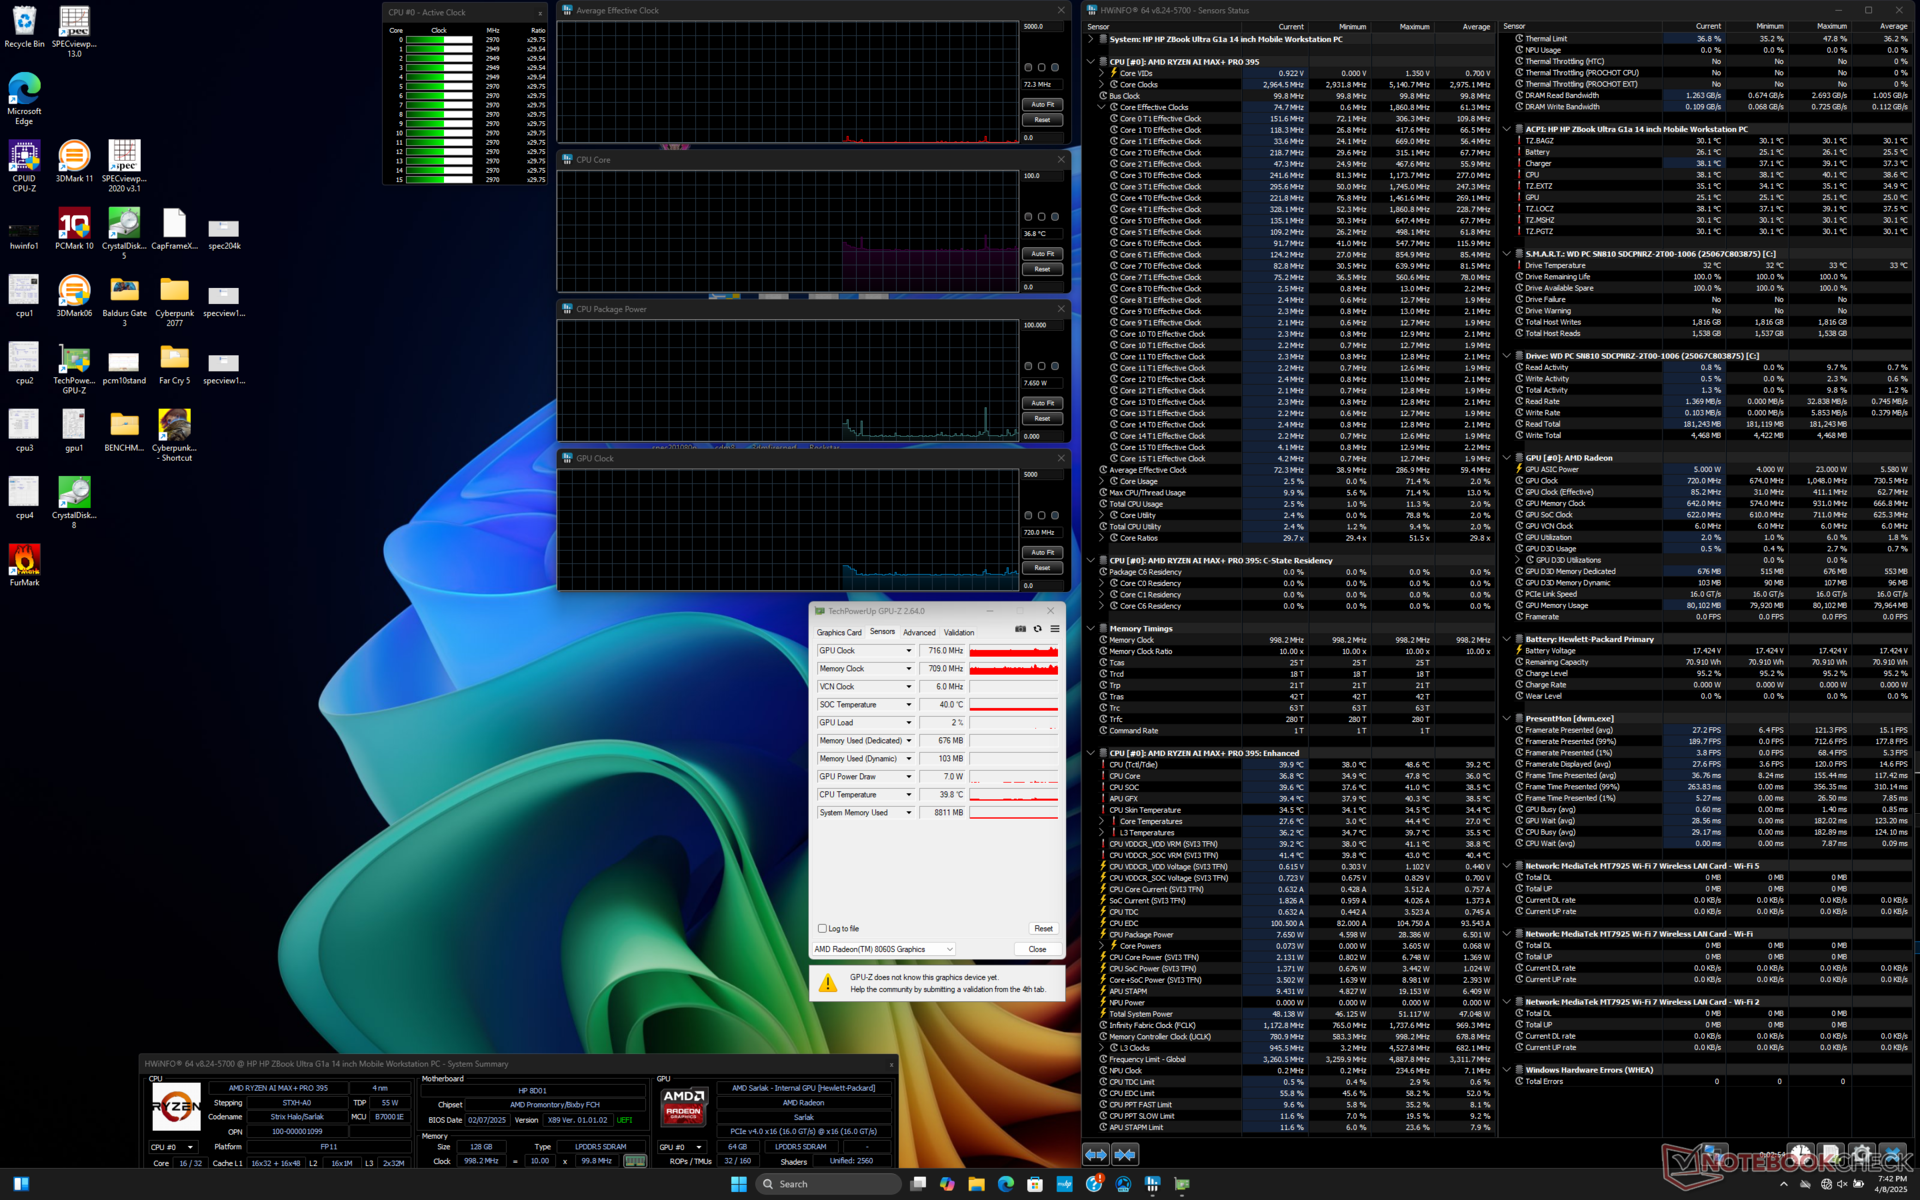
Wir haben sowohl Windows als auch MyHP auf den Modus "High Performance" eingestellt, bevor wir die folgenden Benchmarks durchgeführt haben.
Der verlötete Arbeitsspeicher ist zwischen System-RAM und Video-RAM konfigurierbar, wie hier beschrieben ist.
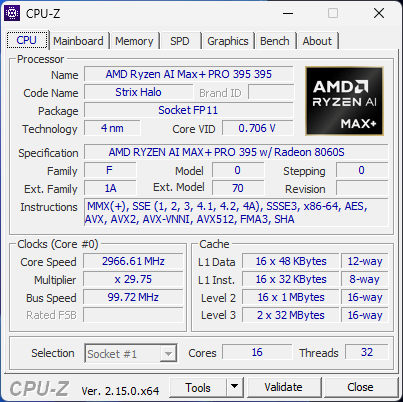
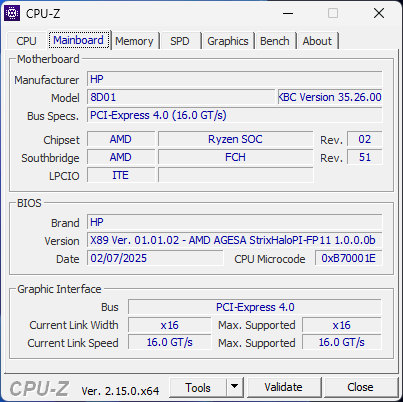
Prozessor
Die rohe Prozessorleistung mit dem Ryzen AI Max+ PRO 395 ist eine der schnellsten aller 14-Zoll-Workstation-PCs, wenn nicht sogar die schnellste. Sie übertrifft die Leistung des Core Ultra 9 185H im konkurrierenden Precision 5470 um ~80 Prozent bei Multi-Thread-Workloads und liegt Kopf an Kopf mit dem 14 Core Apple M4 Pro. Die Single-Thread-Leistung ist jedoch durchschnittlich, so dass unter bestimmten Bedingungen immer noch das Apple-Flaggschiff die Nase vorn hat.
Die Nachhaltigkeit der Leistung unter Last ist ausgezeichnet und besser als von einem 14-Zoll-Formfaktor erwartet.
Cinebench R15 Multi Loop
Cinebench 2024: CPU Multi Core | CPU Single Core
Cinebench R23: Multi Core | Single Core
Cinebench R20: CPU (Multi Core) | CPU (Single Core)
Cinebench R15: CPU Multi 64Bit | CPU Single 64Bit
Blender: v2.79 BMW27 CPU
7-Zip 18.03: 7z b 4 | 7z b 4 -mmt1
Geekbench 6.7: Multi-Core | Single-Core
Geekbench 5.5: Multi-Core | Single-Core
HWBOT x265 Benchmark v2.2: 4k Preset
LibreOffice : 20 Documents To PDF
R Benchmark 2.5: Overall mean
| CPU Performance Rating | |
| Apple MacBook Pro 14 2024 M4 Pro -11! | |
| Asus ROG Flow Z13 GZ302EA-RU073W | |
| Durchschnittliche AMD Ryzen AI Max+ PRO 395 | |
| HP ZBook Ultra G1a 14 | |
| Xiaomi RedmiBook Pro 14 2025 | |
| Asus VivoBook S 14 OLED M5406WA -2! | |
| Lenovo Yoga Pro 7 14ASP G9 | |
| Dell Precision 5000 5490 -2! | |
| Asus Zenbook 14 OLED UM3406HA | |
| HP ZBook Firefly 14 G11 -1! | |
| Lenovo ThinkPad X1 Carbon Gen 13 21NS0010GE | |
| Asus ExpertBook P5 P5405-NZ0102X -2! | |
| Lenovo Yoga 7 2-in-1 14AHP9 Arctic Grey | |
| Cinebench 2024 / CPU Multi Core | |
| Durchschnittliche AMD Ryzen AI Max+ PRO 395 (1643 - 1738, n=2) | |
| Apple MacBook Pro 14 2024 M4 Pro | |
| Asus ROG Flow Z13 GZ302EA-RU073W | |
| HP ZBook Ultra G1a 14 | |
| Xiaomi RedmiBook Pro 14 2025 | |
| Lenovo Yoga Pro 7 14ASP G9 | |
| Asus Zenbook 14 OLED UM3406HA | |
| Lenovo Yoga 7 2-in-1 14AHP9 Arctic Grey | |
| HP ZBook Firefly 14 G11 | |
| Lenovo ThinkPad X1 Carbon Gen 13 21NS0010GE | |
| Cinebench 2024 / CPU Single Core | |
| Apple MacBook Pro 14 2024 M4 Pro | |
| Xiaomi RedmiBook Pro 14 2025 | |
| Lenovo ThinkPad X1 Carbon Gen 13 21NS0010GE | |
| Asus ROG Flow Z13 GZ302EA-RU073W | |
| Lenovo Yoga Pro 7 14ASP G9 | |
| Durchschnittliche AMD Ryzen AI Max+ PRO 395 (112.2 - 113, n=2) | |
| HP ZBook Ultra G1a 14 | |
| Asus Zenbook 14 OLED UM3406HA | |
| Lenovo Yoga 7 2-in-1 14AHP9 Arctic Grey | |
Cinebench 2024: CPU Multi Core | CPU Single Core
Cinebench R23: Multi Core | Single Core
Cinebench R20: CPU (Multi Core) | CPU (Single Core)
Cinebench R15: CPU Multi 64Bit | CPU Single 64Bit
Blender: v2.79 BMW27 CPU
7-Zip 18.03: 7z b 4 | 7z b 4 -mmt1
Geekbench 6.7: Multi-Core | Single-Core
Geekbench 5.5: Multi-Core | Single-Core
HWBOT x265 Benchmark v2.2: 4k Preset
LibreOffice : 20 Documents To PDF
R Benchmark 2.5: Overall mean
* ... kleinere Werte sind besser
AIDA64: FP32 Ray-Trace | FPU Julia | CPU SHA3 | CPU Queen | FPU SinJulia | FPU Mandel | CPU AES | CPU ZLib | FP64 Ray-Trace | CPU PhotoWorxx
| Performance Rating | |
| Durchschnittliche AMD Ryzen AI Max+ PRO 395 | |
| HP ZBook Ultra G1a 14 | |
| Dell Precision 5000 5490 | |
| HP ZBook Firefly 14 G11 | |
| Asus ExpertBook P5 P5405-NZ0102X | |
| Lenovo ThinkPad X1 Carbon Gen 13 21NS0010GE | |
| AIDA64 / FP32 Ray-Trace | |
| Durchschnittliche AMD Ryzen AI Max+ PRO 395 (61611 - 76534, n=2) | |
| HP ZBook Ultra G1a 14 | |
| Dell Precision 5000 5490 | |
| Asus ExpertBook P5 P5405-NZ0102X | |
| HP ZBook Firefly 14 G11 | |
| Lenovo ThinkPad X1 Carbon Gen 13 21NS0010GE | |
| AIDA64 / FPU Julia | |
| Durchschnittliche AMD Ryzen AI Max+ PRO 395 (183843 - 211003, n=2) | |
| HP ZBook Ultra G1a 14 | |
| Dell Precision 5000 5490 | |
| Asus ExpertBook P5 P5405-NZ0102X | |
| Lenovo ThinkPad X1 Carbon Gen 13 21NS0010GE | |
| HP ZBook Firefly 14 G11 | |
| AIDA64 / CPU SHA3 | |
| Durchschnittliche AMD Ryzen AI Max+ PRO 395 (8341 - 8869, n=2) | |
| HP ZBook Ultra G1a 14 | |
| Dell Precision 5000 5490 | |
| Asus ExpertBook P5 P5405-NZ0102X | |
| Lenovo ThinkPad X1 Carbon Gen 13 21NS0010GE | |
| HP ZBook Firefly 14 G11 | |
| AIDA64 / CPU Queen | |
| Durchschnittliche AMD Ryzen AI Max+ PRO 395 (114210 - 152694, n=2) | |
| HP ZBook Ultra G1a 14 | |
| Dell Precision 5000 5490 | |
| HP ZBook Firefly 14 G11 | |
| Asus ExpertBook P5 P5405-NZ0102X | |
| Lenovo ThinkPad X1 Carbon Gen 13 21NS0010GE | |
| AIDA64 / FPU SinJulia | |
| Durchschnittliche AMD Ryzen AI Max+ PRO 395 (29343 - 30299, n=2) | |
| HP ZBook Ultra G1a 14 | |
| Dell Precision 5000 5490 | |
| HP ZBook Firefly 14 G11 | |
| Asus ExpertBook P5 P5405-NZ0102X | |
| Lenovo ThinkPad X1 Carbon Gen 13 21NS0010GE | |
| AIDA64 / FPU Mandel | |
| Durchschnittliche AMD Ryzen AI Max+ PRO 395 (97385 - 112137, n=2) | |
| HP ZBook Ultra G1a 14 | |
| Dell Precision 5000 5490 | |
| Asus ExpertBook P5 P5405-NZ0102X | |
| Lenovo ThinkPad X1 Carbon Gen 13 21NS0010GE | |
| HP ZBook Firefly 14 G11 | |
| AIDA64 / CPU AES | |
| HP ZBook Ultra G1a 14 | |
| Durchschnittliche AMD Ryzen AI Max+ PRO 395 (151664 - 187841, n=2) | |
| Dell Precision 5000 5490 | |
| HP ZBook Firefly 14 G11 | |
| Asus ExpertBook P5 P5405-NZ0102X | |
| Lenovo ThinkPad X1 Carbon Gen 13 21NS0010GE | |
| AIDA64 / CPU ZLib | |
| Durchschnittliche AMD Ryzen AI Max+ PRO 395 (2057 - 2346, n=2) | |
| HP ZBook Ultra G1a 14 | |
| Dell Precision 5000 5490 | |
| HP ZBook Firefly 14 G11 | |
| Asus ExpertBook P5 P5405-NZ0102X | |
| Lenovo ThinkPad X1 Carbon Gen 13 21NS0010GE | |
| AIDA64 / FP64 Ray-Trace | |
| Durchschnittliche AMD Ryzen AI Max+ PRO 395 (32891 - 41221, n=2) | |
| HP ZBook Ultra G1a 14 | |
| Dell Precision 5000 5490 | |
| Asus ExpertBook P5 P5405-NZ0102X | |
| HP ZBook Firefly 14 G11 | |
| Lenovo ThinkPad X1 Carbon Gen 13 21NS0010GE | |
| AIDA64 / CPU PhotoWorxx | |
| HP ZBook Ultra G1a 14 | |
| Durchschnittliche AMD Ryzen AI Max+ PRO 395 (92934 - 93684, n=2) | |
| Asus ExpertBook P5 P5405-NZ0102X | |
| Lenovo ThinkPad X1 Carbon Gen 13 21NS0010GE | |
| Dell Precision 5000 5490 | |
| HP ZBook Firefly 14 G11 | |
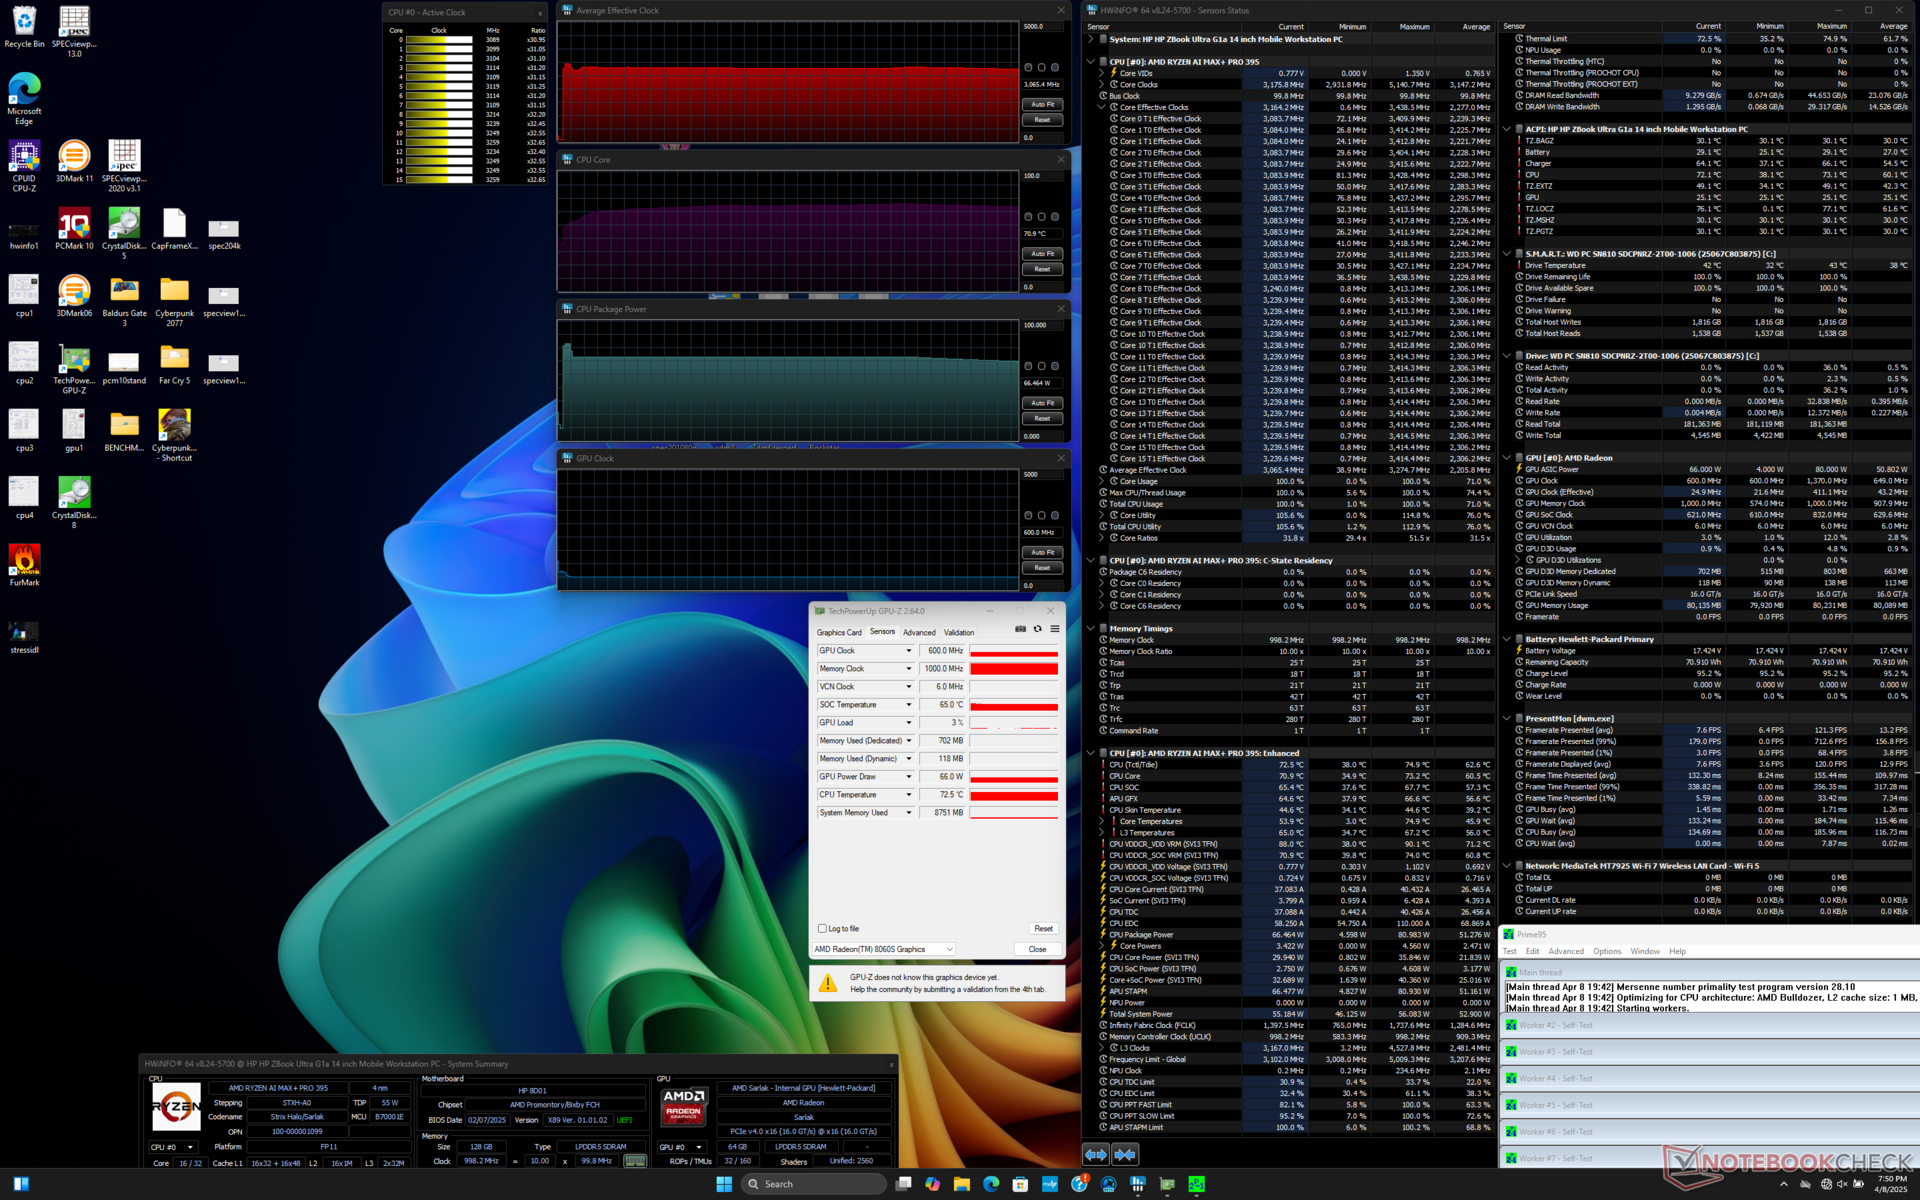
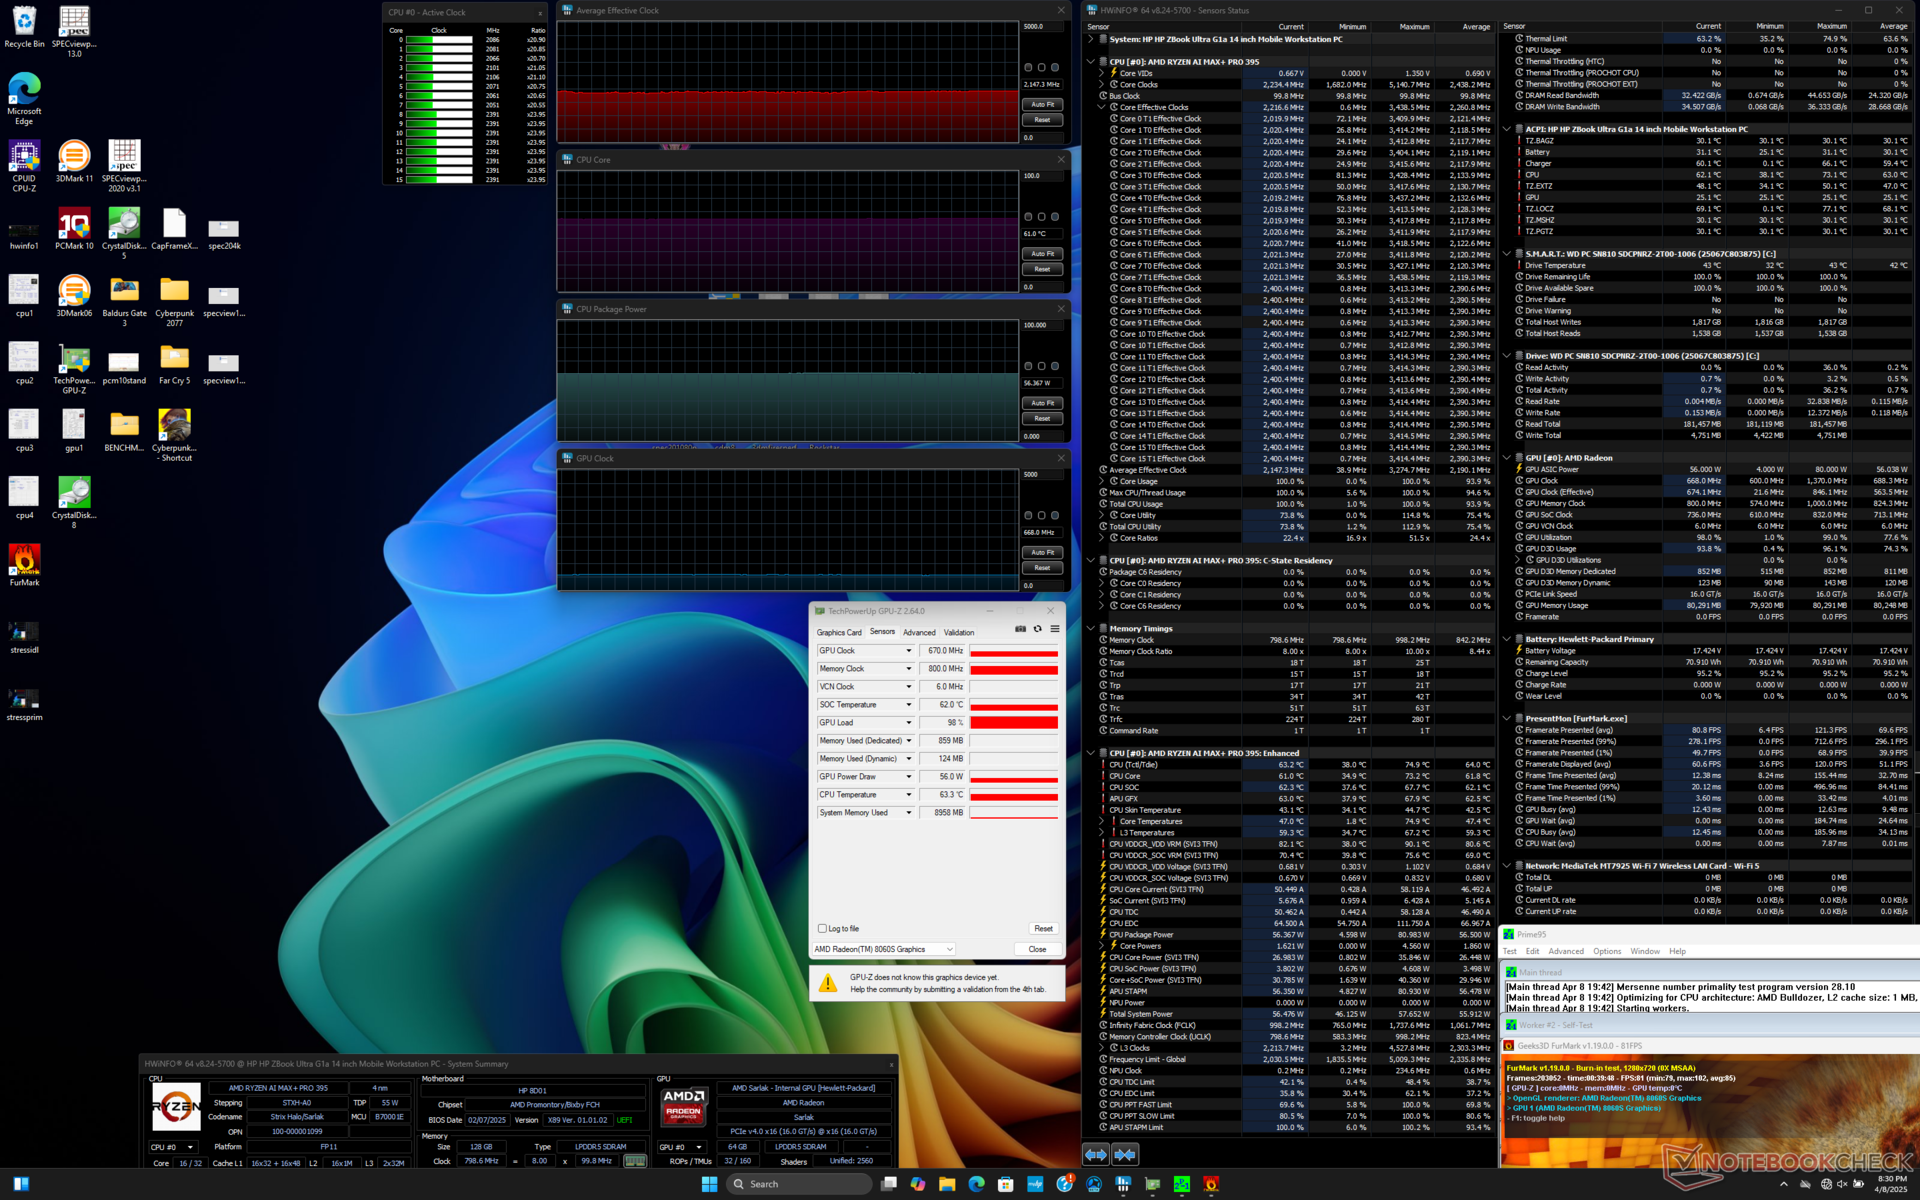
Stress Test
Beim Starten von Prime95 erhöht sich die CPU für einige Sekunden auf 3,3 GHz und 81 W, bevor sie auf 3,1 GHz, 66 W und 71 C fällt und sich stabilisiert. Die Kerntemperatur erreicht bei anspruchsvoller Last einen Spitzenwert von ca. 70° C, was angesichts des relativ hohen Stromverbrauchs und der schnellen Leistung für die Größe niedriger ist als erwartet.

| Durchschnittlicher CPU-Takt (GHz) | GPU-Takt (MHz) | Durchschnittliche CPU-Temperatur (°C) | |
| System Leerlauf | -- | -- | 37 |
| Prime95 Stress | 3.1 | -- | 71 |
| Prime95 + FurMark Stress | 2.2 | 670 | 61 |
| Cyberpunk 2077 Stress | 0.9 | 2107 | 64 |
System Performance
CrossMark: Overall | Productivity | Creativity | Responsiveness
WebXPRT 3: Overall
WebXPRT 4: Overall
Mozilla Kraken 1.1: Total
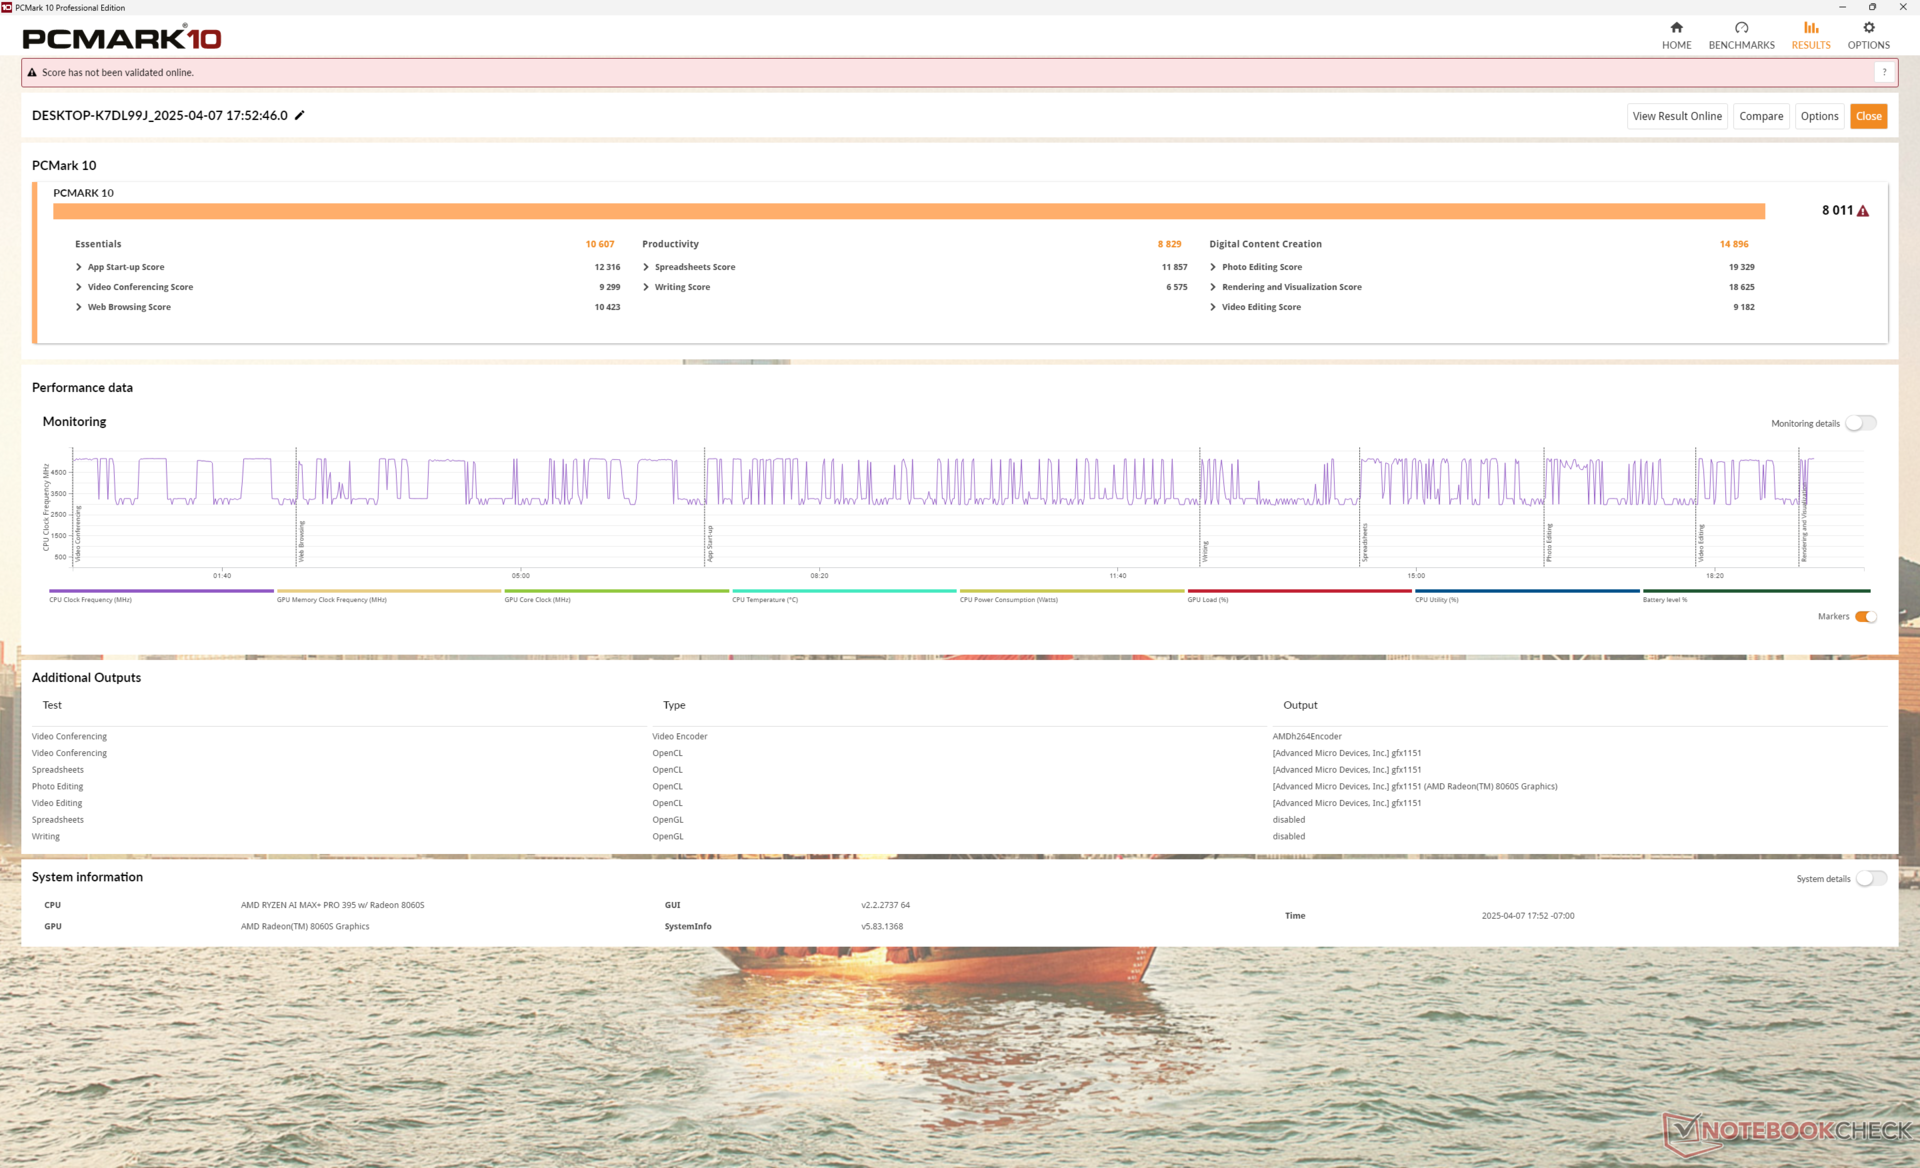
| PCMark 10 / Score | |
| Durchschnittliche AMD Ryzen AI Max+ PRO 395, AMD Radeon 8060S (8011 - 8396, n=2) | |
| HP ZBook Ultra G1a 14 | |
| Dell Precision 5000 5490 | |
| Lenovo ThinkPad X1 Carbon Gen 13 21NS0010GE | |
| Asus ExpertBook P5 P5405-NZ0102X | |
| HP ZBook Firefly 14 G11 | |
| PCMark 10 / Essentials | |
| Dell Precision 5000 5490 | |
| Durchschnittliche AMD Ryzen AI Max+ PRO 395, AMD Radeon 8060S (10607 - 10689, n=2) | |
| HP ZBook Ultra G1a 14 | |
| Lenovo ThinkPad X1 Carbon Gen 13 21NS0010GE | |
| HP ZBook Firefly 14 G11 | |
| Asus ExpertBook P5 P5405-NZ0102X | |
| PCMark 10 / Productivity | |
| HP ZBook Firefly 14 G11 | |
| Durchschnittliche AMD Ryzen AI Max+ PRO 395, AMD Radeon 8060S (8829 - 9897, n=2) | |
| Dell Precision 5000 5490 | |
| Lenovo ThinkPad X1 Carbon Gen 13 21NS0010GE | |
| Asus ExpertBook P5 P5405-NZ0102X | |
| HP ZBook Ultra G1a 14 | |
| PCMark 10 / Digital Content Creation | |
| Durchschnittliche AMD Ryzen AI Max+ PRO 395, AMD Radeon 8060S (14896 - 15186, n=2) | |
| HP ZBook Ultra G1a 14 | |
| Dell Precision 5000 5490 | |
| Lenovo ThinkPad X1 Carbon Gen 13 21NS0010GE | |
| Asus ExpertBook P5 P5405-NZ0102X | |
| HP ZBook Firefly 14 G11 | |
| CrossMark / Overall | |
| Apple MacBook Pro 14 2024 M4 Pro | |
| Durchschnittliche AMD Ryzen AI Max+ PRO 395, AMD Radeon 8060S (1892 - 1926, n=2) | |
| HP ZBook Ultra G1a 14 | |
| Dell Precision 5000 5490 | |
| Lenovo ThinkPad X1 Carbon Gen 13 21NS0010GE | |
| HP ZBook Firefly 14 G11 | |
| Asus ExpertBook P5 P5405-NZ0102X | |
| CrossMark / Productivity | |
| Apple MacBook Pro 14 2024 M4 Pro | |
| Lenovo ThinkPad X1 Carbon Gen 13 21NS0010GE | |
| Durchschnittliche AMD Ryzen AI Max+ PRO 395, AMD Radeon 8060S (1620 - 1667, n=2) | |
| Dell Precision 5000 5490 | |
| HP ZBook Ultra G1a 14 | |
| Asus ExpertBook P5 P5405-NZ0102X | |
| HP ZBook Firefly 14 G11 | |
| CrossMark / Creativity | |
| Apple MacBook Pro 14 2024 M4 Pro | |
| Durchschnittliche AMD Ryzen AI Max+ PRO 395, AMD Radeon 8060S (2412 - 2445, n=2) | |
| HP ZBook Ultra G1a 14 | |
| Dell Precision 5000 5490 | |
| Lenovo ThinkPad X1 Carbon Gen 13 21NS0010GE | |
| HP ZBook Firefly 14 G11 | |
| Asus ExpertBook P5 P5405-NZ0102X | |
| CrossMark / Responsiveness | |
| Apple MacBook Pro 14 2024 M4 Pro | |
| HP ZBook Ultra G1a 14 | |
| Durchschnittliche AMD Ryzen AI Max+ PRO 395, AMD Radeon 8060S (1450 - 1455, n=2) | |
| Dell Precision 5000 5490 | |
| HP ZBook Firefly 14 G11 | |
| Lenovo ThinkPad X1 Carbon Gen 13 21NS0010GE | |
| Asus ExpertBook P5 P5405-NZ0102X | |
| WebXPRT 3 / Overall | |
| Apple MacBook Pro 14 2024 M4 Pro | |
| Durchschnittliche AMD Ryzen AI Max+ PRO 395, AMD Radeon 8060S (275 - 334, n=2) | |
| HP ZBook Firefly 14 G11 | |
| Dell Precision 5000 5490 | |
| Asus ExpertBook P5 P5405-NZ0102X | |
| HP ZBook Ultra G1a 14 | |
| WebXPRT 4 / Overall | |
| Apple MacBook Pro 14 2024 M4 Pro | |
| Lenovo ThinkPad X1 Carbon Gen 13 21NS0010GE | |
| Dell Precision 5000 5490 | |
| Asus ExpertBook P5 P5405-NZ0102X | |
| HP ZBook Firefly 14 G11 | |
| Durchschnittliche AMD Ryzen AI Max+ PRO 395, AMD Radeon 8060S (225 - 275, n=2) | |
| HP ZBook Ultra G1a 14 | |
| Mozilla Kraken 1.1 / Total | |
| Dell Precision 5000 5490 | |
| HP ZBook Firefly 14 G11 | |
| Asus ExpertBook P5 P5405-NZ0102X | |
| Lenovo ThinkPad X1 Carbon Gen 13 21NS0010GE | |
| HP ZBook Ultra G1a 14 | |
| Durchschnittliche AMD Ryzen AI Max+ PRO 395, AMD Radeon 8060S (428 - 433, n=2) | |
| Apple MacBook Pro 14 2024 M4 Pro | |
* ... kleinere Werte sind besser
| PCMark 10 Score | 8011 Punkte | |
Hilfe | ||
| AIDA64 / Memory Copy | |
| HP ZBook Ultra G1a 14 | |
| Durchschnittliche AMD Ryzen AI Max+ PRO 395 (154332 - 158632, n=2) | |
| Asus ExpertBook P5 P5405-NZ0102X | |
| Lenovo ThinkPad X1 Carbon Gen 13 21NS0010GE | |
| Dell Precision 5000 5490 | |
| HP ZBook Firefly 14 G11 | |
| AIDA64 / Memory Read | |
| Durchschnittliche AMD Ryzen AI Max+ PRO 395 (121177 - 122850, n=2) | |
| HP ZBook Ultra G1a 14 | |
| Asus ExpertBook P5 P5405-NZ0102X | |
| Lenovo ThinkPad X1 Carbon Gen 13 21NS0010GE | |
| Dell Precision 5000 5490 | |
| HP ZBook Firefly 14 G11 | |
| AIDA64 / Memory Write | |
| Durchschnittliche AMD Ryzen AI Max+ PRO 395 (212172 - 216693, n=2) | |
| HP ZBook Ultra G1a 14 | |
| Asus ExpertBook P5 P5405-NZ0102X | |
| Lenovo ThinkPad X1 Carbon Gen 13 21NS0010GE | |
| Dell Precision 5000 5490 | |
| HP ZBook Firefly 14 G11 | |
| AIDA64 / Memory Latency | |
| HP ZBook Ultra G1a 14 | |
| Durchschnittliche AMD Ryzen AI Max+ PRO 395 (154.1 - 165.2, n=2) | |
| Dell Precision 5000 5490 | |
| HP ZBook Firefly 14 G11 | |
| Lenovo ThinkPad X1 Carbon Gen 13 21NS0010GE | |
| Asus ExpertBook P5 P5405-NZ0102X | |
* ... kleinere Werte sind besser
DPC-Latenzzeit
LatencyMon zeigt nur geringe DPC-Probleme beim Öffnen mehrerer Browser-Tabs unserer Homepage. Die Wiedergabe von 4K-Videos mit 60 FPS läuft ansonsten reibungslos und es wurden keine Bildaussetzer festgestellt.
Interessanterweise tritt ein Problem auf, wenn 4K60-Inhalte abgespielt werden, während LatencyMon gleichzeitig läuft. Die Zahl der Bildausfälle steigt sprunghaft an und das System wird scheinbar grundlos träge. Ein Stopp von LatencyMon behebt das Problem. Das Programm meldet ein mögliches Problem im Zusammenhang mit dem DirectX-Kernel, wenn die Ruckler beginnen.
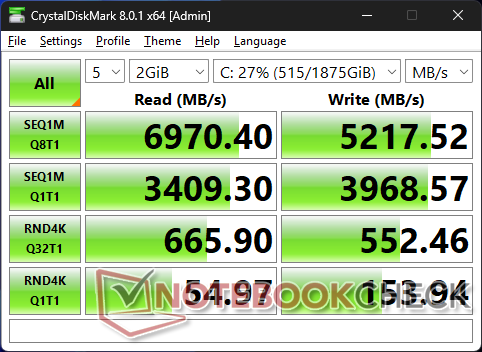
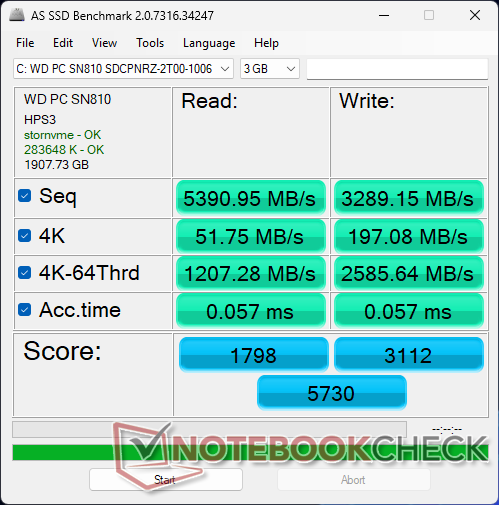
Speichergeräte
Die WD SN810 PCIe4 NVMe SSD im ZBook Ultra G1a 14 leidet nicht unter den Leistungsdrosselungsproblemen, die wir beim HP ZBook Firefly 14 G11 beobachtet haben.

| Drive Performance Rating - Percent | |
| HP ZBook Ultra G1a 14 | |
| Lenovo ThinkPad X1 Carbon Gen 13 21NS0010GE | |
| Dell Precision 5000 5490 | |
| HP ZBook Firefly 14 G11 | |
| Asus ExpertBook P5 P5405-NZ0102X | |
* ... kleinere Werte sind besser
Disk Throttling: DiskSpd Read Loop, Queue Depth 8
GPU Performance
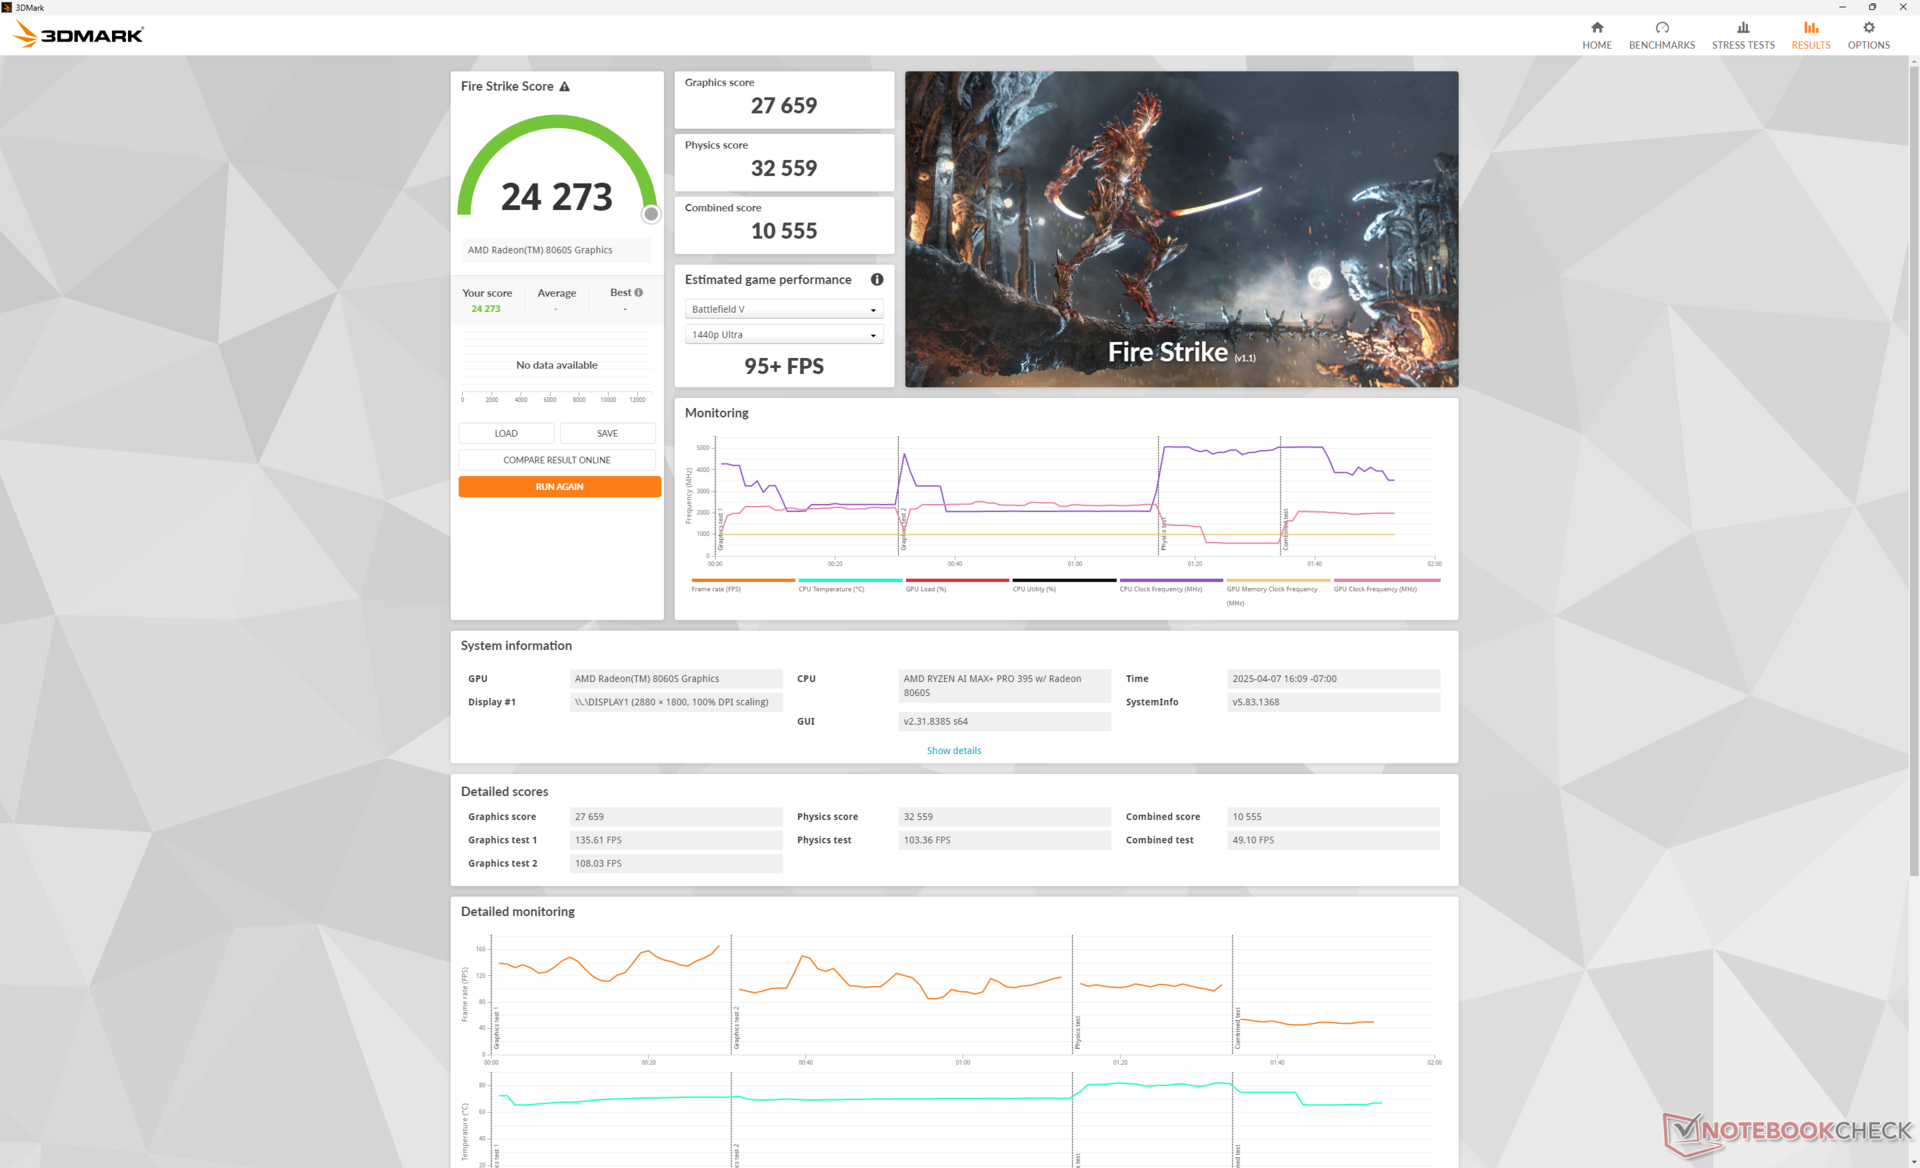
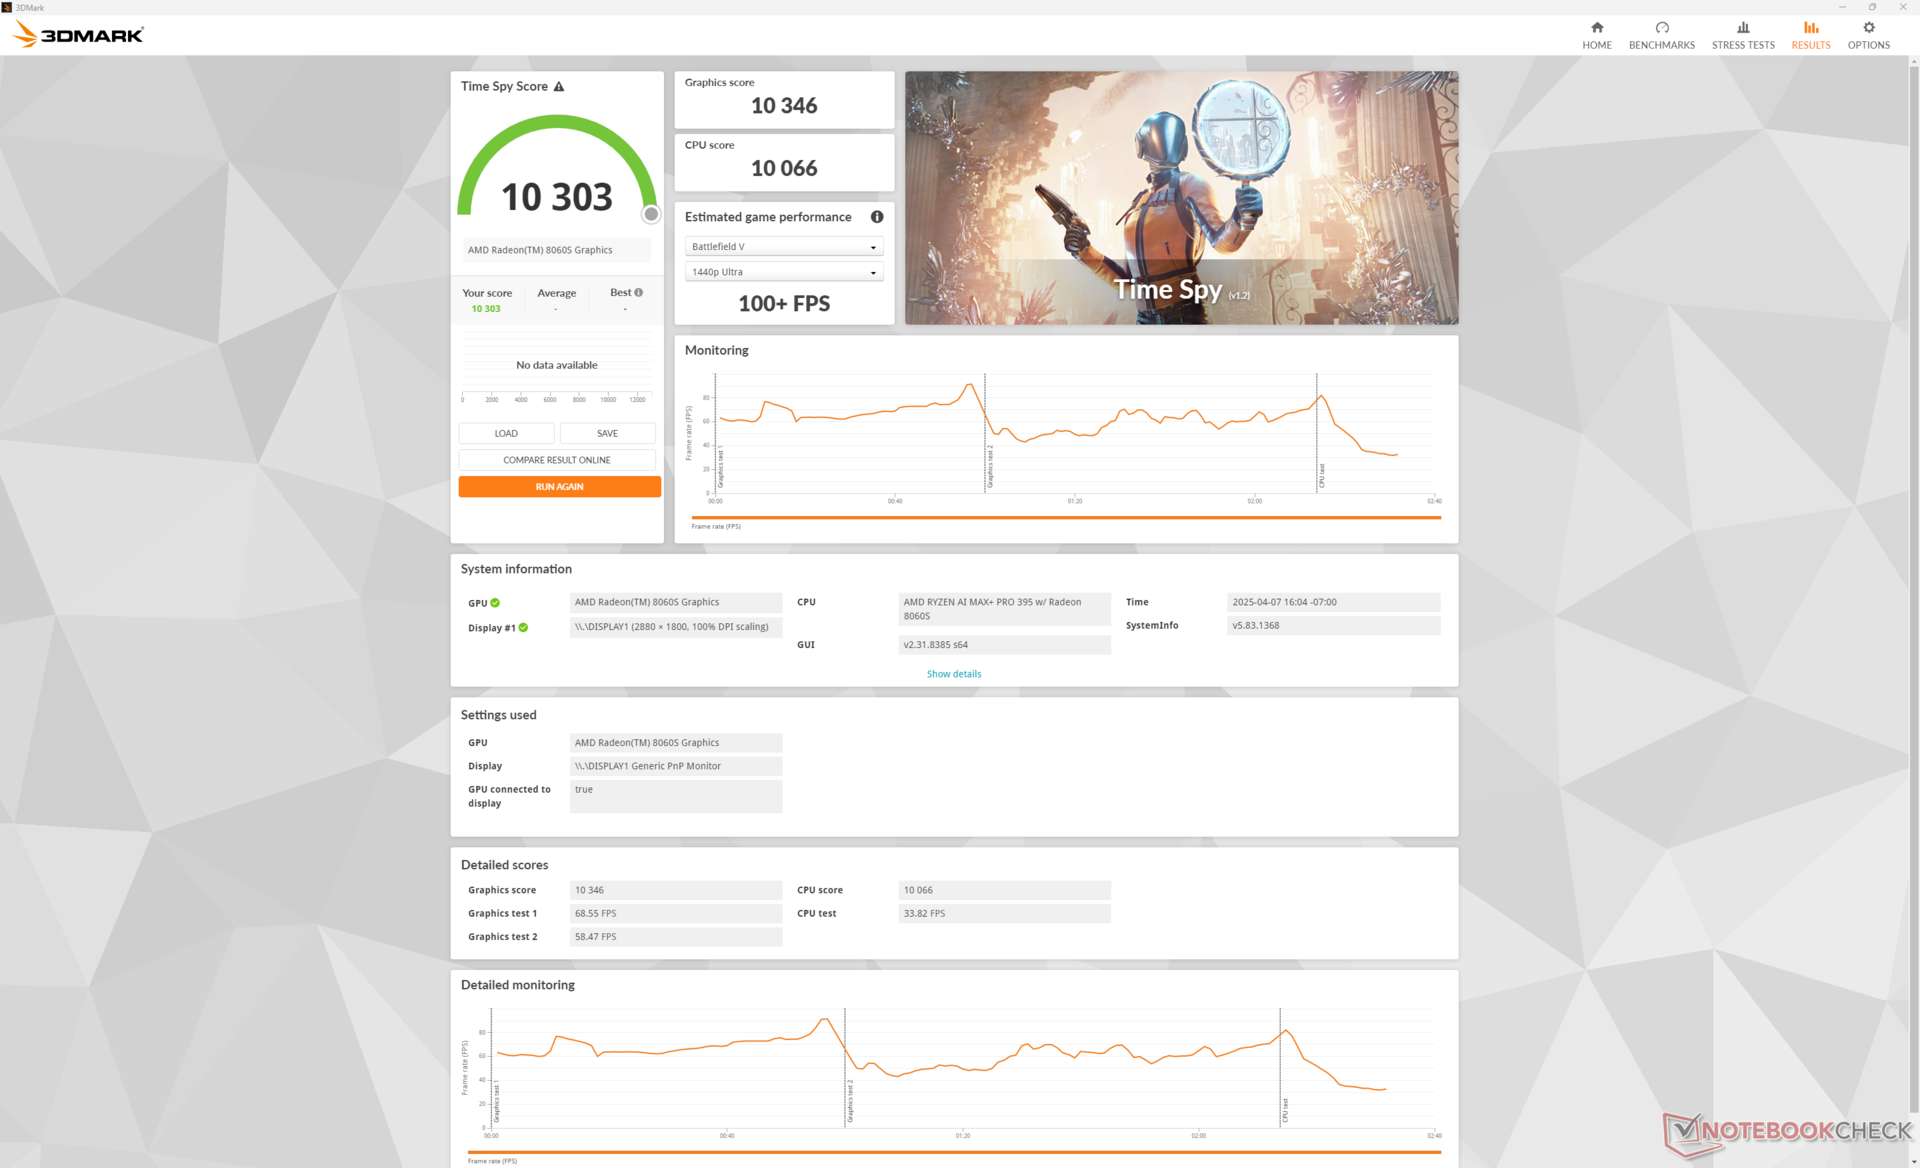
Die Radeon RX 8060S liegt zwischen der diskreten RTX 3000 Ada und RTX 4000 Ada in Bezug auf das reine Grafikpotenzial. Wenn man bedenkt, dass die AMD-Lösung integriert ist, ist das beachtlich, insbesondere im Hinblick auf die Leistung pro Volumen oder die Leistung pro Watt. Soweit wir wissen, gibt es derzeit keine größeren 14-Zoll-Workstations mit RTX 4000 Ada-Optionen, was HPs Behauptung von der "schnellsten 14-Zoll-Workstation der Welt" untermauert.
| Leistungsprofil | Grafik-Punktzahl | Physik-Wertung | Kombinierte Punktzahl |
| Performance Modus | 27659 | 32559 | 10555 |
| Ausgeglichener Modus | 25972 (-6%) | 31510 (-3%) | 9739 (-8%) |
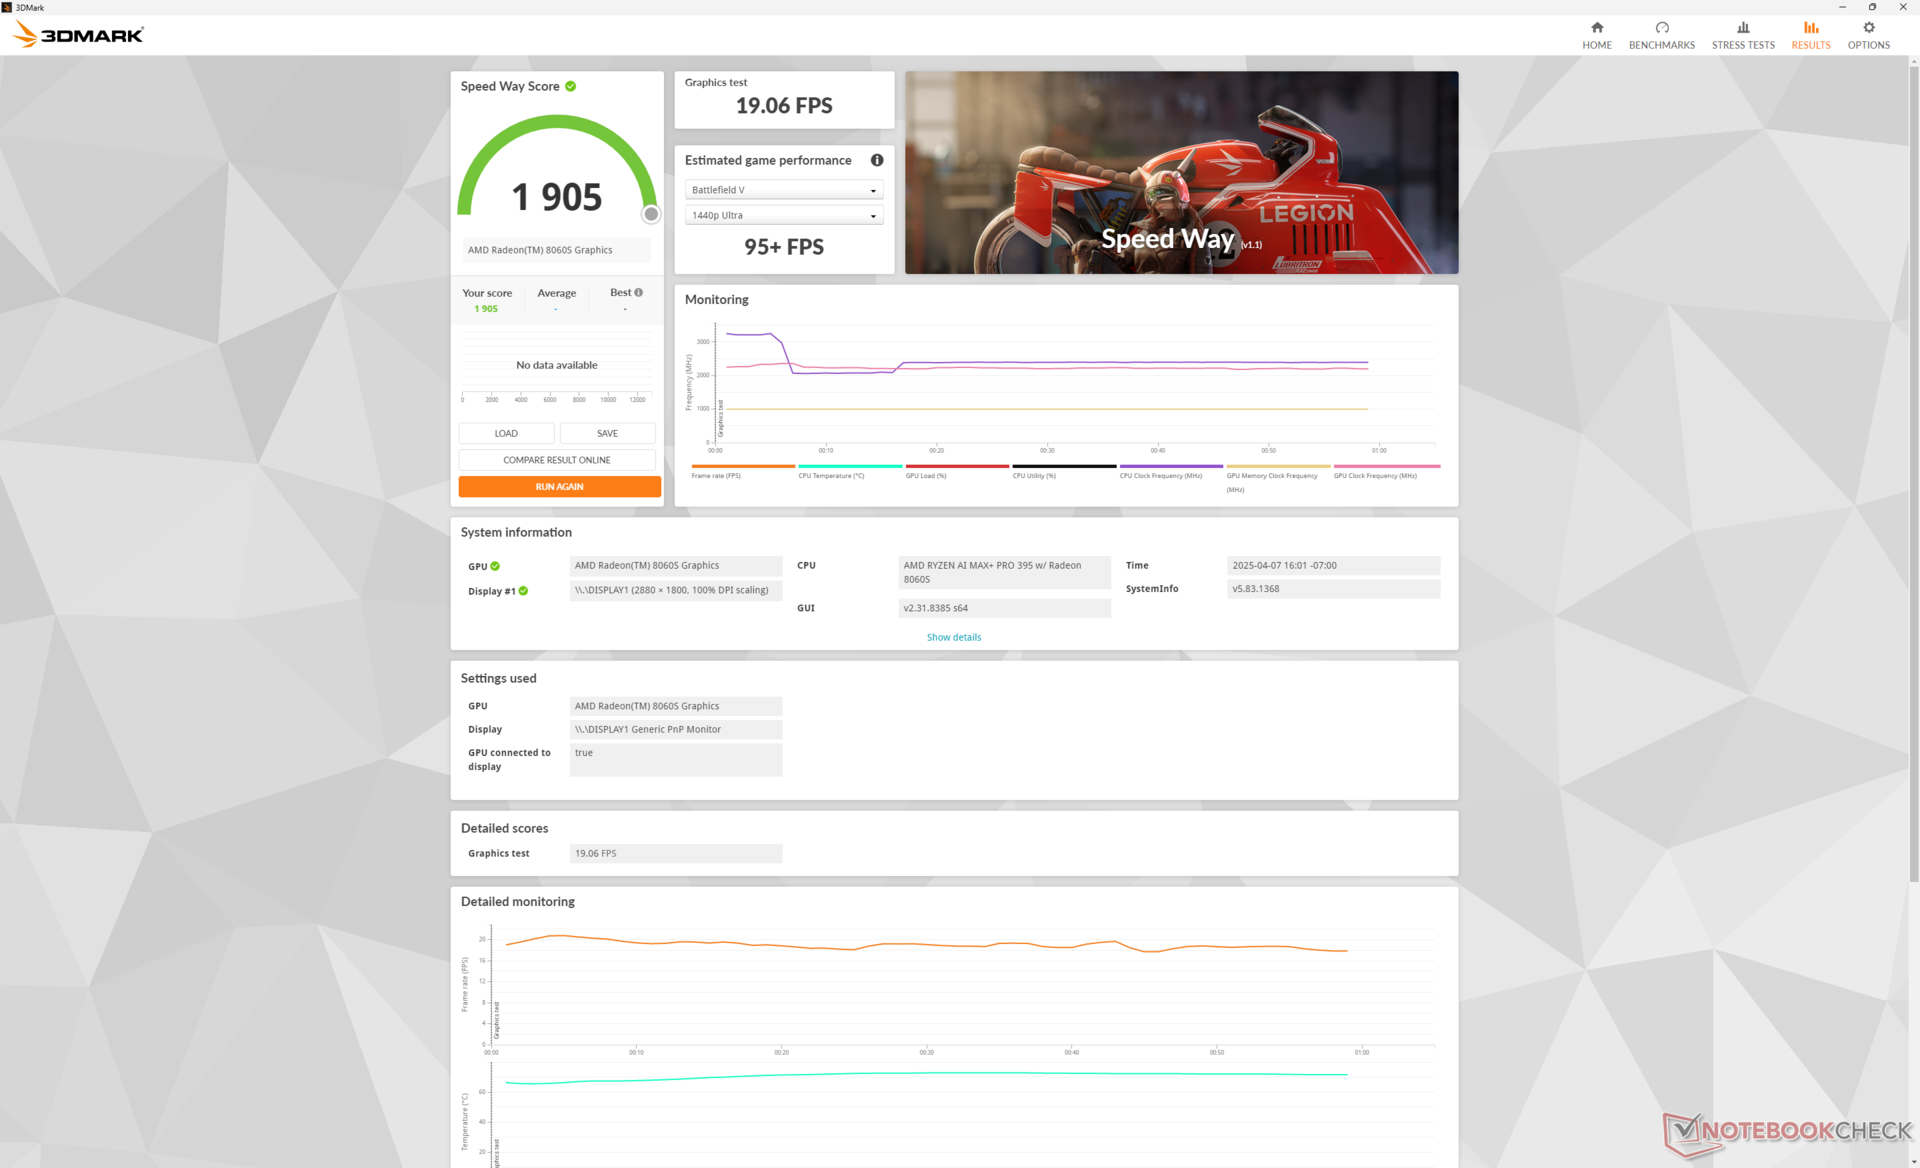
| Akku-Leistung | 20915 (-24%) | 25705 (-21%) | 6915 (-35%) |
Leider sinkt die Leistung im Akkubetrieb um bis zu 25 bis 35 Prozent, selbst wenn der Modus "High Performance" eingestellt ist, wie unsere Fire-Strike-Ergebnisse in der obigen Tabelle zeigen.
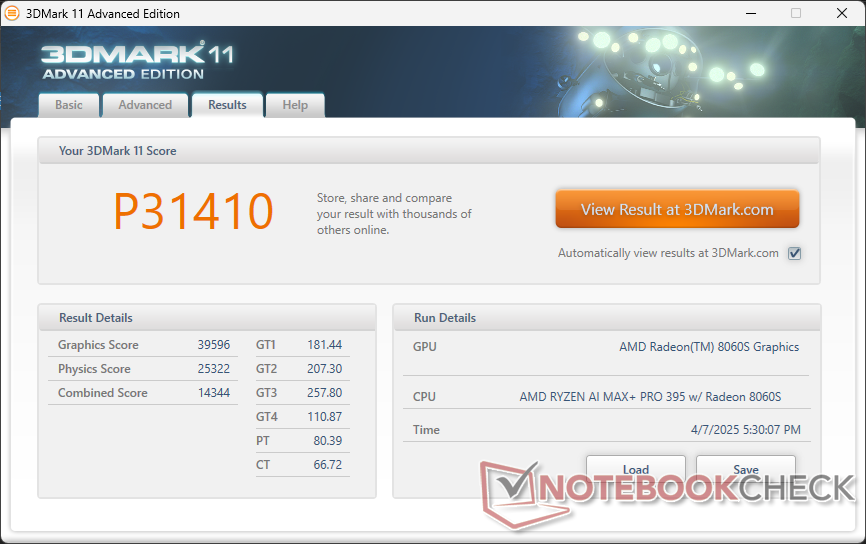
| 3DMark 11 Performance | 31410 Punkte | |
| 3DMark Cloud Gate Standard Score | 66462 Punkte | |
| 3DMark Fire Strike Score | 24273 Punkte | |
| 3DMark Time Spy Score | 10303 Punkte | |
Hilfe | ||
* ... kleinere Werte sind besser
Gaming Performance
Die integrierte Radeon 8060S ähnelt am ehesten der diskreten GeForce RTX 4050, wenn es um die Ausführung von Spielen geht. Spiele sind allerdings nicht die Hauptfunktion des ZBook.
| F1 22 | |
| 1280x720 Ultra Low Preset AA:T AF:16x | |
| HP ZBook Ultra G1a 14 | |
| Durchschnittliche AMD Radeon 8060S (n=1) | |
| Dell Precision 5000 5490 | |
| HP ZBook Firefly 14 G11 | |
| HP EliteBook x360 1040 G11 | |
| 1920x1080 Low Preset AA:T AF:16x | |
| HP ZBook Ultra G1a 14 | |
| Durchschnittliche AMD Radeon 8060S (n=1) | |
| Dell Precision 5000 5490 | |
| HP ZBook Firefly 14 G11 | |
| HP EliteBook x360 1040 G11 | |
| 1920x1080 Medium Preset AA:T AF:16x | |
| HP ZBook Ultra G1a 14 | |
| Durchschnittliche AMD Radeon 8060S (n=1) | |
| Dell Precision 5000 5490 | |
| HP ZBook Firefly 14 G11 | |
| HP EliteBook x360 1040 G11 | |
| 1920x1080 High Preset AA:T AF:16x | |
| HP ZBook Ultra G1a 14 | |
| Durchschnittliche AMD Radeon 8060S (n=1) | |
| Dell Precision 5000 5490 | |
| HP ZBook Firefly 14 G11 | |
| HP EliteBook x360 1040 G11 | |
| 1920x1080 Ultra High Preset AA:T AF:16x | |
| HP ZBook Ultra G1a 14 | |
| Durchschnittliche AMD Radeon 8060S (n=1) | |
| Dell Precision 5000 5490 | |
| HP ZBook Firefly 14 G11 | |
| Tiny Tina's Wonderlands | |
| 1280x720 Lowest Preset (DX12) | |
| HP ZBook Ultra G1a 14 | |
| Durchschnittliche AMD Radeon 8060S (n=1) | |
| HP ZBook Firefly 14 G11 | |
| HP EliteBook x360 1040 G11 | |
| 1920x1080 Low Preset (DX12) | |
| Durchschnittliche AMD Radeon 8060S (n=1) | |
| HP ZBook Ultra G1a 14 | |
| Dell Precision 5000 5490 | |
| HP ZBook Firefly 14 G11 | |
| HP EliteBook x360 1040 G11 | |
| 1920x1080 Medium Preset (DX12) | |
| HP ZBook Ultra G1a 14 | |
| Durchschnittliche AMD Radeon 8060S (n=1) | |
| Dell Precision 5000 5490 | |
| HP ZBook Firefly 14 G11 | |
| HP EliteBook x360 1040 G11 | |
| 1920x1080 High Preset (DX12) | |
| HP ZBook Ultra G1a 14 | |
| Durchschnittliche AMD Radeon 8060S (n=1) | |
| Dell Precision 5000 5490 | |
| HP ZBook Firefly 14 G11 | |
| HP EliteBook x360 1040 G11 | |
| 1920x1080 Badass Preset (DX12) | |
| HP ZBook Ultra G1a 14 | |
| Durchschnittliche AMD Radeon 8060S (n=1) | |
| Dell Precision 5000 5490 | |
| HP ZBook Firefly 14 G11 | |
| HP EliteBook x360 1040 G11 | |
Cyberpunk 2077 ultra FPS Chart
| min. | mittel | hoch | max. | QHD FSR | QHD | |
|---|---|---|---|---|---|---|
| GTA V (2015) | 184.4 | 177.7 | 164.3 | 86.6 | ||
| Dota 2 Reborn (2015) | 210 | 177.2 | 147.7 | 133.1 | ||
| Final Fantasy XV Benchmark (2018) | 192.9 | 122.6 | 84.8 | 63.4 | ||
| X-Plane 11.11 (2018) | 109.5 | 66.4 | 57.2 | |||
| Far Cry 5 (2018) | 116 | 96 | 95 | 92 | ||
| Strange Brigade (2018) | 491 | 218 | 188.6 | 171 | 104.1 | |
| Tiny Tina's Wonderlands (2022) | 220.5 | 162.3 | 110.2 | 90 | ||
| F1 22 (2022) | 250 | 239 | 185.1 | 57.4 | ||
| Baldur's Gate 3 (2023) | 139.6 | 118.3 | 101.2 | 99.4 | 65.5 | |
| Cyberpunk 2077 (2023) | 135.4 | 111.5 | 90.2 | 80.7 | 48.4 | |
| Black Myth: Wukong (2024) | 81 | 62 | 46 | 25 | 18 | |
| Monster Hunter Wilds (2025) | 55.8 | 47 | 34.5 | |||
| ARC Raiders (2025) | 166.6 | 106.9 | 82.9 | 50.6 | 52.6 | 38.9 |
Emissionen
Lautstärke
Die Lüfter bleiben mit etwa 28 dB(A) vor einem Hintergrund von 24 dB(A) leise, wenn sie mit anspruchsloser Last wie Excel oder Browsern arbeiten. Sie steigen jedoch relativ schnell an, sobald höhere Lasten anfallen, und sind dann so laut wie der Precision 5490 mit fast 50 dB(A).
Lautstärkediagramm
| Idle |
| 23.9 / 23.9 / 26.8 dB(A) |
| Last |
| 42.2 / 49.2 dB(A) |
 | ||
30 dB leise 40 dB(A) deutlich hörbar 50 dB(A) störend |
||
min: | ||
| HP ZBook Ultra G1a 14 Radeon 8060S, Ryzen AI Max+ PRO 395, WDC PC SN810 2TB | HP ZBook Firefly 14 G11 RTX A500 Laptop GPU, Ultra 7 165H, Kioxia XG8 KXG80ZNV512G | Lenovo ThinkPad X1 Carbon Gen 13 21NS0010GE Arc 140V, Core Ultra 7 258V, SK hynix PCB01 HFS001TFM9X179N GL | Dell Precision 5000 5490 RTX 3000 Ada Generation Laptop, Ultra 9 185H, Kioxia XG8 KXG80ZNV1T02 | Asus ExpertBook P5 P5405-NZ0102X Arc 140V, Core Ultra 7 258V, Western Digital PC SN5000S SDEQNSJ-1T00 | Apple MacBook Pro 14 2024 M4 Pro M4 Pro 20-Core GPU, M4 Pro 14-Core, Apple SSD AP2048Z | |
|---|---|---|---|---|---|---|
| Geräuschentwicklung | 3% | 12% | 3% | 15% | 8% | |
| aus / Umgebung * (dB) | 23.9 | 24.3 -2% | 23.2 3% | 22.8 5% | 24.1 -1% | 23.9 -0% |
| Idle min * (dB) | 23.9 | 24.6 -3% | 23.2 3% | 23.8 -0% | 24.1 -1% | 23.9 -0% |
| Idle avg * (dB) | 23.9 | 25.2 -5% | 23.2 3% | 23.8 -0% | 24.1 -1% | 23.9 -0% |
| Idle max * (dB) | 26.8 | 26.8 -0% | 23.2 13% | 24.7 8% | 24.1 10% | 23.9 11% |
| Last avg * (dB) | 42.2 | 38.9 8% | 29.9 29% | 38.9 8% | 31.2 26% | 30.2 28% |
| Cyberpunk 2077 ultra * (dB) | 49.1 | 41.8 15% | 43.3 12% | 31.7 35% | 44.5 9% | |
| Last max * (dB) | 49.2 | 45.8 7% | 40.5 18% | 51.4 -4% | 31.2 37% | 44.5 10% |
| Witcher 3 ultra * (dB) | 49.9 |
* ... kleinere Werte sind besser
Temperatur
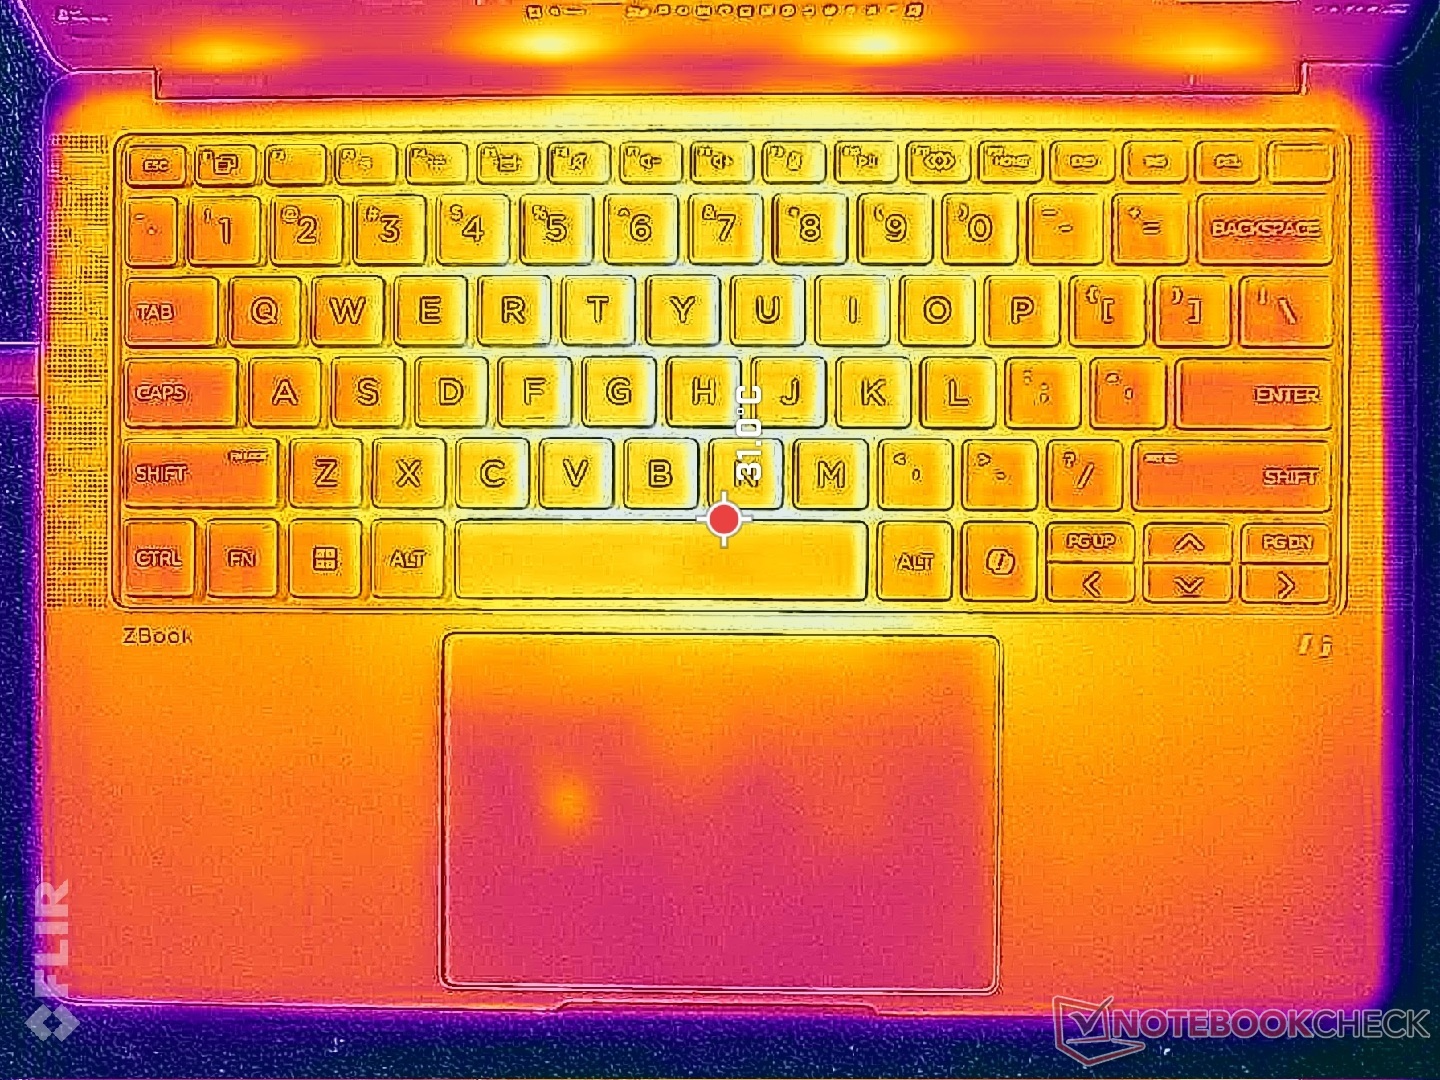
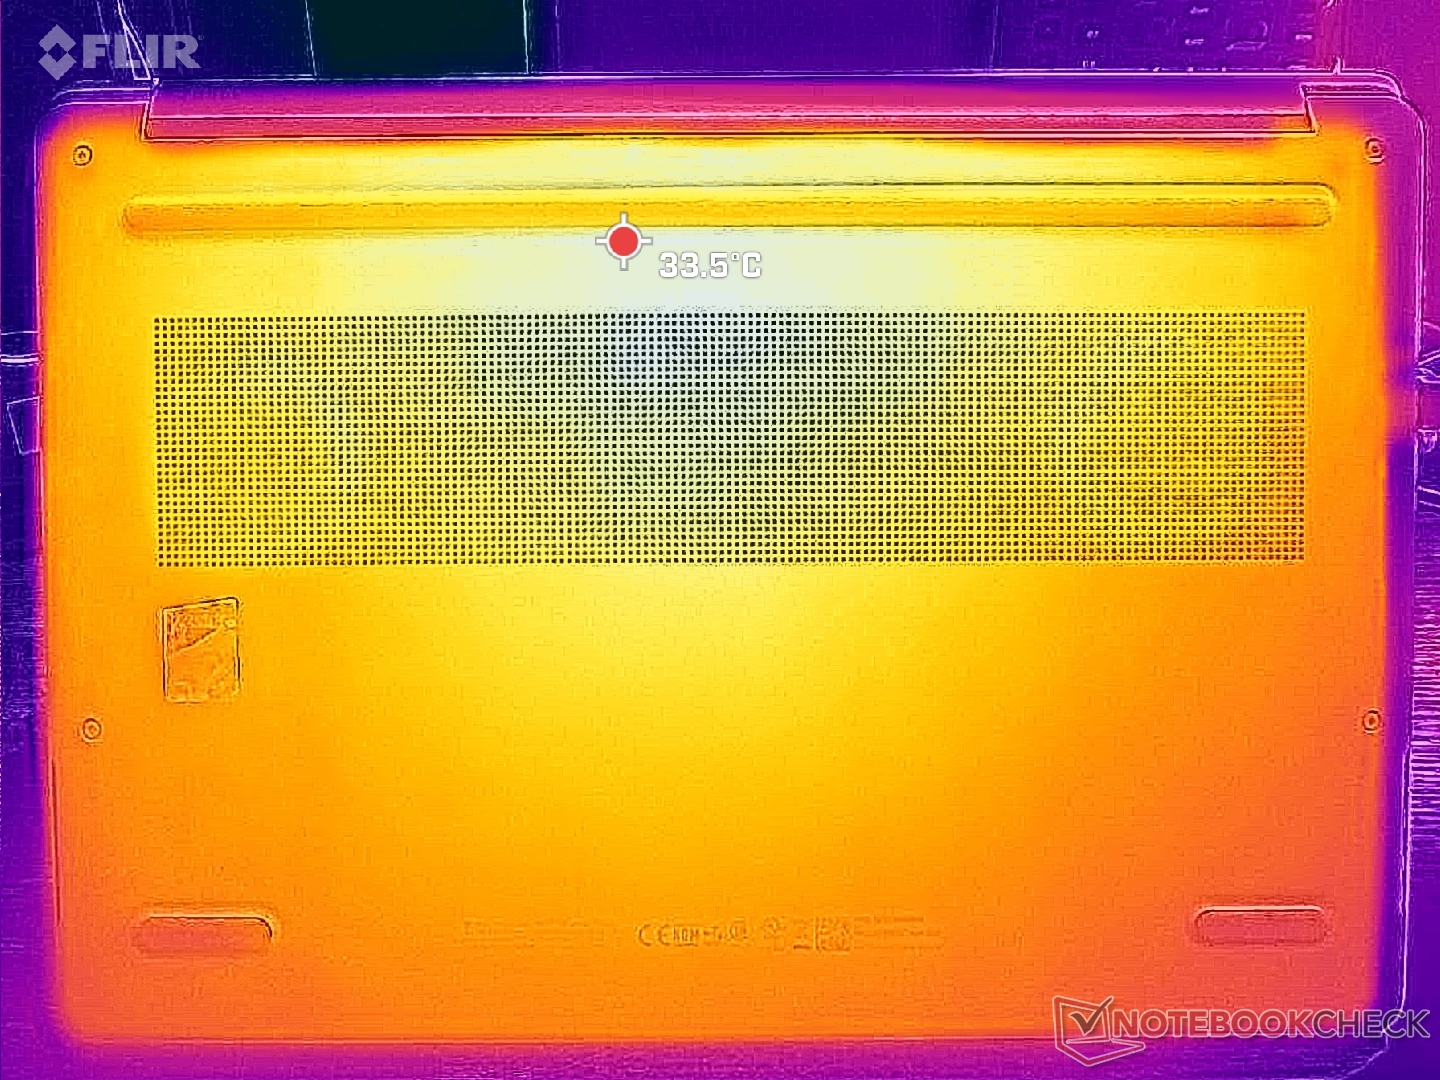
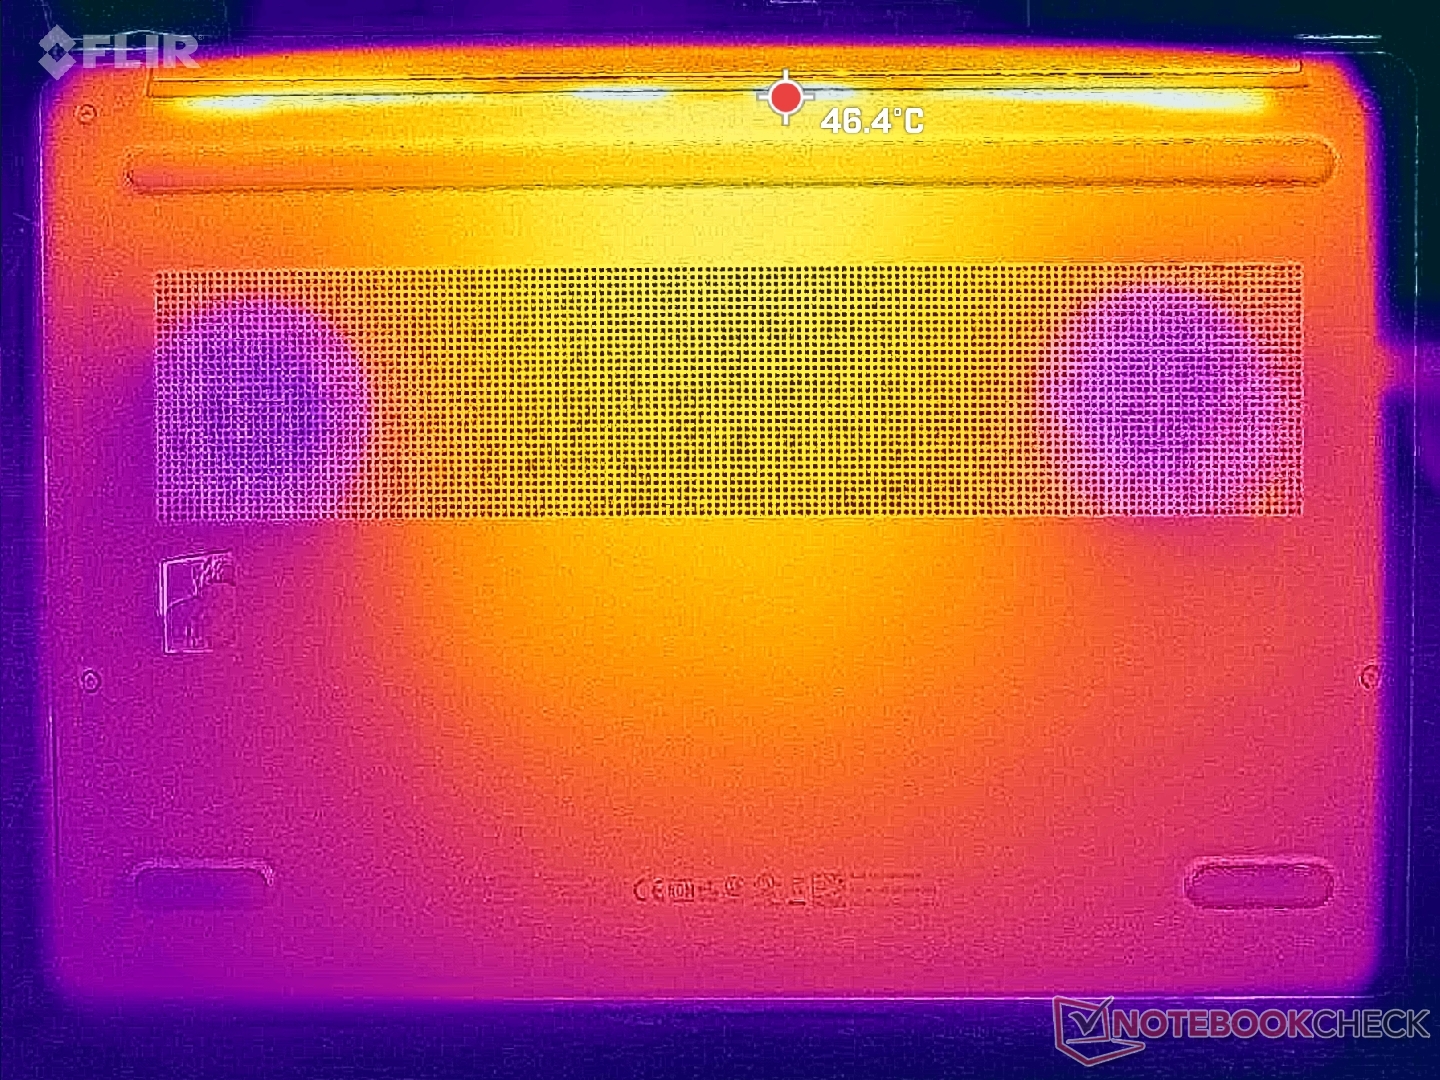
Die durchschnittlichen Oberflächentemperaturen bei anspruchsvoller Last sind wärmer als auf dem Dell Precision 5490, aber kühler als beim MacBook Pro 14. Die heißen Stellen befinden sich in der Mitte der Tastatur, aber auch die Handballenablagen können aufgrund der dicht gepackten Innereien und des kleinen Formfaktors merklich wärmer werden.
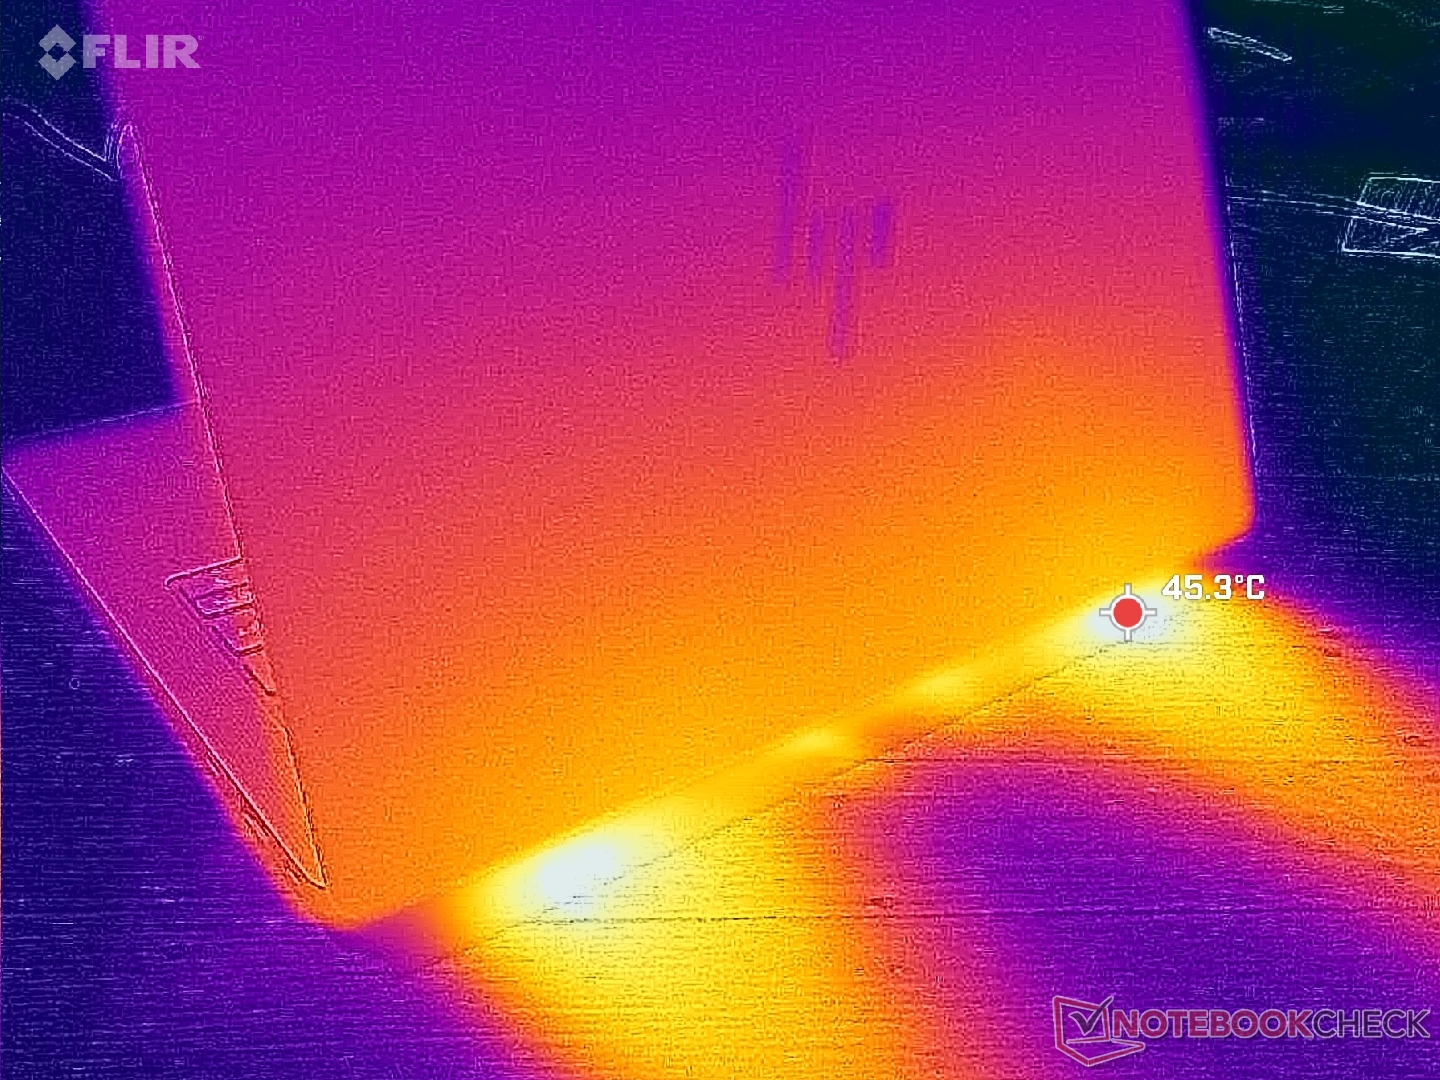
(±) Die maximale Temperatur auf der Oberseite ist 41.4 °C. Im Vergleich liegt der Klassendurchschnitt bei 38.2 °C (von 22.2 bis 69.8 °C für die Klasse Workstation).
(+) Auf der Unterseite messen wir eine maximalen Wert von 36.6 °C (im Vergleich zum Durchschnitt von 41.1 °C).
(±) Ohne Last messen wir eine durchschnittliche Temperatur von 32.5 °C auf der Oberseite. Der Klassendurchschnitt erreicht 32 °C.
(+) Die Handballen und der Touchpad-Bereich erreichen maximal 32 °C und damit die typische Hauttemperatur und fühlen sich daher nicht heiß an.
(-) Die durchschnittliche Handballen-Temperatur anderer getesteter Geräte war 27.8 °C (-4.2 °C).

| HP ZBook Ultra G1a 14 AMD Ryzen AI Max+ PRO 395, AMD Radeon 8060S | HP ZBook Firefly 14 G11 Intel Core Ultra 7 165H, NVIDIA RTX A500 Laptop GPU | Lenovo ThinkPad X1 Carbon Gen 13 21NS0010GE Intel Core Ultra 7 258V, Intel Arc Graphics 140V | Dell Precision 5000 5490 Intel Core Ultra 9 185H, NVIDIA RTX 3000 Ada Generation Laptop | Asus ExpertBook P5 P5405-NZ0102X Intel Core Ultra 7 258V, Intel Arc Graphics 140V | Apple MacBook Pro 14 2024 M4 Pro Apple M4 Pro 14-Core, Apple M4 Pro 20-Core GPU | |
|---|---|---|---|---|---|---|
| Hitze | -2% | 6% | 2% | 8% | 9% | |
| Last oben max * (°C) | 41.4 | 42.8 -3% | 42.3 -2% | 43.2 -4% | 41.6 -0% | 47.3 -14% |
| Last unten max * (°C) | 36.6 | 44 -20% | 40.1 -10% | 38.4 -5% | 43.2 -18% | 44.2 -21% |
| Idle oben max * (°C) | 34 | 30.6 10% | 27.3 20% | 31.6 7% | 25.7 24% | 22.1 35% |
| Idle unten max * (°C) | 33.6 | 31.4 7% | 28.3 16% | 30.6 9% | 25.3 25% | 22.1 34% |
* ... kleinere Werte sind besser
Lautsprecher
HP ZBook Ultra G1a 14 Audio Analyse
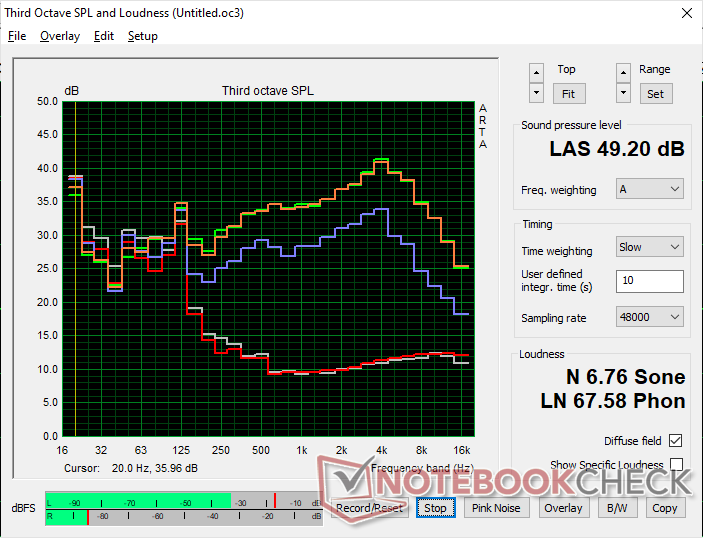
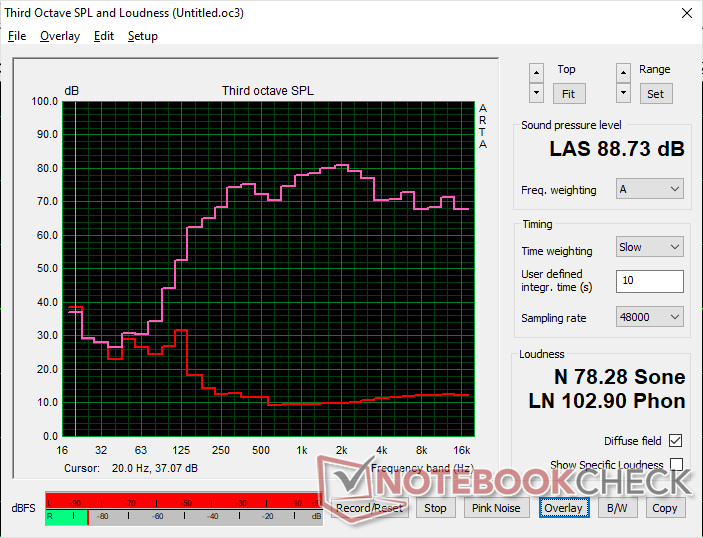
(+) | Die Lautsprecher können relativ laut spielen (88.7 dB)
Bass 100 - 315 Hz
(±) | abgesenkter Bass - 11.8% geringer als der Median
(±) | durchschnittlich lineare Bass-Wiedergabe (11% Delta zum Vorgänger)
Mitteltöne 400 - 2000 Hz
(+) | ausgeglichene Mitten, vom Median nur 4.5% abweichend
(+) | lineare Mitten (3.4% Delta zum Vorgänger)
Hochtöne 2 - 16 kHz
(+) | ausgeglichene Hochtöne, vom Median nur 3.4% abweichend
(+) | sehr lineare Hochtöne (4.3% Delta zum Vorgänger)
Gesamt im hörbaren Bereich 100 - 16.000 Hz
(+) | hörbarer Bereich ist sehr linear (10.4% Abstand zum Median
Im Vergleich zu allen Geräten derselben Klasse
» 6% aller getesteten Geräte dieser Klasse waren besser, 6% vergleichbar, 88% schlechter
» Das beste Gerät hat einen Delta-Wert von 7%, durchschnittlich ist 17%, das schlechteste Gerät hat 35%
Im Vergleich zu allen Geräten im Test
» 5% aller getesteten Geräte waren besser, 1% vergleichbar, 93% schlechter
» Das beste Gerät hat einen Delta-Wert von 4%, durchschnittlich ist 24%, das schlechteste Gerät hat 134%
Apple MacBook Pro 16 2021 M1 Pro Audio Analyse
(+) | Die Lautsprecher können relativ laut spielen (84.7 dB)
Bass 100 - 315 Hz
(+) | guter Bass - nur 3.8% Abweichung vom Median
(+) | lineare Bass-Wiedergabe (5.2% Delta zum Vorgänger)
Mitteltöne 400 - 2000 Hz
(+) | ausgeglichene Mitten, vom Median nur 1.3% abweichend
(+) | lineare Mitten (2.1% Delta zum Vorgänger)
Hochtöne 2 - 16 kHz
(+) | ausgeglichene Hochtöne, vom Median nur 1.9% abweichend
(+) | sehr lineare Hochtöne (2.7% Delta zum Vorgänger)
Gesamt im hörbaren Bereich 100 - 16.000 Hz
(+) | hörbarer Bereich ist sehr linear (4.6% Abstand zum Median
Im Vergleich zu allen Geräten derselben Klasse
» 0% aller getesteten Geräte dieser Klasse waren besser, 0% vergleichbar, 100% schlechter
» Das beste Gerät hat einen Delta-Wert von 5%, durchschnittlich ist 17%, das schlechteste Gerät hat 45%
Im Vergleich zu allen Geräten im Test
» 0% aller getesteten Geräte waren besser, 0% vergleichbar, 100% schlechter
» Das beste Gerät hat einen Delta-Wert von 4%, durchschnittlich ist 24%, das schlechteste Gerät hat 134%
Energieverwaltung
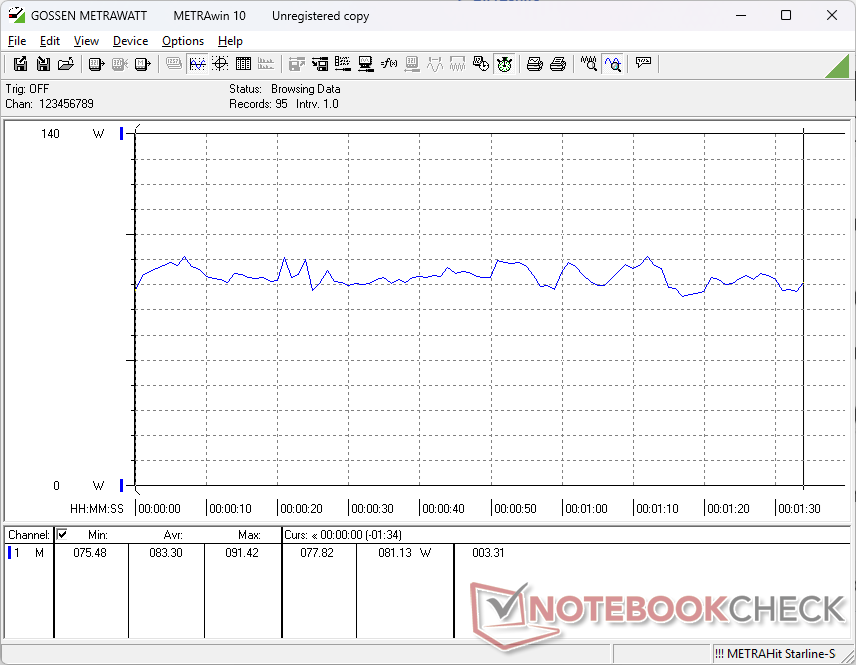
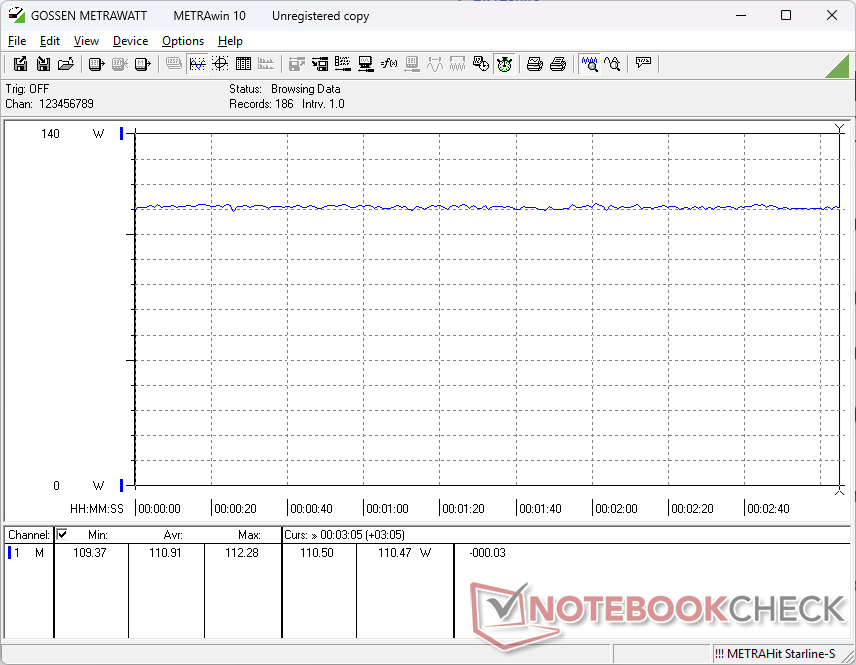
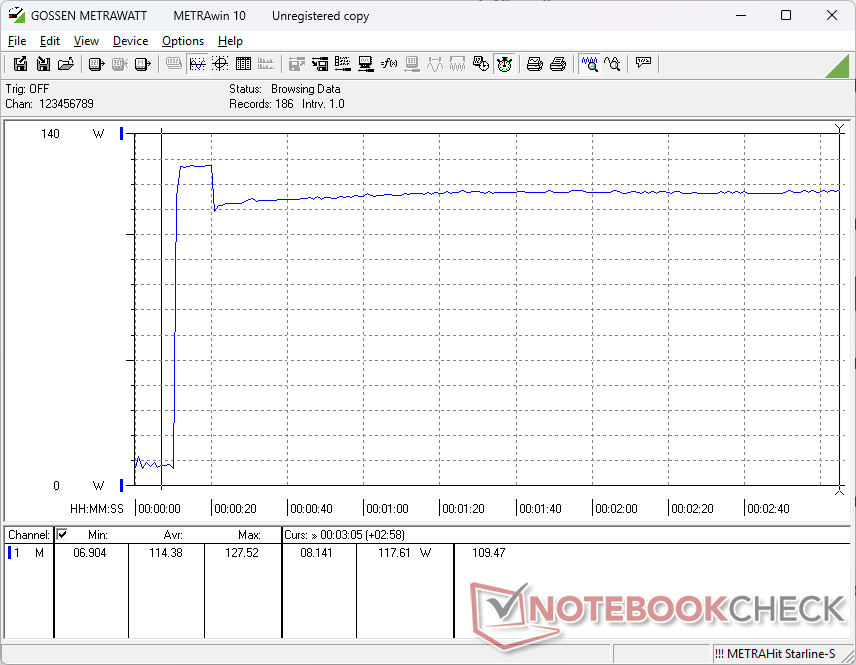
Stromverbrauch
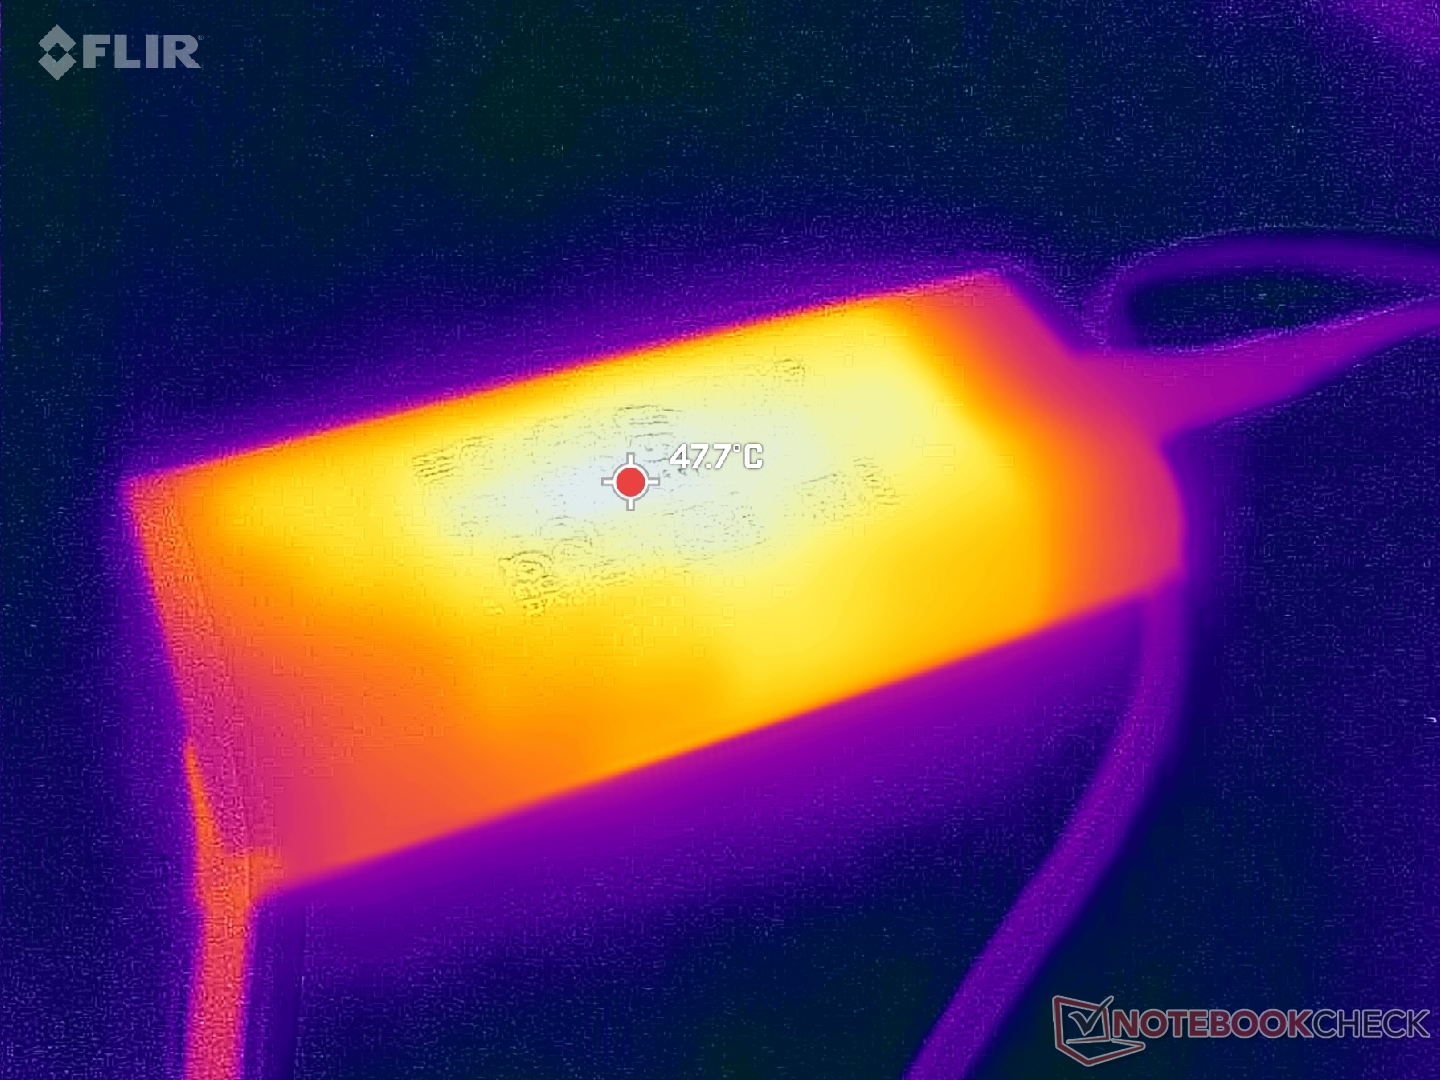
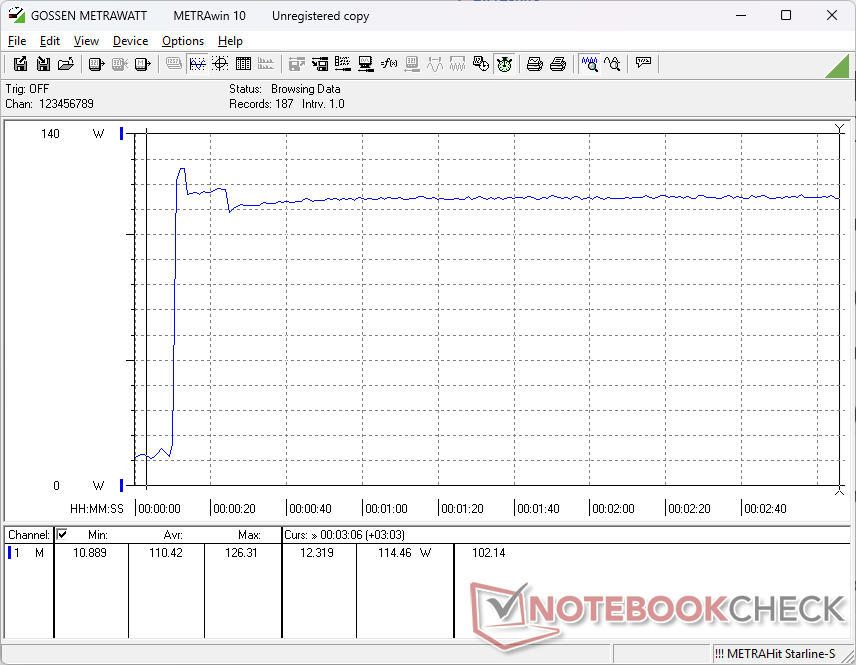
Schnelle Leistung gibt es nicht zum Nulltarif, da das HP für seinen 14 Zoll recht anspruchsvoll sein kann, wie unsere Vergleichstabellen unten zeigen. Das zeigt sich auch an dem klobigen (~14x6,5x2,8cm) 140-W-USB-C-Netzteil. Die meisten anderen 14-Zoll-Notebooks werden mit kleineren und leichteren Adaptern ausgeliefert.
| Aus / Standby | |
| Idle | |
| Last |
|
Legende:
min: | |
| HP ZBook Ultra G1a 14 Ryzen AI Max+ PRO 395, Radeon 8060S, WDC PC SN810 2TB, OLED, 2880x1800, 14" | HP ZBook Firefly 14 G11 Ultra 7 165H, RTX A500 Laptop GPU, Kioxia XG8 KXG80ZNV512G, IPS, 2560x1600, 14" | Lenovo ThinkPad X1 Carbon Gen 13 21NS0010GE Core Ultra 7 258V, Arc 140V, SK hynix PCB01 HFS001TFM9X179N GL, OLED, 2880x1800, 14" | Dell Precision 5000 5490 Ultra 9 185H, RTX 3000 Ada Generation Laptop, Kioxia XG8 KXG80ZNV1T02, IPS, 2560x1600, 14" | Asus ExpertBook P5 P5405-NZ0102X Core Ultra 7 258V, Arc 140V, Western Digital PC SN5000S SDEQNSJ-1T00, IPS LED, 2560x1600, 14" | Apple MacBook Pro 14 2024 M4 Pro M4 Pro 14-Core, M4 Pro 20-Core GPU, Apple SSD AP2048Z, MiniLED, 3024x1964, 14.2" | |
|---|---|---|---|---|---|---|
| Stromverbrauch | 12% | 53% | -32% | 40% | 19% | |
| Idle min * (Watt) | 6.9 | 6.6 4% | 4.7 32% | 11.1 -61% | 3.9 43% | 2.17 69% |
| Idle avg * (Watt) | 7.7 | 12.7 -65% | 5.7 26% | 14.8 -92% | 8.9 -16% | 10.9 -42% |
| Idle max * (Watt) | 14.7 | 13.3 10% | 6.1 59% | 16.5 -12% | 9.6 35% | 11 25% |
| Last avg * (Watt) | 83.3 | 67 20% | 29.8 64% | 70.1 16% | 43.4 48% | 74.3 11% |
| Cyberpunk 2077 ultra external monitor * (Watt) | 110.5 | 58.1 47% | 34.1 69% | 41.8 62% | 80.5 27% | |
| Cyberpunk 2077 ultra * (Watt) | 110.9 | 63.4 43% | 35.3 68% | 42.8 61% | ||
| Last max * (Watt) | 126.3 | 94.9 25% | 60.1 52% | 137.5 -9% | 64.1 49% | 98.1 22% |
| Witcher 3 ultra * (Watt) | 93.1 |
* ... kleinere Werte sind besser
Power Consumption Cyberpunk / Stress Test
Power Consumption external Monitor
Akkulaufzeit
Die Gesamtlaufzeit ist kürzer als bei vielen 14-Zoll-Notebooks, was zum Teil auf den oben erwähnten höheren Verbrauch zurückzuführen ist.
| HP ZBook Ultra G1a 14 Ryzen AI Max+ PRO 395, Radeon 8060S, 74.5 Wh | HP ZBook Firefly 14 G11 Ultra 7 165H, RTX A500 Laptop GPU, 56 Wh | Lenovo ThinkPad X1 Carbon Gen 13 21NS0010GE Core Ultra 7 258V, Arc 140V, 57 Wh | Dell Precision 5000 5490 Ultra 9 185H, RTX 3000 Ada Generation Laptop, 72 Wh | Asus ExpertBook P5 P5405-NZ0102X Core Ultra 7 258V, Arc 140V, 63 Wh | Apple MacBook Pro 14 2024 M4 Pro M4 Pro 14-Core, M4 Pro 20-Core GPU, 72.6 Wh | |
|---|---|---|---|---|---|---|
| Akkulaufzeit | 23% | 57% | 57% | 131% | 126% | |
| WLAN (h) | 7 | 8.6 23% | 11 57% | 11 57% | 16.2 131% | 15.8 126% |
| Cyberpunk 2077 ultra 150cd (h) | 1.6 | |||||
| Last (h) | 1.4 | 2.9 | ||||
| H.264 (h) | 19.8 |
Notebookcheck Bewertung
HP ZBook Ultra G1a 14
- 11.04.2025 v8
Allen Ngo
 Total Sustainability Score:
 Potential Competitors in Comparison
Bild | Modell / Test | Preis ab | Gewicht | Dicke | Display |
|---|---|---|---|---|---|
1. 87.4%  | HP ZBook Ultra G1a 14 AMD Ryzen AI Max+ PRO 395 ⎘ AMD Radeon 8060S ⎘ 128 GB RAM, 2048 GB SSD | Amazon: 3.828,59 € Bestpreis 3399€ Jacob Elektronik direkt 2. 3427.56€ Jacob Elektronik direkt (AT) 3. 3642.28€ JACOB | 1.6 kg | 18.5 mm | 14.00" 2880x1800 243 PPI OLED |
Transparenz
Die Auswahl der zu testenden Geräte erfolgt innerhalb der Redaktion. Das vorliegende Testmuster wurde dem Autor vom Hersteller oder einem Shop zu Testzwecken leihweise zur Verfügung gestellt. Eine Einflussnahme des Leihstellers auf den Testbericht gab es nicht, der Hersteller erhielt keine Version des Reviews vor der Veröffentlichung. Es bestand keine Verpflichtung zur Publikation. Als eigenständiges, unabhängiges Unternehmen unterliegt Notebookcheck keiner Diktion von Herstellern, Shops und Verlagen.
So testet Notebookcheck
Pro Jahr werden von Notebookcheck hunderte Laptops und Smartphones unabhängig in von uns standardisierten technischen Verfahren getestet, um eine Vergleichbarkeit aller Testergebnisse zu gewährleisten. Seit rund 20 Jahren entwickeln wir diese Testmethoden kontinuierlich weiter und setzen damit Branchenstandards. In unseren Testlaboren kommt ausschließlich hochwertiges Messequipment in die Hände erfahrener Techniker und Redakteure. Die Tests unterliegen einer mehrstufigen Kontrolle. Unsere komplexe Gesamtbewertung basiert auf hunderten fundierten Messergebnissen und Benchmarks, womit Ihnen Objektivität garantiert ist. Weitere Informationen zu unseren Testmethoden gibt es hier.

