Acer Predator Orion 3000 Desktop-PC mit Core i7-12700F und RTX 3070 im Test
")
Die Predator-Serie aus dem Hause Acer gibt es schon viele Jahre und richtet sich dabei vorwiegend an Gamer. Sowohl bei Laptops als auch bei Desktop-PCs gibt es diverse Modelle mit dieser Bezeichnung. Mit dem aktuellen Predator Orion 3000 betreibt der Hersteller nicht nur einfache Produktpflege, sondern setzt im Vergleich zu der älteren Generation auch auf ein neues Gehäuse.
Als Basis dient immer ein Intel Core i7-12700 oder ein Intel Core i7-12700F, wie auch in unserem Sample. Bei der GPU-Bestückung gibt es jedoch verschiedene Modelle, wenngleich die GeForce RTX 3070 hier das Topmodell in dieser Serie ist. Beim Arbeitsspeicher ist man immer mit DDR4-RAM unterwegs. Gleichwohl kann man beim Kauf je nach Geldbeutel zwischen 16 GB oder 32 GB entscheiden. Gleiches gilt auch für den Massenspeicher, welcher in unserem System mit 1 TB das Minimum darstellt, welches Acer beim aktuellen Predator Orion 3000 anbietet.
mögliche Konkurrenten im Vergleich
Bew. | Datum | Modell | Gewicht | Dicke | Preis ab |
|---|---|---|---|---|---|
v7 (old) | 09 / 2022 | Acer Predator Orion 3000 PO3-640 i7-12700F, GeForce RTX 3070 | 7.4 kg | 377 mm | |
v (old) | 12 / 2021 | Intel Beast Canyon NUC i9-11900KB, GeForce RTX 3060 | 189 mm | ||
v (old) | 06 / 2021 | Zotac Magnus One (ECM73070C) i7-10700, GeForce RTX 3070 | |||
v (old) | 05 / 2022 | Zotac ZBOX Magnus EN173070C i7-11800H, GeForce RTX 3070 Laptop GPU | 1.8 kg | 62.2 mm | |
v (old) | 04 / 2022 | Intel Dragon Canyon NUC - RTX 3060 i9-12900, GeForce RTX 3060 | 189 mm | ||
v (old) | 06 / 2020 | Zotac MEK Mini (RTX 2070 Super) i7-9700, GeForce RTX 2070 Super (Desktop) |
Acer Predator Orion 3000 PO3-640 im Detail


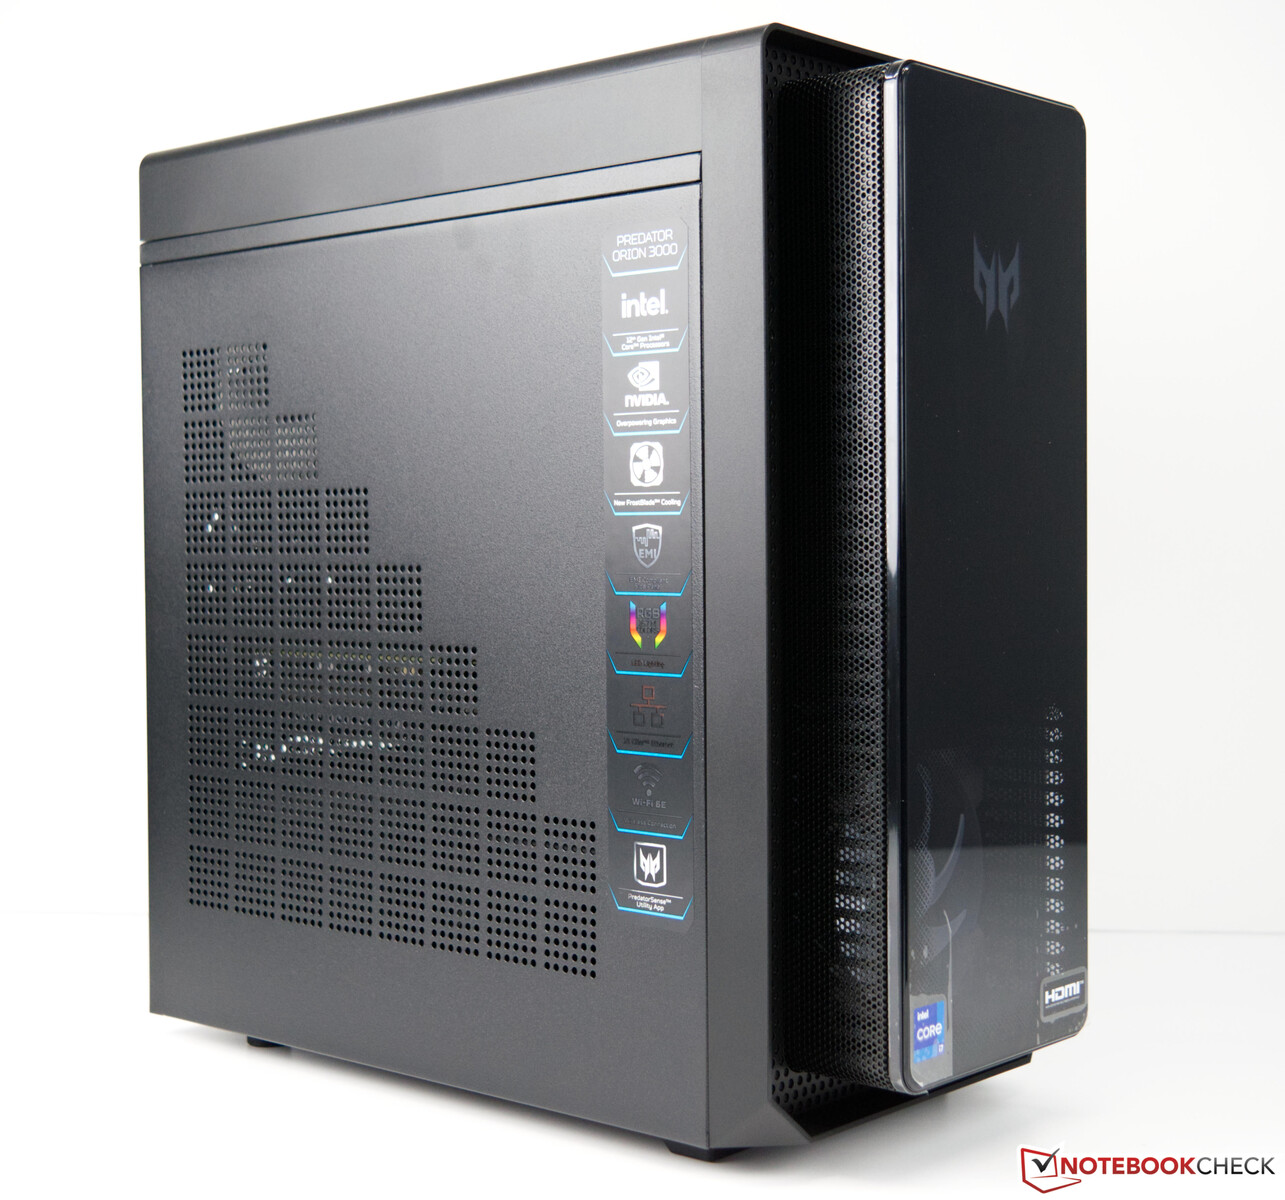
Gehäuse
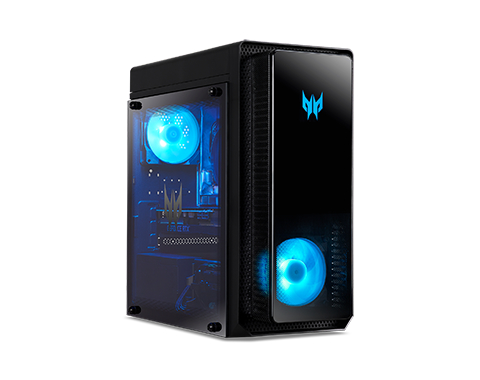
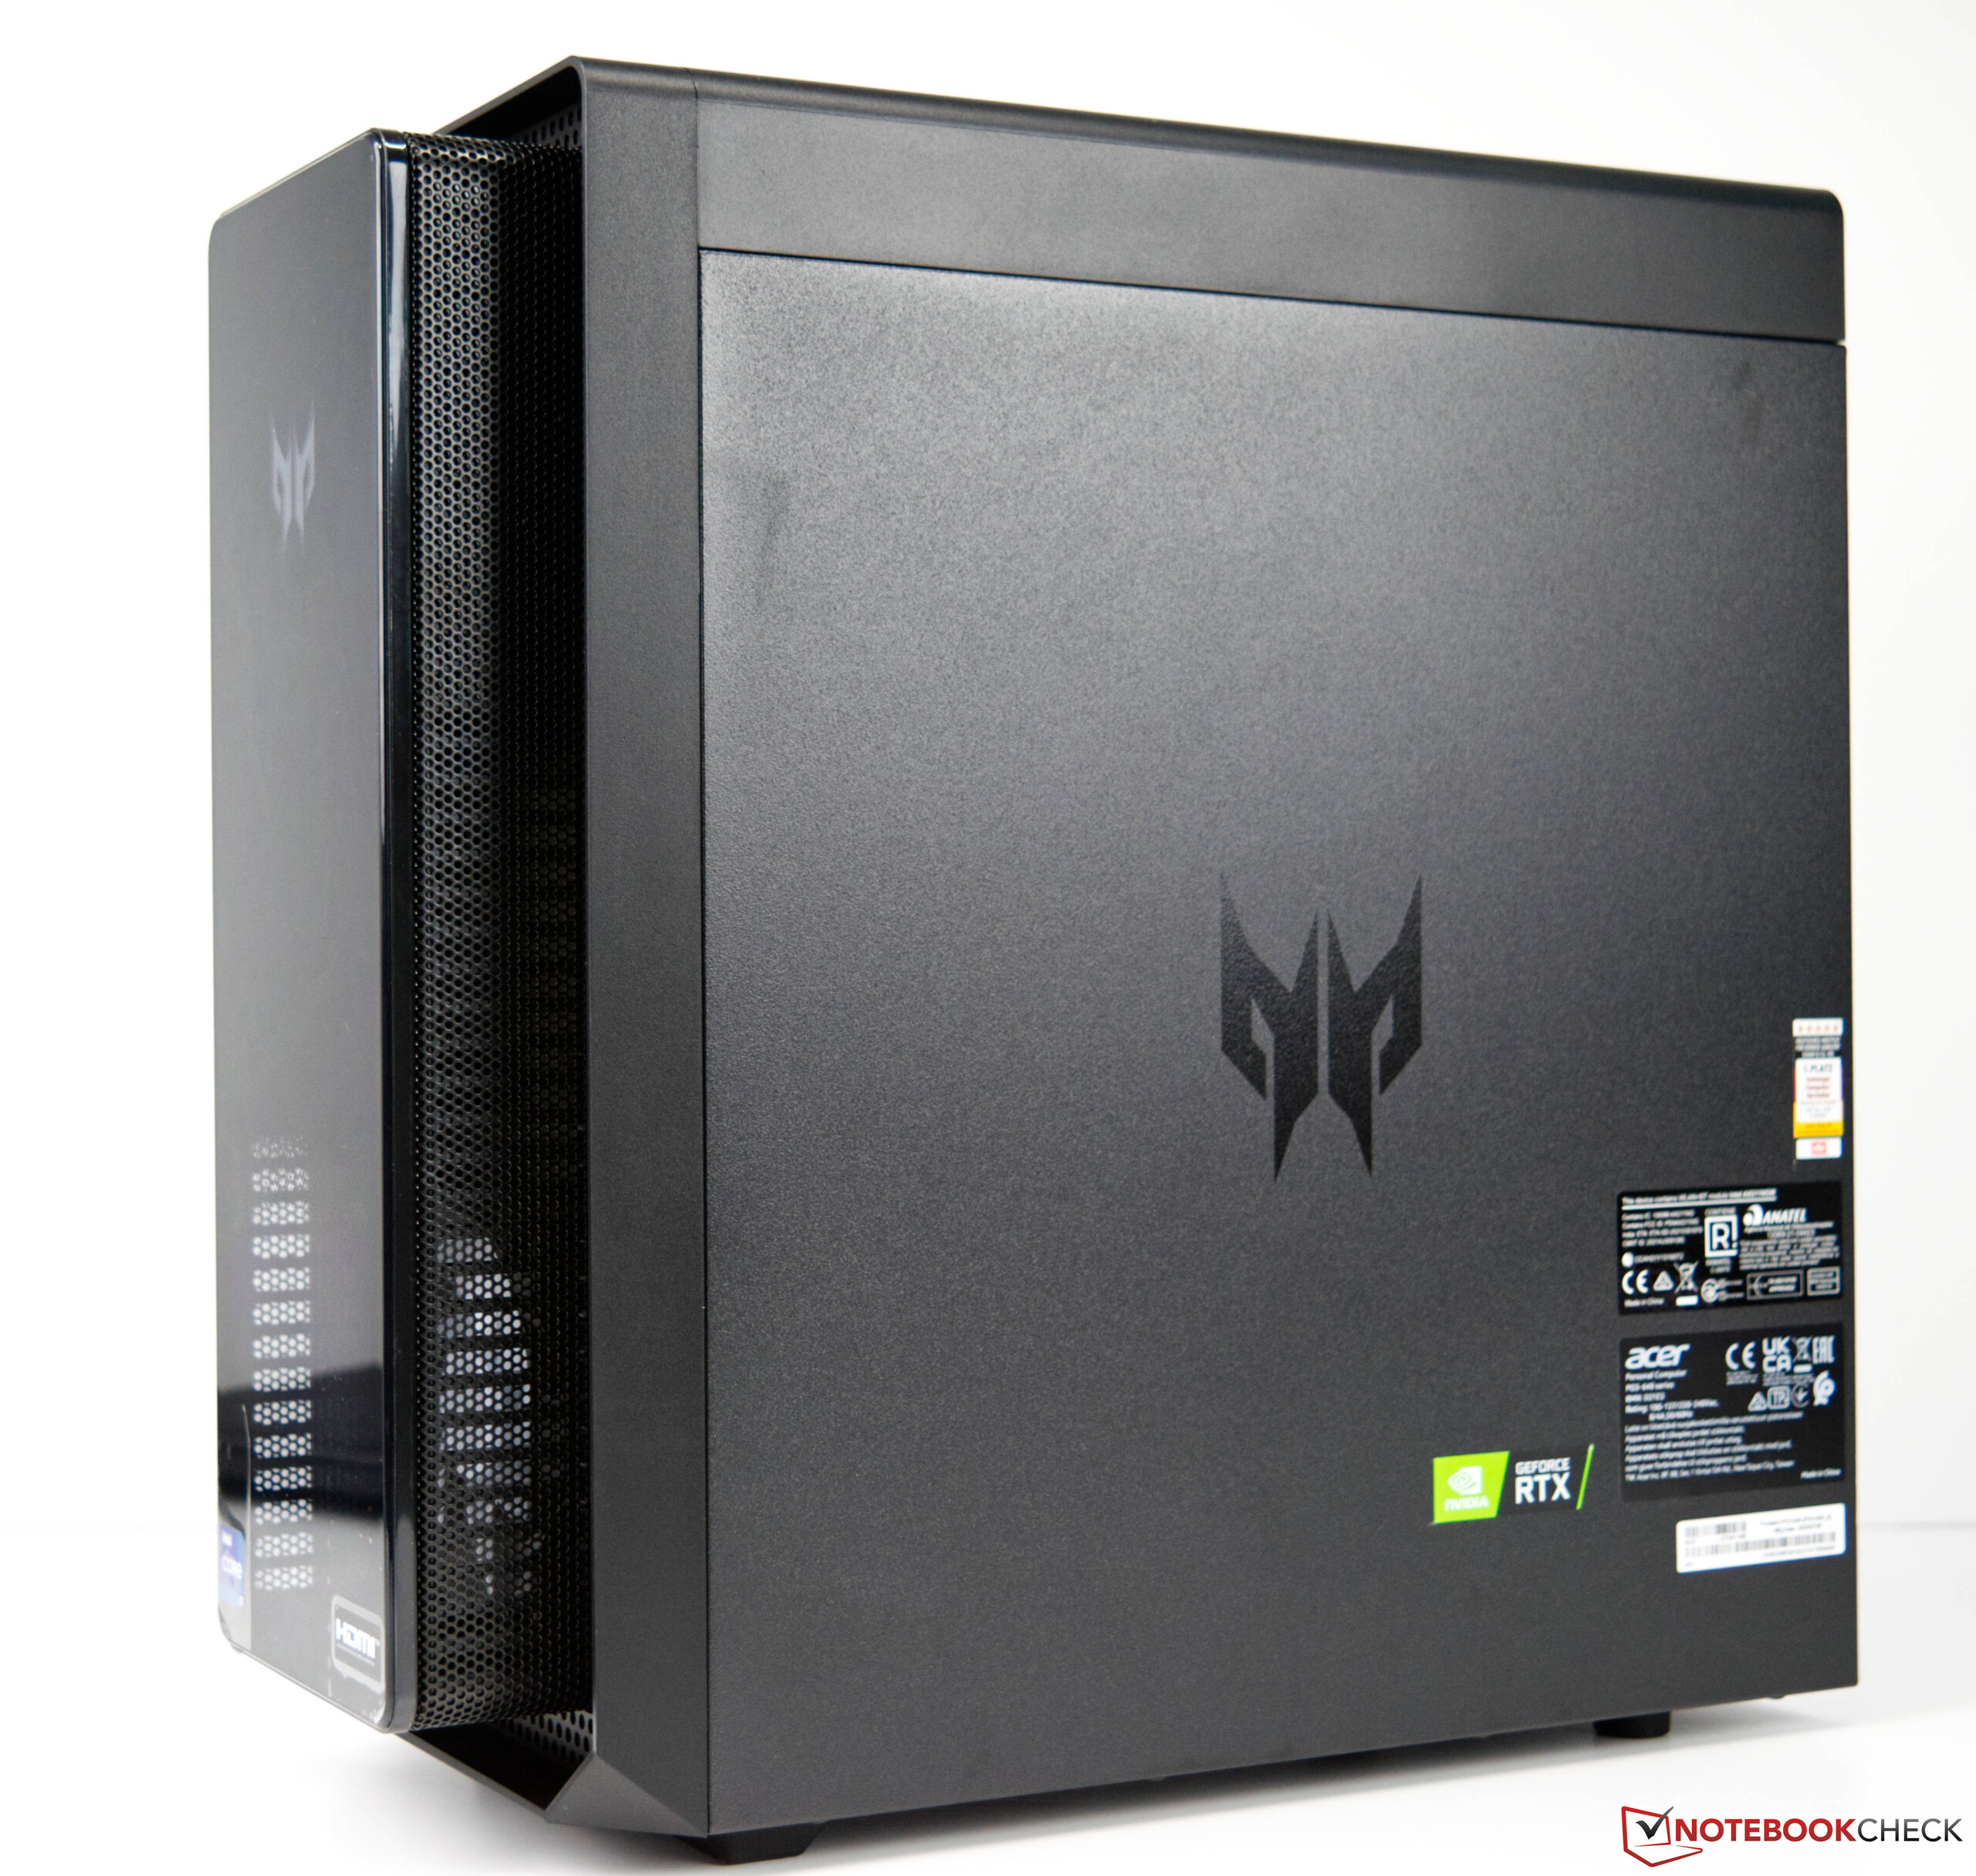
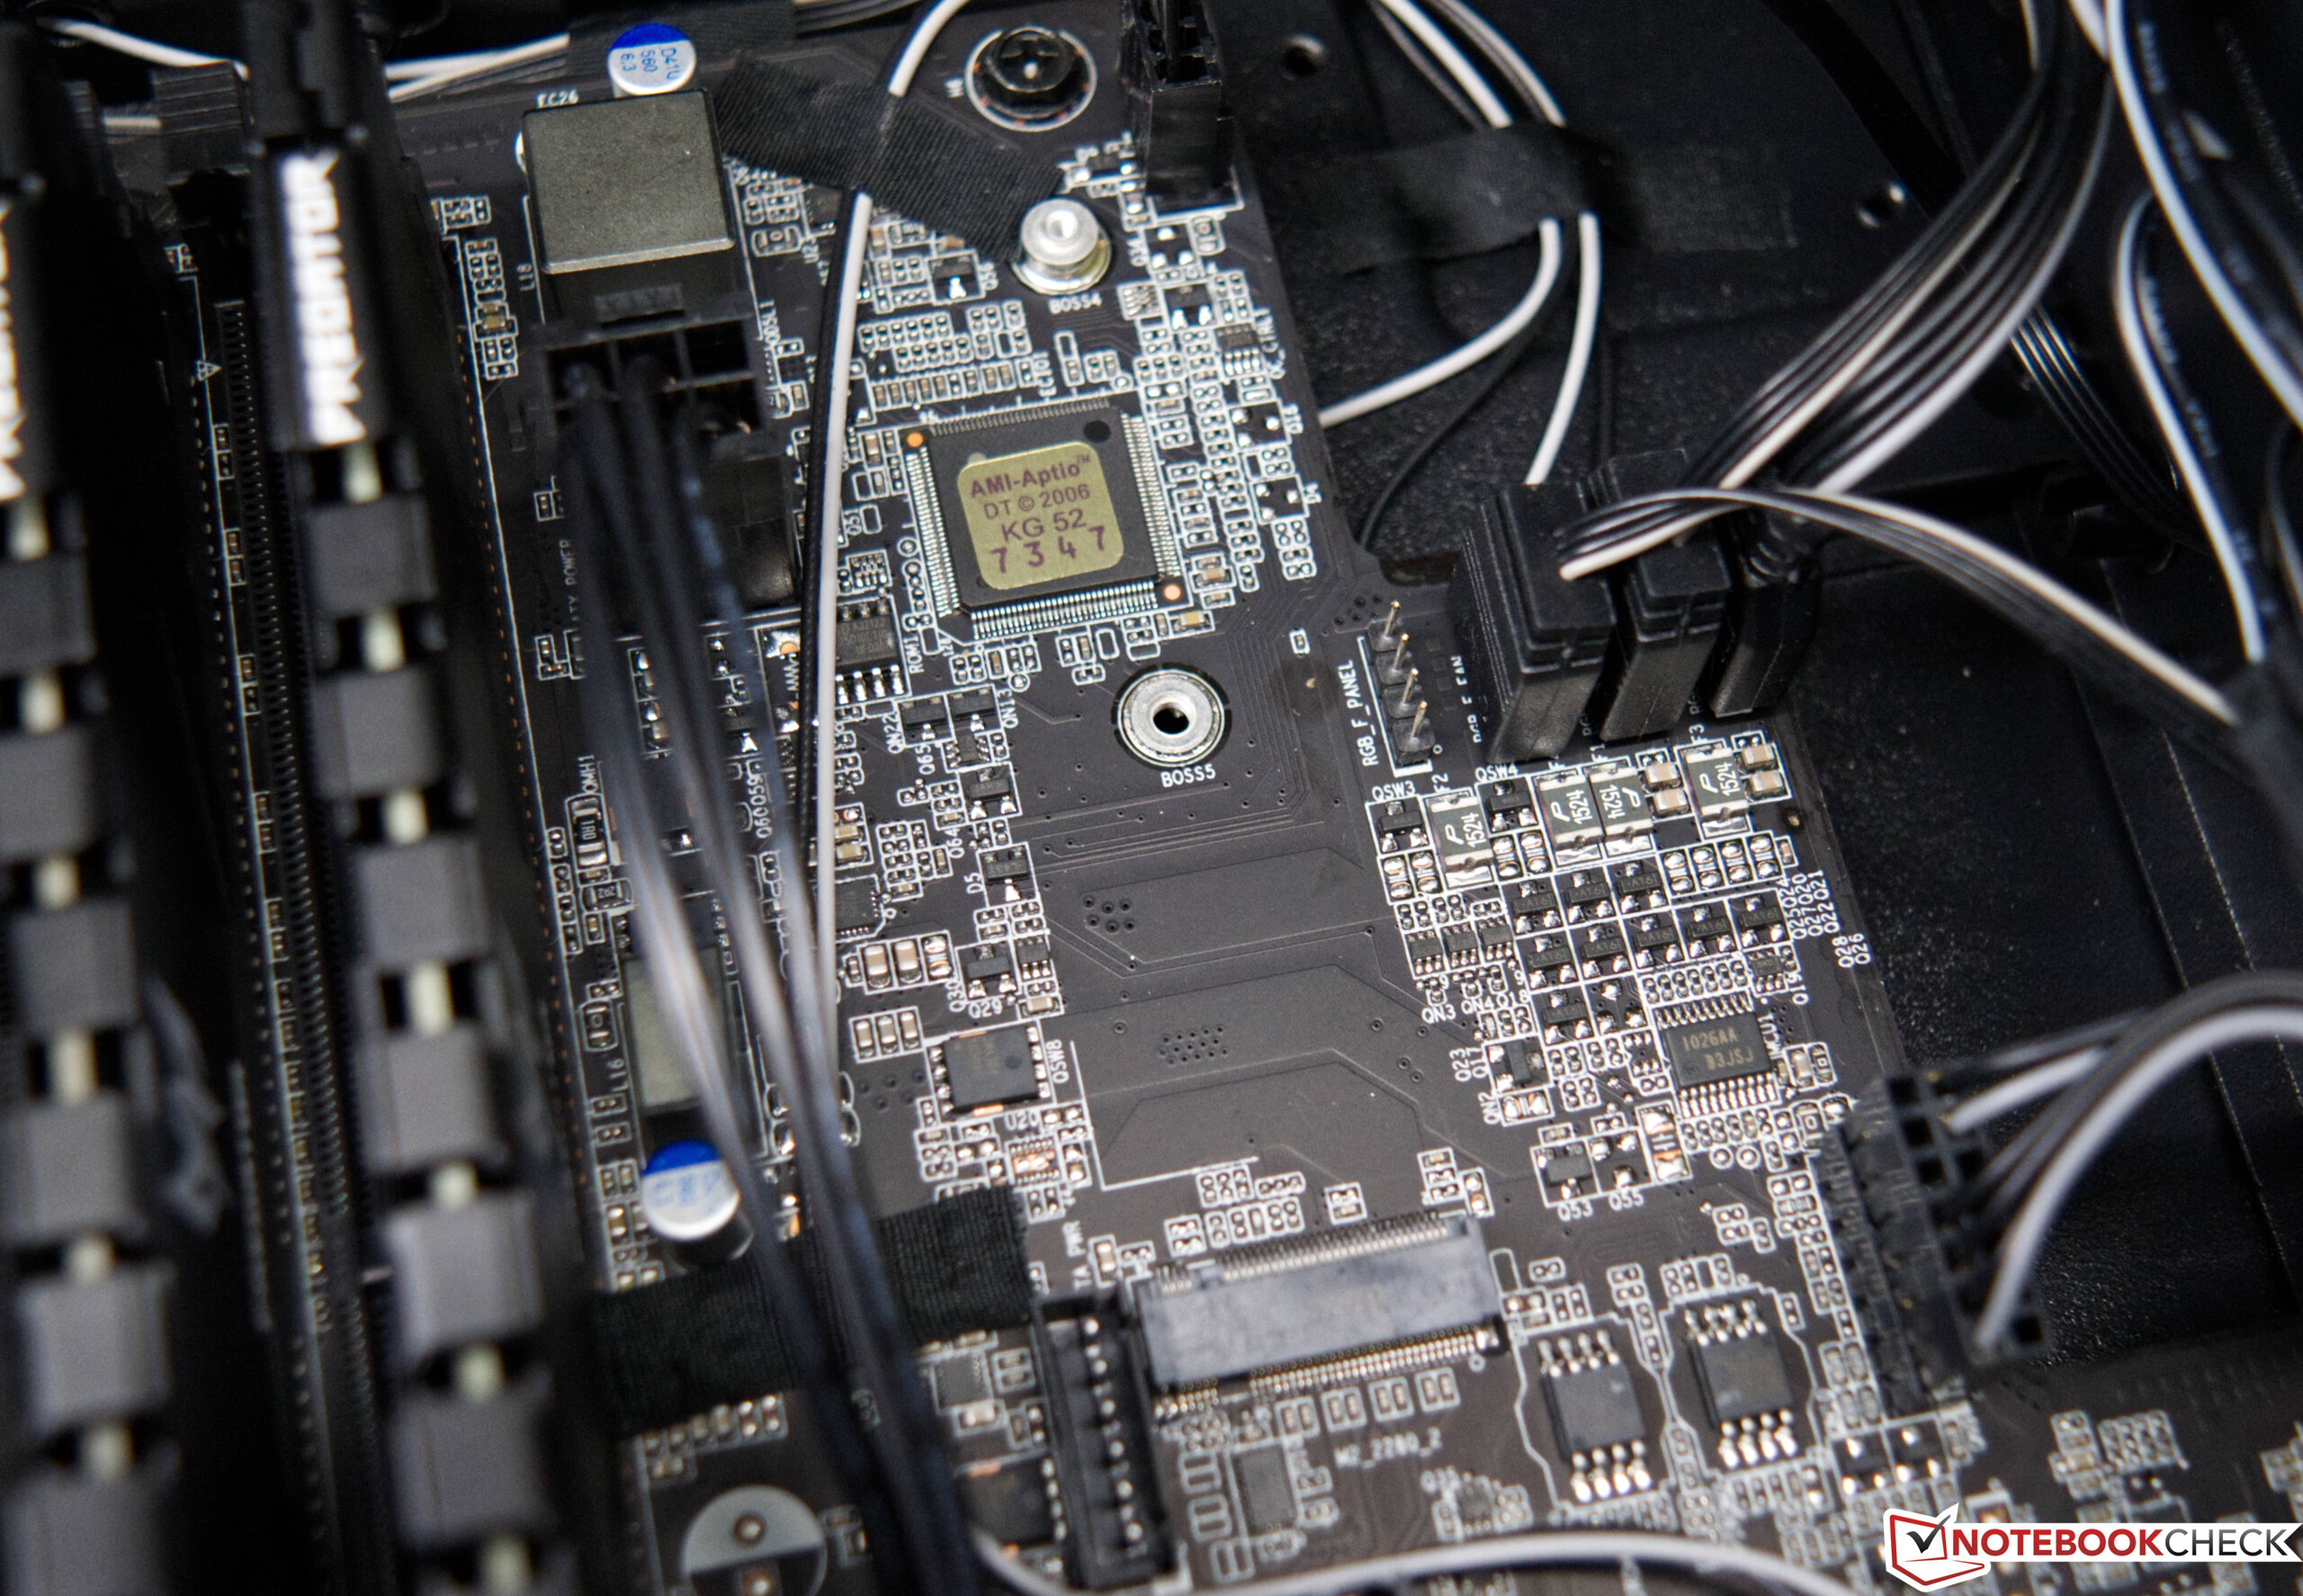
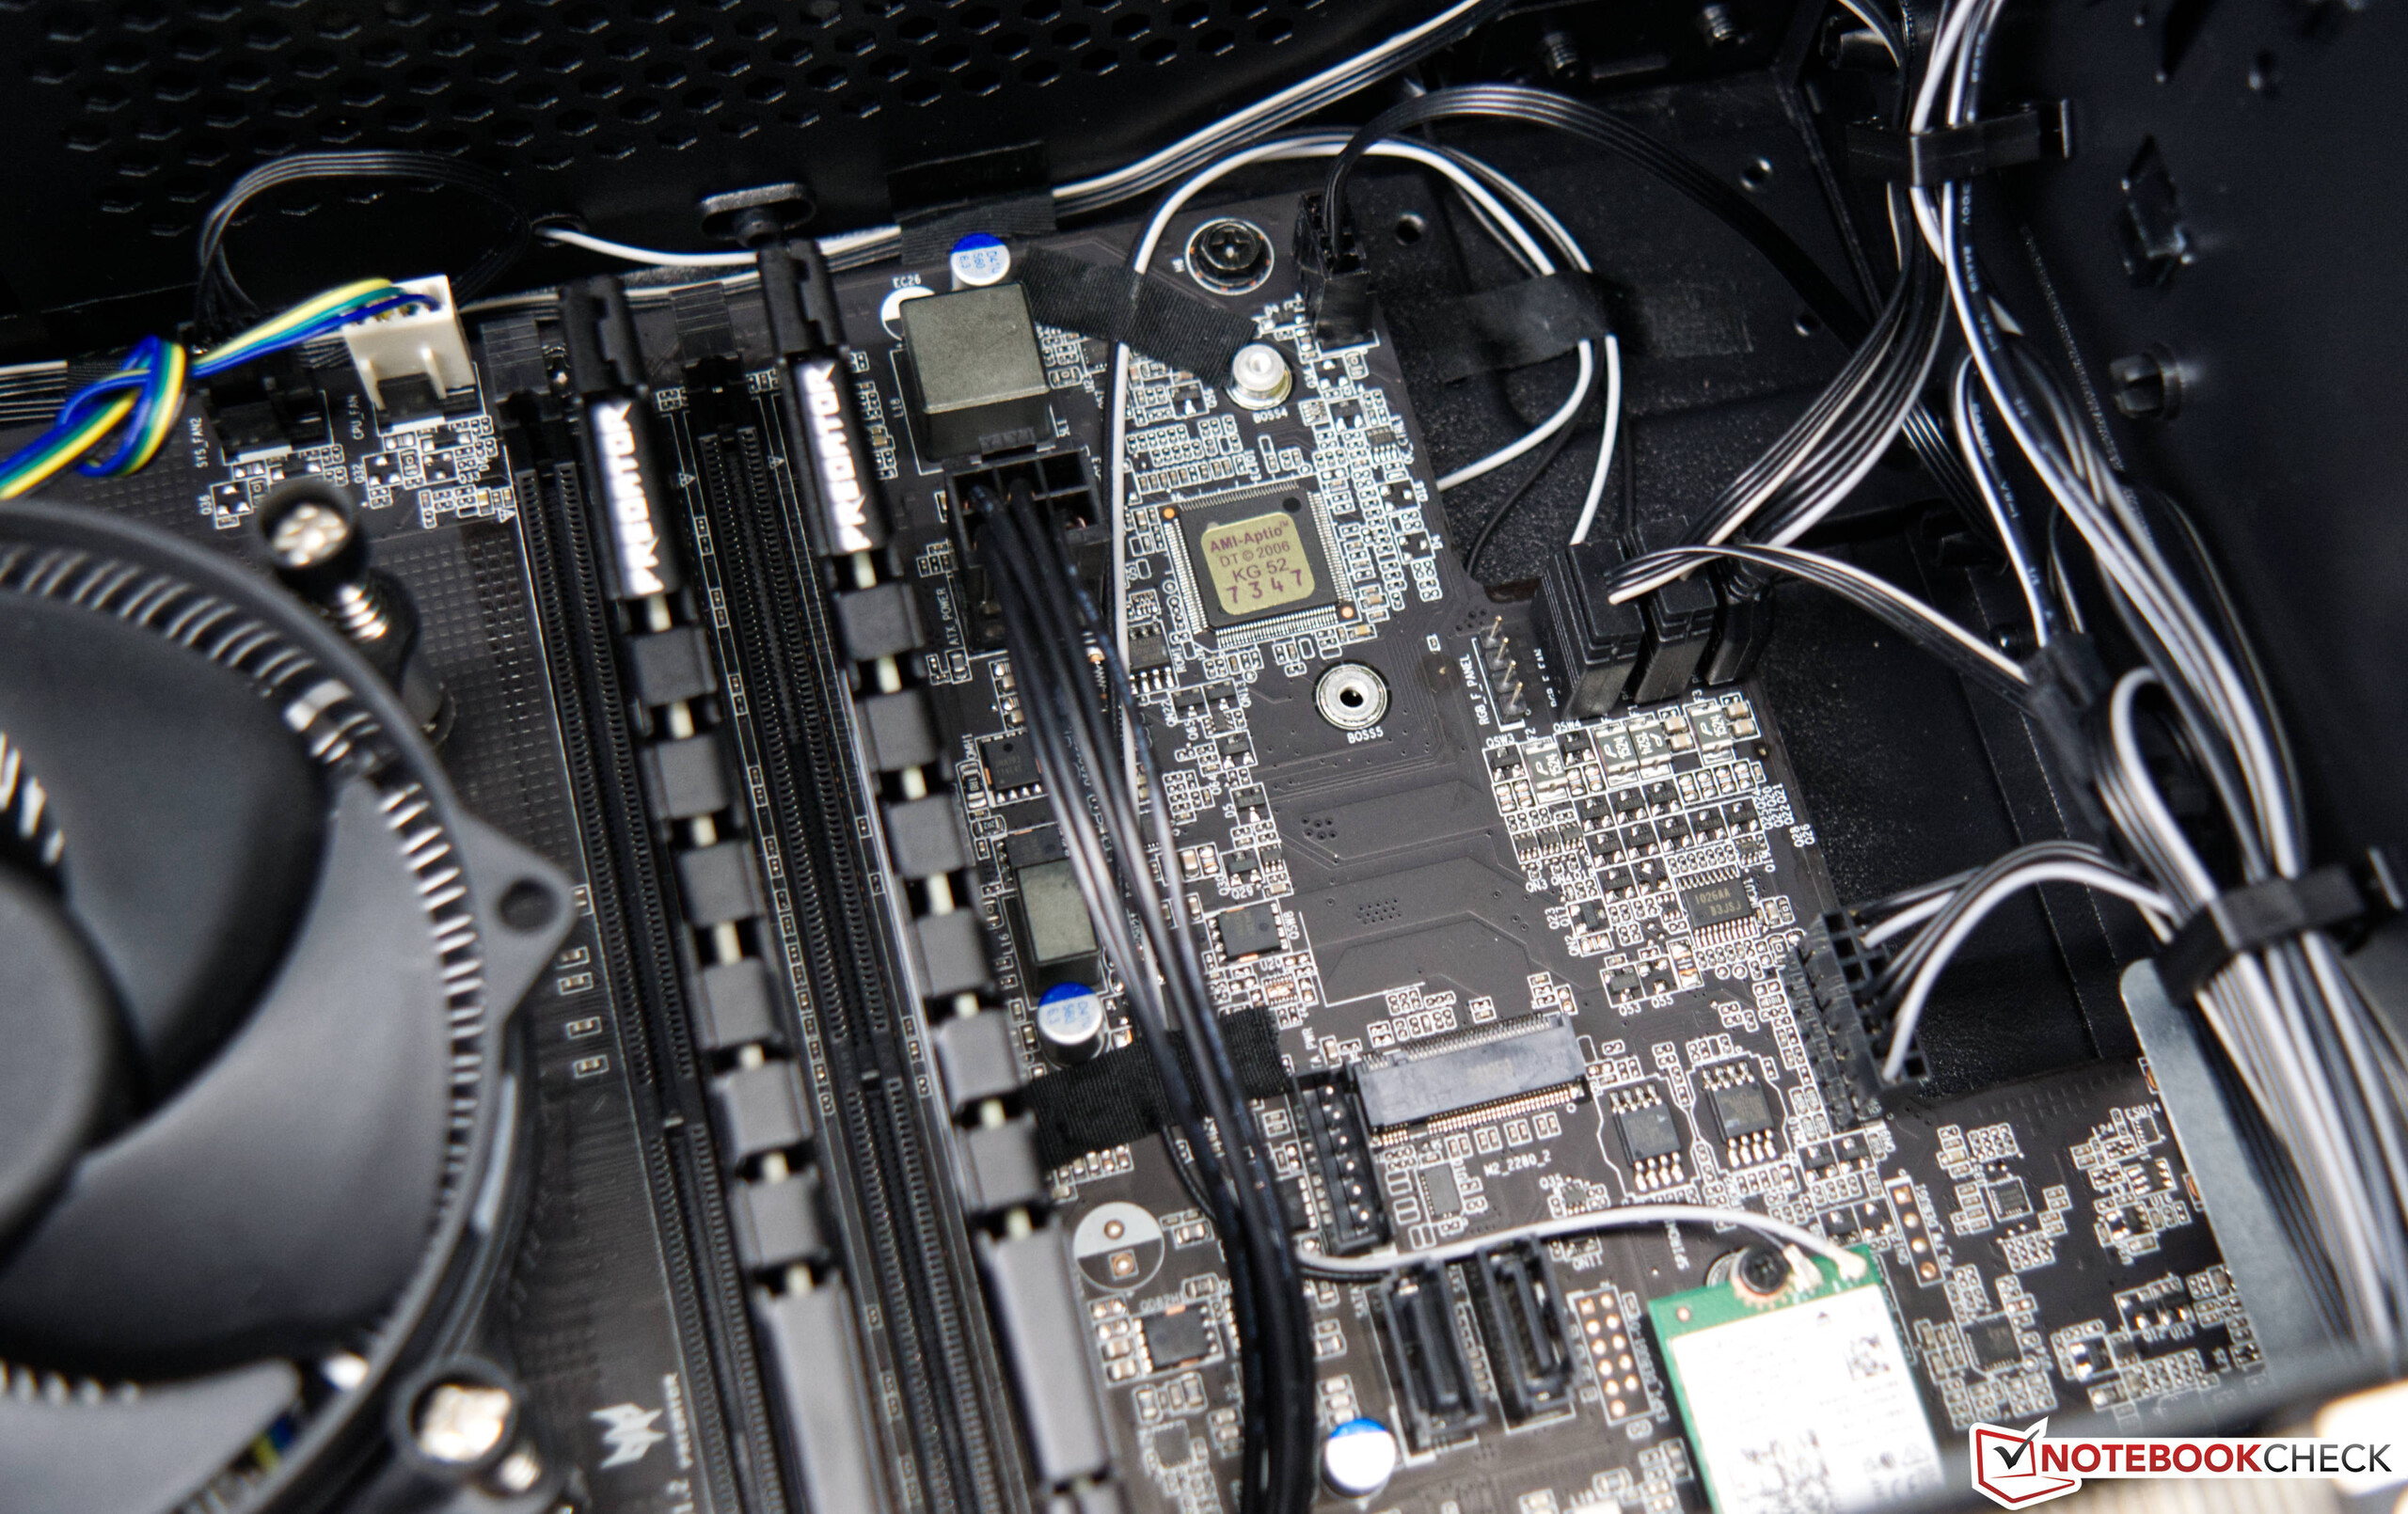
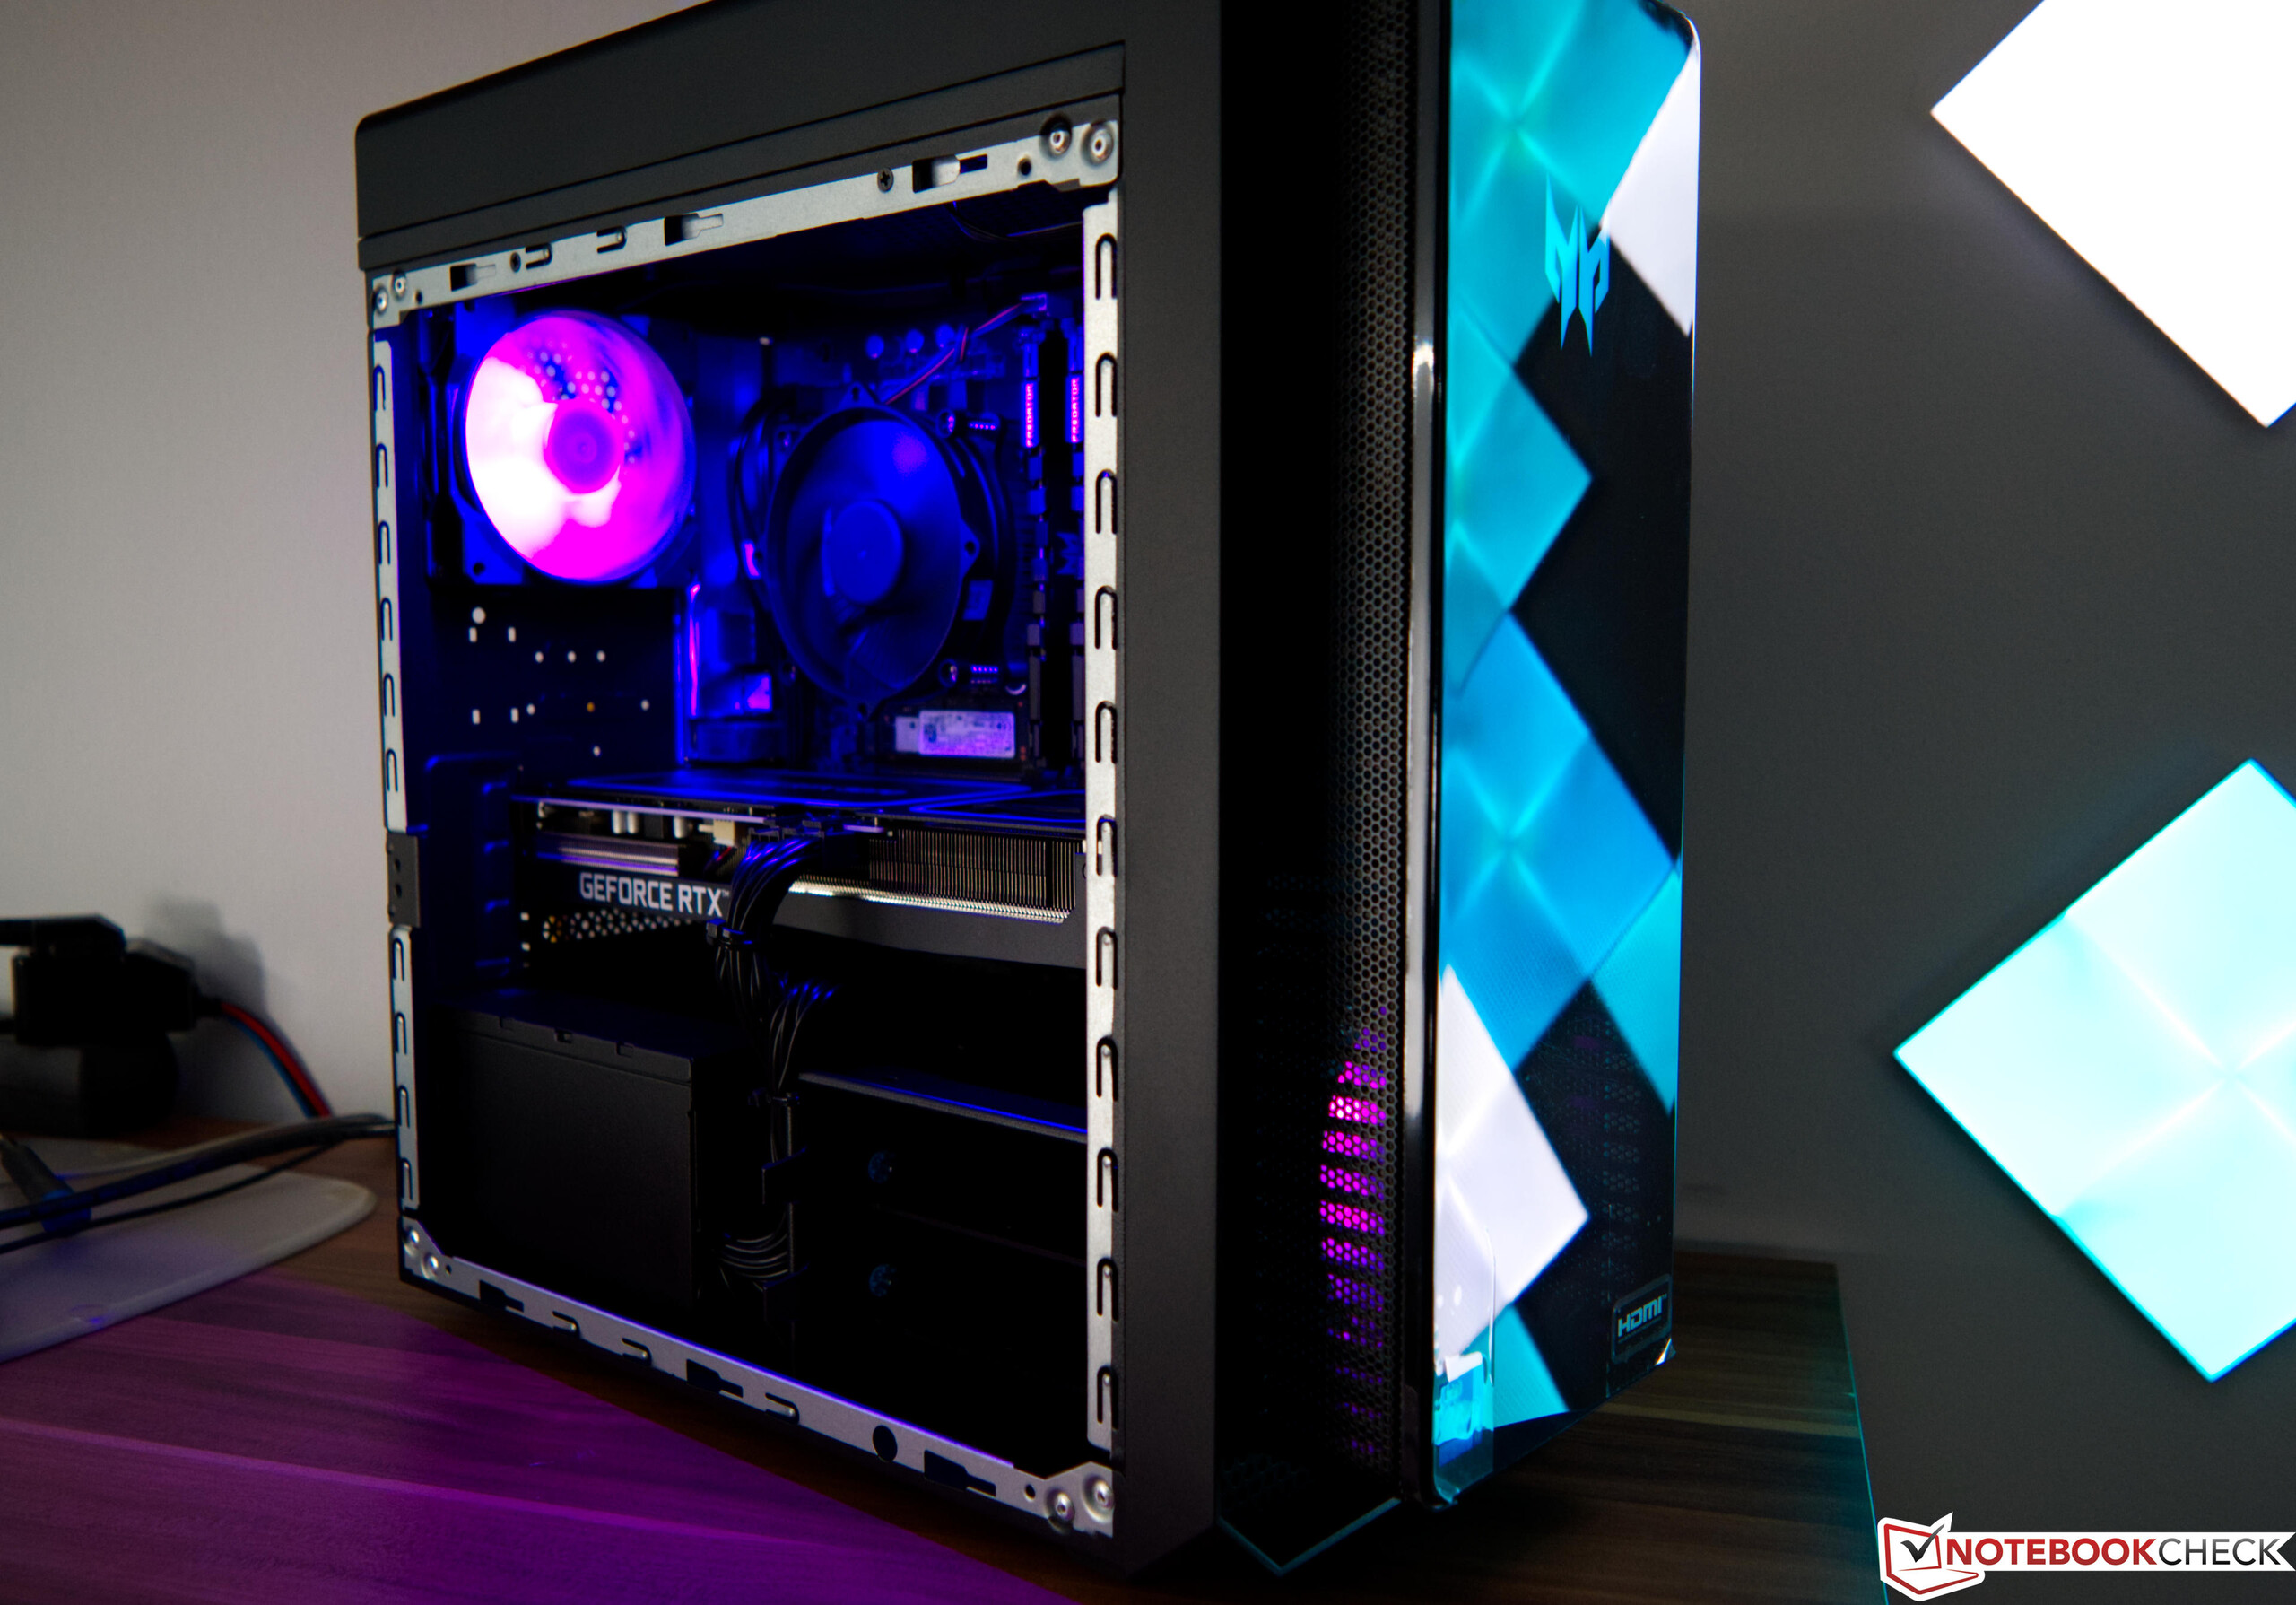
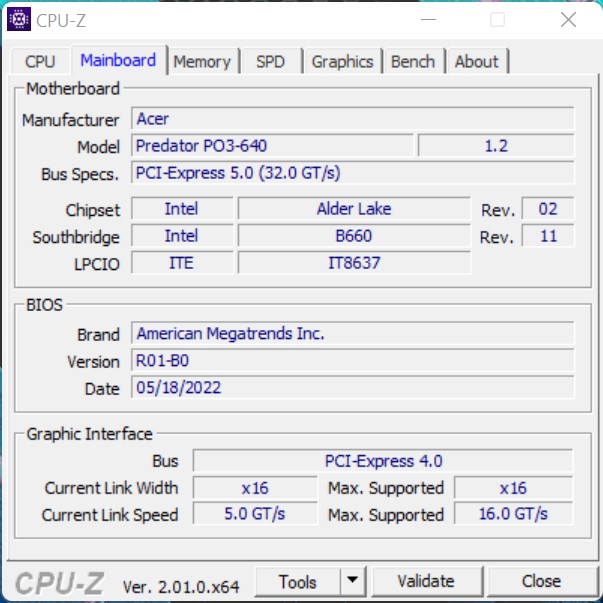
Das Gehäuse des Acer Predator Orion 3000 PO3-640 wirkt auf den ersten Blick wie ein Standard ATX-Gehäuse. Dennoch weicht der Hersteller hier von dem Standard ab, denn die vorderen Anschlüsse befinden sich direkt auf dem Mainboard und sind nicht per Kabel mit der Hauptplatine verbunden. Mit solchen Konstruktionen ist ein Austausch des Mainboards so gut wie unmöglich. Allerdings gehen andere Hersteller ähnliche Wege und verbauen proprietäre Mainboards in proprietäre Gehäuse. Das Gehäuse ist gut verarbeitet, wenngleich die Optik tatsächlich Geschmacksache ist. Zum Lieferumfang gehört auch ein Seitenteil mit Sichtfenster, um die verbauten Komponenten besser in Szene zu setzen. Aufgrund des ohnehin sehr eingeschränkten Airflows haben wir aber beim Test auf den Einsatz der optisch schickeren Seitenverkleidung verzichtet. Immerhin bietet die Metallabdeckung wenigstens ein paar Löcher, um Frischluft anzusaugen.
Ausstattung
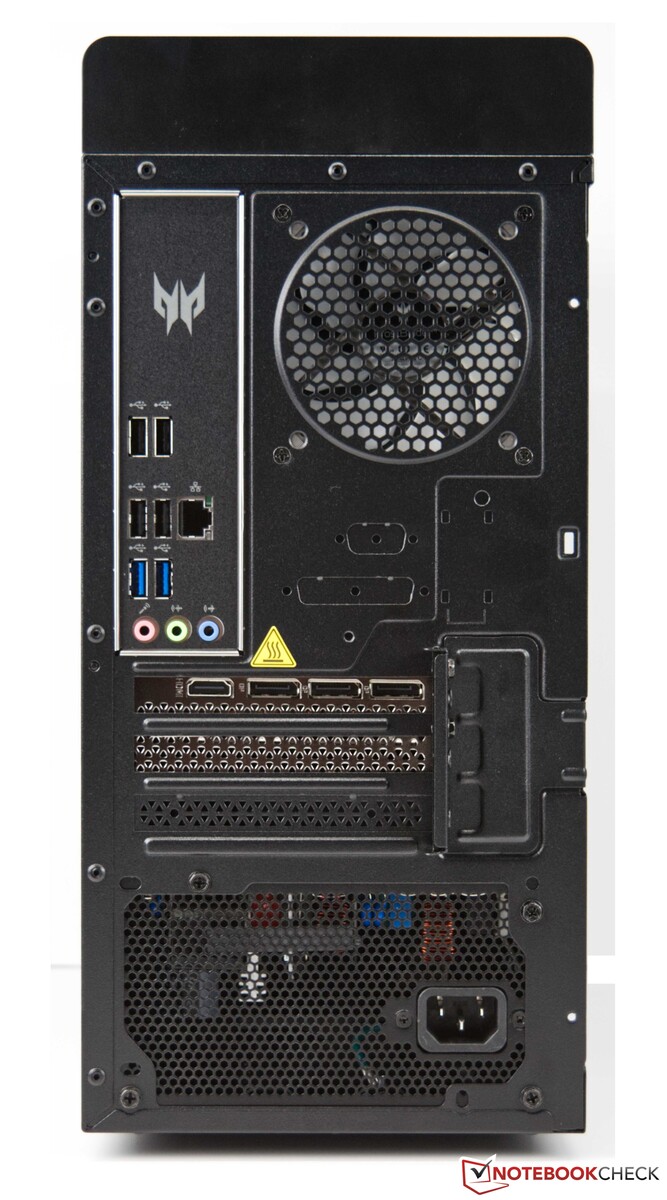
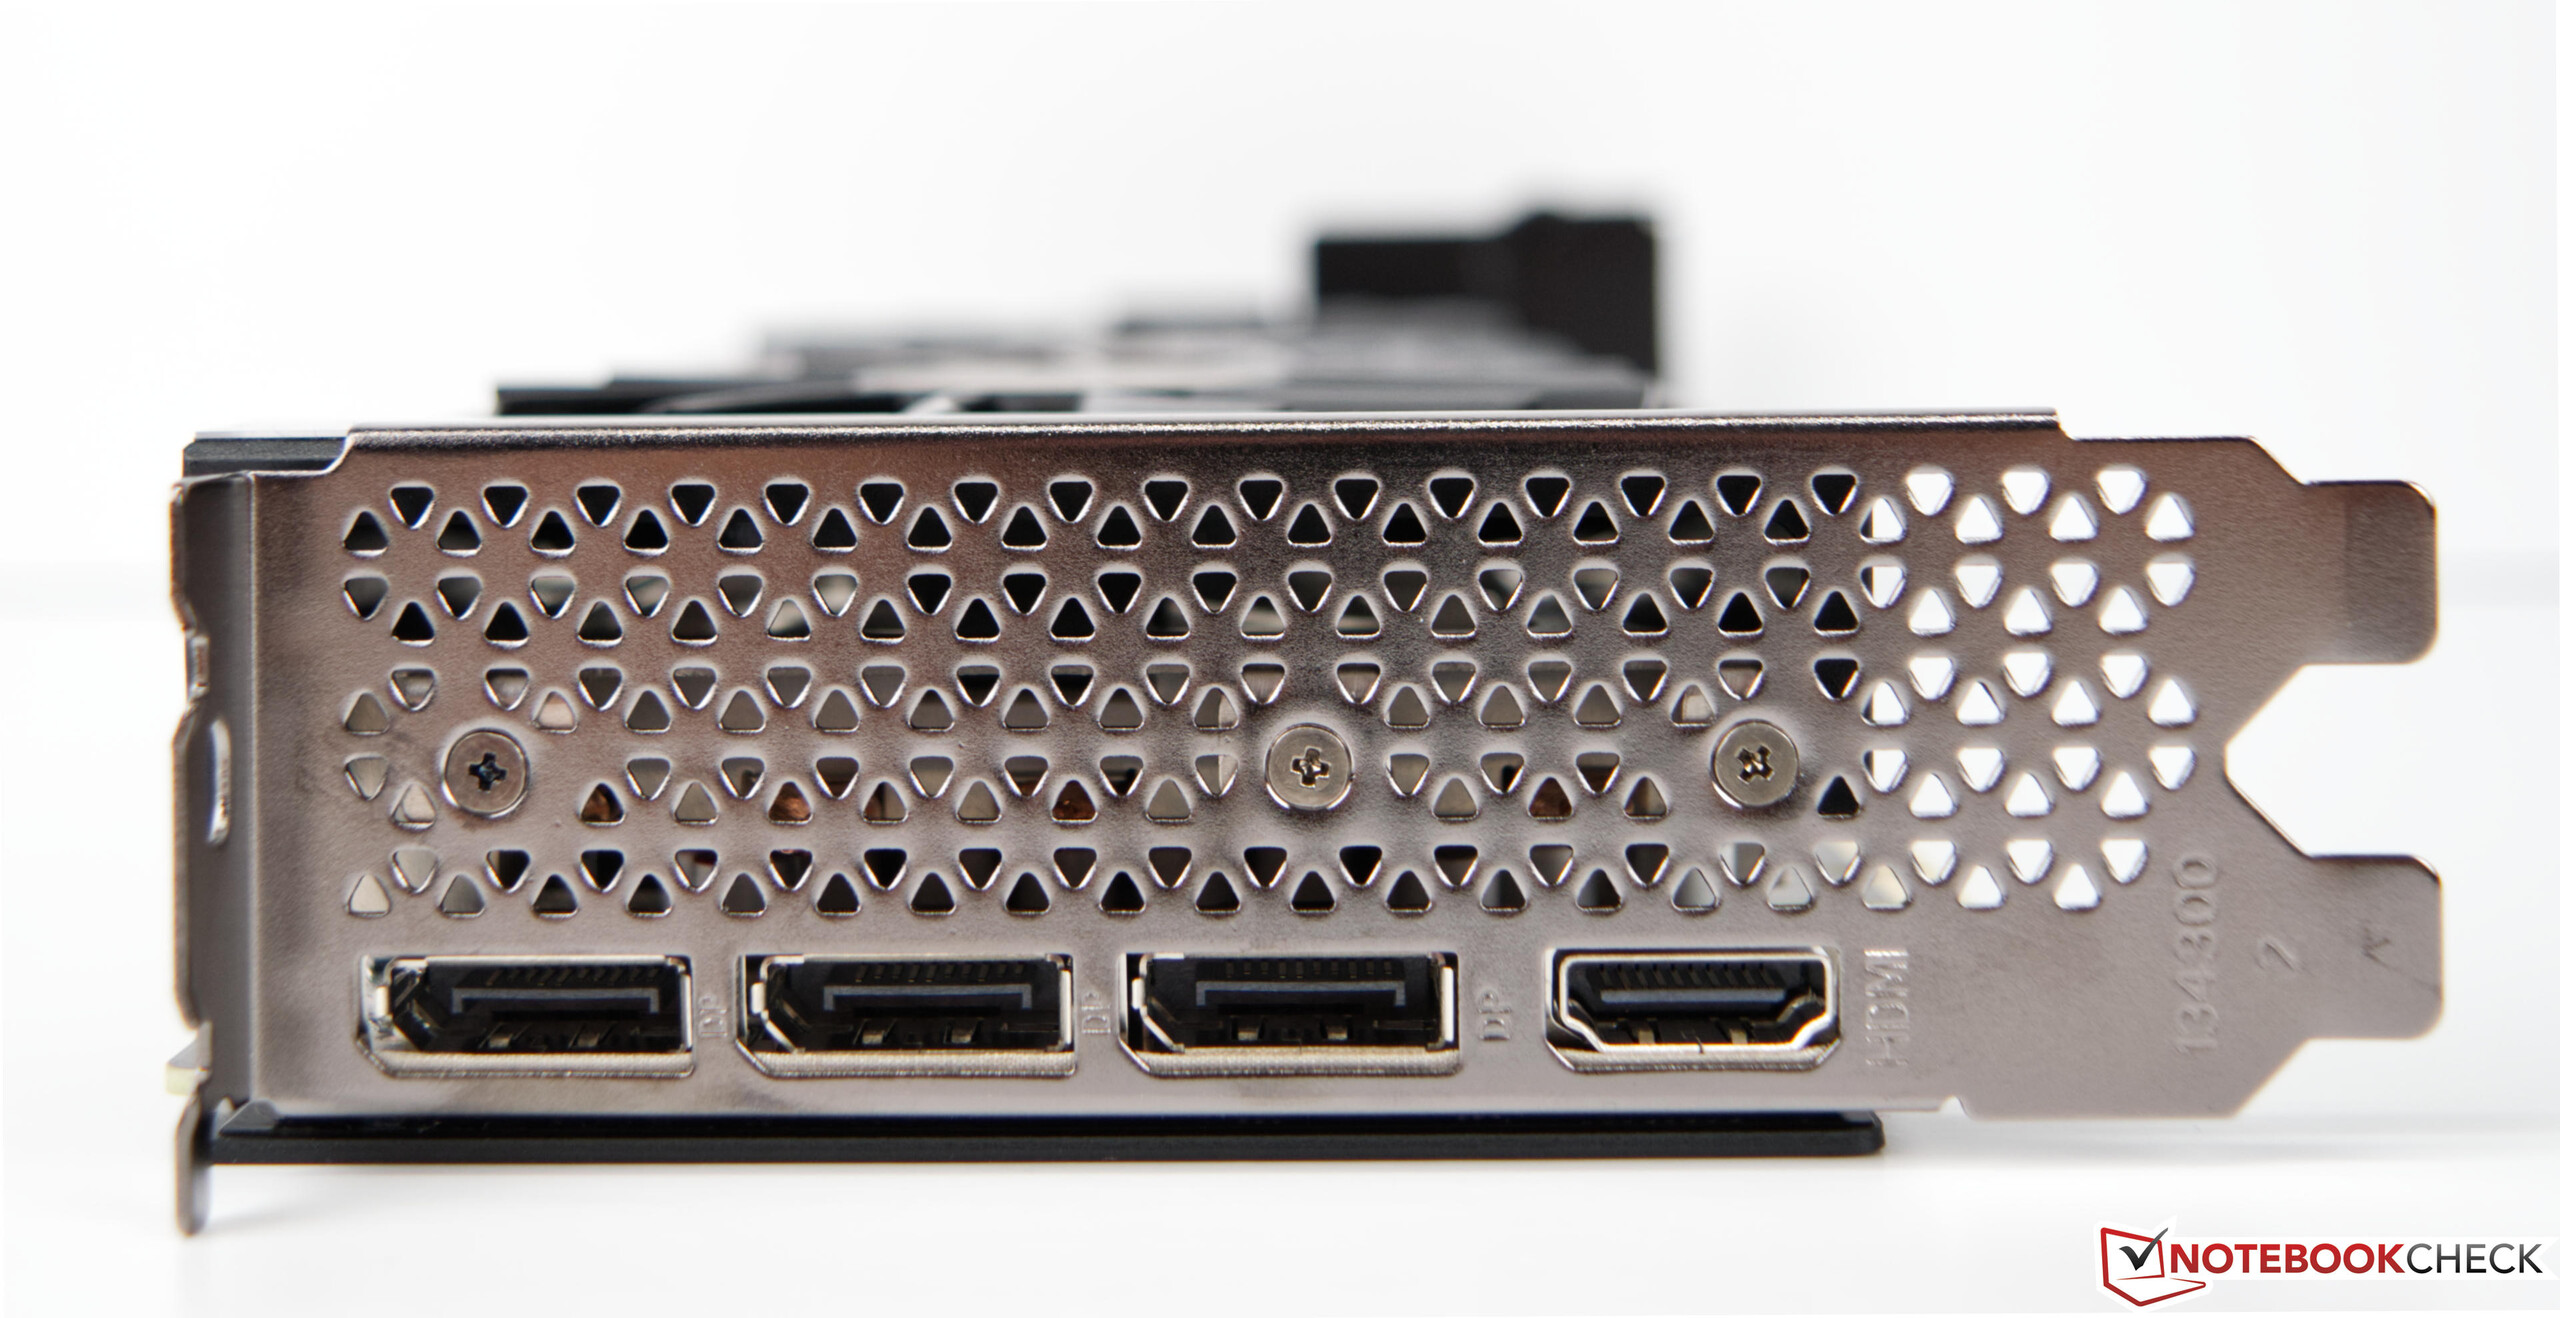
Bei der Schnittstellenauswahl gibt es nicht viel zu kritisieren. Insgesamt gibt es 8x USB, welche sich in 7x TypA und 1x in Tpy-C aufteilen. Die GPU bietet standardgemäß 3x DisplayPort und einmal HDMI. Als Netzwerkschnittstelle gibt es hingegen nur Gigabit LAN. Hier hätten wir uns einen schnelleren 2,5G- oder 5G-LAN-Port gewünscht. Ebenso muss man auf einen SD-Kartenleser verzichten. Geräteklassen-typisch gestaltet sich die Verteilung der Anschlüsse. So verwundert es nicht, dass die meisten Schnittstellen auf der Rückseite zu finden sind. Die USB-Ports an der Vorderseite sind allerdings aufgrund der Gehäusebauform, etwas schwierig zu erreichen.
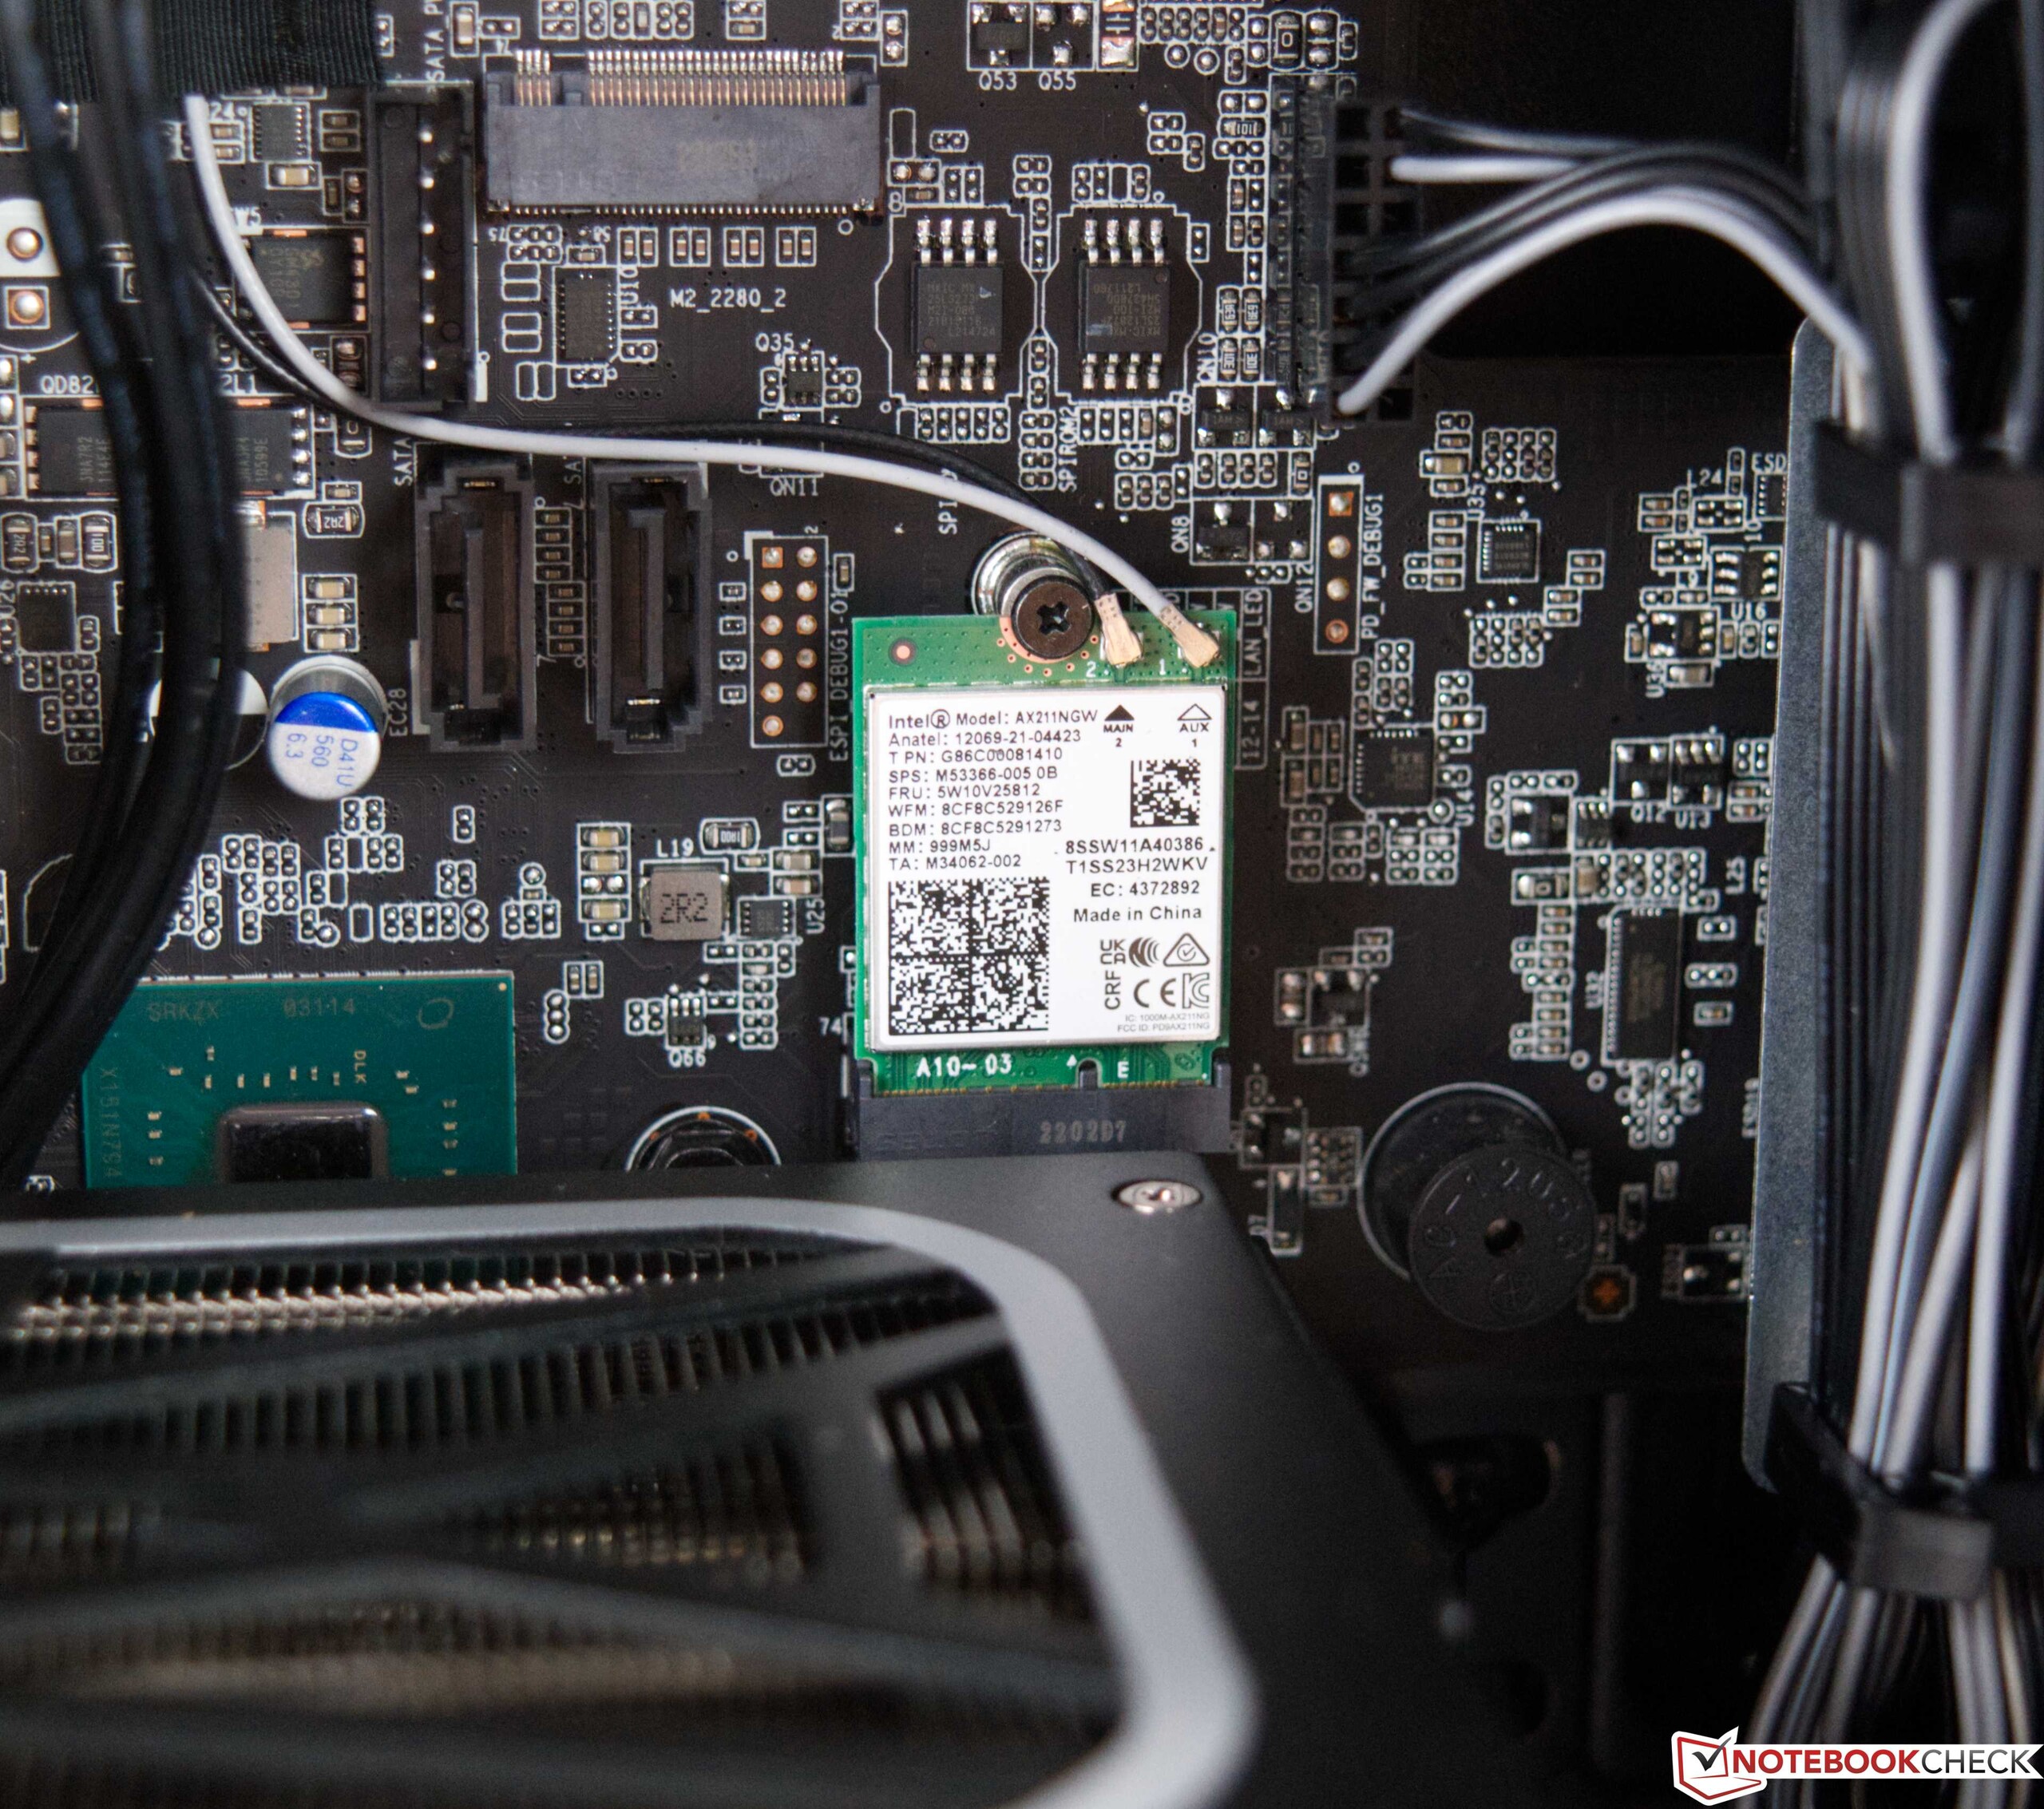
Kommunikation
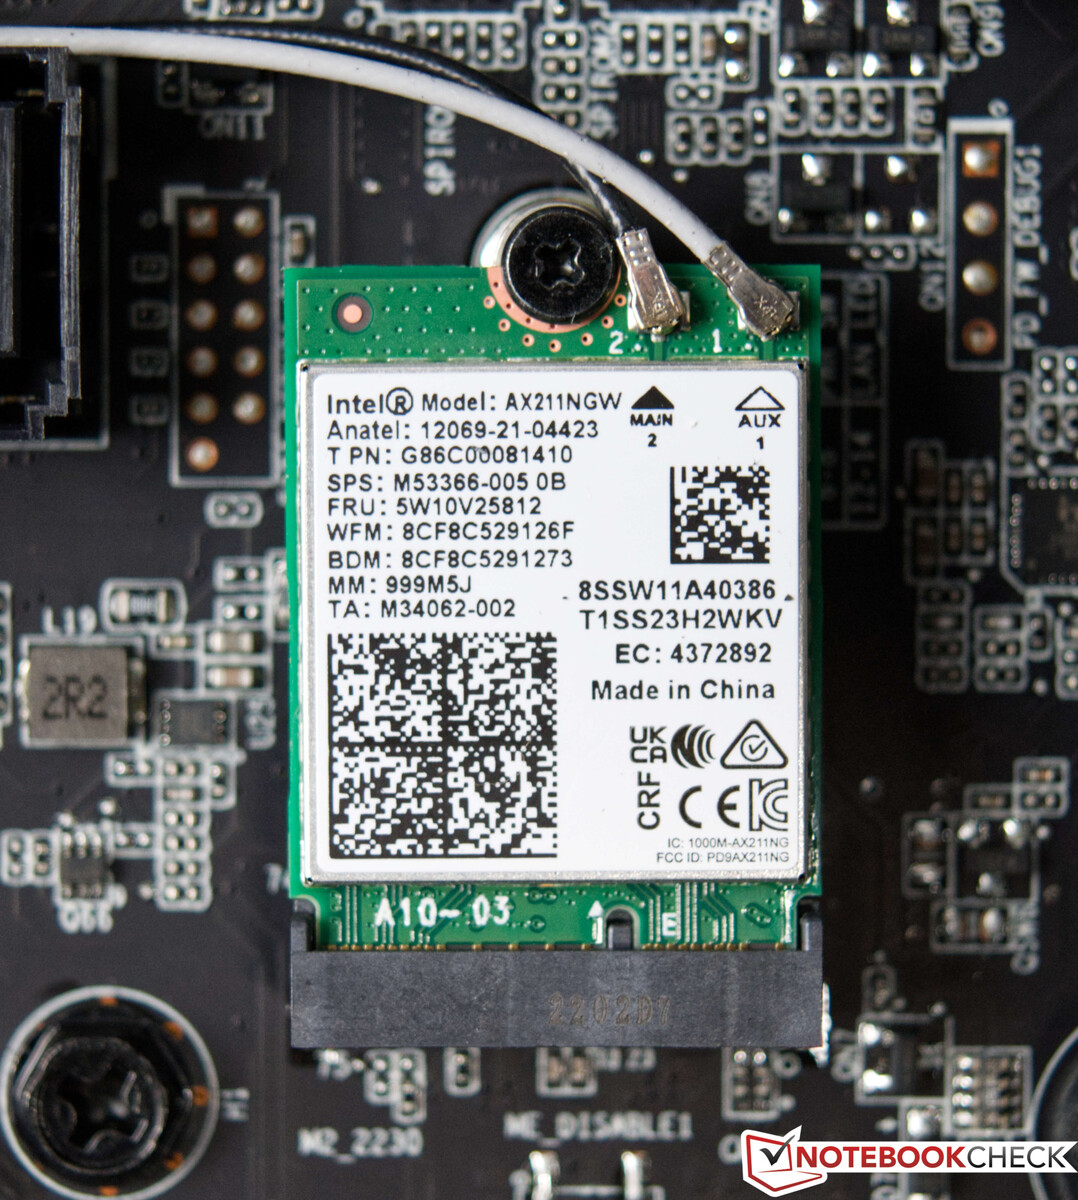
Acer stattet den Predator zusätzlich mit einem Intel Wi-Fi 6E AX211 Modul aus. Dieses befindet sich als M.2-Steckkarte direkt auf dem Mainboard und liefert relativ gute Transferraten. Nichtsdestotrotz kann die Leistung des Intel Wi-Fi 6E AX211 aber beim Datenempfang nicht mit den guten Werten beim Senden mithalten. Hier liefern die Vergleichsgeräte teilweise bessere Werten. Der Alltagstest zeigte jedoch, dass man auch mit dem verbauten WLAN-Modul gut zurechtkommt. Wir hatten keinerlei Problem beim Benutzen der Funkverbindung. Als Alternative steht dem Nutzer noch ein RJ45-Port zur Verfügung, welcher auf einen Killer-E2600-Chip setzt. Bedauerlicherweise bietet dieser nur maximal 1 GBit/s.
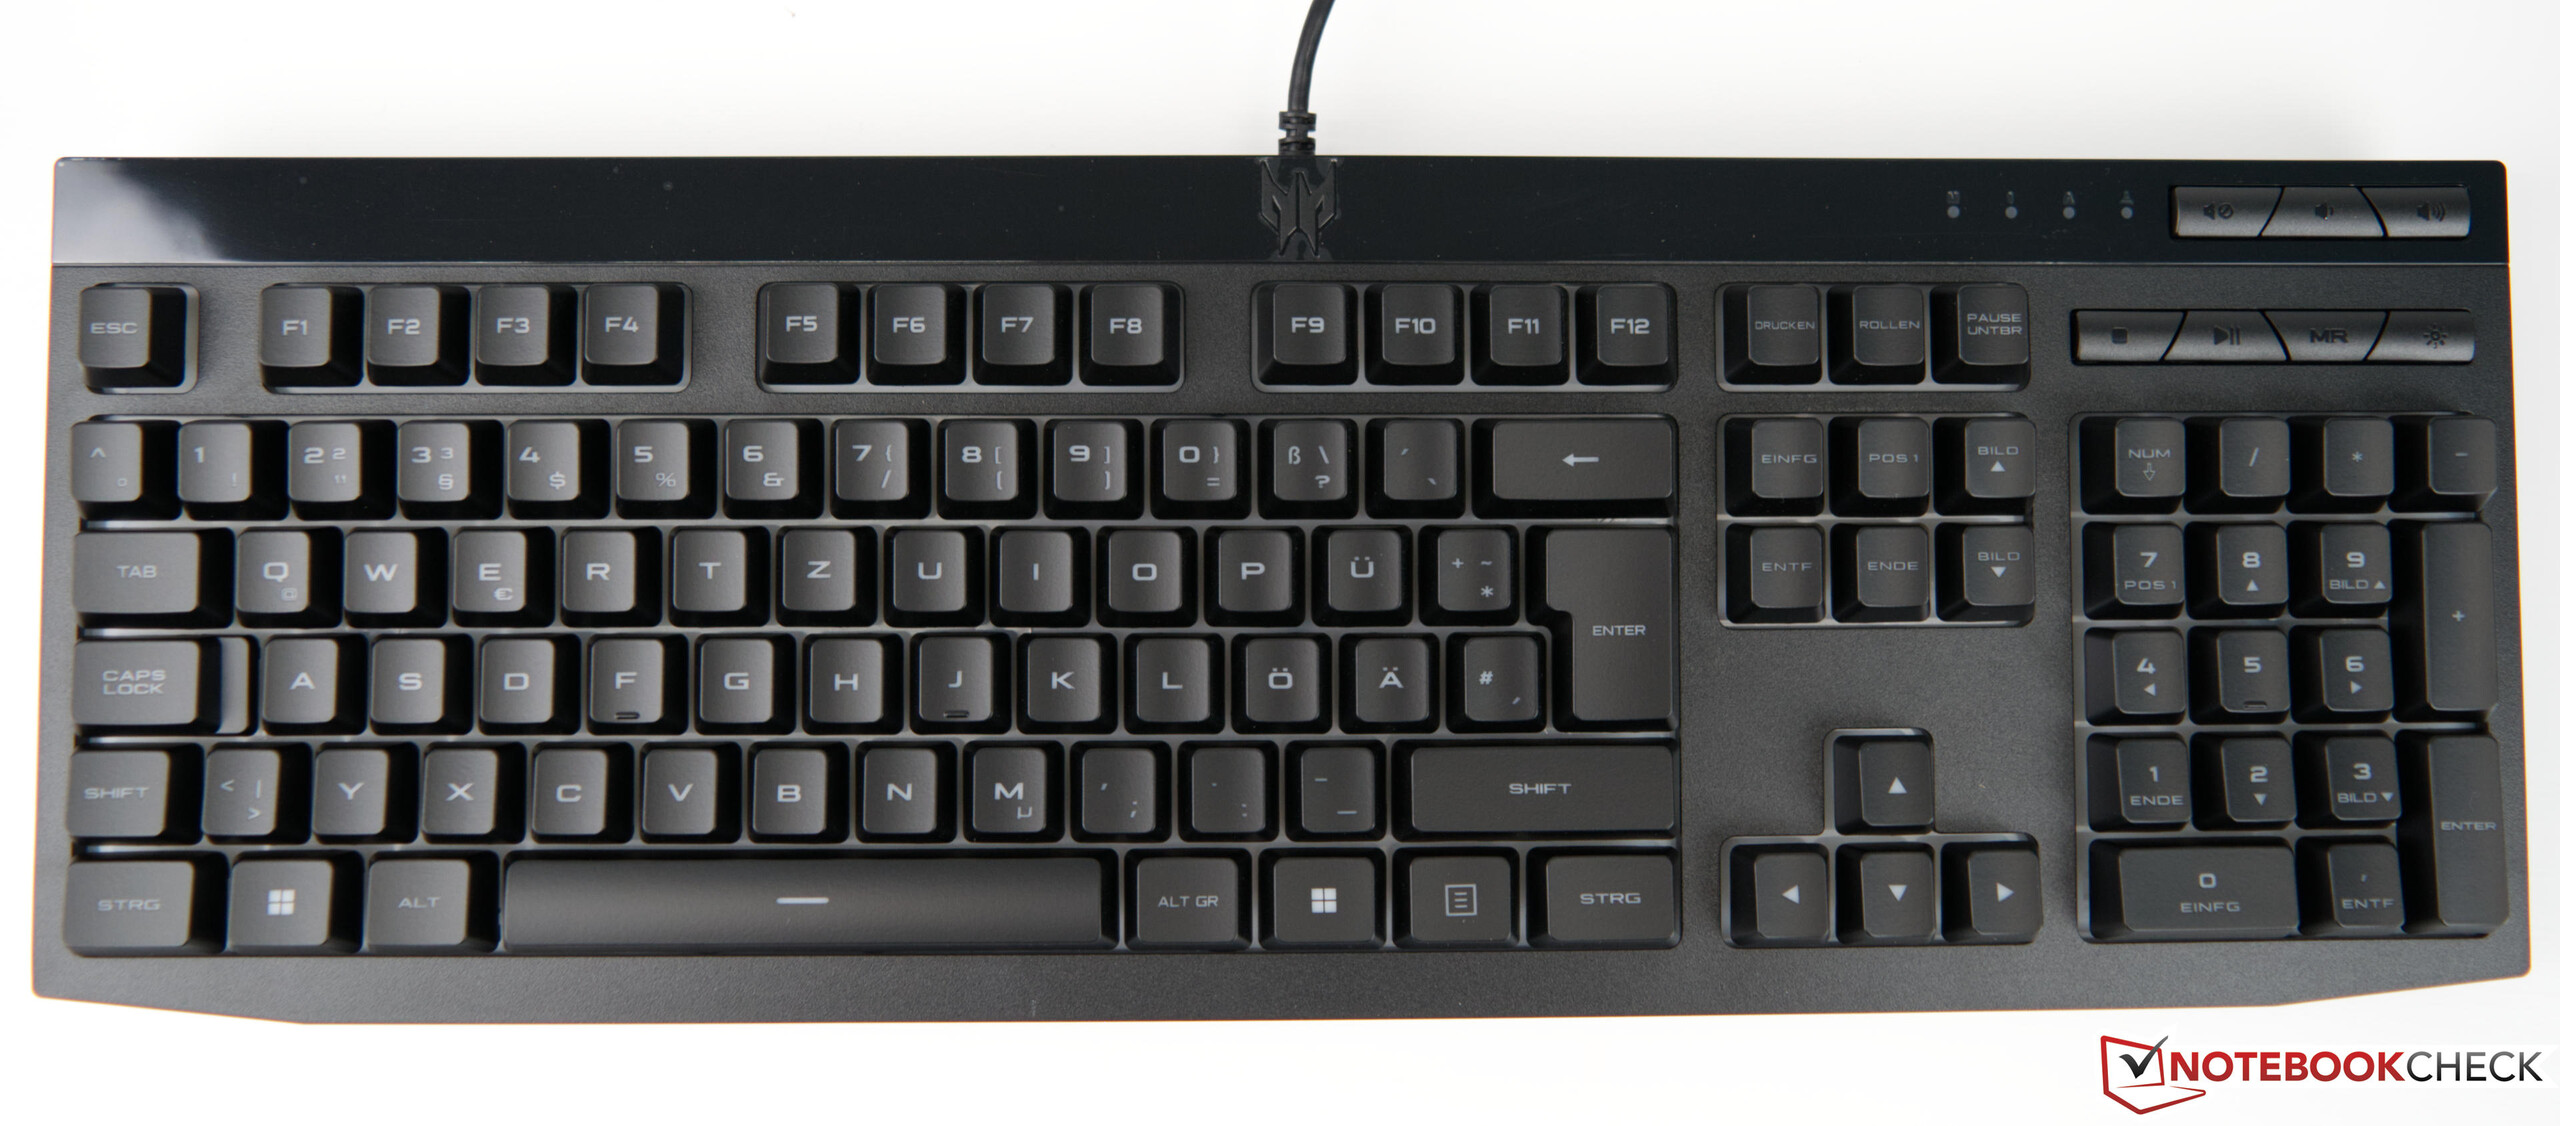
Zubehör
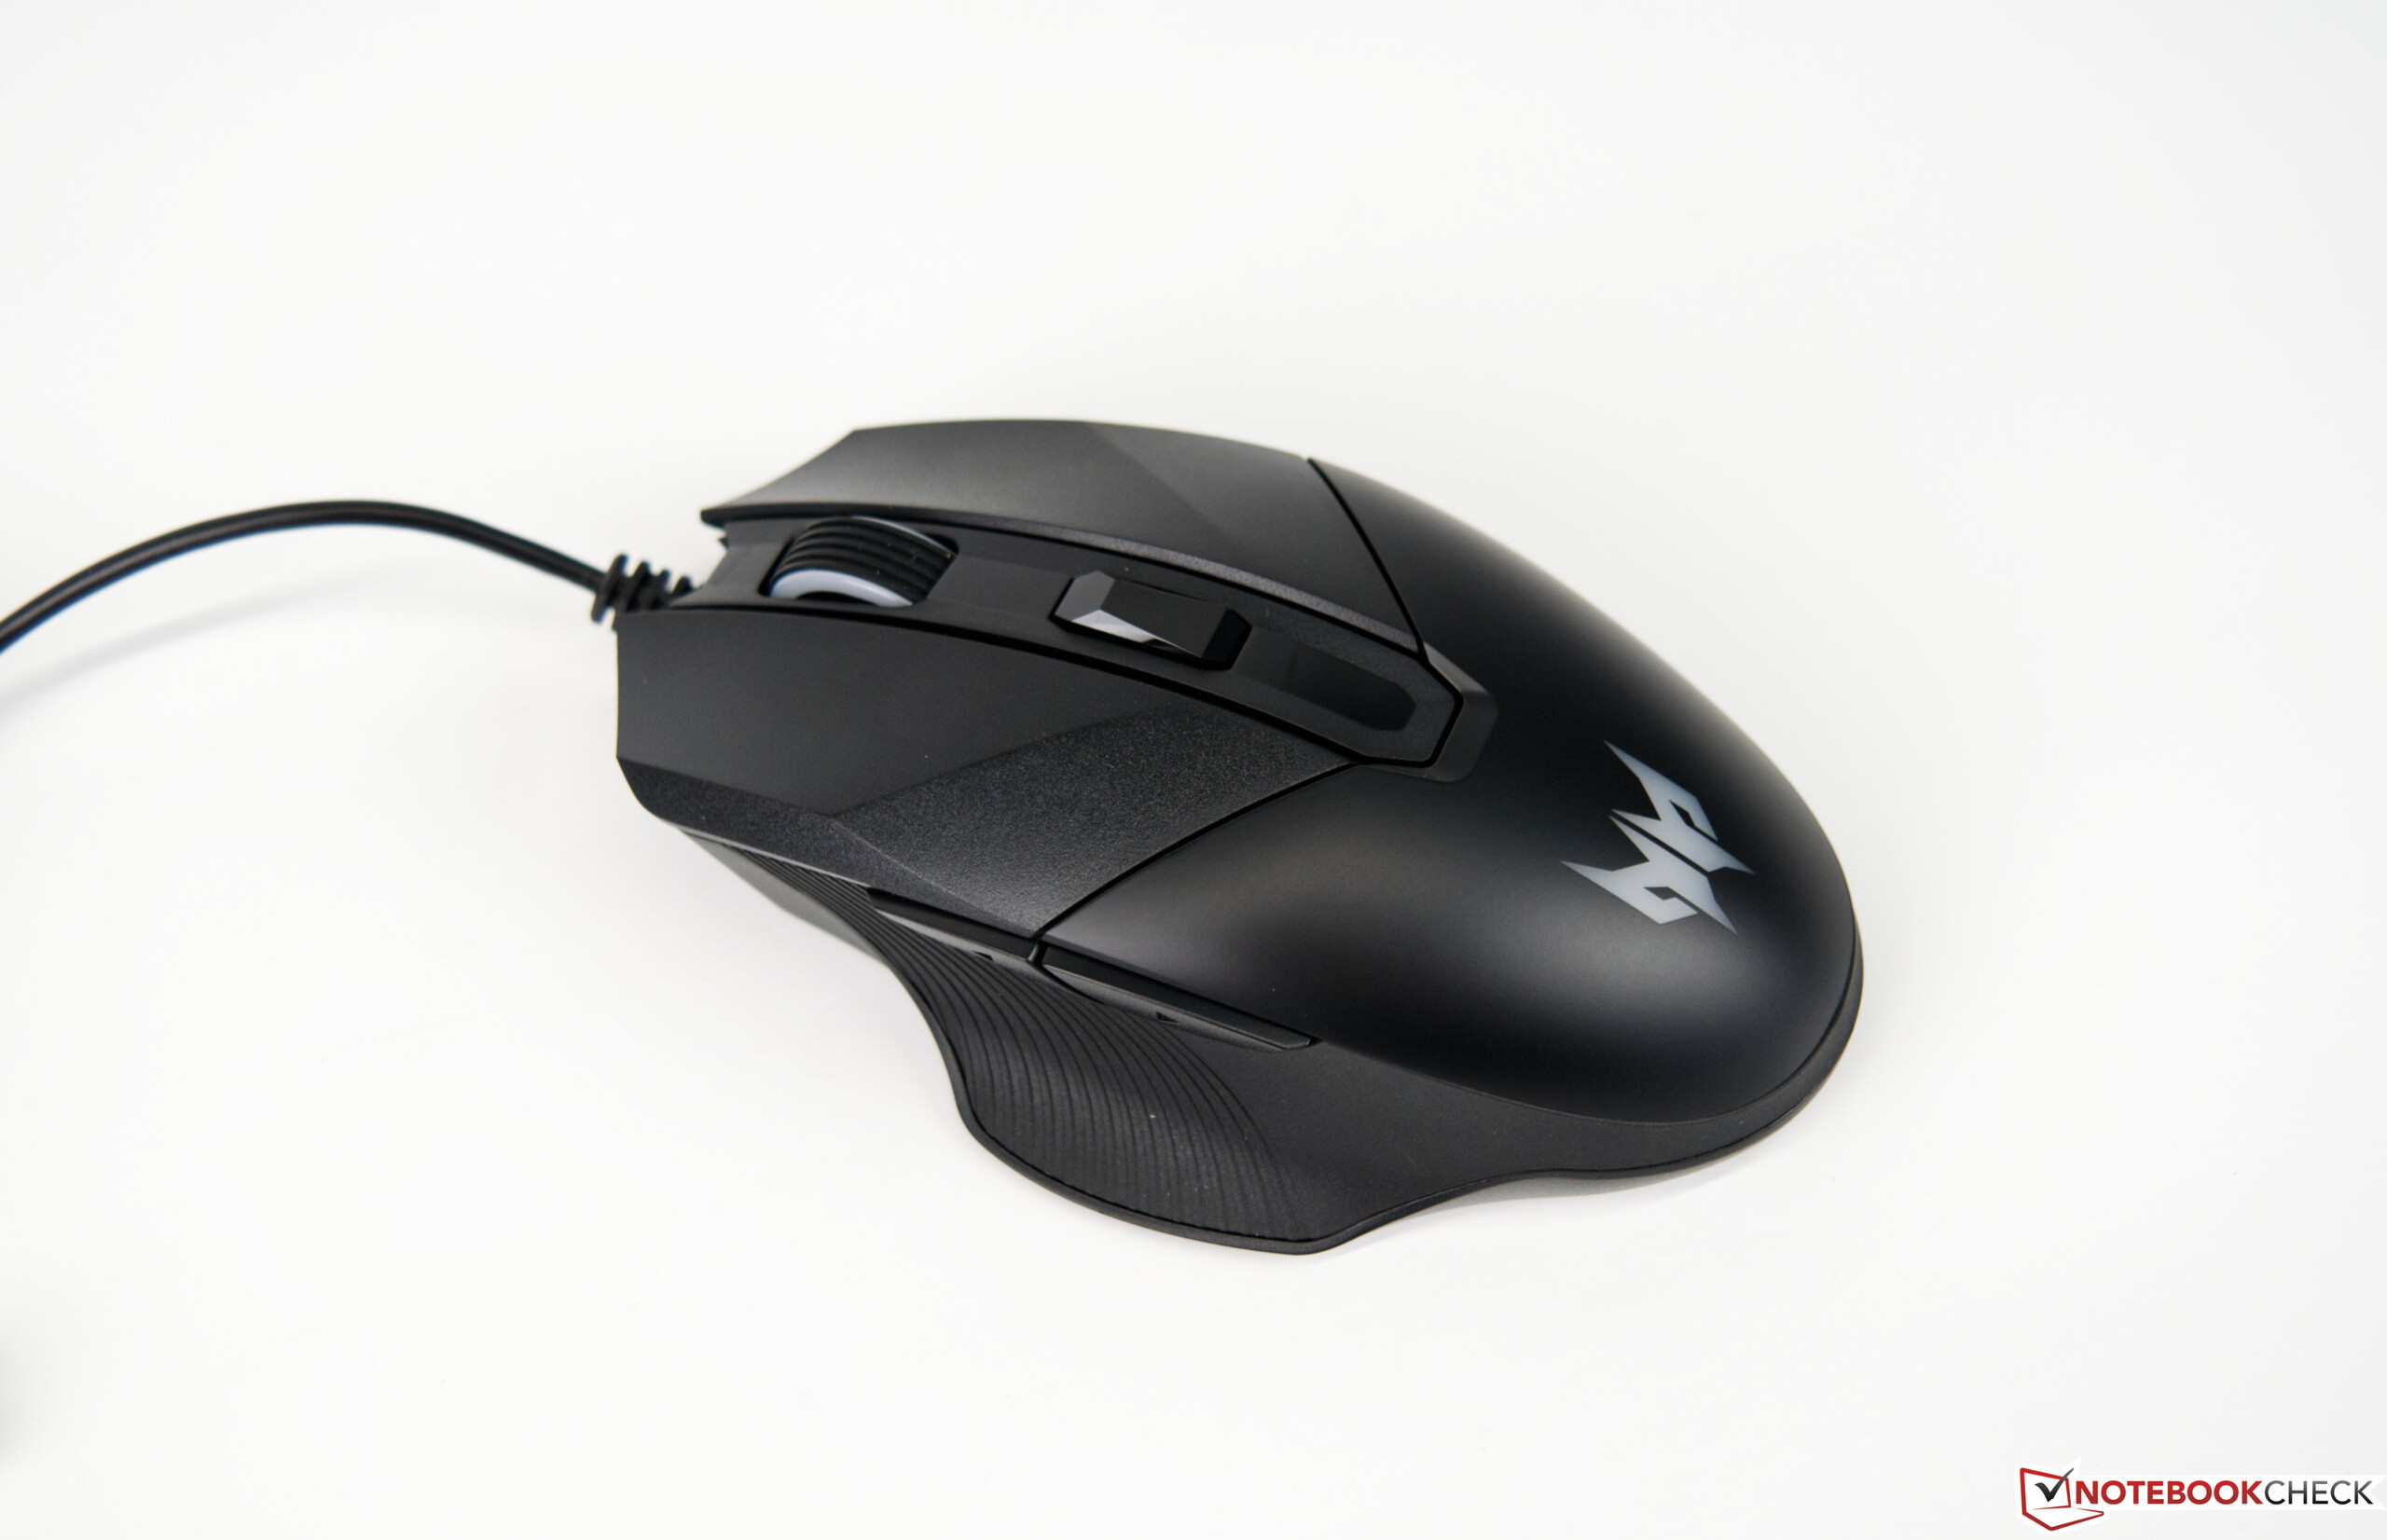
Wer sich einen Acer Predator Orion 3000 kauft, bekommt obendrein noch eine optisch passenden Tastatur sowie eine Gamingmaus, welche ebenso im Predator-Style daherkommt. Damit ist man für den Start gut gewappnet und die Hardware sorgt für einen stimmigen Gesamteindruck. Der Tower kann hingegen auch mit dem optionalen Seitenteil inklusive Sichtfenster aufgewertet werden. Damit kommt die verbaute RGB-Beleuchtung besser zur Geltung.
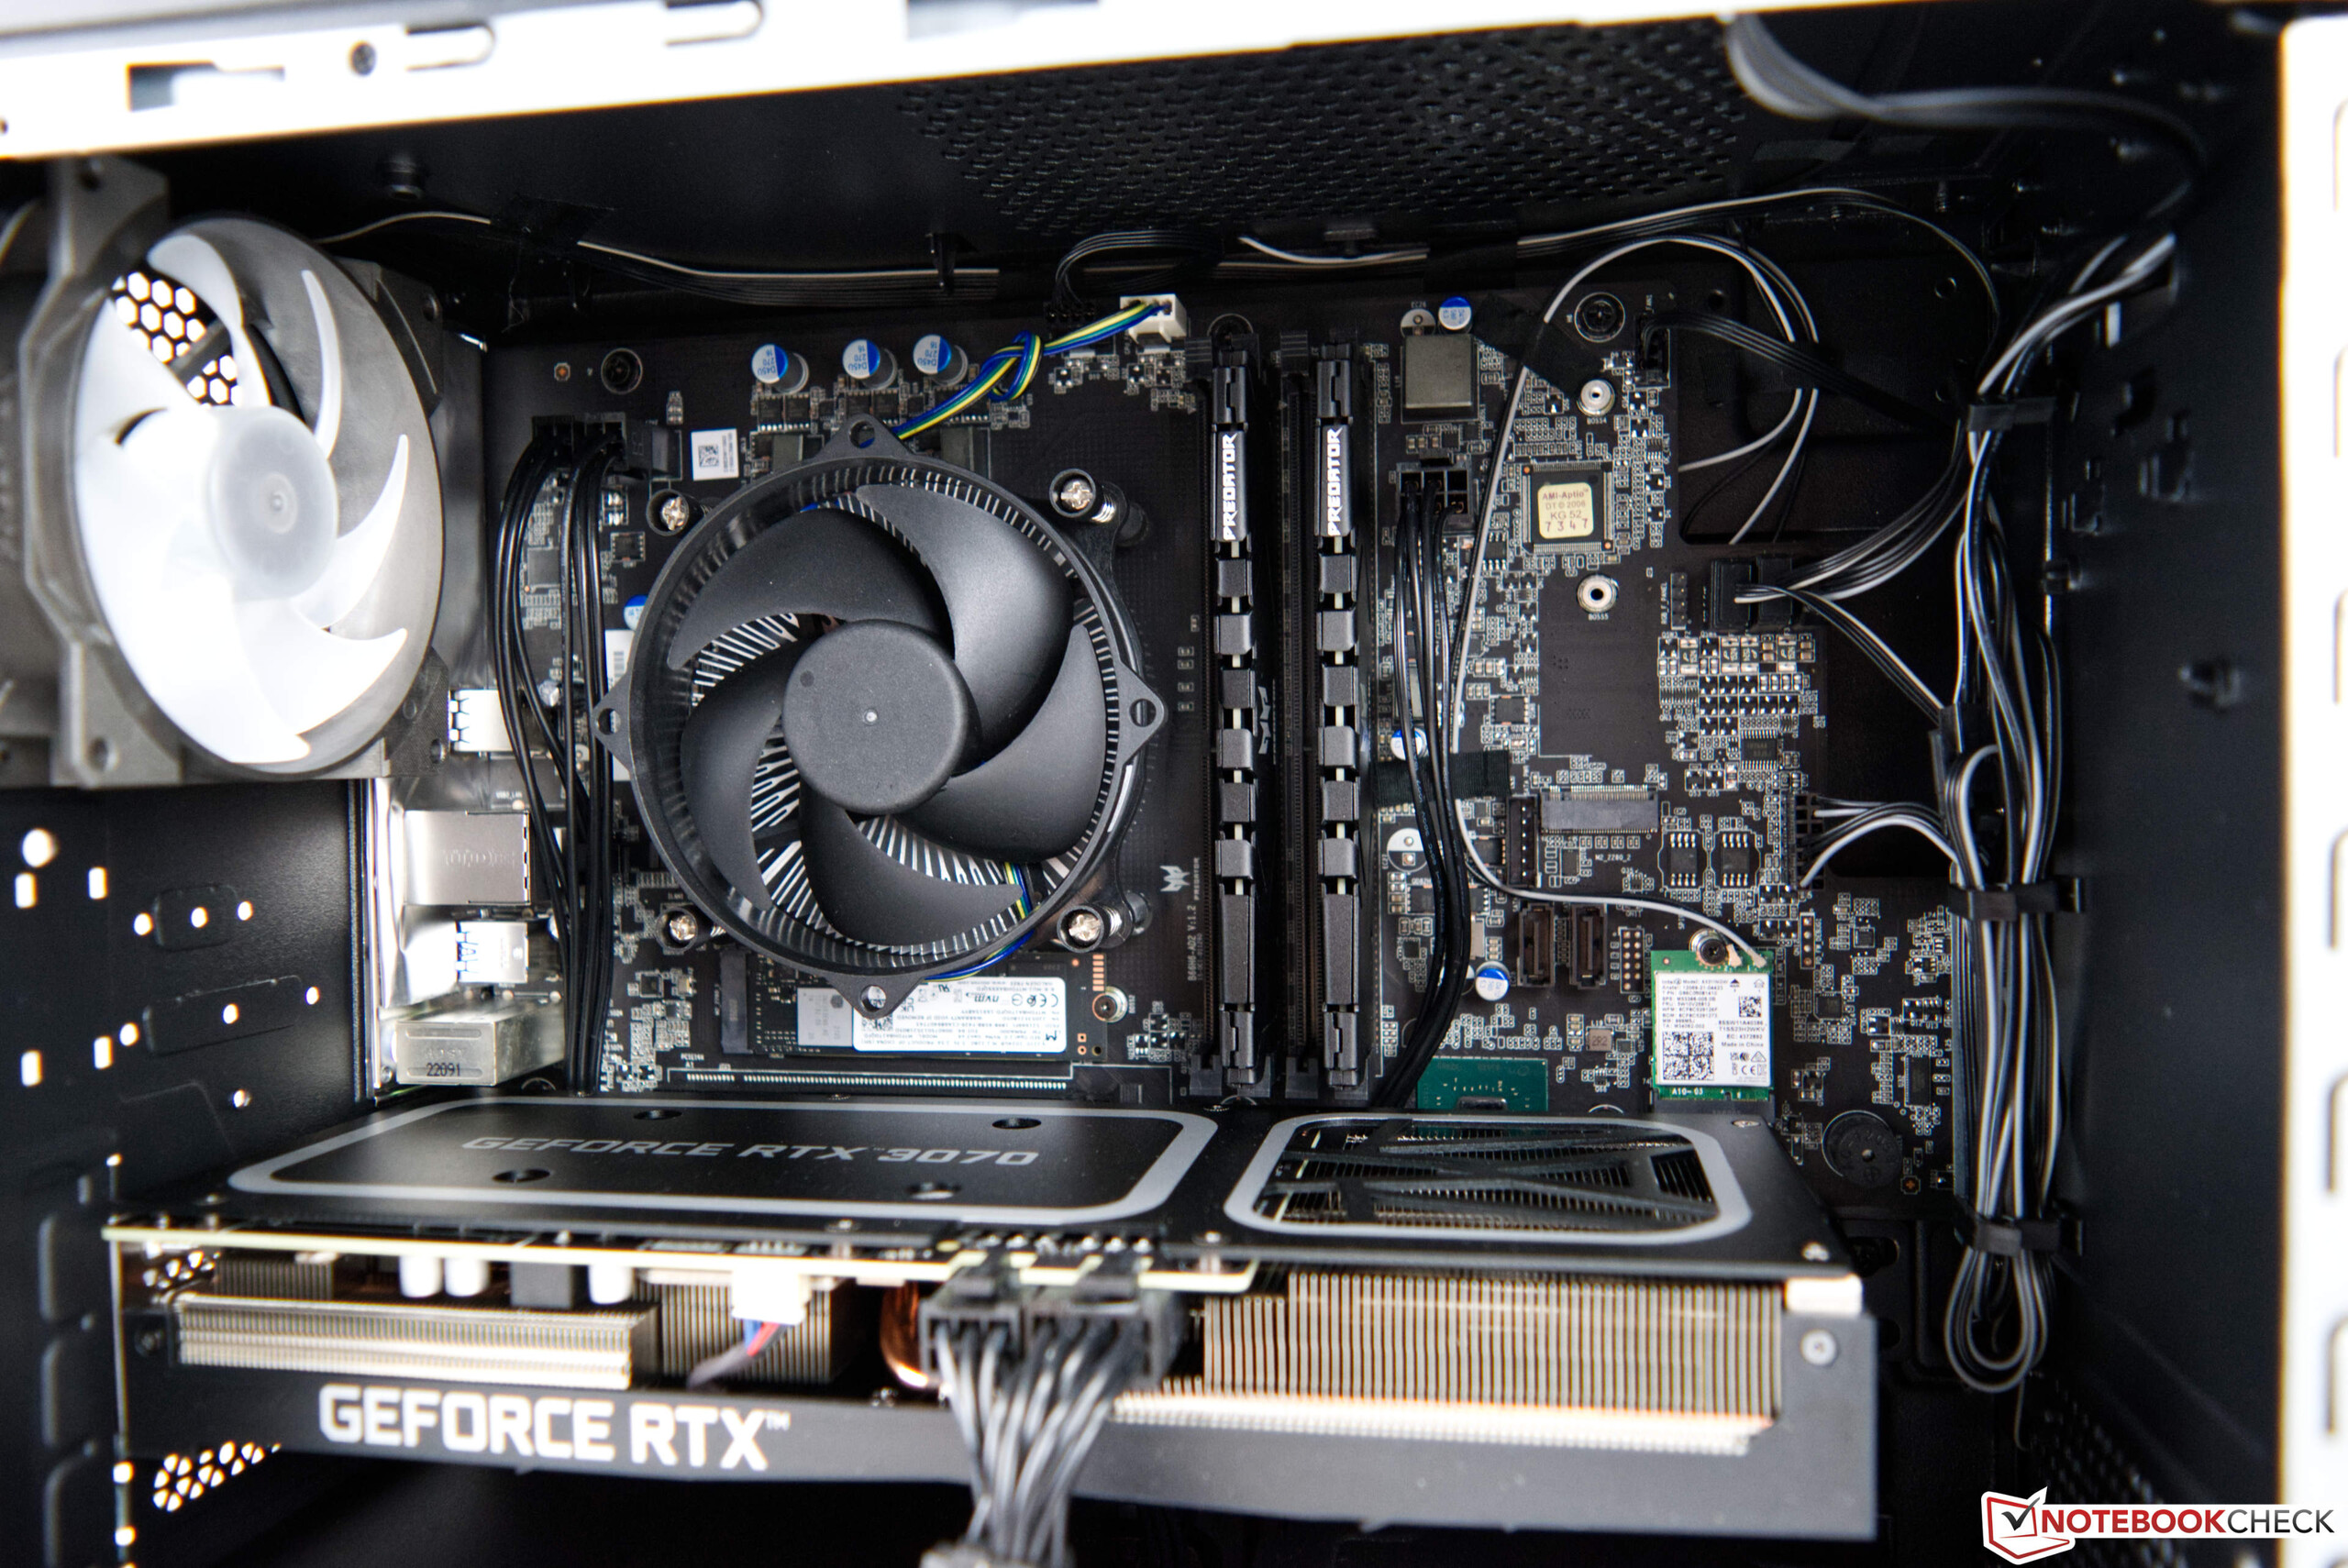
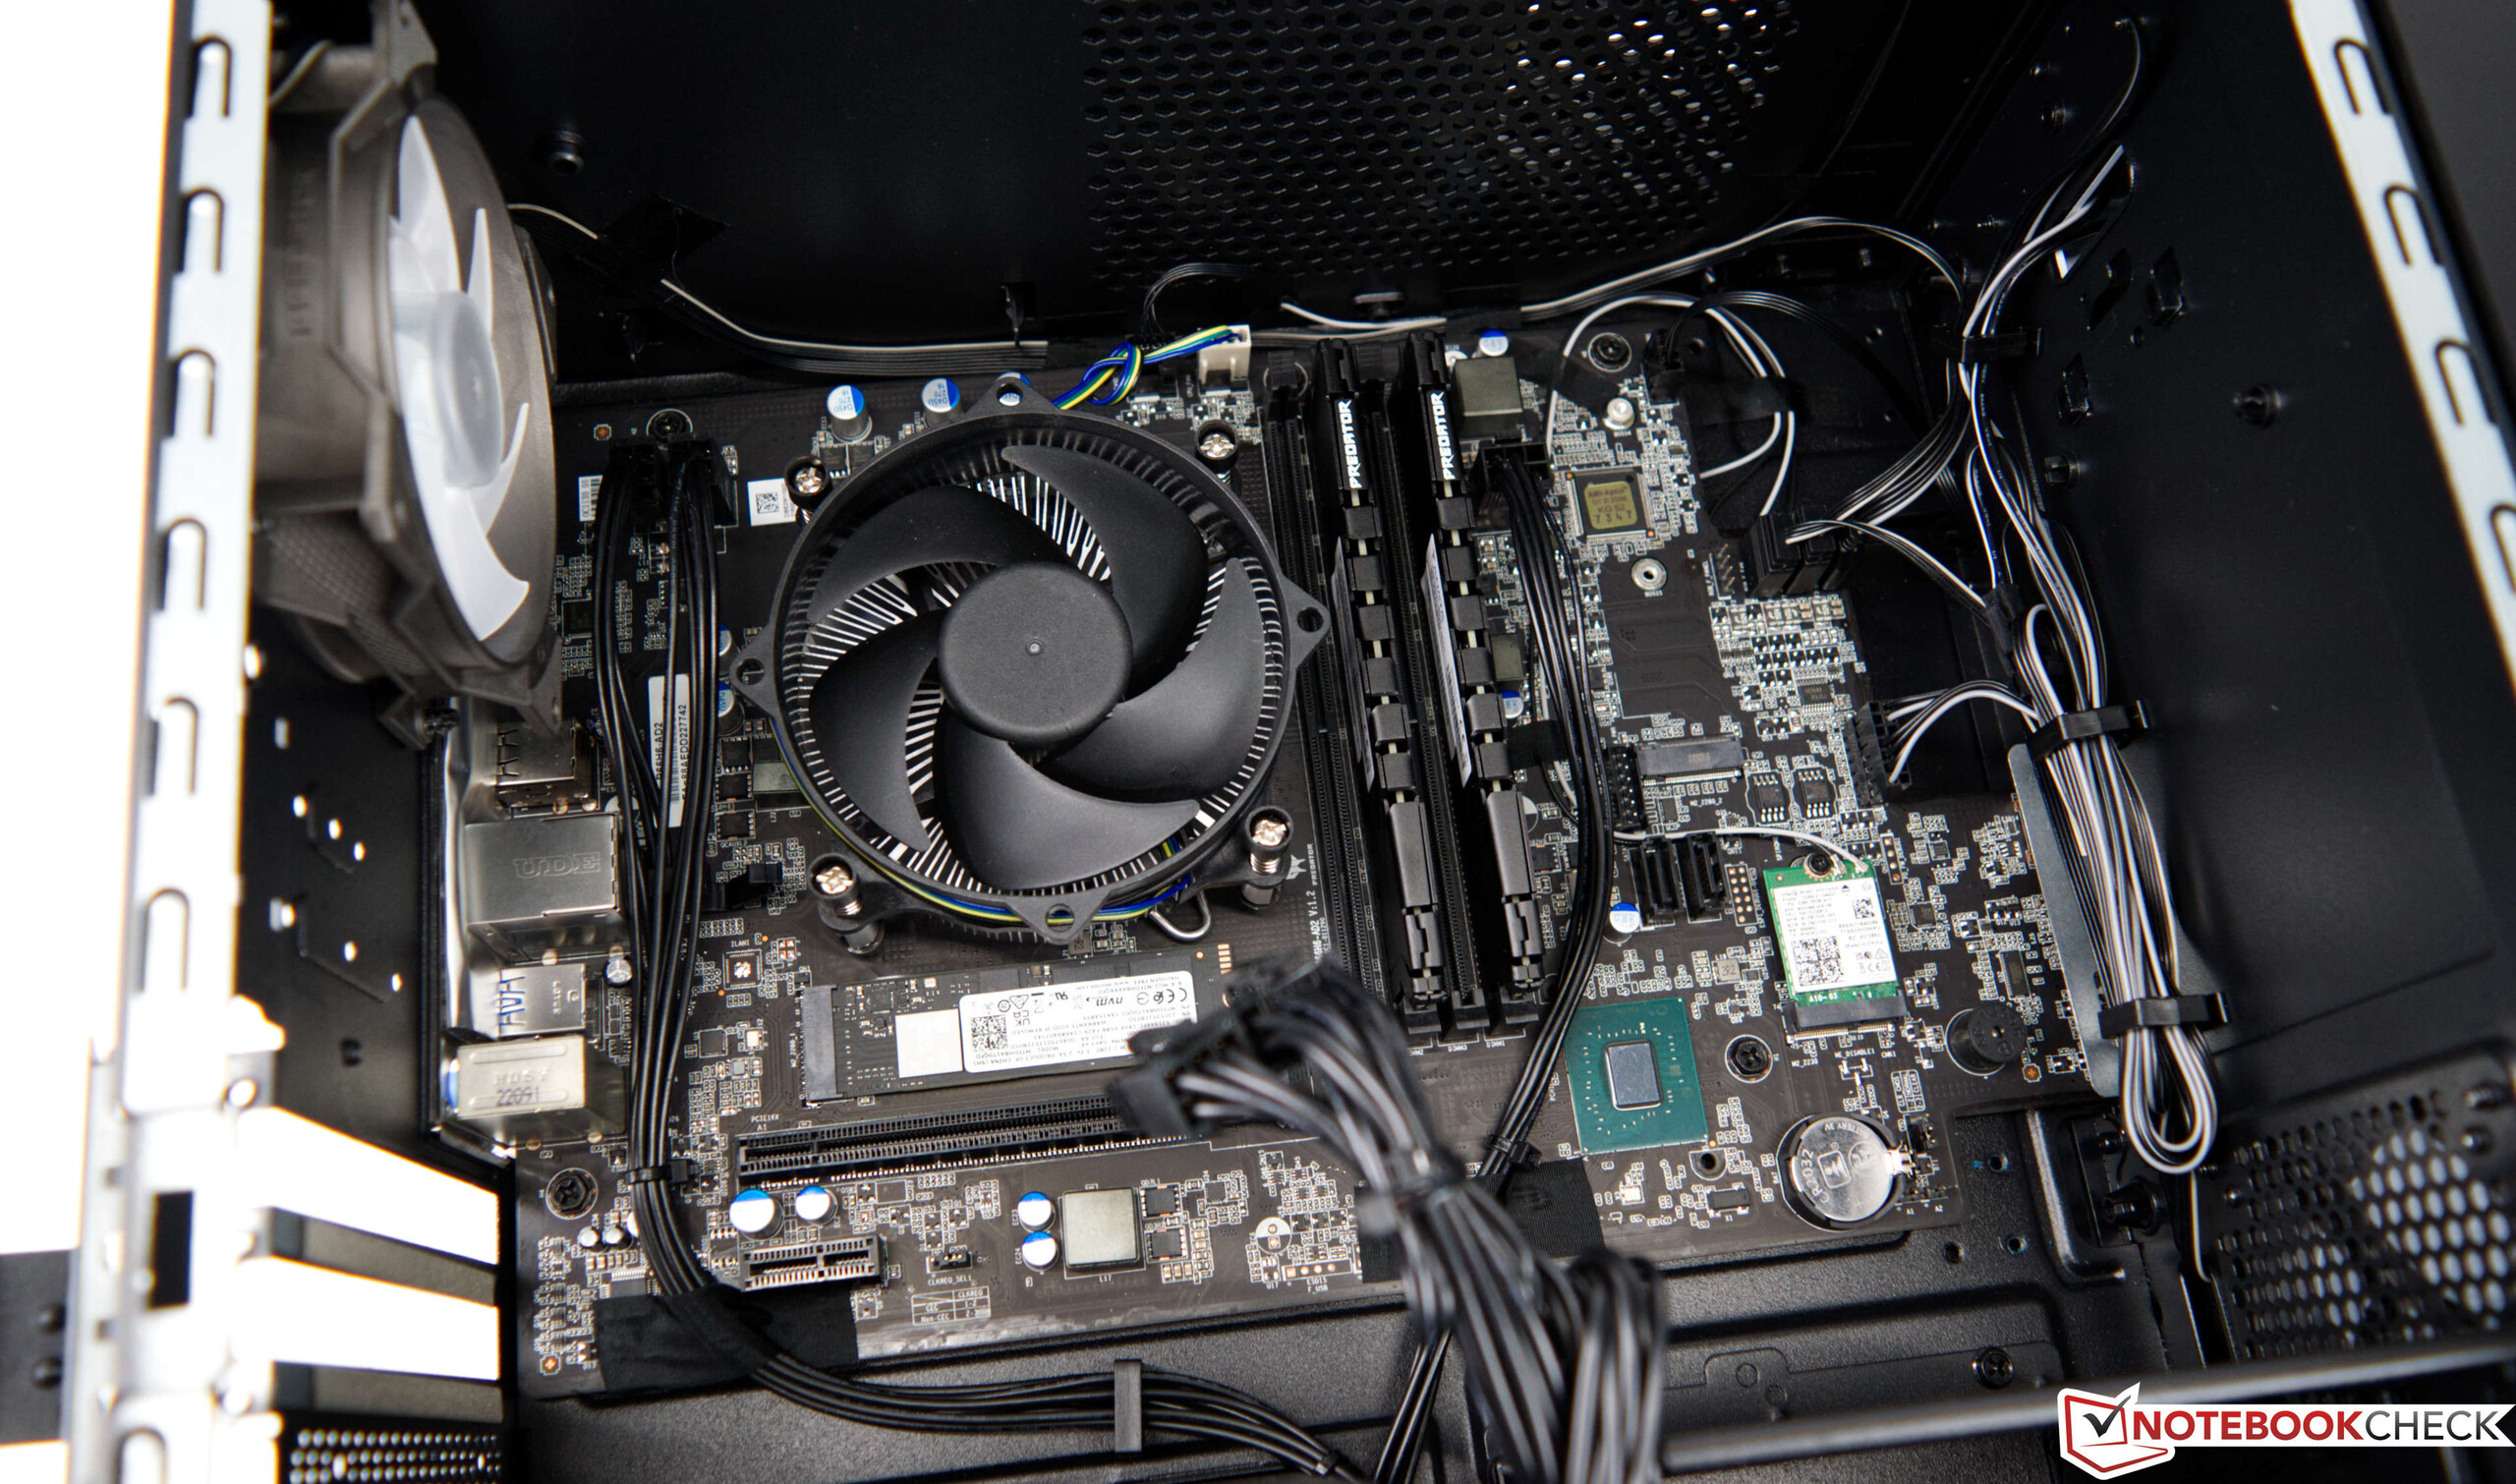
Wartung
Wartungsarbeiten sind beim Acer Predator Orion 3000 kein großes Problem. Das Seitenteil ist mit zwei Schrauben fixiert und lässt sich leicht entfernen. Intern gelangt man gut an die verbauten Komponenten. So lässt sich der Massenspeicher beispielsweise noch mit einem zweiten M.2-Modul erweitern. Alternativ lassen sich auch bis zu zwei herkömmliche 3,5-Zoll-Festplatten unterbringen.
Leistung - Eingebremster Core i7-12700F
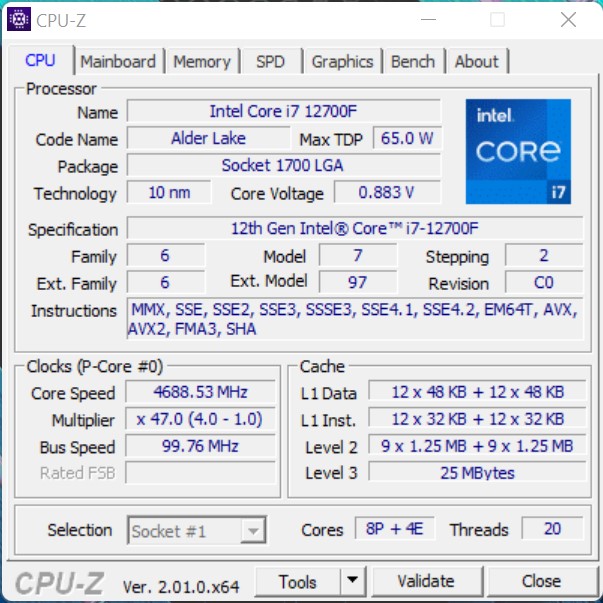
In der aktuellen Version des Predator Orion 3000 von Acer werkelt immer eine sparsame 65-Watt-CPU. So kommt im stärksten Modell der Intel Core i7-12700F zum Einsatz. Dieser bietet eine sehr gute Leistung und kann dank des hybriden Aufbaus aus E- und P-Kernen immer die beste Leistung für die jeweilige Anwendung bereitstellen. In einer preiswerteren Konfiguration kann man den Predator Orion 3000 auch mit einem Intel Core i5-12400 bekommen. Dieser bietet ebenfalls eine gute Gaming-Performance, muss aber auf die E-Kerne verzichten. Als Grafikkarte bekommt man mindestens eine GeForce RTX 3060, welche für 1.080p-Gaming ausgelegt ist. Mehr Leistung gibt es mit der GeForce RTX 3070, mit der auch 1440p-Gaming möglich ist.
Testbedingungen
Alle Tests haben wir mit dem Energieprofil Höchstleistung
durchgeführt. Zudem haben wir bei dem Gehäuse auf das durchsichtige Seitenteil verzichtet. Über das Tool Predator Sense
lassen sich zudem die Lüfterdrehzahlen konfigurieren. Wir haben hier die Auto-Einstellung beibehalten, um hier einen guten Kompromiss aus Lautstärke und Leistung einzugehen.
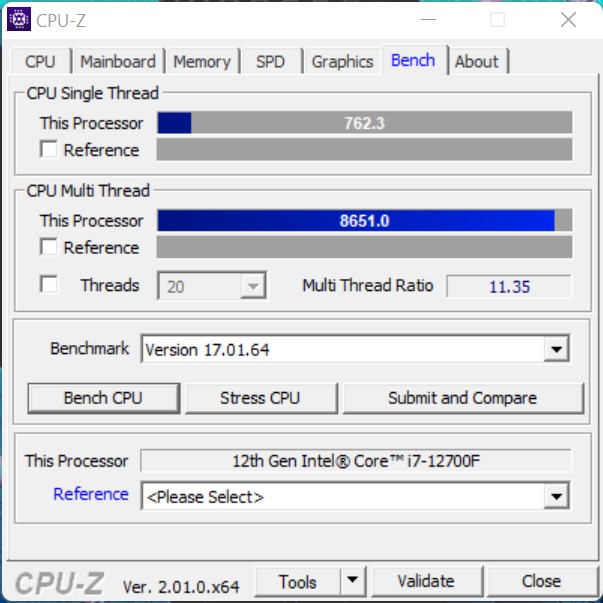
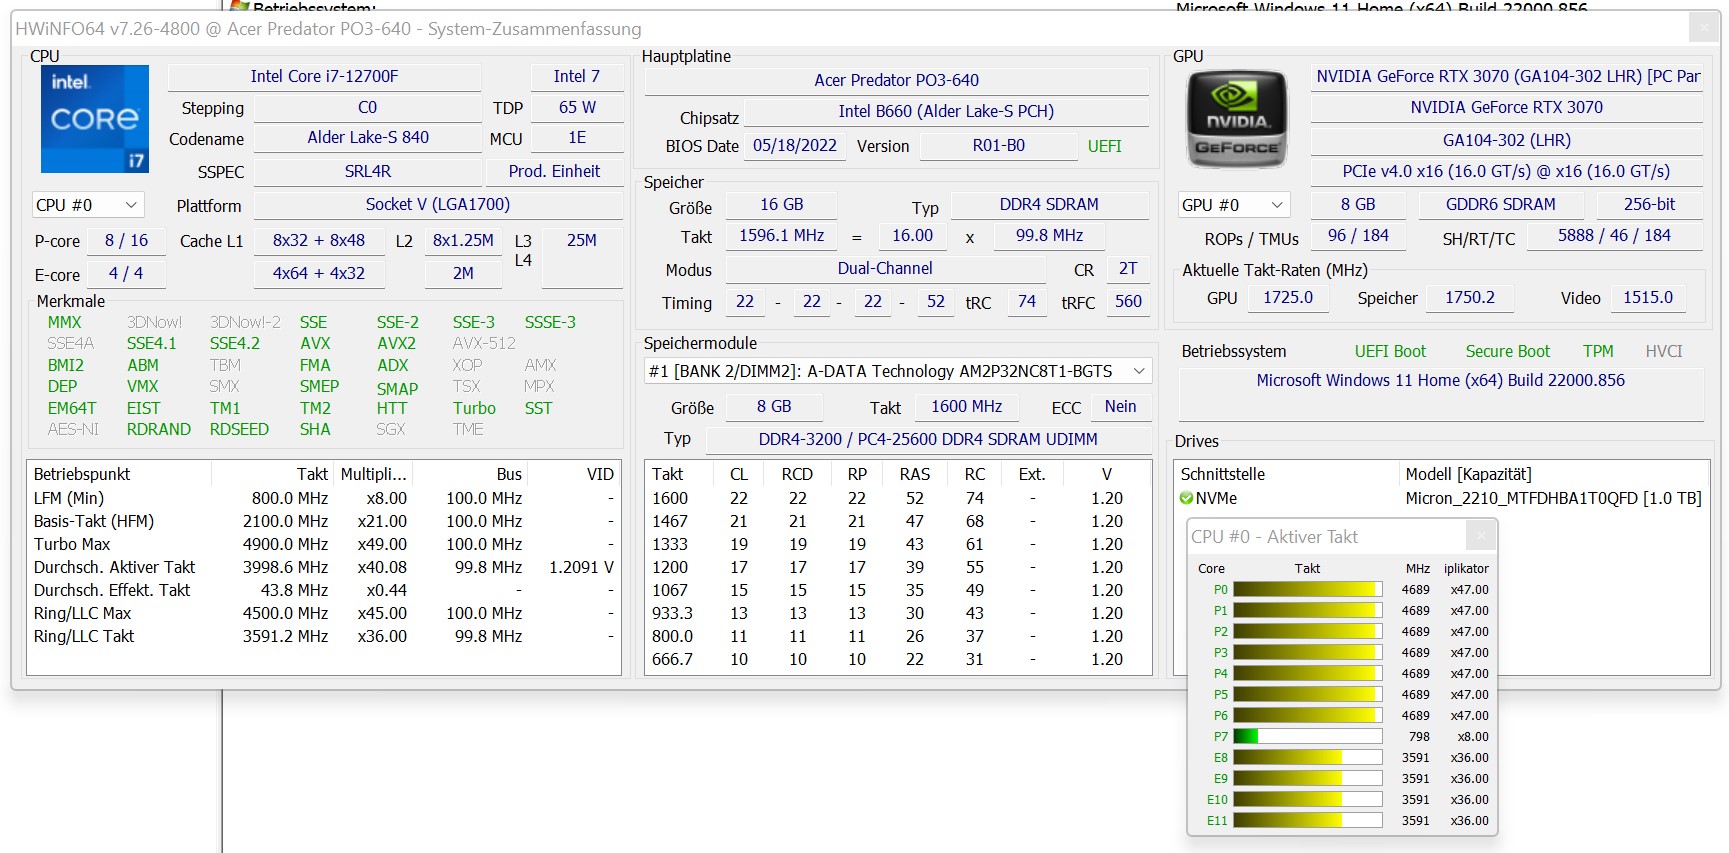
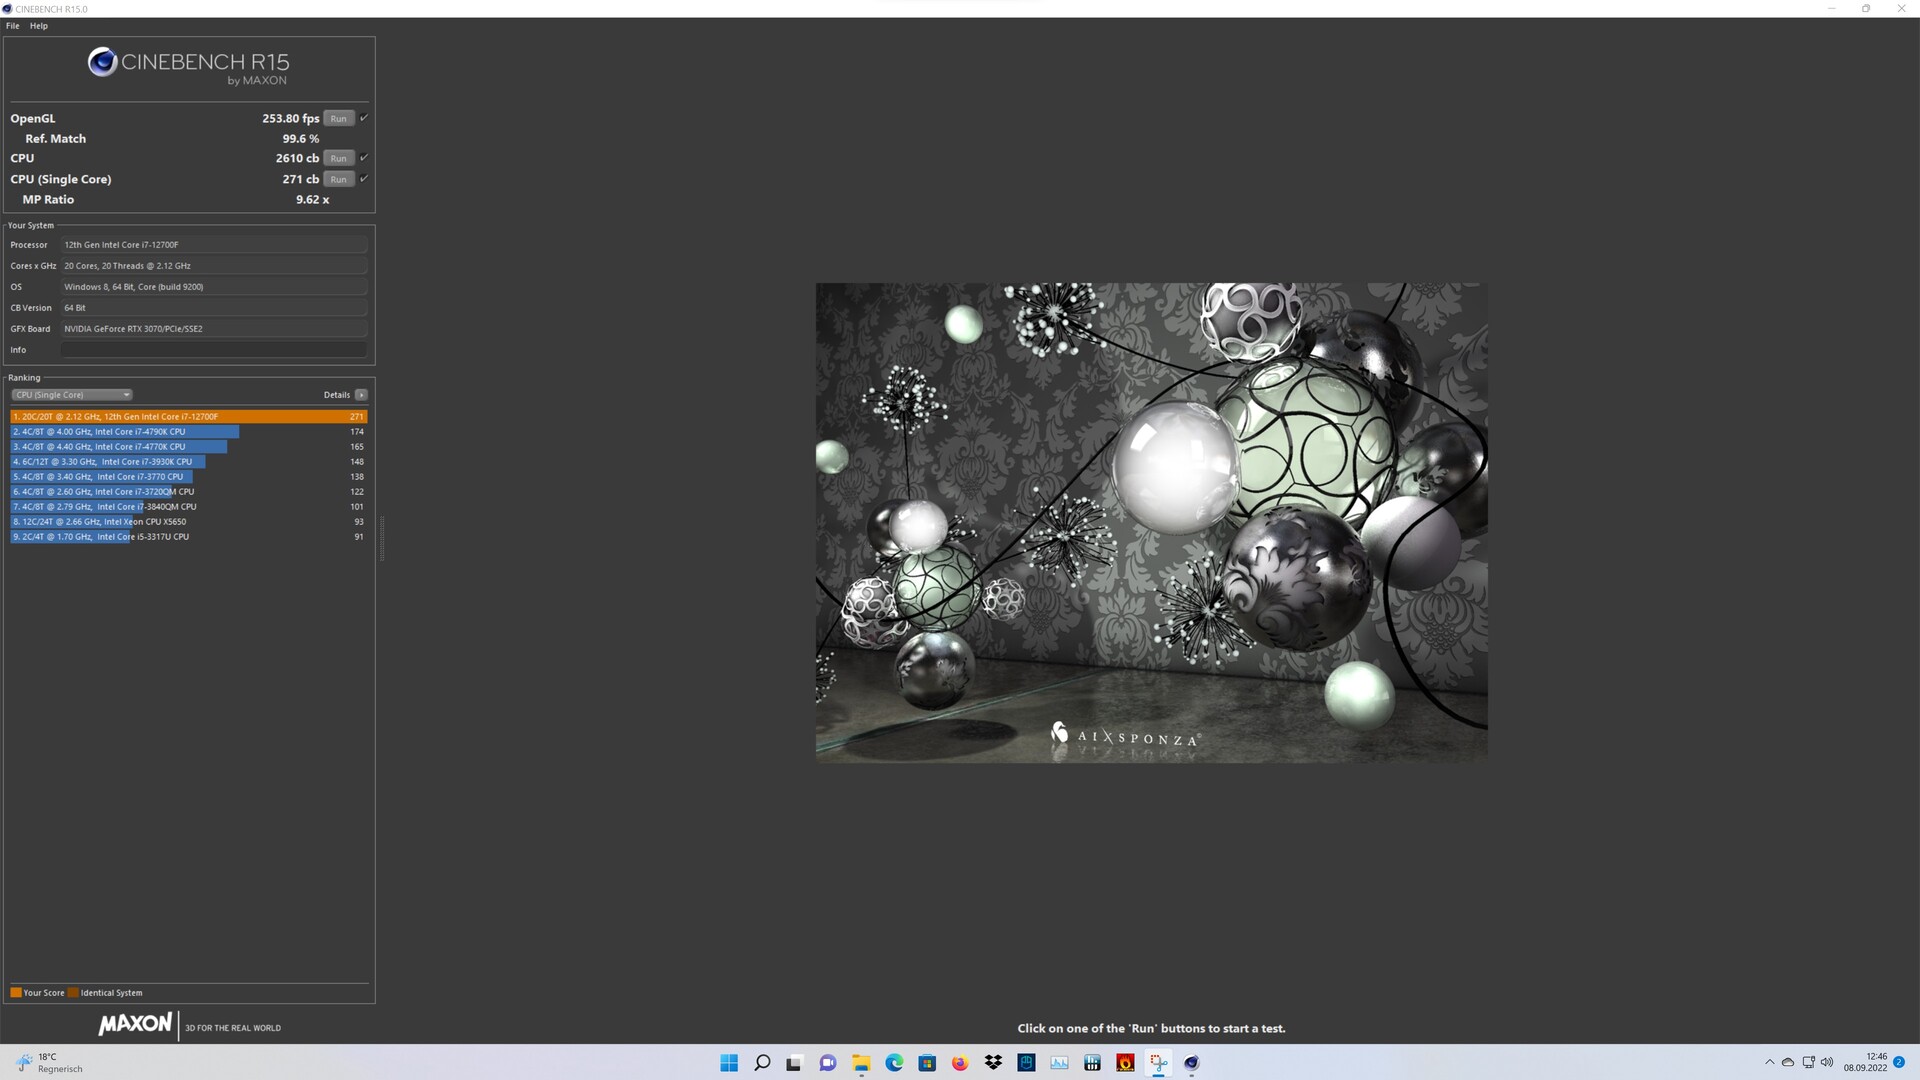
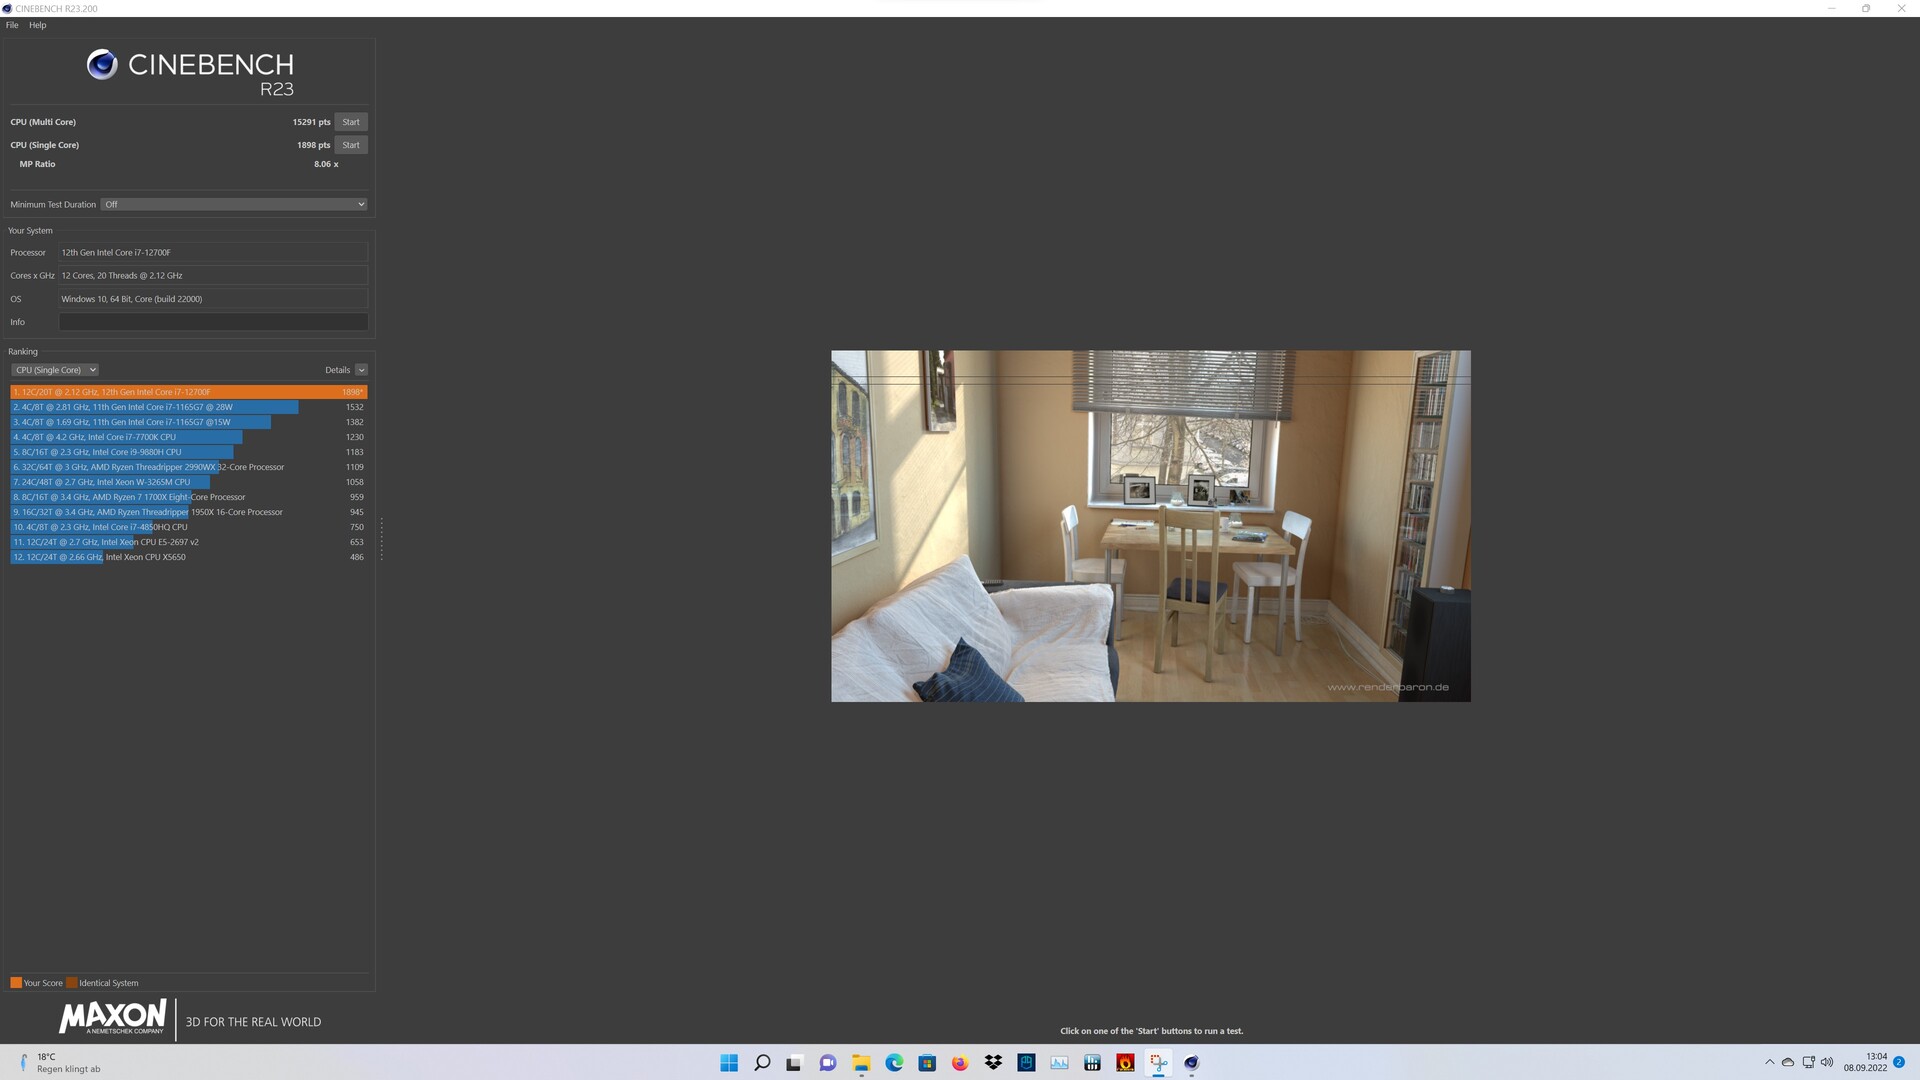
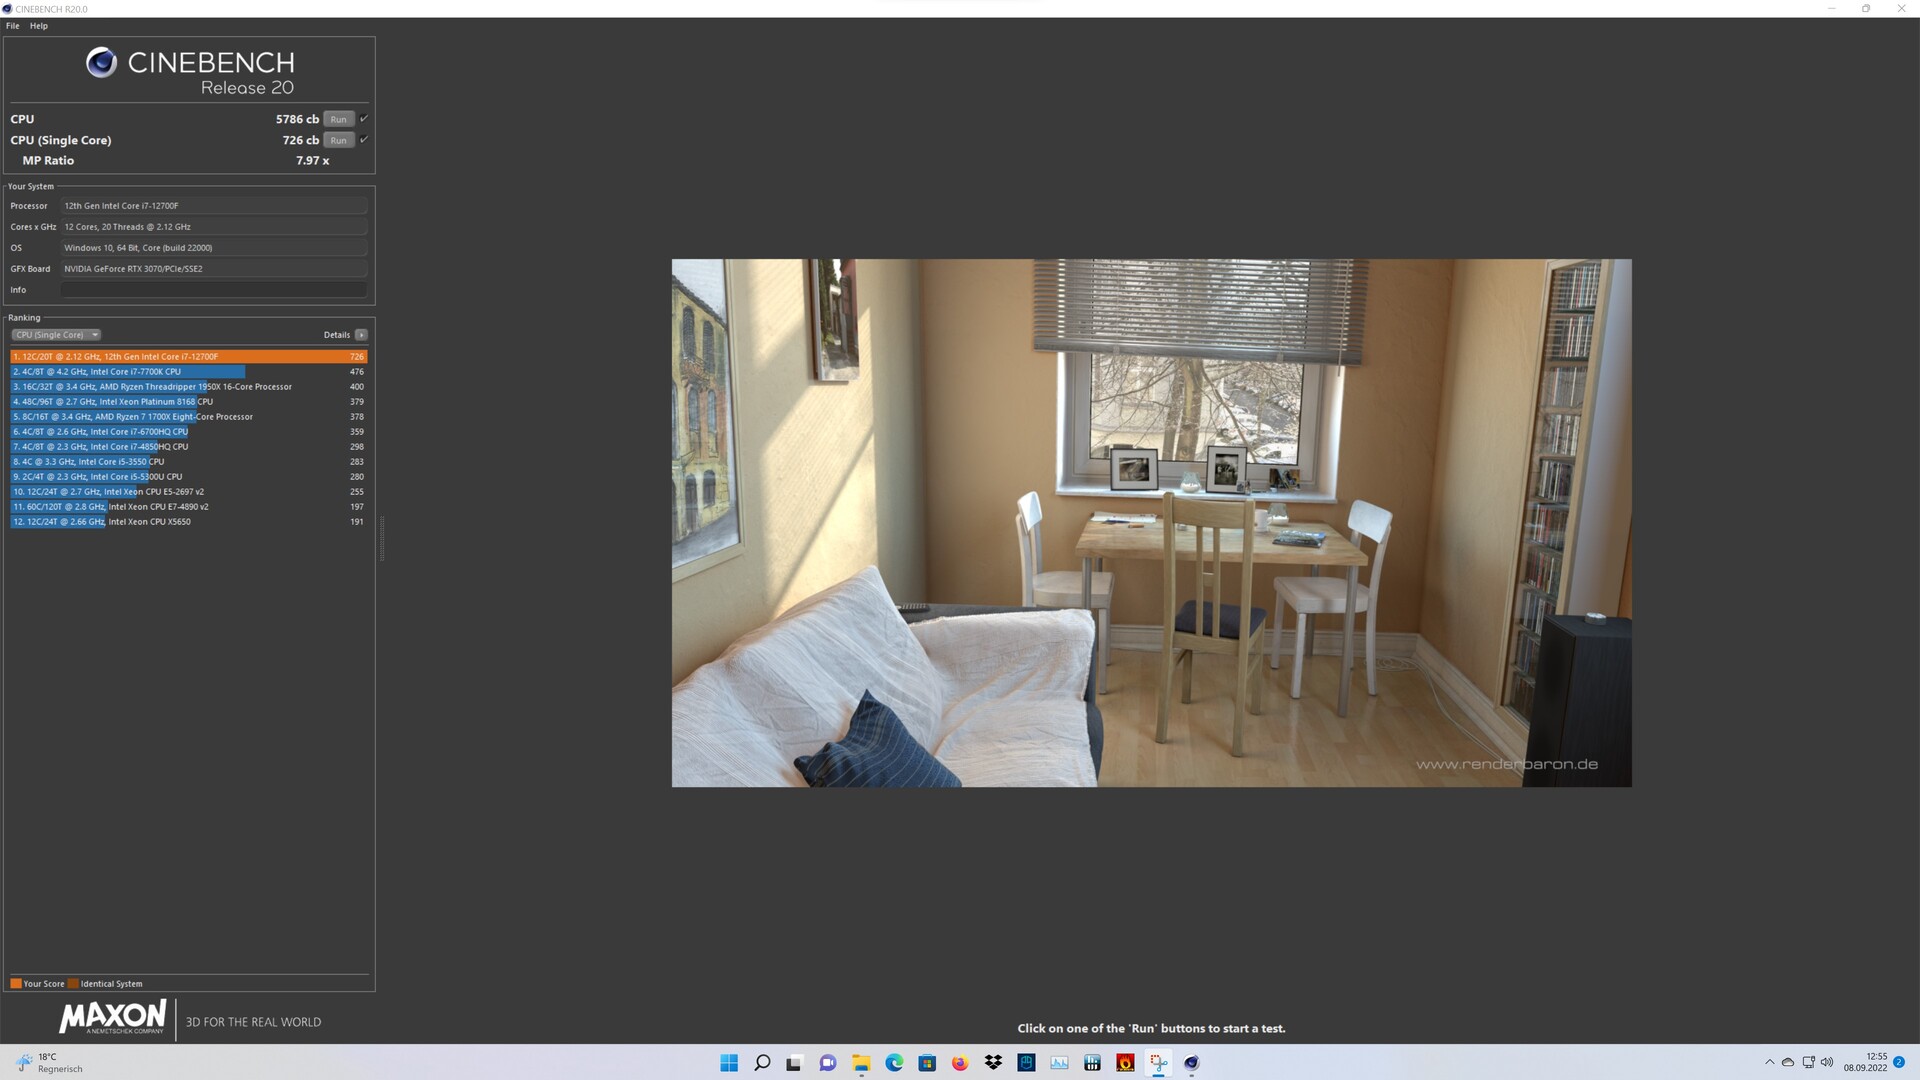
Prozessor
Mit dem Intel Core i5-12700F ist der Predator Orion 3000 in diesem Test mit dem schnellsten Modell ausgestattet, welchen Acer für diesen PC anbietet. Das 65-Watt-SoC bietet 8 P-Kerne und 4 E-Kerne, welche zusammen bis zu 20 Threads gleichzeitig verarbeiten können. Bei der maximalen Leistung schränkt Acer den Intel Core i5-12700F allerdings etwas ein, denn das PL2 beträgt bei diesem Modell normalerweise 180 Watt. Acer hingegen begrenzt die maximale Leistungsaufnahme hier bei 126 Watt für maximal 28 Sekunden. Im Vergleich zu den anderen Vergleichsgeräten kann der Acer Predator Orion 3000 aber dennoch ein gutes Ergebnis erzeilen. Gleichwohl verschenkt der Hersteller hier aber Leistung für ein besseres Gesamtergebnis.
Für weitere Vergleiche und Benchmarks verweisen wir hier auf unsere CPU-Vergleichstabelle.
* ... kleinere Werte sind besser
AIDA64: FP32 Ray-Trace | FPU Julia | CPU SHA3 | CPU Queen | FPU SinJulia | FPU Mandel | CPU AES | CPU ZLib | FP64 Ray-Trace | CPU PhotoWorxx
| Performance Rating | |
| Durchschnitt der Klasse Desktop | |
| Intel Beast Canyon NUC | |
| Intel Dragon Canyon NUC - RTX 3060 | |
| Zotac ZBOX Magnus EN173070C | |
| Asus ExpertCenter D9 SFF | |
| Intel Core i5-12600K | |
| Acer Predator Orion 3000 PO3-640 | |
| Zotac MEK Mini (RTX 2070 Super) | |
| AIDA64 / FP32 Ray-Trace | |
| Durchschnitt der Klasse Desktop (12248 - 84577, n=16, der letzten 2 Jahre) | |
| Acer Predator Orion 3000 PO3-640 | |
| Intel Beast Canyon NUC | |
| Intel Dragon Canyon NUC - RTX 3060 | |
| Zotac ZBOX Magnus EN173070C | |
| Asus ExpertCenter D9 SFF | |
| Zotac MEK Mini (RTX 2070 Super) | |
| Intel Core i5-12600K | |
| AIDA64 / FP64 Ray-Trace | |
| Durchschnitt der Klasse Desktop (6471 - 44013, n=16, der letzten 2 Jahre) | |
| Acer Predator Orion 3000 PO3-640 | |
| Intel Beast Canyon NUC | |
| Intel Dragon Canyon NUC - RTX 3060 | |
| Zotac ZBOX Magnus EN173070C | |
| Asus ExpertCenter D9 SFF | |
| Zotac MEK Mini (RTX 2070 Super) | |
| Intel Core i5-12600K | |
| AIDA64 / CPU PhotoWorxx | |
| Intel Core i5-12600K | |
| Durchschnitt der Klasse Desktop (33304 - 55966, n=16, der letzten 2 Jahre) | |
| Acer Predator Orion 3000 PO3-640 | |
| Asus ExpertCenter D9 SFF | |
| Zotac ZBOX Magnus EN173070C | |
| Intel Beast Canyon NUC | |
| Intel Dragon Canyon NUC - RTX 3060 | |
| Zotac MEK Mini (RTX 2070 Super) | |
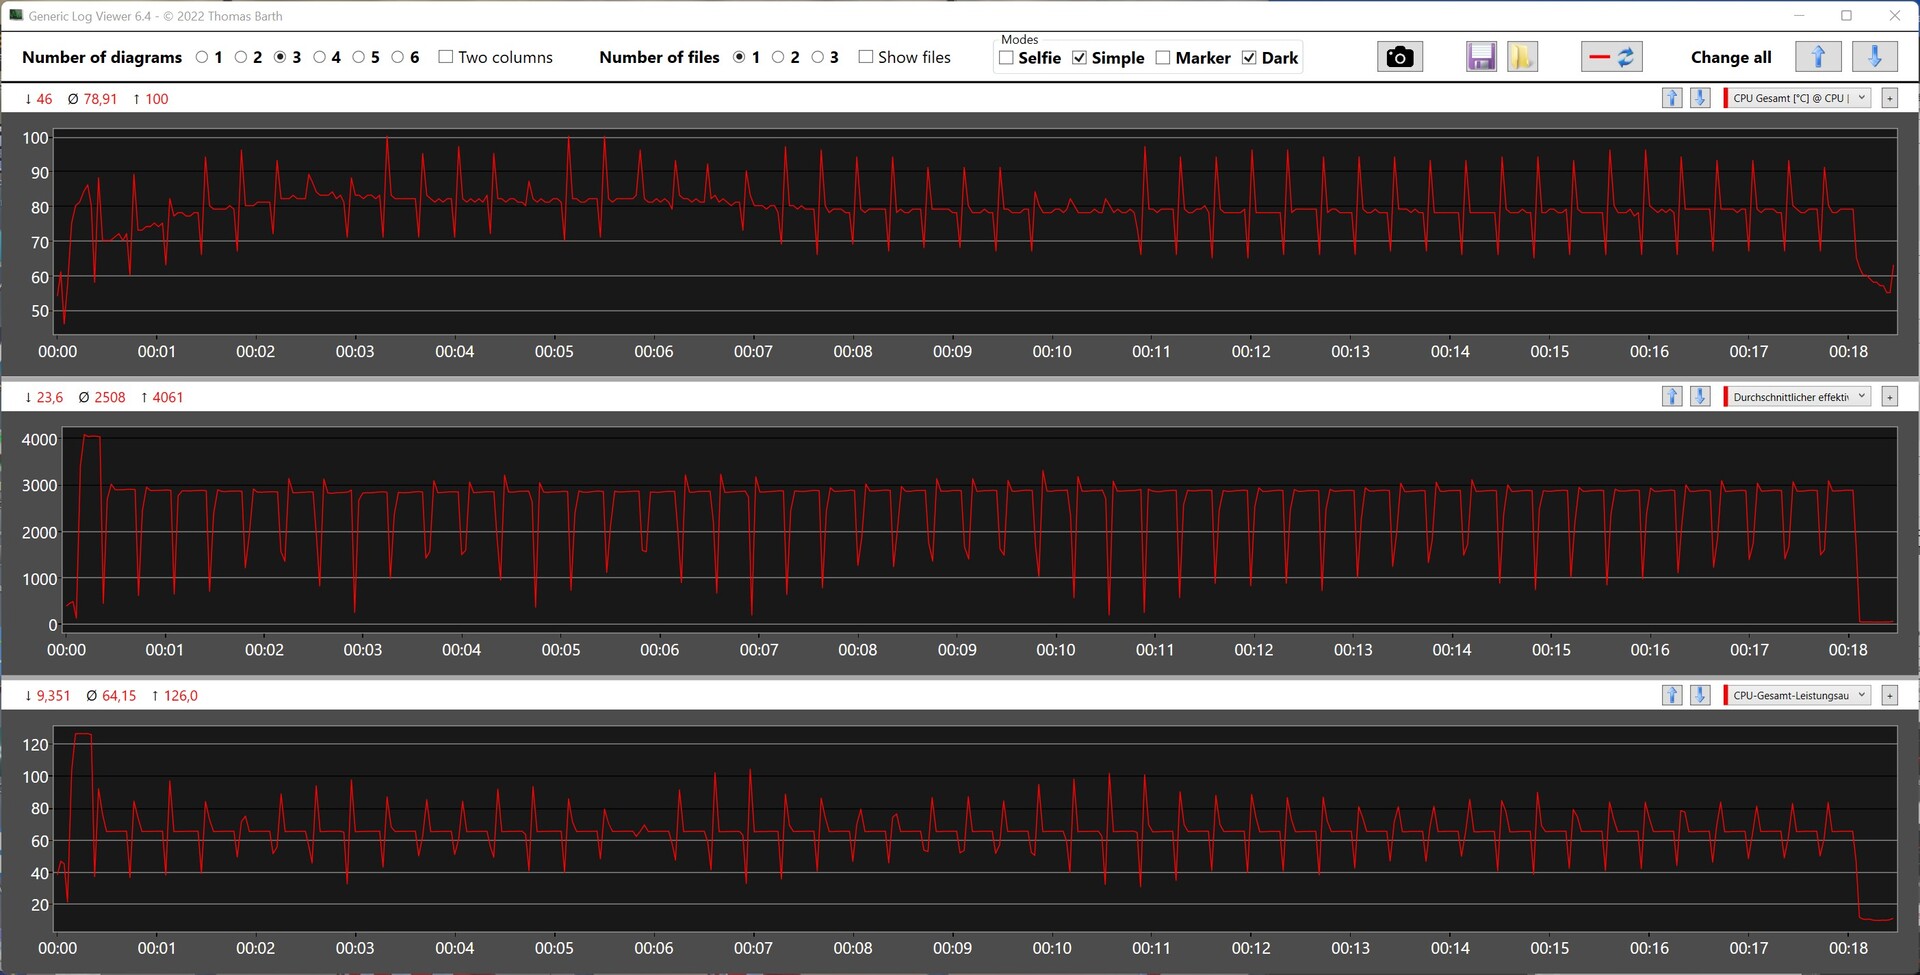
Acer Predator Orion 3000 bei der Cinebench-R15-Multi-Schleife
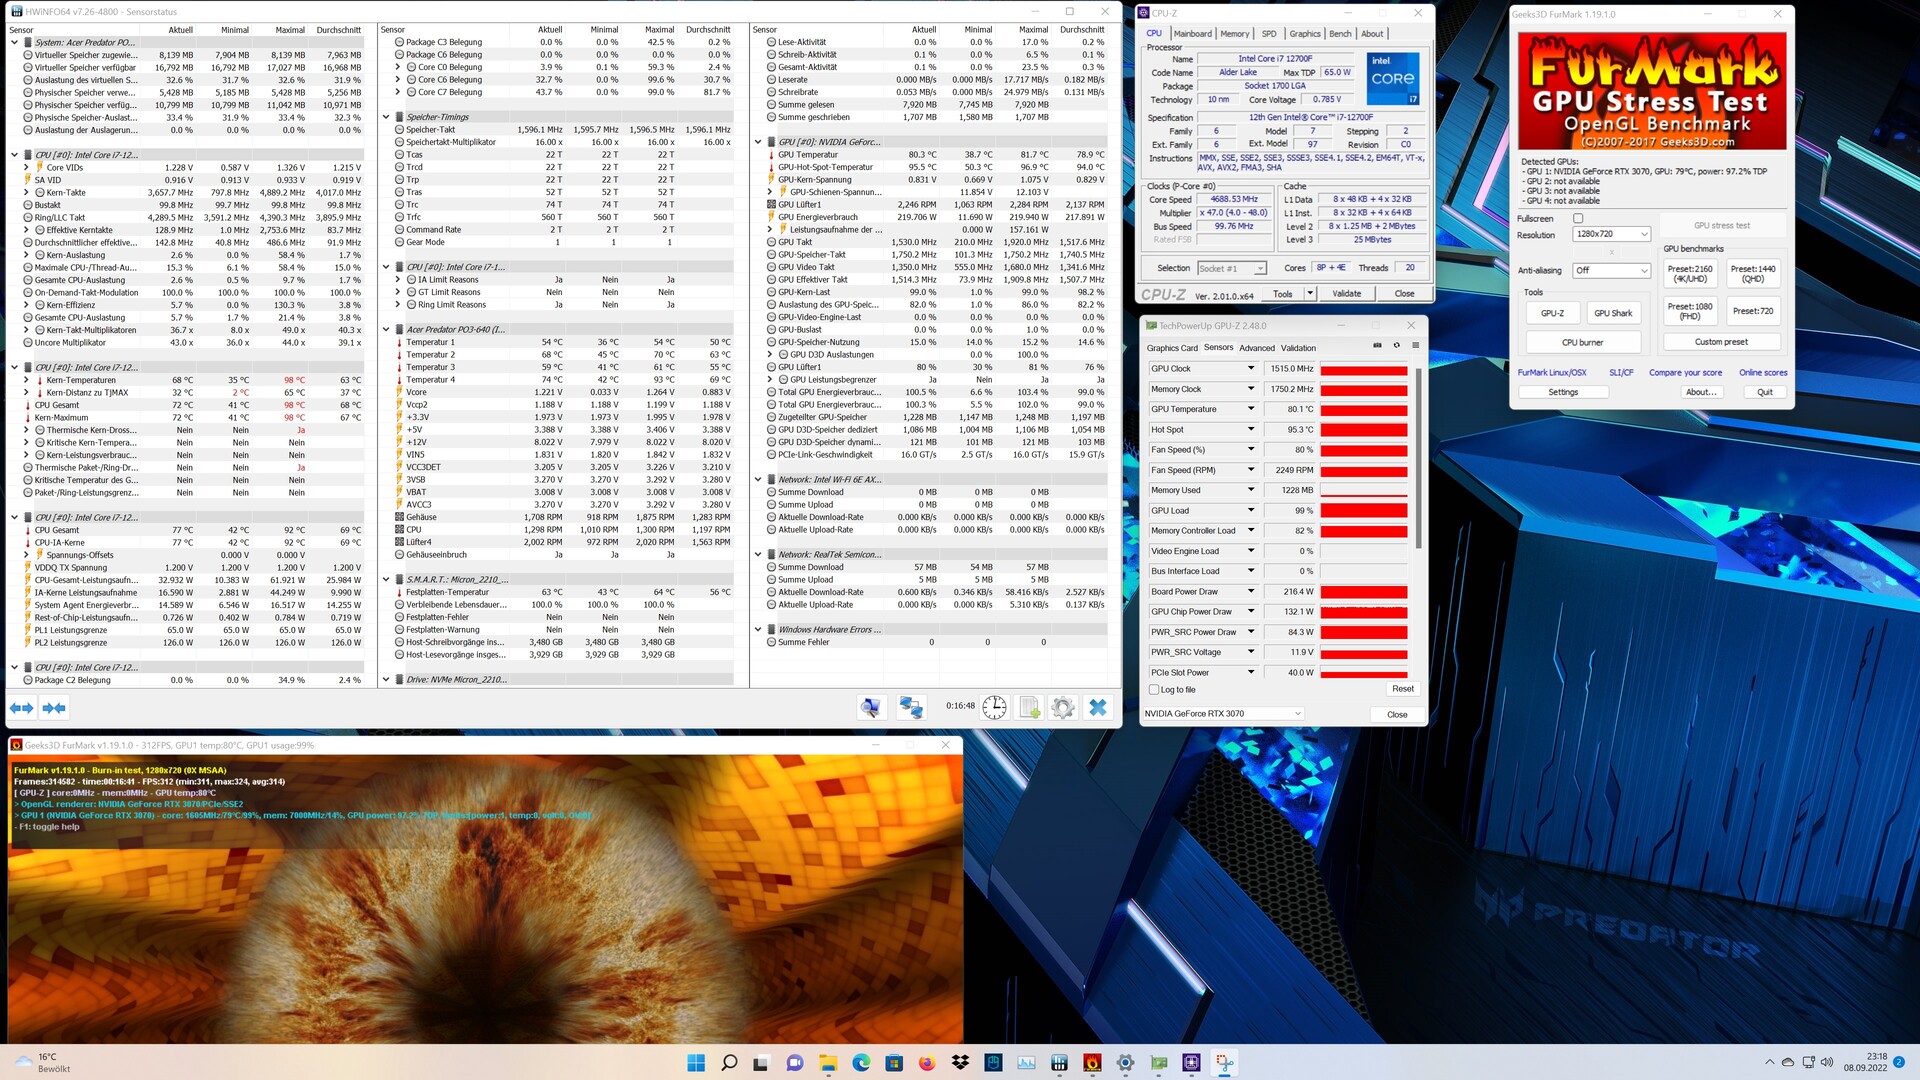
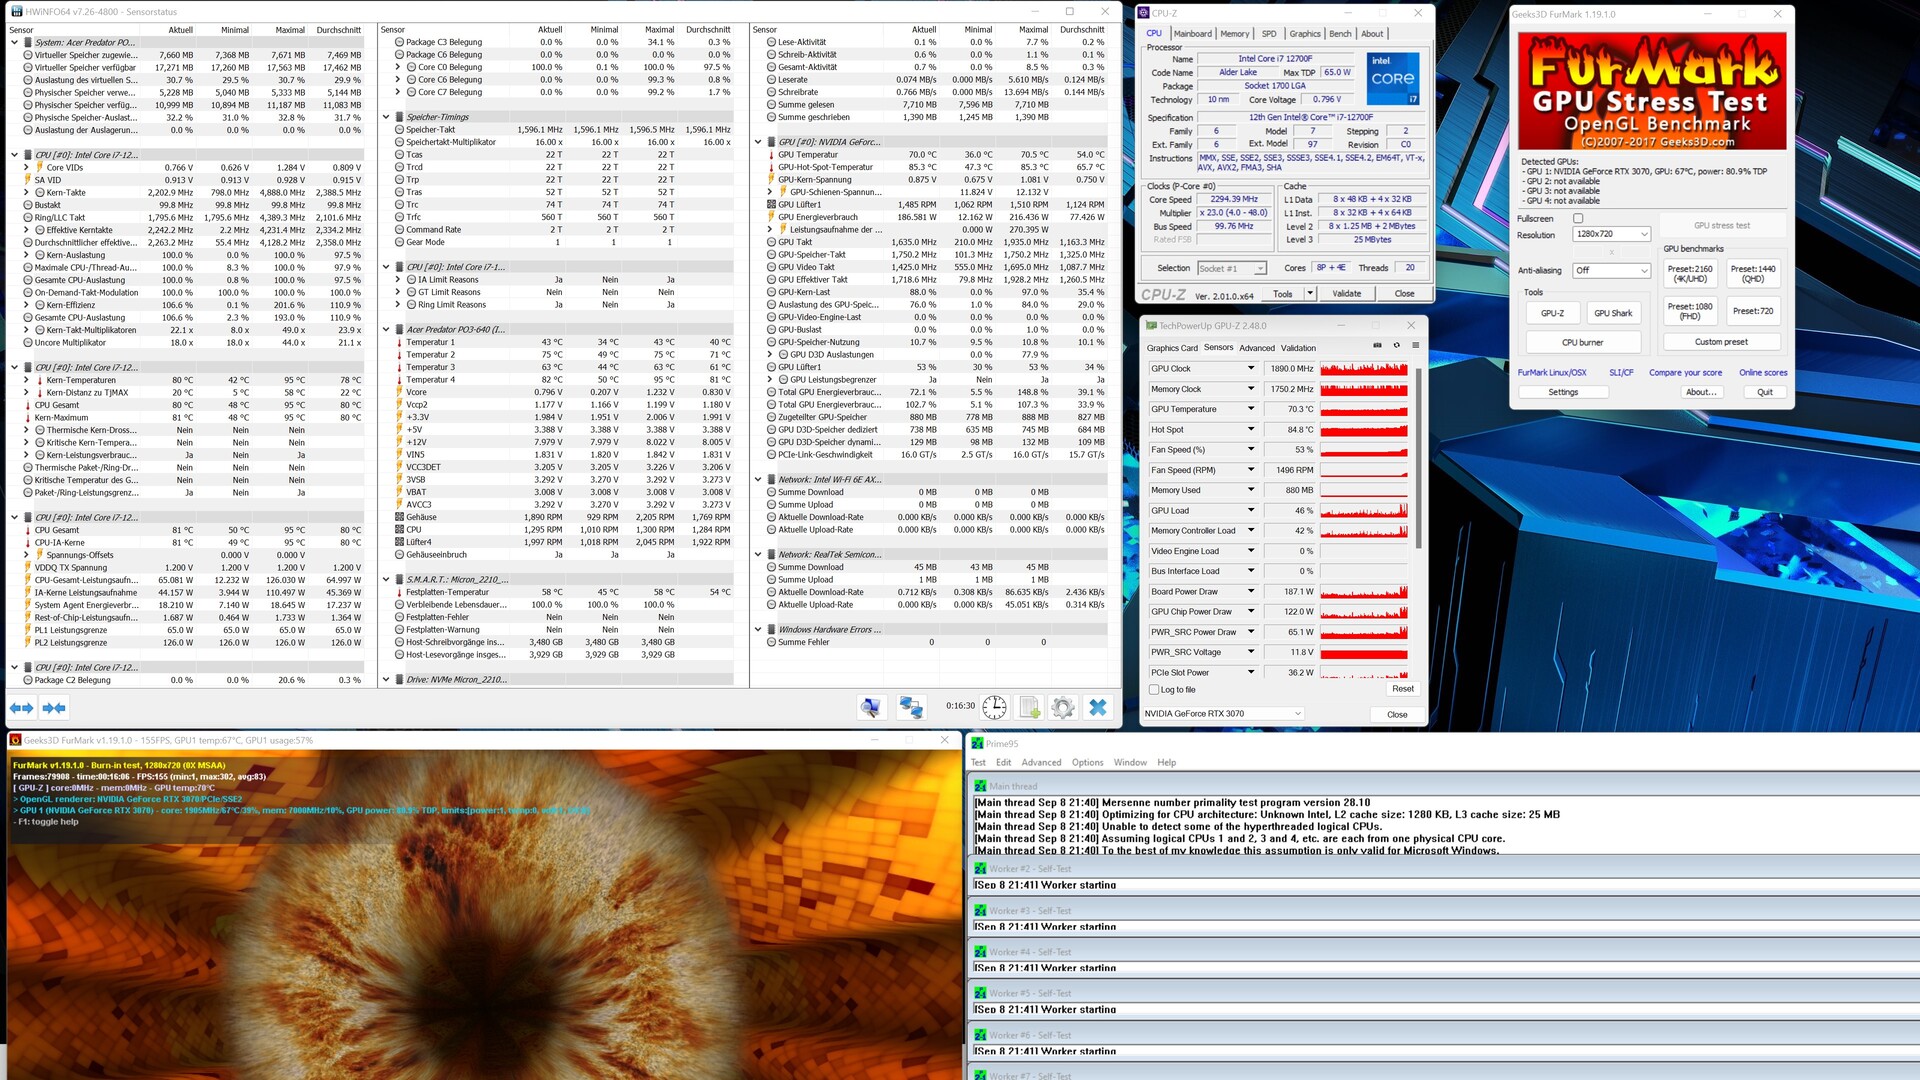
Einen guten ersten Einblick hinsichtlich der Effizienz in Verbindung mit der eingebauten Kühlung bekommen wir bei der Cinebench-R15-Dauerschleife. Nach dem ersten Durchlauf sinkt die Leistung drastisch, denn das erhöhte PL2 kann nur beim ersten Durchlauf länger gehalten werden, als bei den weiteren Durchläufen. Die aufgezeichnete CPU-Metrik während des Tests zeigt dies sehr gut.
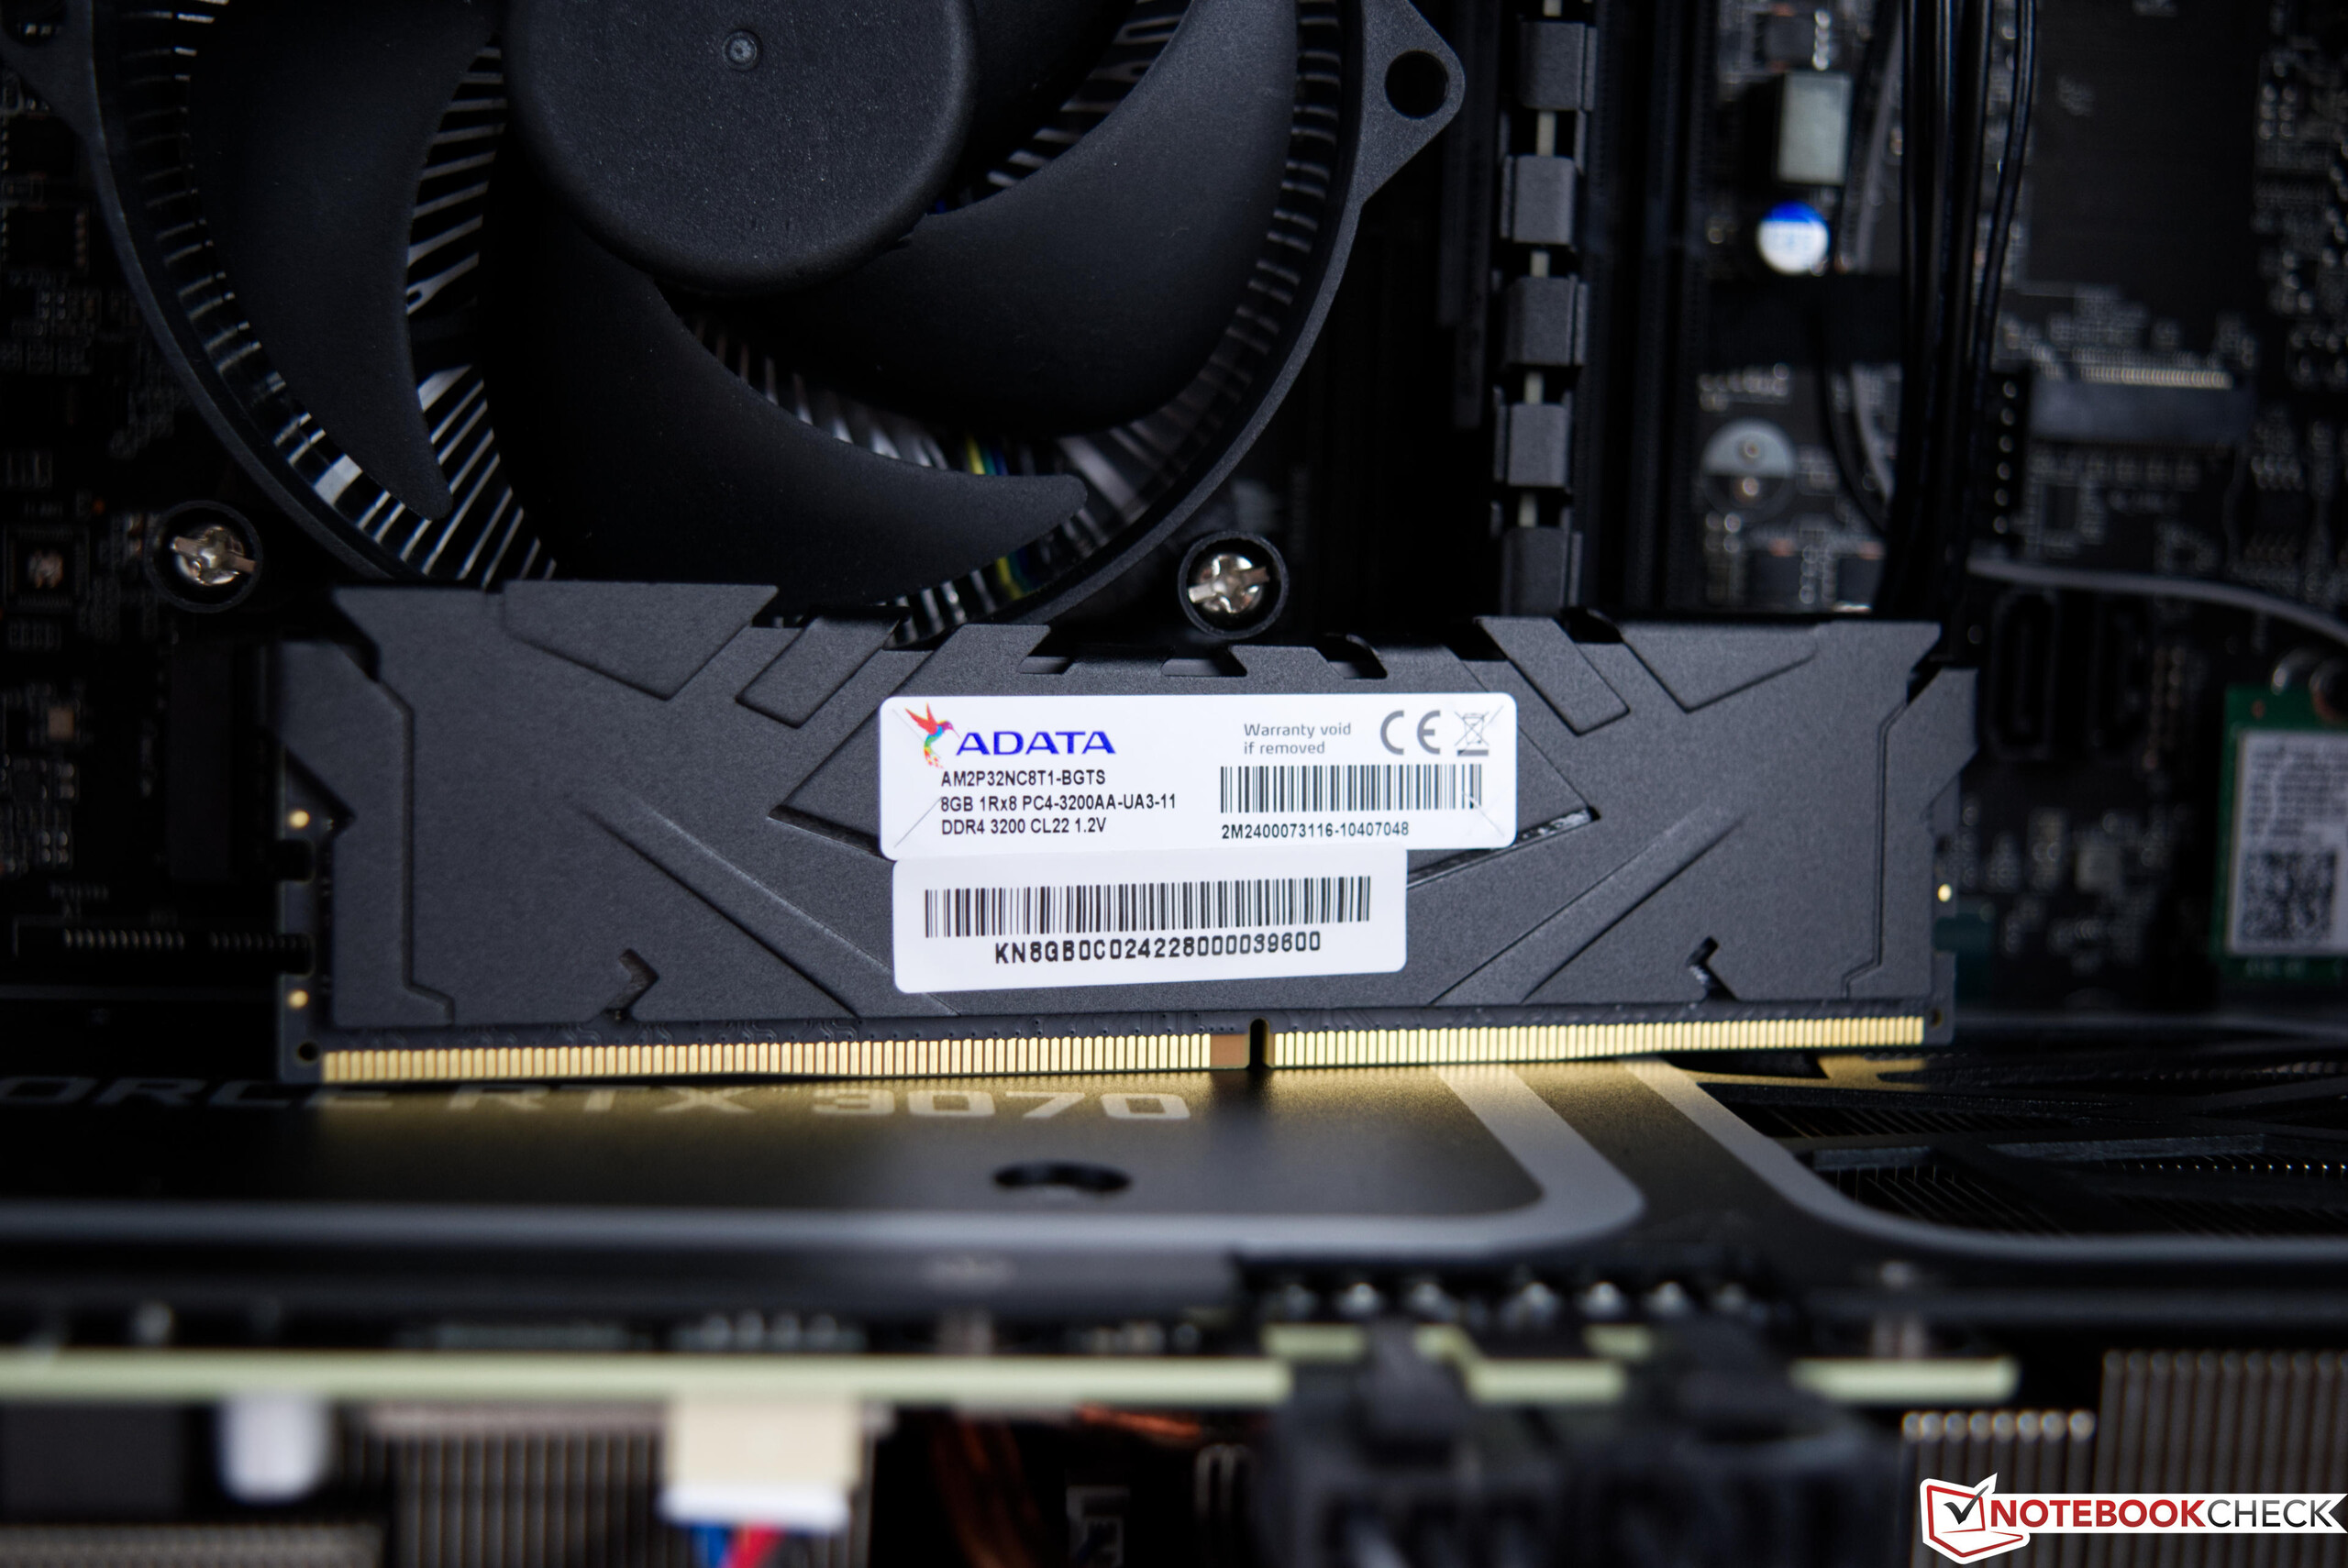
System Performance
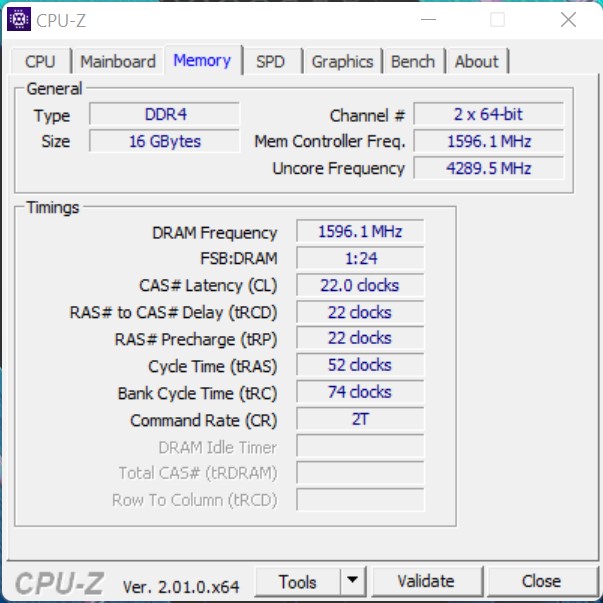
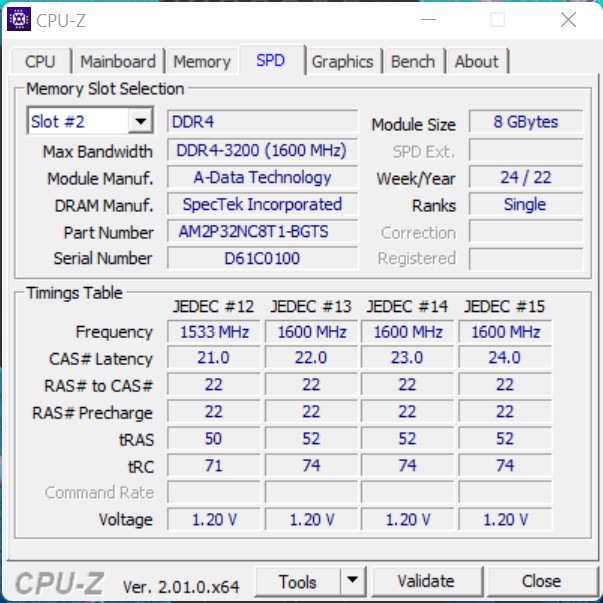
Dass bei den Benchmarks zur System-Performance nicht dauerhaft die volle Leistung abgerufen wird, kommt dem Acer Predator Orion 3000 deutlich entgegen. Die Ergebnisse sind gut und nur wenige Prozentpunkte schlechter als beim Intel Dragon Canyon NUC mit Intel Core i9-12900. Der Arbeitsspeicher performt im Vergleich zu den Vergleichsgeräten hier im Test recht gut, wenngleich hier mit schnellerem RAM und geringeren Latenzen noch etwas mehr Leistung herausgeholt werden könnte.
| AIDA64 / Memory Copy | |
| Durchschnitt der Klasse Desktop (53867 - 88386, n=16, der letzten 2 Jahre) | |
| Acer Predator Orion 3000 PO3-640 | |
| Durchschnittliche Intel Core i7-12700F (n=1) | |
| Intel Beast Canyon NUC | |
| Intel Dragon Canyon NUC - RTX 3060 | |
| Zotac ZBOX Magnus EN173070C | |
| Zotac MEK Mini (RTX 2070 Super) | |
| AIDA64 / Memory Read | |
| Durchschnitt der Klasse Desktop (54278 - 92063, n=16, der letzten 2 Jahre) | |
| Zotac ZBOX Magnus EN173070C | |
| Acer Predator Orion 3000 PO3-640 | |
| Durchschnittliche Intel Core i7-12700F (n=1) | |
| Intel Beast Canyon NUC | |
| Intel Dragon Canyon NUC - RTX 3060 | |
| Zotac MEK Mini (RTX 2070 Super) | |
| AIDA64 / Memory Write | |
| Durchschnitt der Klasse Desktop (60635 - 85195, n=16, der letzten 2 Jahre) | |
| Zotac ZBOX Magnus EN173070C | |
| Intel Beast Canyon NUC | |
| Intel Dragon Canyon NUC - RTX 3060 | |
| Acer Predator Orion 3000 PO3-640 | |
| Durchschnittliche Intel Core i7-12700F (n=1) | |
| Zotac MEK Mini (RTX 2070 Super) | |
| AIDA64 / Memory Latency | |
| Durchschnitt der Klasse Desktop (68.5 - 168, n=16, der letzten 2 Jahre) | |
| Intel Beast Canyon NUC | |
| Intel Dragon Canyon NUC - RTX 3060 | |
| Zotac ZBOX Magnus EN173070C | |
| Acer Predator Orion 3000 PO3-640 | |
| Durchschnittliche Intel Core i7-12700F (n=1) | |
| Zotac MEK Mini (RTX 2070 Super) | |
* ... kleinere Werte sind besser
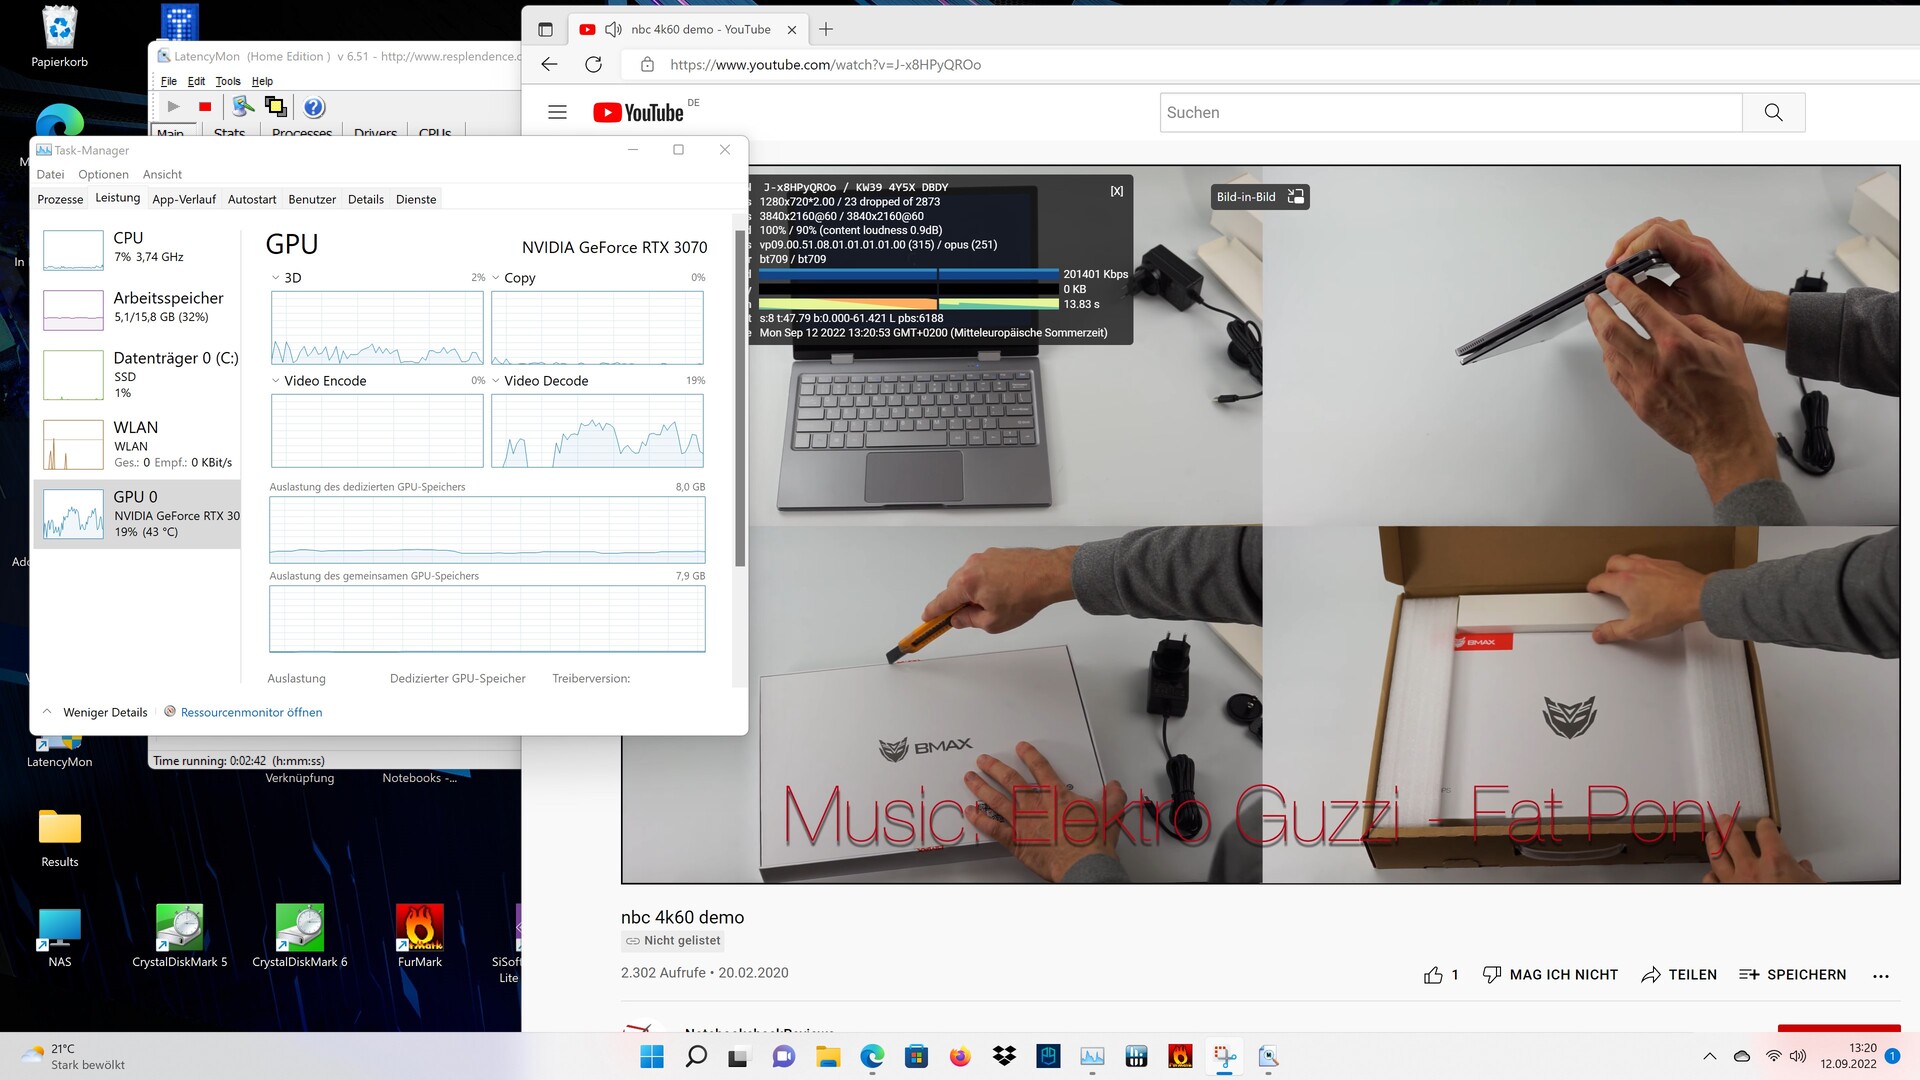
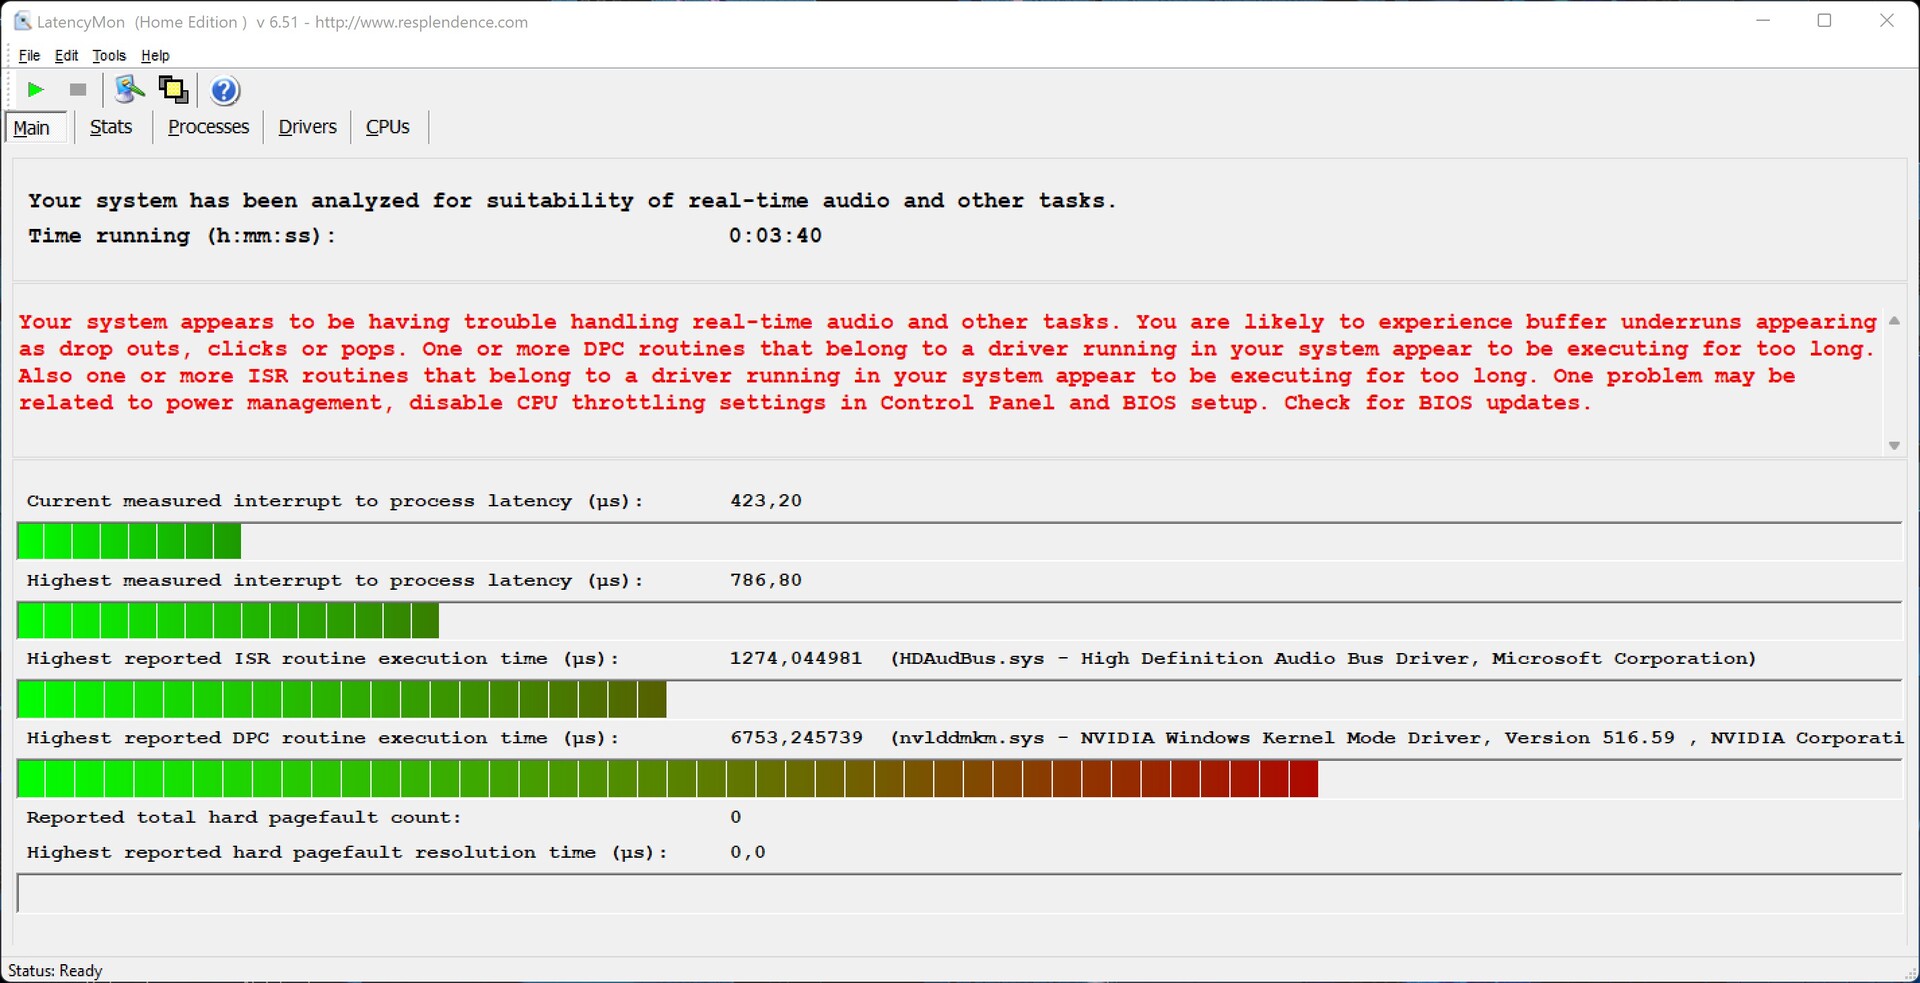
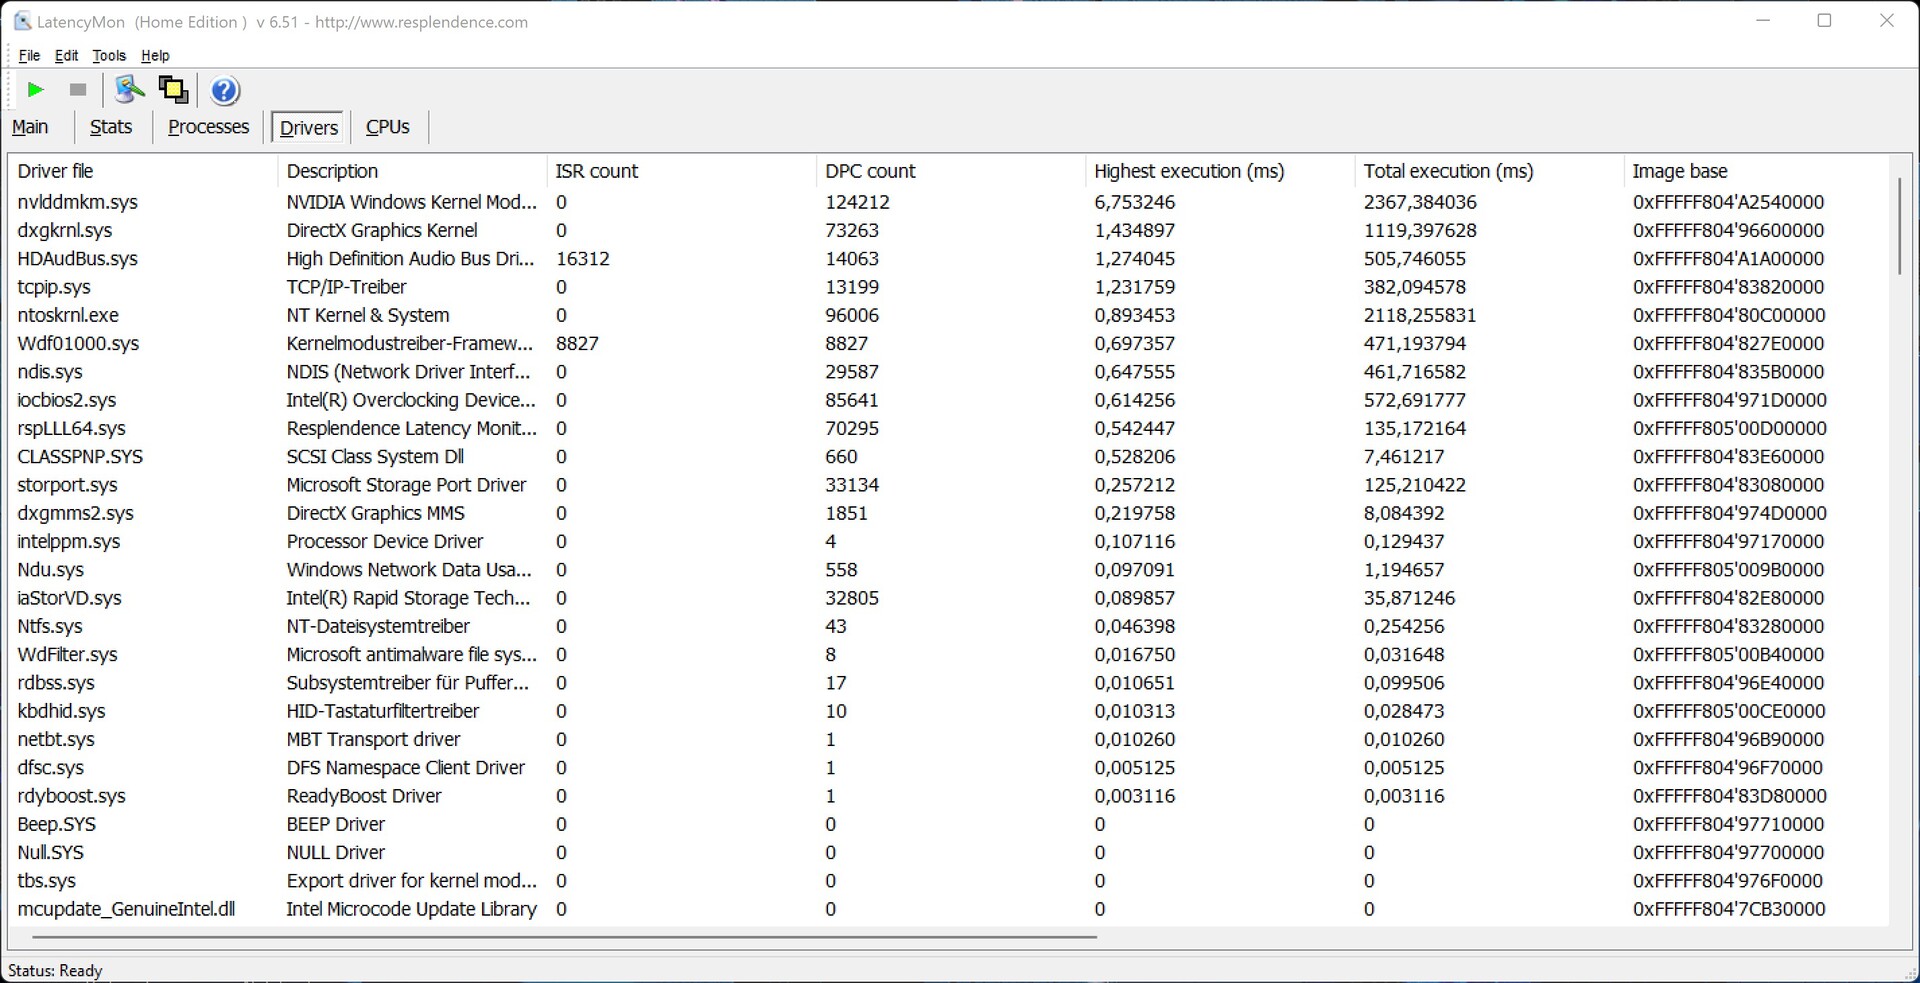
DPC-Latenzen
Latenzprobleme meldet uns LatencyMon schon beim Öffnen mehrerer Tabs in Edge. Hier scheinen die Treiber noch nicht optimal aufeinander abgestimmt zu sein.
| DPC Latencies / LatencyMon - interrupt to process latency (max), Web, Youtube, Prime95 | |
| Acer Predator Orion 3000 PO3-640, Intel Core i7-12700F | |
| Minisforum EliteMini B550, AMD Ryzen 7 5700G | |
| Asus ExpertCenter D9 SFF, Intel Core i7-11700 | |
| Zotac ZBOX Magnus EN173070C, Intel Core i7-11800H | |
| Minisforum EliteMini HX90, AMD Ryzen 9 5900HX | |
* ... kleinere Werte sind besser
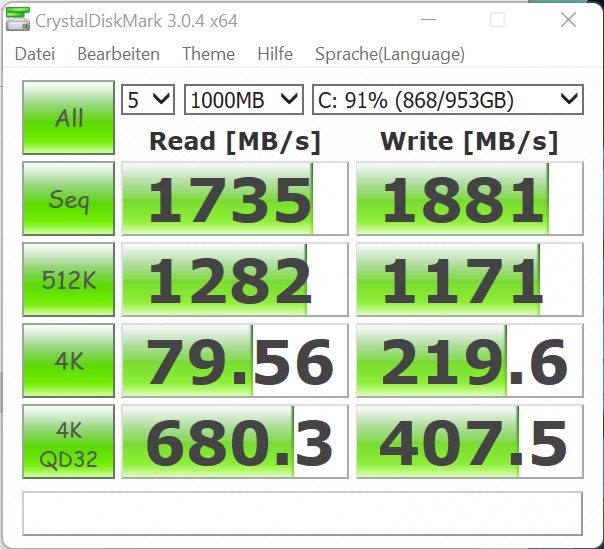
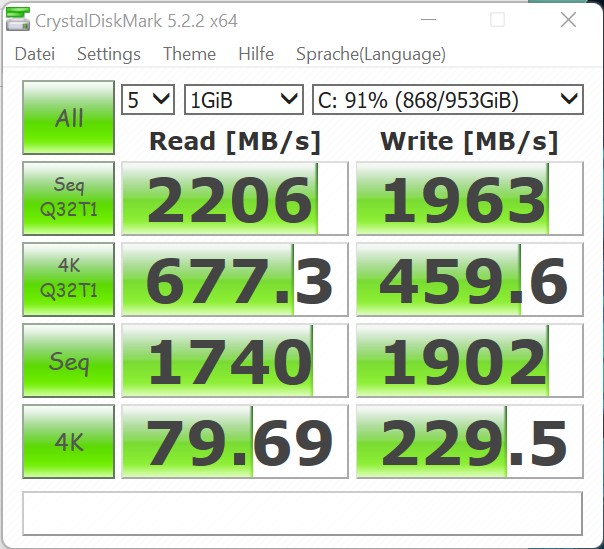
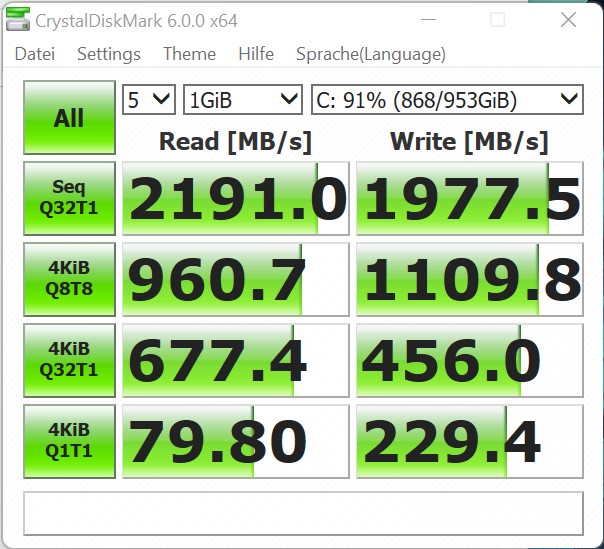
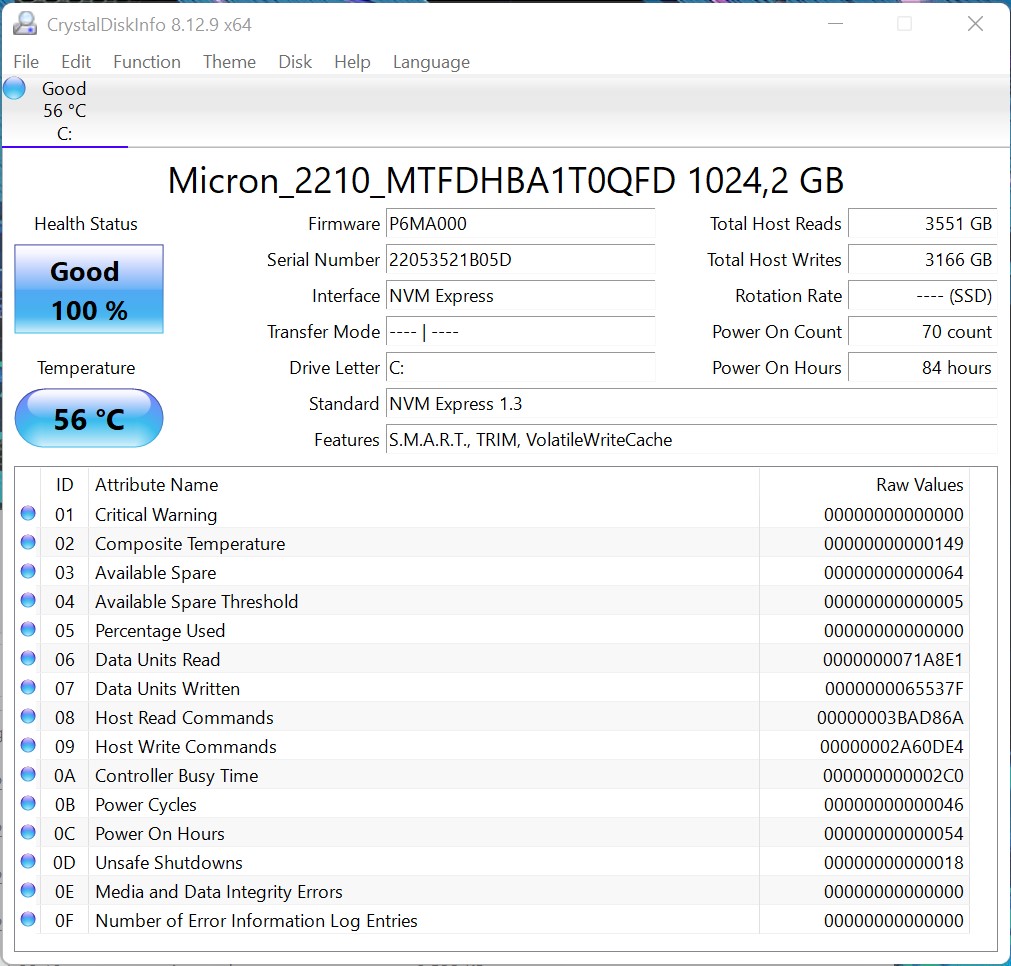
Massenspeicher

In unserem Testsample steckt eine 1 TB SSD von Micron. Das M.2-Modul bietet gute Transferraten, wenngleich die maximalen Übertragungsraten nicht ganz mit den Vergleichsgeräten mithalten können. Im Alltag ist davon aber so gut wie nichts zu merken. Viel größeren Einfluss hat beispielsweise der 4K-Lesewert, welcher beim Acer Predator Orion 3000 sehr gut ausfällt. Der Speicherplatz ist mit 1 TB ausreichend und sollte unserer Ansicht nach bei einem Gaming-Gerät auch nicht kleiner gewählt werden. Erweitern lässt sich der Massenspeicher des Acer Predator Orion 3000 relativ leicht. Ein zweites M.2-Modul kann noch auf dem Mainboard verstaut werden. Des Weitern finden auch noch zwei 3,5-Zoll-Festplatten in dem Gehäuse Platz. Alle nötigen Anschlusskabel liegen dem Gerät bei.
Für weitere Vergleiche und Benchmarks verweisen wir hier auf unsere Vergleichstabelle.


* ... kleinere Werte sind besser
Dauerleistung Lesen: DiskSpd Read Loop, Queue Depth 8
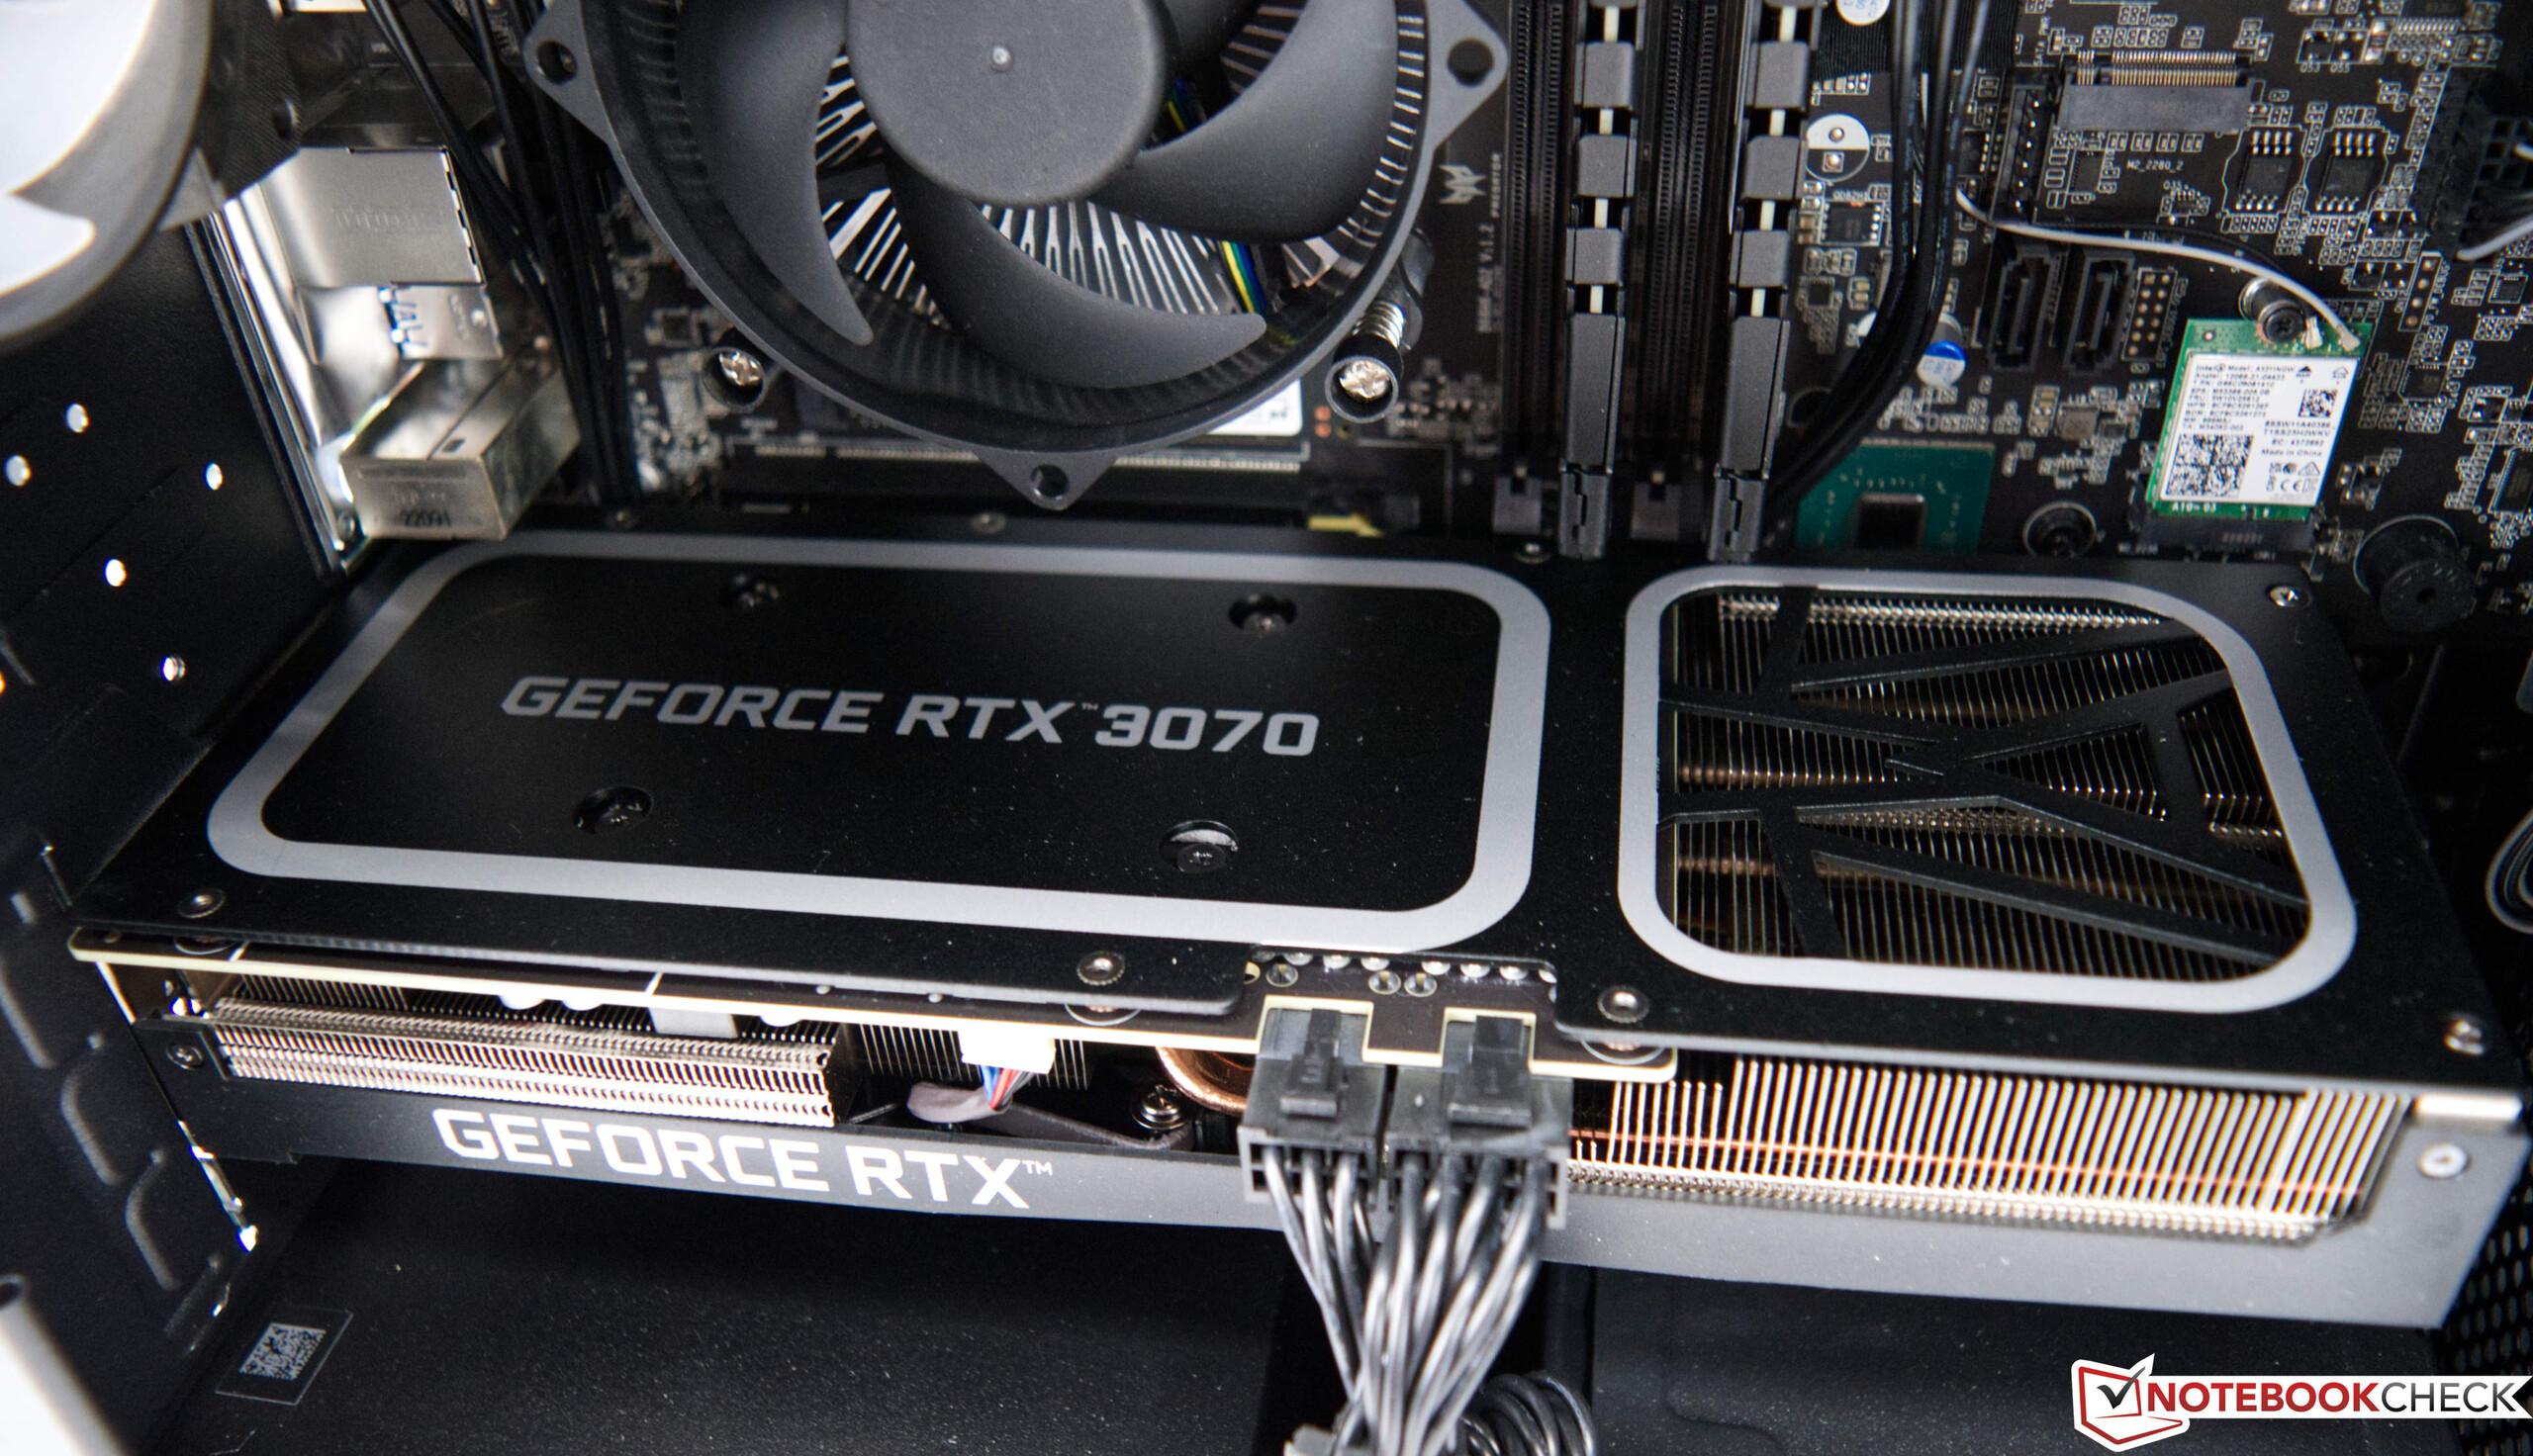
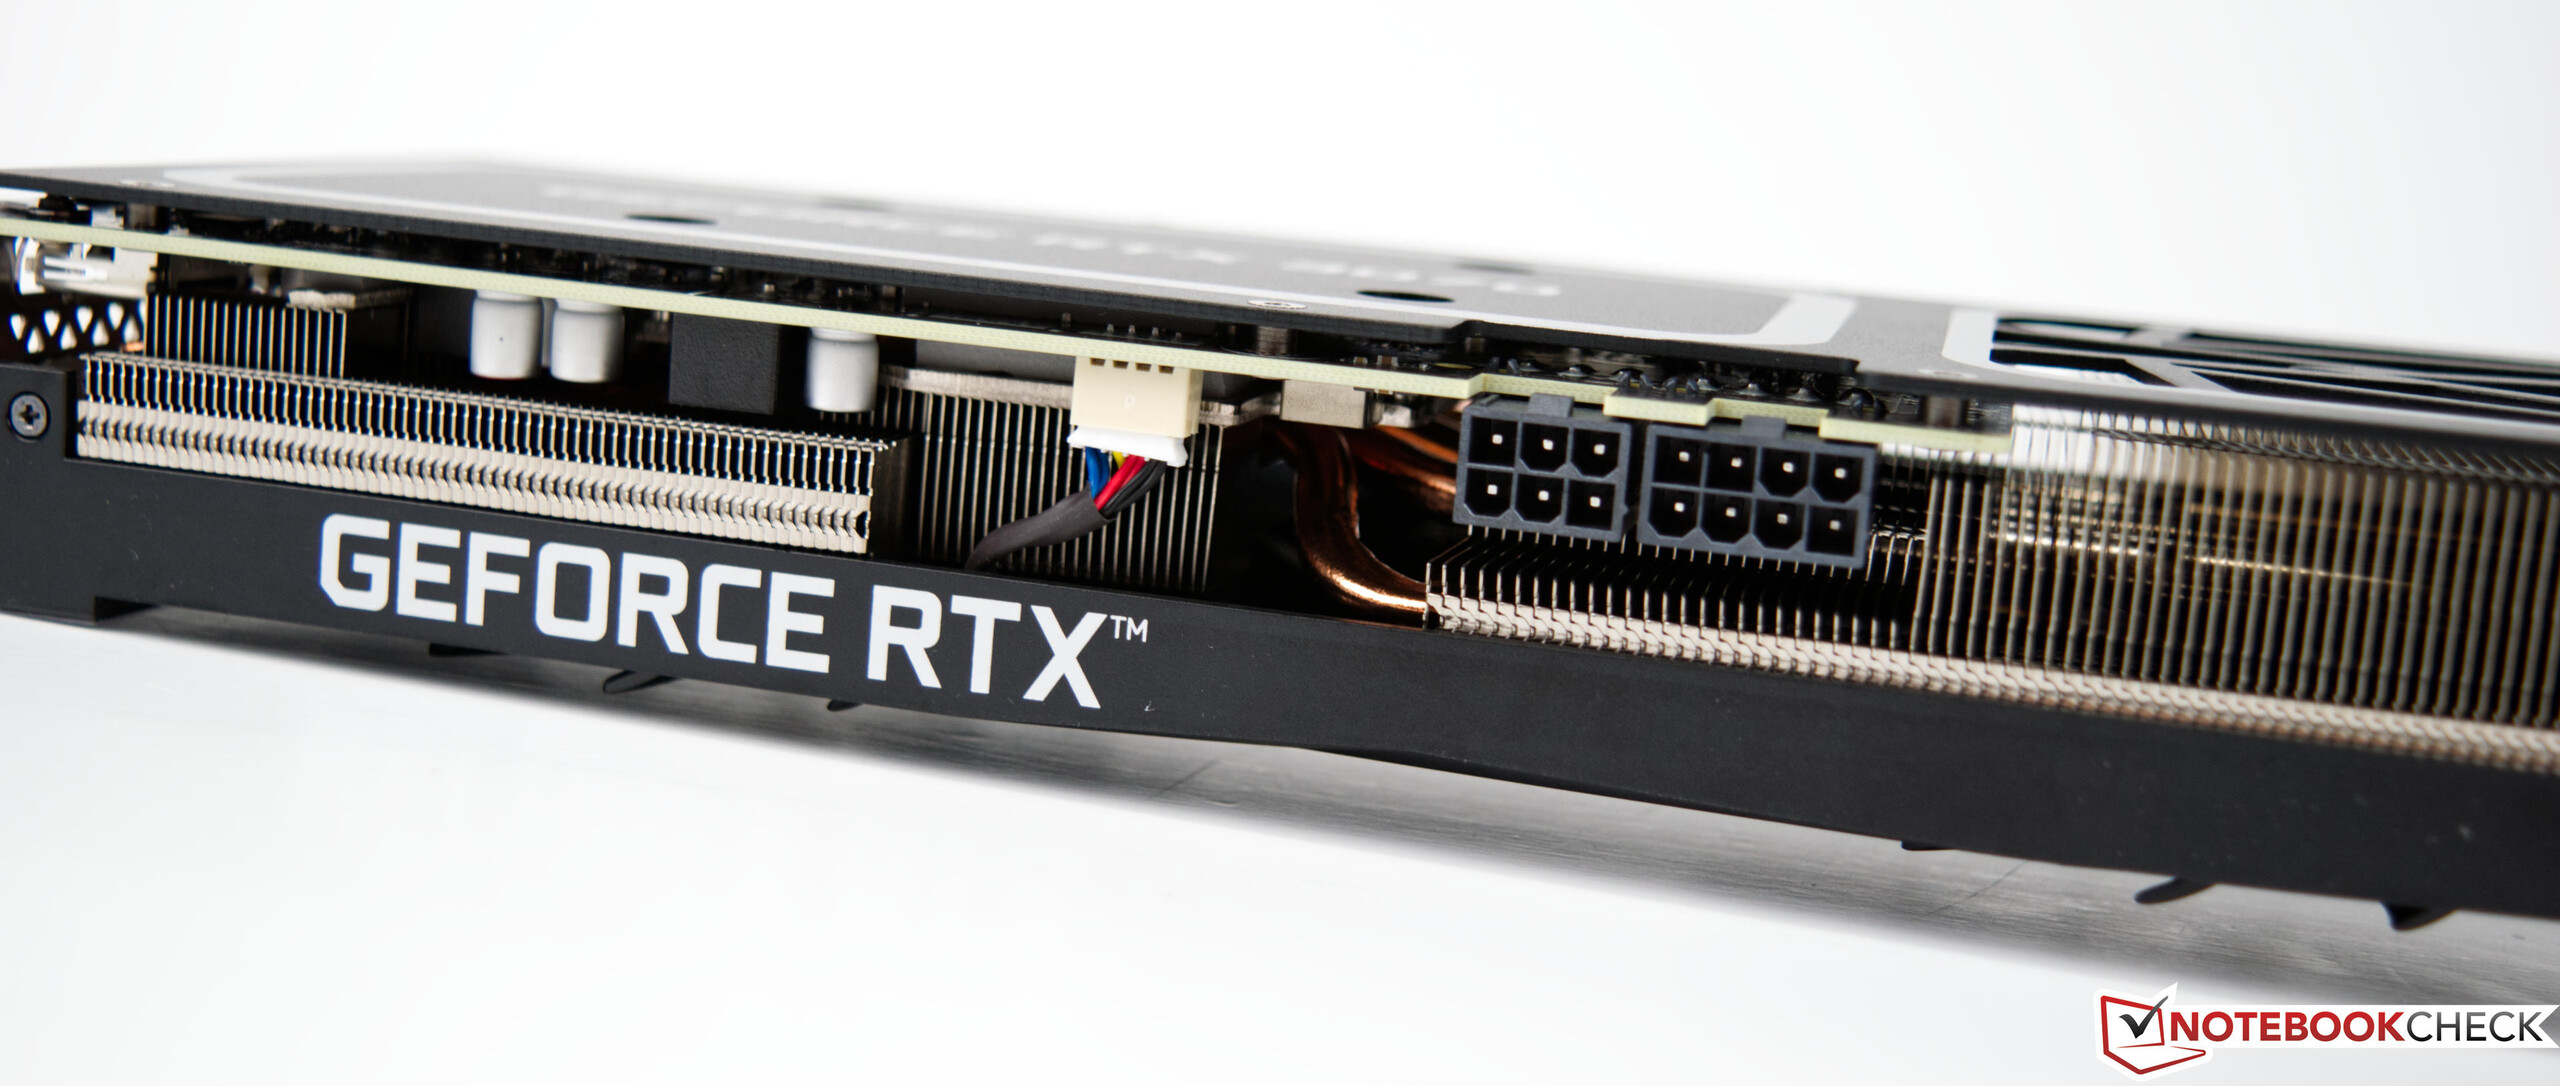
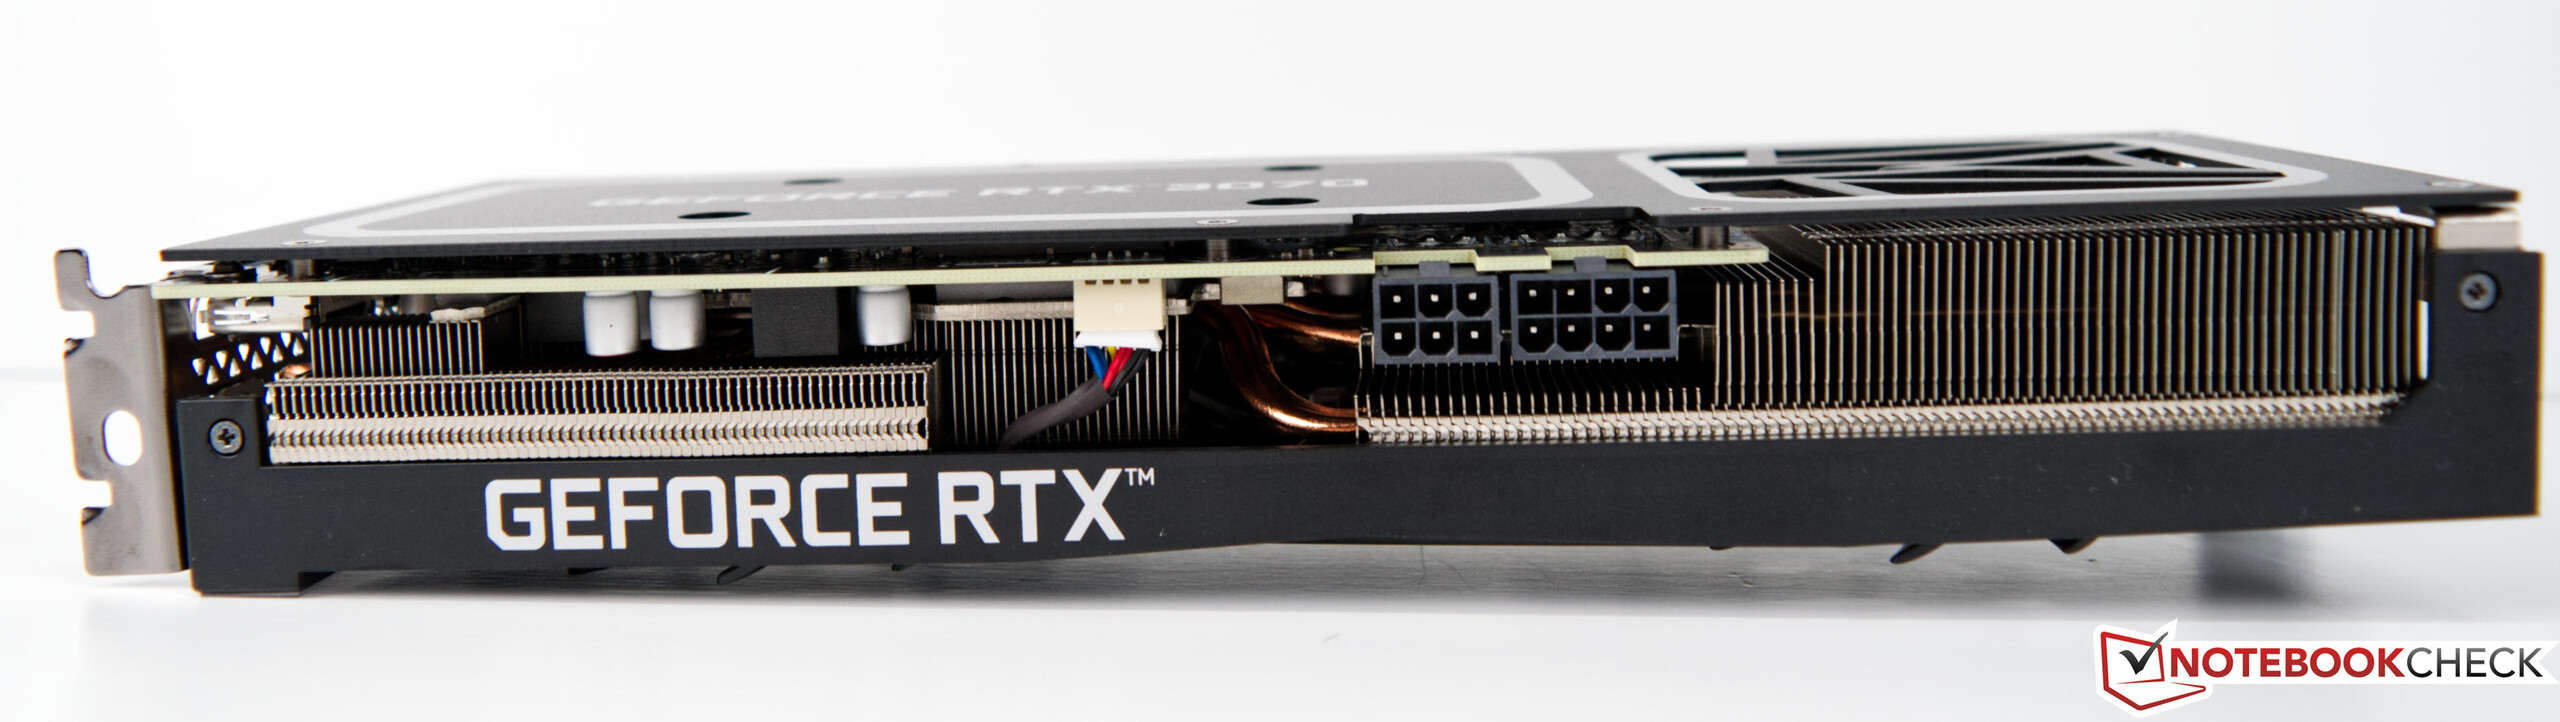
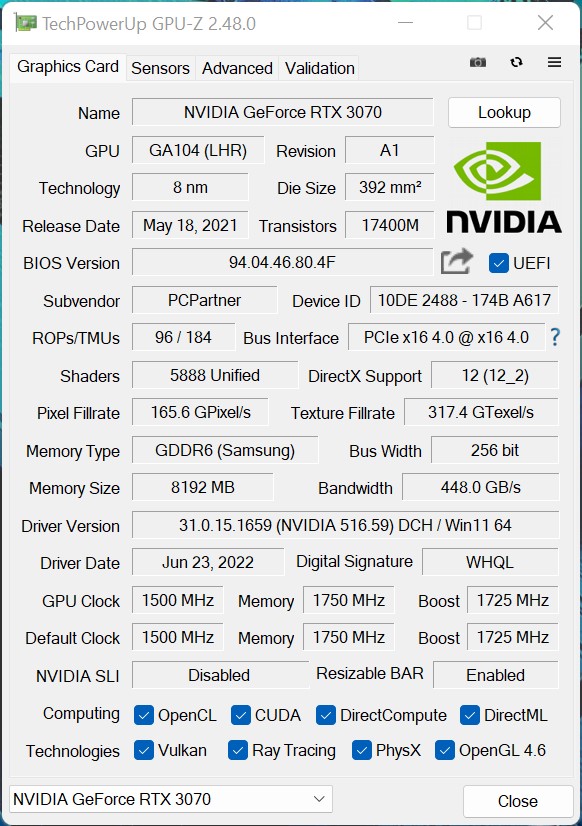
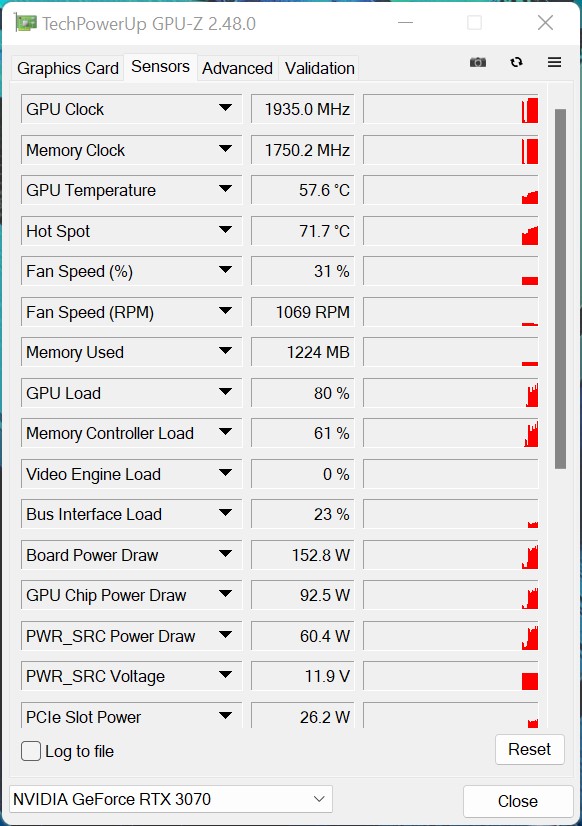
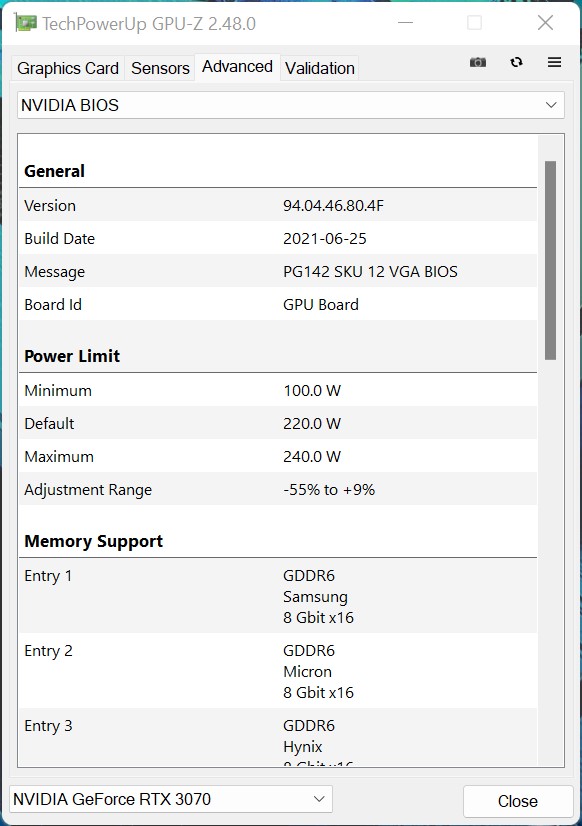
Grafikkarte
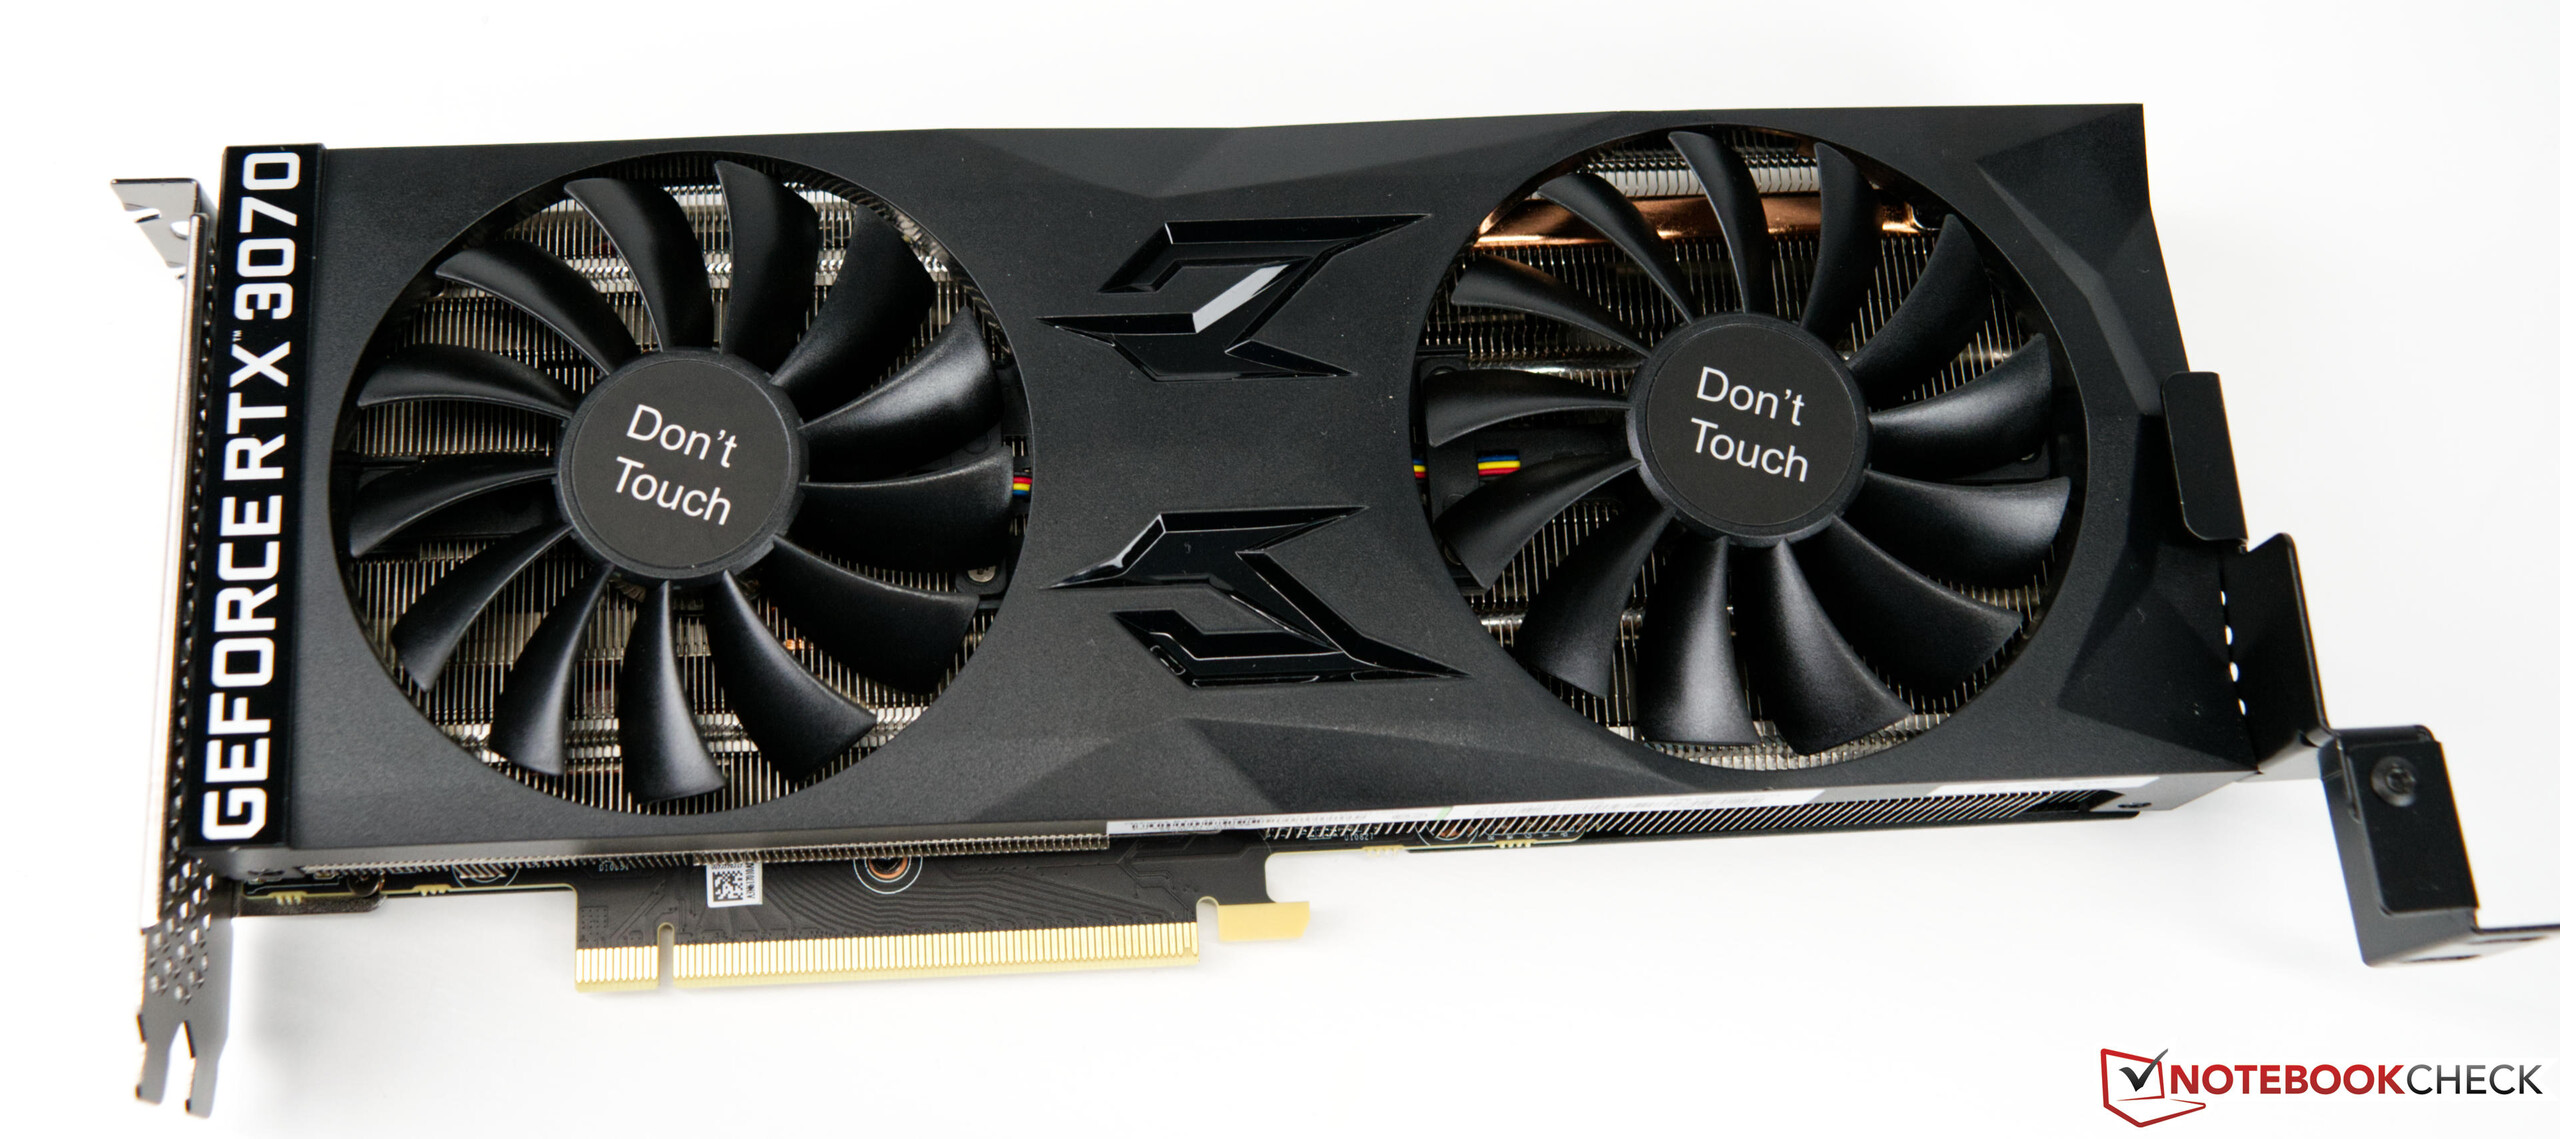
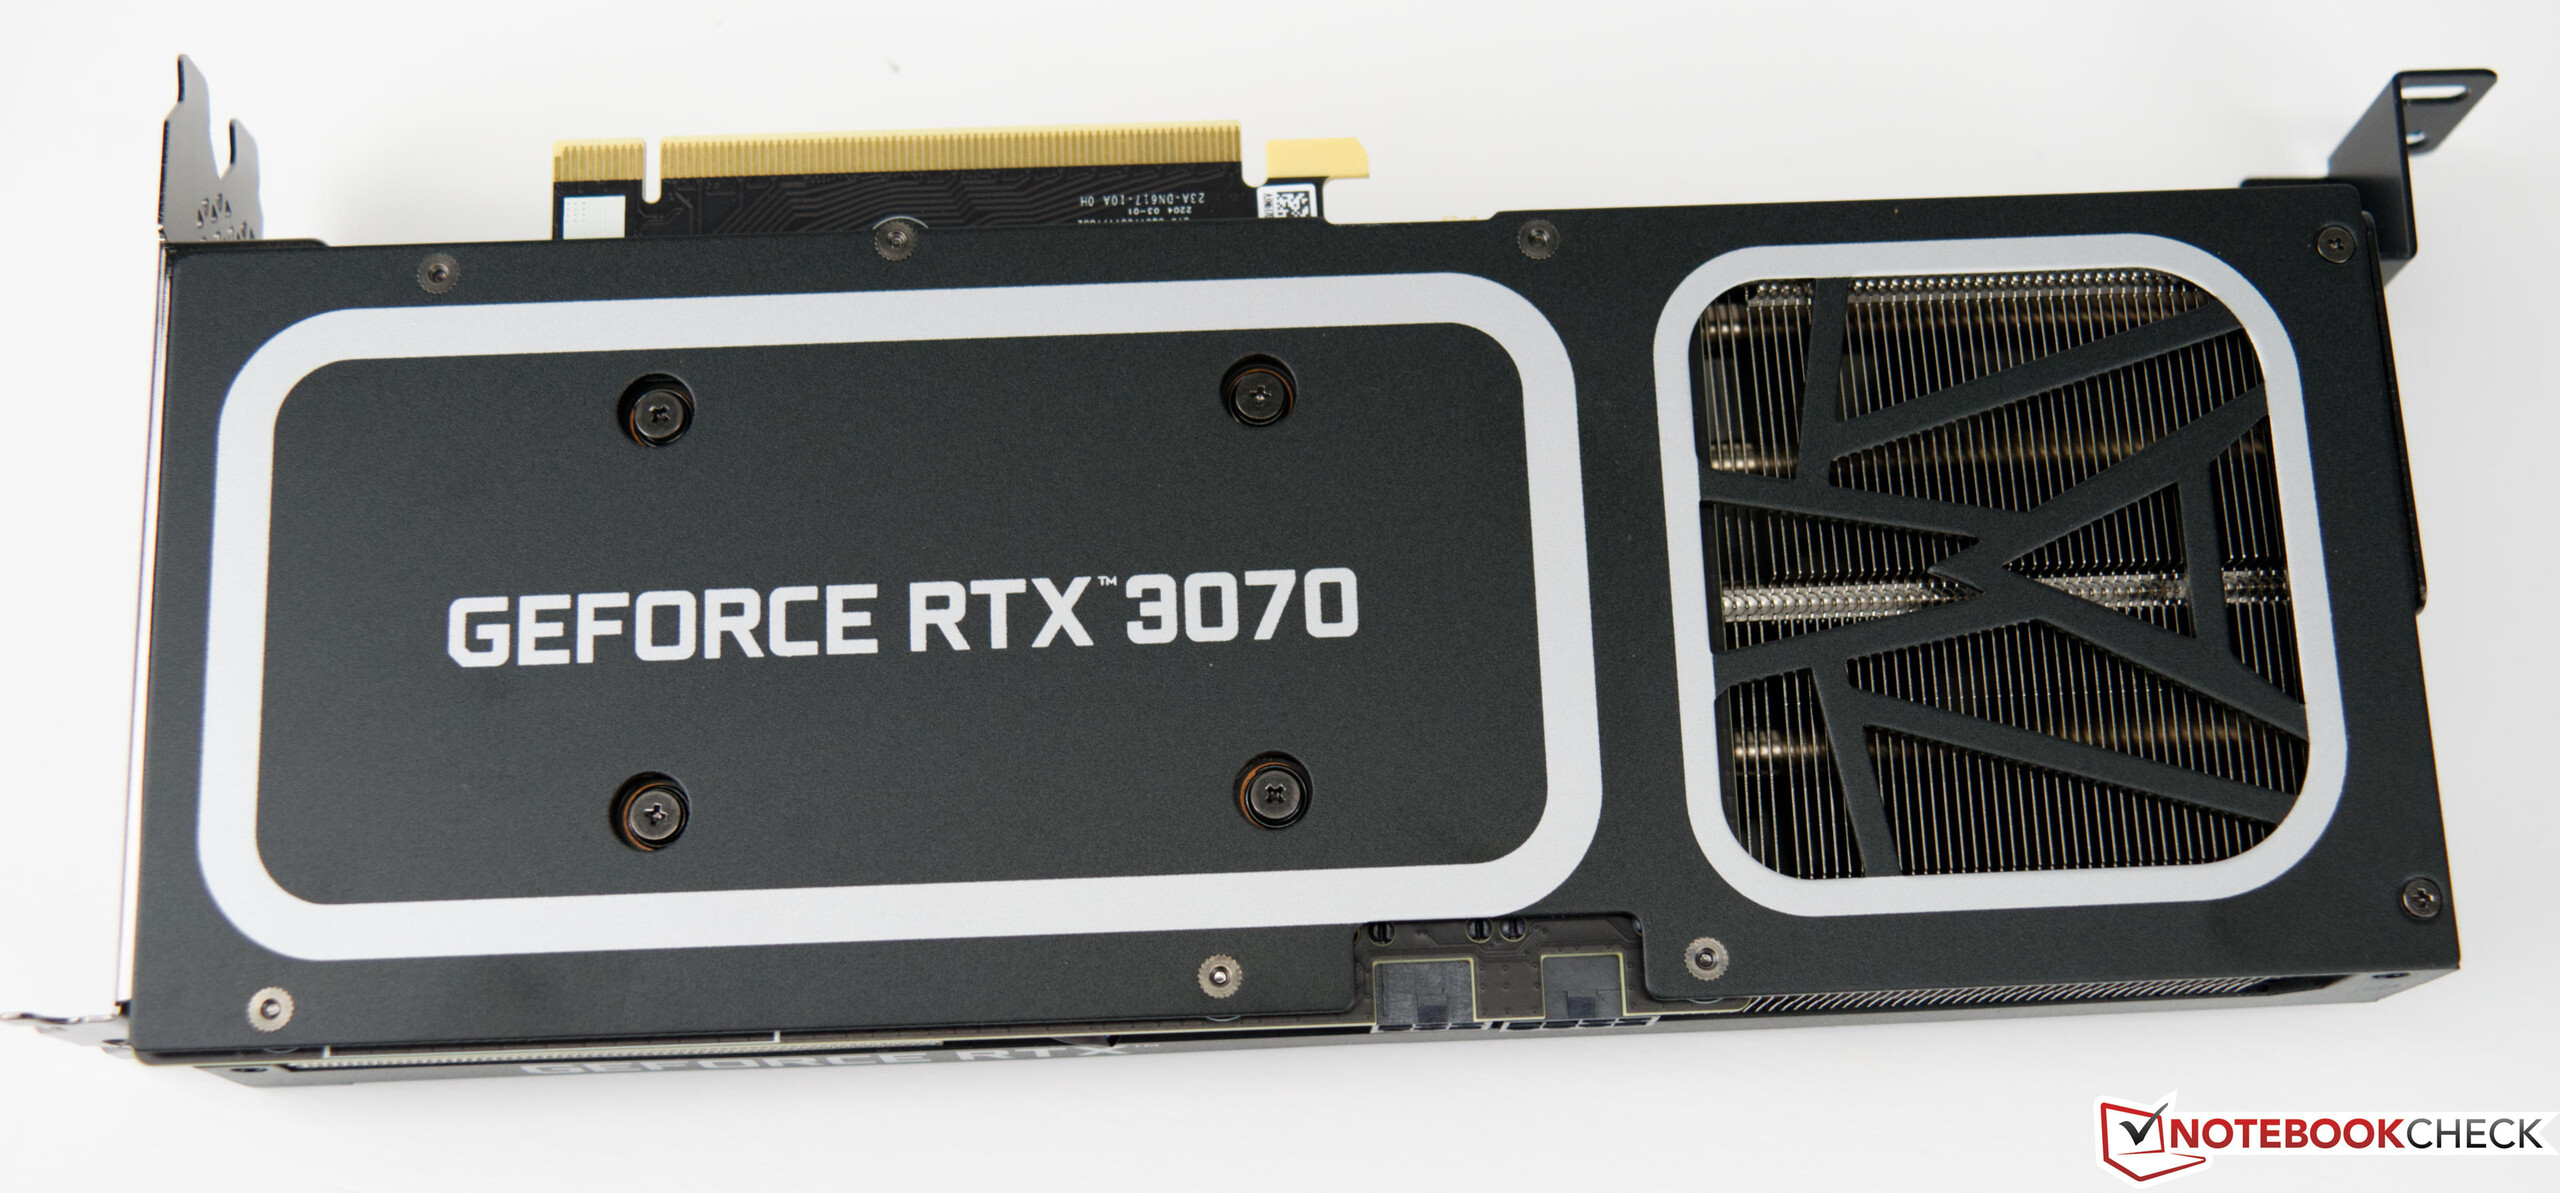
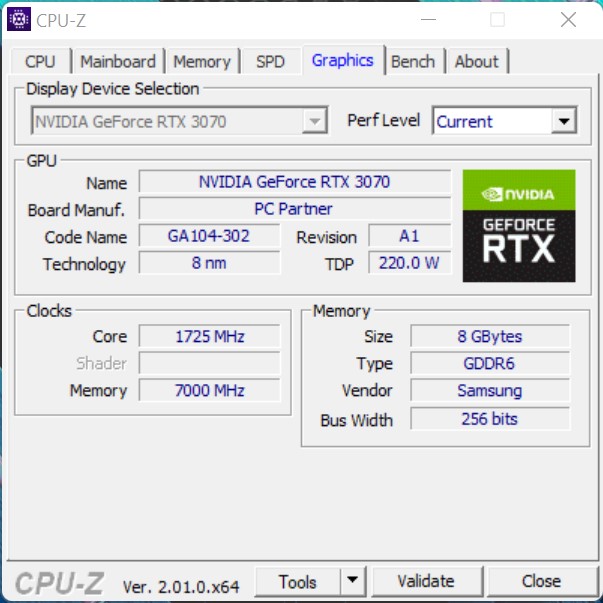
Mit der Nvidia GeForce RTX 3070 haben wir den Acer Predator Orion 3000 in der stärksten Konfiguration im Test. In Anbetracht der etwas gedrosselten CPU-Leistung fällt die 3D-Performance bei den synthetischen Tests sehr gut aus. Das nicht weiter bekannte Modell der GeForce RTX 3070 arbeitet genau nach den Spezifikationen, welche Nvidia vorgegeben hat. Das bedeutet einen GPU-Takt von 1.500 MHz, welcher im Boost mit 1.750 MHz angegeben ist. Beim VRAM gibt es RTX 3070 typisch die 8 GB-GDDR6 und insgesamt beträgt die Leistungsaufnahme des verbauten Modells 220 Watt. Gegenüber dem Zotac Magus One kann sich der Acer Predator Orion 3000 aufgrund der besseren CPU durchsetzen.
Weitere Benchmarks zu der Nvidia GeForce RTX 3070 finden Sie hier.
| Performance Rating - Percent | |
| Acer Predator Orion 3000 PO3-640 | |
| Zotac Magnus One (ECM73070C) | |
| Zotac ZBOX Magnus EN173070C | |
| Intel Dragon Canyon NUC - RTX 3060 | |
| Intel Beast Canyon NUC | |
| Unigine Valley 1.0 | |
| 1920x1080 Extreme HD DirectX AA:x8 | |
| Acer Predator Orion 3000 PO3-640 | |
| Zotac Magnus One (ECM73070C) | |
| Zotac ZBOX Magnus EN173070C | |
| Intel Dragon Canyon NUC - RTX 3060 | |
| Intel Beast Canyon NUC | |
| 1920x1080 Extreme HD Preset OpenGL AA:x8 | |
| Acer Predator Orion 3000 PO3-640 | |
| Zotac Magnus One (ECM73070C) | |
| Zotac ZBOX Magnus EN173070C | |
| Intel Dragon Canyon NUC - RTX 3060 | |
| Intel Beast Canyon NUC | |
| 3DMark 05 Standard | 58568 Punkte | |
| 3DMark 06 Standard Score | 59134 Punkte | |
| 3DMark Vantage P Result | 91011 Punkte | |
| 3DMark 11 Performance | 36421 Punkte | |
| 3DMark Ice Storm Standard Score | 237580 Punkte | |
| 3DMark Cloud Gate Standard Score | 59231 Punkte | |
| 3DMark Fire Strike Score | 25739 Punkte | |
| 3DMark Fire Strike Extreme Score | 15841 Punkte | |
| 3DMark Time Spy Score | 12665 Punkte | |
Hilfe | ||
Gaming Performance
Der Acer Predator Orion 3000 profitiert bei den Spiele-Tests sehr gut von dem Alder-Lake-Prozessor. Dieser bietet eine sehr hohe Leistung pro Takt (IPC Instuctions per Cycle), was beim Spielen zu einem ordentlichen Boost führt. Dieses kann der Predator Orion 3000 trotz der Einschränkungen bei der TDP sehr gut umsetzen, da Spiele oft nicht immer die volle CPU-Leistung benötigen. Zusammen mit der Nvidia GeForce RTX 3070 lassen sich auch aktuellste Spiele problemlos zocken. Hierbei sollte man sich jedoch auf maximal 1.440p beschränken. Nichtsdestotrotz kann die GeForce RTX 3070 aber auch viele in 2.160p meistern. Für einen Überblick über die Leistung aller getesteten Spiele im Vergleich zu anderen Modellen verweisen wir auf unsere GPU-Spieleliste.
| GTA V | |
| 1920x1080 Highest AA:4xMSAA + FX AF:16x | |
| KFA2 GeForce RTX 3080 SG | |
| Acer Predator Orion 3000 PO3-640 | |
| Durchschnittliche NVIDIA GeForce RTX 3070 (91.1 - 122.4, n=5) | |
| Zotac ZBOX Magnus EN173070C | |
| Intel Beast Canyon NUC | |
| Intel Dragon Canyon NUC - RTX 3060 | |
| Zotac Magnus One (ECM73070C) | |
| 1920x1080 High/On (Advanced Graphics Off) AA:2xMSAA + FX AF:8x | |
| KFA2 GeForce RTX 3080 SG | |
| Acer Predator Orion 3000 PO3-640 | |
| Intel Beast Canyon NUC | |
| Intel Dragon Canyon NUC - RTX 3060 | |
| Durchschnittliche NVIDIA GeForce RTX 3070 (157 - 177.7, n=5) | |
| Zotac ZBOX Magnus EN173070C | |
| Zotac Magnus One (ECM73070C) | |
| The Witcher 3 | |
| 1920x1080 High Graphics & Postprocessing (Nvidia HairWorks Off) | |
| KFA2 GeForce RTX 3080 SG | |
| Acer Predator Orion 3000 PO3-640 | |
| Zotac Magnus One (ECM73070C) | |
| Durchschnittliche NVIDIA GeForce RTX 3070 (100 - 264, n=8) | |
| Zotac ZBOX Magnus EN173070C | |
| Intel Dragon Canyon NUC - RTX 3060 | |
| Zotac MEK Mini (RTX 2070 Super) | |
| 1920x1080 Ultra Graphics & Postprocessing (HBAO+) | |
| KFA2 GeForce RTX 3080 SG | |
| Acer Predator Orion 3000 PO3-640 | |
| Zotac Magnus One (ECM73070C) | |
| Durchschnittliche NVIDIA GeForce RTX 3070 (52.8 - 132.2, n=7) | |
| Zotac ZBOX Magnus EN173070C | |
| Zotac MEK Mini (RTX 2070 Super) | |
| Intel Dragon Canyon NUC - RTX 3060 | |
| min. | mittel | hoch | max. | QHD | 4K | |
|---|---|---|---|---|---|---|
| GTA V (2015) | 184.7 | 181.6 | 177.7 | 122.4 | 113.1 | 125.9 |
| The Witcher 3 (2015) | 507 | 408 | 264 | 132.2 | 93.9 | |
| Dota 2 Reborn (2015) | 146.5 | 133.9 | 129.3 | 121.4 | 122.7 | |
| Rise of the Tomb Raider (2016) | 376 | 266 | 182.9 | 153.7 | 76.7 | |
| Final Fantasy XV Benchmark (2018) | 195.8 | 172.3 | 129.7 | 99.3 | 58.2 | |
| X-Plane 11.11 (2018) | 150.6 | 137.4 | 111.3 | 98.4 | ||
| Far Cry 5 (2018) | 179 | 159 | 151 | 141 | 125 | 72 |
| Strange Brigade (2018) | 466 | 328 | 268 | 233 | 173.2 | 98.7 |
| Shadow of the Tomb Raider (2018) | 194.8 | 173.8 | 166.8 | 157.1 | 114.8 | 62.6 |
| Far Cry New Dawn (2019) | 162 | 140 | 135 | 121 | 113 | 74 |
| Metro Exodus (2019) | 224 | 156.8 | 121.9 | 97.7 | 78.3 | 49.7 |
| Anno 1800 (2019) | 167.5 | 164.1 | 130.8 | 74.7 | 69.3 | 41.8 |
| Control (2019) | 240 | 167.7 | 124.9 | 81.3 | 40.6 | |
| Borderlands 3 (2019) | 171.5 | 144.7 | 127.9 | 108.9 | 82.9 | 46.3 |
| F1 2020 (2020) | 351 | 302 | 288 | 215 | 162.2 | 92.7 |
| Watch Dogs Legion (2020) | 125 | 123 | 109 | 89 | 67 | 37 |
| Dirt 5 (2020) | 248.1 | 191.8 | 157 | 122.1 | 99 | 65.3 |
| F1 2021 (2021) | 407 | 361 | 304 | 158 | 118 | 67.3 |
| New World (2021) | 166.9 | 139.5 | 128.3 | 117.5 | 95 | 48.9 |
| Far Cry 6 (2021) | 154.9 | 138.3 | 121.1 | 114.2 | 95.9 | 26.4 |
| Forza Horizon 5 (2021) | 247 | 171 | 160 | 115 | 100 | 73 |
| God of War (2022) | 142.3 | 140.5 | 117.8 | 83.5 | 69.3 | 49.8 |
| GRID Legends (2022) | 249 | 224 | 198 | 151 | 127 | 84 |
| Cyberpunk 2077 1.6 (2022) | 146.7 | 145.1 | 136 | 90.3 | 60.6 | 29 |
| Tiny Tina's Wonderlands (2022) | 248 | 204 | 145.8 | 113.9 | 80.7 | 44.4 |
| F1 22 (2022) | 258 | 249 | 228 | 81 | 52 | 25 |
Emissionen - schwaches Kühlsystem
Geräuschemissionen
Die Kühlung des Acer Predator Orion 3000 besteht aus einem Lüfter an Front, welcher Frischluft ansaugt und einem Lüfter auf der Rückseite, der die warme Luft aus dem Gehäuse befördern soll. In der Theorie klingt das ganz gut, aber in der Praxis zeigt sich, dass dieses nicht optimal ist. Denn nicht umsonst begrenzt Acer hier beim Predator Orion 3000 die maximale Leistungsaufnahme des Prozessors. Im Test fällt der PC aber trotz des sehr kleinen CPU-Kühlers mit nur 31,6 dB(A) im Leerlauf nicht negativ auf. Auch unter Last arbeitet das System relativ leise und erreicht beim Stresstest etwa 38 dB(A). Lassen wir die Lüfter jedoch mit voller Drehzahl laufen (über Predator Sense-Gaming-Mode), zeigt unser Messgerät jedoch 54 dB(A) an.
Lautstärkediagramm
| Idle |
| 31.5 / 31.6 / 31.6 dB(A) |
| Last |
| 32.7 / 38.1 dB(A) |
 | ||
30 dB leise 40 dB(A) deutlich hörbar 50 dB(A) störend |
||
min: | ||
| Acer Predator Orion 3000 PO3-640 i7-12700F, GeForce RTX 3070 | Zotac Magnus One (ECM73070C) i7-10700, GeForce RTX 3070 | Zotac ZBOX Magnus EN173070C i7-11800H, GeForce RTX 3070 Laptop GPU | Intel Dragon Canyon NUC - RTX 3060 i9-12900, GeForce RTX 3060 | |
|---|---|---|---|---|
| Geräuschentwicklung | -18% | -10% | -2% | |
| aus / Umgebung * (dB) | 29.8 | 30 -1% | 30.7 -3% | 30.2 -1% |
| Idle min * (dB) | 31.5 | 33.58 -7% | 32.7 -4% | 30.2 4% |
| Idle avg * (dB) | 31.6 | 32.8 -4% | 30.4 4% | |
| Idle max * (dB) | 31.6 | 32.8 -4% | 30.8 3% | |
| Last avg * (dB) | 32.7 | 44.25 -35% | 41.7 -28% | |
| Last max * (dB) | 38.1 | 48.72 -28% | 45.4 -19% | 45.1 -18% |
* ... kleinere Werte sind besser
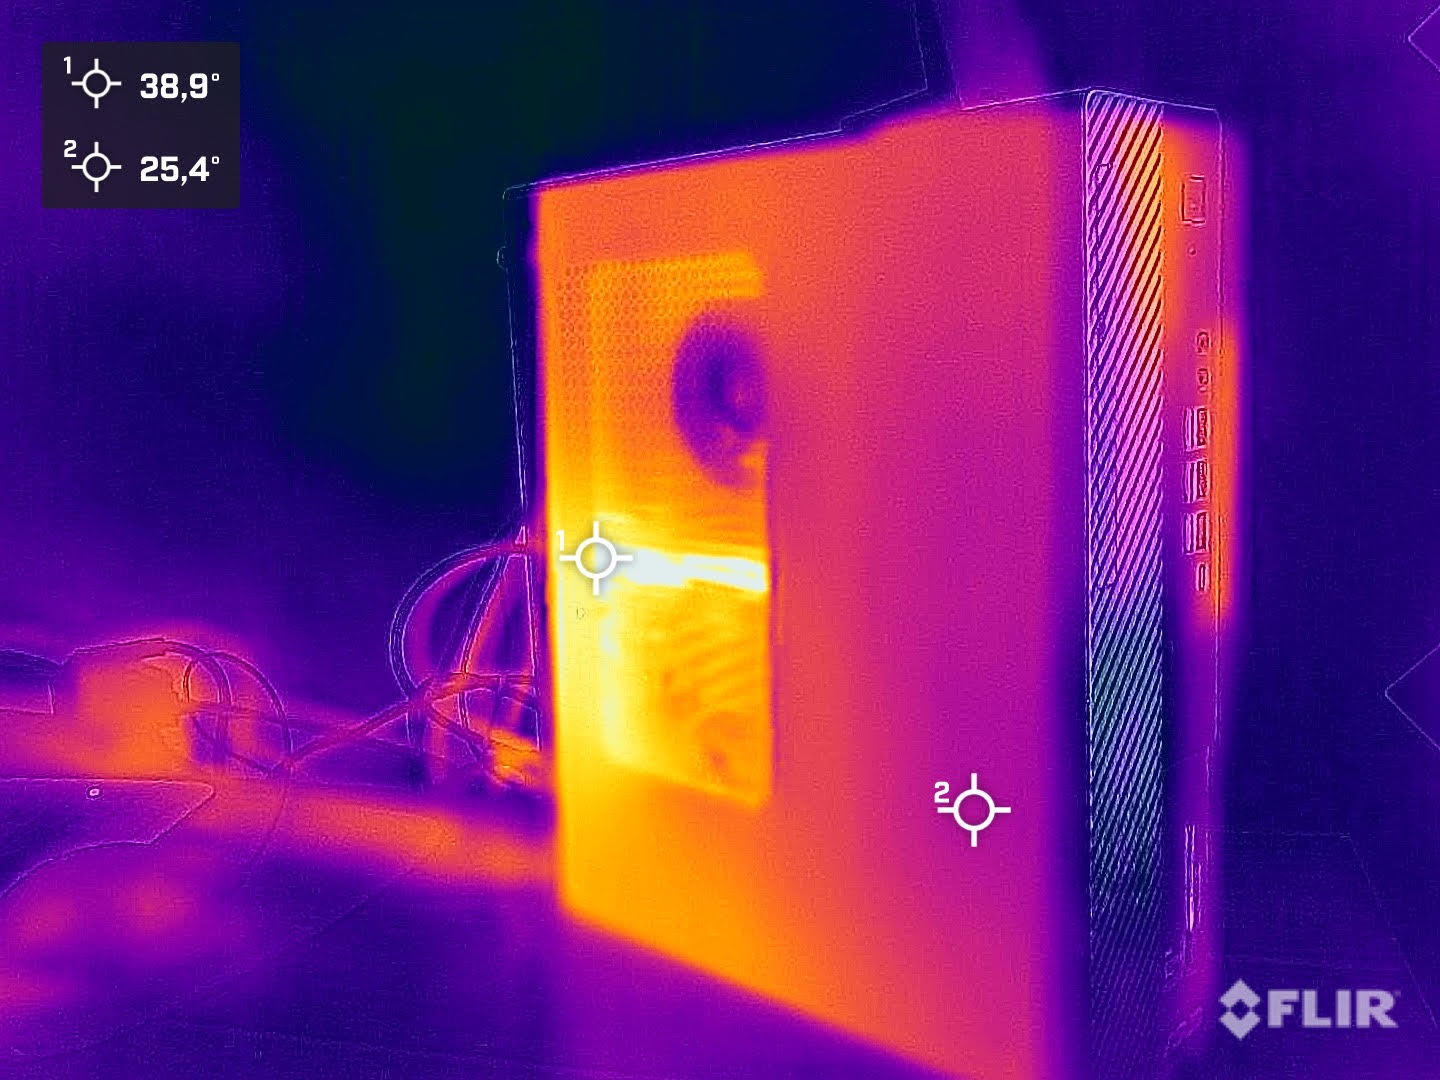
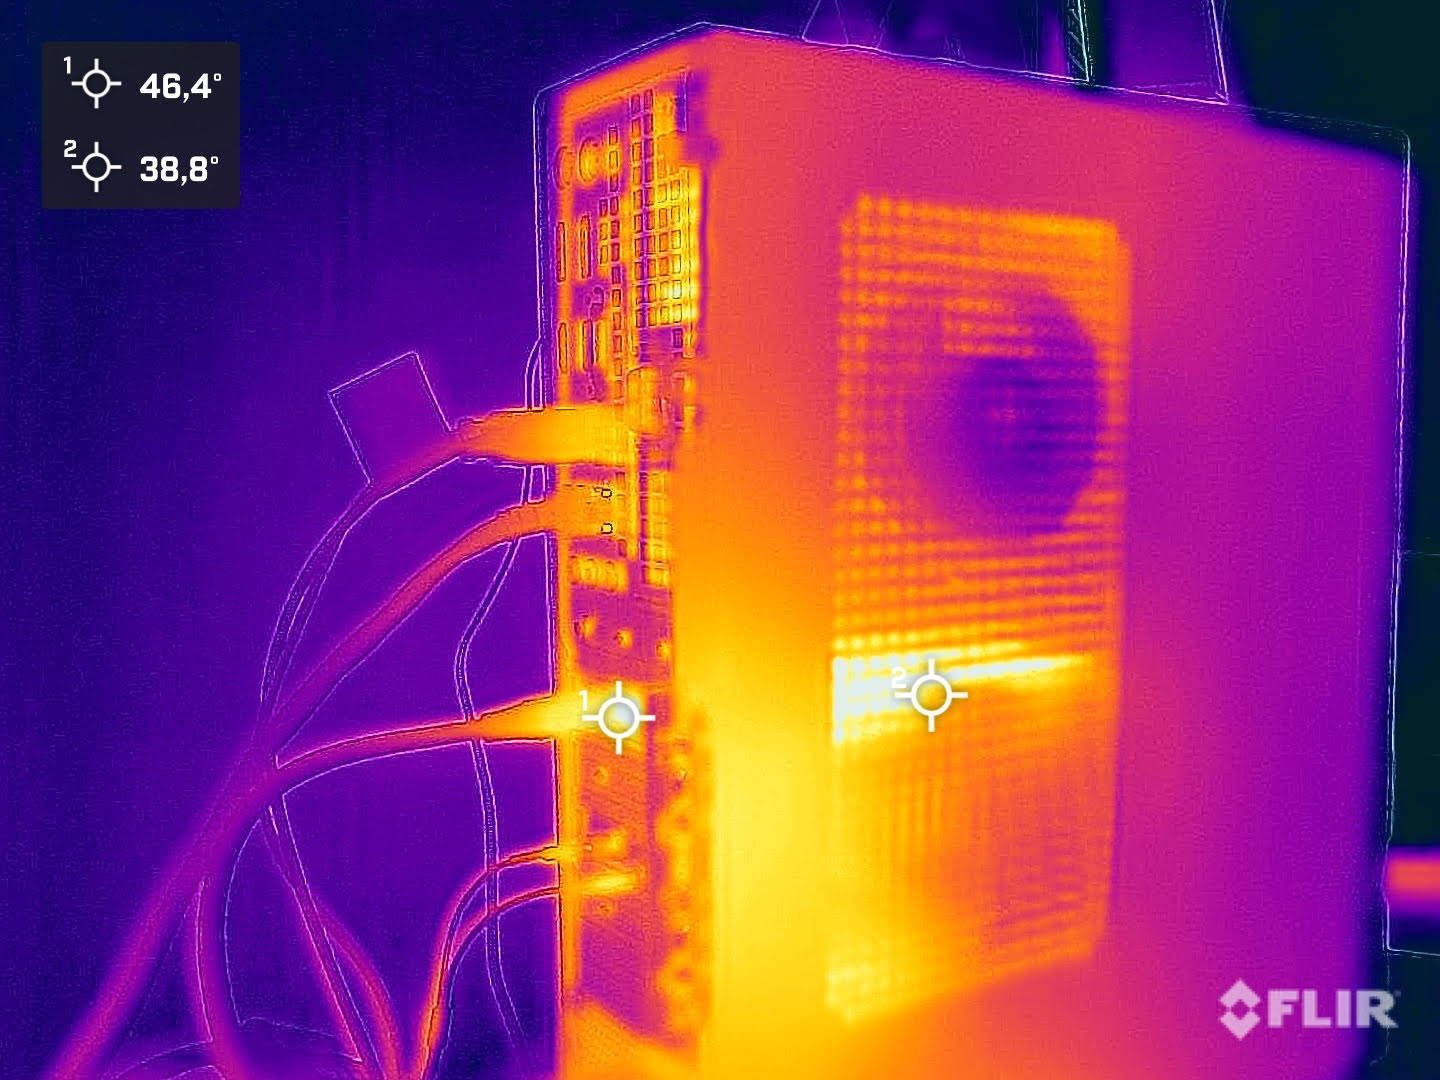
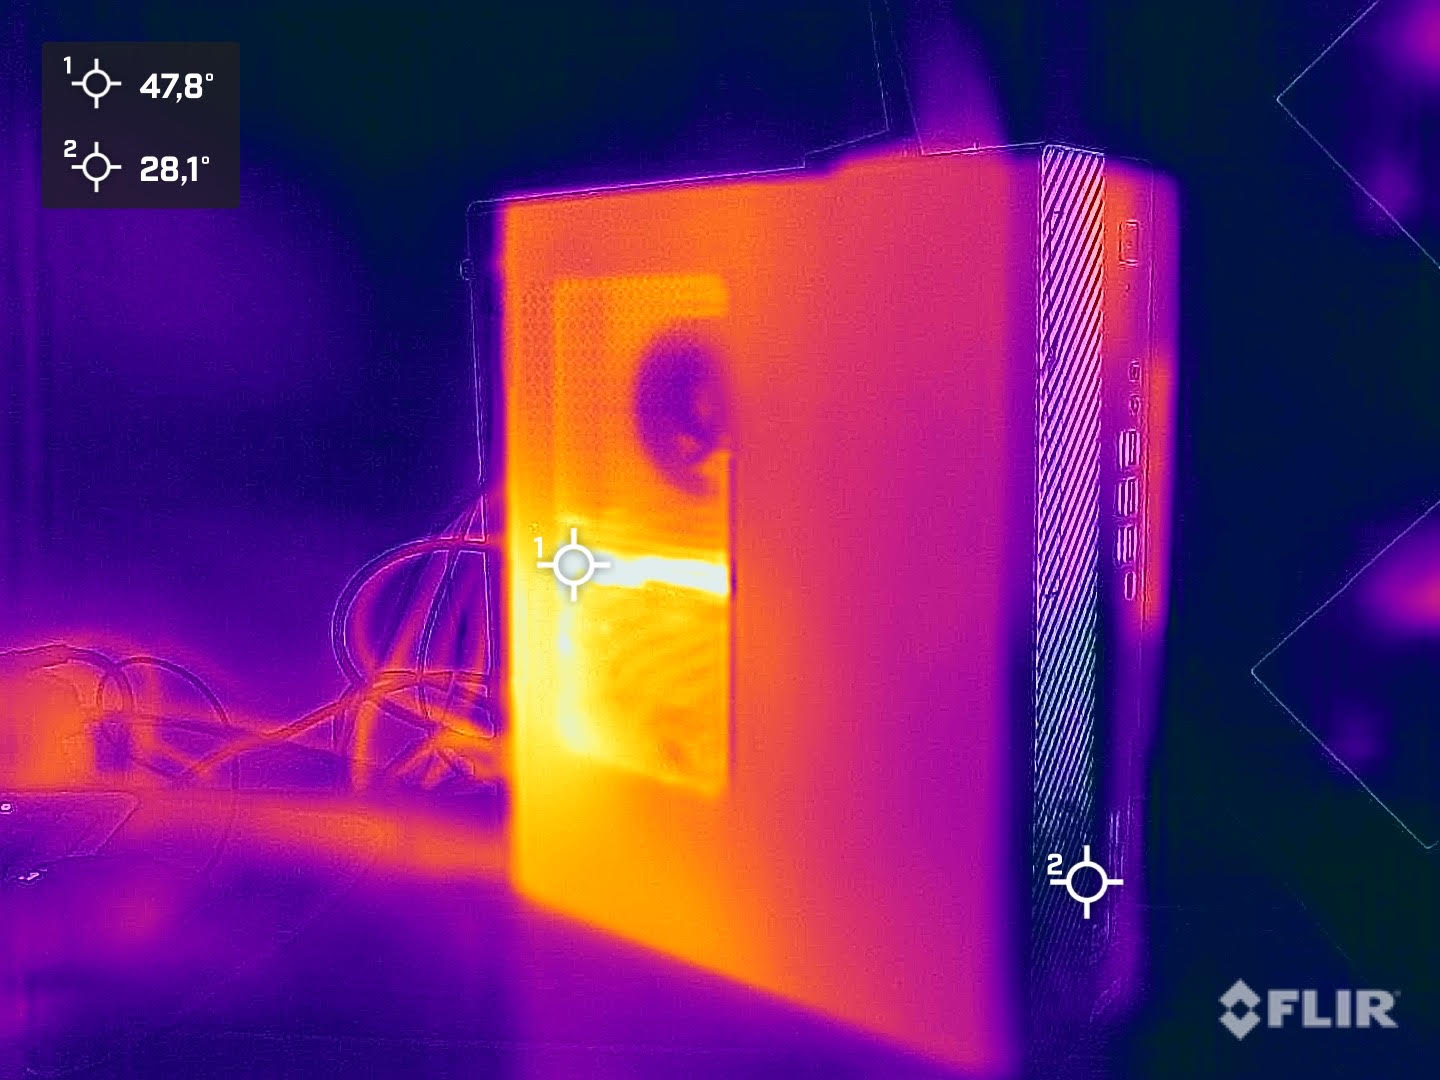
Temperatur
Das Gehäuse des Acer Predator Orion 3000 erwärmt sich unter Last etwas, was aber nicht problematisch ist. Der einzelne Lüfter auf der Rückseite schaufelt hingegen sehr warme Luft aus dem Gehäuse. Hier wäre eine zusätzliche Wärmeabfuhr nach oben hin noch effektiver. Mit 98 °C notieren wir den höchsten Wert des Prozessors unter Last. Das zeigt, dass Acer hier mit der verbauten Kühlung bereits am Limit ist, obwohl der Intel Core i7-12700F noch Reserven hätte. Nichtsdestotrotz konnte der Predator Orion 3000 im Test aber trotzdem eine gute Leitung abliefern. Bei der GPU ist die Höchsttemperatur mit 70,5 °C deutlich geringer.

Energieaufnahme
Beim Energieverbrauch ist der Acer Predator Orion 3000 im Leerlauf und bei geringer Last erstaunlich sparsam unterwegs. Nur knapp 30 Watt zeigt unser Messgerät an. Beim Stresstest sind es kurzfristig bis zu 361 Watt, wenngleich im Durchschnitt nur 186 Watt anliegen. Dies ist dem PL2 geschuldet, welches nur maximal 28 Sekunden anliegen darf. Beim Spielen beträgt die Leistungsaufnahme des Systems im Schnitt 338 Watt. Hierbei haben wir kurzzeitige Spitzen von bis zu 364 Watt dokumentiert. Verbaut ist ein 500-Watt-ATX-Netzteil, welches den Hardwareanforderungen gewachsen ist.
| Aus / Standby | |
| Idle | |
| Last |
|
Legende:
min: | |
| Acer Predator Orion 3000 PO3-640 i7-12700F, GeForce RTX 3070 | Zotac ZBOX Magnus EN173070C i7-11800H, GeForce RTX 3070 Laptop GPU | Durchschnittliche NVIDIA GeForce RTX 3070 | Durchschnitt der Klasse Desktop | |
|---|---|---|---|---|
| Stromverbrauch | -27% | -93% | -4% | |
| Idle min * (Watt) | 24.6 | 31.3 -27% | 56 ? -128% | 17.9 ? 27% |
| Idle avg * (Watt) | 24.6 | 35.1 -43% | 58.5 ? -138% | 37.2 ? -51% |
| Idle max * (Watt) | 29.6 | 41.6 -41% | 70.5 ? -138% | 41.3 ? -40% |
| Last avg * (Watt) | 124.6 | 214 -72% | 122.1 ? 2% | 96.7 ? 22% |
| Witcher 3 ultra * (Watt) | 338.1 | 193.5 43% | ||
| Last max * (Watt) | 186.1 | 231 -24% | 305 ? -64% | 141.6 ? 24% |
* ... kleinere Werte sind besser
Energieaufnahme mit externem Monitor
Pro
Contra
Fazit - Schneller Gaming-PC mit schwacher Kühlung
Der Acer Predator Orion 3000 ist ein kompakter Gaming-PC und basiert auf Intels aktueller CPU-Generation. Der Intel Core i5-12700F bietet eine sehr gute Leistung und ist trotz der PL2-Limitierung schnell genug, um den Anforderungen aktueller Spiele gerecht zu werden. Mit einer besseren Kühlung wäre hier noch mehr drin gewesen. Bei der Nvidia GeForce RTX 3070 bekommt man ein herkömmliches Modell, welches den Spezifikationen von Nvidia entspricht. Dafür performt das Modell aber gut und erreicht auch in aktuellen Spielen flüssige Frameraten in 1.440p. Die restliche Konfiguration ist mit einer 1-TB-SSD und 16-GB-DDR4-RAM eher Standard. Zukunftssicher wäre hier der Einsatz von schnellerem DDR5-RAM gewesen.
Um den Acer Predator Orion 3000 optisch etwas aufzuwerten, kann man das linke Seitenteil auch gegen ein Seitenteil mit Sichtfenster tauschen. Dies ist Bestandteil des Lieferumfanges. Ebenso gibt es auch noch eine Tastatur sowie eine Maus, welche den Acer Predator Look aufgreifen und somit für ein stimmiges Gesamtbild sorgen.
Der Acer Predator Orion 3000 bietet dank Intel Core i7-12700F und der Nvidia GeForce RTX 3070 eine gute Grundlage als Gaming-PC. Abstriche muss man leider bei der Kühlung in Kauf nehmen.
Als größter Kritikpunkt bleibt die zu kleine Kühlung des Prozessors. Unterm Strich ist es aber dennoch erstaunlich, dass der Acer Predator Orion 3000 hier nicht unerträglich laut wird. Hier hat der Hersteller vermutlich zulasten höherer Temperaturen auf höhere Drehzahlen im Auto-Mode verzichtet. Eine selbst angepasste Lüfter-kurve kann hier für etwas bessere Temperaturen unter Last sorgen. Doch damit sind die geringen Geräuschemissionen unter Last auch passé.
Preise und Verfügbarkeit
Den Acer Predator Orion 3000 ist direkt bei Acer erhältlich und kostet dort in unserer Testausstattung 2.200 Euro. Derzeit kann man das Gerät aber auch bei Computer Universe bekommen. Hier muss man nur 1.900 Euro einkalkulieren.
Acer Predator Orion 3000 PO3-640
- 13.09.2022 v7 (old)
Sebastian Bade
Preisvergleich
