 Deutsch
 English
 Español
 Français
 Italiano
 Nederlands
 Polski
 Português
 Русский
 Türkçe
 Svenska
 Chinese
 Magyar
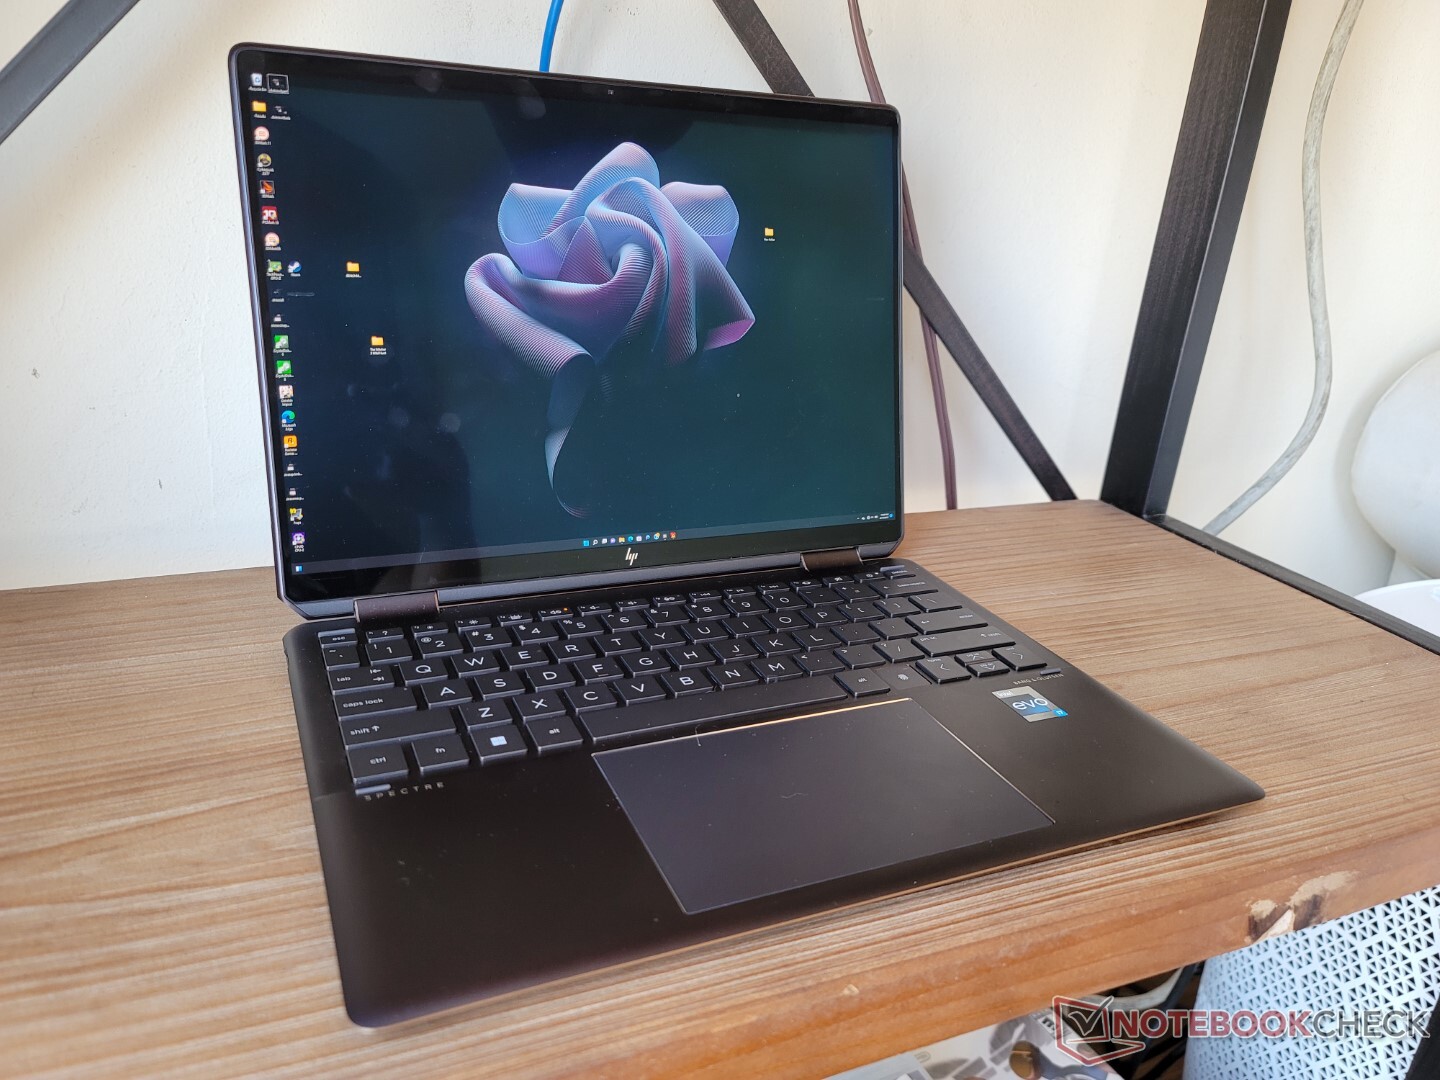
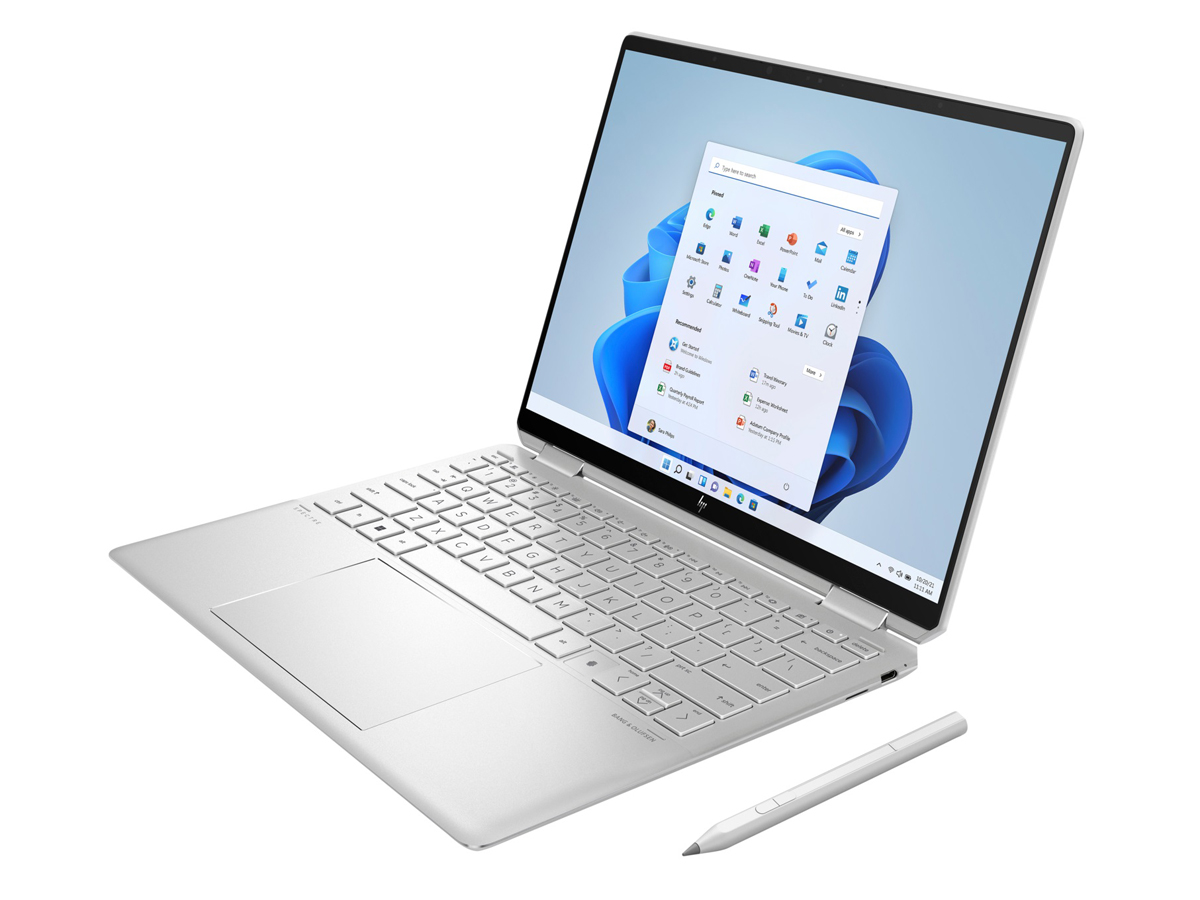
Test HP Spectre x360 2022 13.5: Die Spitze der Subnotebook-Convertibles

Das 13.5-Zoll HP Spectre x360 ist 2020 erstmalig auf den Markt gekommen und wurde schnell zu einem unserer Favoriten in seiner Convertible-Größenklasse. Die in 2021 aktualisierte Version hat nur wenige Neuerungen mitgebracht, was insgesamt in einer sehr ähnlichen Leistung und einem vergleichbaren Benutzererlebnis resultierte. Zum Glück beinhaltet die 2022er-Version auch abgesehen vom obligatorischen CPU-Upgrade einige Neuerungen, die für potenzielle Käufer definitiv interessant sein können.
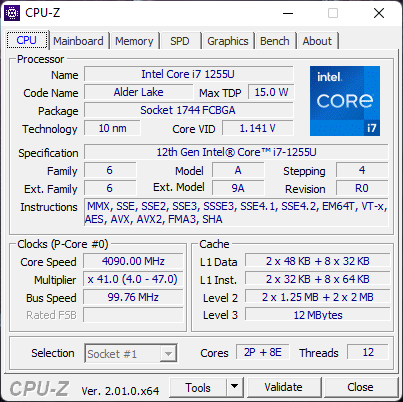
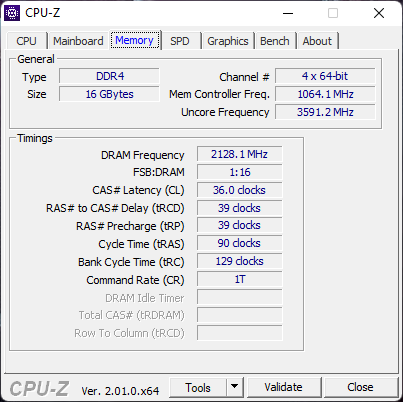
Bei unserem Testgerät handelt es sich um eine High-End-Konfiguration mit einem Core i7-1255U, einem 3.000-x-2.000-OLED-Touchscreen und 16 GB verlötetem RAM für rund 2.000 Euro. Günstigere Modelle mit dem Core i5-1235U und einem 1.980-x-1.280-IPS-Touchscreen sind ebenfalls verfügbar. Außerdem gibt es eine 1.000-cd/m²-Version bestimmter 1.280p-IPS-Modelle. Davon abgesehen unterscheiden sich die Varianten in Bezug auf die integrierte Grafik und die fehlenden WAN-Optionen nicht.
Zur Konkurrenz des HP Spectre x360 13.5 zählen andere Profi- bzw. Bürolaptops im 13,5-Zoll-Format wie der Framework-Laptop, Microsoft Surface Laptop 4 13 und die Lenovo-ThinkPad-X1-Yoga-Reihe. Man sollte beachten, dass das 2022er-HP-Modell als "Spectre x360 13.5", frühere Modelle aus 2020 und 2021 jedoch "Spectre x360 14" beworben werden. Wir vermuten, dass der Hersteller den Namen dieses Jahr geändert hat, um die 13,5-Zoll-Displaygröße präziser zu kommunizieren.
Weitere HP-Tests:
Mögliche Konkurrenten im Vergleich
Bew. | Datum | Modell | Gewicht | Dicke | Größe | Auflösung | Preis ab |
|---|---|---|---|---|---|---|---|
| 90.3 % | 08.2022 | HP Spectre x360 13.5 14t-ef000 i7-1255U, Iris Xe G7 96EUs | 1.4 kg | 17 mm | 13.50" | 3000x2000 | |
| 89.5 % | 05.2021 | HP Spectre x360 14-ea0378ng i7-1165G7, Iris Xe G7 96EUs | 1.3 kg | 16.9 mm | 13.50" | 3000x2000 | |
| 85.1 % | 07.2022 | Framework Laptop 13.5 12th Gen Intel i7-1260P, Iris Xe G7 96EUs | 1.3 kg | 15.85 mm | 13.50" | 2256x1504 | |
| 88.5 % | 03.2022 | Lenovo ThinkPad X1 Titanium Yoga G1 20QB0016GE i5-1140G7, Iris Xe G7 80EUs | 1.2 kg | 11.5 mm | 13.50" | 2256x1504 | |
| 85.4 % | 07.2021 | Framework Laptop 13.5 i7-1165G7, Iris Xe G7 96EUs | 1.3 kg | 15.85 mm | 13.50" | 2256x1504 | |
| 84 % | 08.2021 | HP EliteBook Folio 13.5-3G2L2EA SD 8cx Gen 2 5G, Adreno 680 | 1.3 kg | 16 mm | 13.50" | 1920x1280 | |
| 85.2 % | 05.2021 | Microsoft Surface Laptop 4 13 Ryzen 5 R5 4680U, Vega 7 | 1.3 kg | 14 mm | 13.50" | 2256x1504 |
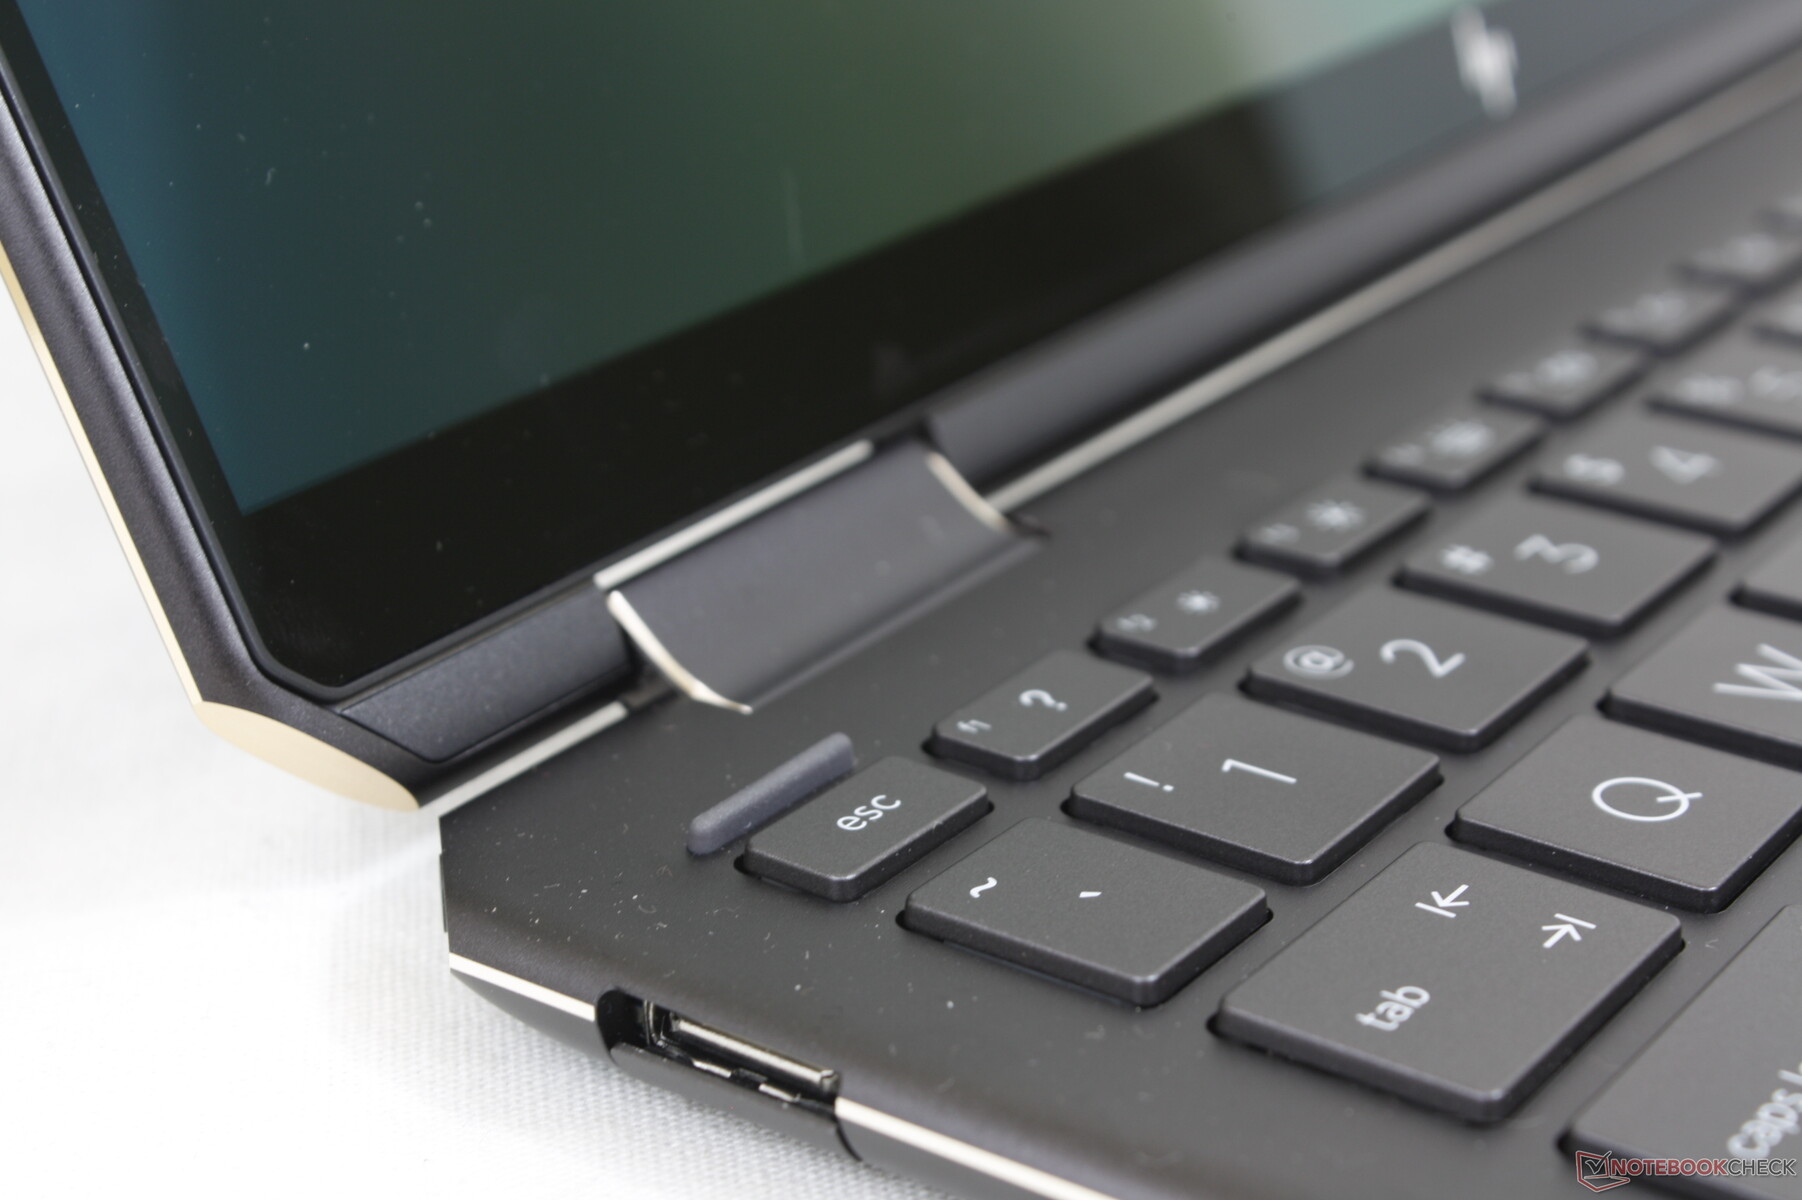
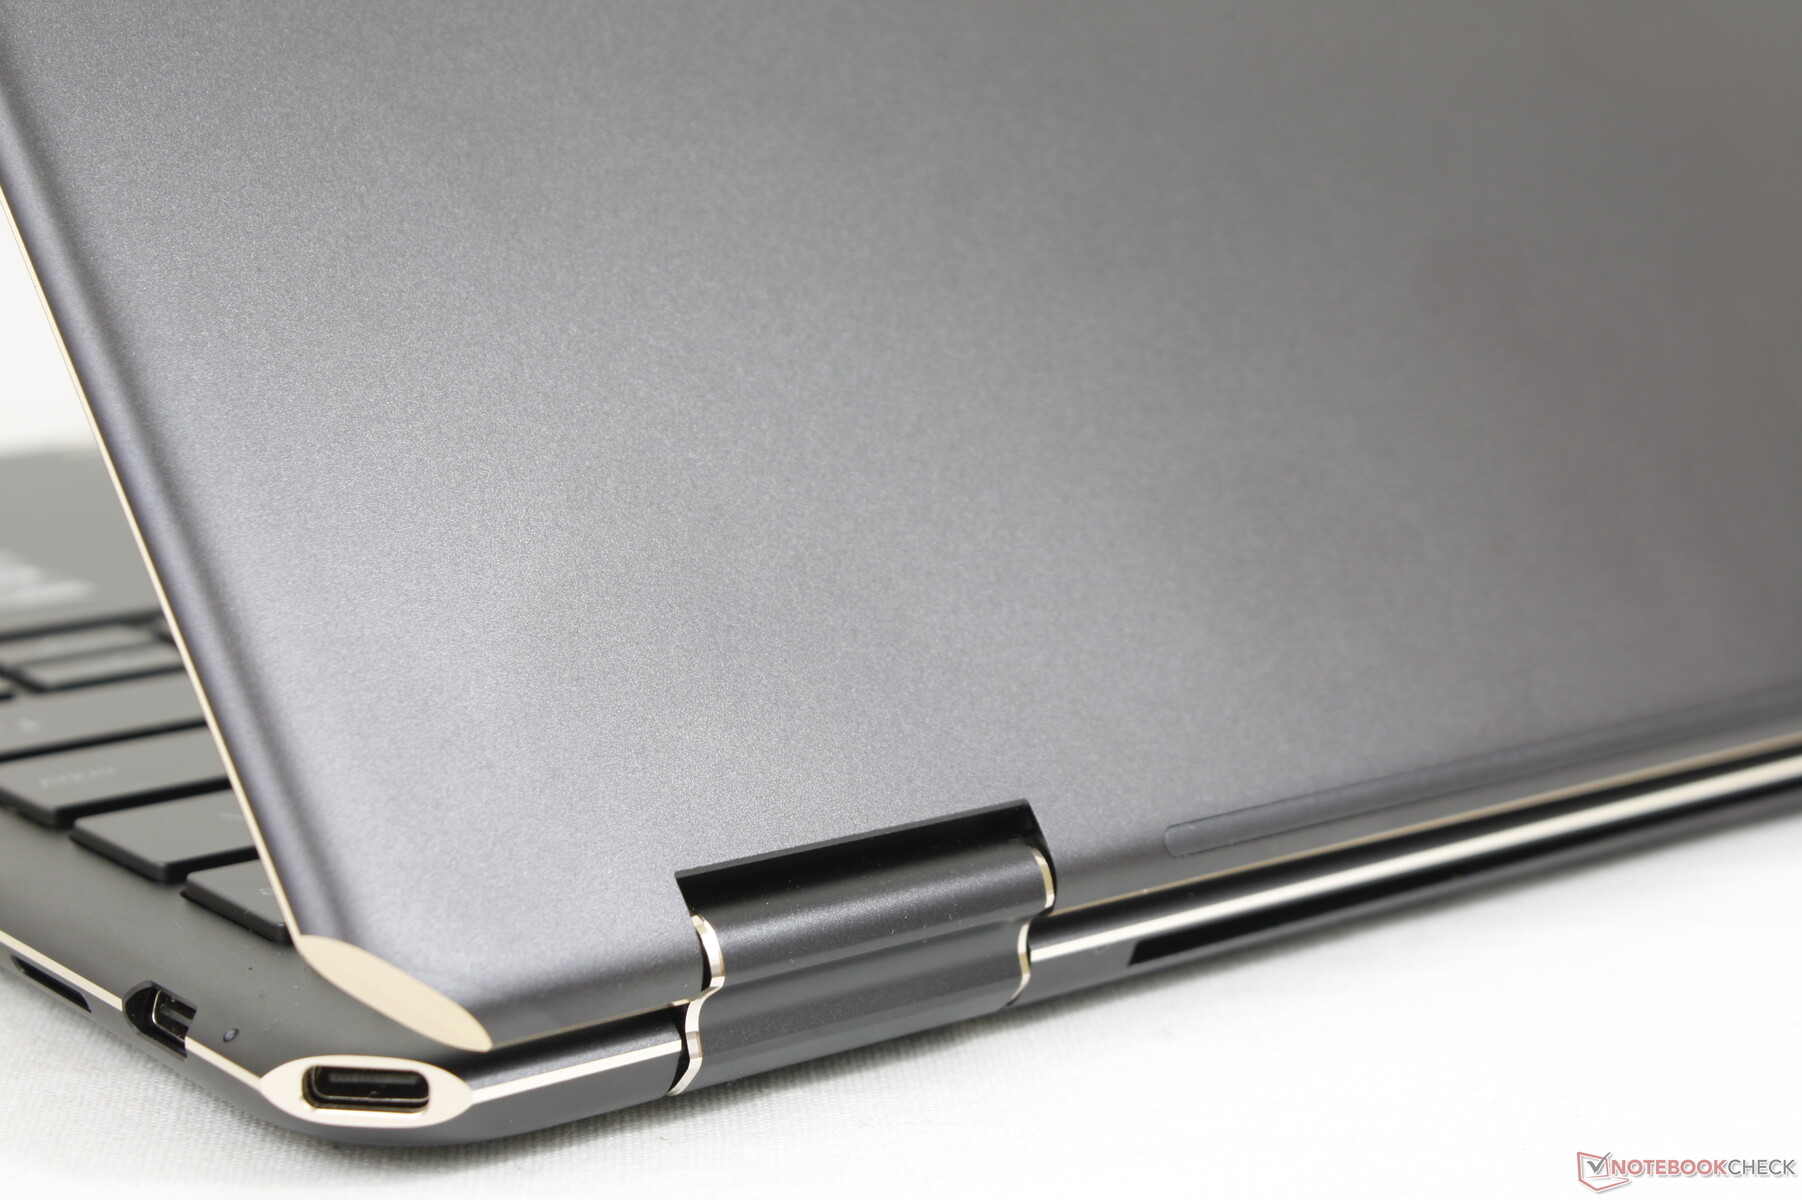
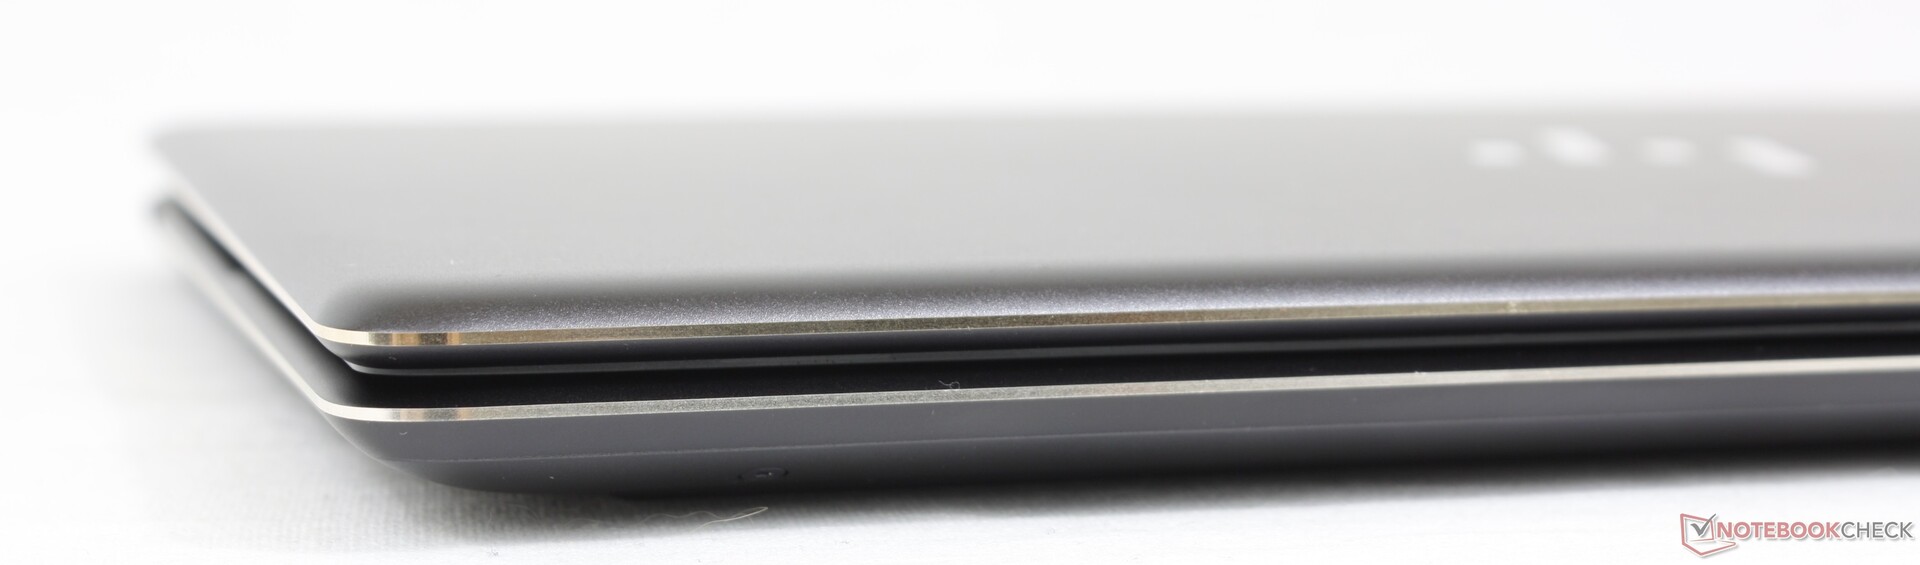
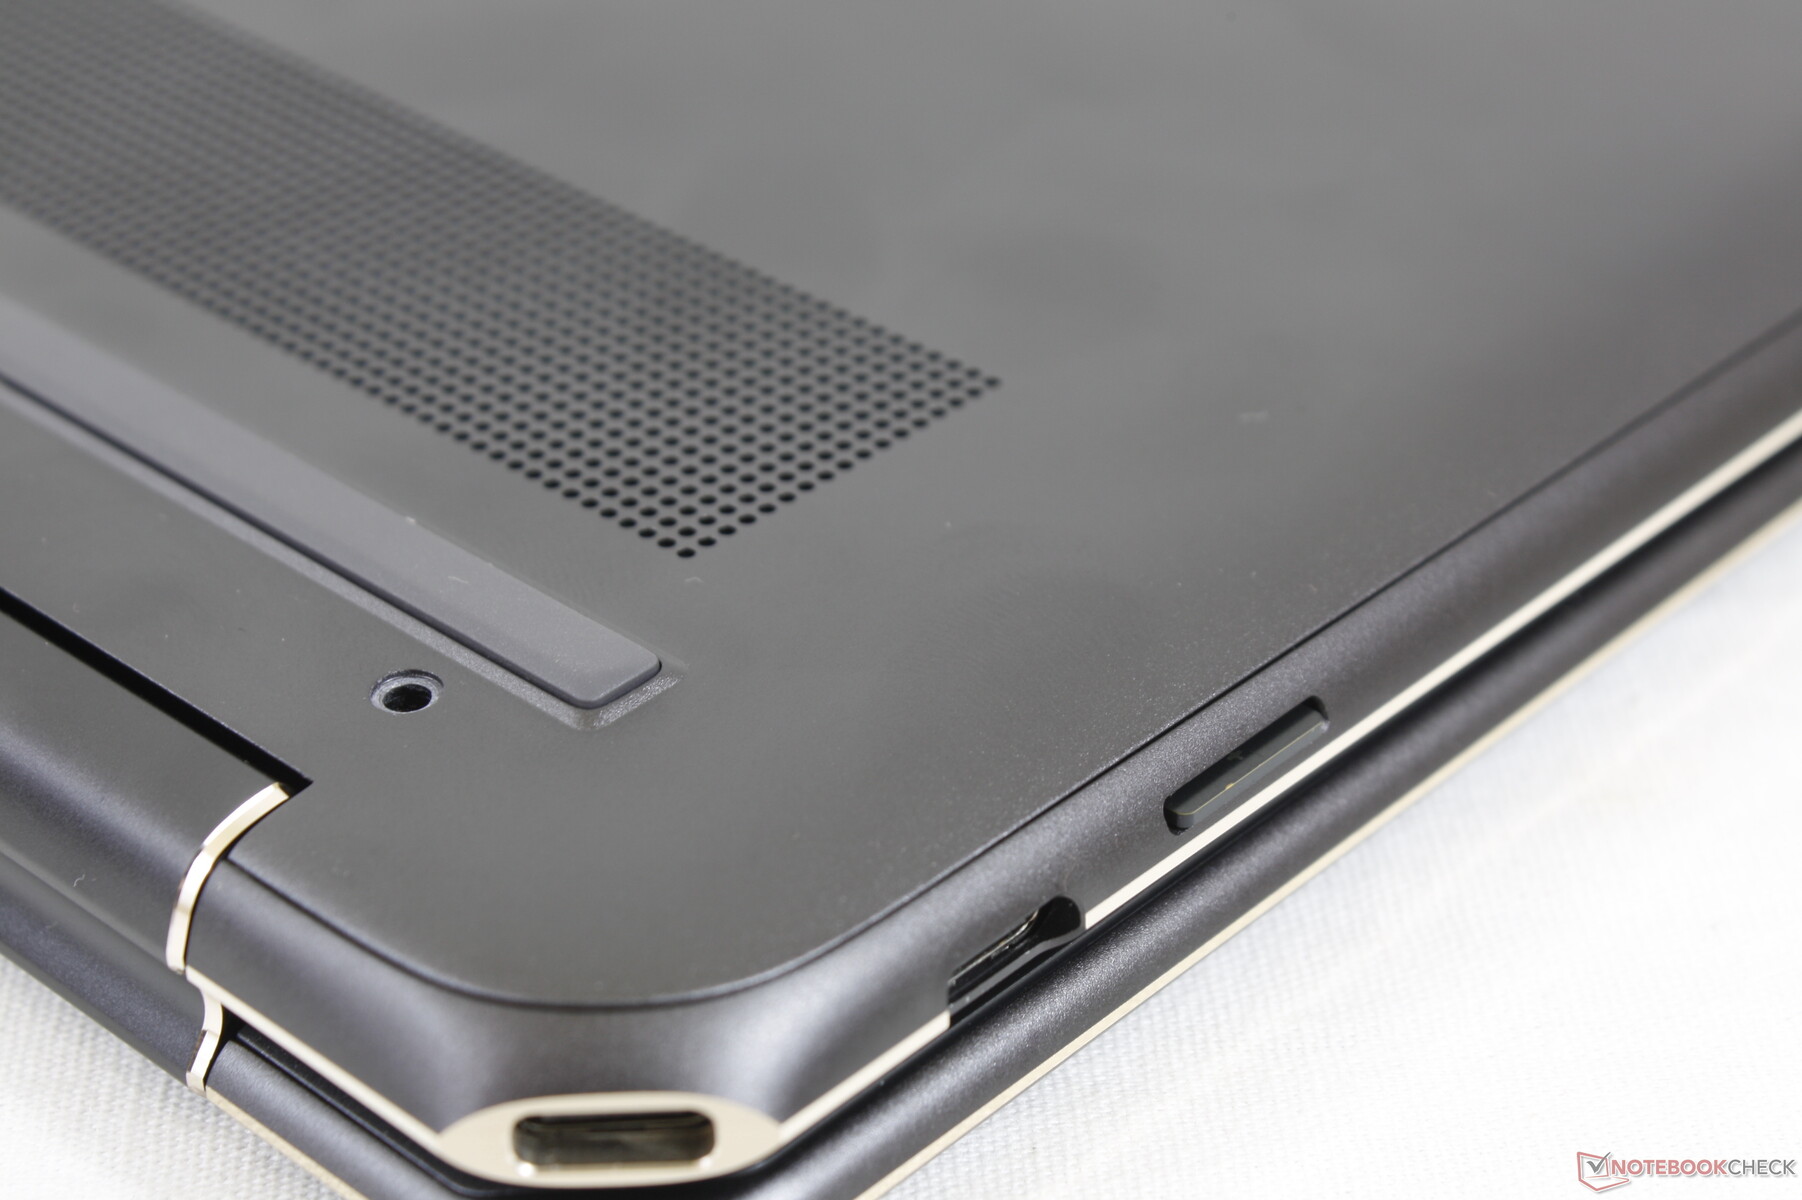
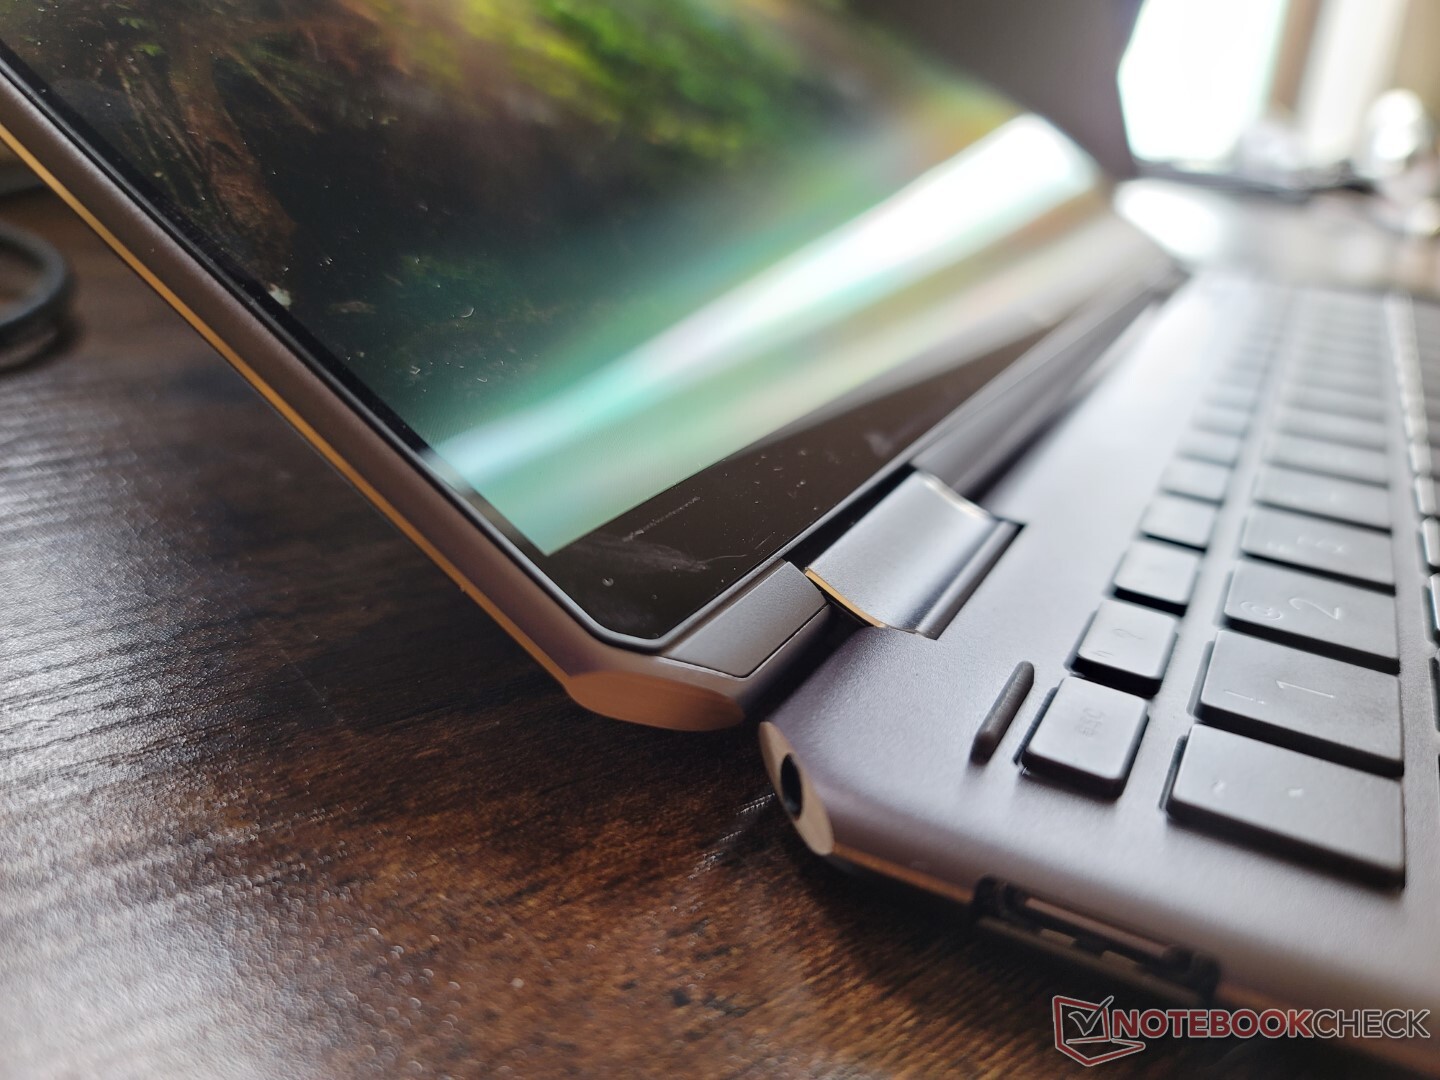
Gehäuse — Runder und glatter
HP hat das Design des 2020er-Modells mit der 2022er-Version überarbeitet. Im Inneren gibt es jedoch nur geringfügige Anpassungen, da die meisten Änderungen eher oberflächlich sind. Durch die abgerundeten Ecken und Kanten und das neue Tasten- bzw. Anschlusslayout lässt sich das 2022er-Modell leicht von der 2020er-Version unterscheiden. Die Gehäusestabilität ist unverändert gut und ergänzt den hochwertigen optischen Eindruck durch eine luxuriöse Haptik. Besonders gut gefällt uns, wie viel wartungsfreundlicher bzw. stabiler das HP-Design gegenüber dem verschlossenen System des Surface Laptop 4 13 und dem knarzenden Framework-Laptop ist.
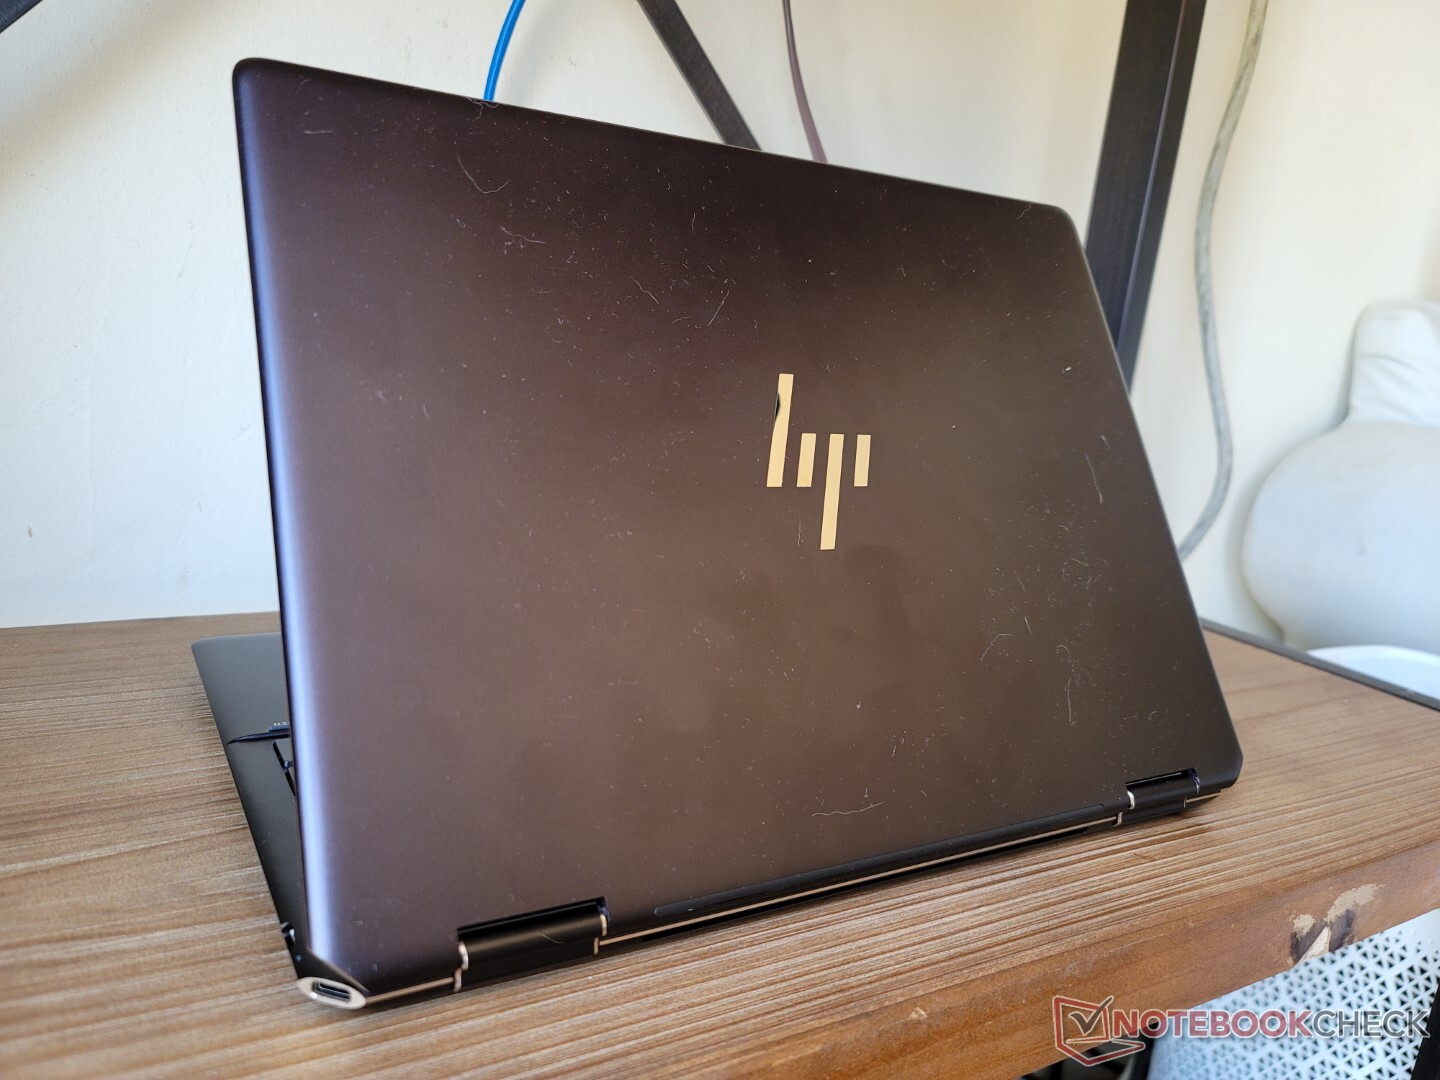
Dass sich weder die Abmessungen noch das Gewicht gegenüber denen des Originals aus 2020 verändert haben, hat Vor- und Nachteile. Schlecht schneidet es zwar nicht ab, viele andere 13,5-Zoll-Laptops wie zum Beispiel der Surface Laptop 4, Framework-Laptop und das Lenovo ThinkPad X1 Titanium Yoga G1 sind jedoch zumindest einige Millimeter dünner als unser Spectre.
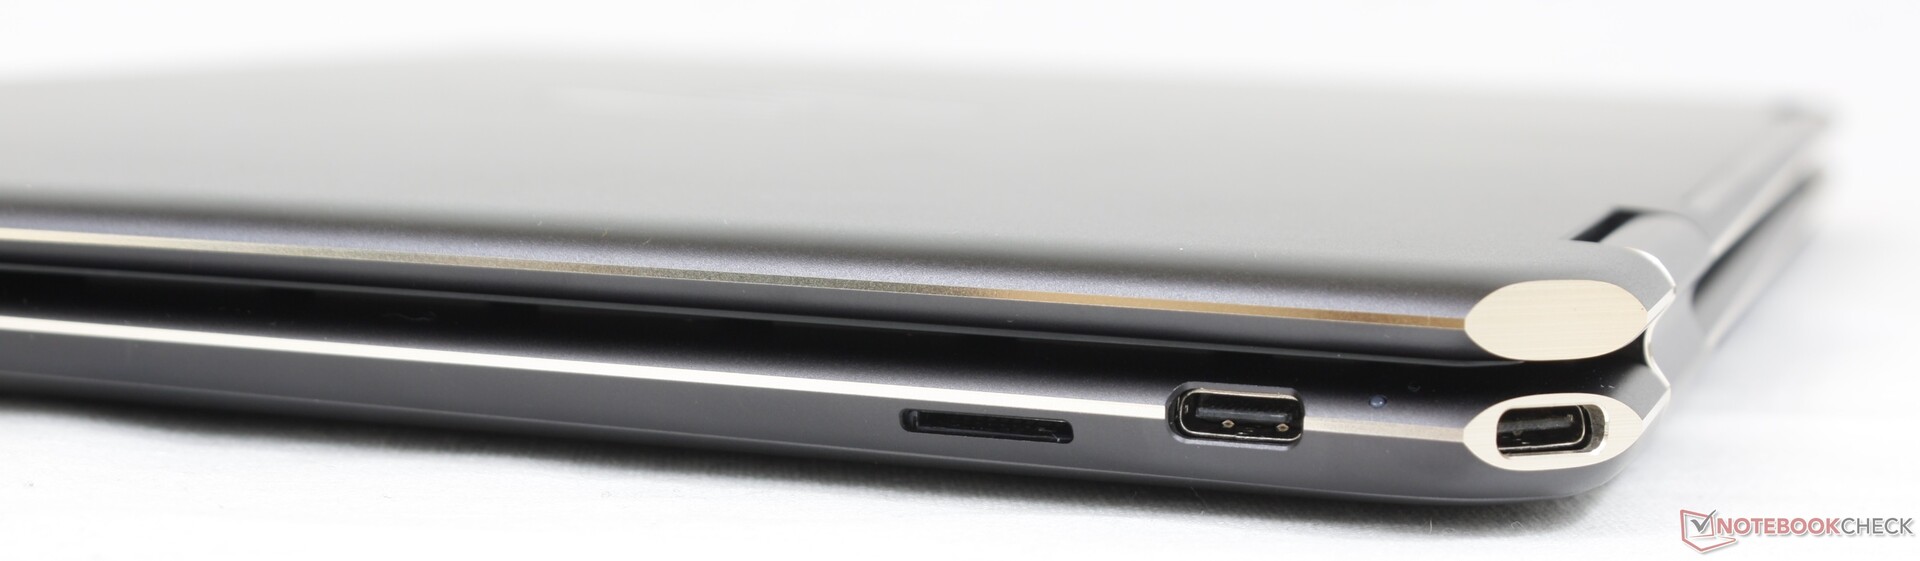
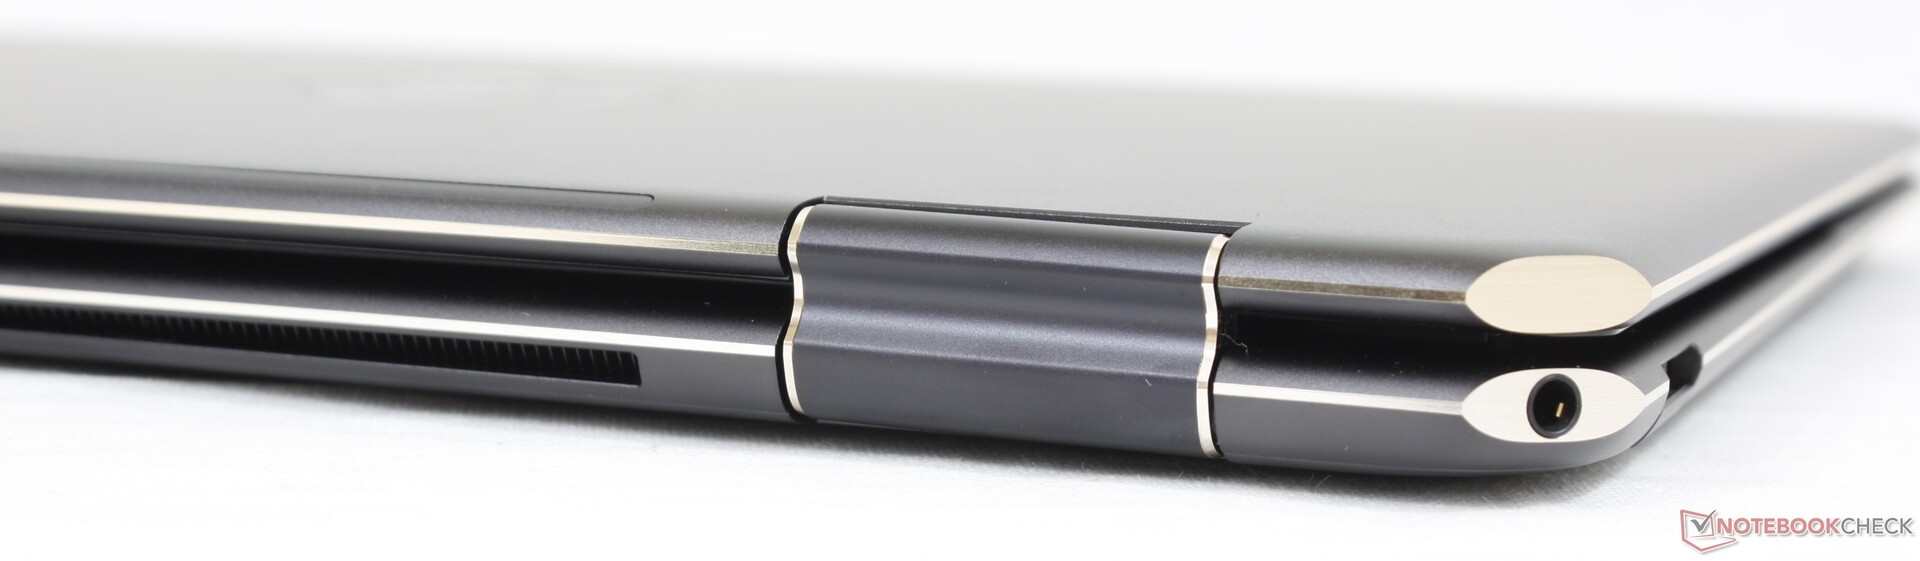
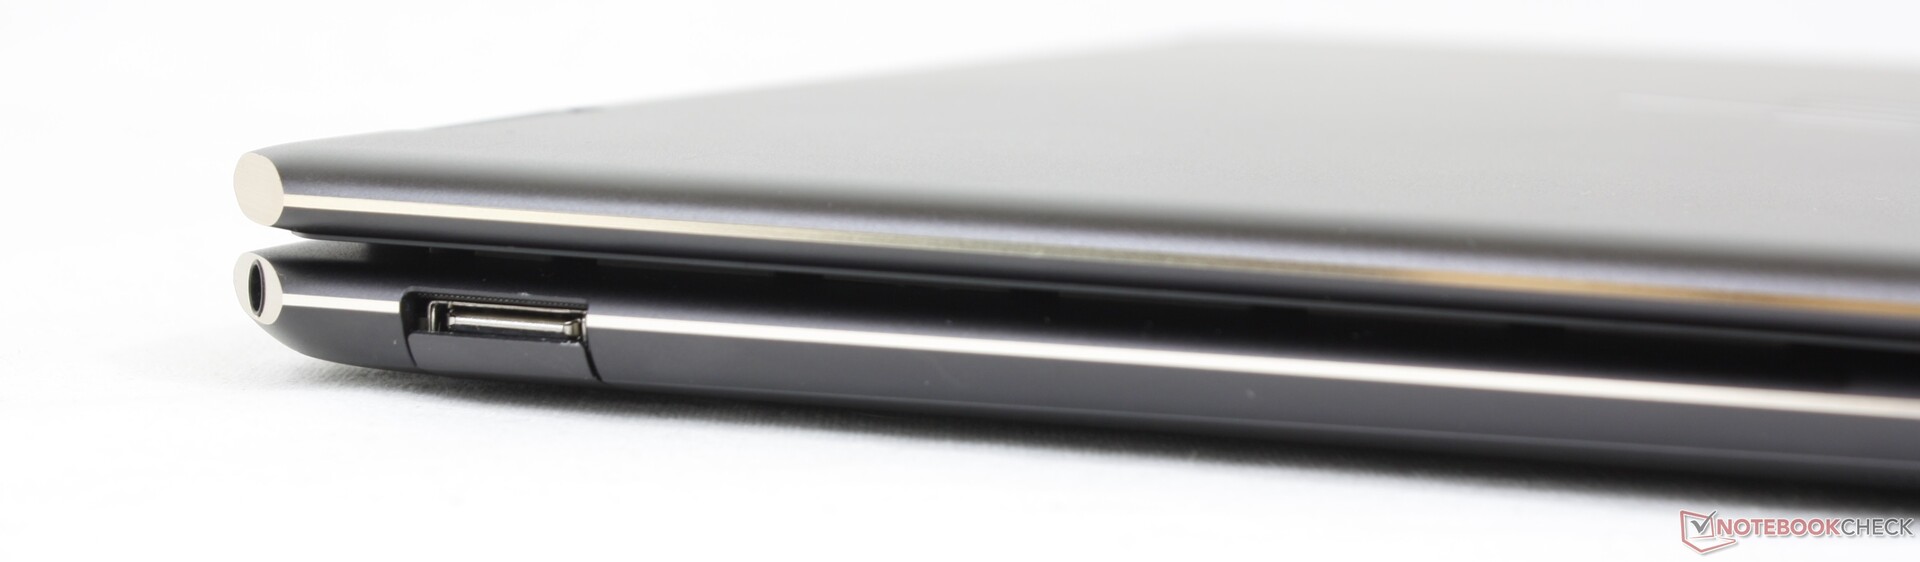
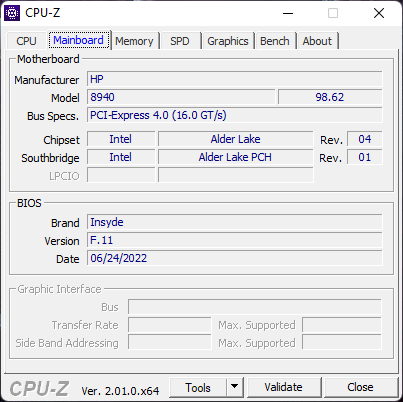
Ausstattung - Mit Thunderbolt 4
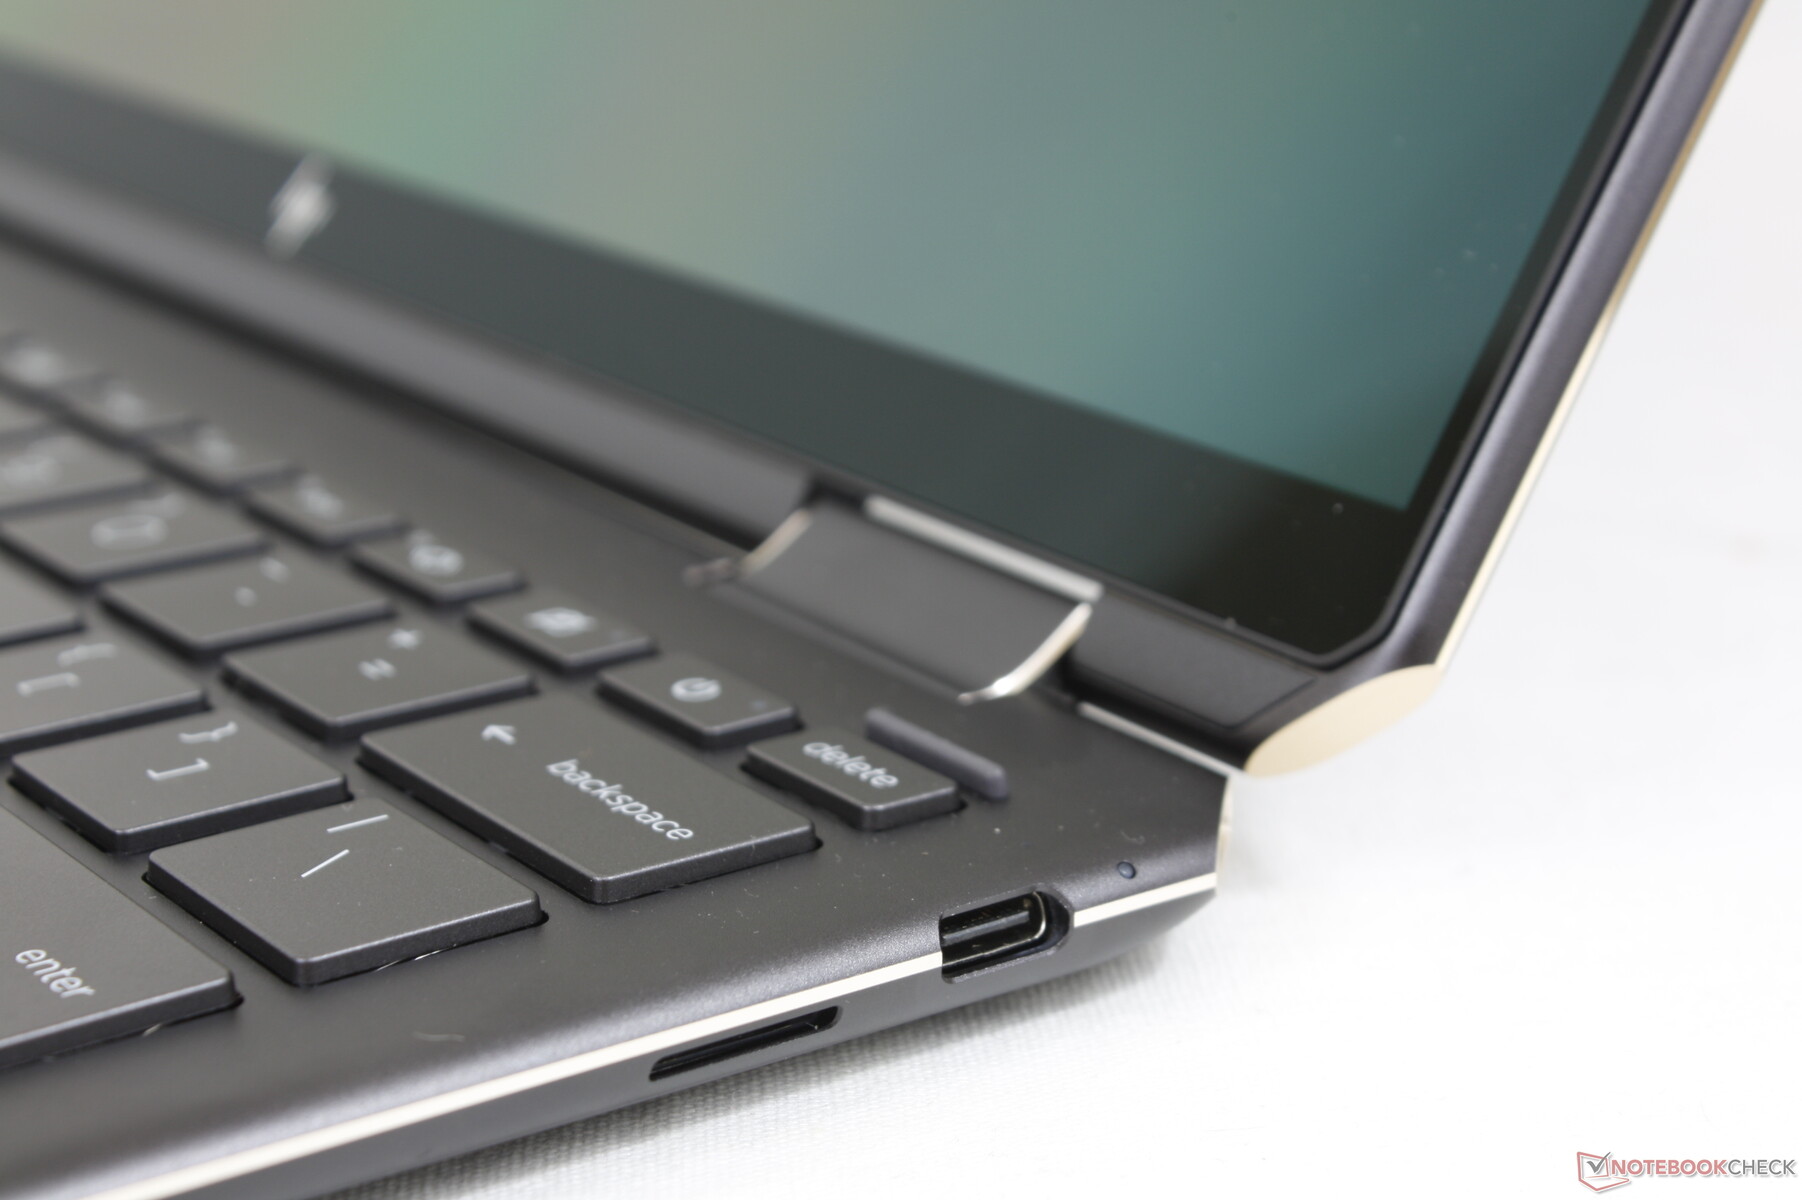
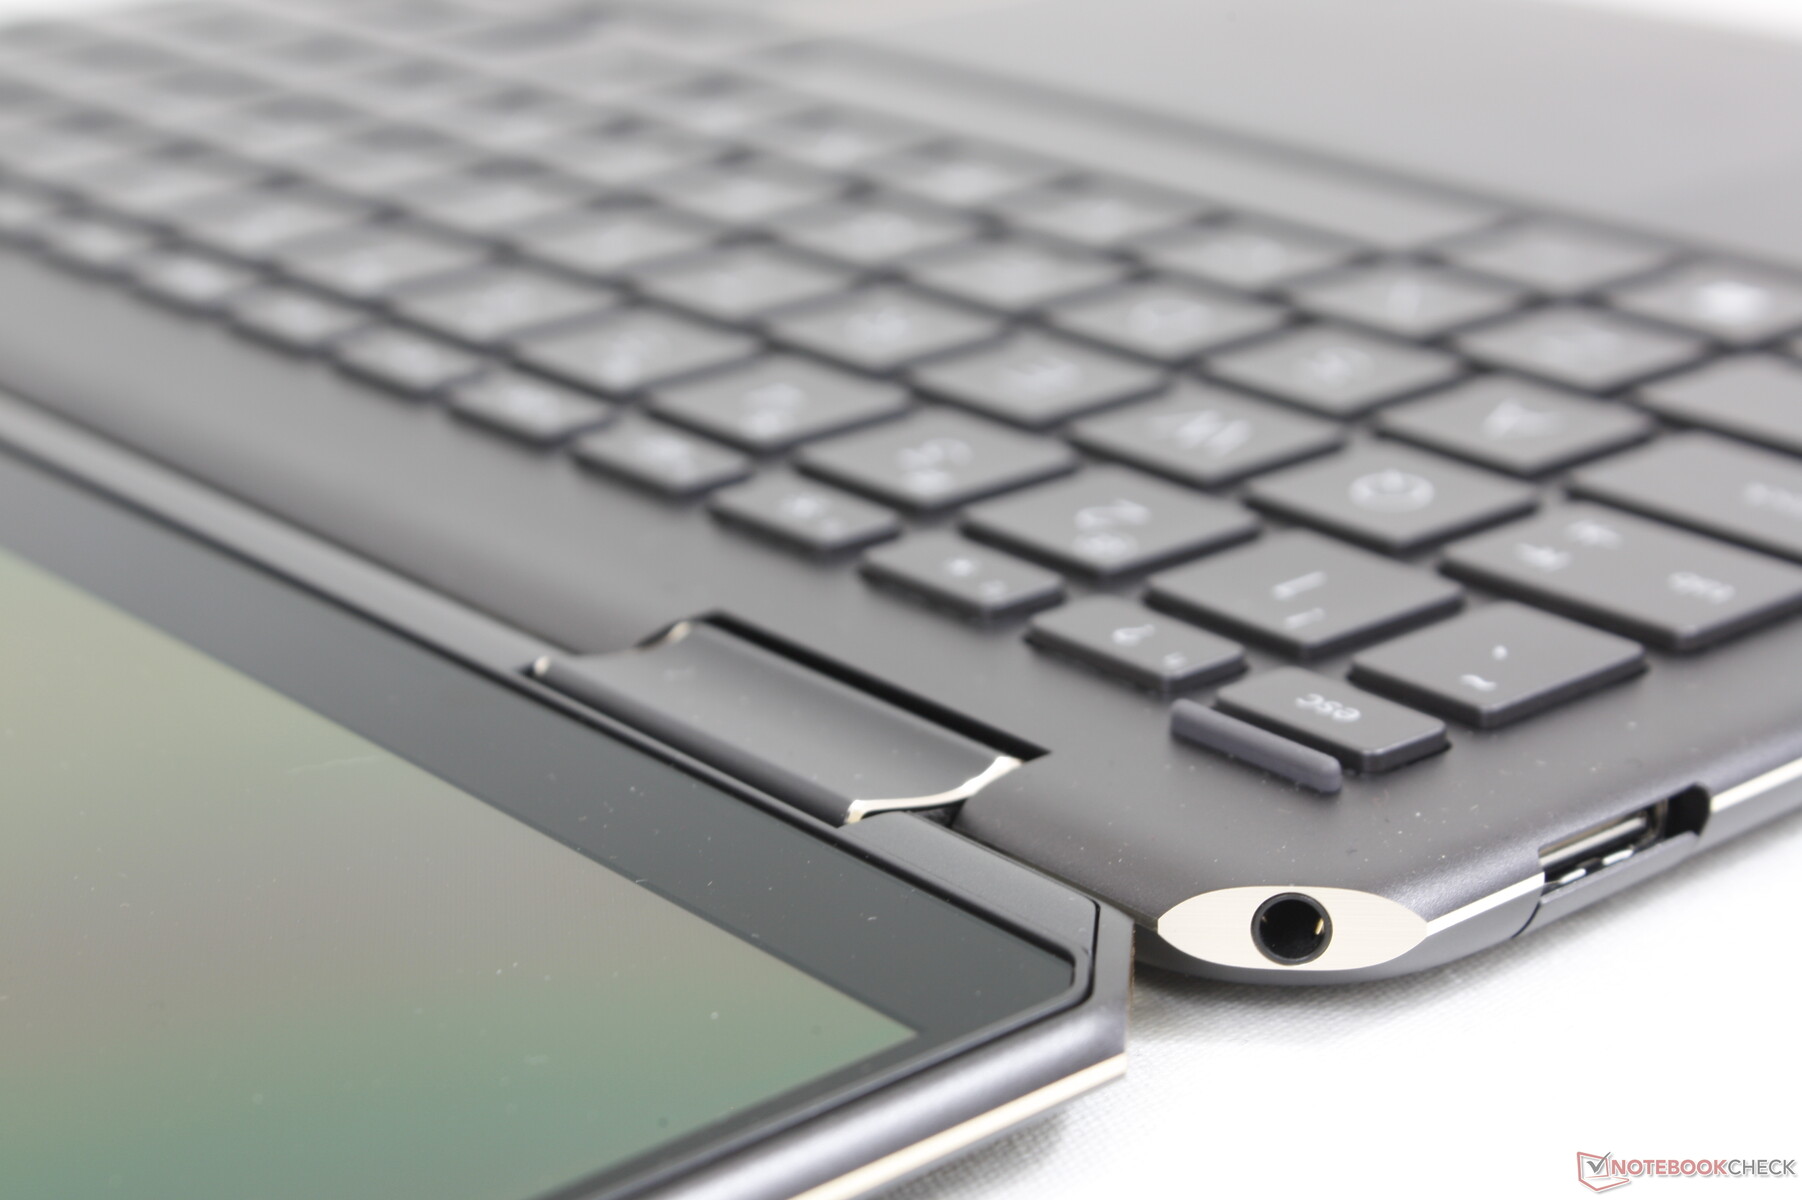
Das 2022er-Modell behält alle Anschlüsse des 2021er-Modells bei, platziert den 3,5-mm-Audioanschluss jedoch an einer anderen Stelle. Die in die Ecke verschobenen Anschlüsse sind weiterhin ein charakteristischens Merkmal der Spectre-Reihe.
SD-Kartenleser
Aus unerfindlichen Gründen ist der microSD-Kartenleser unseres HP-Testgeräts deutlich langsamer als beim Vorgänger. 1 GB Bilder von unserer UHS-II-Testkarte auf den Desktop zu verschieben dauert hier ganze 21 Sekunden statt nur 5 bis 6 Sekunden beim älteren Spectre x360 14.
| SD Card Reader | |
| average JPG Copy Test (av. of 3 runs) | |
| HP Spectre x360 14-ea0378ng (Toshiba Exceria Pro M501 microSDXC 64GB) | |
| Framework Laptop 13.5 (AV Pro UHS-II V60) | |
| Framework Laptop 13.5 12th Gen Intel (AV Pro UHS-II V60) | |
| HP Spectre x360 13.5 14t-ef000 (AV Pro UHS-II V60) | |
| maximum AS SSD Seq Read Test (1GB) | |
| HP Spectre x360 14-ea0378ng (Toshiba Exceria Pro M501 microSDXC 64GB) | |
| Framework Laptop 13.5 (AV Pro UHS-II V60) | |
| Framework Laptop 13.5 12th Gen Intel (AV Pro UHS-II V60) | |
| HP Spectre x360 13.5 14t-ef000 (AV Pro UHS-II V60) | |
Kommunikation
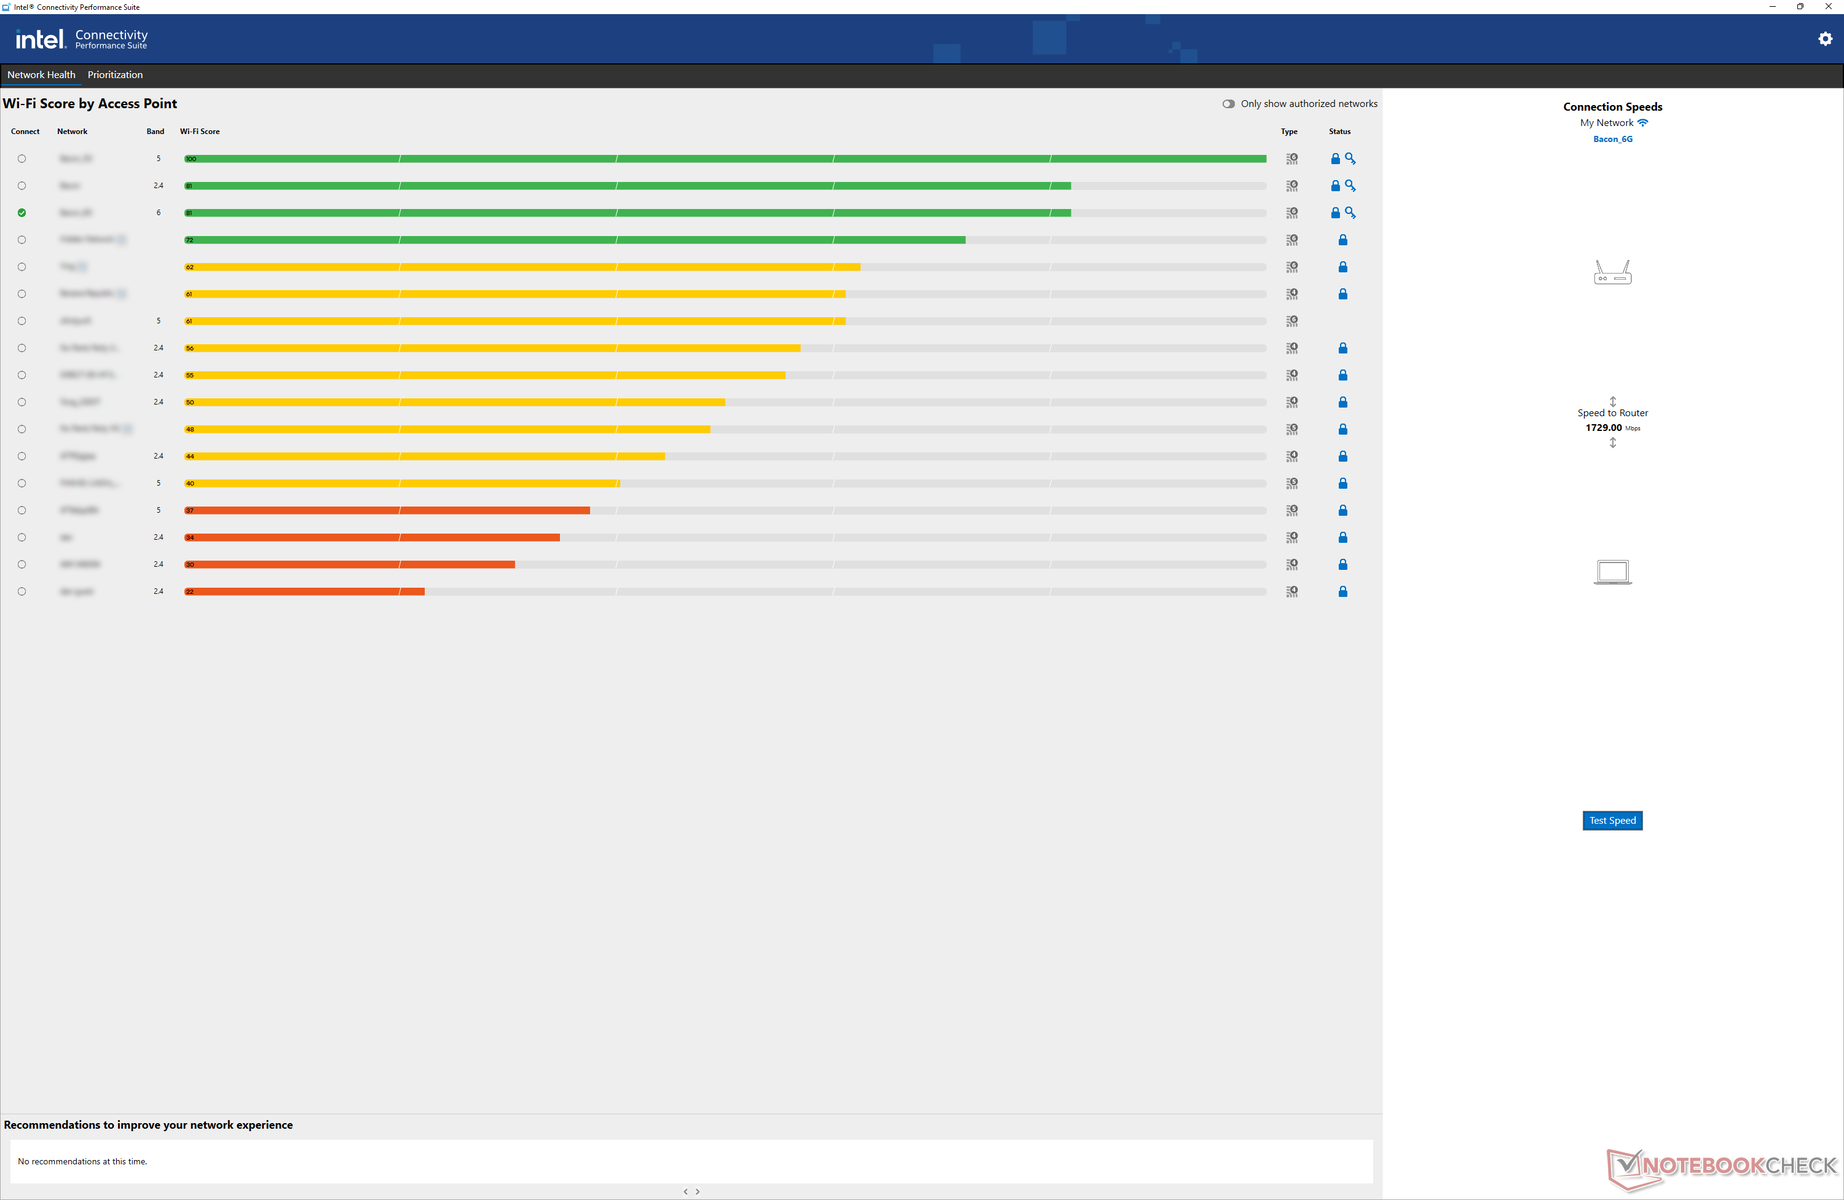
Intels AX211-Modul ist standardmäßig an Bord und bietet WLAN-6E- und Bluetooth-5.2-Unterstützung. Die Übertragungsraten sind konstant und in Verbindung mit unserem 6-GHz-Netzwerk sind keine Probleme aufgetreten.
| Networking | |
| iperf3 transmit AX12 | |
| Microsoft Surface Laptop 4 13 Ryzen 5 | |
| Framework Laptop 13.5 | |
| HP Spectre x360 14-ea0378ng | |
| HP EliteBook Folio 13.5-3G2L2EA | |
| iperf3 receive AX12 | |
| Microsoft Surface Laptop 4 13 Ryzen 5 | |
| Framework Laptop 13.5 | |
| HP Spectre x360 14-ea0378ng | |
| HP EliteBook Folio 13.5-3G2L2EA | |
| iperf3 receive AXE11000 6GHz | |
| Framework Laptop 13.5 12th Gen Intel | |
| HP Spectre x360 13.5 14t-ef000 | |
| iperf3 transmit AXE11000 6GHz | |
| HP Spectre x360 13.5 14t-ef000 | |
| Framework Laptop 13.5 12th Gen Intel | |
Webcam
HP hat die eingebaute 1-MP-Webcam beim 2022er-Modell auf eine 5-MP-Webcam aufgerüstet. Die höhere Auflösung fällt sofort auf und macht sie zur besten Subnotebook-Webcam überhaupt. Tatsächlich ist das Spectre das erste Laptop in seiner Größenklasse mit einer 5-MP-Webcam. Videoaufnahmen sind jedoch immer noch auf 1080p mit 30 Fps beschränkt.
Eine Webcam-Abdeckung und eine IR-Kamera sind vorhanden und verbessern die Privatsphäre bzw. erlauben die Nutzung von Windows Hello.


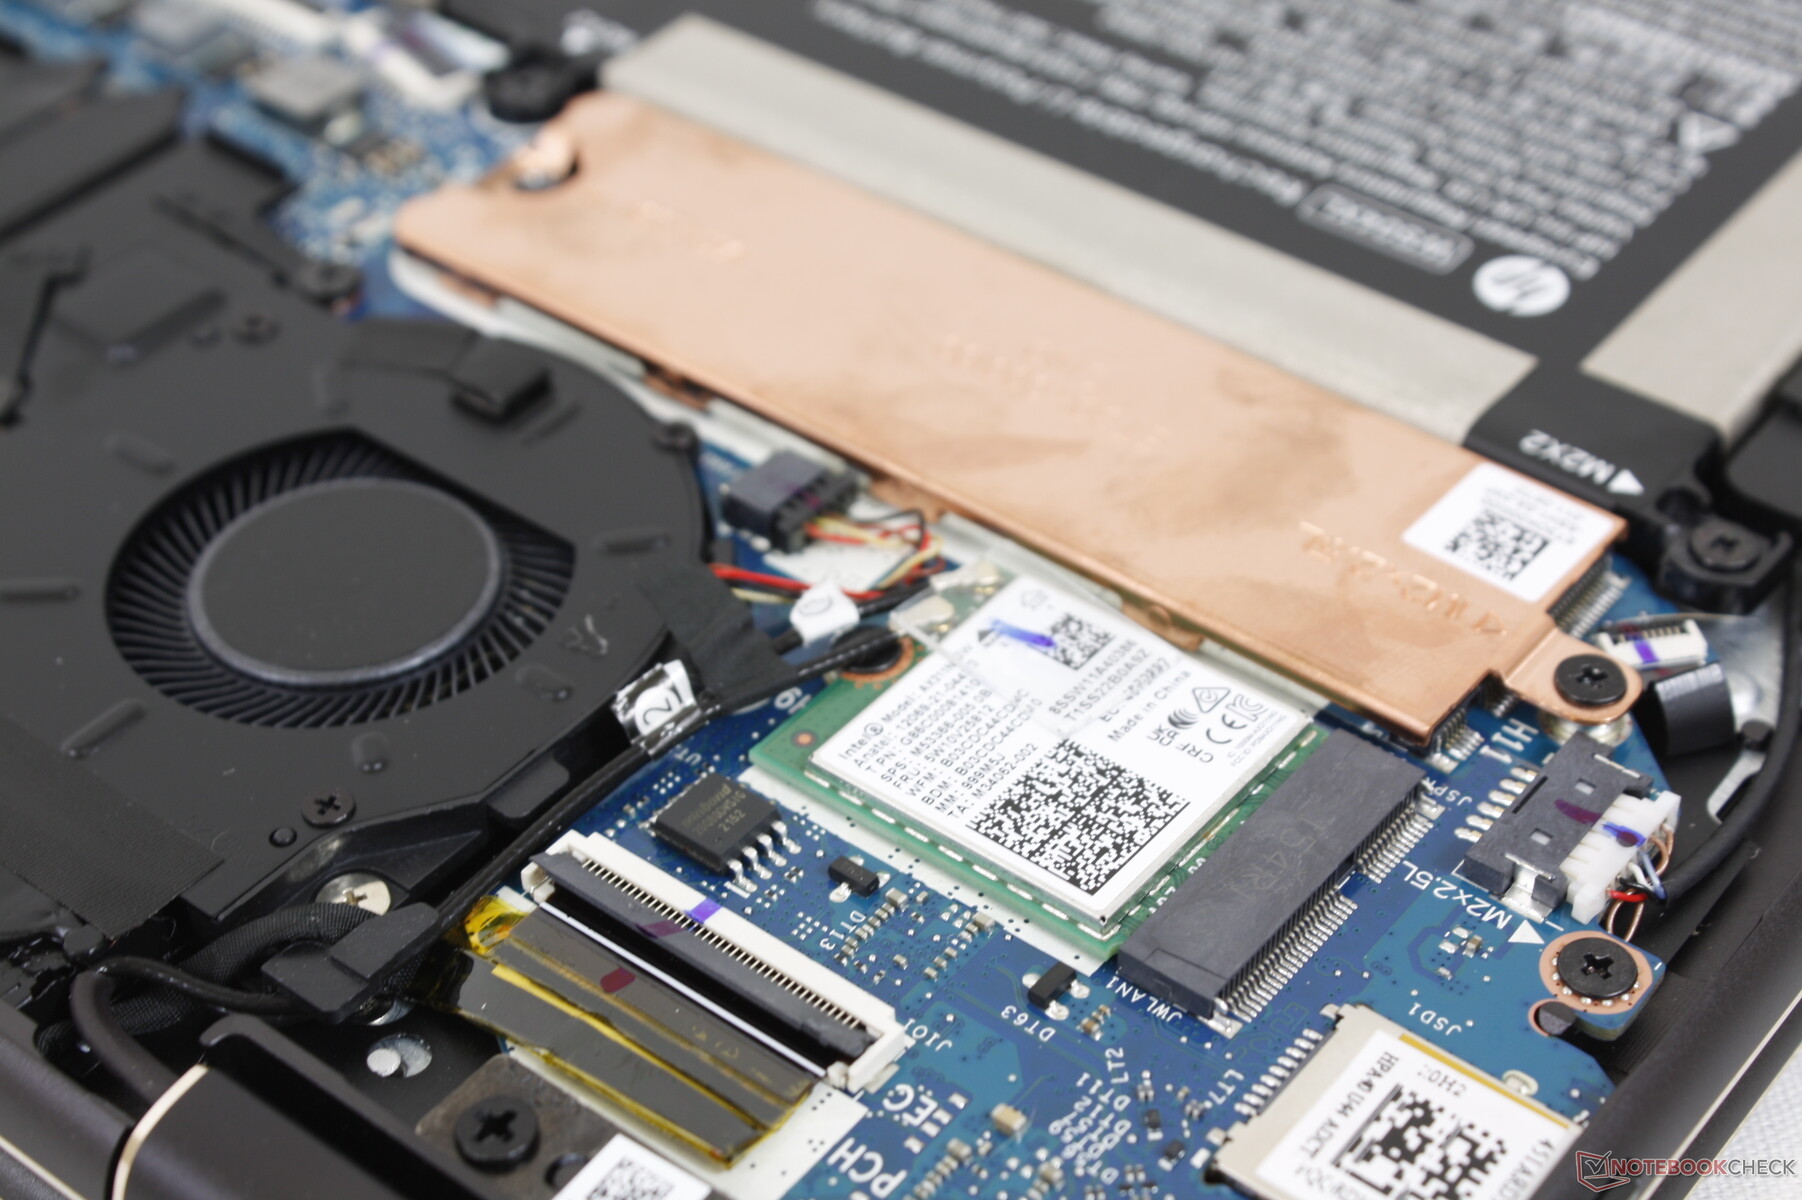
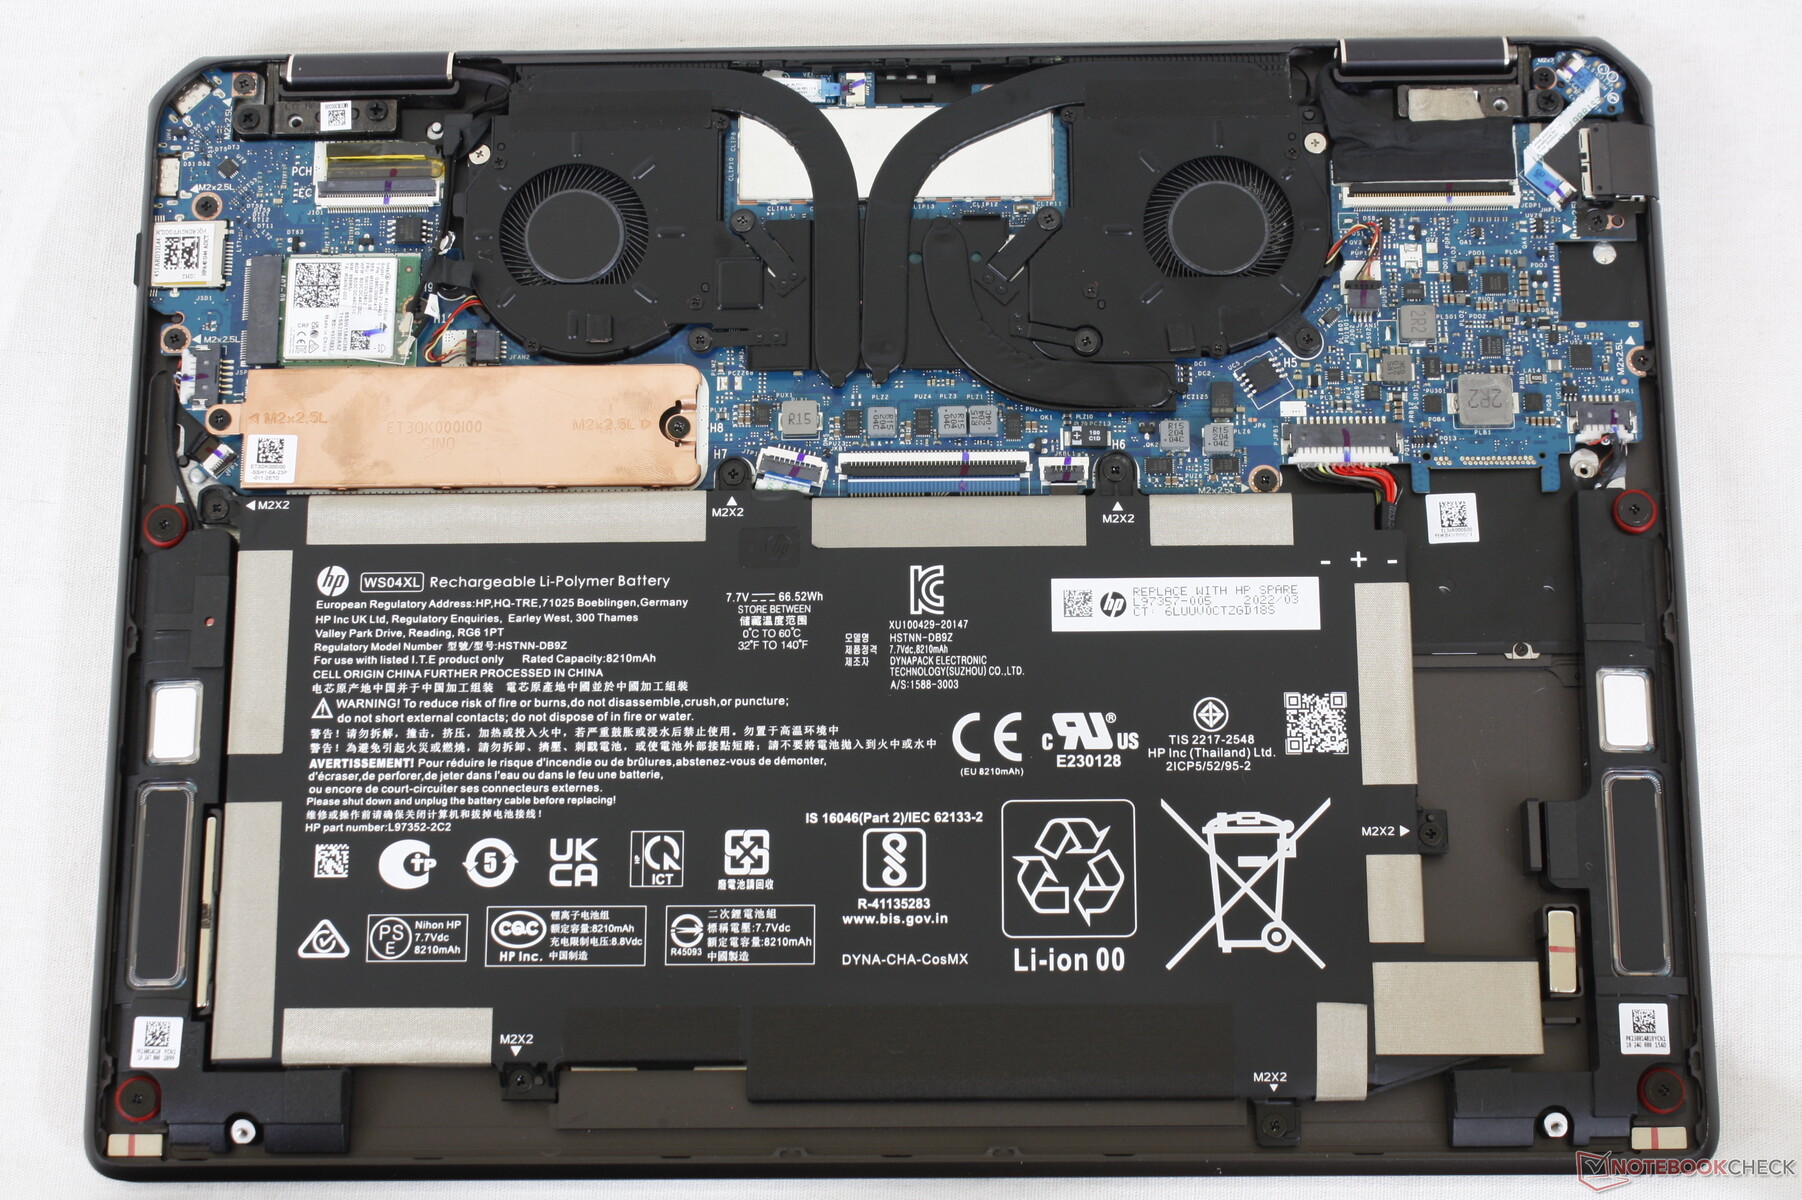
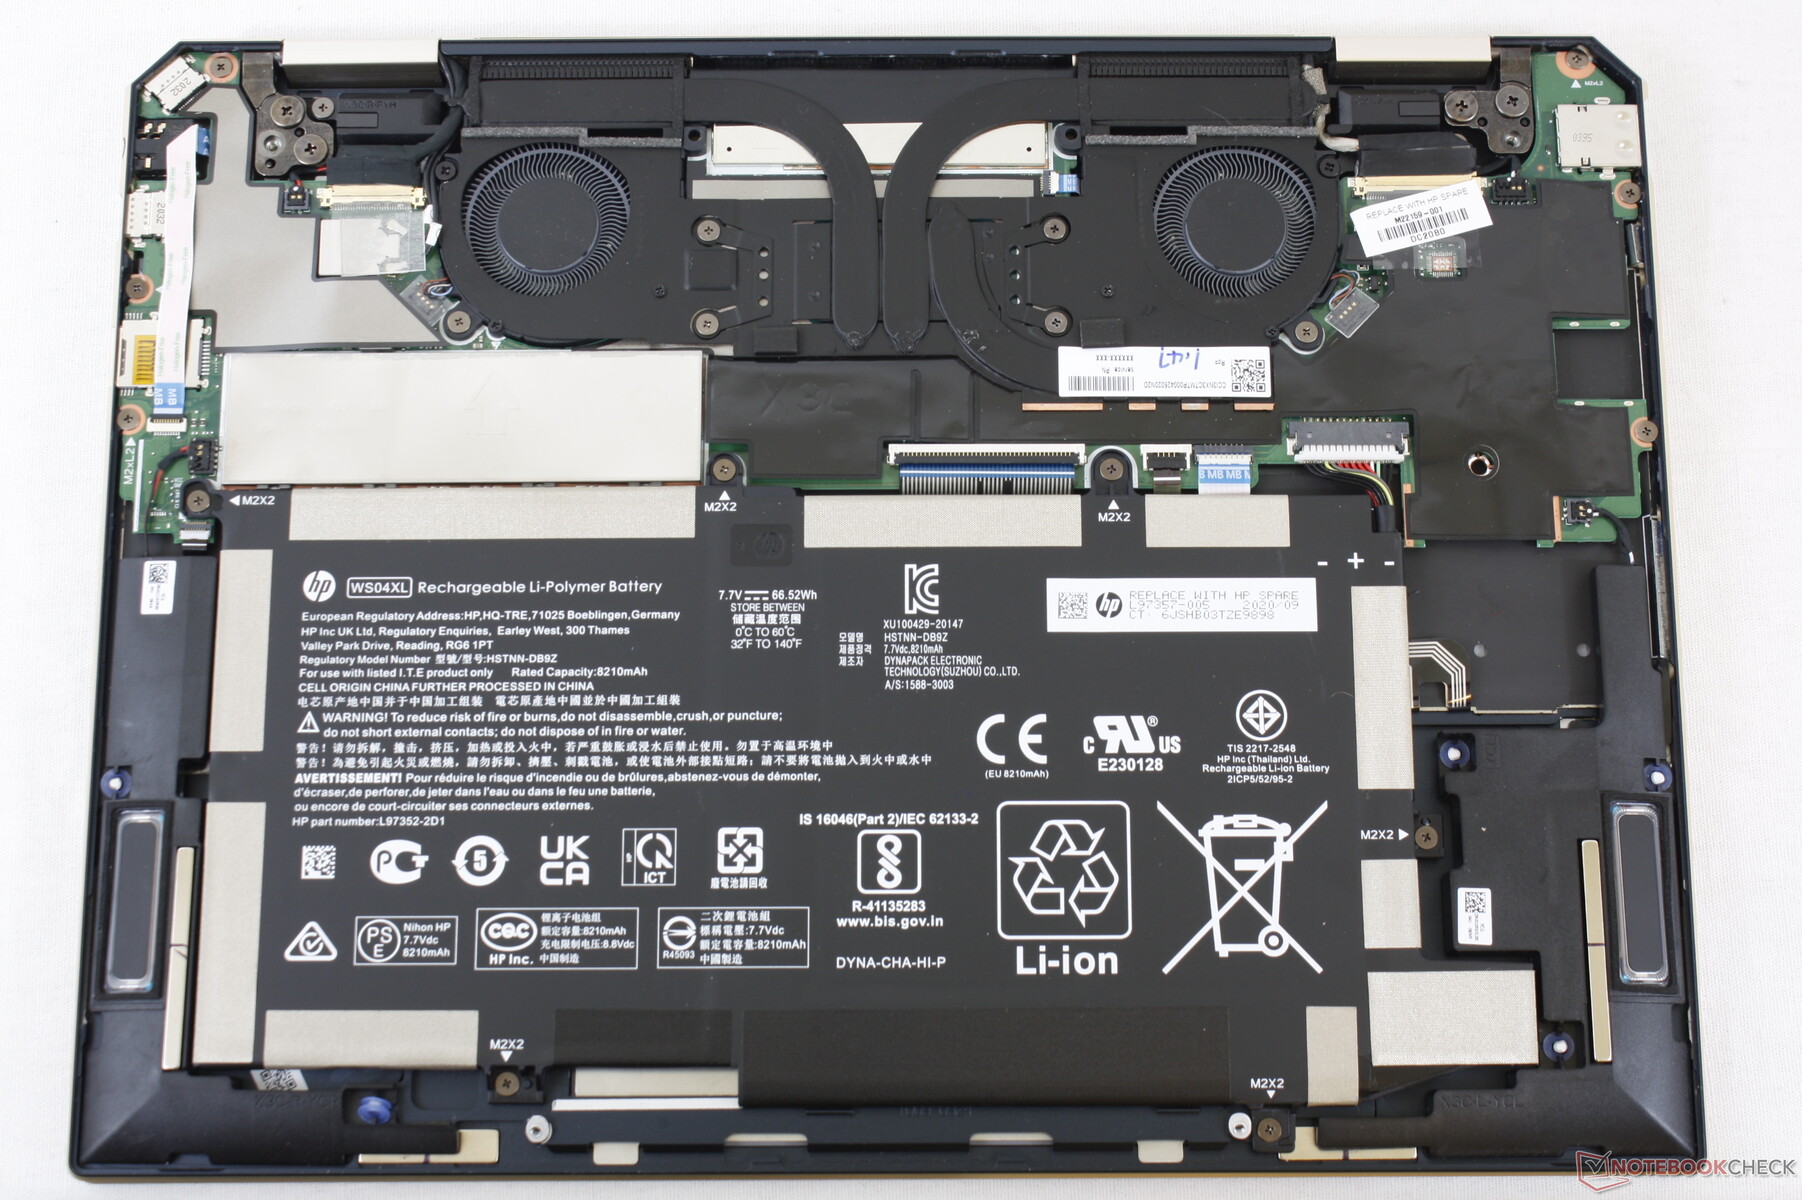
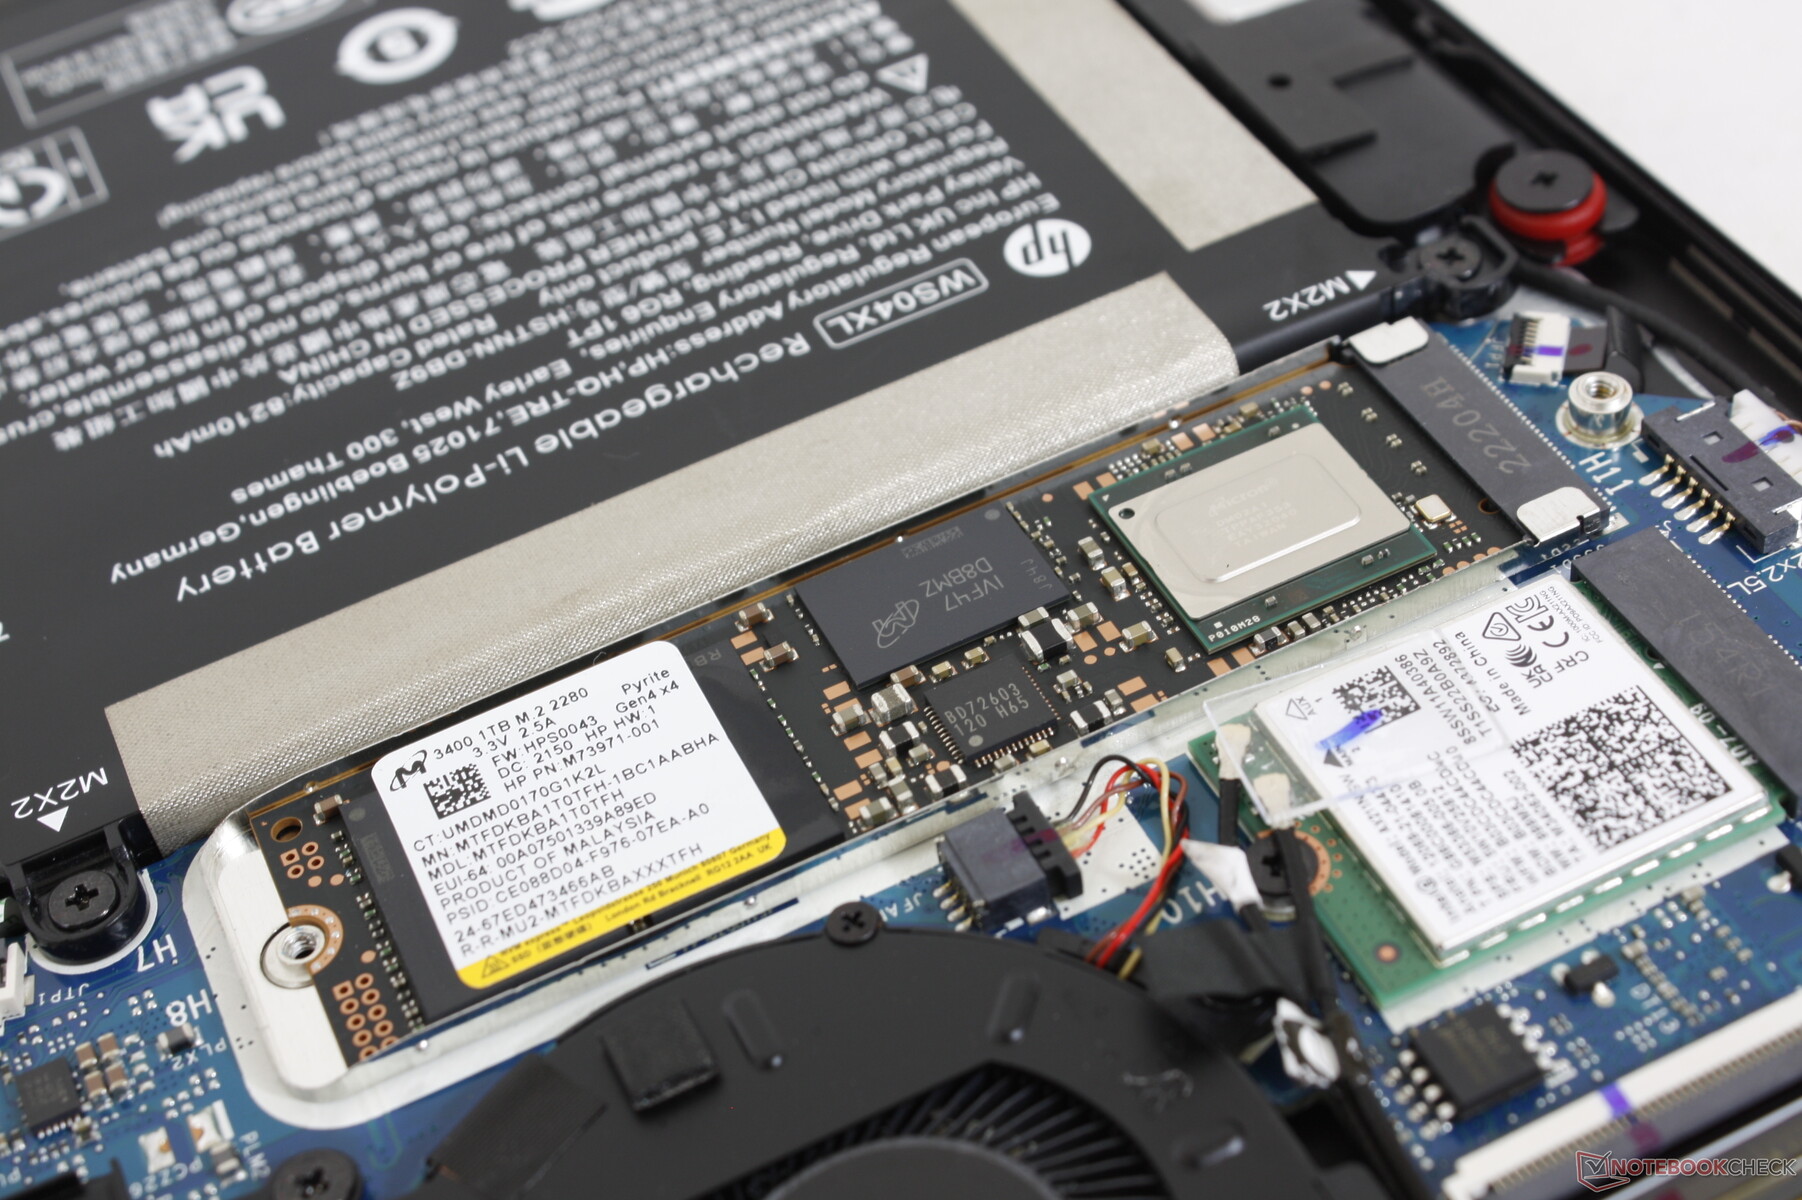
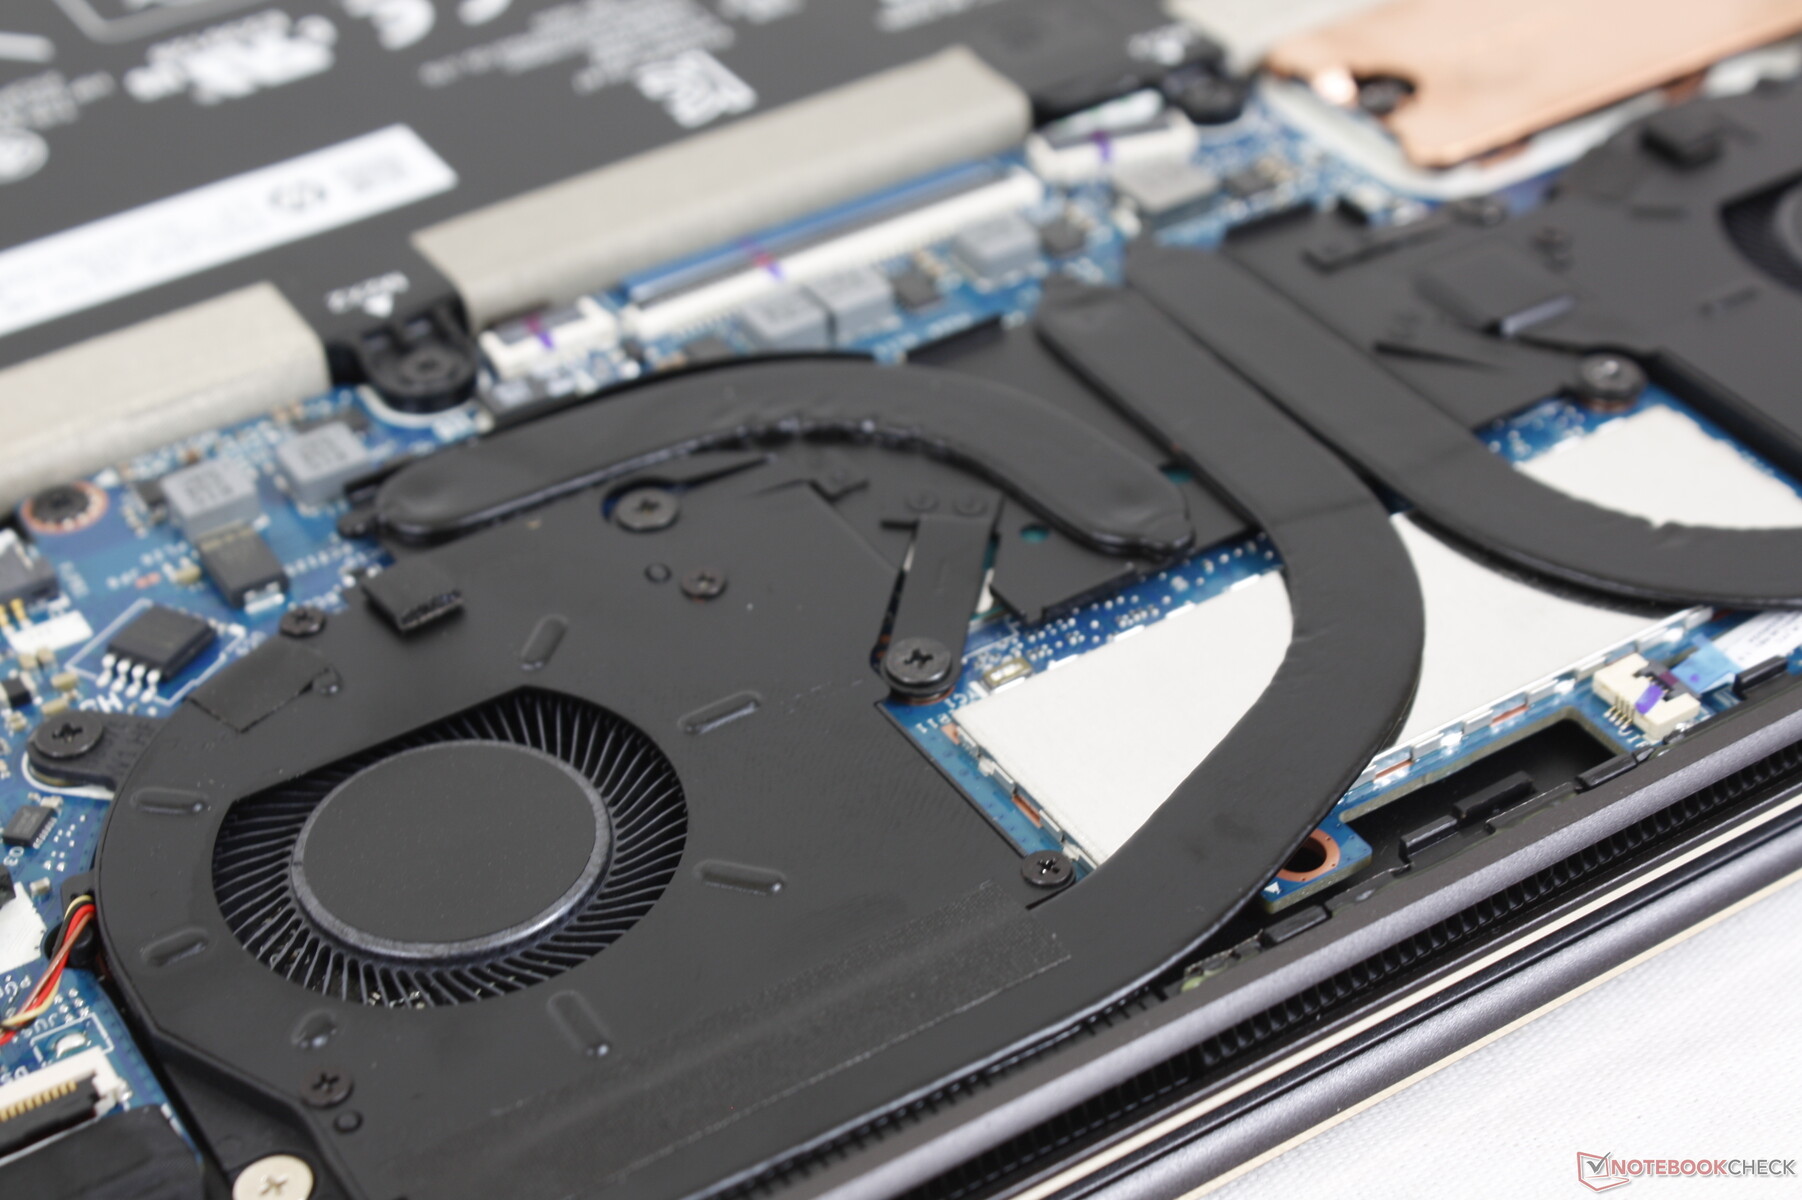
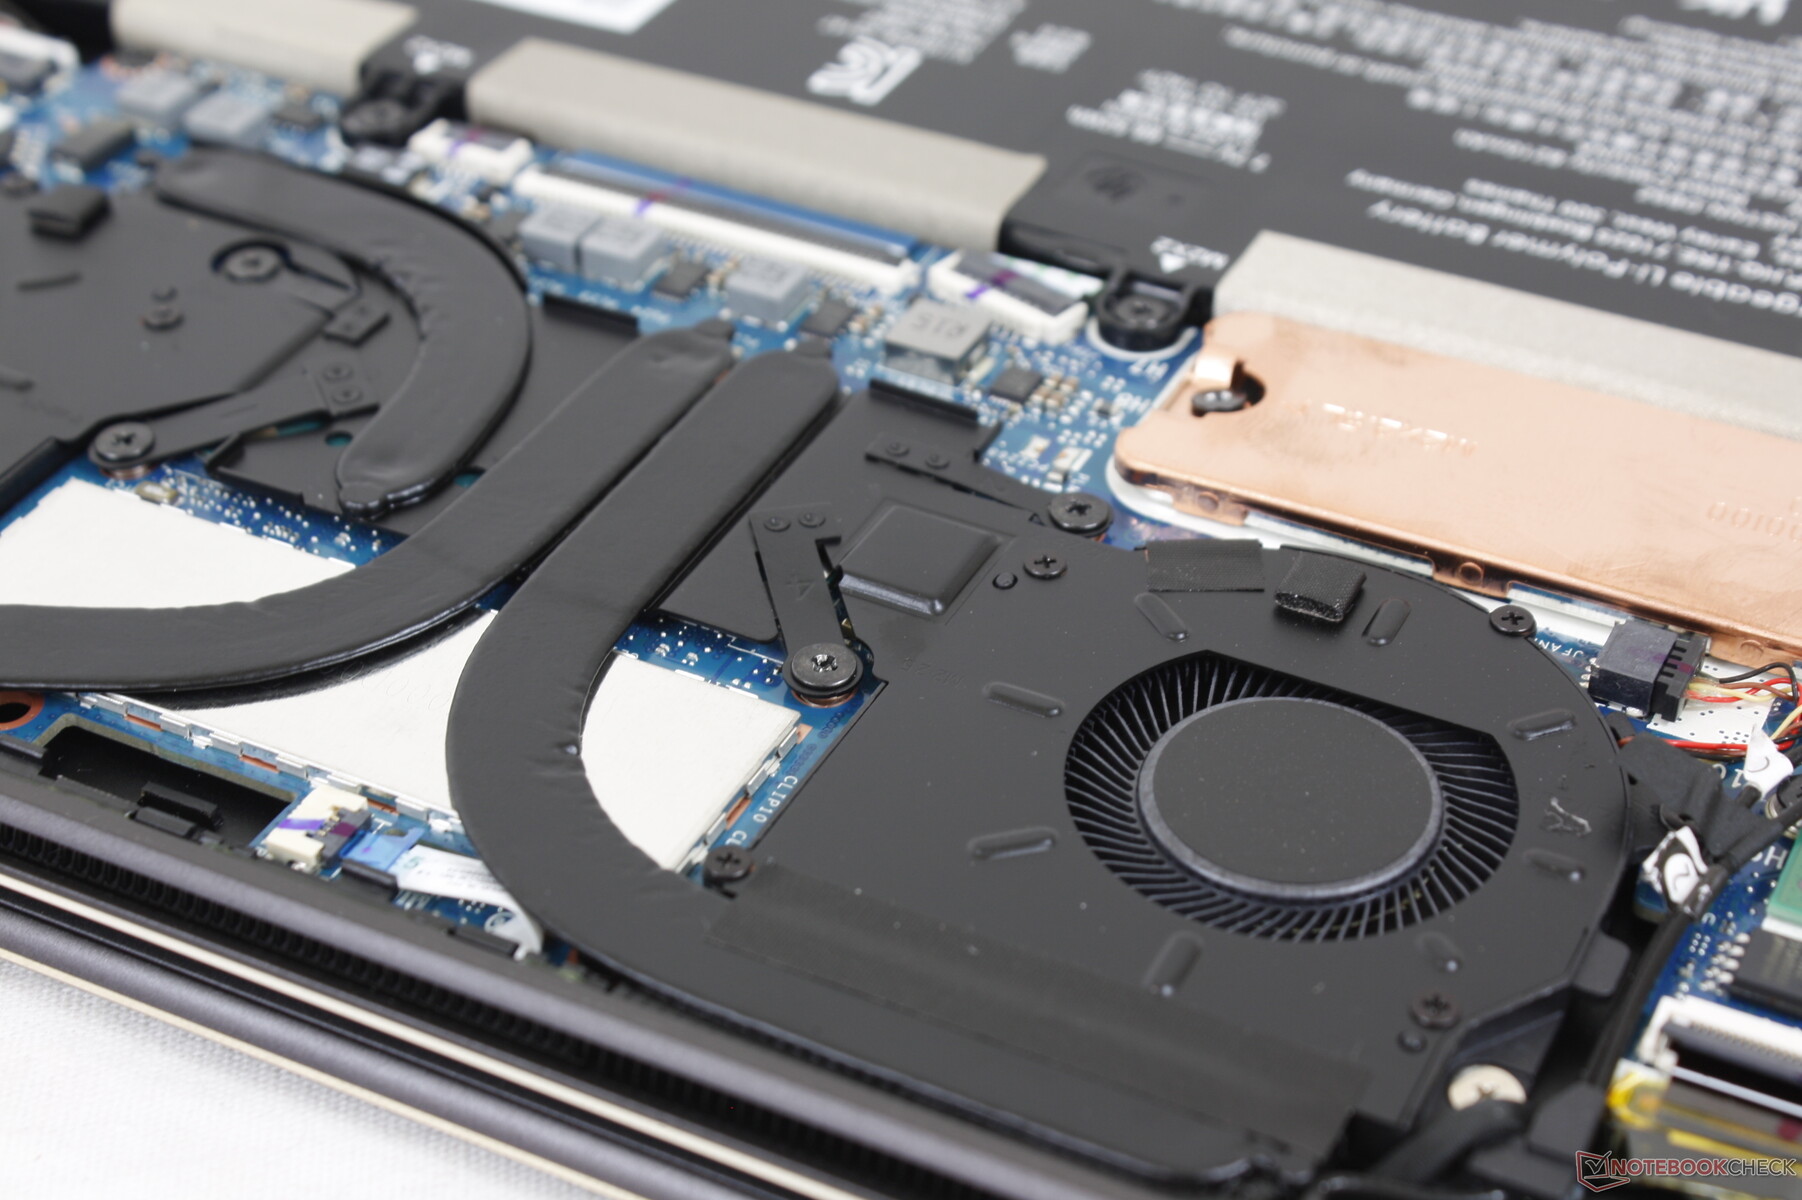
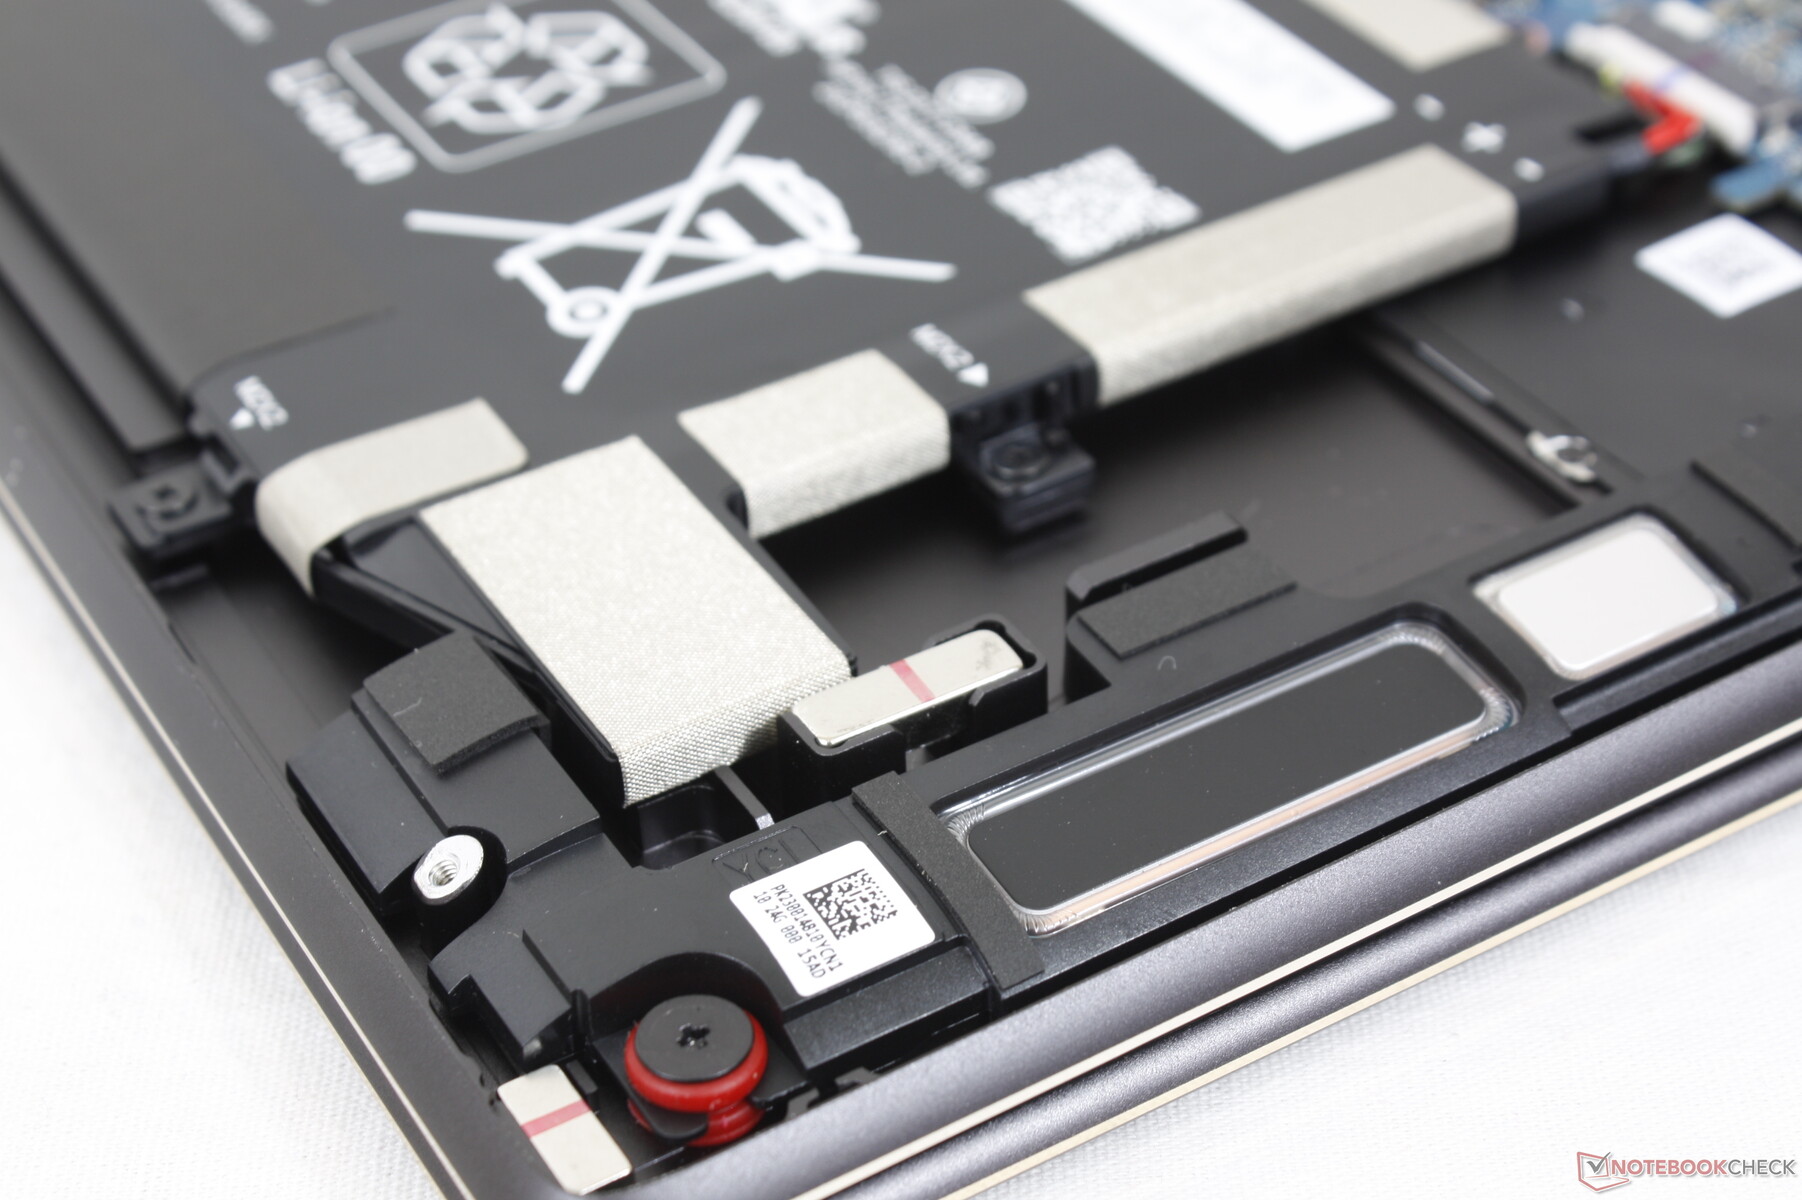
Wartung
Die Bodenplatte lässt sich mithilfe eines Torxschraubenziehers entfernen. Erfreulicherweise sind auch keine Schrauben unter den Gummifüßen versteckt.
Die SSD und das WLAN-Modul können getauscht werden, die RAM-Module sind jedoch verlötet. Wie die Vergleichsbilder zeigen, war das WLAN-Modul beim 2021er-/2020er-Modell nicht austauschbar.
Accessories and Warranty
Der Lieferumfang beinhaltet eine Tragetasche, einen magnetischen Aktivstylus (Tilt Pen MPP 2.0) und einen USB-C-Hub mit 4 Anschlüssen (2x USB-A, HDMI und USB-C). Wir sind froh, dass HP im Gegensatz zu anderen Herstellern dem Laptop praktisches Zubehör beilegt.
Eingabegeräte — Gute Tastatur und großes ClickPad
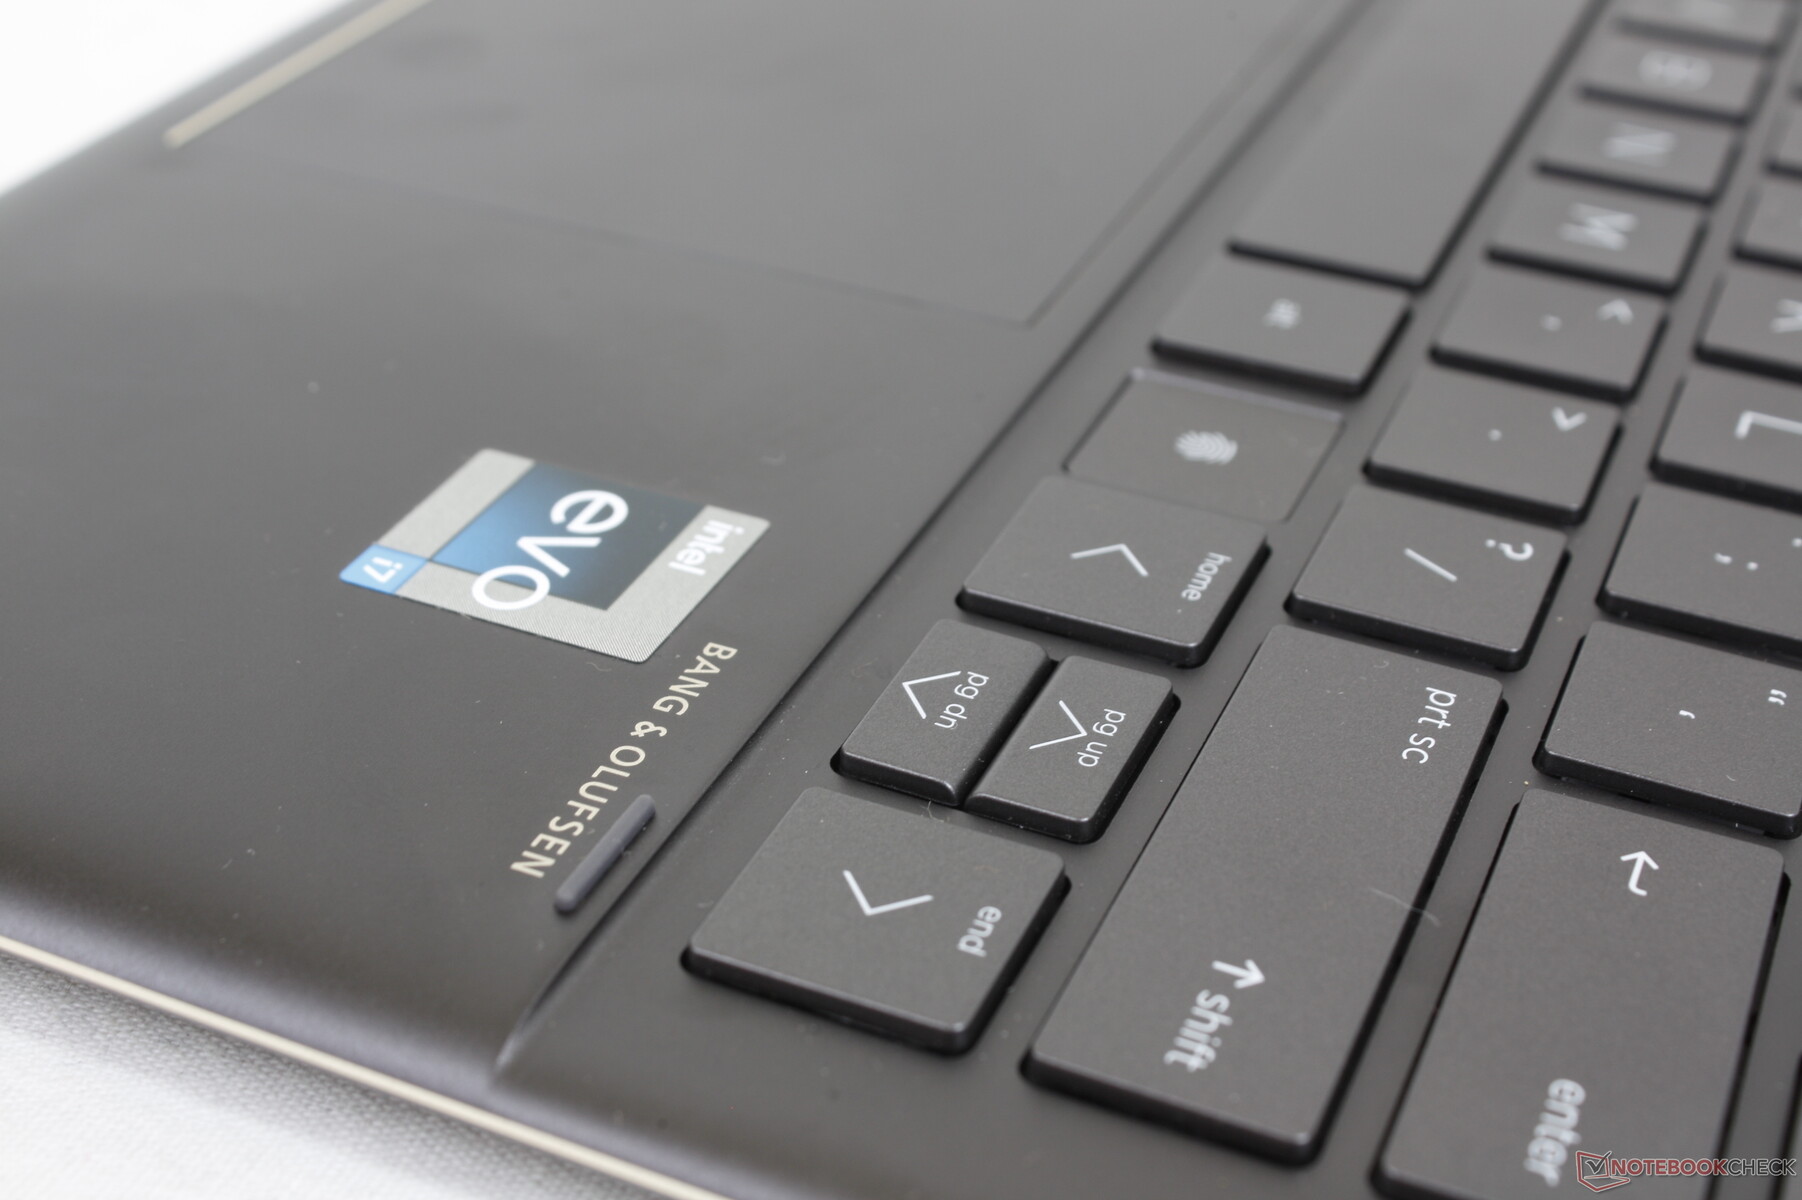
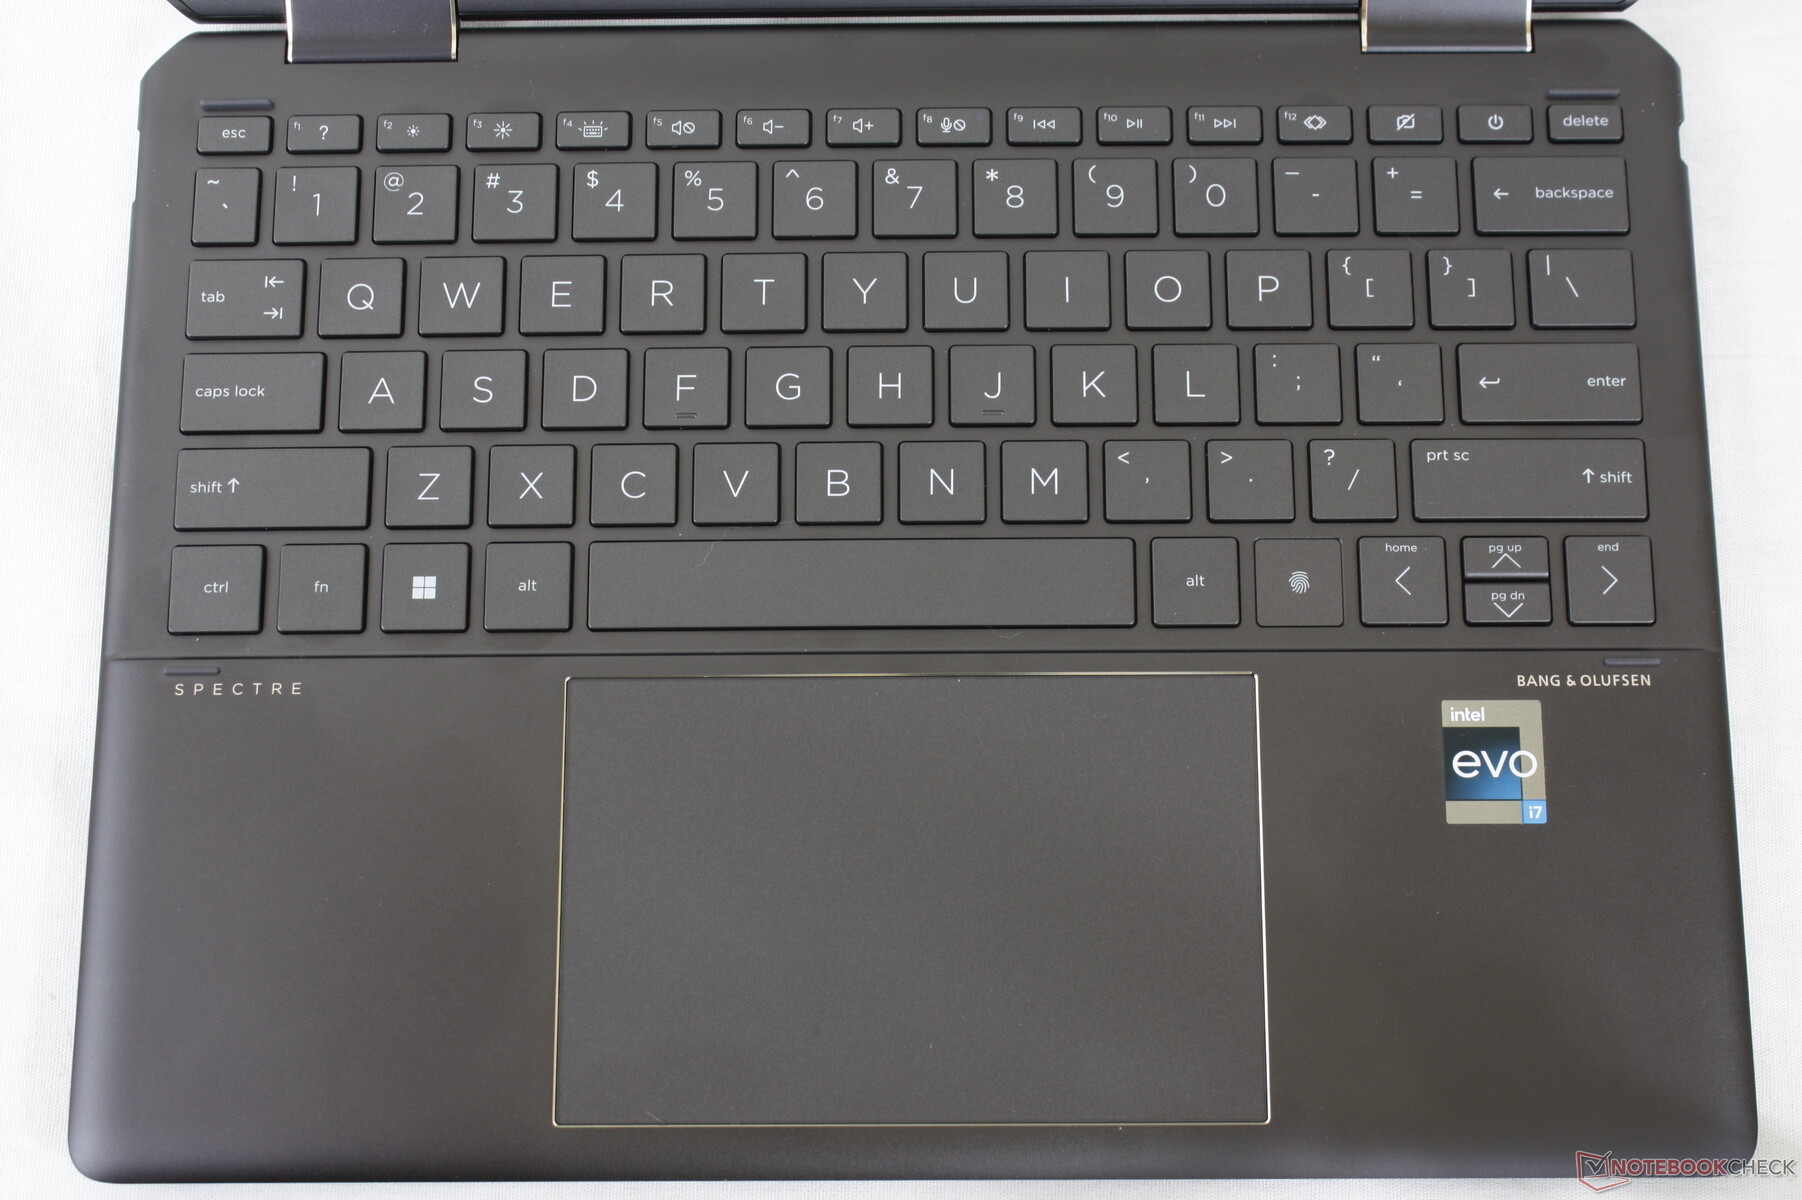
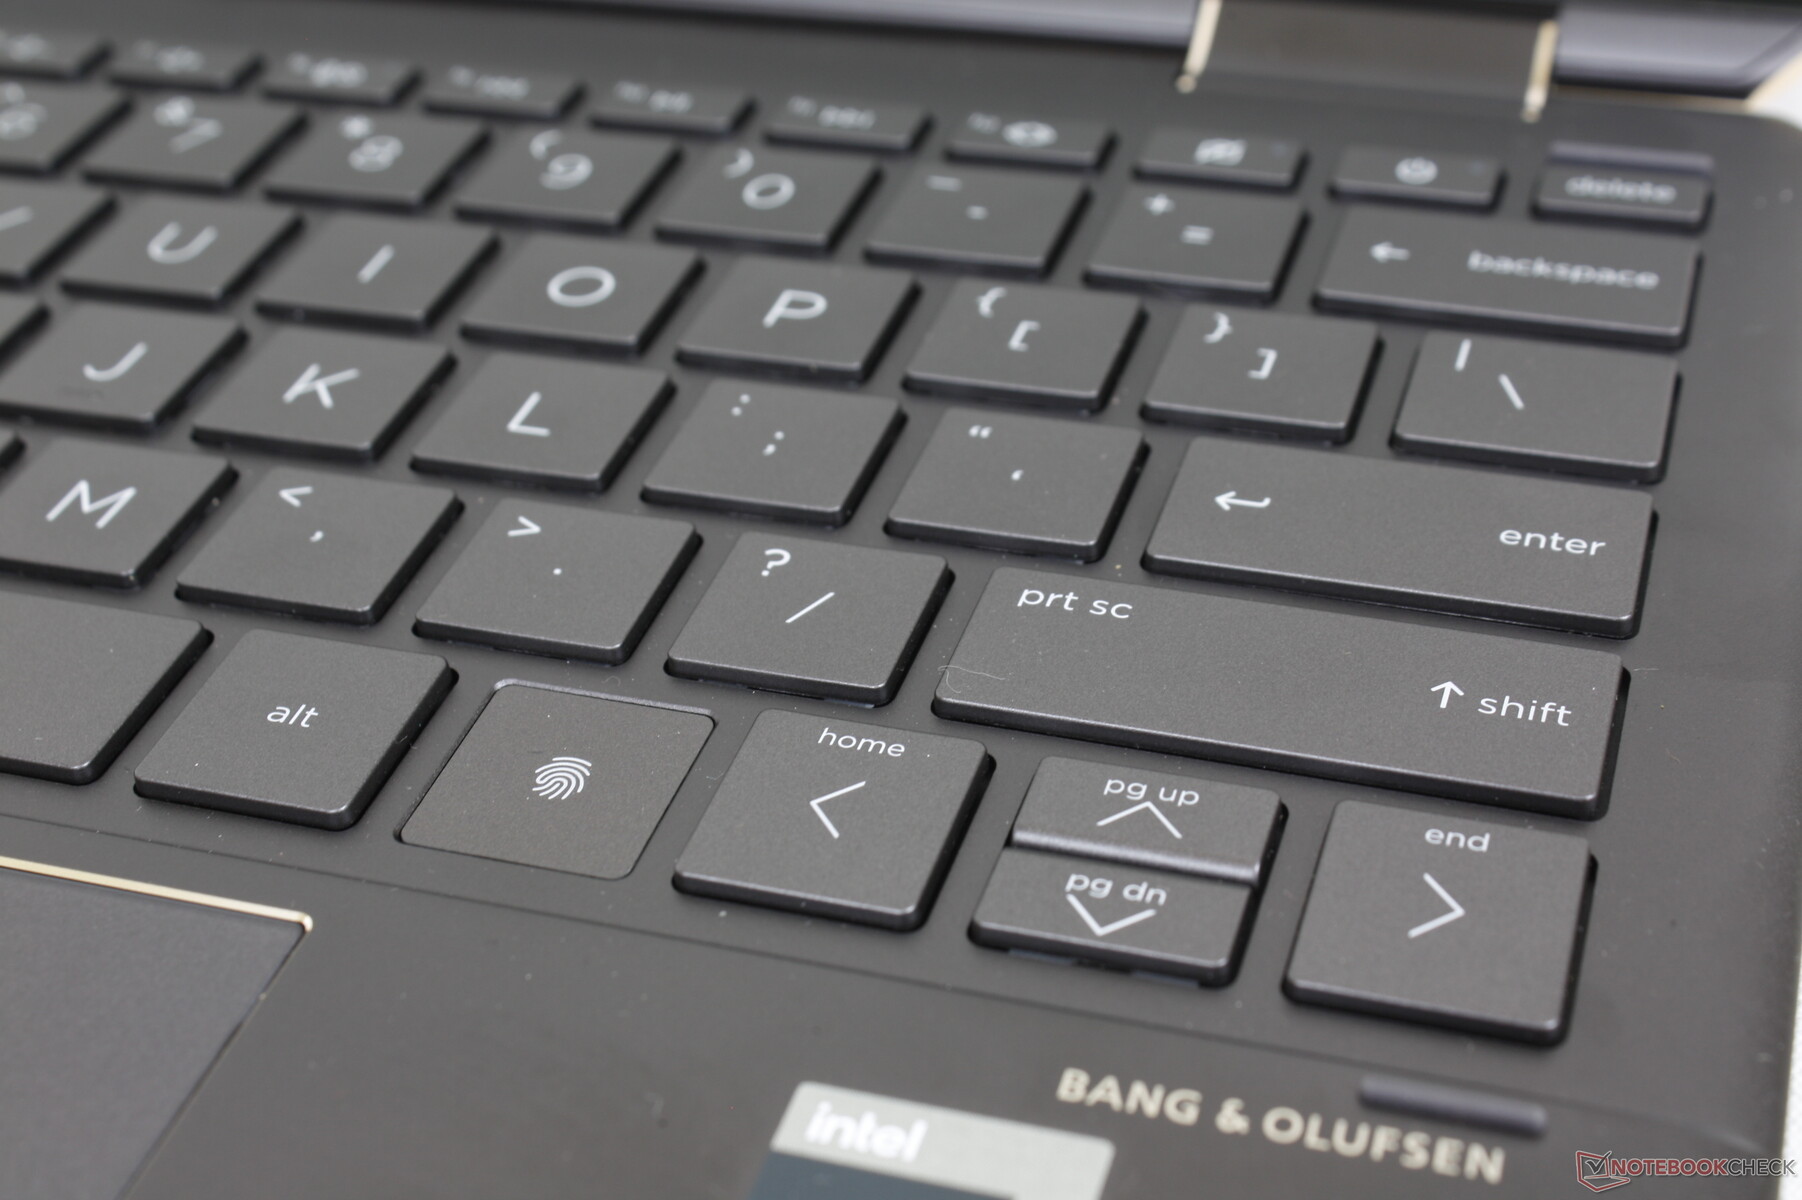
Tastatur
Die rechte Tastenspalte des 2020er-Modells hat HP beim 2022er-Modell komplett gestrichen. Daher gibt es keine eigenen Bild-auf-, Bild-ab-, Home- oder Ende-Tasten mehr und die entsprechenden Funktionen sind zu Sekundärbelegungen der Pfeiltasten geworden. Wer diese Tasten oft nutzt, ist von dieser plötzlichen Änderung vermutlich enttäuscht.
Das Tastenlayout und -feedback ist mit dem des 2020er-Modells vergleichbar und resultiert in einem ähnlichen Tippgefühl. Da sie weniger schwammig sind und mehr Tastenhub bieten, zählen die HP-Spectre-, Envy- und Elitebook-Tastaturen im Ultrabook-Bereich immer noch zu den besten.
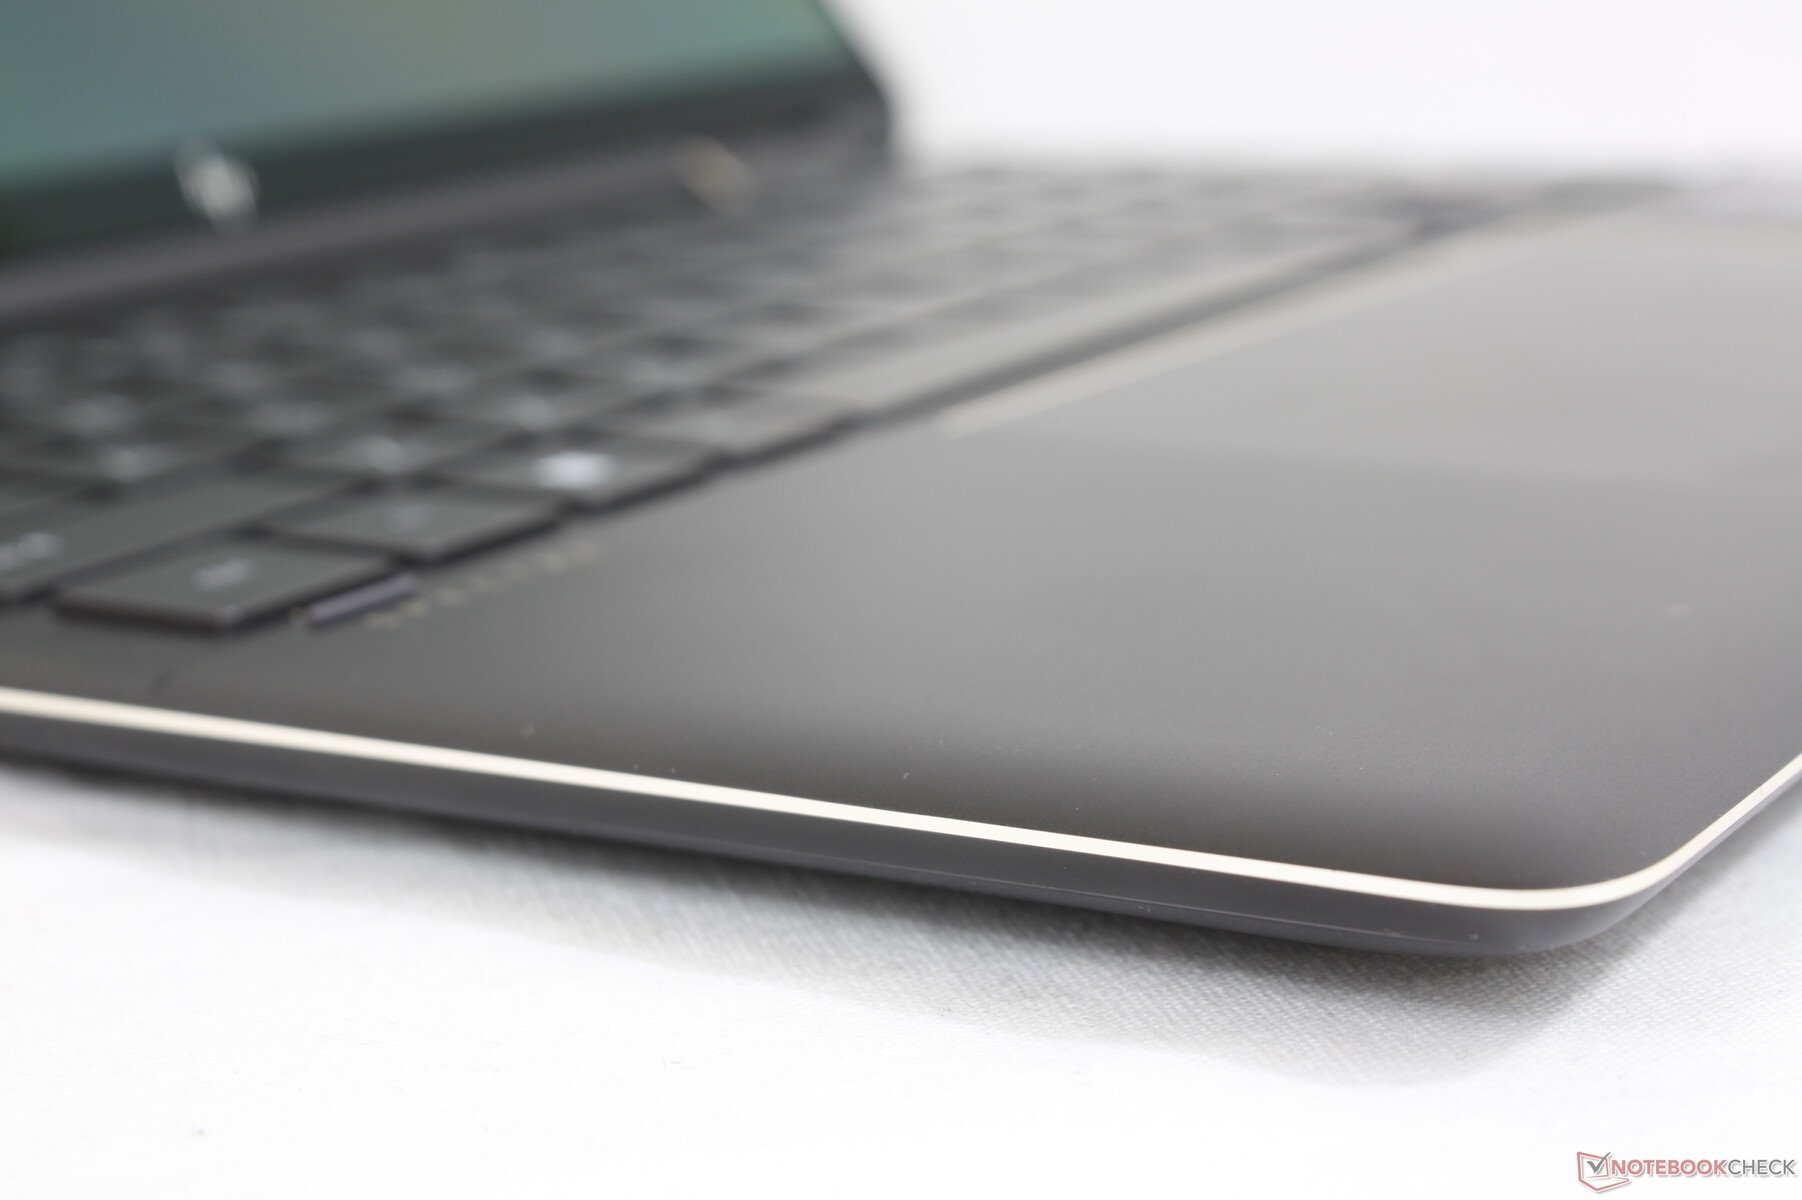
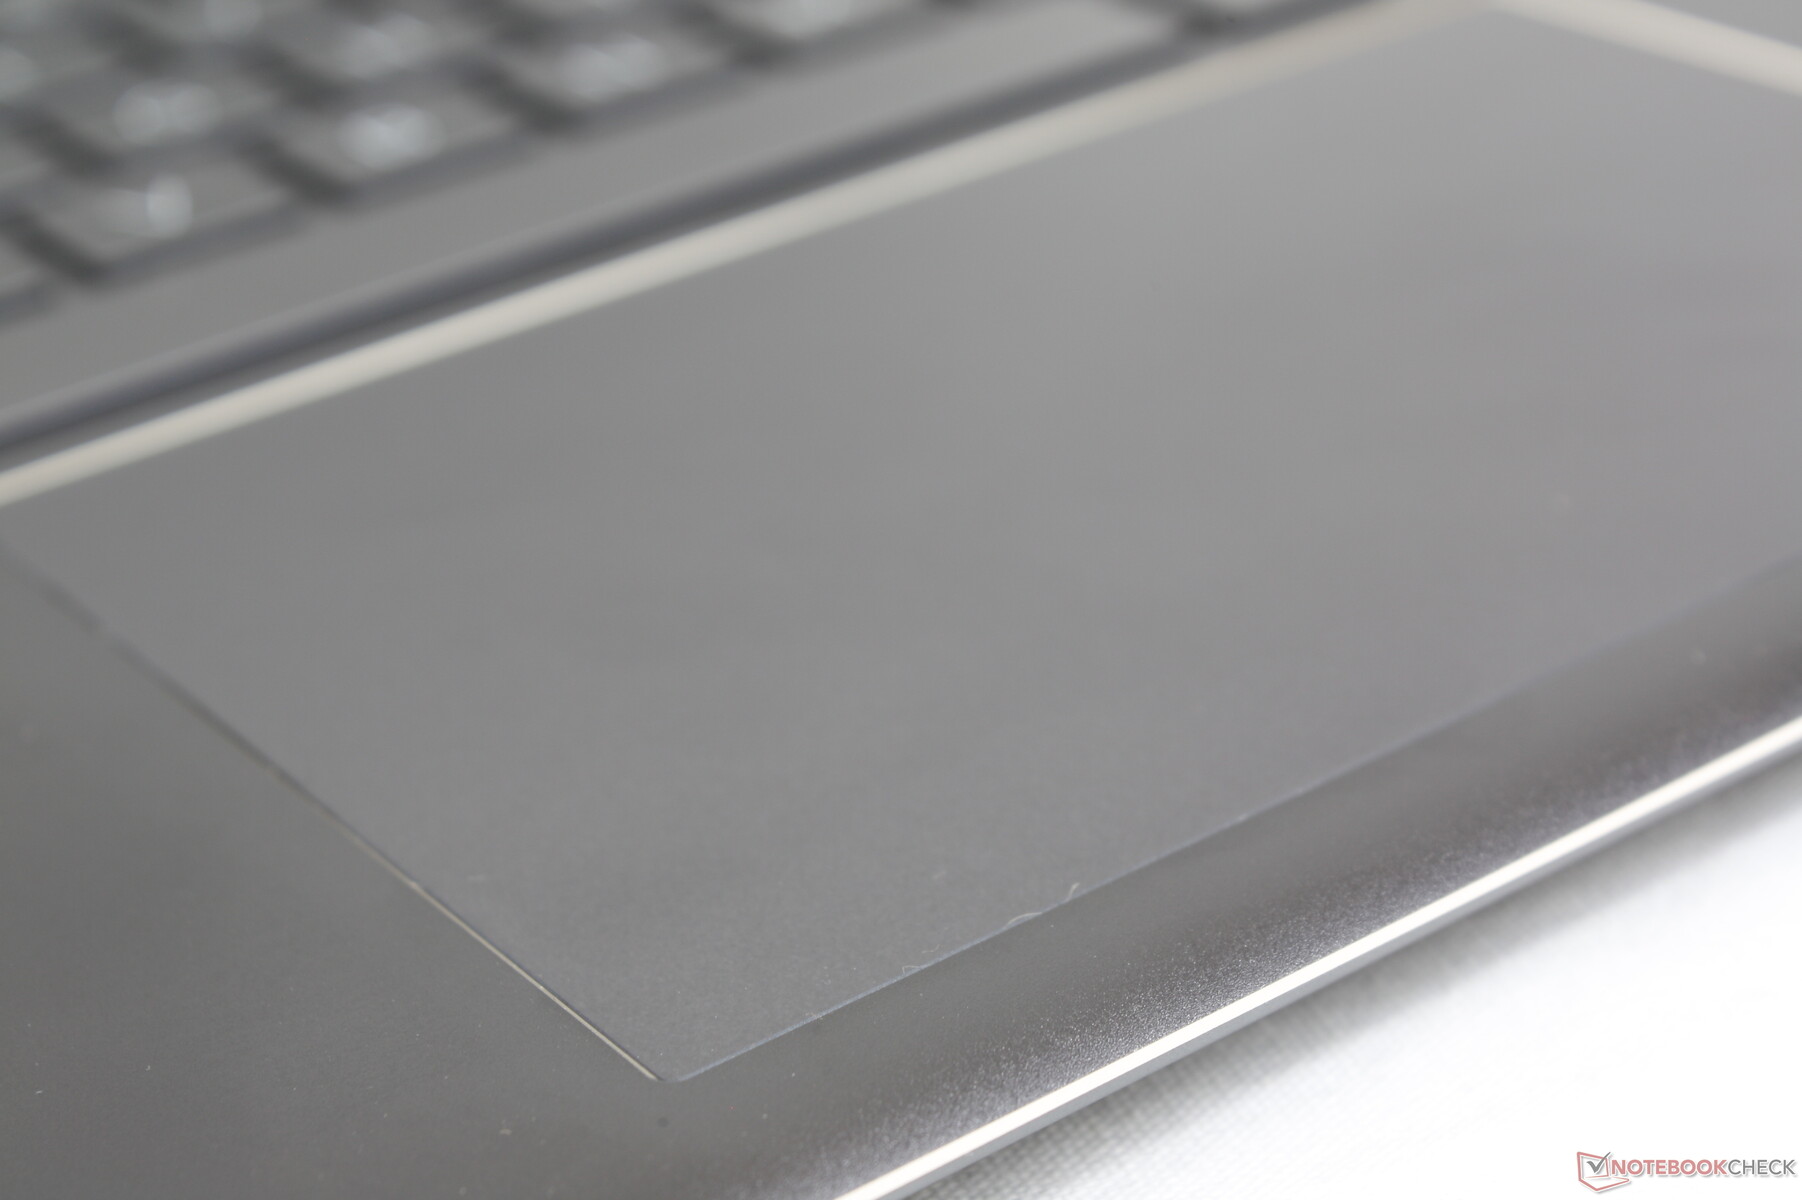
Touchpad
Das ClickPad ist noch größer als beim Modell aus 2020 (12,5 x 8 cm vs. 11,5 x 7,4 cm) und macht Multi-Touch-Eingaben noch komfortabler. Die Klicks der integrierten Maustasten sind für unseren Geschmack jedoch immer noch zu weich und schwammig.

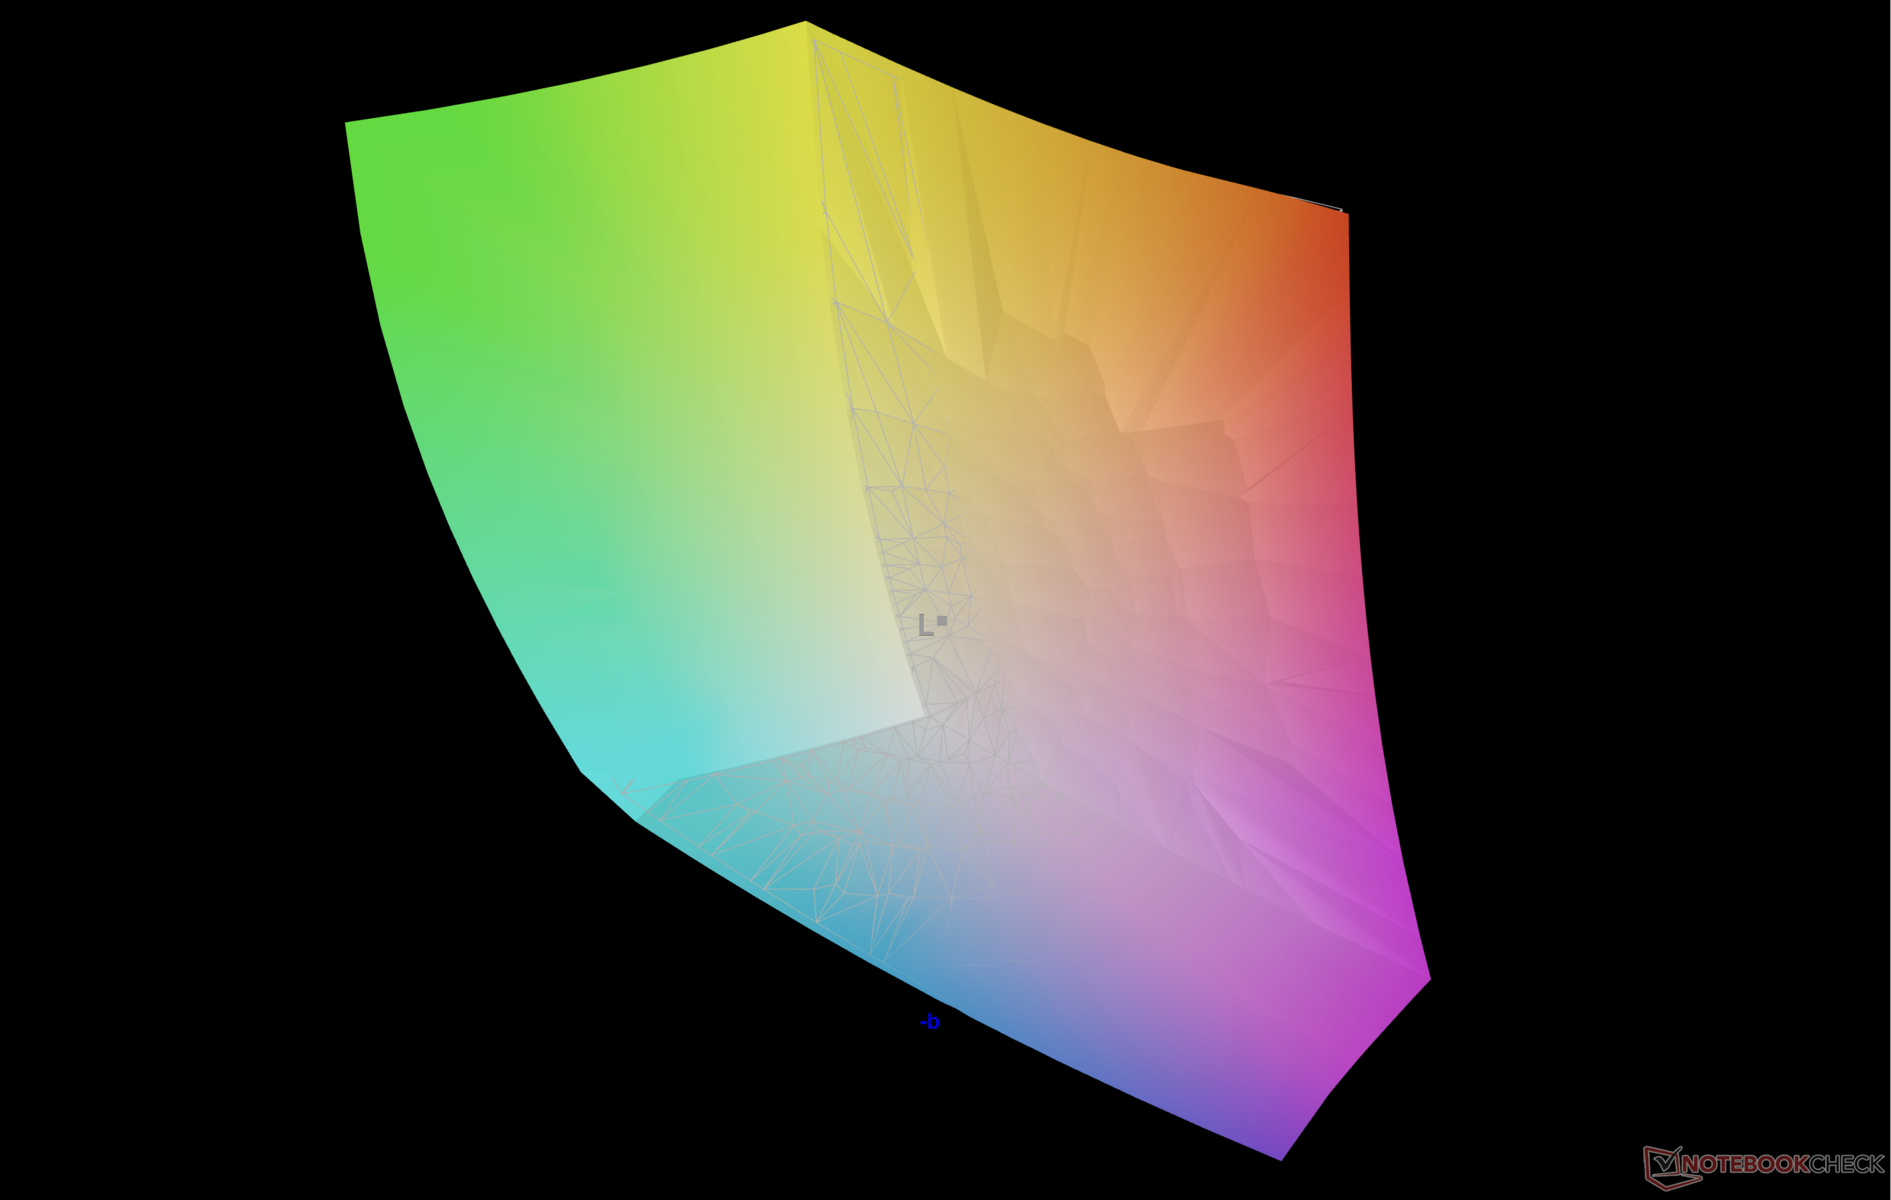
Display — Gleiche Darstellung dank 3:2, 60 Hz und Samsung OLED

Unser aktuelles Testgerät nutzt zwar einen neuen Displaycontroller als das Modell aus dem Vorjahr (SDC4160 vs. SDC4148), bei beiden Displays kommt jedoch ein 3:2-OLED-Panel von Samsung zum Einsatz, wodurch die Darstellung nun seit zwei Jahren unverändert geblieben ist. Kernattribute wie die Auflösung, Bildwiederholfrequenz, das Farbspektrum und die Helligkeit sind ebenfalls unverändert. In Zukunft hoffen wir auf 90-Hz- oder 120-Hz-OLED-Optionen, wie Asus sie derzeit in manchen ZenBook- und VivoBook-Modellen anbietet.

| |||||||||||||||||||||||||
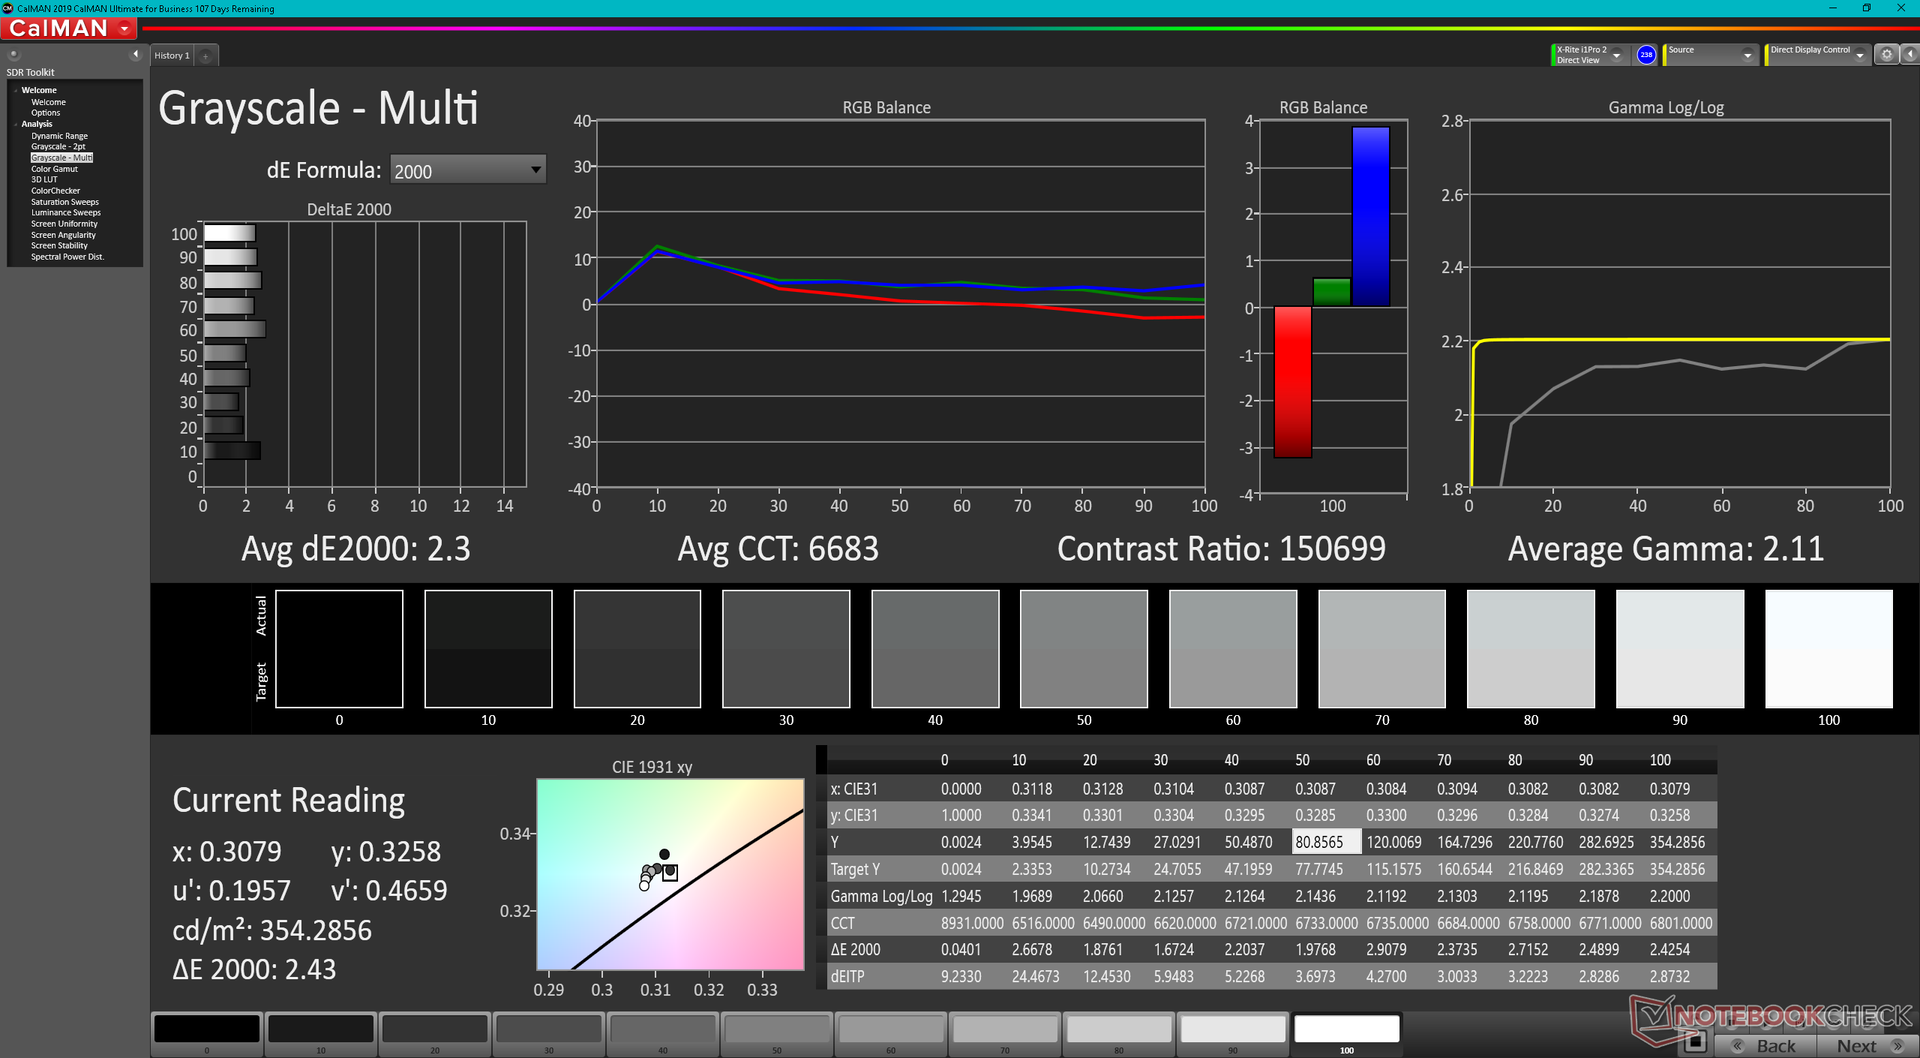
Ausleuchtung: 87 %
Helligkeit Akku: 351.7 cd/m²
Kontrast: ∞:1 (Schwarzwert: 0 cd/m²)
ΔE Color 1.78 | 0.5-29.43 Ø5
ΔE Greyscale 2.3 | 0.57-98 Ø5.3
90.8% AdobeRGB 1998 (Argyll 2.2.0 3D)
100% sRGB (Argyll 2.2.0 3D)
99.9% Display P3 (Argyll 2.2.0 3D)
Gamma: 2.11
| HP Spectre x360 13.5 14t-ef000 SDC4160, OLED, 3000x2000, 13.50 | HP Spectre x360 14-ea0378ng Samsung SDC4148, OLED, 3000x2000, 13.50 | Framework Laptop 13.5 12th Gen Intel BOE CQ NE135FBM-N41, IPS, 2256x1504, 13.50 | Lenovo ThinkPad X1 Titanium Yoga G1 20QB0016GE LPM135M467, IPS LED, 2256x1504, 13.50 | Framework Laptop 13.5 BOE CQ NE135FBM-N41, IPS, 2256x1504, 13.50 | HP EliteBook Folio 13.5-3G2L2EA LGD0663, IPS, 1920x1280, 13.50 | Microsoft Surface Laptop 4 13 i7 LQ135P1JX51, IPS, 2256x1504, 13.50 | |
|---|---|---|---|---|---|---|---|
| Display | 2% | -18% | -20% | -18% | -21% | ||
| Display P3 Coverage | 99.9 | 99.9 0% | 69.9 -30% | 66.8 -33% | 69 -31% | 64.7 -35% | |
| sRGB Coverage | 100 | 100 0% | 99.4 -1% | 98 -2% | 99.3 -1% | 97.2 -3% | |
| AdobeRGB 1998 Coverage | 90.8 | 96.1 6% | 71.1 -22% | 68.6 -24% | 70.3 -23% | 66.9 -26% | |
| Response Times | 106% | -1450% | -2603% | -2197% | -1683% | 10460% | |
| Response Time Grey 50% / Grey 80% * | 1.9 ? | 2 ? -5% | 34.7 ? -1726% | 64 ? -3268% | 55.6 ? -2826% | 44 ? -2216% | 62.8 ? -3205% |
| Response Time Black / White * | 2.16 ? | 2 ? 7% | 27.5 ? -1173% | 44 ? -1937% | 36 ? -1567% | 27 ? -1150% | 39.8 ? -1743% |
| PWM Frequency | 60.2 ? | 250 ? 315% | 21930 ? 36329% | ||||
| Bildschirm | 0% | -26% | 9% | -15% | -40% | -3% | |
| Helligkeit Bildmitte | 351.7 | 370 5% | 449.6 28% | 465 32% | 449 28% | 250 -29% | 413 17% |
| Brightness | 351 | 374 7% | 431 23% | 451 28% | 435 24% | 226 -36% | 400 14% |
| Brightness Distribution | 87 | 90 3% | 90 3% | 92 6% | 93 7% | 82 -6% | 94 8% |
| Schwarzwert * | 0.01 | 0.31 | 0.28 | 0.39 | 0.215 | 0.29 | |
| Delta E Colorchecker * | 1.78 | 2.57 -44% | 2.76 -55% | 2 -12% | 2.34 -31% | 3.59 -102% | 2.8 -57% |
| Colorchecker dE 2000 max. * | 6.14 | 4.52 26% | 7.96 -30% | 4.7 23% | 7.07 -15% | 5.9 4% | 7.2 -17% |
| Delta E Graustufen * | 2.3 | 2.2 4% | 5.2 -126% | 2.9 -26% | 4.7 -104% | 3.99 -73% | 1.9 17% |
| Gamma | 2.11 104% | 2.36 93% | 2.23 99% | 2.09 105% | 2.29 96% | 2.98 74% | 2.12 104% |
| CCT | 6683 97% | 6154 106% | 6475 100% | 6181 105% | 6760 96% | 6765 96% | 6510 100% |
| Kontrast | 37000 | 1450 | 1661 | 1151 | 1163 | 1424 | |
| Colorchecker dE 2000 calibrated * | 2.31 | 0.58 | 0.7 | 0.96 | 0.8 | ||
| Farbraum (Prozent von AdobeRGB 1998) | 85.8 | 61.6 | |||||
| Color Space (Percent of sRGB) | 100 | 97.2 | |||||
| Durchschnitt gesamt (Programm / Settings) | 36% /
27% | -498% /
-283% | -871% /
-474% | -743% /
-413% | -862% /
-451% | 3479% /
2608% |
* ... kleinere Werte sind besser
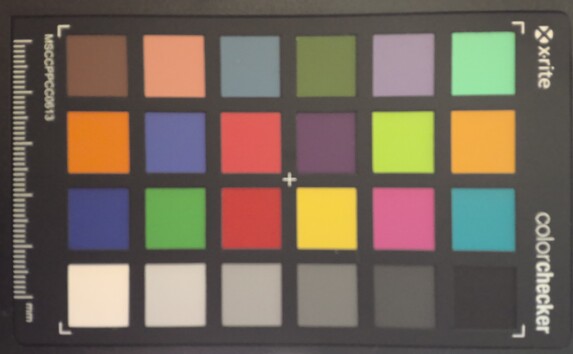
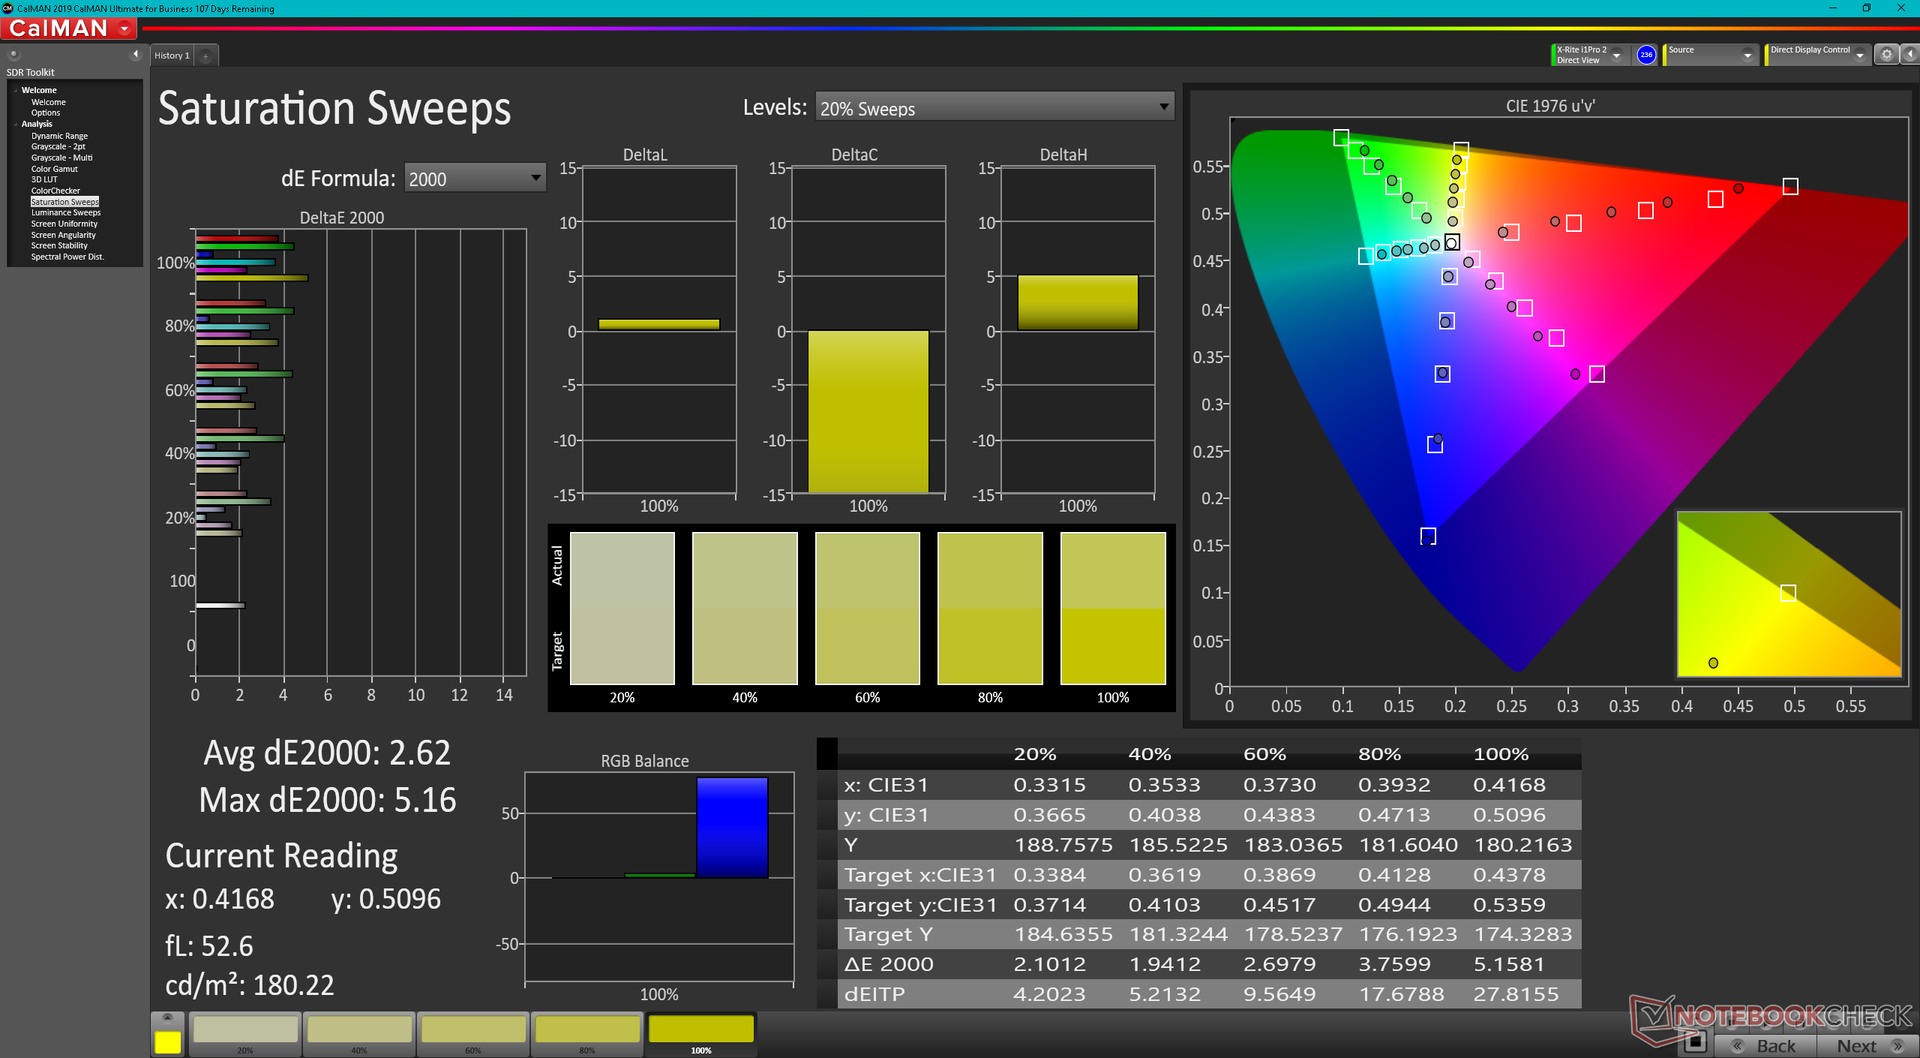
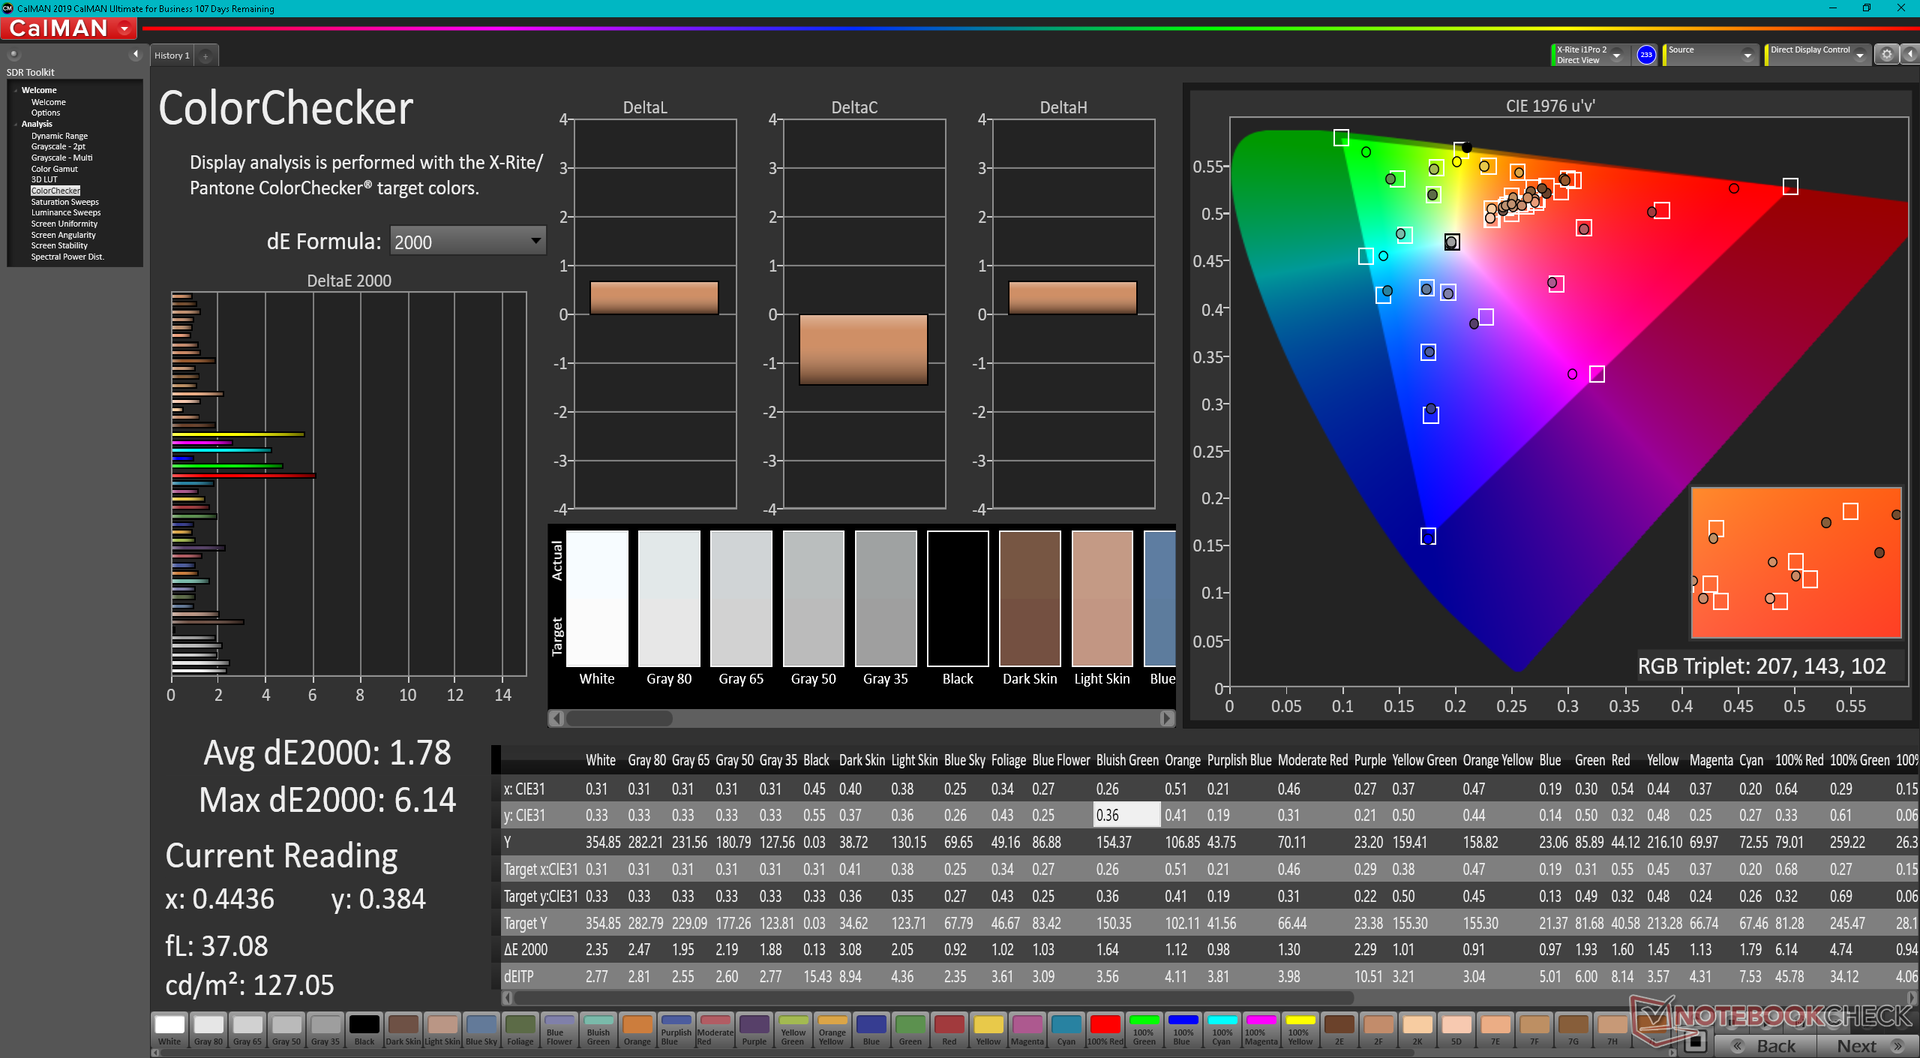
HP wirbt mit einer vollständigen P3-Farbraumabdeckung, die wir durch unsere unabhängige Messung bestätigen können. Die Farboptionen kann man über HPs Menü den eigenen Bedürfnissen anpassen, indem man im Command Center "Displayoptionen" in der unteren linken Ecke anklickt.
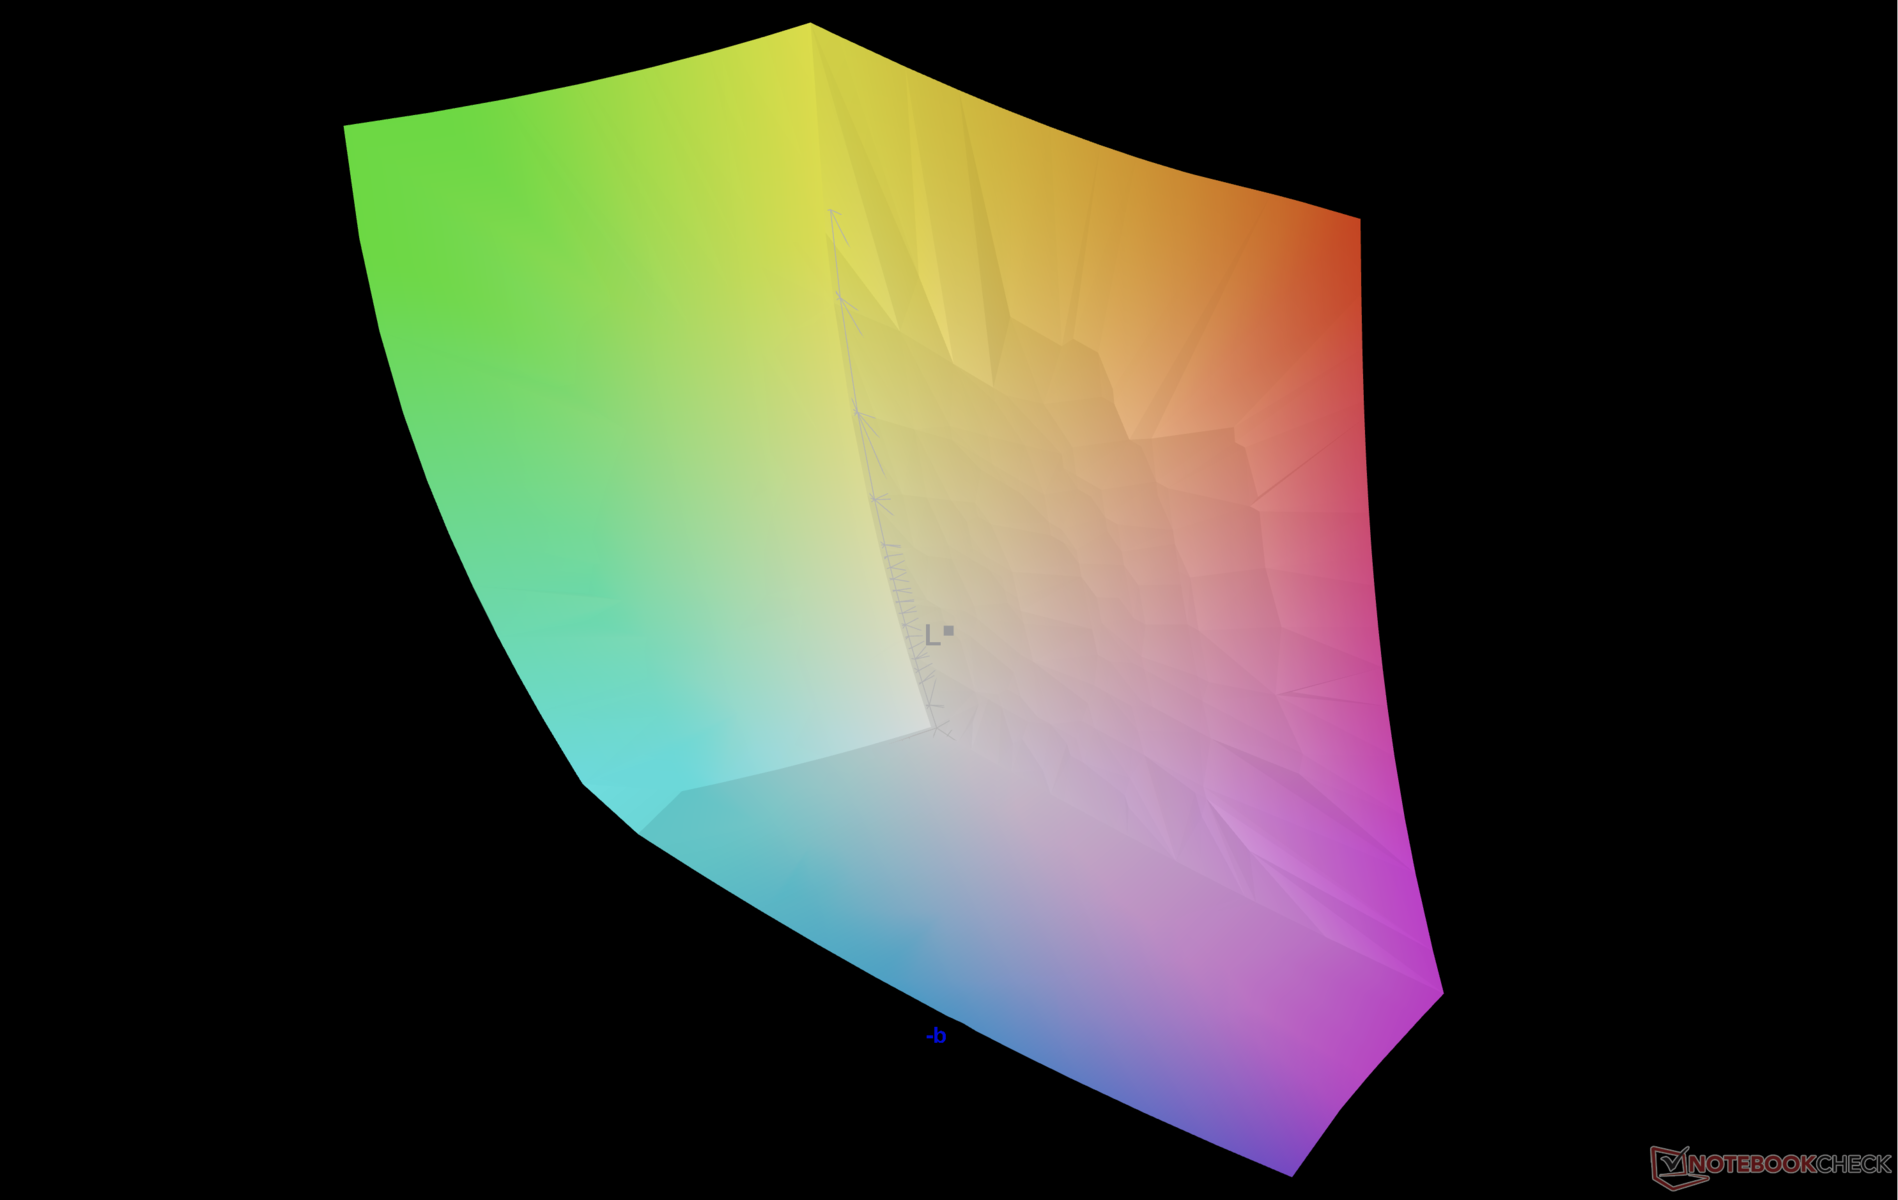
Dass das OLED-Panel nicht vorkalibriert ist, was vermutlich darauf zurückzuführen ist, dass es sich hierbei nicht um ein EliteBook oder einen professionellen Laptop handelt, ist schade, denn OLED ist dazu in der Lage, Farben sehr genau wiederzugeben. Die durchschnittlichen Graustufen- und Farb-DeltaE-Werte sind mit 2,3 bzw. 1,78 dennoch sehr gut.
Reaktionszeiten (Response Times) des Displays
| ↔ Reaktionszeiten Schwarz zu Weiß | ||
|---|---|---|
| 2.16 ms ... steigend ↗ und fallend ↘ kombiniert | ↗ 0.96 ms steigend | 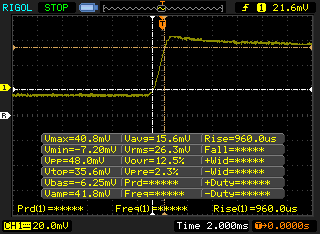 |
| ↘ 1.2 ms fallend | ||
| Die gemessenen Reaktionszeiten sind sehr kurz, wodurch sich der Bildschirm auch für schnelle 3D Spiele eignen sollte. Im Vergleich rangierten die bei uns getesteten Geräte von 0.1 (Minimum) zu 240 (Maximum) ms. » 7 % aller Screens waren schneller als der getestete. Daher sind die gemessenen Reaktionszeiten besser als der Durchschnitt aller vermessenen Geräte (21.5 ms). | ||
| ↔ Reaktionszeiten 50% Grau zu 80% Grau | ||
| 1.9 ms ... steigend ↗ und fallend ↘ kombiniert | ↗ 0.92 ms steigend | 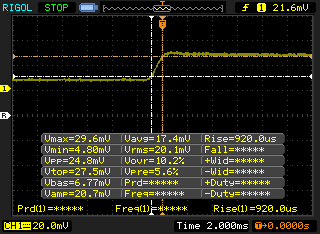 |
| ↘ 0.98 ms fallend | ||
| Die gemessenen Reaktionszeiten sind sehr kurz, wodurch sich der Bildschirm auch für schnelle 3D Spiele eignen sollte. Im Vergleich rangierten die bei uns getesteten Geräte von 0.2 (Minimum) zu 636 (Maximum) ms. » 5 % aller Screens waren schneller als der getestete. Daher sind die gemessenen Reaktionszeiten besser als der Durchschnitt aller vermessenen Geräte (33.7 ms). | ||
Bildschirm-Flackern / PWM (Pulse-Width Modulation)
| Flackern / PWM festgestellt | 60.2 Hz | ≤ 100 % Helligkeit | 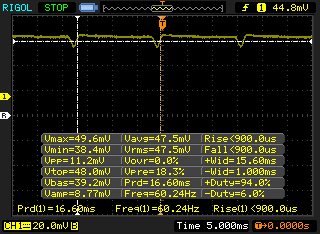 |
Das Display flackert mit 60.2 Hz (im schlimmsten Fall, eventuell durch Pulsweitenmodulation PWM) bei einer eingestellten Helligkeit von 100 % und darunter. Darüber sollte es zu keinem Flackern kommen. Die Frequenz von 60.2 Hz ist sehr gering und daher kann es bei allen Usern zu sichtbaren Flackern, brennenden Augen oder Kopfweh kommen. Im Vergleich: 53 % aller getesteten Geräte nutzten kein PWM um die Helligkeit zu reduzieren. Wenn PWM eingesetzt wurde, dann bei einer Frequenz von durchschnittlich 17900 (Minimum 5, Maximum 3846000) Hz. | |||
Wie bei den meisten anderen OLED-Laptop-Panels, die wir bisher getestet haben, flackert das Display auf allen Helligkeitsstufen. PWM mit einer Frequenz von 238 Hz ist auf den Helligkeitsstufen 0-37 % und einer Frequenz von 60 Hz auf den Helligkeitsstufen von 38-100 % präsent.

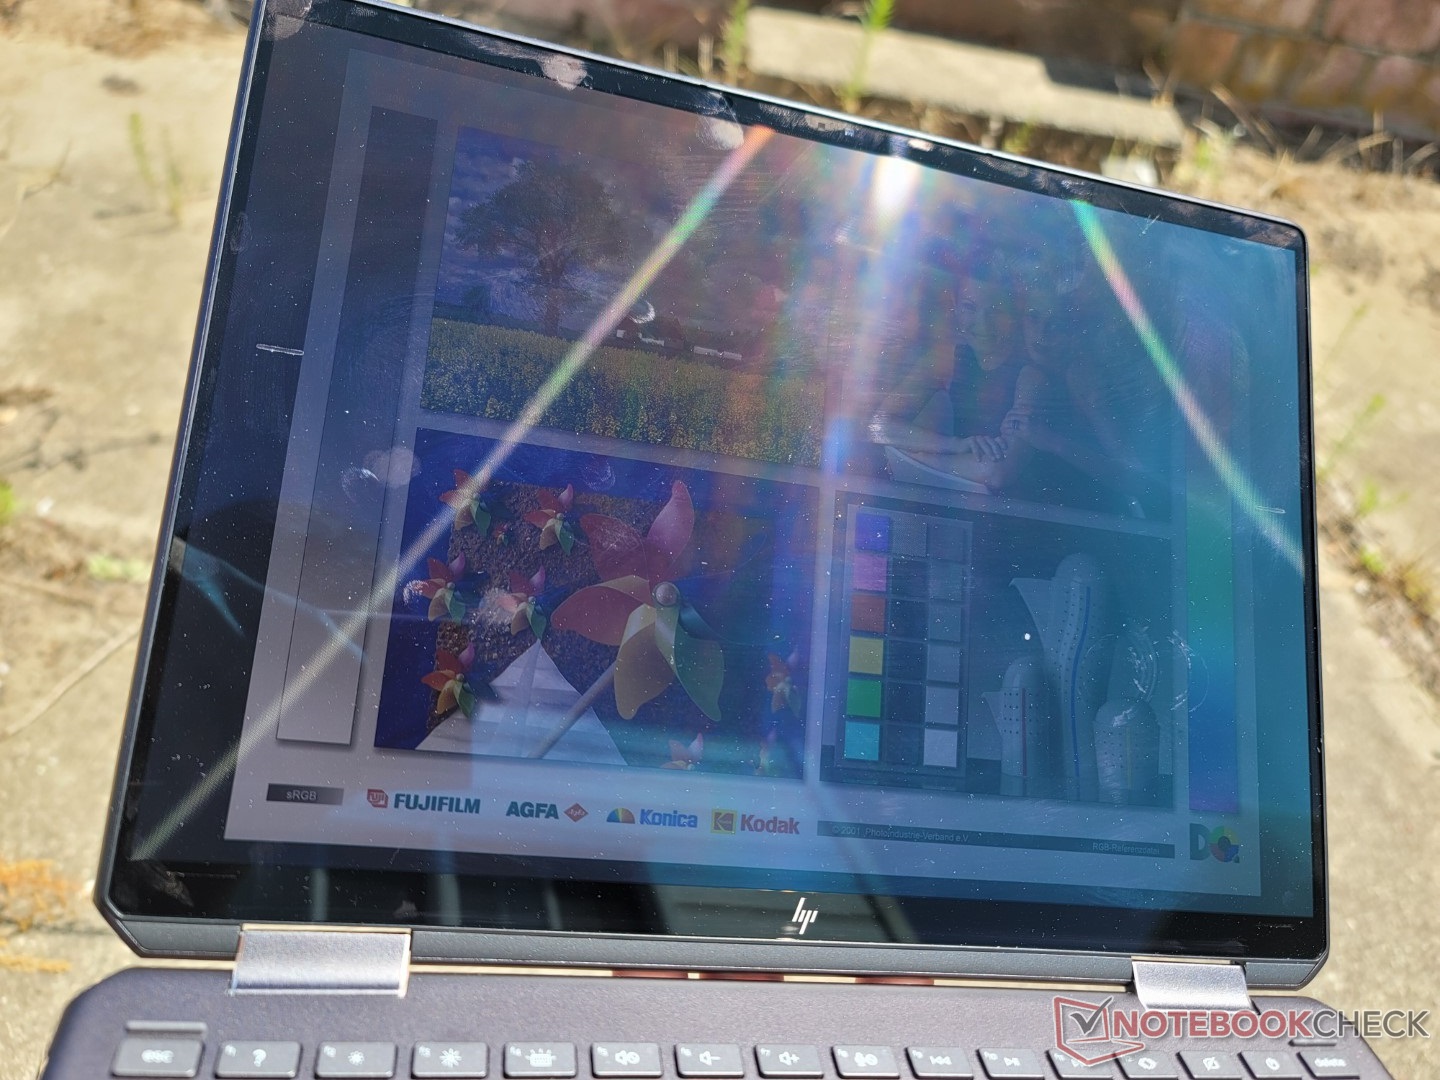
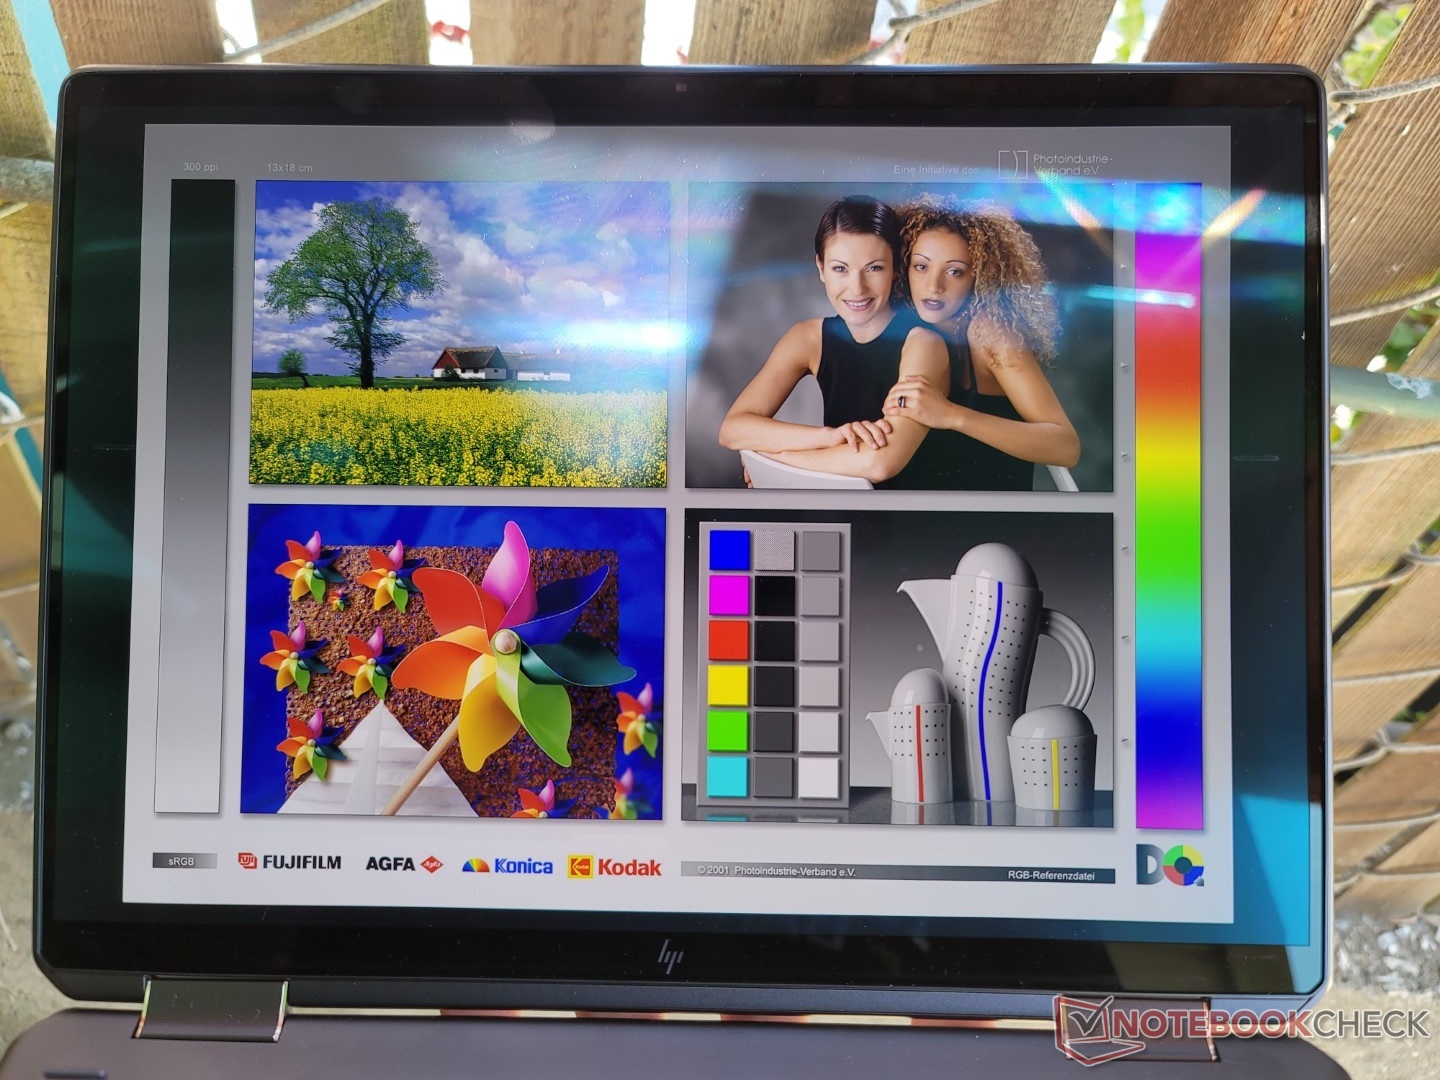
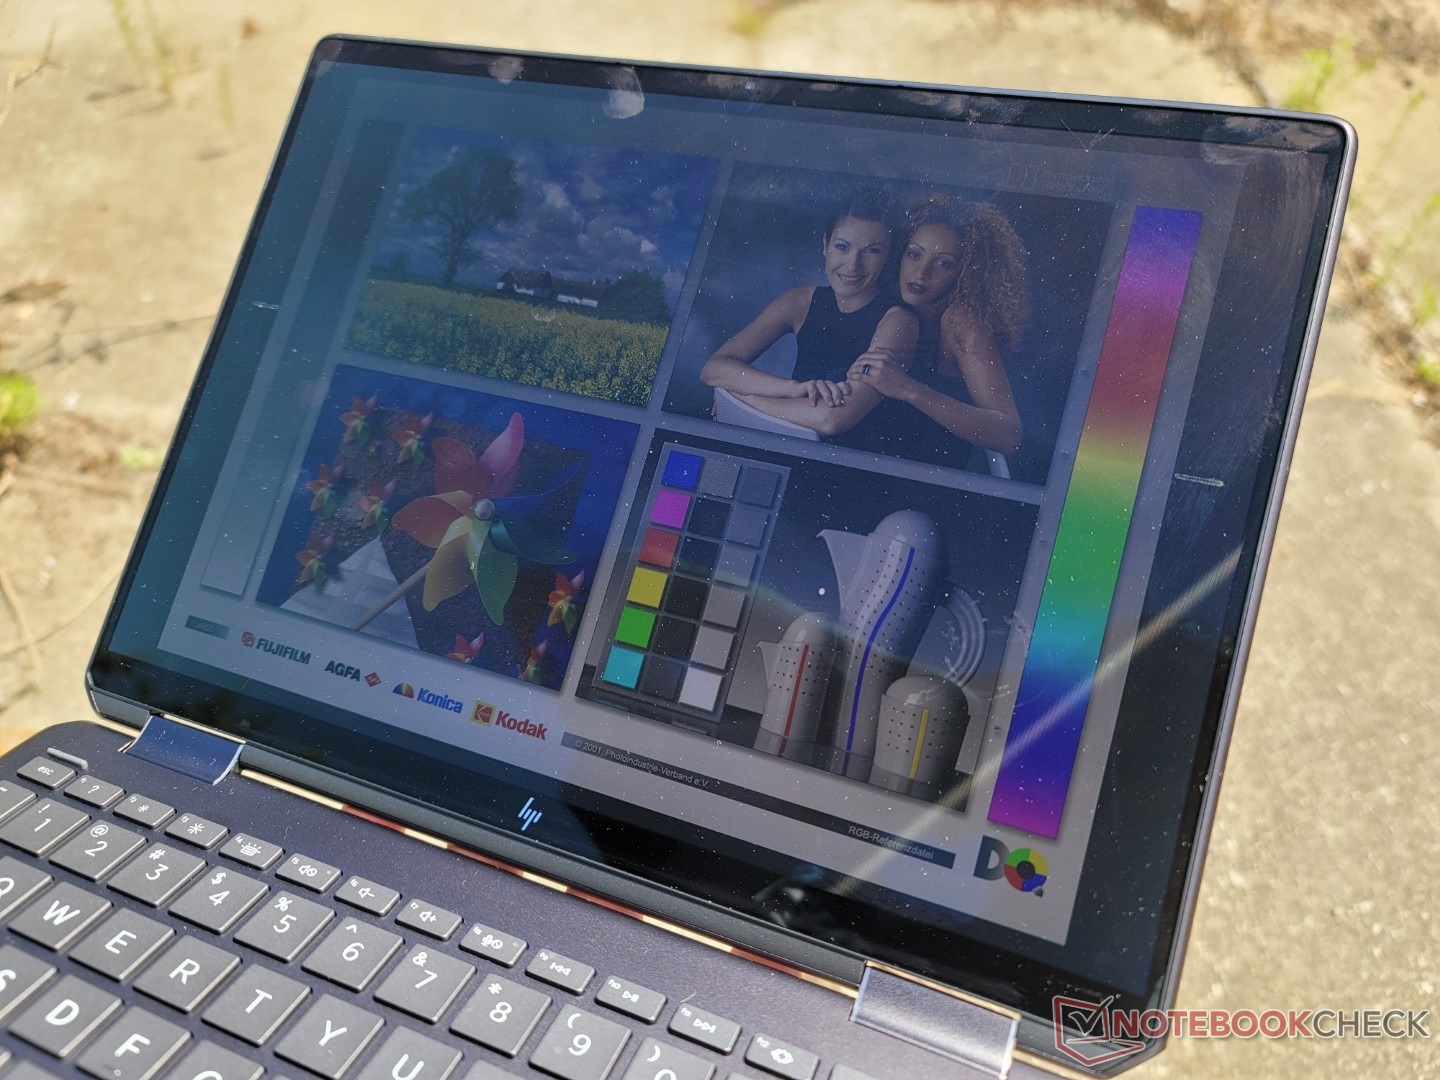
Die Lesbarkeit im Freien bleibt aufgrund der seit dem ursprünglichen Spectre x360 14 unveränderten Maximalhelligkeit gleich. Wer eine gute Lesbarkeit im Freien dringend benötigt, sollte sich eventuell das 1.000-cd/m²-IPS-Modell ansehen.

Leistung — Die 12. Intel-Generation macht den Unterschied

Testbedingungen
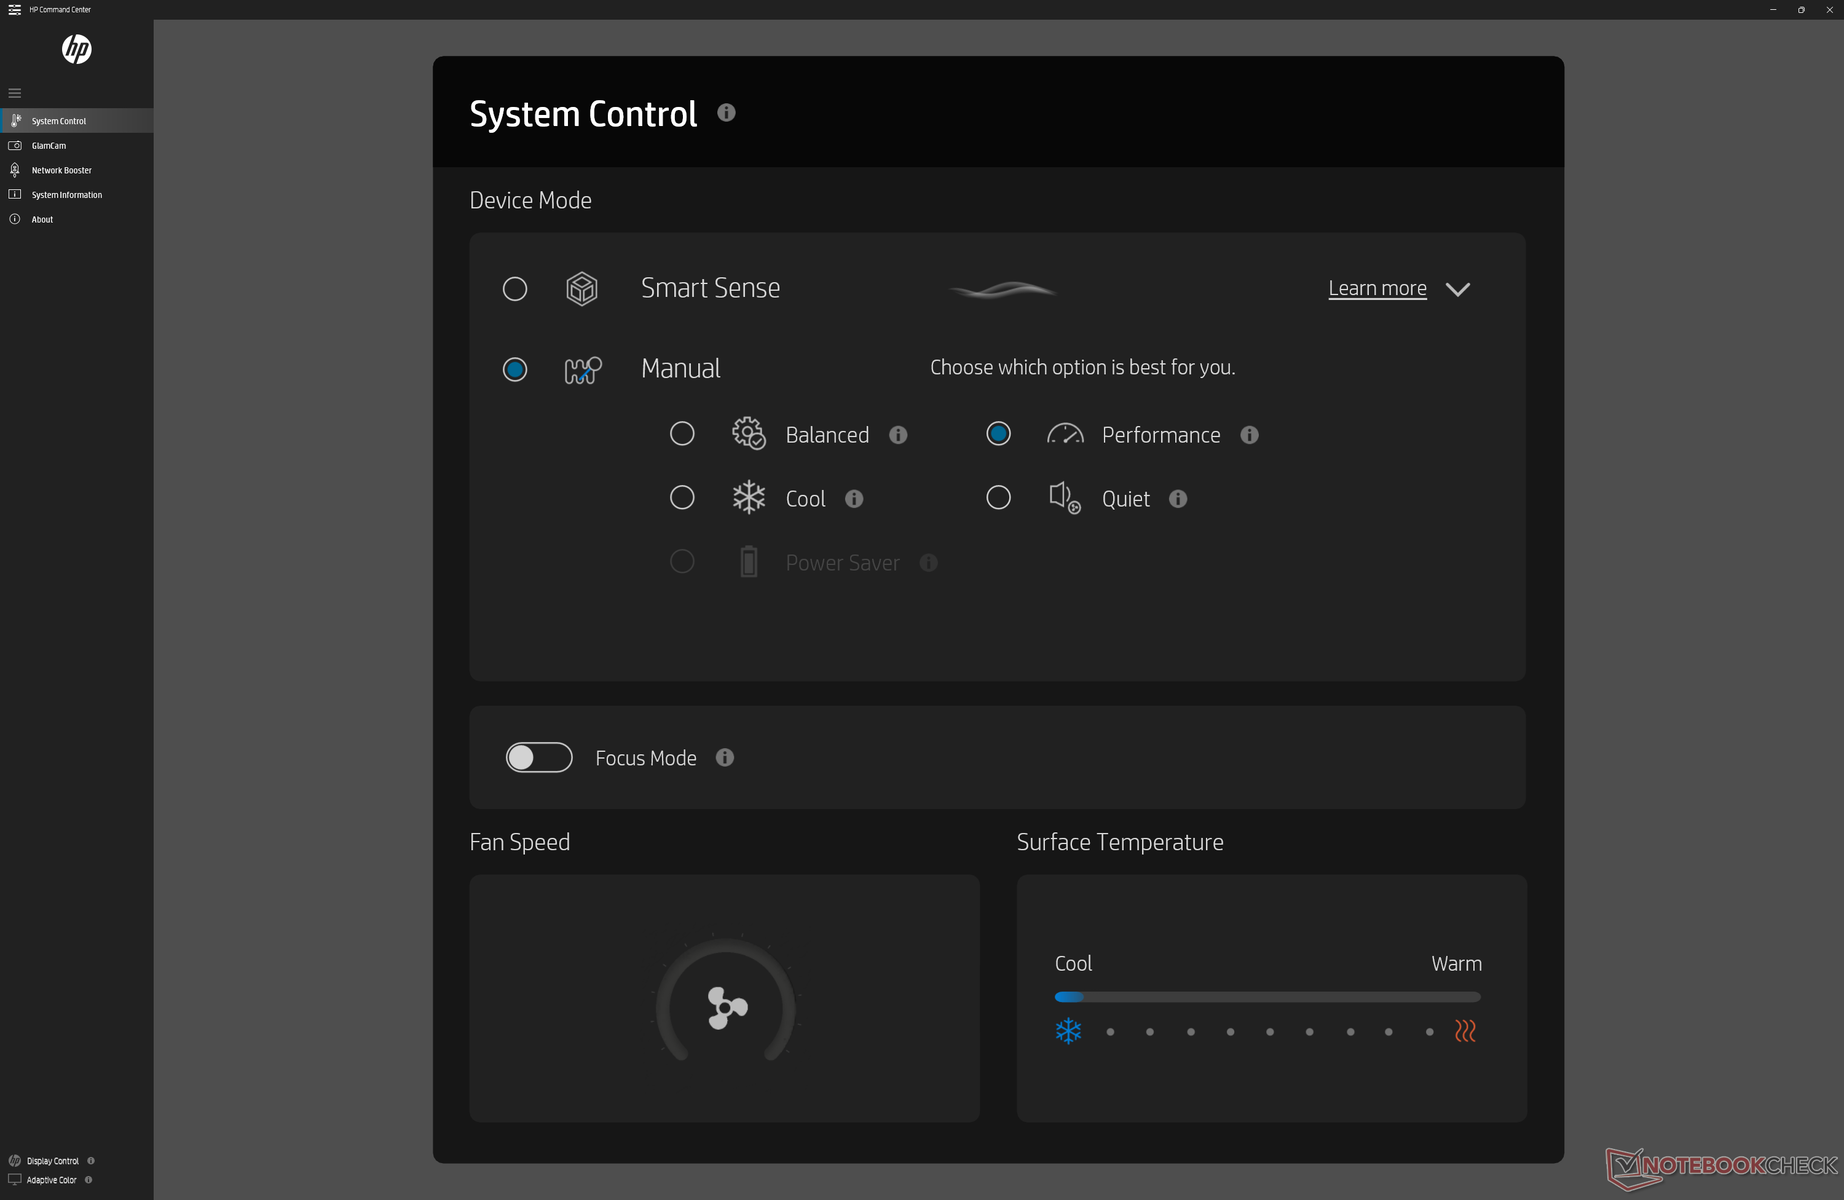
Vor dem Durchführen der folgenden Benchmarks haben wir unser Testgerät über das HP Command Center in den Leistungsmodus versetzt. Man sollte sich mit der Software vertraut machen, da hier eines der sechs Leistungsprofile ausgewählt werden kann: Smart Sense (auto), Energiesparmodus, Leise, Kühl, Ausbalanciert und Leistung.
Prozessor
Die CPU-Leistung ist ausgezeichnet und übertrifft hinsichtlich der Multi-Thread-Leistung das Inspiron 14 7420 2-in-1 und das HP ProBook 450 G9, die jeweils mit der gleichen Core i7-1255U-CPU ausgestattet sind. Die Punktzahlen gehen erfreulicherweise in Richtung des Core i7-1260P or Core i7-1280P und sind somit um ca. 50-100% höher sind als beim Core i7-1165G7 des Vorgängers.
Wir empfehlen, das schwächere Core i5-1235U-Modell zu meiden, da die CPU kaum schneller als ein Core i7-1165G7 ist.
Dauertest: Cinebench R15 Multi
Cinebench R23: Multi Core | Single Core
Cinebench R15: CPU Multi 64Bit | CPU Single 64Bit
Blender: v2.79 BMW27 CPU
7-Zip 18.03: 7z b 4 | 7z b 4 -mmt1
Geekbench 5.5: Multi-Core | Single-Core
HWBOT x265 Benchmark v2.2: 4k Preset
LibreOffice : 20 Documents To PDF
R Benchmark 2.5: Overall mean
Cinebench R23: Multi Core | Single Core
Cinebench R15: CPU Multi 64Bit | CPU Single 64Bit
Blender: v2.79 BMW27 CPU
7-Zip 18.03: 7z b 4 | 7z b 4 -mmt1
Geekbench 5.5: Multi-Core | Single-Core
HWBOT x265 Benchmark v2.2: 4k Preset
LibreOffice : 20 Documents To PDF
R Benchmark 2.5: Overall mean
* ... kleinere Werte sind besser
AIDA64: FP32 Ray-Trace | FPU Julia | CPU SHA3 | CPU Queen | FPU SinJulia | FPU Mandel | CPU AES | CPU ZLib | FP64 Ray-Trace | CPU PhotoWorxx
| Performance Rating | |
| Microsoft Surface Laptop 4 13 Ryzen 5 | |
| HP Spectre x360 13.5 14t-ef000 | |
| Framework Laptop 13.5 12th Gen Intel | |
| Durchschnittliche Intel Core i7-1255U | |
| Framework Laptop 13.5 | |
| HP Spectre x360 14-ea0378ng | |
| Lenovo ThinkPad X1 Titanium Yoga G1 20QB0016GE | |
| AIDA64 / FP32 Ray-Trace | |
| Microsoft Surface Laptop 4 13 Ryzen 5 | |
| HP Spectre x360 13.5 14t-ef000 | |
| Framework Laptop 13.5 | |
| Durchschnittliche Intel Core i7-1255U (4313 - 8127, n=9) | |
| Framework Laptop 13.5 12th Gen Intel | |
| HP Spectre x360 14-ea0378ng | |
| Lenovo ThinkPad X1 Titanium Yoga G1 20QB0016GE | |
| AIDA64 / FPU Julia | |
| Microsoft Surface Laptop 4 13 Ryzen 5 | |
| HP Spectre x360 13.5 14t-ef000 | |
| Durchschnittliche Intel Core i7-1255U (19813 - 41353, n=9) | |
| Framework Laptop 13.5 | |
| Framework Laptop 13.5 12th Gen Intel | |
| Lenovo ThinkPad X1 Titanium Yoga G1 20QB0016GE | |
| HP Spectre x360 14-ea0378ng | |
| AIDA64 / CPU SHA3 | |
| HP Spectre x360 13.5 14t-ef000 | |
| Framework Laptop 13.5 | |
| Framework Laptop 13.5 12th Gen Intel | |
| Durchschnittliche Intel Core i7-1255U (1325 - 2135, n=9) | |
| Microsoft Surface Laptop 4 13 Ryzen 5 | |
| Lenovo ThinkPad X1 Titanium Yoga G1 20QB0016GE | |
| HP Spectre x360 14-ea0378ng | |
| AIDA64 / CPU Queen | |
| Framework Laptop 13.5 12th Gen Intel | |
| Microsoft Surface Laptop 4 13 Ryzen 5 | |
| HP Spectre x360 13.5 14t-ef000 | |
| Durchschnittliche Intel Core i7-1255U (61460 - 65892, n=9) | |
| HP Spectre x360 14-ea0378ng | |
| Framework Laptop 13.5 | |
| Lenovo ThinkPad X1 Titanium Yoga G1 20QB0016GE | |
| AIDA64 / FPU SinJulia | |
| Microsoft Surface Laptop 4 13 Ryzen 5 | |
| Framework Laptop 13.5 12th Gen Intel | |
| Framework Laptop 13.5 | |
| Durchschnittliche Intel Core i7-1255U (3577 - 5095, n=9) | |
| HP Spectre x360 13.5 14t-ef000 | |
| HP Spectre x360 14-ea0378ng | |
| Lenovo ThinkPad X1 Titanium Yoga G1 20QB0016GE | |
| AIDA64 / FPU Mandel | |
| Microsoft Surface Laptop 4 13 Ryzen 5 | |
| HP Spectre x360 13.5 14t-ef000 | |
| Framework Laptop 13.5 | |
| Durchschnittliche Intel Core i7-1255U (11759 - 20187, n=9) | |
| Framework Laptop 13.5 12th Gen Intel | |
| HP Spectre x360 14-ea0378ng | |
| Lenovo ThinkPad X1 Titanium Yoga G1 20QB0016GE | |
| AIDA64 / CPU AES | |
| Framework Laptop 13.5 | |
| HP Spectre x360 13.5 14t-ef000 | |
| Framework Laptop 13.5 12th Gen Intel | |
| Lenovo ThinkPad X1 Titanium Yoga G1 20QB0016GE | |
| HP Spectre x360 14-ea0378ng | |
| Durchschnittliche Intel Core i7-1255U (27900 - 67458, n=9) | |
| Microsoft Surface Laptop 4 13 Ryzen 5 | |
| AIDA64 / CPU ZLib | |
| Framework Laptop 13.5 12th Gen Intel | |
| Microsoft Surface Laptop 4 13 Ryzen 5 | |
| HP Spectre x360 13.5 14t-ef000 | |
| Durchschnittliche Intel Core i7-1255U (393 - 640, n=9) | |
| Framework Laptop 13.5 | |
| HP Spectre x360 14-ea0378ng | |
| Lenovo ThinkPad X1 Titanium Yoga G1 20QB0016GE | |
| AIDA64 / FP64 Ray-Trace | |
| Microsoft Surface Laptop 4 13 Ryzen 5 | |
| HP Spectre x360 13.5 14t-ef000 | |
| Framework Laptop 13.5 | |
| Durchschnittliche Intel Core i7-1255U (2474 - 4400, n=9) | |
| Framework Laptop 13.5 12th Gen Intel | |
| HP Spectre x360 14-ea0378ng | |
| Lenovo ThinkPad X1 Titanium Yoga G1 20QB0016GE | |
| AIDA64 / CPU PhotoWorxx | |
| HP Spectre x360 13.5 14t-ef000 | |
| HP Spectre x360 14-ea0378ng | |
| Lenovo ThinkPad X1 Titanium Yoga G1 20QB0016GE | |
| Durchschnittliche Intel Core i7-1255U (13899 - 44054, n=9) | |
| Framework Laptop 13.5 12th Gen Intel | |
| Microsoft Surface Laptop 4 13 Ryzen 5 | |
| Framework Laptop 13.5 | |
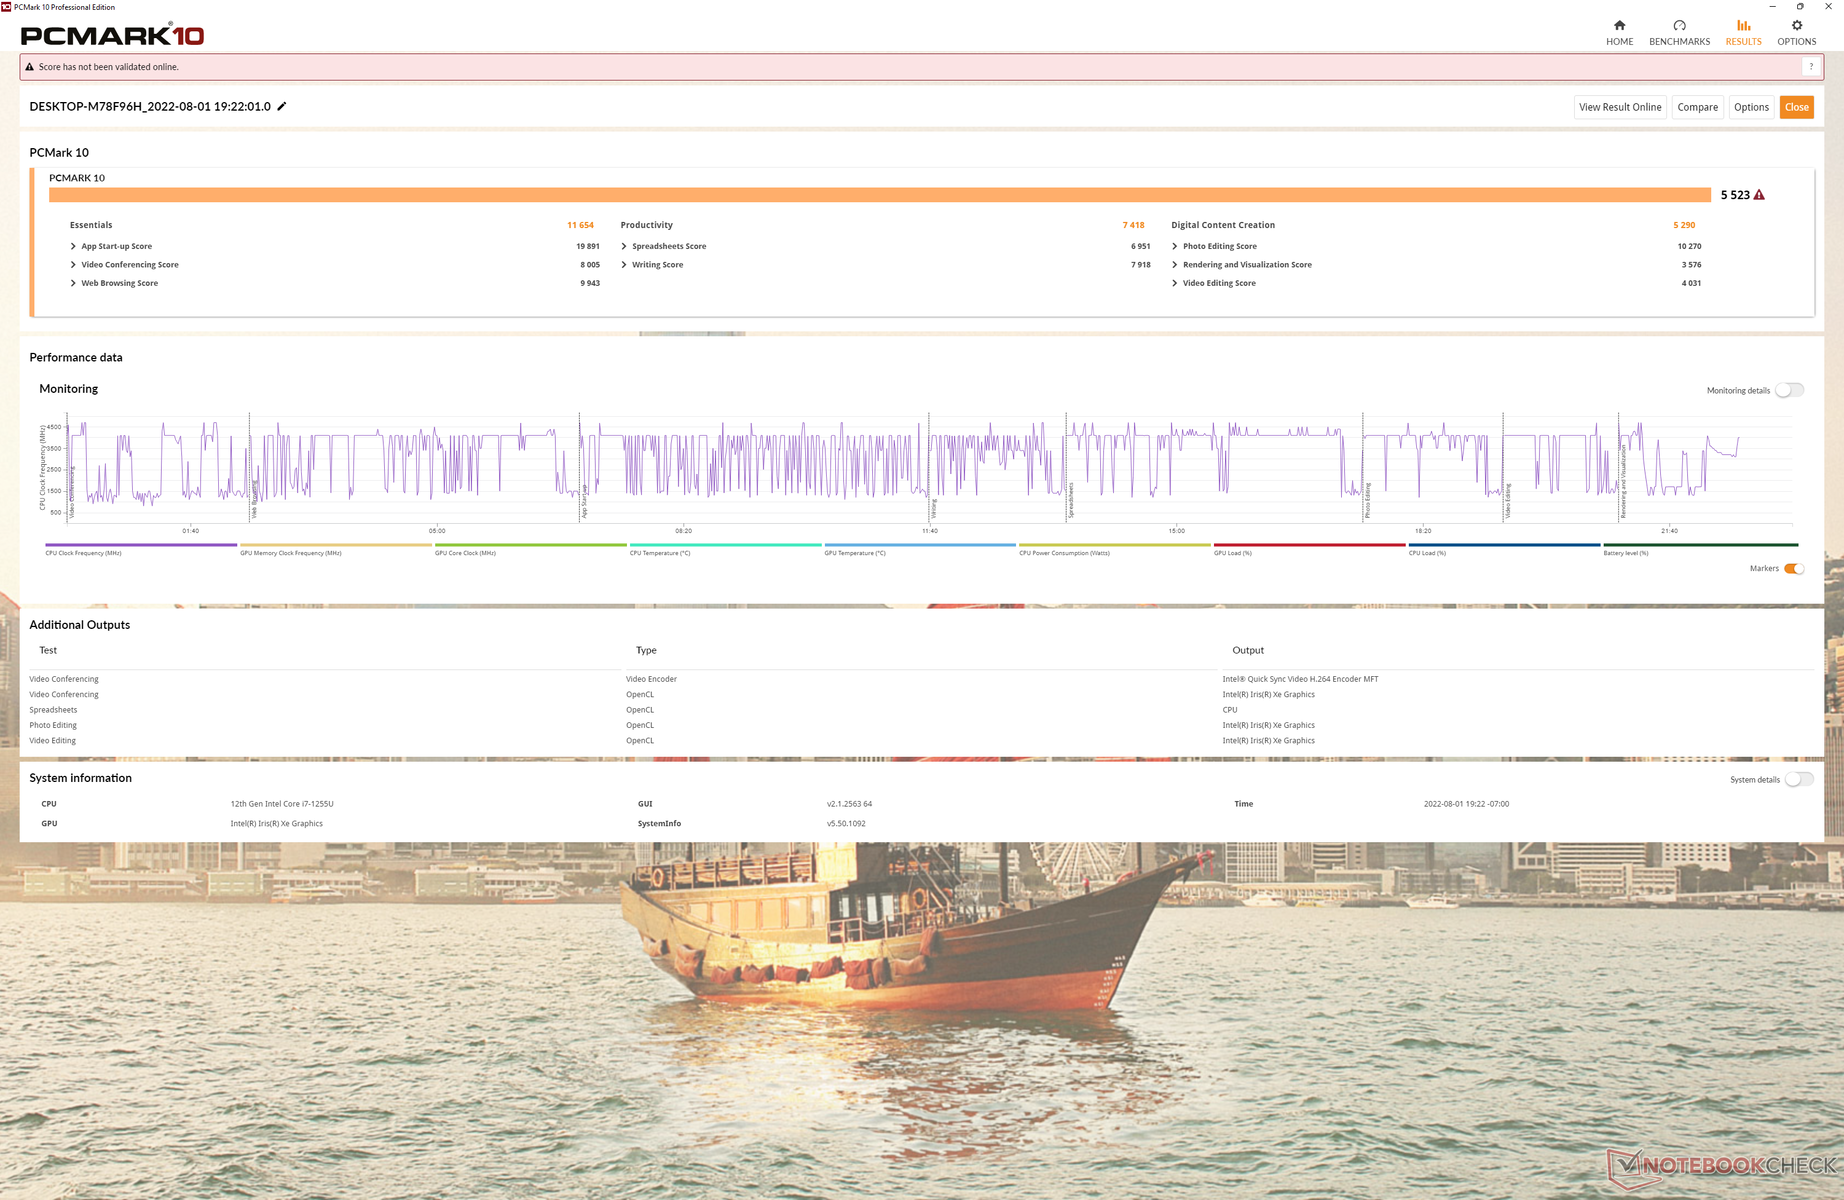
Systemleistung
Die PCMark-10-Punktzahlen fallen konstant und manchmal deutlich höher aus als beim Modell aus dem Vorjahr. Wir vermuten, dass die neuere CPU und der Wechsel von PCIe3 bzw. Optane auf PCIe4-Speicher maßgeblich für die höhere PCMark-10-Leistung verantwortlich sind.
CrossMark: Overall | Productivity | Creativity | Responsiveness
| PCMark 10 / Score | |
| Framework Laptop 13.5 12th Gen Intel | |
| HP Spectre x360 13.5 14t-ef000 | |
| Durchschnittliche Intel Core i7-1255U, Intel Iris Xe Graphics G7 96EUs (4676 - 5523, n=8) | |
| Framework Laptop 13.5 | |
| Microsoft Surface Laptop 4 13 Ryzen 5 | |
| HP Spectre x360 14-ea0378ng | |
| Lenovo ThinkPad X1 Titanium Yoga G1 20QB0016GE | |
| PCMark 10 / Essentials | |
| HP Spectre x360 13.5 14t-ef000 | |
| Framework Laptop 13.5 12th Gen Intel | |
| Durchschnittliche Intel Core i7-1255U, Intel Iris Xe Graphics G7 96EUs (9381 - 11654, n=8) | |
| Framework Laptop 13.5 | |
| Lenovo ThinkPad X1 Titanium Yoga G1 20QB0016GE | |
| HP Spectre x360 14-ea0378ng | |
| Microsoft Surface Laptop 4 13 Ryzen 5 | |
| PCMark 10 / Productivity | |
| HP Spectre x360 13.5 14t-ef000 | |
| Framework Laptop 13.5 12th Gen Intel | |
| Durchschnittliche Intel Core i7-1255U, Intel Iris Xe Graphics G7 96EUs (6530 - 7418, n=8) | |
| Microsoft Surface Laptop 4 13 Ryzen 5 | |
| HP Spectre x360 14-ea0378ng | |
| Lenovo ThinkPad X1 Titanium Yoga G1 20QB0016GE | |
| Framework Laptop 13.5 | |
| PCMark 10 / Digital Content Creation | |
| Framework Laptop 13.5 12th Gen Intel | |
| Durchschnittliche Intel Core i7-1255U, Intel Iris Xe Graphics G7 96EUs (4498 - 6203, n=8) | |
| HP Spectre x360 13.5 14t-ef000 | |
| Framework Laptop 13.5 | |
| Microsoft Surface Laptop 4 13 Ryzen 5 | |
| HP Spectre x360 14-ea0378ng | |
| Lenovo ThinkPad X1 Titanium Yoga G1 20QB0016GE | |
| CrossMark / Overall | |
| Framework Laptop 13.5 12th Gen Intel | |
| HP Spectre x360 13.5 14t-ef000 | |
| Durchschnittliche Intel Core i7-1255U, Intel Iris Xe Graphics G7 96EUs (1329 - 1573, n=8) | |
| CrossMark / Productivity | |
| Framework Laptop 13.5 12th Gen Intel | |
| HP Spectre x360 13.5 14t-ef000 | |
| Durchschnittliche Intel Core i7-1255U, Intel Iris Xe Graphics G7 96EUs (1364 - 1554, n=8) | |
| CrossMark / Creativity | |
| Framework Laptop 13.5 12th Gen Intel | |
| HP Spectre x360 13.5 14t-ef000 | |
| Durchschnittliche Intel Core i7-1255U, Intel Iris Xe Graphics G7 96EUs (1372 - 1660, n=8) | |
| CrossMark / Responsiveness | |
| Framework Laptop 13.5 12th Gen Intel | |
| HP Spectre x360 13.5 14t-ef000 | |
| Durchschnittliche Intel Core i7-1255U, Intel Iris Xe Graphics G7 96EUs (1117 - 1434, n=8) | |
| PCMark 10 Score | 5523 Punkte | |
Hilfe | ||
| AIDA64 / Memory Copy | |
| HP Spectre x360 13.5 14t-ef000 | |
| HP Spectre x360 14-ea0378ng | |
| Lenovo ThinkPad X1 Titanium Yoga G1 20QB0016GE | |
| Durchschnittliche Intel Core i7-1255U (22846 - 67017, n=9) | |
| Framework Laptop 13.5 12th Gen Intel | |
| Microsoft Surface Laptop 4 13 Ryzen 5 | |
| Framework Laptop 13.5 | |
| AIDA64 / Memory Read | |
| HP Spectre x360 13.5 14t-ef000 | |
| Lenovo ThinkPad X1 Titanium Yoga G1 20QB0016GE | |
| HP Spectre x360 14-ea0378ng | |
| Durchschnittliche Intel Core i7-1255U (22877 - 67398, n=9) | |
| Framework Laptop 13.5 12th Gen Intel | |
| Microsoft Surface Laptop 4 13 Ryzen 5 | |
| Framework Laptop 13.5 | |
| AIDA64 / Memory Write | |
| HP Spectre x360 13.5 14t-ef000 | |
| Lenovo ThinkPad X1 Titanium Yoga G1 20QB0016GE | |
| HP Spectre x360 14-ea0378ng | |
| Durchschnittliche Intel Core i7-1255U (22883 - 65839, n=9) | |
| Framework Laptop 13.5 12th Gen Intel | |
| Microsoft Surface Laptop 4 13 Ryzen 5 | |
| Framework Laptop 13.5 | |
| AIDA64 / Memory Latency | |
| Microsoft Surface Laptop 4 13 Ryzen 5 | |
| HP Spectre x360 13.5 14t-ef000 | |
| Lenovo ThinkPad X1 Titanium Yoga G1 20QB0016GE | |
| HP Spectre x360 14-ea0378ng | |
| Durchschnittliche Intel Core i7-1255U (76 - 163.2, n=9) | |
| Framework Laptop 13.5 12th Gen Intel | |
| Framework Laptop 13.5 | |
* ... kleinere Werte sind besser
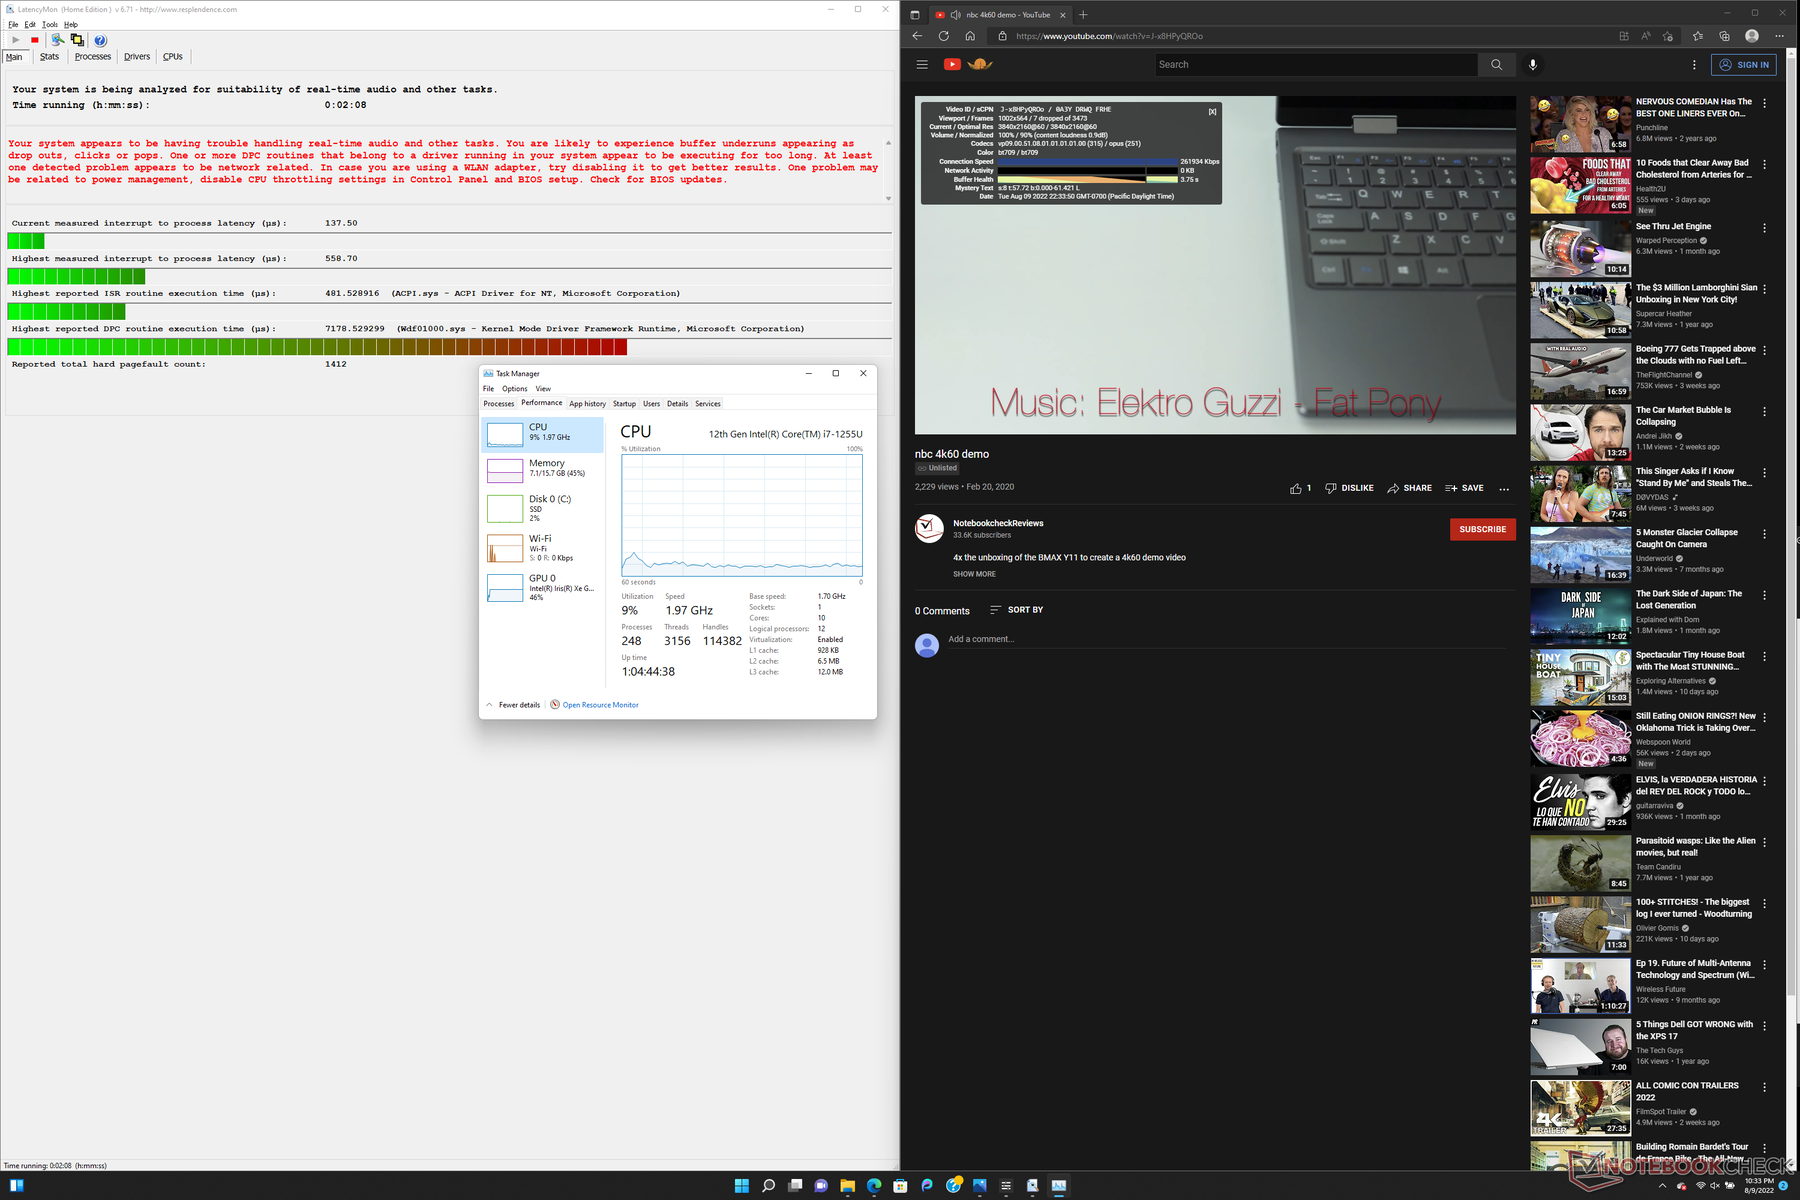
DPC-Latenzen
LatencyMon meldet beim Öffnen unserer Webseite in mehreren Tabs problematische DPC-Latenzen. Die Wiedergabe eines einminütigen 4K-Videos mit 60 Fps geht mit 7 verlorenen Frames auch nicht reibungslos vonstatten.
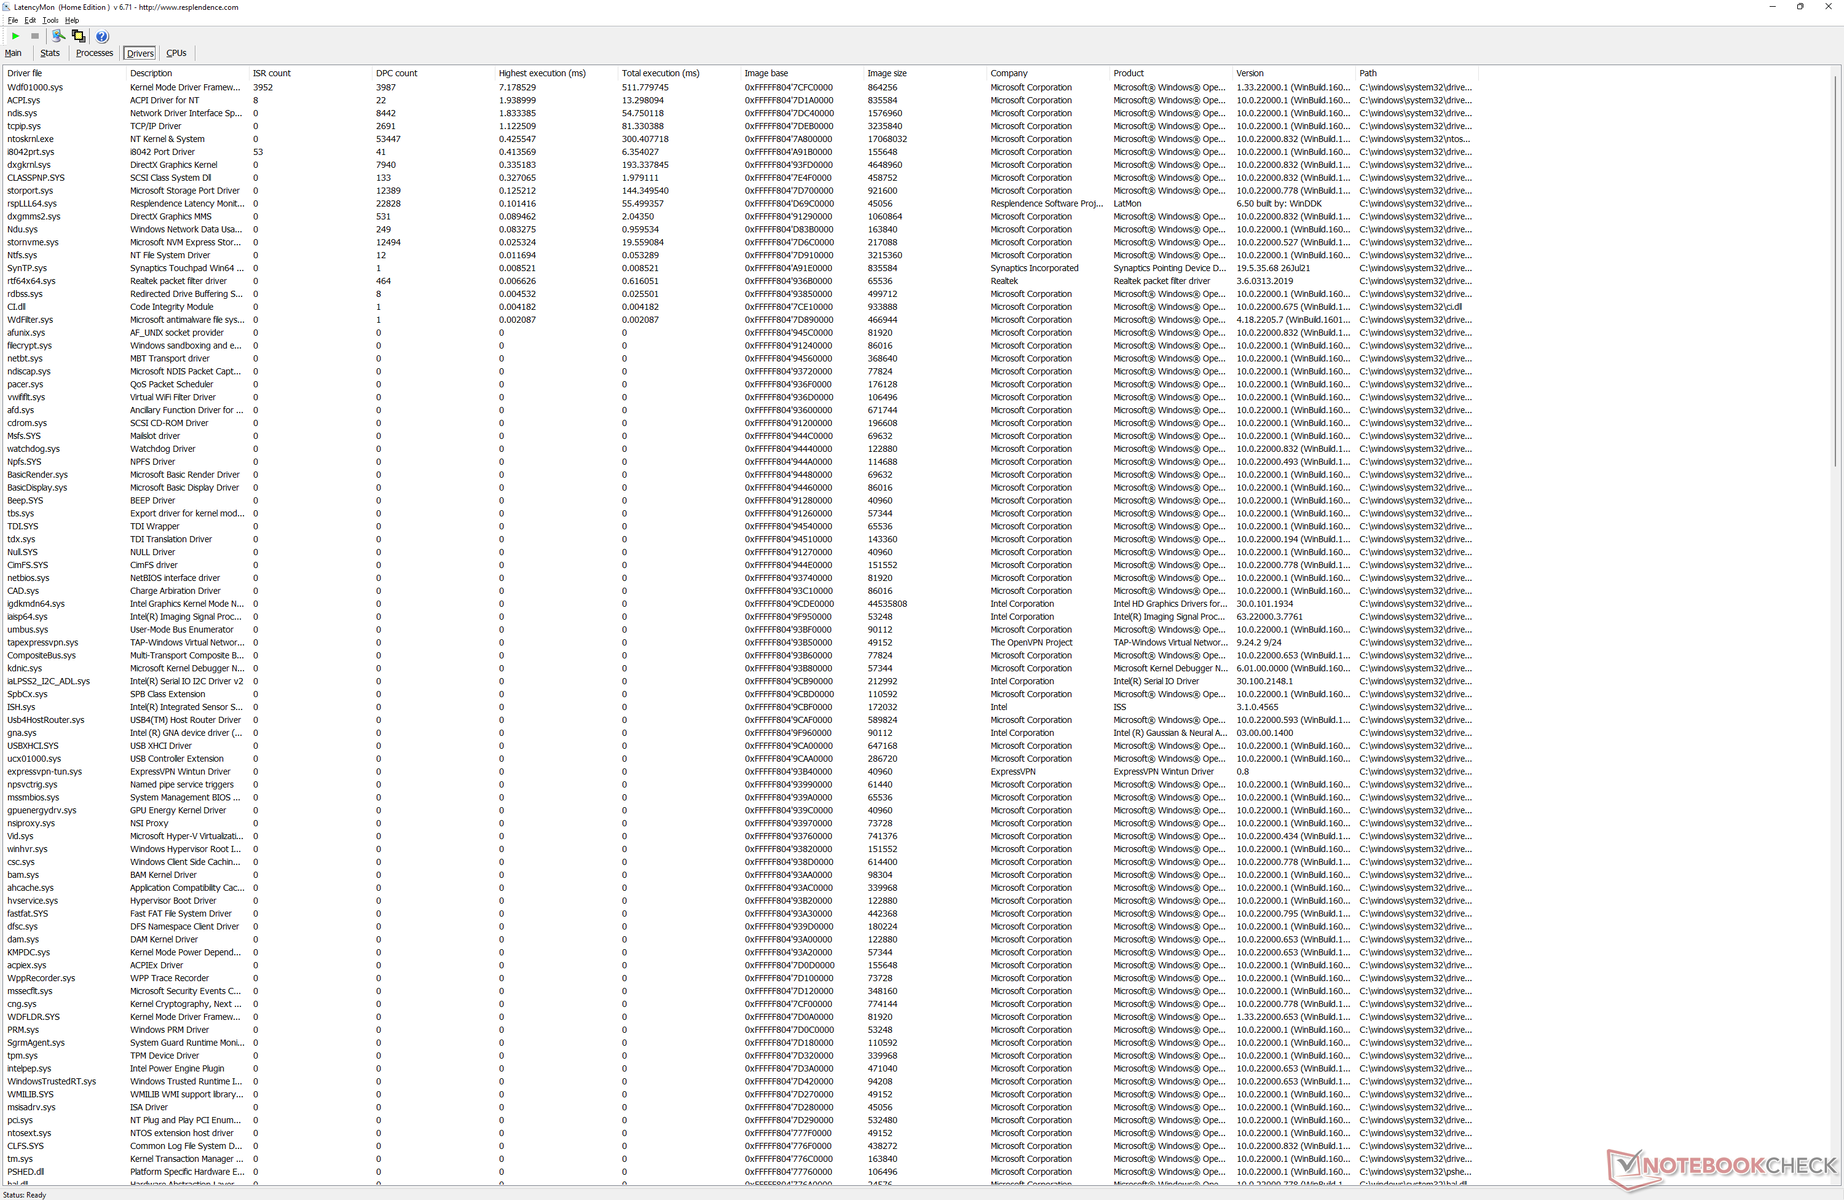
| DPC Latencies / LatencyMon - interrupt to process latency (max), Web, Youtube, Prime95 | |
| Framework Laptop 13.5 | |
| HP Spectre x360 14-ea0378ng | |
| Framework Laptop 13.5 12th Gen Intel | |
| Microsoft Surface Laptop 4 13 Ryzen 5 | |
| Lenovo ThinkPad X1 Titanium Yoga G1 20QB0016GE | |
| HP Spectre x360 13.5 14t-ef000 | |
* ... kleinere Werte sind besser
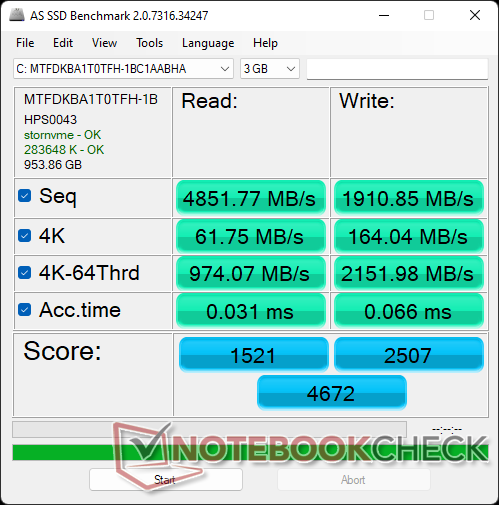
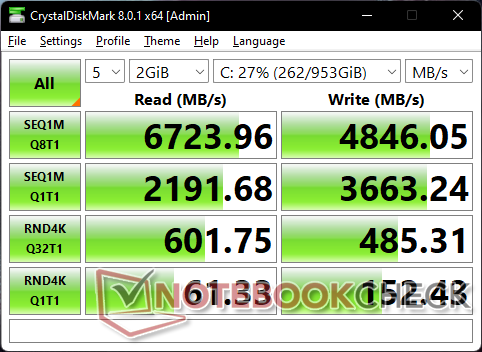
Massenspeicher
Unser Testgerät ist mit der 1 TB großen PCIe4-x4-NVMe-SSD Micron 3400 (MTFDKBA1T0TFH) ausgestattet und bietet dadurch sehr hohe sequenzielle Lese- und Schreibraten von 6.600 MB/s bzw. 5.000 MB/s. Obwohl sie sich der Western Digital SN850 vor allem bei kleineren Blockgrößen geschlagen geben muss, kann unser System die maximalen Transferraten der SSD auch langfristig aufrechterhalten, wie unsere DiskSpd-Leseschleife unten zeigt.

* ... kleinere Werte sind besser
Laufwerksdrosseln: DiskSpd-Leseschleife, Warteschlangentiefe 8
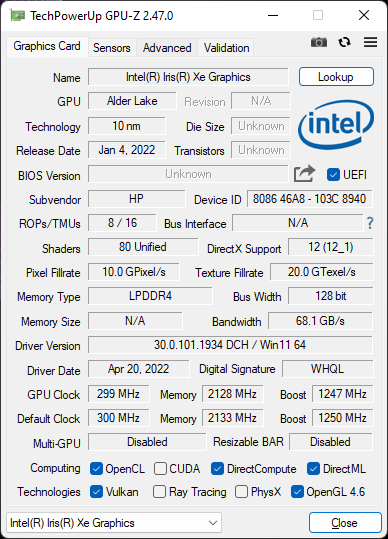
Grafikkarte — Altbekannte Iris-Xe-Leistung
Die Grafikleistung ist im Vergleich zu der des Modells aus 2021 nur um 2 bis 17 % gestiegen, da Intel an der integrierten Iris Xe 96 EUs-GPU keine Änderungen vorgenommen hat. Für eine integrierte GPU ist das immer noch respektabel, die vor kurzem erschienene Radeon 680M ist ihr jedoch um Längen voraus.
Wie unsere 3DMark-11-Ergebnisse unten zeigen, fällt die Grafikleistung im ausbalancierten Modus gegenüber dem Leistungsmodus deutlich.
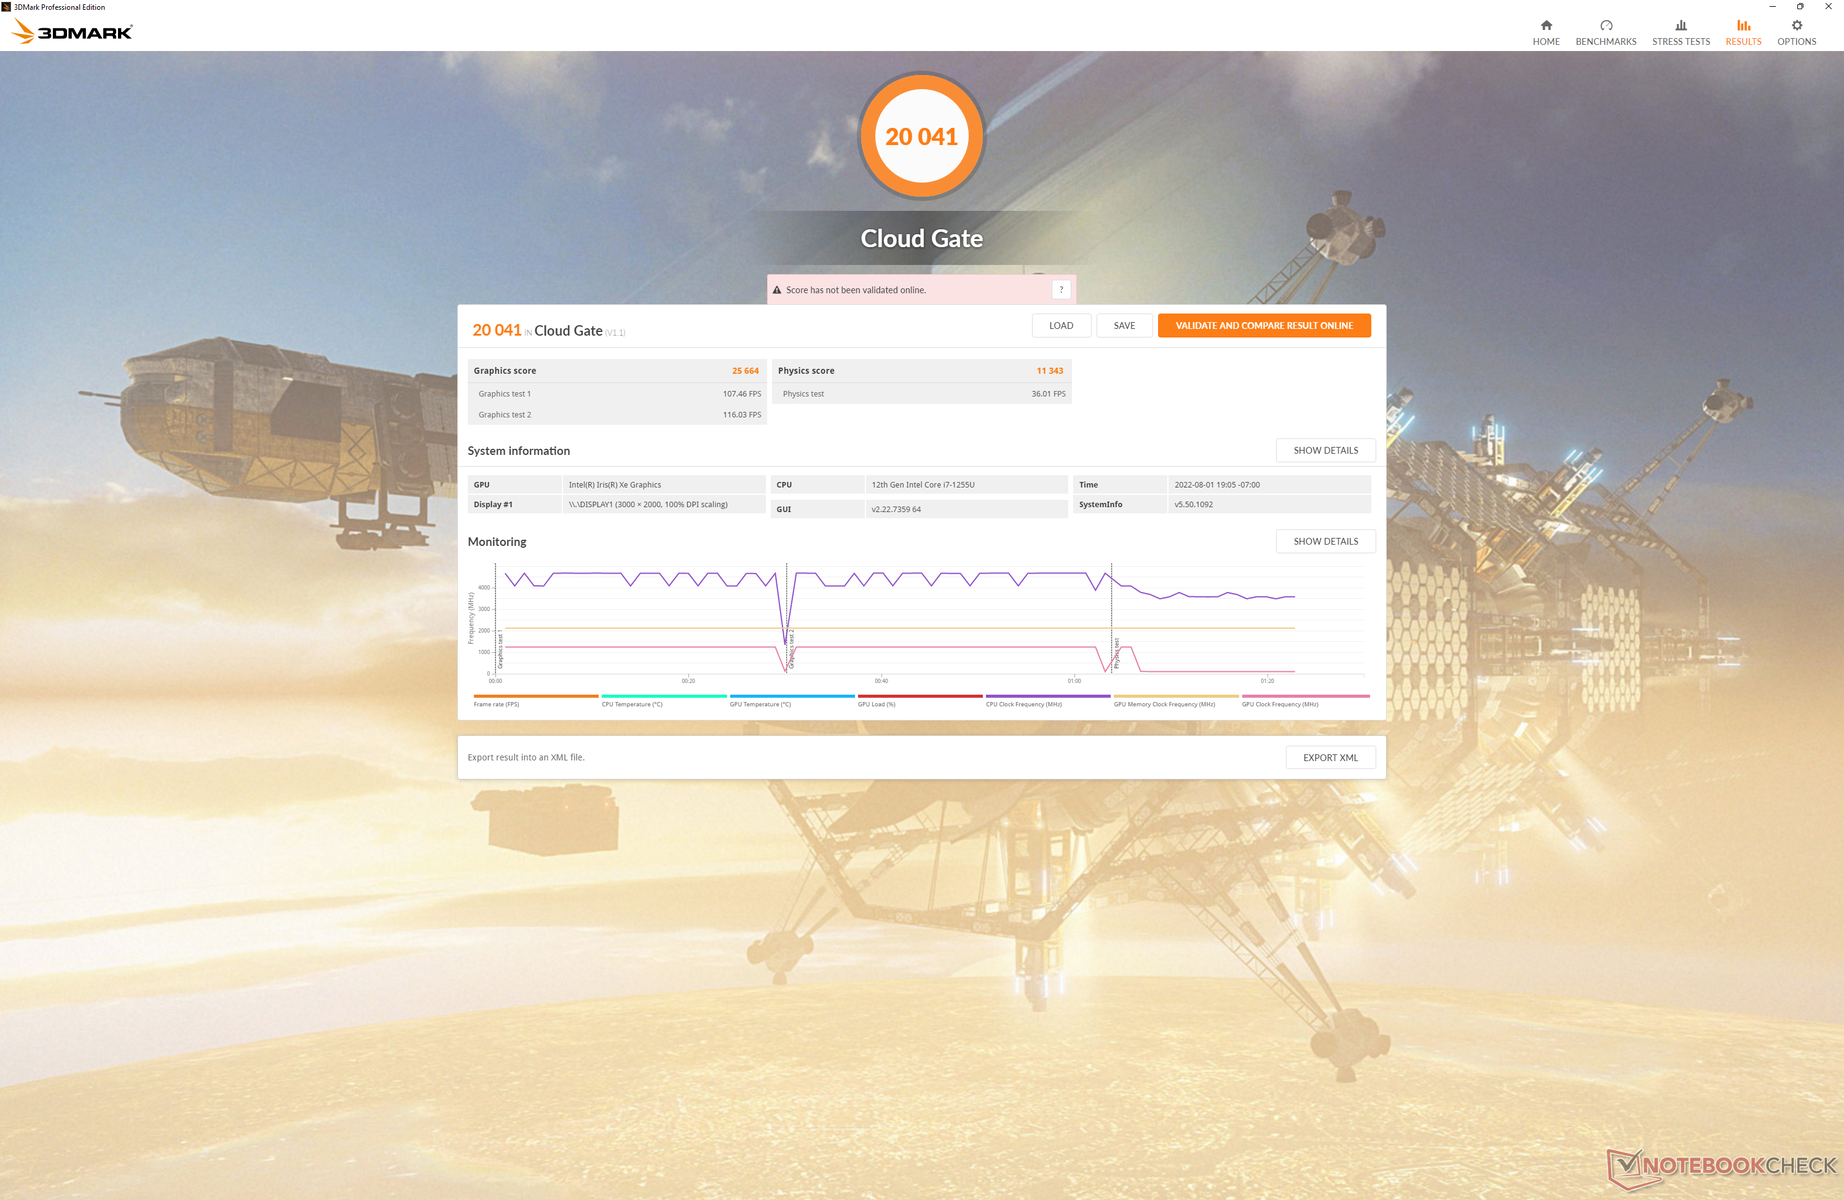

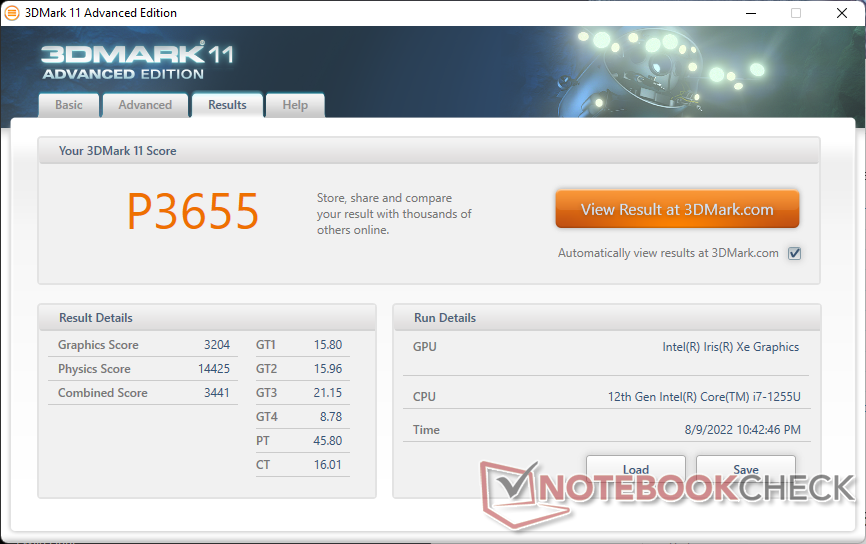
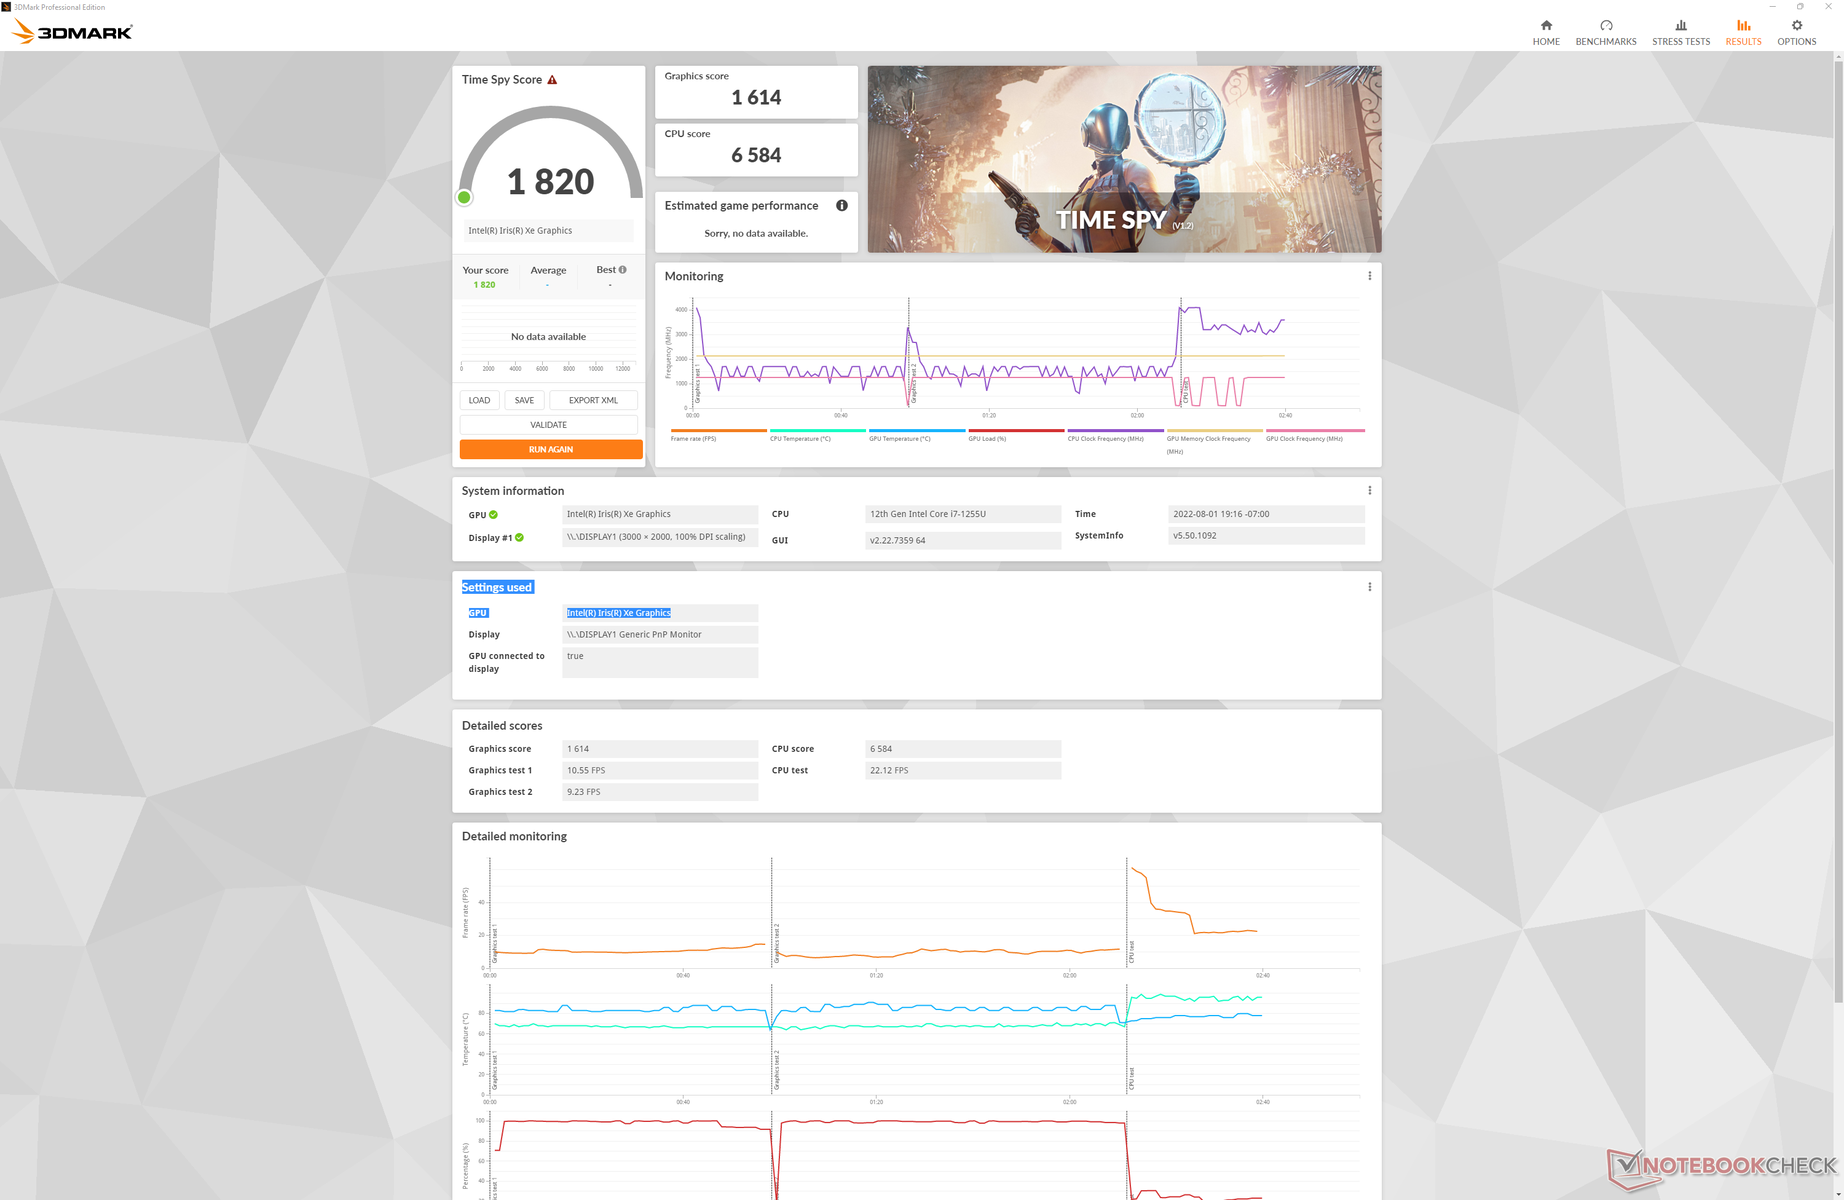
| 3DMark 11 Performance | 6834 Punkte | |
| 3DMark Cloud Gate Standard Score | 20041 Punkte | |
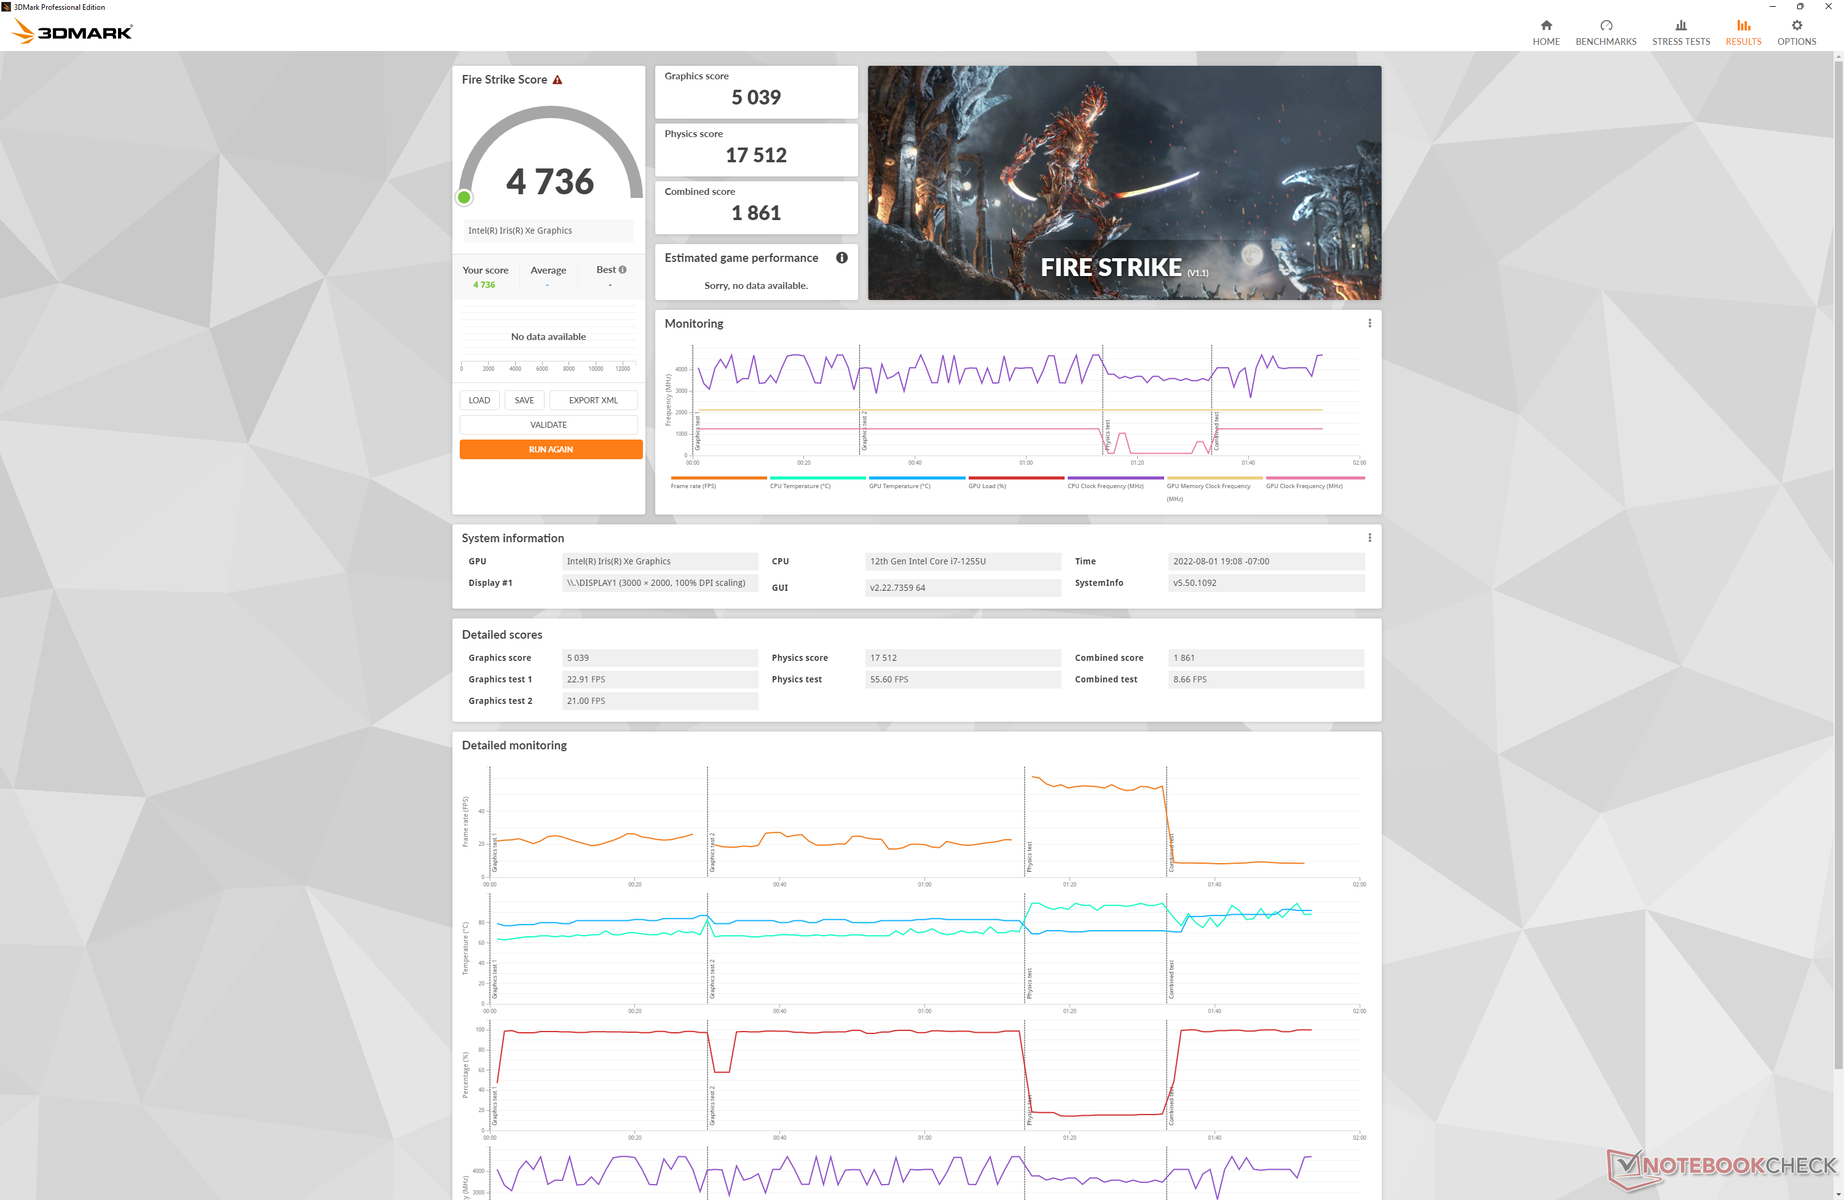
| 3DMark Fire Strike Score | 4736 Punkte | |
| 3DMark Time Spy Score | 1820 Punkte | |
Hilfe | ||
Witcher 3 FPS-Diagramm
| min. | mittel | hoch | max. | |
| GTA V (2015) | 113.9 | 100.9 | 24 | 10.3 |
| The Witcher 3 (2015) | 94.8 | 50.1 | 32.7 | 14.8 |
| Dota 2 Reborn (2015) | 117.8 | 92.2 | 68.1 | 62.4 |
| Final Fantasy XV Benchmark (2018) | 43.4 | 23.8 | 16.6 | |
| X-Plane 11.11 (2018) | 40.4 | 41.1 | 36.2 | |
| Strange Brigade (2018) | 89 | 40.8 | 32.4 | 26.1 |
| Cyberpunk 2077 1.6 (2022) | 22.6 | 18.6 | 14.2 | 11.2 |
Emissionen — Nur etwas leiser
Geräuschemissionen
In der Theorie sollten die zusätzlichen, dünneren Lüfterblätter die Kühllösung des HP-Laptops aufwerten. In der Praxis sind die Unterschiede jedoch nur schwer erkennbar. Im Gaming-Betrieb und in anderen Hochlastszenarien sind die Lüftergeräuschmessungen des 2020er- und des 2022er-Modells nahezu identisch. Da das 2020er-Modell auch im Leistungsmodus schon nicht besonders laut war, waren wesentliche Verbesserungen in Bezug auf die Geräuschkulisse auch nicht unbedingt notwendig. Alternativen wie das Lenovo ThinkPad X1 Titanium Yoga G1 oder der Framework-Laptop werden früher lauter.
Lautstärkediagramm
| Idle |
| 23.5 / 23.5 / 23.5 dB(A) |
| Last |
| 27 / 42.4 dB(A) |
 | ||
30 dB leise 40 dB(A) deutlich hörbar 50 dB(A) störend |
||
min: | ||
| HP Spectre x360 13.5 14t-ef000 Iris Xe G7 96EUs, i7-1255U, Micron 3400 1TB MTFDKBA1T0TFH | HP Spectre x360 14t-ea000 Iris Xe G7 96EUs, i7-1165G7, Samsung SSD PM981a MZVLB512HBJQ | Framework Laptop 13.5 12th Gen Intel Iris Xe G7 96EUs, i7-1260P, WDC PC SN730 SDBPNTY-512G | Lenovo ThinkPad X1 Titanium Yoga G1 20QB0016GE Iris Xe G7 80EUs, i5-1140G7, Lenovo UMIS RPJTJ256MEE1OWX | Framework Laptop 13.5 Iris Xe G7 96EUs, i7-1165G7, Western Digital WD_BLACK SN850 WDS100T1X0E | Microsoft Surface Laptop 4 13 Ryzen 5 Vega 7, R5 4680U, Samsung PM991 MZ9LQ256HBJQ | |
|---|---|---|---|---|---|---|
| Geräuschentwicklung | -5% | -16% | -13% | -17% | -10% | |
| aus / Umgebung * | 23.5 | 25.8 -10% | 22.8 3% | 25.61 -9% | 23.9 -2% | 24.6 -5% |
| Idle min * | 23.5 | 25.9 -10% | 23 2% | 25.61 -9% | 23.9 -2% | 24.6 -5% |
| Idle avg * | 23.5 | 25.9 -10% | 23 2% | 25.61 -9% | 23.9 -2% | 24.6 -5% |
| Idle max * | 23.5 | 25.9 -10% | 23 2% | 25.61 -9% | 23.9 -2% | 24.6 -5% |
| Last avg * | 27 | 26.4 2% | 47.3 -75% | 40.14 -49% | 45.6 -69% | 39.5 -46% |
| Witcher 3 ultra * | 36.2 | 36.9 -2% | 47.3 -31% | 47.1 -30% | ||
| Last max * | 42.4 | 41.5 2% | 49.8 -17% | 40.14 5% | 47.9 -13% | 39.5 7% |
* ... kleinere Werte sind besser
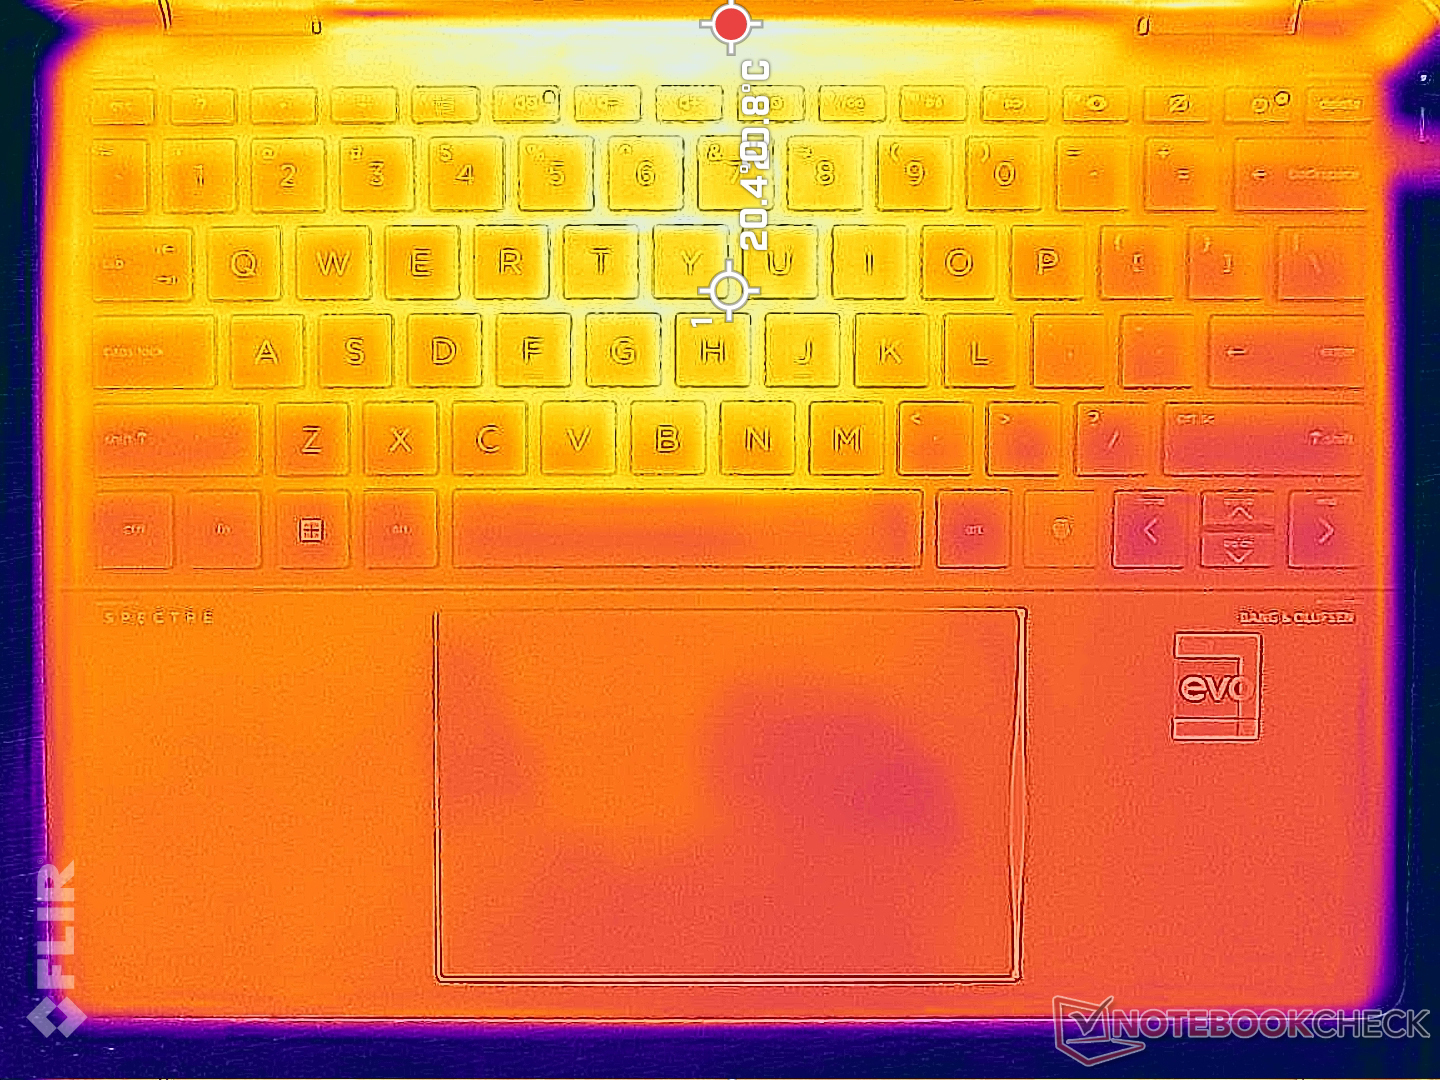
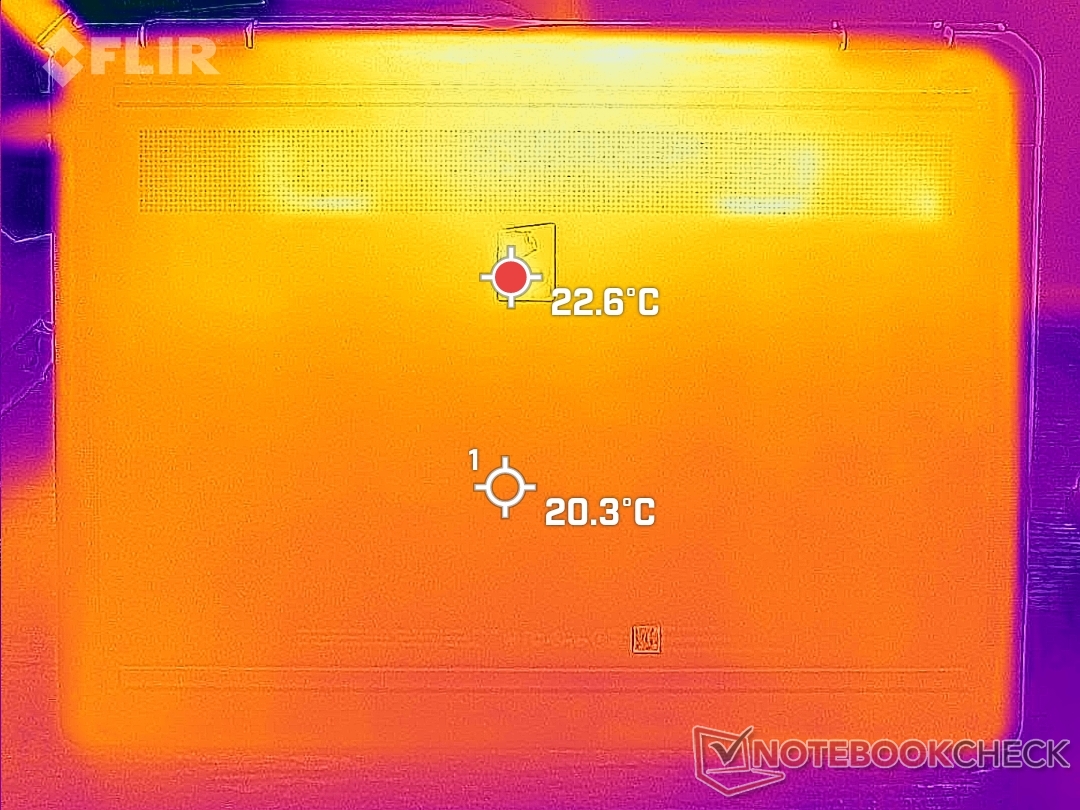
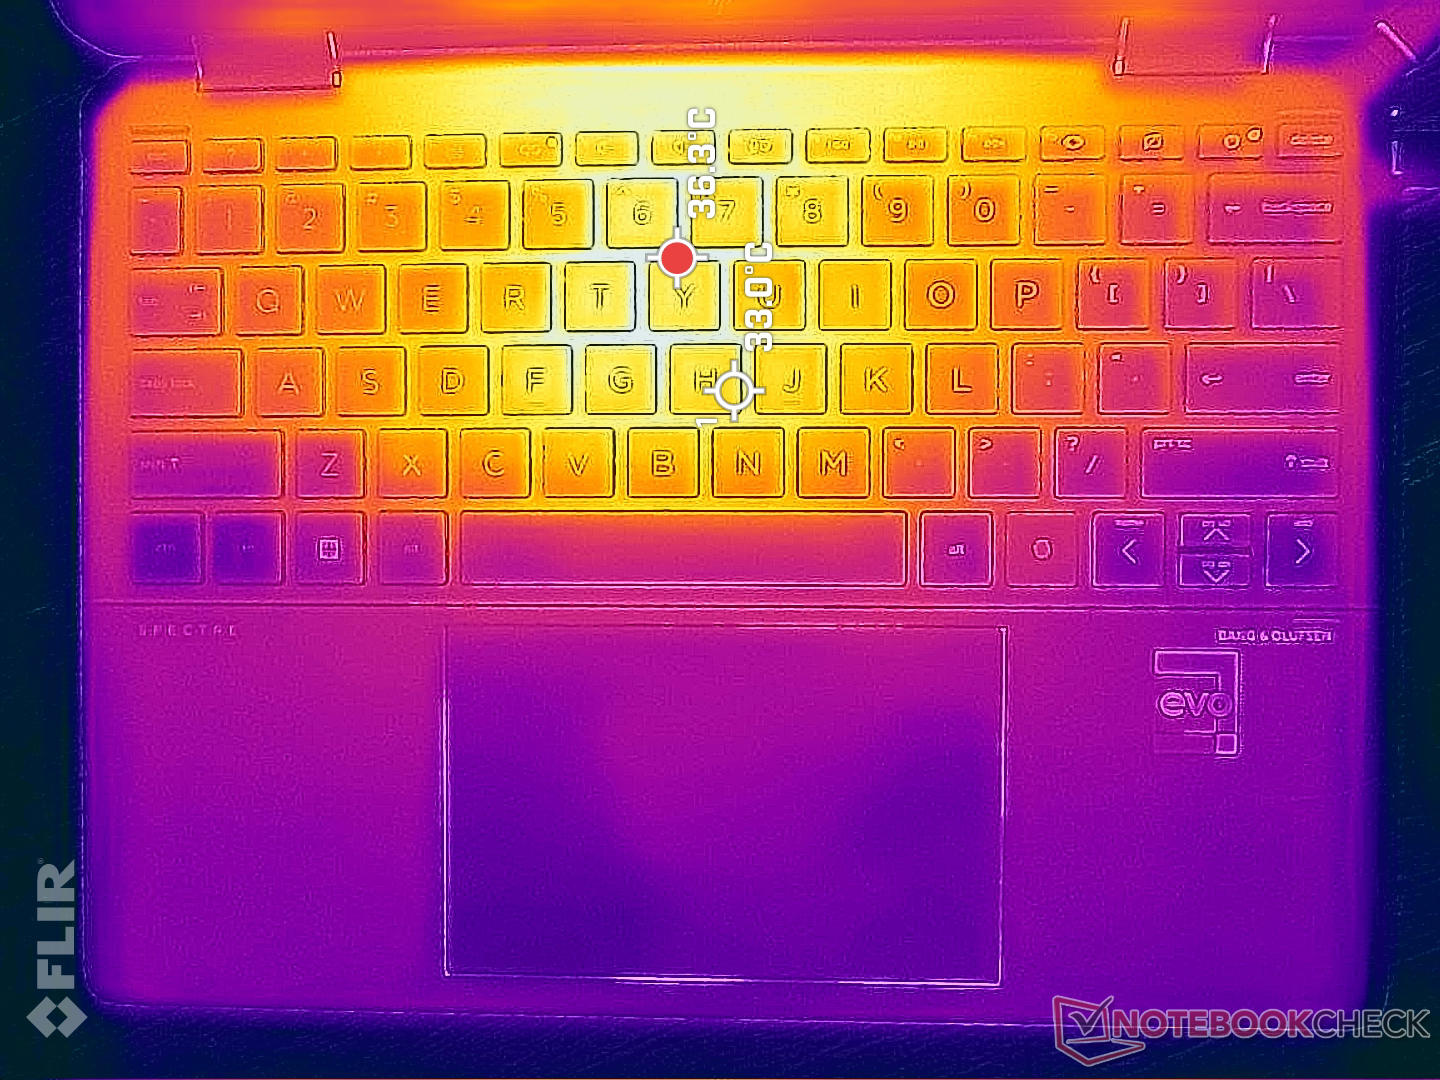
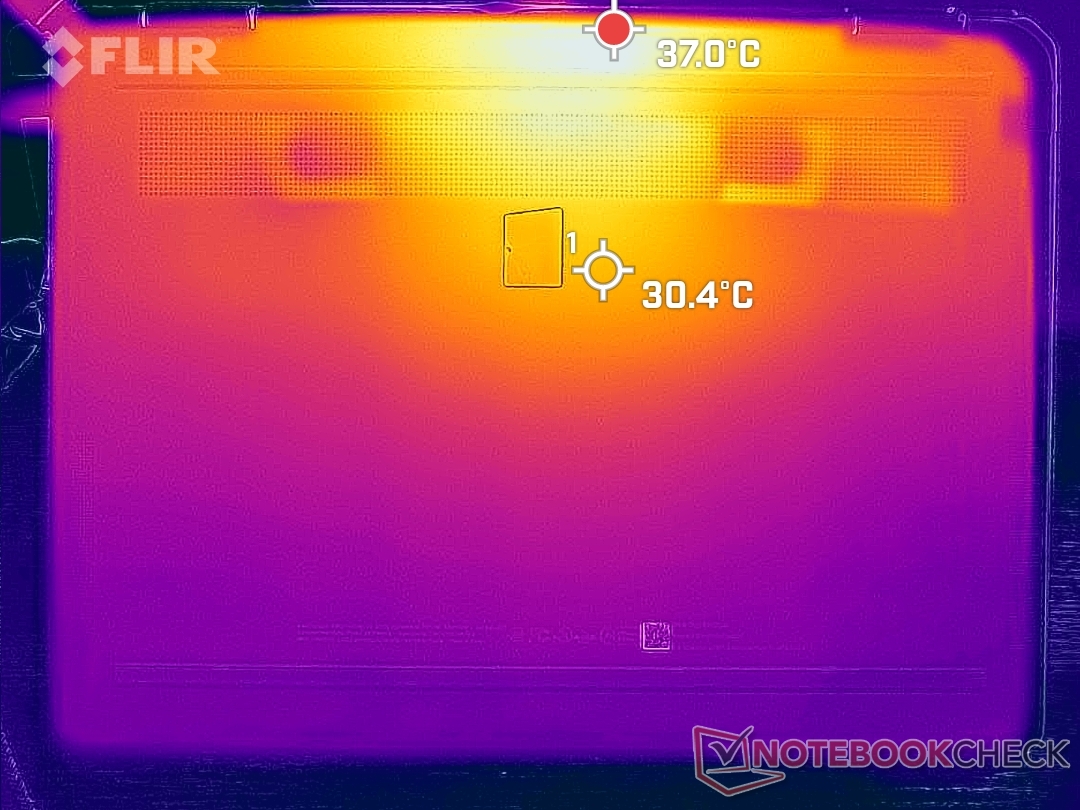
Temperatur
Die Oberflächentemperaturen sind kühler als beim Vorgäner obwohl die Prozessorleistung gesteigert wurde. Auch im Leerlauf auf dem Desktop belaufen sich die Temperaturunterschiede der wärmsten Stellen auf der Ober- und Unterseite auf 6 °C bzw. 7 °C. Unter extrem hoher Last erwärmen sich die wärmsten Stellen der Tastatur beider Modelle mit ca. 37 °C ungefähr gleich stark.
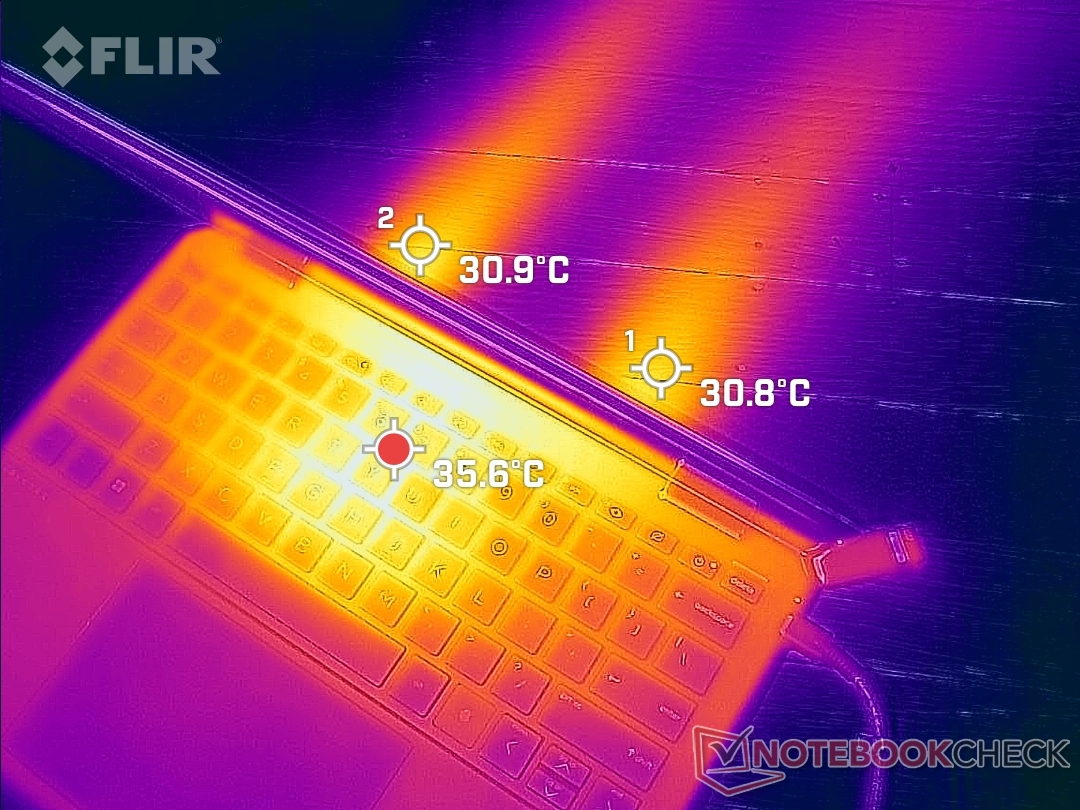
(+) Die maximale Temperatur auf der Oberseite ist 36.4 °C. Im Vergleich liegt der Klassendurchschnitt bei 35.3 °C (von 19.6 bis 55.7 °C für die Klasse Convertible v7).
(+) Auf der Unterseite messen wir eine maximalen Wert von 37 °C (im Vergleich zum Durchschnitt von 36.7 °C).
(+) Ohne Last messen wir eine durchschnittliche Temperatur von 19 °C auf der Oberseite. Der Klassendurchschnitt erreicht 30.2 °C.
(+) Die Handballen und der Touchpad-Bereich sind mit gemessenen 22.4 °C kühler als die typische Hauttemperatur und fühlen sich dadurch kühl an.
(+) Die durchschnittliche Handballen-Temperatur anderer getesteter Geräte war 28.1 °C (+5.7 °C).
| HP Spectre x360 13.5 14t-ef000 Intel Core i7-1255U, Intel Iris Xe Graphics G7 96EUs | HP Spectre x360 14-ea0378ng Intel Core i7-1165G7, Intel Iris Xe Graphics G7 96EUs | Framework Laptop 13.5 12th Gen Intel Intel Core i7-1260P, Intel Iris Xe Graphics G7 96EUs | Lenovo ThinkPad X1 Titanium Yoga G1 20QB0016GE Intel Core i5-1140G7, Intel Iris Xe Graphics G7 80EUs | Framework Laptop 13.5 Intel Core i7-1165G7, Intel Iris Xe Graphics G7 96EUs | HP EliteBook Folio 13.5-3G2L2EA Qualcomm Snapdragon 8cx Gen 2 5G, Qualcomm Adreno 680 | Microsoft Surface Laptop 4 13 Ryzen 5 AMD Ryzen 5 4680U, AMD Radeon RX Vega 7 | |
|---|---|---|---|---|---|---|---|
| Hitze | -21% | -15% | -25% | -20% | -6% | -21% | |
| Last oben max * | 36.4 | 37.1 -2% | 36.8 -1% | 46.3 -27% | 47.2 -30% | 34.3 6% | 45.8 -26% |
| Last unten max * | 37 | 43.1 -16% | 42.4 -15% | 43.3 -17% | 39.4 -6% | 35.4 4% | 45.5 -23% |
| Idle oben max * | 20.8 | 29 -39% | 24.2 -16% | 26.8 -29% | 25.2 -21% | 25.7 -24% | 24.9 -20% |
| Idle unten max * | 22.6 | 28.6 -27% | 29 -28% | 28.3 -25% | 27.8 -23% | 25.1 -11% | 25.7 -14% |
* ... kleinere Werte sind besser
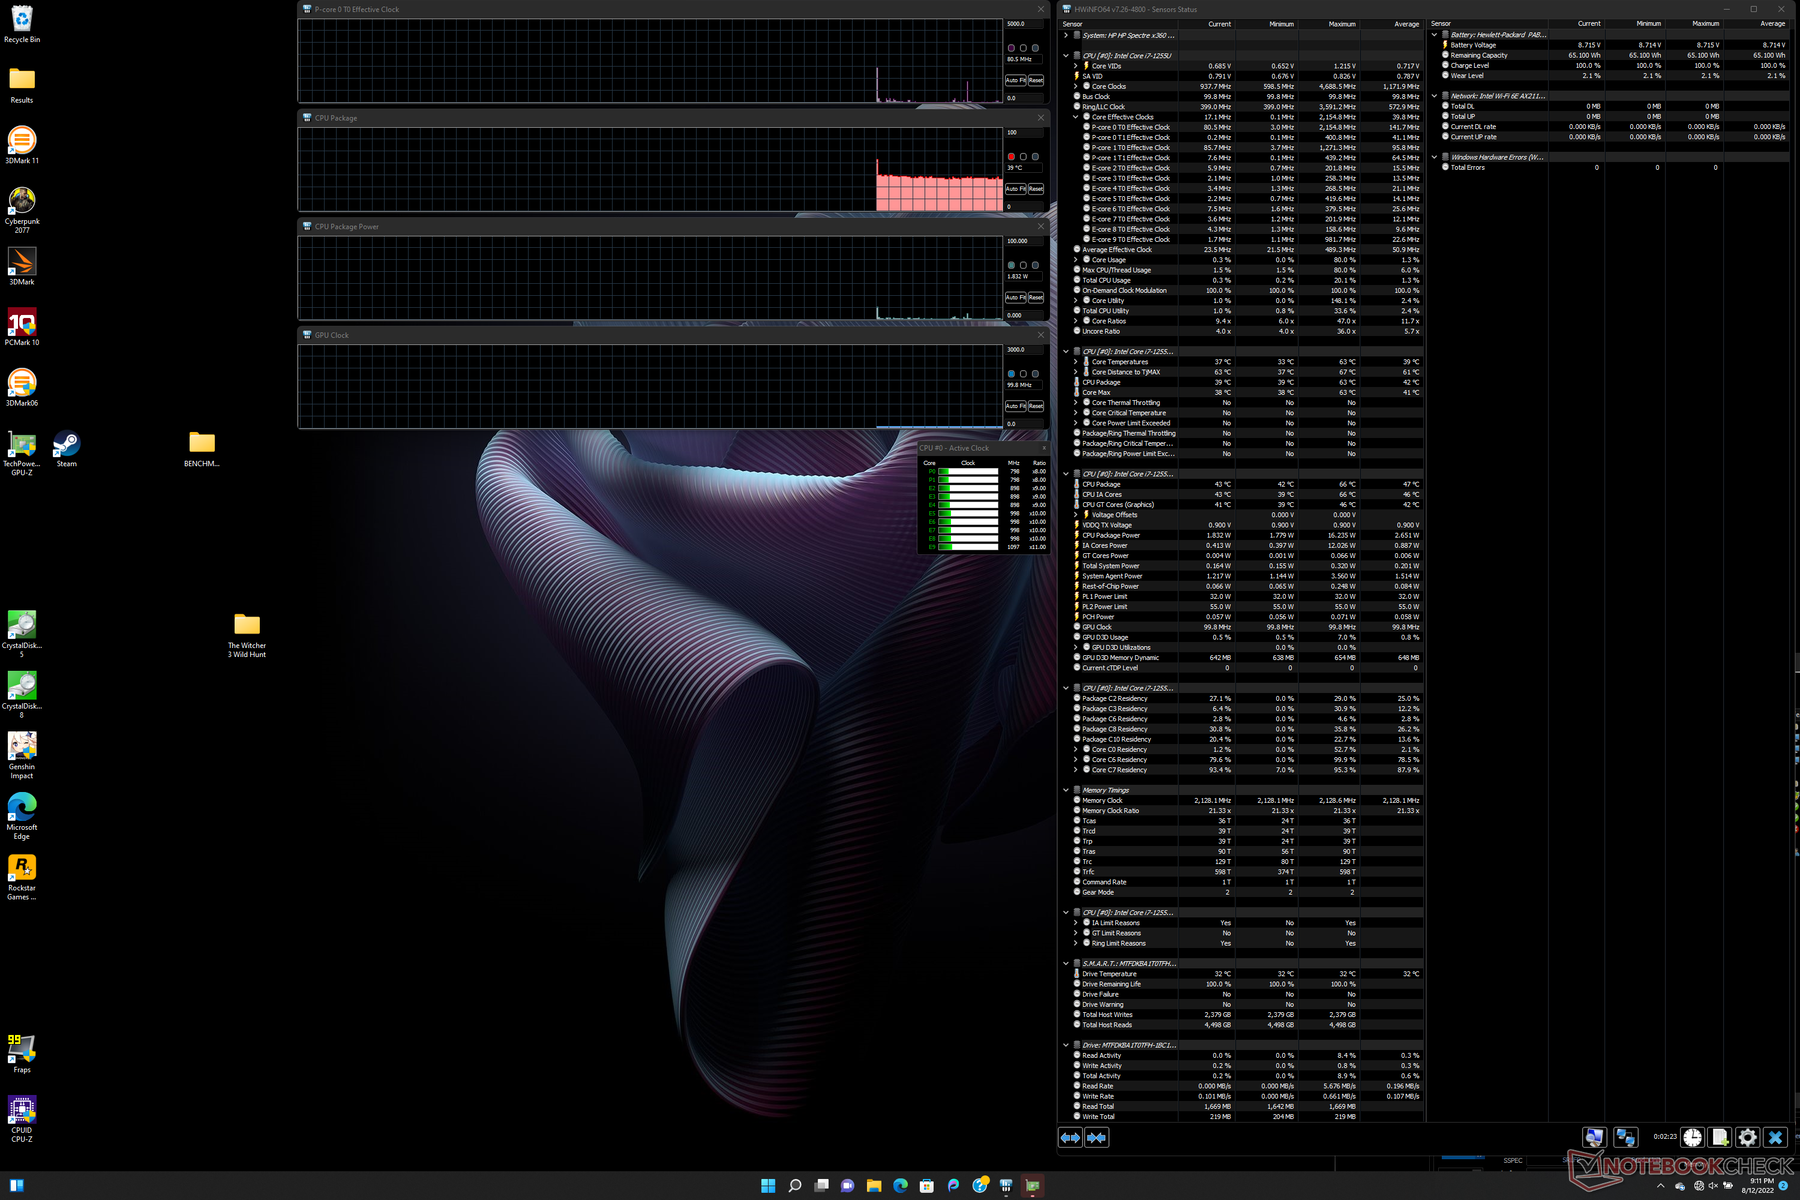
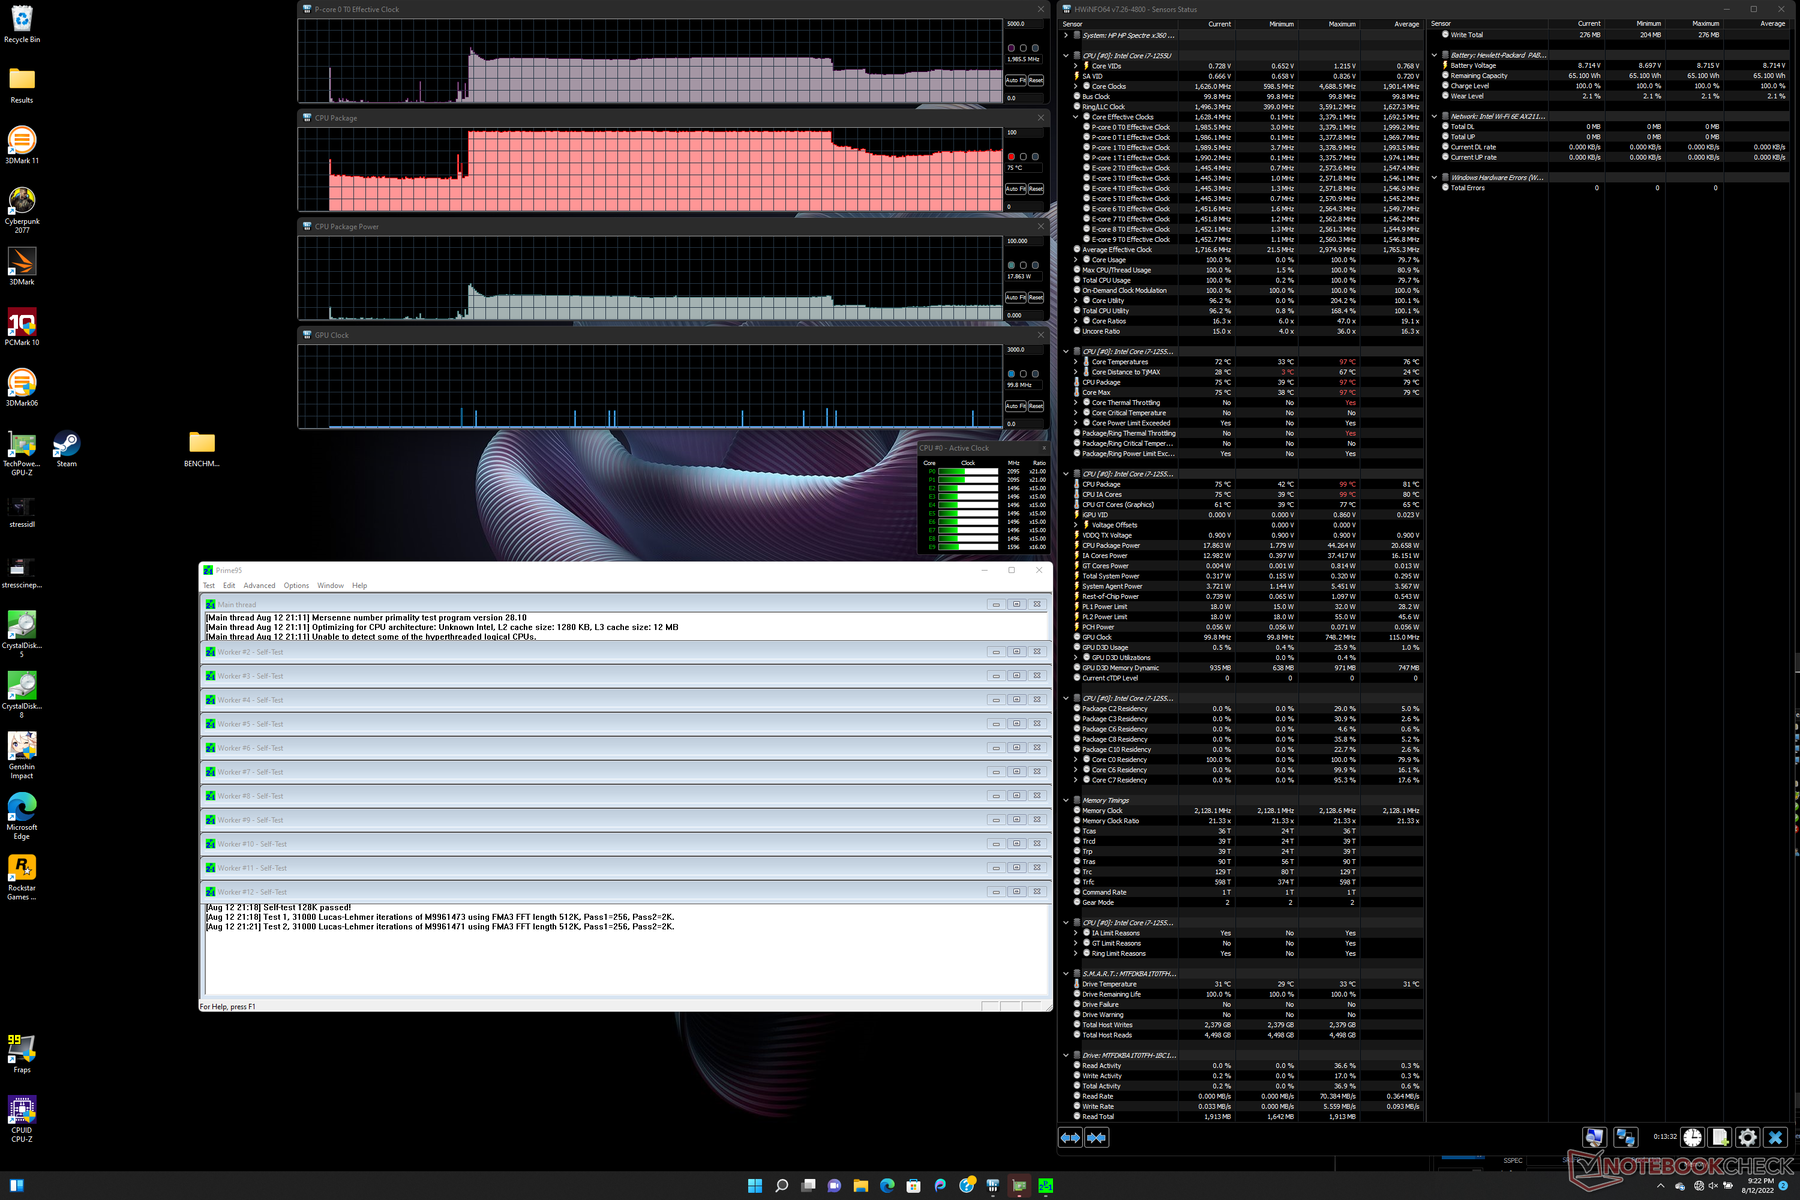
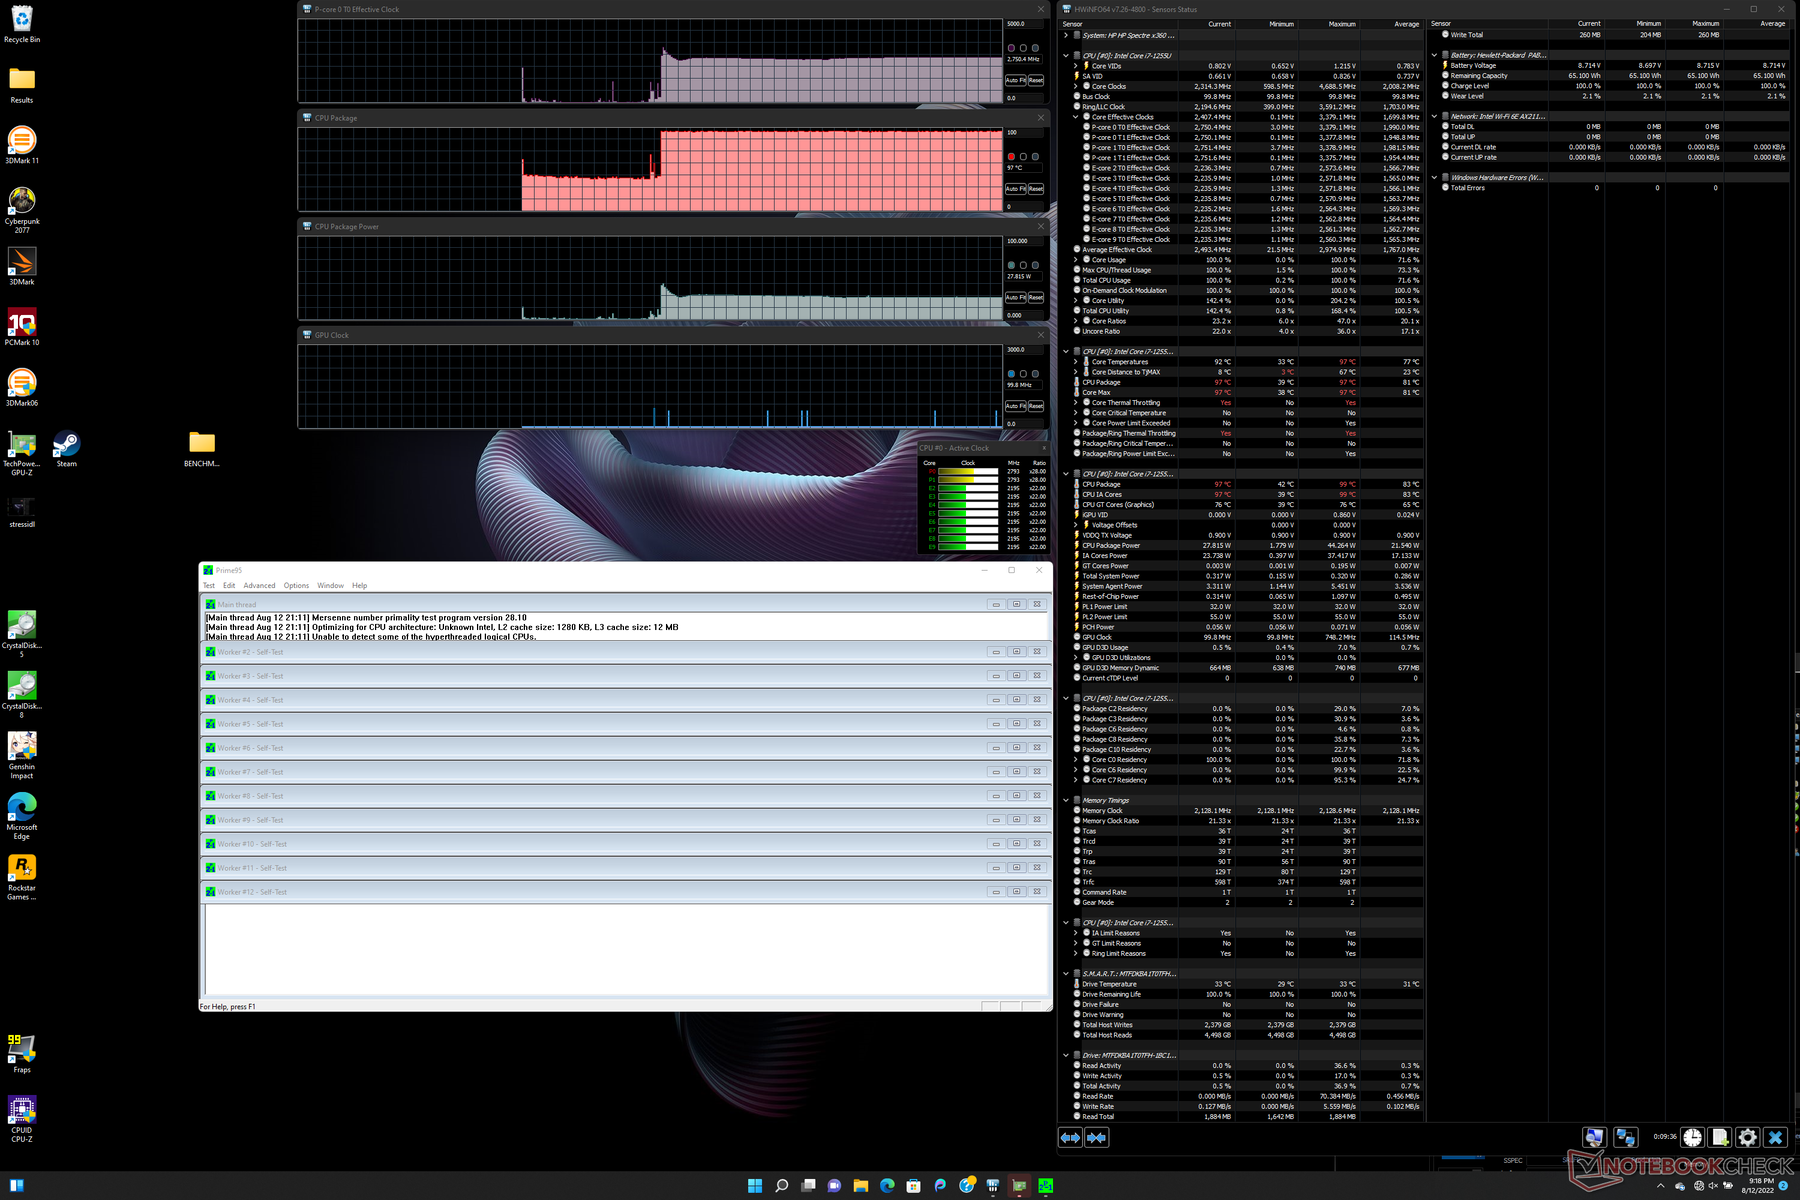
Stresstest
Beim Ausführen von Prime95 im Leistungsmodus springen die CPU-Taktfrequenz, Temperatur und der Board Power Draw auf 3,2 GHz, 99 °C bzw. 44 W, fallen darauf stetig ab und stabilisieren sich schließlich bei 2,8 GHz, 97 °C und 28 W. Die Kerntemperatur bleibt dabei sehr hoch, was zeigt, dass die Kühllösung am Limit arbeitet, um der anspruchsvollen Alder-Lake-CPU gerecht zu werden. Wir sind jedenfalls froh, dass die Leistung und die Temperaturen dieses Mal zumindest konstant bleiben und während des Stresstests nicht so stark schwanken wie beim Tiger-Lake-U-Modell aus 2020. Im ausbalancierten Modus sinken die Taktfrequenzen, Temperatur und der Board Power Draw weiter auf nur 2,0 GHz, 75 °C bzw. 18 W.
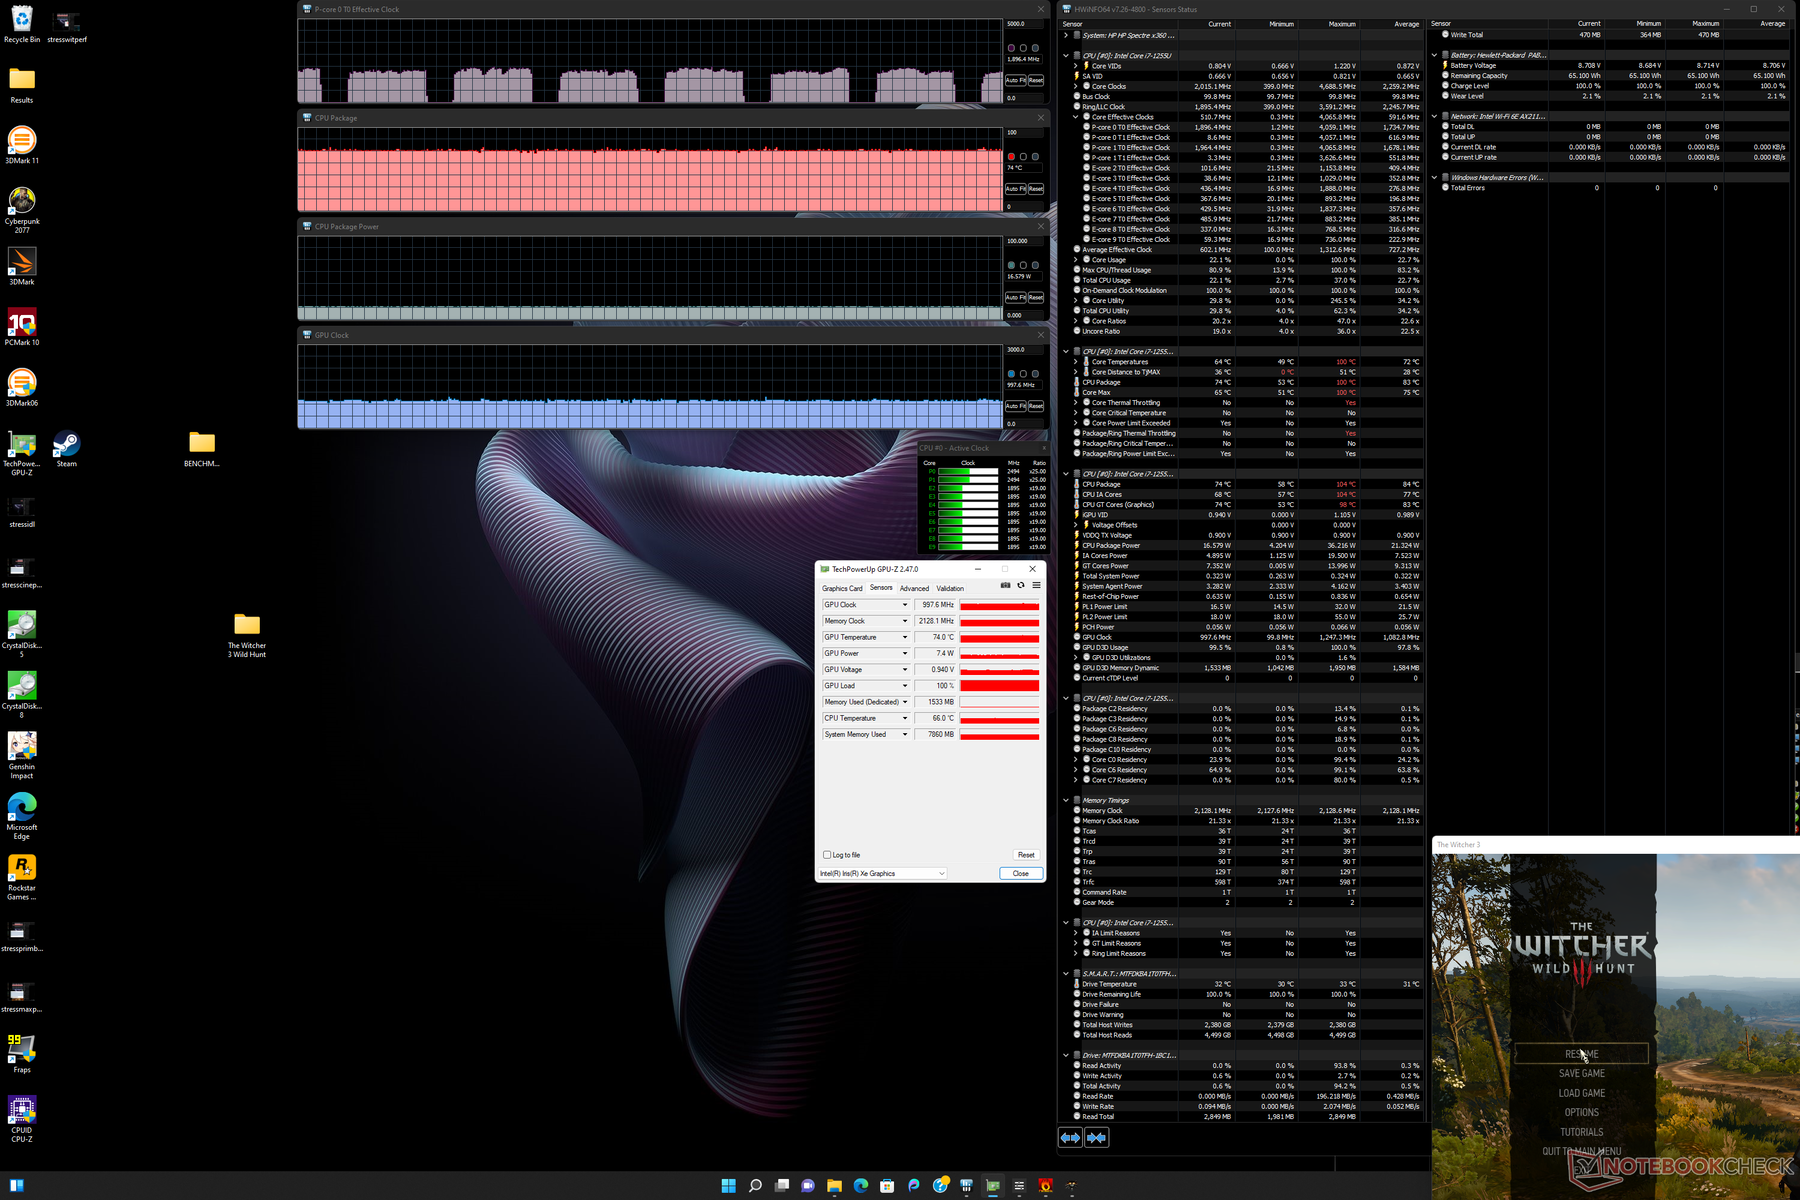
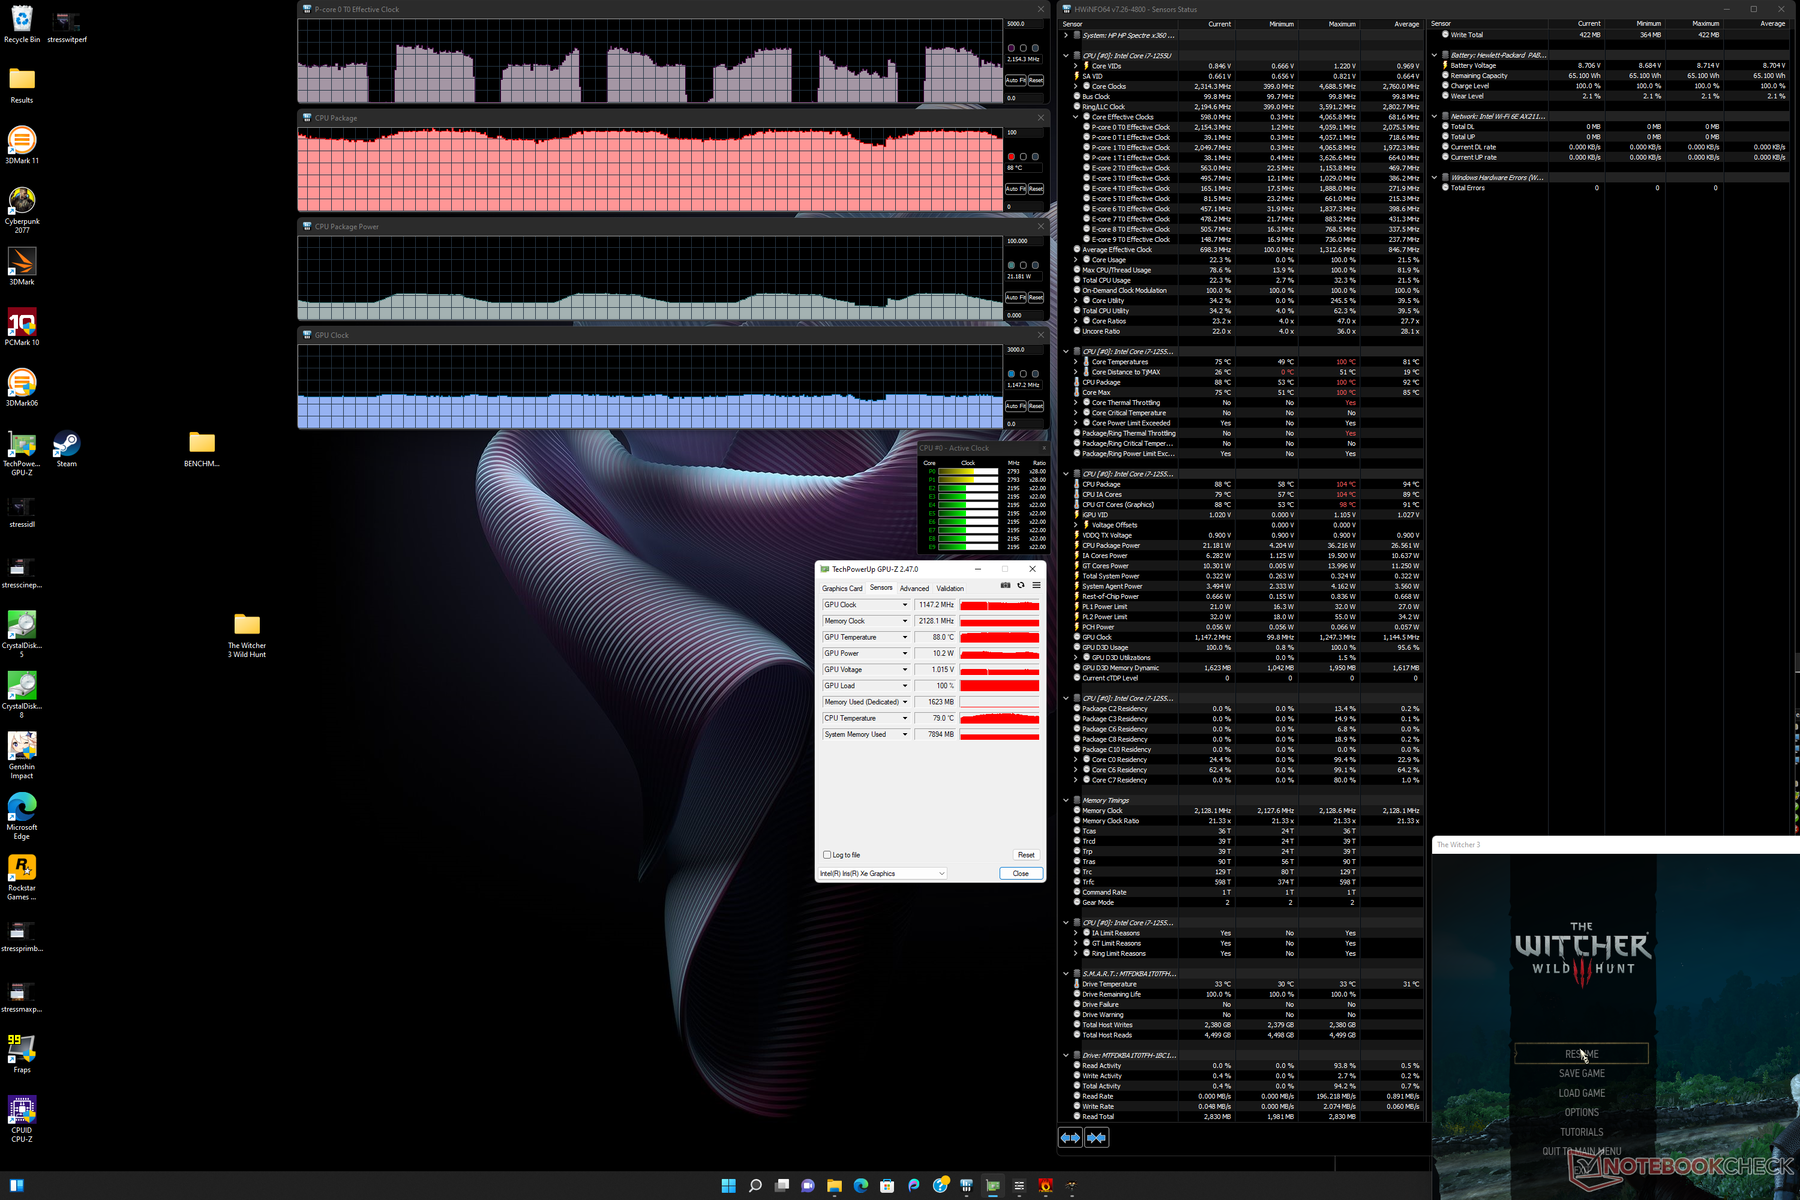
Beim Spielen von The Witcher 3 im Leistungsmodus stabilisiert sich die GPU-Taktfrequenz bei 1.147 MHz, während die Temperatur zwischen 72 °C und 97 °C schwankt. Durch die konstante Taktfrequenz treten die schwankenden Frameraten des 2020er-Modells hier nicht mehr auf. Im ausbalancierten Modus senkt die GPU ihren Takt auf 998 MHz und leidet unter weiteren Defiziten, wie die Screenshots unten zeigen.
Im Akkumodus ist die Leistung eingeschränkt. Ein 3DMark-11-Test liefert im Akkumodus Physik- und Grafikpunktzahlen von 11.227 bzw. 6.194 Punkten, im Netzbetrieb werden 14.505 bzw. 6.243 Punkte erreicht.

| CPU-Takt (GHz) | GPU-Takt (MHz) | Durchschnittliche CPU-Temperatur (°C) | |
| Leerlauf | -- | -- | 39 |
| Prime95-Stress (Leistungsmodus) | 2,8 | -- | 97 |
| Prime95-+FurMark-Stress (Leistungsmodus) | 1,4 - 2,3 | 750 - 850 | 79 - 96 |
| Witcher-3-Stress (ausbalancierter Modus) | ~1,9 | 998 | 74 |
| Witcher-3-Stress (Leistungsmodus) | ~1,9 - 4,0 | 1.147 | 72 - 97 |
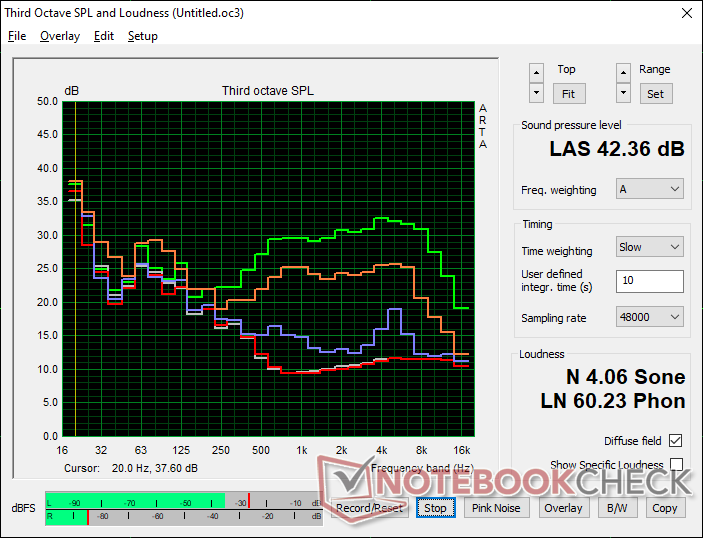
Lautsprecher
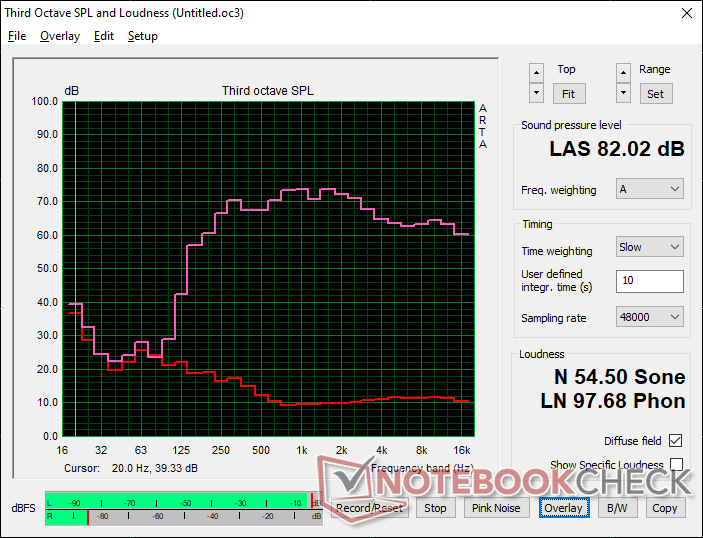
HP Spectre x360 13.5 14t-ef000 Audio Analyse
(+) | Die Lautsprecher können relativ laut spielen (82 dB)
Bass 100 - 315 Hz
(±) | abgesenkter Bass - 13.6% geringer als der Median
(±) | durchschnittlich lineare Bass-Wiedergabe (14.1% Delta zum Vorgänger)
Mitteltöne 400 - 2000 Hz
(+) | ausgeglichene Mitten, vom Median nur 4.4% abweichend
(+) | lineare Mitten (3.7% Delta zum Vorgänger)
Hochtöne 2 - 16 kHz
(+) | ausgeglichene Hochtöne, vom Median nur 2.9% abweichend
(+) | sehr lineare Hochtöne (2.9% Delta zum Vorgänger)
Gesamt im hörbaren Bereich 100 - 16.000 Hz
(+) | hörbarer Bereich ist sehr linear (12.6% Abstand zum Median
Im Vergleich zu allen Geräten derselben Klasse
» 11% aller getesteten Geräte dieser Klasse waren besser, 3% vergleichbar, 86% schlechter
» Das beste Gerät hat einen Delta-Wert von 6%, durchschnittlich ist 21%, das schlechteste Gerät hat 57%
Im Vergleich zu allen Geräten im Test
» 9% aller getesteten Geräte waren besser, 2% vergleichbar, 89% schlechter
» Das beste Gerät hat einen Delta-Wert von 4%, durchschnittlich ist 25%, das schlechteste Gerät hat 134%
Apple MacBook Pro 16 2021 M1 Pro Audio Analyse
(+) | Die Lautsprecher können relativ laut spielen (84.7 dB)
Bass 100 - 315 Hz
(+) | guter Bass - nur 3.8% Abweichung vom Median
(+) | lineare Bass-Wiedergabe (5.2% Delta zum Vorgänger)
Mitteltöne 400 - 2000 Hz
(+) | ausgeglichene Mitten, vom Median nur 1.3% abweichend
(+) | lineare Mitten (2.1% Delta zum Vorgänger)
Hochtöne 2 - 16 kHz
(+) | ausgeglichene Hochtöne, vom Median nur 1.9% abweichend
(+) | sehr lineare Hochtöne (2.7% Delta zum Vorgänger)
Gesamt im hörbaren Bereich 100 - 16.000 Hz
(+) | hörbarer Bereich ist sehr linear (4.6% Abstand zum Median
Im Vergleich zu allen Geräten derselben Klasse
» 0% aller getesteten Geräte dieser Klasse waren besser, 0% vergleichbar, 100% schlechter
» Das beste Gerät hat einen Delta-Wert von 5%, durchschnittlich ist 18%, das schlechteste Gerät hat 45%
Im Vergleich zu allen Geräten im Test
» 0% aller getesteten Geräte waren besser, 0% vergleichbar, 100% schlechter
» Das beste Gerät hat einen Delta-Wert von 4%, durchschnittlich ist 25%, das schlechteste Gerät hat 134%
Energieverwaltung — Weniger genügsam
Energieaufnahme
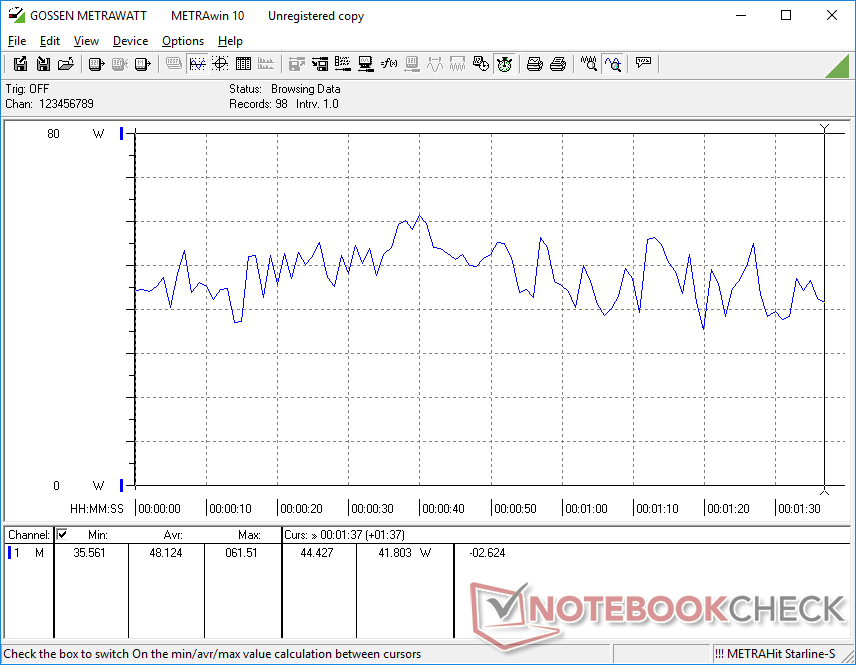
Im Leerlauf auf dem Desktop werden je nach Helligkeitsstufe und Energieprofil zwischen 4 und 13 W verbraucht. Aufgrund der eingesetzten OLED-Technologie werden beim Darstellen einer vollständig weißen Fläche auf der maximalen Helligkeitsstufe 8 W mehr verbraucht als bei einer vollständig schwarzen Fläche. Die Akkulaufzeit kann durch die Wahl dunklerer Displayfarben verlängert werden.
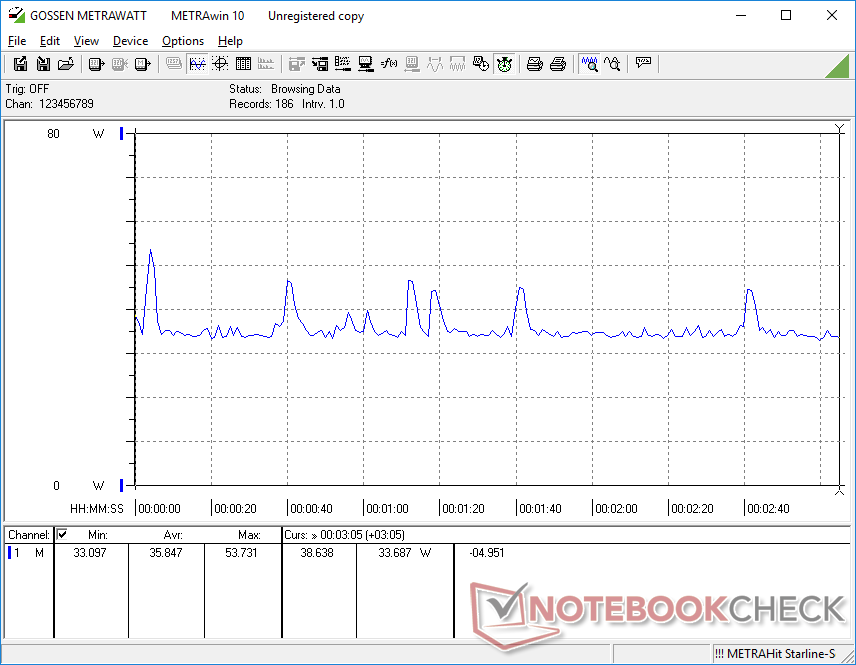
3DMark 06 auszuführen resultiert trotz der nur geringfügig gesteigerten Grafikleistung in einem um 50 % höheren Stromverbrauch als beim Spectre x360 14 2021, das mit einer älteren CPU aus Intels 11. Generation ausgestattet ist. Das ist hauptsächlich auf das höhere Turbo-Boost-Potenzial und den dadurch höheren Gesamtverbrauch der CPU zurückzuführen.
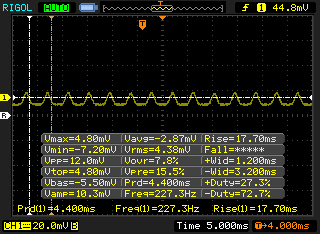
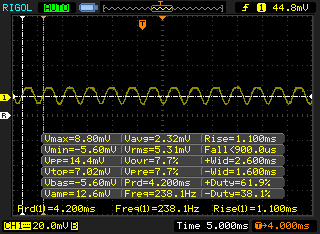
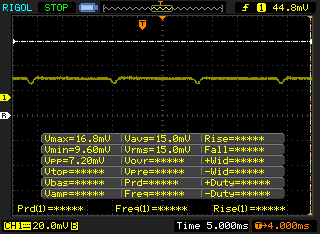
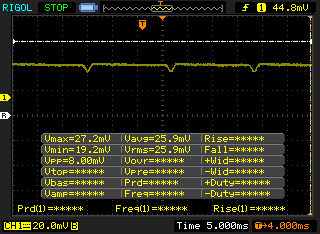
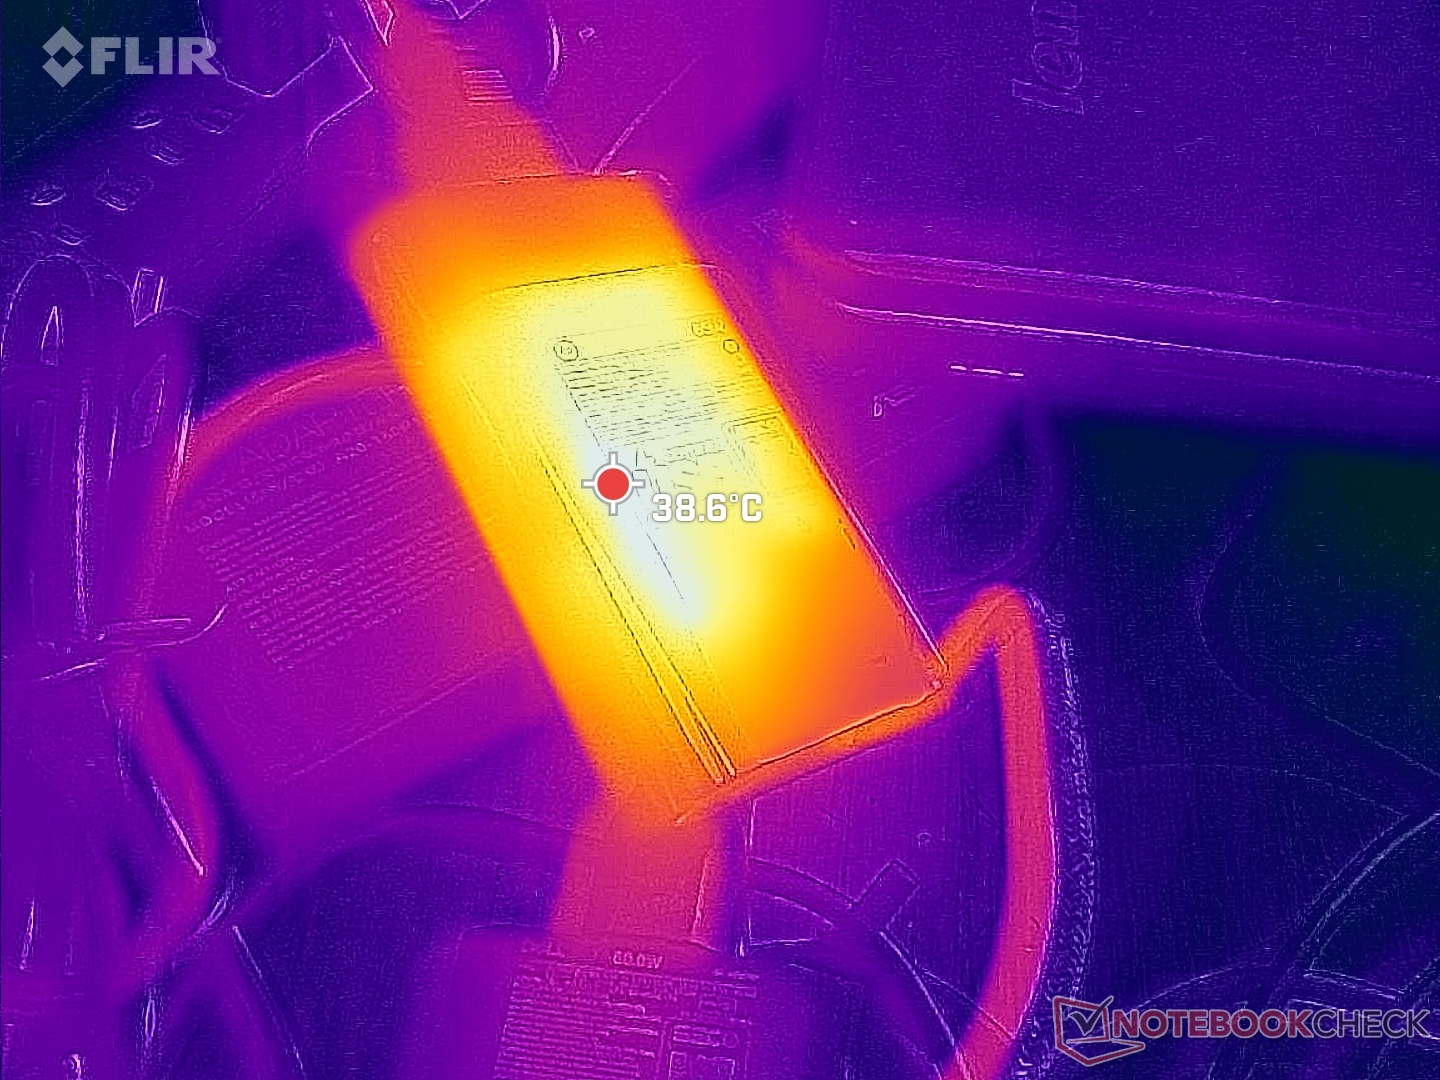
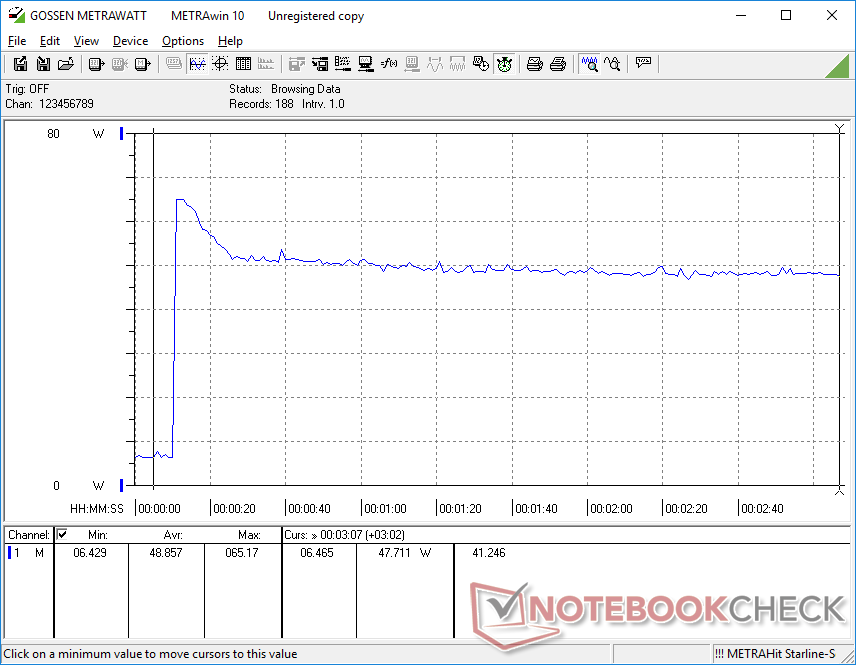
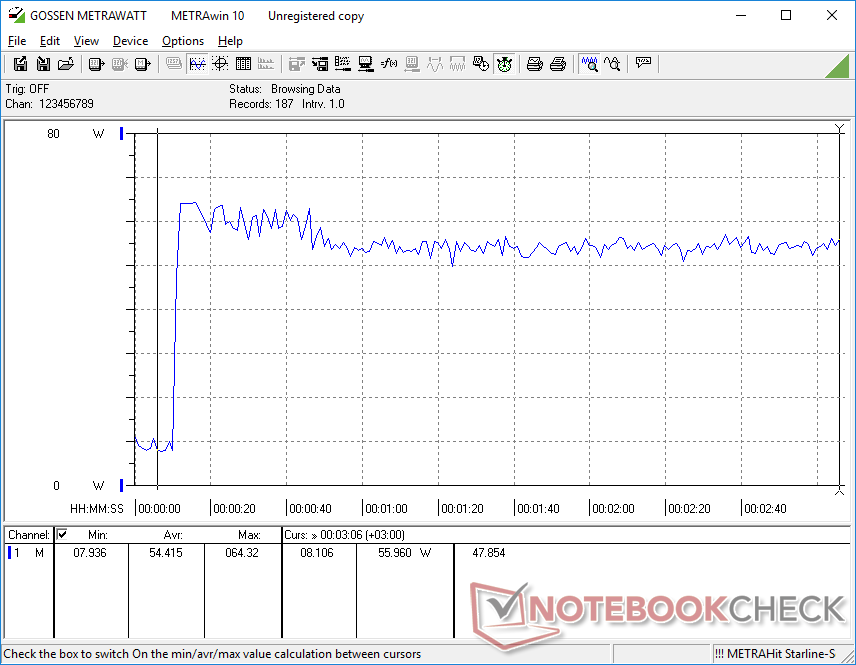
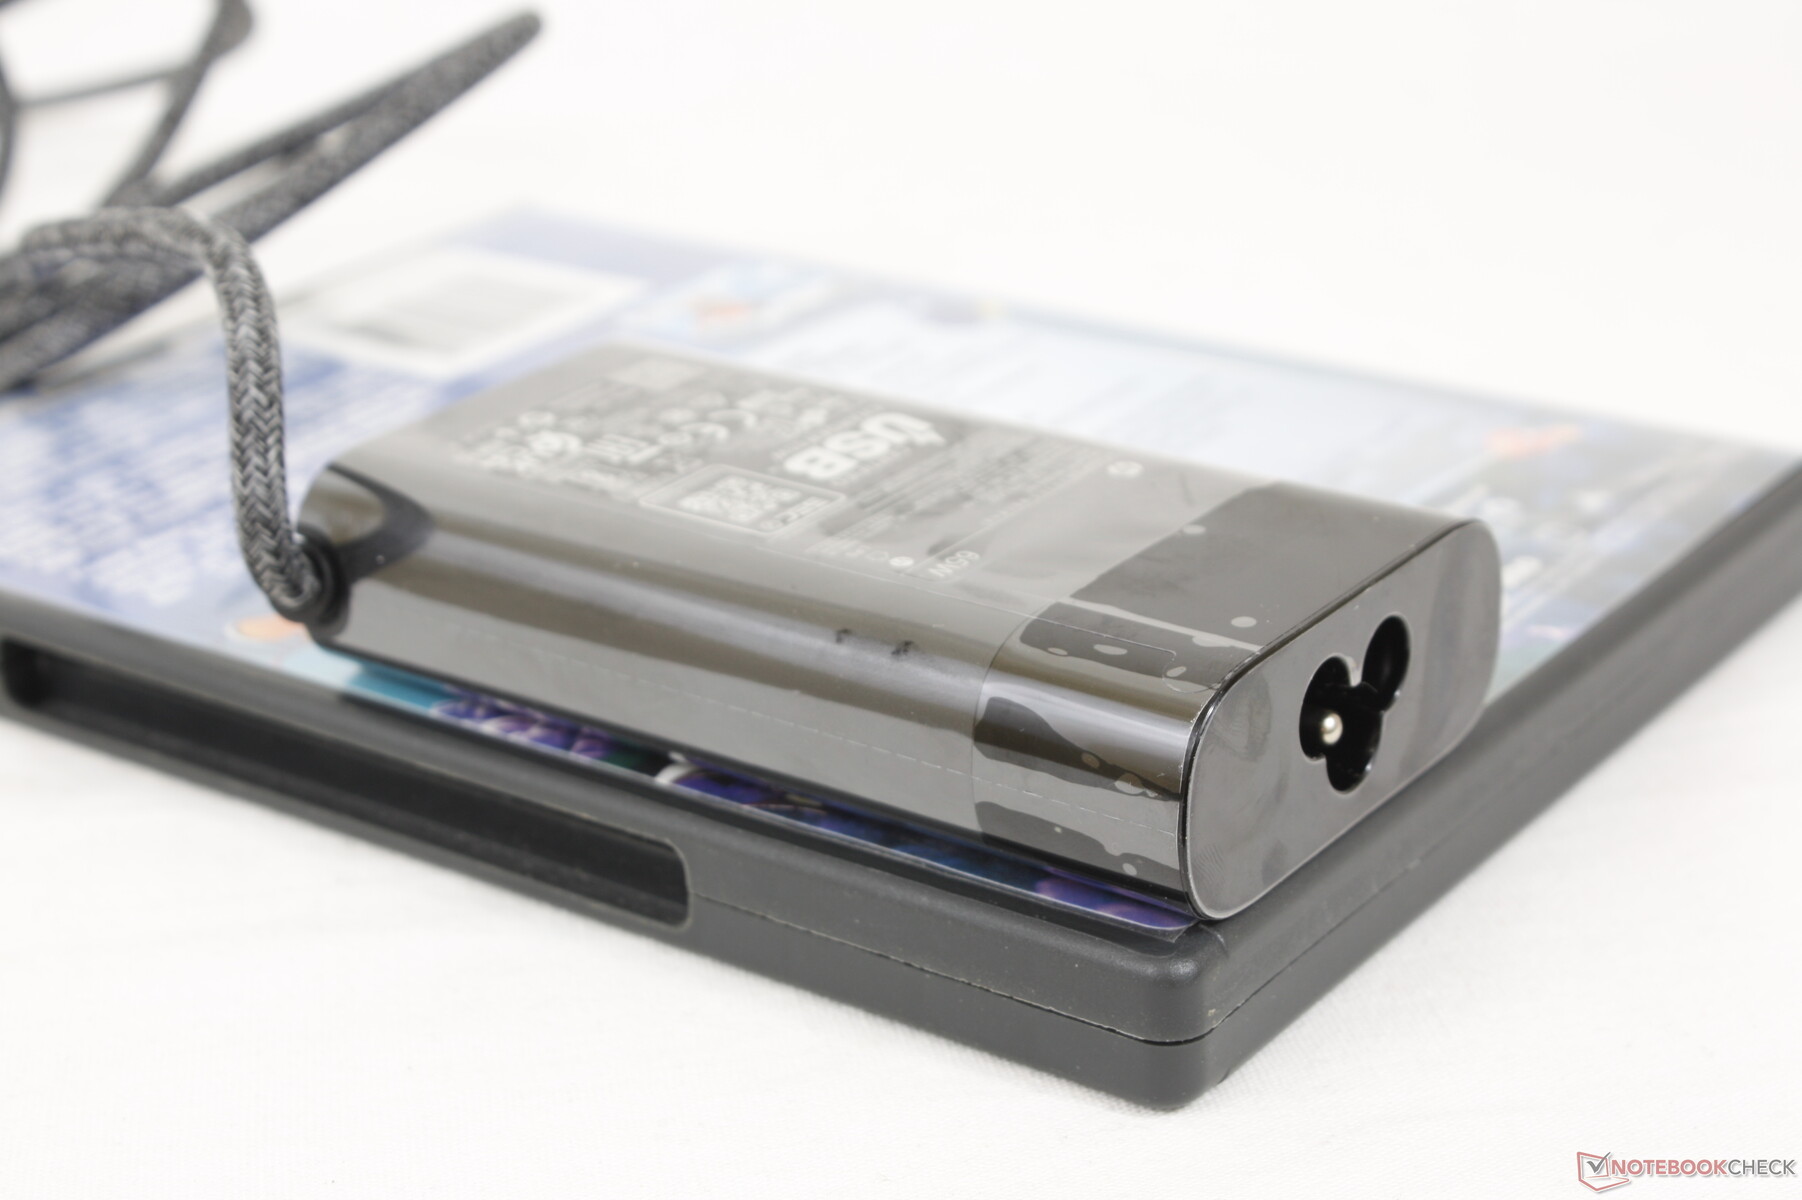
Wir konnten einen temporären Spitzenverbrauch von 65,2 W an dem kleinen (~9,6 x 5,3 x 2,2 cm) 65-W-Netzteil messen, als die CPU zu 100 % ausgelastet war, wie die Screenshots unten zeigen.
| Aus / Standby | |
| Idle | |
| Last |
|
Legende:
min: Derzeit nutzen wir das Metrahit Energy, ein professionelles TRMS Leistungs-Multimeter und PQ Analysator, für unsere Messungen. Mehr Details zu dem Messgerät finden Sie hier. Alle unsere Testmethoden beschreiben wir in diesem Artikel. | |
| HP Spectre x360 13.5 14t-ef000 i7-1255U, Iris Xe G7 96EUs, Micron 3400 1TB MTFDKBA1T0TFH, OLED, 3000x2000, 13.50 | HP Spectre x360 14-ea0378ng i7-1165G7, Iris Xe G7 96EUs, Intel Optane Memory H10 with Solid State Storage 32GB + 1TB HBRPEKNX0203AH(L/H), OLED, 3000x2000, 13.50 | Framework Laptop 13.5 12th Gen Intel i7-1260P, Iris Xe G7 96EUs, WDC PC SN730 SDBPNTY-512G, IPS, 2256x1504, 13.50 | Lenovo ThinkPad X1 Titanium Yoga G1 20QB0016GE i5-1140G7, Iris Xe G7 80EUs, Lenovo UMIS RPJTJ256MEE1OWX, IPS LED, 2256x1504, 13.50 | Framework Laptop 13.5 i7-1165G7, Iris Xe G7 96EUs, Western Digital WD_BLACK SN850 WDS100T1X0E, IPS, 2256x1504, 13.50 | HP EliteBook Folio 13.5-3G2L2EA SD 8cx Gen 2 5G, Adreno 680, Toshiba XG6 KXG60ZNV512G, IPS, 1920x1280, 13.50 | Microsoft Surface Laptop 4 13 Ryzen 5 R5 4680U, Vega 7, Samsung PM991 MZ9LQ256HBJQ, IPS, 2256x1504, 13.50 | |
|---|---|---|---|---|---|---|---|
| Stromverbrauch | -23% | -23% | 13% | -9% | 51% | 10% | |
| Idle min * | 4 | 6.3 -58% | 5.3 -33% | 3.75 6% | 4.3 -8% | 2.3 42% | 3.4 15% |
| Idle avg * | 4.9 | 11.2 -129% | 8.4 -71% | 7.75 -58% | 8.2 -67% | 3.7 24% | 6.3 -29% |
| Idle max * | 12.5 | 13.3 -6% | 11.2 10% | 8.69 30% | 8.7 30% | 5.6 55% | 8.1 35% |
| Last avg * | 48.1 | 32 33% | 57.4 -19% | 33.12 31% | 43.5 10% | 13 73% | 36.2 25% |
| Witcher 3 ultra * | 35.8 | 46.7 -30% | 28.7 20% | 43.5 -22% | |||
| Last max * | 65.2 | 35.6 45% | 61.2 6% | 35.19 46% | 61.8 5% | 25 62% | 64.1 2% |
* ... kleinere Werte sind besser
Verbrauch Witcher 3 / Stresstest
Verbrauch externer Monitor
Akkulaufzeit
Die Akkukapazität von 66 Wh ist mit der des Vorgängers identisch. Auch die praxisnahe WLAN-Laufzeit ist mit 8 Stunden nahezu identisch, allerdings hält das neue Modell im Leerlauf auf dem Desktop etwas länger durch. 8 Stunden sind für ein 14-Zoll-Ultrabook in etwa der Durchschnitt. Das Asus ZenBook 14X OLED UX5400EA hält zwar 2 Stunden kürzer durch, ist jedoch mit einer schnellere, dedizierten Nvidia-MX-Grafikkarte ausgerüstet.
Den leeren Akku voll aufzuladen dauert knapp 2 Stunden.
| HP Spectre x360 13.5 14t-ef000 i7-1255U, Iris Xe G7 96EUs, 66 Wh | HP Spectre x360 14-ea0378ng i7-1165G7, Iris Xe G7 96EUs, 66 Wh | Framework Laptop 13.5 12th Gen Intel i7-1260P, Iris Xe G7 96EUs, 55 Wh | Framework Laptop 13.5 i7-1165G7, Iris Xe G7 96EUs, 55 Wh | HP EliteBook Folio 13.5-3G2L2EA SD 8cx Gen 2 5G, Adreno 680, 46 Wh | Microsoft Surface Laptop 4 13 Ryzen 5 R5 4680U, Vega 7, 47.4 Wh | |
|---|---|---|---|---|---|---|
| Akkulaufzeit | -6% | -7% | -1% | 86% | 36% | |
| Idle | 1223 | 803 -34% | ||||
| WLAN | 481 | 466 -3% | 447 -7% | 478 -1% | 874 82% | 653 36% |
| Last | 133 | 157 18% | 251 89% | |||
| H.264 | 666 |
Pro
Contra
Fazit — Das Profi-Convertible der Wahl
Das Spectre x360 13.5 2022 adressiert einige unserer Kritikpunkte zum Vorgängermodell aus 2020. Insbesondere die Leistung und die Taktraten des Prozessors sind stabiler, was im Gaming-Betrieb in konstanteren Bildwiederholraten resultiert. Die reine CPU-Leistung ist deutlich höher als beim Intel-11.-Gen.-Modell, die Temperaturen und das Geräuschniveau jedoch nicht unbedingt. Außerdem ist zwar der Stromverbrauch erheblich höher, zumindest beim Surfen und bei der Videowiedergabe scheint sich das jedoch nicht negativ auf die Akkulaufzeit auszuwirken.
Dem Spectre x360 13.5 fehlen nur ein oder zwei Funktionsmerkmale zu einem vollwertigen EliteBook für professionelle Privatnutzer. Es ist etwas schwerer und größer als vergleichbare 13-Zoll-Convertibles, allerdings bekommt man dafür eine höhere Leistung und eine der besten Subnotebook-Webcams überhaupt.
Andere wichtige Änderungen sind die hochauflösende 5-MP-Webcam, PCIe4-Speicher, ein austauschbares WLAN-Modul, ein größeres ClickPad, ein überarbeitetes Tastenlayout und der langsamere microSD-Kartenleser. Bei vielen Dingen handelt es sich zwar um willkommene Verbesserungen, die im Vergleich zum 2020er-Modell beschnittene Tastatur und der langsamere microSD-Kartenleser dürfte jedoch so manchen potenziellen Käufer stören.
Freuen darf man sich hingegen über den USB-A-Anschluss, der bei vielen anderen 13-Zoll-Convertibles wie dem Dell XPS 13 9310 2-in-1 oder dem Lenovo ThinkPad X1 Titanium Yoga fehlt. Die mit USB-C-Ports bestückten Alternativen sind etwas leichter und dünner als unser HP, weshalb man sich, wenn man auf die 5-MP-Webcam und den USB-A-Anschluss des Spectre x360 13.5 nicht verzichten möchte, mit einem insgesamt größeren Gerät zufriedengeben muss.
Bei zukünftigen Modellen würden wir uns über ein werksseitig kalibriertes Display, 5G-WAN-Optionen, 90- oder 120-Hz-OLED-Panels und einen schmaleren oberen Displayrand freuen. Da Spectre-Notebooks heutzutage vom Preisniveau eines EliteBooks nicht allzu weit entfernt sind, sollten diese erweiterten Konfigurationsmöglichkeiten im Rahmen des Möglichen liegen.
Preis und Verfügbarkeit
Das Spectre x360 13.5 2022 ist mittlerweile großflächig verfügbar; eine ähnliche Konfiguration mit OLED-Panel, Core i7-1255U und einer 2-TB-SSD kostet auf HP's offizieller Homepage rund 2.000 Euro. Ein günstigeres Modell mit einem IPS-Touchscreen und einer 512-GB-SSD ist für 1.669 Euro verfügbar.
HP Spectre x360 13.5 14t-ef000
-
30.08.2022 v7
Allen Ngo


Preisvergleich

