 Deutsch
 English
 Español
 Français
 Italiano
 Nederlands
 Polski
 Português
 Русский
 Türkçe
 Svenska
 Chinese
 Magyar
Intel Core i7-2640M vs Intel Core i5-2520M vs Intel Core i5-2410M
Intel Core i7-2640M
► remove from comparison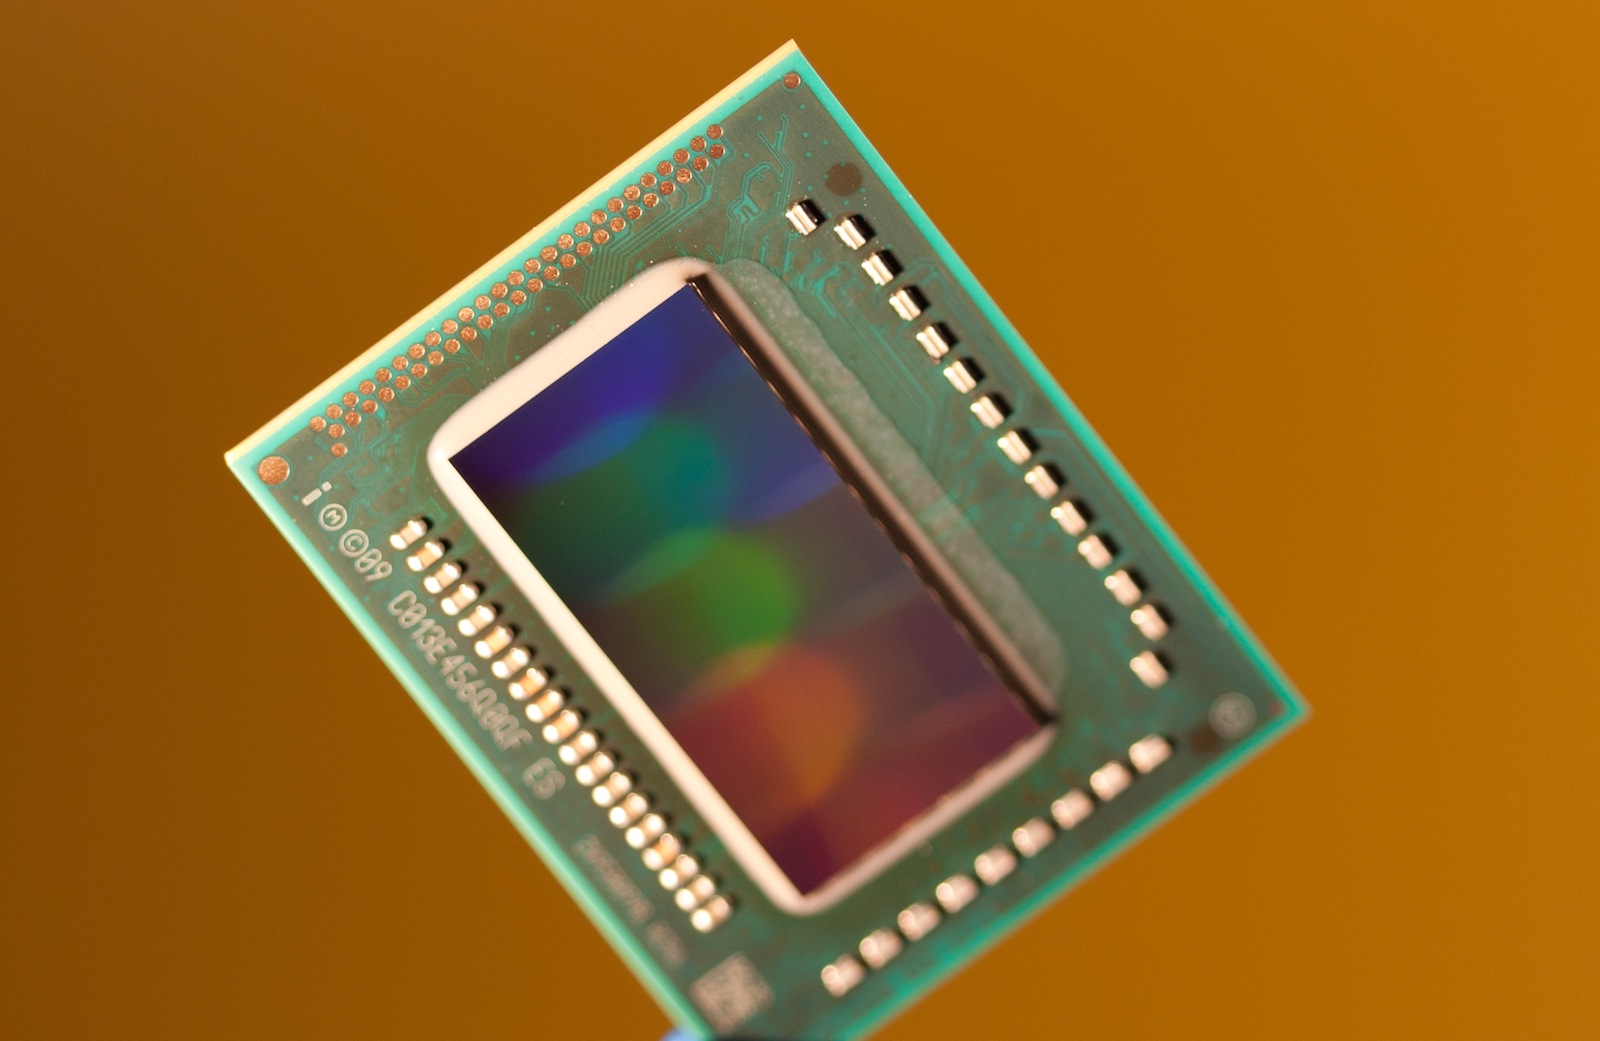
Der Intel Core i7-2640M ist der schnellste Doppelkernprozessor für Notebooks im 3. Quartal 2011 und löst den Core i7-2620M ab. Er bietet zwei Kerne und kann dank Hyperthreading 4 Threads gleichzeitig bearbeiten. Der Basistakt von 2,8 GHz kann durch Turbo Boost bei ausreichender Kühlung auf 3,3 GHz (Belastung von 2 Kernen) und 3,5 (1 Kern) dynamisch gesteigert werden. Im Vergleich zum langsameren i5-2540M, bietet der 2620M nicht nur eine höhere Taktrate, sondern auch mehr Last Level Cache (4 versus 3MB), der ältere 2620M ist jedoch nur geringer getaktet.
Sandy Bridge ist eine Weiterentwicklung der Arrandale Architektur. Neben Optimierungen sind besonders die neuen 256 Bit AVX Instruktionen im CPU Teil und der verbesserte Turbo 2.0 erwähnenswert. Weiters sind nun ebenfalls AES Funktionen und ein verbesserter Dual Channel DDR3 Speicherkontroller für max. 8 GB DDR3-1333MHz direkt im Prozessor integriert.
Die intergrierte DirectX 10 fähige Intel HD Graphics 3000 Grafikkarte ist direkt in der CPU untergebracht und teilt sich mit dieser den Level 3 / Last Level Cache. Dadurch sinkt zwar die Prozessorleistung etwas bei aktivierter Grafik, die Grafikleistung ist jedoch deutlich besser als bei der alten Intel HD Graphics und auf Niveau einer Nvidia Geforce 310M Einstiegsgrafikkarte.
Die Performance liegt dank der verbesserten Architektur und des überarbeiteten Turbo Boost oberhalb einer ähnlich getakteten Arrandale CPU. Der 2640M sollte dadurch die Performance der schnellsten Arrandale Quad-Core Modelle erreichen (z.B. Core i7-920XM). Daher reicht die Leistung auch für anspruchsvolle Tätigkeiten wie HD Videoschnitt oder 3D Spiele. Durch die hohe Taktrate von 2.8 GHz (3.3 - 3.5 GHz mittels Turbo) hat der 2640M auch Vorteile gegenüber den langsamer getakteten Quad-Core Prozessoren bei Software die nur 1-2 Threads auslastet.
Die Sandy Bridge Doppelkernprozessoren beinhalten im angegebenen TDP von 35 Watt auch die Grafikkarte und den Speicherkontroller. Durch den Turbo Boost 2.0 wird der TDP jedoch unter Last durchaus ausgenutzt. Mit 35W TDP eignet sich der Prozessor am besten für 14" Notebooks und größer.
Intel Core i5-2520M
► remove from comparisonDer Intel Core i5-2520M ist ein schneller High-End Doppelkernprozessor für Notebooks welcher Anfang 2011 vorgestellt wurde. Er bietet zwei Kerne und kann dank Hyperthreading 4 Threads gleichzeitig bearbeiten. Der Basistakt von 2,5 GHz kann durch Turbo Boost bei ausreichender Kühlung auf 3 GHz (Belastung von 2 Kernen) bzw. 3,2 (1 Kern) dynamisch gesteigert werden. Im Vergleich zum schnelleren i5-2540M, bietet der 2520M nur eine geringer Taktrate (i7 Dual Cores bieten auch mehr Last Level Cache).
Sandy Bridge ist eine Weiterentwicklung der Arrandale Architektur. Neben Optimierungen sind besonders die neuen 256 Bit AVX Instruktionen im CPU Teil und der verbesserte Turbo 2.0 erwähnenswert. Weiters sind nun ebenfalls AES Funktionen und ein verbesserter Dual Channel DDR3 Speicherkontroller für max. 8 GB DDR3-1333MHz direkt im Prozessor integriert.
Die intergrierte DirectX 10 fähige Intel HD Graphics 3000 Grafikkarte ist direkt in der CPU untergebracht und teilt sich mit dieser den Level 3 / Last Level Cache. Dadurch sinkt zwar die Prozessorleistung etwas bei aktivierter Grafik, die Grafikleistung ist jedoch deutlich besser als bei der alten Intel HD Graphics und auf Niveau einer Nvidia Geforce 310M Einstiegsgrafikkarte. Dank Turbo Boost wird sie von 650MHz bis 1300MHz getaktet.
Die Performance liegt dank der verbesserten Architektur und des überarbeiteten Turbo Boost etwas oberhalb einer ähnlich getakteten Arrandale CPU. Dadurch sollte der i5-2520M in etwa auf dem Niveau des alten Core i5-560M (2.7-3.2GHz) liegen. Daher reicht die Leistung auch für anspruchsvolle Tätigkeiten wie HD Videoschnitt oder 3D Spiele. Durch die hohe Taktrate von 2.5 GHz (3 - 3.2 GHz mittels Turbo) hat der 2520M auch Vorteile gegenüber den langsamer getakteten Quad-Core Prozessoren bei Software die nur 1-2 Threads auslastet.
Die Sandy Bridge Doppelkernprozessoren beinhalten im angegebenen TDP von 35 Watt auch die Grafikkarte und den Speicherkontroller. Durch den Turbo Boost 2.0 wird der TDP jedoch unter Last durchaus ausgenutzt. Mit 35W TDP eignet sich der Prozessor am besten für 14" Notebooks und größer.
Intel Core i5-2410M
► remove from comparisonThe Intel Core i5-2410M is a fast dual core processor at the time of introduction in Q1 2011. It is based on the Sandy Bridge architecture and offers Hyperthreading to handle 4 threads at once (for a better usage of the pipeline). Compared to the faster Core i7, the i5 offers a smaller last level cache of 3MB. The base clock speed is 2.3 GHz but due to Turbo Boost it can reach 2.6 GHz (2 cores active) and 2.9 GHz (1 core active). Compared to the 2510M, the 2410M does not support AES, VT-d, and Trusted Execution functions.
Sandy Bridge is the evolutionary successor of the Arrandale architecture. The most noteable improvements is the improved Turbo 2.0 and the integration of the graphics card into the 32nm CPU core.
The i5-2410M offers an integrated graphics card (Intel HD Graphics 3000) which is clearly faster then the older Intel HD Graphics in the Arrandale CPUs. As the new GPU is included in the CPU, it is also manufactured in 32nm and shares the fast level 3 cache with the CPU cores (using a new ring bus). In the 2410M it is clocked from 650-1200MHz (with Turbo Boost). The faster Sandy Bridge CPUs are clocked up to 1300 MHz (like the i5-2520M).
Furthermore, an improved dual-channel DDR3 memory controller is included on the CPU die that is used by the CPU and GPU part.
Due to the improved architecture and the new Turbo Boost 2.0, the average performance of the Core i5-2410M is higher than a similar clocked Arrandale Core i5. In our benchmarks, the 2410M was able to beat the fast Intel Core i5-560M with 2.7-3.2GHz and is therefore suited for even demanding tasks.
The 35W TDP rating includes the integrated GPU and memory controller.
| Model | Intel Core i7-2640M | Intel Core i5-2520M | Intel Core i5-2410M | ||||||||||||||||||||||||||||||||||||||||||||||||||||||||||||||||||||||||||||||||||||||||||||||||||||||||||||||||||||||||||||||||||||||||||||||||||||||||
| Series | Intel Core i7 | Intel Core i5 | Intel Core i5 | ||||||||||||||||||||||||||||||||||||||||||||||||||||||||||||||||||||||||||||||||||||||||||||||||||||||||||||||||||||||||||||||||||||||||||||||||||||||||
| Codename | Sandy Bridge | Sandy Bridge | Sandy Bridge | ||||||||||||||||||||||||||||||||||||||||||||||||||||||||||||||||||||||||||||||||||||||||||||||||||||||||||||||||||||||||||||||||||||||||||||||||||||||||
| Serie: Core i5 Sandy Bridge |
|
|
| ||||||||||||||||||||||||||||||||||||||||||||||||||||||||||||||||||||||||||||||||||||||||||||||||||||||||||||||||||||||||||||||||||||||||||||||||||||||||
| Clock | 2800 - 3500 MHz | 2500 - 3200 MHz | 2300 - 2900 MHz | ||||||||||||||||||||||||||||||||||||||||||||||||||||||||||||||||||||||||||||||||||||||||||||||||||||||||||||||||||||||||||||||||||||||||||||||||||||||||
| L1 Cache | 128 KB | 128 KB | 128 KB | ||||||||||||||||||||||||||||||||||||||||||||||||||||||||||||||||||||||||||||||||||||||||||||||||||||||||||||||||||||||||||||||||||||||||||||||||||||||||
| L2 Cache | 512 KB | 512 KB | 512 KB | ||||||||||||||||||||||||||||||||||||||||||||||||||||||||||||||||||||||||||||||||||||||||||||||||||||||||||||||||||||||||||||||||||||||||||||||||||||||||
| L3 Cache | 4 MB | 3 MB | 3 MB | ||||||||||||||||||||||||||||||||||||||||||||||||||||||||||||||||||||||||||||||||||||||||||||||||||||||||||||||||||||||||||||||||||||||||||||||||||||||||
| Cores / Threads | 2 / 4 | 2 / 4 | 2 / 4 | ||||||||||||||||||||||||||||||||||||||||||||||||||||||||||||||||||||||||||||||||||||||||||||||||||||||||||||||||||||||||||||||||||||||||||||||||||||||||
| TDP | 35 Watt | 35 Watt | 35 Watt | ||||||||||||||||||||||||||||||||||||||||||||||||||||||||||||||||||||||||||||||||||||||||||||||||||||||||||||||||||||||||||||||||||||||||||||||||||||||||
| Transistors | 624 Million | 624 Million | 624 Million | ||||||||||||||||||||||||||||||||||||||||||||||||||||||||||||||||||||||||||||||||||||||||||||||||||||||||||||||||||||||||||||||||||||||||||||||||||||||||
| Technology | 32 nm | 32 nm | 32 nm | ||||||||||||||||||||||||||||||||||||||||||||||||||||||||||||||||||||||||||||||||||||||||||||||||||||||||||||||||||||||||||||||||||||||||||||||||||||||||
| Die Size | 149 mm2 | 149 mm2 | 149 mm2 | ||||||||||||||||||||||||||||||||||||||||||||||||||||||||||||||||||||||||||||||||||||||||||||||||||||||||||||||||||||||||||||||||||||||||||||||||||||||||
| max. Temp. | 100 °C | 100 °C | 100 °C | ||||||||||||||||||||||||||||||||||||||||||||||||||||||||||||||||||||||||||||||||||||||||||||||||||||||||||||||||||||||||||||||||||||||||||||||||||||||||
| Features | HD Graphics 3000, DDR3-1066/1333 Memory Controller (max 8GB), HyperThreading, AVX, Quick Sync, Virtualization | HD Graphics 3000 (650-1300MHz), DDR3-1066/1333 Memory Controller (max 8GB), HyperThreading, AVX, Quick Sync, Virtualization | HD Graphics 3000 (650-1200MHz), DDR3-1066/1333 Memory Controller (max 16GB), HyperThreading, AVX, Quick Sync, Virtualization | ||||||||||||||||||||||||||||||||||||||||||||||||||||||||||||||||||||||||||||||||||||||||||||||||||||||||||||||||||||||||||||||||||||||||||||||||||||||||
| iGPU | Intel HD Graphics 3000 (650 - 1300 MHz) | Intel HD Graphics 3000 (650 - 1300 MHz) | Intel HD Graphics 3000 (650 - 1200 MHz) | ||||||||||||||||||||||||||||||||||||||||||||||||||||||||||||||||||||||||||||||||||||||||||||||||||||||||||||||||||||||||||||||||||||||||||||||||||||||||
| Architecture | x86 | x86 | x86 | ||||||||||||||||||||||||||||||||||||||||||||||||||||||||||||||||||||||||||||||||||||||||||||||||||||||||||||||||||||||||||||||||||||||||||||||||||||||||
| $346 U.S. | $225 U.S. | ||||||||||||||||||||||||||||||||||||||||||||||||||||||||||||||||||||||||||||||||||||||||||||||||||||||||||||||||||||||||||||||||||||||||||||||||||||||||||
| Announced | |||||||||||||||||||||||||||||||||||||||||||||||||||||||||||||||||||||||||||||||||||||||||||||||||||||||||||||||||||||||||||||||||||||||||||||||||||||||||||
| Socket | rPGA988B / BGA1023 | rPGA988B / BGA1023 | |||||||||||||||||||||||||||||||||||||||||||||||||||||||||||||||||||||||||||||||||||||||||||||||||||||||||||||||||||||||||||||||||||||||||||||||||||||||||
| Manufacturer | ark.intel.com | ark.intel.com |

