Schenker XMG Neo 17 (2020) im Test: Overboost entfesselt den Core-i7-Prozessor

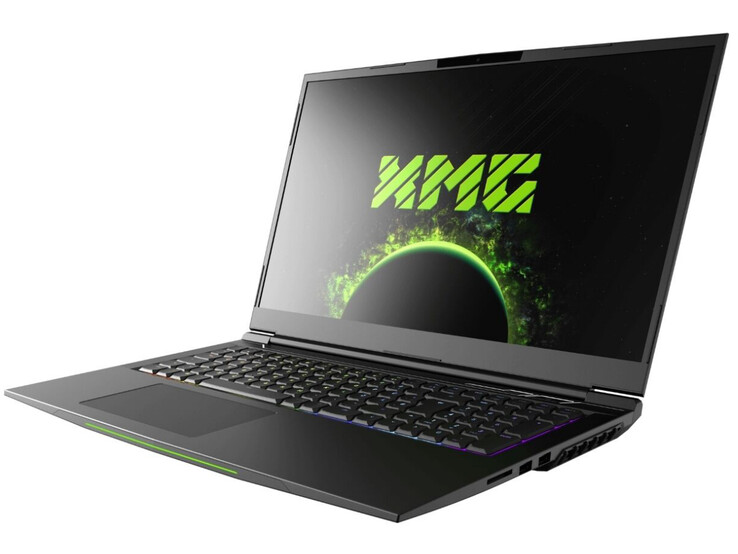
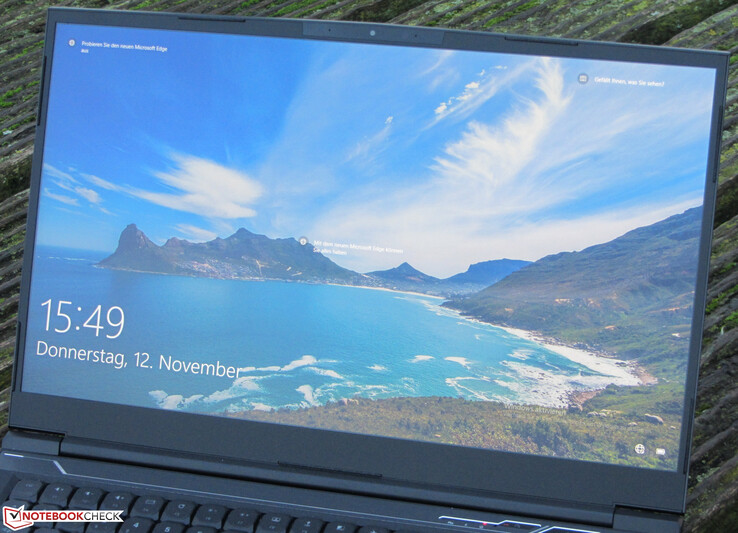
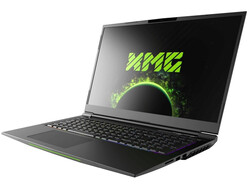
Schenker führt mit dem XMG Neo 17 ein 17,3-Zoll-Gaming-Notebook im Sortiment, das mit leistungsfähiger Hardware ausgestattet ist. Das uns zur Verfügung gestellte Testgerät wird von einem Core-i7-10875H-Achtkernprozessor und einer GeForce-RTX-2070-Super-GPU angetrieben. Das Neo basiert auf dem Tongfang-GM7MPHS-Barebone. Zu den Konkurrenten zählen das Acer Predator Helios 300 PH317-54, das MSI GL75 10SFR, das Asus Strix G17 G712LWS und das Aorus 17G XB.
Da das Gerät baugleich mit seinem Vorgänger ist, gehen wir nicht weiter auf das Gehäuse, die Ausstattung, die Eingabegeräte und die Lautsprecher ein - außer es bestehen Unterschiede. Entsprechende Informationen können dem Testbericht zum Schenker XMG Neo 17 (Tongfang GK7CP7S) entnommen werden.
Bew. | Datum | Modell | Gewicht | Dicke | Größe | Auflösung | Preis ab |
|---|---|---|---|---|---|---|---|
| 85.8 % v7 (old) | 11 / 2020 | Schenker XMG Neo 17 Comet Lake i7-10875H, GeForce RTX 2070 Super Mobile | 2.6 kg | 27.45 mm | 17.30" | 1920x1080 | |
| 83.6 % v7 (old) | 10 / 2020 | Acer Predator Helios 300 PH317-54-75G8 i7-10750H, GeForce RTX 2060 Mobile | 2.8 kg | 25 mm | 17.30" | 1920x1080 | |
| 83.5 % v7 (old) | 08 / 2020 | MSI GL75 10SFR i7-10750H, GeForce RTX 2070 Mobile | 2.6 kg | 28 mm | 17.30" | 1920x1080 | |
| 83.1 % v7 (old) | 10 / 2020 | Asus Strix G17 G712LWS i7-10750H, GeForce RTX 2070 Super Mobile | 2.8 kg | 26.5 mm | 17.30" | 1920x1080 | |
| 86.5 % v7 (old) | 05 / 2020 | Aorus 17G XB i7-10875H, GeForce RTX 2070 Super Max-Q | 2.7 kg | 26 mm | 17.30" | 1920x1080 |
Ausstattung - Neo 17 jetzt mit Thunderbolt 3
Auf Seiten der Schnittstellen hat sich gegenüber dem Vorgängermodell etwas getan: Die zwei Mini-Displayports wurden durch einen Thunderbolt-3-Steckplatz (Displayport per USB-C wird unterstützt) ersetzt. Laut Schenker können zwei Monitore (via Reihenschaltung/MST) an den TB3-Steckplatz angeschlossen werden. Ein Typ-C-USB-auf-Displayport-Adapter liegt bei. Darüber hinaus wurde der USB-2.0-Anschluss zu einem USB-3.2-Gen-2-Steckplatz (Typ A) aufgewertet.
Anschlussausstattung
| SD Card Reader | |
| average JPG Copy Test (av. of 3 runs) | |
| Aorus 17G XB (Toshiba Exceria Pro SDXC 64 GB UHS-II) | |
| Durchschnitt der Klasse Gaming (20 - 210, n=63, der letzten 2 Jahre) | |
| Schenker XMG Neo 17 Comet Lake (Toshiba Exceria Pro SDXC 64 GB UHS-II) | |
| Schenker XMG Neo 17 (Toshiba Exceria Pro SDXC 64 GB UHS-II) | |
| Schenker XMG Neo 17 XNE17M19 (Toshiba Exceria Pro SDXC 64 GB UHS-II) | |
| MSI GL75 10SFR (Toshiba Exceria Pro SDXC 64 GB UHS-II) | |
| maximum AS SSD Seq Read Test (1GB) | |
| Aorus 17G XB (Toshiba Exceria Pro SDXC 64 GB UHS-II) | |
| Durchschnitt der Klasse Gaming (25.5 - 261, n=60, der letzten 2 Jahre) | |
| Schenker XMG Neo 17 (Toshiba Exceria Pro SDXC 64 GB UHS-II) | |
| Schenker XMG Neo 17 XNE17M19 (Toshiba Exceria Pro SDXC 64 GB UHS-II) | |
| Schenker XMG Neo 17 Comet Lake (Toshiba Exceria Pro SDXC 64 GB UHS-II) | |
| MSI GL75 10SFR (Toshiba Exceria Pro SDXC 64 GB UHS-II) | |
Display - 240-Hz-IPS
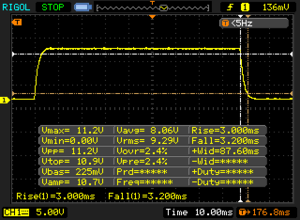
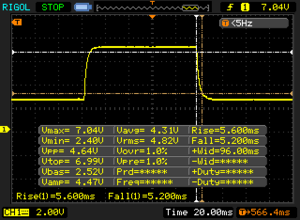
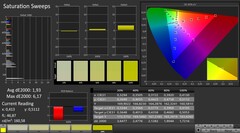
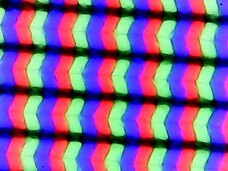
Der matte 17,3-Zoll-Bildschirm des Neo 17 arbeitet mit einer nativen Auflösung von 1.920 x 1.080 Bildpunkten. Helligkeit (305,4 cd/m²) und Kontrast (1.022:1) fallen gut aus. Das 240-Hz-Panel liefert kurze Reaktionszeiten. Positiv: Das Display zeigt kein PWM-Flimmern.
| |||||||||||||||||||||||||
Ausleuchtung: 87 %
Helligkeit Akku: 327 cd/m²
Kontrast: 1022:1 (Schwarzwert: 0.32 cd/m²)
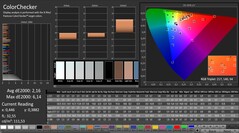
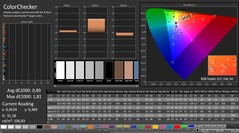
ΔE ColorChecker Calman: 2.16 | ∀{0.5-29.43 Ø4.76}
calibrated: 0.89
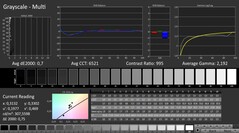
ΔE Greyscale Calman: 3.7 | ∀{0.09-98 Ø5}
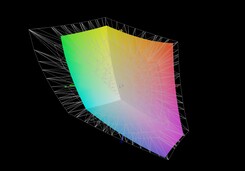
93% sRGB (Argyll 1.6.3 3D)
71% AdobeRGB 1998 (Argyll 1.6.3 3D)
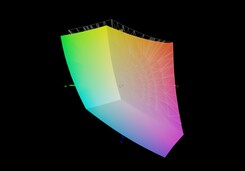
70.9% AdobeRGB 1998 (Argyll 3D)
99.2% sRGB (Argyll 3D)
69.4% Display P3 (Argyll 3D)
Gamma: 2.24
CCT: 6799 K
| Schenker XMG Neo 17 Comet Lake BOE HF NE173FHM-NZ1, IPS, 1920x1080, 17.3" | Schenker XMG Neo 17 BOEhydis NV173FHM-N44 (BOE07B6), IPS, 1920x1080, 17.3" | Schenker XMG Neo 17 XNE17M19 LG LP173WFG-SPB1 (LGD0615), IPS, 1920x1080, 17.3" | Acer Predator Helios 300 PH317-54-75G8 Chi Mei N173HCE-G33, IPS, 1920x1080, 17.3" | MSI GL75 10SFR Chi Mei N173HCE-G33, IPS, 1920x1080, 17.3" | Asus Strix G17 G712LWS LG Philips LP173WFG-SPB3, IPS, 1920x1080, 17.3" | Aorus 17G XB AU Optronics B173HAN05.0 (AUO509D), IPS, 1920x1080, 17.3" | |
|---|---|---|---|---|---|---|---|
| Display | -6% | -6% | -8% | -6% | -5% | 1% | |
| Display P3 Coverage (%) | 69.4 | 65.2 -6% | 64.6 -7% | 62.6 -10% | 63.9 -8% | 65.2 -6% | 70.6 2% |
| sRGB Coverage (%) | 99.2 | 92.2 -7% | 95.6 -4% | 94.3 -5% | 96.2 -3% | 96.8 -2% | 97.2 -2% |
| AdobeRGB 1998 Coverage (%) | 70.9 | 66.5 -6% | 65.6 -7% | 64.7 -9% | 66 -7% | 66.4 -6% | 72.8 3% |
| Response Times | -81% | -63% | -61% | -26% | -48% | -68% | |
| Response Time Grey 50% / Grey 80% * (ms) | 10.8 ? | 18.8 ? -74% | 15.6 ? -44% | 16.4 ? -52% | 12 ? -11% | 14.4 ? -33% | 16 ? -48% |
| Response Time Black / White * (ms) | 6.4 ? | 12 ? -88% | 11.6 ? -81% | 10.8 ? -69% | 9 ? -41% | 10.4 ? -63% | 12 ? -88% |
| PWM Frequency (Hz) | 971 ? | 24510 ? | 208 ? | ||||
| Bildschirm | -5% | -15% | 23% | 1% | -8% | 17% | |
| Helligkeit Bildmitte (cd/m²) | 327 | 304 -7% | 318 -3% | 322 -2% | 333 2% | 323 -1% | 293 -10% |
| Brightness (cd/m²) | 305 | 289 -5% | 286 -6% | 308 1% | 309 1% | 300 -2% | 285 -7% |
| Brightness Distribution (%) | 87 | 90 3% | 86 -1% | 92 6% | 86 -1% | 89 2% | 95 9% |
| Schwarzwert * (cd/m²) | 0.32 | 0.26 19% | 0.23 28% | 0.18 44% | 0.215 33% | 0.31 3% | 0.24 25% |
| Kontrast (:1) | 1022 | 1169 14% | 1383 35% | 1789 75% | 1549 52% | 1042 2% | 1221 19% |
| Delta E Colorchecker * | 2.16 | 2.65 -23% | 3.89 -80% | 1.53 29% | 1.98 8% | 3.01 -39% | 1.27 41% |
| Colorchecker dE 2000 max. * | 6.14 | 6.11 -0% | 10.56 -72% | 3.14 49% | 4.34 29% | 7.65 -25% | 2.24 64% |
| Colorchecker dE 2000 calibrated * | 0.89 | 1.5 -69% | 1.03 -16% | 0.74 17% | 2.01 -126% | 1 -12% | 1.06 -19% |
| Delta E Graustufen * | 3.7 | 2.75 26% | 5.3 -43% | 1.9 49% | 2.97 20% | 3.8 -3% | 1.34 64% |
| Gamma | 2.24 98% | 2.46 89% | 2.46 89% | 2.144 103% | 2.41 91% | 2.154 102% | 2.38 92% |
| CCT | 6799 96% | 6763 96% | 7462 87% | 6809 95% | 6750 96% | 7507 87% | 6542 99% |
| Farbraum (Prozent von AdobeRGB 1998) (%) | 71 | 60 -15% | 60 -15% | 65 -8% | 61 -14% | 66 -7% | 73 3% |
| Color Space (Percent of sRGB) (%) | 93 | 92 -1% | 96 3% | 87 -6% | 96 3% | 90 -3% | 94 1% |
| Durchschnitt gesamt (Programm / Settings) | -31% /
-15% | -28% /
-20% | -15% /
7% | -10% /
-4% | -20% /
-12% | -17% /
4% |
* ... kleinere Werte sind besser
Reaktionszeiten (Response Times) des Displays
| ↔ Reaktionszeiten Schwarz zu Weiß | ||
|---|---|---|
| 6.4 ms ... steigend ↗ und fallend ↘ kombiniert | ↗ 3 ms steigend | |
| ↘ 3.2 ms fallend | ||
| Die gemessenen Reaktionszeiten sind sehr kurz, wodurch sich der Bildschirm auch für schnelle 3D Spiele eignen sollte. Im Vergleich rangierten die bei uns getesteten Geräte von 0.1 (Minimum) zu 240 (Maximum) ms. » 19 % aller Screens waren schneller als der getestete. Daher sind die gemessenen Reaktionszeiten besser als der Durchschnitt aller vermessenen Geräte (20.1 ms). | ||
| ↔ Reaktionszeiten 50% Grau zu 80% Grau | ||
| 10.8 ms ... steigend ↗ und fallend ↘ kombiniert | ↗ 5.6 ms steigend | |
| ↘ 5.2 ms fallend | ||
| Die gemessenen Reaktionszeiten sind gut, für anspruchsvolle Spieler könnten der Bildschirm jedoch zu langsam sein. Im Vergleich rangierten die bei uns getesteten Geräte von 0.165 (Minimum) zu 636 (Maximum) ms. » 23 % aller Screens waren schneller als der getestete. Daher sind die gemessenen Reaktionszeiten besser als der Durchschnitt aller vermessenen Geräte (31.5 ms). | ||
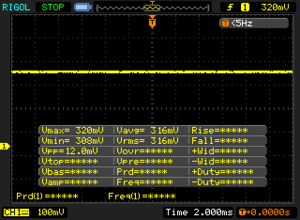
Bildschirm-Flackern / PWM (Pulse-Width Modulation)
| Flackern / PWM nicht festgestellt | |||
Im Vergleich: 53 % aller getesteten Geräte nutzten kein PWM um die Helligkeit zu reduzieren. Wenn PWM eingesetzt wurde, dann bei einer Frequenz von durchschnittlich 8023 (Minimum 5, Maximum 343500) Hz. | |||
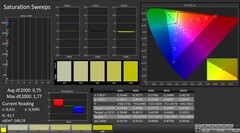
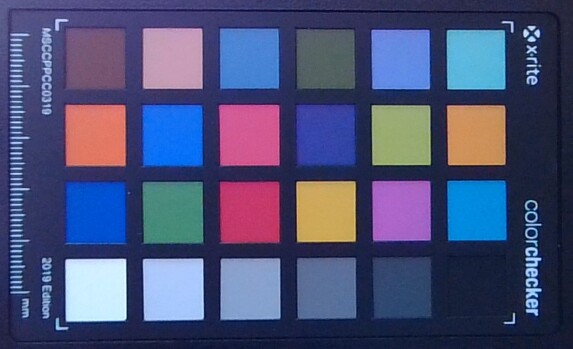
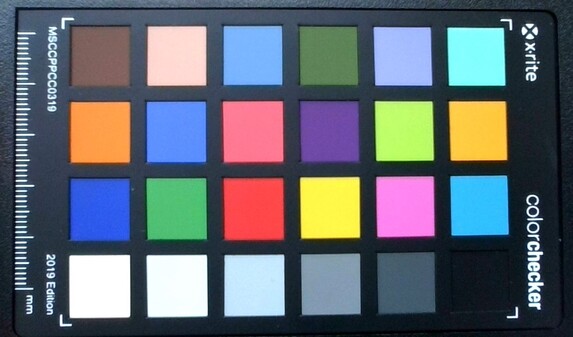
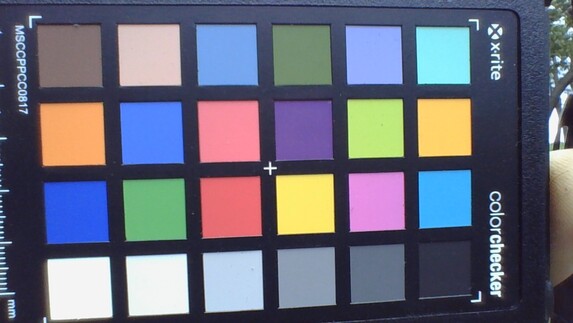
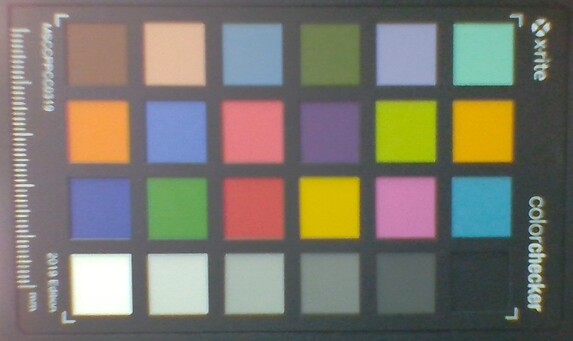
Der Bildschirm zeigt eine gute Farbdarstellung. Mit einer Farbabweichung von 2,16 wird das Soll (Delta-E kleiner 3) erfüllt. Unter einem Blaustich leidet das Display nicht. Eine Kalibrierung sorgt für Verbesserungen. So sinkt die Farbabweichung auf 0,89 und die Graustufen werden ausgewogener dargestellt. Die Farbräume AdobeRGB (71 Prozent) und sRGB (93 Prozent) werden nicht vollständig abgebildet.
Leistung - Genug für die nächsten Jahre
Schenker hat mit dem Neo 17 ein 17,3-Zoll-Gaming-Notebook im Sortiment, das jedes aktuelle Spiel flüssig auf den Bildschirm bringt und auch in allen anderen Anwendungsbereichen eine gute Figur abgibt. Für unser Testgerät müssen etwa 2.349 Euro auf den Tisch gelegt werden. Das Gerät kann individuell im Schenker Onlineshop konfiguriert werden.
Testbedingungen
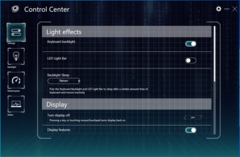
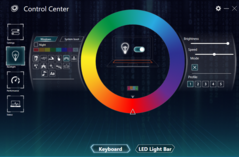
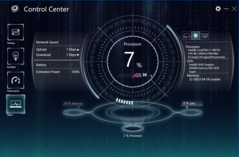
Das vorinstallierte Control Center ermöglicht die Überwachung des Systemstatus, die Anpassung der Tastenbeleuchtung und die Wahl eines Leistungsprofils ("Balanced", "Enthusiast", "Overboost"). Wir haben unseren Test bei aktivem "Enthusiast"-Profil und automatischer Lüftersteuerung durchgeführt. Einige Benchmarks haben wir auch bei aktivem "Overboost"-Profil durchlaufen laufen. Die Ergebnisse finden sich in den Vergleichsdiagrammen.
Prozessor
Der Core-i7-10875H-Achtkernprozessor (Comet Lake) arbeitet mit einer Basisgeschwindigkeit von 2,3 GHz. Per Turbo kann der Takt auf 4,3 GHz (acht Kerne) bis 5,1 GHz (ein Kern) gesteigert werden. Hyperthreading (zwei Threads pro Kern) wird unterstützt.
Den Multi-Thread-Test des Cinebench-R15-Benchmarks bearbeitet die CPU mit 2,2 bis 4,2 GHz. Der Single-Thread-Test wird mit 4 bis 5,1 GHz durchlaufen. Im Akkubetrieb liegen die Geschwindigkeiten bei 2,7 bis 2,8 GHz (Multi-Thread) bzw. 2,4 bis 4,2 GHz (Single-Thread).
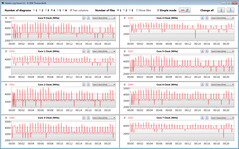
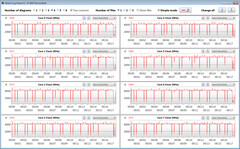
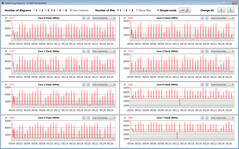
Ob der CPU-Turbo im Netzbetrieb auch dauerhaft genutzt wird, überprüfen wir, indem wir den Multi-Thread-Test des Cinebench-R15-Benchmarks für mindestens 30 Minuten in einer Schleife laufen lassen. Die Resultate fallen zum dritten Durchlauf hin leicht ab und verbleiben dann auf konstanter Höhe. Der Turbo kommt zum Einsatz. Der "Overboost"-Modus lässt die Turbo-Taktraten deutlich ansteigen.
| Blender - v2.79 BMW27 CPU | |
| MSI GL75 10SFR | |
| Acer Predator Helios 300 PH317-54-75G8 | |
| Asus Strix G17 G712LWS | |
| Durchschnittliche Intel Core i7-10875H (259 - 535, n=30) | |
| Schenker XMG Neo 17 Comet Lake | |
| Aorus 17G XB | |
| Schenker XMG Neo 17 Comet Lake (Overboost) | |
| Durchschnitt der Klasse Gaming (80 - 517, n=132, der letzten 2 Jahre) | |
| 7-Zip 18.03 | |
| 7z b 4 -mmt1 | |
| Durchschnitt der Klasse Gaming (4199 - 7508, n=133, der letzten 2 Jahre) | |
| Schenker XMG Neo 17 Comet Lake | |
| Schenker XMG Neo 17 Comet Lake (Overboost) | |
| Durchschnittliche Intel Core i7-10875H (5071 - 5780, n=31) | |
| Aorus 17G XB | |
| Acer Predator Helios 300 PH317-54-75G8 | |
| MSI GL75 10SFR | |
| Asus Strix G17 G712LWS | |
| 7z b 4 | |
| Durchschnitt der Klasse Gaming (23795 - 148086, n=133, der letzten 2 Jahre) | |
| Schenker XMG Neo 17 Comet Lake (Overboost) | |
| Aorus 17G XB | |
| Schenker XMG Neo 17 Comet Lake | |
| Durchschnittliche Intel Core i7-10875H (29844 - 49562, n=31) | |
| Asus Strix G17 G712LWS | |
| MSI GL75 10SFR | |
| Acer Predator Helios 300 PH317-54-75G8 | |
| Cinebench R20 | |
| CPU (Single Core) | |
| Durchschnitt der Klasse Gaming (439 - 870, n=135, der letzten 2 Jahre) | |
| Schenker XMG Neo 17 Comet Lake | |
| Schenker XMG Neo 17 Comet Lake (Overboost) | |
| Asus Strix G17 G712LWS | |
| Aorus 17G XB | |
| Durchschnittliche Intel Core i7-10875H (430 - 524, n=32) | |
| MSI GL75 10SFR | |
| Acer Predator Helios 300 PH317-54-75G8 | |
| Schenker XMG Neo 17 XNE17M19 | |
| CPU (Multi Core) | |
| Durchschnitt der Klasse Gaming (2179 - 16108, n=135, der letzten 2 Jahre) | |
| Schenker XMG Neo 17 Comet Lake (Overboost) | |
| Aorus 17G XB | |
| Durchschnittliche Intel Core i7-10875H (1986 - 4176, n=32) | |
| Schenker XMG Neo 17 Comet Lake | |
| Asus Strix G17 G712LWS | |
| Acer Predator Helios 300 PH317-54-75G8 | |
| MSI GL75 10SFR | |
| Schenker XMG Neo 17 XNE17M19 | |
| Geekbench 5.5 | |
| Single-Core | |
| Durchschnitt der Klasse Gaming (986 - 2474, n=133, der letzten 2 Jahre) | |
| Schenker XMG Neo 17 Comet Lake | |
| Schenker XMG Neo 17 Comet Lake (Overboost) | |
| Durchschnittliche Intel Core i7-10875H (1233 - 1371, n=29) | |
| Aorus 17G XB | |
| MSI GL75 10SFR | |
| Asus Strix G17 G712LWS | |
| Acer Predator Helios 300 PH317-54-75G8 | |
| Multi-Core | |
| Durchschnitt der Klasse Gaming (4557 - 27010, n=133, der letzten 2 Jahre) | |
| Schenker XMG Neo 17 Comet Lake (Overboost) | |
| Aorus 17G XB | |
| Durchschnittliche Intel Core i7-10875H (5715 - 8620, n=29) | |
| Schenker XMG Neo 17 Comet Lake | |
| Asus Strix G17 G712LWS | |
| Acer Predator Helios 300 PH317-54-75G8 | |
| MSI GL75 10SFR | |
| HWBOT x265 Benchmark v2.2 - 4k Preset | |
| Durchschnitt der Klasse Gaming (7.7 - 44.3, n=133, der letzten 2 Jahre) | |
| Schenker XMG Neo 17 Comet Lake (Overboost) | |
| Aorus 17G XB | |
| Schenker XMG Neo 17 Comet Lake | |
| Durchschnittliche Intel Core i7-10875H (7.27 - 14.1, n=27) | |
| Asus Strix G17 G712LWS | |
| Acer Predator Helios 300 PH317-54-75G8 | |
| MSI GL75 10SFR | |
| LibreOffice - 20 Documents To PDF | |
| Asus Strix G17 G712LWS | |
| Acer Predator Helios 300 PH317-54-75G8 | |
| Aorus 17G XB | |
| Schenker XMG Neo 17 Comet Lake | |
| MSI GL75 10SFR | |
| Durchschnittliche Intel Core i7-10875H (30.2 - 84.3, n=30) | |
| Durchschnitt der Klasse Gaming (19 - 88.8, n=133, der letzten 2 Jahre) | |
| Schenker XMG Neo 17 Comet Lake (Overboost) | |
| R Benchmark 2.5 - Overall mean | |
| Acer Predator Helios 300 PH317-54-75G8 | |
| Asus Strix G17 G712LWS | |
| MSI GL75 10SFR | |
| Aorus 17G XB | |
| Durchschnittliche Intel Core i7-10875H (0.546 - 0.662, n=29) | |
| Schenker XMG Neo 17 Comet Lake (Overboost) | |
| Schenker XMG Neo 17 Comet Lake | |
| Durchschnitt der Klasse Gaming (0.3439 - 0.759, n=134, der letzten 2 Jahre) | |
* ... kleinere Werte sind besser
System Performance
Das System arbeitet rund und flüssig. Problemen sind wir nicht begegnet. Die PC-Mark-Resultate bescheinigen dem Notebook, dass es über genug Rechenleistung für alle gängigen Anwendungsbereiche verfügt.
| PCMark 8 Home Score Accelerated v2 | 4405 Punkte | |
| PCMark 8 Creative Score Accelerated v2 | 6494 Punkte | |
| PCMark 8 Work Score Accelerated v2 | 5803 Punkte | |
| PCMark 10 Score | 5747 Punkte | |
Hilfe | ||
| DPC Latencies / LatencyMon - interrupt to process latency (max), Web, Youtube, Prime95 | |
| Aorus 17G XB | |
| Asus Strix G17 G712LWS | |
| MSI GL75 10SFR | |
| Acer Predator Helios 300 PH317-54-75G8 | |
| Schenker XMG Neo 17 Comet Lake | |
* ... kleinere Werte sind besser
Massenspeicher
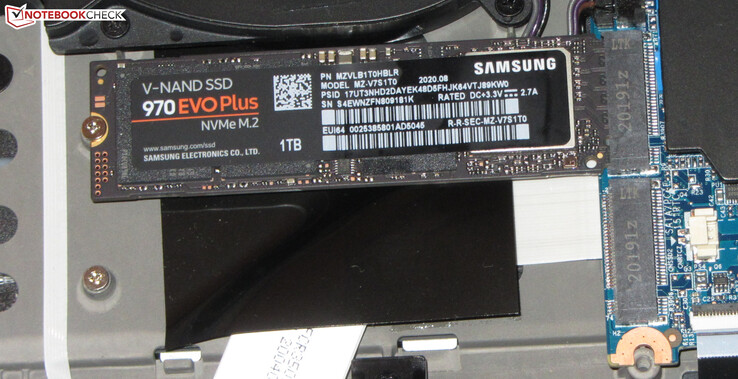
Einer der zwei M.2-2280-Steckplätze (1x NVMe, 1x NVMe/SATA; RAID-0/1) ist mit einer 1-TB-NVMe-SSD der Firma Samsung bestückt, die hervorragende Transferraten liefert.
Grundsätzlich bietet das Notebook noch Platz für ein 2,5-Zoll-Speichermedium. Da unser Testgerät mit dem größeren der zwei verfügbaren Akkus (46 Wh, 62 Wh) ausgestattet ist, nimmt der Akku den vorgesehenen Platz in Beschlag.
| Schenker XMG Neo 17 Comet Lake Samsung SSD 970 EVO Plus 1TB | Schenker XMG Neo 17 Samsung SSD 970 EVO Plus 1TB | Acer Predator Helios 300 PH317-54-75G8 WDC PC SN730 SDBQNTY-1T00 | MSI GL75 10SFR Lite-On CL1-8D512 | Asus Strix G17 G712LWS Intel SSD 660p 1TB SSDPEKNW010T8 | Aorus 17G XB Samsung SSD PM981a MZVLB512HBJQ | Durchschnittliche Samsung SSD 970 EVO Plus 1TB | Durchschnitt der Klasse Gaming | |
|---|---|---|---|---|---|---|---|---|
| CrystalDiskMark 5.2 / 6 | -31% | -10% | -28% | -25% | -9% | -3% | 43% | |
| Write 4K (MB/s) | 158.6 | 92.7 -42% | 141.9 -11% | 132.2 -17% | 141.1 -11% | 123.4 -22% | 155.5 ? -2% | 202 ? 27% |
| Read 4K (MB/s) | 53.6 | 41.4 -23% | 48.75 -9% | 45.62 -15% | 60.9 14% | 45.02 -16% | 51.6 ? -4% | 75.2 ? 40% |
| Write Seq (MB/s) | 2671 | 1363 -49% | 2734 2% | 1511 -43% | 1681 -37% | 2526 -5% | 2660 ? 0% | 3717 ? 39% |
| Read Seq (MB/s) | 2130 | 1259 -41% | 1921 -10% | 1890 -11% | 1602 -25% | 2062 -3% | 2390 ? 12% | 3534 ? 66% |
| Write 4K Q32T1 (MB/s) | 525 | 289.7 -45% | 422.6 -20% | 375.9 -28% | 406.6 -23% | 497.9 -5% | 447 ? -15% | 584 ? 11% |
| Read 4K Q32T1 (MB/s) | 609 | 337.5 -45% | 509 -16% | 525 -14% | 470.2 -23% | 579 -5% | 544 ? -11% | 700 ? 15% |
| Write Seq Q32T1 (MB/s) | 3308 | 3332 1% | 3055 -8% | 1505 -55% | 1759 -47% | 2982 -10% | 3296 ? 0% | 5095 ? 54% |
| Read Seq Q32T1 (MB/s) | 3557 | 3477 -2% | 3257 -8% | 2008 -44% | 1932 -46% | 3440 -3% | 3551 ? 0% | 6803 ? 91% |
| AS SSD | -7% | -12% | -63% | -42% | -16% | 5% | 35% | |
| Seq Read (MB/s) | 2882 | 2359 -18% | 2828 -2% | 1923 -33% | 1778 -38% | 1791 -38% | 2800 ? -3% | 5335 ? 85% |
| Seq Write (MB/s) | 2764 | 2469 -11% | 2677 -3% | 1065 -61% | 1478 -47% | 2193 -21% | 2633 ? -5% | 3893 ? 41% |
| 4K Read (MB/s) | 55.9 | 53.5 -4% | 39.94 -29% | 25.43 -55% | 49.76 -11% | 50.7 -9% | 51.2 ? -8% | 69.4 ? 24% |
| 4K Write (MB/s) | 129.4 | 117.6 -9% | 100.9 -22% | 101.9 -21% | 117.9 -9% | 116.8 -10% | 131.2 ? 1% | 217 ? 68% |
| 4K-64 Read (MB/s) | 1793 | 1579 -12% | 1562 -13% | 477.9 -73% | 591 -67% | 1525 -15% | 1839 ? 3% | 1710 ? -5% |
| 4K-64 Write (MB/s) | 2140 | 2048 -4% | 1867 -13% | 563 -74% | 875 -59% | 1958 -9% | 2144 ? 0% | 2859 ? 34% |
| Access Time Read * (ms) | 0.054 | 0.048 11% | 0.053 2% | 0.082 -52% | 0.07 -30% | 0.04528 ? 16% | 0.06095 ? -13% | |
| Access Time Write * (ms) | 0.03 | 0.03 -0% | 0.037 -23% | 0.126 -320% | 0.041 -37% | 0.032 -7% | 0.03128 ? -4% | 0.03679 ? -23% |
| Score Read (Points) | 2137 | 1869 -13% | 1885 -12% | 696 -67% | 818 -62% | 1755 -18% | 2171 ? 2% | 2312 ? 8% |
| Score Write (Points) | 2546 | 2413 -5% | 2236 -12% | 771 -70% | 1140 -55% | 2294 -10% | 2539 ? 0% | 3464 ? 36% |
| Score Total (Points) | 5774 | 5248 -9% | 5076 -12% | 1785 -69% | 2377 -59% | 4972 -14% | 5812 ? 1% | 6894 ? 19% |
| Copy ISO MB/s (MB/s) | 2189 | 1870 -15% | 1710 -22% | 1495 -32% | 2133 ? -3% | 3020 ? 38% | ||
| Copy Program MB/s (MB/s) | 625 | 545 -13% | 465.3 -26% | 446 -29% | 698 ? 12% | 964 ? 54% | ||
| Copy Game MB/s (MB/s) | 936 | 1083 16% | 1042 11% | 697 -26% | 1521 ? 63% | 2067 ? 121% | ||
| Durchschnitt gesamt (Programm / Settings) | -19% /
-17% | -11% /
-11% | -46% /
-50% | -34% /
-36% | -13% /
-13% | 1% /
3% | 39% /
38% |
* ... kleinere Werte sind besser
Dauerleistung Lesen: DiskSpd Read Loop, Queue Depth 8
Grafikkarte
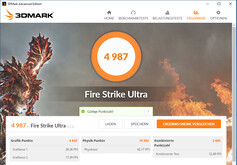
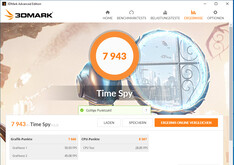
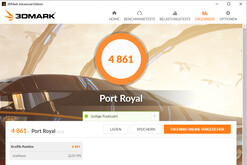
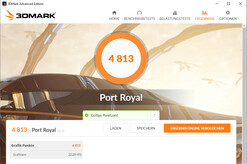
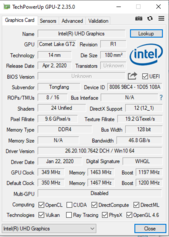
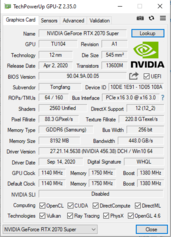
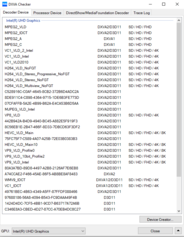
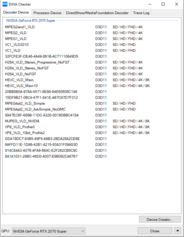
Der GeForce-RTX-2070-Super-Grafikkern (Turing) gehört der leistungsfähigen GPU-Oberklasse an. Ihm steht schneller GDDR6-Speicher (8.192 GB) zur Seite. Die 3D-Mark-Resultate bewegen sich auf einem normalen Niveau für die hier verbaute GPU. Der "Overboost"-Modus bewirkt keinen Anstieg der Grafikleistung. Die im Prozessor integrierte UHD-Graphics-630-GPU ist aktiv, und das Notebook arbeitet mit Nvidias Umschaltgrafiklösung Optimus.
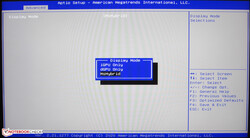
Die Verwendung von Optimus ist nicht zwingend notwendig. Das BIOS des Rechners bietet drei Optionen: "MSHybrid" (= Optimus), "iGPU Only" (= UHD Graphics 630), "dGPU Only" (= 2070 Super). Somit besteht die Möglichkeit der direkten Anbindung des Displays an die GeForce GPU.
| 3DMark 11 Performance | 24031 Punkte | |
| 3DMark Cloud Gate Standard Score | 46745 Punkte | |
| 3DMark Fire Strike Score | 18229 Punkte | |
| 3DMark Time Spy Score | 7943 Punkte | |
Hilfe | ||
Gaming Performance
Das Neo 17 bringt alle aktuellen Spiele in Full-HD-Auflösung und mit maximalen Qualitätseinstellungen flüssig auf den Bildschirm. Höhere Auflösungen (hierfür muss ein entsprechender Monitor angeschlossen werden) bewältigt die Hardware ebenfalls. Der "Overboost"-Modus führt nicht zu einem Anstieg der Bildwiederholraten (siehe Vergleichsdiagramm).
| Serious Sam 4 - 1920x1080 Ultra (DX12) AA:2xMS | |
| Durchschnittliche NVIDIA GeForce RTX 2070 Super Mobile (71.1 - 82.1, n=4) | |
| Schenker XMG Neo 17 Comet Lake | |
| Asus Strix G17 G712LWS | |
| Acer Predator Helios 300 PH317-54-75G8 | |
| Mafia Definitive Edition - 1920x1080 High Preset | |
| Schenker XMG Neo 17 Comet Lake | |
| Durchschnittliche NVIDIA GeForce RTX 2070 Super Mobile (92 - 96.6, n=2) | |
| Asus Strix G17 G712LWS | |
| Acer Predator Helios 300 PH317-54-75G8 | |
| Watch Dogs Legion - 1920x1080 Ultra Preset (DX12) | |
| Durchschnittliche NVIDIA GeForce RTX 2070 Super Mobile (59.3 - 64, n=4) | |
| Schenker XMG Neo 17 Comet Lake (Overboost) | |
| Schenker XMG Neo 17 Comet Lake | |
| Dirt 5 - 1920x1080 Ultra High Preset | |
| Durchschnittliche NVIDIA GeForce RTX 2070 Super Mobile (45.5 - 68.6, n=3) | |
| Schenker XMG Neo 17 Comet Lake | |
| Flight Simulator 2020 - 1920x1080 Ultra AA:TAA AF:16x | |
| Schenker XMG Neo 17 Comet Lake (Overboost) | |
| Schenker XMG Neo 17 Comet Lake | |
| Durchschnittliche NVIDIA GeForce RTX 2070 Super Mobile (37.8 - 43.8, n=3) | |
| Asus Strix G17 G712LWS | |
| Acer Predator Helios 300 PH317-54-75G8 | |
| Durchschnitt der Klasse Gaming (n=1der letzten 2 Jahre) | |
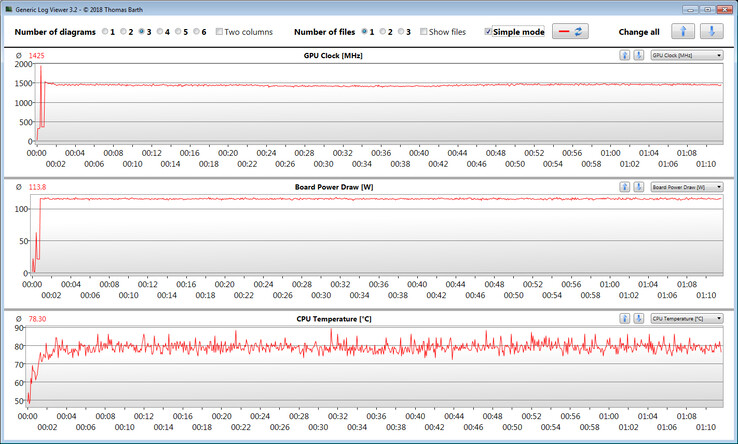
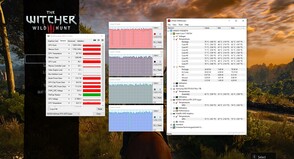
Um zu überprüfen, ob die Bildwiederholraten über einen längeren Zeitraum weitgehend konstant bleiben, lassen wir das Spiel "The Witcher 3" für etwa 60 Minuten mit Full-HD-Auflösung und maximalen Qualitätseinstellungen laufen. Die Spielfigur wird nicht bewegt. Ein Einbruch der Bildwiederholraten ist nicht festzustellen.
| min. | mittel | hoch | max. | |
|---|---|---|---|---|
| The Witcher 3 (2015) | 274 | 247.1 | 162.9 | 90.8 |
| Doom Eternal (2020) | 234.1 | 171.5 | 151.9 | 151 |
| Horizon Zero Dawn (2020) | 152 | 129 | 116 | 98 |
| Flight Simulator 2020 (2020) | 71.2 | 61.7 | 53.3 | 42.1 |
| Serious Sam 4 (2020) | 122 | 93.7 | 87.8 | 72.5 |
| Mafia Definitive Edition (2020) | 149.5 | 106 | 96.6 | |
| Watch Dogs Legion (2020) | 112.2 | 102.7 | 90.1 | 59.3 |
| Dirt 5 (2020) | 157 | 91 | 73.6 | 45.5 |
| Assassin´s Creed Valhalla (2020) | 122 | 83 | 71 | 60 |
Emissionen & Energie - XMG Neo bietet nur maue Akkulaufzeiten
Geräuschemissionen
Die beiden Lüfter arbeiten im Leerlauf überwiegend mit niedrigen Drehgeschwindigkeiten. Gelegentlich stehen sie still, und es herrscht Lautlosigkeit. Unter Last drehen die Lüfter auf. So registrieren wir maximale Schalldruckpegel von 52 dB(A) (Stresstest) bzw. 50 dB(A) (Witcher-3-Test). Die Nutzung eines Headsets empfiehlt sich.
Lautstärkediagramm
| Idle |
| 26 / 30 / 33 dB(A) |
| Last |
| 50 / 52 dB(A) |
 | ||
30 dB leise 40 dB(A) deutlich hörbar 50 dB(A) störend |
||
min: | ||
Temperatur
Unseren Stresstest (Prime95 und Furmark laufen für mindestens eine Stunde) durchlaufen CPU und GPU mit 2,7 GHz bzw. 1.125 MHz. Der Stresstest stellt ein Extremszenario dar. Wir überprüfen mit diesem Test, ob das System auch bei voller Auslastung stabil läuft.
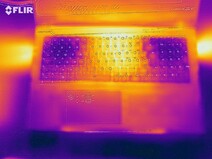
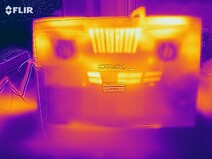
Das Notebook erwärmt sich spürbar: Während des Stresstests registrieren wir an einigen Messpunkten Temperaturen im 50-Grad-Celsius-Bereich. Etwas geringer fällt die Erwärmung bei der Durchführung des Witcher-3-Tests aus. Auf den Oberschenkeln sollte das Gerät nicht abgestellt werden. Im Alltagsbetrieb bewegen sich die Temperaturen im grünen Bereich.
(-) Die maximale Temperatur auf der Oberseite ist 48 °C. Im Vergleich liegt der Klassendurchschnitt bei 40.4 °C (von 21.2 bis 68.8 °C für die Klasse Gaming).
(-) Auf der Unterseite messen wir eine maximalen Wert von 54 °C (im Vergleich zum Durchschnitt von 43.3 °C).
(+) Ohne Last messen wir eine durchschnittliche Temperatur von 29.1 °C auf der Oberseite. Der Klassendurchschnitt erreicht 33.9 °C.
(-) Beim längeren Spielen von The Witcher 3 erhitzt sich das Gerät durchschnittlich auf 41.6 °C. Der Durchschnitt der Klasse ist derzeit 33.9 °C.
(±) Die Handballen und der Touchpad-Bereich können sehr heiß werden mit maximal 39 °C.
(-) Die durchschnittliche Handballen-Temperatur anderer getesteter Geräte war 28.8 °C (-10.2 °C).
Lautsprecher
Schenker XMG Neo 17 Comet Lake Audio Analyse
(+) | Die Lautsprecher können relativ laut spielen (82 dB)
Bass 100 - 315 Hz
(-) | kaum Bass - 25.2% niedriger als der Median
(±) | durchschnittlich lineare Bass-Wiedergabe (12.7% Delta zum Vorgänger)
Mitteltöne 400 - 2000 Hz
(+) | ausgeglichene Mitten, vom Median nur 3.3% abweichend
(+) | lineare Mitten (4.4% Delta zum Vorgänger)
Hochtöne 2 - 16 kHz
(+) | ausgeglichene Hochtöne, vom Median nur 2.8% abweichend
(±) | durchschnittlich lineare Hochtöne (7.8% Delta zum Vorgänger)
Gesamt im hörbaren Bereich 100 - 16.000 Hz
(±) | hörbarer Bereich ist durchschnittlich linear (17.1% Abstand zum Median)
Im Vergleich zu allen Geräten derselben Klasse
» 45% aller getesteten Geräte dieser Klasse waren besser, 12% vergleichbar, 43% schlechter
» Das beste Gerät hat einen Delta-Wert von 6%, durchschnittlich ist 18%, das schlechteste Gerät hat 132%
Im Vergleich zu allen Geräten im Test
» 30% aller getesteten Geräte waren besser, 8% vergleichbar, 61% schlechter
» Das beste Gerät hat einen Delta-Wert von 4%, durchschnittlich ist 24%, das schlechteste Gerät hat 134%
Energieaufnahme
Im Leerlauf registrieren wir eine maximale Leistungsaufnahme von 29 Watt. Stresstest bzw. Witcher-3-Test lassen den Bedarf auf bis zu 258 Watt bzw. durchschnittlich 199 Watt steigen.
| Aus / Standby | |
| Idle | |
| Last |
|
Legende:
min: | |
Akkulaufzeit
Die Akkulaufzeiten sind nicht der Rede wert. Unseren WLAN-Test (Aufruf von Webseiten mittels eines Skripts; Displayhelligkeit etwa 150 cd/m²) beendet der 17,3-Zöller nach 3:47 h. Das Mehr an Akkukapazität (46 vs. 62 Wh) gegenüber den getesteten 2019er-Modellen bringt dem aktuellen Neo 17 keine Vorteile.
Update 12.12.20: Laut Schenker war ein Bug (Ethernet-Treiber) für die mäßige Akkulaufzeit verantwortlich, der inzwischen behoben wurde. Anhand des Neo 15 können Sie sehen, wie groß die Verbesserung im einwandfreien Zustand etwa ist.
Pro
Contra
Fazit
Das XMG Neo 17 ist dank Core-i7-10875H-Achtkernprozessor, GeForce-RTX-2070-Super-Grafikkern und 32 GB Arbeitsspeicher für alle Herausforderungen gerüstet. Die Hardware bringt alle aktuellen Computerspiele flüssig auf den Bildschirm. Kompromisse müssen nicht eingegangen werden.
Schenker liefert mit dem XMG Neo 17 (2020) ein bärenstarkes Gaming-Notebook, dessen seriöses Äußeres die Nutzung im Büro erlaubt.
Sollte der Speicherplatz der verbauten 1-TB-NVMe-SSD ausgehen, könnte nachgelegt werden: Das Notebook bietet Platz für zwei M.2-2280-SSDs (1x NVMe, 1x NVMe/SATA; RAID-0/1). Der reaktionsschnelle Bildschirm (FHD, IPS, 240 Hz) bietet eine gute Farbdarstellung und eine akzeptable Farbraumabdeckung. Helligkeit und Kontrast erfüllen das Soll. Die Akkulaufzeiten fallen mau aus.
Die mechanische Tastatur (mit RGB-Beleuchtung) hat einen guten Eindruck hinterlassen und wird für viele potentielle Käufer ein wichtiges Kaufkriterium darstellen. Der gegenüber dem Vorgängermodell hinzugewonnene Thunderbolt-3-Steckplatz ermöglicht den Anschluss einer umfangreichen Docking-Lösung oder einer externen GPU.
Schenker XMG Neo 17 Comet Lake
- 27.11.2020 v7 (old)
Sascha Mölck


