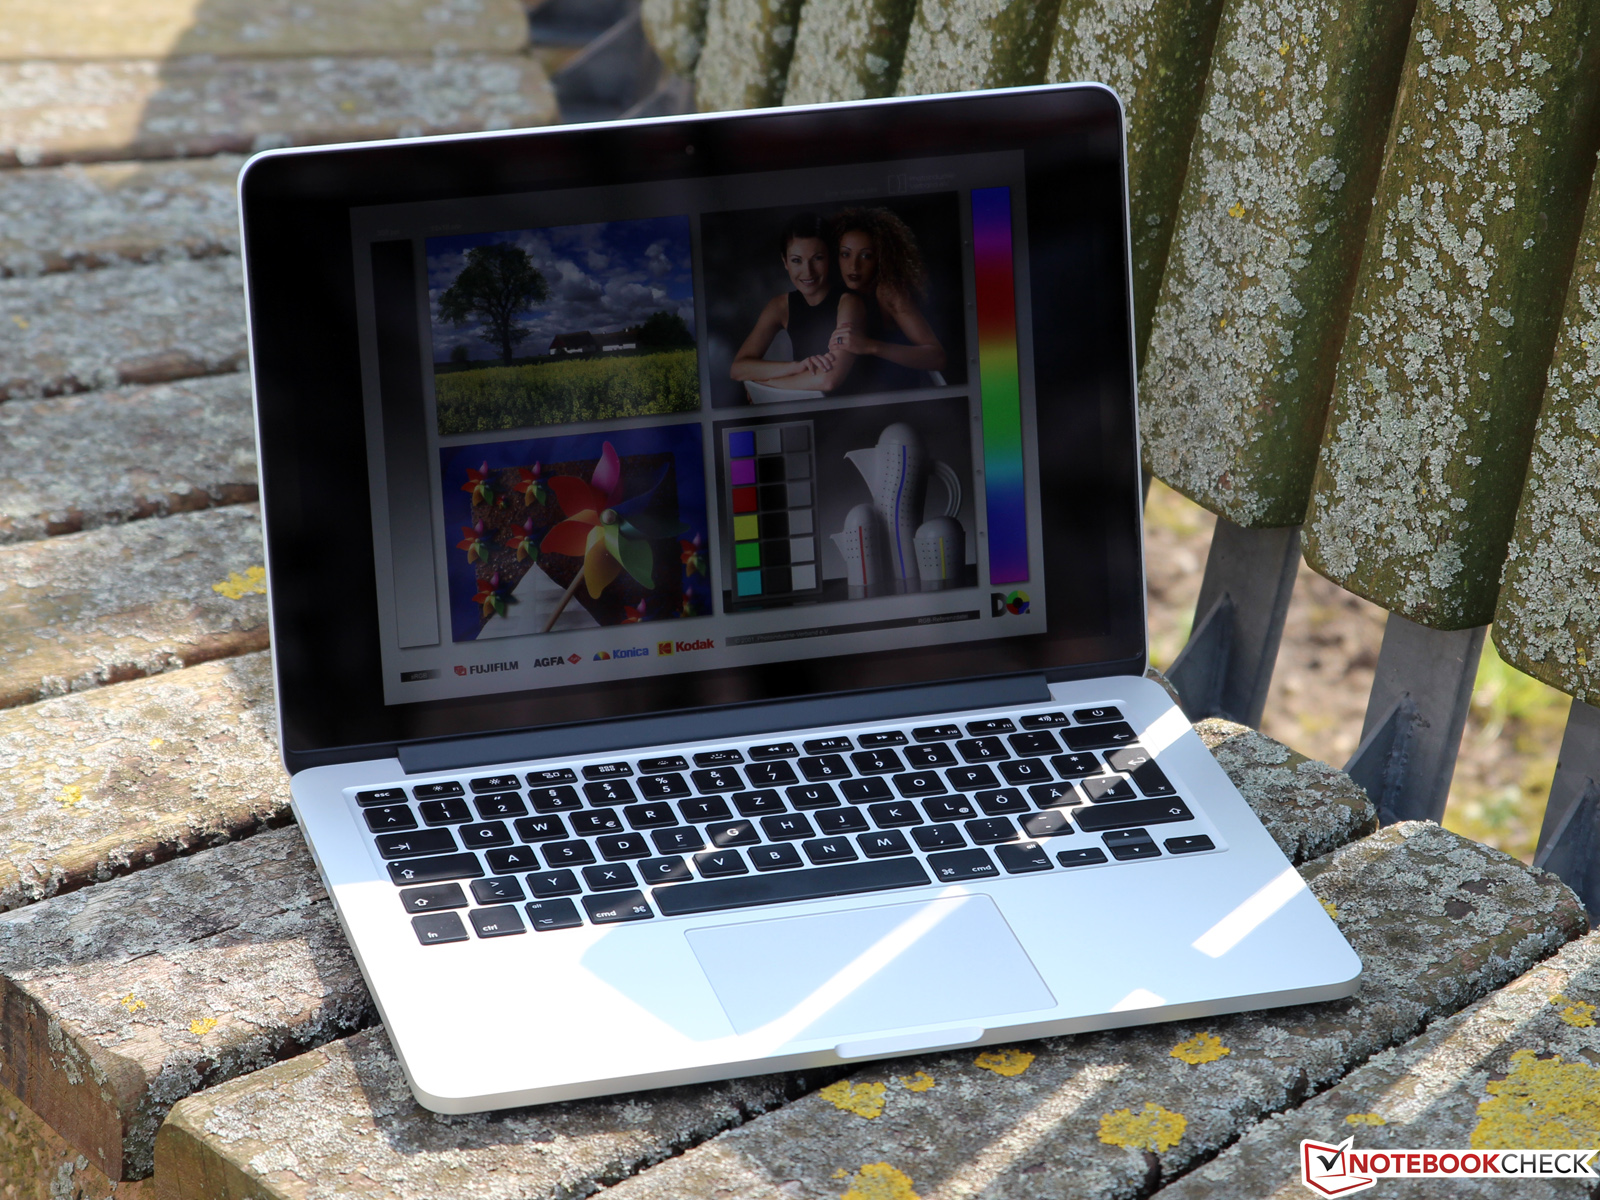
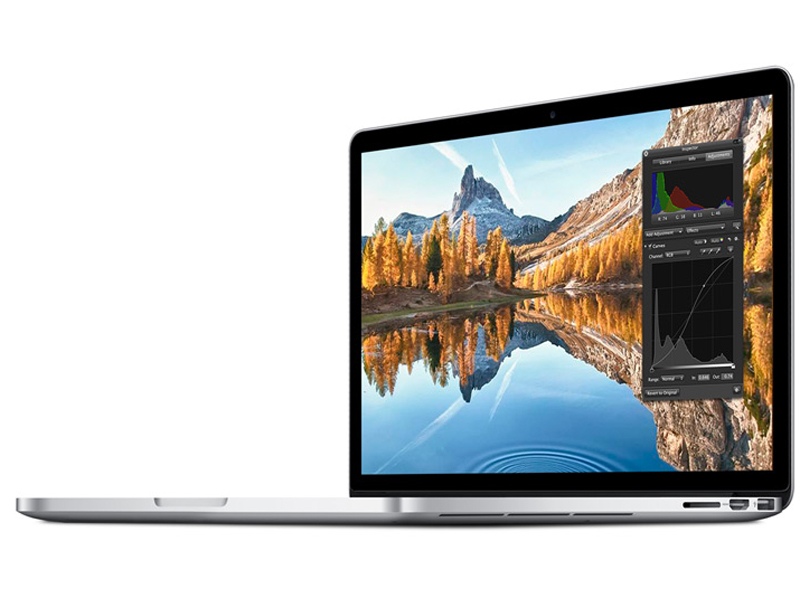
Test Apple MacBook Pro Retina 13 (Early 2015)
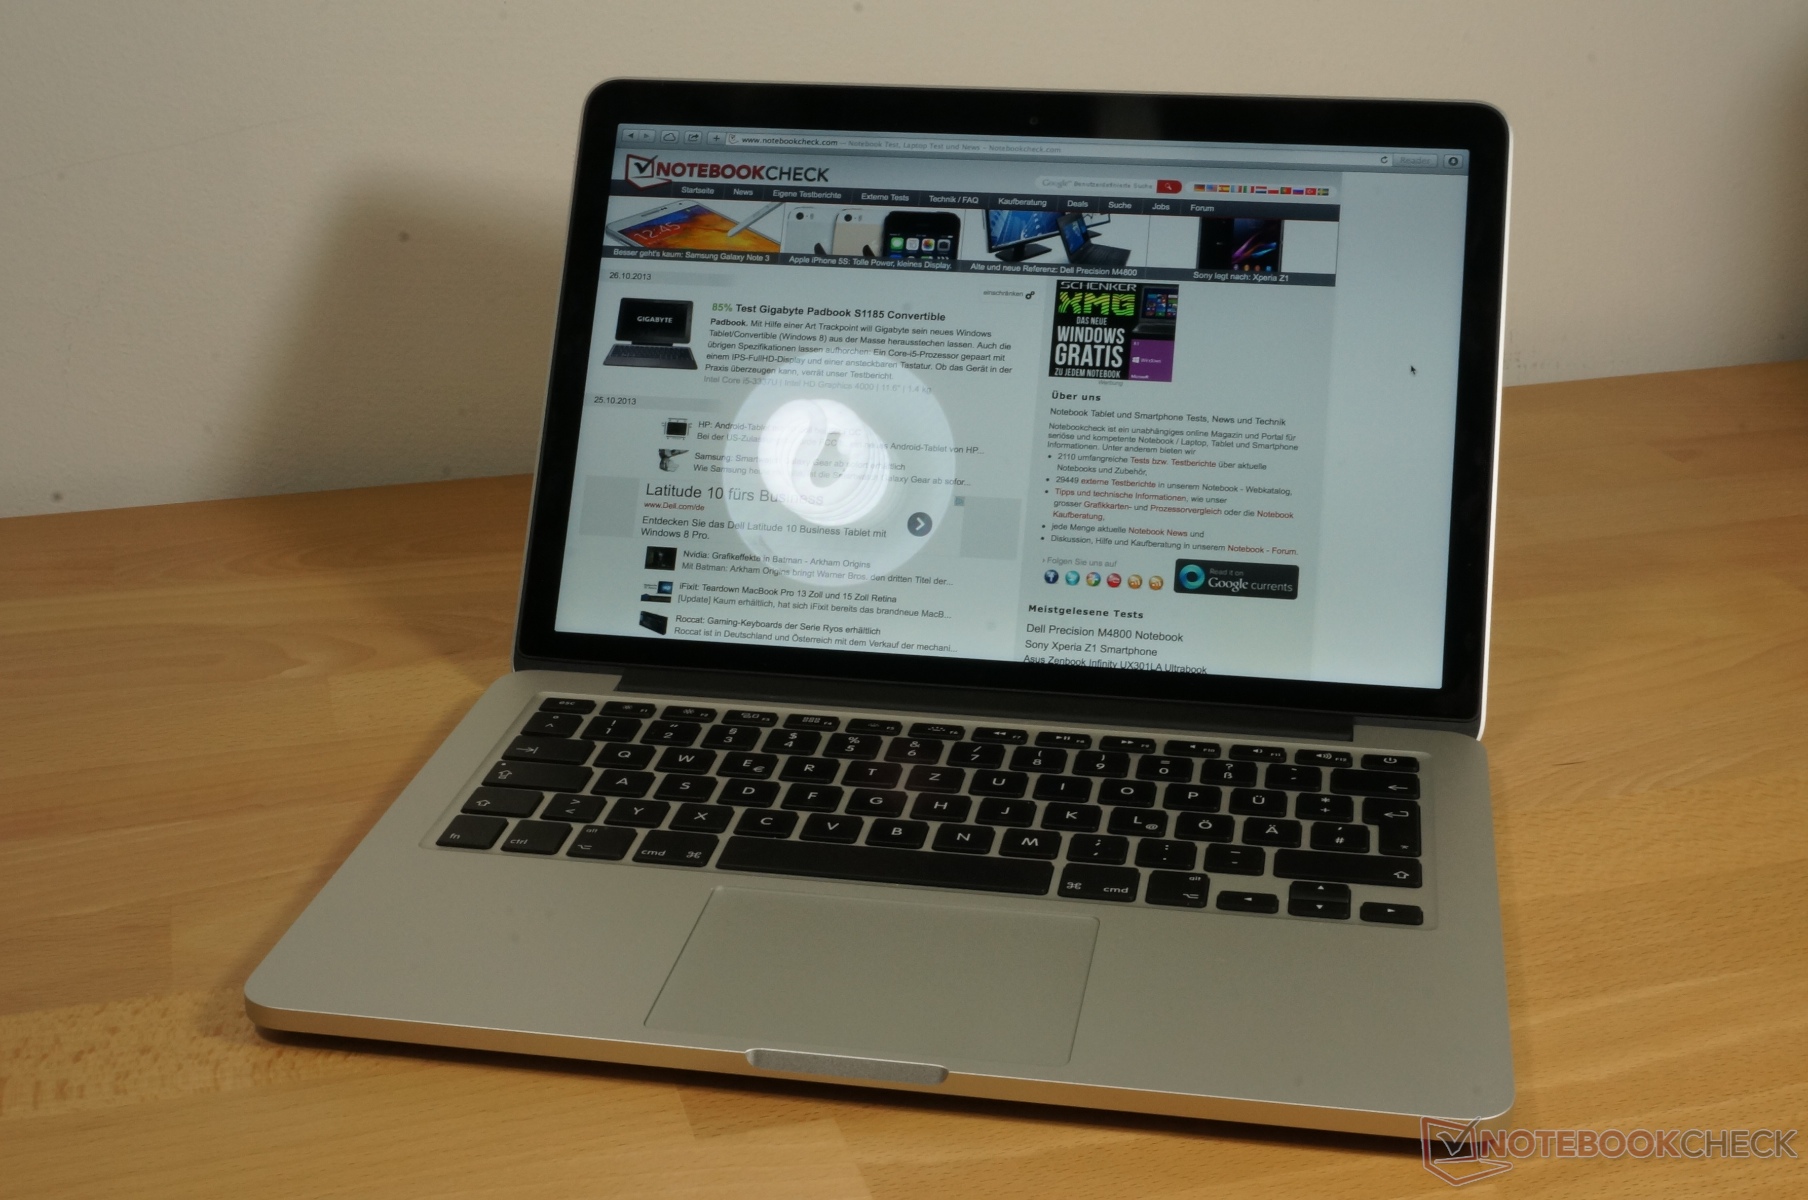
Für viele ist es das wohl beste Subnotebook auf dem Markt: Apples MacBook Pro 13 Retina. Vor allem die Kombination aus hervorragender Mobilität, toller Performance und Apple-typisch makelloser Verarbeitung bescherte dem 13-Zöller Ende 2013 einen Spitzenplatz in unserer entsprechenden Top-10-Rangliste.
Seit Anfang dieses Jahres gibt es nun eine Neuauflage des "MBP 13", die wir in diesem Test genauer unter die Lupe nehmen wollen. Im Mittelpunkt steht dabei die aktualisierte Hardware-Plattform auf Basis der Intel-Broadwell-Generation, deren gesteigerte Energieeffizienz für noch längere Laufzeiten sorgen soll. Darüber hinaus hat der Hersteller weitere kleine Verbesserungen einfließen lassen, beginnend vom neuen Force Touch Trackpad bis hin zu einer laut Apple nun doppelt so schnellen SSD.
Dass ein MacBook nicht gerade den preiswertesten Einstieg in die Notebook-Welt repräsentiert, dürfte wohl niemanden überraschen. Gleichwohl müssen Interessenten in diesem Jahr ganz besonders tief in die Tasche greifen – im Zuge des aktuell extrem schwachen Euro hat Apple die Preise kräftig angehoben. So geht das uns vorliegende Basismodell mit einem Core i5-5257U, 8 GB RAM und 128-GB-SSD nun für satte 1.449 Euro über die virtuelle Ladentheke, für die üppig ausgestattete Top-Konfiguration (Core i7/16 GB/1 TB) werden sogar fast 3.000 Euro fällig. Bei manchem Händler kann man gegenüber dem offiziellen Apple-Preis zwar den ein oder anderen Euro sparen, ein teures Vergnügen bleibt das MBP 13 aber in jedem Fall.
Gehäuse, Ausstattung und Kommunikation
Da Gehäuse und Schnittstellen unverändert vom Vorgänger übernommen wurden, wollen wir diese Themen nicht noch einmal ausführlich untersuchen; sämtliche Details hierzu können unseren Unboxing- und Test-Videos auf Youtube sowie dem vergangenen Testbericht entnommen werden.
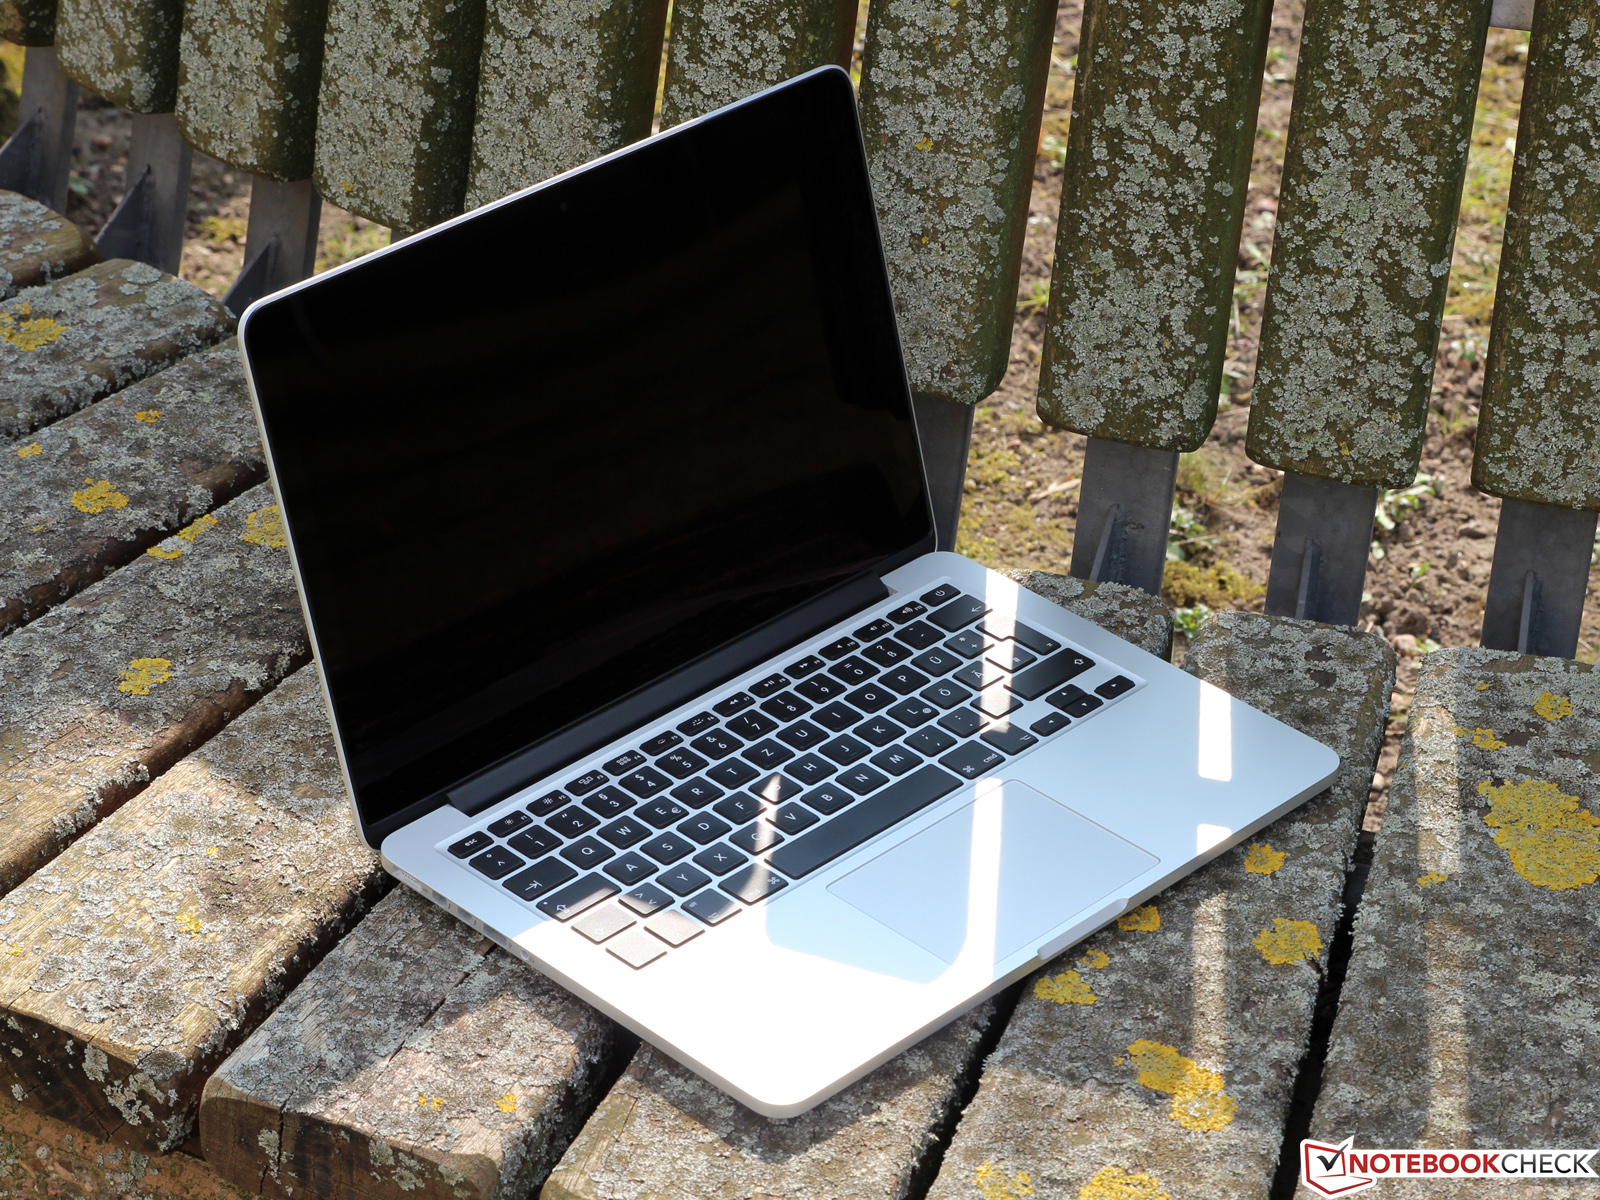
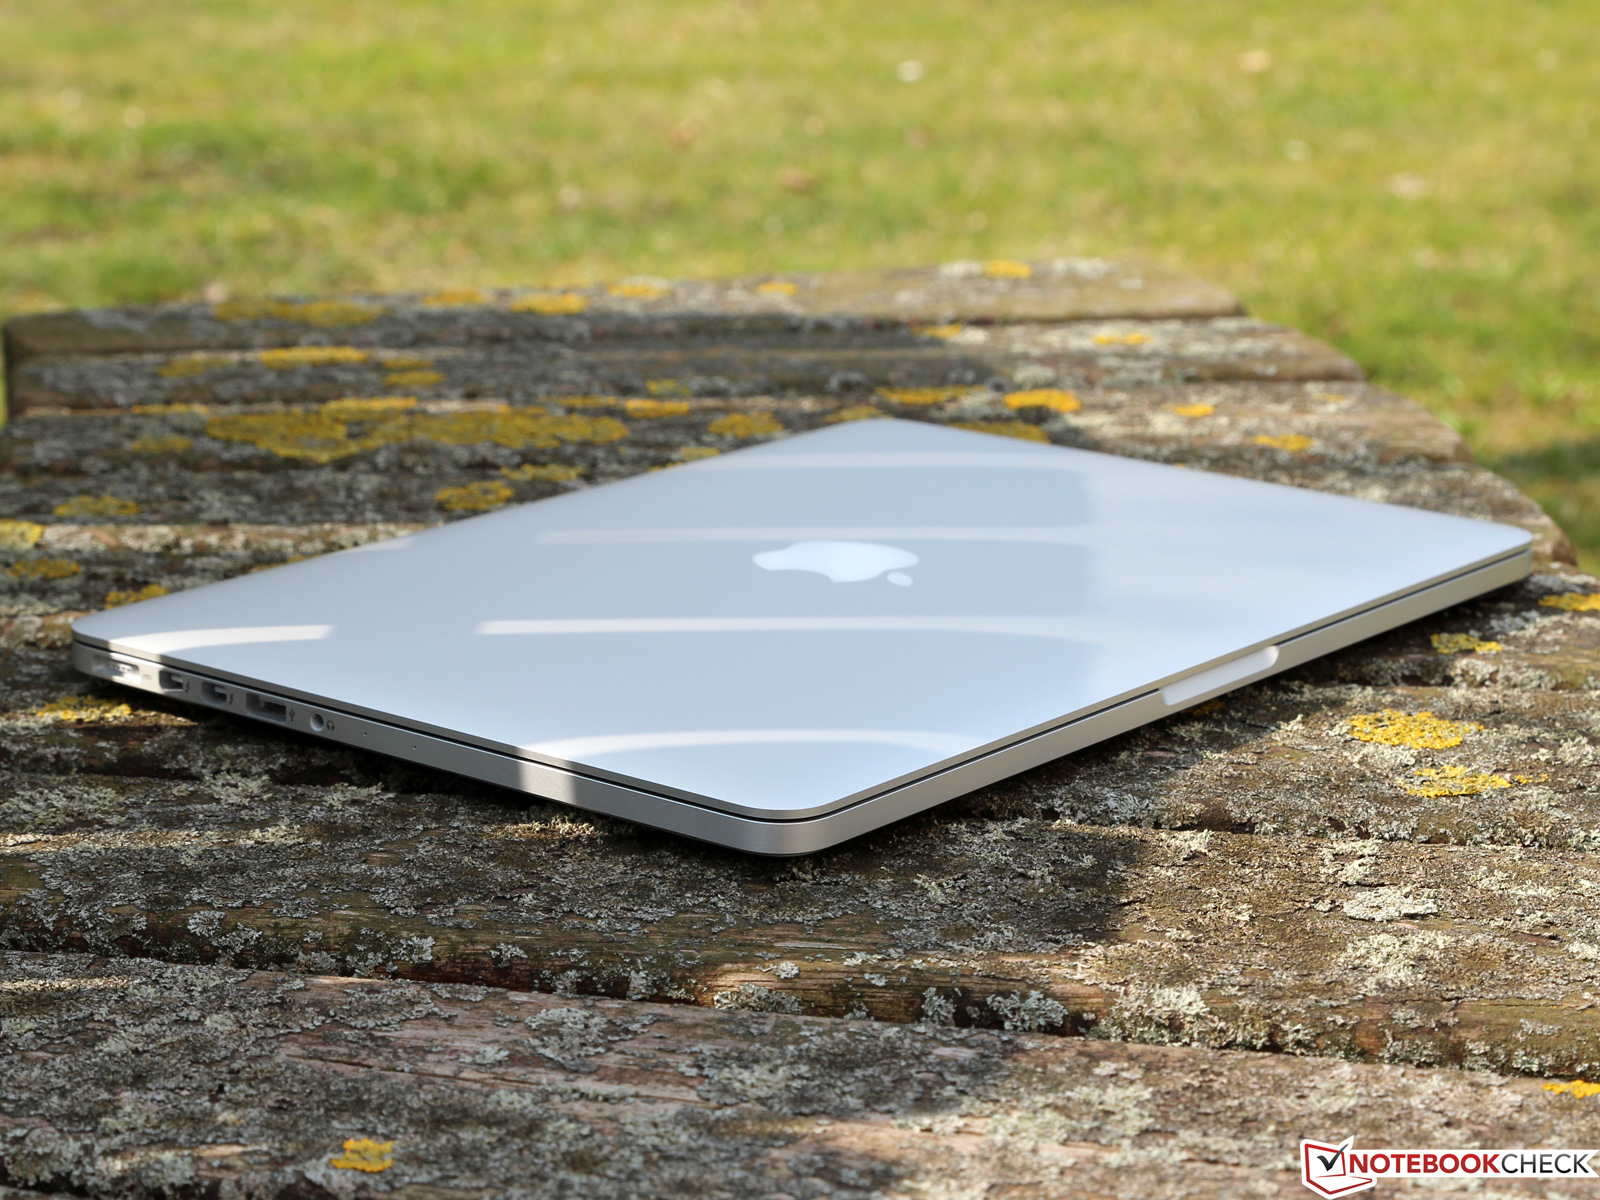
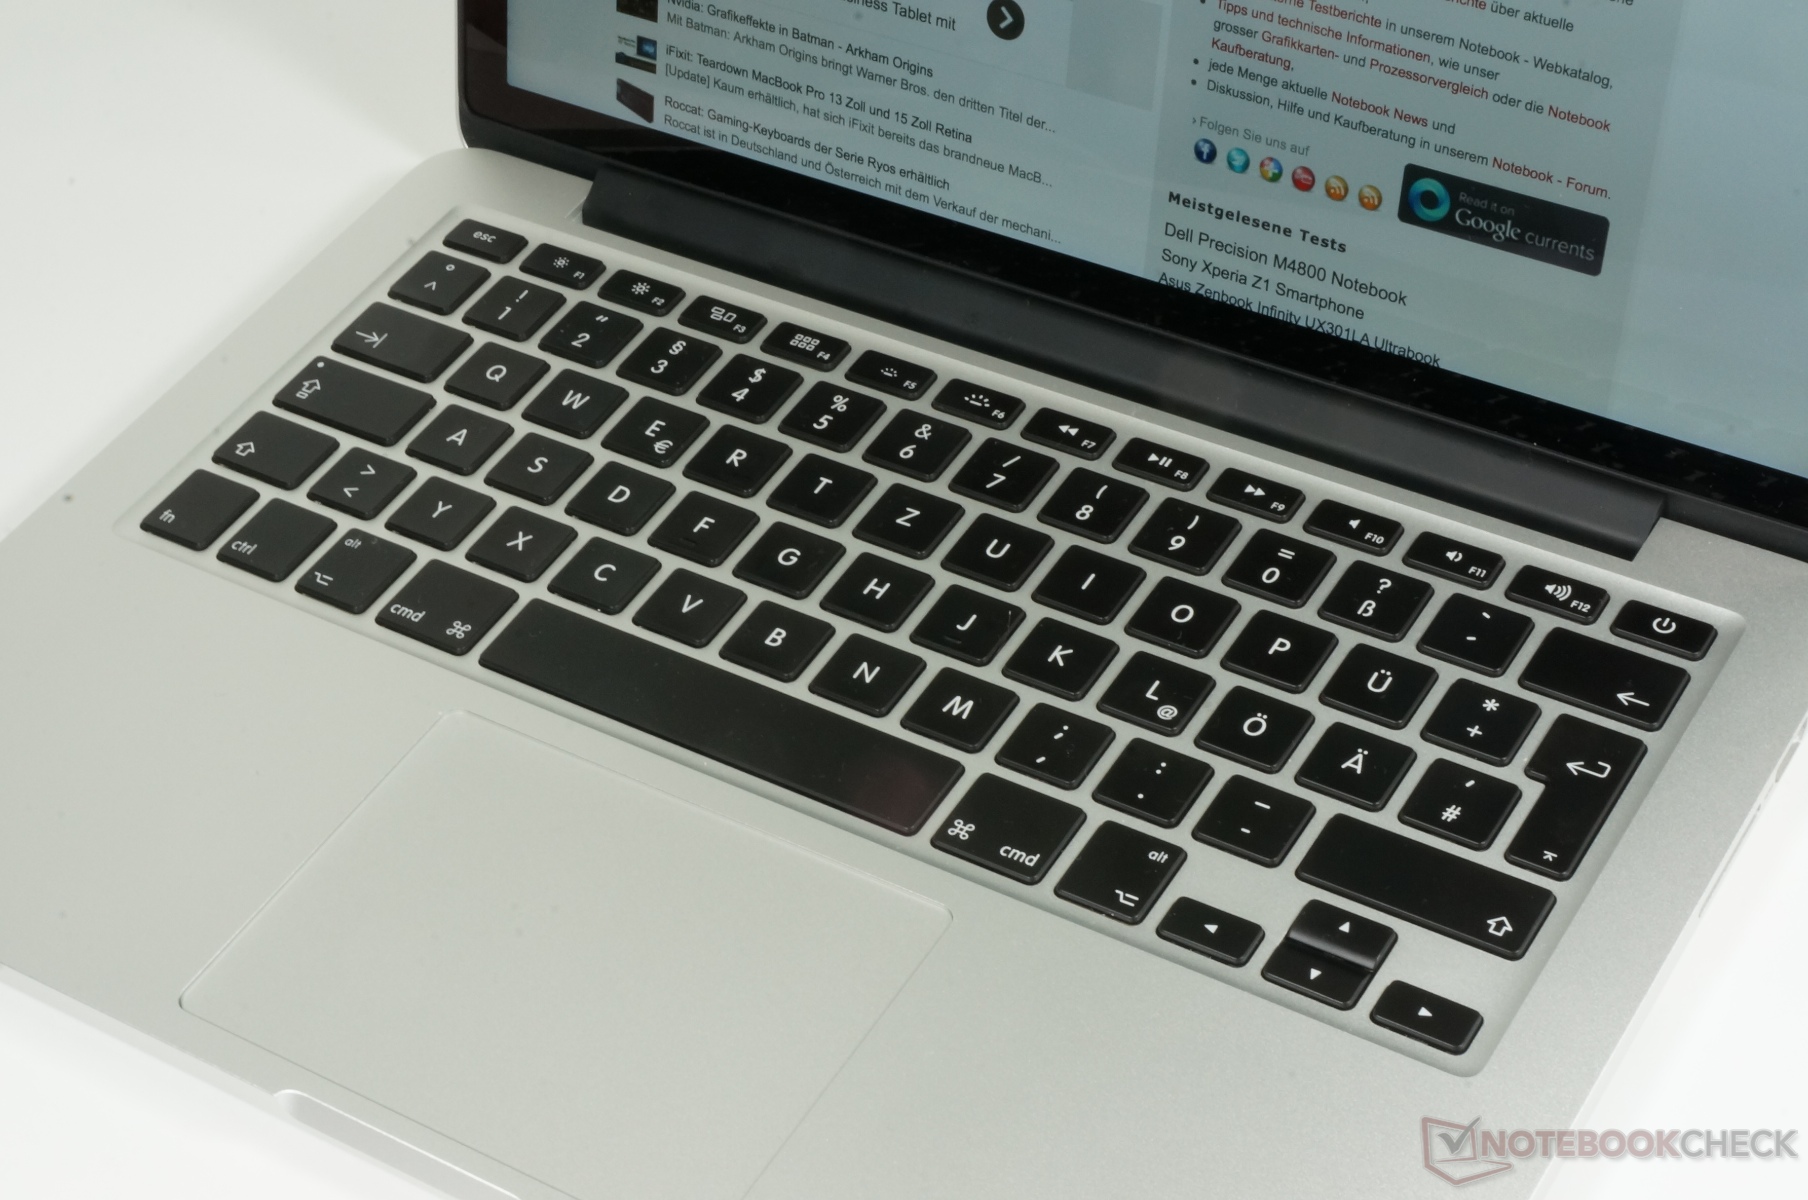
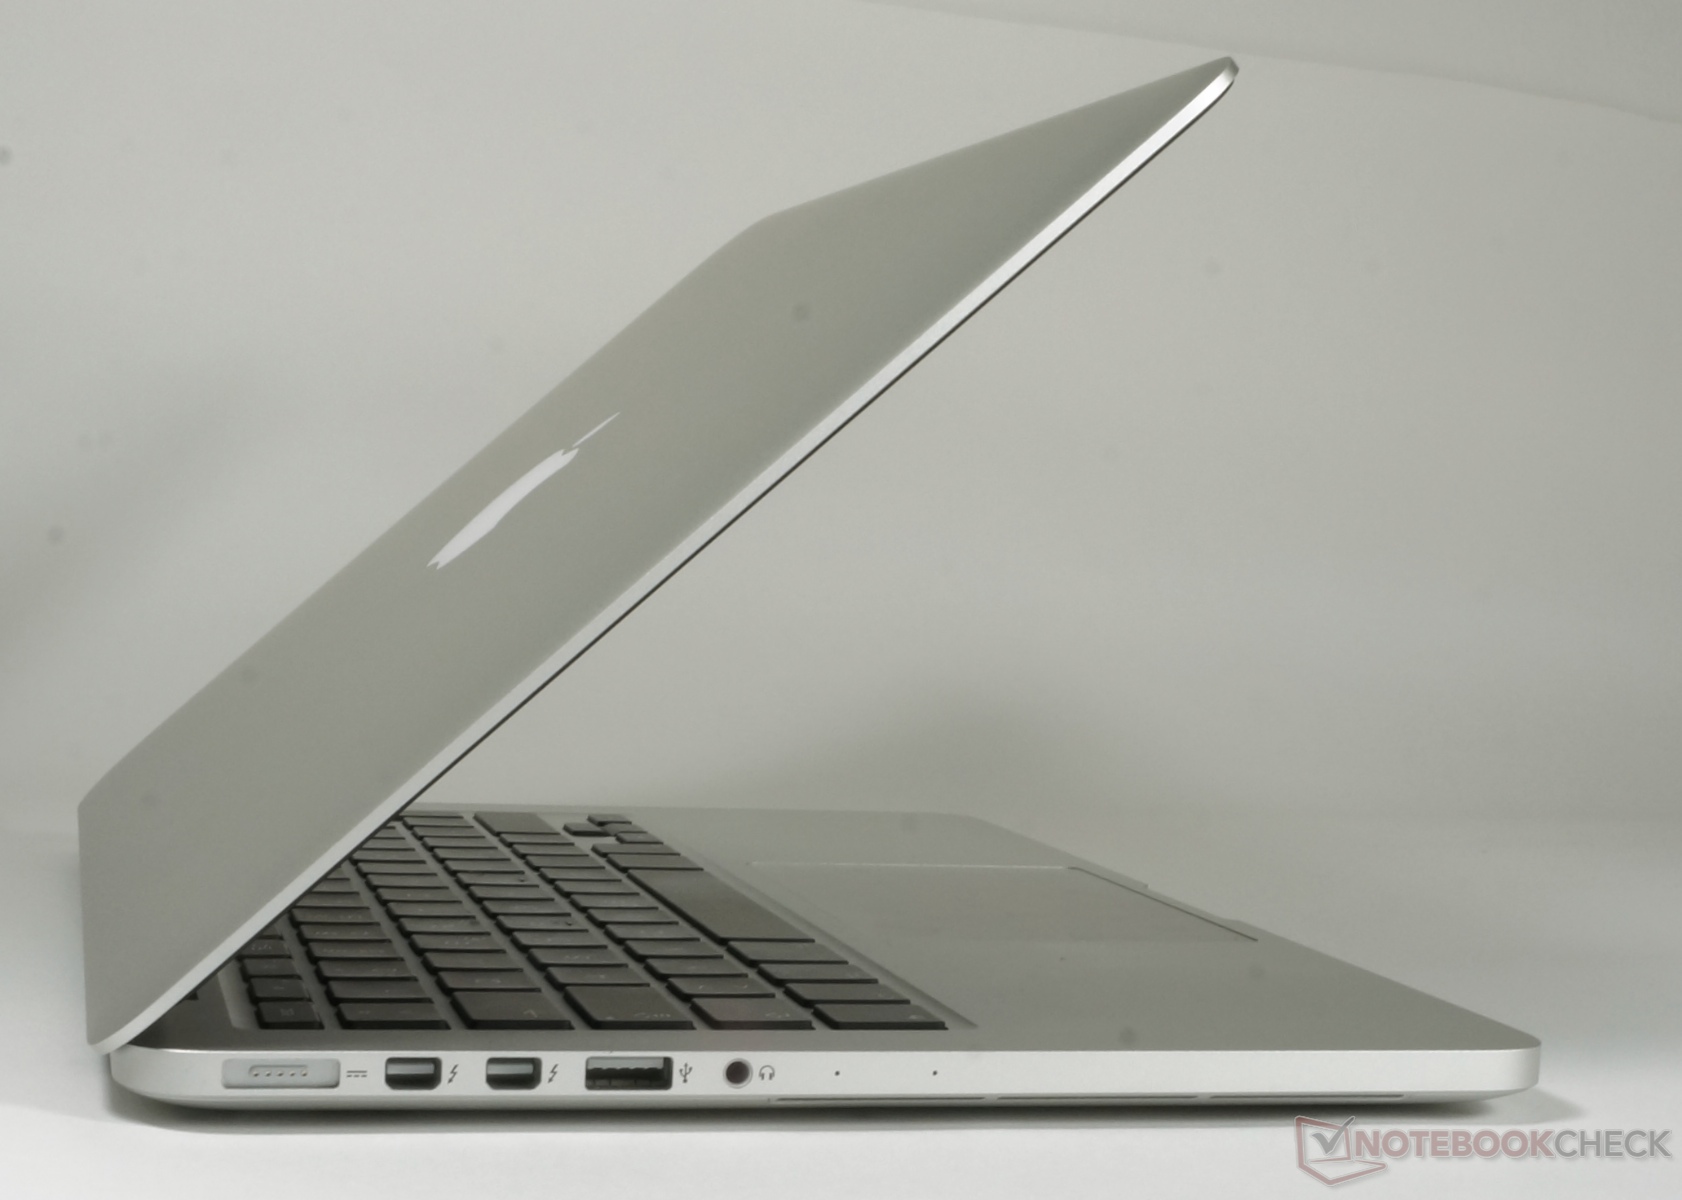
Qualitativ setzt das MacBook weiterhin den Maßstab für die versammelte Konkurrenz. Auch wenn mittlerweile viele durchaus hochwertige Ultrabooks auf Windows-Basis angeboten werden, erreichen doch nur die allerwenigsten die von Apple gesetzte Messlatte. Das aus dem vollen gefräste Aluminium-Chassis zählt mit knapp 1,6 Kilogramm nicht zu den leichtesten seiner Gattung, glänzt dafür aber mit geradezu unverwüstlicher Stabilität und den vielleicht präzisesten Displayscharnieren seiner Klasse. Verarbeitungsmängel konnte unser kritisches Auge nicht entdecken, wohl aber die noch immer sehr eingeschränkten Aufrüstmöglichkeiten. Die Spezialisten von iFixit strafen das MacBook darum mit einem Score von nur 1 von 10 möglichen Punkten ab.
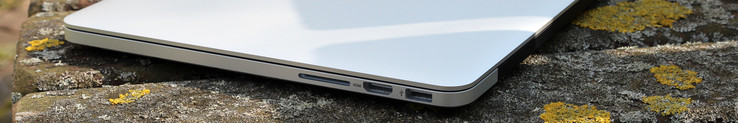
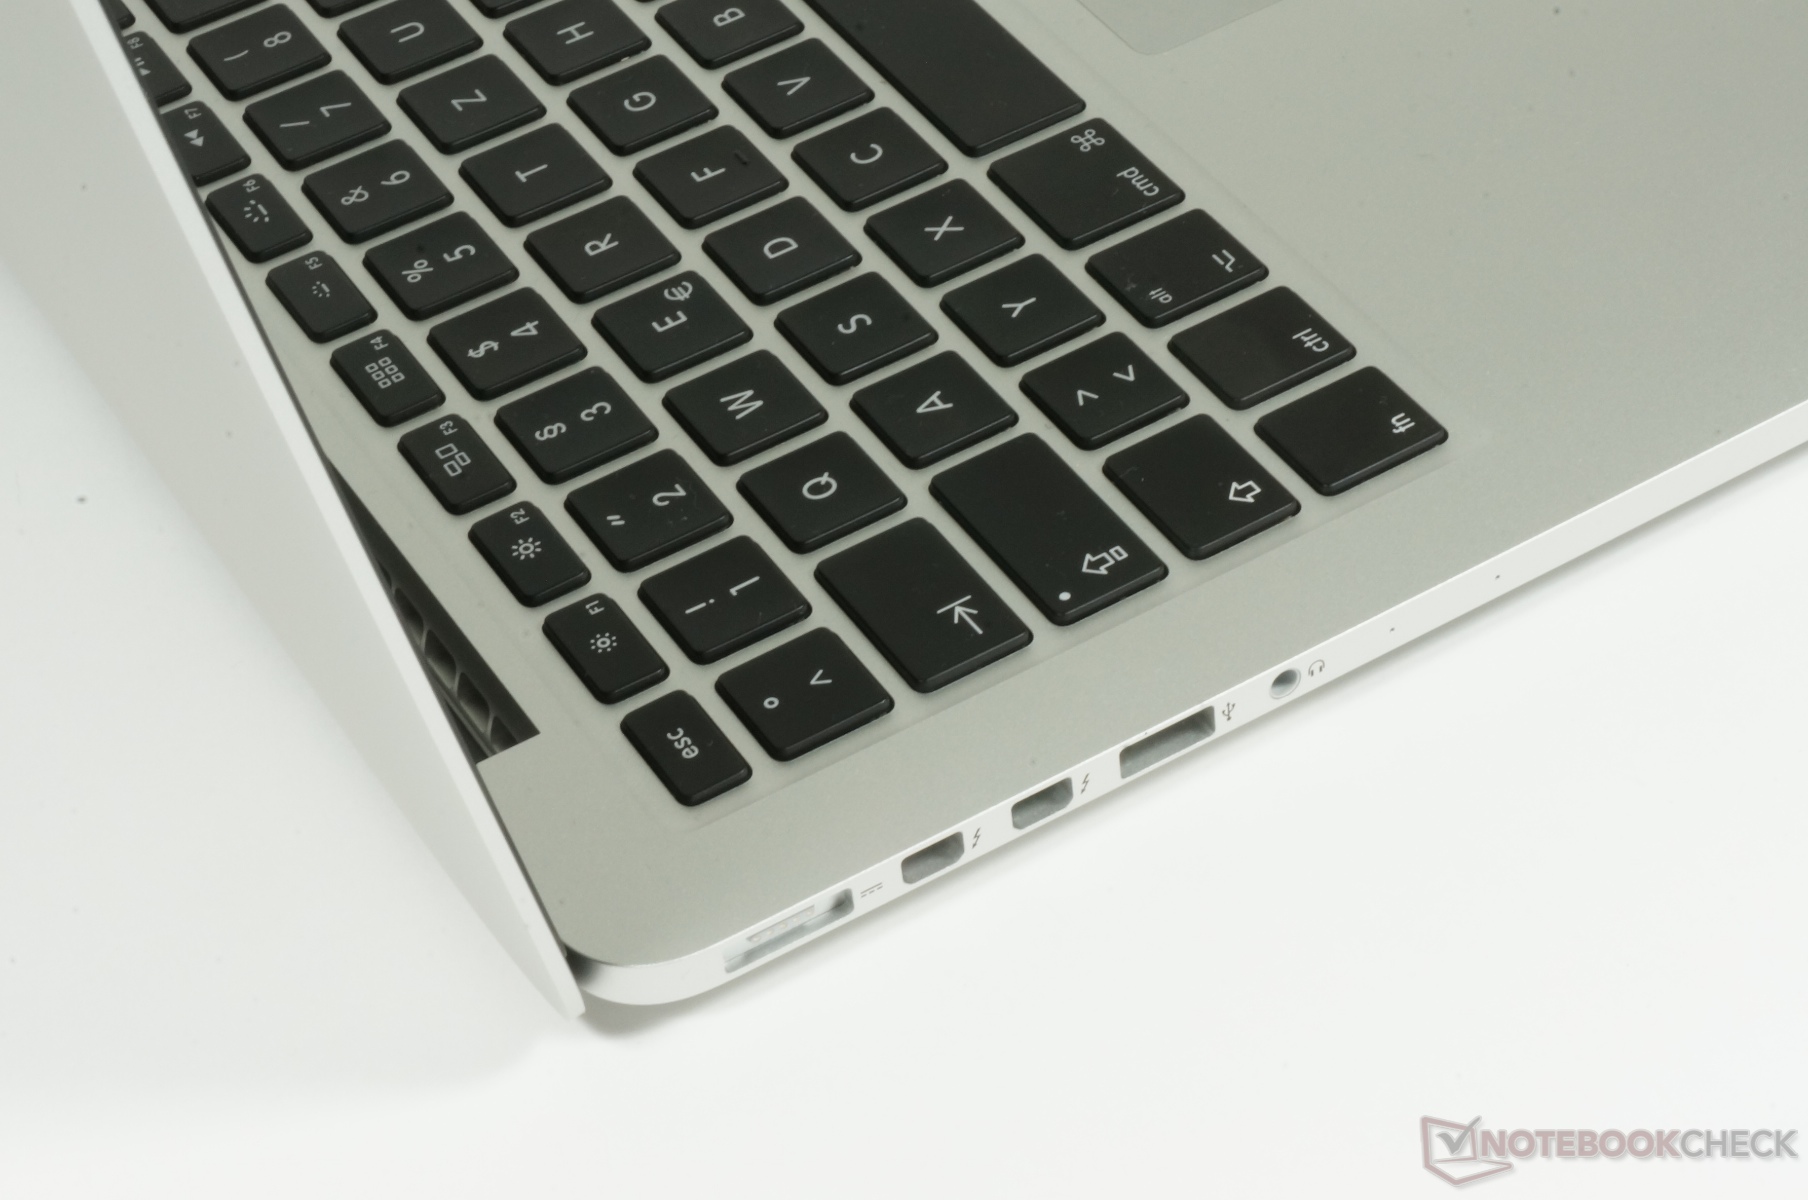
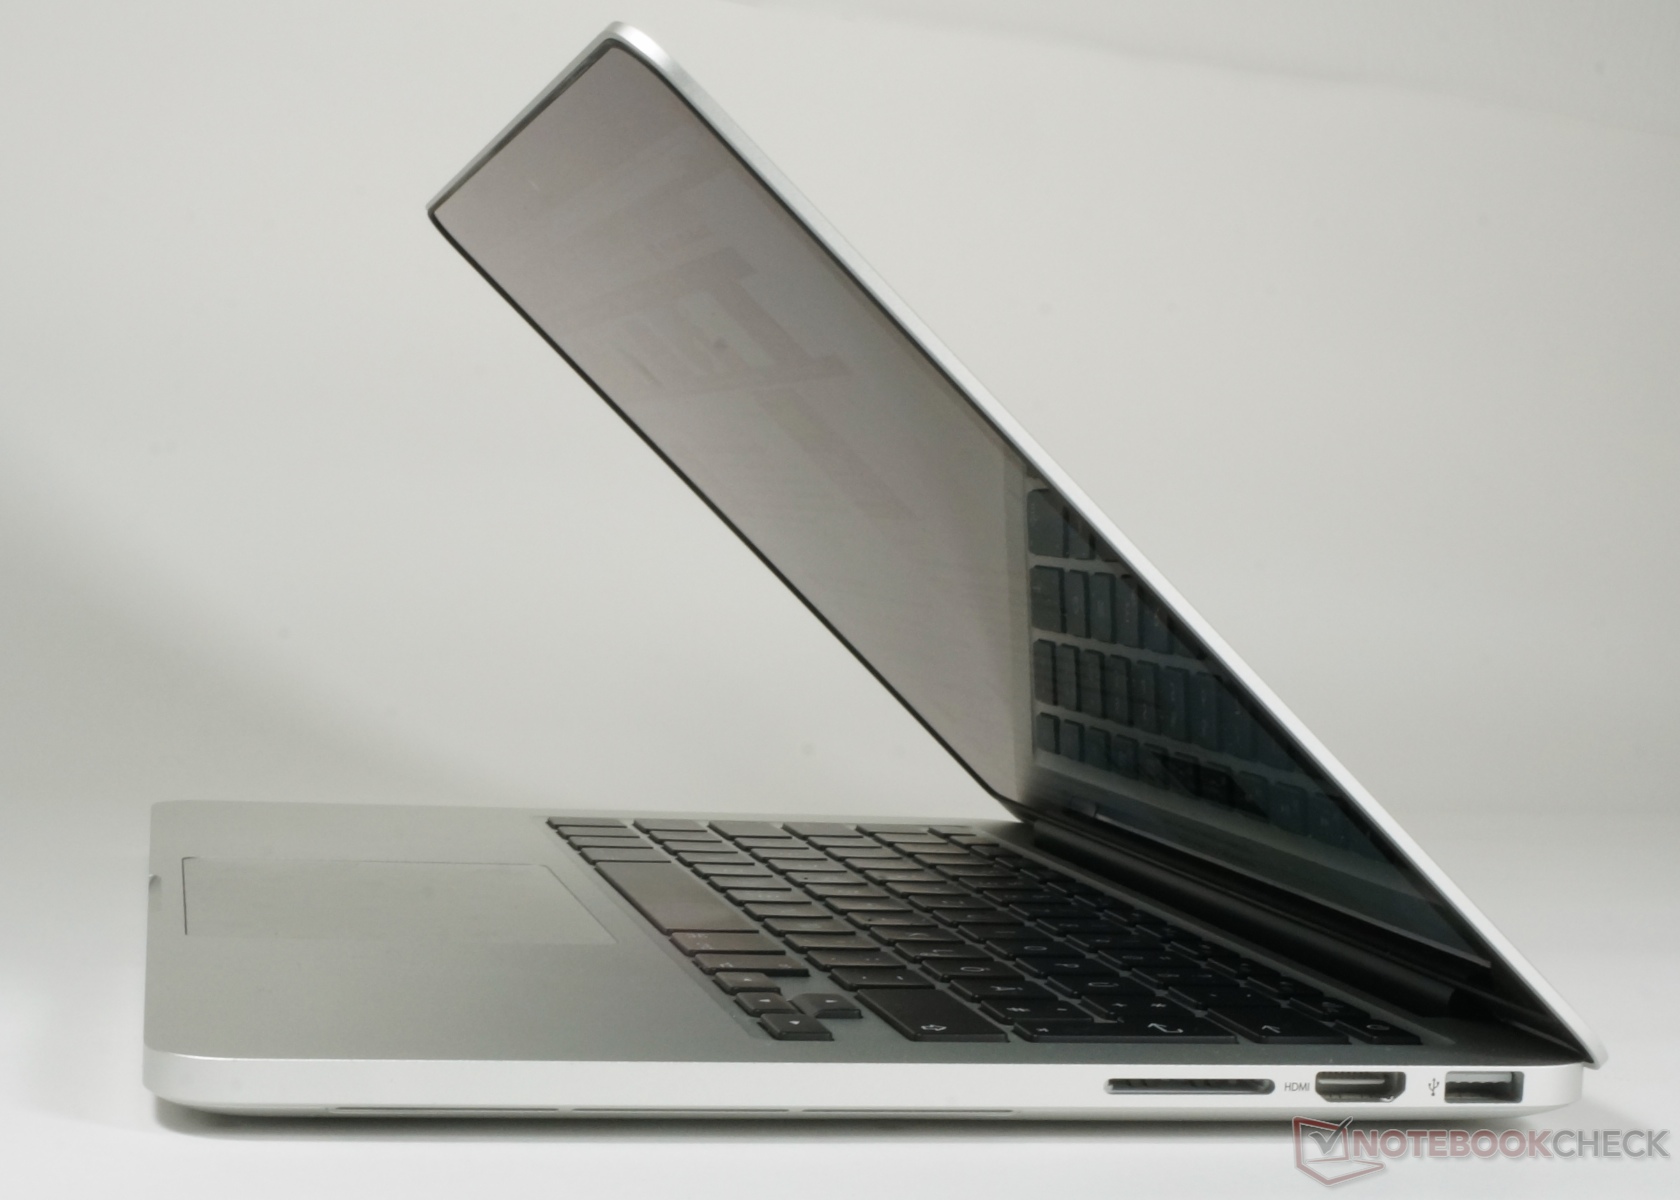
Beim Blick auf das Anschlussfeld stechen insbesondere die beiden Thunderbolt-2-Ausgänge hervor (auch als Mini-DisplayPort nutzbar, bis zu 4K @ 60 Hz), hinzu kommen zwei USB-3.0- sowie ein HDMI-Port (4K @ 24 Hz). Damit qualifiziert sich das MBP als ernsthaftes Arbeitsgerät – eine Ambition, die man der diesbezüglich stark abgespeckten Air-Serie oder dem neuen 12-Zoll-MacBook nicht nachsagen kann. Das drahtlose Kommunikations-Repertoire umfasst wie üblich Bluetooth 4.0 sowie WLAN nach 802.11ac, wobei Apple auf einen besonders flotten Triple-Stream-Adapter von Broadcom setzt.
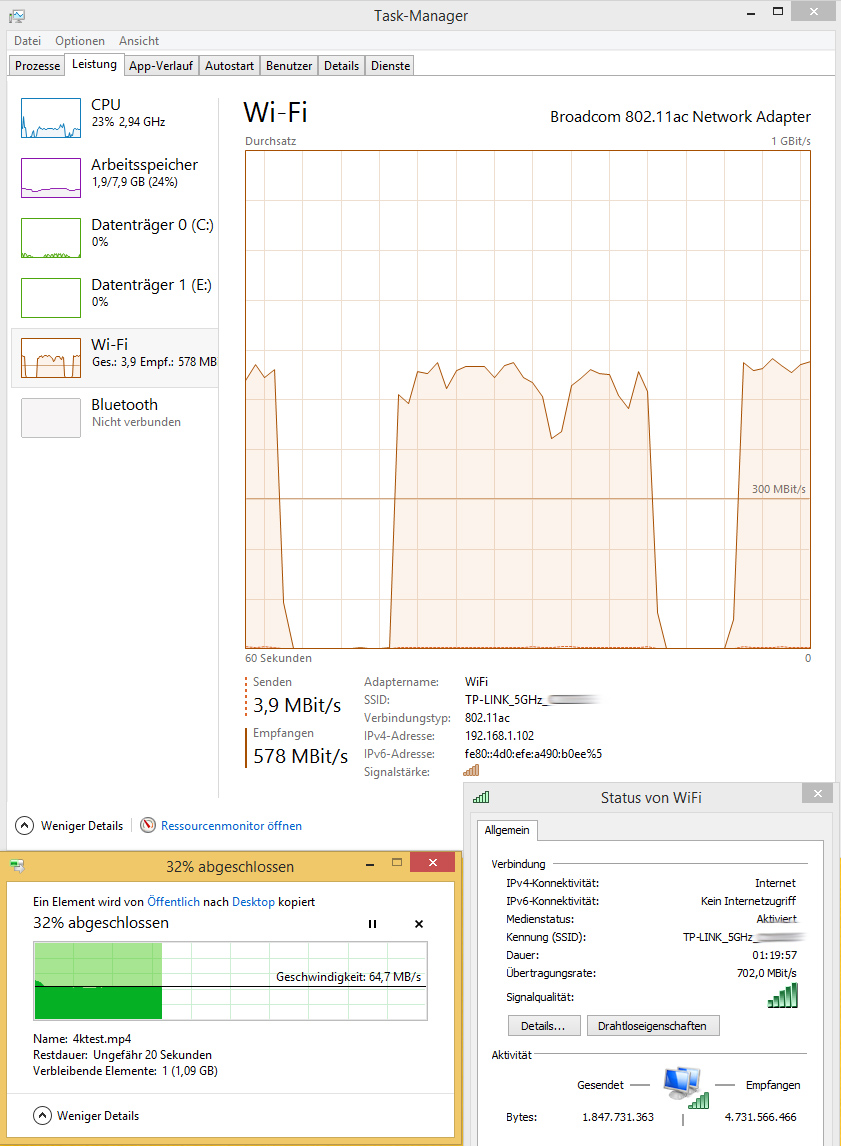
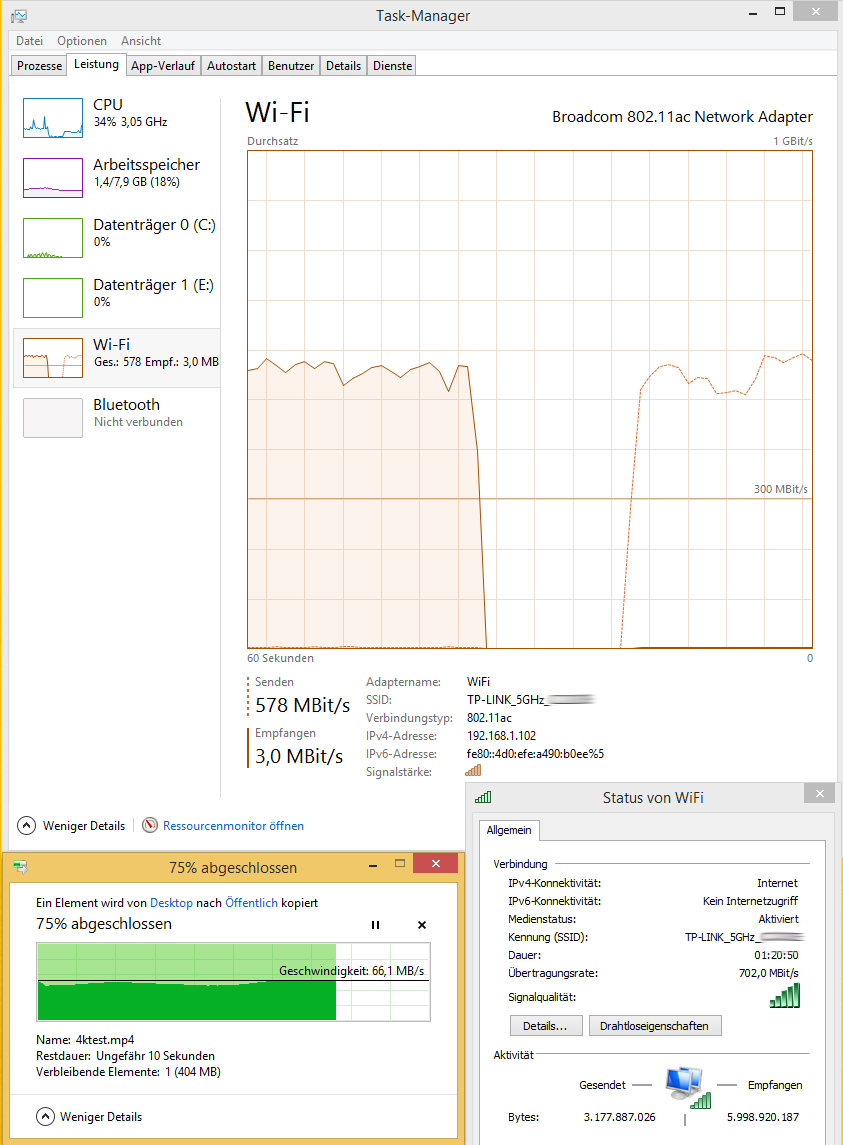
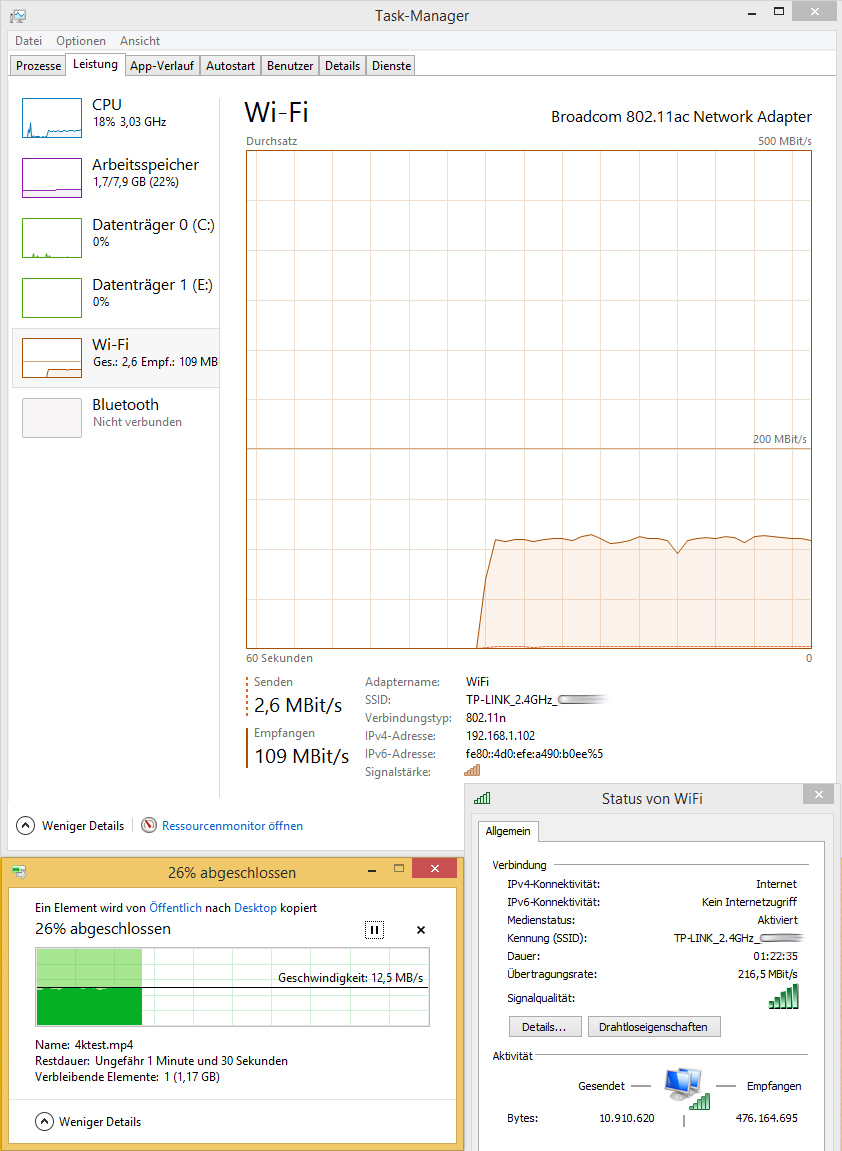
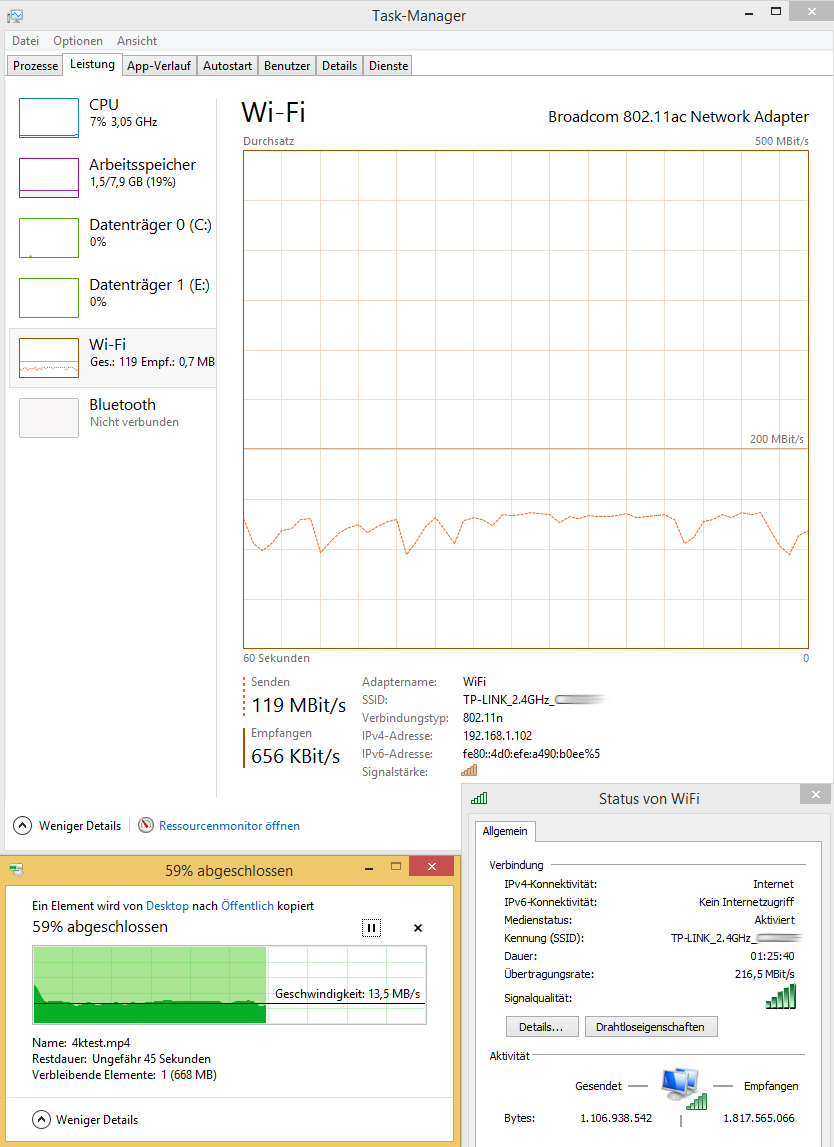
Auf dem Papier erreicht der BCM94360CS enorme 1,3 Gbit/s Bruttodatenrate; mit unserem TP-Link Archer C7 harmonierte das Modul allerdings nicht sonderlich gut und kam zunächst kaum über etwa 100 Mbit/s hinaus. Nach einem Firmware-Update des Routers stieg die Übertragungsgeschwindigkeit dagegen auf knapp 580 Mbit/s beziehungsweise rund 65 MB/s netto an – ein absolut rekordverdächtiges Ergebnis, mit dem der Broadcom-Chip übliche Dual-Stream-Lösungen wie Intels Wireless-AC 7265 um satte 50 Prozent übertrifft.
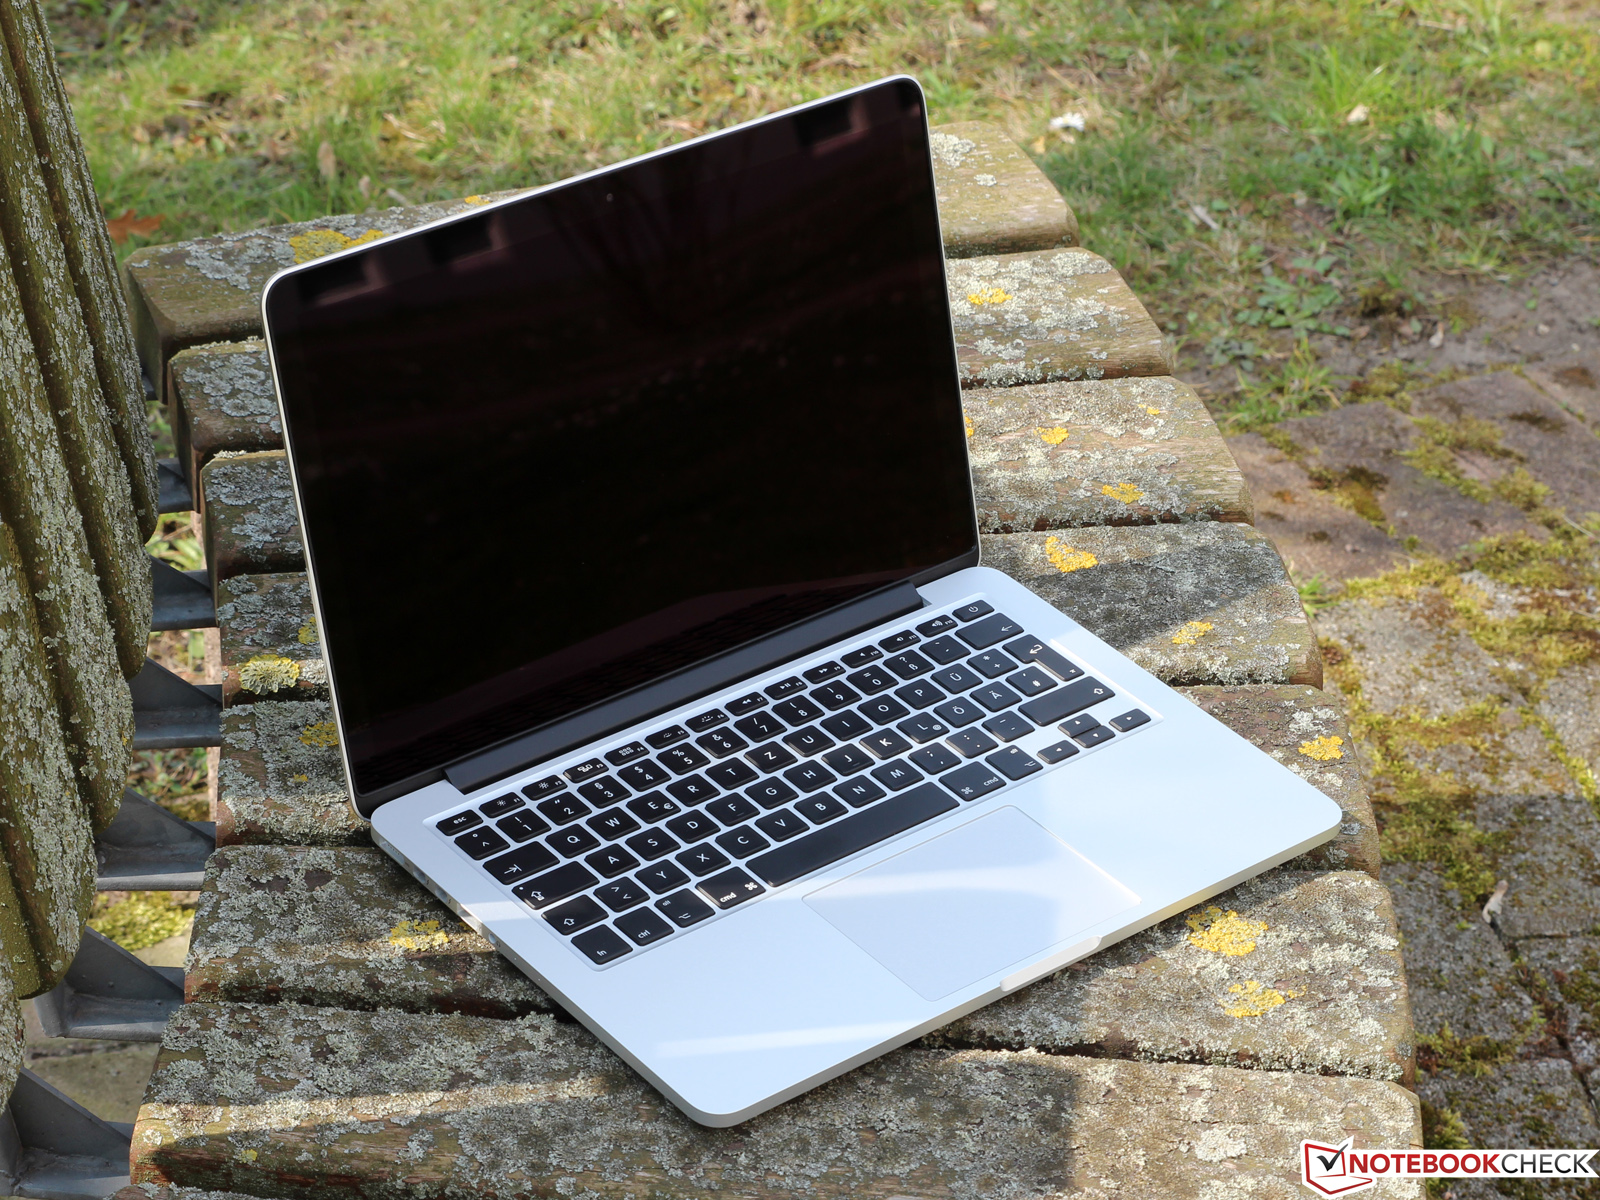
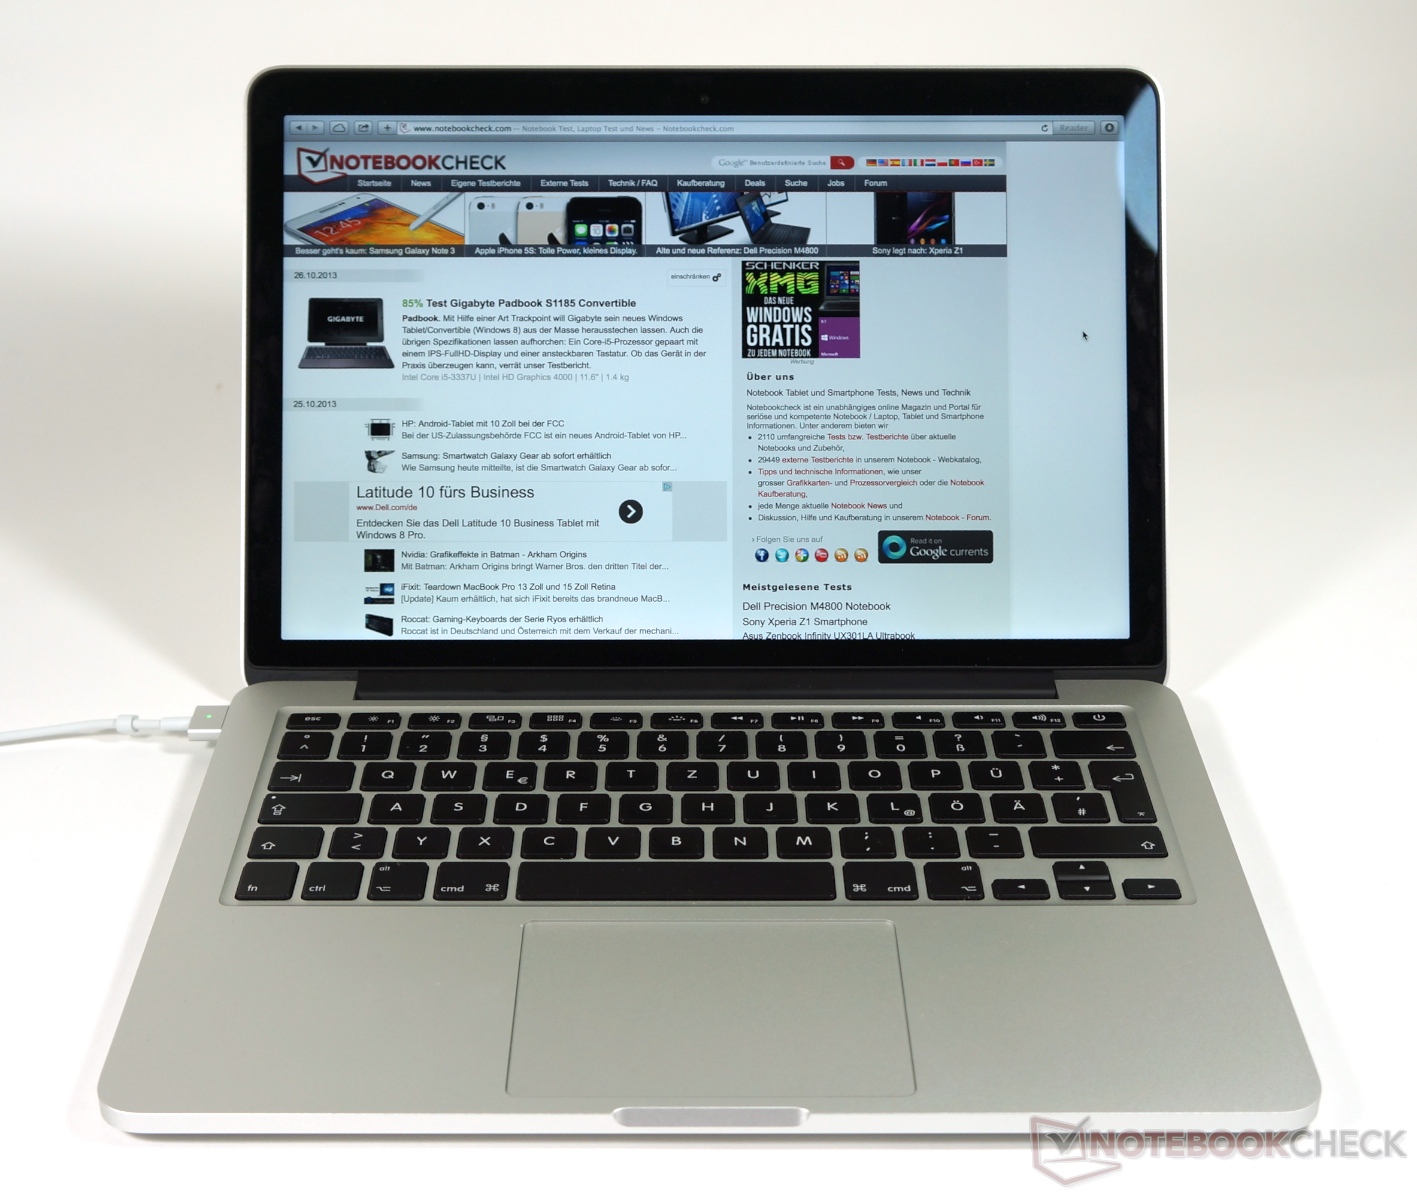
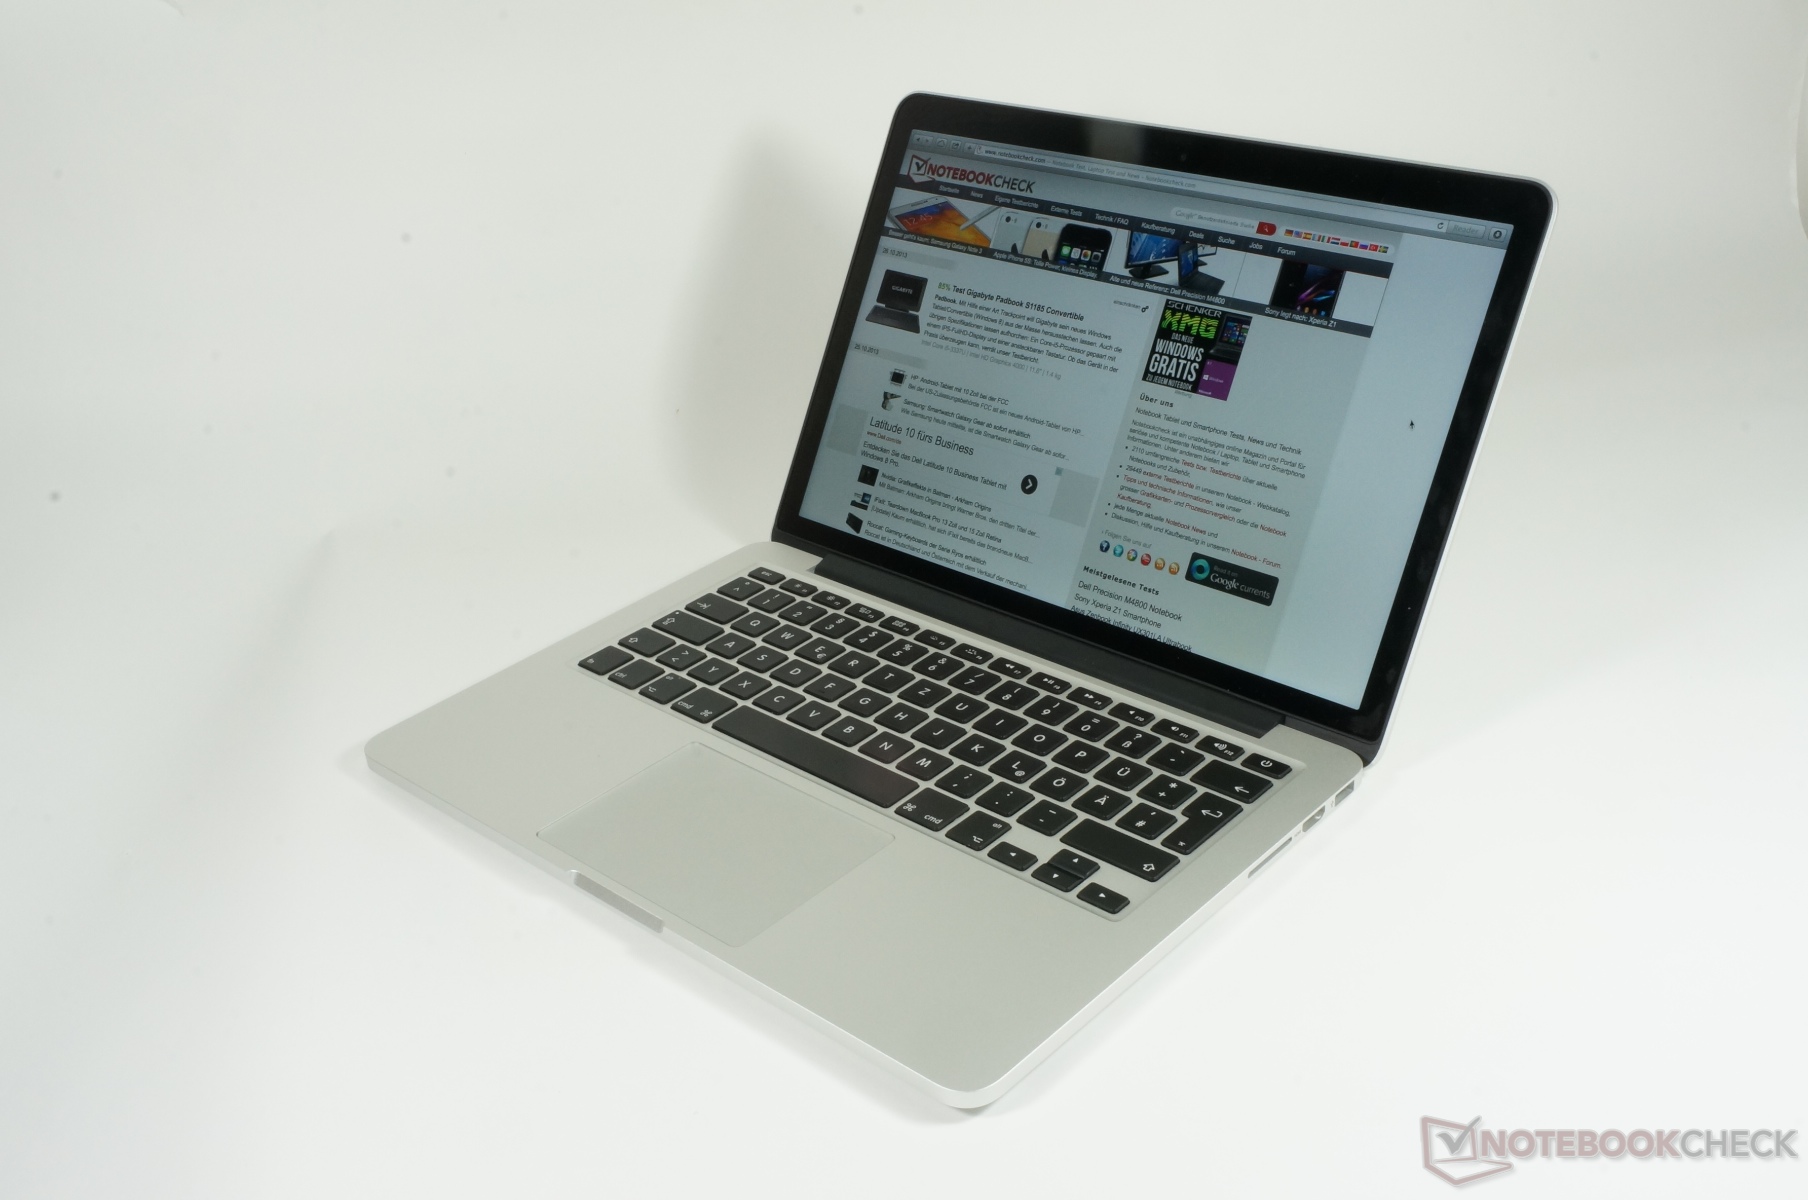
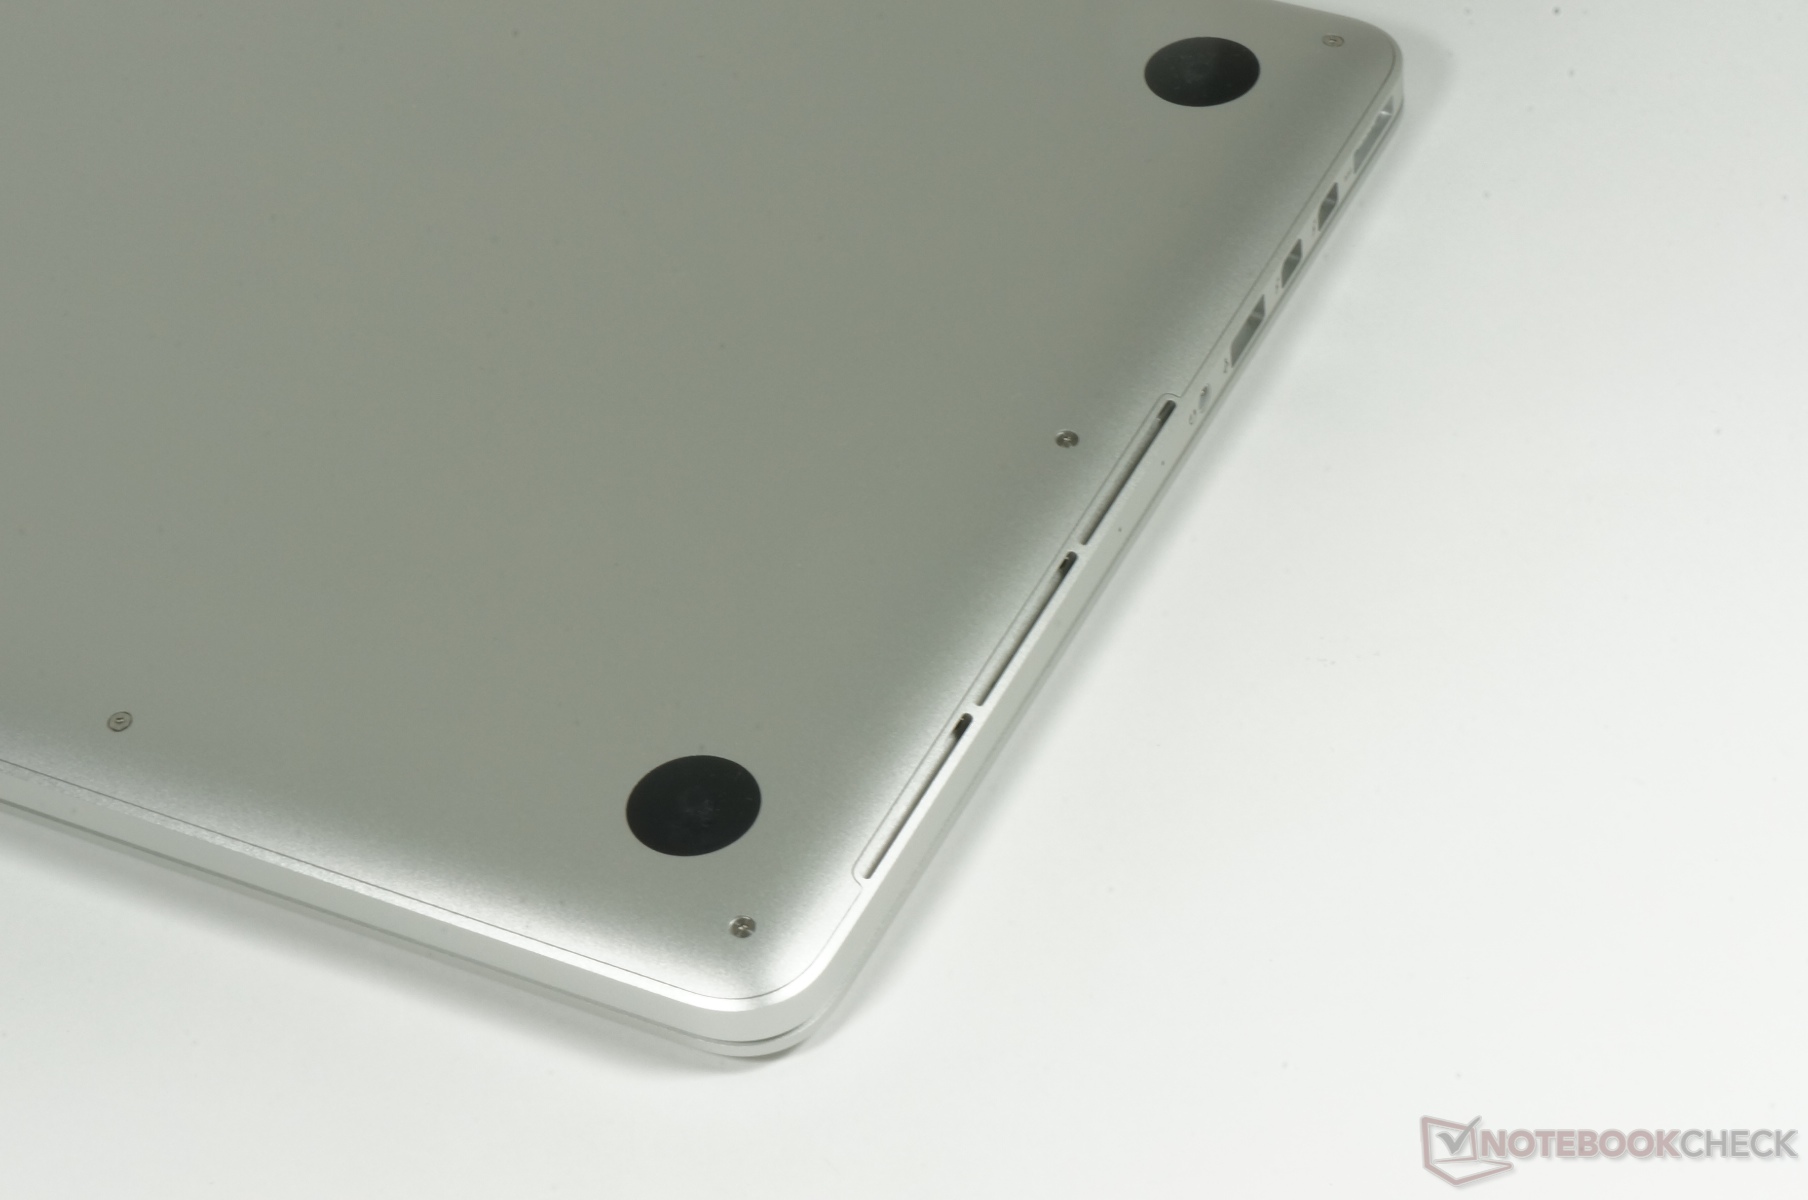
(Bilder zeigen teils das äußerlich identische Vorgängermodell)
Das neue Force Touch Trackpad
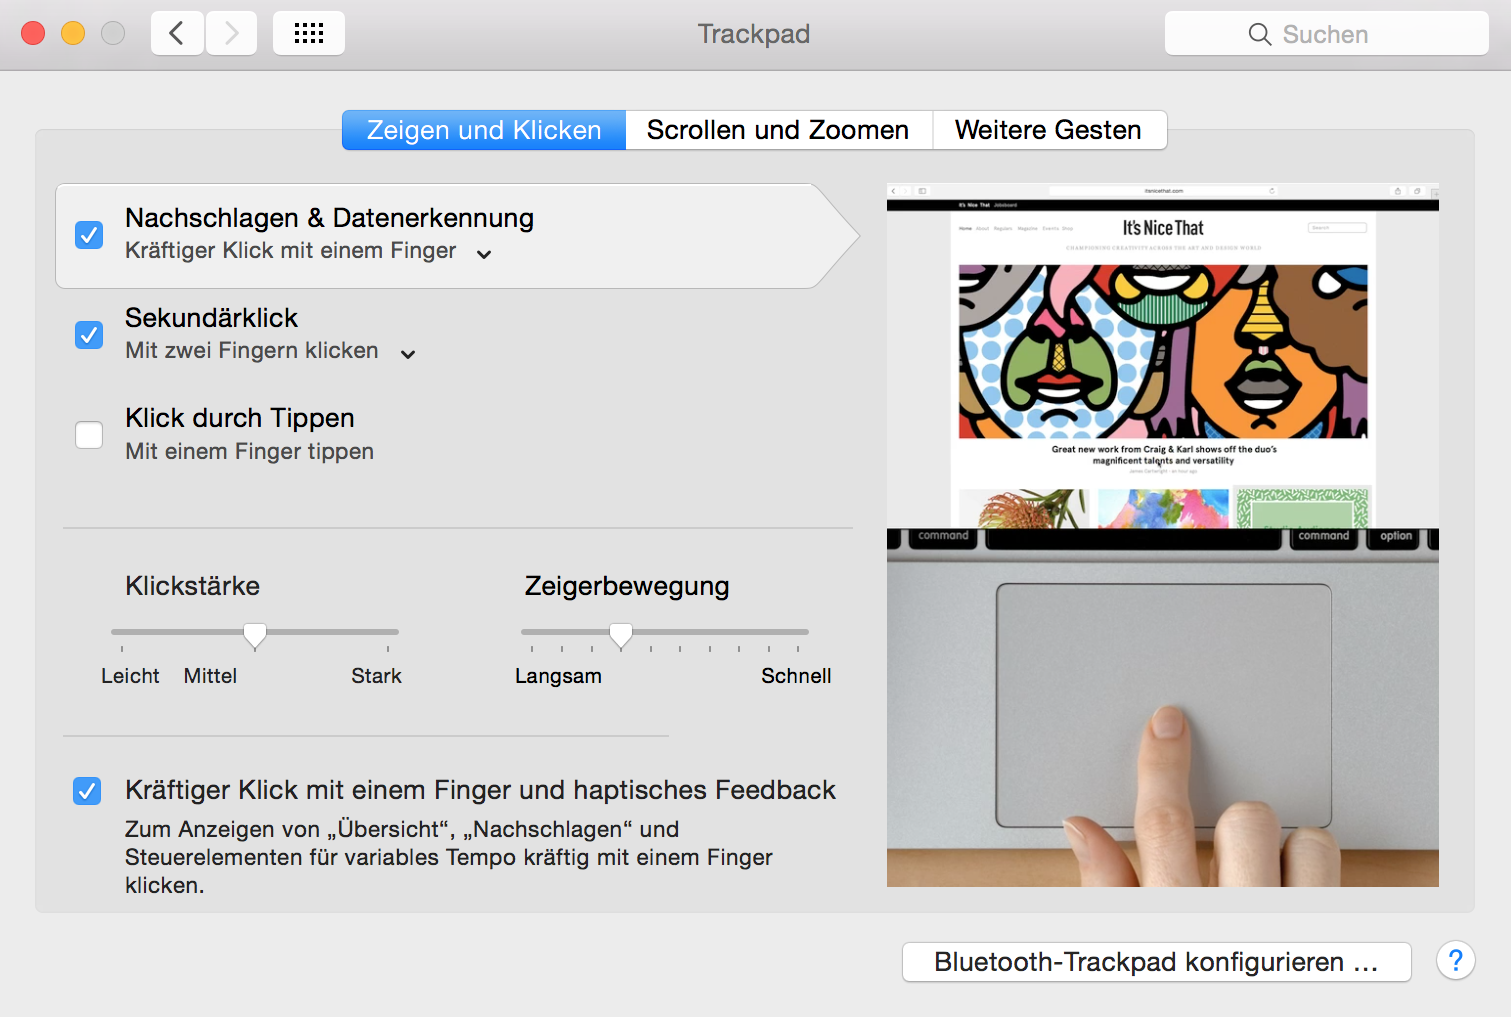
Das neue Force Touch Trackpad ist die vermutlich innovativste Neuerung der 2015er MacBooks. Abmessungen und Oberflächenbeschaffenheit entsprechen exakt der bisherigen Lösung – die eigentliche Besonderheit steckt in der darunterliegenden Konstruktion. Während ein klassisches Clickpad eine Art Scharnier darstellt und deshalb nur im unteren Teil bewegt werden kann, liegt Apples Pad an allen vier Ecken mehr oder weniger fest auf. Versucht man, bei ausgeschaltetem Gerät einen Klick auszulösen, passiert darum – genau, nichts.
Im Betrieb dagegen analysieren Sensoren den vom Anwender ausgeübten Fingerdruck. Erfolgt ein Eingabebefehl, simuliert das Pad mittels Elektromagneten eine leichte physische Auslenkung und gibt dabei sogar das typische Klick-Geräusch von sich. In der Praxis fühlt sich dieser Trick derart realistisch an, dass man glaubt, vor einem ganz normalen – vielleicht etwas kurzhubigen – Touchpad mit äußerst knackigem Druckpunkt zu sitzen.
Doch wo liegen nun die Vorteile dieser technisch sicherlich sehr aufwändigen Bauweise? Nun: Zunächst einmal ist das Pad dadurch über die gesamte Eingabefläche "klickbar", was beispielsweise Drag'n'Drop-Operationen mit nur einem Finger erlaubt. Zum anderen kann das Notebook so in Abhängigkeit von der aufgewandten Kraft unterschiedliche Aktionen ausführen. Apple hat hierfür den sogenannten Force Klick erfunden, der durch einen besonders kräftigen Druck ausgelöst und ebenfalls akustisch/haptisch von einem zweiten "Klicken" begleitet wird. Mit diesem Force Klick kann man im Text einer Website nach Begriffen suchen, Dateinamen im Finder bearbeiten oder im Dock sämtliche geöffnete Fenster einer App anzeigen lassen.
Im Internet hat der Hersteller eine Übersicht zu den vielfältigen Möglichkeiten des Pads zusammengestellt – einiges erschien uns nach kurzer Eingewöhnung recht praktisch, anderes eher als überflüssige Spielerei. Es bleibt abzuwarten, welchen Nutzen Anwendungen von Apple und Drittanbietern künftig noch aus dem neuen Feature ziehen werden.
Boot Camp und Windows 8.1
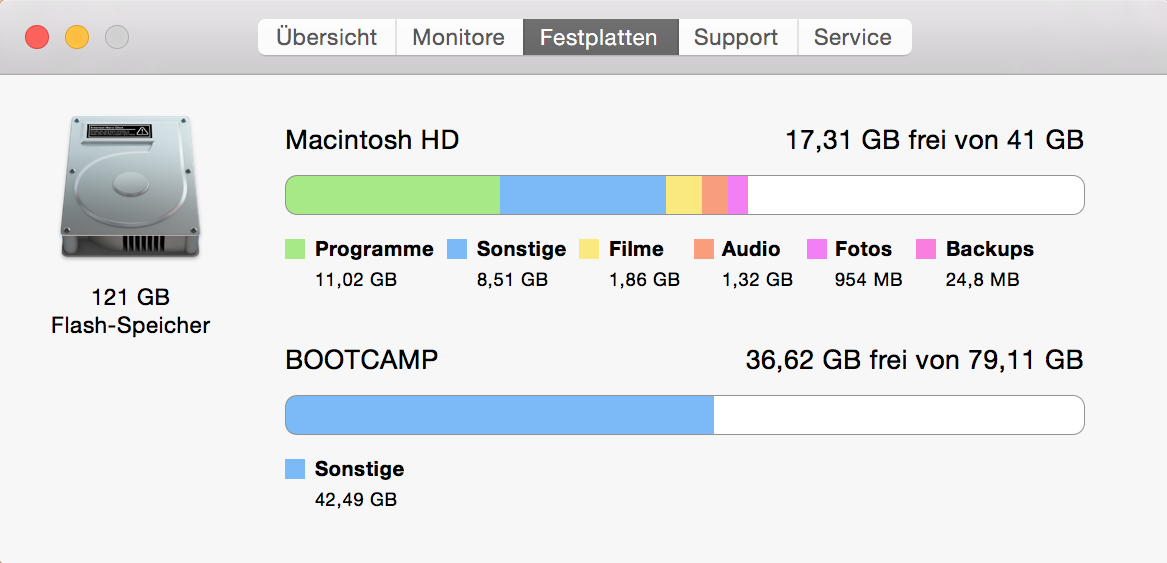
Hatten wir beim Vorgänger noch mit einigen Schwierigkeiten bei der Installation von Windows 8.1 via Boot Camp zu kämpfen, klappt dies beim 2015er-Modell weitgehend problemlos: ISO-Datei auf einen USB-Stick kopieren, Größe der Windows-Partition festlegen, Installation abwarten, fertig – nach weniger als 30 Minuten ist das Zweit-OS betriebsbereit. Sämtliche Hardwarekomponenten inklusive Touchpad (natürlich ohne Force-Touch-Feature) werden automatisch erkannt und installiert, lediglich einige Kleinigkeiten wie Pinch-to-Zoom wollten bei uns nicht funktionieren. Auf weitere Besonderheiten und Probleme beim Betrieb eines MacBooks unter Windows werden wir nachfolgend noch genauer eingehen. Übrigens: Windows 7 sowie sämtliche 32-Bit-Versionen des Microsoft'schen OS' werden von Boot Camp leider nicht mehr unterstützt.
Display
Angesichts des jüngst vorgestellten Dell XPS 13, welches bei gleicher Bilddiagonale satte 3.200 x 1.800 Pixel darstellt, erscheinen die 2.560 x 1.600 Bildpunkte des MBP 13 weit weniger eindrucksvoll als noch vor ein oder zwei Jahren. Zudem umhüllt Dell das Display mit einem zierlicheren Rahmen, der extrem kompakte Gehäuseabmessungen erlaubt und obendrein unverschämt gut aussieht.
In puncto Auflösung mag man Apple jedoch zugestehen, einen sinnvollen Kompromiss getroffen zu haben: 227 ppi (XPS 13: 276 ppi) sind mehr als genug, um selbst kleine Symbole und Schriften aus typischem Betrachtungsabstand gestochen scharf dazustellen. Wer mittels Boot Camp ältere Windows-Programme ausführt, hat ohnehin des Öfteren mit Skalierungsproblemen zu kämpfen, die sich bei noch höheren Pixeldichten weiter intensivieren würden. Ebenfalls nicht zu vernachlässigen ist der enorme Energiebedarf extrem hochauflösender Monitore.
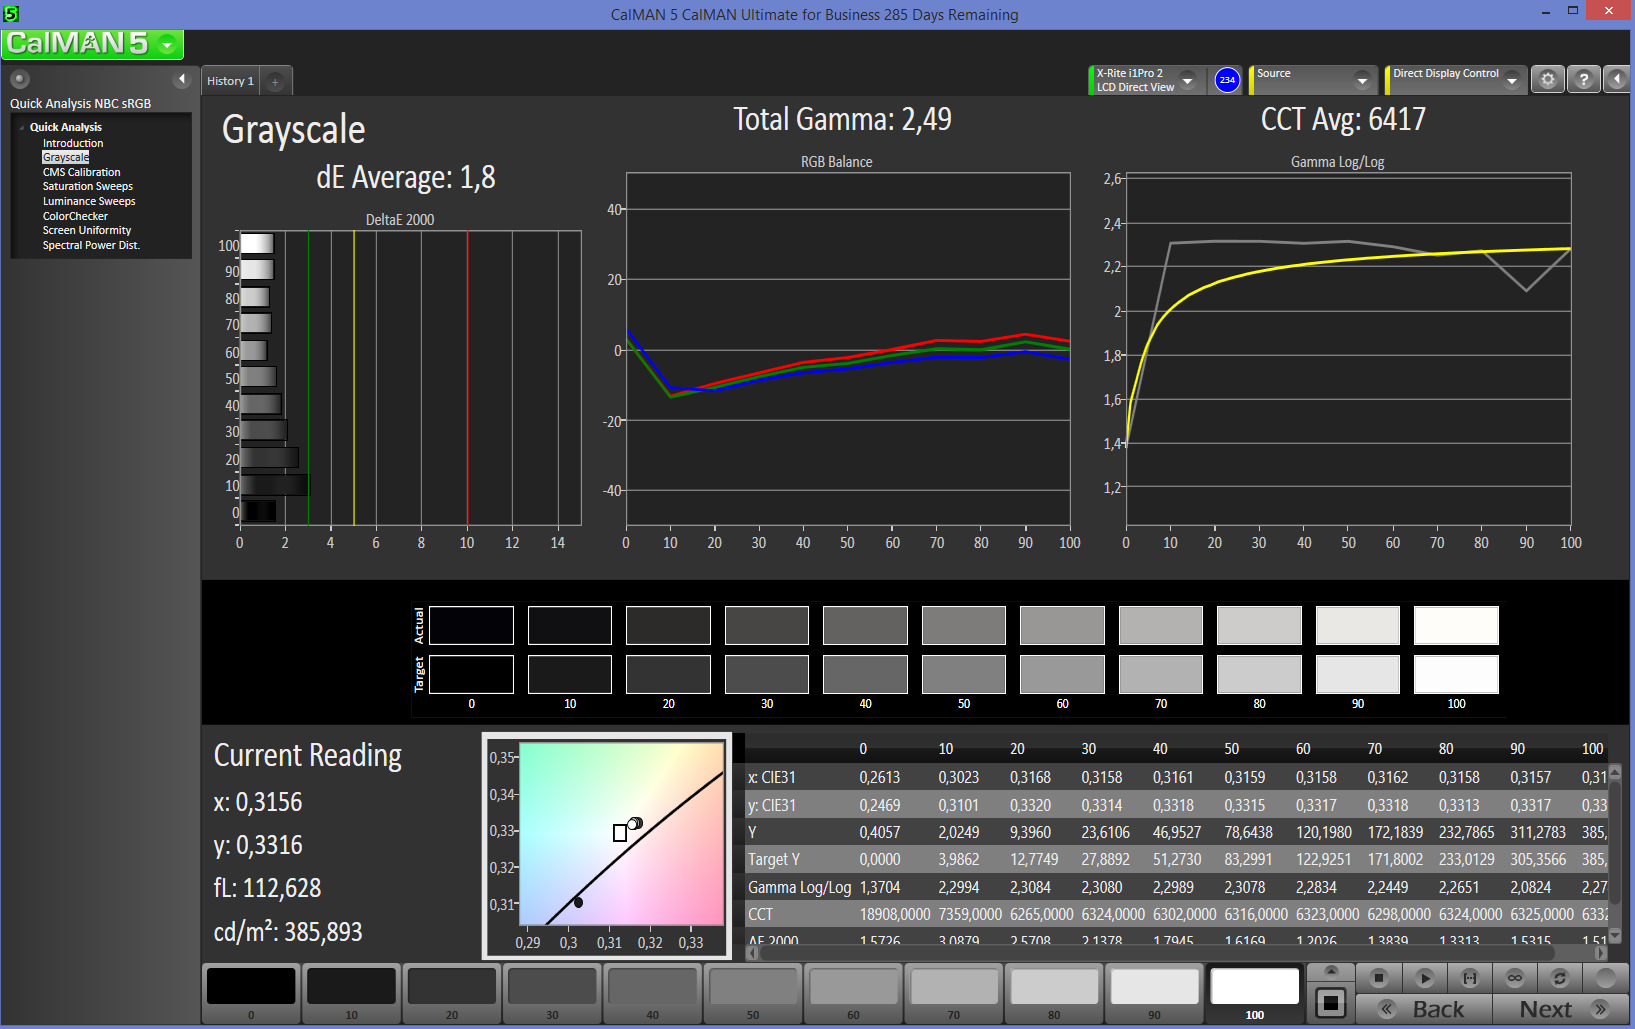
Mit 342 cd/m² erreicht das Display in etwa die gleiche Maximalhelligkeit wie in unserem letzten Test – im Konkurrenzvergleich bewegt sich das MacBook damit auf Augenhöhe mit den Probanden von Asus (UX303LN: 339 cd/m²) und Dell (XPS 13: 372 cd/m²). Dass sich die Leuchtdichte nicht vollkommen gleichmäßig über die gesamte Bildfläche verteilt, sondern von rechts nach links leicht abfällt, ist mit bloßem Auge kaum zu erkennen. Auch den klassischen Worst-Case-Test – die Darstellung eines schwarzen Bildes bei maximaler Helligkeit in einem abgedunkelten Raum – meistert die Anzeige bravourös und liefert ein absolut homogenes Ergebnis ab. Störendes PWM-Flimmern konnten wir nicht feststellen.
| |||||||||||||||||||||||||
Ausleuchtung: 81 %
Helligkeit Akku: 360 cd/m²
Kontrast: 1000:1 (Schwarzwert: 0.361 cd/m²)
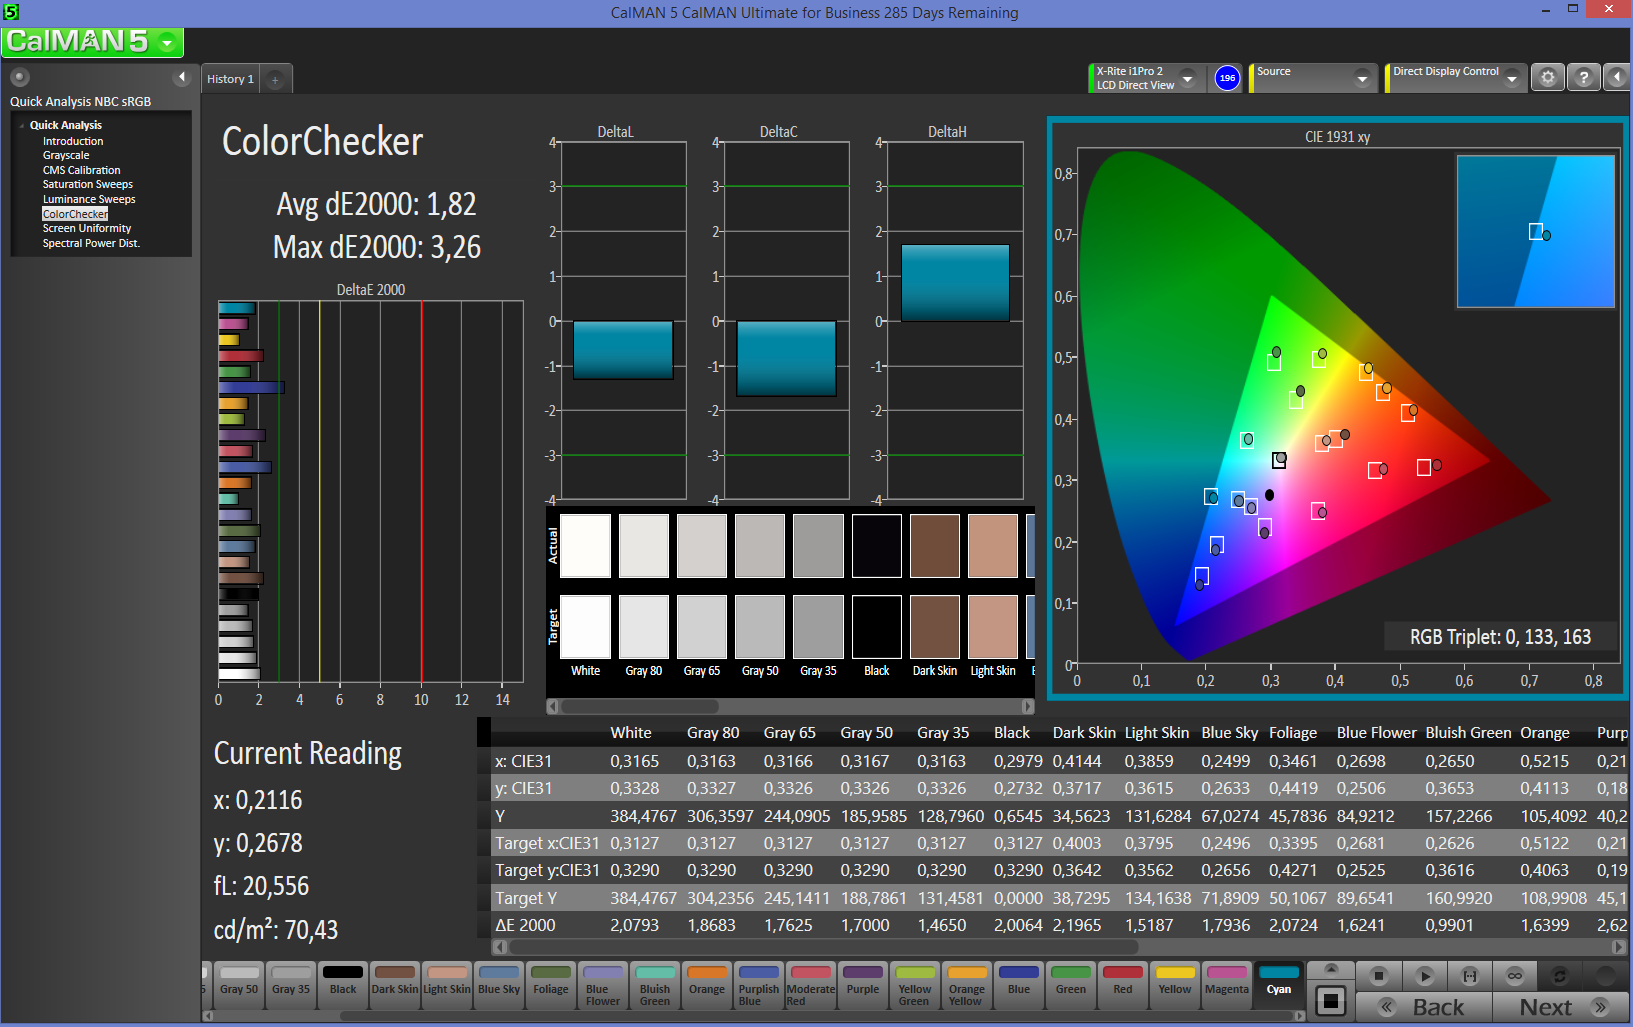
ΔE ColorChecker Calman: 1.82 | ∀{0.5-29.43 Ø4.73}
ΔE Greyscale Calman: 1.8 | ∀{0.09-98 Ø4.97}
96.9% sRGB (Argyll 1.6.3 3D)
61.9% AdobeRGB 1998 (Argyll 1.6.3 3D)
67.4% AdobeRGB 1998 (Argyll 3D)
97% sRGB (Argyll 3D)
65.9% Display P3 (Argyll 3D)
Gamma: 2.49
CCT: 6417 K
| Apple MBP 13 Early 2015 2560x1600; IPS | Dell XPS 13 3200x1800; IPS | Asus UX303LN 1920x1080; IPS | Acer Aspire R13 1920x1080; IPS | Apple MBP 13 Late 2013 2560x1600; IPS | |
|---|---|---|---|---|---|
| Display | 5% | ||||
| Display P3 Coverage (%) | 65.9 | 72 9% | |||
| sRGB Coverage (%) | 97 | 96 -1% | |||
| AdobeRGB 1998 Coverage (%) | 67.4 | 71.6 6% | |||
| Response Times | |||||
| Response Time Grey 50% / Grey 80% * (ms) | 33 ? | ||||
| Response Time Black / White * (ms) | 26.2 ? | ||||
| PWM Frequency (Hz) | |||||
| Bildschirm | -25% | -32% | -37% | -11% | |
| Helligkeit Bildmitte (cd/m²) | 361 | 367.3 2% | 376 4% | 316 -12% | 327 -9% |
| Brightness (cd/m²) | 342 | 372 9% | 368 8% | 305 -11% | 300 -12% |
| Brightness Distribution (%) | 81 | 77 -5% | 88 9% | 90 11% | 84 4% |
| Schwarzwert * (cd/m²) | 0.361 | 0.178 51% | 0.7 -94% | 0.23 36% | 0.42 -16% |
| Kontrast (:1) | 1000 | 2063 106% | 537 -46% | 1374 37% | 779 -22% |
| Delta E Colorchecker * | 1.82 | 5.92 -225% | 3.09 -70% | 4.21 -131% | |
| Colorchecker dE 2000 max. * | 3.26 | ||||
| Delta E Graustufen * | 1.8 | 4.79 -166% | 2.4 -33% | 5.16 -187% | |
| Gamma | 2.49 88% | 2.42 91% | 2.24 98% | 2.58 85% | |
| CCT | 6417 101% | 7013 93% | 6781 96% | 6934 94% | |
| Farbraum (Prozent von AdobeRGB 1998) (%) | 61.9 | 63 2% | |||
| Color Space (Percent of sRGB) (%) | 96.9 | 96.4 -1% | |||
| Durchschnitt gesamt (Programm / Settings) | -10% /
-18% | -32% /
-32% | -37% /
-37% | -11% /
-11% |
* ... kleinere Werte sind besser
Bei der Auswahl des Display-Panels hat sich Apple nicht lumpen lassen und setzt auch weiterhin auf ein hochwertiges IPS-Fabrikat. Vermutlich kommt dabei das gleiche (oder ein sehr ähnliches) Modell wie beim Vorgänger zum Einsatz; dies deuten jedenfalls die nur marginal voneinander abweichenden Messwerte an. Aus dem satten Schwarzwert von nur 0,36 cd/m² errechnet sich ein Kontrastverhältnis von exakt 1.000:1 – ein sehr ordentliches Ergebnis, wenngleich das XPS 13 hier nochmals besser abschneidet. Subjektiv wird man in dieser Größenordnung allerdings nur schwerlich einen Unterschied sehen können.
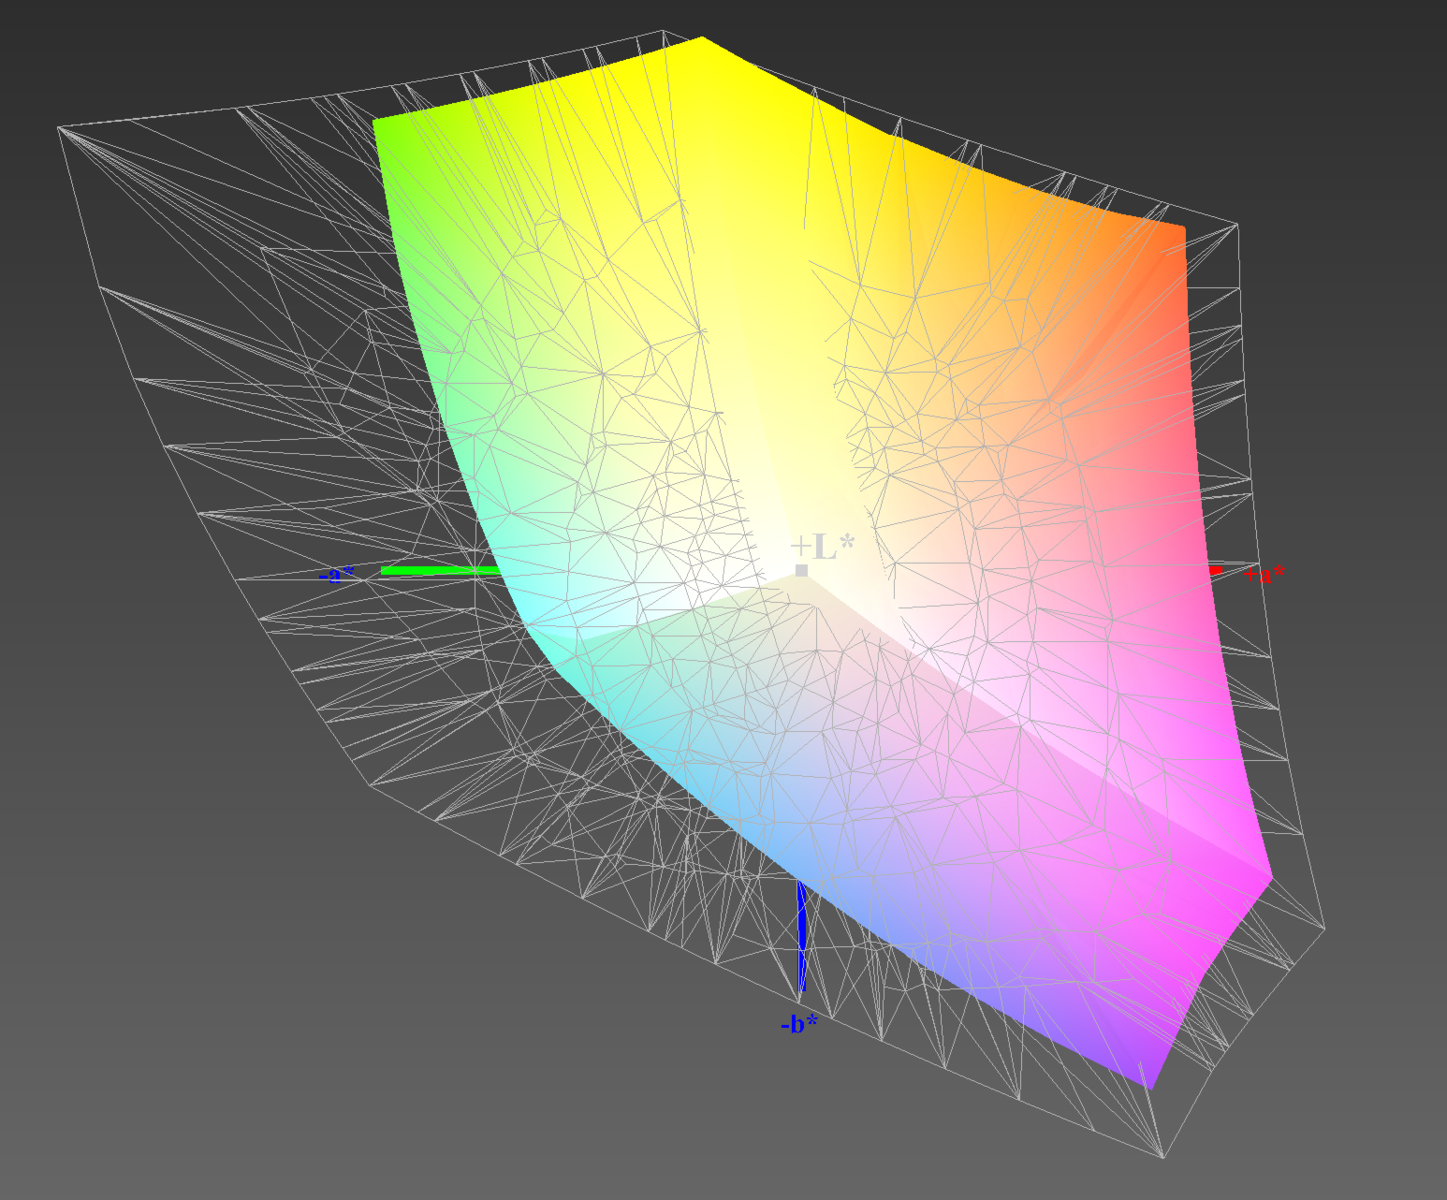
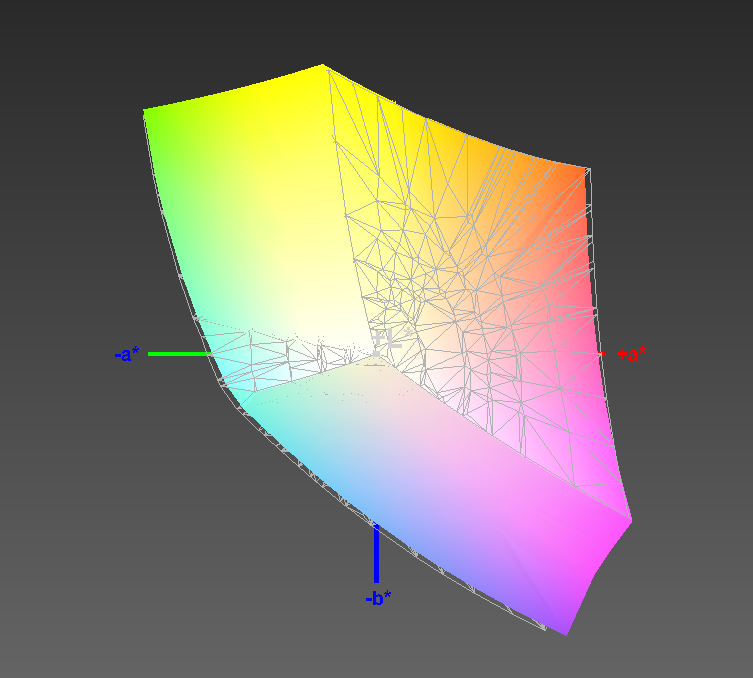
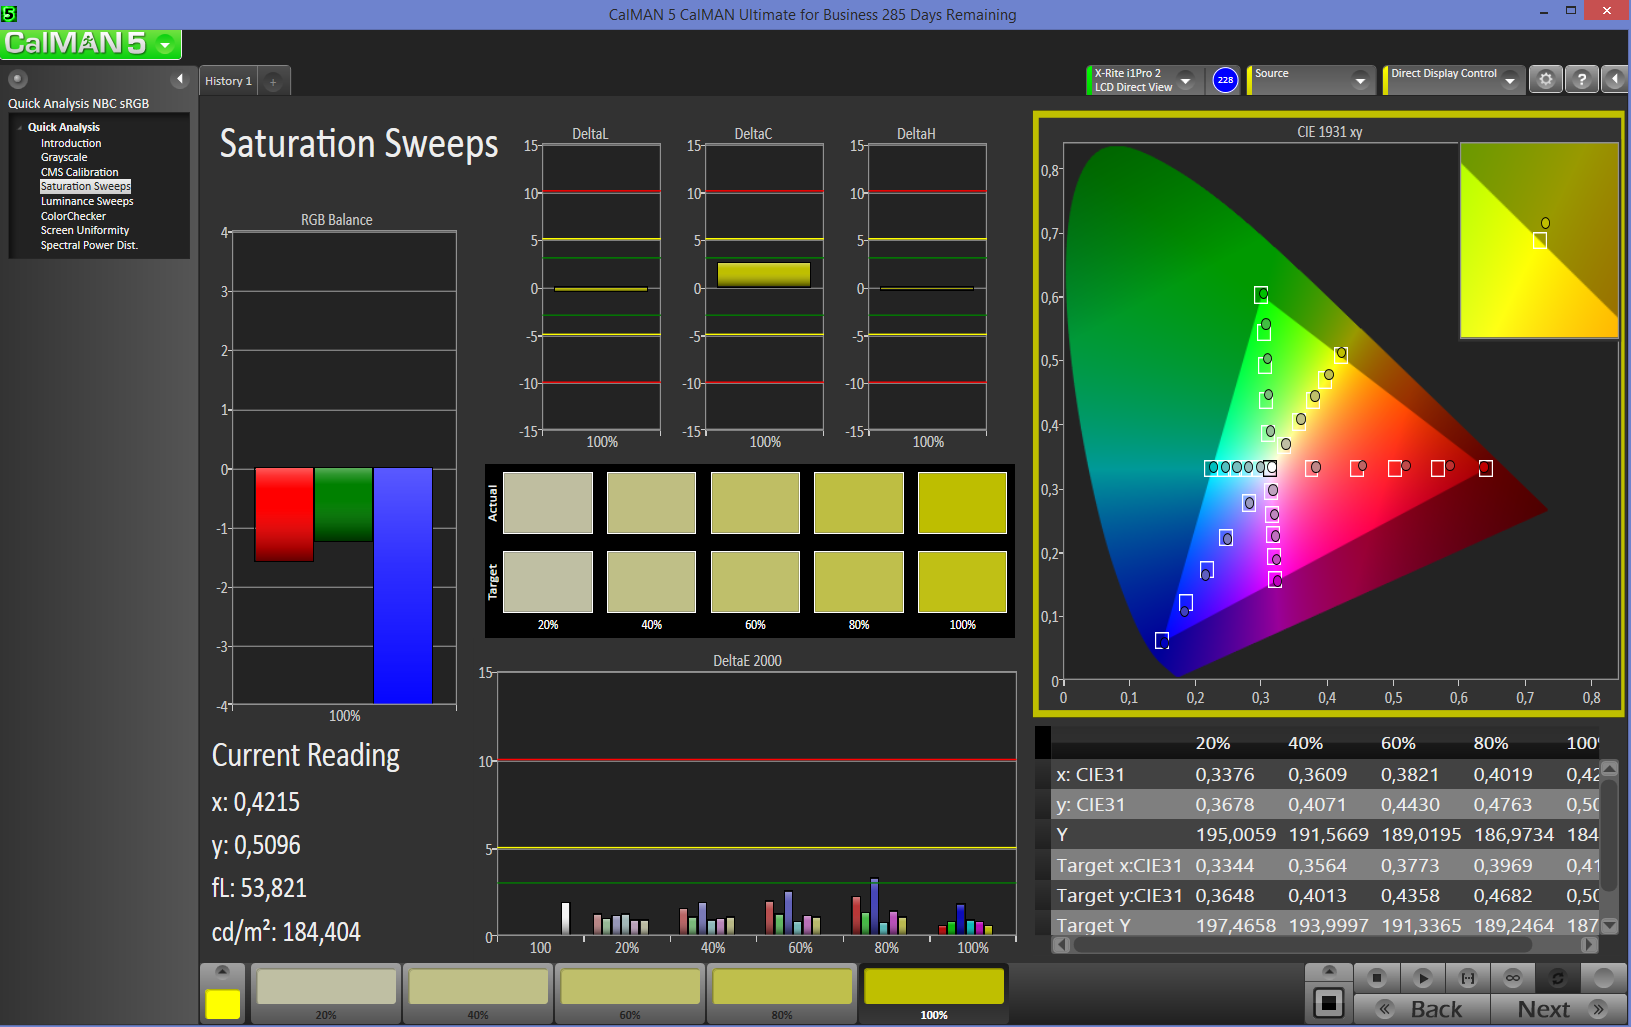
Die MacBook-Serie steht nicht ohne Grund bei vielen Anwendern aus der Foto- und Grafik-Branche hoch im Kurs: Seit Jahren punkten die Geräte aus Cupertino mit ihrer akkuraten Farbwiedergabe. Das neue MBP 13 bestätigt diese Vorschusslorbeeren mit beeindruckend niedrigen Delta-E-Abweichungen, die sich mittels nachträglicher Kalibrierung sogar noch weiter reduzieren lassen. Der wichtige sRGB-Standard wird zu 97 Prozent (Korrektur 20.5.2015 zufolge fehlerhaften Referenz-sRGB-Profils) abgedeckt, der größere AdobeRGB-Farbraum zu immerhin 61,9 Prozent.


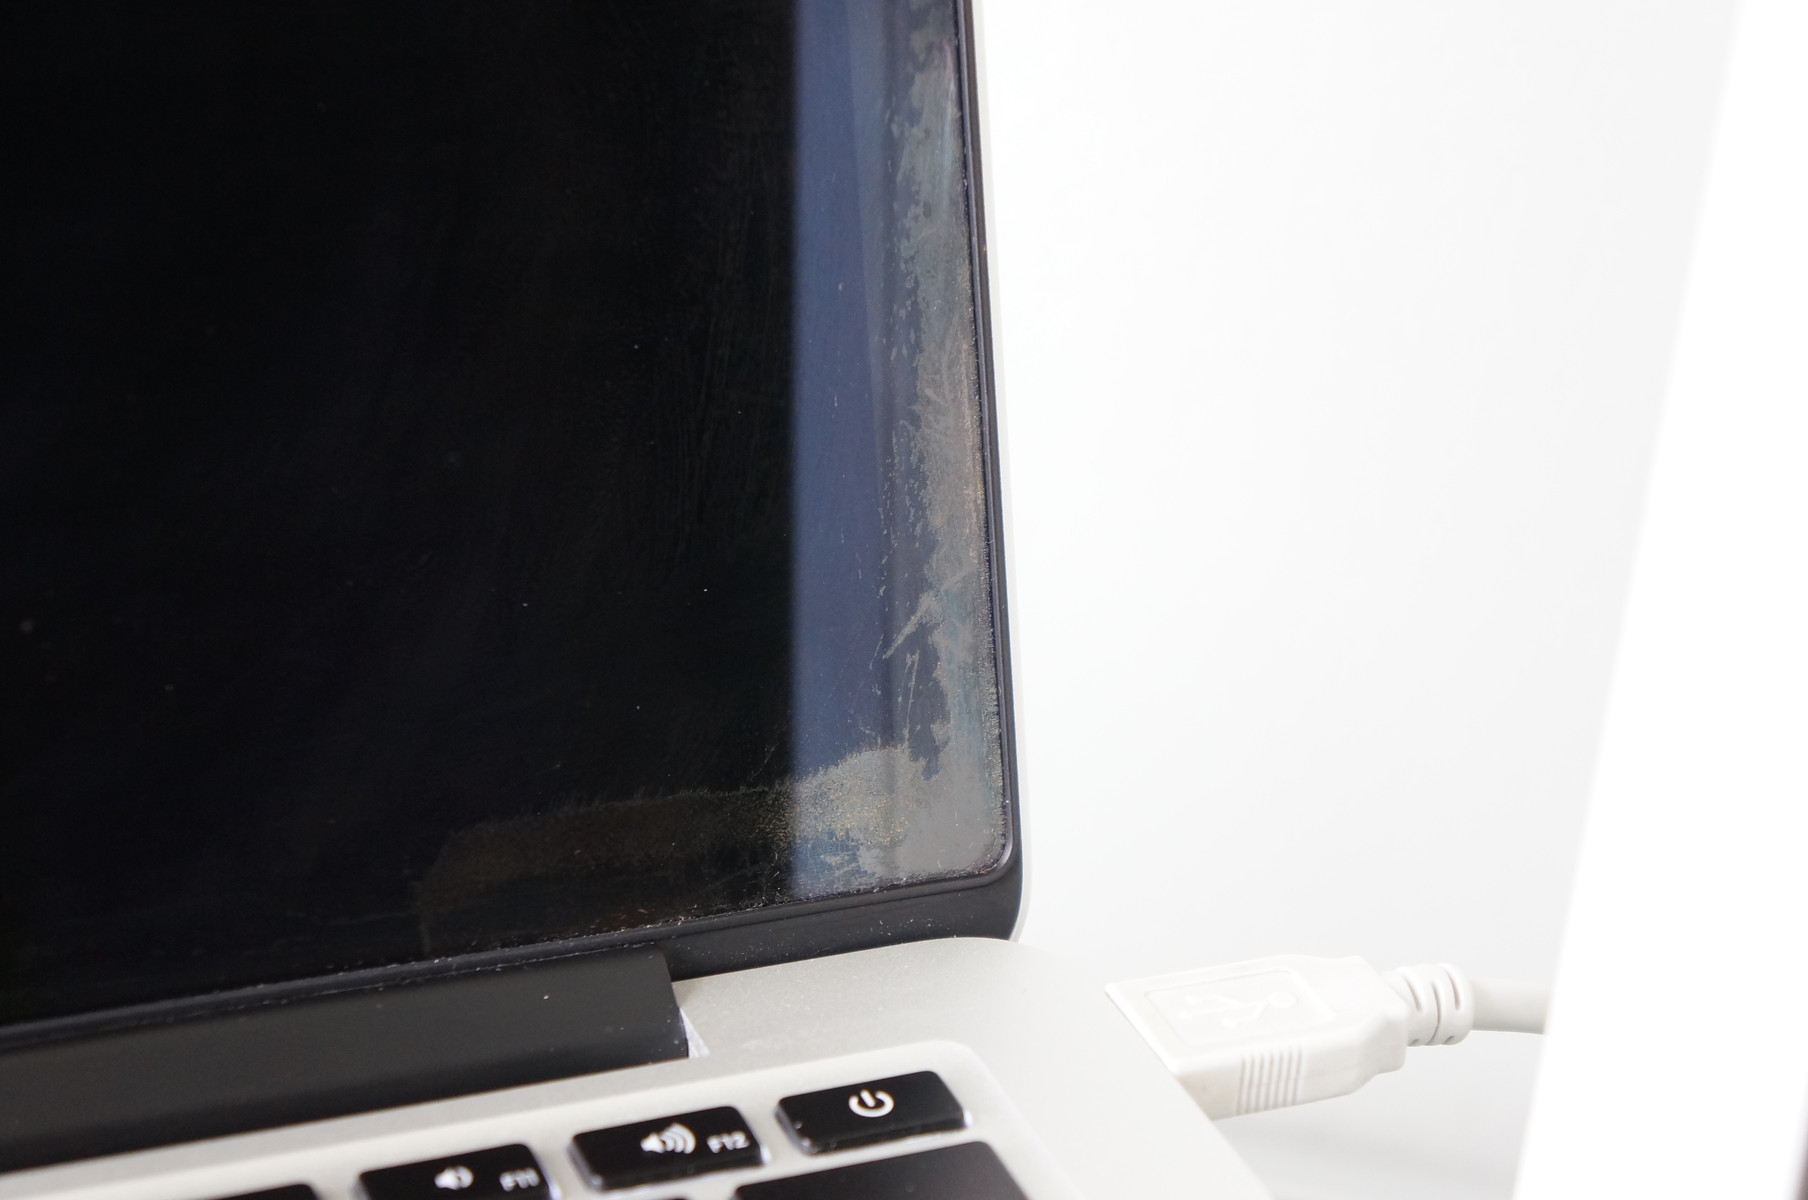
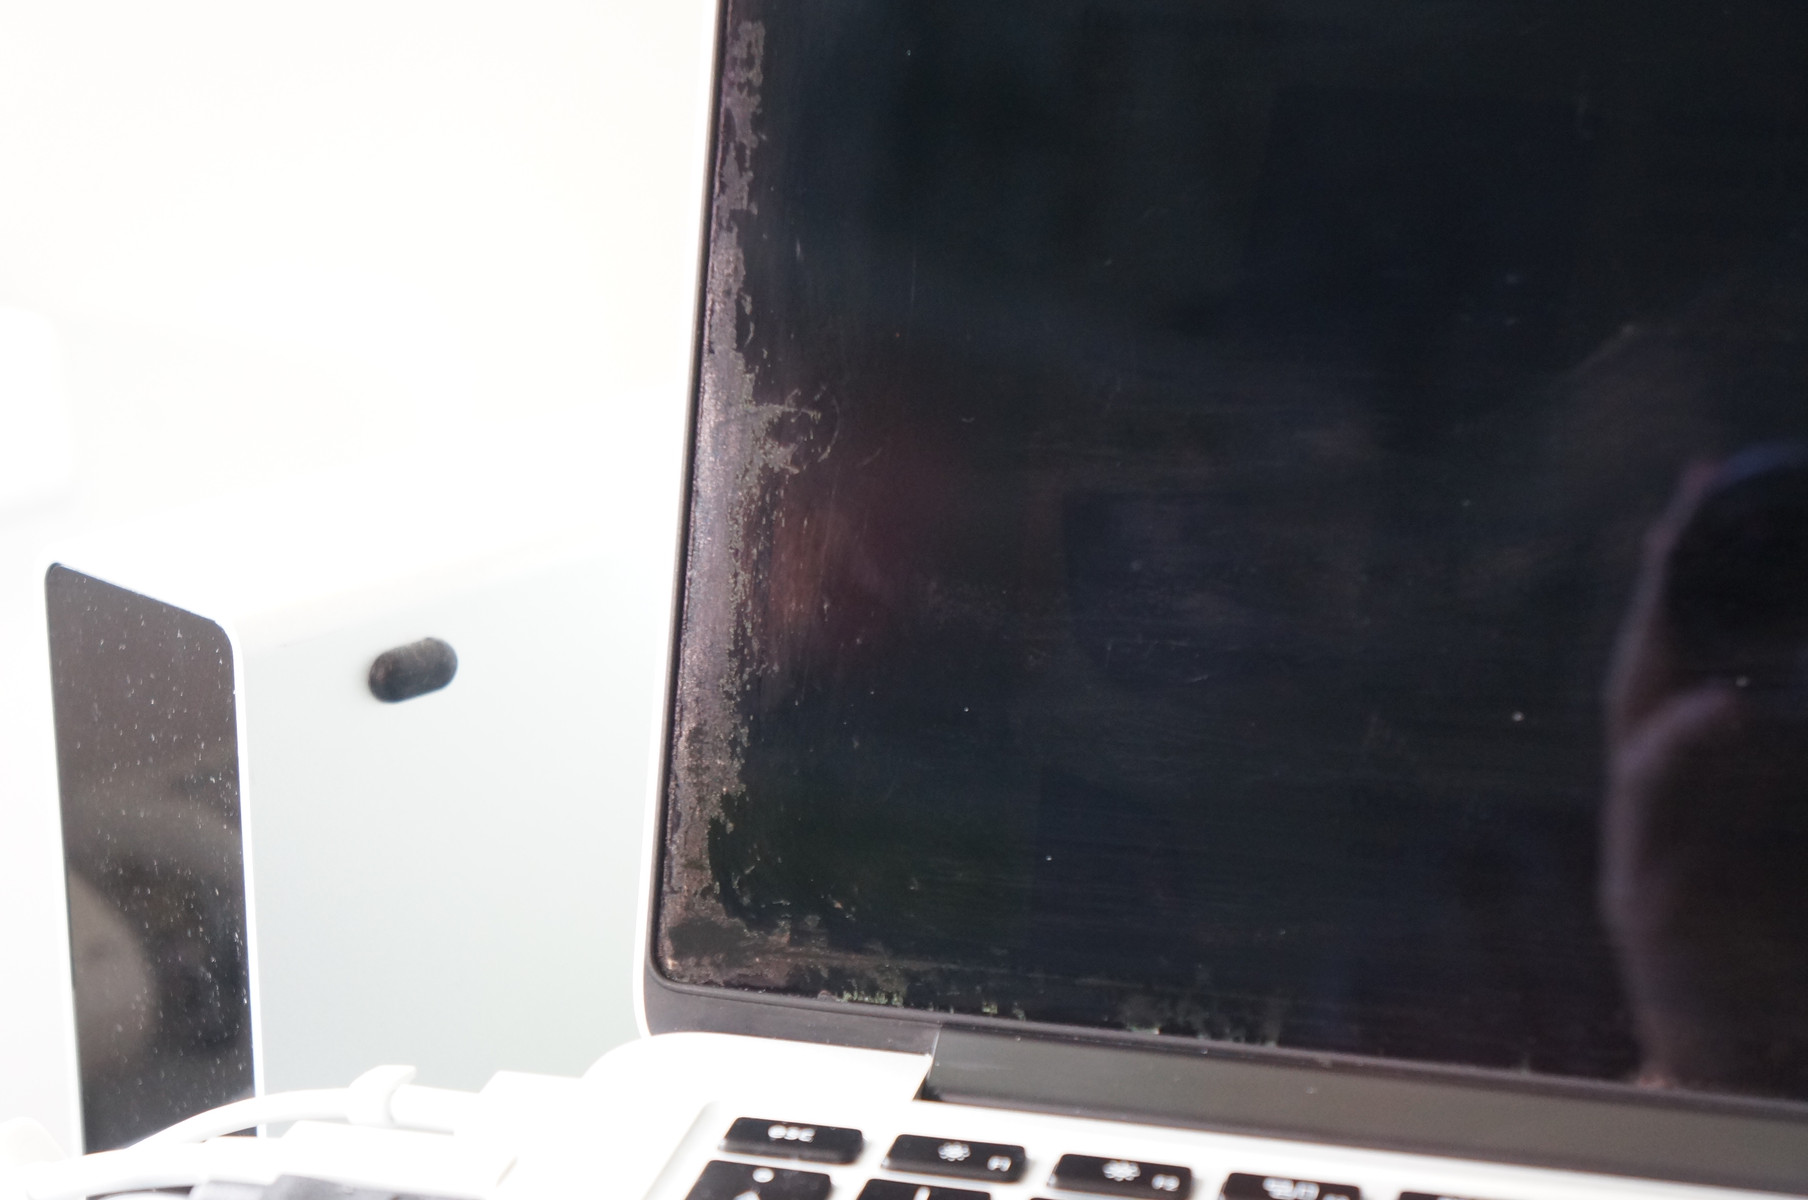
Obwohl wir das Display prinzipiell als Glare-Panel bezeichnen würden, reflektiert es das Umgebungslicht etwas weniger stark als die meisten Konkurrenzmodelle. Dies dürfte vor allem der speziellen Oberflächenbeschichtung zu verdanken sein, die jedoch zuletzt vermehrt für Negativschlagzeilen gesorgt hat: Unter dem Schlagwort "Staingate" klagen mittlerweile hunderte Nutzer im Netz über glänzende Flecken und Verfärbungen, die sich teils nach weniger als einem Jahr bilden und danach stetig wachsen. Auf die Herstellergarantie kann man in diesem Fall leider nicht zwangsläufig vertrauen – oftmals scheint Apple den Fehler als kosmetisches Problem einzustufen und bietet betroffenen Kunden nur eine rund 800 US-Dollar teure Reparatur an. Auch in unserer Redaktion ist ein im Herbst 2013 gekauftes MacBook Pro Retina 13 betroffen. Es bleibt abzuwarten, ob die 2015er-Generation hiervon verschont bleibt.
Abseits dieser Problematik erweist sich die reflektionsmindernde Oberfläche als recht nützlich und sorgt dafür, dass sich das Display auch unter freiem Himmel einwandfrei ablesen lässt. Einzig direktes Sonnenlicht sollte der Anwender besser meiden – selbst mit weit über 300 cd/m² ist das LED-Backlight dafür einfach nicht leuchtstark genug.
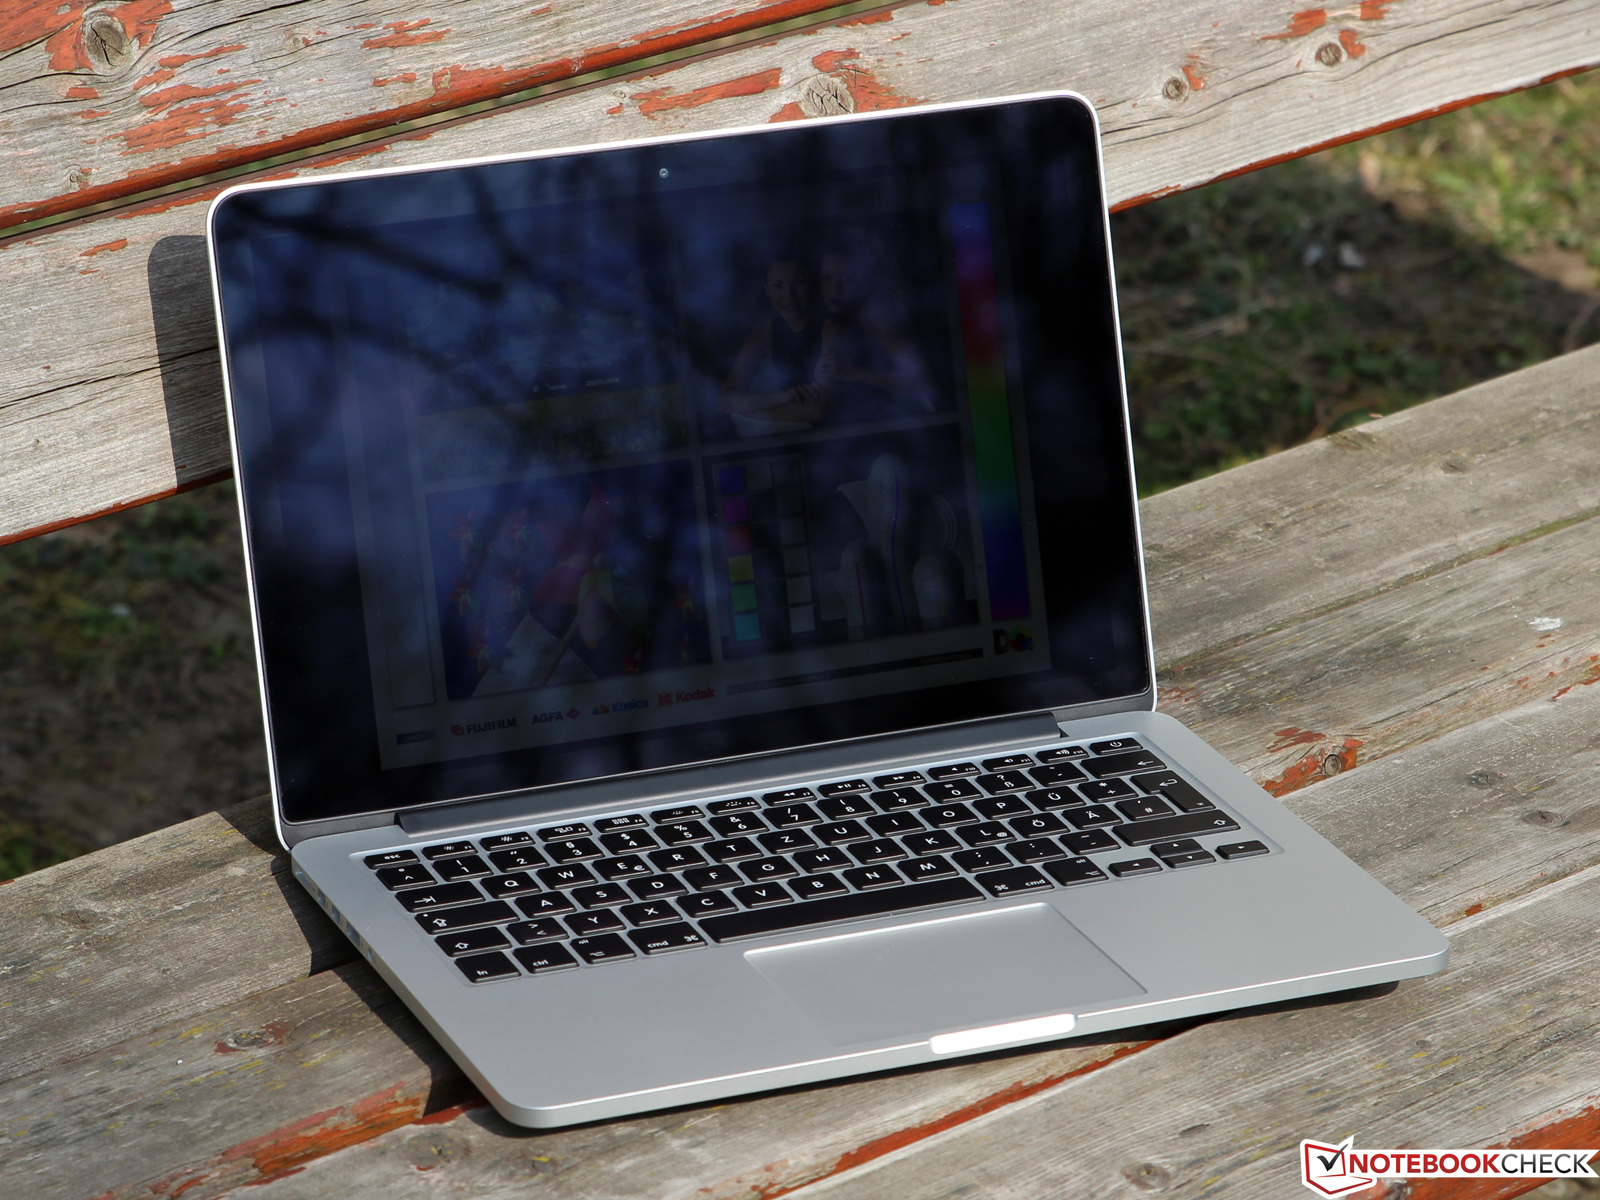
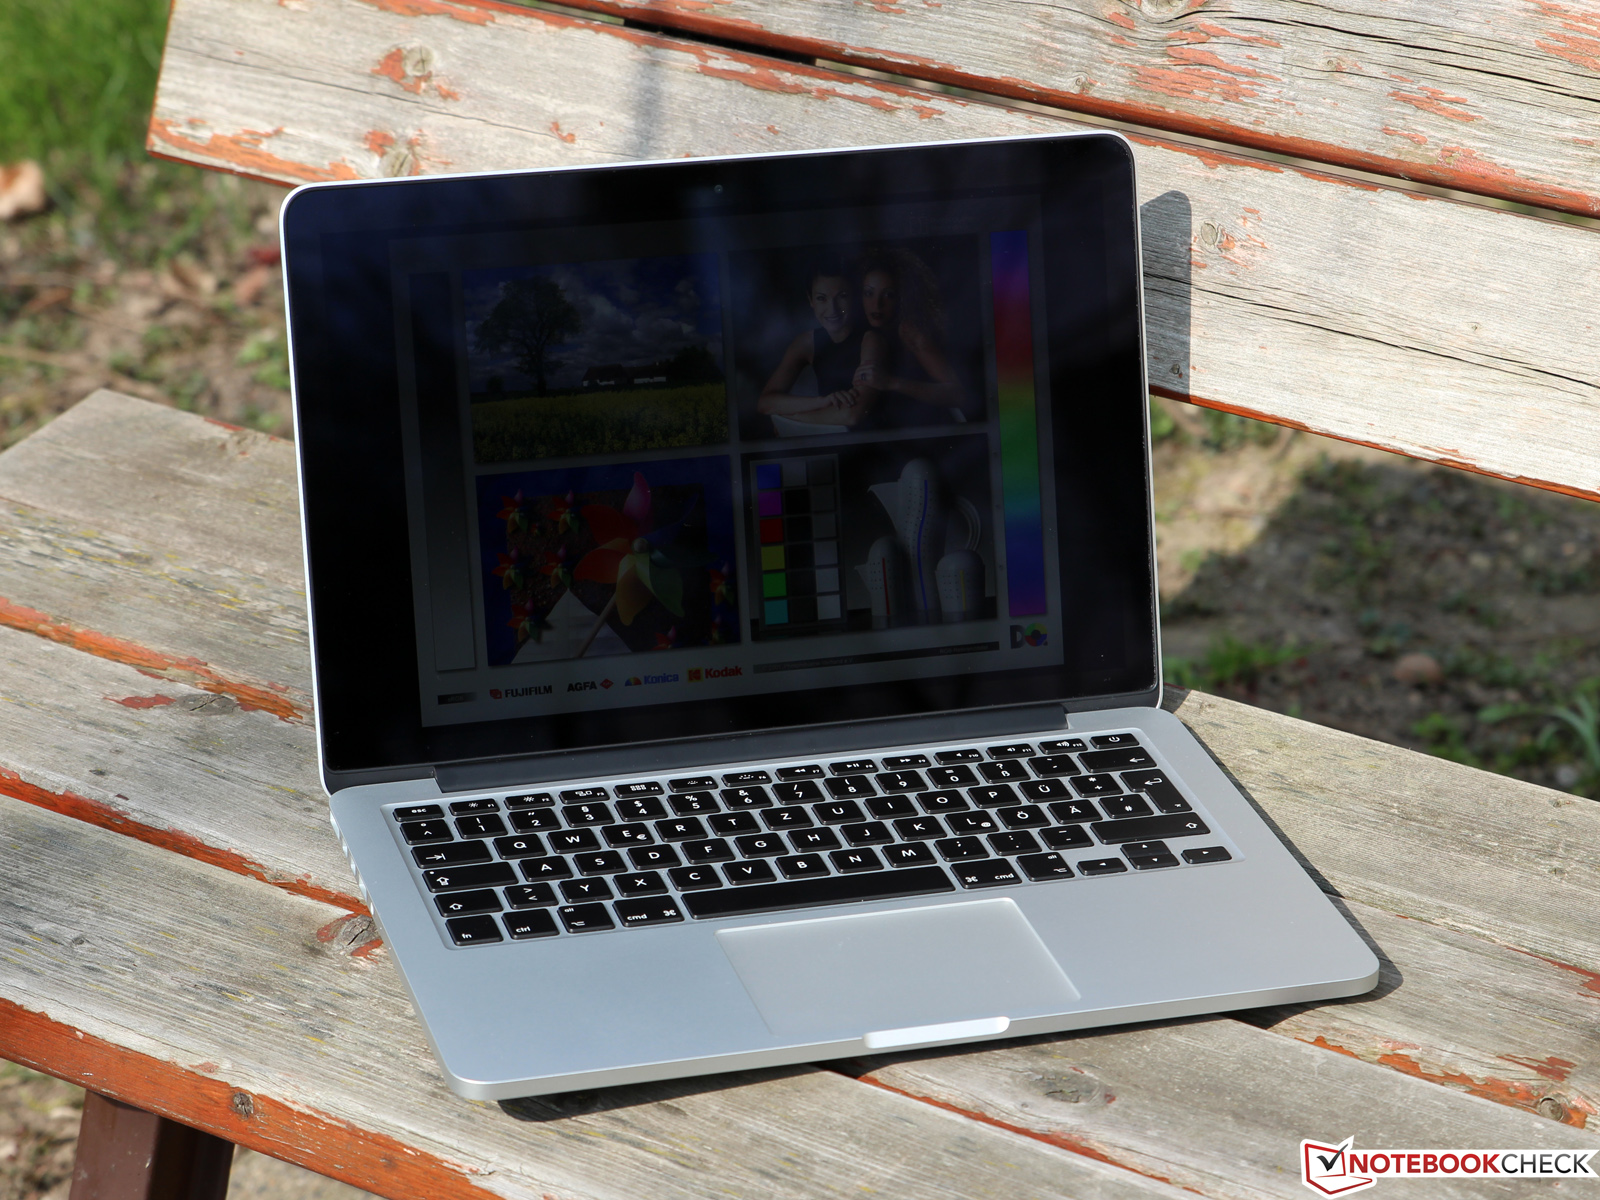
Außeneinsatz (Mittagssonne)

IPS-Panel ist nicht gleich IPS-Panel: Zwar gelten Displays auf Basis dieser Technik generell als relativ blickwinkelstabil, doch gibt es auch hier große Unterschiede zwischen verschiedenen Fabrikaten. Das im MBP 13 verbaute Modell zählt diesbezüglich zur absoluten Spitzenklasse und zeigt selbst bei extrem schräger Betrachtung kaum Einbußen bei Kontrastverhältnis und Farbwiedergabe. Hier zeigt sich ein deutliches Qualitätsgefälle gegenüber etwas preiswerteren Kontrahenten wie dem Asus Zenbook UX303LN.
Leistung
Subnotebooks im 13-Zoll-Format werden heutzutage fast ausschließlich mit ULV-CPUs der 15-Watt-Klasse ausgestattet, die zwar für gute Akkulaufzeiten, jedoch nicht unbedingt überragende Leistungswerte sorgen. Das MacBook Pro 13 setzt dagegen auf Intel-Broadwell-Prozessoren mit 28 Watt TDP, was insbesondere bei kombinierter CPU- und GPU-Belastung deutlich größere Performance-Reserven verspricht.
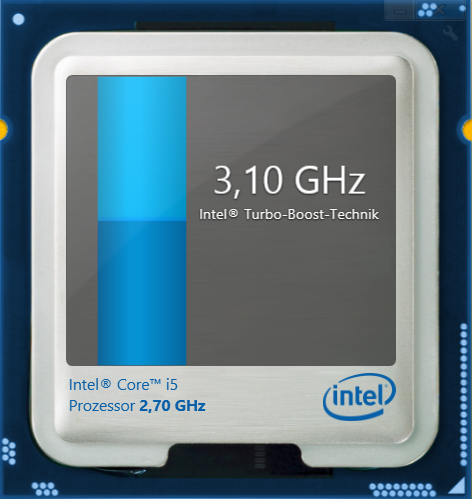
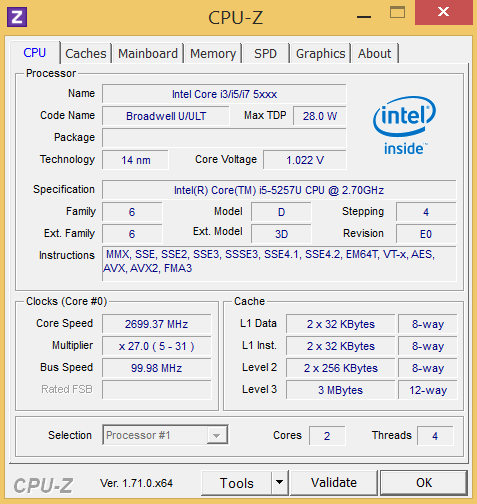
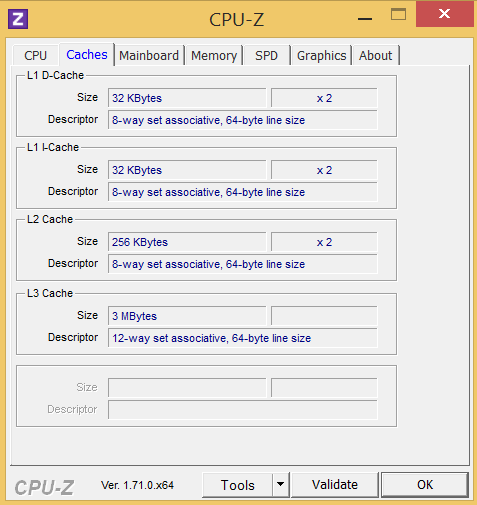
Der in unserer Einstiegskonfiguration verbaute Core i5-5257U kommt mit einem Basistakt von 2,7 GHz daher und kann mittels Turbo Boost Frequenzen von bis zu 3,1 GHz erreichen. Optional bietet Apple ein Upgrade auf den Core i5-5287U (2,9 - 3,3 GHz, 100 Euro Aufpreis) oder Core i7-5557U (3,1 - 3,4 GHz, 350 Euro Aufpreis) an. Abseits der Taktdifferenzen sowie eines etwas größeren L3-Caches der i7-Version unterscheiden sich die genannten Modelle jedoch kaum: Alle drei verfügen über jeweils zwei Prozessorkerne sowie Hyper-Threading zur parallelen Bearbeitung von bis zu vier Threads.
In Ermangelung einer dedizierten Grafiklösung (wie beispielsweise im Asus UX303LN) werden sämtliche 3D-Berechnungen von der integrierten Iris Graphics 6100 übernommen. Im Vergleich mit der alten Iris Graphics 5100 hat Intel die GPU von 40 auf nunmehr 48 Execution Units (EUs) aufgebohrt, sodass die Shader-Power rund Faktor zwei über der beliebten HD Graphics 5500 (24 EUs) liegt. Erfahrungsgemäß skaliert die Framerate (zumindest bei Intel-GPUs der letzten Jahre) jedoch nicht annähernd linear mit der theoretischen Rechenleistung.
Ein Grund dafür ist die begrenzte Speicherbandbreite. Auch bei Broadwell müssen sich Prozessor und Grafikeinheit ein schmales 128-Bit-Interface (2x 64 Bit Dual-Channel) teilen, allerdings erlaubt Intel – zumindest bei den 28-Watt-Modellen – nun etwas höhere Taktraten bis LPDDR3-1866. Wahlweise 8 oder 16 GB verlötet Apple davon auf dem Mainboard, letztere gegen saftige 200 Euro Aufpreis. Ebenso kostspielig gerät ein Upgrade der 128-GB-SSD; 200 Euro für 256 GB beziehungsweise 450 Euro für 512 GB (ausstattungsbereinigt) erscheinen uns doch etwas überzogen.
| Core i5-5257U | Core i5-5287U | Core i7-5557U | Core i5-4258U | |
|---|---|---|---|---|
| Architektur | Broadwell | Broadwell | Broadwell | Haswell |
| Fertigung | 14 nm | 14 nm | 14 nm | 22 nm |
| Taktrate | 2,7 - 3,1 GHz | 2,9 - 3,3 GHz | 3,1 - 3,4 GHz | 2,4 - 2,9 GHz |
| Kerne/Threads | 2/4 | 2/4 | 2/4 | 2/4 |
| L3-Cache | 3 MB | 3 MB | 4 MB | 3 MB |
| Grafikeinheit | Iris Graphics 6100 48 EUs, 300 - 1.050 MHz |
Iris Graphics 6100 48 EUs, 300 - 1.100 MHz |
Iris Graphics 6100 48 EUs, 300 - 1.100 MHz |
Iris Graphics 5100 40 EUs, 200 - 1.100 MHz |
| Speichercontroller | Dual-Channel 1.866 MHz | Dual-Channel 1.866 MHz | Dual-Channel 1.866 MHz | Dual-Channel 1.600 MHz |
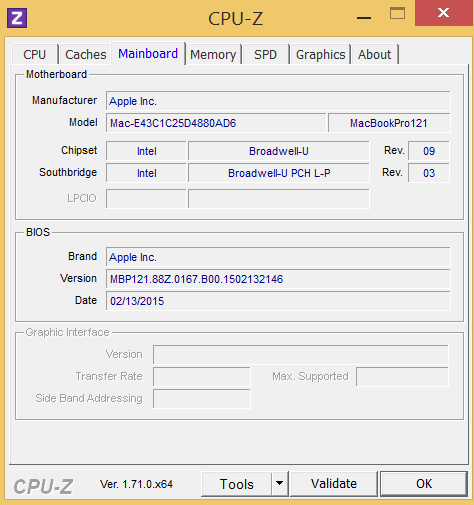
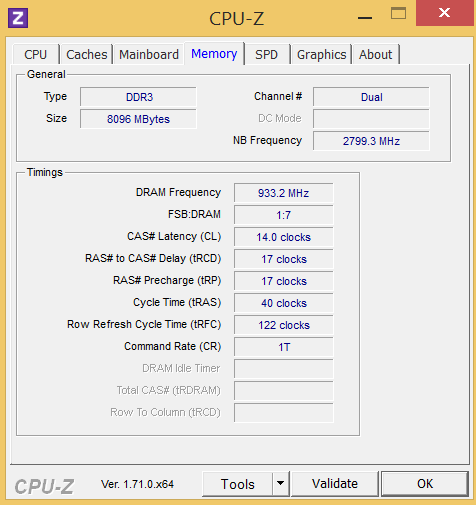
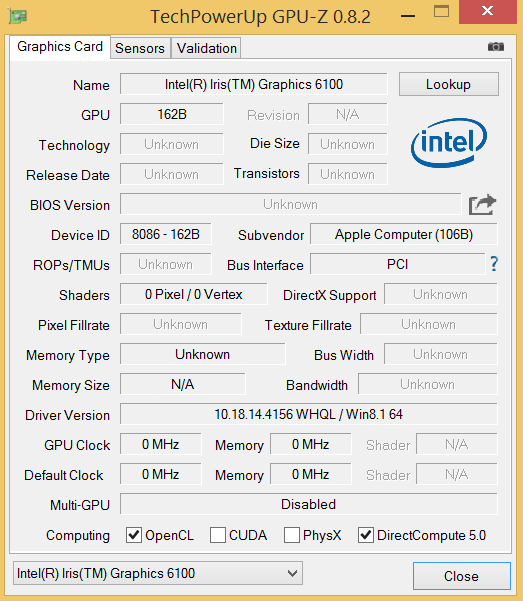
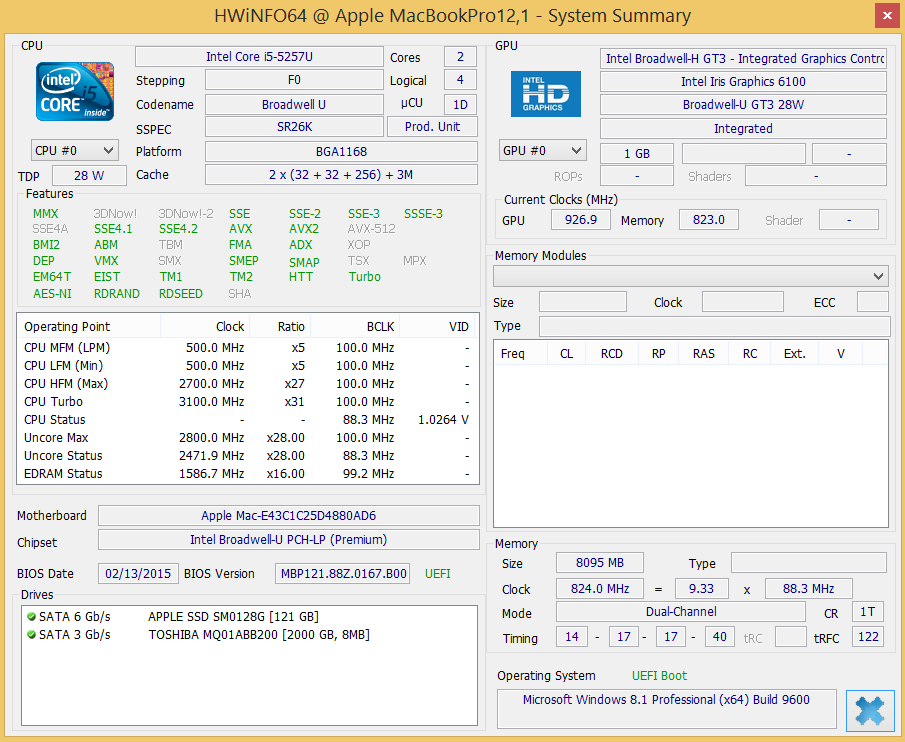
Systeminformationen Apple MacBook Pro Retina 13
Prozessor
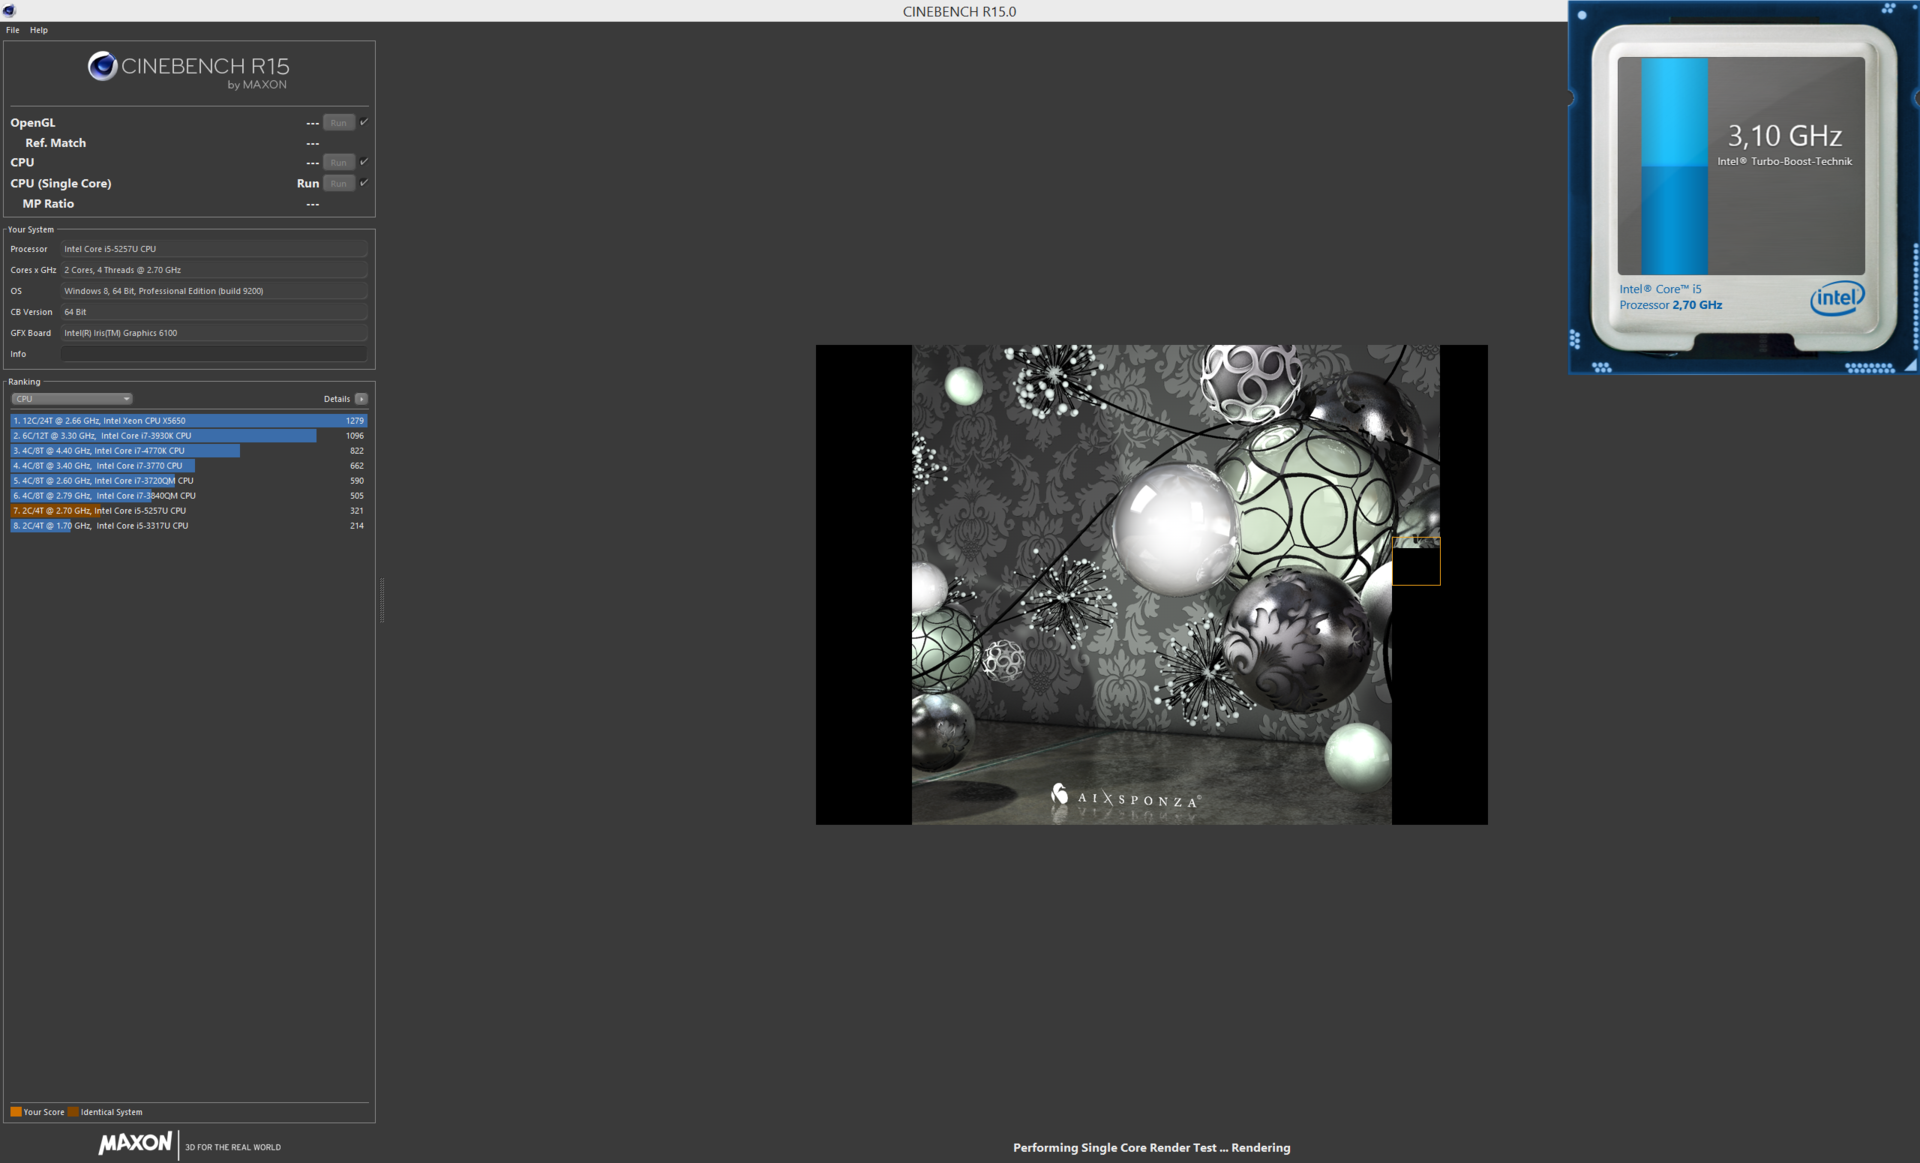
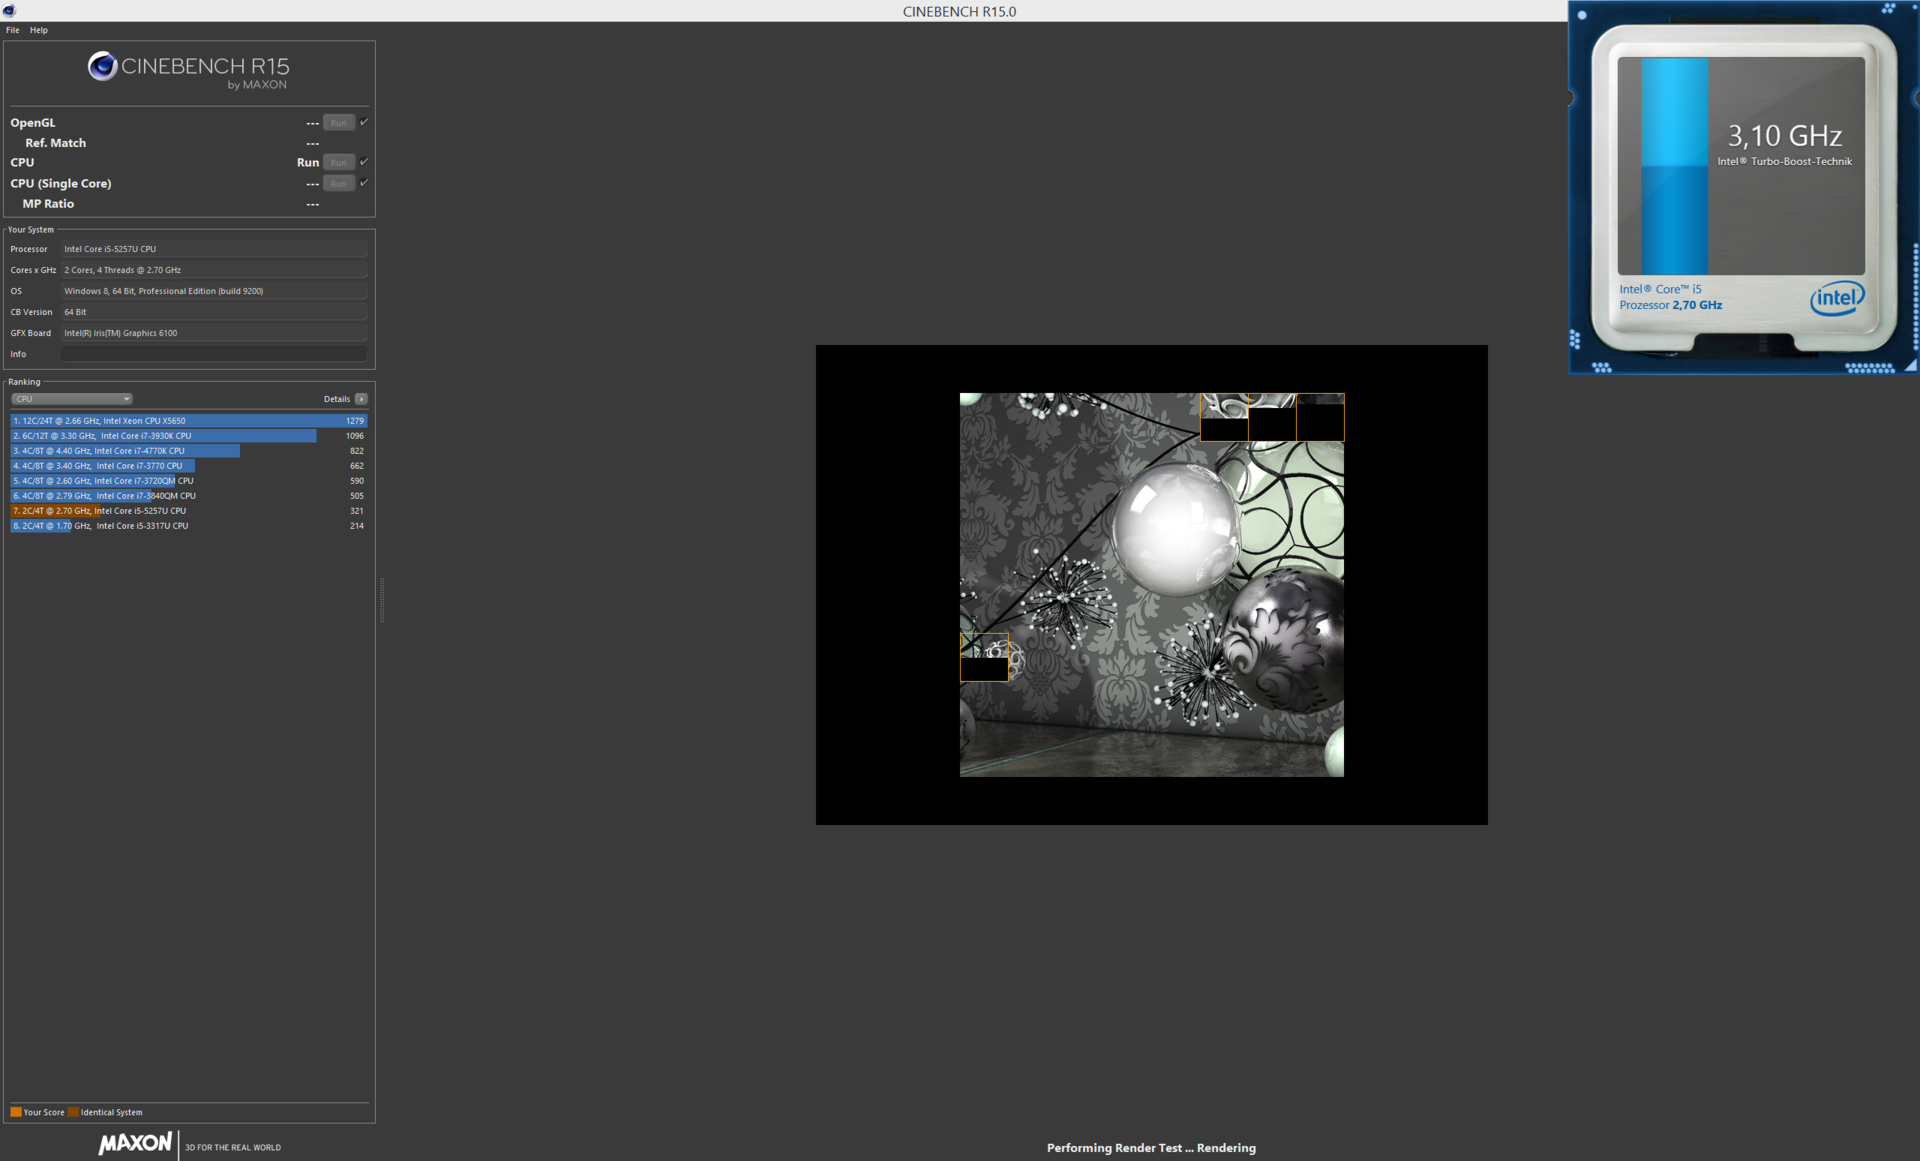
Die Kombination aus gesteigerter Taktfrequenz und leicht verbesserter Pro-MHz-Leistung führt dazu, dass der Core i5-5257U den bisherigen Core i5-4258U um etwa 10 bis 15 Prozent distanziert. Dies entspricht ziemlich genau dem Level eines Core i5-4310M oder Core i5-4200H, die beide mit einer weitaus höheren TDP von 37 respektive 47 Watt spezifiziert werden. Interessanterweise liegen unsere Benchmarkergebnisse unter Windows 8.1 reproduzierbar über denen unter OS X – wir vermuten, dass Apple den Turbo Boost etwas defensiver abgestimmt hat, um so die Energieeffizienz zu steigern. Die Performance im Netz- und Akkubetrieb ist bei beiden Betriebssystemen identisch.
Ebenfalls spannend ist ein Vergleich des Core i5-5257U mit dem Core i7-5500U im Zenbook UX303LN. Das "kleine" 15-Watt-Modell kommt dem 5257U erstaunlich nah, was allerdings nur auf den ersten Blick für Verwunderung sorgt: Dank fortschrittlicher 14-Nanometer-Fertigung pendelt sich die reale Leistungsaufnahme in reinen CPU-Benchmarks wie Cinebench ohnehin klar unter 20 Watt ein, sodass die höhere TDP-Einstufung kaum einen Unterschied macht. Schade, dass Intel im (U)LV-Segment bislang keine Quad-Core-Prozessoren anbietet (Atom-Ableger einmal ausgeklammert) – vier niedrig taktende Kerne könnten gut parallelisierte Software zweifellos effizienter als ein extrem schneller Dual-Core abarbeiten.
| Cinebench R11.5 | |
| CPU Single 64Bit (nach Ergebnis sortieren) | |
| Apple MacBook Pro Retina 13 inch 2015-03 | |
| Apple MacBook Pro Retina 13 inch 2015-03 | |
| Asus Zenbook UX303LN-R4274H | |
| Dell XPS 13 9343 Core i7 | |
| Lenovo Yoga 3 Pro | |
| Apple MacBook Pro Retina 13 inch 2013-10 | |
| Apple MacBook Pro Retina 15 inch 2013-10 | |
| CPU Multi 64Bit (nach Ergebnis sortieren) | |
| Apple MacBook Pro Retina 13 inch 2015-03 | |
| Apple MacBook Pro Retina 13 inch 2015-03 | |
| Asus Zenbook UX303LN-R4274H | |
| Dell XPS 13 9343 Core i7 | |
| Lenovo Yoga 3 Pro | |
| Apple MacBook Pro Retina 13 inch 2013-10 | |
| Apple MacBook Pro Retina 15 inch 2013-10 | |
| Cinebench R15 | |
| CPU Single 64Bit (nach Ergebnis sortieren) | |
| Apple MacBook Pro Retina 13 inch 2015-03 | |
| Asus Zenbook UX303LN-R4274H | |
| Dell XPS 13 9343 Core i7 | |
| Lenovo Yoga 3 Pro | |
| Apple MacBook Pro Retina 13 inch 2013-10 | |
| Apple MacBook Pro Retina 15 inch 2013-10 | |
| CPU Multi 64Bit (nach Ergebnis sortieren) | |
| Apple MacBook Pro Retina 13 inch 2015-03 | |
| Asus Zenbook UX303LN-R4274H | |
| Dell XPS 13 9343 Core i7 | |
| Lenovo Yoga 3 Pro | |
| Apple MacBook Pro Retina 13 inch 2013-10 | |
| Apple MacBook Pro Retina 15 inch 2013-10 | |
| X264 HD Benchmark 4.0 | |
| Pass 1 (nach Ergebnis sortieren) | |
| Apple MacBook Pro Retina 13 inch 2015-03 | |
| Lenovo Yoga 3 Pro | |
| Apple MacBook Pro Retina 13 inch 2013-10 | |
| Pass 2 (nach Ergebnis sortieren) | |
| Apple MacBook Pro Retina 13 inch 2015-03 | |
| Lenovo Yoga 3 Pro | |
| Apple MacBook Pro Retina 13 inch 2013-10 | |
Massenspeicher
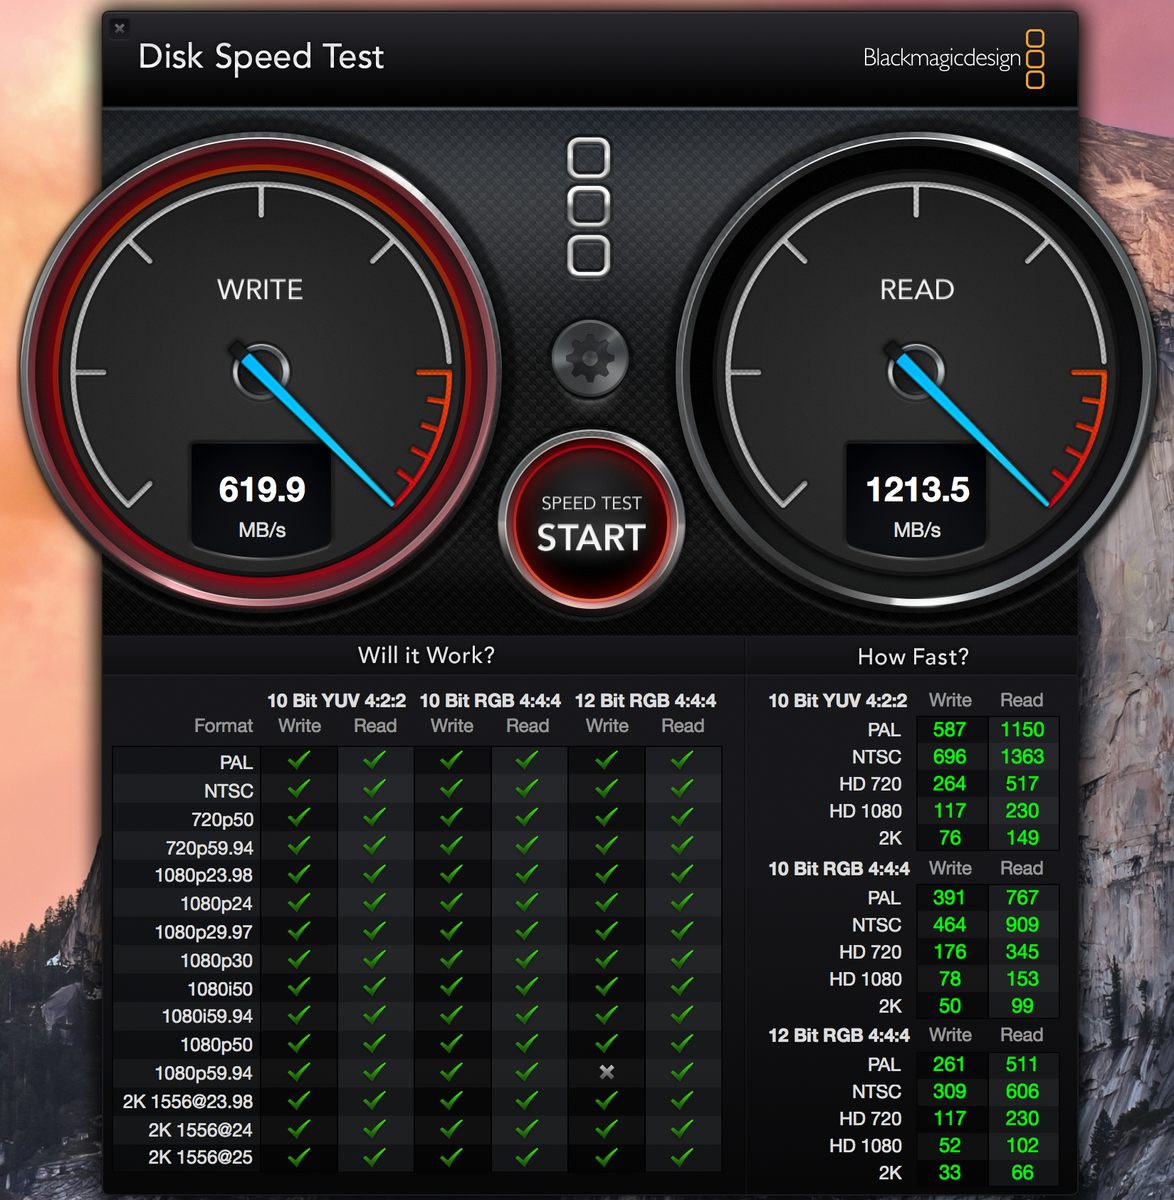
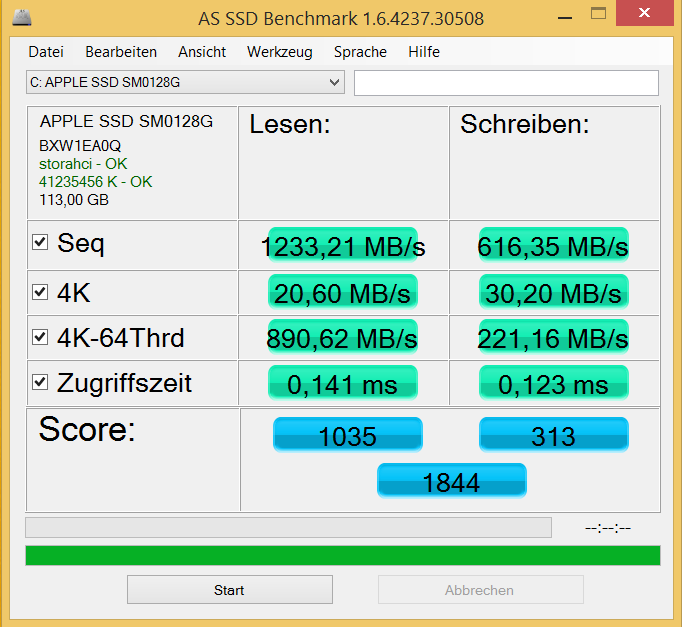
Klassische SATA-SSDs haben bei Apple schon seit einiger Zeit ausgedient, stattdessen setzt der Hersteller auf die sehr viel schnellere PCIe-Schnittstelle. Während SATA-III die Nettodatenrate auf knapp unter 600 MB/s limitiert, erlaubt PCIe 3.0 x4 fast 4 GB/s.
Auch wenn sich unser 128 GB großes Modell unter dem Namen "Apple SSD SM0128G" meldet, handelt es sich in Wahrheit vermutlich um die erst kürzlich vorgestellte Samsung SM951 (eventuell mit angepasster Firmware). Diese SSD im M.2-2280-Format basiert auf Samsungs S4LN058A01-Controller in Kombination mit 19-Nanometer-MLC-NAND und 512 MB LPDDR3-Cache.
Losgelöst von jeglichen Interface-Limitierungen klettern die sequentiellen Übertragungsraten auf mehr als 1.200 MB/s beim Lesen sowie gut 600 MB/s beim Schreiben – die höchsten Werte, die wir je bei Einzellaufwerken dieser Kapazität messen konnten. Ein wenig enttäuschend fallen dagegen die Ergebnisse der 4K-Tests aus, in denen die Apple-/Samsung-SSD diversen SATA-Konkurrenten unterliegt. Erst bei mehrfach parallelen Zugriffen wird diese kleine Schwäche überwunden und das MacBook setzt sich wieder klar an die Spitze des Testfeldes.
| Apple MacBook Pro Retina 13 (Early 2015) | Dell XPS 13-9343 | Asus Zenbook UX303LN | Acer Aspire R13 | Apple MacBook Pro Retina 13 (Late 2013) | |
|---|---|---|---|---|---|
| AS SSD | 2% | 16% | 11% | -24% | |
| Seq Write (MB/s) | 616 | 416.8 -32% | 421 -32% | 659 7% | 592 -4% |
| Seq Read (MB/s) | 1233 | 484.7 -61% | 480.1 -61% | 411.6 -67% | 711 -42% |
| 4K Read (MB/s) | 20.6 | 30.89 50% | 30.65 49% | 31.97 55% | 16.2 -21% |
| 4K Write (MB/s) | 30.2 | 58.8 95% | 83.1 175% | 66.4 120% | 19.8 -34% |
| 4K-64 Read (MB/s) | 891 | 345.5 -61% | 349.3 -61% | 350.6 -61% | 441 -51% |
| 4K-64 Write (MB/s) | 221.2 | 268.3 21% | 275.9 25% | 246.1 11% | 238 8% |

System Performance
Nicht zuletzt dank der überragenden SSD-Performance dominiert das MBP 13 sämtliche Sysmtenleistungsbenchmarks der PCMark-Serie. Gleichwohl sei darauf hingewiesen, dass sich diese Ergebnisse nur bedingt auf die Praxis übertragen lassen: Leistungsdifferenzen zwischen verschieden SSDs sind im Alltag in der Regel kaum zu spüren, subjektiv fühlt sich ein XPS 13 oder UX303LN jedenfalls nicht langsamer an. Auch die nur marginal höhere Performance des 28-Watt-Prozessors sorgt – auf hohem Niveau – für leichte Enttäuschung. Besonders anspruchsvolle Anwender, die sehr CPU-lastige Software nutzen oder exzessives Multitasking betreiben, sind mit einem MBP 15 und dessen Quad-Core-i7 womöglich besser beraten. Dies trifft natürlich ebenso auf vergleichbare Windows-Geräte zu.
Insgesamt bleibt das MacBook Pro 13 dennoch eines der schnellsten Subnotebooks auf dem Markt und bewältigt übliche Office-, Multimedia- und Web-Anwendungen ohne erkennbare Schwierigkeiten.
| PCMark 7 - Score (nach Ergebnis sortieren) | |
| Apple MacBook Pro Retina 13 inch 2015-03 | |
| Dell XPS 13-9343 | |
| Asus Zenbook UX303LN-R4141H | |
| Acer Aspire R13 R7-371T-779K | |
| Apple MacBook Pro Retina 13 inch 2013-10 | |
| PCMark 7 Score | 5620 Punkte | |
| PCMark 8 Home Score Accelerated v2 | 3363 Punkte | |
| PCMark 8 Creative Score Accelerated v2 | 4593 Punkte | |
| PCMark 8 Work Score Accelerated v2 | 4105 Punkte | |
Hilfe | ||
Grafikkarte
Nachdem wir die technischen Daten der Iris Graphics 6100 bereits zuvor abgehandelt haben, wollen wir nun einen Blick auf die Leistungswerte werfen. Ein wirklich einheitliches Bild ergibt sich dabei allerdings nicht: Während die GPU im 3DMark 11 rund 50 Prozent vor der HD Graphics 5500 und Iris Graphics 5100 landet, schrumpft der Vorsprung im bandbreitenlastigeren 3DMark 2013 auf etwa 10 bis 20 Prozent zusammen. Gut möglich, dass die (Windows-)Treiber derzeit noch etwas Potential verschenken; dennoch zeichnet sich ab, dass das Level einer GeForce 840M für die Iris Graphics 6100 unerreichbar bleibt. Daran dürfte sich auch im Falle eines Upgrades auf den Core i5-5287U oder Core i7-5557U – beide mit etwas höheren CPU- und GPU-Taktraten – wenig ändern.
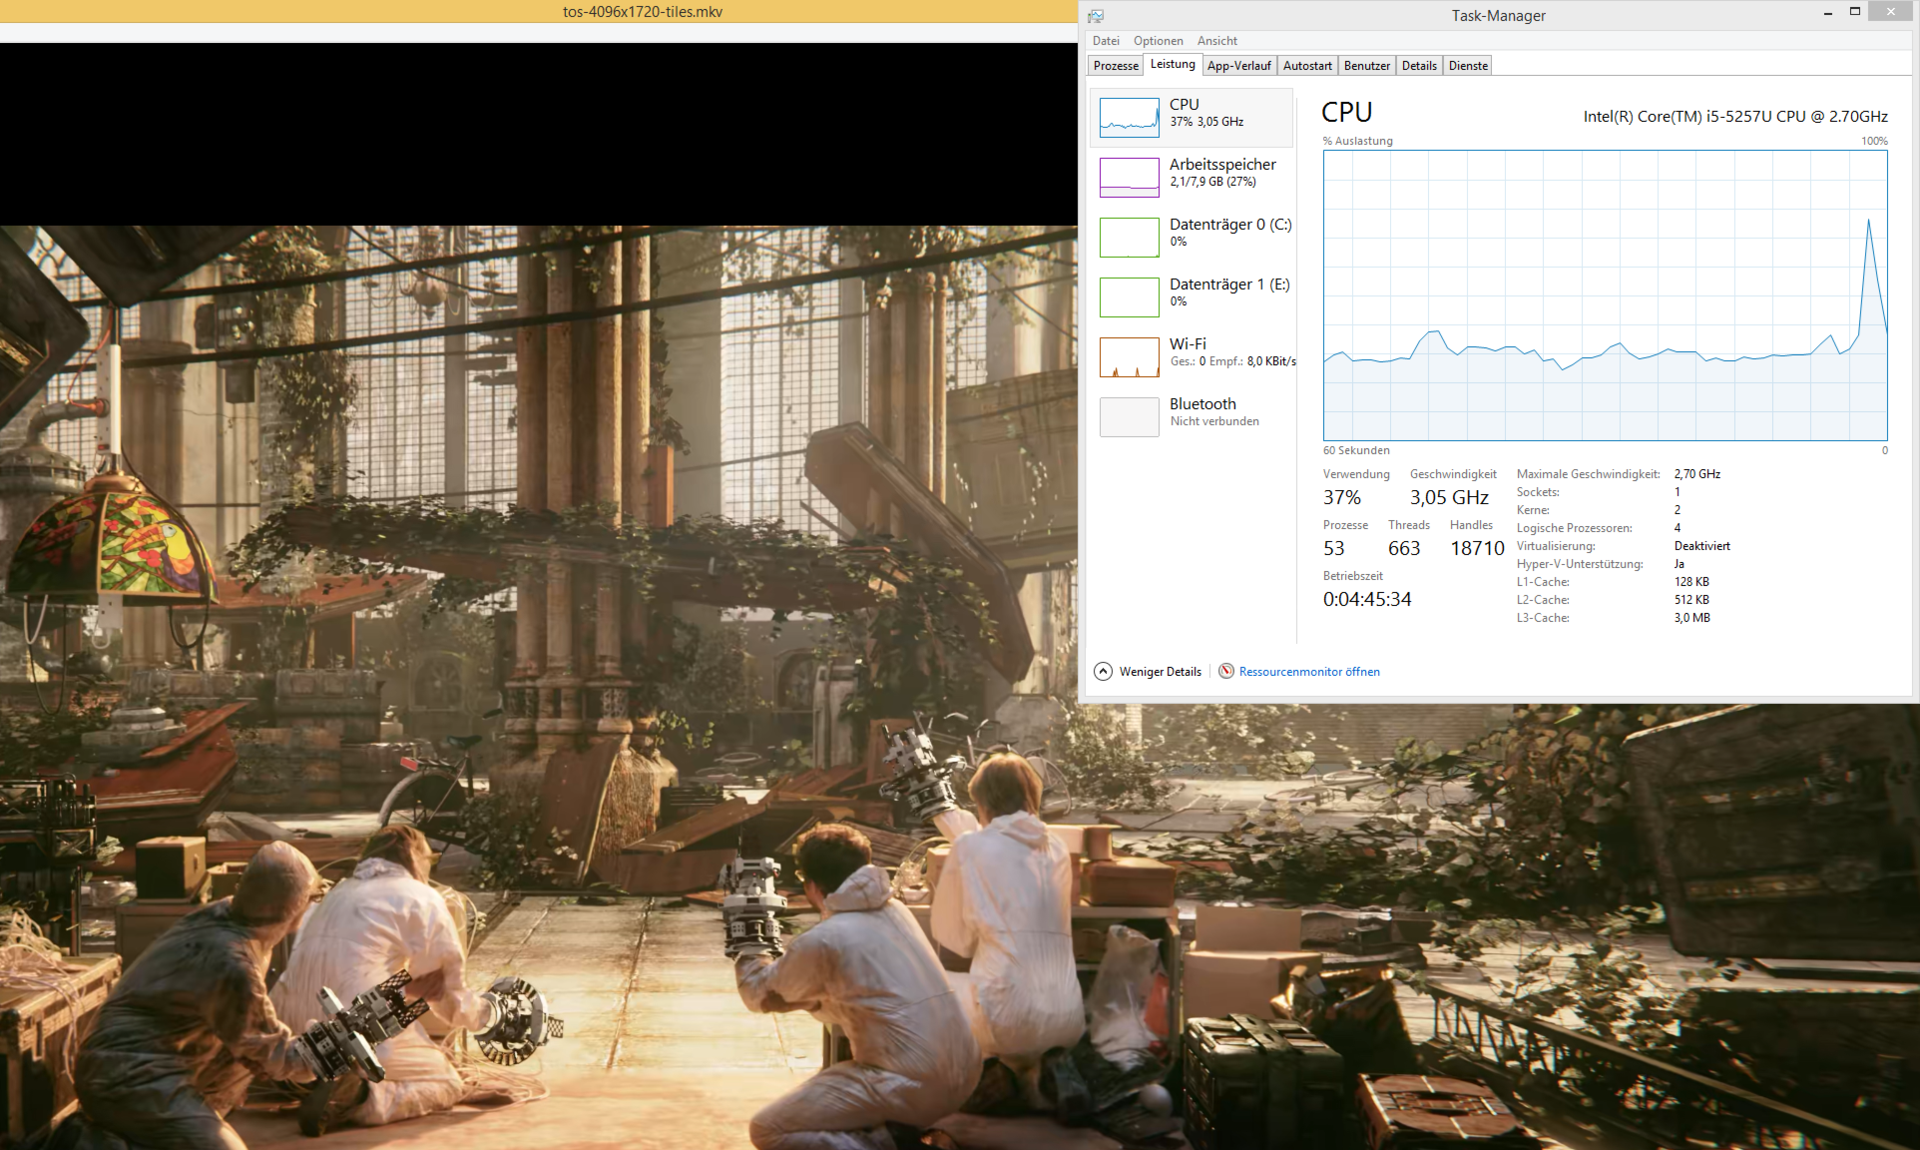
Erwartungsgemäß souverän meistert der Grafikchip unsere Multimedia-Tests. Selbst ein 4K-Video im H.265-Codec wird flüssig und bei akzeptabler CPU-Auslastung wiedergegeben; vorausgesetzt, ein geeigneter Player mit funktionierender Hardwarebeschleunigung ist installiert. Zum En- oder Transcoding von Filmen empfiehlt es sich, auf die besonders effiziente Quick-Sync-Einheit des Prozessors zurückzugreifen (beispielsweise via HandBrake).
| 3DMark 11 | |
| 1280x720 Performance (nach Ergebnis sortieren) | |
| Apple MacBook Pro Retina 13 inch 2015-03 | |
| Dell XPS 13 9343 Core i7 | |
| Asus Zenbook UX303LN-R4274H | |
| Acer Aspire R13 R7-371T-779K | |
| Apple MacBook Pro Retina 13 inch 2013-10 | |
| Lenovo ThinkPad T450s-20BWS03F00 | |
| 1280x720 Performance GPU (nach Ergebnis sortieren) | |
| Apple MacBook Pro Retina 13 inch 2015-03 | |
| Dell XPS 13 9343 Core i7 | |
| Asus Zenbook UX303LN-R4274H | |
| Acer Aspire R13 R7-371T-779K | |
| Apple MacBook Pro Retina 13 inch 2013-10 | |
| Lenovo ThinkPad T450s-20BWS03F00 | |
| 3DMark | |
| 1280x720 Cloud Gate Standard Score (nach Ergebnis sortieren) | |
| Apple MacBook Pro Retina 13 inch 2015-03 | |
| Dell XPS 13 9343 Core i7 | |
| Asus Zenbook UX303LN-R4274H | |
| Acer Aspire R13 R7-371T-779K | |
| Apple MacBook Pro Retina 13 inch 2013-10 | |
| Lenovo ThinkPad T450s-20BWS03F00 | |
| 1280x720 Cloud Gate Standard Graphics (nach Ergebnis sortieren) | |
| Apple MacBook Pro Retina 13 inch 2015-03 | |
| Dell XPS 13 9343 Core i7 | |
| Asus Zenbook UX303LN-R4274H | |
| Acer Aspire R13 R7-371T-779K | |
| Apple MacBook Pro Retina 13 inch 2013-10 | |
| Lenovo ThinkPad T450s-20BWS03F00 | |
| 1920x1080 Fire Strike Score (nach Ergebnis sortieren) | |
| Apple MacBook Pro Retina 13 inch 2015-03 | |
| Dell XPS 13 9343 Core i7 | |
| Asus Zenbook UX303LN-R4274H | |
| Apple MacBook Pro Retina 13 inch 2013-10 | |
| Lenovo ThinkPad T450s-20BWS03F00 | |
| 1920x1080 Fire Strike Graphics (nach Ergebnis sortieren) | |
| Apple MacBook Pro Retina 13 inch 2015-03 | |
| Dell XPS 13 9343 Core i7 | |
| Asus Zenbook UX303LN-R4274H | |
| Apple MacBook Pro Retina 13 inch 2013-10 | |
| Lenovo ThinkPad T450s-20BWS03F00 | |
| GFXBench (DX / GLBenchmark) 2.7 - 1920x1080 T-Rex Offscreen (nach Ergebnis sortieren) | |
| Apple MacBook Pro Retina 13 inch 2015-03 | |
| Apple MacBook Pro Retina 13 inch 2013-10 | |
| Lenovo ThinkPad T450s-20BWS03F00 | |
| GFXBench 3.0 - 1920x1080 1080p Manhattan Offscreen (nach Ergebnis sortieren) | |
| Apple MacBook Pro Retina 13 inch 2015-03 | |
| Lenovo ThinkPad T450s-20BWS03F00 | |
| SPECviewperf 12 | |
| 1900x1060 Catia (catia-04) (nach Ergebnis sortieren) | |
| Apple MacBook Pro Retina 13 inch 2015-03 | |
| Lenovo ThinkPad T450s-20BWS03F00 | |
| 1900x1060 Creo (creo-01) (nach Ergebnis sortieren) | |
| Apple MacBook Pro Retina 13 inch 2015-03 | |
| Lenovo ThinkPad T450s-20BWS03F00 | |
| 1900x1060 Energy (energy-01) (nach Ergebnis sortieren) | |
| Apple MacBook Pro Retina 13 inch 2015-03 | |
| Lenovo ThinkPad T450s-20BWS03F00 | |
| 1900x1060 Maya (maya-04) (nach Ergebnis sortieren) | |
| Apple MacBook Pro Retina 13 inch 2015-03 | |
| 1900x1060 Medical (medical-01) (nach Ergebnis sortieren) | |
| Apple MacBook Pro Retina 13 inch 2015-03 | |
| Lenovo ThinkPad T450s-20BWS03F00 | |
| 1900x1060 Showcase (showcase-01) (nach Ergebnis sortieren) | |
| Apple MacBook Pro Retina 13 inch 2015-03 | |
| Lenovo ThinkPad T450s-20BWS03F00 | |
| 1900x1060 Siemens NX (snx-02) (nach Ergebnis sortieren) | |
| Apple MacBook Pro Retina 13 inch 2015-03 | |
| Lenovo ThinkPad T450s-20BWS03F00 | |
| 1900x1060 Solidworks (sw-03) (nach Ergebnis sortieren) | |
| Apple MacBook Pro Retina 13 inch 2015-03 | |
| Lenovo ThinkPad T450s-20BWS03F00 | |
| 3DMark 06 Standard Score | 9332 Punkte | |
| 3DMark Vantage P Result | 6531 Punkte | |
| 3DMark 11 Performance | 1828 Punkte | |
| 3DMark Ice Storm Standard Score | 53847 Punkte | |
| 3DMark Cloud Gate Standard Score | 6190 Punkte | |
| 3DMark Fire Strike Score | 981 Punkte | |
| 3DMark Fire Strike Extreme Score | 448 Punkte | |
Hilfe | ||
Gaming Performance
Wer sich mit reduzierten Grafikeinstellungen zufrieden gibt, kann mit dem MBP 13 viele aktuelle Titel in niedrigen Einstellungen flüssig spielen. Allerdings bestätigt sich, dass die Iris Graphics 6100 ihre hohe Shaderleistung in vielen Fällen nicht sonderlich gut umsetzen kann – nur selten fallen HD Graphics 5500 oder Iris Graphics 5100 (beide mit in etwa ähnlicher Performance) mehr als 15 bis 20 Prozent zurück. Eine dedizierte GeForce 840M rechnet im Mittel mindestens 40 Prozent schneller.
Bei unseren Benchmarks, die allesamt unter Windows 8.1 durchgeführt wurden, sind wir mehrfach auf ein rätselhaftes Problem gestoßen: Nach Auflösungswechseln begann der Bildschirm des MacBooks stark zu flimmern und blendete während des Spielens kurzzeitig Ausschnitte von dem Menü oder Desktop ein. Unter OS X konnten wir ein derartiges Verhalten nicht beobachten, weshalb wir stark von einem fehlerhaften Grafiktreiber ausgehen. Leider stand zum Testzeitpunkt keine neuere Version zur Verfügung.
| Tomb Raider | |
| 1024x768 Low Preset (nach Ergebnis sortieren) | |
| Apple MacBook Pro Retina 13 inch 2015-03 | |
| Acer Aspire V3-371-58DJ | |
| Dell Latitude E7450 | |
| Asus UX32LN | |
| Acer Aspire V 15 Nitro VN7-571G-56NX | |
| Lenovo IdeaPad Z50-70 (59427656) | |
| Apple MacBook Pro Retina 13 inch 2013-10 | |
| Asus Zenbook UX301 | |
| Schenker S413 | |
| 1366x768 Normal Preset AA:FX AF:4x (nach Ergebnis sortieren) | |
| Apple MacBook Pro Retina 13 inch 2015-03 | |
| Acer Aspire V3-371-58DJ | |
| Dell Latitude E7450 | |
| Asus UX32LN | |
| Acer Aspire V 15 Nitro VN7-571G-56NX | |
| Lenovo IdeaPad Z50-70 (59427656) | |
| Apple MacBook Pro Retina 13 inch 2013-10 | |
| Asus Zenbook UX301 | |
| Schenker S413 | |
| 1366x768 High Preset AA:FX AF:8x (nach Ergebnis sortieren) | |
| Apple MacBook Pro Retina 13 inch 2015-03 | |
| Acer Aspire V3-371-58DJ | |
| Dell Latitude E7450 | |
| Asus UX32LN | |
| Acer Aspire V 15 Nitro VN7-571G-56NX | |
| Lenovo IdeaPad Z50-70 (59427656) | |
| Apple MacBook Pro Retina 13 inch 2013-10 | |
| Asus Zenbook UX301 | |
| Schenker S413 | |
| The Elder Scrolls V: Skyrim | |
| 1280x720 Low Preset (nach Ergebnis sortieren) | |
| Apple MacBook Pro Retina 13 inch 2015-03 | |
| Asus Zenbook UX301 | |
| Schenker S413 | |
| 1366x768 Medium Preset AA:4x (nach Ergebnis sortieren) | |
| Apple MacBook Pro Retina 13 inch 2015-03 | |
| Asus Zenbook UX301 | |
| Schenker S413 | |
| 1366x768 High Preset AA:8x AF:8x (nach Ergebnis sortieren) | |
| Apple MacBook Pro Retina 13 inch 2015-03 | |
| Asus Zenbook UX301 | |
| Schenker S413 | |
| Diablo III | |
| 1024x768 Low / off (nach Ergebnis sortieren) | |
| Apple MacBook Pro Retina 13 inch 2015-03 | |
| Dell Latitude E7450 | |
| Asus UX32LN | |
| Asus Zenbook UX301 | |
| Schenker S413 | |
| 1366x768 Medium / low (nach Ergebnis sortieren) | |
| Apple MacBook Pro Retina 13 inch 2015-03 | |
| Dell Latitude E7450 | |
| Asus UX32LN | |
| Asus Zenbook UX301 | |
| Schenker S413 | |
| 1366x768 High AA:on (nach Ergebnis sortieren) | |
| Apple MacBook Pro Retina 13 inch 2015-03 | |
| Dell Latitude E7450 | |
| Asus UX32LN | |
| Asus Zenbook UX301 | |
| Schenker S413 | |
| Counter-Strike: GO | |
| 1024x768 (Very) Low (nach Ergebnis sortieren) | |
| Apple MacBook Pro Retina 13 inch 2015-03 | |
| Dell Latitude E7450 | |
| Asus Zenbook UX301 | |
| Schenker S413 | |
| 1366x768 Medium (nach Ergebnis sortieren) | |
| Apple MacBook Pro Retina 13 inch 2015-03 | |
| Dell Latitude E7450 | |
| Asus Zenbook UX301 | |
| Schenker S413 | |
| 1366x768 High AA:2x MS AF:4x (nach Ergebnis sortieren) | |
| Apple MacBook Pro Retina 13 inch 2015-03 | |
| Dell Latitude E7450 | |
| Asus Zenbook UX301 | |
| Schenker S413 | |
| Metro: Last Light | |
| 1024x768 Low (DX10) AF:4x (nach Ergebnis sortieren) | |
| Apple MacBook Pro Retina 13 inch 2015-03 | |
| Acer Aspire V3-371-58DJ | |
| Asus UX32LN | |
| Asus Zenbook UX301 | |
| Schenker S413 | |
| 1366x768 Medium (DX10) AF:4x (nach Ergebnis sortieren) | |
| Apple MacBook Pro Retina 13 inch 2015-03 | |
| Acer Aspire V3-371-58DJ | |
| Asus UX32LN | |
| Asus Zenbook UX301 | |
| Schenker S413 | |
| 1366x768 High (DX11) AF:16x (nach Ergebnis sortieren) | |
| Apple MacBook Pro Retina 13 inch 2015-03 | |
| Acer Aspire V3-371-58DJ | |
| Asus UX32LN | |
| Asus Zenbook UX301 | |
| Schenker S413 | |
| Company of Heroes 2 | |
| 1024x768 Minimum / Low / Off AA:Off (nach Ergebnis sortieren) | |
| Apple MacBook Pro Retina 13 inch 2015-03 | |
| Acer Aspire V3-371-58DJ | |
| Acer Aspire V3-371-58DJ | |
| Lenovo IdeaPad Z50-70 (59427656) | |
| Apple MacBook Pro Retina 13 inch 2013-10 | |
| Asus Zenbook UX301 | |
| Schenker S413 | |
| 1366x768 Medium AA:Off (nach Ergebnis sortieren) | |
| Acer Aspire V3-371-58DJ | |
| Acer Aspire V3-371-58DJ | |
| Lenovo IdeaPad Z50-70 (59427656) | |
| Apple MacBook Pro Retina 13 inch 2013-10 | |
| Asus Zenbook UX301 | |
| Schenker S413 | |
| 1366x768 High AA:Medium (nach Ergebnis sortieren) | |
| Asus Zenbook UX301 | |
| Schenker S413 | |
| Dota 2 | |
| 1024x768 Low / Off, Render Quality: 40 % (nach Ergebnis sortieren) | |
| Apple MacBook Pro Retina 13 inch 2015-03 | |
| Dell Latitude E7450 | |
| Asus UX32LN | |
| Lenovo IdeaPad Z50-70 (59427656) | |
| Asus Zenbook UX301 | |
| 1366x768 Medium / On, Render Quality: 70 % (nach Ergebnis sortieren) | |
| Apple MacBook Pro Retina 13 inch 2015-03 | |
| Dell Latitude E7450 | |
| Asus UX32LN | |
| Lenovo IdeaPad Z50-70 (59427656) | |
| Asus Zenbook UX301 | |
| 1920x1080 High / On, Render Quality: 100 % (nach Ergebnis sortieren) | |
| Apple MacBook Pro Retina 13 inch 2015-03 | |
| Dell Latitude E7450 | |
| Asus UX32LN | |
| Lenovo IdeaPad Z50-70 (59427656) | |
| Asus Zenbook UX301 | |
| Battlefield 4 | |
| 1024x768 Low Preset (nach Ergebnis sortieren) | |
| Apple MacBook Pro Retina 13 inch 2015-03 | |
| Acer Aspire V3-371-58DJ | |
| Apple MacBook Pro Retina 13 inch 2013-10 | |
| 1366x768 Medium Preset (nach Ergebnis sortieren) | |
| Apple MacBook Pro Retina 13 inch 2015-03 | |
| Acer Aspire V3-371-58DJ | |
| Apple MacBook Pro Retina 13 inch 2013-10 | |
| 1366x768 High Preset (nach Ergebnis sortieren) | |
| Apple MacBook Pro Retina 13 inch 2015-03 | |
| Acer Aspire V3-371-58DJ | |
| Apple MacBook Pro Retina 13 inch 2013-10 | |
| Thief | |
| 1024x768 Very Low Preset (nach Ergebnis sortieren) | |
| Apple MacBook Pro Retina 13 inch 2015-03 | |
| Acer Aspire V3-371-58DJ | |
| Dell Latitude E7450 | |
| Acer Aspire V 15 Nitro VN7-571G-56NX | |
| Asus Zenbook UX303LN-R4141H | |
| Lenovo IdeaPad Z50-70 (59427656) | |
| Apple MacBook Pro Retina 13 inch 2013-10 | |
| 1366x768 Normal Preset AA:FX (nach Ergebnis sortieren) | |
| Apple MacBook Pro Retina 13 inch 2015-03 | |
| Acer Aspire V3-371-58DJ | |
| Dell Latitude E7450 | |
| Acer Aspire V 15 Nitro VN7-571G-56NX | |
| Asus Zenbook UX303LN-R4141H | |
| Apple MacBook Pro Retina 13 inch 2013-10 | |
| 1366x768 High Preset AA:FXAA & Low SS AF:4x (nach Ergebnis sortieren) | |
| Apple MacBook Pro Retina 13 inch 2015-03 | |
| Acer Aspire V3-371-58DJ | |
| Dell Latitude E7450 | |
| Acer Aspire V 15 Nitro VN7-571G-56NX | |
| Asus Zenbook UX303LN-R4141H | |
| Apple MacBook Pro Retina 13 inch 2013-10 | |
| GRID: Autosport | |
| 1024x768 Ultra Low Preset (nach Ergebnis sortieren) | |
| Apple MacBook Pro Retina 13 inch 2015-03 | |
| Acer Aspire V3-371-58DJ | |
| Lenovo IdeaPad Z50-70 (59427656) | |
| Apple MacBook Pro Retina 13 inch 2013-10 | |
| Schenker S413 | |
| 1366x768 Medium Preset (nach Ergebnis sortieren) | |
| Apple MacBook Pro Retina 13 inch 2015-03 | |
| Acer Aspire V3-371-58DJ | |
| Lenovo IdeaPad Z50-70 (59427656) | |
| Apple MacBook Pro Retina 13 inch 2013-10 | |
| Schenker S413 | |
| 1920x1080 High Preset (nach Ergebnis sortieren) | |
| Apple MacBook Pro Retina 13 inch 2015-03 | |
| Acer Aspire V3-371-58DJ | |
| Lenovo IdeaPad Z50-70 (59427656) | |
| Apple MacBook Pro Retina 13 inch 2013-10 | |
| Schenker S413 | |
| Sims 4 | |
| 1024x768 Low Preset (nach Ergebnis sortieren) | |
| Apple MacBook Pro Retina 13 inch 2015-03 | |
| Acer Aspire V3-371-58DJ | |
| Dell Latitude E7450 | |
| Asus Zenbook UX303LN-R4141H | |
| Schenker S413 | |
| 1366x768 Medium Preset (nach Ergebnis sortieren) | |
| Apple MacBook Pro Retina 13 inch 2015-03 | |
| Acer Aspire V3-371-58DJ | |
| Dell Latitude E7450 | |
| Asus Zenbook UX303LN-R4141H | |
| Schenker S413 | |
| 1920x1080 High Preset (nach Ergebnis sortieren) | |
| Apple MacBook Pro Retina 13 inch 2015-03 | |
| Acer Aspire V3-371-58DJ | |
| Dell Latitude E7450 | |
| Asus Zenbook UX303LN-R4141H | |
| Schenker S413 | |
| Fifa 15 | |
| 1280x720 Low Preset (nach Ergebnis sortieren) | |
| Apple MacBook Pro Retina 13 inch 2015-03 | |
| Acer Aspire V3-371-58DJ | |
| Dell Latitude E7450 | |
| Acer Aspire V 15 Nitro VN7-571G-56NX | |
| Asus Zenbook UX303LN-R4141H | |
| Apple MacBook Pro Retina 13 inch 2013-10 | |
| Schenker S413 | |
| 1366x768 High Preset AA:2x MS (nach Ergebnis sortieren) | |
| Apple MacBook Pro Retina 13 inch 2015-03 | |
| Dell Latitude E7450 | |
| Acer Aspire V 15 Nitro VN7-571G-56NX | |
| Asus Zenbook UX303LN-R4141H | |
| Apple MacBook Pro Retina 13 inch 2013-10 | |
| Schenker S413 | |
| 1920x1080 High Preset AA:4x MS (nach Ergebnis sortieren) | |
| Apple MacBook Pro Retina 13 inch 2015-03 | |
| Acer Aspire V3-371-58DJ | |
| Dell Latitude E7450 | |
| Acer Aspire V 15 Nitro VN7-571G-56NX | |
| Asus Zenbook UX303LN-R4141H | |
| Apple MacBook Pro Retina 13 inch 2013-10 | |
| Schenker S413 | |
| Middle-earth: Shadow of Mordor | |
| 1280x720 Lowest Preset (nach Ergebnis sortieren) | |
| Apple MacBook Pro Retina 13 inch 2015-03 | |
| Acer Aspire V3-371-58DJ | |
| Dell Latitude E7450 | |
| Acer Aspire V 15 Nitro VN7-571G-56NX | |
| Asus Zenbook UX303LN-R4141H | |
| Apple MacBook Pro Retina 13 inch 2013-10 | |
| Schenker S413 | |
| 1344x756 Medium Preset (nach Ergebnis sortieren) | |
| Apple MacBook Pro Retina 13 inch 2015-03 | |
| Acer Aspire V3-371-58DJ | |
| Dell Latitude E7450 | |
| Acer Aspire V 15 Nitro VN7-571G-56NX | |
| Asus Zenbook UX303LN-R4141H | |
| Apple MacBook Pro Retina 13 inch 2013-10 | |
| Schenker S413 | |
| 1920x1080 High Preset (nach Ergebnis sortieren) | |
| Apple MacBook Pro Retina 13 inch 2015-03 | |
| Acer Aspire V3-371-58DJ | |
| Dell Latitude E7450 | |
| Acer Aspire V 15 Nitro VN7-571G-56NX | |
| Asus Zenbook UX303LN-R4141H | |
| Apple MacBook Pro Retina 13 inch 2013-10 | |
| Schenker S413 | |
| Alien: Isolation | |
| 1024x768 (Very) Low, Off, Shadow Map 512 AF:1x (nach Ergebnis sortieren) | |
| Apple MacBook Pro Retina 13 inch 2015-03 | |
| Acer Aspire V3-371-58DJ | |
| Dell Latitude E7450 | |
| Schenker S413 | |
| 1366x768 Medium, On (AA & SSAO Off), Shadow Map 1024 AF:4x (nach Ergebnis sortieren) | |
| Apple MacBook Pro Retina 13 inch 2015-03 | |
| Acer Aspire V3-371-58DJ | |
| Dell Latitude E7450 | |
| Schenker S413 | |
| 1920x1080 High, On, Shadow Map 1536, Standard SSAO AA:FX AF:8x (nach Ergebnis sortieren) | |
| Apple MacBook Pro Retina 13 inch 2015-03 | |
| Acer Aspire V3-371-58DJ | |
| Dell Latitude E7450 | |
| Schenker S413 | |
| Ryse: Son of Rome | |
| 1024x768 Low Texture Res. + Low Graphics Quality (Rest Off/Disabled) AF:2x (nach Ergebnis sortieren) | |
| Apple MacBook Pro Retina 13 inch 2015-03 | |
| Acer Aspire V3-371-58DJ | |
| Schenker S413 | |
| 1366x768 Medium Texture Res. + Normal Graphics Quality (Rest Off/Disabled) AF:4x (nach Ergebnis sortieren) | |
| Apple MacBook Pro Retina 13 inch 2015-03 | |
| Acer Aspire V3-371-58DJ | |
| Schenker S413 | |
| 1920x1080 High Texture Res. + High Graphics Quality (Rest Off/Disabled) AF:8x (nach Ergebnis sortieren) | |
| Apple MacBook Pro Retina 13 inch 2015-03 | |
| The Evil Within | |
| 1024x768 Low / Disabled (nach Ergebnis sortieren) | |
| Apple MacBook Pro Retina 13 inch 2015-03 | |
| Acer Aspire V3-371-58DJ | |
| Acer Aspire V 15 Nitro VN7-571G-56NX | |
| Schenker S413 | |
| 1366x768 Medium / Enabled AA:FX (nach Ergebnis sortieren) | |
| Apple MacBook Pro Retina 13 inch 2015-03 | |
| Acer Aspire V3-371-58DJ | |
| Acer Aspire V 15 Nitro VN7-571G-56NX | |
| Schenker S413 | |
| 1920x1080 High / Enabled AA:SM (nach Ergebnis sortieren) | |
| Apple MacBook Pro Retina 13 inch 2015-03 | |
| Acer Aspire V 15 Nitro VN7-571G-56NX | |
| Schenker S413 | |
| F1 2014 | |
| 1024x768 Ultra Low Preset (nach Ergebnis sortieren) | |
| Apple MacBook Pro Retina 13 inch 2015-03 | |
| Acer Aspire V3-371-58DJ | |
| Dell Latitude E7450 | |
| Acer Aspire V 15 Nitro VN7-571G-56NX | |
| Schenker S413 | |
| 1366x768 Medium Preset (nach Ergebnis sortieren) | |
| Apple MacBook Pro Retina 13 inch 2015-03 | |
| Acer Aspire V3-371-58DJ | |
| Dell Latitude E7450 | |
| Acer Aspire V 15 Nitro VN7-571G-56NX | |
| Schenker S413 | |
| 1920x1080 High Preset (nach Ergebnis sortieren) | |
| Apple MacBook Pro Retina 13 inch 2015-03 | |
| Acer Aspire V3-371-58DJ | |
| Dell Latitude E7450 | |
| Acer Aspire V 15 Nitro VN7-571G-56NX | |
| Schenker S413 | |
| Civilization: Beyond Earth | |
| 1024x768 Minimum Preset (nach Ergebnis sortieren) | |
| Apple MacBook Pro Retina 13 inch 2015-03 | |
| Acer Aspire V3-371-58DJ | |
| Schenker S413 | |
| 1366x768 Medium Preset (nach Ergebnis sortieren) | |
| Apple MacBook Pro Retina 13 inch 2015-03 | |
| Acer Aspire V3-371-58DJ | |
| Schenker S413 | |
| 1920x1080 High Preset (nach Ergebnis sortieren) | |
| Apple MacBook Pro Retina 13 inch 2015-03 | |
| Acer Aspire V3-371-58DJ | |
| Schenker S413 | |
| Call of Duty: Advanced Warfare | |
| 1024x768 Low / Off (Shader Preload On) (nach Ergebnis sortieren) | |
| Apple MacBook Pro Retina 13 inch 2015-03 | |
| Acer Aspire V3-371-58DJ | |
| Apple MacBook Pro Retina 13 inch 2013-10 | |
| Schenker S413 | |
| 1366x768 Normal / On (Cache Shadow Maps Off) (nach Ergebnis sortieren) | |
| Acer Aspire V3-371-58DJ | |
| Apple MacBook Pro Retina 13 inch 2013-10 | |
| Schenker S413 | |
| 1920x1080 High / On (Cache Shadow Maps Off) AA:FX (nach Ergebnis sortieren) | |
| Schenker S413 | |
| Evolve | |
| 1024x768 Low Graphics Quality (nach Ergebnis sortieren) | |
| Apple MacBook Pro Retina 13 inch 2015-03 | |
| Apple MacBook Pro Retina 13 inch 2013-10 | |
| Schenker S413 | |
| 1366x768 Medium Graphics Quality (nach Ergebnis sortieren) | |
| Apple MacBook Pro Retina 13 inch 2015-03 | |
| Apple MacBook Pro Retina 13 inch 2013-10 | |
| Schenker S413 | |
| 1920x1080 High Graphics Quality AA:FX (nach Ergebnis sortieren) | |
| Apple MacBook Pro Retina 13 inch 2015-03 | |
| Schenker S413 | |
| min. | mittel | hoch | max. | |
|---|---|---|---|---|
| The Elder Scrolls V: Skyrim (2011) | 41.4 | 23.9 | 15.2 | 8.3 |
| Anno 2070 (2011) | 57.5 | 41.4 | 26 | 13.3 |
| Diablo III (2012) | 73.8 | 54.6 | 44.8 | 29.2 |
| Counter-Strike: GO (2012) | 112.5 | 81.2 | 63 | 32.8 |
| Crysis 3 (2013) | 22 | 15.9 | 11.3 | 4.4 |
| Tomb Raider (2013) | 64.6 | 34.3 | 25 | 12.5 |
| BioShock Infinite (2013) | 44.5 | 28.6 | 23.3 | 7.7 |
| Metro: Last Light (2013) | 23 | 18.5 | 13.3 | 7 |
| Company of Heroes 2 (2013) | 22.4 | |||
| Dota 2 (2013) | 78.1 | 49.5 | 26.3 | |
| Battlefield 4 (2013) | 35.1 | 26.8 | 17.2 | 6.4 |
| Thief (2014) | 17.3 | 12.7 | 10.7 | 5.7 |
| GRID: Autosport (2014) | 93.4 | 35.7 | 21.8 | 12.5 |
| Sims 4 (2014) | 178.3 | 55 | 25.2 | 17.4 |
| Fifa 15 (2014) | 52.5 | 46.5 | 28.2 | |
| Middle-earth: Shadow of Mordor (2014) | 27.8 | 18.6 | 10.8 | 8.6 |
| Alien: Isolation (2014) | 36 | 29.4 | 16 | 11.3 |
| Ryse: Son of Rome (2014) | 24.4 | 14.9 | 7.3 | 6.9 |
| The Evil Within (2014) | 19.9 | 15.4 | 9.4 | |
| F1 2014 (2014) | 60 | 38 | 26 | 16 |
| Civilization: Beyond Earth (2014) | 43.4 | 23.2 | 15.9 | 12.6 |
| Call of Duty: Advanced Warfare (2014) | 32.7 | |||
| Evolve (2015) | 20.8 | 15.4 | 8.7 | 7.5 |
Emissionen
Geräuschemissionen
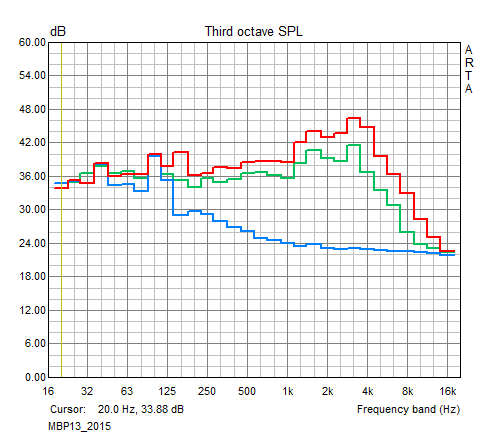
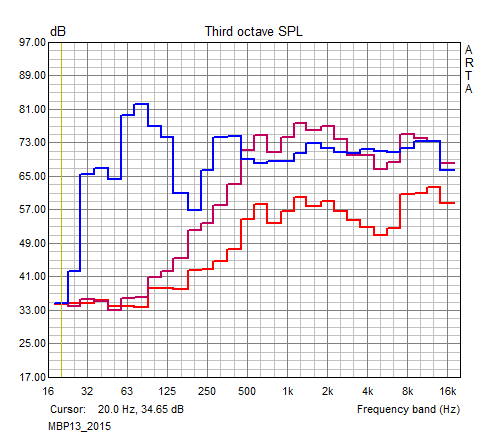
Im Leerlauf und bei alltäglichen Tätigkeiten wie Surfen bleibt das MacBook Pro absolut lautlos (blaue Kurve) – das schafft die Konkurrenz allerdings auch. Wirklich beeindruckend ist jedoch, dass sich daran selbst bei voller CPU-Auslastung nichts ändert. Unterhalb einer Drehzahl von etwa 2.500 U/min arbeitet der Lüfter so leise, dass unsere Messgeräte keinerlei Anstieg des Lärmpegels feststellen können. Um diesen Wert einordnen zu können: Nach 10 Iterationen des Cinebench R11.5 lesen wir unter OS X rund 2.300 U/min ab, unter Windows sind es gut 400 U/min mehr.
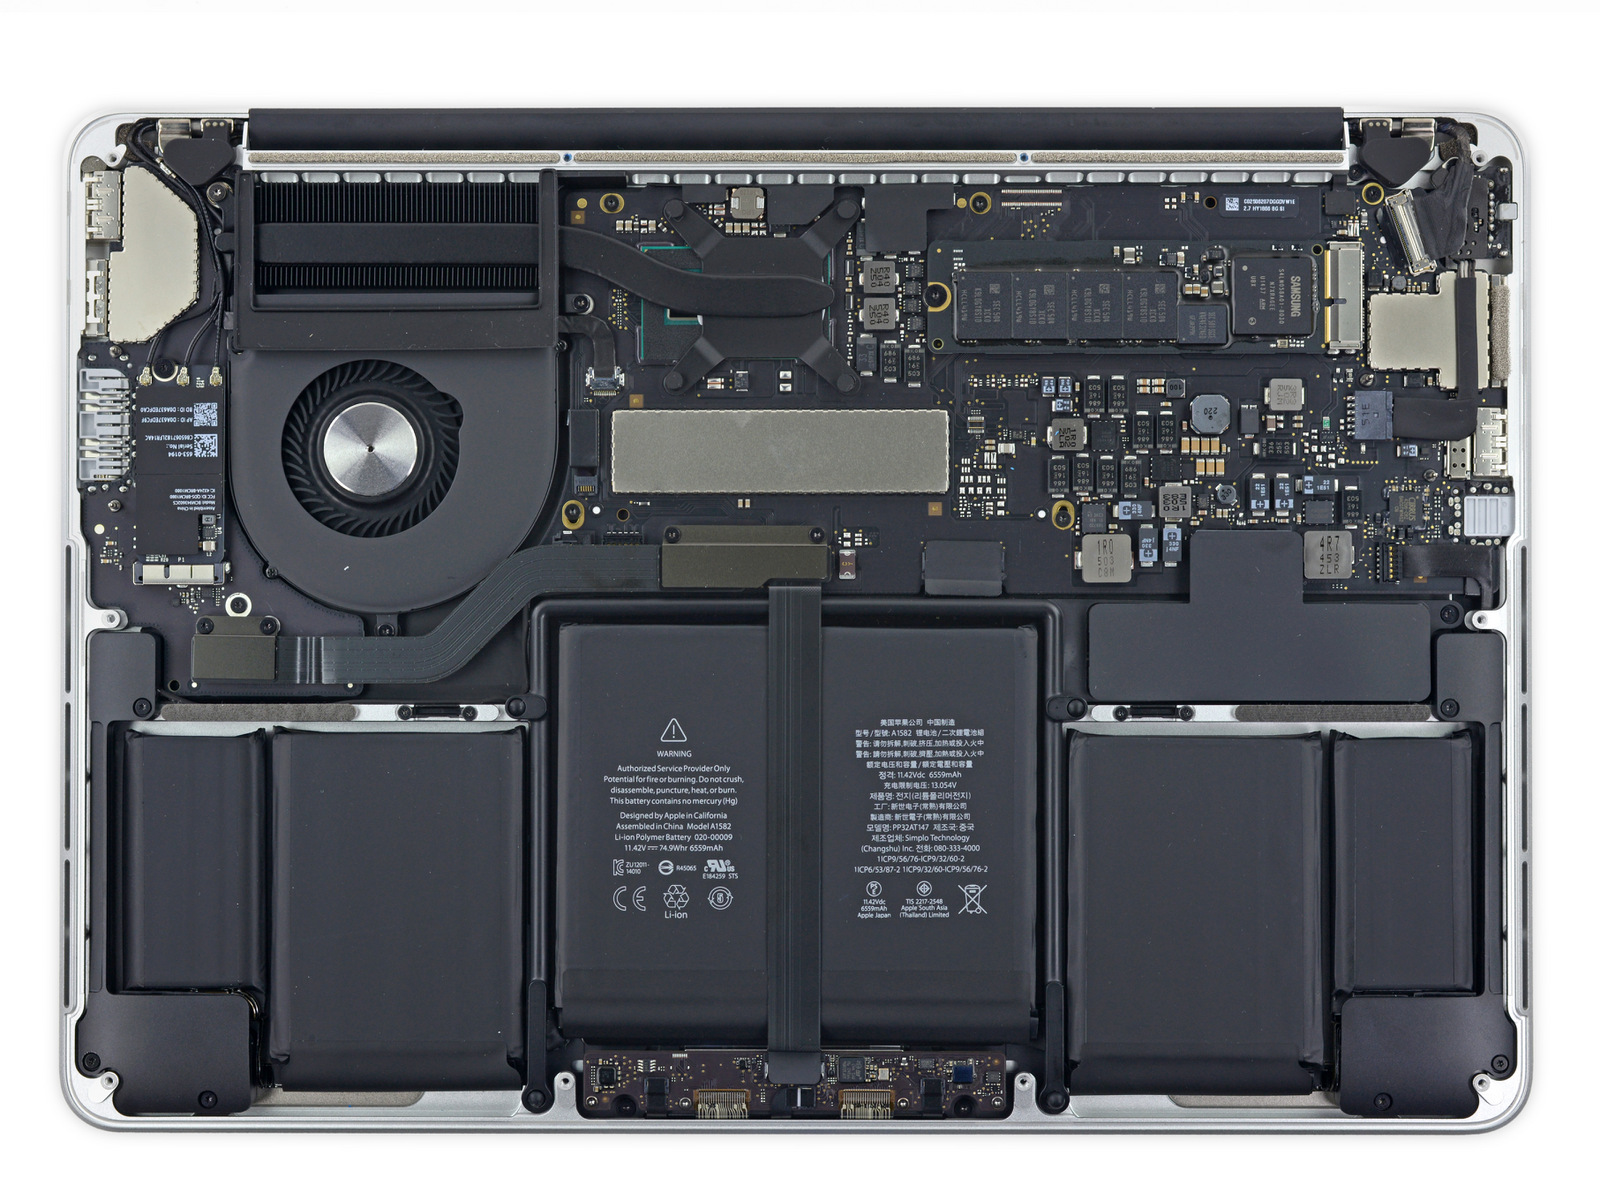
Leider agiert das MBP nicht immer so leise: In 3D-Anwendungen klettert der Lärmpegel innerhalb weniger Minuten über die 40-dB(A)-Grenze, wobei auch hier Windows (45,6 dB(A), 5.400 U/min, rote Kurve) etwas höhere Werte als OS X (44,0 dB(A), 5.200 U/min, grüne Kurve) produziert. Unabhängig von der Drehzahl lässt sich das Lüfterrauschen als nicht übermäßig hochfrequent und angenehm gleichmäßig beschreiben. Gemessen an der Leistungsaufnahme, auf die wir später noch genauer blicken werden, hat Apple damit ein höchst effektives Kühlsystem abgeliefert.
Hinweis: Die Pegel im nebenstehenden Frequenzgang sind aufgrund des abweichenden Messaufbaus nicht mit den Werten der Lautstärkemessung vergleichbar.
Lautstärkediagramm
| Idle |
| 29 / 29 / 29 dB(A) |
| Last |
| 42.5 / 45.6 dB(A) |
 | ||
30 dB leise 40 dB(A) deutlich hörbar 50 dB(A) störend |
||
min: | ||
Temperatur
Die recht defensiv abgestimmte Drehzahlkennlinie des Lüfters hat leider auch ihre Schattenseite: Im Alltagsbetrieb erwärmt sich die Gehäuseoberfläche spürbar mehr als bei vielen Ultrabooks, was durch die gute Wärmeleitfähigkeit des Aluminium-Chassis subjektiv sogar noch verstärkt wird. Wirklich unangenehm heiß wird das MacBook allerdings nie, da Temperaturen über 40 °C auf einen kleinen Bereich fernab der Handballenauflage begrenzt bleiben.
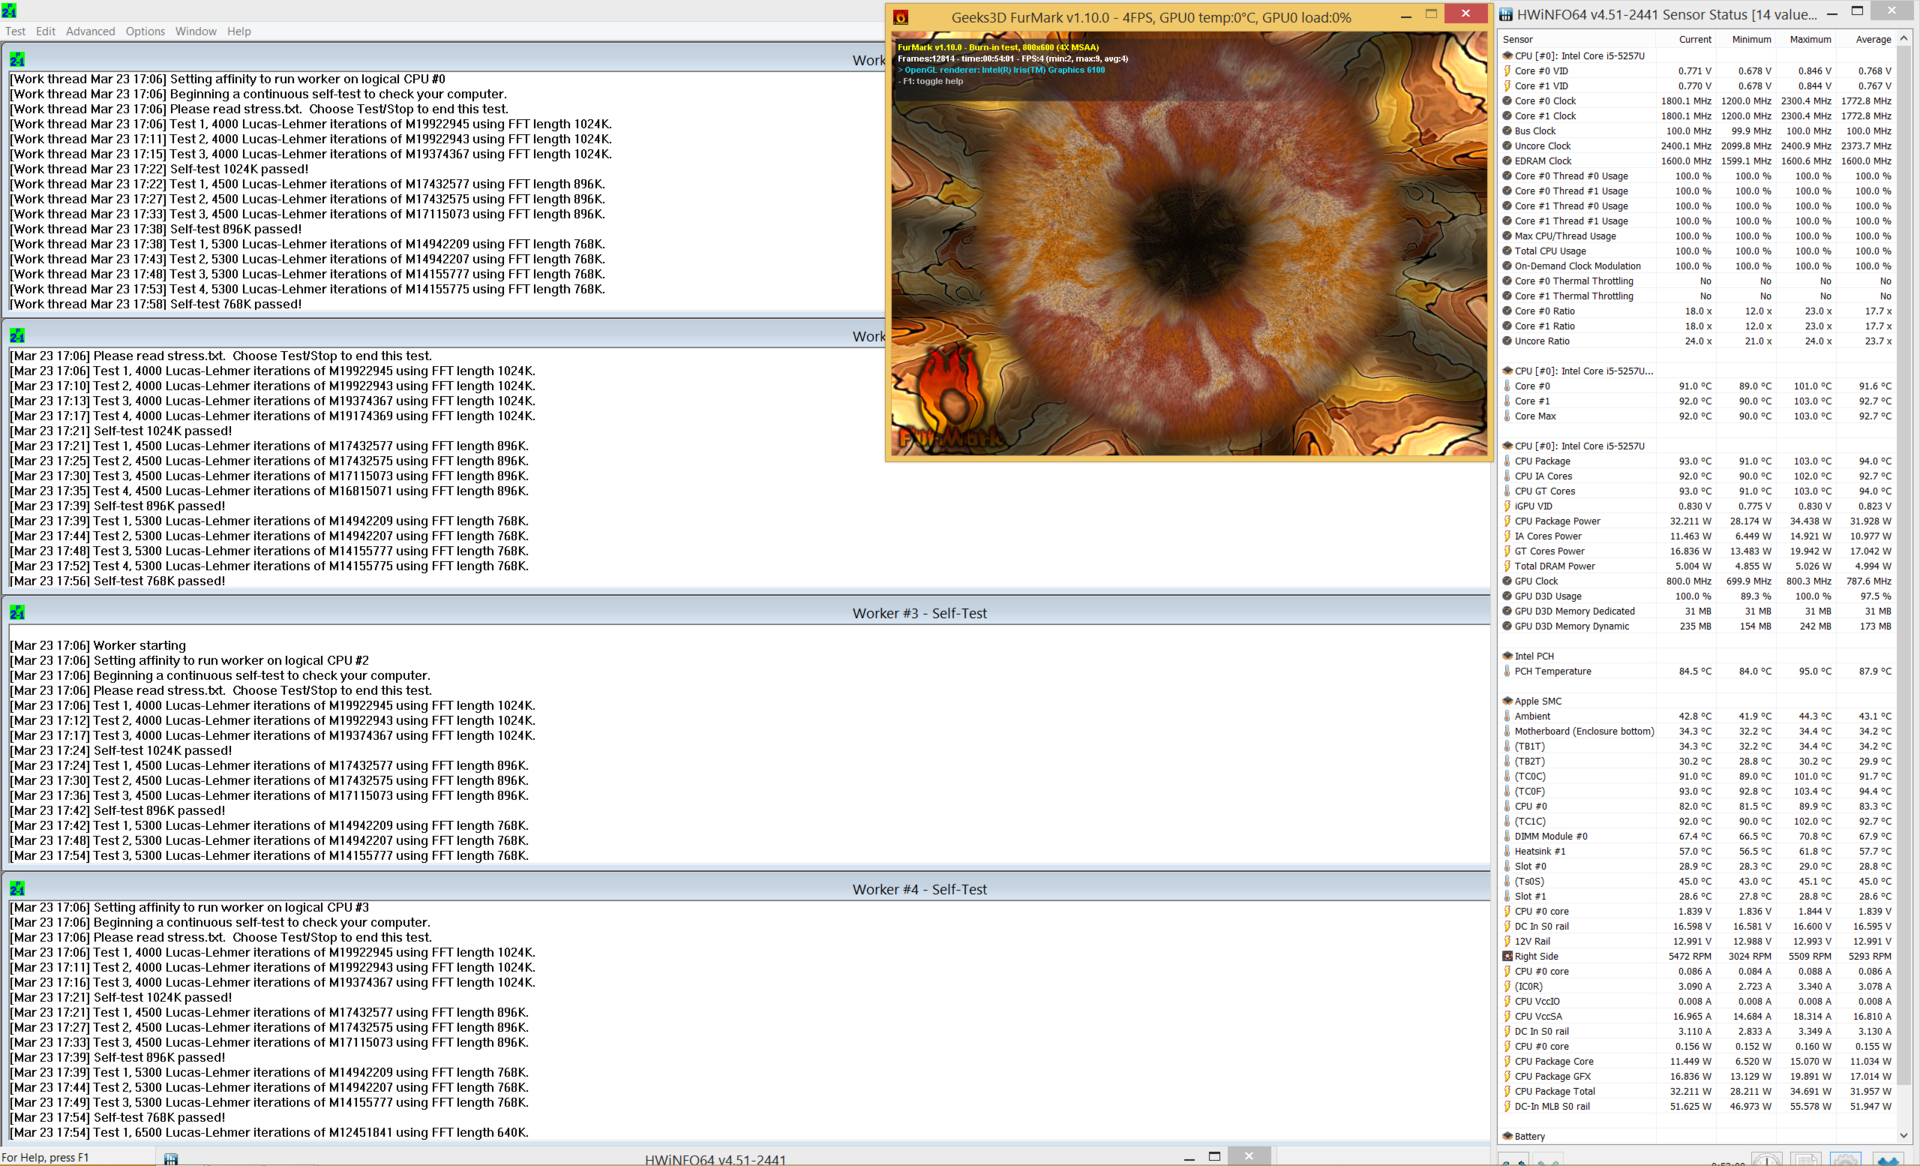
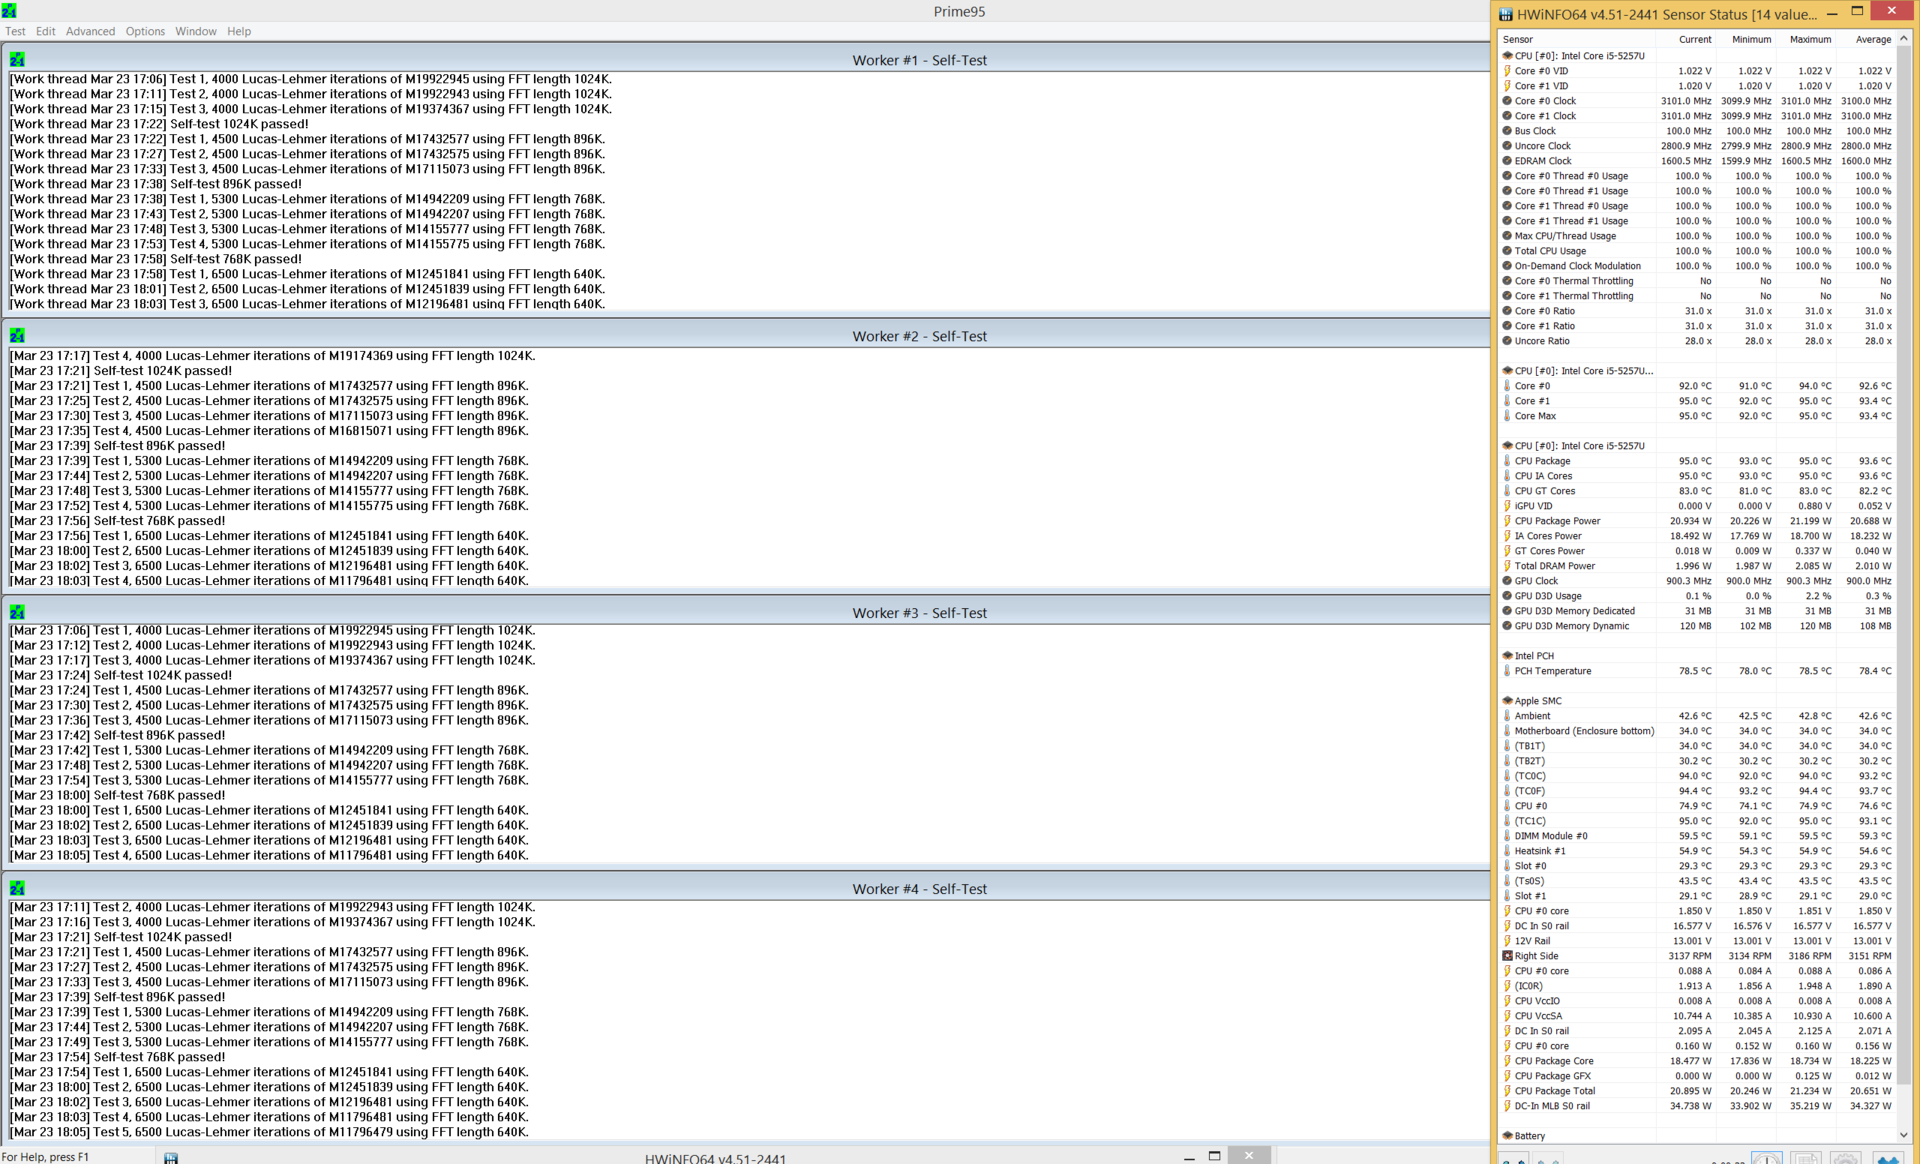
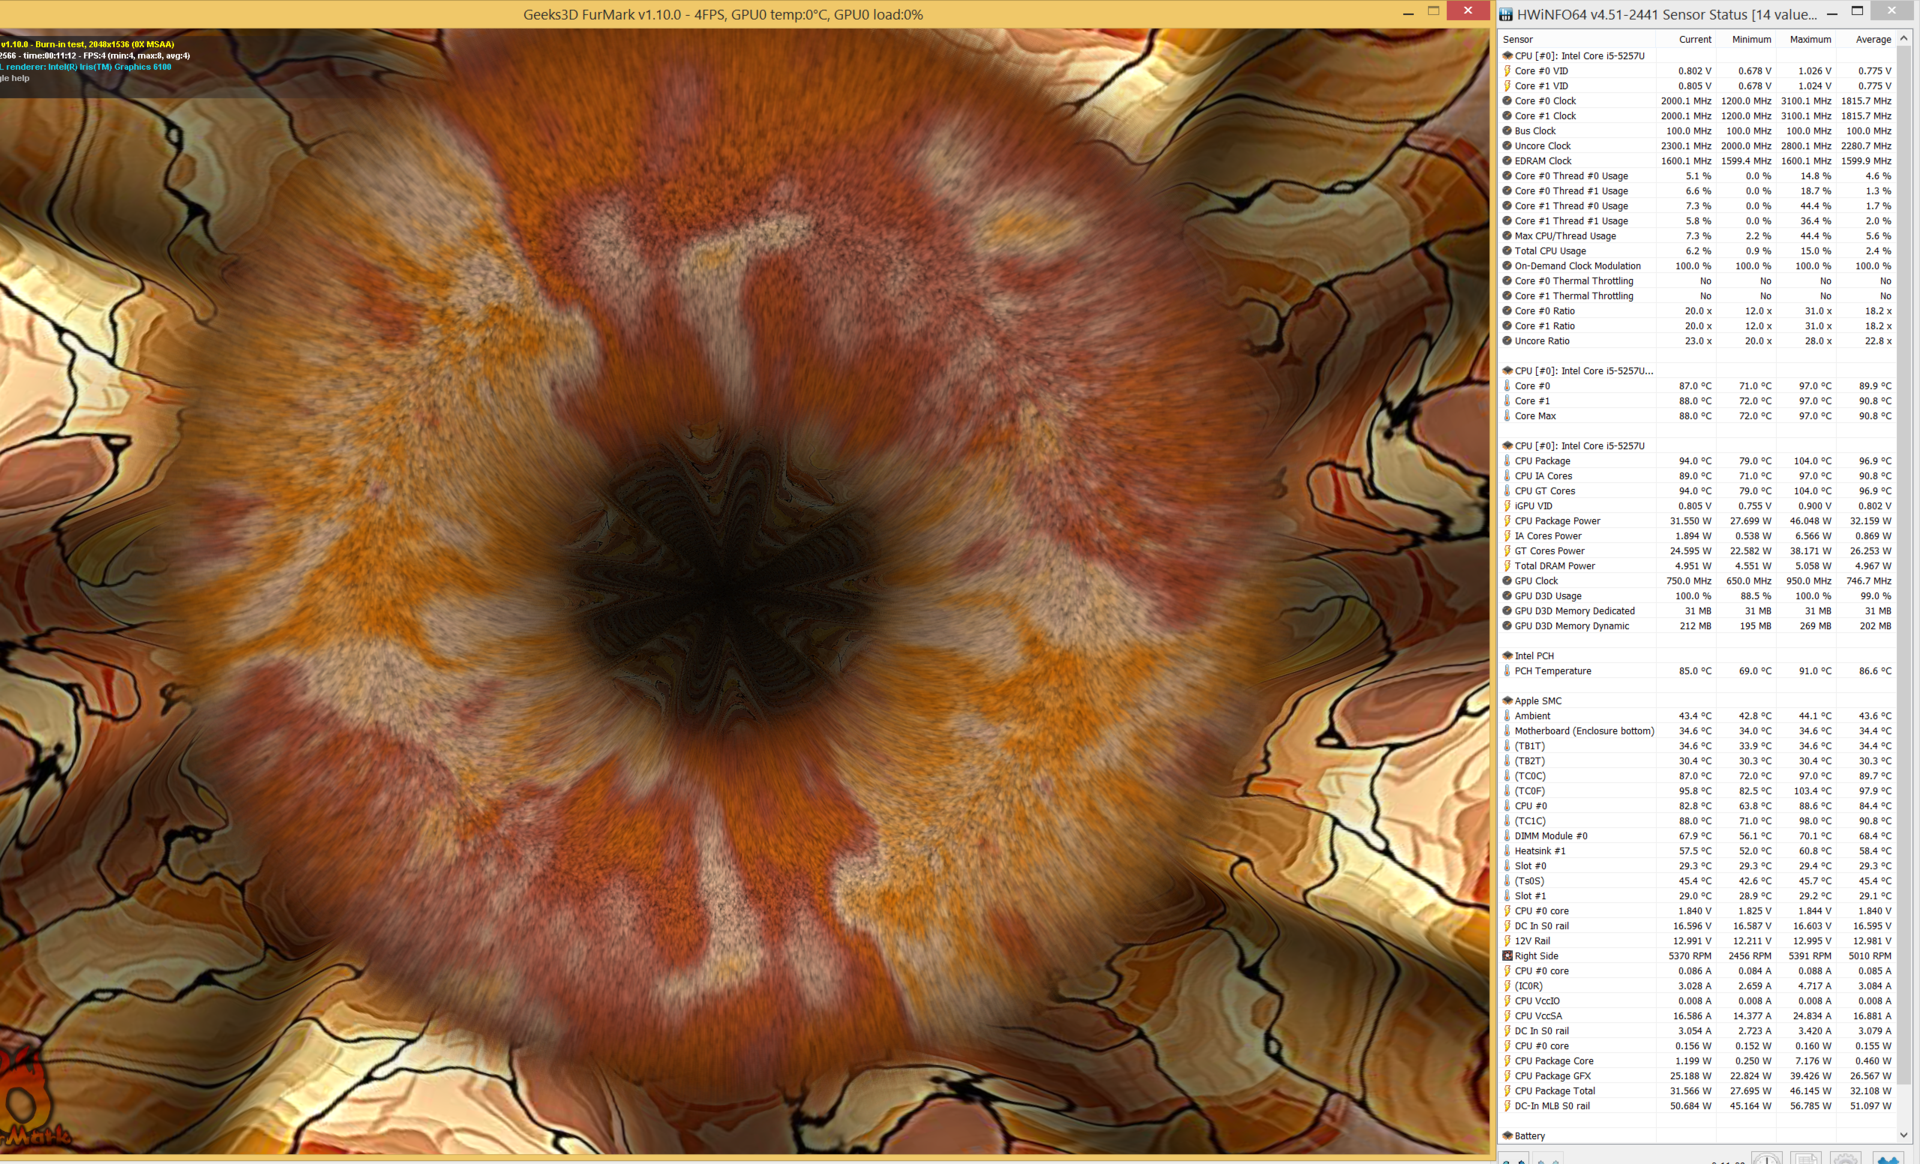
Glaubt man den von uns ausgelesenen Sensorwerten, scheint Apple den Core i5-5257U nicht wie erwartet bei 28, sondern erst bei 32 Watt abzuregeln. Dennoch muss der Prozessor bei Volllast TDP-bedingt throtteln und fällt in unserem Stresstest auf 1,8 GHz CPU- und 800 MHz GPU-Takt zurück. Intels Temperaturfreigabe bis 105 °C wird von Apple dabei gnadenlos ausgereizt, kurzzeitig konnten wir bis zu 103 °C auf den CPU-Kernen beobachten. Wird Prime95 einzeln ausgeführt, steigt der Prozessortakt auf volle 3,1 GHz an und die Leistungsaufnahme des Chips pendelt sich bei gut 20 Watt ein.
(-) Die maximale Temperatur auf der Oberseite ist 45.1 °C. Im Vergleich liegt der Klassendurchschnitt bei 35.9 °C (von 21.4 bis 59 °C für die Klasse Subnotebook).
(+) Auf der Unterseite messen wir eine maximalen Wert von 39.6 °C (im Vergleich zum Durchschnitt von 39.2 °C).
(+) Ohne Last messen wir eine durchschnittliche Temperatur von 27.7 °C auf der Oberseite. Der Klassendurchschnitt erreicht 30.8 °C.
(+) Die Handballen und der Touchpad-Bereich sind mit gemessenen 31 °C kühler als die typische Hauttemperatur und fühlen sich dadurch kühl an.
(-) Die durchschnittliche Handballen-Temperatur anderer getesteter Geräte war 28.2 °C (-2.8 °C).
Lautsprecher
Für ein Subnotebook spielen die beiden (mutmaßlich unveränderten) Stereolautsprecher recht laut (max. 82 dB(A) aus 30 cm) und kräftig auf, lassen naturgemäß aber den gewünschten Nachdruck im Bassbereich vermissen. Bis 500 Hz verläuft der Amplitudenfrequenzgang mehr oder weniger linear, darunter fällt der Pegel stetig ab. Schon preiswerte 2.1-Systeme wie unser Logitech X-230 katapultieren den Klang auf ein vollkommen anderes Niveau – ein zugegebenermaßen etwas unfairer Vergleich.
Energieverwaltung
Energieaufnahme
Obwohl OS X als überaus energieeffizientes Betriebssystem gilt, kommt der Leerlaufverbrauch des MacBook Pro mit 2,8 bis 8,1 Watt (Windows 8.1: 3,6 bis 11,9 Watt) nicht ganz an die sparsamsten Ultrabooks auf Windows-Basis heran. Dies dürfte vor allem auf das sehr helle und hochauflösende IPS-Display zurückzuführen sein, welches bei ruhendem Desktop den Löwenanteil der aufgenommenen Gesamtleistung für sich beansprucht.
Unter Volllast benötigt das MBP 13 (weitgehend unabhängig vom OS) fast doppelt so viel Energie wie typische Konkurrenzmodelle mit 15-Watt-CPU. Auch wenn die Prozessor- und Grafik-Performance zweifellos leicht überlegen ist: In einem angemessenen Verhältnis steht dieser Mehrverbrauch keinesfalls. Vor allem die Iris-6100-GPU verbrät für ihr Leistungsniveau definitiv zu viel Strom, wie ein Vergleich mit dem in 3D-Anwendungen klar überlegenen Zenbook UX303LN (40,1 bis 52,1 Watt) beweist. Vielleicht hätte Apple ebenfalls auf eine 15-Watt-CPU samt dedizierter GeForce 840M setzen sollen – das würde zwar ein größeres Mainboard erfordern, dafür aber die Effizenz deutlich verbessern.
| Aus / Standby | |
| Idle | |
| Last |
|
Legende:
min: | |
Akkulaufzeit
Während die typische Akkugröße eines 13-Zoll-Ultrabooks bei vielleicht 50 Wh liegt, spendiert Apple seinem MacBook einen beeindruckenden 74,9-Wh-Speicher – das sollte ausreichen, um der energiehungrigen Hardware entgegenzuwirken.
In der Tat begeistert das MBP mit praxisnahen Laufzeiten zwischen 9 und 10 Stunden, die bei einer Displayhelligkeit von 167 cd/m² ermittelt wurden. Unter Windows 8.1 reduziert sich die Ausdauer analog zur gemessenen Leistungsaufnahme um etwa ein bis zwei Stunden. Beim Vergleich mit dem Vorgänger sowie einigen Kontrahenten bitten wir darum zu beachten, dass unser neuer WLAN-Test v1.2 generell etwa 10 Prozent kürzere Laufzeiten als das alte Szenario erzeugt.
Für den Ladevorgang müssen im Betrieb etwa 3 Stunden einkalkuliert werden. Wird die Hardware gleichzeitig stark beansprucht, kann sich diese Zeitspanne aufgrund des knapp dimensionierten 60-Watt-Netzteils jedoch stark verlängern.
| Apple MacBook Pro Retina 13 inch 2015-03 74.9 Wh | Dell XPS 13-9343 52 Wh | Asus Zenbook UX303LN-R4274H 50 Wh | Acer Aspire R13 R7-371T-779K 61 Wh | Apple MacBook Pro Retina 13 inch 2013-10 71.8 Wh | |
|---|---|---|---|---|---|
| Akkulaufzeit | -1% | -2% | -16% | -8% | |
| Idle (h) | 28.2 | 15.2 -46% | 8.7 -69% | 25.6 -9% | |
| H.264 (h) | 9.7 | 6.2 -36% | 7.8 -20% | ||
| WLAN (h) | 9 | 8.8 -2% | |||
| Last (h) | 1.6 | 2.3 44% | 2.5 56% | 1.7 6% | |
| WLAN (alt) (h) | 9.7 | 6.6 | 9.5 |
Fazit
Pro
Contra
Apple hat es wieder einmal geschafft: Mit einer Gesamtnote von 89 Prozent räumt das MacBook Pro 13 Retina nicht nur eine sehr gute Bewertung ab, sondern verdrängt auch das Dell XPS 13 von Platz 1 unserer Subnotebook-Top-Ten – wenngleich der Abstand zwischen beiden mit nur einem Prozentpunkt denkbar knapp ausfällt.
Seinen Vorsprung sichert das MBP vor allem in klassischen Apple-Paradedisziplinen wie Gehäusequalität, Emissionen oder Display. Auch wenn letzteres die Auflösungskrone längst verloren hat: Was den subjektiven Bildeindruck oder die Präzision der Farbwiedergabe betrifft, liegt das blickwinkelstabile IPS-Panel nach wie vor auf Referenzniveau. Doch nicht nur hier ist Apple der Konkurrenz noch immer einen kleinen Schritt voraus: Highlights wie Triple-Stream-WLAN, eine ultraschnelle PCIe-SSD oder das auch unter Windows höchst praktische Force Touch Trackpad findet man – zumindest in dieser Kombination – bei keinem anderen Modell.
Auch wenn der Hersteller Thermik und Geräuschentwicklung gut im Griff hat, kann man geteilter Meinung darüber sein, ob die Wahl eines 28-Watt-Prozessors wirklich klug war. Das Performance-Plus gegenüber den schnellsten 15-Watt-Chips bleibt in den meisten Situationen vernachlässigbar klein, und insbesondere die GPU enttäuscht beim Vergleich mit dedizierten Alternativen. Obwohl Intel in puncto Fertigungstechnik dem Rest der Branche derzeit zwei Schritte voraus ist, kann sich die Iris Graphics 6100 nicht mit (obendrein sparsameren) Einstiegslösungen wie einer GeForce 840M messen. Einige MacBook-Konkurrenten wie das Asus Zenbook UX303LN nutzen das gekonnt aus.
Derlei Makel hinterlassen jedoch nur einen kleinen Schatten auf der weitgehend weißen Weste des MBP 13 – gerade im Gesamtpaket mit OS X gibt das Subnotebook ein hervorragendes Arbeitsgerät mit überragender Ausdauer ab.
So kann man vielleicht auch über die zweifellos happige Preisgestaltung hinwegsehen, die spätestens nach einigen Häkchen in der Aufpreisliste geradezu schwindelerregende Höhen erreicht.
Apple MacBook Pro Retina 13 inch 2015-03
- 16.02.2016 v5 (old)
Sebastian Jentsch
Erfahren Sie hier mehr über die Änderungen der neuen Bewertung mit Version 5
Preisvergleich
