 Deutsch
 English
 Español
 Français
 Italiano
 Nederlands
 Polski
 Português
 Русский
 Türkçe
 Svenska
 Chinese
 Magyar
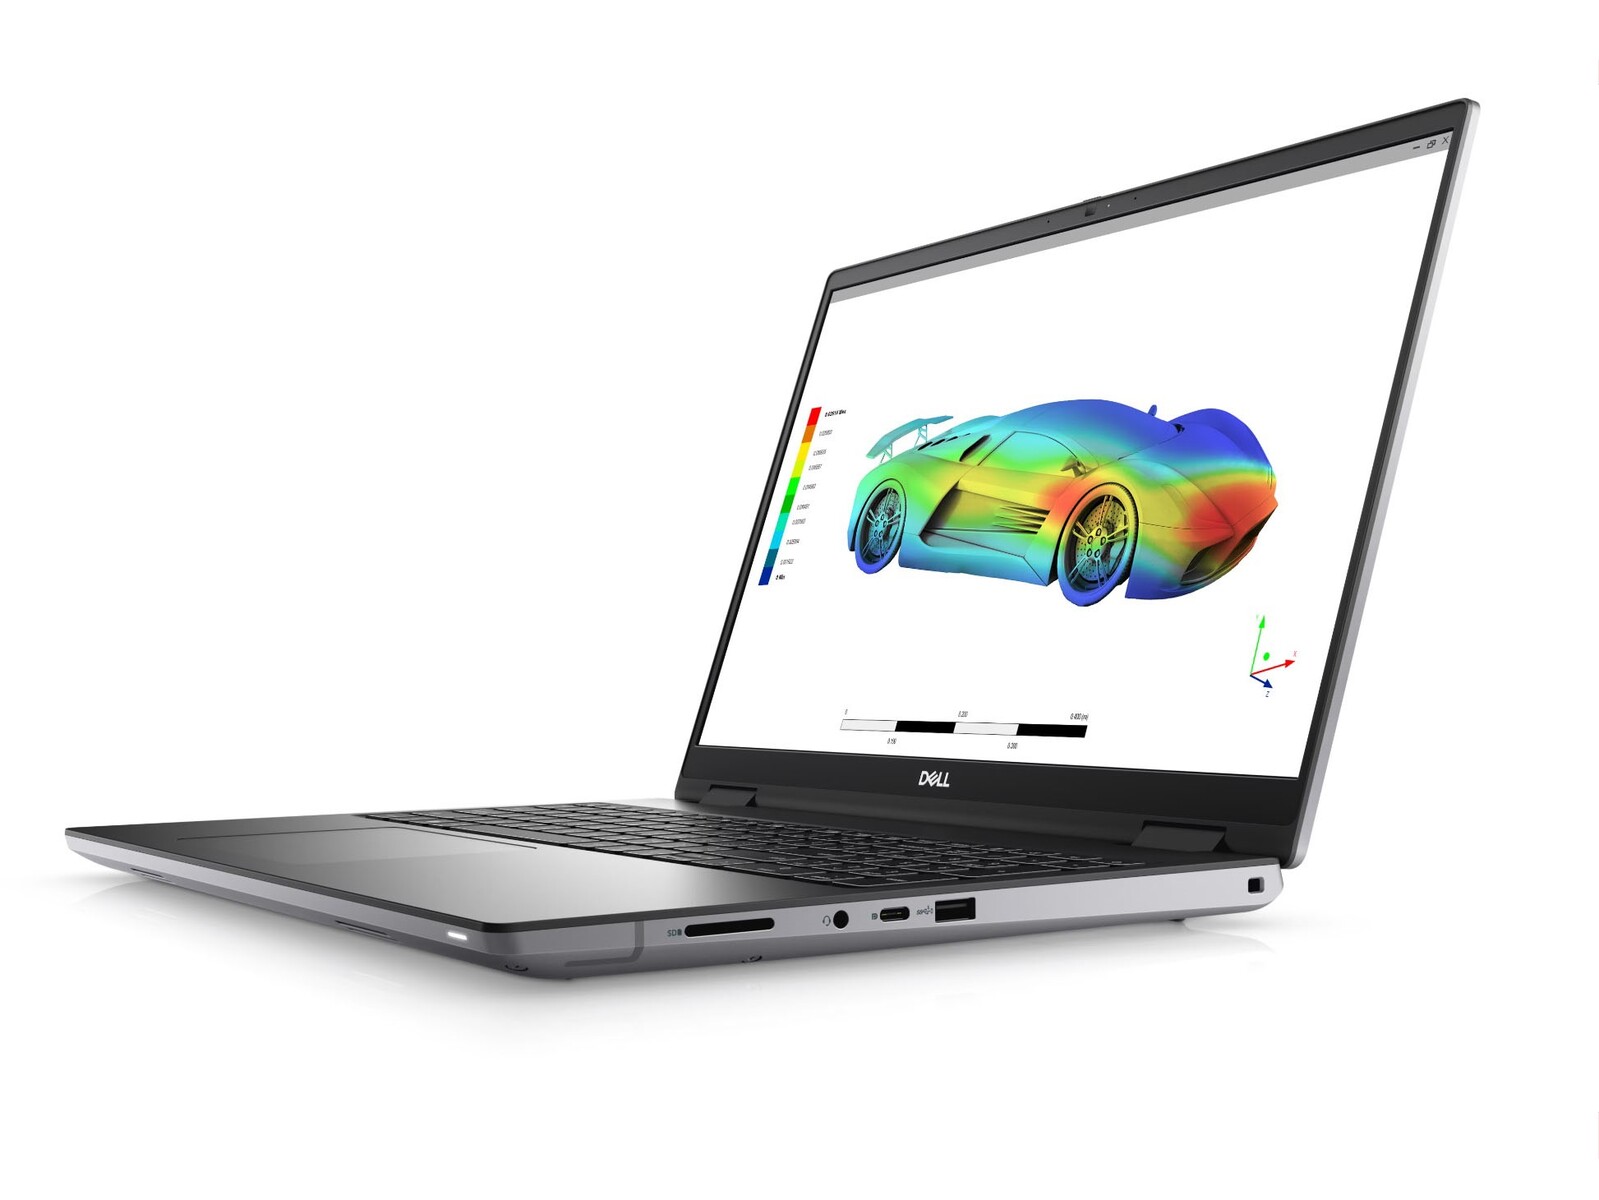
Nvidia RTX A5500 und Core i9-12950HX im Dell Precision 7670 Performance Notebook
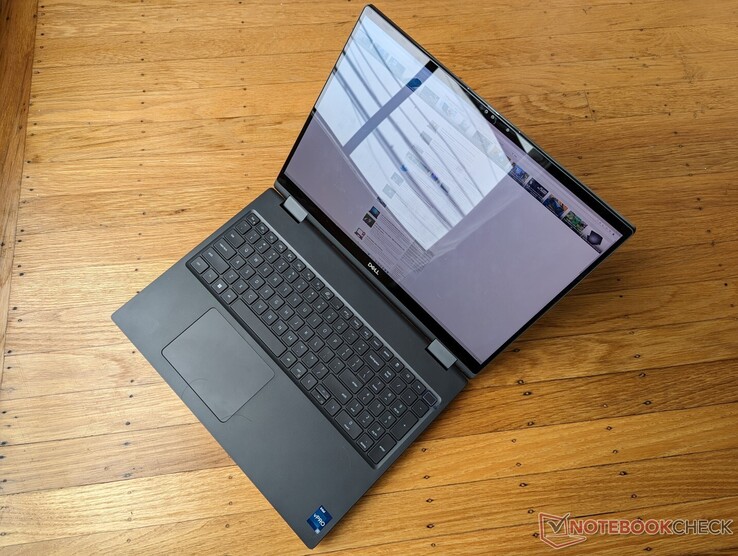
Dell bringt mit seinen neuen Precision-7670-Modellen die erste Laptop-Serie, die CAMM verwendet auf den Markt. Die Serie selbst besteht aus einem dünneren Modell und einem leistungsfähigeren, dickeren Modell (je nach Konfiguration "Performance" oder "Ultimate" genannt). Letzten Monat haben wir das dünnere Modell getestet, jetzt werden wir uns das dickere vorknöpfen.
Abgesehen vom geringfügigen Unterschied der Dicke haben die beiden Modelle genau das gleiche Gehäuse-Design und die gleichen Funktionen. Wir empfehlen daher einen Blick auf unseren Test zum dünneren Precision 7670 zu werfen, um mehr über die physikalischen Eigenschaften der Serie zu erfahren.
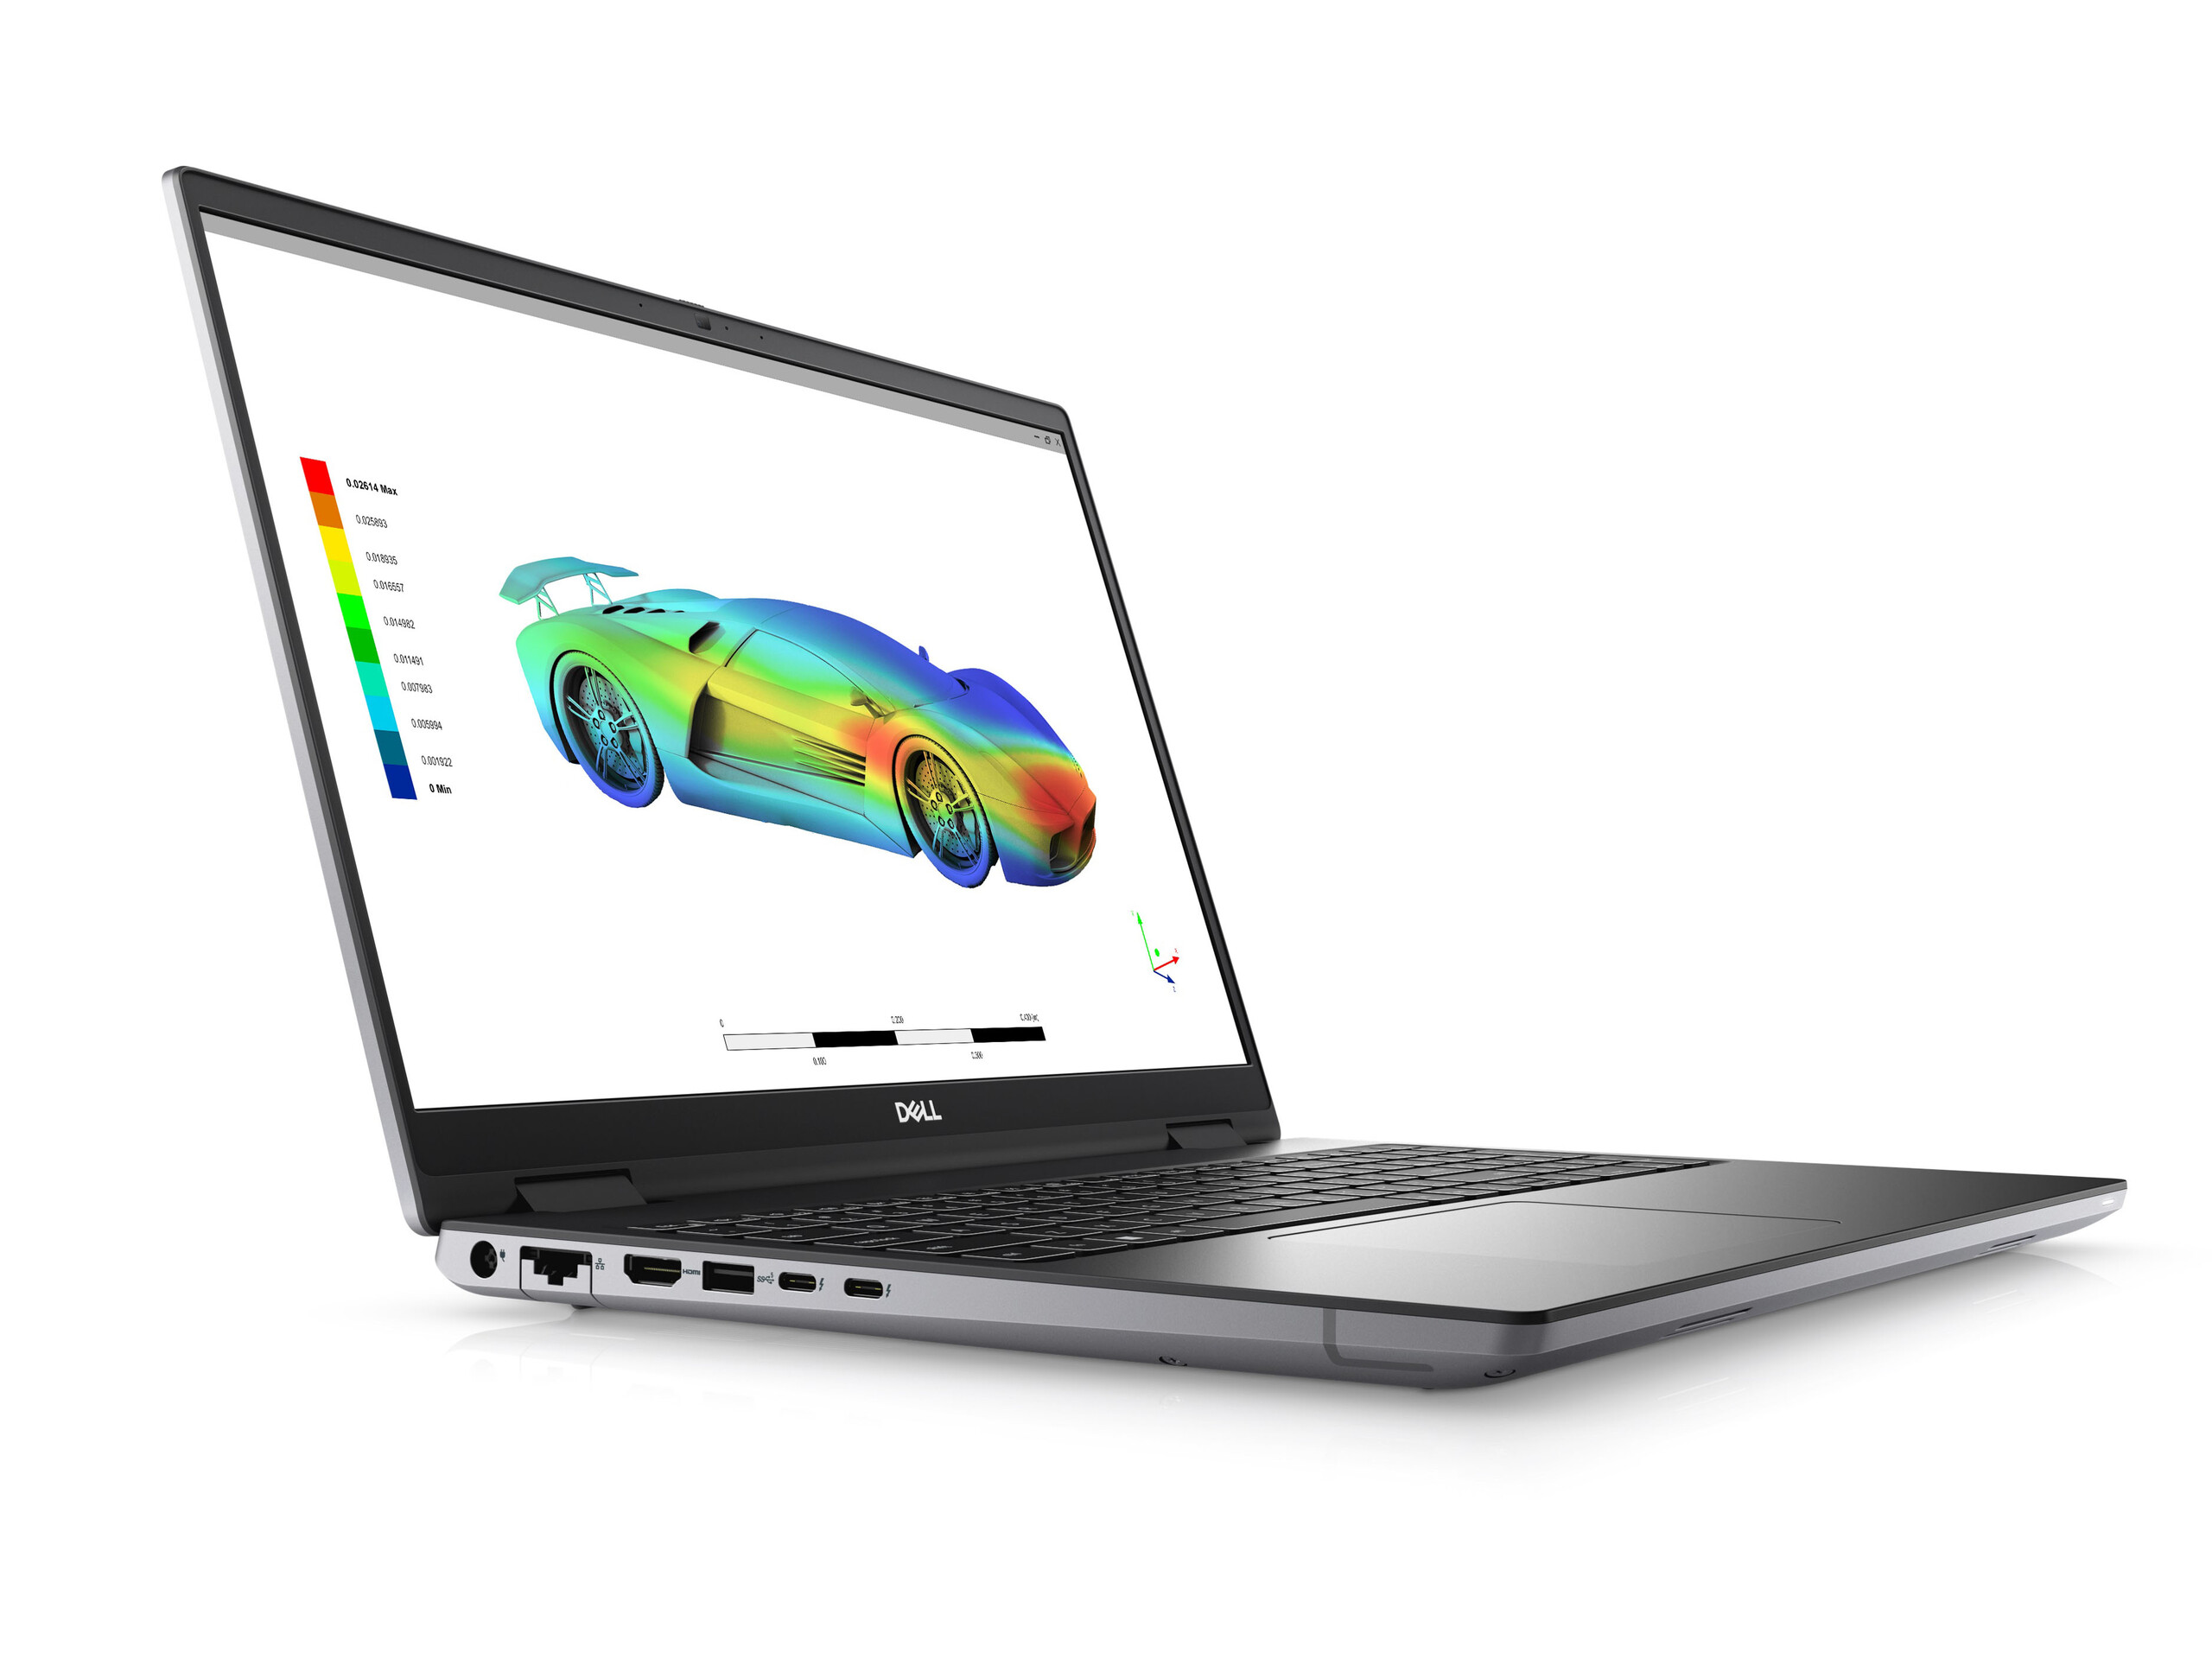
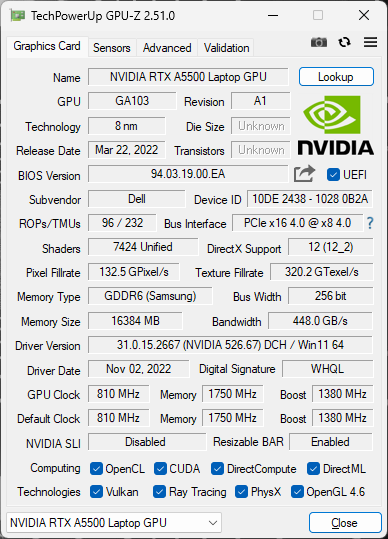
Unser heutiges Testgerät ist die High-End-Konfiguration mit Core i9-12950HX CPU, RTX A5500 GPU und 2400p 16:10 OLED-Touchscreen für knappe 7.000 Euro. Geringere SKUs gehen runter bis zum Core i7-12850HX oder RTX A4500, aber alle Optionen sind mit dem gleichen 2400p IPS-Touchscreen ausgestattet. Im Gegensatz dazu gibt es das dünnere Precision 7670 nur bis zur RTX A2000.
Zu den Konkurrenten in diesem Bereich gehören andere mobile 16-Zoll-Workstations wie das MSI CreatorPro Z16P, HPs ZBook Studio 16 oder das Lenovo ThinkPad P1 G4.
Mehr Dell-Tests:
Mögliche Konkurrenten im Vergleich
Bew. | Datum | Modell | Gewicht | Dicke | Größe | Auflösung | Preis ab |
|---|---|---|---|---|---|---|---|
| 89.1 % | 12.2022 | Dell Precision 7000 7670 Performance i9-12950HX, RTX A5500 Laptop GPU | 2.8 kg | 25.95 mm | 16.00" | 3840x2400 | |
| 84.3 % | 11.2022 | MSI CreatorPro Z16P B12UKST i7-12700H, RTX A3000 Laptop GPU | 2.4 kg | 19 mm | 16.00" | 2560x1600 | |
| 90.1 % | 11.2022 | HP ZBook Studio 16 G9 62U04EA i7-12800H, RTX A2000 Laptop GPU | 1.8 kg | 19 mm | 16.00" | 3840x2400 | |
| 82.9 % | 10.2022 | HP ZBook Firefly 16 G9-6B897EA i7-1265U, T550 Laptop GPU | 2 kg | 19.2 mm | 16.00" | 1920x1200 | |
| 89.3 % | 02.2022 | Lenovo ThinkPad P1 G4-20Y4Z9DVUS i7-11800H, T1200 Laptop GPU | 1.8 kg | 17.7 mm | 16.00" | 2560x1600 | |
| 88.4 % | 10.2022 | Dell Precision 7670 i7-12850HX, RTX A2000 Laptop GPU | 2.7 kg | 24.7 mm | 16.00" | 3840x2400 |
Gehäuse
Länge und Breite sind identisch mit dem schlankeren Precision 7670, während Dicke und Gewicht um etwa 1,3 mm bzw. 100 g zugenommen haben. In der Praxis sind die Unterschiede kaum zu bemerken, da das reguläre Precision 7670 bereits zu den dickeren und schwereren mobilen Workstations gehört.
SD-Kartenleser
| SD Card Reader | |
| average JPG Copy Test (av. of 3 runs) | |
| Lenovo ThinkPad P1 G4-20Y4Z9DVUS (Angelbird AV Pro V60) | |
| Dell Precision 7670 (Toshiba Exceria Pro SDXC 64 GB UHS-II) | |
| Dell Precision 7000 7670 Performance (Toshiba Exceria Pro SDXC 64 GB UHS-II) | |
| MSI CreatorPro Z16P B12UKST (AV Pro V60) | |
| HP ZBook Studio 16 G9 62U04EA (Angelbird AV PRO V60) | |
| maximum AS SSD Seq Read Test (1GB) | |
| Dell Precision 7670 (Toshiba Exceria Pro SDXC 64 GB UHS-II) | |
| Dell Precision 7000 7670 Performance (Toshiba Exceria Pro SDXC 64 GB UHS-II) | |
| Lenovo ThinkPad P1 G4-20Y4Z9DVUS (Angelbird AV Pro V60) | |
| MSI CreatorPro Z16P B12UKST (AV Pro V60) | |
| HP ZBook Studio 16 G9 62U04EA (Angelbird AV PRO V60) | |
Kommunikation
Obwohl der Intel AX211 in allen Precision 7670 SKUs vorhanden ist, ist die Leistung auf unserem Testgerät langsamer als erwartet. Die durchschnittliche Übertragungsrate beträgt nur 891 Mbps, wenn es mit unserem 6-GHz-Netzwerk verbunden ist, verglichen mit dem MSI CreatorPro Z16P oder dem HP ZBook Firefly 16 G9 jeweils mit demselben AX211-Modul. Wir haben diesen Test sechsmal an zwei verschiedenen Tagen wiederholt, nur um sicherzugehen, aber die Ergebnisse blieben ident.

| Networking | |
| iperf3 transmit AX12 | |
| Lenovo ThinkPad P1 G4-20Y4Z9DVUS | |
| iperf3 receive AX12 | |
| Lenovo ThinkPad P1 G4-20Y4Z9DVUS | |
| iperf3 receive AXE11000 6GHz | |
| MSI CreatorPro Z16P B12UKST | |
| HP ZBook Studio 16 G9 62U04EA | |
| HP ZBook Firefly 16 G9-6B897EA | |
| Dell Precision 7000 7670 Performance | |
| Dell Precision 7670 | |
| iperf3 receive AXE11000 | |
| Dell Precision 7000 7670 Performance | |
| iperf3 transmit AXE11000 | |
| Dell Precision 7000 7670 Performance | |
| iperf3 transmit AXE11000 6GHz | |
| MSI CreatorPro Z16P B12UKST | |
| HP ZBook Firefly 16 G9-6B897EA | |
| HP ZBook Studio 16 G9 62U04EA | |
| Dell Precision 7670 | |
| Dell Precision 7000 7670 Performance | |
Webcam


Wartung
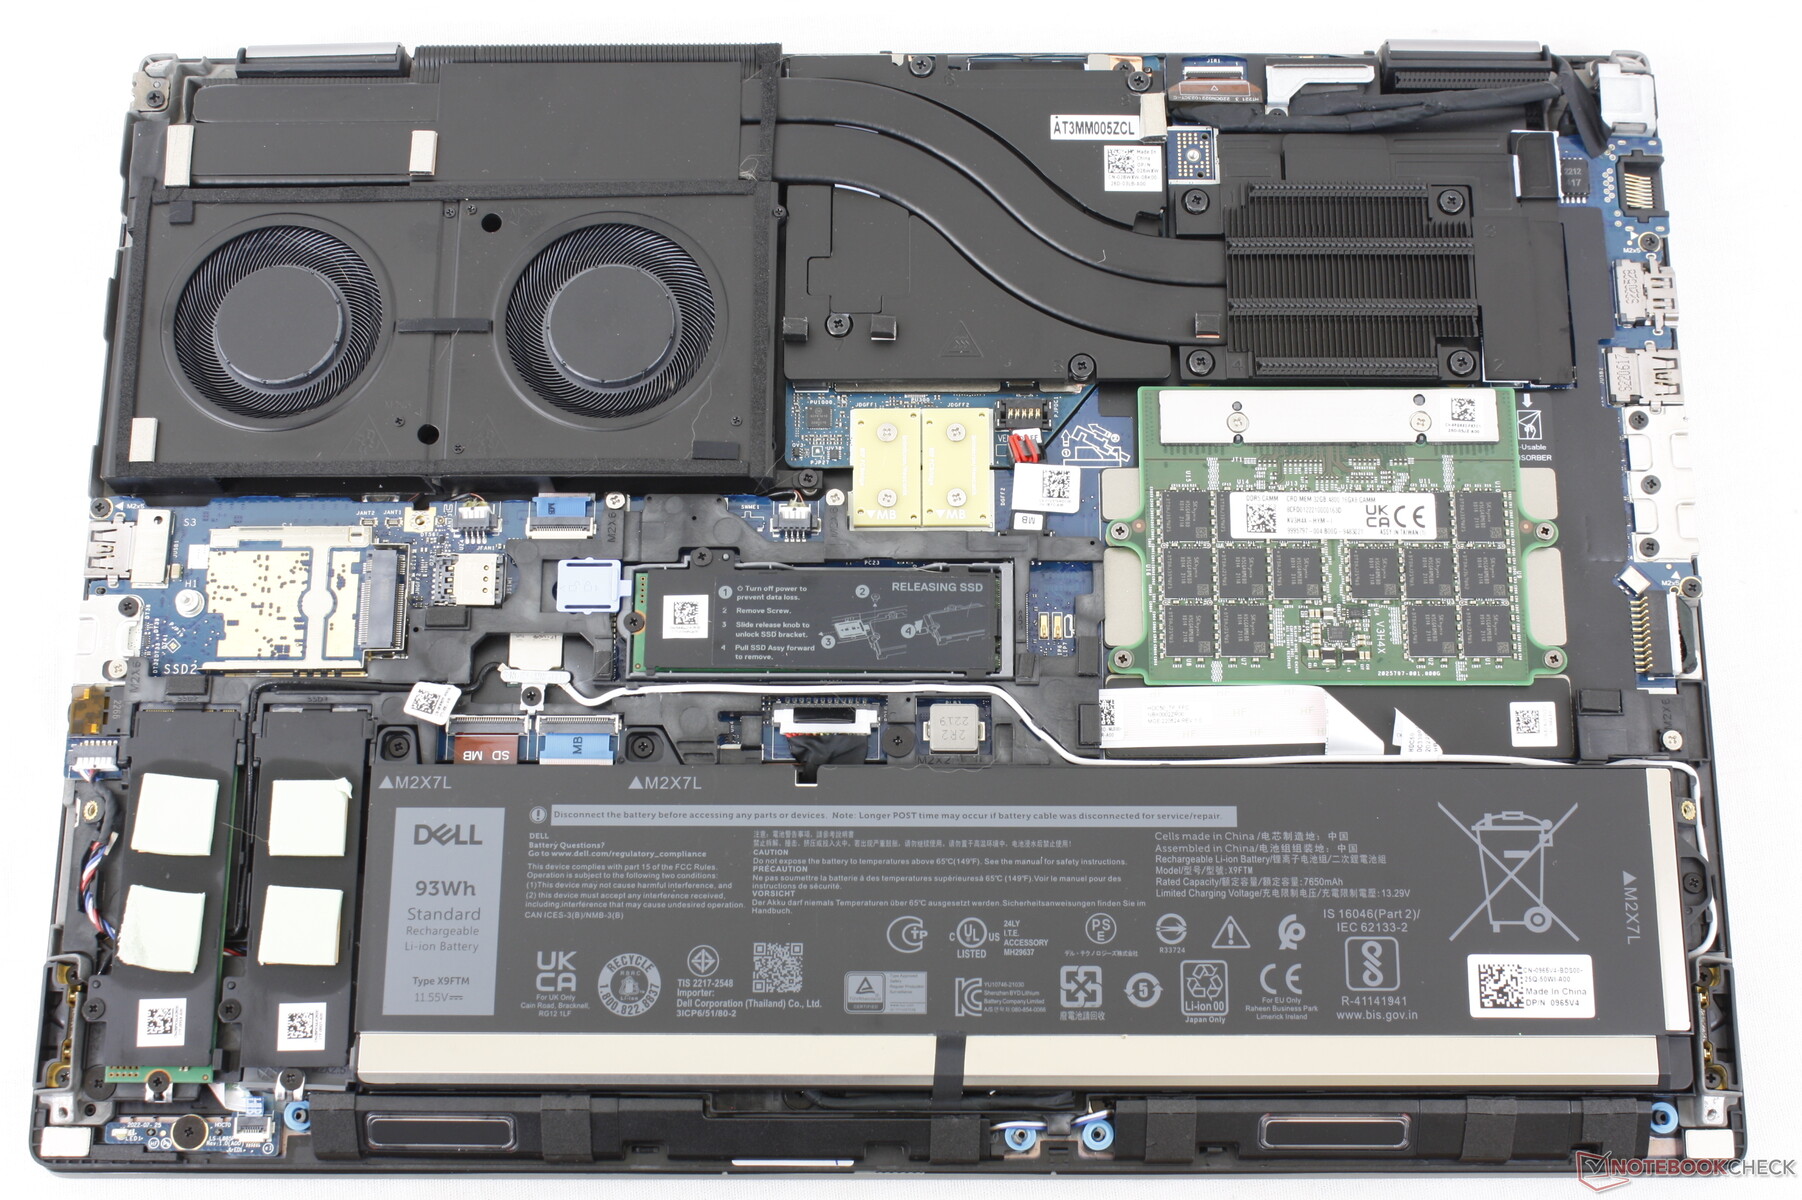
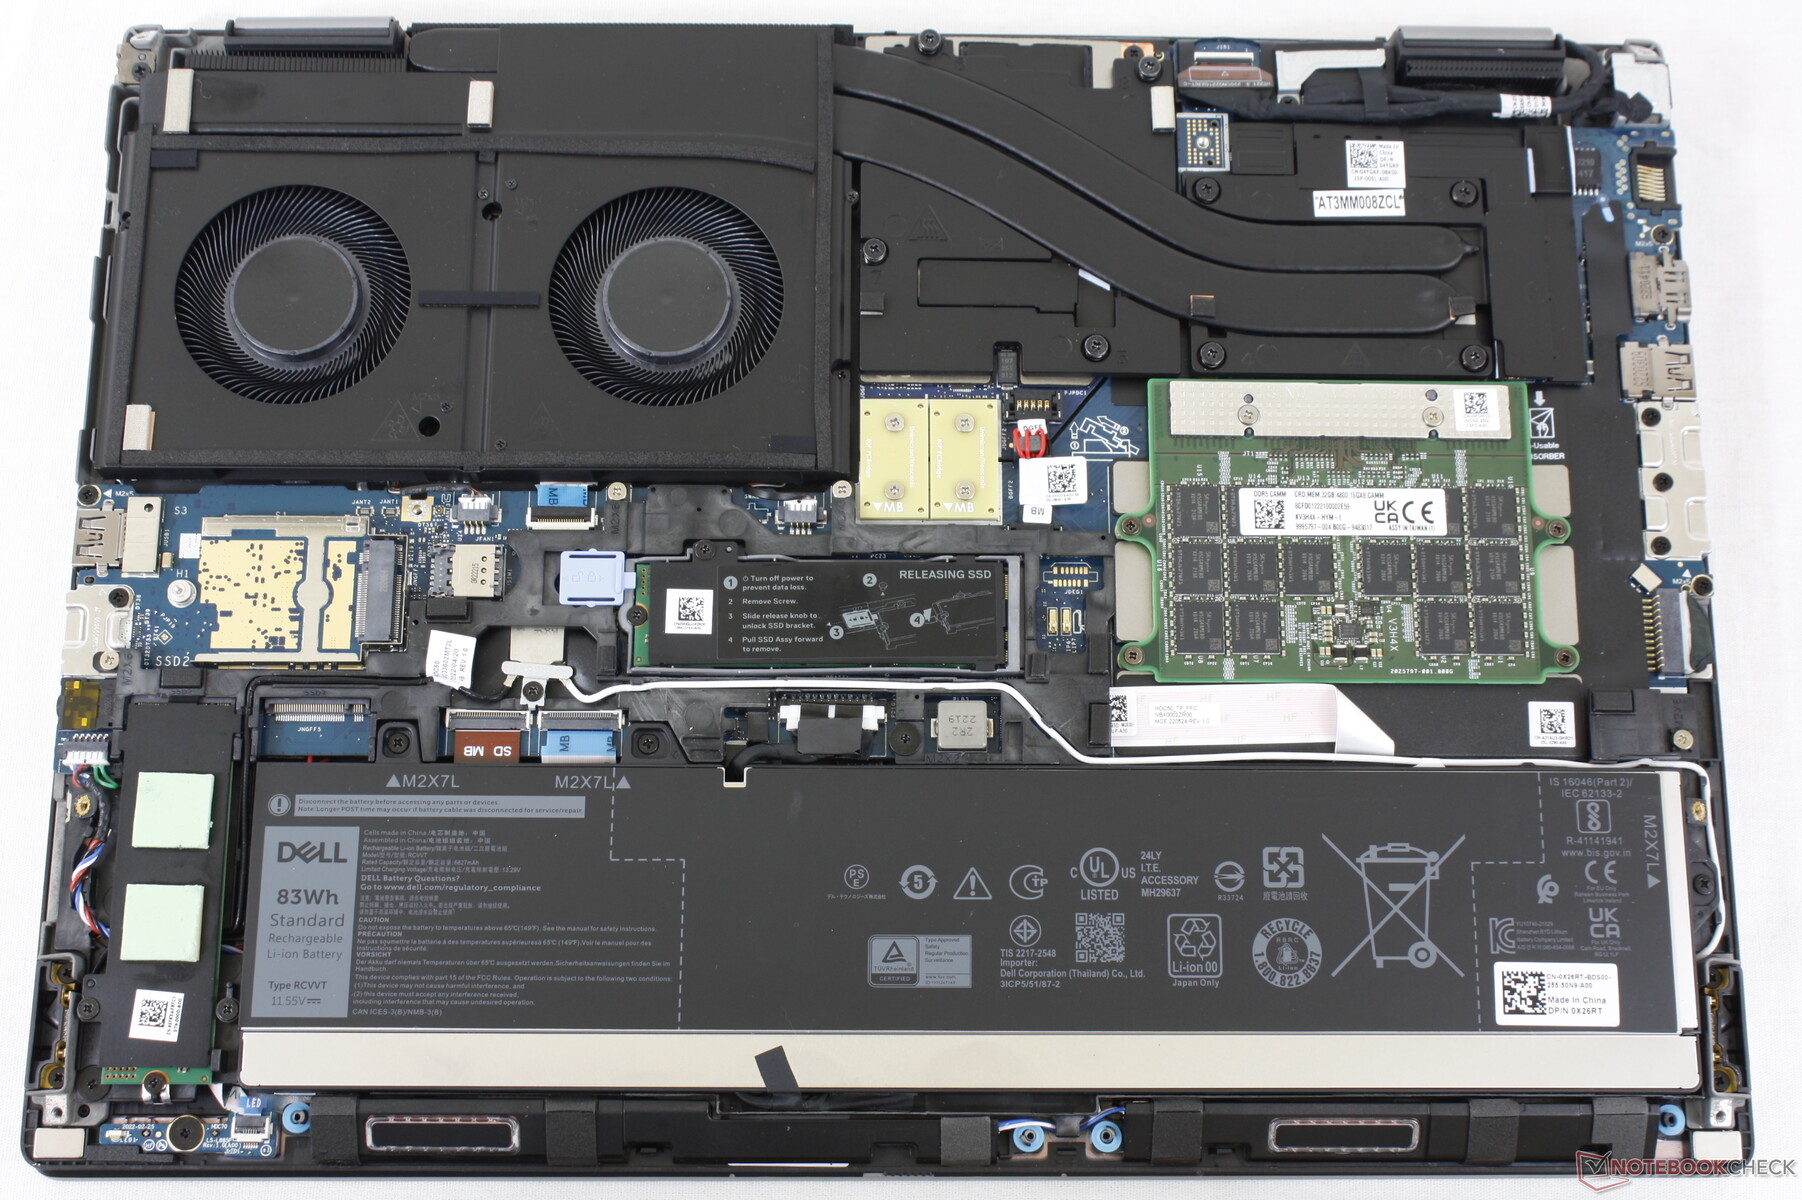
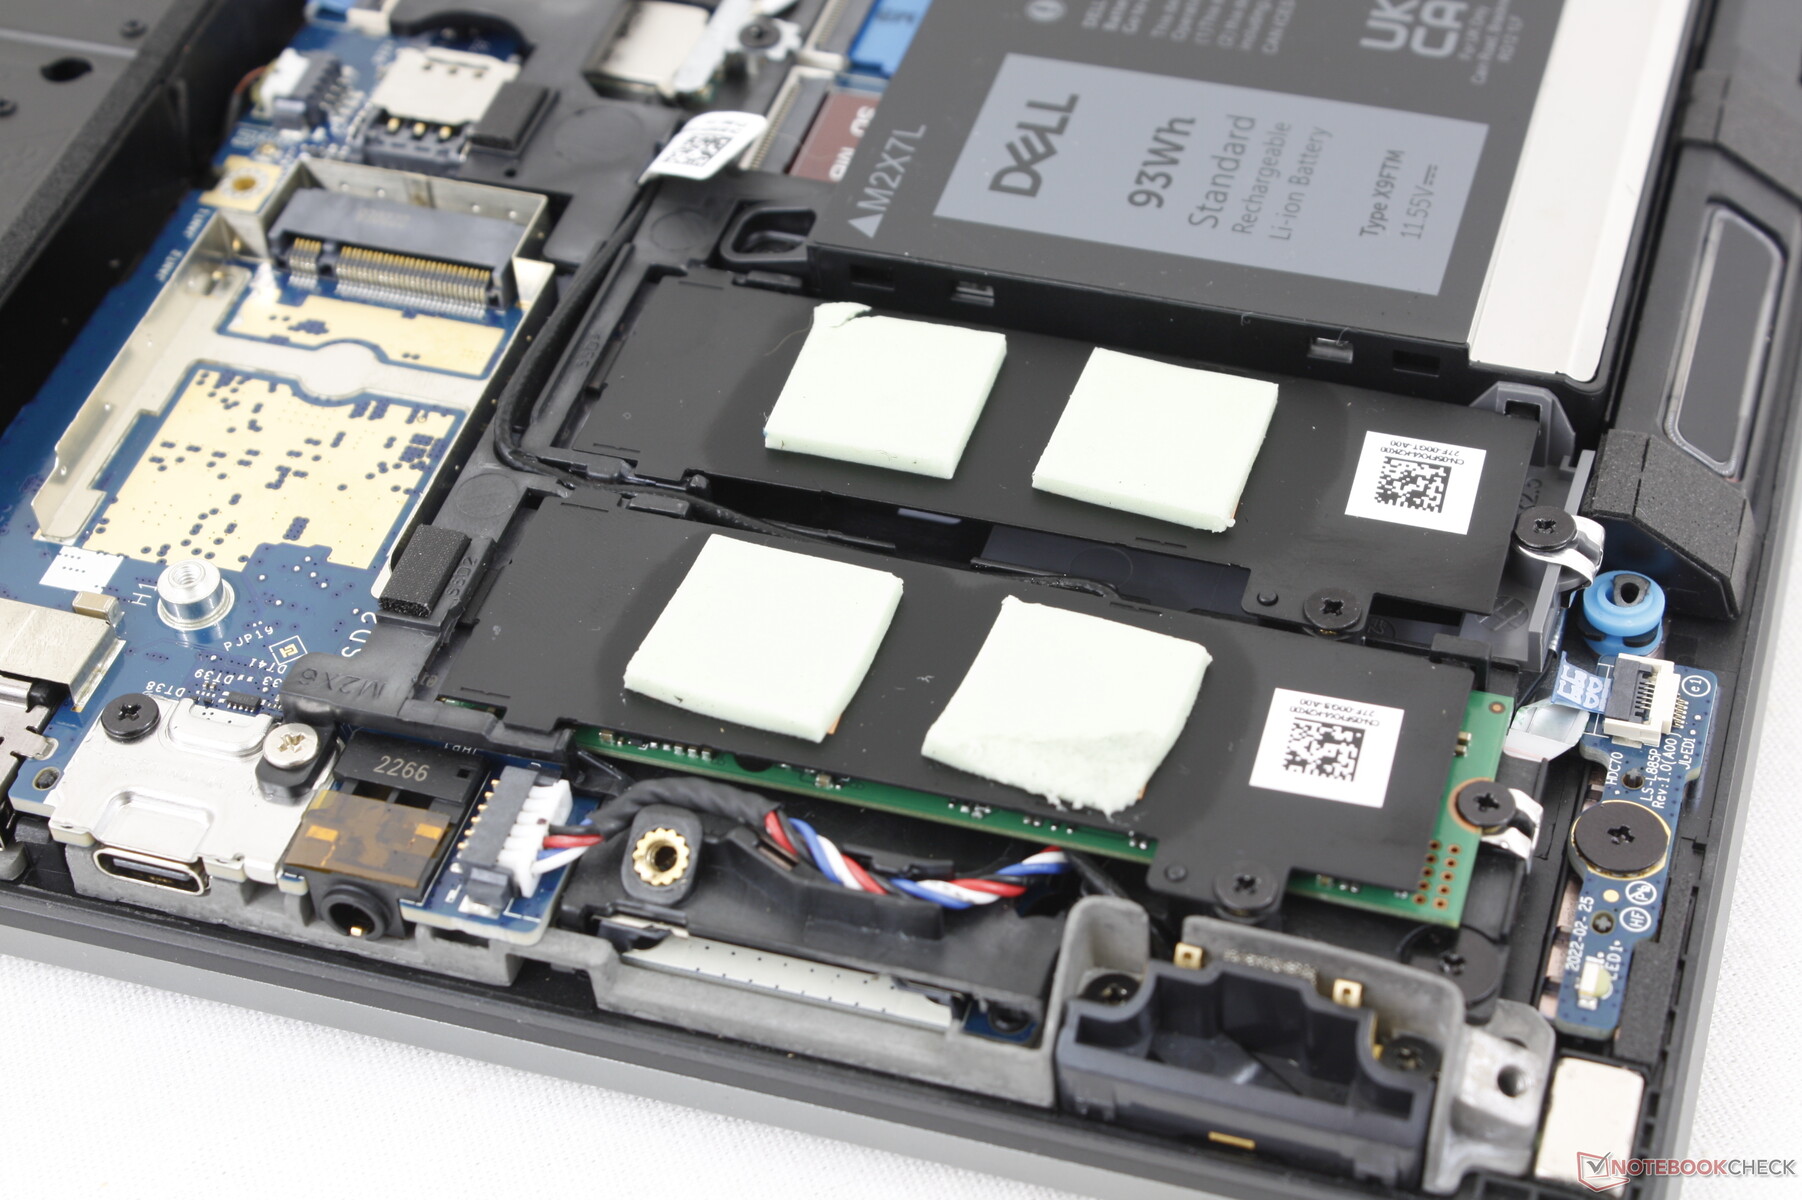
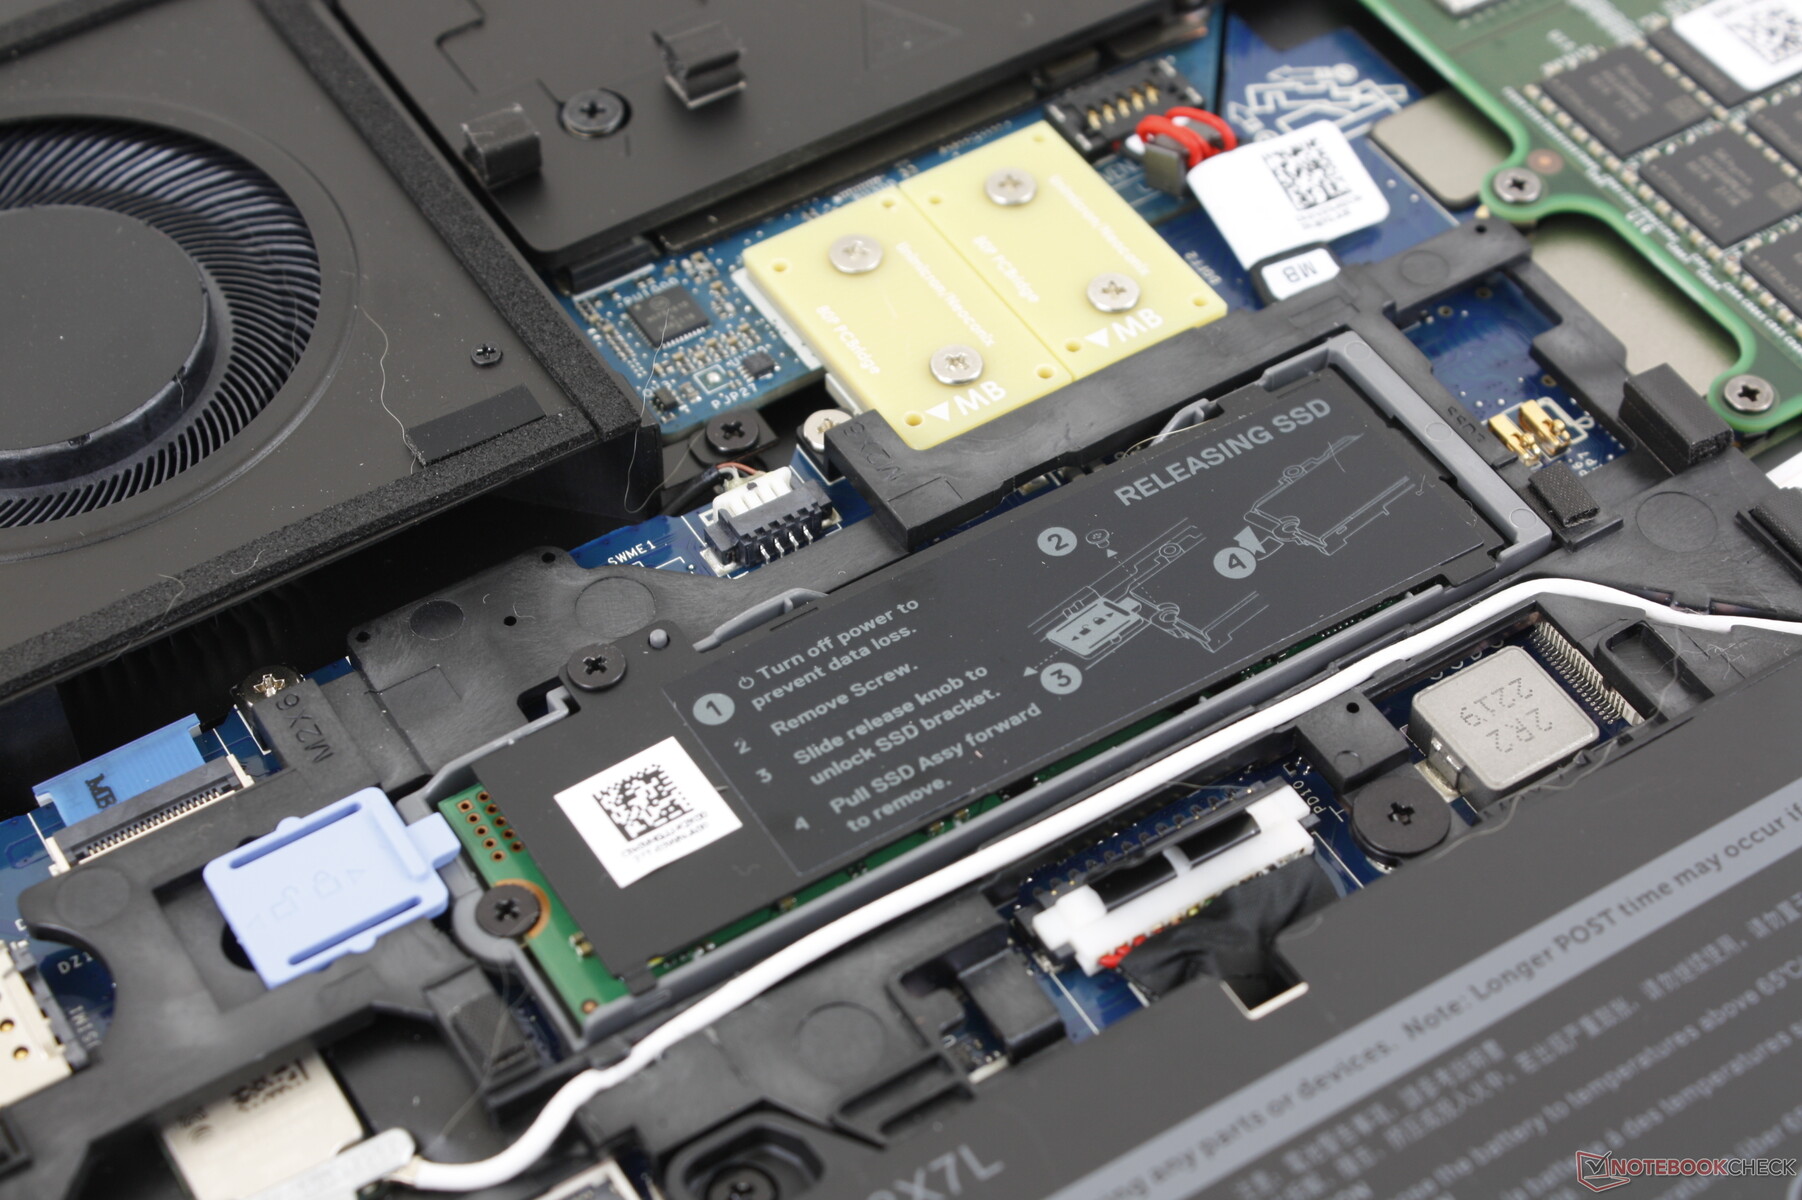
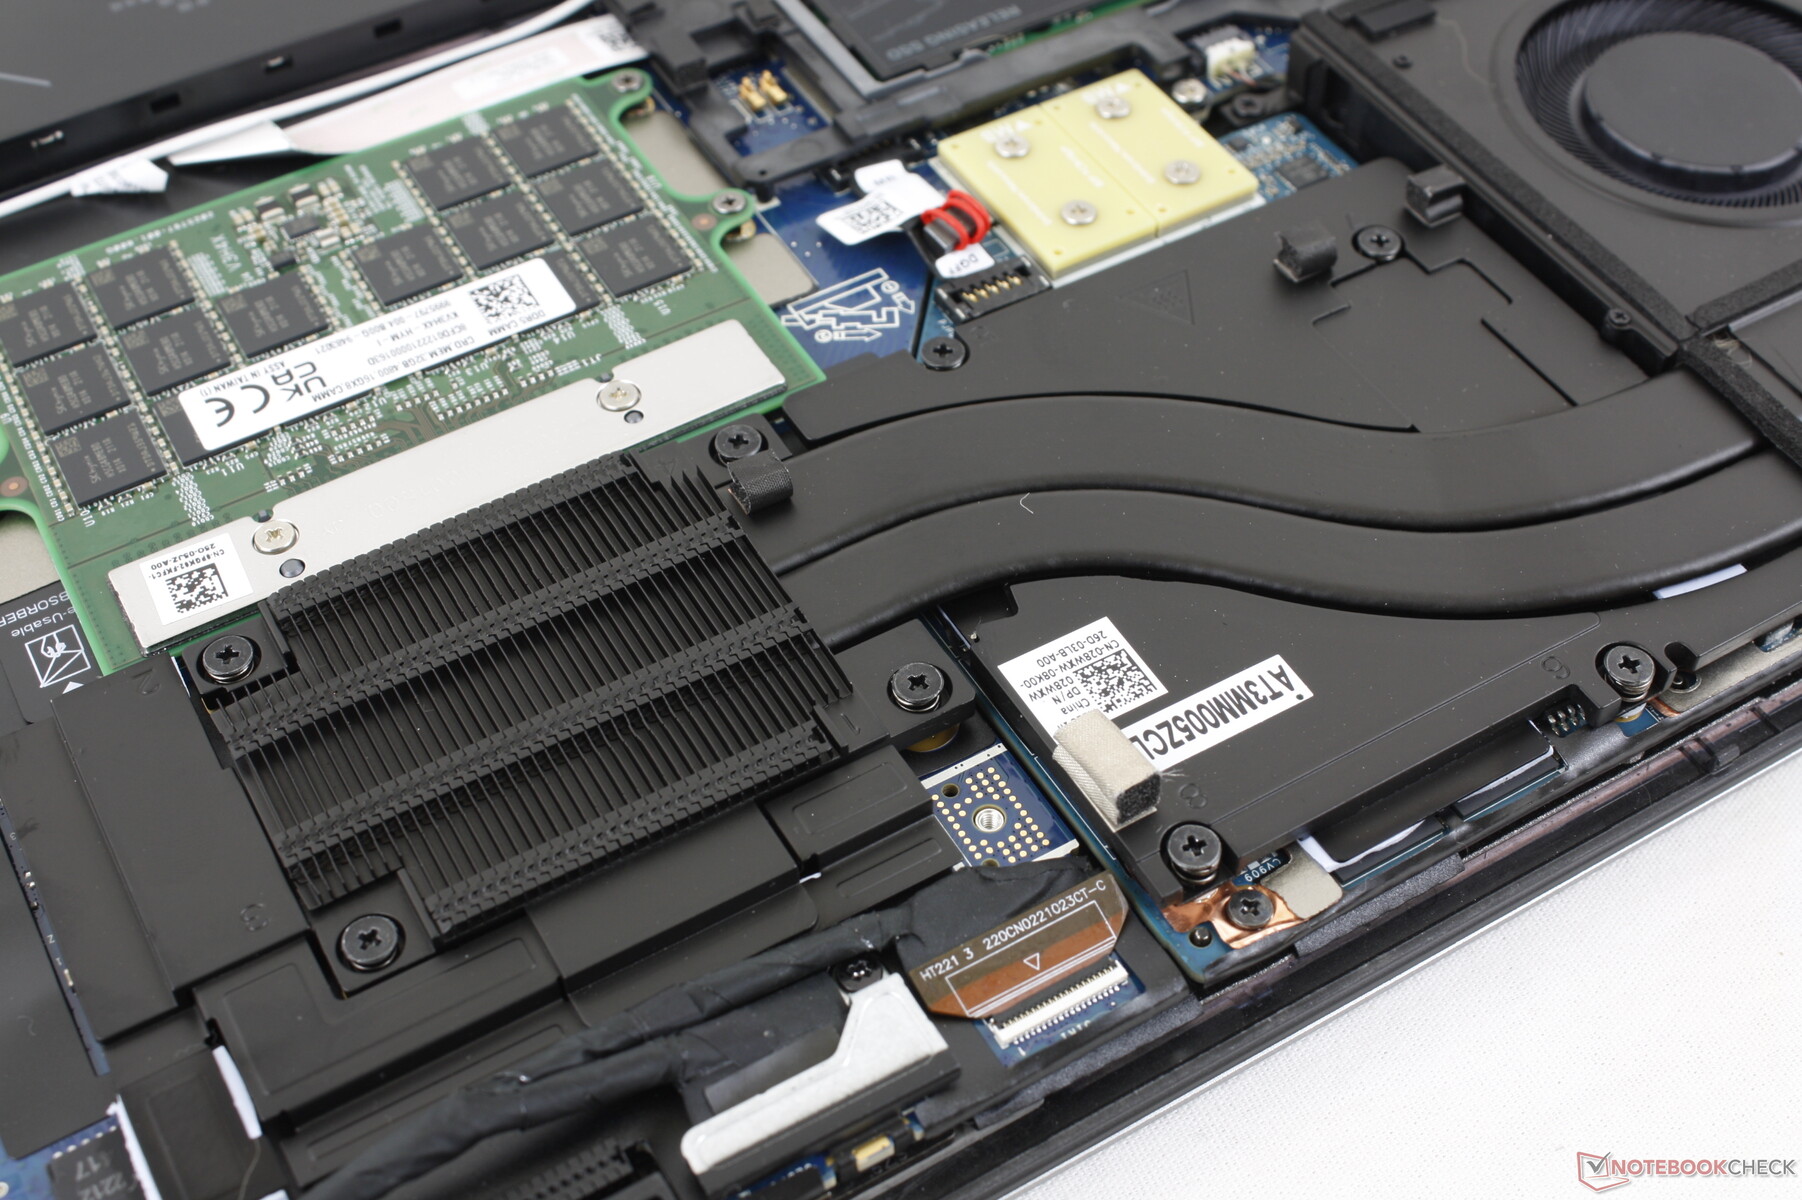
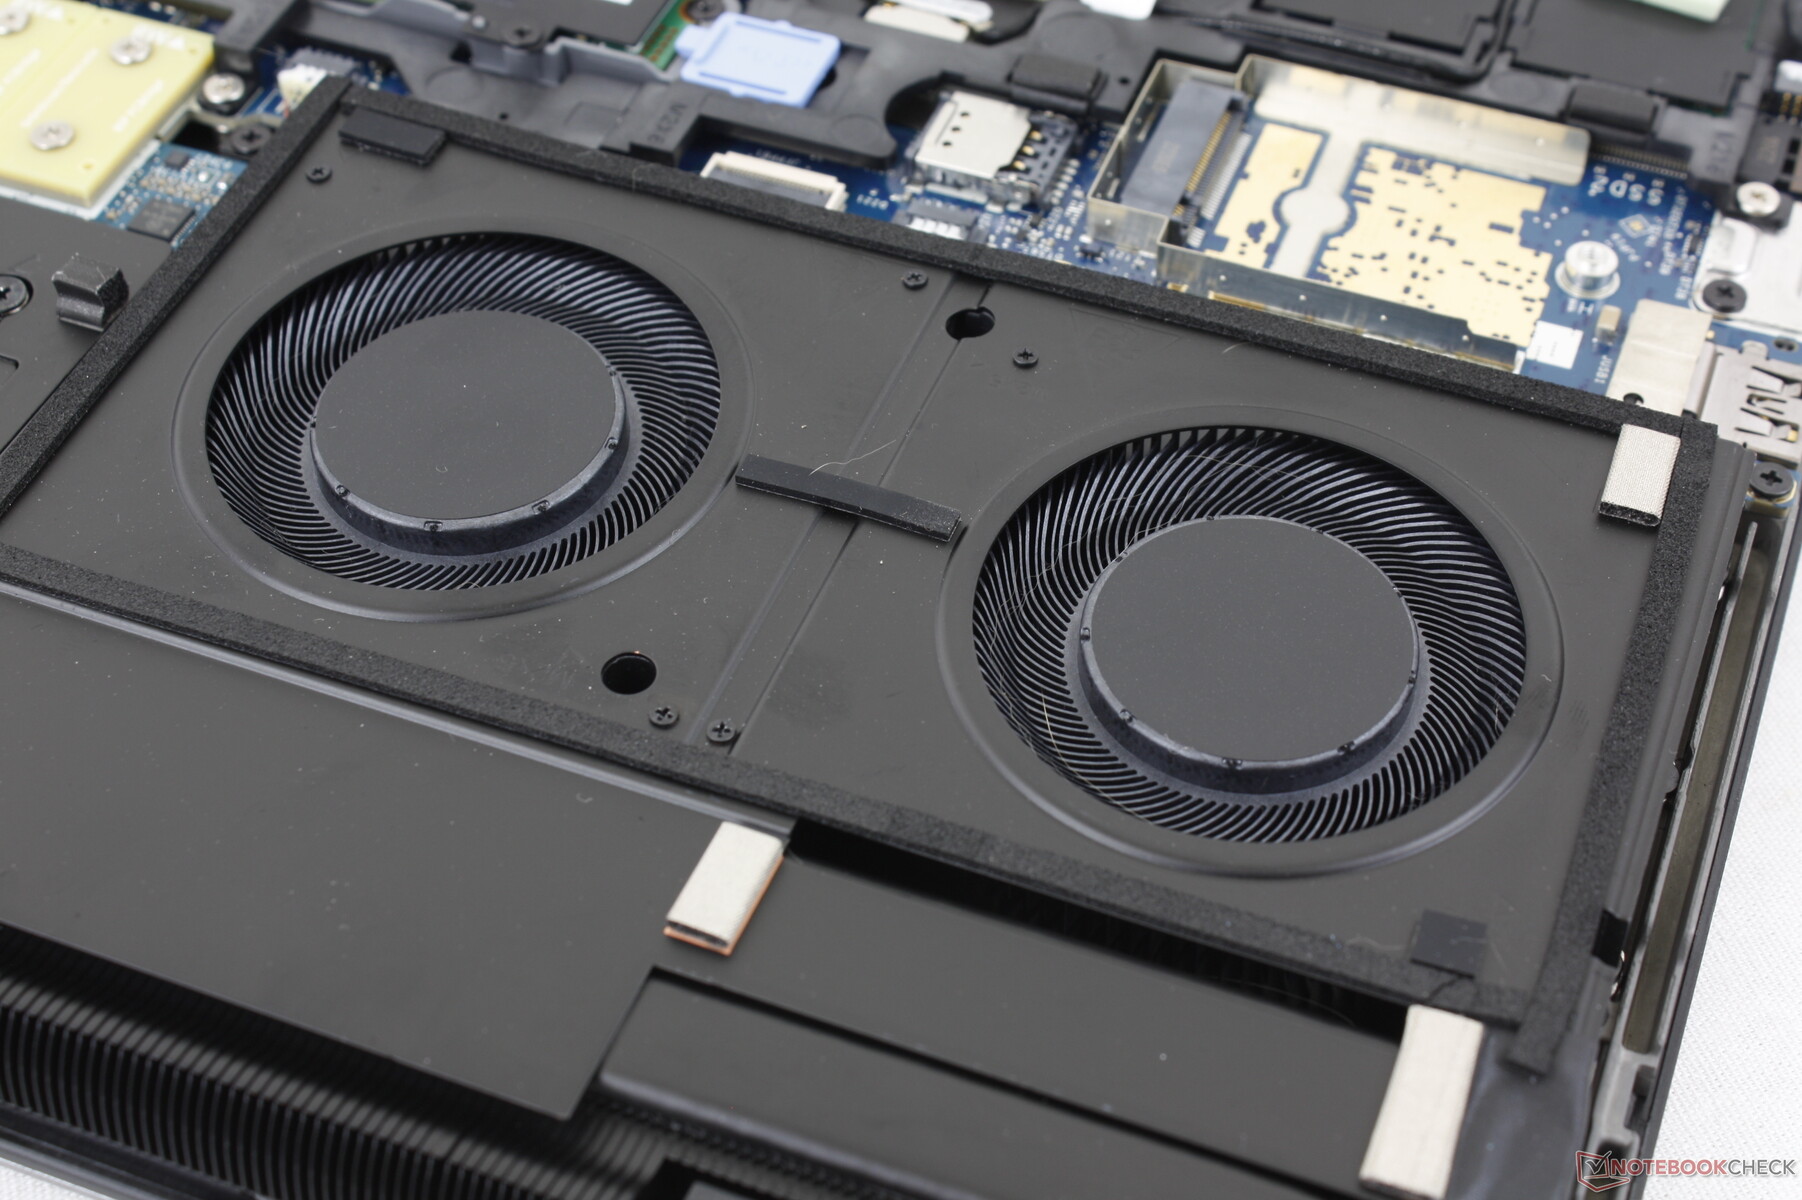
Die Unterseite ist mit sechs Kreuzschlitzschrauben leicht zu öffnen. Das Innenleben ähnelt dem des schlankeren Precision 7670, mit Ausnahme der Unterschiede bei der Akkukapazität, der Anzahl der verfügbaren Speicherschächte und dem Vorhandensein eines kleinen Kühlkörpers.
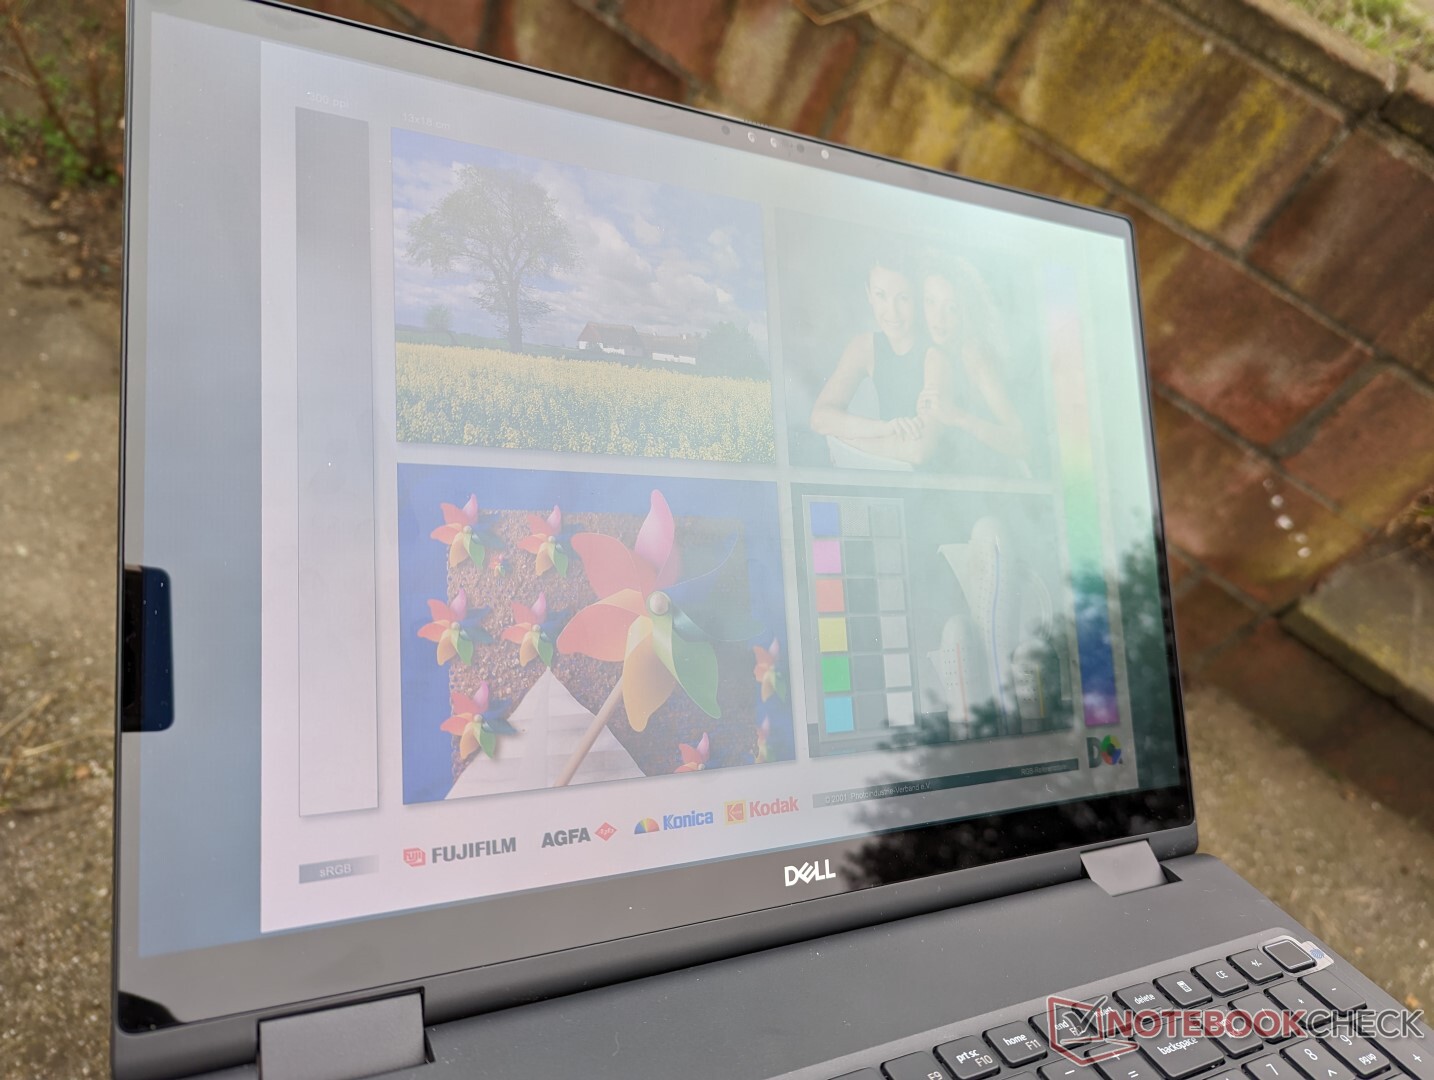
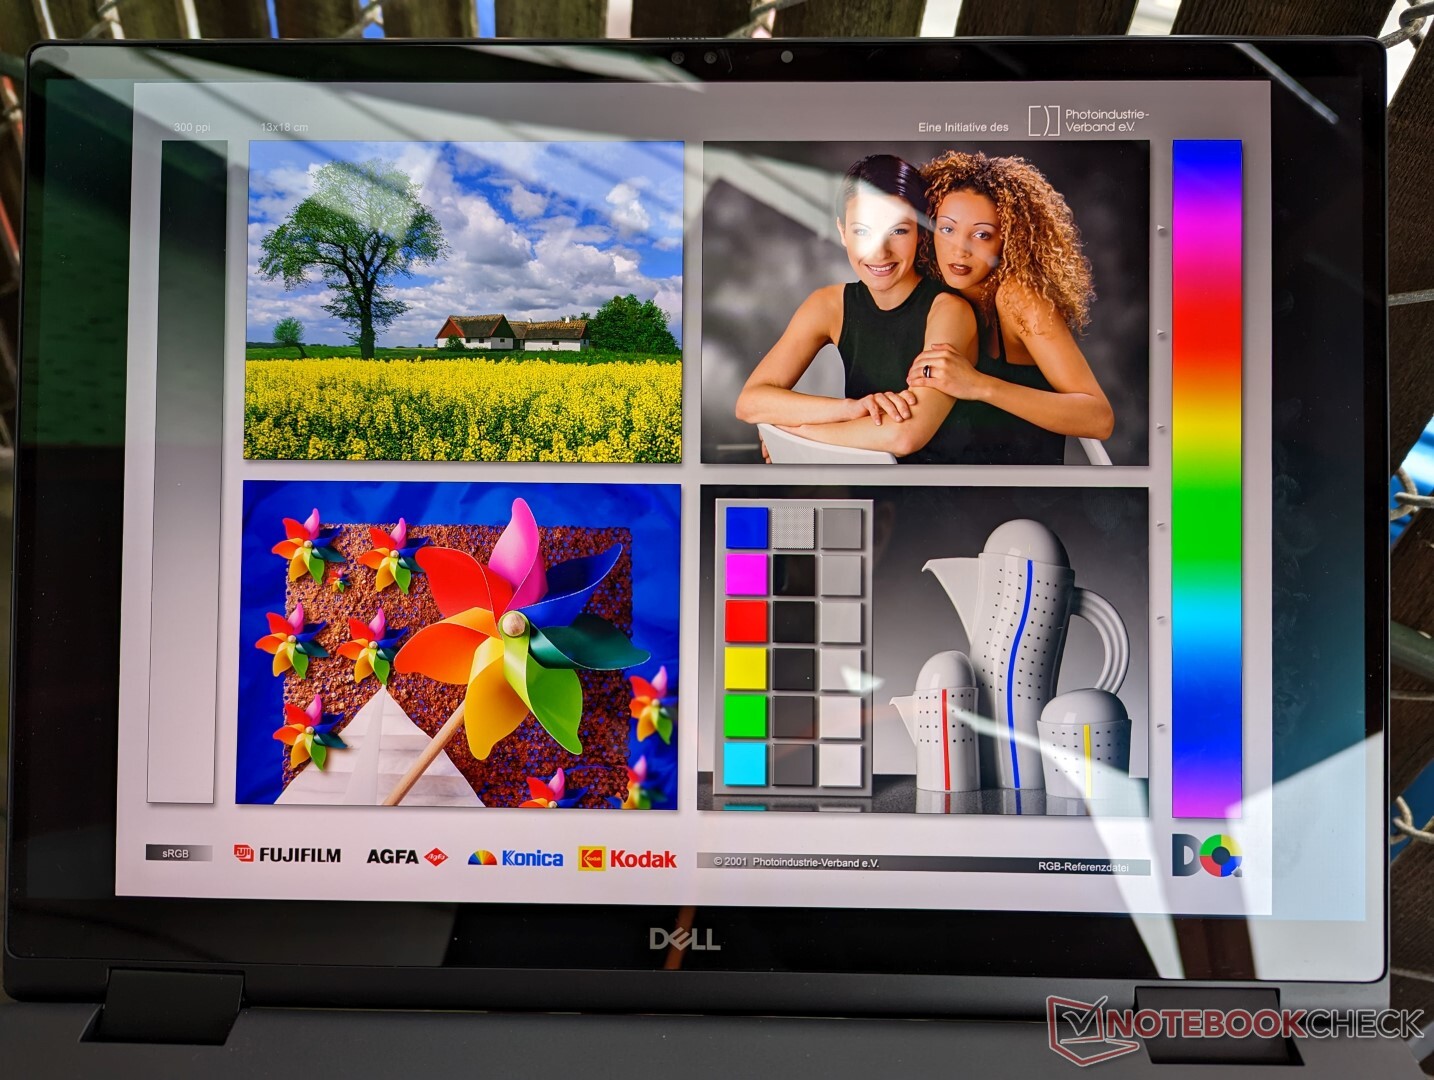
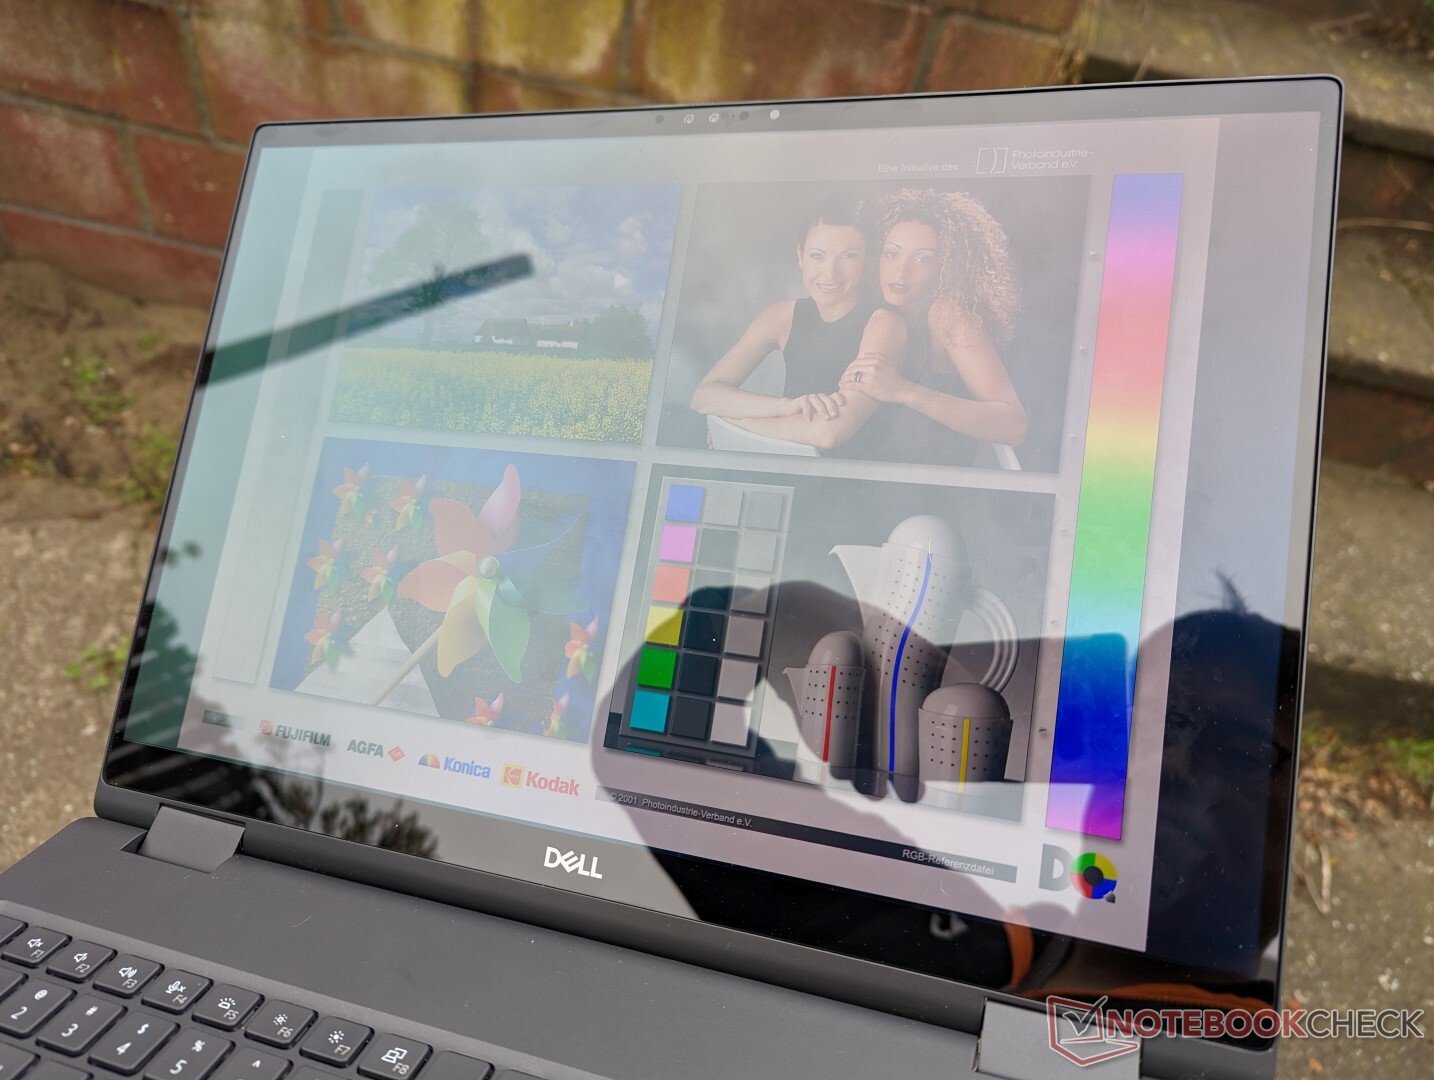
Display
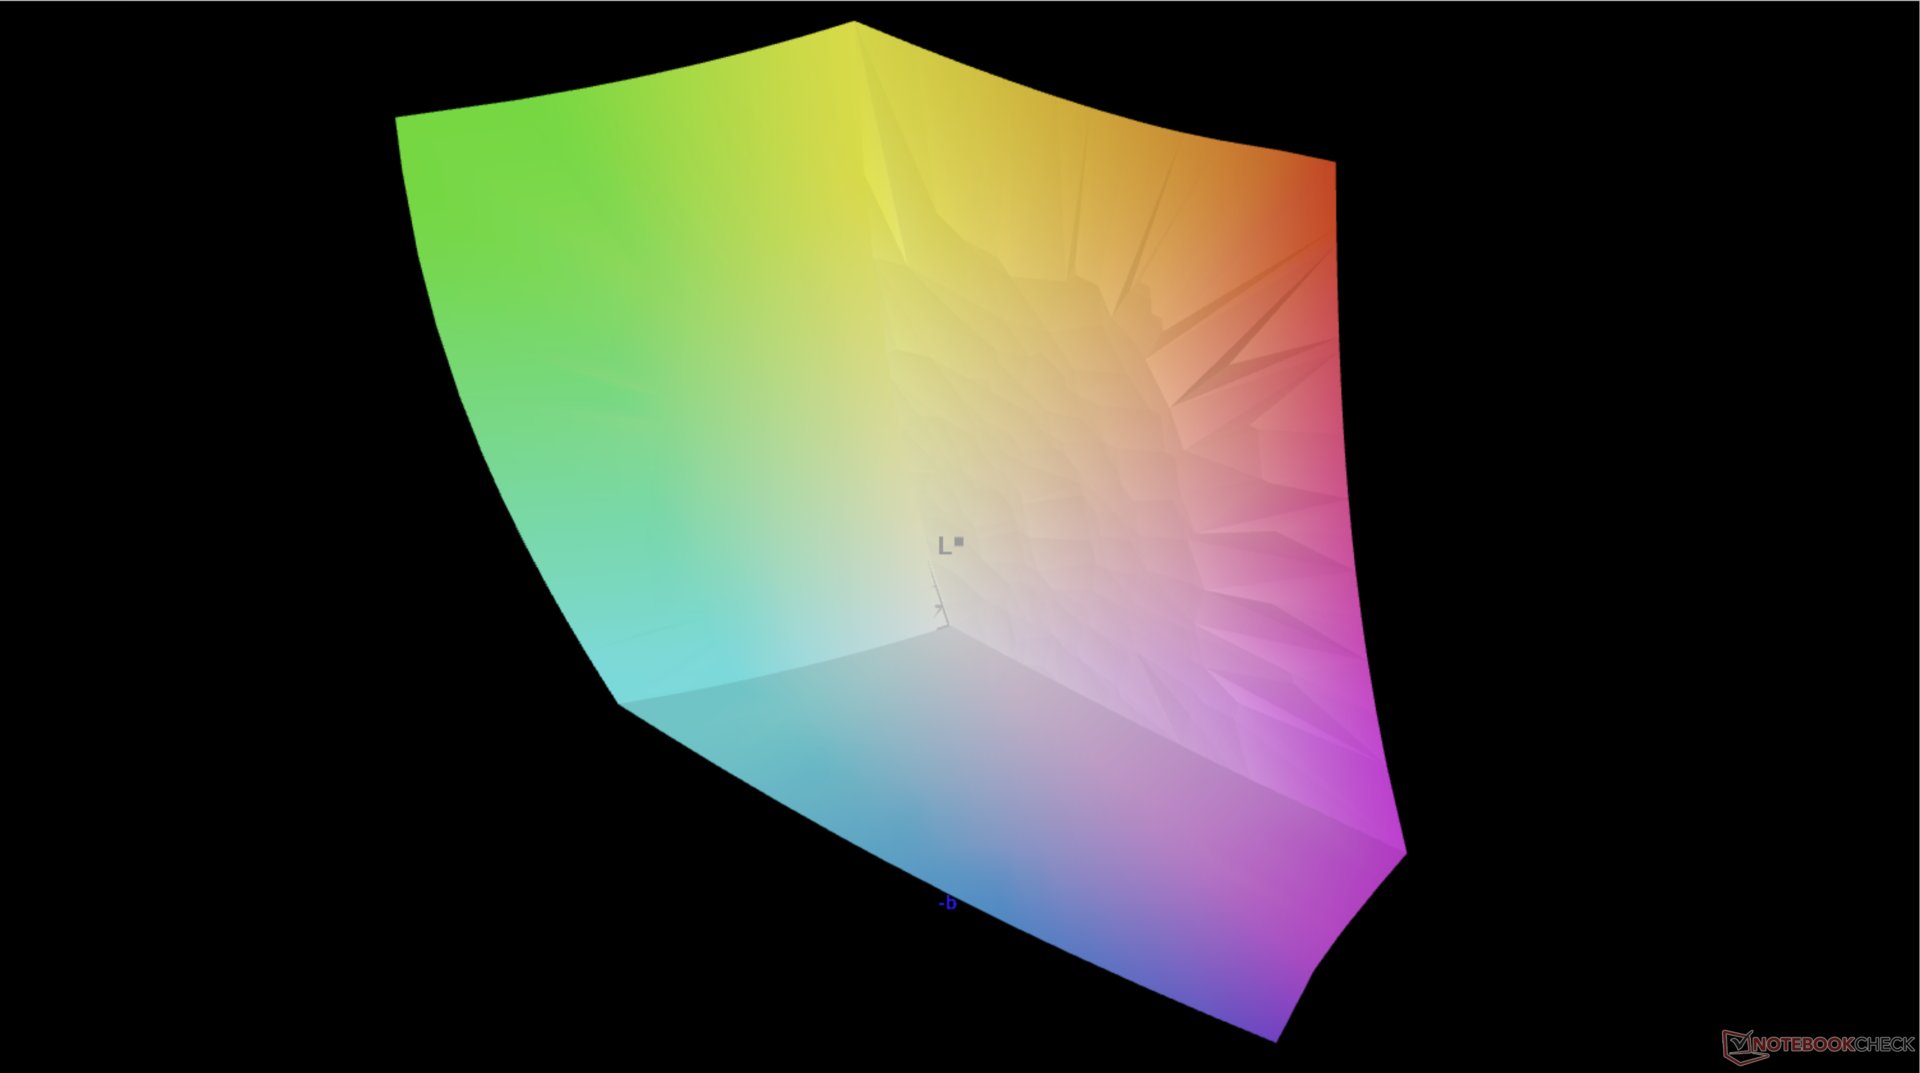
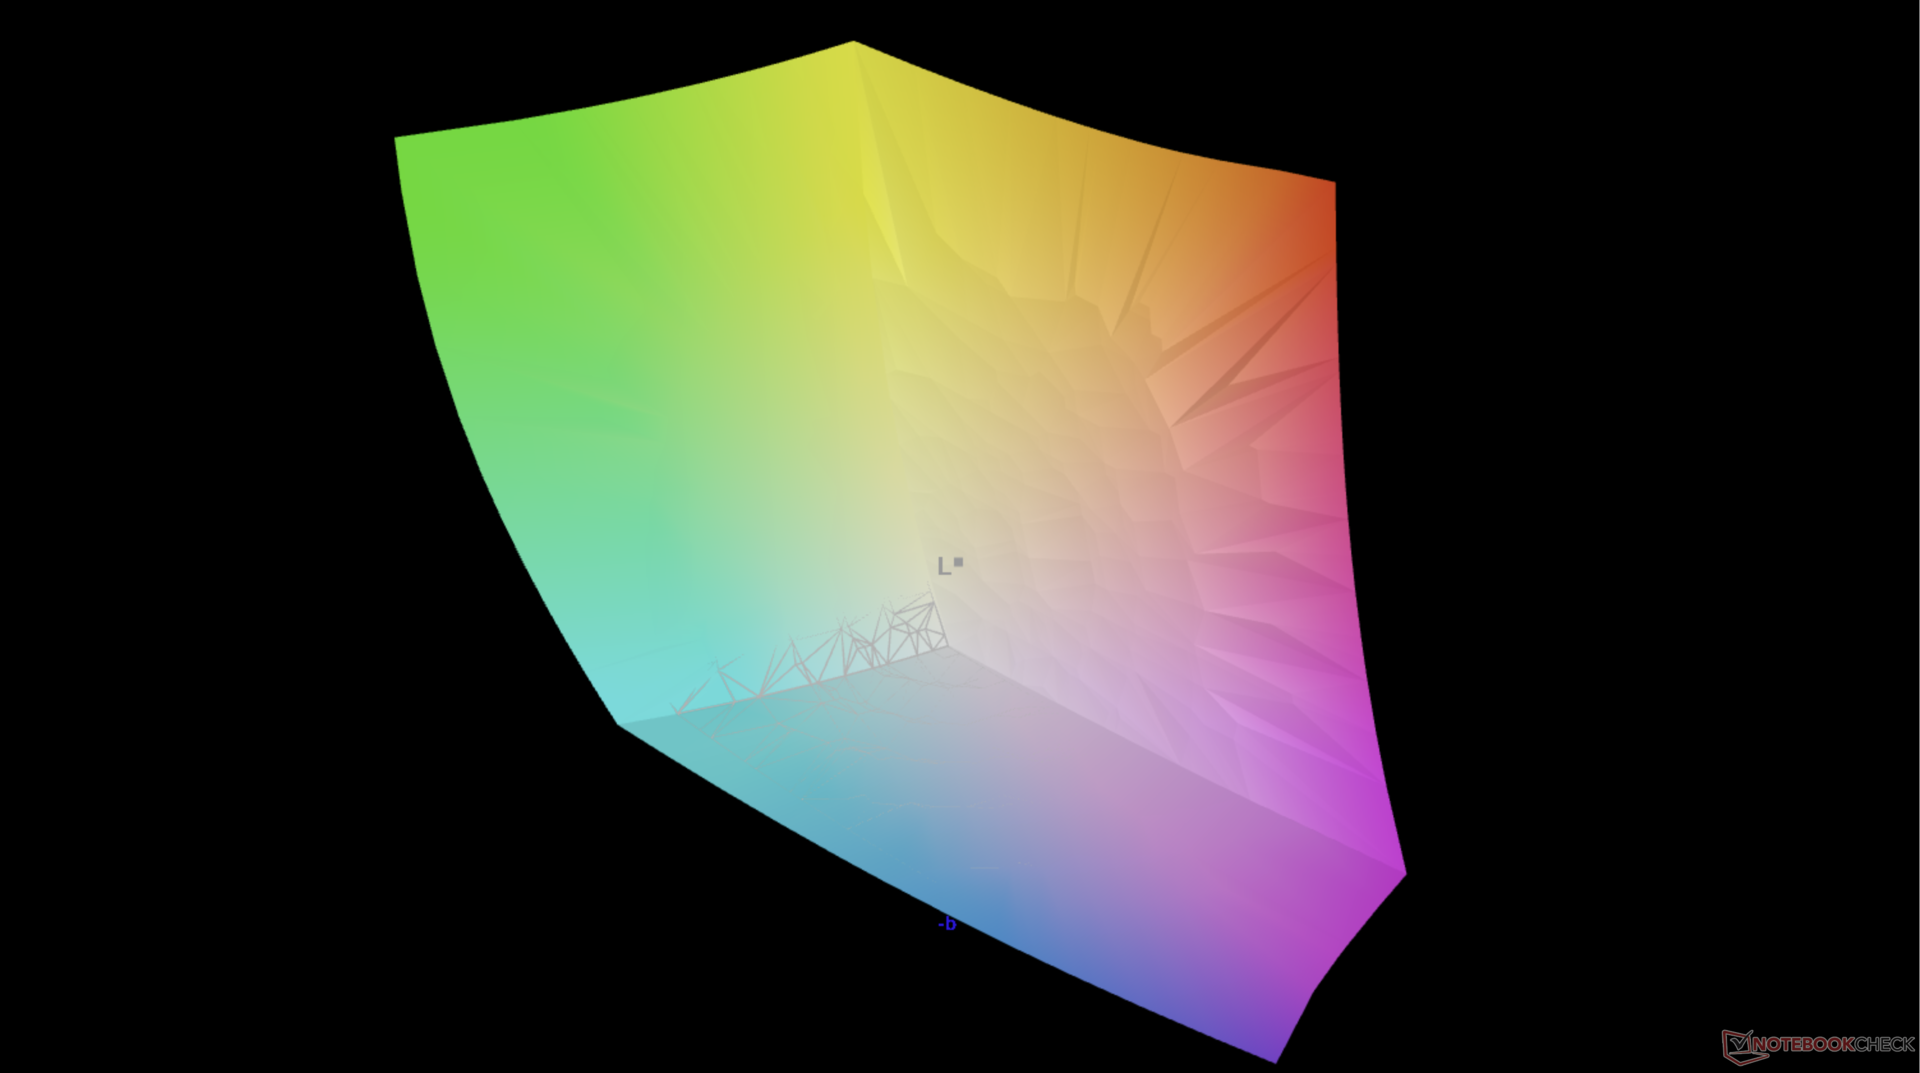
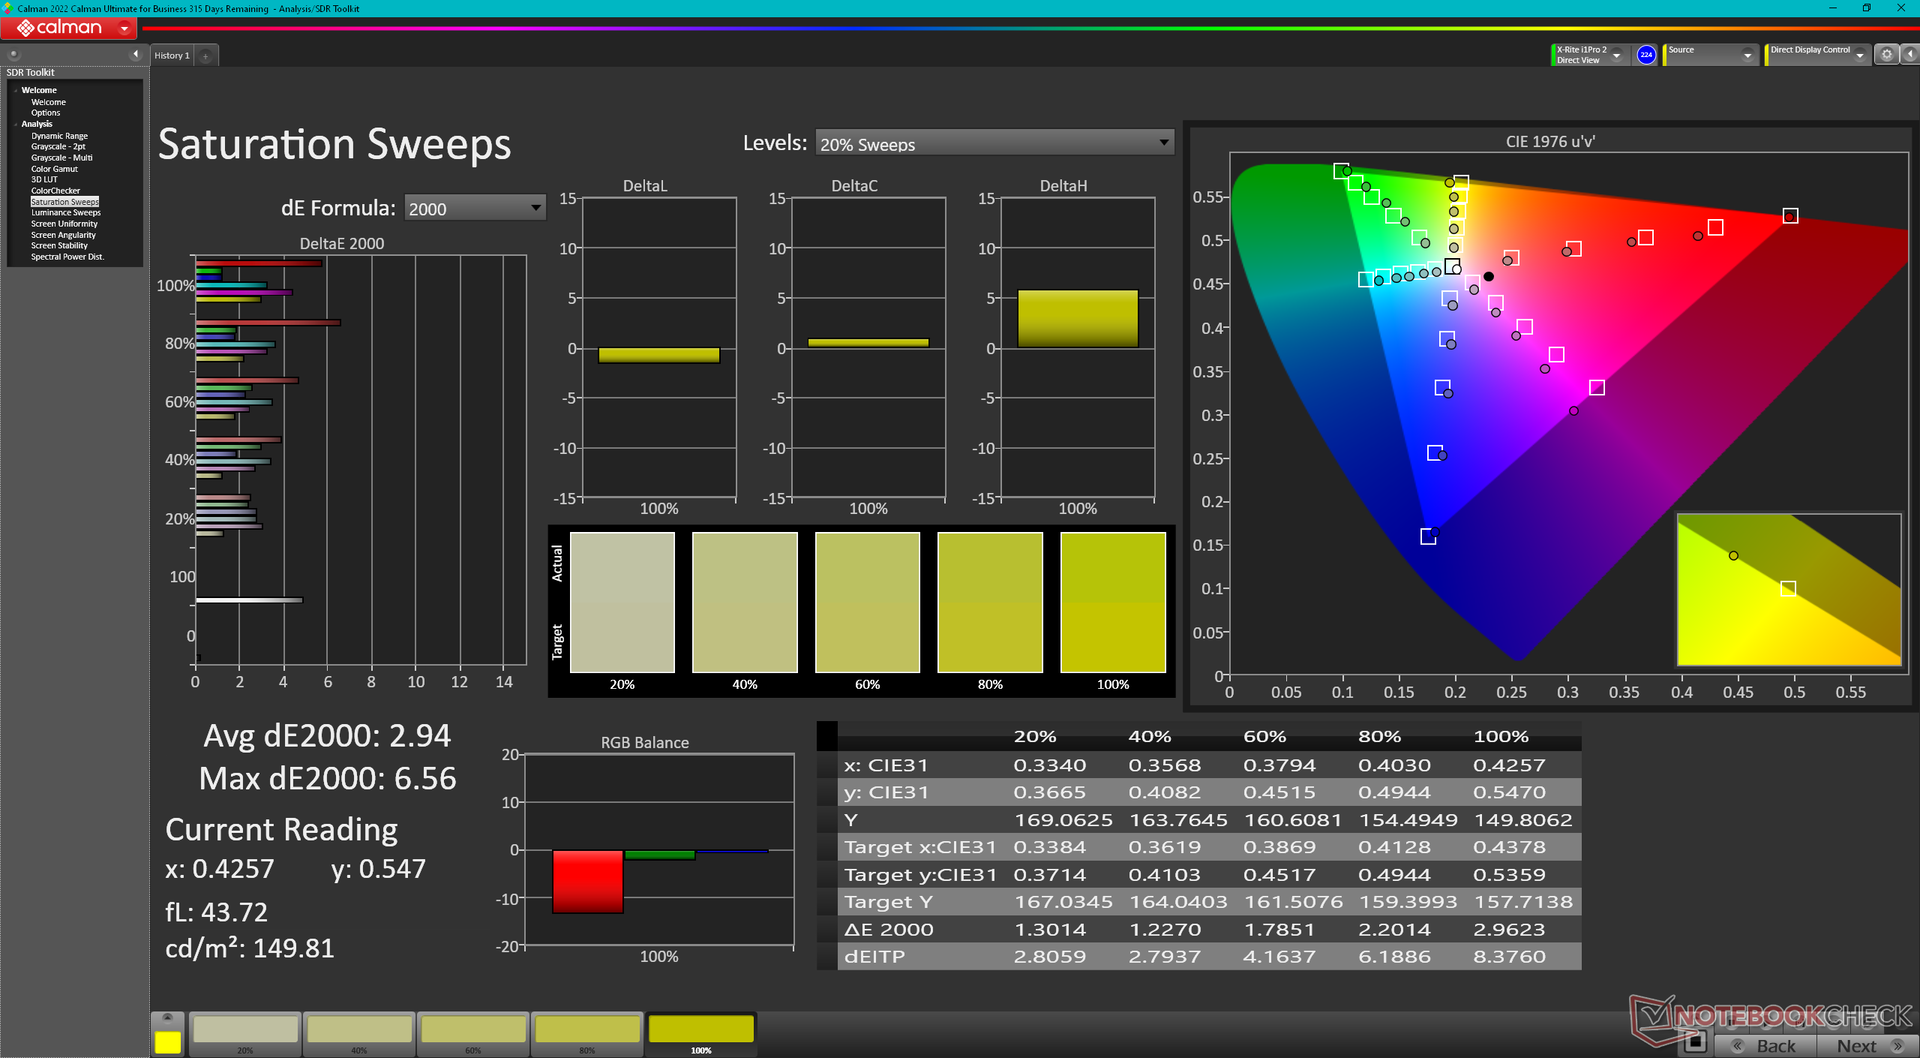
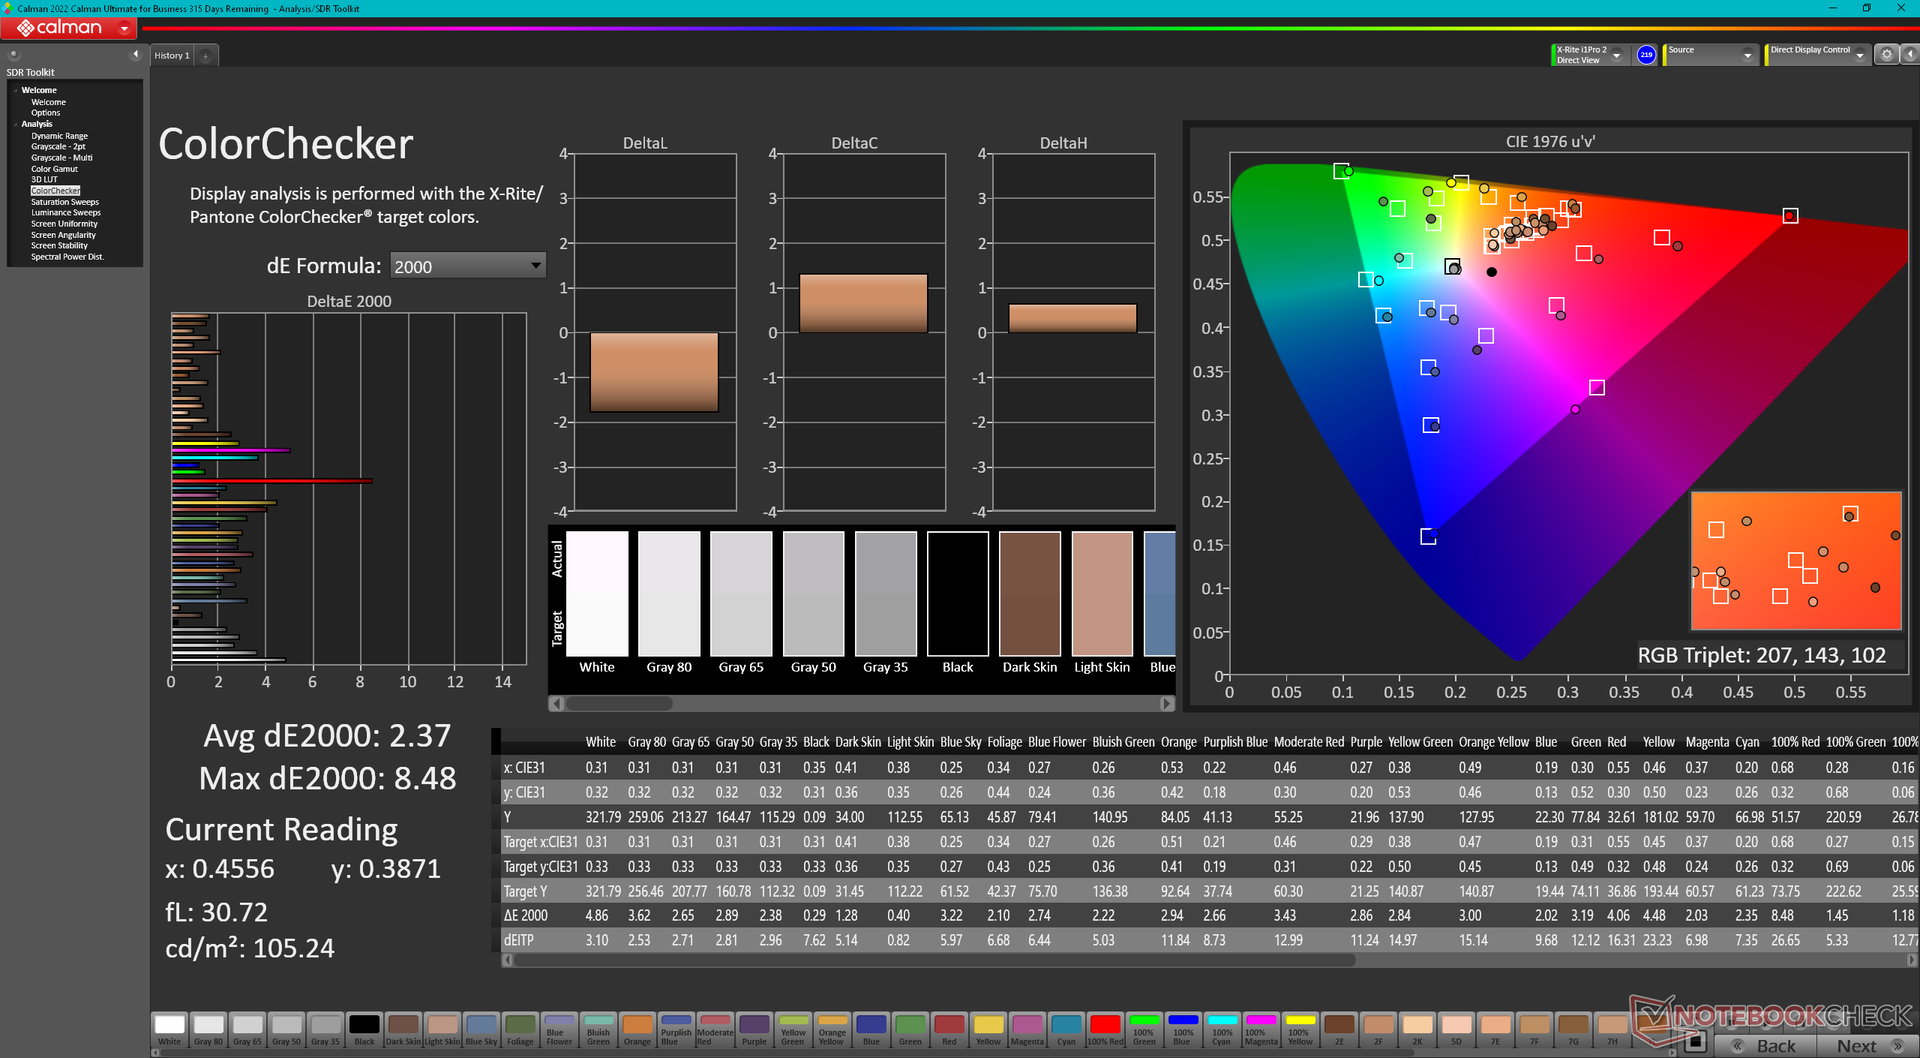
Displayoptionen sind identisch mit denen des dünneren Precision 7670. Unser Testgerät verwendet das gleiche Samsung 160YV03 OLED-Panel, das volle P3-Farben verspricht.
| |||||||||||||||||||||||||
Ausleuchtung: 97 %
Helligkeit Akku: 325.2 cd/m²
Kontrast: ∞:1 (Schwarzwert: 0 cd/m²)
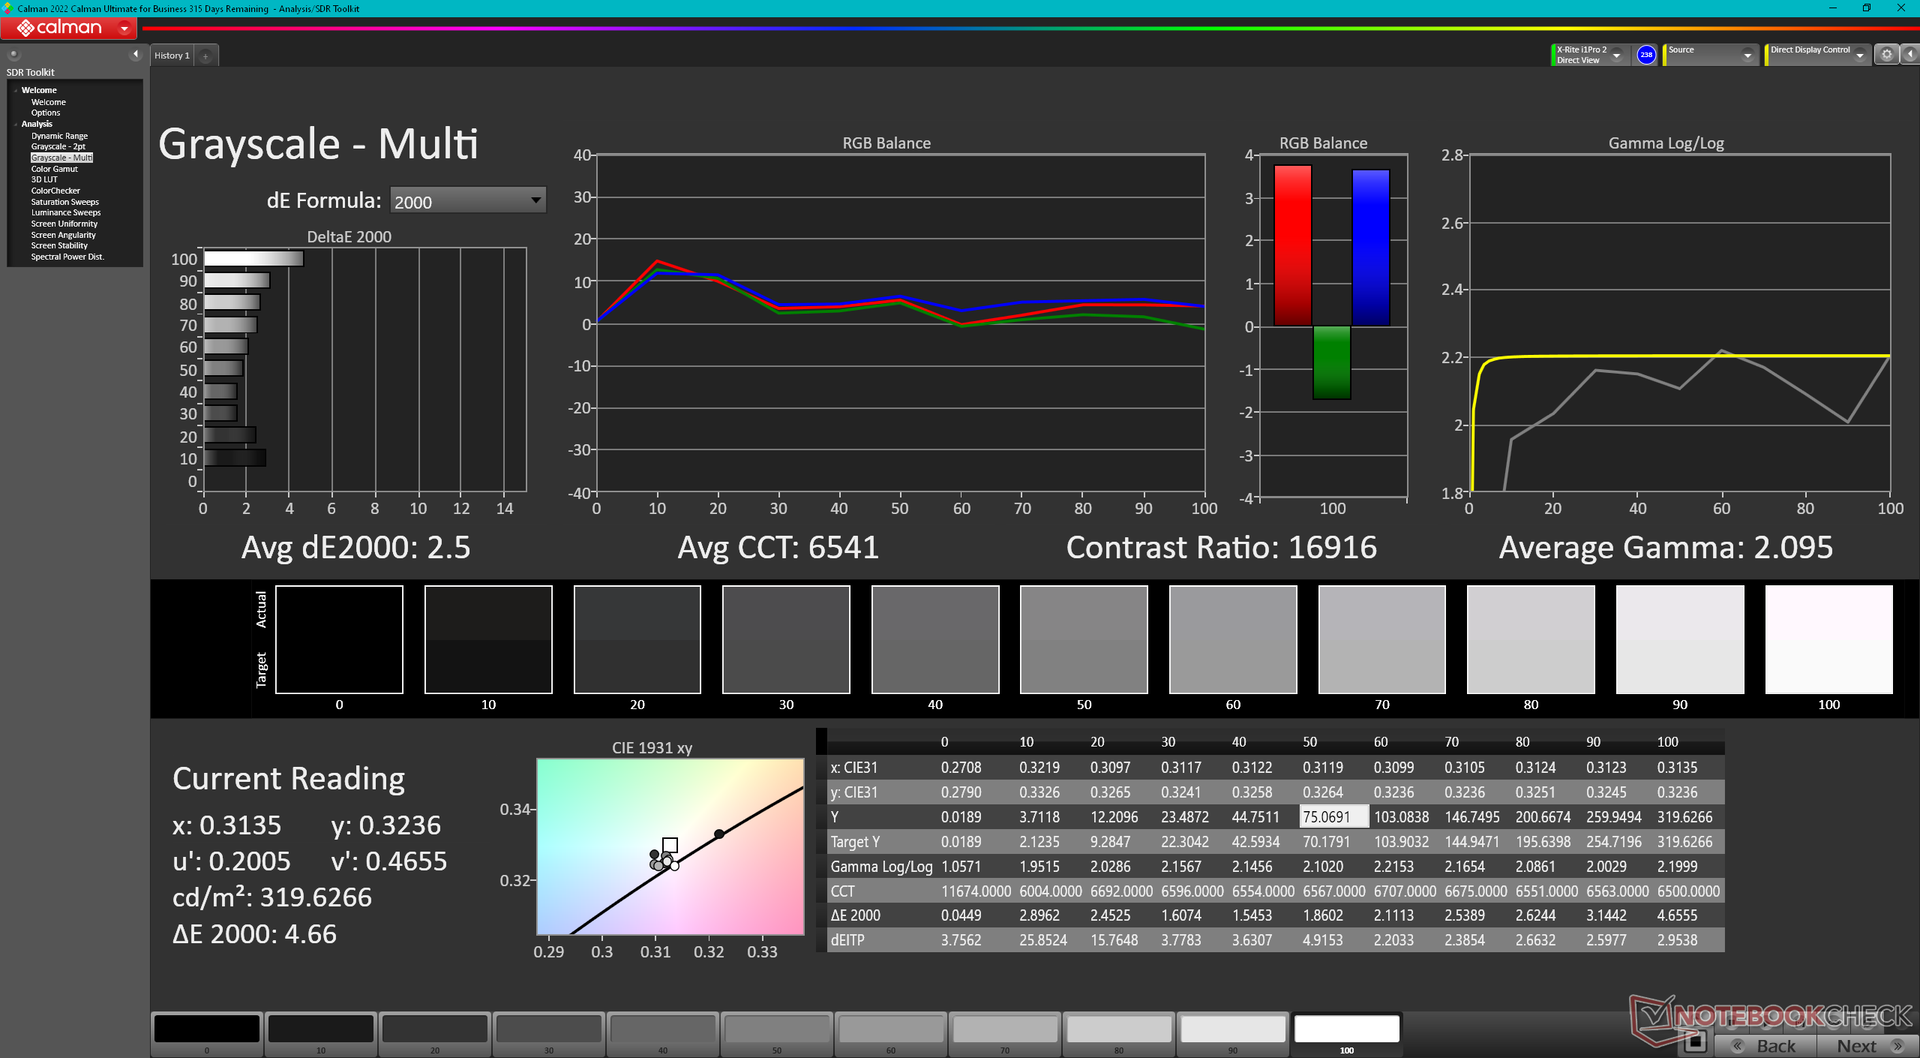
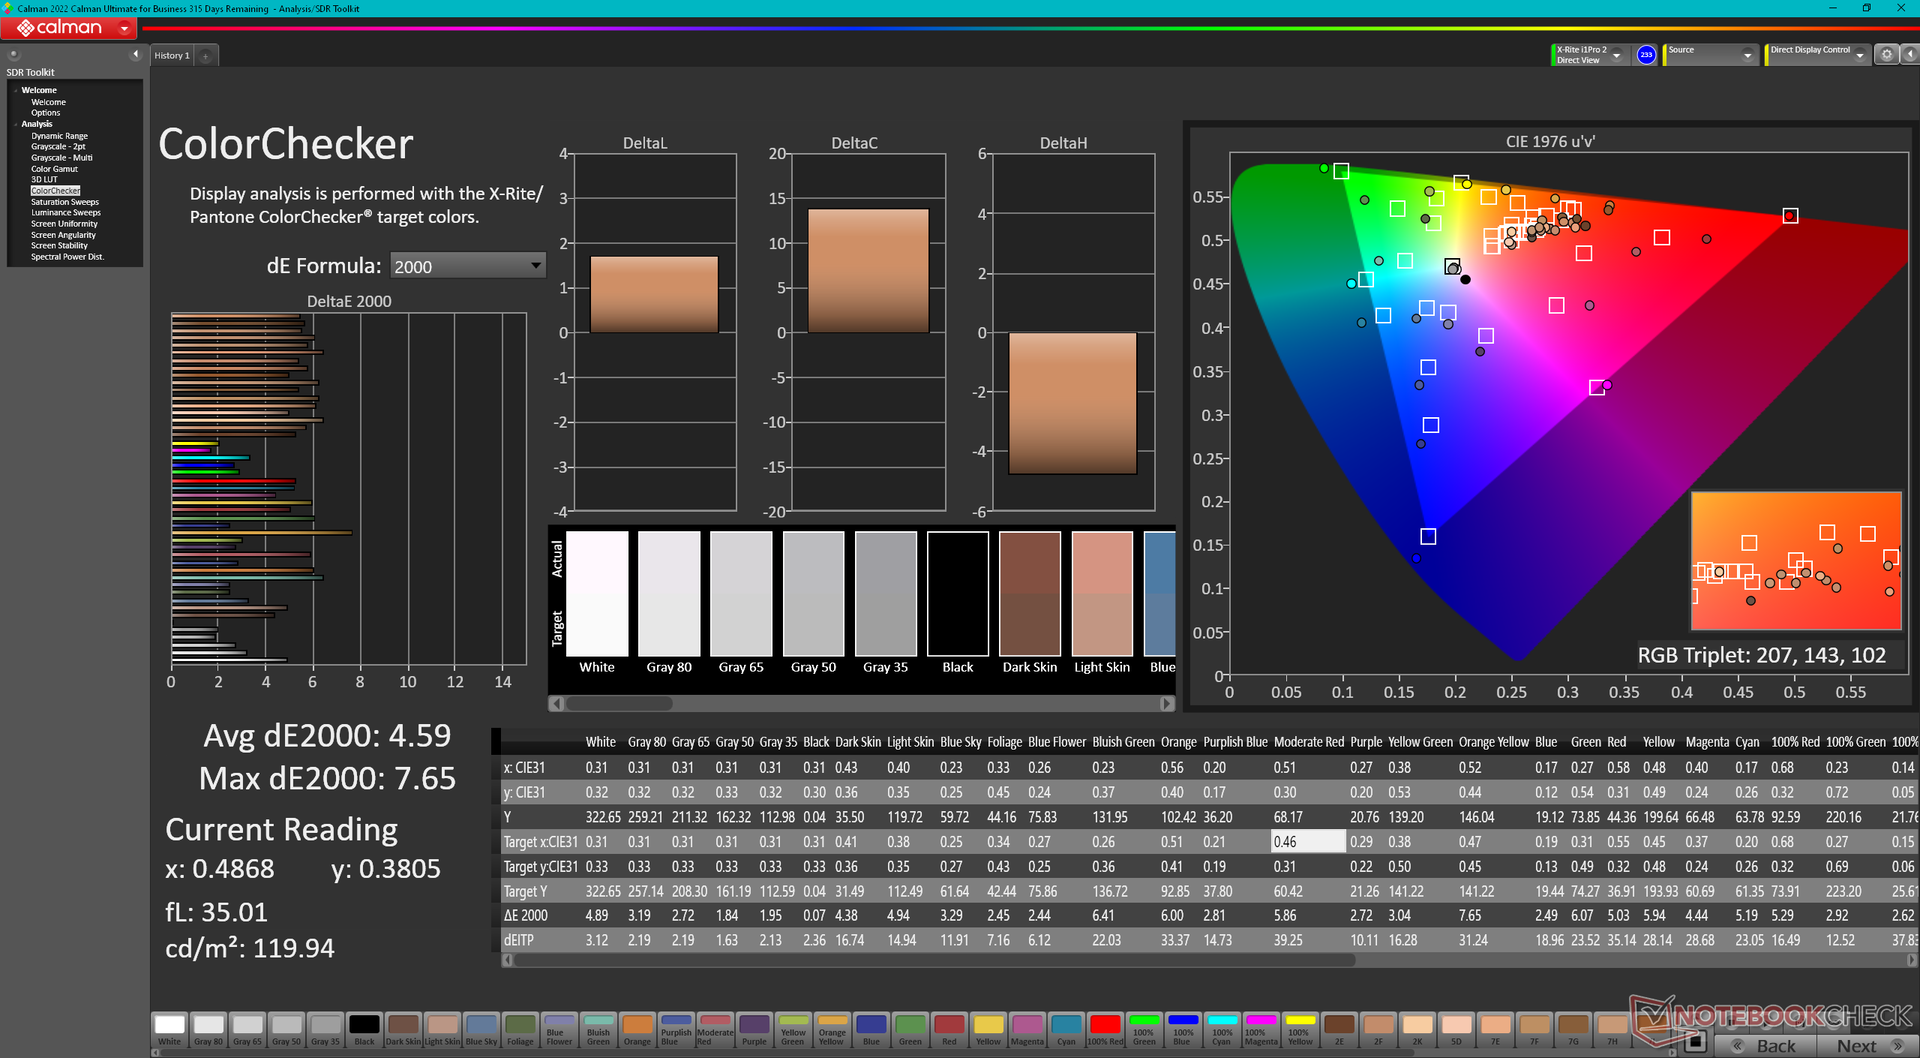
ΔE Color 4.59 | 0.5-29.43 Ø5
ΔE Greyscale 2.5 | 0.57-98 Ø5.3
98.1% AdobeRGB 1998 (Argyll 2.2.0 3D)
100% sRGB (Argyll 2.2.0 3D)
99.9% Display P3 (Argyll 2.2.0 3D)
Gamma: 2.1
| Dell Precision 7000 7670 Performance Samsung 160YV03, OLED, 3840x2400, 16.00 | MSI CreatorPro Z16P B12UKST B160QAN02.N, IPS, 2560x1600, 16.00 | HP ZBook Studio 16 G9 62U04EA BOE0A52, IPS, 3840x2400, 16.00 | HP ZBook Firefly 16 G9-6B897EA BOE0A02, IPS, 1920x1200, 16.00 | Lenovo ThinkPad P1 G4-20Y4Z9DVUS NE160QDM-N63, IPS, 2560x1600, 16.00 | Dell Precision 7670 Samsung 160YV03, OLED, 3840x2400, 16.00 | |
|---|---|---|---|---|---|---|
| Display | -4% | -5% | -22% | -17% | -0% | |
| Display P3 Coverage | 99.9 | 97.6 -2% | 97.5 -2% | 68.1 -32% | 72.7 -27% | 99.9 0% |
| sRGB Coverage | 100 | 99.9 0% | 99.9 0% | 96.1 -4% | 99.3 -1% | 100 0% |
| AdobeRGB 1998 Coverage | 98.1 | 87.4 -11% | 86.3 -12% | 70 -29% | 74.7 -24% | 97.5 -1% |
| Response Times | -441% | -475% | -1843% | -1550% | -2% | |
| Response Time Grey 50% / Grey 80% * | 1.84 ? | 12.8 ? -596% | 15.3 ? -732% | 52.8 ? -2770% | 40.8 -2117% | 1.9 ? -3% |
| Response Time Black / White * | 1.92 ? | 7.4 ? -285% | 6.1 ? -218% | 19.5 ? -916% | 20.8 -983% | 2 ? -4% |
| PWM Frequency | 59.52 ? | 59.5 ? 0% | ||||
| Bildschirm | 32% | 50% | 4% | 7% | 2% | |
| Helligkeit Bildmitte | 325.2 | 407 25% | 554 70% | 526 62% | 441 36% | 340.1 5% |
| Brightness | 328 | 388 18% | 516 57% | 499 52% | 420 28% | 342 4% |
| Brightness Distribution | 97 | 88 -9% | 84 -13% | 93 -4% | 90 -7% | 98 1% |
| Schwarzwert * | 0.36 | 0.47 | 0.31 | 0.27 | ||
| Delta E Colorchecker * | 4.59 | 1.3 72% | 1 78% | 3.6 22% | 2.6 43% | 2.5 46% |
| Colorchecker dE 2000 max. * | 7.65 | 2.5 67% | 2.4 69% | 6.6 14% | 6 22% | 8.19 -7% |
| Delta E Graustufen * | 2.5 | 2.1 16% | 1.6 36% | 5.5 -120% | 4.5 -80% | 3.5 -40% |
| Gamma | 2.1 105% | 2.26 97% | 2.29 96% | 2.02 109% | 2.18 101% | 2.12 104% |
| CCT | 6541 99% | 6437 101% | 6458 101% | 6527 100% | 6623 98% | 6704 97% |
| Kontrast | 1131 | 1179 | 1697 | 1633 | ||
| Colorchecker dE 2000 calibrated * | 0.7 | 0.6 | 2.6 | 1.2 | ||
| Durchschnitt gesamt (Programm / Settings) | -138% /
-64% | -143% /
-61% | -620% /
-339% | -520% /
-283% | 0% /
0% |
* ... kleinere Werte sind besser
Reaktionszeiten (Response Times) des Displays
| ↔ Reaktionszeiten Schwarz zu Weiß | ||
|---|---|---|
| 1.92 ms ... steigend ↗ und fallend ↘ kombiniert | ↗ 0.92 ms steigend | 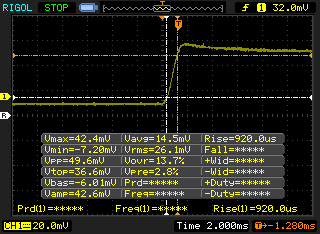 |
| ↘ 1 ms fallend | ||
| Die gemessenen Reaktionszeiten sind sehr kurz, wodurch sich der Bildschirm auch für schnelle 3D Spiele eignen sollte. Im Vergleich rangierten die bei uns getesteten Geräte von 0.1 (Minimum) zu 240 (Maximum) ms. » 6 % aller Screens waren schneller als der getestete. Daher sind die gemessenen Reaktionszeiten besser als der Durchschnitt aller vermessenen Geräte (21.5 ms). | ||
| ↔ Reaktionszeiten 50% Grau zu 80% Grau | ||
| 1.84 ms ... steigend ↗ und fallend ↘ kombiniert | ↗ 0.92 ms steigend | 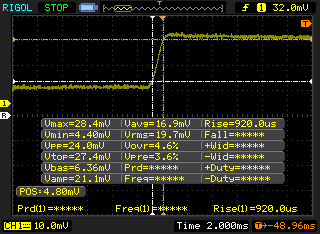 |
| ↘ 0.92 ms fallend | ||
| Die gemessenen Reaktionszeiten sind sehr kurz, wodurch sich der Bildschirm auch für schnelle 3D Spiele eignen sollte. Im Vergleich rangierten die bei uns getesteten Geräte von 0.2 (Minimum) zu 636 (Maximum) ms. » 5 % aller Screens waren schneller als der getestete. Daher sind die gemessenen Reaktionszeiten besser als der Durchschnitt aller vermessenen Geräte (33.7 ms). | ||
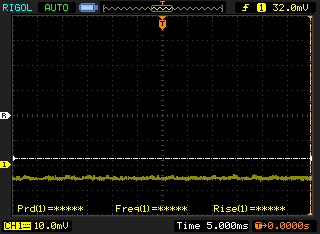
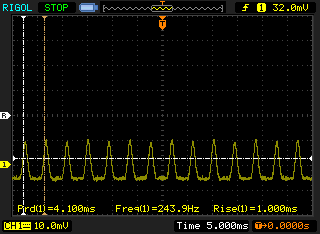
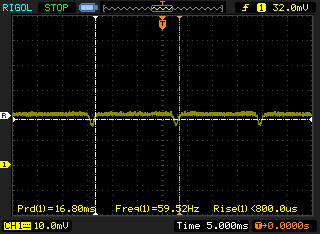
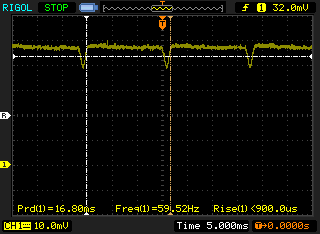
Bildschirm-Flackern / PWM (Pulse-Width Modulation)
| Flackern / PWM festgestellt | 59.52 Hz | ≤ 100 % Helligkeit | 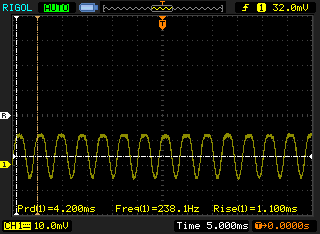 |
Das Display flackert mit 59.52 Hz (im schlimmsten Fall, eventuell durch Pulsweitenmodulation PWM) bei einer eingestellten Helligkeit von 100 % und darunter. Darüber sollte es zu keinem Flackern kommen. Die Frequenz von 59.52 Hz ist sehr gering und daher kann es bei allen Usern zu sichtbaren Flackern, brennenden Augen oder Kopfweh kommen. Im Vergleich: 53 % aller getesteten Geräte nutzten kein PWM um die Helligkeit zu reduzieren. Wenn PWM eingesetzt wurde, dann bei einer Frequenz von durchschnittlich 17908 (Minimum 5, Maximum 3846000) Hz. | |||
Wie bei den meisten OLED-Panels tritt bei allen Helligkeitseinstellungen Flackern auf. Wir konnten eine Frequenz von 238,1 Hz von 0 bis 57 Prozent Helligkeit und 59,5 Hz von 58 Prozent bis zum Maximum aufzeichnen.

Performance

Testbedingungen
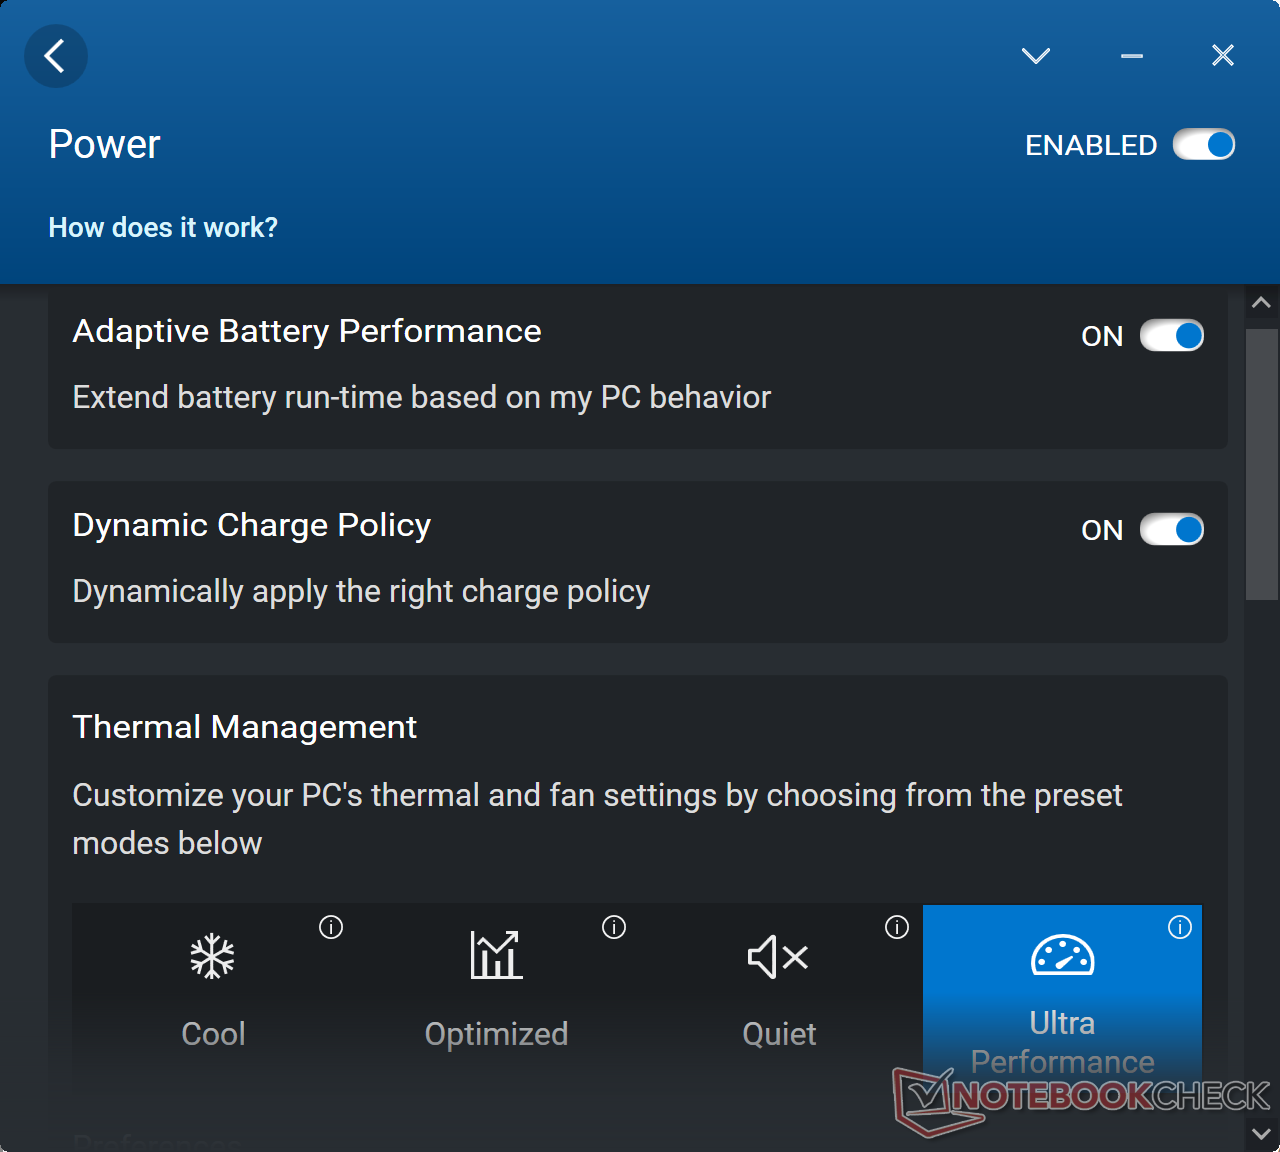
Wir haben unser Gerät über die Dell Optimizer Software auf den Ultra Performance Modus und die GPU auf diskrete Grafik eingestellt, bevor wir die folgenden Leistungsbenchmarks durchgeführt haben. Wir empfehlen sich mit dem Optimizer vertraut machen, da er die zentrale Steuerung vieler spezifischer Funktionen des Laptops ist, einschließlich der Anwesenheitserkennung und des Ladeverhaltens.
Wir konnten nirgendwo in der Software oder im BIOS einen MUX-Schalter finden.
Prozessor
Die Multi-Thread-Leistung ist nur etwa 8 bis 14 Prozent schneller als die des Core i7-12850HX in unserem schlankeren Precision 7670. Der knappe Vorsprung ist nicht unerwartet, überraschender ist da die etwas geringe Turbo-Boost-Tauglichkeit unseres Core i9-12950HX. Wenn wir den CineBench R15 xT in einer Schleife laufen lassen, sinkt die Leistung im Laufe der Zeit um etwa 17 %, anstatt durchgehend konstant zu bleiben. Das Leistungsdefizit ist vergleichbar mit dem, das wir beim regulären Precision 7670 beobachtet haben.
Cinebench R15 Multi Loop
Cinebench R23: Multi Core | Single Core
Cinebench R15: CPU Multi 64Bit | CPU Single 64Bit
Blender: v2.79 BMW27 CPU
7-Zip 18.03: 7z b 4 | 7z b 4 -mmt1
Geekbench 5.5: Multi-Core | Single-Core
HWBOT x265 Benchmark v2.2: 4k Preset
LibreOffice : 20 Documents To PDF
R Benchmark 2.5: Overall mean
| Cinebench R20 / CPU (Multi Core) | |
| Durchschnittliche Intel Core i9-12950HX (6625 - 8777, n=7) | |
| MSI CreatorPro Z16P B12UKST | |
| Dell Precision 7000 7670 Performance | |
| HP ZBook Studio 16 G9 62U04EA | |
| Dell Precision 7670 | |
| Lenovo ThinkPad P1 G4-20Y4Z9DVUS | |
| HP ZBook Firefly 16 G9-6B897EA | |
| Cinebench R20 / CPU (Single Core) | |
| Durchschnittliche Intel Core i9-12950HX (703 - 741, n=7) | |
| HP ZBook Studio 16 G9 62U04EA | |
| Dell Precision 7000 7670 Performance | |
| Dell Precision 7670 | |
| MSI CreatorPro Z16P B12UKST | |
| Lenovo ThinkPad P1 G4-20Y4Z9DVUS | |
| HP ZBook Firefly 16 G9-6B897EA | |
| Cinebench R23 / Multi Core | |
| Durchschnittliche Intel Core i9-12950HX (16277 - 23113, n=7) | |
| MSI CreatorPro Z16P B12UKST | |
| HP ZBook Studio 16 G9 62U04EA | |
| Dell Precision 7000 7670 Performance | |
| Dell Precision 7670 | |
| Lenovo ThinkPad P1 G4-20Y4Z9DVUS | |
| HP ZBook Firefly 16 G9-6B897EA | |
| Cinebench R23 / Single Core | |
| HP ZBook Studio 16 G9 62U04EA | |
| Durchschnittliche Intel Core i9-12950HX (1465 - 1922, n=7) | |
| MSI CreatorPro Z16P B12UKST | |
| Dell Precision 7670 | |
| Lenovo ThinkPad P1 G4-20Y4Z9DVUS | |
| Dell Precision 7000 7670 Performance | |
| HP ZBook Firefly 16 G9-6B897EA | |
| Cinebench R15 / CPU Multi 64Bit | |
| Durchschnittliche Intel Core i9-12950HX (2464 - 3530, n=7) | |
| Dell Precision 7000 7670 Performance | |
| HP ZBook Studio 16 G9 62U04EA | |
| Dell Precision 7670 | |
| MSI CreatorPro Z16P B12UKST | |
| Lenovo ThinkPad P1 G4-20Y4Z9DVUS | |
| HP ZBook Firefly 16 G9-6B897EA | |
| Cinebench R15 / CPU Single 64Bit | |
| HP ZBook Studio 16 G9 62U04EA | |
| Dell Precision 7000 7670 Performance | |
| Durchschnittliche Intel Core i9-12950HX (167 - 276, n=7) | |
| Dell Precision 7670 | |
| MSI CreatorPro Z16P B12UKST | |
| Lenovo ThinkPad P1 G4-20Y4Z9DVUS | |
| HP ZBook Firefly 16 G9-6B897EA | |
| Blender / v2.79 BMW27 CPU | |
| HP ZBook Firefly 16 G9-6B897EA | |
| Lenovo ThinkPad P1 G4-20Y4Z9DVUS | |
| Dell Precision 7670 | |
| MSI CreatorPro Z16P B12UKST | |
| Dell Precision 7000 7670 Performance | |
| HP ZBook Studio 16 G9 62U04EA | |
| Durchschnittliche Intel Core i9-12950HX (138 - 193, n=7) | |
| 7-Zip 18.03 / 7z b 4 | |
| Durchschnittliche Intel Core i9-12950HX (65637 - 85019, n=7) | |
| HP ZBook Studio 16 G9 62U04EA | |
| MSI CreatorPro Z16P B12UKST | |
| Dell Precision 7000 7670 Performance | |
| Dell Precision 7670 | |
| Lenovo ThinkPad P1 G4-20Y4Z9DVUS | |
| HP ZBook Firefly 16 G9-6B897EA | |
| 7-Zip 18.03 / 7z b 4 -mmt1 | |
| Durchschnittliche Intel Core i9-12950HX (6022 - 6318, n=7) | |
| Dell Precision 7000 7670 Performance | |
| HP ZBook Studio 16 G9 62U04EA | |
| MSI CreatorPro Z16P B12UKST | |
| Dell Precision 7670 | |
| Lenovo ThinkPad P1 G4-20Y4Z9DVUS | |
| HP ZBook Firefly 16 G9-6B897EA | |
| Geekbench 5.5 / Multi-Core | |
| Durchschnittliche Intel Core i9-12950HX (14028 - 16009, n=7) | |
| Dell Precision 7000 7670 Performance | |
| HP ZBook Studio 16 G9 62U04EA | |
| MSI CreatorPro Z16P B12UKST | |
| Dell Precision 7670 | |
| Lenovo ThinkPad P1 G4-20Y4Z9DVUS | |
| HP ZBook Firefly 16 G9-6B897EA | |
| Geekbench 5.5 / Single-Core | |
| Dell Precision 7000 7670 Performance | |
| Durchschnittliche Intel Core i9-12950HX (1847 - 1945, n=7) | |
| HP ZBook Studio 16 G9 62U04EA | |
| HP ZBook Firefly 16 G9-6B897EA | |
| MSI CreatorPro Z16P B12UKST | |
| Dell Precision 7670 | |
| Lenovo ThinkPad P1 G4-20Y4Z9DVUS | |
| HWBOT x265 Benchmark v2.2 / 4k Preset | |
| Durchschnittliche Intel Core i9-12950HX (18.6 - 26.5, n=7) | |
| HP ZBook Studio 16 G9 62U04EA | |
| MSI CreatorPro Z16P B12UKST | |
| Dell Precision 7000 7670 Performance | |
| Dell Precision 7670 | |
| Lenovo ThinkPad P1 G4-20Y4Z9DVUS | |
| HP ZBook Firefly 16 G9-6B897EA | |
| LibreOffice / 20 Documents To PDF | |
| HP ZBook Firefly 16 G9-6B897EA | |
| Lenovo ThinkPad P1 G4-20Y4Z9DVUS | |
| Dell Precision 7670 | |
| Dell Precision 7000 7670 Performance | |
| HP ZBook Studio 16 G9 62U04EA | |
| Durchschnittliche Intel Core i9-12950HX (34.7 - 45.4, n=7) | |
| MSI CreatorPro Z16P B12UKST | |
| R Benchmark 2.5 / Overall mean | |
| Lenovo ThinkPad P1 G4-20Y4Z9DVUS | |
| HP ZBook Firefly 16 G9-6B897EA | |
| Dell Precision 7670 | |
| MSI CreatorPro Z16P B12UKST | |
| Dell Precision 7000 7670 Performance | |
| HP ZBook Studio 16 G9 62U04EA | |
| Durchschnittliche Intel Core i9-12950HX (0.4251 - 0.4515, n=7) | |
* ... kleinere Werte sind besser
AIDA64: FP32 Ray-Trace | FPU Julia | CPU SHA3 | CPU Queen | FPU SinJulia | FPU Mandel | CPU AES | CPU ZLib | FP64 Ray-Trace | CPU PhotoWorxx
| Performance Rating | |
| Durchschnittliche Intel Core i9-12950HX | |
| MSI CreatorPro Z16P B12UKST | |
| HP ZBook Studio 16 G9 62U04EA | |
| Dell Precision 7000 7670 Performance | |
| Lenovo ThinkPad P1 G4-20Y4Z9DVUS | |
| Dell Precision 7670 | |
| HP ZBook Firefly 16 G9-6B897EA | |
| AIDA64 / FP32 Ray-Trace | |
| Durchschnittliche Intel Core i9-12950HX (15499 - 22868, n=7) | |
| Dell Precision 7000 7670 Performance | |
| Lenovo ThinkPad P1 G4-20Y4Z9DVUS | |
| HP ZBook Studio 16 G9 62U04EA | |
| MSI CreatorPro Z16P B12UKST | |
| Dell Precision 7670 | |
| HP ZBook Firefly 16 G9-6B897EA | |
| AIDA64 / FPU Julia | |
| Durchschnittliche Intel Core i9-12950HX (77846 - 115907, n=7) | |
| HP ZBook Studio 16 G9 62U04EA | |
| Dell Precision 7000 7670 Performance | |
| MSI CreatorPro Z16P B12UKST | |
| Dell Precision 7670 | |
| Lenovo ThinkPad P1 G4-20Y4Z9DVUS | |
| HP ZBook Firefly 16 G9-6B897EA | |
| AIDA64 / CPU SHA3 | |
| Lenovo ThinkPad P1 G4-20Y4Z9DVUS | |
| Durchschnittliche Intel Core i9-12950HX (3426 - 5069, n=7) | |
| HP ZBook Studio 16 G9 62U04EA | |
| MSI CreatorPro Z16P B12UKST | |
| Dell Precision 7000 7670 Performance | |
| Dell Precision 7670 | |
| HP ZBook Firefly 16 G9-6B897EA | |
| AIDA64 / CPU Queen | |
| HP ZBook Studio 16 G9 62U04EA | |
| Durchschnittliche Intel Core i9-12950HX (102752 - 104726, n=7) | |
| Dell Precision 7000 7670 Performance | |
| MSI CreatorPro Z16P B12UKST | |
| Lenovo ThinkPad P1 G4-20Y4Z9DVUS | |
| HP ZBook Firefly 16 G9-6B897EA | |
| Dell Precision 7670 | |
| AIDA64 / FPU SinJulia | |
| Durchschnittliche Intel Core i9-12950HX (10134 - 12823, n=7) | |
| Dell Precision 7000 7670 Performance | |
| Dell Precision 7670 | |
| Lenovo ThinkPad P1 G4-20Y4Z9DVUS | |
| HP ZBook Studio 16 G9 62U04EA | |
| MSI CreatorPro Z16P B12UKST | |
| HP ZBook Firefly 16 G9-6B897EA | |
| AIDA64 / FPU Mandel | |
| Durchschnittliche Intel Core i9-12950HX (37146 - 57340, n=7) | |
| HP ZBook Studio 16 G9 62U04EA | |
| Lenovo ThinkPad P1 G4-20Y4Z9DVUS | |
| Dell Precision 7000 7670 Performance | |
| MSI CreatorPro Z16P B12UKST | |
| Dell Precision 7670 | |
| HP ZBook Firefly 16 G9-6B897EA | |
| AIDA64 / CPU AES | |
| MSI CreatorPro Z16P B12UKST | |
| Durchschnittliche Intel Core i9-12950HX (72599 - 181128, n=7) | |
| Lenovo ThinkPad P1 G4-20Y4Z9DVUS | |
| HP ZBook Studio 16 G9 62U04EA | |
| Dell Precision 7000 7670 Performance | |
| Dell Precision 7670 | |
| HP ZBook Firefly 16 G9-6B897EA | |
| AIDA64 / CPU ZLib | |
| Durchschnittliche Intel Core i9-12950HX (996 - 1417, n=7) | |
| HP ZBook Studio 16 G9 62U04EA | |
| MSI CreatorPro Z16P B12UKST | |
| Dell Precision 7000 7670 Performance | |
| Dell Precision 7670 | |
| Lenovo ThinkPad P1 G4-20Y4Z9DVUS | |
| HP ZBook Firefly 16 G9-6B897EA | |
| AIDA64 / FP64 Ray-Trace | |
| Durchschnittliche Intel Core i9-12950HX (8455 - 12432, n=7) | |
| HP ZBook Studio 16 G9 62U04EA | |
| Dell Precision 7000 7670 Performance | |
| Lenovo ThinkPad P1 G4-20Y4Z9DVUS | |
| MSI CreatorPro Z16P B12UKST | |
| Dell Precision 7670 | |
| HP ZBook Firefly 16 G9-6B897EA | |
| AIDA64 / CPU PhotoWorxx | |
| MSI CreatorPro Z16P B12UKST | |
| Dell Precision 7000 7670 Performance | |
| Dell Precision 7670 | |
| Durchschnittliche Intel Core i9-12950HX (35479 - 42655, n=7) | |
| HP ZBook Studio 16 G9 62U04EA | |
| HP ZBook Firefly 16 G9-6B897EA | |
| Lenovo ThinkPad P1 G4-20Y4Z9DVUS | |
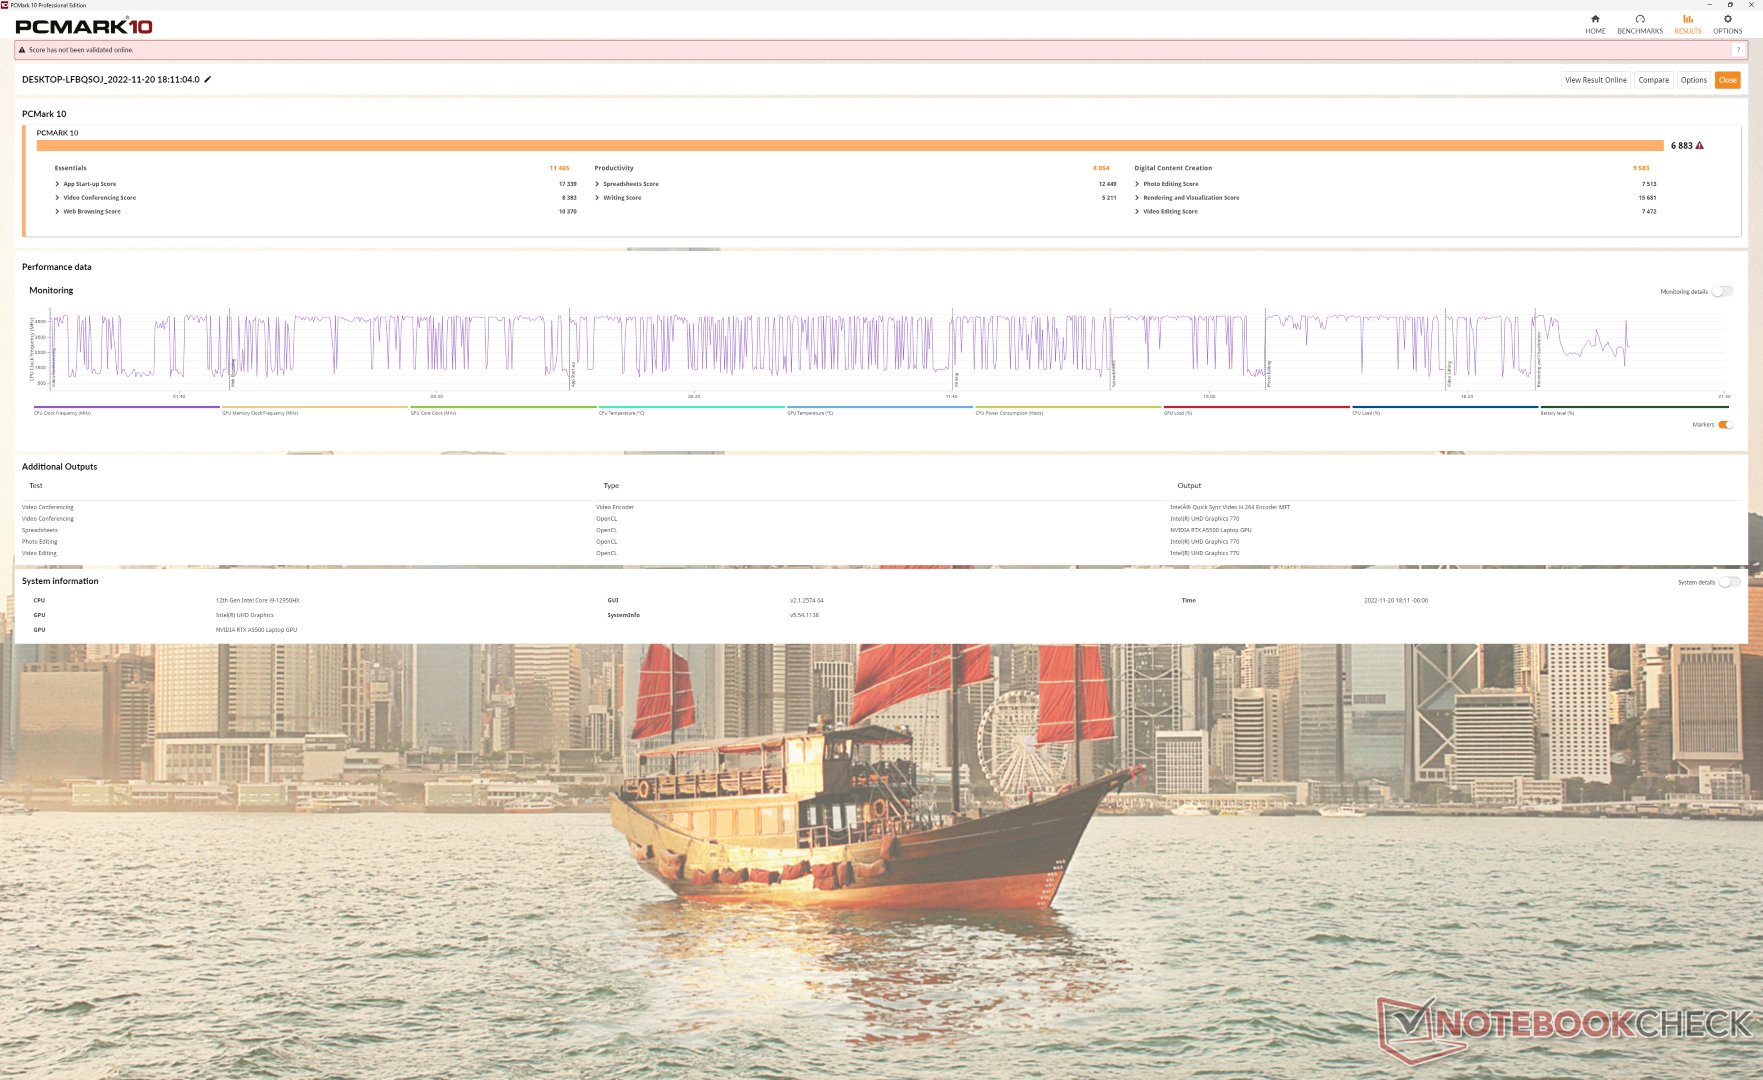
System Performance
Die PCMark-Ergebnisse sind vergleichbar mit denen der derzeit erhältlichen mobilen Workstations der oberen Leistungsklasse, wie dem HP ZBook Fury 15 G8.
CrossMark: Overall | Productivity | Creativity | Responsiveness
| PCMark 10 / Score | |
| MSI CreatorPro Z16P B12UKST | |
| MSI WE76 11UM-456 | |
| Durchschnittliche Intel Core i9-12950HX, NVIDIA RTX A5500 Laptop GPU (6883 - 7236, n=3) | |
| Dell Precision 7000 7670 Performance | |
| Dell Precision 7670 | |
| HP ZBook Studio 16 G9 62U04EA | |
| Lenovo ThinkPad P1 G4-20Y4Z9DVUS | |
| HP ZBook Firefly 16 G9-6B897EA | |
| PCMark 10 / Essentials | |
| Dell Precision 7000 7670 Performance | |
| Durchschnittliche Intel Core i9-12950HX, NVIDIA RTX A5500 Laptop GPU (10898 - 11465, n=3) | |
| MSI CreatorPro Z16P B12UKST | |
| Dell Precision 7670 | |
| HP ZBook Firefly 16 G9-6B897EA | |
| Lenovo ThinkPad P1 G4-20Y4Z9DVUS | |
| MSI WE76 11UM-456 | |
| HP ZBook Studio 16 G9 62U04EA | |
| PCMark 10 / Productivity | |
| MSI WE76 11UM-456 | |
| MSI CreatorPro Z16P B12UKST | |
| Dell Precision 7670 | |
| Durchschnittliche Intel Core i9-12950HX, NVIDIA RTX A5500 Laptop GPU (8054 - 9489, n=3) | |
| HP ZBook Firefly 16 G9-6B897EA | |
| Lenovo ThinkPad P1 G4-20Y4Z9DVUS | |
| Dell Precision 7000 7670 Performance | |
| HP ZBook Studio 16 G9 62U04EA | |
| PCMark 10 / Digital Content Creation | |
| MSI WE76 11UM-456 | |
| MSI CreatorPro Z16P B12UKST | |
| Dell Precision 7000 7670 Performance | |
| Durchschnittliche Intel Core i9-12950HX, NVIDIA RTX A5500 Laptop GPU (9155 - 9944, n=3) | |
| HP ZBook Studio 16 G9 62U04EA | |
| Dell Precision 7670 | |
| Lenovo ThinkPad P1 G4-20Y4Z9DVUS | |
| HP ZBook Firefly 16 G9-6B897EA | |
| CrossMark / Overall | |
| MSI CreatorPro Z16P B12UKST | |
| Durchschnittliche Intel Core i9-12950HX, NVIDIA RTX A5500 Laptop GPU (1801 - 1889, n=3) | |
| HP ZBook Studio 16 G9 62U04EA | |
| Dell Precision 7000 7670 Performance | |
| MSI WE76 11UM-456 | |
| HP ZBook Firefly 16 G9-6B897EA | |
| Lenovo ThinkPad P1 G4-20Y4Z9DVUS | |
| Dell Precision 7670 | |
| CrossMark / Productivity | |
| MSI CreatorPro Z16P B12UKST | |
| Durchschnittliche Intel Core i9-12950HX, NVIDIA RTX A5500 Laptop GPU (1684 - 1785, n=3) | |
| HP ZBook Studio 16 G9 62U04EA | |
| Dell Precision 7000 7670 Performance | |
| MSI WE76 11UM-456 | |
| HP ZBook Firefly 16 G9-6B897EA | |
| Lenovo ThinkPad P1 G4-20Y4Z9DVUS | |
| Dell Precision 7670 | |
| CrossMark / Creativity | |
| Durchschnittliche Intel Core i9-12950HX, NVIDIA RTX A5500 Laptop GPU (2042 - 2192, n=3) | |
| HP ZBook Studio 16 G9 62U04EA | |
| MSI CreatorPro Z16P B12UKST | |
| Dell Precision 7000 7670 Performance | |
| MSI WE76 11UM-456 | |
| HP ZBook Firefly 16 G9-6B897EA | |
| Dell Precision 7670 | |
| Lenovo ThinkPad P1 G4-20Y4Z9DVUS | |
| CrossMark / Responsiveness | |
| MSI CreatorPro Z16P B12UKST | |
| HP ZBook Studio 16 G9 62U04EA | |
| Durchschnittliche Intel Core i9-12950HX, NVIDIA RTX A5500 Laptop GPU (1501 - 1585, n=3) | |
| Dell Precision 7000 7670 Performance | |
| MSI WE76 11UM-456 | |
| HP ZBook Firefly 16 G9-6B897EA | |
| Lenovo ThinkPad P1 G4-20Y4Z9DVUS | |
| Dell Precision 7670 | |
| PCMark 10 Score | 6883 Punkte | |
Hilfe | ||
| AIDA64 / Memory Copy | |
| Dell Precision 7000 7670 Performance | |
| Durchschnittliche Intel Core i9-12950HX (59731 - 64732, n=7) | |
| Dell Precision 7670 | |
| MSI CreatorPro Z16P B12UKST | |
| HP ZBook Studio 16 G9 62U04EA | |
| HP ZBook Firefly 16 G9-6B897EA | |
| Lenovo ThinkPad P1 G4-20Y4Z9DVUS | |
| AIDA64 / Memory Read | |
| Dell Precision 7670 | |
| Dell Precision 7000 7670 Performance | |
| Durchschnittliche Intel Core i9-12950HX (59744 - 70359, n=7) | |
| MSI CreatorPro Z16P B12UKST | |
| HP ZBook Studio 16 G9 62U04EA | |
| HP ZBook Firefly 16 G9-6B897EA | |
| Lenovo ThinkPad P1 G4-20Y4Z9DVUS | |
| AIDA64 / Memory Write | |
| MSI CreatorPro Z16P B12UKST | |
| Dell Precision 7000 7670 Performance | |
| HP ZBook Studio 16 G9 62U04EA | |
| Dell Precision 7670 | |
| Durchschnittliche Intel Core i9-12950HX (57750 - 67899, n=7) | |
| HP ZBook Firefly 16 G9-6B897EA | |
| Lenovo ThinkPad P1 G4-20Y4Z9DVUS | |
| AIDA64 / Memory Latency | |
| MSI CreatorPro Z16P B12UKST | |
| HP ZBook Firefly 16 G9-6B897EA | |
| HP ZBook Studio 16 G9 62U04EA | |
| Dell Precision 7670 | |
| Durchschnittliche Intel Core i9-12950HX (84.5 - 92.2, n=7) | |
| Dell Precision 7000 7670 Performance | |
| Lenovo ThinkPad P1 G4-20Y4Z9DVUS | |
* ... kleinere Werte sind besser
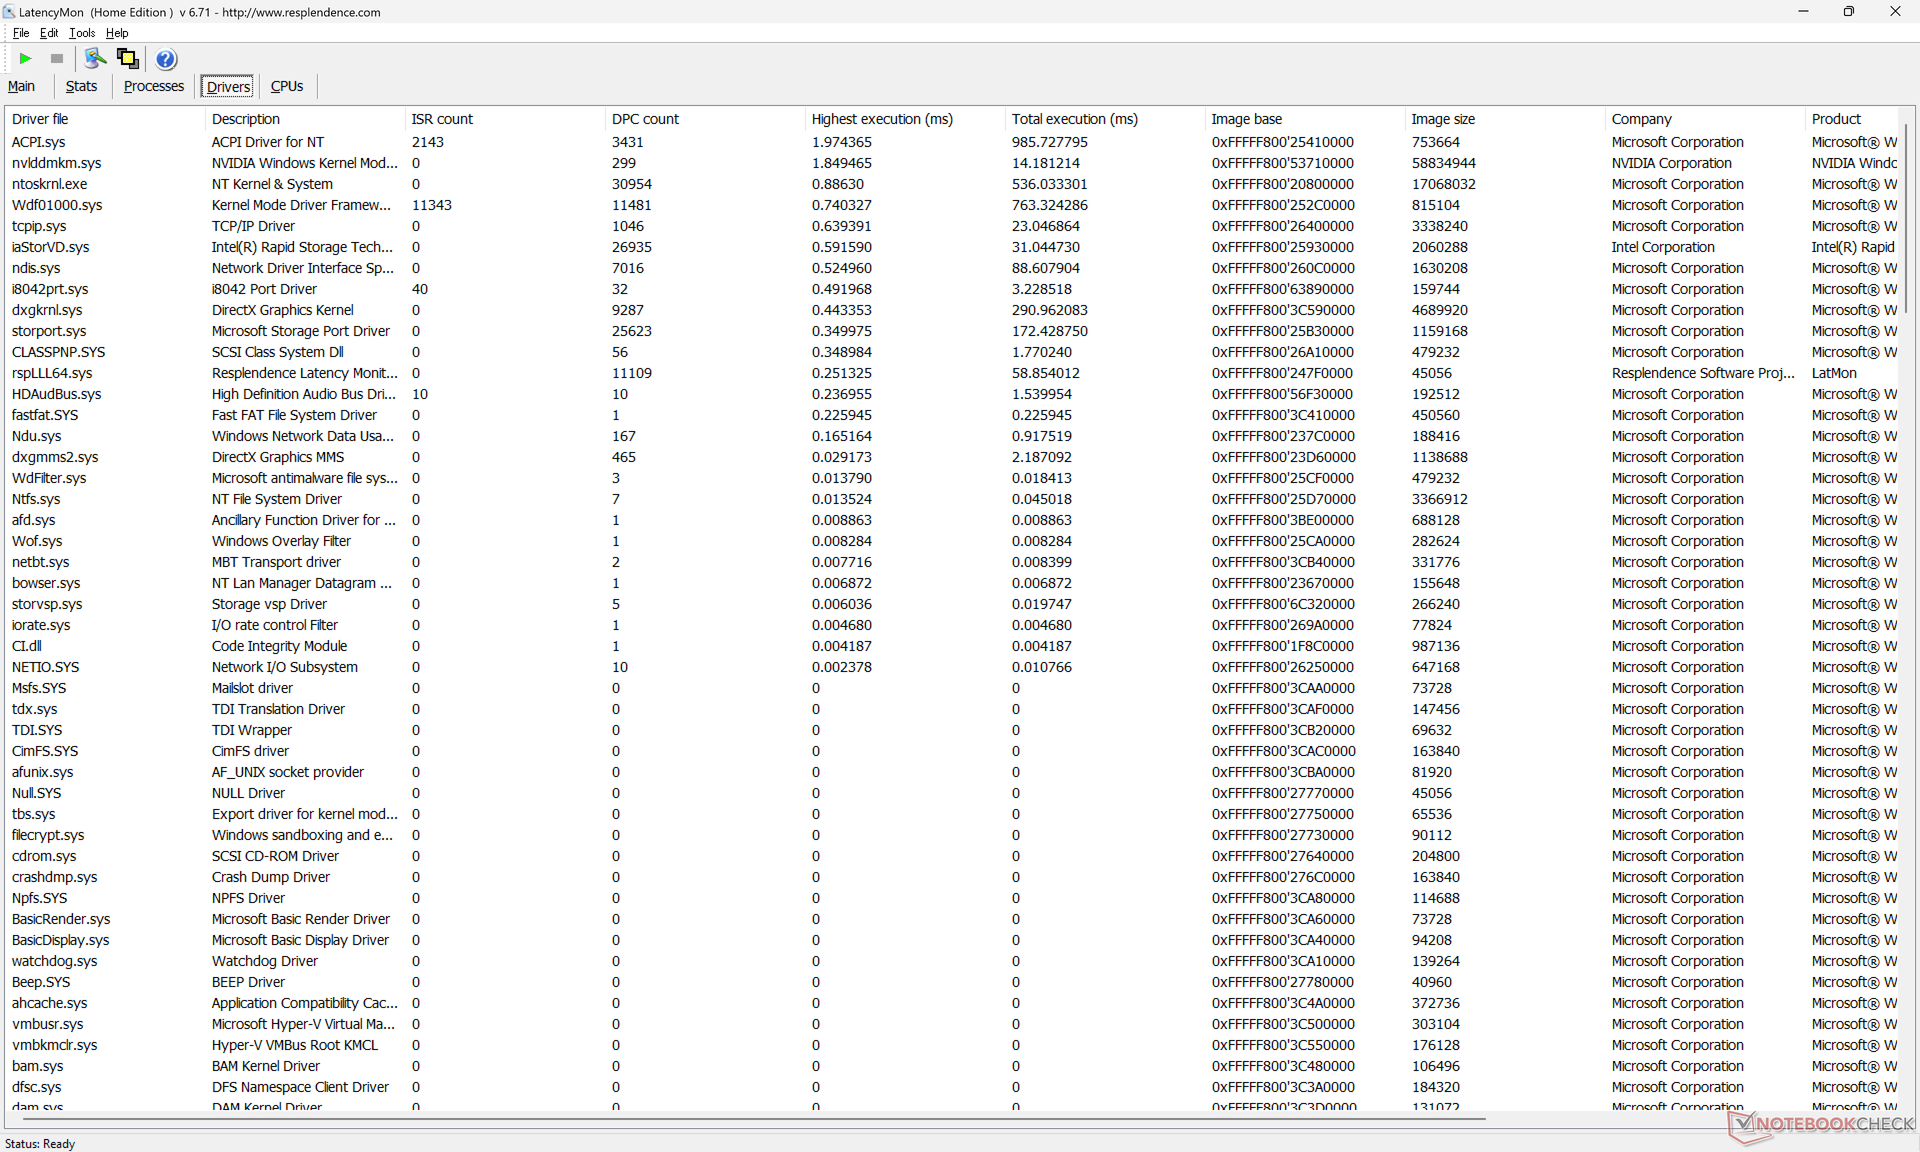
DPC-Latenzzeit
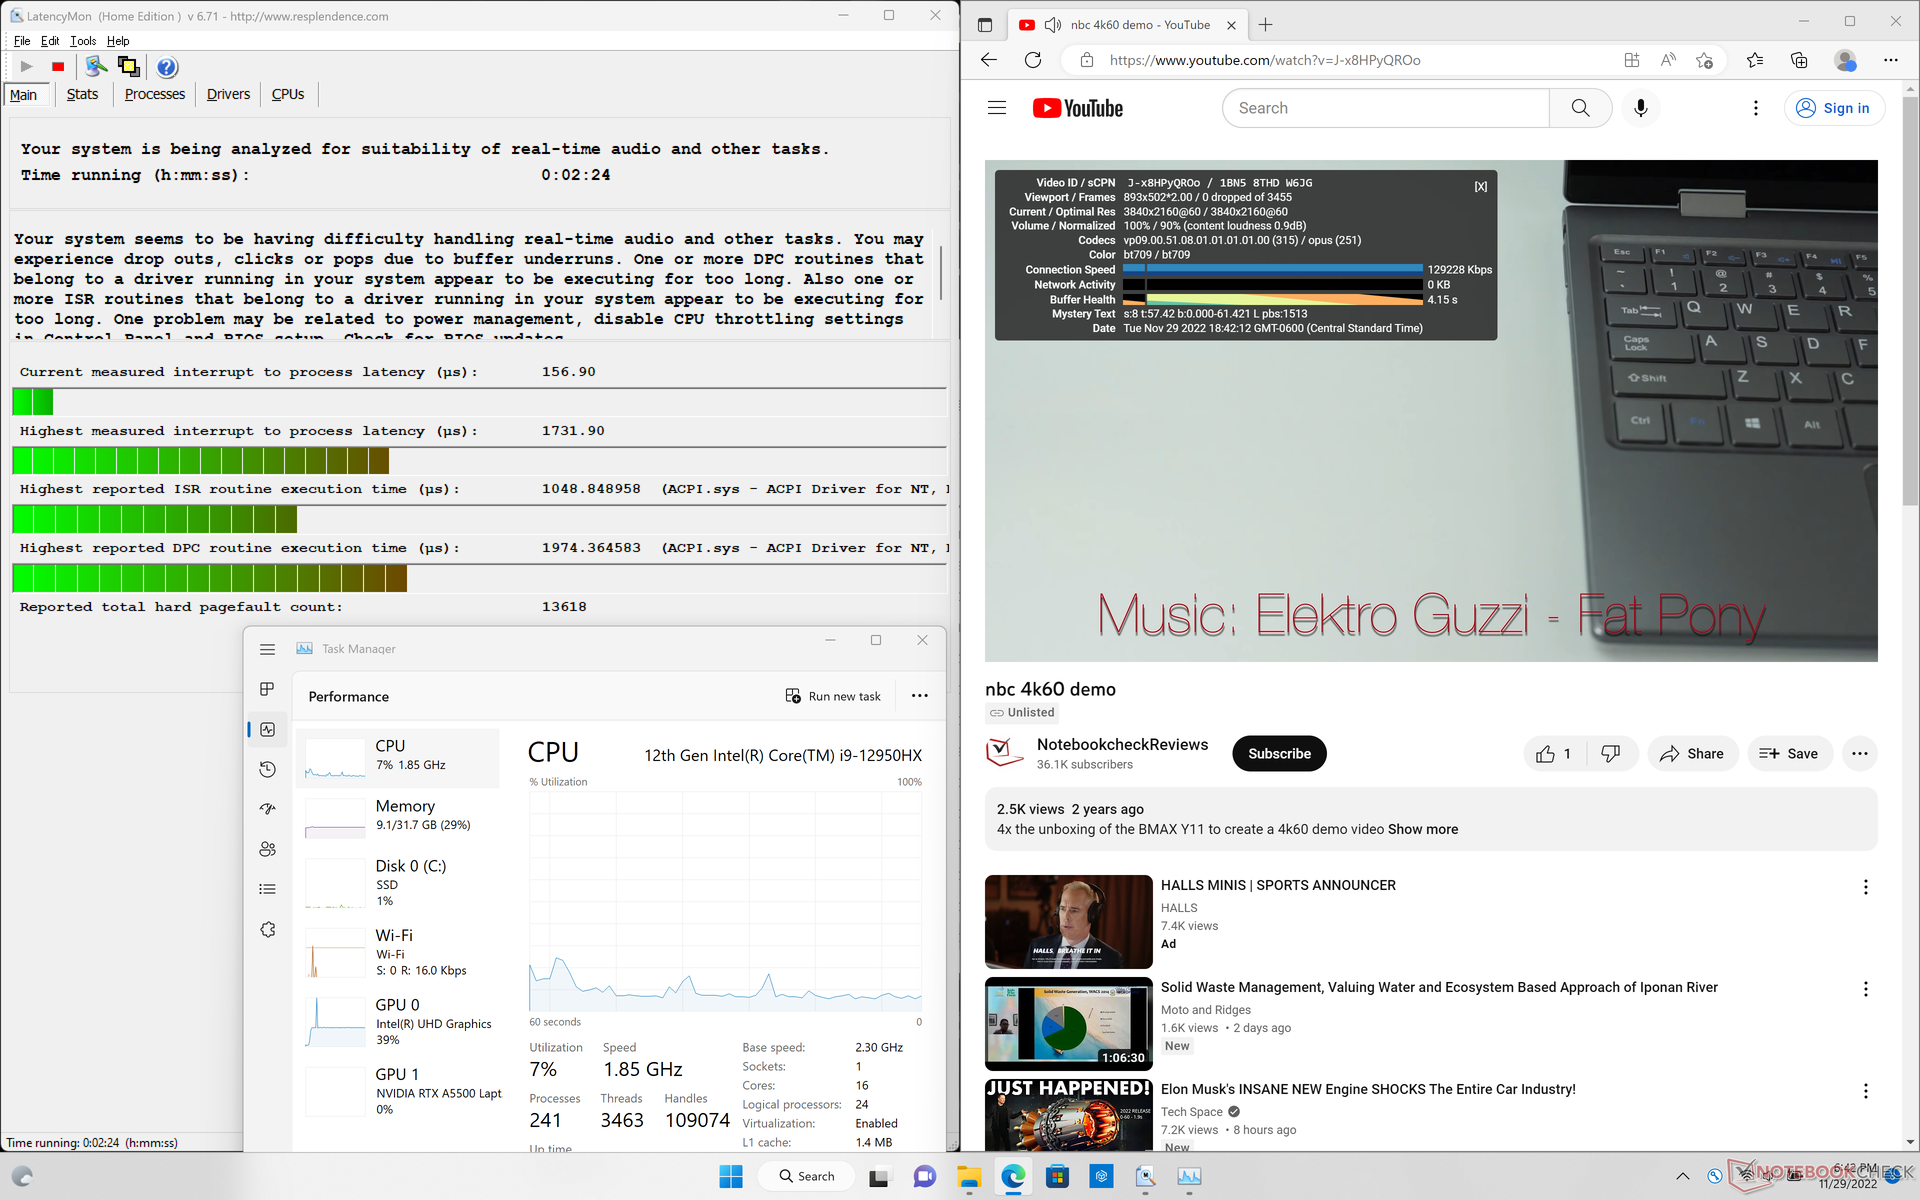
LatencyMon zeigt DPC-Probleme beim Öffnen mehrerer Browsertabs auf unserer Homepage auch nach mehreren Wiederholungstests. Die 4K-Videowiedergabe bei 60 FPS läuft ansonsten flüssig und ohne Bildaussetzer.
| DPC Latencies / LatencyMon - interrupt to process latency (max), Web, Youtube, Prime95 | |
| Dell Precision 7000 7670 Performance | |
| Lenovo ThinkPad P1 G4-20Y4Z9DVUS | |
| Dell Precision 7670 | |
| HP ZBook Studio 16 G9 62U04EA | |
| HP ZBook Firefly 16 G9-6B897EA | |
| MSI CreatorPro Z16P B12UKST | |
* ... kleinere Werte sind besser
Speichergeräte
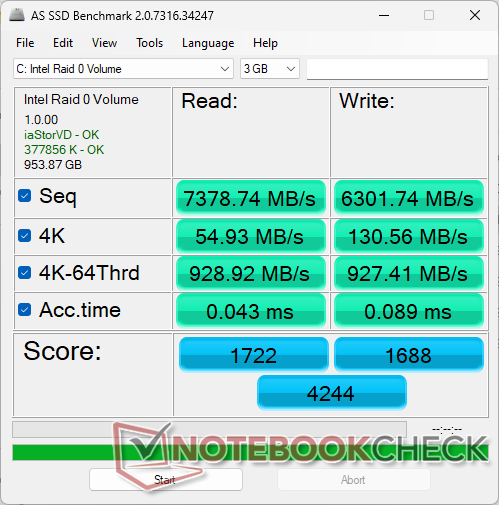
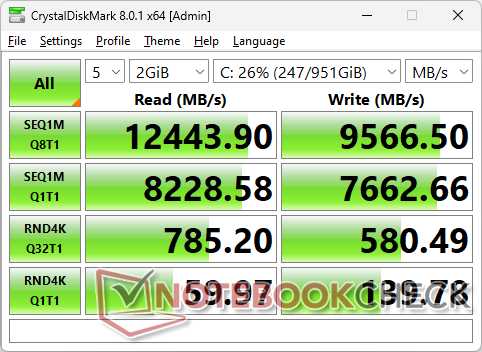
Nutzer können bis zu drei PCIe4 x4 NVMe M.2 2280 SSDs einbauen, beim schlankeren regulären Modell hingegen nur zwei. Die zwei SK Hynix PC801 Laufwerke in unserem Gerät sind in einer RAID-0-Konfiguration installiert und erreichen in der Praxis extrem hohe sequentielle Lese- und Schreibraten von etwa 13000 MB/s bzw. 10000 MB/s. Jeder SSD-Steckplatz verfügt über einen eigenen Heatspreader und ein Wärmeleitpad zur Wärmeableitung.

* ... kleinere Werte sind besser
Disk Throttling: DiskSpd Read Loop, Queue Depth 8
GPU Performance
Die RTX A5500 ist etwa 60 bis 80 Prozent schneller als die RTX A2000 im schlankeren Precision 7670 und damit eine der schnellsten mobilen Workstations, die derzeit auf dem Markt sind. Sie ist jedoch nicht viel besser als die zwei Jahre alte Quadro RTX 5000 im Acer ConceptD 9 Pro oder im Asus ProArt StudioBook Pro Xauch in Bezug auf die Raytracing-Leistung. Die RTX A5000 im größeren 17,3-Zoll MSI WE76 übertrifft unsere RTX A5500 in den meisten Benchmarks.
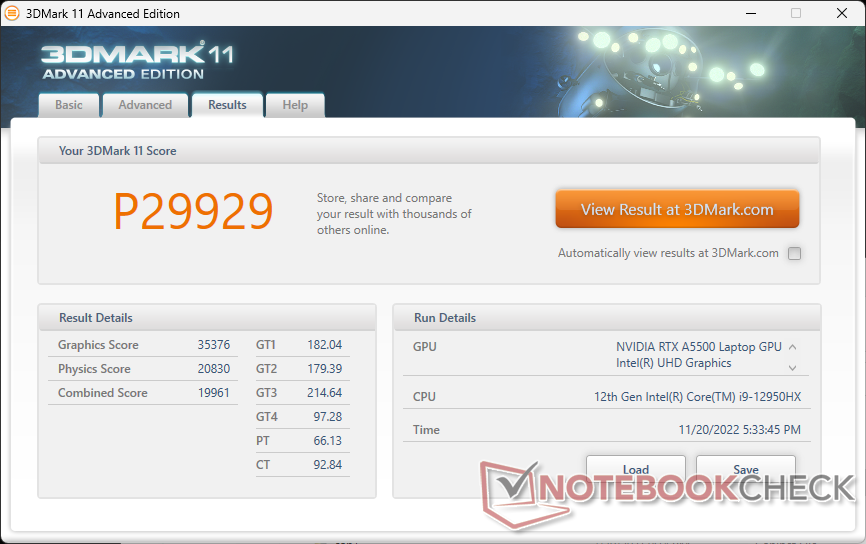
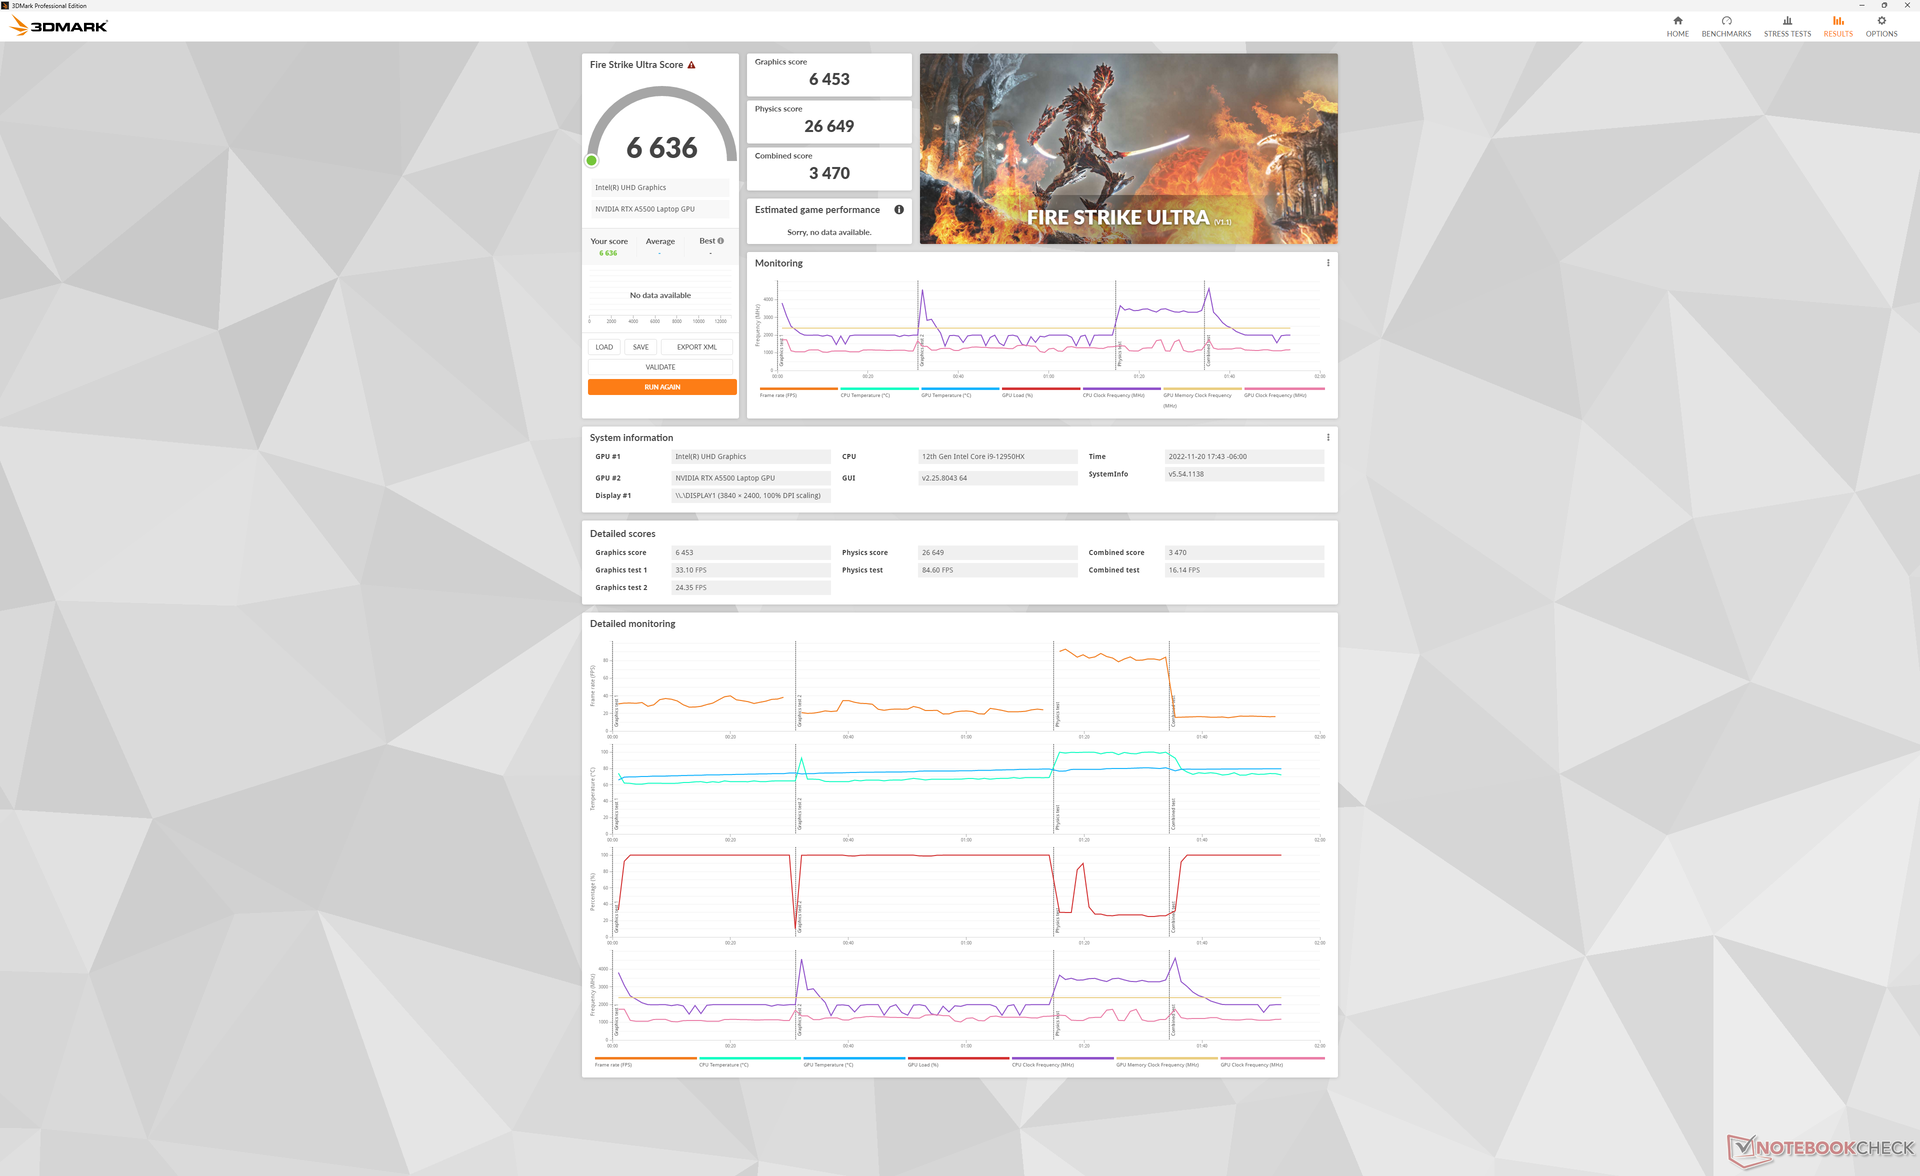
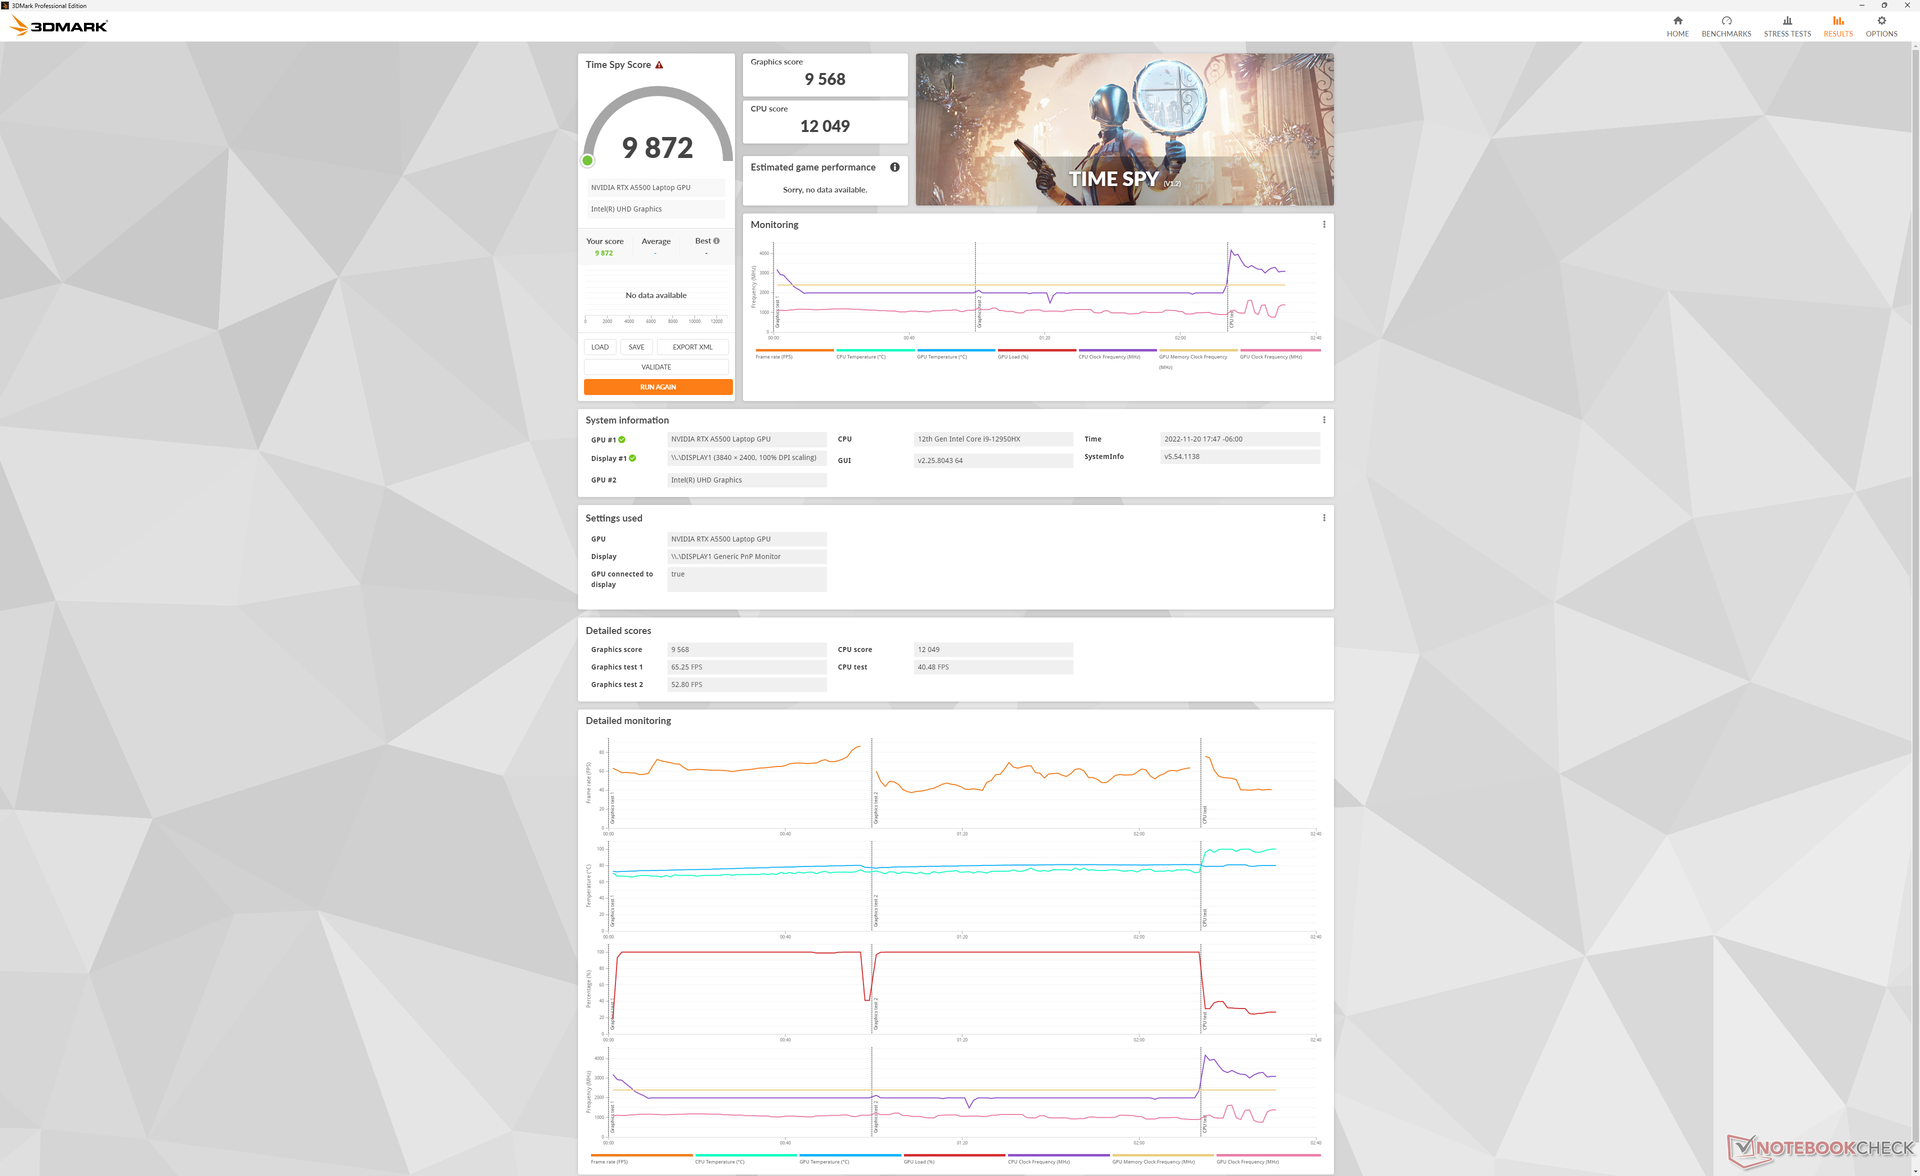

| 3DMark 11 Performance | 29929 Punkte | |
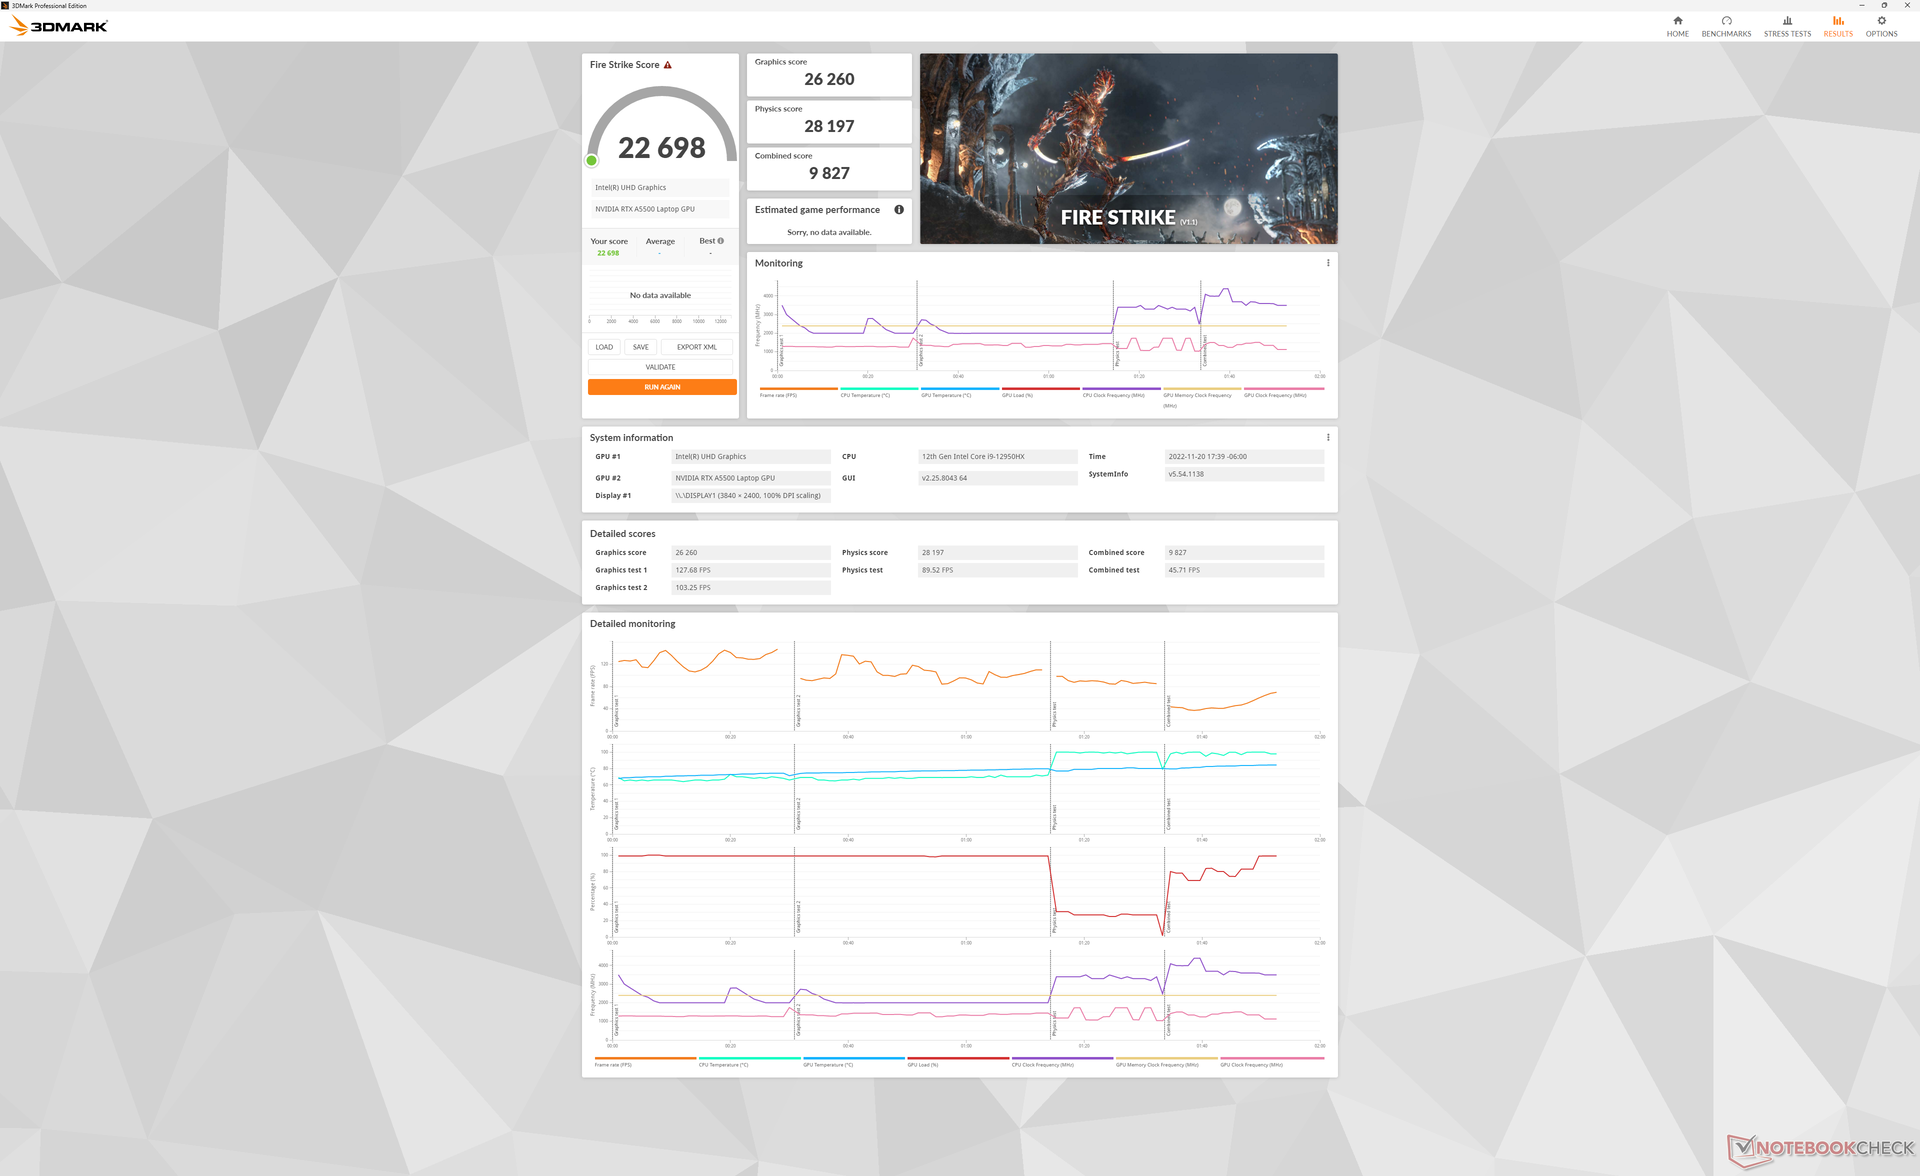
| 3DMark Fire Strike Score | 22698 Punkte | |
| 3DMark Time Spy Score | 9872 Punkte | |
Hilfe | ||
* ... kleinere Werte sind besser
| The Witcher 3 - 1920x1080 Ultra Graphics & Postprocessing (HBAO+) | |
| Dell Precision 7000 7670 Performance | |
| MSI CreatorPro Z16P B12UKST | |
| Dell Precision 7670 | |
| HP ZBook Studio 16 G9 62U04EA | |
| Lenovo ThinkPad P1 G4-20Y4Z9DVUS | |
| HP ZBook Firefly 16 G9-6B897EA | |
| GTA V - 1920x1080 Highest Settings possible AA:4xMSAA + FX AF:16x | |
| Dell Precision 7000 7670 Performance | |
| MSI CreatorPro Z16P B12UKST | |
| Dell Precision 7670 | |
| HP ZBook Studio 16 G9 62U04EA | |
| HP ZBook Firefly 16 G9-6B897EA | |
| Final Fantasy XV Benchmark - 1920x1080 High Quality | |
| Dell Precision 7000 7670 Performance | |
| MSI CreatorPro Z16P B12UKST | |
| Dell Precision 7670 | |
| HP ZBook Studio 16 G9 62U04EA | |
| Lenovo ThinkPad P1 G4-20Y4Z9DVUS | |
| HP ZBook Firefly 16 G9-6B897EA | |
| Strange Brigade - 1920x1080 ultra AA:ultra AF:16 | |
| Dell Precision 7000 7670 Performance | |
| MSI CreatorPro Z16P B12UKST | |
| Dell Precision 7670 | |
| HP ZBook Studio 16 G9 62U04EA | |
| HP ZBook Firefly 16 G9-6B897EA | |
| Dota 2 Reborn - 1920x1080 ultra (3/3) best looking | |
| Dell Precision 7000 7670 Performance | |
| HP ZBook Studio 16 G9 62U04EA | |
| MSI CreatorPro Z16P B12UKST | |
| Dell Precision 7670 | |
| Lenovo ThinkPad P1 G4-20Y4Z9DVUS | |
| HP ZBook Firefly 16 G9-6B897EA | |
| Cyberpunk 2077 1.6 | |
| 1920x1080 Low Preset | |
| Dell Precision 7000 7670 Performance | |
| Dell Precision 7670 | |
| MSI CreatorPro Z16P B12UKST | |
| HP ZBook Studio 16 G9 62U04EA | |
| 1920x1080 Medium Preset | |
| Dell Precision 7000 7670 Performance | |
| MSI CreatorPro Z16P B12UKST | |
| Dell Precision 7670 | |
| HP ZBook Studio 16 G9 62U04EA | |
| 1920x1080 High Preset | |
| Dell Precision 7000 7670 Performance | |
| Dell Precision 7670 | |
| MSI CreatorPro Z16P B12UKST | |
| HP ZBook Studio 16 G9 62U04EA | |
| 1920x1080 Ultra Preset | |
| Dell Precision 7000 7670 Performance | |
| Dell Precision 7670 | |
| MSI CreatorPro Z16P B12UKST | |
| HP ZBook Studio 16 G9 62U04EA | |
| 2560x1440 Ultra Preset | |
| Dell Precision 7000 7670 Performance | |
| Dell Precision 7670 | |
| MSI CreatorPro Z16P B12UKST | |
| HP ZBook Studio 16 G9 62U04EA | |
| 3840x2160 Ultra Preset | |
| Dell Precision 7000 7670 Performance | |
Witcher 3 lief eine Stunde lang im Leerlauf, dabei konnten wir etwa 10 Minuten nach Beginn des Tests massive Einbrüche bei den Bildraten feststellen, wie die folgende Grafik zeigt. Dies deutet auf eine schlechte Programmpriorisierung oder unterbrechende Hintergrundaktivitäten hin, die möglicherweise die Leistung des Hauptprogramms beeinträchtigen können.
Witcher 3 FPS Chart
| min. | mittel | hoch | max. | QHD | 4K | |
| GTA V (2015) | 183.4 | 178.1 | 166.2 | 102.6 | 99.2 | |
| The Witcher 3 (2015) | 421.2 | 306.8 | 205.4 | 101.5 | 62.5 | |
| Dota 2 Reborn (2015) | 193.3 | 171.3 | 161.8 | 152.9 | 131.4 | |
| Final Fantasy XV Benchmark (2018) | 170.1 | 138.9 | 107.8 | 78.9 | 43.5 | |
| X-Plane 11.11 (2018) | 146.2 | 134.3 | 107.8 | 92.7 | ||
| Strange Brigade (2018) | 377 | 244 | 200 | 177.9 | 129.3 | |
| Metro Exodus (2019) | 171 | 125.8 | 95.3 | 75.7 | 58.5 | 31.3 |
| Borderlands 3 (2019) | 162.9 | 135.4 | 110.4 | 89.3 | 62.7 | 30.2 |
| Gears Tactics (2020) | 314.1 | 189.7 | 139.2 | 110.1 | 77.1 | 34.9 |
| Horizon Zero Dawn (2020) | 139 | 130 | 111 | 101 | 89 | 42 |
| Watch Dogs Legion (2020) | 119 | 98 | 93 | 77 | 58 | 30 |
| Dirt 5 (2020) | 167.6 | 130 | 114.8 | 92.2 | 71.9 | 39.8 |
| Hitman 3 (2021) | 229 | 186.6 | 179.9 | 161.4 | 104.6 | 43.8 |
| Far Cry 6 (2021) | 132 | 115 | 104 | 95 | 79 | 42 |
| Guardians of the Galaxy (2021) | 142 | 124 | 137 | 134 | 104 | 49 |
| God of War (2022) | 128.9 | 119.6 | 105.6 | 79 | 62.2 | 35.6 |
| Cyberpunk 2077 1.6 (2022) | 93.9 | 80.2 | 79.3 | 75.7 | 45.3 | 17.8 |
| F1 22 (2022) | 190.8 | 188.2 | 163.1 | 66.4 | 40.8 | 18.8 |
Emissionen
System-Rauschen
Die Lüfter im Inneren des Precision 7670 Performance neigen dazu, häufiger zu pulsieren als die Lüfter im schlankeren Precision 7670, was wahrscheinlich auf die höhere Turbo-Boost-Obergrenze des Core i9-12950HX gegenüber dem Core i7-12850HX zurückzuführen ist. Dies sollte jedoch kein Problem darstellen, wenn das Energieprofil auf den Modus Ausgeglichen oder Leise eingestellt ist.
Das Lüftergeräusch ist im Allgemeinen leiser als das des schlankeren Precision 7670. Bei Gaming-Belastungen stabilisiert sich das Geräusch im Bereich von 42 bis 47 dB(A) im Vergleich zu 45 bis 49 dB(A) beim kleineren Modell. Wir erreichen ein Maximum von 48 dB(A), wenn sowohl CPU als auch GPU zu 100 Prozent ausgelastet sind.
Lautstärkediagramm
| Idle |
| 24 / 24 / 38 dB(A) |
| Last |
| 46.3 / 47.9 dB(A) |
 | ||
30 dB leise 40 dB(A) deutlich hörbar 50 dB(A) störend |
||
min: | ||
| Dell Precision 7000 7670 Performance RTX A5500 Laptop GPU, i9-12950HX | MSI CreatorPro Z16P B12UKST RTX A3000 Laptop GPU, i7-12700H, Samsung PM9A1 MZVL21T0HCLR | HP ZBook Studio 16 G9 62U04EA RTX A2000 Laptop GPU, i7-12800H, Micron 3400 1TB MTFDKBA1T0TFH | HP ZBook Firefly 16 G9-6B897EA T550 Laptop GPU, i7-1265U, Samsung PM9A1 MZVL21T0HCLR | Lenovo ThinkPad P1 G4-20Y4Z9DVUS T1200 Laptop GPU, i7-11800H, Samsung PM9A1 MZVL2512HCJQ | Dell Precision 7670 RTX A2000 Laptop GPU, i7-12850HX, SK Hynix HFS001TEJ9X115N | |
|---|---|---|---|---|---|---|
| Geräuschentwicklung | 1% | 3% | 10% | 2% | 4% | |
| aus / Umgebung * | 23.9 | 24.1 -1% | 24 -0% | 23.8 -0% | 24.3 -2% | 22.7 5% |
| Idle min * | 24 | 27.1 -13% | 24 -0% | 23.8 1% | 24.3 -1% | 22.9 5% |
| Idle avg * | 24 | 27.1 -13% | 27.7 -15% | 23.8 1% | 24.3 -1% | 22.9 5% |
| Idle max * | 38 | 27.1 29% | 27.7 27% | 23.8 37% | 26.6 30% | 24.5 36% |
| Last avg * | 46.3 | 42.9 7% | 39.8 14% | 39.4 15% | 46.8 -1% | 48.7 -5% |
| Witcher 3 ultra * | 41.9 | 44 -5% | 44.3 -6% | 40.5 3% | 46.8 -12% | 45.2 -8% |
| Last max * | 47.9 | 47 2% | 47.7 -0% | 41.4 14% | 46.8 2% | 52.1 -9% |
* ... kleinere Werte sind besser
Temperatur
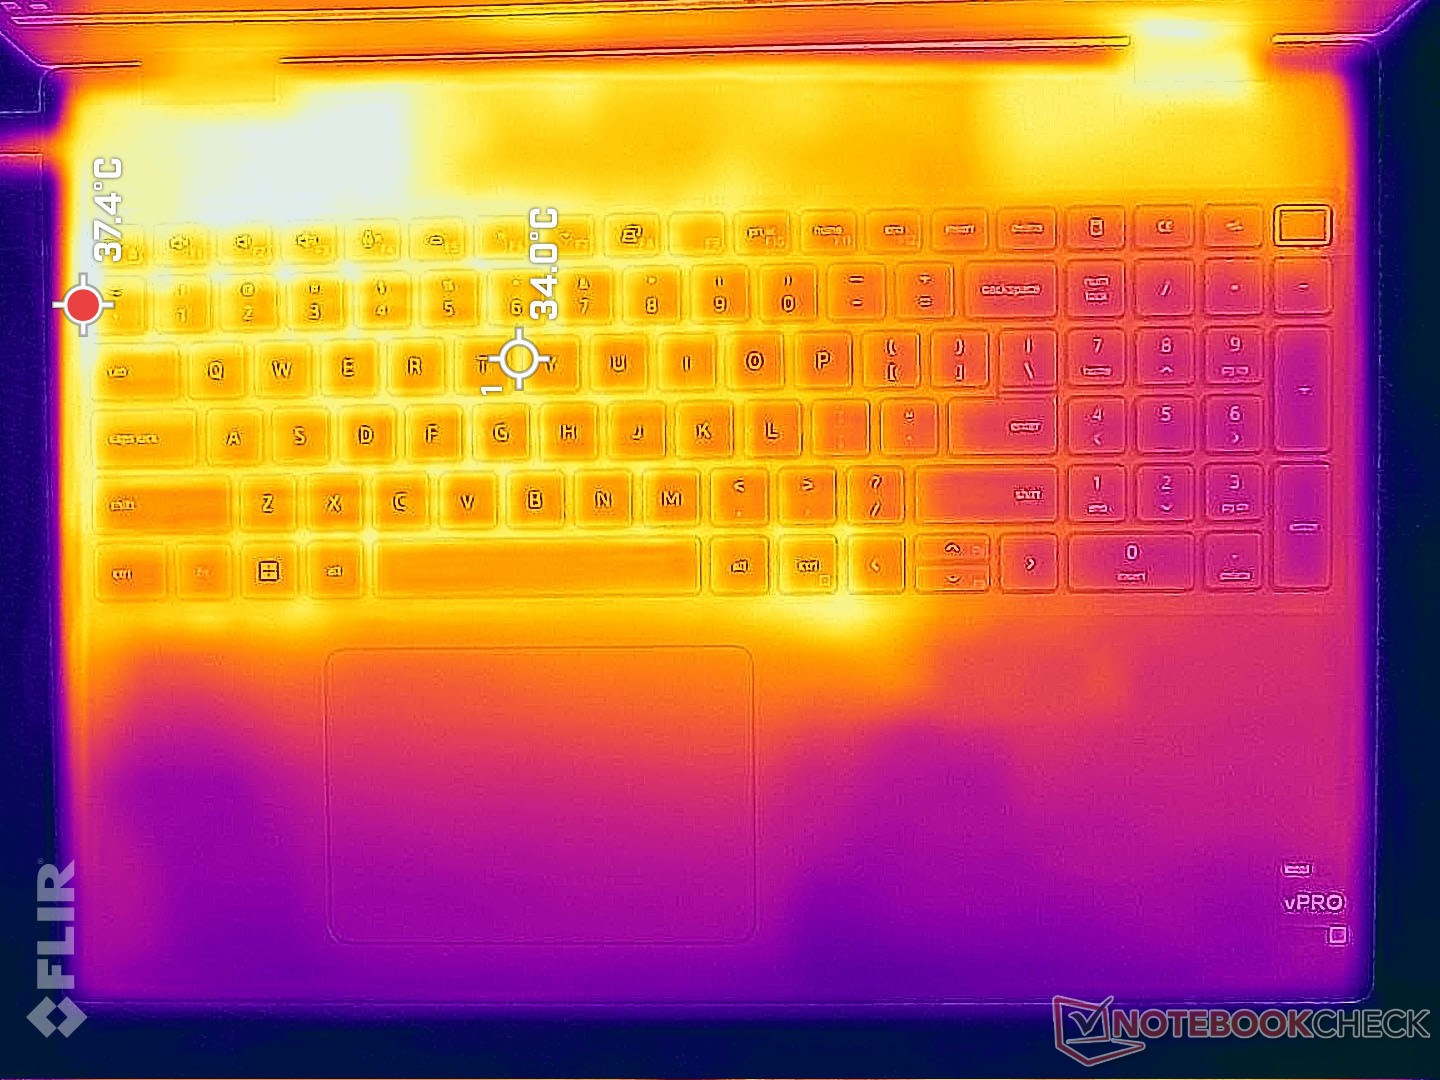
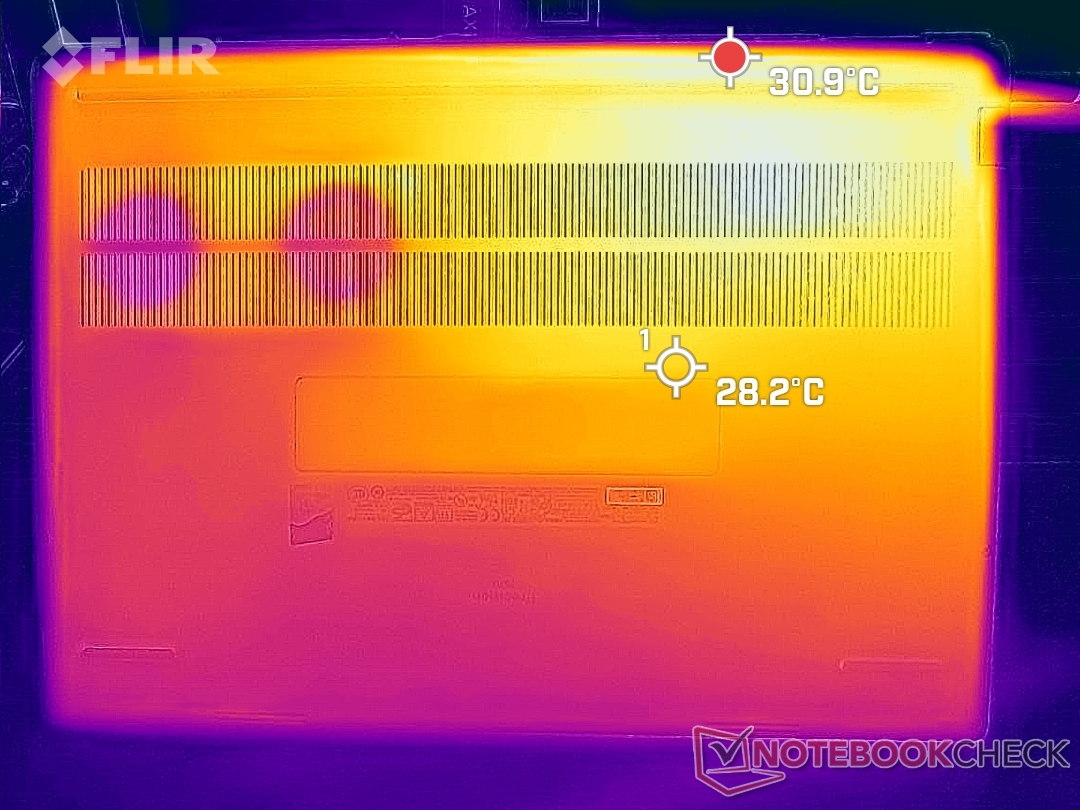
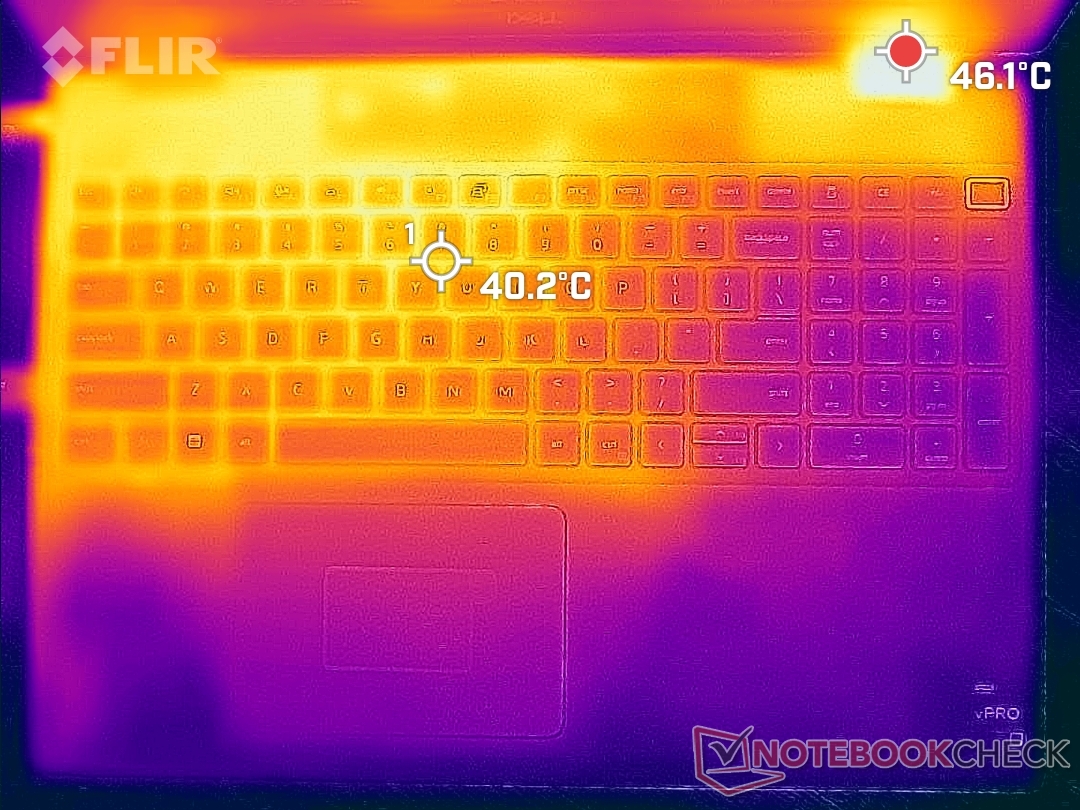
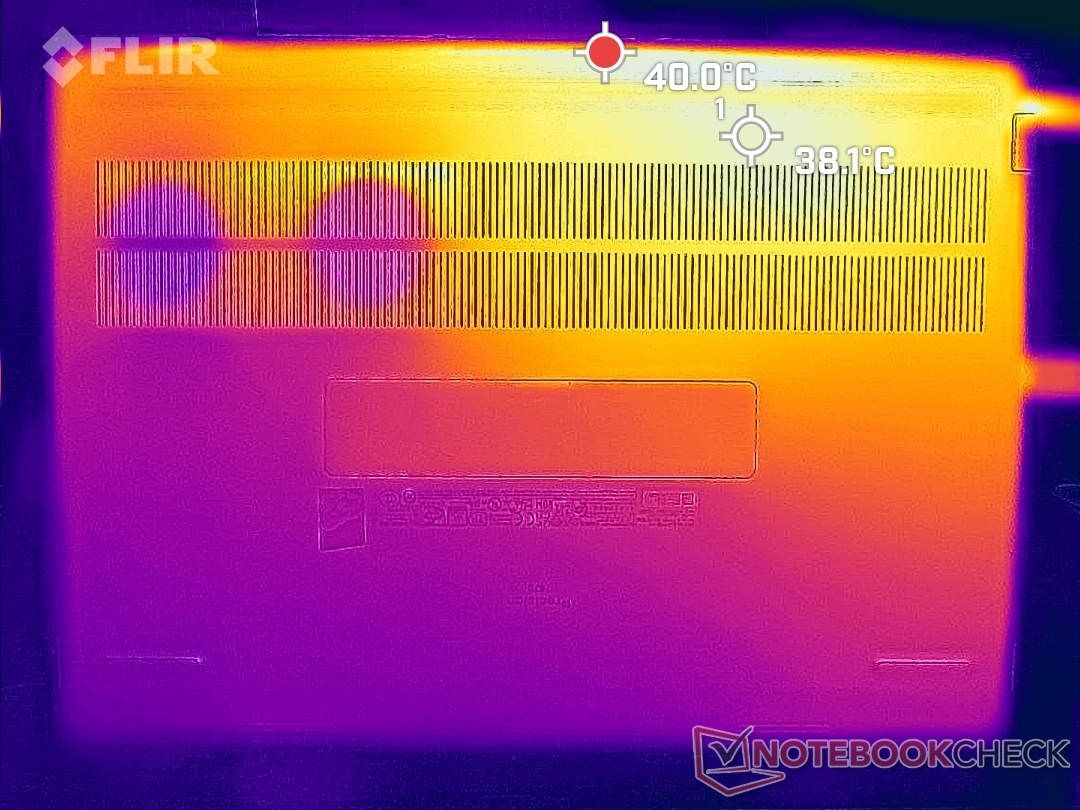
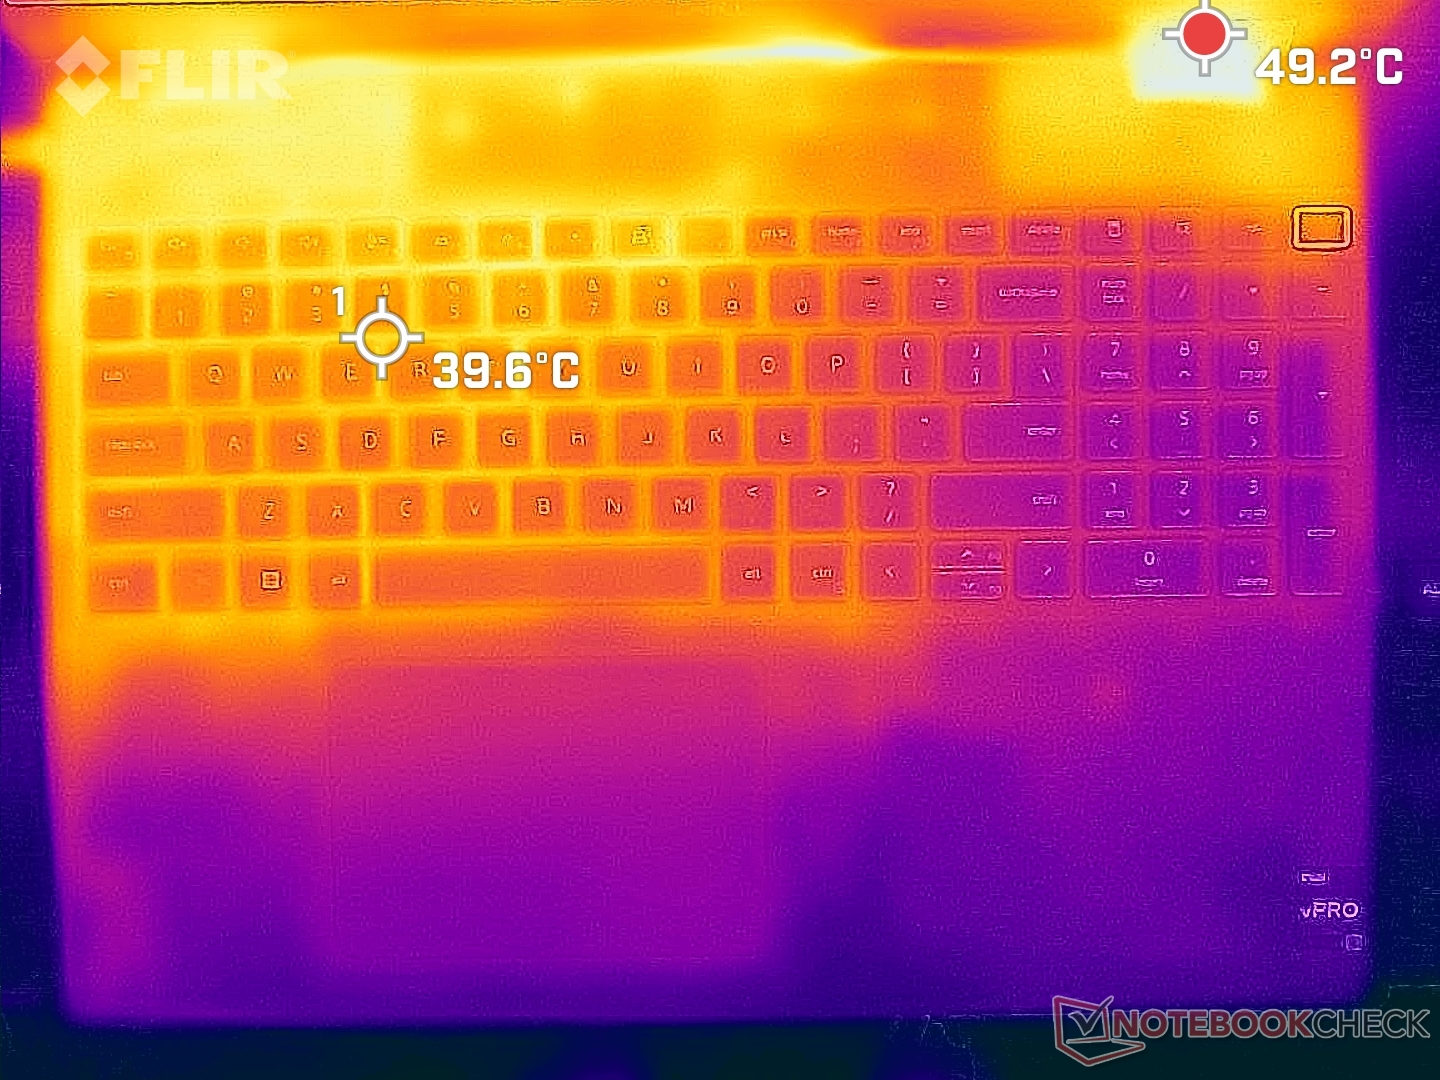
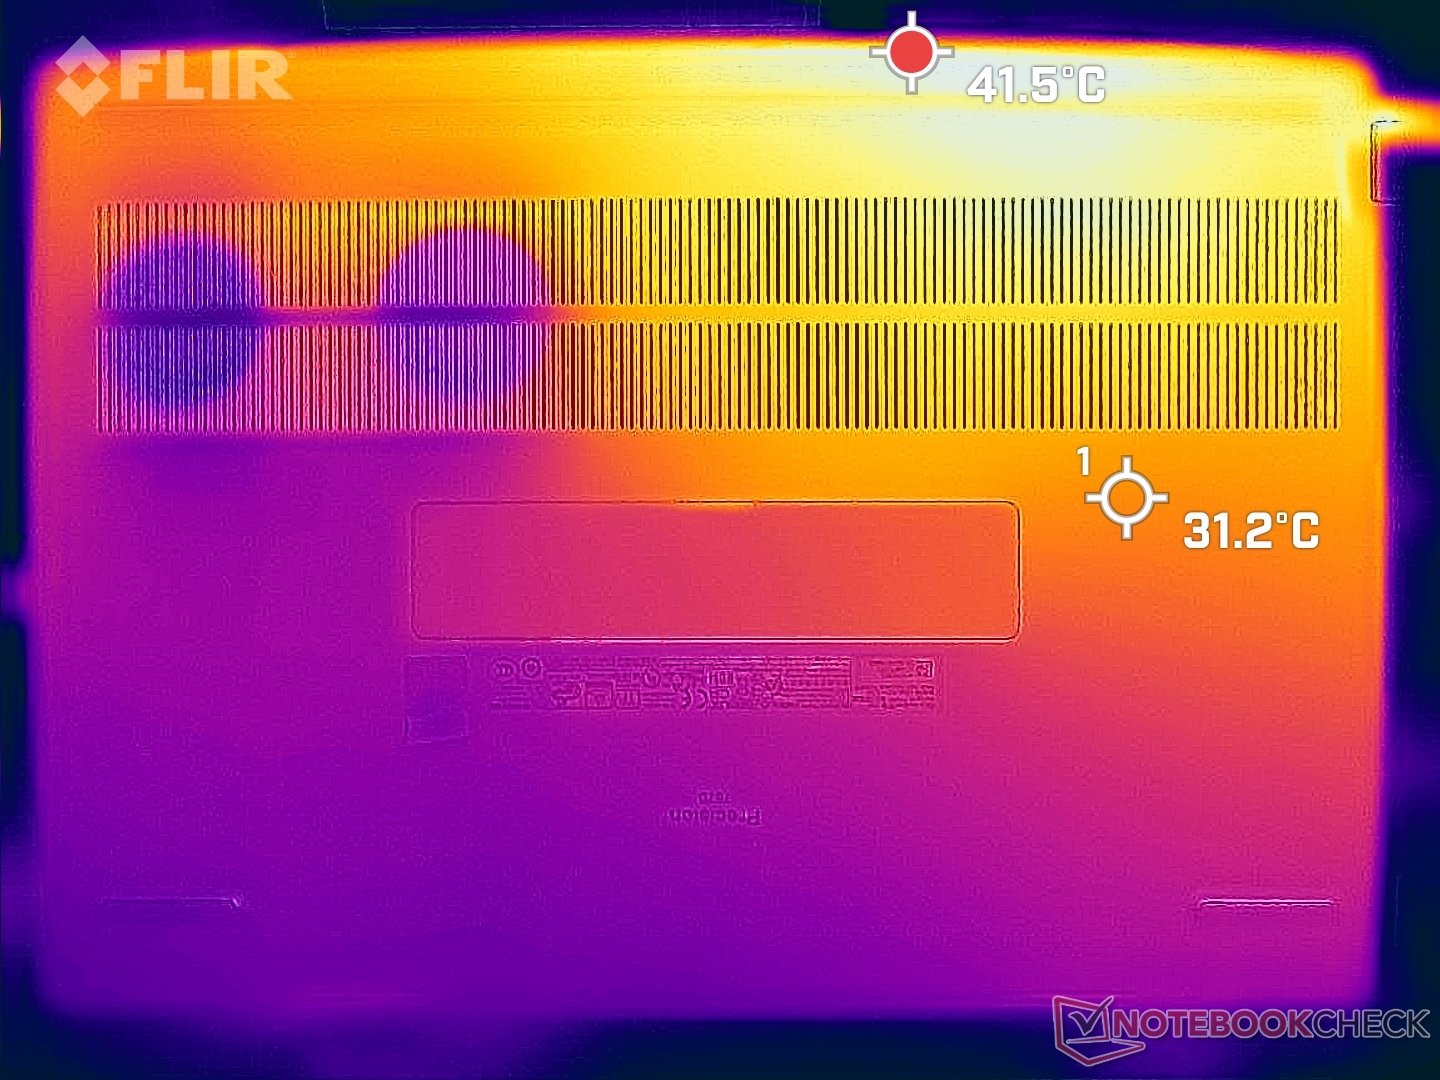
Die Oberflächentemperaturen sind in der Tat etwas wärmer als die, die wir beim regulären Precision 7670 gemessen haben. Hot Spots auf der Tastatur und der Rückseite können bei anspruchsvollen Aufgaben wie Spielen über einen längeren Zeitraum jeweils etwa 40 °C erreichen, verglichen mit 35 °C beim dünneren Modell. Diese Ergebnisse stimmen mit unseren Kerntemperaturmessungen im nächsten Abschnitt überein, wo sich unsere CPU und GPU bei wärmeren Temperaturen stabilisieren.
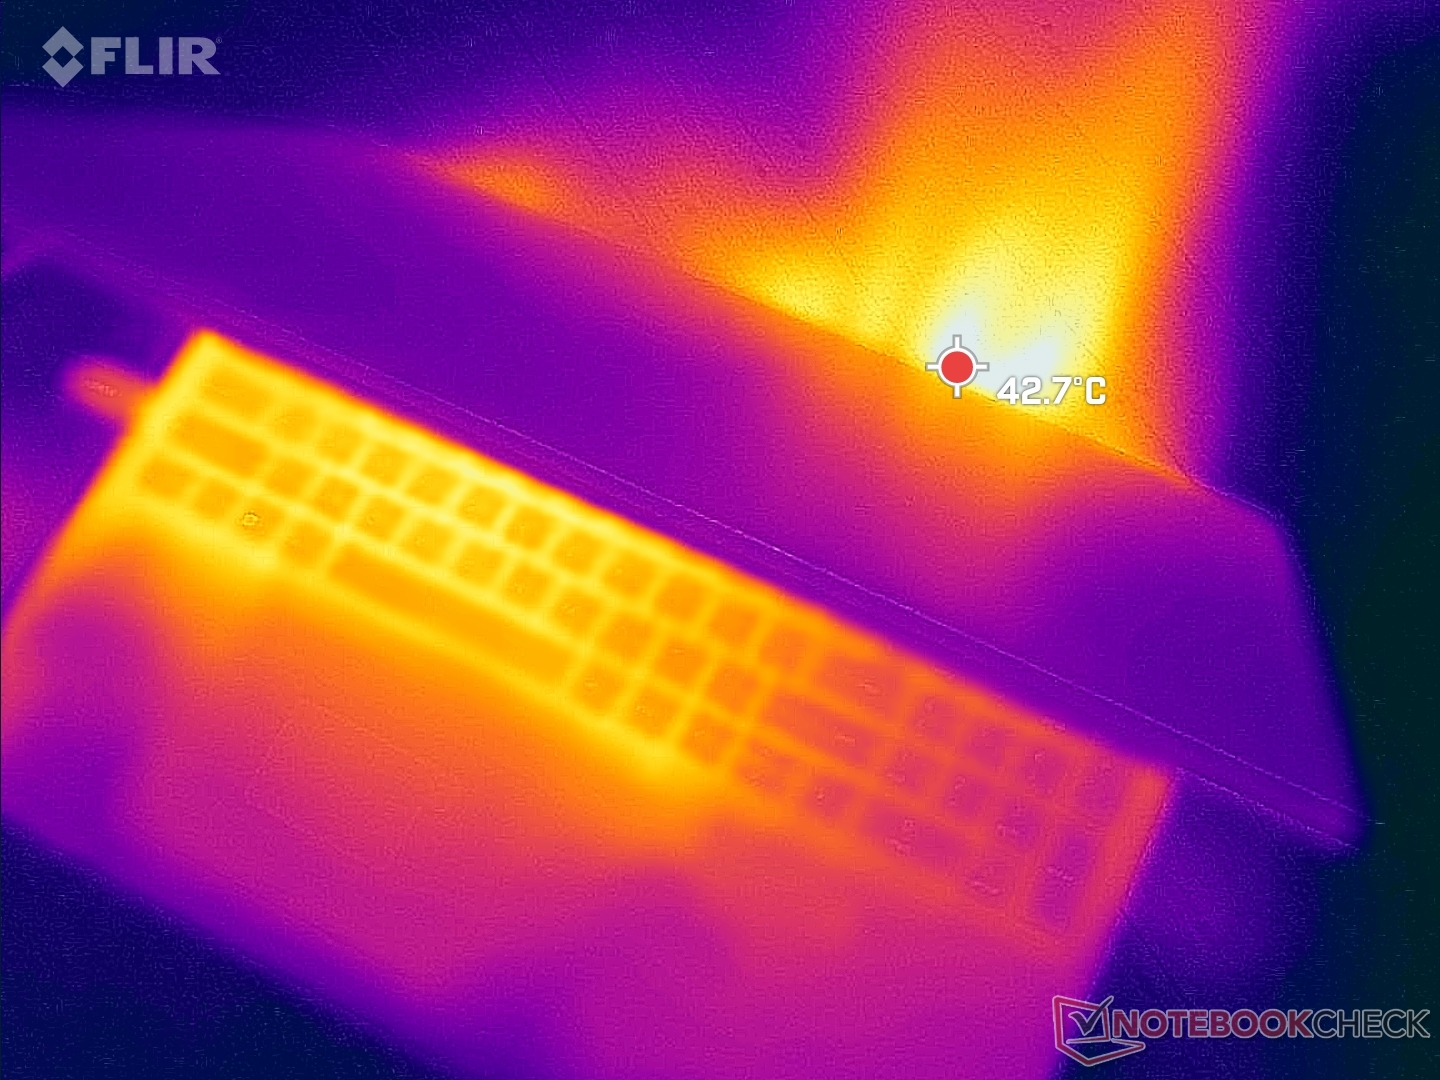
(-) Die maximale Temperatur auf der Oberseite ist 53 °C. Im Vergleich liegt der Klassendurchschnitt bei 38.1 °C (von 22.2 bis 69.8 °C für die Klasse Workstation v7).
(±) Auf der Unterseite messen wir eine maximalen Wert von 43.2 °C (im Vergleich zum Durchschnitt von 41.3 °C).
(+) Ohne Last messen wir eine durchschnittliche Temperatur von 31.8 °C auf der Oberseite. Der Klassendurchschnitt erreicht 32 °C.
(±) Beim längeren Spielen von The Witcher 3 erhitzt sich das Gerät durchschnittlich auf 37 °C. Der Durchschnitt der Klasse ist derzeit 32 °C.
(+) Die Handballen und der Touchpad-Bereich sind mit gemessenen 30.6 °C kühler als die typische Hauttemperatur und fühlen sich dadurch kühl an.
(-) Die durchschnittliche Handballen-Temperatur anderer getesteter Geräte war 27.8 °C (-2.8 °C).
| Dell Precision 7000 7670 Performance Intel Core i9-12950HX, NVIDIA RTX A5500 Laptop GPU | MSI CreatorPro Z16P B12UKST Intel Core i7-12700H, NVIDIA RTX A3000 Laptop GPU | HP ZBook Studio 16 G9 62U04EA Intel Core i7-12800H, NVIDIA RTX A2000 Laptop GPU | HP ZBook Firefly 16 G9-6B897EA Intel Core i7-1265U, NVIDIA T550 Laptop GPU | Lenovo ThinkPad P1 G4-20Y4Z9DVUS Intel Core i7-11800H, NVIDIA T1200 Laptop GPU | Dell Precision 7670 Intel Core i7-12850HX, NVIDIA RTX A2000 Laptop GPU | |
|---|---|---|---|---|---|---|
| Hitze | -2% | 9% | 8% | 7% | 4% | |
| Last oben max * | 53 | 56.3 -6% | 38.7 27% | 42.1 21% | 49.9 6% | 51 4% |
| Last unten max * | 43.2 | 68.3 -58% | 53.4 -24% | 48 -11% | 56.7 -31% | 45.8 -6% |
| Idle oben max * | 36.8 | 25.2 32% | 27.3 26% | 29.9 19% | 25.5 31% | 31.8 14% |
| Idle unten max * | 33.8 | 25.9 23% | 31.6 7% | 32.9 3% | 26.2 22% | 32.6 4% |
* ... kleinere Werte sind besser
Stress Test
Beim Betrieb mit Prime95-Stress steigen die Taktraten und die Temperatur fast augenblicklich auf 3,4 GHz bzw. 99 °C, bei einer hohen Prozessor-Leistungsaufnahme von 147 W. Diese hohe Temperatur ist nicht haltbar, und so sinken die Taktraten und die Temperatur schnell auf stabilere 2,3 GHz bzw. 78 °C, bei einer endgültigen Prozessor Leistungsaufnahme von 76 W. Der stetige, signifikante Rückgang des Turbo-Boost-Potenzials entspricht unseren obigen CineBench R15 xT-Schleifentest-Ergebnissen, bei denen die Ergebnisse langsam sinken, bevor sie sich im Laufe der Zeit stabilisieren.
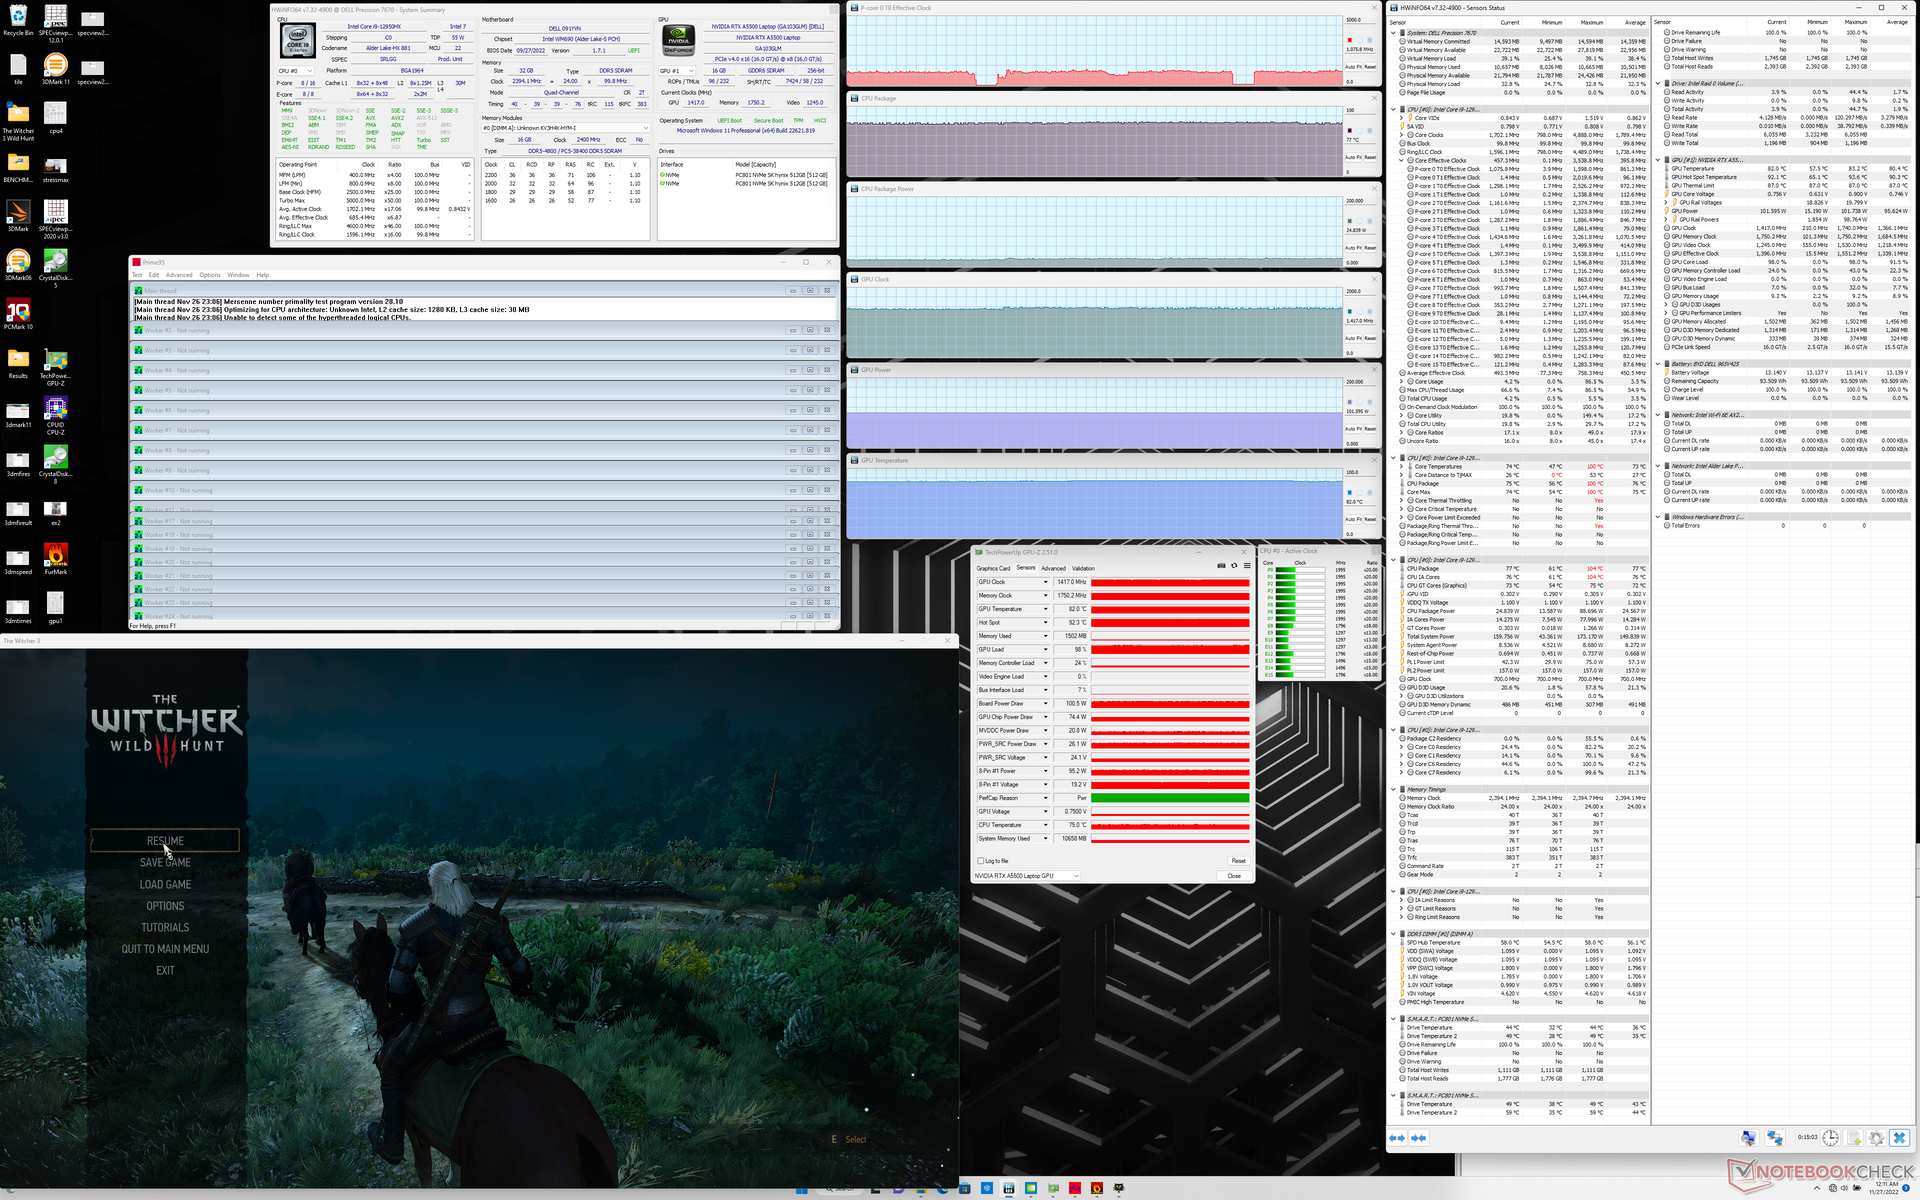
Die CPU- und GPU-Temperaturen im Betrieb Witcher 3 stabilisieren sich bei 77 °C bzw. 82 °C, verglichen mit 70 °C bzw. 80 °C auf dem normalen Precision 7670.
Performance ist im Akkubetrieb begrenzt. Fire Strike erreicht im Akkubetrieb 18901 bzw. 9254 Punkte für Physik und Grafik, im Netzbetrieb dagegen 28197 bzw. 26260 Punkte.
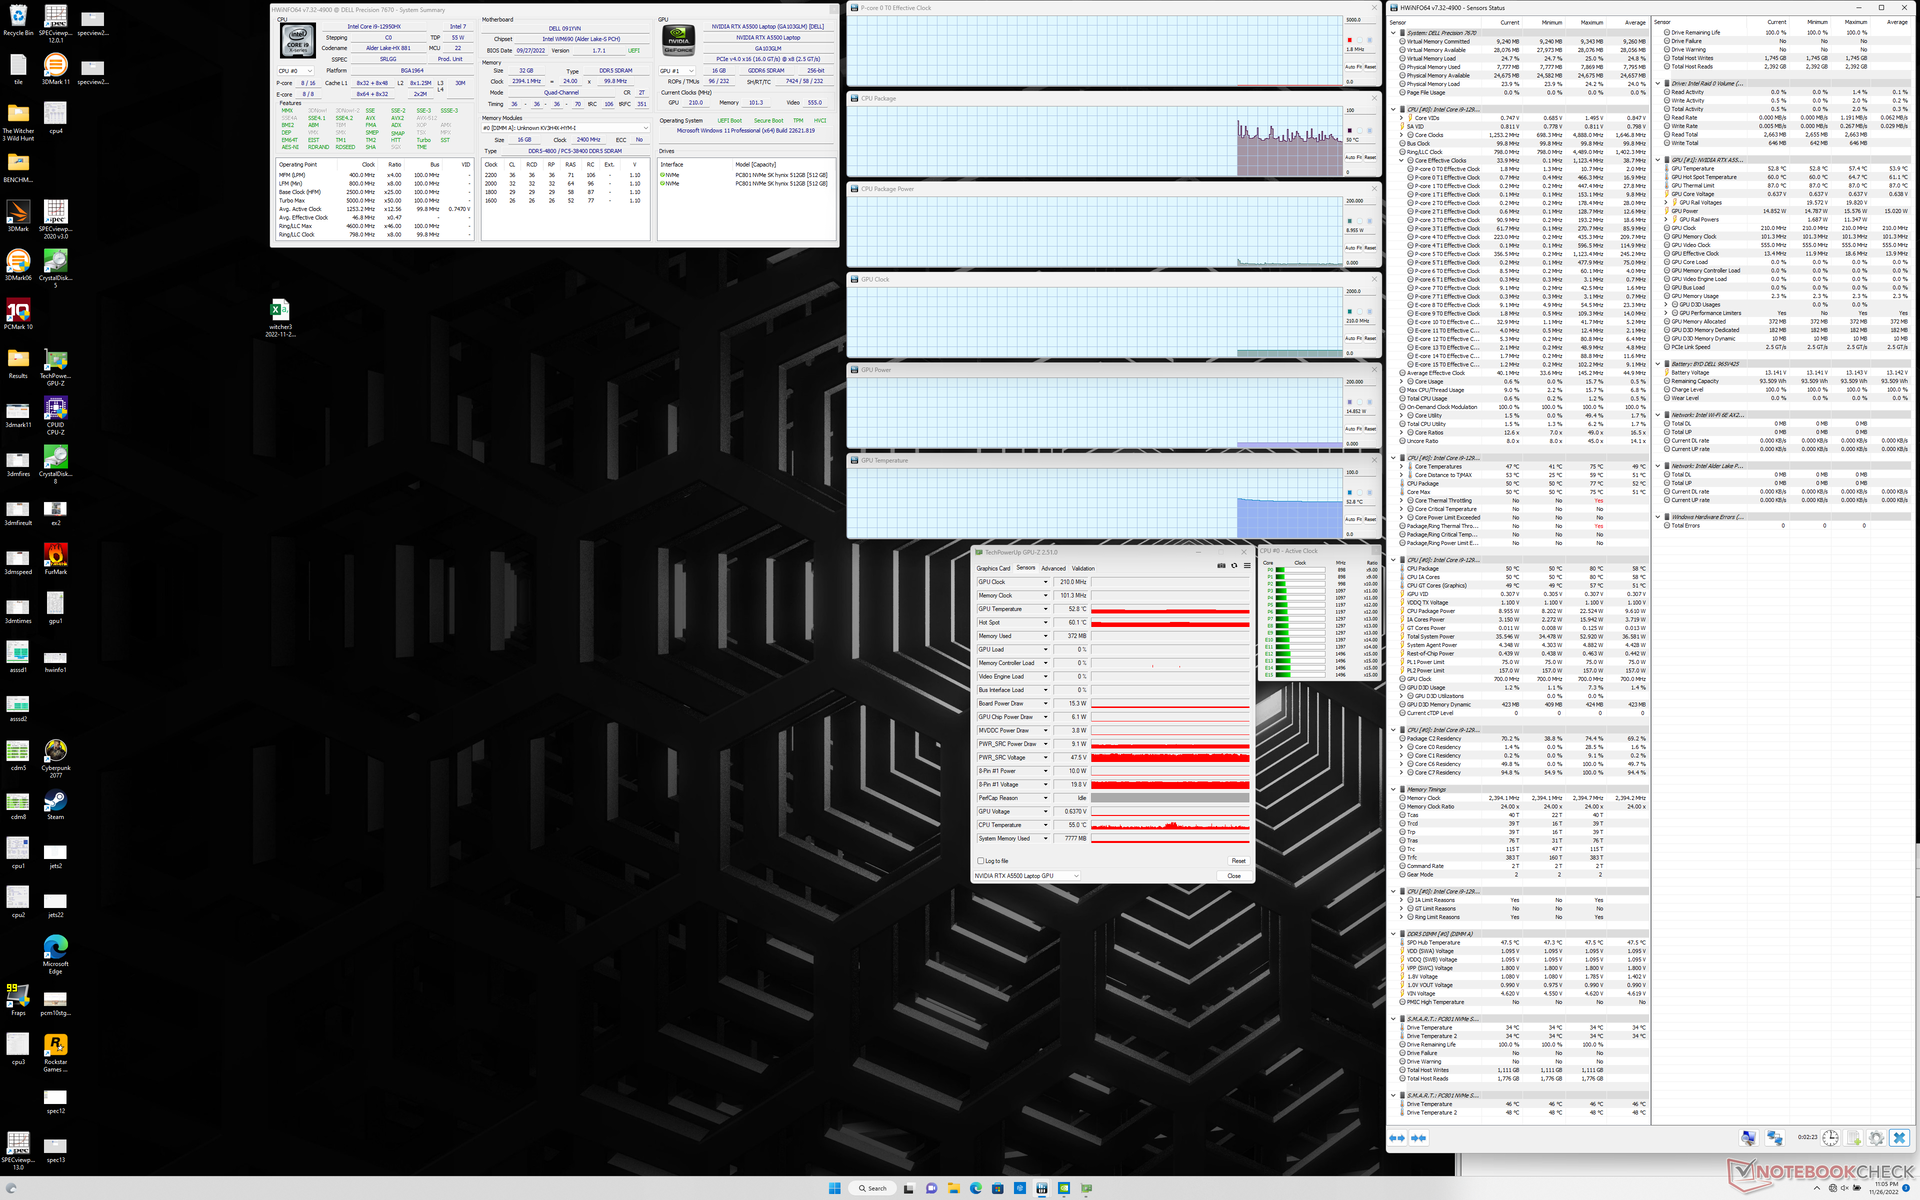
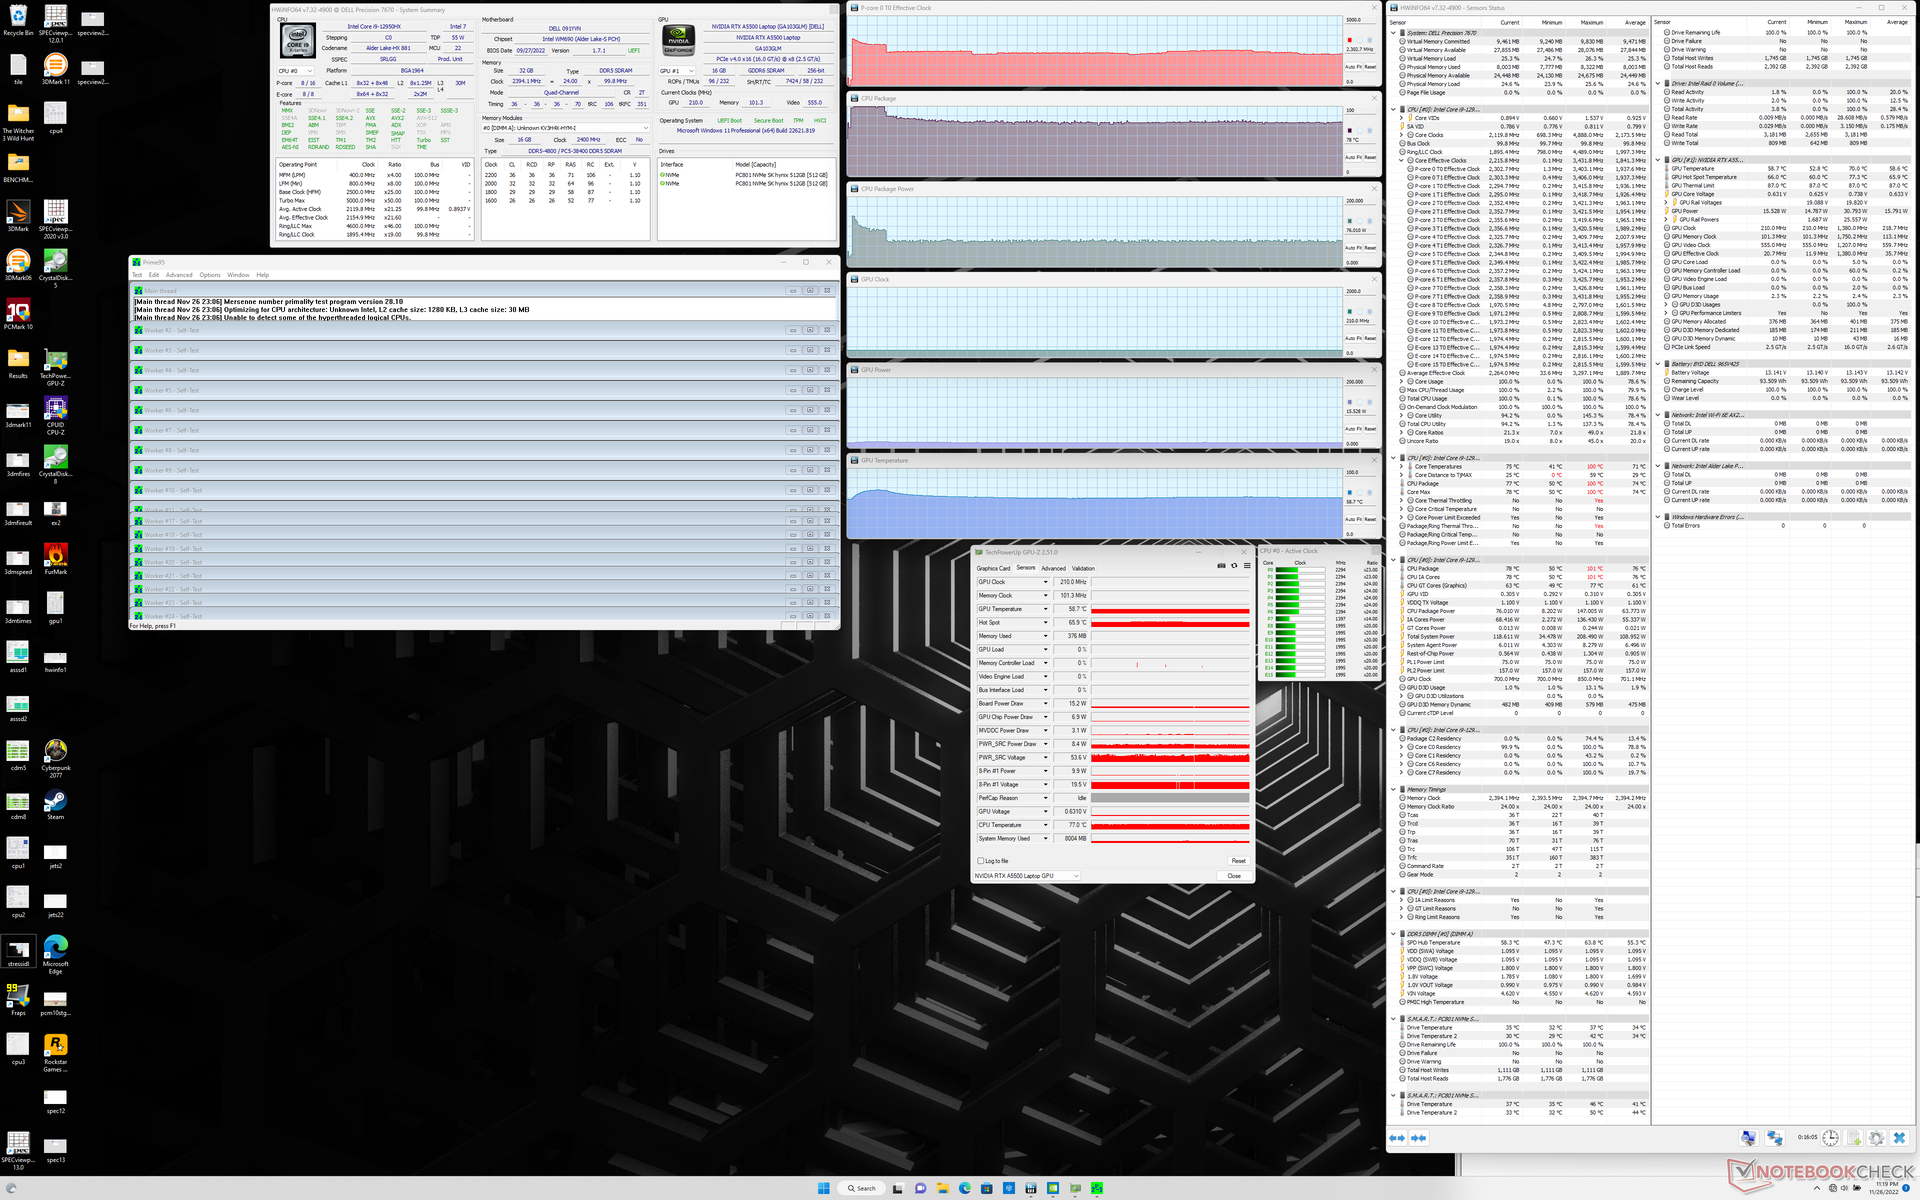
| CPU-Takt (GHz) | GPU-Takt (MHz) | Durchschnittliche CPU-Temperatur (°C) | Durchschnittliche GPU-Temperatur (°C) | |
| System Leerlauf | -- | -- | 50 | 53 |
| Prime95 Stress | 2.3 | -- | 78 | 59 |
| Prime95 + FurMark Stress | 0.8 - 1.4 | 500 - 1555 | 79 - 83 | 81 |
| Witcher 3 Stress | 1.1 | 1417 | 77 | 82 |
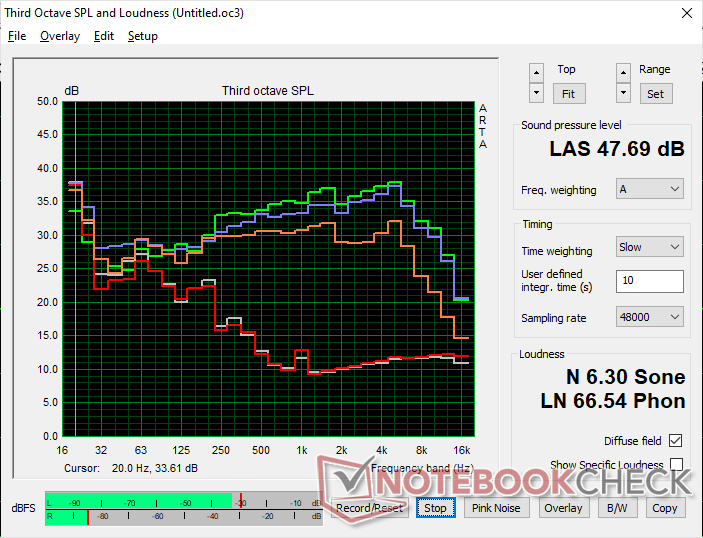
Dell Precision 7000 7670 Performance Audio Analyse
(+) | Die Lautsprecher können relativ laut spielen (91.1 dB)
Bass 100 - 315 Hz
(-) | kaum Bass - 15.1% niedriger als der Median
(±) | durchschnittlich lineare Bass-Wiedergabe (7.1% Delta zum Vorgänger)
Mitteltöne 400 - 2000 Hz
(+) | ausgeglichene Mitten, vom Median nur 2.9% abweichend
(+) | lineare Mitten (3.7% Delta zum Vorgänger)
Hochtöne 2 - 16 kHz
(+) | ausgeglichene Hochtöne, vom Median nur 3.5% abweichend
(+) | sehr lineare Hochtöne (1.6% Delta zum Vorgänger)
Gesamt im hörbaren Bereich 100 - 16.000 Hz
(+) | hörbarer Bereich ist sehr linear (10.4% Abstand zum Median
Im Vergleich zu allen Geräten derselben Klasse
» 5% aller getesteten Geräte dieser Klasse waren besser, 4% vergleichbar, 91% schlechter
» Das beste Gerät hat einen Delta-Wert von 7%, durchschnittlich ist 18%, das schlechteste Gerät hat 35%
Im Vergleich zu allen Geräten im Test
» 4% aller getesteten Geräte waren besser, 1% vergleichbar, 95% schlechter
» Das beste Gerät hat einen Delta-Wert von 4%, durchschnittlich ist 25%, das schlechteste Gerät hat 134%
Apple MacBook Pro 16 2021 M1 Pro Audio Analyse
(+) | Die Lautsprecher können relativ laut spielen (84.7 dB)
Bass 100 - 315 Hz
(+) | guter Bass - nur 3.8% Abweichung vom Median
(+) | lineare Bass-Wiedergabe (5.2% Delta zum Vorgänger)
Mitteltöne 400 - 2000 Hz
(+) | ausgeglichene Mitten, vom Median nur 1.3% abweichend
(+) | lineare Mitten (2.1% Delta zum Vorgänger)
Hochtöne 2 - 16 kHz
(+) | ausgeglichene Hochtöne, vom Median nur 1.9% abweichend
(+) | sehr lineare Hochtöne (2.7% Delta zum Vorgänger)
Gesamt im hörbaren Bereich 100 - 16.000 Hz
(+) | hörbarer Bereich ist sehr linear (4.6% Abstand zum Median
Im Vergleich zu allen Geräten derselben Klasse
» 0% aller getesteten Geräte dieser Klasse waren besser, 0% vergleichbar, 100% schlechter
» Das beste Gerät hat einen Delta-Wert von 5%, durchschnittlich ist 18%, das schlechteste Gerät hat 45%
Im Vergleich zu allen Geräten im Test
» 0% aller getesteten Geräte waren besser, 0% vergleichbar, 100% schlechter
» Das beste Gerät hat einen Delta-Wert von 4%, durchschnittlich ist 25%, das schlechteste Gerät hat 134%
Energieverwaltung
Stromverbrauch
Das reguläre Precision 7670 ist bereits ein stromhungriges Gerät und das Precision 7670 Performance ist es noch mehr. Allein der Leerlauf auf dem Desktop erfordert zwischen 16 W und 47 W, je nach Helligkeitsstufe, Leistungsprofil und OLED-Farben. Die meisten anderen Workstations bewegen sich im Vergleich dazu im mittleren 15-Watt-Bereich.
Bei anspruchsvoller Last, wie z. B. Spielen, verbraucht unser Gerät etwa 159 W im Vergleich zu 134 W auf dem regulären Precision 7670. Der Anstieg des Stromverbrauchs um 19 Prozent ist relativ gering, wenn man bedenkt, dass die Grafikleistung gegenüber dem Quadro A2000 um 70 bis 80 Prozent steigt.
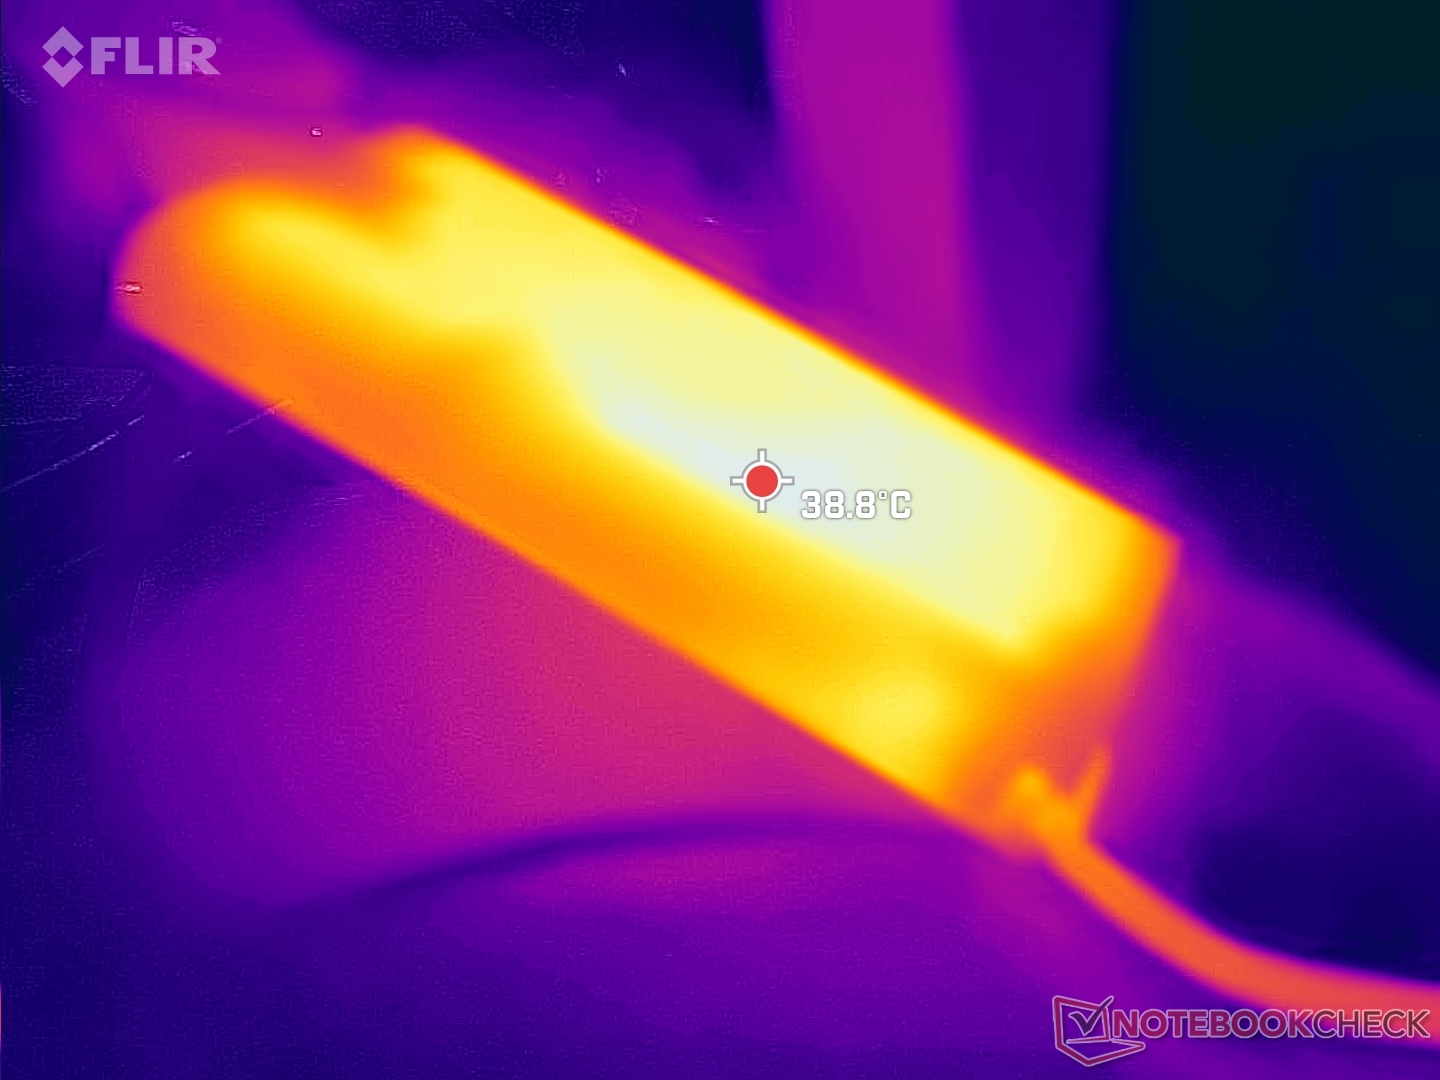
Im Lieferumfang ist ein mittelgroßes (~15,2 x 7,8 x 2,3 cm) 240-W-Netzteil enthalten, während das reguläre Precision 7670 mit einem kleineren 180-W-Netzteil geliefert wird. Wir konnten eine temporäre maximale Leistungsaufnahme von 311 W aufzeichnen, wenn sowohl CPU als auch GPU zu 100 Prozent ausgelastet sind, wie die Screenshots unten zeigen. Dies deutet sowohl auf eine begrenzte Turbo-Boost-Leistung als auch auf ein potenziell unterdimensioniertes Netzteil hin, wenn man bedenkt, wie anspruchsvoll die internen Komponenten sein können.

| Aus / Standby | |
| Idle | |
| Last |
|
Legende:
min: Derzeit nutzen wir das Metrahit Energy, ein professionelles TRMS Leistungs-Multimeter und PQ Analysator, für unsere Messungen. Mehr Details zu dem Messgerät finden Sie hier. Alle unsere Testmethoden beschreiben wir in diesem Artikel. | |
| Dell Precision 7000 7670 Performance i9-12950HX, RTX A5500 Laptop GPU, , OLED, 3840x2400, 16.00 | MSI CreatorPro Z16P B12UKST i7-12700H, RTX A3000 Laptop GPU, Samsung PM9A1 MZVL21T0HCLR, IPS, 2560x1600, 16.00 | HP ZBook Studio 16 G9 62U04EA i7-12800H, RTX A2000 Laptop GPU, Micron 3400 1TB MTFDKBA1T0TFH, IPS, 3840x2400, 16.00 | HP ZBook Firefly 16 G9-6B897EA i7-1265U, T550 Laptop GPU, Samsung PM9A1 MZVL21T0HCLR, IPS, 1920x1200, 16.00 | Lenovo ThinkPad P1 G4-20Y4Z9DVUS i7-11800H, T1200 Laptop GPU, Samsung PM9A1 MZVL2512HCJQ, IPS, 2560x1600, 16.00 | Dell Precision 7670 i7-12850HX, RTX A2000 Laptop GPU, SK Hynix HFS001TEJ9X115N, OLED, 3840x2400, 16.00 | MSI WE76 11UM-456 i9-11980HK, RTX A5000 Laptop GPU, Samsung PM9A1 MZVL22T0HBLB, IPS, 3840x2160, 17.30 | |
|---|---|---|---|---|---|---|---|
| Stromverbrauch | 37% | 44% | 73% | 48% | 36% | 19% | |
| Idle min * | 16.4 | 10.8 34% | 7.2 56% | 4.5 73% | 9.9 40% | 7.5 54% | 10.5 36% |
| Idle avg * | 35.9 | 16.3 55% | 18.1 50% | 8 78% | 13.9 61% | 9.5 74% | 18.6 48% |
| Idle max * | 47 | 16.9 64% | 18.5 61% | 8.7 81% | 14.6 69% | 28.4 40% | 20 57% |
| Last avg * | 147.1 | 111.7 24% | 112.8 23% | 48.3 67% | 95 35% | 139.1 5% | 132.4 10% |
| Witcher 3 ultra * | 158.8 | 152.1 4% | 106.7 33% | 45.3 71% | 98.9 38% | 134 16% | 232 -46% |
| Last max * | 311 | 177.4 43% | 186 40% | 94.7 70% | 170.8 45% | 220.8 29% | 281.6 9% |
* ... kleinere Werte sind besser
Power Consumption Witcher 3 / Stresstest
Power Consumption external Monitor
Akkulaufzeit
Die Akkukapazität ist mit 93 Wh etwas größer als bei dem schlankeren Precision 7670 mit 83 Wh. Trotzdem ist die WLAN-Laufzeit bei unserem Performance-Modell aufgrund des leistungsfähigeren Innenlebens um fast eine Stunde kürzer.
Das Aufladen von der leeren zur vollen Kapazität dauert mit etwa 2,5 Stunden lange.
| Dell Precision 7000 7670 Performance i9-12950HX, RTX A5500 Laptop GPU, 93 Wh | MSI CreatorPro Z16P B12UKST i7-12700H, RTX A3000 Laptop GPU, 90 Wh | HP ZBook Studio 16 G9 62U04EA i7-12800H, RTX A2000 Laptop GPU, 86 Wh | HP ZBook Firefly 16 G9-6B897EA i7-1265U, T550 Laptop GPU, 76 Wh | Lenovo ThinkPad P1 G4-20Y4Z9DVUS i7-11800H, T1200 Laptop GPU, 90 Wh | Dell Precision 7670 i7-12850HX, RTX A2000 Laptop GPU, 83 Wh | |
|---|---|---|---|---|---|---|
| Akkulaufzeit | 24% | 35% | 178% | 89% | 27% | |
| WLAN | 280 | 348 24% | 377 35% | 779 178% | 529 89% | 355 27% |
| H.264 | 509 | 1104 | ||||
| Last | 63 | 118 | 75 | |||
| Idle | 472 |
Pro
Contra
Fazit
Das Precision 7670 Performance ist unmerklich dicker und schwerer als das Standard Precision 7670, aber es bietet eine etwa 10 % bzw. 80 % schnellere CPU- und GPU-Leistung, wenn es mit den stärksten Prozessoroptionen konfiguriert ist. Wenn Sie genau das nicht vorhaben, gibt es allerdings kaum einen Grund, das Performance- dem Standardmodell vorzuziehen.
Das Precision 7670 Performance liefert, was die High-End-Prozessoroptionen und -funktionen angeht. Dennoch sind das begrenzte Turbo-Boost-Potenzial, die hohen Kerntemperaturen und die DPC-Latenzprobleme etwas enttäuschend.
Bei der Gesamtleistung gibt es noch viel Raum für Verbesserungen. Obwohl es sich um das dickere Performance-Modell handelt, sind die Kerntemperaturen nicht besser als beim Standardmodell. Folglich dauert der CPU-Turbo-Boost viel kürzer als erwartet. Die hohen DPC-Latenzen, die ungleichmäßige WiFi-Leistung, der hohe Stromverbrauch im Leerlauf und das unterdimensionierte Netzteil sind weitere Probleme, die bei einer professionellen Workstation wie dieser überhaupt nicht vorkommen sollten.
Preis und Verfügbarkeit
Direkt bei Dell kostet das Precision 7670 Performance mit der Ausstattung, wie sie unser Testgerät aufweist, knapp unter 7.000 Euro. Andere Konfigurationen sind ab 2.600 erhältlich.
Dell Precision 7000 7670 Performance
-
03.12.2022 v7
Allen Ngo
Weitere Artikel zur Serie
Dell Precision 7000 7670 Performance (Precision 7000 Serie)Verwandte Artikel


Preisvergleich

