Acer Predator Helios 300 PH315-53 im Test: Flinker Gamer mit Leistungsreserven

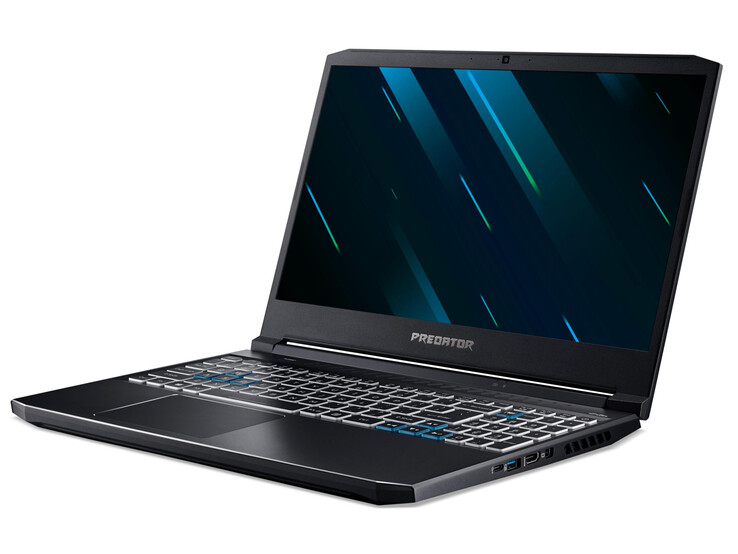
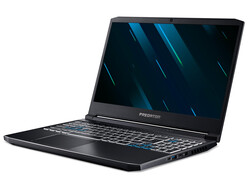
Das Predator Helios zählt zu den Gaming-Notebooks im 15,6-Zoll-Format. Das Gerät wird von einem Core-i7-10750H-Prozessor und einer GeForce-RTX-2060-GPU angetrieben. Zu den Konkurrenten zählen Geräte wie das Dell G5 15 SE, das Aorus 5 KB, das Schenker XMG Core 15 sowie das Asus TUF A15 FA506IV.
Da das Predator weitgehend baugleich mit seinem Vorgänger ist, gehen wir nicht weiter auf das Gehäuse, die Ausstattung, die Eingabegeräte, das Display und die Lautsprecher ein - außer es bestehen Unterschiede. Die entsprechenden Informationen sind dem Testbericht zum Acer Predator Helios 300 PH315-52 zu entnehmen.
Bew. | Datum | Modell | Gewicht | Dicke | Größe | Auflösung | Preis ab |
|---|---|---|---|---|---|---|---|
| 82.9 % v7 (old) | 11 / 2020 | Acer Predator Helios 300 PH315-53-77N5 i7-10750H, GeForce RTX 2060 Mobile | 2.5 kg | 22.9 mm | 15.60" | 1920x1080 | |
| 83.7 % v7 (old) | 06 / 2020 | Dell G5 15 SE 5505 P89F R7 4800H, Radeon RX 5600M | 2.4 kg | 21.6 mm | 15.60" | 1920x1080 | |
| 83.7 % v7 (old) | 10 / 2020 | Aorus 5 KB i7-10750H, GeForce RTX 2060 Mobile | 2.1 kg | 28 mm | 15.60" | 1920x1080 | |
| 82.1 % v7 (old) | 09 / 2020 | Schenker XMG Core 15 GK5NR0O R7 4800H, GeForce RTX 2060 Mobile | 2 kg | 19.9 mm | 15.60" | 1920x1080 | |
| 82.7 % v7 (old) | 06 / 2020 | Asus TUF Gaming A15 FA506IV-HN172 R7 4800H, GeForce RTX 2060 Mobile | 2.2 kg | 24.9 mm | 15.60" | 1920x1080 |
Gehäuse & Ausstattung - Leichte Änderungen im Vergleich zum Vorgänger
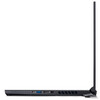
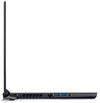
Auf den ersten Blick gleicht das Gehäuse dem des Vorgängers. Es bestehen aber Unterschiede. So ist der Netzteilanschluss von der Mitte der linken Seite in die Mitte der Rückseite gewandert. HDMI-Ausgang und Mini-Displayport haben die Plätze getauscht. Darüber hinaus wurden oberhalb der Tastatur zusätzliche Belüftungsöffnungen geschaffen. Zudem hat das aktuelle Modell etwas an Gewicht zugelegt. Eine Neuerung gibt es bei den Steckplätzen: Statt eines Typ-C-USB-3.2-Gen-1-Steckplatzes hat das aktuelle Predator-Modell einen Typ-C-USB-3.2-Gen-2-Steckplatz an Bord.


Display - 144-Hz-IPS
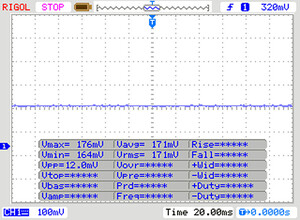
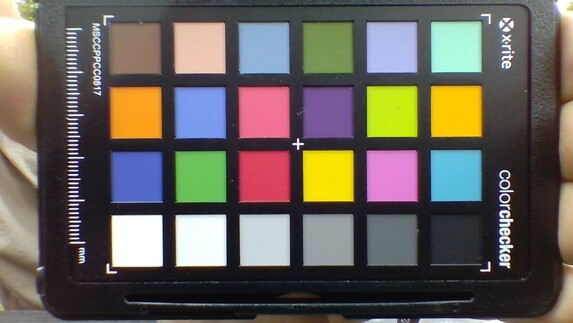
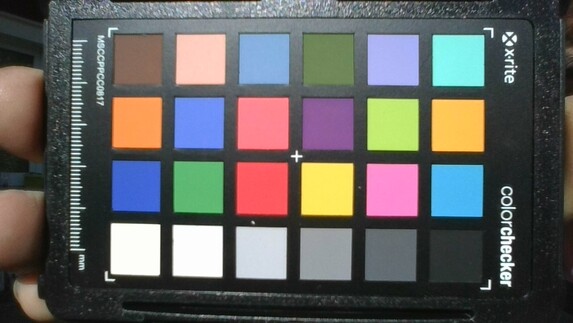
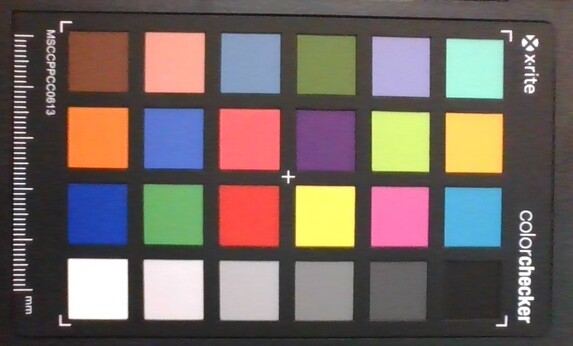
Während der Kontrast (1.450:1) des matten, blickwinkelstabilen 15,6-Zoll-Bildschirms (FHD, IPS) gut ausfällt, geht die Helligkeit (294,3 cd/m²) gerade so in Ordnung. Wir sehen Werte jenseits von 300 cd/m² als gut an. Das verwendete 144-Hz-Panel bietet schnelle Reaktionszeiten und eine ordentliche Farbdarstellung. Positiv: PWM-Flimmern konnten wir nicht feststellen.
Es handelt sich hierbei um das gleiche Panel, welches auch im Vorgängermodell steckt. Nichtsdestotrotz unterscheiden sich die Messwerte etwas. Hierbei handelt es sich um einen normalen Zustand. Zwei baugleiche Bildschirme stimmen nie zu einhundert Prozent überein.
| |||||||||||||||||||||||||
Ausleuchtung: 83 %
Helligkeit Akku: 254 cd/m²
Kontrast: 1450:1 (Schwarzwert: 0.22 cd/m²)
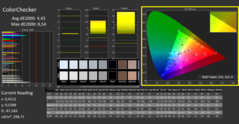
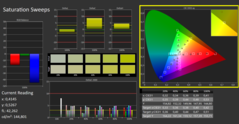
ΔE ColorChecker Calman: 4.42 | ∀{0.5-29.43 Ø4.76}
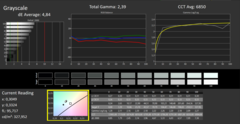
ΔE Greyscale Calman: 4.84 | ∀{0.09-98 Ø5}
92% sRGB (Argyll 1.6.3 3D)
60% AdobeRGB 1998 (Argyll 1.6.3 3D)
66.3% AdobeRGB 1998 (Argyll 3D)
92.3% sRGB (Argyll 3D)
65.2% Display P3 (Argyll 3D)
Gamma: 2.39
CCT: 6850 K
| Acer Predator Helios 300 PH315-53-77N5 AU Optronics B156HAN08.2, IPS, 1920x1080, 15.6" | Acer Predator Helios 300 PH315-52-79TY AUO, B156HAN08.2, IPS, 1920x1080, 15.6" | Dell G5 15 SE 5505 P89F BOE NV156FH, WVA, 1920x1080, 15.6" | Aorus 5 KB LG Philips LP156WFG-SPB2 (LGD05E8), IPS, 1920x1080, 15.6" | Schenker XMG Core 15 GK5NR0O LM156LF-1F02, IPS, 1920x1080, 15.6" | Asus TUF Gaming A15 FA506IV-HN172 LM156LF-2F01, IPS, 1920x1080, 15.6" | |
|---|---|---|---|---|---|---|
| Display | -1% | -3% | -1% | 3% | -39% | |
| Display P3 Coverage (%) | 65.2 | 64.1 -2% | 63 -3% | 63.4 -3% | 67.2 3% | 38.92 -40% |
| sRGB Coverage (%) | 92.3 | 93 1% | 90.1 -2% | 92.8 1% | 95.9 4% | 58.5 -37% |
| AdobeRGB 1998 Coverage (%) | 66.3 | 65.7 -1% | 64.1 -3% | 64.8 -2% | 68.5 3% | 40.22 -39% |
| Response Times | 15% | -9% | 7% | 29% | -109% | |
| Response Time Grey 50% / Grey 80% * (ms) | 17 ? | 15 ? 12% | 20.4 ? -20% | 14.4 ? 15% | 9.6 ? 44% | 34 ? -100% |
| Response Time Black / White * (ms) | 11 ? | 9 ? 18% | 10.8 ? 2% | 11.2 ? -2% | 9.6 ? 13% | 24 ? -118% |
| PWM Frequency (Hz) | 198.4 ? | |||||
| Bildschirm | -2% | 0% | 10% | -13% | -17% | |
| Helligkeit Bildmitte (cd/m²) | 319 | 325 2% | 292 -8% | 318 0% | 312 -2% | 280 -12% |
| Brightness (cd/m²) | 294 | 310 5% | 290 -1% | 298 1% | 290 -1% | 254 -14% |
| Brightness Distribution (%) | 83 | 82 -1% | 77 -7% | 87 5% | 87 5% | 88 6% |
| Schwarzwert * (cd/m²) | 0.22 | 0.255 -16% | 0.27 -23% | 0.3 -36% | 0.2 9% | 0.15 32% |
| Kontrast (:1) | 1450 | 1275 -12% | 1081 -25% | 1060 -27% | 1560 8% | 1867 29% |
| Delta E Colorchecker * | 4.42 | 4.28 3% | 3.99 10% | 2.49 44% | 4.84 -10% | 5.89 -33% |
| Colorchecker dE 2000 max. * | 8.54 | 8.42 1% | 6.11 28% | 5.06 41% | 13.85 -62% | 19 -122% |
| Delta E Graustufen * | 4.84 | 5.01 -4% | 3.3 32% | 1.6 67% | 9 -86% | 4.08 16% |
| Gamma | 2.39 92% | 2.6 85% | 2.25 98% | 2.211 100% | 2.105 105% | 2.33 94% |
| CCT | 6850 95% | 7678 85% | 7047 92% | 6714 97% | 8099 80% | 7303 89% |
| Farbraum (Prozent von AdobeRGB 1998) (%) | 60 | 60 0% | 58.1 -3% | 65 8% | 68 13% | 37 -38% |
| Color Space (Percent of sRGB) (%) | 92 | 93 1% | 89.7 -2% | 89 -3% | 92 0% | 58 -37% |
| Colorchecker dE 2000 calibrated * | 1.45 | 3.02 | 1.53 | 1.77 | 4.79 | |
| Durchschnitt gesamt (Programm / Settings) | 4% /
0% | -4% /
-2% | 5% /
7% | 6% /
-4% | -55% /
-34% |
* ... kleinere Werte sind besser
Reaktionszeiten (Response Times) des Displays
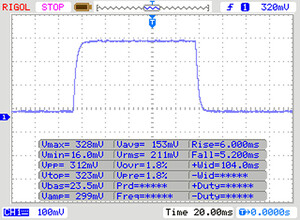
| ↔ Reaktionszeiten Schwarz zu Weiß | ||
|---|---|---|
| 11 ms ... steigend ↗ und fallend ↘ kombiniert | ↗ 6 ms steigend | |
| ↘ 5 ms fallend | ||
| Die gemessenen Reaktionszeiten sind gut, für anspruchsvolle Spieler könnten der Bildschirm jedoch zu langsam sein. Im Vergleich rangierten die bei uns getesteten Geräte von 0.1 (Minimum) zu 240 (Maximum) ms. » 29 % aller Screens waren schneller als der getestete. Daher sind die gemessenen Reaktionszeiten besser als der Durchschnitt aller vermessenen Geräte (20.1 ms). | ||
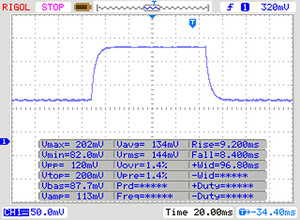
| ↔ Reaktionszeiten 50% Grau zu 80% Grau | ||
| 17 ms ... steigend ↗ und fallend ↘ kombiniert | ↗ 9 ms steigend | |
| ↘ 8 ms fallend | ||
| Die gemessenen Reaktionszeiten sind gut, für anspruchsvolle Spieler könnten der Bildschirm jedoch zu langsam sein. Im Vergleich rangierten die bei uns getesteten Geräte von 0.165 (Minimum) zu 636 (Maximum) ms. » 30 % aller Screens waren schneller als der getestete. Daher sind die gemessenen Reaktionszeiten besser als der Durchschnitt aller vermessenen Geräte (31.5 ms). | ||
Bildschirm-Flackern / PWM (Pulse-Width Modulation)
| Flackern / PWM nicht festgestellt | |||
Im Vergleich: 53 % aller getesteten Geräte nutzten kein PWM um die Helligkeit zu reduzieren. Wenn PWM eingesetzt wurde, dann bei einer Frequenz von durchschnittlich 8082 (Minimum 5, Maximum 343500) Hz. | |||
Leistung - Predator mit automatischer GPU-Übertaktung
Acer hat mit dem Predator Helios 300 ein 15,6-Zoll-Gaming-Notebook im Sortiment, das jedes aktuelle Spiel flüssig auf den Bildschirm bringt. Der Preis unseres Testgeräts sollte schätzungsweise zwischen 1.500 und 1.600 Euro liegen. Andere Ausstattungsvarianten sind verfügbar. Die Preise beginnen bei etwa 1.020 Euro.
Testbedingungen
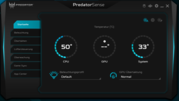
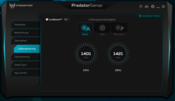
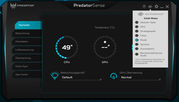
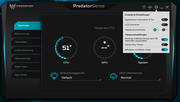
Die vorinstallierte Predator-Sense-Software ermöglicht die Anpassung der Lüftersteuerung und die automatische Übertaktung der GPU. Es stehen die GPU-Profile "Normal", "Schnell" und "Extrem" zur Auswahl. Wir haben unseren Test mit automatischer Lüftersteuerung und dem GPU-Profil "Normal" durchgeführt. Einige Benchmarks haben wir zusätzlich bei aktivem "Extrem"-Profil durchlaufen lassen.
Oberhalb der Tastatur hat Acer eine "Turbo"-Taste angebracht. Wird diese gedrückt, laufen die Lüfter dauerhaft mit voller Kraft und das GPU-Profil "Extrem" wird aktiviert.
Prozessor
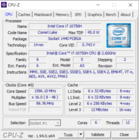
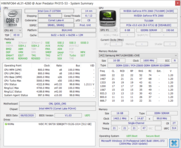
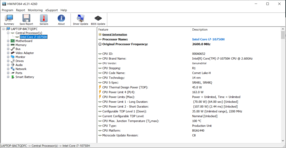
Der Core-i7-10750H-Sechskernprozessor (Comet Lake) arbeitet mit einer Basisgeschwindigkeit von 2,6 GHz. Per Turbo kann der Takt auf 4,3 GHz (sechs Kerne) bis 5 GHz (ein Kern) gesteigert werden. Hyperthreading (zwei Threads pro Kern) wird unterstützt.
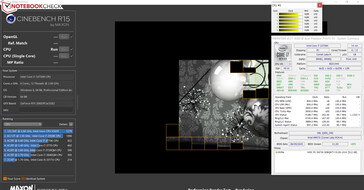
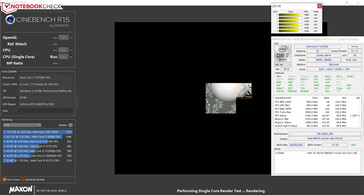
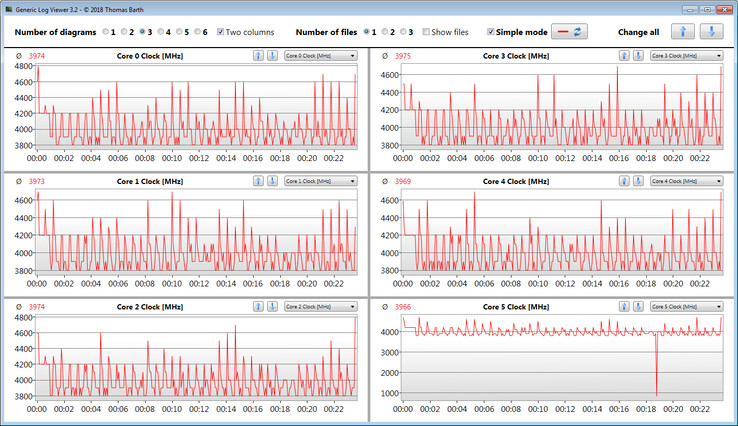
Die CPU-Tests des Cinebench-R15-Benchmarks bearbeitet der Prozessor mit 4,2 GHz (Multi-Thread) bzw. 4,2 bis 5 GHz (Single-Thread). Im Akkubetrieb liegen die Taktraten bei 2,4 bis 2,6 GHz (Multi-Thread) bzw. 2,4 bis 3,2 GHz (Single-Thread).
Ob der CPU-Turbo im Netzbetrieb dauerhaft genutzt wird, überprüfen wir, indem wir den Multi-Thread-Test des CB15-Benchmarks für mindestens 30 Minuten in einer Schleife laufen lassen. Der Turbo kommt auf hohem Niveau zum Einsatz.
* ... kleinere Werte sind besser
System Performance
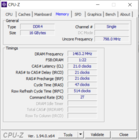
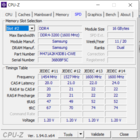
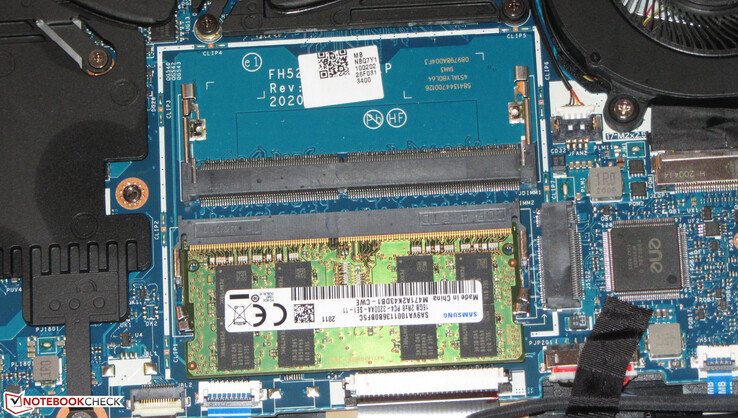
Das System arbeitet flink und flüssig. Die PC-Mark-Resultate fallen gut aus. Das Notebook bietet über die nächsten Jahre genug Rechenleistung für leistungsfordernde Anwendungsbereiche wie Gaming, Videoschnitt und Bildbearbeitung. Eine leichte Steigerung der Leistung wäre durch Aktivierung des Dual-Channel-Modus zu erreichen. Dazu müsste dem Notebook ein zweites Arbeitsspeichermodul spendiert werden.
| PCMark 8 Home Score Accelerated v2 | 4160 Punkte | |
| PCMark 8 Creative Score Accelerated v2 | 5899 Punkte | |
| PCMark 8 Work Score Accelerated v2 | 5405 Punkte | |
| PCMark 10 Score | 5921 Punkte | |
Hilfe | ||
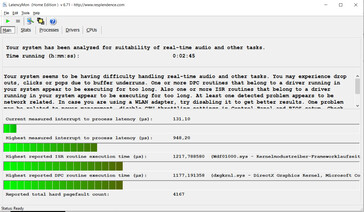
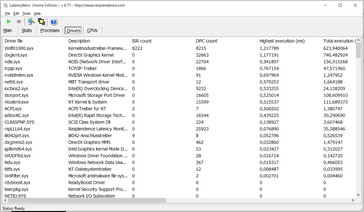
DPC-Latenzen
| DPC Latencies / LatencyMon - interrupt to process latency (max), Web, Youtube, Prime95 | |
| Dell G5 15 SE 5505 P89F | |
| Schenker XMG Core 15 GK5NR0O | |
| MSI Bravo 15 A4DCR | |
| Aorus 5 KB | |
| Acer Predator Helios 300 PH315-53-77N5 | |
| Asus TUF Gaming A15 FA506IV-HN172 | |
| HP Pavilion Gaming 15-ec1177ng | |
* ... kleinere Werte sind besser
Massenspeicher
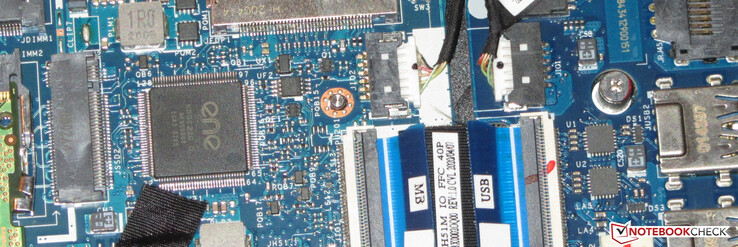
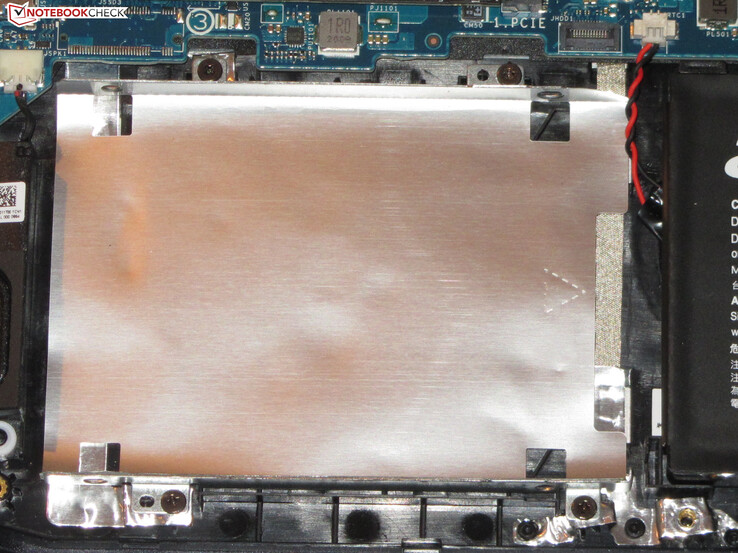
Das Notebook kann zwei NVMe-SSDs im M.2-2280-Format aufnehmen, die bei Bedarf einen RAID-0-Verbund bilden könnten. Unser Testgerät ist lediglich mit einer NVMe-SSD bestückt, die 512 GB Speicherplatz bereitstellt. Die Transferraten fallen gut aus. Das Predator bietet noch Platz für ein 2,5-Zoll-Speichermedium. Unser Testgerät kann nicht um ein solches Medium erweitert werden, da der nötige SATA-Steckplatz fehlt.
| Acer Predator Helios 300 PH315-53-77N5 WDC PC SN730 SDBQNTY-512GB | Acer Predator Helios 300 PH315-52-79TY WDC PC SN720 SDAPNTW-512G | Dell G5 15 SE 5505 P89F Samsung PM991 MZ9LQ512HALU | Aorus 5 KB ADATA XPG SX8200 Pro (ASX8200PNP-512GT) | Schenker XMG Core 15 GK5NR0O Samsung SSD 970 EVO Plus 500GB | Asus TUF Gaming A15 FA506IV-HN172 Kingston OM8PCP3512F-AB | Durchschnittliche WDC PC SN730 SDBQNTY-512GB | |
|---|---|---|---|---|---|---|---|
| CrystalDiskMark 5.2 / 6 | -7% | -17% | 11% | 29% | -13% | -2% | |
| Write 4K (MB/s) | 137.5 | 108.7 -21% | 142.1 3% | 162.1 18% | 233 69% | 219.8 60% | 140.9 ? 2% |
| Read 4K (MB/s) | 48.24 | 44.91 -7% | 46.43 -4% | 60.7 26% | 54.5 13% | 50.2 4% | 45.6 ? -5% |
| Write Seq (MB/s) | 2644 | 2424 -8% | 1108 -58% | 2366 -11% | 3050 15% | 979 -63% | 2066 ? -22% |
| Read Seq (MB/s) | 1718 | 1617 -6% | 1622 -6% | 2633 53% | 3042 77% | 1990 16% | 2014 ? 17% |
| Write 4K Q32T1 (MB/s) | 416.6 | 356.9 -14% | 467 12% | 428.2 3% | 520 25% | 516 24% | 472 ? 13% |
| Read 4K Q32T1 (MB/s) | 525 | 557 6% | 525 0% | 582 11% | 546 4% | 298.3 -43% | 453 ? -14% |
| Write Seq Q32T1 (MB/s) | 2705 | 2542 -6% | 1203 -56% | 2480 -8% | 3241 20% | 982 -64% | 2433 ? -10% |
| Read Seq Q32T1 (MB/s) | 3213 | 3218 0% | 2288 -29% | 3121 -3% | 3538 10% | 1907 -41% | 3237 ? 1% |
| Write 4K Q8T8 (MB/s) | 1138 | 981 | |||||
| Read 4K Q8T8 (MB/s) | 1346 | 300.9 | |||||
| AS SSD | 4% | -29% | 0% | 32% | -23% | 3% | |
| Seq Read (MB/s) | 2753 | 2841 3% | 1386 -50% | 2795 2% | 2836 3% | 1682 -39% | 2506 ? -9% |
| Seq Write (MB/s) | 2495 | 2009 -19% | 1234 -51% | 2172 -13% | 2452 -2% | 904 -64% | 1655 ? -34% |
| 4K Read (MB/s) | 38.64 | 39.34 2% | 41.32 7% | 53.3 38% | 60.4 56% | 60.2 56% | 42.2 ? 9% |
| 4K Write (MB/s) | 88.8 | 102.8 16% | 128 44% | 121.3 37% | 190.5 115% | 164.8 86% | 127.5 ? 44% |
| 4K-64 Read (MB/s) | 952 | 1257 32% | 854 -10% | 714 -25% | 1283 35% | 472.5 -50% | 1061 ? 11% |
| 4K-64 Write (MB/s) | 1568 | 1522 -3% | 721 -54% | 1376 -12% | 2298 47% | 845 -46% | 1480 ? -6% |
| Access Time Read * (ms) | 0.086 | 0.098 | 0.049 | 0.034 | 0.087 | 0.1012 ? | |
| Access Time Write * (ms) | 0.044 | 0.036 18% | 0.095 -116% | 0.036 18% | 0.02 55% | 0.02 55% | 0.03833 ? 13% |
| Score Read (Points) | 1266 | 1581 25% | 1034 -18% | 1046 -17% | 1627 29% | 701 -45% | 1354 ? 7% |
| Score Write (Points) | 1906 | 1825 -4% | 973 -49% | 1714 -10% | 2734 43% | 1101 -42% | 1772 ? -7% |
| Score Total (Points) | 3811 | 4175 10% | 2536 -33% | 3279 -14% | 5184 36% | 2143 -44% | 3781 ? -1% |
| Copy ISO MB/s (MB/s) | 2037 | 1446 -29% | 1284 -37% | 2039 0% | 675 -67% | 1903 ? -7% | |
| Copy Program MB/s (MB/s) | 475.6 | 473.4 0% | 401.9 -15% | 438 -8% | 248.4 -48% | 533 ? 12% | |
| Copy Game MB/s (MB/s) | 1018 | 971 -5% | 1013 0% | 1137 12% | 535 -47% | 1074 ? 6% | |
| Durchschnitt gesamt (Programm / Settings) | -2% /
-0% | -23% /
-25% | 6% /
5% | 31% /
31% | -18% /
-19% | 1% /
1% |
* ... kleinere Werte sind besser
Dauerleistung Lesen: DiskSpd Read Loop, Queue Depth 8
Grafikkarte
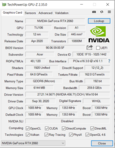
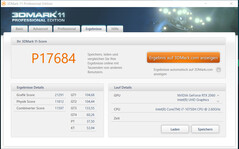
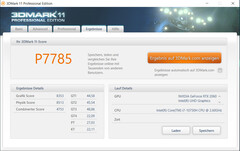
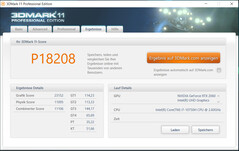
Der GeForce-RTX-2060-Grafikkern stellt ein Einstiegsmodell in die GPU-Oberklasse dar. Er kann auf schnellen GDDR6-Grafikspeicher (6.144 MB) zurückgreifen. Die Resultate in den 3D-Mark-Benchmarks bewegen sich auf einem normalen Niveau für die RTX-2060-GPU. Das Predator-Sense-GPU-Profil "Extrem" bewirkt nur einen leichten Anstieg der Leistung. Der im Prozessor integrierte UHD-Graphics-630-Chip ist aktiv und das Notebook arbeitet mit Nvidias Umschaltgrafiklösung Optimus.
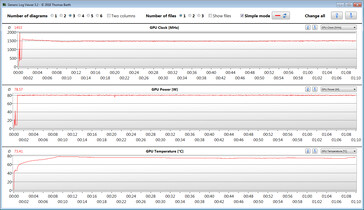
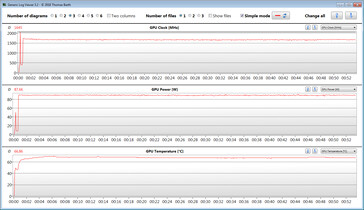
Nvidia sieht für diese DirectX-12-GPU einen Taktbereich zwischen 1.005 MHz (Basis) und 1.350 MHz (Boost) vor. Höhere Geschwindigkeiten sind machbar, wenn die GPU eine festgelegte Temperatur- und/oder Energieschwelle nicht erreicht. Das Maximum liegt bei 2.032 MHz. Der Witcher-3-Test wird mit einer Durchschnittsgeschwindigkeit von 1.453 MHz bzw. 1.645 MHz (GPU-Profil: Extrem) durchlaufen.
| 3DMark 11 Performance | 17684 Punkte | |
| 3DMark Cloud Gate Standard Score | 36435 Punkte | |
| 3DMark Fire Strike Score | 14732 Punkte | |
| 3DMark Time Spy Score | 6011 Punkte | |
Hilfe | ||
| 3DMark 11 - 1280x720 Performance GPU | |
| Durchschnitt der Klasse Gaming (16033 - 80022, n=127, der letzten 2 Jahre) | |
| Dell G5 15 SE 5505 P89F | |
| Acer Predator Helios 300 PH315-53-77N5 (Extrem) | |
| Aorus 5 KB | |
| Schenker XMG Core 15 GK5NR0O | |
| Asus TUF Gaming A15 FA506IV-HN172 | |
| Durchschnittliche NVIDIA GeForce RTX 2060 Mobile (19143 - 24662, n=40) | |
| Acer Predator Helios 300 PH315-53-77N5 | |
| Acer Predator Helios 300 PH315-52-79TY | |
| HP Pavilion Gaming 15-ec1177ng | |
| MSI Bravo 15 A4DCR | |
Gaming Performance
Die verbaute CPU-GPU-Kombination kann alle aktuellen Spiele flüssig auf den Bildschirm bringen. Dabei können meistens Full-HD-Auflösungen und hohe bis maximale Qualitätseinstellungen gewählt werden. Höhere Auflösungen (hierfür müsste ein entsprechender Monitor angestöpselt werden) erfordern ein Absenken des Qualitätsniveaus. Das GPU-Profil "Extrem" bewirkt nur einen leichten Anstieg der Bildwiederholraten (siehe Vergleichsdiagramm)
Der im Single-Channel-Modus laufende Arbeitsspeicher ist dafür verantwortlich, dass einige Spiele bei niedrigen Settings deutlich geringere Bildwiederholraten erreichen als auf vergleichbar ausgestatteten Notebooks. Ein zweites Arbeitsspeichermodul (= Dual-Channel-Modus aktiv) würde für Besserung sorgen.
| Shadow of the Tomb Raider | |
| 1920x1080 Highest Preset AA:T | |
| Durchschnitt der Klasse Gaming (131 - 212, n=2, der letzten 2 Jahre) | |
| Acer Predator Helios 300 PH317-54-75G8 | |
| Aorus 7 KB | |
| Acer Predator Helios 300 PH315-53-77N5 (Extrem) | |
| Durchschnittliche NVIDIA GeForce RTX 2060 Mobile (54 - 86, n=22) | |
| Acer Predator Helios 300 PH315-53-77N5 | |
| Dell G5 15 SE 5505 P89F | |
| MSI Bravo 15 A4DCR | |
| 1280x720 Lowest Preset | |
| Dell G5 15 SE 5505 P89F | |
| Aorus 7 KB | |
| Durchschnittliche NVIDIA GeForce RTX 2060 Mobile (88 - 133, n=19) | |
| Acer Predator Helios 300 PH317-54-75G8 | |
| MSI Bravo 15 A4DCR | |
| Acer Predator Helios 300 PH315-53-77N5 | |
| Serious Sam 4 - 1920x1080 Ultra (DX12) AA:2xMS | |
| Acer Predator Helios 300 PH315-53-77N5 (Extrem) | |
| Acer Predator Helios 300 PH317-54-75G8 | |
| Aorus 7 KB | |
| Durchschnittliche NVIDIA GeForce RTX 2060 Mobile (50.3 - 63.3, n=6) | |
| Acer Predator Helios 300 PH315-53-77N5 | |
| Horizon Zero Dawn - 1920x1080 Ultimate Quality | |
| Durchschnitt der Klasse Gaming (n=1der letzten 2 Jahre) | |
| Acer Predator Helios 300 PH317-54-75G8 | |
| Acer Predator Helios 300 PH315-53-77N5 (Extrem) | |
| Durchschnittliche NVIDIA GeForce RTX 2060 Mobile (54 - 67, n=6) | |
| Acer Predator Helios 300 PH315-53-77N5 | |
| Aorus 7 KB | |
| HP Pavilion Gaming 15-ec1177ng | |
| Mafia Definitive Edition - 1920x1080 High Preset | |
| Aorus 7 KB | |
| Durchschnittliche NVIDIA GeForce RTX 2060 Mobile (60.2 - 76.1, n=4) | |
| Acer Predator Helios 300 PH317-54-75G8 | |
| Acer Predator Helios 300 PH315-53-77N5 | |
| Star Wars Squadrons - 1920x1080 Ultra Preset | |
| Durchschnittliche NVIDIA GeForce RTX 2060 Mobile (156.2 - 181, n=3) | |
| Acer Predator Helios 300 PH317-54-75G8 | |
| Acer Predator Helios 300 PH315-53-77N5 | |
Um zu überprüfen, ob die Bildwiederholraten über einen längeren Zeitraum weitgehend konstant bleiben, lassen wir das Spiel "The Witcher 3" für etwa 60 Minuten mit Full-HD-Auflösung und maximalen Qualitätseinstellungen laufen. Die Spielfigur wird nicht bewegt. Ein Einbruch der Bildwiederholraten ist nicht festzustellen.
| min. | mittel | hoch | max. | |
|---|---|---|---|---|
| BioShock Infinite (2013) | 307.3 | 270.5 | 249.6 | 130.9 |
| The Witcher 3 (2015) | 226.4 | 172.4 | 110.7 | 64.8 |
| Shadow of the Tomb Raider (2018) | 88 | 80 | 76 | 71 |
| Doom Eternal (2020) | 171 | 126.9 | 117.9 | 114 |
| Gears Tactics (2020) | 201.6 | 128.5 | 93.4 | 66.5 |
| Horizon Zero Dawn (2020) | 106 | 72 | 67 | 57 |
| Serious Sam 4 (2020) | 113 | 75.7 | 69.9 | 56.6 |
| Mafia Definitive Edition (2020) | 94.3 | 62.5 | 60.2 | |
| Star Wars Squadrons (2020) | 262.1 | 184.5 | 172.8 | 156.2 |
Emissionen - Unter Last wird das Helios 300 laut
Geräuschemissionen
Die Lüfter lassen im Leerlauf nicht viel von sich hören. Entweder stehen sie still oder arbeiten mit sehr niedrigen Geschwindigkeiten. Damit ist es unter Last vorbei. So registrieren wir maximale Schalldruckpegel von 56 dB(A) (Stresstest) bzw. 53,1 dB(A) (Witcher-3-Test).
Lautstärkediagramm
| Idle |
| 25.2 / 25.2 / 25.2 dB(A) |
| Last |
| 43.5 / 56 dB(A) |
 | ||
30 dB leise 40 dB(A) deutlich hörbar 50 dB(A) störend |
||
min: | ||
| Acer Predator Helios 300 PH315-53-77N5 i7-10750H, GeForce RTX 2060 Mobile | Acer Predator Helios 300 PH315-52-79TY i7-9750H, GeForce GTX 1660 Ti Mobile | Dell G5 15 SE 5505 P89F R7 4800H, Radeon RX 5600M | Aorus 5 KB i7-10750H, GeForce RTX 2060 Mobile | Schenker XMG Core 15 GK5NR0O R7 4800H, GeForce RTX 2060 Mobile | Asus TUF Gaming A15 FA506IV-HN172 R7 4800H, GeForce RTX 2060 Mobile | Durchschnittliche NVIDIA GeForce RTX 2060 Mobile | Durchschnitt der Klasse Gaming | |
|---|---|---|---|---|---|---|---|---|
| Geräuschentwicklung | -8% | 1% | -11% | -4% | -7% | -12% | -4% | |
| aus / Umgebung * (dB) | 25.2 | 30.2 -20% | 28 -11% | 25 1% | 25 1% | 30.2 -20% | 27.9 ? -11% | 24.2 ? 4% |
| Idle min * (dB) | 25.2 | 31 -23% | 28 -11% | 26 -3% | 26 -3% | 30.2 -20% | 29 ? -15% | 26 ? -3% |
| Idle avg * (dB) | 25.2 | 31 -23% | 28 -11% | 30 -19% | 30 -19% | 30.2 -20% | 30 ? -19% | 27.6 ? -10% |
| Idle max * (dB) | 25.2 | 31 -23% | 28 -11% | 34 -35% | 32 -27% | 30.2 -20% | 33 ? -31% | 30.2 ? -20% |
| Last avg * (dB) | 43.5 | 41.5 5% | 28 36% | 53 -22% | 46 -6% | 40 8% | 44 ? -1% | 43.1 ? 1% |
| Witcher 3 ultra * (dB) | 53.1 | 46.7 12% | 50.6 5% | 51 4% | 48 10% | 49 8% | ||
| Last max * (dB) | 56 | 46.9 16% | 50.6 10% | 56 -0% | 48 14% | 49 12% | 51.6 ? 8% | 53.9 ? 4% |
* ... kleinere Werte sind besser
Temperatur
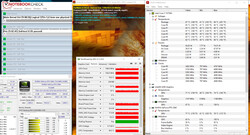
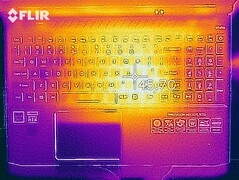
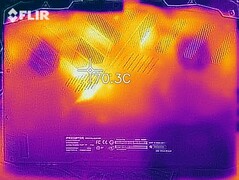
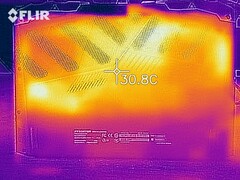
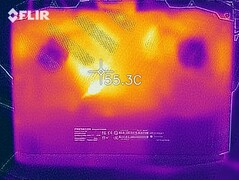
Den Stresstest (Prime95 und Furmark laufen für mindestens eine Stunde) durchlaufen CPU bzw. GPU mit 3 bis 3,5 GHz bzw. 1,2 bis 1,4 GHz. Im Akkubetrieb liegen die Taktraten bei 800 MHz (CPU) bzw. 1.380 MHz (GPU). Der Stresstest stellt ein Extremszenario dar. Wir überprüfen mit diesem Test, ob das System auch bei voller Auslastung stabil läuft.
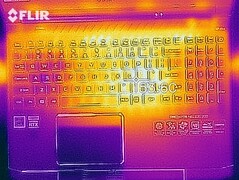
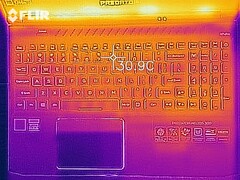
Während des Stresstests registrieren wir an einigen Messpunkten Temperaturen im 40-Grad-Celsius-Bereich. Deutlich geringer fällt die Erwärmung bei der Durchführung des Witcher-3-Tests aus. Im Alltagsbetrieb liegen die Werte im grünen Bereich.
(±) Die maximale Temperatur auf der Oberseite ist 44.1 °C. Im Vergleich liegt der Klassendurchschnitt bei 40.4 °C (von 21.2 bis 68.8 °C für die Klasse Gaming).
(-) Auf der Unterseite messen wir eine maximalen Wert von 48 °C (im Vergleich zum Durchschnitt von 43.3 °C).
(+) Ohne Last messen wir eine durchschnittliche Temperatur von 24.1 °C auf der Oberseite. Der Klassendurchschnitt erreicht 33.9 °C.
(±) Beim längeren Spielen von The Witcher 3 erhitzt sich das Gerät durchschnittlich auf 33.9 °C. Der Durchschnitt der Klasse ist derzeit 33.9 °C.
(+) Die Handballen und der Touchpad-Bereich sind mit gemessenen 31.9 °C kühler als die typische Hauttemperatur und fühlen sich dadurch kühl an.
(-) Die durchschnittliche Handballen-Temperatur anderer getesteter Geräte war 28.8 °C (-3.1 °C).
| Acer Predator Helios 300 PH315-53-77N5 i7-10750H, GeForce RTX 2060 Mobile | Acer Predator Helios 300 PH315-52-79TY i7-9750H, GeForce GTX 1660 Ti Mobile | Dell G5 15 SE 5505 P89F R7 4800H, Radeon RX 5600M | Aorus 5 KB i7-10750H, GeForce RTX 2060 Mobile | Schenker XMG Core 15 GK5NR0O R7 4800H, GeForce RTX 2060 Mobile | Asus TUF Gaming A15 FA506IV-HN172 R7 4800H, GeForce RTX 2060 Mobile | Durchschnittliche NVIDIA GeForce RTX 2060 Mobile | Durchschnitt der Klasse Gaming | |
|---|---|---|---|---|---|---|---|---|
| Hitze | -3% | -18% | -19% | -22% | -4% | -17% | -16% | |
| Last oben max * (°C) | 44.1 | 52 -18% | 53 -20% | 50 -13% | 51 -16% | 42.9 3% | 47.2 ? -7% | 45.7 ? -4% |
| Last unten max * (°C) | 48 | 46.3 4% | 57.6 -20% | 49 -2% | 64 -33% | 49.9 -4% | 52.7 ? -10% | 48.5 ? -1% |
| Idle oben max * (°C) | 25.2 | 24.8 2% | 27.4 -9% | 35 -39% | 29 -15% | 27.8 -10% | 31 ? -23% | 31.5 ? -25% |
| Idle unten max * (°C) | 25.7 | 25.4 1% | 31 -21% | 31 -21% | 32 -25% | 27 -5% | 32.9 ? -28% | 34.6 ? -35% |
* ... kleinere Werte sind besser
Lautsprecher
Die Stereolautsprecher haben ihren Platz im vorderen Bereich der Geräteunterseite gefunden. Sie produzieren einen ordentlichen Klang, dem der Bass fehlt. Für ein besseres Klangerlebnis muss zu Kopfhörern oder externen Lautsprechern gegriffen werden.
Acer Predator Helios 300 PH315-53-77N5 Audio Analyse
(±) | Mittelmäßig laut spielende Lautsprecher (74.4 dB)
Bass 100 - 315 Hz
(-) | kaum Bass - 20.9% niedriger als der Median
(±) | durchschnittlich lineare Bass-Wiedergabe (10.1% Delta zum Vorgänger)
Mitteltöne 400 - 2000 Hz
(±) | zu hohe Mitten, vom Median 5.7% abweichend
(±) | Linearität der Mitten ist durchschnittlich (10.3% Delta zum Vorgänger)
Hochtöne 2 - 16 kHz
(+) | ausgeglichene Hochtöne, vom Median nur 1.3% abweichend
(+) | sehr lineare Hochtöne (4.7% Delta zum Vorgänger)
Gesamt im hörbaren Bereich 100 - 16.000 Hz
(±) | hörbarer Bereich ist durchschnittlich linear (18.2% Abstand zum Median)
Im Vergleich zu allen Geräten derselben Klasse
» 57% aller getesteten Geräte dieser Klasse waren besser, 8% vergleichbar, 35% schlechter
» Das beste Gerät hat einen Delta-Wert von 6%, durchschnittlich ist 18%, das schlechteste Gerät hat 132%
Im Vergleich zu allen Geräten im Test
» 38% aller getesteten Geräte waren besser, 8% vergleichbar, 54% schlechter
» Das beste Gerät hat einen Delta-Wert von 4%, durchschnittlich ist 24%, das schlechteste Gerät hat 134%
Energieverwaltung - Die Akkulaufzeiten des PH315 fallen akzeptabel aus
Energieaufnahme
Im Leerlauf registrieren wir eine maximale Leistungsaufnahme von 19,8 Watt. Stresstest bzw. Witcher-3-Test lassen den Bedarf auf 177 Watt bzw. 127 Watt ansteigen. Die Nennleistung des Netzteils beträgt 230 Watt.
| Aus / Standby | |
| Idle | |
| Last |
|
Legende:
min: | |
| Acer Predator Helios 300 PH315-53-77N5 i7-10750H, GeForce RTX 2060 Mobile | Acer Predator Helios 300 PH315-52-79TY i7-9750H, GeForce GTX 1660 Ti Mobile | Dell G5 15 SE 5505 P89F R7 4800H, Radeon RX 5600M | Aorus 5 KB i7-10750H, GeForce RTX 2060 Mobile | Schenker XMG Core 15 GK5NR0O R7 4800H, GeForce RTX 2060 Mobile | Asus TUF Gaming A15 FA506IV-HN172 R7 4800H, GeForce RTX 2060 Mobile | Durchschnittliche NVIDIA GeForce RTX 2060 Mobile | Durchschnitt der Klasse Gaming | |
|---|---|---|---|---|---|---|---|---|
| Stromverbrauch | -115% | -10% | -38% | -54% | -7% | -71% | -101% | |
| Idle min * (Watt) | 2.9 | 17.2 -493% | 6.5 -124% | 8 -176% | 12 -314% | 5.4 -86% | 11.5 ? -297% | 13.8 ? -376% |
| Idle avg * (Watt) | 13.2 | 22.6 -71% | 10.6 20% | 12 9% | 14 -6% | 10 24% | 16.5 ? -25% | 19.6 ? -48% |
| Idle max * (Watt) | 19.8 | 25.5 -29% | 11 44% | 21 -6% | 20 -1% | 10.5 47% | 23.7 ? -20% | 25.8 ? -30% |
| Last avg * (Watt) | 105 | 88 16% | 84.1 20% | 128 -22% | 103 2% | 135 -29% | 107.5 ? -2% | 110.4 ? -5% |
| Witcher 3 ultra * (Watt) | 127 | 152.9 -20% | 138 -9% | 125 2% | 144 -13% | |||
| Last max * (Watt) | 177 | 177 -0% | 180.4 -2% | 217 -23% | 193 -9% | 147 17% | 199.7 ? -13% | 258 ? -46% |
* ... kleinere Werte sind besser
Akkulaufzeit
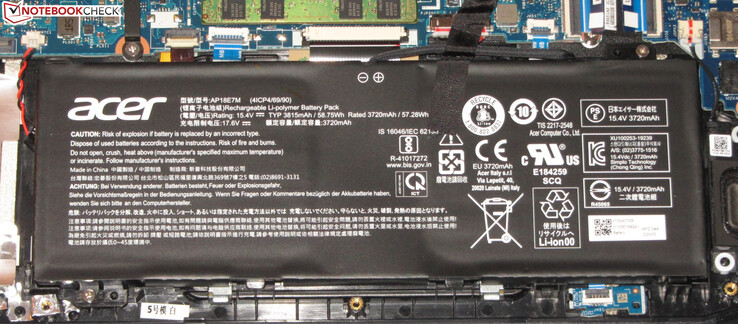
Das Acer-Notebook erreicht in unserem WLAN-Test (Aufruf von Webseiten mittels eines Skripts) bzw. Videotest (Kurzfilm Big Buck Bunny (H.264-Kodierung, FHD) läuft in einer Schleife) Laufzeiten von 4:40 h bzw. 5:38 h. Während beider Tests sind die Energiesparfunktionen deaktiviert und die Displayhelligkeit wird auf etwa 150 cd/m² geregelt. Zur Durchführung des Videotests werden zudem die Funkmodule abgeschaltet.
| Acer Predator Helios 300 PH315-53-77N5 i7-10750H, GeForce RTX 2060 Mobile, 58.7 Wh | Acer Predator Helios 300 PH315-52-79TY i7-9750H, GeForce GTX 1660 Ti Mobile, 58.75 Wh | Dell G5 15 SE 5505 P89F R7 4800H, Radeon RX 5600M, 51 Wh | Aorus 5 KB i7-10750H, GeForce RTX 2060 Mobile, 48.96 Wh | Schenker XMG Core 15 GK5NR0O R7 4800H, GeForce RTX 2060 Mobile, 62 Wh | Asus TUF Gaming A15 FA506IV-HN172 R7 4800H, GeForce RTX 2060 Mobile, 48 Wh | Durchschnitt der Klasse Gaming | |
|---|---|---|---|---|---|---|---|
| Akkulaufzeit | -38% | 8% | -18% | -1% | 7% | 14% | |
| Idle (h) | 10.4 | 5 -52% | 11.2 8% | 9 -13% | 7.8 -25% | 9.8 -6% | 9.23 ? -11% |
| H.264 (h) | 5.6 | 3.4 -39% | 6.2 11% | 5.4 -4% | 7.93 ? 42% | ||
| WLAN (h) | 4.7 | 3.5 -26% | 6.2 32% | 4.8 2% | 5.9 26% | 6.2 32% | 6.73 ? 43% |
| Last (h) | 1.8 | 1.2 -33% | 1.5 -17% | 1 -44% | 1.5 -17% | 1.9 6% | 1.472 ? -18% |
Pro
Contra
Fazit
Acers Gaming-Notebook bringt dank Core-i7-10750H-Prozessor und GeForce-RTX-2060-Grafikkern alle aktuellen Spiele flüssig auf den Bildschirm. Dabei können in der Regel die Full-HD-Auflösung und hohe bis maximale Qualitätseinstellungen verwendet werden. Die GPU-Leistung kann bei Bedarf gesteigert werden.
Das Acer Predator Helios 300 PH315-53 stellt ein weitgehend rundes Gaming-Notebook dar, das noch Luft nach oben bietet.
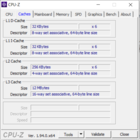
Der Hardware stehen 16 GB Arbeitsspeicher (1x 16 GB, Single-Channel-Modus) zur Seite. Das Notebook kann bzw. sollte um ein zweites Speichermodul erweitert werden, um so den Dual-Channel-Modus zu aktivieren. Dieser bewirkt einen leichten Leistungsanstieg. Das Speicherplatzangebot (512 GB, NVMe-SSD) fällt für ein Gaming-Notebook nicht üppig aus. Es könnte eine zweite NVMe-SSD nachgerüstet werden. Das Predator unterstützt zudem RAID 0.
Der Bildschirm (FHD, IPS, 144 Hz) bietet stabile Blickwinkel, eine matte Oberfläche, einen guten Kontrast, kurze Reaktionszeiten und eine ordentliche Farbstellung. Die Maximalhelligkeit dürfte höher ausfallen. Die Tastatur (beleuchtet) hat sich als alltagstauglich erwiesen. Die Akkulaufzeiten fallen akzeptabel aus. Einen Thunderbolt-3-Anschluss hat das Helios nicht zu bieten. Es gibt nur einen Typ-C-USB-3.2-Gen-2-Steckplatz, der weder Displayport noch Power Delivery unterstützt.
Das Predator hat grundsätzlich einen guten Eindruck hinterlassen. In Sachen Speicher ist die uns vorliegende Ausstattungsvariante aber nicht optimal aufgestellt. Es können Folgekosten für ein zweites Arbeitsspeichermodul bzw. eine zweite NVMe-SSD entstehen. Besteht grundsätzlich Interesse am Predator, empfiehlt sich der Kauf einer besser ausgestatteten Variante.
Acer Predator Helios 300 PH315-53-77N5
- 30.10.2020 v7 (old)
Sascha Mölck


