Notebookcheck Logo
Teaser

Workstation Laptops haben eine schlechte Akkulaufzeit? Von wegen! Lenovo ThinkPad P1 Gen 9 Test

ThinkPad P1 Marathon Edition.

Bei älteren Windows-Workstation-Laptops war die Leistung hoch, die Akkulaufzeit jedoch kurz. Anders beim neuen Lenovo ThinkPad P1 Gen 9: Dank Intel Panther Lake hält dieser leistungsstarke 16-Zoll-Premium-Laptop 22 Stunden durch, obwohl er auch mit der Nvidia RTX Pro 2000 Blackwell ausgestattet ist.
Benjamin Herzig 👁 (übersetzt von Benjamin Herzig) Veröffentlicht am 🇺🇸 🇪🇸 ...
Business AI Workstation Windows Wi-Fi 7 ThinkPad Thunderbolt Laptop / Notebook Intel Panther Lake Nvidia

Fazit: 22 Std. Akkulaufzeit sind für das ThinkPad P1 außergewöhnlich

Die Akkulaufzeit war schon immer ein heikles Thema bei der Lenovo ThinkPad P1-Reihe, Lenovos Premium-Workstation-Laptops im dünnen und leichten Format. Diese Laptop-Serie setzte stets auf leistungsstarke Intel-Prozessoren der H-Klasse sowie dedizierte Nvidia-GPUs, die beide eine hohe Leistung garantierten - aber auch eine ziemlich schwache Akkulaufzeit. Trotz großer Akkus erreichten die älteren ThinkPad P1-Modelle in unserem WLAN-Websurfing-Test (150 cd/m²) stets nur zwischen fünf und zehn Stunden Akkulaufzeit. Anders das neue Lenovo ThinkPad P1 Gen 9: Mit einer Panther-Lake-CPU der H-Klasse und einer Nvidia RTX Pro 2000 Blackwell schaffte es dennoch über 22 Stunden Akkulaufzeit, hat also wirklich genug Ausdauer für den ganzen Tag.

Download der lizensierten Bewertungsgrafik als SVG / PNG

Damit ist das neue ThinkPad P1 Gen 9 die bislang vielseitigste Version der P1-Serie. Es bietet weiterhin eine sehr starke Leistung, ein äußerst hochwertiges Gehäuse, erstklassige Eingabegeräte sowie eine hervorragende Anschlussauswahl, Aufrüstbarkeit und Konnektivität - sogar 5G ist endlich wieder optional verfügbar. Hier gibt es wenig zu bemängeln - die Gehäusetemperaturen sind unter Last etwas zu hoch, und die Tastatur sollte vom Nutzer repariert werden können. Außerdem bleibt abzuwarten, ob die Akkulaufzeit auch mit den höher auflösenden Displays ebenfalls hervorragend ist. Das einfache WUXGA-Display unseres Testgeräts hat sicherlich zu einer längeren Akkulaufzeit beigetragen.

Pro

+ 22 Std. Akkulaufzeit
+ hochwertiges Gehäuse
+ tolle Eingabegeräte
+ hohe CPU- und GPU-Leistung
+ aufrüstbar (2x SSD, LPCAMM2)
+ Anschlussauswahl inklusive Thunderbolt 5
+ gute Lautsprecher

Contra

- hohe Gehäusetemperaturen unter Last
- Tastatur nicht vom Benutzer reparierbar
- sehr teuer
- dGPU auf 75 W und RTX Pro 2000 beschränkt

Preis und Verfügbarkeit

Im freien Handel geht es beim Lenovo ThinkPad P1 Gen 9 bei rund 3.700 Euro los. Konfiguriert man das ThinkPad P1 G9 etwa unserer Konfiguration entsprechend, muss man aktuell bei Lenovo rund 6.000 Euro bezahlen.

Amazon: Amazon Creators API credentials are incomplete.
Bestpreis 5154 € notebookstore
Lenovo ThinkPad P1 G9, Core Ultra 7 356H, 64GB RAM, 1TB SSD, RTX PRO 2000 Blackwell, DE (21UE000JGE)
2. 5161.81 € Klarsicht IT
3. 5162 € HEINZSOFT
4. 5205.38 € HEINZSOFT (AT)

Spezifikationen

Lenovo ThinkPad P1 Gen 9 21UE000MGE
Prozessor
Intel Core Ultra 7 366H 16c/16t, 4 x 4.8 GHz Intel Cougar Cove P-Core, 8 x 3.8 GHz Intel Darkmont E-Core, 4 x 3.4 GHz Intel Darkmont LP E-Core, 80 W PL2 / Short Burst, 65 W PL1 / Sustained, Panther Lake
Grafikkarte
NVIDIA RTX PRO 2000 Blackwell Generation Laptop - 8 GB VRAM, Kerntakt: 2070 MHz, Speichertakt: 1500 MHz, 75 W TDP ( beinhaltet 60 W Dynamic Boost), GB206, 596.05
RAM
64 GB 
, LPDDR5X-8533, LPCAMM2, dual channel
Bildschirm
16.00 Zoll 16:10, 1920 x 1200 Pixel 142 PPI, N160JCA-GT1, IP LED, spiegelnd: nein, 60 Hz
Mainboard
Intel Panther Lake-H PCH
Massenspeicher
Samsung PM9E1 1 TB MZVLC1T0HFLU, 1024 GB 
, M.2 2280, NVMe PCIe 5.0, 834 GB verfügbar
Soundkarte
Cirrus Logic CS42L43
Anschlüsse
1 USB 3.1 Gen2, 1 Thunderbolt 4, 2 Thunderbolt 5, USB-C Power Delivery (PD), 1 HDMI, 3 DisplayPort, 1 Kensington Lock, Audio Anschlüsse: 3.5mm Audio, Card Reader: SD Express 7.0, 1 Fingerprint Reader
Netzwerk
Intel Wi-Fi 7 BE211 320MHz (a/b/g/n = Wi-Fi 4/ac = Wi-Fi 5/ax = Wi-Fi 6/ Wi-Fi 6E 6 GHz be = Wi-Fi 7), Bluetooth 5.4
Abmessungen
Höhe x Breite x Tiefe (in mm): 21 x 354.4 x 241.2
Akku
90 Wh Lithium-Polymer
Betriebssystem
Microsoft Windows 11 Pro
Kamera
Webcam: 5.0 Mpix w/ThinkShutter & IR
Sonstiges
Lautsprecher: 2 W Stereo, Tastatur: 6 row Chiclet full-size, 1.5mm travel, 140 W GaN USB-C Charger, Lenovo Commercial Vantage, Lenovo AI Now, 36 Monate Garantie
Gewicht
1.947 kg, Netzteil: 419 g
Preis
5300 Euro
Geizhals
Preisvergleich
Geizhals Bestpreis 5154€ (Historischer Bestpreis: 4790€)
Lenovo ThinkPad P1 G9, Core Ultra 7 356H, 64GB RAM, 1TB SSD, RTX PRO 2000 Blackwell, DE (21UE000JGE)
Hinweis: Der Hersteller kann abweichende Bauteile wie Bildschirme, Laufwerke und Speicherriegel mit ähnlichen Spezifikationen unter dem gleichen Modellnamen einsetzen.


Gehäuse, Konnektivität und Eingabegeräte

Lenovo ThinkPad P1 Gen 9

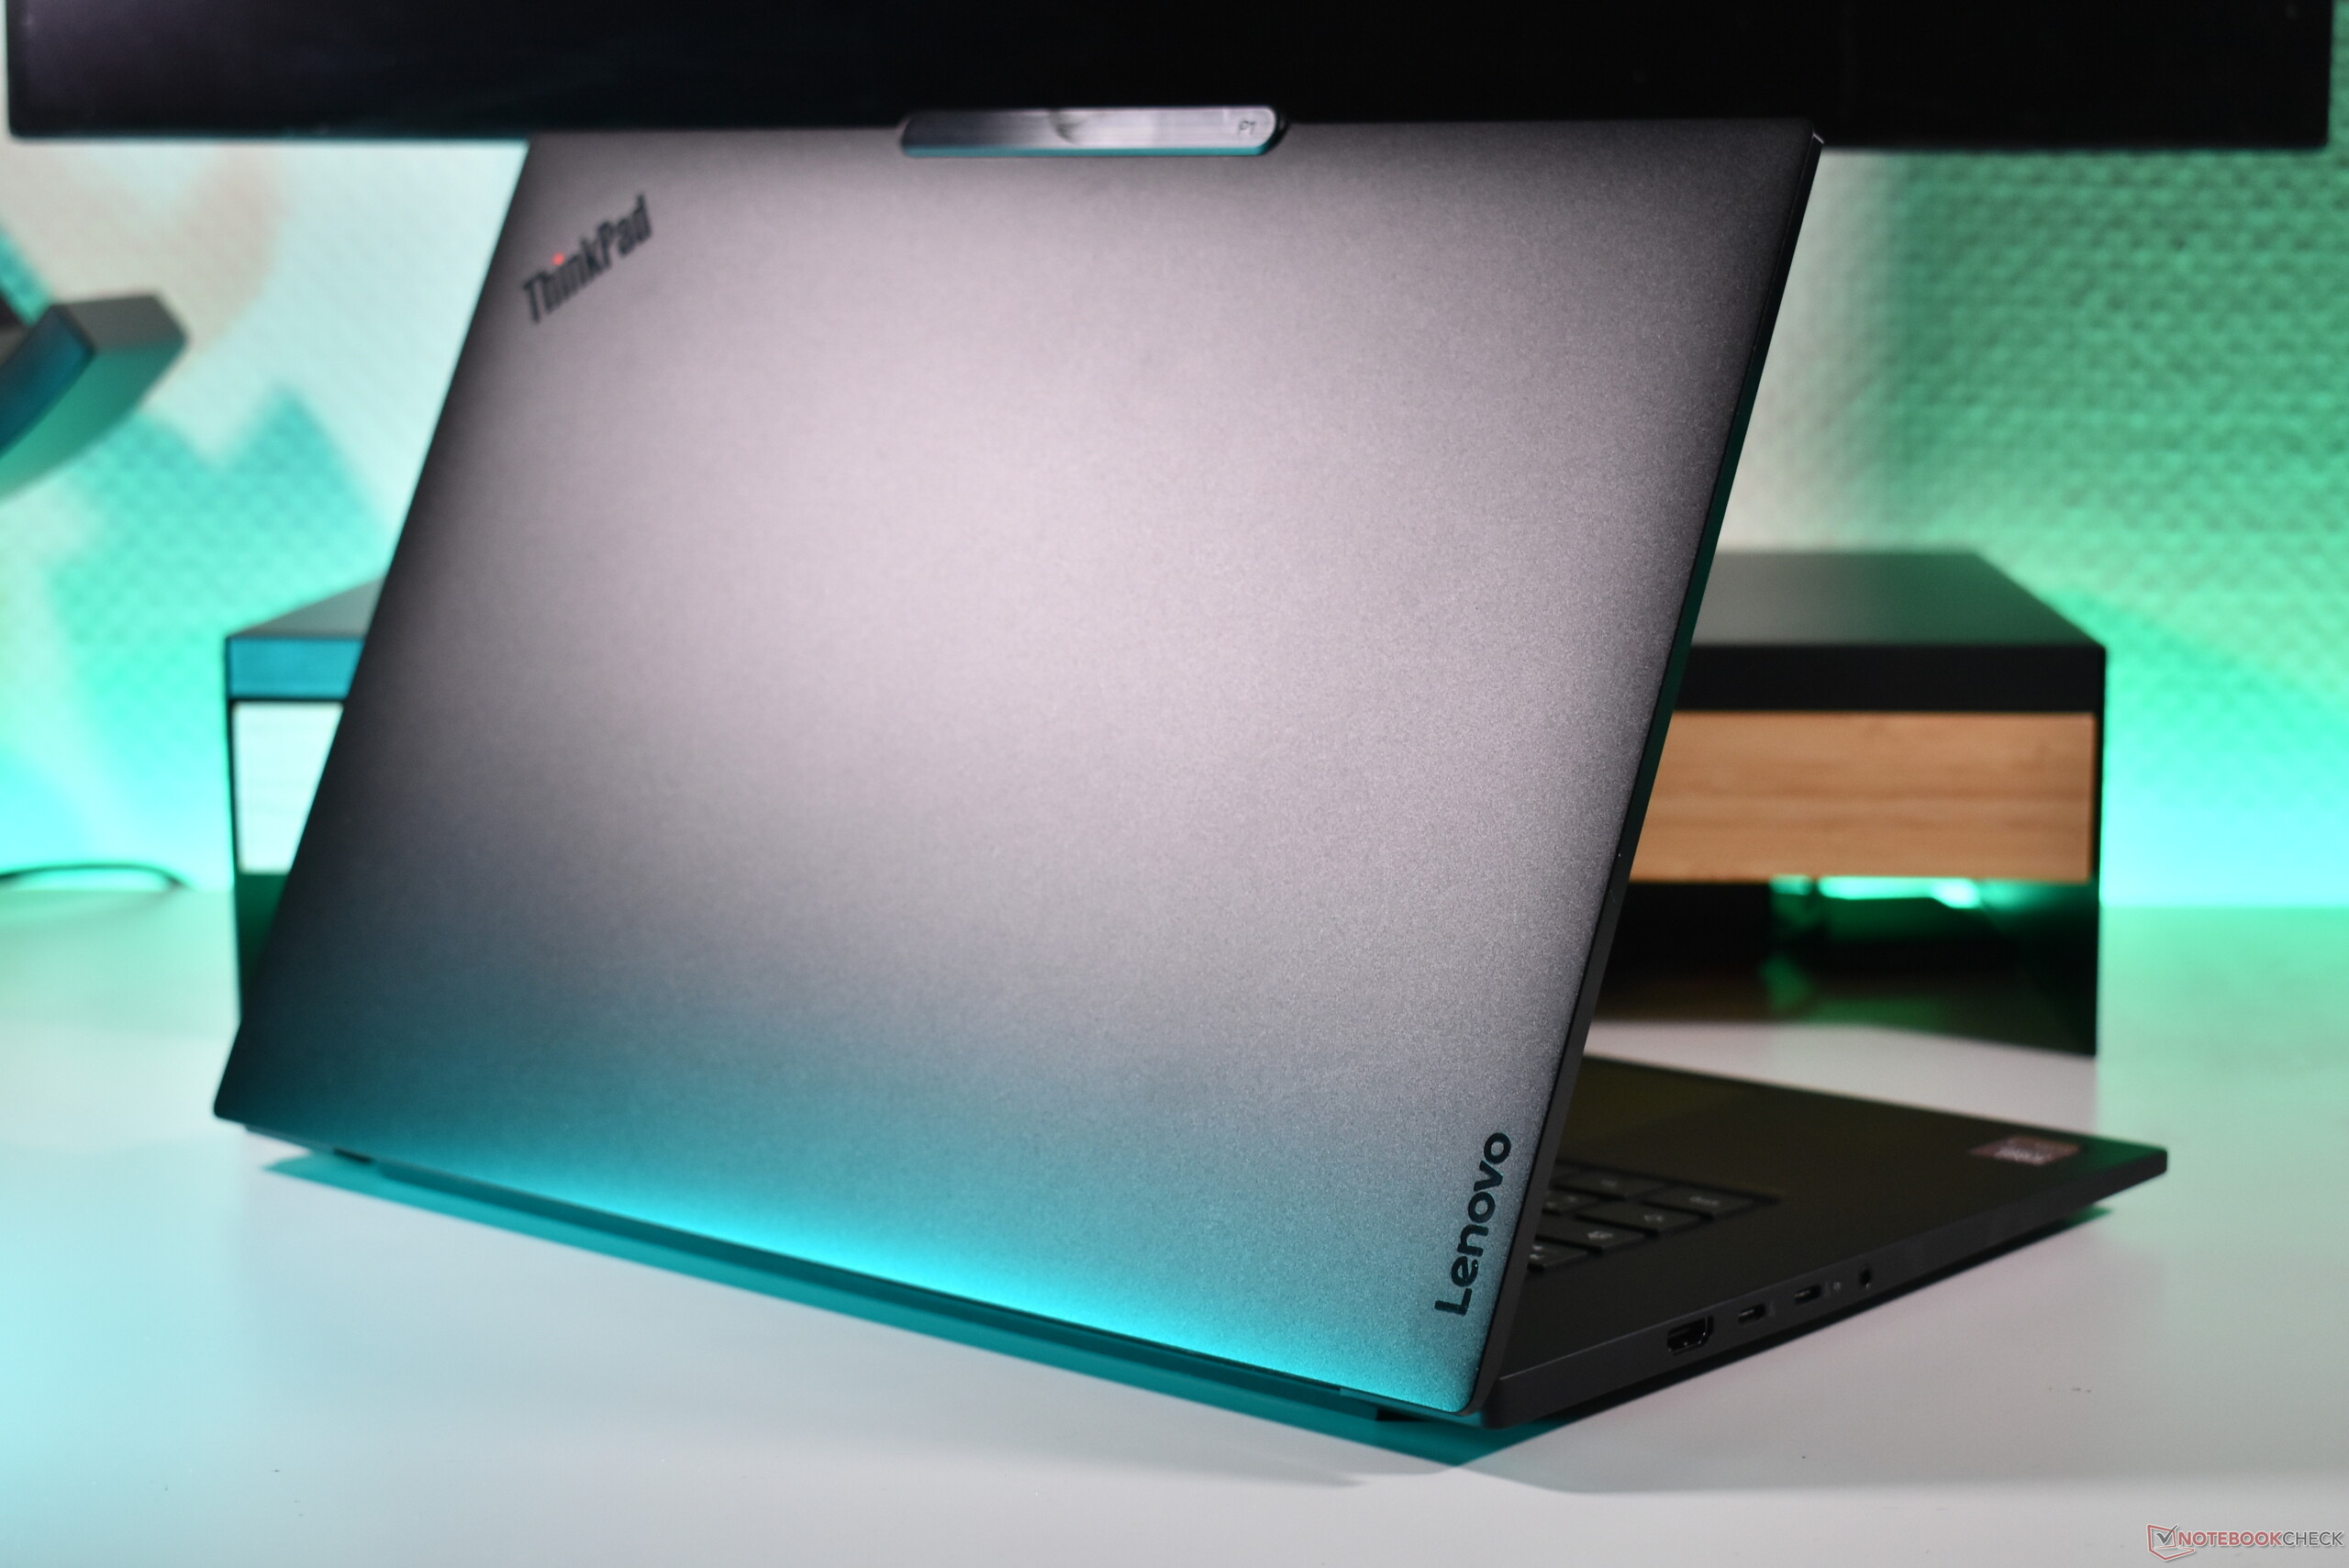
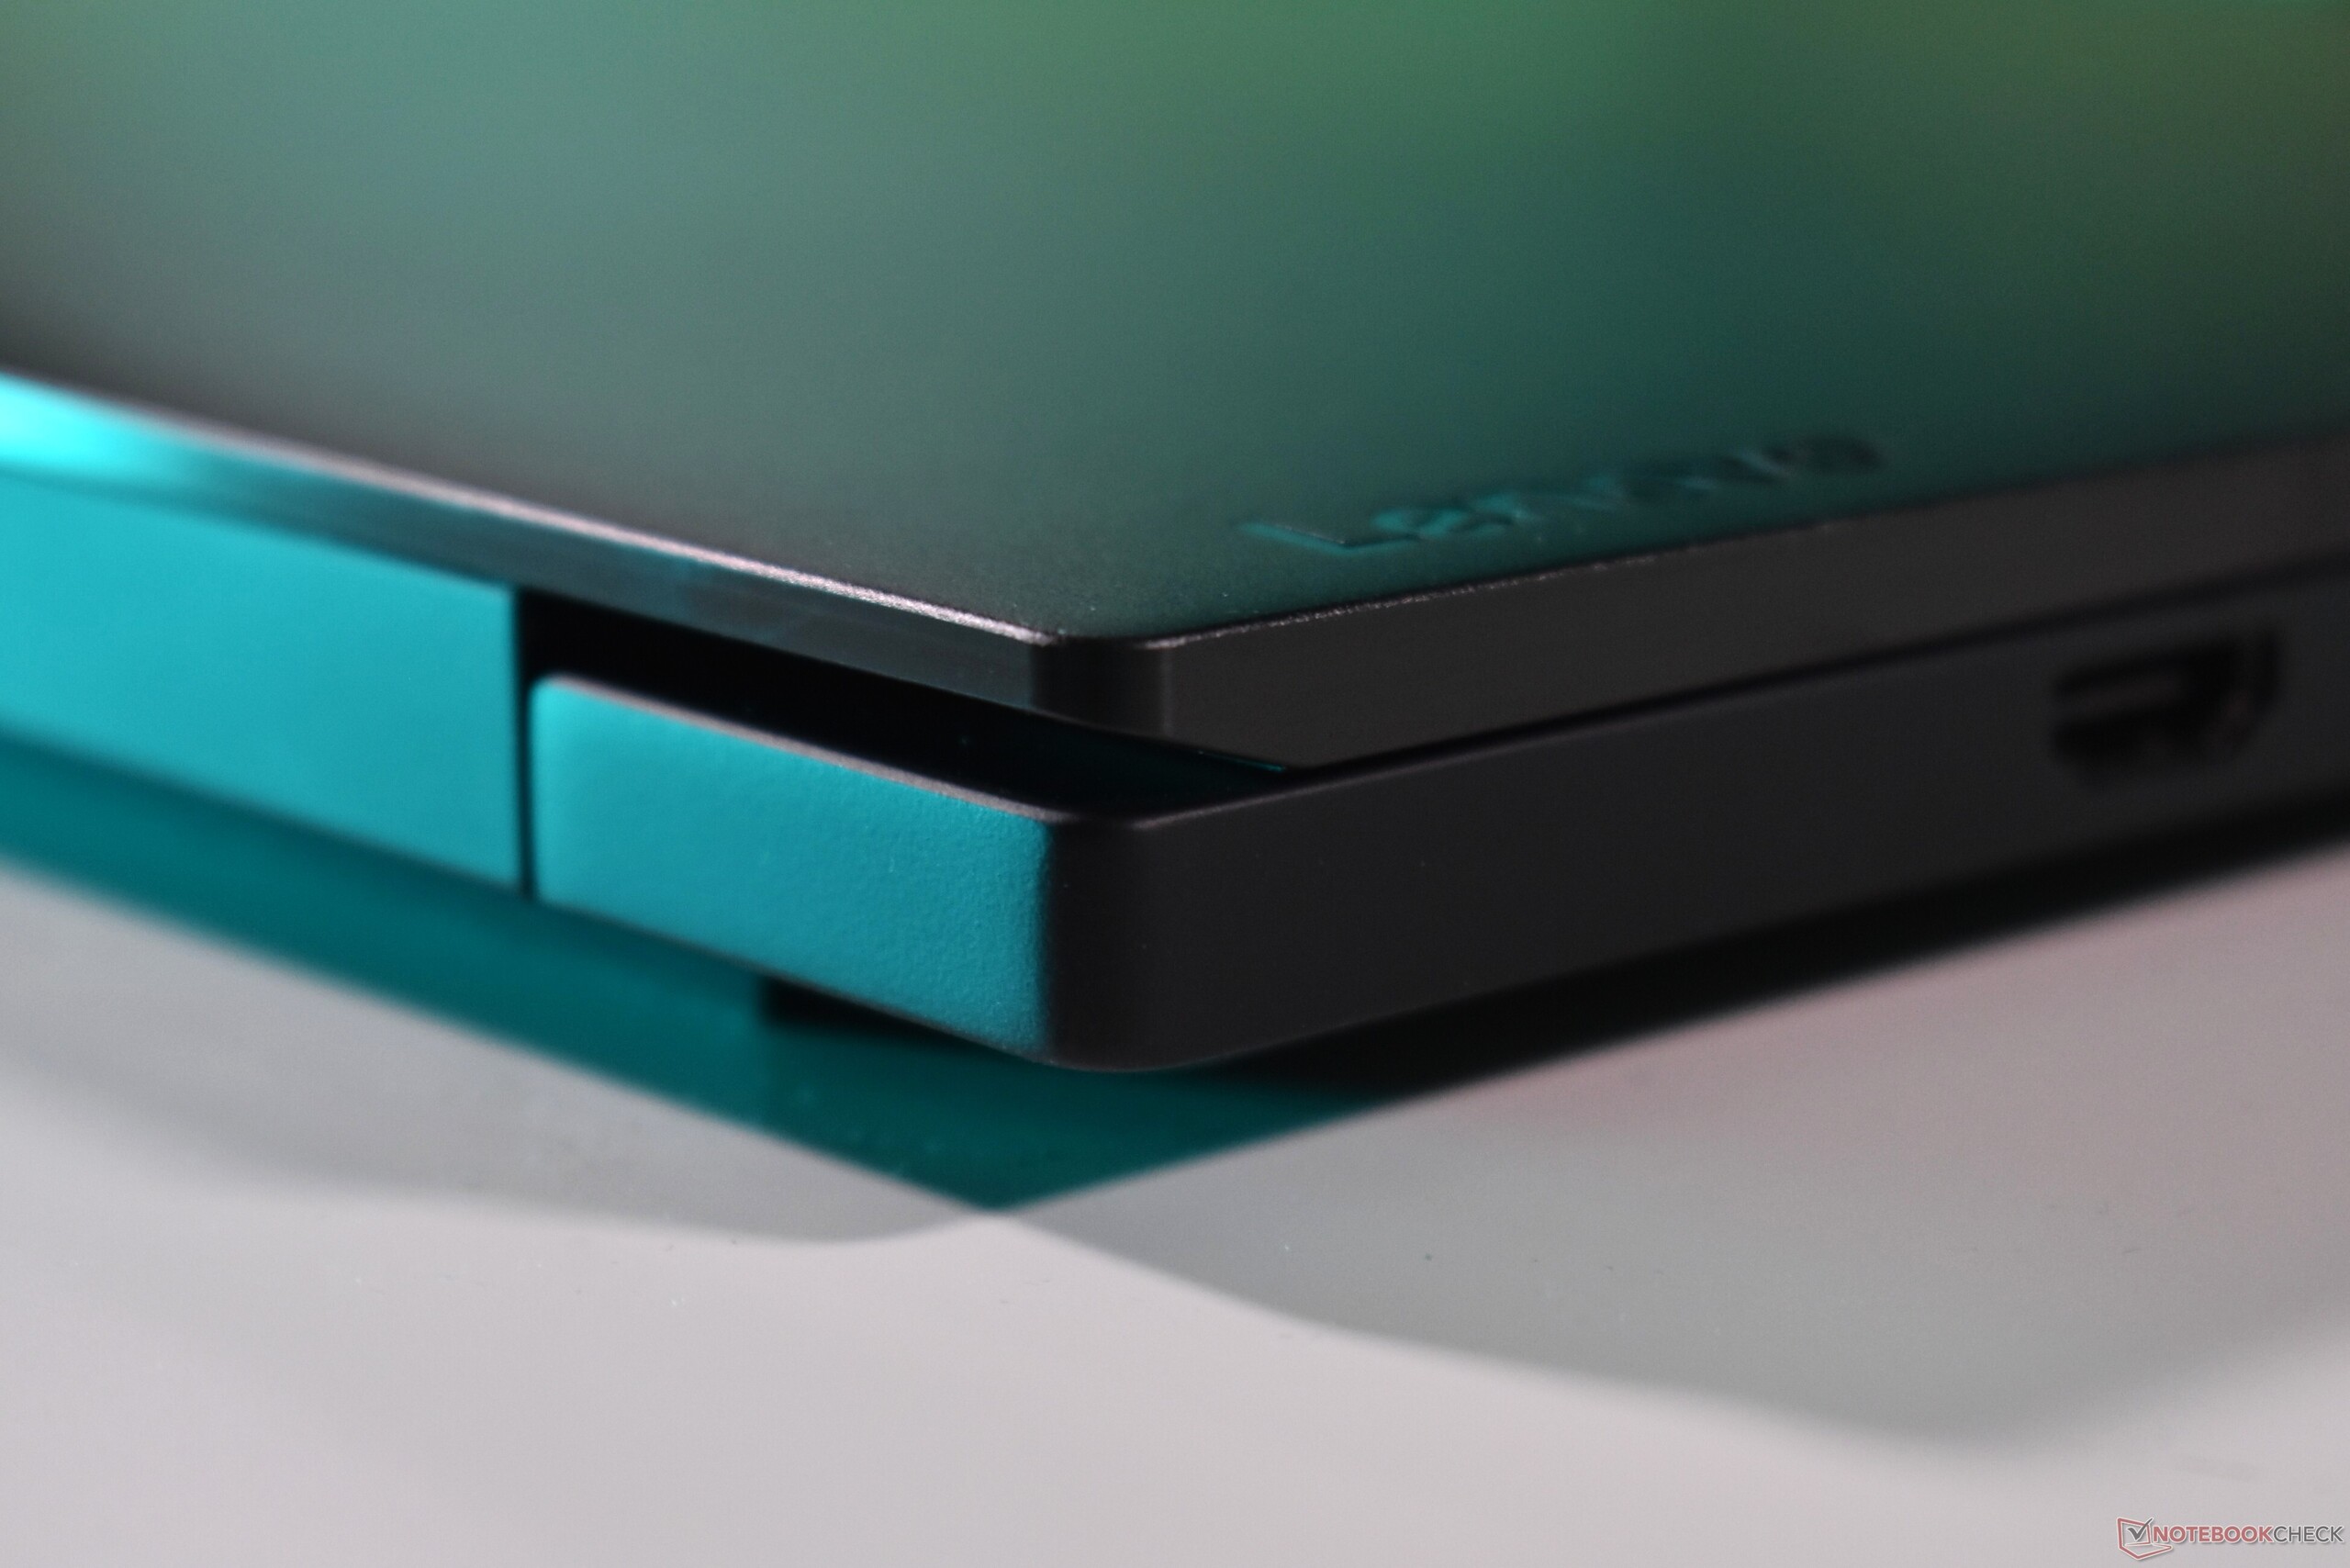
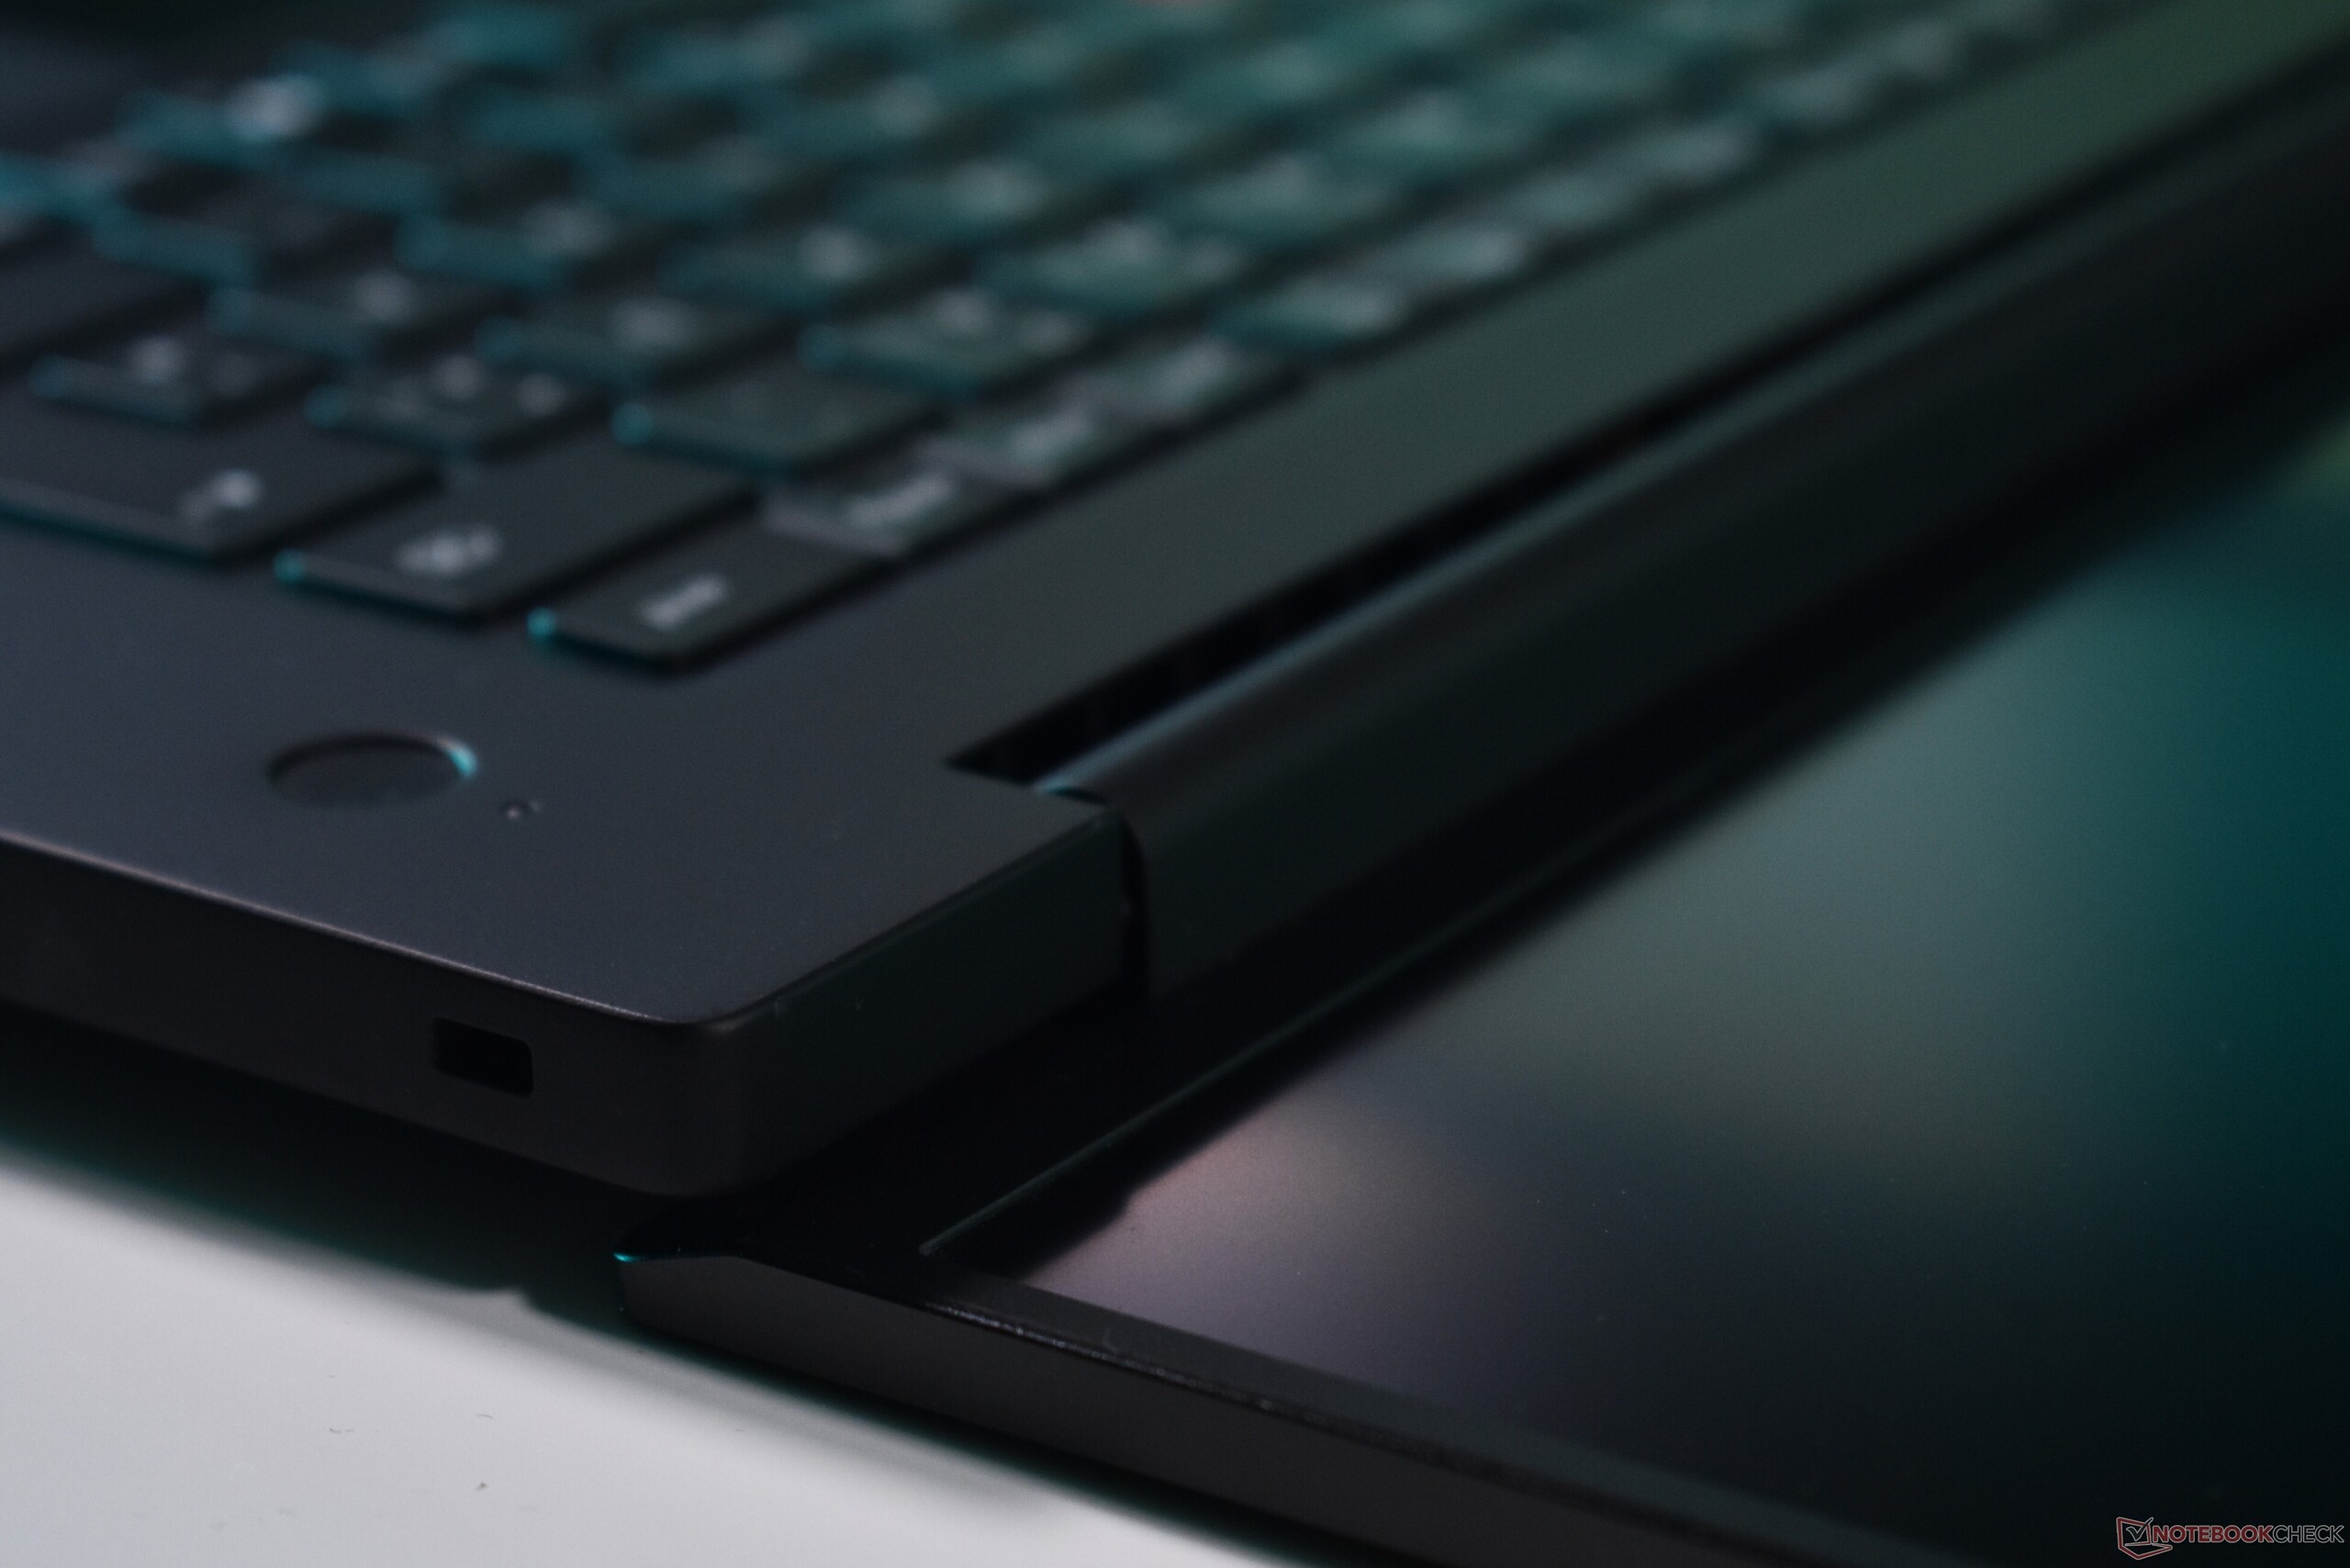
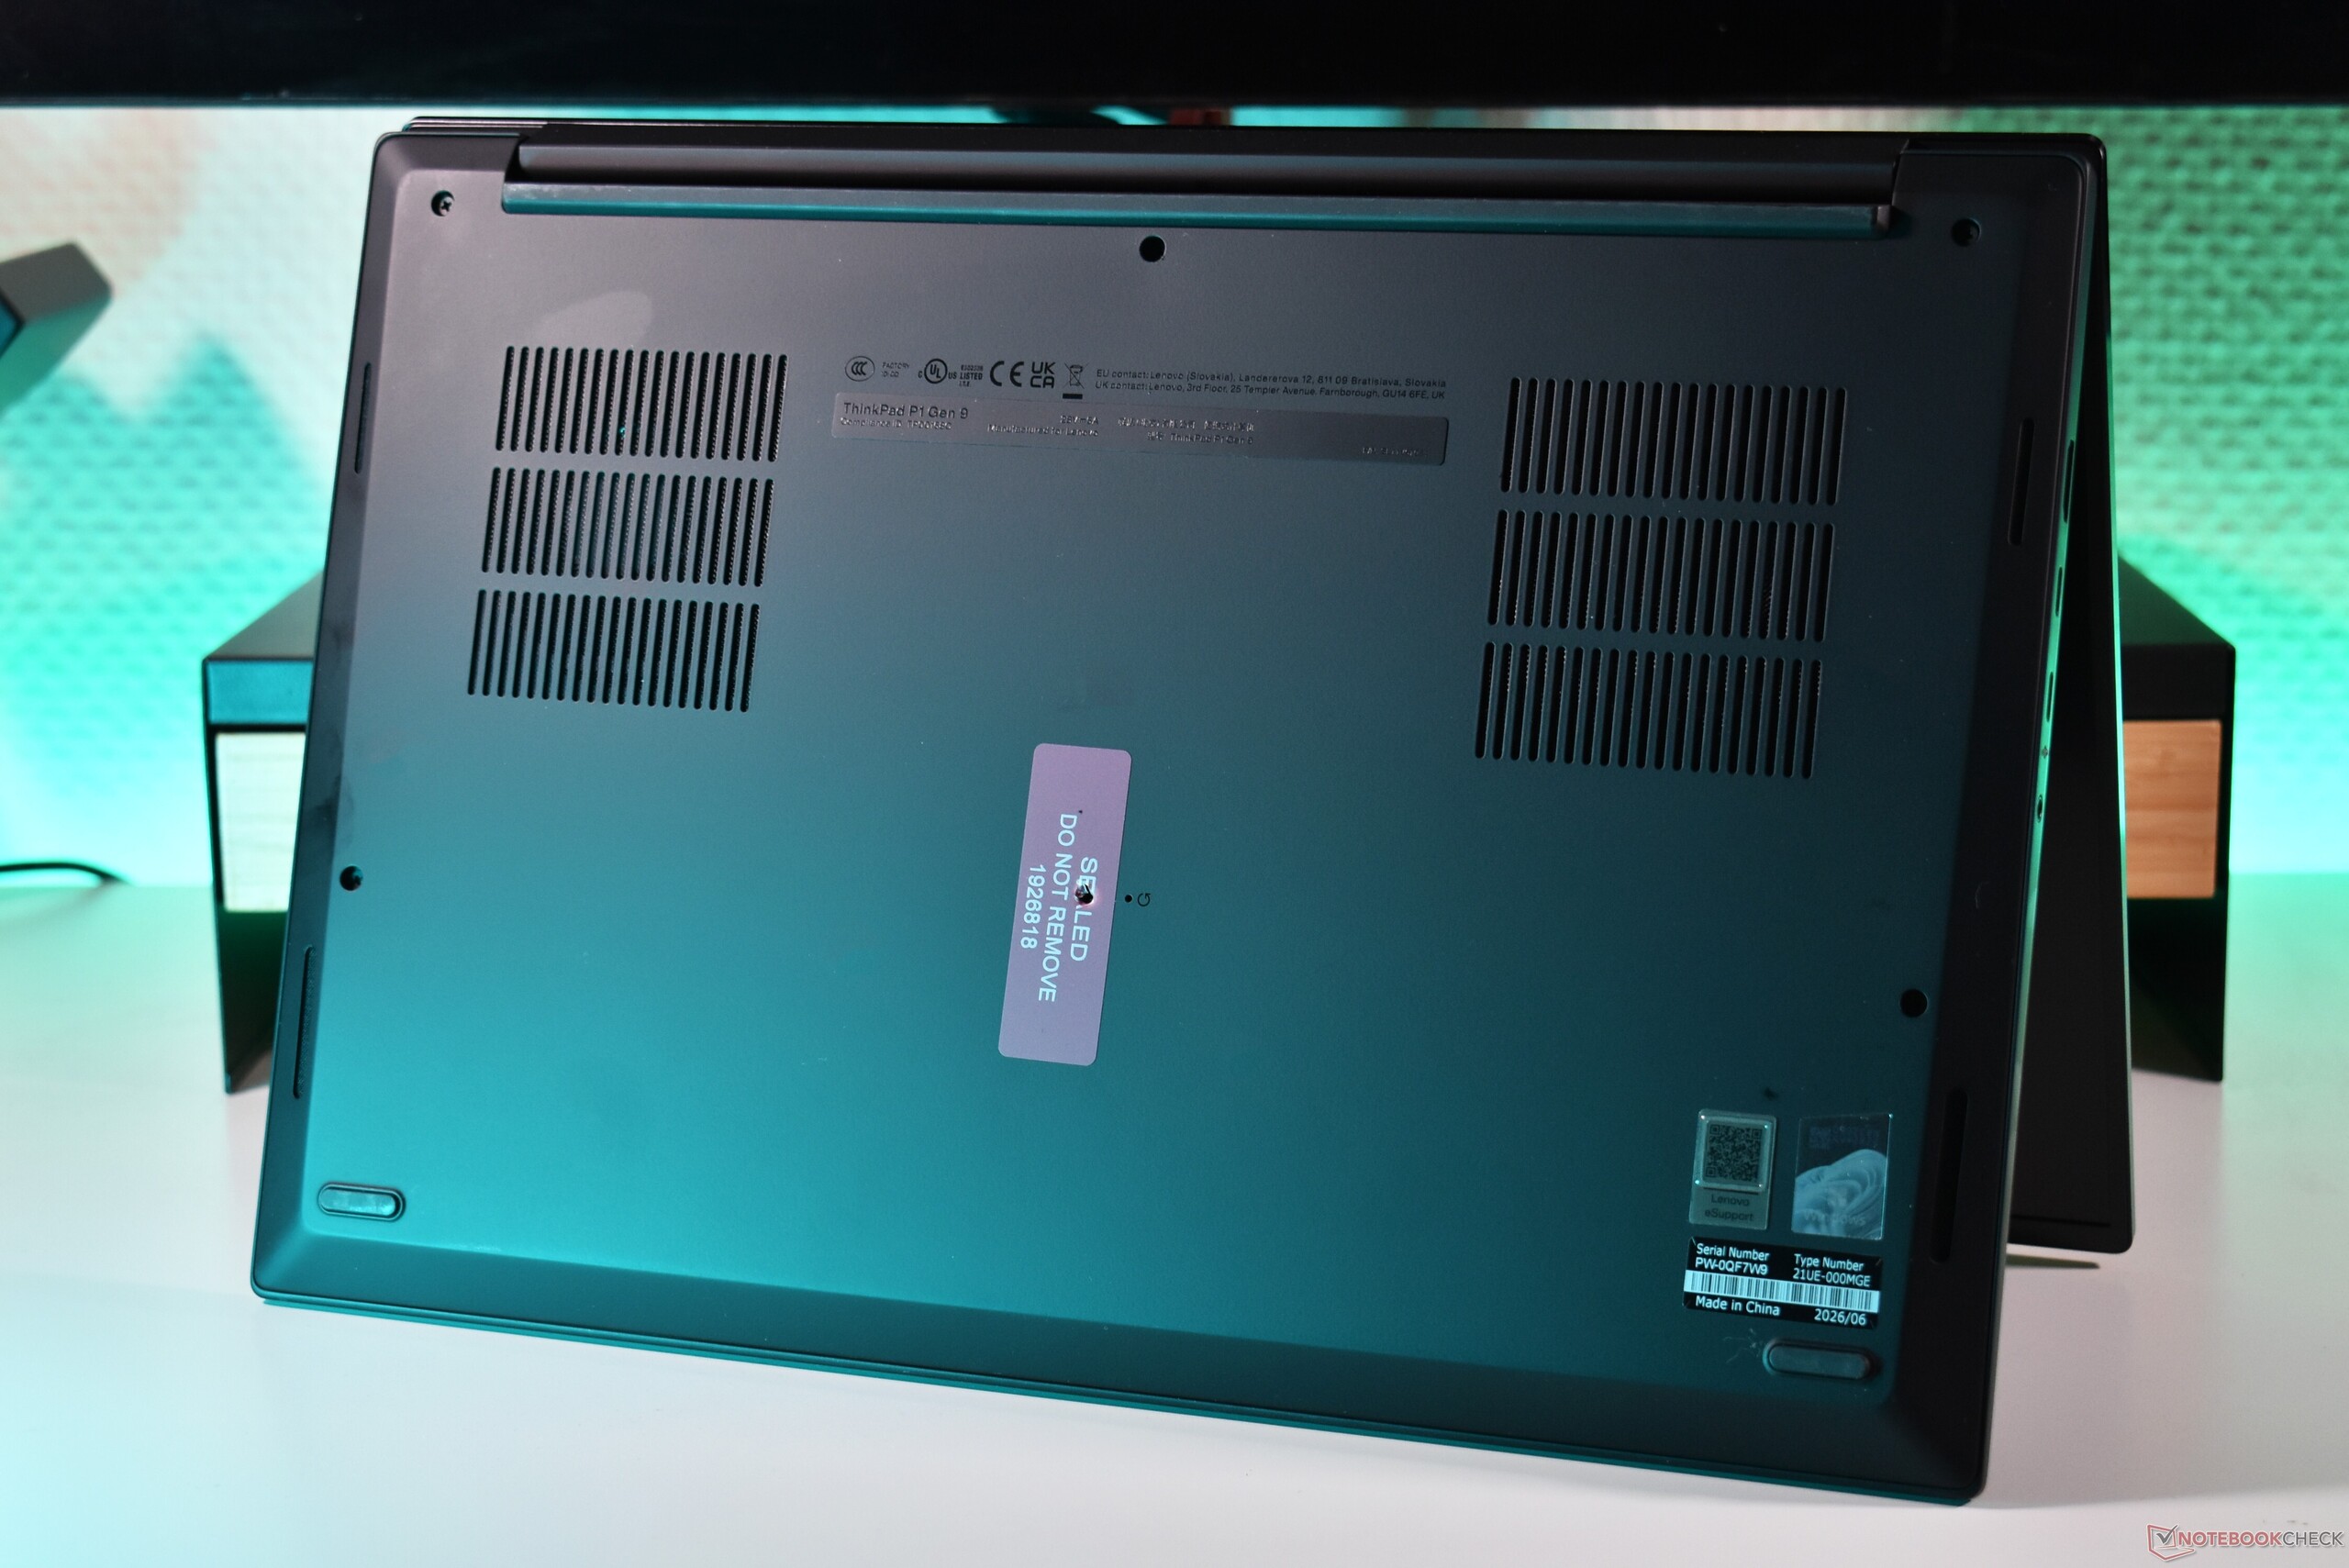
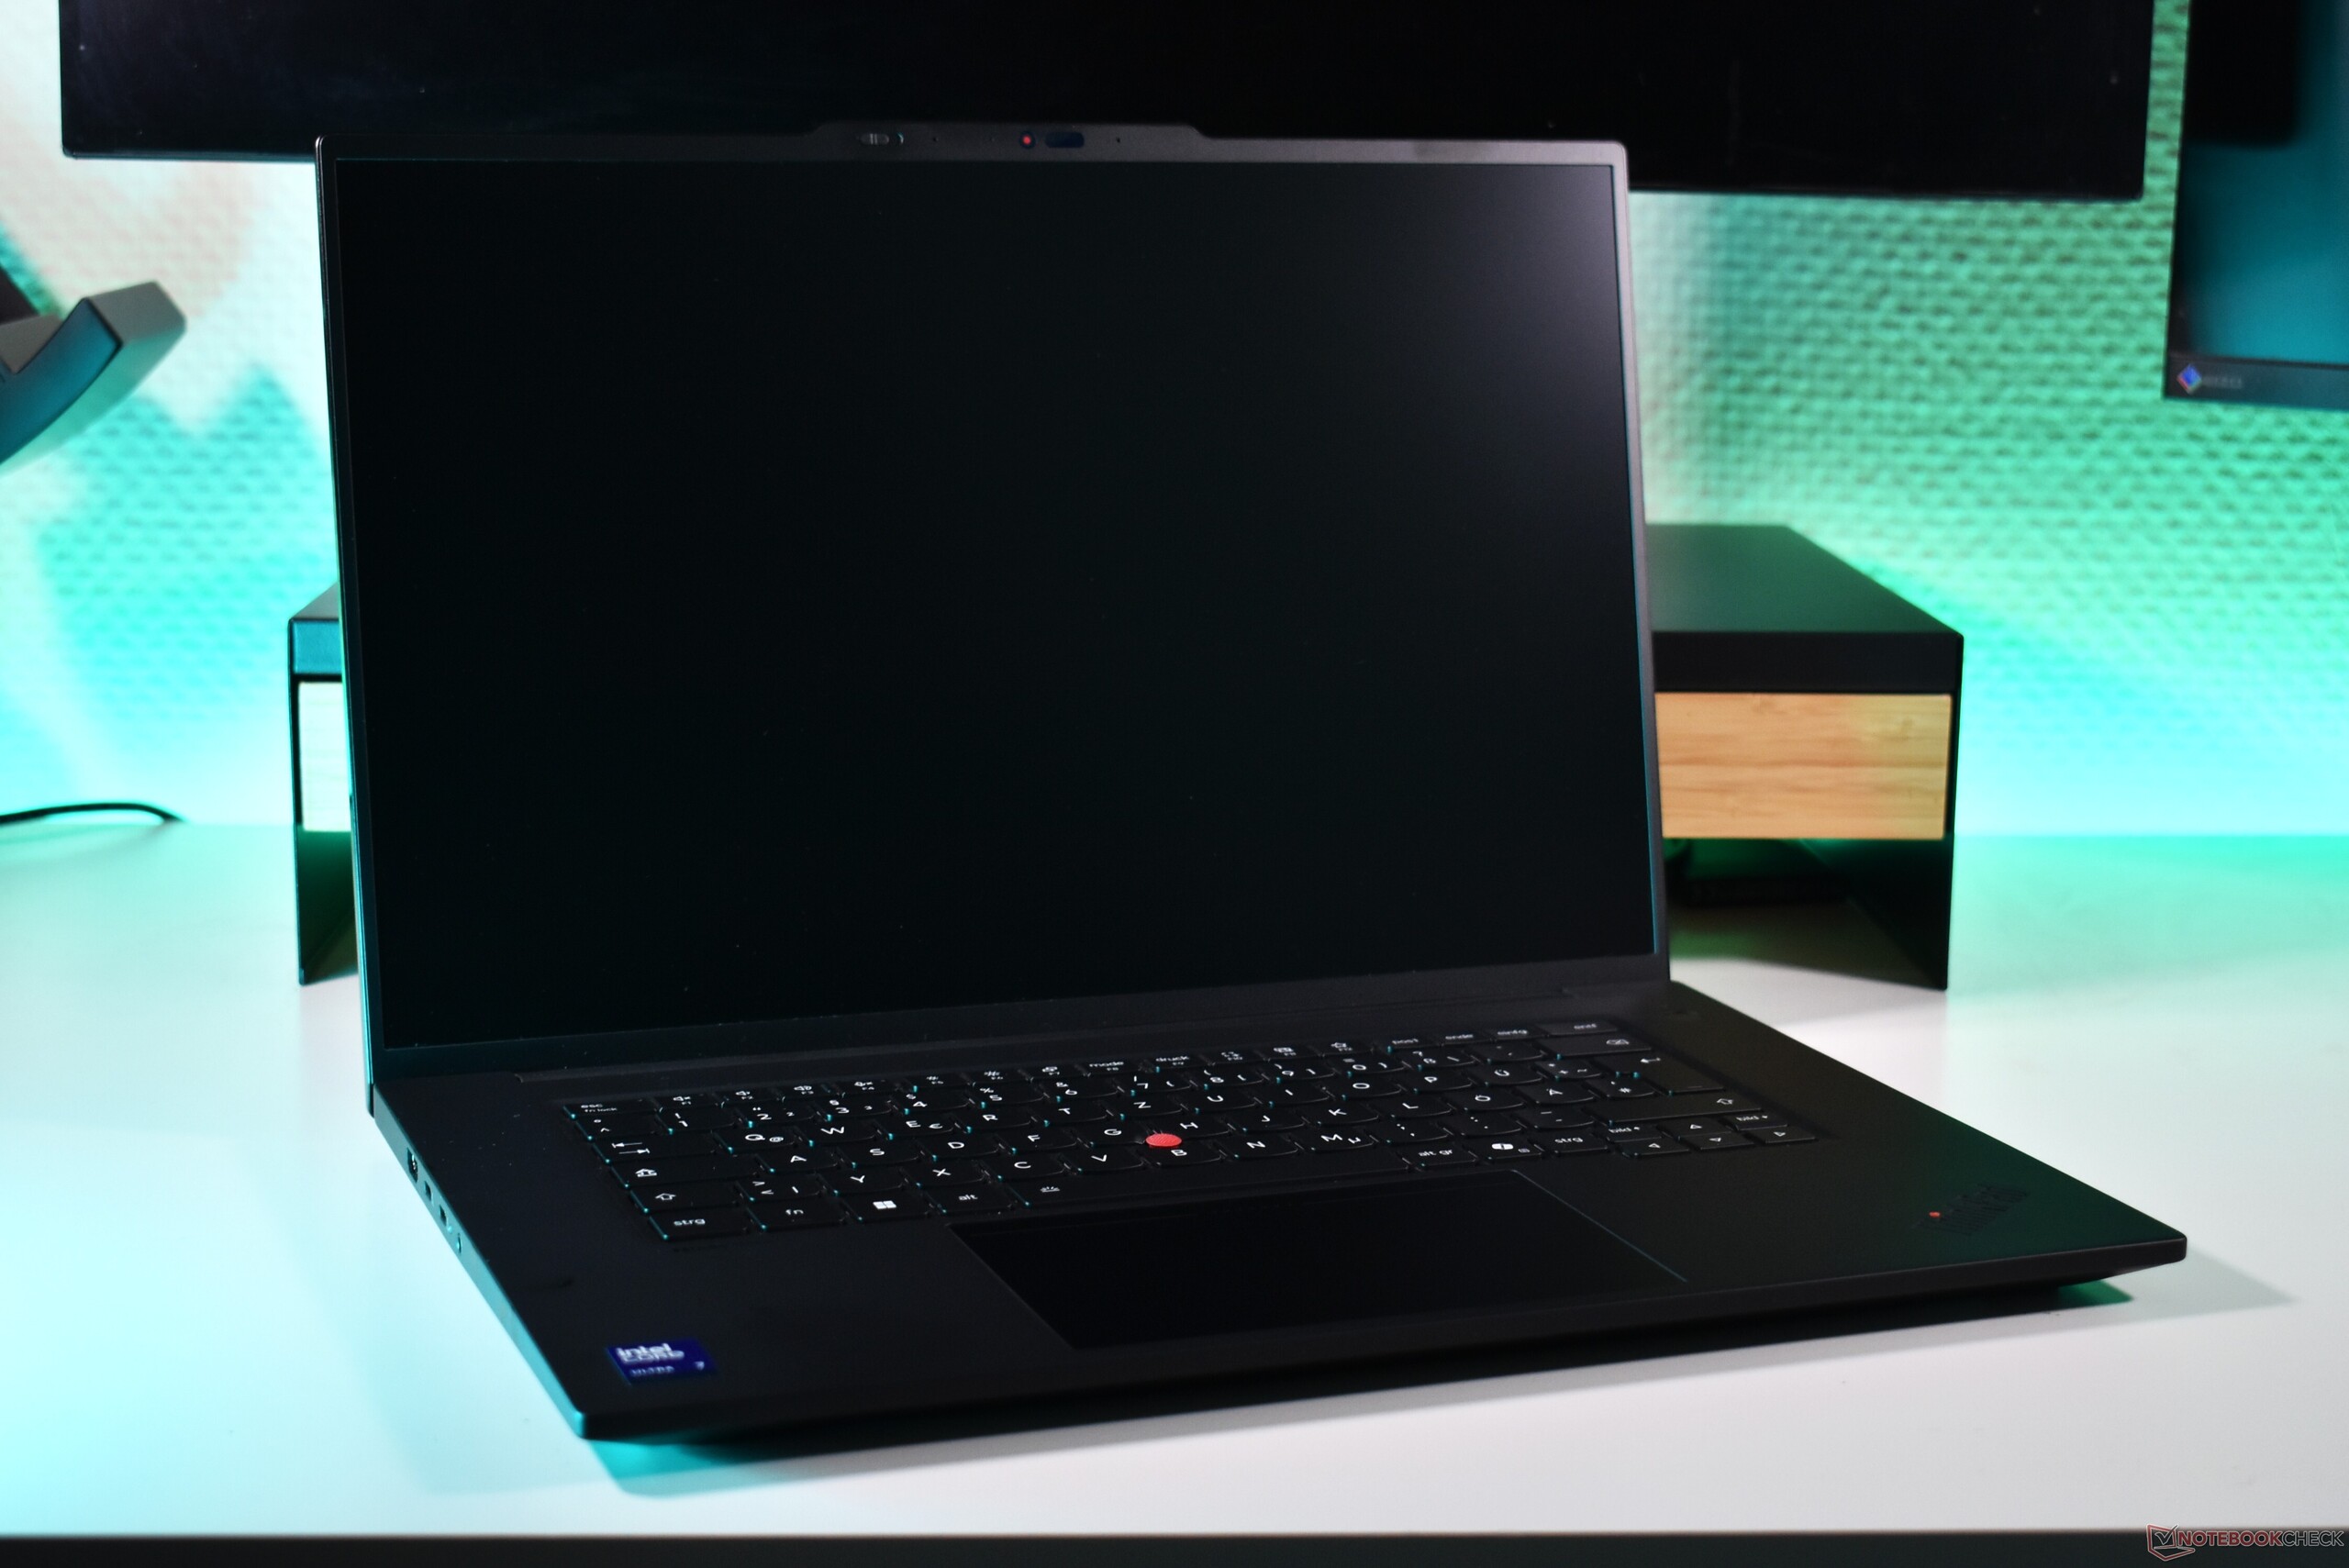
Lenovo hat das Gehäusedesign des ThinkPad P1 Gen 9 nicht verändert, das praktisch identisch mit dem früheren ThinkPad P1 Gen 7 und dem ThinkPad P1 Gen 8 ist. Diese Premium-Workstation setzt also auf eine Kombination aus Aluminium und Magnesium, mit einem Deckel aus eloxiertem Aluminium, einer Handballenauflage aus Magnesium und einer Bodenplatte aus Aluminium. Die Verarbeitungsqualität ist in jeder Hinsicht hervorragend: Das Gerät fühlt sich robust und hochwertig an, und das Display wackelt nicht. Eine Schwachstelle: Auf der schwarzen Lackierung der Handballenauflage bilden sich recht leicht Fettflecken.

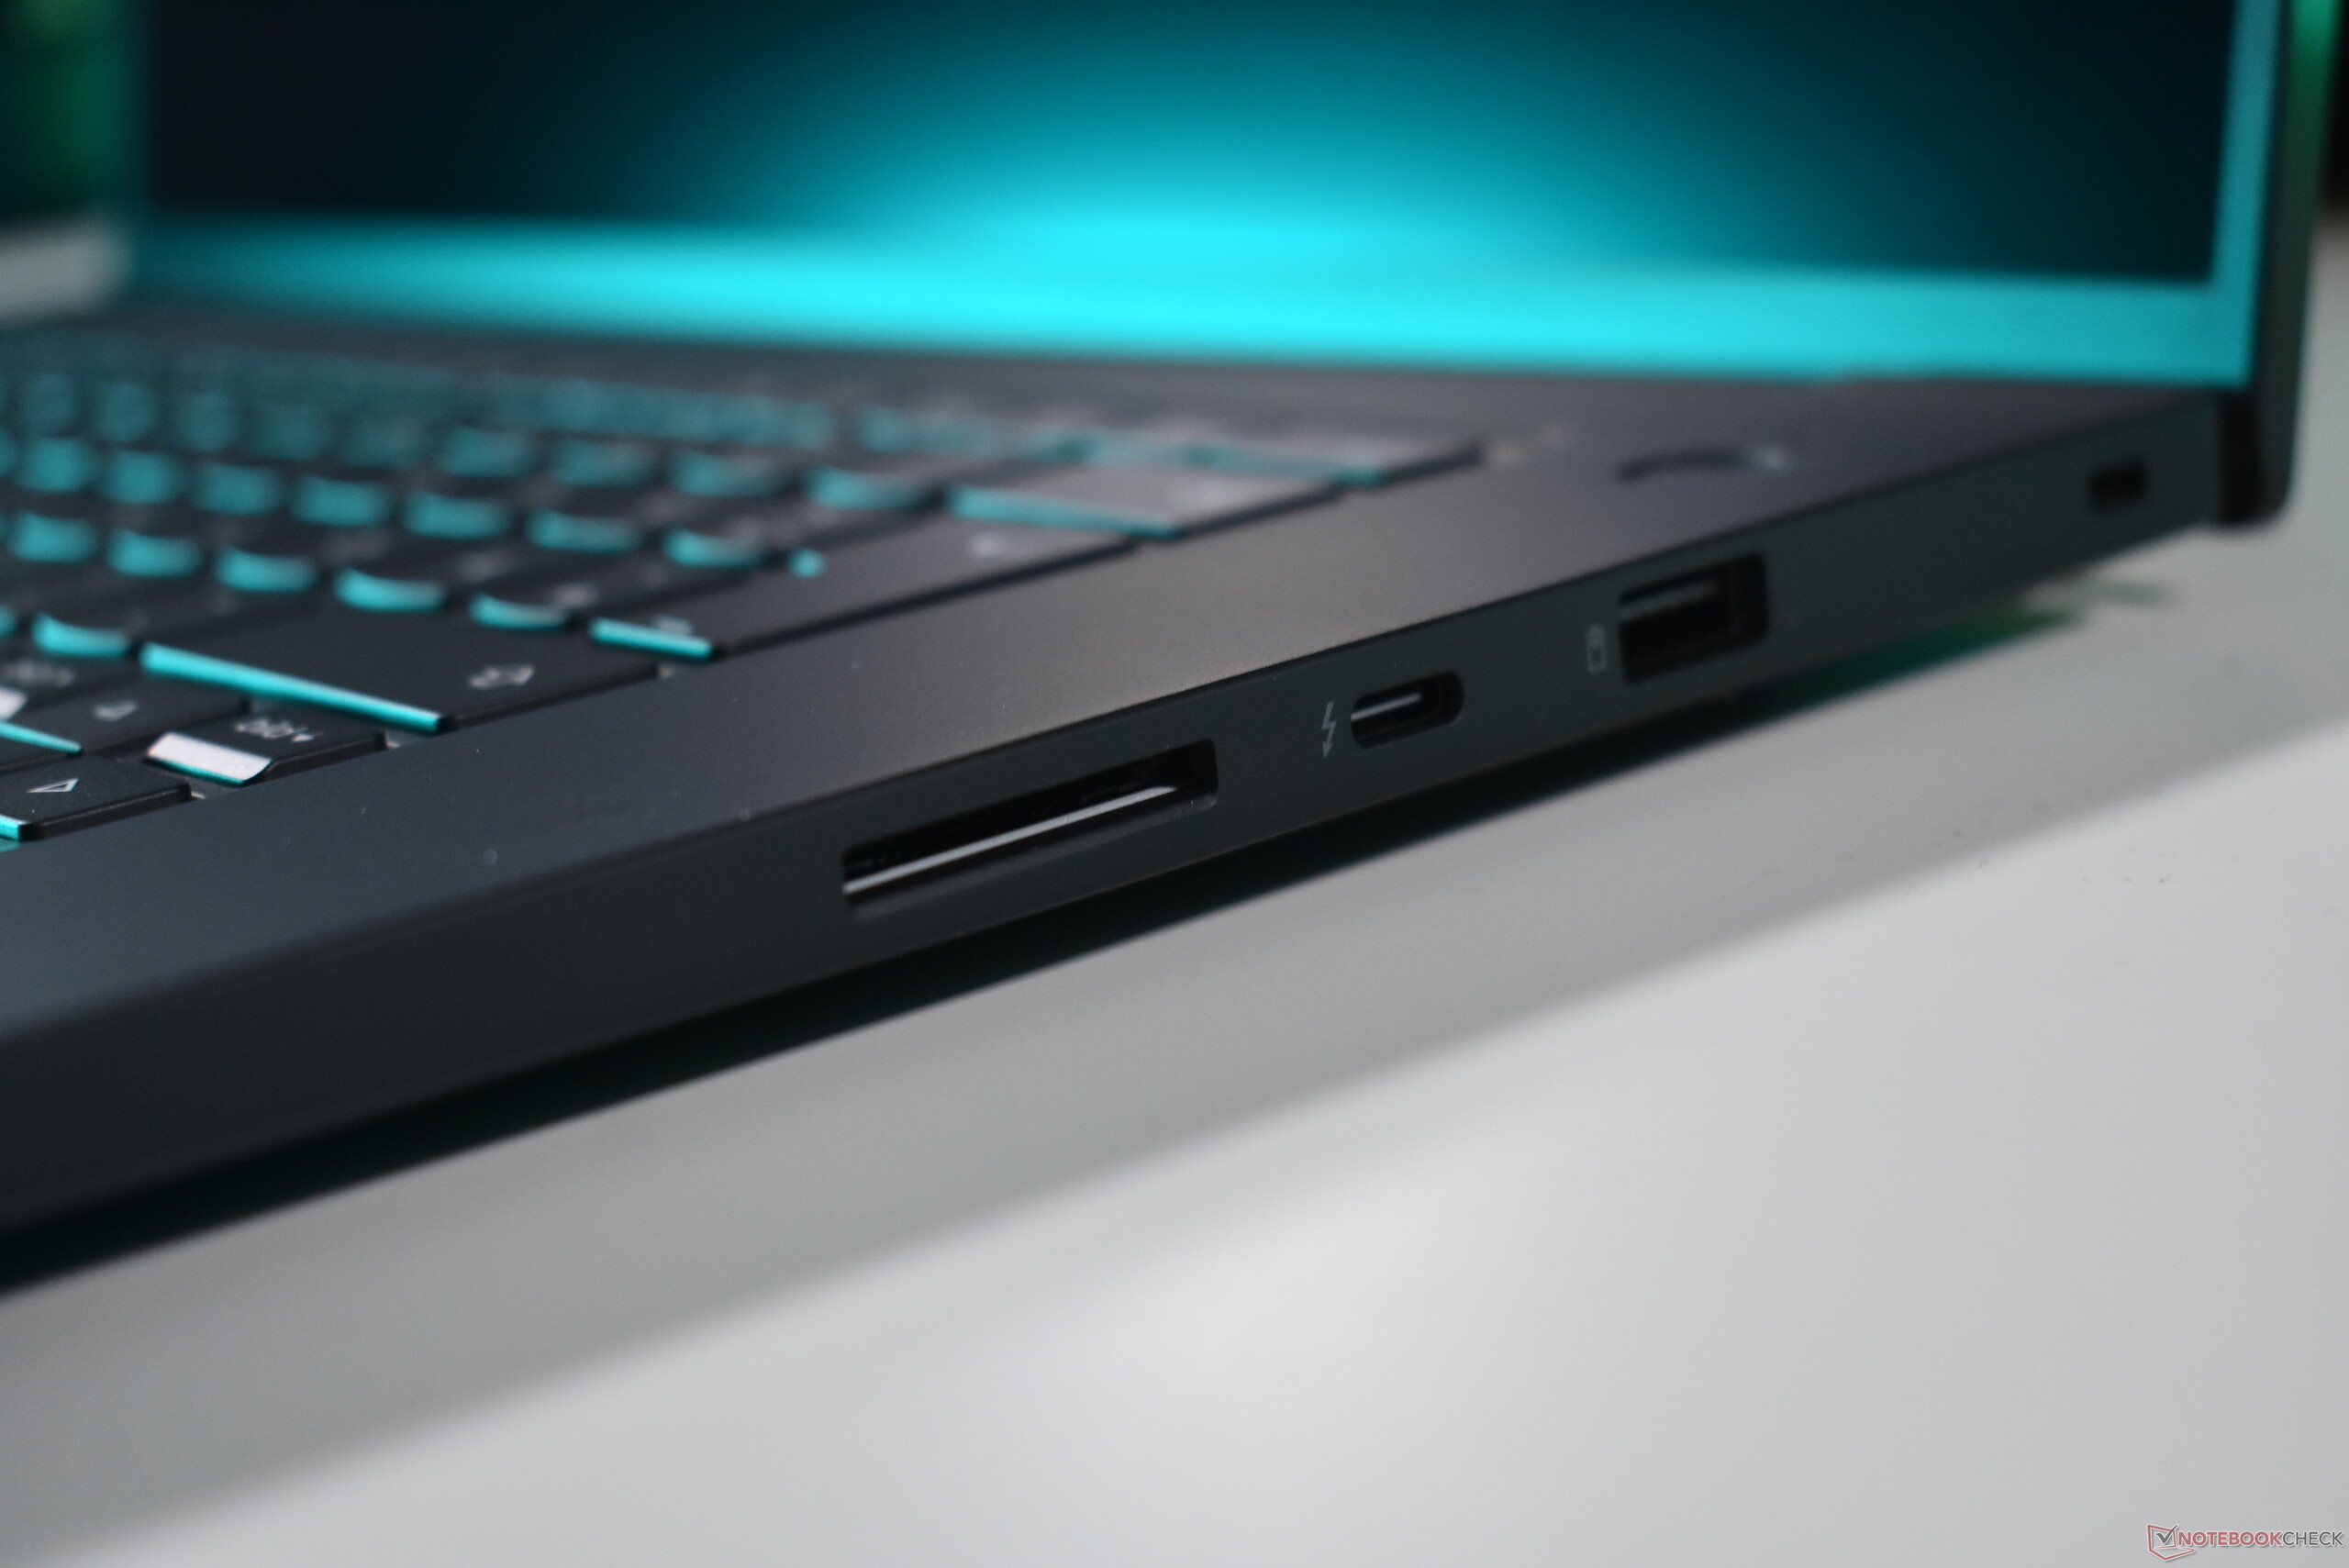
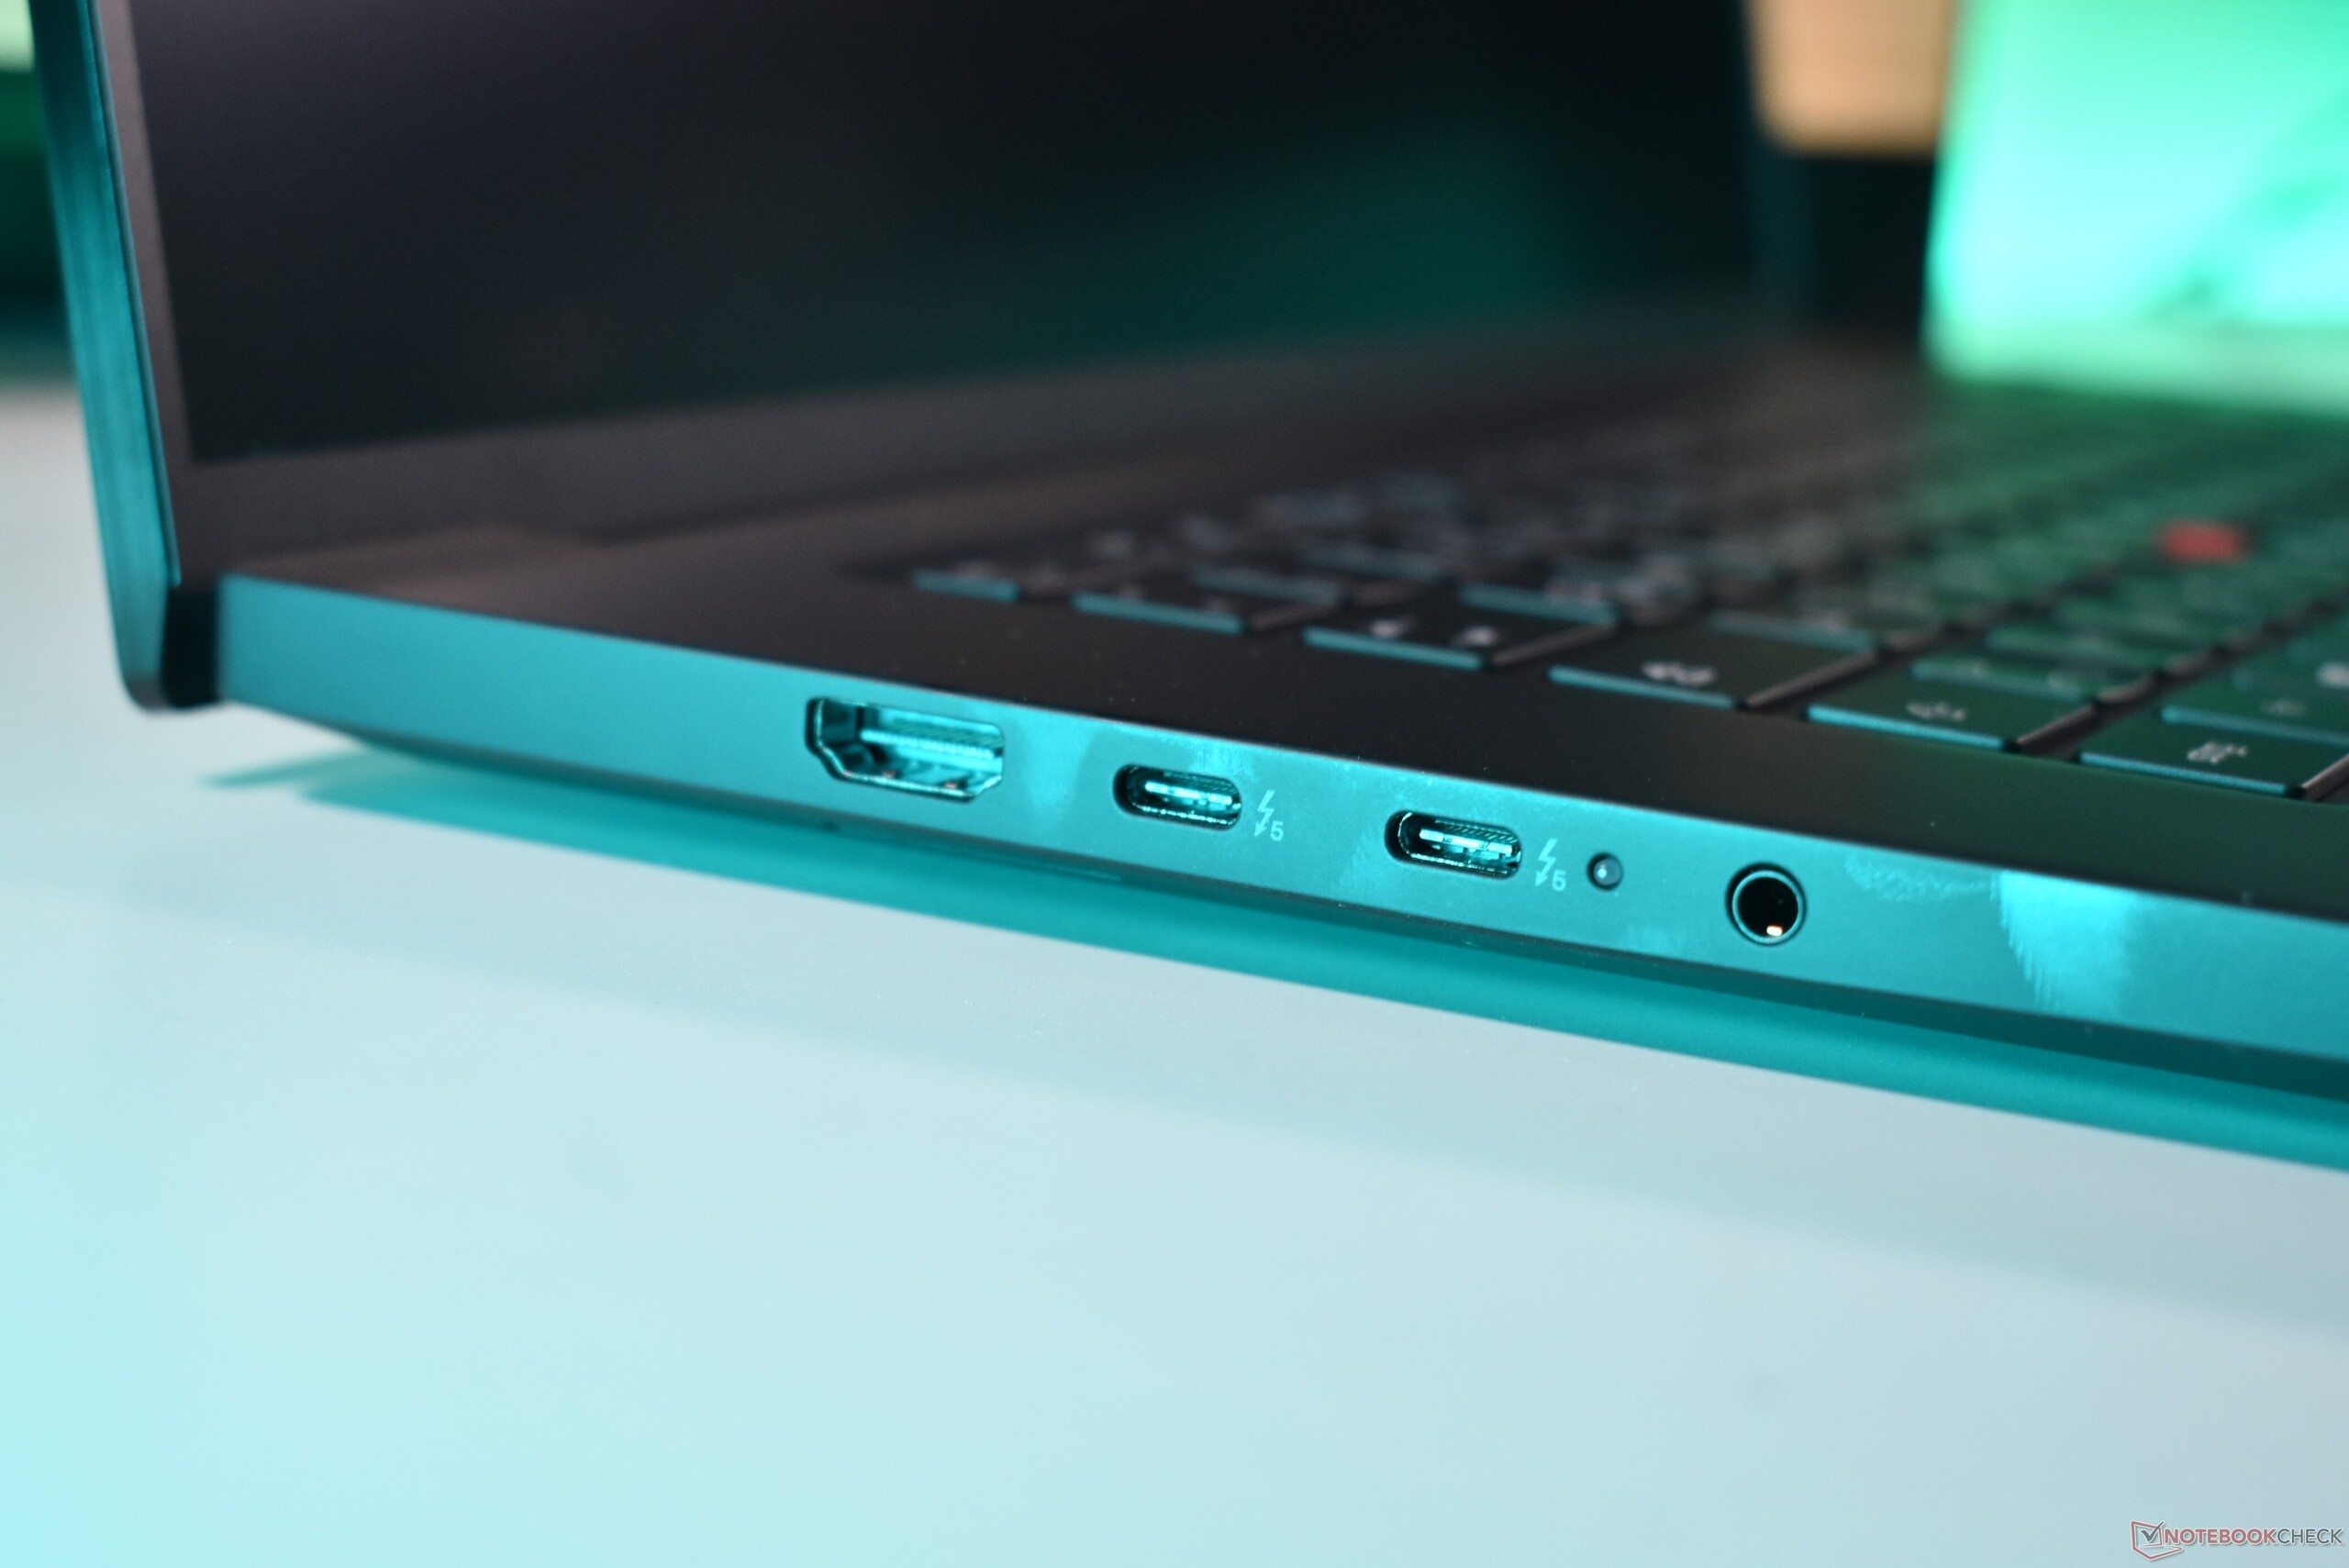
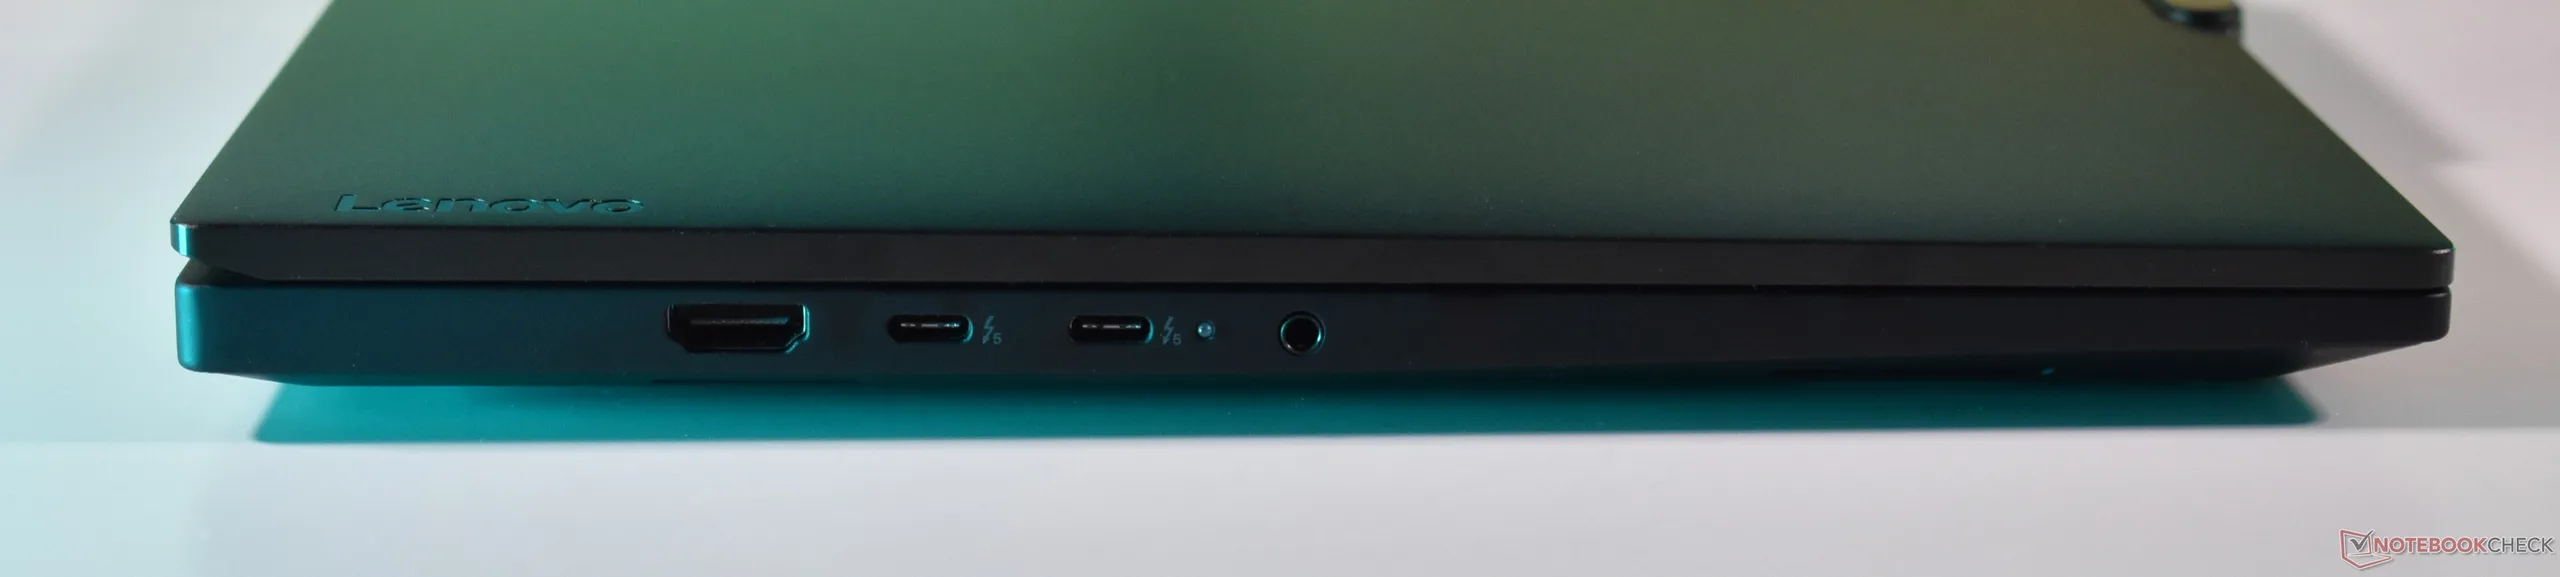
Die Anschlussausstattung bleibt gegenüber dem ThinkPad P1 G8 unverändert, womit der ThinkPad-Laptop auch Thunderbolt 5 bietet. Zudem verfügt er über einen SD-Kartenleser in voller Größe, der SD-Karten vollständig aufnimmt.

Als Workstation bietet das ThinkPad P1 Gen 9 mehr Aufrüstpotenzial als die meisten ThinkPads. Dazu gehören zwei M.2-2280-Steckplätze, sodass sich das Gerät potenziell mit zwei SSDs bestücken lässt und auch RAID-Modi unterstützt. Der Arbeitsspeicher ist in Form eines LPCAMM2-Moduls ebenfalls modular. Verbesserungspotenzial gibt es bei der verlöteten WLAN-Karte sowie bei der Tastatur, die nicht vom Nutzer ausgetauscht werden kann.
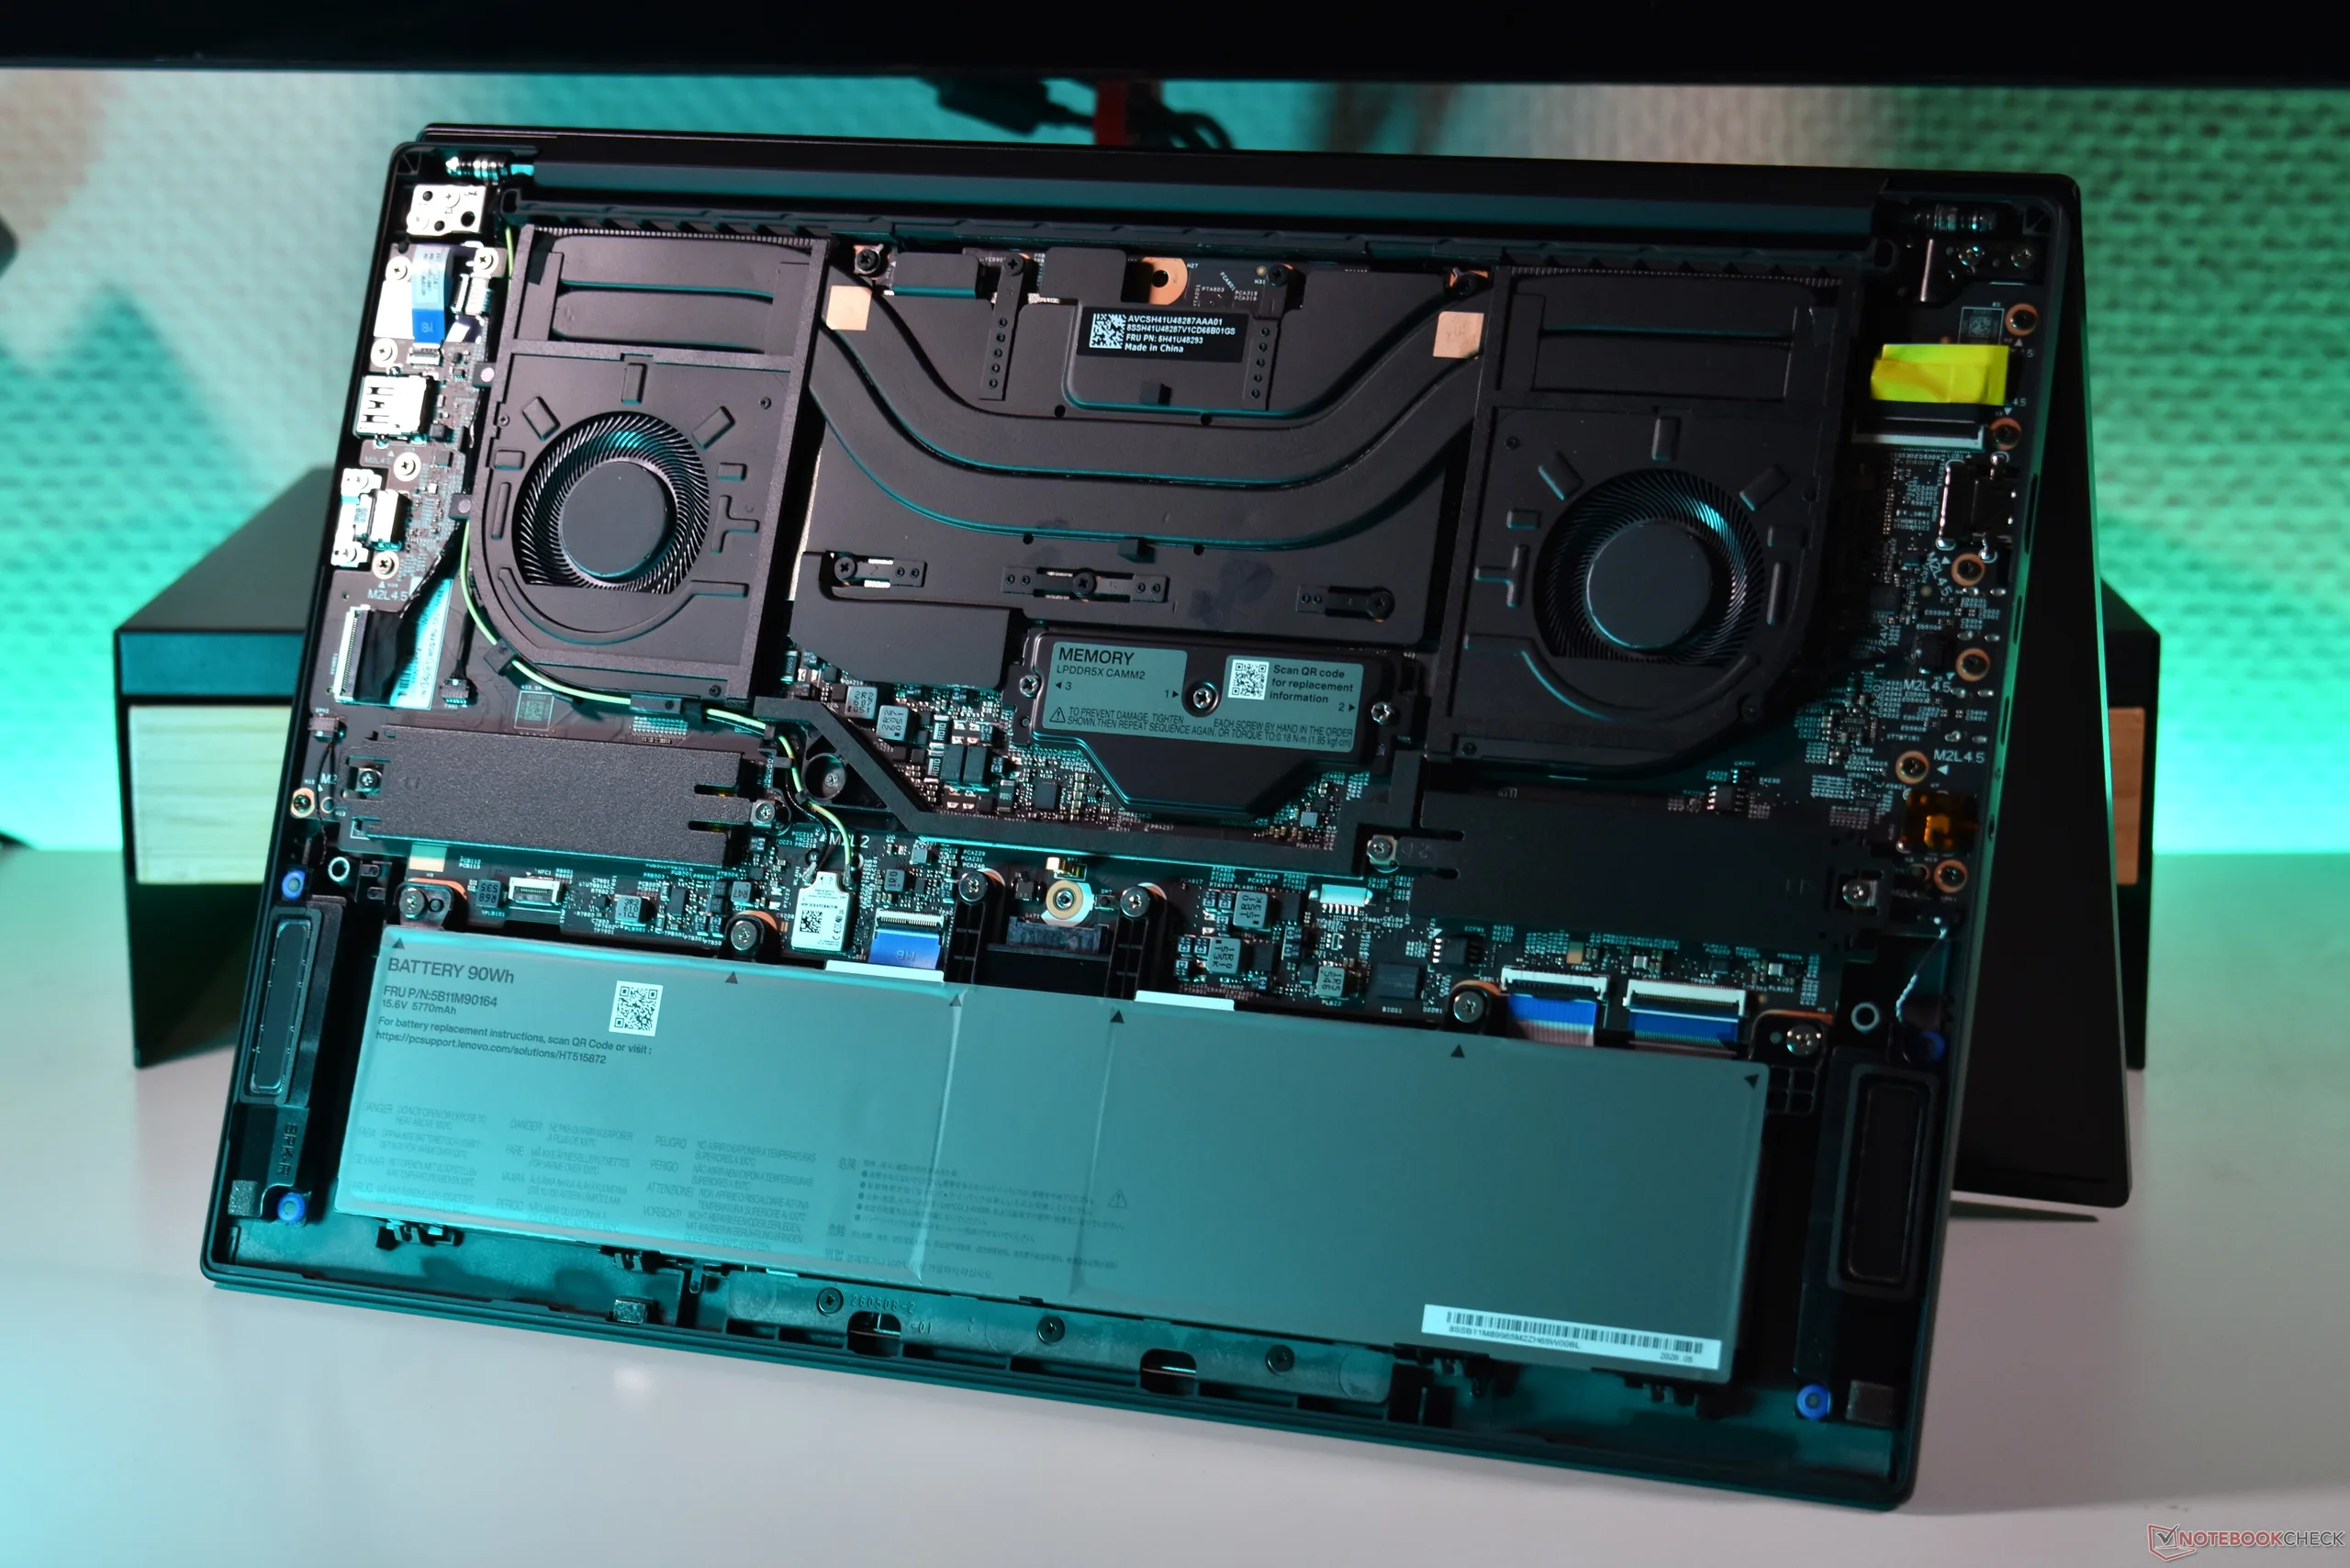
Lenovo ThinkPad P1 Gen 9: Innenleben

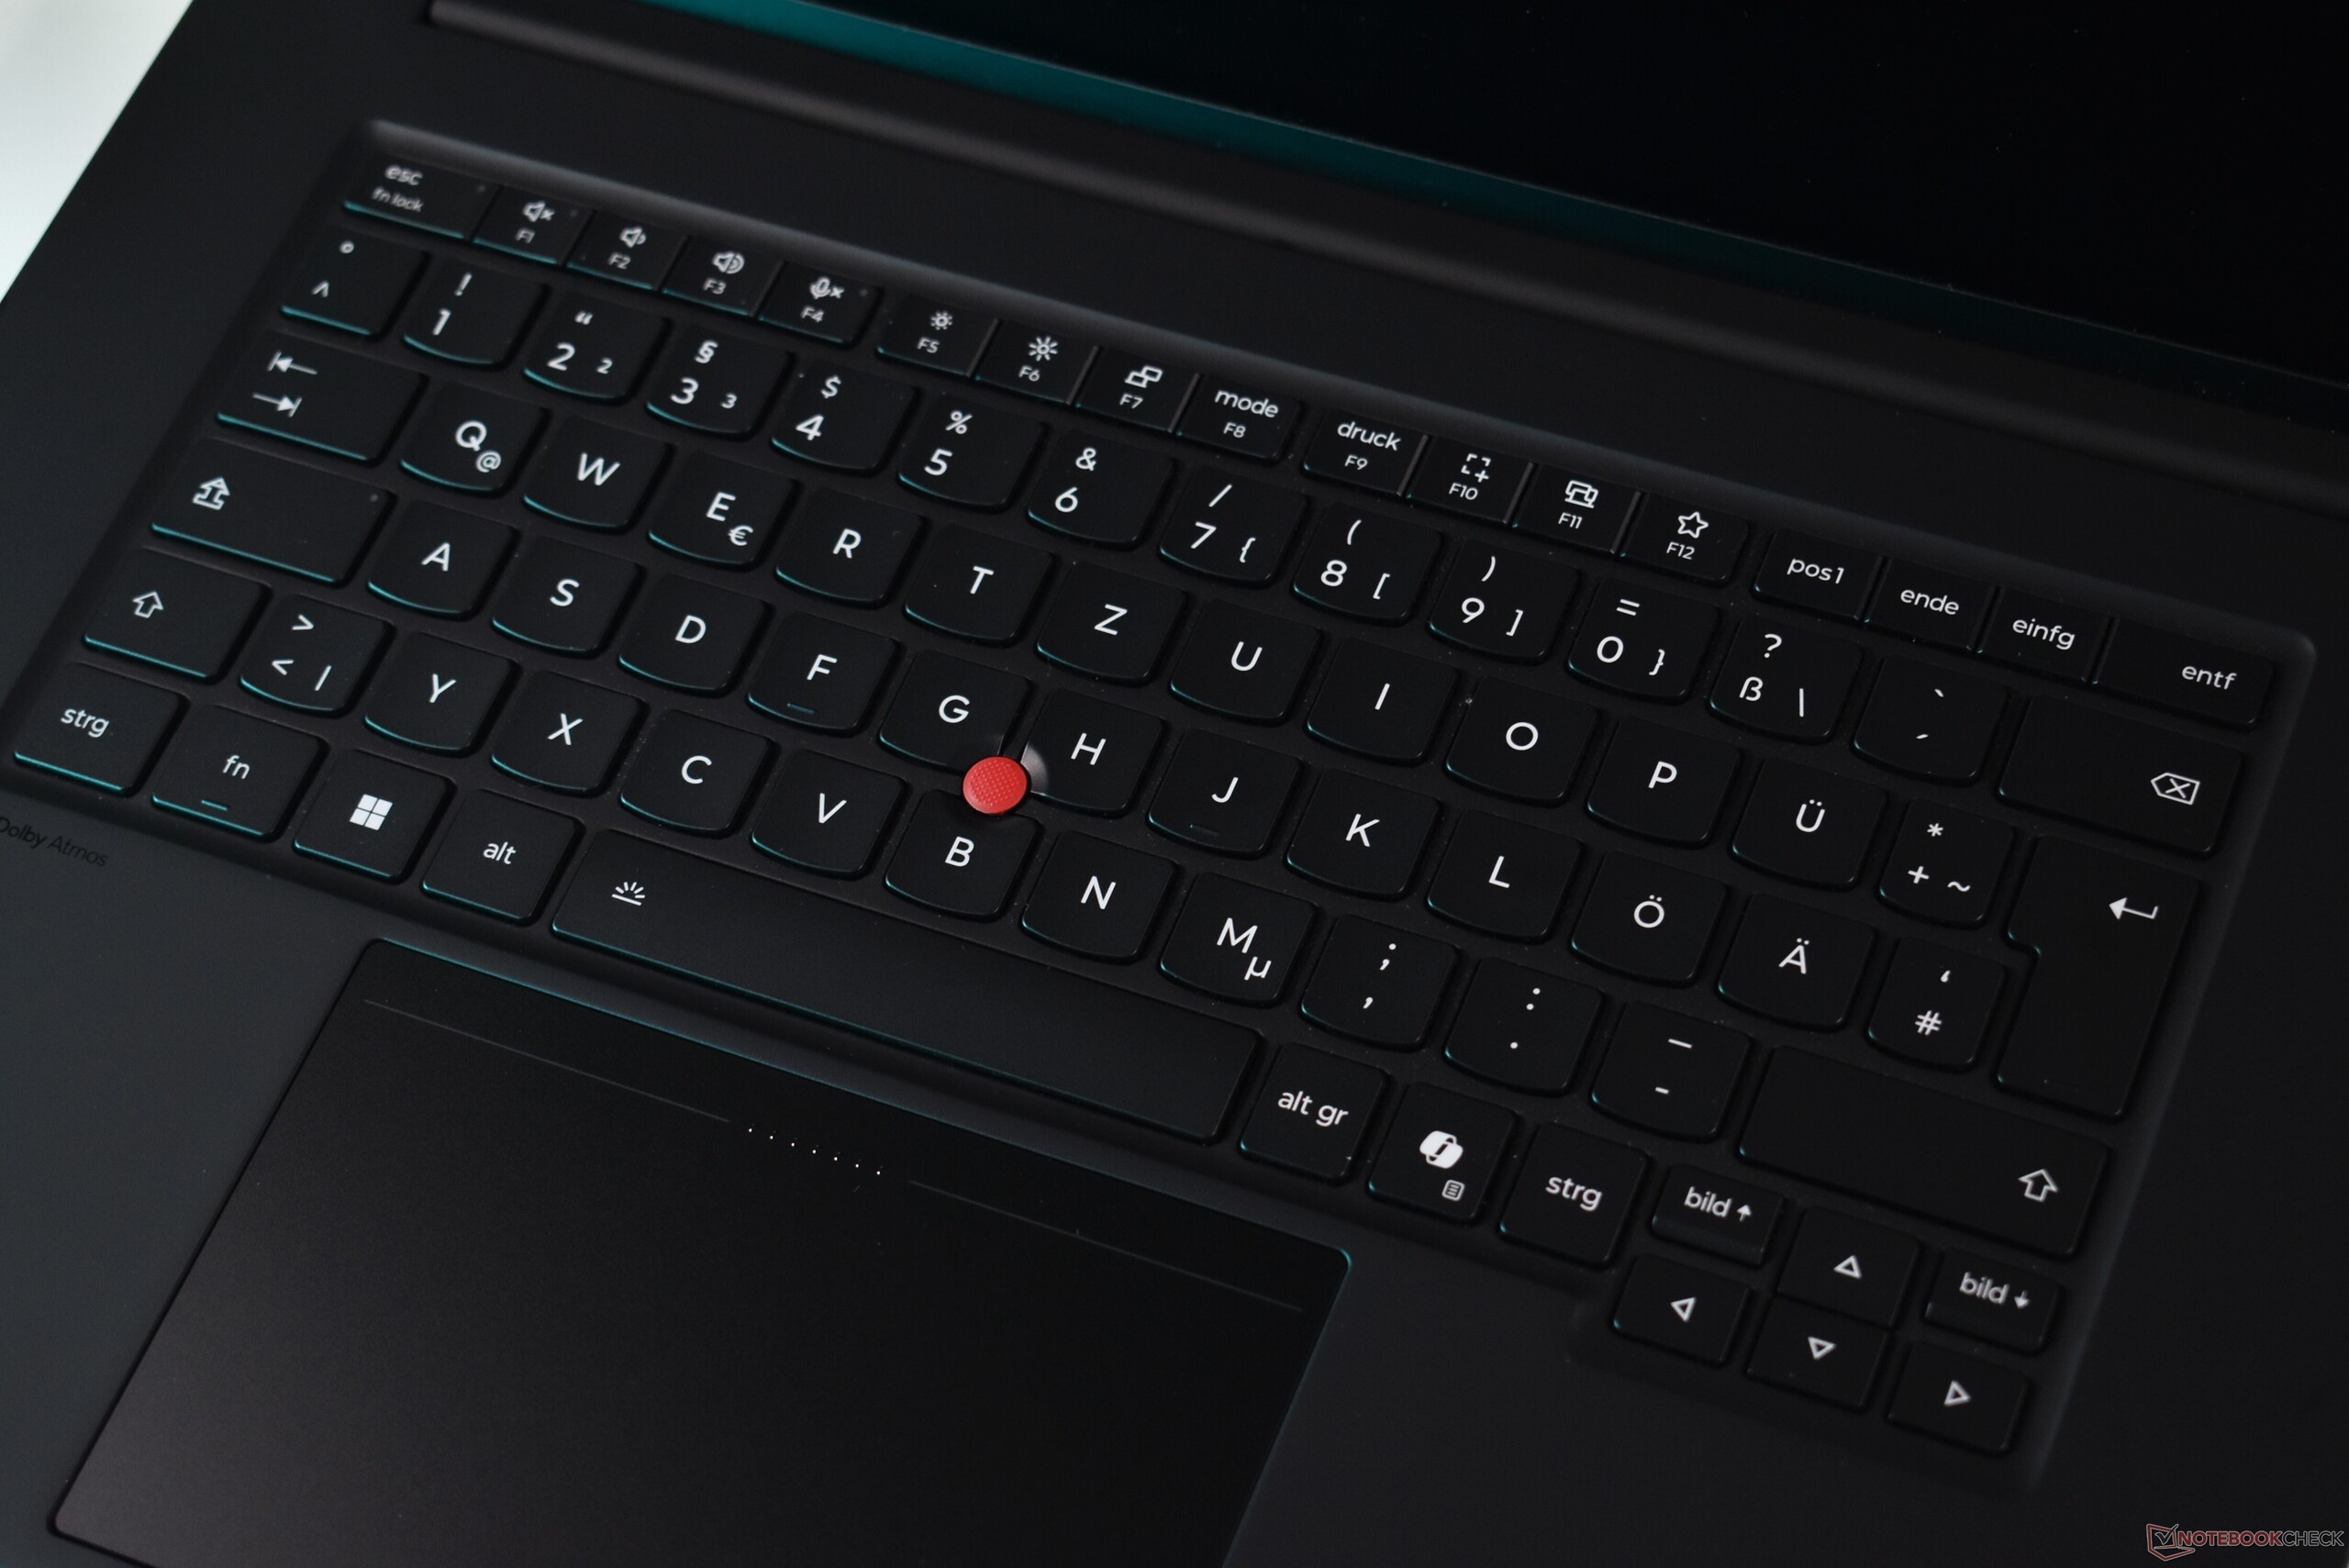
Zur Tastatur: Lenovo nimmt einige Änderungen daran vor und übernimmt das neue Design der 2026er ThinkPads. Dazu gehören zentrierte Tastenbeschriftungen mit einer neuen Schriftart sowie Änderungen am europäischen ISO-Layout, das wir testen. Insbesondere ist die Eingabetaste auf europäischen Tastaturen etwas schmaler, während die beiden deutschen Umlauttasten Ü/Ä etwas breiter sind. Das große haptische Glas-Trackpad bleibt hingegen unverändert. Insgesamt gefallen uns die Eingabegeräte dieses ThinkPads sehr gut, denn seine Tastatur gehört zu den besten unter den aktuellen ThinkPads.
Größenvergleich

❌
359 mm 251 mm 23 mm 2.2 kg354.4 mm 241.2 mm 21 mm 1.9 kg354.3 mm 241 mm 20.6 mm 1.9 kg355.7 mm 248.1 mm 16.8 mm 2.1 kg356.8 mm 247.9 mm 15.4 mm 1.9 kg352.58 mm 237.47 mm 14.62 mm 1.7 kg297 mm 210 mm 1 mm 5.7 g
links: HDMI, 2x Thunderbolt 5, 3,5-mm-Audio
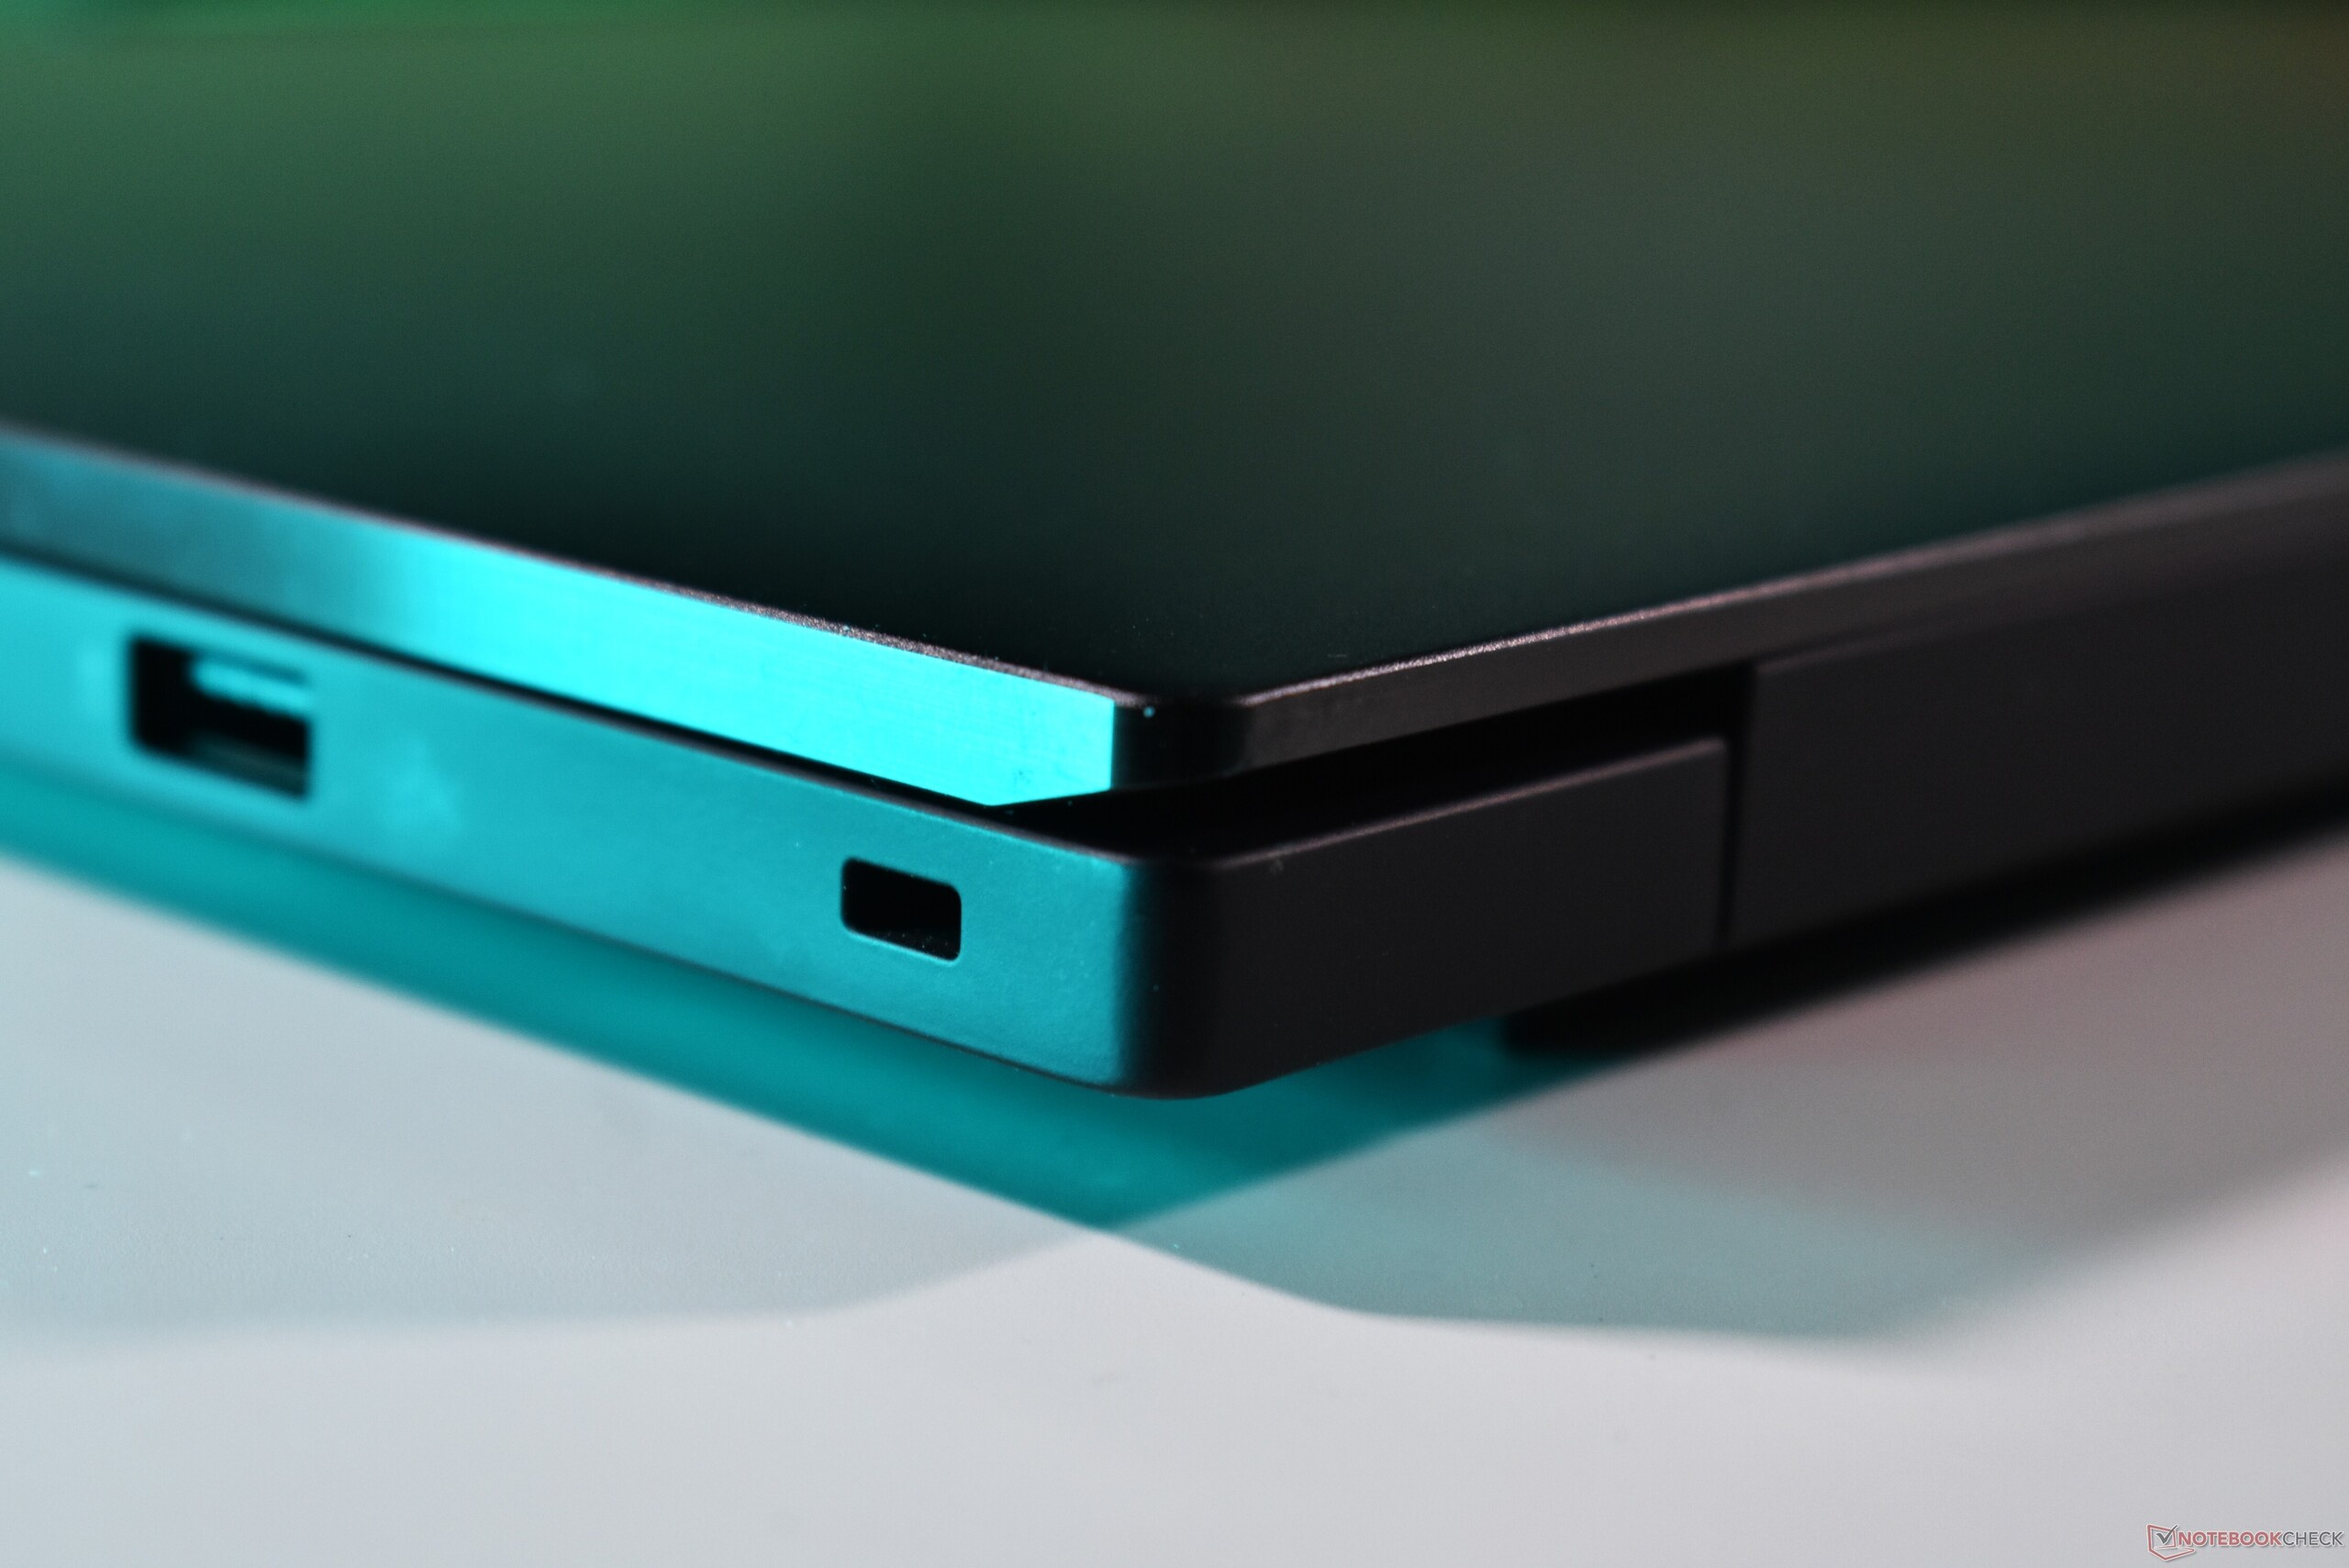
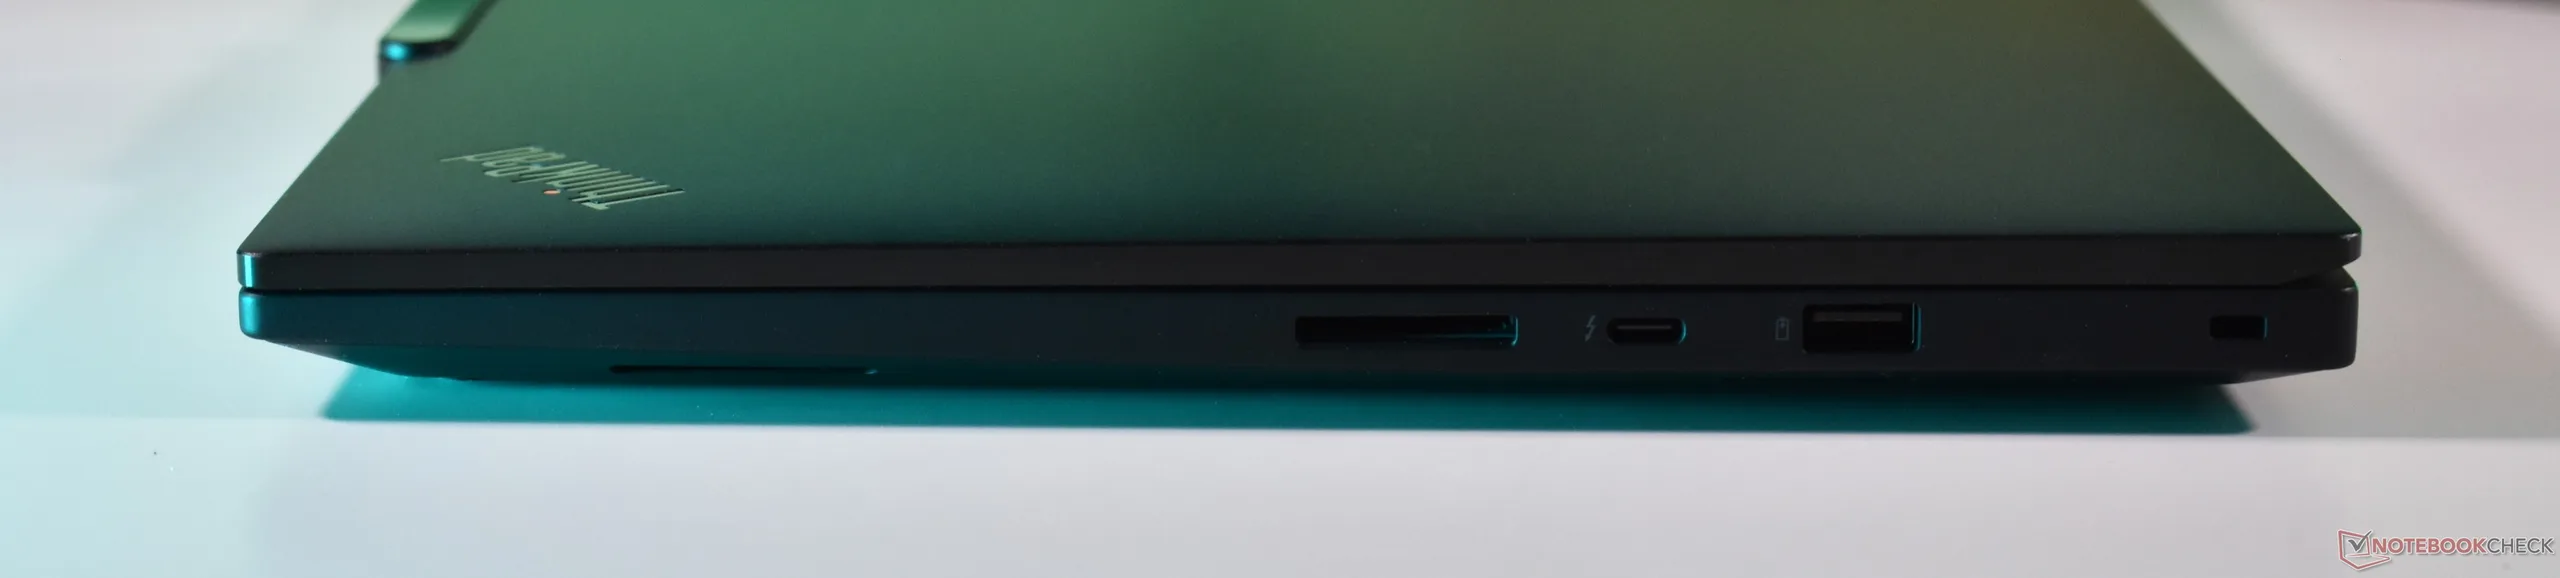
rechts: SD-Kartenleser, Thunderbolt 4, USB-A 3.2 Gen 2, Kensington-Lock-Slot
SD Card Reader
average JPG Copy Test (av. of 3 runs)
HP ZBook X G1i 16
Intel Core Ultra 7 265H (Toshiba Exceria Pro SDXC 64 GB UHS-II)
189.3 MB/s +468%
Durchschnitt der Klasse Workstation
  (33.3 - 681, n=11, der letzten 2 Jahre)
151.7 MB/s +356%
Apple MacBook Pro 16 2026 M5 Pro
Apple M5 Pro 18-Core (Angelbird AV Pro V60)
125.4 MB/s +277%
Lenovo ThinkPad P1 Gen 8
Intel Core Ultra 7 255H (Toshiba Exceria Pro SDXC 64 GB UHS-II)
85 MB/s +155%
Samsung Galaxy Book6 Ultra
Intel Core Ultra 7 356H (Angelbird AV Pro V60)
76.3 MB/s +129%
Lenovo ThinkPad P1 Gen 9 21UE000MGE
Intel Core Ultra 7 366H (AV Pro V60)
33.3 MB/s
maximum AS SSD Seq Read Test (1GB)
Durchschnitt der Klasse Workstation
  (82 - 1455, n=11, der letzten 2 Jahre)
245 MB/s +199%
Apple MacBook Pro 16 2026 M5 Pro
Apple M5 Pro 18-Core (Angelbird AV Pro V60)
222.3 MB/s +171%
HP ZBook X G1i 16
Intel Core Ultra 7 265H (Toshiba Exceria Pro SDXC 64 GB UHS-II)
222.2 MB/s +171%
Lenovo ThinkPad P1 Gen 8
Intel Core Ultra 7 255H (Toshiba Exceria Pro SDXC 64 GB UHS-II)
89.51 MB/s +9%
Samsung Galaxy Book6 Ultra
Intel Core Ultra 7 356H (Angelbird AV Pro V60)
88.4 MB/s +8%
Lenovo ThinkPad P1 Gen 9 21UE000MGE
Intel Core Ultra 7 366H (AV Pro V60)
82 MB/s
Networking
iperf3 transmit Wi-Fi6/7 RT-BE96U
Lenovo ThinkPad P1 Gen 9 21UE000MGE
Intel Wi-Fi 7 BE211 320MHz
4111 (3907min - 4251max) MBit/s
Durchschnittliche Intel Wi-Fi 7 BE211 320MHz
  (2246 - 4557, n=12)
3861 MBit/s -6%
Durchschnitt der Klasse Workstation
  (2227 - 4111, n=2, der letzten 2 Jahre)
3169 MBit/s -23%
iperf3 receive Wi-Fi6/7 RT-BE96U
Lenovo ThinkPad P1 Gen 9 21UE000MGE
Intel Wi-Fi 7 BE211 320MHz
3092 (2952min - 3189max) MBit/s
Durchschnittliche Intel Wi-Fi 7 BE211 320MHz
  (1950 - 3290, n=12)
2870 MBit/s -7%
Durchschnitt der Klasse Workstation
  (2150 - 3092, n=3, der letzten 2 Jahre)
2514 MBit/s -19%
iperf3 receive AXE11000 6GHz
Dell XPS 16 Core Ultra X7 358H
Intel Wi-Fi 7 BE211 320MHz
1735 (1715min - 1747max) MBit/s
Durchschnittliche Intel Wi-Fi 7 BE211 320MHz
  (1450 - 1757, n=17)
1658 MBit/s
Durchschnitt der Klasse Workstation
  (1196 - 1762, n=15, der letzten 2 Jahre)
1587 MBit/s
Lenovo ThinkPad P1 Gen 8
Intel BE201 320MHz
1443 (1318min - 1478max) MBit/s
HP ZBook X G1i 16
Intel BE201 320MHz
1375 (1224min - 1496max) MBit/s
iperf3 transmit AXE11000 6GHz
Dell XPS 16 Core Ultra X7 358H
Intel Wi-Fi 7 BE211 320MHz
1619 (1525min - 1692max) MBit/s
Durchschnittliche Intel Wi-Fi 7 BE211 320MHz
  (1247 - 1662, n=17)
1583 MBit/s
Lenovo ThinkPad P1 Gen 8
Intel BE201 320MHz
1231 (1035min - 1315max) MBit/s
Durchschnitt der Klasse Workstation
  (604 - 1642, n=15, der letzten 2 Jahre)
1153 MBit/s
HP ZBook X G1i 16
Intel BE201 320MHz
1065 (524min - 1125max) MBit/s
0100200300400500600700800900100011001200130014001500160017001800190020002100220023002400250026002700280029003000310032003300340035003600370038003900400041004200Tooltip
Lenovo ThinkPad P1 Gen 9 21UE000MGE; iperf3 transmit Wi-Fi6/7 RT-BE96U; iperf 3.21: Ø4111 (3907-4251) MBit/s
Lenovo ThinkPad P1 Gen 9 21UE000MGE; iperf3 receive Wi-Fi6/7 RT-BE96U; iperf 3.21: Ø3092 (2952-3189) MBit/s
ColorChecker
15.6 ∆E
11.6 ∆E
16.8 ∆E
18.6 ∆E
15 ∆E
12.6 ∆E
10.4 ∆E
19.1 ∆E
11.3 ∆E
10.6 ∆E
12.1 ∆E
11.5 ∆E
13.6 ∆E
18 ∆E
9.9 ∆E
9 ∆E
10.6 ∆E
21.6 ∆E
1.8 ∆E
6.9 ∆E
10.9 ∆E
12 ∆E
8.8 ∆E
6.2 ∆E
ColorChecker Lenovo ThinkPad P1 Gen 9 21UE000MGE: 12.27 ∆E min: 1.76 - max: 21.65 ∆E

Bildschirm

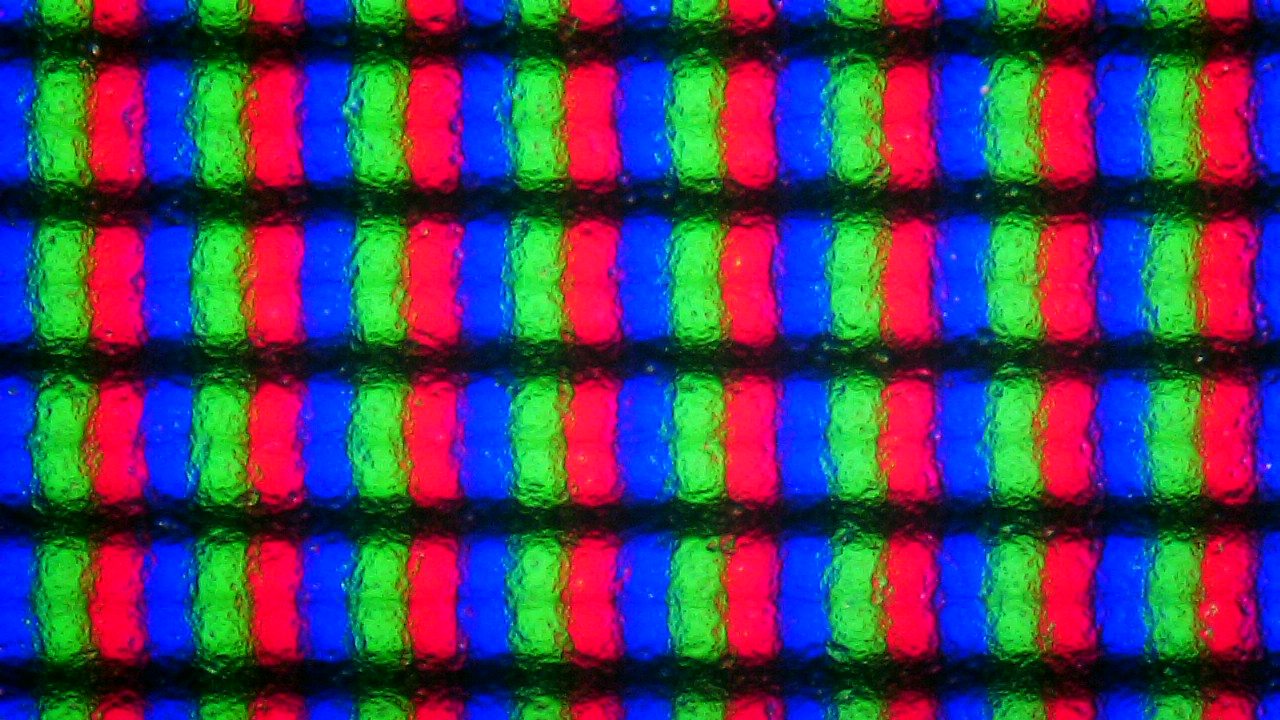
Subpixel-Matrix
Subpixel-Matrix
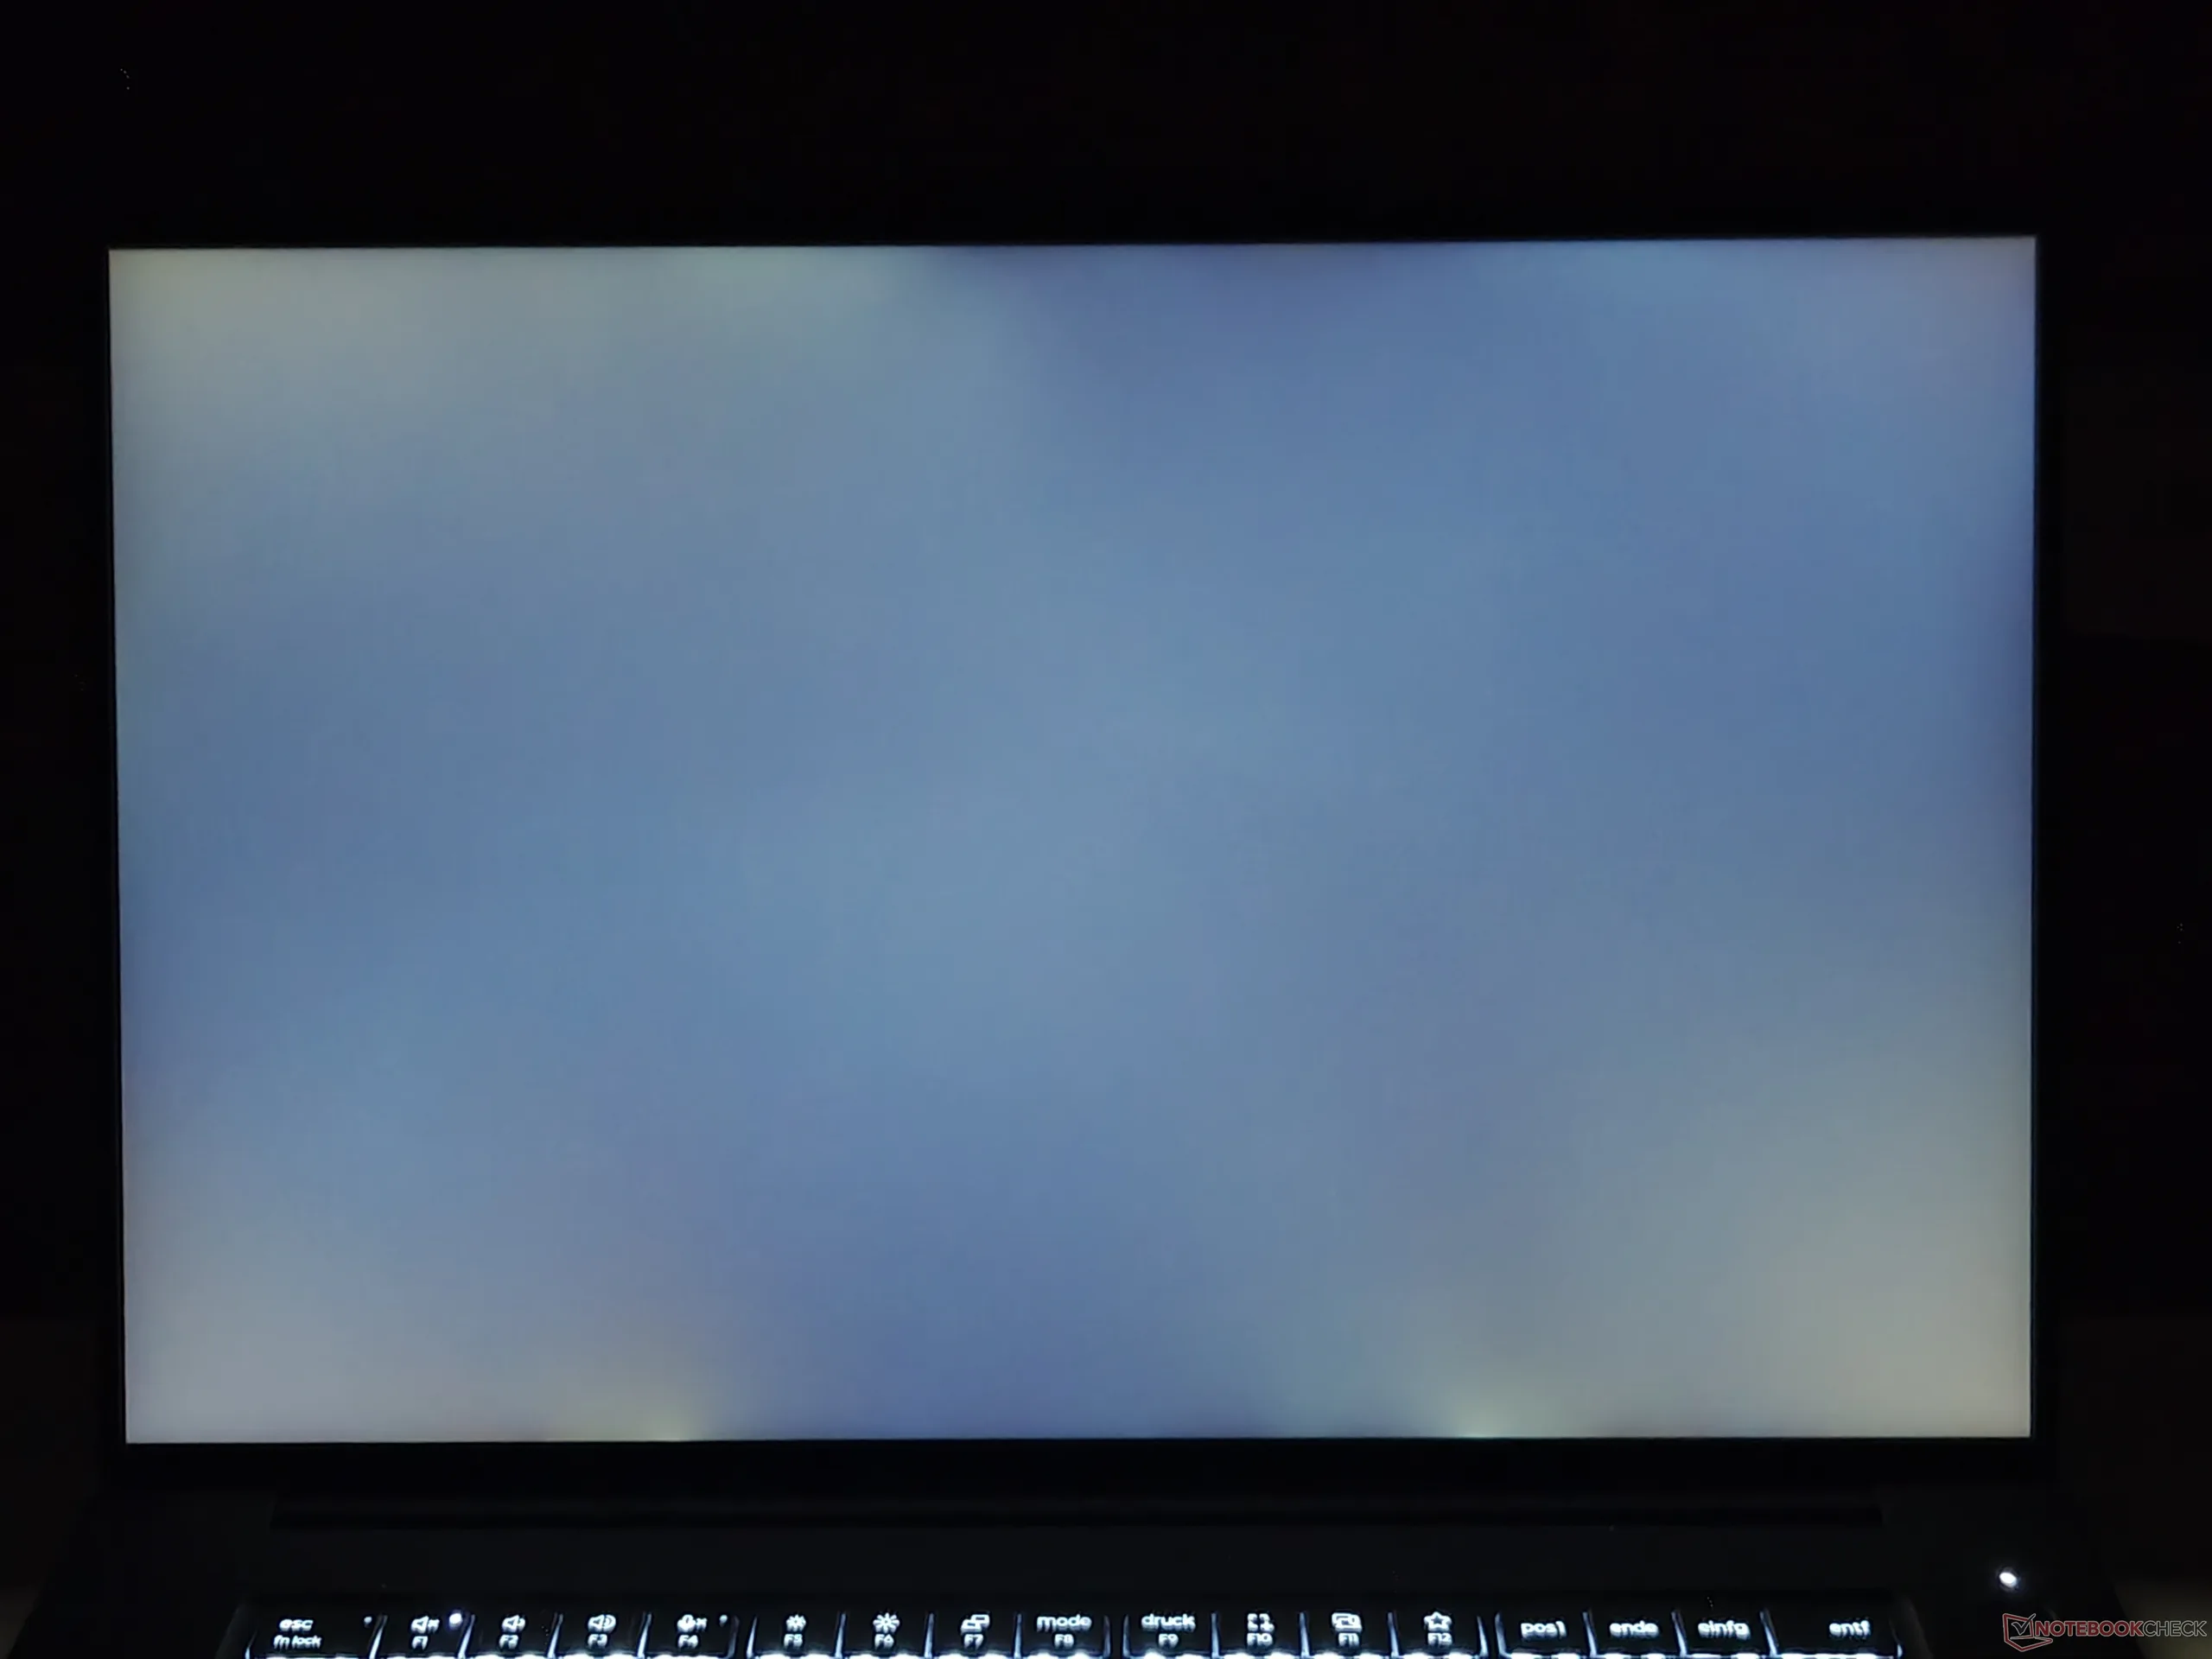
Backlight Bleeding
Backlight Bleeding

Lenovo bietet insgesamt drei 16-Zoll-Bildschirmoptionen im 16:10-Format für das Lenovo ThinkPad P1 Gen 9 an:

  • WUXGA (1,920 x 1,200), IPS, 500 cd/m², 100 % sRGB, matt
  • 3.2K (3,200 x 2,000), Tandem OLED, 600 cd/m² (1500 cd/m² HDR-Spitzenhelligkeit), 100 % DCI-P3, matt, 40-120 Hz VRR, Dolby Vision, Touch
  • WQUXGA (3,840 x 2,400), IPS, 800 cd/m², matt, Dolby Vision

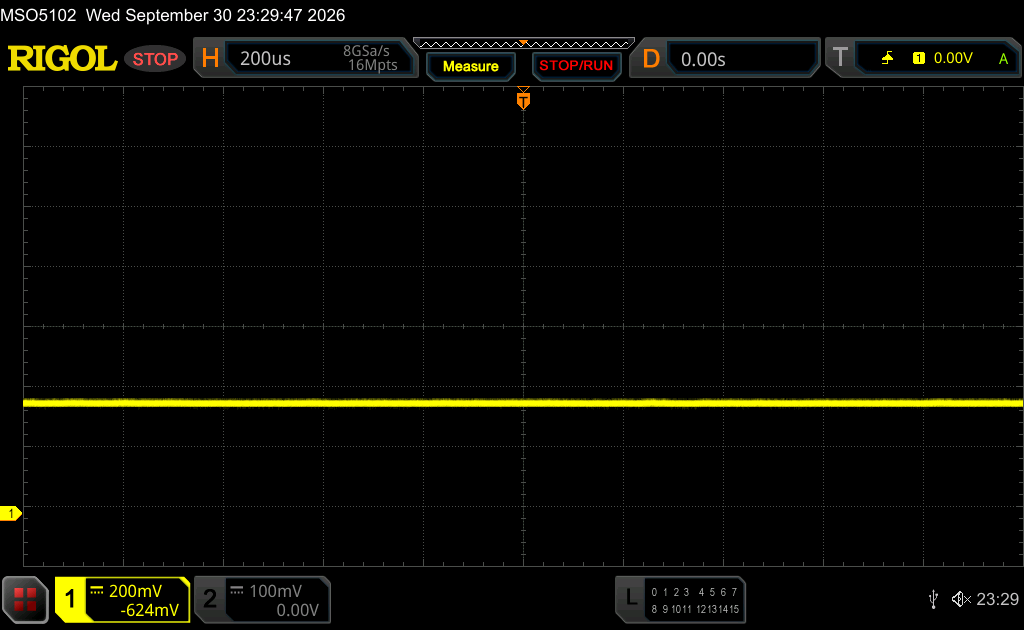
Das Basispanel in unserem Testgerät erreicht mit einer durchschnittlichen Helligkeit von 495 cd/m² beinahe die versprochene Helligkeit. Unter den getesteten Workstation- und Multimedia-Laptops in unserem Vergleich ist dies das Panel mit der niedrigsten Auflösung. Neben dem niedrigeren Preis hat es einen weiteren Vorteil: Es nutzt kein PWM zur Helligkeitsregelung.

497
cd/m²
468
cd/m²
495
cd/m²
503
cd/m²
527
cd/m²
504
cd/m²
487
cd/m²
488
cd/m²
483
cd/m²
Ausleuchtung des Bildschirms
N160JCA-GT1 getestet mit X-Rite i1Pro 3
Maximal: 527 cd/m² (Nits) Durchschnitt: 494.7 cd/m² Minimum: 9 cd/m²
Ausleuchtung: 89 %
Helligkeit Akku: 527 cd/m²
Kontrast: 1464:1 (Schwarzwert: 0.36 cd/m²)
ΔE ColorChecker Calman: 3.6 | ∀{0.5-29.43 Ø4.68}
calibrated: 1
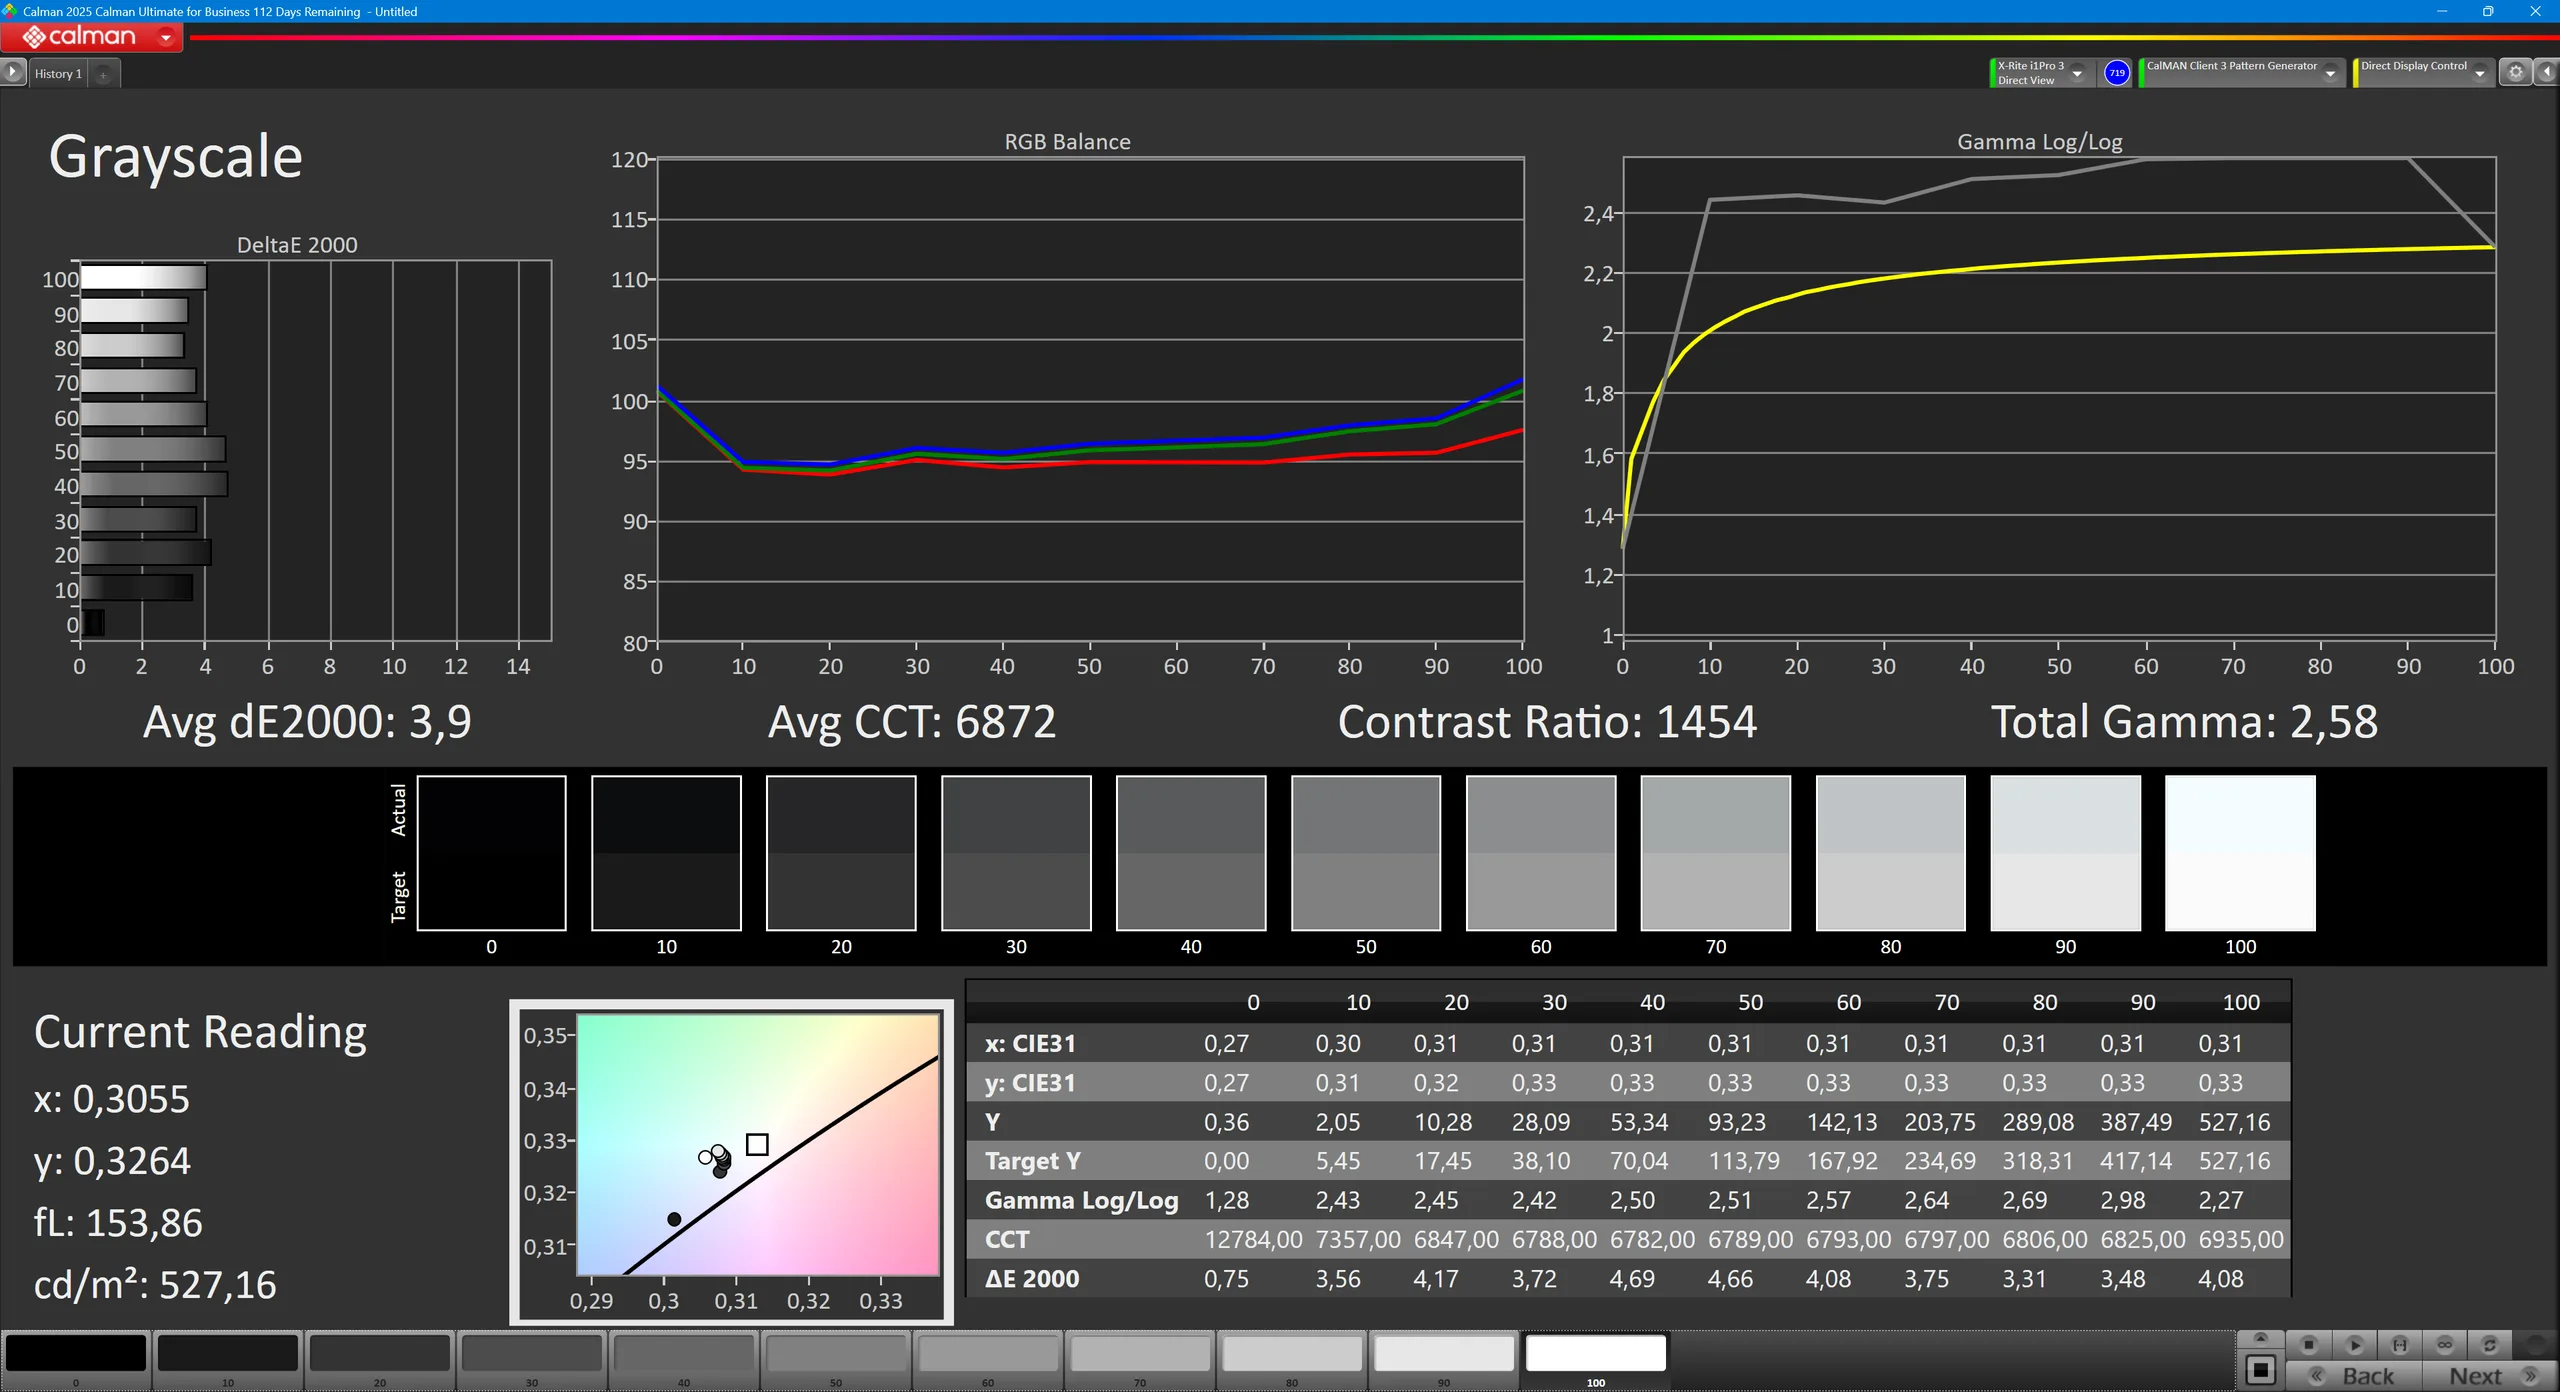
ΔE Greyscale Calman: 3.9 | ∀{0.09-98 Ø4.93}
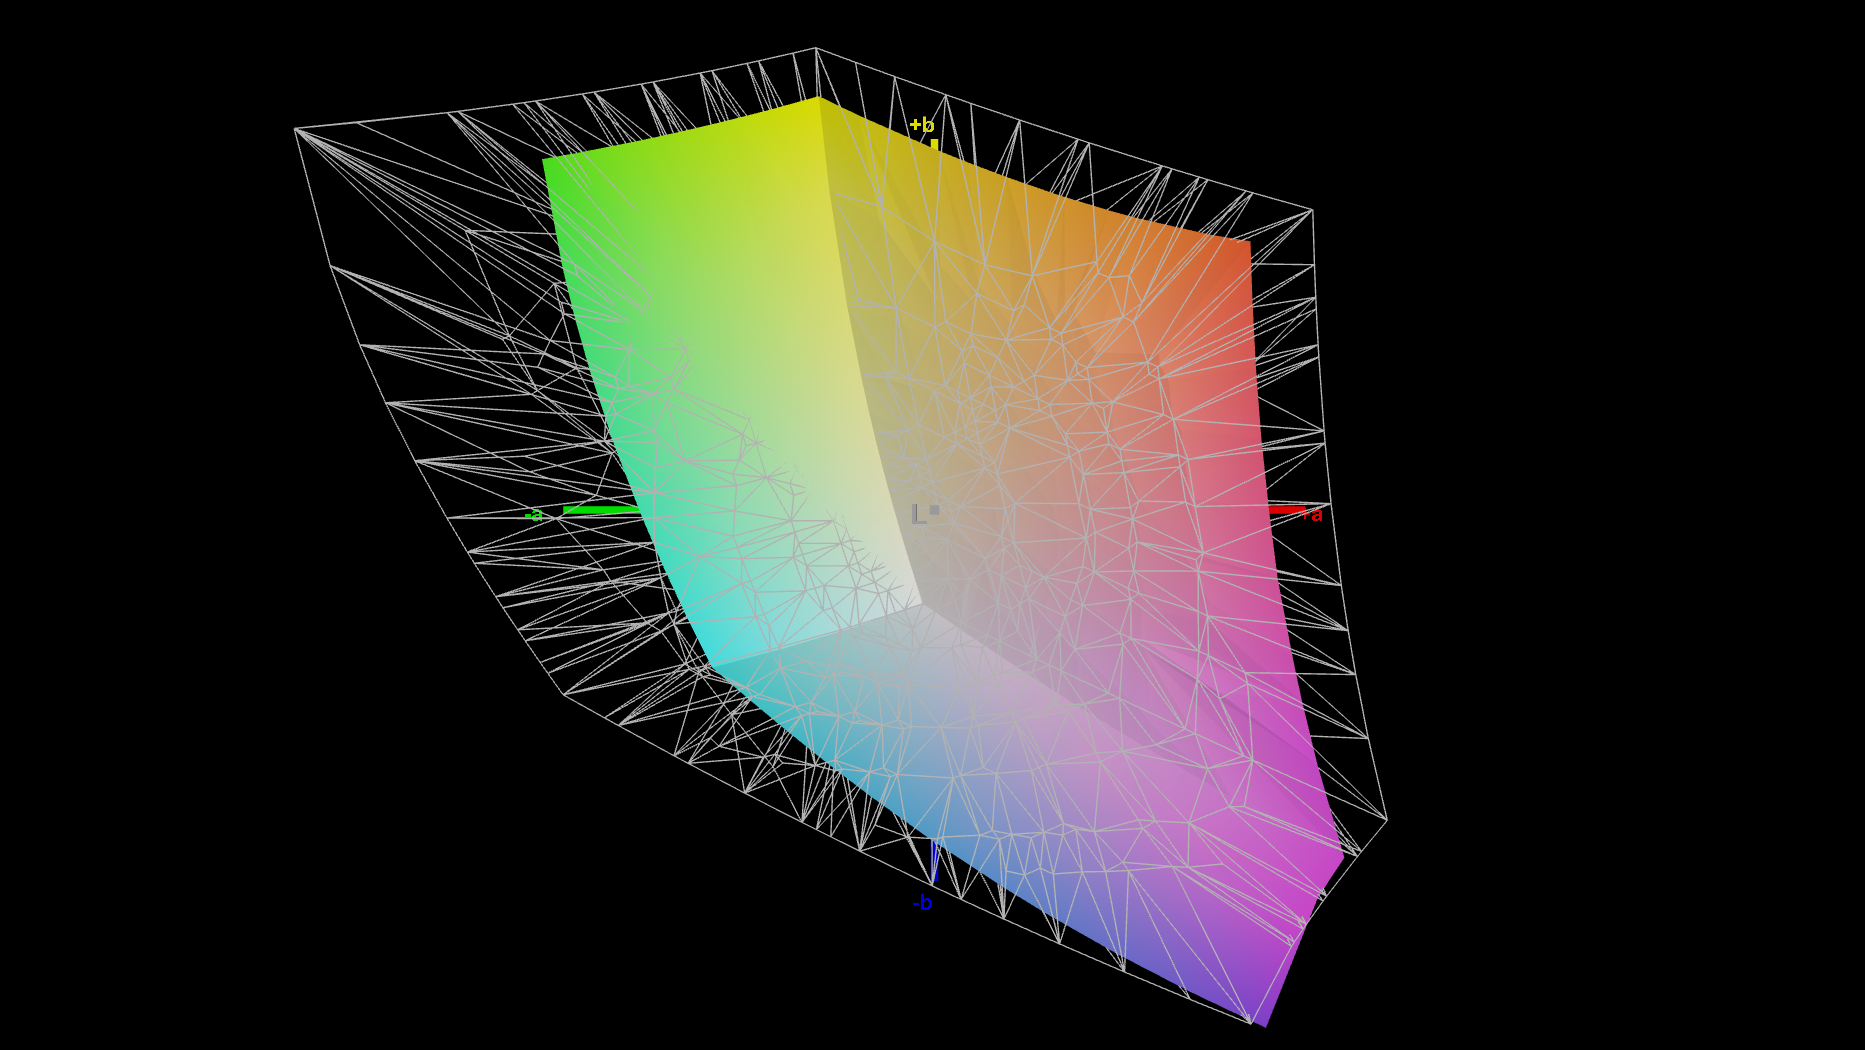
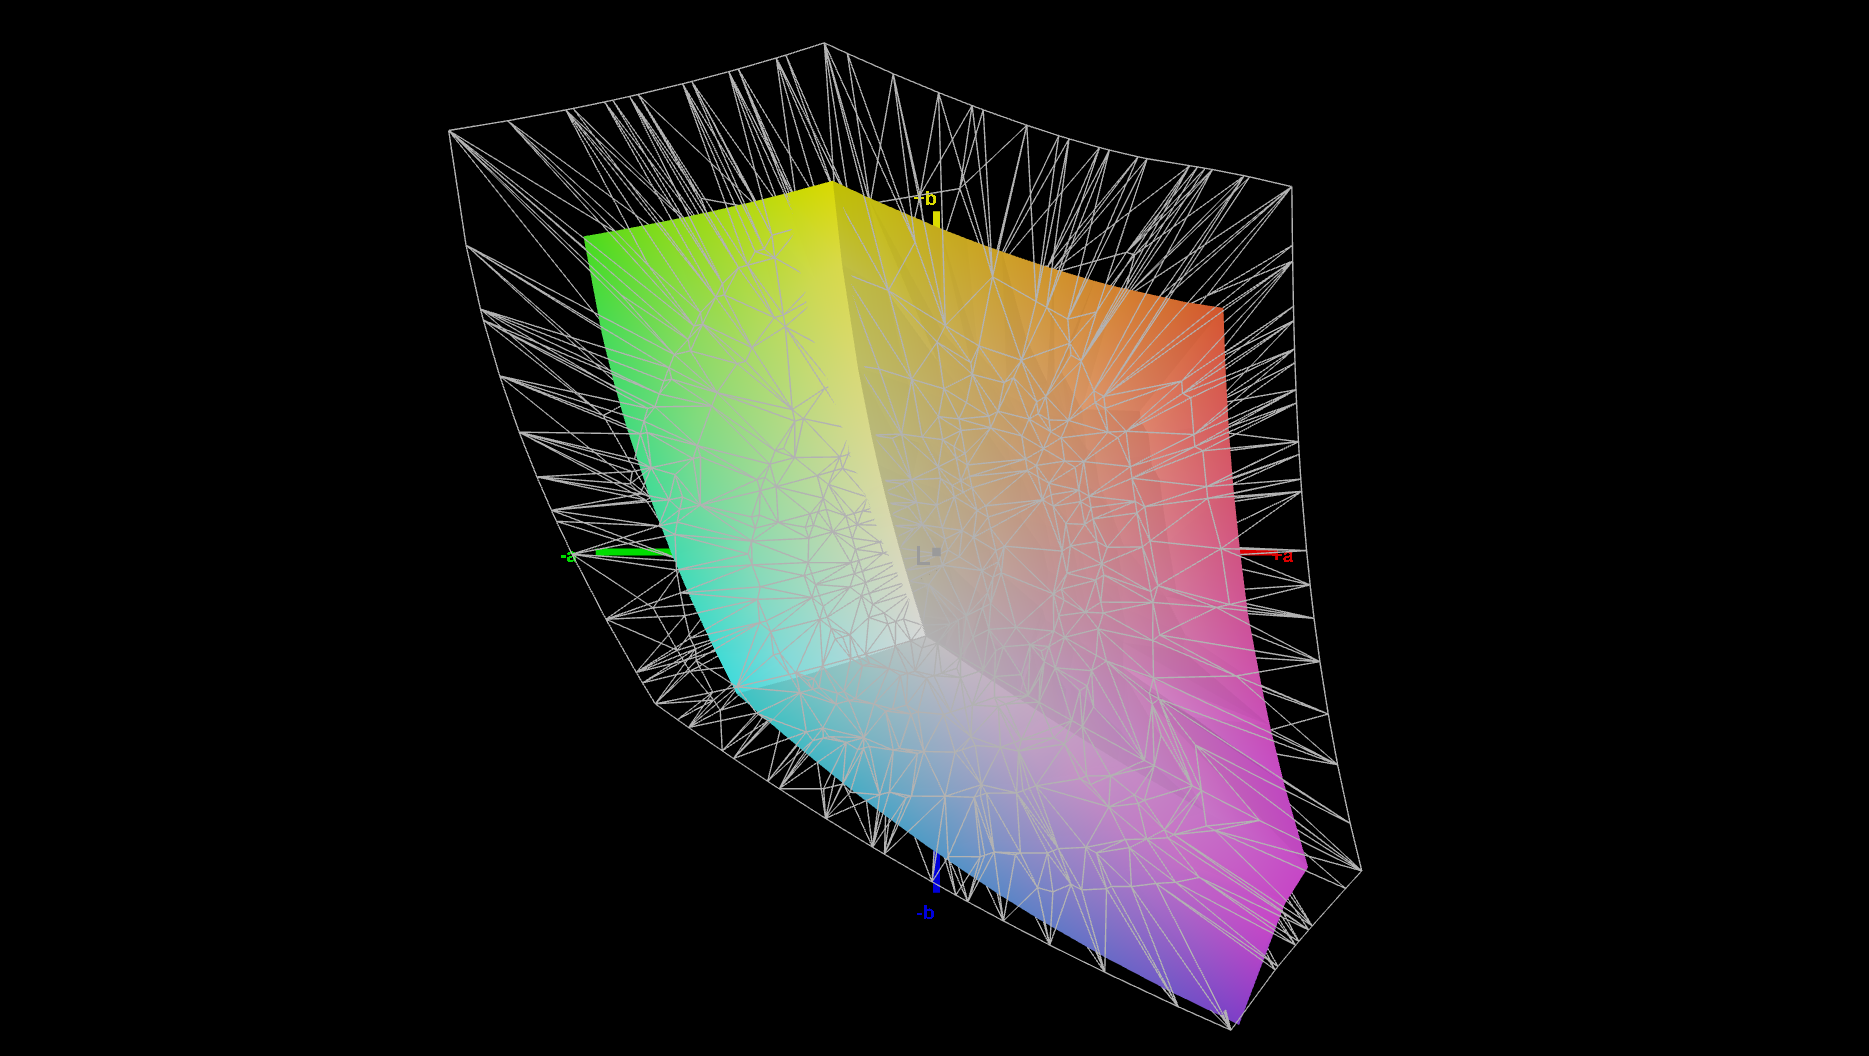
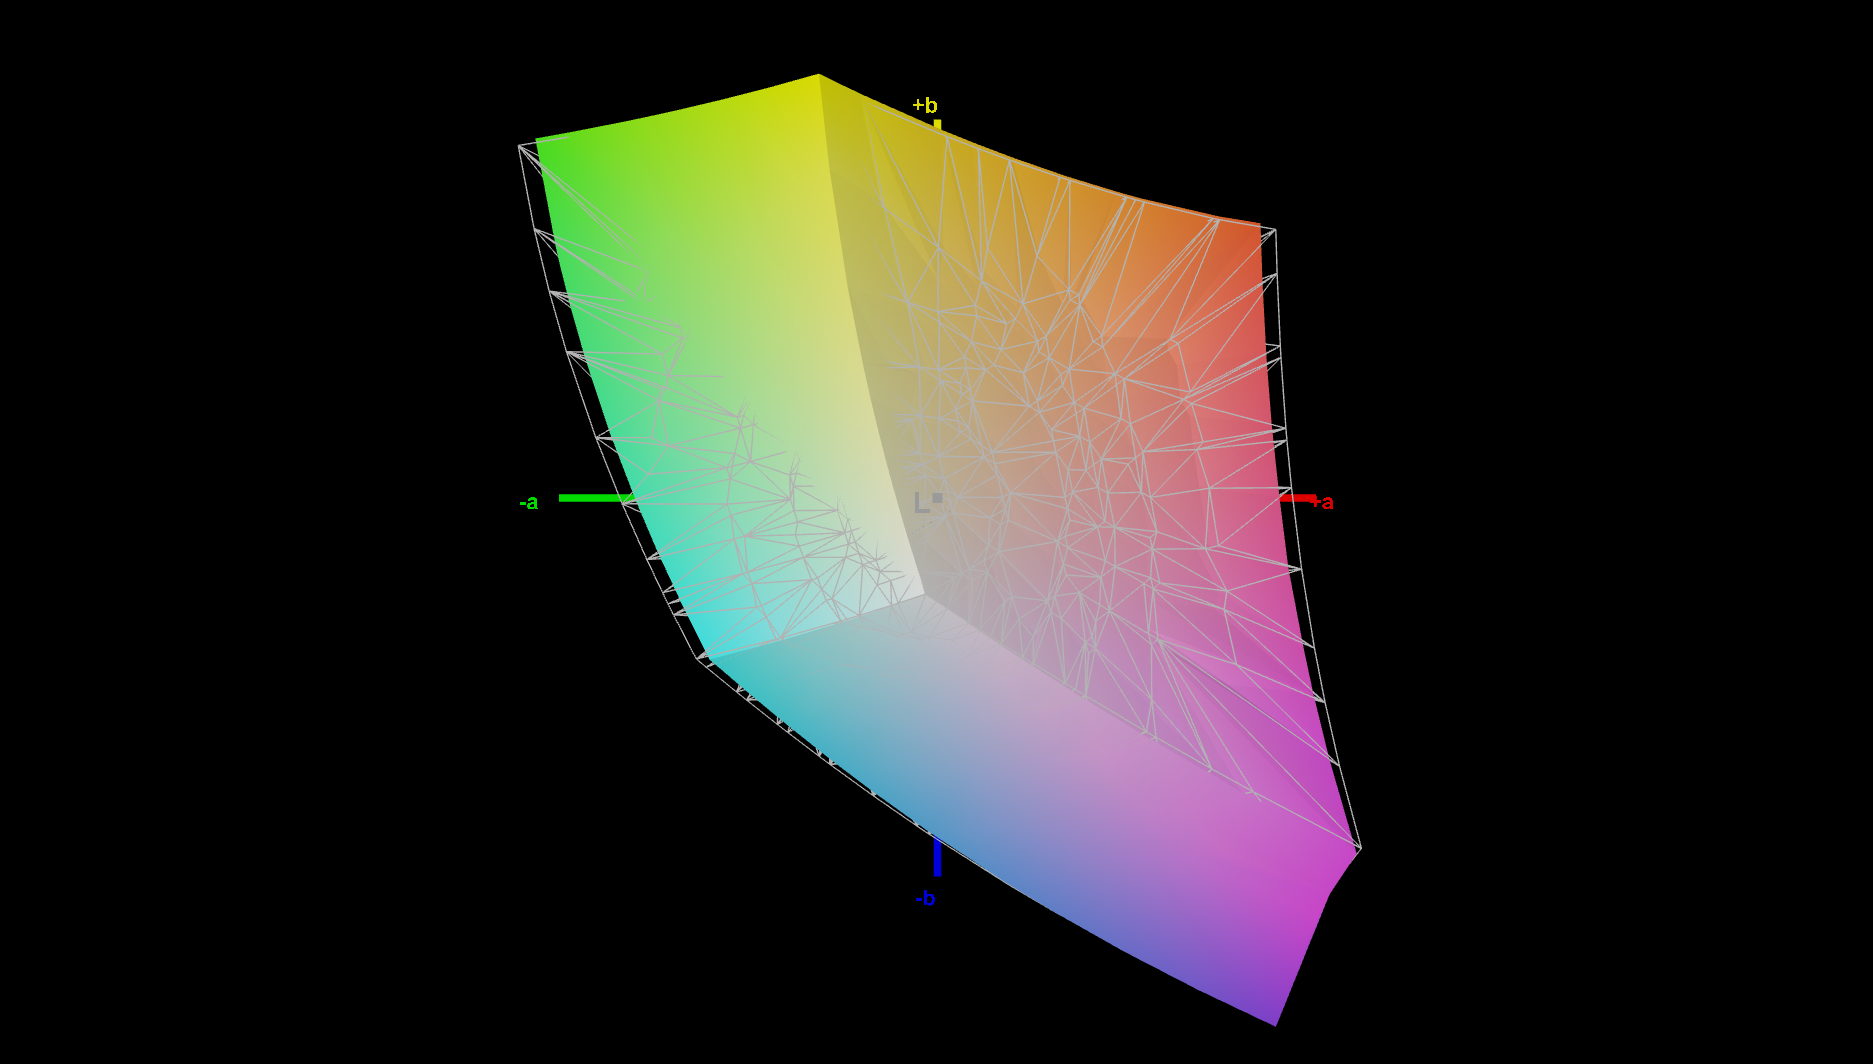
66.5% AdobeRGB 1998 (Argyll 3D)
96.2% sRGB (Argyll 3D)
64.7% Display P3 (Argyll 3D)
Gamma: 2.58
CCT: 6872 K
Lenovo ThinkPad P1 Gen 9 21UE000MGE
N160JCA-GT1, IP LED, 1920x1200, 16", 60 Hz
Lenovo ThinkPad P1 Gen 8
Samsung ATNA60KA02-0, Tandem OLED, 3200x2000, 16", 120 Hz
HP ZBook X G1i 16
LG Philips LGD07B3, IPS, 2560x1600, 16", 120 Hz
Dell XPS 16 Core Ultra X7 358H
LG Philips 160WV1, OLED, 3200x2000, 16", 120 Hz
Samsung Galaxy Book6 Ultra
ATNA60HR05-0, OLED, 2880x1800, 16", 120 Hz
Display
35%
35%
34%
27%
HDR Peak Brightness (cd/m²)
518
1182
Display P3 Coverage (%)
64.7
98.8
53%
97.2
50%
99.5
54%
97
50%
sRGB Coverage (%)
96.2
100
4%
100
4%
100
4%
99.9
4%
AdobeRGB 1998 Coverage (%)
66.5
97.5
47%
99.9
50%
96.5
45%
85.3
28%
Response Times
97%
-51%
97%
98%
Response Time Grey 50% / Grey 80% * (ms)
27 ?(10, 17)
0.57 ?(0.29, 0.28)
98%
45.5 ?(21.1, 24.4)
-69%
0.65 ?(0.36, 0.29)
98%
0.5 ?(0.25, 0.25)
98%
Response Time Black / White * (ms)
19.6 ?(11.9, 7.7)
0.73 ?(0.34, 0.39)
96%
26.1 ?(11.8, 14.3)
-33%
0.87 ?(0.43, 0.44)
96%
0.4 ?(0.2, 0.2)
98%
PWM Frequency (Hz)
1199
26536 ?(74)
240.2 ?(100)
240 ?(100)
PWM Amplitude * (%)
18
47
31
100
Bildschirm
32%
-13%
-1%
33%
Helligkeit Bildmitte (cd/m²)
527
561.8
7%
461.8
-12%
395.4
-25%
499
-5%
Brightness (cd/m²)
495
566
14%
427
-14%
392
-21%
505
2%
Brightness Distribution (%)
89
99
11%
88
-1%
95
7%
97
9%
Schwarzwert * (cd/m²)
0.36
0.46
-28%
Kontrast (:1)
1464
1004
-31%
Delta E Colorchecker *
3.6
1.29
64%
4.08
-13%
3.69
-2%
0.9
75%
Colorchecker dE 2000 max. *
5.3
2.96
44%
8.1
-53%
7.94
-50%
2.1
60%
Colorchecker dE 2000 calibrated *
1
0.81
19%
0.75
25%
0.68
32%
Delta E Graustufen *
3.9
1.4
64%
3.5
10%
1.9
51%
1.6
59%
Gamma
2.58 85%
2.23 99%
2.15 102%
2.28 96%
2.22 99%
CCT
6872 95%
6319 103%
6715 97%
6274 104%
6445 101%
Durchschnitt gesamt (Programm / Settings)
55% / 43%
-10% / -8%
43% / 24%
53% / 43%

* ... kleinere Werte sind besser

Graustufen
Graustufen
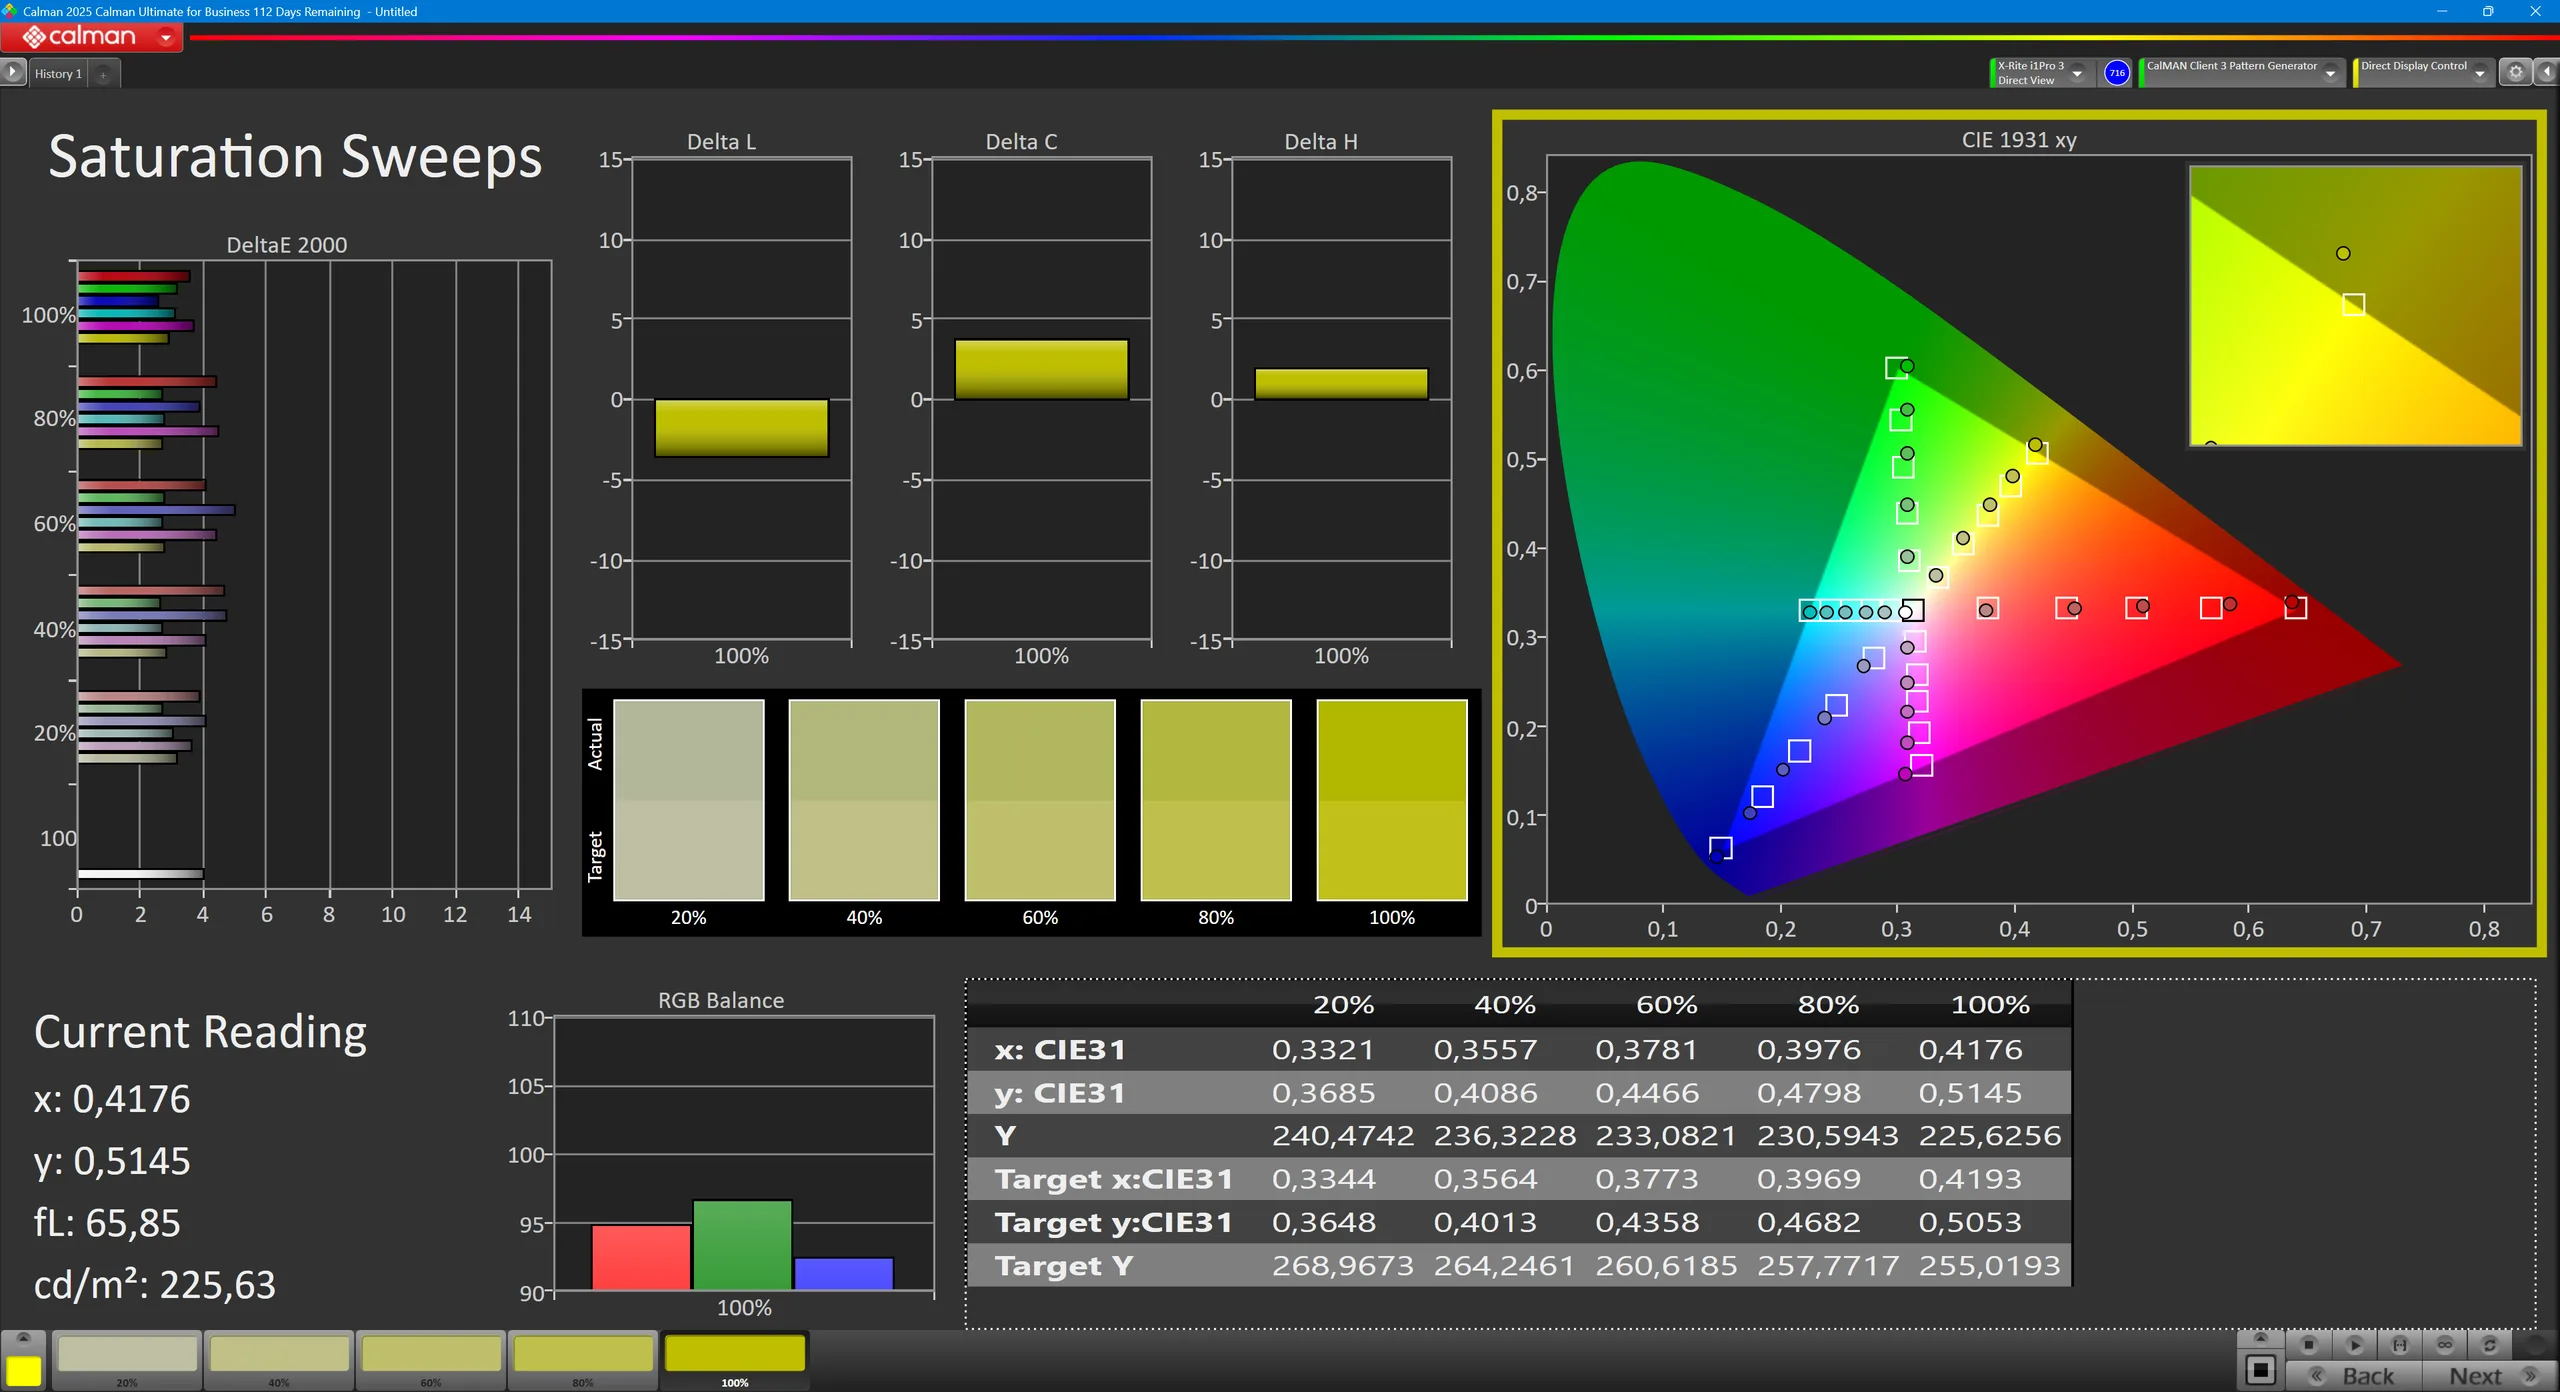
Sättigung
Sättigung
Colorchecker
Colorchecker
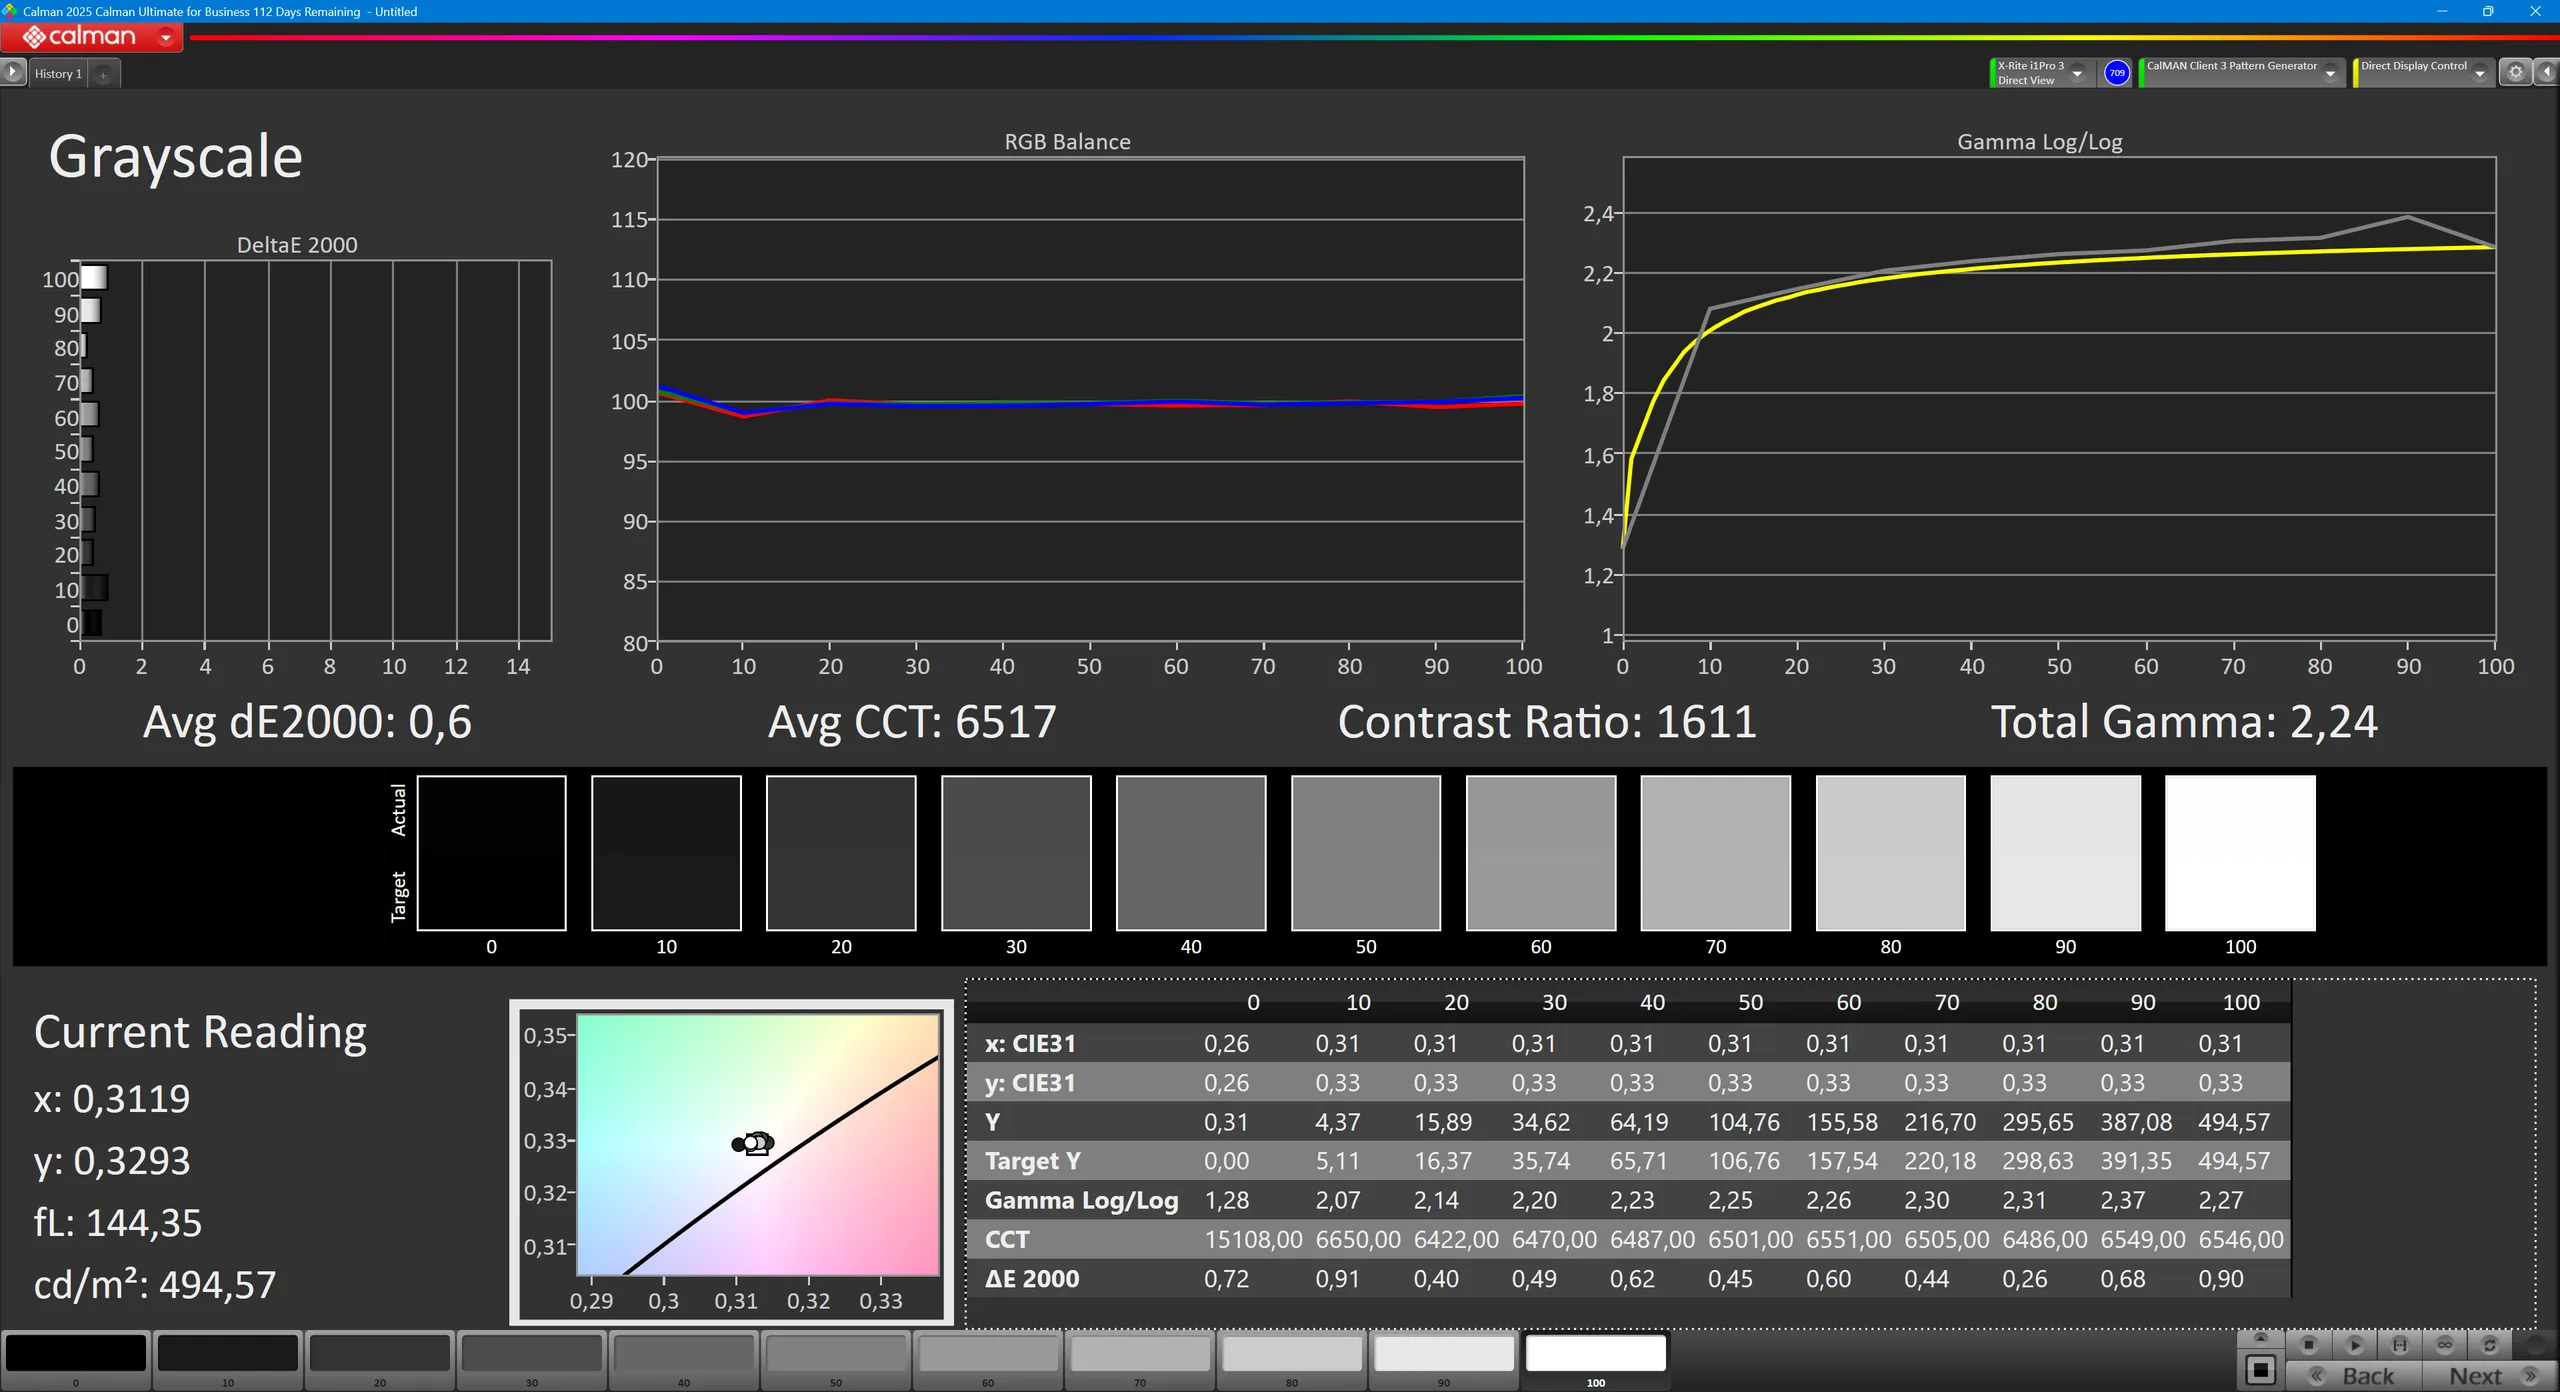
Graustufen kalibriert
Mit Colorchecker kalibriert
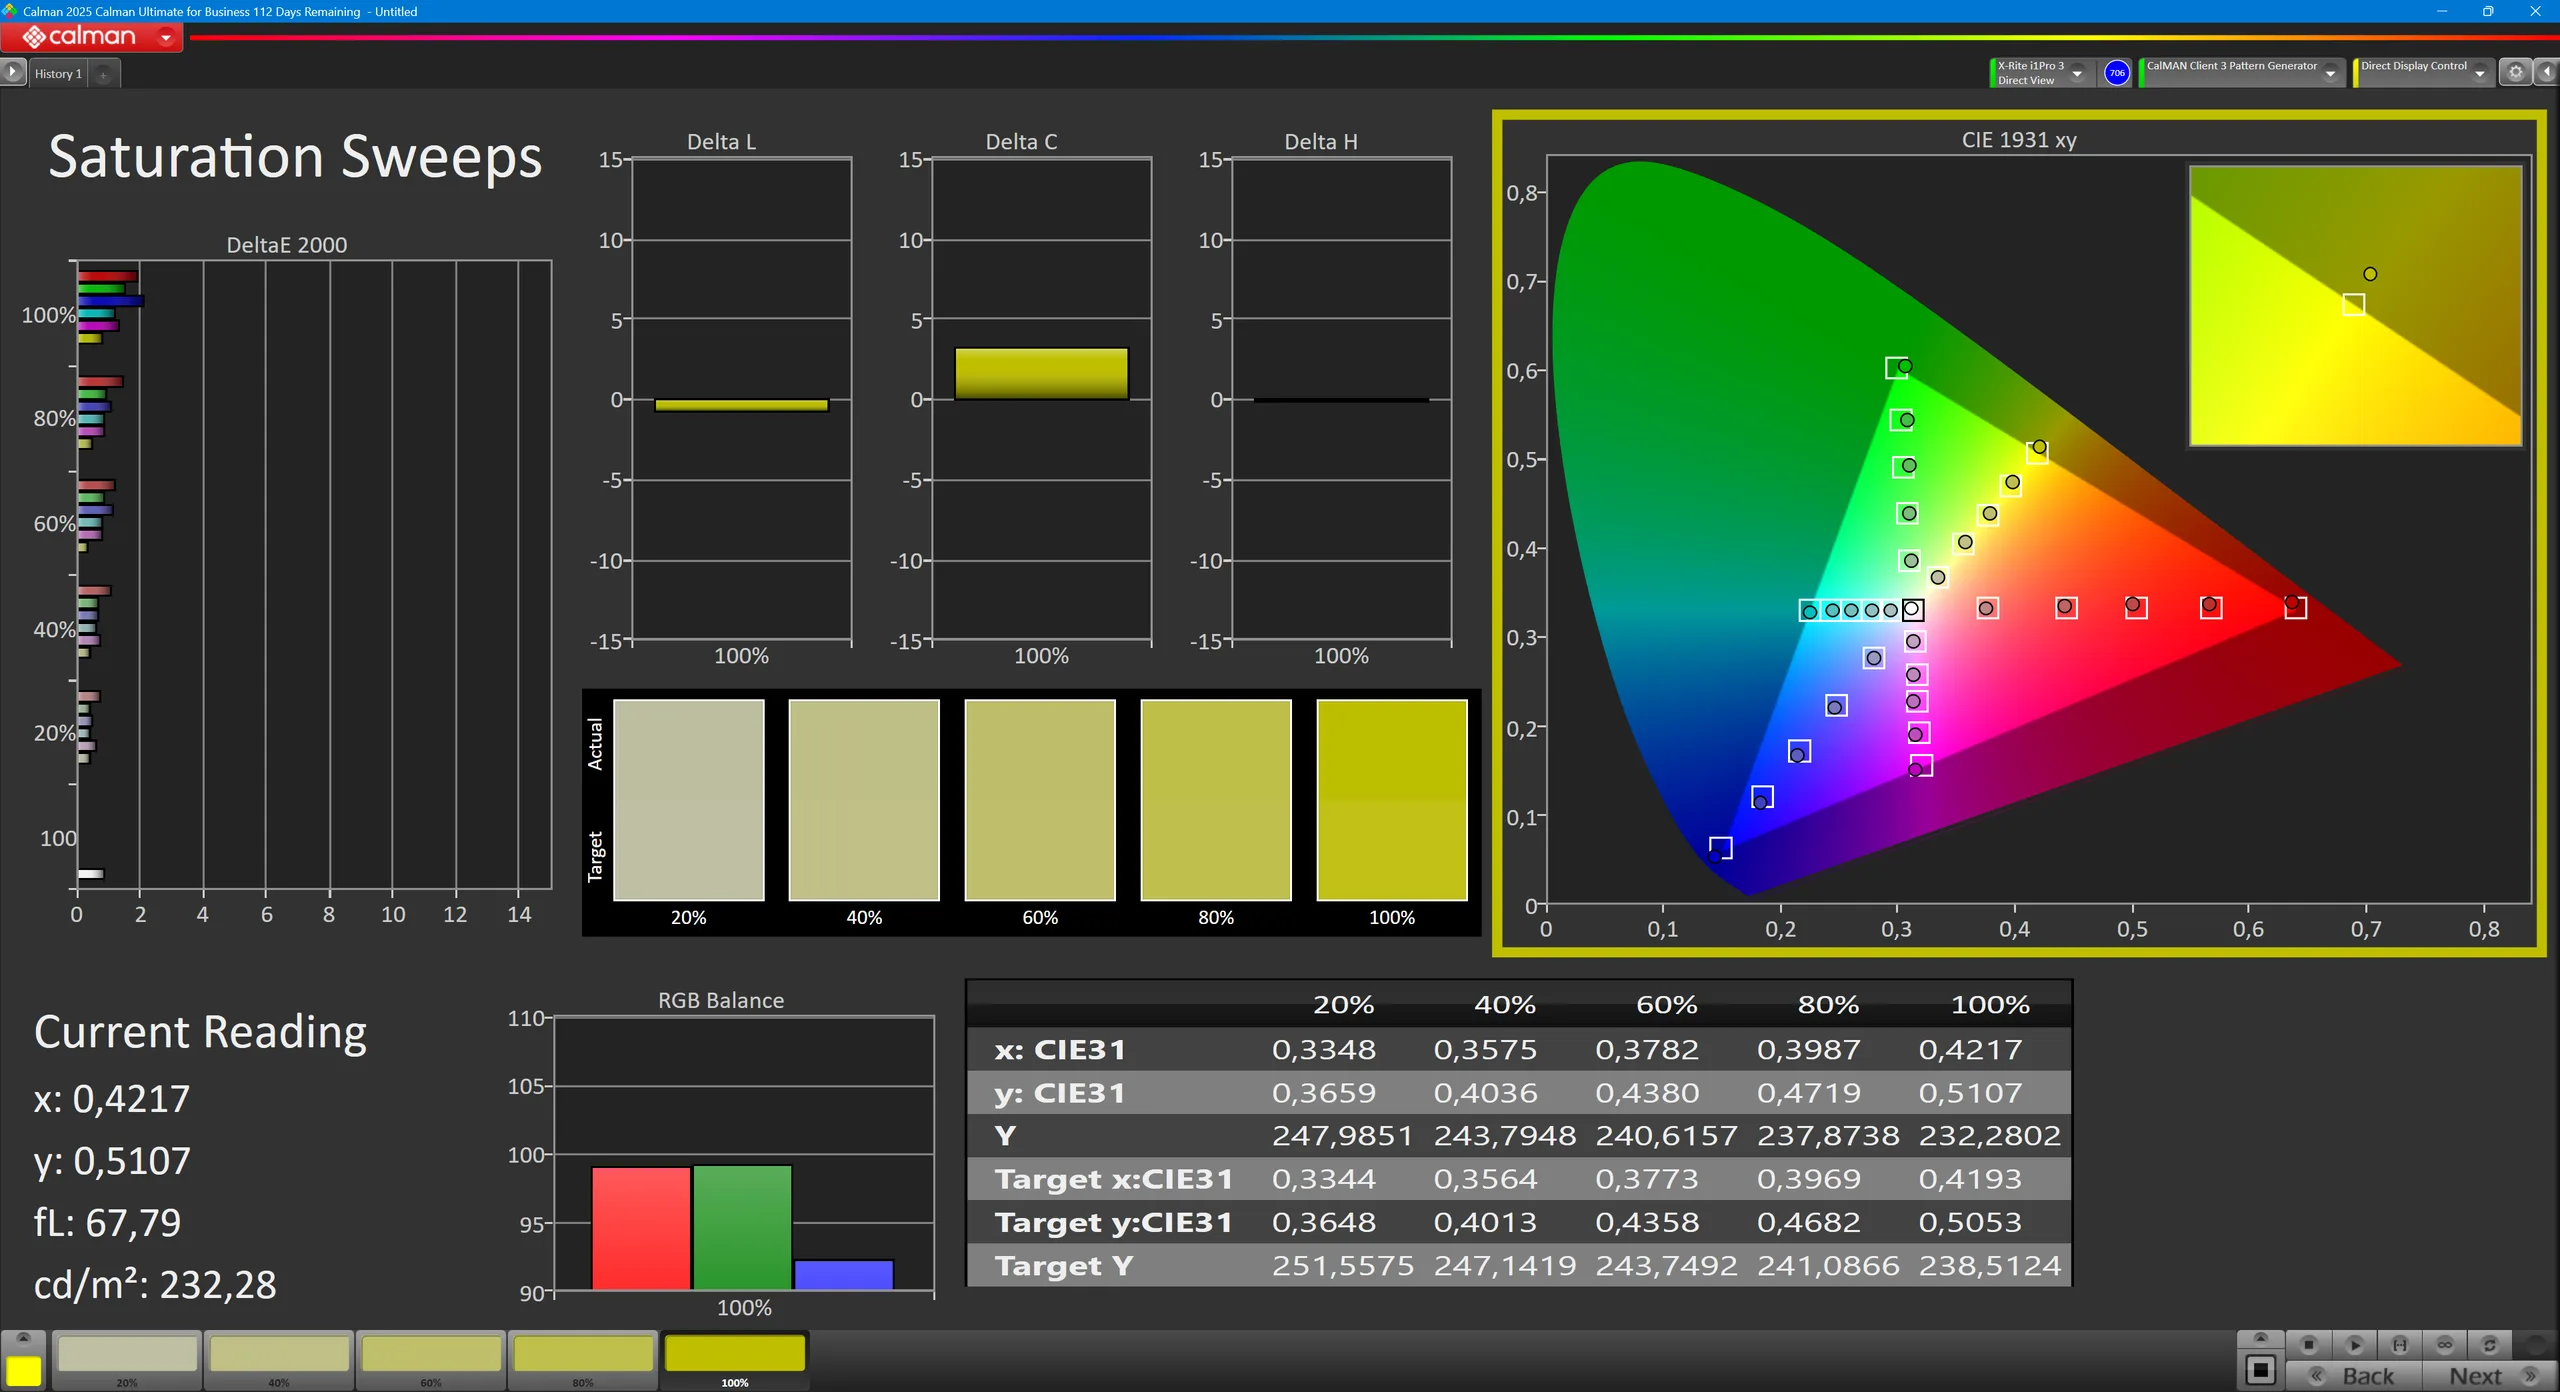
Sättigung kalibriert

Dies ist ein recht einfaches Panel, aber immerhin deckt es fast 100 Prozent des sRGB-Farbraums ab. Das bedeutet, dass es für einfache Bildbearbeitung verwendet werden kann und die Farbgenauigkeit nach einer Kalibrierung ebenfalls hoch ist.

Mit einer Helligkeit von fast 500 cd/m² und einer matten Oberfläche ist dieser Bildschirm durchaus auch außerhalb des Büros und sogar in der Sonne nutzbar.
DCI P3
DCI P3
SRGB
SRGB
AdobeRGB
AdobeRGB
Im Freien (sonnig)
Im Freien (sonnig)

Reaktionszeiten (Response Times) des Displays

ℹ
Die Reaktionszeiten (Response Times) beschreiben wie schnell zwischen zwei Farben eines Pixels umgeschaltet werden kann. Langsame Response Times können zu einer verschwommenen Darstellung, Schlieren und Geisterbilder führen. Besonders bei schnellen 3D-Spielen sind kurze Umschaltzeiten wichtig.
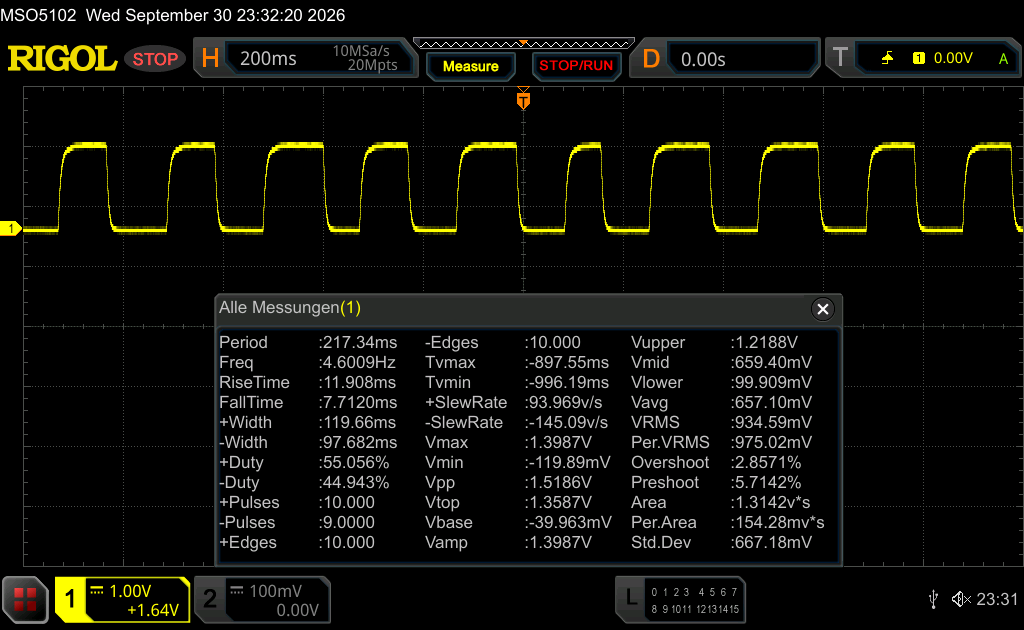
   ↔    Reaktionszeiten Schwarz zu Weiß
19.6 ms ... steigend ↗ und fallend ↘ kombiniert↗ 11.9 ms steigend
↘ 7.7 ms fallend
Die gemessenen Reaktionszeiten sind gut, für anspruchsvolle Spieler könnten der Bildschirm jedoch zu langsam sein.
Im Vergleich rangierten die bei uns getesteten Geräte von 0.1 (Minimum) zu 240 (Maximum) ms. » 44 % aller Screens waren schneller als der getestete.
Daher sind die gemessenen Reaktionszeiten durchschnittlich (19.6 ms).
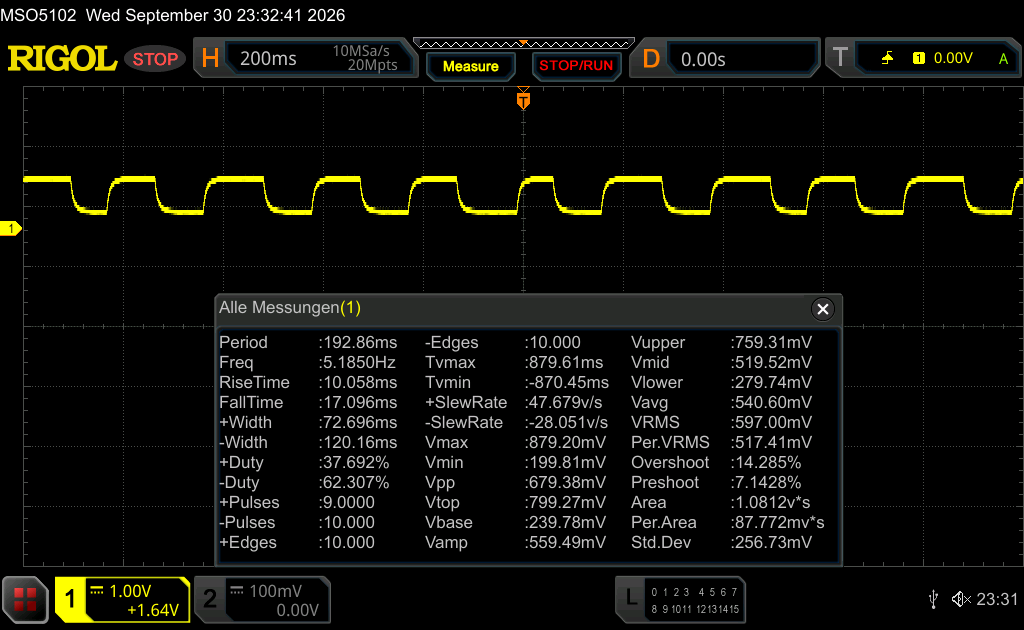
   ↔    Reaktionszeiten 50% Grau zu 80% Grau
27 ms ... steigend ↗ und fallend ↘ kombiniert↗ 10 ms steigend
↘ 17 ms fallend
Die gemessenen Reaktionszeiten sind mittelmäßig und dadurch für Spieler eventuell zu langsam.
Im Vergleich rangierten die bei uns getesteten Geräte von 0.13 (Minimum) zu 636 (Maximum) ms. » 37 % aller Screens waren schneller als der getestete.
Daher sind die gemessenen Reaktionszeiten besser als der Durchschnitt aller vermessenen Geräte (30.6 ms).

Bildschirm-Flackern / PWM (Pulse-Width Modulation)

ℹ
Eine günstige Methode um die Helligkeit eines Bildschirms zu steuern, ist die Beleuchtung periodisch ein- und auszuschalten. Dies nennt sich PWM (Pulsweitenmodulation) Diese Umschaltung sollte mit einer hohen Frequenz stattfinden damit das menschliche Auge kein Flimmern wahrnimmt. Wenn die Frequenz zu niedrig ist, kann dies zu Ermüdungserscheinungen, Augenbrennen, Kopfweh und auch sichtbaren Flackern führen.
Flackern / PWM nicht festgestellt

Im Vergleich: 52 % aller getesteten Geräte nutzten kein PWM um die Helligkeit zu reduzieren. Wenn PWM eingesetzt wurde, dann bei einer Frequenz von durchschnittlich 7556 (Minimum 5, Maximum 343500) Hz.

Leistung

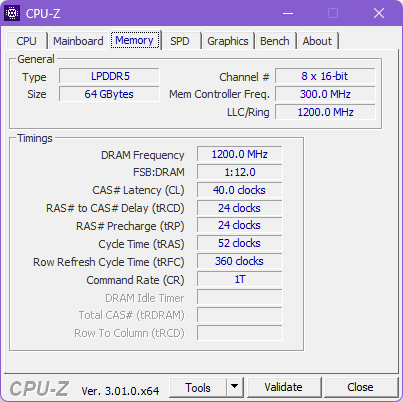
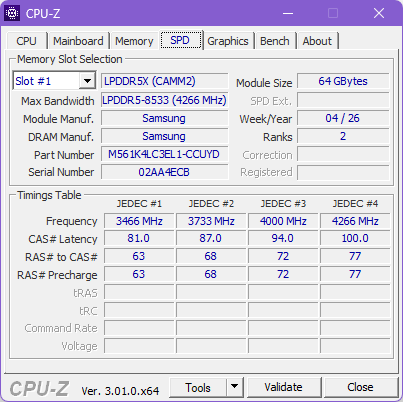
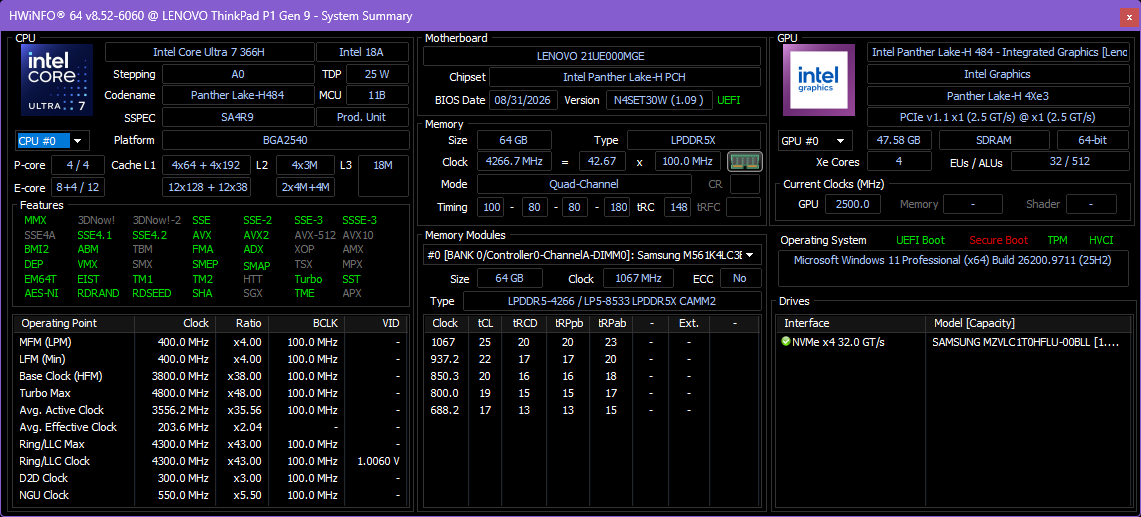
Für das ThinkPad P1 G9 werden insgesamt sechs verschiedene CPUs angeboten, die alle von Intel stammen (Core Ultra 7 356H, Ultra 7 366H, Ultra 9 386H, Ultra X7 368H, Ultra X9 388H). Diese CPUs werden mit unterschiedlichen GPUs kombiniert: Die CPUs mit einer Sechs am Ende können entweder mit der Nvidia RTX Pro 1000 Blackwell oder der RTX Pro 2000 Blackwell konfiguriert werden, während die CPUs mit einer Acht am Ende immer mit der integrierten Intel ARC B390 kombiniert werden.

Im Vergleich zum älteren ThinkPad P1 G8 hat Lenovo die maximale RAM-Kapazität des einzelnen LPCAMM2-Moduls von 64 auf 96 GB LPDDR5X-8533-Arbeitsspeicher erhöht. Die beiden M.2-2280-Steckplätze, von denen einer PCIe-5.0-Geschwindigkeit unterstützt, können insgesamt bis zu 8 TB SSD-Kapazität aufnehmen (jeweils 4 TB).
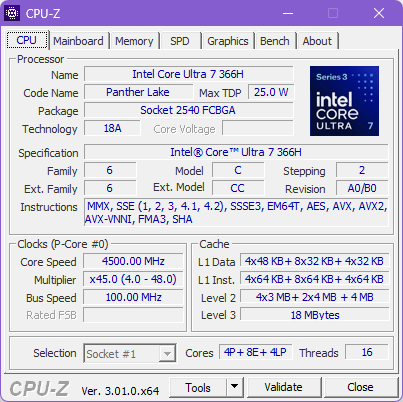
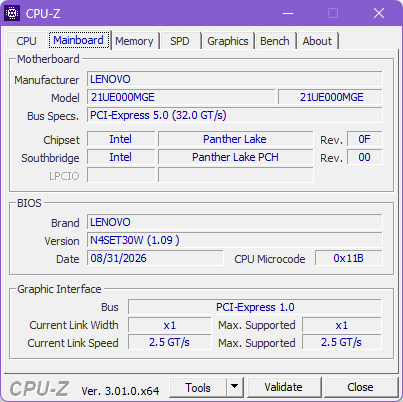
CPU-Z
CPU-Z
CPU-Z Mainboard
CPU-Z Mainboard
CPU-Z Speicher
CPU-Z Speicher
CPU-Z SPD
CPU-Z SPD
HWiNFO
HWiNFO
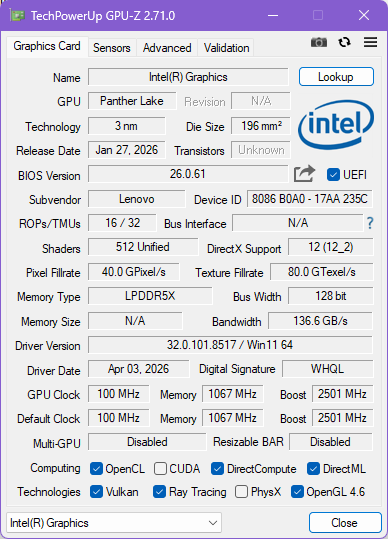
GPU-Z Intel
GPU-Z Intel

Testbedingungen

Es gibt drei Windows-Energiemodi, die bestimmen, wie viel Leistung das System dem Prozessor unter Dauerlast (PL1) oder maximal (PL2) zuführt:

  • Beste Energieeffizienz: PL1 20 W / PL2 75 W
  • Ausbalanciert: PL1 55 W / PL2 80 W
  • Beste Leistung: PL1 65 W / PL2 80 W

Alle Benchmarks wurden im Modus "Beste Leistung" durchgeführt.

Prozessorleistung

Der Intel Core Ultra 7 366H ist eine CPU mit sechzehn Kernen aus Intels "Panther Lake"-Serie. Die vier P-Kerne erreichen bis zu 4,8 GHz, während die acht E-Kerne eine maximale Taktfrequenz von 3,8 GHz aufweisen. Zu guter Letzt kommen die vier kleinen E-Kerne auf bis zu 3,4 GHz. Weitere Vergleiche mit anderen Prozessoren sind mit unserer CPU-Benchmarkliste möglich.

Die CPU-Leistung bleibt gegenüber dem älteren ThinkPad P1 Gen 8 und seinem Arrow-Lake-Prozessor weitgehend unverändert. Es handelt sich um eine schnelle CPU, die auch unter Last kaum drosselt.

Im Akkubetrieb erreicht die CPU im Cinebench R23 Multicore nur 17.925 Punkte, was einem Leistungsverlust von 18 Prozent entspricht.

Cinebench R15 Multi-Schleife

07014021028035042049056063070077084091098010501120119012601330140014701540161016801750182018901960203021002170224023102380245025202590266027302800287029403010308031503220329033603430Tooltip
Lenovo ThinkPad P1 Gen 9 21UE000MGE Intel Core Ultra 7 366H: Ø3161 (3132.59-3258.66) Points
Lenovo ThinkPad P1 Gen 8 Intel Core Ultra 7 255H: Ø3081 (2958.36-3387.53) Points
HP ZBook X G1i 16 Intel Core Ultra 7 265H: Ø3025 (2966.92-3439.97) Points
Dell XPS 16 Core Ultra X7 358H Intel Core Ultra X7 358H: Ø2543 (2491.75-2985.52) Points
Samsung Galaxy Book6 Ultra Intel Core Ultra 7 356H: Ø3156 (3127.69-3200.77) Points
CPU Performance Rating: Percent
Cinebench R23: Multi Core | Single Core
Cinebench R20: CPU (Multi Core) | CPU (Single Core)
Cinebench R15: CPU Multi 64Bit | CPU Single 64Bit
Blender: v2.79 BMW27 CPU
7-Zip 18.03: 7z b 4 | 7z b 4 -mmt1
Geekbench 6.7: Multi-Core | Single-Core
Geekbench 5.5: Multi-Core | Single-Core
HWBOT x265 Benchmark v2.2: 4k Preset
LibreOffice : 20 Documents To PDF
R Benchmark 2.5: Overall mean
CPU Performance Rating
Durchschnitt der Klasse Workstation
 
82.3 pt
HP ZBook X G1i 16
Intel Core Ultra 7 265H
79 pt
Samsung Galaxy Book6 Ultra
Intel Core Ultra 7 356H
77.7 pt
Lenovo ThinkPad P1 Gen 9 21UE000MGE
Intel Core Ultra 7 366H
77.3 pt
Lenovo ThinkPad P1 Gen 8
Intel Core Ultra 7 255H
77.3 pt
Dell XPS 16 Core Ultra X7 358H
Intel Core Ultra X7 358H
74.1 pt
Durchschnittliche Intel Core Ultra 7 366H
 
73.6 pt
Cinebench R23 / Multi Core
Durchschnitt der Klasse Workstation
  (14621 - 38520, n=21, der letzten 2 Jahre)
24877 Points +17%
Lenovo ThinkPad P1 Gen 8
Intel Core Ultra 7 255H
22191 (21038.4min - 22190.6max) Points +5%
HP ZBook X G1i 16
Intel Core Ultra 7 265H
21369 (19383min - 21369.2max) Points +1%
Lenovo ThinkPad P1 Gen 9 21UE000MGE
Intel Core Ultra 7 366H
21193 Points
Samsung Galaxy Book6 Ultra
Intel Core Ultra 7 356H
20650 Points -3%
Durchschnittliche Intel Core Ultra 7 366H
  (16974 - 21193, n=5)
18568 Points -12%
Dell XPS 16 Core Ultra X7 358H
Intel Core Ultra X7 358H
17884 (15984.6min - 17883.7max) Points -16%
Cinebench R23 / Single Core
Dell XPS 16 Core Ultra X7 358H
Intel Core Ultra X7 358H
2087 Points +1%
Durchschnittliche Intel Core Ultra 7 366H
  (2065 - 2089, n=5)
2081 Points +1%
Lenovo ThinkPad P1 Gen 9 21UE000MGE
Intel Core Ultra 7 366H
2065 Points
Samsung Galaxy Book6 Ultra
Intel Core Ultra 7 356H
2045 Points -1%
Durchschnitt der Klasse Workstation
  (1712 - 2228, n=21, der letzten 2 Jahre)
2036 Points -1%
HP ZBook X G1i 16
Intel Core Ultra 7 265H
2011 Points -3%
Lenovo ThinkPad P1 Gen 8
Intel Core Ultra 7 255H
1999 Points -3%
Cinebench R20 / CPU (Multi Core)
Durchschnitt der Klasse Workstation
  (5721 - 15043, n=21, der letzten 2 Jahre)
9629 Points +16%
Lenovo ThinkPad P1 Gen 8
Intel Core Ultra 7 255H
8651 Points +5%
HP ZBook X G1i 16
Intel Core Ultra 7 265H
8400 Points +2%
Lenovo ThinkPad P1 Gen 9 21UE000MGE
Intel Core Ultra 7 366H
8270 Points
Samsung Galaxy Book6 Ultra
Intel Core Ultra 7 356H
8074 Points -2%
Dell XPS 16 Core Ultra X7 358H
Intel Core Ultra X7 358H
7195 Points -13%
Durchschnittliche Intel Core Ultra 7 366H
  (6517 - 8270, n=5)
7011 Points -15%
Cinebench R20 / CPU (Single Core)
Lenovo ThinkPad P1 Gen 9 21UE000MGE
Intel Core Ultra 7 366H
791 Points
Durchschnitt der Klasse Workstation
  (671 - 857, n=21, der letzten 2 Jahre)
788 Points 0%
Durchschnittliche Intel Core Ultra 7 366H
  (760 - 791, n=5)
782 Points -1%
Dell XPS 16 Core Ultra X7 358H
Intel Core Ultra X7 358H
780 Points -1%
HP ZBook X G1i 16
Intel Core Ultra 7 265H
776 Points -2%
Samsung Galaxy Book6 Ultra
Intel Core Ultra 7 356H
773 Points -2%
Lenovo ThinkPad P1 Gen 8
Intel Core Ultra 7 255H
760 Points -4%
Cinebench R15 / CPU Multi 64Bit
Durchschnitt der Klasse Workstation
  (2223 - 5810, n=21, der letzten 2 Jahre)
3875 Points +19%
HP ZBook X G1i 16
Intel Core Ultra 7 265H
3440 (2966.92min - 3439.97max) Points +6%
Lenovo ThinkPad P1 Gen 8
Intel Core Ultra 7 255H
3388 (2958.36min - 3387.53max) Points +4%
Lenovo ThinkPad P1 Gen 9 21UE000MGE
Intel Core Ultra 7 366H
3259 (3132.59min - 3258.66max) Points
Samsung Galaxy Book6 Ultra
Intel Core Ultra 7 356H
3201 (3127.69min - 3200.77max) Points -2%
Dell XPS 16 Core Ultra X7 358H
Intel Core Ultra X7 358H
2986 (2491.75min - 2985.52max) Points -8%
Durchschnittliche Intel Core Ultra 7 366H
  (2793 - 3259, n=5)
2977 Points -9%
Cinebench R15 / CPU Single 64Bit
Samsung Galaxy Book6 Ultra
Intel Core Ultra 7 356H
306 Points +1%
HP ZBook X G1i 16
Intel Core Ultra 7 265H
305 Points 0%
Dell XPS 16 Core Ultra X7 358H
Intel Core Ultra X7 358H
304 Points 0%
Lenovo ThinkPad P1 Gen 9 21UE000MGE
Intel Core Ultra 7 366H
304 Points
Lenovo ThinkPad P1 Gen 8
Intel Core Ultra 7 255H
302 Points -1%
Durchschnitt der Klasse Workstation
  (191.4 - 328, n=21, der letzten 2 Jahre)
301 Points -1%
Durchschnittliche Intel Core Ultra 7 366H
  (291 - 305, n=5)
297 Points -2%
Blender / v2.79 BMW27 CPU
Dell XPS 16 Core Ultra X7 358H
Intel Core Ultra X7 358H
196 Seconds * -22%
Durchschnittliche Intel Core Ultra 7 366H
  (161 - 211, n=5)
193.4 Seconds * -20%
Lenovo ThinkPad P1 Gen 8
Intel Core Ultra 7 255H
166 Seconds * -3%
HP ZBook X G1i 16
Intel Core Ultra 7 265H
164 Seconds * -2%
Samsung Galaxy Book6 Ultra
Intel Core Ultra 7 356H
163 Seconds * -1%
Lenovo ThinkPad P1 Gen 9 21UE000MGE
Intel Core Ultra 7 366H
161 Seconds *
Durchschnitt der Klasse Workstation
  (91 - 225, n=21, der letzten 2 Jahre)
147.9 Seconds * +8%
7-Zip 18.03 / 7z b 4
Durchschnitt der Klasse Workstation
  (51408 - 116969, n=21, der letzten 2 Jahre)
81720 MIPS +15%
Lenovo ThinkPad P1 Gen 9 21UE000MGE
Intel Core Ultra 7 366H
71004 MIPS
Samsung Galaxy Book6 Ultra
Intel Core Ultra 7 356H
69785 MIPS -2%
HP ZBook X G1i 16
Intel Core Ultra 7 265H
68913 MIPS -3%
Lenovo ThinkPad P1 Gen 8
Intel Core Ultra 7 255H
64912 MIPS -9%
Dell XPS 16 Core Ultra X7 358H
Intel Core Ultra X7 358H
64852 MIPS -9%
Durchschnittliche Intel Core Ultra 7 366H
  (61043 - 71004, n=5)
64648 MIPS -9%
7-Zip 18.03 / 7z b 4 -mmt1
Dell XPS 16 Core Ultra X7 358H
Intel Core Ultra X7 358H
6441 MIPS +2%
Samsung Galaxy Book6 Ultra
Intel Core Ultra 7 356H
6305 MIPS 0%
Lenovo ThinkPad P1 Gen 9 21UE000MGE
Intel Core Ultra 7 366H
6300 MIPS
Durchschnittliche Intel Core Ultra 7 366H
  (6065 - 6404, n=5)
6268 MIPS -1%
HP ZBook X G1i 16
Intel Core Ultra 7 265H
6160 MIPS -2%
Durchschnitt der Klasse Workstation
  (5126 - 6792, n=21, der letzten 2 Jahre)
6137 MIPS -3%
Lenovo ThinkPad P1 Gen 8
Intel Core Ultra 7 255H
5126 MIPS -19%
Geekbench 6.7 / Multi-Core
HP ZBook X G1i 16
Intel Core Ultra 7 265H
17144 Points +2%
Dell XPS 16 Core Ultra X7 358H
Intel Core Ultra X7 358H
16943 Points +1%
Lenovo ThinkPad P1 Gen 8
Intel Core Ultra 7 255H
16940 Points +1%
Lenovo ThinkPad P1 Gen 9 21UE000MGE
Intel Core Ultra 7 366H
16763 Points
Samsung Galaxy Book6 Ultra
Intel Core Ultra 7 356H
16676 Points -1%
Durchschnittliche Intel Core Ultra 7 366H
  (16080 - 16948, n=7)
16554 Points -1%
Durchschnitt der Klasse Workstation
  (12139 - 20887, n=21, der letzten 2 Jahre)
16363 Points -2%
Geekbench 6.7 / Single-Core
HP ZBook X G1i 16
Intel Core Ultra 7 265H
2911 Points +2%
Dell XPS 16 Core Ultra X7 358H
Intel Core Ultra X7 358H
2903 Points +2%
Durchschnitt der Klasse Workstation
  (2495 - 3065, n=21, der letzten 2 Jahre)
2861 Points 0%
Samsung Galaxy Book6 Ultra
Intel Core Ultra 7 356H
2851 Points 0%
Durchschnittliche Intel Core Ultra 7 366H
  (2819 - 2866, n=6)
2848 Points 0%
Lenovo ThinkPad P1 Gen 9 21UE000MGE
Intel Core Ultra 7 366H
2847 Points
Lenovo ThinkPad P1 Gen 8
Intel Core Ultra 7 255H
2811 Points -1%
Geekbench 5.5 / Multi-Core
Durchschnitt der Klasse Workstation
  (11542 - 25554, n=20, der letzten 2 Jahre)
17306 Points +3%
Lenovo ThinkPad P1 Gen 9 21UE000MGE
Intel Core Ultra 7 366H
16786 Points
Dell XPS 16 Core Ultra X7 358H
Intel Core Ultra X7 358H
16763 Points 0%
Samsung Galaxy Book6 Ultra
Intel Core Ultra 7 356H
16761 Points 0%
Durchschnittliche Intel Core Ultra 7 366H
  (15891 - 16949, n=4)
16506 Points -2%
Lenovo ThinkPad P1 Gen 8
Intel Core Ultra 7 255H
16483 Points -2%
HP ZBook X G1i 16
Intel Core Ultra 7 265H
16453 Points -2%
Geekbench 5.5 / Single-Core
Dell XPS 16 Core Ultra X7 358H
Intel Core Ultra X7 358H
2119 Points +1%
Lenovo ThinkPad P1 Gen 9 21UE000MGE
Intel Core Ultra 7 366H
2102 Points
Durchschnittliche Intel Core Ultra 7 366H
  (2085 - 2125, n=4)
2100 Points 0%
Samsung Galaxy Book6 Ultra
Intel Core Ultra 7 356H
2086 Points -1%
Durchschnitt der Klasse Workstation
  (1848 - 2183, n=20, der letzten 2 Jahre)
2083 Points -1%
HP ZBook X G1i 16
Intel Core Ultra 7 265H
2079 Points -1%
Lenovo ThinkPad P1 Gen 8
Intel Core Ultra 7 255H
1998 Points -5%
HWBOT x265 Benchmark v2.2 / 4k Preset
Durchschnitt der Klasse Workstation
  (17.8 - 40.5, n=21, der letzten 2 Jahre)
27.6 fps +12%
Lenovo ThinkPad P1 Gen 8
Intel Core Ultra 7 255H
26.5 fps +8%
HP ZBook X G1i 16
Intel Core Ultra 7 265H
25.3 fps +3%
Samsung Galaxy Book6 Ultra
Intel Core Ultra 7 356H
25.1 fps +2%
Lenovo ThinkPad P1 Gen 9 21UE000MGE
Intel Core Ultra 7 366H
24.6 fps
Dell XPS 16 Core Ultra X7 358H
Intel Core Ultra X7 358H
21 fps -15%
Durchschnittliche Intel Core Ultra 7 366H
  (19.2 - 24.6, n=5)
21 fps -15%
LibreOffice / 20 Documents To PDF
Lenovo ThinkPad P1 Gen 9 21UE000MGE
Intel Core Ultra 7 366H
52 s *
Dell XPS 16 Core Ultra X7 358H
Intel Core Ultra X7 358H
49.5 s * +5%
Durchschnitt der Klasse Workstation
  (37.1 - 74.7, n=21, der letzten 2 Jahre)
49.1 s * +6%
Samsung Galaxy Book6 Ultra
Intel Core Ultra 7 356H
47.3 s * +9%
Durchschnittliche Intel Core Ultra 7 366H
  (40.3 - 52.7, n=5)
47 s * +10%
HP ZBook X G1i 16
Intel Core Ultra 7 265H
42.2 s * +19%
Lenovo ThinkPad P1 Gen 8
Intel Core Ultra 7 255H
41.8 s * +20%
R Benchmark 2.5 / Overall mean
Lenovo ThinkPad P1 Gen 9 21UE000MGE
Intel Core Ultra 7 366H
0.4581 sec *
Durchschnitt der Klasse Workstation
  (0.3974 - 0.603, n=21, der letzten 2 Jahre)
0.4388 sec * +4%
Lenovo ThinkPad P1 Gen 8
Intel Core Ultra 7 255H
0.4382 sec * +4%
Durchschnittliche Intel Core Ultra 7 366H
  (0.4144 - 0.4581, n=5)
0.4342 sec * +5%
Samsung Galaxy Book6 Ultra
Intel Core Ultra 7 356H
0.4268 sec * +7%
HP ZBook X G1i 16
Intel Core Ultra 7 265H
0.4241 sec * +7%
Dell XPS 16 Core Ultra X7 358H
Intel Core Ultra X7 358H
0.4216 sec * +8%

* ... kleinere Werte sind besser

Cinebench R15 OpenGL 64Bit
322 fps
Cinebench R15 Ref. Match 64Bit
99.6 %
Cinebench R15 CPU Multi 64Bit
3259 Points
Cinebench R15 CPU Single 64Bit
304 Points
Cinebench R20 CPU (Single Core)
791 Points
Cinebench R20 CPU (Multi Core)
8270 Points
Cinebench R23 Single Core
2065 Points
Cinebench R23 Multi Core
21193 Points
Hilfe
Performance Rating
Durchschnitt der Klasse Workstation
 
96.6 pt
Lenovo ThinkPad P1 Gen 8 -1!
Intel Core Ultra 7 255H, RTX PRO 2000 Blackwell Generation Laptop
78.3 pt
Lenovo ThinkPad P1 Gen 9 21UE000MGE -1!
Intel Core Ultra 7 366H, RTX PRO 2000 Blackwell Generation Laptop
73.7 pt
Samsung Galaxy Book6 Ultra -1!
Intel Core Ultra 7 356H, GeForce RTX 5070 Laptop
73.6 pt
Durchschnittliche Intel Core Ultra 7 366H -1!
 
63.8 pt
Dell XPS 16 Core Ultra X7 358H -1!
Intel Core Ultra X7 358H, Arc B390 Panther Lake iGPU
62.9 pt
AIDA64 / FP32 Ray-Trace
Durchschnitt der Klasse Workstation
  (16730 - 61611, n=21, der letzten 2 Jahre)
30566 KRay/s +49%
Lenovo ThinkPad P1 Gen 8
Intel Core Ultra 7 255H, RTX PRO 2000 Blackwell Generation Laptop (v6.92.6600)
24095 KRay/s +17%
Lenovo ThinkPad P1 Gen 9 21UE000MGE
Intel Core Ultra 7 366H, RTX PRO 2000 Blackwell Generation Laptop (v8.20.8100)
20583 KRay/s
Samsung Galaxy Book6 Ultra
Intel Core Ultra 7 356H, GeForce RTX 5070 Laptop (v8.20.8100)
20528 KRay/s 0%
Durchschnittliche Intel Core Ultra 7 366H
  (14248 - 20583, n=5)
16521 KRay/s -20%
Dell XPS 16 Core Ultra X7 358H
Intel Core Ultra X7 358H, Arc B390 Panther Lake iGPU (v8.20.8100)
15681 KRay/s -24%
AIDA64 / FPU Julia
Durchschnitt der Klasse Workstation
  (89740 - 186971, n=21, der letzten 2 Jahre)
137010 Points +28%
Lenovo ThinkPad P1 Gen 8
Intel Core Ultra 7 255H, RTX PRO 2000 Blackwell Generation Laptop (v6.92.6600)
119222 Points +11%
Samsung Galaxy Book6 Ultra
Intel Core Ultra 7 356H, GeForce RTX 5070 Laptop (v8.20.8100)
108092 Points +1%
Lenovo ThinkPad P1 Gen 9 21UE000MGE
Intel Core Ultra 7 366H, RTX PRO 2000 Blackwell Generation Laptop (v8.20.8100)
107380 Points
Durchschnittliche Intel Core Ultra 7 366H
  (75534 - 107380, n=5)
86310 Points -20%
Dell XPS 16 Core Ultra X7 358H
Intel Core Ultra X7 358H, Arc B390 Panther Lake iGPU (v8.20.8100)
83114 Points -23%
AIDA64 / CPU SHA3
Durchschnitt der Klasse Workstation
  (3590 - 8975, n=21, der letzten 2 Jahre)
6264 MB/s +19%
Lenovo ThinkPad P1 Gen 8
Intel Core Ultra 7 255H, RTX PRO 2000 Blackwell Generation Laptop (v6.92.6600)
5440 MB/s +4%
Samsung Galaxy Book6 Ultra
Intel Core Ultra 7 356H, GeForce RTX 5070 Laptop (v8.20.8100)
5284 MB/s +1%
Lenovo ThinkPad P1 Gen 9 21UE000MGE
Intel Core Ultra 7 366H, RTX PRO 2000 Blackwell Generation Laptop (v8.20.8100)
5249 MB/s
Durchschnittliche Intel Core Ultra 7 366H
  (3837 - 5249, n=5)
4315 MB/s -18%
Dell XPS 16 Core Ultra X7 358H
Intel Core Ultra X7 358H, Arc B390 Panther Lake iGPU (v8.20.8100)
4200 MB/s -20%
AIDA64 / CPU Queen
Durchschnitt der Klasse Workstation
  (60778 - 137783, n=18, der letzten 2 Jahre)
103976 Points
Lenovo ThinkPad P1 Gen 8
Intel Core Ultra 7 255H, RTX PRO 2000 Blackwell Generation Laptop (v6.92.6600)
68460 Points
AIDA64 / FPU SinJulia
Durchschnitt der Klasse Workstation
  (7136 - 29343, n=21, der letzten 2 Jahre)
13606 Points +91%
Lenovo ThinkPad P1 Gen 8
Intel Core Ultra 7 255H, RTX PRO 2000 Blackwell Generation Laptop (v6.92.6600)
8971 Points +26%
Lenovo ThinkPad P1 Gen 9 21UE000MGE
Intel Core Ultra 7 366H, RTX PRO 2000 Blackwell Generation Laptop (v8.20.8100)
7136 Points
Samsung Galaxy Book6 Ultra
Intel Core Ultra 7 356H, GeForce RTX 5070 Laptop (v8.20.8100)
6960 Points -2%
Durchschnittliche Intel Core Ultra 7 366H
  (6482 - 7136, n=5)
6895 Points -3%
Dell XPS 16 Core Ultra X7 358H
Intel Core Ultra X7 358H, Arc B390 Panther Lake iGPU (v8.20.8100)
6892 Points -3%
AIDA64 / FPU Mandel
Durchschnitt der Klasse Workstation
  (44497 - 98153, n=21, der letzten 2 Jahre)
72168 Points +25%
Lenovo ThinkPad P1 Gen 8
Intel Core Ultra 7 255H, RTX PRO 2000 Blackwell Generation Laptop (v6.92.6600)
62526 Points +8%
Samsung Galaxy Book6 Ultra
Intel Core Ultra 7 356H, GeForce RTX 5070 Laptop (v8.20.8100)
58505 Points +1%
Lenovo ThinkPad P1 Gen 9 21UE000MGE
Intel Core Ultra 7 366H, RTX PRO 2000 Blackwell Generation Laptop (v8.20.8100)
57706 Points
Durchschnittliche Intel Core Ultra 7 366H
  (40198 - 57706, n=5)
46466 Points -19%
Dell XPS 16 Core Ultra X7 358H
Intel Core Ultra X7 358H, Arc B390 Panther Lake iGPU (v8.20.8100)
44733 Points -22%
AIDA64 / CPU AES
Durchschnitt der Klasse Workstation
  (68072 - 187841, n=21, der letzten 2 Jahre)
106254 MB/s +56%
Lenovo ThinkPad P1 Gen 8
Intel Core Ultra 7 255H, RTX PRO 2000 Blackwell Generation Laptop (v6.92.6600)
83568 MB/s +23%
Lenovo ThinkPad P1 Gen 9 21UE000MGE
Intel Core Ultra 7 366H, RTX PRO 2000 Blackwell Generation Laptop (v8.20.8100)
68072 MB/s
Samsung Galaxy Book6 Ultra
Intel Core Ultra 7 356H, GeForce RTX 5070 Laptop (v8.20.8100)
67037 MB/s -2%
Durchschnittliche Intel Core Ultra 7 366H
  (57542 - 68072, n=5)
63563 MB/s -7%
Dell XPS 16 Core Ultra X7 358H
Intel Core Ultra X7 358H, Arc B390 Panther Lake iGPU (v8.20.8100)
61102 MB/s -10%
AIDA64 / CPU ZLib
Durchschnitt der Klasse Workstation
  (917 - 2148, n=21, der letzten 2 Jahre)
1525 MB/s +25%
Lenovo ThinkPad P1 Gen 8
Intel Core Ultra 7 255H, RTX PRO 2000 Blackwell Generation Laptop (v6.92.6600)
1305 MB/s +7%
Lenovo ThinkPad P1 Gen 9 21UE000MGE
Intel Core Ultra 7 366H, RTX PRO 2000 Blackwell Generation Laptop (v8.20.8100)
1219 MB/s
Samsung Galaxy Book6 Ultra
Intel Core Ultra 7 356H, GeForce RTX 5070 Laptop (v8.20.8100)
1199 MB/s -2%
Durchschnittliche Intel Core Ultra 7 366H
  (921 - 1219, n=5)
1038 MB/s -15%
Dell XPS 16 Core Ultra X7 358H
Intel Core Ultra X7 358H, Arc B390 Panther Lake iGPU (v8.20.8100)
991 MB/s -19%
AIDA64 / FP64 Ray-Trace
Durchschnitt der Klasse Workstation
  (8545 - 32891, n=21, der letzten 2 Jahre)
16407 KRay/s +49%
Lenovo ThinkPad P1 Gen 8
Intel Core Ultra 7 255H, RTX PRO 2000 Blackwell Generation Laptop (v6.92.6600)
13186 KRay/s +20%
Samsung Galaxy Book6 Ultra
Intel Core Ultra 7 356H, GeForce RTX 5070 Laptop (v8.20.8100)
11057 KRay/s 0%
Lenovo ThinkPad P1 Gen 9 21UE000MGE
Intel Core Ultra 7 366H, RTX PRO 2000 Blackwell Generation Laptop (v8.20.8100)
11027 KRay/s
Durchschnittliche Intel Core Ultra 7 366H
  (7395 - 11027, n=5)
8637 KRay/s -22%
Dell XPS 16 Core Ultra X7 358H
Intel Core Ultra X7 358H, Arc B390 Panther Lake iGPU (v8.20.8100)
8285 KRay/s -25%
AIDA64 / CPU PhotoWorxx
Dell XPS 16 Core Ultra X7 358H
Intel Core Ultra X7 358H, Arc B390 Panther Lake iGPU (v8.20.8100)
88154 MPixel/s +6%
Lenovo ThinkPad P1 Gen 9 21UE000MGE
Intel Core Ultra 7 366H, RTX PRO 2000 Blackwell Generation Laptop (v8.20.8100)
83297 MPixel/s
Samsung Galaxy Book6 Ultra
Intel Core Ultra 7 356H, GeForce RTX 5070 Laptop (v8.20.8100)
83099 MPixel/s 0%
Durchschnittliche Intel Core Ultra 7 366H
  (74842 - 83297, n=5)
80848 MPixel/s -3%
Lenovo ThinkPad P1 Gen 8
Intel Core Ultra 7 255H, RTX PRO 2000 Blackwell Generation Laptop (v6.92.6600)
59263 MPixel/s -29%
Durchschnitt der Klasse Workstation
  (37482 - 93684, n=21, der letzten 2 Jahre)
54808 MPixel/s -34%
AIDA64 / CPU CheckMate
Durchschnitt der Klasse Workstation
  (4591 - 7823, n=3, der letzten 2 Jahre)
6639 MP/s +45%
Samsung Galaxy Book6 Ultra
Intel Core Ultra 7 356H, GeForce RTX 5070 Laptop (v8.20.8100)
4629 MP/s +1%
Lenovo ThinkPad P1 Gen 9 21UE000MGE
Intel Core Ultra 7 366H, RTX PRO 2000 Blackwell Generation Laptop (v8.20.8100)
4591 MP/s
Durchschnittliche Intel Core Ultra 7 366H
  (4202 - 4591, n=5)
4317 MP/s -6%
Dell XPS 16 Core Ultra X7 358H
Intel Core Ultra X7 358H, Arc B390 Panther Lake iGPU (v8.20.8100)
4269 MP/s -7%

Systemleistung

Performance Rating: Percent
PCMark 10: Score | Essentials | Productivity | Digital Content Creation
CrossMark: Overall | Productivity | Creativity | Responsiveness
WebXPRT 3: Overall
WebXPRT 4: Overall
Mozilla Kraken 1.1: Total
Performance Rating
Apple MacBook Pro 16 2026 M5 Pro -4!
M5 Pro 20-Core GPU, M5 Pro 18-Core, Apple SSD AP4096Z
91.3 pt
Lenovo ThinkPad P1 Gen 9 21UE000MGE
RTX PRO 2000 Blackwell Generation Laptop, Ultra 7 366H, Samsung PM9E1 1 TB MZVLC1T0HFLU
75.7 pt
Durchschnittliche Intel Core Ultra 7 366H, NVIDIA RTX PRO 2000 Blackwell Generation Laptop
 
75.7 pt
Dell XPS 16 Core Ultra X7 358H
Arc B390 Panther Lake iGPU, Ultra X7 358H
75.5 pt
Lenovo ThinkPad P1 Gen 8
RTX PRO 2000 Blackwell Generation Laptop, Ultra 7 255H, Samsung PM9E1 1 TB MZVLC1T0HFLU
73.3 pt
Samsung Galaxy Book6 Ultra
GeForce RTX 5070 Laptop, Ultra 7 356H, Samsung PM9C1b MZVL81T0HFLB-00BH1
71.1 pt
Durchschnitt der Klasse Workstation
 
68.2 pt
HP ZBook X G1i 16 -4!
RTX PRO 2000 Blackwell Generation Laptop, Ultra 7 265H, Samsung PM9A1 MZVL22T0HBLB
60 pt
PCMark 10 / Score
Dell XPS 16 Core Ultra X7 358H
Arc B390 Panther Lake iGPU, Ultra X7 358H
9717 Points +4%
Lenovo ThinkPad P1 Gen 8
RTX PRO 2000 Blackwell Generation Laptop, Ultra 7 255H, Samsung PM9E1 1 TB MZVLC1T0HFLU
9625 Points +3%
Lenovo ThinkPad P1 Gen 9 21UE000MGE
RTX PRO 2000 Blackwell Generation Laptop, Ultra 7 366H, Samsung PM9E1 1 TB MZVLC1T0HFLU
9384 Points
Durchschnittliche Intel Core Ultra 7 366H, NVIDIA RTX PRO 2000 Blackwell Generation Laptop
  (n=1)
9384 Points 0%
Samsung Galaxy Book6 Ultra
GeForce RTX 5070 Laptop, Ultra 7 356H, Samsung PM9C1b MZVL81T0HFLB-00BH1
9383 Points 0%
Durchschnitt der Klasse Workstation
  (6563 - 10409, n=17, der letzten 2 Jahre)
8280 Points -12%
PCMark 10 / Essentials
Dell XPS 16 Core Ultra X7 358H
Arc B390 Panther Lake iGPU, Ultra X7 358H
11122 Points +9%
Lenovo ThinkPad P1 Gen 8
RTX PRO 2000 Blackwell Generation Laptop, Ultra 7 255H, Samsung PM9E1 1 TB MZVLC1T0HFLU
10650 Points +4%
Durchschnitt der Klasse Workstation
  (9622 - 11087, n=17, der letzten 2 Jahre)
10446 Points +2%
Lenovo ThinkPad P1 Gen 9 21UE000MGE
RTX PRO 2000 Blackwell Generation Laptop, Ultra 7 366H, Samsung PM9E1 1 TB MZVLC1T0HFLU
10208 Points
Durchschnittliche Intel Core Ultra 7 366H, NVIDIA RTX PRO 2000 Blackwell Generation Laptop
  (n=1)
10208 Points 0%
Samsung Galaxy Book6 Ultra
GeForce RTX 5070 Laptop, Ultra 7 356H, Samsung PM9C1b MZVL81T0HFLB-00BH1
10046 Points -2%
PCMark 10 / Productivity
Lenovo ThinkPad P1 Gen 8
RTX PRO 2000 Blackwell Generation Laptop, Ultra 7 255H, Samsung PM9E1 1 TB MZVLC1T0HFLU
18261 Points +1%
Lenovo ThinkPad P1 Gen 9 21UE000MGE
RTX PRO 2000 Blackwell Generation Laptop, Ultra 7 366H, Samsung PM9E1 1 TB MZVLC1T0HFLU
18113 Points
Durchschnittliche Intel Core Ultra 7 366H, NVIDIA RTX PRO 2000 Blackwell Generation Laptop
  (n=1)
18113 Points 0%
Samsung Galaxy Book6 Ultra
GeForce RTX 5070 Laptop, Ultra 7 356H, Samsung PM9C1b MZVL81T0HFLB-00BH1
17702 Points -2%
Dell XPS 16 Core Ultra X7 358H
Arc B390 Panther Lake iGPU, Ultra X7 358H
16422 Points -9%
Durchschnitt der Klasse Workstation
  (8789 - 20616, n=17, der letzten 2 Jahre)
12716 Points -30%
PCMark 10 / Digital Content Creation
Dell XPS 16 Core Ultra X7 358H
Arc B390 Panther Lake iGPU, Ultra X7 358H
13633 Points +12%
Samsung Galaxy Book6 Ultra
GeForce RTX 5070 Laptop, Ultra 7 356H, Samsung PM9C1b MZVL81T0HFLB-00BH1
12606 Points +4%
Lenovo ThinkPad P1 Gen 8
RTX PRO 2000 Blackwell Generation Laptop, Ultra 7 255H, Samsung PM9E1 1 TB MZVLC1T0HFLU
12443 Points +3%
Lenovo ThinkPad P1 Gen 9 21UE000MGE
RTX PRO 2000 Blackwell Generation Laptop, Ultra 7 366H, Samsung PM9E1 1 TB MZVLC1T0HFLU
12128 Points
Durchschnittliche Intel Core Ultra 7 366H, NVIDIA RTX PRO 2000 Blackwell Generation Laptop
  (n=1)
12128 Points 0%
Durchschnitt der Klasse Workstation
  (8108 - 15631, n=17, der letzten 2 Jahre)
12049 Points -1%
CrossMark / Overall
Apple MacBook Pro 16 2026 M5 Pro
M5 Pro 20-Core GPU, M5 Pro 18-Core, Apple SSD AP4096Z
2725 Points +25%
Lenovo ThinkPad P1 Gen 9 21UE000MGE
RTX PRO 2000 Blackwell Generation Laptop, Ultra 7 366H, Samsung PM9E1 1 TB MZVLC1T0HFLU
2187 Points
Durchschnittliche Intel Core Ultra 7 366H, NVIDIA RTX PRO 2000 Blackwell Generation Laptop
  (n=1)
2187 Points 0%
Dell XPS 16 Core Ultra X7 358H
Arc B390 Panther Lake iGPU, Ultra X7 358H
2114 Points -3%
HP ZBook X G1i 16
RTX PRO 2000 Blackwell Generation Laptop, Ultra 7 265H, Samsung PM9A1 MZVL22T0HBLB
1978 Points -10%
Lenovo ThinkPad P1 Gen 8
RTX PRO 2000 Blackwell Generation Laptop, Ultra 7 255H, Samsung PM9E1 1 TB MZVLC1T0HFLU
1953 Points -11%
Durchschnitt der Klasse Workstation
  (1307 - 2267, n=21, der letzten 2 Jahre)
1923 Points -12%
Samsung Galaxy Book6 Ultra
GeForce RTX 5070 Laptop, Ultra 7 356H, Samsung PM9C1b MZVL81T0HFLB-00BH1
1905 Points -13%
CrossMark / Productivity
Apple MacBook Pro 16 2026 M5 Pro
M5 Pro 20-Core GPU, M5 Pro 18-Core, Apple SSD AP4096Z
2489 Points +26%
Lenovo ThinkPad P1 Gen 9 21UE000MGE
RTX PRO 2000 Blackwell Generation Laptop, Ultra 7 366H, Samsung PM9E1 1 TB MZVLC1T0HFLU
1983 Points
Durchschnittliche Intel Core Ultra 7 366H, NVIDIA RTX PRO 2000 Blackwell Generation Laptop
  (n=1)
1983 Points 0%
Dell XPS 16 Core Ultra X7 358H
Arc B390 Panther Lake iGPU, Ultra X7 358H
1898 Points -4%
HP ZBook X G1i 16
RTX PRO 2000 Blackwell Generation Laptop, Ultra 7 265H, Samsung PM9A1 MZVL22T0HBLB
1864 Points -6%
Lenovo ThinkPad P1 Gen 8
RTX PRO 2000 Blackwell Generation Laptop, Ultra 7 255H, Samsung PM9E1 1 TB MZVLC1T0HFLU
1836 Points -7%
Durchschnitt der Klasse Workstation
  (1130 - 2122, n=21, der letzten 2 Jahre)
1785 Points -10%
Samsung Galaxy Book6 Ultra
GeForce RTX 5070 Laptop, Ultra 7 356H, Samsung PM9C1b MZVL81T0HFLB-00BH1
1688 Points -15%
CrossMark / Creativity
Apple MacBook Pro 16 2026 M5 Pro
M5 Pro 20-Core GPU, M5 Pro 18-Core, Apple SSD AP4096Z
3438 Points +39%
Dell XPS 16 Core Ultra X7 358H
Arc B390 Panther Lake iGPU, Ultra X7 358H
2529 Points +2%
Lenovo ThinkPad P1 Gen 9 21UE000MGE
RTX PRO 2000 Blackwell Generation Laptop, Ultra 7 366H, Samsung PM9E1 1 TB MZVLC1T0HFLU
2480 Points
Durchschnittliche Intel Core Ultra 7 366H, NVIDIA RTX PRO 2000 Blackwell Generation Laptop
  (n=1)
2480 Points 0%
Samsung Galaxy Book6 Ultra
GeForce RTX 5070 Laptop, Ultra 7 356H, Samsung PM9C1b MZVL81T0HFLB-00BH1
2296 Points -7%
HP ZBook X G1i 16
RTX PRO 2000 Blackwell Generation Laptop, Ultra 7 265H, Samsung PM9A1 MZVL22T0HBLB
2292 Points -8%
Durchschnitt der Klasse Workstation
  (1657 - 2725, n=21, der letzten 2 Jahre)
2219 Points -11%
Lenovo ThinkPad P1 Gen 8
RTX PRO 2000 Blackwell Generation Laptop, Ultra 7 255H, Samsung PM9E1 1 TB MZVLC1T0HFLU
2211 Points -11%
CrossMark / Responsiveness
Lenovo ThinkPad P1 Gen 9 21UE000MGE
RTX PRO 2000 Blackwell Generation Laptop, Ultra 7 366H, Samsung PM9E1 1 TB MZVLC1T0HFLU
2008 Points
Durchschnittliche Intel Core Ultra 7 366H, NVIDIA RTX PRO 2000 Blackwell Generation Laptop
  (n=1)
2008 Points 0%
Apple MacBook Pro 16 2026 M5 Pro
M5 Pro 20-Core GPU, M5 Pro 18-Core, Apple SSD AP4096Z
1780 Points -11%
Dell XPS 16 Core Ultra X7 358H
Arc B390 Panther Lake iGPU, Ultra X7 358H
1706 Points -15%
Lenovo ThinkPad P1 Gen 8
RTX PRO 2000 Blackwell Generation Laptop, Ultra 7 255H, Samsung PM9E1 1 TB MZVLC1T0HFLU
1622 Points -19%
Durchschnitt der Klasse Workstation
  (993 - 2096, n=21, der letzten 2 Jahre)
1583 Points -21%
Samsung Galaxy Book6 Ultra
GeForce RTX 5070 Laptop, Ultra 7 356H, Samsung PM9C1b MZVL81T0HFLB-00BH1
1565 Points -22%
HP ZBook X G1i 16
RTX PRO 2000 Blackwell Generation Laptop, Ultra 7 265H, Samsung PM9A1 MZVL22T0HBLB
1523 Points -24%
WebXPRT 3 / Overall
Apple MacBook Pro 16 2026 M5 Pro
M5 Pro 20-Core GPU, M5 Pro 18-Core, Apple SSD AP4096Z
596 Points +95%
Lenovo ThinkPad P1 Gen 8
RTX PRO 2000 Blackwell Generation Laptop, Ultra 7 255H, Samsung PM9E1 1 TB MZVLC1T0HFLU
330 Points +8%
HP ZBook X G1i 16
RTX PRO 2000 Blackwell Generation Laptop, Ultra 7 265H, Samsung PM9A1 MZVL22T0HBLB
321 Points +5%
Durchschnitt der Klasse Workstation
  (260 - 360, n=21, der letzten 2 Jahre)
318 Points +4%
Lenovo ThinkPad P1 Gen 9 21UE000MGE
RTX PRO 2000 Blackwell Generation Laptop, Ultra 7 366H, Samsung PM9E1 1 TB MZVLC1T0HFLU
305 Points
Durchschnittliche Intel Core Ultra 7 366H, NVIDIA RTX PRO 2000 Blackwell Generation Laptop
  (n=1)
305 Points 0%
Samsung Galaxy Book6 Ultra
GeForce RTX 5070 Laptop, Ultra 7 356H, Samsung PM9C1b MZVL81T0HFLB-00BH1
304 Points 0%
Dell XPS 16 Core Ultra X7 358H
Arc B390 Panther Lake iGPU, Ultra X7 358H
304 Points 0%
WebXPRT 4 / Overall
Apple MacBook Pro 16 2026 M5 Pro
M5 Pro 20-Core GPU, M5 Pro 18-Core, Apple SSD AP4096Z
402 Points +42%
HP ZBook X G1i 16
RTX PRO 2000 Blackwell Generation Laptop, Ultra 7 265H, Samsung PM9A1 MZVL22T0HBLB
302 Points +6%
Dell XPS 16 Core Ultra X7 358H
Arc B390 Panther Lake iGPU, Ultra X7 358H
300 Points +6%
Lenovo ThinkPad P1 Gen 8
RTX PRO 2000 Blackwell Generation Laptop, Ultra 7 255H, Samsung PM9E1 1 TB MZVLC1T0HFLU
298 Points +5%
Samsung Galaxy Book6 Ultra
GeForce RTX 5070 Laptop, Ultra 7 356H, Samsung PM9C1b MZVL81T0HFLB-00BH1
292 Points +3%
Durchschnitt der Klasse Workstation
  (189.2 - 326, n=21, der letzten 2 Jahre)
286 Points +1%
Lenovo ThinkPad P1 Gen 9 21UE000MGE
RTX PRO 2000 Blackwell Generation Laptop, Ultra 7 366H, Samsung PM9E1 1 TB MZVLC1T0HFLU
284 Points
Durchschnittliche Intel Core Ultra 7 366H, NVIDIA RTX PRO 2000 Blackwell Generation Laptop
  (n=1)
284 Points 0%
Mozilla Kraken 1.1 / Total
Samsung Galaxy Book6 Ultra
GeForce RTX 5070 Laptop, Ultra 7 356H, Samsung PM9C1b MZVL81T0HFLB-00BH1
463 ms * -3%
Lenovo ThinkPad P1 Gen 8
RTX PRO 2000 Blackwell Generation Laptop, Ultra 7 255H, Samsung PM9E1 1 TB MZVLC1T0HFLU
461 ms * -2%
HP ZBook X G1i 16
RTX PRO 2000 Blackwell Generation Laptop, Ultra 7 265H, Samsung PM9A1 MZVL22T0HBLB
459 ms * -2%
Lenovo ThinkPad P1 Gen 9 21UE000MGE
RTX PRO 2000 Blackwell Generation Laptop, Ultra 7 366H, Samsung PM9E1 1 TB MZVLC1T0HFLU
451 ms *
Durchschnittliche Intel Core Ultra 7 366H, NVIDIA RTX PRO 2000 Blackwell Generation Laptop
  (n=1)
451 ms * -0%
Dell XPS 16 Core Ultra X7 358H
Arc B390 Panther Lake iGPU, Ultra X7 358H
450 ms * -0%
Durchschnitt der Klasse Workstation
  (411 - 538, n=21, der letzten 2 Jahre)
449 ms * -0%
Apple MacBook Pro 16 2026 M5 Pro
M5 Pro 20-Core GPU, M5 Pro 18-Core, Apple SSD AP4096Z
230 ms * +49%

* ... kleinere Werte sind besser

PCMark 10 Score
9384 Punkte
Hilfe
AIDA64 / Memory Copy
Dell XPS 16 Core Ultra X7 358H
Intel Core Ultra X7 358H, Arc B390 Panther Lake iGPU
132135 MB/s +12%
Lenovo ThinkPad P1 Gen 9 21UE000MGE
Intel Core Ultra 7 366H, RTX PRO 2000 Blackwell Generation Laptop
118316 MB/s
Samsung Galaxy Book6 Ultra
Intel Core Ultra 7 356H, GeForce RTX 5070 Laptop
116043 MB/s -2%
Durchschnittliche Intel Core Ultra 7 366H
  (107814 - 120004, n=5)
116043 MB/s -2%
Lenovo ThinkPad P1 Gen 8
Intel Core Ultra 7 255H, RTX PRO 2000 Blackwell Generation Laptop
96582 MB/s -18%
Durchschnitt der Klasse Workstation
  (56003 - 164795, n=21, der letzten 2 Jahre)
86161 MB/s -27%
AIDA64 / Memory Read
Dell XPS 16 Core Ultra X7 358H
Intel Core Ultra X7 358H, Arc B390 Panther Lake iGPU
118888 MB/s +10%
Durchschnittliche Intel Core Ultra 7 366H
  (102778 - 111878, n=5)
108175 MB/s 0%
Lenovo ThinkPad P1 Gen 9 21UE000MGE
Intel Core Ultra 7 366H, RTX PRO 2000 Blackwell Generation Laptop
108023 MB/s
Samsung Galaxy Book6 Ultra
Intel Core Ultra 7 356H, GeForce RTX 5070 Laptop
107881 MB/s 0%
Durchschnitt der Klasse Workstation
  (55795 - 121563, n=21, der letzten 2 Jahre)
82543 MB/s -24%
Lenovo ThinkPad P1 Gen 8
Intel Core Ultra 7 255H, RTX PRO 2000 Blackwell Generation Laptop
77931 MB/s -28%
AIDA64 / Memory Write
Dell XPS 16 Core Ultra X7 358H
Intel Core Ultra X7 358H, Arc B390 Panther Lake iGPU
134998 MB/s +12%
Lenovo ThinkPad P1 Gen 9 21UE000MGE
Intel Core Ultra 7 366H, RTX PRO 2000 Blackwell Generation Laptop
120492 MB/s
Samsung Galaxy Book6 Ultra
Intel Core Ultra 7 356H, GeForce RTX 5070 Laptop
120431 MB/s 0%
Durchschnittliche Intel Core Ultra 7 366H
  (106062 - 120952, n=5)
117552 MB/s -2%
Durchschnitt der Klasse Workstation
  (55663 - 214520, n=21, der letzten 2 Jahre)
91615 MB/s -24%
Lenovo ThinkPad P1 Gen 8
Intel Core Ultra 7 255H, RTX PRO 2000 Blackwell Generation Laptop
60162 MB/s -50%
AIDA64 / Memory Latency
Lenovo ThinkPad P1 Gen 8
Intel Core Ultra 7 255H, RTX PRO 2000 Blackwell Generation Laptop
137.3 ns * -48%
Durchschnitt der Klasse Workstation
  (93 - 165.2, n=21, der letzten 2 Jahre)
128 ns * -38%
Durchschnittliche Intel Core Ultra 7 366H
  (89.5 - 103, n=5)
93.3 ns * -0%
Lenovo ThinkPad P1 Gen 9 21UE000MGE
Intel Core Ultra 7 366H, RTX PRO 2000 Blackwell Generation Laptop
93 ns *
Samsung Galaxy Book6 Ultra
Intel Core Ultra 7 356H, GeForce RTX 5070 Laptop
90 ns * +3%
Dell XPS 16 Core Ultra X7 358H
Intel Core Ultra X7 358H, Arc B390 Panther Lake iGPU
84.6 ns * +9%

* ... kleinere Werte sind besser

DPC-Latenz
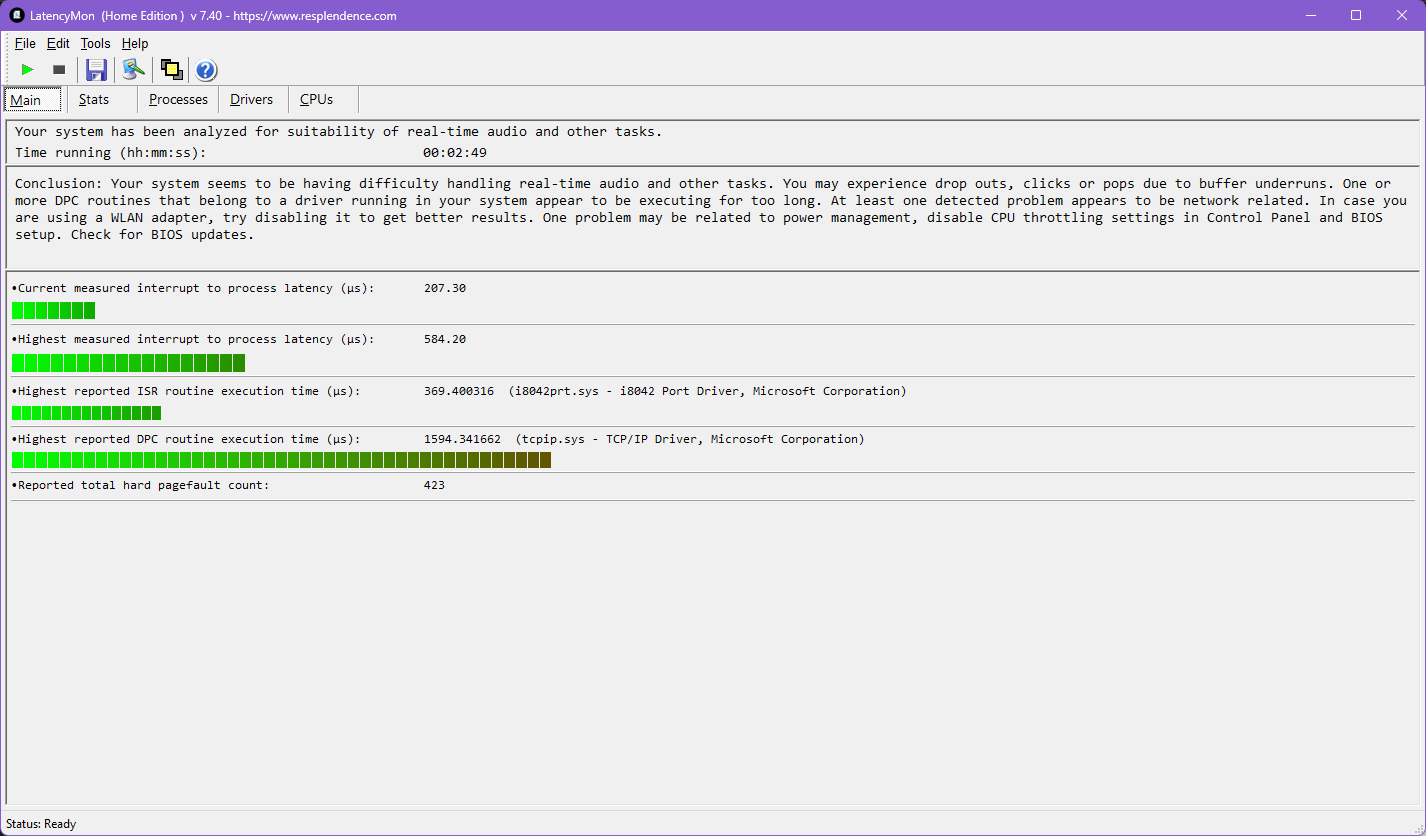
LatencyMon
LatencyMon
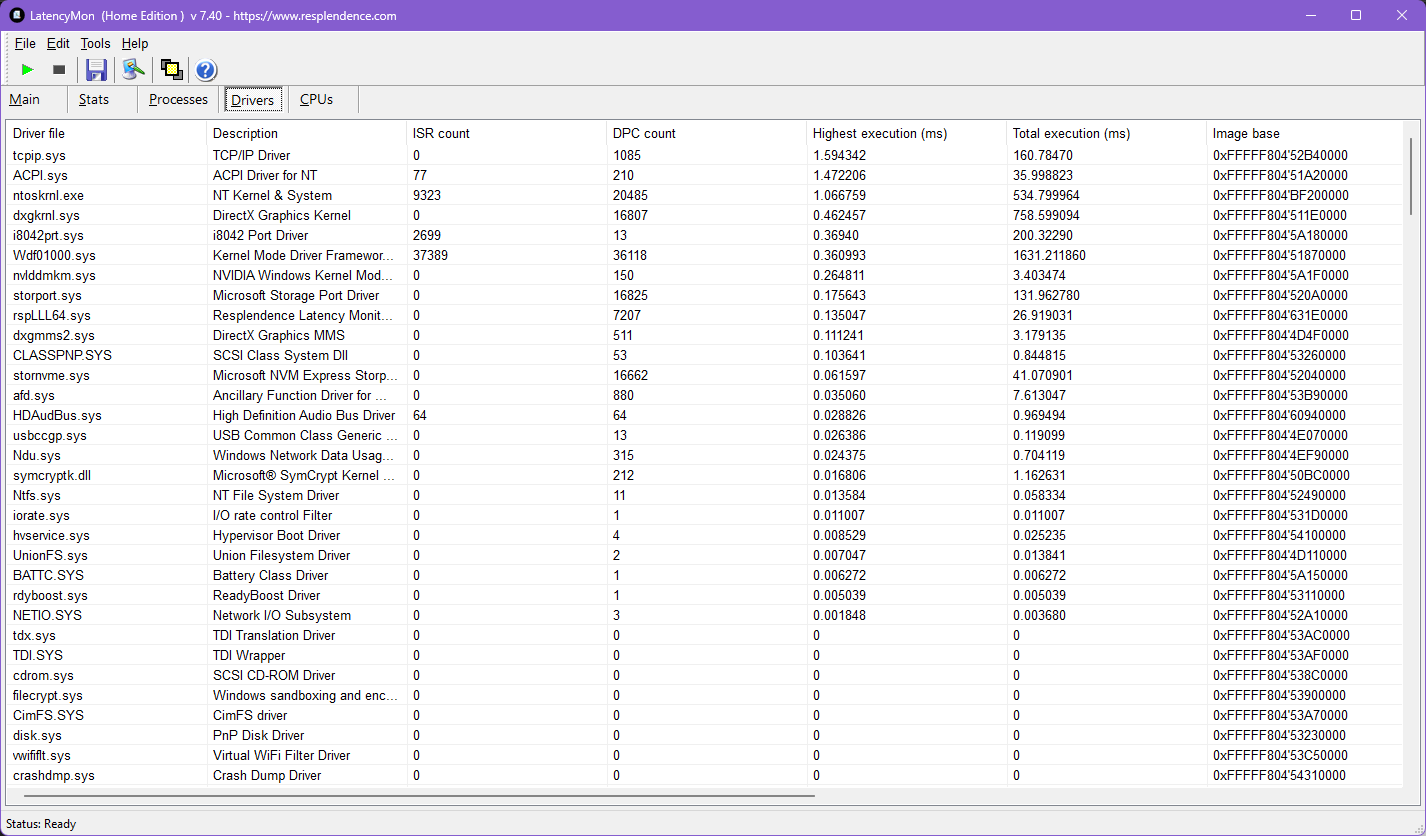
LatencyMon Treiber
LatencyMon Treiber
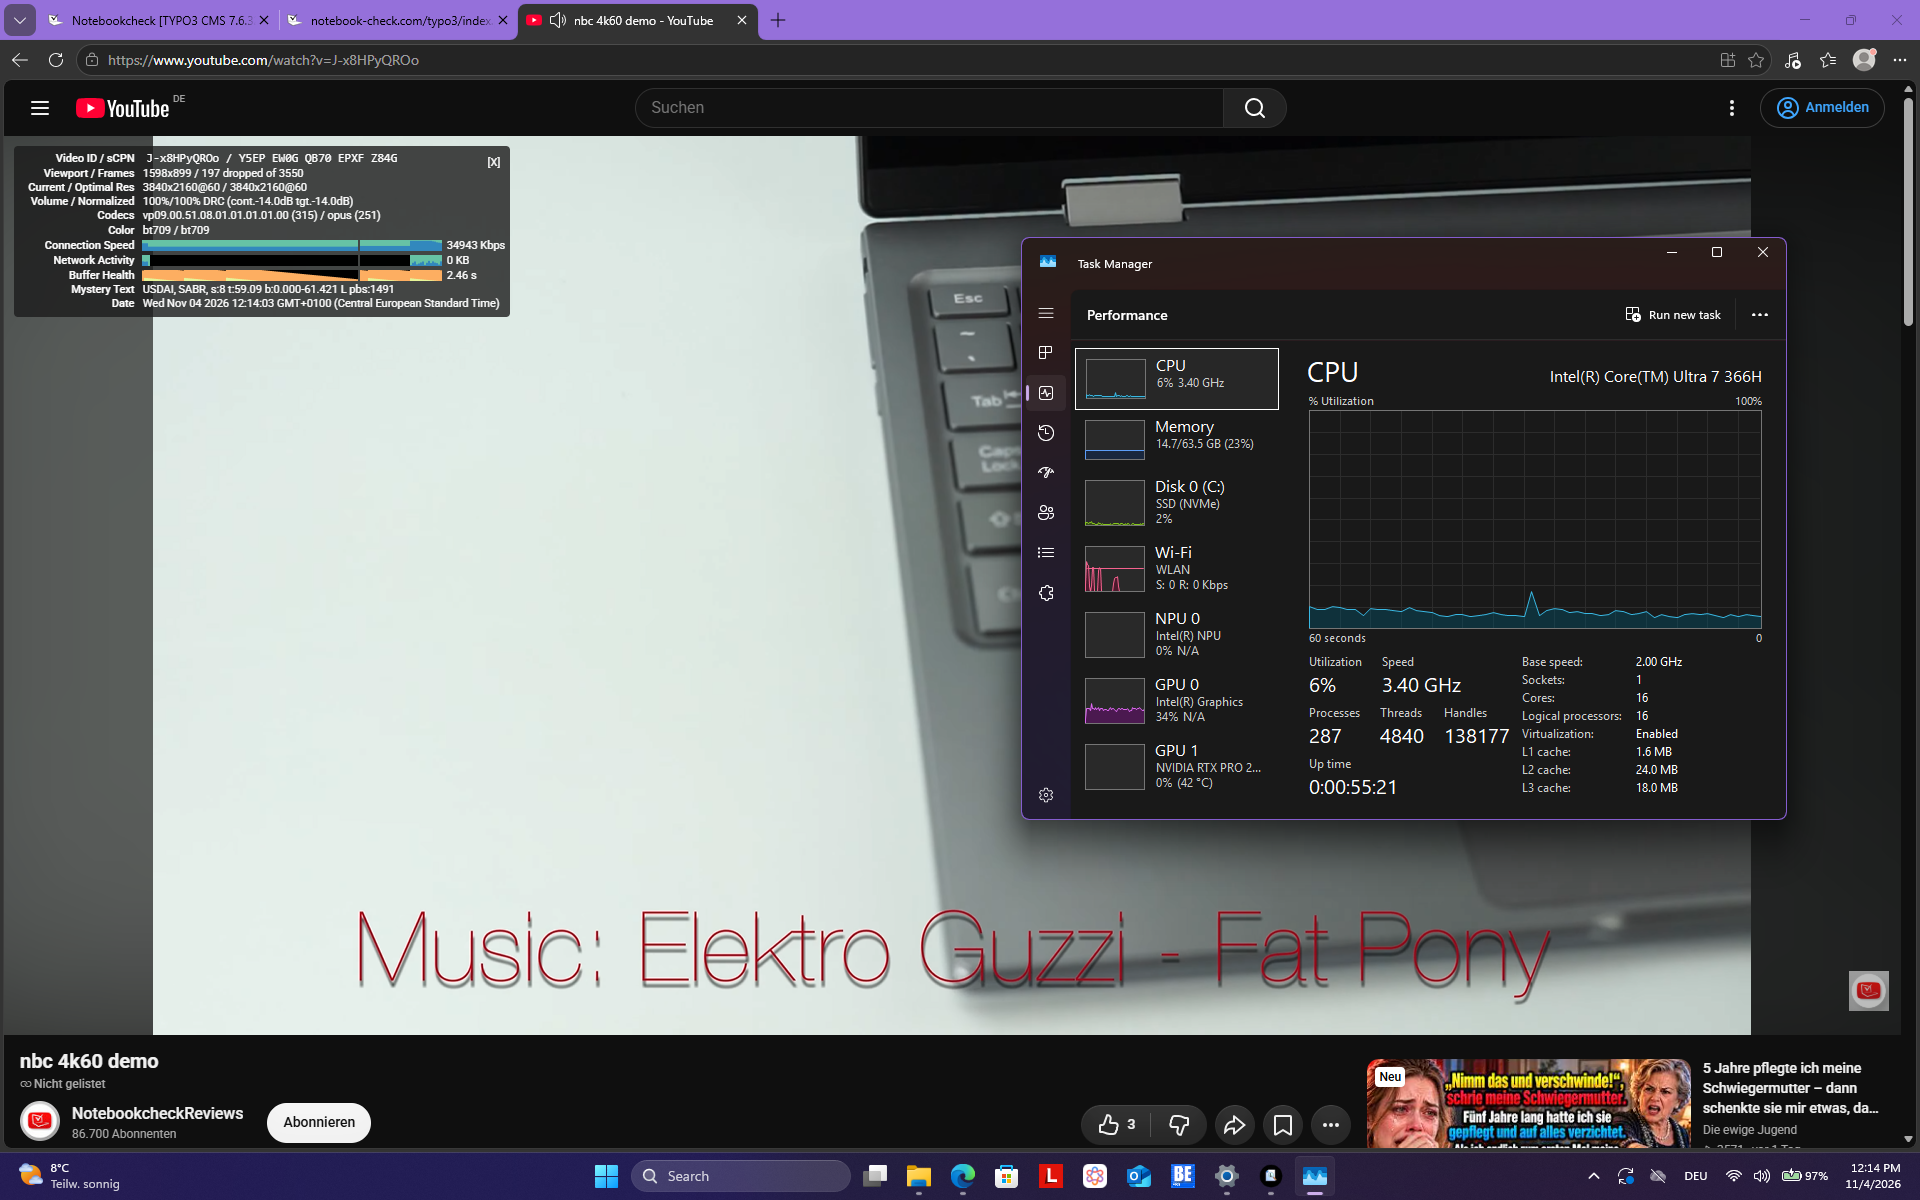
YouTube-Test
YouTube-Test
DPC Latencies / LatencyMon - interrupt to process latency (max), Web, Youtube, Prime95
Lenovo ThinkPad P1 Gen 8
RTX PRO 2000 Blackwell Generation Laptop, Ultra 7 255H, Samsung PM9E1 1 TB MZVLC1T0HFLU
2876.4 μs * -392%
Durchschnitt der Klasse Workstation
  (439 - 5165, n=19, der letzten 2 Jahre)
1695 μs * -190%
Samsung Galaxy Book6 Ultra
GeForce RTX 5070 Laptop, Ultra 7 356H, Samsung PM9C1b MZVL81T0HFLB-00BH1
627.7 μs * -7%
HP ZBook X G1i 16
RTX PRO 2000 Blackwell Generation Laptop, Ultra 7 265H, Samsung PM9A1 MZVL22T0HBLB
620.8 μs * -6%
Lenovo ThinkPad P1 Gen 9 21UE000MGE
RTX PRO 2000 Blackwell Generation Laptop, Ultra 7 366H, Samsung PM9E1 1 TB MZVLC1T0HFLU
584.2 μs *
Dell XPS 16 Core Ultra X7 358H
Arc B390 Panther Lake iGPU, Ultra X7 358H
513.7 μs * +12%

* ... kleinere Werte sind besser

Speichergeräte

Das ThinkPad P1 Gen 9 verwendet die gleiche SSD wie das ältere P1 G8, aber es gibt einen wesentlichen Unterschied: Während diese M.2-2280-PCIe-5.0-SSD im älteren P1 auf PCIe-4.0-Geschwindigkeit begrenzt war, ist das beim P1 Gen 9 nicht der Fall. Diese SSD ist sehr schnell und drosselt auch unter Dauerlast überhaupt nicht.

Samsung PM9E1 1 TB MZVLC1T0HFLU
DiskSpd seq_q8t1_read: 13967MB/s
DiskSpd seq_q8t1_write: 13496MB/s
DiskSpd seq_read: 9471MB/s
DiskSpd seq_write: 9931MB/s
DiskSpd 4k_q32t16_read: 5313MB/s
DiskSpd 4k_q32t16_write: 3041MB/s
DiskSpd 4k_q1t1_read: 93.5MB/s
DiskSpd 4k_q1t1_write: 230MB/s
DiskSpd Loop seq_q8t1_read: 14163MB/s
Drive Performance Rating - Percent
Lenovo ThinkPad P1 Gen 9 21UE000MGE
Samsung PM9E1 1 TB MZVLC1T0HFLU
98.2 pt
Durchschnittliche Samsung PM9E1 1 TB MZVLC1T0HFLU
 
67.2 pt
HP ZBook X G1i 16
Samsung PM9A1 MZVL22T0HBLB
65.8 pt
Durchschnitt der Klasse Workstation
 
56.9 pt
Lenovo ThinkPad P1 Gen 8
Samsung PM9E1 1 TB MZVLC1T0HFLU
44.9 pt
Dell XPS 16 Core Ultra X7 358H
 
38.9 pt
Samsung Galaxy Book6 Ultra
Samsung PM9C1b MZVL81T0HFLB-00BH1
33.4 pt
DiskSpd
seq read
Lenovo ThinkPad P1 Gen 9 21UE000MGE
Samsung PM9E1 1 TB MZVLC1T0HFLU
9471 (9420.23min - 9471.09max) MB/s
Durchschnittliche Samsung PM9E1 1 TB MZVLC1T0HFLU
  (4612 - 9471, n=6)
5995 MB/s -37%
Durchschnitt der Klasse Workstation
  (2868 - 9471, n=21, der letzten 2 Jahre)
4953 MB/s -48%
Lenovo ThinkPad P1 Gen 8
Samsung PM9E1 1 TB MZVLC1T0HFLU
4612 (4522.48min - 4612.48max) MB/s -51%
HP ZBook X G1i 16
Samsung PM9A1 MZVL22T0HBLB
4216 (4195.35min - 4215.86max) MB/s -55%
Dell XPS 16 Core Ultra X7 358H
 
3600 (3100.64min - 3600.18max) MB/s -62%
Samsung Galaxy Book6 Ultra
Samsung PM9C1b MZVL81T0HFLB-00BH1
2490 (1953.08min - 2489.95max) MB/s -74%
seq write
Lenovo ThinkPad P1 Gen 9 21UE000MGE
Samsung PM9E1 1 TB MZVLC1T0HFLU
9931 (4713.57min - 9930.71max) MB/s
Durchschnittliche Samsung PM9E1 1 TB MZVLC1T0HFLU
  (3358 - 9931, n=6)
5989 MB/s -40%
Durchschnitt der Klasse Workstation
  (3255 - 9931, n=21, der letzten 2 Jahre)
4943 MB/s -50%
HP ZBook X G1i 16
Samsung PM9A1 MZVL22T0HBLB
4128 (4107.86min - 4127.61max) MB/s -58%
Lenovo ThinkPad P1 Gen 8
Samsung PM9E1 1 TB MZVLC1T0HFLU
3678 (3328.86min - 3677.76max) MB/s -63%
Dell XPS 16 Core Ultra X7 358H
 
2599 (796.92min - 2599.25max) MB/s -74%
Samsung Galaxy Book6 Ultra
Samsung PM9C1b MZVL81T0HFLB-00BH1
2024 (1020.53min - 2024.32max) MB/s -80%
seq q8 t1 read
Lenovo ThinkPad P1 Gen 9 21UE000MGE
Samsung PM9E1 1 TB MZVLC1T0HFLU
13967 (13046min - 13967.2max) MB/s
Durchschnittliche Samsung PM9E1 1 TB MZVLC1T0HFLU
  (7112 - 14162, n=6)
10444 MB/s -25%
Durchschnitt der Klasse Workstation
  (6653 - 16102, n=21, der letzten 2 Jahre)
9129 MB/s -35%
Lenovo ThinkPad P1 Gen 8
Samsung PM9E1 1 TB MZVLC1T0HFLU
7112 (6580.91min - 7112.11max) MB/s -49%
Dell XPS 16 Core Ultra X7 358H
 
7039 (5536.1min - 7039.48max) MB/s -50%
Samsung Galaxy Book6 Ultra
Samsung PM9C1b MZVL81T0HFLB-00BH1
7001 (5891.57min - 7001.18max) MB/s -50%
HP ZBook X G1i 16
Samsung PM9A1 MZVL22T0HBLB
6744 (6071.07min - 6743.96max) MB/s -52%
seq q8 t1 write
Lenovo ThinkPad P1 Gen 9 21UE000MGE
Samsung PM9E1 1 TB MZVLC1T0HFLU
13496 (1928.04min - 13495.6max) MB/s
Durchschnittliche Samsung PM9E1 1 TB MZVLC1T0HFLU
  (6669 - 13512, n=6)
9519 MB/s -29%
Durchschnitt der Klasse Workstation
  (4923 - 13496, n=21, der letzten 2 Jahre)
7834 MB/s -42%
Lenovo ThinkPad P1 Gen 8
Samsung PM9E1 1 TB MZVLC1T0HFLU
6669 (6458.27min - 6669.15max) MB/s -51%
Dell XPS 16 Core Ultra X7 358H
 
6101 (5938.22min - 6101.03max) MB/s -55%
Samsung Galaxy Book6 Ultra
Samsung PM9C1b MZVL81T0HFLB-00BH1
5837 (5518.66min - 5837.07max) MB/s -57%
HP ZBook X G1i 16
Samsung PM9A1 MZVL22T0HBLB
4959 (4947.14min - 4958.72max) MB/s -63%
4k q1 t1 read
Lenovo ThinkPad P1 Gen 9 21UE000MGE
Samsung PM9E1 1 TB MZVLC1T0HFLU
93.5 (92.2min - 93.53max) MB/s
Durchschnittliche Samsung PM9E1 1 TB MZVLC1T0HFLU
  (65.2 - 93.5, n=6)
80.2 MB/s -14%
HP ZBook X G1i 16
Samsung PM9A1 MZVL22T0HBLB
79.9 (79.65min - 79.85max) MB/s -15%
Lenovo ThinkPad P1 Gen 8
Samsung PM9E1 1 TB MZVLC1T0HFLU
76.6 (75.14min - 76.63max) MB/s -18%
Durchschnitt der Klasse Workstation
  (38.9 - 99.2, n=21, der letzten 2 Jahre)
72.4 MB/s -23%
Dell XPS 16 Core Ultra X7 358H
 
59.1 (53.74min - 59.08max) MB/s -37%
Samsung Galaxy Book6 Ultra
Samsung PM9C1b MZVL81T0HFLB-00BH1
43.7 (43.01min - 43.71max) MB/s -53%
4k q1 t1 write
Lenovo ThinkPad P1 Gen 9 21UE000MGE
Samsung PM9E1 1 TB MZVLC1T0HFLU
230 (173.15min - 229.93max) MB/s
HP ZBook X G1i 16
Samsung PM9A1 MZVL22T0HBLB
213 (200.84min - 213.03max) MB/s -7%
Durchschnittliche Samsung PM9E1 1 TB MZVLC1T0HFLU
  (132 - 230, n=6)
177.3 MB/s -23%
Durchschnitt der Klasse Workstation
  (82.4 - 304, n=21, der letzten 2 Jahre)
169.4 MB/s -26%
Dell XPS 16 Core Ultra X7 358H
 
145.5 (139.46min - 145.49max) MB/s -37%
Lenovo ThinkPad P1 Gen 8
Samsung PM9E1 1 TB MZVLC1T0HFLU
142.9 (126.19min - 142.94max) MB/s -38%
Samsung Galaxy Book6 Ultra
Samsung PM9C1b MZVL81T0HFLB-00BH1
129.8 (127.79min - 129.79max) MB/s -44%
4k q32 t16 read
Lenovo ThinkPad P1 Gen 9 21UE000MGE
Samsung PM9E1 1 TB MZVLC1T0HFLU
5313 (5248.41min - 5312.89max) MB/s
HP ZBook X G1i 16
Samsung PM9A1 MZVL22T0HBLB
4084 (4068.55min - 4083.66max) MB/s -23%
Durchschnittliche Samsung PM9E1 1 TB MZVLC1T0HFLU
  (750 - 5313, n=6)
2940 MB/s -45%
Durchschnitt der Klasse Workstation
  (689 - 7342, n=21, der letzten 2 Jahre)
2159 MB/s -59%
Lenovo ThinkPad P1 Gen 8
Samsung PM9E1 1 TB MZVLC1T0HFLU
858 (841.36min - 858.1max) MB/s -84%
Samsung Galaxy Book6 Ultra
Samsung PM9C1b MZVL81T0HFLB-00BH1
683 (624.47min - 682.86max) MB/s -87%
Dell XPS 16 Core Ultra X7 358H
 
652 (602.16min - 651.54max) MB/s -88%
4k q32 t16 write
HP ZBook X G1i 16
Samsung PM9A1 MZVL22T0HBLB
3541 (3514.91min - 3540.62max) MB/s +16%
Lenovo ThinkPad P1 Gen 9 21UE000MGE
Samsung PM9E1 1 TB MZVLC1T0HFLU
3041 (3003.35min - 3041.48max) MB/s
Durchschnittliche Samsung PM9E1 1 TB MZVLC1T0HFLU
  (417 - 3291, n=6)
1795 MB/s -41%
Durchschnitt der Klasse Workstation
  (365 - 4763, n=21, der letzten 2 Jahre)
1351 MB/s -56%
Lenovo ThinkPad P1 Gen 8
Samsung PM9E1 1 TB MZVLC1T0HFLU
447 (382.52min - 447.21max) MB/s -85%
Dell XPS 16 Core Ultra X7 358H
 
447 (308.53min - 447.08max) MB/s -85%
Samsung Galaxy Book6 Ultra
Samsung PM9C1b MZVL81T0HFLB-00BH1
399 (289.28min - 399.36max) MB/s -87%

Datenträgerdrosselung: DiskSpd-Leseschleife, Warteschlangentiefe 8

0285570855114014251710199522802565285031353420370539904275456048455130541557005985627065556840712574107695798082658550883591209405969099751026010545108301111511400116851197012255125401282513110133951368013965Tooltip
Lenovo ThinkPad P1 Gen 9 21UE000MGE; diskspd 2.0.17 f: Ø14163 (12786.77-14212.72) MB/s

Grafikkarte

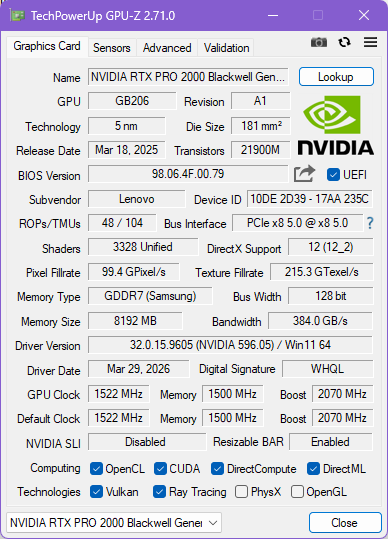
GPU-Z Nvidia RTX Pro 2000 Blackwell

Wir testen das Lenovo ThinkPad P1 Gen 9 mit der leistungsstärksten angebotenen GPU, der Nvidia RTX Pro 2000 Blackwell. Dabei handelt es sich um eine ISV-zertifizierte Workstation-GPU, die in etwa der Nvidia GeForce RTX 5060 Laptop entspricht.

Lenovo gewährt der GPU eine TGP von 75 W. Das ist nicht viel für einen Chip, der für eine Leistungsaufnahme von bis zu 100 W ausgelegt ist. Dennoch übertrifft das ThinkPad P1 Gen 9 die Intel ARC iGPU-Lösung mühelos und deutlich.

3DMark Performance Rating - Percent
Samsung Galaxy Book6 Ultra
NVIDIA GeForce RTX 5070 Laptop, Intel Core Ultra 7 356H
100 pt
Lenovo ThinkPad P1 Gen 9 21UE000MGE
NVIDIA RTX PRO 2000 Blackwell Generation Laptop, Intel Core Ultra 7 366H
86.6 pt
Lenovo ThinkPad P1 Gen 8
NVIDIA RTX PRO 2000 Blackwell Generation Laptop, Intel Core Ultra 7 255H
85.3 pt
Durchschnitt der Klasse Workstation
 
84.1 pt
Durchschnittliche NVIDIA RTX PRO 2000 Blackwell Generation Laptop
 
81.4 pt
HP ZBook X G1i 16
NVIDIA RTX PRO 2000 Blackwell Generation Laptop, Intel Core Ultra 7 265H
76.8 pt
Dell XPS 16 Core Ultra X7 358H
Intel Arc B390 12 Xe3 Panther Lake iGPU, Intel Core Ultra X7 358H
51.7 pt
3DMark 11 - 1280x720 Performance GPU
Samsung Galaxy Book6 Ultra
NVIDIA GeForce RTX 5070 Laptop, Intel Core Ultra 7 356H
40985 Points +20%
Lenovo ThinkPad P1 Gen 8
NVIDIA RTX PRO 2000 Blackwell Generation Laptop, Intel Core Ultra 7 255H
35003 Points +3%
Durchschnitt der Klasse Workstation
  (12535 - 69594, n=21, der letzten 2 Jahre)
34677 Points +2%
Lenovo ThinkPad P1 Gen 9 21UE000MGE
NVIDIA RTX PRO 2000 Blackwell Generation Laptop, Intel Core Ultra 7 366H
34072 Points
Durchschnittliche NVIDIA RTX PRO 2000 Blackwell Generation Laptop
  (31736 - 35003, n=4)
33152 Points -3%
HP ZBook X G1i 16
NVIDIA RTX PRO 2000 Blackwell Generation Laptop, Intel Core Ultra 7 265H
31736 Points -7%
Dell XPS 16 Core Ultra X7 358H
Intel Arc B390 12 Xe3 Panther Lake iGPU, Intel Core Ultra X7 358H
18308 Points -46%
3DMark
1920x1080 Fire Strike Graphics
Samsung Galaxy Book6 Ultra
NVIDIA GeForce RTX 5070 Laptop, Intel Core Ultra 7 356H
32528 Points +12%
Lenovo ThinkPad P1 Gen 9 21UE000MGE
NVIDIA RTX PRO 2000 Blackwell Generation Laptop, Intel Core Ultra 7 366H
28931 Points
Lenovo ThinkPad P1 Gen 8
NVIDIA RTX PRO 2000 Blackwell Generation Laptop, Intel Core Ultra 7 255H
27781 Points -4%
Durchschnittliche NVIDIA RTX PRO 2000 Blackwell Generation Laptop
  (25085 - 28931, n=4)
26850 Points -7%
Durchschnitt der Klasse Workstation
  (8293 - 52560, n=21, der letzten 2 Jahre)
25428 Points -12%
HP ZBook X G1i 16
NVIDIA RTX PRO 2000 Blackwell Generation Laptop, Intel Core Ultra 7 265H
25085 Points -13%
Dell XPS 16 Core Ultra X7 358H
Intel Arc B390 12 Xe3 Panther Lake iGPU, Intel Core Ultra X7 358H
17018 Points -41%
2560x1440 Time Spy Graphics
Samsung Galaxy Book6 Ultra
NVIDIA GeForce RTX 5070 Laptop, Intel Core Ultra 7 356H
12027 Points +14%
Durchschnitt der Klasse Workstation
  (2725 - 24806, n=21, der letzten 2 Jahre)
10759 Points +2%
Lenovo ThinkPad P1 Gen 9 21UE000MGE
NVIDIA RTX PRO 2000 Blackwell Generation Laptop, Intel Core Ultra 7 366H
10556 Points
Lenovo ThinkPad P1 Gen 8
NVIDIA RTX PRO 2000 Blackwell Generation Laptop, Intel Core Ultra 7 255H
10230 Points -3%
Durchschnittliche NVIDIA RTX PRO 2000 Blackwell Generation Laptop
  (8994 - 10556, n=4)
9725 Points -8%
HP ZBook X G1i 16
NVIDIA RTX PRO 2000 Blackwell Generation Laptop, Intel Core Ultra 7 265H
9120 Points -14%
Dell XPS 16 Core Ultra X7 358H
Intel Arc B390 12 Xe3 Panther Lake iGPU, Intel Core Ultra X7 358H
6972 Points -34%
SPECviewperf Performance Rating - Percent
Lenovo ThinkPad P1 Gen 8
RTX PRO 2000 Blackwell Generation Laptop, Ultra 7 255H, Samsung PM9E1 1 TB MZVLC1T0HFLU
96.5 pt
Lenovo ThinkPad P1 Gen 9 21UE000MGE
RTX PRO 2000 Blackwell Generation Laptop, Ultra 7 366H, Samsung PM9E1 1 TB MZVLC1T0HFLU
93.7 pt
HP ZBook X G1i 16
RTX PRO 2000 Blackwell Generation Laptop, Ultra 7 265H, Samsung PM9A1 MZVL22T0HBLB
86.6 pt
Durchschnitt der Klasse Workstation
 
85.9 pt
SPECviewperf 2020
1920x1080 Siemens NX (snx-04)
Lenovo ThinkPad P1 Gen 8
RTX PRO 2000 Blackwell Generation Laptop, Ultra 7 255H, Samsung PM9E1 1 TB MZVLC1T0HFLU
646.29 fps +58%
Lenovo ThinkPad P1 Gen 9 21UE000MGE
RTX PRO 2000 Blackwell Generation Laptop, Ultra 7 366H, Samsung PM9E1 1 TB MZVLC1T0HFLU
410.11 fps
HP ZBook X G1i 16
RTX PRO 2000 Blackwell Generation Laptop, Ultra 7 265H, Samsung PM9A1 MZVL22T0HBLB
373.04 fps -9%
Durchschnitt der Klasse Workstation
  (35.9 - 903, n=20, der letzten 2 Jahre)
341 fps -17%
1920x1080 Medical (medical-03)
Lenovo ThinkPad P1 Gen 9 21UE000MGE
RTX PRO 2000 Blackwell Generation Laptop, Ultra 7 366H, Samsung PM9E1 1 TB MZVLC1T0HFLU
116.02 fps
Lenovo ThinkPad P1 Gen 8
RTX PRO 2000 Blackwell Generation Laptop, Ultra 7 255H, Samsung PM9E1 1 TB MZVLC1T0HFLU
115.65 fps 0%
HP ZBook X G1i 16
RTX PRO 2000 Blackwell Generation Laptop, Ultra 7 265H, Samsung PM9A1 MZVL22T0HBLB
108.3 fps -7%
Durchschnitt der Klasse Workstation
  (34.7 - 227, n=20, der letzten 2 Jahre)
106.3 fps -8%
1920x1080 Maya (maya-06)
Lenovo ThinkPad P1 Gen 8
RTX PRO 2000 Blackwell Generation Laptop, Ultra 7 255H, Samsung PM9E1 1 TB MZVLC1T0HFLU
399.88 fps 0%
Lenovo ThinkPad P1 Gen 9 21UE000MGE
RTX PRO 2000 Blackwell Generation Laptop, Ultra 7 366H, Samsung PM9E1 1 TB MZVLC1T0HFLU
399.85 fps
HP ZBook X G1i 16
RTX PRO 2000 Blackwell Generation Laptop, Ultra 7 265H, Samsung PM9A1 MZVL22T0HBLB
384.46 fps -4%
Durchschnitt der Klasse Workstation
  (117.8 - 724, n=19, der letzten 2 Jahre)
381 fps -5%
1920x1080 Energy (energy-03)
Durchschnitt der Klasse Workstation
  (17.3 - 176.7, n=20, der letzten 2 Jahre)
66.8 fps +4%
Lenovo ThinkPad P1 Gen 9 21UE000MGE
RTX PRO 2000 Blackwell Generation Laptop, Ultra 7 366H, Samsung PM9E1 1 TB MZVLC1T0HFLU
64.44 fps
Lenovo ThinkPad P1 Gen 8
RTX PRO 2000 Blackwell Generation Laptop, Ultra 7 255H, Samsung PM9E1 1 TB MZVLC1T0HFLU
63.71 fps -1%
HP ZBook X G1i 16
RTX PRO 2000 Blackwell Generation Laptop, Ultra 7 265H, Samsung PM9A1 MZVL22T0HBLB
59.39 fps -8%
1920x1080 Creo (creo-03)
Lenovo ThinkPad P1 Gen 9 21UE000MGE
RTX PRO 2000 Blackwell Generation Laptop, Ultra 7 366H, Samsung PM9E1 1 TB MZVLC1T0HFLU
189.81 fps
Lenovo ThinkPad P1 Gen 8
RTX PRO 2000 Blackwell Generation Laptop, Ultra 7 255H, Samsung PM9E1 1 TB MZVLC1T0HFLU
180.91 fps -5%
HP ZBook X G1i 16
RTX PRO 2000 Blackwell Generation Laptop, Ultra 7 265H, Samsung PM9A1 MZVL22T0HBLB
173.6 fps -9%
Durchschnitt der Klasse Workstation
  (49.2 - 261, n=20, der letzten 2 Jahre)
141.8 fps -25%
1920x1080 CATIA (catia-06)
Lenovo ThinkPad P1 Gen 9 21UE000MGE
RTX PRO 2000 Blackwell Generation Laptop, Ultra 7 366H, Samsung PM9E1 1 TB MZVLC1T0HFLU
100.22 fps
Lenovo ThinkPad P1 Gen 8
RTX PRO 2000 Blackwell Generation Laptop, Ultra 7 255H, Samsung PM9E1 1 TB MZVLC1T0HFLU
93.11 fps -7%
HP ZBook X G1i 16
RTX PRO 2000 Blackwell Generation Laptop, Ultra 7 265H, Samsung PM9A1 MZVL22T0HBLB
90.64 fps -10%
Durchschnitt der Klasse Workstation
  (27.1 - 182.2, n=20, der letzten 2 Jahre)
86.9 fps -13%
1920x1080 3ds Max (3dsmax-07)
Durchschnitt der Klasse Workstation
  (24.7 - 251, n=20, der letzten 2 Jahre)
114.1 fps +4%
Lenovo ThinkPad P1 Gen 9 21UE000MGE
RTX PRO 2000 Blackwell Generation Laptop, Ultra 7 366H, Samsung PM9E1 1 TB MZVLC1T0HFLU
109.78 fps
Lenovo ThinkPad P1 Gen 8
RTX PRO 2000 Blackwell Generation Laptop, Ultra 7 255H, Samsung PM9E1 1 TB MZVLC1T0HFLU
105.57 fps -4%
HP ZBook X G1i 16
RTX PRO 2000 Blackwell Generation Laptop, Ultra 7 265H, Samsung PM9A1 MZVL22T0HBLB
101 fps -8%
3DMark 11 Performance
29894 Punkte
3DMark Fire Strike Score
25692 Punkte
3DMark Time Spy Score
11084 Punkte
Hilfe
Blender
v3.3 Classroom METAL
Apple MacBook Pro 16 2026 M5 Pro
Apple M5 Pro 20-Core GPU, Apple M5 Pro 18-Core
36.6 Seconds *
v3.3 Classroom OPTIX/RTX
HP ZBook X G1i 16
NVIDIA RTX PRO 2000 Blackwell Generation Laptop, Intel Core Ultra 7 265H
25 Seconds * -4%
Lenovo ThinkPad P1 Gen 9 21UE000MGE
NVIDIA RTX PRO 2000 Blackwell Generation Laptop, Intel Core Ultra 7 366H
24 Seconds *
Durchschnittliche NVIDIA RTX PRO 2000 Blackwell Generation Laptop
  (22 - 25, n=4)
23.3 Seconds * +3%
Lenovo ThinkPad P1 Gen 8
NVIDIA RTX PRO 2000 Blackwell Generation Laptop, Intel Core Ultra 7 255H
22 Seconds * +8%
Durchschnitt der Klasse Workstation
  (10 - 43, n=13, der letzten 2 Jahre)
20.9 Seconds * +13%
Samsung Galaxy Book6 Ultra
NVIDIA GeForce RTX 5070 Laptop, Intel Core Ultra 7 356H
20 Seconds * +17%
v3.3 Classroom CUDA
HP ZBook X G1i 16
NVIDIA RTX PRO 2000 Blackwell Generation Laptop, Intel Core Ultra 7 265H
45 Seconds * -10%
Durchschnittliche NVIDIA RTX PRO 2000 Blackwell Generation Laptop
  (41 - 45, n=4)
42.5 Seconds * -4%
Lenovo ThinkPad P1 Gen 8
NVIDIA RTX PRO 2000 Blackwell Generation Laptop, Intel Core Ultra 7 255H
42 Seconds * -2%
Lenovo ThinkPad P1 Gen 9 21UE000MGE
NVIDIA RTX PRO 2000 Blackwell Generation Laptop, Intel Core Ultra 7 366H
41 Seconds *
Durchschnitt der Klasse Workstation
  (16 - 74, n=13, der letzten 2 Jahre)
36.5 Seconds * +11%
Samsung Galaxy Book6 Ultra
NVIDIA GeForce RTX 5070 Laptop, Intel Core Ultra 7 356H
35 Seconds * +15%
v3.3 Classroom CPU
Dell XPS 16 Core Ultra X7 358H
Intel Arc B390 12 Xe3 Panther Lake iGPU, Intel Core Ultra X7 358H
328 Seconds * -27%
Lenovo ThinkPad P1 Gen 8
NVIDIA RTX PRO 2000 Blackwell Generation Laptop, Intel Core Ultra 7 255H
273 Seconds * -5%
Durchschnittliche NVIDIA RTX PRO 2000 Blackwell Generation Laptop
  (259 - 273, n=4)
267 Seconds * -3%
HP ZBook X G1i 16
NVIDIA RTX PRO 2000 Blackwell Generation Laptop, Intel Core Ultra 7 265H
266 Seconds * -3%
Samsung Galaxy Book6 Ultra
NVIDIA GeForce RTX 5070 Laptop, Intel Core Ultra 7 356H
261 Seconds * -1%
Lenovo ThinkPad P1 Gen 9 21UE000MGE
NVIDIA RTX PRO 2000 Blackwell Generation Laptop, Intel Core Ultra 7 366H
259 Seconds *
Durchschnitt der Klasse Workstation
  (148 - 364, n=21, der letzten 2 Jahre)
241 Seconds * +7%
Apple MacBook Pro 16 2026 M5 Pro
Apple M5 Pro 20-Core GPU, Apple M5 Pro 18-Core
134.5 Seconds * +48%
v3.3 Classroom oneAPI/Intel
Dell XPS 16 Core Ultra X7 358H
Intel Arc B390 12 Xe3 Panther Lake iGPU, Intel Core Ultra X7 358H
105 Seconds *

* ... kleinere Werte sind besser

Performance Rating - Percent
Samsung Galaxy Book6 Ultra
Intel Core Ultra 7 356H, NVIDIA GeForce RTX 5070 Laptop
97.9 pt
Lenovo ThinkPad P1 Gen 9 21UE000MGE
Intel Core Ultra 7 366H, NVIDIA RTX PRO 2000 Blackwell Generation Laptop
94.4 pt
Lenovo ThinkPad P1 Gen 8
Intel Core Ultra 7 255H, NVIDIA RTX PRO 2000 Blackwell Generation Laptop
90.3 pt
HP ZBook X G1i 16
Intel Core Ultra 7 265H, NVIDIA RTX PRO 2000 Blackwell Generation Laptop
88.3 pt
Durchschnitt der Klasse Workstation
 
82.2 pt
Apple MacBook Pro 16 2026 M5 Pro -4!
Apple M5 Pro 18-Core, Apple M5 Pro 20-Core GPU
72.5 pt
Dell XPS 16 Core Ultra X7 358H
Intel Core Ultra X7 358H, Intel Arc B390 12 Xe3 Panther Lake iGPU
50.2 pt
Cyberpunk 2077 - 1920x1080 Ultra Preset (FSR off)
Samsung Galaxy Book6 Ultra
Intel Core Ultra 7 356H, NVIDIA GeForce RTX 5070 Laptop
84.6 (62.2min) fps +8%
Lenovo ThinkPad P1 Gen 9 21UE000MGE
Intel Core Ultra 7 366H, NVIDIA RTX PRO 2000 Blackwell Generation Laptop
78.3 (62.9min, 59.6P1) fps
Lenovo ThinkPad P1 Gen 8
Intel Core Ultra 7 255H, NVIDIA RTX PRO 2000 Blackwell Generation Laptop
77.8 (62.5min, 57.4P1) fps -1%
Durchschnitt der Klasse Workstation
  (21.5 - 152.4, n=21, der letzten 2 Jahre)
72.3 fps -8%
HP ZBook X G1i 16
Intel Core Ultra 7 265H, NVIDIA RTX PRO 2000 Blackwell Generation Laptop
72.1 (57.6min, 52.5P1) fps -8%
Apple MacBook Pro 16 2026 M5 Pro
Apple M5 Pro 18-Core, Apple M5 Pro 20-Core GPU
57.8 fps -26%
Dell XPS 16 Core Ultra X7 358H
Intel Core Ultra X7 358H, Intel Arc B390 12 Xe3 Panther Lake iGPU
48.7 (40min, 37.6P1) fps -38%
Baldur's Gate 3 - 1920x1080 Ultra Preset AA:T
Samsung Galaxy Book6 Ultra
Intel Core Ultra 7 356H, NVIDIA GeForce RTX 5070 Laptop
109.2 (88.4min, 93.8P0.1, 97.6P1) fps +12%
Lenovo ThinkPad P1 Gen 8
Intel Core Ultra 7 255H, NVIDIA RTX PRO 2000 Blackwell Generation Laptop
102 (90.5min, 90.6P0.1, 91.9P1) fps +5%
Lenovo ThinkPad P1 Gen 9 21UE000MGE
Intel Core Ultra 7 366H, NVIDIA RTX PRO 2000 Blackwell Generation Laptop
97.5 (80.9min, 82.3P0.1, 86.3P1) fps
Durchschnitt der Klasse Workstation
  (23.7 - 205, n=22, der letzten 2 Jahre)
91.3 fps -6%
HP ZBook X G1i 16
Intel Core Ultra 7 265H, NVIDIA RTX PRO 2000 Blackwell Generation Laptop
89.5 fps -8%
Apple MacBook Pro 16 2026 M5 Pro
Apple M5 Pro 18-Core, Apple M5 Pro 20-Core GPU
83.8 fps -14%
Dell XPS 16 Core Ultra X7 358H
Intel Core Ultra X7 358H, Intel Arc B390 12 Xe3 Panther Lake iGPU
54.3 (48.6min, 49.6P0.1, 51P1) fps -44%
GTA V - 1920x1080 Highest AA:4xMSAA + FX AF:16x
Samsung Galaxy Book6 Ultra
Intel Core Ultra 7 356H, NVIDIA GeForce RTX 5070 Laptop
137.1 (2.52min, 90.9P1) fps +6%
Lenovo ThinkPad P1 Gen 9 21UE000MGE
Intel Core Ultra 7 366H, NVIDIA RTX PRO 2000 Blackwell Generation Laptop
129.7 (6.57min, 90.9P1) fps
Lenovo ThinkPad P1 Gen 8
Intel Core Ultra 7 255H, NVIDIA RTX PRO 2000 Blackwell Generation Laptop
119.3 (9.25min, 83.3P1) fps -8%
HP ZBook X G1i 16
Intel Core Ultra 7 265H, NVIDIA RTX PRO 2000 Blackwell Generation Laptop
112.7 (4.68min, 76.9P1) fps -13%
Durchschnitt der Klasse Workstation
  (18.1 - 156.1, n=20, der letzten 2 Jahre)
93.7 fps -28%
Dell XPS 16 Core Ultra X7 358H
Intel Core Ultra X7 358H, Intel Arc B390 12 Xe3 Panther Lake iGPU
45.2 (6.18min, 34.5P1) fps -65%
Final Fantasy XV Benchmark - 1920x1080 High Quality
Samsung Galaxy Book6 Ultra
Intel Core Ultra 7 356H, NVIDIA GeForce RTX 5070 Laptop
116.6 fps +11%
Lenovo ThinkPad P1 Gen 8
Intel Core Ultra 7 255H, NVIDIA RTX PRO 2000 Blackwell Generation Laptop
106.5 fps +2%
Lenovo ThinkPad P1 Gen 9 21UE000MGE
Intel Core Ultra 7 366H, NVIDIA RTX PRO 2000 Blackwell Generation Laptop
104.8 fps
HP ZBook X G1i 16
Intel Core Ultra 7 265H, NVIDIA RTX PRO 2000 Blackwell Generation Laptop
100.2 fps -4%
Durchschnitt der Klasse Workstation
  (26.4 - 197.6, n=20, der letzten 2 Jahre)
98.2 fps -6%
Dell XPS 16 Core Ultra X7 358H
Intel Core Ultra X7 358H, Intel Arc B390 12 Xe3 Panther Lake iGPU
56.2 fps -46%
Dota 2 Reborn - 1920x1080 ultra (3/3) best looking
Lenovo ThinkPad P1 Gen 9 21UE000MGE
Intel Core Ultra 7 366H, NVIDIA RTX PRO 2000 Blackwell Generation Laptop
150.3 (129.9min) fps
HP ZBook X G1i 16
Intel Core Ultra 7 265H, NVIDIA RTX PRO 2000 Blackwell Generation Laptop
141.8 (121.7min) fps -6%
Samsung Galaxy Book6 Ultra
Intel Core Ultra 7 356H, NVIDIA GeForce RTX 5070 Laptop
139.7 (113.2min) fps -7%
Lenovo ThinkPad P1 Gen 8
Intel Core Ultra 7 255H, NVIDIA RTX PRO 2000 Blackwell Generation Laptop
125.7 (107.7min) fps -16%
Durchschnitt der Klasse Workstation
  (50.7 - 166, n=21, der letzten 2 Jahre)
124.4 fps -17%
Dell XPS 16 Core Ultra X7 358H
Intel Core Ultra X7 358H, Intel Arc B390 12 Xe3 Panther Lake iGPU
96.9 (57min) fps -36%
X-Plane 11.11 - 1920x1080 high (fps_test=3)
HP ZBook X G1i 16
Intel Core Ultra 7 265H, NVIDIA RTX PRO 2000 Blackwell Generation Laptop
80.6 fps 0%
Lenovo ThinkPad P1 Gen 9 21UE000MGE
Intel Core Ultra 7 366H, NVIDIA RTX PRO 2000 Blackwell Generation Laptop
80.5 fps
Lenovo ThinkPad P1 Gen 8
Intel Core Ultra 7 255H, NVIDIA RTX PRO 2000 Blackwell Generation Laptop
76.3 fps -5%
Samsung Galaxy Book6 Ultra
Intel Core Ultra 7 356H, NVIDIA GeForce RTX 5070 Laptop
76 fps -6%
Durchschnitt der Klasse Workstation
  (30.5 - 110.4, n=21, der letzten 2 Jahre)
71.4 fps -11%
Dell XPS 16 Core Ultra X7 358H
Intel Core Ultra X7 358H, Intel Arc B390 12 Xe3 Panther Lake iGPU
38.8 fps -52%

Cyberpunk 2077 Ultra-FPS-Diagramm

05101520253035404550556065Tooltip
Lenovo ThinkPad P1 Gen 9 21UE000MGE Ultra 7 366H, RTX PRO 2000 Blackwell Generation Laptop: Ø69.1 (65.1-69.7) fps
min.mittelhochmax.
GTA V (2015) 187.3 184.7 179.6 129.7
Dota 2 Reborn (2015) 183.9 164.8 161 150.3
Final Fantasy XV Benchmark (2018) 212 138.9 104.8
X-Plane 11.11 (2018) 116.9 99.3 80.5
Baldur's Gate 3 (2023) 147.3 114.9 100.9 97.5
Cyberpunk 2077 (2023) 124.8 104.4 87.7 78.3
F1 25 (2025) 195.1 166.7 132.9 24.4

Emissionen & Stromverbrauch

Geräuschemissionen

Das Lenovo ThinkPad P1 Gen 9 ist zwar keineswegs ein lautes System, wird unter Last aber hörbar, wobei die beiden Lüfter maximal 47,9 dB(a) erzeugen. Damit liegt der Geräuschpegel ungefähr auf dem Niveau der Vergleichsgeräte. Im Leerlauf ist das ThinkPad-Notebook völlig lautlos, da auch kein Spulenfiepen auftritt.

Lautstärkediagramm

Idle
25.6 / 25.6 / 25.6 dB(A)
Last
41.5 / 47.9 dB(A)
  red to green bar
 
 
30 dB
leise
40 dB(A)
deutlich hörbar
50 dB(A)
störend
 
min: dark, med: mid, max: light   Earthworks M23R, Arta (aus 15 cm gemessen)   Umgebungsgeräusche: 25.6 dB(A)
dB(A) 0102030405060708090Deep BassMiddle BassHigh BassLower RangeMidsHigher MidsLower HighsMid HighsUpper HighsSuper Highs2041.336.44141.32535.929.73535.93133.429.933.733.44038.638.439.338.6504037.135.9406329.424.924.429.48025.321.321.525.310021.818.617.321.812523.319.915.123.31602823.6192820027.72415.927.725030.223.81730.23153025.715.63040034.12915.434.150033.927.814.133.963035.630.713.735.680037.631.412.837.6100038.332.614.238.3125036.830.914.136.8160037.731.41337.7200035.629.611.835.6250037.630.811.937.6315036.829.812.436.8400035.728.712.735.7500034.2271334.2630033.324.213.533.3800031.321.814.931.31000029.518.914.229.51250027.717.113.927.71600022.514.813.522.5SPL47.941.525.647.9N6.33.70.76.3median 33.9median 27median 14.1median 33.9Delta4.35.11.24.337.736.135.635.335.134.430.829.827.926.426.527.231.93131.628.132.533.43633.832.532.533.434.13532.227.832.331.332.830.827.525.729.327.22728.328.921.923.122.822.327.424.12320.721.322.826.626.72118.824.121.725.429.220.919.81920.925.427.522.821.519.422.726.829.624.822.921.723.42630.224.118.717.922.627.634.726.116.813.722.23036.924.515.513.320.827.835.723.514.91321.627.233.723.314.911.821.32733.722.314.511.721.931.539.228.416.411.924.130.838.427.215.611.224.327.135.52313.511.620.929.137.124.31511.921.628.138.42516.412.32227.7362613.912.323.130.337.626.313.412.721.524.536.621.413.212.715.419.132.922.113.113.51415.926.718.513.112.913.414.323.716.412.912.81312.82017.512.212.612.140.348.536.927.225.133.73.56.52.60.90.71.9median 27.1median 33.7median 23.3median 15median 12.8median 21.62.84.922.72.22.7hearing rangehide median Fan NoiseLenovo ThinkPad P1 Gen 9 21UE000MGESamsung Galaxy Book6 Ultra
Lenovo ThinkPad P1 Gen 9 21UE000MGE
Ultra 7 366H, RTX PRO 2000 Blackwell Generation Laptop
Lenovo ThinkPad P1 Gen 8
Ultra 7 255H, RTX PRO 2000 Blackwell Generation Laptop
HP ZBook X G1i 16
Ultra 7 265H, RTX PRO 2000 Blackwell Generation Laptop
Dell XPS 16 Core Ultra X7 358H
Ultra X7 358H, Arc B390 Panther Lake iGPU
Samsung Galaxy Book6 Ultra
Ultra 7 356H, GeForce RTX 5070 Laptop
Apple MacBook Pro 16 2026 M5 Pro
M5 Pro 18-Core, M5 Pro 20-Core GPU
Geräuschentwicklung
12%
6%
8%
2%
9%
aus / Umgebung * (dB)
25.6
23.1
10%
23.7
7%
23.3
9%
25.1
2%
25.4
1%
Idle min * (dB)
25.6
23.1
10%
23.7
7%
23.4
9%
25.1
2%
25.4
1%
Idle avg * (dB)
25.6
23.1
10%
23.7
7%
23.4
9%
25.1
2%
25.4
1%
Idle max * (dB)
25.6
23.1
10%
23.7
7%
25.8
-1%
25.1
2%
25.4
1%
Last avg * (dB)
41.5
27.3
34%
32.7
21%
38
8%
36.9
11%
25.4
39%
Cyberpunk 2077 ultra * (dB)
47.8
50.9
-6%
38.1
20%
48.5
-1%
33.6
30%
Last max * (dB)
47.9
47.9
-0%
48
-0%
48.6
-1%
48.5
-1%
51.7
-8%

* ... kleinere Werte sind besser

Temperatur
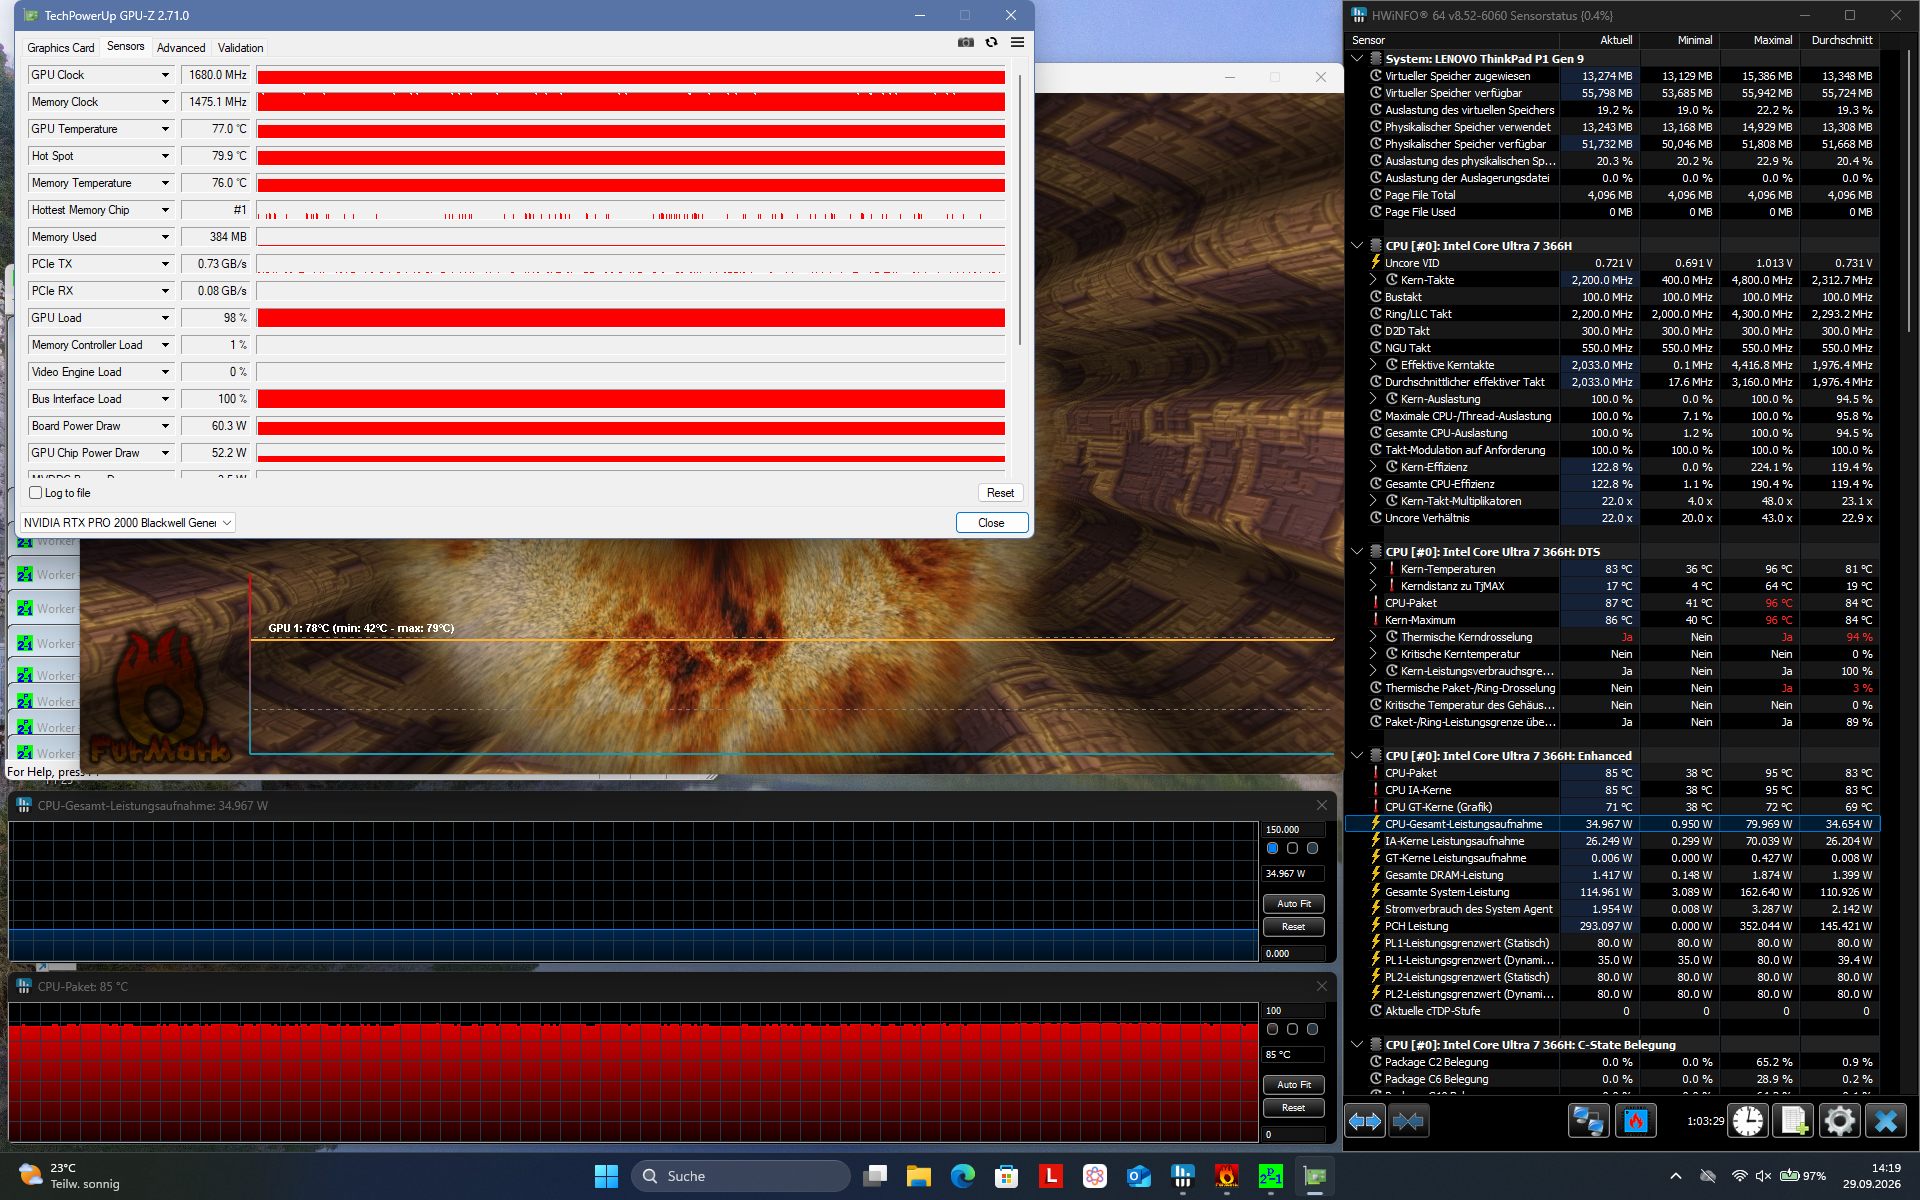
Stresstest (Prime95 + FurMark)

Ein schlankes Gehäuse, das einen leistungsstarken Intel-Chip mit einer dedizierten GPU der RTX-Klasse kombiniert, sorgt für ziemlich hohe Gehäusetemperaturen - überraschenderweise liegen diese auch deutlich höher als beim älteren P1 Gen 8. Die maximal gemessene Temperatur betrug 51 Grad Celsius oder 124 F.

Glücklicherweise gilt dies nur, wenn das Gerät unseren Stresstest durchläuft. Während des Tests kann das Gerät bis zu 95 W abführen, wobei die CPU 35 W und die GPU 60 W verbraucht.

Max. Last
41.5 °C51 °C38.6 °C
33.2 °C45.4 °C32.1 °C
29.8 °C30.6 °C29.3 °C
Maximal: 51 °C
Durchschnitt: 36.8 °C
36.3 °C43.9 °C37 °C
30.3 °C39.3 °C32.5 °C
28.6 °C30.7 °C29.7 °C
Maximal: 43.9 °C
Durchschnitt: 34.3 °C
Netzteil (max.)  41.6 °C | Raumtemperatur 24.7 °C | Fluke 62 Max+
(±) Die Durchschnittstemperatur auf der Oberseite unter extremer Last ist 36.8 °C. Im Vergleich erhitzte sich der Durchschnitt der Geräteklasse Workstation auf 32 °C.
(-) Die maximale Temperatur auf der Oberseite ist 51 °C. Im Vergleich liegt der Klassendurchschnitt bei 38.3 °C (von 22.2 bis 69.8 °C für die Klasse Workstation).
(±) Auf der Unterseite messen wir eine maximalen Wert von 43.9 °C (im Vergleich zum Durchschnitt von 41.1 °C).
(+) Ohne Last messen wir eine durchschnittliche Temperatur von 27 °C auf der Oberseite. Der Klassendurchschnitt erreicht 32 °C.
(-) 3: The average temperature for the upper side is 38.3 °C / 101 F, compared to the average of 32 °C / 90 F for the class Workstation.
(+) Die Handballen und der Touchpad-Bereich erreichen maximal 32.8 °C und damit die typische Hauttemperatur und fühlen sich daher nicht heiß an.
(-) Die durchschnittliche Handballen-Temperatur anderer getesteter Geräte war 27.8 °C (-5 °C).
Lenovo ThinkPad P1 Gen 9 21UE000MGE
Ultra 7 366H, RTX PRO 2000 Blackwell Generation Laptop
Lenovo ThinkPad P1 Gen 8
Ultra 7 255H, RTX PRO 2000 Blackwell Generation Laptop
HP ZBook X G1i 16
Ultra 7 265H, RTX PRO 2000 Blackwell Generation Laptop
Dell XPS 16 Core Ultra X7 358H
Ultra X7 358H, Arc B390 Panther Lake iGPU
Samsung Galaxy Book6 Ultra
Ultra 7 356H, GeForce RTX 5070 Laptop
Apple MacBook Pro 16 2026 M5 Pro
M5 Pro 18-Core, M5 Pro 20-Core GPU
Hitze
5%
5%
16%
6%
14%
Last oben max * (°C)
51
45
12%
36
29%
40.6
20%
42.7
16%
40.6
20%
Last unten max * (°C)
43.9
33
25%
39.4
10%
39.8
9%
49.1
-12%
42.4
3%
Idle oben max * (°C)
28.3
30.6
-8%
30.4
-7%
23.2
18%
25.4
10%
23.8
16%
Idle unten max * (°C)
28.6
31.6
-10%
31.8
-11%
23.8
17%
25.5
11%
23.6
17%

* ... kleinere Werte sind besser

Lautsprecher

Die Anzahl der Lautsprecher hängt davon ab, welche Variante des ThinkPad P1 Gen 9 man kauft - WWAN-Modelle mit 5G haben vier Lautsprecher, Modelle ohne WWAN wie unseres haben zwei. Die nach unten abstrahlenden Stereo-Lautsprecher liefern dennoch eine ziemlich gute Leistung, da sie recht laut sind und sogar etwas Bass bieten. Sie haben zwar weniger Bass als ein MacBook Pro 16, aber dennoch ist das Musikhören mit dem ThinkPad ein angenehmes Erlebnis.

dB(A) 0102030405060708090Deep BassMiddle BassHigh BassLower RangeMidsHigher MidsLower HighsMid HighsUpper HighsSuper Highs204143.8253534.83133.731.14039.3385035.937.86324.428.88021.528.810017.343.212515.1551601962.420015.971.22501771.931515.676.140015.47550014.174.163013.779.680012.882.9100014.279.5125014.179.116001379.5200011.876.9250011.975.4315012.475.7400012.773.850001375.6630013.577.2800014.972.41000014.274.61250013.972.71600013.568.1SPL25.689.5N0.788.7median 14.1median 75.4Delta1.22.935.436.123.131.930.234.635.13724.137.828.346.621.955.92260.217.465.416.667.818.673.821.373.116.775.814.171.914.27212.873.113.274.112.772.412.174.611.77311.871.712.174.912.175.21270.112.168.812.169.71269.71268.611.768.911.46824.984.70.669.5median 12.1median 71.922.2hearing rangehide median Pink NoiseLenovo ThinkPad P1 Gen 9 21UE000MGEApple MacBook Pro 16 2026 M5 Pro
Frequenzdiagramm (für Vergleiche die Checkboxen oben an-/abwählen)
Lenovo ThinkPad P1 Gen 9 21UE000MGE Audio Analyse

(+) | Die Lautsprecher können relativ laut spielen (89.5 dB)
Bass 100 - 315 Hz
(±) | abgesenkter Bass - 12.3% geringer als der Median
(±) | durchschnittlich lineare Bass-Wiedergabe (12.9% Delta zum Vorgänger)
Mitteltöne 400 - 2000 Hz
(+) | ausgeglichene Mitten, vom Median nur 3.4% abweichend
(+) | lineare Mitten (3.6% Delta zum Vorgänger)
Hochtöne 2 - 16 kHz
(+) | ausgeglichene Hochtöne, vom Median nur 1.1% abweichend
(+) | sehr lineare Hochtöne (3.3% Delta zum Vorgänger)
Gesamt im hörbaren Bereich 100 - 16.000 Hz
(+) | hörbarer Bereich ist sehr linear (9.5% Abstand zum Median
Im Vergleich zu allen Geräten derselben Klasse
» 6% aller getesteten Geräte dieser Klasse waren besser, 1% vergleichbar, 94% schlechter
» Das beste Gerät hat einen Delta-Wert von 7%, durchschnittlich ist 17%, das schlechteste Gerät hat 35%
Im Vergleich zu allen Geräten im Test
» 4% aller getesteten Geräte waren besser, 1% vergleichbar, 95% schlechter
» Das beste Gerät hat einen Delta-Wert von 4%, durchschnittlich ist 23%, das schlechteste Gerät hat 136%

Apple MacBook Pro 16 2026 M5 Pro Audio Analyse

(+) | Die Lautsprecher können relativ laut spielen (84.7 dB)
Bass 100 - 315 Hz
(+) | guter Bass - nur 4.9% Abweichung vom Median
(+) | lineare Bass-Wiedergabe (6% Delta zum Vorgänger)
Mitteltöne 400 - 2000 Hz
(+) | ausgeglichene Mitten, vom Median nur 1% abweichend
(+) | lineare Mitten (2.7% Delta zum Vorgänger)
Hochtöne 2 - 16 kHz
(+) | ausgeglichene Hochtöne, vom Median nur 2.7% abweichend
(+) | sehr lineare Hochtöne (2.9% Delta zum Vorgänger)
Gesamt im hörbaren Bereich 100 - 16.000 Hz
(+) | hörbarer Bereich ist sehr linear (5.2% Abstand zum Median
Im Vergleich zu allen Geräten derselben Klasse
» 1% aller getesteten Geräte dieser Klasse waren besser, 1% vergleichbar, 98% schlechter
» Das beste Gerät hat einen Delta-Wert von 5%, durchschnittlich ist 17%, das schlechteste Gerät hat 45%
Im Vergleich zu allen Geräten im Test
» 0% aller getesteten Geräte waren besser, 0% vergleichbar, 100% schlechter
» Das beste Gerät hat einen Delta-Wert von 4%, durchschnittlich ist 23%, das schlechteste Gerät hat 136%

Stromverbrauch und Akkulaufzeit
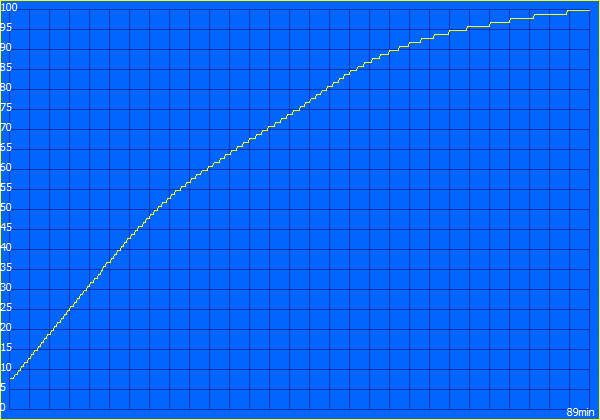
Ladezeit: 89 Minuten

Noch vor nicht allzu langer Zeit boten Workstation-Laptops wie das ThinkPad P1 Gen 9 aufgrund ihres hohen Stromverbrauchs eine miserable Akkulaufzeit. Das ist inzwischen nicht mehr der Fall: Unser Testgerät hielt in unserem standardisierten WLAN-Websurfing-Test (150 cd/m² Bildschirmhelligkeit) über 22 Stunden durch – mehr als doppelt so lange wie der Durchschnitt der Workstation-Kategorie. Intel Panther Lake hat hier eindeutig ganze Arbeit geleistet und bringt eine Effizienz auf Ultrabook-Niveau in den Workstation-Bereich.

Stromverbrauch
Aus / Standbydarklight 0.2 / 0.8 Watt
Idledarkmidlight 2.2 / 7.8 / 8.7 Watt
Last midlight 112.1 / 142.9 Watt
 color bar
Legende: min: dark, med: mid, max: light        Metrahit Energy

Stromverbrauch Cyberpunk / Stresstest

05101520253035404550556065707580859095100105110115120125130135140Tooltip
Lenovo ThinkPad P1 Gen 9 21UE000MGE; 1280x720 Prime95 28.10 and Furmark 1.25: Ø134.1 (126.6-143) Watt
Lenovo ThinkPad P1 Gen 9 21UE000MGE; Idle 150cd/m2: Ø9.36 (4.98-14.8) Watt
Lenovo ThinkPad P1 Gen 9 21UE000MGE; Cyberpunk 2077 FHD ultra no FSR 150cd: Ø121.6 (120-125.4) Watt

Stromverbrauch externer Monitor

05101520253035404550556065707580859095100105110115120125130Tooltip
Lenovo ThinkPad P1 Gen 9 21UE000MGE; Prime95 V2810 Stress (external Monitor): Ø108.7 (100.4-121.8) Watt
Lenovo ThinkPad P1 Gen 9 21UE000MGE; Cinebench R23 Multi (external Monitor): Ø96.3 (90.2-100.2) Watt
Lenovo ThinkPad P1 Gen 9 21UE000MGE; 1280x720 FurMark 1.19 GPU Stress Test (external Monitor): Ø107.4 (102.9-120.3) Watt
Lenovo ThinkPad P1 Gen 9 21UE000MGE; Idle 1min (external Monitor): Ø5.91 (0.00513-13.1) Watt
Lenovo ThinkPad P1 Gen 9 21UE000MGE; Cyberpunk 2077 FHD ultra no FSR (external Monitor): Ø126.5 (124.3-130.4) Watt
Akkulaufzeit
WiFi Websurfing (Edge 154)
22h 38min
Last (volle Helligkeit)
2h 02min
Lenovo ThinkPad P1 Gen 9 21UE000MGE
Ultra 7 366H, RTX PRO 2000 Blackwell Generation Laptop, 90 Wh
Lenovo ThinkPad P1 Gen 8
Ultra 7 255H, RTX PRO 2000 Blackwell Generation Laptop, 90 Wh
HP ZBook X G1i 16
Ultra 7 265H, RTX PRO 2000 Blackwell Generation Laptop, 83 Wh
Dell XPS 16 Core Ultra X7 358H
Ultra X7 358H, Arc B390 Panther Lake iGPU, 70 Wh
Samsung Galaxy Book6 Ultra
Ultra 7 356H, GeForce RTX 5070 Laptop, 80.2 Wh
Apple MacBook Pro 16 2026 M5 Pro
M5 Pro 18-Core, M5 Pro 20-Core GPU, 99.6 Wh
Durchschnitt der Klasse Workstation
 
Akkulaufzeit
-76%
-45%
-54%
-26%
-18%
-42%
WLAN (h)
22.6
5.5
-76%
12.5
-45%
10.3
-54%
16.8
-26%
18.5
-18%
Last (h)
2

Notebookcheck-Bewertung

Lenovo ThinkPad P1 Gen 9 21UE000MGE - 05.11.2026 v8
Benjamin Herzig

Gehäuse
93 / 98 → 95%
Tastatur
97%
Pointing Device
97%
Konnektivität
77 / 80 → 96%
Gewicht
64 / 10-66 → 96%
Akkulaufzeit
91 / 95 → 96%
Display
84%
Leistung Spiele
83%
Leistung Anwendungen
91%
Workstation
91%
Temperatur
89 / 95 → 94%
Lautstärke
81 / 90 → 90%
Audio
87%
Kamera
43 / 75 → 57%
Durchschnitt
84%
91%
Workstation - gewichteter Durchschnitt
Weitere Informationen über unsere Bewertung finden Sie hier.
CO2 Emissions
70.8%
Materials
70%
Packaging
100%
Power Use
81.6%
Repairability
90%
Software Updates
100%
Recycle Logo Total Sustainability Score: 85.4%

Potenzielle Wettbewerber im Vergleich

Bild
Modell / Test
Preis ab
Gewicht
Dicke
Display
1.
90.8%
Lenovo ThinkPad P1 Gen 9 21UE000MGE
Intel Core Ultra 7 366H ⎘
NVIDIA RTX PRO 2000 Blackwell Generation Laptop ⎘
64 GB RAM, 1024 GB SSD
Bestpreis 5154€ notebookstore
2. 5161.81€ Klarsicht IT
3. 5162€ HEINZSOFT5300 Euro
1.9 kg21 mm16.00"
1920x1200
142 PPI
IP LED
2.
91.6%
Lenovo ThinkPad P1 Gen 8
Intel Core Ultra 7 255H ⎘
NVIDIA RTX PRO 2000 Blackwell Generation Laptop ⎘
32 GB RAM, 1024 GB SSD
Listenpreis 2000 USD
Geizhals Suche
1.9 kg20.6 mm16.00"
3200x2000
236 PPI
Tandem OLED
3.
87.4%
HP ZBook X G1i 16
HP ZBook X G1i 16
Intel Core Ultra 7 265H ⎘
NVIDIA RTX PRO 2000 Blackwell Generation Laptop ⎘
64 GB RAM, 2048 GB SSD
Bestpreis 4699€ notebooksbilliger.de
2. 4729€ 1ashop.at
3. 4738.49€ notebooksbilliger.at2700 USD
2.2 kg23 mm16.00"
2560x1600
189 PPI
IPS
4.
87.2%
Dell XPS 16 Core Ultra X7 358H
Intel Core Ultra X7 358H ⎘
Intel Arc B390 12 Xe3 Panther Lake iGPU ⎘
32 GB RAM
Listenpreis 2350 USD
Geizhals Suche
1.7 kg14.62 mm16.00"
3200x2000
236 PPI
OLED
5.
90.7%
Samsung Galaxy Book6 Ultra
Intel Core Ultra 7 356H ⎘
NVIDIA GeForce RTX 5070 Laptop ⎘
32 GB RAM, 1000 GB SSD
Bestpreis 3399€ computeruniverse.net
2. 3399€ computeruniverse.net
3. 3399€ Cyberport Stores Deutschland3599€
1.9 kg15.4 mm16.00"
2880x1800
212 PPI
OLED
6.
92.3%
Apple MacBook Pro 16 2026 M5 Pro
Apple M5 Pro 18-Core ⎘
Apple M5 Pro 20-Core GPU ⎘
64 GB RAM, 4096 GB SSD
Bestpreis 2708.88€ MobPicker
2. 2749€ Centroelektro
3. 2769€ galaxus5298€
2.1 kg16.8 mm16.20"
3456x2234
254 PPI
Mini-LED

Transparenz

Die Auswahl der zu testenden Geräte erfolgt innerhalb der Redaktion. Das vorliegende Testmuster wurde dem Autor vom Hersteller oder einem Shop zu Testzwecken leihweise zur Verfügung gestellt. Eine Einflussnahme des Leihstellers auf den Testbericht gab es nicht, der Hersteller erhielt keine Version des Reviews vor der Veröffentlichung. Es bestand keine Verpflichtung zur Publikation. Als eigenständiges, unabhängiges Unternehmen unterliegt Notebookcheck keiner Diktion von Herstellern, Shops und Verlagen.

So testet Notebookcheck

Pro Jahr werden von Notebookcheck hunderte Laptops und Smartphones unabhängig in von uns standardisierten technischen Verfahren getestet, um eine Vergleichbarkeit aller Testergebnisse zu gewährleisten. Seit rund 20 Jahren entwickeln wir diese Testmethoden kontinuierlich weiter und setzen damit Branchenstandards. In unseren Testlaboren kommt ausschließlich hochwertiges Messequipment in die Hände erfahrener Techniker und Redakteure. Die Tests unterliegen einer mehrstufigen Kontrolle. Unsere komplexe Gesamtbewertung basiert auf hunderten fundierten Messergebnissen und Benchmarks, womit Ihnen Objektivität garantiert ist. Weitere Informationen zu unseren Testmethoden gibt es hier.

Google LogoAls bevorzugte Quelle auf Google hinzufügen
Mail Logo
> Notebook Test, Laptop Test und News > Tests > Notebook Testberichte > Workstation Laptops haben eine schlechte Akkulaufzeit? Von wegen! Lenovo ThinkPad P1 Gen 9 Test
Autor: Benjamin Herzig,  6.11.2026 (Update:  5.11.2026)