Kaby Lake (Core i7-7500U) im Test: Skylake auf Steroiden
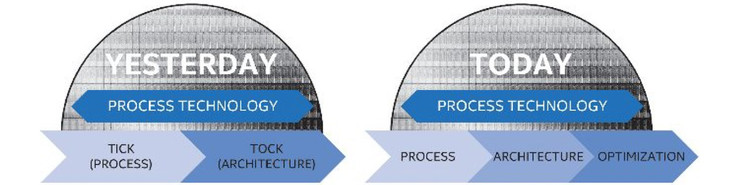
Seit der letzten P4-Generation folgt Intels CPU-Entwicklung dem sogenannten Tick-Tock-Modell, bei dem sich die Einführung feinerer Fertigungsprozesse (Tick) und neuer Mikroarchitekturen (Tock) im Jahresrhythmus abwechseln. Über viele Jahre ging dieses Konzept hervorragend auf – mit oftmals kleinen, aber stetigen Performance- und Effizienzsteigerungen konnte der CPU-Riese die Konkurrenz zunehmend distanzieren.
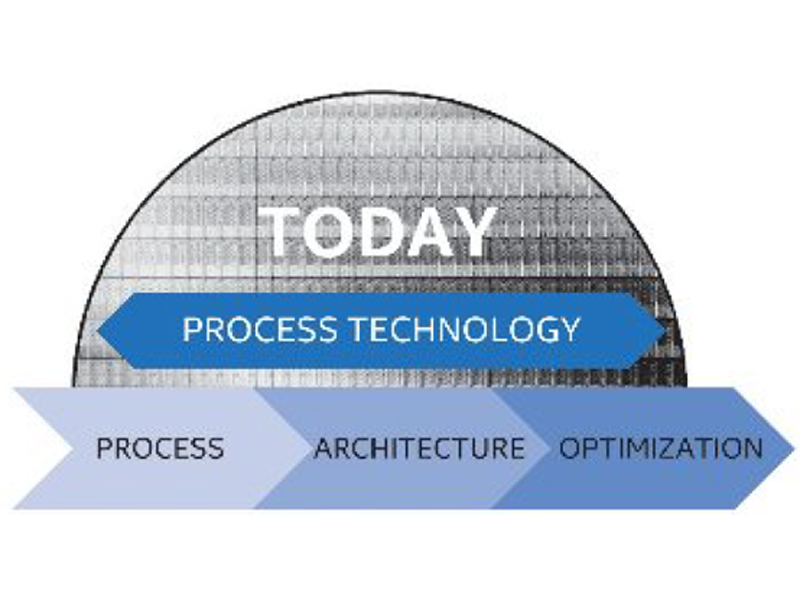
Infolge der immer weiter steigenden Komplexität und Kosten einer neuen Fertigung muss Intel nun jedoch umplanen: Statt zwei werfen künftig jeweils drei CPU-Designs den gleichen Prozess nutzen – aus Tick-Tock wird "Process -> Architecture -> Optimization". Übertragen auf die aktuelle 14-Nanometer-Generation entsprechen Broadwell und Skylake den ersten beiden Schritten, die nun vorgestellte Kaby-Lake-Plattform bildet den krönenden Abschluss der Serie.
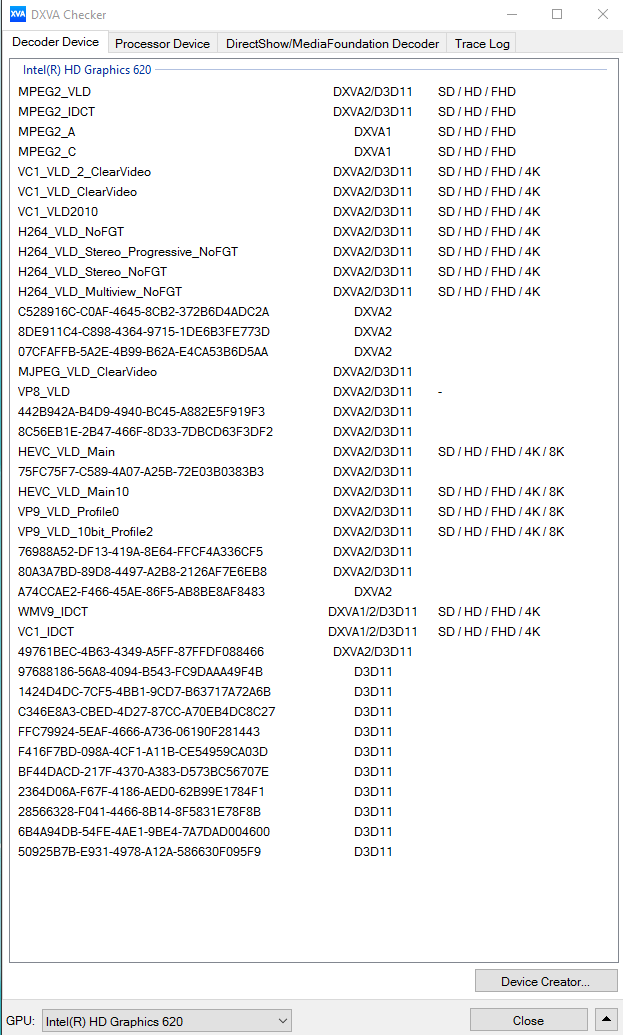
Doch was hat Kaby Lake nun Neues zu bieten? Erstmals seit langem bleibt das CPU- und GPU-Design praktisch unangetastet, Steigerungen der Pro-MHz-Leistung sind deshalb nicht zu erwarten. Dennoch verspricht der Hersteller spürbar mehr Performance, die allerdings einzig aus höheren Taktraten respektive einer besseren Turbo-Boost-Ausnutzung bei gleichbleibender Leistungsaufnahme resultiert. Grundlegend überarbeitet wurde lediglich die Videoeinheit, die nun auch den VP9- und HEVC-Main10-Codec mit 10 Bit Farbtiefe unterstützt und nochmals effizienter als bislang agieren soll. Zudem ist erstmals HDMI 2.0 mit HDCP-2.2-Support mit an Bord, allerdings erst in einer neuen Chip-Revision ab Jahresende. Die ersten Chargen bleiben dagegen auf HDCP 1.4 beschränkt und können somit beispielsweise Netflix nicht in 4K ausgeben.
Modellübersicht
Auch wenn hinter den Kulissen bereits erste Details zu kommenden Quad-Core-Ablegern die Runde machen, stellt Intel am heutigen Tag zunächst nur 6 ULV-Modelle der U- (15 Watt) und Y-Serie (4,5 Watt) vor. Neu: Nur der Core m3-7Y30 gibt sich auch offiziell als Core "m" zu erkennen, die beiden schnelleren Modelle 7Y54 sowie 7Y75 ordnet der Hersteller in die i5- respektive i7-Serie ein – aus Verbrauchersicht eine nicht unbedingt begrüßenswerte Entscheidung, hat die TDP-Klasse doch einen erheblichen Einfluss auf die Leistungsfähigkeit des Prozessors. Unter Umständen kann dadurch ein Core i3 mit 15 Watt TDP auch einmal schneller als ein Core i7 mit 4,5 Watt TDP rechnen.
| Modell | Kerne/Threads | Basistakt | Turbo 1C/2C | Grafikeinheit | TDP |
|---|---|---|---|---|---|
| Kaby Lake | |||||
| i7-7500U | 2/4 | 2,7 GHz | 3,5/3,5 GHz | HD Graphics 620 (300 - 1.050 MHz) | 15 Watt |
| i5-7200U | 2/4 | 2,5 GHz | 3,1/3,1(?) GHz | HD Graphics 620 (300 - 1.000 MHz) | 15 Watt |
| i3-7100U | 2/4 | 2,4 GHz | – | HD Graphics 620 (300 - 1.000 MHz) | 15 Watt |
| i7-7Y75 | 2/4 | 1,3 GHz | 3,6/? GHz | HD Graphics 615 (300 - 1.050 MHz) | 4,5 Watt |
| i5-7Y54 | 2/4 | 1,2 GHz | 3,2/? GHz | HD Graphics 615 (300 - 950 MHz) | 4,5 Watt |
| m3-7Y30 | 2/4 | 1,0 GHz | 2,6/? GHz | HD Graphics 615 (300 - 900 MHz) | 4,5 Watt |
| Skylake | |||||
| i7-6500U | 2/4 | 2,5 GHz | 3,1/3,0 GHz | HD Graphics 520 (300 - 1.050 MHz) | 15 Watt |
| i5-6200U | 2/4 | 2,3 GHz | 2,8/2,7 GHz | HD Graphics 520 (300 - 1.000 MHz) | 15 Watt |
| i3-6100U | 2/4 | 2,3 GHz | – | HD Graphics 520 (300 - 1.000 MHz) | 15 Watt |
| m7-6Y75 | 2/4 | 1,2 GHz | 3,1/2,9 GHz | HD Graphics 515 (300 - 1.000 MHz) | 4,5 Watt |
| m5-6Y54 | 2/4 | 1,1 GHz | 2,7/2,4 GHz | HD Graphics 515 (300 - 900 MHz) | 4,5 Watt |
| m3-6Y30 | 2/4 | 0,9 GHz | 2,2/2,0 GHz | HD Graphics 515 (300 - 850 MHz) | 4,5 Watt |
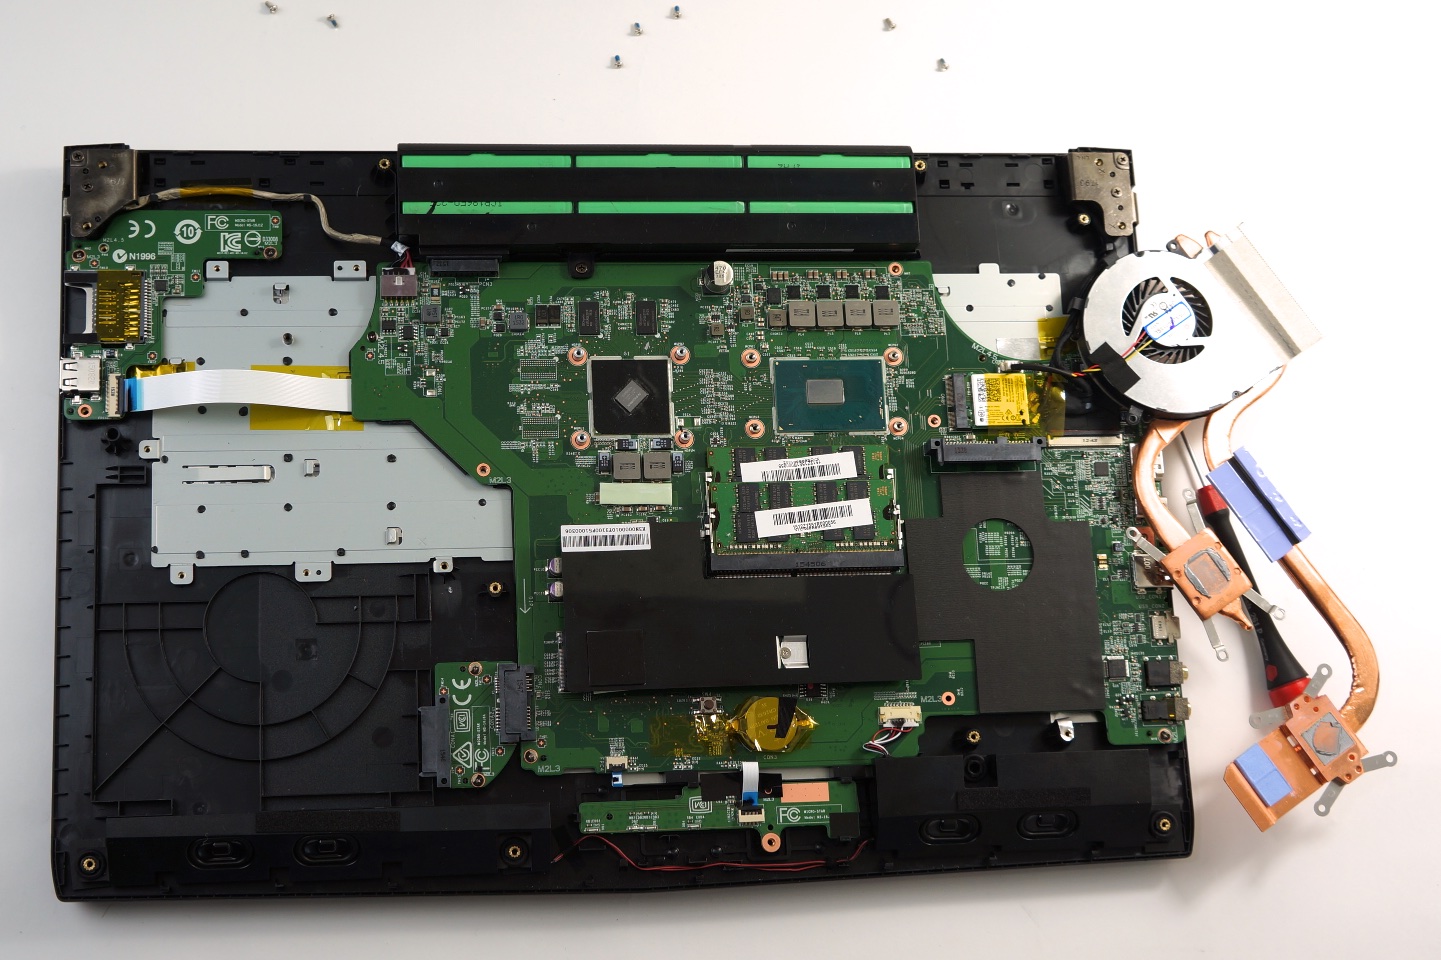
Das Testgerät
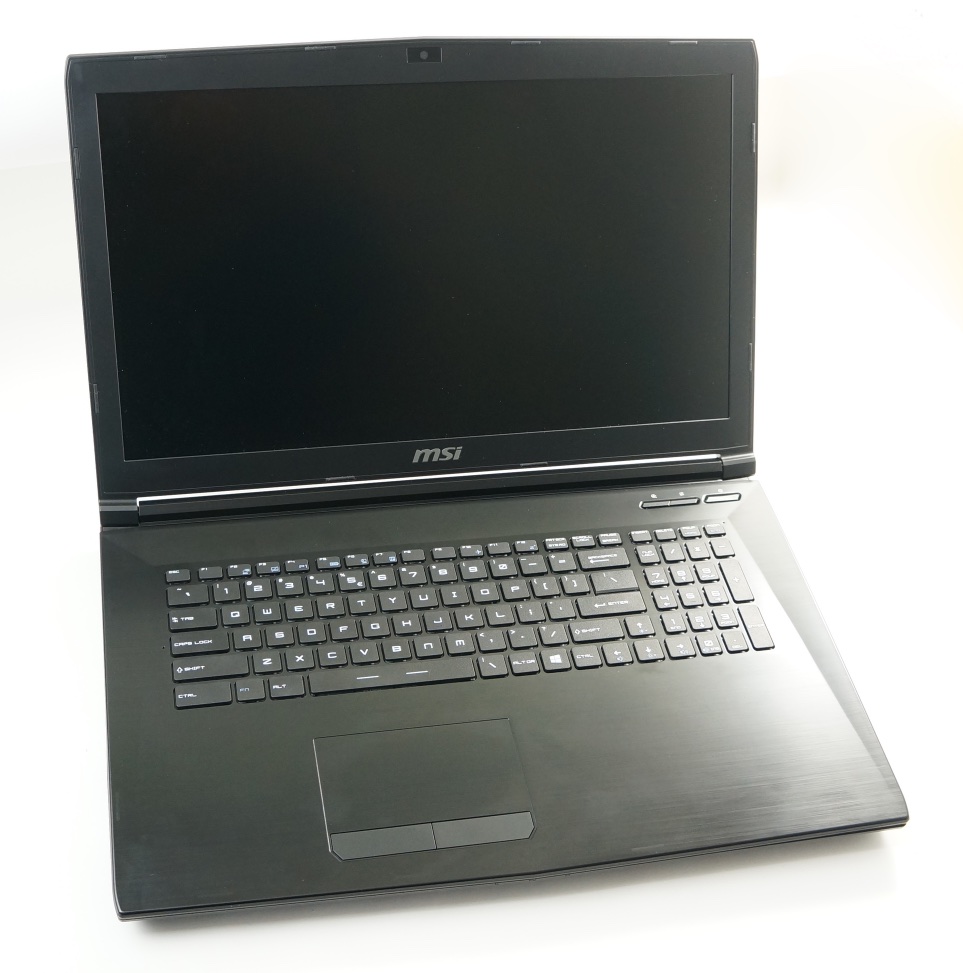
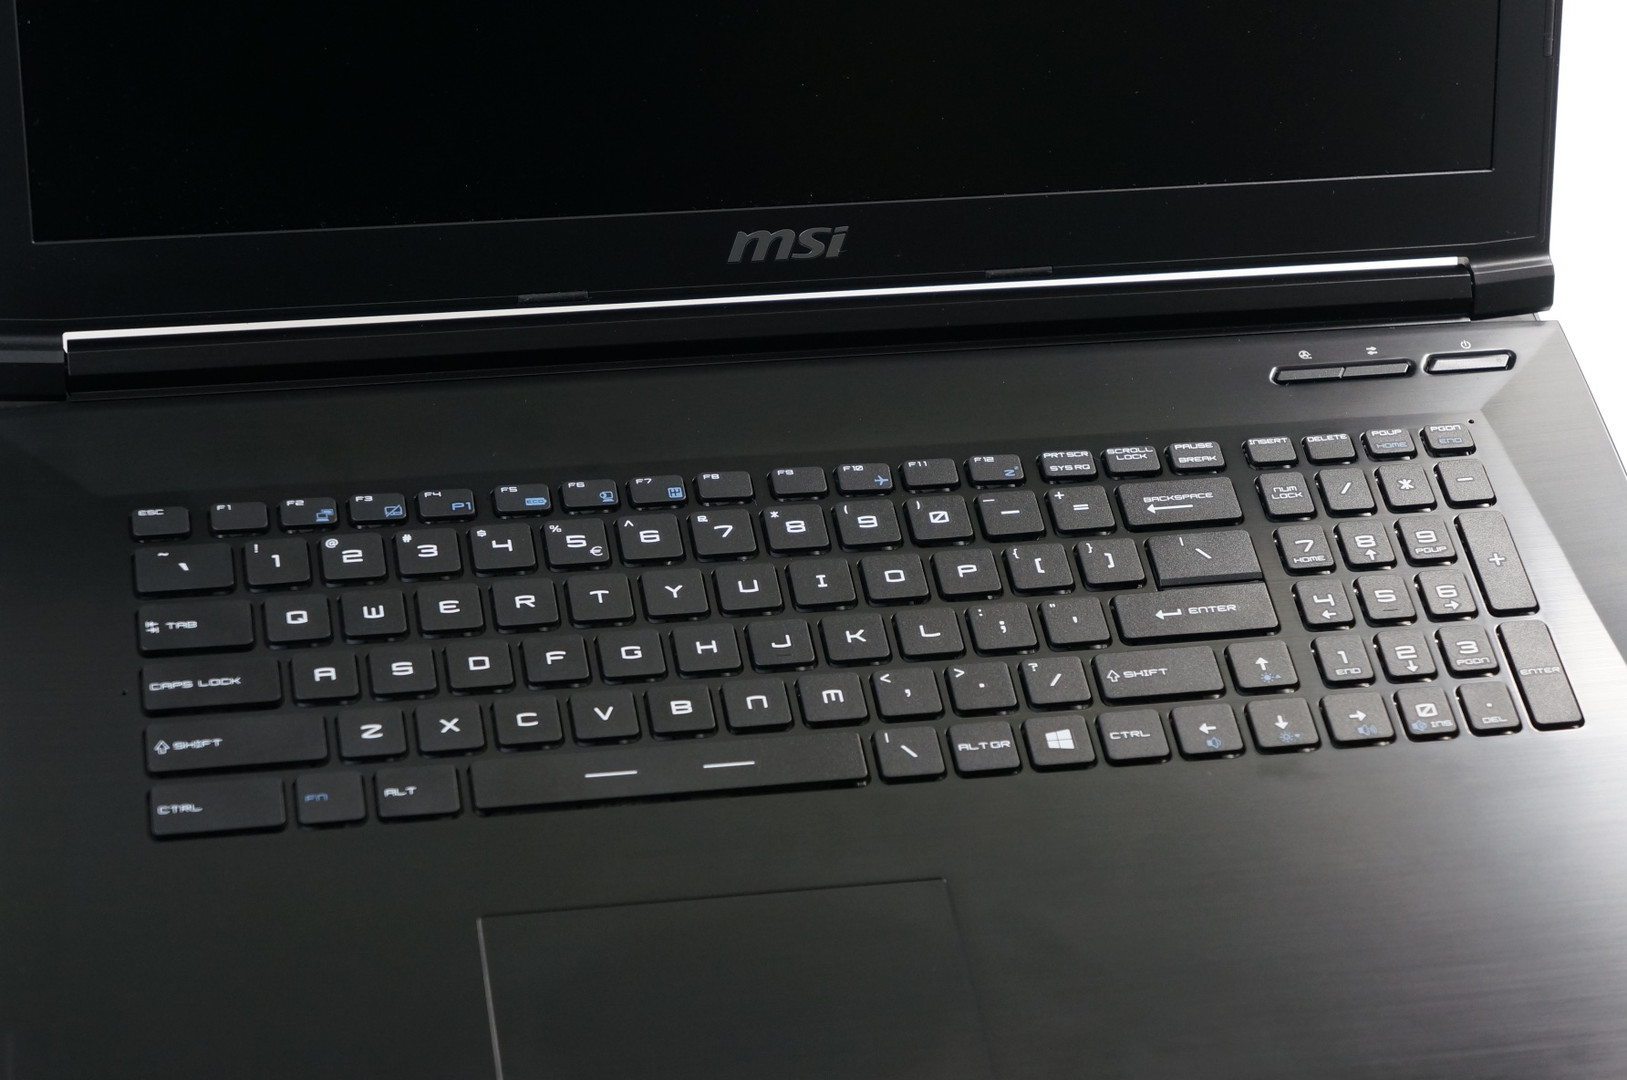
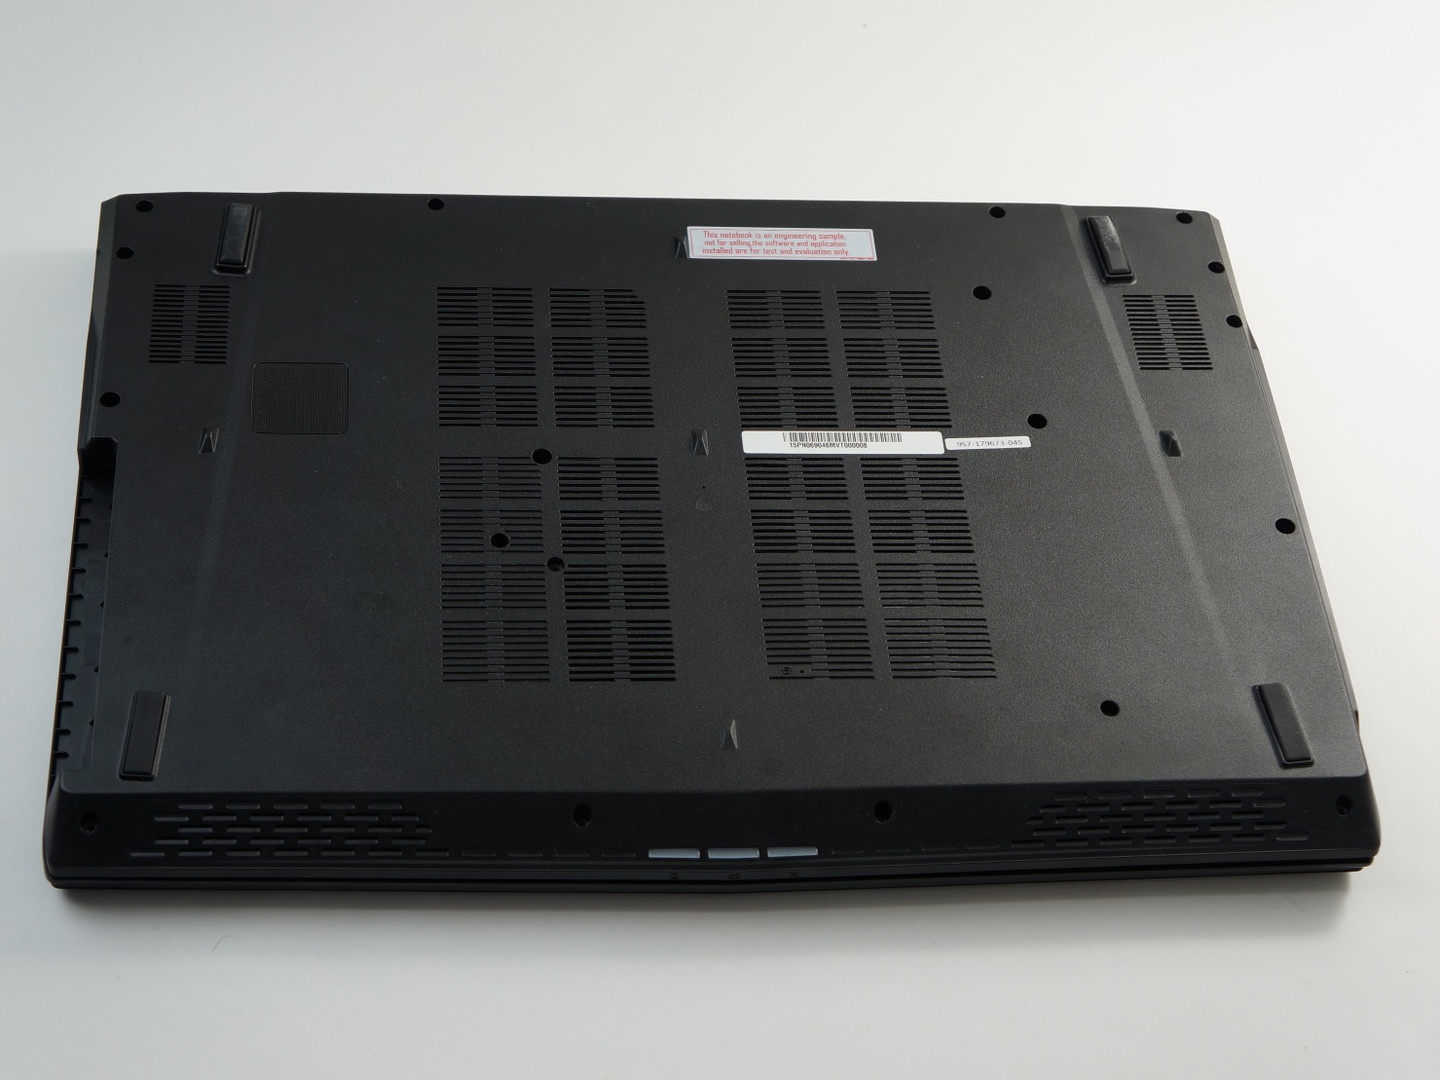
Unser herzlicher Dank für die Bereitstellung des Testgerätes geht an MSI, von denen uns das neue CX72-7QL zugesendet wurde. Der wuchtige 17-Zoll-Bolide stellt eine leicht abgespeckte Variante des bekannten GE72 dar und ist uns bereits aus dem Test der Nvidia GeForce 940MX bekannt. Die nachfolgenden Gehäusefotos wurden diesem Artikel entnommen. Die genaue Ausstattung des Notebooks umfasst unter anderem folgende Komponenten:
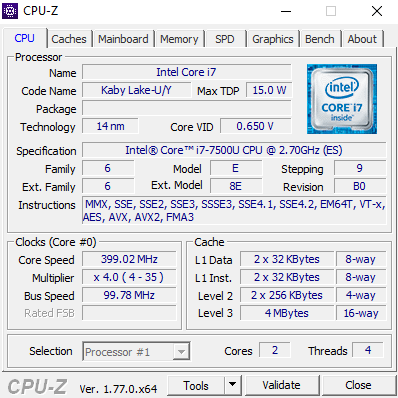
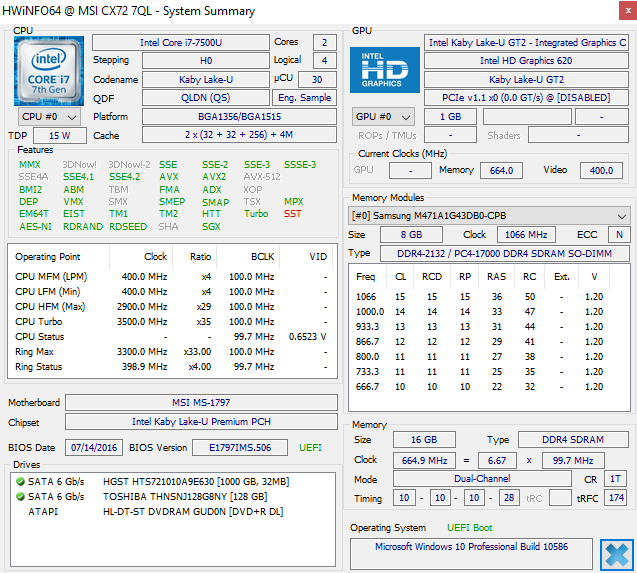
- Intel Core i7-7500U (Kaby Lake)
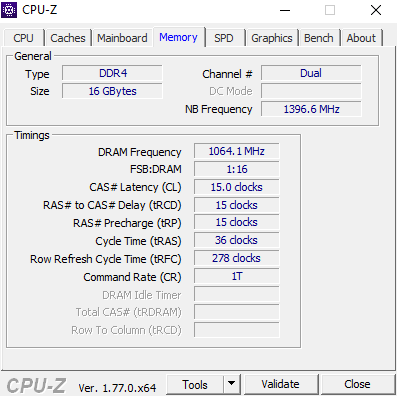
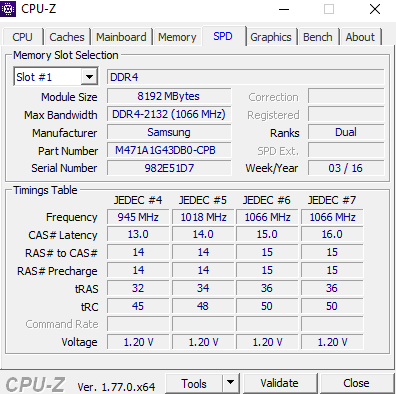
- 2x 8 GB DDR4-2133
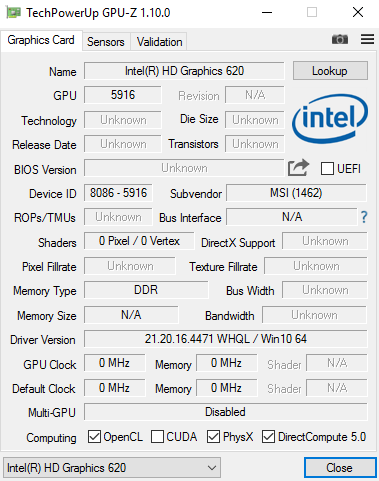
- HD Graphics 620 + GeForce 940MX (deaktiviert), Treiber 21.20.1.4471
- 128-GB-SSD (Toshiba HG6z M.2) + 1-TB-HDD (HGST Travelstar 7K1000)
- 17,3-Zoll-Full-HD-Display (1.920 x 1.080 Pixel), TN-Panel, matt
- Windows 10 Pro 64 Bit
Benchmarks
CPU-Performance
Im Vergleich mit dem direkten Vorgängermodell, dem Core i7-6500U (2,5 GHz Basis, 3,1 GHz für einen Kern, 3,0 GHz für zwei Kerne), sind die Taktraten des Core i7-7500U (2,7 GHz Basis, 3,5 GHz für einen Kern, 3,5 GHz für zwei Kerne) um etwa 10 bis 15 Prozent gestiegen und liegen damit sogar über dem Skylake-Topmodell Core i7-6600U (2,6 GHz Basis, 3,4 GHz für einen Kern, 3,2 GHz für zwei Kerne).
Wie immer sind die maximalen Taktraten jedoch nur eine Seite der Medaille – nur wenn die TDP nicht überschritten wird, kann der Prozessor die spezifizierten Höchstwerte auch dauerhaft halten. Im Falle des Core i7-7500U gilt dies nur für Single-Threading, wo stets die vollen 3,5 GHz anliegen. Bei Multi-Threading fallen die Frequenzen dagegen von zunächst 3,5 Ghz nach etwa 30 Sekunden auf 3,2 - 3,3 GHz ab. Summa summarum ergibt sich in beiden Fällen ein Vorsprung von respektablen 15 Prozent auf den i7-6500U. Selbst ein Core i7-6600U mit TDP-Anhebung auf 25 Watt (ThinkPad T460s) kann da nicht mithalten.
Update vom 12.09.16: Auch der kleinere Core i5-7200U (2,5 GHz Basistakt, 3,1 GHz Turbo für einen und beide Kerne) hinterlässt in unseren Benchmarks einen ausgezeichneten Eindruck. Die Performance liegt konstant knapp oberhalb des ehemaligen High-End-Modells Core i7-6500U und nur knapp hinter dem i7-6600U. Der maximale Turbo-Boost wird in sämtlichen Einzel- und Mehrkerntests stabil gehalten.
Bei unserem Testsample des i5-7200U scheint es sich um ein qualitativ eher schlechtes Exemplar zu handeln, da der Chip bereits bei 3,1 GHz im Cinebench R15 Multi rund 16 Watt aufnimmt. Eigentlich müsste die CPU deshalb ihre Frequenz um etwa 100 MHz drosseln, was jedoch nicht geschieht, da Acer beim getesteten Aspire E15 E5-575G-549D (Testbericht folgt) ebenfalls die TDP auf 25 Watt angehoben hat. Ohne diese Maßnahme würde die Performance vermutlich rund 2 bis 3 Prozent schlechter ausfallen.
| WinRAR - Result | |
| Intel Core i7-6700HQ | |
| Intel Core i7-7500U | |
| Intel Core i5-6300HQ | |
| Intel Core i7-6600U | |
| Intel Core i5-7200U | |
| Intel Core i7-6500U | |
| Intel Core i5-6200U | |
| Super Pi Mod 1.5 XS 32M - 32M | |
| Intel Core i5-6300U | |
| Intel Core i7-6500U | |
| Intel Core i5-7200U | |
| Intel Core i5-6300HQ | |
| Intel Core i7-6700HQ | |
| Intel Core i7-6600U | |
| Intel Core i7-7500U | |
| 3DMark 06 - CPU - CPU Score | |
| Intel Core i7-6700HQ | |
| Intel Core i5-6300HQ | |
| Intel Core i7-7500U | |
| Intel Core i7-6600U | |
| Intel Core i7-6500U | |
| Intel Core i5-7200U | |
| Intel Core i5-6300U | |
| Intel Core i5-6200U | |
| Geekbench 3 | |
| 32 Bit Single-Core Score | |
| Intel Core i7-7500U | |
| Intel Core i7-6600U | |
| Intel Core i5-6300HQ | |
| Intel Core i7-6700HQ | |
| Intel Core i5-7200U | |
| Intel Core i7-6500U | |
| 32 Bit Multi-Core Score | |
| Intel Core i7-6700HQ | |
| Intel Core i5-6300HQ | |
| Intel Core i7-7500U | |
| Intel Core i7-6600U | |
| Intel Core i5-7200U | |
| Intel Core i7-6500U | |
| Mozilla Kraken 1.1 - Total | |
| Intel Core i5-6200U | |
| Intel Core i5-7200U | |
| Intel Core i5-6300HQ | |
| Intel Core i7-6500U | |
| Intel Core i7-6600U | |
| Intel Core i7-6700HQ | |
| Intel Core i7-7500U | |
| Octane V2 - Total Score | |
| Intel Core i7-6700HQ | |
| Intel Core i7-7500U | |
| Intel Core i7-6600U | |
| Intel Core i5-7200U | |
| Intel Core i5-6300HQ | |
| Intel Core i7-6500U | |
| Intel Core i5-6200U | |
* ... kleinere Werte sind besser
Performance-Beständigkeit bei andauernder CPU-Last
Blicken wir noch einmal etwas genauer auf das Turbo-Boost-Verhalten sowie die zugehörige Leistungsaufnahme im Vergleich mit der Skylake-Generation. Obwohl die Single-Thread-Frequenz gegenüber dem Core i7-6600U um knapp 3 Prozent gestiegen ist, begnügt sich der Kaby-Lake-Chip mit fast 20 Prozent weniger Leistungsaufnahme (CPU Package Power).
Ähnliche Effizienzsteigerungen zwischen 15 und 25 Prozent zeigen sich in unseren Multi-Thread-Benchmarks wie dem entsprechenden Test des Cinebench R15. Zwar kann der Core i7-7500U bei 15 Watt TDP wie bereits erwähnt nicht durchgängig seinen Maximaltakt halten; mit 3,2 bis 3,3 GHz taktet die CPU aber dennoch merklich höher als ein vergleichbares Skylake-Modell, welches bereits bei rund 2,8 GHz die 15-Watt-Schallmauer durchbrechen würde. Der hier gegenübergestellte Core i7-6600U aus dem ThinkPad T460s erreicht lediglich dank des angehobenen TDP-Limits ebenfalls stabile 3,2 GHz, nimmt dabei aber deutlich mehr Leistung auf.
| Start | nach 30 Sekunden | nach 5 Minuten | |
|---|---|---|---|
Core i7-7500U |
|||
Cinebench R15 (Single) |
3,5 GHz (9,5 Watt) | 3,5 GHz (9,5 Watt) | 3,5 GHz (9,5 Watt) |
Cinebench R15 (Multi) |
3,5 GHz (18,2 Watt) | 3,2 - 3,3 GHz (14,9 Watt) | 3,2 - 3,3 GHz (14,9 Watt) |
Prime95 |
3,5 GHz (20,6 Watt) | 3,0 - 3,1 GHz (14,9 Watt) | 3,0 - 3,1 GHz (14,9 Watt) |
Core i7-6600U (25 Watt) |
|||
Cinebench R15 (Single) |
3,4 GHz (11,8 Watt) | 3,4 GHz (11,8 Watt) | 3,4 GHz (11,8 Watt) |
Cinebench R15 (Multi) |
3,2 GHz (19,3 Watt) | 3,2 GHz (19,3 Watt) | 3,2 GHz (19,3 Watt) |
Prime95 |
3,2 GHz (21,7 Watt) | 3,2 GHz (21,7 Watt) | 3,2 GHz (21,7 Watt) |
GPU-Performance
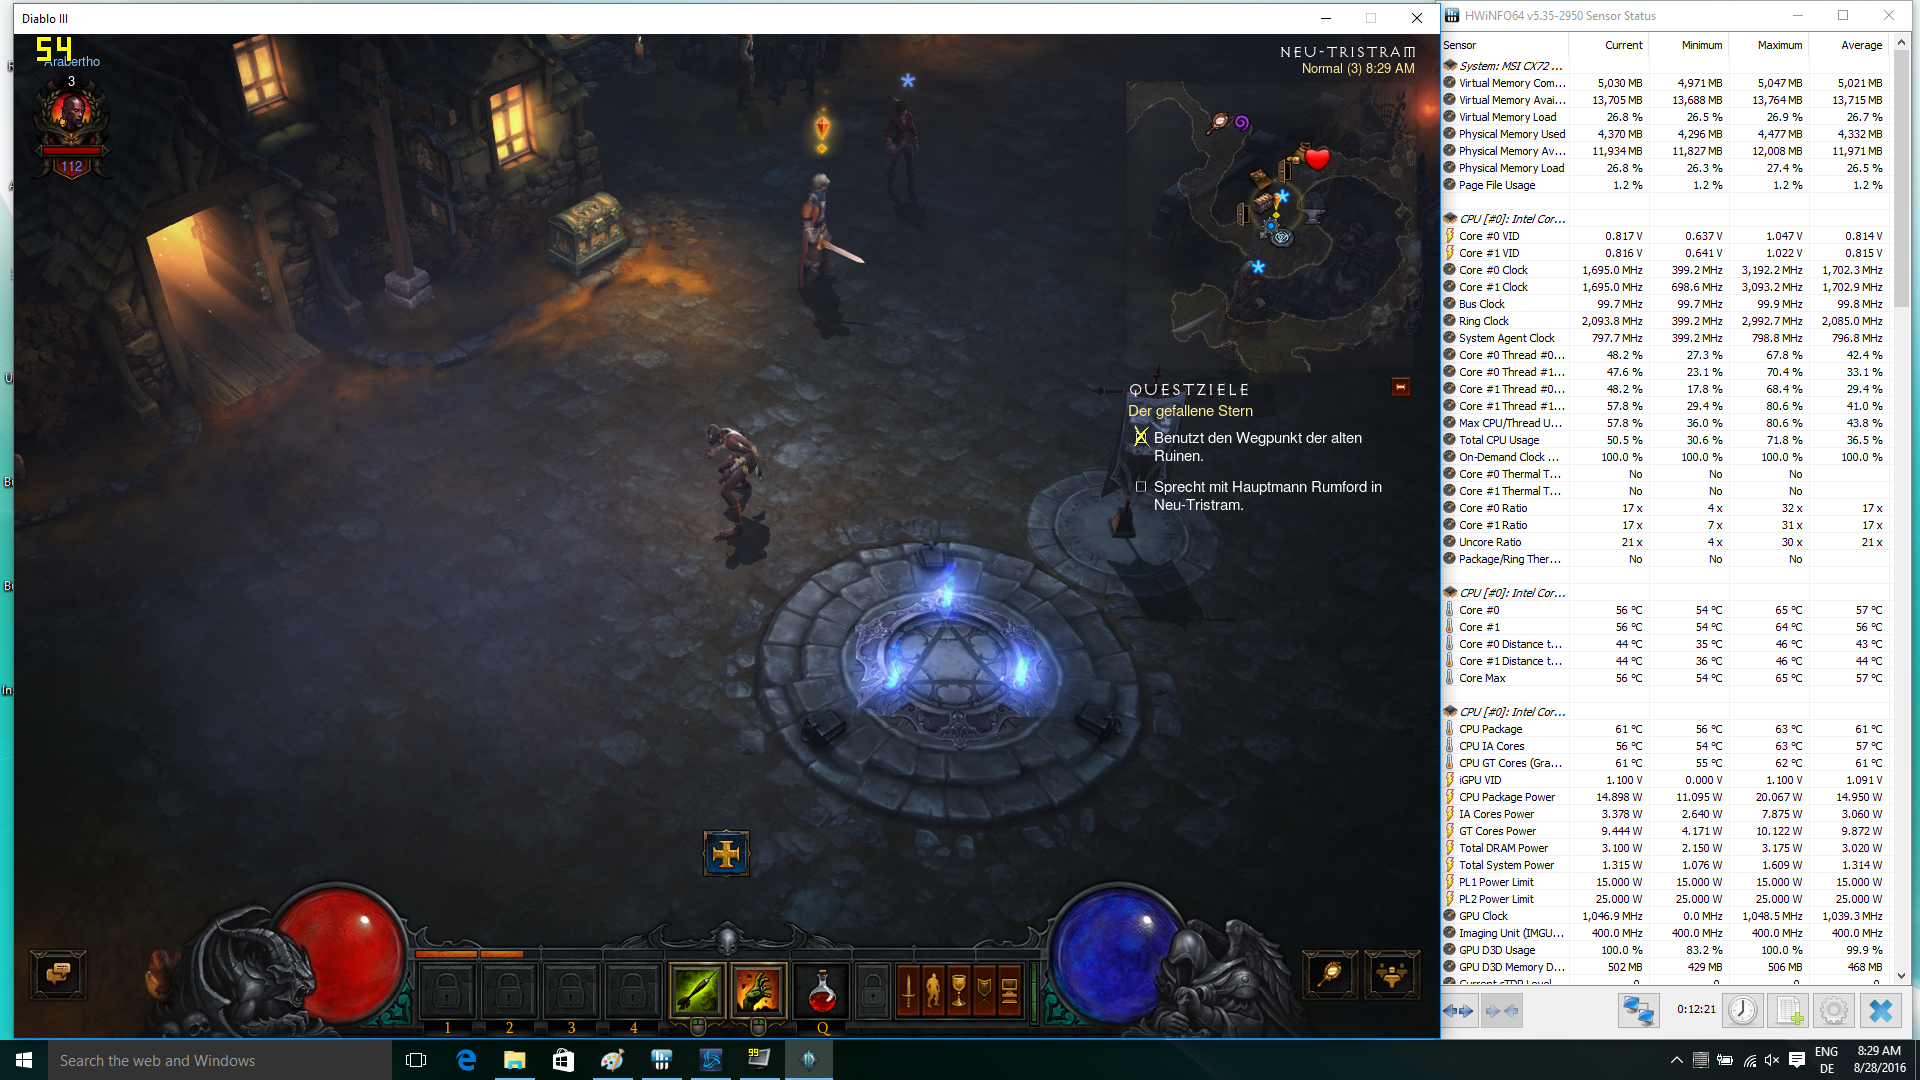
Mit 16 GB schnellem DDR4-2133-Speicher im Dual-Channel-Betrieb bringt das MSI CX72-7QL die besten Voraussetzungen dafür mit, das Performance-Potential der HD Graphics 620 bestmöglich auszureizen. Obwohl der HD-Graphics-520-Nachfolger auch weiterhin nur über 24 Ausführungseinheiten (EUs) verfügt und der Taktspielraum stagniert (i7-6500U/i7-7500U: max. 1.050 MHz), konnte Intel die Performance merklich steigern: Im Schnitt steigt die Spiele-Performance um gut 20 bis 30 Prozent und legt damit sogar etwas mehr zu, als die synthetischen 3DMark-Benches zunächst erwarten ließen. Einen Grund für die vergleichsweise guten Ergebnisse stellt abermals die hervorragende Turbo-Boost-Nutzung dar: Je nach Spiel vermeldet die GPU Kerntaktraten zwischen 1.000 und 1.050 MHz.
Insgesamt sehen wir die HD Graphics 620 etwa auf dem Niveau einer dedizierten Nvidia GeForce 920M oder AMD Radeon R7 M440. Kommende Kaby-Lake-Ableger mit stärkerer Iris-Graphics-GPU (GT3e-Ausbau, 48 EUs, eDRAM) dürften sogar die GeForce 940M(X) übertrumpfen.
| Sims 4 | |
| 1024x768 Low Preset | |
| HD Graphics 620 (i7-7500U; Dual-Channel) | |
| HD Graphics 520 (i7-6600U; Dual-Channel) | |
| HD Graphics 520 (i5-6200U; Dual-Channel) | |
| HD Graphics 520 (i5-6200U; Single-Channel) | |
| 1366x768 Medium Preset | |
| HD Graphics 620 (i7-7500U; Dual-Channel) | |
| HD Graphics 520 (i5-6200U; Dual-Channel) | |
| HD Graphics 520 (i7-6600U; Dual-Channel) | |
| HD Graphics 520 (i5-6200U; Single-Channel) | |
| 1920x1080 High Preset | |
| HD Graphics 620 (i7-7500U; Dual-Channel) | |
| HD Graphics 520 (i5-6200U; Dual-Channel) | |
| HD Graphics 520 (i7-6600U; Dual-Channel) | |
| HD Graphics 520 (i5-6200U; Single-Channel) | |
| Diablo III | |
| 1024x768 Low / off | |
| HD Graphics 620 (i7-7500U; Dual-Channel) | |
| HD Graphics 520 (i5-6200U; Dual-Channel) | |
| HD Graphics 520 (i5-6200U; Single-Channel) | |
| 1366x768 Medium / low | |
| HD Graphics 620 (i7-7500U; Dual-Channel) | |
| HD Graphics 520 (i5-6200U; Dual-Channel) | |
| HD Graphics 520 (i5-6200U; Single-Channel) | |
| 1366x768 High AA:on | |
| HD Graphics 620 (i7-7500U; Dual-Channel) | |
| HD Graphics 520 (i5-6200U; Dual-Channel) | |
| HD Graphics 520 (i5-6200U; Single-Channel) | |
| Dirt Rally | |
| 1024x768 Ultra Low Preset | |
| Iris Graphics 540 (i5-6260U; Dual-Channel) | |
| HD Graphics 620 (i7-7500U; Dual-Channel) | |
| Iris Graphics 540 (i7-6560U; Dual-Channel) | |
| HD Graphics 520 (i5-6200U; Dual-Channel) | |
| HD Graphics 520 (i5-6200U; Single-Channel) | |
| 1366x768 Medium Preset | |
| Iris Graphics 540 (i5-6260U; Dual-Channel) | |
| HD Graphics 620 (i7-7500U; Dual-Channel) | |
| Iris Graphics 540 (i7-6560U; Dual-Channel) | |
| HD Graphics 520 (i5-6200U; Dual-Channel) | |
| HD Graphics 520 (i5-6200U; Single-Channel) | |
| 1920x1080 High Preset | |
| Iris Graphics 540 (i5-6260U; Dual-Channel) | |
| HD Graphics 620 (i7-7500U; Dual-Channel) | |
| Iris Graphics 540 (i7-6560U; Dual-Channel) | |
| HD Graphics 520 (i5-6200U; Single-Channel) | |
| HD Graphics 520 (i5-6200U; Dual-Channel) | |
| The Witcher 3 | |
| 1024x768 Low Graphics & Postprocessing | |
| Iris Graphics 540 (i5-6260U; Dual-Channel) | |
| Iris Graphics 540 (i7-6560U; Dual-Channel) | |
| HD Graphics 620 (i7-7500U; Dual-Channel) | |
| HD Graphics 520 (i5-6200U; Dual-Channel) | |
| 1366x768 Medium Graphics & Postprocessing | |
| Iris Graphics 540 (i5-6260U; Dual-Channel) | |
| Iris Graphics 540 (i7-6560U; Dual-Channel) | |
| HD Graphics 620 (i7-7500U; Dual-Channel) | |
| HD Graphics 520 (i5-6200U; Dual-Channel) | |
| 1920x1080 High Graphics & Postprocessing (Nvidia HairWorks Off) | |
| Iris Graphics 540 (i7-6560U; Dual-Channel) | |
| World of Warships | |
| 1366x768 Low Preset AF:Trilinear | |
| Iris Graphics 540 (i5-6260U; Dual-Channel) | |
| HD Graphics 620 (i7-7500U; Dual-Channel) | |
| HD Graphics 520 (i5-6200U; Dual-Channel) | |
| HD Graphics 520 (i5-6200U; Single-Channel) | |
| 1366x768 Medium Preset AF:Trilinear | |
| Iris Graphics 540 (i5-6260U; Dual-Channel) | |
| HD Graphics 620 (i7-7500U; Dual-Channel) | |
| HD Graphics 520 (i5-6200U; Dual-Channel) | |
| HD Graphics 520 (i5-6200U; Single-Channel) | |
| 1920x1080 High Preset AF:8x | |
| Iris Graphics 540 (i5-6260U; Dual-Channel) | |
| HD Graphics 620 (i7-7500U; Dual-Channel) | |
| HD Graphics 520 (i5-6200U; Dual-Channel) | |
| HD Graphics 520 (i5-6200U; Single-Channel) | |
| Star Wars Battlefront | |
| 1024x768 Low Preset | |
| HD Graphics 620 (i7-7500U; Dual-Channel) | |
| Iris Graphics 540 (i7-6560U; Dual-Channel) | |
| HD Graphics 520 (i7-6600U; Single-Channel) | |
| 1366x768 Medium Preset AA:FX | |
| Iris Graphics 540 (i7-6560U; Dual-Channel) | |
| HD Graphics 620 (i7-7500U; Dual-Channel) | |
| HD Graphics 520 (i7-6600U; Single-Channel) | |
| 1920x1080 High Preset AA:FX | |
| HD Graphics 620 (i7-7500U; Dual-Channel) | |
| Iris Graphics 540 (i7-6560U; Dual-Channel) | |
| Just Cause 3 | |
| 1024x768 Low / Off AF:2x | |
| Iris Graphics 540 (i5-6260U; Dual-Channel) | |
| HD Graphics 620 (i7-7500U; Dual-Channel) | |
| HD Graphics 520 (i7-6500U; Dual-Channel) | |
| 1366x768 Medium / Off AF:4x | |
| Iris Graphics 540 (i5-6260U; Dual-Channel) | |
| HD Graphics 620 (i7-7500U; Dual-Channel) | |
| HD Graphics 520 (i7-6500U; Dual-Channel) | |
| 1920x1080 High / On AA:FX AF:8x | |
| Iris Graphics 540 (i5-6260U; Dual-Channel) | |
| HD Graphics 620 (i7-7500U; Dual-Channel) | |
| HD Graphics 520 (i7-6500U; Dual-Channel) | |
| min. | mittel | hoch | max. | |
|---|---|---|---|---|
| Diablo III (2012) | 105.9 | 72.2 | 64.1 | 37.8 |
| Counter-Strike: GO (2012) | 166.3 | 112.8 | 70.5 | 42.7 |
| Crysis 3 (2013) | 38.2 | 23.1 | 14.7 | 5.4 |
| BioShock Infinite (2013) | 67.8 | 36.6 | 30.9 | 9.5 |
| Metro: Last Light (2013) | 35.2 | 28.6 | 17.5 | 8.2 |
| Battlefield 4 (2013) | 53.3 | 36.1 | 24.3 | 7.9 |
| Sims 4 (2014) | 186.8 | 63 | 29.5 | 21.8 |
| Dirt Rally (2015) | 139.9 | 35.5 | 15.5 | 12.5 |
| The Witcher 3 (2015) | 15.8 | 10.5 | ||
| World of Warships (2015) | 81.3 | 54.6 | 26 | 19.1 |
| FIFA 16 (2015) | 78.4 | 50.9 | 29.3 | |
| Star Wars Battlefront (2015) | 40.3 | 22.7 | 10.2 | |
| Assassin's Creed Syndicate (2015) | 5.4 | |||
| Rainbow Six Siege (2015) | 41.9 | 25.8 | 14.3 | 11.5 |
| Just Cause 3 (2015) | 29 | 22.2 | 10.8 | |
| Rise of the Tomb Raider (2016) | 18.9 | 12.1 | 6.6 | |
| XCOM 2 (2016) | 19.8 | 7.6 | 5.2 | |
| Far Cry Primal (2016) | 20 | 10 | 8 | |
| Hitman 2016 (2016) | 14.5 | 19.7 | 11.7 | |
| Overwatch (2016) | 55.9 | 40.2 | 17.8 | |
| Mirror's Edge Catalyst (2016) | 28.8 | 17 | 7.1 |
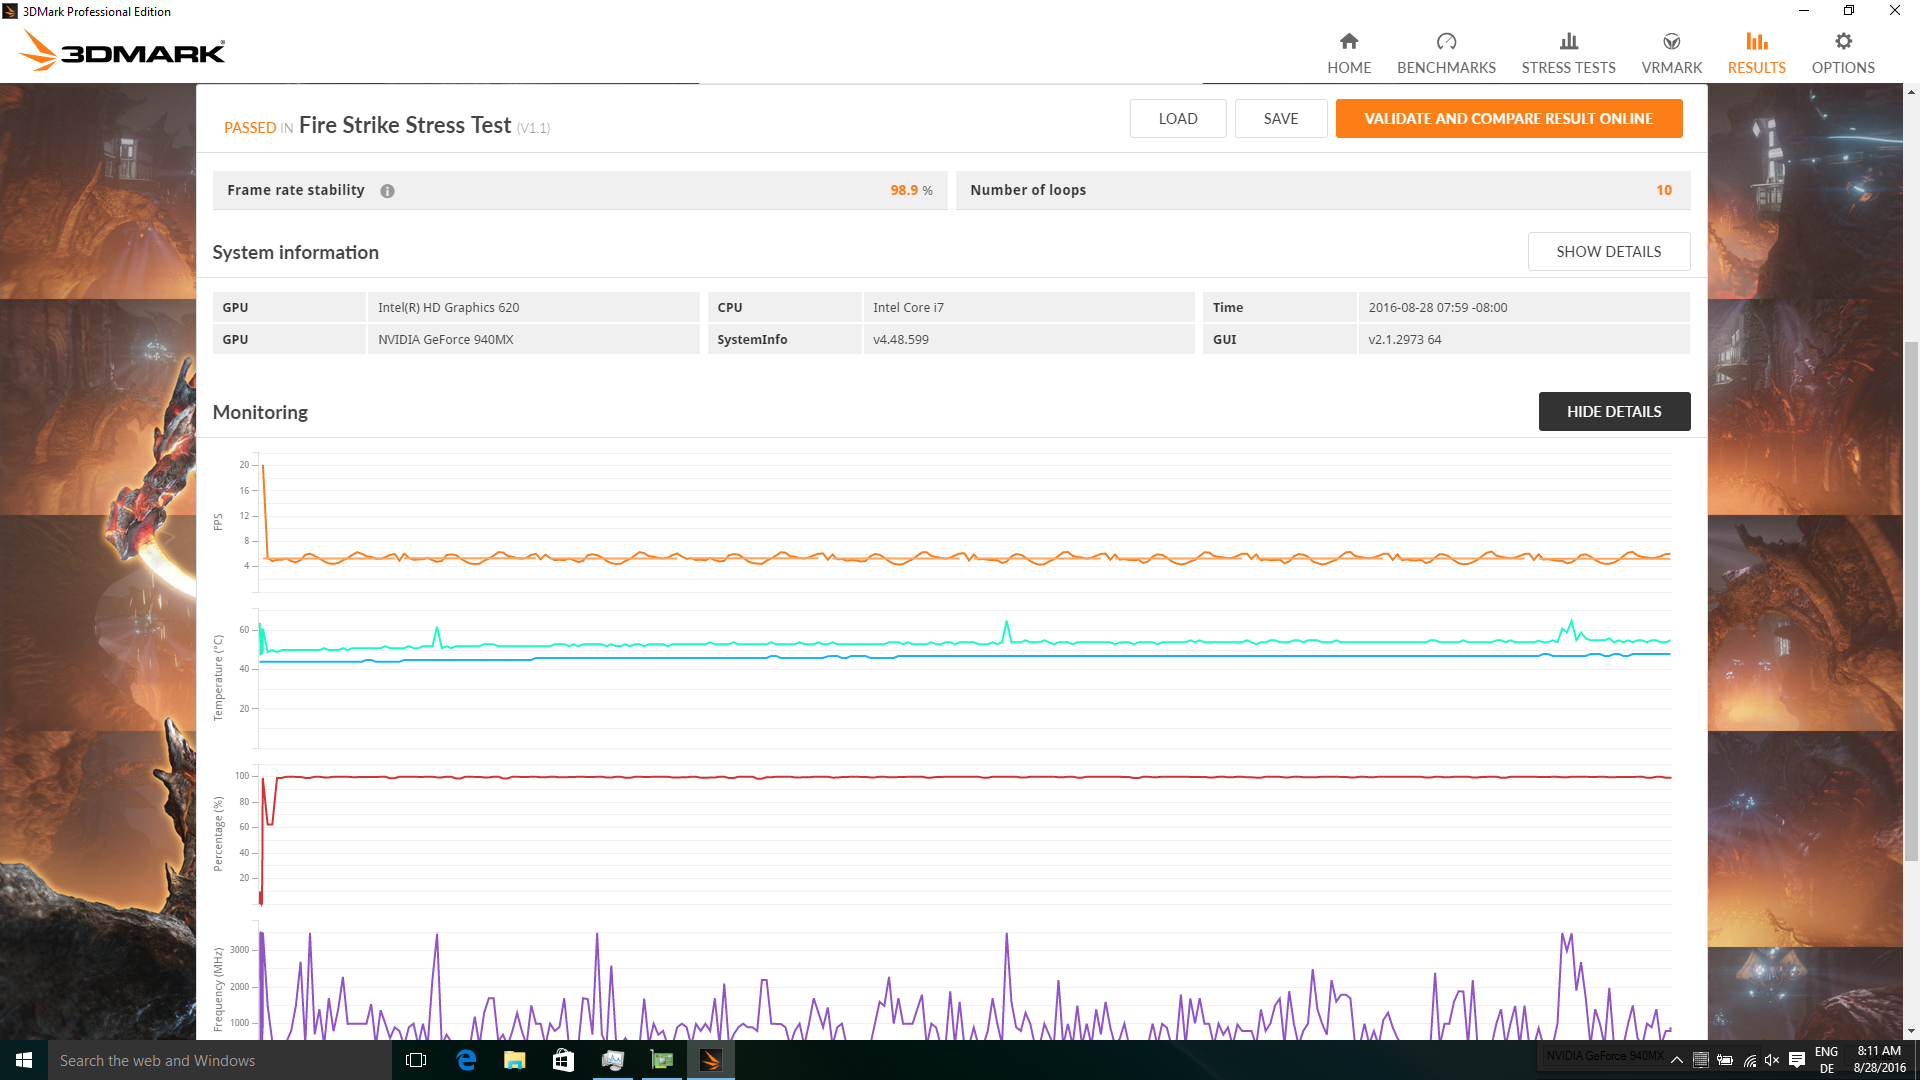
Performance-Beständigkeit bei andauernder CPU-/GPU-Last
ULV-Prozessoren können ihre TDP durchaus temporär überschreiten, bei aktuellen Intel-Modellen typischerweise für etwa 30 Sekunden. Auch der Core i7-7500U macht davon Gebrauch und kann in Spielen kurzzeitig mehr als 20 Watt aufnehmen. Da diese "Overboost"-Phase meist jedoch schon nach ein paar Klicks im Menü und dem Ladevorgang vorbei ist, fällt die Framerate im weiteren Spielverlauf nicht weiter ab. Auch der 3DMark Fire Strike Stress Test bescheinigt unserem Kandidaten eine nahezu perfekte Frame Rate Stability von 98,9 Prozent.
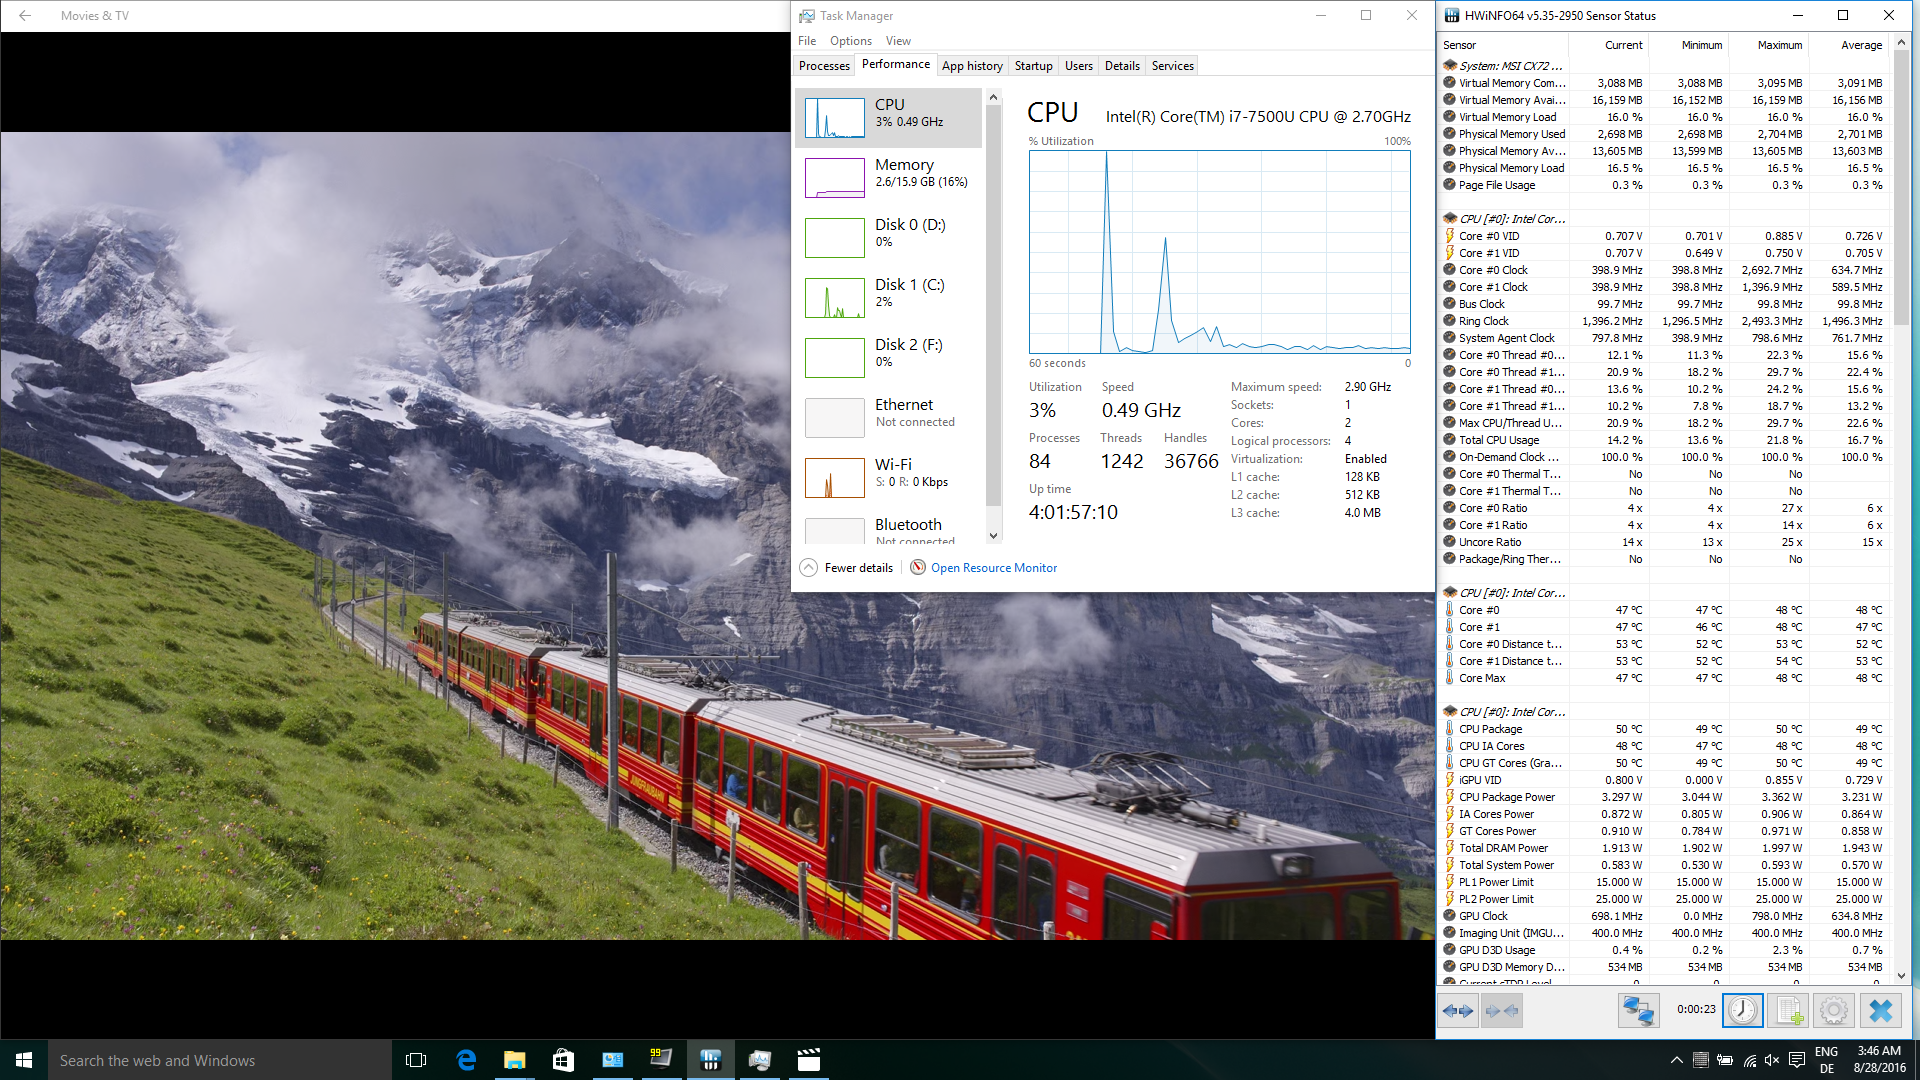
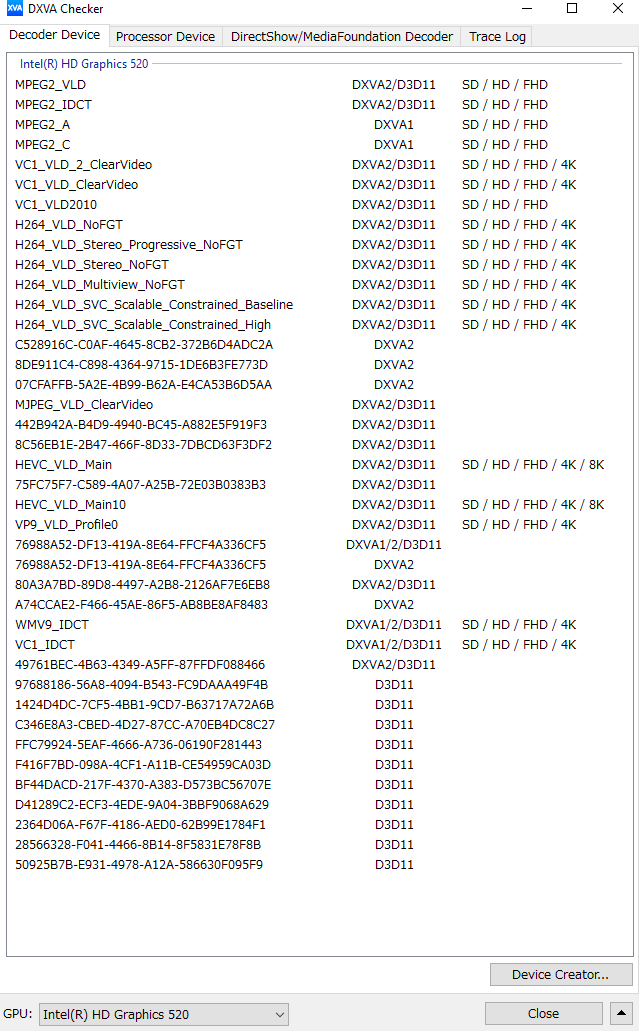
HEVC- und VP9-Wiedergabe
Zwar kann bereits Skylake H.265/HEVC-kodierte Videos bei niedriger Leistungsaufnahme in Hardware dekodieren, beherrscht jedoch noch nicht den Main10-Standard für Material mit 10 Bit Farbtiefe. Kaby Lake ändert das: Unseren anspruchsvollen 4K-Trailer (HEVC Main10, 50 MBit/s, 60 fps) spielt der i7-7500U bei einer durchschnittlichen Leistungsaufnahme (CPU Package Power) von lediglich 3,2 Watt flüssig ab, wohingegen das Video auf dem i7-6600U trotz 16,5 Watt Chipverbrauch sichtbar vor sich hin ruckelt. Ein einfacheres 4K-Video mit nur 8 Bit Farbtiefe (HEVC, 6 MBit/s, 60 fps) bewältigen beide CPUs ohne Probleme, allerdings bleibt Kaby Lake (3,4 Watt) auch hier etwas sparsamer als sein Vorgänger (4,1 Watt).
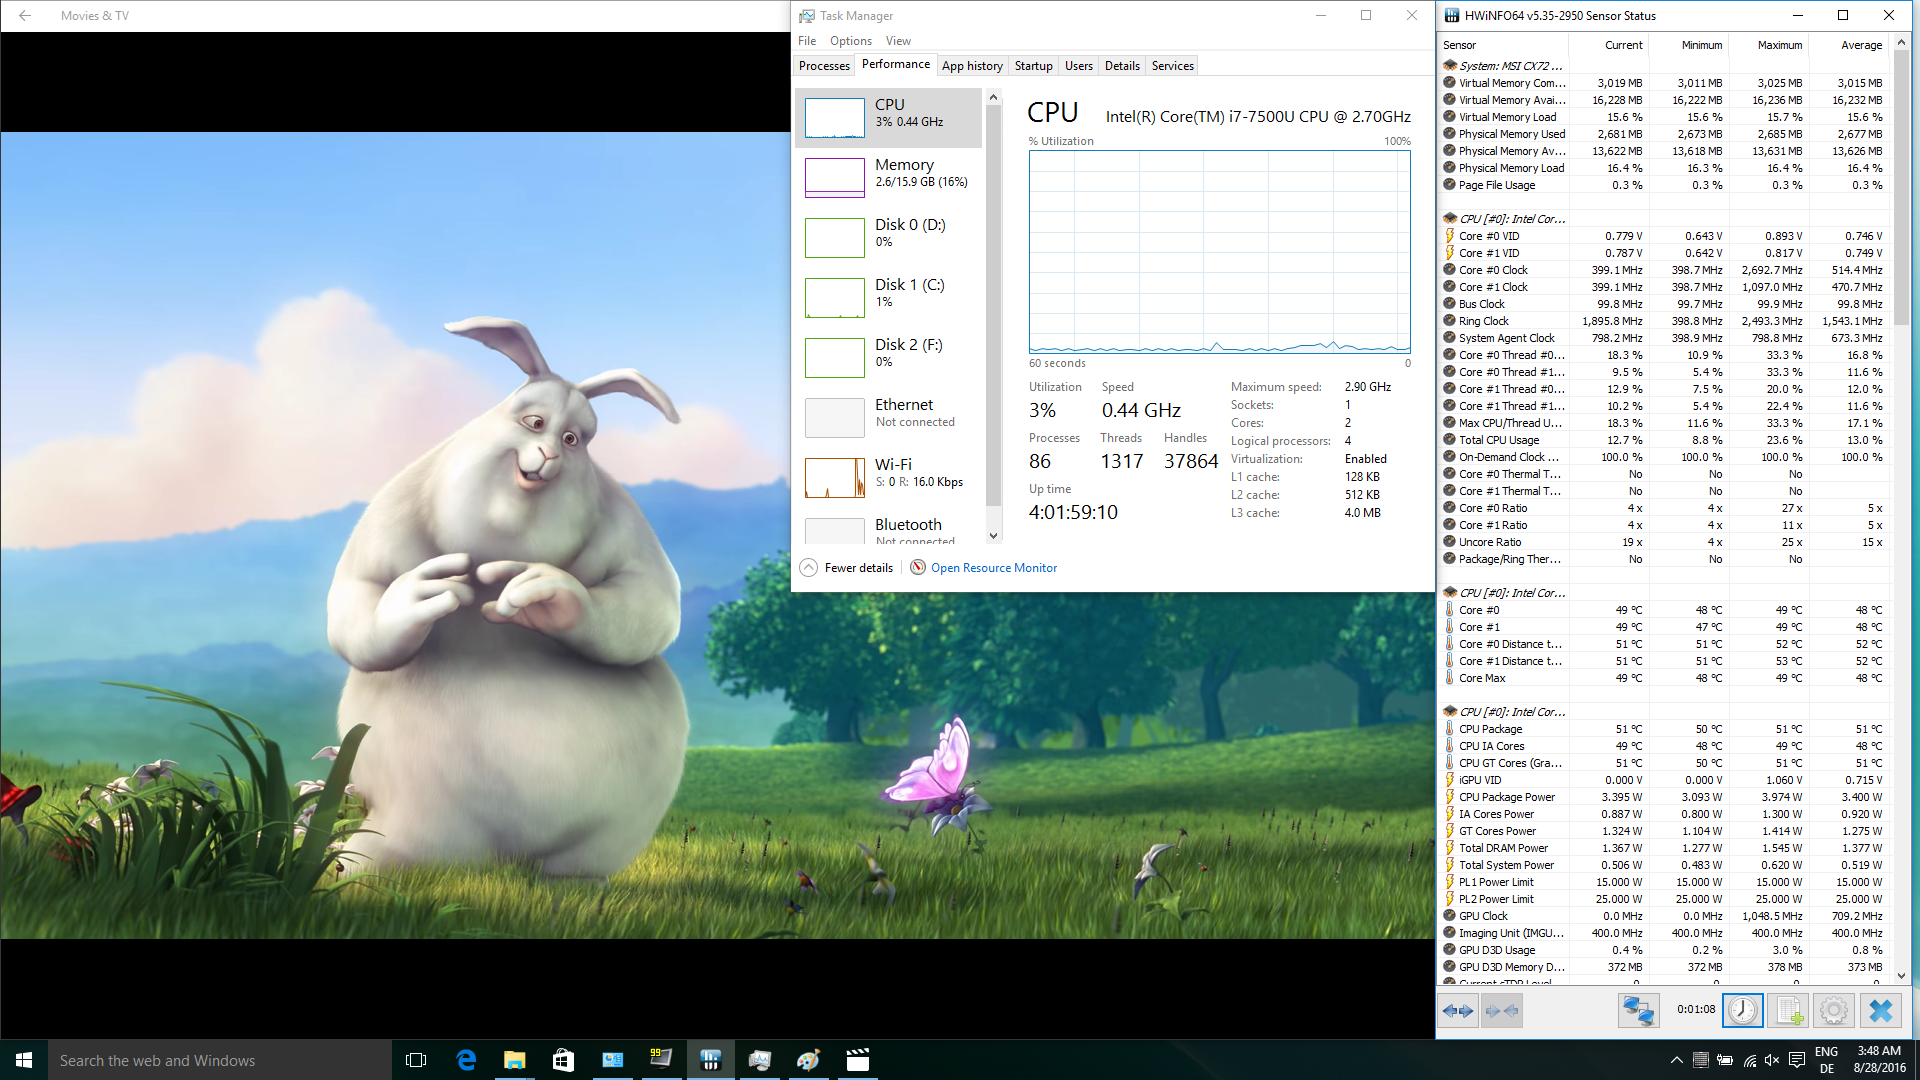
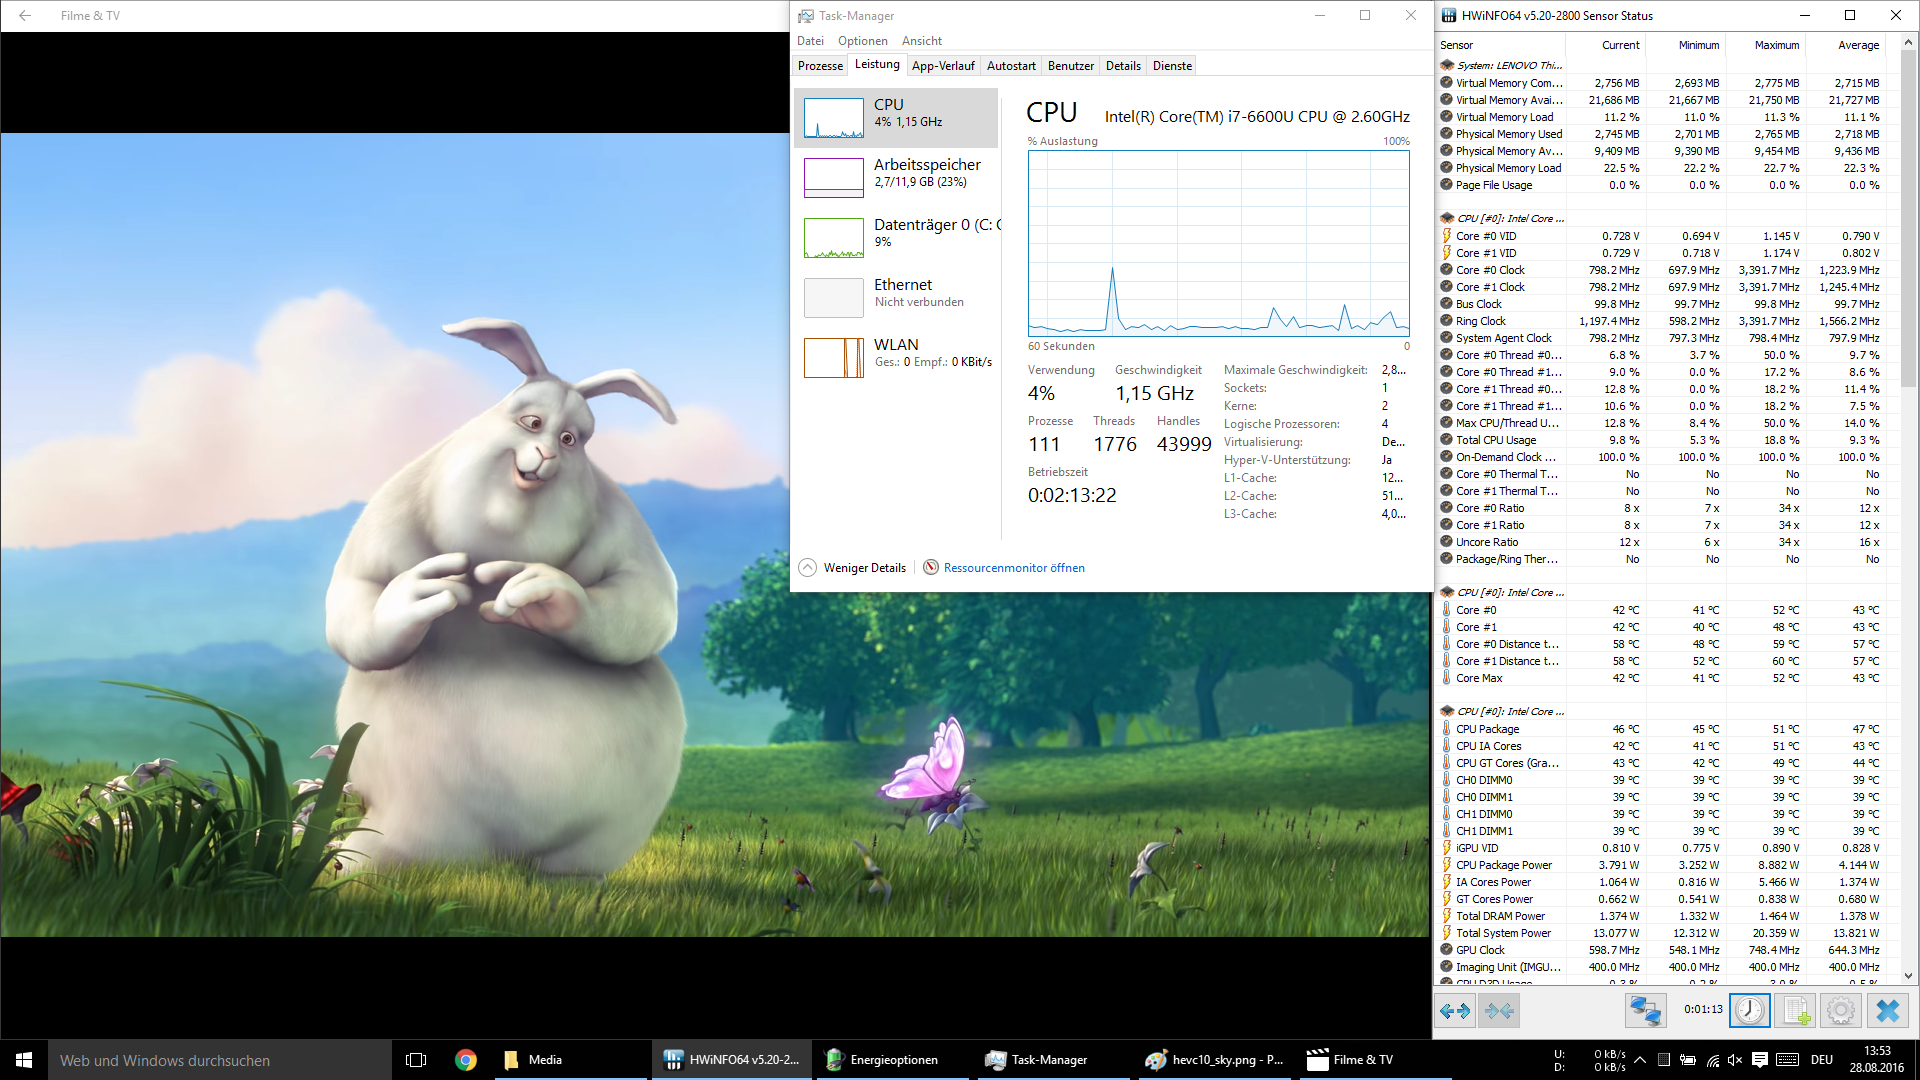
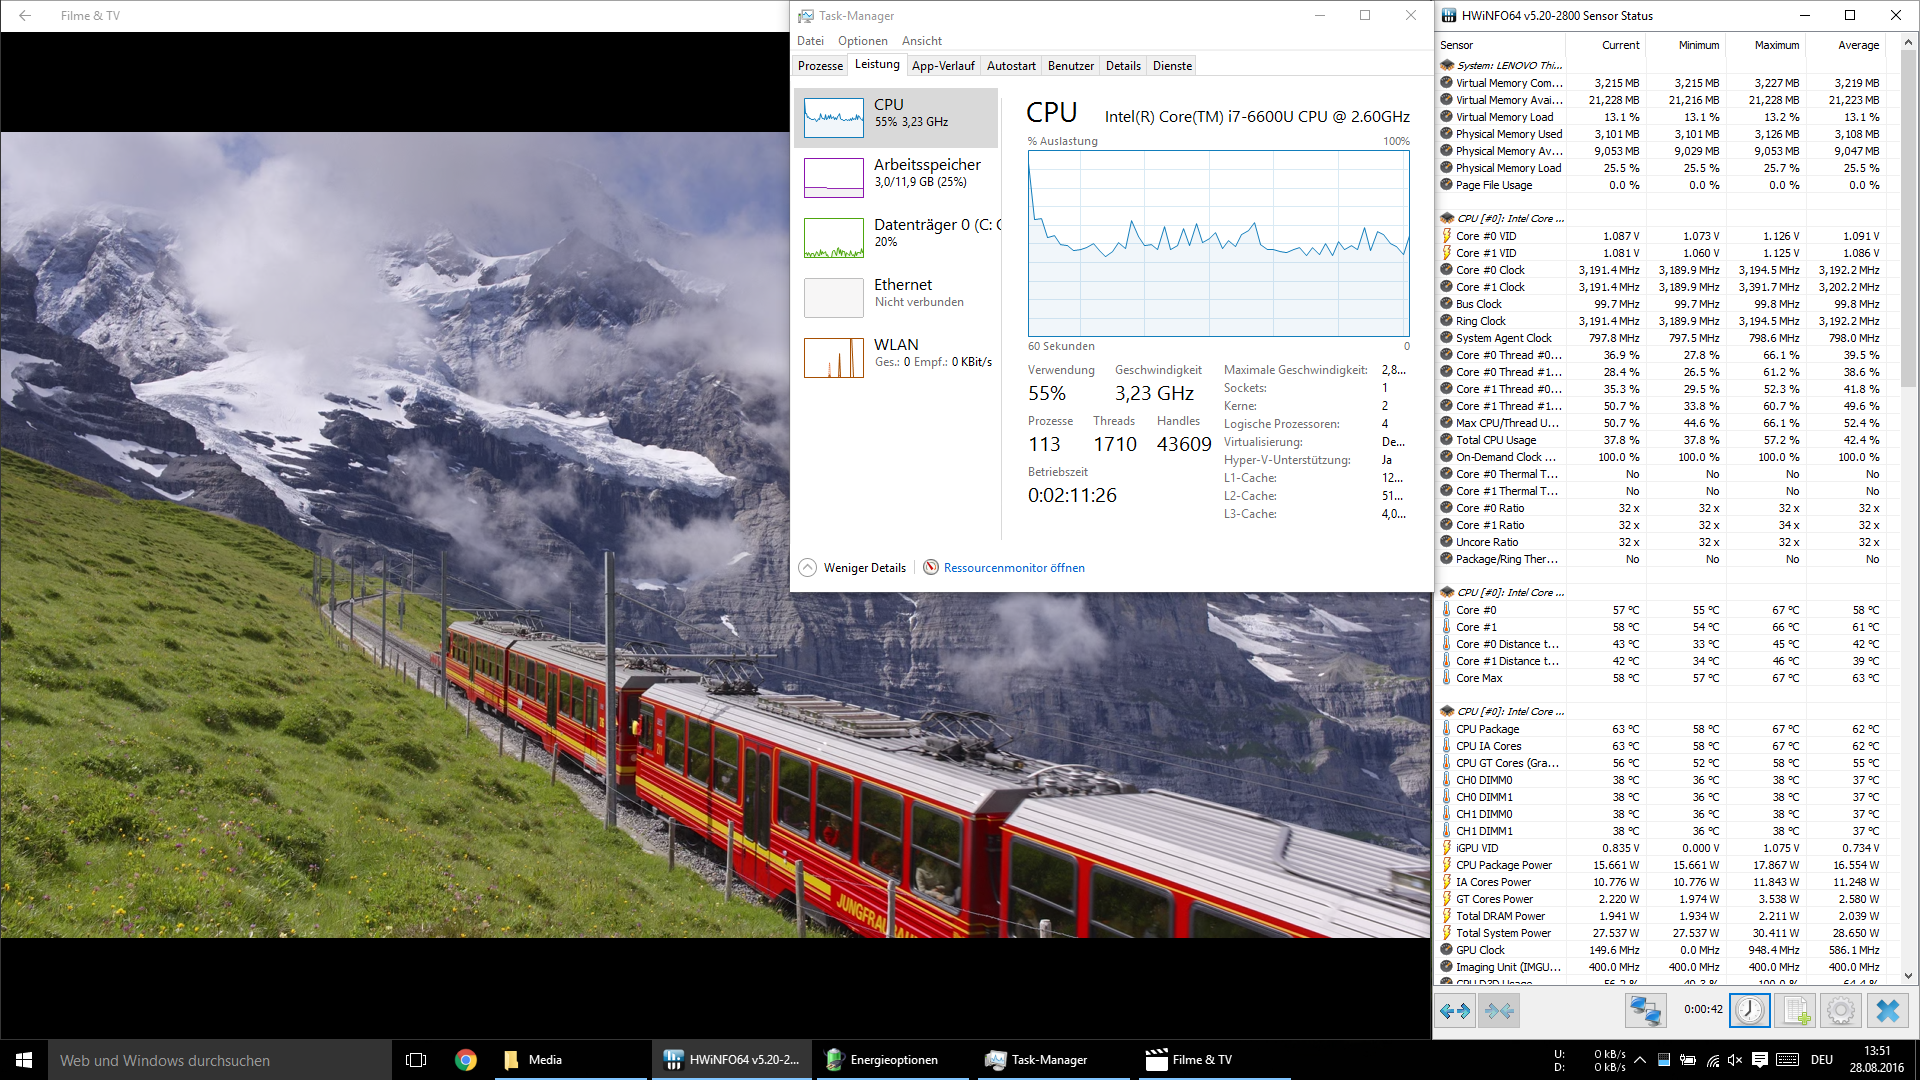
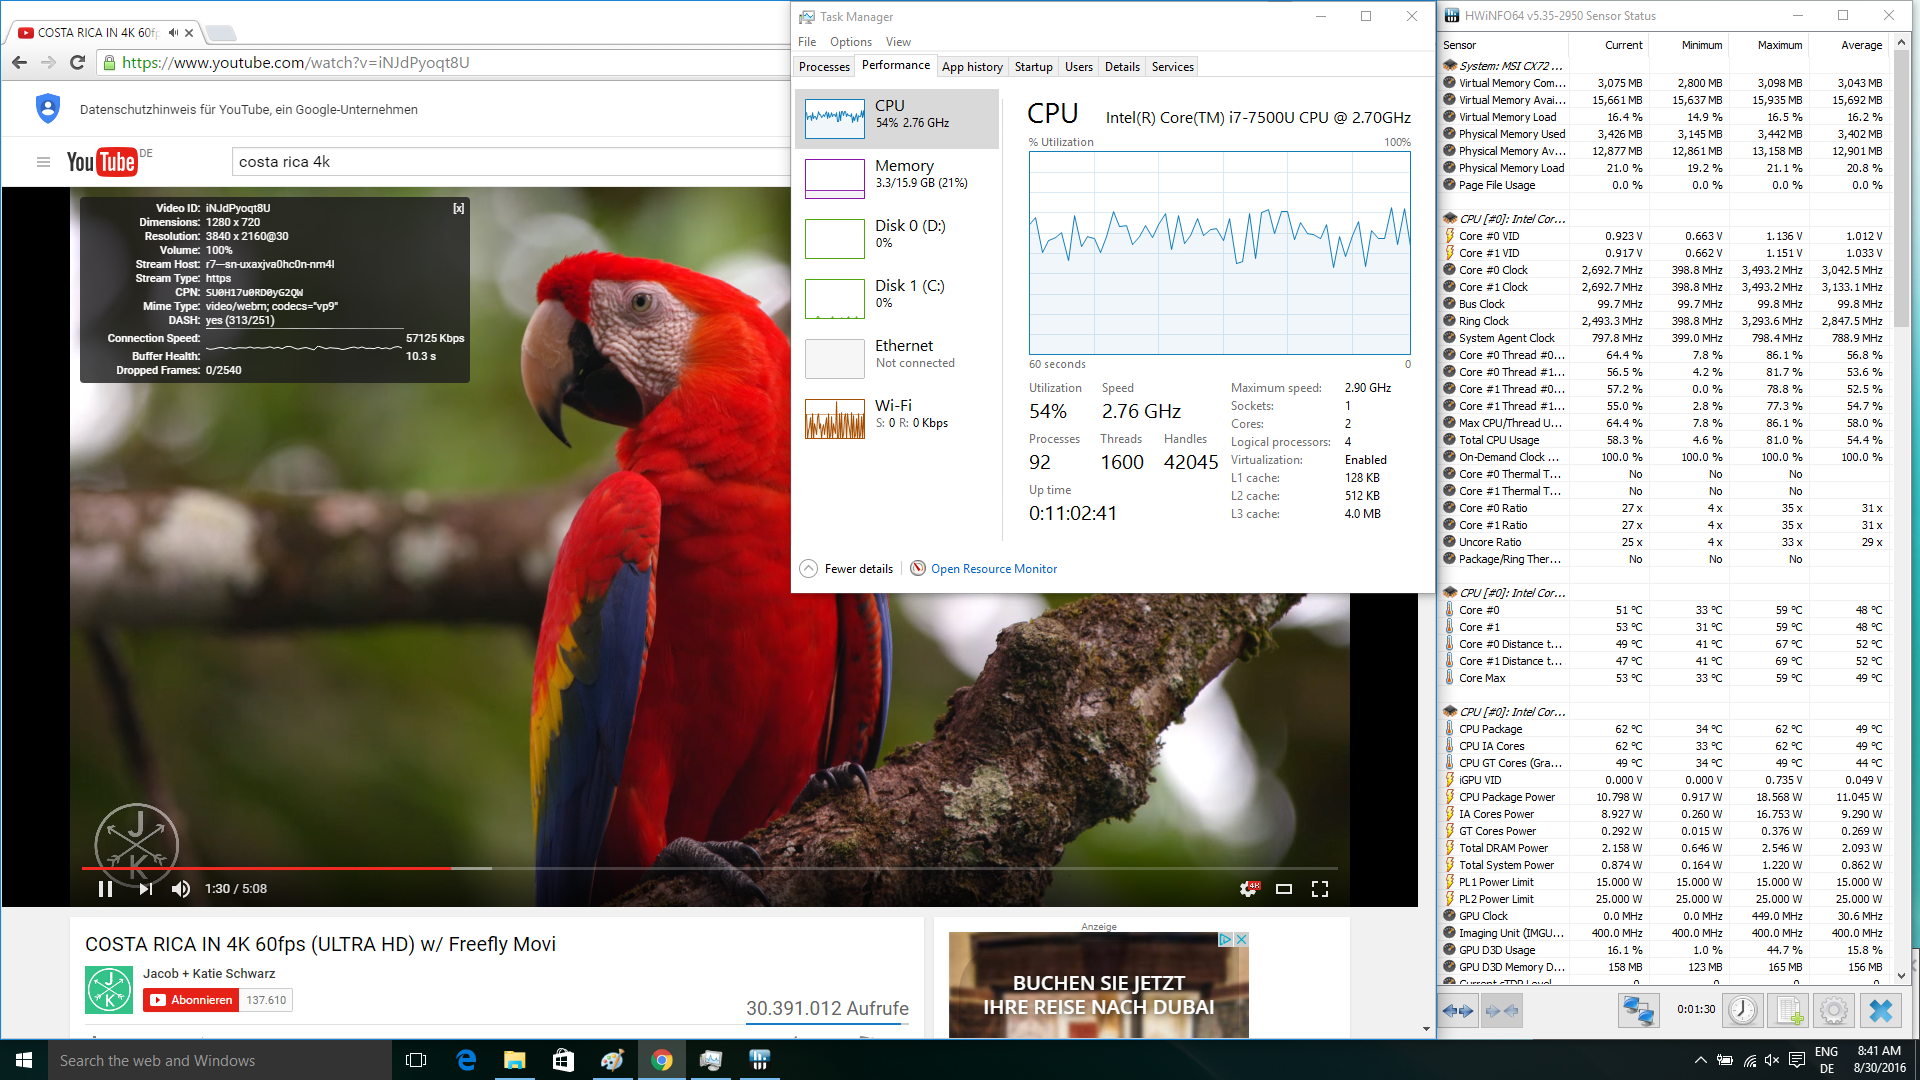
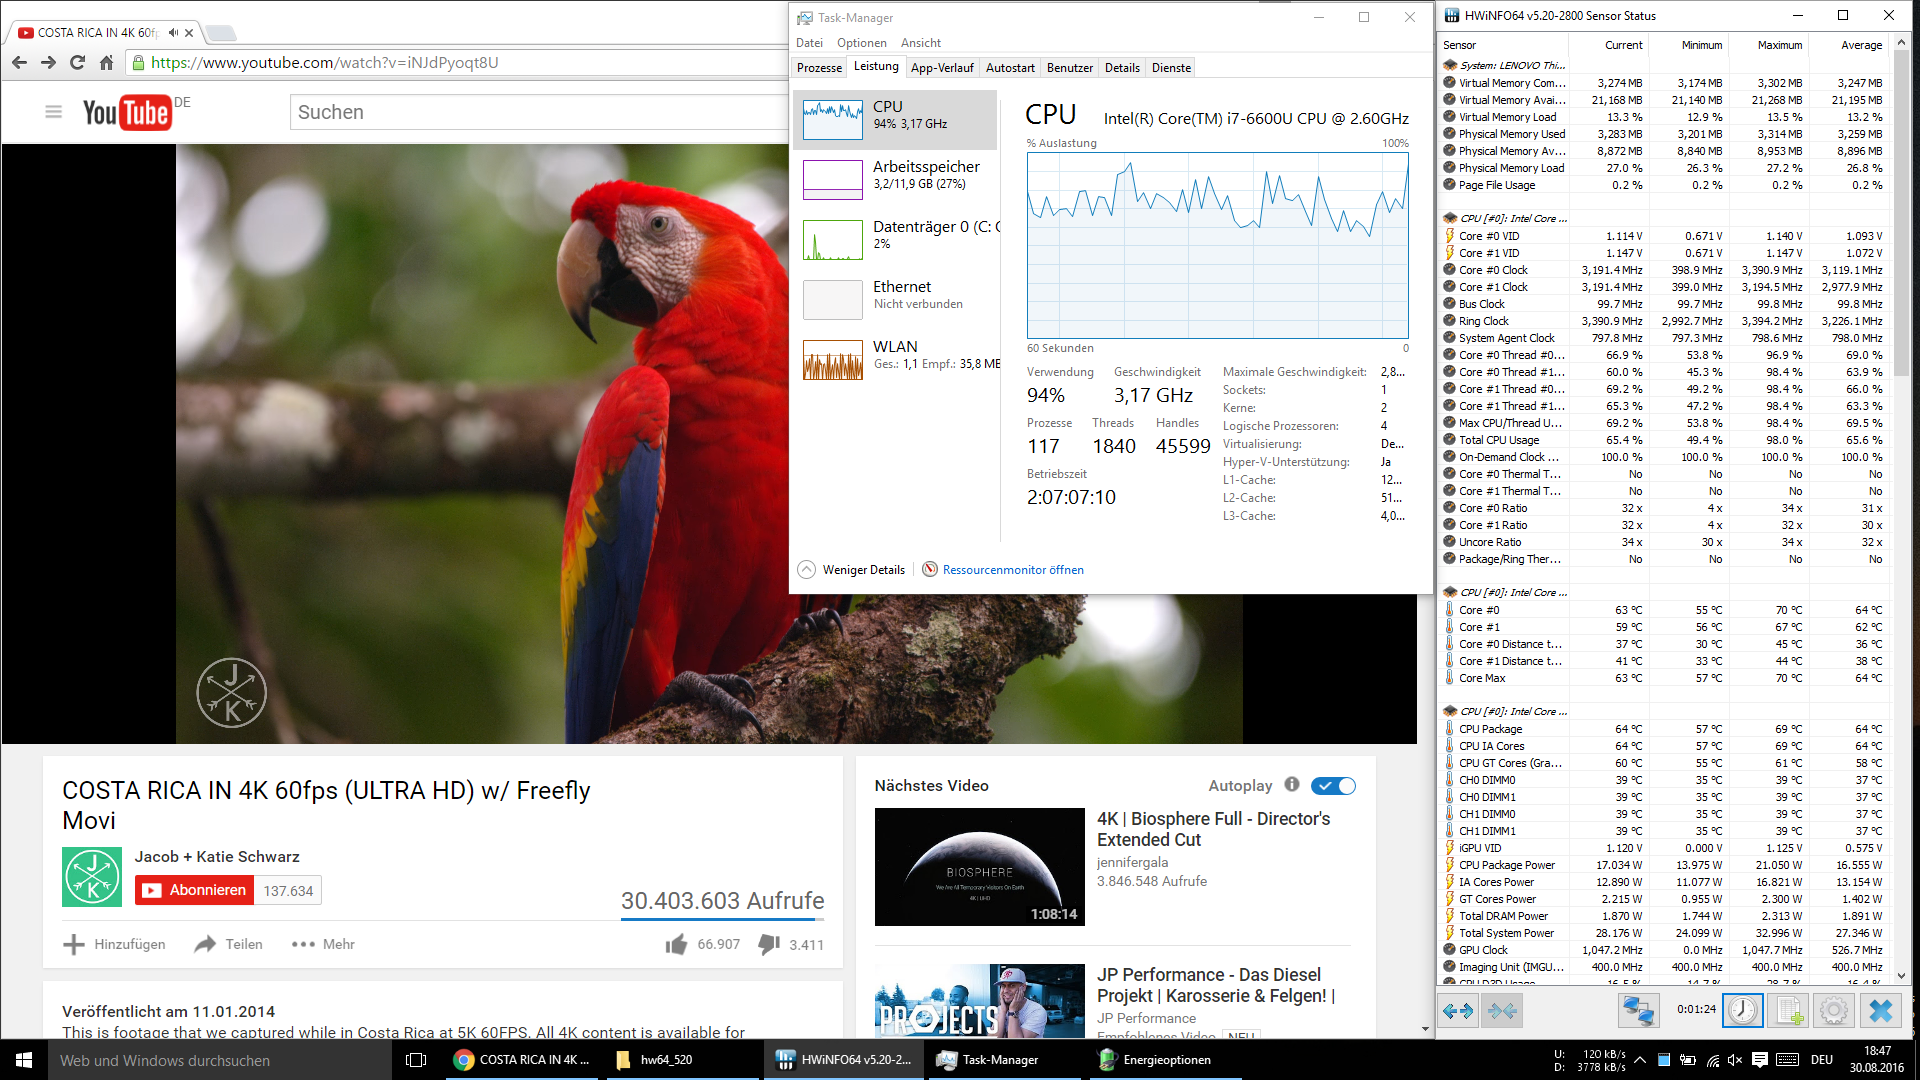
Die ebenfalls neue hinzugekommene VP9-Unterstützung ist insbesondere für 4K-Videos auf Youtube interessant, die bei Verwendung des Google-Chrome-Browsers standardmäßig in diesem Format ausgeliefert werden. Leider scheint die Hardwarebeschleunigung hier noch nicht so recht zu funktionieren: Zwar sinkt die durchschnittliche CPU-Last leicht von 66 (i7-6600U) auf 54 Prozent (i7-7500U) und damit auch die Leistungsaufnahme (11,0 statt 16,6 Watt), wirklich effizient ist auch das aber noch lange nicht. Mutmaßlich fehlt hier noch ein Treiber- oder Browserupdate, um die volle Hardwareunterstützung zu aktivieren.
Fazit
Zugegebenermaßen: Auf den ersten Blick mutet Intels Kaby-Lake-Generation recht langweilig an. Keine neue Fertigung, keine neue Mikroarchitektur – all das erinnert ein wenig an den anno 2014 vorgestellten Haswell-Refresh, der praktisch keinen nennenswerten Fortschritt mit sich brachte.
Kaby Lake stellt dagegen mehr als ein simples Rebranding der Skylake-Serie dar. Auch wenn der verwendete 14-Nanometer-Prozess formal der gleiche bleibt, konnte der Hersteller diesen doch so stark optimieren, dass die Taktraten überraschend kräftig ansteigen beziehungsweise bei gleichem Takt weit weniger Energie benötigt wird. Je nach Frequenzbereich sehen wir die Effizienzsteigerungen in einer Größenordnung zwischen 15 und 25 Prozent; ob die niedriger getaktete Core-m-/Y-Serie da vielleicht sogar noch etwas darauflegen kann, bleibt abzuwarten. Besonders gespannt sind wir zudem auf die für 2017 avisierten Quad-Core-ULV-Modelle, die der 15-Watt-Klasse den größten Leistungsschub seit Jahren bescheren dürften.
Last, but not least soll auch der überarbeitete Videodecoder gelobt werden, der nicht nur neue Formate wie HEVC Main10 beherrscht, sondern ebenfalls merklich effizienter als zuvor arbeitet. Zusammen mit den sonstigen Effizienzverbesserungen dürften Kaby-Lake-Notebooks damit noch längere Akkulaufzeiten als ihre Skylake-Vorgänger liefern.
