 Deutsch
 English
 Español
 Français
 Italiano
 Nederlands
 Polski
 Português
 Русский
 Türkçe
 Svenska
 Chinese
 Magyar
Dell XPS 15 9530 RTX 4070 Laptop im Test: Beeindruckend und enttäuschend zugleich

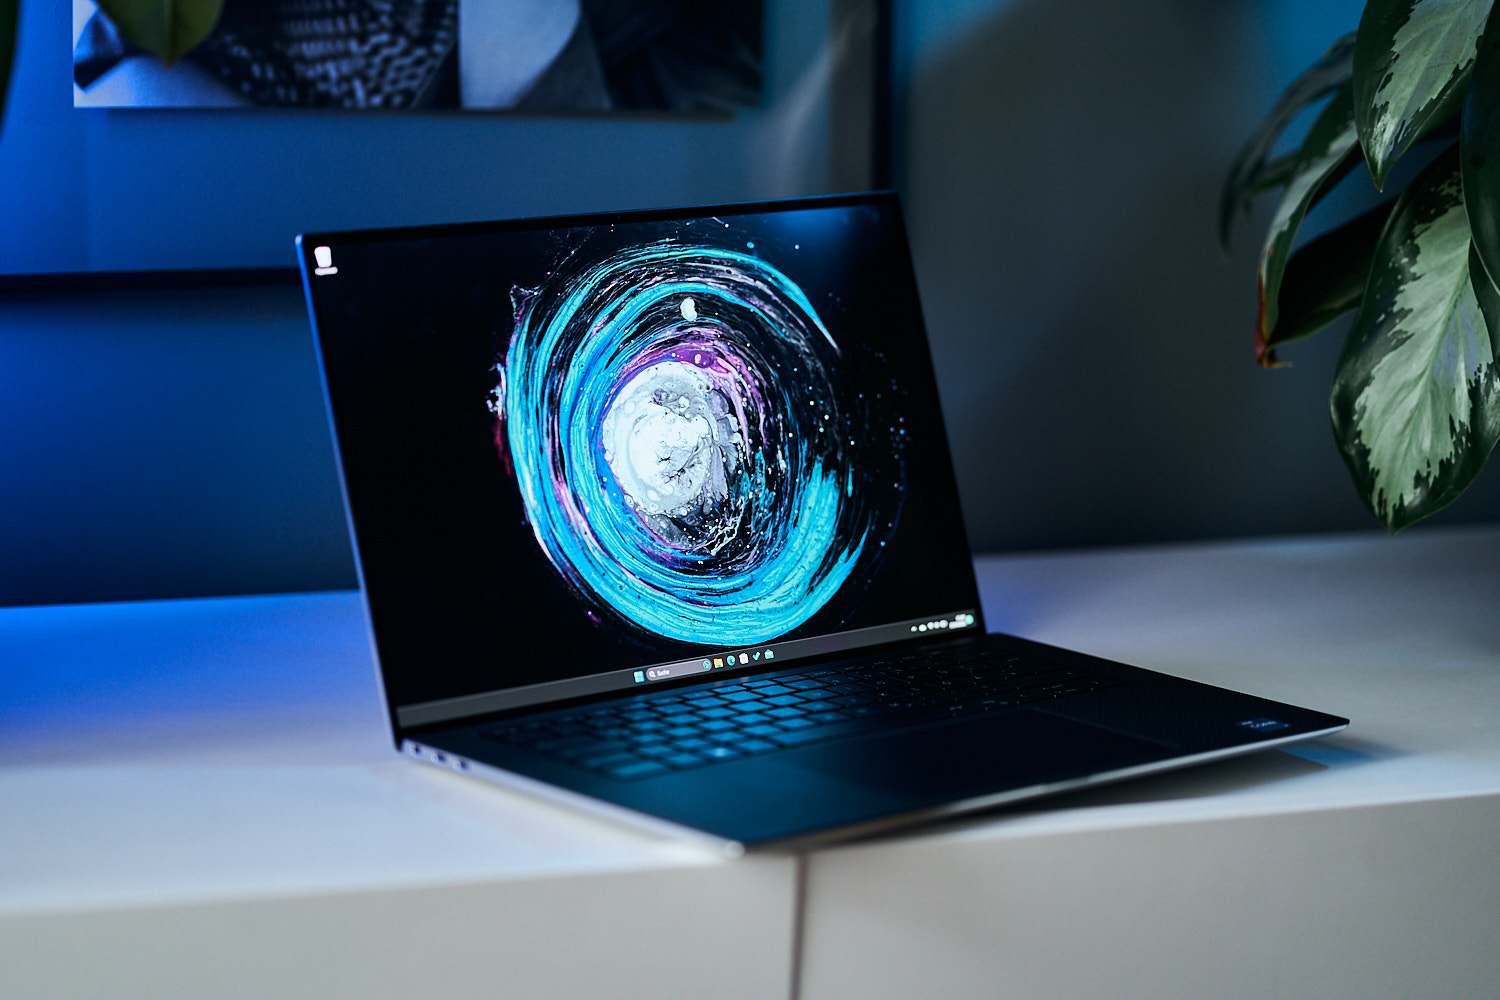
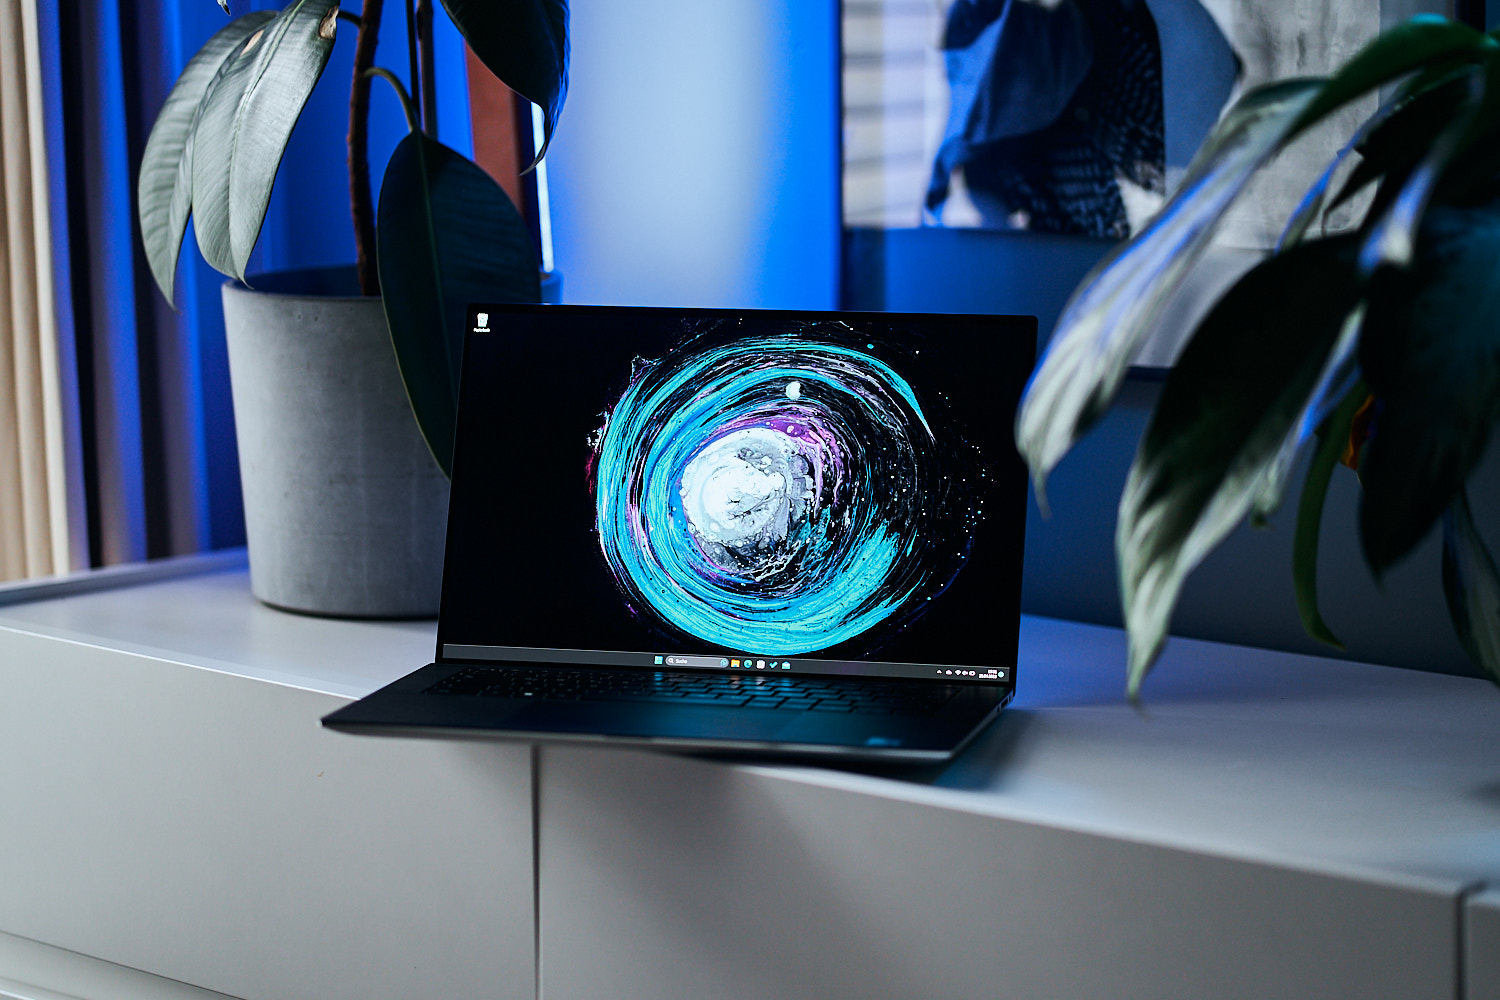
Das XPS 15 9530 ist ein internes Update des 2022er XPS 15 9520. Die Alder-Lake-H-CPUs der 12. Generation und Nvidia-Ampere-GPUs aus dem Vorjahresmodell wurden durch Raptor Lake-H der 13. Generation bzw. Ada-Lovelace-Optionen auf den neuesten Stand gebracht. Am Gehäuse und Display hat sich im Vergleich zum Vorjahr nichts geändert. Daher raten wir Ihnen, einen Blick auf unsere Testberichte des XPS 15 9520, 9510 und 9500 zu werfen, um mehr über die physikalischen Eigenschaften des Modells zu erfahren.
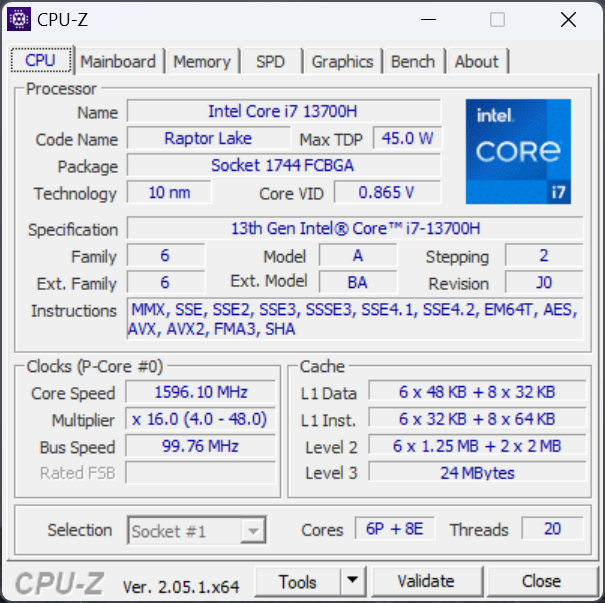
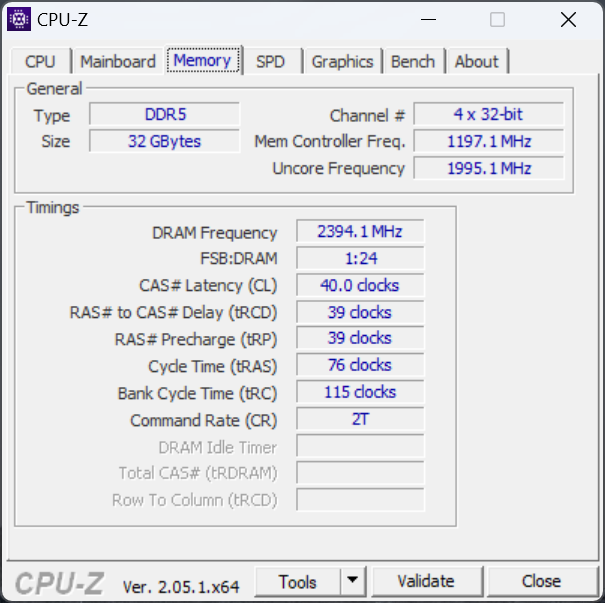
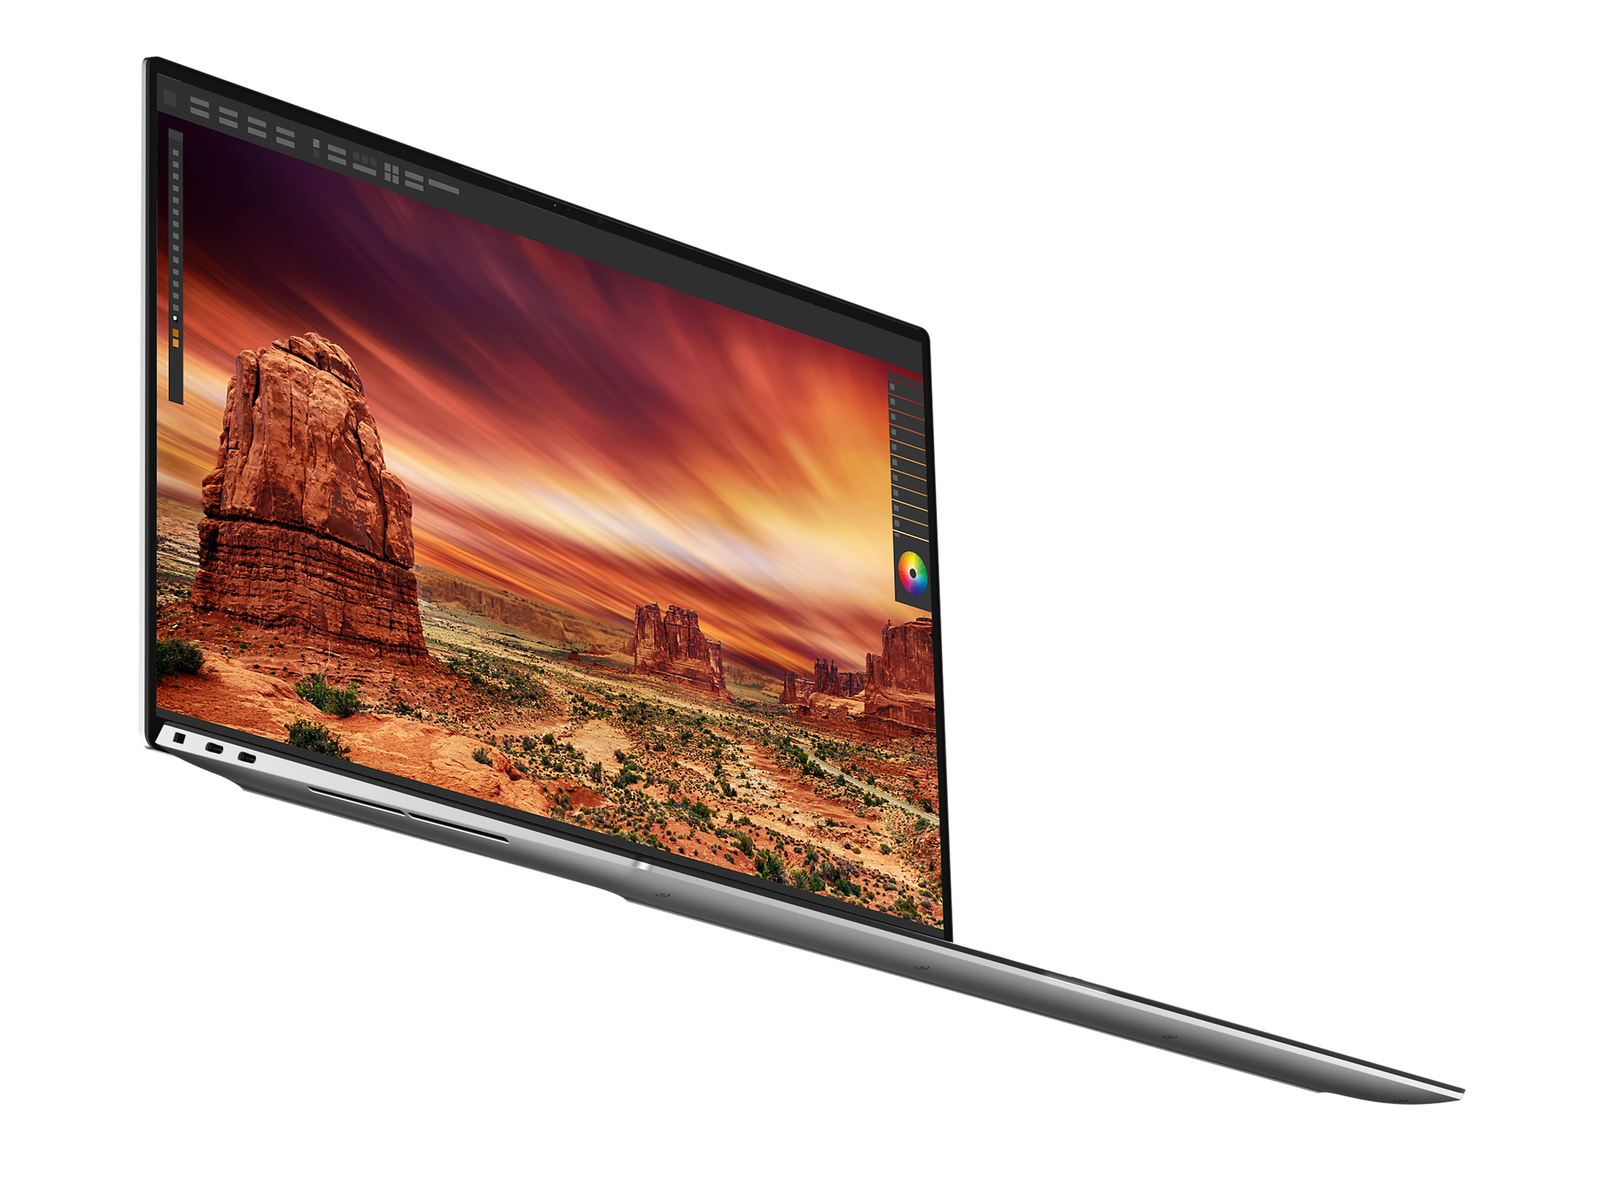
Unser heutiges Testgerät gehört zu den besser ausgestatteten Konfigurationen und wartet mit einem Core i7-13700H, einer RTX 4070, 32 GB RAM, einer 1-TB-SSD und einem glänzenden 3,5K-OLED-Touchscreen auf. Erhältlich ist der Spaß für rund $2800. Andere Konfigurationen sind etwa mit dem noch schnelleren Core i9-13900H, einer langsameren RTX 4060 oder einem FHD+-Panel mit niedrigerer Auflösung ausgestattet. Dies ist übrigens einer der wenigen Laptops, der mit einer 50-W-GeForce-RTX-4070 ausgestattet ist. Die meisten Laptops mit dieser GPU arbeiten hier mit mindestens 100 W.
Zu den Mitstreitern gehören weitere High-End-15-Zoll-Multimedia-Laptops wie das Asus Zenbook Pro 15, das MSI Summit E15, das Gigabyte Aero 15 und das Razer Blade 15 Studio.
Weitere Dell-Testberichte:
Potenzielle Mitstreiter im Vergleich
Bew. | Datum | Modell | Gewicht | Dicke | Größe | Auflösung | Preis ab |
|---|---|---|---|---|---|---|---|
| 90.3 % | 04.2023 | Dell XPS 15 9530 RTX 4070 i7-13700H, NVIDIA GeForce RTX 4070 Laptop GPU | 1.9 kg | 18 mm | 15.60" | 3456x2160 | |
| 89.5 % | 05.2022 | Dell XPS 15 9520 RTX 3050 Ti i7-12700H, GeForce RTX 3050 Ti Laptop GPU | 1.9 kg | 18 mm | 15.60" | 3456x2160 | |
| 90.1 % | 06.2020 | Dell XPS 15 9500 Core i7 4K UHD i7-10875H, GeForce GTX 1650 Ti Mobile | 2 kg | 18 mm | 15.60" | 3840x2400 | |
| 87.7 % | 05.2022 | Asus Zenbook Pro 15 OLED UM535Q R9 5900HX, GeForce RTX 3050 Ti Laptop GPU | 1.9 kg | 18 mm | 15.60" | 1920x1080 | |
| 85.4 % | 12.2022 | MSI Prestige 15 A12UD-093 i7-1280P, GeForce RTX 3050 Ti Laptop GPU | 1.8 kg | 20.1 mm | 15.60" | 3840x2160 | |
| 85.6 % | 07.2021 | Gigabyte Aero 15 OLED XD i7-11800H, GeForce RTX 3070 Laptop GPU | 2.2 kg | 20 mm | 15.60" | 3840x2160 |
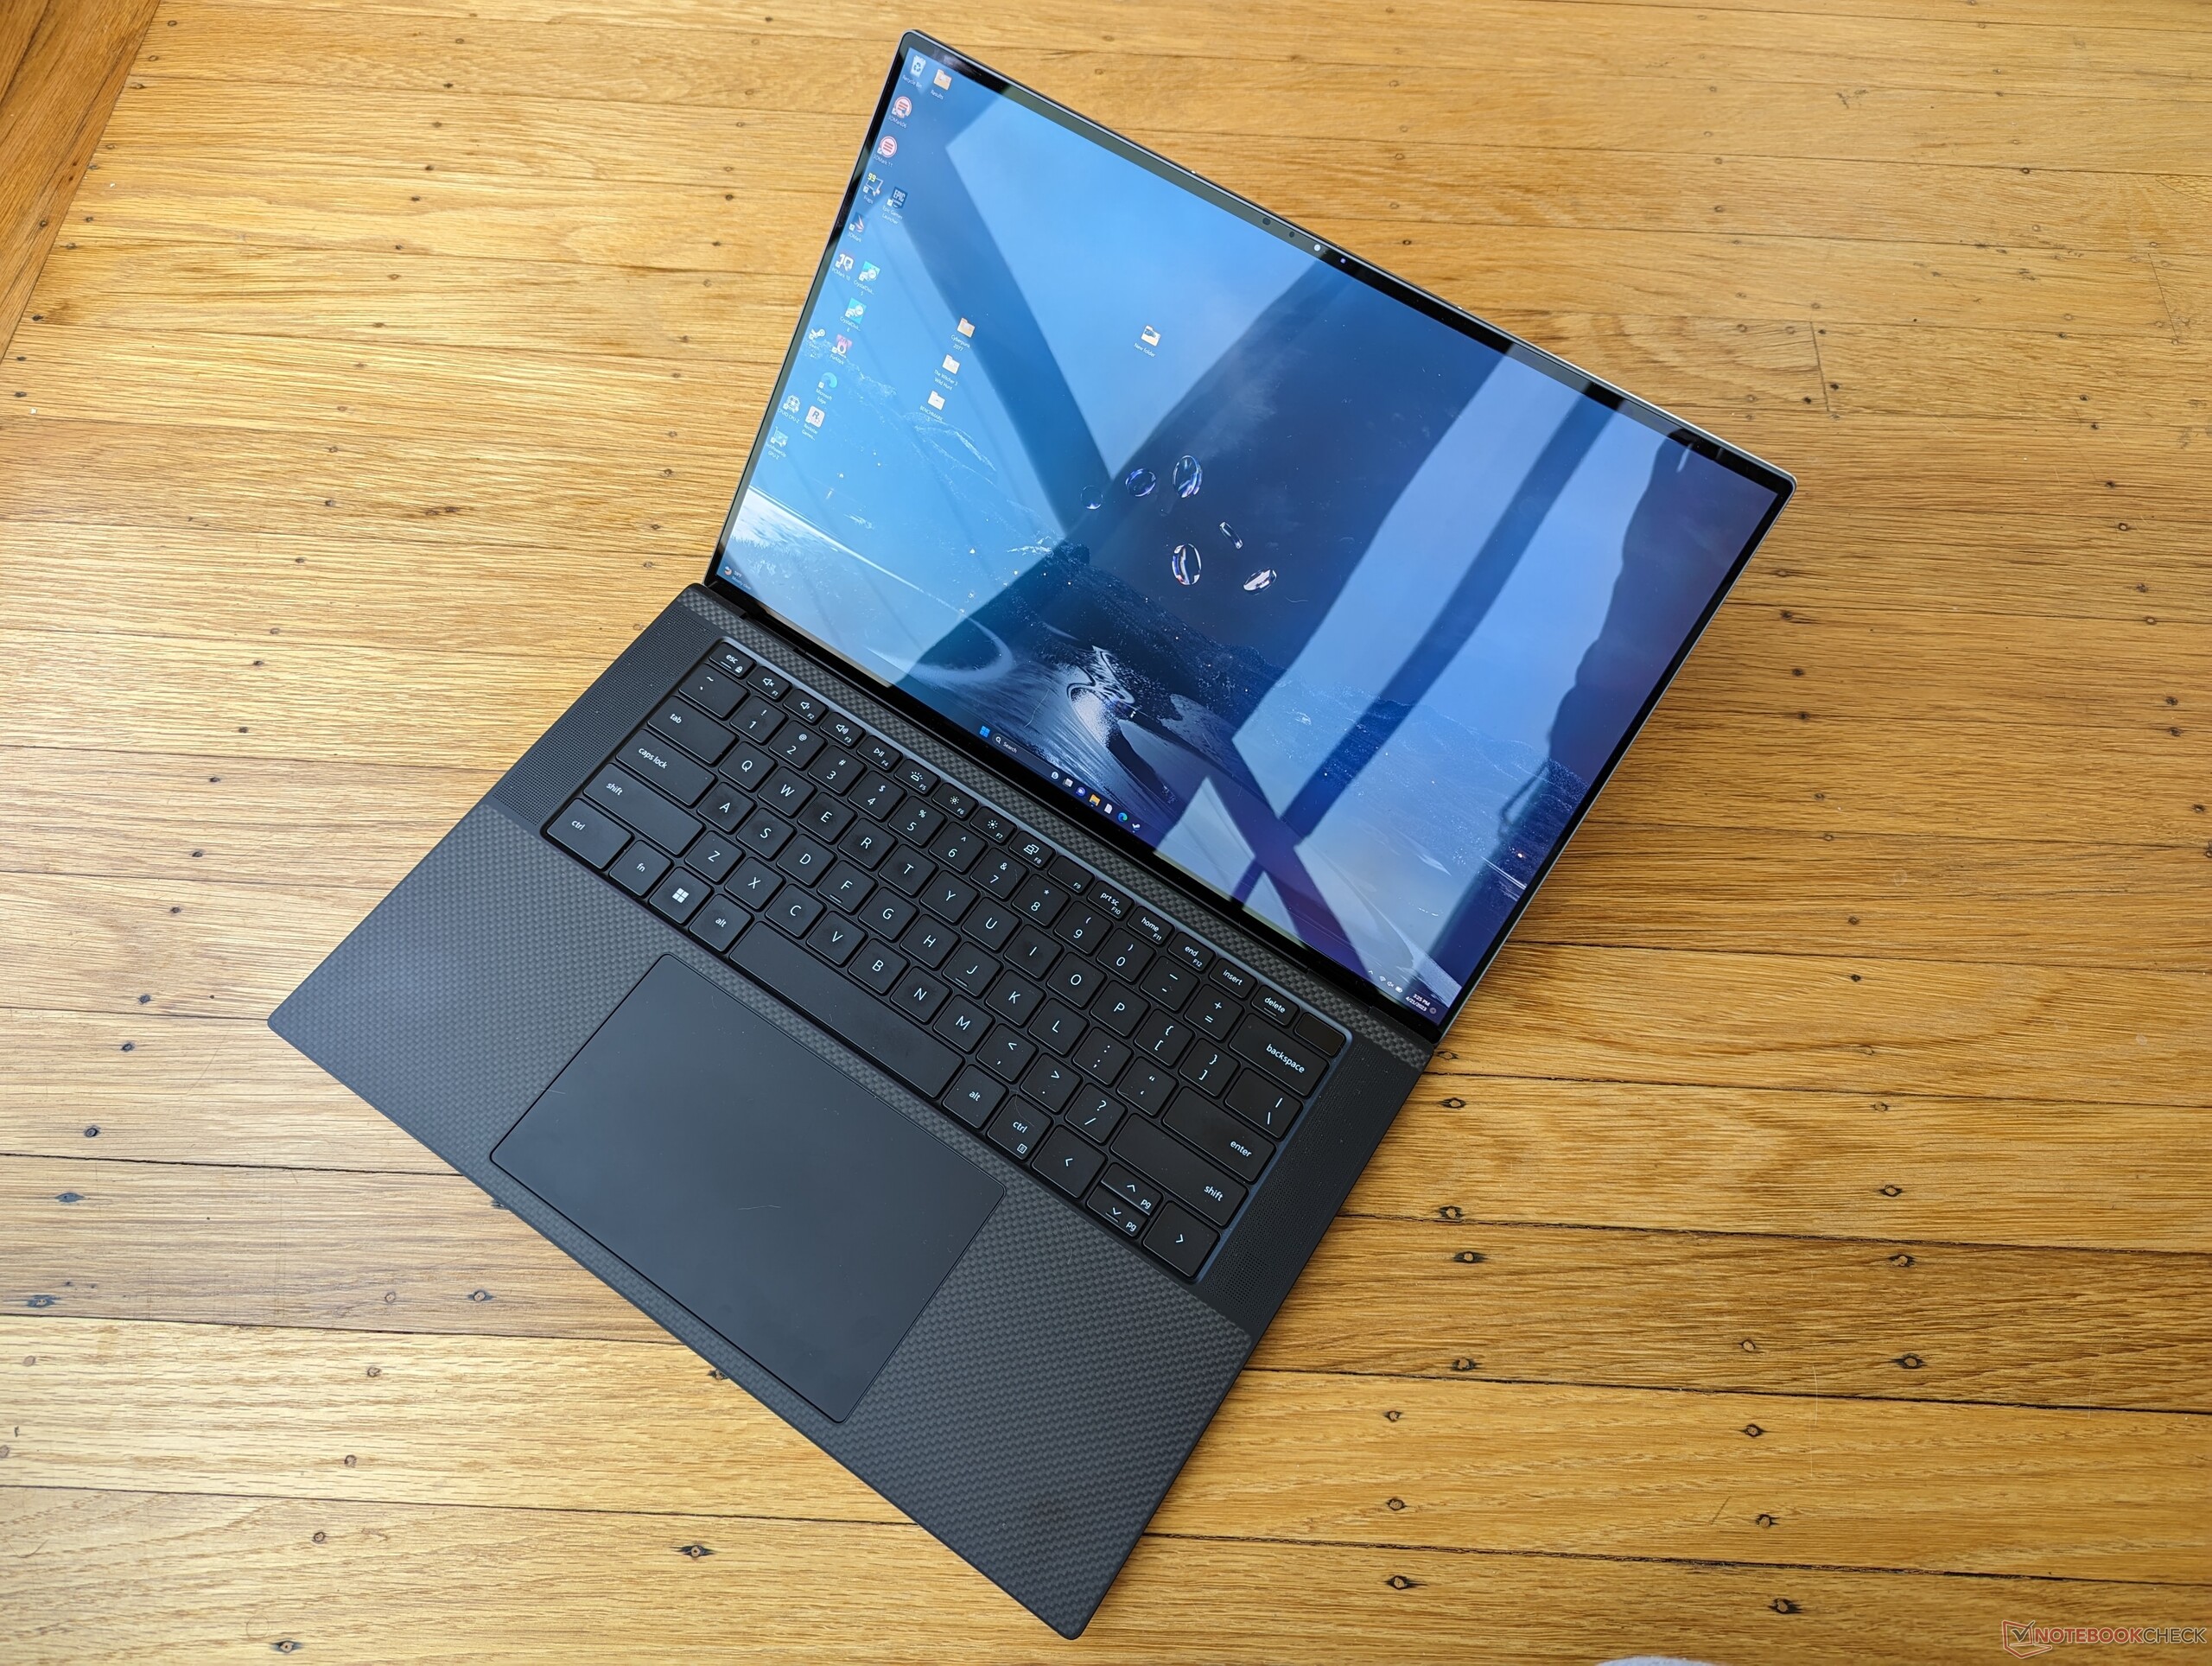
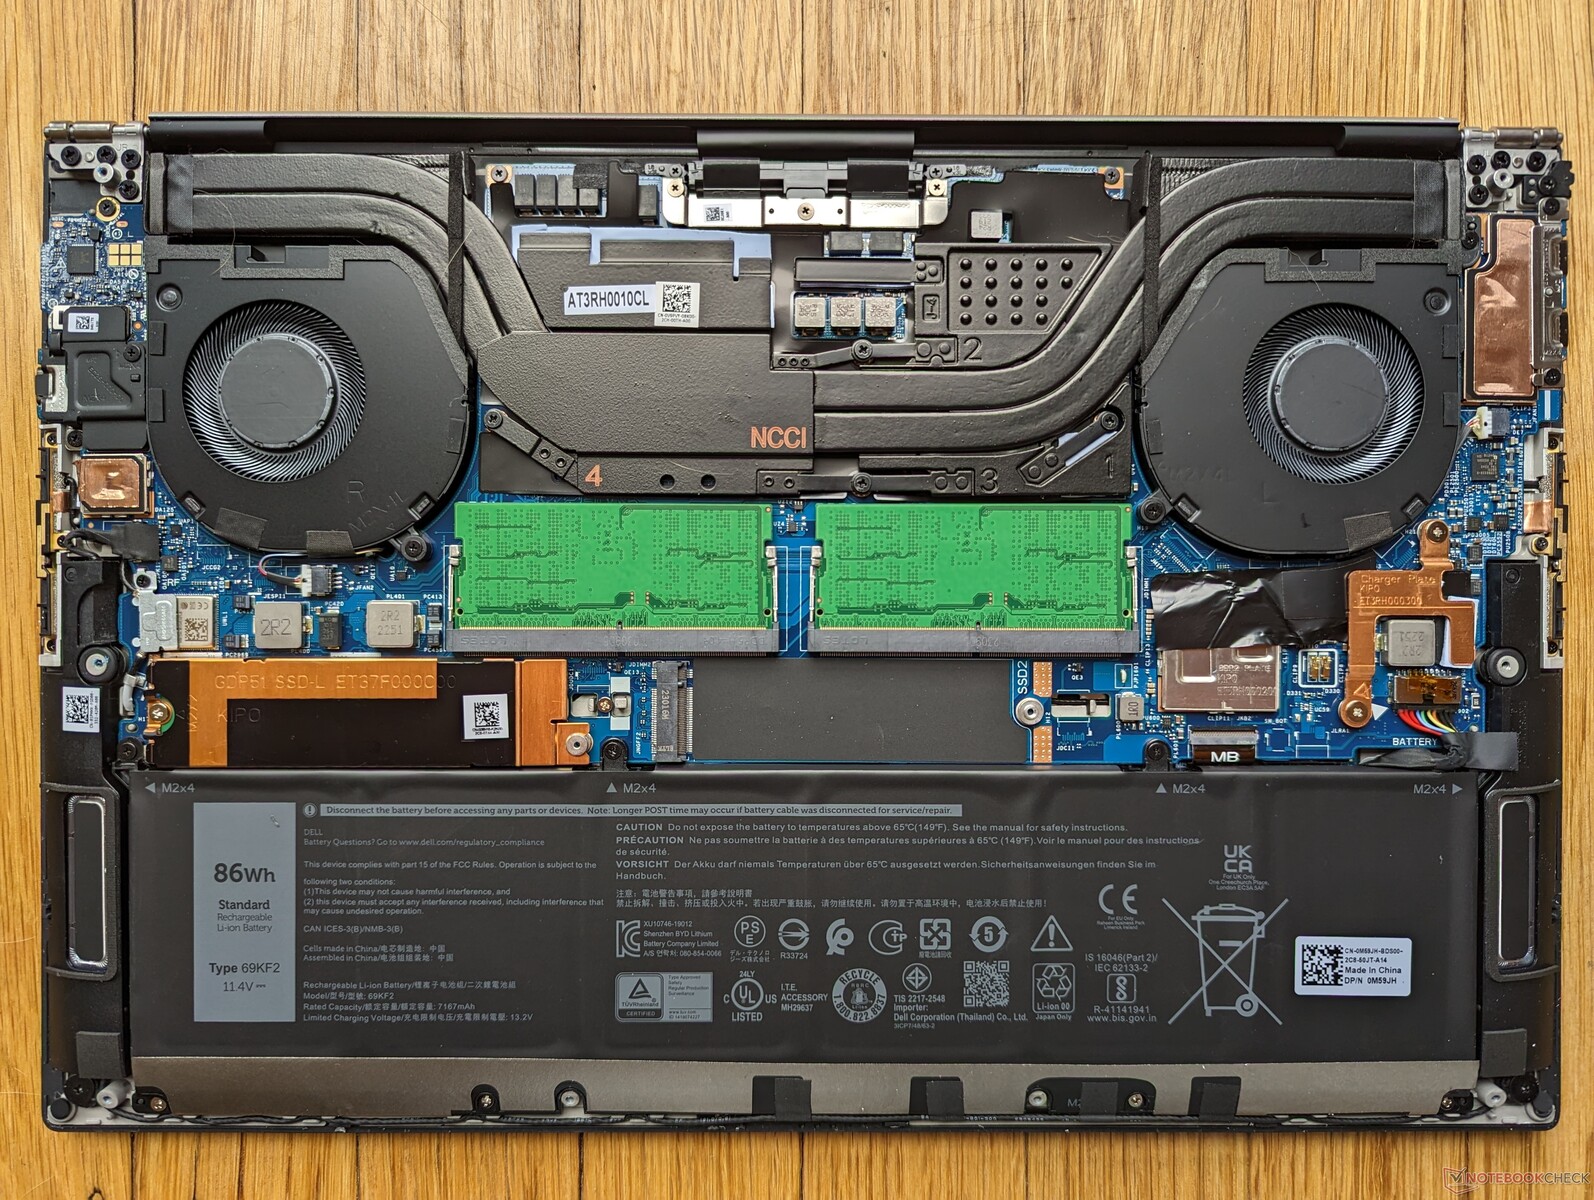
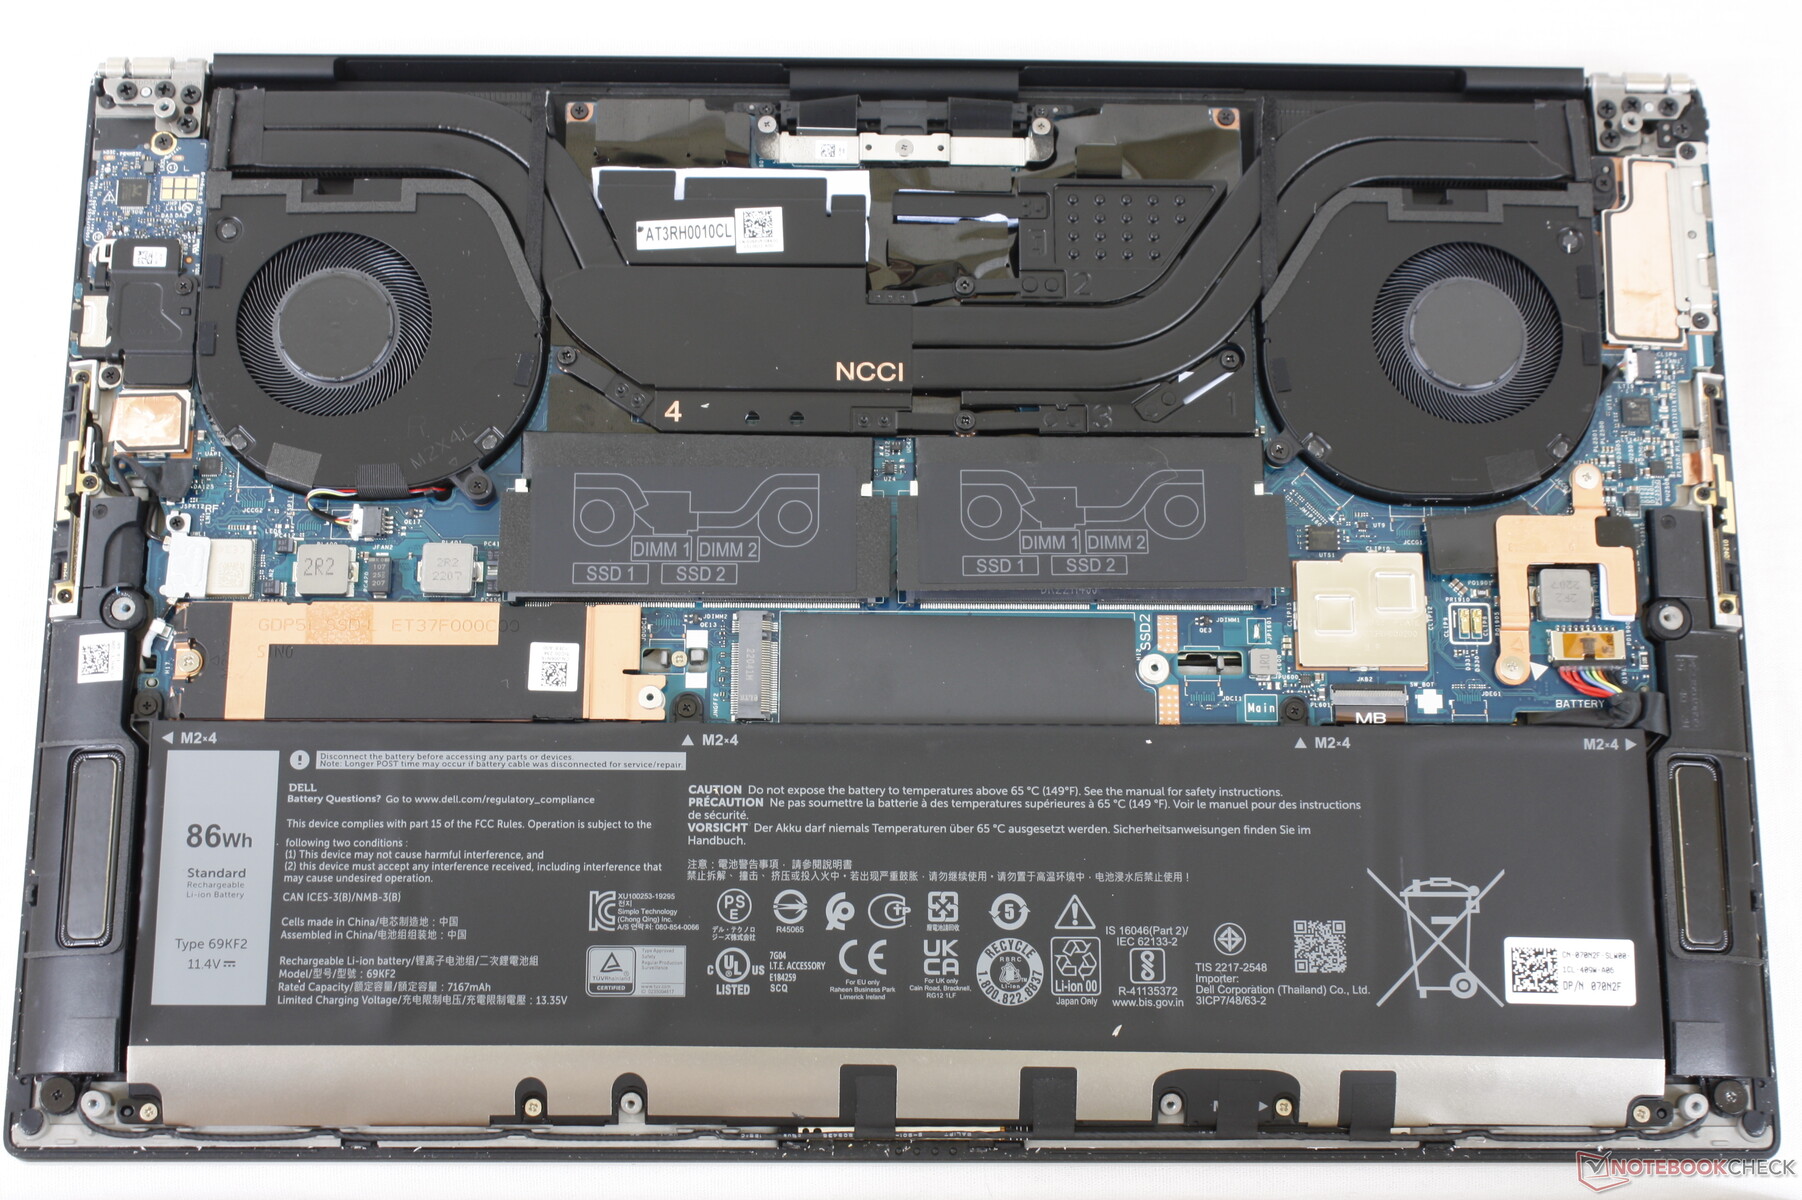
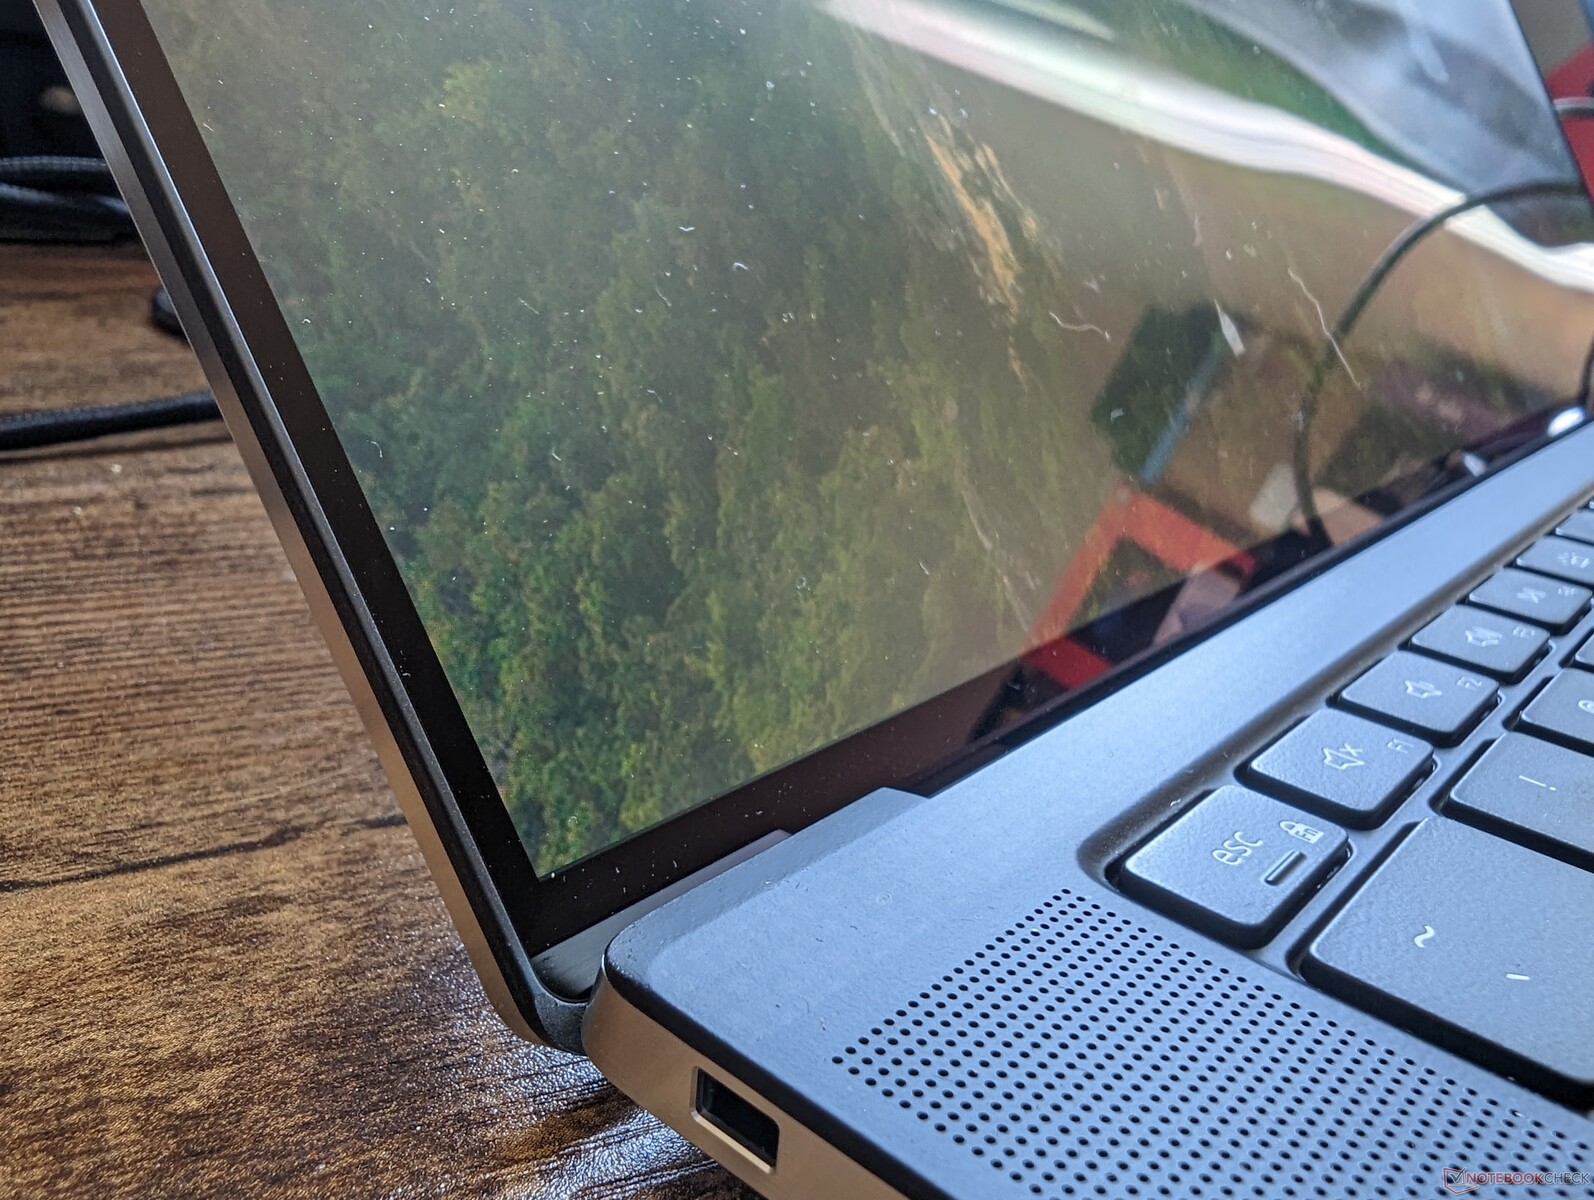
Gehäuse — Keine großen Änderungen seit dem XPS 15 9500


SD Card Reader
| SD Card Reader | |
| average JPG Copy Test (av. of 3 runs) | |
| Dell XPS 15 9500 Core i7 4K UHD (Toshiba Exceria Pro SDXC 64 GB UHS-II) | |
| Gigabyte Aero 15 OLED XD (AV PRO microSD 128 GB V60) | |
| Dell XPS 15 9520 RTX 3050 Ti (Toshiba Exceria Pro SDXC 64 GB UHS-II) | |
| Dell XPS 15 9530 RTX 4070 (Toshiba Exceria Pro SDXC 64 GB UHS-II) | |
| Asus Zenbook Pro 15 OLED UM535Q (Toshiba Exceria Pro SDXC 64 GB UHS-II) | |
| MSI Prestige 15 A12UD-093 (AV Pro SD microSD 128 GB V60) | |
| maximum AS SSD Seq Read Test (1GB) | |
| Dell XPS 15 9500 Core i7 4K UHD (Toshiba Exceria Pro SDXC 64 GB UHS-II) | |
| Gigabyte Aero 15 OLED XD (AV PRO microSD 128 GB V60) | |
| Dell XPS 15 9530 RTX 4070 (Toshiba Exceria Pro SDXC 64 GB UHS-II) | |
| Dell XPS 15 9520 RTX 3050 Ti (Toshiba Exceria Pro SDXC 64 GB UHS-II) | |
| MSI Prestige 15 A12UD-093 (AV Pro SD microSD 128 GB V60) | |
| Asus Zenbook Pro 15 OLED UM535Q (Toshiba Exceria Pro SDXC 64 GB UHS-II) | |
Kommunikation
Das Gerät ist standardmäßig mit einem Intel AX211-Modul ausgestattet, das Wi-Fi 6E und Bluetooth 5.2 unterstützt. Wir konnten uns ohne Probleme mit unserem Asus AXE11000-Wi-Fi-6-Netz verbinden, allerdings erkannte der Laptop merkwürdigerweise unser 6-GHz-Wi-Fi-6E-Netz nicht und konnte sich damit nicht verbinden. Andere Geräte, wie etwa das Pixel 7 Pro, die Wi-Fi 6E unterstützen, hatten keine Probleme, das 6-GHz-Netzwerk zu erkennen und sich damit zu verbinden.
| Networking | |
| iperf3 transmit AX12 | |
| Gigabyte Aero 15 OLED XD | |
| Dell XPS 15 9500 Core i7 4K UHD | |
| Asus Zenbook Pro 15 OLED UM535Q | |
| iperf3 receive AX12 | |
| Dell XPS 15 9500 Core i7 4K UHD | |
| Gigabyte Aero 15 OLED XD | |
| Asus Zenbook Pro 15 OLED UM535Q | |
| iperf3 transmit AXE11000 | |
| Dell XPS 15 9530 RTX 4070 | |
| Dell XPS 15 9520 RTX 3050 Ti | |
| MSI Prestige 15 A12UD-093 | |
| iperf3 receive AXE11000 | |
| Dell XPS 15 9520 RTX 3050 Ti | |
| Dell XPS 15 9530 RTX 4070 | |
| MSI Prestige 15 A12UD-093 | |
| iperf3 transmit AXE11000 6GHz | |
| MSI Prestige 15 A12UD-093 | |
| iperf3 receive AXE11000 6GHz | |
| MSI Prestige 15 A12UD-093 | |
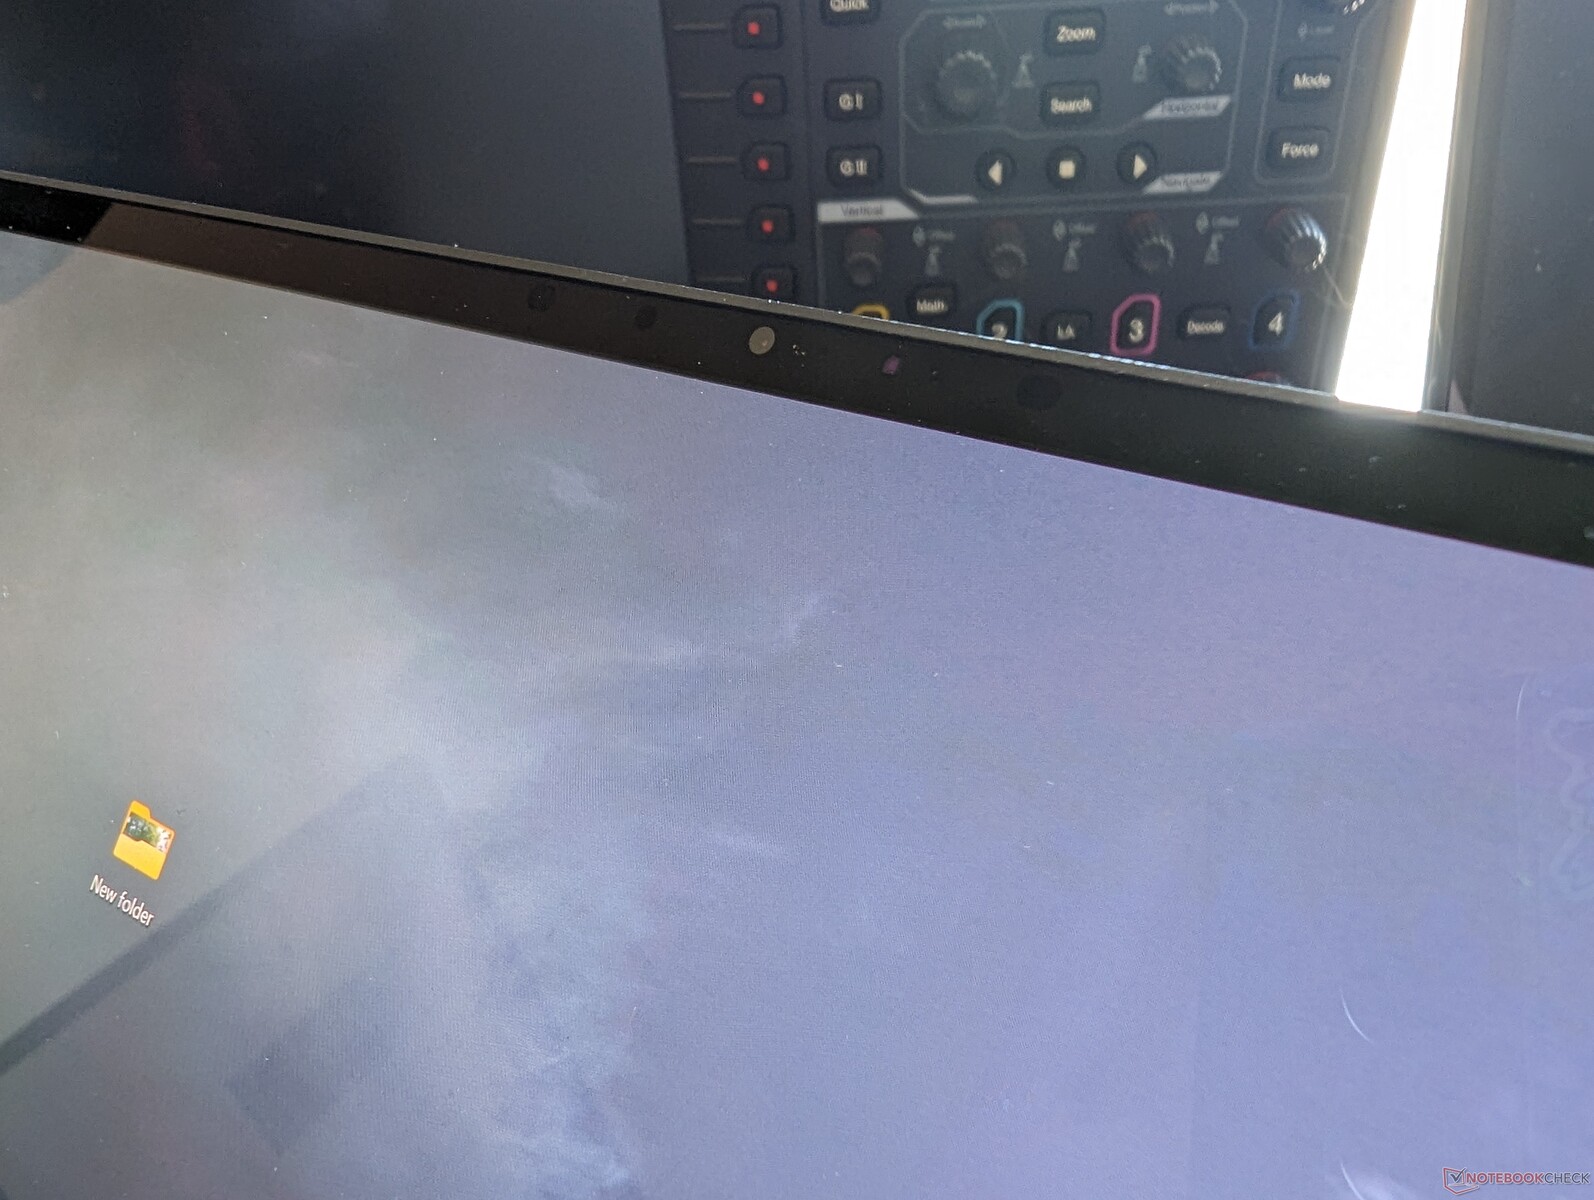
Webcam — Die 1-MP-Auflösung wird langsam peinlich
Das neueste XPS 15 verlässt sich *immer noch* auf eine Webcam mit nur 1-MP/720p-Auflösung und ohne Privacy Shutter — trotz seines Kaufpreises von >$2000. Mitstreiter wie das HP Spectre x360 16 oder die Razer-Blade-Serie setzen bereits Sensoren mit 2 bzw. sogar 5 MP ein. Die Bildqualität wirkt auf dem ansonsten schönen OLED-Display dadurch natürlich sehr unscharf. Immerhin ist die Infrarotfunktion vorhanden.
Dell behauptet, die schwach auflösende Webcam sei eine Konsequenz des besonders schmalen Laptoprands. Um eine Webcam mit besserer Auflösung aufzunehmen, müsste diesen Bildschirmrand angeblich breiter ausfallen.


Wartung
Zubehör und Garantie
Dell versendet weiterhin mit jedem Gerät einen nützlichen USB-C-auf-USB-A- und HDMI-Adapter. Es gilt die übliche einjährige Herstellergarantie.
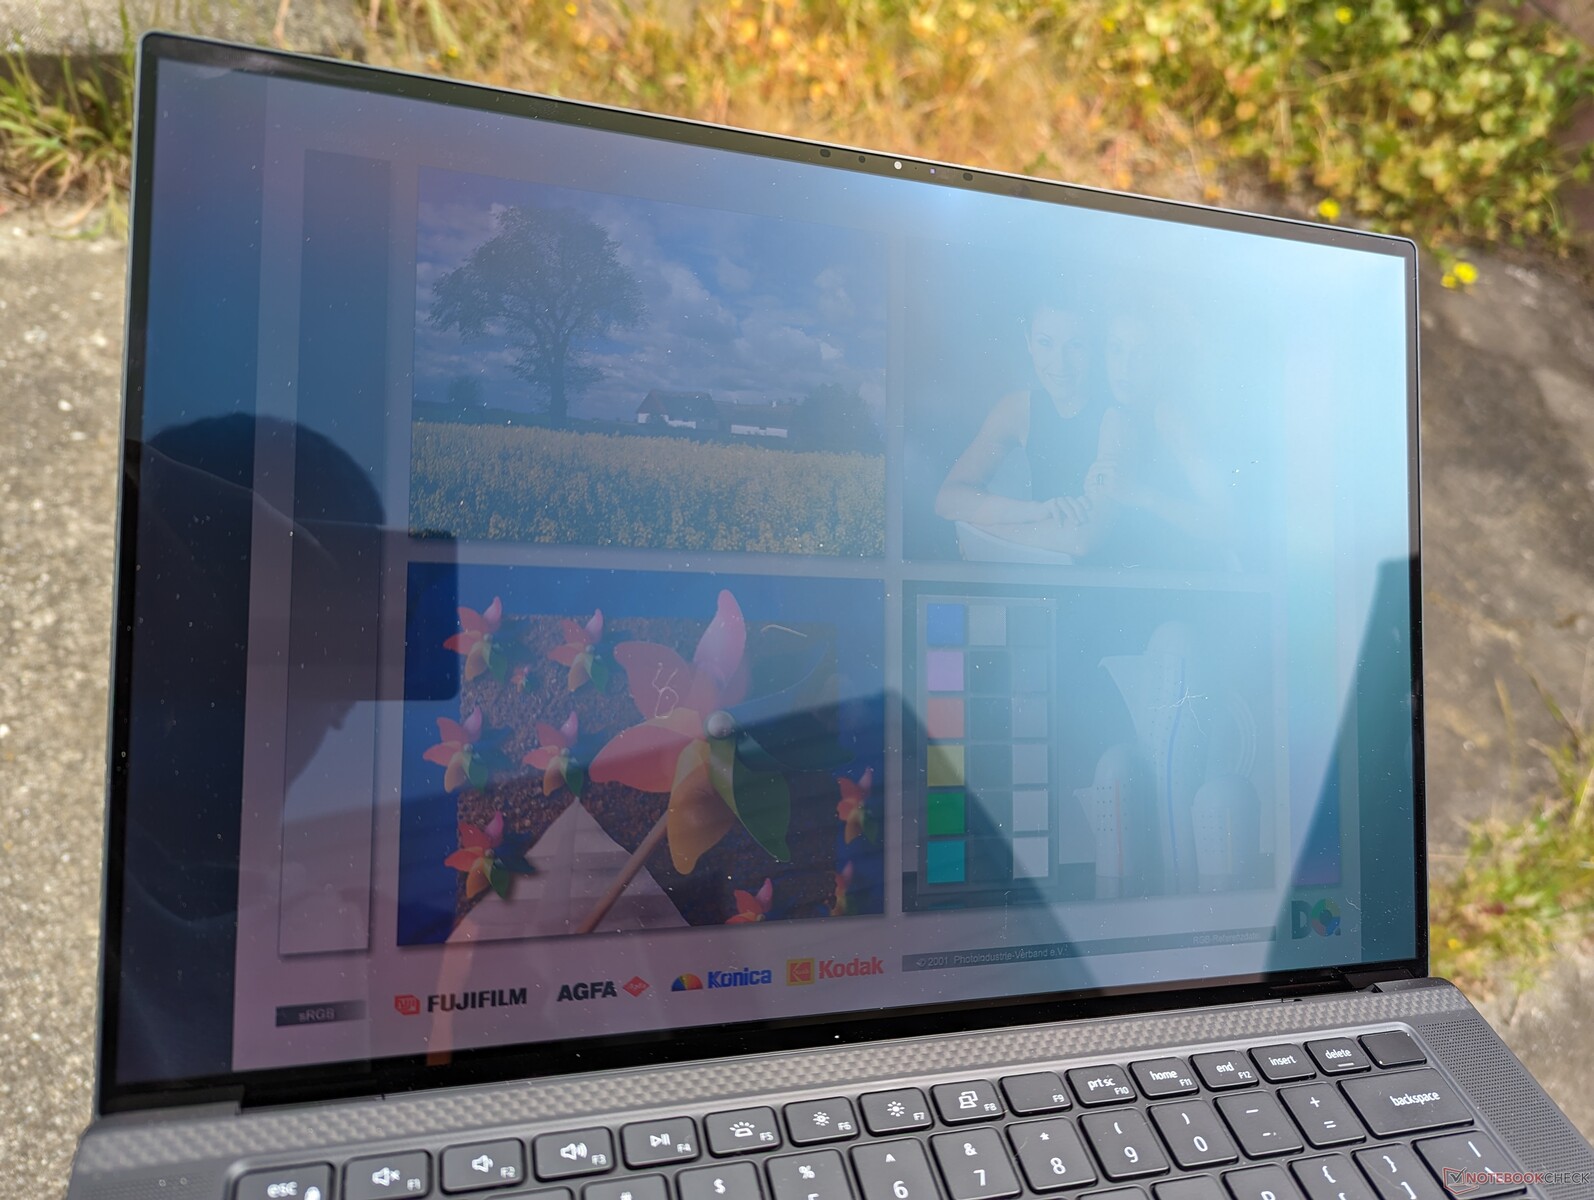
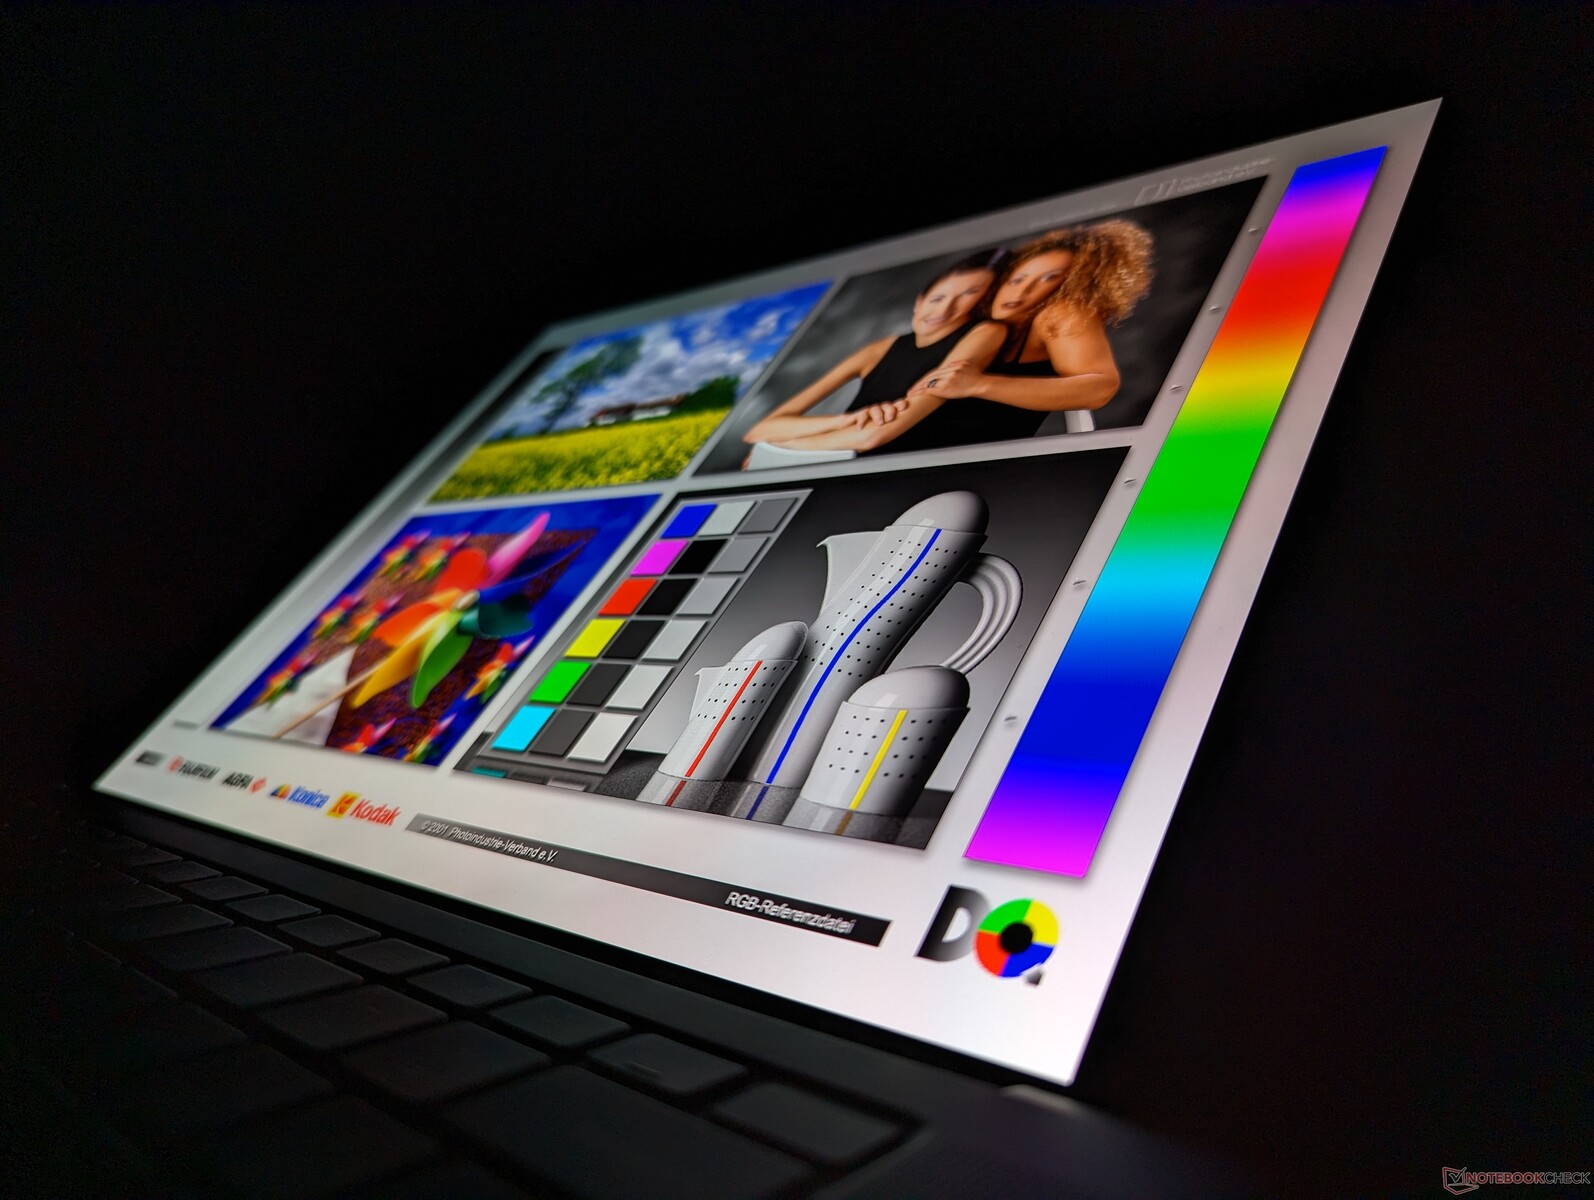
Display — 3,5K-Samsung-OLED sieht immer noch toll aus

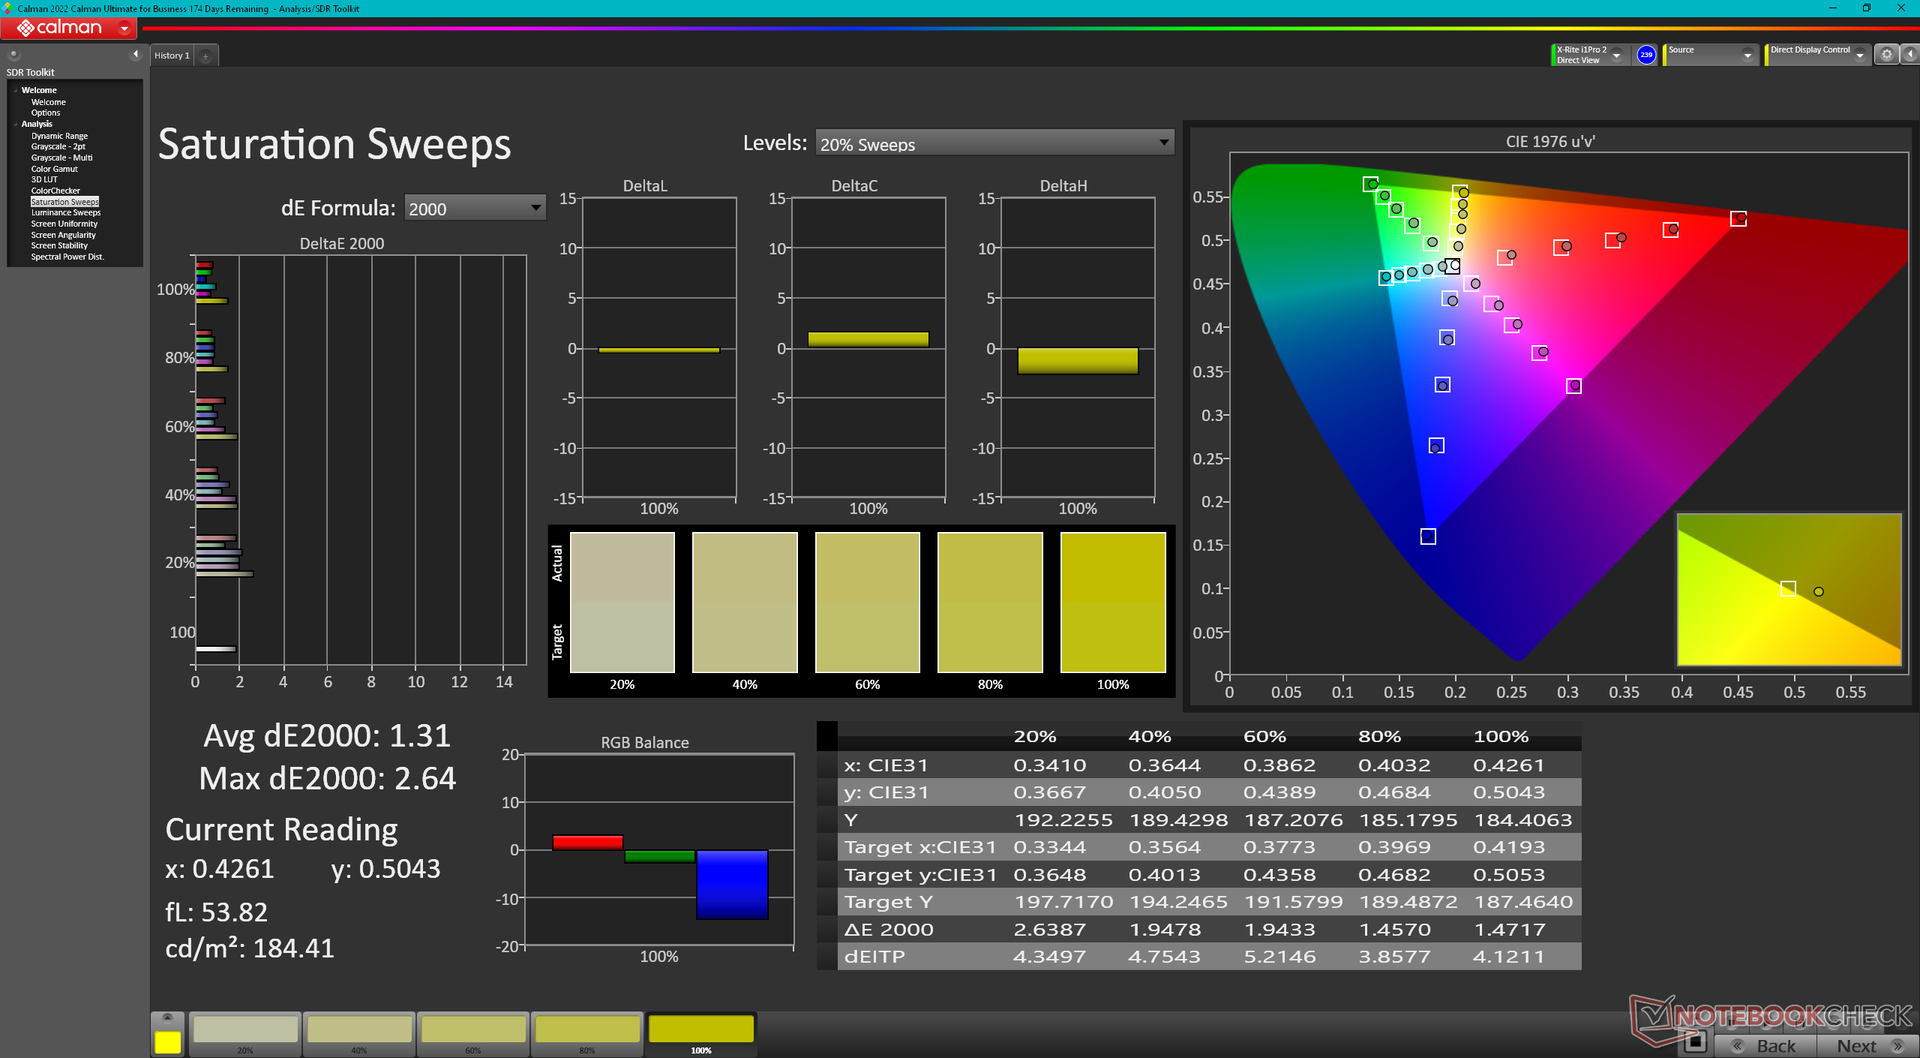
Dell verwendet für sein 2023er Modell das gleiche Samsung-156XG01-OLED-Panel wie im 2022er XPS 15. Das Nutzererlebnis der beiden Geräte ist sehr ähnlich. Das ist nicht unbedingt schlecht, denn das Samsung-Panel deckt den DCI-P3-Farbraum vollständig ab und bietet ein scharfes Bild, dennoch hätten wir uns über eine Displayoption mit 90+-Hz-Bildwiederholrate gefreut. Manche Asus-VivoBook-Modelle sind etwa mit einem 120-Hz-OLED-Panel ausgestattet, was ein noch flüssigeres visuelles Erlebnis ermöglicht.
| |||||||||||||||||||||||||
Ausleuchtung: 98 %
Helligkeit Akku: 389.5 cd/m²
Kontrast: ∞:1 (Schwarzwert: 0 cd/m²)
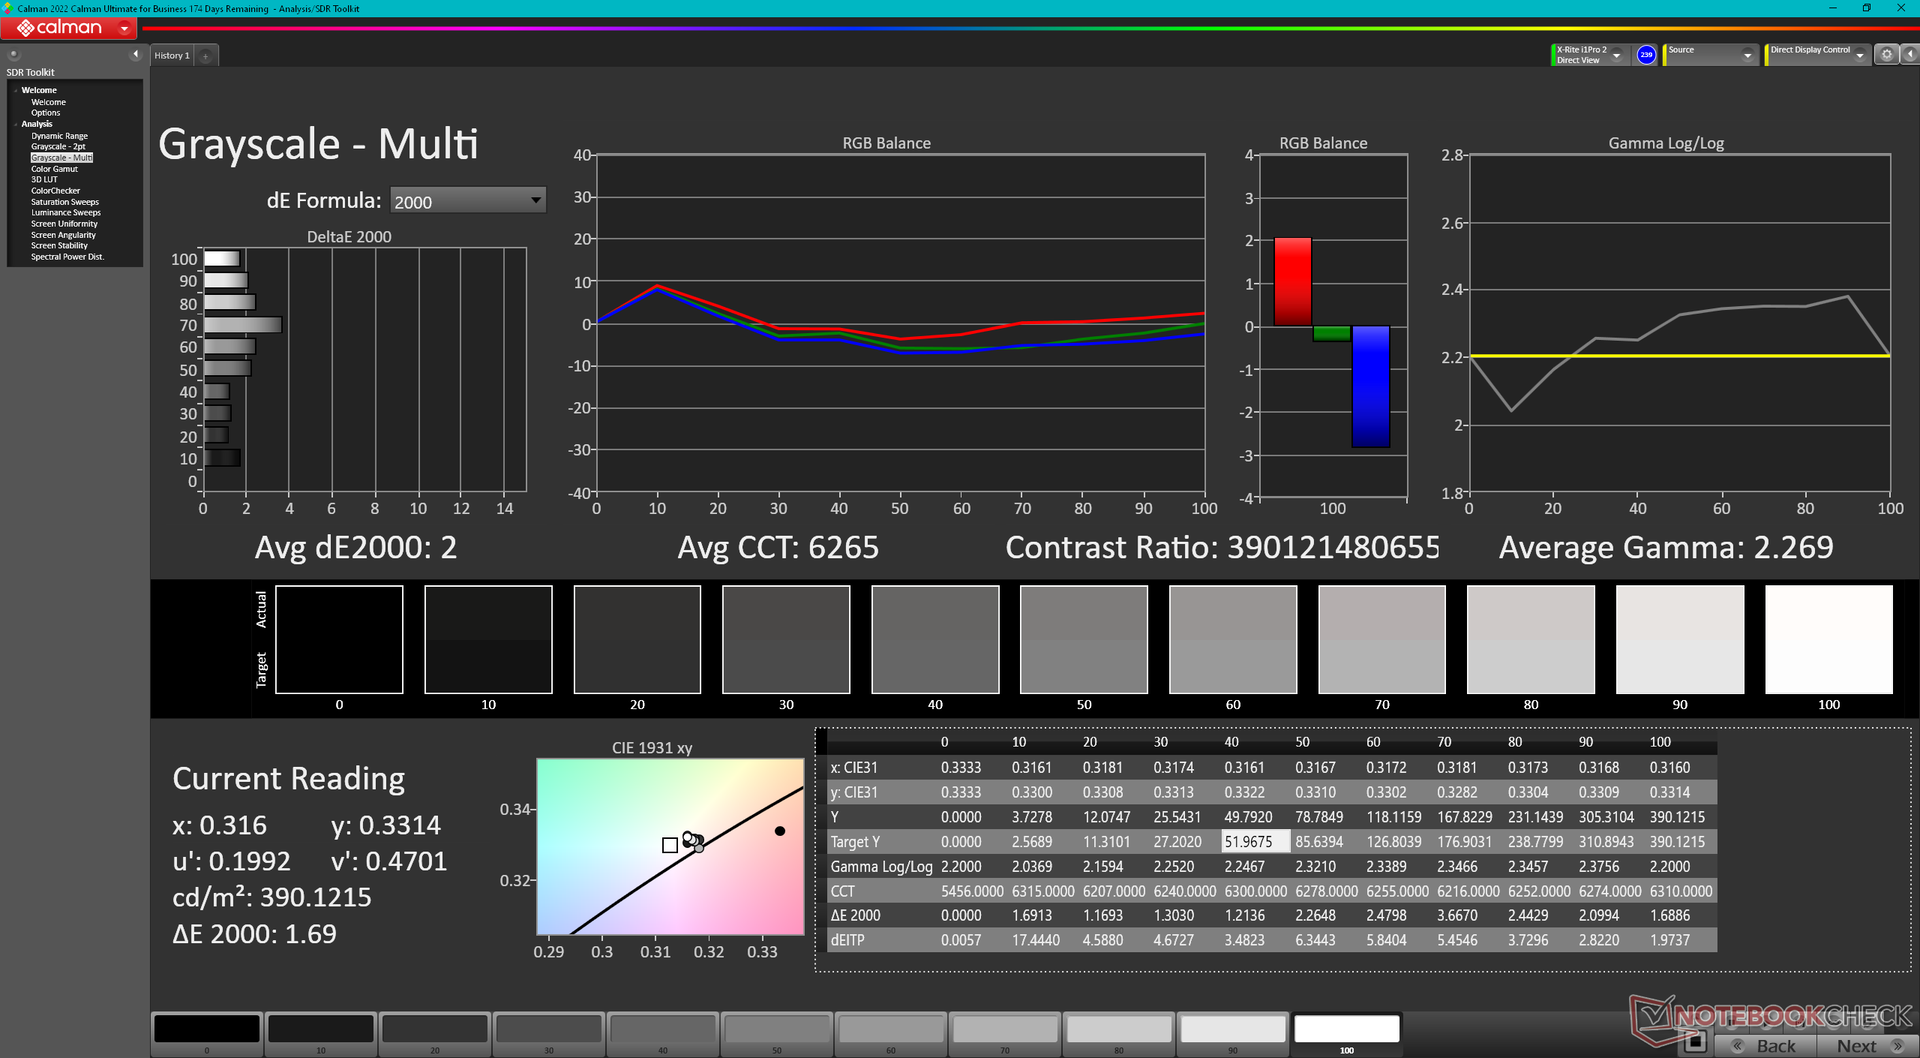
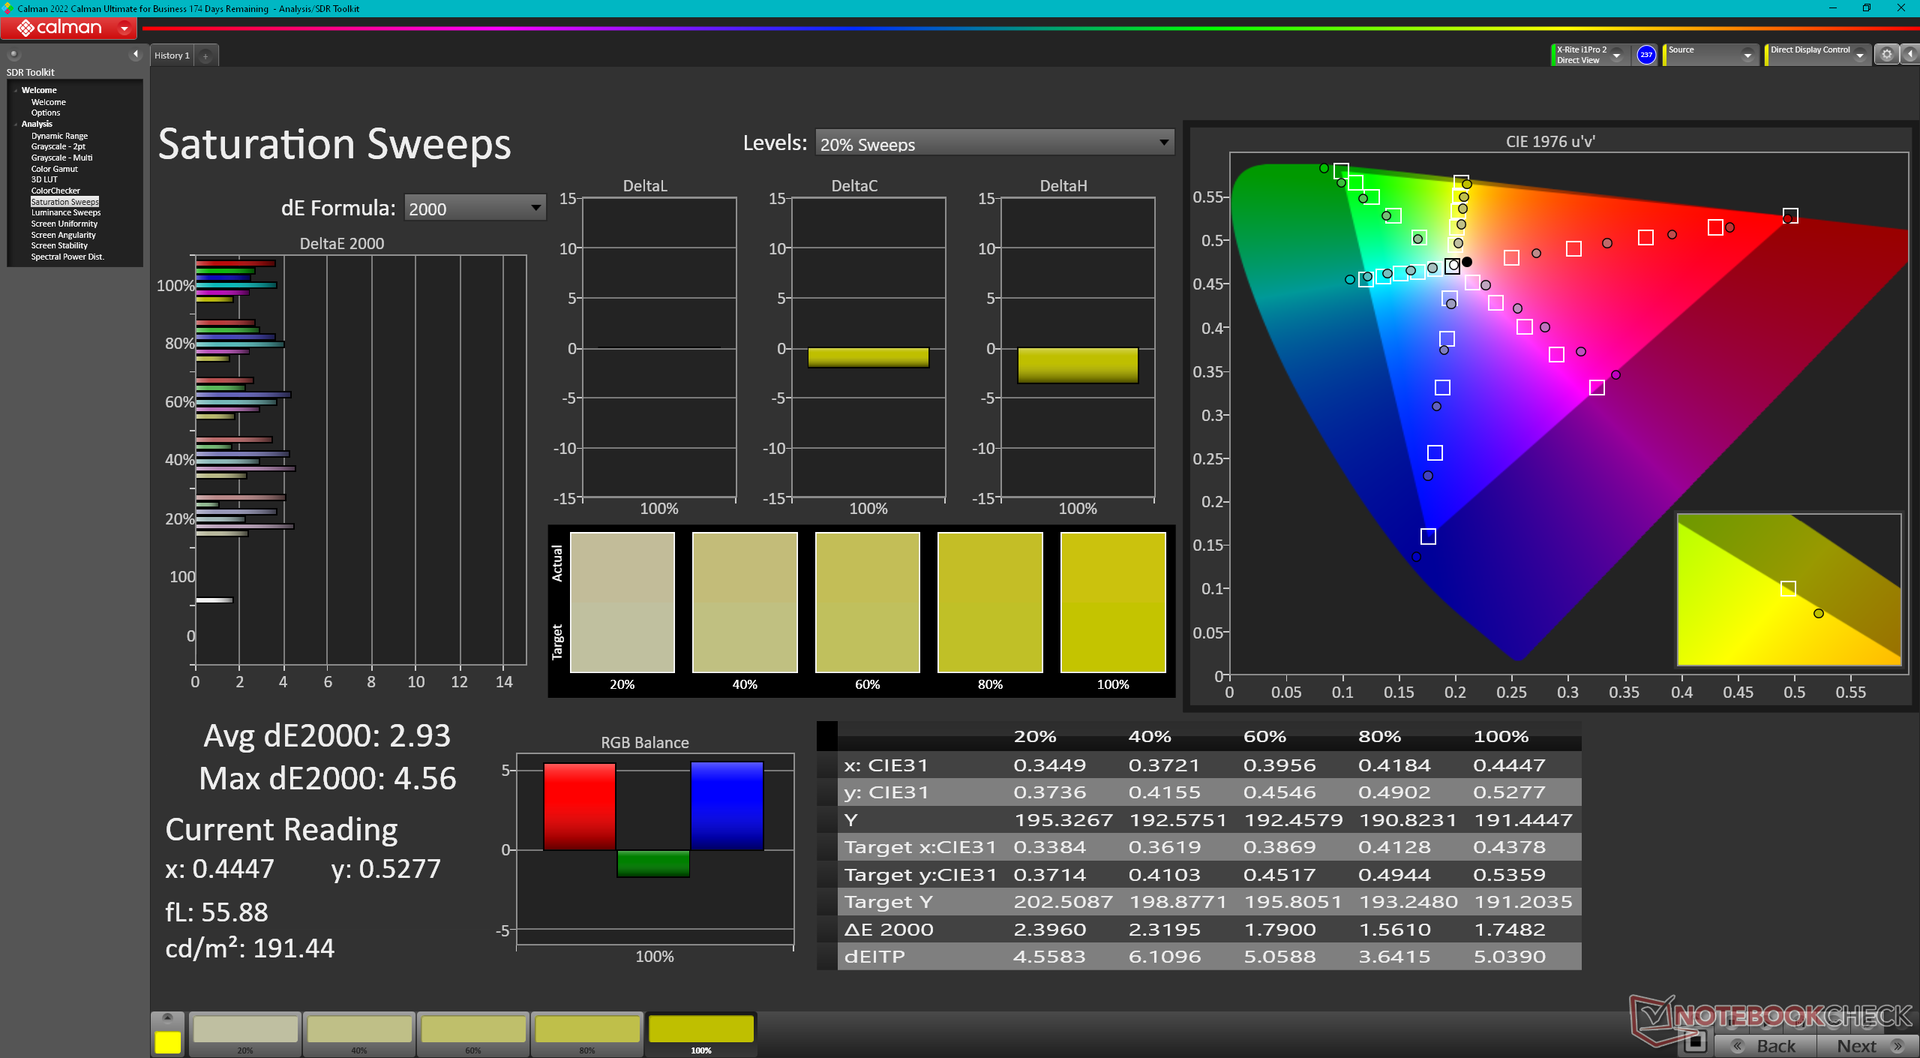
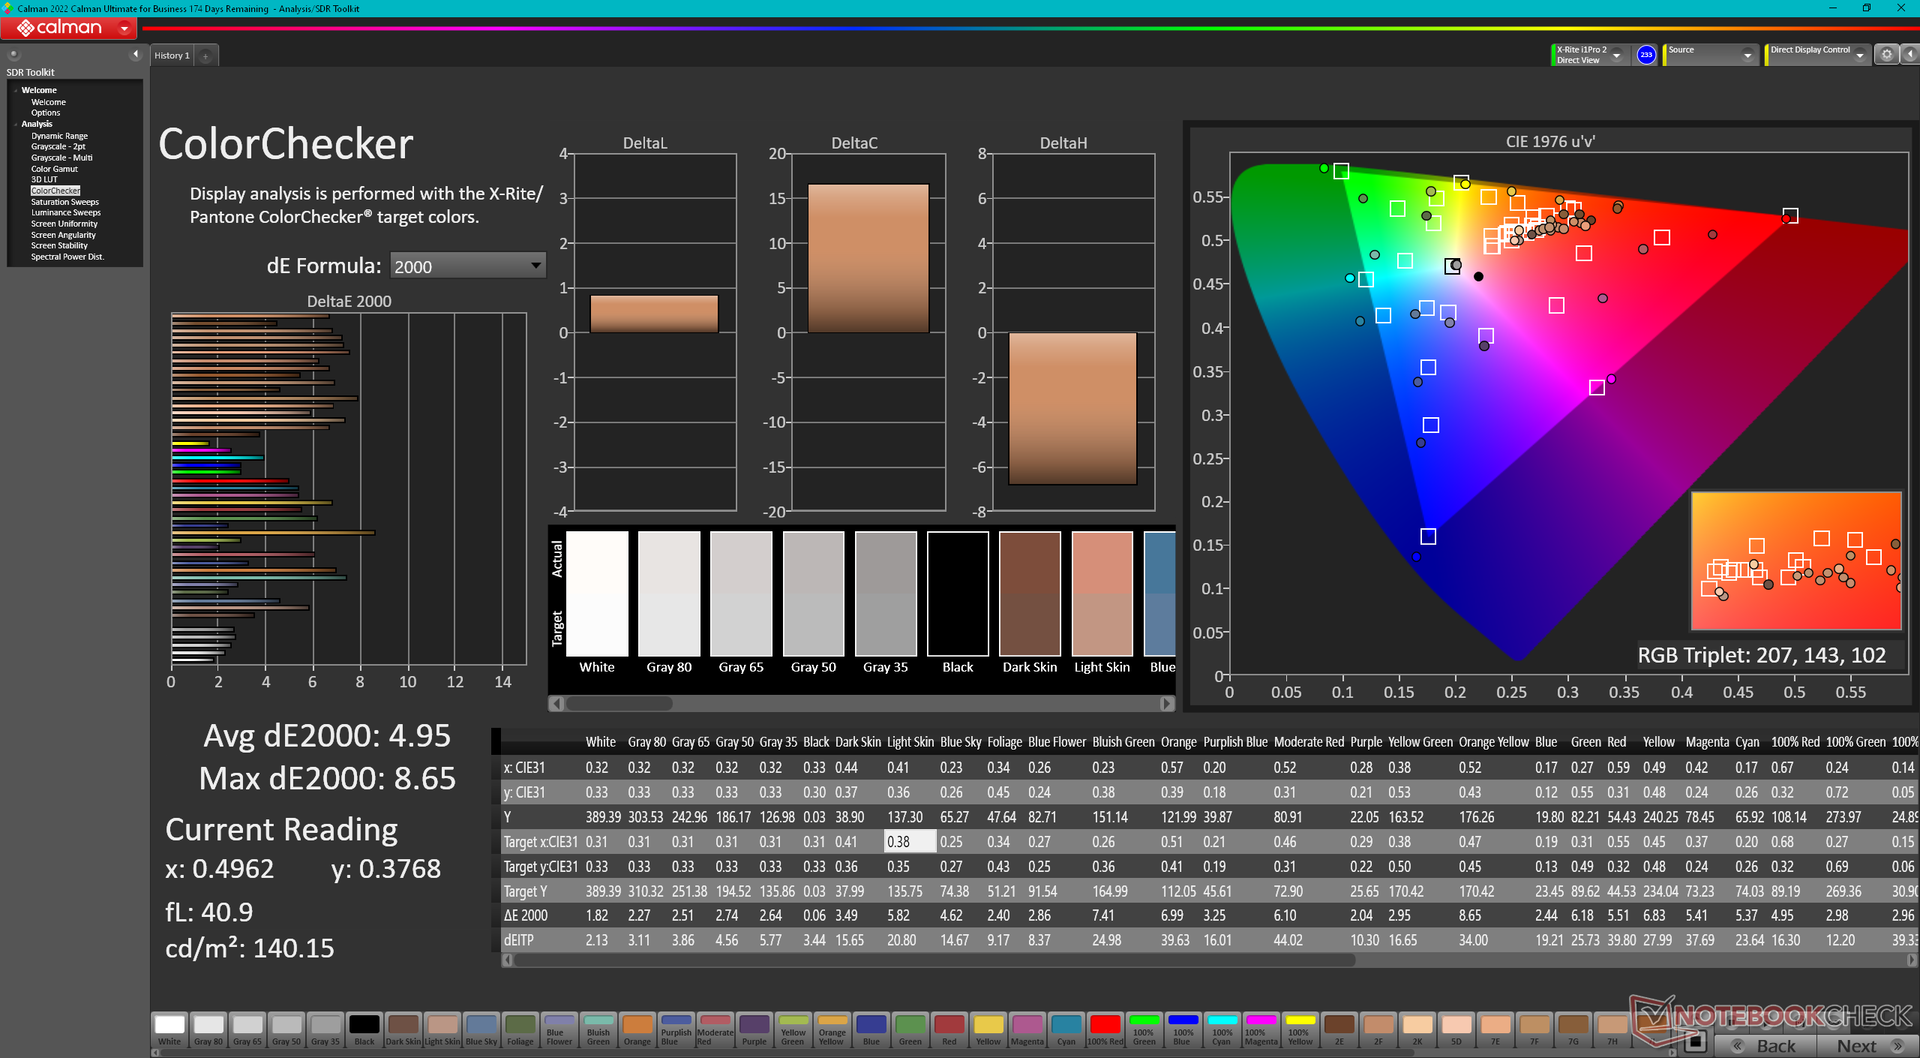
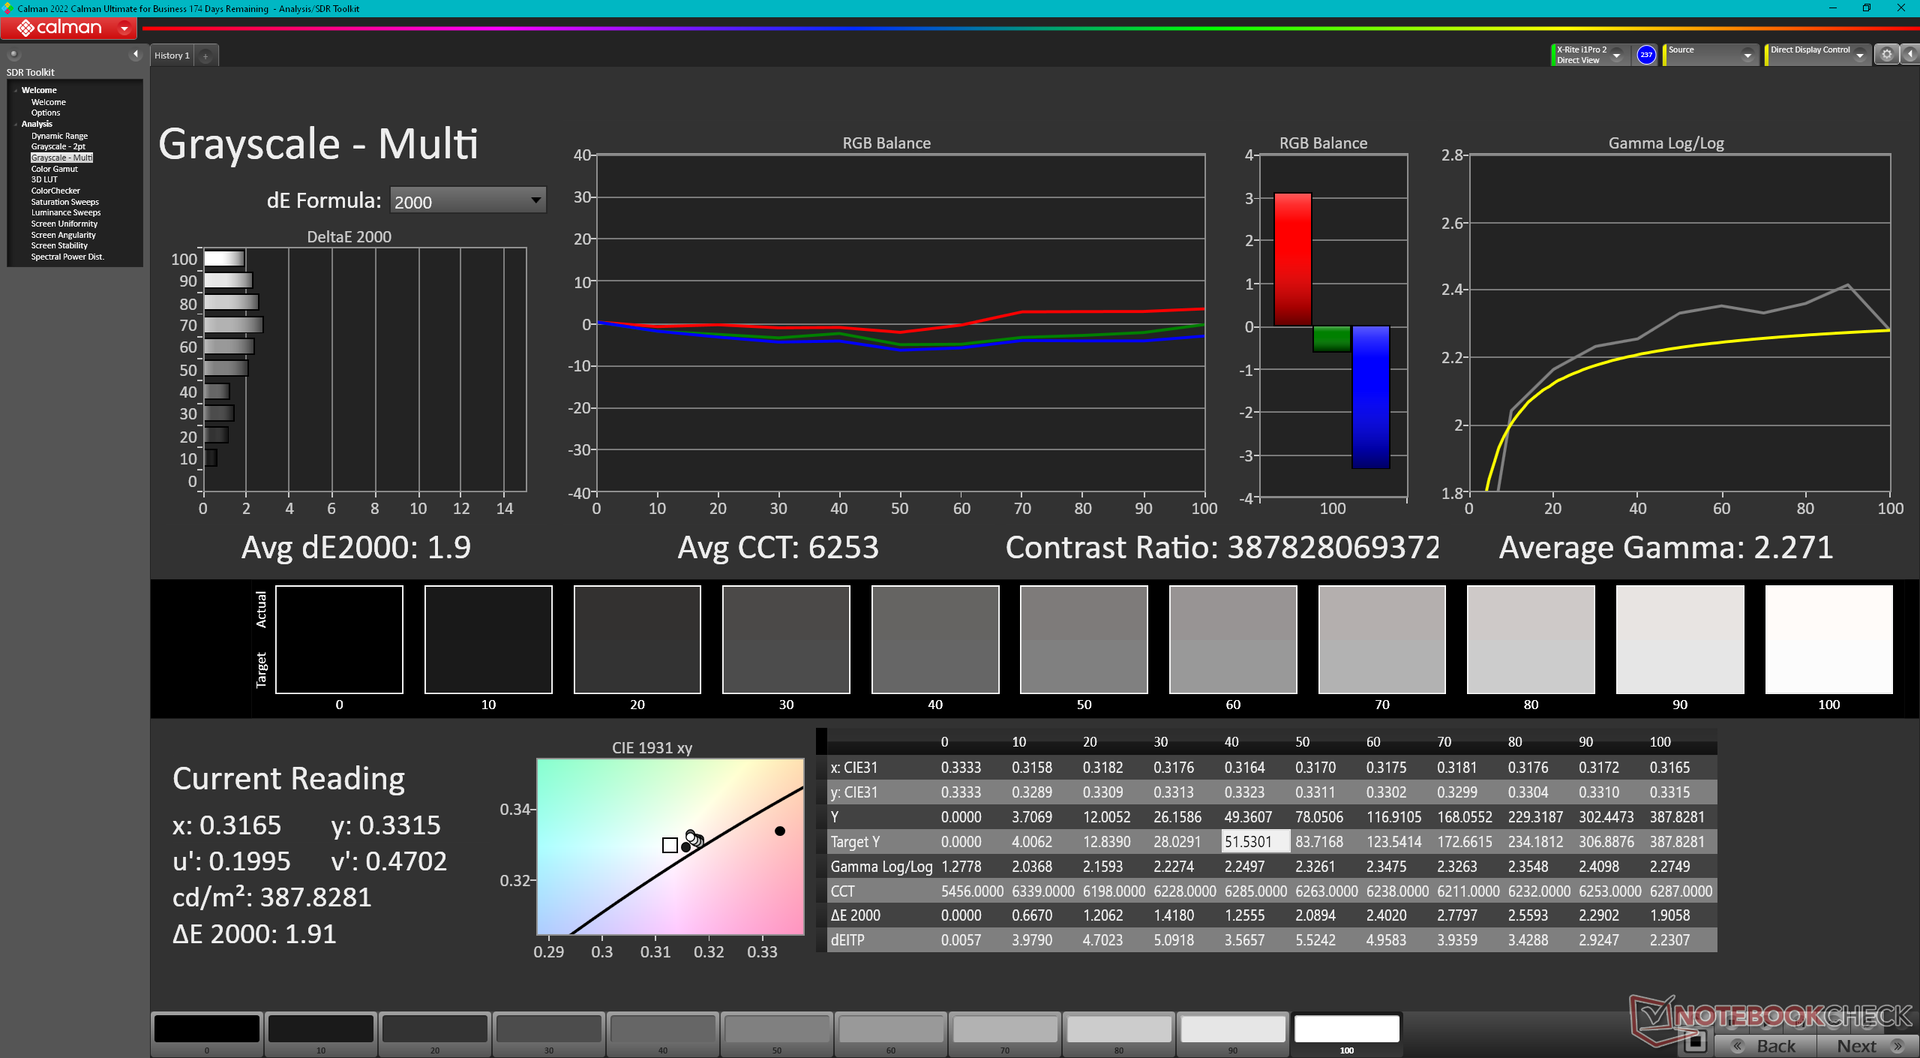
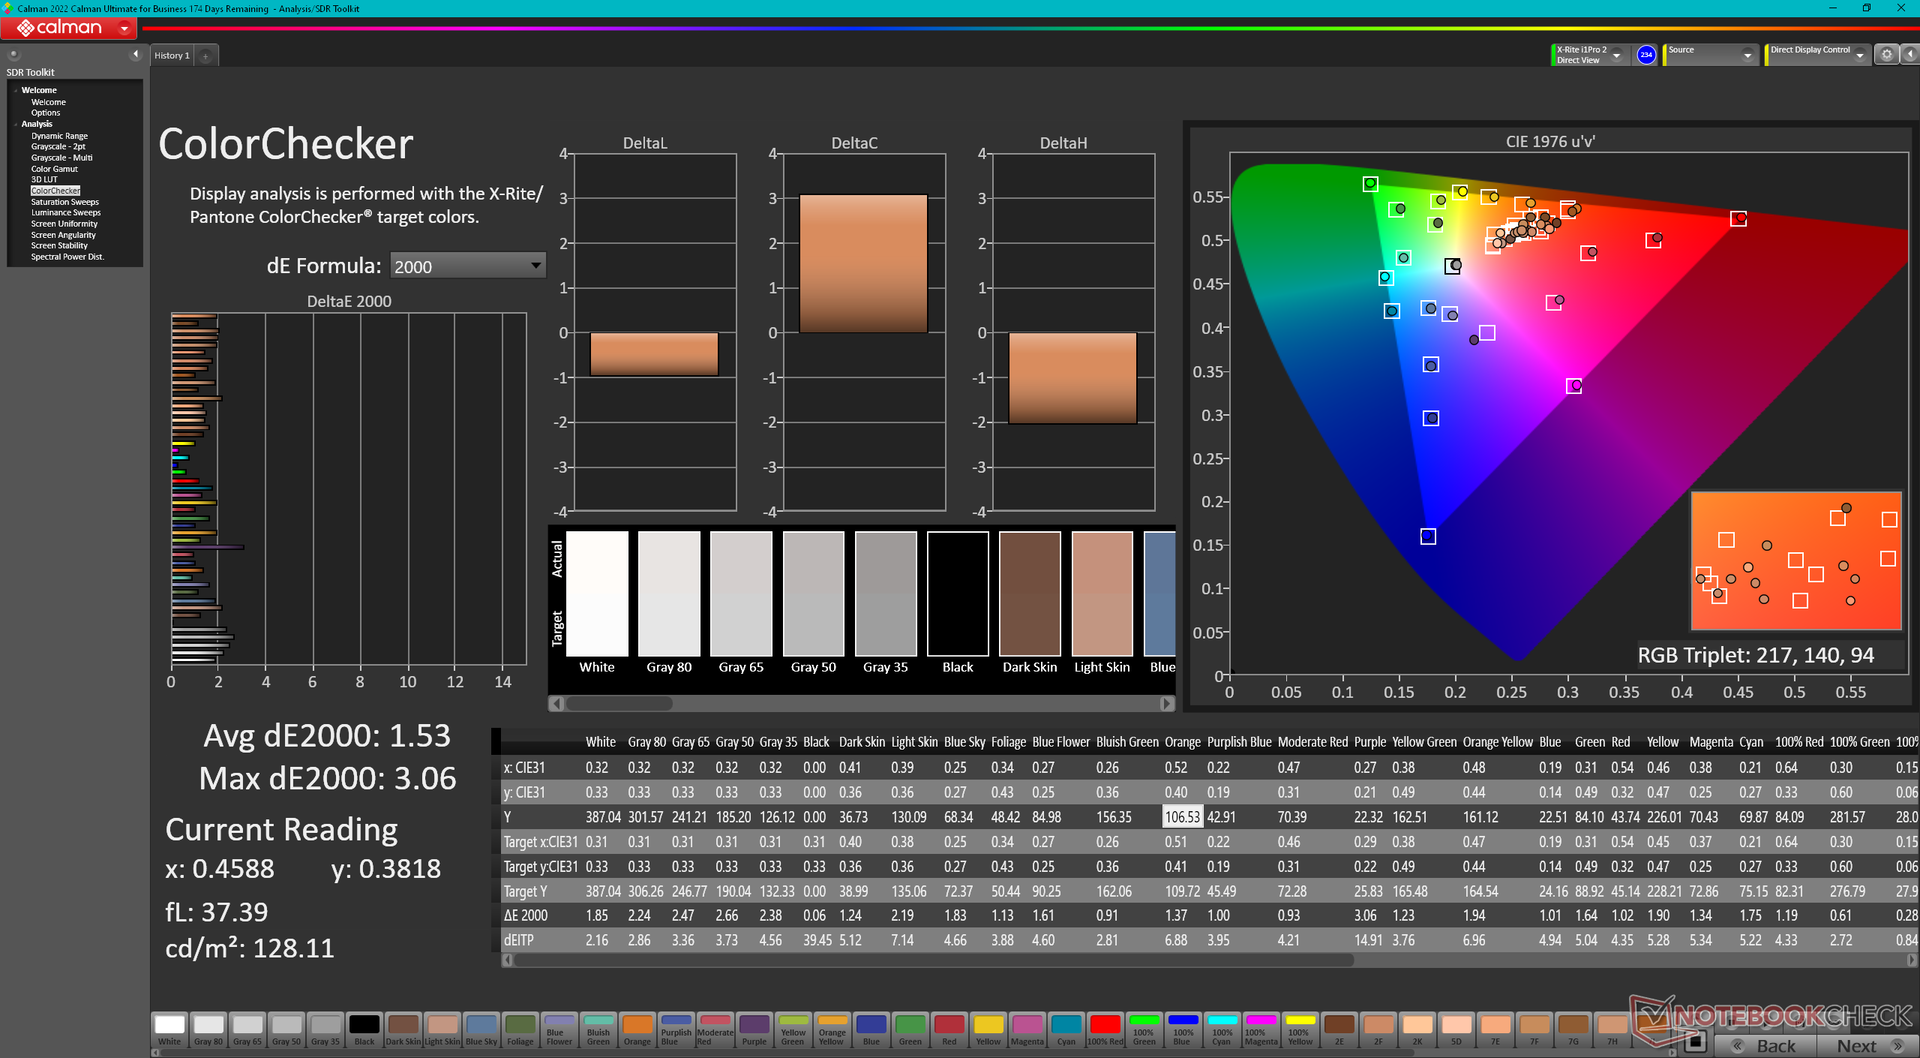
ΔE Color 4.95 | 0.5-29.43 Ø5, calibrated: 1.53
ΔE Greyscale 2 | 0.57-98 Ø5.3
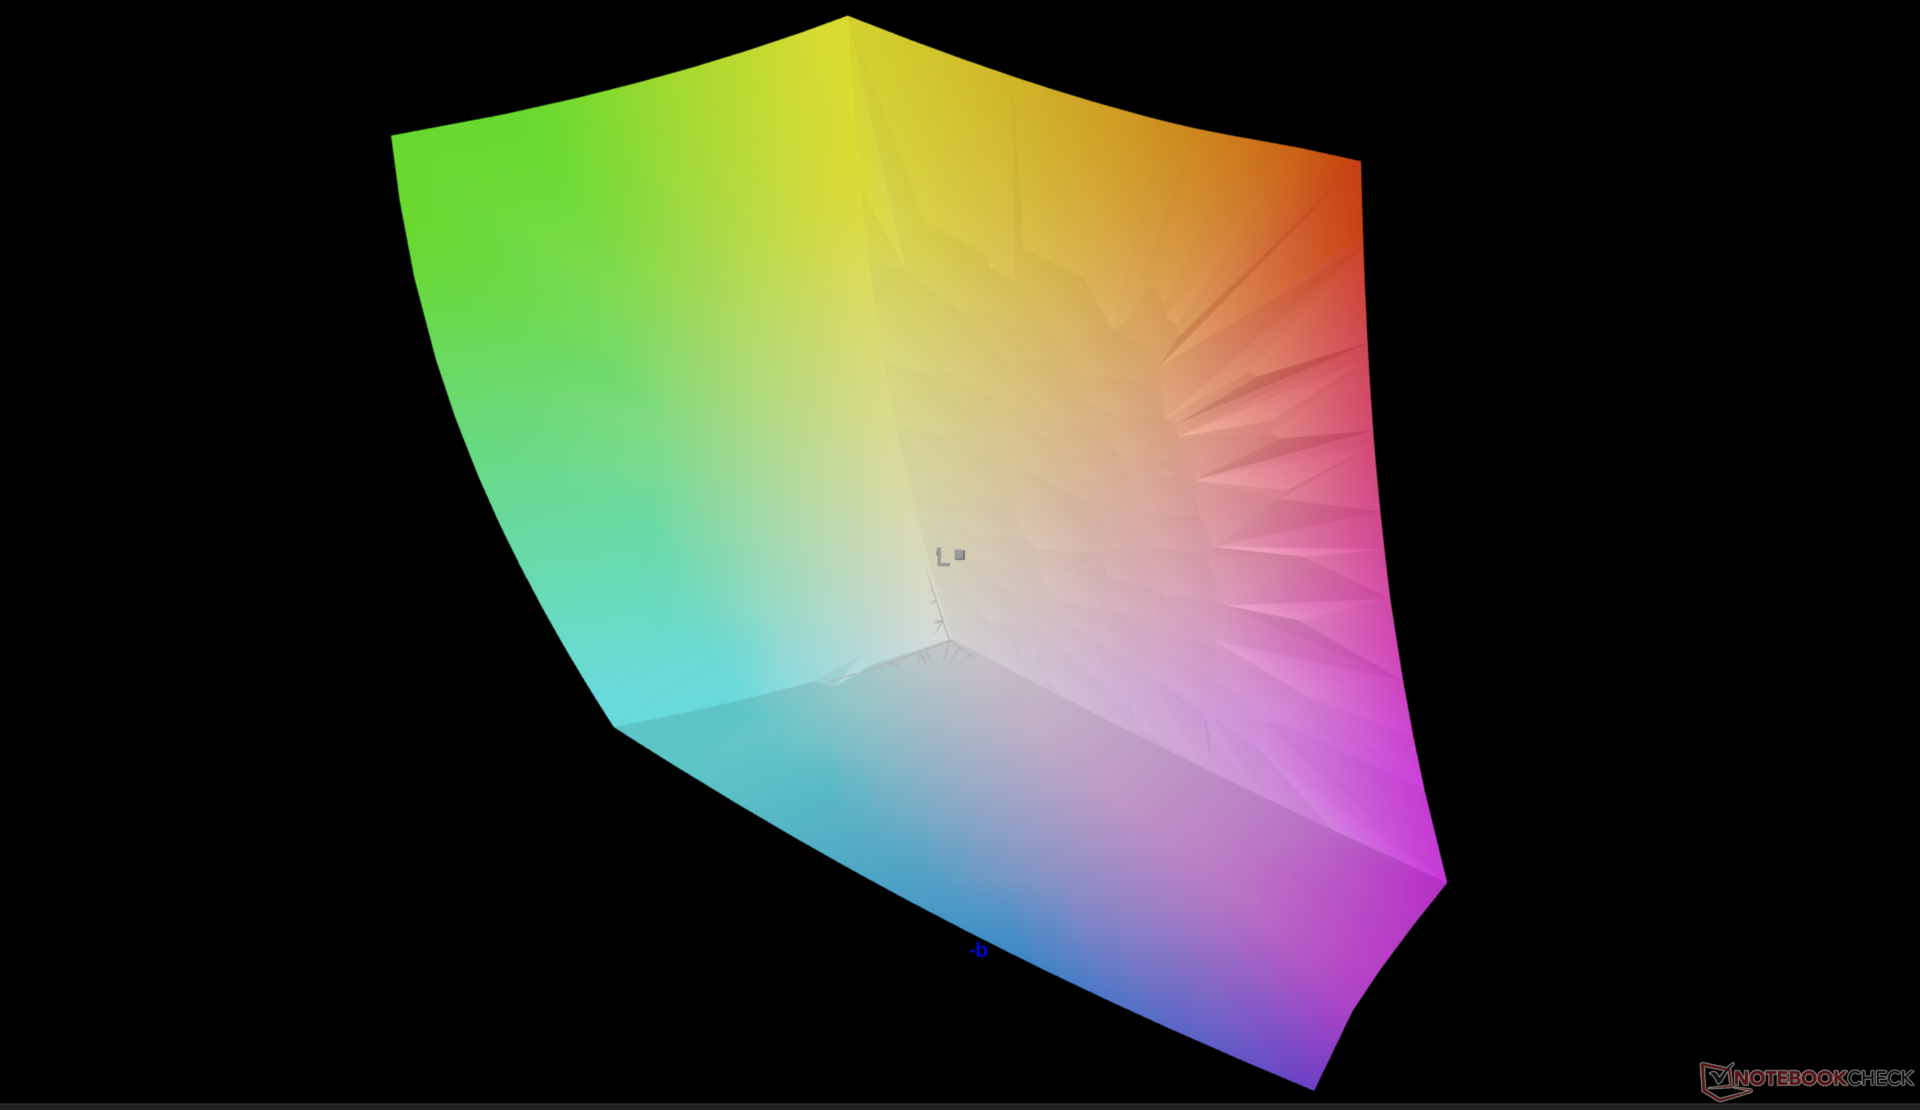
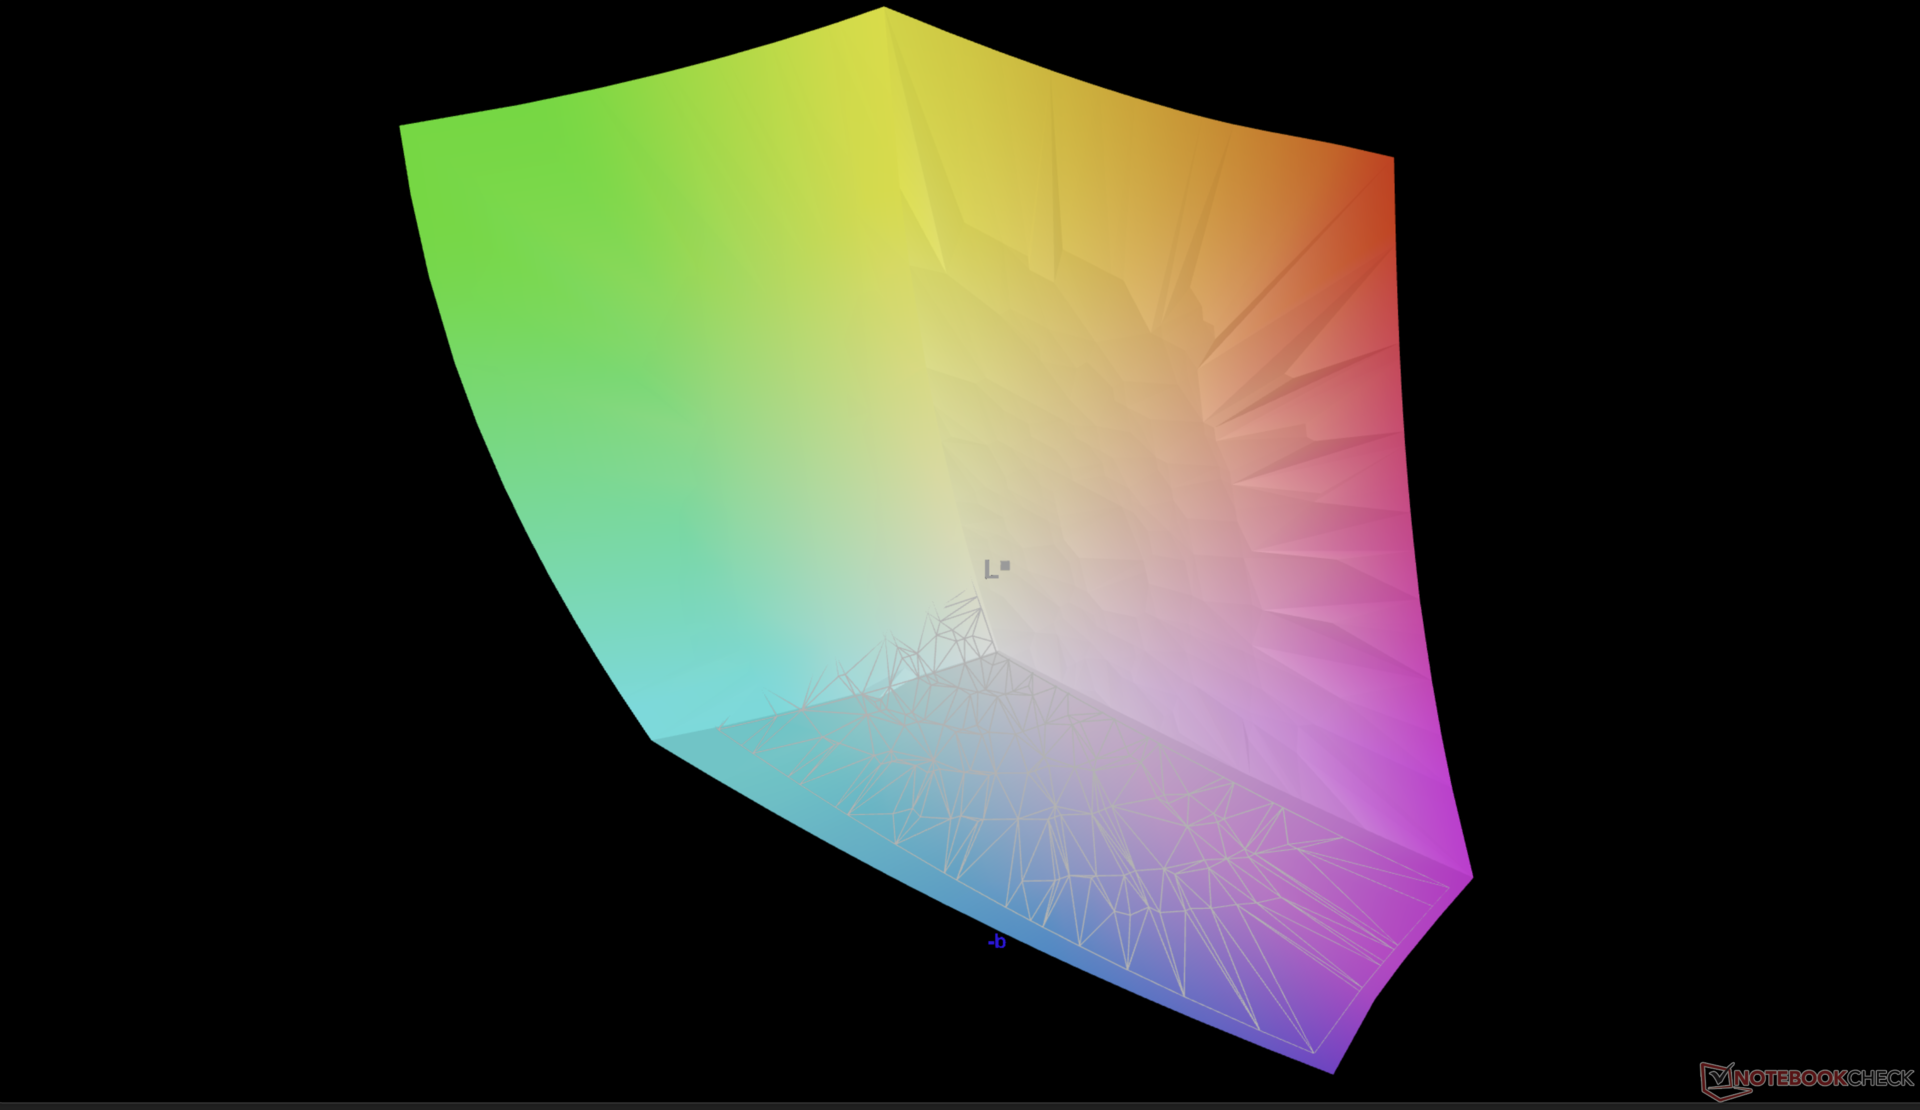
98.4% AdobeRGB 1998 (Argyll 2.2.0 3D)
100% sRGB (Argyll 2.2.0 3D)
99.8% Display P3 (Argyll 2.2.0 3D)
Gamma: 2.27
| Dell XPS 15 9530 RTX 4070 Samsung 156XG01, OLED, 3456x2160, 15.60 | Dell XPS 15 9520 RTX 3050 Ti Samsung 156XG01, OLED, 3456x2160, 15.60 | Dell XPS 15 9500 Core i7 4K UHD Sharp LQ156R1, IPS, 3840x2400, 15.60 | Asus Zenbook Pro 15 OLED UM535Q Samsung ATNA56YX03-0, OLED, 1920x1080, 15.60 | MSI Prestige 15 A12UD-093 Sharp LQ156D1JW42, IPS, 3840x2160, 15.60 | Gigabyte Aero 15 OLED XD Samsung SDC4143, OLED, 3840x2160, 15.60 | |
|---|---|---|---|---|---|---|
| Display | -5% | -3% | -12% | -9% | 0% | |
| Display P3 Coverage | 99.8 | 97.8 -2% | 89.7 -10% | 79.3 -21% | 80.48 -19% | 99.9 0% |
| sRGB Coverage | 100 | 99.9 0% | 100 0% | 95.6 -4% | 96.95 -3% | 100 0% |
| AdobeRGB 1998 Coverage | 98.4 | 86 -13% | 99.8 1% | 87.3 -11% | 94.02 -4% | 99.5 1% |
| Response Times | -29% | -2363% | -40% | -2088% | -23% | |
| Response Time Grey 50% / Grey 80% * | 1.68 ? | 1.9 ? -13% | 54 ? -3114% | 2.1 ? -25% | 51 ? -2936% | 2.8 ? -67% |
| Response Time Black / White * | 1.94 ? | 1.9 ? 2% | 33.2 ? -1611% | 2.3 ? -19% | 26 ? -1240% | 2 ? -3% |
| PWM Frequency | 239 | 59.52 ? -75% | 60.2 -75% | 240 ? 0% | ||
| Bildschirm | -0% | -17% | 13% | 18% | 7% | |
| Helligkeit Bildmitte | 389.5 | 381.4 -2% | 557.9 43% | 342.9 -12% | 441 13% | 440 13% |
| Brightness | 392 | 384 -2% | 541 38% | 346 -12% | 416 6% | 446 14% |
| Brightness Distribution | 98 | 95 -3% | 91 -7% | 98 0% | 85 -13% | 92 -6% |
| Schwarzwert * | 0.39 | 0.155 | 0.04 | |||
| Delta E Colorchecker * | 4.95 | 4.34 12% | 4.54 8% | 2.42 51% | 1.51 69% | 2.53 49% |
| Colorchecker dE 2000 max. * | 8.65 | 9.24 -7% | 7.92 8% | 4.05 53% | 3.56 59% | 7.82 10% |
| Colorchecker dE 2000 calibrated * | 1.53 | 3.82 -150% | 2.57 -68% | |||
| Delta E Graustufen * | 2 | 2 -0% | 3.2 -60% | 2.1 -5% | 2.49 -25% | 1.2 40% |
| Gamma | 2.27 97% | 2.13 103% | 1.99 111% | 2.21 100% | 2.17 101% | 2.206 100% |
| CCT | 6265 104% | 6210 105% | 6451 101% | 6364 102% | 6292 103% | 6371 102% |
| Kontrast | 1431 | 2845 | 11000 | |||
| Farbraum (Prozent von AdobeRGB 1998) | 89.5 | |||||
| Color Space (Percent of sRGB) | 100 | |||||
| Durchschnitt gesamt (Programm / Settings) | -11% /
-9% | -794% /
-405% | -13% /
-7% | -693% /
-372% | -5% /
-1% |
* ... kleinere Werte sind besser
Das Panel ist bereits im Auslieferzustand gut kalibriert. Dennoch können Nutzer unser kalibriertes ICM-Profil nutzen, um die Farbgenauigkeit noch leicht zu verbessern. Dell hat die verschiedenen Farbprofile wie sRGB, AdobeRGB, DCI-P3, usw. endlich in das Windows-Display-Menü integriert, sodass Sie viel leichter zwischen einzelnen Profilen umschalten können.
Reaktionszeiten (Response Times) des Displays
| ↔ Reaktionszeiten Schwarz zu Weiß | ||
|---|---|---|
| 1.94 ms ... steigend ↗ und fallend ↘ kombiniert | ↗ 0.97 ms steigend | 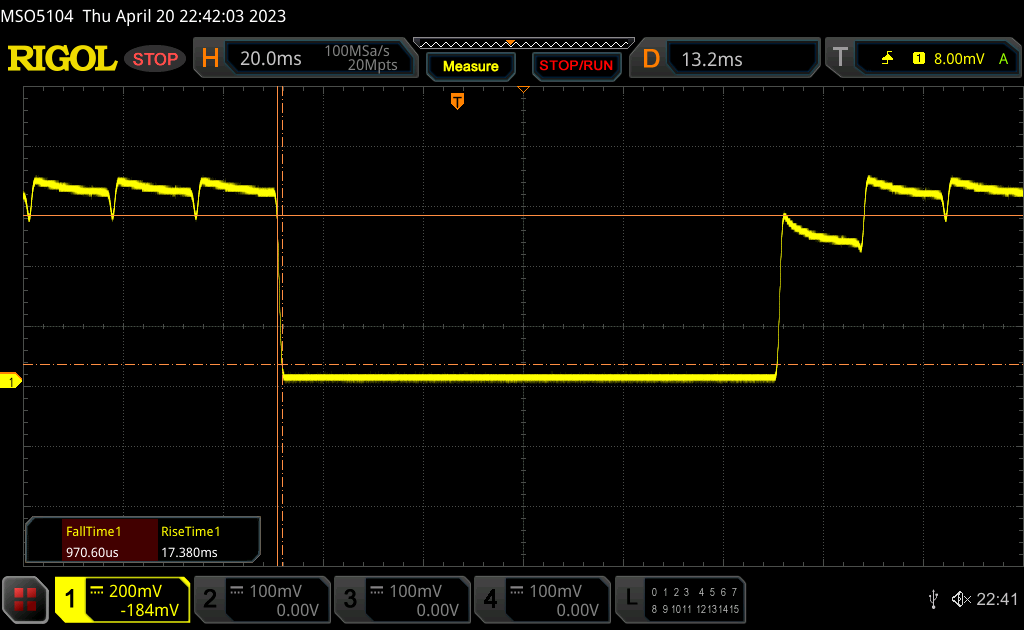 |
| ↘ 0.97 ms fallend | ||
| Die gemessenen Reaktionszeiten sind sehr kurz, wodurch sich der Bildschirm auch für schnelle 3D Spiele eignen sollte. Im Vergleich rangierten die bei uns getesteten Geräte von 0.1 (Minimum) zu 240 (Maximum) ms. » 6 % aller Screens waren schneller als der getestete. Daher sind die gemessenen Reaktionszeiten besser als der Durchschnitt aller vermessenen Geräte (21.5 ms). | ||
| ↔ Reaktionszeiten 50% Grau zu 80% Grau | ||
| 1.68 ms ... steigend ↗ und fallend ↘ kombiniert | ↗ 0.8 ms steigend | 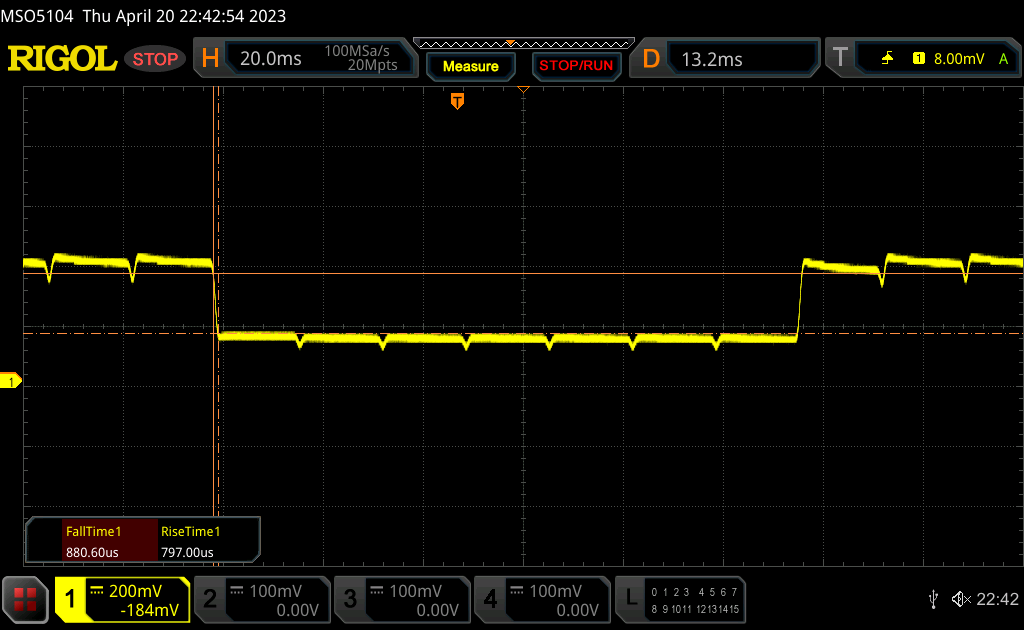 |
| ↘ 0.88 ms fallend | ||
| Die gemessenen Reaktionszeiten sind sehr kurz, wodurch sich der Bildschirm auch für schnelle 3D Spiele eignen sollte. Im Vergleich rangierten die bei uns getesteten Geräte von 0.2 (Minimum) zu 636 (Maximum) ms. » 4 % aller Screens waren schneller als der getestete. Daher sind die gemessenen Reaktionszeiten besser als der Durchschnitt aller vermessenen Geräte (33.7 ms). | ||
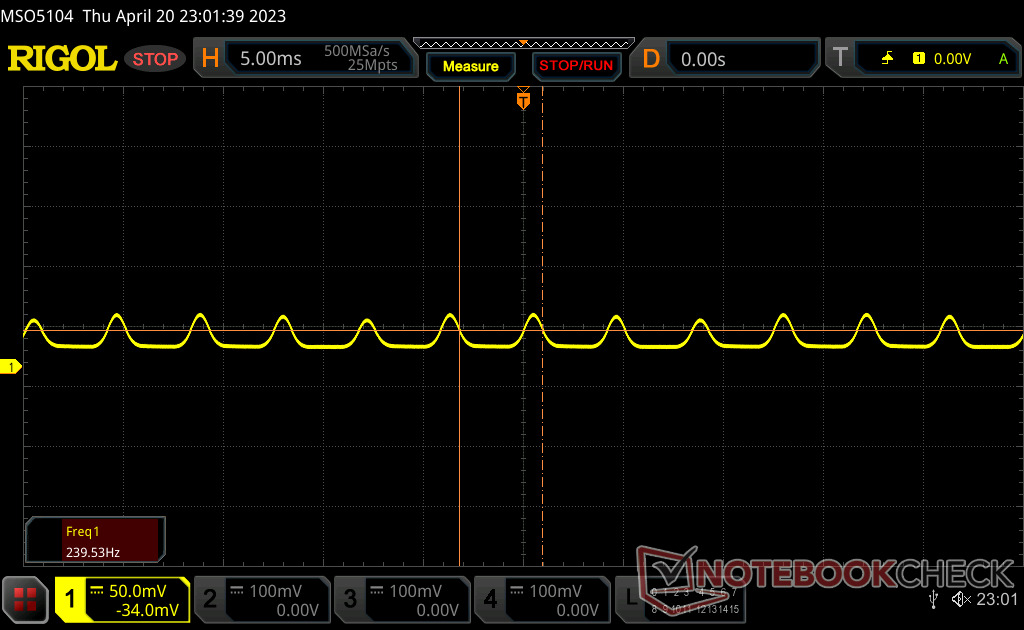
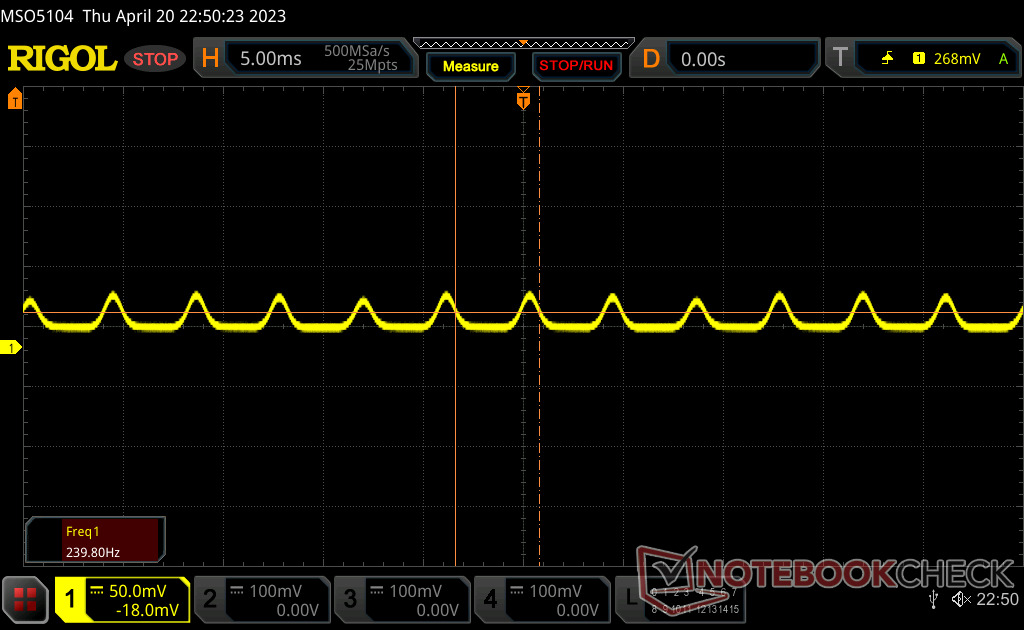
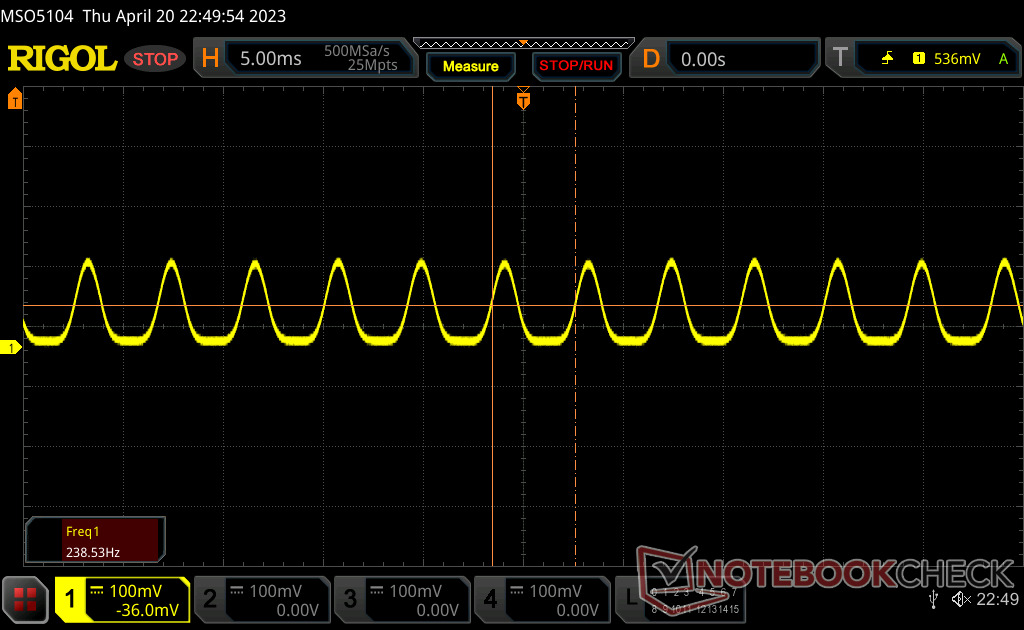
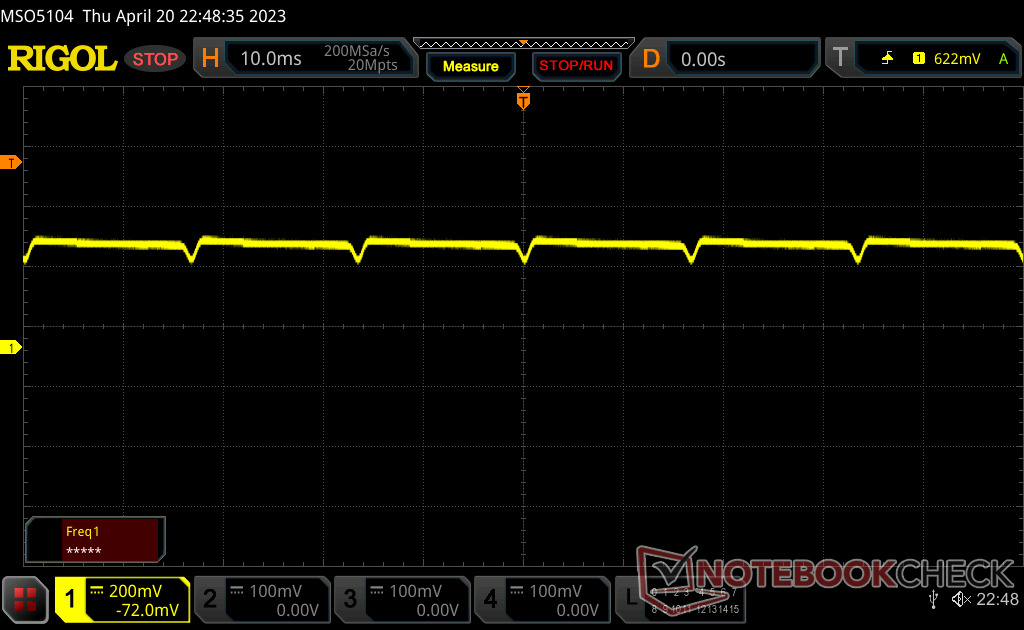
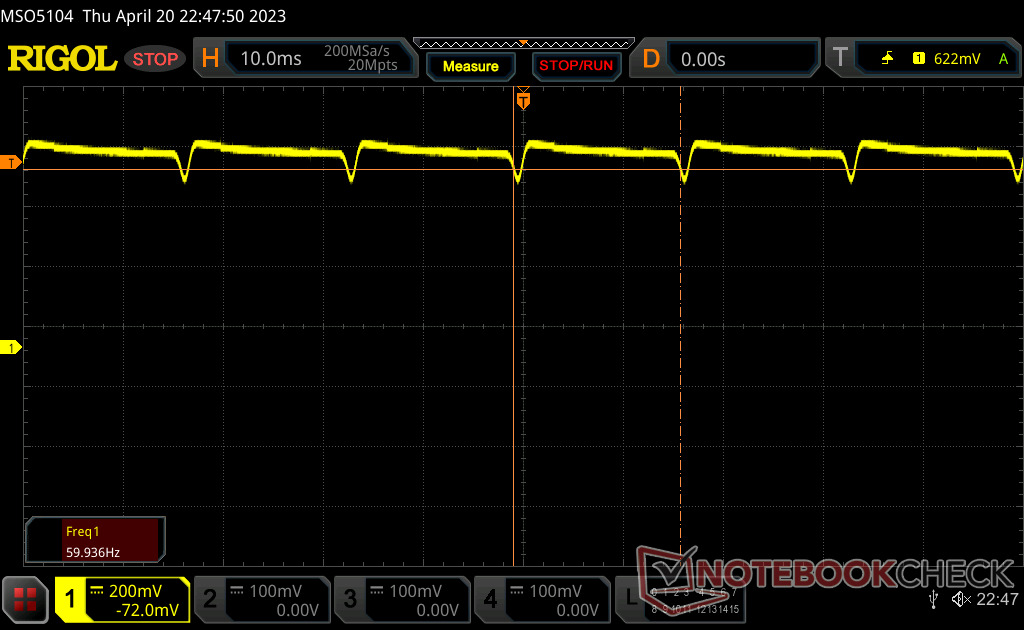
Bildschirm-Flackern / PWM (Pulse-Width Modulation)
| Flackern / PWM festgestellt | 239 Hz | 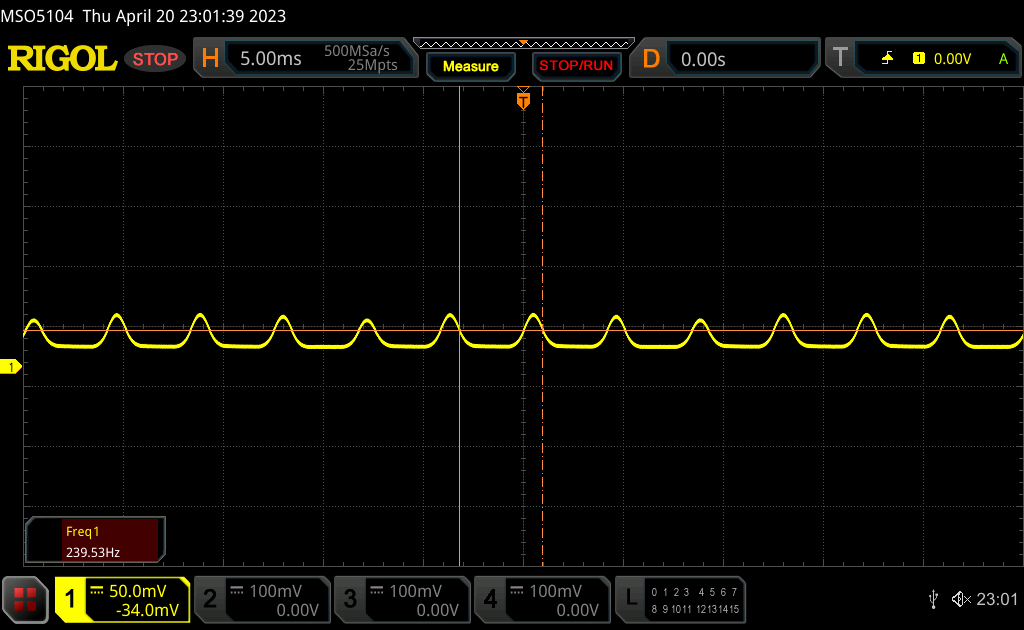 | |
Das Display flackert mit 239 Hz (im schlimmsten Fall, eventuell durch Pulsweitenmodulation PWM) . Die Frequenz von 239 Hz ist relativ gering und daher sollte es bei sensiblen Personen zu Problemen wie Flackern oder Augenbeschwerden führen. Im Vergleich: 53 % aller getesteten Geräte nutzten kein PWM um die Helligkeit zu reduzieren. Wenn PWM eingesetzt wurde, dann bei einer Frequenz von durchschnittlich 17903 (Minimum 5, Maximum 3846000) Hz. | |||
Das Flackern ist bei jeder Helligkeitsstufe präsent, wie das bei OLED-Paneelen oft der Fall ist. Gemessen wurden Frequenzen von 240 Hz bei 0 bis 52 Prozent Helligkeit und 60 Hz bei 53 bis 100 Prozent Helligkeit.

Leistung — Intel 13. Gen + GeForce RTX 4070 Graphics
Testkonditionen
Vor der Durchführung der im Folgenden beschriebenen Benchmarks haben wir unser Testgerät in den Modus "Leistung" und "dGPU" gesetzt. Advanced Optimus oder MUX werden nicht unterstützt.
Prozessor
Die CPU-Leistung ist aufgrund des eingeschränkten Turbo-Boost-Potenzials des Systems durchwachsen. Zum Beispiel ist das CineBench-R15-xT-Ergebnis des Core i7-13700H zu Beginn um 19 Prozent höher als das des i7-12700H im XPS 15 9520 aus dem Vorjahr. Nach einigen Benchmark-Durchläufen schmälert sich der Leistungsunterschied allerdings, und das Ergebnis nähert sich dem des Vorgängers. Das kleinere MSI Stealth 14 Studio, welches wie unser XPS 15 9530 auch mit einem Core i7-13700H ausgestattet ist, zeigt ein ähnliches Verhalten.
Der Aufstieg auf die Konfiguration mit Core i9-13900H bringt vermutlich einen Leistungsschub von 15 bis 25 Prozent. Allerdings könnten die Vorteile auch noch geringer sein, da Core-i9-CPUs in schlanken Multimedia-Laptops wie dem XPS 15 tendenziell stärker drosseln.
Cinebench R15 Multi Dauerschleife
Cinebench R23: Multi Core | Single Core
Cinebench R20: CPU (Multi Core) | CPU (Single Core)
Cinebench R15: CPU Multi 64Bit | CPU Single 64Bit
Blender: v2.79 BMW27 CPU
7-Zip 18.03: 7z b 4 | 7z b 4 -mmt1
Geekbench 5.5: Multi-Core | Single-Core
HWBOT x265 Benchmark v2.2: 4k Preset
LibreOffice : 20 Documents To PDF
R Benchmark 2.5: Overall mean
| CPU Performance Rating | |
| Asus Zephyrus Duo 16 GX650PY-NM006W | |
| Uniwill GM6PX7X RTX 4070 | |
| Asus ROG Zephyrus M16 GU604VY-NM042X | |
| Alienware x15 R2 P111F | |
| Dell XPS 15 9530 RTX 4070 | |
| Durchschnittliche Intel Core i7-13700H | |
| Dell XPS 15 9520 RTX 3050 Ti | |
| MSI Prestige 15 A12UD-093 -1! | |
| Asus ROG Strix G15 G513RW | |
| Asus Zenbook Pro 15 OLED UM535Q | |
| Gigabyte Aero 15 OLED XD | |
| Dell XPS 15 9500 Core i7 4K UHD -2! | |
| Cinebench R23 / Multi Core | |
| Asus Zephyrus Duo 16 GX650PY-NM006W | |
| Uniwill GM6PX7X RTX 4070 | |
| Asus ROG Zephyrus M16 GU604VY-NM042X | |
| Alienware x15 R2 P111F | |
| Dell XPS 15 9530 RTX 4070 | |
| Durchschnittliche Intel Core i7-13700H (5890 - 20034, n=27) | |
| Dell XPS 15 9520 RTX 3050 Ti | |
| Asus ROG Strix G15 G513RW | |
| Asus Zenbook Pro 15 OLED UM535Q | |
| MSI Prestige 15 A12UD-093 | |
| Gigabyte Aero 15 OLED XD | |
| Cinebench R23 / Single Core | |
| Asus ROG Zephyrus M16 GU604VY-NM042X | |
| Asus Zephyrus Duo 16 GX650PY-NM006W | |
| Alienware x15 R2 P111F | |
| Dell XPS 15 9530 RTX 4070 | |
| Uniwill GM6PX7X RTX 4070 | |
| Durchschnittliche Intel Core i7-13700H (1323 - 1914, n=27) | |
| Dell XPS 15 9520 RTX 3050 Ti | |
| MSI Prestige 15 A12UD-093 | |
| Asus ROG Strix G15 G513RW | |
| Asus Zenbook Pro 15 OLED UM535Q | |
| Gigabyte Aero 15 OLED XD | |
| Cinebench R20 / CPU (Multi Core) | |
| Asus Zephyrus Duo 16 GX650PY-NM006W | |
| Uniwill GM6PX7X RTX 4070 | |
| Asus ROG Zephyrus M16 GU604VY-NM042X | |
| Alienware x15 R2 P111F | |
| Dell XPS 15 9530 RTX 4070 | |
| Durchschnittliche Intel Core i7-13700H (2322 - 7674, n=27) | |
| Dell XPS 15 9520 RTX 3050 Ti | |
| Asus ROG Strix G15 G513RW | |
| Asus Zenbook Pro 15 OLED UM535Q | |
| MSI Prestige 15 A12UD-093 | |
| Gigabyte Aero 15 OLED XD | |
| Dell XPS 15 9500 Core i7 4K UHD | |
| Cinebench R20 / CPU (Single Core) | |
| Asus Zephyrus Duo 16 GX650PY-NM006W | |
| Asus ROG Zephyrus M16 GU604VY-NM042X | |
| Alienware x15 R2 P111F | |
| Uniwill GM6PX7X RTX 4070 | |
| Dell XPS 15 9530 RTX 4070 | |
| Durchschnittliche Intel Core i7-13700H (508 - 741, n=27) | |
| Dell XPS 15 9520 RTX 3050 Ti | |
| MSI Prestige 15 A12UD-093 | |
| Asus ROG Strix G15 G513RW | |
| Asus Zenbook Pro 15 OLED UM535Q | |
| Gigabyte Aero 15 OLED XD | |
| Dell XPS 15 9500 Core i7 4K UHD | |
| Cinebench R15 / CPU Multi 64Bit | |
| Asus Zephyrus Duo 16 GX650PY-NM006W | |
| Uniwill GM6PX7X RTX 4070 | |
| Asus ROG Zephyrus M16 GU604VY-NM042X | |
| Alienware x15 R2 P111F | |
| Dell XPS 15 9530 RTX 4070 | |
| Durchschnittliche Intel Core i7-13700H (905 - 2982, n=27) | |
| MSI Prestige 15 A12UD-093 | |
| Dell XPS 15 9520 RTX 3050 Ti | |
| Asus ROG Strix G15 G513RW | |
| Asus Zenbook Pro 15 OLED UM535Q | |
| Gigabyte Aero 15 OLED XD | |
| Dell XPS 15 9500 Core i7 4K UHD | |
| Cinebench R15 / CPU Single 64Bit | |
| Asus Zephyrus Duo 16 GX650PY-NM006W | |
| Asus ROG Zephyrus M16 GU604VY-NM042X | |
| Alienware x15 R2 P111F | |
| Dell XPS 15 9530 RTX 4070 | |
| Uniwill GM6PX7X RTX 4070 | |
| Durchschnittliche Intel Core i7-13700H (213 - 276, n=27) | |
| Dell XPS 15 9520 RTX 3050 Ti | |
| Asus ROG Strix G15 G513RW | |
| Asus Zenbook Pro 15 OLED UM535Q | |
| Dell XPS 15 9500 Core i7 4K UHD | |
| Gigabyte Aero 15 OLED XD | |
| MSI Prestige 15 A12UD-093 | |
| Blender / v2.79 BMW27 CPU | |
| Dell XPS 15 9500 Core i7 4K UHD | |
| Gigabyte Aero 15 OLED XD | |
| MSI Prestige 15 A12UD-093 | |
| Asus Zenbook Pro 15 OLED UM535Q | |
| Asus ROG Strix G15 G513RW | |
| Durchschnittliche Intel Core i7-13700H (169 - 555, n=27) | |
| Dell XPS 15 9520 RTX 3050 Ti | |
| Dell XPS 15 9530 RTX 4070 | |
| Alienware x15 R2 P111F | |
| Asus ROG Zephyrus M16 GU604VY-NM042X | |
| Uniwill GM6PX7X RTX 4070 | |
| Asus Zephyrus Duo 16 GX650PY-NM006W | |
| 7-Zip 18.03 / 7z b 4 | |
| Asus Zephyrus Duo 16 GX650PY-NM006W | |
| Uniwill GM6PX7X RTX 4070 | |
| Asus ROG Zephyrus M16 GU604VY-NM042X | |
| Alienware x15 R2 P111F | |
| Dell XPS 15 9520 RTX 3050 Ti | |
| Durchschnittliche Intel Core i7-13700H (27322 - 76344, n=27) | |
| Dell XPS 15 9530 RTX 4070 | |
| Asus ROG Strix G15 G513RW | |
| Asus Zenbook Pro 15 OLED UM535Q | |
| MSI Prestige 15 A12UD-093 | |
| Gigabyte Aero 15 OLED XD | |
| Dell XPS 15 9500 Core i7 4K UHD | |
| 7-Zip 18.03 / 7z b 4 -mmt1 | |
| Asus Zephyrus Duo 16 GX650PY-NM006W | |
| Asus ROG Zephyrus M16 GU604VY-NM042X | |
| Dell XPS 15 9530 RTX 4070 | |
| Uniwill GM6PX7X RTX 4070 | |
| Durchschnittliche Intel Core i7-13700H (4825 - 6238, n=27) | |
| Alienware x15 R2 P111F | |
| Asus ROG Strix G15 G513RW | |
| Dell XPS 15 9520 RTX 3050 Ti | |
| Asus Zenbook Pro 15 OLED UM535Q | |
| MSI Prestige 15 A12UD-093 | |
| Gigabyte Aero 15 OLED XD | |
| Dell XPS 15 9500 Core i7 4K UHD | |
| Geekbench 5.5 / Multi-Core | |
| Asus Zephyrus Duo 16 GX650PY-NM006W | |
| Uniwill GM6PX7X RTX 4070 | |
| Asus ROG Zephyrus M16 GU604VY-NM042X | |
| Alienware x15 R2 P111F | |
| Dell XPS 15 9530 RTX 4070 | |
| Durchschnittliche Intel Core i7-13700H (6165 - 14215, n=27) | |
| Dell XPS 15 9520 RTX 3050 Ti | |
| MSI Prestige 15 A12UD-093 | |
| Asus ROG Strix G15 G513RW | |
| Gigabyte Aero 15 OLED XD | |
| Asus Zenbook Pro 15 OLED UM535Q | |
| Dell XPS 15 9500 Core i7 4K UHD | |
| Geekbench 5.5 / Single-Core | |
| Asus Zephyrus Duo 16 GX650PY-NM006W | |
| Asus ROG Zephyrus M16 GU604VY-NM042X | |
| Dell XPS 15 9530 RTX 4070 | |
| Alienware x15 R2 P111F | |
| Uniwill GM6PX7X RTX 4070 | |
| Durchschnittliche Intel Core i7-13700H (1362 - 1919, n=27) | |
| Dell XPS 15 9520 RTX 3050 Ti | |
| Asus ROG Strix G15 G513RW | |
| MSI Prestige 15 A12UD-093 | |
| Asus Zenbook Pro 15 OLED UM535Q | |
| Gigabyte Aero 15 OLED XD | |
| Dell XPS 15 9500 Core i7 4K UHD | |
| HWBOT x265 Benchmark v2.2 / 4k Preset | |
| Asus Zephyrus Duo 16 GX650PY-NM006W | |
| Uniwill GM6PX7X RTX 4070 | |
| Asus ROG Zephyrus M16 GU604VY-NM042X | |
| Alienware x15 R2 P111F | |
| Dell XPS 15 9530 RTX 4070 | |
| Durchschnittliche Intel Core i7-13700H (6.72 - 21.2, n=27) | |
| Asus ROG Strix G15 G513RW | |
| Asus Zenbook Pro 15 OLED UM535Q | |
| Dell XPS 15 9520 RTX 3050 Ti | |
| Gigabyte Aero 15 OLED XD | |
| Dell XPS 15 9500 Core i7 4K UHD | |
| LibreOffice / 20 Documents To PDF | |
| Asus ROG Strix G15 G513RW | |
| MSI Prestige 15 A12UD-093 | |
| MSI Prestige 15 A12UD-093 | |
| Asus Zephyrus Duo 16 GX650PY-NM006W | |
| Dell XPS 15 9500 Core i7 4K UHD | |
| Asus ROG Zephyrus M16 GU604VY-NM042X | |
| Asus Zenbook Pro 15 OLED UM535Q | |
| Durchschnittliche Intel Core i7-13700H (31.3 - 62.4, n=27) | |
| Gigabyte Aero 15 OLED XD | |
| Alienware x15 R2 P111F | |
| Dell XPS 15 9530 RTX 4070 | |
| Dell XPS 15 9520 RTX 3050 Ti | |
| Uniwill GM6PX7X RTX 4070 | |
| R Benchmark 2.5 / Overall mean | |
| Gigabyte Aero 15 OLED XD | |
| Dell XPS 15 9500 Core i7 4K UHD | |
| Asus Zenbook Pro 15 OLED UM535Q | |
| Asus ROG Strix G15 G513RW | |
| Durchschnittliche Intel Core i7-13700H (0.4308 - 0.607, n=27) | |
| Uniwill GM6PX7X RTX 4070 | |
| Dell XPS 15 9520 RTX 3050 Ti | |
| MSI Prestige 15 A12UD-093 | |
| Dell XPS 15 9530 RTX 4070 | |
| Alienware x15 R2 P111F | |
| Asus ROG Zephyrus M16 GU604VY-NM042X | |
| Asus Zephyrus Duo 16 GX650PY-NM006W | |
* ... kleinere Werte sind besser
AIDA64: FP32 Ray-Trace | FPU Julia | CPU SHA3 | CPU Queen | FPU SinJulia | FPU Mandel | CPU AES | CPU ZLib | FP64 Ray-Trace | CPU PhotoWorxx
| Performance Rating | |
| Asus Zenbook Pro 15 OLED UM535Q | |
| Durchschnittliche Intel Core i7-13700H | |
| Dell XPS 15 9530 RTX 4070 | |
| MSI Prestige 15 A12UD-093 | |
| Dell XPS 15 9520 RTX 3050 Ti | |
| Dell XPS 15 9500 Core i7 4K UHD | |
| Gigabyte Aero 15 OLED XD -9! | |
| AIDA64 / FP32 Ray-Trace | |
| Asus Zenbook Pro 15 OLED UM535Q | |
| Durchschnittliche Intel Core i7-13700H (4986 - 18908, n=27) | |
| Dell XPS 15 9530 RTX 4070 | |
| MSI Prestige 15 A12UD-093 | |
| Dell XPS 15 9500 Core i7 4K UHD | |
| Dell XPS 15 9520 RTX 3050 Ti | |
| AIDA64 / FPU Julia | |
| Asus Zenbook Pro 15 OLED UM535Q | |
| Durchschnittliche Intel Core i7-13700H (25360 - 92359, n=27) | |
| Dell XPS 15 9530 RTX 4070 | |
| Dell XPS 15 9500 Core i7 4K UHD | |
| MSI Prestige 15 A12UD-093 | |
| Dell XPS 15 9520 RTX 3050 Ti | |
| AIDA64 / CPU SHA3 | |
| Asus Zenbook Pro 15 OLED UM535Q | |
| Durchschnittliche Intel Core i7-13700H (1339 - 4224, n=27) | |
| Dell XPS 15 9530 RTX 4070 | |
| Dell XPS 15 9500 Core i7 4K UHD | |
| Dell XPS 15 9520 RTX 3050 Ti | |
| MSI Prestige 15 A12UD-093 | |
| AIDA64 / CPU Queen | |
| Dell XPS 15 9530 RTX 4070 | |
| Asus Zenbook Pro 15 OLED UM535Q | |
| Dell XPS 15 9520 RTX 3050 Ti | |
| Durchschnittliche Intel Core i7-13700H (68763 - 107159, n=27) | |
| Dell XPS 15 9500 Core i7 4K UHD | |
| MSI Prestige 15 A12UD-093 | |
| AIDA64 / FPU SinJulia | |
| Asus Zenbook Pro 15 OLED UM535Q | |
| Dell XPS 15 9500 Core i7 4K UHD | |
| Durchschnittliche Intel Core i7-13700H (4800 - 11050, n=27) | |
| Dell XPS 15 9530 RTX 4070 | |
| Dell XPS 15 9520 RTX 3050 Ti | |
| MSI Prestige 15 A12UD-093 | |
| AIDA64 / FPU Mandel | |
| Asus Zenbook Pro 15 OLED UM535Q | |
| Durchschnittliche Intel Core i7-13700H (12321 - 45118, n=27) | |
| Dell XPS 15 9530 RTX 4070 | |
| Dell XPS 15 9500 Core i7 4K UHD | |
| MSI Prestige 15 A12UD-093 | |
| Dell XPS 15 9520 RTX 3050 Ti | |
| AIDA64 / CPU AES | |
| Asus Zenbook Pro 15 OLED UM535Q | |
| MSI Prestige 15 A12UD-093 | |
| Dell XPS 15 9520 RTX 3050 Ti | |
| Durchschnittliche Intel Core i7-13700H (28769 - 151254, n=27) | |
| Dell XPS 15 9530 RTX 4070 | |
| Dell XPS 15 9500 Core i7 4K UHD | |
| AIDA64 / CPU ZLib | |
| Durchschnittliche Intel Core i7-13700H (389 - 1215, n=27) | |
| Dell XPS 15 9530 RTX 4070 | |
| Dell XPS 15 9520 RTX 3050 Ti | |
| Asus Zenbook Pro 15 OLED UM535Q | |
| MSI Prestige 15 A12UD-093 | |
| Dell XPS 15 9500 Core i7 4K UHD | |
| Gigabyte Aero 15 OLED XD | |
| AIDA64 / FP64 Ray-Trace | |
| Asus Zenbook Pro 15 OLED UM535Q | |
| Dell XPS 15 9530 RTX 4070 | |
| Durchschnittliche Intel Core i7-13700H (2540 - 10135, n=27) | |
| MSI Prestige 15 A12UD-093 | |
| Dell XPS 15 9520 RTX 3050 Ti | |
| Dell XPS 15 9500 Core i7 4K UHD | |
| AIDA64 / CPU PhotoWorxx | |
| Dell XPS 15 9530 RTX 4070 | |
| MSI Prestige 15 A12UD-093 | |
| Durchschnittliche Intel Core i7-13700H (19552 - 52727, n=27) | |
| Dell XPS 15 9520 RTX 3050 Ti | |
| Dell XPS 15 9500 Core i7 4K UHD | |
| Asus Zenbook Pro 15 OLED UM535Q | |
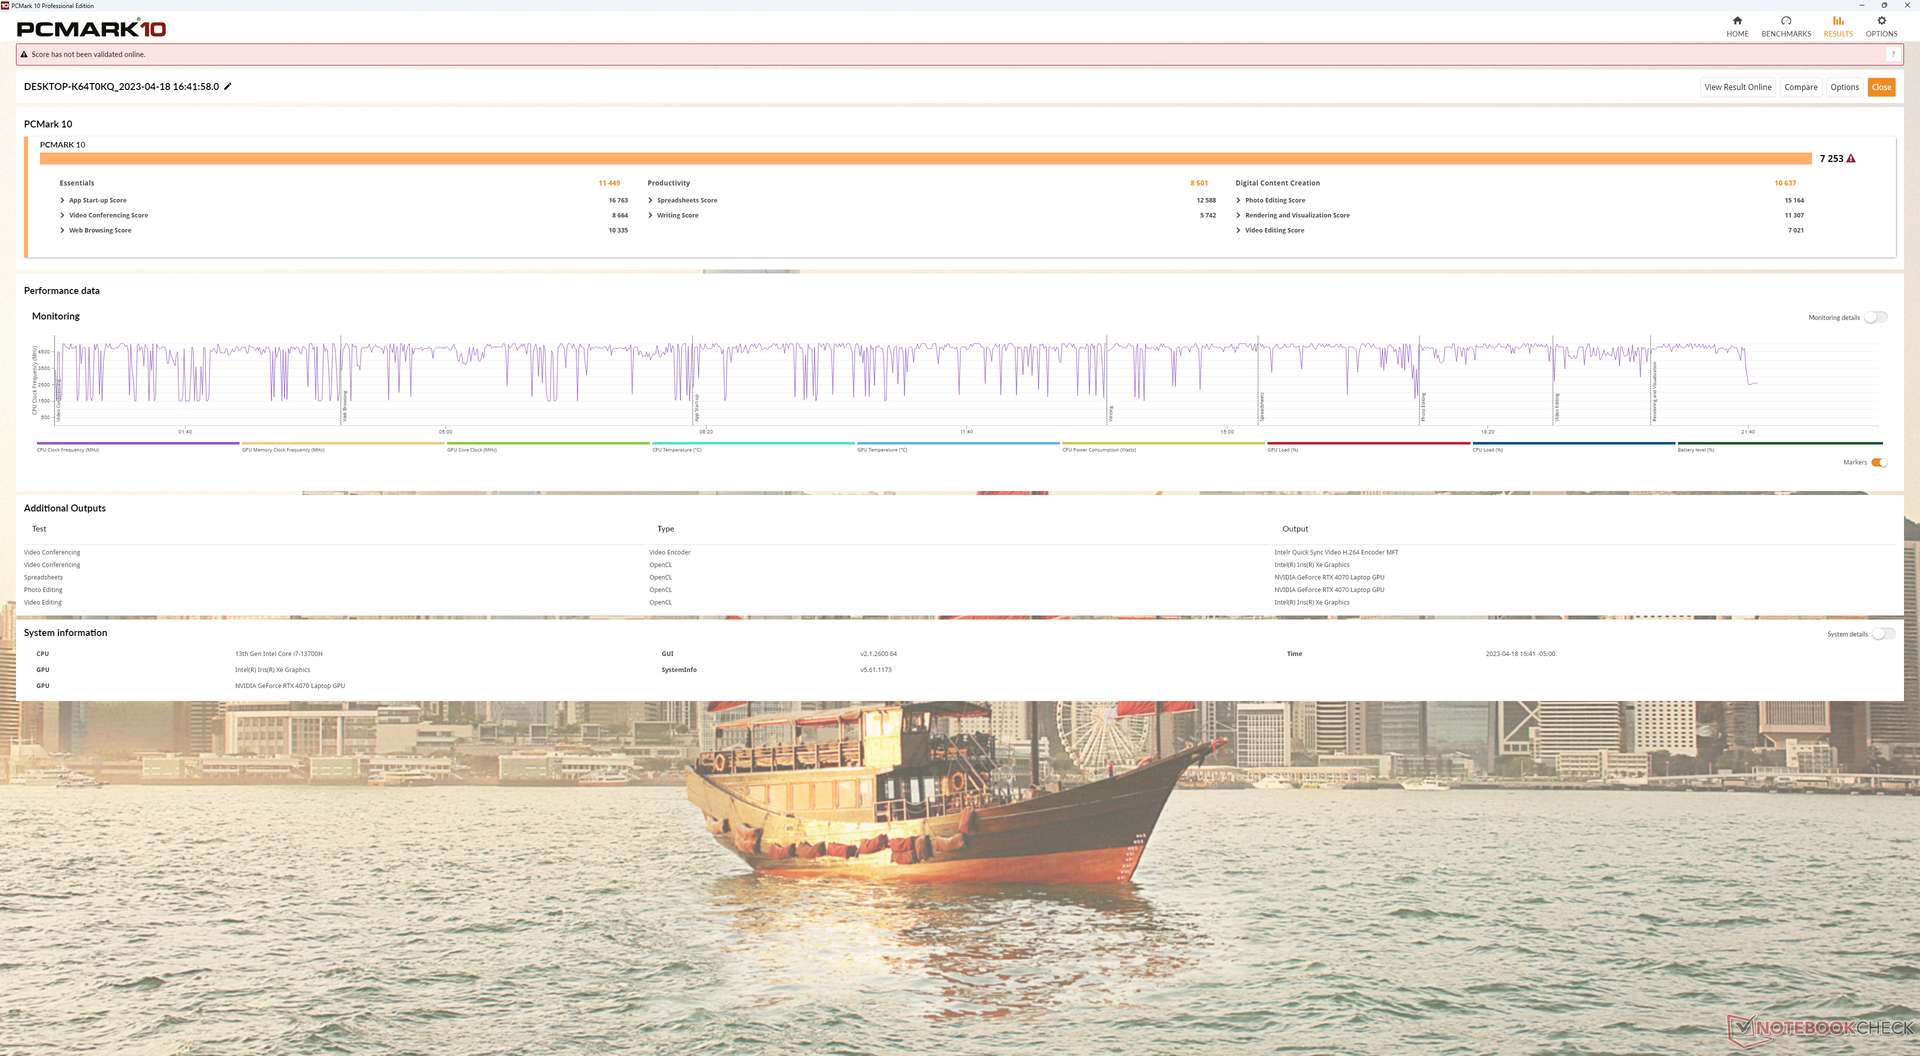
Systemleistung
CrossMark: Overall | Productivity | Creativity | Responsiveness
| PCMark 10 / Score | |
| Durchschnittliche Intel Core i7-13700H, NVIDIA GeForce RTX 4070 Laptop GPU (7158 - 7956, n=8) | |
| Dell XPS 15 9530 RTX 4070 | |
| Dell XPS 15 9520 RTX 3050 Ti | |
| Gigabyte Aero 15 OLED XD | |
| Asus Zenbook Pro 15 OLED UM535Q | |
| MSI Prestige 15 A12UD-093 | |
| Dell XPS 15 9500 Core i7 4K UHD | |
| PCMark 10 / Essentials | |
| Dell XPS 15 9530 RTX 4070 | |
| Dell XPS 15 9520 RTX 3050 Ti | |
| Durchschnittliche Intel Core i7-13700H, NVIDIA GeForce RTX 4070 Laptop GPU (10252 - 11449, n=8) | |
| Asus Zenbook Pro 15 OLED UM535Q | |
| MSI Prestige 15 A12UD-093 | |
| Gigabyte Aero 15 OLED XD | |
| Dell XPS 15 9500 Core i7 4K UHD | |
| PCMark 10 / Productivity | |
| Gigabyte Aero 15 OLED XD | |
| Asus Zenbook Pro 15 OLED UM535Q | |
| Dell XPS 15 9520 RTX 3050 Ti | |
| Durchschnittliche Intel Core i7-13700H, NVIDIA GeForce RTX 4070 Laptop GPU (8501 - 10769, n=8) | |
| MSI Prestige 15 A12UD-093 | |
| Dell XPS 15 9530 RTX 4070 | |
| Dell XPS 15 9500 Core i7 4K UHD | |
| PCMark 10 / Digital Content Creation | |
| Durchschnittliche Intel Core i7-13700H, NVIDIA GeForce RTX 4070 Laptop GPU (10358 - 12908, n=8) | |
| Dell XPS 15 9530 RTX 4070 | |
| Gigabyte Aero 15 OLED XD | |
| Dell XPS 15 9520 RTX 3050 Ti | |
| Asus Zenbook Pro 15 OLED UM535Q | |
| MSI Prestige 15 A12UD-093 | |
| Dell XPS 15 9500 Core i7 4K UHD | |
| CrossMark / Overall | |
| Dell XPS 15 9530 RTX 4070 | |
| Durchschnittliche Intel Core i7-13700H, NVIDIA GeForce RTX 4070 Laptop GPU (1768 - 2073, n=6) | |
| Dell XPS 15 9520 RTX 3050 Ti | |
| MSI Prestige 15 A12UD-093 | |
| Asus Zenbook Pro 15 OLED UM535Q | |
| CrossMark / Productivity | |
| Dell XPS 15 9520 RTX 3050 Ti | |
| Durchschnittliche Intel Core i7-13700H, NVIDIA GeForce RTX 4070 Laptop GPU (1645 - 2006, n=6) | |
| Dell XPS 15 9530 RTX 4070 | |
| MSI Prestige 15 A12UD-093 | |
| Asus Zenbook Pro 15 OLED UM535Q | |
| CrossMark / Creativity | |
| Dell XPS 15 9530 RTX 4070 | |
| Durchschnittliche Intel Core i7-13700H, NVIDIA GeForce RTX 4070 Laptop GPU (1936 - 2137, n=6) | |
| Dell XPS 15 9520 RTX 3050 Ti | |
| MSI Prestige 15 A12UD-093 | |
| Asus Zenbook Pro 15 OLED UM535Q | |
| CrossMark / Responsiveness | |
| Dell XPS 15 9520 RTX 3050 Ti | |
| Durchschnittliche Intel Core i7-13700H, NVIDIA GeForce RTX 4070 Laptop GPU (1451 - 2202, n=6) | |
| Dell XPS 15 9530 RTX 4070 | |
| MSI Prestige 15 A12UD-093 | |
| Asus Zenbook Pro 15 OLED UM535Q | |
| PCMark 10 Score | 7253 Punkte | |
Hilfe | ||
| AIDA64 / Memory Copy | |
| Dell XPS 15 9530 RTX 4070 | |
| MSI Prestige 15 A12UD-093 | |
| Durchschnittliche Intel Core i7-13700H (40018 - 78081, n=27) | |
| Dell XPS 15 9520 RTX 3050 Ti | |
| Asus Zenbook Pro 15 OLED UM535Q | |
| Dell XPS 15 9500 Core i7 4K UHD | |
| AIDA64 / Memory Read | |
| Dell XPS 15 9530 RTX 4070 | |
| Durchschnittliche Intel Core i7-13700H (44583 - 79656, n=27) | |
| MSI Prestige 15 A12UD-093 | |
| Dell XPS 15 9520 RTX 3050 Ti | |
| Asus Zenbook Pro 15 OLED UM535Q | |
| Dell XPS 15 9500 Core i7 4K UHD | |
| AIDA64 / Memory Write | |
| Durchschnittliche Intel Core i7-13700H (42710 - 99898, n=27) | |
| Dell XPS 15 9530 RTX 4070 | |
| MSI Prestige 15 A12UD-093 | |
| Dell XPS 15 9520 RTX 3050 Ti | |
| Asus Zenbook Pro 15 OLED UM535Q | |
| Dell XPS 15 9500 Core i7 4K UHD | |
| AIDA64 / Memory Latency | |
| Dell XPS 15 9520 RTX 3050 Ti | |
| MSI Prestige 15 A12UD-093 | |
| Asus Zenbook Pro 15 OLED UM535Q | |
| Durchschnittliche Intel Core i7-13700H (82.4 - 136.8, n=27) | |
| Dell XPS 15 9530 RTX 4070 | |
| Dell XPS 15 9500 Core i7 4K UHD | |
| Gigabyte Aero 15 OLED XD | |
* ... kleinere Werte sind besser
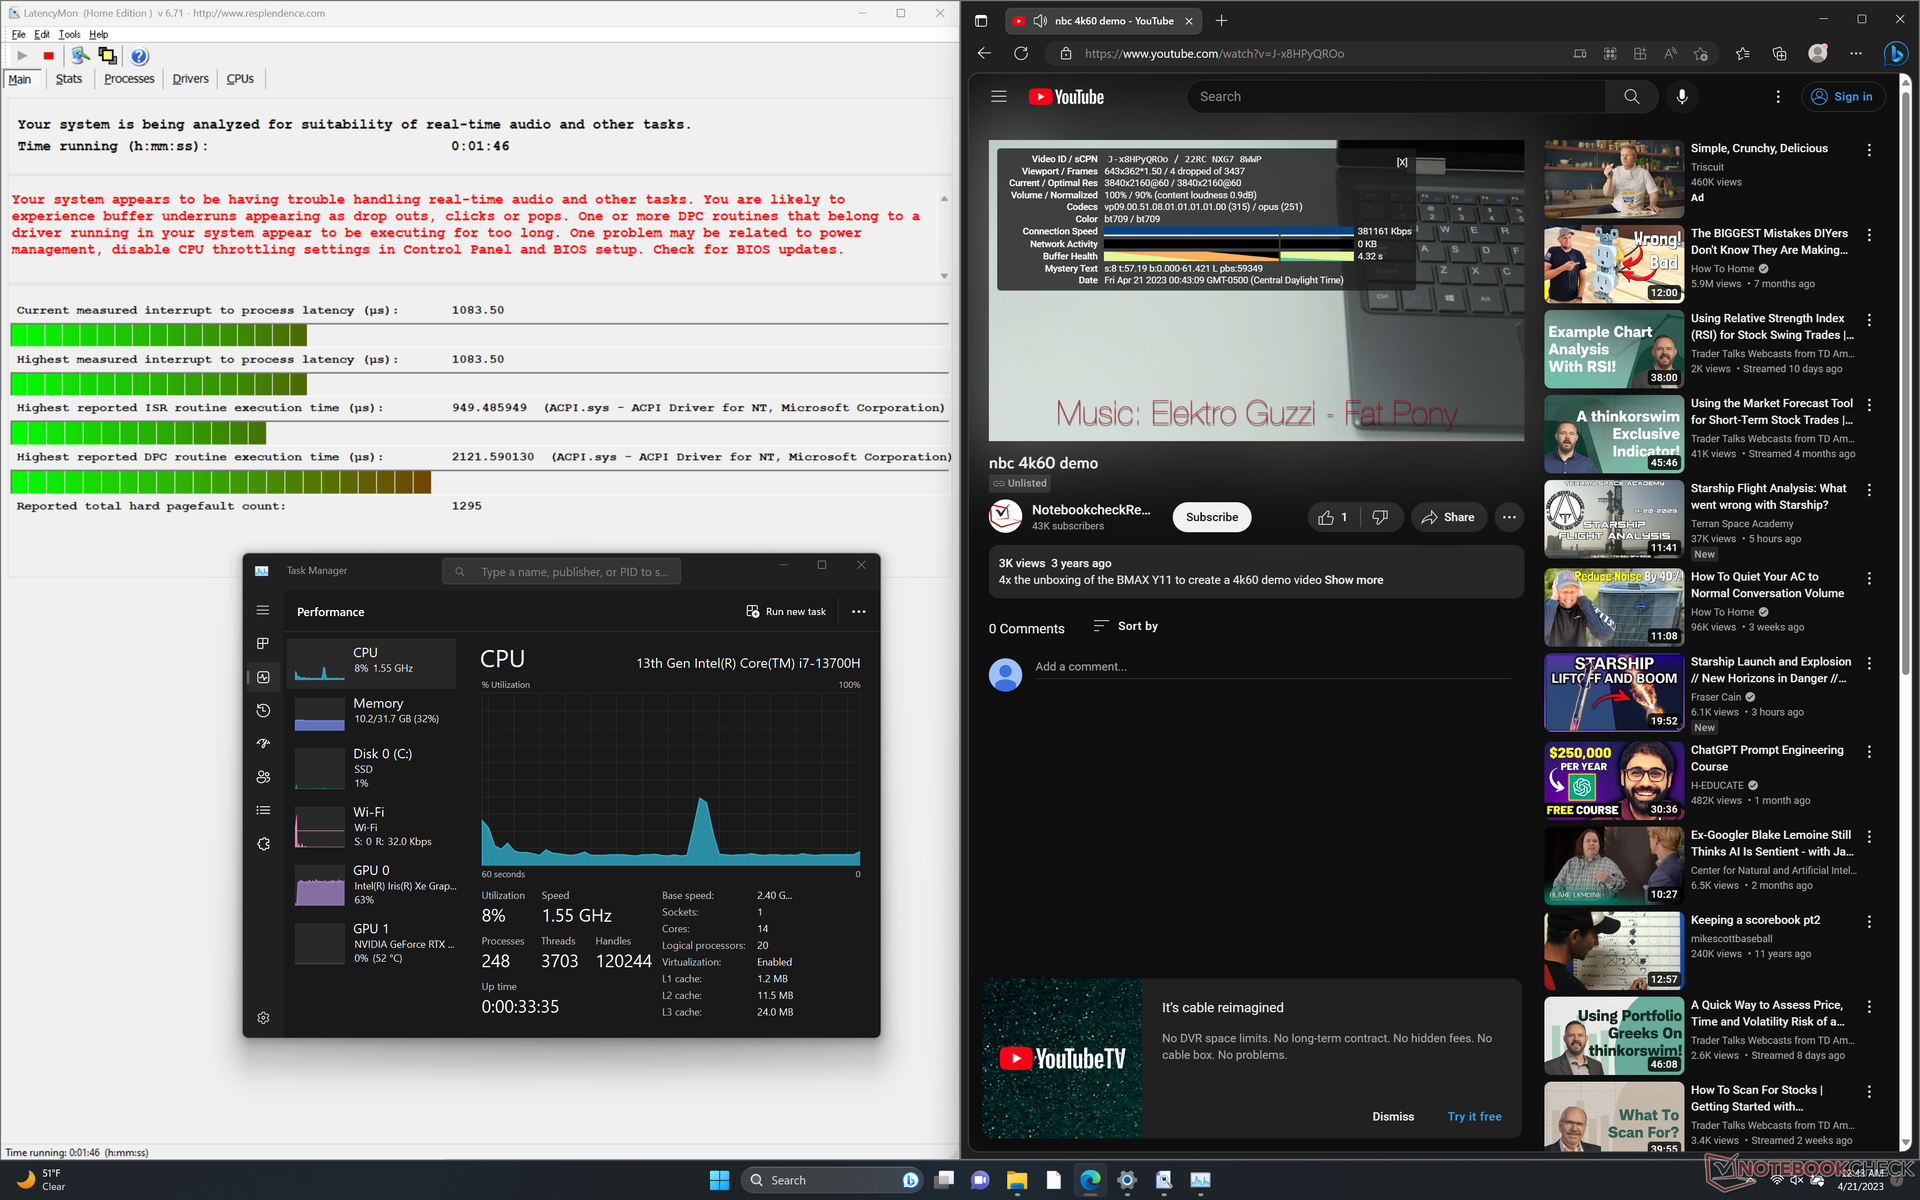
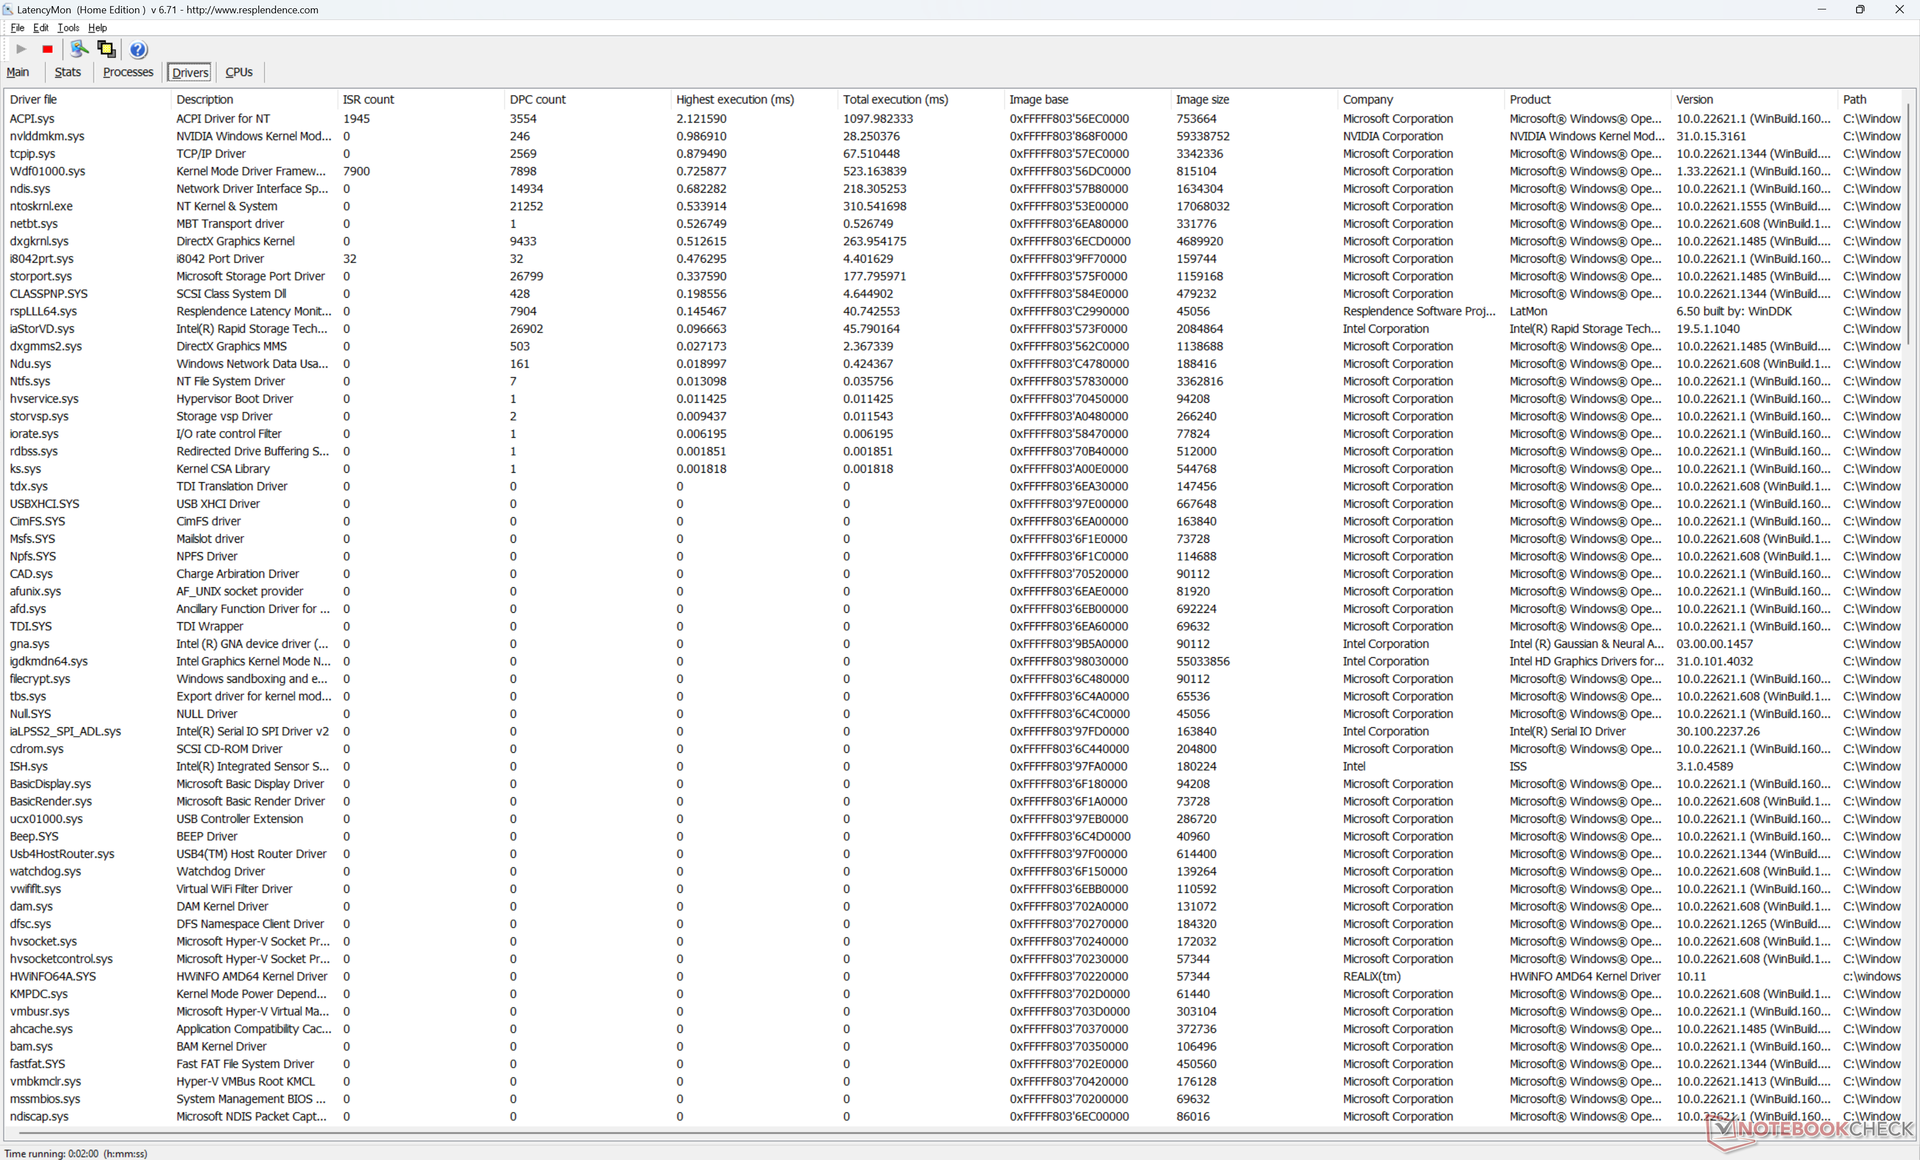
DPC Latency
Der LatencyMon offenbart DPC-Probleme beim Öffnen mehrerer Tabs auf unsere Homepage. Das 4K60-Videoplayback ist ebenfalls fehlerhaft: Im einminütigen Testvideo wurden 4 Frames ausgelassen.
| DPC Latencies / LatencyMon - interrupt to process latency (max), Web, Youtube, Prime95 | |
| Dell XPS 15 9500 Core i7 4K UHD | |
| MSI Prestige 15 A12UD-093 | |
| Dell XPS 15 9530 RTX 4070 | |
| Dell XPS 15 9520 RTX 3050 Ti | |
| Gigabyte Aero 15 OLED XD | |
| Asus Zenbook Pro 15 OLED UM535Q | |
* ... kleinere Werte sind besser
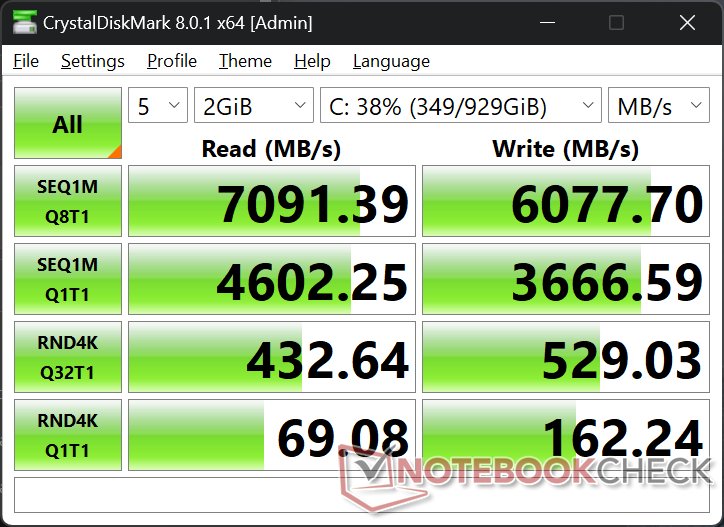
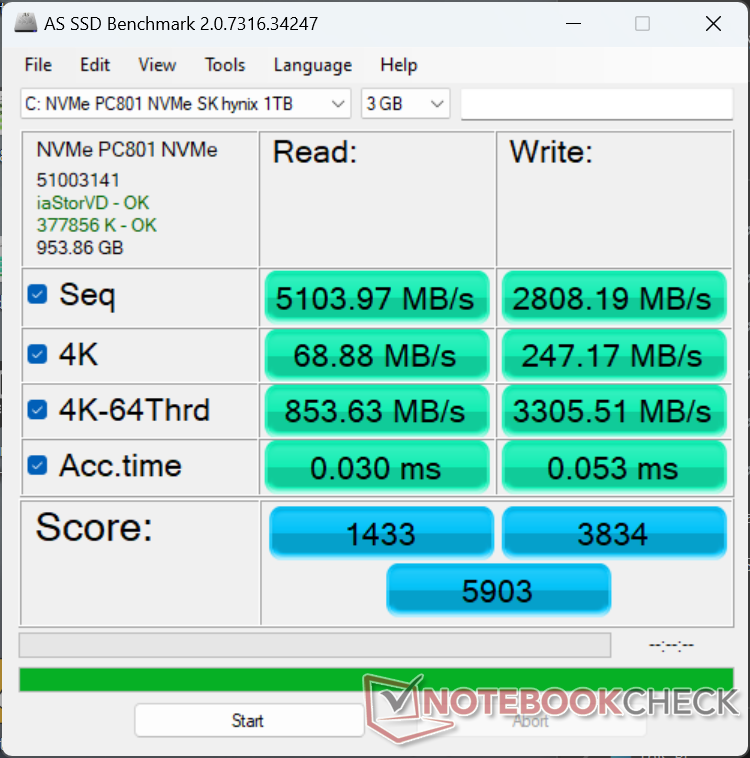
Massenspeicher — Bis zu zwei PCIe4-SSDs
Unser Testgerät ist mit einer SK Hynix PC801 PCIe4-x4-NVMe-SSD ausgestattet, die die WD SN810 im älteren XPS 15 9510 ersetzt. Die Leistung der beiden SSDs ist grundsätzlich vergleichbar. Keine kann mit der beliebten Samsung PM9A1 mithalten.
Auch die Langlebigkeit der Leistung ist ausgezeichnet. Selbst unter Last wird nicht gedrosselt. Schade, dass kein Upgrade auf PCIe5-SSDs angeboten wird.

| Drive Performance Rating - Percent | |
| Gigabyte Aero 15 OLED XD | |
| Dell XPS 15 9530 RTX 4070 | |
| Dell XPS 15 9520 RTX 3050 Ti | |
| MSI Prestige 15 A12UD-093 | |
| Asus Zenbook Pro 15 OLED UM535Q | |
| Dell XPS 15 9500 Core i7 4K UHD | |
* ... kleinere Werte sind besser
Dauerleistung Lesen: DiskSpd Read Loop, Queue Depth 8
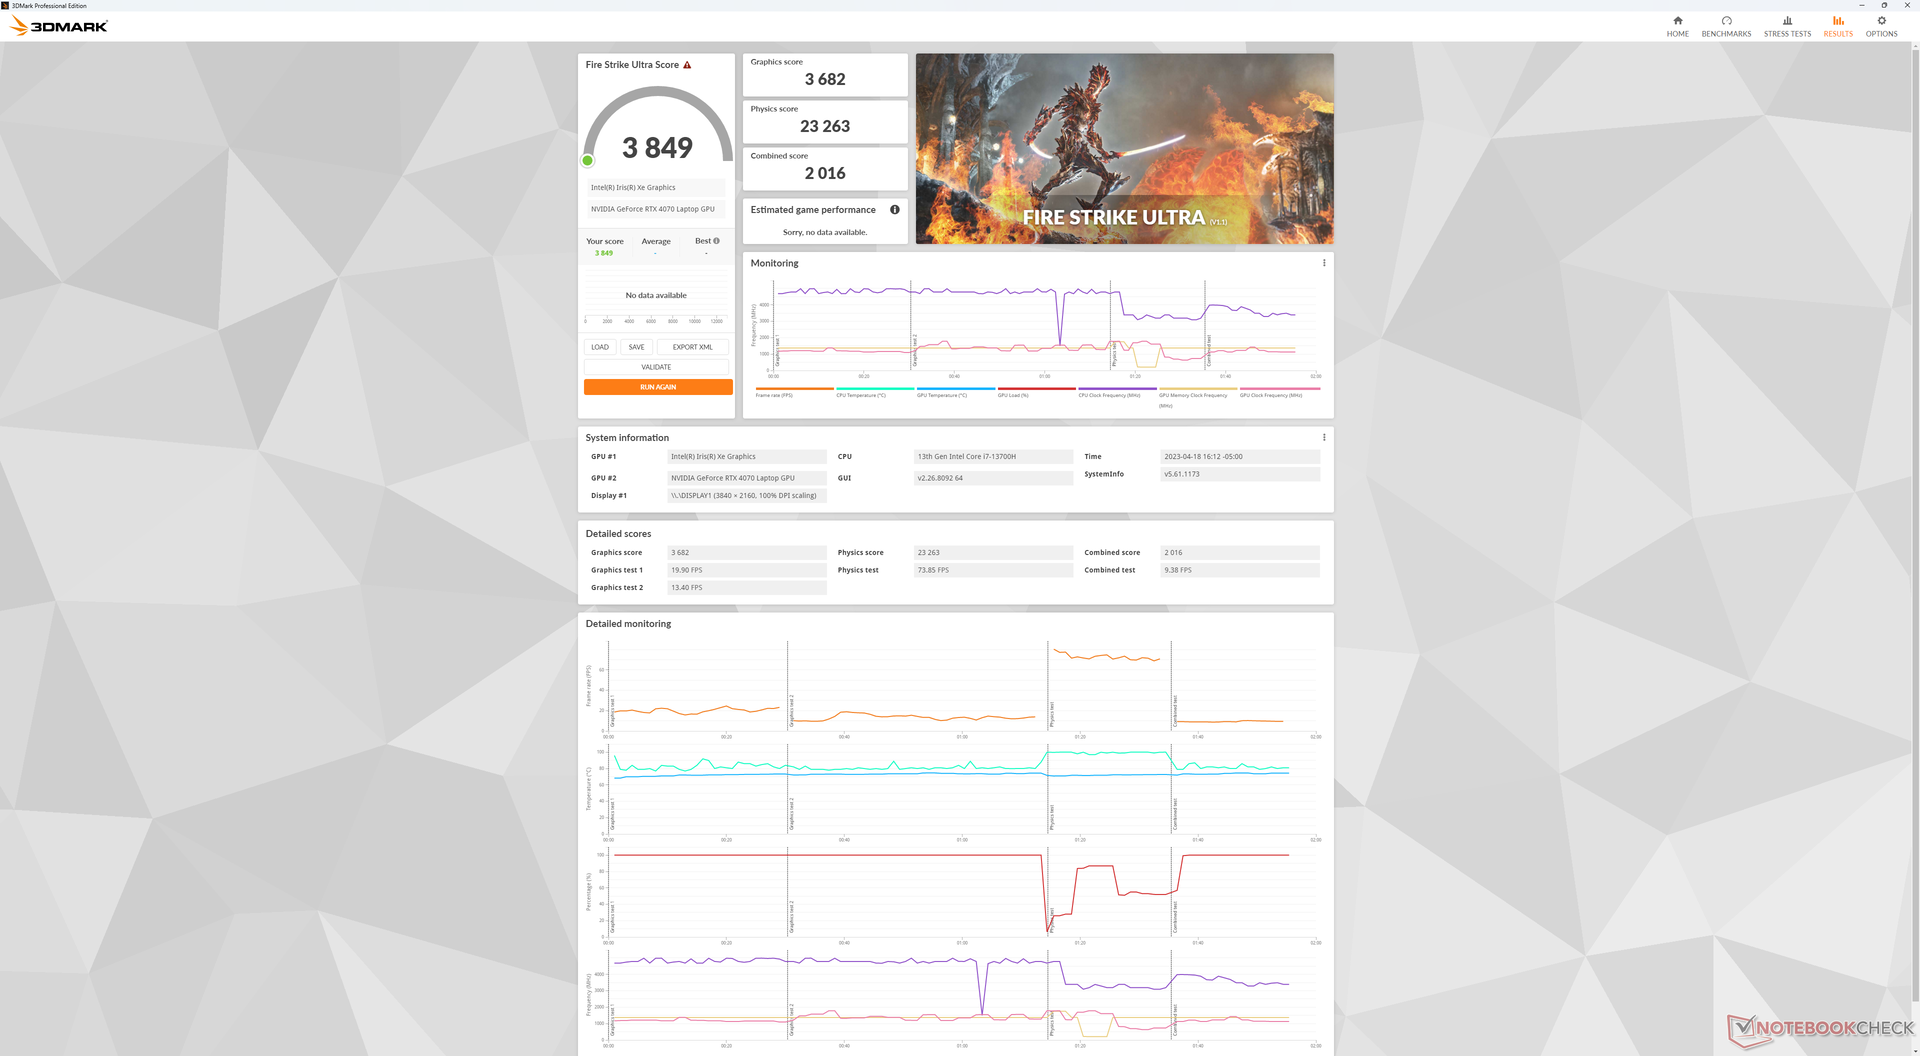
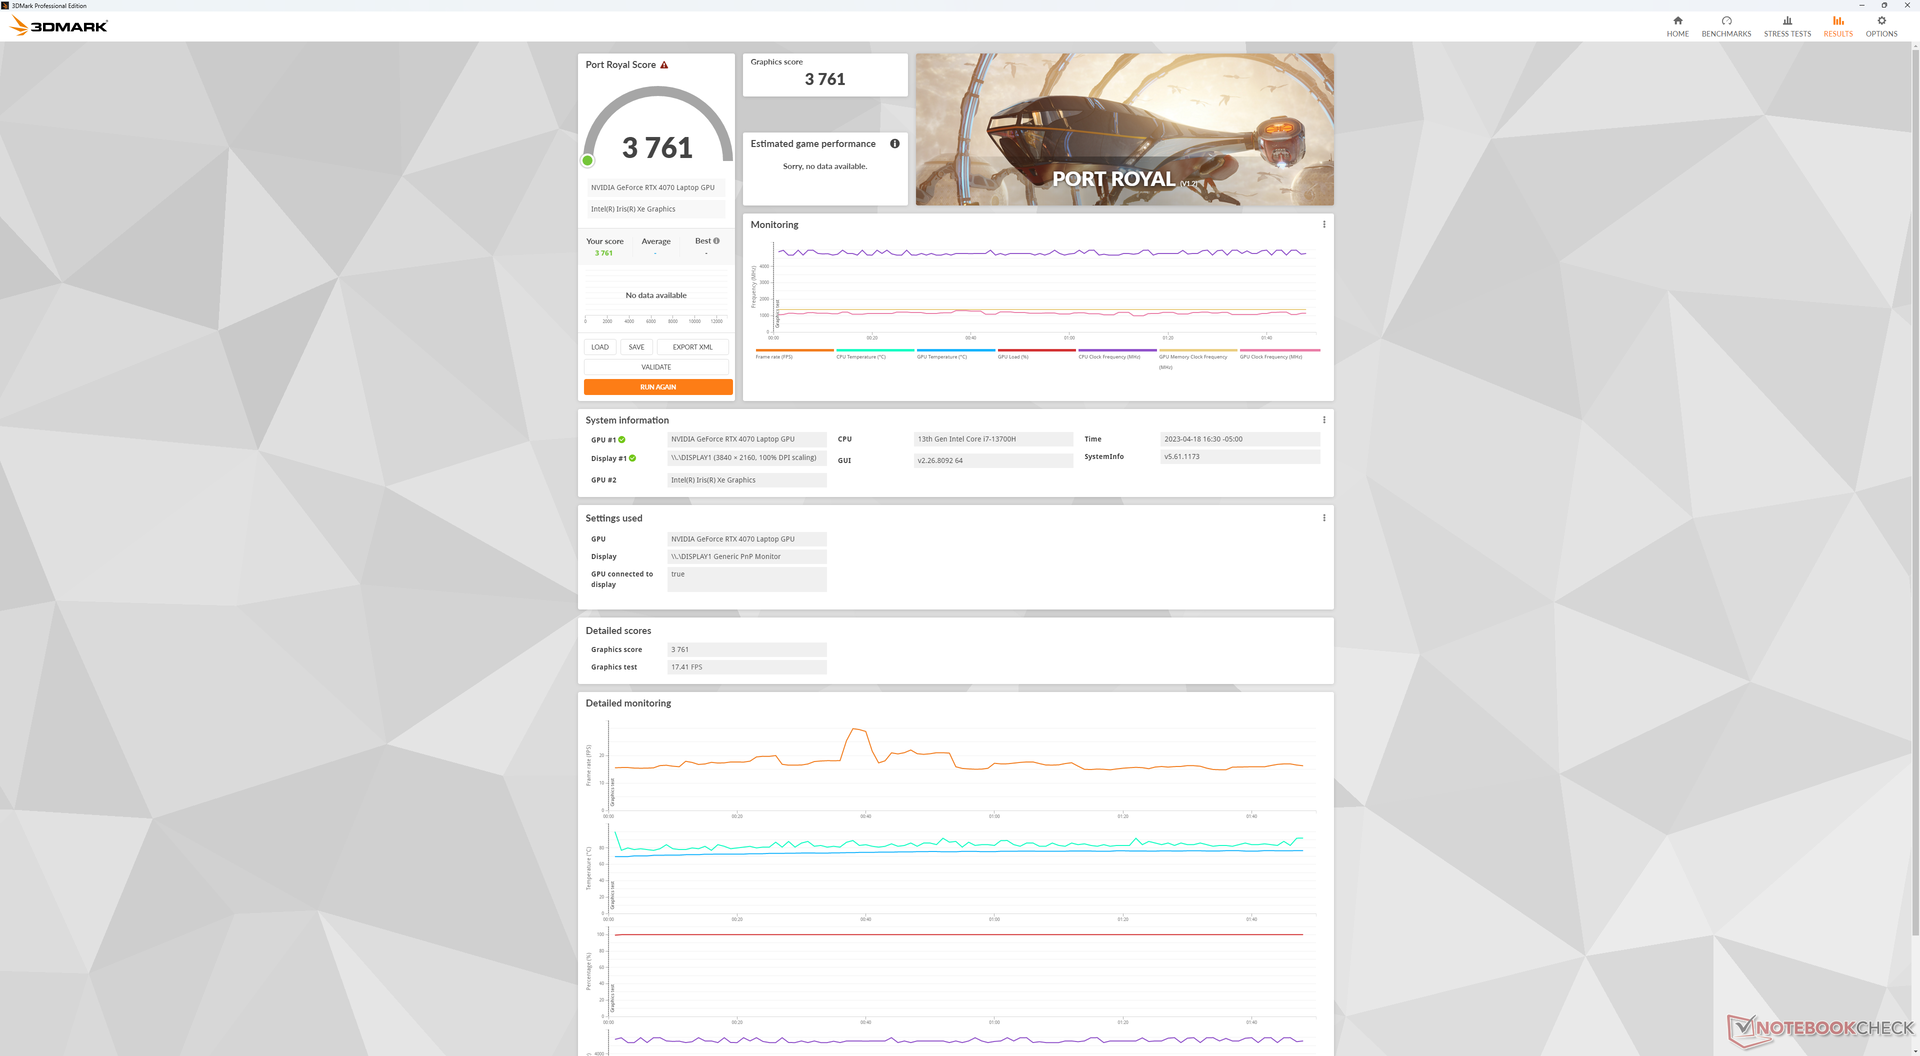
Graphics — Halbe TGP bedeutet halbe Leistung
Natürlich ist zu erwarten, dass die Grafikleistung hier langsamer ist als bei einem "durchschnittlichen" GeForce-RTX-4070-Laptop, denn die GPU im XPS 15 ist auf 50 W TGP eingeschränkt. Dennoch waren wir überrascht. Anhand des Testgeräts wissen wir nun, dass dieser Leistungsunterschied durchaus markant sein kann. Bis zu 40 oder 50 Prozent langsamer ist das XPS 15 9530 laut 3DMark im Vergleich zum Durchschnitt in unserer Datenbank. Das Ergebnis ist so schlecht, dass sogar ein vier Jahre alter RTX-2070-Laptop wie das HP Omen 15 eine ähnliche Leistung erreicht wie unser teureres XPS 15 mit RTX 4070. Wenn Sie beabsichtigen, viele Spiele zu spielen, wird das XPS 15 so zu einer sehr unattraktiven Lösung.
Die gute Nachricht ist, dass die Grafikleistung dennoch um 30 bis 35 Prozent schneller ist, als die des RTX 3050 Ti im XPS 15 9520. Somit ergibt dies einen spürbaren Anstieg im Vergleich zum Vorjahr. Dennoch halten wir hier locker eine der langsamsten Versionen einer mobilen RTX 4070 in den Händen.
Interessanterweise ist die Grafikbeschleunigung bei der Verwendung von 3D-Softwaretools deutlich schneller als angesichts der 50-W-TGP erwartet. Blender Classroom mit CUDA-Beschleunigung, etwa, wird in nur 46 Sekunden abgeschlossen. Das ist nur rund 25 Prozent langsamer als der durchschnittliche RTX-4070-Laptop, bei denen TGP-Werte von mindestens 100 W üblich sind. Die ältere RTX 3050 Ti benötigt für den gleichen Benchmark fast 2,5 Mal länger. Content Creator werden daher im Vergleich zu älteren Modellen am meisten vom 2023er XPS 15 profitieren.
| 3DMark Performance Rating - Percent | |
| Asus Zephyrus Duo 16 GX650PY-NM006W | |
| Uniwill GM6PX7X RTX 4070 | |
| Alienware x15 R2 P111F -1! | |
| Durchschnittliche NVIDIA GeForce RTX 4070 Laptop GPU | |
| Lenovo Legion 5 15IAH7H 82RB -1! | |
| Gigabyte Aero 15 OLED XD -2! | |
| Dell XPS 15 9530 RTX 4070 | |
| MSI Stealth 15M A11SEK -2! | |
| Dell XPS 15 9520 RTX 3050 Ti -2! | |
| Dell XPS 15 9500 Core i7 4K UHD -2! | |
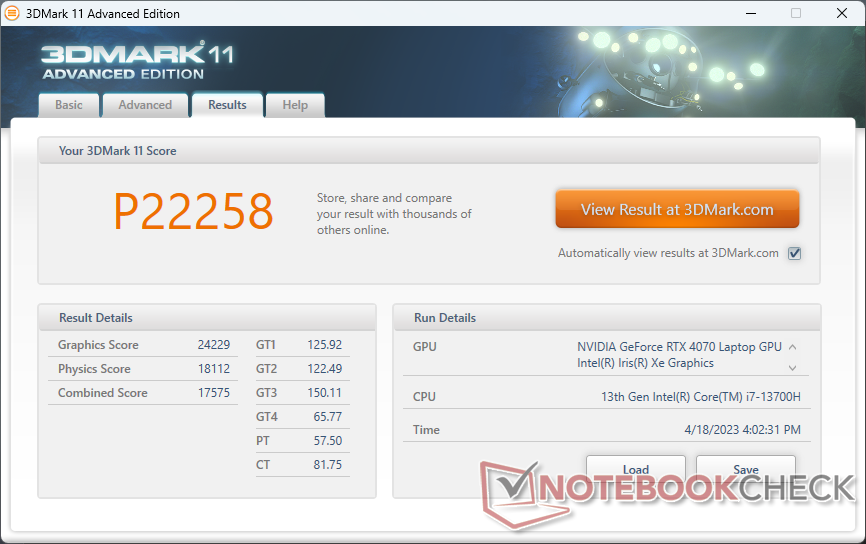
| 3DMark 11 Performance | 22258 Punkte | |
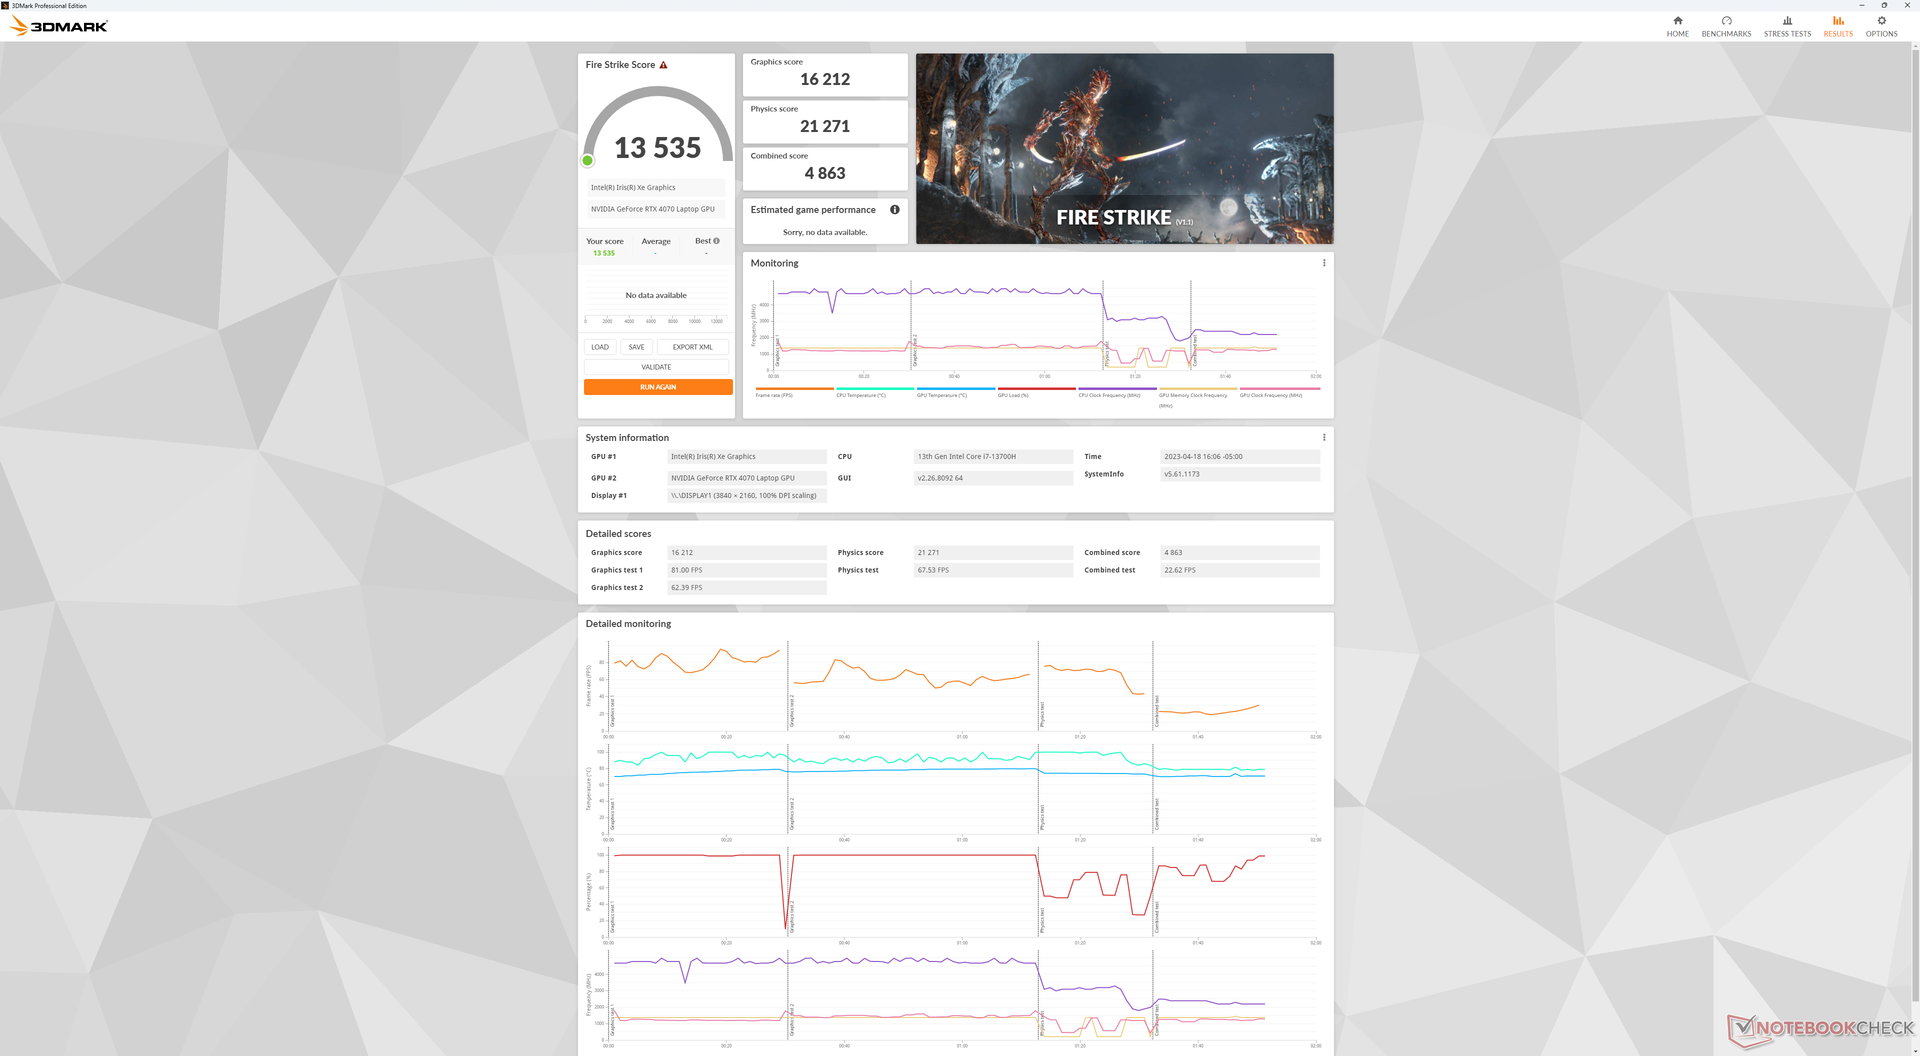
| 3DMark Fire Strike Score | 13535 Punkte | |
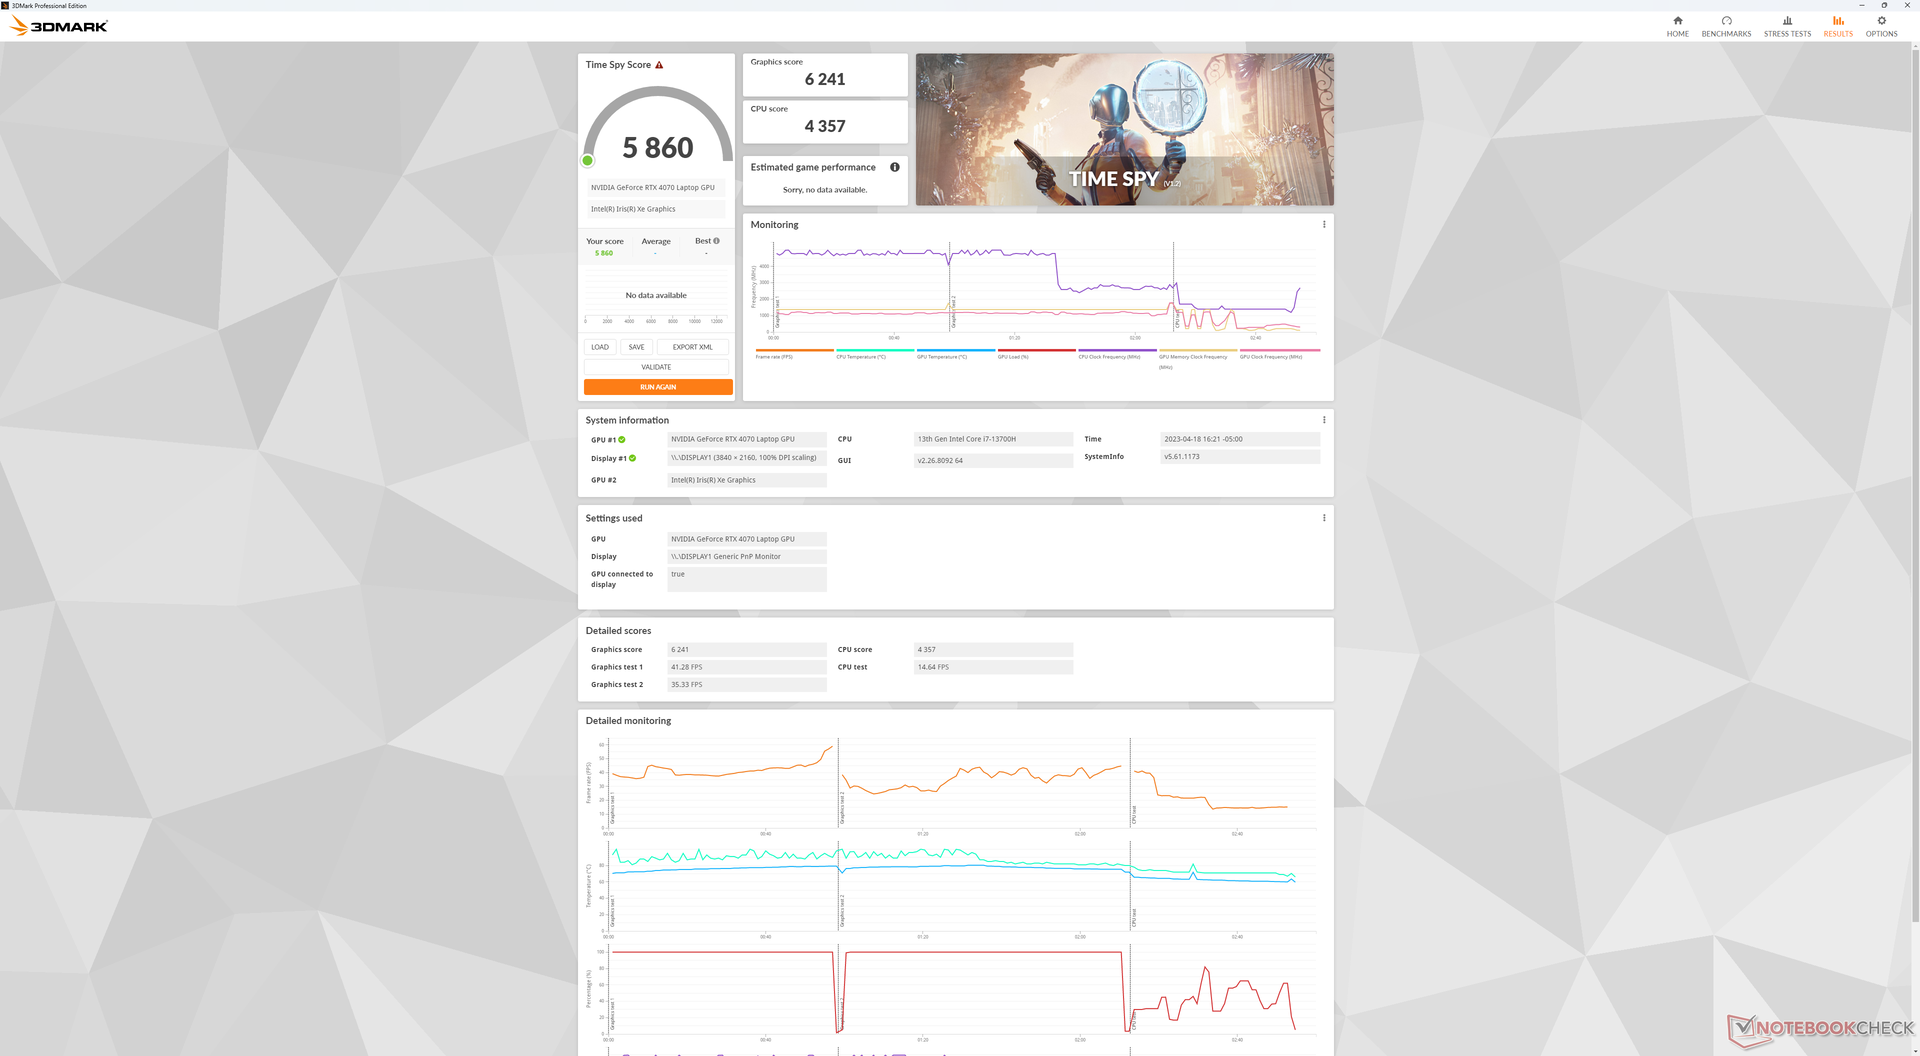
| 3DMark Time Spy Score | 5860 Punkte | |
Hilfe | ||
* ... kleinere Werte sind besser
Gaming Performance
Trotz der bereits besprochenen enttäuschenden RTX-4070-Leistung kann das System dennoch alle aktuellen Titel mit mittleren bis hohen Einstellungen und 1080p sowie 60 FPS abspielen. Stellt man noch höhere Werte ein, beginnt die GPU zu straucheln. Anspruchsvolle Titel wie Cyberpunk 2077 oder Returnal fallen bei mehr als mittleren Einstellungen jeweils auf 40 FPS ab. Das führt ohne G-Sync-Unterstützung zu deutlichem Screen Tearing. Abgesehen von wenig anspruchsvollen Multiplayer-Spielen wie DOTA 2 können die meisten Spiele kaum in der nativen 3,5K-Auflösung gespielt werden.
Des Weiteren kann die Leistung beim Gamen stark schwanken. Frameraten im Leerlauf auf Witcher 3 fallen regelmäßig von 50 FPS auf 40 FPS ab, und springen dann scheinbar ohne Grund wieder auf 50 FPS zurück. Solches Verhalten deutet auf eine schlechte Prioritätensetzung der Hintergrundaktivitäten.
Ein weiterer unglücklicher Nachteil ist, dass die Frameraten bei sehr niedrigen Einstellungen manchmal langsamer sind als die Frameraten bei höheren Einstellungen. Das zeigte sich etwa, als wir Cyberpunk 2077 und Returnal bei niedrigen Einstellungen in 1080p spielten. Hier war die Framerate durchgehend (selbst bei Wiederholung des Tests) langsamer als bei mittleren Einstellungen und 1080p. Solches Verhalten deutet auf eine PSU-Einschränkung und einen daraus folgenden Machtkampf zwischen CPU und GPU, wenn beide stark belastet werden.
| Performance Rating - Percent | |
| Asus Zephyrus Duo 16 GX650PY-NM006W | |
| Uniwill GM6PX7X RTX 4070 | |
| Alienware x15 R2 P111F -1! | |
| Gigabyte Aero 15 OLED XD | |
| Dell XPS 15 9530 RTX 4070 | |
| Dell XPS 15 9500 Core i7 4K UHD -3! | |
| MSI Stealth 15M A11SEK | |
| Dell XPS 15 9520 RTX 3050 Ti | |
| The Witcher 3 - 1920x1080 Ultra Graphics & Postprocessing (HBAO+) | |
| Asus Zephyrus Duo 16 GX650PY-NM006W | |
| Uniwill GM6PX7X RTX 4070 | |
| Alienware x15 R2 P111F | |
| Gigabyte Aero 15 OLED XD | |
| Dell XPS 15 9530 RTX 4070 | |
| MSI Stealth 15M A11SEK | |
| Dell XPS 15 9500 Core i7 4K UHD | |
| Dell XPS 15 9520 RTX 3050 Ti | |
| GTA V - 1920x1080 Highest Settings possible AA:4xMSAA + FX AF:16x | |
| Asus Zephyrus Duo 16 GX650PY-NM006W | |
| Uniwill GM6PX7X RTX 4070 | |
| Gigabyte Aero 15 OLED XD | |
| MSI Stealth 15M A11SEK | |
| Dell XPS 15 9530 RTX 4070 | |
| Dell XPS 15 9520 RTX 3050 Ti | |
| Final Fantasy XV Benchmark - 1920x1080 High Quality | |
| Asus Zephyrus Duo 16 GX650PY-NM006W | |
| Uniwill GM6PX7X RTX 4070 | |
| Alienware x15 R2 P111F | |
| Gigabyte Aero 15 OLED XD | |
| Dell XPS 15 9530 RTX 4070 | |
| MSI Stealth 15M A11SEK | |
| Dell XPS 15 9520 RTX 3050 Ti | |
| Strange Brigade - 1920x1080 ultra AA:ultra AF:16 | |
| Asus Zephyrus Duo 16 GX650PY-NM006W | |
| Uniwill GM6PX7X RTX 4070 | |
| Alienware x15 R2 P111F | |
| Gigabyte Aero 15 OLED XD | |
| Dell XPS 15 9530 RTX 4070 | |
| MSI Stealth 15M A11SEK | |
| Dell XPS 15 9520 RTX 3050 Ti | |
| Dota 2 Reborn - 1920x1080 ultra (3/3) best looking | |
| Asus Zephyrus Duo 16 GX650PY-NM006W | |
| Uniwill GM6PX7X RTX 4070 | |
| Alienware x15 R2 P111F | |
| Dell XPS 15 9530 RTX 4070 | |
| Gigabyte Aero 15 OLED XD | |
| Gigabyte Aero 15 OLED XD | |
| Dell XPS 15 9500 Core i7 4K UHD | |
| MSI Stealth 15M A11SEK | |
| Dell XPS 15 9520 RTX 3050 Ti | |
| X-Plane 11.11 - 1920x1080 high (fps_test=3) | |
| Uniwill GM6PX7X RTX 4070 | |
| Asus Zephyrus Duo 16 GX650PY-NM006W | |
| Alienware x15 R2 P111F | |
| Dell XPS 15 9520 RTX 3050 Ti | |
| Dell XPS 15 9530 RTX 4070 | |
| Gigabyte Aero 15 OLED XD | |
| Gigabyte Aero 15 OLED XD | |
| MSI Stealth 15M A11SEK | |
| Dell XPS 15 9500 Core i7 4K UHD | |
| Returnal | |
| 1920x1080 Low Preset | |
| Durchschnittliche NVIDIA GeForce RTX 4070 Laptop GPU (65 - 119, n=10) | |
| Dell XPS 15 9530 RTX 4070 | |
| 1920x1080 Medium Preset | |
| Durchschnittliche NVIDIA GeForce RTX 4070 Laptop GPU (69 - 117, n=11) | |
| Dell XPS 15 9530 RTX 4070 | |
| 1920x1080 High Preset | |
| Durchschnittliche NVIDIA GeForce RTX 4070 Laptop GPU (64 - 106, n=11) | |
| Dell XPS 15 9530 RTX 4070 | |
| 1920x1080 Epic Preset | |
| Durchschnittliche NVIDIA GeForce RTX 4070 Laptop GPU (54 - 90, n=11) | |
| Dell XPS 15 9530 RTX 4070 | |
| 2560x1440 Epic Preset | |
| Durchschnittliche NVIDIA GeForce RTX 4070 Laptop GPU (39 - 66, n=11) | |
| Dell XPS 15 9530 RTX 4070 | |
| 3840x2160 Epic Preset | |
| Durchschnittliche NVIDIA GeForce RTX 4070 Laptop GPU (21 - 39, n=7) | |
| Dell XPS 15 9530 RTX 4070 | |
Witcher 3 FPS-Tabelle
| min. | mittel | hoch | max. | QHD | 4K | |
| GTA V (2015) | 180 | 168.1 | 134.3 | 63.5 | 52.9 | 53 |
| The Witcher 3 (2015) | 354.2 | 233.3 | 123.9 | 69.8 | 47 | 26.5 |
| Dota 2 Reborn (2015) | 189.5 | 163.1 | 147.6 | 137 | 88.4 | |
| Final Fantasy XV Benchmark (2018) | 108.6 | 84 | 66 | 48.8 | 26.6 | |
| X-Plane 11.11 (2018) | 134.2 | 91.6 | 90.6 | 67.3 | ||
| Strange Brigade (2018) | 334 | 172.1 | 136.6 | 117.7 | 79.9 | 42.7 |
| Cyberpunk 2077 1.6 (2022) | 55.3 | 70 | 57.5 | 48 | 30 | 12.8 |
| Tiny Tina's Wonderlands (2022) | 98.1 | 92.5 | 74.3 | 58.6 | 49.8 | 39.2 |
| F1 22 (2022) | 155.1 | 148.5 | 123.5 | 39.2 | 10.6 | 4.7 |
| Returnal (2023) | 65 | 69 | 64 | 54 | 39 | 21 |
Emissionen
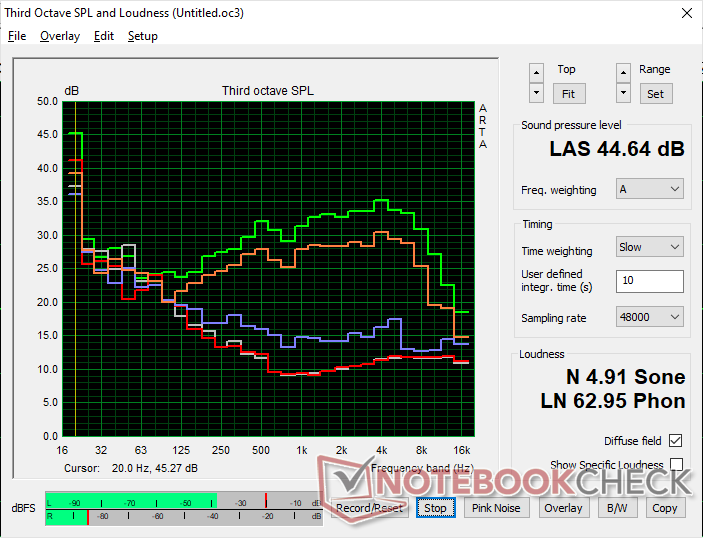
Geräuschemissionen — Für diese Größe nicht zu laut
Das Lüftergeräusch beim Surfen im Netz oder beim Streamen von Videos liegt bei etwa 24 dB(A) und ist somit bei einem lautlosen Hintergrundgeräusch von 23 dB(A) kaum hörbar. Unter stärkerer Belastung, etwa beim Gamen, steigt das Lüftergeräusch auf 40 bis 45 dB(A) und ist somit leiser als das Asus Zenbook Pro 15 oder Gigabyte Aero 15 unter ähnlicher Belastung. Das XPS 15 ist grundsätzlich nicht so laut wie andere leistungsfähige 15-Zoll-Multimedia-Laptops.
Lautstärkediagramm
| Idle |
| 23.1 / 23.1 / 24.2 dB(A) |
| Last |
| 27.1 / 44.6 dB(A) |
 | ||
30 dB leise 40 dB(A) deutlich hörbar 50 dB(A) störend |
||
min: | ||
| Dell XPS 15 9530 RTX 4070 NVIDIA GeForce RTX 4070 Laptop GPU, i7-13700H, SK hynix PC801 HFS001TEJ9X101N | Dell XPS 15 9520 RTX 3050 Ti GeForce RTX 3050 Ti Laptop GPU, i7-12700H, WDC PC SN810 512GB | Dell XPS 15 9500 Core i7 4K UHD GeForce GTX 1650 Ti Mobile, i7-10875H, SK Hynix PC611 512GB | Asus Zenbook Pro 15 OLED UM535Q GeForce RTX 3050 Ti Laptop GPU, R9 5900HX, WDC PC SN730 SDBPNTY-1T00 | MSI Prestige 15 A12UD-093 GeForce RTX 3050 Ti Laptop GPU, i7-1280P, Micron 3400 1TB MTFDKBA1T0TFH | Gigabyte Aero 15 OLED XD GeForce RTX 3070 Laptop GPU, i7-11800H, Samsung PM9A1 MZVL21T0HCLR | |
|---|---|---|---|---|---|---|
| Geräuschentwicklung | 0% | -24% | -7% | -22% | -35% | |
| aus / Umgebung * | 23.1 | 22.8 1% | 28.4 -23% | 22.8 1% | 26 -13% | 25 -8% |
| Idle min * | 23.1 | 22.9 1% | 28.4 -23% | 22.9 1% | 26 -13% | 30 -30% |
| Idle avg * | 23.1 | 22.9 1% | 28.4 -23% | 22.9 1% | 30.7 -33% | 32 -39% |
| Idle max * | 24.2 | 22.9 5% | 28.4 -17% | 22.9 5% | 30.7 -27% | 35 -45% |
| Last avg * | 27.1 | 30.9 -14% | 46 -70% | 33.2 -23% | 41.9 -55% | 44 -62% |
| Witcher 3 ultra * | 40.1 | 37.8 6% | 42 -5% | 47.3 -18% | 51 -27% | |
| Last max * | 44.6 | 44.7 -0% | 47.1 -6% | 52.8 -18% | 40.7 9% | 60 -35% |
* ... kleinere Werte sind besser
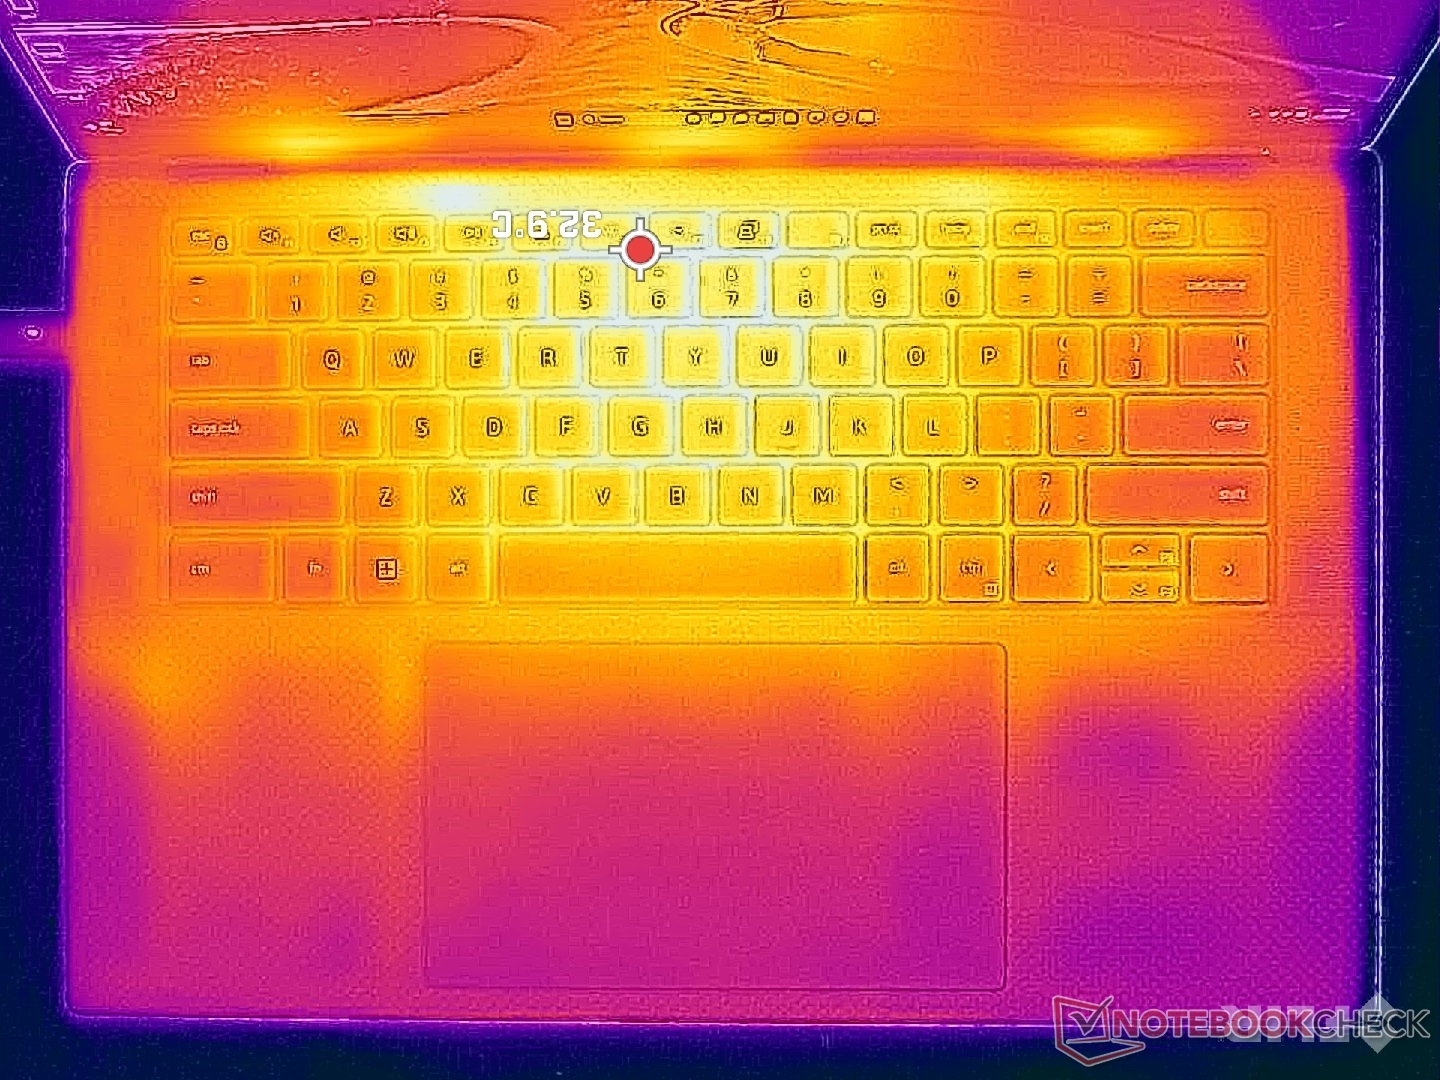
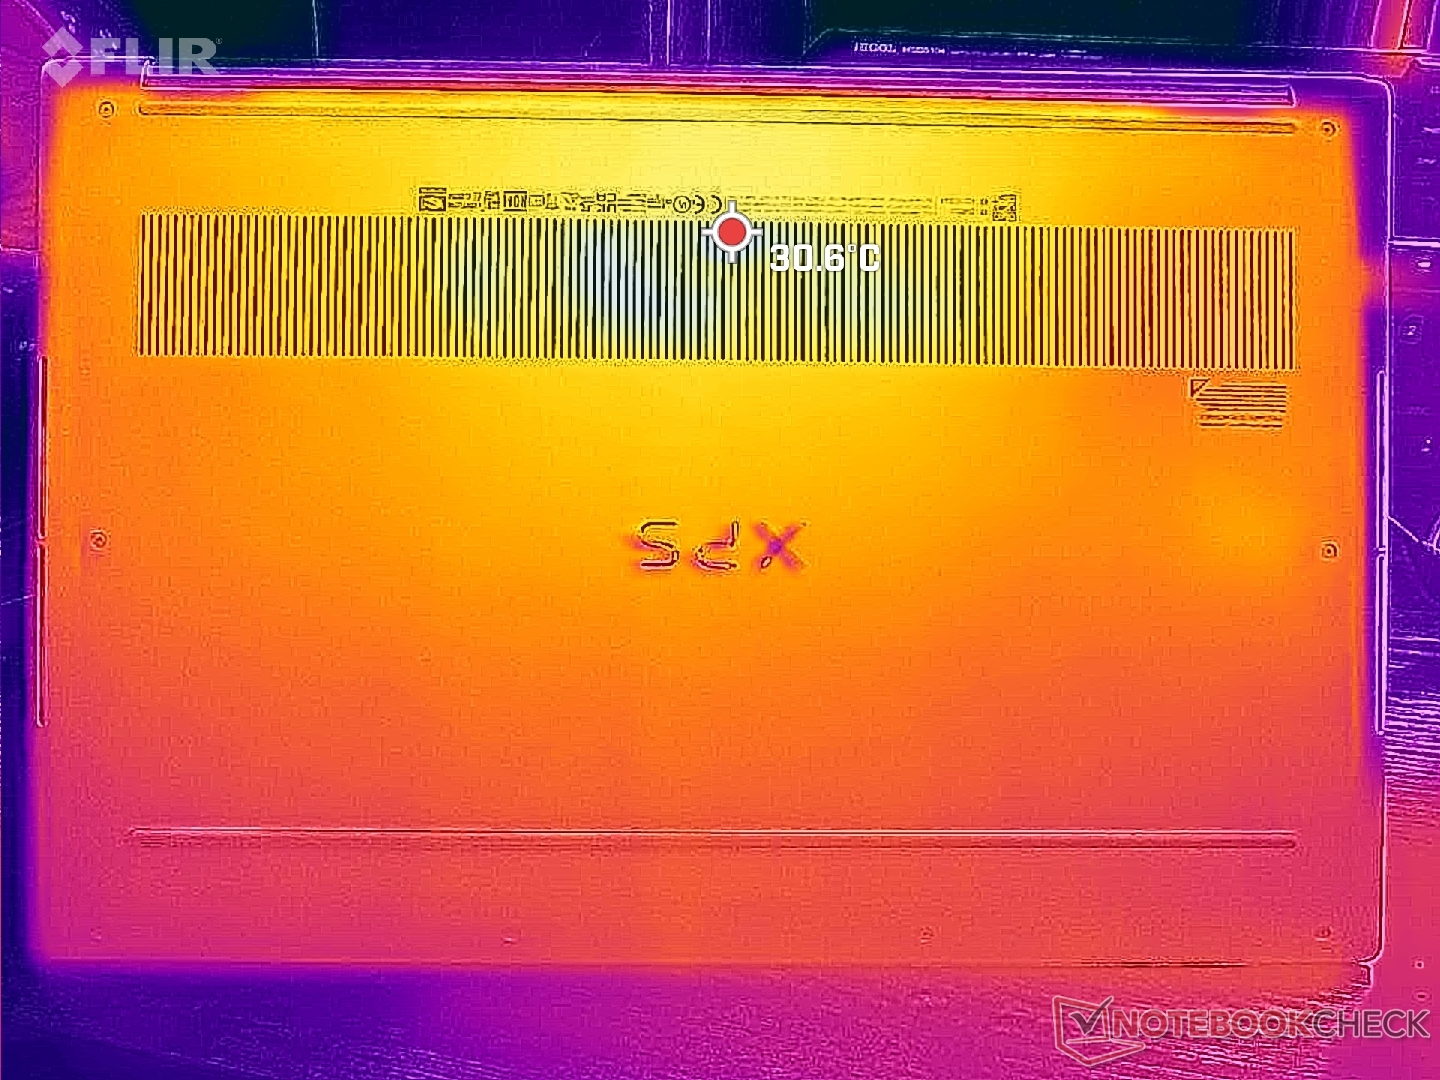
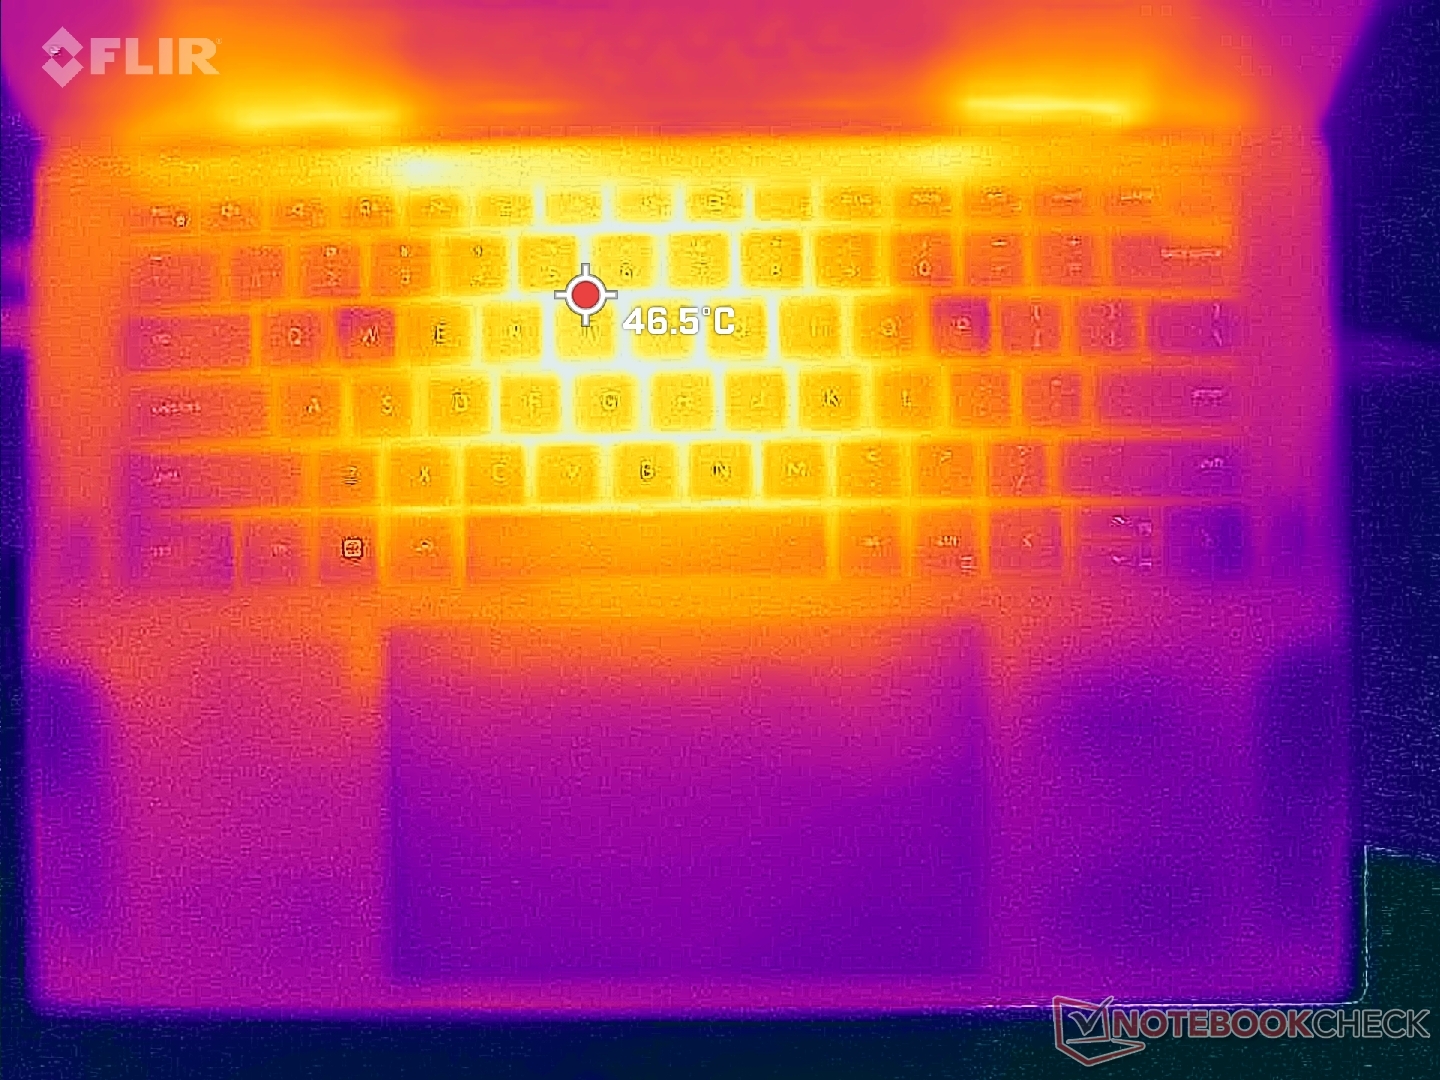
Temperatur
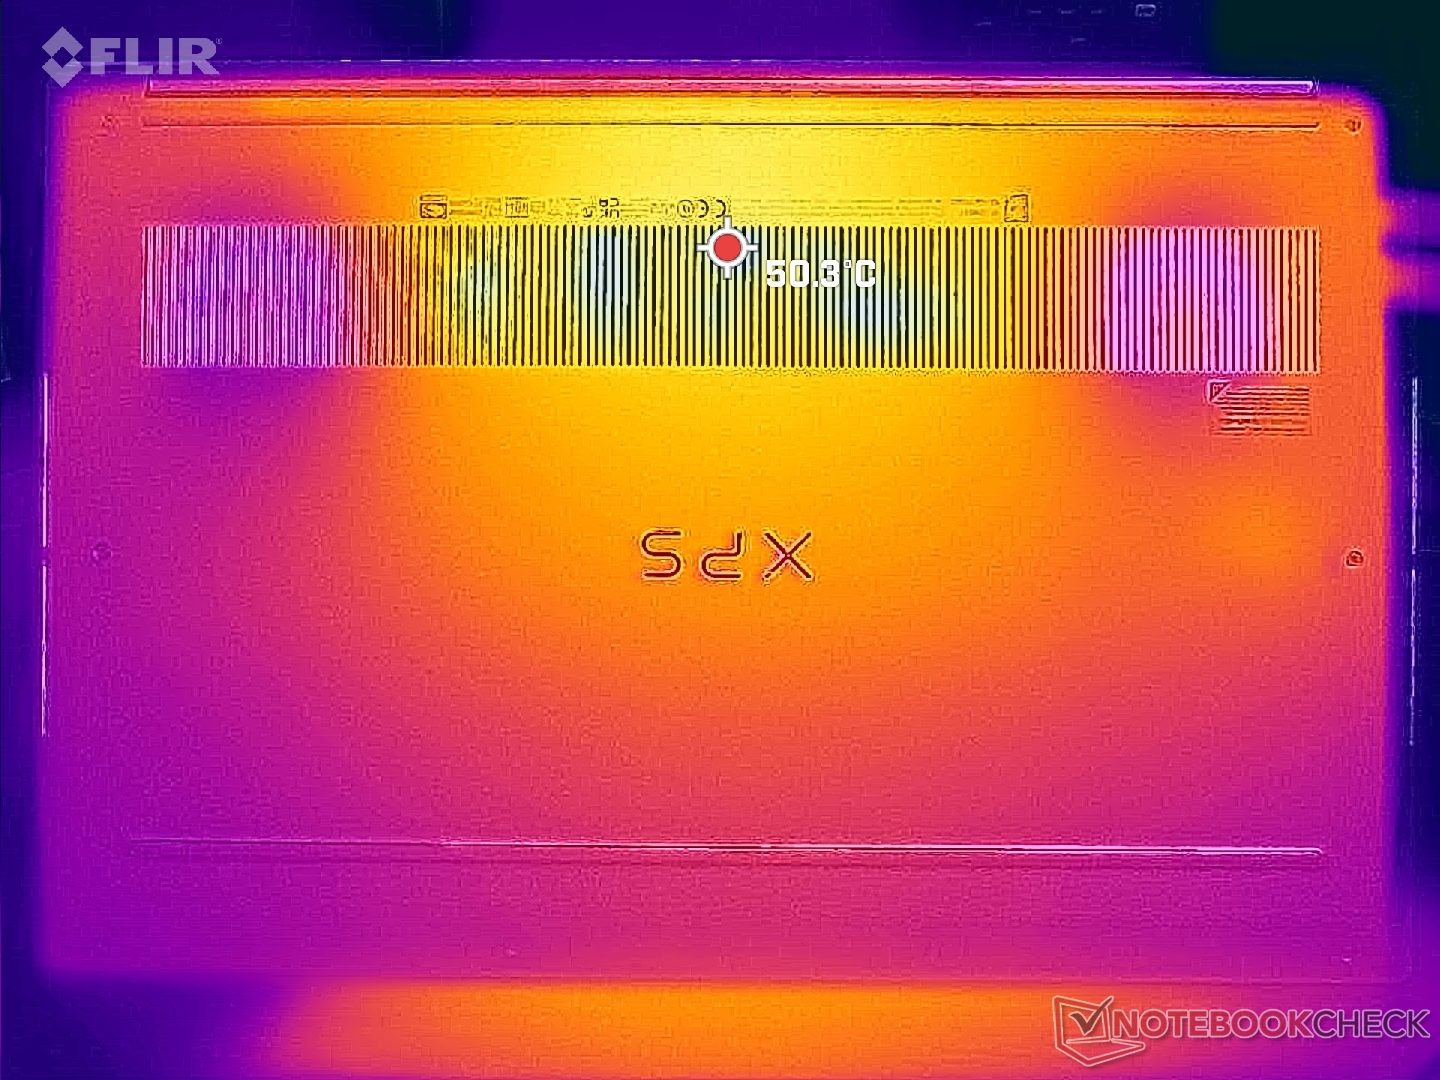
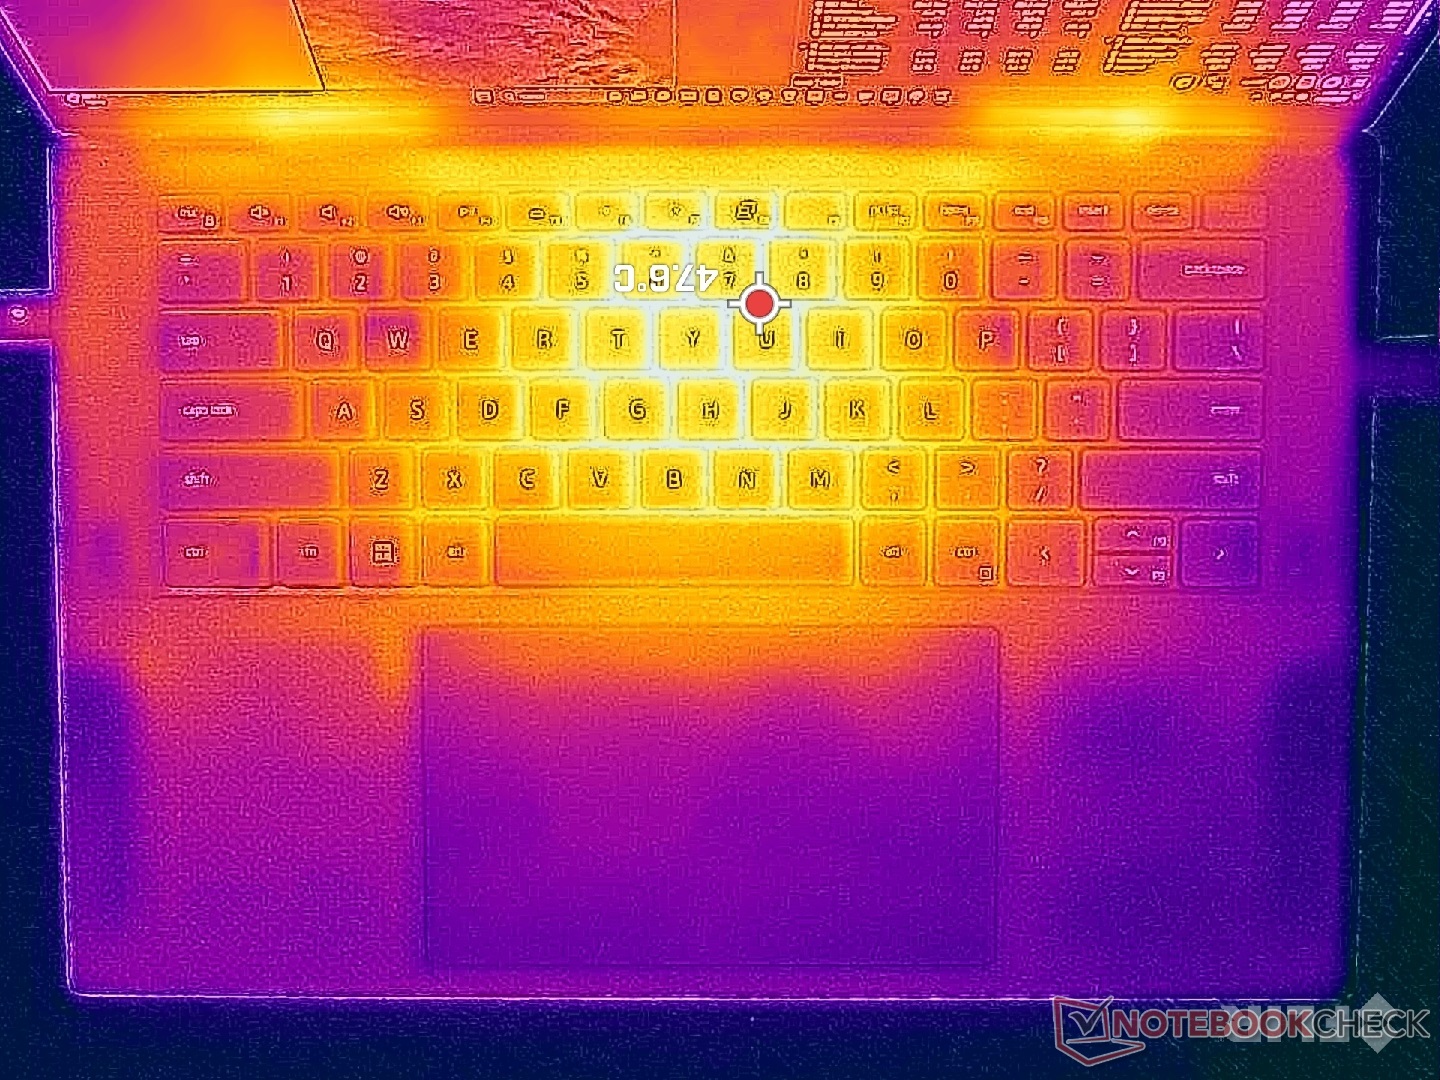
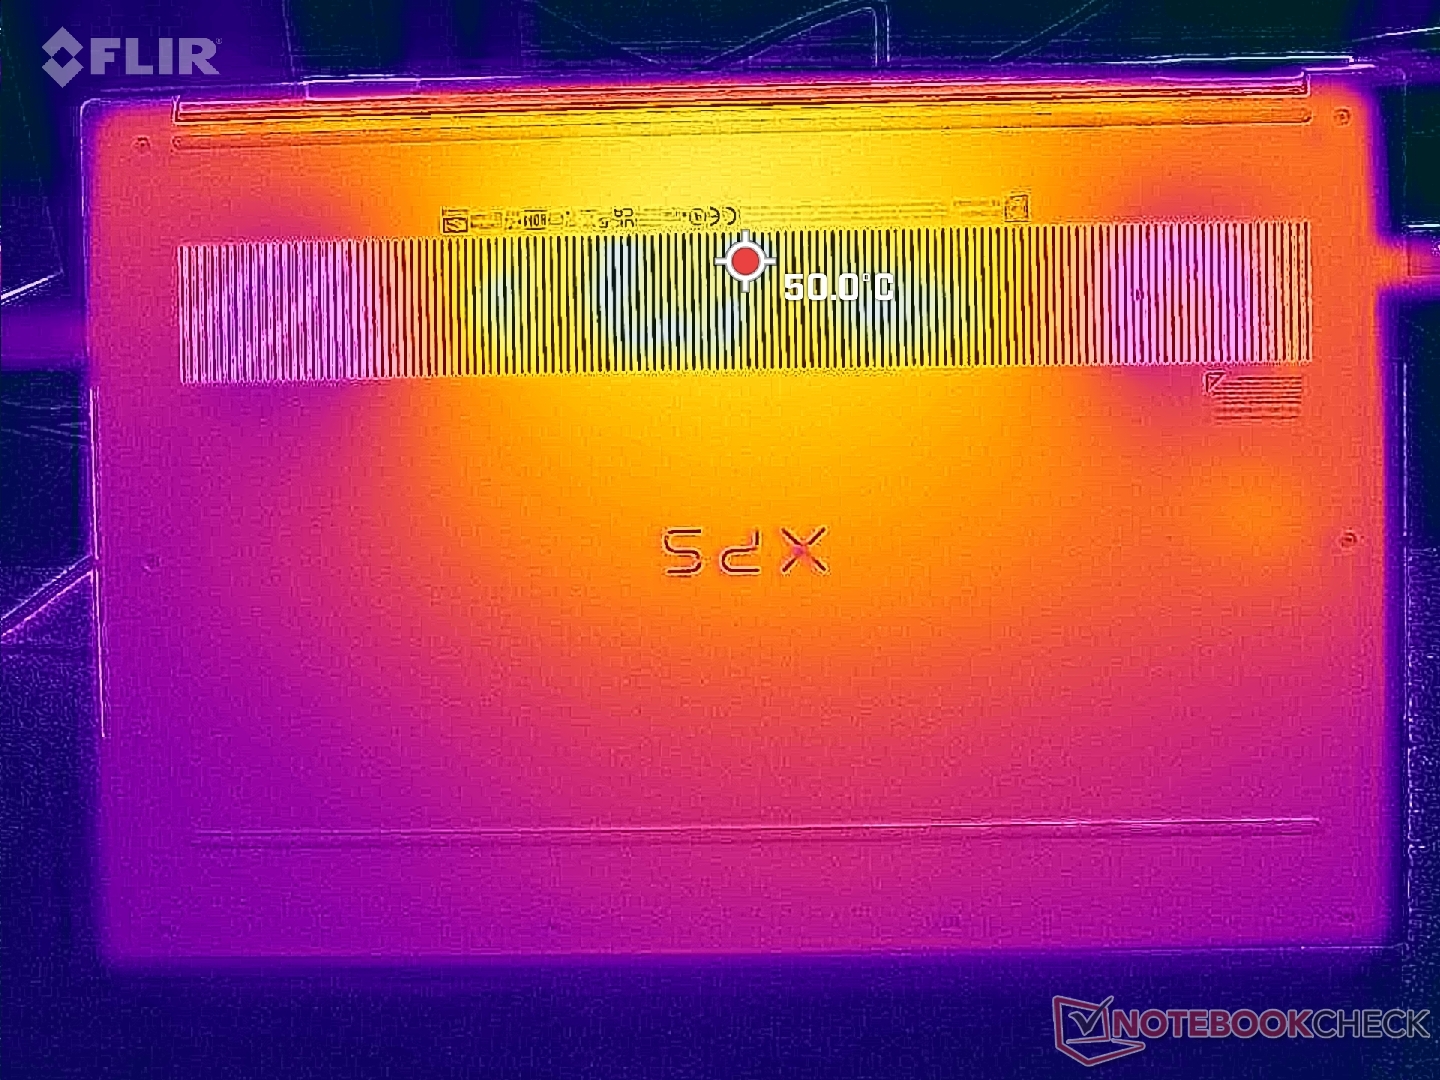
Die Oberflächentemperatur ist im Leerlauf auf dem Desktop mit rund 30 °C relativ warm, was auf die hohe Leistungsdichte im schlanken Gehäuse zurückzuführen ist. Das war auch beim Vorjahresmodell ähnlich, da die Leistungsaufnahme ungefähr gleich geblieben ist. Die Oberflächentemperatur wird auf der Unterseite bei anspruchsvoller Belastung, etwa beim Gamen, mit 45 °C unangenehm warm.
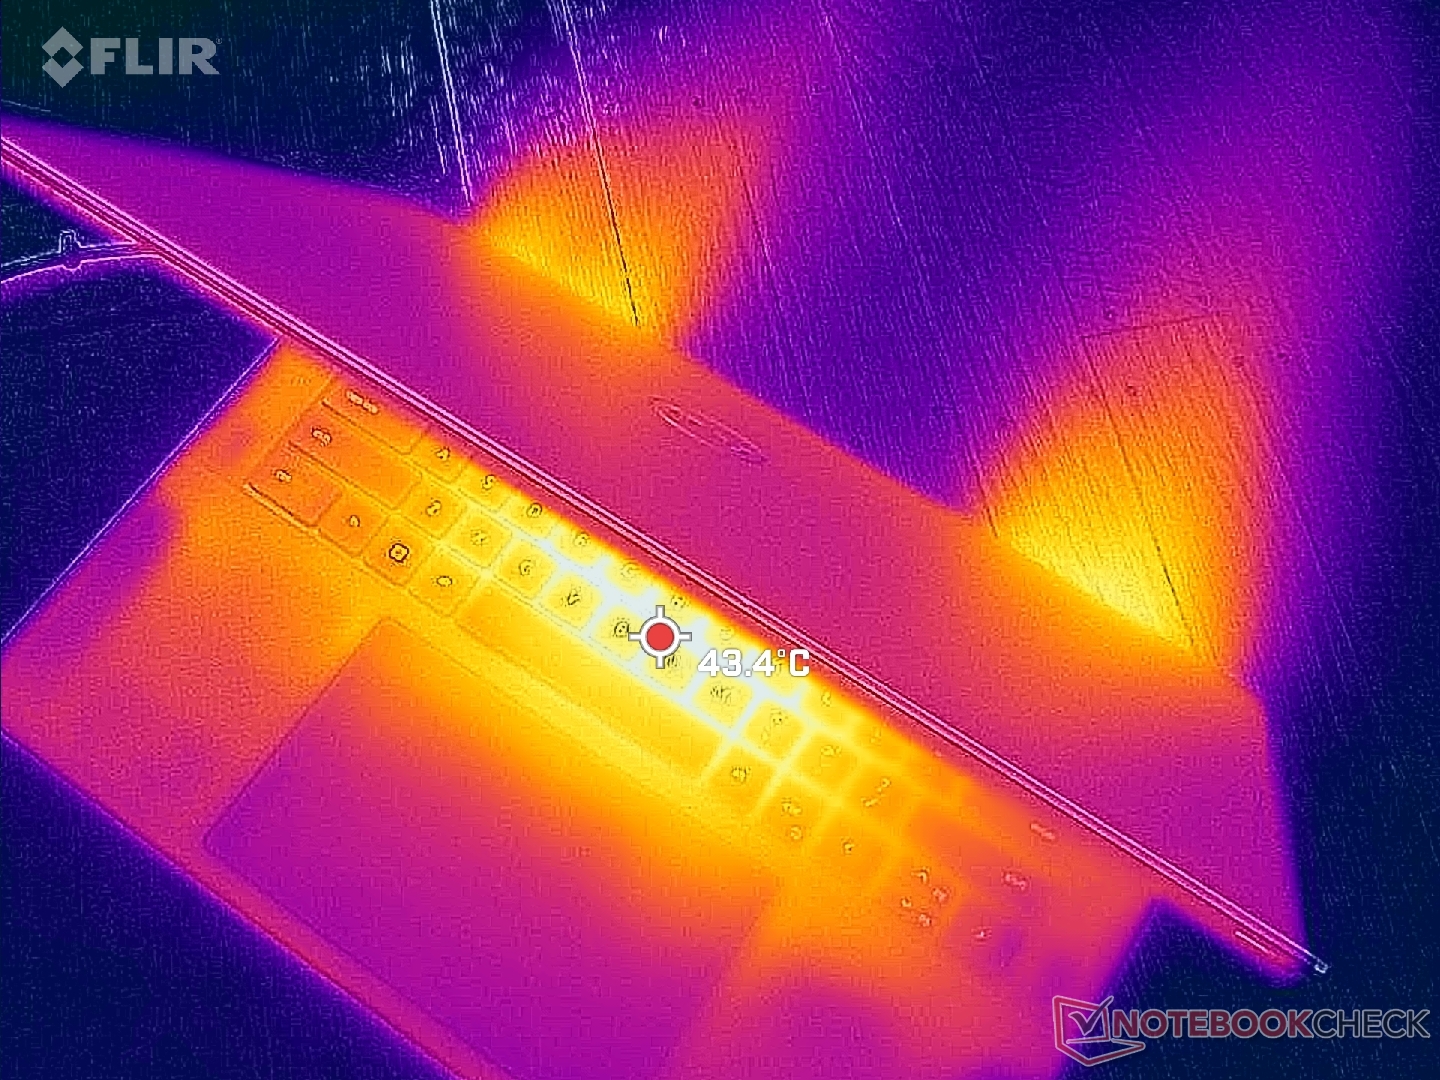
(-) Die maximale Temperatur auf der Oberseite ist 45.6 °C. Im Vergleich liegt der Klassendurchschnitt bei 36.9 °C (von 21.1 bis 71 °C für die Klasse Multimedia v7).
(±) Auf der Unterseite messen wir eine maximalen Wert von 42 °C (im Vergleich zum Durchschnitt von 39.1 °C).
(+) Ohne Last messen wir eine durchschnittliche Temperatur von 31.1 °C auf der Oberseite. Der Klassendurchschnitt erreicht 31.2 °C.
(±) Beim längeren Spielen von The Witcher 3 erhitzt sich das Gerät durchschnittlich auf 37.2 °C. Der Durchschnitt der Klasse ist derzeit 31.2 °C.
(+) Die Handballen und der Touchpad-Bereich sind mit gemessenen 30.6 °C kühler als die typische Hauttemperatur und fühlen sich dadurch kühl an.
(±) Die durchschnittliche Handballen-Temperatur anderer getesteter Geräte war 28.8 °C (-1.8 °C).
| Dell XPS 15 9530 RTX 4070 Intel Core i7-13700H, NVIDIA GeForce RTX 4070 Laptop GPU | Dell XPS 15 9520 RTX 3050 Ti Intel Core i7-12700H, NVIDIA GeForce RTX 3050 Ti Laptop GPU | Dell XPS 15 9500 Core i7 4K UHD Intel Core i7-10875H, NVIDIA GeForce GTX 1650 Ti Mobile | Asus Zenbook Pro 15 OLED UM535Q AMD Ryzen 9 5900HX, NVIDIA GeForce RTX 3050 Ti Laptop GPU | MSI Prestige 15 A12UD-093 Intel Core i7-1280P, NVIDIA GeForce RTX 3050 Ti Laptop GPU | Gigabyte Aero 15 OLED XD Intel Core i7-11800H, NVIDIA GeForce RTX 3070 Laptop GPU | |
|---|---|---|---|---|---|---|
| Hitze | -5% | -2% | -4% | -3% | -9% | |
| Last oben max * | 45.6 | 51.4 -13% | 44 4% | 36 21% | 49 -7% | 45 1% |
| Last unten max * | 42 | 51 -21% | 48.8 -16% | 47.2 -12% | 52.6 -25% | 54 -29% |
| Idle oben max * | 34.4 | 30 13% | 33 4% | 37 -8% | 29.7 14% | 34 1% |
| Idle unten max * | 33.2 | 33 1% | 32.4 2% | 39.2 -18% | 30.7 8% | 36 -8% |
* ... kleinere Werte sind besser
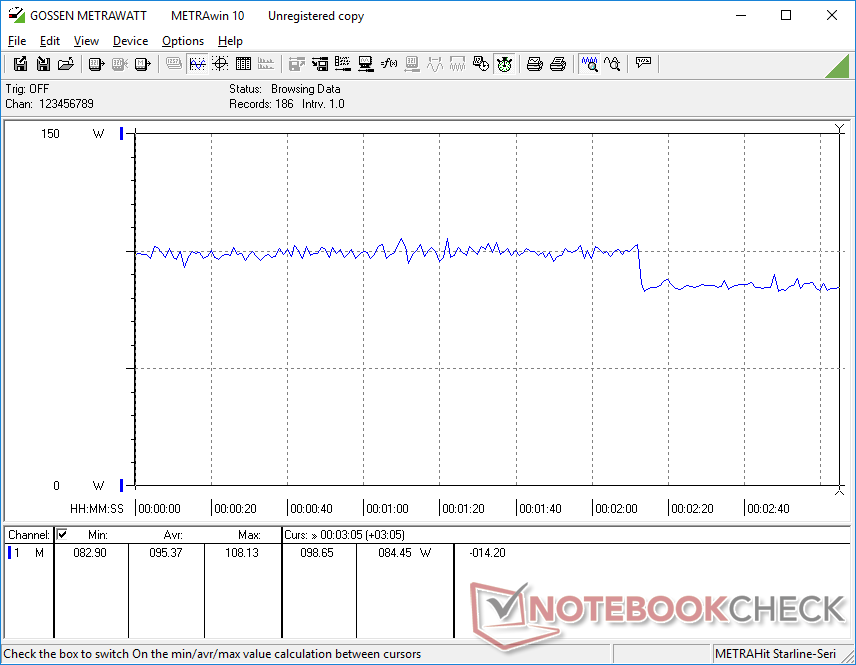
Stresstest — Hohe CPU-Temperaturen
Nach dem Start von Prime95 steigt die Taktrate der CPU zu Beginn ein paar Sekunden lang auf 3,7 GHz und 96 W, fällt dann aber stetig auf nur 2,7 GHz und 55 W zurück. Dies ist auf die sehr hohe Kerntemperatur von 88 bis 100 °C zurückzuführen, die die CPU unter maximaler Belastung erreicht. Im Vergleich dazu ergibt derselbe Test im Asus Zenbook Pro 15 UM535Q mit AMD-Chip eine kühlere Kerntemperatur von nur 76 °C. Die überdurchschnittlich hohe Kerntemperatur im Dell ist nicht überraschend — es ist ein gemeinsames Merkmal der XPS-15-Reihe. Ein Upgrade auf die Core-i9-Konfiguration könnte dadurch nur sehr eingeschränkte Vorteilen bieten, da unsere Core-i7-Konfiguration selbst bereits am 100-°C-Limit kratzt.
Unter Witcher 3 als typische Gaming-Belastung stabilisiert sich die GPU bei 1,590 MHz Kerntaktrate, 1,375 MHz Speichertaktrate, 70 °C und 43 W aus 50 W. Die Wiederholung des gleichen Tests im größeren Uniwill GM6PX7X IDX, welches mit einer leistungsstärkeren 130-W-RTX-4070 ausgestattet ist, ergibt eine stabilere Kerntaktrate, Speichertaktrate, Temperatur und GPU-Leistung von 2.370 MHz, 2.125 MHz, 73 °C und 100 W. Der Leistungsunterschied zwischen der 50-W- und der 100+-W-RTX-4070 ist in diesem Beispiel mehr als deutlich.
Überraschend ist, dass der Akkumodus die Leistung nicht beeinflusst. Das ist bei Laptops mit GeForce RTX ungewöhnlich. Ein Durchlauf von 3DMark 11 im Akkumodus ergibt Physics- und Graphics-Ergebnisse von 20.751 bzw. 24.569 Punkte. Hängt das Gerät am Stromnetz, erreicht es 18.112 bzw. 24.229 Punkte.
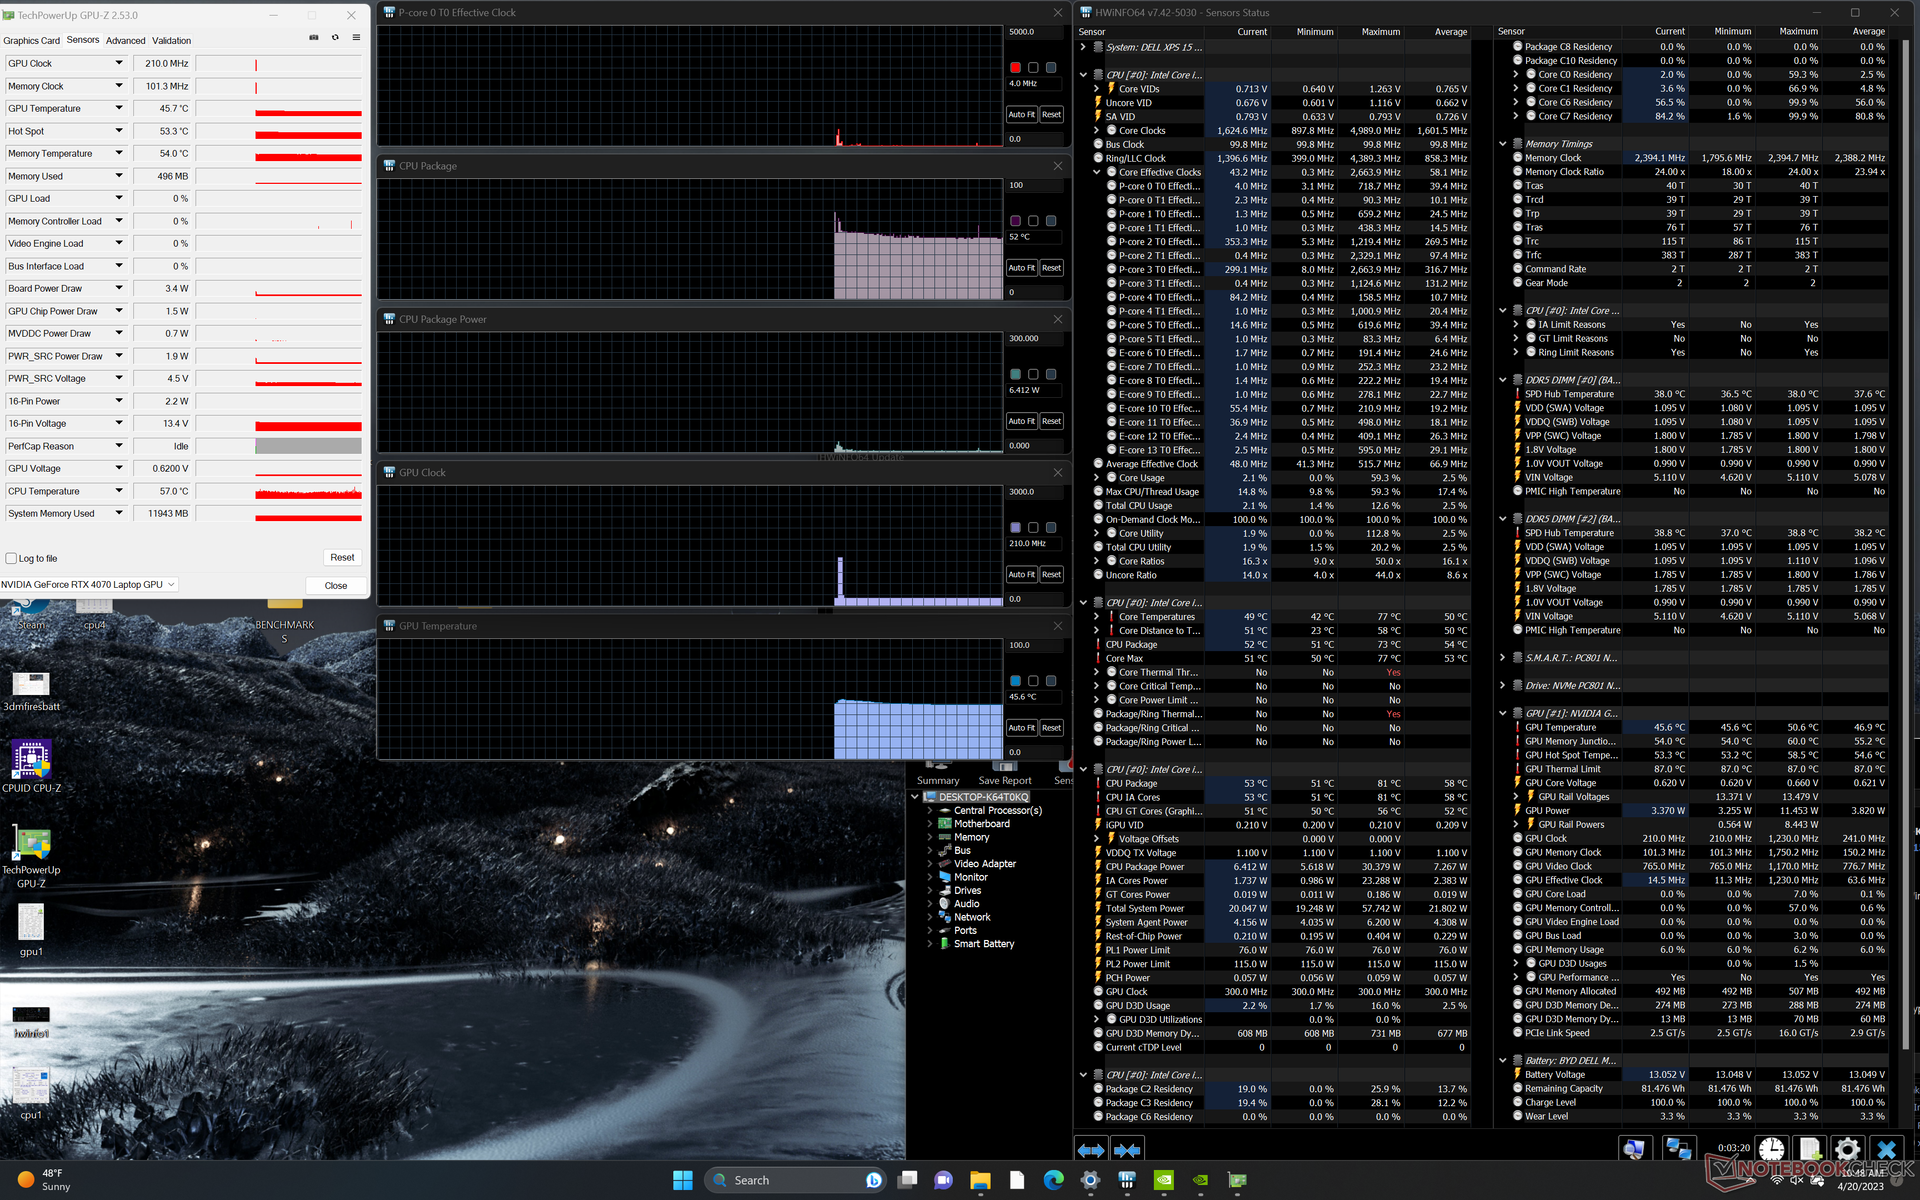
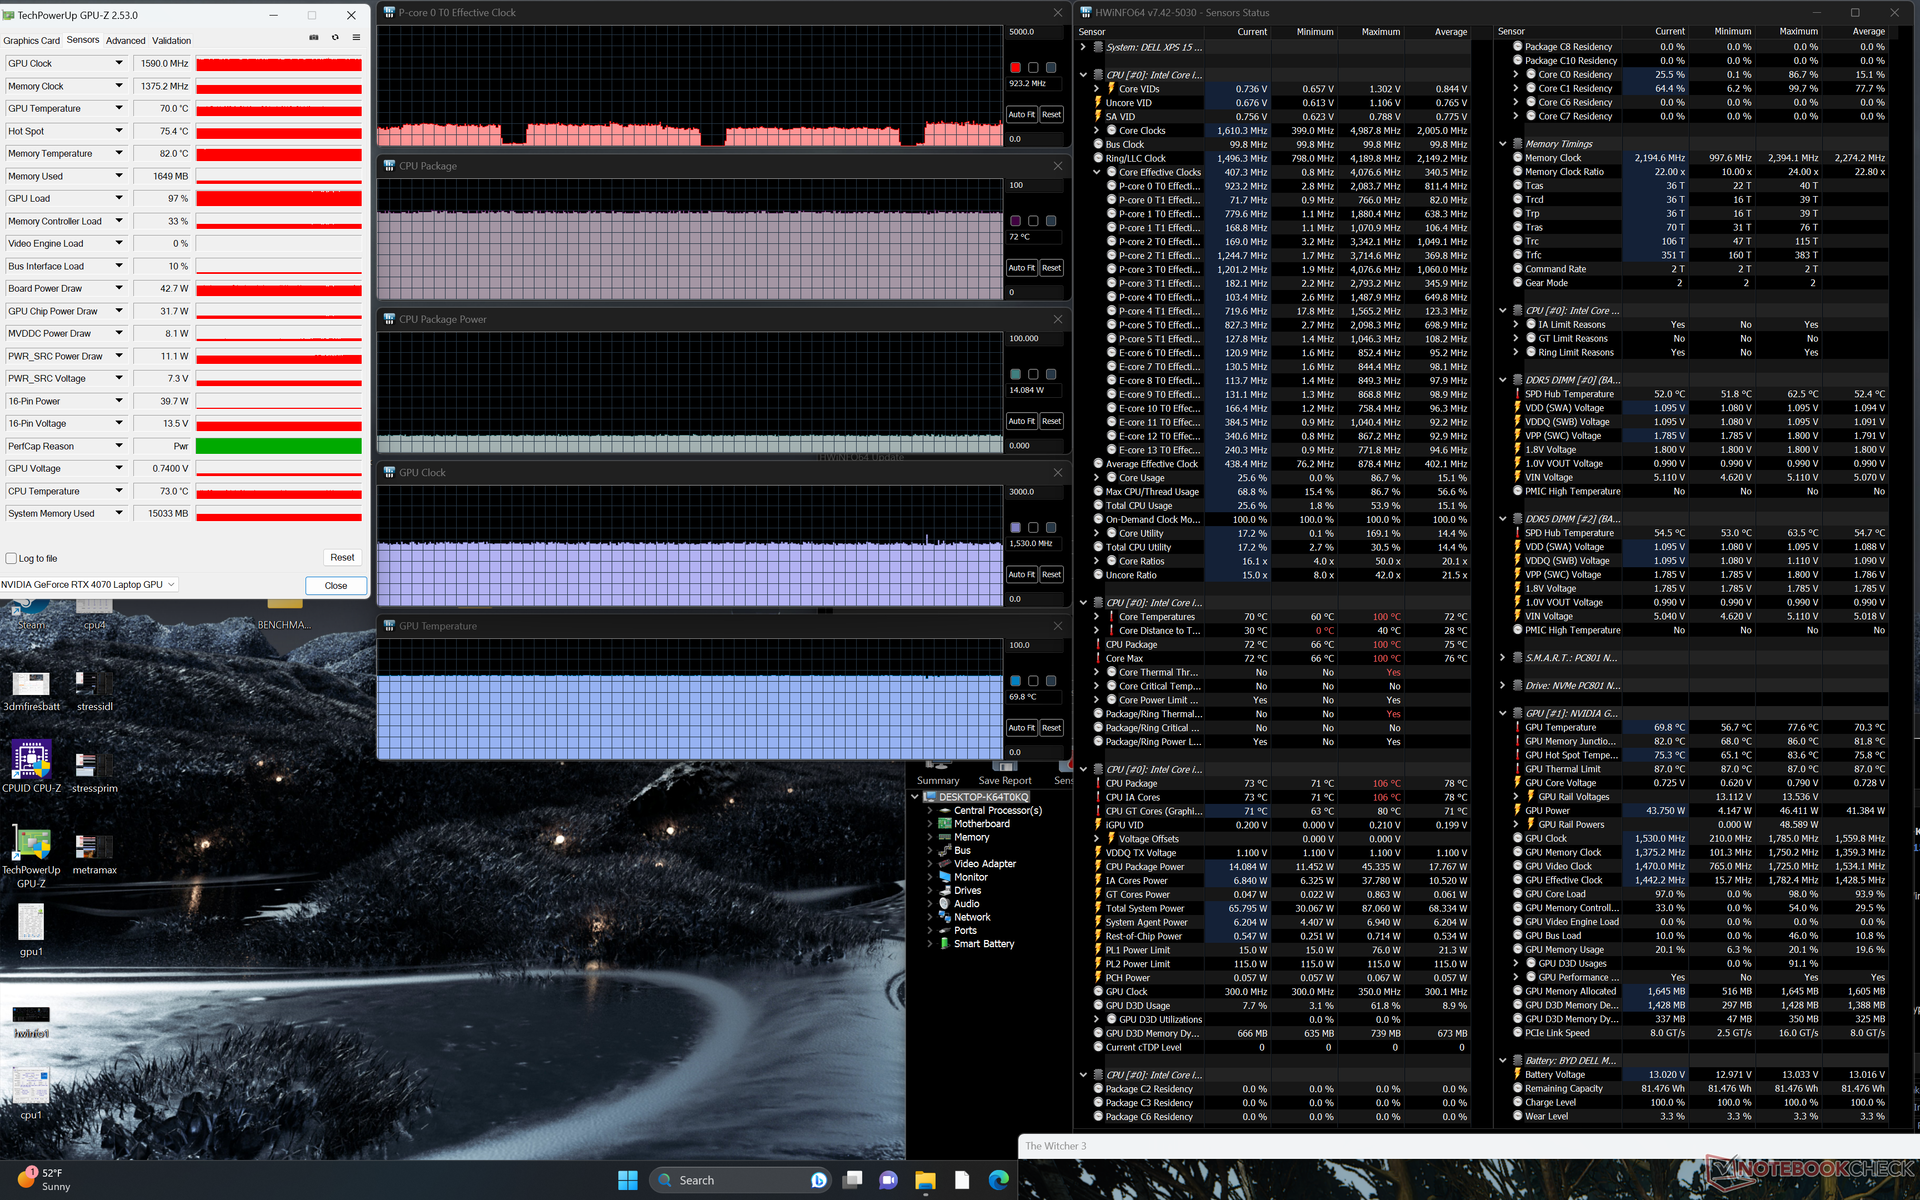
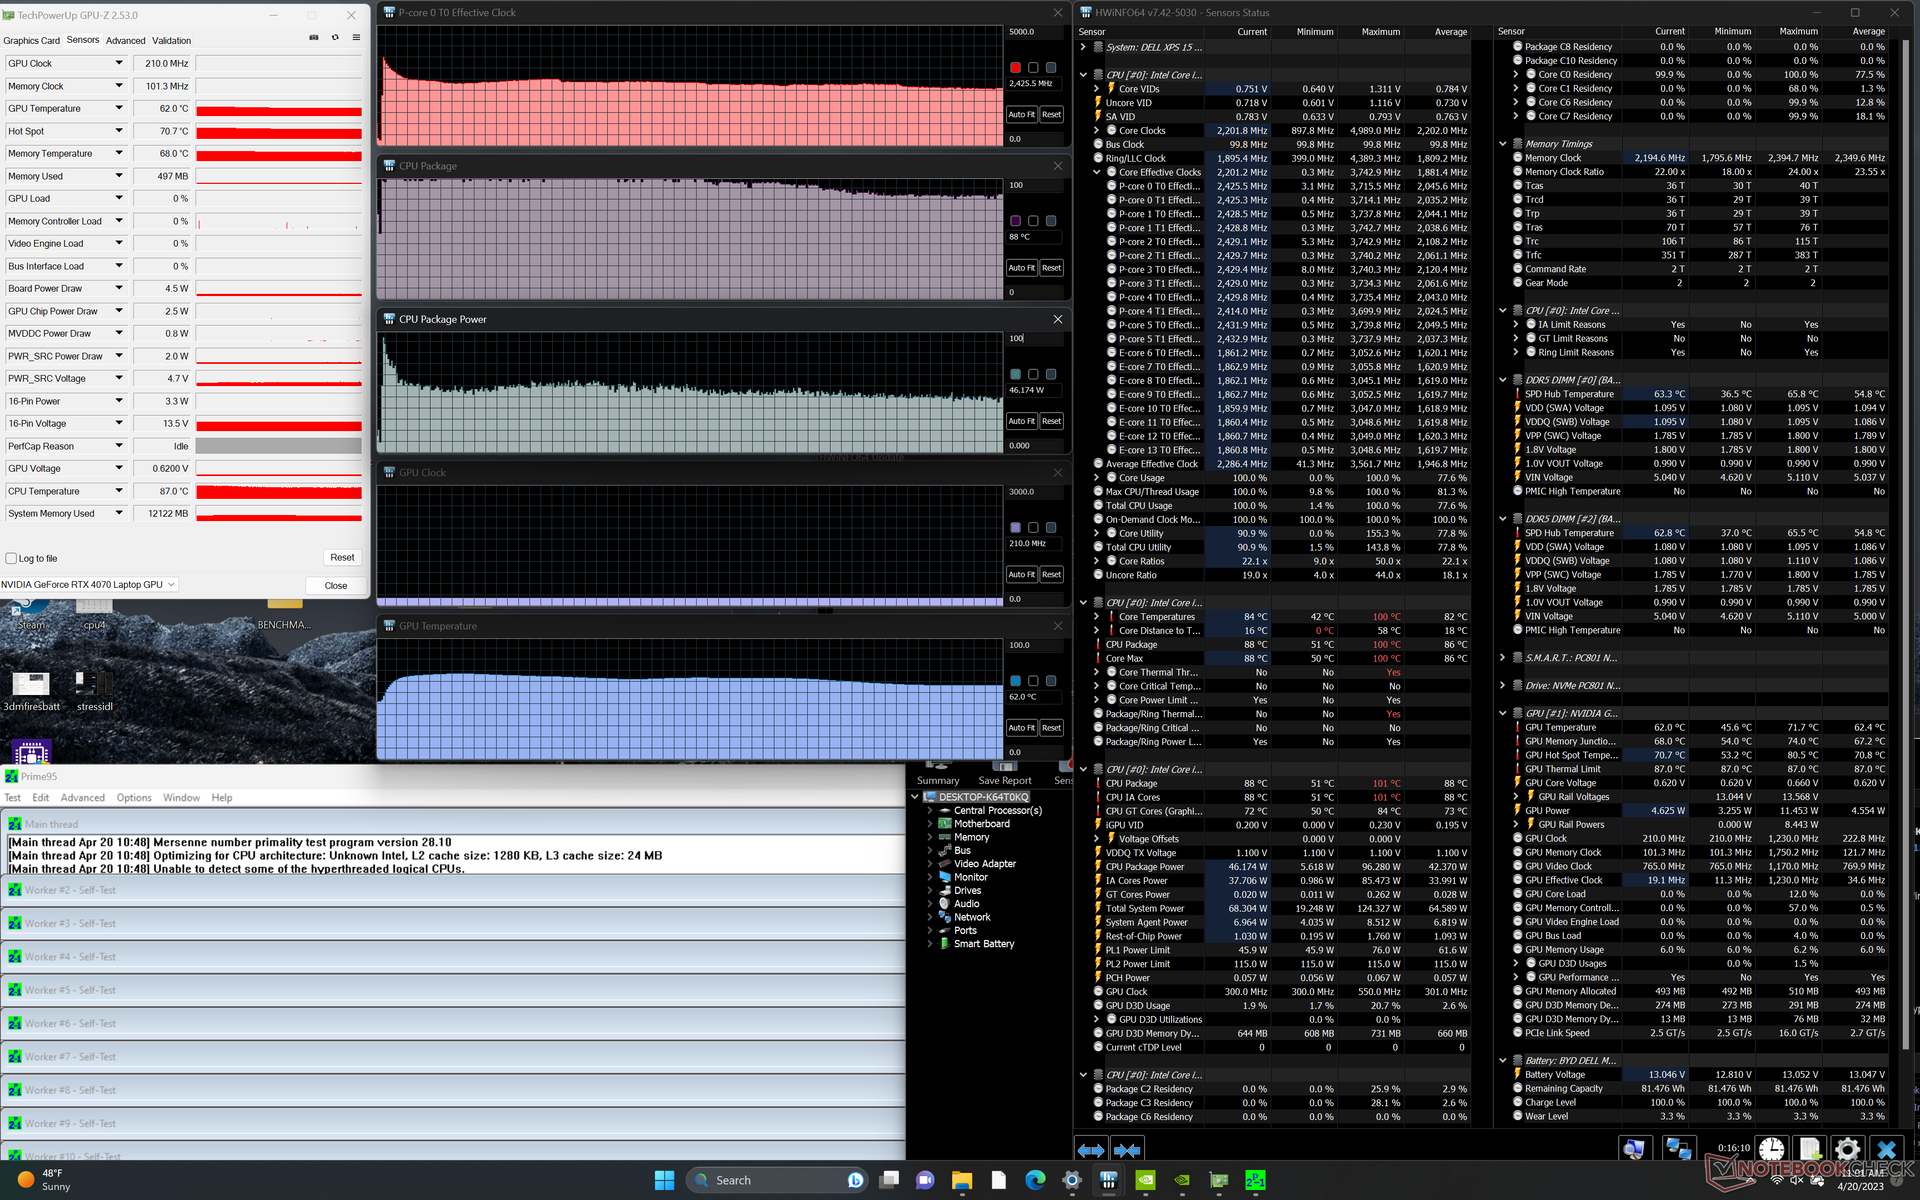
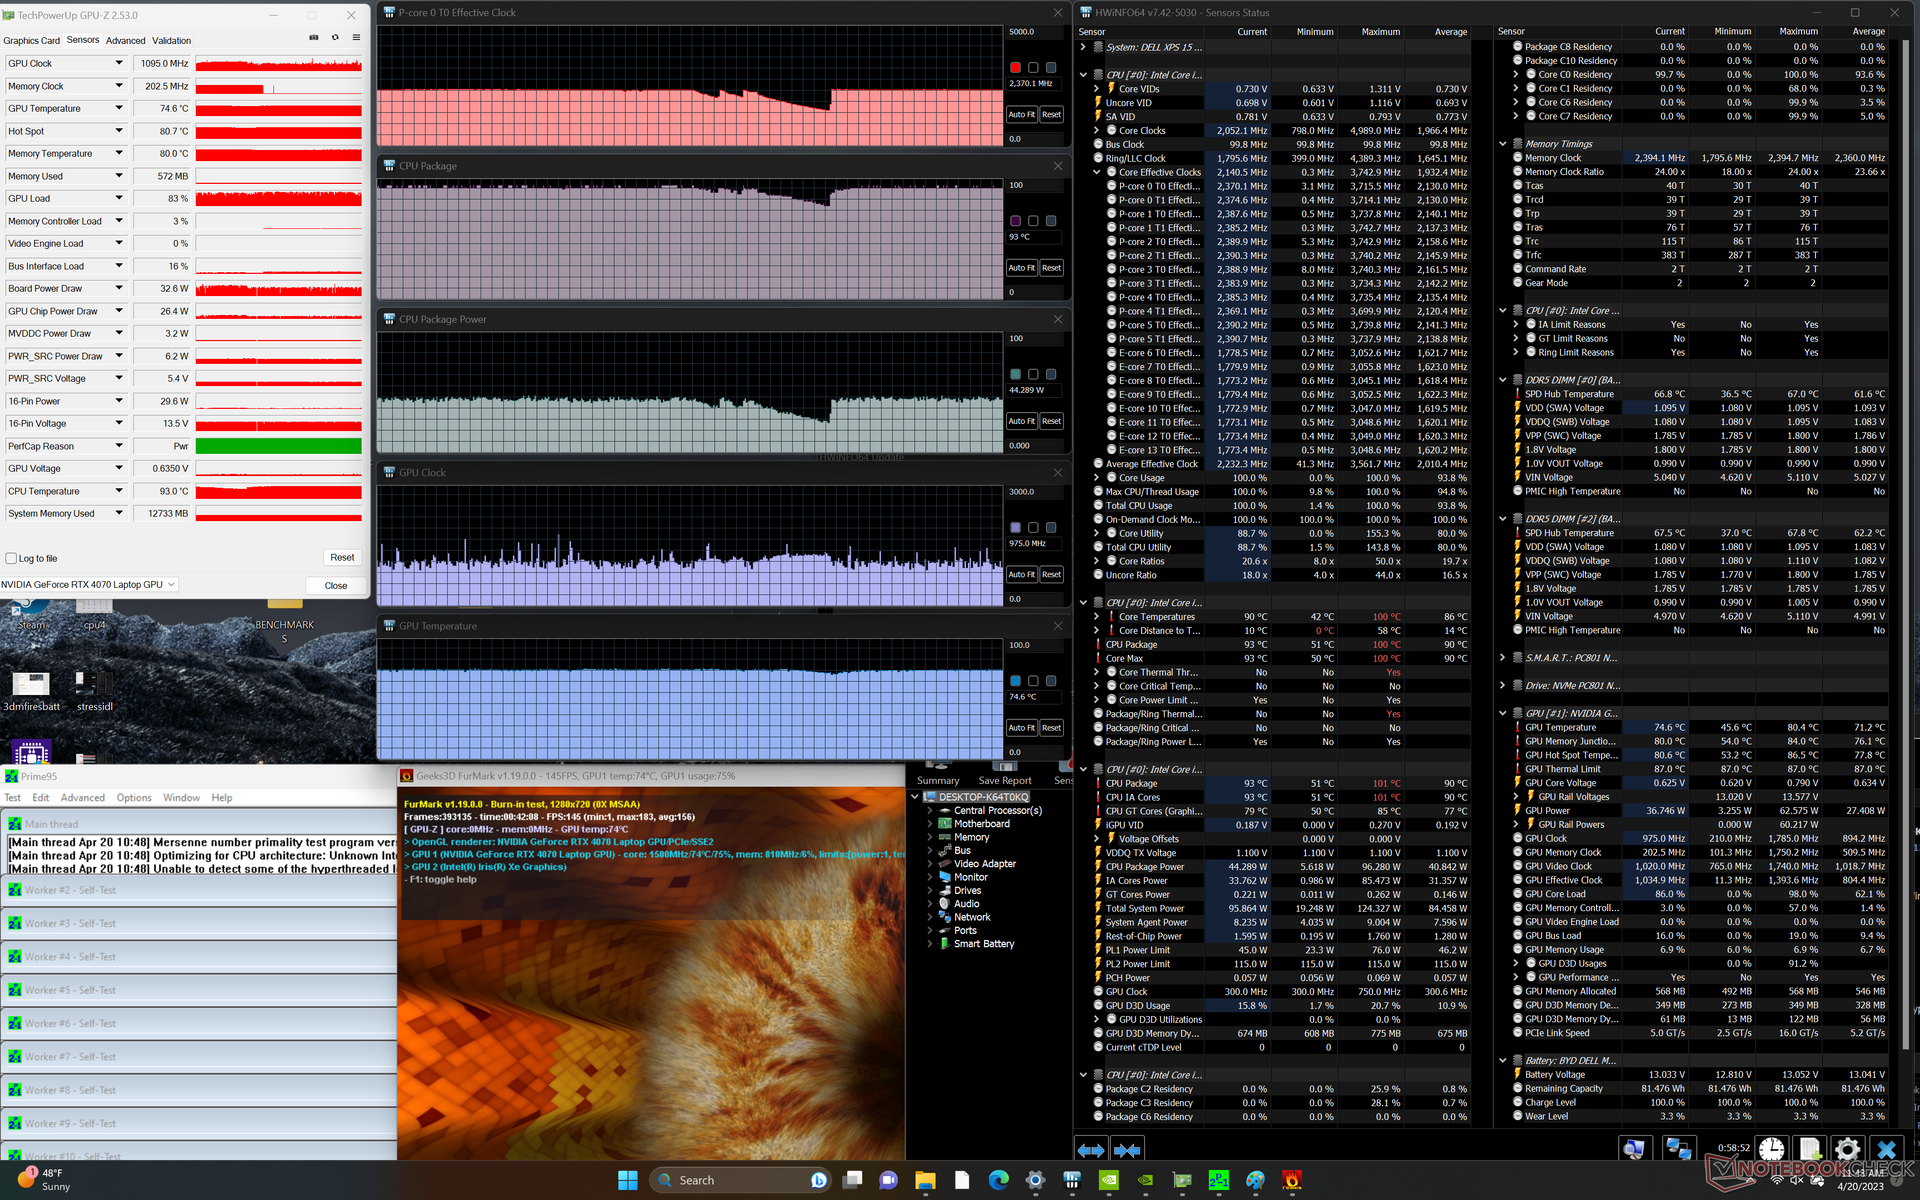
| CPU-Takt (GHz) | GPU-Takt (MHz) | Durchschnittliche CPU-Temperatur (°C) | Durchschnittliche GPU-Temperatur (°C) | |
| Leerlauf | -- | -- | 52 | 46 |
| Prime95-Last | 2,4 | -- | 88 | 62 |
| Prime95-+-FurMark-Last | 2,4 | ~1095 | 93 | 75 |
| Witcher-3-Last | ~0,9 | 1590 | 72 | 70 |
Lautsprecher
Dell XPS 15 9530 RTX 4070 Audio Analyse
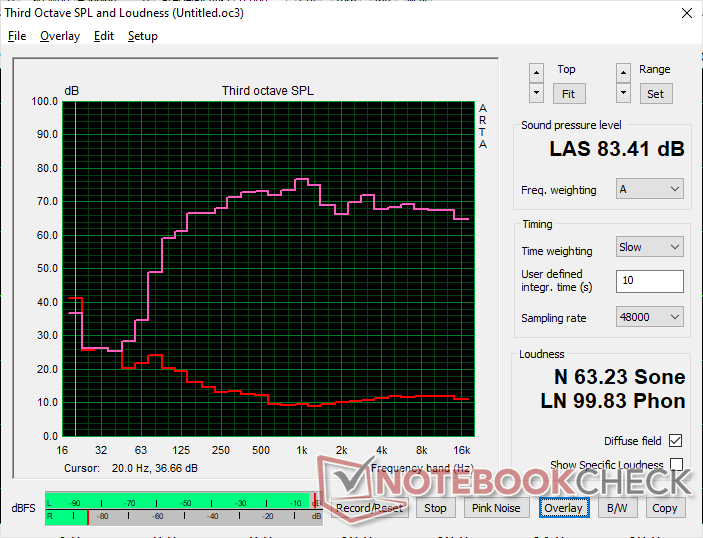
(+) | Die Lautsprecher können relativ laut spielen (83.4 dB)
Bass 100 - 315 Hz
(+) | guter Bass - nur 3.9% Abweichung vom Median
(+) | lineare Bass-Wiedergabe (6.8% Delta zum Vorgänger)
Mitteltöne 400 - 2000 Hz
(+) | ausgeglichene Mitten, vom Median nur 4.4% abweichend
(+) | lineare Mitten (4.1% Delta zum Vorgänger)
Hochtöne 2 - 16 kHz
(+) | ausgeglichene Hochtöne, vom Median nur 1.1% abweichend
(+) | sehr lineare Hochtöne (3.3% Delta zum Vorgänger)
Gesamt im hörbaren Bereich 100 - 16.000 Hz
(+) | hörbarer Bereich ist sehr linear (6.4% Abstand zum Median
Im Vergleich zu allen Geräten derselben Klasse
» 2% aller getesteten Geräte dieser Klasse waren besser, 1% vergleichbar, 97% schlechter
» Das beste Gerät hat einen Delta-Wert von 5%, durchschnittlich ist 18%, das schlechteste Gerät hat 45%
Im Vergleich zu allen Geräten im Test
» 0% aller getesteten Geräte waren besser, 0% vergleichbar, 99% schlechter
» Das beste Gerät hat einen Delta-Wert von 4%, durchschnittlich ist 25%, das schlechteste Gerät hat 134%
Apple MacBook Pro 16 2021 M1 Pro Audio Analyse
(+) | Die Lautsprecher können relativ laut spielen (84.7 dB)
Bass 100 - 315 Hz
(+) | guter Bass - nur 3.8% Abweichung vom Median
(+) | lineare Bass-Wiedergabe (5.2% Delta zum Vorgänger)
Mitteltöne 400 - 2000 Hz
(+) | ausgeglichene Mitten, vom Median nur 1.3% abweichend
(+) | lineare Mitten (2.1% Delta zum Vorgänger)
Hochtöne 2 - 16 kHz
(+) | ausgeglichene Hochtöne, vom Median nur 1.9% abweichend
(+) | sehr lineare Hochtöne (2.7% Delta zum Vorgänger)
Gesamt im hörbaren Bereich 100 - 16.000 Hz
(+) | hörbarer Bereich ist sehr linear (4.6% Abstand zum Median
Im Vergleich zu allen Geräten derselben Klasse
» 0% aller getesteten Geräte dieser Klasse waren besser, 0% vergleichbar, 100% schlechter
» Das beste Gerät hat einen Delta-Wert von 5%, durchschnittlich ist 18%, das schlechteste Gerät hat 45%
Im Vergleich zu allen Geräten im Test
» 0% aller getesteten Geräte waren besser, 0% vergleichbar, 100% schlechter
» Das beste Gerät hat einen Delta-Wert von 4%, durchschnittlich ist 25%, das schlechteste Gerät hat 134%
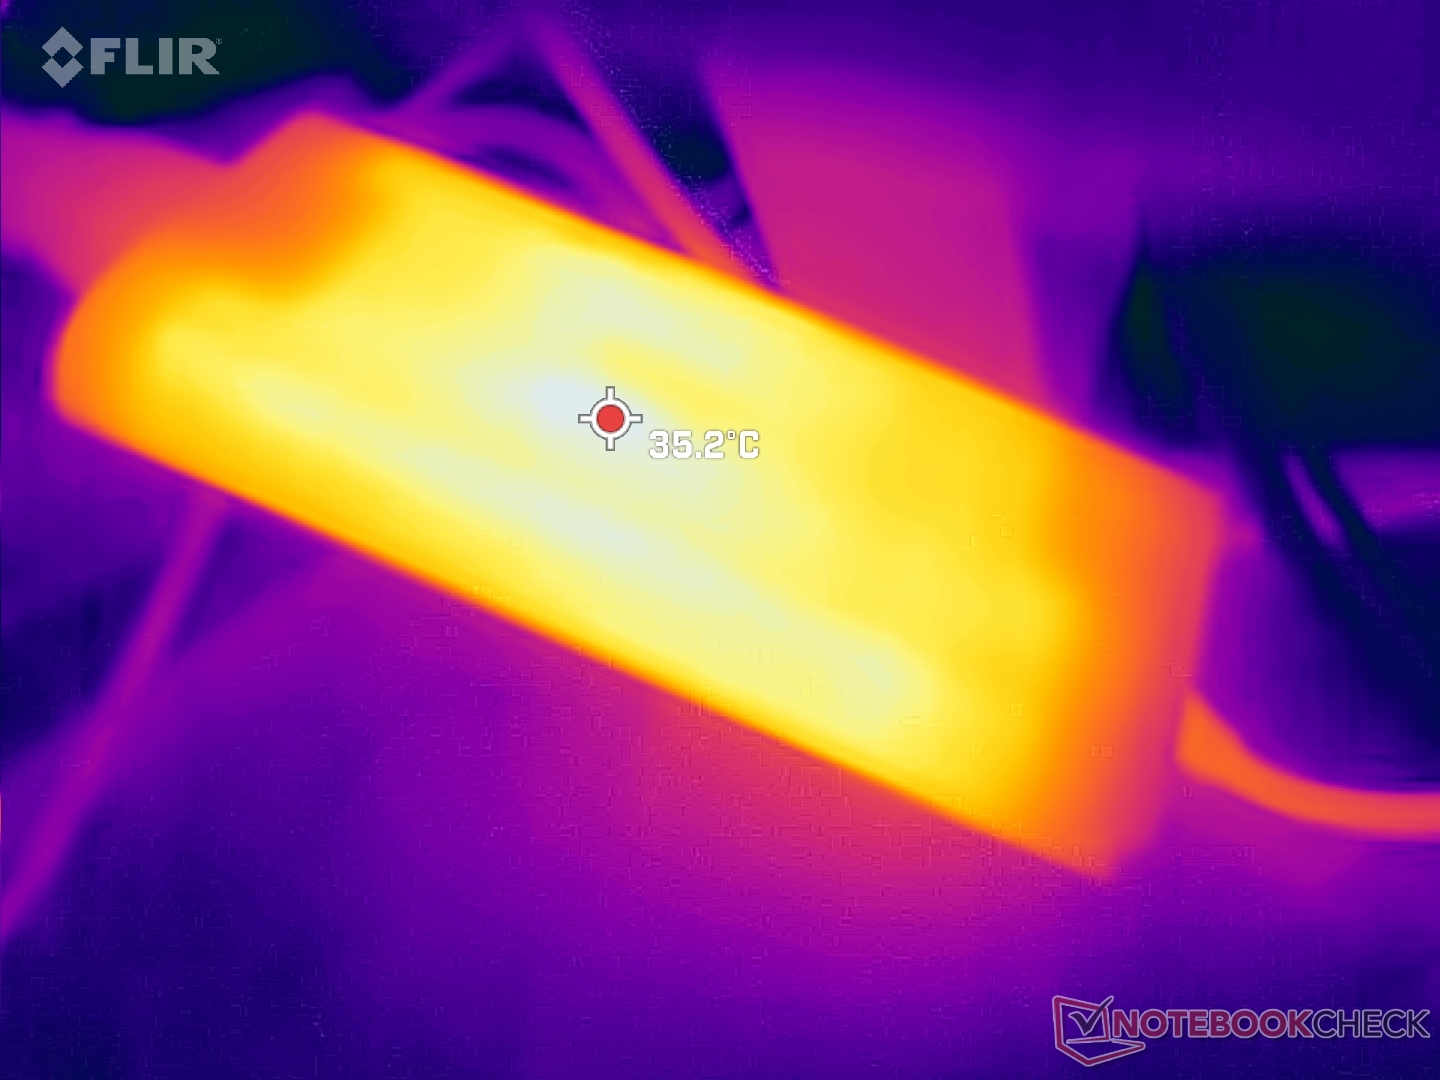
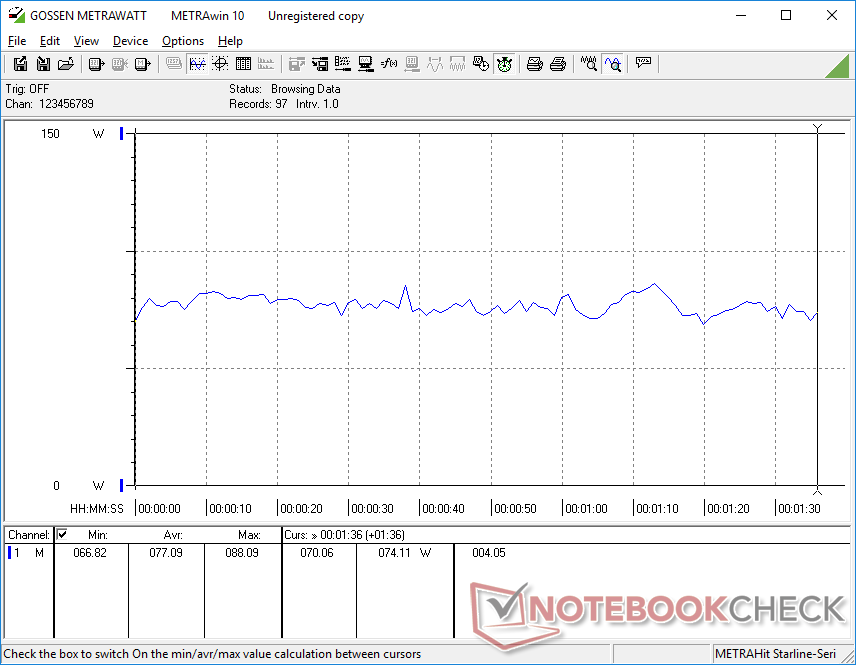
Energieverwaltung — Core H und GeForce RTX auf USB-C
Energieaufnahme
Die Energieaufnahme ist im Vergleich zum Vorjahresmodell grundsätzlich höher. Im Leerlauf auf dem Desktop bei niedrigen Einstellungen verbraucht das XPS 15 9530 rund 20 W, während das ältere XPS 15 9520 nur 5 bis 6 W benötigte. Beim Gamen ist die Energieaufnahme rund 25 Prozent höher, was bedeutet, dass der Leistungszuwachs im Vergleich zur älteren RTX 3050 Ti durchaus seine Kosten hat.
Die maximale Leistungsaufnahme lag kurzfristig bei 133 W, bei einem 130-W-Netzgerät (~14,3 x 6,6 x 2,2 cm groß). Das XPS 15 ist eines der ersten Laptops, das sowohl mit einer CPU der Core-H-Serie als auch einer GeForce-RTX-4070-GPU ausgestattet ist und nur über USB-C aufgeladen werden kann. Das hat im Sinne der Mobilität und Flexibilität durchaus seine Vorteile, allerdings kann sowohl die Leistung als auch das Laden dabei unter der limitierten Stromzufuhr leiden. Das vollständige Aufladen von 0 auf 100 Prozent ist mit 2,5 Stunden zum Beispiel langsamer als üblich. Wird der Laptop gleichzeitig stark belastet, dauert das Laden sogar noch länger.
Zum Glück reicht die Stromzufuhr aus, sodass die Akkuladung beim Gamen oder bei anspruchsvollen Aktivitäten nicht abnimmt, wie wir das bei älteren XPS-17-Modellen festgestellt haben.
| Aus / Standby | |
| Idle | |
| Last |
|
Legende:
min: Derzeit nutzen wir das Metrahit Energy, ein professionelles TRMS Leistungs-Multimeter und PQ Analysator, für unsere Messungen. Mehr Details zu dem Messgerät finden Sie hier. Alle unsere Testmethoden beschreiben wir in diesem Artikel. | |
| Dell XPS 15 9530 RTX 4070 i7-13700H, NVIDIA GeForce RTX 4070 Laptop GPU, SK hynix PC801 HFS001TEJ9X101N, OLED, 3456x2160, 15.60 | Dell XPS 15 9520 RTX 3050 Ti i7-12700H, GeForce RTX 3050 Ti Laptop GPU, WDC PC SN810 512GB, OLED, 3456x2160, 15.60 | Dell XPS 15 9500 Core i7 4K UHD i7-10875H, GeForce GTX 1650 Ti Mobile, SK Hynix PC611 512GB, IPS, 3840x2400, 15.60 | Asus Zenbook Pro 15 OLED UM535Q R9 5900HX, GeForce RTX 3050 Ti Laptop GPU, WDC PC SN730 SDBPNTY-1T00, OLED, 1920x1080, 15.60 | MSI Prestige 15 A12UD-093 i7-1280P, GeForce RTX 3050 Ti Laptop GPU, Micron 3400 1TB MTFDKBA1T0TFH, IPS, 3840x2160, 15.60 | Gigabyte Aero 15 OLED XD i7-11800H, GeForce RTX 3070 Laptop GPU, Samsung PM9A1 MZVL21T0HCLR, OLED, 3840x2160, 15.60 | |
|---|---|---|---|---|---|---|
| Stromverbrauch | 28% | 12% | 34% | 51% | -39% | |
| Idle min * | 20 | 5.5 72% | 5.7 71% | 5.5 72% | 5.4 73% | 23 -15% |
| Idle avg * | 20.7 | 7.2 65% | 13.5 35% | 7.4 64% | 11.8 43% | 26 -26% |
| Idle max * | 22.4 | 16 29% | 19.6 12% | 14.9 33% | 12.7 43% | 34 -52% |
| Last avg * | 77.1 | 91.8 -19% | 114.1 -48% | 78.2 -1% | 45.9 40% | 99 -28% |
| Witcher 3 ultra * | 95.4 | 74.6 22% | 93 3% | 80.1 16% | 45.7 52% | 163 -71% |
| Last max * | 133.4 | 134.7 -1% | 135.2 -1% | 110.9 17% | 63 53% | 190 -42% |
* ... kleinere Werte sind besser
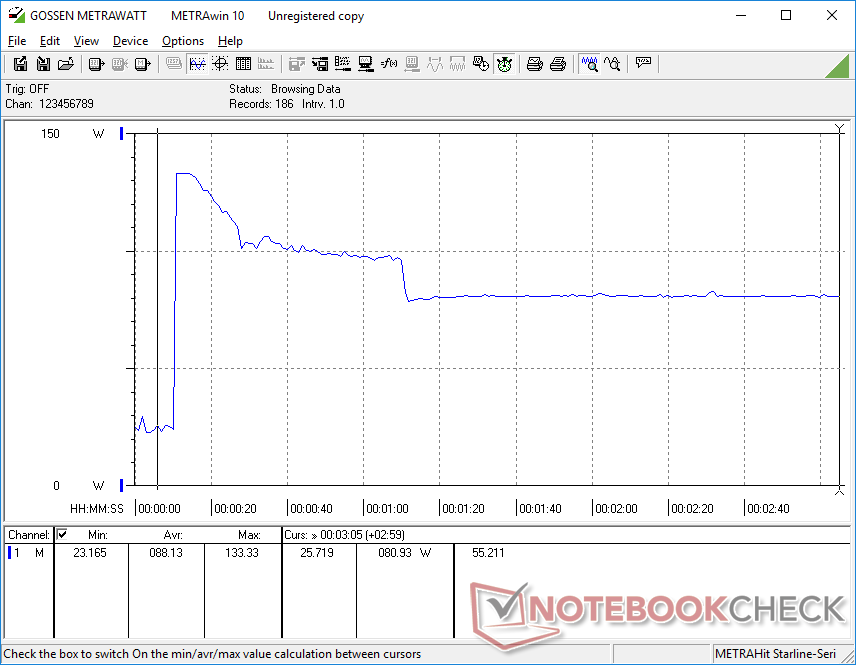
Energieaufnahme Witcher 3 / Stresstest
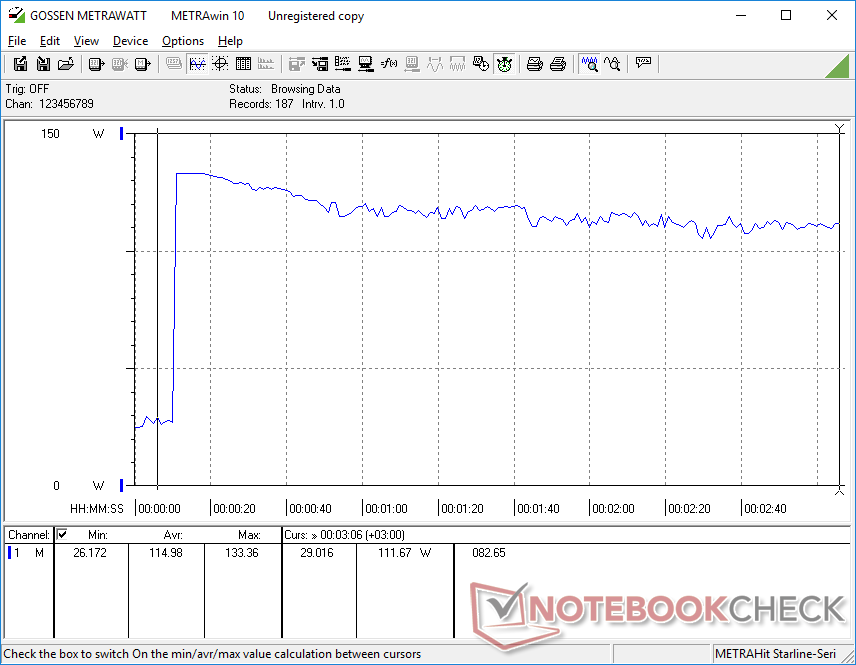
Energieaufnahme externer Monitor
Akkulaufzeit — Etwas kürzer, aber nicht schlecht
Die Akkulaufzeit ist grundsätzlich nur etwas kürzer als beim Vorjahresmodell, was aber nicht überrascht, da die Intel-CPU der 13. Generation und die GeForce-40-GPU eine ähnliche Leistungsaufnahme haben wie ihre jeweiligen Vorläufer. Wir erreichten 8 Stunden realistische WLAN-Nutzung — das sind 40 Minuten weniger als beim 2022er XPS 15. Das ist ein gutes Ergebnis, auch wenn manche Mitstreiter, wie das Asus Zenbook Pro 15, etwas länger durchhalten.
Nutzer können die Akkulaufzeit verlängern, indem sie in der OLED-Konfiguration anstatt weiß dunkle Farben einstellen. Wie das funktioniert, erfahren Sie hier. Wir erwarten, dass die IPS-SKU mit ihrer niedrigeren Auflösung längere Akkulaufzeiten erreicht als unsere Testkonfiguration.
| Dell XPS 15 9530 RTX 4070 i7-13700H, NVIDIA GeForce RTX 4070 Laptop GPU, 86 Wh | Dell XPS 15 9520 RTX 3050 Ti i7-12700H, GeForce RTX 3050 Ti Laptop GPU, 86 Wh | Dell XPS 15 9500 Core i7 4K UHD i7-10875H, GeForce GTX 1650 Ti Mobile, 86 Wh | Asus Zenbook Pro 15 OLED UM535Q R9 5900HX, GeForce RTX 3050 Ti Laptop GPU, 96 Wh | MSI Prestige 15 A12UD-093 i7-1280P, GeForce RTX 3050 Ti Laptop GPU, 80 Wh | Gigabyte Aero 15 OLED XD i7-11800H, GeForce RTX 3070 Laptop GPU, 99 Wh | |
|---|---|---|---|---|---|---|
| Akkulaufzeit | 52% | 50% | 110% | 2% | 6% | |
| Idle | 688 | 886 29% | 1382 101% | 1571 128% | ||
| WLAN | 481 | 528 10% | 546 14% | 766 59% | 531 10% | 508 6% |
| Last | 89 | 192 116% | 121 36% | 215 142% | 83 -7% | |
| H.264 | 423 | |||||
| Witcher 3 ultra | 131 |
Pro
Contra
Fazit — Schlank auf Kosten der Leistung
Der Core i7-13700H und die GeForce RTX 4070 werden üblicherweise nur für größere Gaming-Laptops wie das Asus ROG Strix G18 oder das Aorus 15X ASF eingesetzt, die jeweils mit massigen 200+-W-Ladekabeln ausgestattet sind. Natürlich kann es funktionieren, sie in leichte, schlanke Designs wie das des XPS 15 einzubauen, doch die Leistung leidet zwangsläufig darunter. In diesem Fall wurde die TGP um mindestens die Hälfte reduziert, was zu einem mageren Preis-Leistungs-Verhältnis führt. Wenn Sie planen, sowohl Grafikprogramme als auch Spiele zu verwenden, bietet ein spezielles Gaming-Gerät wie das Alienware x15 trotz gleicher CPU und GPU-Ausstattung locker deutlich mehr Leistung als unser XPS 15.
Die Leistungseinbuße bei Grafikprogrammen ist weniger groß als der Verlust an Gaming-Leistung im Vergleich zu größeren Laptops mit höheren TGP-Raten. Das liegt großteils daran, dass selbst eine 50-W-RTX-4070 die gleiche Menge an CUDA-Kernen für die Beschleunigung hat, wie die 100+-W-Version. Daher überzeugt das XPS 15 9530 bei der Content Creation, solange nur ab und an gespielt wird. Es ist schließlich ein Nvidia-Studio-Laptop.
Das XPS 15 9530 ist DER Content-Creation-Laptop, wenn Sie sich sowohl Leistung als auch Mobilität wünschen. Erwarten Sie aber nicht, dass das Gerät die gleiche Leistung erreicht, wie die meisten anderen mit dieser GPU ausgestatteten Geräte.
Verbesserungsmöglichkeiten für zukünftige Modelle gibt es genug. Erstens: Neuere Displayoptionen mit 90-Hz- oder 120-Hz-Bildwiederholraten würden das Nutzererlebnis deutlich verbessern. Zweitens: Die 720p-Webcam ist grottenschlecht und wirkt, als wäre sie aus dem letzten Jahrzehnt. Drittens: Eine überholte Kühllösung, etwa mit Flüssigmetall, könnte die Turbo-Boost-Leistung erhöhen, ohne dabei das schlanke Design zu verändern. Zu guter Letzt: Die DPC-Probleme sowie die übersprungenen und ausgelassenen Frames sollten für ein Flaggschiff-Gerät, das sich an Content Creator richtet, unbedingt verbessert werden. Das PS 15 macht vieles richtig — vor allem, für diejenigen die die Leichtigkeit und Mobilität von Geräten wie dem MacBook Pro schätzen. Doch die Prozessoren im Inneren sind etwas zu groß für ihr Zuhause und wirken dadurch etwas beengt.
Preis und Verfügbarkeit
Das XPS 15 9530 ist zum Zeitpunkt der Verfassung dieses Testberichts noch nicht allgemein im Handel erhältlich. Auf der Herstellerwebsite von Dell ist es jedoch bereits zu haben. Unsere Testkonfiguration ist dort etwa für 1,500 Euro erhältlichUnsere Testkonfiguration ist dort etwa für 2,500 Euro erhältlich.
Website von DellDell-WebsiteFalls Sie sich doch für das ältere Modell XPS 15 9520 interessieren, werden Sie auf Amazon fündig.
Dell XPS 15 9530 RTX 4070
-
23.04.2023 v7
Allen Ngo

Transparenz
Das vorliegende Testmuster wurde dem Autor vom Hersteller oder einem Shop zu Testzwecken leihweise zur Verfügung gestellt. Eine Einflussnahme des Leihstellers auf den Testbericht gab es nicht, der Hersteller hat keine Version des Reviews vor der Veröffentlichung erhalten. Es bestand keine Verpflichtung zur Veröffentlichung.
Preisvergleich

