Notebookcheck Logo

KFA2 GeForce RTX 4080 SG Desktop-Grafikkarte im Test: Gute Leistung trifft auf fragwürdige Preisgestaltung

Viele fps und viel RGB-Beleuchtung! Neben der Nvidia GeForce RTX 4090 gibt es mit der Nvidia GeForce RTX 4080 ein etwas weniger teures Modell auf Basis der aktuellen Ada-Lovelace-Architektur von Nvidia. Dennoch verlangen die Hersteller weit über 1.000 Euro für die zweitschnellste Grafikkarte aus dem grünen Lager. Wir haben das Modell von KFA2 einmal genauer unter die Lupe genommen, und in diesem Review erfahren Sie, wo sich das Modell leistungstechnisch einordnet.
KFA2 GeForce RTX 4080 Serious Gaming
Die externen Anschlüsse der KFA2 GeForce RTX 4080 SG

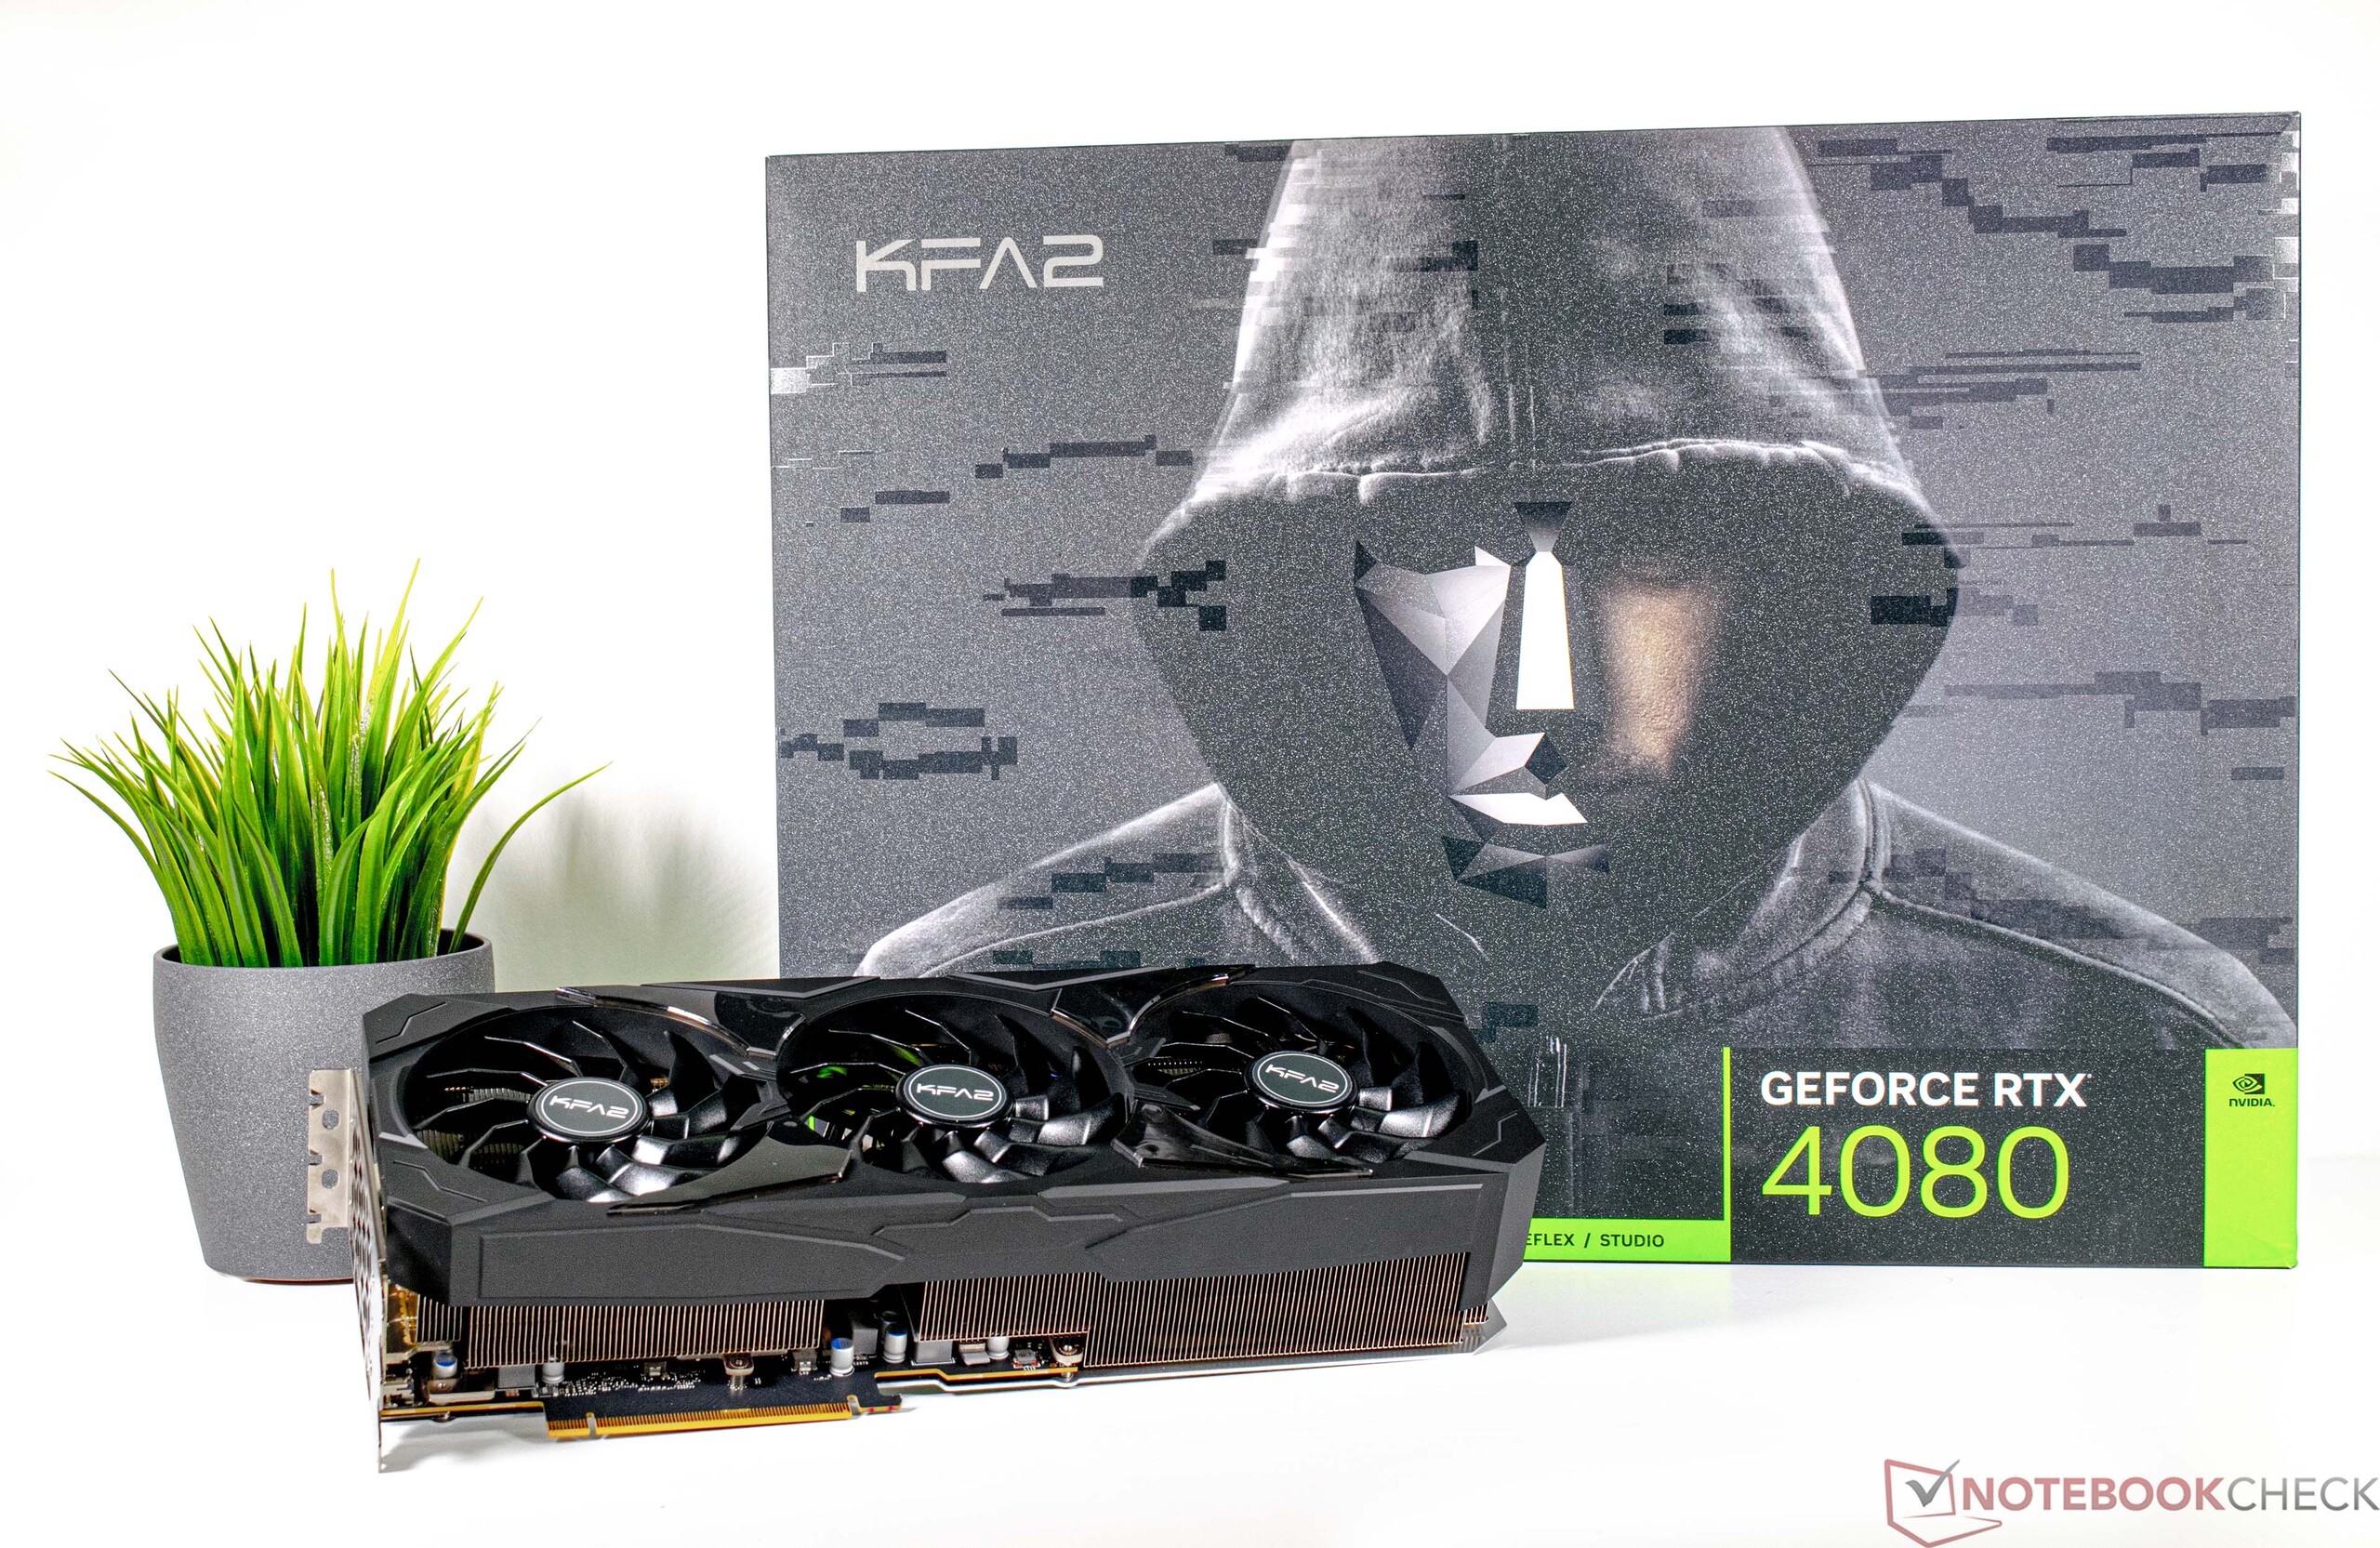
Nachdem wir uns vor kurzem der KFA2 GeForce RTX 4090 SG gewidmet haben, muss nun das kleine Modell, die KFA2 GeForce RTX 4080 SG, zeigen, was unter der Haube steckt. Apropos unter der Haube – anders als bei Ampere basiert das zweitschnellste Modell der aktuellen Generation auf einem anderen Grafikchip als das Topmodell. Somit kommt nur der kleinere AD103-GPU-Chip zum Einsatz. Dieser ist deutlich kleiner und somit auch in der Herstellung günstiger, was sich allerdings nicht komplett in der aktuellen Preisgestaltung niederschlägt. Das Thema ist derzeit sehr präsent, und auch wir sind der Meinung, dass hier eine deutliche Preissenkung erfolgen muss, damit die neuesten Grafikkarten nicht zum Ladenhüter werden. Die UVP ist im Verhältnis zum Vorgänger (Nvidia GeForce RTX 3080) einfach mal mehr als verdoppelt worden. Vorerst soll es das mit der Kritik am Preis erst einmal gewesen sein, denn nachfolgend wollen wir uns vielmehr der Leistung und den Features der KFA2 GeForce RTX 4080 SG widmen und einordnen, wie gut sich das Modell vor allem gegenüber AMDs RDNA3 GPUs schlägt.

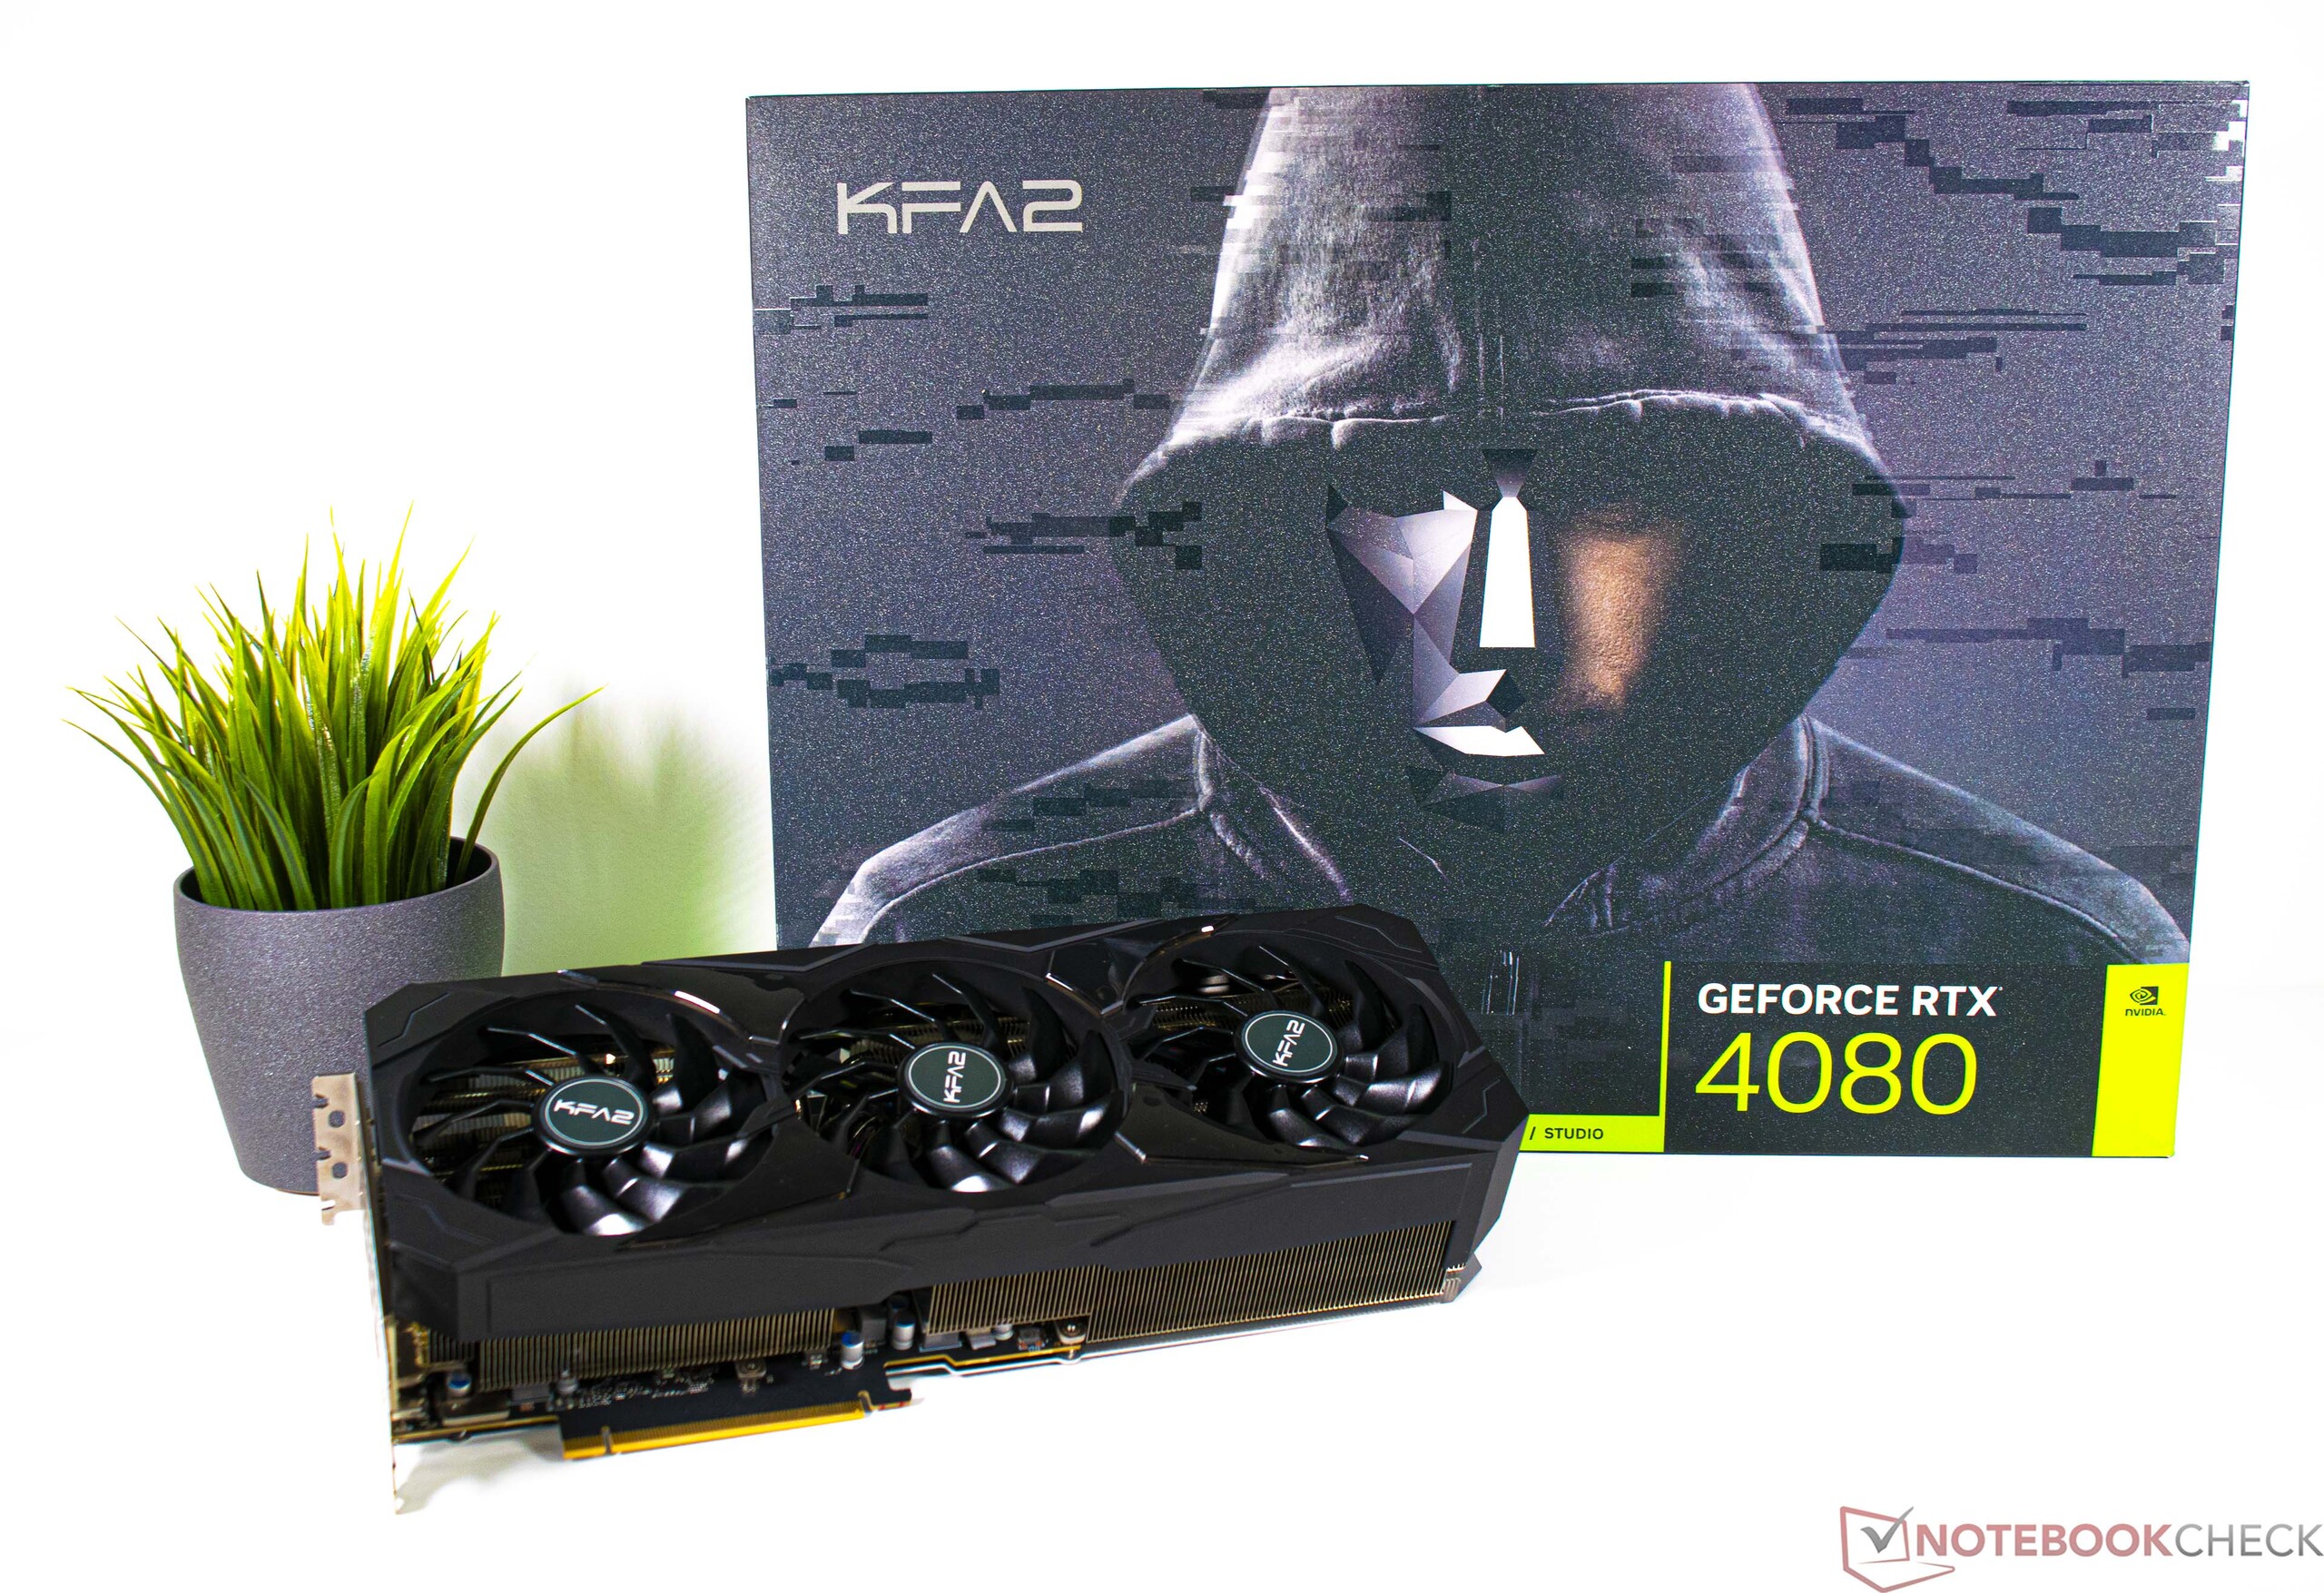
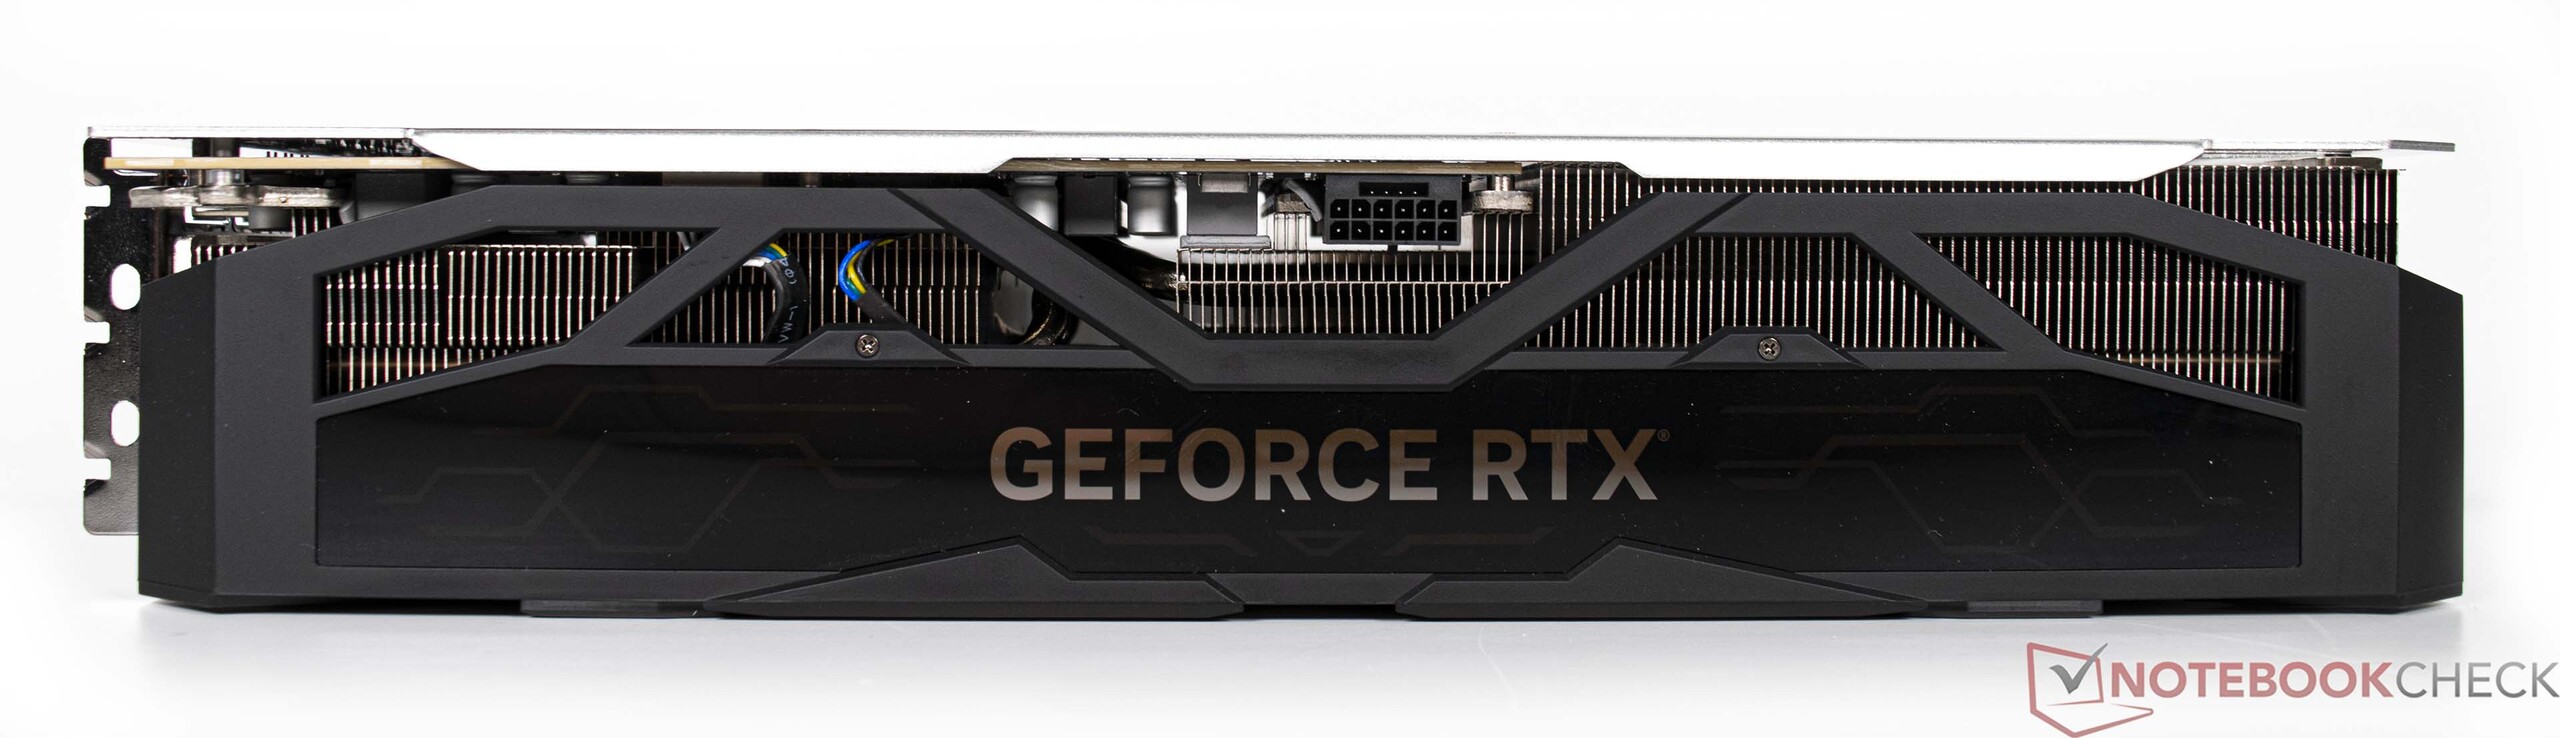
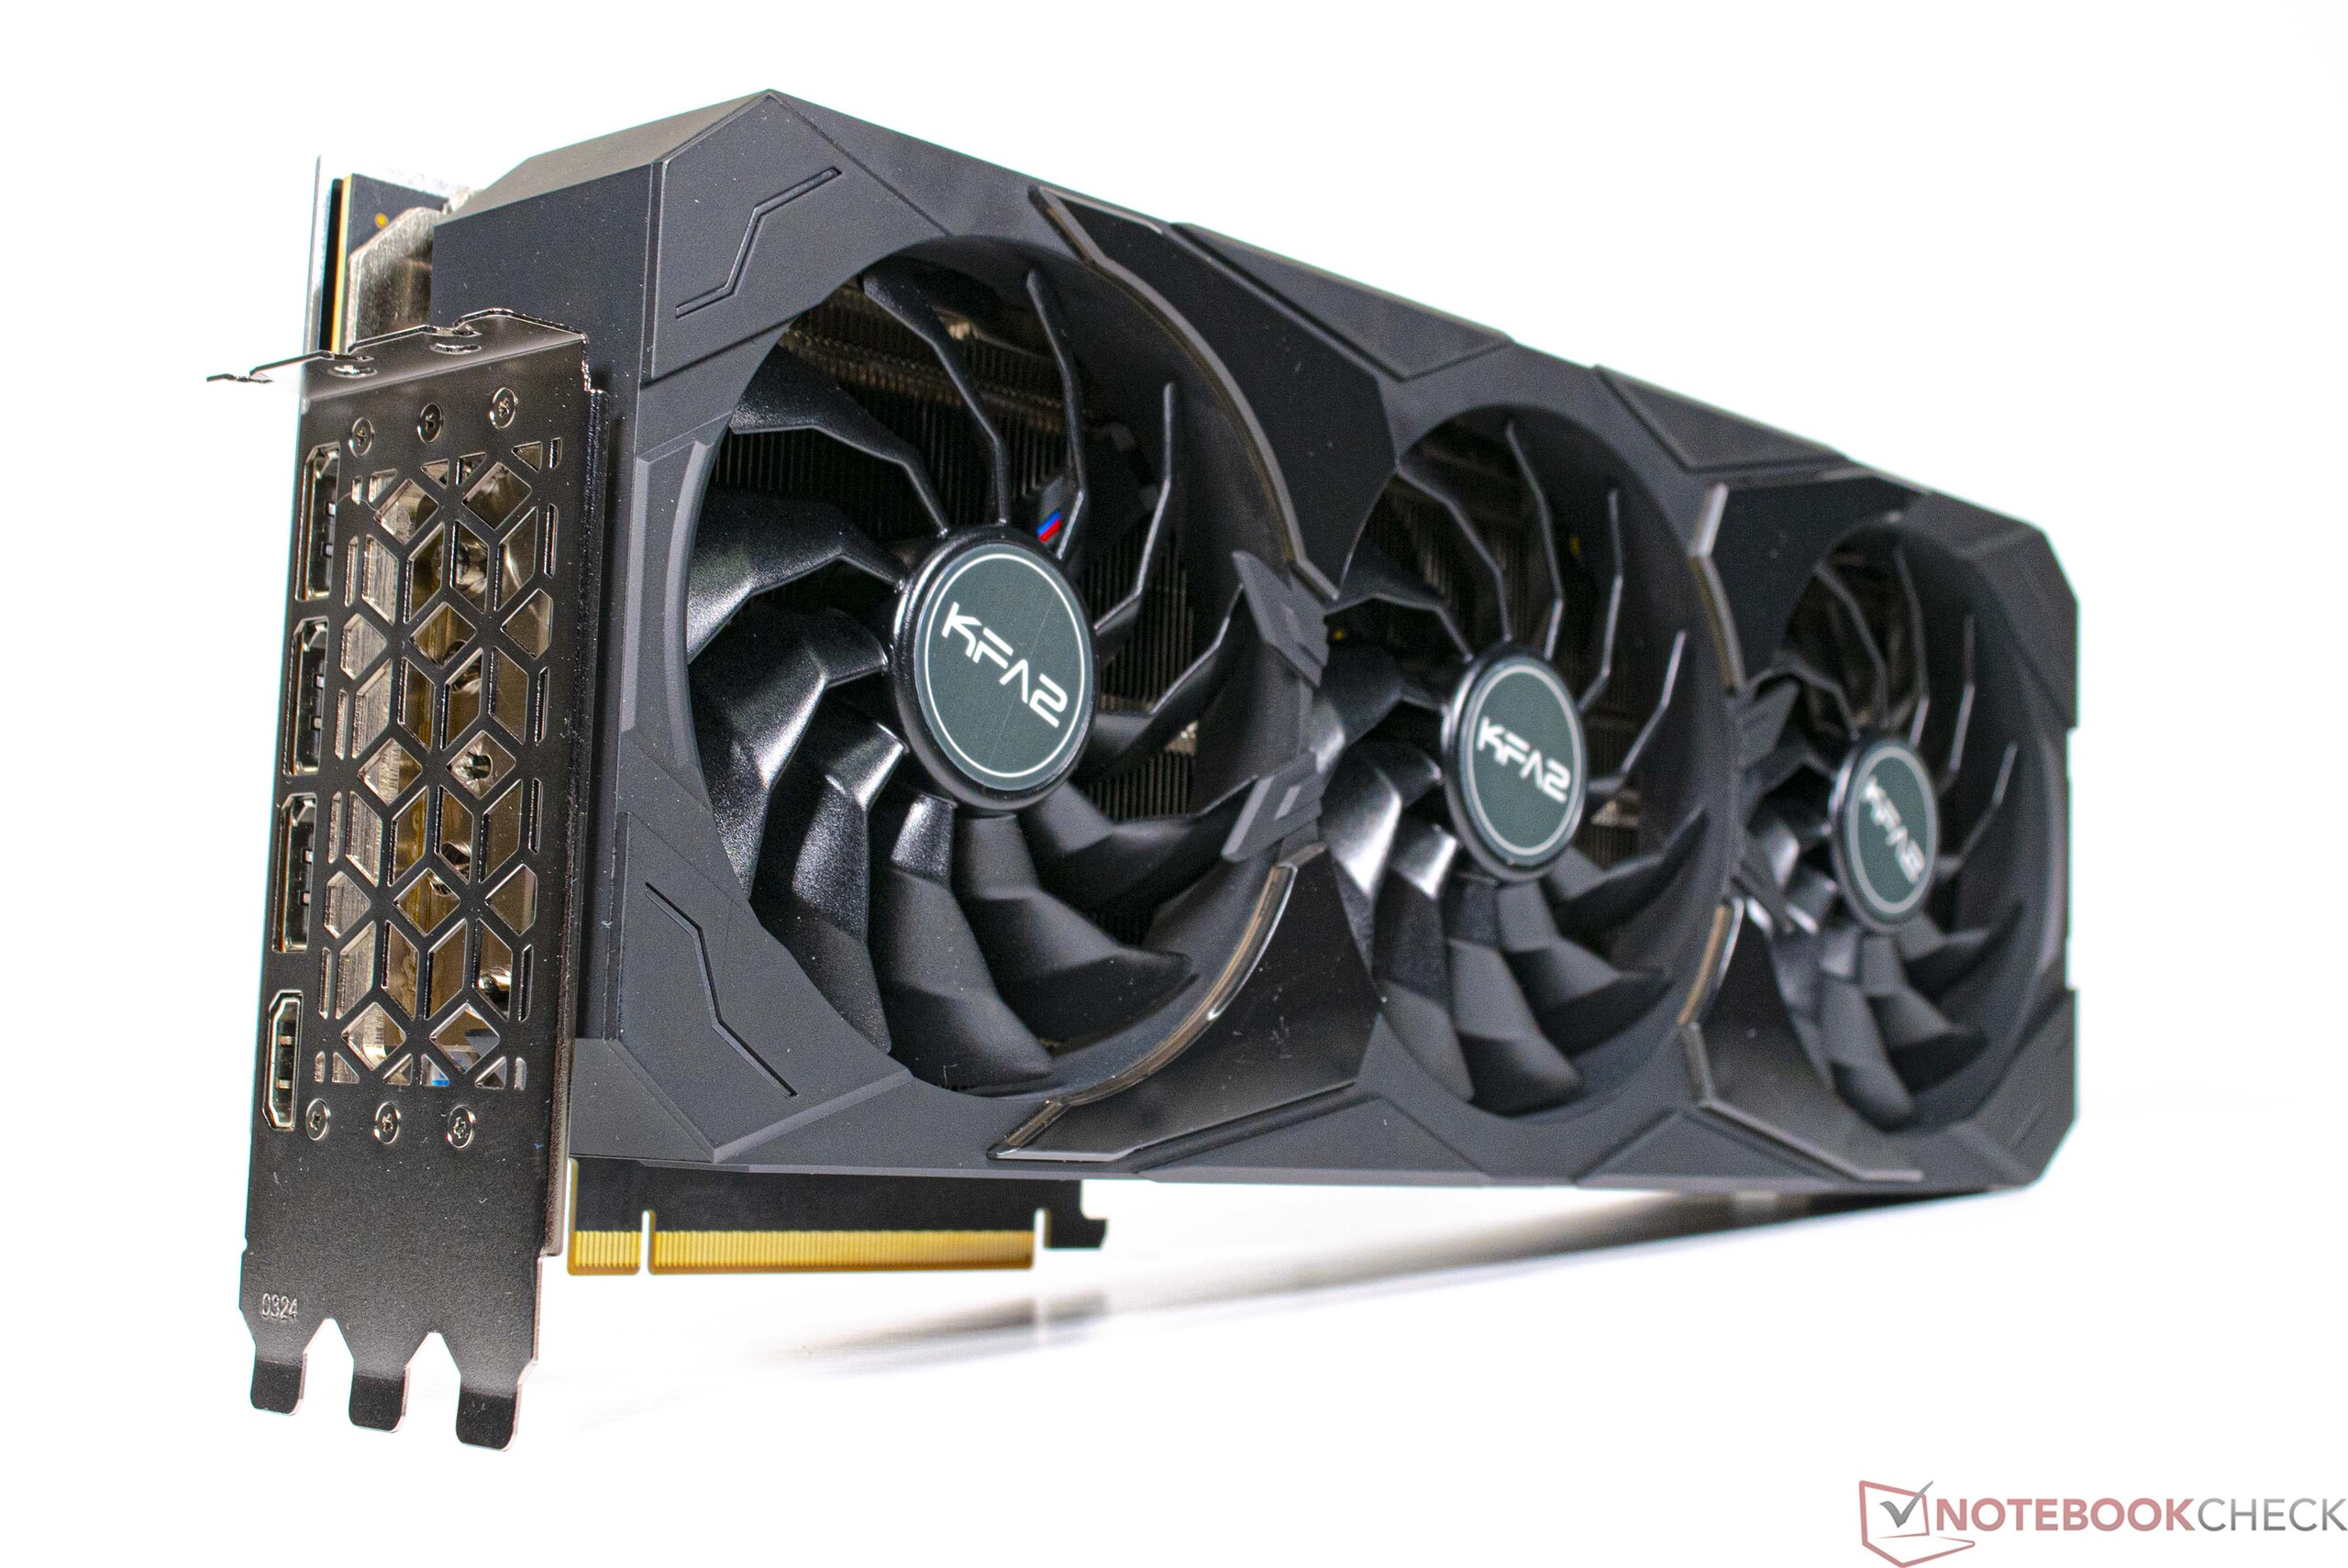
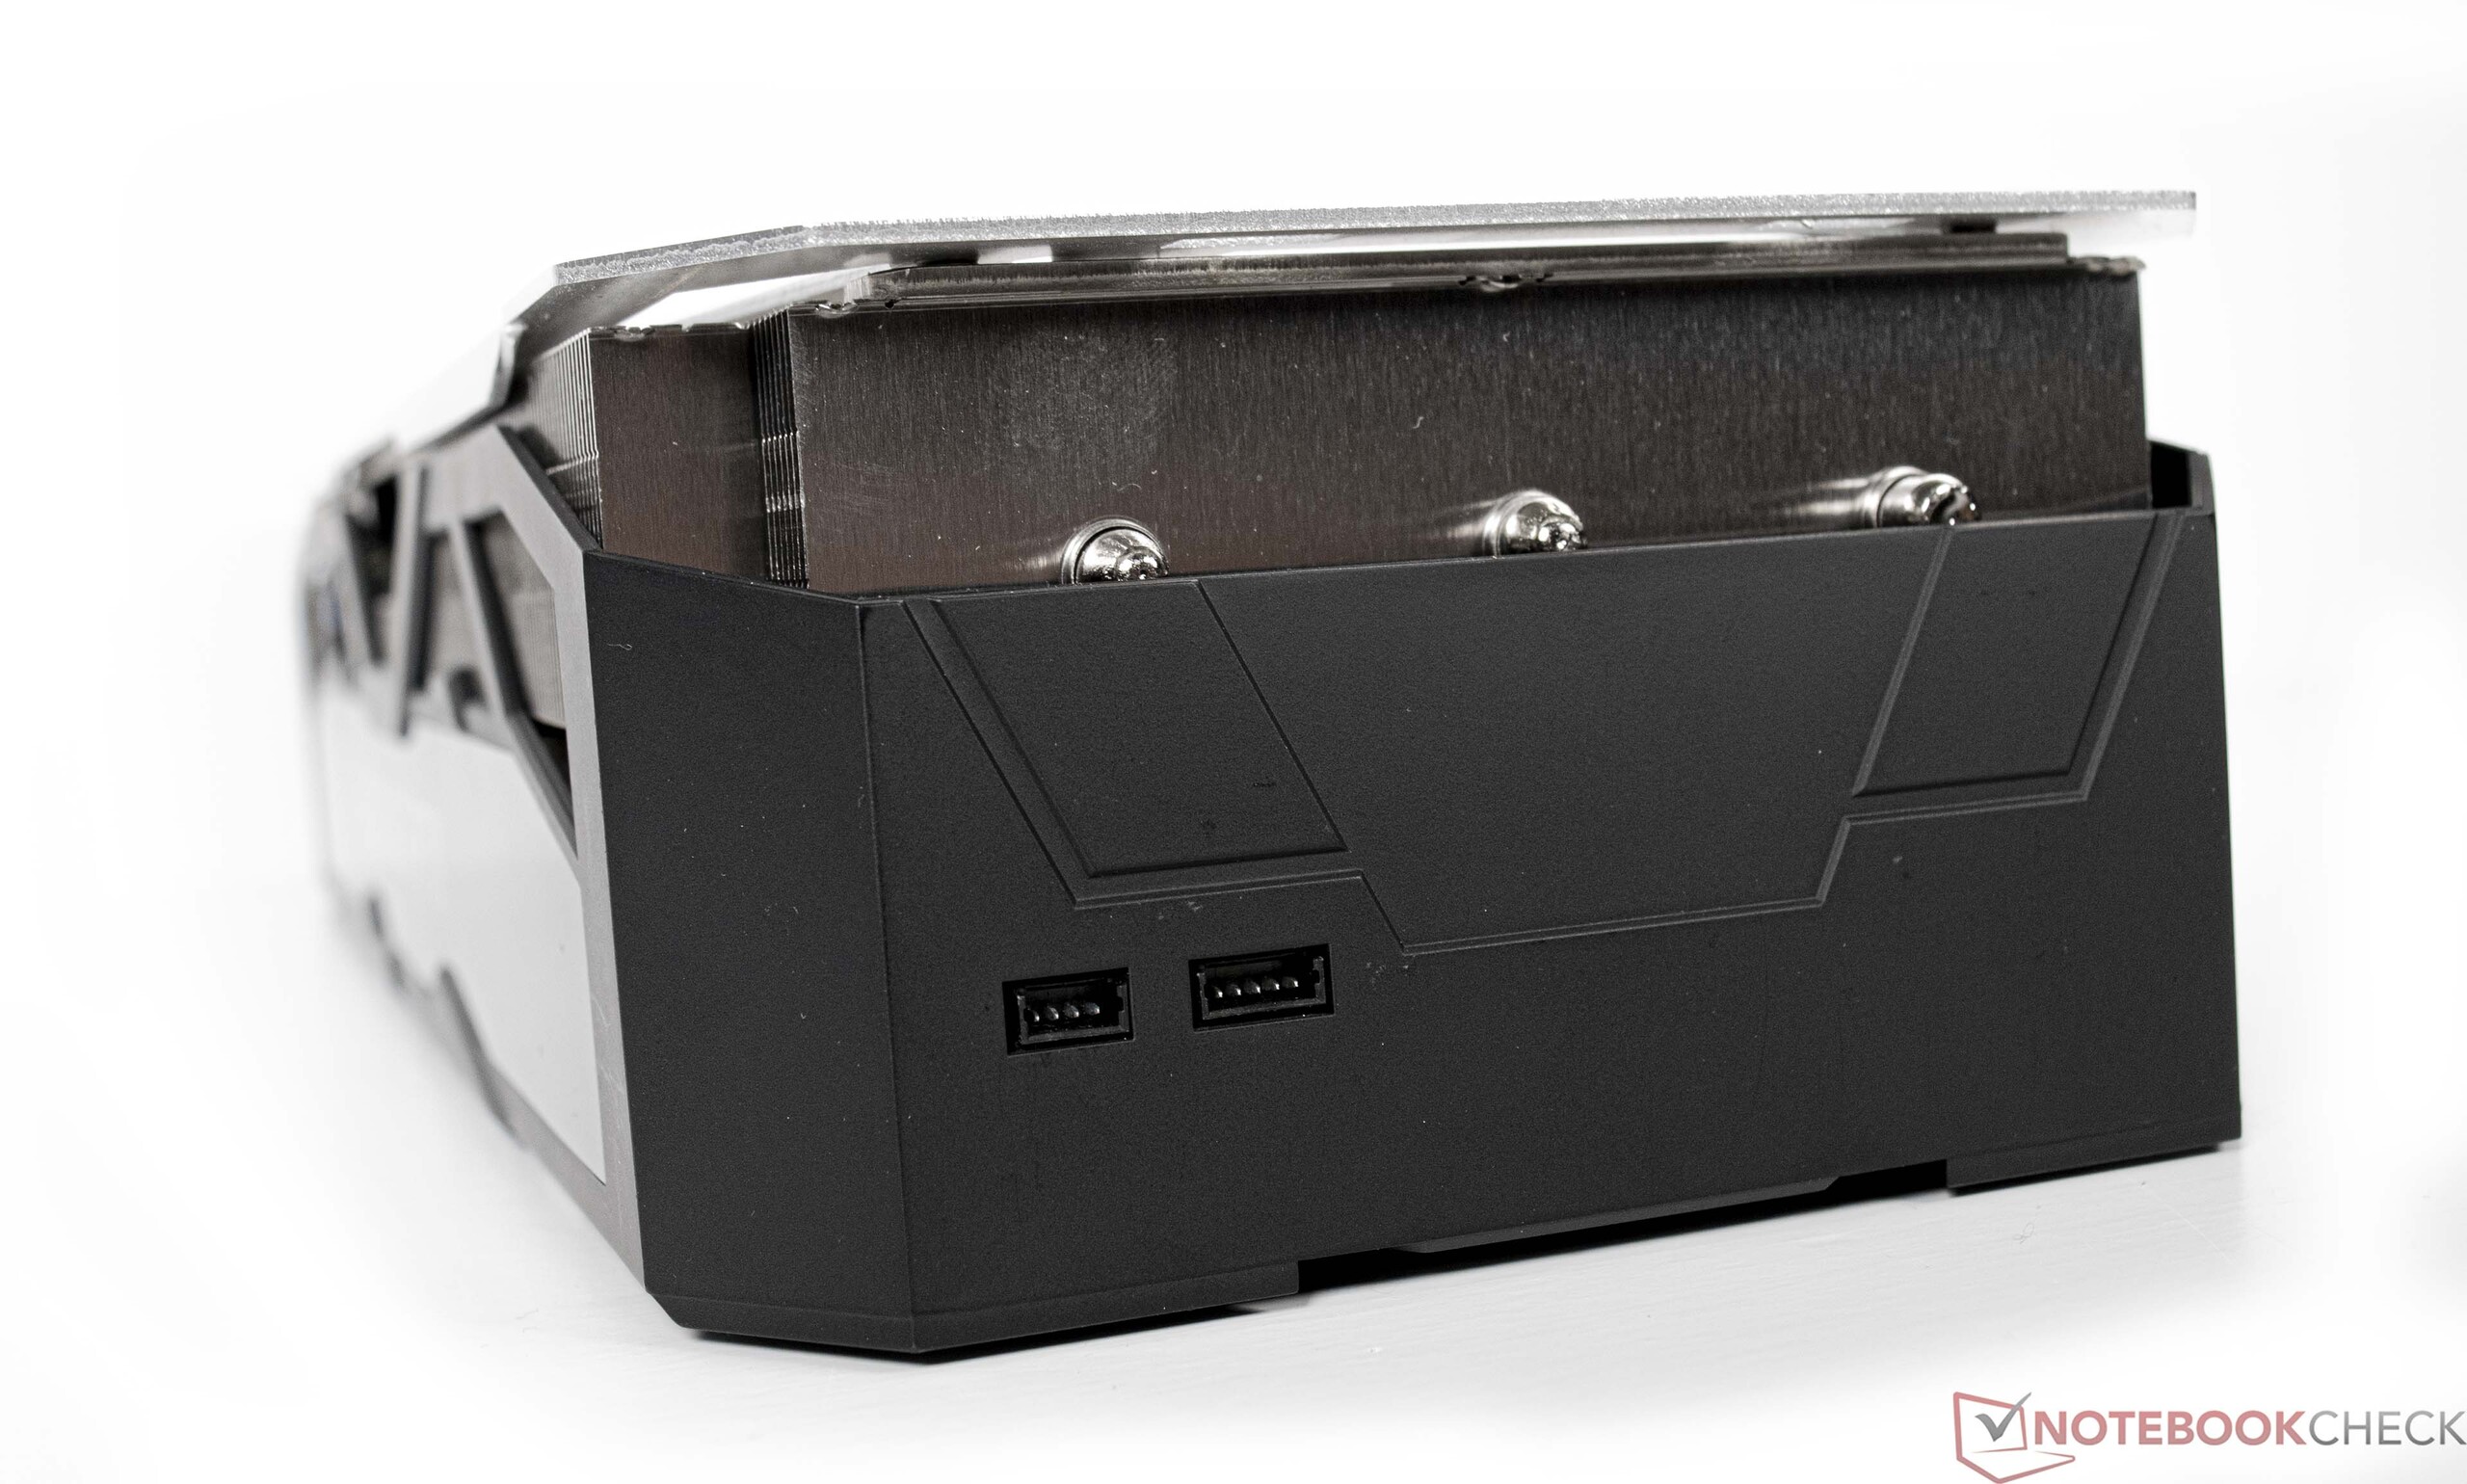
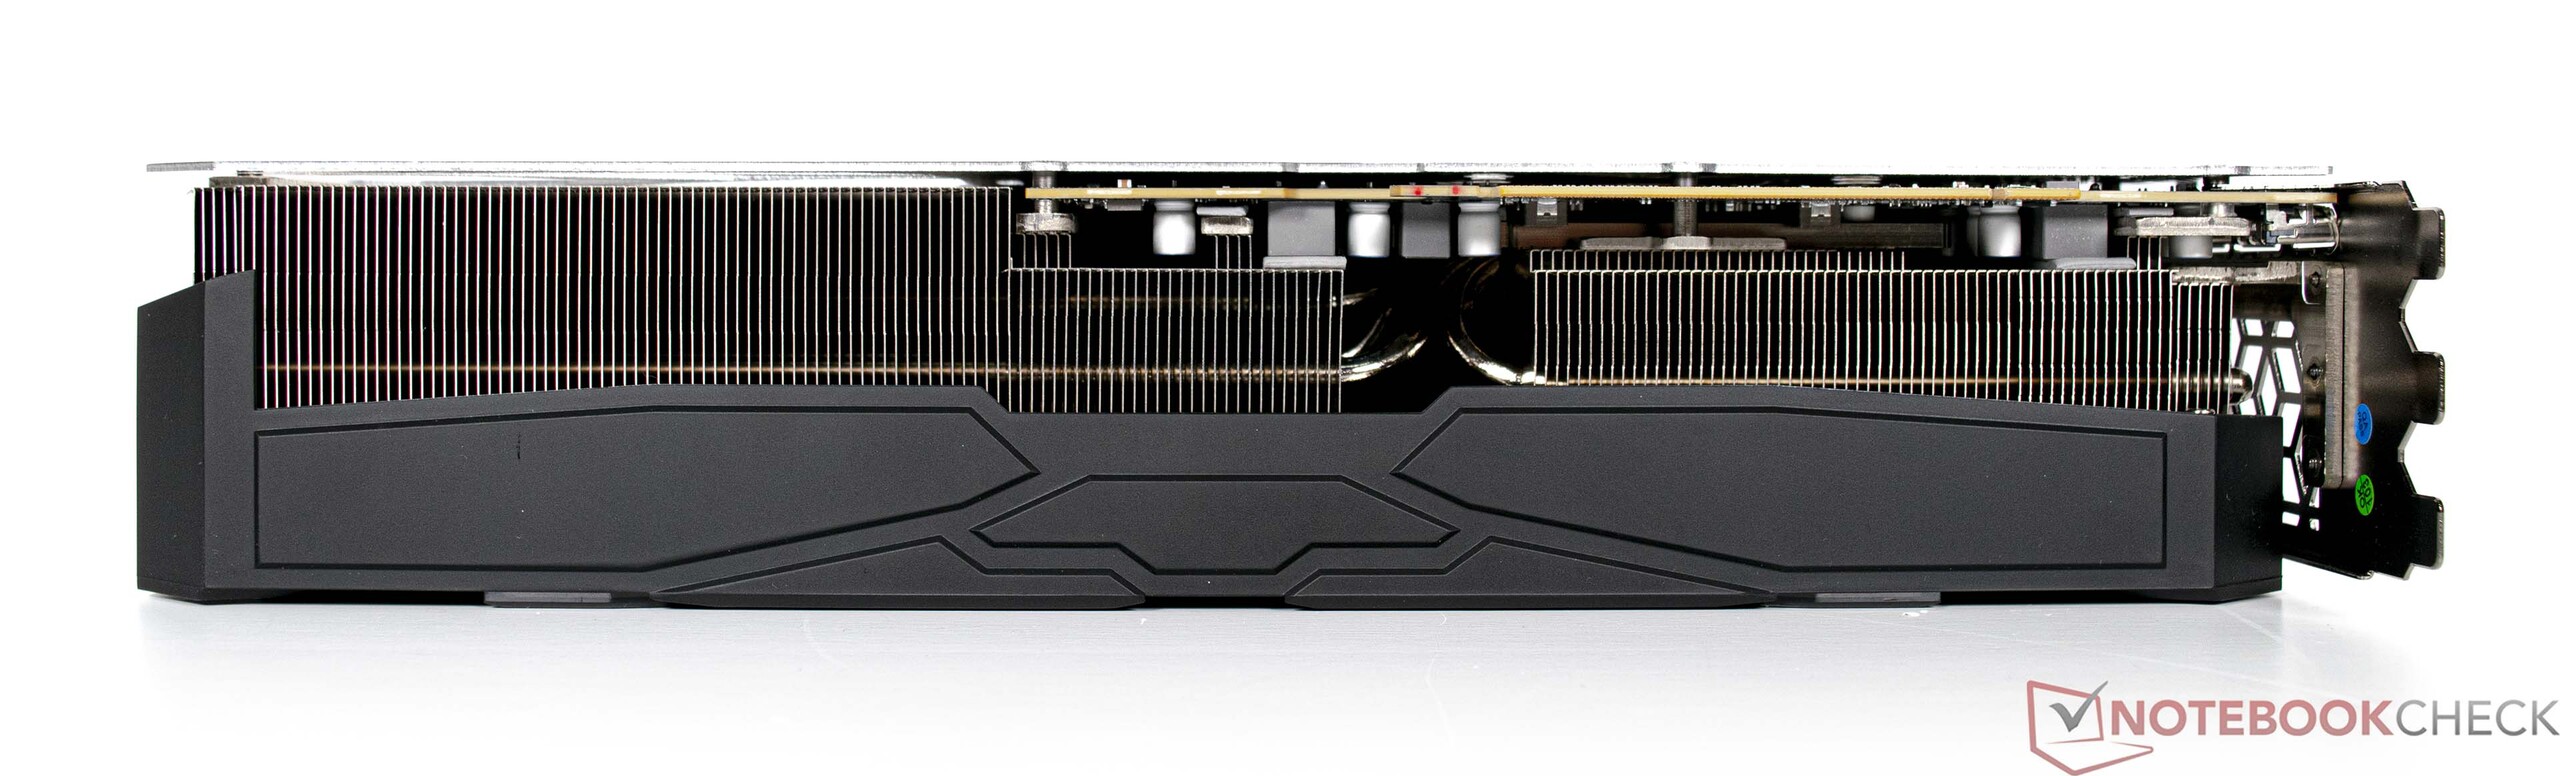
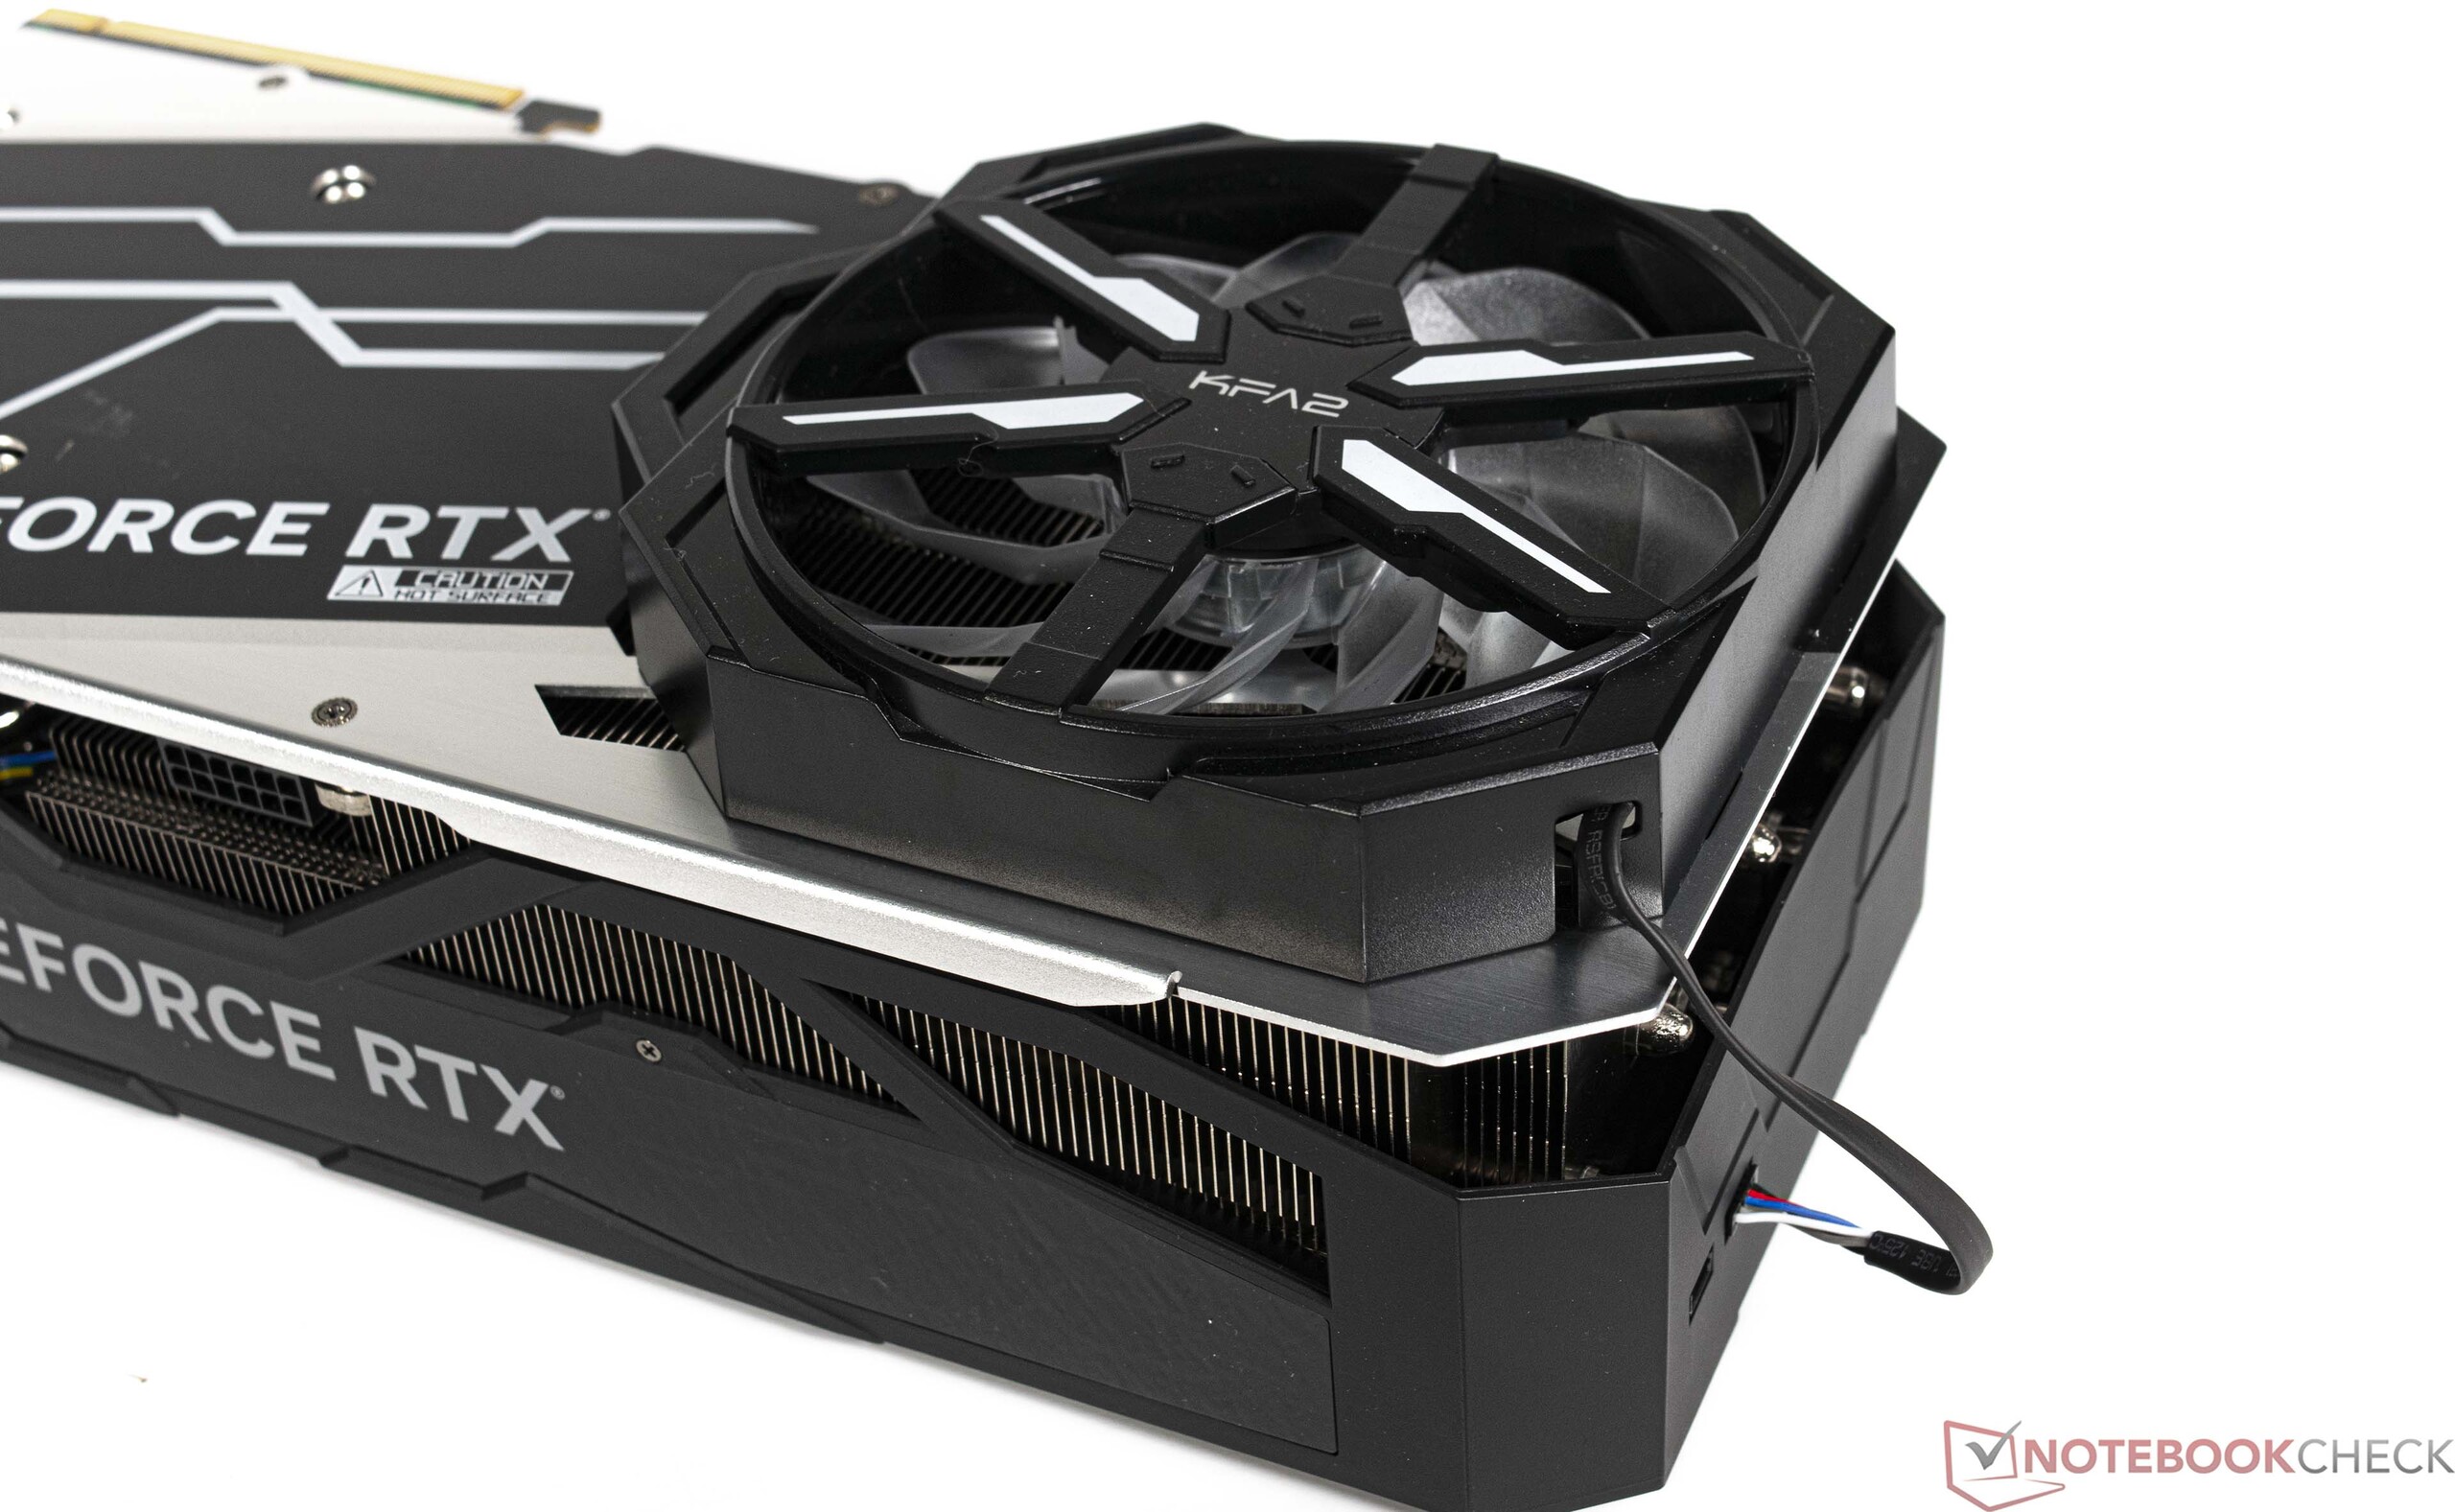
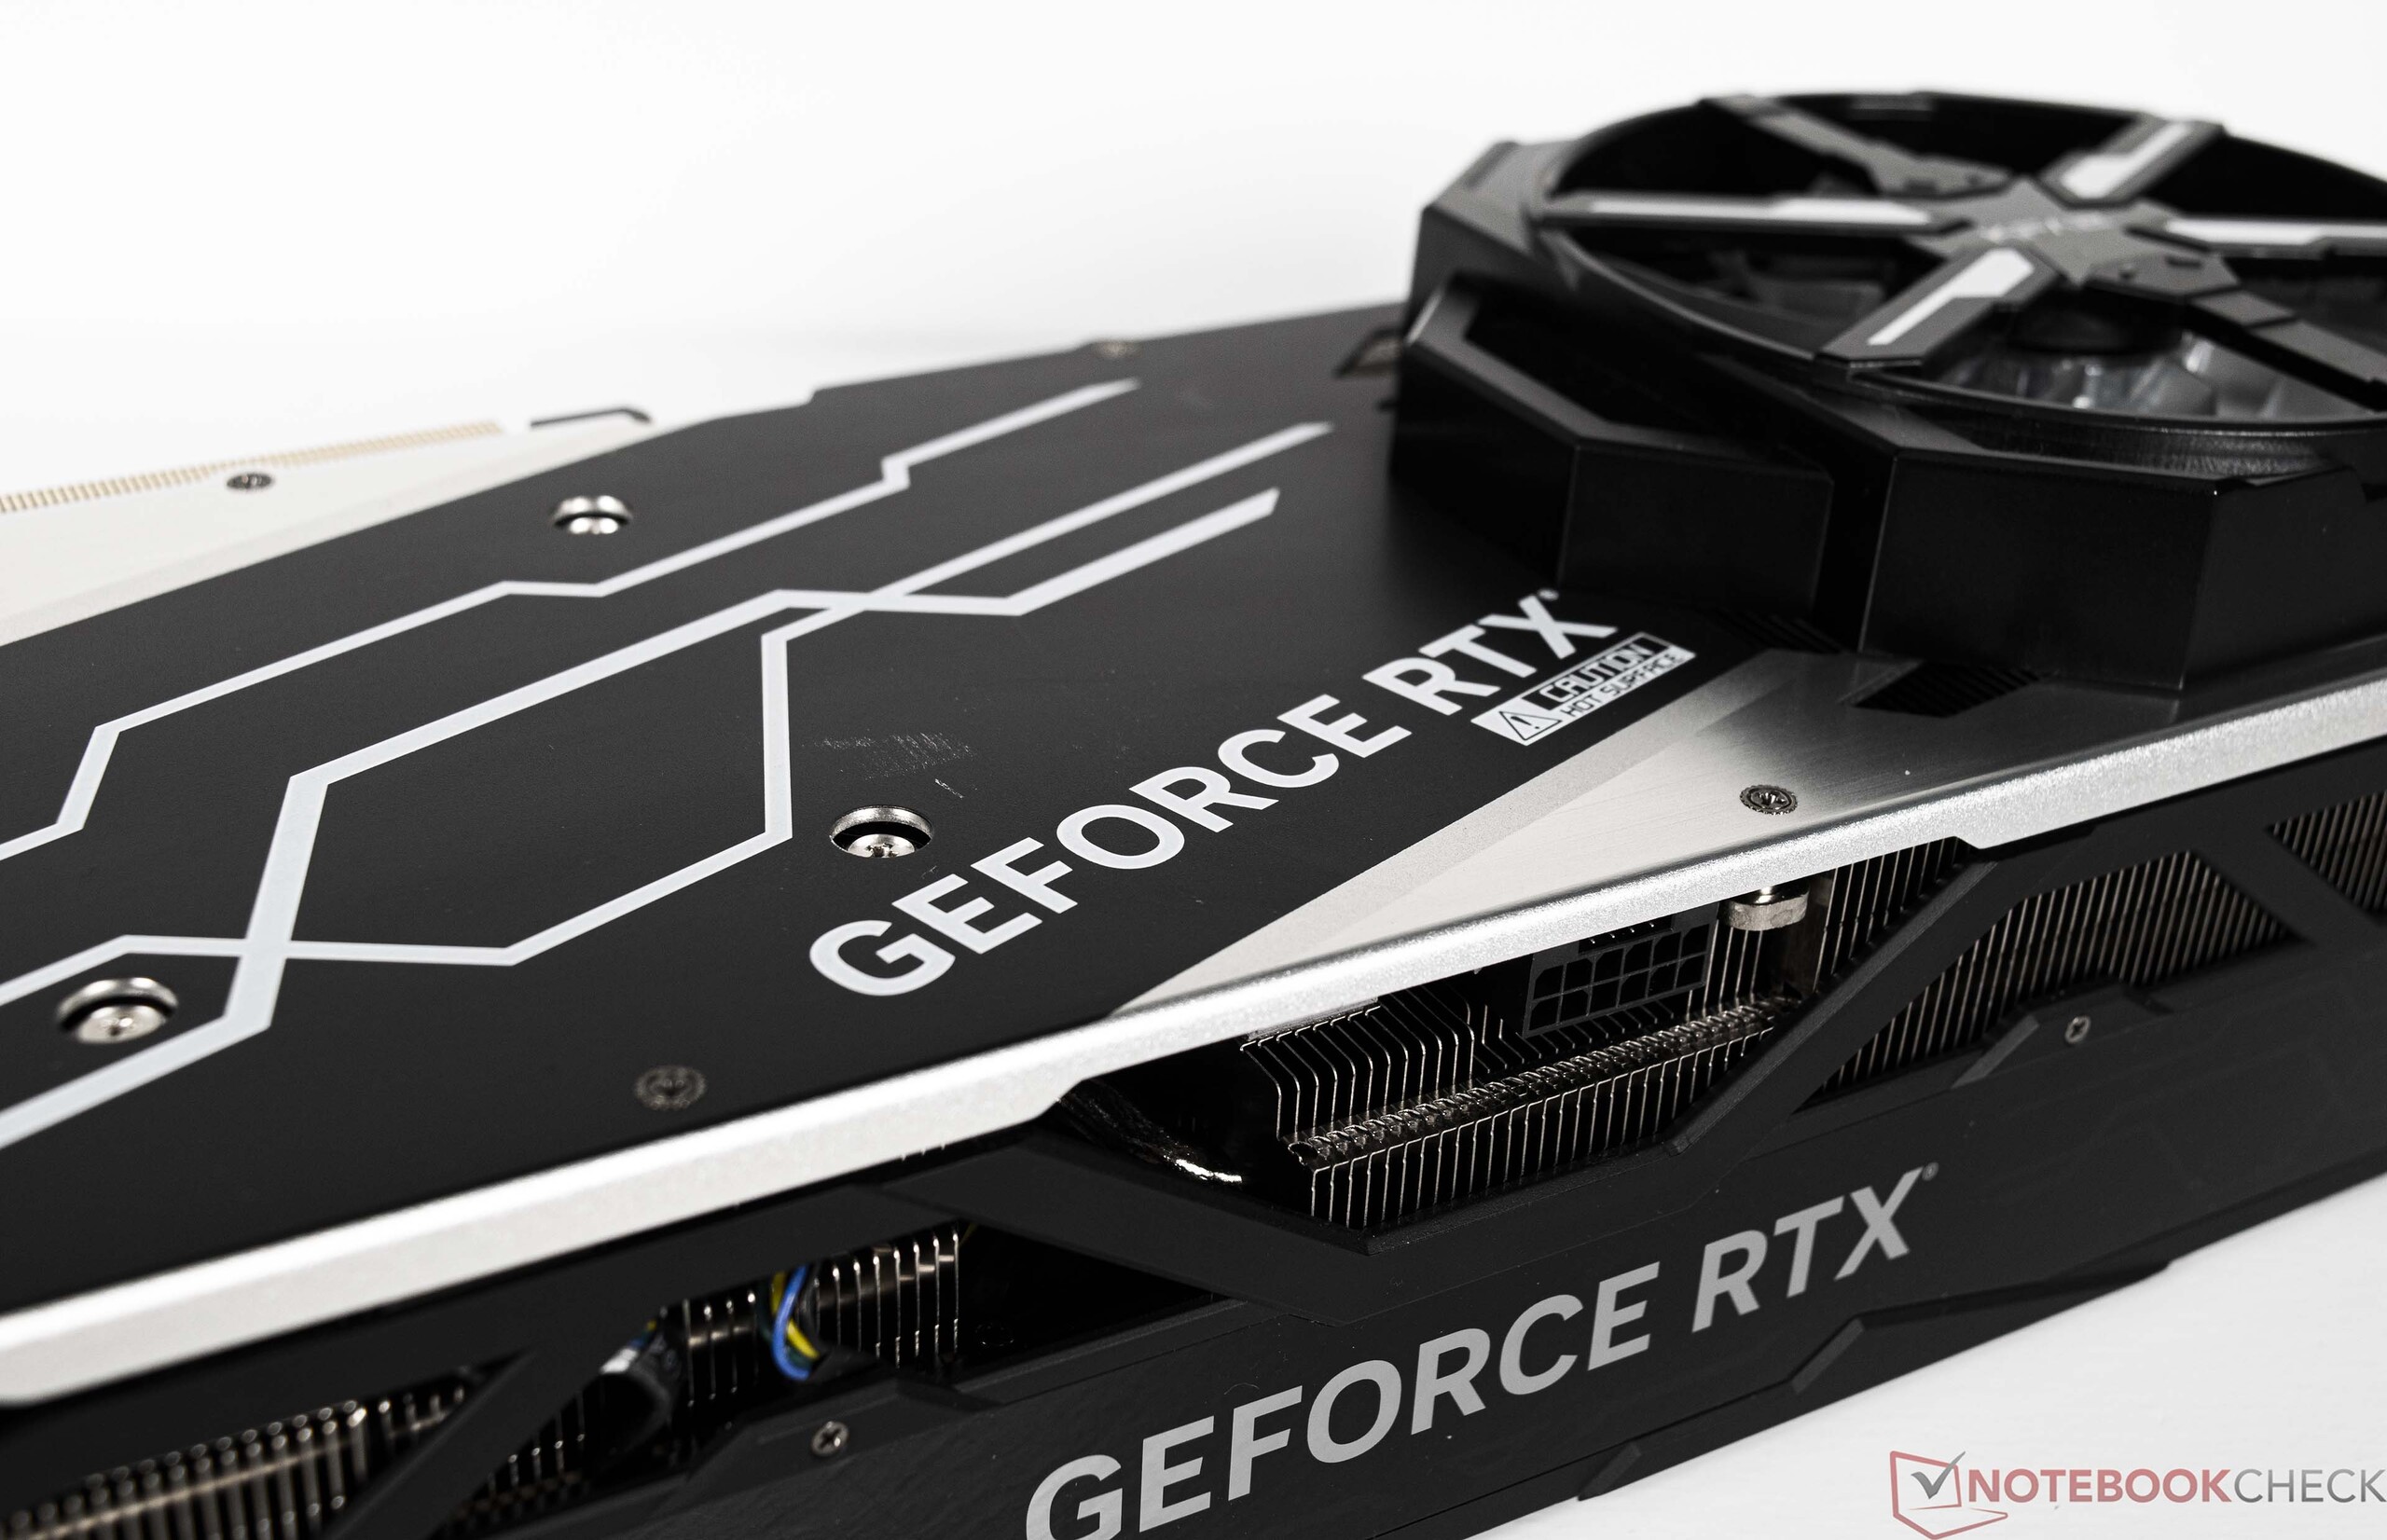
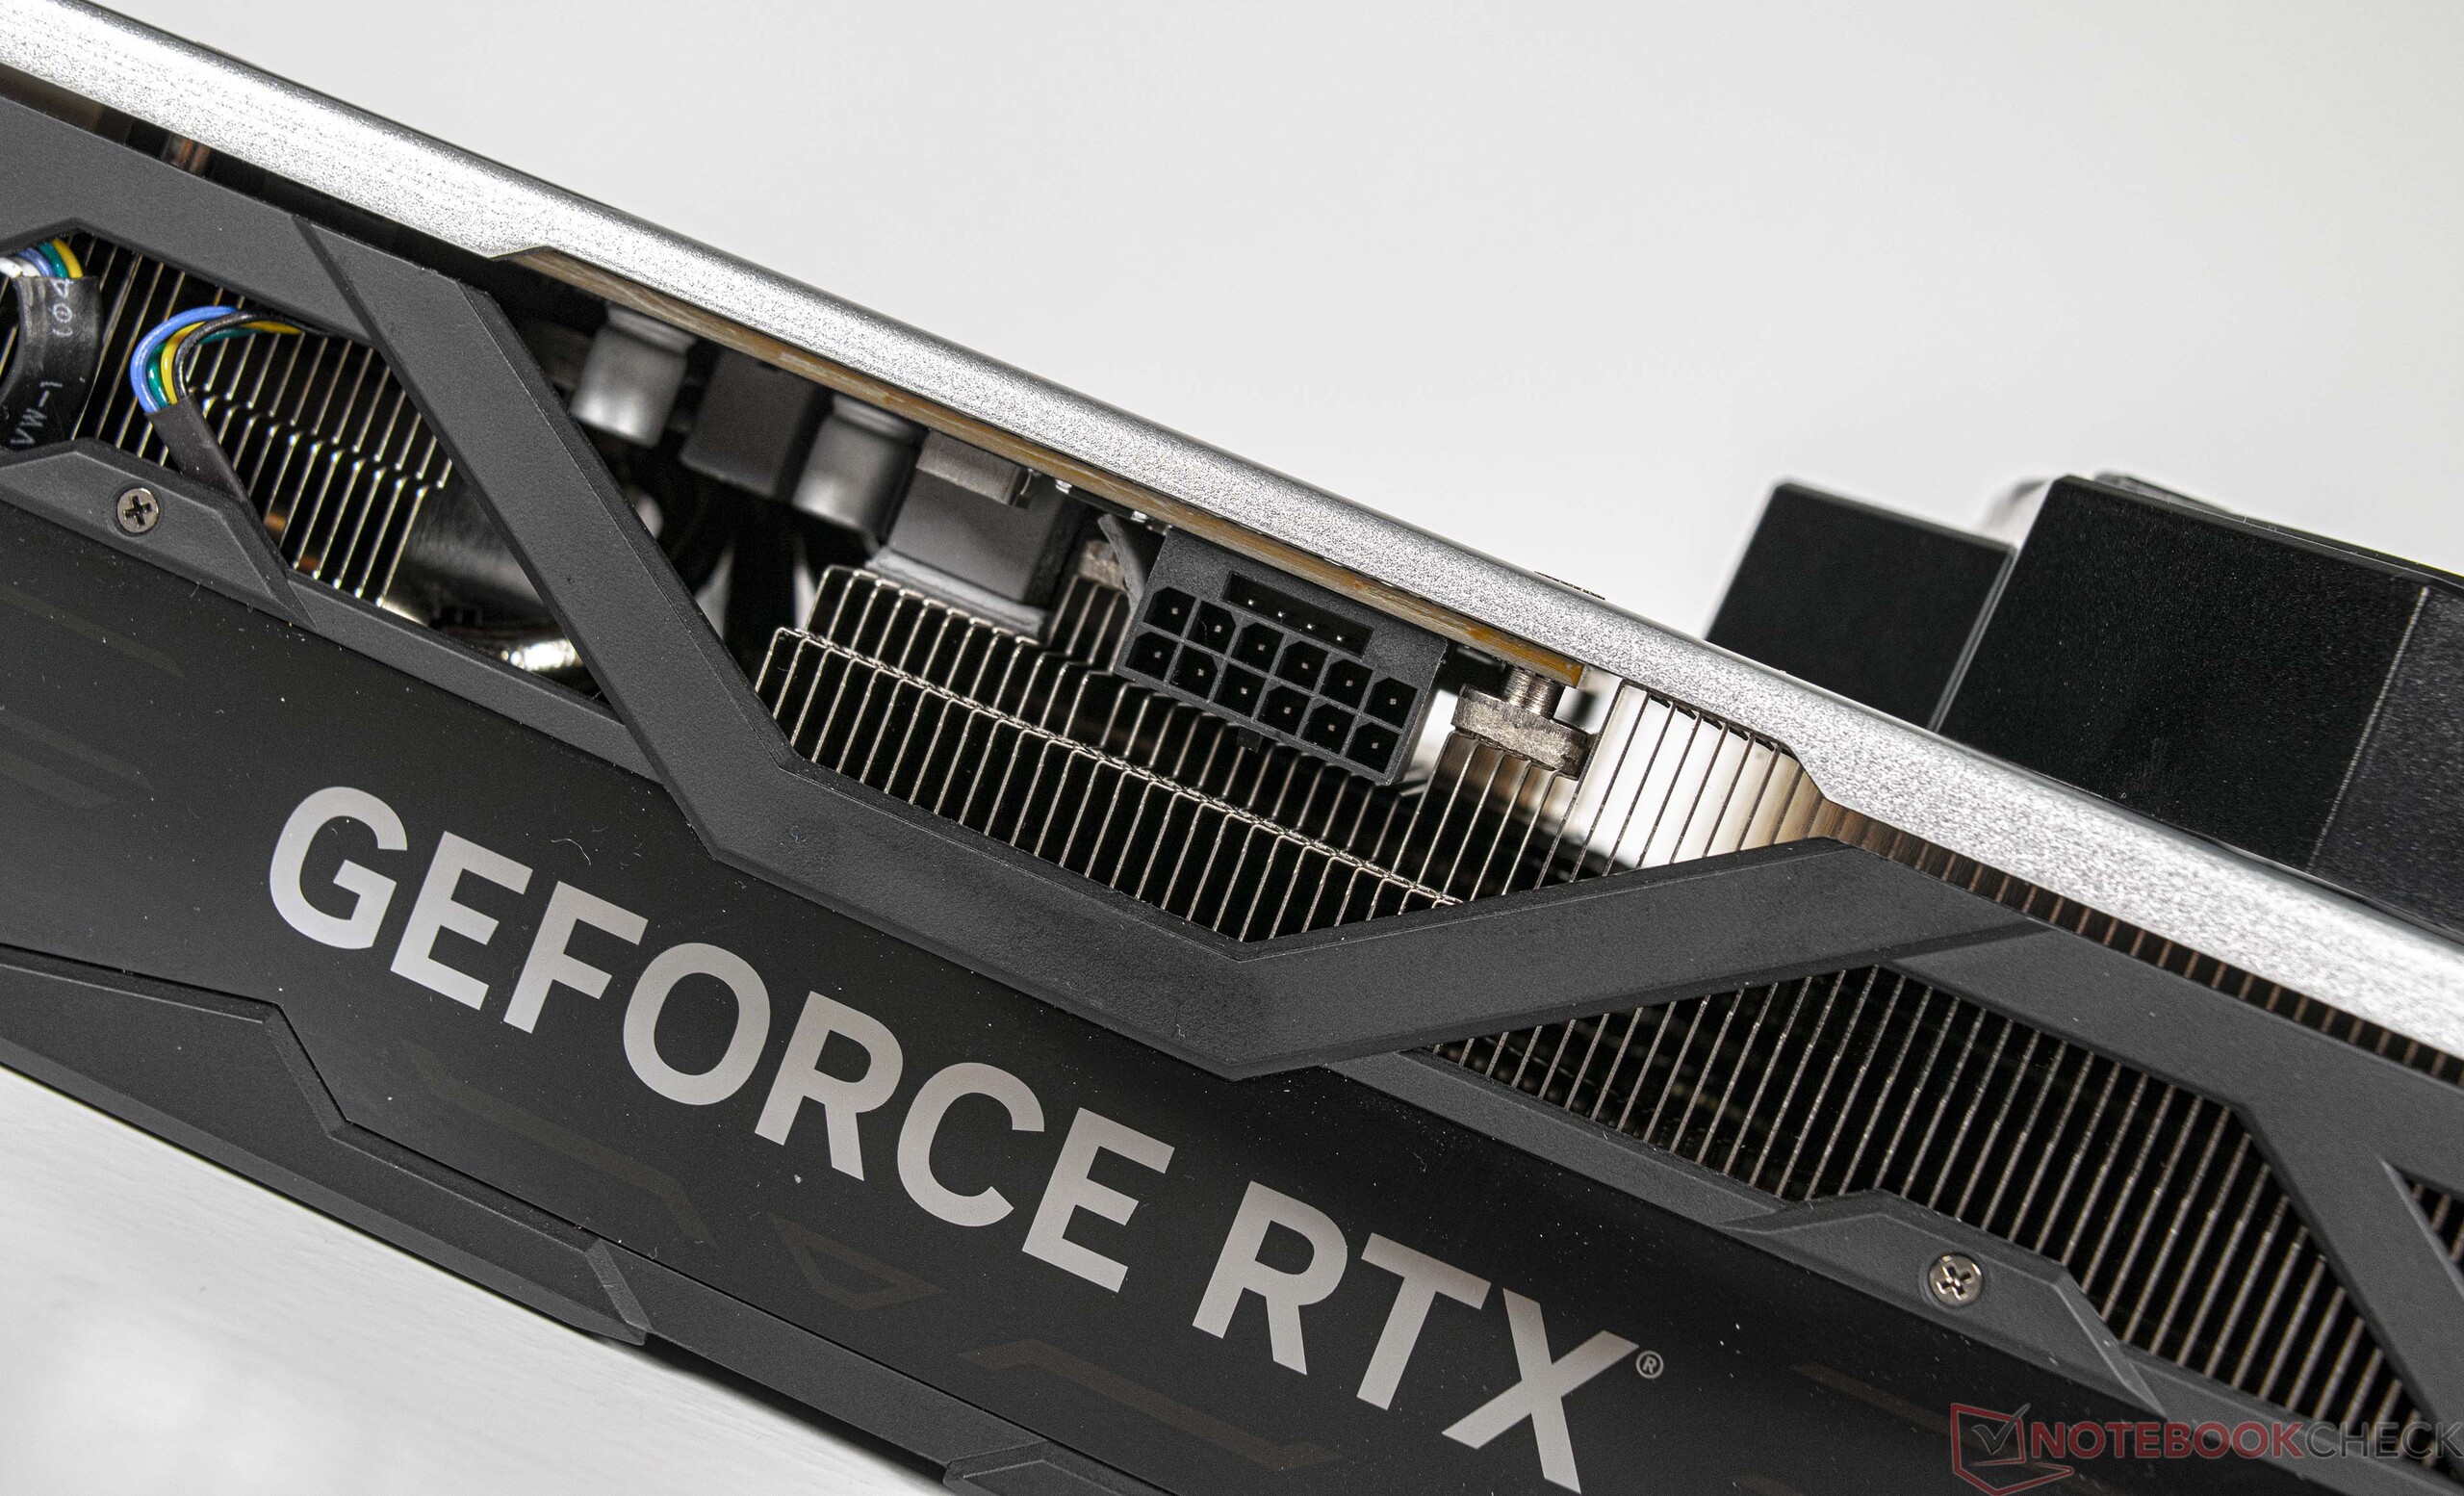
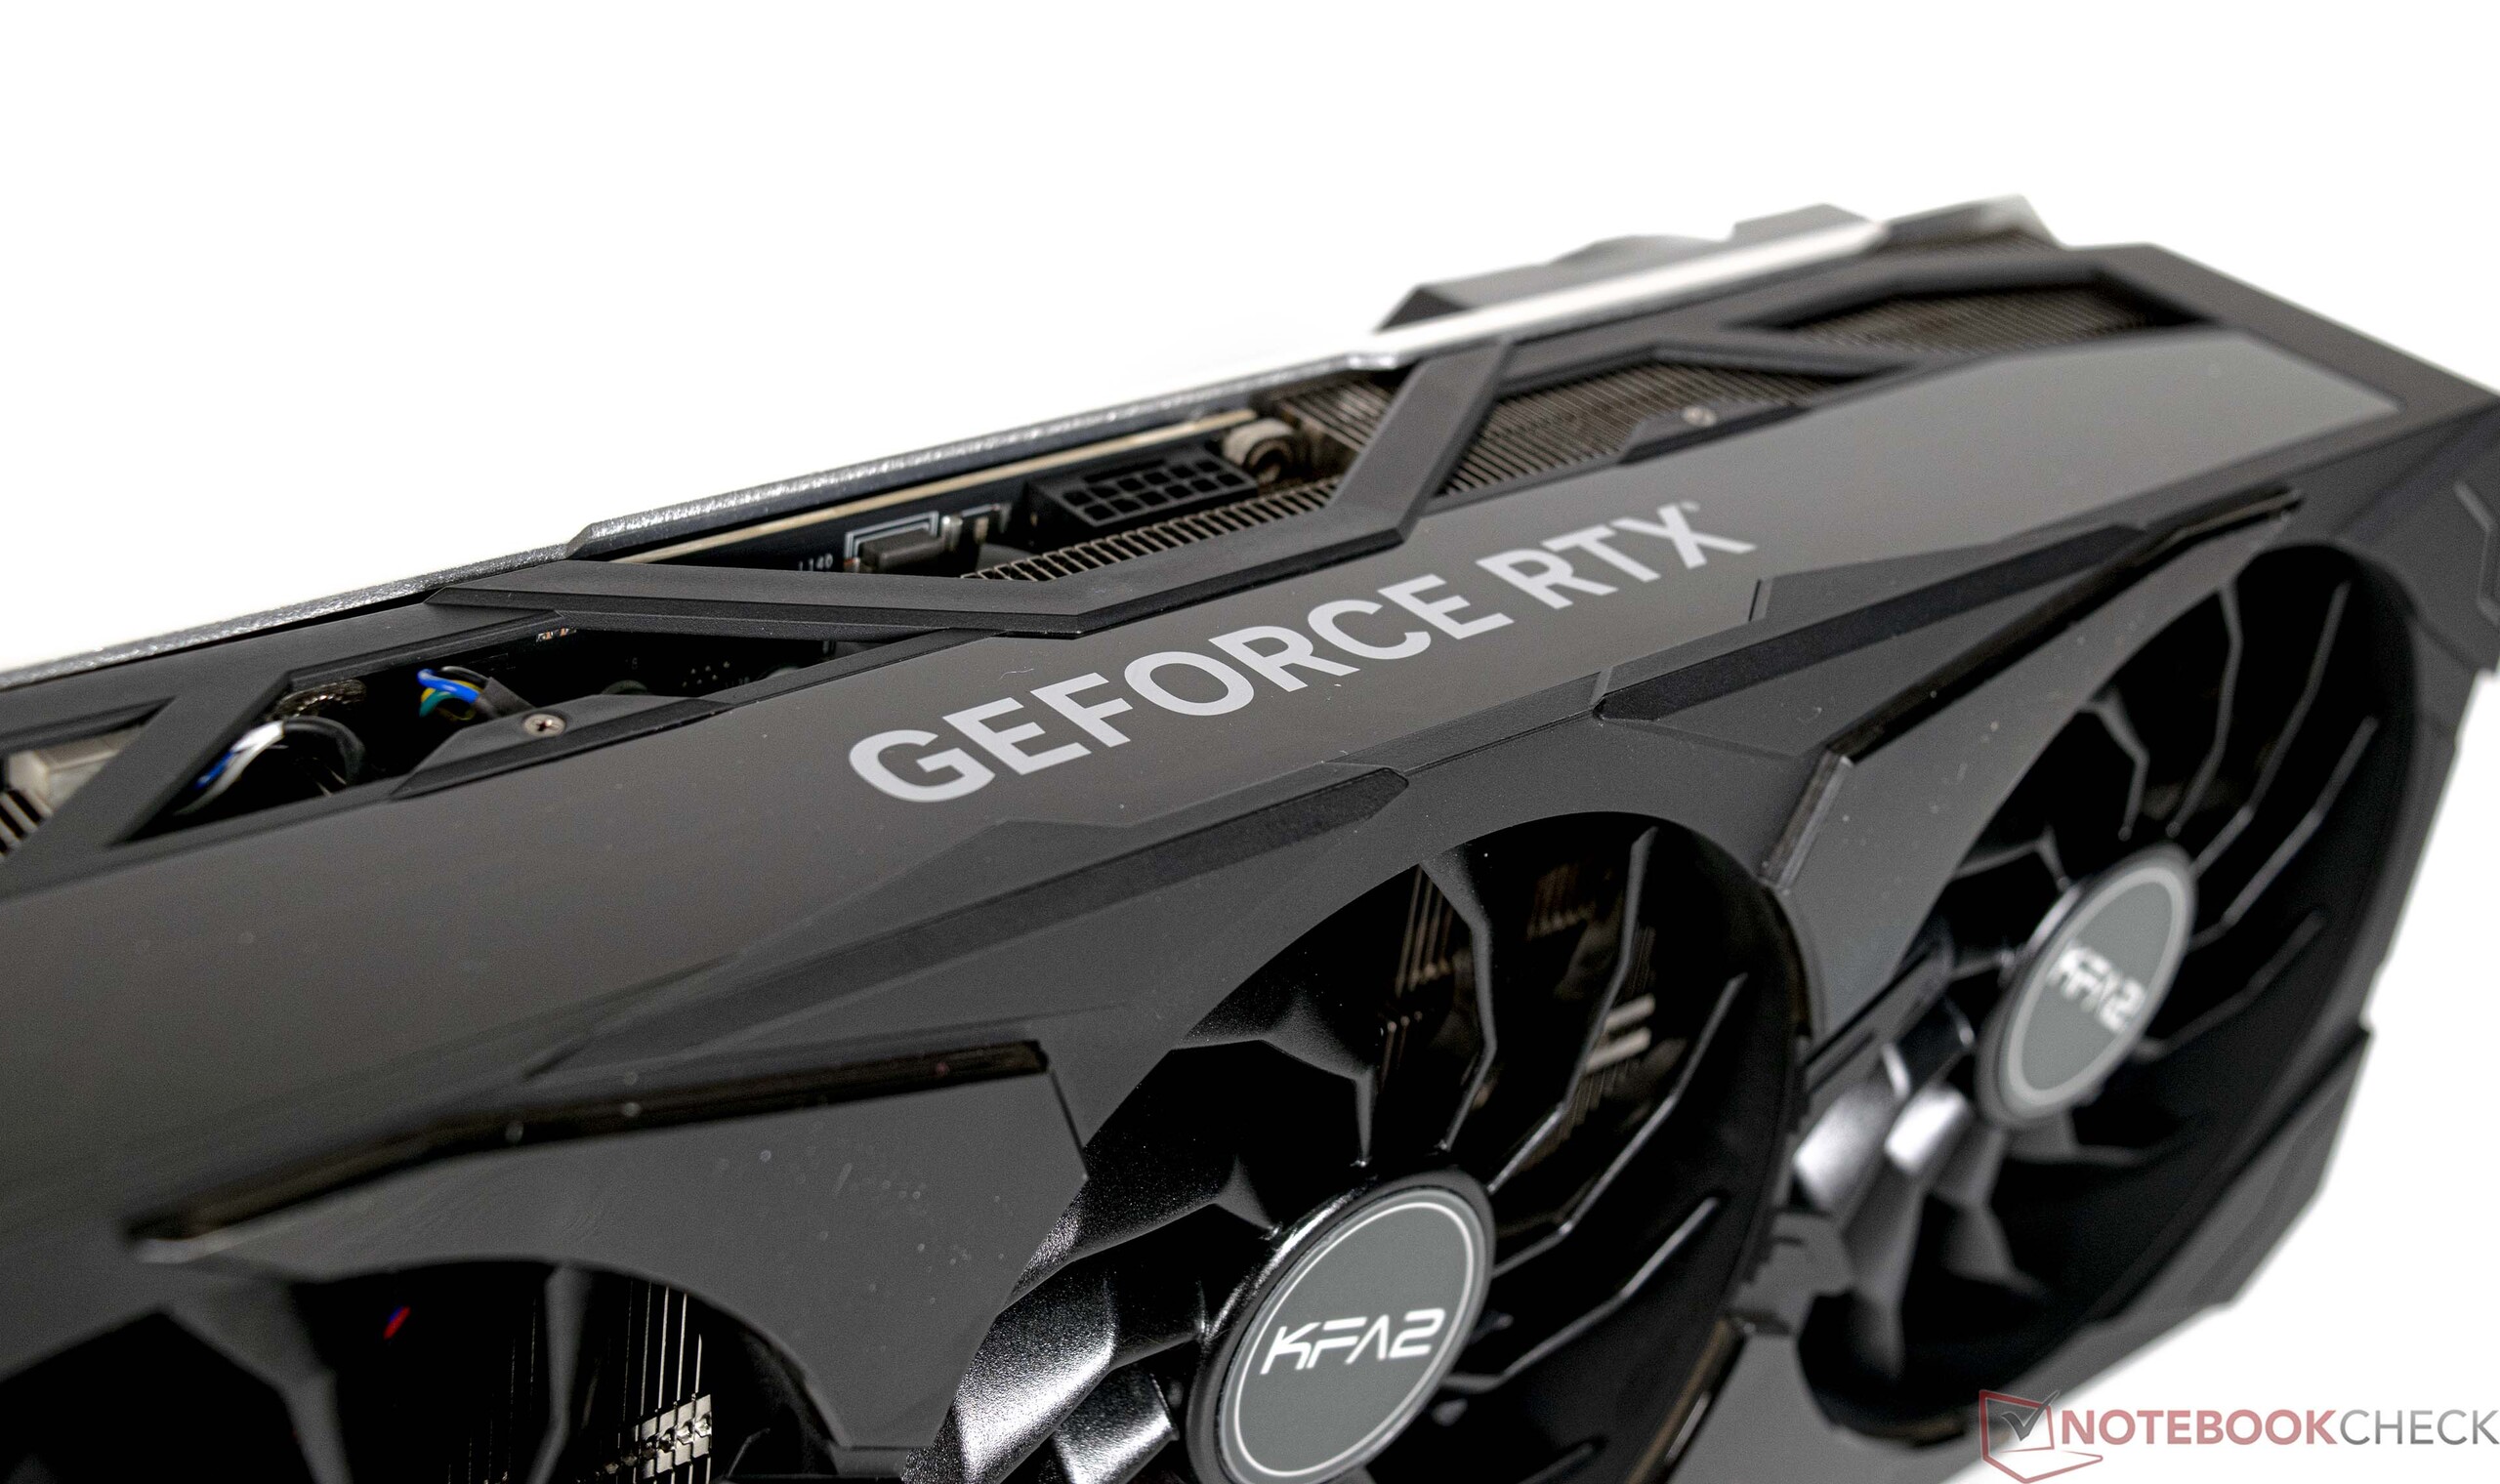
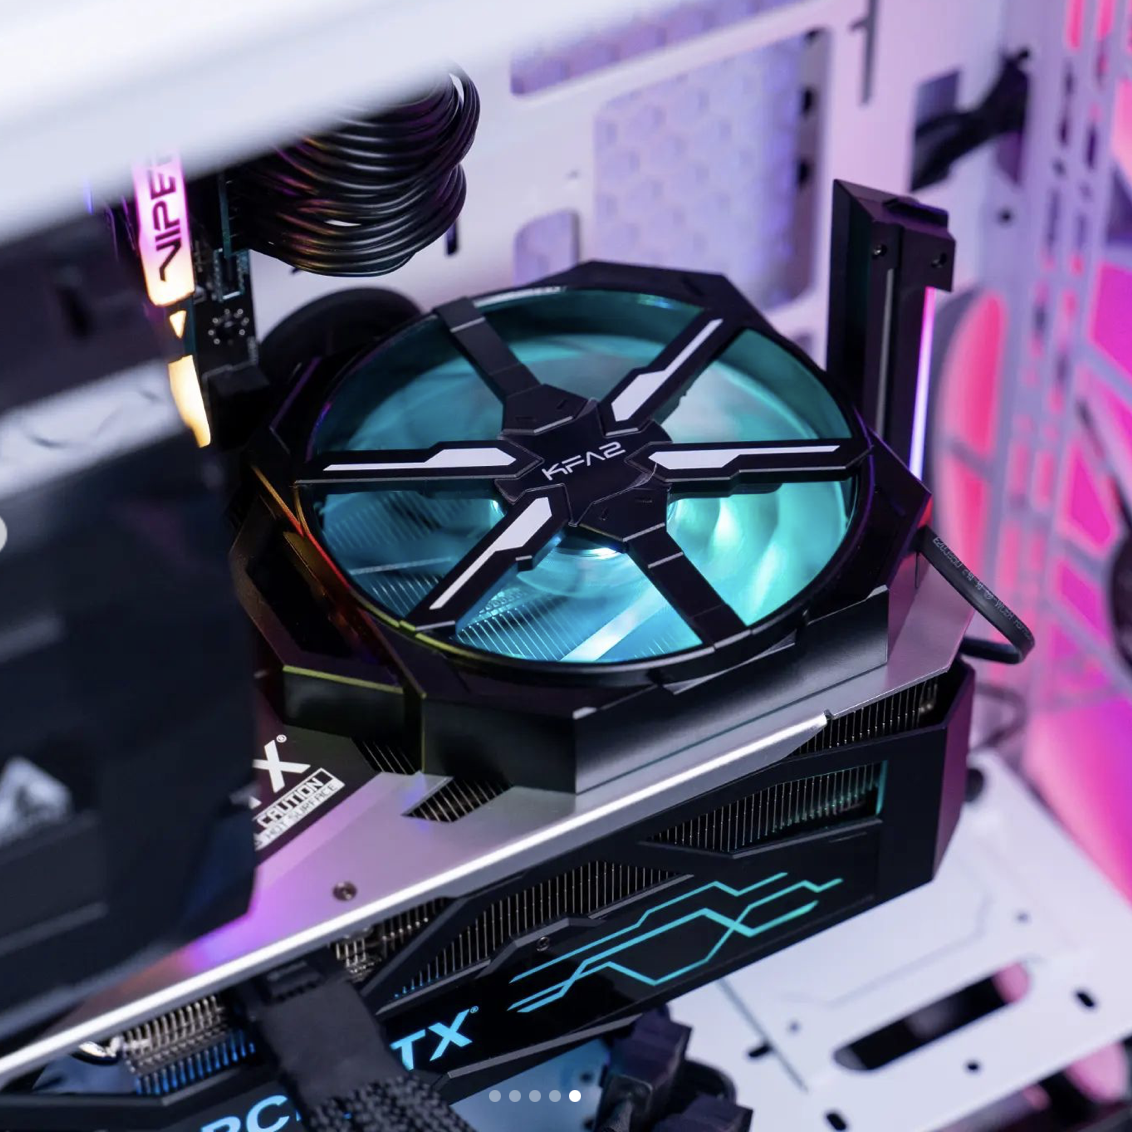
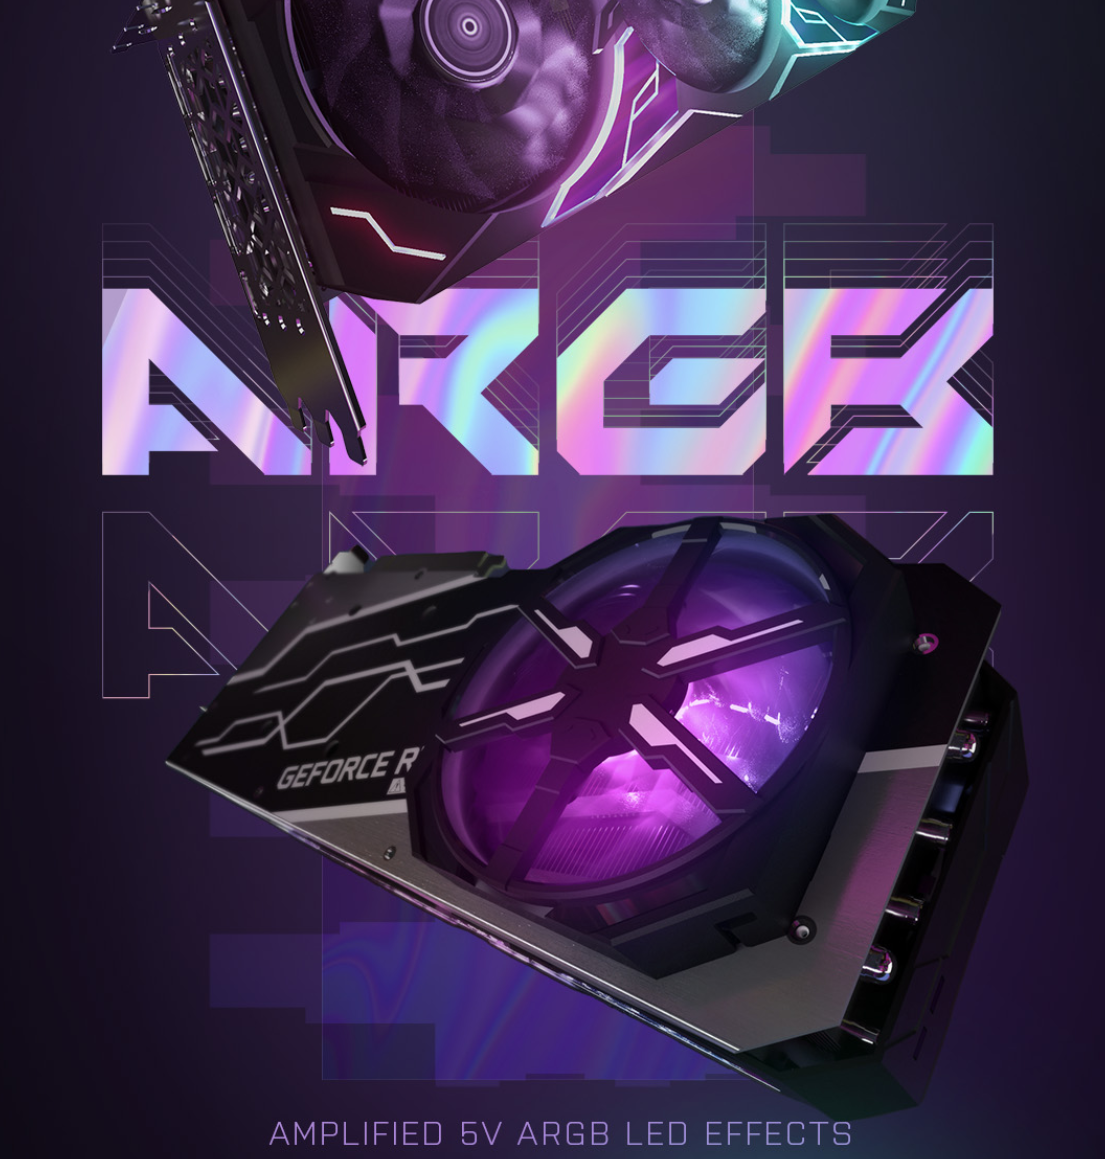
Obwohl KFA2 oftmals mit zu den preiswertesten Herstellern zählt, so sieht man sich selbst aber als Gegner von teureren Modellen anderer Hersteller wie beispielsweise Asus mit der Strix Serie oder MSI mit seinen Suprim-X-Modellen. Ein direkter Schlagabtausch ist leider aufgrund der fehlenden Modelle von Asus und MSI nicht möglich. Dennoch können wir aber festhalten, dass sich die KFA2 GeForce RTX 4080 SG auf demselben Verarbeitungslevel befindet wie die KFA2 GeForce RTX 4090 SG. Obwohl die Leistungsaufnahme mit 320 Watt deutlich geringer ist als beim Topmodell, so bekommt die Grafikkarte dennoch einen riesigen Quad-Slot-Kühler verpasst. Zudem gibt es viel RGB, womit das Modell die Blicke auf sich zieht. Für die Stromversorgung kommt wie bei allen Modellen der aktuellen GeForce-RTX-4000-Grafikkarten der neue 12VHPWR-Anschluss zum Einsatz. Hier macht auch KFA2 keine Ausnahme und legt der Grafikkarte einen passenden Adapter von 3x 6 +2 Pin PCIe auf 12VHPWR bei.

Extern gibt es bei der KFA2 GeForce RTX 4080 SG 1x HDMI 2.1a und 3x DisplayPort 1.4a.

KFA2 GeForce RTX 4080 SG
KFA2 GeForce RTX 4080 SG (Quelle: KFA2)

Die Specs der GeForce-Grafikkarten im Vergleich

Ausstattung RTX 4090 (FE) RTX 4080 KFA2 RTX 4080 RTX 3090 Ti RTX 3090 (FE) RTX 3080 Ti (FE) RTX 3080 (FE) Titan RTX
Chip AD102 AD103 AD103 GA102 GA102 GA102 GA102 TU102
FinFET Prozess 4 nm 4 nm 4 nm 8 nm 8 nm 8 nm 8 nm 12 nm
CUDA Cores 16.384 9.728 9.728 10.752 10.496 10.240 8.704 4.608
Texture Units 512 304 304 336 328 320 272 288
Tensor Cores 512 4. Gen. 304 4. Gen. 304 4. Gen. 336 3. Gen. 328 3. Gen. 320 3. Gen. 272 3. Gen. 576 2. Gen.
RT Cores 128 76 76 84 82 80 68 72
GPU Base Clock 2.235 MHz 2.205 MHz 2.205 MHz 1.560 MHz 1.395 MHz 1.365 MHz 1.440 MHz 1.350 MHz
GPU Boost Clock 2.520 MHz 2.505 MHz 2.565 MHz 1.860 MHz 1.695 MHz 1.665 MHz 1.710 MHz 1.770 MHz
Memory Bus 384 bit 256 Bit 256 Bit 384 bit 384 bit 384 bit 320 bit 384-bit
Memory Bandwidth 1.008 GB/s 716.8 GB/s 716.8 GB/s 1.008 GB/s 936 GB/s 912.4 GB/s 760 GB/s 672 GB/s
Video Memory 24 GB GDDR6X 16 GB GDDR6X 16 GB GDDR6X 24 GB GDDR6X 24 GB GDDR6X 12 GB GDDR6X 10 GB GDDR6X 24 GB GDDR6
Energieverbrauch 450 W 320 W 320 W 450 W 350 W 350 W 320 W 280 W

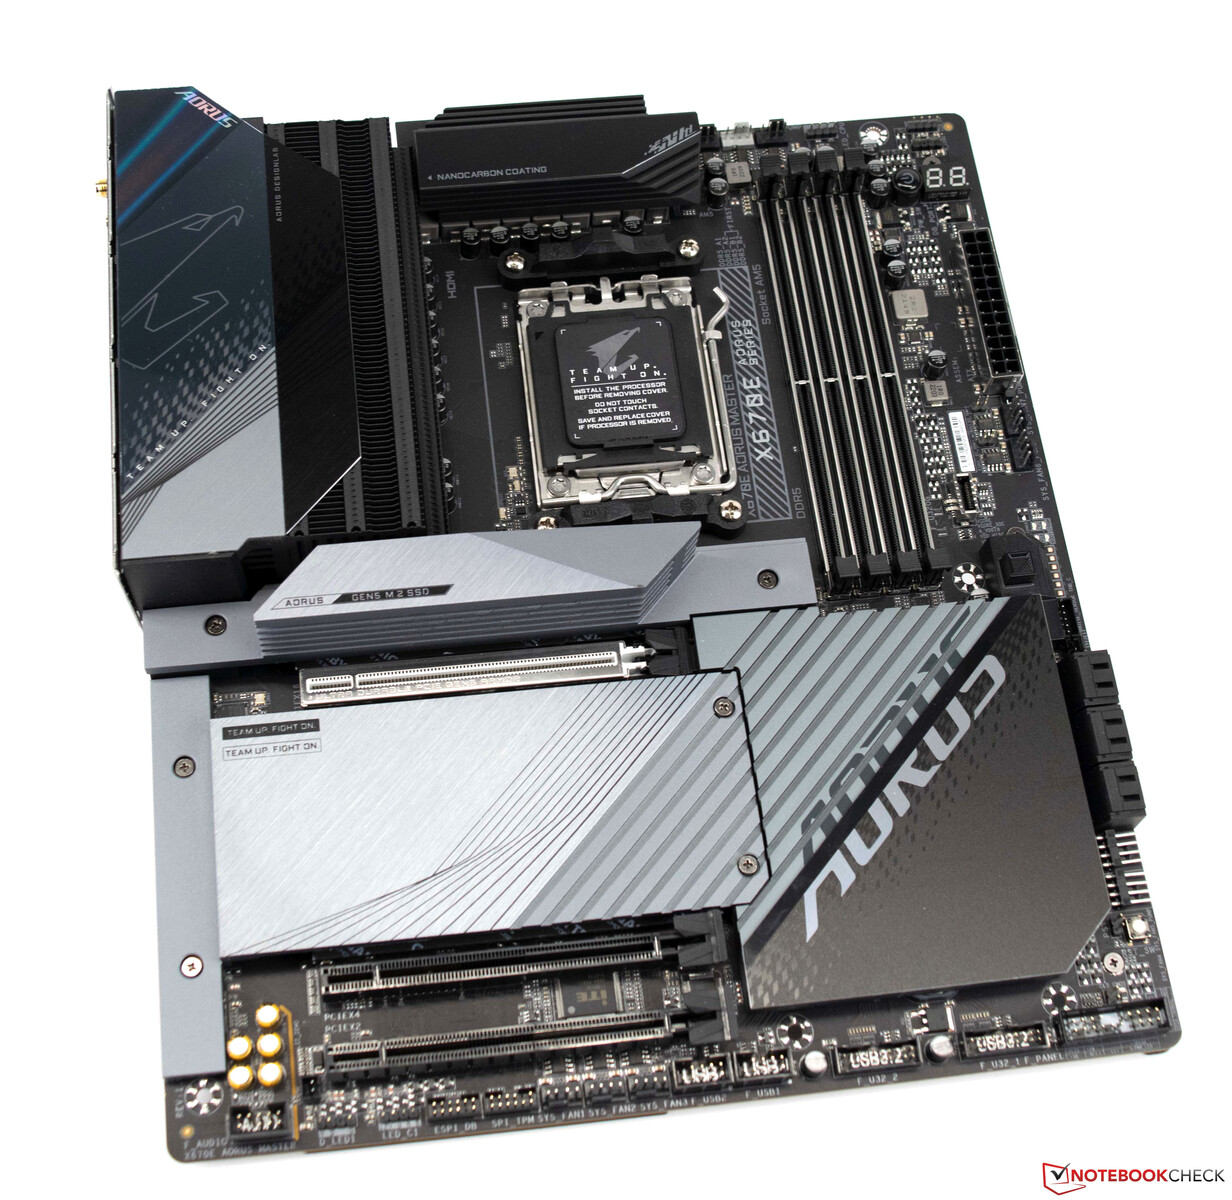
Unser Testsystem mit AMD Ryzen 9 7950X als Basis

Als Testsystem dient eine aktuelle AMD Plattform auf Basis des Gigabyte X670E Aorus Master. Die CPU (AMD Ryzen 9 7950X) bietet eine gute Leistung, und als Kühlung nutzen wir eine AiO-Lösung von Alphacool (Alphacool Eisbear Aurora 360 mm). Der 32-GB-Arbeitsspeicher stammt von G.Skill und wird mit dem passenden EXPO-Profil betrieben. Als Monitor hatten wir den Gigabyte M32U in Verwendung.

Gigabyte X670E Aorus Master
AMD Ryzen 9 7950X
AMD Ryzen 9 7950X
G.Skill Trident Z5 Neo

Das Testsystem im Detail

Für die folgenden Benchmarks und Tests nutzen wir folgendes System:

  • Lian-Li O11 Dynamic
  • AMD Ryzen 9 7950X
  • Gigabyte X670E Aorus Master, BIOS: F8a
  • Alphacool Eisbear 360 AiO
  • Corsair RM 1000x Netzteil
  • G.Skill Trident Z5 Neo DDR5-6000 2x 16 GB, EXPO (DDR5-6000 CL30-38-38-96)
  • Corsair MP600 2 TB
  • Crucial MX500 2 TB
  • Microsoft Windows 11 Professional 64-Bit (Version 22H2)

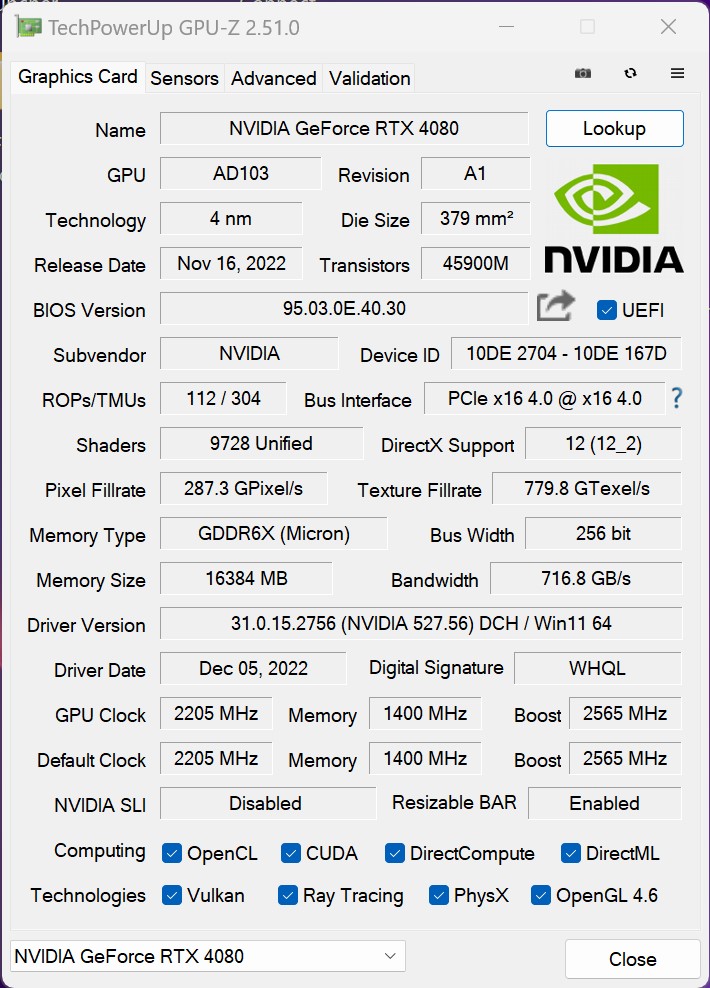
Details zur KFA2 GeForce RTX 4080 SG

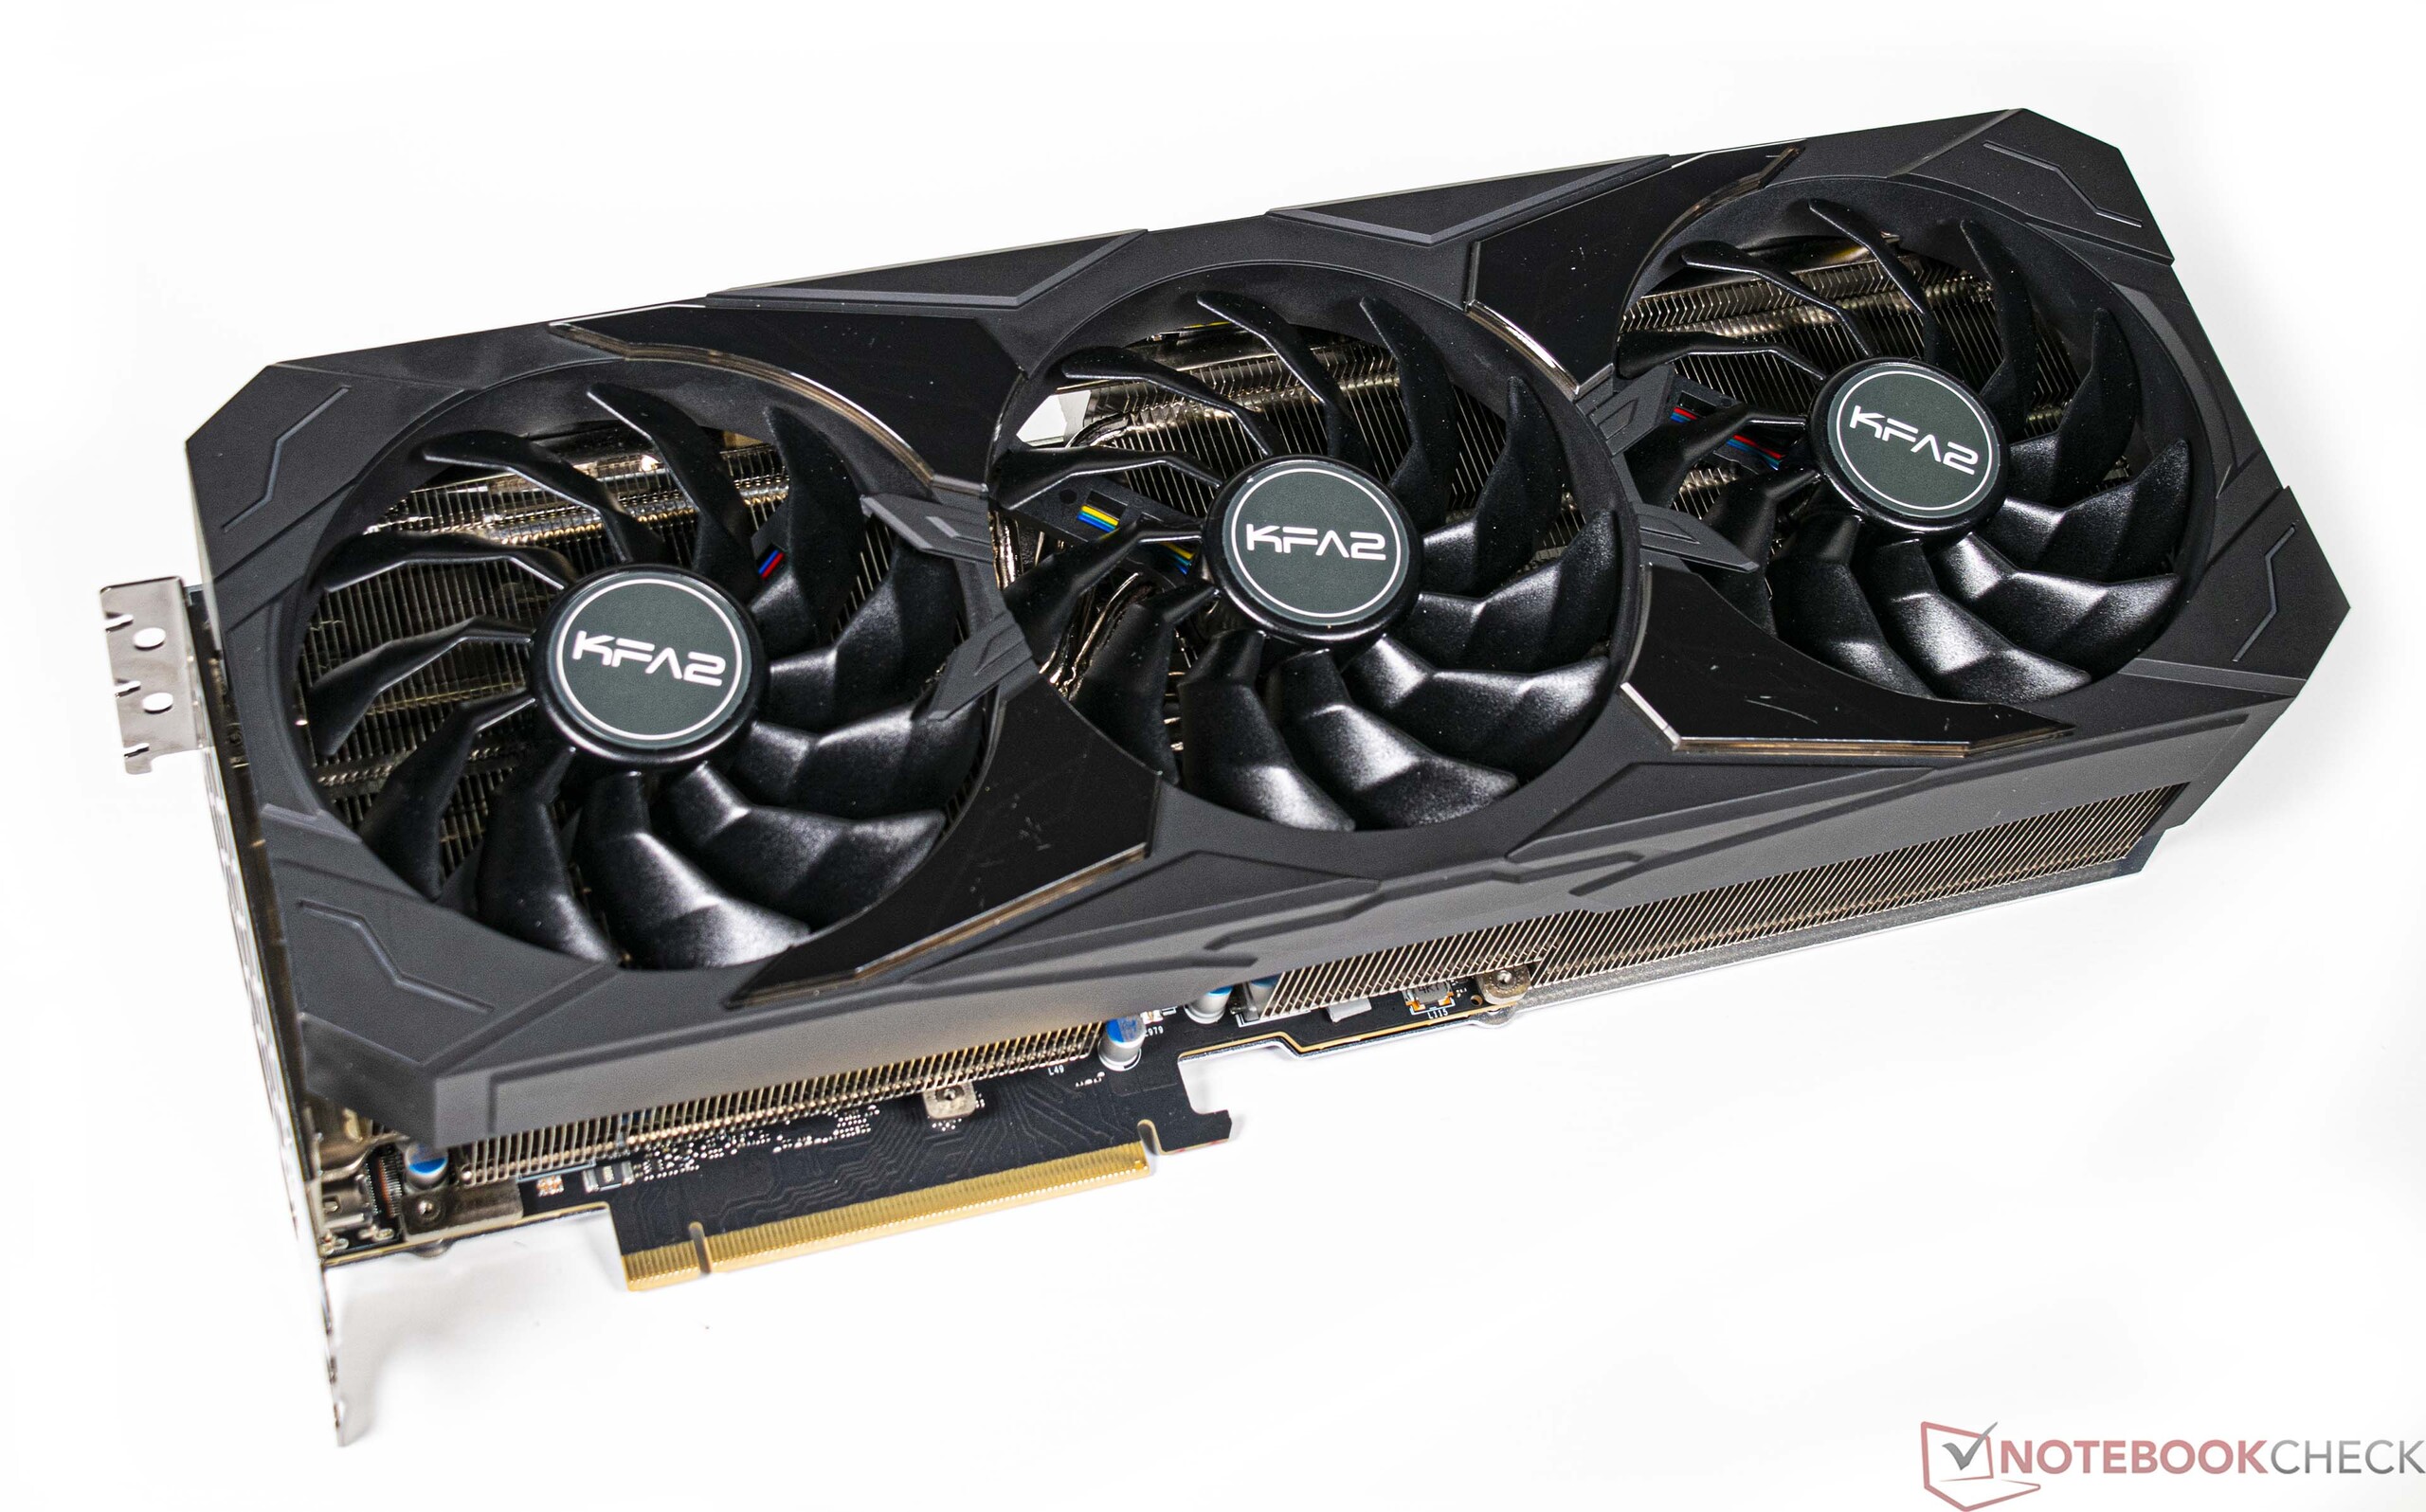
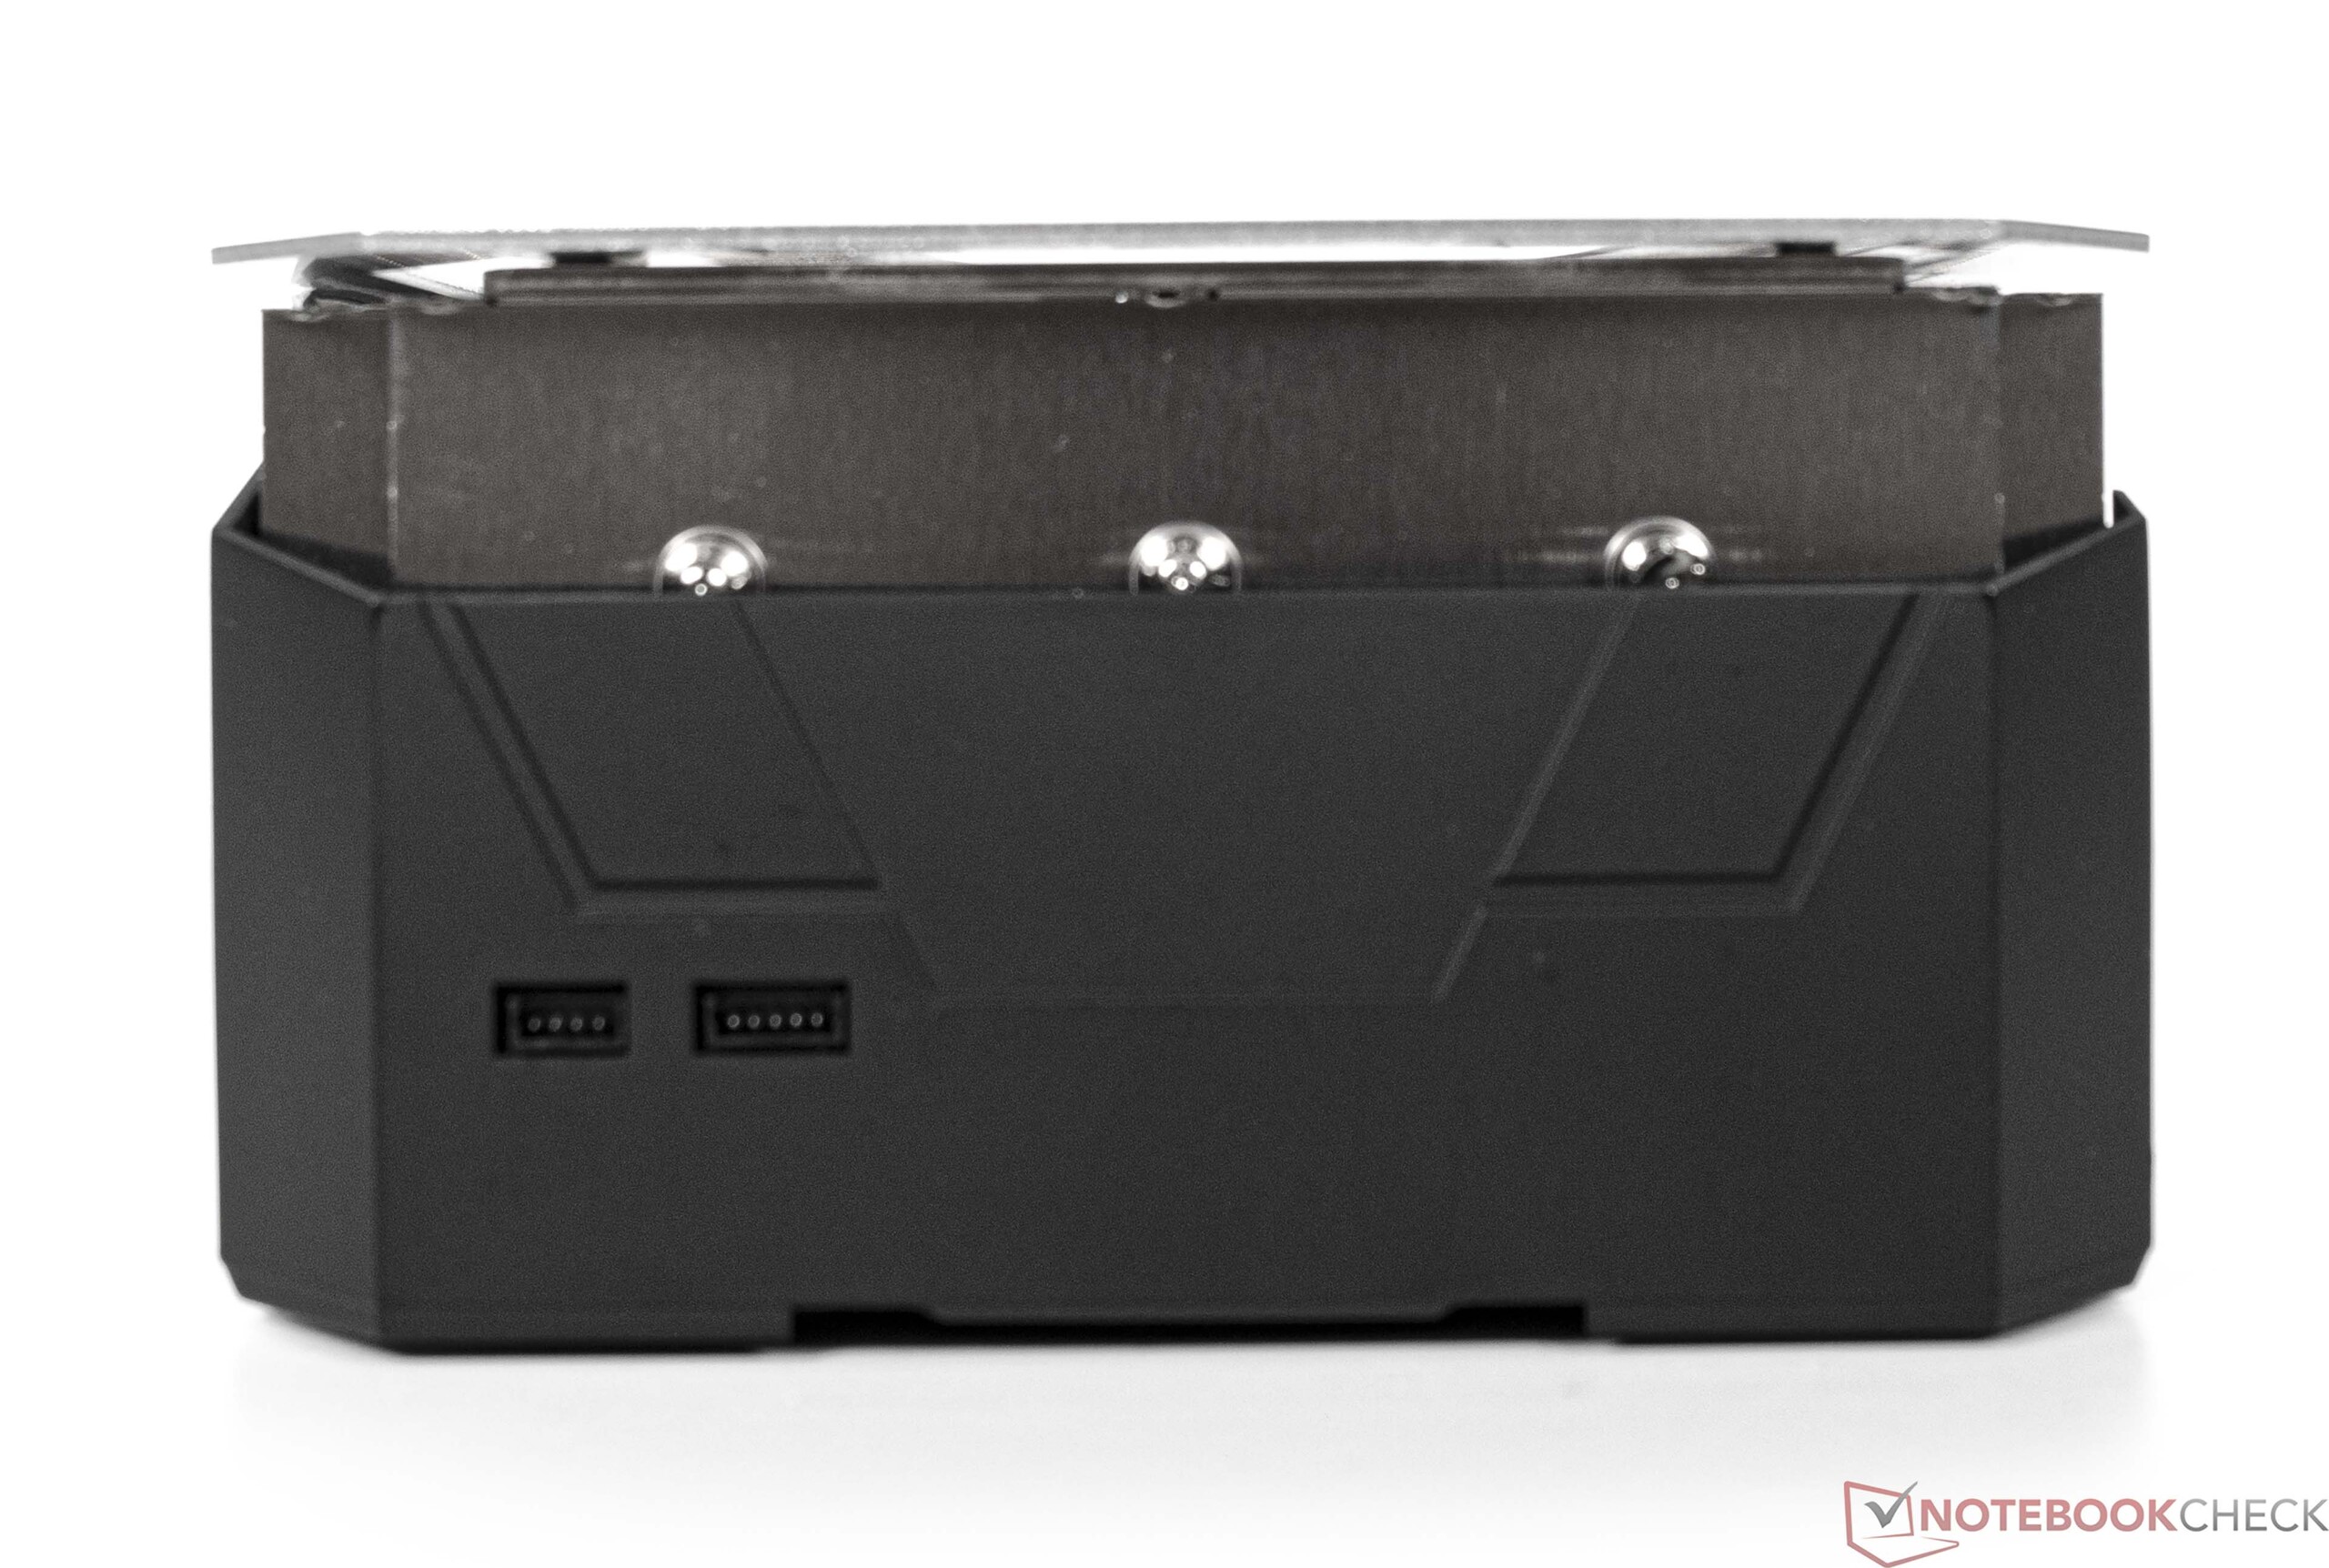
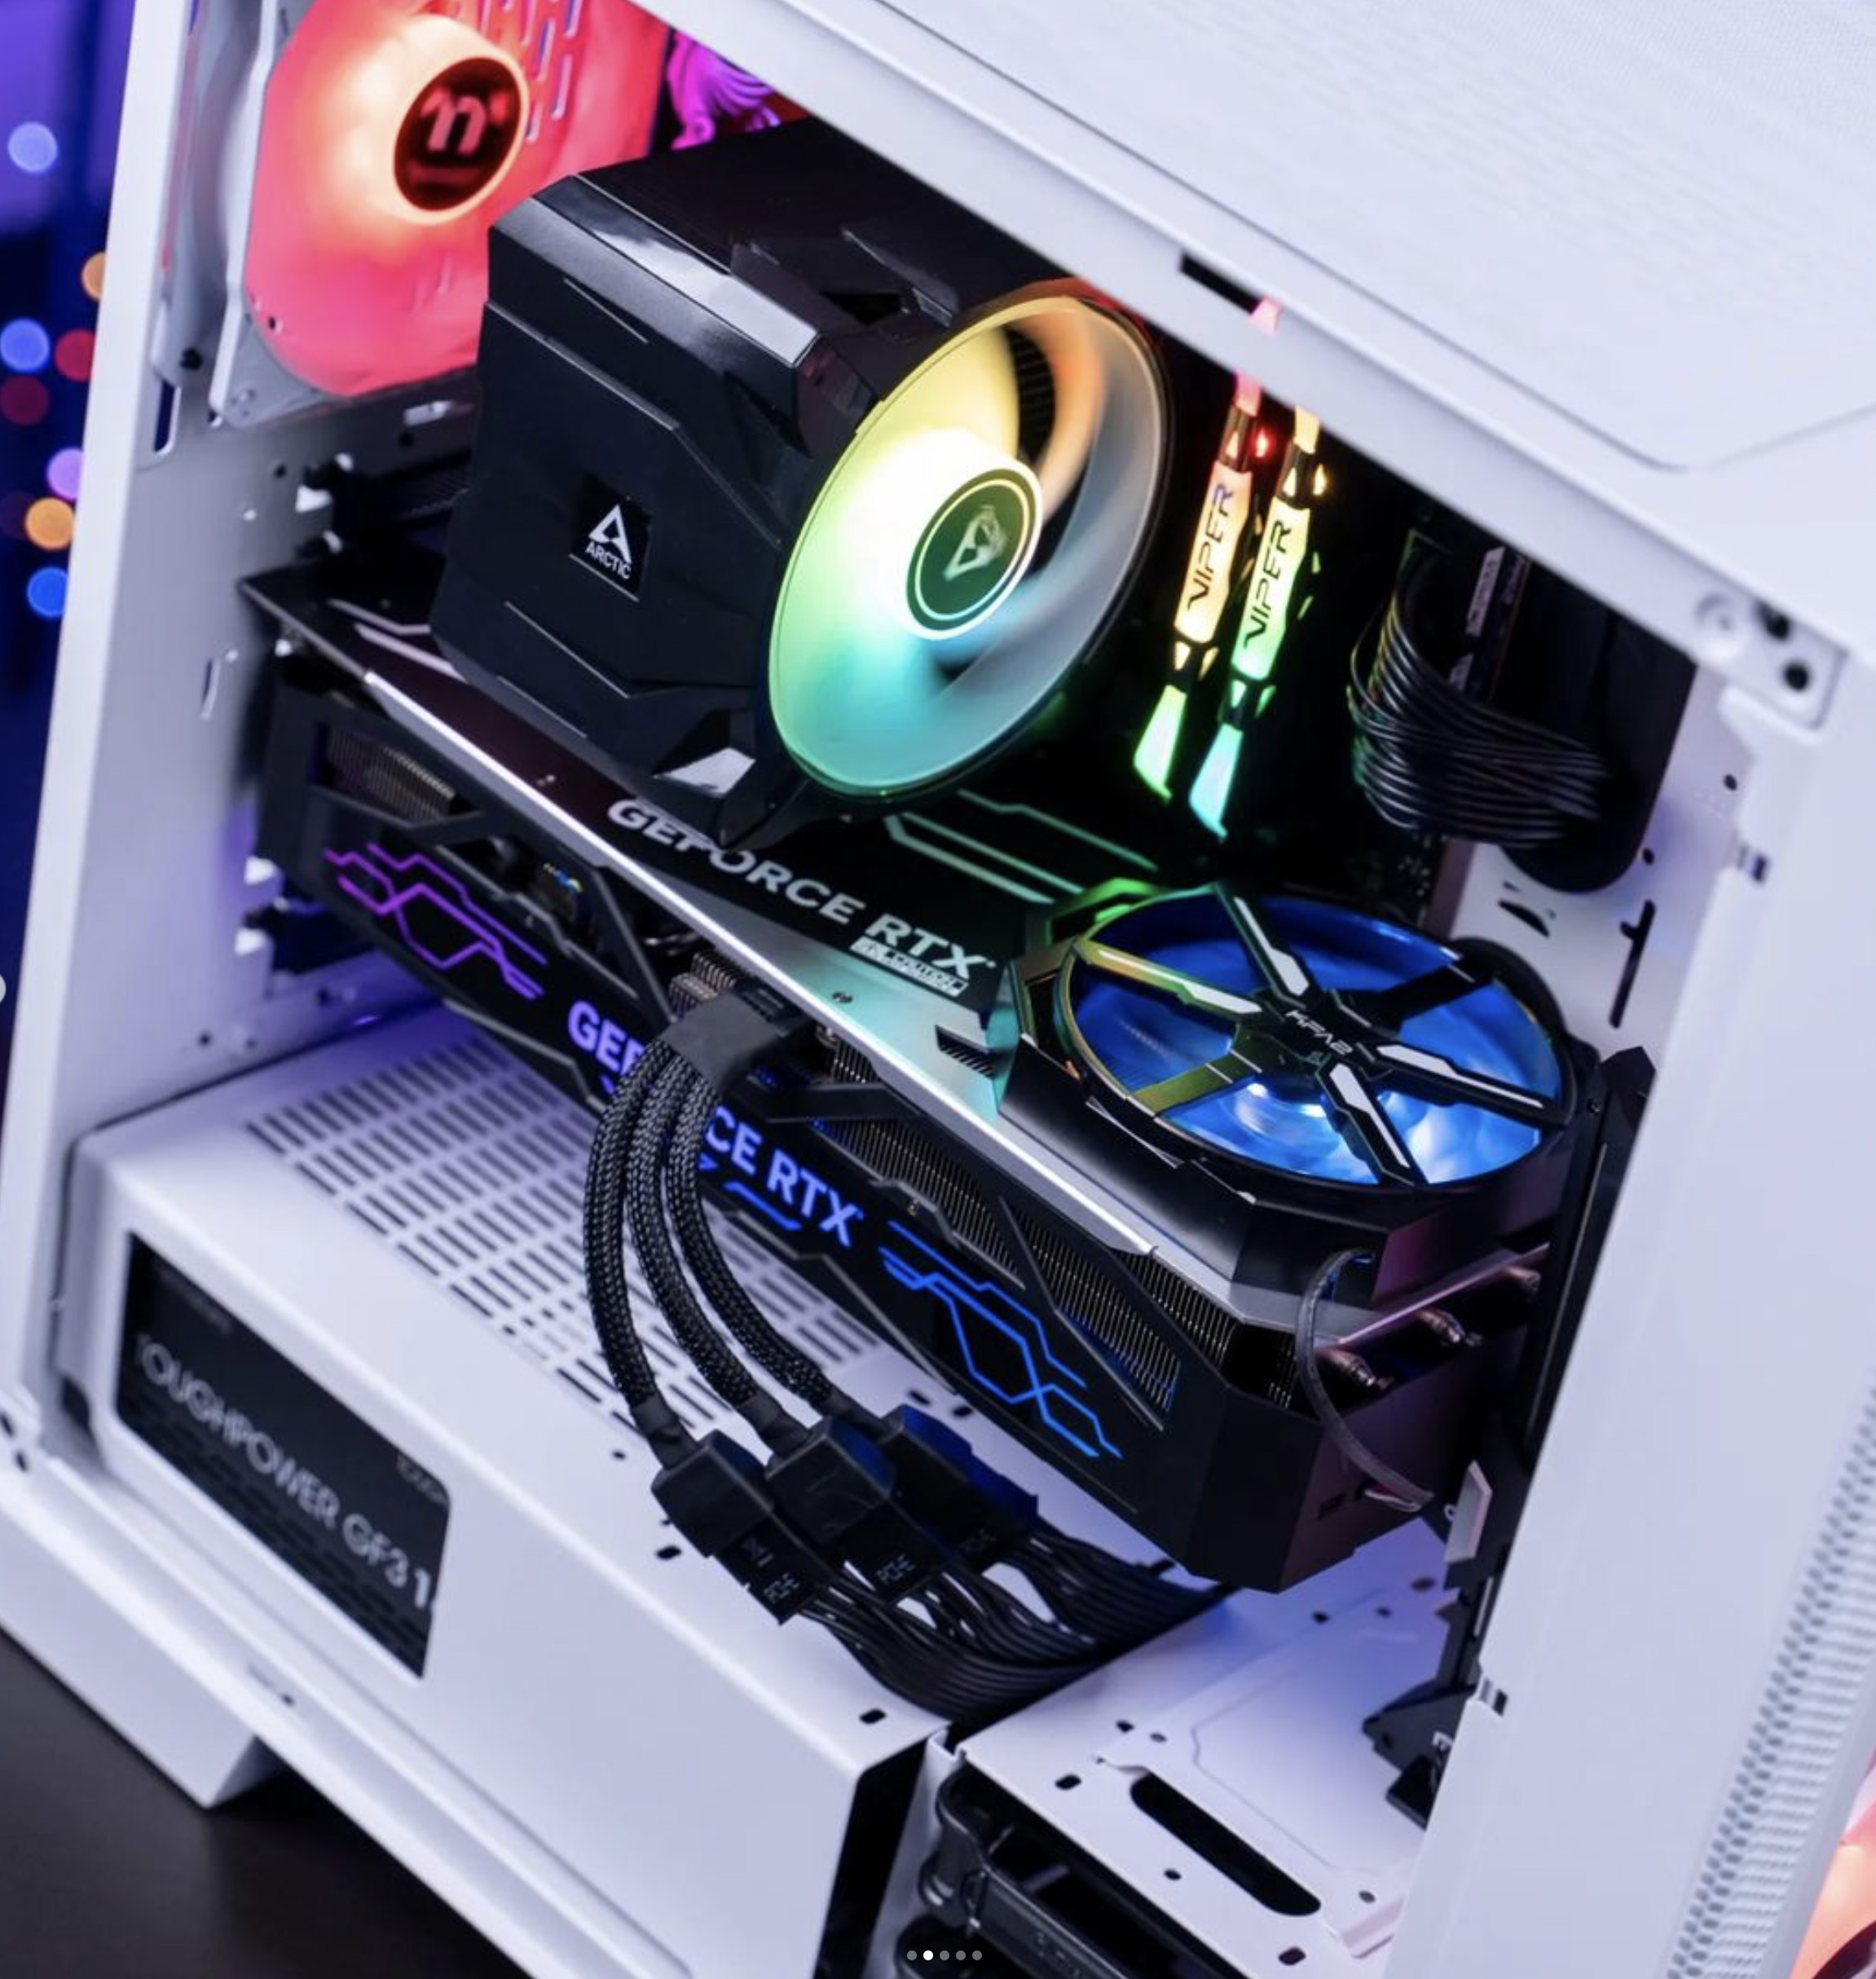
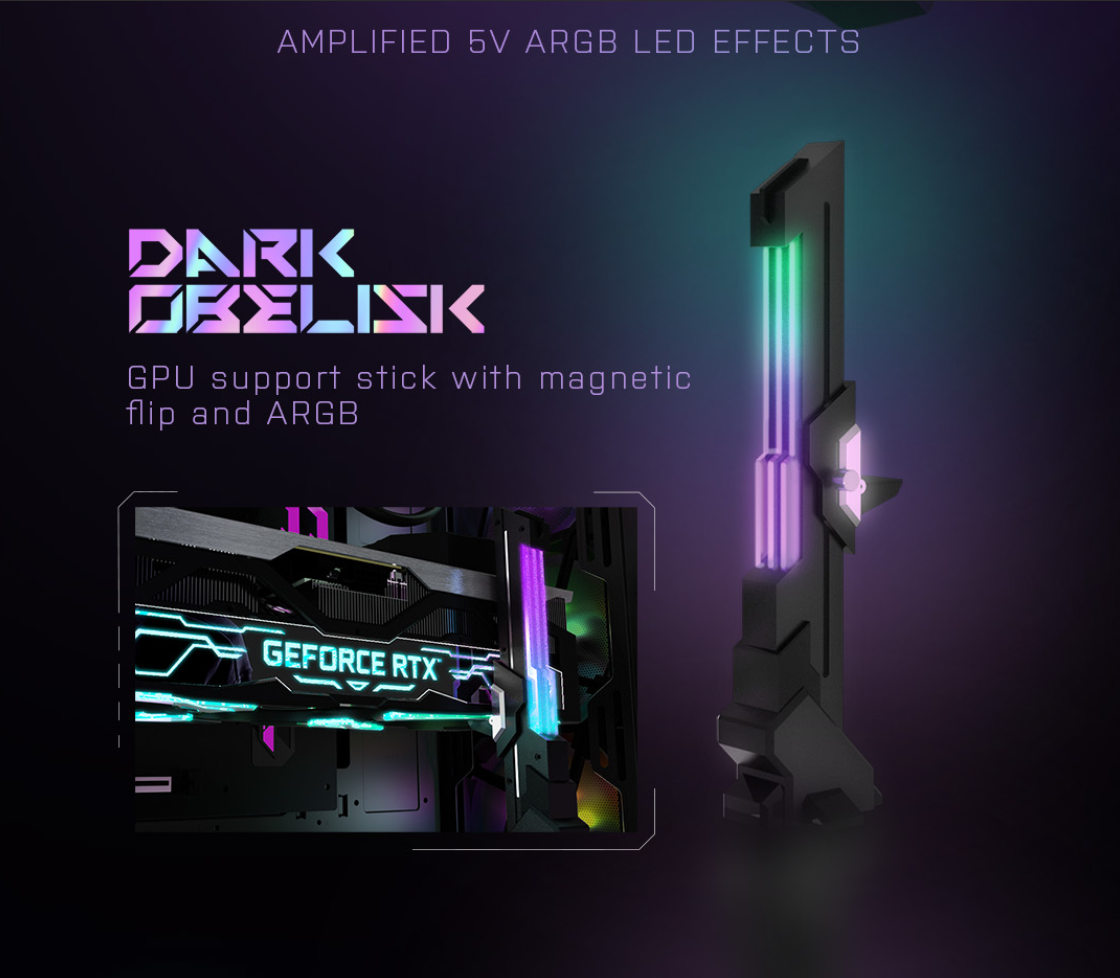
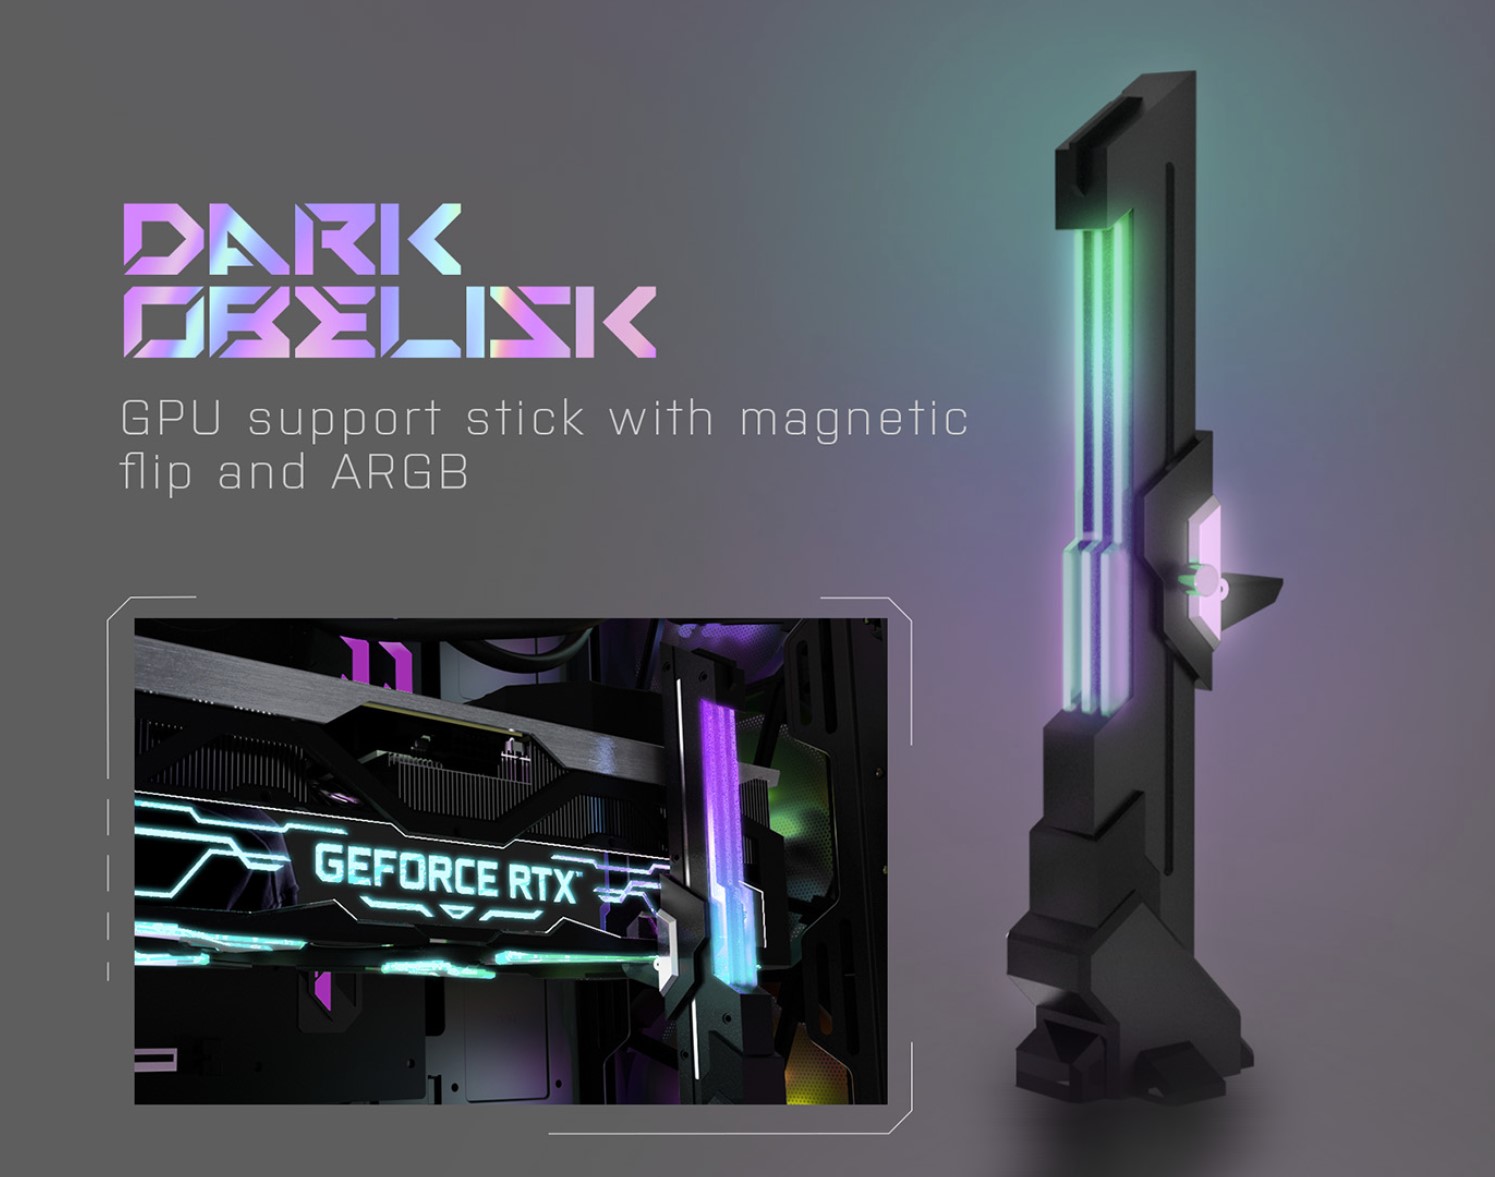
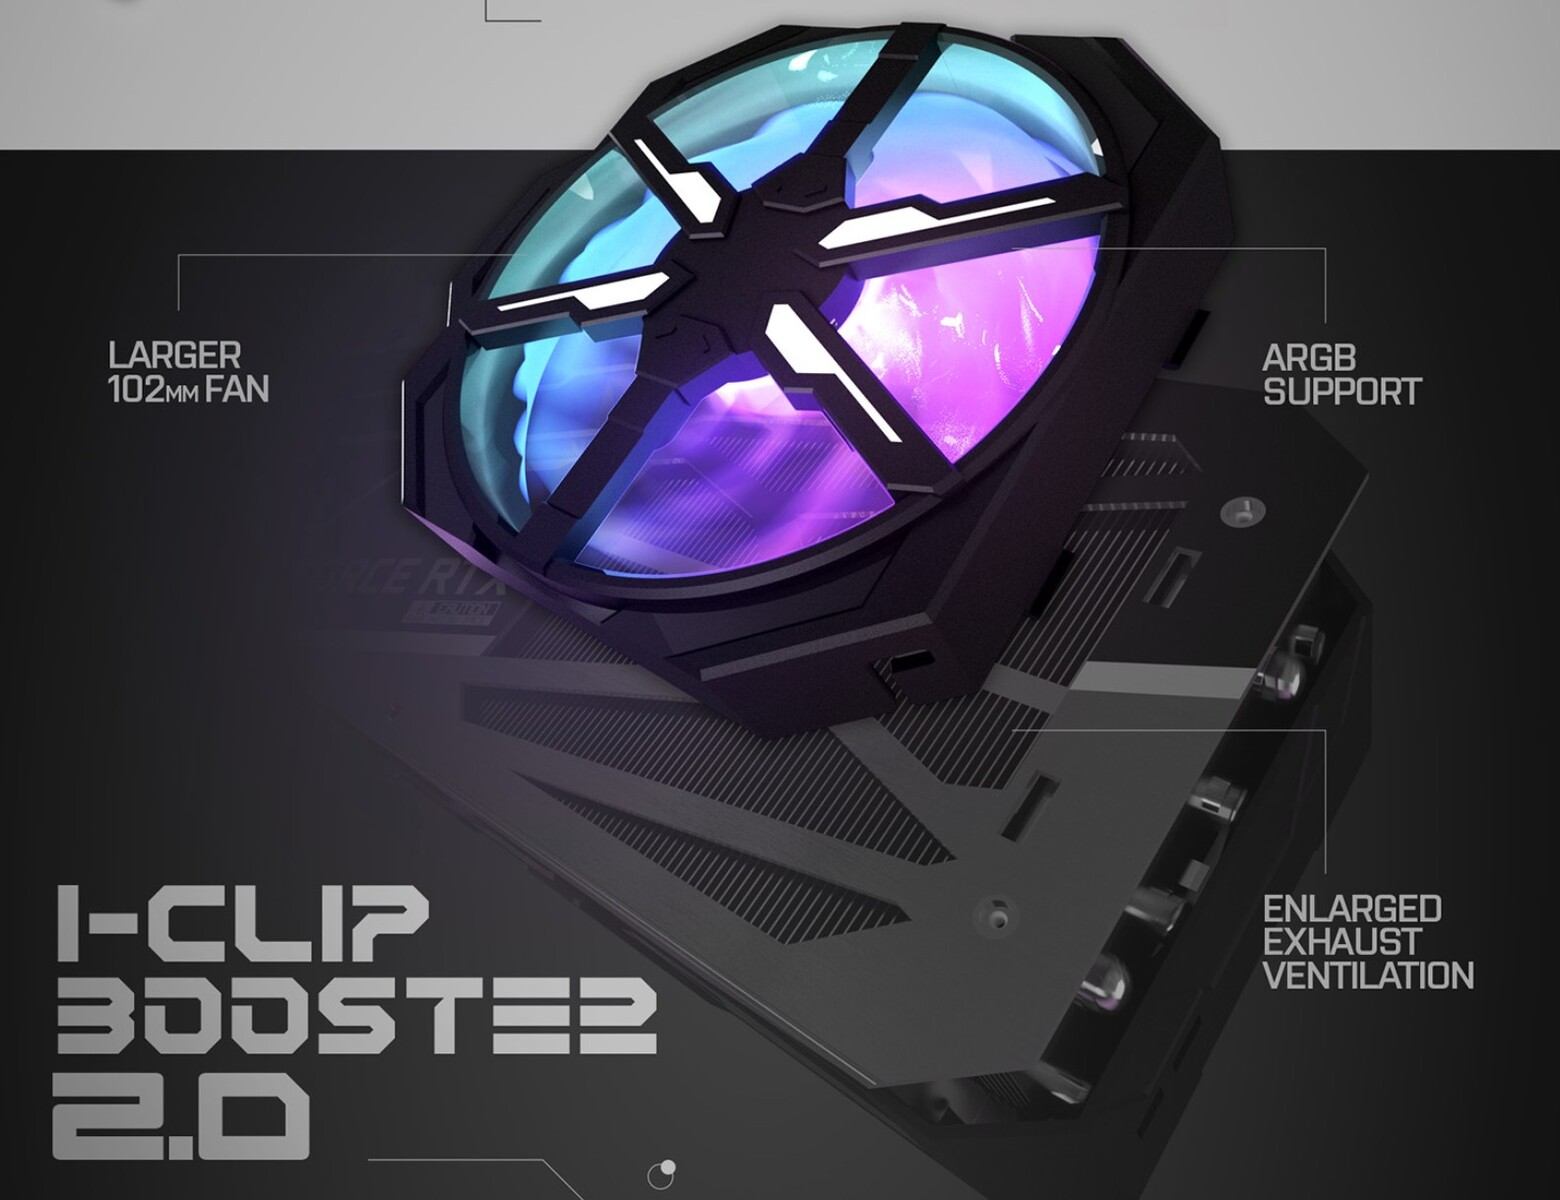
Bei den Taktraten weicht die KFA2 bei der GeForce RTX 4080 SG leicht von den Herstellervorgaben ab. Genauer wird der maximale Boost um 60 MHz erhöht, was aber in der Praxis irrelevant ist, da wir im Test durchweg höhere Taktraten erreicht haben. Im Durchschnitt sehen wir beim Spielen GPU-Taktraten von etwa 2,8 GHz. Über das kleine Tool Xtreme-Tuner lassen sich die Lüfter sowie die Beleuchtung der Grafikkarte steuern. Für den Test haben wir die vordefinierten Einstellungen allerdings nicht verändert. Das 1-Click-OC-Feature, welches bei KFA2-Modellen oft zum Einsatz kommt, ist jedoch mehr Schein als Sein. Nur 15 MHz mehr Takt bei der GPU machen in der Praxis keinen Unterschied. Für dieses Features wünschen wir uns in Zukunft eine deutlichere Divergenz. Im Lieferumfang befindet sich neben der Grafikkarte noch ein optionaler Lüfter, der auf die Rückseite der Grafikkarte montiert werden kann. Unser Mainboard ist leider inkompatibel, weshalb wir diesen im Test nicht verwenden konnten. Weiterhin legt der Hersteller einen GPU-Halter (ARGB Dark Obelisk) bei. Dieser verfügt über eine integrierte RGB-Beleuchtung und passt somit zum Gesamtkonzept der KFA2 bei der GeForce RTX 4080 SG.

GPU-Z
GPU-Z
GPU-Z
GPU-Z
GPU-Z
GPU-Z
ARGB Dark Obelisk - GPU-Halter (Quelle: KFA2)
optionaler ARGB Lüfter für die Rückseite (Quelle: KFA2)

Synthetische Benchmarks

Bei den synthetischen Tests zeigt die KFA2 bei der GeForce RTX 4080 SG eine identische Leistung wie die Founders-Edition von Nvidia. Gegenüber AMD kann sich die KFA2 bei der GeForce RTX 4080 SG gegenüber einer AMD Radeon RX 7900 XT durchsetzten und ist hier im Vergleich elf Prozent schneller. AMDs Topmodell, die Radeon RX 7900 XTX, ist in Reichweite und nur unwesentlich schneller als unser Testsample. Nachdem wir schon einen enormen Leistungssprung der GeForce RTX 4090 gegenüber der GeForce RTX 3090 gesehen haben, stellen wir einen ähnlichen Leistungsgewinn auch bei der GeForce RTX 4080 gegenüber der GeForce RTX 3080 Ti fest. Satte 26 Prozent mehr Performance kann Nvidia mit Ada Lovelace gegenüber Ampere für sich verbuchen.

Beim Blick auf die Compute-Performance hat mal Nvidia und mal AMD klar die Nase vorn. Wer also vorrangig Wert auf eine hohe Compute-Leistung legt, sollte sich im Vorfeld gut überlegen, welche Software verwendet wird und welche Grafikkarte hier einen Vorteil hat. Somit können wir an dieser Stelle nicht eindeutig festlegen, welches Produkt zu empfehlen ist.

Performance Rating - Percent
Palit GeForce RTX 4090 GameRock OC
99.4 pt
KFA2 GeForce RTX 4090 SG
98.3 pt
AMD Radeon RX 7900 XTX
80.9 pt
NVIDIA GeForce RTX 4080 Founders Edition
80.2 pt
KFA2 GeForce RTX 4080 SG
79.5 pt
AMD Radeon RX 7900 XT
71.9 pt
MSI Radeon RX 6950 XT Gaming X Trio
65.2 pt
ASUS TUF Gaming GeForce RTX 3080 Ti OC
62.9 pt
NVIDIA GeForce RTX 3090 Founders Edition
62.4 pt
Sapphire AMD Radeon RX 6950 XT Nitro+ Pure
61.5 pt
KFA2 GeForce RTX 3080 SG
55.4 pt
Nvidia Titan RTX
50.3 pt
3DMark
2560x1440 Time Spy Graphics
Palit GeForce RTX 4090 GameRock OC
36836 Points +33%
KFA2 GeForce RTX 4090 SG
36252 Points +30%
AMD Radeon RX 7900 XTX
29699 Points +7%
NVIDIA GeForce RTX 4080 Founders Edition
28133 Points +1%
KFA2 GeForce RTX 4080 SG
27791 Points
AMD Radeon RX 7900 XT
25874 Points -7%
MSI Radeon RX 6950 XT Gaming X Trio
22289 Points -20%
Sapphire AMD Radeon RX 6950 XT Nitro+ Pure
21719 Points -22%
NVIDIA GeForce RTX 3090 Founders Edition
19467 Points -30%
ASUS TUF Gaming GeForce RTX 3080 Ti OC
19460 Points -30%
KFA2 GeForce RTX 3080 SG
17956 Points -35%
Nvidia Titan RTX
15106 Points -46%
Fire Strike Extreme Graphics
Palit GeForce RTX 4090 GameRock OC
46270 Points +36%
KFA2 GeForce RTX 4090 SG
45470 Points +34%
AMD Radeon RX 7900 XTX
39570 Points +17%
KFA2 GeForce RTX 4080 SG
33912 Points
AMD Radeon RX 7900 XT
33747 Points 0%
NVIDIA GeForce RTX 4080 Founders Edition
33475 Points -1%
MSI Radeon RX 6950 XT Gaming X Trio
30406 Points -10%
Sapphire AMD Radeon RX 6950 XT Nitro+ Pure
29704 Points -12%
NVIDIA GeForce RTX 3090 Founders Edition
24730 Points -27%
ASUS TUF Gaming GeForce RTX 3080 Ti OC
24250 Points -28%
KFA2 GeForce RTX 3080 SG
22078 Points -35%
Nvidia Titan RTX
17759 Points -48%
3840x2160 Fire Strike Ultra Graphics
Palit GeForce RTX 4090 GameRock OC
25018 Points +46%
KFA2 GeForce RTX 4090 SG
24633 Points +44%
AMD Radeon RX 7900 XTX
20214 Points +18%
NVIDIA GeForce RTX 4080 Founders Edition
17122 Points 0%
KFA2 GeForce RTX 4080 SG
17120 Points
AMD Radeon RX 7900 XT
17078 Points 0%
MSI Radeon RX 6950 XT Gaming X Trio
15188 Points -11%
Sapphire AMD Radeon RX 6950 XT Nitro+ Pure
14978 Points -13%
NVIDIA GeForce RTX 3090 Founders Edition
12587 Points -26%
ASUS TUF Gaming GeForce RTX 3080 Ti OC
12341 Points -28%
KFA2 GeForce RTX 3080 SG
11340 Points -34%
Nvidia Titan RTX
8755 Points -49%
1920x1080 Fire Strike Graphics
Palit GeForce RTX 4090 GameRock OC
72678 Points +11%
KFA2 GeForce RTX 4090 SG
72165 Points +11%
AMD Radeon RX 7900 XTX
66967 Points +3%
KFA2 GeForce RTX 4080 SG
65190 Points
AMD Radeon RX 7900 XT
63712 Points -2%
Sapphire AMD Radeon RX 6950 XT Nitro+ Pure
60092 Points -8%
MSI Radeon RX 6950 XT Gaming X Trio
59672 Points -8%
NVIDIA GeForce RTX 4080 Founders Edition
58893 Points -10%
NVIDIA GeForce RTX 3090 Founders Edition
48831 Points -25%
ASUS TUF Gaming GeForce RTX 3080 Ti OC
48709 Points -25%
KFA2 GeForce RTX 3080 SG
44533 Points -32%
Nvidia Titan RTX
37257 Points -43%
Unigine Superposition
7680x4320 8k Optimized
Palit GeForce RTX 4090 GameRock OC
13082 Points +52%
KFA2 GeForce RTX 4090 SG
12979 Points +51%
AMD Radeon RX 7900 XTX
8751 Points +2%
KFA2 GeForce RTX 4080 SG
8604 Points
NVIDIA GeForce RTX 4080 Founders Edition
8556 Points -1%
ASUS TUF Gaming GeForce RTX 3080 Ti OC
7161 Points -17%
NVIDIA GeForce RTX 3090 Founders Edition
7051 Points -18%
AMD Radeon RX 7900 XT
7034 Points -18%
Sapphire AMD Radeon RX 6950 XT Nitro+ Pure
6645 Points -23%
KFA2 GeForce RTX 3080 SG
6548 Points -24%
MSI Radeon RX 6950 XT Gaming X Trio
6464 Points -25%
Nvidia Titan RTX
5402 Points -37%
3840x2160 4k Optimized
Palit GeForce RTX 4090 GameRock OC
33943 Points +51%
KFA2 GeForce RTX 4090 SG
33581 Points +49%
AMD Radeon RX 7900 XTX
23174 Points +3%
KFA2 GeForce RTX 4080 SG
22482 Points
NVIDIA GeForce RTX 4080 Founders Edition
22343 Points -1%
AMD Radeon RX 7900 XT
18806 Points -16%
Sapphire AMD Radeon RX 6950 XT Nitro+ Pure
17725 Points -21%
MSI Radeon RX 6950 XT Gaming X Trio
16993 Points -24%
ASUS TUF Gaming GeForce RTX 3080 Ti OC
16412 Points -27%
NVIDIA GeForce RTX 3090 Founders Edition
16188 Points -28%
KFA2 GeForce RTX 3080 SG
14986 Points -33%
Nvidia Titan RTX
12050 Points -46%
1920x1080 1080p Extreme
Palit GeForce RTX 4090 GameRock OC
21824 Points +31%
KFA2 GeForce RTX 4090 SG
21288 Points +28%
AMD Radeon RX 7900 XTX
17264 Points +4%
KFA2 GeForce RTX 4080 SG
16635 Points
NVIDIA GeForce RTX 4080 Founders Edition
16623 Points 0%
AMD Radeon RX 7900 XT
14181 Points -15%
ASUS TUF Gaming GeForce RTX 3080 Ti OC
12347 Points -26%
Sapphire AMD Radeon RX 6950 XT Nitro+ Pure
12079 Points -27%
NVIDIA GeForce RTX 3090 Founders Edition
12059 Points -28%
MSI Radeon RX 6950 XT Gaming X Trio
12048 Points -28%
KFA2 GeForce RTX 3080 SG
11424 Points -31%
Nvidia Titan RTX
9014 Points -46%
1920x1080 1080p High
Palit GeForce RTX 4090 GameRock OC
46814 Points +27%
KFA2 GeForce RTX 4090 SG
45619 Points +24%
NVIDIA GeForce RTX 4080 Founders Edition
37399 Points +2%
KFA2 GeForce RTX 4080 SG
36824 Points
AMD Radeon RX 7900 XTX
36536 Points -1%
AMD Radeon RX 7900 XT
31426 Points -15%
MSI Radeon RX 6950 XT Gaming X Trio
28797 Points -22%
Sapphire AMD Radeon RX 6950 XT Nitro+ Pure
28478 Points -23%
ASUS TUF Gaming GeForce RTX 3080 Ti OC
26711 Points -27%
NVIDIA GeForce RTX 3090 Founders Edition
26320 Points -29%
KFA2 GeForce RTX 3080 SG
24051 Points -35%
Nvidia Titan RTX
20335 Points -45%
1280x720 720p Low
NVIDIA GeForce RTX 4080 Founders Edition
55670 Points +12%
Palit GeForce RTX 4090 GameRock OC
51741 Points +4%
Nvidia Titan RTX
50876 Points +2%
KFA2 GeForce RTX 4090 SG
50650 Points +2%
NVIDIA GeForce RTX 3090 Founders Edition
50487 Points +2%
ASUS TUF Gaming GeForce RTX 3080 Ti OC
49754 Points 0%
KFA2 GeForce RTX 4080 SG
49734 Points
AMD Radeon RX 7900 XTX
47274 Points -5%
AMD Radeon RX 7900 XT
45904 Points -8%
MSI Radeon RX 6950 XT Gaming X Trio
42809 Points -14%
KFA2 GeForce RTX 3080 SG
38209 Points -23%
Sapphire AMD Radeon RX 6950 XT Nitro+ Pure
33955 Points -32%
Unigine Heaven 4.0
Extreme Preset DX11
Palit GeForce RTX 4090 GameRock OC
491.5 fps +23%
KFA2 GeForce RTX 4090 SG
486.9 fps +22%
KFA2 GeForce RTX 4080 SG
399.9 fps
NVIDIA GeForce RTX 4080 Founders Edition
389.4 (11.3min - 813.1max) fps -3%
AMD Radeon RX 7900 XTX
357.6 fps -11%
AMD Radeon RX 7900 XT
319.7 fps -20%
MSI Radeon RX 6950 XT Gaming X Trio
317.8 fps -21%
ASUS TUF Gaming GeForce RTX 3080 Ti OC
311.6 fps -22%
NVIDIA GeForce RTX 3090 Founders Edition
309.7 fps -23%
Sapphire AMD Radeon RX 6950 XT Nitro+ Pure
293.8 fps -27%
KFA2 GeForce RTX 3080 SG
274.3 fps -31%
Nvidia Titan RTX
248.1 fps -38%
Extreme Preset OpenGL
Palit GeForce RTX 4090 GameRock OC
450.4 fps +21%
KFA2 GeForce RTX 4090 SG
447.1 fps +20%
KFA2 GeForce RTX 4080 SG
371.1 fps
AMD Radeon RX 7900 XTX
370.2 fps 0%
NVIDIA GeForce RTX 4080 Founders Edition
364.2 (15min - 770.5max) fps -2%
AMD Radeon RX 7900 XT
330.2 fps -11%
ASUS TUF Gaming GeForce RTX 3080 Ti OC
282.1 fps -24%
NVIDIA GeForce RTX 3090 Founders Edition
274.7 fps -26%
MSI Radeon RX 6950 XT Gaming X Trio
251.9 fps -32%
KFA2 GeForce RTX 3080 SG
251.4 fps -32%
Sapphire AMD Radeon RX 6950 XT Nitro+ Pure
222.7 fps -40%
Nvidia Titan RTX
218 fps -41%
Unigine Valley 1.0
1920x1080 Extreme HD DirectX AA:x8
NVIDIA GeForce RTX 4080 Founders Edition
277.5 (71.7min - 487.9max) fps +8%
KFA2 GeForce RTX 4090 SG
276 fps +7%
Palit GeForce RTX 4090 GameRock OC
270.7 fps +5%
AMD Radeon RX 7900 XTX
264.5 fps +3%
KFA2 GeForce RTX 4080 SG
257 fps
AMD Radeon RX 7900 XT
243.3 fps -5%
MSI Radeon RX 6950 XT Gaming X Trio
239.4 fps -7%
ASUS TUF Gaming GeForce RTX 3080 Ti OC
237.3 fps -8%
NVIDIA GeForce RTX 3090 Founders Edition
235.4 fps -8%
Sapphire AMD Radeon RX 6950 XT Nitro+ Pure
209.2 fps -19%
KFA2 GeForce RTX 3080 SG
203.8 fps -21%
Nvidia Titan RTX
191.4 fps -26%
1920x1080 Extreme HD Preset OpenGL AA:x8
Palit GeForce RTX 4090 GameRock OC
288 fps +24%
KFA2 GeForce RTX 4090 SG
288 fps +24%
NVIDIA GeForce RTX 4080 Founders Edition
257 (79.3min - 462.8max) fps +11%
AMD Radeon RX 7900 XTX
254.2 fps +10%
KFA2 GeForce RTX 4080 SG
231.8 fps
AMD Radeon RX 7900 XT
225.9 fps -3%
ASUS TUF Gaming GeForce RTX 3080 Ti OC
208.8 fps -10%
NVIDIA GeForce RTX 3090 Founders Edition
205.8 fps -11%
MSI Radeon RX 6950 XT Gaming X Trio
186.5 fps -20%
KFA2 GeForce RTX 3080 SG
186.1 fps -20%
Sapphire AMD Radeon RX 6950 XT Nitro+ Pure
176.9 fps -24%
Nvidia Titan RTX
160.8 fps -31%
3DMark 11
1280x720 Performance GPU
Palit GeForce RTX 4090 GameRock OC
107723 Points +22%
KFA2 GeForce RTX 4090 SG
106709 Points +21%
KFA2 GeForce RTX 4080 SG
88359 Points
NVIDIA GeForce RTX 4080 Founders Edition
86838 Points -2%
AMD Radeon RX 7900 XTX
83322 Points -6%
AMD Radeon RX 7900 XT
77784 Points -12%
MSI Radeon RX 6950 XT Gaming X Trio
73975 Points -16%
Sapphire AMD Radeon RX 6950 XT Nitro+ Pure
70480 Points -20%
NVIDIA GeForce RTX 3090 Founders Edition
62735 Points -29%
ASUS TUF Gaming GeForce RTX 3080 Ti OC
62189 Points -30%
KFA2 GeForce RTX 3080 SG
56634 Points -36%
Nvidia Titan RTX
50900 Points -42%
1280x720 Performance
Palit GeForce RTX 4090 GameRock OC
69323 Points +10%
KFA2 GeForce RTX 4090 SG
69012 Points +10%
KFA2 GeForce RTX 4080 SG
62760 Points
NVIDIA GeForce RTX 4080 Founders Edition
60209 Points -4%
AMD Radeon RX 7900 XTX
56526 Points -10%
AMD Radeon RX 7900 XT
54796 Points -13%
MSI Radeon RX 6950 XT Gaming X Trio
52806 Points -16%
ASUS TUF Gaming GeForce RTX 3080 Ti OC
51094 Points -19%
NVIDIA GeForce RTX 3090 Founders Edition
48185 Points -23%
Nvidia Titan RTX
44979 Points -28%
Sapphire AMD Radeon RX 6950 XT Nitro+ Pure
44827 Points -29%
KFA2 GeForce RTX 3080 SG
41410 Points -34%

Compute-Benchmarks und professionelle Anwendungen

LuxMark v2.0 64Bit
Sala GPUs-only
AMD Radeon RX 6950 XT
31954 Samples/s +34%
NVIDIA GeForce RTX 4090
27201 Samples/s +14%
NVIDIA GeForce RTX 4090
26576 Samples/s +12%
NVIDIA GeForce RTX 4080
24835 Samples/s +4%
KFA2 GeForce RTX 4080 SG
23809 Samples/s
NVIDIA GeForce RTX 3080 Ti
15115 Samples/s -37%
AMD Radeon RX 7900 XTX
15019 Samples/s -37%
NVIDIA GeForce RTX 3090
14990 Samples/s -37%
NVIDIA GeForce RTX 3080 12 GB
14204 Samples/s -40%
AMD Radeon RX 7900 XT
13489 Samples/s -43%
AMD Radeon RX 6950 XT
12057 Samples/s -49%
NVIDIA Titan RTX
10996 Samples/s -54%
Room GPUs-only
NVIDIA GeForce RTX 4090
12316 Samples/s +26%
NVIDIA GeForce RTX 4090
12190 Samples/s +25%
NVIDIA GeForce RTX 4080
10491 Samples/s +8%
KFA2 GeForce RTX 4080 SG
9757 Samples/s
NVIDIA GeForce RTX 3090
5948 Samples/s -39%
NVIDIA GeForce RTX 3080 Ti
5857 Samples/s -40%
NVIDIA GeForce RTX 3080 12 GB
5768 Samples/s -41%
AMD Radeon RX 7900 XTX
5161 Samples/s -47%
AMD Radeon RX 6950 XT
5097 Samples/s -48%
NVIDIA Titan RTX
4703 Samples/s -52%
AMD Radeon RX 7900 XT
4451 Samples/s -54%
AMD Radeon RX 6950 XT
4173 Samples/s -57%
ComputeMark v2.1
1024x600 Normal, QJuliaRayTrace
NVIDIA GeForce RTX 4090
34332 Points +39%
NVIDIA GeForce RTX 4090
33298 Points +35%
KFA2 GeForce RTX 4080 SG
24631 Points
NVIDIA GeForce RTX 4080
24307 Points -1%
AMD Radeon RX 7900 XTX
17915 Points -27%
NVIDIA GeForce RTX 3080 Ti
17749 Points -28%
NVIDIA GeForce RTX 3090
17713 Points -28%
AMD Radeon RX 7900 XT
16990 Points -31%
NVIDIA GeForce RTX 3080 12 GB
15594 Points -37%
AMD Radeon RX 6950 XT
13672 Points -44%
AMD Radeon RX 6950 XT
13580 Points -45%
NVIDIA Titan RTX
10129 Points -59%
1024x600 Normal, Mandel Scalar
NVIDIA GeForce RTX 4090
22889 Points +55%
NVIDIA GeForce RTX 4090
22402 Points +51%
AMD Radeon RX 7900 XTX
15458 Points +4%
KFA2 GeForce RTX 4080 SG
14810 Points
NVIDIA GeForce RTX 4080
14733 Points -1%
AMD Radeon RX 7900 XT
13989 Points -6%
AMD Radeon RX 6950 XT
12020 Points -19%
AMD Radeon RX 6950 XT
11854 Points -20%
NVIDIA GeForce RTX 3080 Ti
11318 Points -24%
NVIDIA GeForce RTX 3090
11270 Points -24%
NVIDIA GeForce RTX 3080 12 GB
9698 Points -35%
NVIDIA Titan RTX
6406 Points -57%
1024x600 Normal, Mandel Vector
NVIDIA GeForce RTX 4090
17336 Points +55%
NVIDIA GeForce RTX 4090
16935 Points +51%
AMD Radeon RX 7900 XTX
13737 Points +22%
AMD Radeon RX 7900 XT
13022 Points +16%
NVIDIA GeForce RTX 4080
11772 Points +5%
KFA2 GeForce RTX 4080 SG
11220 Points
AMD Radeon RX 6950 XT
9933 Points -11%
NVIDIA GeForce RTX 3090
9861 Points -12%
NVIDIA GeForce RTX 3080 Ti
9860 Points -12%
AMD Radeon RX 6950 XT
9555 Points -15%
NVIDIA GeForce RTX 3080 12 GB
8326 Points -26%
NVIDIA Titan RTX
5440 Points -52%
1024x600 Normal, Fluid 2DTexArr
AMD Radeon RX 7900 XTX
7315 Points +31%
NVIDIA GeForce RTX 4090
6891 Points +23%
NVIDIA GeForce RTX 4090
6792 Points +21%
AMD Radeon RX 7900 XT
6460 Points +15%
KFA2 GeForce RTX 4080 SG
5605 Points
NVIDIA GeForce RTX 4080
5523 Points -1%
NVIDIA GeForce RTX 3080 Ti
4546 Points -19%
NVIDIA GeForce RTX 3090
4517 Points -19%
AMD Radeon RX 6950 XT
4455 Points -21%
AMD Radeon RX 6950 XT
4349 Points -22%
NVIDIA GeForce RTX 3080 12 GB
4175 Points -26%
NVIDIA Titan RTX
3828 Points -32%
1024x600 Normal, Fluid 3DTex
NVIDIA GeForce RTX 4090
10724 Points +65%
NVIDIA GeForce RTX 4090
10589 Points +63%
AMD Radeon RX 7900 XTX
8537 Points +32%
AMD Radeon RX 7900 XT
7109 Points +10%
KFA2 GeForce RTX 4080 SG
6484 Points
NVIDIA GeForce RTX 4080
6385 Points -2%
AMD Radeon RX 6950 XT
5577 Points -14%
AMD Radeon RX 6950 XT
5515 Points -15%
NVIDIA GeForce RTX 3090
5501 Points -15%
NVIDIA GeForce RTX 3080 Ti
5418 Points -16%
NVIDIA GeForce RTX 3080 12 GB
4900 Points -24%
NVIDIA Titan RTX
4027 Points -38%
1024x600 Normal, Score
NVIDIA GeForce RTX 4090
92171 Points +47%
NVIDIA GeForce RTX 4090
90016 Points +43%
AMD Radeon RX 7900 XTX
62963 Points 0%
KFA2 GeForce RTX 4080 SG
62753 Points
NVIDIA GeForce RTX 4080
62720 Points 0%
AMD Radeon RX 7900 XT
57570 Points -8%
NVIDIA GeForce RTX 3080 Ti
48892 Points -22%
NVIDIA GeForce RTX 3090
48862 Points -22%
AMD Radeon RX 6950 XT
45552 Points -27%
AMD Radeon RX 6950 XT
44959 Points -28%
NVIDIA GeForce RTX 3080 12 GB
42692 Points -32%
NVIDIA Titan RTX
29830 Points -52%
Blender
v3.3 Classroom CUDA
NVIDIA Titan RTX
31 Seconds *
NVIDIA GeForce RTX 3080 Ti
21 Seconds *
v3.3 Classroom OPTIX/RTX
NVIDIA Titan RTX
21 Seconds * -133%
NVIDIA GeForce RTX 3080 Ti
14 Seconds * -56%
NVIDIA GeForce RTX 4080
10 Seconds * -11%
KFA2 GeForce RTX 4080 SG
9 Seconds *
Geekbench 5.5
OpenCL Score
NVIDIA GeForce RTX 4090
354266 Points +32%
NVIDIA GeForce RTX 4090
351918 Points +31%
KFA2 GeForce RTX 4080 SG
267859 Points
NVIDIA GeForce RTX 4080
267804 Points 0%
NVIDIA GeForce RTX 3090
214334 Points -20%
NVIDIA GeForce RTX 3080 12 GB
201306 Points -25%
AMD Radeon RX 6950 XT
190428 Points -29%
NVIDIA Titan RTX
145407 Points -46%
Vulkan Score
NVIDIA GeForce RTX 4090
139130 Points
NVIDIA GeForce RTX 4090
112022 Points
NVIDIA Titan RTX
94363 Points
NVIDIA GeForce RTX 3090
91596 Points
AMD Radeon RX 6950 XT
87497 Points
NVIDIA GeForce RTX 3080 12 GB
62742 Points
V-Ray 5 Benchmark
GPU CUDA
NVIDIA GeForce RTX 4090
4393 mpaths +42%
NVIDIA GeForce RTX 4090
4332 mpaths +40%
KFA2 GeForce RTX 4080 SG
3089 mpaths
NVIDIA GeForce RTX 4080
3067 mpaths -1%
NVIDIA GeForce RTX 3090
2102 mpaths -32%
NVIDIA GeForce RTX 3080 Ti
2070 mpaths -33%
NVIDIA GeForce RTX 3080 12 GB
383 mpaths -88%
AMD Radeon RX 6950 XT
383 mpaths -88%
GPU RTX
NVIDIA GeForce RTX 4090
6053 mpaths +44%
NVIDIA GeForce RTX 4090
6010 mpaths +43%
KFA2 GeForce RTX 4080 SG
4209 mpaths
NVIDIA GeForce RTX 4080
4193 mpaths 0%
NVIDIA GeForce RTX 3090
2979 mpaths -29%
NVIDIA GeForce RTX 3080 Ti
2883 mpaths -32%
Premiere Pro PugetBench
Overall Score 0.9
NVIDIA GeForce RTX 4090
1018 Points +6%
KFA2 GeForce RTX 4080 SG
962 Points
NVIDIA Titan RTX
954 Points -1%
AMD Radeon RX 7900 XTX
928 Points -4%
NVIDIA GeForce RTX 3080 Ti
927 Points -4%
AMD Radeon RX 6950 XT
920 Points -4%
AMD Radeon RX 7900 XT
903 Points -6%
NVIDIA GeForce RTX 3080 12 GB
796 Points -17%
AMD Radeon RX 6950 XT
717 Points -25%
GPU 0.9
NVIDIA GeForce RTX 4090
100.2 Points +18%
KFA2 GeForce RTX 4080 SG
85.1 Points
NVIDIA GeForce RTX 3080 Ti
81.3 Points -4%
NVIDIA GeForce RTX 3080 12 GB
81.2 Points -5%
AMD Radeon RX 7900 XTX
71.1 Points -16%
NVIDIA Titan RTX
69.7 Points -18%
AMD Radeon RX 7900 XT
67 Points -21%
AMD Radeon RX 6950 XT
66.1 Points -22%
AMD Radeon RX 6950 XT
65.3 Points -23%
Photoshop PugetBench
Overall Score
AMD Radeon RX 7900 XT
1619 Points +4%
AMD Radeon RX 7900 XTX
1594 Points +2%
KFA2 GeForce RTX 4080 SG
1563 Points
AMD Radeon RX 6950 XT
1560 Points 0%
NVIDIA GeForce RTX 4090
1559 Points 0%
NVIDIA GeForce RTX 3080 Ti
1555 Points -1%
NVIDIA Titan RTX
1346 Points -14%
AMD Radeon RX 6950 XT
1128 Points -28%
NVIDIA GeForce RTX 3080 12 GB
1005 Points -36%
GPU Score
AMD Radeon RX 7900 XT
169.5 Points +7%
AMD Radeon RX 7900 XTX
169.3 Points +7%
AMD Radeon RX 6950 XT
169 Points +7%
KFA2 GeForce RTX 4080 SG
158.4 Points
NVIDIA GeForce RTX 4090
155.7 Points -2%
NVIDIA GeForce RTX 3080 Ti
155.2 Points -2%
NVIDIA Titan RTX
132.1 Points -17%
AMD Radeon RX 6950 XT
131.5 Points -17%
NVIDIA GeForce RTX 3080 12 GB
109.4 Points -31%
Affinity Photo 2 - Combined (Single / Multi GPU)
NVIDIA GeForce RTX 4090
8448 Points +4%
KFA2 GeForce RTX 4080 SG
8144 Points
NVIDIA GeForce RTX 3080 Ti
8130 Points 0%
NVIDIA Titan RTX
6714 Points -18%
AMD Radeon RX 6950 XT
2759 Points -66%
AMD Radeon RX 7900 XTX
2656 Points -67%
AMD Radeon RX 7900 XT
2627 Points -68%
SPECviewperf 12
1900x1060 Solidworks (sw-03)
AMD Radeon RX 7900 XTX
360 fps +219%
AMD Radeon RX 7900 XT
342 fps +203%
AMD Radeon RX 6950 XT
218 fps +93%
NVIDIA Titan RTX
207 fps +83%
AMD Radeon RX 6950 XT
157 fps +39%
NVIDIA GeForce RTX 4080
127 fps +12%
NVIDIA GeForce RTX 4090
127 fps +12%
NVIDIA GeForce RTX 4090
126 fps +12%
KFA2 GeForce RTX 4080 SG
113 fps
NVIDIA GeForce RTX 3080 Ti
106 fps -6%
NVIDIA GeForce RTX 3090
105 fps -7%
NVIDIA GeForce RTX 3080 12 GB
73.8 fps -35%
1900x1060 Siemens NX (snx-02)
AMD Radeon RX 7900 XTX
400 fps +1752%
AMD Radeon RX 7900 XT
373 fps +1627%
NVIDIA Titan RTX
283 fps +1210%
AMD Radeon RX 6950 XT
56.4 fps +161%
AMD Radeon RX 6950 XT
49.4 fps +129%
NVIDIA GeForce RTX 4090
27.1 fps +25%
NVIDIA GeForce RTX 4090
26.4 fps +22%
NVIDIA GeForce RTX 4080
23.4 fps +8%
KFA2 GeForce RTX 4080 SG
21.6 fps
NVIDIA GeForce RTX 3080 Ti
16.6 fps -23%
NVIDIA GeForce RTX 3090
16.4 fps -24%
NVIDIA GeForce RTX 3080 12 GB
12 fps -44%
1900x1060 Showcase (showcase-01)
NVIDIA GeForce RTX 4090
457 fps +37%
NVIDIA GeForce RTX 4090
448 fps +35%
KFA2 GeForce RTX 4080 SG
333 fps
AMD Radeon RX 7900 XTX
322 fps -3%
AMD Radeon RX 6950 XT
308 fps -8%
NVIDIA GeForce RTX 4080
304 fps -9%
AMD Radeon RX 7900 XT
278 fps -17%
AMD Radeon RX 6950 XT
264 fps -21%
NVIDIA GeForce RTX 3090
262 fps -21%
NVIDIA GeForce RTX 3080 Ti
252 fps -24%
NVIDIA GeForce RTX 3080 12 GB
226 fps -32%
NVIDIA Titan RTX
197 fps -41%
1900x1060 Medical (medical-01)
AMD Radeon RX 7900 XTX
347 fps +103%
AMD Radeon RX 7900 XT
288 fps +68%
NVIDIA GeForce RTX 4080
227 fps +33%
KFA2 GeForce RTX 4080 SG
171 fps
NVIDIA GeForce RTX 3080 Ti
142 fps -17%
NVIDIA GeForce RTX 4090
119 fps -30%
NVIDIA GeForce RTX 4090
118 fps -31%
NVIDIA Titan RTX
101 fps -41%
AMD Radeon RX 6950 XT
95.2 fps -44%
NVIDIA GeForce RTX 3090
85.8 fps -50%
AMD Radeon RX 6950 XT
58.3 fps -66%
NVIDIA GeForce RTX 3080 12 GB
40.3 fps -76%
1900x1060 Maya (maya-04)
AMD Radeon RX 7900 XTX
367 fps +19%
AMD Radeon RX 7900 XT
347 fps +12%
NVIDIA GeForce RTX 4090
317 fps +3%
NVIDIA GeForce RTX 4090
316 fps +2%
NVIDIA GeForce RTX 4080
310 fps 0%
KFA2 GeForce RTX 4080 SG
309 fps
NVIDIA GeForce RTX 3090
302 fps -2%
NVIDIA GeForce RTX 3080 Ti
302 fps -2%
NVIDIA Titan RTX
260 fps -16%
AMD Radeon RX 6950 XT
195 fps -37%
NVIDIA GeForce RTX 3080 12 GB
139 fps -55%
AMD Radeon RX 6950 XT
90.7 fps -71%
1900x1060 Energy (energy-01)
AMD Radeon RX 7900 XTX
85.2 fps +45%
AMD Radeon RX 7900 XT
72.4 fps +23%
KFA2 GeForce RTX 4080 SG
58.8 fps
NVIDIA GeForce RTX 4080
57.5 fps -2%
NVIDIA GeForce RTX 4090
54.7 fps -7%
NVIDIA GeForce RTX 4090
54.2 fps -8%
AMD Radeon RX 6950 XT
34.3 fps -42%
NVIDIA Titan RTX
28.8 fps -51%
NVIDIA GeForce RTX 3080 Ti
27.6 fps -53%
NVIDIA GeForce RTX 3090
25.6 fps -56%
AMD Radeon RX 6950 XT
23 fps -61%
NVIDIA GeForce RTX 3080 12 GB
17.2 fps -71%
1900x1060 Creo (creo-01)
NVIDIA Titan RTX
197 fps +79%
AMD Radeon RX 7900 XTX
187 fps +70%
AMD Radeon RX 7900 XT
176 fps +60%
AMD Radeon RX 6950 XT
163 fps +48%
NVIDIA GeForce RTX 4080
118 fps +7%
AMD Radeon RX 6950 XT
115 fps +5%
NVIDIA GeForce RTX 4090
115 fps +5%
NVIDIA GeForce RTX 4090
114 fps +4%
KFA2 GeForce RTX 4080 SG
110 fps
NVIDIA GeForce RTX 3080 Ti
94.7 fps -14%
NVIDIA GeForce RTX 3090
93.7 fps -15%
NVIDIA GeForce RTX 3080 12 GB
74.4 fps -32%
1900x1060 Catia (catia-04)
AMD Radeon RX 7900 XTX
536 fps +143%
AMD Radeon RX 7900 XT
481 fps +118%
AMD Radeon RX 6950 XT
368 fps +67%
NVIDIA Titan RTX
332 fps +50%
NVIDIA GeForce RTX 4090
257 fps +16%
NVIDIA GeForce RTX 4090
254 fps +15%
NVIDIA GeForce RTX 4080
229 fps +4%
KFA2 GeForce RTX 4080 SG
221 fps
AMD Radeon RX 6950 XT
199 fps -10%
NVIDIA GeForce RTX 3080 Ti
171 fps -23%
NVIDIA GeForce RTX 3090
167 fps -24%
NVIDIA GeForce RTX 3080 12 GB
79.1 fps -64%
1900x1060 3ds Max (3dsmax-05)
NVIDIA GeForce RTX 4090
571 fps +14%
NVIDIA GeForce RTX 4090
561 fps +12%
AMD Radeon RX 7900 XTX
553 fps +10%
KFA2 GeForce RTX 4080 SG
502 fps
AMD Radeon RX 7900 XT
502 fps 0%
AMD Radeon RX 6950 XT
484 fps -4%
NVIDIA GeForce RTX 4080
477 fps -5%
AMD Radeon RX 6950 XT
418 fps -17%
NVIDIA GeForce RTX 3090
389 fps -23%
NVIDIA GeForce RTX 3080 Ti
385 fps -23%
NVIDIA GeForce RTX 3080 12 GB
334 fps -33%
NVIDIA Titan RTX
315 fps -37%
SPECviewperf 13
Solidworks (sw-04)
AMD Radeon RX 7900 XTX
323 fps +80%
AMD Radeon RX 7900 XT
307 fps +72%
AMD Radeon RX 6950 XT
254 fps +42%
NVIDIA Titan RTX
218 fps +22%
AMD Radeon RX 6950 XT
210 fps +17%
NVIDIA GeForce RTX 4090
186 fps +4%
NVIDIA GeForce RTX 4080
183 fps +2%
NVIDIA GeForce RTX 4090
182 fps +2%
KFA2 GeForce RTX 4080 SG
179 fps
NVIDIA GeForce RTX 3080 Ti
153 fps -15%
NVIDIA GeForce RTX 3090
151 fps -16%
NVIDIA GeForce RTX 3080 12 GB
108 fps -40%
Siemens NX (snx-03)
AMD Radeon RX 7900 XTX
725 fps +1759%
AMD Radeon RX 7900 XT
675 fps +1631%
NVIDIA Titan RTX
512 fps +1213%
AMD Radeon RX 6950 XT
101 fps +159%
AMD Radeon RX 6950 XT
89.7 fps +130%
NVIDIA GeForce RTX 4090
49.1 fps +26%
NVIDIA GeForce RTX 4090
47.9 fps +23%
NVIDIA GeForce RTX 4080
42.1 fps +8%
KFA2 GeForce RTX 4080 SG
39 fps
NVIDIA GeForce RTX 3080 Ti
29.9 fps -23%
NVIDIA GeForce RTX 3090
29.7 fps -24%
NVIDIA GeForce RTX 3080 12 GB
26.3 fps -33%
Showcase (showcase-02)
NVIDIA GeForce RTX 4090
455 fps +36%
NVIDIA GeForce RTX 4090
448 fps +34%
KFA2 GeForce RTX 4080 SG
334 fps
AMD Radeon RX 7900 XTX
323 fps -3%
AMD Radeon RX 6950 XT
312 fps -7%
NVIDIA GeForce RTX 4080
305 fps -9%
AMD Radeon RX 7900 XT
279 fps -16%
AMD Radeon RX 6950 XT
264 fps -21%
NVIDIA GeForce RTX 3090
262 fps -22%
NVIDIA GeForce RTX 3080 Ti
252 fps -25%
NVIDIA GeForce RTX 3080 12 GB
228 fps -32%
NVIDIA Titan RTX
198 fps -41%
Medical (medical-02)
AMD Radeon RX 7900 XTX
263 fps +75%
AMD Radeon RX 7900 XT
237 fps +58%
NVIDIA GeForce RTX 4090
186 fps +24%
NVIDIA GeForce RTX 4090
182 fps +21%
AMD Radeon RX 6950 XT
157 fps +5%
KFA2 GeForce RTX 4080 SG
150 fps
NVIDIA GeForce RTX 4080
148 fps -1%
NVIDIA GeForce RTX 3080 Ti
107 fps -29%
NVIDIA GeForce RTX 3090
106 fps -29%
NVIDIA GeForce RTX 3080 12 GB
102 fps -32%
NVIDIA Titan RTX
92 fps -39%
Maya (maya-05)
AMD Radeon RX 7900 XTX
735 fps +8%
NVIDIA GeForce RTX 4080
726 fps +7%
NVIDIA GeForce RTX 4090
715 fps +5%
NVIDIA GeForce RTX 4090
715 fps +5%
KFA2 GeForce RTX 4080 SG
678 fps
AMD Radeon RX 7900 XT
670 fps -1%
NVIDIA GeForce RTX 3080 Ti
569 fps -16%
NVIDIA GeForce RTX 3090
556 fps -18%
NVIDIA Titan RTX
499 fps -26%
NVIDIA GeForce RTX 3080 12 GB
460 fps -32%
AMD Radeon RX 6950 XT
460 fps -32%
AMD Radeon RX 6950 XT
372 fps -45%
Energy (energy-02)
AMD Radeon RX 7900 XTX
187 fps +102%
AMD Radeon RX 7900 XT
147 fps +59%
NVIDIA GeForce RTX 4090
126 fps +36%
NVIDIA GeForce RTX 4090
123 fps +33%
KFA2 GeForce RTX 4080 SG
92.6 fps
NVIDIA GeForce RTX 4080
91.7 fps -1%
AMD Radeon RX 6950 XT
60.8 fps -34%
AMD Radeon RX 6950 XT
60.3 fps -35%
NVIDIA Titan RTX
51.8 fps -44%
NVIDIA GeForce RTX 3080 Ti
44.1 fps -52%
NVIDIA GeForce RTX 3090
43.8 fps -53%
NVIDIA GeForce RTX 3080 12 GB
37.6 fps -59%
Creo (creo-02)
AMD Radeon RX 7900 XTX
613 fps +16%
AMD Radeon RX 7900 XT
567 fps +7%
NVIDIA GeForce RTX 4090
552 fps +4%
NVIDIA GeForce RTX 4080
544 fps +3%
NVIDIA GeForce RTX 4090
544 fps +3%
KFA2 GeForce RTX 4080 SG
529 fps
NVIDIA GeForce RTX 3080 Ti
402 fps -24%
NVIDIA GeForce RTX 3090
392 fps -26%
NVIDIA Titan RTX
386 fps -27%
AMD Radeon RX 6950 XT
374 fps -29%
NVIDIA GeForce RTX 3080 12 GB
324 fps -39%
AMD Radeon RX 6950 XT
323 fps -39%
Catia (catia-05)
AMD Radeon RX 7900 XTX
825 fps +143%
AMD Radeon RX 7900 XT
728 fps +114%
AMD Radeon RX 6950 XT
588 fps +73%
NVIDIA Titan RTX
534 fps +57%
AMD Radeon RX 6950 XT
450 fps +32%
NVIDIA GeForce RTX 4090
402 fps +18%
NVIDIA GeForce RTX 4090
396 fps +16%
KFA2 GeForce RTX 4080 SG
340 fps
NVIDIA GeForce RTX 4080
333 fps -2%
NVIDIA GeForce RTX 3080 Ti
258 fps -24%
NVIDIA GeForce RTX 3090
252 fps -26%
NVIDIA GeForce RTX 3080 12 GB
206 fps -39%
3ds Max (3dsmax-06)
AMD Radeon RX 7900 XTX
564 fps +13%
NVIDIA GeForce RTX 4090
563 fps +13%
NVIDIA GeForce RTX 4090
558 fps +12%
AMD Radeon RX 7900 XT
506 fps +2%
KFA2 GeForce RTX 4080 SG
497 fps
AMD Radeon RX 6950 XT
483 fps -3%
NVIDIA GeForce RTX 4080
478 fps -4%
AMD Radeon RX 6950 XT
416 fps -16%
NVIDIA GeForce RTX 3090
387 fps -22%
NVIDIA GeForce RTX 3080 Ti
382 fps -23%
NVIDIA GeForce RTX 3080 12 GB
334 fps -33%
NVIDIA Titan RTX
321 fps -35%
SPECviewperf 2020
3840x2160 CATIA (catia-06)
AMD Radeon RX 7900 XTX
127 fps +68%
AMD Radeon RX 7900 XT
113 fps +50%
NVIDIA GeForce RTX 4090
95.3 fps +26%
NVIDIA GeForce RTX 4090
94.7 fps +25%
NVIDIA Titan RTX
90.9 fps +20%
NVIDIA GeForce RTX 4080
76.5 fps +1%
KFA2 GeForce RTX 4080 SG
75.5 fps
NVIDIA GeForce RTX 3080 Ti
59.9 fps -21%
AMD Radeon RX 6950 XT
59.7 fps -21%
NVIDIA GeForce RTX 3090
58.5 fps -23%
NVIDIA GeForce RTX 3080 12 GB
53.7 fps -29%
AMD Radeon RX 6950 XT
53 fps -30%
3840x2160 Creo (creo-03)
AMD Radeon RX 7900 XTX
187 fps +46%
AMD Radeon RX 7900 XT
173 fps +35%
NVIDIA GeForce RTX 4080
136 fps +6%
NVIDIA Titan RTX
135 fps +5%
NVIDIA GeForce RTX 4090
133 fps +4%
NVIDIA GeForce RTX 4090
133 fps +4%
KFA2 GeForce RTX 4080 SG
128 fps
NVIDIA GeForce RTX 3090
115 fps -10%
NVIDIA GeForce RTX 3080 Ti
114 fps -11%
AMD Radeon RX 6950 XT
92.4 fps -28%
NVIDIA GeForce RTX 3080 12 GB
90 fps -30%
AMD Radeon RX 6950 XT
73.1 fps -43%
3840x2160 Energy (energy-03)
NVIDIA GeForce RTX 4090
141 fps +56%
NVIDIA GeForce RTX 4090
137 fps +52%
AMD Radeon RX 7900 XTX
129 fps +43%
AMD Radeon RX 7900 XT
99.6 fps +10%
NVIDIA GeForce RTX 3090
96.6 fps +7%
NVIDIA Titan RTX
93.9 fps +4%
KFA2 GeForce RTX 4080 SG
90.4 fps
AMD Radeon RX 6950 XT
69.3 fps -23%
NVIDIA GeForce RTX 3080 Ti
57.5 fps -36%
AMD Radeon RX 6950 XT
47.6 fps -47%
NVIDIA GeForce RTX 4080
45.6 fps -50%
NVIDIA GeForce RTX 3080 12 GB
37.2 fps -59%
3840x2160 Maya (maya-06)
NVIDIA GeForce RTX 4090
525 fps +17%
NVIDIA GeForce RTX 4090
498 fps +11%
AMD Radeon RX 7900 XTX
481 fps +8%
KFA2 GeForce RTX 4080 SG
447 fps
NVIDIA GeForce RTX 4080
426 fps -5%
AMD Radeon RX 7900 XT
401 fps -10%
NVIDIA GeForce RTX 3080 Ti
366 fps -18%
NVIDIA GeForce RTX 3090
356 fps -20%
AMD Radeon RX 6950 XT
315 fps -30%
NVIDIA GeForce RTX 3080 12 GB
314 fps -30%
AMD Radeon RX 6950 XT
296 fps -34%
NVIDIA Titan RTX
274 fps -39%
3840x2160 Medical (medical-03)
AMD Radeon RX 7900 XTX
62.3 fps +93%
AMD Radeon RX 7900 XT
53.9 fps +67%
NVIDIA GeForce RTX 4090
45.9 fps +43%
NVIDIA GeForce RTX 4090
44.8 fps +39%
AMD Radeon RX 6950 XT
35 fps +9%
AMD Radeon RX 6950 XT
34.4 fps +7%
KFA2 GeForce RTX 4080 SG
32.2 fps
NVIDIA GeForce RTX 4080
28.3 fps -12%
NVIDIA GeForce RTX 3080 Ti
22.9 fps -29%
NVIDIA GeForce RTX 3090
20 fps -38%
NVIDIA GeForce RTX 3080 12 GB
18.8 fps -42%
NVIDIA Titan RTX
16.5 fps -49%
3840x2160 Siemens NX (snx-04)
AMD Radeon RX 7900 XTX
514 fps +1511%
AMD Radeon RX 7900 XT
476 fps +1392%
NVIDIA Titan RTX
375 fps +1076%
AMD Radeon RX 6950 XT
98.4 fps +208%
AMD Radeon RX 6950 XT
88.6 fps +178%
NVIDIA GeForce RTX 4090
41.3 fps +29%
NVIDIA GeForce RTX 4090
41.1 fps +29%
NVIDIA GeForce RTX 4080
34.1 fps +7%
KFA2 GeForce RTX 4080 SG
31.9 fps
NVIDIA GeForce RTX 3080 Ti
24.9 fps -22%
NVIDIA GeForce RTX 3090
24.7 fps -23%
NVIDIA GeForce RTX 3080 12 GB
21.8 fps -32%

* ... kleinere Werte sind besser

Spiele-Benchmarks

Wie schon die KFA2 GeForce RTX 4090 SG bietet auch die KFA2 GeForce RTX 4080 SG eine extrem hohe Spieleleistung, welche erst bei 2.160p gehörig Fahrt aufnimmt. Aber auch in 1.440p fühlt sich das Modell so richtig wohl, und die CPU limitiert hier nicht so stark wie bei der schnelleren GeForce RTX 4090. Die AMD Kontrahenten können die KFA2 GeForce RTX 4080 SG nicht in Bedrängnis bringen. Gleichwohl gibt es aber einzelne Spiele, die auf AMD Grafikkarten besser laufen. Wiederum existieren aber auch Spiele, die weitaus besser mit Nvidia Grafikkarten zurechtkommen. Schalten wir die Raytracing-Features hinzu, so kann Nvidia sich noch weiter von den neuen RDNA3-Grafikkarten absetzen. Ohne DLSS kapitulieren aber auch die aktuell schnellsten Grafikkarten von Nvidia in 2.160p. Ohne DLSS muss man sich mit 1.080p begnügen, wie man am Beispiel mit Cyberpunk 2077 sehen kann.

Zu beachten ist auf jeden Fall, dass DLSS 3.0 exklusiv nur mit den neuen GeForce-RTX-4000-Grafikkarten genutzt werden kann. AMD hat seinerseits mit dem offenen Standard FSR ein ähnliches Feature am Start. Dieses kann auch mit Nvidia Grafikkarten genutzt werden. Schlussendlich hängt es auch an den Spieleherstellern, diese Features in ihren Games zu integrieren. Eine Liste mit Spielen, die schon DLSS 3.0 unterstützen oder zukünftig mit diesem Feature ausgestattet werden, finden Sie hier.

GTA V - 3840x2160 High/On (Advanced Graphics Off) AA:FX AF:8x
Palit GeForce RTX 4090 GameRock OC
187.5 (2.97min, 200P1 - 593max) fps +2%
NVIDIA GeForce RTX 4080 Founders Edition
186.1 (3.61min, 142.9P1 - 612max) fps +1%
AMD Radeon RX 7900 XTX
184.8 (5.75min, 142.9P1 - 559max) fps 0%
KFA2 GeForce RTX 4080 SG
183.9 (5.11min, 142.9P1 - 570max) fps
ASUS TUF Gaming GeForce RTX 3080 Ti OC
182.6 (2.49min, 125P1 - 569max) fps -1%
NVIDIA GeForce RTX 3090 Founders Edition
182.5 (2.85min, 142.9P1 - 284max) fps -1%
MSI Radeon RX 6950 XT Gaming X Trio
175.5 (4.99min, 125P1 - 618max) fps -5%
AMD Radeon RX 7900 XT
175.1 (5.09min, 125P1 - 687max) fps -5%
Sapphire AMD Radeon RX 6950 XT Nitro+ Pure
173.1 (2.93min, 100P1 - 384max) fps -6%
KFA2 GeForce RTX 3080 SG
169.6 (14.8min, 125P1 - 411max) fps -8%
Nvidia Titan RTX
140.8 (6.17min, 100P1 - 320max) fps -23%
The Witcher 3 - 3840x2160 High Graphics & Postprocessing (Nvidia HairWorks Off)
Palit GeForce RTX 4090 GameRock OC
284 (88.3min, 166.6P0.1, 240P1 - 831max) fps +41%
NVIDIA GeForce RTX 4080 Founders Edition
204 (183min, 183.55P1 - 227max) fps +1%
KFA2 GeForce RTX 4080 SG
202 (77.2min, 112.7P0.1, 171.7P1 - 783max) fps
AMD Radeon RX 7900 XTX
163.8 (49.6min, 112P0.1, 134.1P1 - 463max) fps -19%
AMD Radeon RX 7900 XT
158.5 (83.2min, 111.2P0.1, 122.8P1 - 408max) fps -22%
NVIDIA GeForce RTX 3090 Founders Edition
155.5 (28min, 94.5P0.1, 133.8P1 - 704max) fps -23%
ASUS TUF Gaming GeForce RTX 3080 Ti OC
154.9 (54.5min, 91.3P0.1, 134.4P1 - 636max) fps -23%
MSI Radeon RX 6950 XT Gaming X Trio
148.3 (41.6min, 103P0.1, 117.2P1 - 530max) fps -27%
Sapphire AMD Radeon RX 6950 XT Nitro+ Pure
139.7 (10.4min, 105.6P0.1, 118.6P1 - 388max) fps -31%
KFA2 GeForce RTX 3080 SG
131.8 (48.2min, 72.3P0.1, 107.3P1 - 454max) fps -35%
AMD Radeon RX 6900 XT
122 (105min, 105P1 - 134max) fps -40%
Nvidia Titan RTX
107.1 (11min, 80.3P0.1, 94.1P1 - 583max) fps -47%
Final Fantasy XV Benchmark - 3840x2160 High Quality
Palit GeForce RTX 4090 GameRock OC
161.1 fps +38%
KFA2 GeForce RTX 4080 SG
116.9 fps
NVIDIA GeForce RTX 4080 Founders Edition
115.4 fps -1%
AMD Radeon RX 7900 XTX
101.6 fps -13%
NVIDIA GeForce RTX 3090 Founders Edition
87.1 fps -25%
ASUS TUF Gaming GeForce RTX 3080 Ti OC
86.4 fps -26%
Sapphire AMD Radeon RX 6950 XT Nitro+ Pure
86 fps -26%
MSI Radeon RX 6950 XT Gaming X Trio
85.6 fps -27%
AMD Radeon RX 7900 XT
84.9 fps -27%
KFA2 GeForce RTX 3080 SG
76.7 fps -34%
Nvidia Titan RTX
65.2 fps -44%
Strange Brigade - 3840x2160 ultra AA:ultra AF:16
Palit GeForce RTX 4090 GameRock OC
281 (31.7min, 239P1 - 482max) fps +44%
KFA2 GeForce RTX 4080 SG
195.1 (12.1min, 170.6P1 - 503max) fps
MSI Radeon RX 6950 XT Gaming X Trio
175 (140min, 143.3P1 - 264max) fps -10%
AMD Radeon RX 7900 XT
172.6 (138.4min, 143.7P1 - 320max) fps -12%
AMD Radeon RX 7900 XTX
172.6 (138.4min, 143.7P1 - 320max) fps -12%
Sapphire AMD Radeon RX 6950 XT Nitro+ Pure
168.6 (37.6min, 139.6P1 - 268max) fps -14%
NVIDIA GeForce RTX 3090 Founders Edition
163.2 (60.1min, 136.1P1 - 584max) fps -16%
ASUS TUF Gaming GeForce RTX 3080 Ti OC
161.8 (38.7min, 135.9P1 - 423max) fps -17%
KFA2 GeForce RTX 3080 SG
141.5 (44.1min, 113.4P1 - 188.6max) fps -27%
Nvidia Titan RTX
115 (67.4min, 100P1 - 517max) fps -41%
Far Cry 5 - 3840x2160 Ultra Preset AA:T
Palit GeForce RTX 4090 GameRock OC
175 (140min - 212max) fps +26%
AMD Radeon RX 7900 XTX
155 (134min - 180max) fps +12%
NVIDIA GeForce RTX 4080 Founders Edition
140 (126min - 159max) fps +1%
KFA2 GeForce RTX 4080 SG
139 (125min - 163max) fps
AMD Radeon RX 7900 XT
132 (116min - 162max) fps -5%
MSI Radeon RX 6950 XT Gaming X Trio
126 (109min - 157max) fps -9%
Sapphire AMD Radeon RX 6950 XT Nitro+ Pure
121 (106min - 147max) fps -13%
ASUS TUF Gaming GeForce RTX 3080 Ti OC
109 (98min - 128max) fps -22%
NVIDIA GeForce RTX 3090 Founders Edition
107 (96min - 128max) fps -23%
KFA2 GeForce RTX 3080 SG
102 (93min - 121max) fps -27%
Nvidia Titan RTX
82 (73min - 99max) fps -41%
Far Cry New Dawn - 3840x2160 Ultra Preset
Palit GeForce RTX 4090 GameRock OC
145 (104min - 215max) fps +12%
AMD Radeon RX 7900 XTX
138 (98min - 216max) fps +6%
KFA2 GeForce RTX 4080 SG
130 (102min - 169max) fps
AMD Radeon RX 7900 XT
129 (97min - 184max) fps -1%
MSI Radeon RX 6950 XT Gaming X Trio
125 (96min - 174max) fps -4%
Sapphire AMD Radeon RX 6950 XT Nitro+ Pure
111 (75min - 167max) fps -15%
ASUS TUF Gaming GeForce RTX 3080 Ti OC
110 (85min - 131max) fps -15%
NVIDIA GeForce RTX 3090 Founders Edition
108 (93min - 129max) fps -17%
AMD Radeon RX 6900 XT
101 (79min - 135max) fps -22%
KFA2 GeForce RTX 3080 SG
98 (79min - 122max) fps -25%
Nvidia Titan RTX
83 (70min - 100max) fps -36%
Far Cry 6 - 3840x2160 Ultra Graphics Quality + HD Textures AA:T
Palit GeForce RTX 4090 GameRock OC
136.9 (122min - 148max) fps +28%
AMD Radeon RX 7900 XTX
124 (113min - 136max) fps +16%
NVIDIA GeForce RTX 4080 Founders Edition
109 (97min - 117max) fps +2%
KFA2 GeForce RTX 4080 SG
107 (98min - 116max) fps
AMD Radeon RX 7900 XT
104.1 (95min - 114max) fps -3%
MSI Radeon RX 6950 XT Gaming X Trio
94.7 (87min - 103max) fps -11%
Sapphire AMD Radeon RX 6950 XT Nitro+ Pure
86.5 (78min - 100max) fps -19%
ASUS TUF Gaming GeForce RTX 3080 Ti OC
86.2 (79min - 93max) fps -19%
NVIDIA GeForce RTX 3090 Founders Edition
84.9 (78min - 92max) fps -21%
Nvidia Titan RTX
63.6 (56min - 69max) fps -41%
KFA2 GeForce RTX 3080 SG
57.2 (28min - 69max) fps -47%
Metro Exodus - 3840x2160 Ultra Quality AF:16x
Palit GeForce RTX 4090 GameRock OC
139.7 (76.95min - 229.15max) fps +34%
NVIDIA GeForce RTX 4080 Founders Edition
105.7 (67.17min - 159.57max) fps +2%
KFA2 GeForce RTX 4080 SG
103.9 (62.73min - 167.39max) fps
AMD Radeon RX 7900 XTX
103.5 (66.43min - 144.4max) fps 0%
AMD Radeon RX 7900 XT
86.9 (56.86min - 117.84max) fps -16%
MSI Radeon RX 6950 XT Gaming X Trio
79.3 (52.59min - 103.86max) fps -24%
ASUS TUF Gaming GeForce RTX 3080 Ti OC
77.1 (48.66min - 128.68max) fps -26%
NVIDIA GeForce RTX 3090 Founders Edition
75.9 (48.64min - 130.4max) fps -27%
Sapphire AMD Radeon RX 6950 XT Nitro+ Pure
75 (50.07min - 98.87max) fps -28%
AMD Radeon RX 6900 XT
66.7 (42.71min - 92.25max) fps -36%
KFA2 GeForce RTX 3080 SG
65.2 (41.36min - 117.12max) fps -37%
Nvidia Titan RTX
56.8 (35.78min - 93.88max) fps -45%
F1 2020 - 3840x2160 Ultra High Preset AA:T AF:16x
Palit GeForce RTX 4090 GameRock OC
286 (245min - 335max) fps +42%
KFA2 GeForce RTX 4080 SG
201 (172min - 235max) fps
AMD Radeon RX 7900 XTX
199.6 (160min - 242max) fps -1%
AMD Radeon RX 7900 XT
165.5 (136min - 199max) fps -18%
MSI Radeon RX 6950 XT Gaming X Trio
158.1 (126min - 189max) fps -21%
Sapphire AMD Radeon RX 6950 XT Nitro+ Pure
150.1 (119min - 178max) fps -25%
ASUS TUF Gaming GeForce RTX 3080 Ti OC
145.9 (124min - 173max) fps -27%
NVIDIA GeForce RTX 3090 Founders Edition
143.6 (121min - 170max) fps -29%
AMD Radeon RX 6900 XT
137 (109min - 165max) fps -32%
AMD Radeon RX 6900 XT
136 (110min - 161max) fps -32%
KFA2 GeForce RTX 3080 SG
124.6 (107min - 145max) fps -38%
Nvidia Titan RTX
103.4 (89min - 121max) fps -49%
F1 2021 - 3840x2160 Ultra High Preset + Raytracing AA:T AF:16x
Palit GeForce RTX 4090 GameRock OC
199.1 (168min, 166P1 - 223max) fps +38%
KFA2 GeForce RTX 4080 SG
144.3 (123min, 122P1 - 162max) fps
NVIDIA GeForce RTX 4080 Founders Edition
143.5 (123min, 115P1 - 160max) fps -1%
AMD Radeon RX 7900 XTX
133.6 (114min, 113P1 - 154max) fps -7%
AMD Radeon RX 7900 XT
112.3 (95min, 95P1 - 129max) fps -22%
ASUS TUF Gaming GeForce RTX 3080 Ti OC
105.6 (91min, 91P1 - 117max) fps -27%
NVIDIA GeForce RTX 3090 Founders Edition
102.7 (90min, 89P1 - 116max) fps -29%
MSI Radeon RX 6950 XT Gaming X Trio
102.1 (86min, 86P1 - 116max) fps -29%
Sapphire AMD Radeon RX 6950 XT Nitro+ Pure
99.7 (85min, 85P1 - 113max) fps -31%
KFA2 GeForce RTX 3080 SG
93.5 (82min, 82P1 - 105max) fps -35%
Nvidia Titan RTX
73.2 (64min, 64P1 - 84max) fps -49%
F1 22 - 3840x2160 Ultra High Preset AA:T AF:16x
Palit GeForce RTX 4090 GameRock OC
82.5 (72min, 71P1 - 96max) fps +42%
NVIDIA GeForce RTX 4080 Founders Edition
58.9 (50min, 49P1 - 68max) fps +2%
KFA2 GeForce RTX 4080 SG
57.9 (50min, 49P1 - 67max) fps
AMD Radeon RX 7900 XTX
52.4 (37min, 38P1 - 64max) fps -9%
AMD Radeon RX 7900 XT
44.9 (32min, 32P1 - 57max) fps -22%
ASUS TUF Gaming GeForce RTX 3080 Ti OC
43.4 (36min, 36P1 - 51max) fps -25%
NVIDIA GeForce RTX 3090 Founders Edition
42.6 (36min, 28P1 - 49max) fps -26%
MSI Radeon RX 6950 XT Gaming X Trio
36.5 (27min, 27P1 - 47max) fps -37%
Sapphire AMD Radeon RX 6950 XT Nitro+ Pure
35.8 (24min, 25P1 - 47max) fps -38%
Nvidia Titan RTX
29.3 (25min, 24P1 - 34max) fps -49%
Borderlands 3 - 3840x2160 Badass Overall Quality (DX11)
Palit GeForce RTX 4090 GameRock OC
135 fps +42%
NVIDIA GeForce RTX 4080 Founders Edition
95.7 fps +1%
KFA2 GeForce RTX 4080 SG
95.2 fps
AMD Radeon RX 7900 XTX
88.4 fps -7%
AMD Radeon RX 7900 XT
74.6 fps -22%
ASUS TUF Gaming GeForce RTX 3080 Ti OC
73.8 fps -22%
NVIDIA GeForce RTX 3090 Founders Edition
72.8 fps -24%
MSI Radeon RX 6950 XT Gaming X Trio
70.9 fps -26%
KFA2 GeForce RTX 3080 SG
59.9 fps -37%
Sapphire AMD Radeon RX 6950 XT Nitro+ Pure
59.9 fps -37%
AMD Radeon RX 6900 XT
59.8 fps -37%
AMD Radeon RX 6900 XT
57.1 fps -40%
Nvidia Titan RTX
49.7 fps -48%
Cyberpunk 2077 1.6 - 3840x2160 Ultra Preset
Palit GeForce RTX 4090 GameRock OC
78 (48.3min - 106.8max) fps +23%
AMD Radeon RX 7900 XTX
71.4 (59.4min - 93.7max) fps +13%
NVIDIA GeForce RTX 4080 Founders Edition
63.5 (42.2min - 84.6max) fps 0%
KFA2 GeForce RTX 4080 SG
63.4 (54min - 82.1max) fps
AMD Radeon RX 7900 XT
60 (44.6min - 79.3max) fps -5%
ASUS TUF Gaming GeForce RTX 3080 Ti OC
49.7 (41.5min - 63.7max) fps -22%
MSI Radeon RX 6950 XT Gaming X Trio
48.5 (39.1min - 63.9max) fps -24%
Sapphire AMD Radeon RX 6950 XT Nitro+ Pure
43.2 fps -32%
Metro Exodus - 1920x1080 Ultra Quality DXR AF:16x
NVIDIA GeForce RTX 4090
AMD Ryzen 9 7950X, NVIDIA GeForce RTX 4090
157.3 (96.47min - 223.46max) fps +6%
NVIDIA GeForce RTX 4080
AMD Ryzen 9 7950X, NVIDIA GeForce RTX 4080
148.6 (73.78min - 213.36max) fps
AMD Radeon RX 7900 XTX
AMD Ryzen 9 7950X, AMD Radeon RX 7900 XTX
141.2 (89.03min - 194.63max) fps -5%
NVIDIA GeForce RTX 4080
Intel Core i9-13900K, NVIDIA GeForce RTX 4080
137.2 (68.42min - 213.17max) fps -8%
AMD Radeon RX 7900 XT
AMD Ryzen 9 7950X, AMD Radeon RX 7900 XT
124.3 (78.88min - 166max) fps -16%
NVIDIA GeForce RTX 3080 Ti
AMD Ryzen 9 7950X, NVIDIA GeForce RTX 3080 Ti
121.2 (66.05min - 193.46max) fps -18%
NVIDIA GeForce RTX 3090
AMD Ryzen 9 7950X, NVIDIA GeForce RTX 3090
115.4 (65.7min - 181.59max) fps -22%
AMD Radeon RX 6950 XT
AMD Ryzen 9 7950X, AMD Radeon RX 6950 XT
110.2 (69.77min - 143.88max) fps -26%
Far Cry 6 - 1920x1080 Ultra Graphics Quality + HD Textures + DXR AA:T
NVIDIA GeForce RTX 4080
Intel Core i9-13900K, NVIDIA GeForce RTX 4080
154 (125min - 209max) fps +22%
AMD Radeon RX 7900 XTX
AMD Ryzen 9 7950X, AMD Radeon RX 7900 XTX
152.1 (75min - 229max) fps +20%
AMD Radeon RX 7900 XT
AMD Ryzen 9 7950X, AMD Radeon RX 7900 XT
143.6 (46min - 227max) fps +13%
NVIDIA GeForce RTX 4090
AMD Ryzen 9 7950X, NVIDIA GeForce RTX 4090
133.4 (108min - 196max) fps +5%
AMD Radeon RX 6950 XT
AMD Ryzen 9 7950X, AMD Radeon RX 6950 XT
132.8 (51min - 198max) fps +5%
NVIDIA GeForce RTX 3080 Ti
AMD Ryzen 9 7950X, NVIDIA GeForce RTX 3080 Ti
128.6 (109min - 170max) fps +1%
NVIDIA GeForce RTX 4080
AMD Ryzen 9 7950X, NVIDIA GeForce RTX 4080
126.7 (103min - 189max) fps
NVIDIA GeForce RTX 3090
AMD Ryzen 9 7950X, NVIDIA GeForce RTX 3090
123 (106min - 155max) fps -3%
AMD Radeon RX 6800
AMD Ryzen 9 7950X, AMD Radeon RX 6800
112.6 (63min - 152max) fps -11%
AMD Radeon RX 6950 XT
AMD Ryzen 9 5900X, AMD Radeon RX 6950 XT
101.6 (24min - 161max) fps -20%
Cyberpunk 2077 1.6
3840x2160 Ray Tracing Ultra Preset (DLSS off)
NVIDIA GeForce RTX 4090
AMD Ryzen 9 7950X, NVIDIA GeForce RTX 4090 (1.6)
42.5 (31.9min - 56.3max) fps +43%
NVIDIA GeForce RTX 4080
Intel Core i9-13900K, NVIDIA GeForce RTX 4080 (1.6)
30.7 (23.5min - 40.6max) fps +3%
NVIDIA GeForce RTX 4080
AMD Ryzen 9 7950X, NVIDIA GeForce RTX 4080 (1.61)
29.8 (22.7min - 39.4max) fps
NVIDIA GeForce RTX 3090
AMD Ryzen 9 7950X, NVIDIA GeForce RTX 3090 (1.6)
20.8 (14.2min - 28.9max) fps -30%
AMD Radeon RX 7900 XTX
AMD Ryzen 9 7950X, AMD Radeon RX 7900 XTX (1.61)
20.7 (14.4min - 28.9max) fps -31%
NVIDIA GeForce RTX 3080 Ti
AMD Ryzen 9 7950X, NVIDIA GeForce RTX 3080 Ti (1.61)
18.6 (9.13min - 27.1max) fps -38%
AMD Radeon RX 7900 XT
AMD Ryzen 9 7950X, AMD Radeon RX 7900 XT (1.61)
17.6 (12min - 25max) fps -41%
AMD Radeon RX 6950 XT
AMD Ryzen 9 7950X, AMD Radeon RX 6950 XT (1.61)
13.7 (9.28min - 20.6max) fps -54%
AMD Radeon RX 6800
AMD Ryzen 9 7950X, AMD Radeon RX 6800 (1.61)
9.47 (6.59min - 14.7max) fps -68%
1920x1080 Ray Tracing Ultra Preset (DLSS off)
NVIDIA GeForce RTX 4090
AMD Ryzen 9 7950X, NVIDIA GeForce RTX 4090 (1.6)
118.6 (69.3min - 161.9max) fps +23%
NVIDIA GeForce RTX 4080
Intel Core i9-13900K, NVIDIA GeForce RTX 4080 (1.6)
100.1 (77.6min - 133.3max) fps +4%
NVIDIA GeForce RTX 4080
AMD Ryzen 9 7950X, NVIDIA GeForce RTX 4080 (1.61)
96.1 (60.6min - 138.8max) fps
NVIDIA GeForce RTX 3080 Ti
AMD Ryzen 9 7950X, NVIDIA GeForce RTX 3080 Ti (1.61)
69.1 (53.3min - 89.8max) fps -28%
NVIDIA GeForce RTX 3090
AMD Ryzen 9 7950X, NVIDIA GeForce RTX 3090 (1.6)
65.7 (51min - 85.4max) fps -32%
AMD Radeon RX 7900 XTX
AMD Ryzen 9 7950X, AMD Radeon RX 7900 XTX (1.61)
64.6 (49.1min - 85.9max) fps -33%
AMD Radeon RX 7900 XT
AMD Ryzen 9 7950X, AMD Radeon RX 7900 XT (1.61)
57.1 (41.7min - 77.1max) fps -41%
AMD Radeon RX 6950 XT
AMD Ryzen 9 7950X, AMD Radeon RX 6950 XT (1.61)
47.7 (32.5min - 66.9max) fps -50%
AMD Radeon RX 6800
AMD Ryzen 9 7950X, AMD Radeon RX 6800 (1.61)
33.7 (23.1min - 47.4max) fps -65%
Control - 1920x1080 High Quality Preset & High Ray Tracing Preset (DX12)
NVIDIA GeForce RTX 4090
AMD Ryzen 9 7950X, NVIDIA GeForce RTX 4090
189.9 (19.4min, 126.6P0.1, 139.6P1 - 292max) fps +19%
NVIDIA GeForce RTX 4080
Intel Core i9-13900K, NVIDIA GeForce RTX 4080
162.8 (28.9min, 60.8P0.1, 129.4P1 - 273max) fps +2%
NVIDIA GeForce RTX 4080
AMD Ryzen 9 7950X, NVIDIA GeForce RTX 4080
159.4 (18.2min, 92.7P0.1, 125.9P1 - 262max) fps
AMD Radeon RX 7900 XTX
AMD Ryzen 9 7950X, AMD Radeon RX 7900 XTX
133.7 (23.2min, 92.6P0.1, 104.6P1 - 239max) fps -16%
NVIDIA GeForce RTX 3080 Ti
AMD Ryzen 9 7950X, NVIDIA GeForce RTX 3080 Ti
120.6 (6.57min, 82.4P0.1, 100.1P1 - 224max) fps -24%
AMD Radeon RX 7900 XT
AMD Ryzen 9 7950X, AMD Radeon RX 7900 XT
116.1 (8.47min, 62.1P0.1, 91.4P1 - 219max) fps -27%
AMD Radeon RX 6950 XT
AMD Ryzen 9 7950X, AMD Radeon RX 6950 XT
102.9 (20.6min, 66.5P0.1, 80.5P1 - 242max) fps -35%
AMD Radeon RX 6950 XT
AMD Ryzen 9 5900X, AMD Radeon RX 6950 XT
97.7 (7.66min, 62.8P0.1, 73.5P1 - 198.6max) fps -39%
Ghostwire Tokyo - 1920x1080 Highest Settings + Maximum Ray Tracing
NVIDIA GeForce RTX 4090
AMD Ryzen 9 7950X, NVIDIA GeForce RTX 4090
183.2 (43min, 94.2P0.1, 137.8P1 - 221max) fps +15%
NVIDIA GeForce RTX 4080
Intel Core i9-13900K, NVIDIA GeForce RTX 4080
166.2 (30.4min, 60P0.1, 115.2P1 - 248max) fps +4%
NVIDIA GeForce RTX 4080
AMD Ryzen 9 7950X, NVIDIA GeForce RTX 4080
159.6 (39.5min, 86.7P0.1, 114.5P1 - 226max) fps
AMD Radeon RX 7900 XTX
AMD Ryzen 9 7950X, AMD Radeon RX 7900 XTX
136.3 (39.1min, 76.4P0.1, 95.8P1 - 243max) fps -15%
NVIDIA GeForce RTX 3080 Ti
AMD Ryzen 9 7950X, NVIDIA GeForce RTX 3080 Ti
119.9 (39.2min, 61.9P0.1, 80.9P1 - 230max) fps -25%
AMD Radeon RX 7900 XT
AMD Ryzen 9 7950X, AMD Radeon RX 7900 XT
116.5 (30.3min, 71.6P0.1, 78.1P1 - 246max) fps -27%
AMD Radeon RX 6950 XT
AMD Ryzen 9 7950X, AMD Radeon RX 6950 XT
99 (35.8min, 58.6P0.1, 66P1 - 237max) fps -38%
The Callisto Protocol - 1920x1080 Ultra Preset (without FSR Upscaling) + Full Ray-Tracing
AMD Radeon RX 7900 XTX
AMD Ryzen 9 7950X, AMD Radeon RX 7900 XTX
98 fps +13%
NVIDIA GeForce RTX 4090
AMD Ryzen 9 7950X, NVIDIA GeForce RTX 4090
92 fps +6%
AMD Radeon RX 7900 XT
AMD Ryzen 9 7950X, AMD Radeon RX 7900 XT
89 fps +2%
NVIDIA GeForce RTX 4080
AMD Ryzen 9 7950X, NVIDIA GeForce RTX 4080
87 fps
AMD Radeon RX 6950 XT
AMD Ryzen 9 7950X, AMD Radeon RX 6950 XT
84 fps -3%
NVIDIA GeForce RTX 3080 Ti
AMD Ryzen 9 7950X, NVIDIA GeForce RTX 3080 Ti
76 fps -13%
AMD Radeon RX 6800
AMD Ryzen 9 7950X, AMD Radeon RX 6800
66 fps -24%
Spider-Man Miles Morales - 1920x0180 Very High Preset + Ray-Tracing AA:T
NVIDIA GeForce RTX 4090
AMD Ryzen 9 7950X, NVIDIA GeForce RTX 4090
122.2 (60.2min, 67.7P0.1, 89P1 - 221max) fps +7%
NVIDIA GeForce RTX 4080
AMD Ryzen 9 7950X, NVIDIA GeForce RTX 4080
114.7 (49.8min, 65.7P0.1, 93.2P1 - 157.5max) fps
AMD Radeon RX 7900 XTX
AMD Ryzen 9 7950X, AMD Radeon RX 7900 XTX
98.6 (68.4min, 71.9P0.1, 82.3P1 - 147.1max) fps -14%
NVIDIA GeForce RTX 3080 Ti
AMD Ryzen 9 7950X, NVIDIA GeForce RTX 3080 Ti
93.9 (66.7min, 73.8P0.1, 79.2P1 - 160.1max) fps -18%
AMD Radeon RX 7900 XT
AMD Ryzen 9 7950X, AMD Radeon RX 7900 XT
88.5 (67.1min, 70.7P0.1, 74.7P1 - 196.4max) fps -23%
AMD Radeon RX 6950 XT
AMD Ryzen 9 7950X, AMD Radeon RX 6950 XT
80.9 (60.3min, 63.4P0.1, 67.7P1 - 165.3max) fps -29%
AMD Radeon RX 6800
AMD Ryzen 9 7950X, AMD Radeon RX 6800
65 (48.7min, 50.9P0.1, 52.4P1 - 129.3max) fps -43%
min. mittel hoch max.QHD4K DLSS4K
GTA V (2015) 188.1 188 187.7 164.3 159.2 183.9
The Witcher 3 (2015) 811 719 549 268 202
Dota 2 Reborn (2015) 287.8 256.8 247.1 228.6 221.7
Final Fantasy XV Benchmark (2018) 236 235 225 195.7 116.9
X-Plane 11.11 (2018) 219 193.6 149.4 124.9
Far Cry 5 (2018) 239 209 203 188 185 139
Strange Brigade (2018) 681 548 531 482 390 195.1
Shadow of the Tomb Raider (2018) 334 299 304 288 241 132.2
Far Cry New Dawn (2019) 196 173 166 150 149 130
Metro Exodus (2019) 300 256 212 177.7 153.7 103.9
Control (2019) 240 240 235 162 82.4
Borderlands 3 (2019) 239 203 189.9 187.2 163.2 95.2
F1 2020 (2020) 552 478 463 396 332 201
F1 2021 (2021) 656 606 514 256 240 144.3
Far Cry 6 (2021) 205 177.3 161.6 155 150.6 107
Forza Horizon 5 (2021) 302 242 238 177 164 124
God of War (2022) 274 271 229 164.9 136.3 95.3
GRID Legends (2022) 318 287 254 237 233 163.3
Cyberpunk 2077 1.6 (2022) 216 213 201 190.1 129.1 63.4
Ghostwire Tokyo (2022) 294 283 252 124.6
Tiny Tina's Wonderlands (2022) 385 320 269 226 165.8 89
F1 22 (2022) 423 411 384 172.8 113.8 57.9
The Quarry (2022) 376 291 249 207 149 79.2
FIFA 23 (2022) 278 274 274 274 272 218
A Plague Tale Requiem (2022) 174.1 172.5 153.9 127 95.4 54.4
Uncharted Legacy of Thieves Collection (2022) 145.5 144.7 142.1 140.4 125.6 77.7
Call of Duty Modern Warfare 2 2022 (2022) 317 286 230 219 170 158 112
Spider-Man Miles Morales (2022) 198.6 180.3 178.2 157.3 202 103.9
The Callisto Protocol (2022) 231 213 172 171 138 85
Need for Speed Unbound (2022) 177.8 171.4 160.4 140.3 137.8 104.5

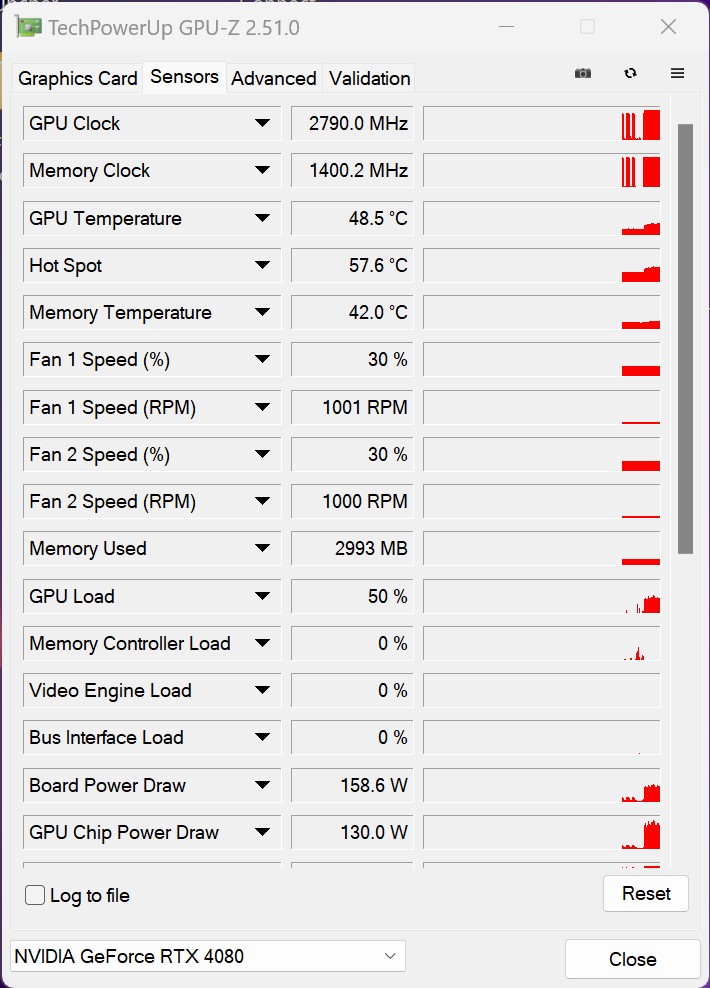
Emissionen der KFA2 GeForce RTX 4080 SG

Überarbeitetes Lüfterdesign mit mehr Durchsatz (Quelle: KFA2)
12VHPWR-Anschluss der KFA2 GeForce RTX 4080 SG (Quelle: KFA2)

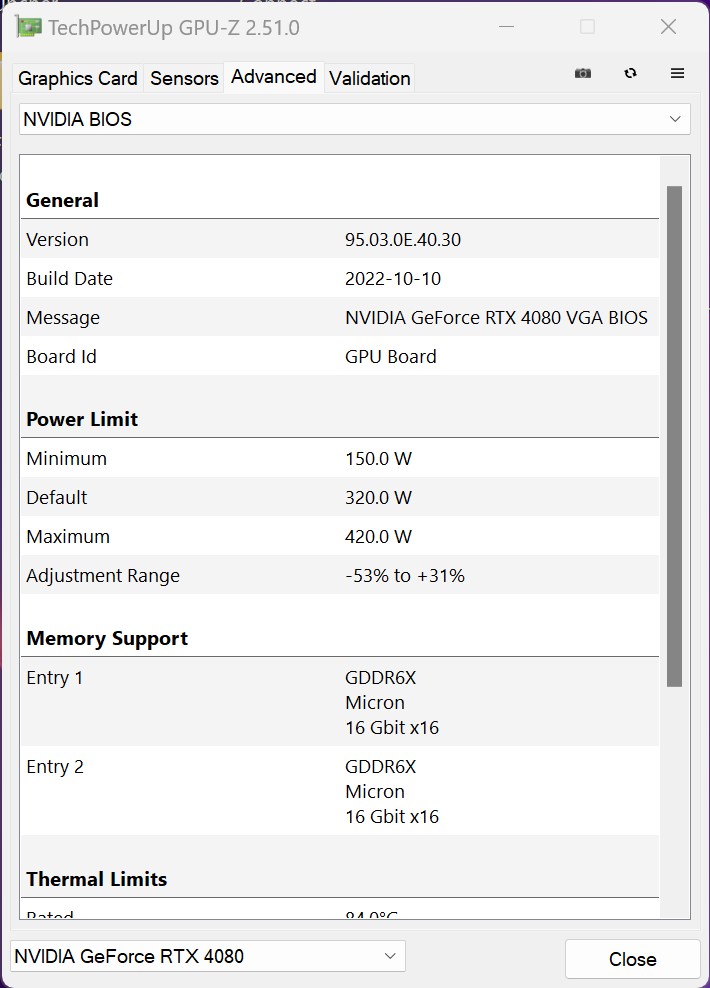
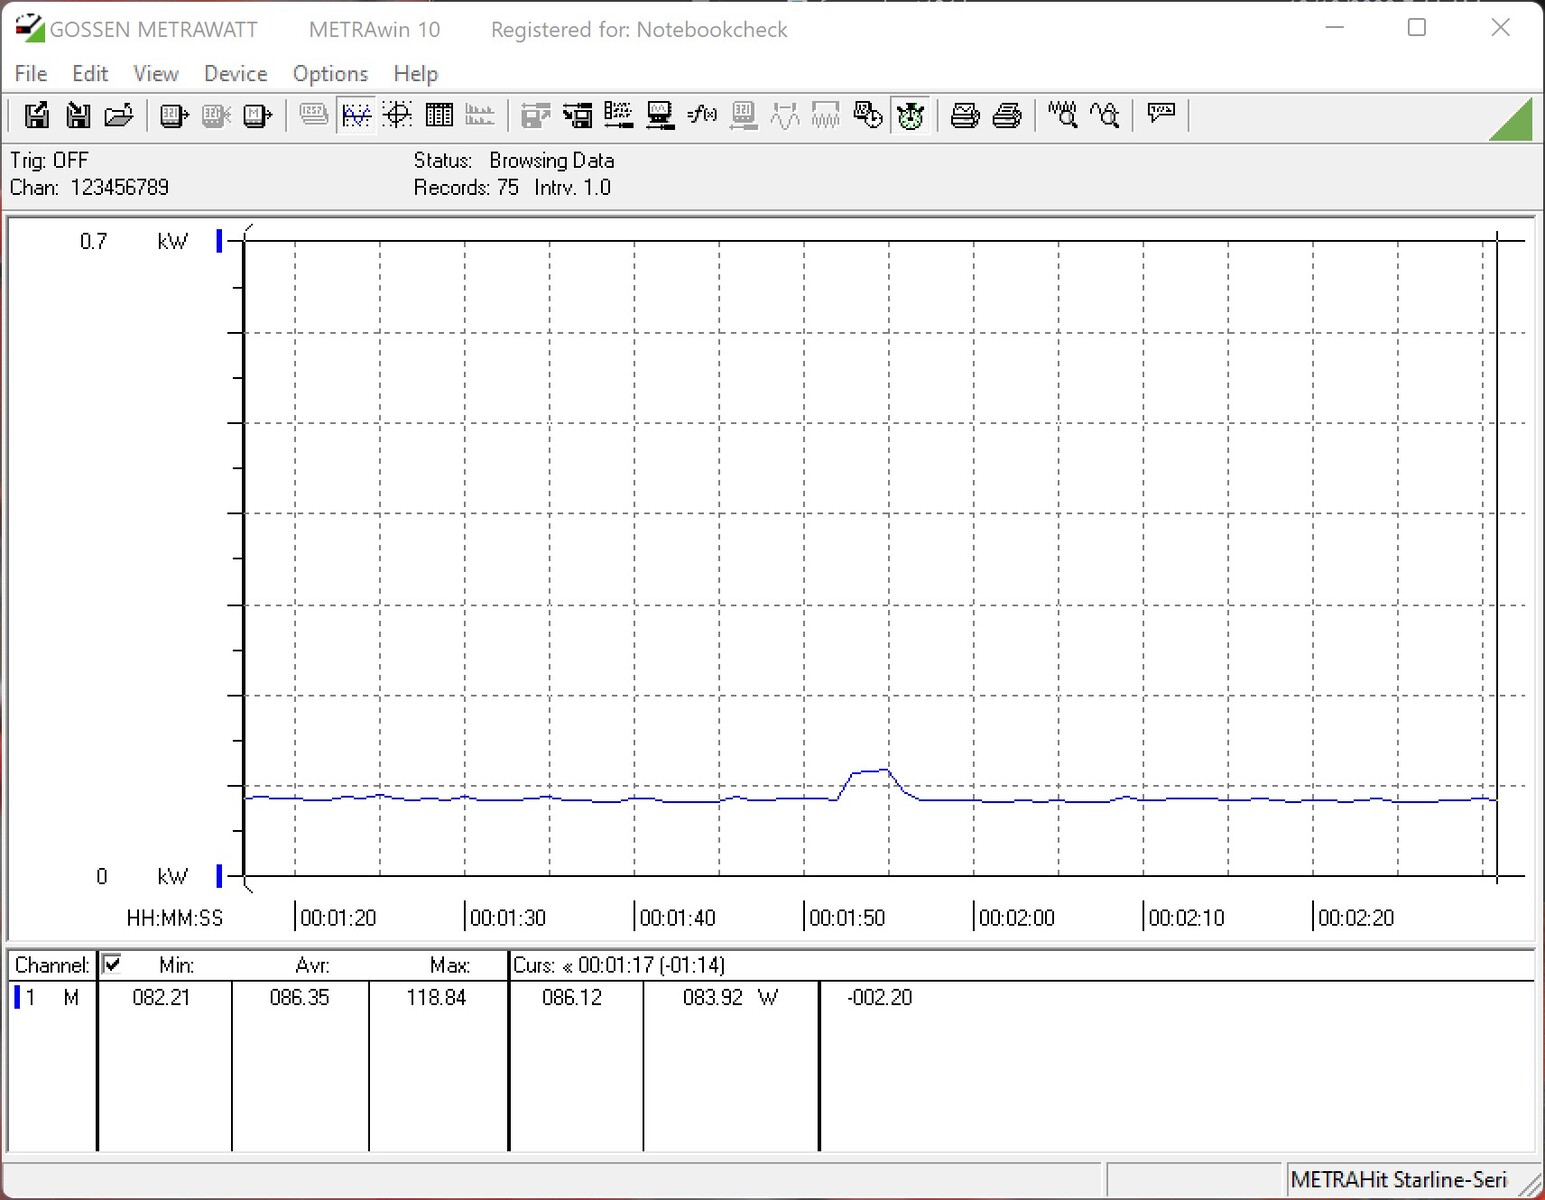
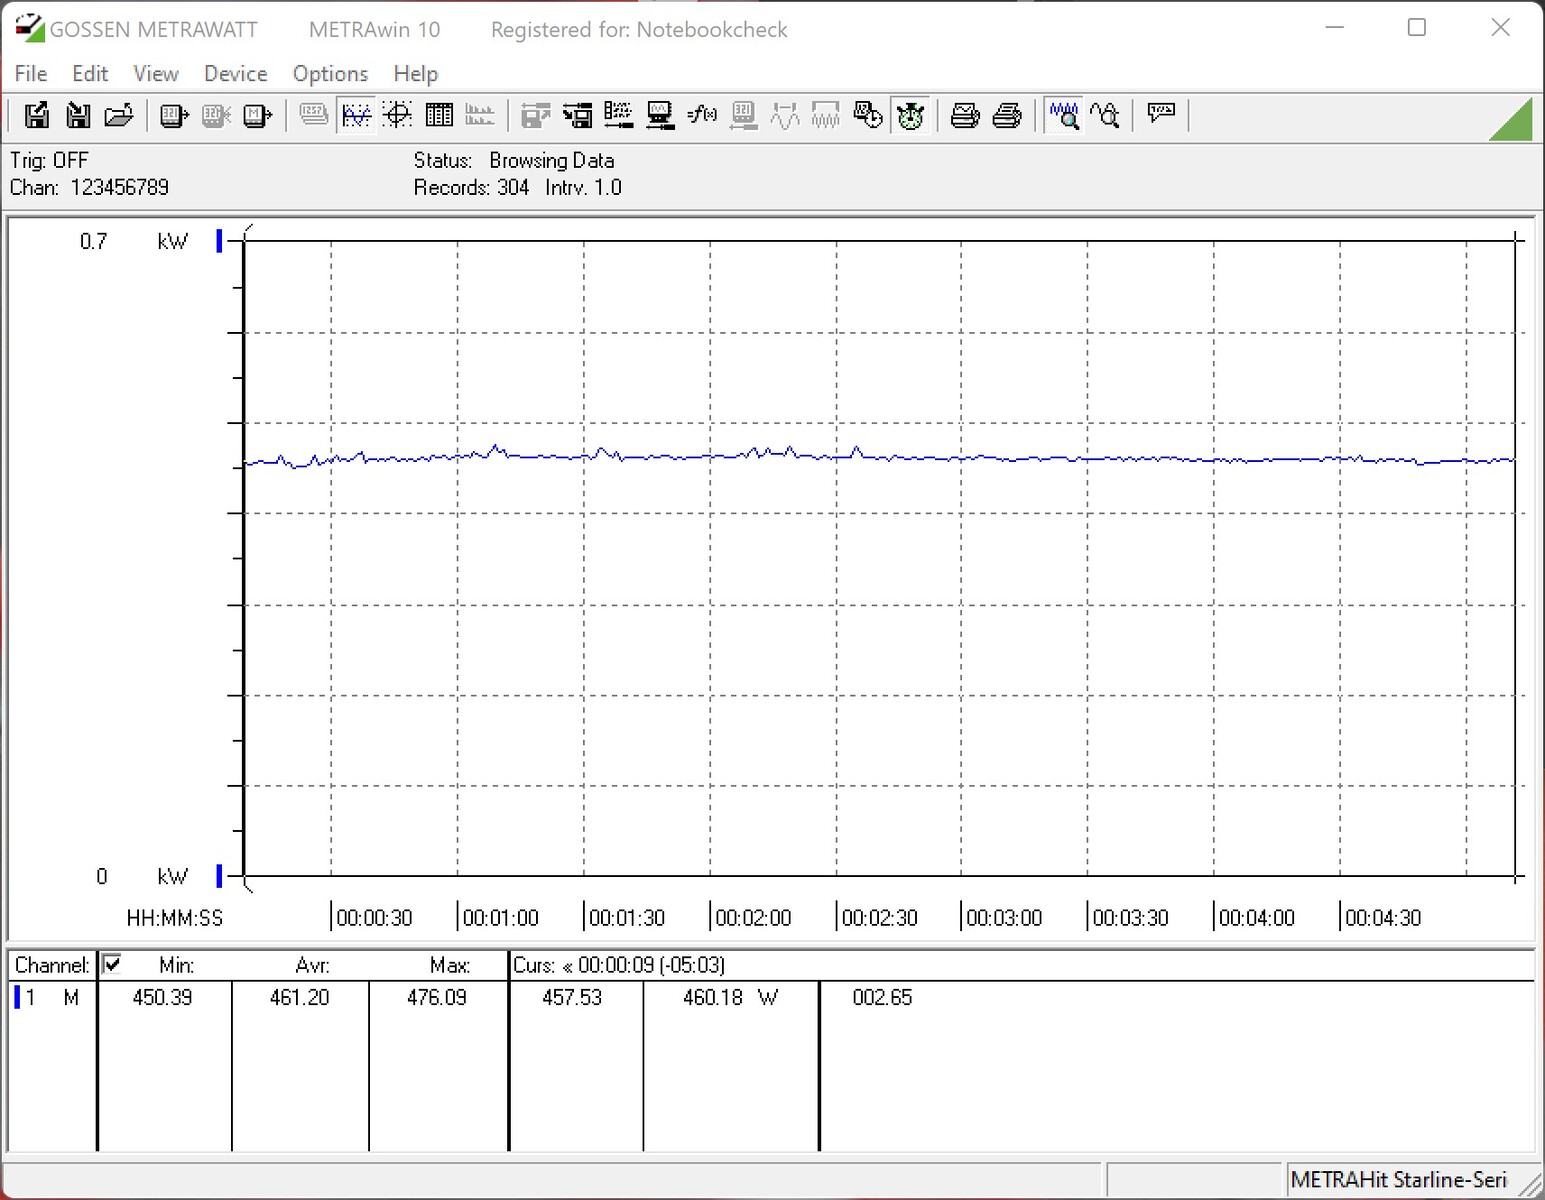
Die Leistungsaufnahme der KFA2 GeForce RTX 4080 SG beträgt 320 Watt. Damit bewegen wir uns mit unserem Testsample auf demselben Level wie Nvidia mit seiner Founders Edition. Verglichen mit einer Nvidia GeForce RTX 3080 ist die Leistungsaufnahme gleich geblieben. Dennoch wurde die Leistung in den Tests deutlich übertroffen. Die Energieeffizienz konnte mit Ada Lovelace und dem 4-nm-Node eindrucksvoll verbessert werden. Das Power-Target der KFA2 GeForce RTX 4080 SG lässt sich um bis zu 31 Prozent erhöhen, womit die Grafikkarte allein bis zu 420 Watt verbrauchen darf. Über den 12VHPWR-Anschluss, welcher als Adapter mit 3x6+2 Pin-PCIe-Buchsen im Lieferumfang vorhanden ist, bewegt sich die Grafikkarte im Rahmen des Erlaubten. Um Problemen mit der Spannungsversorgung vorzubeugen, ist unsere Empfehlung, drei separate Kabel – kommend vom Netzteil – zu verwenden.

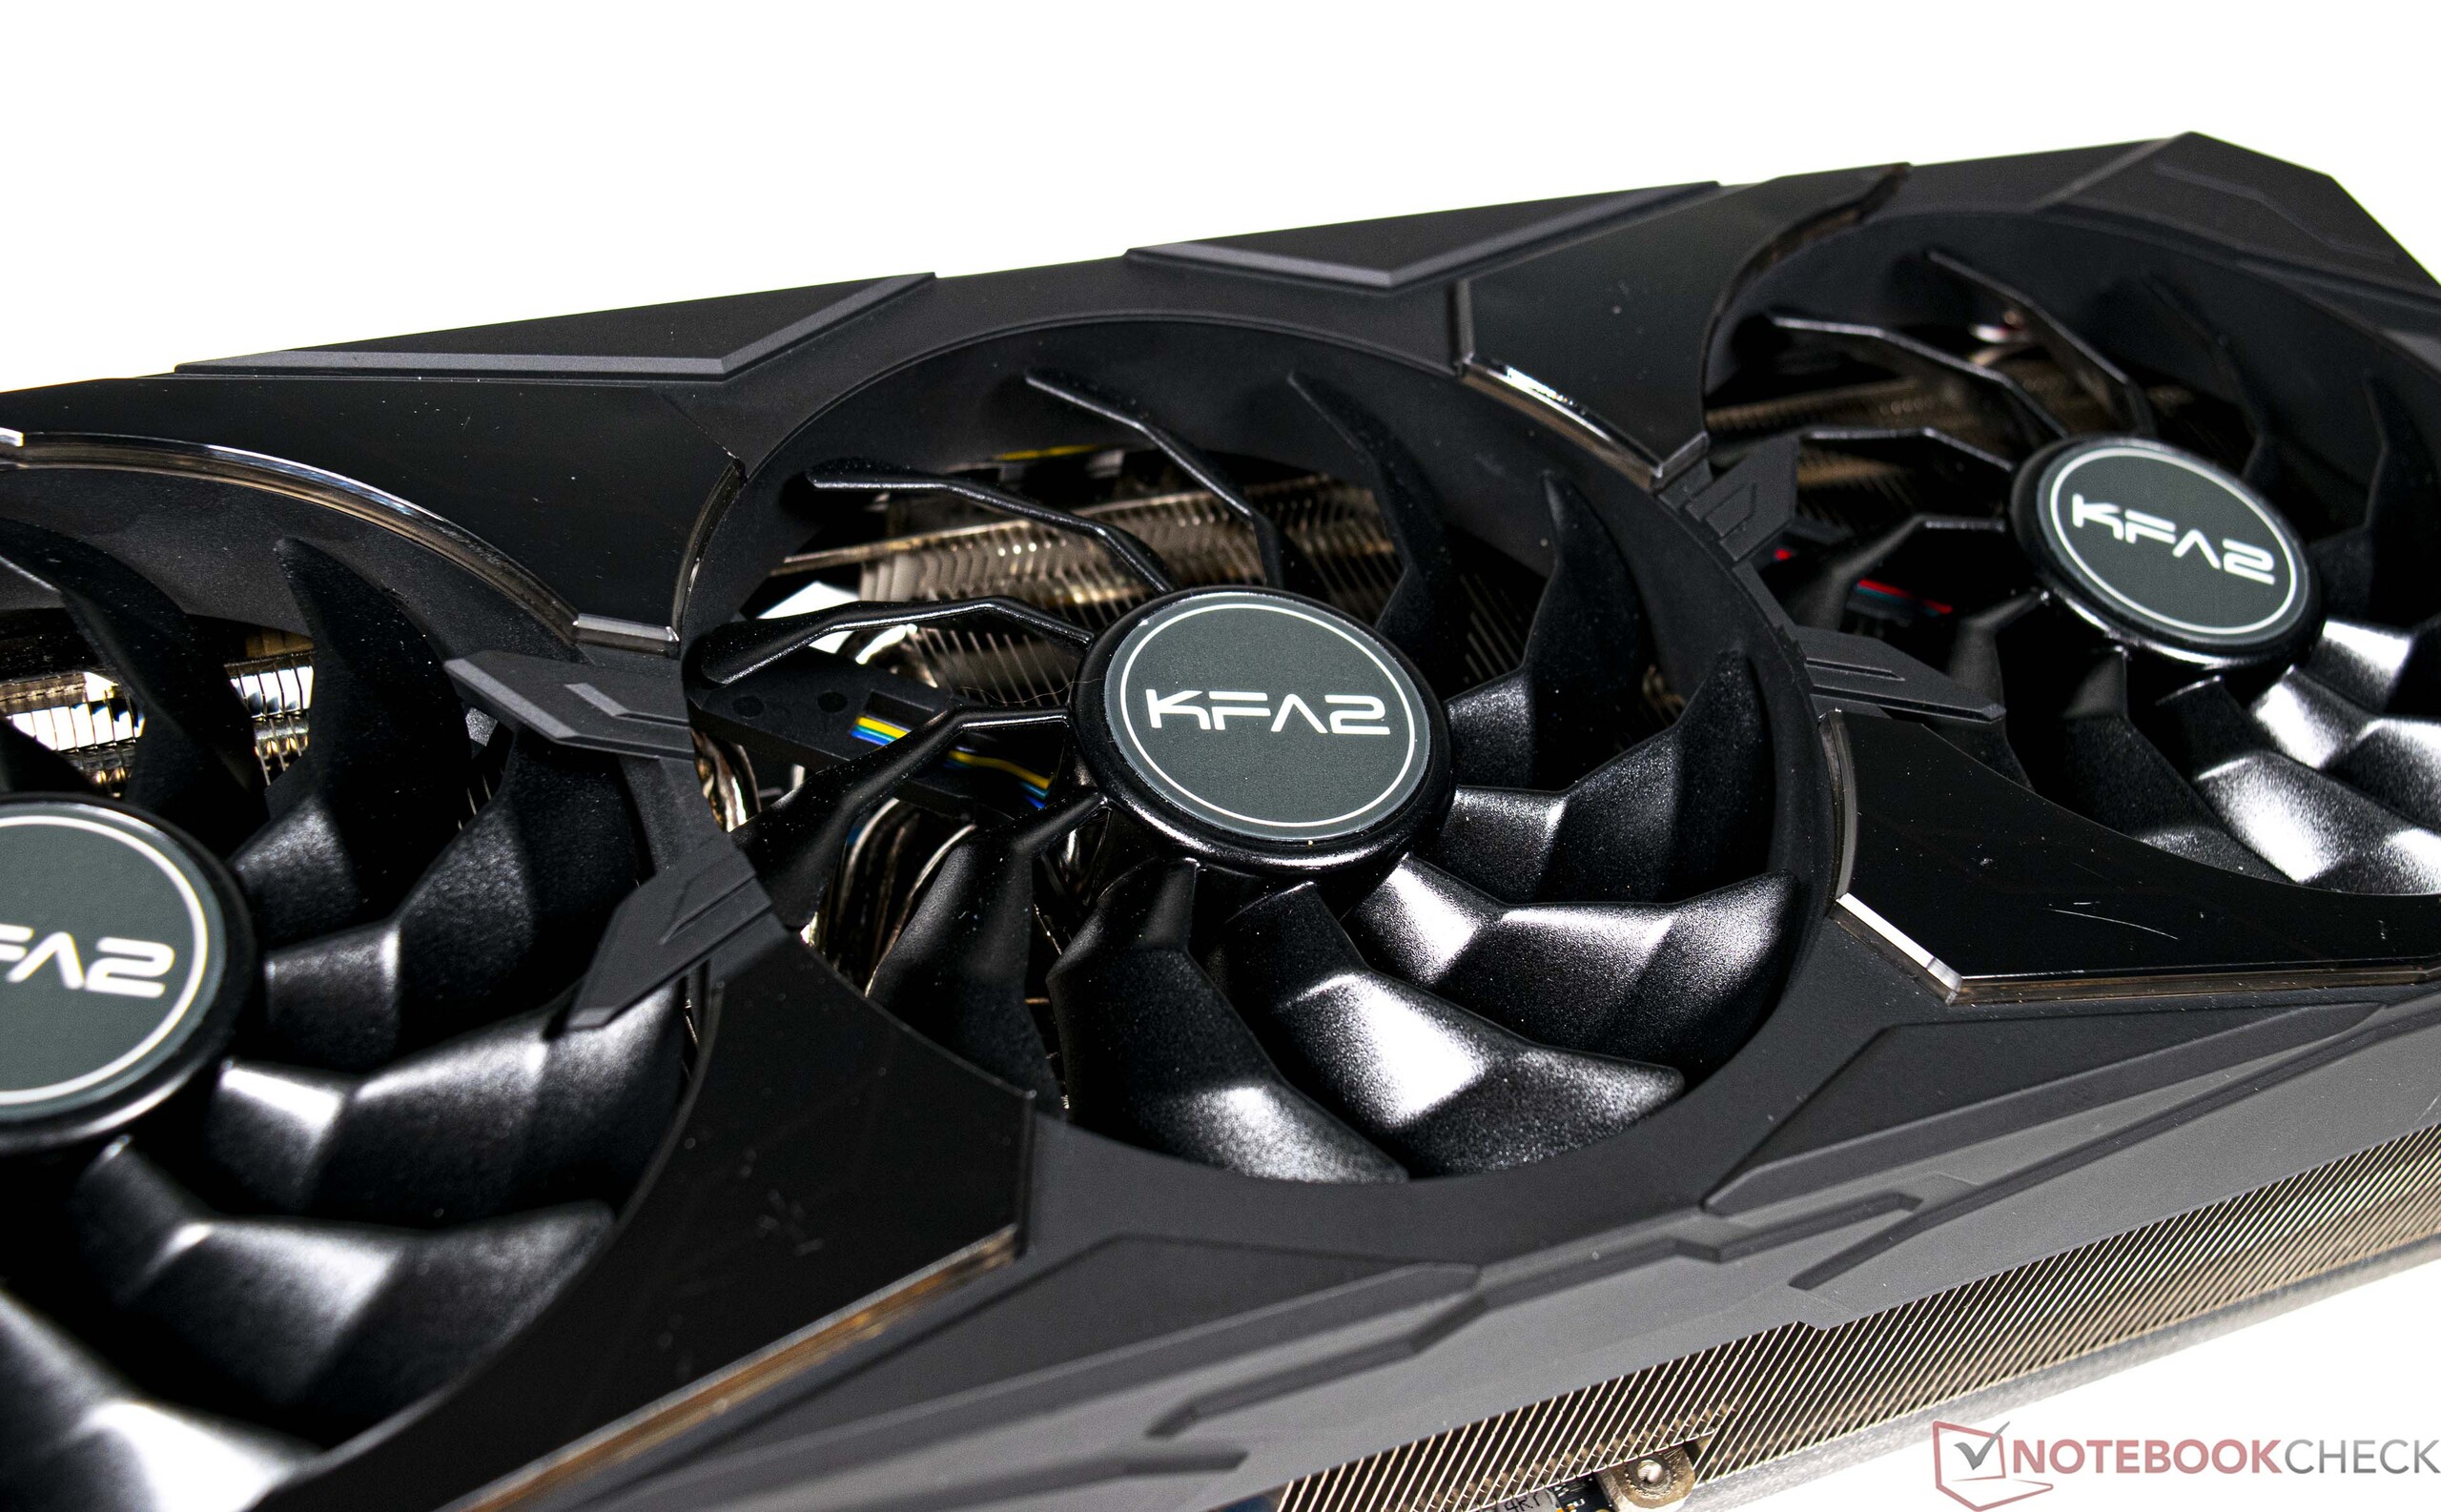
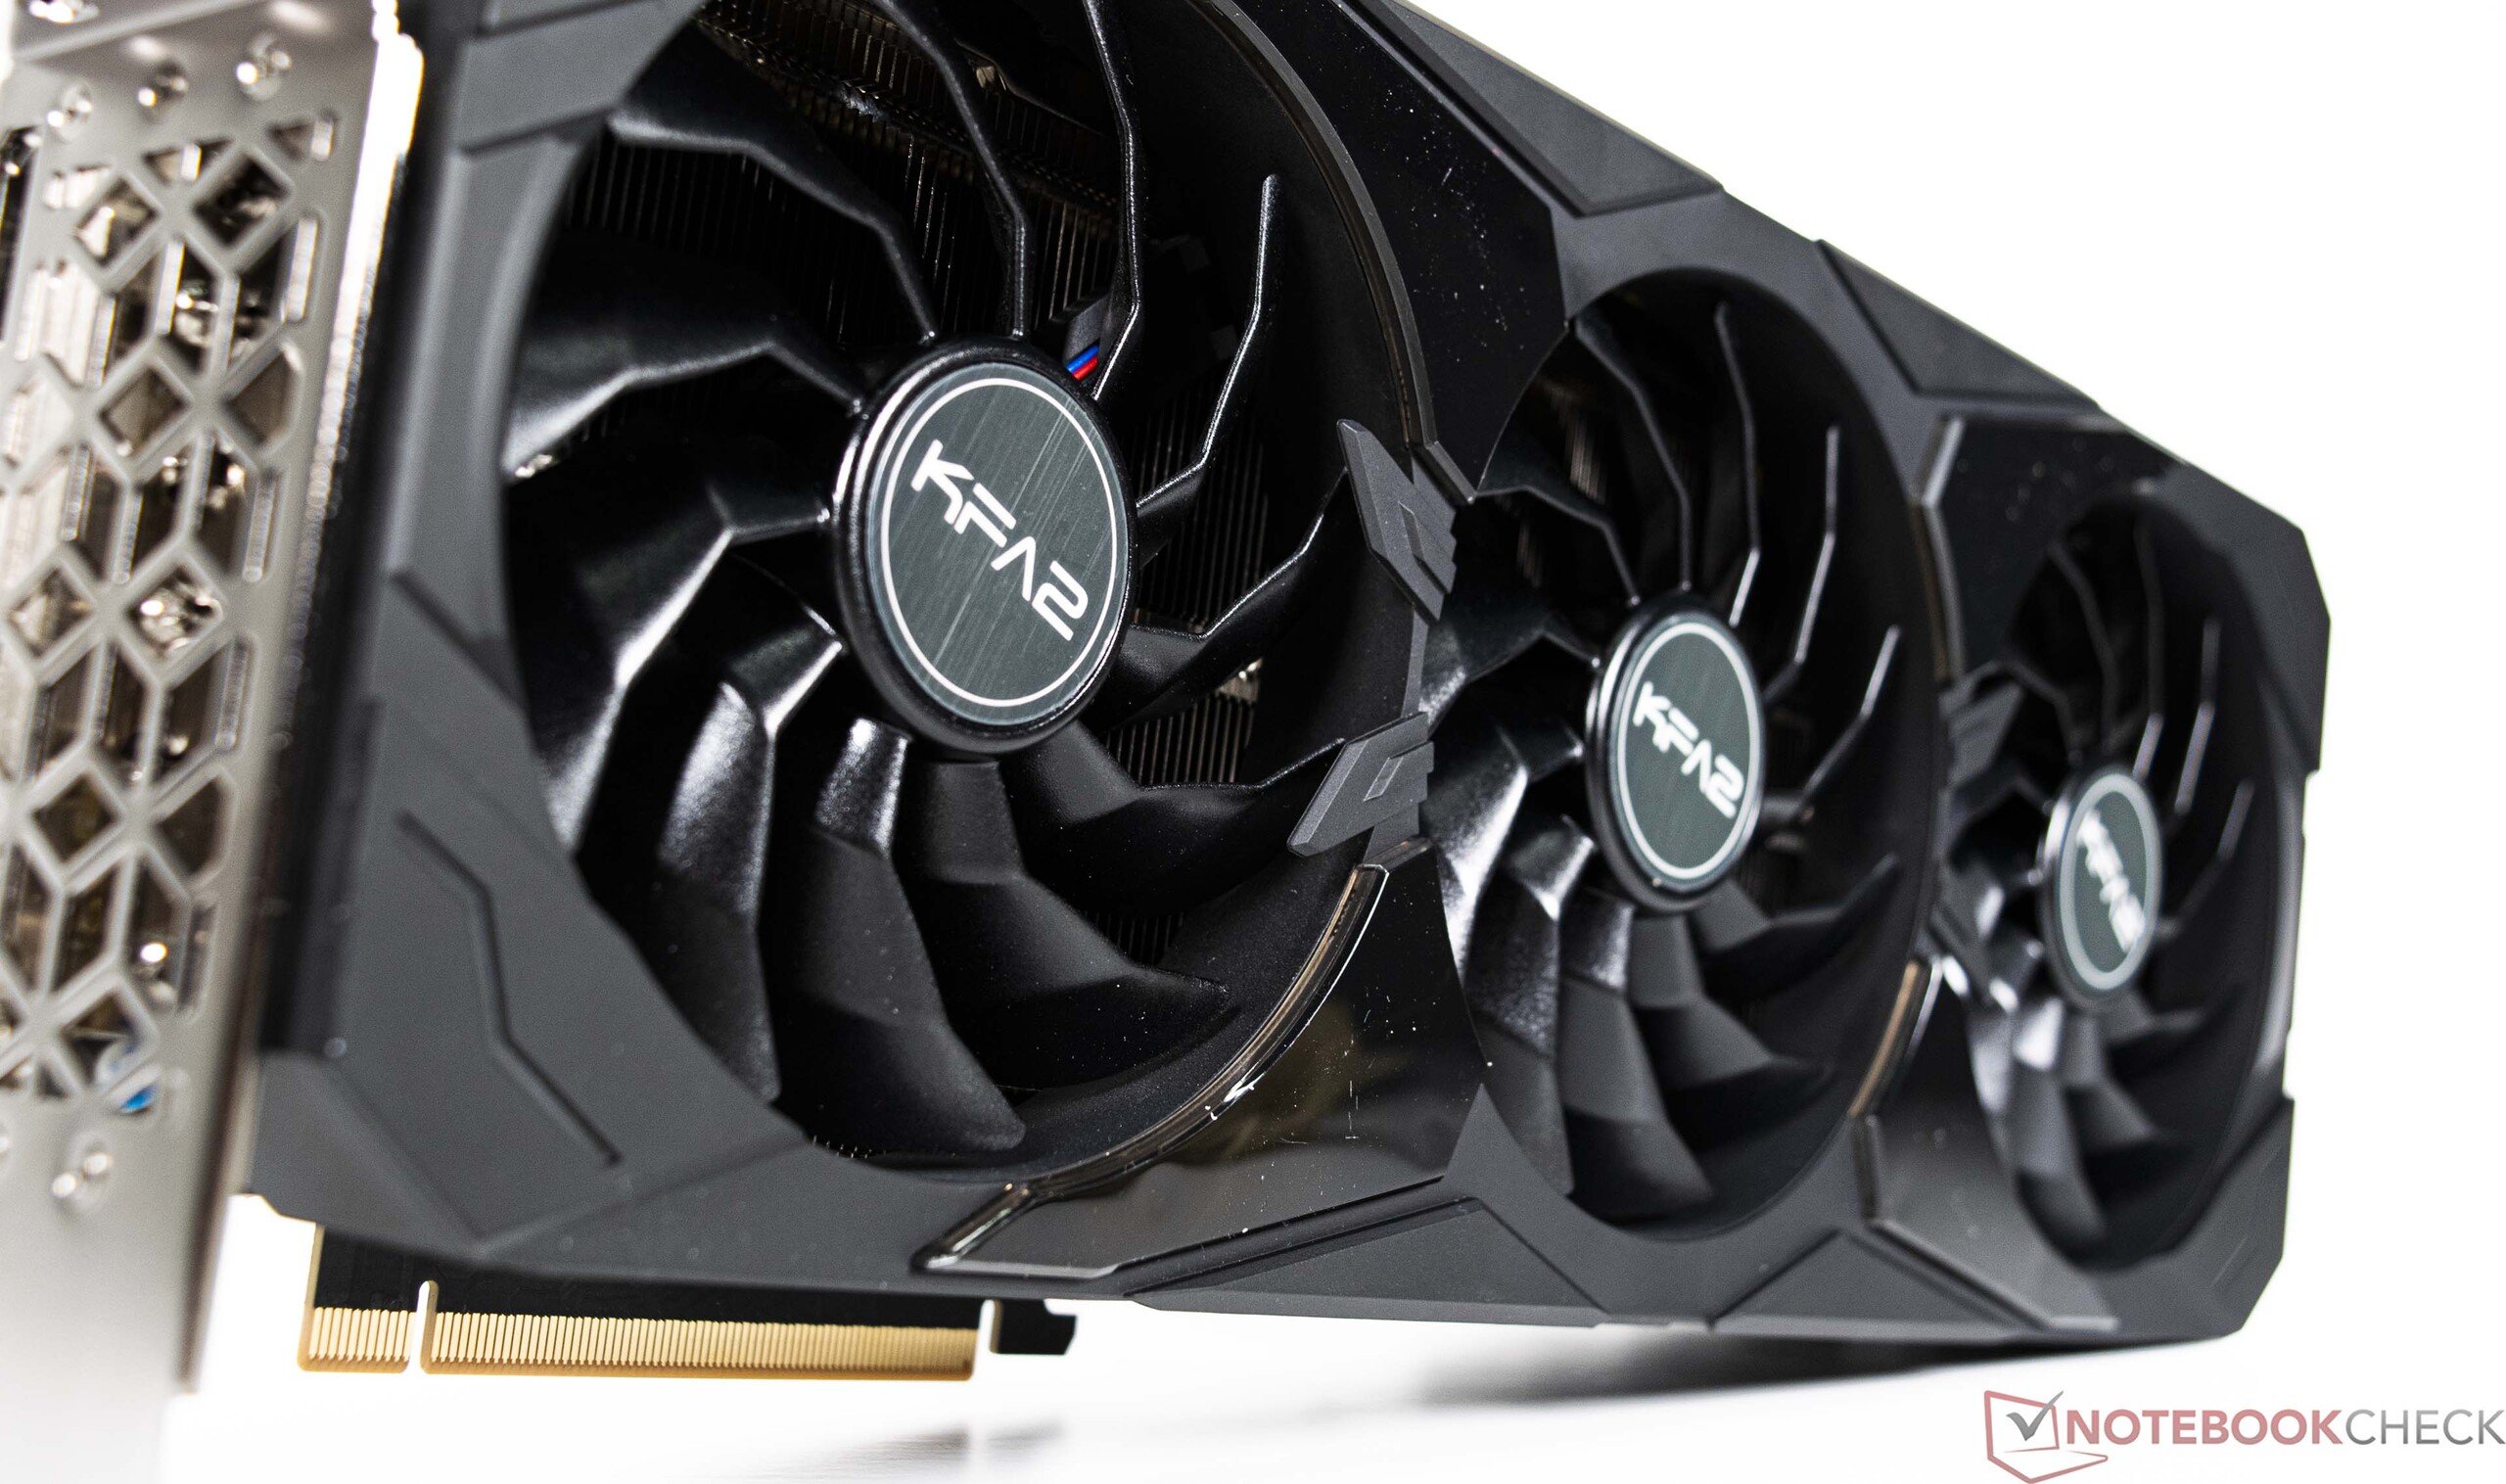
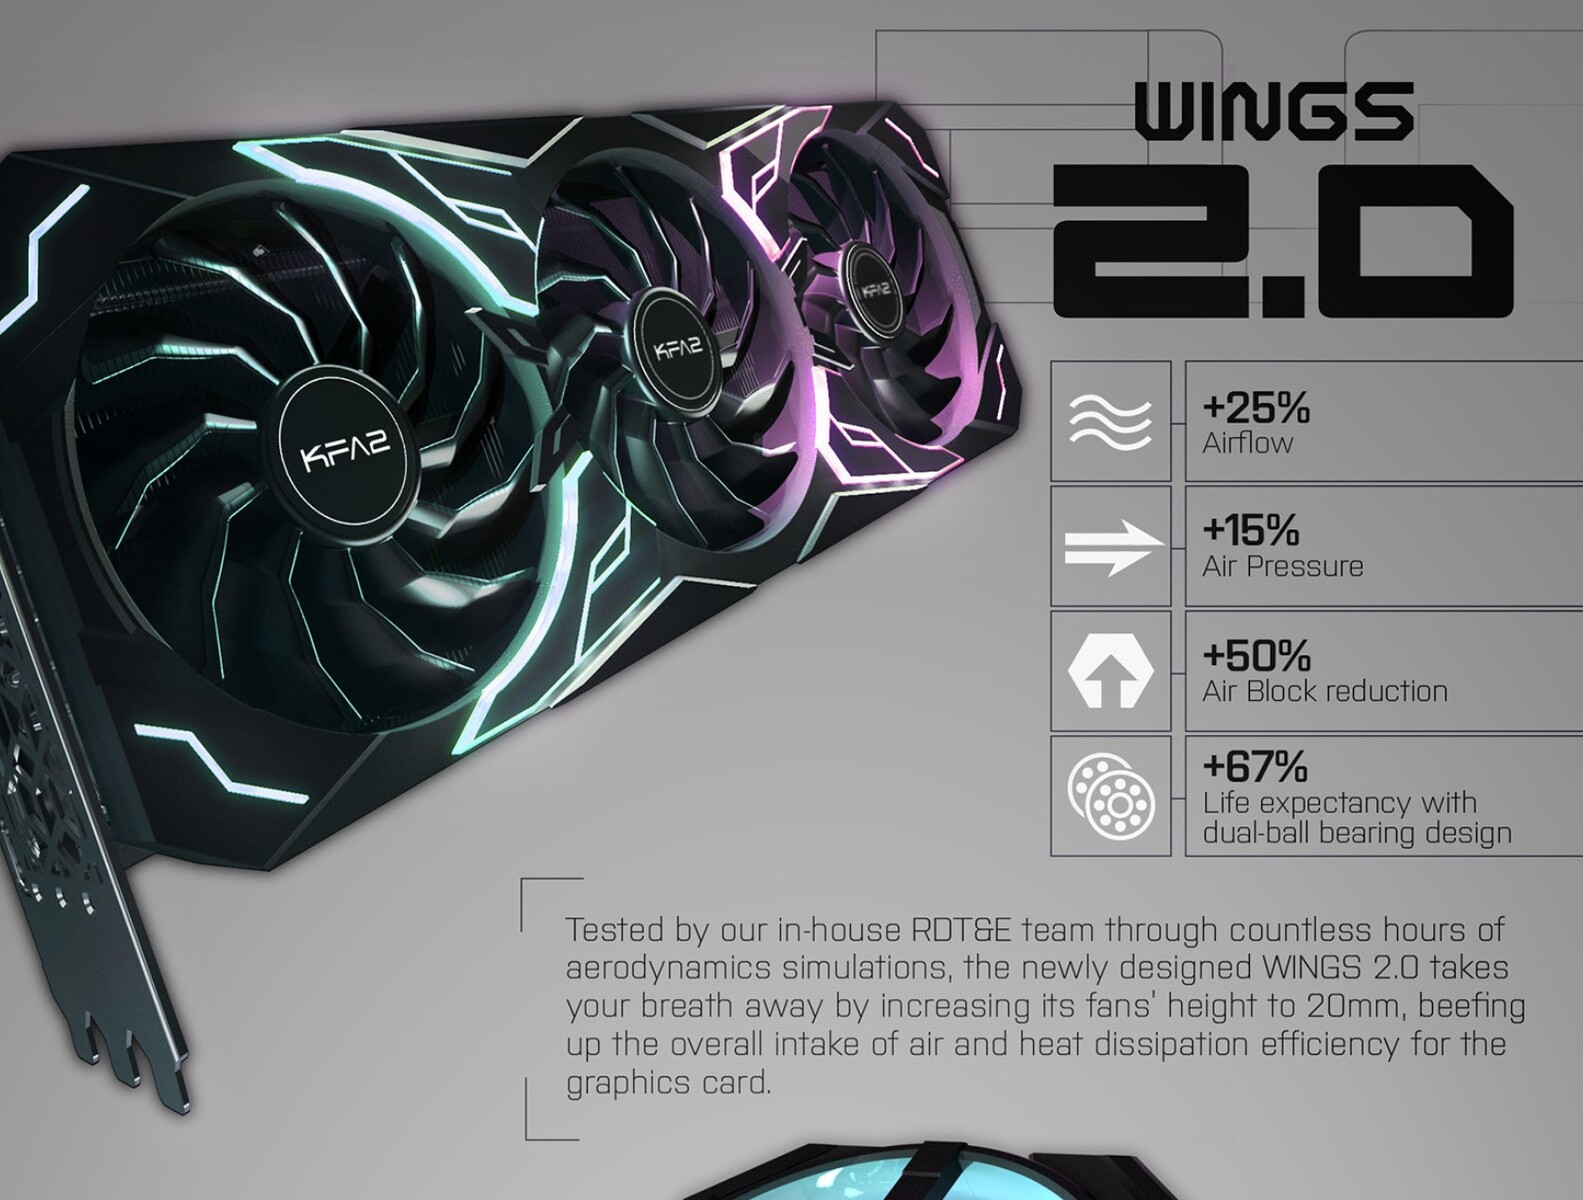
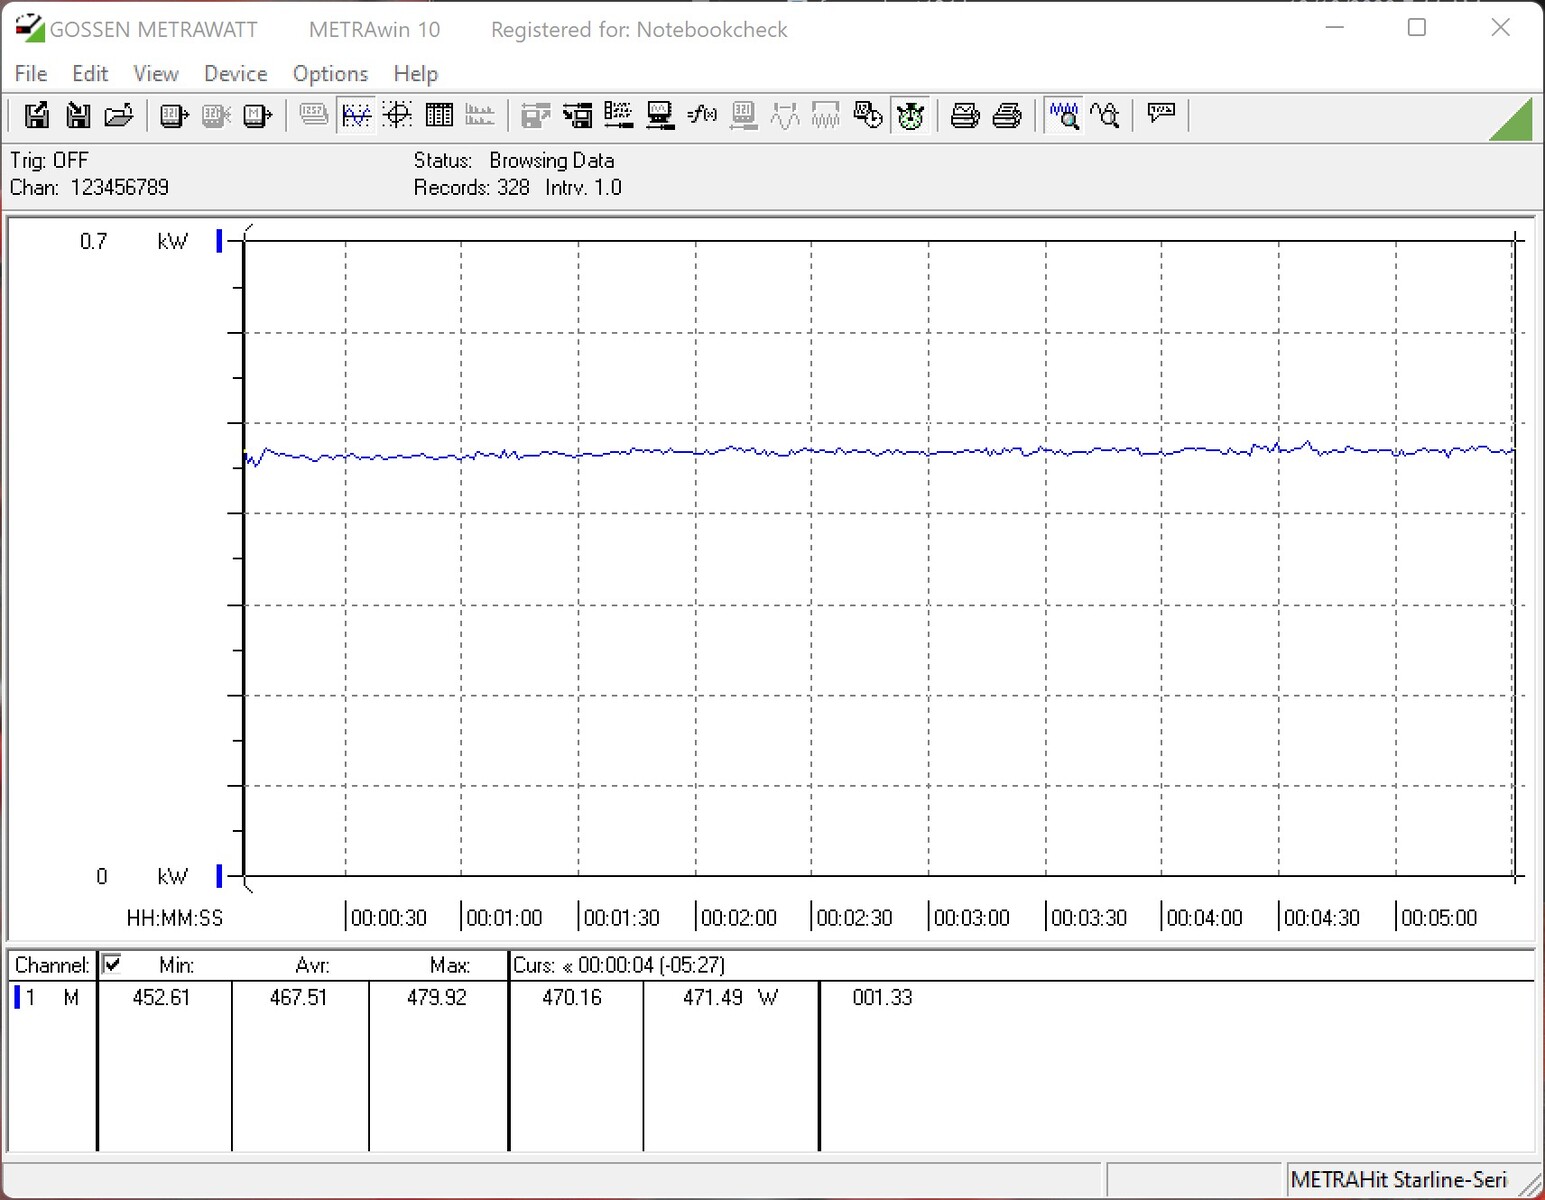
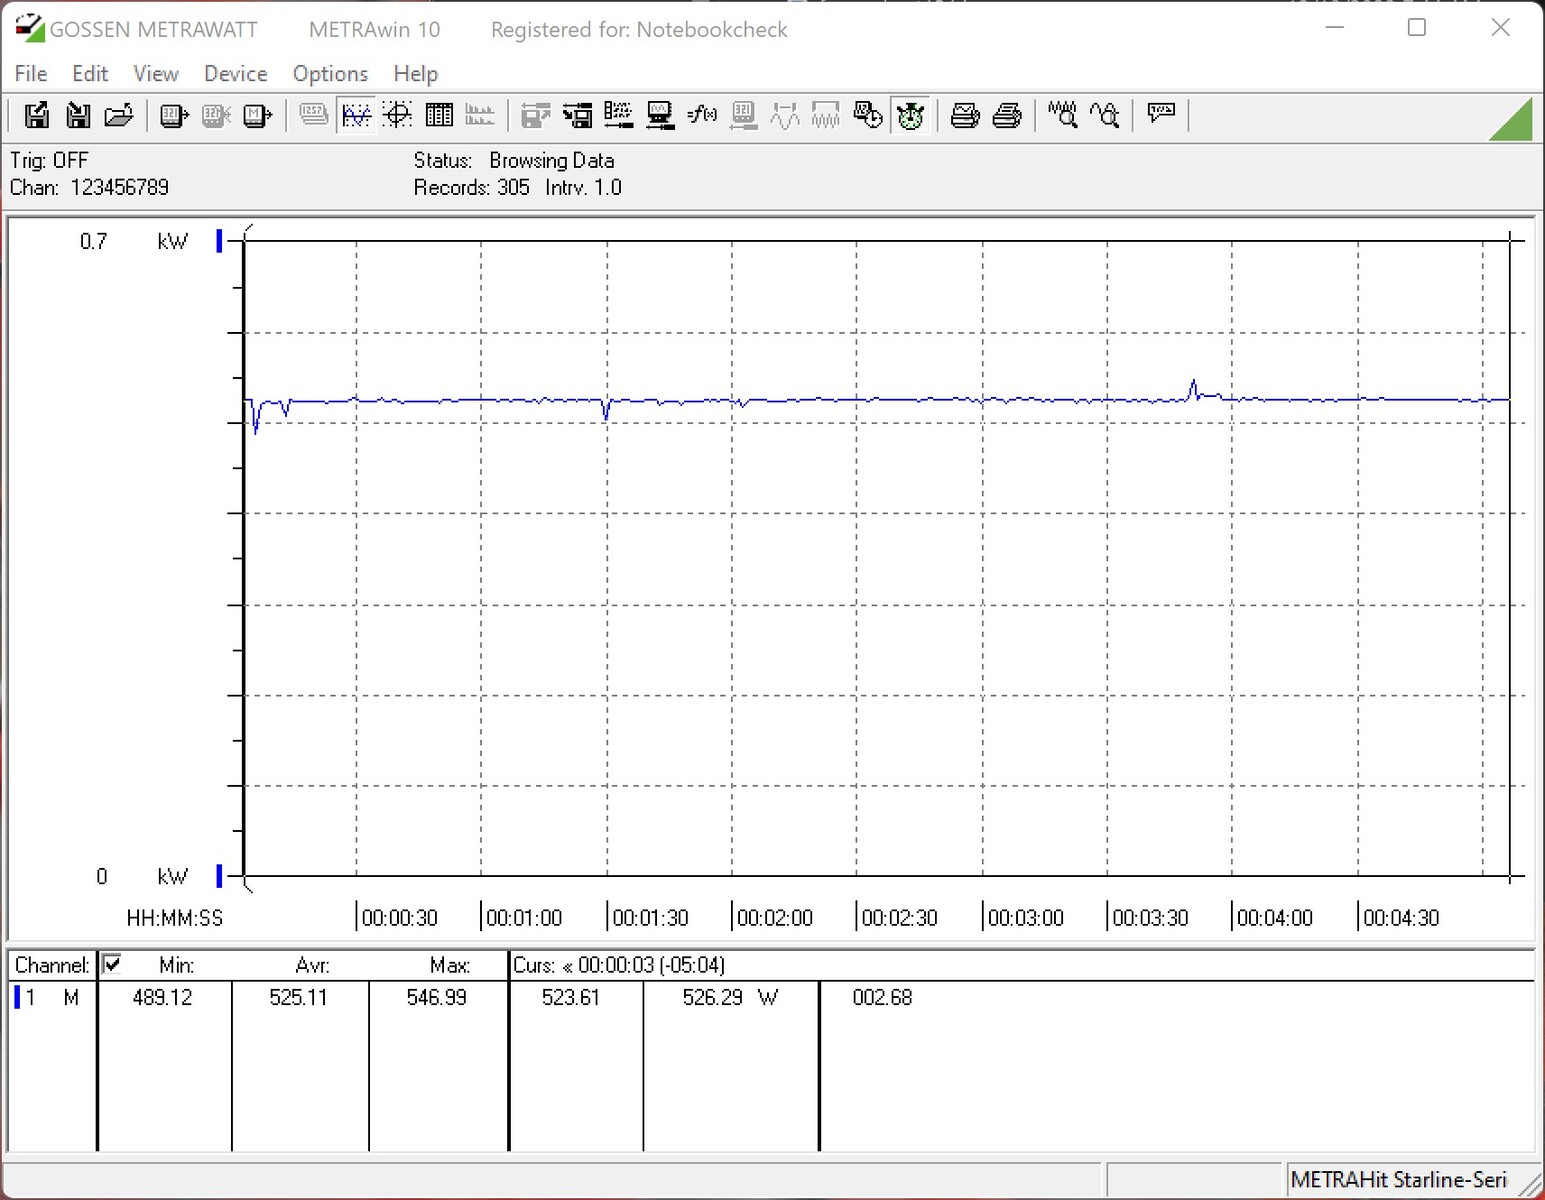
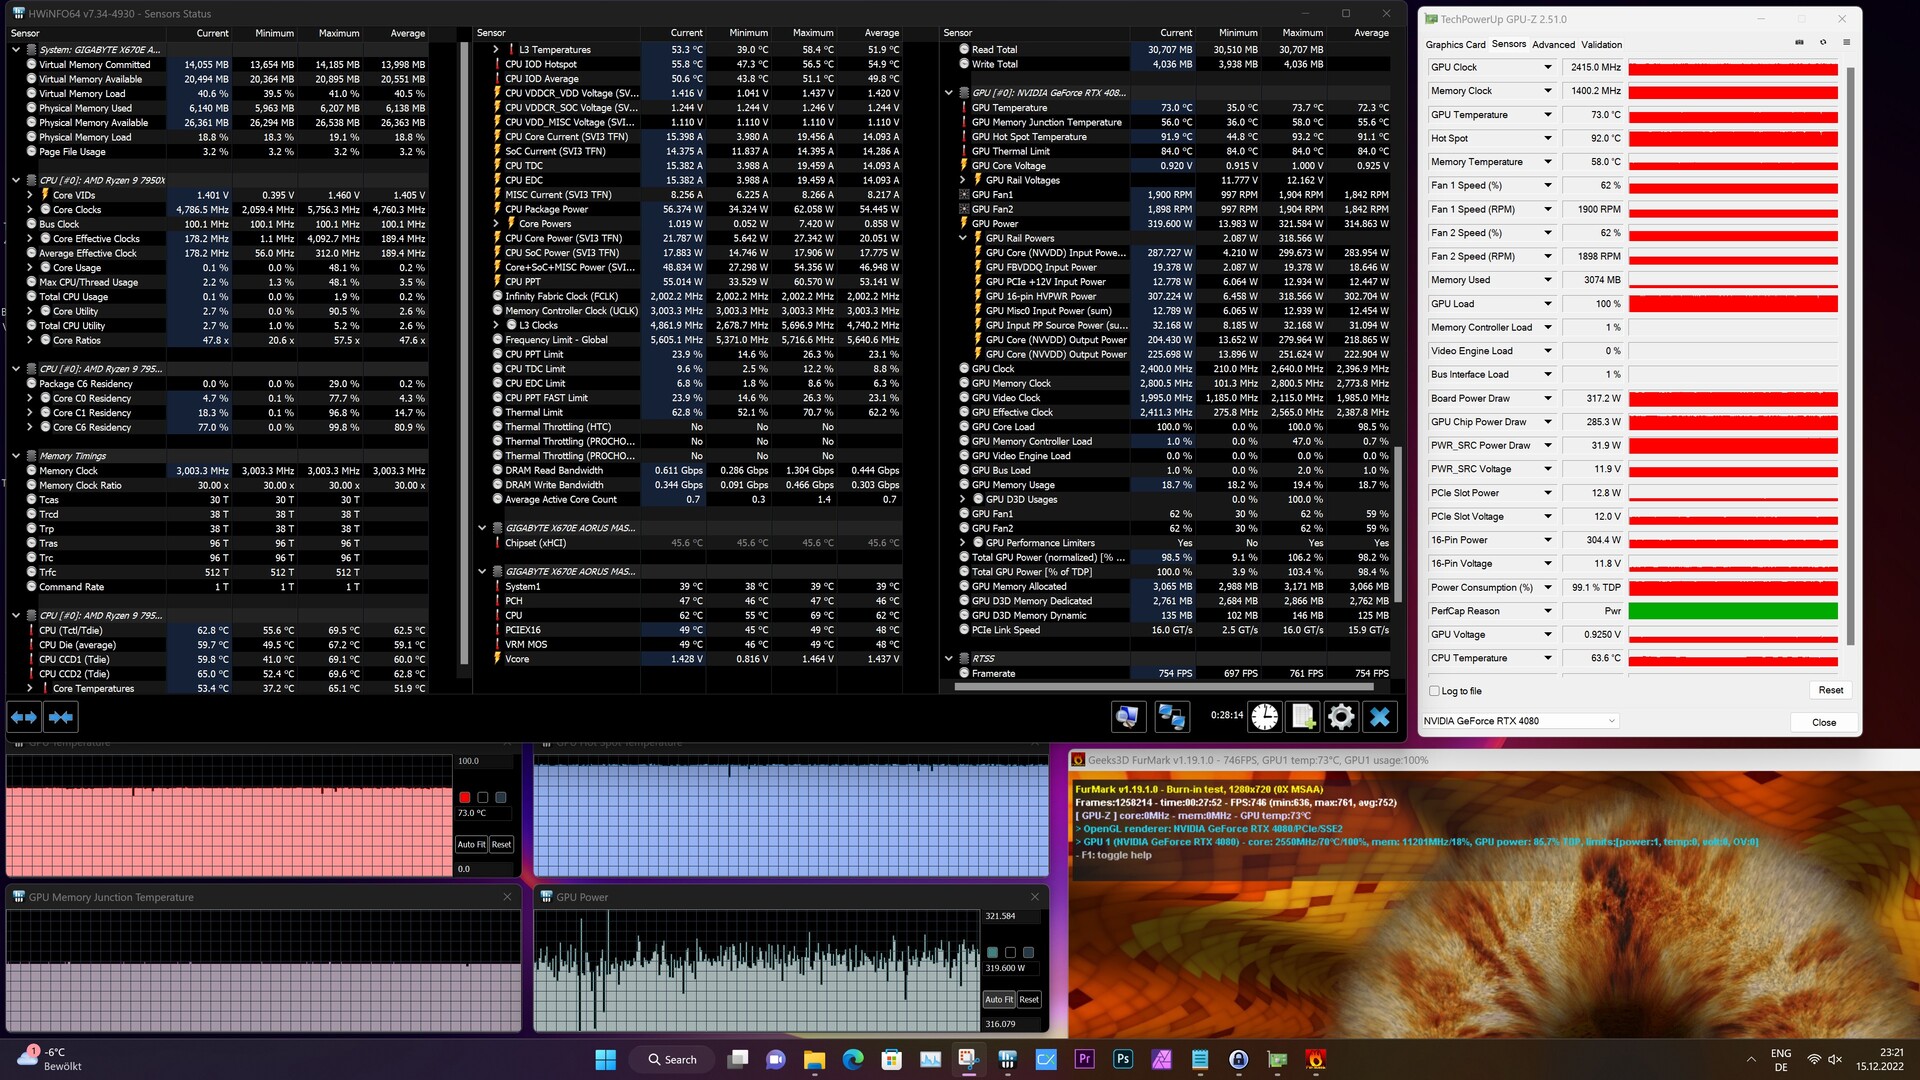
Beim Stresstest erreicht die KFA2 GeForce RTX 4080 SG problemlos die 320 Watt, und bei der GPU-Temperatur notieren wir etwa 74 °C. Die Hot-Spot-Temperatur des Grafikchips beträgt unter Last jedoch 93 °C. Der VRAM bleibt mit 58 °C erstaunlich kühl. Die KFA2 GeForce RTX 4080 SG vertraut dabei auf einen großen Kühlkörper mit drei 102 Millimetern Axiallüftern. Optional kann auf der Rückseite noch ein weiterer 102-Millimeter-Lüfter installiert werden. Leider ist die Kompatibilität mit unserem Mainboard nicht gegeben, sodass wir diesen im Test nicht nutzen konnten. Mit einem gemessenen Schalldruckpegel von 42 dB(A) erzeugen die Lüfter ein leises Rauschen, welches auch aus einem geschlossenen System zu hören ist. Bei erhöhtem Power-Limit (420 Watt) steigt die gemessene Lautstärke der Grafikkarte auf 43 dB(A) an. Beim Spielen (The Wicher 3, 1.080p, Ultra Preset) messen wir in unserem Aufbau angenehme 36 dB(A). Zudem konnten wir kein nerviges Spulenfiepen feststellen.

Bei der Energieaufnahme hinterlässt die KFA2 GeForce RTX 4080 SG einen guten Eindruck und duelliert sich mit der AMD Radeon RX 7900 XT, welche deutlich weniger Leistung bietet. Die ebenfalls von uns getestete KFA2 GeForce RTX 3080 SG benötigte ebenfalls mehr Energie unter Last. Verglichen mit der KFA2 GeForce RTX 4090 SG ist die kleinere Ada-Lovelace-Grafikkarte 30 Prozent sparsamer. Gleichwohl muss aber auch erwähnt werden, dass die GeForce RTX 4090 mit 450 Watt beziffert ist und nochmals deutlich mehr Leistung bietet.

Die Netzteilempfehlung des Herstellers ist mit 750 Watt angegeben. Dabei bezieht man sich auf ein System auf Basis eines AMD Ryzen 9 5900X. Wer jedoch ein Ryzen 9 der 7000er-Generation oder ein Intel-Raptor-Lake-System als Basis nutzt, sollte den höheren Energiebedarf der Prozessoren unter Last beachten. Aus diesem Grund in unserer Empfehlung ein 850-Watt-Netzteil.

Lautstärkediagramm

Idle
30.9 / 30.9 / 30.9 dB(A)
Last
31 / 42.1 dB(A)
  red to green bar
 
 
30 dB
leise
40 dB(A)
deutlich hörbar
50 dB(A)
störend
 
min: dark, med: mid, max: light   Earthworks M23R, Arta (aus 15 cm gemessen)   Umgebungsgeräusche: 30.4 dB(A)
dB(A) 0102030405060708090Deep BassMiddle BassHigh BassLower RangeMidsHigher MidsLower HighsMid HighsUpper HighsSuper Highs2033.331.232.53233.931.533.32532.433.631.130.729.631.732.4313131.731.329.63030.6314029.329.429.328.530.730.329.35028.934.234.233.533.432.928.96328.327.727.827.927.927.728.38028.326.126.428.829.126.928.310027.72625.625.324.526.827.712525.425.224.924.523.724.425.416025.125.123.823.323.62425.120025.724.222.822.822.522.425.725025.524.521.422.821.121.225.531524.822.620.221.320.821.324.840024.721.519.82020.520.124.750023.620.619.219.719.21923.663023.820.318.618.919.118.923.880025.52118.418.31818.225.5100026.422.117.917.317.817.226.4125028.920.817.416.917.216.928.91600312116.816.817.316.931200032.623.816.616.517.316.532.6250031.520.516.816.616.916.331.5315030.221.116.316.51816.130.240002919.716.416.417.416.629500028.517.316.716.717.116.528.563002417.116.716.81716.624800019.917.116.916.917.116.819.91000018.217.417.217.217.117.118.21250017.817.717.517.617.417.417.81600018.118.3181817.917.918.1SPL40.832.729.629.629.929.540.8N3.31.81.31.31.31.33.3median 25.5median 21median 17.9median 17.6median 17.9median 17.4median 25.5Delta3.52.82.32.31.82.33.5hearing rangehide median Fan NoiseKFA2 GeForce RTX 4080 SG
Stromverbrauch Testsystem (Idle)
Stromverbrauch Testsystem (FurMark PT 100 Prozent)
Stromverbrauch Testsystem (FurMark PT 131 Prozent)
Stromverbrauch Testsystem (beim Spielen - The Witcher 3, Ultra Preset)
Stresstest FurMark (PT 100 Prozent)
Power Consumption / The Witcher 3 ultra (external Monitor)
MSI Radeon RX 6950 XT Gaming X Trio
MSI Radeon RX 6950 XT Gaming X Trio, AMD Ryzen 9 7950X (Idle: 79.6 W)
610 (607min, 608P1 - 618max) Watt * -32%
Sapphire AMD Radeon RX 6950 XT Nitro+ Pure
Sapphire AMD Radeon RX 6950 XT Nitro+ Pure, AMD Ryzen 9 5900X
589 (583min, 584P1 - 598max) Watt * -28%
AMD Ryzen 7 5800X3D
AMD Ryzen 7 5800X3D, AMD Ryzen 7 5800X3D (Idle: 102 W)
561 (533min, 542P1 - 582max) Watt * -22%
KFA2 GeForce RTX 4090 SG
KFA2 GeForce RTX 4090 SG, AMD Ryzen 9 7950X
546 (526min, 532P1 - 564max) Watt * -18%
AMD Radeon RX 7900 XTX
AMD Radeon RX 7900 XTX, AMD Ryzen 9 7950X (Idle: 86.5 W)
540 (527min, 530P1 - 564max) Watt * -17%
NVIDIA GeForce RTX 3090 Founders Edition
NVIDIA GeForce RTX 3090 Founders Edition, AMD Ryzen 9 7950X
538 (532min, 532P1 - 570max) Watt * -17%
ASUS TUF Gaming GeForce RTX 3080 Ti OC
ASUS TUF Gaming GeForce RTX 3080 Ti OC, AMD Ryzen 9 7950X (Idle: 78.2 W)
528 (511min, 523P1 - 549max) Watt * -15%
KFA2 GeForce RTX 3080 SG
KFA2 GeForce RTX 3080 SG, AMD Ryzen 9 5900X
518 (509min, 510P1 - 539max) Watt * -12%
AMD Radeon RX 6900 XT
AMD Radeon RX 6900 XT, AMD Ryzen 9 5950X (Idle: 99.15 W)
488.3 (459.99min - 512.79max) Watt * -6%
KFA2 GeForce RTX 4080 SG
KFA2 GeForce RTX 4080 SG, AMD Ryzen 9 7950X (Idle: 86.4 W)
461 (450min, 453P1 - 476max) Watt *
AMD Radeon RX 7900 XT
AMD Radeon RX 7900 XT, AMD Ryzen 9 7950X (Idle: 84.6 W)
459 (451min, 453P1 - 488max) Watt * -0%
Power Consumption / FurMark 1.19 GPU Stress Test (external Monitor)
KFA2 GeForce RTX 4090 SG
KFA2 GeForce RTX 4090 SG, AMD Ryzen 9 7950X
618 (593min, 605P1 - 652max) Watt * -32%
MSI Radeon RX 6950 XT Gaming X Trio
MSI Radeon RX 6950 XT Gaming X Trio, AMD Ryzen 9 7950X (Idle: 79.6 W)
604 (579min, 587P1 - 627max) Watt * -29%
Sapphire AMD Radeon RX 6950 XT Nitro+ Pure
Sapphire AMD Radeon RX 6950 XT Nitro+ Pure, AMD Ryzen 9 5900X
564 (525min, 551P1 - 601max) Watt * -21%
AMD Radeon RX 7900 XTX
AMD Radeon RX 7900 XTX, AMD Ryzen 9 7950X (Idle: 86.5 W)
518 (501min, 502P1 - 525max) Watt * -11%
NVIDIA GeForce RTX 3090 Founders Edition
NVIDIA GeForce RTX 3090 Founders Edition, AMD Ryzen 9 7950X
516 (512min, 514P1 - 541max) Watt * -10%
ASUS TUF Gaming GeForce RTX 3080 Ti OC
ASUS TUF Gaming GeForce RTX 3080 Ti OC, AMD Ryzen 9 7950X (Idle: 78.2 W)
513 (500min, 506P1 - 527max) Watt * -10%
AMD Radeon RX 7900 XT
AMD Radeon RX 7900 XT, AMD Ryzen 9 7950X (Idle: 84.6 W)
513 (500min, 506P1 - 527max) Watt * -10%
KFA2 GeForce RTX 3080 SG
KFA2 GeForce RTX 3080 SG, AMD Ryzen 9 5900X
487 (475min, 477P1 - 501max) Watt * -4%
KFA2 GeForce RTX 4080 SG
KFA2 GeForce RTX 4080 SG, AMD Ryzen 9 7950X (Idle: 86.4 W)
468 (453min, 459P1 - 480max) Watt *
AMD Radeon RX 6900 XT
AMD Radeon RX 6900 XT, AMD Ryzen 9 5950X (Idle: 99.15 W)
456.8 (378.13min - 484.67max) Watt * +2%

* ... kleinere Werte sind besser

Energieaufnahme mit externem Monitor

0255075100125150175200225250275300325350375400425450475Tooltip
KFA2 GeForce RTX 4080 SG; 1280x720 FurMark 1.19 GPU Stress Test (external Monitor): Ø468 (453-480)
KFA2 GeForce RTX 4080 SG; 1920x1080 The Witcher 3 ultra (external Monitor): Ø461 (450-476)
KFA2 GeForce RTX 4080 SG; Idle 1min (external Monitor): Ø86.3 (82.2-118.8)

Pro

+ hohe 3D-Performance
+ großer Leistungssprung zur Vorgängergeneration bei gleicher TDP
+ moderne 4 nm Architektur
+ 16-GB-VRAM + DLSS 3.0 inklusive Frame Generation
+ Fan-Stop-Mode
+ tolles Design
+ ansprechendes Design
+ optionaler 4. Lüfter
+ stabiler GPU-Halter mit RGB-Beleuchtung

Contra

- ungünstige Position des Stromanschlusses
- sehr groß (Gehäusekompatibilität beachten)
- kein DisplayPort 2.1
- zu teuer

Fazit - Viel Leistung trifft auf viel RGB

KFA2 GeForce RTX 4080 SG im Test: zur Verfügung gestellt von KFA2 Deutschland

Die KFA2 GeForce RTX 4080 SG ist durchweg eine sehr schnelle Grafikkarte und eignet sich für anspruchsvolles Gaming ohne Kompromisse. Gegenüber der Nvidia GeForce RTX 3080 konnte die Leistung bei gleicher Leistungsaufnahme merklich gesteigert werden. Vor allem bei aktiviertem Raytracing sind die Vorteile der neuen Grafikkartengeneration spürbar. Im Zusammenspiel mit DLSS 3.0 inklusive Frame Generation lassen sich selbst aktuelle Spiele in 2.160p mit aktivierten Raytracing-Effekten flüssig spielen. Leider wird hierfür zwingend eine GeForce RTX 4080 oder eine GeForce RTX 4090 benötigt. Alle Nutzer einer älteren Nvidia Grafikkarte bleiben außen vor.

Das getestete Modell aus dem Hause KFA2 bietet ein eigens entwickeltes Design und ist mit einem massiven Kühler ausgestattet. Dieser performt im Test erstaunlich gut und kühlt die Grafikkarte im 2D-Betrieb dank Fan-Stop-Mode sogar lautlos. Mit 320 Watt benötigt die Grafikkarte viel Energie, wenngleich wir uns hier aber noch in einem vertretbaren Rahmen bewegen. Eine stetige Erhöhung der Leistungsaufnahme ist unserer Ansicht nach nicht der richtige Weg.

Die KFA2 GeForce RTX 4080 SG ist eine tolle Grafikkarte und überzeugt voll und ganz mit einer hohen Spieleleistung. Der sehr große Kühler zieht dank viel RGB-Beleuchtung die Blicke auf sich.

Die Stromversorgung der Grafikkarte wird über einen 12VHPWR-Anschluss realisiert. Über diesen kann man geteilter Meinung sein, dennoch haben wir auch weiterhin keine Probleme gehabt. Einzig die Positionierung des 12VHPWR-Anschlusses ist unserer Ansicht nach nicht optimal gewählt. Durch die enorme Höhe der Grafikkarte über dem PCIe-Steckplatz muss aufgrund des großen Stromadapters, welcher nicht direkt an der Grafikkarte geknickt werden sollte, genügend Platz einplant werden. Damit kann es in vielen Gehäusen zu Platzproblemen kommen. 

Als Kontrahenten der KFA2 GeForce RTX 4080 SG sehen wir AMDs aktuelle Radeon-RX-7900-Grafikkarten, wenn es um die reine Spielleistung ohne aktiviertes Raytracing geht. Oftmals rangiert unser Testsample genau zwischen der AMD Radeon RX 7900 XTX und der AMD Radeon RX 7900 XT. Aber wie immer kommt es auf das jeweilige Spiel an, welches mal auf AMD- und mal auf Nvidia Grafikkarten besser performt. Mit aktivierten Raytracing-Features ist die KFA2 GeForce RTX 4080 SG der AMD Radeon RX 7900 XTX deutlich überlegen. Wer also nicht auf diese Features verzichten will, muss sich mit Nvidia arrangieren.

Für die KFA2 GeForce RTX 4080 SG werden aktuell 1.379 Euro aufgerufen. Damit ist das Modell tatsächlich deutlich preiswerter als eine Nvidia GeForce RTX 3090 Ti (ca. 1.600 Euro), welche zudem schlechter abschneidet. AMDs Radeon RX 7900 XTX ist aktuell für 1.350 Euro zu bekommen, wenngleich das etwas langsamere Modell (AMD Radeon RX 7900 XT) mit 1.020 Euro zu Buche schlägt. Mit etwas Glück kann man das Topmodell im AMD Shop für 1.120 Euro ergattern. Auch diese Preise sehen wir aktuell sehr kritisch, denn viele Nutzer sind nicht gewillt, solche Summen für eine Grafikkarte auf den Tisch zu legen. 

Alle 2 Beträge lesen / Antworten
static version load dynamic
Die Kommentare zum Artikel werden geladen
Diesen Artikel kommentieren / Antworten
Teilen Sie diesen Artikel, um uns zu unterstützen. Jeder Link hilft!
> Notebook Test, Laptop Test und News > Tests > Sonstige Tests > KFA2 GeForce RTX 4080 SG Desktop-Grafikkarte im Test: Gute Leistung trifft auf fragwürdige Preisgestaltung
Autor: Sebastian Bade, 30.12.2022 (Update: 15.01.2023)