HP EliteBook 845 G7 Laptop-Test - Ryzen-Power für Unternehmen
Wir hatten kürzlich das HP EliteBook 845 G7 mit der Hexacore-CPU Ryzen 5 Pro 4650U, 8 GB Single-Channel-RAM und 250-Nit-Display-Panel-Option im Test. Dieses Mal wollen wir sehen, wie gut die preiswertere Konfiguration mit der Ryzen-7-Pro-4750U-CPU mit Okta-Kern, 16 GB Dual-Channel-RAM und 400-Nit-Panel-Option im Vergleich zum anderen Modell abschneidet. Welche Leistungs- und Displayunterschiede können Benutzer zwischen diesen beiden SKUs erwarten?
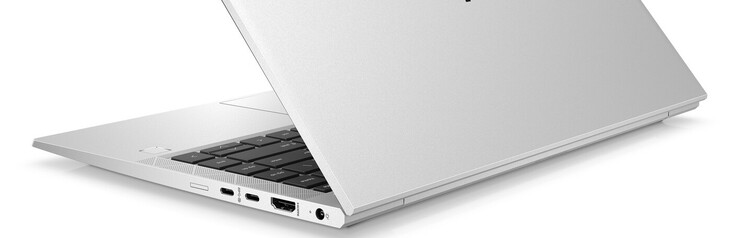
Unsere Testeinheit in der konfigurierten Ausführung ist im Einzelhandel für etwa $1300 oder mehr erhältlich. Wir empfehlen, sich auf unserer Website über die Ryzen-5-Konfiguration zu informieren, um mehr über die physischen Merkmale des Laptops, einschließlich der Tastatur, der Anschlussoptionen und der Wartungsfreundlichkeit zu erfahren.
Zu den Alternativen zum HP EliteBook 845 G7 gehören andere High-End-14-Zoll Business-Notebooks wie das Lenovo X1 Carbon und das Dell Latitude 7410 oder Prosumer-Notebooks wie das Huawei MateBook X Pro oder das Asus ZenBook S UX393.
Mehr HP Tests:
potential competitors in comparison
Bew. | Datum | Modell | Gewicht | Dicke | Größe | Auflösung | Preis ab |
|---|---|---|---|---|---|---|---|
| 88.2 % v7 (old) | 11 / 2020 | HP EliteBook 845 G7 Ryzen 7 Pro 4750U R7 PRO 4750U, Vega 7 | 1.4 kg | 17.9 mm | 14.00" | 1920x1080 | |
| 88.9 % v7 (old) | 11 / 2020 | Lenovo ThinkPad T14-20UES00H00 R5 PRO 4650U, Vega 6 | 1.5 kg | 17.9 mm | 14.00" | 1920x1080 | |
| 88.9 % v7 (old) | 08 / 2020 | Dell Latitude 7410 i7-10610U, UHD Graphics 620 | 1.4 kg | 19.3 mm | 14.00" | 3840x2160 | |
| 83.2 % v7 (old) | 07 / 2020 | HP ProBook 445 G7 175W4EA R5 4500U, Vega 6 | 1.6 kg | 18 mm | 14.00" | 1920x1080 | |
| 85.3 % v7 (old) | 08 / 2020 | Lenovo Yoga Slim 7-14ARE R7 4800U, Vega 8 | 1.4 kg | 14.9 mm | 14.00" | 1920x1080 | |
| 85.4 % v7 (old) | 11 / 2020 | Dynabook Portégé X40-G-10K i5-10210U, UHD Graphics 620 | 1.3 kg | 16.9 mm | 14.00" | 1920x1080 |
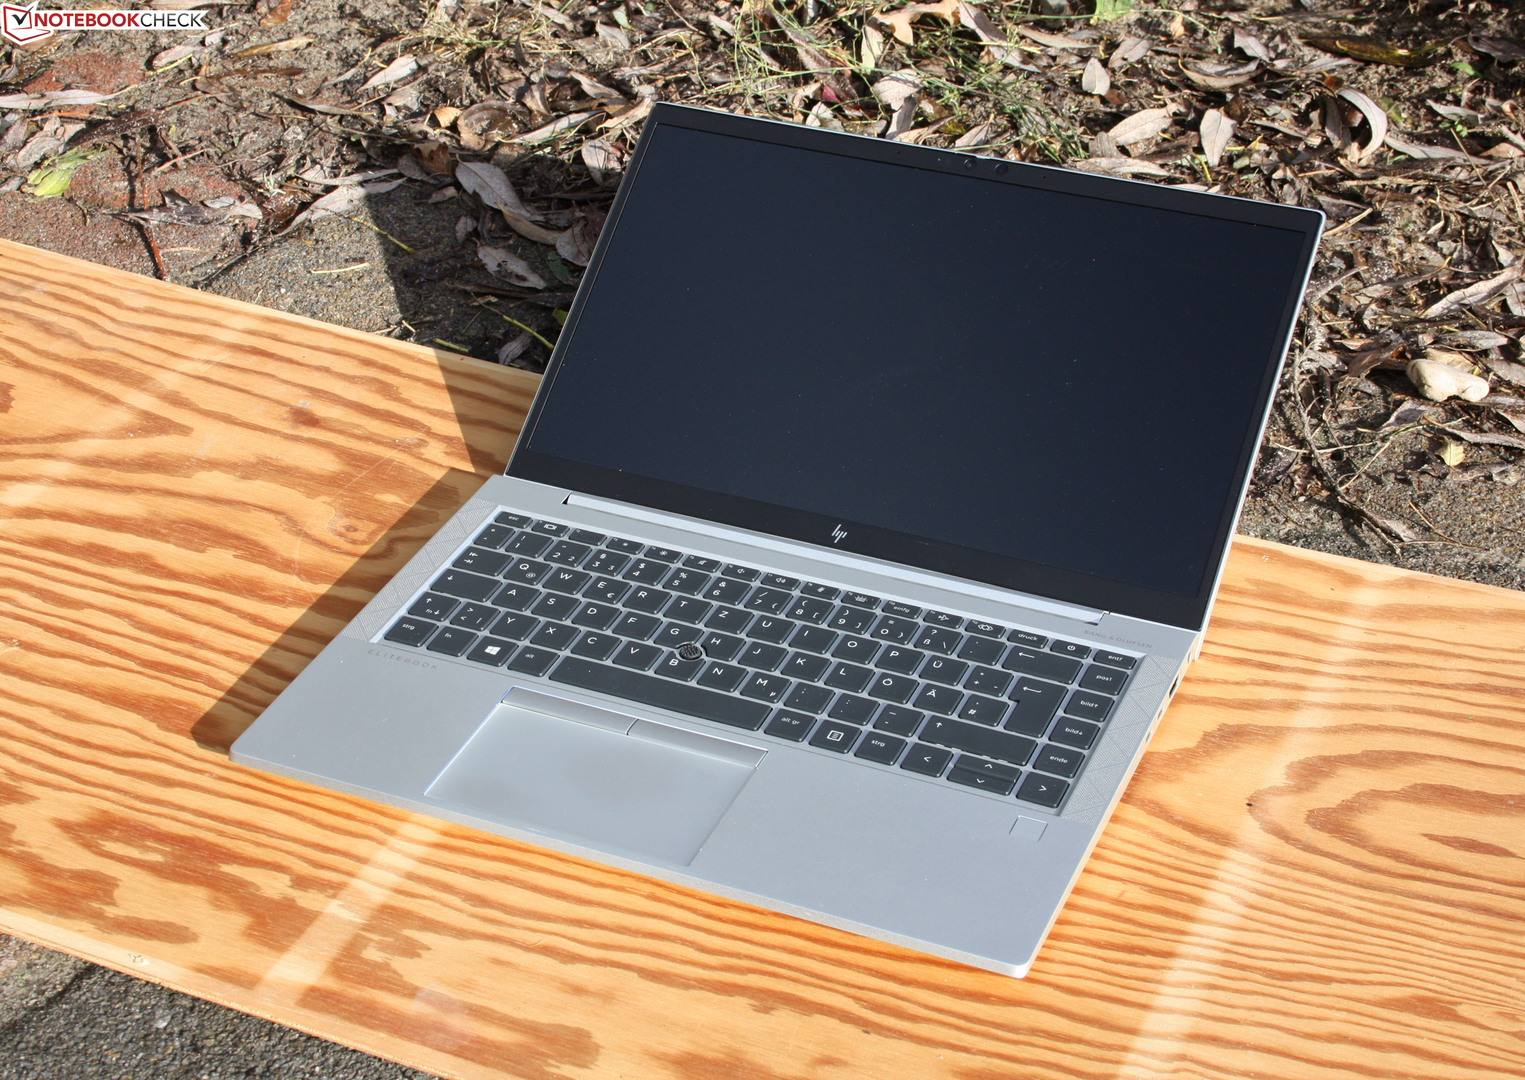
Gehäuse
Kommunikation
Webcam


Display
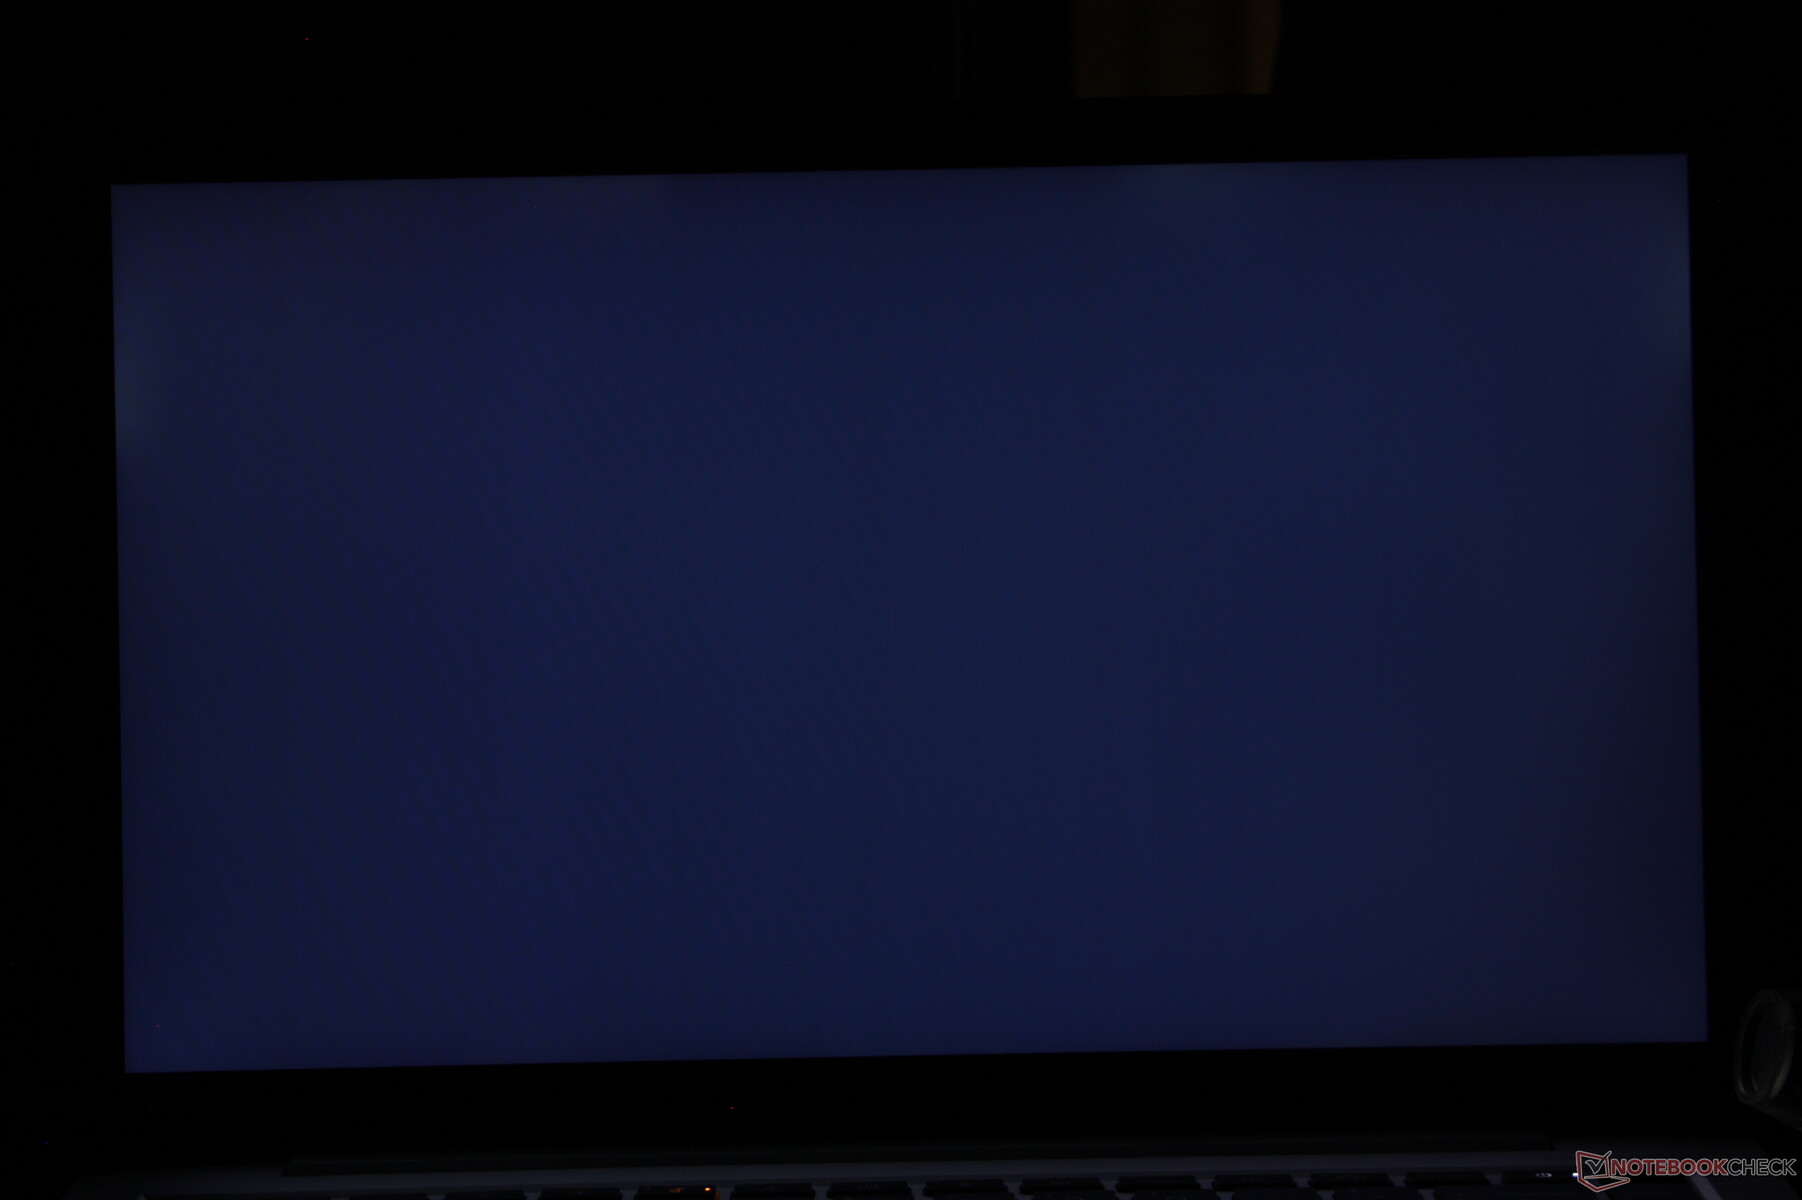
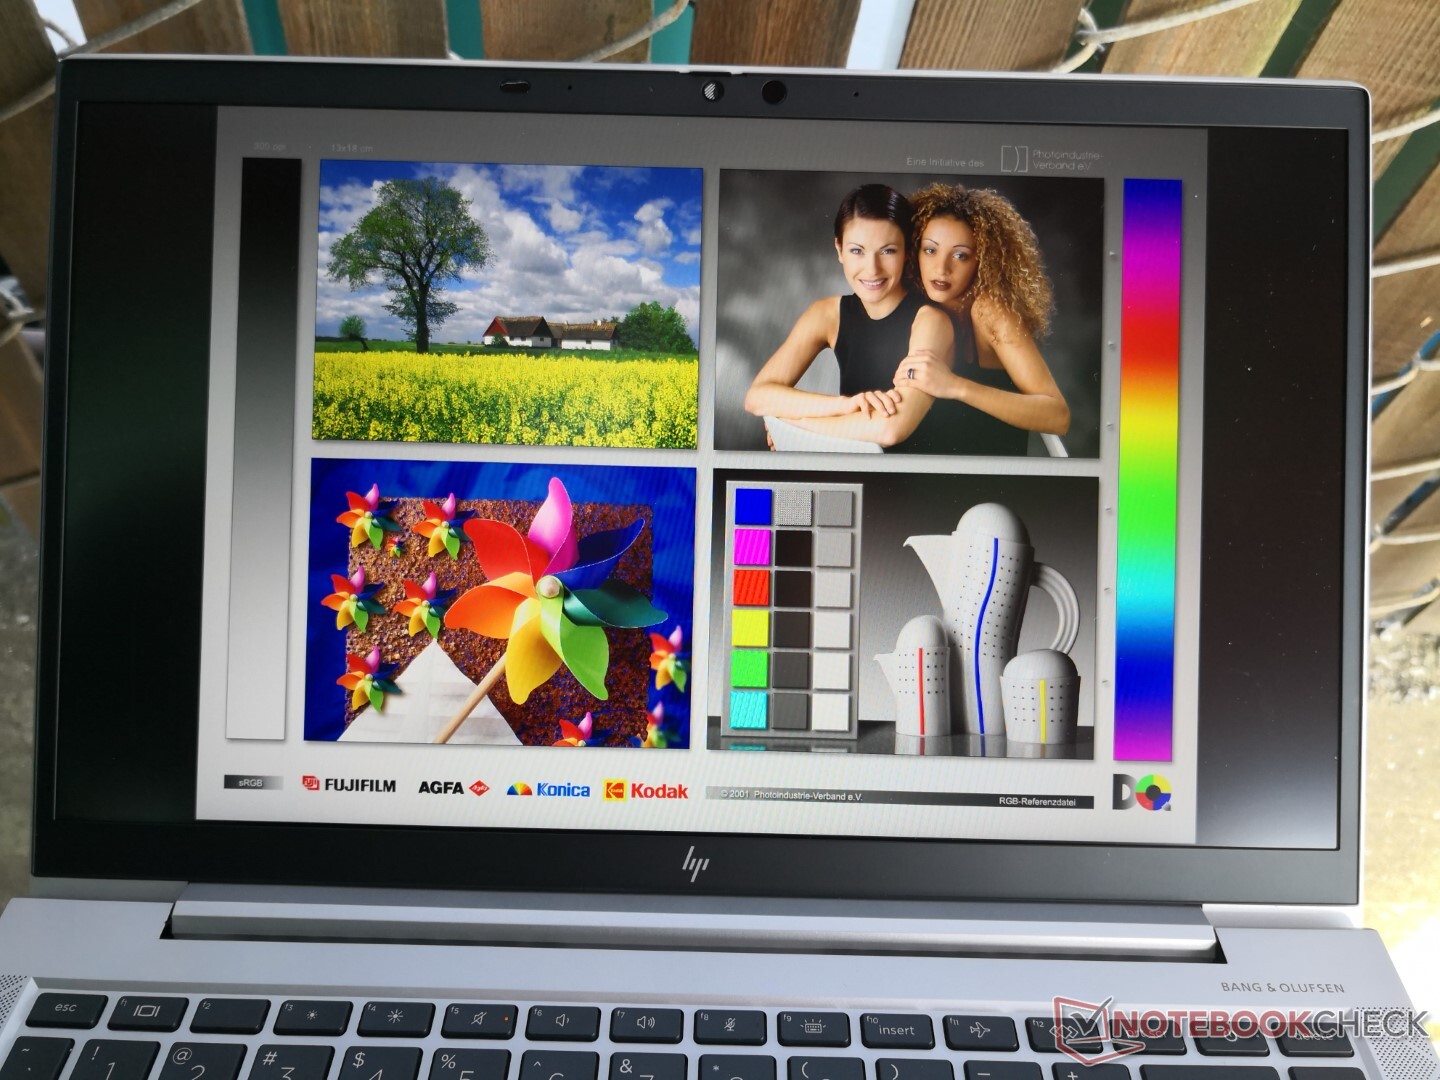
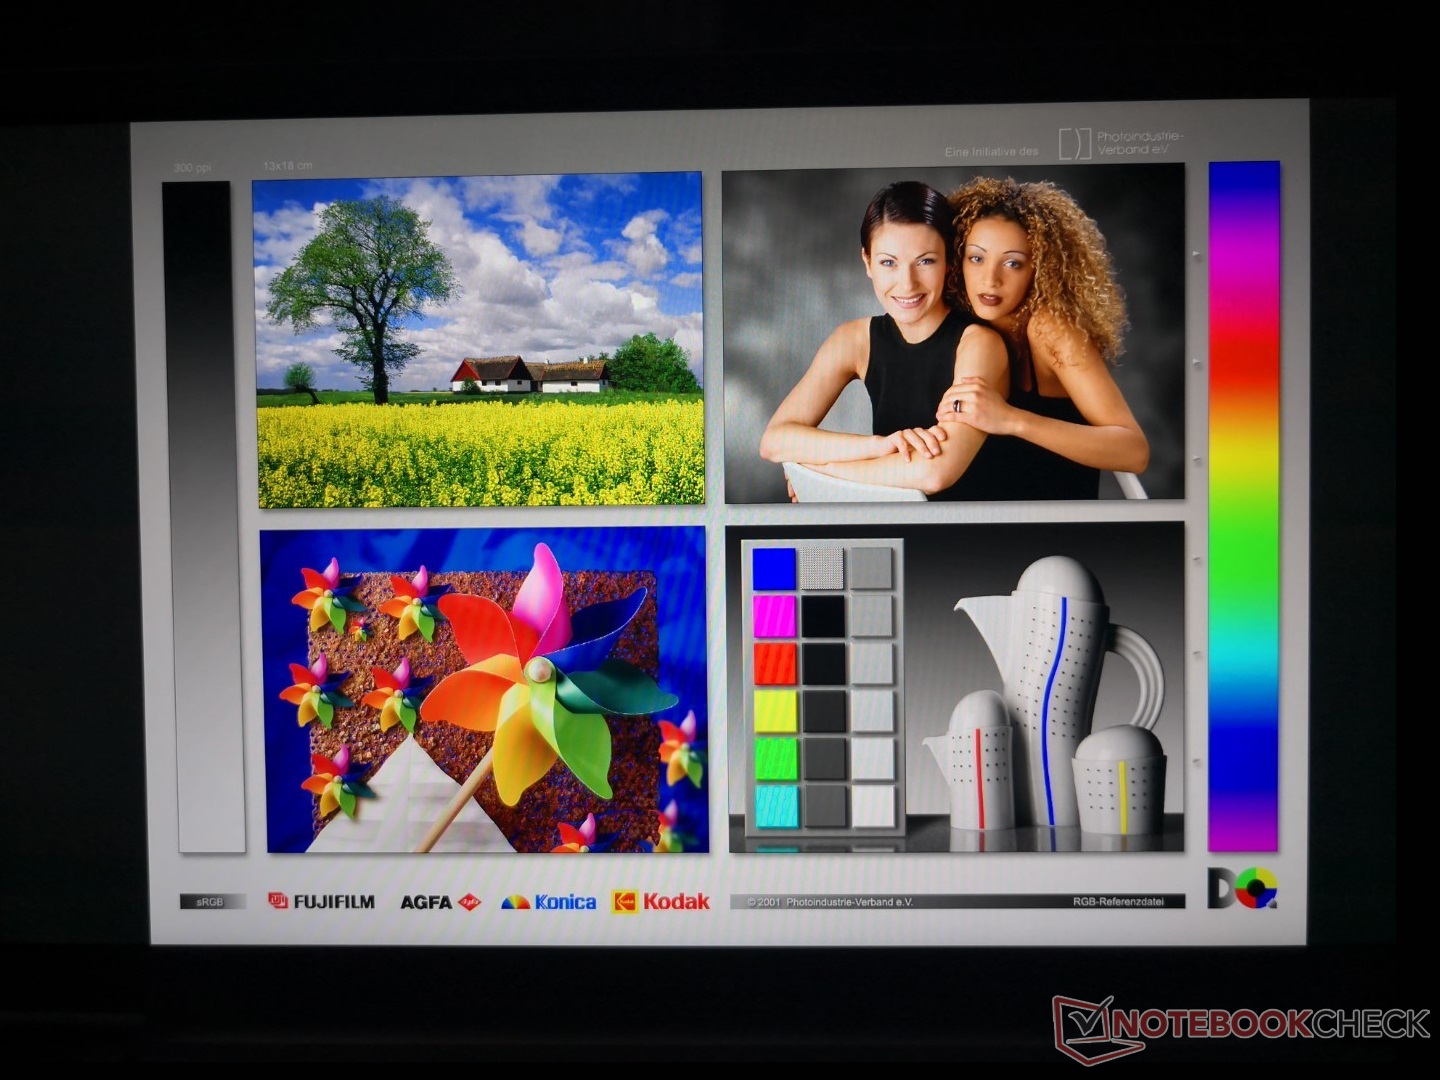
Unsere Konfiguration ist mit einem 400-Nit-AU-Optronics-Panel ausgestattet, im Gegensatz zu dem 250-Nit-LG-Philips-Panel unserer Ryzen-5-SKU. Dieses spezielle Panel ist nicht nur heller, sondern bietet auch bessere Farben und ein ähnliches Kontrastverhältnis von über 1000:1. Die Schwarz-zu-Weiß- und Grau-zu-Grau-Response-Zeiten sind jedoch langsamer, so dass ghosting hier deutlicher zu erkennen ist. Dennoch finden wir, dass sich dieser Kompromiss vor allem bei einem Office-Laptop lohnt, bei dem Farben und Helligkeit oft wichtiger sind als superschnelle Reaktionszeiten.
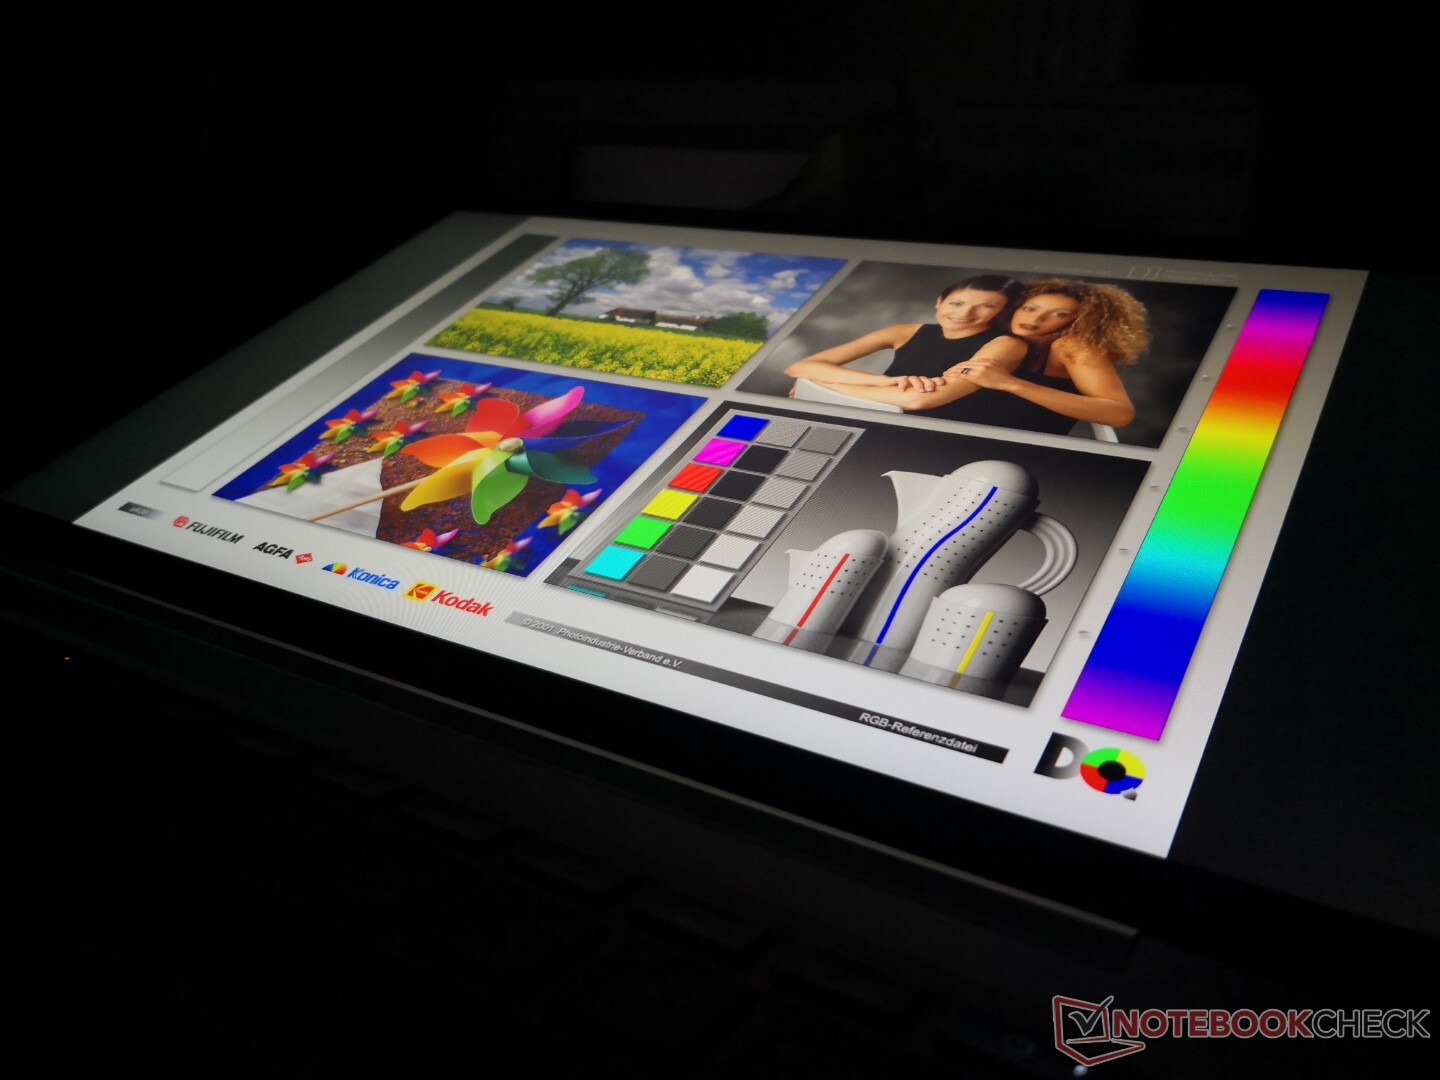
Beachten Sie, dass die maximale Helligkeit aufgrund von AMD Vari-Bright im Akkubetrieb automatisch auf nur 184 nits sinkt. Die Deaktivierung dieser Funktion über die mitgelieferte Radeon-Software hebt diese niedrige Obergrenze auf bis zu 432,5 nits an.

| |||||||||||||||||||||||||
Ausleuchtung: 86 %
Helligkeit Akku: 432.5 cd/m²
Kontrast: 1442:1 (Schwarzwert: 0.3 cd/m²)
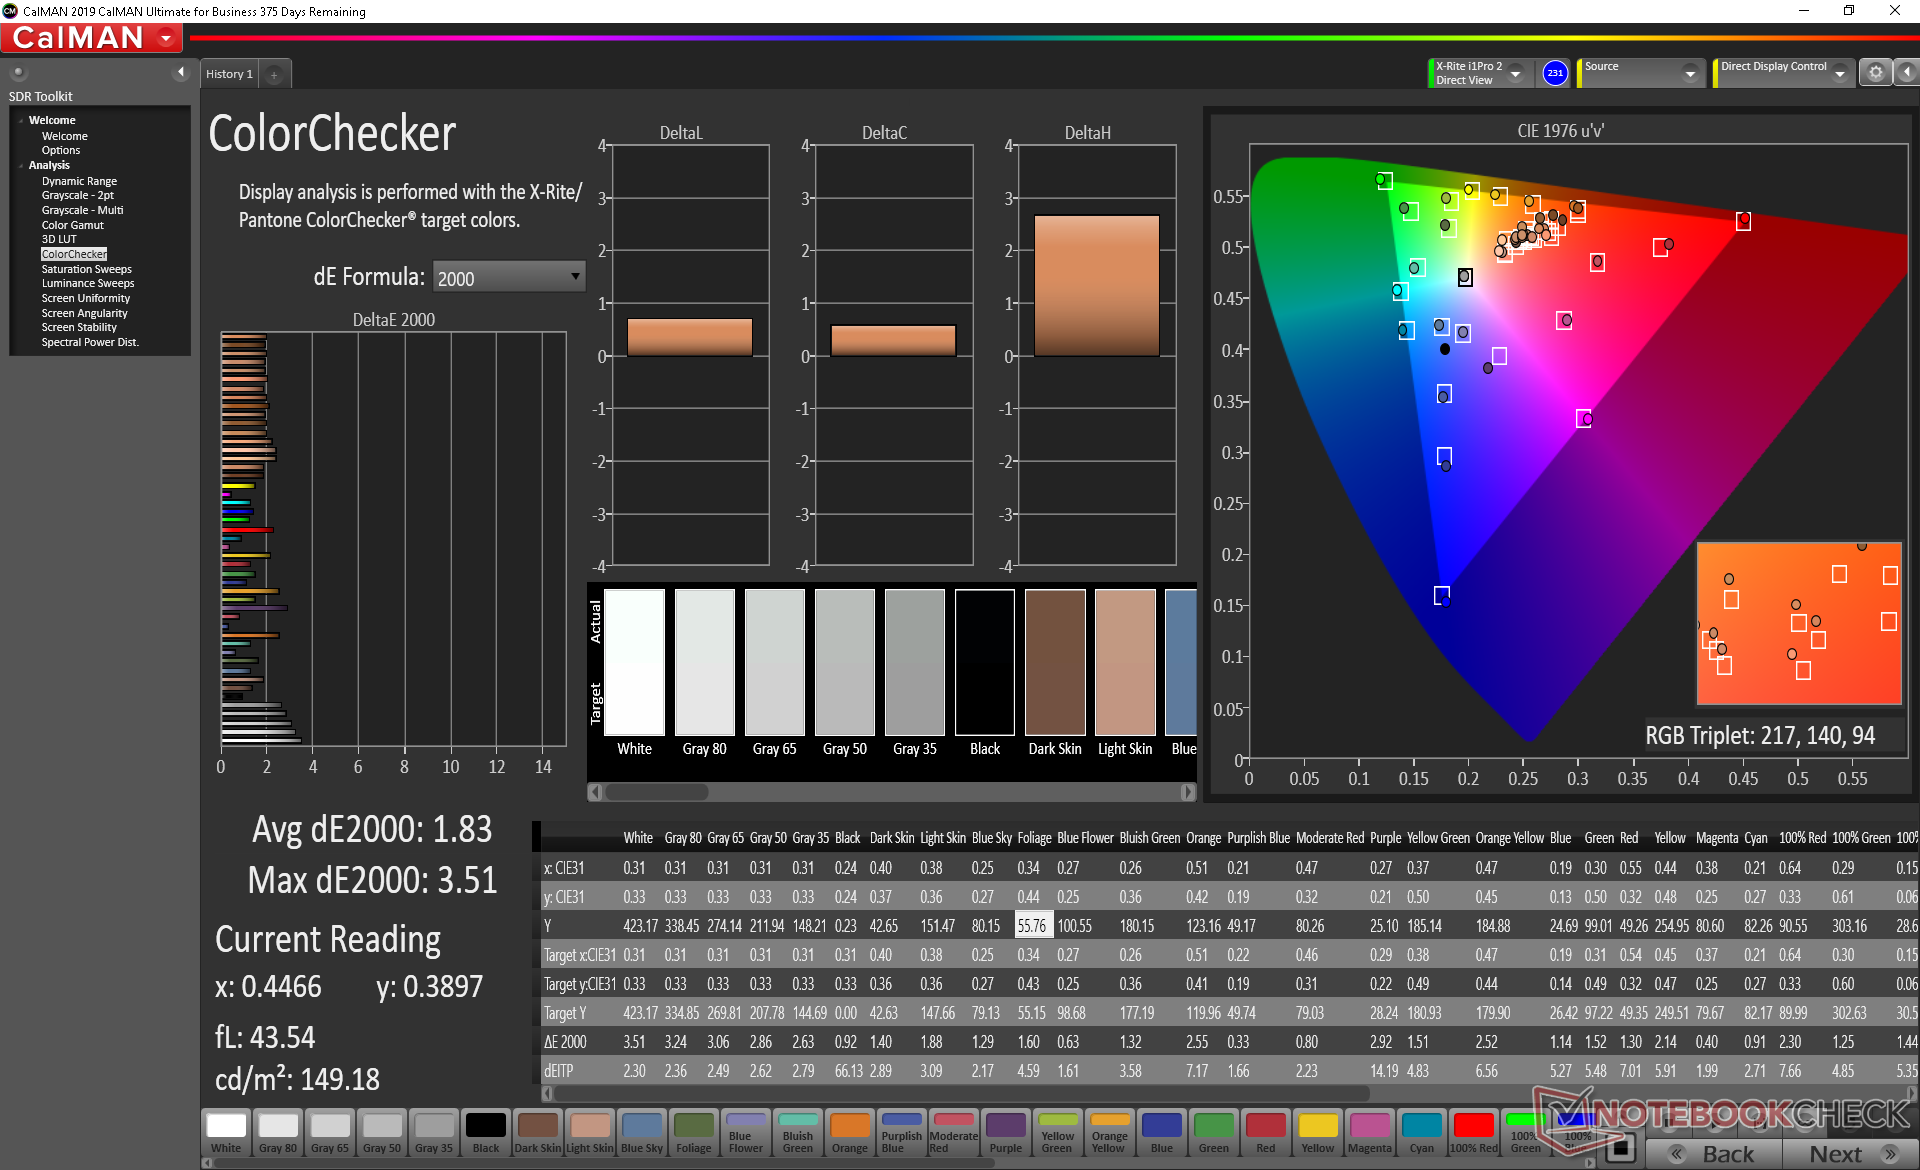
ΔE ColorChecker Calman: 2.34 | ∀{0.5-29.43 Ø4.72}
calibrated: 1.83
ΔE Greyscale Calman: 2.5 | ∀{0.09-98 Ø4.97}
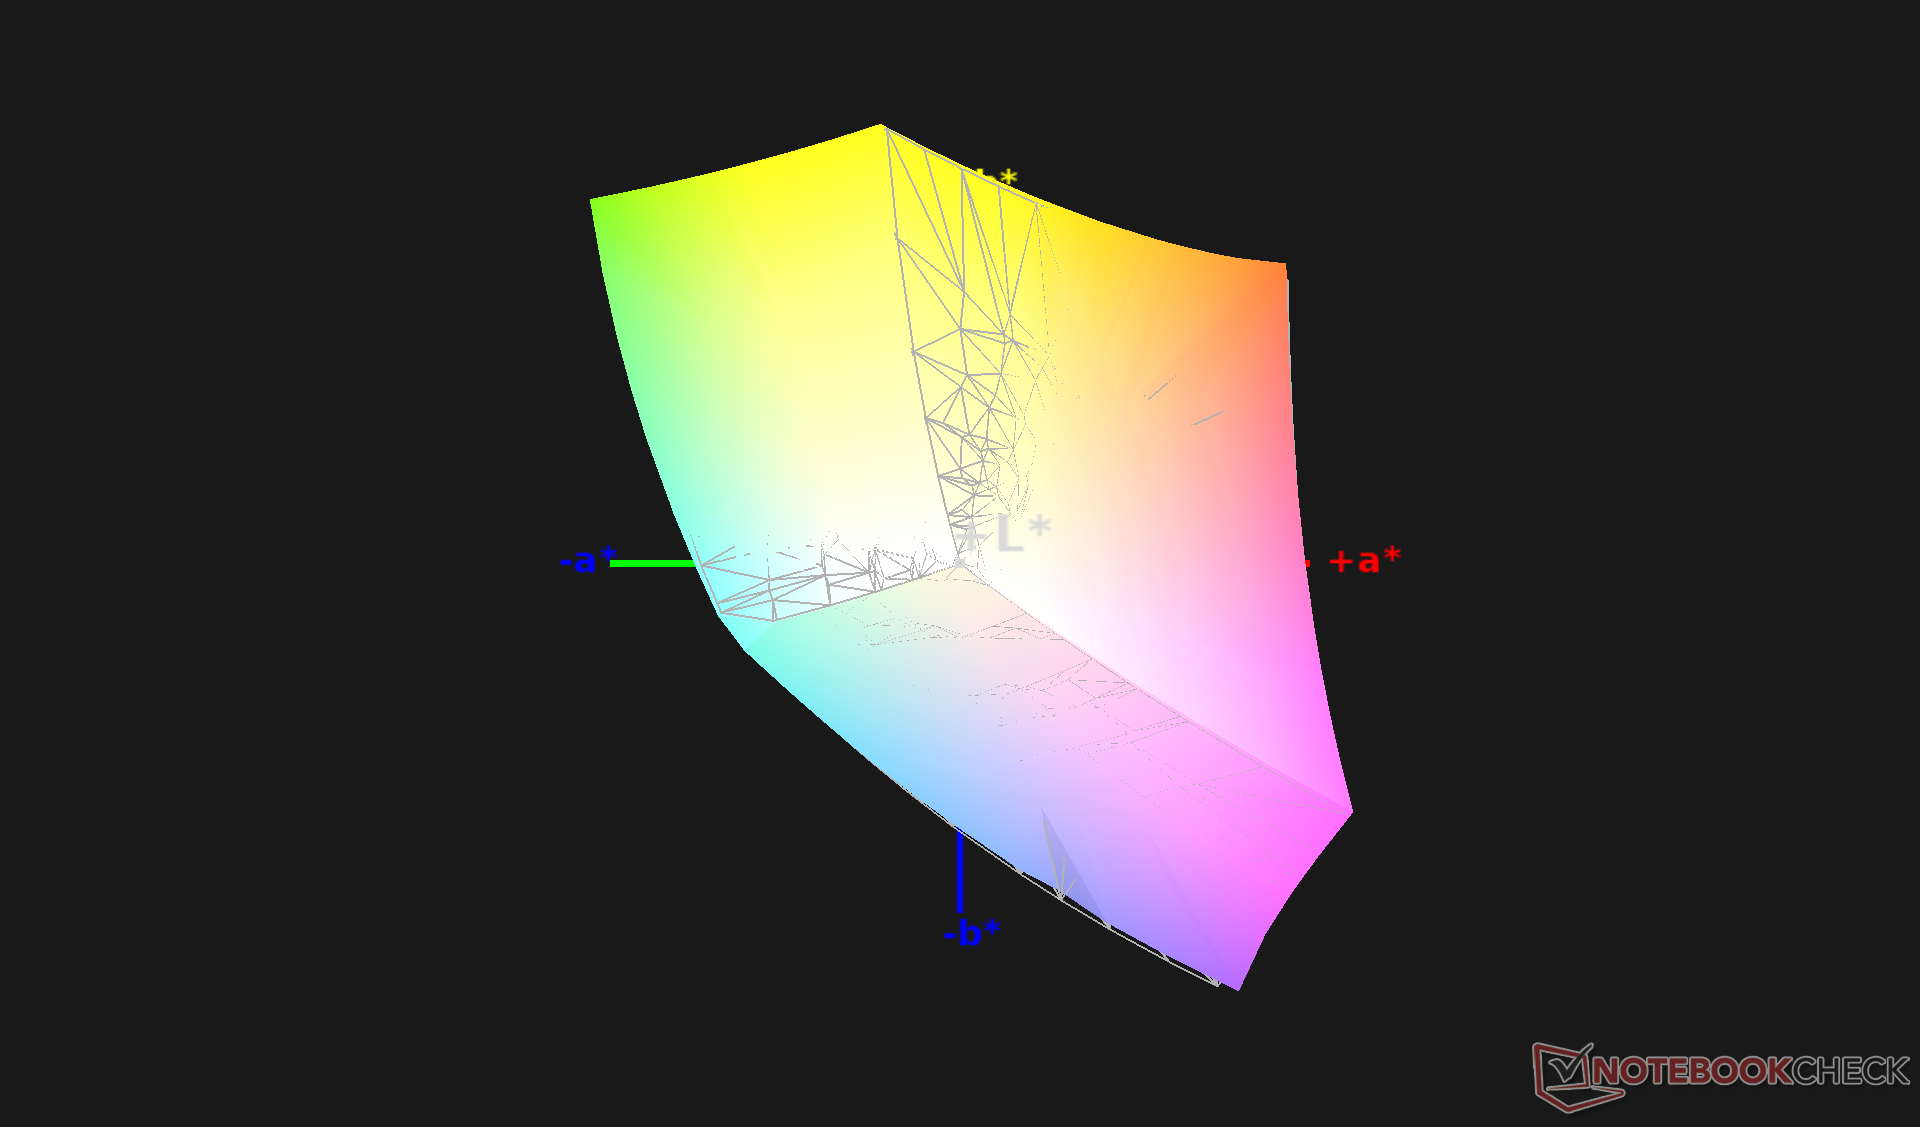
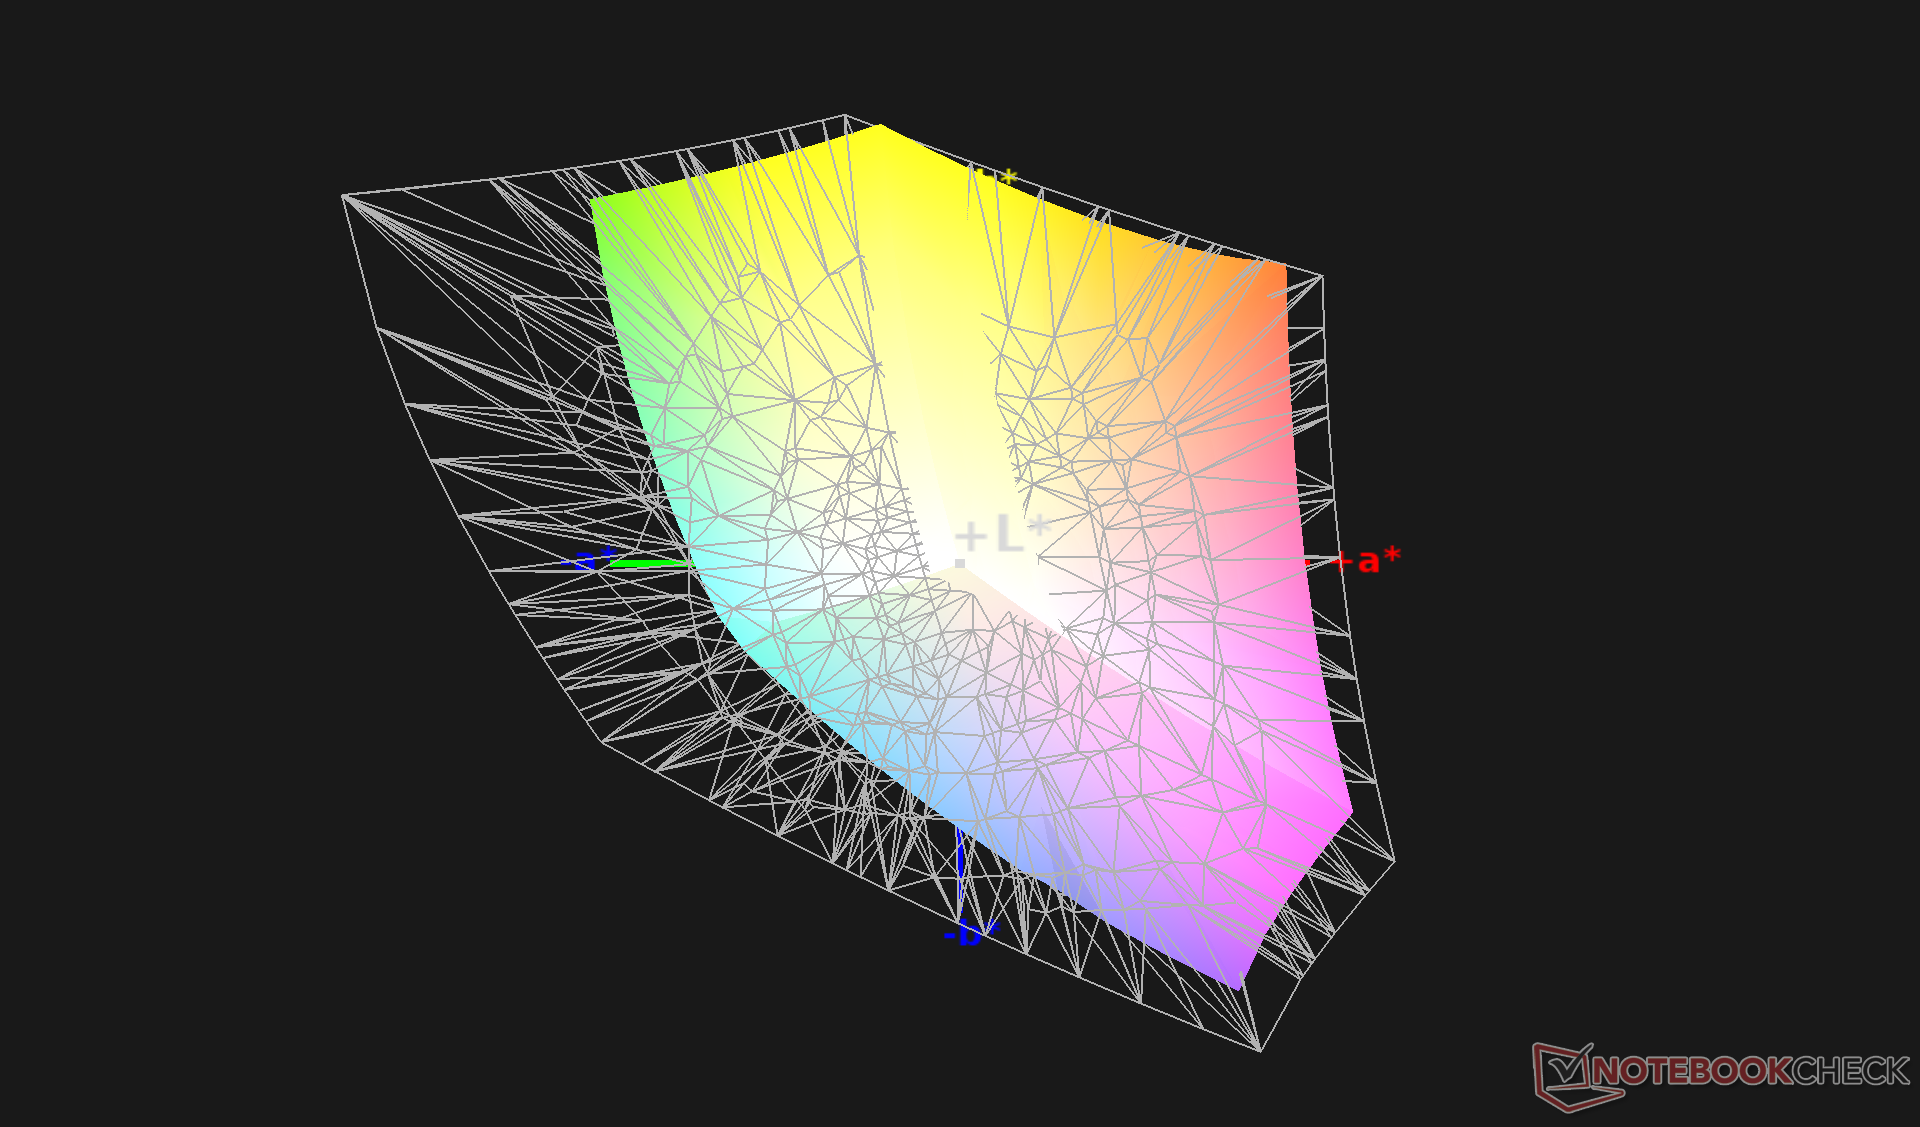
99.4% sRGB (Argyll 1.6.3 3D)
63.8% AdobeRGB 1998 (Argyll 1.6.3 3D)
69.8% AdobeRGB 1998 (Argyll 3D)
98.5% sRGB (Argyll 3D)
68.2% Display P3 (Argyll 3D)
Gamma: 2.1
CCT: 6582 K
| HP EliteBook 845 G7 Ryzen 7 Pro 4750U AU Optronics AUO068B, IPS, 14", 1920x1080 | HP EliteBook 845 G7-23Y60EA LG Philips LGD064E, IPS, 14", 1920x1080 | Lenovo ThinkPad T14-20UES00H00 B140HAN05.7, IPS, 14", 1920x1080 | Dell Latitude 7410 AU Optronics B140ZAN, IPS, 14", 3840x2160 | HP ProBook 445 G7 175W4EA BOE0868, IPS, 14", 1920x1080 | Huawei Matebook X Pro i5 Tianma XM, IPS, 13.9", 3000x2000 | |
|---|---|---|---|---|---|---|
| Display | -45% | -3% | 3% | -40% | -3% | |
| Display P3 Coverage (%) | 68.2 | 36.76 -46% | 66.1 -3% | 71.8 5% | 39.92 -41% | 65.9 -3% |
| sRGB Coverage (%) | 98.5 | 55.3 -44% | 95.8 -3% | 99.3 1% | 59.6 -39% | 95.2 -3% |
| AdobeRGB 1998 Coverage (%) | 69.8 | 37.98 -46% | 67.2 -4% | 72.4 4% | 41.25 -41% | 67.6 -3% |
| Response Times | 43% | 14% | 42% | 32% | 37% | |
| Response Time Grey 50% / Grey 80% * (ms) | 65.2 ? | 37 ? 43% | 64 ? 2% | 39.2 ? 40% | 40 ? 39% | 40.4 ? 38% |
| Response Time Black / White * (ms) | 39.6 ? | 23 ? 42% | 29.6 ? 25% | 22.4 ? 43% | 30 ? 24% | 25.6 ? 35% |
| PWM Frequency (Hz) | 192 ? | |||||
| Bildschirm | -40% | -4% | -38% | -73% | -32% | |
| Helligkeit Bildmitte (cd/m²) | 432.5 | 227 -48% | 406 -6% | 388.6 -10% | 277 -36% | 442.7 2% |
| Brightness (cd/m²) | 405 | 220 -46% | 403 0% | 365 -10% | 270 -33% | 428 6% |
| Brightness Distribution (%) | 86 | 82 -5% | 88 2% | 82 -5% | 88 2% | 84 -2% |
| Schwarzwert * (cd/m²) | 0.3 | 0.18 40% | 0.2 33% | 0.35 -17% | 0.285 5% | 0.31 -3% |
| Kontrast (:1) | 1442 | 1261 -13% | 2030 41% | 1110 -23% | 972 -33% | 1428 -1% |
| Delta E Colorchecker * | 2.34 | 4.1 -75% | 3.3 -41% | 4.04 -73% | 5.53 -136% | 2.24 4% |
| Colorchecker dE 2000 max. * | 3.59 | 7.06 -97% | 4.8 -34% | 9.2 -156% | 10.68 -197% | 7.19 -100% |
| Colorchecker dE 2000 calibrated * | 1.83 | 4.04 -121% | 1.5 18% | 1.25 32% | 4.43 -142% | 1.11 39% |
| Delta E Graustufen * | 2.5 | 1.99 20% | 3.6 -44% | 6.4 -156% | 6.2 -148% | 9.7 -288% |
| Gamma | 2.1 105% | 2.48 89% | 2.43 91% | 2.3 96% | 2.34 94% | 1.42 155% |
| CCT | 6582 99% | 6607 98% | 6893 94% | 6957 93% | 7342 89% | 6227 104% |
| Farbraum (Prozent von AdobeRGB 1998) (%) | 63.8 | 35 -45% | 61.5 -4% | 66.4 4% | 38 -40% | 61.6 -3% |
| Color Space (Percent of sRGB) (%) | 99.4 | 55 -45% | 95.5 -4% | 99.4 0% | 59 -41% | 95 -4% |
| Durchschnitt gesamt (Programm / Settings) | -14% /
-30% | 2% /
-1% | 2% /
-20% | -27% /
-54% | 1% /
-18% |
* ... kleinere Werte sind besser
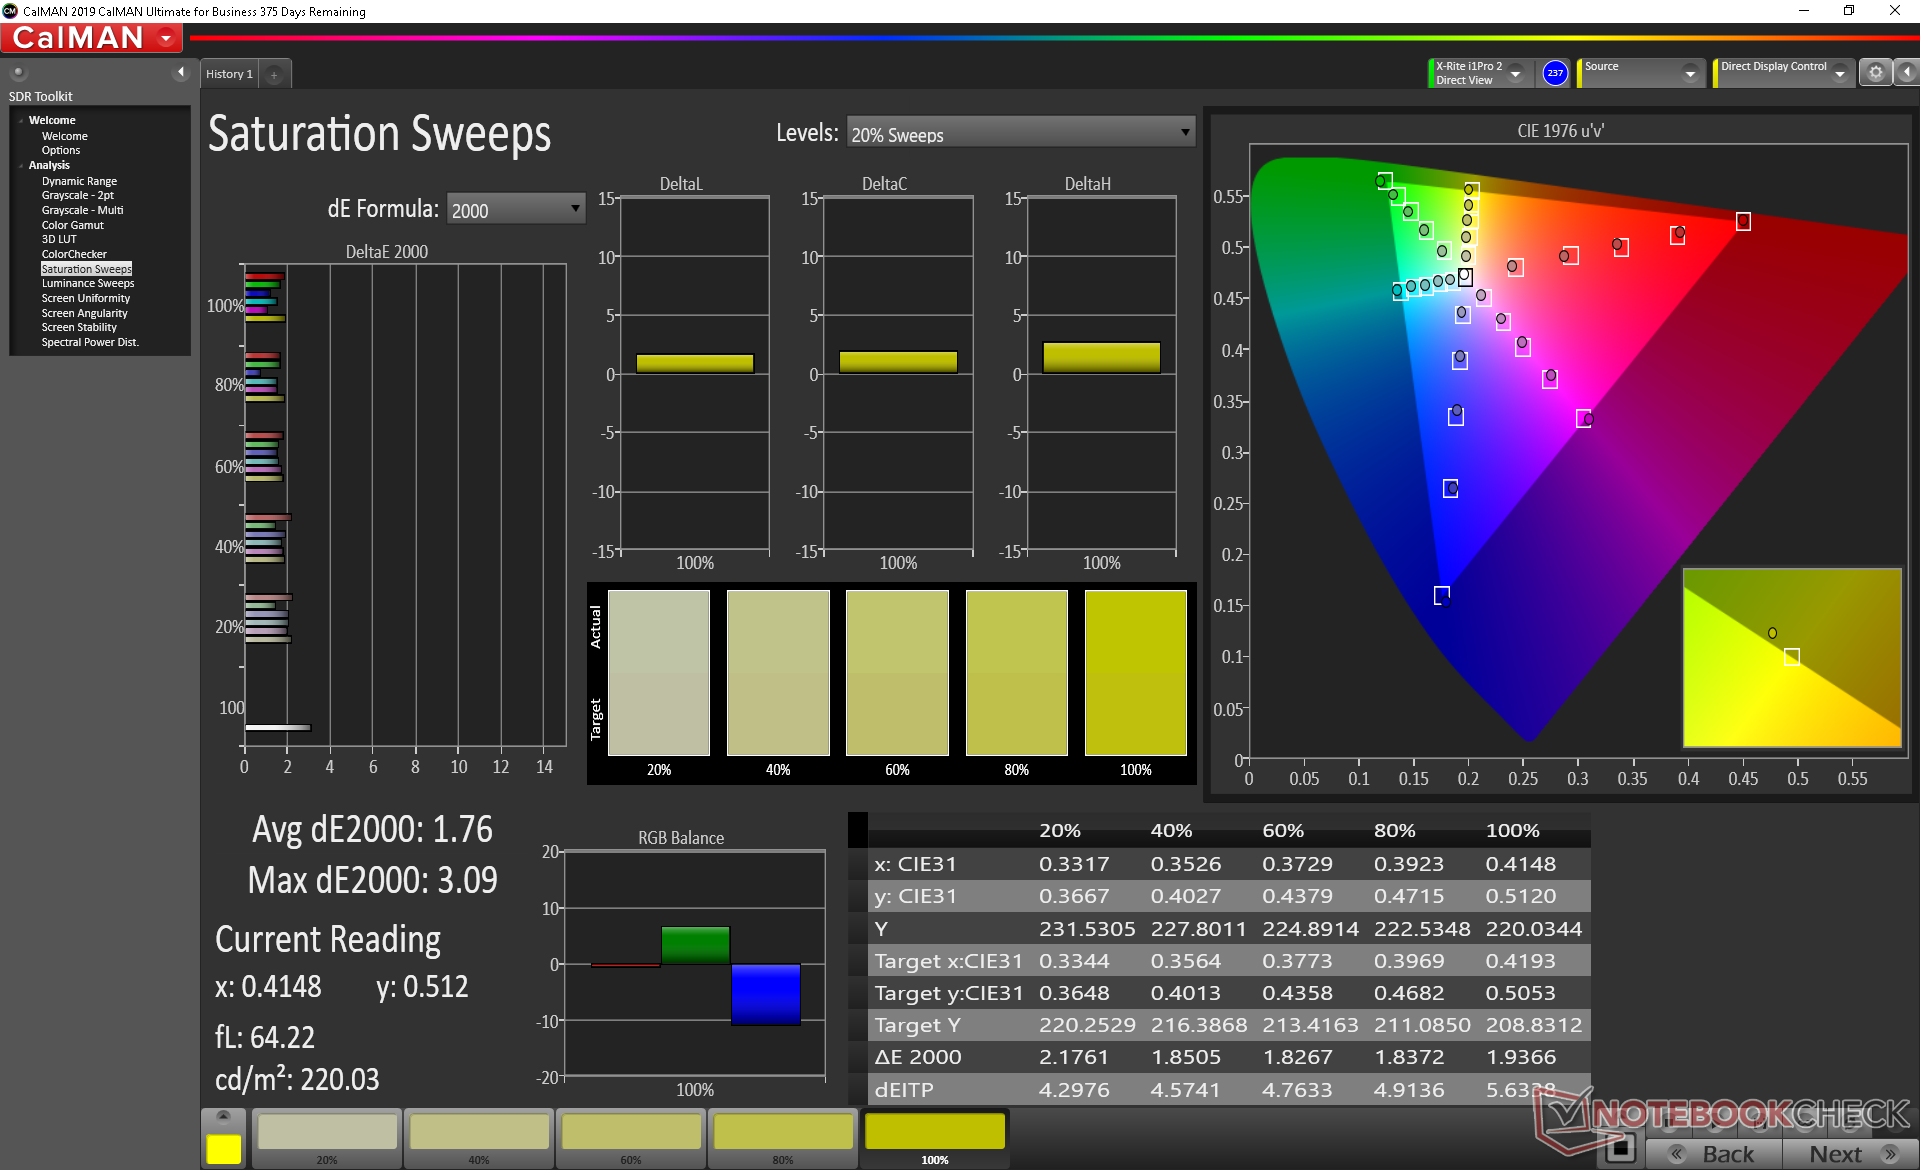
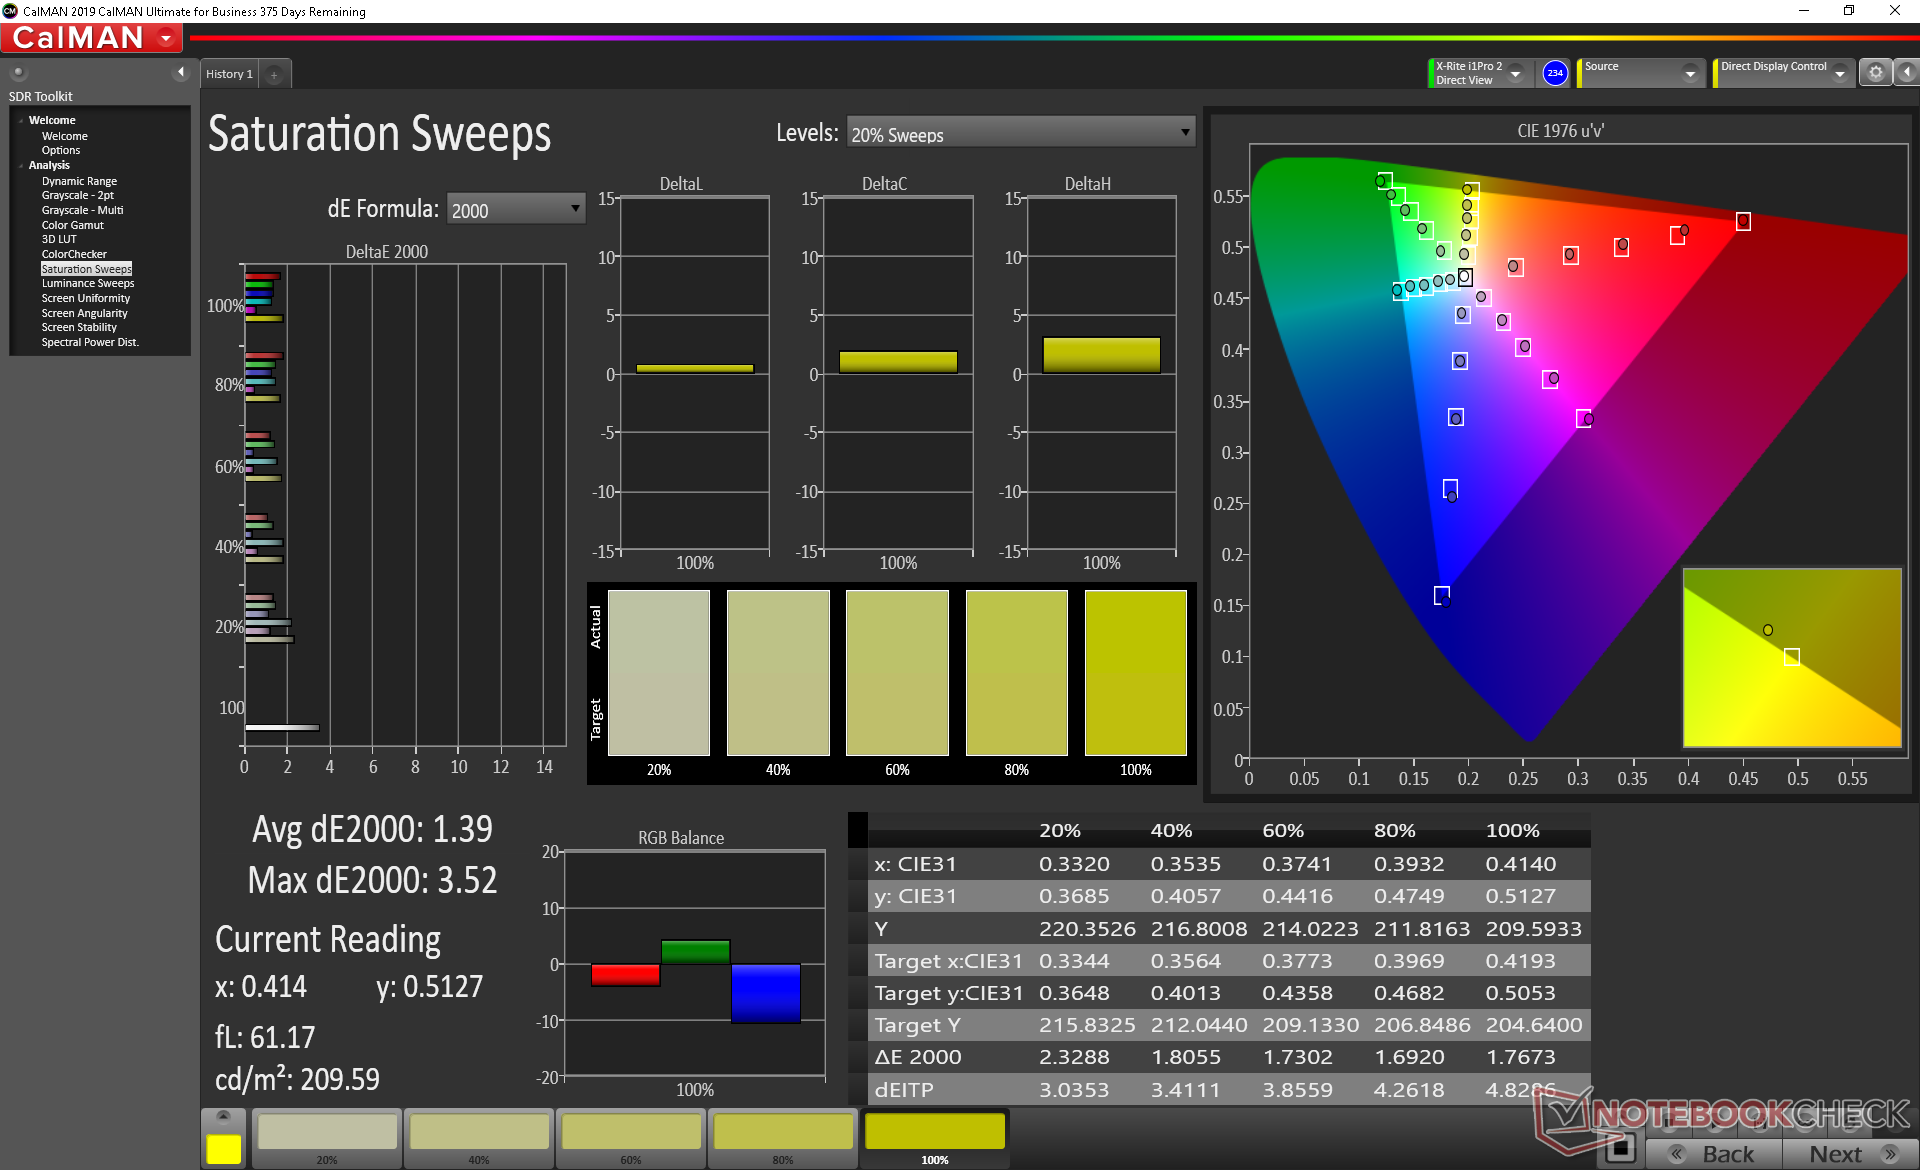
Der Farbraum ist doppelt so groß wie bei unserer preiswerteren 6-Core-EliteBook-845-G7-Konfiguration. Unsere 400-Nit-Panel-Option deckt den gesamten sRGB- und etwa 64 Prozent des AdobeRGB-Farbraums ab, so dass sie durchaus auch für die meisten Redakteure oder Content-Creators geeignet ist.
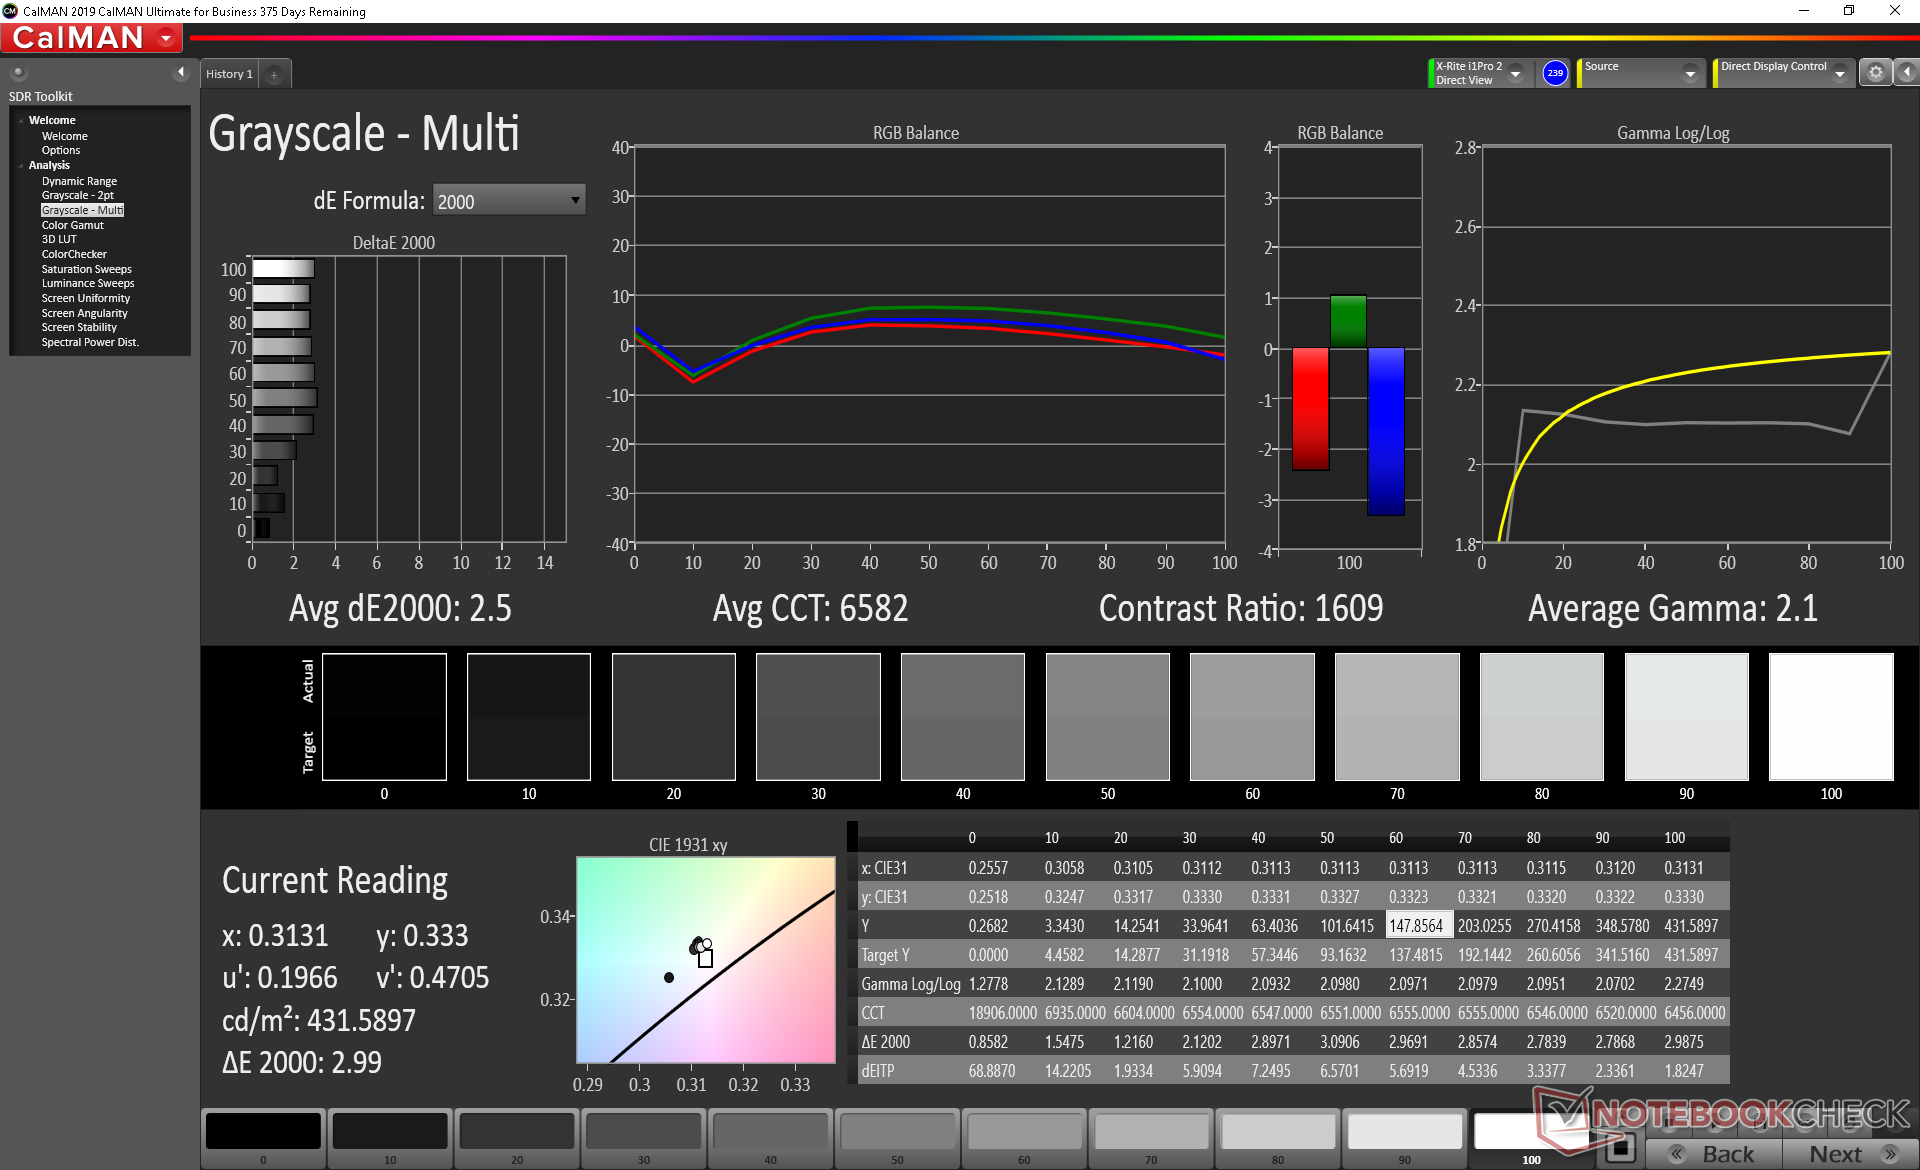
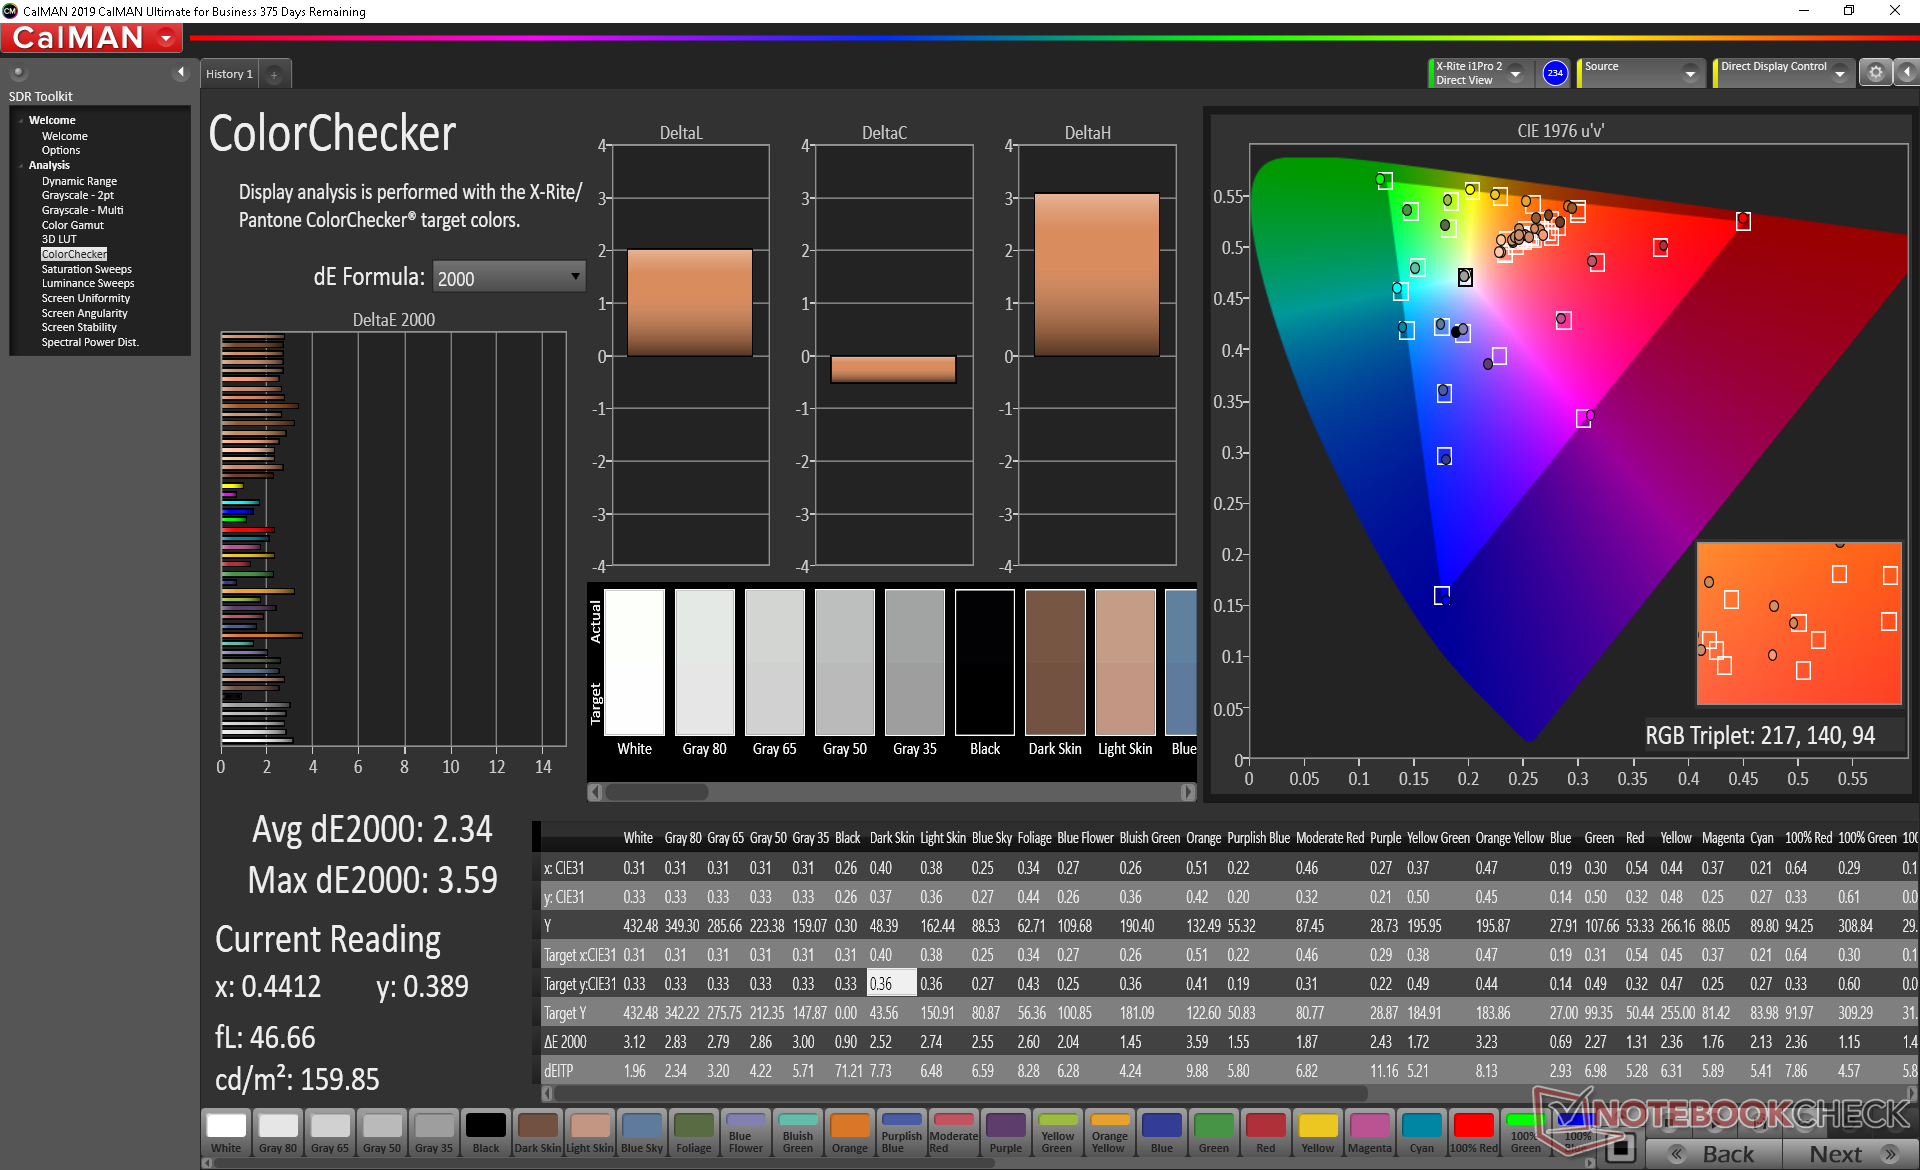
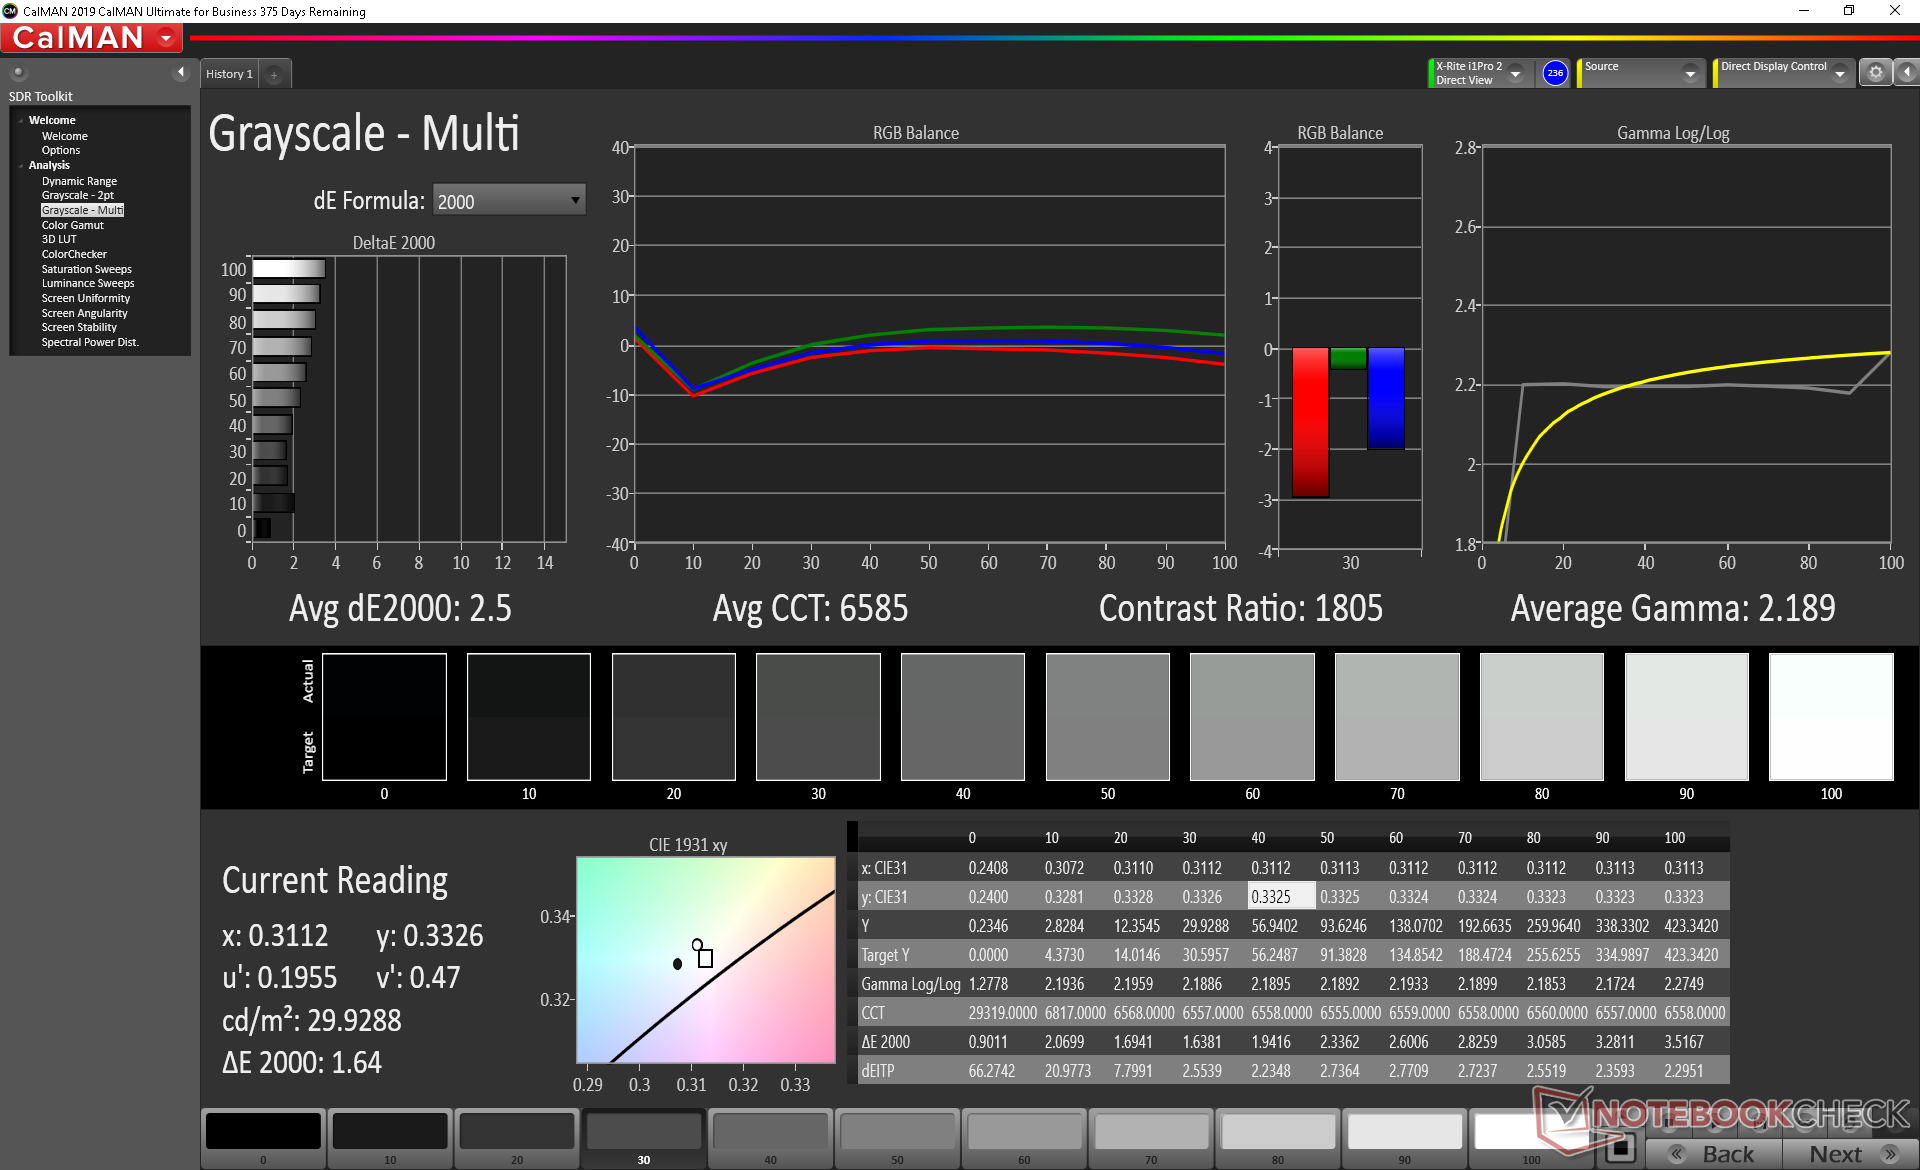
Das Panel ist ab Werkszustand gut kalibriert und weist durchschnittliche Graustufen- und Farb-DeltaE-Werte von nur 2,5 bzw. 2,34 auf. Wenn wir den Bildschirm selbst noch weiter kalibrieren würden, würde sich sowohl die Gamma- als auch die RGB-Balance nur geringfügig verbessern.
Reaktionszeiten (Response Times) des Displays
| ↔ Reaktionszeiten Schwarz zu Weiß | ||
|---|---|---|
| 39.6 ms ... steigend ↗ und fallend ↘ kombiniert | ↗ 20 ms steigend | 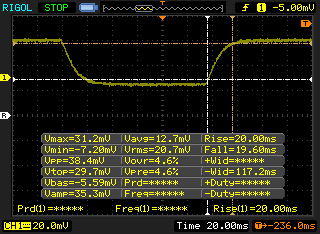 |
| ↘ 19.6 ms fallend | ||
| Die gemessenen Reaktionszeiten sind langsam und dadurch für viele Spieler wahrscheinlich zu langsam. Im Vergleich rangierten die bei uns getesteten Geräte von 0.1 (Minimum) zu 240 (Maximum) ms. » 97 % aller Screens waren schneller als der getestete. Daher sind die gemessenen Reaktionszeiten schlechter als der Durchschnitt aller vermessenen Geräte (19.8 ms). | ||
| ↔ Reaktionszeiten 50% Grau zu 80% Grau | ||
| 65.2 ms ... steigend ↗ und fallend ↘ kombiniert | ↗ 30.8 ms steigend | 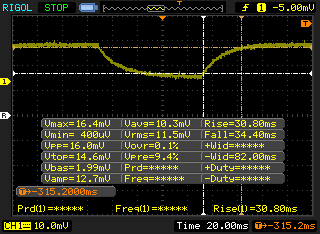 |
| ↘ 34.4 ms fallend | ||
| Die gemessenen Reaktionszeiten sind langsam und dadurch für viele Spieler wahrscheinlich zu langsam. Im Vergleich rangierten die bei uns getesteten Geräte von 0.165 (Minimum) zu 636 (Maximum) ms. » 98 % aller Screens waren schneller als der getestete. Daher sind die gemessenen Reaktionszeiten schlechter als der Durchschnitt aller vermessenen Geräte (31 ms). | ||
Bildschirm-Flackern / PWM (Pulse-Width Modulation)
| Flackern / PWM nicht festgestellt | 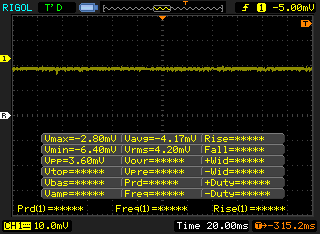 | ||
Im Vergleich: 52 % aller getesteten Geräte nutzten kein PWM um die Helligkeit zu reduzieren. Wenn PWM eingesetzt wurde, dann bei einer Frequenz von durchschnittlich 7772 (Minimum 5, Maximum 343500) Hz. | |||
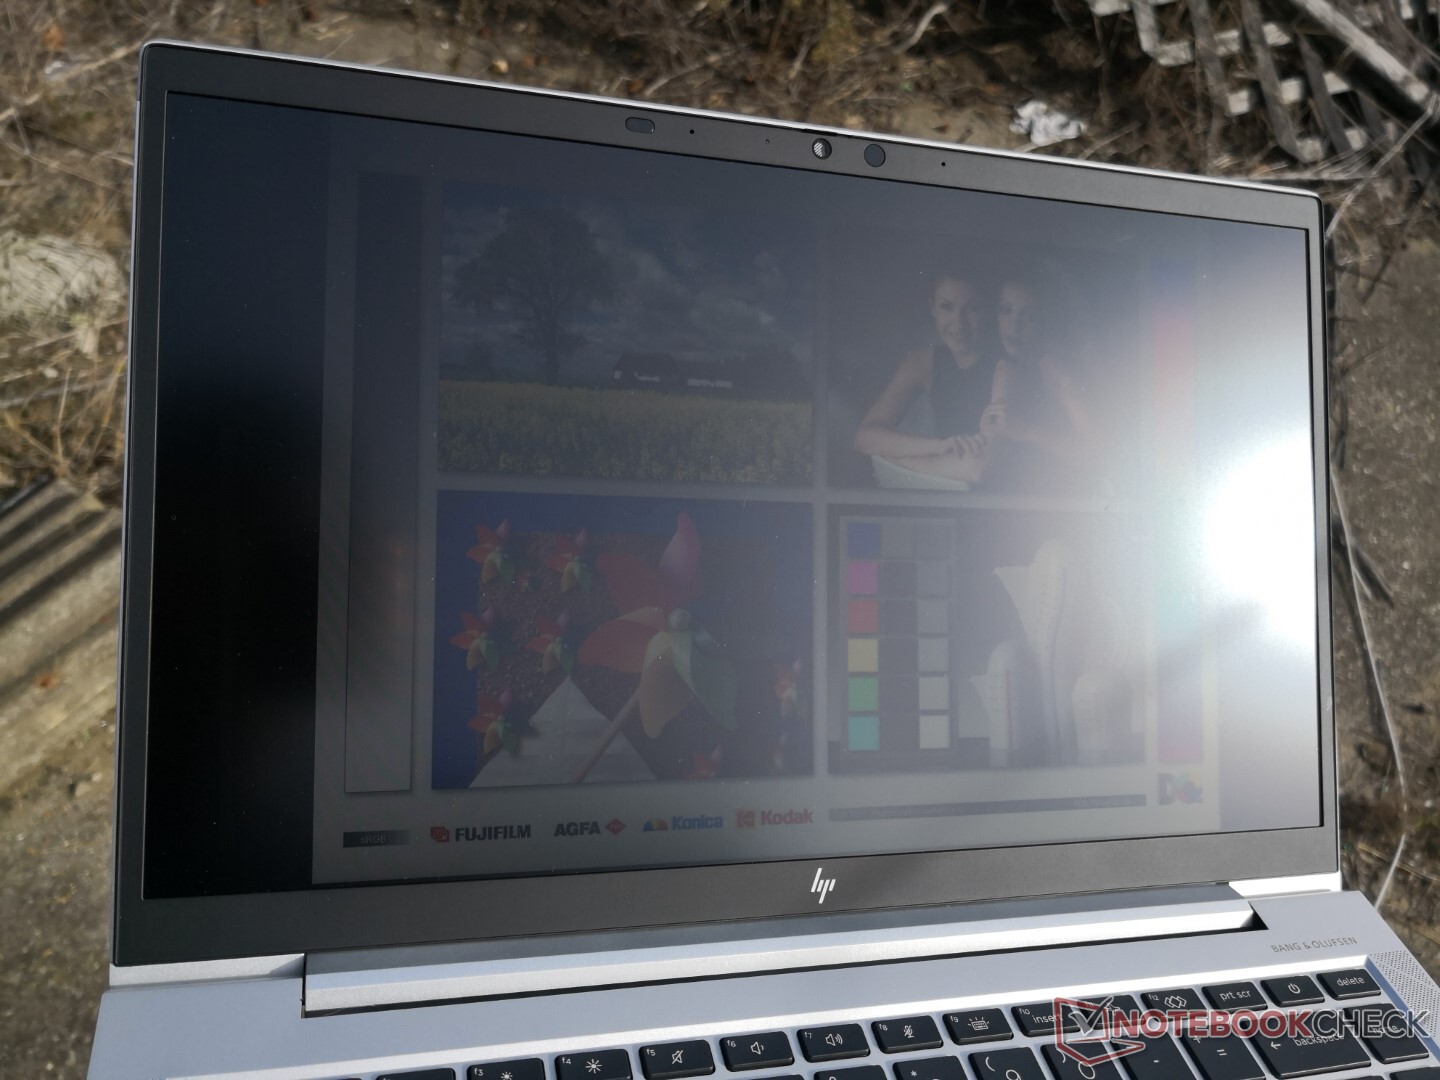
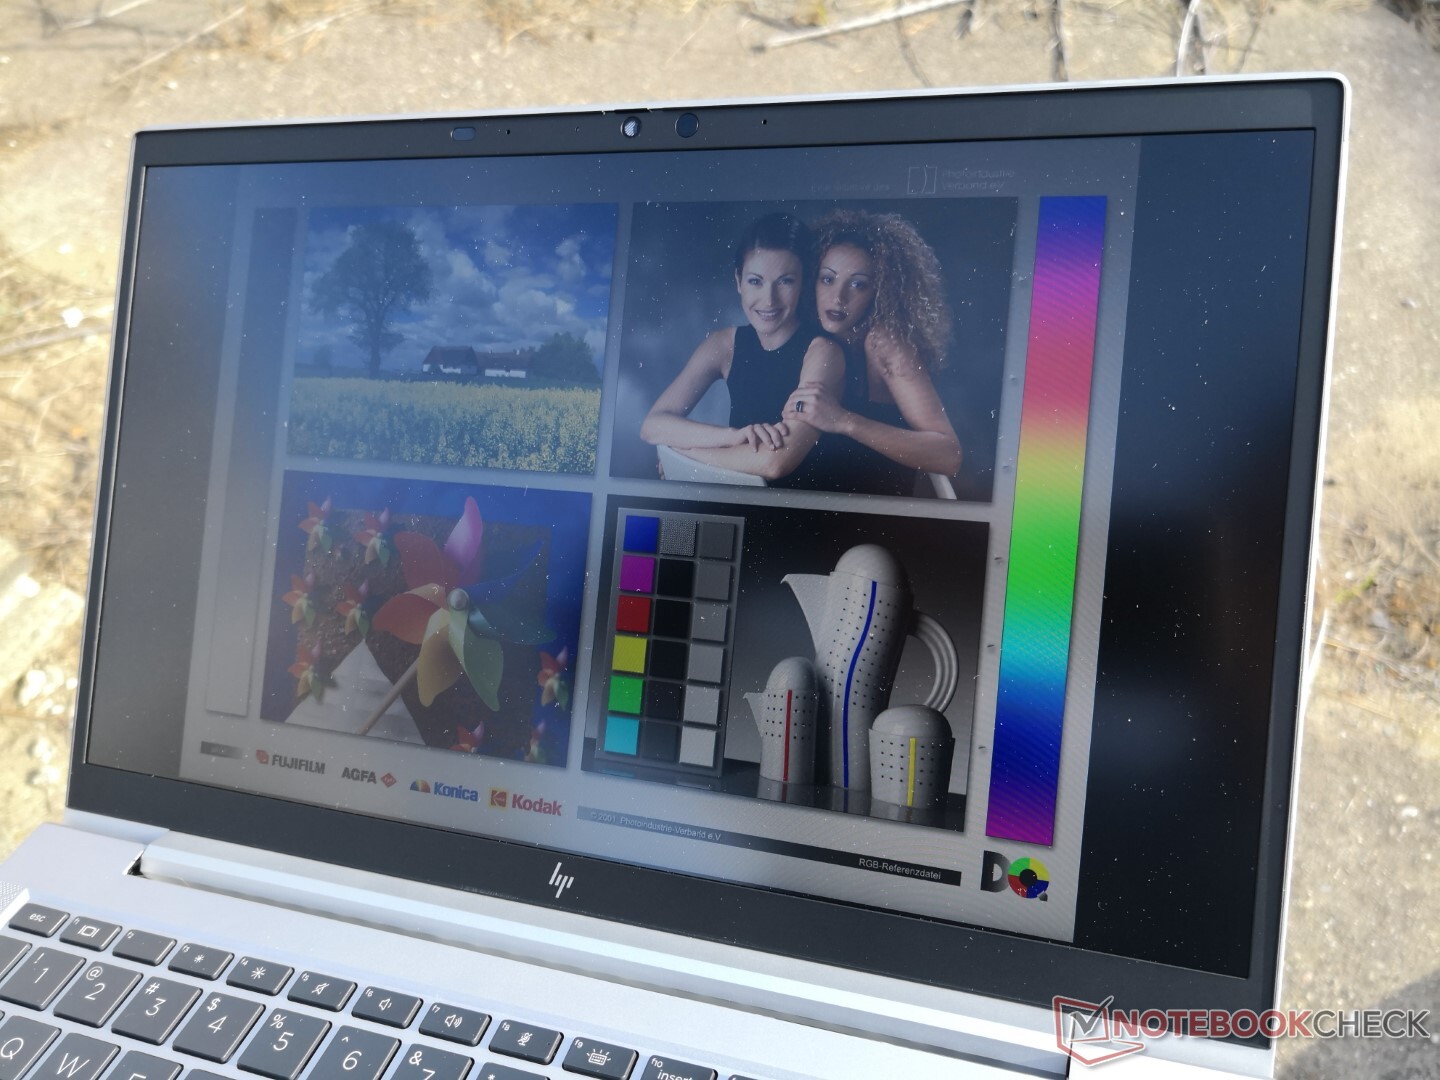
Obwohl das 400-Nit-Display heller ist als das 250-Nit-Display unseres Modells Ryzen 5, ist es immer noch nicht hell genug, um auch im Freienohne Einschränkungen betrachtet werden zu können. Glücklicherweise bietet HP für die EliteBook-845-Serie eine noch hellere 1000-Nit-Panel-Option an, ähnlich wie für die EliteBook-1030/1040-Serien.
Performance
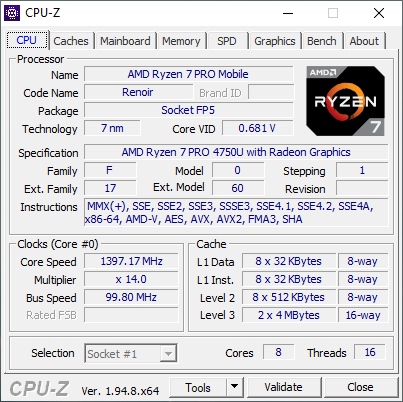
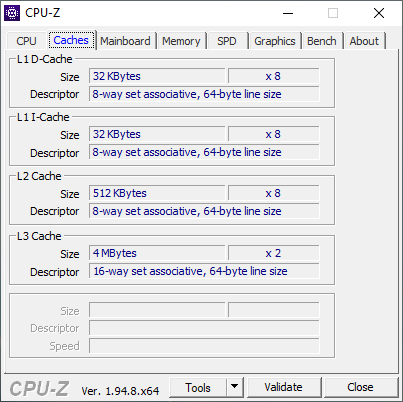
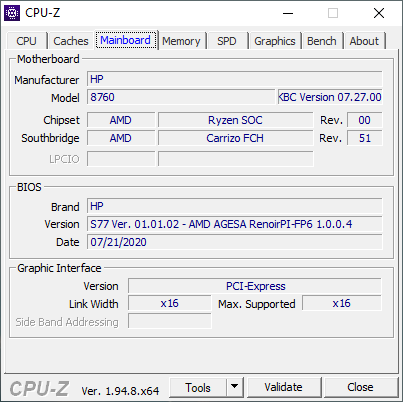
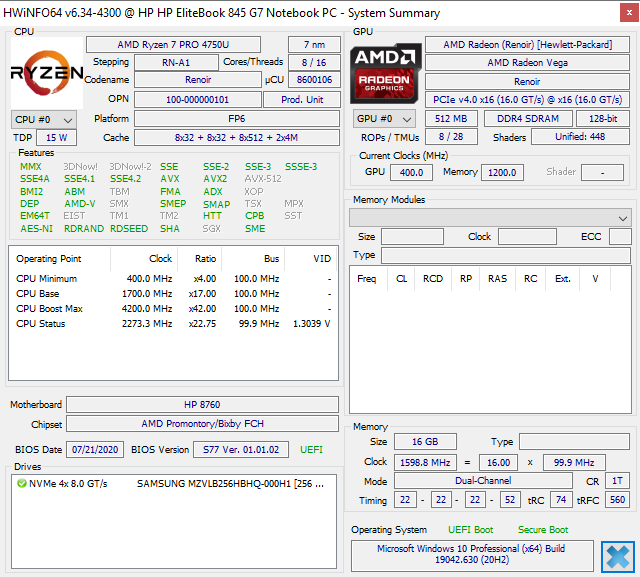
Im Gegensatz zur EliteBook-840-G7-Serie mit Intel-Antrieb verfügt die EliteBook-845-G7-Serie über alle 7-nm-AMD-Optionen. Benutzer können zwischen Ryzen 3 Pro 4450U, Ryzen 5 Pro 4650U oder Ryzen 7 Pro 4750U wählen. Der Ryzen 7 Pro 4750U ist im Wesentlichen die Businessversion des Ryzen 7 4800U, d.h. er unterstützt Secure Boot, Trusted Applications und andere hardwarebasierte Sicherheitsmaßnahmen. Die Taktraten sind etwas langsamer als die des Ryzen 7 4800U, was auf den security overhead zurückzuführen ist (1,7 GHz vs. 1,8 GHz Basis). Die Anzahl der GPU-Kerne wurde von 8 (Vega 8) auf 7 (Vega 7) reduziert.
Prozessor
Ähnlich wie beim Ryzen 7 4800U ist die Multi-Thread-Leistung des Ryzen 7 Pro 4750U mit Okta-Kern wahnsinnig schnell, vor allem wenn man das kleine Gehäuse und den kleinen TDP-Bereich von 15 W bis 25 W mitberücksichtigt. CineBench-Ergebnisse bewerten unseren Prozessor als gleichwertig mit dem Hexacore-Core Core i7-10750H, einem viel leistungshungrigeren Chip, den man gewöhnlich in größeren Laptops wie dem HP Envy 15, HP Spectre x360 15 oder dem Dell XPS 15 findet. Intel hat derzeit kein ordentliches Octa-Core-Äquivalent der U-Serie. Die nächste Alternative wäre der 14-nm-Hexacore-Core i7-10810U, der ebenfalls nur eine viel langsamere integrierte Grafikleistung bietet.
Ein Upgrade vom 6-Core Ryzen 5 Pro 4650U auf den 8-Core Ryzen Pro 4750U bringt eine Leistungssteigerung von 20 bis 25 Prozent bei Multi-Threading-Workloads, während die Single-Core-Leistung im Wesentlichen die gleiche ist.
Cinebench R15: CPU Multi 64Bit | CPU Single 64Bit
Blender: v2.79 BMW27 CPU
7-Zip 18.03: 7z b 4 -mmt1 | 7z b 4
Geekbench 5.5: Single-Core | Multi-Core
HWBOT x265 Benchmark v2.2: 4k Preset
LibreOffice : 20 Documents To PDF
R Benchmark 2.5: Overall mean
Cinebench R15: CPU Multi 64Bit | CPU Single 64Bit
Blender: v2.79 BMW27 CPU
7-Zip 18.03: 7z b 4 -mmt1 | 7z b 4
Geekbench 5.5: Single-Core | Multi-Core
HWBOT x265 Benchmark v2.2: 4k Preset
LibreOffice : 20 Documents To PDF
R Benchmark 2.5: Overall mean
* ... kleinere Werte sind besser
System Performance
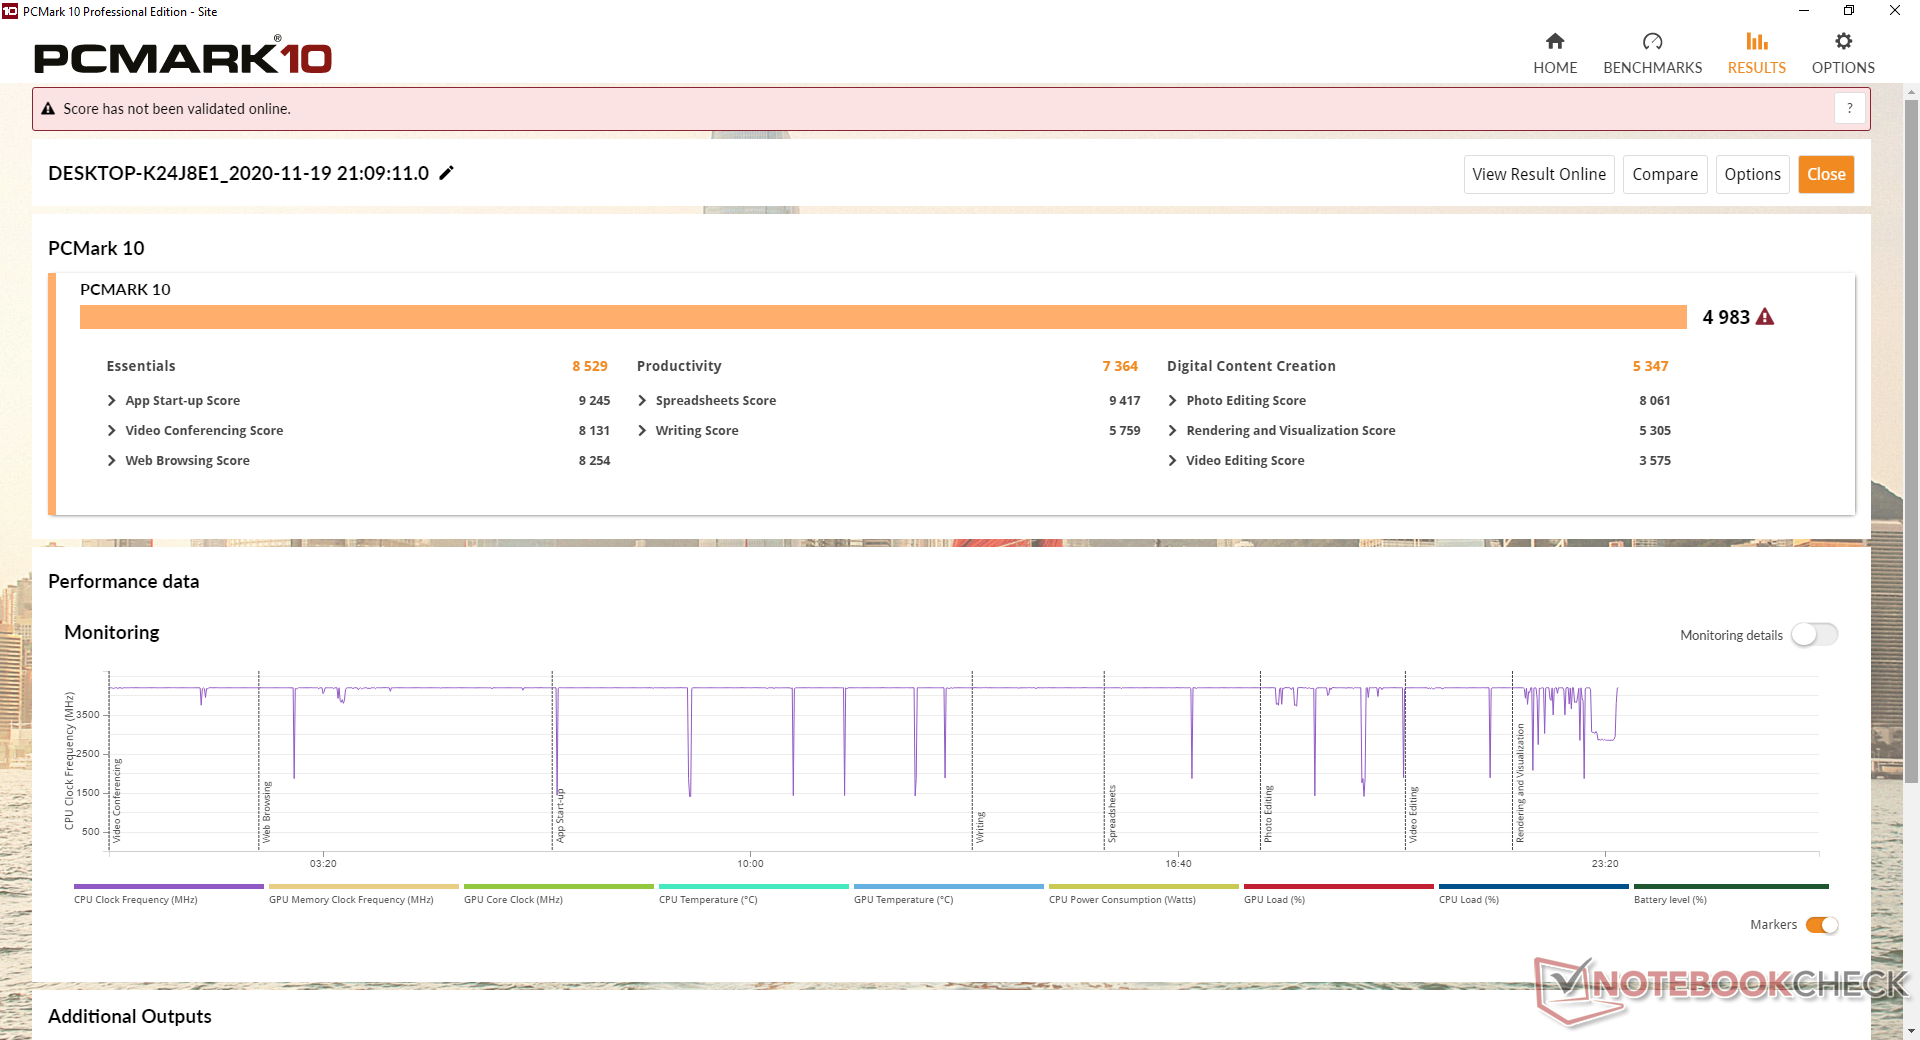
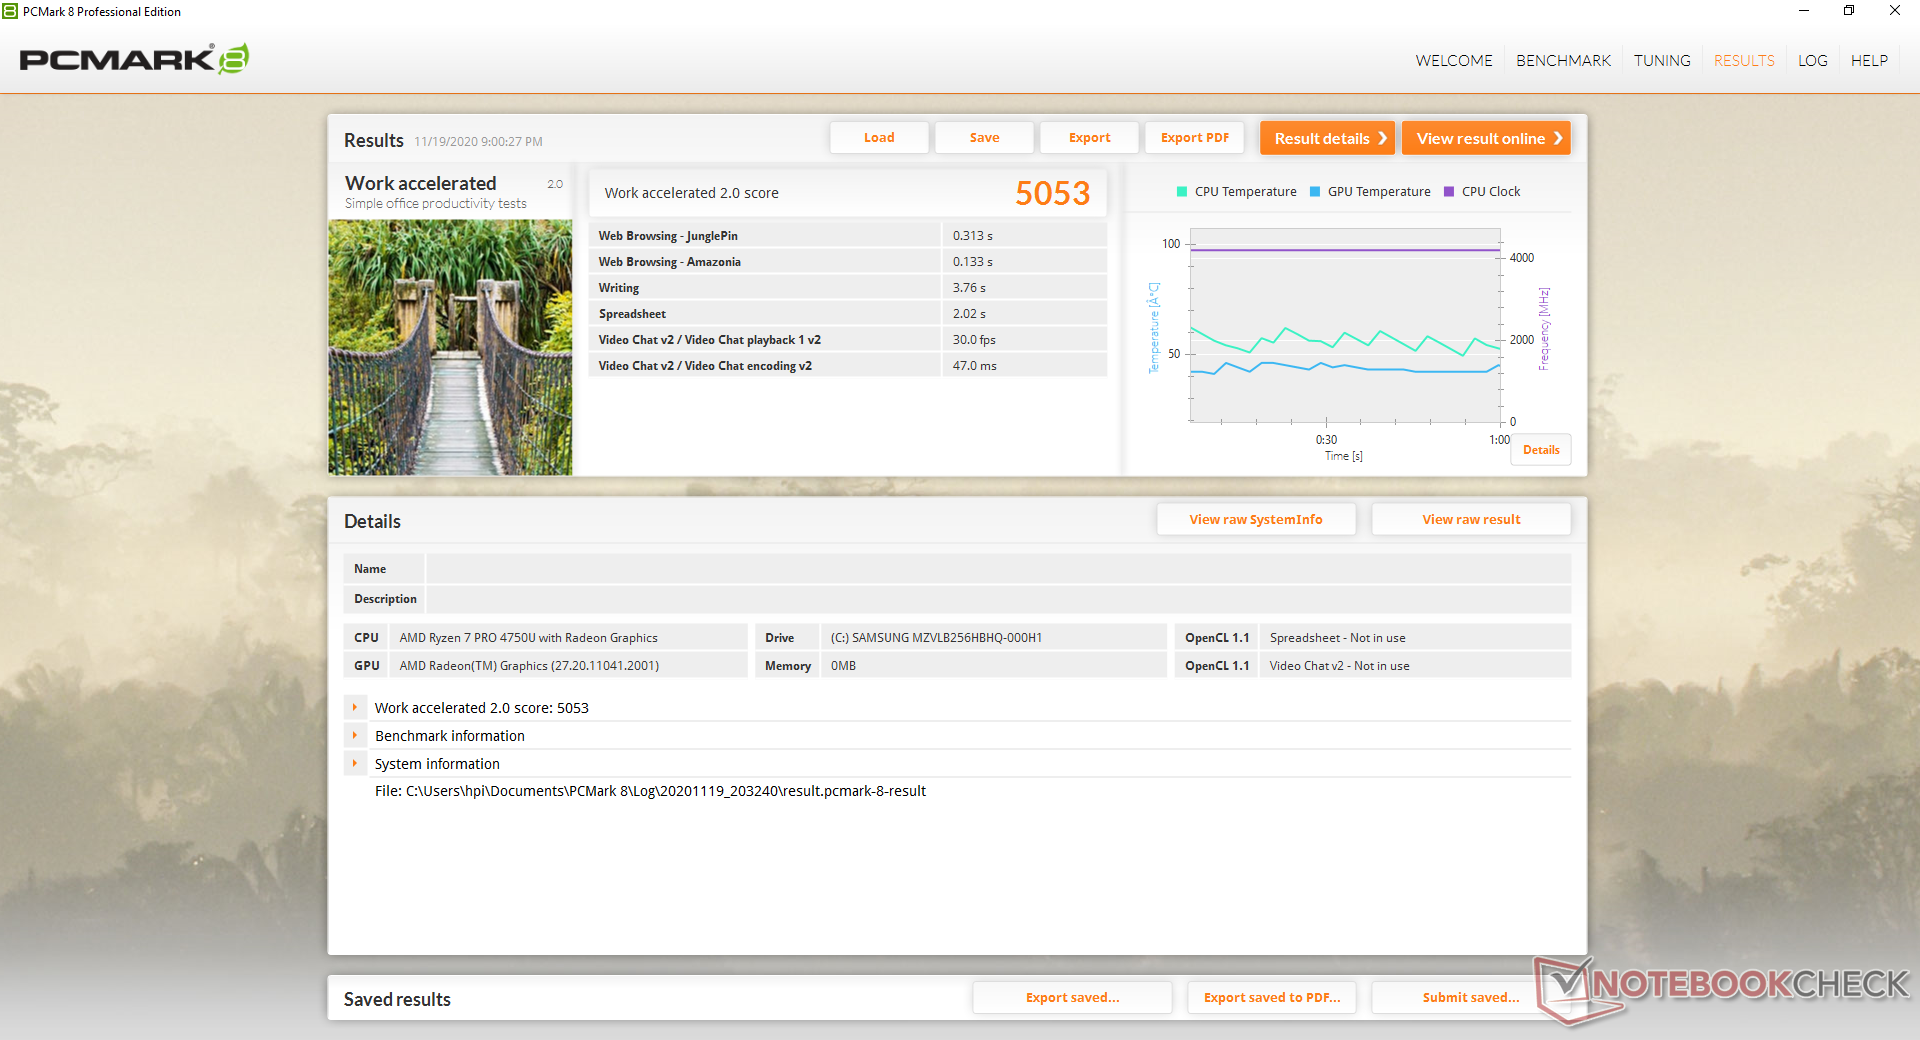
Die PCMark-Ergebnisse sind hervorragend für einen Business-Laptop, insbesondere bei der Digital Content Creation, wo sich die zusätzlichen CPU-Kerne und die schnelle integrierte Vega 7-Grafik als nützlich erweisen.
Wir hatten keine Softwareprobleme mit unserer Testeinheit. Auf der Hardwareseite wurde unsere externe HP P700 SSD jedoch ständig getrennt und wieder erkannt, wenn sie an einen der USB-A-Anschlüsse des Laptops angeschlossen wurde. Der Anschluss der externen SSD über USB-C löst das Problem. Nichtsdestotrotz empfehlen wir, verschiedene USB-A-Geräte zu testen, um zu überprüfen, ob die USB-Anschlüsse irgendwelche Probleme aufweisen.
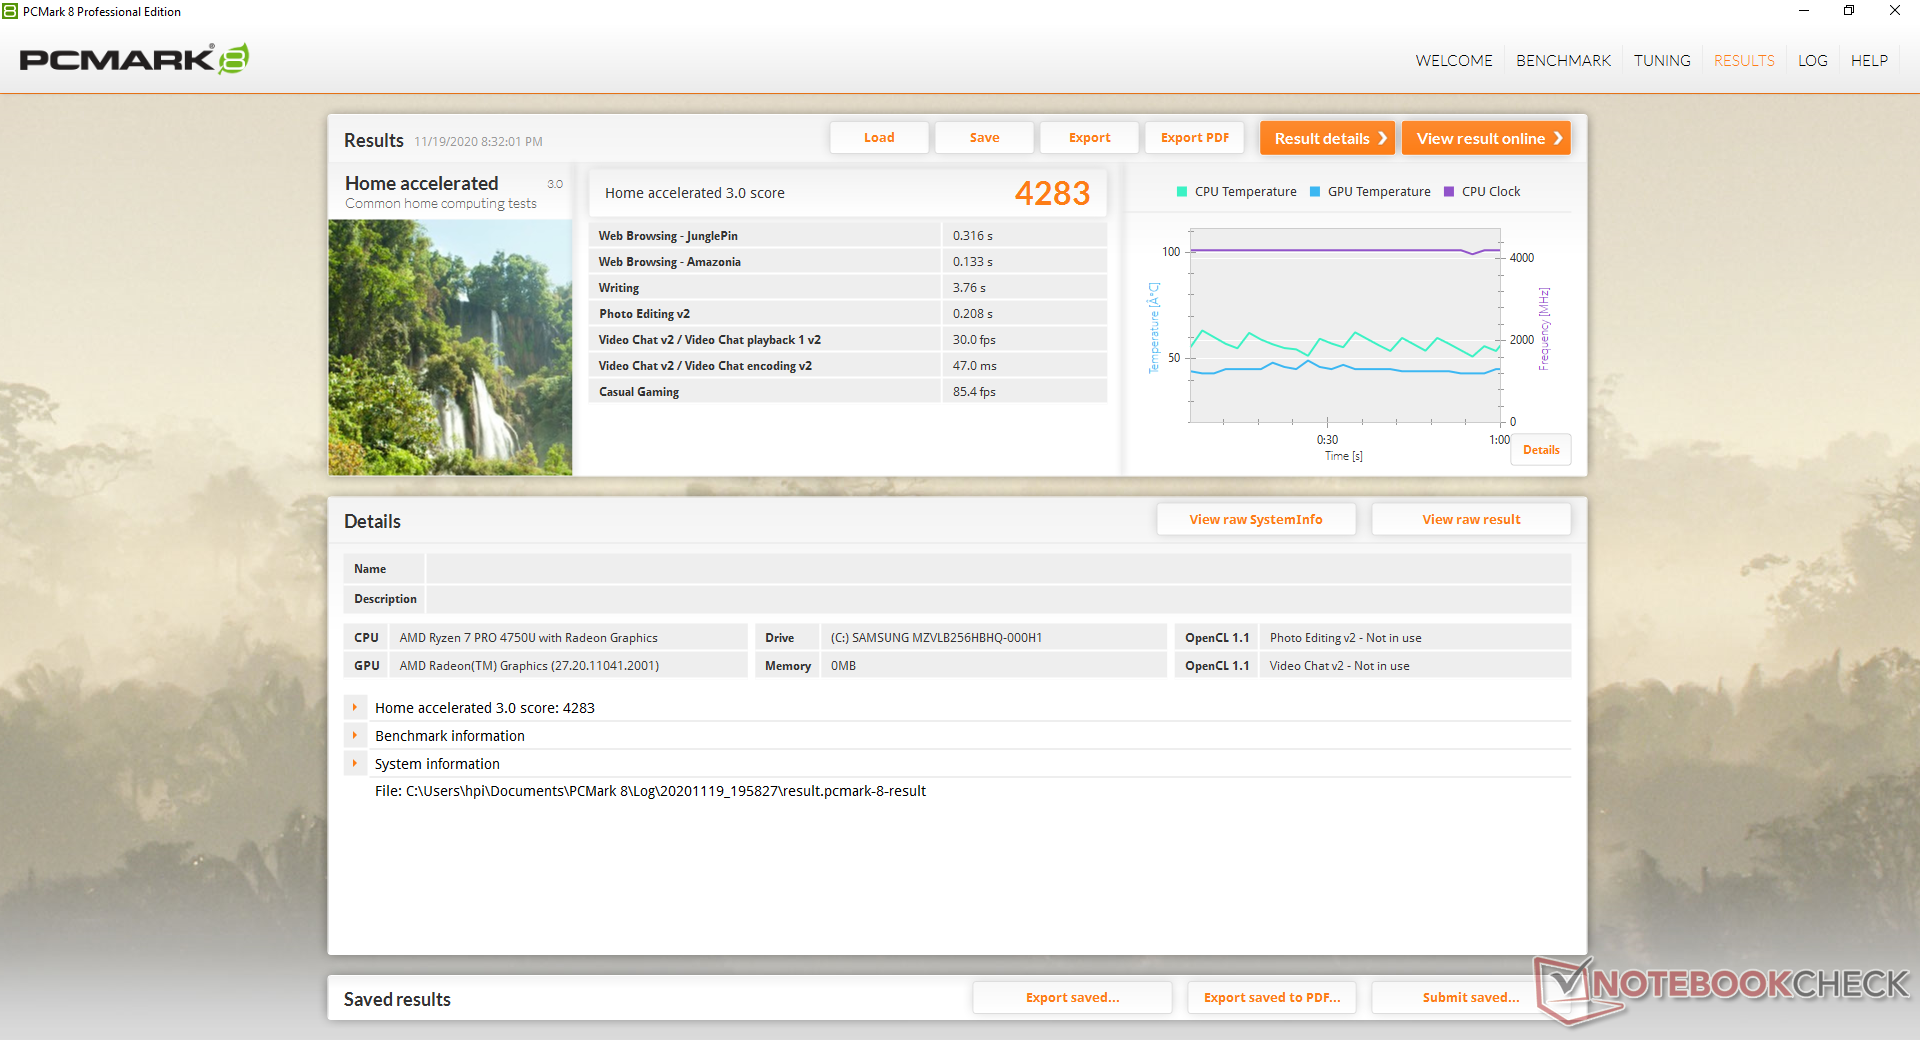
| PCMark 8 Home Score Accelerated v2 | 4283 Punkte | |
| PCMark 8 Work Score Accelerated v2 | 5053 Punkte | |
| PCMark 10 Score | 4983 Punkte | |
Hilfe | ||
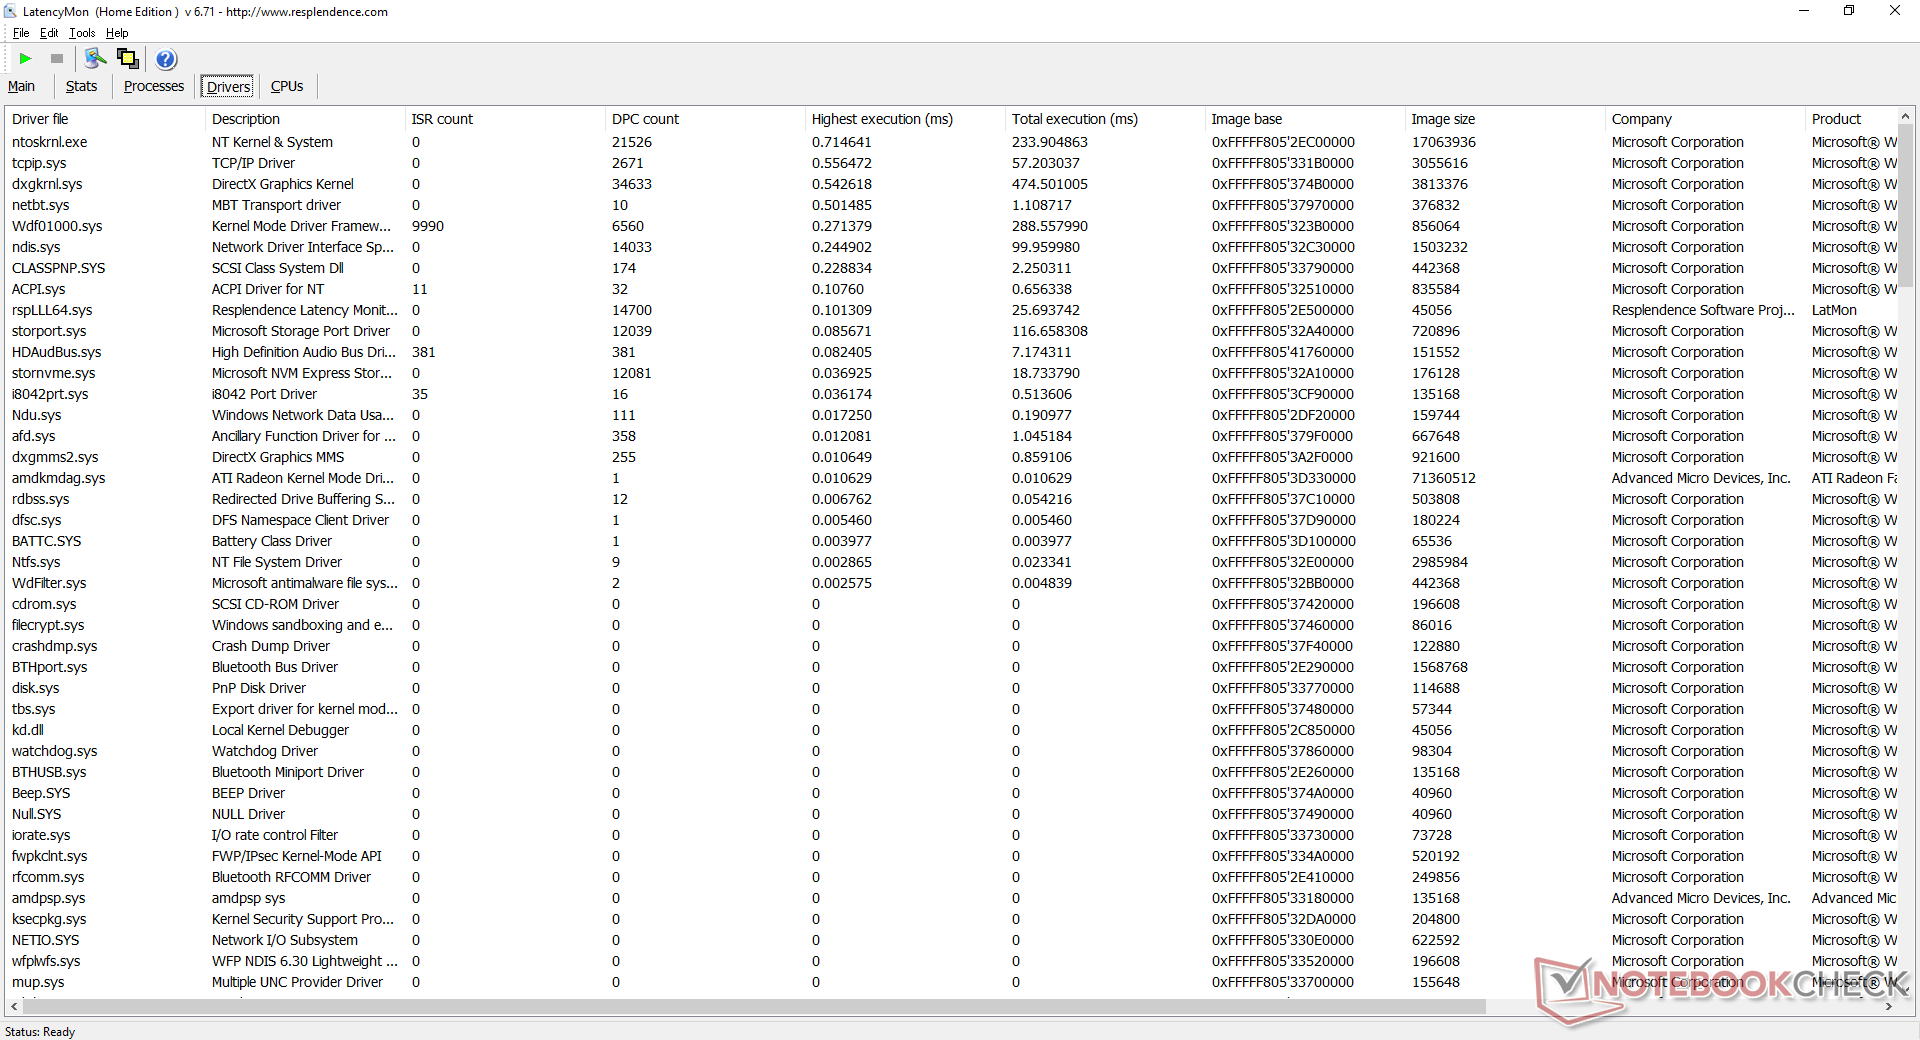
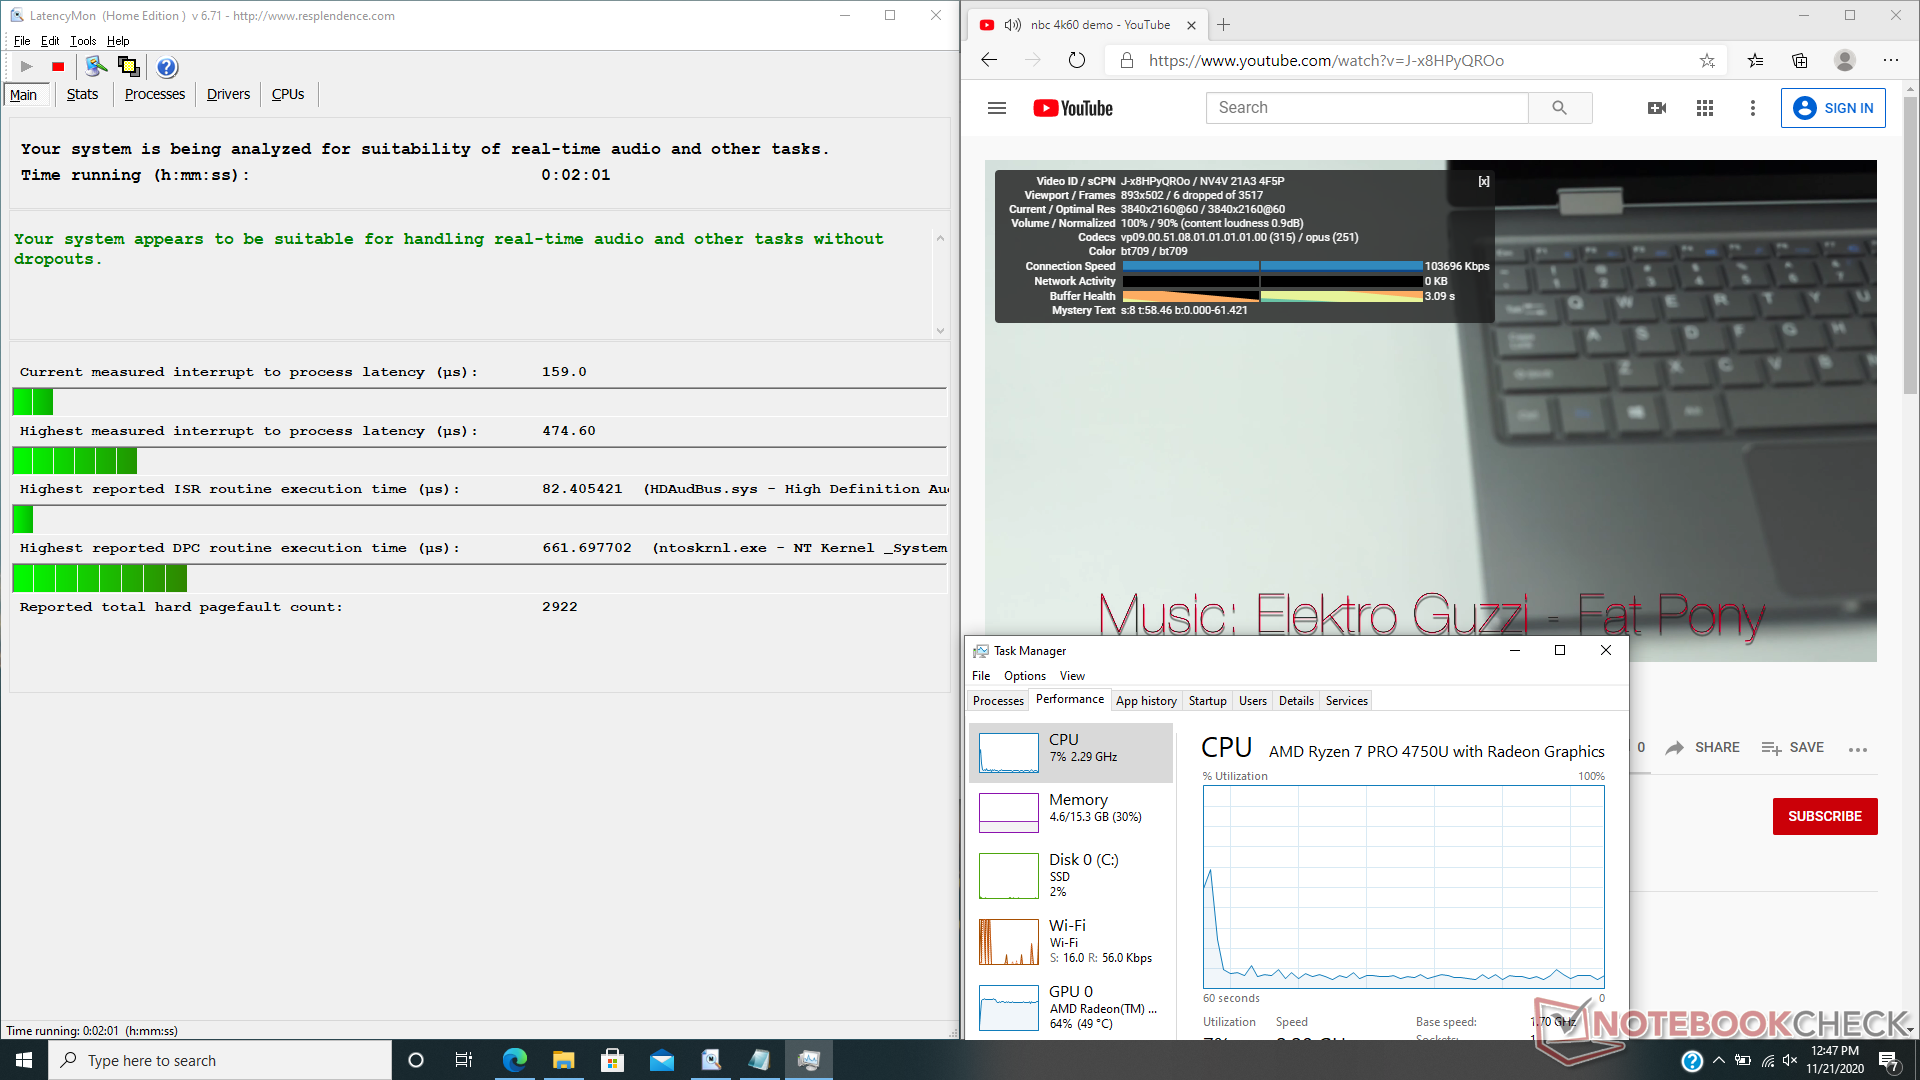
DPC-Latenzzeit
LattencyMon zeigt keine DPC-Latenzprobleme beim Öffnen mehrerer Browser-Tabs auf unserer Homepage. Auch die 4K-UHD-Videowiedergabe ist mit nur 6 dropped frames während unseres minutenlangen YouTube-Tests reibungslos.
| DPC Latencies / LatencyMon - interrupt to process latency (max), Web, Youtube, Prime95 | |
| Lenovo ThinkPad T14-20UES00H00 | |
| HP ProBook 445 G7 175W4EA | |
| HP EliteBook 845 G7-23Y60EA | |
| Dell Latitude 7410 | |
| HP EliteBook 845 G7 Ryzen 7 Pro 4750U | |
* ... kleinere Werte sind besser
Speichergeräte
Speicherlaufwerke unterscheiden sich oft zwischen Regionen oder Anbietern. Unser Ryzen 7 EliteBook 845 G7 wird zum Beispiel mit einer 256 GB Samsung PM981a SSD im Vergleich zu der 256 GB PM991 bei der Ryzen-5-Option geliefert. Die PM981a ist deutlich schneller als die PM991, insbesondere bei sequentiellen Schreibgeschwindigkeiten. Benutzer können bis zu 1 TB konfigurieren, aber wir können nicht garantieren, welche spezifischen Laufwerke tatsächlich enthalten sein werden.
| HP EliteBook 845 G7 Ryzen 7 Pro 4750U Samsung SSD PM981a MZVLB256HBHQ | HP EliteBook 845 G7-23Y60EA Samsung PM991 MZVLQ256HAJD | Lenovo ThinkPad T14-20UES00H00 Samsung SSD PM981a MZVLB512HBJQ | Dell Latitude 7410 Toshiba XG6 KXG60ZNV512G | HP ProBook 445 G7 175W4EA Samsung PM991 MZVLQ512HALU | Huawei Matebook X Pro i5 Samsung PM961 MZVLW256HEHP | |
|---|---|---|---|---|---|---|
| AS SSD | -42% | 59% | 67% | -18% | 21% | |
| Seq Read (MB/s) | 1976 | 1649 -17% | 2138 8% | 1837 -7% | 1936 -2% | 2416 22% |
| Seq Write (MB/s) | 1389 | 615 -56% | 1226 -12% | 1438 4% | 1213 -13% | 1170 -16% |
| 4K Read (MB/s) | 50.7 | 42.8 -16% | 55 8% | 48.1 -5% | 44.09 -13% | 48.33 -5% |
| 4K Write (MB/s) | 105.5 | 110.5 5% | 123.5 17% | 132.1 25% | 118.5 12% | 103.1 -2% |
| 4K-64 Read (MB/s) | 853 | 450 -47% | 850 0% | 660 -23% | 867 2% | 1039 22% |
| 4K-64 Write (MB/s) | 1970 | 780 -60% | 1852 -6% | 1163 -41% | 838 -57% | 399.6 -80% |
| Access Time Read * (ms) | 0.058 | 0.154 -166% | 0.04 31% | 0.059 -2% | 0.122 -110% | 0.058 -0% |
| Access Time Write * (ms) | 0.104 | 0.035 66% | 0.029 72% | 0.096 8% | 0.034 67% | 0.036 65% |
| Score Read (Points) | 1101 | 658 -40% | 1119 2% | 891 -19% | 1105 0% | 1329 21% |
| Score Write (Points) | 2214 | 953 -57% | 2098 -5% | 1439 -35% | 1078 -51% | 620 -72% |
| Score Total (Points) | 3862 | 1910 -51% | 3758 -3% | 2780 -28% | 2721 -30% | 2575 -33% |
| Copy ISO MB/s (MB/s) | 1422 | 236 -83% | 1386 -3% | 2089 47% | 739 -48% | |
| Copy Program MB/s (MB/s) | 71 | 60.6 -15% | 417.7 488% | 548 672% | 312.3 340% | |
| Copy Game MB/s (MB/s) | 277.8 | 126.6 -54% | 916 230% | 1226 341% | 486.3 75% | |
| CrystalDiskMark 5.2 / 6 | -41% | -8% | -5% | -23% | -33% | |
| Write 4K (MB/s) | 111.4 | 80.6 -28% | 88.1 -21% | 133.4 20% | 144.6 30% | 116.5 5% |
| Read 4K (MB/s) | 58.2 | 31.2 -46% | 38.28 -34% | 51.3 -12% | 38.08 -35% | 42.18 -28% |
| Write Seq (MB/s) | 2195 | 883 -60% | 2002 -9% | 1897 -14% | 1320 -40% | 1079 -51% |
| Read Seq (MB/s) | 2516 | 1352 -46% | 2153 -14% | 2202 -12% | 1397 -44% | 1030 -59% |
| Write 4K Q32T1 (MB/s) | 472.1 | 361 -24% | 423.7 -10% | 384.9 -18% | 324.2 -31% | 225.7 -52% |
| Read 4K Q32T1 (MB/s) | 380.5 | 272 -29% | 393.2 3% | 318.7 -16% | 434.8 14% | 302.9 -20% |
| Write Seq Q32T1 (MB/s) | 2339 | 979 -58% | 2889 24% | 2866 23% | 1382 -41% | 1174 -50% |
| Read Seq Q32T1 (MB/s) | 3565 | 2286 -36% | 3566 0% | 3122 -12% | 2354 -34% | 3394 -5% |
| Durchschnitt gesamt (Programm / Settings) | -42% /
-42% | 26% /
35% | 31% /
41% | -21% /
-20% | -6% /
1% |
* ... kleinere Werte sind besser

Disk Throttling: DiskSpd Read Loop, Queue Depth 8
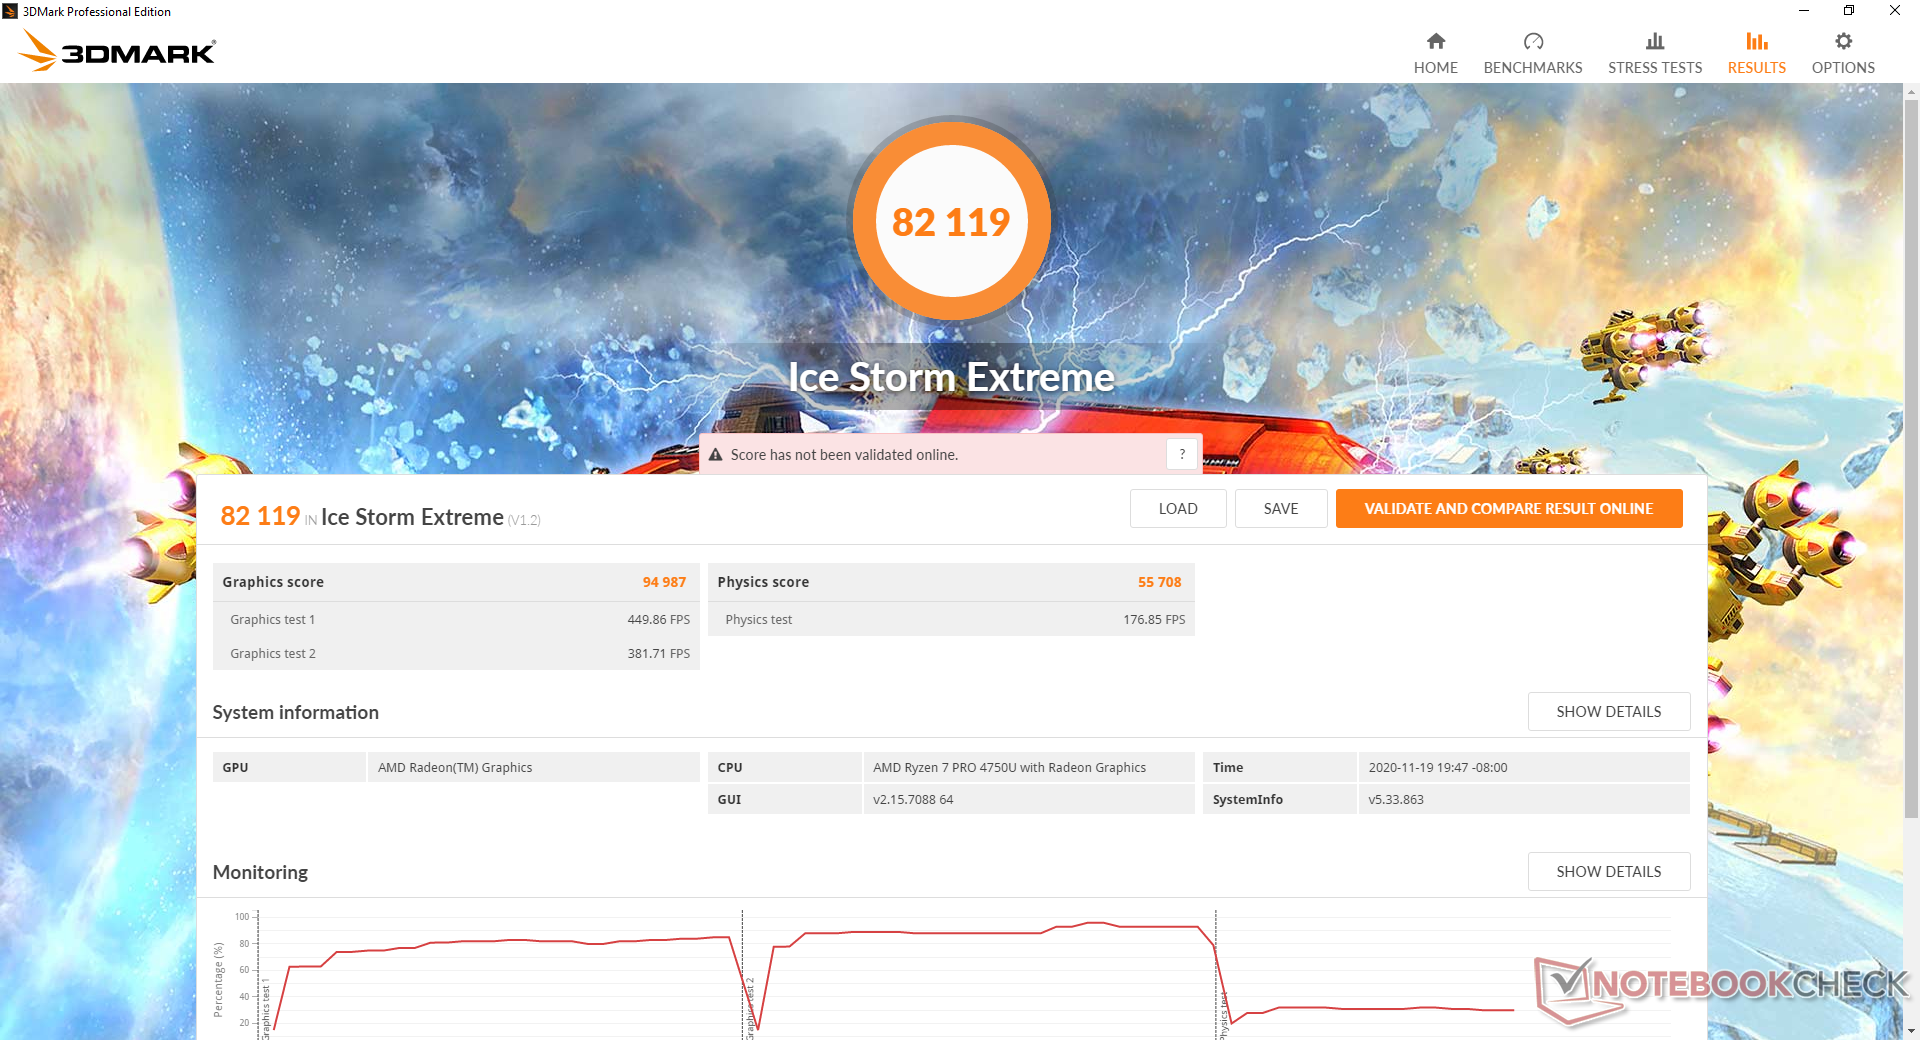
GPU Performance
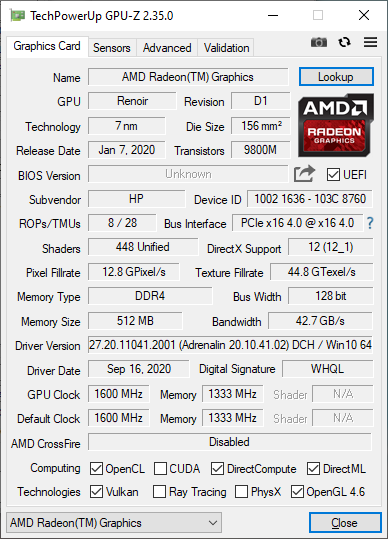
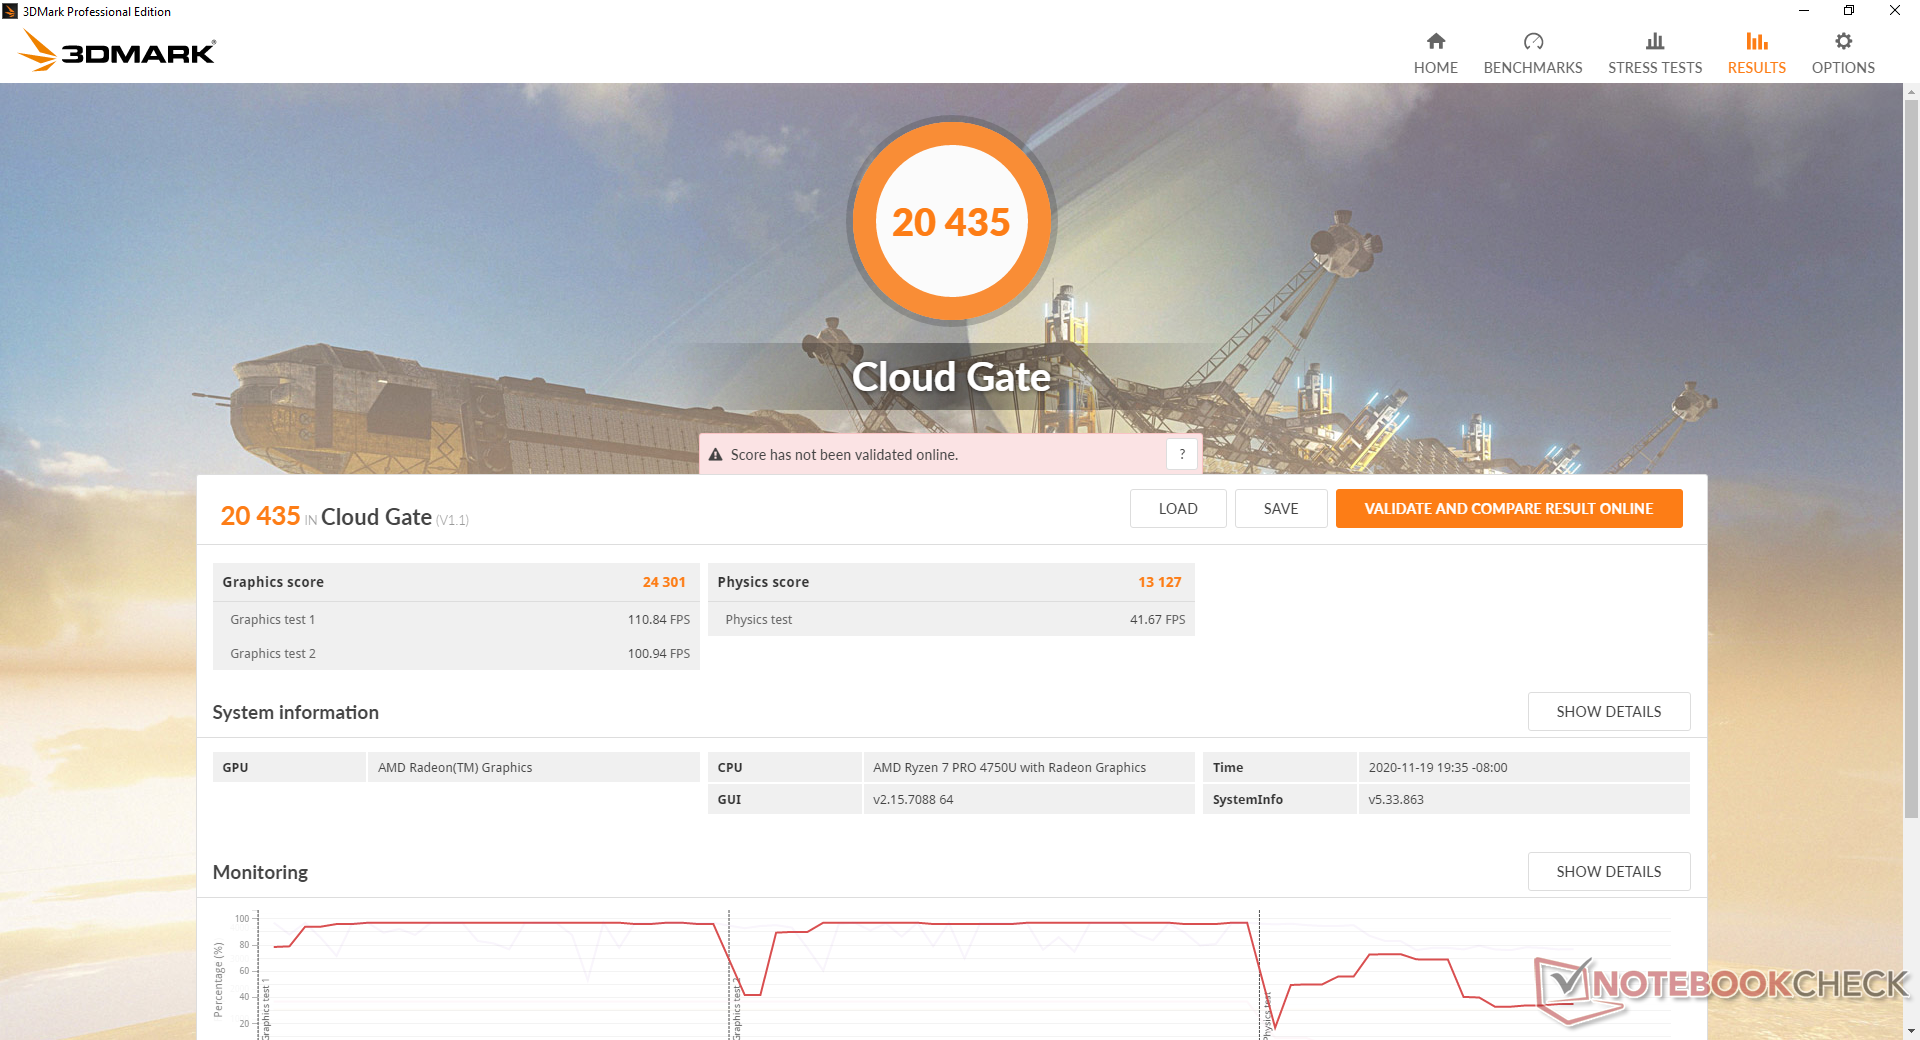
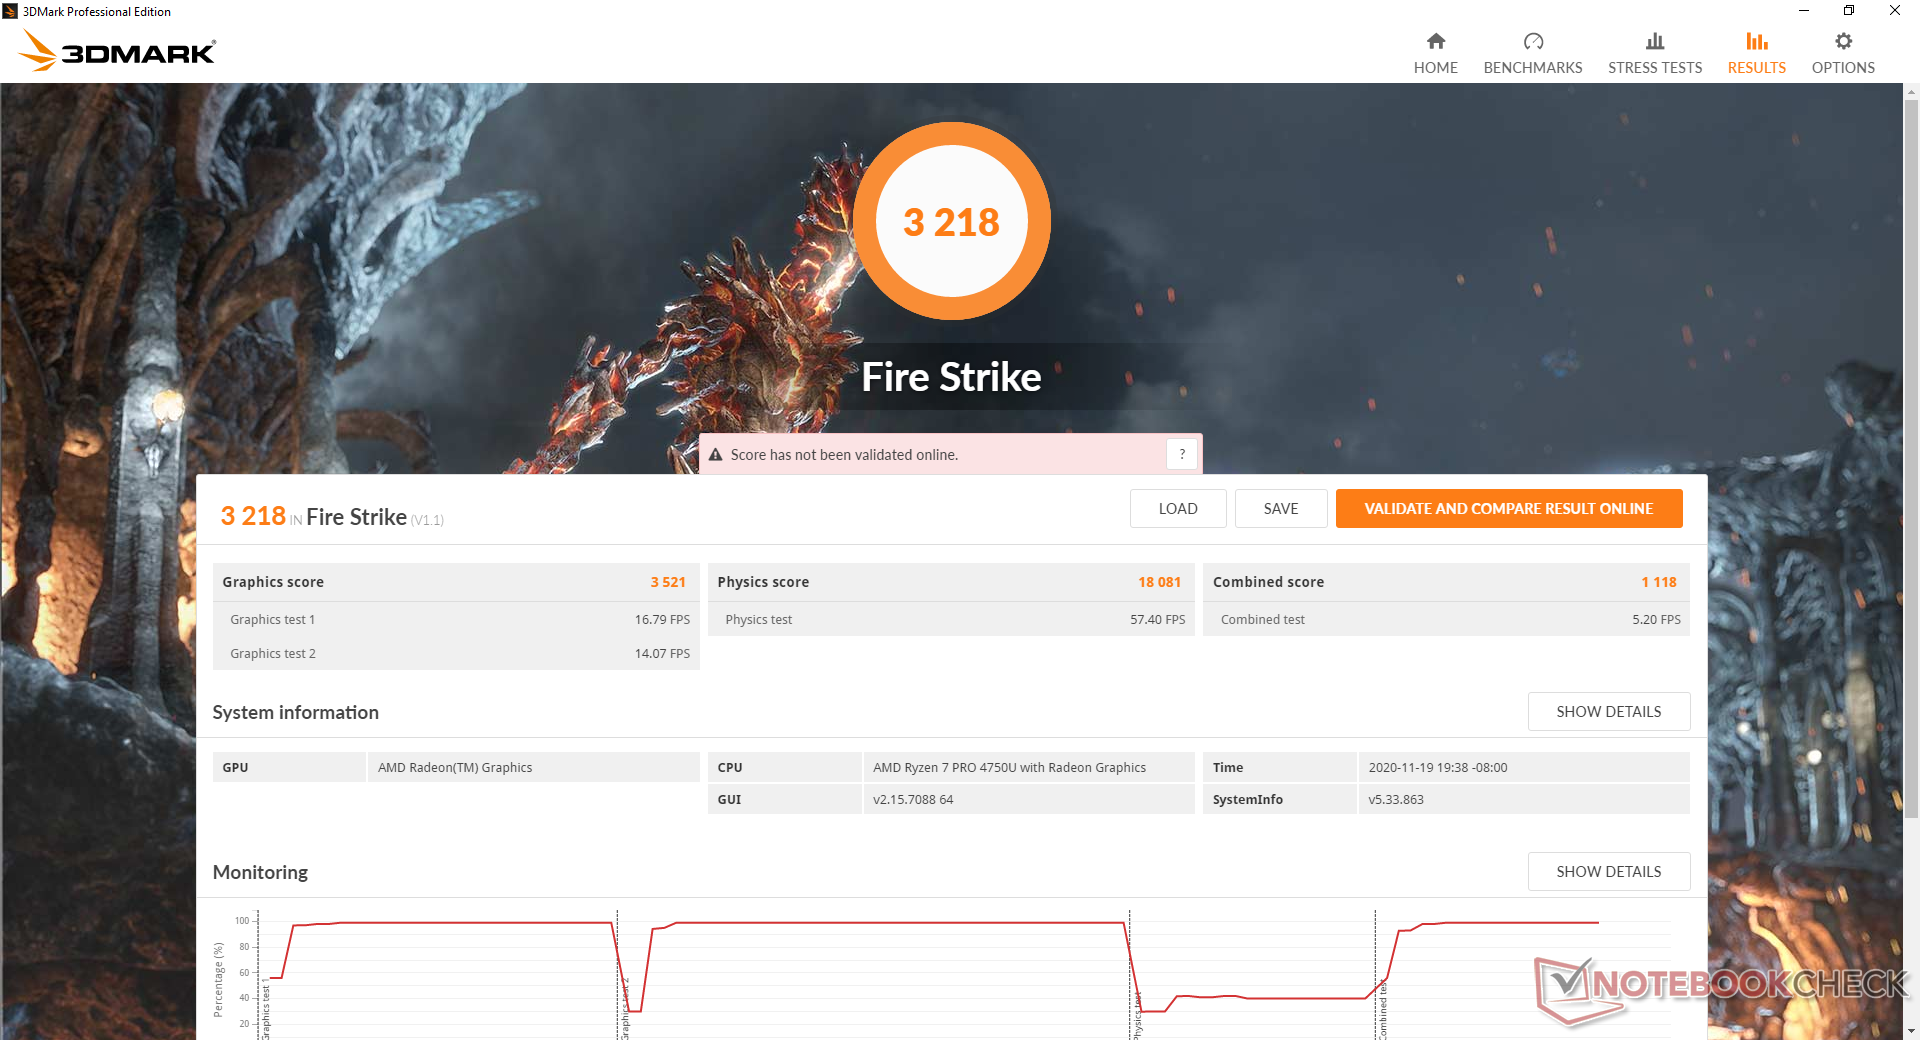
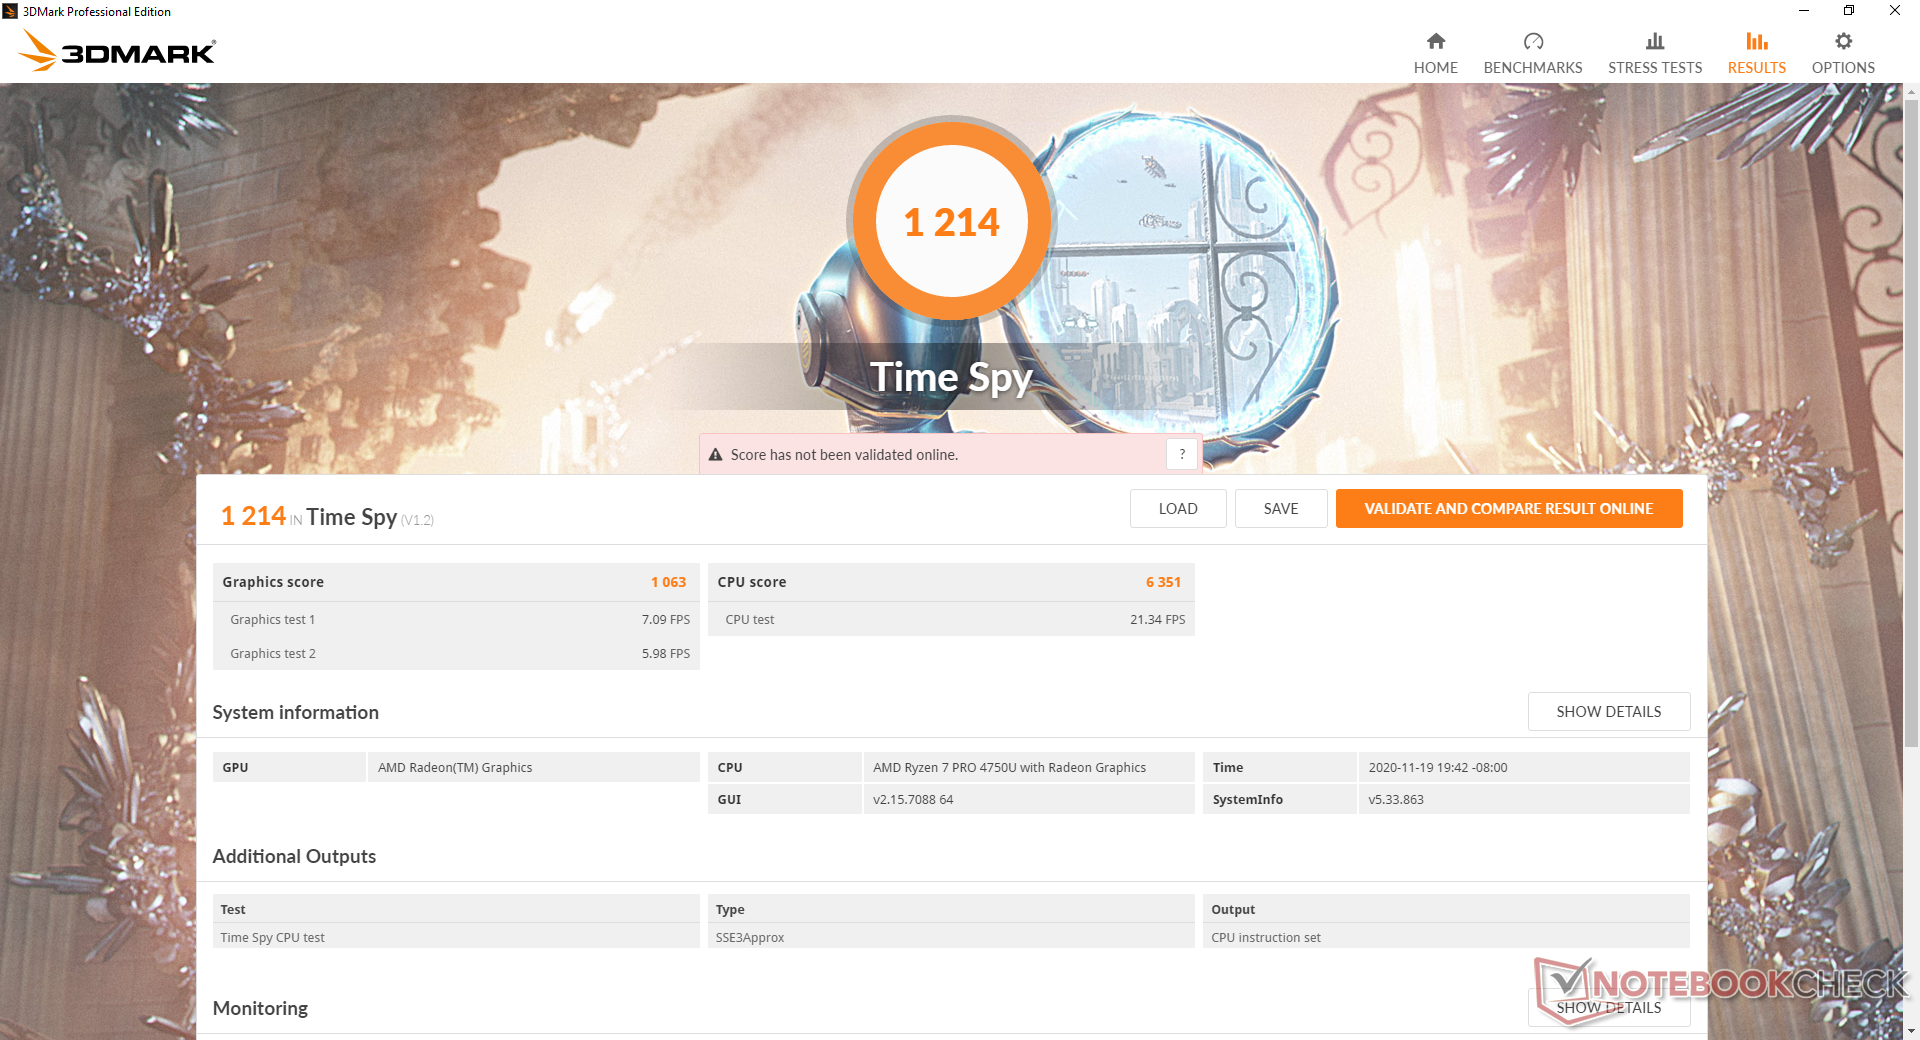
Die Grafikleistung ist hervorragend, insbesondere für einen Business-Laptop, der nur mit integrierter Grafik läuft. Die Radeon RX Vega 7 ist hier in den 3DMark-Benchmarks durchweg schneller als der Core i7 Iris Xe im kürzlich erschienenen AsusZenBook 14 UX425EA. Die Ergebnisse liegen auch auf dem Niveau der diskreten GeForce MX250. Das bedeutet nicht unbedingt, dass unser HP-System Spiele aufgrund von Unterschieden bei Treibern und Optimierungen schneller als andere Systeme wie Iris Xe oder GeForce MX250 ausführt, aber die Rohleistung ist dennoch beeindruckend.
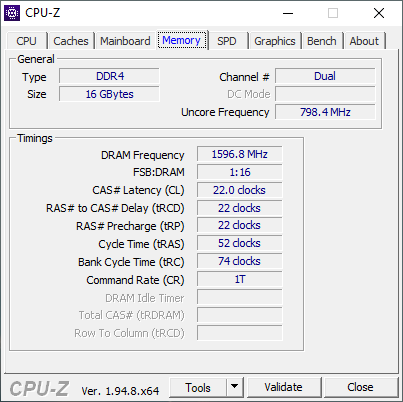
Beachten Sie, dass unser Vega 7-Grafikprozessor über 60 Prozent schneller arbeitet als der Vega 6-Grafikprozessor unseres Ryzen 5 EliteBook 845 G7. Das große Delta kann zum Teil dem single-channel 8-GB-RAM unseres Ryzen 5 SKU im Vergleich zu dem dual-channel 16-GB-RAM unseres Ryzen 7 SKU zugeschrieben werden. Der Unterschied in der Grafikleistung zwischen Vega 6 und Vega 7 dürfte daher viel geringer sein als der unten dargestellte Unterschied zwischen diesen beiden HP-Laptops.
| 3DMark 06 Standard Score | 22324 Punkte | |
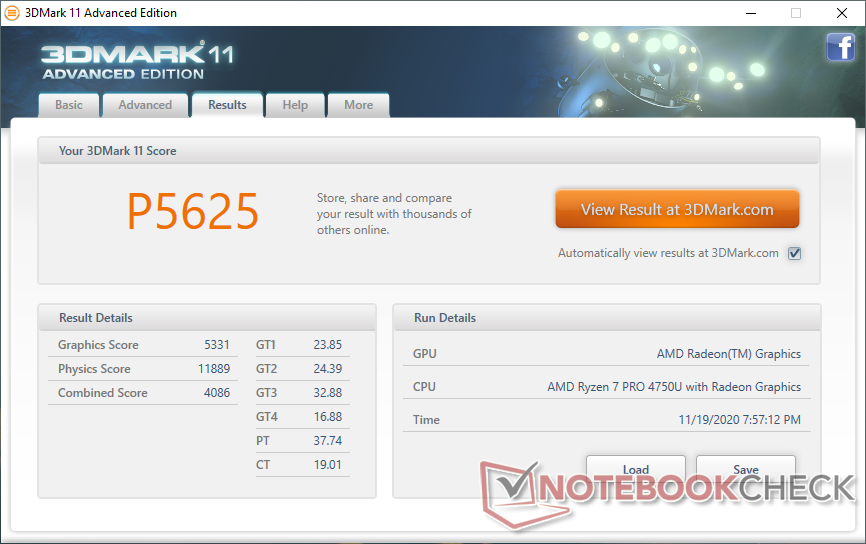
| 3DMark 11 Performance | 5625 Punkte | |
| 3DMark Cloud Gate Standard Score | 20435 Punkte | |
| 3DMark Fire Strike Score | 3218 Punkte | |
| 3DMark Time Spy Score | 1214 Punkte | |
Hilfe | ||
| min. | mittel | hoch | max. | |
|---|---|---|---|---|
| The Witcher 3 (2015) | 70.5 | 43.4 | 22.3 | 14.4 |
| Dota 2 Reborn (2015) | 91.6 | 78.9 | 53.9 | 50.7 |
| Final Fantasy XV Benchmark (2018) | 34 | 17.1 | 10.7 | |
| X-Plane 11.11 (2018) | 39.5 | 31.5 | 28.1 |
Emissionen
Geräuschemissionen
Die Lautstärke ist vergleichbar mit der beim Ryzen 5 SKU, wenn man die Unterschiede im Umgebungslärm berücksichtigt. Eine Ausnahme tritt jedoch auf, wenn Prime95 läuft oder wenn die Prozessor ähnlich extremen Belastungen ausgesetzt ist. In solchen Szenarien wird der Lüfterlärm mit fast 40 dB(A) lauter. Der Pegel ist auch höher, als wir es gerne hätten, was bedeutet, dass der Ventilator beim Hochfahren deutlicher zu hören ist.
| HP EliteBook 845 G7 Ryzen 7 Pro 4750U Vega 7, R7 PRO 4750U, Samsung SSD PM981a MZVLB256HBHQ | HP EliteBook 845 G7-23Y60EA Vega 6, R5 PRO 4650U, Samsung PM991 MZVLQ256HAJD | Lenovo ThinkPad T14-20UES00H00 Vega 6, R5 PRO 4650U, Samsung SSD PM981a MZVLB512HBJQ | Dell Latitude 7410 UHD Graphics 620, i7-10610U, Toshiba XG6 KXG60ZNV512G | HP ProBook 445 G7 175W4EA Vega 6, R5 4500U, Samsung PM991 MZVLQ512HALU | Huawei Matebook X Pro i5 GeForce MX150, i5-8250U, Samsung PM961 MZVLW256HEHP | |
|---|---|---|---|---|---|---|
| Geräuschentwicklung | 17% | 6% | 7% | 2% | 2% | |
| aus / Umgebung * (dB) | 30 | 25.4 15% | 29.3 2% | 28.1 6% | 30.7 -2% | 27.9 7% |
| Idle min * (dB) | 30.6 | 25.4 17% | 29.3 4% | 28.1 8% | 30.7 -0% | 27.9 9% |
| Idle avg * (dB) | 30.6 | 25.4 17% | 29.3 4% | 28.1 8% | 30.7 -0% | 27.9 9% |
| Idle max * (dB) | 30.6 | 25.4 17% | 30.3 1% | 28.1 8% | 30.7 -0% | 27.9 9% |
| Last avg * (dB) | 33.6 | 29.6 12% | 31.3 7% | 30 11% | 32.3 4% | 36.2 -8% |
| Last max * (dB) | 39.2 | 29.5 25% | 33 16% | 39.3 -0% | 34.8 11% | 45.2 -15% |
| Witcher 3 ultra * (dB) | 33 | 45 |
* ... kleinere Werte sind besser
Lautstärkediagramm
| Idle |
| 30.6 / 30.6 / 30.6 dB(A) |
| Last |
| 33.6 / 39.2 dB(A) |
 | ||
30 dB leise 40 dB(A) deutlich hörbar 50 dB(A) störend |
||
min: | ||
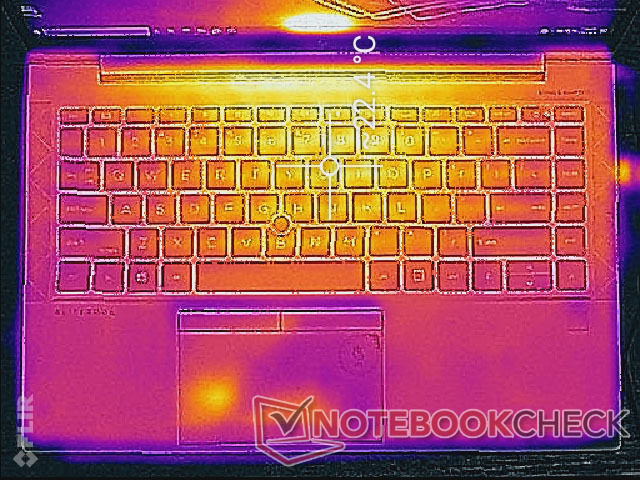
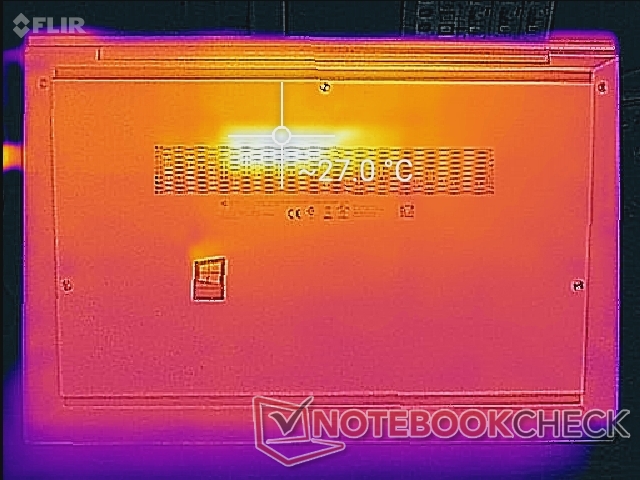
Temperatur
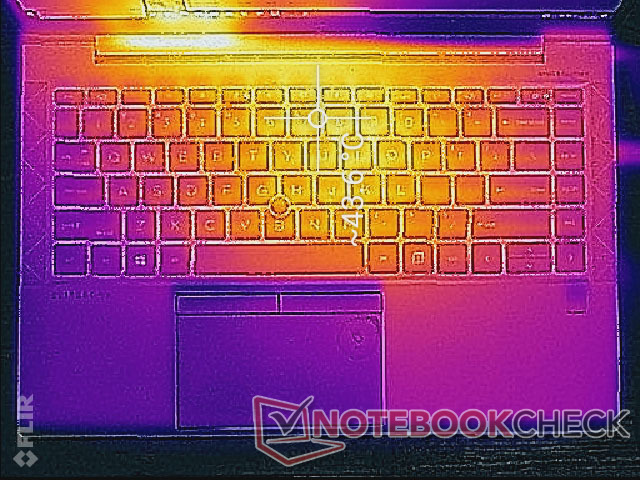
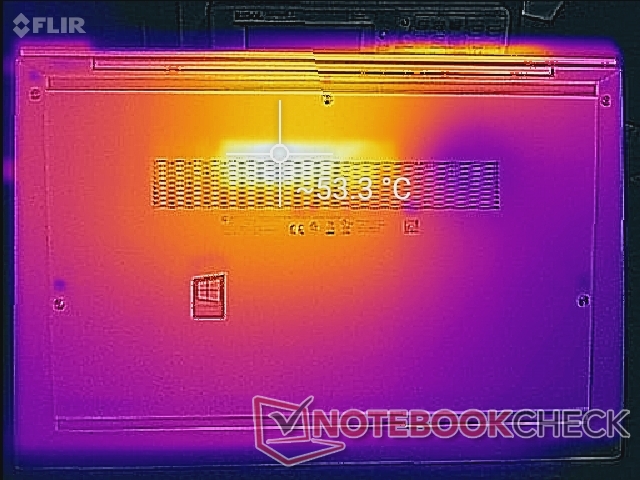
Die Oberflächentemperaturen sind im Allgemeinen wärmer als beim 6-Kern-EliteBook 845 G7. Hot Spots bei extremen Belastungen erreichen an der Ober- bzw. Unterseite des Chassis bis zu 44 °C bzw. 53 °C, im Vergleich zu nur 39 °C bei der 6-Kern-Konfiguration. Die Handballenauflagen und die meisten Tasten der Tastatur bleiben kühler, so dass die höheren Temperaturen nicht störend sind.
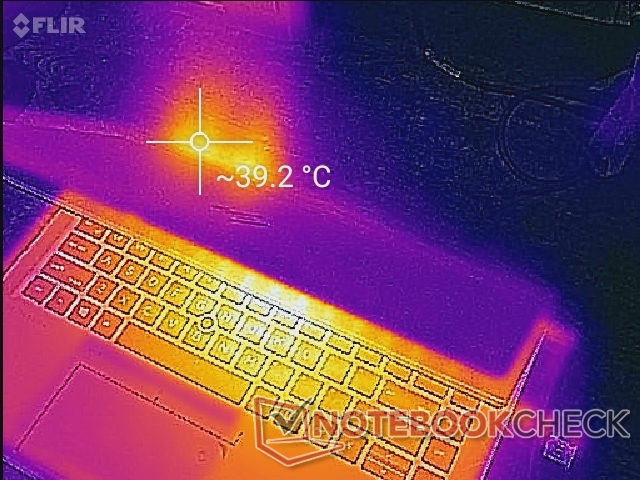
(±) Die maximale Temperatur auf der Oberseite ist 43.6 °C. Im Vergleich liegt der Klassendurchschnitt bei 35.9 °C (von 21.4 bis 59 °C für die Klasse Subnotebook).
(-) Auf der Unterseite messen wir eine maximalen Wert von 52.6 °C (im Vergleich zum Durchschnitt von 39.2 °C).
(+) Ohne Last messen wir eine durchschnittliche Temperatur von 21.5 °C auf der Oberseite. Der Klassendurchschnitt erreicht 30.8 °C.
(+) Die Handballen und der Touchpad-Bereich sind mit gemessenen 29.4 °C kühler als die typische Hauttemperatur und fühlen sich dadurch kühl an.
(±) Die durchschnittliche Handballen-Temperatur anderer getesteter Geräte war 28.2 °C (-1.2 °C).
Stresstest
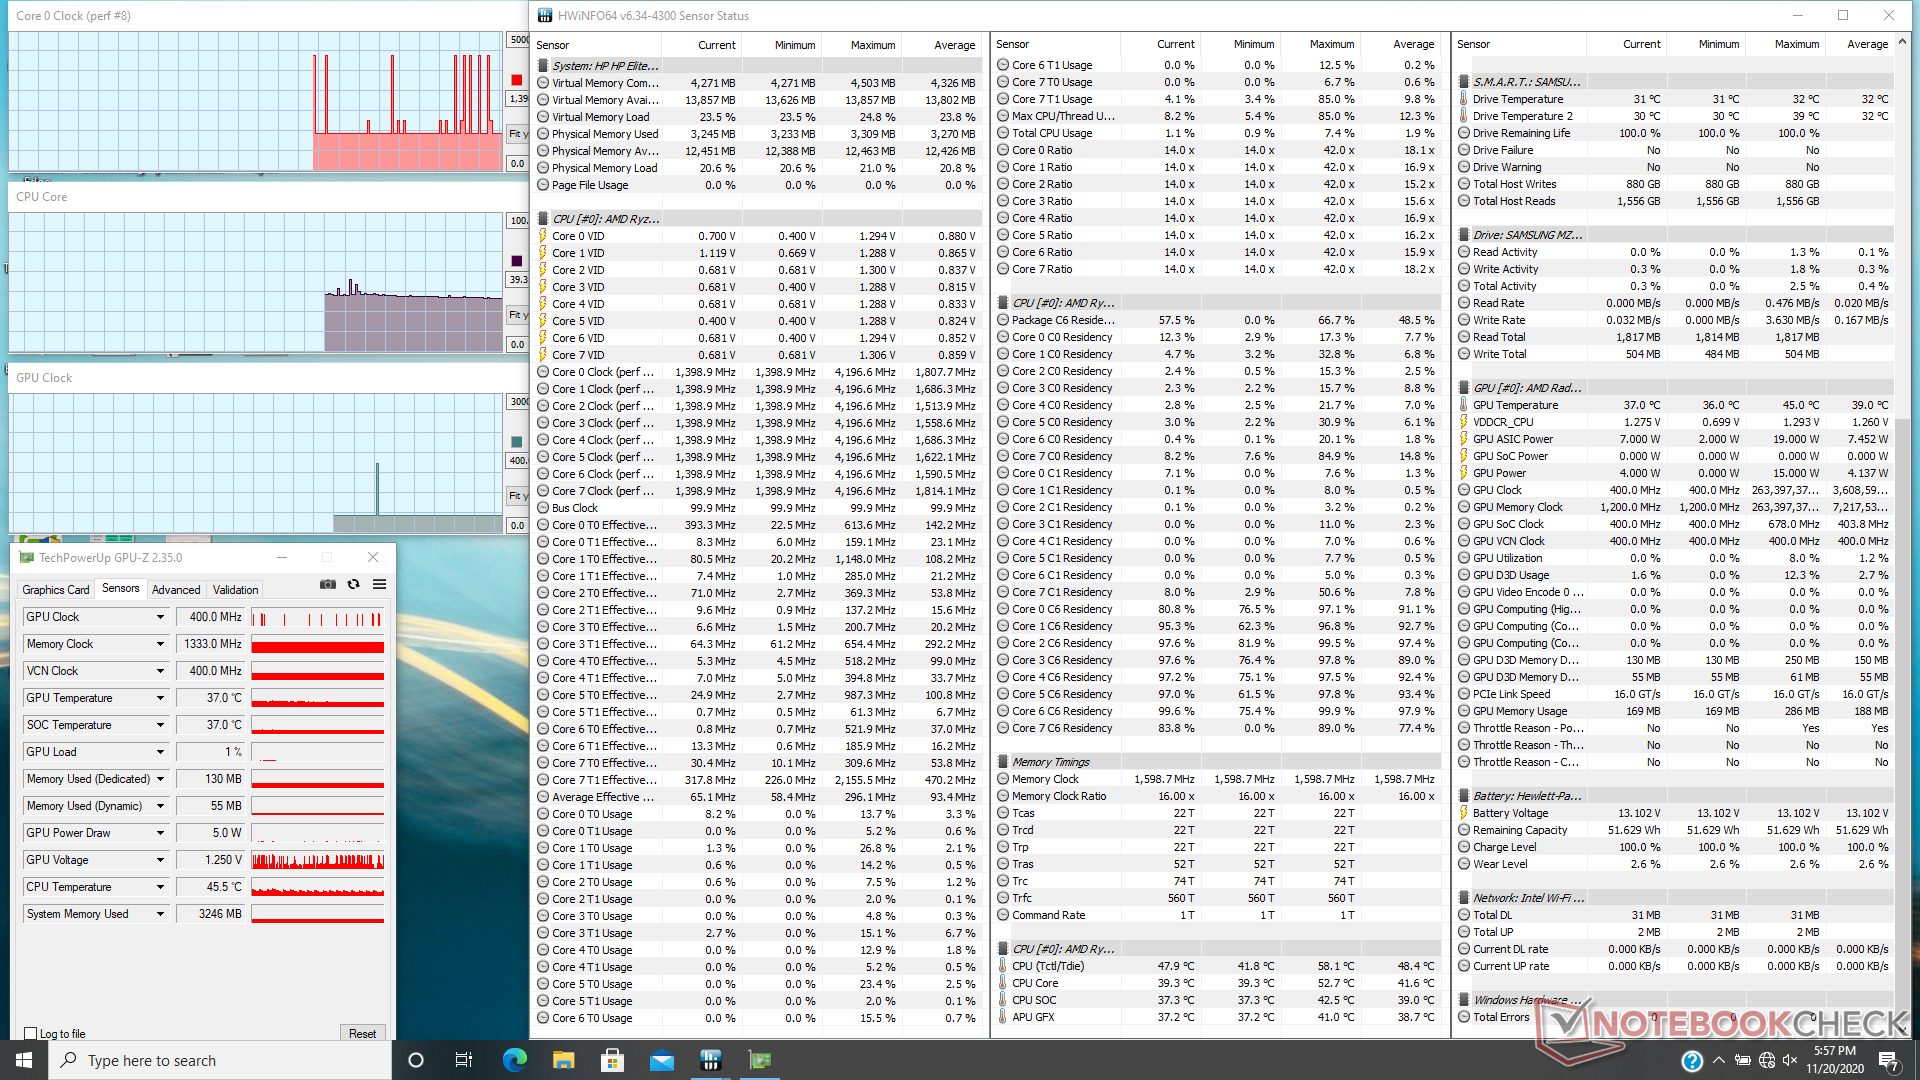
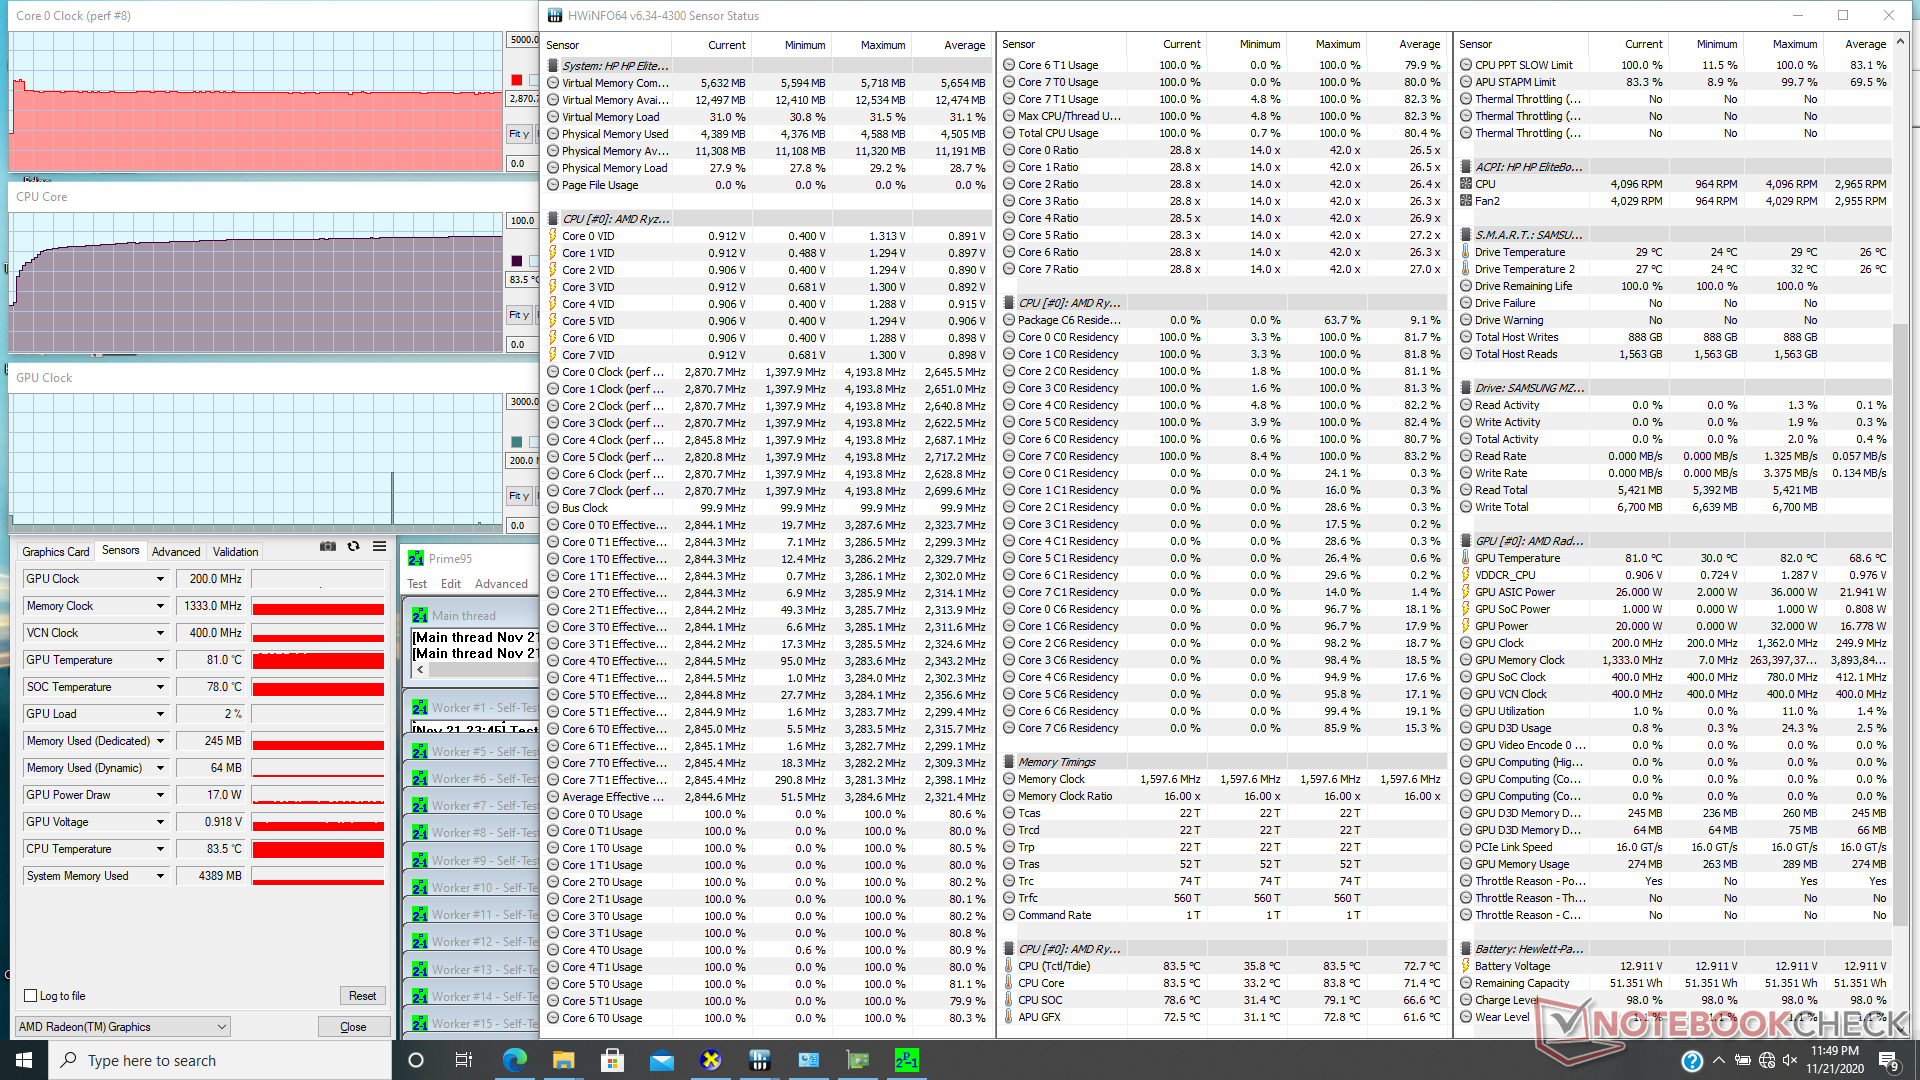
Wenn Prime95 lief, stieg die CPU für nur wenige Sekunden auf 3,2 GHz, bevor sie abfiel und sich bei 2,9 GHz und 84 C stabilisierte, was wärmer ist als bei den meisten Ultrabooks. Interessanterweise ist die Kerntemperatur im Allgemeinen kühler als das, was wir bei der Ryzen 5-Version des EliteBook 845 G7 beobachtet haben, wo die CPU beim Ausführen der CineBench R15 100 C erreichen würde
Der Betrieb mit Batterieleistung wird die Leistung nicht einschränken. Ein 3DMark 11-Test mit Batterien würde für Physik und Grafik Werte von 12102 bzw. 5134 Punkten ergeben, verglichen mit 11889 und 5331 Punkten bei Netzstrom.
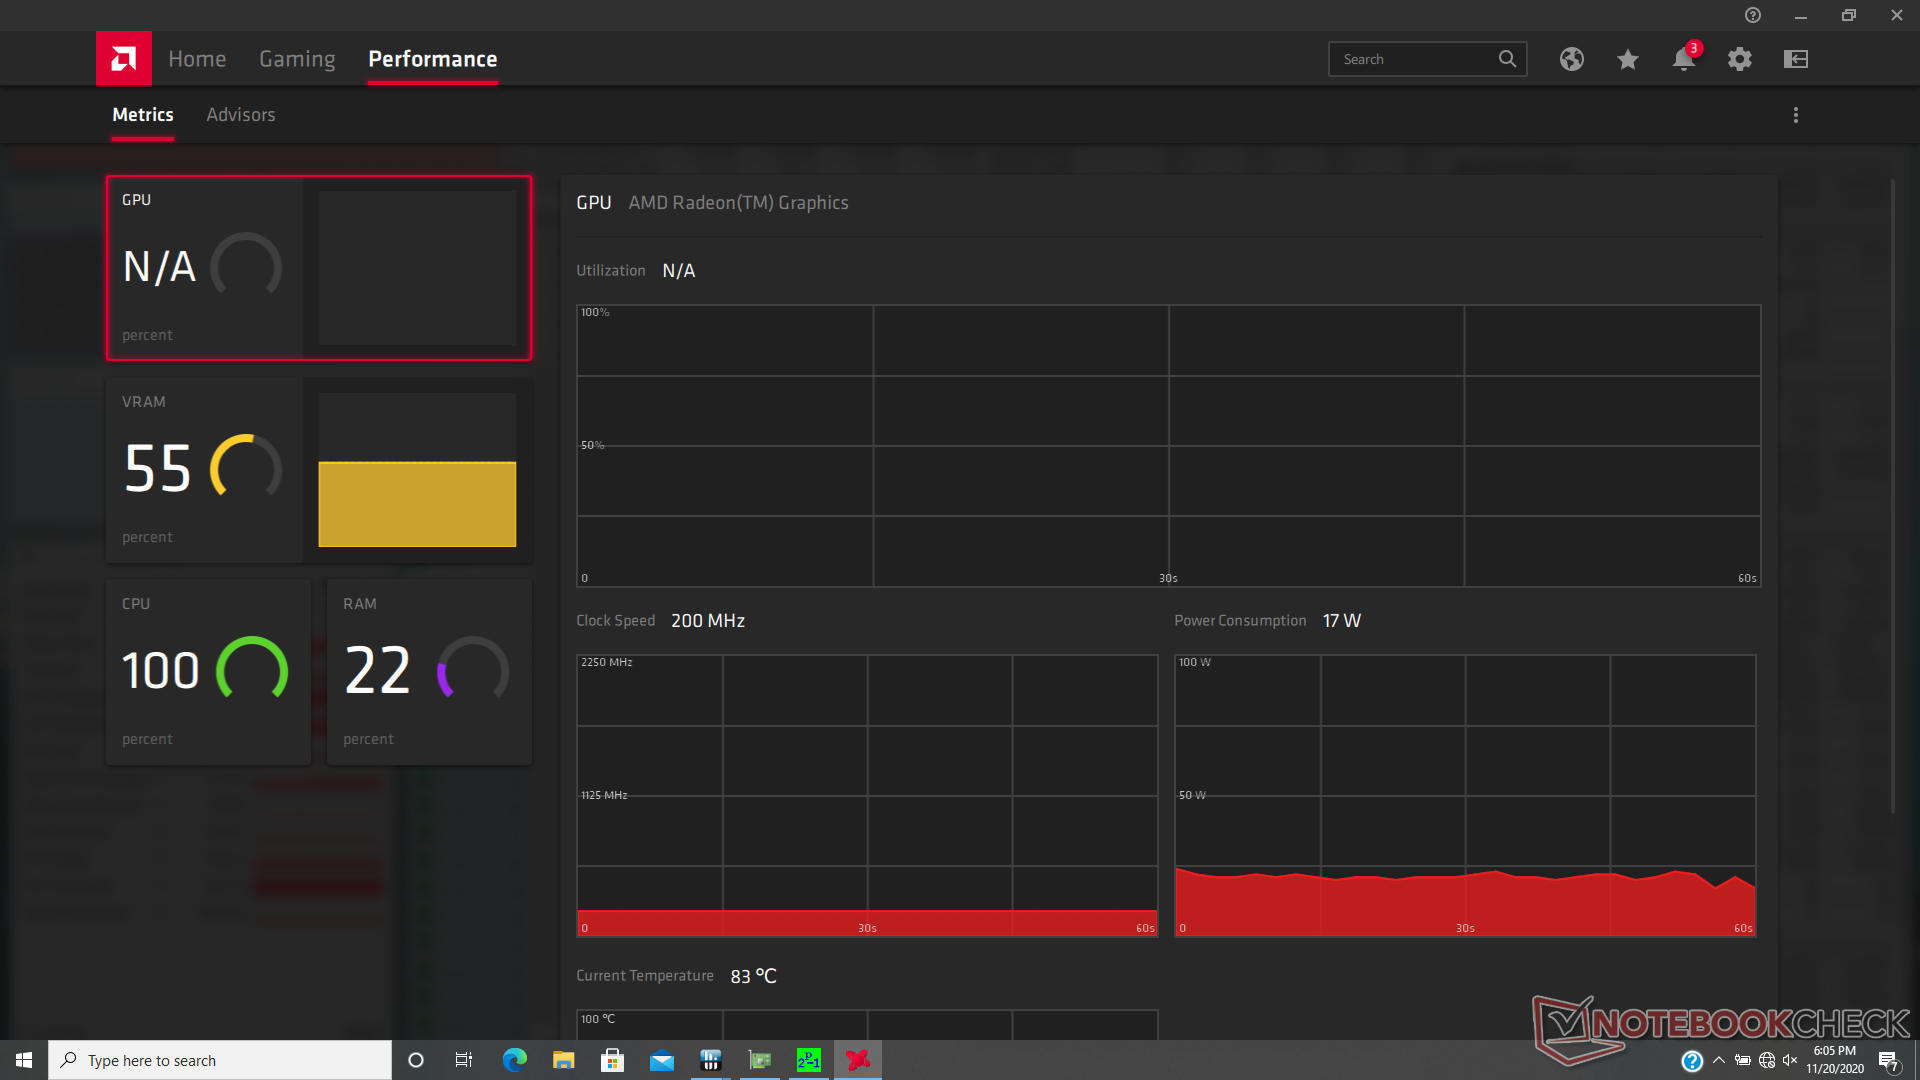
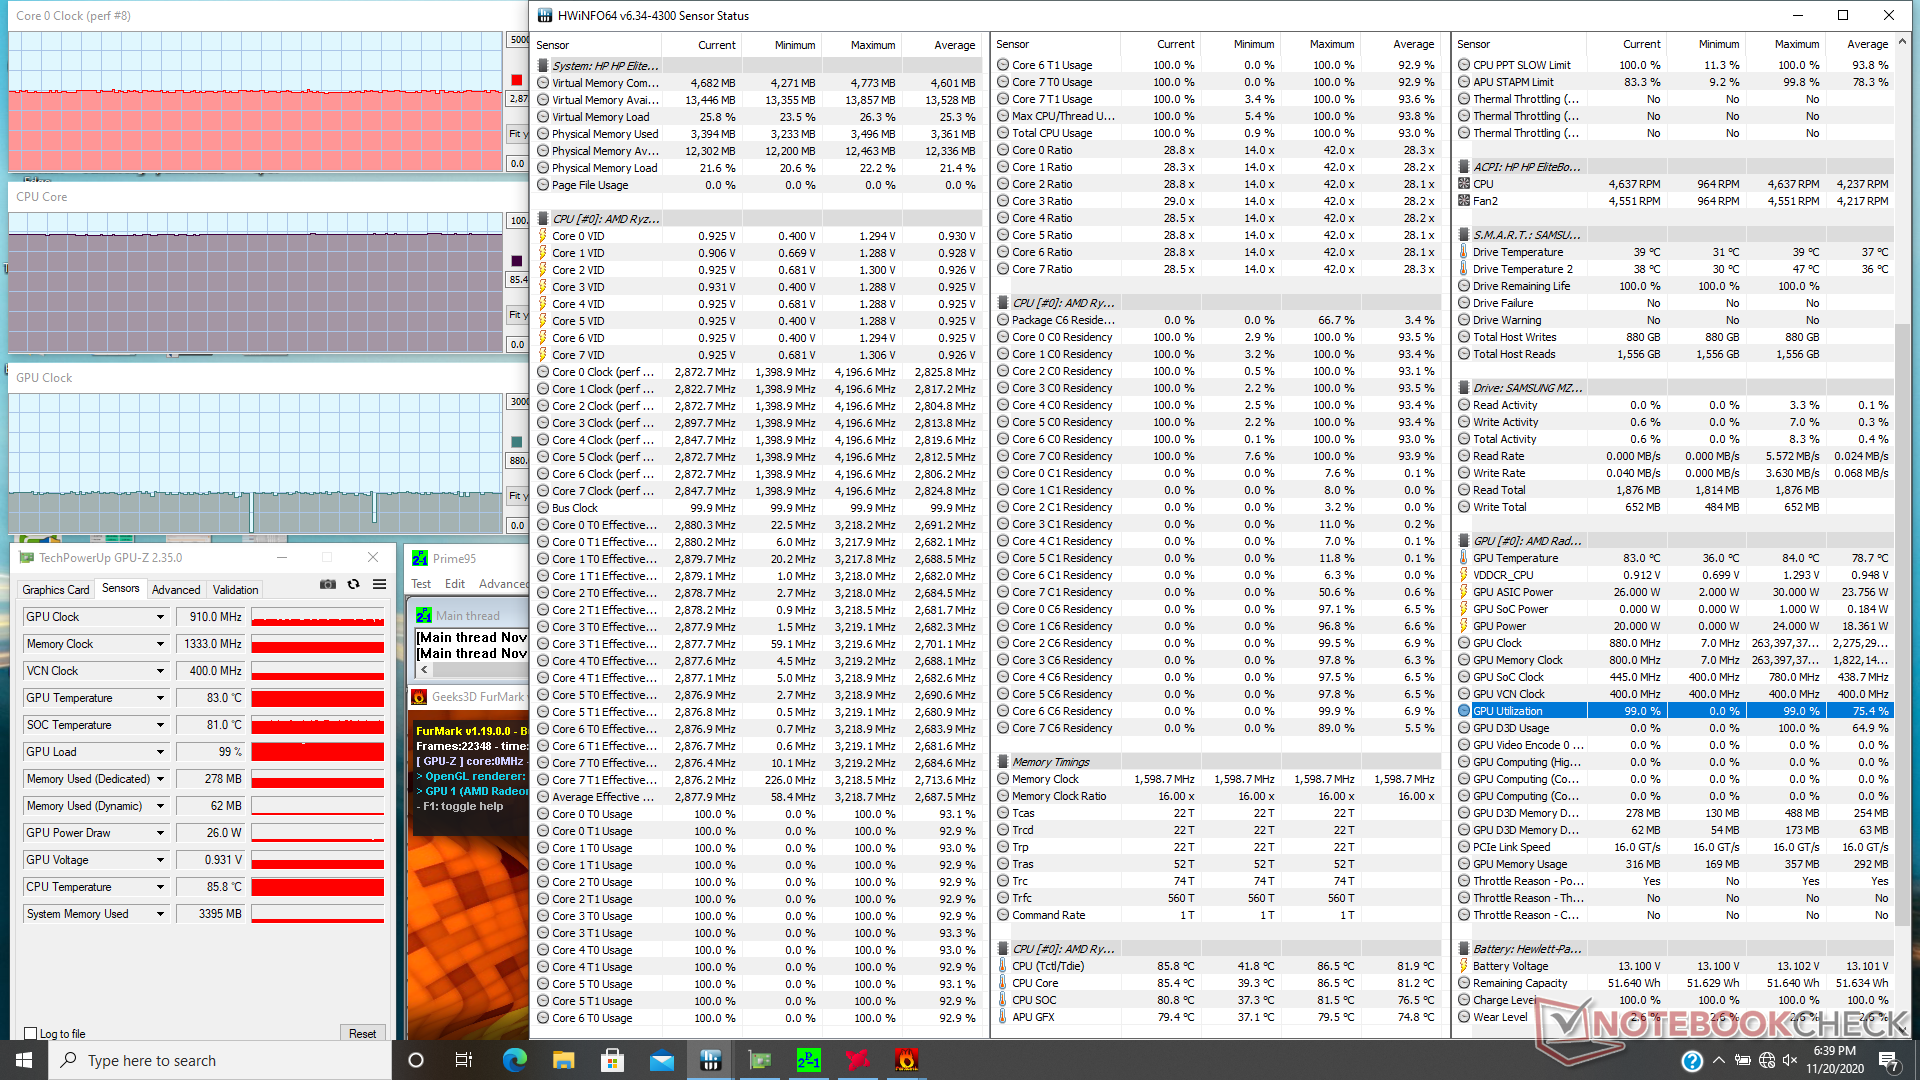
| CPU-Takt (GHz) | GPU-Takt (MHz) | DurchschnittlicheCPU-Temperatur (°C) | |
| System Idle | -- | -- | --39 |
| Prime95 Stress | 2.9 | -- | 84 |
| Prime95 + FurMark Stress | 2.9 | 910 | 85 |
Lautsprecher
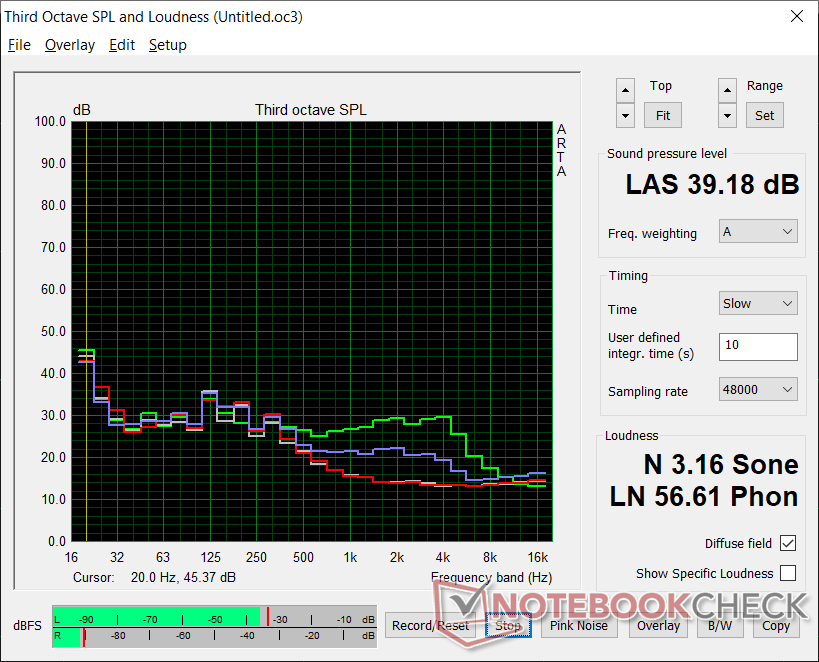
HP EliteBook 845 G7 Ryzen 7 Pro 4750U Audio Analyse
(±) | Mittelmäßig laut spielende Lautsprecher (78.7 dB)
Bass 100 - 315 Hz
(±) | abgesenkter Bass - 13.1% geringer als der Median
(±) | durchschnittlich lineare Bass-Wiedergabe (10.8% Delta zum Vorgänger)
Mitteltöne 400 - 2000 Hz
(+) | ausgeglichene Mitten, vom Median nur 2.2% abweichend
(+) | lineare Mitten (3.5% Delta zum Vorgänger)
Hochtöne 2 - 16 kHz
(+) | ausgeglichene Hochtöne, vom Median nur 3.4% abweichend
(+) | sehr lineare Hochtöne (6.6% Delta zum Vorgänger)
Gesamt im hörbaren Bereich 100 - 16.000 Hz
(+) | hörbarer Bereich ist sehr linear (13.4% Abstand zum Median
Im Vergleich zu allen Geräten derselben Klasse
» 22% aller getesteten Geräte dieser Klasse waren besser, 5% vergleichbar, 72% schlechter
» Das beste Gerät hat einen Delta-Wert von 5%, durchschnittlich ist 18%, das schlechteste Gerät hat 53%
Im Vergleich zu allen Geräten im Test
» 14% aller getesteten Geräte waren besser, 4% vergleichbar, 83% schlechter
» Das beste Gerät hat einen Delta-Wert von 4%, durchschnittlich ist 24%, das schlechteste Gerät hat 134%
Apple MacBook 12 (Early 2016) 1.1 GHz Audio Analyse
(+) | Die Lautsprecher können relativ laut spielen (83.6 dB)
Bass 100 - 315 Hz
(±) | abgesenkter Bass - 11.3% geringer als der Median
(±) | durchschnittlich lineare Bass-Wiedergabe (14.2% Delta zum Vorgänger)
Mitteltöne 400 - 2000 Hz
(+) | ausgeglichene Mitten, vom Median nur 2.4% abweichend
(+) | lineare Mitten (5.5% Delta zum Vorgänger)
Hochtöne 2 - 16 kHz
(+) | ausgeglichene Hochtöne, vom Median nur 2% abweichend
(+) | sehr lineare Hochtöne (4.5% Delta zum Vorgänger)
Gesamt im hörbaren Bereich 100 - 16.000 Hz
(+) | hörbarer Bereich ist sehr linear (10.2% Abstand zum Median
Im Vergleich zu allen Geräten derselben Klasse
» 7% aller getesteten Geräte dieser Klasse waren besser, 2% vergleichbar, 91% schlechter
» Das beste Gerät hat einen Delta-Wert von 5%, durchschnittlich ist 18%, das schlechteste Gerät hat 53%
Im Vergleich zu allen Geräten im Test
» 5% aller getesteten Geräte waren besser, 1% vergleichbar, 94% schlechter
» Das beste Gerät hat einen Delta-Wert von 4%, durchschnittlich ist 24%, das schlechteste Gerät hat 134%
Energieverwaltung
Energieaufnahme
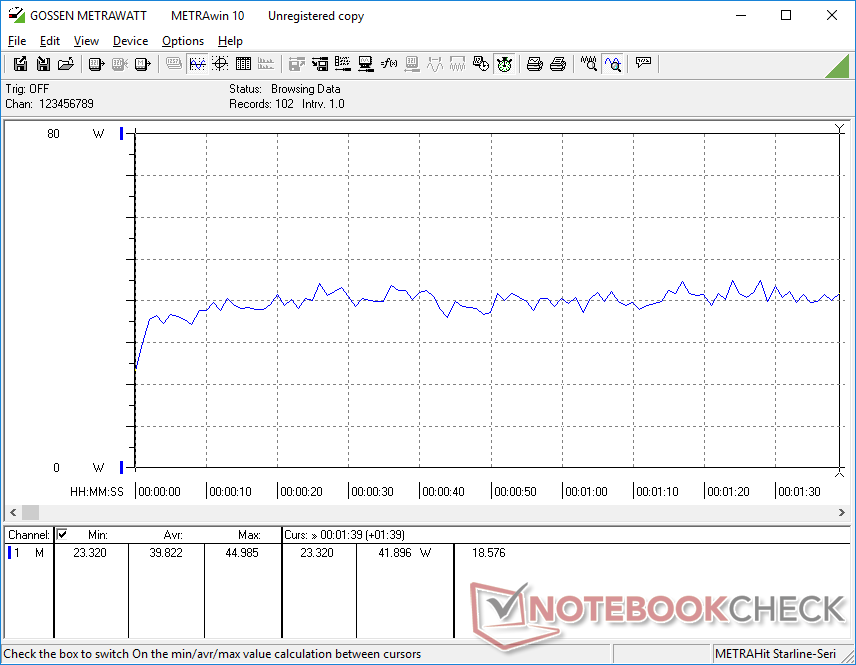
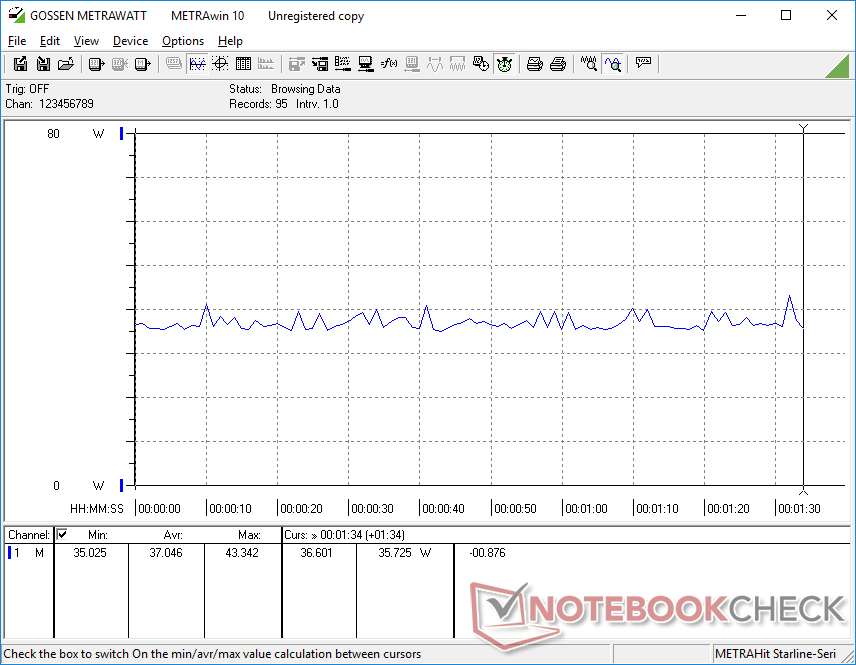
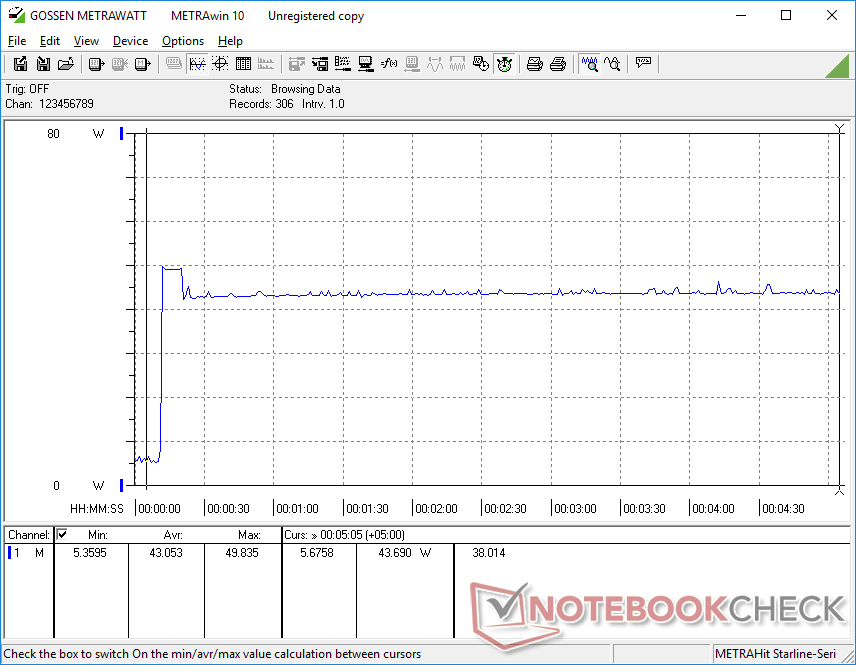
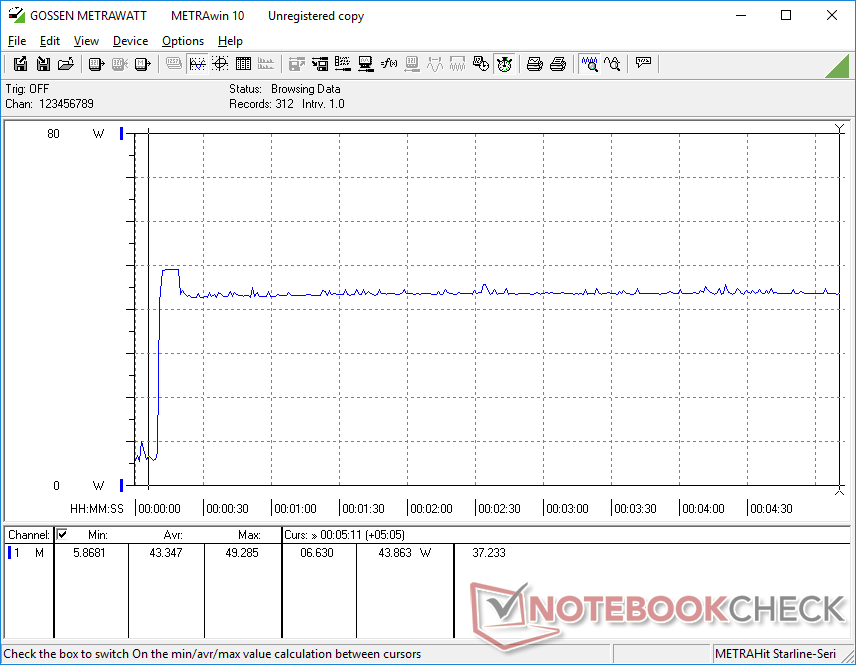
Im Vergleich zum 6-Core-EliteBook 845 G7 verbraucht unsere 8-Core-Version unter Last mehr Strom. Wenn der 3DMark 06 ausgeführt wird, wird 40 Prozent mehr aus der Steckdose gezogen, wodurch die Multi-Thread-CPU-Leistung um ca. 25 Prozent und die Grafikleistung um 60 Prozent gesteigert wird. Performance pro Watt ist hier höher als erwartet, insbesondere im Vergleich zu Intels letzter Generation Ice Lake oder der Comet Lake-U-Serie.
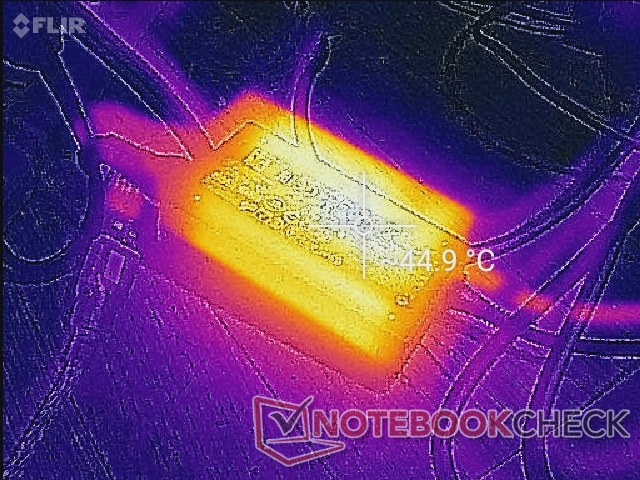
Das 65-W-Netzteil ist klein (~8,8 x 5 x 2,8 cm) und in der Lage, den Laptop bei extremer Belastung mit einer vernünftigen Geschwindigkeit aufzuladen.
| Aus / Standby | |
| Idle | |
| Last |
|
Legende:
min: | |
| HP EliteBook 845 G7 Ryzen 7 Pro 4750U R7 PRO 4750U, Vega 7, Samsung SSD PM981a MZVLB256HBHQ, IPS, 1920x1080, 14" | HP EliteBook 845 G7-23Y60EA R5 PRO 4650U, Vega 6, Samsung PM991 MZVLQ256HAJD, IPS, 1920x1080, 14" | Lenovo ThinkPad T14-20UES00H00 R5 PRO 4650U, Vega 6, Samsung SSD PM981a MZVLB512HBJQ, IPS, 1920x1080, 14" | Dell Latitude 7410 i7-10610U, UHD Graphics 620, Toshiba XG6 KXG60ZNV512G, IPS, 3840x2160, 14" | HP ProBook 445 G7 175W4EA R5 4500U, Vega 6, Samsung PM991 MZVLQ512HALU, IPS, 1920x1080, 14" | Huawei Matebook X Pro i5 i5-8250U, GeForce MX150, Samsung PM961 MZVLW256HEHP, IPS, 3000x2000, 13.9" | |
|---|---|---|---|---|---|---|
| Stromverbrauch | -5% | -53% | -27% | -16% | -48% | |
| Idle min * (Watt) | 2.6 | 3.1 -19% | 5.8 -123% | 3.7 -42% | 3.5 -35% | 3.5 -35% |
| Idle avg * (Watt) | 5 | 5.6 -12% | 8.3 -66% | 6.2 -24% | 6.2 -24% | 8.9 -78% |
| Idle max * (Watt) | 5.6 | 8.6 -54% | 11 -96% | 7 -25% | 8.8 -57% | 12.3 -120% |
| Last avg * (Watt) | 39.8 | 28.4 29% | 39.5 1% | 43.2 -9% | 30 25% | 54.2 -36% |
| Witcher 3 ultra * (Watt) | 37.1 | 42.4 -14% | ||||
| Last max * (Watt) | 49.9 | 35.4 29% | 40.8 18% | 68.6 -37% | 45 10% | 52.1 -4% |
* ... kleinere Werte sind besser
Akkulaufzeit
Rechnen Sie mit etwa 13 Stunden realer WLAN-Nutzung im Akkubetrieb. Das System kann über USB-C oder den proprietären AC Barrel Port aufgeladen werden.
| HP EliteBook 845 G7 Ryzen 7 Pro 4750U R7 PRO 4750U, Vega 7, 53 Wh | HP EliteBook 845 G7-23Y60EA R5 PRO 4650U, Vega 6, 56 Wh | Lenovo ThinkPad T14-20UES00H00 R5 PRO 4650U, Vega 6, 50 Wh | Dell Latitude 7410 i7-10610U, UHD Graphics 620, 68 Wh | HP ProBook 445 G7 175W4EA R5 4500U, Vega 6, 45 Wh | Huawei Matebook X Pro i5 i5-8250U, GeForce MX150, 57.4 Wh | |
|---|---|---|---|---|---|---|
| Akkulaufzeit | -8% | -37% | -17% | -35% | -30% | |
| WLAN (h) | 13.3 | 12.2 -8% | 8.4 -37% | 11 -17% | 8.7 -35% | 9.3 -30% |
| Idle (h) | 16.2 | 31.3 | 12.4 | 20.7 | ||
| Last (h) | 2.3 | 1.2 | 2.9 | 1.6 | 2.2 |
Pro
Contra
Fazit
Laptops mit den neuesten AMD Renoir-CPUs verdienen mehr Aufmerksamkeit als sie bekommen, einfach weil sie die üblichen Intel-Optionen bei gleichem oder sogar geringerem Preis übertreffen, insbesondere bei der Grafikleistung. Wenn Ihre Anwendungsbereiche von zusätzlichen Kernen oder einer schnelleren GPU-Leistung profitieren können, dann ist eine Ryzen-5- oder Ryzen-7-Konfiguration die richtige Wahl. Es ist schade, dass HP nicht dieselben AMD-Optionen für mehr seiner EliteBook-Modelle anbietet.
Das EliteBook 845 G7 ist der schnellste bisher von uns getestete 14-Zoll-Business-Laptop mit einem AMD-Prozessor. Weitere Hersteller sollten in die Fußstapfen von HP treten und beginnen, 6- und 8-Kern-Optionen der Ryzen-U-Serie in eine breitere Palette von Business-Ultrabooks zu integrieren. Wenn Sie jedoch unbedingt Thunderbolt-Anschlussmöglichkeiten und ein SD-Lesegerät benötigen, dann müssen Sie sich anderswo umsehen.
Was den Bildschirm betrifft, so sind wir der Meinung, dass die Aufrüstung von 250-Nit auf 400-Nit vor allem deshalb eine Überlegung wert ist, weil sie neben der Steigerung der Helligkeit tiefere und genauere Farben bringt. Die Akkulaufzeit wird nicht wesentlich beeinträchtigt, und auch die Sichtbarkeit im Freien wird etwas besser. Bei richtiger Konfiguration macht man mit dem EliteBook 845 G7 fast alles richtig.
HP EliteBook 845 G7 Ryzen 7 Pro 4750U
- 24.11.2020 v7 (old)
Allen Ngo
Preisvergleich

