Notebookcheck Logo
Teaser

Lenovo ThinkPad X13 Detachable Gen 1 im Test: Außergewöhnlich durch seine Normalität

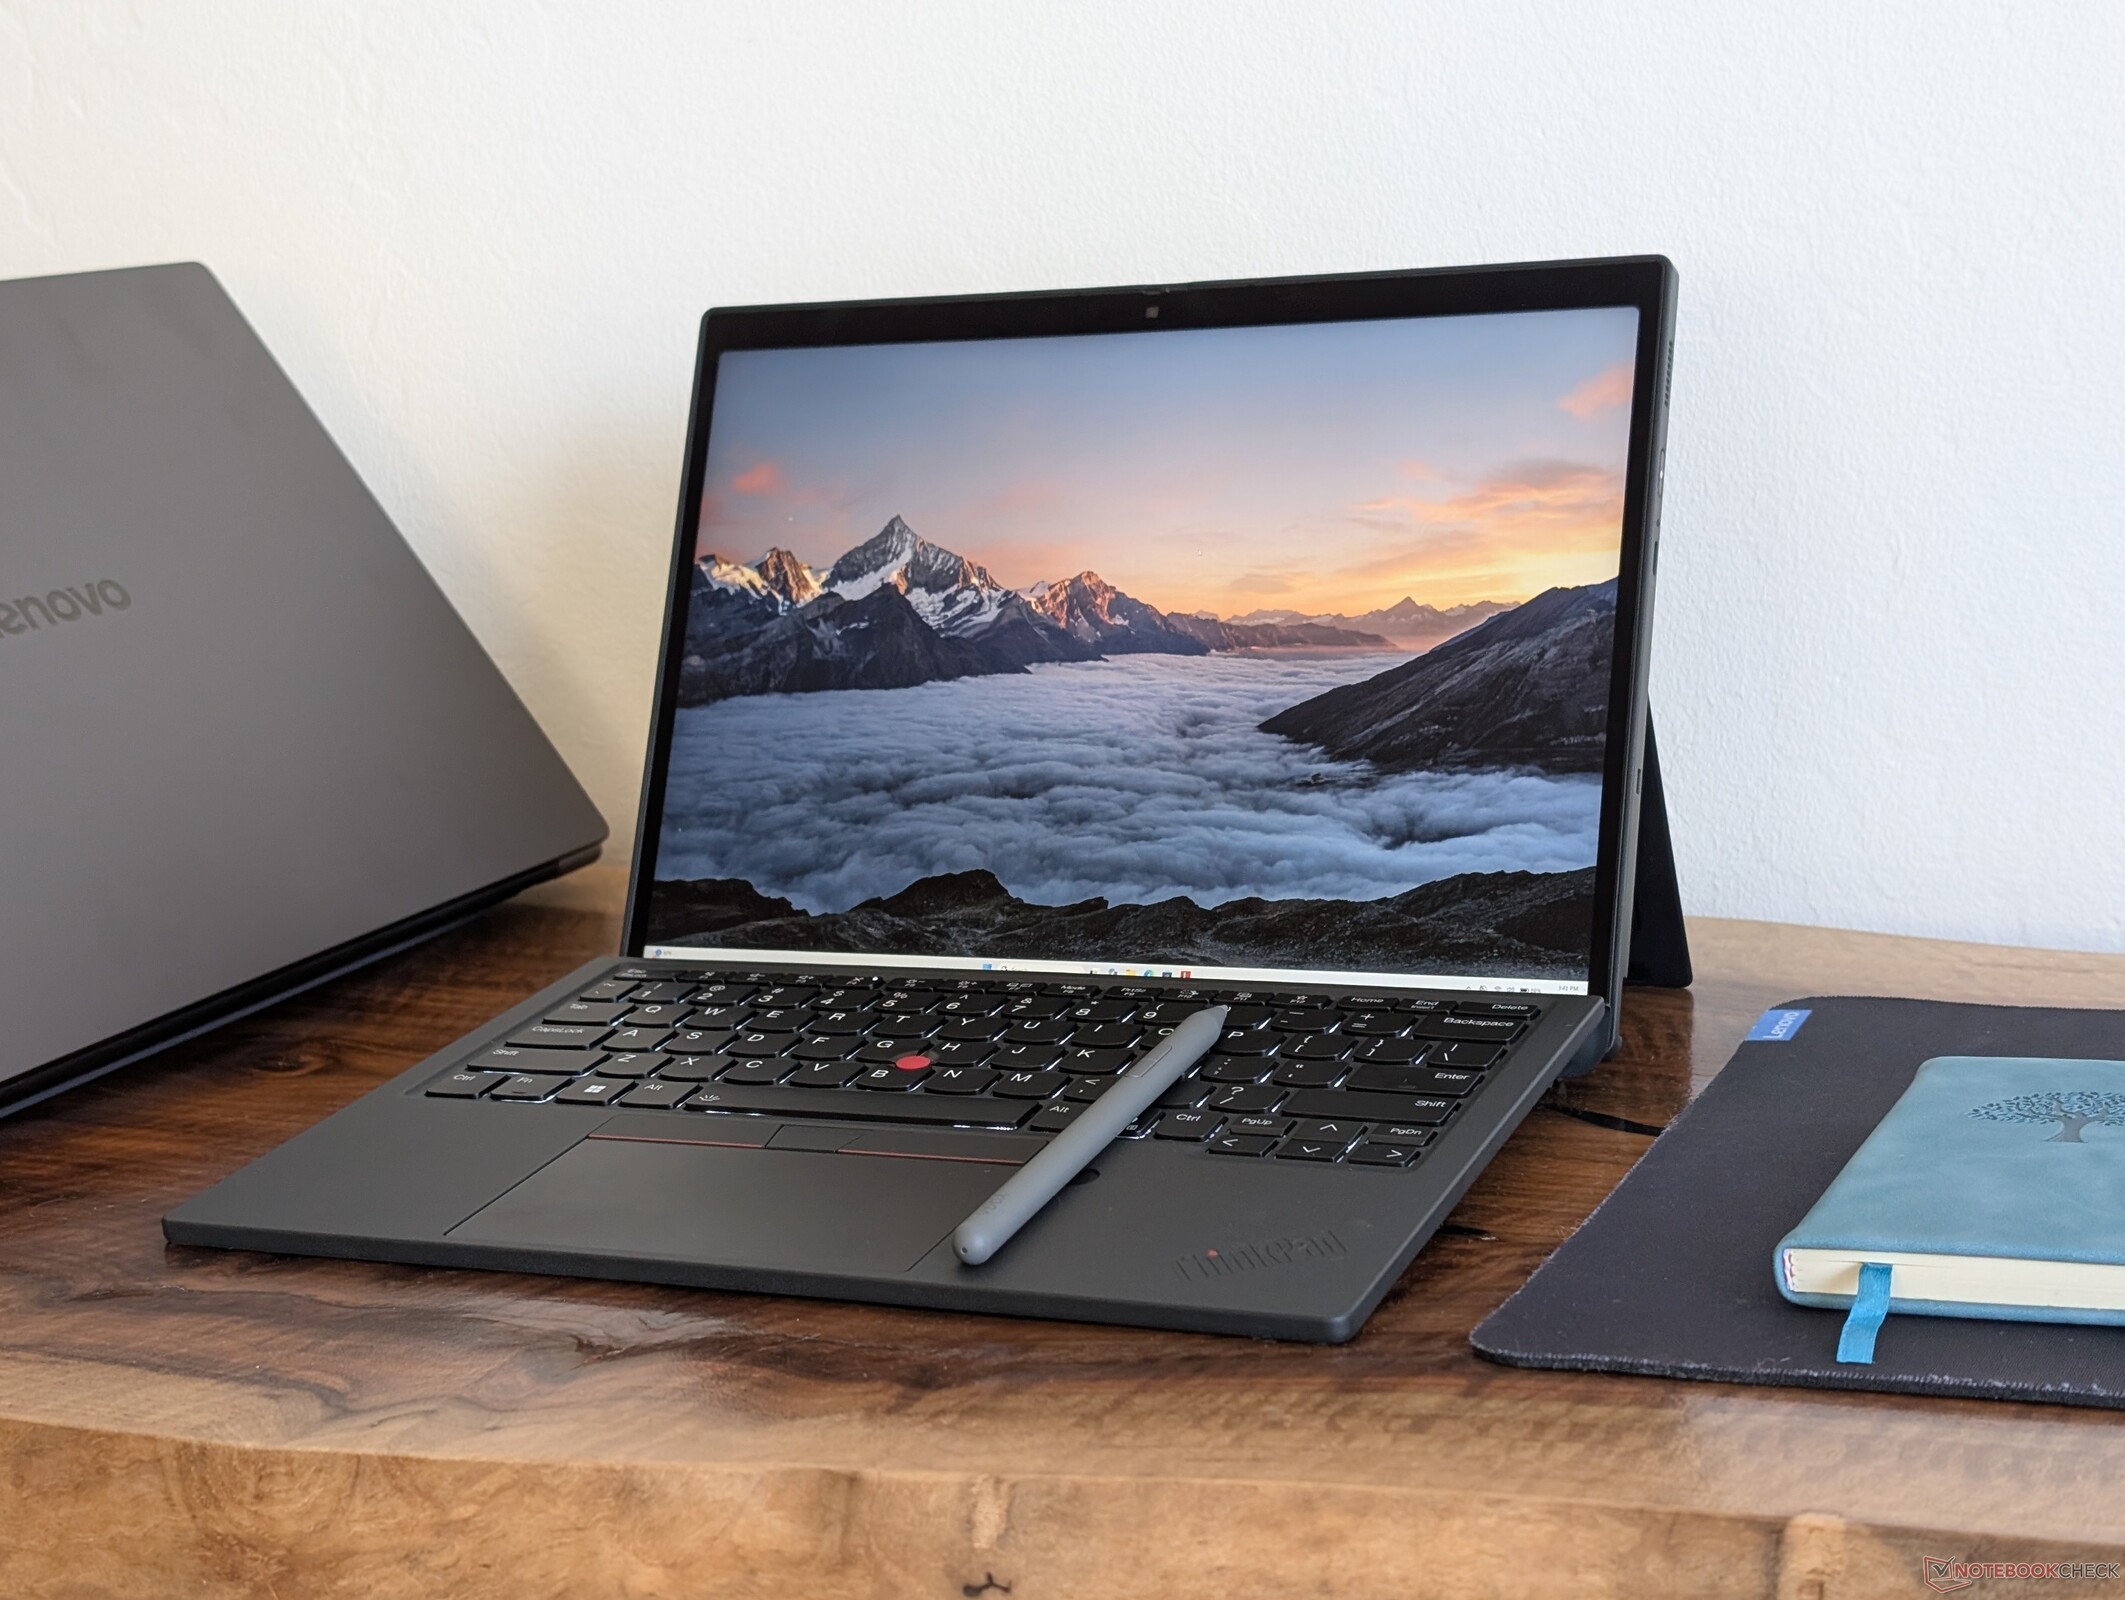
Eines der besten Detachables von Lenovo.

Keine faltbaren Displays oder ablenkenden Spielereien – Das ThinkPad X13 Detachable ist ein rundum gelungenes, klassisches Detachable, das Geschäftskunden und professionelle Anwender zu schätzen wissen.
Allen Ngo (übersetzt von Falk Hinrichs) Veröffentlicht am 🇺🇸
Convertible / 2-in-1 Business Panther Lake Touchscreen

Fazit – Wenn „langweilig“ zum Kompliment wird

Das ThinkPad X13 Detachable Gen 1 beweist, dass ein gutes 2-in-1-Gerät keine rollbaren oder faltbaren Displays braucht. Es konzentriert sich auf die wesentlichen Grundlagen und überzeugt bei den Dingen, die wirklich zählen: Gehäusestabilität, Bildqualität, Benutzerfreundlichkeit und eine überraschend gute Folio-Tastatur, die ein besseres Tippgefühl bietet als erwartet. Auch der Touchscreen ist für ein IPS-Panel besser und heller als erwartet und bietet eine höhere Bildwiederholrate und native Auflösung als viele andere Windows-Tablets oder 2-in-1-Geräte. Obwohl es als ThinkPad vermarktet wird, können wir dieses Modell allein aufgrund seiner grundlegenden Stärken auch Privatanwendern uneingeschränkt empfehlen.

Download der lizensierten Bewertungsgrafik als SVG / PNG

Die Nachteile fallen je nach Einsatzszenario relativ gering aus. Insbesondere die Turbo-Boost-Leistung ist begrenzt, und HDR wird nicht unterstützt. Die Lautsprecherqualität ist schwächer als bei den meisten HP-Elite-Modellen, und der fehlende USB-A-Anschluss kann ärgerlich sein, wenn das Surface Pro einen solchen bietet. Ein leichterer Zugang zur SSD – nach dem Vorbild des Surface Pro – hätte auch die Wartungsfreundlichkeit verbessert. Wer viel Bildbearbeitung betreibt oder CPU-intensive Aufgaben ausführt, erhält mit Geräten ohne abnehmbare Tastatur wie dem Dell Pro 7 13 Convertible oder dem ThinkPad X13 Gen 7 mehr Leistung.

Pro

+ heller IPS-Touchscreen mit 120 Hz und vollständiger sRGB-Abdeckung
+ eine der komfortableren Folio-Tastaturen
+ stabile Konstruktion mit festem Standfuß
+ gute Akkulaufzeit

Contra

- schwache Turbo-Boost- und GPU-Leistung
- Helligkeitsverteilung könnte besser sein
- keine P3-Farben oder HDR-Unterstützung
- wenige Anschlüsse; nur USB-C
- blecherner Klang

Preis und Verfügbarkeit

Lenovo liefert das ThinkPad X13 Detachable Gen 1 inzwischen zu Preisen ab 2.230 US-Dollar aus. In der hier getesteten Konfiguration kostet es 3.150 US-Dollar.

Amazon Logo
2.161,00 € Stand 2026-11-18 00:40.
Lenovo ThinkPad X13 Detachable Gen 1 21U

Das ThinkPad X13 Detachable Gen 1 ist das erste Detachable der seit Langem bestehenden ThinkPad-X13-Serie. Im Vergleich zur ThinkPad-T-Serie sind die Modelle der X-Serie in der Regel noch leichter und kleiner, allerdings kommen mehr Verbundwerkstoffe im Gehäuse zum Einsatz und die Konfigurationsmöglichkeiten sind eingeschränkter.

Unser Testgerät ist die Spitzenkonfiguration mit Core-Ultra-7-365-vPro-Prozessor und 32 GB verlötetem Arbeitsspeicher für etwa 3.150 US-Dollar. Günstigere Konfigurationen beginnen mit dem Core Ultra 5 332, aber alle Varianten bieten serienmäßig vPro und denselben 2,8K-IPS-Touchscreen mit 120 Hz.

Weitere Lenovo-Tests:

Technische Daten

Lenovo ThinkPad X13 Detachable Gen 1 (ThinkPad X13 Serie)
Prozessor
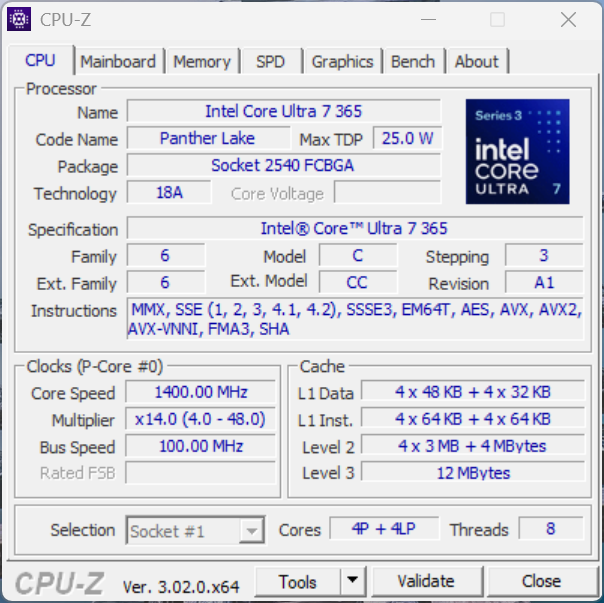
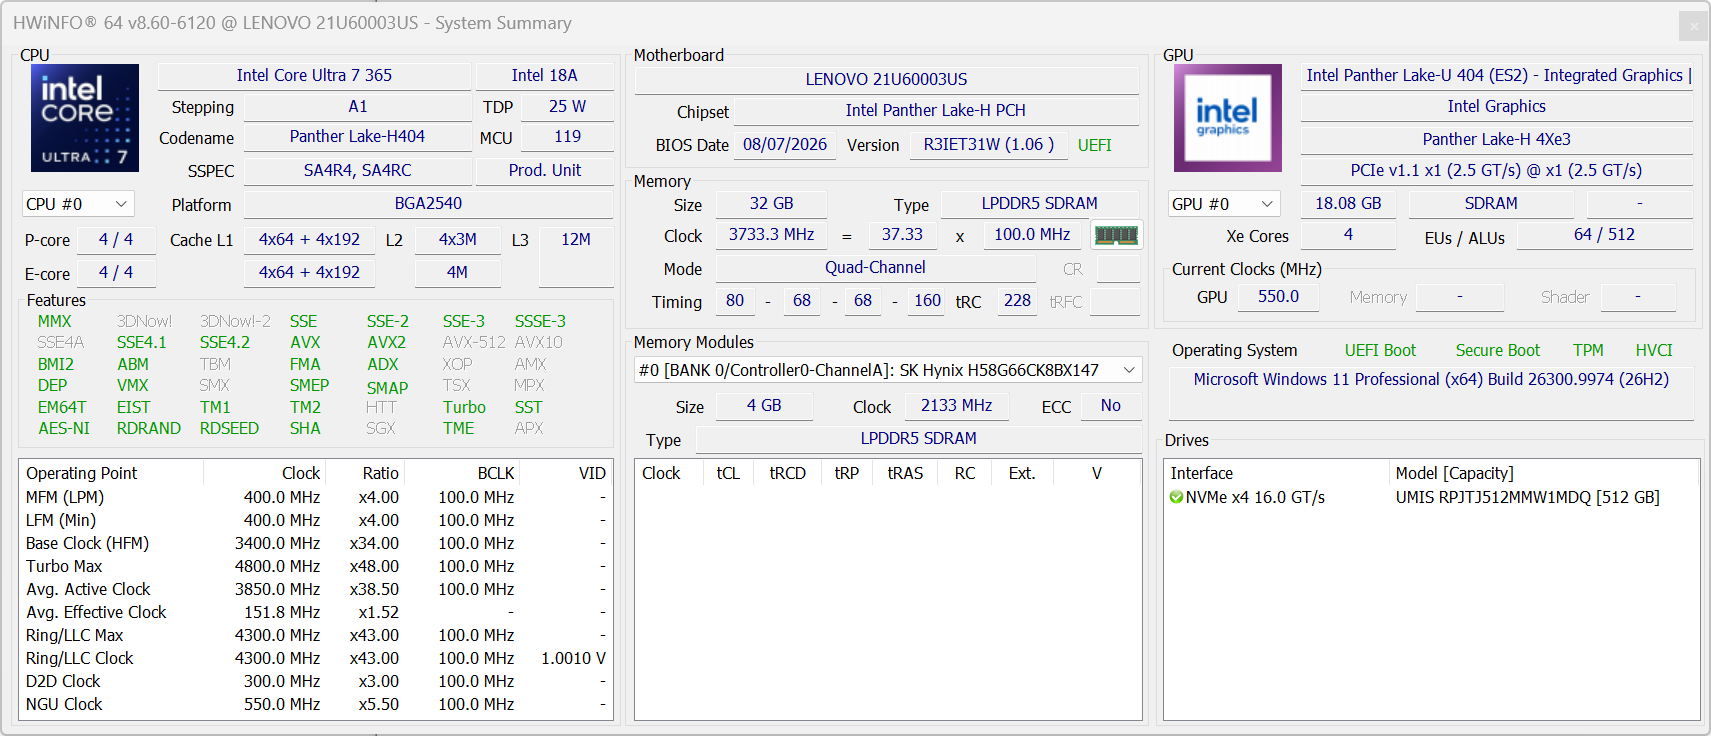
Intel Core Ultra 7 365 8c/8t, 4 x 4.8 GHz Intel Cougar Cove P-Core, 4 x 3.6 GHz Intel Darkmont LP E-Core, 37 W PL2 / Short Burst, 15 W PL1 / Sustained, Panther Lake
Grafikkarte
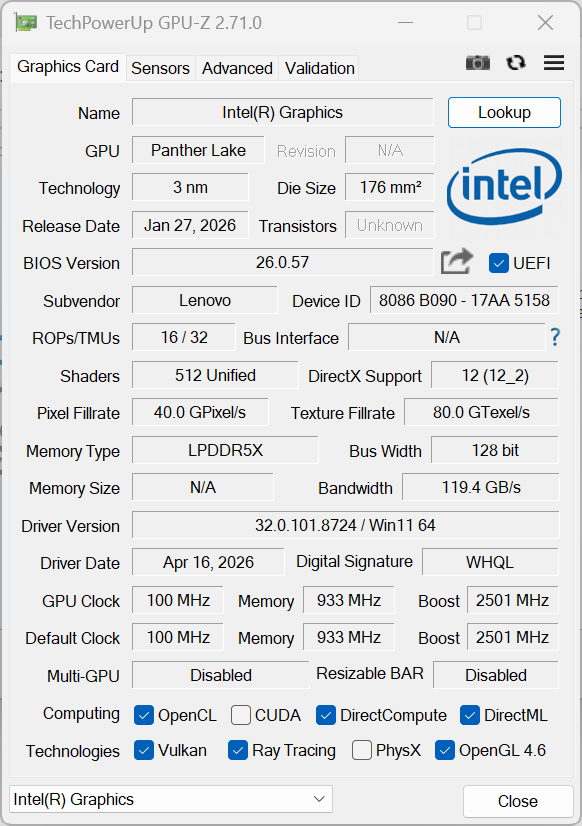
Intel Graphics 4 Xe3 Panther Lake iGPU, Kerntakt: 1950 MHz, LPDDR5X, 32.0.101.8724
RAM
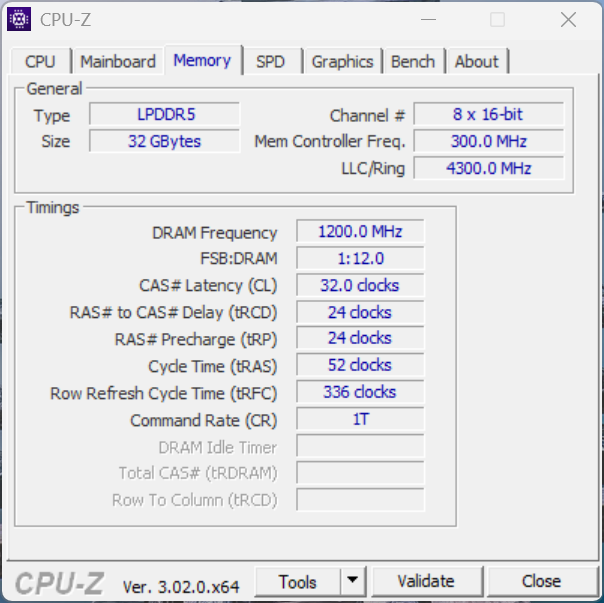
32 GB 
, LPDDR5X-7467, Soldered
Bildschirm
13.00 Zoll 3:2, 2880 x 1920 Pixel 266 PPI, 10-point capacitive, Native Unterstützung für die Stifteingabe, NS130A10-M60, IPS, spiegelnd: ja, abnehmbarer Bildschirm, 120 Hz
Mainboard
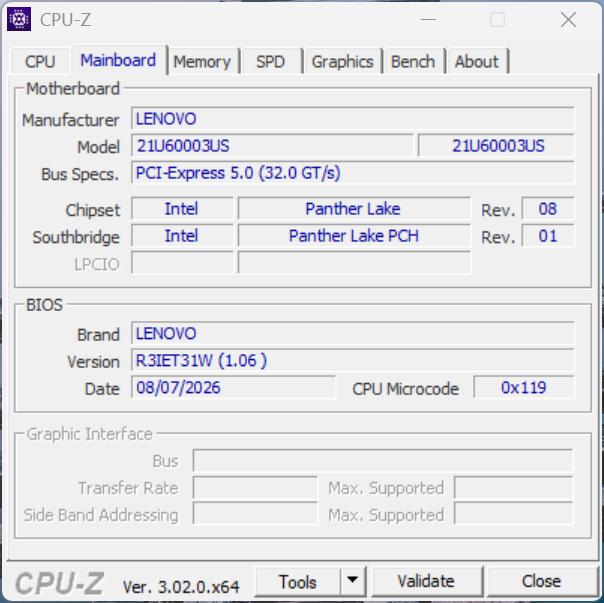
Intel Panther Lake-H PCH
Soundkarte
Intel Panther Lake-H PCH - High Definition Audio - AVS (Audio, Voice, Speech)
Anschlüsse
2 USB4 40 Gbps, 2 Thunderbolt 4, USB-C Power Delivery (PD), 2 DisplayPort, Audio Anschlüsse: 3.5 mm combo, 1 Fingerprint Reader, Sensoren: Accelerometer, Gyroscope, Hall
Netzwerk
Intel Wi-Fi 7 BE211 320MHz (a/b/g/n = Wi-Fi 4/ac = Wi-Fi 5/ax = Wi-Fi 6/ Wi-Fi 6E 6 GHz be = Wi-Fi 7), Bluetooth 5.4
Abmessungen
Höhe x Breite x Tiefe (in mm): 9.3 x 290 x 210
Akku
45 Wh Lithium-Polymer
Betriebssystem
Microsoft Windows 11 Pro
Kamera
Primary Camera: 8 MPix
Secondary Camera: 5 MPix w/ IR + privacy shutter
Sonstiges
Lautsprecher: 2x 2 W, Dolby Atmos, Tastatur: Chiclet, Tastatur-Beleuchtung: ja, Slim Pen 2, Folio keyboard, Lenovo Commercial Advantage, 12 Monate Garantie
Gewicht
827 g, Netzteil: 245 g
Preis
3150 USD
Geizhals
Preisvergleich
Geizhals Bestpreis 2497€
Lenovo ThinkPad X13 Detachable G1, Core Ultra 7 365, 32GB RAM, 512GB, 5G (21U6000NGE)
Hinweis: Der Hersteller kann abweichende Bauteile wie Bildschirme, Laufwerke und Speicherriegel mit ähnlichen Spezifikationen unter dem gleichen Modellnamen einsetzen.


Gehäuse

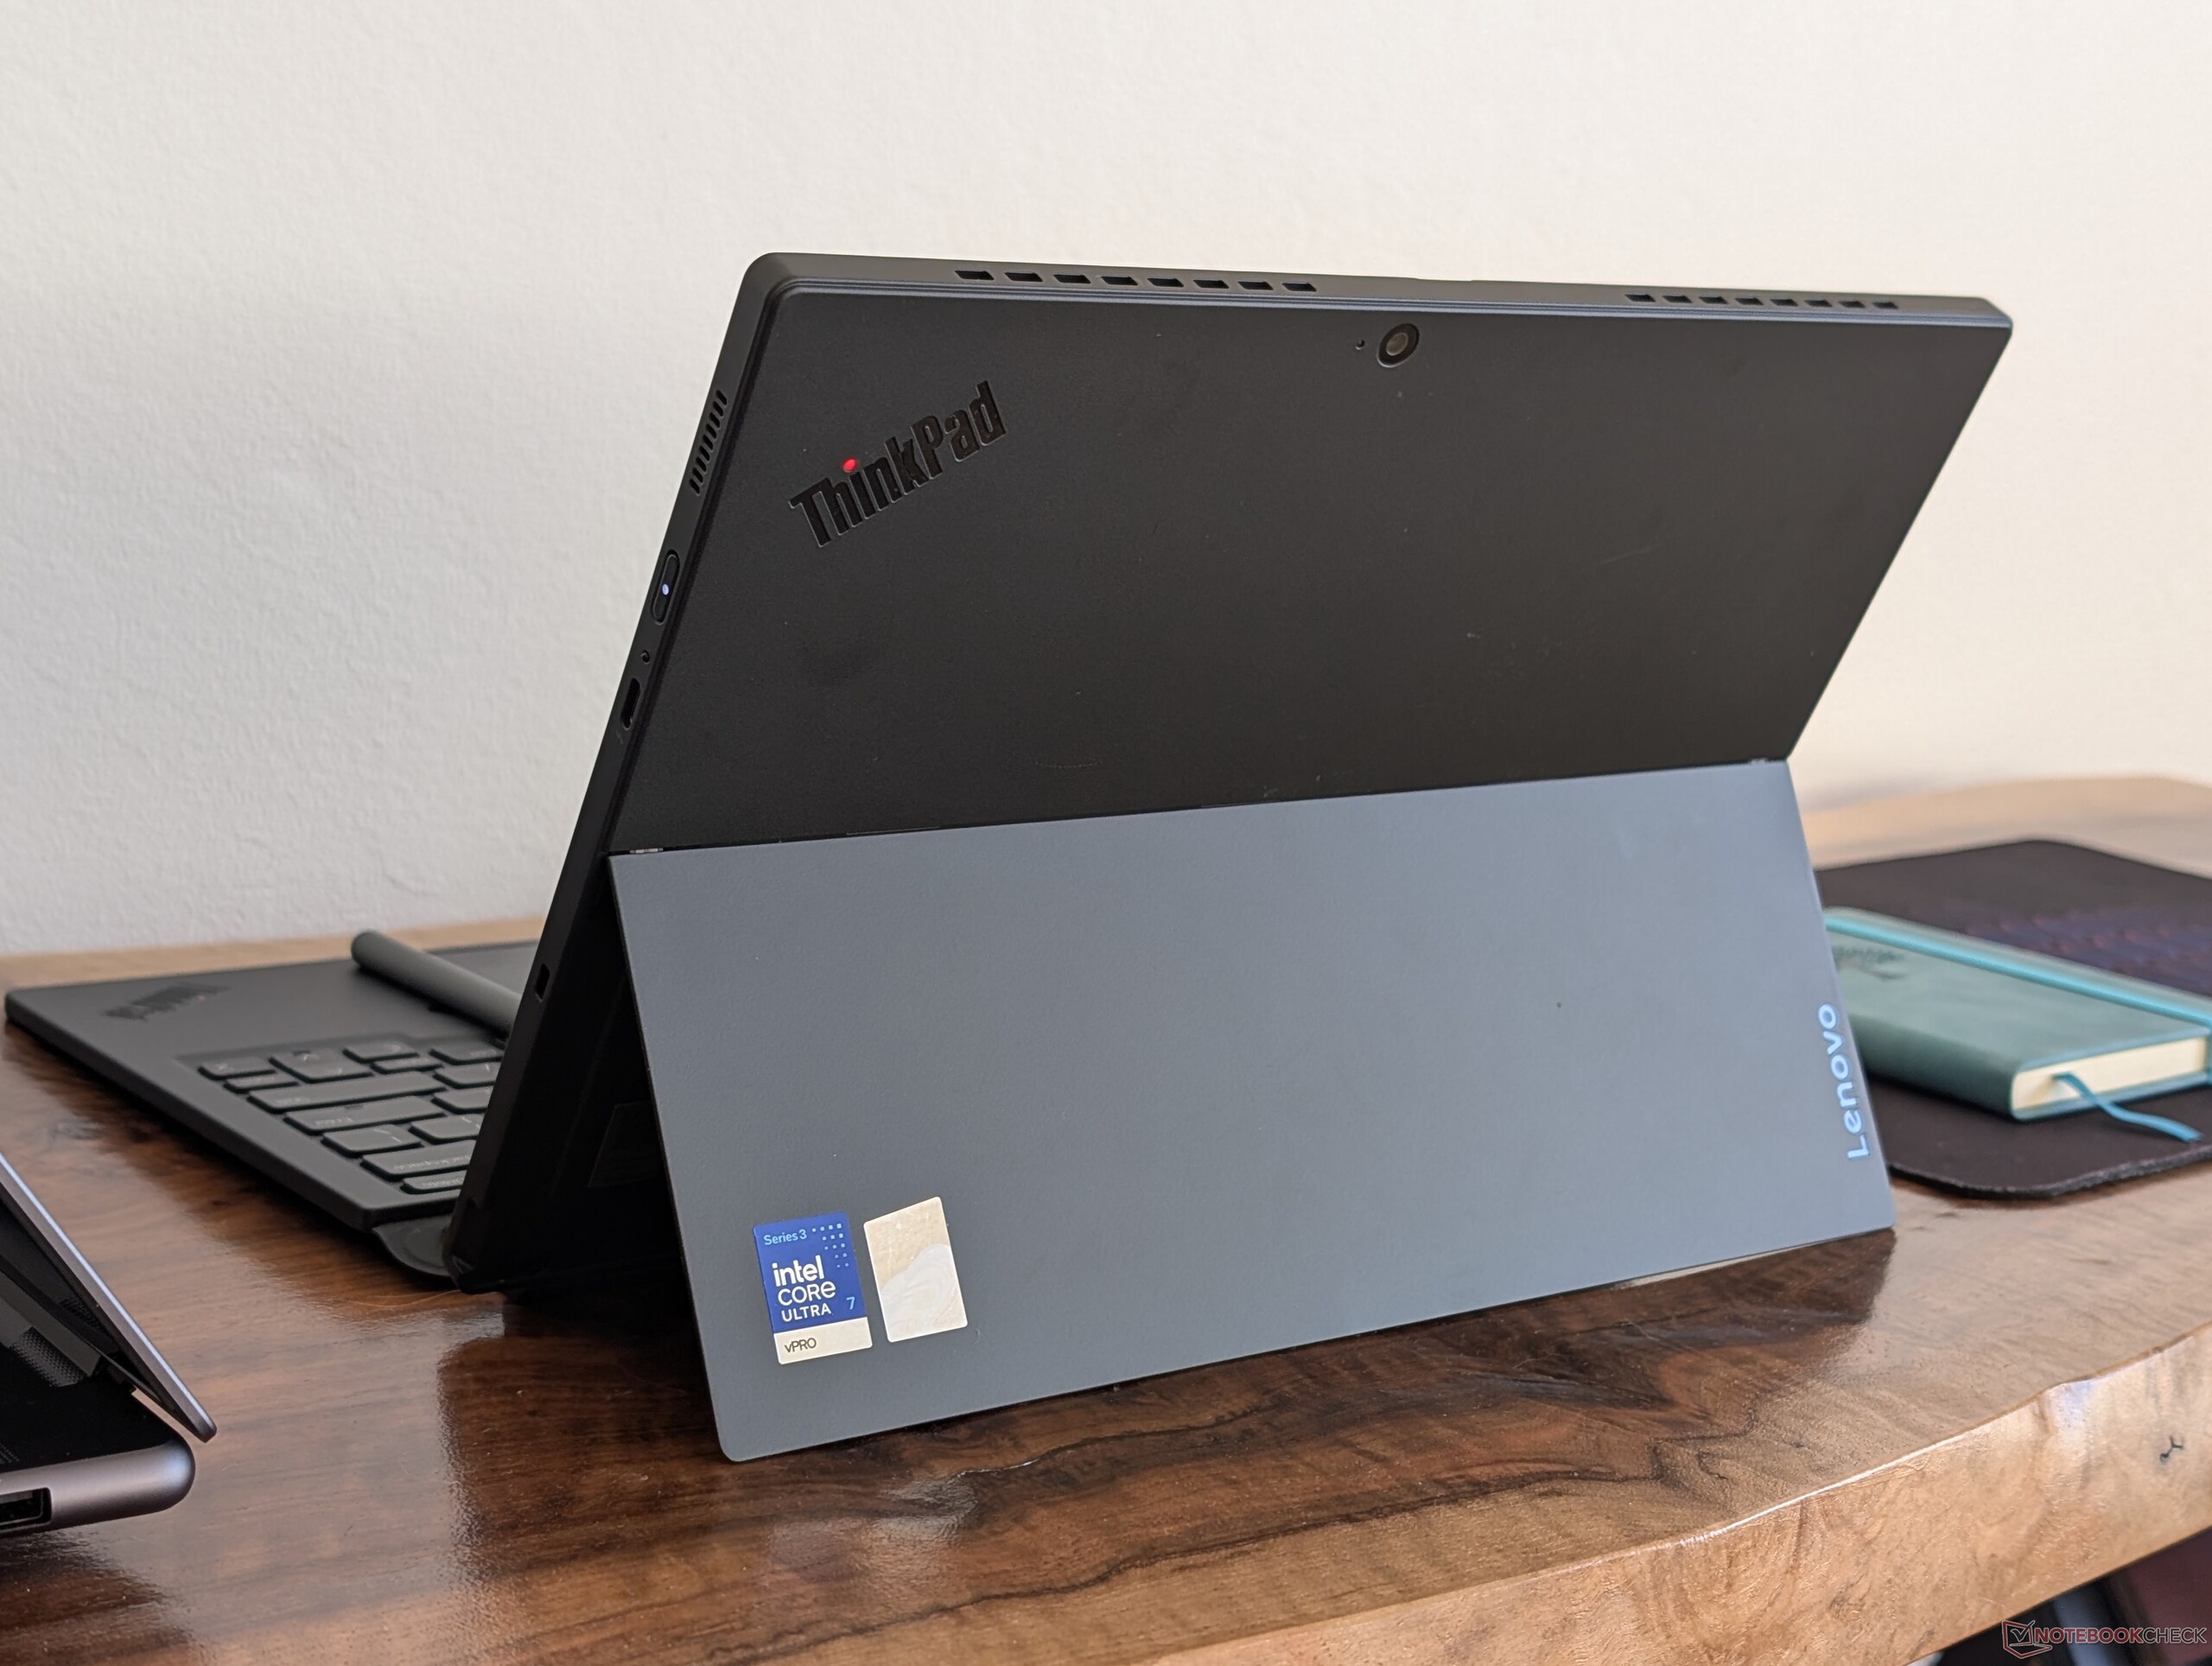
Die Rückseite aus einer Metalllegierung und die relativ breiten Displayränder sorgen für eine verwindungssteife Konstruktion, die dem Namen ThinkPad gerecht wird. Selbst die Tastatur lässt sich dank ihrer gleichmäßigen Dicke und ihrer Glasfaserkonstruktion deutlich weniger durchbiegen als erwartet.

Tablet290 x 210 x 9,3 mm827 g
Tablet mit Folio-Tastatur290 x 215 x 15,2 mm1186 g

Größenvergleich

❌
300 mm 216.3 mm 17.95 mm 1.4 kg301.8 mm 215.2 mm 15.5 mm 1.4 kg299 mm 210 mm 15.9 mm 888 g296 mm 208.9 mm 17.2 mm 1.1 kg299 mm 207 mm 13 mm 1.1 kg290 mm 210 mm 9.3 mm 827 g297 mm 210 mm 1 mm 5.7 g

Anschlüsse

Rechts: Ein-/Ausschalter, USB-C Thunderbolt 4 mit DisplayPort 2.1 + Power Delivery (65 W), Kensington-Schloss
Unten: Magnetkontakte zum Anbringen der Folio-Tastatur
Links: Lautstärkewippe, USB-C Thunderbolt 4 mit DisplayPort 2.1 + Power Delivery (65 W), 3,5-mm-Headsetanschluss
Oben: Lüftungsgitter

Kommunikation

Networking
iperf3 transmit Wi-Fi6/7 RT-BE96U
Lenovo ThinkPad X13 Detachable Gen 1
Intel Wi-Fi 7 BE211 320MHz
3795 (3473min - 3989max) MBit/s
MSI Prestige 13 AI+ A3MG
Intel® Killer™ Wi-Fi 7 BE1775s
2156 (1157min - 2458max) MBit/s -43%
Lenovo ThinkPad X13 Gen 7 AMD
Mediatek Wi-Fi 7 MT7925 Wireless LAN Card
1703 (819min - 1820max) MBit/s -55%
iperf3 receive Wi-Fi6/7 RT-BE96U
Lenovo ThinkPad X13 Detachable Gen 1
Intel Wi-Fi 7 BE211 320MHz
2619 (2378min - 2704max) MBit/s
MSI Prestige 13 AI+ A3MG
Intel® Killer™ Wi-Fi 7 BE1775s
2236 (2052min - 2301max) MBit/s -15%
Lenovo ThinkPad X13 Gen 7 AMD
Mediatek Wi-Fi 7 MT7925 Wireless LAN Card
1892 (1806min - 1919max) MBit/s -28%
iperf3 receive AXE11000 6GHz
Dell Pro 7 13 2-in-1
Intel Wi-Fi 7 BE211 320MHz
1607 (1552min - 1645max) MBit/s
Dell Pro 13 Premium PA13250
Intel BE201 320MHz
1502 (1380min - 1534max) MBit/s
HP EliteBook 8 Flip G1i 13
Intel BE201 320MHz
1427 (1322min - 1556max) MBit/s
iperf3 transmit AXE11000 6GHz
Dell Pro 13 Premium PA13250
Intel BE201 320MHz
1673 (1594min - 1720max) MBit/s
Dell Pro 7 13 2-in-1
Intel Wi-Fi 7 BE211 320MHz
1625 (1344min - 1707max) MBit/s
HP EliteBook 8 Flip G1i 13
Intel BE201 320MHz
1144 (992min - 1311max) MBit/s
0100200300400500600700800900100011001200130014001500160017001800190020002100220023002400250026002700280029003000310032003300340035003600370038003900Tooltip
Lenovo ThinkPad X13 Detachable Gen 1; iperf3 transmit Wi-Fi6/7 RT-BE96U; iperf 3.1.3: Ø3795 (3473-3989) MBit/s
Lenovo ThinkPad X13 Detachable Gen 1; iperf3 receive Wi-Fi6/7 RT-BE96U; iperf 3.1.3: Ø2618 (2378-2704) MBit/s

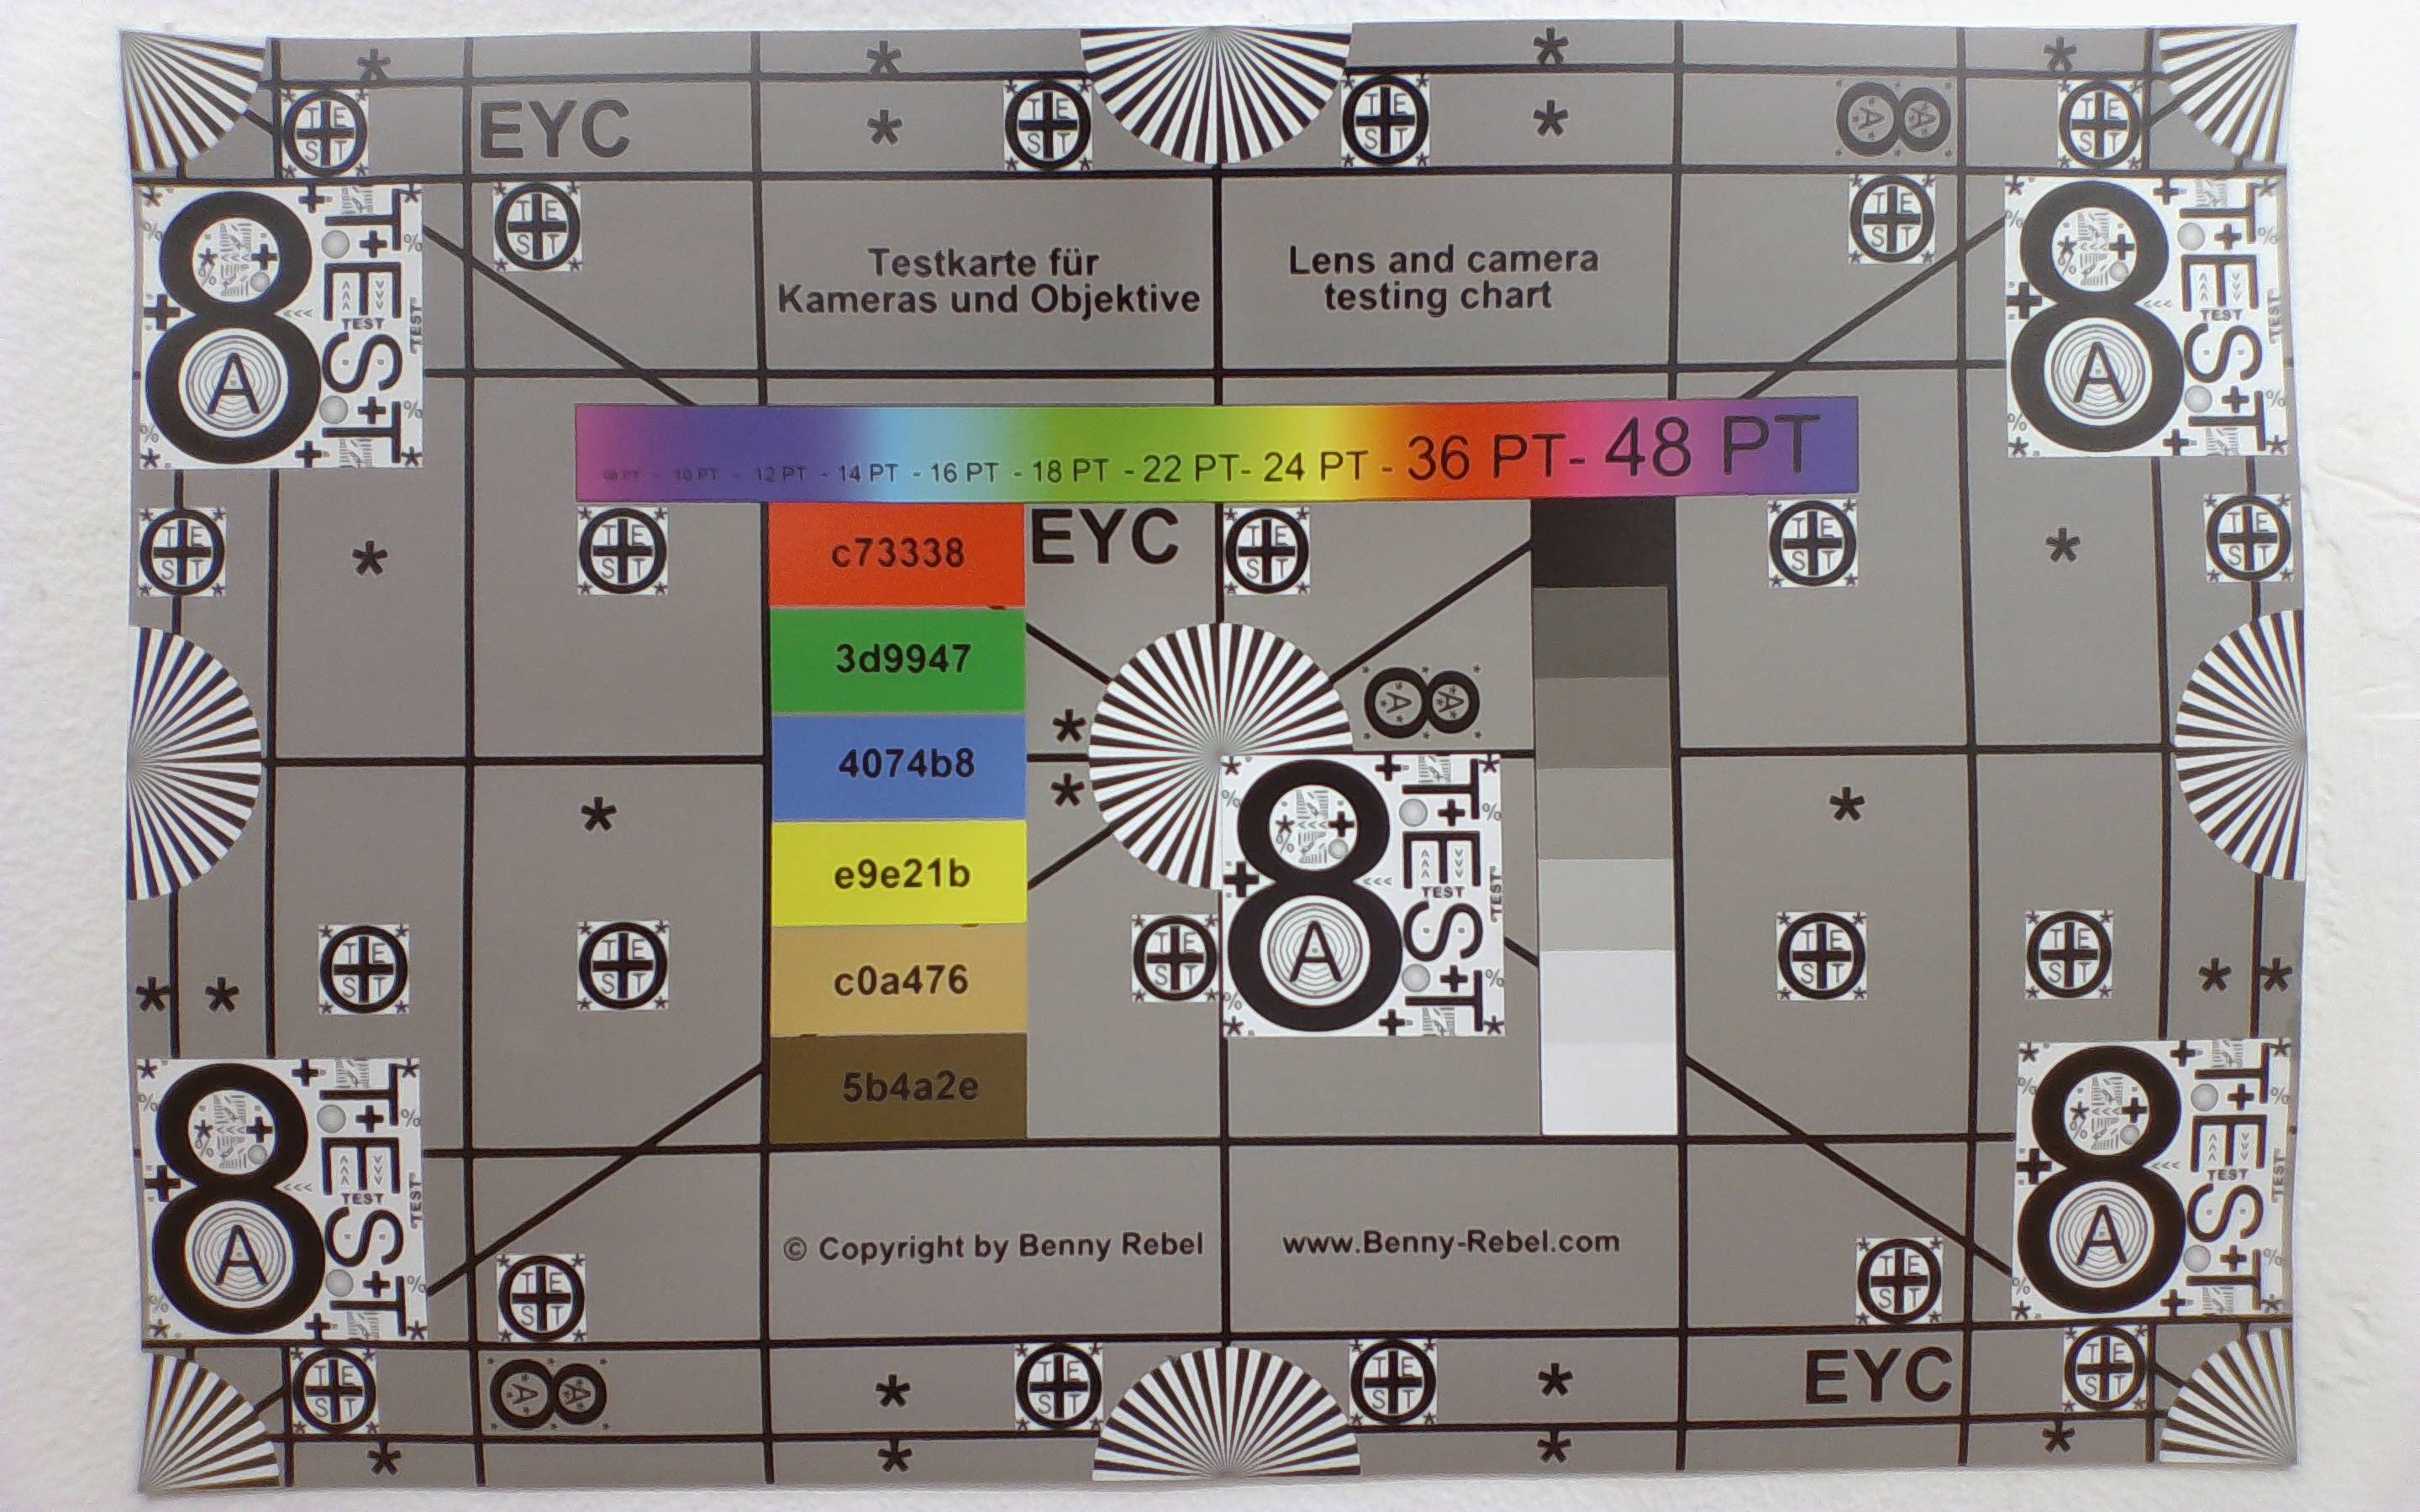
Webcam

ColorChecker
4.3 ∆E
8.5 ∆E
9.4 ∆E
7.9 ∆E
10.6 ∆E
9.7 ∆E
3.8 ∆E
3.3 ∆E
16.9 ∆E
5 ∆E
6.2 ∆E
7.4 ∆E
3.4 ∆E
5.8 ∆E
14 ∆E
4 ∆E
7 ∆E
10.3 ∆E
10.8 ∆E
6.9 ∆E
6.3 ∆E
4.9 ∆E
4.6 ∆E
3.5 ∆E
ColorChecker Lenovo ThinkPad X13 Detachable Gen 1: 7.28 ∆E min: 3.25 - max: 16.94 ∆E

Wartung

Die Komponenten sind nicht auf eine einfache Aufrüstung ausgelegt. Dennoch gibt es hier eine ausführliche Demontageanleitung, falls Komponenten oder die SSD ausgetauscht werden müssen.

Nachhaltigkeit

Das im Akku enthaltene Kobalt und die im Standfuß verwendete Aluminiumlegierung sind jeweils zu 100 Prozent recycelt. Bei Kunststoffen und Magnesium beträgt der Recyclinganteil je nach Bauteil bis zu 90 Prozent.

Zubehör und Garantie

Derzeit sind bei allen von Lenovo angebotenen Konfigurationen die Folio-Tastatur und der Slim Pen 2 serienmäßig enthalten. In den USA gilt die einjährige Basisgarantie.

Eingabegeräte
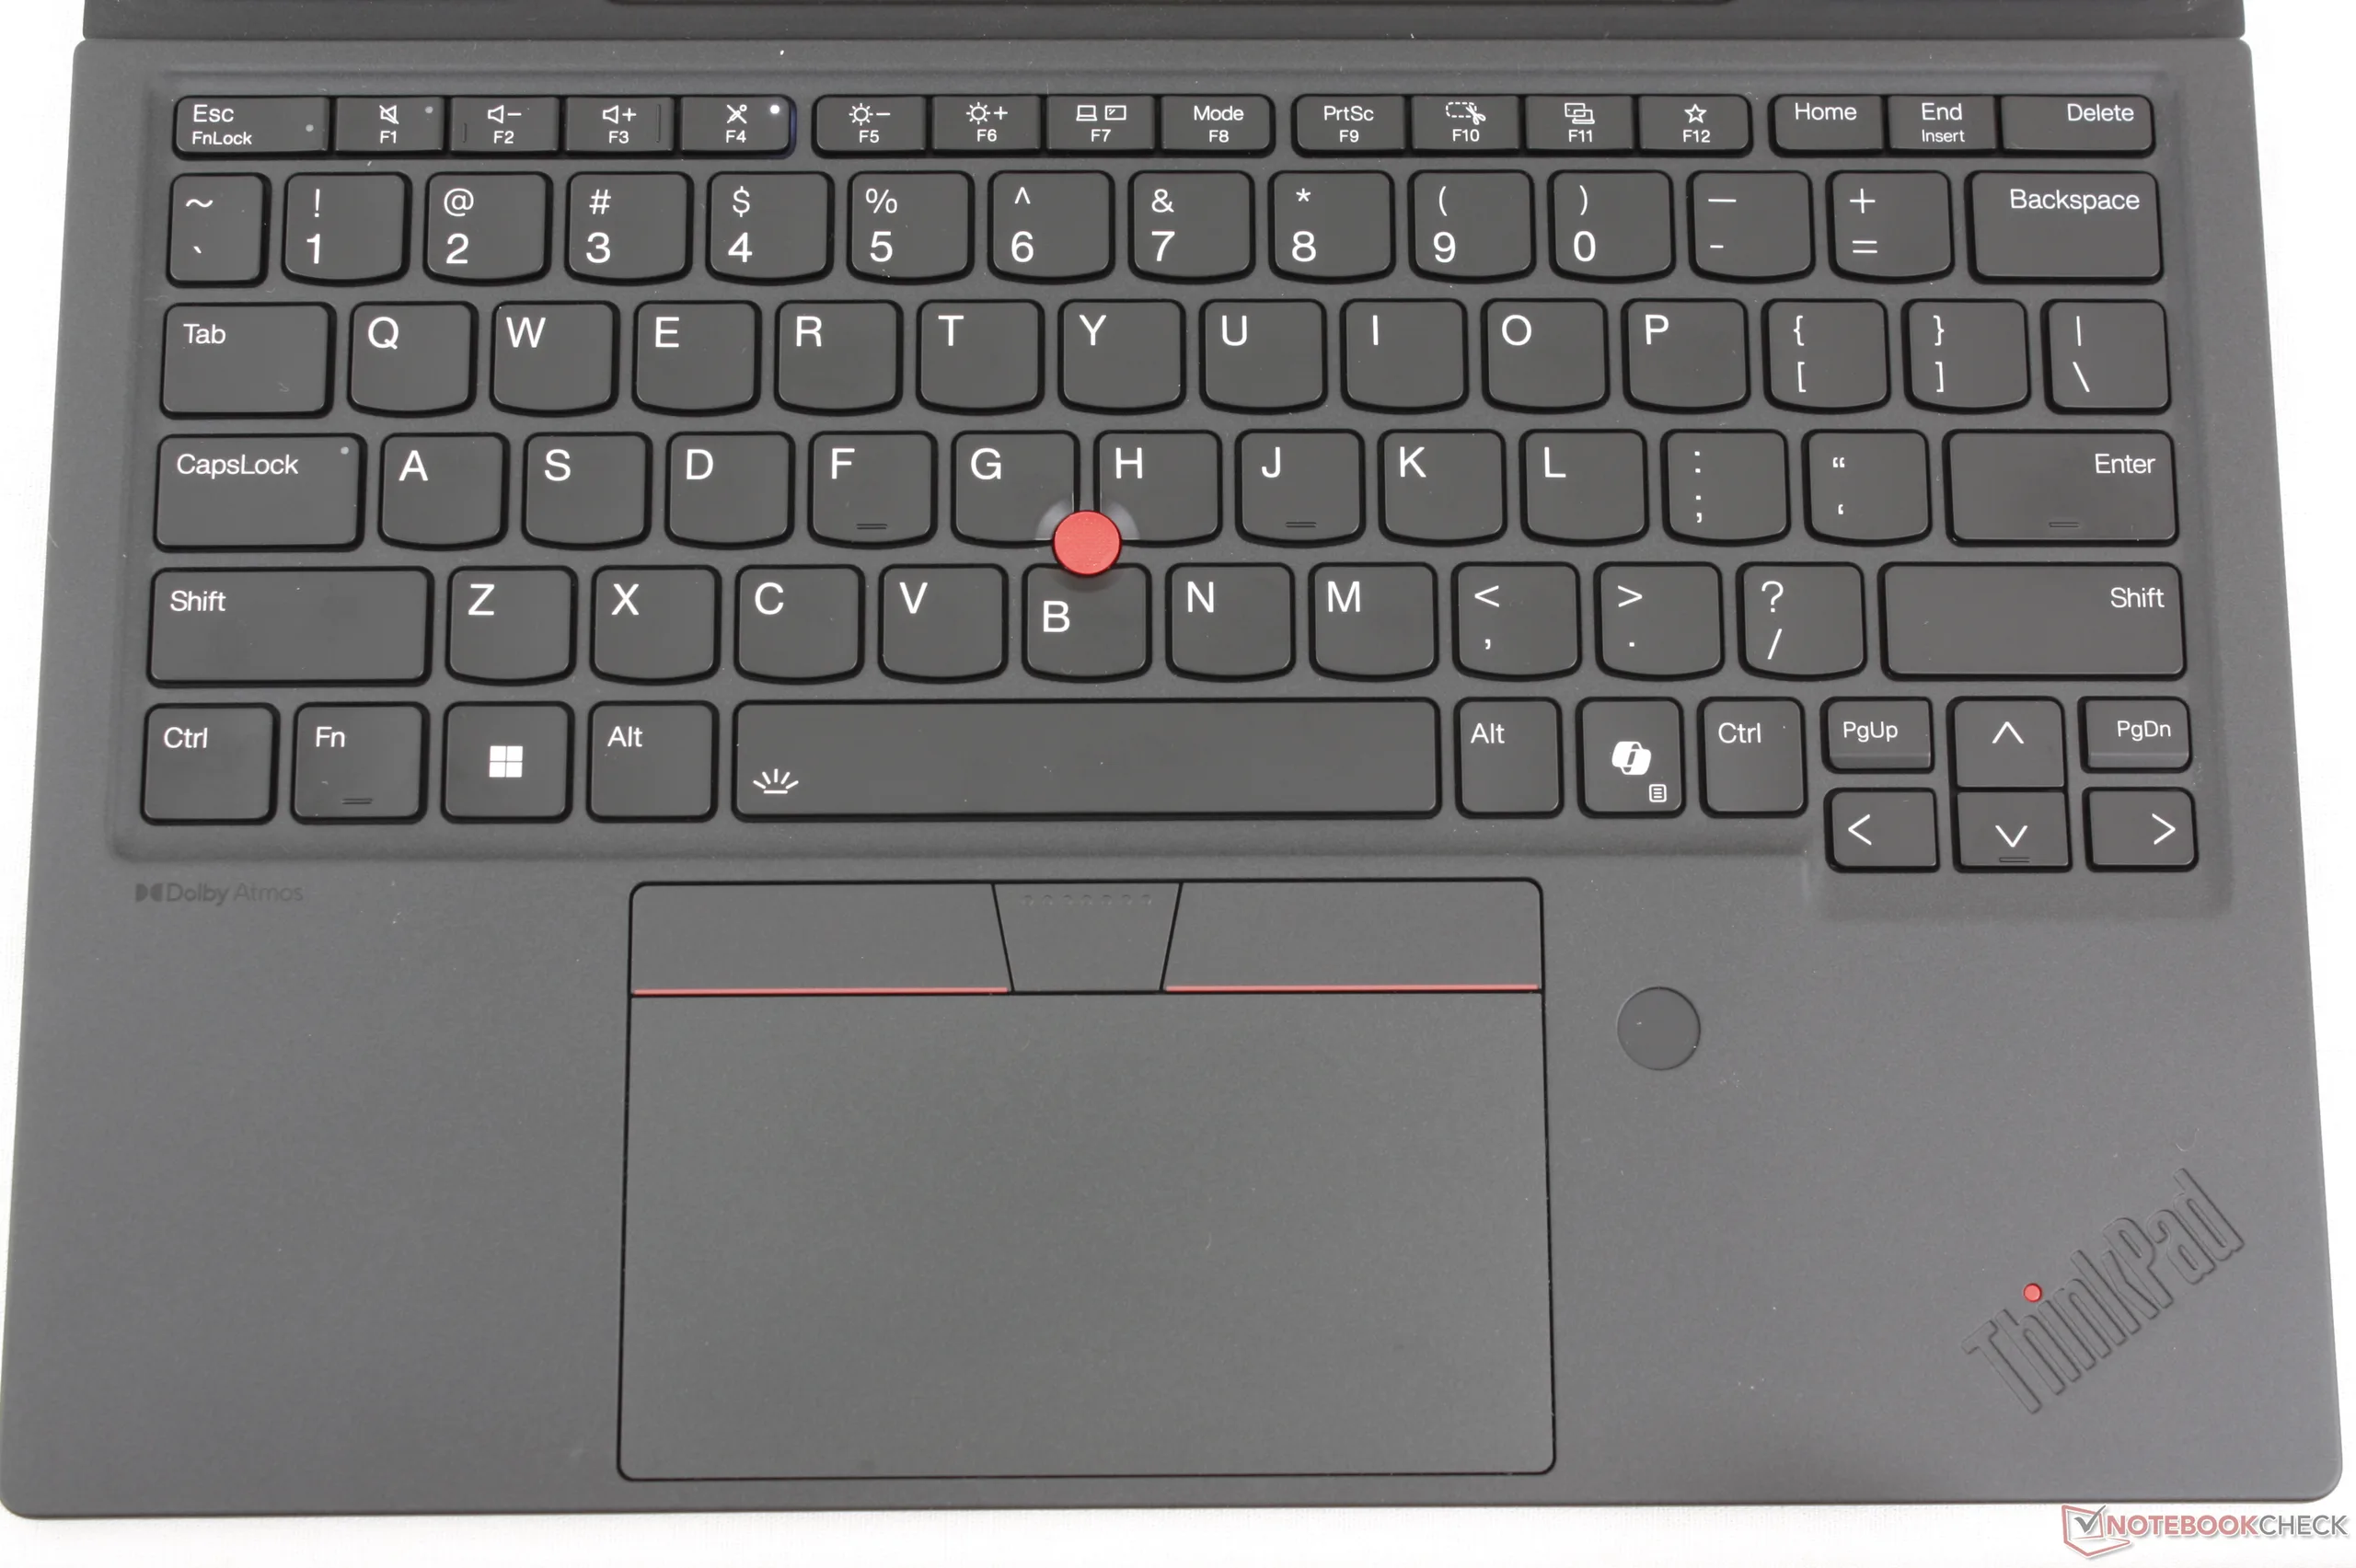
Die Folio-Tastatur ist zwar nicht ganz so stabil wie die eines klassischen ThinkPads, bietet aber einen knackigeren Anschlag und mehr Tastenhub als die meisten anderen Detachable-Tastaturen

Display

Der Touchscreen ist fast so hell wie das Display des Dell Pro 7 13 2-in-1, bietet aber die doppelte Bildwiederholrate für eine flüssigere und reaktionsschnellere Benutzeroberfläche. 
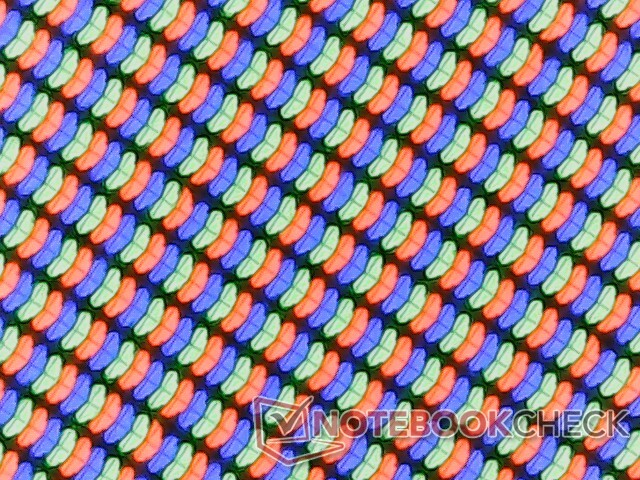
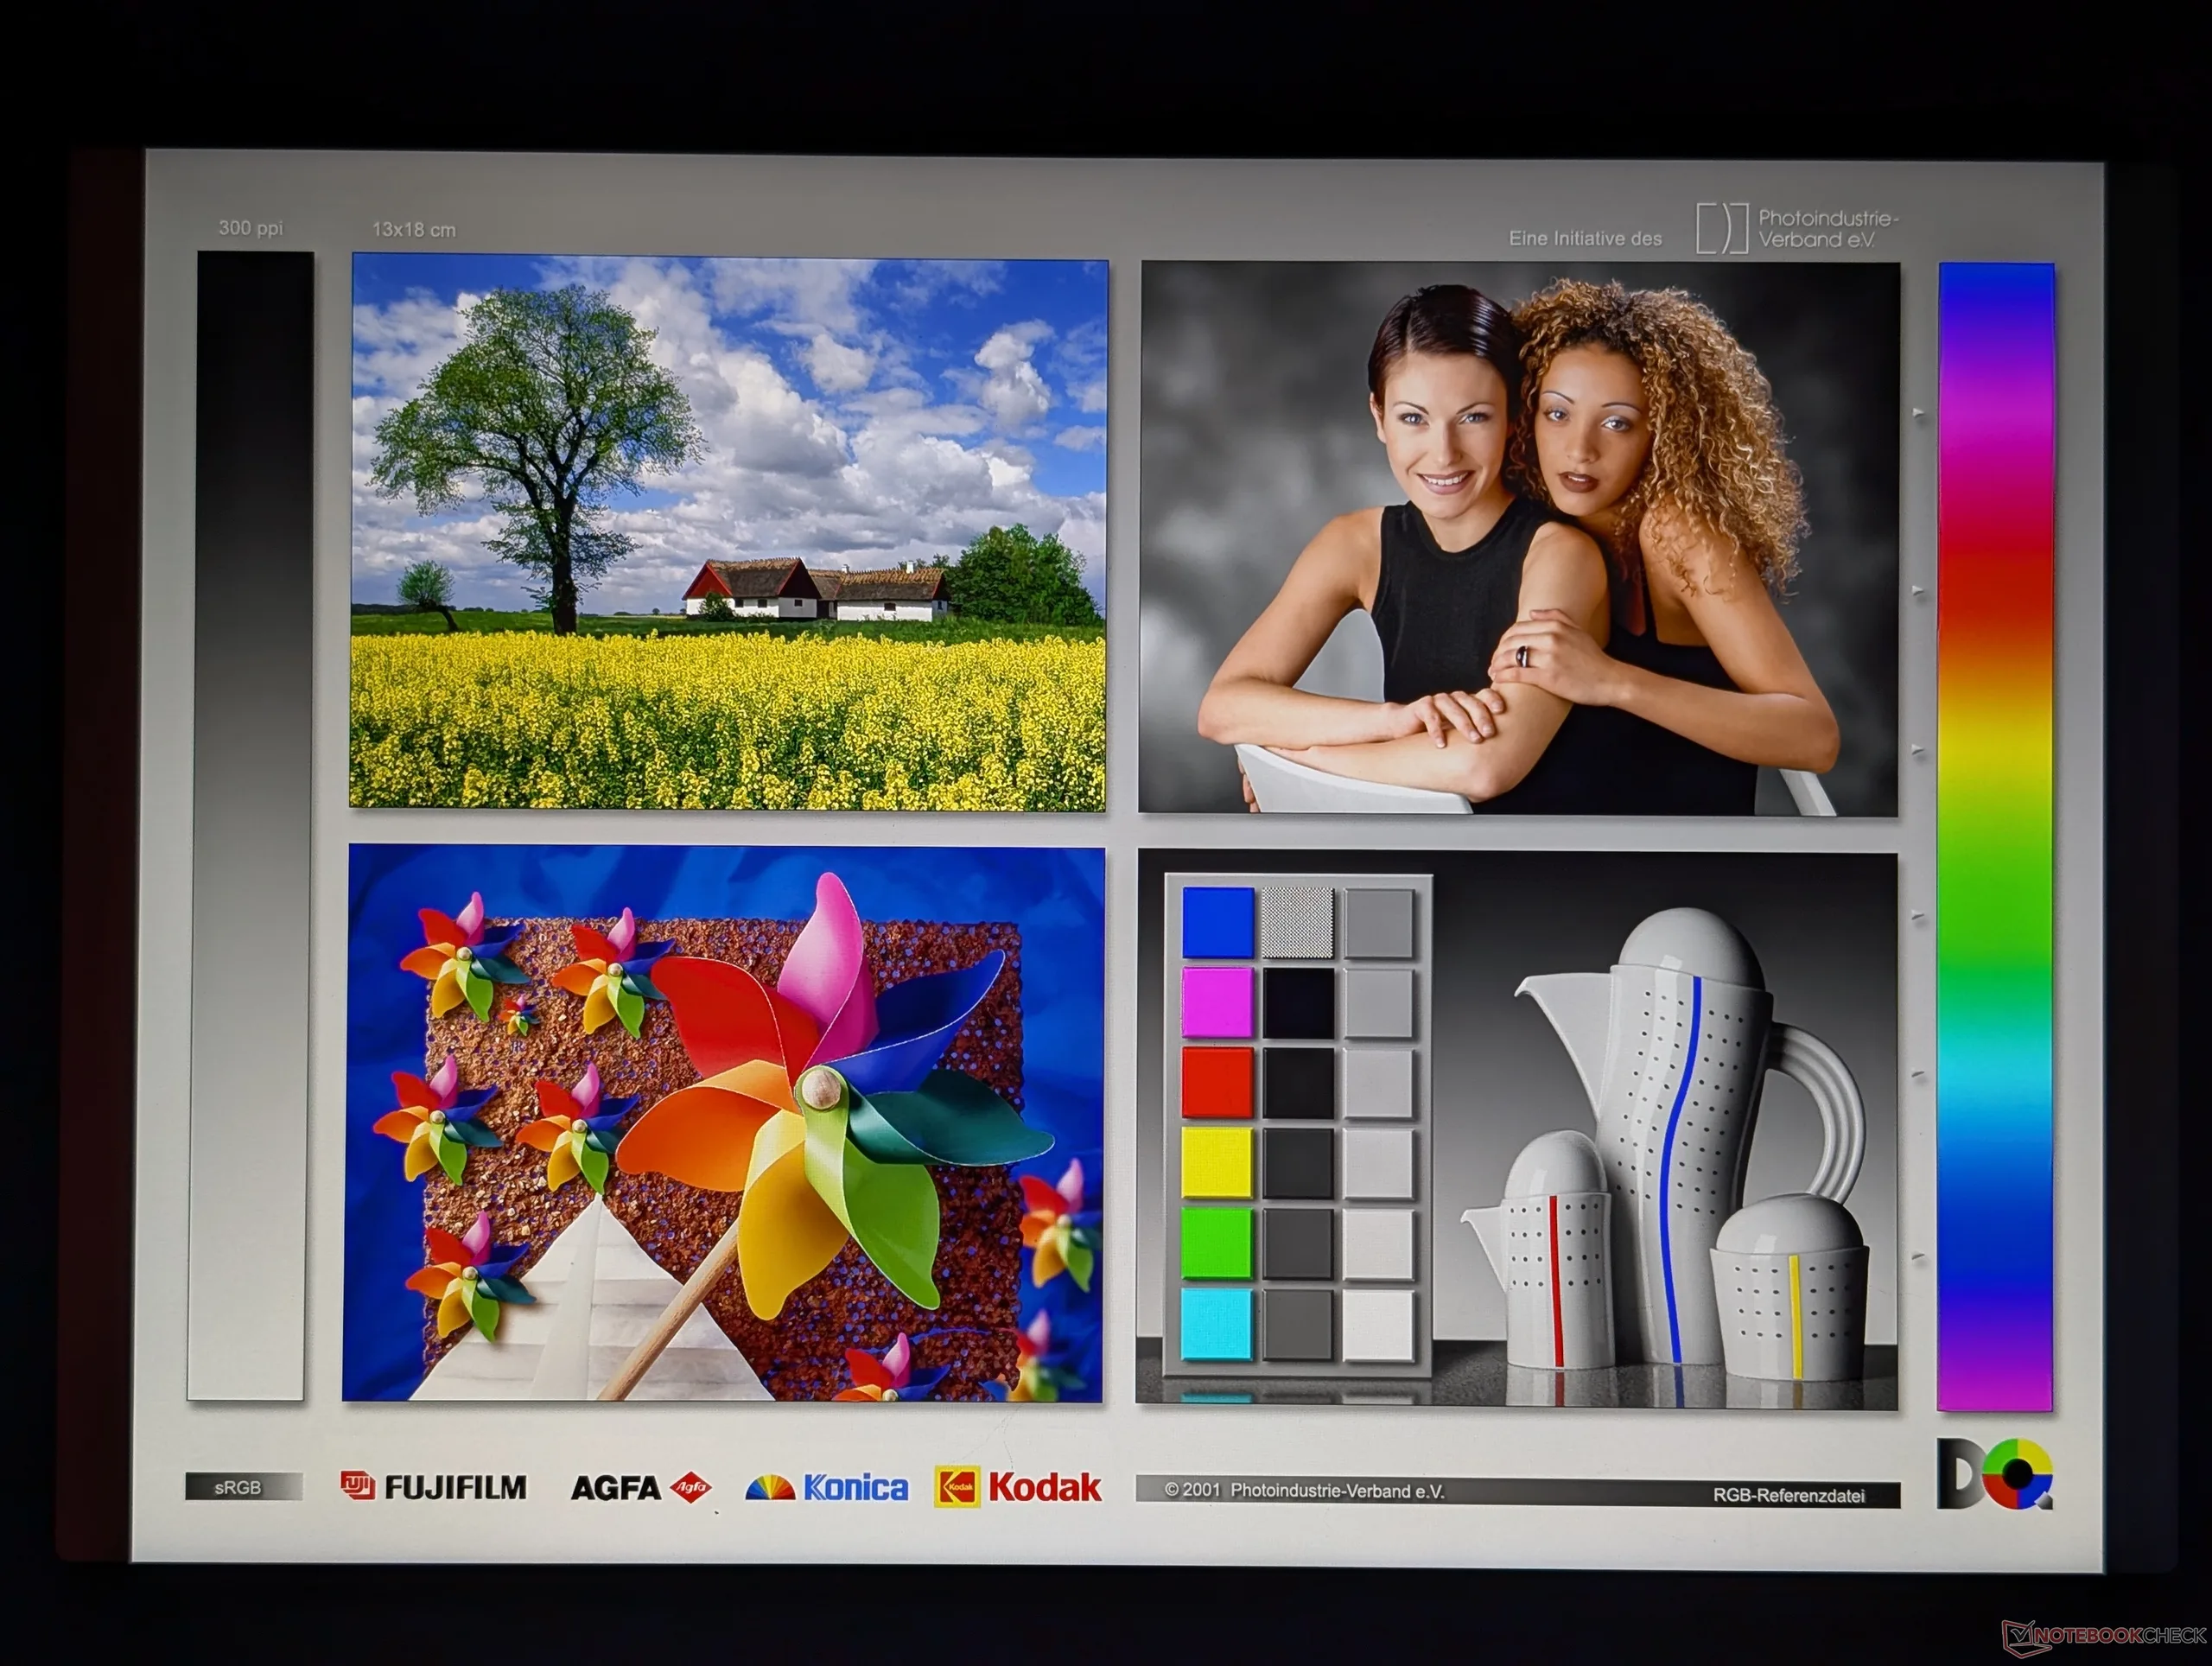
Scharfe RGB-Subpixel
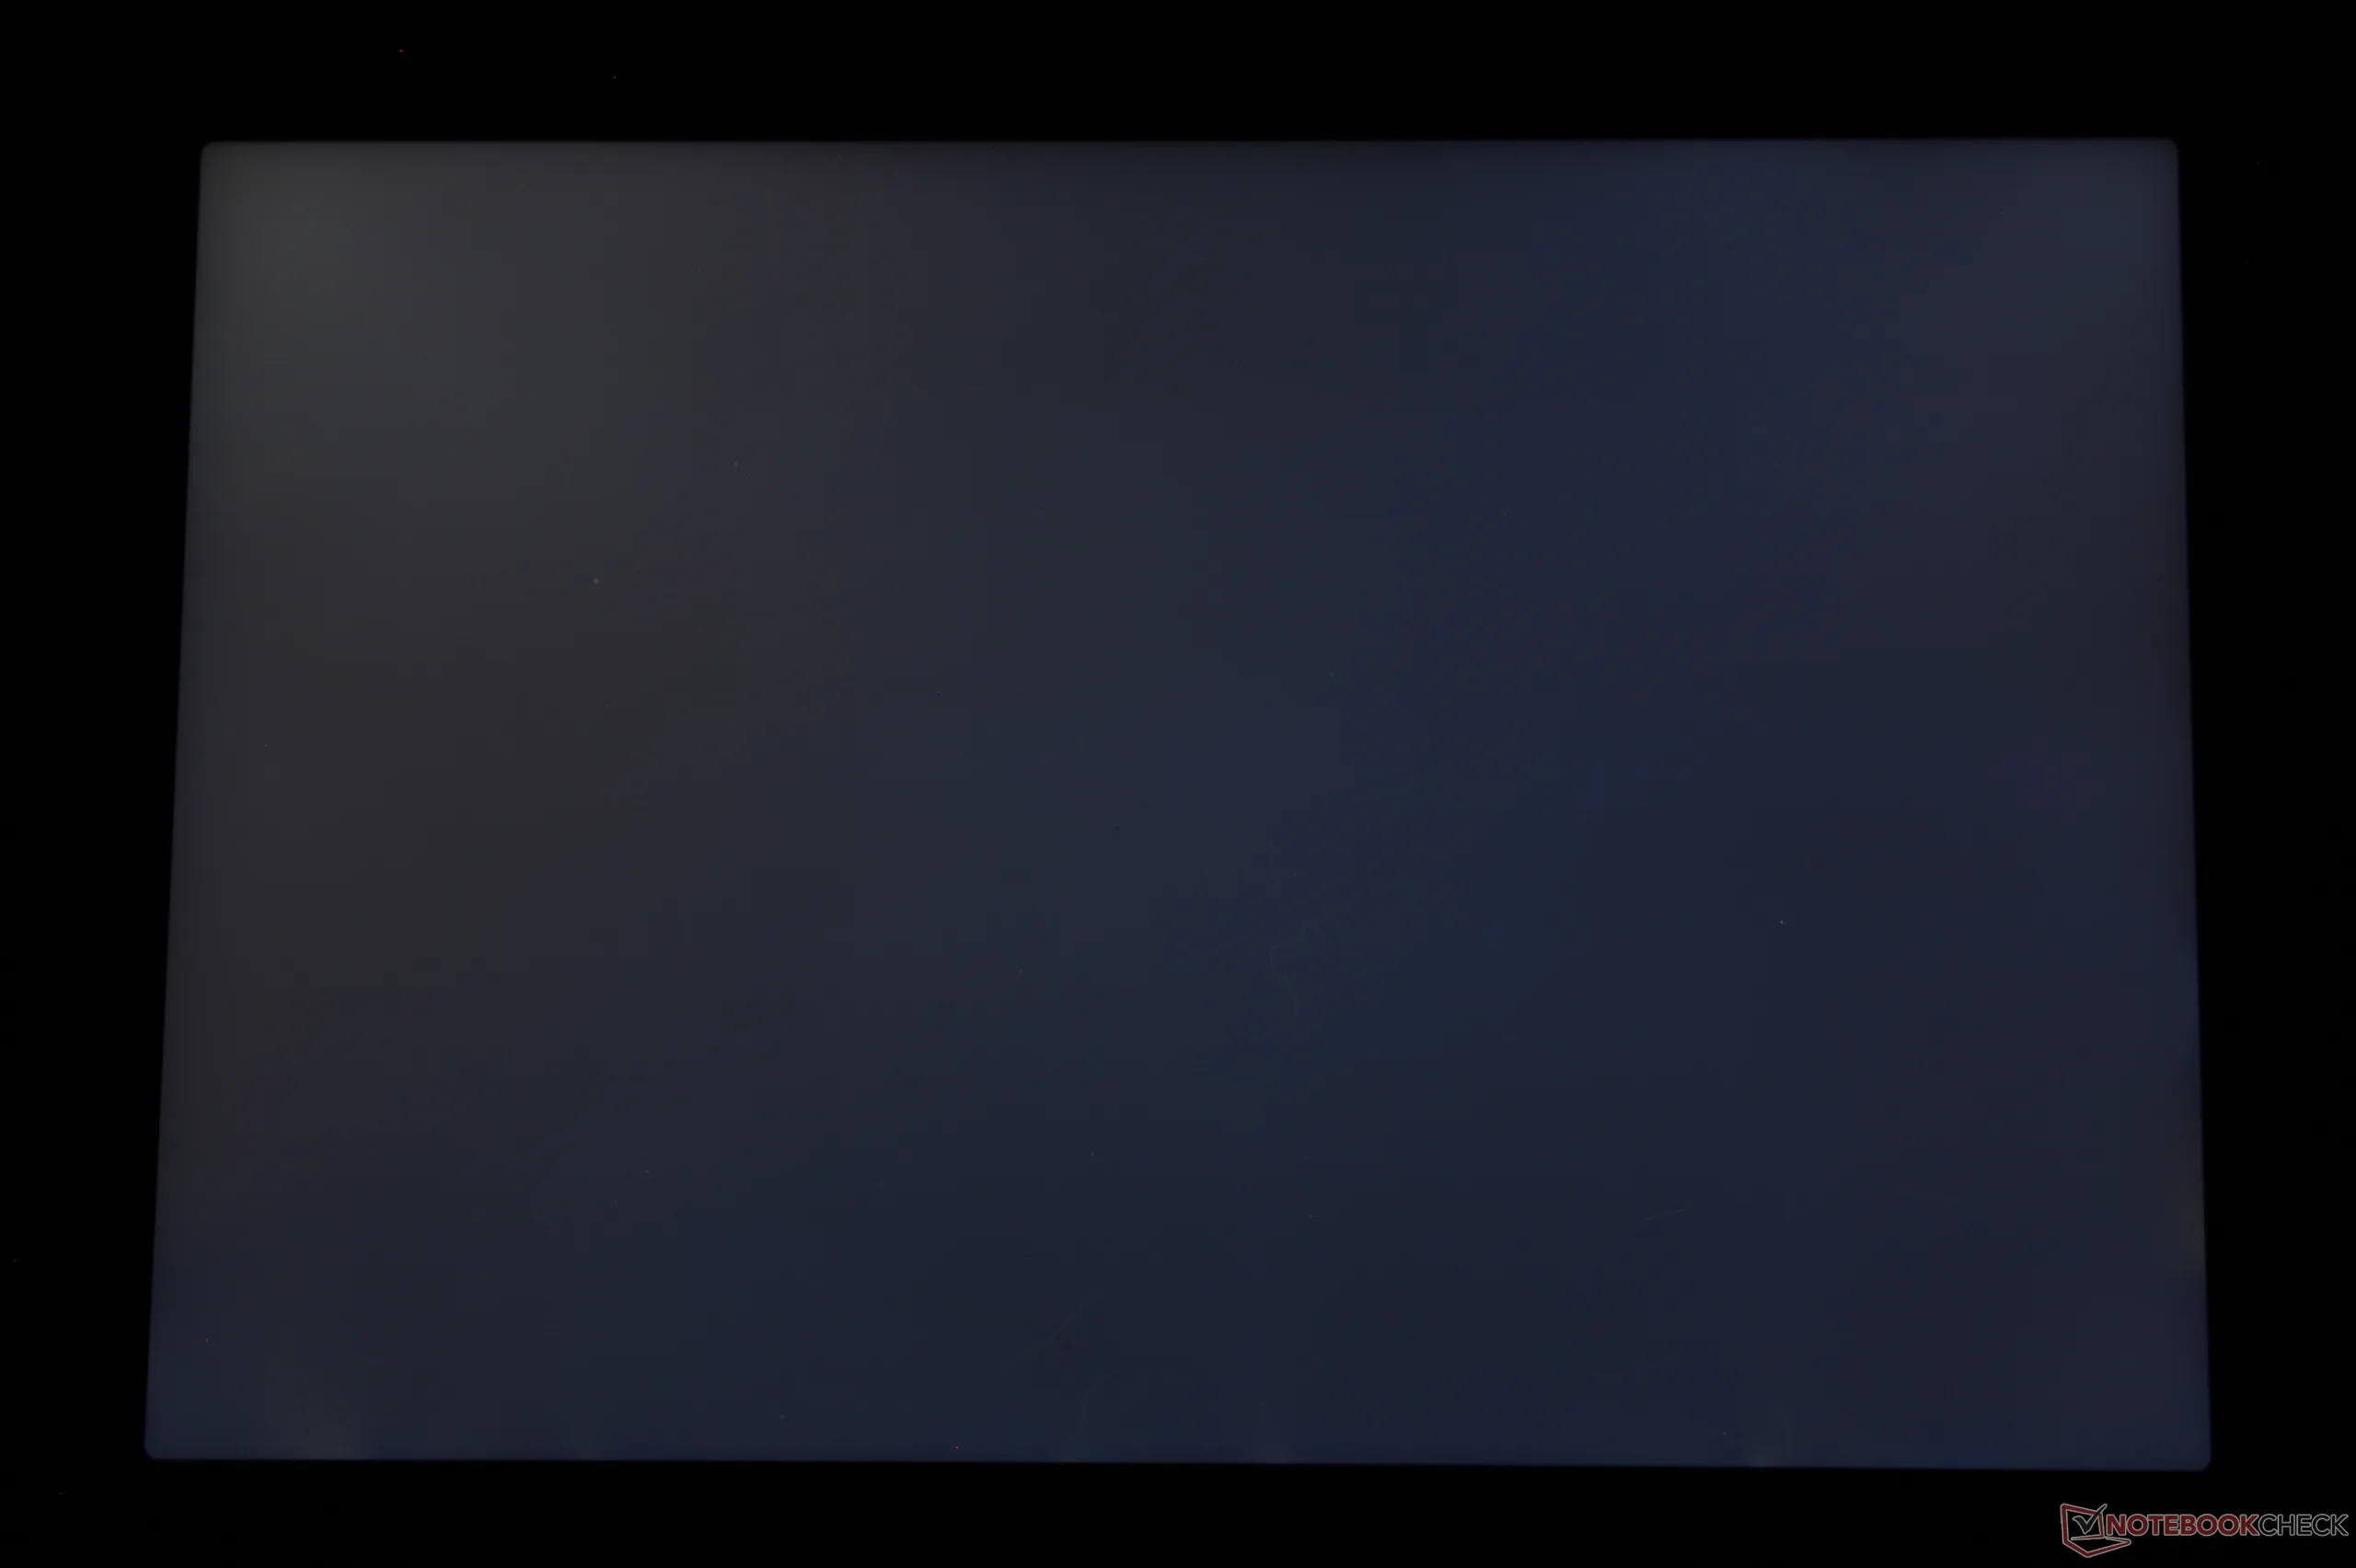
Leichte bis mäßige, ungleichmäßige Lichthöfe an den Ecken
517.2
cd/m²
538.5
cd/m²
529.8
cd/m²
502.8
cd/m²
573
cd/m²
494
cd/m²
520.5
cd/m²
495.3
cd/m²
495.6
cd/m²
Ausleuchtung des Bildschirms
NS130A10-M60 getestet mit X-Rite i1Pro 3
Maximal: 573 cd/m² (Nits) Durchschnitt: 518.5 cd/m² Minimum: 7.73 cd/m²
Ausleuchtung: 86 %
Helligkeit Akku: 573 cd/m²
Kontrast: 1273:1 (Schwarzwert: 0.45 cd/m²)
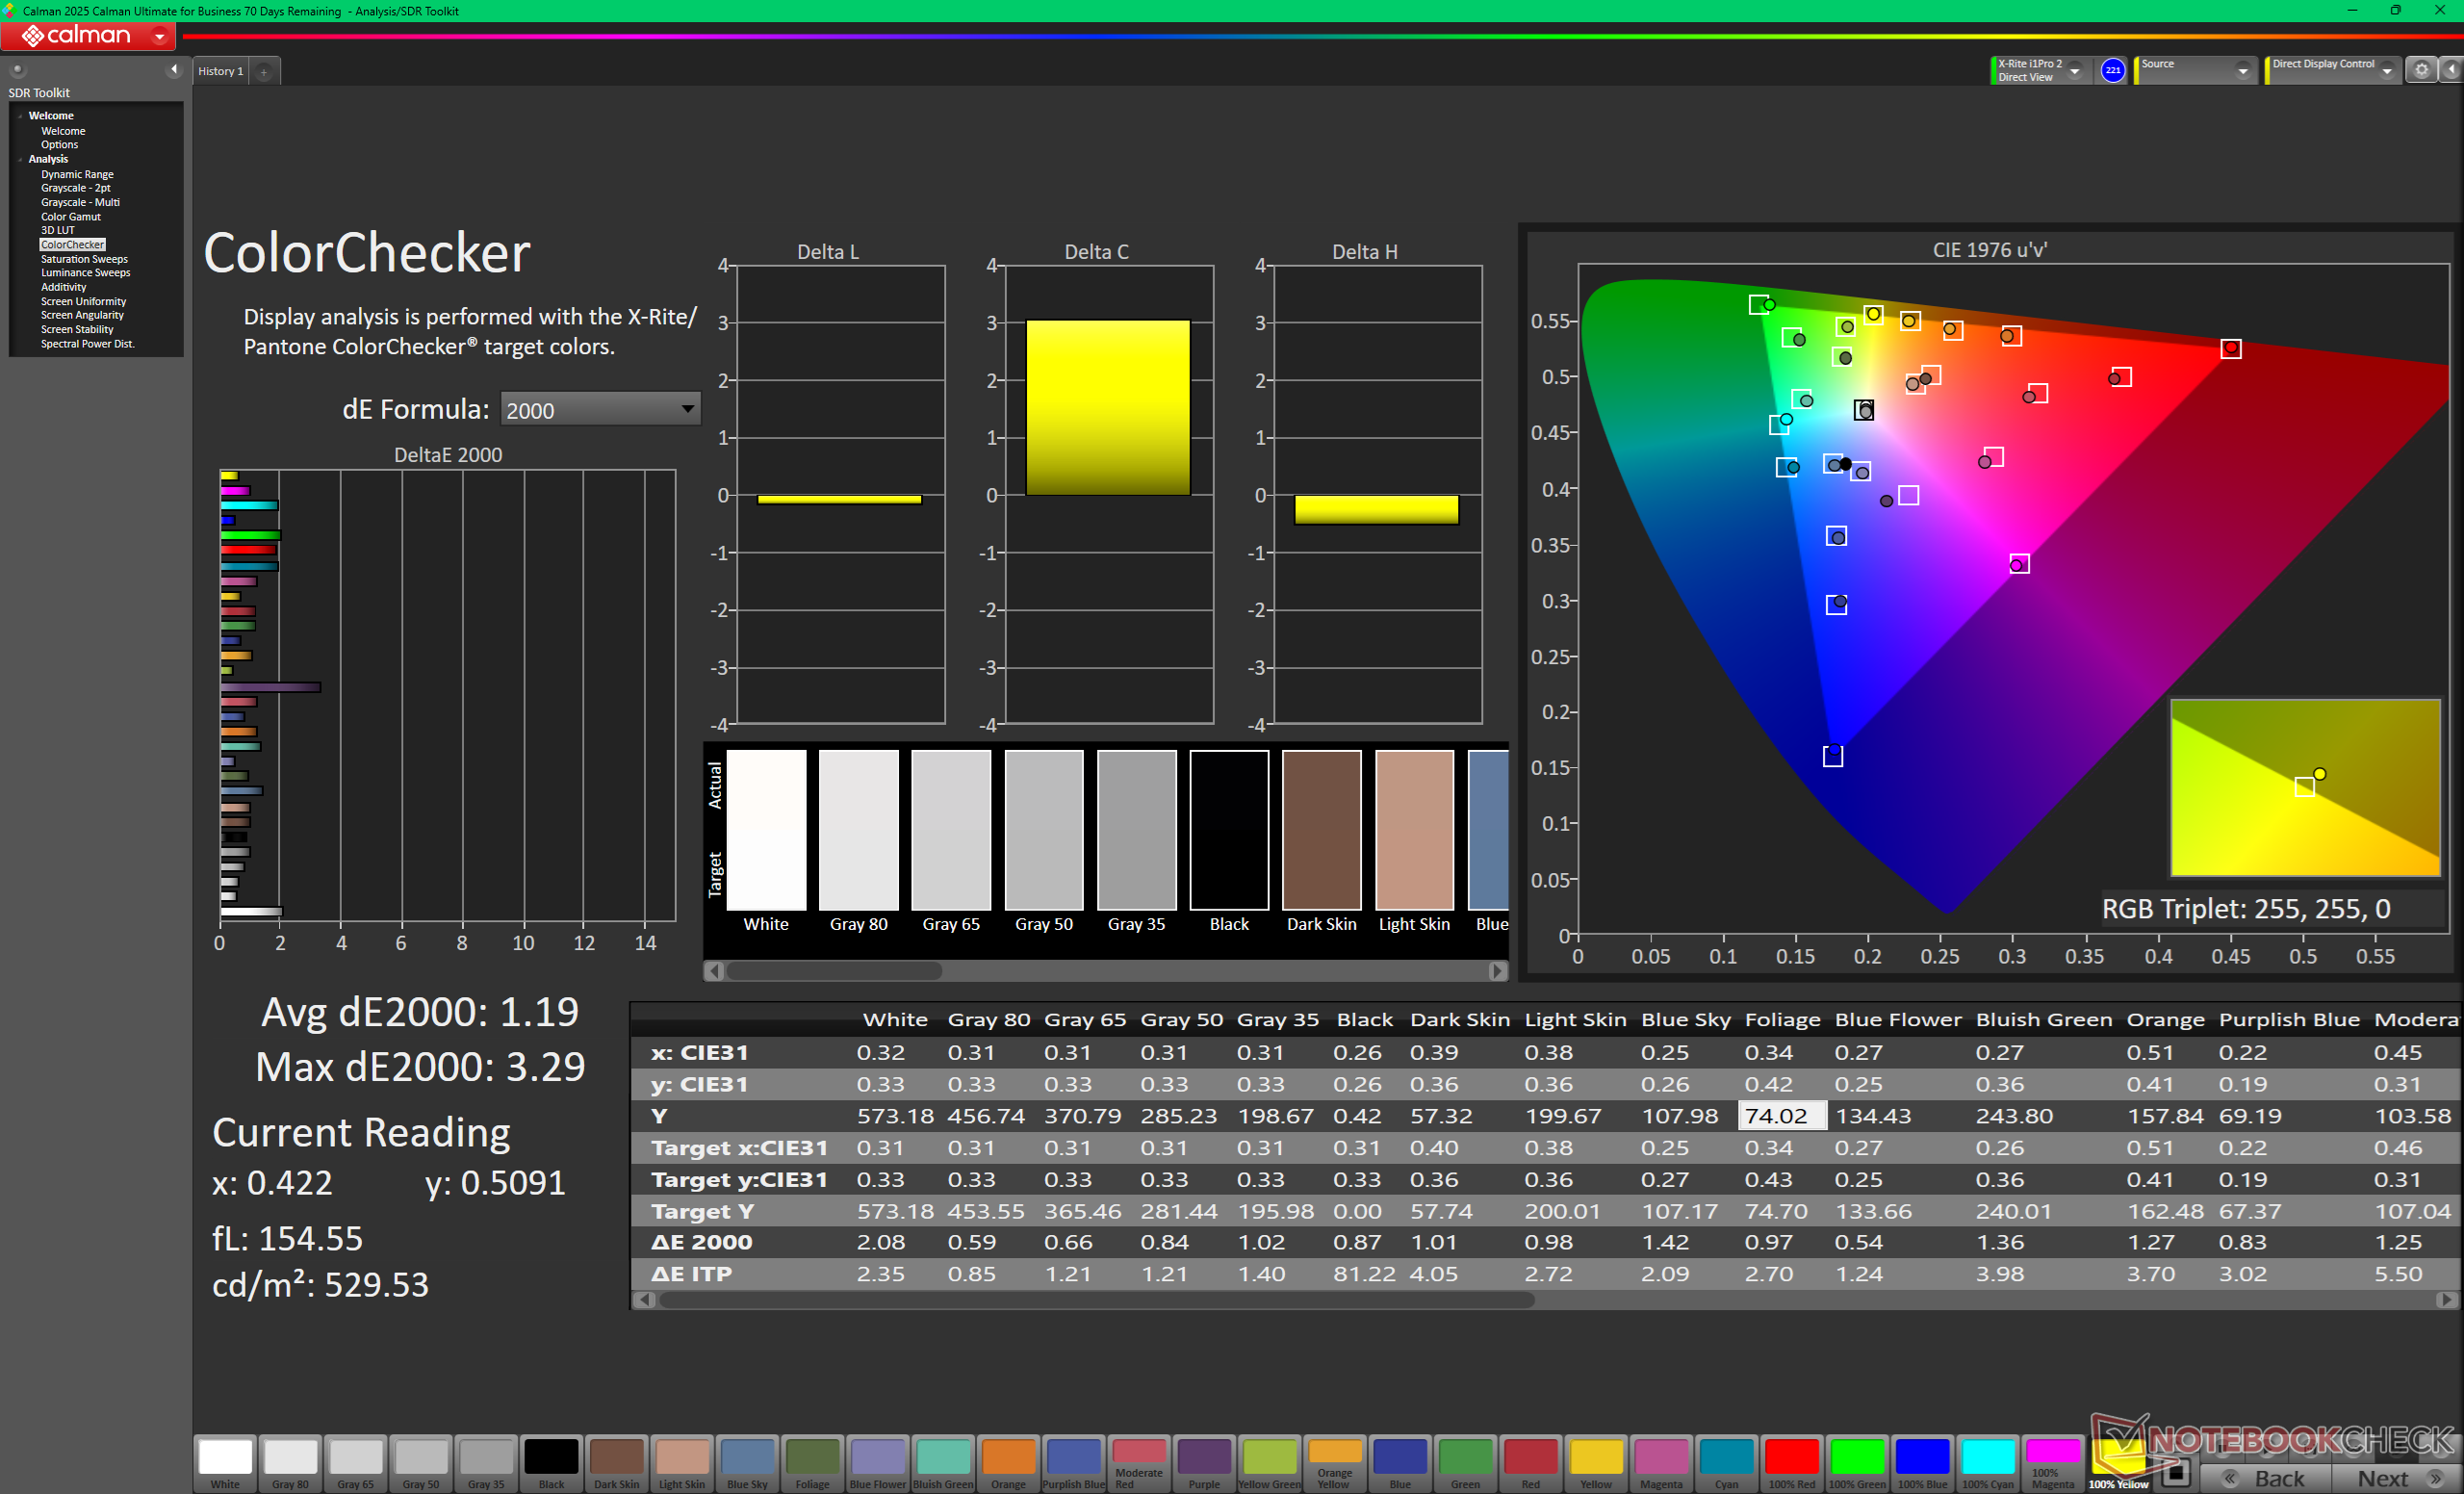
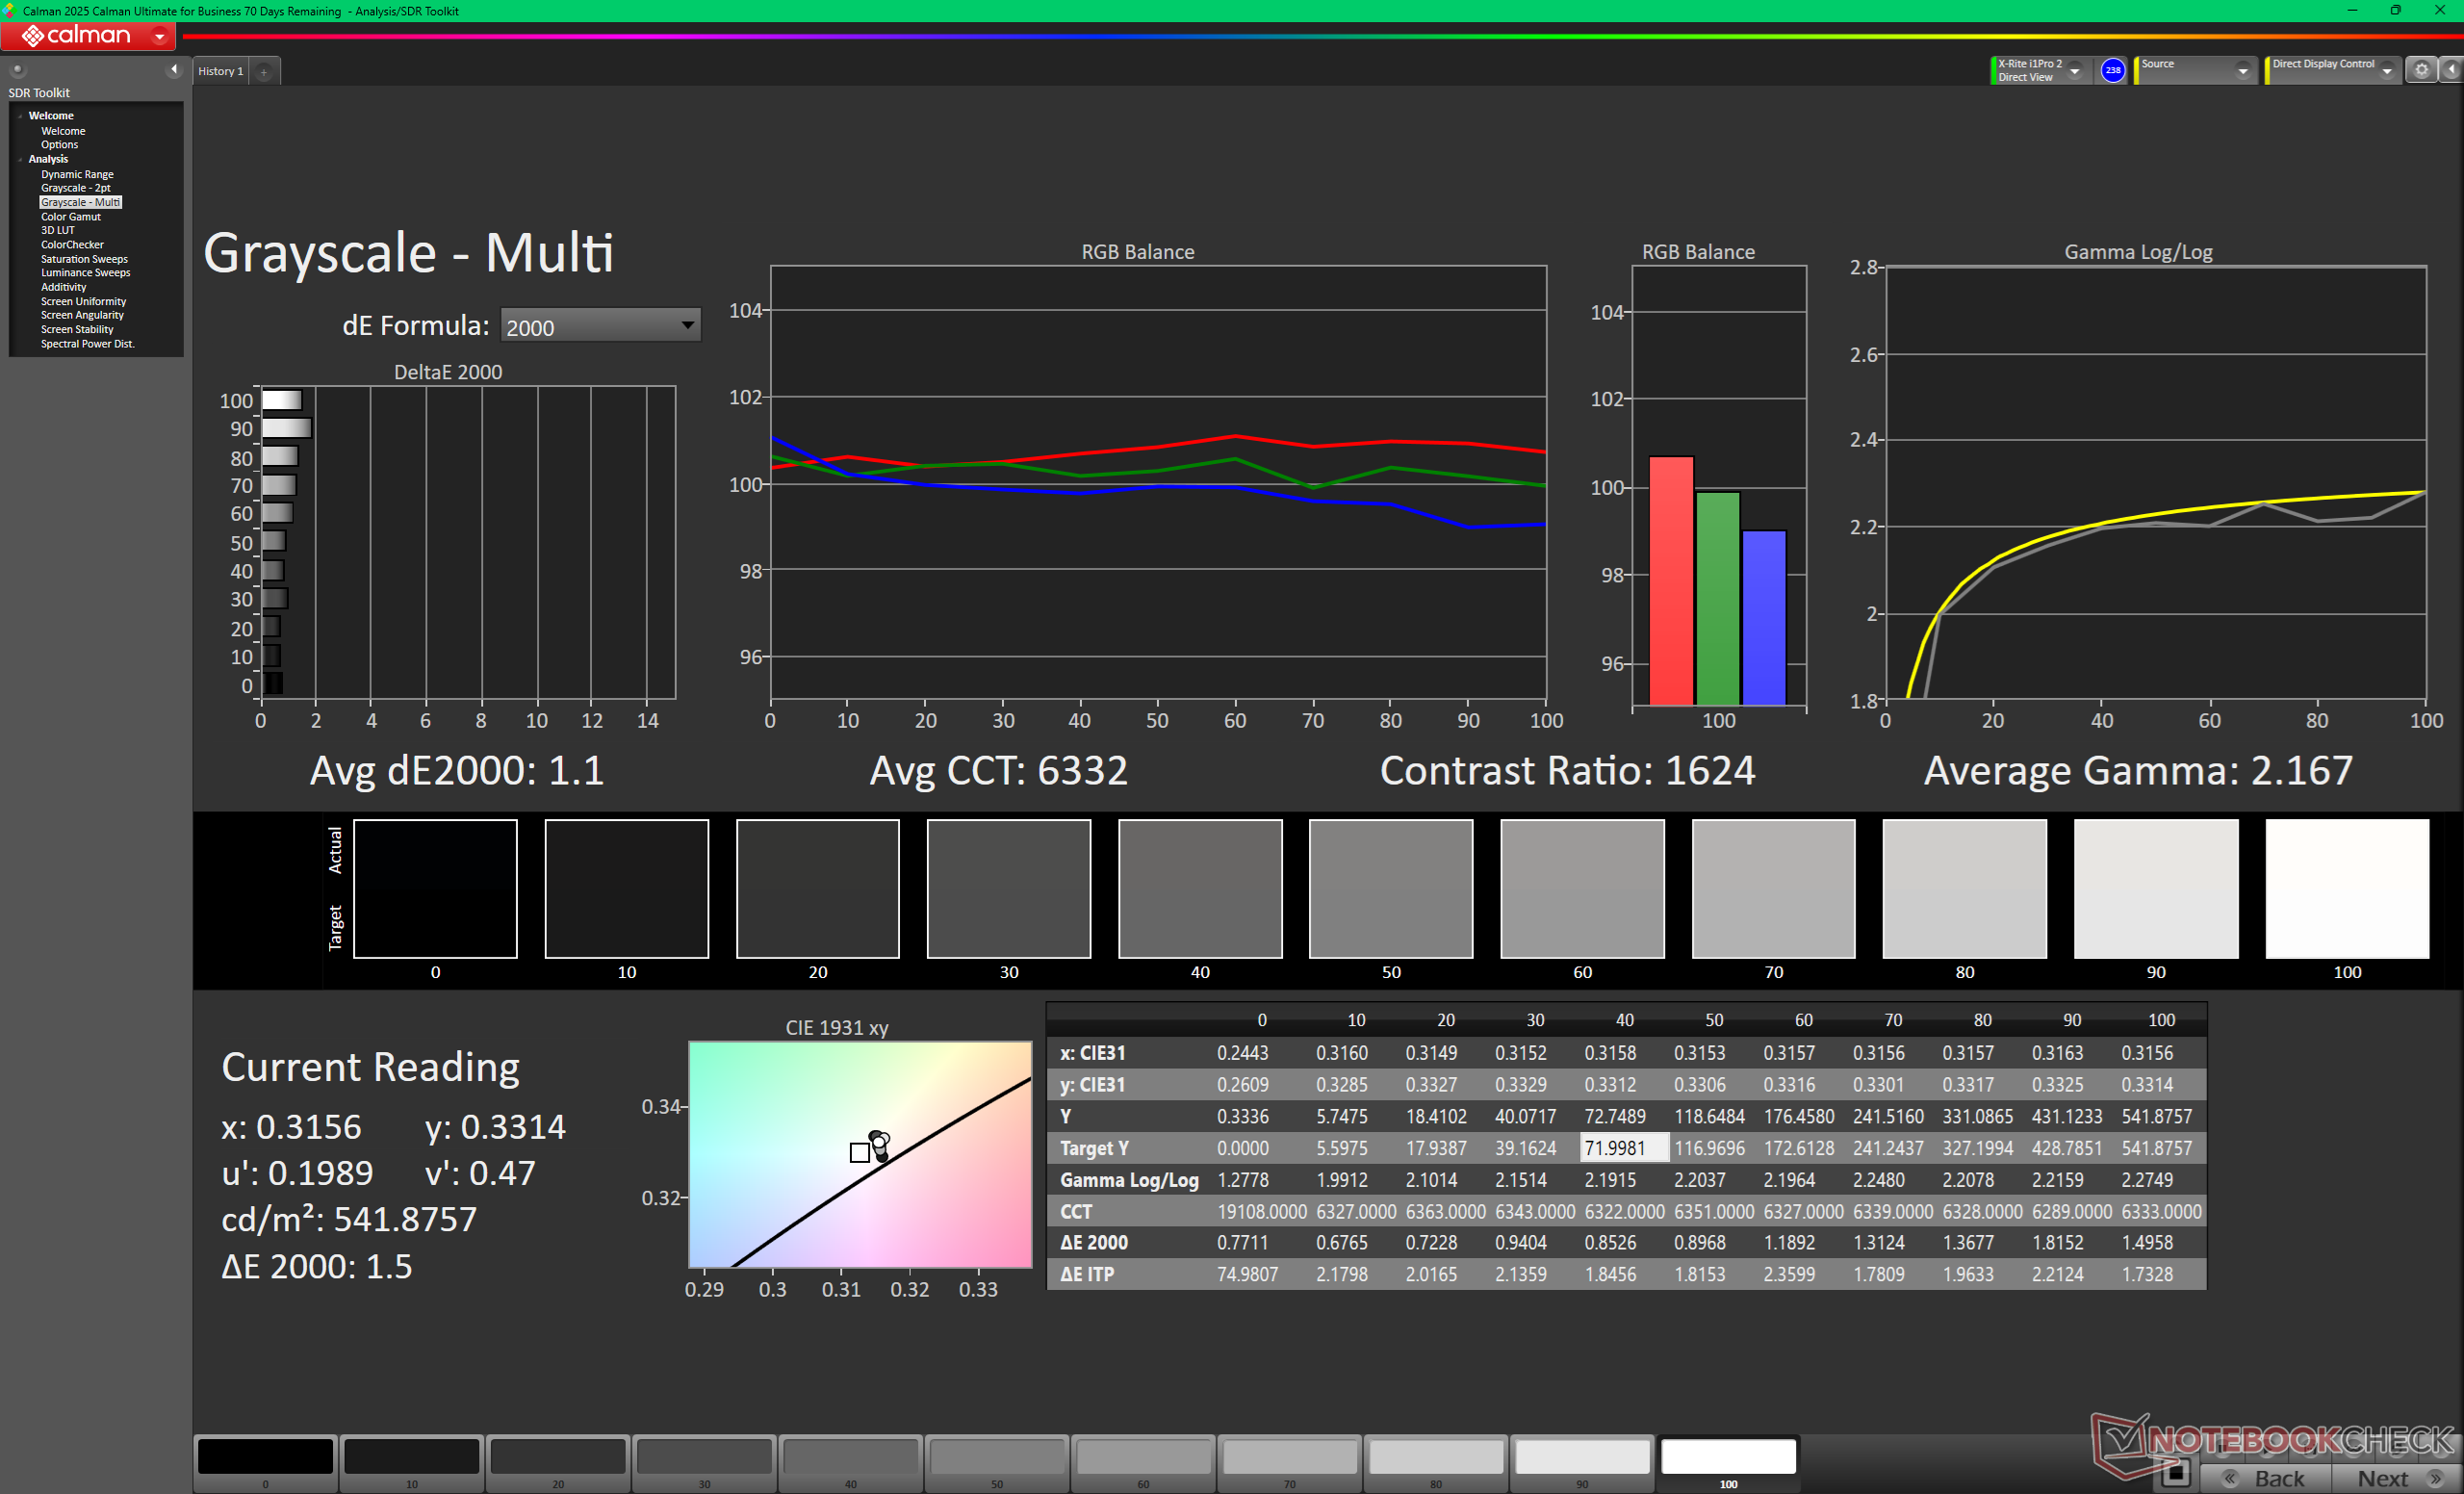
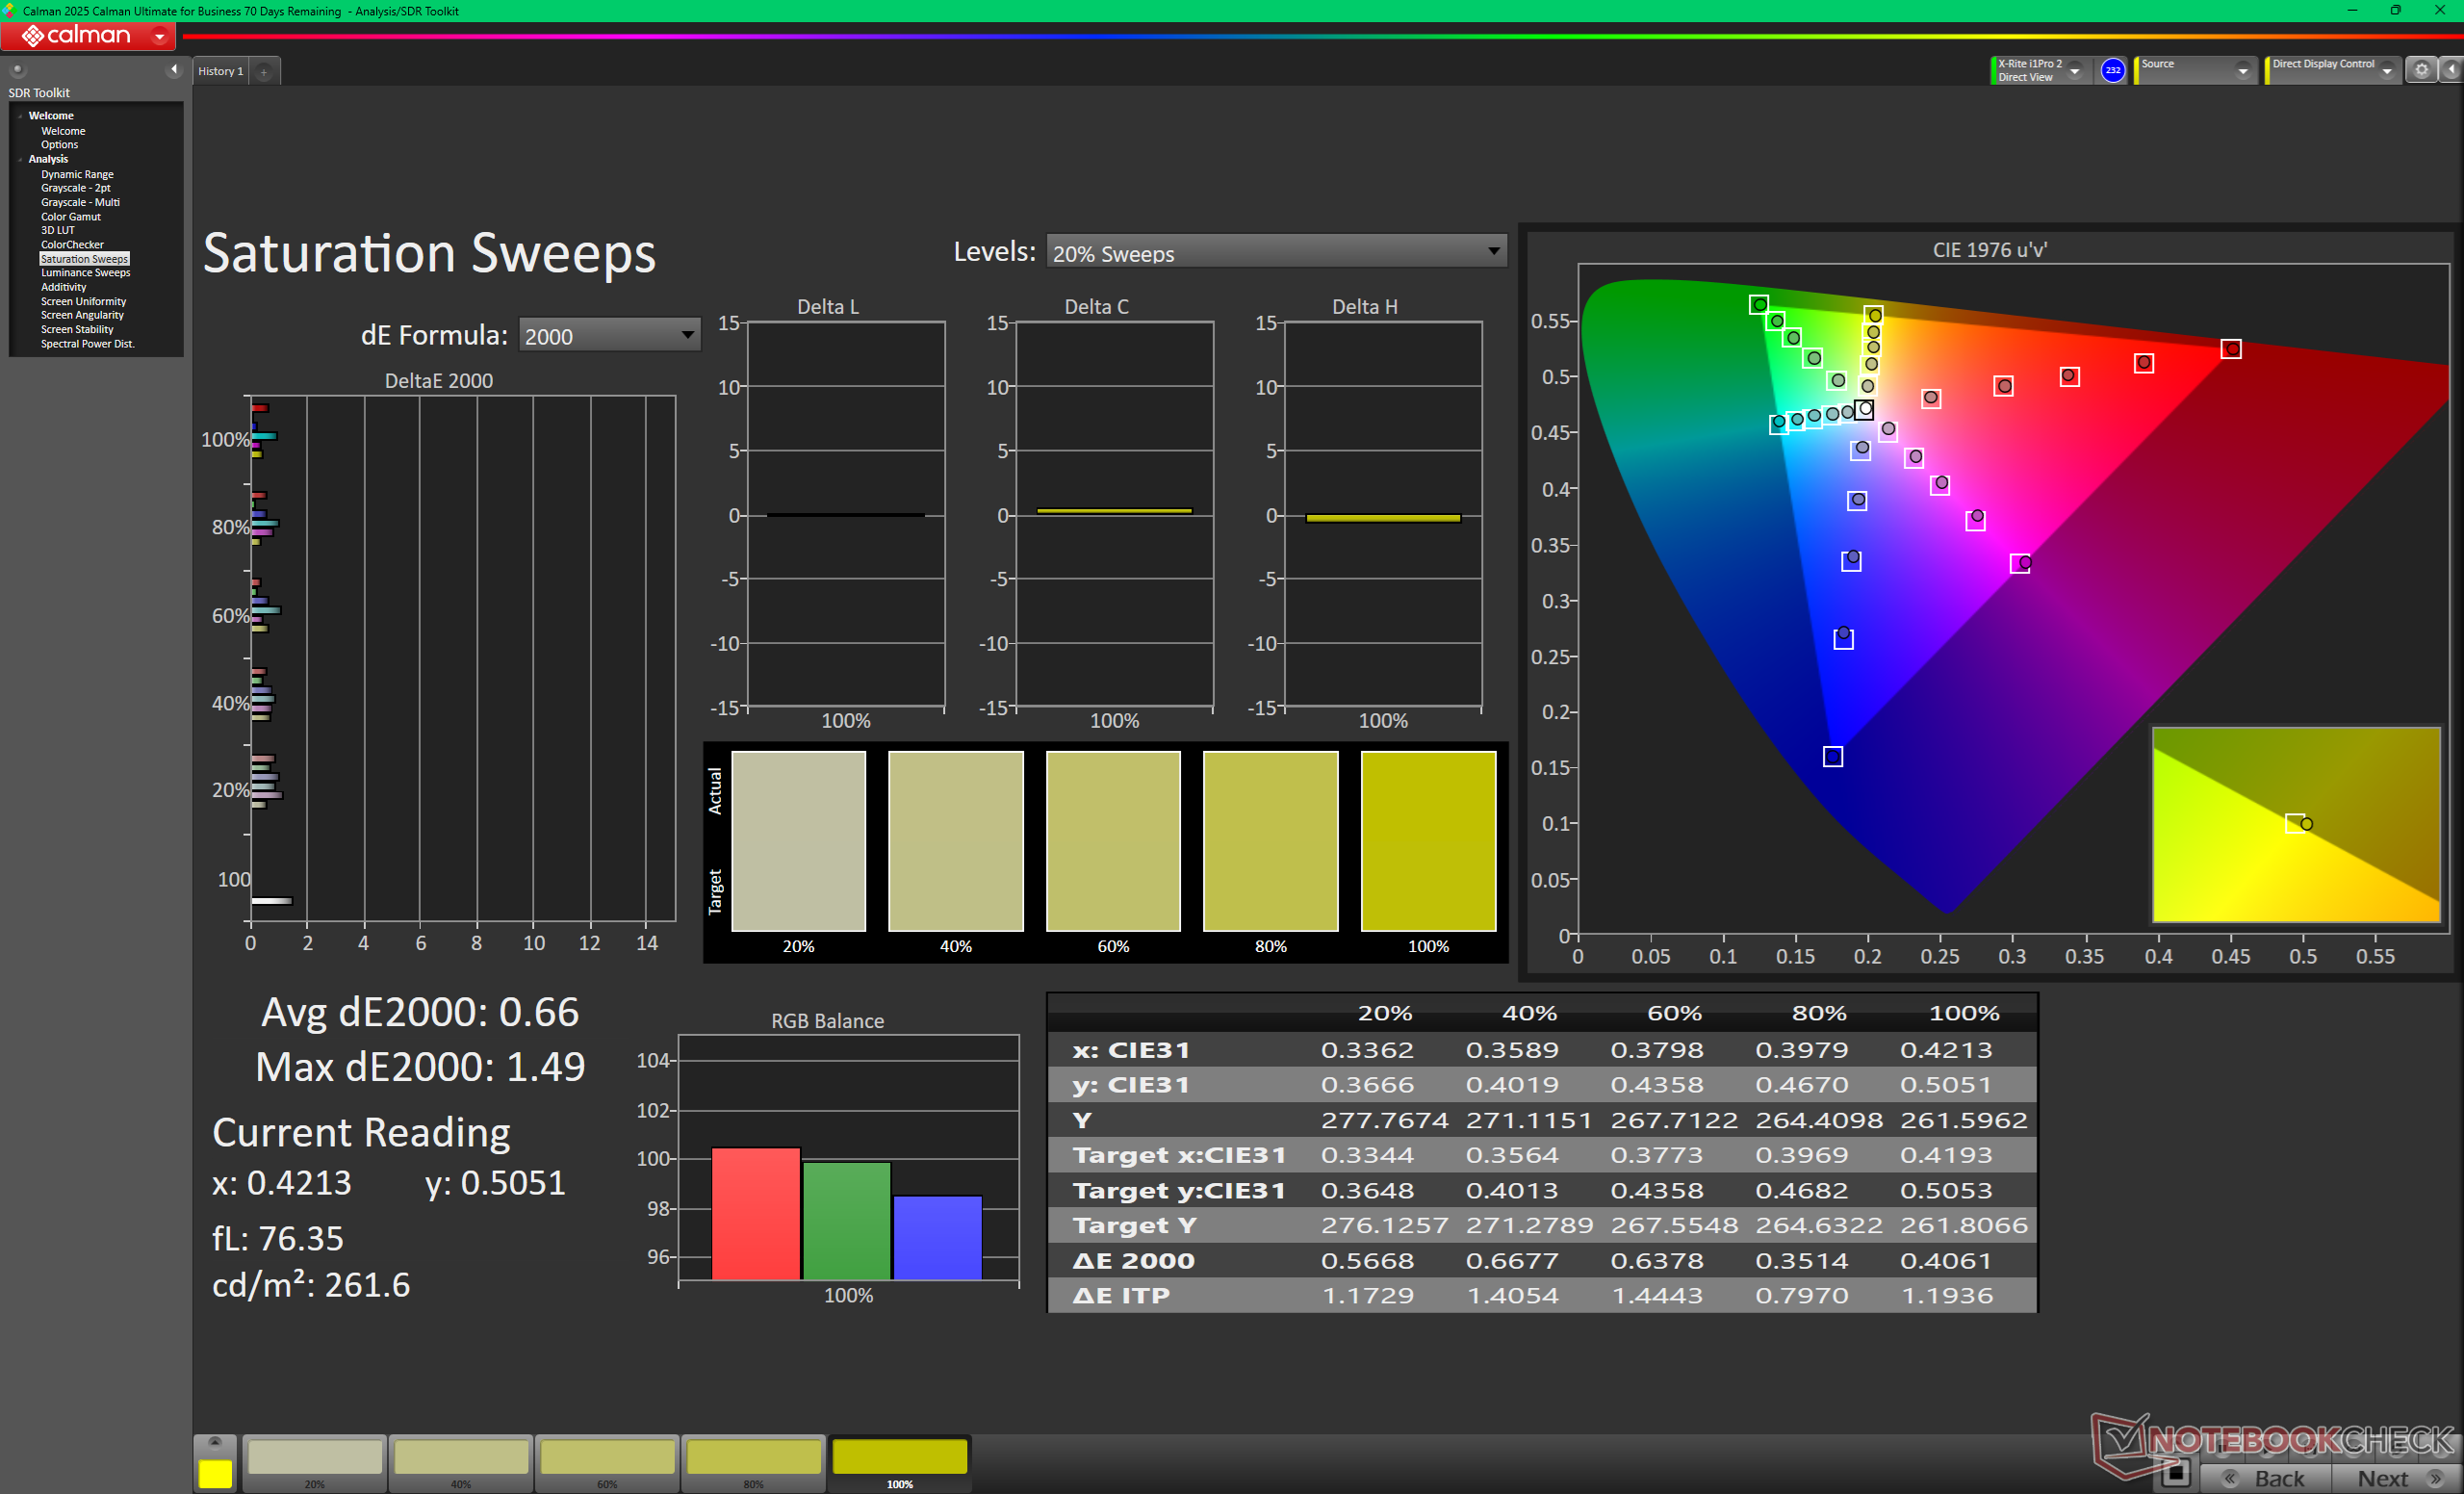
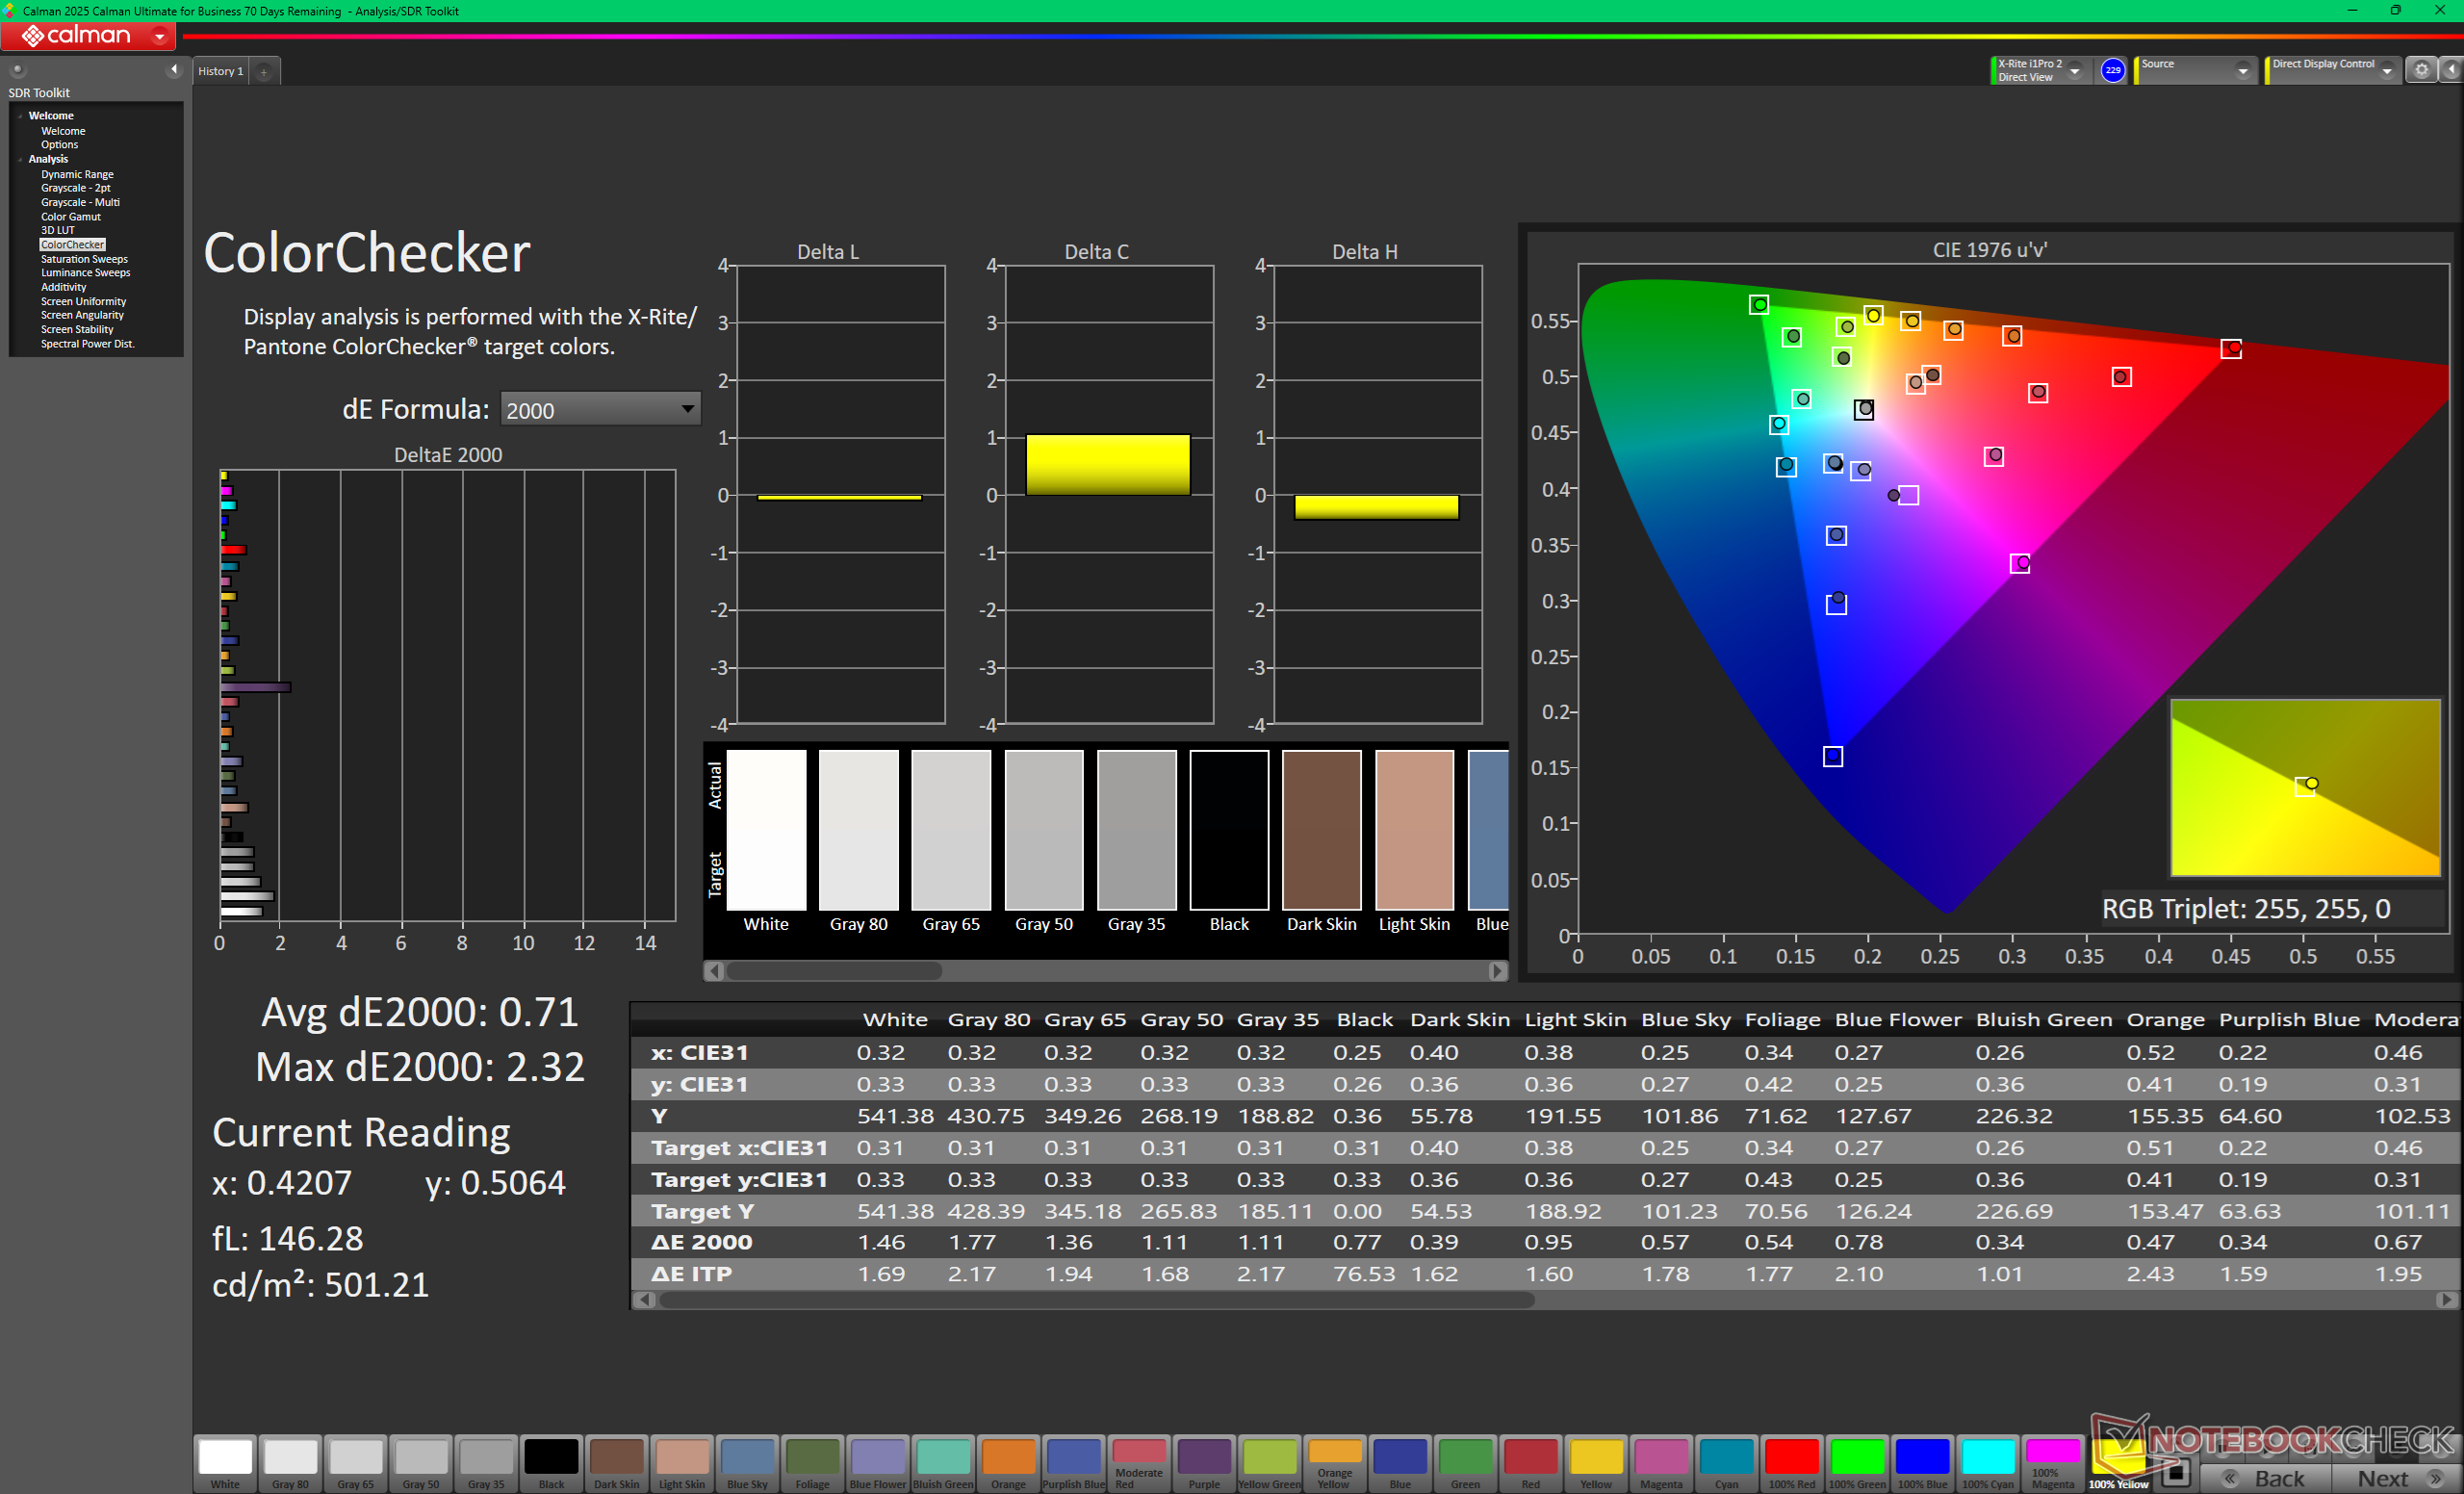
ΔE ColorChecker Calman: 1.19 | ∀{0.5-29.43 Ø4.68}
calibrated: 0.71
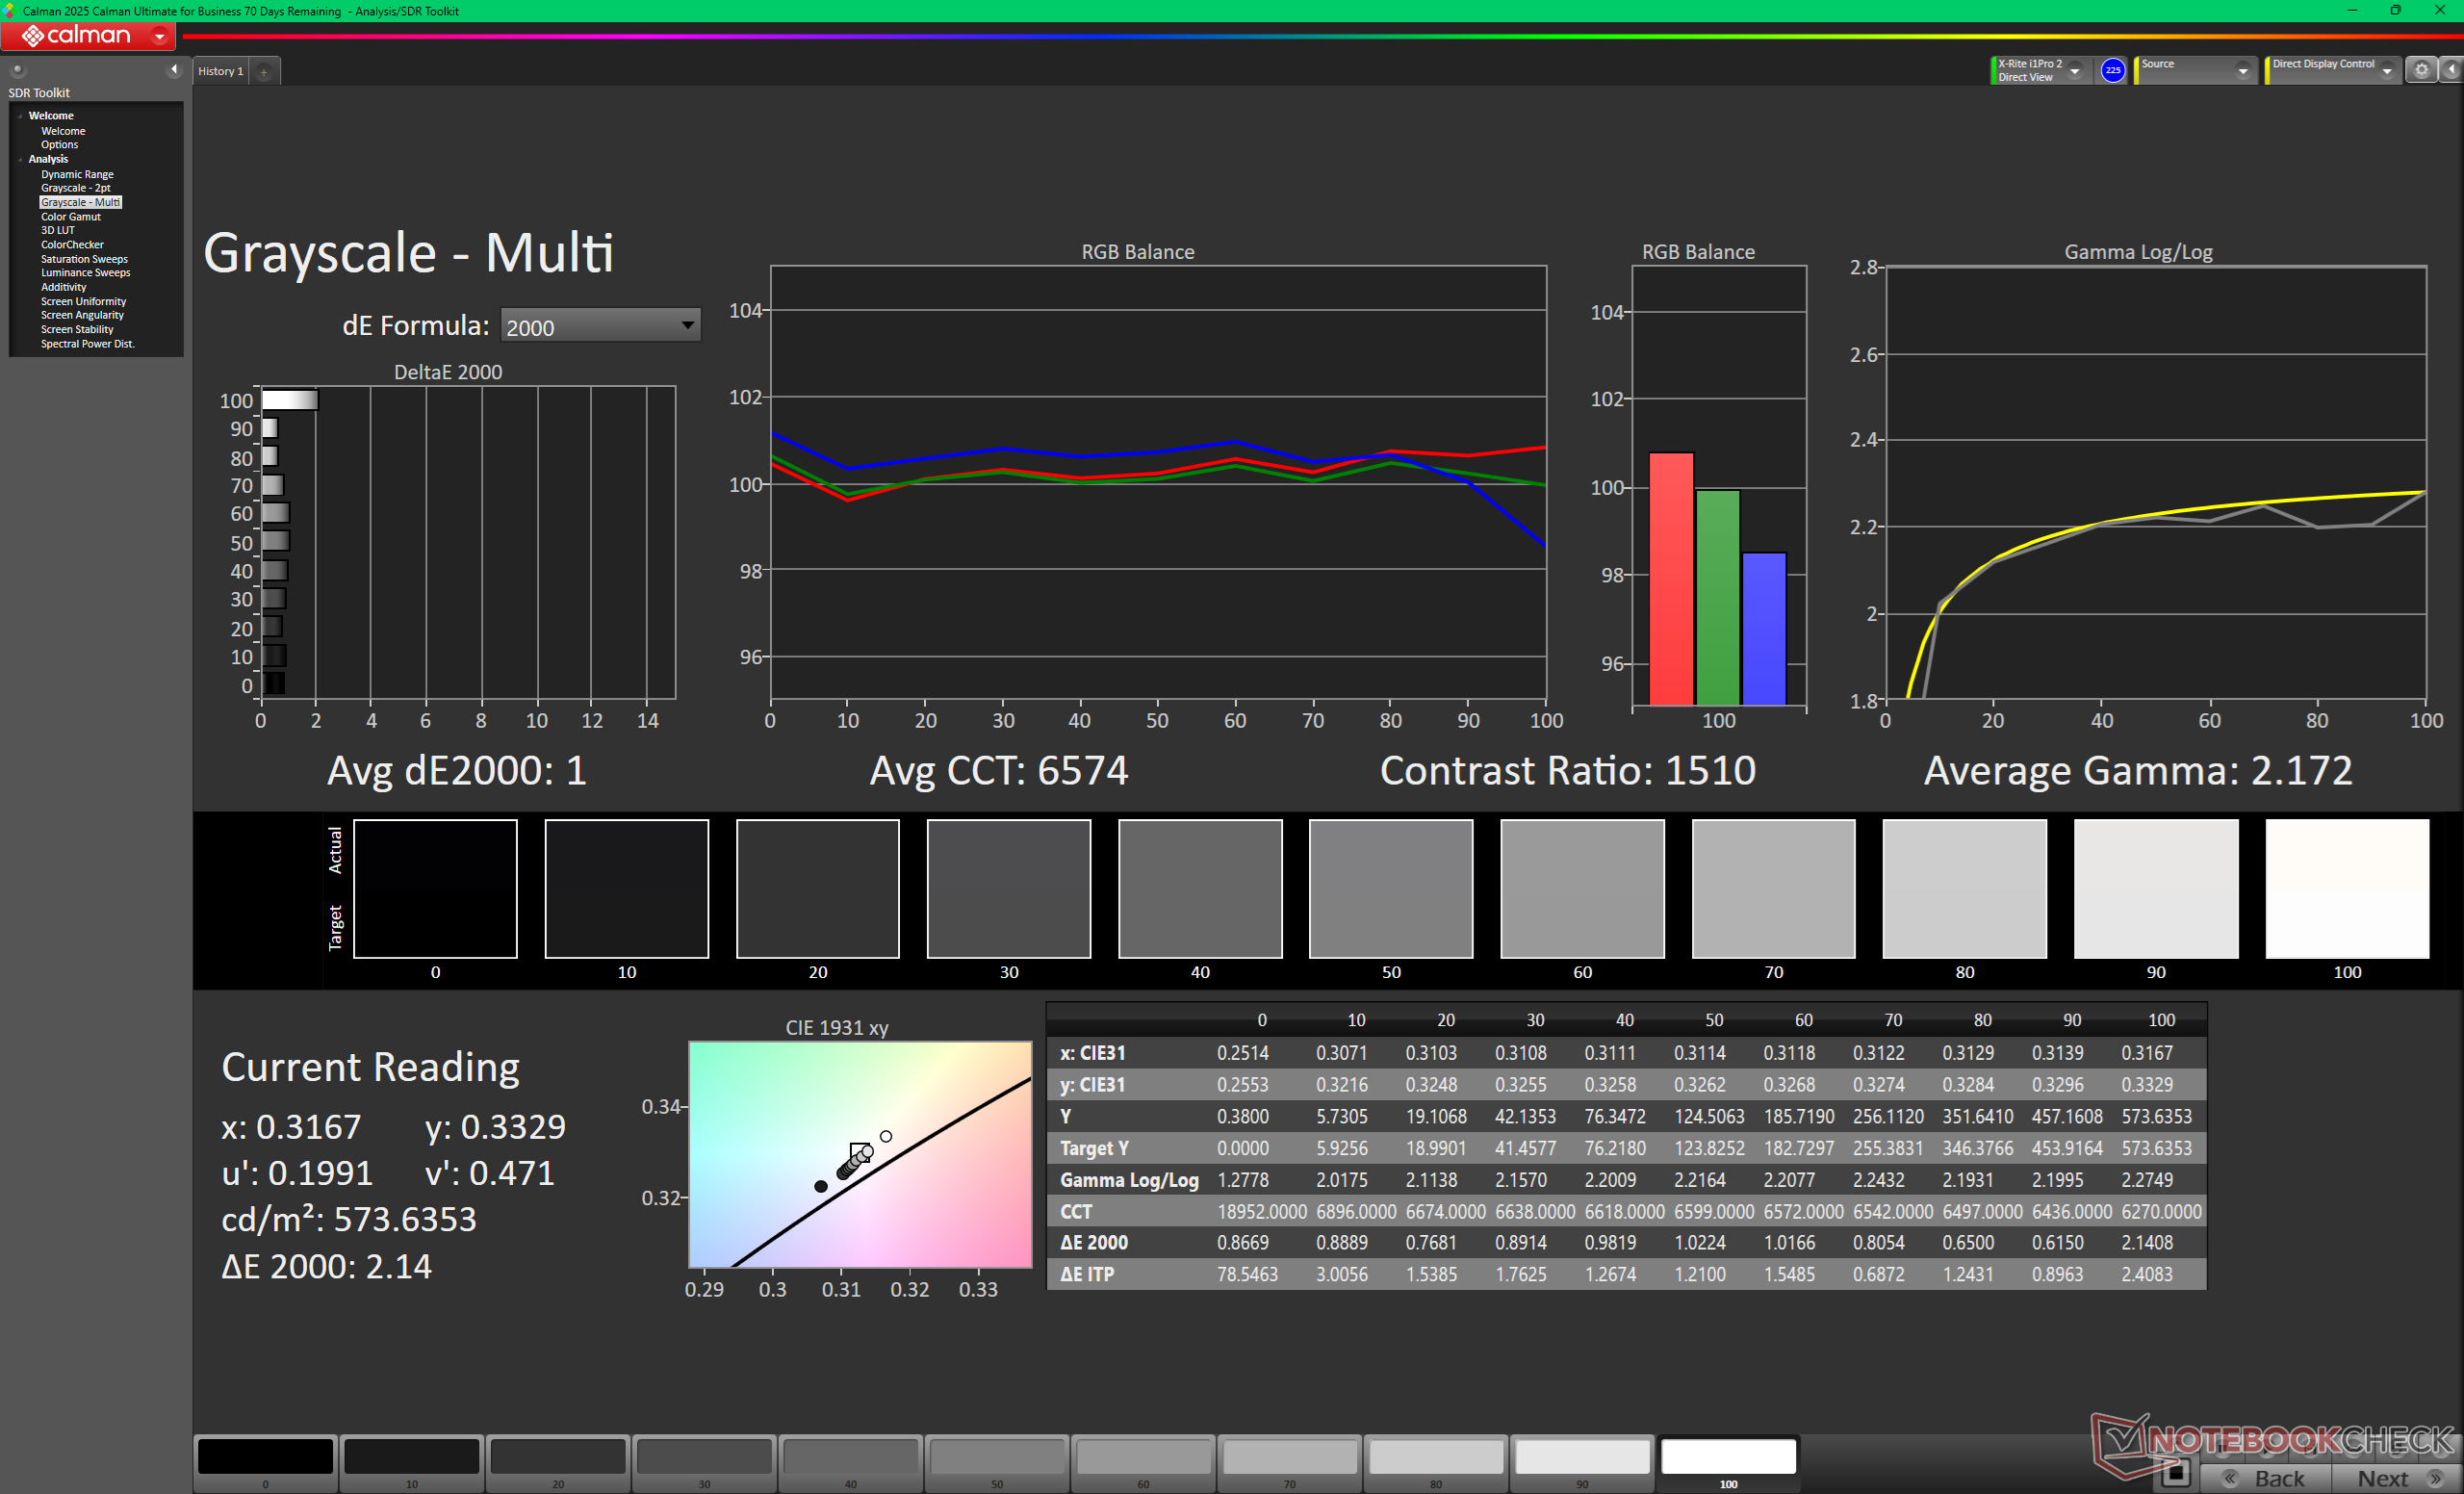
ΔE Greyscale Calman: 1 | ∀{0.09-98 Ø4.92}
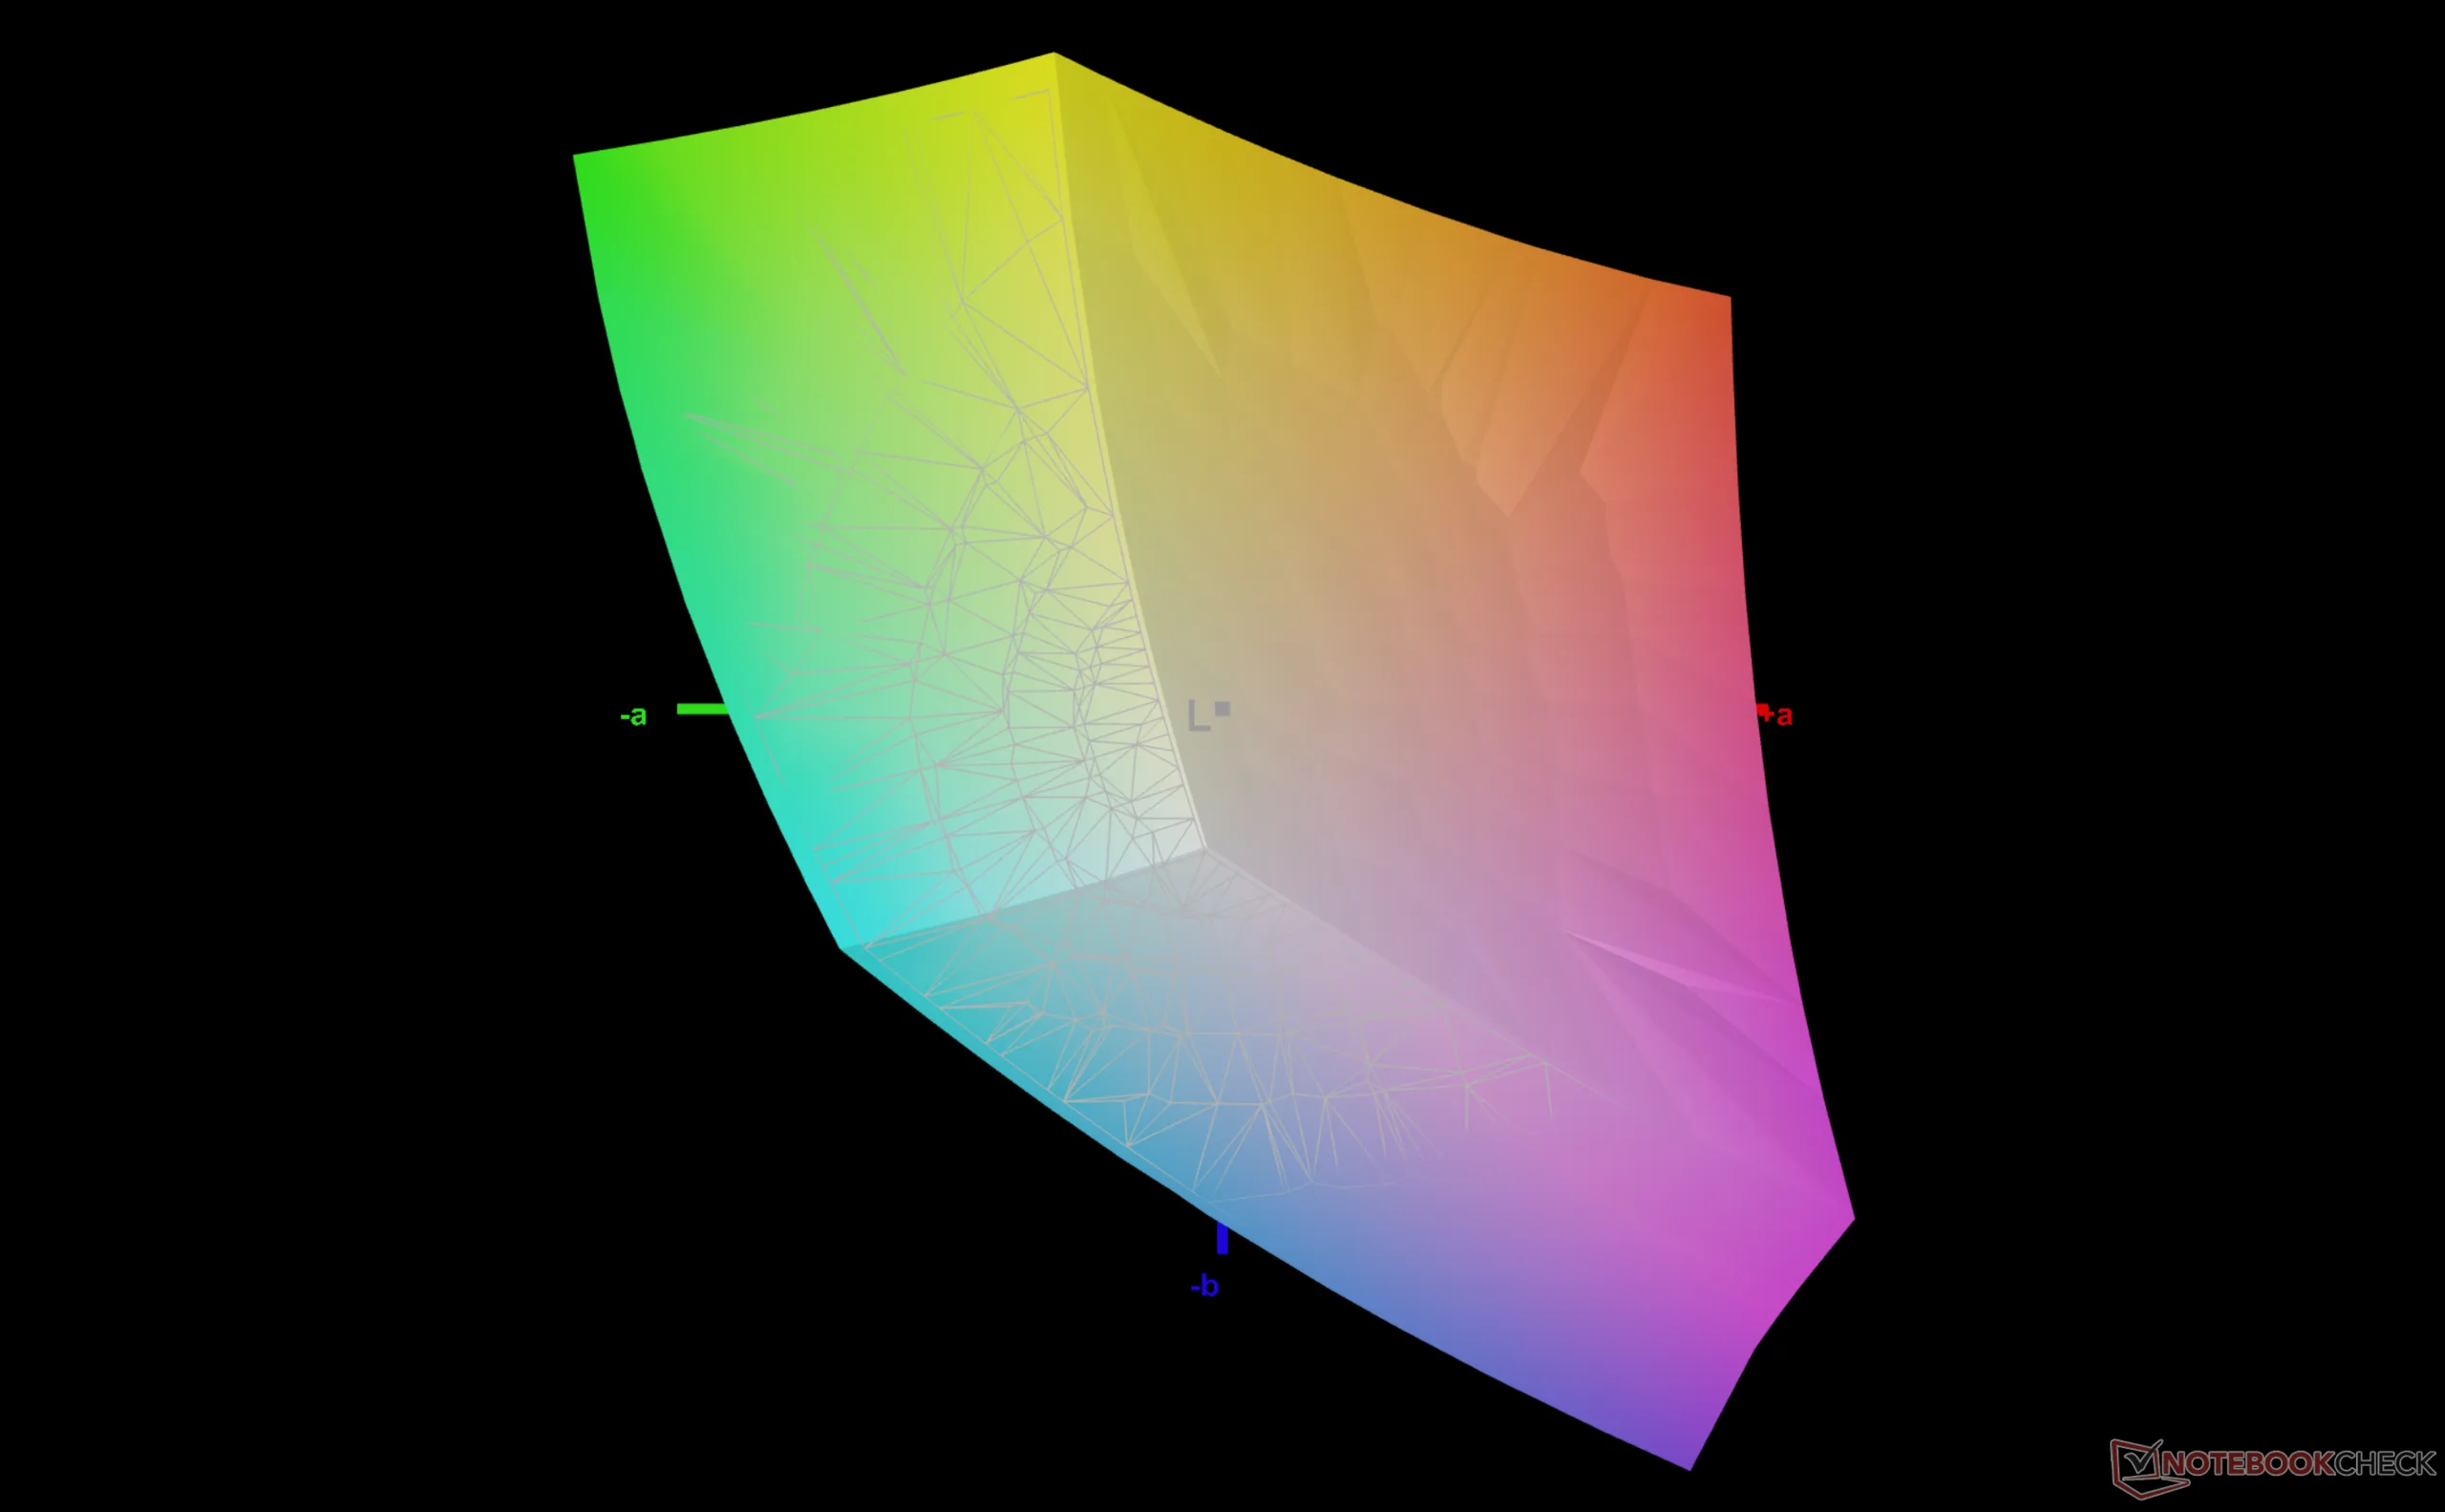
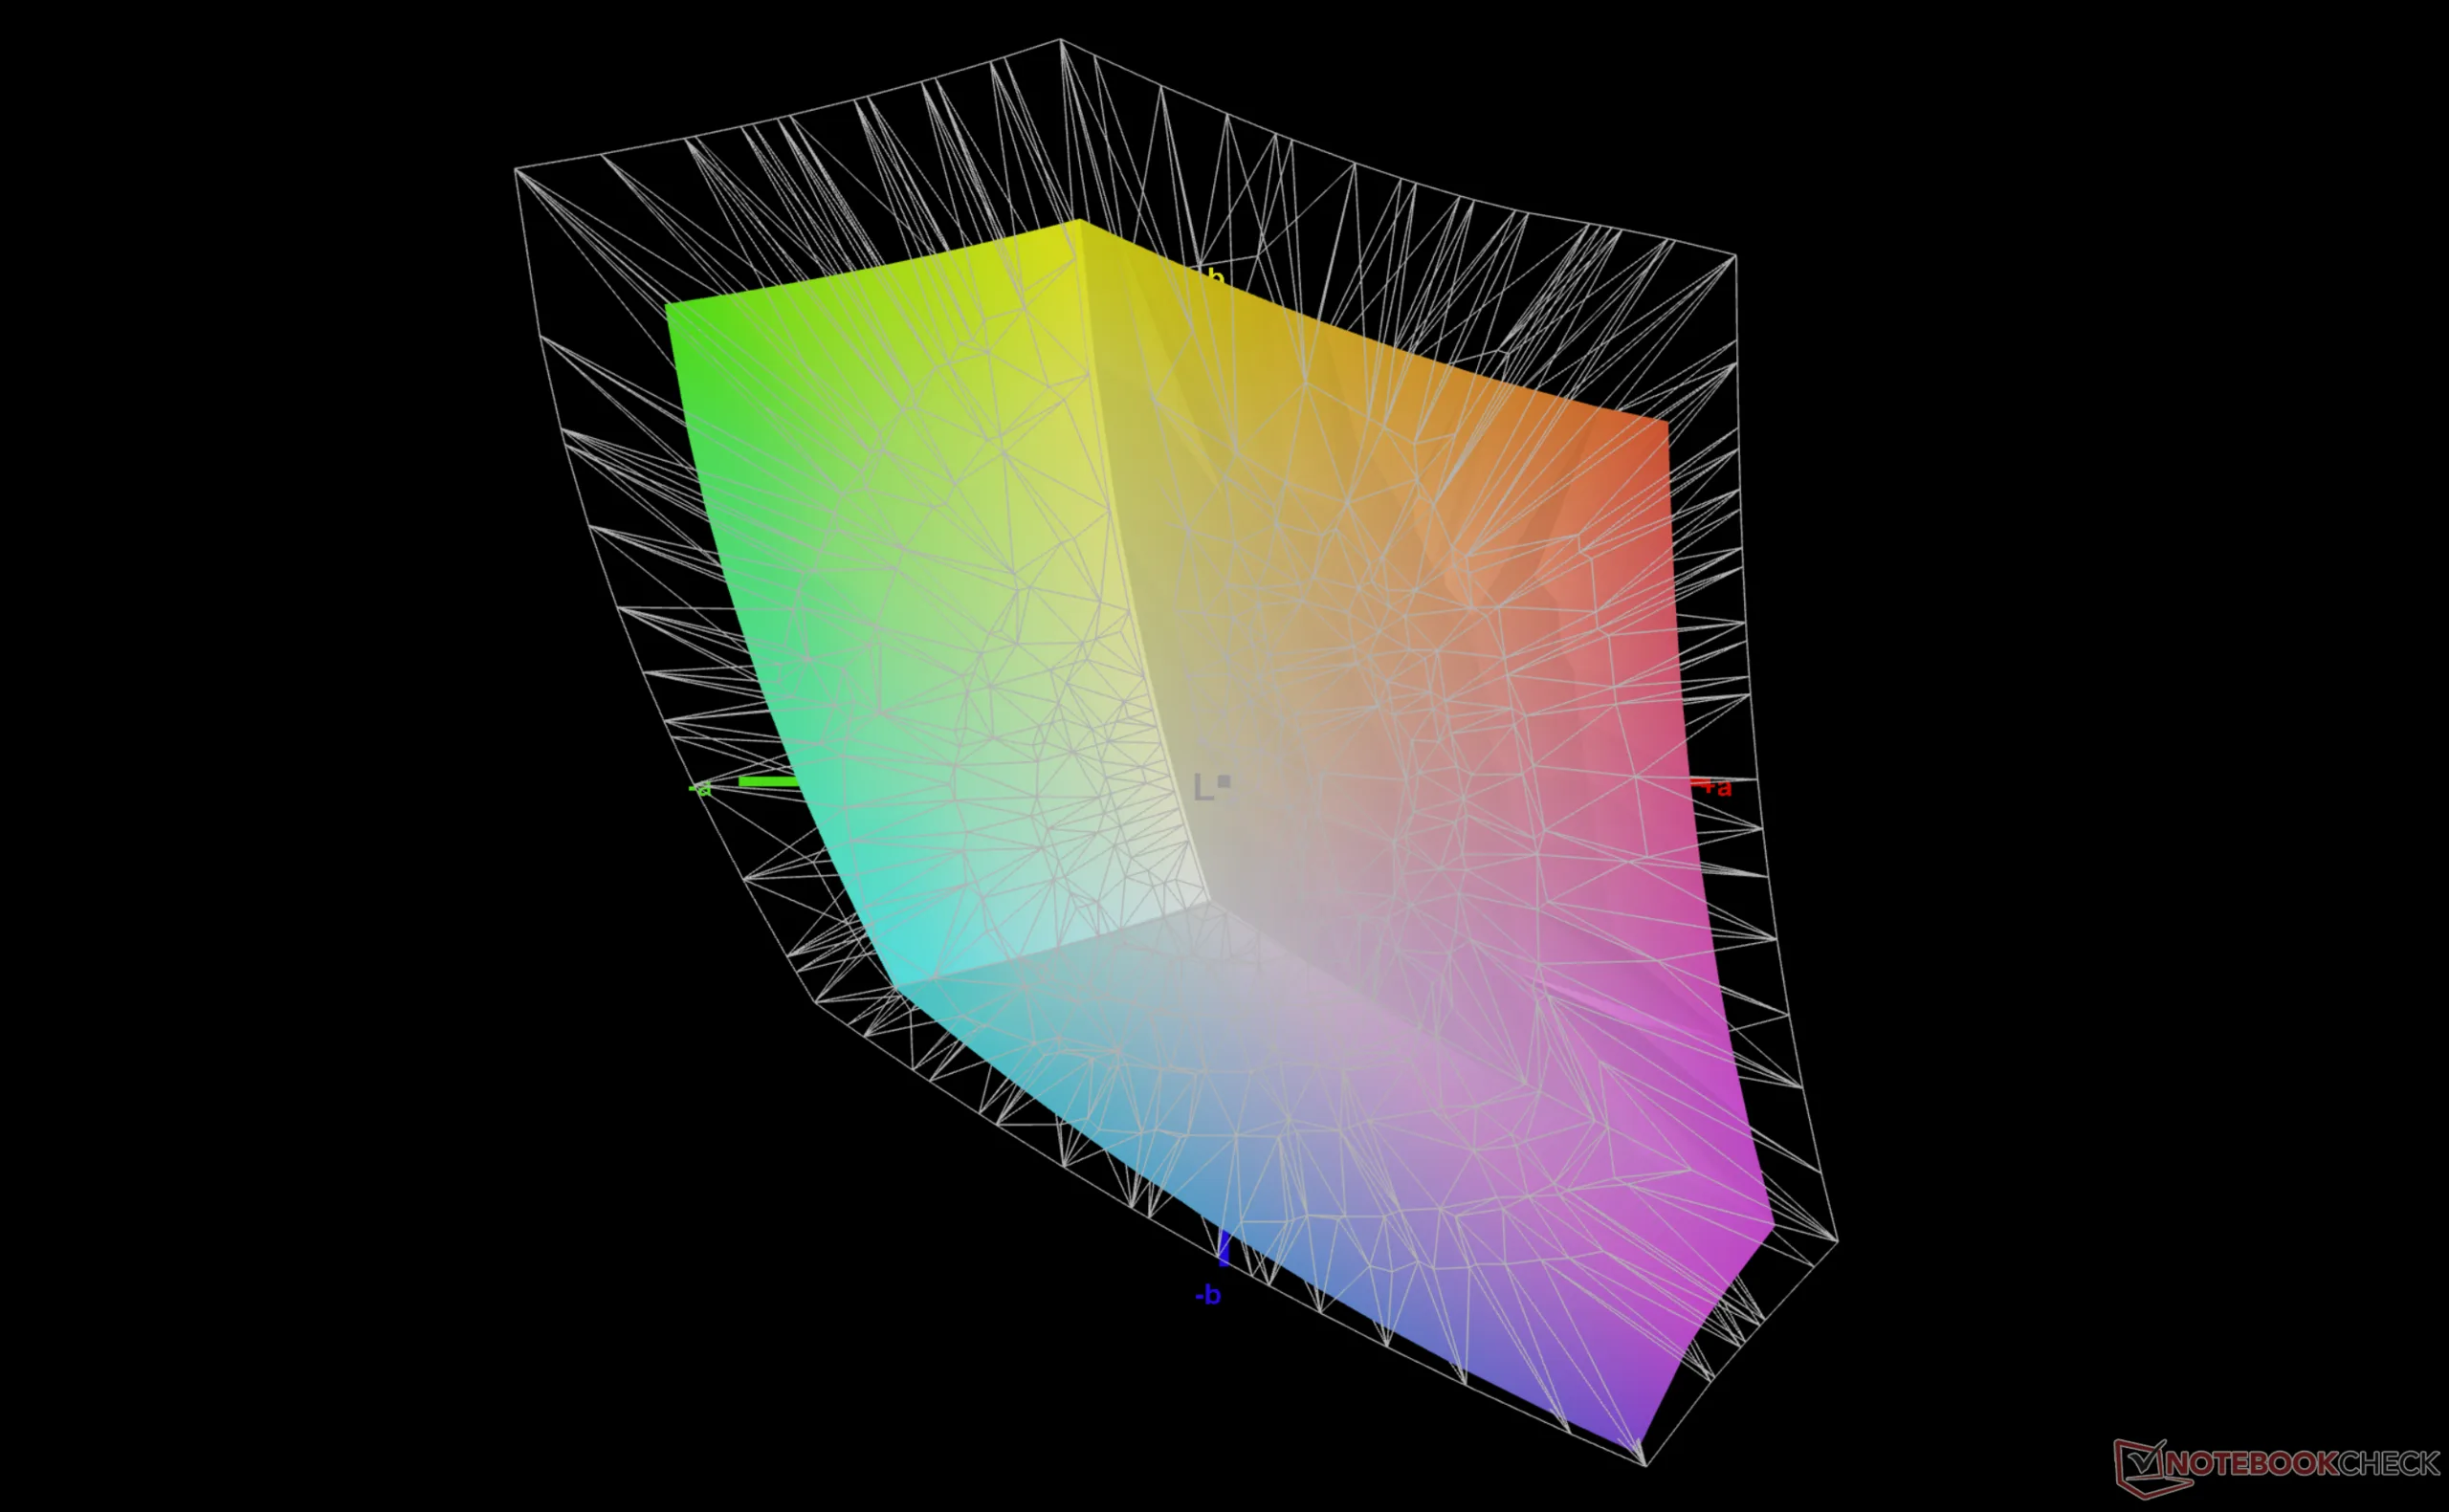
73.6% AdobeRGB 1998 (Argyll 3D)
99.9% sRGB (Argyll 3D)
71.5% Display P3 (Argyll 3D)
Gamma: 2.17
CCT: 6574 K
Lenovo ThinkPad X13 Detachable Gen 1
NS130A10-M60, IPS, 2880x1920, 13", 120 Hz
Lenovo ThinkPad X13 Gen 7 AMD
TL133VDMP01, IPS, 1920x1200, 13.3", 60 Hz
Dell Pro 7 13 2-in-1
BOE NV13M65, IPS, 1920x1200, 13.3", 60 Hz
Dell Pro 13 Premium PA13250
B133UAN (AUOBEB0), IPS, 1920x1200, 13.3", 60 Hz
MSI Prestige 13 AI+ A3MG
ATNA33AA07-0, OLED, 2880x1800, 13.3", 60 Hz
HP EliteBook 8 Flip G1i 13
Chi Mei CMN13E4, IPS, 1920x1200, 13.3", 60 Hz
Display
-3%
-6%
2%
23%
-4%
Display P3 Coverage (%)
71.5
68.9
-4%
66.9
-6%
74.3
4%
99.9
40%
68.9
-4%
sRGB Coverage (%)
99.9
99.5
0%
96.4
-4%
99.1
-1%
100
0%
96.4
-4%
AdobeRGB 1998 Coverage (%)
73.6
70.8
-4%
67.5
-8%
75.9
3%
95.7
30%
70.7
-4%
Response Times
-23%
-103%
-82%
92%
-82%
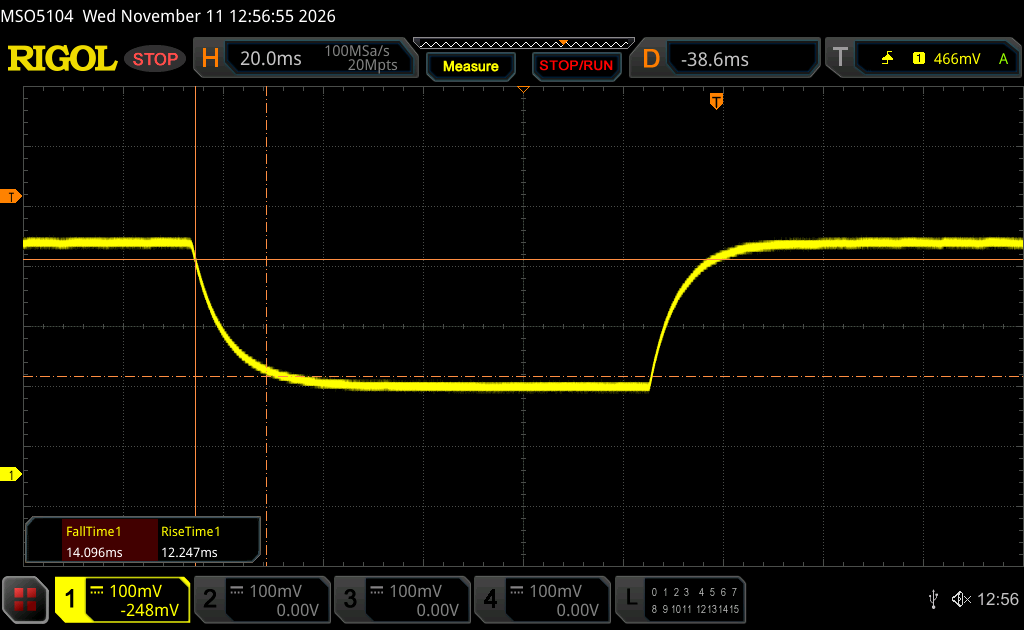
Response Time Grey 50% / Grey 80% * (ms)
26.6 ?(12.5, 14.1)
35.4 ?(16.5, 18.9)
-33%
54.9 ?(26.4, 28.5)
-106%
52.8 ?(23.4, 29.4)
-98%
1.8 ?(0.9, 0.9)
93%
49.3 ?(23.1, 26.2)
-85%
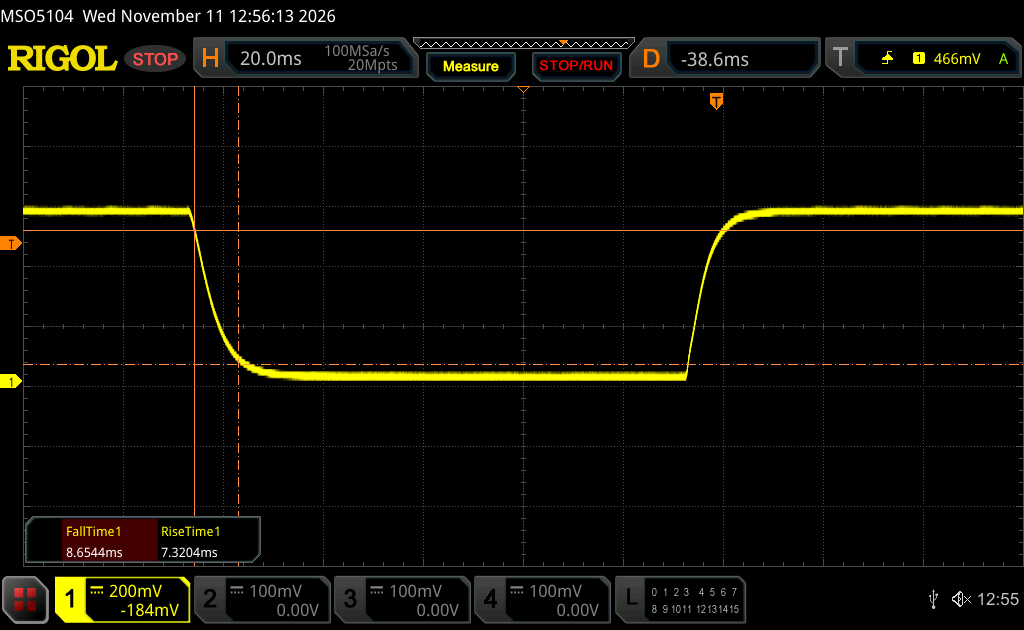
Response Time Black / White * (ms)
16 ?(7.3, 8.7)
17.9 ?(7.8, 10.1)
-12%
32 ?(15.9, 16.1)
-100%
26.4 ?(12.2, 14.2)
-65%
1.5 ?(0.8, 0.7)
91%
28.7 ?(14.4, 14.3)
-79%
PWM Frequency (Hz)
60 ?(90)
PWM Amplitude * (%)
33
Bildschirm
-73%
-84%
-75%
759%
-20%
Helligkeit Bildmitte (cd/m²)
573
464
-19%
607.1
6%
456
-20%
394
-31%
390.1
-32%
Brightness (cd/m²)
519
438
-16%
568
9%
460
-11%
395
-24%
365
-30%
Brightness Distribution (%)
86
90
5%
90
5%
89
3%
98
14%
90
5%
Schwarzwert * (cd/m²)
0.45
0.27
40%
0.34
24%
0.23
49%
0.005
99%
0.27
40%
Kontrast (:1)
1273
1719
35%
1786
40%
1983
56%
78800
6090%
1445
14%
Delta E Colorchecker *
1.19
3
-152%
3.74
-214%
3.3
-177%
1.67
-40%
1.73
-45%
Colorchecker dE 2000 max. *
3.29
7
-113%
6.62
-101%
6.47
-97%
3.9
-19%
6.3
-91%
Colorchecker dE 2000 calibrated *
0.71
1
-41%
1.73
-144%
1.7
-139%
1
-41%
Delta E Graustufen *
1
5
-400%
4.8
-380%
4.35
-335%
1.2
-20%
1
-0%
Gamma
2.17 101%
2.17 101%
2.17 101%
2.51 88%
2.212 99%
2.2 100%
CCT
6574 99%
7185 90%
7689 85%
6215 105%
6470 100%
6627 98%
Durchschnitt gesamt (Programm / Settings)
-33% / -51%
-64% / -70%
-52% / -59%
291% / 486%
-35% / -25%

* ... kleinere Werte sind besser
Im Vergleich zu sRGB
Im Vergleich zu P3
Im Vergleich zu P3
Graustufen vor der Kalibrierung (im Vergleich zu sRGB)
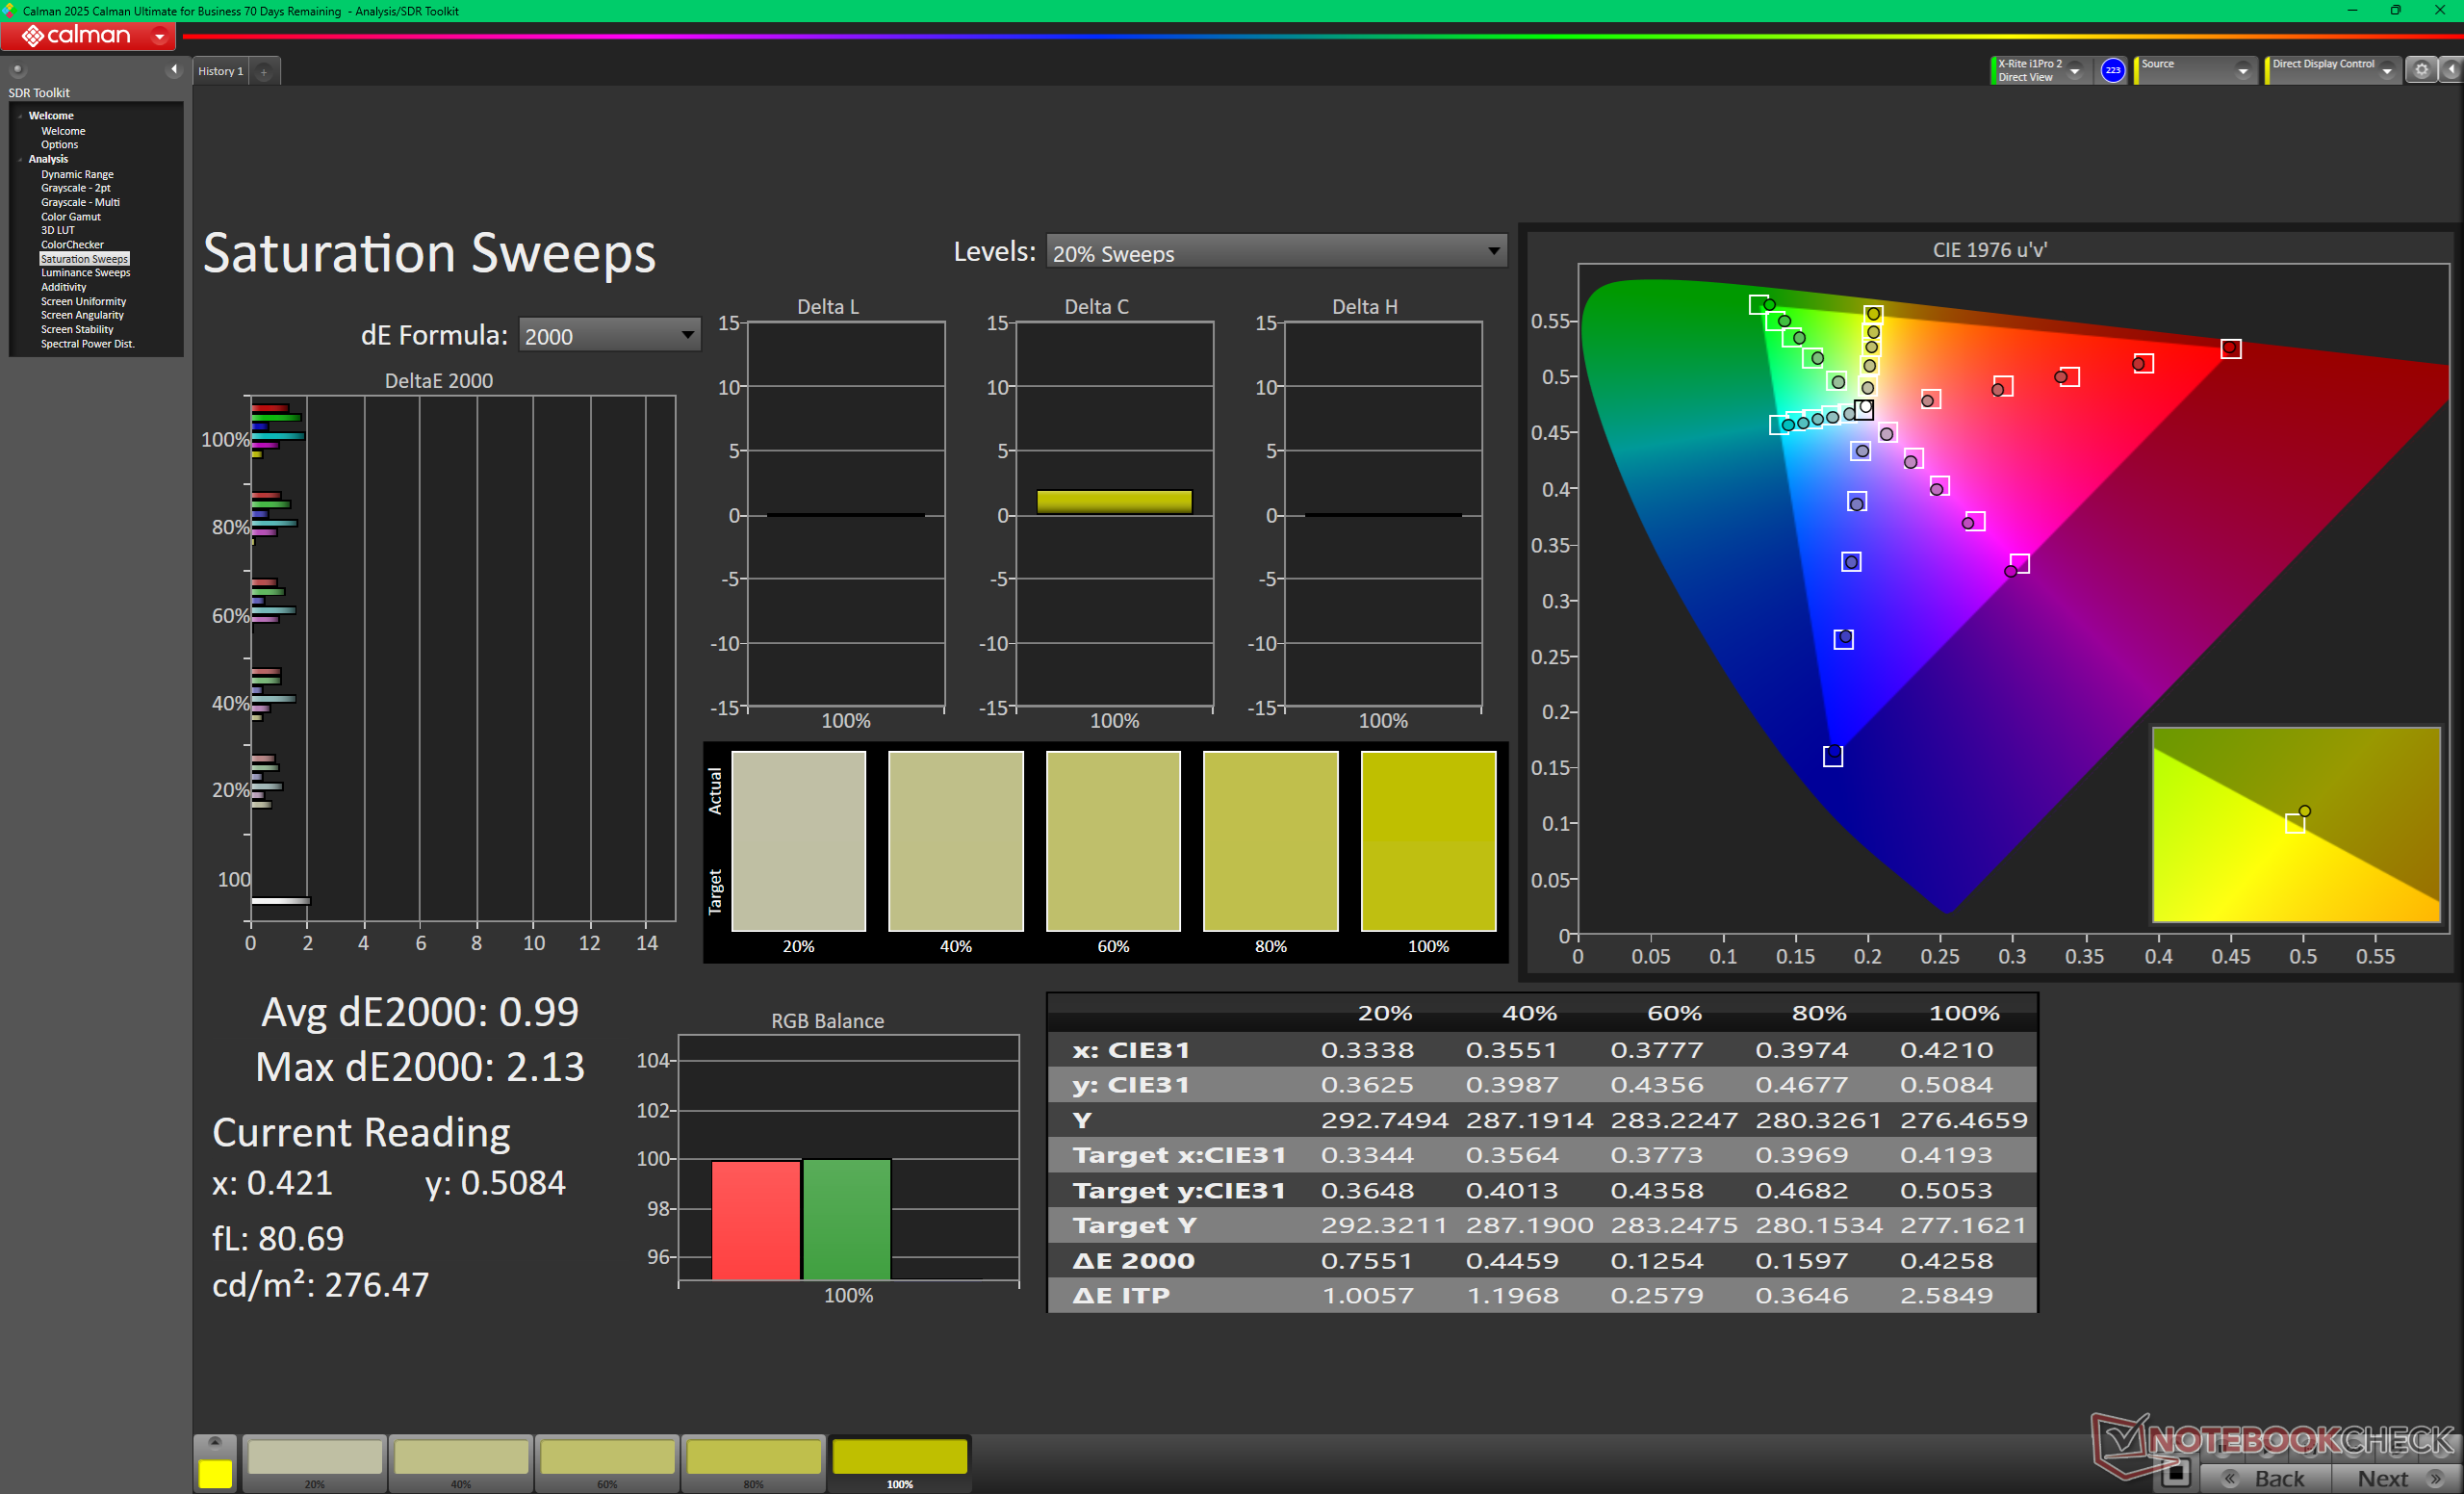
Sättigung vor der Kalibrierung (im Vergleich zu sRGB)
ColorChecker vor der Kalibrierung (im Vergleich zu sRGB)
Graustufen nach der Kalibrierung
Sättigung nach der Kalibrierung
ColorChecker nach der Kalibrierung

Reaktionszeiten (Response Times) des Displays

ℹ
Die Reaktionszeiten (Response Times) beschreiben wie schnell zwischen zwei Farben eines Pixels umgeschaltet werden kann. Langsame Response Times können zu einer verschwommenen Darstellung, Schlieren und Geisterbilder führen. Besonders bei schnellen 3D-Spielen sind kurze Umschaltzeiten wichtig.
   ↔    Reaktionszeiten Schwarz zu Weiß
16 ms ... steigend ↗ und fallend ↘ kombiniert↗ 7.3 ms steigend
↘ 8.7 ms fallend
Die gemessenen Reaktionszeiten sind gut, für anspruchsvolle Spieler könnten der Bildschirm jedoch zu langsam sein.
Im Vergleich rangierten die bei uns getesteten Geräte von 0.1 (Minimum) zu 240 (Maximum) ms. » 38 % aller Screens waren schneller als der getestete.
Daher sind die gemessenen Reaktionszeiten besser als der Durchschnitt aller vermessenen Geräte (19.6 ms).
   ↔    Reaktionszeiten 50% Grau zu 80% Grau
26.6 ms ... steigend ↗ und fallend ↘ kombiniert↗ 12.5 ms steigend
↘ 14.1 ms fallend
Die gemessenen Reaktionszeiten sind mittelmäßig und dadurch für Spieler eventuell zu langsam.
Im Vergleich rangierten die bei uns getesteten Geräte von 0.13 (Minimum) zu 636 (Maximum) ms. » 37 % aller Screens waren schneller als der getestete.
Daher sind die gemessenen Reaktionszeiten besser als der Durchschnitt aller vermessenen Geräte (30.6 ms).

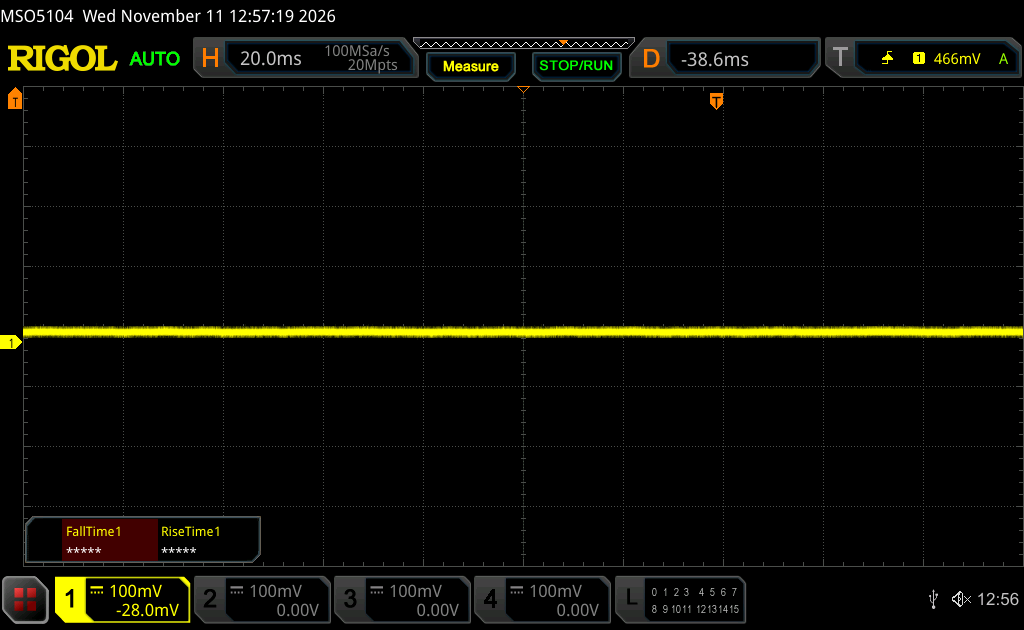
Bildschirm-Flackern / PWM (Pulse-Width Modulation)

ℹ
Eine günstige Methode um die Helligkeit eines Bildschirms zu steuern, ist die Beleuchtung periodisch ein- und auszuschalten. Dies nennt sich PWM (Pulsweitenmodulation) Diese Umschaltung sollte mit einer hohen Frequenz stattfinden damit das menschliche Auge kein Flimmern wahrnimmt. Wenn die Frequenz zu niedrig ist, kann dies zu Ermüdungserscheinungen, Augenbrennen, Kopfweh und auch sichtbaren Flackern führen.
Flackern / PWM nicht festgestellt

Im Vergleich: 52 % aller getesteten Geräte nutzten kein PWM um die Helligkeit zu reduzieren. Wenn PWM eingesetzt wurde, dann bei einer Frequenz von durchschnittlich 7544 (Minimum 5, Maximum 343500) Hz.

Im Freien bei Sonnenlicht
Im Freien im Schatten
Im Freien bei Sonnenlicht
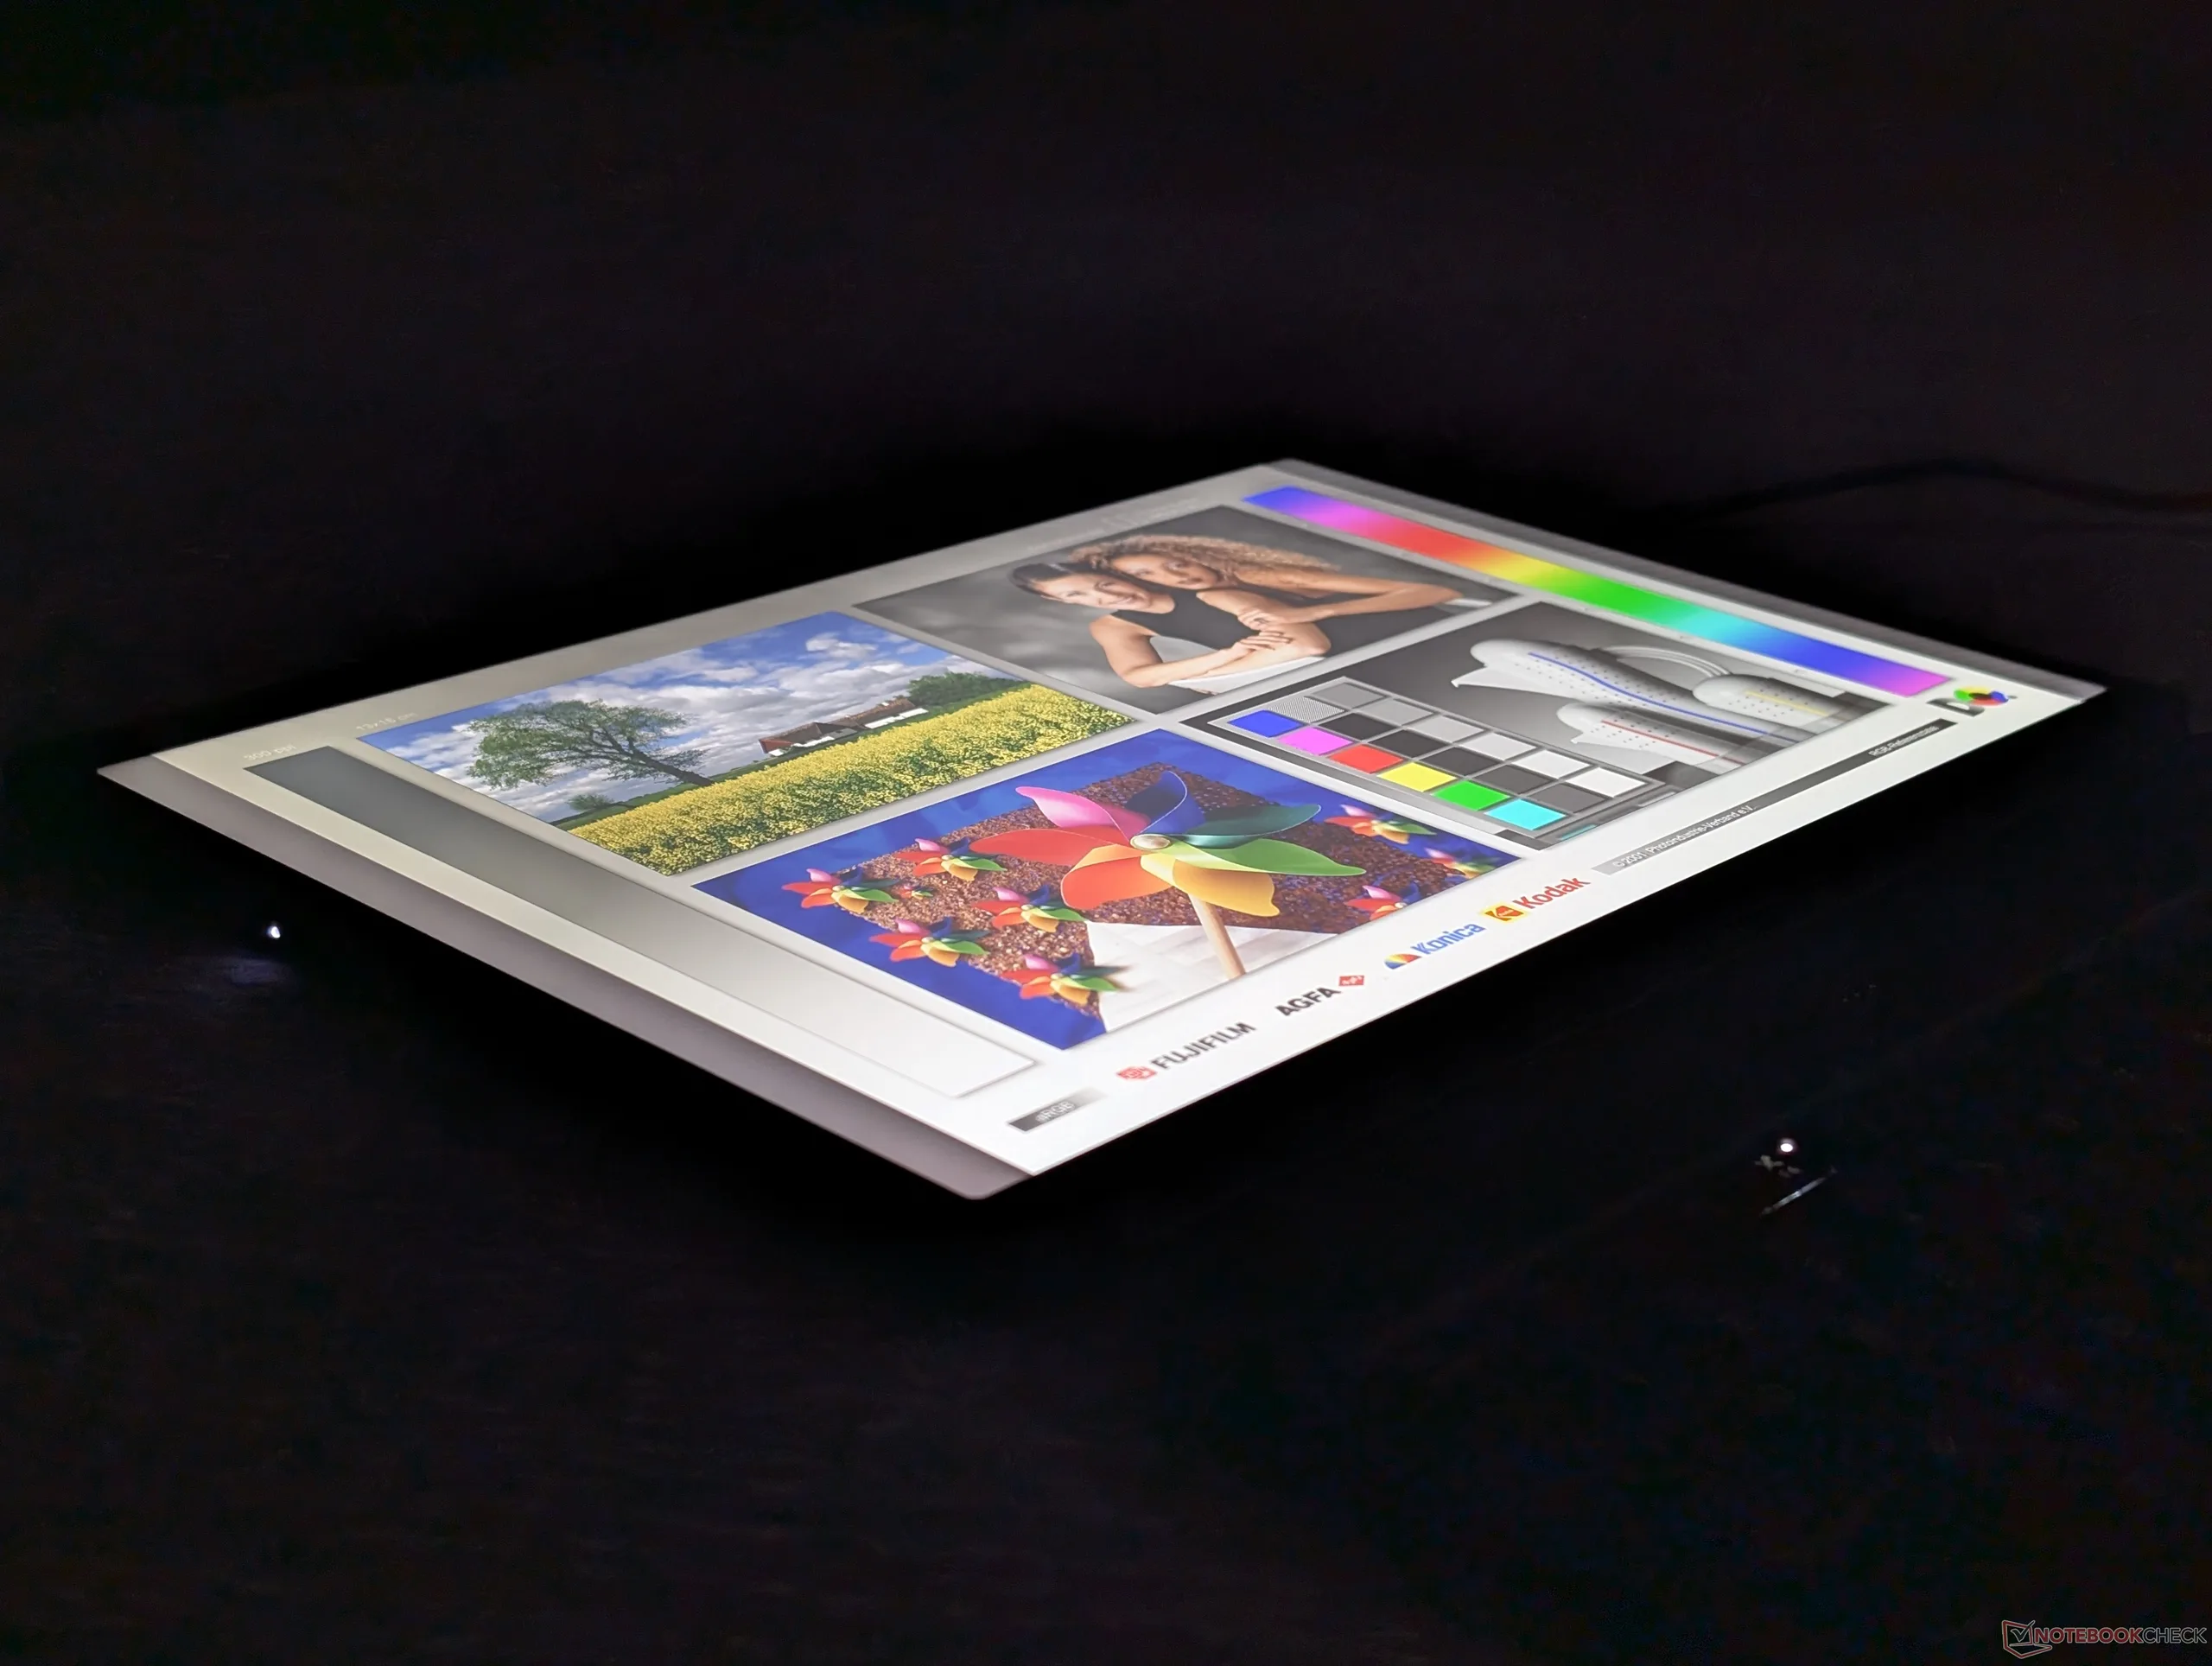
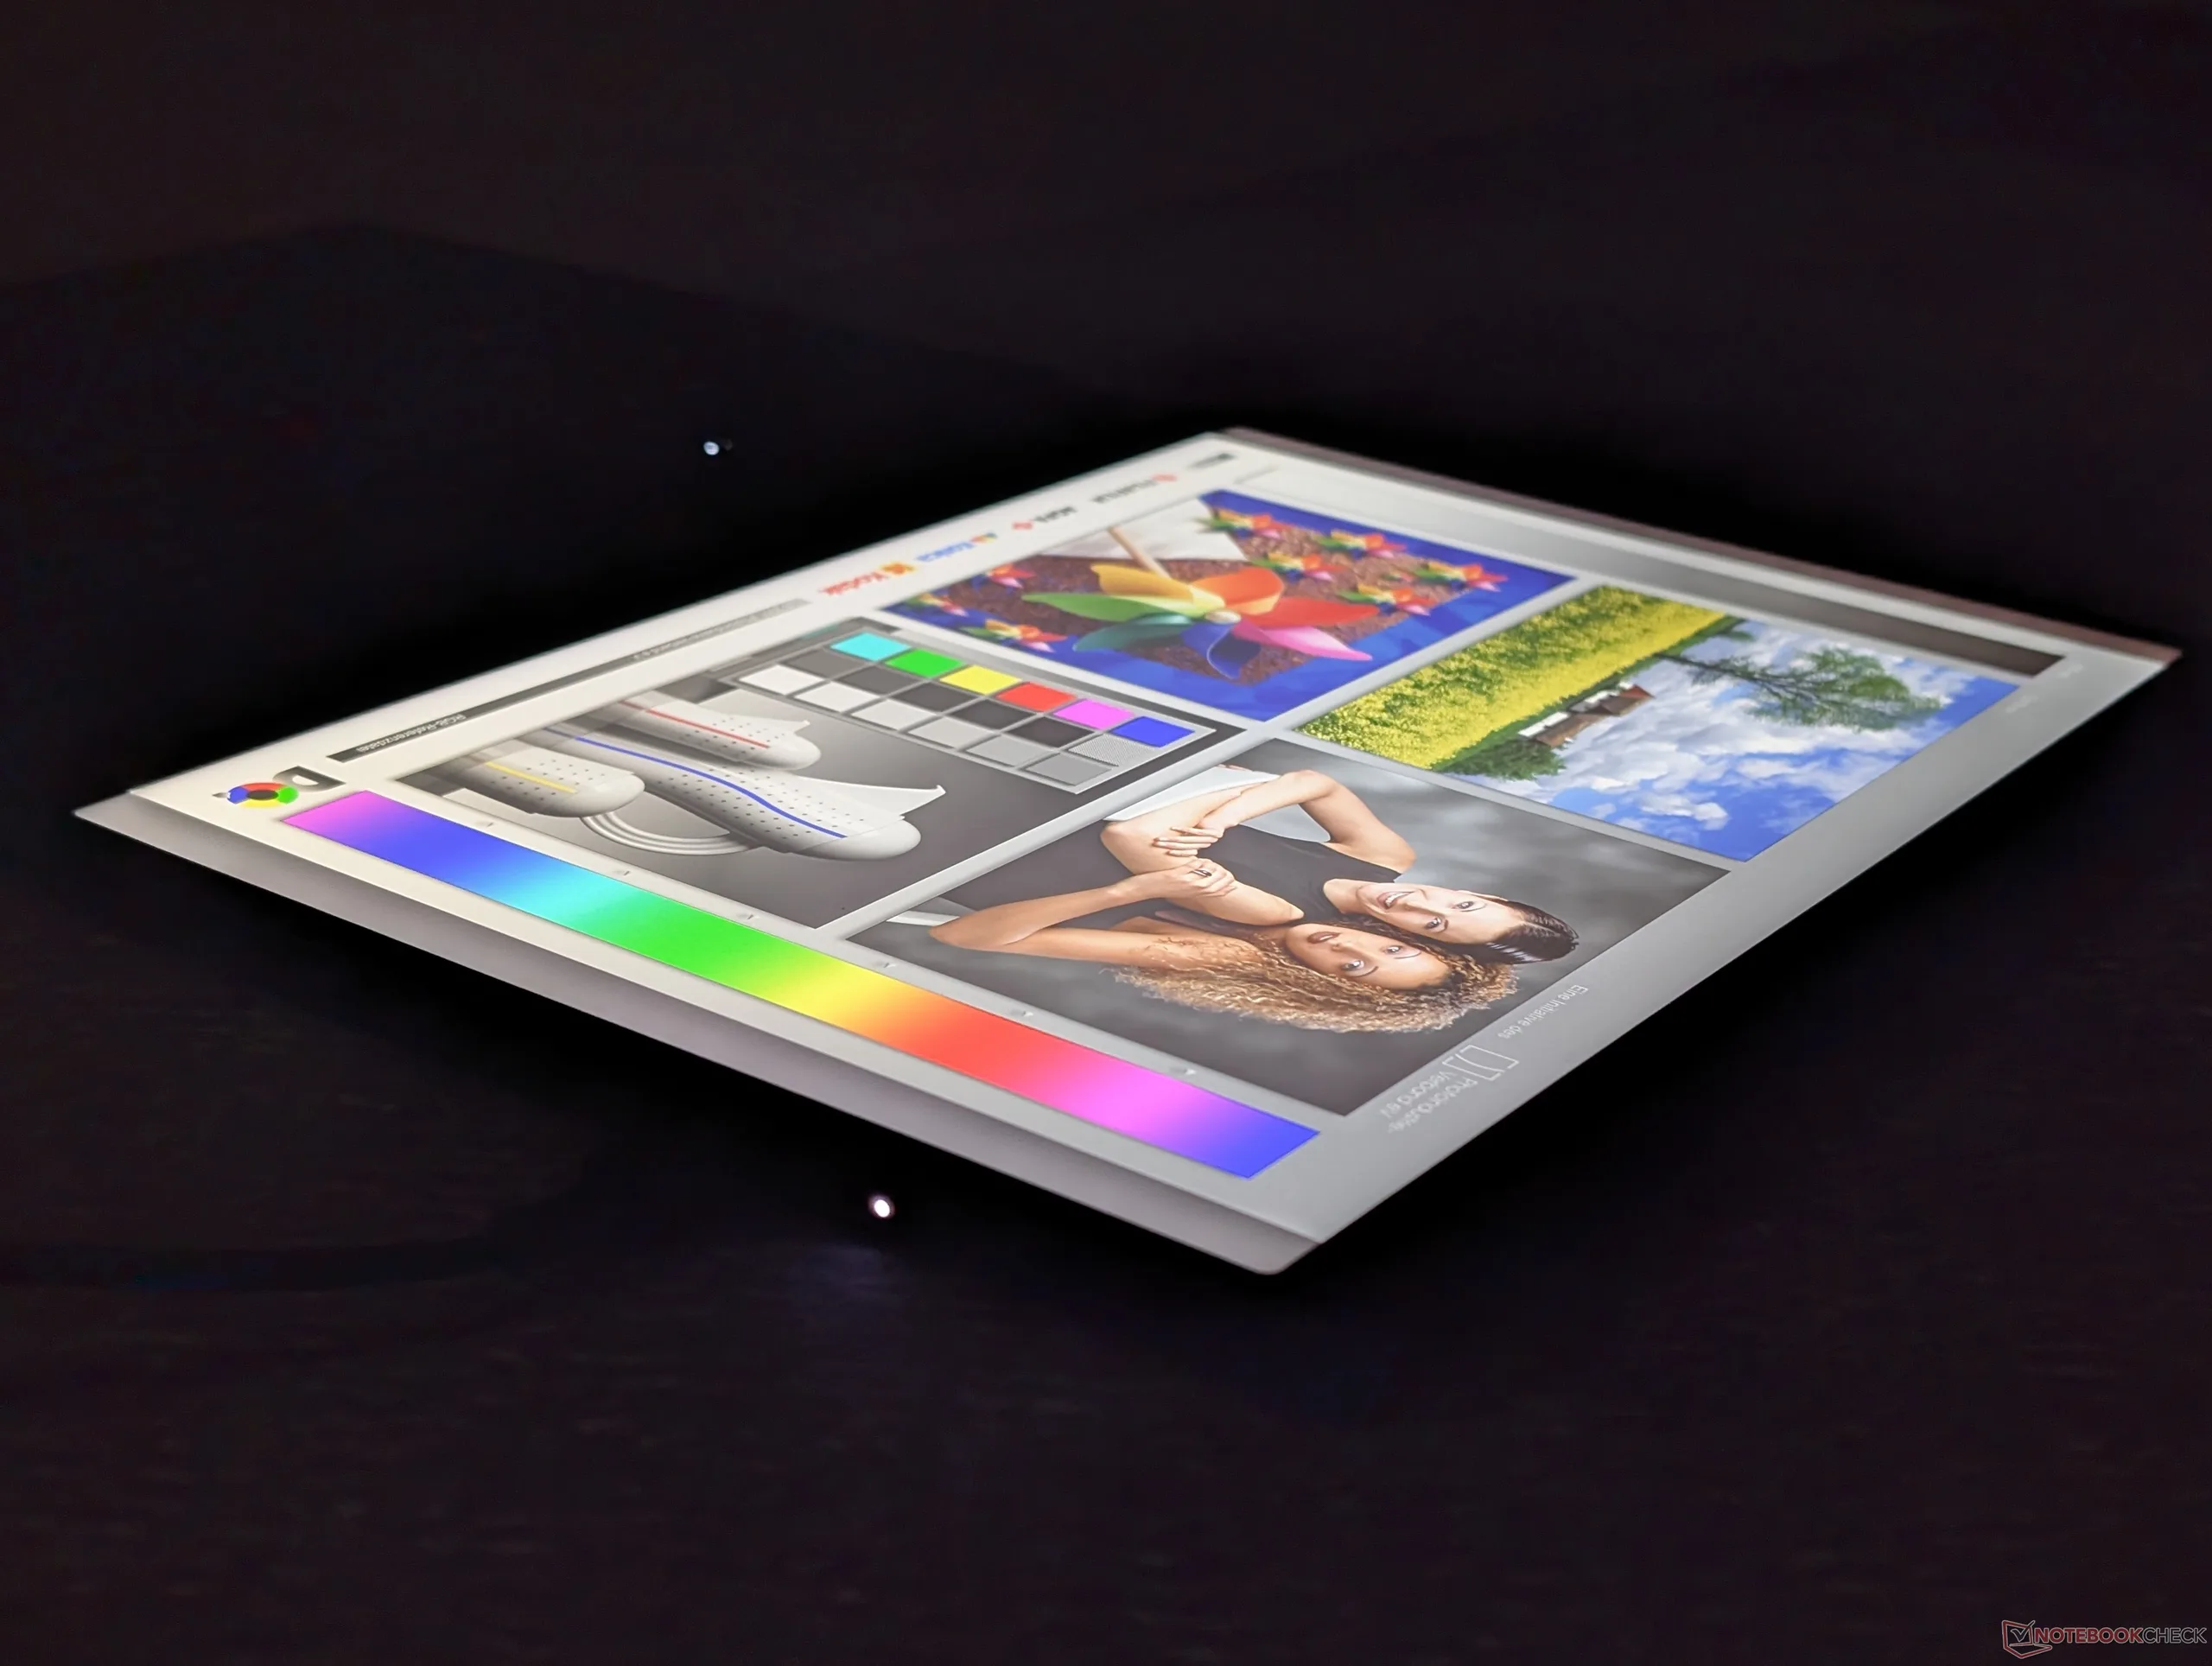
Große IPS-Blickwinkel

Leistung

Testbedingungen

Vor der Durchführung der folgenden Benchmarks haben wir Windows in den Leistungsmodus versetzt.

Prozessorleistung

In unserem CineBench-R15-xT-Schleifentest sank die Multi-Thread-Leistung recht deutlich von anfänglich 1620 Punkten auf einen Tiefstwert von 1090 Punkten, wie die folgende Grafik zeigt. Durch diesen Rückgang um 33 Prozent ist der Core Ultra 7 365 langsamer als viele Alternativen mit Core Ultra 7 355, darunter auch Lenovos eigenes Yoga 9 2-in-1 14.

Cinebench-R15-Multi-Dauertest

060120180240300360420480540600660720780840900960102010801140120012601320138014401500156016201680174018001860192019802040210021602220228023402400246025202580264027002760Tooltip
Lenovo ThinkPad X13 Detachable Gen 1 Intel Core Ultra 7 365: Ø1117 (1085.13-1620.55) Points
Lenovo ThinkPad X13 Gen 7 AMD AMD Ryzen AI 7 PRO 450: Ø2144 (2038.94-2337.27) Points
Dell Pro 7 13 2-in-1 Intel Core Ultra 7 366H: Ø2326 (2282.32-2793.3) Points
Dell Pro 13 Premium PA13250 Intel Core Ultra 7 268V: Ø1199 (1128.6-1600.9) Points
MSI Prestige 13 AI+ A3MG Intel Core Ultra 9 386H: Ø1637 (1576.85-2196.6) Points
HP EliteBook 8 Flip G1i 13 Intel Core Ultra 7 265U: Ø1309 (1258.93-1735.81) Points
CPU Performance Rating: Percent
Cinebench 2024: CPU Multi Core | CPU Single Core
Cinebench 2026: CPU Multi | CPU Single Thread
Cinebench R23: Multi Core | Single Core
Cinebench R20: CPU (Multi Core) | CPU (Single Core)
Cinebench R15: CPU Multi 64Bit | CPU Single 64Bit
Blender: v2.79 BMW27 CPU
7-Zip 18.03: 7z b 4 | 7z b 4 -mmt1
Geekbench 7: Multi-Core | Single-Core
Geekbench 6.7: Multi-Core | Single-Core
HWBOT x265 Benchmark v2.2: 4k Preset
LibreOffice : 20 Documents To PDF
R Benchmark 2.5: Overall mean
CPU Performance Rating
Dell Pro 7 13 2-in-1 -2!
Intel Core Ultra 7 366H
88.5 pt
Lenovo ThinkPad X13 Gen 7 AMD -2!
AMD Ryzen AI 7 PRO 450
81.6 pt
HP OmniBook 7 Aero 13-bg1077nr -4!
AMD Ryzen AI 7 350
76.7 pt
MSI Prestige 13 AI+ A3MG -4!
Intel Core Ultra 9 386H
74.4 pt
Lenovo Yoga 9 2-in-1 14IPH11 -2!
Intel Core Ultra 7 355
69.2 pt
Durchschnittliche Intel Core Ultra 7 365
 
68.3 pt
Lenovo ThinkPad X13 Detachable Gen 1
Intel Core Ultra 7 365
68.1 pt
Dell XPS 13 9350 -4!
Intel Core Ultra 7 256V
65.3 pt
MSI Summit E13 AI Evo A1MTG -4!
Intel Core Ultra 7 155H
62.8 pt
Dell Pro 13 Premium PA13250 -6!
Intel Core Ultra 7 268V
61.6 pt
HP EliteBook 8 Flip G1i 13 -4!
Intel Core Ultra 7 265U
60.7 pt
Microsoft Surface Laptop 13 2026 -2!
Qualcomm Snapdragon X2 Plus X2P-42-100
59.9 pt
Lenovo Yoga Book 9 13IMU9 -6!
Intel Core Ultra 7 155U
57 pt
Cinebench 2024 / CPU Multi Core
Dell Pro 7 13 2-in-1
Intel Core Ultra 7 366H
935 Points +96%
MSI Prestige 13 AI+ A3MG
Intel Core Ultra 9 386H
873 Points +83%
HP OmniBook 7 Aero 13-bg1077nr
AMD Ryzen AI 7 350
819 Points +72%
Lenovo ThinkPad X13 Gen 7 AMD
AMD Ryzen AI 7 PRO 450
775 Points +63%
Microsoft Surface Laptop 13 2026
Qualcomm Snapdragon X2 Plus X2P-42-100
669 Points +41%
Lenovo Yoga 9 2-in-1 14IPH11
Intel Core Ultra 7 355
650 Points +37%
MSI Summit E13 AI Evo A1MTG
Intel Core Ultra 7 155H
609 Points +28%
Dell XPS 13 9350
Intel Core Ultra 7 256V
582 Points +22%
HP EliteBook 8 Flip G1i 13
Intel Core Ultra 7 265U
517 Points +9%
Lenovo ThinkPad X13 Detachable Gen 1
Intel Core Ultra 7 365
476 Points
Durchschnittliche Intel Core Ultra 7 365
  (n=1)
476 Points 0%
Cinebench 2024 / CPU Single Core
Microsoft Surface Laptop 13 2026
Qualcomm Snapdragon X2 Plus X2P-42-100
130 Points +11%
Dell Pro 7 13 2-in-1
Intel Core Ultra 7 366H
122.5 Points +5%
MSI Prestige 13 AI+ A3MG
Intel Core Ultra 9 386H
120 Points +3%
Lenovo Yoga 9 2-in-1 14IPH11
Intel Core Ultra 7 355
119.4 Points +2%
Dell XPS 13 9350
Intel Core Ultra 7 256V
117.4 Points 0%
Lenovo ThinkPad X13 Detachable Gen 1
Intel Core Ultra 7 365
117 Points
Durchschnittliche Intel Core Ultra 7 365
  (n=1)
117 Points 0%
HP OmniBook 7 Aero 13-bg1077nr
AMD Ryzen AI 7 350
115.5 Points -1%
Lenovo ThinkPad X13 Gen 7 AMD
AMD Ryzen AI 7 PRO 450
115.1 Points -2%
HP EliteBook 8 Flip G1i 13
Intel Core Ultra 7 265U
102.3 Points -13%
MSI Summit E13 AI Evo A1MTG
Intel Core Ultra 7 155H
97.1 Points -17%
Cinebench 2026 / CPU Multi
Dell Pro 7 13 2-in-1
Intel Core Ultra 7 366H
3799 Points +92%
Lenovo Yoga 9 2-in-1 14IPH11
Intel Core Ultra 7 355
2632 Points +33%
Lenovo ThinkPad X13 Detachable Gen 1
Intel Core Ultra 7 365
1978 Points
Durchschnittliche Intel Core Ultra 7 365
  (n=1)
1978 Points 0%
Cinebench 2026 / CPU Single Thread
Dell Pro 7 13 2-in-1
Intel Core Ultra 7 366H
506 Points +6%
Lenovo Yoga 9 2-in-1 14IPH11
Intel Core Ultra 7 355
487 Points +2%
Lenovo ThinkPad X13 Detachable Gen 1
Intel Core Ultra 7 365
477 Points
Durchschnittliche Intel Core Ultra 7 365
  (n=1)
477 Points 0%
Cinebench R23 / Multi Core
Dell Pro 7 13 2-in-1
Intel Core Ultra 7 366H
16974 (12709min - 16973.9max) Points +61%
Lenovo ThinkPad X13 Gen 7 AMD
AMD Ryzen AI 7 PRO 450
15348 Points +45%
HP OmniBook 7 Aero 13-bg1077nr
AMD Ryzen AI 7 350
14244 (12235.7min - 14243.7max) Points +35%
MSI Prestige 13 AI+ A3MG
Intel Core Ultra 9 386H
12144 Points +15%
MSI Summit E13 AI Evo A1MTG
Intel Core Ultra 7 155H
11840 (10698.4min - 11840.3max) Points +12%
Lenovo Yoga 9 2-in-1 14IPH11
Intel Core Ultra 7 355
11456 (10514.2min - 11456max) Points +8%
HP EliteBook 8 Flip G1i 13
Intel Core Ultra 7 265U
10623 (8296.55min - 10623.2max) Points 0%
Lenovo ThinkPad X13 Detachable Gen 1
Intel Core Ultra 7 365
10573 (7430.6min - 10573.1max) Points
Durchschnittliche Intel Core Ultra 7 365
  (n=1)
10573 Points 0%
Dell XPS 13 9350
Intel Core Ultra 7 256V
10391 (9371.44min - 10390.8max) Points -2%
Dell Pro 13 Premium PA13250
Intel Core Ultra 7 268V
9835 Points -7%
Lenovo Yoga Book 9 13IMU9
Intel Core Ultra 7 155U
9385 (8670.97min - 9384.63max) Points -11%
Microsoft Surface Laptop 13 2026
Qualcomm Snapdragon X2 Plus X2P-42-100
6827 Points -35%
Cinebench R23 / Single Core
Dell Pro 7 13 2-in-1
Intel Core Ultra 7 366H
2087 Points +6%
MSI Prestige 13 AI+ A3MG
Intel Core Ultra 9 386H
2077 Points +5%
Lenovo ThinkPad X13 Gen 7 AMD
AMD Ryzen AI 7 PRO 450
2005 Points +2%
Dell Pro 13 Premium PA13250
Intel Core Ultra 7 268V
1985 Points +1%
HP OmniBook 7 Aero 13-bg1077nr
AMD Ryzen AI 7 350
1979 Points 0%
Lenovo Yoga 9 2-in-1 14IPH11
Intel Core Ultra 7 355
1977 Points 0%
Lenovo ThinkPad X13 Detachable Gen 1
Intel Core Ultra 7 365
1971 Points
Durchschnittliche Intel Core Ultra 7 365
  (n=1)
1971 Points 0%
Dell XPS 13 9350
Intel Core Ultra 7 256V
1875 Points -5%
HP EliteBook 8 Flip G1i 13
Intel Core Ultra 7 265U
1749 Points -11%
MSI Summit E13 AI Evo A1MTG
Intel Core Ultra 7 155H
1679 Points -15%
Lenovo Yoga Book 9 13IMU9
Intel Core Ultra 7 155U
1675 Points -15%
Microsoft Surface Laptop 13 2026
Qualcomm Snapdragon X2 Plus X2P-42-100
1396 Points -29%
Cinebench R20 / CPU (Multi Core)
Dell Pro 7 13 2-in-1
Intel Core Ultra 7 366H
6517 Points +60%
Lenovo ThinkPad X13 Gen 7 AMD
AMD Ryzen AI 7 PRO 450
6004 Points +47%
HP OmniBook 7 Aero 13-bg1077nr
AMD Ryzen AI 7 350
5404 Points +32%
MSI Prestige 13 AI+ A3MG
Intel Core Ultra 9 386H
4757 Points +17%
MSI Summit E13 AI Evo A1MTG
Intel Core Ultra 7 155H
4534 Points +11%
Lenovo Yoga 9 2-in-1 14IPH11
Intel Core Ultra 7 355
4408 Points +8%
Lenovo ThinkPad X13 Detachable Gen 1
Intel Core Ultra 7 365
4082 Points
Durchschnittliche Intel Core Ultra 7 365
  (n=1)
4082 Points 0%
HP EliteBook 8 Flip G1i 13
Intel Core Ultra 7 265U
4061 Points -1%
Dell XPS 13 9350
Intel Core Ultra 7 256V
4038 Points -1%
Dell Pro 13 Premium PA13250
Intel Core Ultra 7 268V
3811 Points -7%
Lenovo Yoga Book 9 13IMU9
Intel Core Ultra 7 155U
3613 Points -11%
Microsoft Surface Laptop 13 2026
Qualcomm Snapdragon X2 Plus X2P-42-100
2679 Points -34%
Cinebench R20 / CPU (Single Core)
Dell Pro 7 13 2-in-1
Intel Core Ultra 7 366H
789 Points +7%
MSI Prestige 13 AI+ A3MG
Intel Core Ultra 9 386H
787 Points +7%
Lenovo ThinkPad X13 Gen 7 AMD
AMD Ryzen AI 7 PRO 450
787 Points +7%
HP OmniBook 7 Aero 13-bg1077nr
AMD Ryzen AI 7 350
774 Points +5%
Dell Pro 13 Premium PA13250
Intel Core Ultra 7 268V
764 Points +4%
Lenovo Yoga 9 2-in-1 14IPH11
Intel Core Ultra 7 355
741 Points +1%
Lenovo ThinkPad X13 Detachable Gen 1
Intel Core Ultra 7 365
735 Points
Durchschnittliche Intel Core Ultra 7 365
  (n=1)
735 Points 0%
Dell XPS 13 9350
Intel Core Ultra 7 256V
720 Points -2%
HP EliteBook 8 Flip G1i 13
Intel Core Ultra 7 265U
678 Points -8%
Lenovo Yoga Book 9 13IMU9
Intel Core Ultra 7 155U
646 Points -12%
MSI Summit E13 AI Evo A1MTG
Intel Core Ultra 7 155H
642 Points -13%
Microsoft Surface Laptop 13 2026
Qualcomm Snapdragon X2 Plus X2P-42-100
532 Points -28%
Cinebench R15 / CPU Multi 64Bit
Dell Pro 7 13 2-in-1
Intel Core Ultra 7 366H
2793 (2282.32min - 2793.3max) Points +72%
Lenovo ThinkPad X13 Gen 7 AMD
AMD Ryzen AI 7 PRO 450
2337 (2038.94min - 2337.27max) Points +44%
MSI Prestige 13 AI+ A3MG
Intel Core Ultra 9 386H
2197 (1576.85min - 2196.6max) Points +36%
MSI Summit E13 AI Evo A1MTG
Intel Core Ultra 7 155H
2145 (1553.04min - 2145.23max) Points +32%
HP OmniBook 7 Aero 13-bg1077nr
AMD Ryzen AI 7 350
2038 (1917.36min - 2037.7max) Points +26%
HP EliteBook 8 Flip G1i 13
Intel Core Ultra 7 265U
1736 (1258.93min - 1735.81max) Points +7%
Lenovo Yoga 9 2-in-1 14IPH11
Intel Core Ultra 7 355
1701 (1405.88min - 1700.68max) Points +5%
Lenovo ThinkPad X13 Detachable Gen 1
Intel Core Ultra 7 365
1621 (1085.13min - 1620.55max) Points
Durchschnittliche Intel Core Ultra 7 365
  (n=1)
1621 Points 0%
Dell Pro 13 Premium PA13250
Intel Core Ultra 7 268V
1601 (1128.6min - 1600.9max) Points -1%
Dell XPS 13 9350
Intel Core Ultra 7 256V
1570 (1369.16min - 1569.86max) Points -3%
Lenovo Yoga Book 9 13IMU9
Intel Core Ultra 7 155U
1505 (1278.32min - 1504.72max) Points -7%
Microsoft Surface Laptop 13 2026
Qualcomm Snapdragon X2 Plus X2P-42-100
1395 (1213.92min - 1394.6max) Points -14%
Cinebench R15 / CPU Single 64Bit
Dell Pro 13 Premium PA13250
Intel Core Ultra 7 268V
302 Points +9%
HP OmniBook 7 Aero 13-bg1077nr
AMD Ryzen AI 7 350
297 Points +8%
MSI Prestige 13 AI+ A3MG
Intel Core Ultra 9 386H
293 Points +6%
Lenovo Yoga 9 2-in-1 14IPH11
Intel Core Ultra 7 355
293 Points +6%
Dell Pro 7 13 2-in-1
Intel Core Ultra 7 366H
291 Points +5%
Dell XPS 13 9350
Intel Core Ultra 7 256V
285 Points +3%
Lenovo ThinkPad X13 Detachable Gen 1
Intel Core Ultra 7 365
276 Points
Durchschnittliche Intel Core Ultra 7 365
  (n=1)
276 Points 0%
Microsoft Surface Laptop 13 2026
Qualcomm Snapdragon X2 Plus X2P-42-100
259 Points -6%
HP EliteBook 8 Flip G1i 13
Intel Core Ultra 7 265U
244 Points -12%
MSI Summit E13 AI Evo A1MTG
Intel Core Ultra 7 155H
240 Points -13%
Lenovo Yoga Book 9 13IMU9
Intel Core Ultra 7 155U
230 Points -17%
Lenovo ThinkPad X13 Gen 7 AMD
AMD Ryzen AI 7 PRO 450
223 Points -19%
Blender / v2.79 BMW27 CPU
Microsoft Surface Laptop 13 2026
Qualcomm Snapdragon X2 Plus X2P-42-100
492 Seconds * -25%
Dell Pro 13 Premium PA13250
Intel Core Ultra 7 268V
410 Seconds * -4%
Lenovo ThinkPad X13 Detachable Gen 1
Intel Core Ultra 7 365
395 Seconds *
Durchschnittliche Intel Core Ultra 7 365
  (n=1)
395 Seconds * -0%
Lenovo Yoga Book 9 13IMU9
Intel Core Ultra 7 155U
353 Seconds * +11%
Dell XPS 13 9350
Intel Core Ultra 7 256V
339 Seconds * +14%
HP EliteBook 8 Flip G1i 13
Intel Core Ultra 7 265U
335 Seconds * +15%
Lenovo Yoga 9 2-in-1 14IPH11
Intel Core Ultra 7 355
306 Seconds * +23%
MSI Prestige 13 AI+ A3MG
Intel Core Ultra 9 386H
299 Seconds * +24%
MSI Summit E13 AI Evo A1MTG
Intel Core Ultra 7 155H
293 Seconds * +26%
HP OmniBook 7 Aero 13-bg1077nr
AMD Ryzen AI 7 350
230 Seconds * +42%
Lenovo ThinkPad X13 Gen 7 AMD
AMD Ryzen AI 7 PRO 450
216 Seconds * +45%
Dell Pro 7 13 2-in-1
Intel Core Ultra 7 366H
209 Seconds * +47%
7-Zip 18.03 / 7z b 4
Dell Pro 7 13 2-in-1
Intel Core Ultra 7 366H
61043 MIPS +63%
Lenovo ThinkPad X13 Gen 7 AMD
AMD Ryzen AI 7 PRO 450
57311 MIPS +53%
HP OmniBook 7 Aero 13-bg1077nr
AMD Ryzen AI 7 350
55010 MIPS +47%
MSI Summit E13 AI Evo A1MTG
Intel Core Ultra 7 155H
45131 MIPS +21%
MSI Prestige 13 AI+ A3MG
Intel Core Ultra 9 386H
44980 MIPS +20%
HP EliteBook 8 Flip G1i 13
Intel Core Ultra 7 265U
38771 MIPS +4%
Lenovo Yoga Book 9 13IMU9
Intel Core Ultra 7 155U
38645 MIPS +3%
Lenovo Yoga 9 2-in-1 14IPH11
Intel Core Ultra 7 355
37739 MIPS +1%
Lenovo ThinkPad X13 Detachable Gen 1
Intel Core Ultra 7 365
37367 MIPS
Durchschnittliche Intel Core Ultra 7 365
  (n=1)
37367 MIPS 0%
Dell XPS 13 9350
Intel Core Ultra 7 256V
35950 MIPS -4%
Dell Pro 13 Premium PA13250
Intel Core Ultra 7 268V
32797 MIPS -12%
Microsoft Surface Laptop 13 2026
Qualcomm Snapdragon X2 Plus X2P-42-100
31674 MIPS -15%
7-Zip 18.03 / 7z b 4 -mmt1
Dell Pro 7 13 2-in-1
Intel Core Ultra 7 366H
6404 MIPS +9%
Lenovo ThinkPad X13 Gen 7 AMD
AMD Ryzen AI 7 PRO 450
6097 MIPS +4%
HP OmniBook 7 Aero 13-bg1077nr
AMD Ryzen AI 7 350
6025 MIPS +2%
MSI Prestige 13 AI+ A3MG
Intel Core Ultra 9 386H
6001 MIPS +2%
Lenovo ThinkPad X13 Detachable Gen 1
Intel Core Ultra 7 365
5890 MIPS
Durchschnittliche Intel Core Ultra 7 365
  (n=1)
5890 MIPS 0%
Dell Pro 13 Premium PA13250
Intel Core Ultra 7 268V
5884 MIPS 0%
Lenovo Yoga 9 2-in-1 14IPH11
Intel Core Ultra 7 355
5769 MIPS -2%
Dell XPS 13 9350
Intel Core Ultra 7 256V
5727 MIPS -3%
Microsoft Surface Laptop 13 2026
Qualcomm Snapdragon X2 Plus X2P-42-100
5514 MIPS -6%
HP EliteBook 8 Flip G1i 13
Intel Core Ultra 7 265U
5088 MIPS -14%
Lenovo Yoga Book 9 13IMU9
Intel Core Ultra 7 155U
4855 MIPS -18%
MSI Summit E13 AI Evo A1MTG
Intel Core Ultra 7 155H
4594 MIPS -22%
Geekbench 7 / Multi-Core
Lenovo ThinkPad X13 Gen 7 AMD
AMD Ryzen AI 7 PRO 450
14007 Points +42%
Microsoft Surface Laptop 13 2026
Qualcomm Snapdragon X2 Plus X2P-42-100
12503 Points +27%
Durchschnittliche Intel Core Ultra 7 365
  (9878 - 11480, n=2)
10679 Points +8%
Lenovo ThinkPad X13 Detachable Gen 1
Intel Core Ultra 7 365
9878 Points
Geekbench 7 / Single-Core
Microsoft Surface Laptop 13 2026
Qualcomm Snapdragon X2 Plus X2P-42-100
2804 Points +15%
Lenovo ThinkPad X13 Gen 7 AMD
AMD Ryzen AI 7 PRO 450
2494 Points +2%
Durchschnittliche Intel Core Ultra 7 365
  (2447 - 2493, n=2)
2470 Points +1%
Lenovo ThinkPad X13 Detachable Gen 1
Intel Core Ultra 7 365
2447 Points
Geekbench 6.7 / Multi-Core
Dell Pro 7 13 2-in-1
Intel Core Ultra 7 366H
16251 Points +42%
MSI Prestige 13 AI+ A3MG
Intel Core Ultra 9 386H
13776 Points +20%
Lenovo ThinkPad X13 Gen 7 AMD
AMD Ryzen AI 7 PRO 450
13683 Points +20%
HP OmniBook 7 Aero 13-bg1077nr
AMD Ryzen AI 7 350
13083 Points +14%
Microsoft Surface Laptop 13 2026
Qualcomm Snapdragon X2 Plus X2P-42-100
12070 Points +5%
Lenovo ThinkPad X13 Detachable Gen 1
Intel Core Ultra 7 365
11447 Points
Durchschnittliche Intel Core Ultra 7 365
  (10960 - 11447, n=2)
11204 Points -2%
Dell XPS 13 9350
Intel Core Ultra 7 256V
10972 Points -4%
Lenovo Yoga 9 2-in-1 14IPH11
Intel Core Ultra 7 355
10971 Points -4%
MSI Summit E13 AI Evo A1MTG
Intel Core Ultra 7 155H
10836 Points -5%
HP EliteBook 8 Flip G1i 13
Intel Core Ultra 7 265U
10707 Points -6%
Dell Pro 13 Premium PA13250
Intel Core Ultra 7 268V
10589 Points -7%
Lenovo Yoga Book 9 13IMU9
Intel Core Ultra 7 155U
9448 Points -17%
Geekbench 6.7 / Single-Core
Microsoft Surface Laptop 13 2026
Qualcomm Snapdragon X2 Plus X2P-42-100
3269 Points +18%
Lenovo ThinkPad X13 Gen 7 AMD
AMD Ryzen AI 7 PRO 450
2916 Points +5%
HP OmniBook 7 Aero 13-bg1077nr
AMD Ryzen AI 7 350
2886 Points +4%
MSI Prestige 13 AI+ A3MG
Intel Core Ultra 9 386H
2873 Points +4%
Dell Pro 7 13 2-in-1
Intel Core Ultra 7 366H
2844 Points +3%
Dell Pro 13 Premium PA13250
Intel Core Ultra 7 268V
2809 Points +1%
Dell XPS 13 9350
Intel Core Ultra 7 256V
2778 Points 0%
Lenovo ThinkPad X13 Detachable Gen 1
Intel Core Ultra 7 365
2769 Points
Lenovo Yoga 9 2-in-1 14IPH11
Intel Core Ultra 7 355
2755 Points -1%
Durchschnittliche Intel Core Ultra 7 365
  (2737 - 2769, n=2)
2753 Points -1%
HP EliteBook 8 Flip G1i 13
Intel Core Ultra 7 265U
2477 Points -11%
Lenovo Yoga Book 9 13IMU9
Intel Core Ultra 7 155U
2324 Points -16%
MSI Summit E13 AI Evo A1MTG
Intel Core Ultra 7 155H
2322 Points -16%
HWBOT x265 Benchmark v2.2 / 4k Preset
Lenovo ThinkPad X13 Gen 7 AMD
AMD Ryzen AI 7 PRO 450
19.4 fps +50%
Dell Pro 7 13 2-in-1
Intel Core Ultra 7 366H
19.2 fps +49%
HP OmniBook 7 Aero 13-bg1077nr
AMD Ryzen AI 7 350
14 fps +9%
MSI Prestige 13 AI+ A3MG
Intel Core Ultra 9 386H
13.2 fps +2%
Dell XPS 13 9350
Intel Core Ultra 7 256V
13.1 fps +2%
MSI Summit E13 AI Evo A1MTG
Intel Core Ultra 7 155H
13 fps +1%
Lenovo ThinkPad X13 Detachable Gen 1
Intel Core Ultra 7 365
12.9 fps
Durchschnittliche Intel Core Ultra 7 365
  (n=1)
12.9 fps 0%
HP EliteBook 8 Flip G1i 13
Intel Core Ultra 7 265U
11.4 fps -12%
Lenovo Yoga Book 9 13IMU9
Intel Core Ultra 7 155U
10.7 fps -17%
Dell Pro 13 Premium PA13250
Intel Core Ultra 7 268V
10.4 fps -19%
Lenovo Yoga 9 2-in-1 14IPH11
Intel Core Ultra 7 355
7.31 fps -43%
Microsoft Surface Laptop 13 2026
Qualcomm Snapdragon X2 Plus X2P-42-100
5.34 fps -59%
LibreOffice / 20 Documents To PDF
MSI Summit E13 AI Evo A1MTG
Intel Core Ultra 7 155H
62.7 s * -57%
Dell Pro 13 Premium PA13250
Intel Core Ultra 7 268V
60.8 s * -52%
HP EliteBook 8 Flip G1i 13
Intel Core Ultra 7 265U
58.1 s * -46%
MSI Prestige 13 AI+ A3MG
Intel Core Ultra 9 386H
56.1 s * -41%
Dell XPS 13 9350
Intel Core Ultra 7 256V
53.2 s * -33%
HP OmniBook 7 Aero 13-bg1077nr
AMD Ryzen AI 7 350
51.2 s * -28%
Lenovo ThinkPad X13 Gen 7 AMD
AMD Ryzen AI 7 PRO 450
47.9 s * -20%
Microsoft Surface Laptop 13 2026
Qualcomm Snapdragon X2 Plus X2P-42-100
46.3 s * -16%
Lenovo Yoga Book 9 13IMU9
Intel Core Ultra 7 155U
44.3 s * -11%
Dell Pro 7 13 2-in-1
Intel Core Ultra 7 366H
43.6 s * -9%
Lenovo ThinkPad X13 Detachable Gen 1
Intel Core Ultra 7 365
39.9 s *
Durchschnittliche Intel Core Ultra 7 365
  (n=1)
39.9 s * -0%
Lenovo Yoga 9 2-in-1 14IPH11
Intel Core Ultra 7 355
39.6 s * +1%
R Benchmark 2.5 / Overall mean
Microsoft Surface Laptop 13 2026
Qualcomm Snapdragon X2 Plus X2P-42-100
0.59 sec * -32%
Lenovo Yoga Book 9 13IMU9
Intel Core Ultra 7 155U
0.508 sec * -14%
HP EliteBook 8 Flip G1i 13
Intel Core Ultra 7 265U
0.492 sec * -10%
MSI Summit E13 AI Evo A1MTG
Intel Core Ultra 7 155H
0.4882 sec * -9%
Lenovo Yoga 9 2-in-1 14IPH11
Intel Core Ultra 7 355
0.4648 sec * -4%
Dell XPS 13 9350
Intel Core Ultra 7 256V
0.4578 sec * -3%
HP OmniBook 7 Aero 13-bg1077nr
AMD Ryzen AI 7 350
0.4555 sec * -2%
Lenovo ThinkPad X13 Detachable Gen 1
Intel Core Ultra 7 365
0.446 sec *
Durchschnittliche Intel Core Ultra 7 365
  (n=1)
0.446 sec * -0%
Dell Pro 13 Premium PA13250
Intel Core Ultra 7 268V
0.4344 sec * +3%
MSI Prestige 13 AI+ A3MG
Intel Core Ultra 9 386H
0.4312 sec * +3%
Dell Pro 7 13 2-in-1
Intel Core Ultra 7 366H
0.4266 sec * +4%
Lenovo ThinkPad X13 Gen 7 AMD
AMD Ryzen AI 7 PRO 450
0.4121 sec * +8%
CPU Performance Rating: Percent
Cinebench 2024: CPU Multi Core | CPU Single Core
Cinebench 2026: CPU Multi | CPU Single Thread
Cinebench R23: Multi Core | Single Core
Cinebench R20: CPU (Multi Core) | CPU (Single Core)
Cinebench R15: CPU Multi 64Bit | CPU Single 64Bit
Blender: v2.79 BMW27 CPU
7-Zip 18.03: 7z b 4 | 7z b 4 -mmt1
Geekbench 7: Multi-Core | Single-Core
Geekbench 6.7: Multi-Core | Single-Core
HWBOT x265 Benchmark v2.2: 4k Preset
LibreOffice : 20 Documents To PDF
R Benchmark 2.5: Overall mean

* ... kleinere Werte sind besser
Cinebench R15 CPU Multi 64Bit
1621 Points
Cinebench R15 OpenGL 64Bit
146.8 fps
Cinebench R15 Ref. Match 64Bit
97.8 %
Cinebench R15 CPU Single 64Bit
276 Points
Cinebench R20 CPU (Multi Core)
4082 Points
Cinebench R20 CPU (Single Core)
735 Points
Cinebench R23 Multi Core
10573 Points
Cinebench R23 Single Core
1971 Points
Cinebench 2024 CPU Multi Core
476 Points
Cinebench 2024 CPU Single Core
117 Points
Cinebench 2026 CPU Multi
1978 Points
Cinebench 2026 CPU Single Thread
477 Points
Hilfe
Performance Rating
Lenovo ThinkPad X13 Gen 7 AMD -1!
AMD Ryzen AI 7 PRO 450, Radeon 860M
94.6 pt
Dell Pro 7 13 2-in-1 -1!
Intel Core Ultra 7 366H, Intel Graphics 4 Xe3 PTL
78.7 pt
MSI Prestige 13 AI+ A3MG -1!
Intel Core Ultra 9 386H, Intel Graphics 4 Xe3 PTL
57.8 pt
Lenovo ThinkPad X13 Detachable Gen 1 -1!
Intel Core Ultra 7 365, Intel Graphics 4 Xe3 PTL
53.7 pt
Durchschnittliche Intel Core Ultra 7 365 -1!
 
53.7 pt
Dell Pro 13 Premium PA13250
Intel Core Ultra 7 268V, Arc 140V
52.9 pt
AIDA64 / FP32 Ray-Trace
Lenovo ThinkPad X13 Gen 7 AMD
AMD Ryzen AI 7 PRO 450, Radeon 860M (v8.20.8100)
22860 KRay/s +135%
Dell Pro 7 13 2-in-1
Intel Core Ultra 7 366H, Intel Graphics 4 Xe3 PTL (v8.20.8100)
14393 KRay/s +48%
Dell Pro 13 Premium PA13250
Intel Core Ultra 7 268V, Arc 140V (v6.92.6600)
10556 KRay/s +9%
MSI Prestige 13 AI+ A3MG
Intel Core Ultra 9 386H, Intel Graphics 4 Xe3 PTL (v8.20.8100)
10001 KRay/s +3%
Lenovo ThinkPad X13 Detachable Gen 1
Intel Core Ultra 7 365, Intel Graphics 4 Xe3 PTL (v8.20.8100)
9723 KRay/s
Durchschnittliche Intel Core Ultra 7 365
  (n=1)
9723 KRay/s 0%
AIDA64 / FPU Julia
Lenovo ThinkPad X13 Gen 7 AMD
AMD Ryzen AI 7 PRO 450, Radeon 860M (v8.20.8100)
95082 Points +69%
Dell Pro 7 13 2-in-1
Intel Core Ultra 7 366H, Intel Graphics 4 Xe3 PTL (v8.20.8100)
76776 Points +36%
Lenovo ThinkPad X13 Detachable Gen 1
Intel Core Ultra 7 365, Intel Graphics 4 Xe3 PTL (v8.20.8100)
56276 Points
Durchschnittliche Intel Core Ultra 7 365
  (n=1)
56276 Points 0%
MSI Prestige 13 AI+ A3MG
Intel Core Ultra 9 386H, Intel Graphics 4 Xe3 PTL (v8.20.8100)
53370 Points -5%
Dell Pro 13 Premium PA13250
Intel Core Ultra 7 268V, Arc 140V (v6.92.6600)
47659 Points -15%
AIDA64 / CPU SHA3
Dell Pro 7 13 2-in-1
Intel Core Ultra 7 366H, Intel Graphics 4 Xe3 PTL (v8.20.8100)
3890 MB/s +56%
Lenovo ThinkPad X13 Gen 7 AMD
AMD Ryzen AI 7 PRO 450, Radeon 860M (v8.20.8100)
3799 MB/s +53%
MSI Prestige 13 AI+ A3MG
Intel Core Ultra 9 386H, Intel Graphics 4 Xe3 PTL (v8.20.8100)
2776 MB/s +12%
Lenovo ThinkPad X13 Detachable Gen 1
Intel Core Ultra 7 365, Intel Graphics 4 Xe3 PTL (v8.20.8100)
2487 MB/s
Durchschnittliche Intel Core Ultra 7 365
  (n=1)
2487 MB/s 0%
Dell Pro 13 Premium PA13250
Intel Core Ultra 7 268V, Arc 140V (v6.92.6600)
2117 MB/s -15%
AIDA64 / CPU Queen
Dell Pro 13 Premium PA13250
Intel Core Ultra 7 268V, Arc 140V (v6.92.6600)
49759 Points
AIDA64 / FPU SinJulia
Lenovo ThinkPad X13 Gen 7 AMD
AMD Ryzen AI 7 PRO 450, Radeon 860M (v8.20.8100)
13384 Points +199%
Dell Pro 7 13 2-in-1
Intel Core Ultra 7 366H, Intel Graphics 4 Xe3 PTL (v8.20.8100)
6482 Points +45%
MSI Prestige 13 AI+ A3MG
Intel Core Ultra 9 386H, Intel Graphics 4 Xe3 PTL (v8.20.8100)
5314 Points +19%
Lenovo ThinkPad X13 Detachable Gen 1
Intel Core Ultra 7 365, Intel Graphics 4 Xe3 PTL (v8.20.8100)
4480 Points
Durchschnittliche Intel Core Ultra 7 365
  (n=1)
4480 Points 0%
Dell Pro 13 Premium PA13250
Intel Core Ultra 7 268V, Arc 140V (v6.92.6600)
4353 Points -3%
AIDA64 / FPU Mandel
Lenovo ThinkPad X13 Gen 7 AMD
AMD Ryzen AI 7 PRO 450, Radeon 860M (v8.20.8100)
49094 Points +66%
Dell Pro 7 13 2-in-1
Intel Core Ultra 7 366H, Intel Graphics 4 Xe3 PTL (v8.20.8100)
42426 Points +43%
Lenovo ThinkPad X13 Detachable Gen 1
Intel Core Ultra 7 365, Intel Graphics 4 Xe3 PTL (v8.20.8100)
29610 Points
Durchschnittliche Intel Core Ultra 7 365
  (n=1)
29610 Points 0%
MSI Prestige 13 AI+ A3MG
Intel Core Ultra 9 386H, Intel Graphics 4 Xe3 PTL (v8.20.8100)
28414 Points -4%
Dell Pro 13 Premium PA13250
Intel Core Ultra 7 268V, Arc 140V (v6.92.6600)
25929 Points -12%
AIDA64 / CPU AES
Lenovo ThinkPad X13 Gen 7 AMD
AMD Ryzen AI 7 PRO 450, Radeon 860M (v8.20.8100)
79014 MB/s +107%
Dell Pro 7 13 2-in-1
Intel Core Ultra 7 366H, Intel Graphics 4 Xe3 PTL (v8.20.8100)
57542 MB/s +51%
MSI Prestige 13 AI+ A3MG
Intel Core Ultra 9 386H, Intel Graphics 4 Xe3 PTL (v8.20.8100)
46362 MB/s +21%
Lenovo ThinkPad X13 Detachable Gen 1
Intel Core Ultra 7 365, Intel Graphics 4 Xe3 PTL (v8.20.8100)
38183 MB/s
Durchschnittliche Intel Core Ultra 7 365
  (n=1)
38183 MB/s 0%
Dell Pro 13 Premium PA13250
Intel Core Ultra 7 268V, Arc 140V (v6.92.6600)
33196 MB/s -13%
AIDA64 / CPU ZLib
Lenovo ThinkPad X13 Gen 7 AMD
AMD Ryzen AI 7 PRO 450, Radeon 860M (v8.20.8100)
970 MB/s +64%
Dell Pro 7 13 2-in-1
Intel Core Ultra 7 366H, Intel Graphics 4 Xe3 PTL (v8.20.8100)
923 MB/s +56%
MSI Prestige 13 AI+ A3MG
Intel Core Ultra 9 386H, Intel Graphics 4 Xe3 PTL (v8.20.8100)
669 MB/s +13%
Lenovo ThinkPad X13 Detachable Gen 1
Intel Core Ultra 7 365, Intel Graphics 4 Xe3 PTL (v8.20.8100)
591 MB/s
Durchschnittliche Intel Core Ultra 7 365
  (n=1)
591 MB/s 0%
Dell Pro 13 Premium PA13250
Intel Core Ultra 7 268V, Arc 140V (v6.92.6600)
441 MB/s -25%
AIDA64 / FP64 Ray-Trace
Lenovo ThinkPad X13 Gen 7 AMD
AMD Ryzen AI 7 PRO 450, Radeon 860M (v8.20.8100)
12380 KRay/s +148%
Dell Pro 7 13 2-in-1
Intel Core Ultra 7 366H, Intel Graphics 4 Xe3 PTL (v8.20.8100)
7614 KRay/s +52%
Dell Pro 13 Premium PA13250
Intel Core Ultra 7 268V, Arc 140V (v6.92.6600)
5938 KRay/s +19%
MSI Prestige 13 AI+ A3MG
Intel Core Ultra 9 386H, Intel Graphics 4 Xe3 PTL (v8.20.8100)
5138 KRay/s +3%
Lenovo ThinkPad X13 Detachable Gen 1
Intel Core Ultra 7 365, Intel Graphics 4 Xe3 PTL (v8.20.8100)
4998 KRay/s
Durchschnittliche Intel Core Ultra 7 365
  (n=1)
4998 KRay/s 0%
AIDA64 / CPU PhotoWorxx
Dell Pro 7 13 2-in-1
Intel Core Ultra 7 366H, Intel Graphics 4 Xe3 PTL (v8.20.8100)
81156 MPixel/s +35%
MSI Prestige 13 AI+ A3MG
Intel Core Ultra 9 386H, Intel Graphics 4 Xe3 PTL (v8.20.8100)
66781 MPixel/s +11%
Lenovo ThinkPad X13 Detachable Gen 1
Intel Core Ultra 7 365, Intel Graphics 4 Xe3 PTL (v8.20.8100)
60035 MPixel/s
Durchschnittliche Intel Core Ultra 7 365
  (n=1)
60035 MPixel/s 0%
Dell Pro 13 Premium PA13250
Intel Core Ultra 7 268V, Arc 140V (v6.92.6600)
46733 MPixel/s -22%
Lenovo ThinkPad X13 Gen 7 AMD
AMD Ryzen AI 7 PRO 450, Radeon 860M (v8.20.8100)
43303 MPixel/s -28%

Systemleistung

PCMark 10 Standard
PCMark 10 Standard
Performance Rating
Dell Pro 7 13 2-in-1
Intel Graphics 4 Xe3 PTL, Ultra 7 366H, SK hynix PCB01 HFS001TFM9X186N
90.9 pt
Lenovo ThinkPad X13 Gen 7 AMD
Radeon 860M, Ryzen AI 7 PRO 450, Micron 2650 MTFDKBA512TGW
87.5 pt
Lenovo ThinkPad X13 Detachable Gen 1
Intel Graphics 4 Xe3 PTL, Ultra 7 365
83 pt
Durchschnittliche Intel Core Ultra 7 365, Intel Graphics 4 Xe3 Panther Lake iGPU
 
83 pt
MSI Prestige 13 AI+ A3MG -4!
Intel Graphics 4 Xe3 PTL, Ultra 9 386H, Micron 2500 1TB MTFDKBA1T0QGN
79.8 pt
Dell Pro 13 Premium PA13250 -4!
Arc 140V, Core Ultra 7 268V, Micron 2550 1TB
68.2 pt
HP EliteBook 8 Flip G1i 13 -1!
Graphics 4-Core iGPU (Arrow Lake), Ultra 7 265U, Samsung PM9A1 MZVL2512HCJQ
60.8 pt
PCMark 10 / Score
Dell Pro 7 13 2-in-1
Intel Graphics 4 Xe3 PTL, Ultra 7 366H, SK hynix PCB01 HFS001TFM9X186N
9080 Points +15%
Lenovo ThinkPad X13 Gen 7 AMD
Radeon 860M, Ryzen AI 7 PRO 450, Micron 2650 MTFDKBA512TGW
8298 Points +5%
Lenovo ThinkPad X13 Detachable Gen 1
Intel Graphics 4 Xe3 PTL, Ultra 7 365
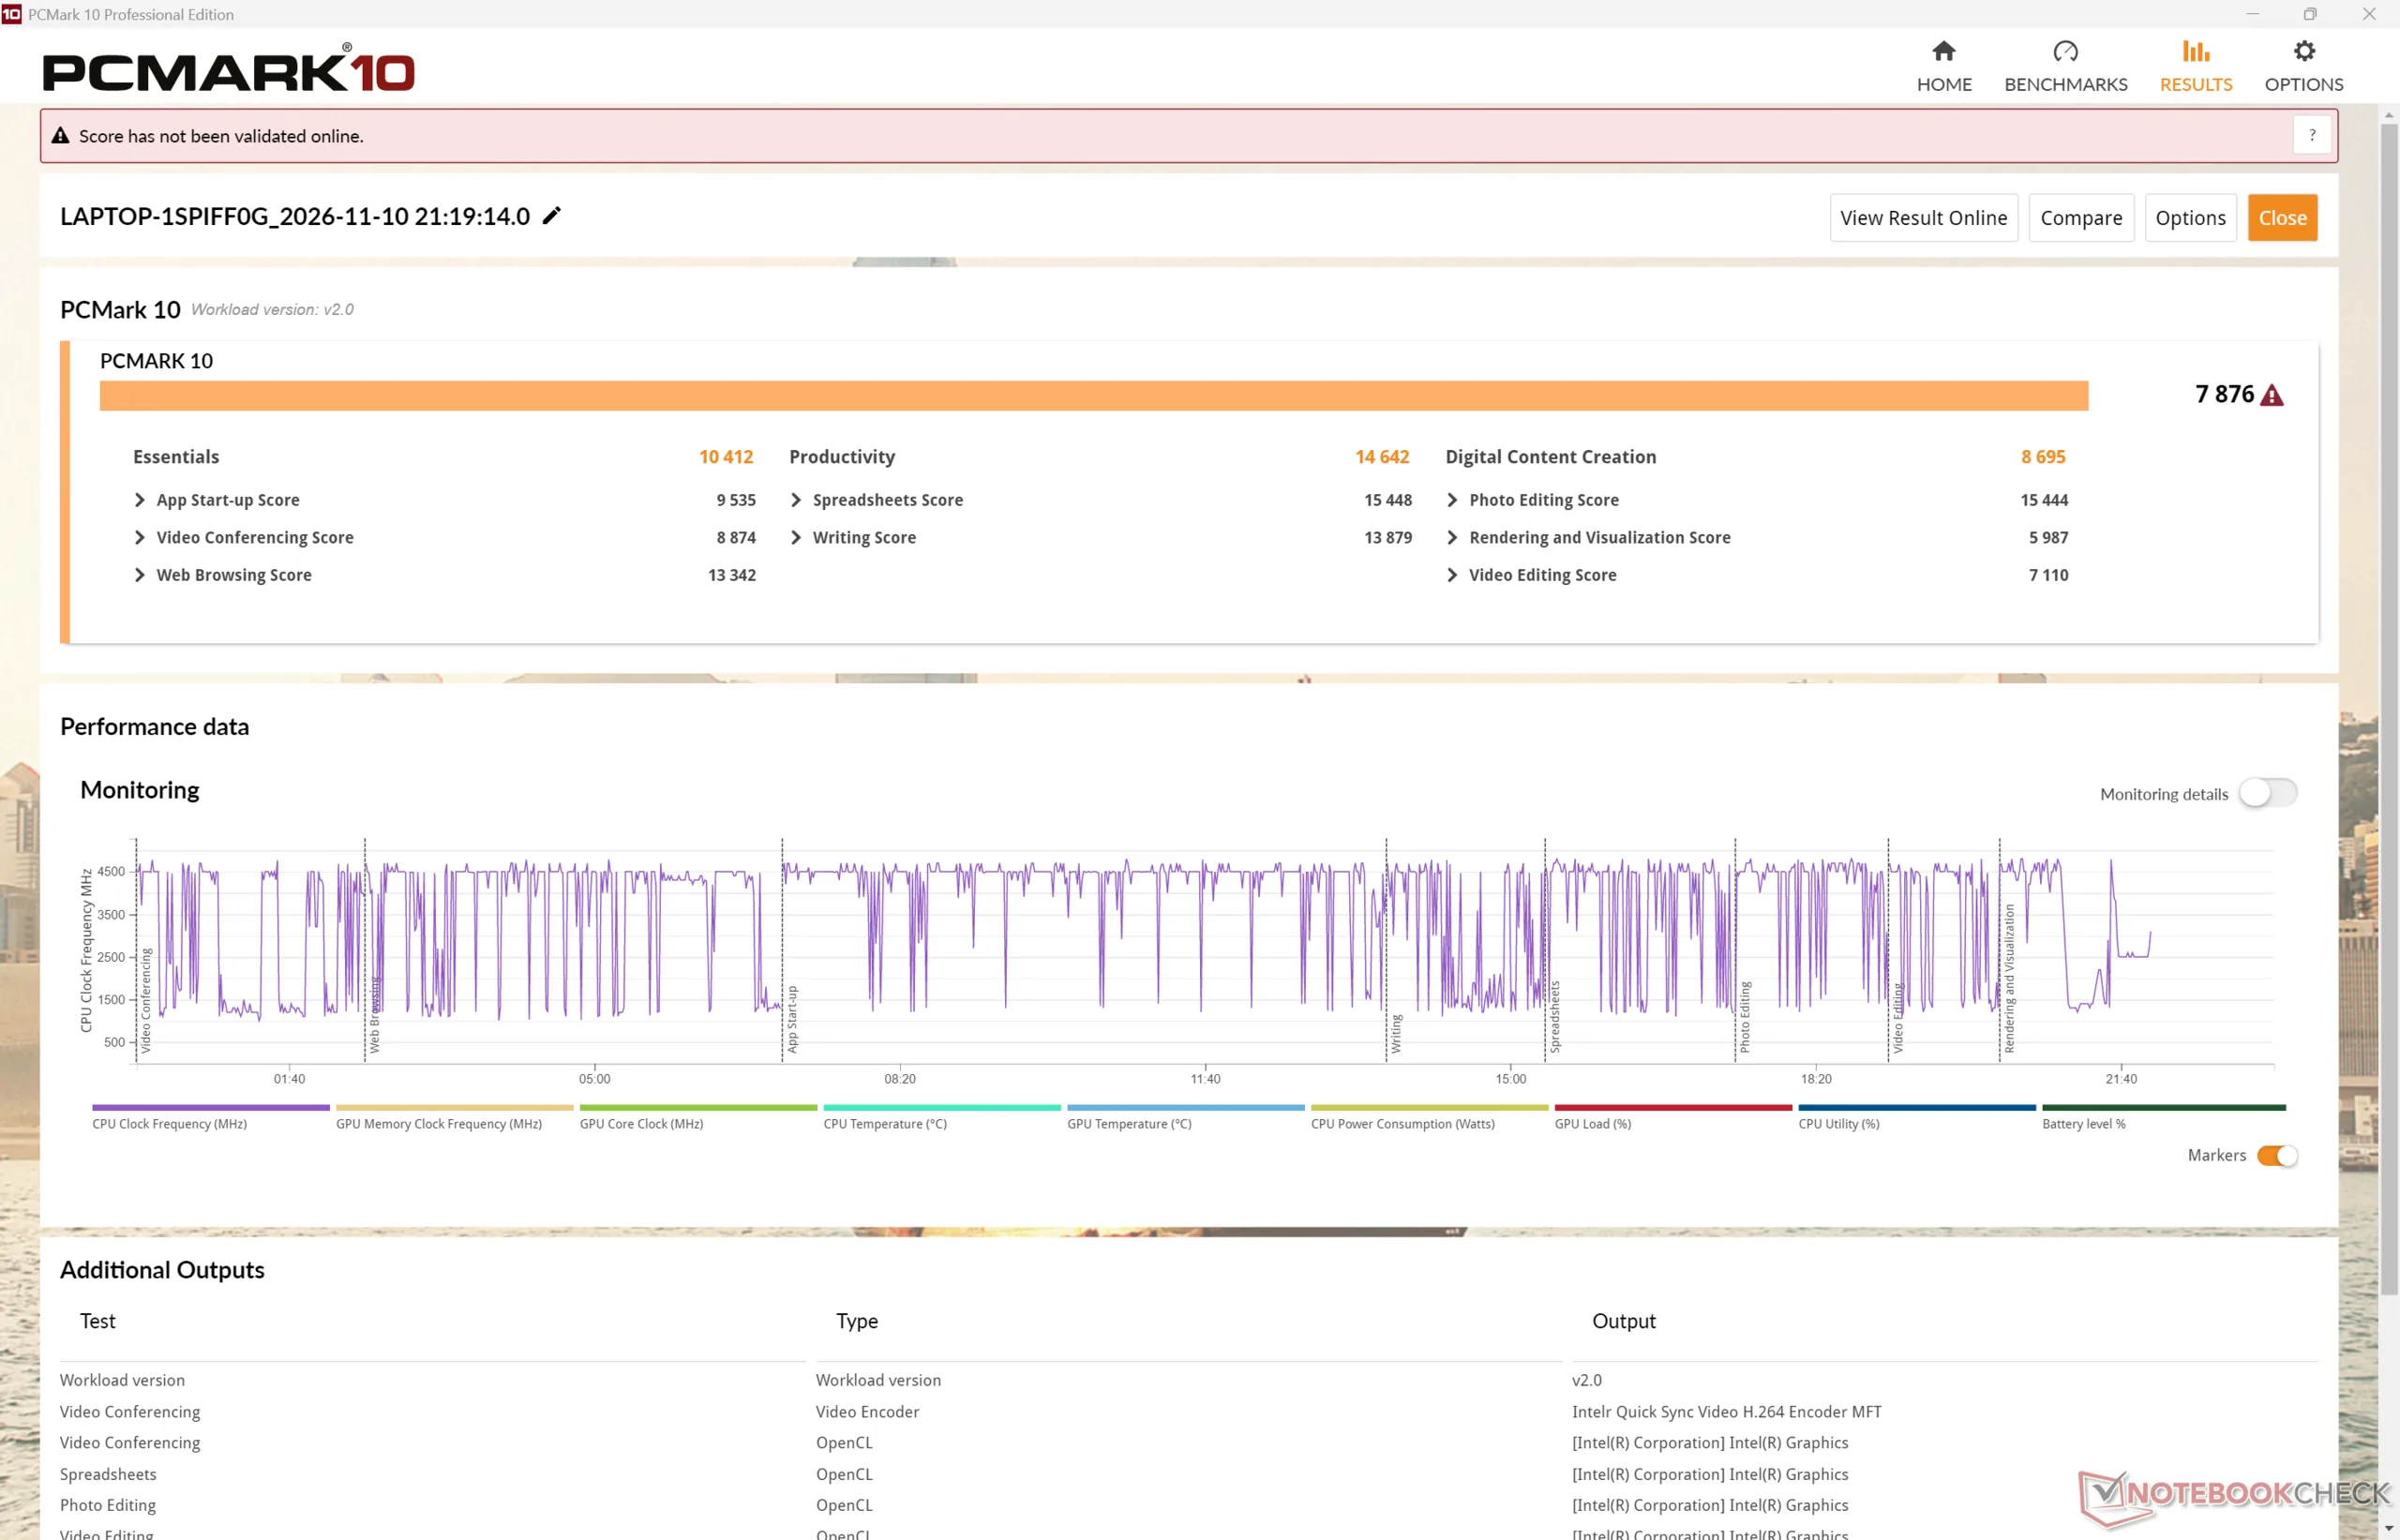
7876 Points
Durchschnittliche Intel Core Ultra 7 365, Intel Graphics 4 Xe3 Panther Lake iGPU
  (n=1)
7876 Points 0%
MSI Prestige 13 AI+ A3MG
Intel Graphics 4 Xe3 PTL, Ultra 9 386H, Micron 2500 1TB MTFDKBA1T0QGN
7679 Points -3%
Dell Pro 13 Premium PA13250
Arc 140V, Core Ultra 7 268V, Micron 2550 1TB
6729 Points -15%
HP EliteBook 8 Flip G1i 13
Graphics 4-Core iGPU (Arrow Lake), Ultra 7 265U, Samsung PM9A1 MZVL2512HCJQ
6237 Points -21%
PCMark 10 / Essentials
Dell Pro 7 13 2-in-1
Intel Graphics 4 Xe3 PTL, Ultra 7 366H, SK hynix PCB01 HFS001TFM9X186N
11657 Points +12%
Lenovo ThinkPad X13 Gen 7 AMD
Radeon 860M, Ryzen AI 7 PRO 450, Micron 2650 MTFDKBA512TGW
11498 Points +10%
MSI Prestige 13 AI+ A3MG
Intel Graphics 4 Xe3 PTL, Ultra 9 386H, Micron 2500 1TB MTFDKBA1T0QGN
10894 Points +5%
HP EliteBook 8 Flip G1i 13
Graphics 4-Core iGPU (Arrow Lake), Ultra 7 265U, Samsung PM9A1 MZVL2512HCJQ
10710 Points +3%
Lenovo ThinkPad X13 Detachable Gen 1
Intel Graphics 4 Xe3 PTL, Ultra 7 365
10412 Points
Durchschnittliche Intel Core Ultra 7 365, Intel Graphics 4 Xe3 Panther Lake iGPU
  (n=1)
10412 Points 0%
Dell Pro 13 Premium PA13250
Arc 140V, Core Ultra 7 268V, Micron 2550 1TB
10007 Points -4%
PCMark 10 / Productivity
Dell Pro 7 13 2-in-1
Intel Graphics 4 Xe3 PTL, Ultra 7 366H, SK hynix PCB01 HFS001TFM9X186N
16597 Points +13%
Lenovo ThinkPad X13 Detachable Gen 1
Intel Graphics 4 Xe3 PTL, Ultra 7 365
14642 Points
Durchschnittliche Intel Core Ultra 7 365, Intel Graphics 4 Xe3 Panther Lake iGPU
  (n=1)
14642 Points 0%
Lenovo ThinkPad X13 Gen 7 AMD
Radeon 860M, Ryzen AI 7 PRO 450, Micron 2650 MTFDKBA512TGW
13954 Points -5%
MSI Prestige 13 AI+ A3MG
Intel Graphics 4 Xe3 PTL, Ultra 9 386H, Micron 2500 1TB MTFDKBA1T0QGN
12295 Points -16%
Dell Pro 13 Premium PA13250
Arc 140V, Core Ultra 7 268V, Micron 2550 1TB
8766 Points -40%
HP EliteBook 8 Flip G1i 13
Graphics 4-Core iGPU (Arrow Lake), Ultra 7 265U, Samsung PM9A1 MZVL2512HCJQ
8288 Points -43%
PCMark 10 / Digital Content Creation
Dell Pro 7 13 2-in-1
Intel Graphics 4 Xe3 PTL, Ultra 7 366H, SK hynix PCB01 HFS001TFM9X186N
10499 Points +21%
Lenovo ThinkPad X13 Gen 7 AMD
Radeon 860M, Ryzen AI 7 PRO 450, Micron 2650 MTFDKBA512TGW
9665 Points +11%
Dell Pro 13 Premium PA13250
Arc 140V, Core Ultra 7 268V, Micron 2550 1TB
9425 Points +8%
MSI Prestige 13 AI+ A3MG
Intel Graphics 4 Xe3 PTL, Ultra 9 386H, Micron 2500 1TB MTFDKBA1T0QGN
9175 Points +6%
Lenovo ThinkPad X13 Detachable Gen 1
Intel Graphics 4 Xe3 PTL, Ultra 7 365
8695 Points
Durchschnittliche Intel Core Ultra 7 365, Intel Graphics 4 Xe3 Panther Lake iGPU
  (n=1)
8695 Points 0%
HP EliteBook 8 Flip G1i 13
Graphics 4-Core iGPU (Arrow Lake), Ultra 7 265U, Samsung PM9A1 MZVL2512HCJQ
7419 Points -15%
CrossMark / Overall
Dell Pro 7 13 2-in-1
Intel Graphics 4 Xe3 PTL, Ultra 7 366H, SK hynix PCB01 HFS001TFM9X186N
2214 Points +16%
Lenovo ThinkPad X13 Gen 7 AMD
Radeon 860M, Ryzen AI 7 PRO 450, Micron 2650 MTFDKBA512TGW
1998 Points +5%
MSI Prestige 13 AI+ A3MG
Intel Graphics 4 Xe3 PTL, Ultra 9 386H, Micron 2500 1TB MTFDKBA1T0QGN
1975 Points +4%
Lenovo ThinkPad X13 Detachable Gen 1
Intel Graphics 4 Xe3 PTL, Ultra 7 365
1907 Points
Durchschnittliche Intel Core Ultra 7 365, Intel Graphics 4 Xe3 Panther Lake iGPU
  (n=1)
1907 Points 0%
Dell Pro 13 Premium PA13250
Arc 140V, Core Ultra 7 268V, Micron 2550 1TB
1643 Points -14%
HP EliteBook 8 Flip G1i 13
Graphics 4-Core iGPU (Arrow Lake), Ultra 7 265U, Samsung PM9A1 MZVL2512HCJQ
1561 Points -18%
CrossMark / Productivity
Dell Pro 7 13 2-in-1
Intel Graphics 4 Xe3 PTL, Ultra 7 366H, SK hynix PCB01 HFS001TFM9X186N
1988 Points +9%
Lenovo ThinkPad X13 Gen 7 AMD
Radeon 860M, Ryzen AI 7 PRO 450, Micron 2650 MTFDKBA512TGW
1888 Points +3%
MSI Prestige 13 AI+ A3MG
Intel Graphics 4 Xe3 PTL, Ultra 9 386H, Micron 2500 1TB MTFDKBA1T0QGN
1842 Points +1%
Lenovo ThinkPad X13 Detachable Gen 1
Intel Graphics 4 Xe3 PTL, Ultra 7 365
1832 Points
Durchschnittliche Intel Core Ultra 7 365, Intel Graphics 4 Xe3 Panther Lake iGPU
  (n=1)
1832 Points 0%
Dell Pro 13 Premium PA13250
Arc 140V, Core Ultra 7 268V, Micron 2550 1TB
1577 Points -14%
HP EliteBook 8 Flip G1i 13
Graphics 4-Core iGPU (Arrow Lake), Ultra 7 265U, Samsung PM9A1 MZVL2512HCJQ
1498 Points -18%
CrossMark / Creativity
Dell Pro 7 13 2-in-1
Intel Graphics 4 Xe3 PTL, Ultra 7 366H, SK hynix PCB01 HFS001TFM9X186N
2556 Points +25%
MSI Prestige 13 AI+ A3MG
Intel Graphics 4 Xe3 PTL, Ultra 9 386H, Micron 2500 1TB MTFDKBA1T0QGN
2240 Points +10%
Lenovo ThinkPad X13 Gen 7 AMD
Radeon 860M, Ryzen AI 7 PRO 450, Micron 2650 MTFDKBA512TGW
2160 Points +6%
Lenovo ThinkPad X13 Detachable Gen 1
Intel Graphics 4 Xe3 PTL, Ultra 7 365
2044 Points
Durchschnittliche Intel Core Ultra 7 365, Intel Graphics 4 Xe3 Panther Lake iGPU
  (n=1)
2044 Points 0%
Dell Pro 13 Premium PA13250
Arc 140V, Core Ultra 7 268V, Micron 2550 1TB
1866 Points -9%
HP EliteBook 8 Flip G1i 13
Graphics 4-Core iGPU (Arrow Lake), Ultra 7 265U, Samsung PM9A1 MZVL2512HCJQ
1721 Points -16%
CrossMark / Responsiveness
Dell Pro 7 13 2-in-1
Intel Graphics 4 Xe3 PTL, Ultra 7 366H, SK hynix PCB01 HFS001TFM9X186N
1985 Points +14%
Lenovo ThinkPad X13 Gen 7 AMD
Radeon 860M, Ryzen AI 7 PRO 450, Micron 2650 MTFDKBA512TGW
1873 Points +7%
Lenovo ThinkPad X13 Detachable Gen 1
Intel Graphics 4 Xe3 PTL, Ultra 7 365
1746 Points
Durchschnittliche Intel Core Ultra 7 365, Intel Graphics 4 Xe3 Panther Lake iGPU
  (n=1)
1746 Points 0%
MSI Prestige 13 AI+ A3MG
Intel Graphics 4 Xe3 PTL, Ultra 9 386H, Micron 2500 1TB MTFDKBA1T0QGN
1667 Points -5%
HP EliteBook 8 Flip G1i 13
Graphics 4-Core iGPU (Arrow Lake), Ultra 7 265U, Samsung PM9A1 MZVL2512HCJQ
1319 Points -24%
Dell Pro 13 Premium PA13250
Arc 140V, Core Ultra 7 268V, Micron 2550 1TB
1267 Points -27%
WebXPRT 5 / Overall
Dell Pro 7 13 2-in-1
Intel Graphics 4 Xe3 PTL, Ultra 7 366H, SK hynix PCB01 HFS001TFM9X186N
122 Points +9%
Lenovo ThinkPad X13 Gen 7 AMD
Radeon 860M, Ryzen AI 7 PRO 450, Micron 2650 MTFDKBA512TGW
118 Points +5%
Lenovo ThinkPad X13 Detachable Gen 1
Intel Graphics 4 Xe3 PTL, Ultra 7 365
112 Points
Durchschnittliche Intel Core Ultra 7 365, Intel Graphics 4 Xe3 Panther Lake iGPU
  (n=1)
112 Points 0%
Mozilla Kraken 1.1 / Total
HP EliteBook 8 Flip G1i 13
Graphics 4-Core iGPU (Arrow Lake), Ultra 7 265U, Samsung PM9A1 MZVL2512HCJQ
599 ms * -28%
Dell Pro 13 Premium PA13250
Arc 140V, Core Ultra 7 268V, Micron 2550 1TB
476 ms * -2%
Lenovo ThinkPad X13 Detachable Gen 1
Intel Graphics 4 Xe3 PTL, Ultra 7 365
467 ms *
Durchschnittliche Intel Core Ultra 7 365, Intel Graphics 4 Xe3 Panther Lake iGPU
  (n=1)
467 ms * -0%
Dell Pro 7 13 2-in-1
Intel Graphics 4 Xe3 PTL, Ultra 7 366H, SK hynix PCB01 HFS001TFM9X186N
450 ms * +4%
MSI Prestige 13 AI+ A3MG
Intel Graphics 4 Xe3 PTL, Ultra 9 386H, Micron 2500 1TB MTFDKBA1T0QGN
447 ms * +4%
Lenovo ThinkPad X13 Gen 7 AMD
Radeon 860M, Ryzen AI 7 PRO 450, Micron 2650 MTFDKBA512TGW
429 ms * +8%
Geekbench AI / Single Precision GPU 1.7
Lenovo ThinkPad X13 Gen 7 AMD
Radeon 860M, Ryzen AI 7 PRO 450, Micron 2650 MTFDKBA512TGW
6983 Points +8%
Lenovo ThinkPad X13 Detachable Gen 1
Intel Graphics 4 Xe3 PTL, Ultra 7 365
6439 Points
Durchschnittliche Intel Core Ultra 7 365, Intel Graphics 4 Xe3 Panther Lake iGPU
  (n=1)
6439 Points 0%
Dell Pro 7 13 2-in-1
Intel Graphics 4 Xe3 PTL, Ultra 7 366H, SK hynix PCB01 HFS001TFM9X186N
6149 Points -5%
HP EliteBook 8 Flip G1i 13
Graphics 4-Core iGPU (Arrow Lake), Ultra 7 265U, Samsung PM9A1 MZVL2512HCJQ
4498 Points -30%
Geekbench AI / Half Precision GPU 1.7
Lenovo ThinkPad X13 Detachable Gen 1
Intel Graphics 4 Xe3 PTL, Ultra 7 365
12865 Points
Durchschnittliche Intel Core Ultra 7 365, Intel Graphics 4 Xe3 Panther Lake iGPU
  (n=1)
12865 Points 0%
Dell Pro 7 13 2-in-1
Intel Graphics 4 Xe3 PTL, Ultra 7 366H, SK hynix PCB01 HFS001TFM9X186N
11904 Points -7%
Lenovo ThinkPad X13 Gen 7 AMD
Radeon 860M, Ryzen AI 7 PRO 450, Micron 2650 MTFDKBA512TGW
10611 Points -18%
HP EliteBook 8 Flip G1i 13
Graphics 4-Core iGPU (Arrow Lake), Ultra 7 265U, Samsung PM9A1 MZVL2512HCJQ
6442 Points -50%
Geekbench AI / Quantized GPU 1.7
Lenovo ThinkPad X13 Gen 7 AMD
Radeon 860M, Ryzen AI 7 PRO 450, Micron 2650 MTFDKBA512TGW
5522 Points +26%
Lenovo ThinkPad X13 Detachable Gen 1
Intel Graphics 4 Xe3 PTL, Ultra 7 365
4390 Points
Durchschnittliche Intel Core Ultra 7 365, Intel Graphics 4 Xe3 Panther Lake iGPU
  (n=1)
4390 Points 0%
Dell Pro 7 13 2-in-1
Intel Graphics 4 Xe3 PTL, Ultra 7 366H, SK hynix PCB01 HFS001TFM9X186N
4230 Points -4%
HP EliteBook 8 Flip G1i 13
Graphics 4-Core iGPU (Arrow Lake), Ultra 7 265U, Samsung PM9A1 MZVL2512HCJQ
3030 Points -31%

* ... kleinere Werte sind besser

PCMark 10 Score
7876 Punkte
Hilfe
AIDA64 / Memory Copy
Dell Pro 7 13 2-in-1
Intel Core Ultra 7 366H, Intel Graphics 4 Xe3 PTL
117220 MB/s +11%
Lenovo ThinkPad X13 Detachable Gen 1
Intel Core Ultra 7 365, Intel Graphics 4 Xe3 PTL
105190 MB/s
Durchschnittliche Intel Core Ultra 7 365
  (n=1)
105190 MB/s 0%
MSI Prestige 13 AI+ A3MG
Intel Core Ultra 9 386H, Intel Graphics 4 Xe3 PTL
104775 MB/s 0%
Dell Pro 13 Premium PA13250
Intel Core Ultra 7 268V, Arc 140V
100445 MB/s -5%
Lenovo ThinkPad X13 Gen 7 AMD
AMD Ryzen AI 7 PRO 450, Radeon 860M
89576 MB/s -15%
AIDA64 / Memory Read
Dell Pro 7 13 2-in-1
Intel Core Ultra 7 366H, Intel Graphics 4 Xe3 PTL
109548 MB/s +29%
MSI Prestige 13 AI+ A3MG
Intel Core Ultra 9 386H, Intel Graphics 4 Xe3 PTL
97068 MB/s +14%
Lenovo ThinkPad X13 Detachable Gen 1
Intel Core Ultra 7 365, Intel Graphics 4 Xe3 PTL
84810 MB/s
Durchschnittliche Intel Core Ultra 7 365
  (n=1)
84810 MB/s 0%
Dell Pro 13 Premium PA13250
Intel Core Ultra 7 268V, Arc 140V
82511 MB/s -3%
Lenovo ThinkPad X13 Gen 7 AMD
AMD Ryzen AI 7 PRO 450, Radeon 860M
66738 MB/s -21%
AIDA64 / Memory Write
Dell Pro 7 13 2-in-1
Intel Core Ultra 7 366H, Intel Graphics 4 Xe3 PTL
120683 MB/s +11%
Lenovo ThinkPad X13 Gen 7 AMD
AMD Ryzen AI 7 PRO 450, Radeon 860M
116102 MB/s +7%
Dell Pro 13 Premium PA13250
Intel Core Ultra 7 268V, Arc 140V
115959 MB/s +7%
Lenovo ThinkPad X13 Detachable Gen 1
Intel Core Ultra 7 365, Intel Graphics 4 Xe3 PTL
108486 MB/s
Durchschnittliche Intel Core Ultra 7 365
  (n=1)
108486 MB/s 0%
MSI Prestige 13 AI+ A3MG
Intel Core Ultra 9 386H, Intel Graphics 4 Xe3 PTL
106460 MB/s -2%
AIDA64 / Memory Latency
Lenovo ThinkPad X13 Gen 7 AMD
AMD Ryzen AI 7 PRO 450, Radeon 860M
116 ns * -17%
MSI Prestige 13 AI+ A3MG
Intel Core Ultra 9 386H, Intel Graphics 4 Xe3 PTL
104.1 ns * -5%
Dell Pro 13 Premium PA13250
Intel Core Ultra 7 268V, Arc 140V
101.2 ns * -2%
Lenovo ThinkPad X13 Detachable Gen 1
Intel Core Ultra 7 365, Intel Graphics 4 Xe3 PTL
99.1 ns *
Durchschnittliche Intel Core Ultra 7 365
  (n=1)
99.1 ns * -0%
Dell Pro 7 13 2-in-1
Intel Core Ultra 7 366H, Intel Graphics 4 Xe3 PTL
90.3 ns * +9%

* ... kleinere Werte sind besser

DPC-Latenzen
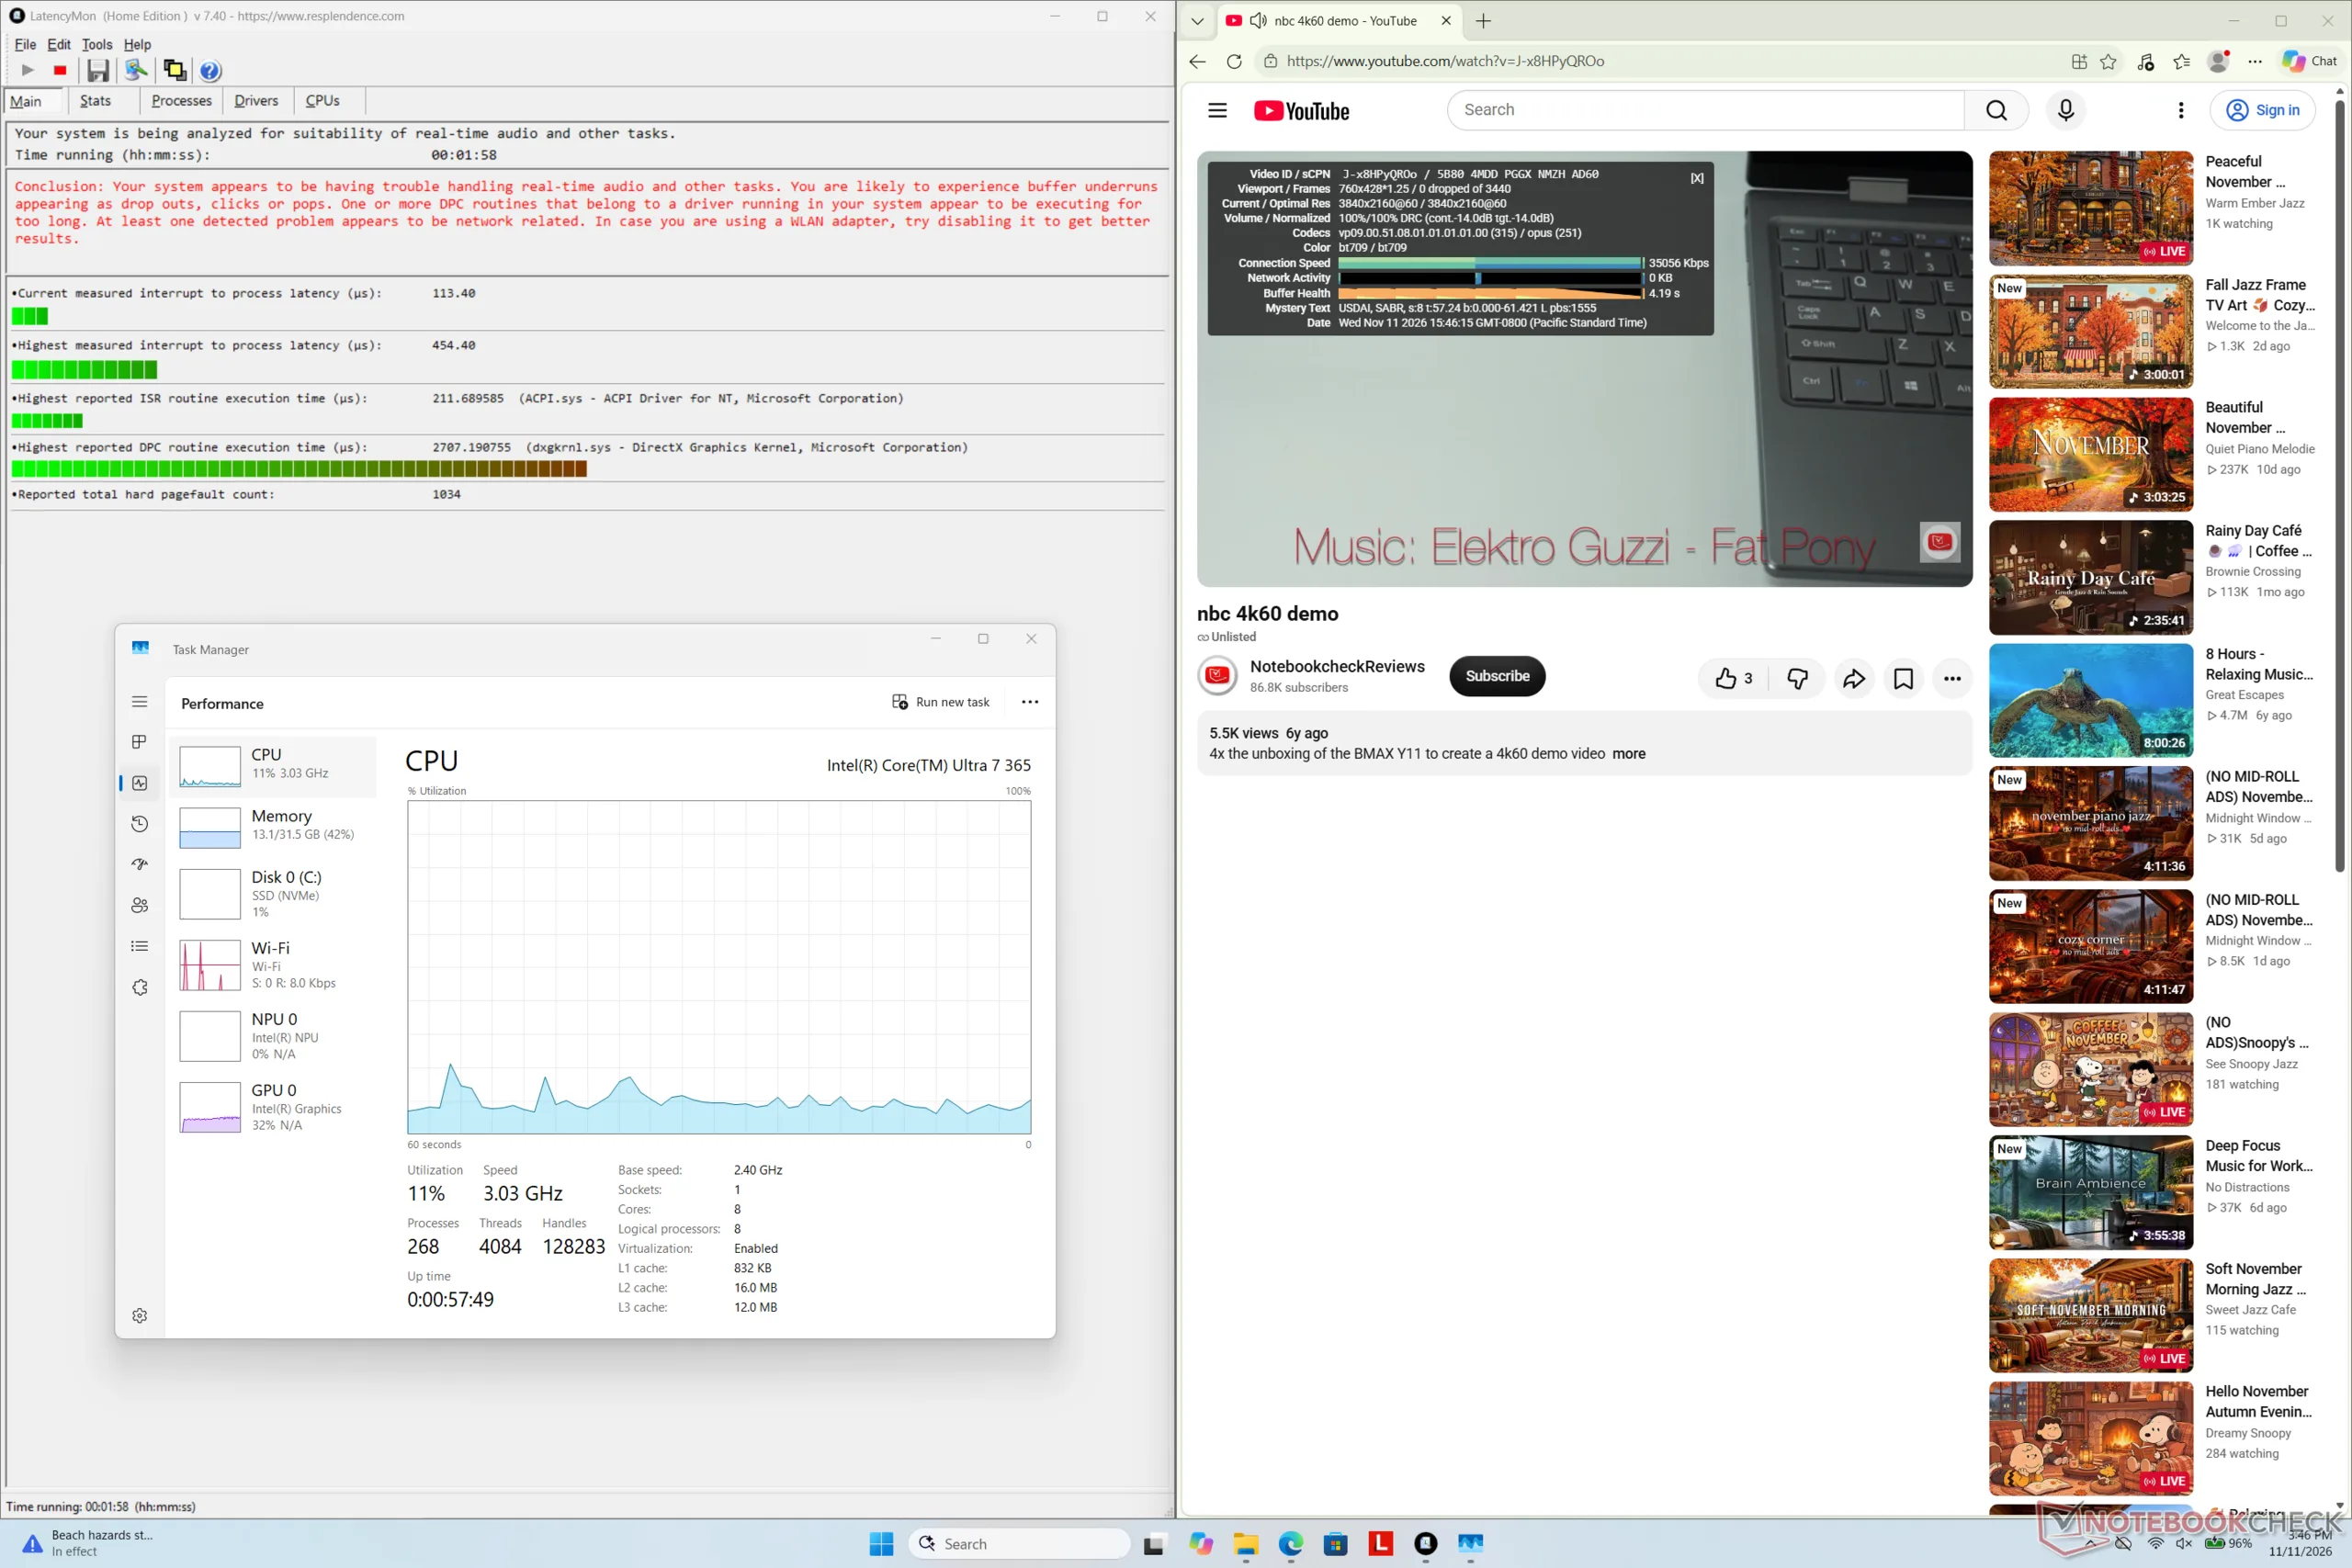
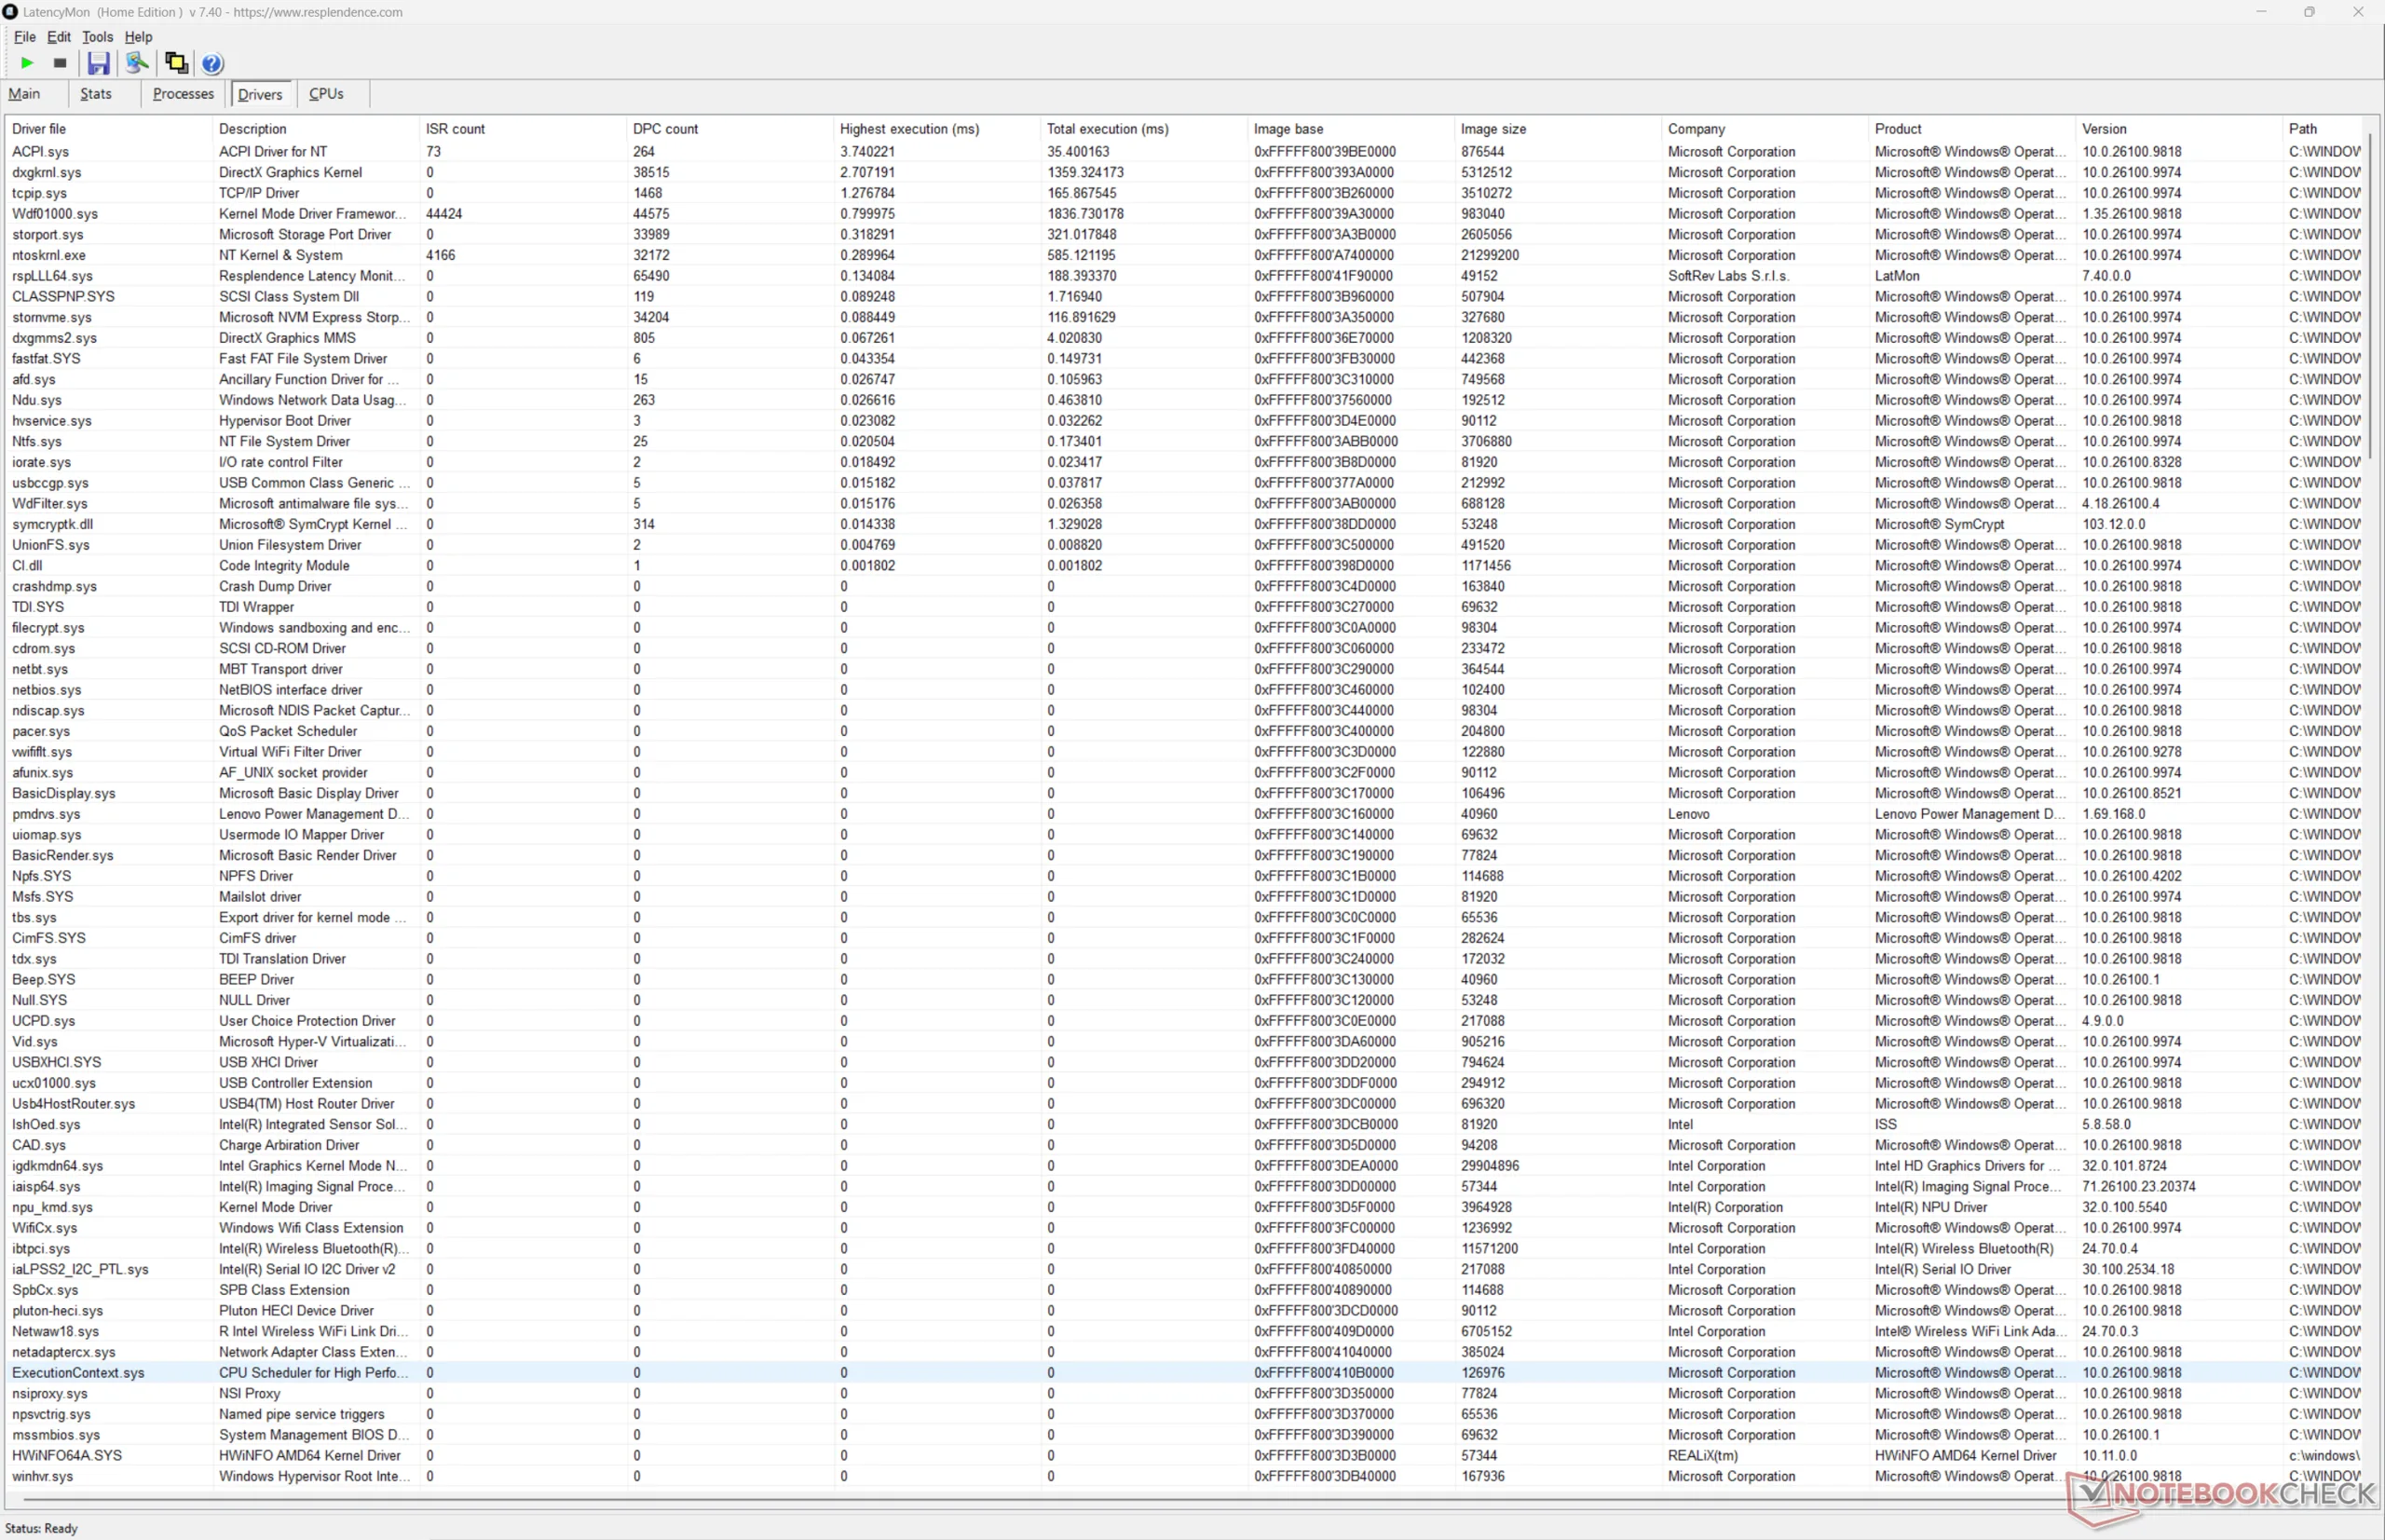
LatencyMon zeigt leichte DPC-Probleme, während in unserem 4K60-Videotest ansonsten keine ausgelassenen Frames aufgezeichnet wurden
Treiberliste
Treiberliste
DPC Latencies / LatencyMon - interrupt to process latency (max), Web, Youtube, Prime95
HP EliteBook 8 Flip G1i 13
Graphics 4-Core iGPU (Arrow Lake), Ultra 7 265U, Samsung PM9A1 MZVL2512HCJQ
1884 μs * -315%
Dell Pro 13 Premium PA13250
Arc 140V, Core Ultra 7 268V, Micron 2550 1TB
1442.4 μs * -217%
Dell Pro 7 13 2-in-1
Intel Graphics 4 Xe3 PTL, Ultra 7 366H, SK hynix PCB01 HFS001TFM9X186N
495.7 μs * -9%
Lenovo ThinkPad X13 Detachable Gen 1
Intel Graphics 4 Xe3 PTL, Ultra 7 365
454.4 μs *
Lenovo ThinkPad X13 Gen 7 AMD
Radeon 860M, Ryzen AI 7 PRO 450, Micron 2650 MTFDKBA512TGW
409.9 μs * +10%

* ... kleinere Werte sind besser

Massenspeicher
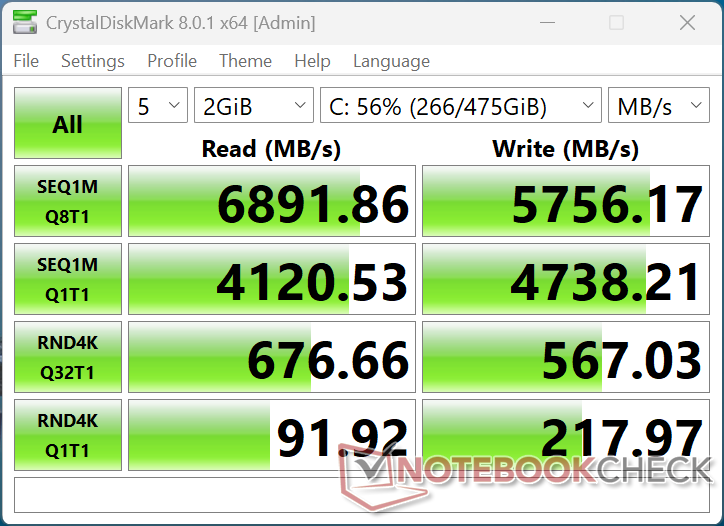
CDM 8
CDM 8

AS SSD läuft nicht fehlerfrei, weshalb die Ergebnisse nachfolgend nicht aufgeführt sind.

CDM 5/6 Read Seq Q32T1: 6795 MB/s
CDM 5/6 Write Seq Q32T1: 5733 MB/s
CDM 5/6 Read 4K Q32T1: 672.6 MB/s
CDM 5/6 Write 4K Q32T1: 565.8 MB/s
CDM 5 Read Seq: 4076 MB/s
CDM 5 Write Seq: 4753 MB/s
CDM 5/6 Read 4K: 91.14 MB/s
CDM 5/6 Write 4K: 214 MB/s
Drive Performance Rating - Percent
Dell Pro 7 13 2-in-1
SK hynix PCB01 HFS001TFM9X186N
89.7 pt
Lenovo ThinkPad X13 Gen 7 AMD
Micron 2650 MTFDKBA512TGW
74.8 pt
Lenovo ThinkPad X13 Detachable Gen 1
 
54.7 pt
MSI Prestige 13 AI+ A3MG
Micron 2500 1TB MTFDKBA1T0QGN
42.7 pt
HP EliteBook 8 Flip G1i 13
Samsung PM9A1 MZVL2512HCJQ
35.4 pt
Dell Pro 13 Premium PA13250
Micron 2550 1TB
33 pt
DiskSpd
seq read
Dell Pro 7 13 2-in-1
SK hynix PCB01 HFS001TFM9X186N
9190 (9011.88min - 9189.72max) MB/s +133%
Lenovo ThinkPad X13 Gen 7 AMD
Micron 2650 MTFDKBA512TGW
4740 (4618.97min - 4739.73max) MB/s +20%
Lenovo ThinkPad X13 Detachable Gen 1
 
3942 (3920.42min - 3942.1max) MB/s
HP EliteBook 8 Flip G1i 13
Samsung PM9A1 MZVL2512HCJQ
3773 (3723.81min - 3773.2max) MB/s -4%
MSI Prestige 13 AI+ A3MG
Micron 2500 1TB MTFDKBA1T0QGN
3220 (3165.44min - 3219.55max) MB/s -18%
Dell Pro 13 Premium PA13250
Micron 2550 1TB
2672 (2651.28min - 2672.4max) MB/s -32%
seq write
Dell Pro 7 13 2-in-1
SK hynix PCB01 HFS001TFM9X186N
7949 (7709.02min - 7948.84max) MB/s +72%
Lenovo ThinkPad X13 Gen 7 AMD
Micron 2650 MTFDKBA512TGW
5251 (5202.28min - 5250.64max) MB/s +14%
Lenovo ThinkPad X13 Detachable Gen 1
 
4609 (4540.75min - 4608.91max) MB/s
MSI Prestige 13 AI+ A3MG
Micron 2500 1TB MTFDKBA1T0QGN
3455 (3334.51min - 3454.86max) MB/s -25%
HP EliteBook 8 Flip G1i 13
Samsung PM9A1 MZVL2512HCJQ
2810 (2730.48min - 2809.97max) MB/s -39%
Dell Pro 13 Premium PA13250
Micron 2550 1TB
2658 (2406.9min - 2658.14max) MB/s -42%
seq q8 t1 read
Dell Pro 7 13 2-in-1
SK hynix PCB01 HFS001TFM9X186N
13922 (12905.2min - 13922max) MB/s +103%
Lenovo ThinkPad X13 Gen 7 AMD
Micron 2650 MTFDKBA512TGW
6991 (6185.97min - 6991.07max) MB/s +2%
MSI Prestige 13 AI+ A3MG
Micron 2500 1TB MTFDKBA1T0QGN
6982 (5981.29min - 6982.05max) MB/s +2%
Lenovo ThinkPad X13 Detachable Gen 1
 
6861 (6259.43min - 6861.04max) MB/s
HP EliteBook 8 Flip G1i 13
Samsung PM9A1 MZVL2512HCJQ
6748 (5594.71min - 6748.22max) MB/s -2%
Dell Pro 13 Premium PA13250
Micron 2550 1TB
5167 (4591.13min - 5167.38max) MB/s -25%
seq q8 t1 write
Dell Pro 7 13 2-in-1
SK hynix PCB01 HFS001TFM9X186N
12332 (12280.1min - 12331.7max) MB/s +114%
MSI Prestige 13 AI+ A3MG
Micron 2500 1TB MTFDKBA1T0QGN
5775 (5721.12min - 5775.12max) MB/s 0%
Lenovo ThinkPad X13 Detachable Gen 1
 
5750 (5655.19min - 5750.01max) MB/s
Lenovo ThinkPad X13 Gen 7 AMD
Micron 2650 MTFDKBA512TGW
5258 (5075.65min - 5257.77max) MB/s -9%
HP EliteBook 8 Flip G1i 13
Samsung PM9A1 MZVL2512HCJQ
4836 (4793.52min - 4836.01max) MB/s -16%
Dell Pro 13 Premium PA13250
Micron 2550 1TB
4213 (4176.44min - 4213.22max) MB/s -27%
4k q1 t1 read
Dell Pro 7 13 2-in-1
SK hynix PCB01 HFS001TFM9X186N
100 (99min - 100.03max) MB/s +55%
Lenovo ThinkPad X13 Gen 7 AMD
Micron 2650 MTFDKBA512TGW
88.2 (85.62min - 88.2max) MB/s +36%
MSI Prestige 13 AI+ A3MG
Micron 2500 1TB MTFDKBA1T0QGN
67.3 (66.31min - 67.31max) MB/s +4%
Lenovo ThinkPad X13 Detachable Gen 1
 
64.7 (64.55min - 64.73max) MB/s
Dell Pro 13 Premium PA13250
Micron 2550 1TB
55.1 (51.41min - 55.07max) MB/s -15%
HP EliteBook 8 Flip G1i 13
Samsung PM9A1 MZVL2512HCJQ
47.5 (47.09min - 47.46max) MB/s -27%
4k q1 t1 write
Lenovo ThinkPad X13 Gen 7 AMD
Micron 2650 MTFDKBA512TGW
282 (276.61min - 281.82max) MB/s +35%
Lenovo ThinkPad X13 Detachable Gen 1
 
209 (165.55min - 208.6max) MB/s
MSI Prestige 13 AI+ A3MG
Micron 2500 1TB MTFDKBA1T0QGN
183.2 (143.32min - 183.17max) MB/s -12%
Dell Pro 7 13 2-in-1
SK hynix PCB01 HFS001TFM9X186N
166.5 (164.77min - 166.53max) MB/s -20%
Dell Pro 13 Premium PA13250
Micron 2550 1TB
128.5 (122.19min - 128.53max) MB/s -39%
HP EliteBook 8 Flip G1i 13
Samsung PM9A1 MZVL2512HCJQ
116.7 (113.61min - 116.67max) MB/s -44%
4k q32 t16 read
Lenovo ThinkPad X13 Gen 7 AMD
Micron 2650 MTFDKBA512TGW
3772 (3762.62min - 3772.27max) MB/s +71%
Dell Pro 7 13 2-in-1
SK hynix PCB01 HFS001TFM9X186N
3109 (2906.66min - 3108.59max) MB/s +41%
Lenovo ThinkPad X13 Detachable Gen 1
 
2212 (2173.36min - 2212.09max) MB/s
HP EliteBook 8 Flip G1i 13
Samsung PM9A1 MZVL2512HCJQ
790 (658.26min - 789.98max) MB/s -64%
MSI Prestige 13 AI+ A3MG
Micron 2500 1TB MTFDKBA1T0QGN
790 (622.32min - 789.52max) MB/s -64%
Dell Pro 13 Premium PA13250
Micron 2550 1TB
631 (625.03min - 631.32max) MB/s -71%
4k q32 t16 write
Lenovo ThinkPad X13 Gen 7 AMD
Micron 2650 MTFDKBA512TGW
3642 (3565.73min - 3642.11max) MB/s +133%
Dell Pro 7 13 2-in-1
SK hynix PCB01 HFS001TFM9X186N
2784 (2402.5min - 2783.73max) MB/s +78%
Lenovo ThinkPad X13 Detachable Gen 1
 
1566 (1538.05min - 1565.68max) MB/s
MSI Prestige 13 AI+ A3MG
Micron 2500 1TB MTFDKBA1T0QGN
470 (362.61min - 470.31max) MB/s -70%
Dell Pro 13 Premium PA13250
Micron 2550 1TB
456 (400.41min - 455.9max) MB/s -71%
HP EliteBook 8 Flip G1i 13
Samsung PM9A1 MZVL2512HCJQ
330 (310.62min - 329.88max) MB/s -79%

Laufwerksdrosselung: DiskSpd-Leseschleife, Warteschlangentiefe 8

0145290435580725870101511601305145015951740188520302175232024652610275529003045319033353480362537703915406042054350449546404785493050755220536555105655580059456090623563806525667068156960Tooltip
Lenovo ThinkPad X13 Detachable Gen 1  ; diskspd 2.0.17 f: Ø6080 (3342.23-6939.44) MB/s
Lenovo ThinkPad X13 Gen 7 AMD Micron 2650 MTFDKBA512TGW; diskspd 2.0.17 f: Ø6980 (6131.02-7004.32) MB/s

GPU-Leistung

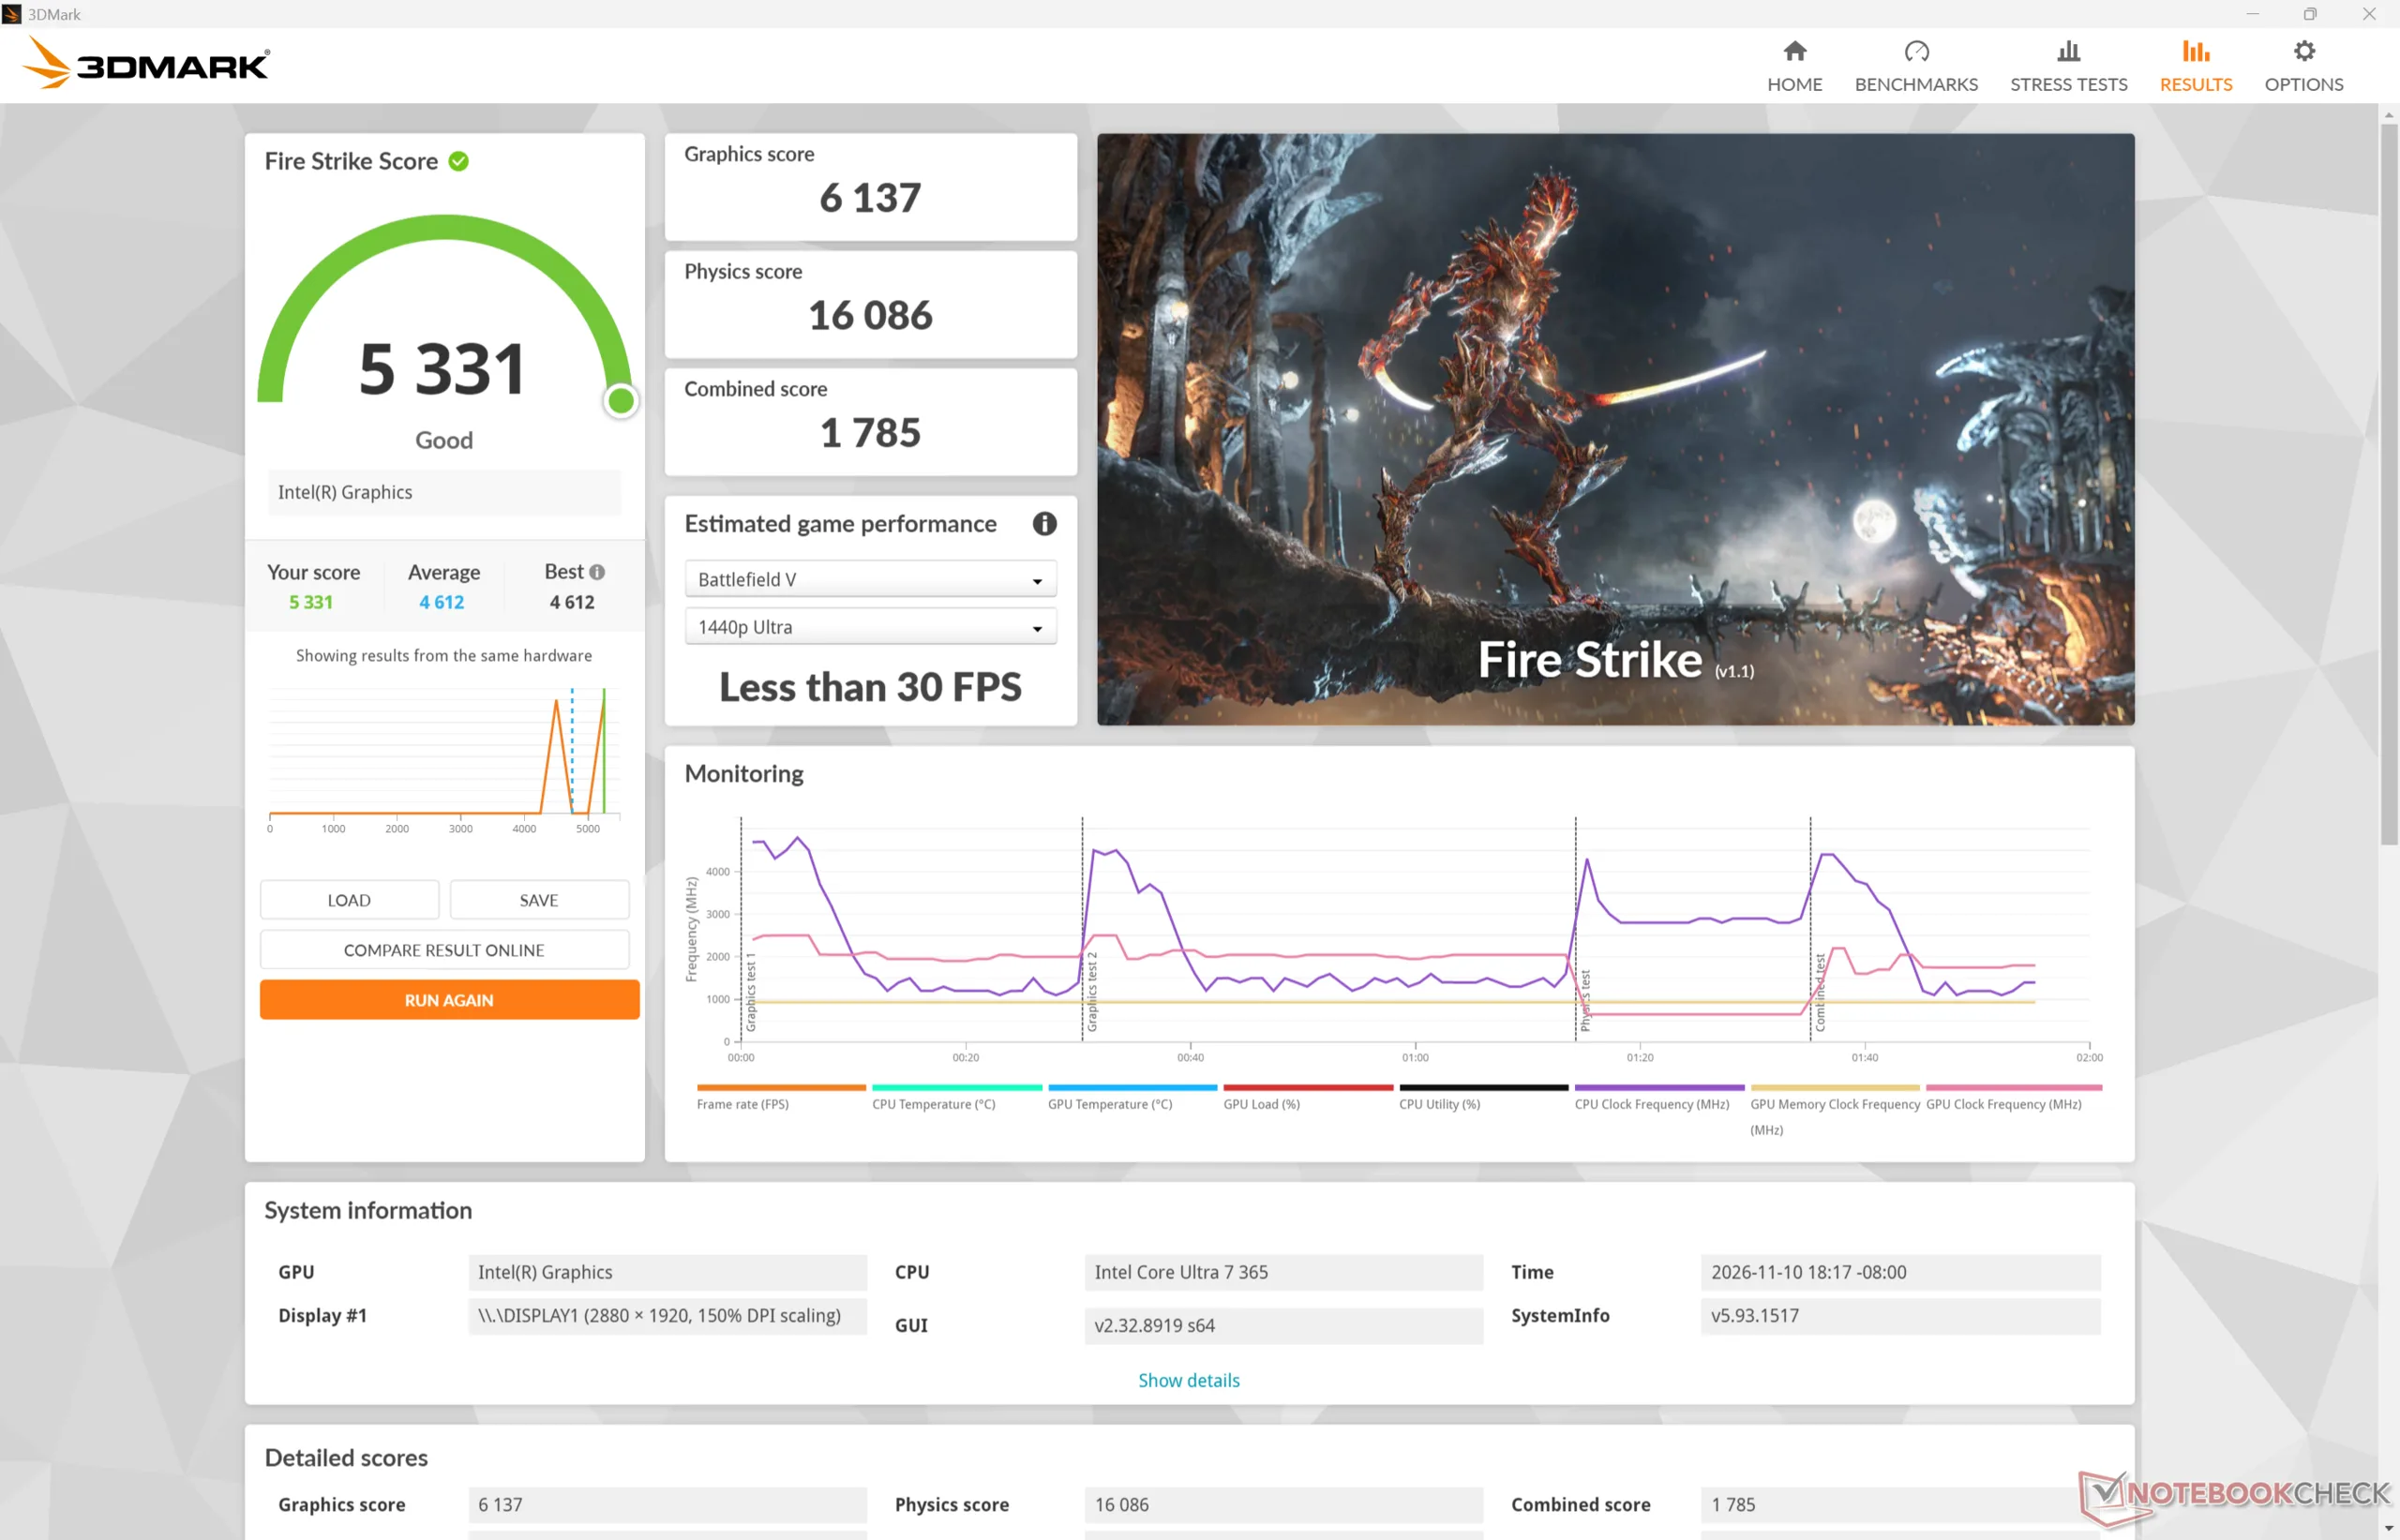
Die Fire-Strike-Ergebnisse können im Akkubetrieb höher ausfallen als im Netzbetrieb. Das deutet in der Regel darauf hin, dass das Modell anfälliger für Leistungsdrosselung ist als die meisten anderen Geräte.

EnergieprofilGrafikpunktePhysikpunkteKombinierte Punkte
Leistungsmodus6137160861785
Ausbalancierter Modus5614 (-9%)14406 (-10%)1564 (-12%)
Akkubetrieb6562 (+7%)16612 (+3%)1979 (+11%)
3DMark 11
3DMark 11
Fire Strike
Fire Strike
Steel Nomad
Steel Nomad
Speed Way
Speed Way
3DMark Performance Rating - Percent
Dell XPS 13 9350
Intel Arc Graphics 140V, Intel Core Ultra 7 256V
98.1 pt
Dell Pro 13 Premium PA13250
Intel Arc Graphics 140V, Intel Core Ultra 7 268V
95 pt
Lenovo ThinkPad X13 Gen 7 AMD
AMD Radeon 860M, AMD Ryzen AI 7 PRO 450
78.1 pt
Dell Pro 7 13 2-in-1
Intel Graphics 4 Xe3 Panther Lake iGPU, Intel Core Ultra 7 366H
75.2 pt
HP OmniBook 7 Aero 13-bg1077nr
AMD Radeon 860M, AMD Ryzen AI 7 350
69.4 pt
MSI Summit E13 AI Evo A1MTG
Intel Arc 8-Core iGPU, Intel Core Ultra 7 155H
69 pt
Durchschnittliche Intel Graphics 4 Xe3 Panther Lake iGPU
 
67.9 pt
Lenovo ThinkPad X13 Detachable Gen 1
Intel Graphics 4 Xe3 Panther Lake iGPU, Intel Core Ultra 7 365
62 pt
MSI Prestige 13 AI+ A3MG
Intel Graphics 4 Xe3 Panther Lake iGPU, Intel Core Ultra 9 386H
59 pt
Lenovo Yoga Book 9 13IMU9
Intel Graphics 4-Core iGPU (Meteor / Arrow Lake), Intel Core Ultra 7 155U
50.3 pt
HP EliteBook 8 Flip G1i 13
Intel Graphics 4-Core iGPU (Meteor / Arrow Lake), Intel Core Ultra 7 265U
49.3 pt
Microsoft Surface Laptop 13 2026
Qualcomm SD X2 Adreno X2-45, Qualcomm Snapdragon X2 Plus X2P-42-100
40 pt
3DMark 11 - 1280x720 Performance GPU
Lenovo ThinkPad X13 Gen 7 AMD
AMD Radeon 860M, AMD Ryzen AI 7 PRO 450
11442 Points +62%
Dell Pro 13 Premium PA13250
Intel Arc Graphics 140V, Intel Core Ultra 7 268V
11147 Points +58%
HP OmniBook 7 Aero 13-bg1077nr
AMD Radeon 860M, AMD Ryzen AI 7 350
11064 Points +57%
Dell XPS 13 9350
Intel Arc Graphics 140V, Intel Core Ultra 7 256V
10651 Points +51%
MSI Summit E13 AI Evo A1MTG
Intel Arc 8-Core iGPU, Intel Core Ultra 7 155H
8634 Points +23%
Dell Pro 7 13 2-in-1
Intel Graphics 4 Xe3 Panther Lake iGPU, Intel Core Ultra 7 366H
7560 Points +7%
Durchschnittliche Intel Graphics 4 Xe3 Panther Lake iGPU
  (5433 - 7678, n=25)
7121 Points +1%
Lenovo ThinkPad X13 Detachable Gen 1
Intel Graphics 4 Xe3 Panther Lake iGPU, Intel Core Ultra 7 365
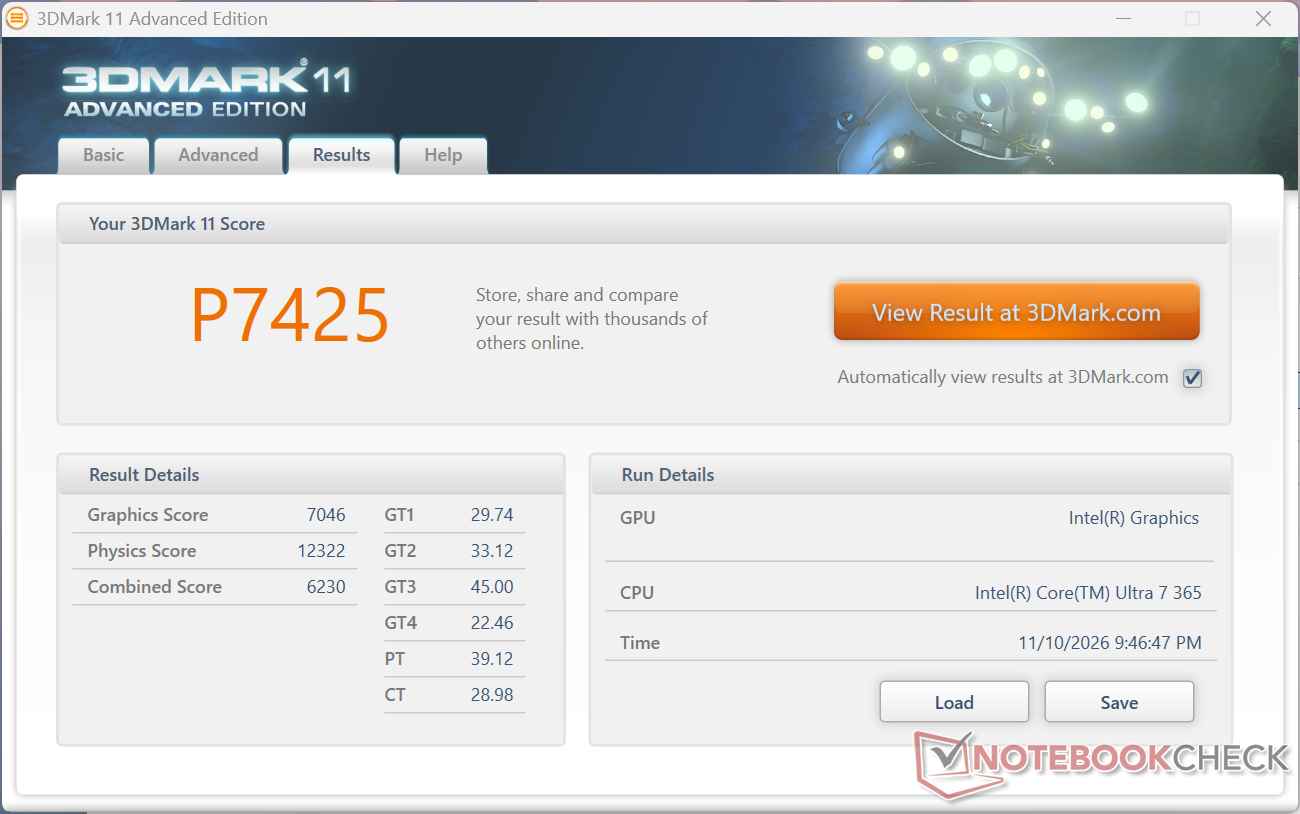
7046 Points
Lenovo Yoga Book 9 13IMU9
Intel Graphics 4-Core iGPU (Meteor / Arrow Lake), Intel Core Ultra 7 155U
6741 Points -4%
MSI Prestige 13 AI+ A3MG
Intel Graphics 4 Xe3 Panther Lake iGPU, Intel Core Ultra 9 386H
6500 Points -8%
HP EliteBook 8 Flip G1i 13
Intel Graphics 4-Core iGPU (Meteor / Arrow Lake), Intel Core Ultra 7 265U
6090 Points -14%
Microsoft Surface Laptop 13 2026
Qualcomm SD X2 Adreno X2-45, Qualcomm Snapdragon X2 Plus X2P-42-100
5097 Points -28%
3DMark
1920x1080 Fire Strike Graphics
Dell Pro 13 Premium PA13250
Intel Arc Graphics 140V, Intel Core Ultra 7 268V
9554 Points +56%
Dell XPS 13 9350
Intel Arc Graphics 140V, Intel Core Ultra 7 256V
9492 Points +55%
Lenovo ThinkPad X13 Gen 7 AMD
AMD Radeon 860M, AMD Ryzen AI 7 PRO 450
7476 Points +22%
Dell Pro 7 13 2-in-1
Intel Graphics 4 Xe3 Panther Lake iGPU, Intel Core Ultra 7 366H
7412 Points +21%
Durchschnittliche Intel Graphics 4 Xe3 Panther Lake iGPU
  (4835 - 7415, n=25)
6719 Points +9%
HP OmniBook 7 Aero 13-bg1077nr
AMD Radeon 860M, AMD Ryzen AI 7 350
6462 Points +5%
MSI Summit E13 AI Evo A1MTG
Intel Arc 8-Core iGPU, Intel Core Ultra 7 155H
6280 Points +2%
Lenovo ThinkPad X13 Detachable Gen 1
Intel Graphics 4 Xe3 Panther Lake iGPU, Intel Core Ultra 7 365
6137 Points
MSI Prestige 13 AI+ A3MG
Intel Graphics 4 Xe3 Panther Lake iGPU, Intel Core Ultra 9 386H
5688 Points -7%
Lenovo Yoga Book 9 13IMU9
Intel Graphics 4-Core iGPU (Meteor / Arrow Lake), Intel Core Ultra 7 155U
5390 Points -12%
HP EliteBook 8 Flip G1i 13
Intel Graphics 4-Core iGPU (Meteor / Arrow Lake), Intel Core Ultra 7 265U
5143 Points -16%
Microsoft Surface Laptop 13 2026
Qualcomm SD X2 Adreno X2-45, Qualcomm Snapdragon X2 Plus X2P-42-100
4430 Points -28%
2560x1440 Time Spy Graphics
Dell XPS 13 9350
Intel Arc Graphics 140V, Intel Core Ultra 7 256V
4115 Points +67%
Dell Pro 13 Premium PA13250
Intel Arc Graphics 140V, Intel Core Ultra 7 268V
3755 Points +52%
Dell Pro 7 13 2-in-1
Intel Graphics 4 Xe3 Panther Lake iGPU, Intel Core Ultra 7 366H
3136 Points +27%
Durchschnittliche Intel Graphics 4 Xe3 Panther Lake iGPU
  (2059 - 3136, n=25)
2788 Points +13%
MSI Summit E13 AI Evo A1MTG
Intel Arc 8-Core iGPU, Intel Core Ultra 7 155H
2726 Points +10%
Lenovo ThinkPad X13 Gen 7 AMD
AMD Radeon 860M, AMD Ryzen AI 7 PRO 450
2682 Points +9%
Lenovo ThinkPad X13 Detachable Gen 1
Intel Graphics 4 Xe3 Panther Lake iGPU, Intel Core Ultra 7 365
2467 Points
MSI Prestige 13 AI+ A3MG
Intel Graphics 4 Xe3 Panther Lake iGPU, Intel Core Ultra 9 386H
2391 Points -3%
HP OmniBook 7 Aero 13-bg1077nr
AMD Radeon 860M, AMD Ryzen AI 7 350
2271 Points -8%
HP EliteBook 8 Flip G1i 13
Intel Graphics 4-Core iGPU (Meteor / Arrow Lake), Intel Core Ultra 7 265U
1808 Points -27%
Lenovo Yoga Book 9 13IMU9
Intel Graphics 4-Core iGPU (Meteor / Arrow Lake), Intel Core Ultra 7 155U
1712 Points -31%
Microsoft Surface Laptop 13 2026
Qualcomm SD X2 Adreno X2-45, Qualcomm Snapdragon X2 Plus X2P-42-100
1374 Points -44%
2560x1440 Time Spy Score
Dell XPS 13 9350
Intel Arc Graphics 140V, Intel Core Ultra 7 256V
4354 Points +61%
Dell Pro 13 Premium PA13250
Intel Arc Graphics 140V, Intel Core Ultra 7 268V
3969 Points +47%
Dell Pro 7 13 2-in-1
Intel Graphics 4 Xe3 Panther Lake iGPU, Intel Core Ultra 7 366H
3518 Points +30%
Durchschnittliche Intel Graphics 4 Xe3 Panther Lake iGPU
  (2285 - 3518, n=25)
3112 Points +15%
Lenovo ThinkPad X13 Gen 7 AMD
AMD Radeon 860M, AMD Ryzen AI 7 PRO 450
2999 Points +11%
MSI Summit E13 AI Evo A1MTG
Intel Arc 8-Core iGPU, Intel Core Ultra 7 155H
2989 Points +11%
Lenovo ThinkPad X13 Detachable Gen 1
Intel Graphics 4 Xe3 Panther Lake iGPU, Intel Core Ultra 7 365
2702 Points
MSI Prestige 13 AI+ A3MG
Intel Graphics 4 Xe3 Panther Lake iGPU, Intel Core Ultra 9 386H
2672 Points -1%
HP OmniBook 7 Aero 13-bg1077nr
AMD Radeon 860M, AMD Ryzen AI 7 350
2533 Points -6%
HP EliteBook 8 Flip G1i 13
Intel Graphics 4-Core iGPU (Meteor / Arrow Lake), Intel Core Ultra 7 265U
2010 Points -26%
Lenovo Yoga Book 9 13IMU9
Intel Graphics 4-Core iGPU (Meteor / Arrow Lake), Intel Core Ultra 7 155U
1922 Points -29%
Microsoft Surface Laptop 13 2026
Qualcomm SD X2 Adreno X2-45, Qualcomm Snapdragon X2 Plus X2P-42-100
1557 Points -42%
3DMark 11 Performance
7425 Punkte
3DMark Cloud Gate Standard Score
21696 Punkte
3DMark Fire Strike Score
5331 Punkte
3DMark Time Spy Score
2702 Punkte
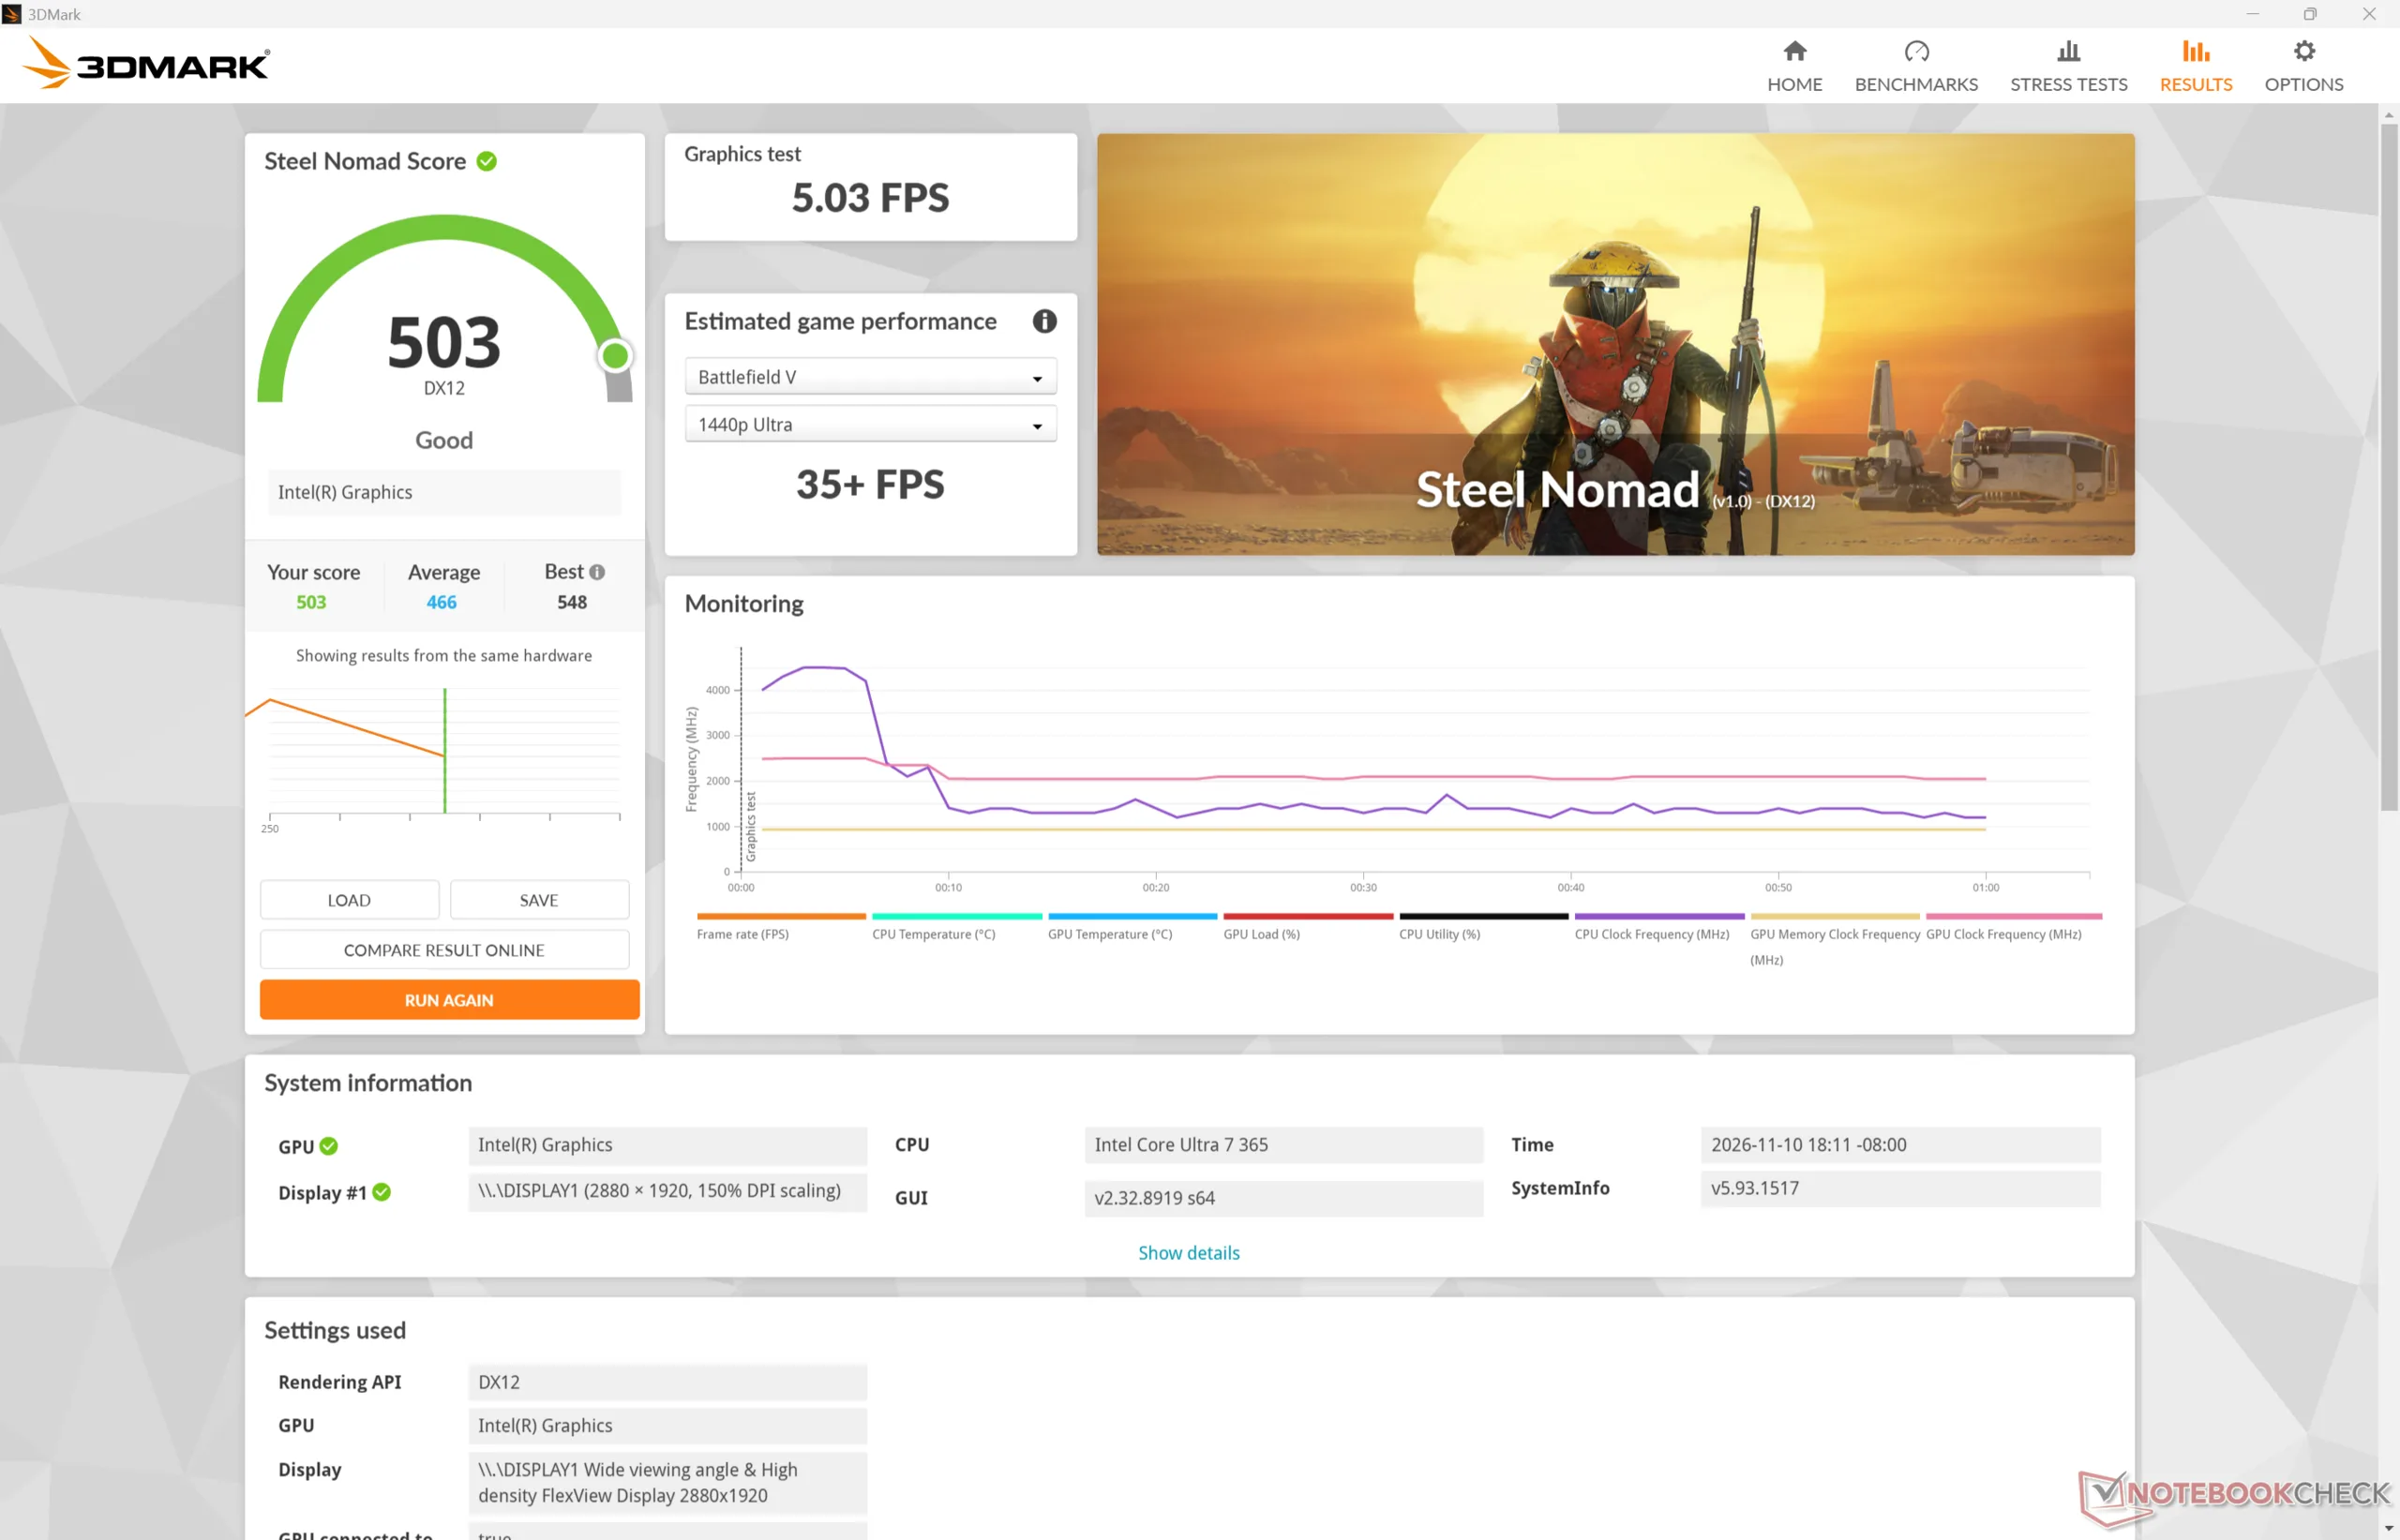
3DMark Steel Nomad Score
503 Punkte
Hilfe
Blender
v3.3 Classroom CPU
Microsoft Surface Laptop 13 2026
Qualcomm SD X2 Adreno X2-45, Qualcomm Snapdragon X2 Plus X2P-42-100
910 Seconds * -35%
Dell Pro 13 Premium PA13250
Intel Arc Graphics 140V, Intel Core Ultra 7 268V
698 Seconds * -3%
Lenovo ThinkPad X13 Detachable Gen 1
Intel Graphics 4 Xe3 Panther Lake iGPU, Intel Core Ultra 7 365
675 Seconds *
HP EliteBook 8 Flip G1i 13
Intel Graphics 4-Core iGPU (Meteor / Arrow Lake), Intel Core Ultra 7 265U
667 Seconds * +1%
Lenovo Yoga Book 9 13IMU9
Intel Graphics 4-Core iGPU (Meteor / Arrow Lake), Intel Core Ultra 7 155U
649 Seconds * +4%
Dell XPS 13 9350
Intel Arc Graphics 140V, Intel Core Ultra 7 256V
580 Seconds * +14%
MSI Summit E13 AI Evo A1MTG
Intel Arc 8-Core iGPU, Intel Core Ultra 7 155H
534 Seconds * +21%
MSI Prestige 13 AI+ A3MG
Intel Graphics 4 Xe3 Panther Lake iGPU, Intel Core Ultra 9 386H
503 Seconds * +25%
Durchschnittliche Intel Graphics 4 Xe3 Panther Lake iGPU
  (298 - 675, n=25)
447 Seconds * +34%
HP OmniBook 7 Aero 13-bg1077nr
AMD Radeon 860M, AMD Ryzen AI 7 350
365 Seconds * +46%
Dell Pro 7 13 2-in-1
Intel Graphics 4 Xe3 Panther Lake iGPU, Intel Core Ultra 7 366H
348 Seconds * +48%
Lenovo ThinkPad X13 Gen 7 AMD
AMD Radeon 860M, AMD Ryzen AI 7 PRO 450
347 Seconds * +49%
v3.3 Classroom oneAPI/Intel
Dell Pro 13 Premium PA13250
Intel Arc Graphics 140V, Intel Core Ultra 7 268V
368 Seconds *
HP EliteBook 8 Flip G1i 13
Intel Graphics 4-Core iGPU (Meteor / Arrow Lake), Intel Core Ultra 7 265U
313 Seconds *
MSI Summit E13 AI Evo A1MTG
Intel Arc 8-Core iGPU, Intel Core Ultra 7 155H
309 Seconds *
Durchschnittliche Intel Graphics 4 Xe3 Panther Lake iGPU
  (231 - 257, n=6)
242 Seconds *
Dell XPS 13 9350
Intel Arc Graphics 140V, Intel Core Ultra 7 256V
211 Seconds *
v4.3 Barbershop CPU
Lenovo ThinkPad X13 Detachable Gen 1
Intel Graphics 4 Xe3 Panther Lake iGPU, Intel Core Ultra 7 365
3506 Seconds *
HP EliteBook 8 Flip G1i 13
Intel Graphics 4-Core iGPU (Meteor / Arrow Lake), Intel Core Ultra 7 265U
3358 Seconds * +4%
MSI Summit E13 AI Evo A1MTG
Intel Arc 8-Core iGPU, Intel Core Ultra 7 155H
2787 Seconds * +21%
Durchschnittliche Intel Graphics 4 Xe3 Panther Lake iGPU
  (1505 - 3506, n=16)
2427 Seconds * +31%
HP OmniBook 7 Aero 13-bg1077nr
AMD Radeon 860M, AMD Ryzen AI 7 350
2075 Seconds * +41%
Dell Pro 7 13 2-in-1
Intel Graphics 4 Xe3 Panther Lake iGPU, Intel Core Ultra 7 366H
1850 Seconds * +47%
v4.3 Barbershop oneAPI
HP EliteBook 8 Flip G1i 13
Intel Graphics 4-Core iGPU (Meteor / Arrow Lake), Intel Core Ultra 7 265U
1308 Seconds * -56%
Durchschnittliche Intel Graphics 4 Xe3 Panther Lake iGPU
  (758 - 1015, n=12)
888 Seconds * -6%
Lenovo ThinkPad X13 Detachable Gen 1
Intel Graphics 4 Xe3 Panther Lake iGPU, Intel Core Ultra 7 365
836 Seconds *

* ... kleinere Werte sind besser

Performance Rating - Percent
Dell Pro 13 Premium PA13250
Intel Core Ultra 7 268V, Intel Arc Graphics 140V
96.1 pt
Dell Pro 7 13 2-in-1
Intel Core Ultra 7 366H, Intel Graphics 4 Xe3 Panther Lake iGPU
86 pt
Lenovo ThinkPad X13 Gen 7 AMD
AMD Ryzen AI 7 PRO 450, AMD Radeon 860M
82.8 pt
MSI Prestige 13 AI+ A3MG -4!
Intel Core Ultra 9 386H, Intel Graphics 4 Xe3 Panther Lake iGPU
78.7 pt
Lenovo ThinkPad X13 Detachable Gen 1
Intel Core Ultra 7 365, Intel Graphics 4 Xe3 Panther Lake iGPU
67.3 pt
HP EliteBook 8 Flip G1i 13
Intel Core Ultra 7 265U, Intel Graphics 4-Core iGPU (Meteor / Arrow Lake)
51.1 pt
Cyberpunk 2077 - 1920x1080 Ultra Preset (FSR off)
Dell Pro 13 Premium PA13250
Intel Core Ultra 7 268V, Intel Arc Graphics 140V
28.1 (22.8min) fps +63%
Dell Pro 7 13 2-in-1
Intel Core Ultra 7 366H, Intel Graphics 4 Xe3 Panther Lake iGPU
21.6 (18.4min, 17.5P1) fps +26%
MSI Prestige 13 AI+ A3MG
Intel Core Ultra 9 386H, Intel Graphics 4 Xe3 Panther Lake iGPU
19.1 (16min) fps +11%
Lenovo ThinkPad X13 Gen 7 AMD
AMD Ryzen AI 7 PRO 450, AMD Radeon 860M
17.5 (13.8min) fps +2%
Lenovo ThinkPad X13 Detachable Gen 1
Intel Core Ultra 7 365, Intel Graphics 4 Xe3 Panther Lake iGPU
17.2 (14.6min, 14.1P1) fps
HP EliteBook 8 Flip G1i 13
Intel Core Ultra 7 265U, Intel Graphics 4-Core iGPU (Meteor / Arrow Lake)
12 (10.3min, 9.93P1) fps -30%
Baldur's Gate 3 - 1920x1080 Ultra Preset AA:T
Dell Pro 13 Premium PA13250
Intel Core Ultra 7 268V, Intel Arc Graphics 140V
30.8 fps +90%
Dell Pro 7 13 2-in-1
Intel Core Ultra 7 366H, Intel Graphics 4 Xe3 Panther Lake iGPU
22.1 (20.3min, 20.3P0.1, 20.7P1) fps +36%
Lenovo ThinkPad X13 Gen 7 AMD
AMD Ryzen AI 7 PRO 450, AMD Radeon 860M
17.7 (14.7min, 14.9P0.1, 16.1P1) fps +9%
Lenovo ThinkPad X13 Detachable Gen 1
Intel Core Ultra 7 365, Intel Graphics 4 Xe3 Panther Lake iGPU
16.2 (14.1min, 14.1P0.1, 14.2P1) fps
HP EliteBook 8 Flip G1i 13
Intel Core Ultra 7 265U, Intel Graphics 4-Core iGPU (Meteor / Arrow Lake)
12.7 fps -22%
GTA V - 1920x1080 Highest AA:4xMSAA + FX AF:16x
Dell Pro 13 Premium PA13250
Intel Core Ultra 7 268V, Intel Arc Graphics 140V
26.3 (6.46min, 20P1) fps +45%
Lenovo ThinkPad X13 Gen 7 AMD
AMD Ryzen AI 7 PRO 450, AMD Radeon 860M
25.5 (4.77min, 18.2P1) fps +41%
Dell Pro 7 13 2-in-1
Intel Core Ultra 7 366H, Intel Graphics 4 Xe3 Panther Lake iGPU
21.8 (7.1min, 15.4P1) fps +20%
Lenovo ThinkPad X13 Detachable Gen 1
Intel Core Ultra 7 365, Intel Graphics 4 Xe3 Panther Lake iGPU
18.1 (4.05min, 11.4P1) fps
HP EliteBook 8 Flip G1i 13
Intel Core Ultra 7 265U, Intel Graphics 4-Core iGPU (Meteor / Arrow Lake)
9.99 (2.84min, 7.46P1) fps -45%
Final Fantasy XV Benchmark - 1920x1080 High Quality
Dell Pro 13 Premium PA13250
Intel Core Ultra 7 268V, Intel Arc Graphics 140V
29.1 fps +29%
Dell Pro 7 13 2-in-1
Intel Core Ultra 7 366H, Intel Graphics 4 Xe3 Panther Lake iGPU
26.3 fps +17%
Lenovo ThinkPad X13 Gen 7 AMD
AMD Ryzen AI 7 PRO 450, AMD Radeon 860M
25.1 fps +12%
Lenovo ThinkPad X13 Detachable Gen 1
Intel Core Ultra 7 365, Intel Graphics 4 Xe3 Panther Lake iGPU
22.5 fps
HP EliteBook 8 Flip G1i 13
Intel Core Ultra 7 265U, Intel Graphics 4-Core iGPU (Meteor / Arrow Lake)
18.2 fps -19%
Strange Brigade - 1920x1080 ultra AA:ultra AF:16
Dell Pro 13 Premium PA13250
Intel Core Ultra 7 268V, Intel Arc Graphics 140V
57.8 (16min, 33.5P1) fps +46%
Dell Pro 7 13 2-in-1
Intel Core Ultra 7 366H, Intel Graphics 4 Xe3 Panther Lake iGPU
56.5 (34.3min, 40.3P1) fps +42%
Lenovo ThinkPad X13 Gen 7 AMD
AMD Ryzen AI 7 PRO 450, AMD Radeon 860M
44.1 (30.6min, 34.1P1) fps +11%
Lenovo ThinkPad X13 Detachable Gen 1
Intel Core Ultra 7 365, Intel Graphics 4 Xe3 Panther Lake iGPU
39.7 (9.5min, 13.8P1) fps
HP EliteBook 8 Flip G1i 13
Intel Core Ultra 7 265U, Intel Graphics 4-Core iGPU (Meteor / Arrow Lake)
27.1 (16.1min, 18.4P1) fps -32%
Dota 2 Reborn - 1920x1080 ultra (3/3) best looking
Lenovo ThinkPad X13 Gen 7 AMD
AMD Ryzen AI 7 PRO 450, AMD Radeon 860M
78.8 (69.7min) fps +31%
Dell Pro 7 13 2-in-1
Intel Core Ultra 7 366H, Intel Graphics 4 Xe3 Panther Lake iGPU
77.8 (47.6min) fps +29%
MSI Prestige 13 AI+ A3MG
Intel Core Ultra 9 386H, Intel Graphics 4 Xe3 Panther Lake iGPU
73 (46.6min) fps +21%
Dell Pro 13 Premium PA13250
Intel Core Ultra 7 268V, Intel Arc Graphics 140V
71.2 (43.6min) fps +18%
Lenovo ThinkPad X13 Detachable Gen 1
Intel Core Ultra 7 365, Intel Graphics 4 Xe3 Panther Lake iGPU
60.3 (30.2min) fps
HP EliteBook 8 Flip G1i 13
Intel Core Ultra 7 265U, Intel Graphics 4-Core iGPU (Meteor / Arrow Lake)
52.4 (32.2min) fps -13%
X-Plane 11.11 - 1920x1080 high (fps_test=3)
Lenovo ThinkPad X13 Gen 7 AMD
AMD Ryzen AI 7 PRO 450, AMD Radeon 860M
39.8 fps +52%
Dell Pro 7 13 2-in-1
Intel Core Ultra 7 366H, Intel Graphics 4 Xe3 Panther Lake iGPU
33.2 fps +27%
Dell Pro 13 Premium PA13250
Intel Core Ultra 7 268V, Intel Arc Graphics 140V
32.7 fps +25%
MSI Prestige 13 AI+ A3MG
Intel Core Ultra 9 386H, Intel Graphics 4 Xe3 Panther Lake iGPU
30.1 fps +15%
Lenovo ThinkPad X13 Detachable Gen 1
Intel Core Ultra 7 365, Intel Graphics 4 Xe3 Panther Lake iGPU
26.2 fps
HP EliteBook 8 Flip G1i 13
Intel Core Ultra 7 265U, Intel Graphics 4-Core iGPU (Meteor / Arrow Lake)
23.7 fps -10%
Baldur's Gate 3
1920x1080 Low Preset AA:SM
Dell Pro 13 Premium PA13250
Intel Core Ultra 7 268V, Intel Arc Graphics 140V
45.5 fps +104%
Dell XPS 13 9350
Intel Core Ultra 7 256V, Intel Arc Graphics 140V
36.6 fps +64%
Dell Pro 7 13 2-in-1
Intel Core Ultra 7 366H, Intel Graphics 4 Xe3 Panther Lake iGPU
31.9 (28.5min, 28.7P0.1, 29.4P1) fps +43%
HP OmniBook 7 Aero 13-bg1077nr
AMD Ryzen AI 7 350, AMD Radeon 860M
31.8 (23.7min, 23.7P0.1, 27.7P1) fps +43%
Lenovo ThinkPad X13 Gen 7 AMD
AMD Ryzen AI 7 PRO 450, AMD Radeon 860M
30.6 (23.6min, 24.1P0.1, 27.5P1) fps +37%
Durchschnittliche Intel Graphics 4 Xe3 Panther Lake iGPU
  (22.3 - 35.1, n=23)
30.4 fps +36%
MSI Summit E13 AI Evo A1MTG
Intel Core Ultra 7 155H, Intel Arc 8-Core iGPU
22.8 fps +2%
Lenovo ThinkPad X13 Detachable Gen 1
Intel Core Ultra 7 365, Intel Graphics 4 Xe3 Panther Lake iGPU
22.3 (20.3min, 20.4P0.1, 20.7P1) fps
Microsoft Surface Laptop 13 2026
Qualcomm Snapdragon X2 Plus X2P-42-100, Qualcomm SD X2 Adreno X2-45
21.2 (14.1min, 14.6P0.1, 15P1) fps -5%
HP EliteBook 8 Flip G1i 13
Intel Core Ultra 7 265U, Intel Graphics 4-Core iGPU (Meteor / Arrow Lake)
18.1 fps -19%
Lenovo Yoga Book 9 13IMU9
Intel Core Ultra 7 155U, Intel Graphics 4-Core iGPU (Meteor / Arrow Lake)
16.2 fps -27%
1920x1080 Medium Preset AA:T
Dell Pro 13 Premium PA13250
Intel Core Ultra 7 268V, Intel Arc Graphics 140V
35.7 fps +94%
Dell XPS 13 9350
Intel Core Ultra 7 256V, Intel Arc Graphics 140V
30.5 fps +66%
HP OmniBook 7 Aero 13-bg1077nr
AMD Ryzen AI 7 350, AMD Radeon 860M
26.4 (15.9min, 16.5P0.1, 20.8P1) fps +43%
Dell Pro 7 13 2-in-1
Intel Core Ultra 7 366H, Intel Graphics 4 Xe3 Panther Lake iGPU
25.6 (22.8min, 22.9P0.1, 23.5P1) fps +39%
Durchschnittliche Intel Graphics 4 Xe3 Panther Lake iGPU
  (18.4 - 27.7, n=23)
24.1 fps +31%
Lenovo ThinkPad X13 Gen 7 AMD
AMD Ryzen AI 7 PRO 450, AMD Radeon 860M
23.8 (19.1min, 19.6P0.1, 21.7P1) fps +29%
MSI Summit E13 AI Evo A1MTG
Intel Core Ultra 7 155H, Intel Arc 8-Core iGPU
19.5 fps +6%
Lenovo ThinkPad X13 Detachable Gen 1
Intel Core Ultra 7 365, Intel Graphics 4 Xe3 Panther Lake iGPU
18.4 (16.9min, 16.9P0.1, 17.1P1) fps
Microsoft Surface Laptop 13 2026
Qualcomm Snapdragon X2 Plus X2P-42-100, Qualcomm SD X2 Adreno X2-45
17 (12min, 12P0.1, 15P1) fps -8%
HP EliteBook 8 Flip G1i 13
Intel Core Ultra 7 265U, Intel Graphics 4-Core iGPU (Meteor / Arrow Lake)
14.9 fps -19%
Lenovo Yoga Book 9 13IMU9
Intel Core Ultra 7 155U, Intel Graphics 4-Core iGPU (Meteor / Arrow Lake)
12.6 fps -32%
1920x1080 High Preset AA:T
Dell Pro 13 Premium PA13250
Intel Core Ultra 7 268V, Intel Arc Graphics 140V
31.3 fps +92%
Dell XPS 13 9350
Intel Core Ultra 7 256V, Intel Arc Graphics 140V
25.8 fps +58%
Dell Pro 7 13 2-in-1
Intel Core Ultra 7 366H, Intel Graphics 4 Xe3 Panther Lake iGPU
21.7 (19.7min, 19.8P0.1, 20.1P1) fps +33%
HP OmniBook 7 Aero 13-bg1077nr
AMD Ryzen AI 7 350, AMD Radeon 860M
21.1 (16.7min, 17.1P0.1, 18.9P1) fps +29%
Durchschnittliche Intel Graphics 4 Xe3 Panther Lake iGPU
  (16.3 - 24.3, n=23)
20.9 fps +28%
Lenovo ThinkPad X13 Gen 7 AMD
AMD Ryzen AI 7 PRO 450, AMD Radeon 860M
18.2 (15.5min, 15.6P0.1, 16.7P1) fps +12%
MSI Summit E13 AI Evo A1MTG
Intel Core Ultra 7 155H, Intel Arc 8-Core iGPU
16.8 fps +3%
Lenovo ThinkPad X13 Detachable Gen 1
Intel Core Ultra 7 365, Intel Graphics 4 Xe3 Panther Lake iGPU
16.3 (14.8min, 14.8P0.1, 15.1P1) fps
Microsoft Surface Laptop 13 2026
Qualcomm Snapdragon X2 Plus X2P-42-100, Qualcomm SD X2 Adreno X2-45
15 (12min, 12P0.1, 12P1) fps -8%
HP EliteBook 8 Flip G1i 13
Intel Core Ultra 7 265U, Intel Graphics 4-Core iGPU (Meteor / Arrow Lake)
12.8 fps -21%
1920x1080 Ultra Preset AA:T
Dell Pro 13 Premium PA13250
Intel Core Ultra 7 268V, Intel Arc Graphics 140V
30.8 fps +90%
Dell XPS 13 9350
Intel Core Ultra 7 256V, Intel Arc Graphics 140V
25.7 fps +59%
Dell Pro 7 13 2-in-1
Intel Core Ultra 7 366H, Intel Graphics 4 Xe3 Panther Lake iGPU
22.1 (20.3min, 20.3P0.1, 20.7P1) fps +36%
HP OmniBook 7 Aero 13-bg1077nr
AMD Ryzen AI 7 350, AMD Radeon 860M
20.6 (17.1min, 17.1P0.1, 18.4P1) fps +27%
Durchschnittliche Intel Graphics 4 Xe3 Panther Lake iGPU
  (16.2 - 23.7, n=23)
20.6 fps +27%
Lenovo ThinkPad X13 Gen 7 AMD
AMD Ryzen AI 7 PRO 450, AMD Radeon 860M
17.7 (14.7min, 14.9P0.1, 16.1P1) fps +9%
MSI Summit E13 AI Evo A1MTG
Intel Core Ultra 7 155H, Intel Arc 8-Core iGPU
16.3 fps +1%
Lenovo ThinkPad X13 Detachable Gen 1
Intel Core Ultra 7 365, Intel Graphics 4 Xe3 Panther Lake iGPU
16.2 (14.1min, 14.1P0.1, 14.2P1) fps
Microsoft Surface Laptop 13 2026
Qualcomm Snapdragon X2 Plus X2P-42-100, Qualcomm SD X2 Adreno X2-45
14.6 (12min, 12P0.1, 12P1) fps -10%
HP EliteBook 8 Flip G1i 13
Intel Core Ultra 7 265U, Intel Graphics 4-Core iGPU (Meteor / Arrow Lake)
12.7 fps -22%
Dota 2 Reborn
1920x1080 high (2/3)
Lenovo ThinkPad X13 Gen 7 AMD
AMD Ryzen AI 7 PRO 450, AMD Radeon 860M
89.8 (76.1min) fps +38%
Dell Pro 13 Premium PA13250
Intel Core Ultra 7 268V, Intel Arc Graphics 140V
87.8 (55.6min) fps +35%
Dell Pro 7 13 2-in-1
Intel Core Ultra 7 366H, Intel Graphics 4 Xe3 Panther Lake iGPU
87.6 (53.3min) fps +35%
Dell XPS 13 9350
Intel Core Ultra 7 256V, Intel Arc Graphics 140V
83 (35.8min) fps +27%
HP OmniBook 7 Aero 13-bg1077nr
AMD Ryzen AI 7 350, AMD Radeon 860M
82.7 (74.6min) fps +27%
Durchschnittliche Intel Graphics 4 Xe3 Panther Lake iGPU
  (56.4 - 97.8, n=25)
80.4 fps +24%
MSI Prestige 13 AI+ A3MG
Intel Core Ultra 9 386H, Intel Graphics 4 Xe3 Panther Lake iGPU
77.7 (49min) fps +19%
Microsoft Surface Laptop 13 2026
Qualcomm Snapdragon X2 Plus X2P-42-100, Qualcomm SD X2 Adreno X2-45
74.5 (65.3min) fps +14%
MSI Summit E13 AI Evo A1MTG
Intel Core Ultra 7 155H, Intel Arc 8-Core iGPU
65.2 (39.3min) fps 0%
Lenovo ThinkPad X13 Detachable Gen 1
Intel Core Ultra 7 365, Intel Graphics 4 Xe3 Panther Lake iGPU
65.1 (26.8min) fps
Lenovo Yoga Book 9 13IMU9
Intel Core Ultra 7 155U, Intel Graphics 4-Core iGPU (Meteor / Arrow Lake)
57.2 (42.7min) fps -12%
HP EliteBook 8 Flip G1i 13
Intel Core Ultra 7 265U, Intel Graphics 4-Core iGPU (Meteor / Arrow Lake)
44.6 (23.8min) fps -31%
1920x1080 ultra (3/3) best looking
Dell XPS 13 9350
Intel Core Ultra 7 256V, Intel Arc Graphics 140V
80.7 (52.1min) fps +34%
Lenovo ThinkPad X13 Gen 7 AMD
AMD Ryzen AI 7 PRO 450, AMD Radeon 860M
78.8 (69.7min) fps +31%
Dell Pro 7 13 2-in-1
Intel Core Ultra 7 366H, Intel Graphics 4 Xe3 Panther Lake iGPU
77.8 (47.6min) fps +29%
Durchschnittliche Intel Graphics 4 Xe3 Panther Lake iGPU
  (51.9 - 91.7, n=25)
76.2 fps +26%
HP OmniBook 7 Aero 13-bg1077nr
AMD Ryzen AI 7 350, AMD Radeon 860M
73.3 (66min) fps +22%
MSI Prestige 13 AI+ A3MG
Intel Core Ultra 9 386H, Intel Graphics 4 Xe3 Panther Lake iGPU
73 (46.6min) fps +21%
Dell Pro 13 Premium PA13250
Intel Core Ultra 7 268V, Intel Arc Graphics 140V
71.2 (43.6min) fps +18%
Microsoft Surface Laptop 13 2026
Qualcomm Snapdragon X2 Plus X2P-42-100, Qualcomm SD X2 Adreno X2-45
65.9 (58.2min) fps +9%
MSI Summit E13 AI Evo A1MTG
Intel Core Ultra 7 155H, Intel Arc 8-Core iGPU
63 (37.1min) fps +4%
Lenovo ThinkPad X13 Detachable Gen 1
Intel Core Ultra 7 365, Intel Graphics 4 Xe3 Panther Lake iGPU
60.3 (30.2min) fps
Lenovo Yoga Book 9 13IMU9
Intel Core Ultra 7 155U, Intel Graphics 4-Core iGPU (Meteor / Arrow Lake)
54.2 (41.9min) fps -10%
HP EliteBook 8 Flip G1i 13
Intel Core Ultra 7 265U, Intel Graphics 4-Core iGPU (Meteor / Arrow Lake)
52.4 (32.2min) fps -13%
Final Fantasy XV Benchmark
1280x720 Lite Quality
Dell XPS 13 9350
Intel Core Ultra 7 256V, Intel Arc Graphics 140V
79.4 fps +36%
Dell Pro 13 Premium PA13250
Intel Core Ultra 7 268V, Intel Arc Graphics 140V
74.9 fps +28%
Dell Pro 7 13 2-in-1
Intel Core Ultra 7 366H, Intel Graphics 4 Xe3 Panther Lake iGPU
73.4 fps +26%
Lenovo ThinkPad X13 Gen 7 AMD
AMD Ryzen AI 7 PRO 450, AMD Radeon 860M
72.9 fps +25%
Durchschnittliche Intel Graphics 4 Xe3 Panther Lake iGPU
  (45 - 76.4, n=23)
65.9 fps +13%
HP OmniBook 7 Aero 13-bg1077nr
AMD Ryzen AI 7 350, AMD Radeon 860M
63.4 fps +9%
Lenovo ThinkPad X13 Detachable Gen 1
Intel Core Ultra 7 365, Intel Graphics 4 Xe3 Panther Lake iGPU
58.4 fps
MSI Summit E13 AI Evo A1MTG
Intel Core Ultra 7 155H, Intel Arc 8-Core iGPU
49.2 fps -16%
Microsoft Surface Laptop 13 2026
Qualcomm Snapdragon X2 Plus X2P-42-100, Qualcomm SD X2 Adreno X2-45
47.3 fps -19%
HP EliteBook 8 Flip G1i 13
Intel Core Ultra 7 265U, Intel Graphics 4-Core iGPU (Meteor / Arrow Lake)
42.6 fps -27%
Lenovo Yoga Book 9 13IMU9
Intel Core Ultra 7 155U, Intel Graphics 4-Core iGPU (Meteor / Arrow Lake)
37.4 fps -36%
1920x1080 Standard Quality
Dell XPS 13 9350
Intel Core Ultra 7 256V, Intel Arc Graphics 140V
46.1 fps +49%
Dell Pro 13 Premium PA13250
Intel Core Ultra 7 268V, Intel Arc Graphics 140V
42.3 fps +36%
Dell Pro 7 13 2-in-1
Intel Core Ultra 7 366H, Intel Graphics 4 Xe3 Panther Lake iGPU
37.7 fps +22%
Lenovo ThinkPad X13 Gen 7 AMD
AMD Ryzen AI 7 PRO 450, AMD Radeon 860M
35.4 fps +14%
Durchschnittliche Intel Graphics 4 Xe3 Panther Lake iGPU
  (21.6 - 39.5, n=23)
34.6 fps +12%
HP OmniBook 7 Aero 13-bg1077nr
AMD Ryzen AI 7 350, AMD Radeon 860M
32.7 fps +5%
Lenovo ThinkPad X13 Detachable Gen 1
Intel Core Ultra 7 365, Intel Graphics 4 Xe3 Panther Lake iGPU
31 fps
MSI Summit E13 AI Evo A1MTG
Intel Core Ultra 7 155H, Intel Arc 8-Core iGPU
29.4 fps -5%
HP EliteBook 8 Flip G1i 13
Intel Core Ultra 7 265U, Intel Graphics 4-Core iGPU (Meteor / Arrow Lake)
24.9 fps -20%
Microsoft Surface Laptop 13 2026
Qualcomm Snapdragon X2 Plus X2P-42-100, Qualcomm SD X2 Adreno X2-45
24.6 fps -21%
Lenovo Yoga Book 9 13IMU9
Intel Core Ultra 7 155U, Intel Graphics 4-Core iGPU (Meteor / Arrow Lake)
23.4 fps -25%
1920x1080 High Quality
Dell XPS 13 9350
Intel Core Ultra 7 256V, Intel Arc Graphics 140V
31.5 fps +40%
Dell Pro 13 Premium PA13250
Intel Core Ultra 7 268V, Intel Arc Graphics 140V
29.1 fps +29%
Dell Pro 7 13 2-in-1
Intel Core Ultra 7 366H, Intel Graphics 4 Xe3 Panther Lake iGPU
26.3 fps +17%
Lenovo ThinkPad X13 Gen 7 AMD
AMD Ryzen AI 7 PRO 450, AMD Radeon 860M
25.1 fps +12%
Durchschnittliche Intel Graphics 4 Xe3 Panther Lake iGPU
  (16.7 - 27.4, n=23)
25 fps +11%
HP OmniBook 7 Aero 13-bg1077nr
AMD Ryzen AI 7 350, AMD Radeon 860M
23.3 fps +4%
Lenovo ThinkPad X13 Detachable Gen 1
Intel Core Ultra 7 365, Intel Graphics 4 Xe3 Panther Lake iGPU
22.5 fps
MSI Summit E13 AI Evo A1MTG
Intel Core Ultra 7 155H, Intel Arc 8-Core iGPU
20.7 fps -8%
HP EliteBook 8 Flip G1i 13
Intel Core Ultra 7 265U, Intel Graphics 4-Core iGPU (Meteor / Arrow Lake)
18.2 fps -19%
Lenovo Yoga Book 9 13IMU9
Intel Core Ultra 7 155U, Intel Graphics 4-Core iGPU (Meteor / Arrow Lake)
16.3 fps -28%
Microsoft Surface Laptop 13 2026
Qualcomm Snapdragon X2 Plus X2P-42-100, Qualcomm SD X2 Adreno X2-45
13.8 fps -39%
X-Plane 11.11
1280x720 low (fps_test=1)
Lenovo ThinkPad X13 Gen 7 AMD
AMD Ryzen AI 7 PRO 450, AMD Radeon 860M
65.3 fps +54%
HP OmniBook 7 Aero 13-bg1077nr
AMD Ryzen AI 7 350, AMD Radeon 860M
60.3 fps +42%
Dell Pro 13 Premium PA13250
Intel Core Ultra 7 268V, Intel Arc Graphics 140V
48.1 fps +13%
Dell XPS 13 9350
Intel Core Ultra 7 256V, Intel Arc Graphics 140V
47.1 fps +11%
MSI Summit E13 AI Evo A1MTG
Intel Core Ultra 7 155H, Intel Arc 8-Core iGPU
46.2 fps +9%
MSI Prestige 13 AI+ A3MG
Intel Core Ultra 9 386H, Intel Graphics 4 Xe3 Panther Lake iGPU
44.6 fps +5%
Lenovo ThinkPad X13 Detachable Gen 1
Intel Core Ultra 7 365, Intel Graphics 4 Xe3 Panther Lake iGPU
42.4 fps
Microsoft Surface Laptop 13 2026
Qualcomm Snapdragon X2 Plus X2P-42-100, Qualcomm SD X2 Adreno X2-45
40.3 fps -5%
Durchschnittliche Intel Graphics 4 Xe3 Panther Lake iGPU
  (33 - 45.7, n=25)
40.1 fps -5%
HP EliteBook 8 Flip G1i 13
Intel Core Ultra 7 265U, Intel Graphics 4-Core iGPU (Meteor / Arrow Lake)
35.3 fps -17%
Dell Pro 7 13 2-in-1
Intel Core Ultra 7 366H, Intel Graphics 4 Xe3 Panther Lake iGPU
35 fps -17%
Lenovo Yoga Book 9 13IMU9
Intel Core Ultra 7 155U, Intel Graphics 4-Core iGPU (Meteor / Arrow Lake)
34.7 fps -18%
1920x1080 med (fps_test=2)
Lenovo ThinkPad X13 Gen 7 AMD
AMD Ryzen AI 7 PRO 450, AMD Radeon 860M
50.4 fps +56%
HP OmniBook 7 Aero 13-bg1077nr
AMD Ryzen AI 7 350, AMD Radeon 860M
48.9 fps +51%
MSI Summit E13 AI Evo A1MTG
Intel Core Ultra 7 155H, Intel Arc 8-Core iGPU
37.5 fps +16%
Dell Pro 13 Premium PA13250
Intel Core Ultra 7 268V, Intel Arc Graphics 140V
36.7 fps +14%
Dell XPS 13 9350
Intel Core Ultra 7 256V, Intel Arc Graphics 140V
36.1 fps +12%
Microsoft Surface Laptop 13 2026
Qualcomm Snapdragon X2 Plus X2P-42-100, Qualcomm SD X2 Adreno X2-45
35 fps +8%
Dell Pro 7 13 2-in-1
Intel Core Ultra 7 366H, Intel Graphics 4 Xe3 Panther Lake iGPU
34.3 fps +6%
MSI Prestige 13 AI+ A3MG
Intel Core Ultra 9 386H, Intel Graphics 4 Xe3 Panther Lake iGPU
33.5 fps +4%
Lenovo ThinkPad X13 Detachable Gen 1
Intel Core Ultra 7 365, Intel Graphics 4 Xe3 Panther Lake iGPU
32.3 fps
Durchschnittliche Intel Graphics 4 Xe3 Panther Lake iGPU
  (24.6 - 37.6, n=25)
31.8 fps -2%
Lenovo Yoga Book 9 13IMU9
Intel Core Ultra 7 155U, Intel Graphics 4-Core iGPU (Meteor / Arrow Lake)
28.3 fps -12%
HP EliteBook 8 Flip G1i 13
Intel Core Ultra 7 265U, Intel Graphics 4-Core iGPU (Meteor / Arrow Lake)
28.1 fps -13%
1920x1080 high (fps_test=3)
HP OmniBook 7 Aero 13-bg1077nr
AMD Ryzen AI 7 350, AMD Radeon 860M
40.4 fps +54%
Lenovo ThinkPad X13 Gen 7 AMD
AMD Ryzen AI 7 PRO 450, AMD Radeon 860M
39.8 fps +52%
Dell Pro 7 13 2-in-1
Intel Core Ultra 7 366H, Intel Graphics 4 Xe3 Panther Lake iGPU
33.2 fps +27%
Dell Pro 13 Premium PA13250
Intel Core Ultra 7 268V, Intel Arc Graphics 140V
32.7 fps +25%
MSI Summit E13 AI Evo A1MTG
Intel Core Ultra 7 155H, Intel Arc 8-Core iGPU
31.4 fps +20%
Microsoft Surface Laptop 13 2026
Qualcomm Snapdragon X2 Plus X2P-42-100, Qualcomm SD X2 Adreno X2-45
30.6 fps +17%
Dell XPS 13 9350
Intel Core Ultra 7 256V, Intel Arc Graphics 140V
30.1 fps +15%
MSI Prestige 13 AI+ A3MG
Intel Core Ultra 9 386H, Intel Graphics 4 Xe3 Panther Lake iGPU
30.1 fps +15%
Durchschnittliche Intel Graphics 4 Xe3 Panther Lake iGPU
  (22.2 - 33.2, n=25)
28.1 fps +7%
Lenovo ThinkPad X13 Detachable Gen 1
Intel Core Ultra 7 365, Intel Graphics 4 Xe3 Panther Lake iGPU
26.2 fps
HP EliteBook 8 Flip G1i 13
Intel Core Ultra 7 265U, Intel Graphics 4-Core iGPU (Meteor / Arrow Lake)
23.7 fps -10%
Lenovo Yoga Book 9 13IMU9
Intel Core Ultra 7 155U, Intel Graphics 4-Core iGPU (Meteor / Arrow Lake)
23.6 fps -10%
F1 24
1920x1080 Low Preset AA:T AF:16x
Dell Pro 7 13 2-in-1
Intel Core Ultra 7 366H, Intel Graphics 4 Xe3 Panther Lake iGPU
76.2 (62min, 57P1) fps +36%
Lenovo ThinkPad X13 Gen 7 AMD
AMD Ryzen AI 7 PRO 450, AMD Radeon 860M
66 (52min, 47P1) fps +18%
Durchschnittliche Intel Graphics 4 Xe3 Panther Lake iGPU
  (51.2 - 76.2, n=18)
63.7 fps +14%
HP OmniBook 7 Aero 13-bg1077nr
AMD Ryzen AI 7 350, AMD Radeon 860M
57.4 (40min, 31P1) fps +3%
Lenovo ThinkPad X13 Detachable Gen 1
Intel Core Ultra 7 365, Intel Graphics 4 Xe3 Panther Lake iGPU
55.9 (43min, 42P1) fps
HP EliteBook 8 Flip G1i 13
Intel Core Ultra 7 265U, Intel Graphics 4-Core iGPU (Meteor / Arrow Lake)
35.1 (7min, 26P1) fps -37%
1920x1080 Medium Preset AA:T AF:16x
Dell Pro 7 13 2-in-1
Intel Core Ultra 7 366H, Intel Graphics 4 Xe3 Panther Lake iGPU
70.5 (60min, 55P1) fps +36%
Lenovo ThinkPad X13 Gen 7 AMD
AMD Ryzen AI 7 PRO 450, AMD Radeon 860M
59.1 (50min, 42P1) fps +14%
Durchschnittliche Intel Graphics 4 Xe3 Panther Lake iGPU
  (47.4 - 70.5, n=18)
59.1 fps +14%
HP OmniBook 7 Aero 13-bg1077nr
AMD Ryzen AI 7 350, AMD Radeon 860M
51.9 (40min, 27P1) fps 0%
Lenovo ThinkPad X13 Detachable Gen 1
Intel Core Ultra 7 365, Intel Graphics 4 Xe3 Panther Lake iGPU
51.7 (38min, 35P1) fps
HP EliteBook 8 Flip G1i 13
Intel Core Ultra 7 265U, Intel Graphics 4-Core iGPU (Meteor / Arrow Lake)
32.7 (8min, 20P1) fps -37%
1920x1080 High Preset AA:T AF:16x
Dell Pro 7 13 2-in-1
Intel Core Ultra 7 366H, Intel Graphics 4 Xe3 Panther Lake iGPU
50.5 (43min, 41P1) fps +29%
Durchschnittliche Intel Graphics 4 Xe3 Panther Lake iGPU
  (34.4 - 50.5, n=18)
43.5 fps +12%
Lenovo ThinkPad X13 Gen 7 AMD
AMD Ryzen AI 7 PRO 450, AMD Radeon 860M
42.6 (34min, 31P1) fps +9%
Lenovo ThinkPad X13 Detachable Gen 1
Intel Core Ultra 7 365, Intel Graphics 4 Xe3 Panther Lake iGPU
39 (29min, 30P1) fps
HP OmniBook 7 Aero 13-bg1077nr
AMD Ryzen AI 7 350, AMD Radeon 860M
37.8 (27min, 22P1) fps -3%
HP EliteBook 8 Flip G1i 13
Intel Core Ultra 7 265U, Intel Graphics 4-Core iGPU (Meteor / Arrow Lake)
23.8 (16P1) fps -39%
1920x1080 Ultra High Preset AA:T AF:16x
Dell Pro 7 13 2-in-1
Intel Core Ultra 7 366H, Intel Graphics 4 Xe3 Panther Lake iGPU
15.3 (12min, 12P1) fps +29%
Durchschnittliche Intel Graphics 4 Xe3 Panther Lake iGPU
  (10.5 - 15.3, n=18)
13.7 fps +15%
Lenovo ThinkPad X13 Detachable Gen 1
Intel Core Ultra 7 365, Intel Graphics 4 Xe3 Panther Lake iGPU
11.9 (9min, 9P1) fps
Lenovo ThinkPad X13 Gen 7 AMD
AMD Ryzen AI 7 PRO 450, AMD Radeon 860M
9.98 (7min, 7P1) fps -16%
HP OmniBook 7 Aero 13-bg1077nr
AMD Ryzen AI 7 350, AMD Radeon 860M
8 (3min, 4P1) fps -33%
HP EliteBook 8 Flip G1i 13
Intel Core Ultra 7 265U, Intel Graphics 4-Core iGPU (Meteor / Arrow Lake)
7.21 (1min, 4P1) fps -39%
Strange Brigade
1280x720 lowest AF:1
Dell Pro 13 Premium PA13250
Intel Core Ultra 7 268V, Intel Arc Graphics 140V
223 (50.2min, 124.2P1) fps +55%
Dell XPS 13 9350
Intel Core Ultra 7 256V, Intel Arc Graphics 140V
201 (47.5min, 157.9P1) fps +40%
Dell Pro 7 13 2-in-1
Intel Core Ultra 7 366H, Intel Graphics 4 Xe3 Panther Lake iGPU
195.4 (83.9min, 162.2P1) fps +36%
Lenovo ThinkPad X13 Gen 7 AMD
AMD Ryzen AI 7 PRO 450, AMD Radeon 860M
168.9 (102.1min, 144.8P1) fps +17%
Durchschnittliche Intel Graphics 4 Xe3 Panther Lake iGPU
  (69.7 - 198.1, n=20)
163.8 fps +14%
Lenovo ThinkPad X13 Detachable Gen 1
Intel Core Ultra 7 365, Intel Graphics 4 Xe3 Panther Lake iGPU
143.9 (22.3min, 107.5P1) fps
HP OmniBook 7 Aero 13-bg1077nr
AMD Ryzen AI 7 350, AMD Radeon 860M
142.8 (78.7min, 119.4P1) fps -1%
MSI Summit E13 AI Evo A1MTG
Intel Core Ultra 7 155H, Intel Arc 8-Core iGPU
131.2 (8.1min, 59.9P1) fps -9%
Lenovo Yoga Book 9 13IMU9
Intel Core Ultra 7 155U, Intel Graphics 4-Core iGPU (Meteor / Arrow Lake)
118.1 (28.9min, 93.5P1) fps -18%
Microsoft Surface Laptop 13 2026
Qualcomm Snapdragon X2 Plus X2P-42-100, Qualcomm SD X2 Adreno X2-45
111.4 (25.3min, 42.9P1) fps -23%
HP EliteBook 8 Flip G1i 13
Intel Core Ultra 7 265U, Intel Graphics 4-Core iGPU (Meteor / Arrow Lake)
93.9 (36.9min, 67.5P1) fps -35%
1920x1080 medium AA:medium AF:4
Dell XPS 13 9350
Intel Core Ultra 7 256V, Intel Arc Graphics 140V
84.4 (36.1min, 70.5P1) fps +49%
Dell Pro 13 Premium PA13250
Intel Core Ultra 7 268V, Intel Arc Graphics 140V
83.3 (44.1min, 71.1P1) fps +47%
Dell Pro 7 13 2-in-1
Intel Core Ultra 7 366H, Intel Graphics 4 Xe3 Panther Lake iGPU
81.1 (65min, 68.7P1) fps +43%
Lenovo ThinkPad X13 Gen 7 AMD
AMD Ryzen AI 7 PRO 450, AMD Radeon 860M
64.9 (44.8min, 50.5P1) fps +14%
Durchschnittliche Intel Graphics 4 Xe3 Panther Lake iGPU
  (32 - 81.1, n=20)
62.5 fps +10%
MSI Summit E13 AI Evo A1MTG
Intel Core Ultra 7 155H, Intel Arc 8-Core iGPU
61.3 (5.4min, 48.2P1) fps +8%
HP OmniBook 7 Aero 13-bg1077nr
AMD Ryzen AI 7 350, AMD Radeon 860M
59.6 (45.2min, 49.7P1) fps +5%
Lenovo ThinkPad X13 Detachable Gen 1
Intel Core Ultra 7 365, Intel Graphics 4 Xe3 Panther Lake iGPU
56.8 (11.6min, 45P1) fps
Lenovo Yoga Book 9 13IMU9
Intel Core Ultra 7 155U, Intel Graphics 4-Core iGPU (Meteor / Arrow Lake)
50.8 (25.8min, 42.3P1) fps -11%
Microsoft Surface Laptop 13 2026
Qualcomm Snapdragon X2 Plus X2P-42-100, Qualcomm SD X2 Adreno X2-45
42.3 (10.9min, 16.9P1) fps -26%
HP EliteBook 8 Flip G1i 13
Intel Core Ultra 7 265U, Intel Graphics 4-Core iGPU (Meteor / Arrow Lake)
41.7 (25.9min, 30.5P1) fps -27%
1920x1080 high AA:high AF:8
Dell Pro 13 Premium PA13250
Intel Core Ultra 7 268V, Intel Arc Graphics 140V
69.5 (38.9min, 55.1P1) fps +52%
Dell XPS 13 9350
Intel Core Ultra 7 256V, Intel Arc Graphics 140V
65.2 (28.3min, 51P1) fps +43%
Dell Pro 7 13 2-in-1
Intel Core Ultra 7 366H, Intel Graphics 4 Xe3 Panther Lake iGPU
58.8 (31.2min, 43.9P1) fps +29%
Durchschnittliche Intel Graphics 4 Xe3 Panther Lake iGPU
  (35.9 - 64.1, n=20)
53.5 fps +17%
Lenovo ThinkPad X13 Gen 7 AMD
AMD Ryzen AI 7 PRO 450, AMD Radeon 860M
52.7 (35.6min, 40.4P1) fps +16%
HP OmniBook 7 Aero 13-bg1077nr
AMD Ryzen AI 7 350, AMD Radeon 860M
48.4 (27.2min, 37P1) fps +6%
MSI Summit E13 AI Evo A1MTG
Intel Core Ultra 7 155H, Intel Arc 8-Core iGPU
45.7 (5min, 10.3P1) fps 0%
Lenovo ThinkPad X13 Detachable Gen 1
Intel Core Ultra 7 365, Intel Graphics 4 Xe3 Panther Lake iGPU
45.6 (11.3min, 20.7P1) fps
Lenovo Yoga Book 9 13IMU9
Intel Core Ultra 7 155U, Intel Graphics 4-Core iGPU (Meteor / Arrow Lake)
37.7 (6.8min, 13.1P1) fps -17%
Microsoft Surface Laptop 13 2026
Qualcomm Snapdragon X2 Plus X2P-42-100, Qualcomm SD X2 Adreno X2-45
33 (8.7min, 12.6P1) fps -28%
HP EliteBook 8 Flip G1i 13
Intel Core Ultra 7 265U, Intel Graphics 4-Core iGPU (Meteor / Arrow Lake)
32.4 (17.9min, 22.3P1) fps -29%
1920x1080 ultra AA:ultra AF:16
Dell XPS 13 9350
Intel Core Ultra 7 256V, Intel Arc Graphics 140V
58 (24.7min, 30.7P1) fps +46%
Dell Pro 13 Premium PA13250
Intel Core Ultra 7 268V, Intel Arc Graphics 140V
57.8 (16min, 33.5P1) fps +46%
Dell Pro 7 13 2-in-1
Intel Core Ultra 7 366H, Intel Graphics 4 Xe3 Panther Lake iGPU
56.5 (34.3min, 40.3P1) fps +42%
Durchschnittliche Intel Graphics 4 Xe3 Panther Lake iGPU
  (28.9 - 56.5, n=20)
46.2 fps +16%
Lenovo ThinkPad X13 Gen 7 AMD
AMD Ryzen AI 7 PRO 450, AMD Radeon 860M
44.1 (30.6min, 34.1P1) fps +11%
HP OmniBook 7 Aero 13-bg1077nr
AMD Ryzen AI 7 350, AMD Radeon 860M
40.3 (28.2min, 31.5P1) fps +2%
Lenovo ThinkPad X13 Detachable Gen 1
Intel Core Ultra 7 365, Intel Graphics 4 Xe3 Panther Lake iGPU
39.7 (9.5min, 13.8P1) fps
MSI Summit E13 AI Evo A1MTG
Intel Core Ultra 7 155H, Intel Arc 8-Core iGPU
33.9 (5min, 7.08P1) fps -15%
Lenovo Yoga Book 9 13IMU9
Intel Core Ultra 7 155U, Intel Graphics 4-Core iGPU (Meteor / Arrow Lake)
30.3 (7.5min, 11.1P1) fps -24%
HP EliteBook 8 Flip G1i 13
Intel Core Ultra 7 265U, Intel Graphics 4-Core iGPU (Meteor / Arrow Lake)
27.1 (16.1min, 18.4P1) fps -32%
Microsoft Surface Laptop 13 2026
Qualcomm Snapdragon X2 Plus X2P-42-100, Qualcomm SD X2 Adreno X2-45
26.9 (5.7min, 8.73P1) fps -32%
GTA V
1024x768 Lowest Settings possible
Lenovo ThinkPad X13 Gen 7 AMD
AMD Ryzen AI 7 PRO 450, AMD Radeon 860M
174.2 (3.13min, 111.1P1) fps +29%
Dell Pro 7 13 2-in-1
Intel Core Ultra 7 366H, Intel Graphics 4 Xe3 Panther Lake iGPU
168.5 (3.37min, 111.1P1) fps +25%
Durchschnittliche Intel Graphics 4 Xe3 Panther Lake iGPU
  (121.5 - 182.4, n=23)
163.3 fps +21%
Dell XPS 13 9350
Intel Core Ultra 7 256V, Intel Arc Graphics 140V
154.9 (4.26min, 83.3P1) fps +15%
Dell Pro 13 Premium PA13250
Intel Core Ultra 7 268V, Intel Arc Graphics 140V
153.4 (3.05min, 76.9P1) fps +14%
HP OmniBook 7 Aero 13-bg1077nr
AMD Ryzen AI 7 350, AMD Radeon 860M
151.9 (4.26min, 90.9P1) fps +13%
Lenovo ThinkPad X13 Detachable Gen 1
Intel Core Ultra 7 365, Intel Graphics 4 Xe3 Panther Lake iGPU
135 (4min, 76.9P1) fps
HP EliteBook 8 Flip G1i 13
Intel Core Ultra 7 265U, Intel Graphics 4-Core iGPU (Meteor / Arrow Lake)
127.4 (5.05min, 62.5P1) fps -6%
Microsoft Surface Laptop 13 2026
Qualcomm Snapdragon X2 Plus X2P-42-100, Qualcomm SD X2 Adreno X2-45
111.6 (4.79min, 50P1) fps -17%
MSI Summit E13 AI Evo A1MTG
Intel Core Ultra 7 155H, Intel Arc 8-Core iGPU
50.6 (12.7min, 25P1) fps -63%
1920x1080 Lowest Settings possible
Dell Pro 7 13 2-in-1
Intel Core Ultra 7 366H, Intel Graphics 4 Xe3 Panther Lake iGPU
149 (4.07min, 83.3P1) fps +35%
Dell XPS 13 9350
Intel Core Ultra 7 256V, Intel Arc Graphics 140V
146.7 (4.88min, 90.9P1) fps +33%
Durchschnittliche Intel Graphics 4 Xe3 Panther Lake iGPU
  (68.6 - 169.5, n=20)
139.1 fps +26%
Dell Pro 13 Premium PA13250
Intel Core Ultra 7 268V, Intel Arc Graphics 140V
136.6 (33min, 83.3P1) fps +24%
HP OmniBook 7 Aero 13-bg1077nr
AMD Ryzen AI 7 350, AMD Radeon 860M
124.9 (15.7min, 83.3P1) fps +13%
Lenovo ThinkPad X13 Detachable Gen 1
Intel Core Ultra 7 365, Intel Graphics 4 Xe3 Panther Lake iGPU
110.3 (33.7min, 71.4P1) fps
HP EliteBook 8 Flip G1i 13
Intel Core Ultra 7 265U, Intel Graphics 4-Core iGPU (Meteor / Arrow Lake)
89.6 (22min, 52.6P1) fps -19%
HP EliteBook 8 Flip G1i 13
Intel Core Ultra 7 265U, Intel Graphics 4-Core iGPU (Meteor / Arrow Lake)
89.3 (24.7min, 50P1) fps -19%
MSI Summit E13 AI Evo A1MTG
Intel Core Ultra 7 155H, Intel Arc 8-Core iGPU
45.6 (11.8min, 21.3P1) fps -59%
1366x768 Normal/Off AF:4x
Lenovo ThinkPad X13 Gen 7 AMD
AMD Ryzen AI 7 PRO 450, AMD Radeon 860M
159.7 (3.66min, 111.1P1) fps +28%
Durchschnittliche Intel Graphics 4 Xe3 Panther Lake iGPU
  (109.1 - 174.7, n=23)
152.7 fps +22%
Dell XPS 13 9350
Intel Core Ultra 7 256V, Intel Arc Graphics 140V
149.4 (4.38min, 90.9P1) fps +19%
Dell Pro 7 13 2-in-1
Intel Core Ultra 7 366H, Intel Graphics 4 Xe3 Panther Lake iGPU
145.9 (2.66min, 90.9P1) fps +17%
HP OmniBook 7 Aero 13-bg1077nr
AMD Ryzen AI 7 350, AMD Radeon 860M
143.2 (4.28min, 90.9P1) fps +14%
Dell Pro 13 Premium PA13250
Intel Core Ultra 7 268V, Intel Arc Graphics 140V
140 (5.12min, 83.3P1) fps +12%
Lenovo ThinkPad X13 Detachable Gen 1
Intel Core Ultra 7 365, Intel Graphics 4 Xe3 Panther Lake iGPU
125.2 (6.81min, 71.4P1) fps
HP EliteBook 8 Flip G1i 13
Intel Core Ultra 7 265U, Intel Graphics 4-Core iGPU (Meteor / Arrow Lake)
105.5 (21.5min, 52.6P1) fps -16%
Microsoft Surface Laptop 13 2026
Qualcomm Snapdragon X2 Plus X2P-42-100, Qualcomm SD X2 Adreno X2-45
101.4 (11.3min, 45.5P1) fps -19%
MSI Summit E13 AI Evo A1MTG
Intel Core Ultra 7 155H, Intel Arc 8-Core iGPU
51.1 (4.16min, 23.3P1) fps -59%
1920x1080 Normal/Off AF:4x
Durchschnittliche Intel Graphics 4 Xe3 Panther Lake iGPU
  (70.7 - 159.6, n=19)
134.3 fps +29%
Dell XPS 13 9350
Intel Core Ultra 7 256V, Intel Arc Graphics 140V
134.2 (5.63min, 83.3P1) fps +29%
Dell Pro 7 13 2-in-1
Intel Core Ultra 7 366H, Intel Graphics 4 Xe3 Panther Lake iGPU
127.9 (27.7min, 76.9P1) fps +23%
HP OmniBook 7 Aero 13-bg1077nr
AMD Ryzen AI 7 350, AMD Radeon 860M
120.3 (16.7min, 83.3P1) fps +16%
Dell Pro 13 Premium PA13250
Intel Core Ultra 7 268V, Intel Arc Graphics 140V
116 (6.05min, 71.4P1) fps +12%
Lenovo ThinkPad X13 Detachable Gen 1
Intel Core Ultra 7 365, Intel Graphics 4 Xe3 Panther Lake iGPU
103.9 (28.9min, 71.4P1) fps
HP EliteBook 8 Flip G1i 13
Intel Core Ultra 7 265U, Intel Graphics 4-Core iGPU (Meteor / Arrow Lake)
74.9 (21.5min, 37P1) fps -28%
MSI Summit E13 AI Evo A1MTG
Intel Core Ultra 7 155H, Intel Arc 8-Core iGPU
45.1 (9.23min, 19.6P1) fps -57%
1920x1080 High/On (Advanced Graphics Off) AA:2xMSAA + FX AF:8x
Lenovo ThinkPad X13 Gen 7 AMD
AMD Ryzen AI 7 PRO 450, AMD Radeon 860M
68.4 (6.7min, 50P1) fps +94%
Dell XPS 13 9350
Intel Core Ultra 7 256V, Intel Arc Graphics 140V
60.8 (2.26min, 43.5P1) fps +73%
HP OmniBook 7 Aero 13-bg1077nr
AMD Ryzen AI 7 350, AMD Radeon 860M
60.8 (3.38min, 41.7P1) fps +73%
Durchschnittliche Intel Graphics 4 Xe3 Panther Lake iGPU
  (35.2 - 58.2, n=22)
49.9 fps +42%
Dell Pro 7 13 2-in-1
Intel Core Ultra 7 366H, Intel Graphics 4 Xe3 Panther Lake iGPU
48.4 (4.46min, 27P1) fps +37%
Microsoft Surface Laptop 13 2026
Qualcomm Snapdragon X2 Plus X2P-42-100, Qualcomm SD X2 Adreno X2-45
43.1 (1.864min, 26.3P1) fps +22%
Lenovo ThinkPad X13 Detachable Gen 1
Intel Core Ultra 7 365, Intel Graphics 4 Xe3 Panther Lake iGPU
35.2 (7.95min, 26.3P1) fps
HP EliteBook 8 Flip G1i 13
Intel Core Ultra 7 265U, Intel Graphics 4-Core iGPU (Meteor / Arrow Lake)
24.4 (7.21min, 18.5P1) fps -31%
MSI Summit E13 AI Evo A1MTG
Intel Core Ultra 7 155H, Intel Arc 8-Core iGPU
23.9 (1.049min, 5.46P1) fps -32%
1920x1080 Highest AA:4xMSAA + FX AF:16x
Dell Pro 13 Premium PA13250
Intel Core Ultra 7 268V, Intel Arc Graphics 140V
26.3 (6.46min, 20P1) fps +45%
HP OmniBook 7 Aero 13-bg1077nr
AMD Ryzen AI 7 350, AMD Radeon 860M
25.7 (2.43min, 16.9P1) fps +42%
Dell XPS 13 9350
Intel Core Ultra 7 256V, Intel Arc Graphics 140V
25.6 (2.46min, 19.6P1) fps +41%
Lenovo ThinkPad X13 Gen 7 AMD
AMD Ryzen AI 7 PRO 450, AMD Radeon 860M
25.5 (4.77min, 18.2P1) fps +41%
Dell Pro 7 13 2-in-1
Intel Core Ultra 7 366H, Intel Graphics 4 Xe3 Panther Lake iGPU
21.8 (7.1min, 15.4P1) fps +20%
Durchschnittliche Intel Graphics 4 Xe3 Panther Lake iGPU
  (11.3 - 23.8, n=23)
20.1 fps +11%
Lenovo ThinkPad X13 Detachable Gen 1
Intel Core Ultra 7 365, Intel Graphics 4 Xe3 Panther Lake iGPU
18.1 (4.05min, 11.4P1) fps
Microsoft Surface Laptop 13 2026
Qualcomm Snapdragon X2 Plus X2P-42-100, Qualcomm SD X2 Adreno X2-45
18 (3.93min, 12.3P1) fps -1%
MSI Summit E13 AI Evo A1MTG
Intel Core Ultra 7 155H, Intel Arc 8-Core iGPU
12 (0.731min, 1.473P1) fps -34%
HP EliteBook 8 Flip G1i 13
Intel Core Ultra 7 265U, Intel Graphics 4-Core iGPU (Meteor / Arrow Lake)
9.99 (2.84min, 7.46P1) fps -45%
Cyberpunk 2077
1280x720 Low Preset (FSR off)
Dell XPS 13 9350
Intel Core Ultra 7 256V, Intel Arc Graphics 140V
66.6 (50.2min) fps +27%
Dell Pro 7 13 2-in-1
Intel Core Ultra 7 366H, Intel Graphics 4 Xe3 Panther Lake iGPU
64.4 (52.8min, 50.4P1) fps +23%
Durchschnittliche Intel Graphics 4 Xe3 Panther Lake iGPU
  (48.1 - 68.3, n=16)
60.5 fps +16%
Dell Pro 13 Premium PA13250
Intel Core Ultra 7 268V, Intel Arc Graphics 140V
59.2 (44.1min) fps +13%
Lenovo ThinkPad X13 Detachable Gen 1
Intel Core Ultra 7 365, Intel Graphics 4 Xe3 Panther Lake iGPU
52.3 (42.3min, 39.4P1) fps
HP OmniBook 7 Aero 13-bg1077nr
AMD Ryzen AI 7 350, AMD Radeon 860M
49 (39min, 12.1P1) fps -6%
MSI Summit E13 AI Evo A1MTG
Intel Core Ultra 7 155H, Intel Arc 8-Core iGPU
40.9 (34.6min, 31.9P1) fps -22%
HP EliteBook 8 Flip G1i 13
Intel Core Ultra 7 265U, Intel Graphics 4-Core iGPU (Meteor / Arrow Lake)
32.7 (26.5min, 25.4P1) fps -37%
Lenovo Yoga Book 9 13IMU9
Intel Core Ultra 7 155U, Intel Graphics 4-Core iGPU (Meteor / Arrow Lake)
32.5 (23.8min) fps -38%
1920x1080 Low Preset (FSR off)
Dell XPS 13 9350
Intel Core Ultra 7 256V, Intel Arc Graphics 140V
45.7 (36.4min) fps +47%
Dell Pro 13 Premium PA13250
Intel Core Ultra 7 268V, Intel Arc Graphics 140V
43.5 (35.2min) fps +40%
Dell Pro 7 13 2-in-1
Intel Core Ultra 7 366H, Intel Graphics 4 Xe3 Panther Lake iGPU
38.8 (33.1min, 31.6P1) fps +25%
MSI Prestige 13 AI+ A3MG
Intel Core Ultra 9 386H, Intel Graphics 4 Xe3 Panther Lake iGPU
37.3 (32min) fps +20%
Durchschnittliche Intel Graphics 4 Xe3 Panther Lake iGPU
  (29.6 - 40.2, n=25)
36.6 fps +18%
Lenovo ThinkPad X13 Gen 7 AMD
AMD Ryzen AI 7 PRO 450, AMD Radeon 860M
34.3 (27.5min) fps +11%
HP OmniBook 7 Aero 13-bg1077nr
AMD Ryzen AI 7 350, AMD Radeon 860M
32.5 (27min, 25.2P1) fps +5%
Lenovo ThinkPad X13 Detachable Gen 1
Intel Core Ultra 7 365, Intel Graphics 4 Xe3 Panther Lake iGPU
31 (26.3min, 25.5P1) fps
MSI Summit E13 AI Evo A1MTG
Intel Core Ultra 7 155H, Intel Arc 8-Core iGPU
28.3 (23.5min, 20P1) fps -9%
Microsoft Surface Laptop 13 2026
Qualcomm Snapdragon X2 Plus X2P-42-100, Qualcomm SD X2 Adreno X2-45
21.8 (17.7min) fps -30%
Lenovo Yoga Book 9 13IMU9
Intel Core Ultra 7 155U, Intel Graphics 4-Core iGPU (Meteor / Arrow Lake)
21.6 (16.7min) fps -30%
HP EliteBook 8 Flip G1i 13
Intel Core Ultra 7 265U, Intel Graphics 4-Core iGPU (Meteor / Arrow Lake)
21.1 (17.8min, 16.2P1) fps -32%
1920x1080 Medium Preset (FSR off)
Dell XPS 13 9350
Intel Core Ultra 7 256V, Intel Arc Graphics 140V
37 (30.1min) fps +55%
Dell Pro 13 Premium PA13250
Intel Core Ultra 7 268V, Intel Arc Graphics 140V
35.4 (29.4min) fps +49%
Dell Pro 7 13 2-in-1
Intel Core Ultra 7 366H, Intel Graphics 4 Xe3 Panther Lake iGPU
29.3 (25.6min, 24.4P1) fps +23%
MSI Prestige 13 AI+ A3MG
Intel Core Ultra 9 386H, Intel Graphics 4 Xe3 Panther Lake iGPU
28.8 (25min) fps +21%
Durchschnittliche Intel Graphics 4 Xe3 Panther Lake iGPU
  (23.2 - 30.9, n=25)
27.8 fps +17%
Lenovo ThinkPad X13 Gen 7 AMD
AMD Ryzen AI 7 PRO 450, AMD Radeon 860M
26.6 (22.3min) fps +12%
HP OmniBook 7 Aero 13-bg1077nr
AMD Ryzen AI 7 350, AMD Radeon 860M
24.9 (21.2min, 18.5P1) fps +5%
Lenovo ThinkPad X13 Detachable Gen 1
Intel Core Ultra 7 365, Intel Graphics 4 Xe3 Panther Lake iGPU
23.8 (20.4min, 19.9P1) fps
MSI Summit E13 AI Evo A1MTG
Intel Core Ultra 7 155H, Intel Arc 8-Core iGPU
23.4 (17.4min, 15.7P1) fps -2%
Lenovo Yoga Book 9 13IMU9
Intel Core Ultra 7 155U, Intel Graphics 4-Core iGPU (Meteor / Arrow Lake)
17.6 (14.4min) fps -26%
HP EliteBook 8 Flip G1i 13
Intel Core Ultra 7 265U, Intel Graphics 4-Core iGPU (Meteor / Arrow Lake)
17.1 (14.8min, 14.3P1) fps -28%
Microsoft Surface Laptop 13 2026
Qualcomm Snapdragon X2 Plus X2P-42-100, Qualcomm SD X2 Adreno X2-45
16.8 (14.1min) fps -29%
1920x1080 High Preset (FSR off)
Dell XPS 13 9350
Intel Core Ultra 7 256V, Intel Arc Graphics 140V
32 (26.2min) fps +55%
Dell Pro 13 Premium PA13250
Intel Core Ultra 7 268V, Intel Arc Graphics 140V
28.6 (22.4min) fps +39%
Dell Pro 7 13 2-in-1
Intel Core Ultra 7 366H, Intel Graphics 4 Xe3 Panther Lake iGPU
25.3 (21.8min, 21.1P1) fps +23%
MSI Prestige 13 AI+ A3MG
Intel Core Ultra 9 386H, Intel Graphics 4 Xe3 Panther Lake iGPU
24.4 (21min) fps +18%
Durchschnittliche Intel Graphics 4 Xe3 Panther Lake iGPU
  (19.6 - 26.8, n=25)
23.5 fps +14%
Lenovo ThinkPad X13 Gen 7 AMD
AMD Ryzen AI 7 PRO 450, AMD Radeon 860M
21.2 (17.6min) fps +3%
Lenovo ThinkPad X13 Detachable Gen 1
Intel Core Ultra 7 365, Intel Graphics 4 Xe3 Panther Lake iGPU
20.6 (17.7min, 17.1P1) fps
HP OmniBook 7 Aero 13-bg1077nr
AMD Ryzen AI 7 350, AMD Radeon 860M
19.8 (16.2min, 14.7P1) fps -4%
Lenovo Yoga Book 9 13IMU9
Intel Core Ultra 7 155U, Intel Graphics 4-Core iGPU (Meteor / Arrow Lake)
14.9 (12.1min) fps -28%
HP EliteBook 8 Flip G1i 13
Intel Core Ultra 7 265U, Intel Graphics 4-Core iGPU (Meteor / Arrow Lake)
14.6 (12.5min, 12.2P1) fps -29%
Microsoft Surface Laptop 13 2026
Qualcomm Snapdragon X2 Plus X2P-42-100, Qualcomm SD X2 Adreno X2-45
14.3 (12min) fps -31%
1920x1080 Ultra Preset (FSR off)
Dell Pro 13 Premium PA13250
Intel Core Ultra 7 268V, Intel Arc Graphics 140V
28.1 (22.8min) fps +63%
Dell Pro 7 13 2-in-1
Intel Core Ultra 7 366H, Intel Graphics 4 Xe3 Panther Lake iGPU
21.6 (18.4min, 17.5P1) fps +26%
Durchschnittliche Intel Graphics 4 Xe3 Panther Lake iGPU
  (16.8 - 22.6, n=25)
20 fps +16%
Dell XPS 13 9350
Intel Core Ultra 7 256V, Intel Arc Graphics 140V
19.1 (15.5min) fps +11%
MSI Prestige 13 AI+ A3MG
Intel Core Ultra 9 386H, Intel Graphics 4 Xe3 Panther Lake iGPU
19.1 (16min) fps +11%
Lenovo ThinkPad X13 Gen 7 AMD
AMD Ryzen AI 7 PRO 450, AMD Radeon 860M
17.5 (13.8min) fps +2%
Lenovo ThinkPad X13 Detachable Gen 1
Intel Core Ultra 7 365, Intel Graphics 4 Xe3 Panther Lake iGPU
17.2 (14.6min, 14.1P1) fps
HP OmniBook 7 Aero 13-bg1077nr
AMD Ryzen AI 7 350, AMD Radeon 860M
16.5 (13.6min, 12.7P1) fps -4%
Lenovo Yoga Book 9 13IMU9
Intel Core Ultra 7 155U, Intel Graphics 4-Core iGPU (Meteor / Arrow Lake)
13 (10.4min) fps -24%
Microsoft Surface Laptop 13 2026
Qualcomm Snapdragon X2 Plus X2P-42-100, Qualcomm SD X2 Adreno X2-45
12.2 (10.2min) fps -29%
HP EliteBook 8 Flip G1i 13
Intel Core Ultra 7 265U, Intel Graphics 4-Core iGPU (Meteor / Arrow Lake)
12 (10.3min, 9.93P1) fps -30%

Cyberpunk 2077: FPS-Diagramm mit Ultra-Einstellungen

05101520Tooltip
Lenovo ThinkPad X13 Detachable Gen 1 Ultra 7 365, Intel Graphics 4 Xe3 PTL: Ø12.8 (10.7-14.9) fps
Dell Pro 7 13 2-in-1 Ultra 7 366H, Intel Graphics 4 Xe3 PTL: Ø20.5 (17-21.7) fps
min.mittelhochmax.
GTA V (2015) 135 125.2 35.2 18.1
Dota 2 Reborn (2015) 108.5 62.6 65.1 60.3
Final Fantasy XV Benchmark (2018) 58.4 31 22.5
X-Plane 11.11 (2018) 42.4 32.3 26.2
Strange Brigade (2018) 143.9 56.8 45.6 39.7
Baldur's Gate 3 (2023) 22.3 18.4 16.3 16.2
Cyberpunk 2077 (2023) 31 23.8 20.6 17.2
F1 24 (2024) 55.9 51.7 39 11.9

Emissionen

Geräuschemissionen

Bei geringer Last oder beim Streamen von 4K60-Videos bleibt das System lautlos. Selbst unter anspruchsvollerer Last ist der Lüfter leiser als bei den meisten anderen Convertibles.
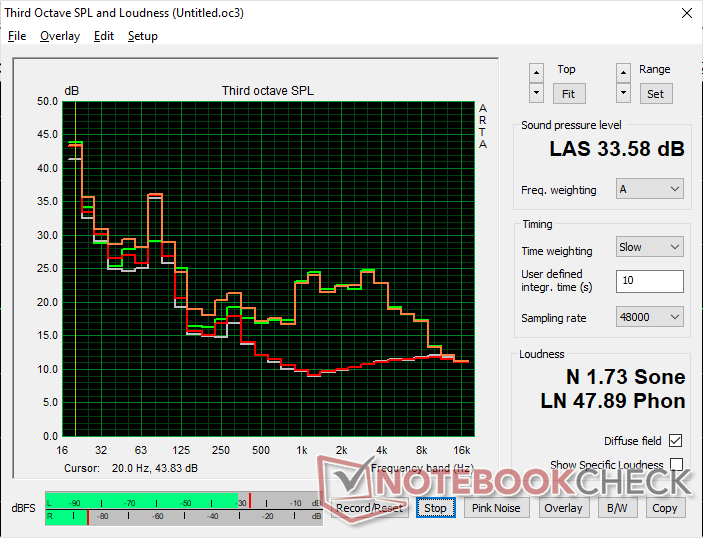
Lüftergeräuschprofil (Weiß: Hintergrund, Rot: Leerlauf, Orange: Cyberpunk 2077, Grün: Prime95-Stresstest)

Lautstärkediagramm

Idle
23.9 / 23.9 / 24 dB(A)
Last
/ 33.6 dB(A)
  red to green bar
 
 
30 dB
leise
40 dB(A)
deutlich hörbar
50 dB(A)
störend
 
min: dark, med: mid, max: light   Earthworks M23R, Arta (aus 15 cm gemessen)   Umgebungsgeräusche: 23.7 dB(A)
dB(A) 0102030405060708090Deep BassMiddle BassHigh BassLower RangeMidsHigher MidsLower HighsMid HighsUpper HighsSuper Highs2043.543.241.443.62535.633.432.533.93130.930.229.129.84028.626.524.925.65029.32724.627.76328.225.825.128.18036.23635.52910028.926.925.825.812524.420.519.225.116018.915.715.316.520018.115.114.916.425020.416.914.817.331521.417.916.819.340019.21413.817.750017.212.112.116.963017.611.51117.280016.710.71017.2100022.89.89.723.11250249.1924.5160021.59.79.621.9200022.3109.922.5250022.510.310.322315024.510.810.724.7400022.811.111.222.850001911.311.519.2630018.111.511.418.2800017.111.711.717.21000013.311.812.113.41250012.211.511.812.11600011.111.111.211.2SPL33.523.923.733.6N1.80.50.51.7median 19.2median 11.5median 11.5median 18.2Delta2.82.32.33hearing rangehide median Fan NoiseLenovo ThinkPad X13 Detachable Gen 1
Lenovo ThinkPad X13 Detachable Gen 1
Ultra 7 365, Intel Graphics 4 Xe3 PTL
Lenovo ThinkPad X13 Gen 7 AMD
Ryzen AI 7 PRO 450, Radeon 860M
Dell Pro 7 13 2-in-1
Ultra 7 366H, Intel Graphics 4 Xe3 PTL
Dell Pro 13 Premium PA13250
Core Ultra 7 268V, Arc 140V
MSI Prestige 13 AI+ A3MG
Ultra 9 386H, Intel Graphics 4 Xe3 PTL
HP EliteBook 8 Flip G1i 13
Ultra 7 265U, Graphics 4-Core iGPU (Arrow Lake)
Geräuschentwicklung
-9%
-12%
-7%
-15%
-7%
aus / Umgebung * (dB)
23.7
24.6
-4%
23.3
2%
23
3%
25
-5%
23.7
-0%
Idle min * (dB)
23.9
24.6
-3%
23.3
3%
23
4%
26
-9%
24.8
-4%
Idle avg * (dB)
23.9
24.6
-3%
23.3
3%
23
4%
27
-13%
24.8
-4%
Idle max * (dB)
24
24.6
-3%
26.7
-11%
23
4%
28
-17%
24.9
-4%
Cyberpunk 2077 ultra * (dB)
33.5
39.9
-19%
44.5
-33%
42.74
-28%
41
-22%
39.5
-18%
Last max * (dB)
33.6
39.9
-19%
46
-37%
42.74
-27%
42
-25%
37.4
-11%
Last avg * (dB)
32.9
29.1
37
31
37.1

* ... kleinere Werte sind besser

Temperatur
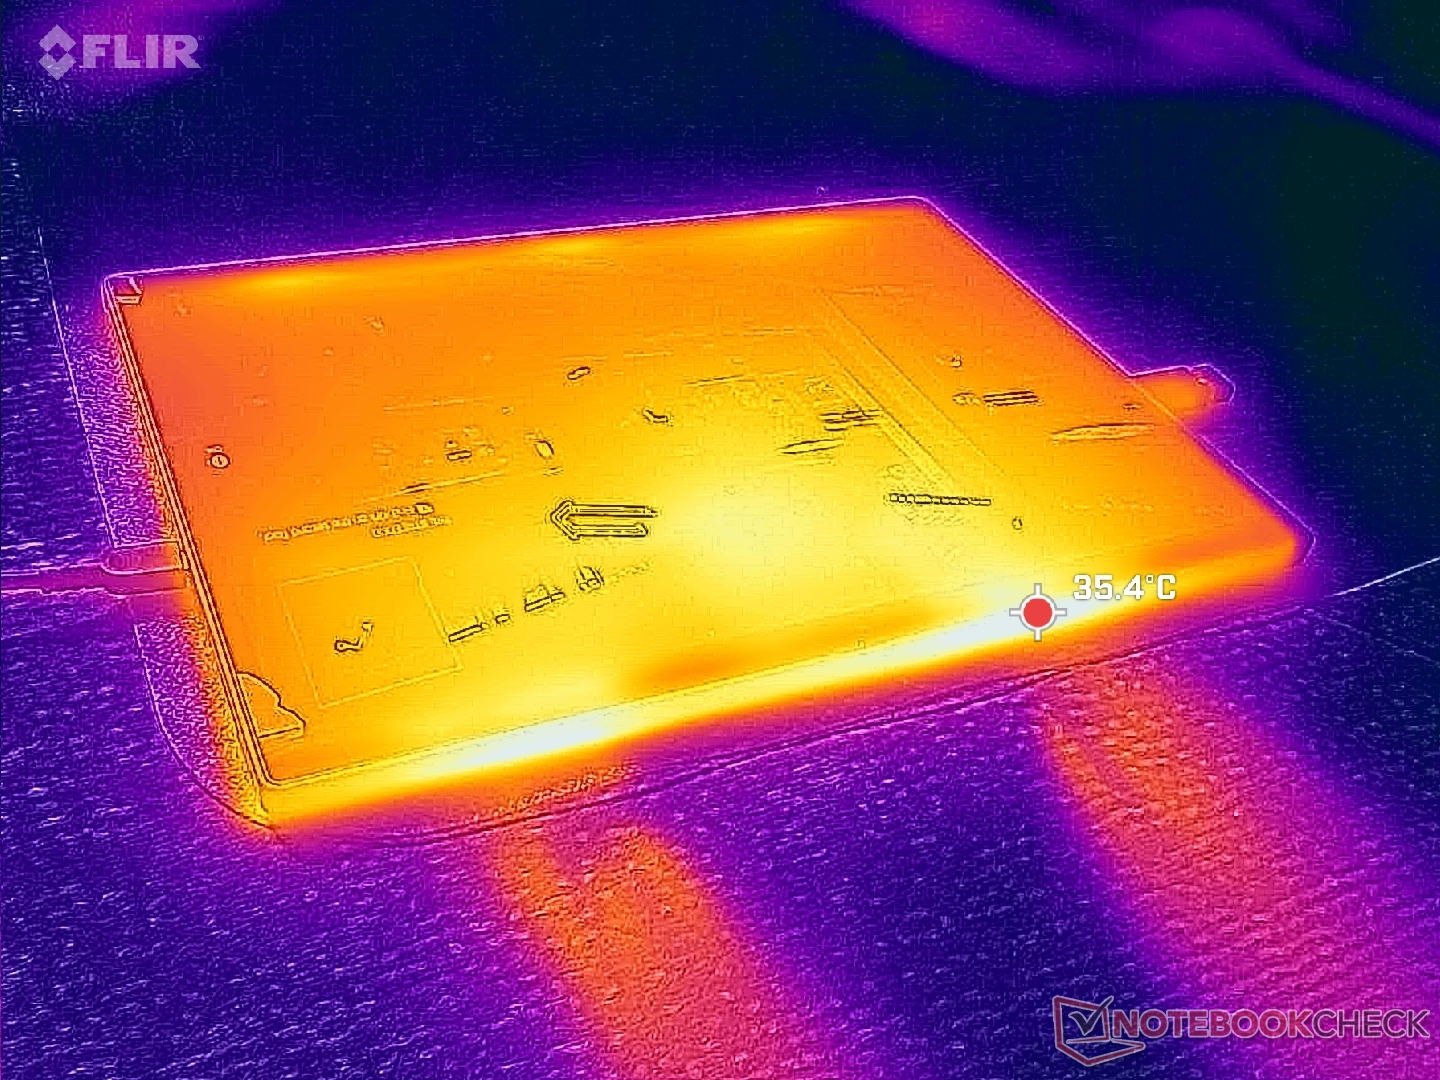
Zwei Luftauslässe an der Oberkante des Tablet-Teils
Das Netzteil erreicht unter anspruchsvoller Last etwas über 30 °C
Max. Last
33.2 °C34.8 °C33.2 °C
33.2 °C35.4 °C31.6 °C
31.6 °C32.6 °C32.2 °C
Maximal: 35.4 °C
Durchschnitt: 33.1 °C
37.4 °C40 °C37.8 °C
34.8 °C39.6 °C36.8 °C
31.8 °C33.4 °C33 °C
Maximal: 40 °C
Durchschnitt: 36.1 °C
Netzteil (max.)  34 °C | Raumtemperatur 20 °C | Fluke 62 Mini IR Thermometer
(±) Die Durchschnittstemperatur auf der Oberseite unter extremer Last ist 33.1 °C. Im Vergleich erhitzte sich der Durchschnitt der Geräteklasse Convertible auf 30.3 °C.
(+) Die maximale Temperatur auf der Oberseite ist 35.4 °C. Im Vergleich liegt der Klassendurchschnitt bei 35.4 °C (von 19.6 bis 60 °C für die Klasse Convertible).
(±) Auf der Unterseite messen wir eine maximalen Wert von 40 °C (im Vergleich zum Durchschnitt von 36.9 °C).
(+) Ohne Last messen wir eine durchschnittliche Temperatur von 26.9 °C auf der Oberseite. Der Klassendurchschnitt erreicht 30.3 °C.
(+) Die Handballen und der Touchpad-Bereich erreichen maximal 32.6 °C und damit die typische Hauttemperatur und fühlen sich daher nicht heiß an.
(-) Die durchschnittliche Handballen-Temperatur anderer getesteter Geräte war 28 °C (-4.6 °C).
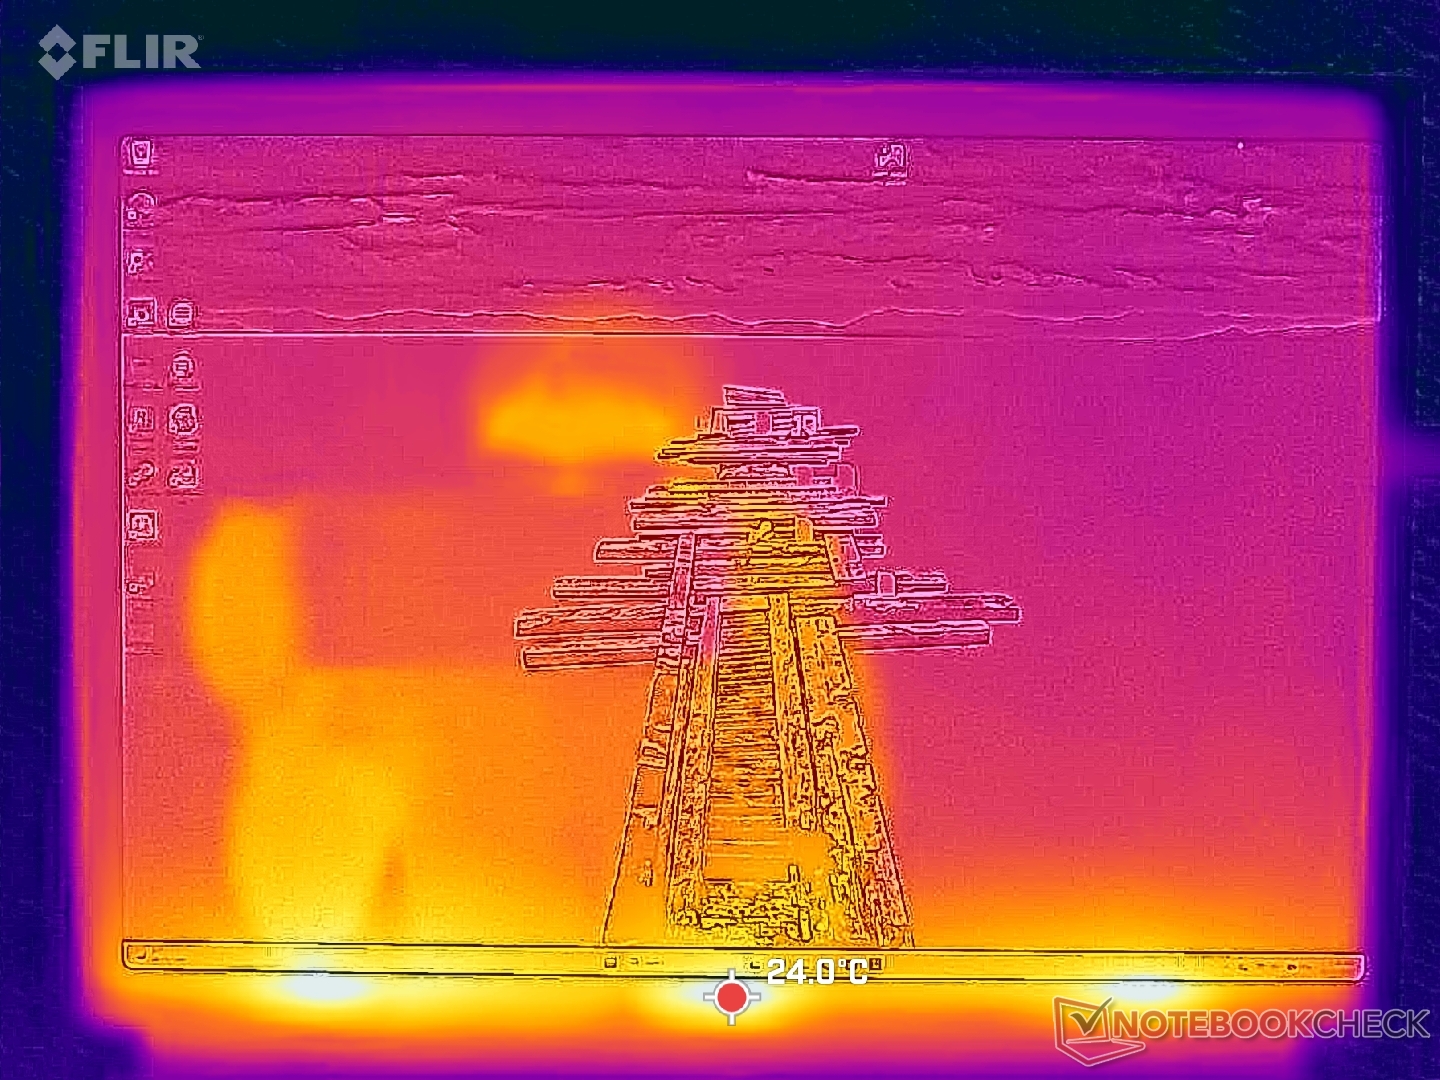
Leerlauf (Vorderseite)
Leerlauf (Rückseite)
Stresstest (Vorderseite)
Stresstest (Rückseite)
Lenovo ThinkPad X13 Detachable Gen 1
Ultra 7 365, Intel Graphics 4 Xe3 PTL
Lenovo ThinkPad X13 Gen 7 AMD
Ryzen AI 7 PRO 450, Radeon 860M
Dell Pro 7 13 2-in-1
Ultra 7 366H, Intel Graphics 4 Xe3 PTL
Dell Pro 13 Premium PA13250
Core Ultra 7 268V, Arc 140V
MSI Prestige 13 AI+ A3MG
Ultra 9 386H, Intel Graphics 4 Xe3 PTL
HP EliteBook 8 Flip G1i 13
Ultra 7 265U, Graphics 4-Core iGPU (Arrow Lake)
Hitze
-8%
2%
15%
-11%
-13%
Last oben max * (°C)
35.4
44.3
-25%
42.2
-19%
31
12%
42
-19%
46.2
-31%
Last unten max * (°C)
40
45.1
-13%
44.2
-11%
31
22%
41
-2%
51
-27%
Idle oben max * (°C)
28.2
26.6
6%
22.8
19%
24
15%
26.8
5%
Idle unten max * (°C)
27.2
26.8
1%
22.6
17%
24
12%
26.4
3%

* ... kleinere Werte sind besser

Stresstest

Das Turbo-Boost-Potenzial der CPU ist begrenzt. Beim Start des Prime95-Stresstests erreicht die CPU zunächst 3,2 GHz, 37 W und heiße 96 °C, bevor sie sich etwa eine Minute später bei 2,0 GHz, 15 W und 73 °C stabilisiert.
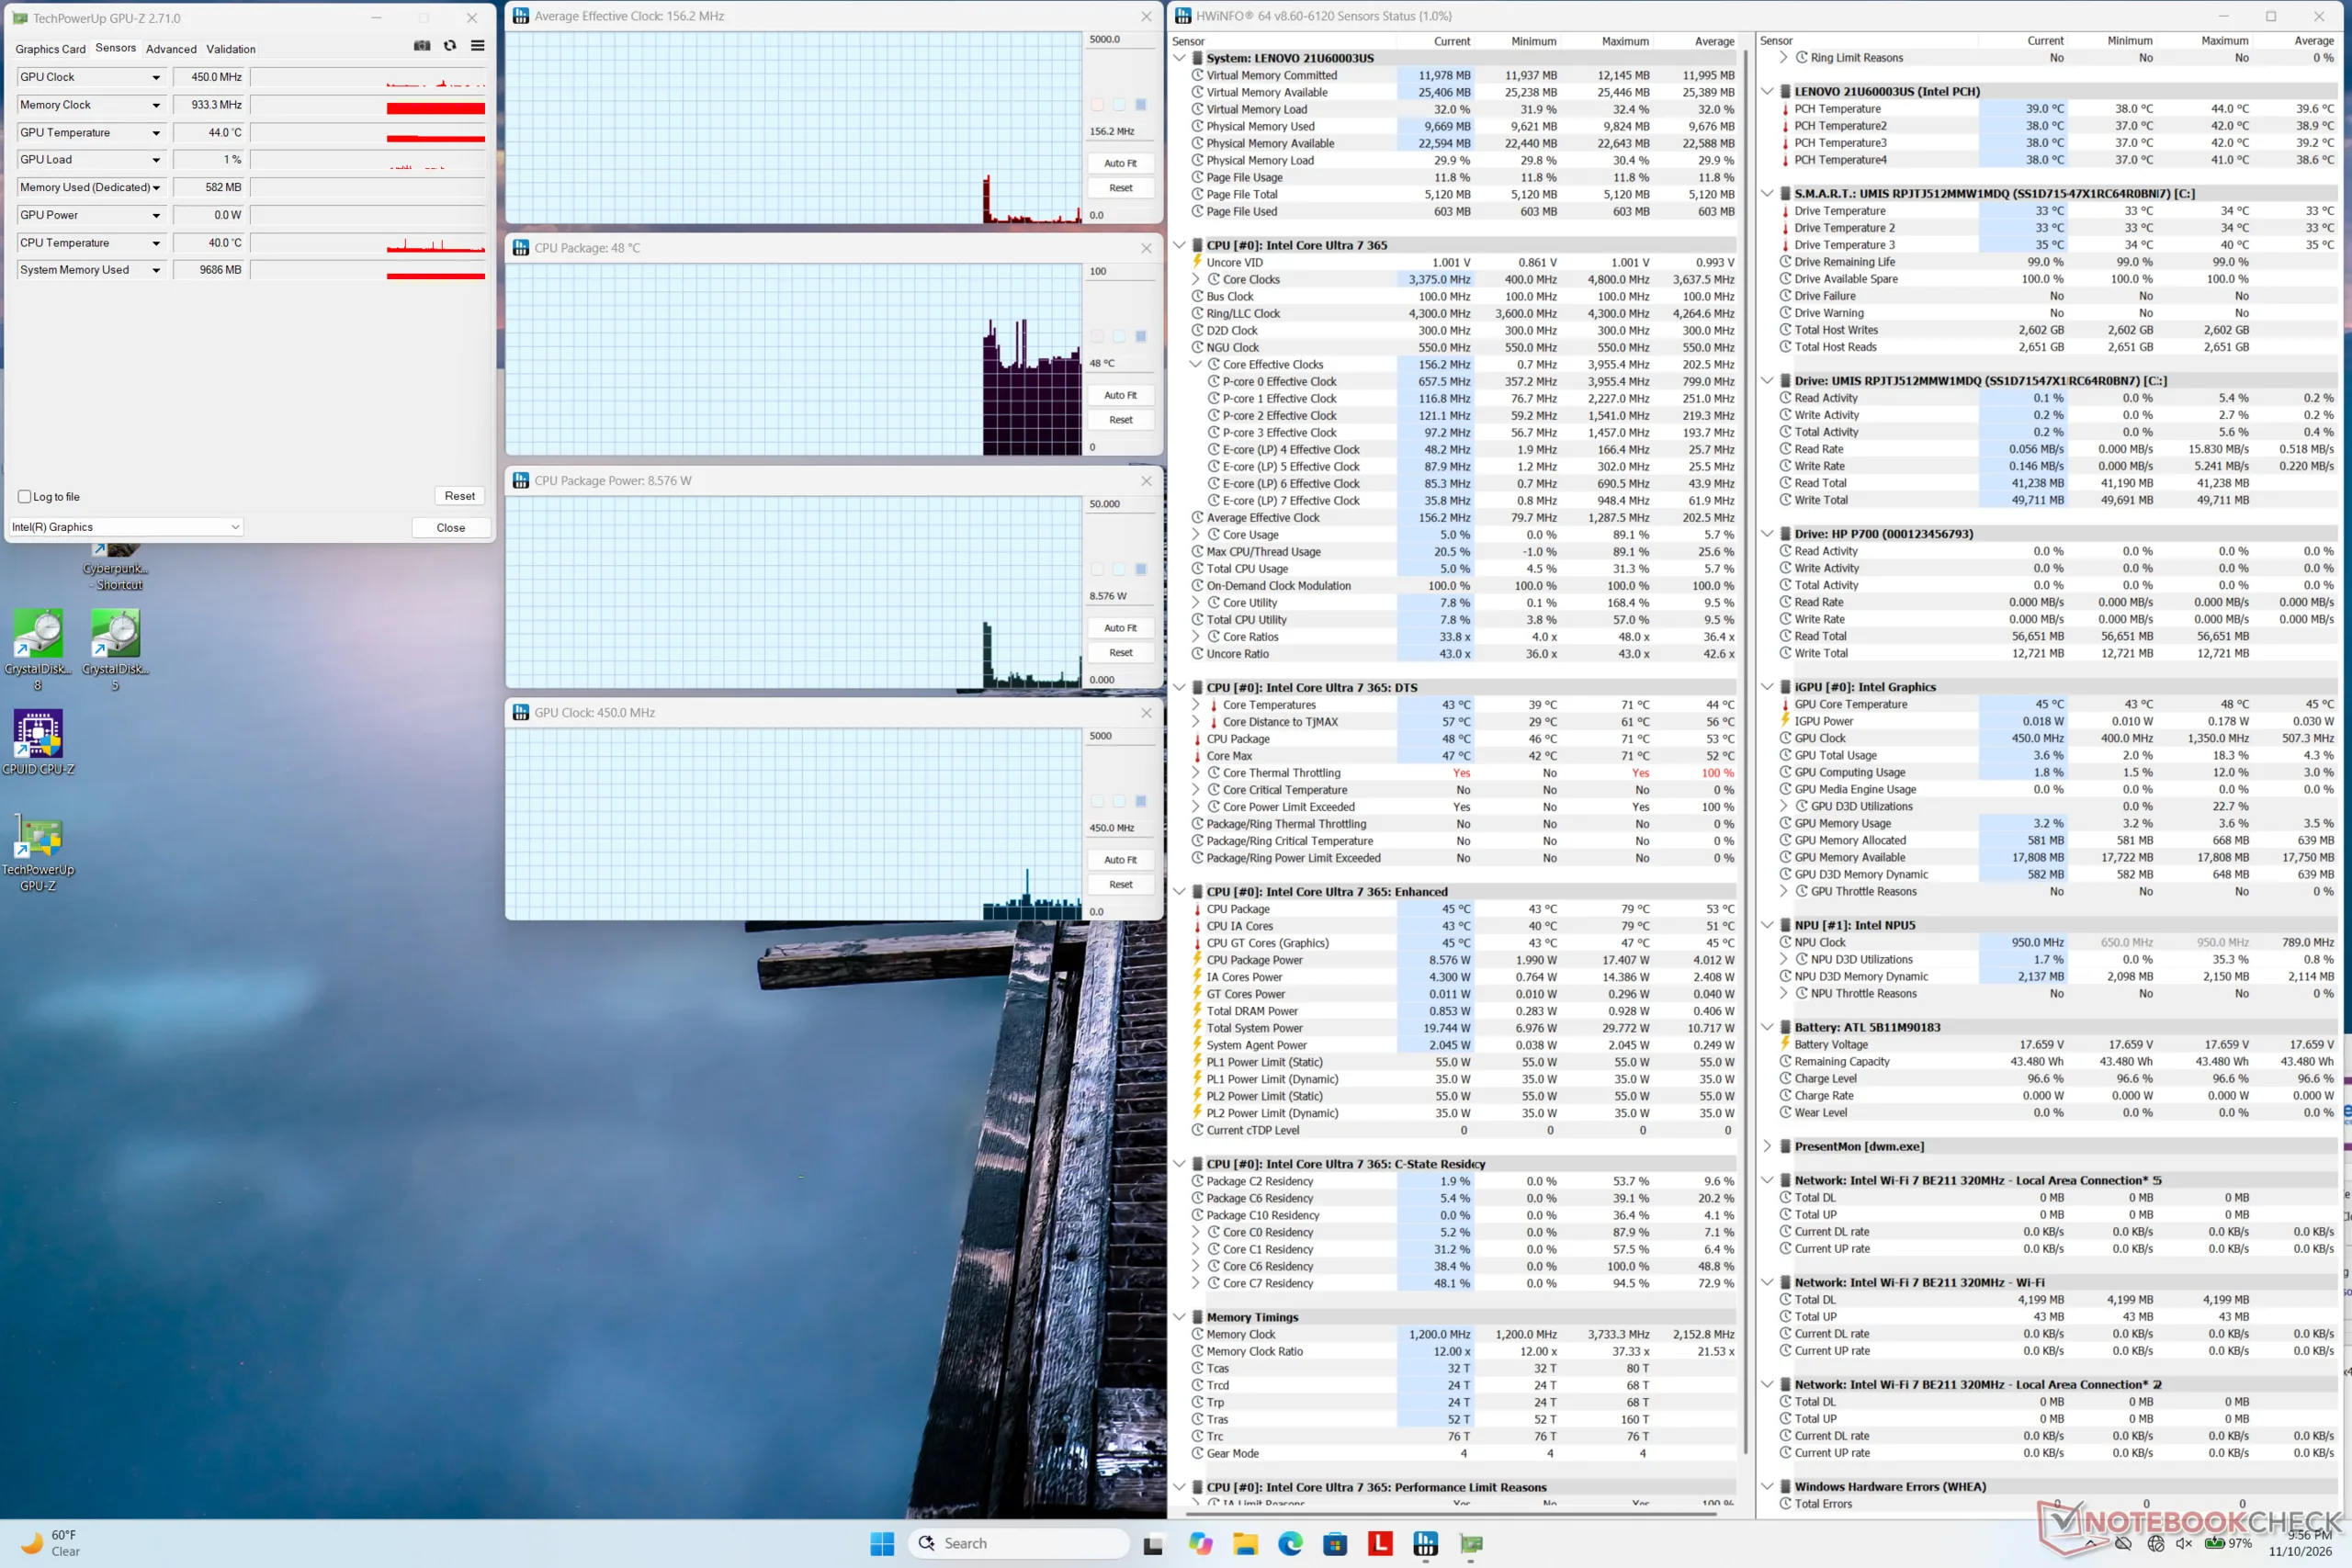
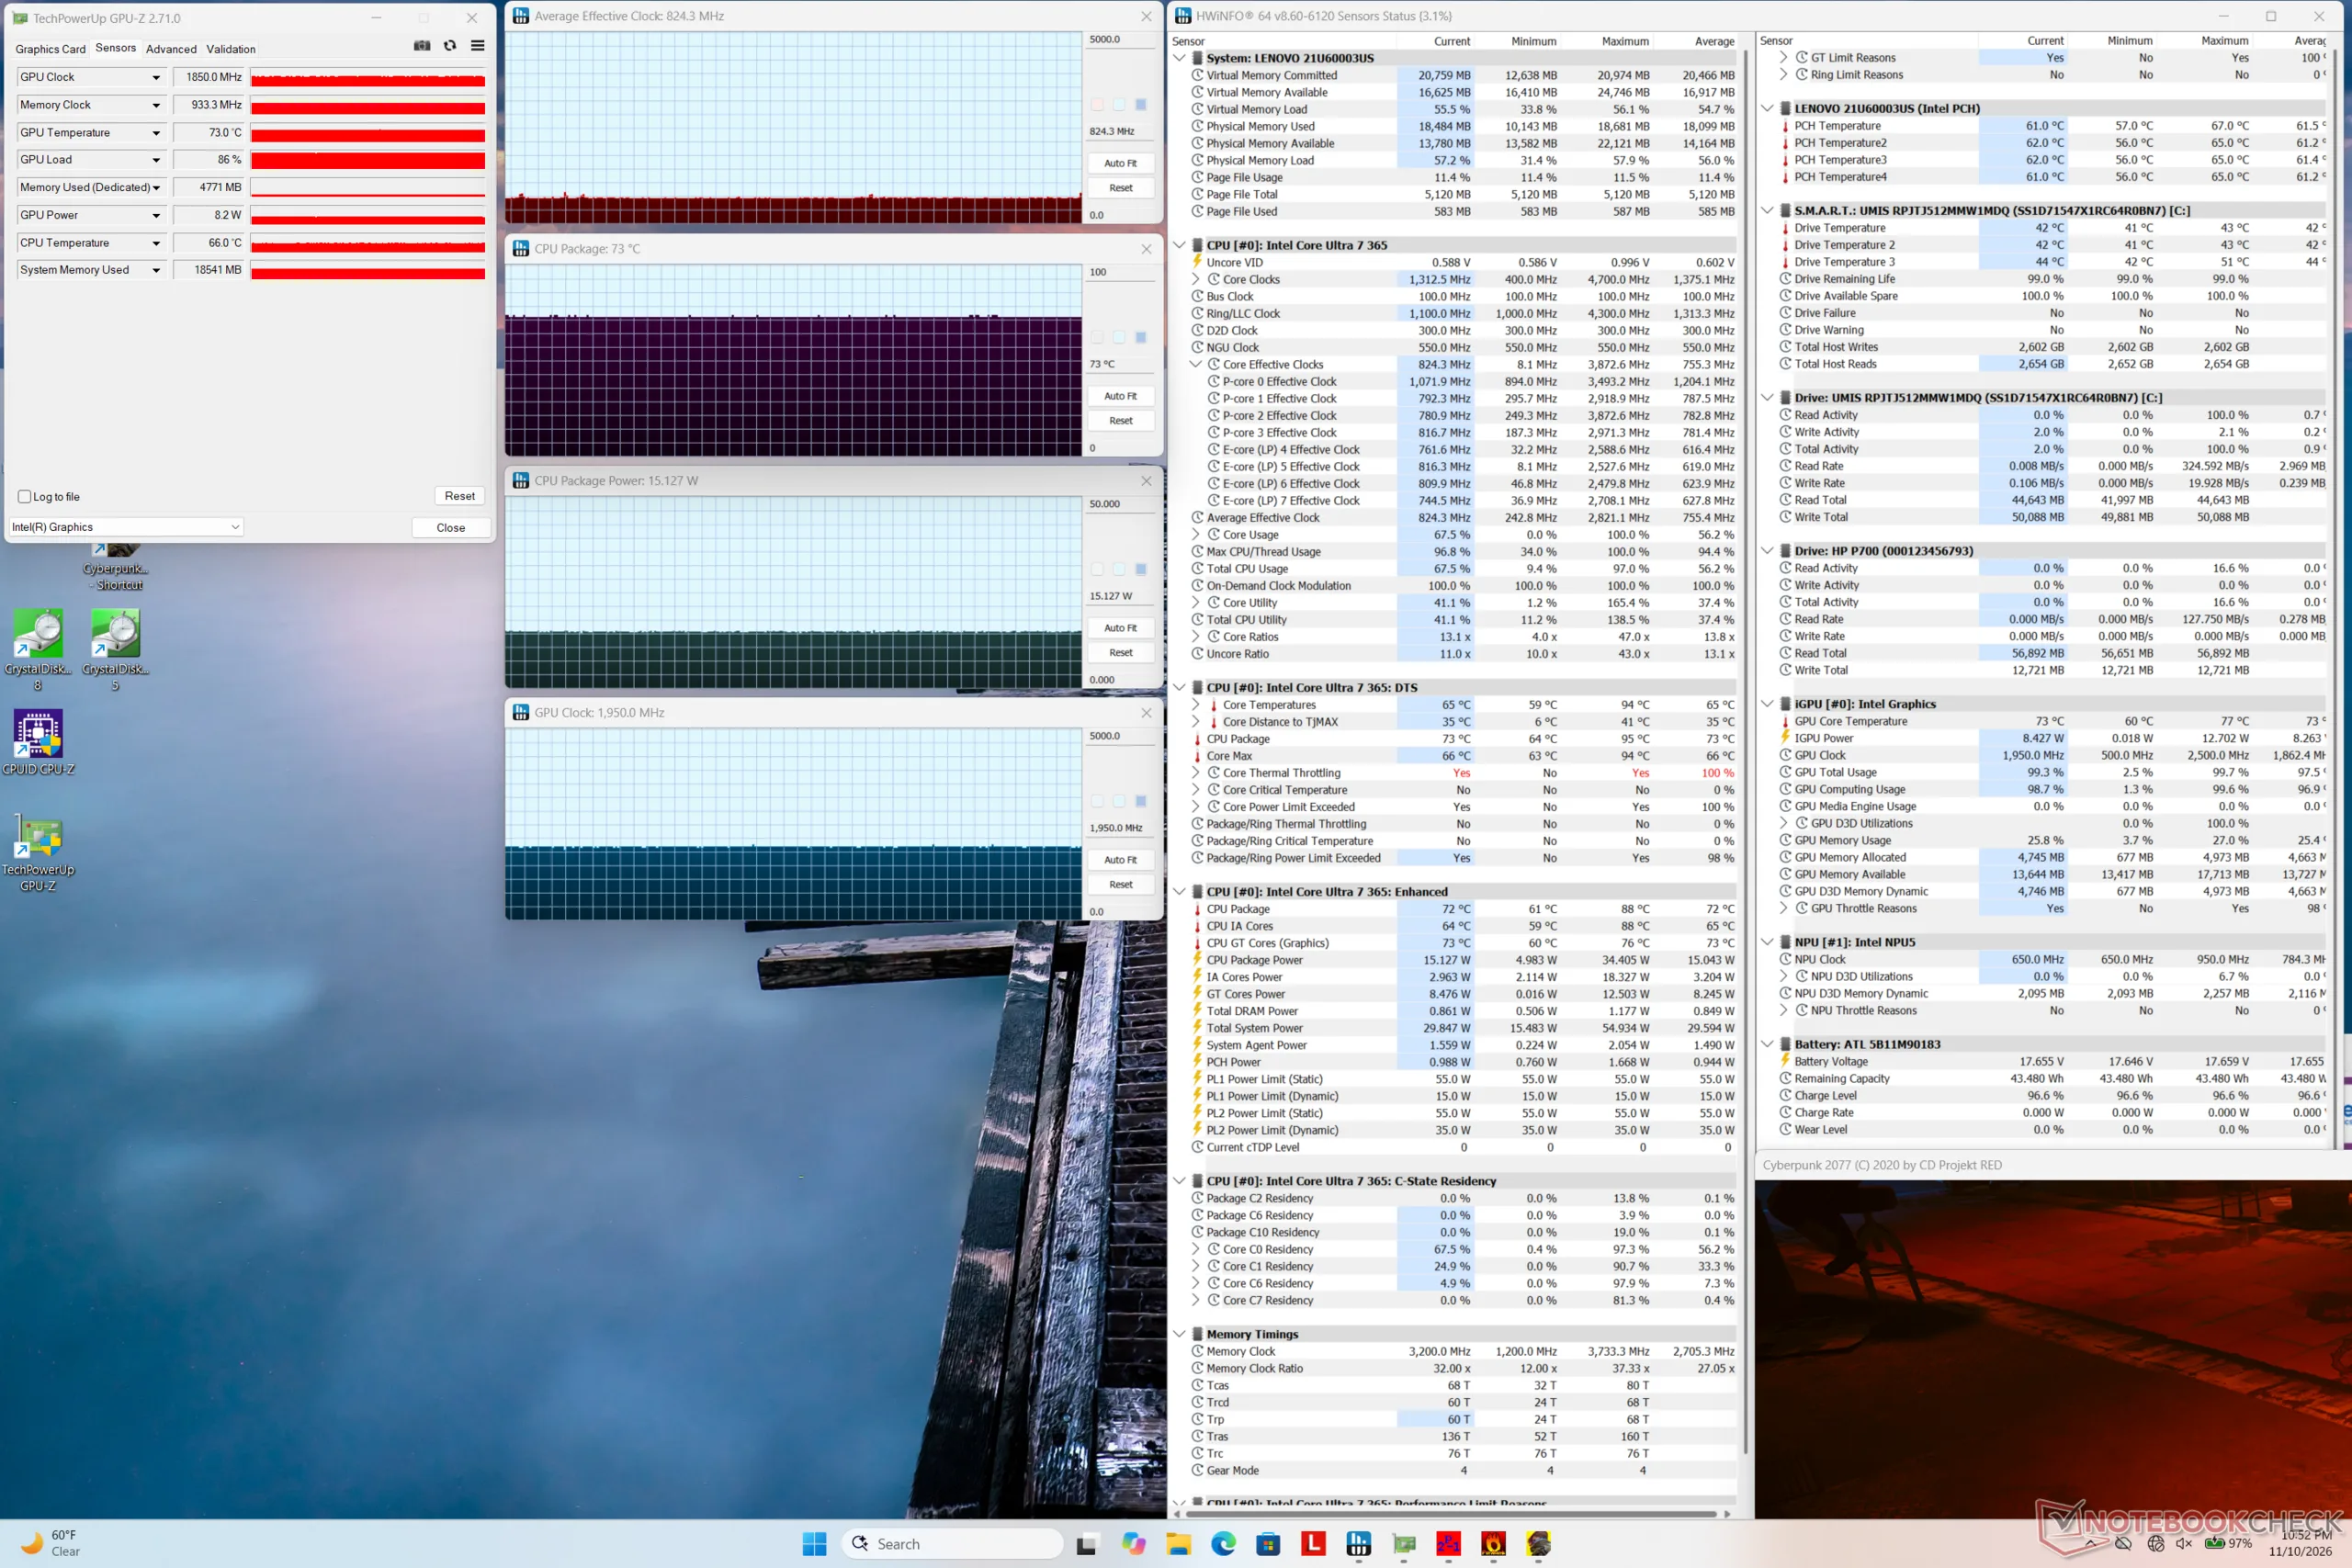
Leerlauf
Leerlauf
Cyberpunk-2077-Stresstest
Prime95-Stresstest
Prime95-Stresstest
Prime95- und FurMark-Stresstest
Durchschnittlicher CPU-Takt (GHz) GPU-Takt (MHz) Durchschnittliche CPU-Temperatur (°C)
Leerlauf -- 450 48
Prime95-Stresstest 2,0 -- 73
Prime95- und FurMark-Stresstest 1,3 1200 72
Cyberpunk-2077-Stresstest 0,8 1950 73

Lautsprecher

Die Messung mit rosa Rauschen zeigt eine hohe Maximallautstärke, aber einen recht begrenzten Frequenzumfang bei Höhen und Bässen, was zu einem „blechernen“ Klang führt
dB(A) 0102030405060708090Deep BassMiddle BassHigh BassLower RangeMidsHigher MidsLower HighsMid HighsUpper HighsSuper Highs2043.239.62533.433.53130.232.44026.525.2502729.56325.827.9803627.110026.929.612520.53516015.746.120015.151.725016.958.531517.963.74001464.150012.159.963011.565.880010.773.910009.876.312509.174.716009.773.120001068.6250010.369.5315010.875.5400011.174.1500011.371.4630011.566.8800011.762.21000011.859.61250011.553.81600011.143.8SPL23.984.1N0.557.5median 11.5median 64.1Delta2.39.426.325.821.422.12624.925.127.622.532.523.448.72655.818.860.922.167.2267019.372.317.674.217.774.319.575.31571.711.871.311.27410.574.21072.710.17210.67210.97511.374.811.671.71269.71269.612.371.112.669.61270.111.269.824.784.70.666.6median 12median 71.73.42.2hearing rangehide median Pink NoiseLenovo ThinkPad X13 Detachable Gen 1Apple MacBook Pro 16 2021 M1 Pro
Frequenzdiagramm (für Vergleiche die Checkboxen oben an-/abwählen)
Lenovo ThinkPad X13 Detachable Gen 1 Audio Analyse

(+) | Die Lautsprecher können relativ laut spielen (84.1 dB)
Bass 100 - 315 Hz
(-) | kaum Bass - 16.7% niedriger als der Median
(±) | durchschnittlich lineare Bass-Wiedergabe (11.6% Delta zum Vorgänger)
Mitteltöne 400 - 2000 Hz
(±) | zu hohe Mitten, vom Median 6.5% abweichend
(+) | lineare Mitten (6.8% Delta zum Vorgänger)
Hochtöne 2 - 16 kHz
(±) | zu hohe Hochtöne, vom Median nur 6.2% abweichend
(+) | sehr lineare Hochtöne (6.2% Delta zum Vorgänger)
Gesamt im hörbaren Bereich 100 - 16.000 Hz
(±) | hörbarer Bereich ist durchschnittlich linear (19.2% Abstand zum Median)
Im Vergleich zu allen Geräten derselben Klasse
» 47% aller getesteten Geräte dieser Klasse waren besser, 7% vergleichbar, 46% schlechter
» Das beste Gerät hat einen Delta-Wert von 6%, durchschnittlich ist 20%, das schlechteste Gerät hat 57%
Im Vergleich zu allen Geräten im Test
» 47% aller getesteten Geräte waren besser, 7% vergleichbar, 46% schlechter
» Das beste Gerät hat einen Delta-Wert von 4%, durchschnittlich ist 23%, das schlechteste Gerät hat 136%

Apple MacBook Pro 16 2021 M1 Pro Audio Analyse

(+) | Die Lautsprecher können relativ laut spielen (84.7 dB)
Bass 100 - 315 Hz
(+) | guter Bass - nur 3.8% Abweichung vom Median
(+) | lineare Bass-Wiedergabe (5.2% Delta zum Vorgänger)
Mitteltöne 400 - 2000 Hz
(+) | ausgeglichene Mitten, vom Median nur 1.3% abweichend
(+) | lineare Mitten (2.1% Delta zum Vorgänger)
Hochtöne 2 - 16 kHz
(+) | ausgeglichene Hochtöne, vom Median nur 1.9% abweichend
(+) | sehr lineare Hochtöne (2.7% Delta zum Vorgänger)
Gesamt im hörbaren Bereich 100 - 16.000 Hz
(+) | hörbarer Bereich ist sehr linear (4.6% Abstand zum Median
Im Vergleich zu allen Geräten derselben Klasse
» 0% aller getesteten Geräte dieser Klasse waren besser, 0% vergleichbar, 100% schlechter
» Das beste Gerät hat einen Delta-Wert von 5%, durchschnittlich ist 17%, das schlechteste Gerät hat 45%
Im Vergleich zu allen Geräten im Test
» 0% aller getesteten Geräte waren besser, 0% vergleichbar, 100% schlechter
» Das beste Gerät hat einen Delta-Wert von 4%, durchschnittlich ist 23%, das schlechteste Gerät hat 136%

Energieverwaltung

Energieverbrauch
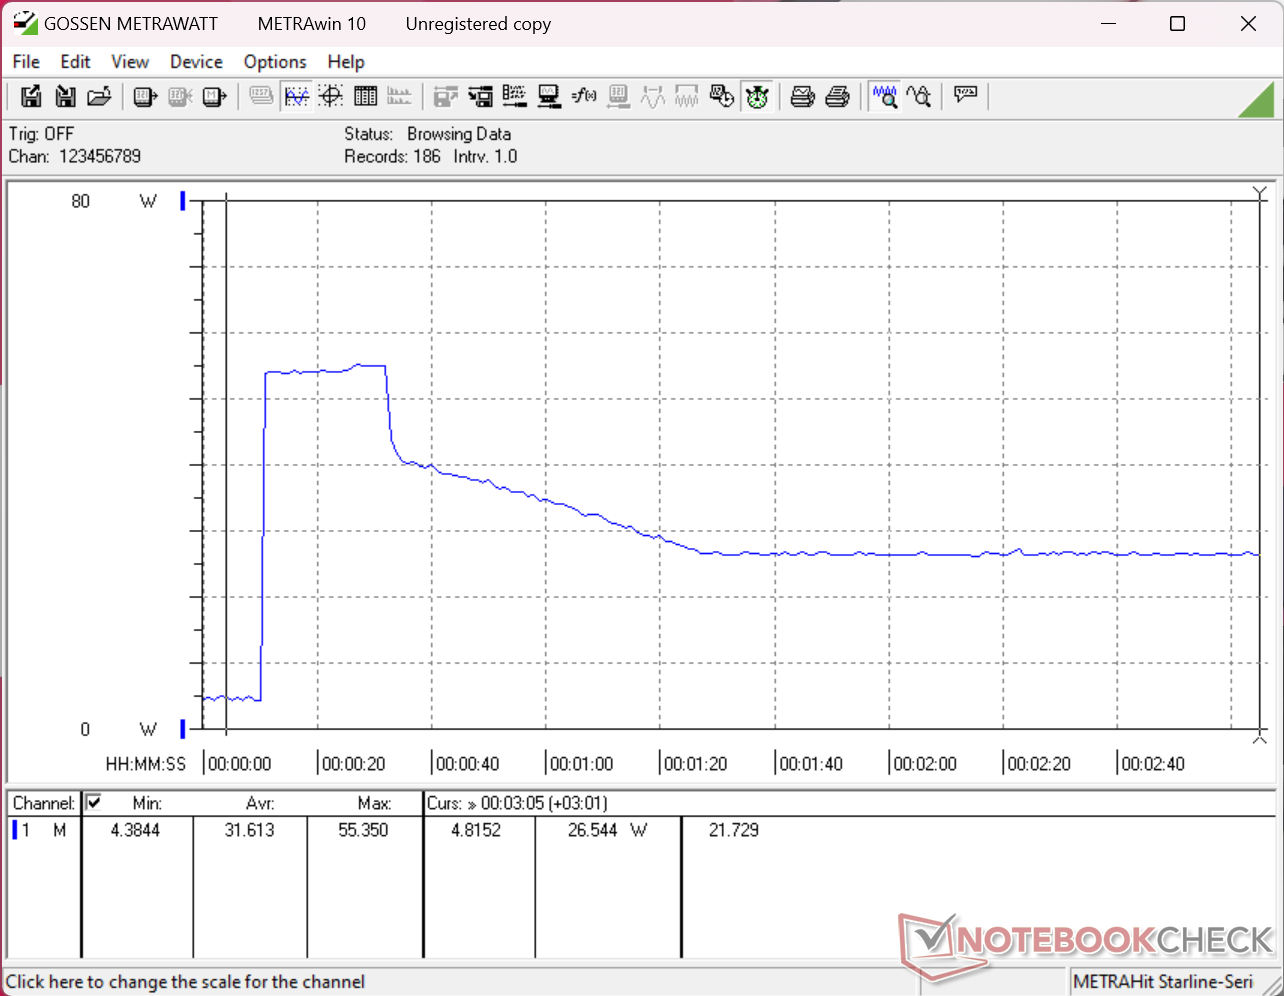
Beim Start des Prime95-Stresstests steigt der Verbrauch kurzzeitig auf 55 W, fällt dann stetig ab und stabilisiert sich etwa eine Minute später bei 27 W – ein Zeichen für die begrenzte Dauer des Turbo Boost
Die maximale Leistungsaufnahme über das kleine USB-C-Netzteil (ca. 12,1 x 6,2 x 2,7 cm) beträgt 60 W
Stromverbrauch
Aus / Standbydarklight 0.24 / 0.65 Watt
Idledarkmidlight 3.1 / 6.5 / 6.7 Watt
Last midlight 44.1 / 60.4 Watt
 color bar
Legende: min: dark, med: mid, max: light        Metrahit Energy
Lenovo ThinkPad X13 Detachable Gen 1
Ultra 7 365, Intel Graphics 4 Xe3 PTL, , IPS, 2880x1920, 13"
Lenovo ThinkPad X13 Gen 7 AMD
Ryzen AI 7 PRO 450, Radeon 860M, Micron 2650 MTFDKBA512TGW, IPS, 1920x1200, 13.3"
Dell Pro 7 13 2-in-1
Ultra 7 366H, Intel Graphics 4 Xe3 PTL, SK hynix PCB01 HFS001TFM9X186N, IPS, 1920x1200, 13.3"
Dell Pro 13 Premium PA13250
Core Ultra 7 268V, Arc 140V, Micron 2550 1TB, IPS, 1920x1200, 13.3"
MSI Prestige 13 AI+ A3MG
Ultra 9 386H, Intel Graphics 4 Xe3 PTL, Micron 2500 1TB MTFDKBA1T0QGN, OLED, 2880x1800, 13.3"
HP EliteBook 8 Flip G1i 13
Ultra 7 265U, Graphics 4-Core iGPU (Arrow Lake), Samsung PM9A1 MZVL2512HCJQ, IPS, 1920x1200, 13.3"
Stromverbrauch
-13%
-27%
9%
2%
-1%
Idle min * (Watt)
3.1
4.1
-32%
2.4
23%
2
35%
3.5
-13%
2.8
10%
Idle avg * (Watt)
6.5
7.3
-12%
7.4
-14%
4.3
34%
4
38%
5.3
18%
Idle max * (Watt)
6.7
7.5
-12%
8.8
-31%
4.75
29%
6.4
4%
5.6
16%
Last avg * (Watt)
44.1
44.9
-2%
50
-13%
40
9%
44
-0%
39.8
10%
Cyberpunk 2077 ultra * (Watt)
31.4
52
-66%
36.4
-16%
41
-31%
40.2
-28%
Cyberpunk 2077 ultra external monitor * (Watt)
28.3
49.8
-76%
38
-34%
34.7
-23%
Last max * (Watt)
60.4
65.4
-8%
67.9
-12%
57
6%
54
11%
68.4
-13%

* ... kleinere Werte sind besser

Energieverbrauch bei Cyberpunk / Stresstest

05101520253035404550556065Tooltip
Lenovo ThinkPad X13 Detachable Gen 1 Ultra 7 365, Intel Graphics 4 Xe3 PTL; 1280x720 Prime95 28.10 and Furmark 1.25: Ø33.7 (29.7-60.4) Watt
Dell Pro 7 13 2-in-1 Ultra 7 366H, Intel Graphics 4 Xe3 PTL; 1280x720 Prime95 28.10 and Furmark 1.25: Ø50.9 (39.6-67.9) Watt
Lenovo ThinkPad X13 Detachable Gen 1 Ultra 7 365, Intel Graphics 4 Xe3 PTL; Idle 150cd/m2: Ø3.96 (3.71-4.59) Watt
Dell Pro 7 13 2-in-1 Ultra 7 366H, Intel Graphics 4 Xe3 PTL; Idle 150cd/m2: Ø3.28 (2.89-5.46) Watt
Lenovo ThinkPad X13 Detachable Gen 1 Ultra 7 365, Intel Graphics 4 Xe3 PTL; Cyberpunk 2077 FHD ultra no FSR 150cd: Ø31.4 (30.6-32.2) Watt
Dell Pro 7 13 2-in-1 Ultra 7 366H, Intel Graphics 4 Xe3 PTL; Cyberpunk 2077 FHD ultra no FSR 150cd: Ø52 (49.5-57.9) Watt

Energieverbrauch mit externem Monitor

05101520253035404550556065Tooltip
Lenovo ThinkPad X13 Detachable Gen 1 Ultra 7 365, Intel Graphics 4 Xe3 PTL; Prime95 V2810 Stress (external Monitor): Ø32.6 (26.2-55.4) Watt
Dell Pro 7 13 2-in-1 Ultra 7 366H, Intel Graphics 4 Xe3 PTL; Prime95 V2810 Stress (external Monitor): Ø48.5 (44-67.8) Watt
Lenovo ThinkPad X13 Detachable Gen 1 Ultra 7 365, Intel Graphics 4 Xe3 PTL; Cinebench R23 Multi (external Monitor): Ø28.4 (24.3-52.3) Watt
Dell Pro 7 13 2-in-1 Ultra 7 366H, Intel Graphics 4 Xe3 PTL; Cinebench R23 Multi (external Monitor): Ø52.2 (41.6-67.9) Watt
Lenovo ThinkPad X13 Detachable Gen 1 Ultra 7 365, Intel Graphics 4 Xe3 PTL; 1280x720 FurMark 1.19 GPU Stress Test (external Monitor): Ø30.3 (18.8-51.1) Watt
Dell Pro 7 13 2-in-1 Ultra 7 366H, Intel Graphics 4 Xe3 PTL; 1280x720 FurMark 1.19 GPU Stress Test (external Monitor): Ø48.4 (47.1-53.2) Watt
Lenovo ThinkPad X13 Detachable Gen 1 Ultra 7 365, Intel Graphics 4 Xe3 PTL; Idle 1min (external Monitor): Ø3.13 (2.89-4.07) Watt
Dell Pro 7 13 2-in-1 Ultra 7 366H, Intel Graphics 4 Xe3 PTL; Idle 1min (external Monitor): Ø2.32 (2.02-3.87) Watt
Lenovo ThinkPad X13 Detachable Gen 1 Ultra 7 365, Intel Graphics 4 Xe3 PTL; Cyberpunk 2077 FHD ultra no FSR (external Monitor): Ø28.3 (27.7-30.2) Watt
Dell Pro 7 13 2-in-1 Ultra 7 366H, Intel Graphics 4 Xe3 PTL; Cyberpunk 2077 FHD ultra no FSR (external Monitor): Ø49.8 (45.3-58) Watt

Akkulaufzeit

Akkulaufzeit
WiFi Websurfing
10h 06min
Lenovo ThinkPad X13 Detachable Gen 1
Ultra 7 365, Intel Graphics 4 Xe3 PTL, 45 Wh
Lenovo ThinkPad X13 Gen 7 AMD
Ryzen AI 7 PRO 450, Radeon 860M, 54.7 Wh
Dell Pro 7 13 2-in-1
Ultra 7 366H, Intel Graphics 4 Xe3 PTL, 56 Wh
Dell Pro 13 Premium PA13250
Core Ultra 7 268V, Arc 140V, 60 Wh
MSI Prestige 13 AI+ A3MG
Ultra 9 386H, Intel Graphics 4 Xe3 PTL, 53.8 Wh
HP EliteBook 8 Flip G1i 13
Ultra 7 265U, Graphics 4-Core iGPU (Arrow Lake), 62 Wh
Akkulaufzeit
62%
31%
138%
19%
36%
WLAN (h)
10.1
16.4
62%
13.2
31%
24
138%
12
19%
13.7
36%
H.264 (h)
23.8
Last (h)
2.8

Notebookcheck-Bewertung

Ein schnörkelloses Business-Detachable, das Displayqualität, Tastaturkomfort und Benutzerfreundlichkeit über ausgefallene Funktionen oder Spielereien stellt.

Lenovo ThinkPad X13 Detachable Gen 1 - 17.11.2026 v8
Allen Ngo

Gehäuse
88 / 98 → 90%
Tastatur
88%
Pointing Device
92%
Konnektivität
74 / 74 → 100%
Gewicht
78 / 20-75 → 100%
Akkulaufzeit
88%
Display
85%
Leistung Spiele
39 / 65 → 60%
Leistung Anwendungen
79 / 92 → 86%
AI Performance
90%
Temperatur
92%
Lautstärke
94%
Audio
69 / 91 → 75%
Kamera
50 / 75 → 66%
Durchschnitt
70%
89%
Convertible - gewichteter Durchschnitt
Weitere Informationen über unsere Bewertung finden Sie hier.
CO2 Emissions
No Data
Materials
50%
Packaging
100%
Power Use
87%
Repairability
50%
Software Updates
22.3%
Recycle Logo Total Sustainability Score: 51.6%

Mögliche Konkurrenten im Vergleich

Bild
Modell / Test
Preis ab
Gewicht
Dicke
Display
1.
89.4%
Lenovo ThinkPad X13 Detachable Gen 1
Intel Core Ultra 7 365 ⎘
Intel Graphics 4 Xe3 Panther Lake iGPU ⎘
32 GB RAM
Amazon: 2.161,00 €
Bestpreis 2497€ ok2.de
2. 2544.95€ lapstars
3. 2545€ MetaComp
827 g9.3 mm13.00"
2880x1920
266 PPI
IPS
2.
87.4%
Lenovo ThinkPad X13 Gen 7 AMD
AMD Ryzen AI 7 PRO 450 ⎘
AMD Radeon 860M ⎘
32 GB RAM, 512 GB SSD
Amazon:
1. 1.649,90 €
Lenovo ThinkPad E14 Gen 7 Bu...
2. 1.835,00 €
Lenovo ThinkPad L14 Gen 7 (A...
3. 
Lenovo ThinkPad E16 Gen 3 21...
Listenpreis: 2900€
1.1 kg13 mm13.30"
1920x1200
170 PPI
IPS
3.
86.7%
Dell Pro 7 13 2-in-1
Intel Core Ultra 7 366H ⎘
Intel Graphics 4 Xe3 Panther Lake iGPU ⎘
64 GB RAM,  SSD
Amazon: 1.699,00 €
Geizhals Suche
1.4 kg17.95 mm13.30"
1920x1200
170 PPI
IPS
4.
90%
Dell Pro 13 Premium PA13250
Intel Core Ultra 7 268V ⎘
Intel Arc Graphics 140V ⎘
32 GB RAM, 1024 GB SSD
Amazon:
Geizhals Suche
1.1 kg17.2 mm13.30"
1920x1200
170 PPI
IPS
5.
84%
MSI Prestige 13 AI+ A3MG
Intel Core Ultra 9 386H ⎘
Intel Graphics 4 Xe3 Panther Lake iGPU ⎘
32 GB RAM, 1024 GB SSD
Amazon: 1.329,05 €
Bestpreis 1449€ Media Markt.at
2. 1479€ Coolblue
3. 1529€ notebooksbilliger.de
888 g15.9 mm13.30"
2880x1800
255 PPI
OLED
6.
87.7%
HP EliteBook 8 Flip G1i 13
Intel Core Ultra 7 265U ⎘
Intel Graphics 4-Core iGPU (Meteor / Arrow Lake) ⎘
16 GB RAM, 512 GB SSD
Amazon: 1.501,35 €
Geizhals Suche
1.4 kg15.5 mm13.30"
1920x1200
170 PPI
IPS

Transparenz

Die Auswahl der zu testenden Geräte erfolgt innerhalb der Redaktion. Das vorliegende Testmuster wurde dem Autor vom Hersteller oder einem Shop zu Testzwecken leihweise zur Verfügung gestellt. Eine Einflussnahme des Leihstellers auf den Testbericht gab es nicht, der Hersteller erhielt keine Version des Reviews vor der Veröffentlichung. Es bestand keine Verpflichtung zur Publikation. Als eigenständiges, unabhängiges Unternehmen unterliegt Notebookcheck keiner Diktion von Herstellern, Shops und Verlagen.

So testet Notebookcheck

Pro Jahr werden von Notebookcheck hunderte Laptops und Smartphones unabhängig in von uns standardisierten technischen Verfahren getestet, um eine Vergleichbarkeit aller Testergebnisse zu gewährleisten. Seit rund 20 Jahren entwickeln wir diese Testmethoden kontinuierlich weiter und setzen damit Branchenstandards. In unseren Testlaboren kommt ausschließlich hochwertiges Messequipment in die Hände erfahrener Techniker und Redakteure. Die Tests unterliegen einer mehrstufigen Kontrolle. Unsere komplexe Gesamtbewertung basiert auf hunderten fundierten Messergebnissen und Benchmarks, womit Ihnen Objektivität garantiert ist. Weitere Informationen zu unseren Testmethoden gibt es hier.

Google LogoAls bevorzugte Quelle auf Google hinzufügen
Mail Logo
Could not open connection to Notebookchat
static version load dynamic
> Notebook Test, Laptop Test und News > Tests > Notebook Testberichte > Lenovo ThinkPad X13 Detachable Gen 1 im Test: Außergewöhnlich durch seine Normalität
Autor: Allen Ngo, 18.11.2026 (Update: 18.11.2026)