Notebookcheck Logo

Radeon RX 5600M vs. GeForce RTX 2060: AMD ist so verdammt nahe dran

Radeon RX 5600M vs. GeForce RTX 2060: AMD ist so verdammt nahe dran (Bildquelle: Dell)
Die Benchmarkergebnisse der Radeon RX 5600M, die vor kurzem erstmals persönlich testen konnten, stehen fest und sie zeigen, dass RDNA in erschwinglichen Laptops wie der Dell-G5-15- und der MSI-Bravo-Reihe definitiv eine Zukunft hat. Die reine Leistung und die Leistung-pro-Watt liegen zwar knapp unterhalb der mobilen GeForce RTX 2060, dafür besitzt das AMD-Modell jedoch das bessere Preis-Leistungs-Verhältnis.

Laptops, die exklusiv mit AMD-Chips bestückt sind, sind schwer zu finden. Aufgrund der erbärmlichen Leistung von Polaris- und Excavator-basierten Komponenten hatten Laptop-Hersteller zwar vor einigen Jahren noch gute Gründe dafür, keine AMD-Hardware anzubieten, allerdings hat sich dies mit der Ankunft von 7-nm-Ryzen und Navi geändert.

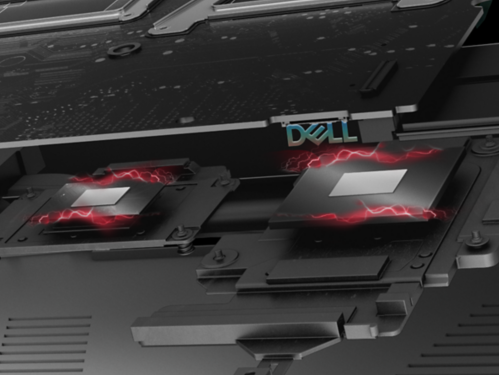
Mit dem Einsteiger-Modell G5 15 Special Edition hat Dell diesen Monat einen der ersten mit einer Radeon RX 5600M bestückten Laptops auf den Markt gebracht. Wir haben so viele synthetische Benchmarks und Spiele-Tests durchgeführt wie möglich, um die GPU mit der beliebten mobilen GeForce RTX 2060 zu vergleichen. Unsere Ergebnisse finden Sie im Vergleich mit dem Durchschnitt von 25 anderen RTX-2060-Gaming-Laptops im Diagramm unten.

Ein Blick auf die synthetischen 3DMark-Benchmarks zeigt, dass die Radeon RX 5600M im Fire-Strike-Test 16 % schneller als eine durchschnittliche mobile RTX 2060 ist, letztere im Time-Spy-Test jedoch nur um 2 % schlägt, was darauf hindeutet, dass die AMD-GPU besser mit DX11- als mit DX12-Titeln zurecht kommt. In den meisten Spielen stellt sich jedoch heraus, dass die Radeon RX 5600M tendenziell wenige Prozente hinter einer durchschnittlichen mobilen RTX 2060 liegt, womit sie eher der GTX 1660 Ti entspricht. Eine erwähnenswerte Ausnahme bildet GRID 2019, da die AMD-GPU hier sogar die Desktop-Variante der RTX 2060 schlägt, allerdings ist das definitiv eher die Ausnahme.

Der Stromverbrauch des AMD-basierten Dell G5 15 SE liegt mit 153 W im Gaming-Betrieb auf einem ähnlichen Niveau wie der von GeForce-RTX-2060-basierten 15,6-Zoll-Gaming-Laptops unter den gleichen Bedingungen. Natürlich spielen hier auch andere Komponenten als die GPU eine bedeutende Rolle, weshalb dies nicht als direkter Vergleich der GPU-Energieaufnahme gewertet werden kann, allerdings zeigt es auch, wie gut aktuelle Intel-Nvidia-Gaming-Laptops optimiert werden konnten, obwohl sie nur mit älteren 12-nm- bzw. 14-nm-Prozessoren ausgestattet sind.

Insgesamt laufen Spiele auf dem Dell-Gaming-Laptop mit Radeon RX 5600M trotz einer etwas niedrigeren Leistung-pro-Watt ähnlich gut wie auf einem Laptop mit einer mobilen GeForce RTX 2060. Da die mobile RDNA-GPU noch sehr neu ist, vermuten wir, dass der Abstand durch zukünftige Treiber-Updates noch verkleinert werden kann. Im Gegensatz zu RTX-2060-basierten Alternativen, die häufig 1.100 US-Dollar (~981 Euro) oder mehr kosten, ist das vollständig AMD-basierte Dell G5 15 SE ab 860 US-Dollar (~767 Euro) zu haben, womit AMD das Preis-Leistungs-Verhältnis klar auf seiner Seite hat. Für Hardware-basiertes Raytracing ist die GeForce-RTX-Reihe jedoch immer noch die bessere Wahl.

Wenn AMD die 7-nm-Prozessoren und die Adrenalin-Treiber noch optimiert, wird es im Einsteiger-Laptop-Markt in den nächsten ein bis zwei Jahren spannend.

3DMark
1920x1080 Fire Strike Graphics
Durchschnittliche NVIDIA GeForce RTX 2070 Mobile
  (18169 - 21138, n=19)
20123 Points +7%
Durchschnittliche NVIDIA GeForce RTX 2060 (Desktop)
  ()
19338 Points +3%
Dell G5 15 SE 5505 P89F
AMD Radeon RX 5600M, R7 4800H
18807 Points
Razer Blade 15 RZ09-0328
NVIDIA GeForce RTX 2070 Max-Q, i7-10750H
18166 Points -3%
Durchschnittliche NVIDIA GeForce RTX 2060 Mobile
  (14768 - 18358, n=43)
16301 Points -13%
Durchschnittliche NVIDIA GeForce RTX 2060 Max-Q
  (14129 - 15650, n=4)
14900 Points -21%
Durchschnittliche NVIDIA GeForce GTX 1660 Ti Mobile
  (14186 - 16488, n=24)
14867 Points -21%
Durchschnittliche AMD Radeon RX 5500M
  (11621 - 13413, n=6)
12349 Points -34%
2560x1440 Time Spy Graphics
Durchschnittliche NVIDIA GeForce RTX 2060 (Desktop)
  ()
7732 Points +22%
Durchschnittliche NVIDIA GeForce RTX 2070 Mobile
  (7006 - 8028, n=18)
7651 Points +21%
Razer Blade 15 RZ09-0328
NVIDIA GeForce RTX 2070 Max-Q, i7-10750H
6722 Points +6%
Dell G5 15 SE 5505 P89F
AMD Radeon RX 5600M, R7 4800H
6312 Points
Durchschnittliche NVIDIA GeForce RTX 2060 Mobile
  (5660 - 6910, n=41)
6206 Points -2%
Durchschnittliche NVIDIA GeForce GTX 1660 Ti Mobile
  (5335 - 6123, n=22)
5653 Points -10%
Durchschnittliche NVIDIA GeForce RTX 2060 Max-Q
  (5357 - 5914, n=4)
5637 Points -11%
Durchschnittliche AMD Radeon RX 5500M
  (3875 - 4376, n=5)
4209 Points -33%
3DMark 11 - 1280x720 Performance GPU
Durchschnittliche NVIDIA GeForce RTX 2060 (Desktop)
  (26413 - 27912, n=2)
27163 Points +6%
Durchschnittliche NVIDIA GeForce RTX 2070 Mobile
  (23335 - 27298, n=21)
25775 Points 0%
Dell G5 15 SE 5505 P89F
AMD Radeon RX 5600M, R7 4800H
25706 Points
Razer Blade 15 RZ09-0328
NVIDIA GeForce RTX 2070 Max-Q, i7-10750H
23326 Points -9%
Durchschnittliche NVIDIA GeForce RTX 2060 Mobile
  (19143 - 24662, n=40)
21459 Points -17%
Durchschnittliche NVIDIA GeForce GTX 1660 Ti Mobile
  (18610 - 22670, n=24)
20096 Points -22%
Durchschnittliche NVIDIA GeForce RTX 2060 Max-Q
  (18863 - 21105, n=4)
19881 Points -23%
Durchschnittliche AMD Radeon RX 5500M
  (15271 - 17668, n=8)
16564 Points -36%
Shadow of the Tomb Raider
1920x1080 Highest Preset AA:T
Durchschnittliche NVIDIA GeForce RTX 2060 (Desktop)
  ()
90 fps +32%
Durchschnittliche NVIDIA GeForce RTX 2070 Mobile
  (74.2 - 97, n=11)
88.7 fps +30%
Durchschnittliche NVIDIA GeForce RTX 2070 Max-Q
  (57 - 89, n=12)
79.1 fps +16%
Durchschnittliche NVIDIA GeForce RTX 2060 Mobile
  (54 - 86, n=22)
74.6 fps +10%
Durchschnittliche NVIDIA GeForce RTX 2060 Max-Q
  (65 - 74, n=2)
69.5 fps +2%
Durchschnittliche NVIDIA GeForce GTX 1660 Ti Mobile
  (62 - 73, n=8)
68.4 fps +1%
Dell G5 15 SE 5505 P89F
AMD Ryzen 7 4800H, AMD Radeon RX 5600M
68 fps
Durchschnittliche AMD Radeon RX 5500M
  (53 - 54, n=3)
53.7 fps -21%
1920x1080 High Preset AA:SM
Durchschnittliche NVIDIA GeForce RTX 2060 (Desktop)
  ()
101 fps +22%
Durchschnittliche NVIDIA GeForce RTX 2070 Mobile
  (80.3 - 107, n=11)
96.3 fps +16%
Durchschnittliche NVIDIA GeForce RTX 2070 Max-Q
  (62 - 98, n=12)
86.8 fps +5%
Durchschnittliche NVIDIA GeForce RTX 2060 Mobile
  (66 - 97, n=21)
84.4 fps +2%
Dell G5 15 SE 5505 P89F
AMD Ryzen 7 4800H, AMD Radeon RX 5600M
83 fps
Durchschnittliche NVIDIA GeForce RTX 2060 Max-Q
  (75 - 84, n=2)
79.5 fps -4%
Durchschnittliche NVIDIA GeForce GTX 1660 Ti Mobile
  (67 - 83, n=8)
76.5 fps -8%
Durchschnittliche AMD Radeon RX 5500M
  (59 - 65, n=2)
62 fps -25%
The Witcher 3 - 1920x1080 Ultra Graphics & Postprocessing (HBAO+)
Durchschnittliche NVIDIA GeForce RTX 2070 Mobile
  (64 - 82.1, n=21)
74.3 fps +12%
Durchschnittliche NVIDIA GeForce RTX 2060 (Desktop)
  ()
72.7 fps +10%
Durchschnittliche NVIDIA GeForce RTX 2070 Max-Q
  (56 - 83.8, n=31)
66.3 fps 0%
Dell G5 15 SE 5505 P89F
AMD Ryzen 7 4800H, AMD Radeon RX 5600M
66.1 (62min - 70max) fps
Durchschnittliche NVIDIA GeForce RTX 2060 Mobile
  (50.6 - 74, n=40)
61.1 fps -8%
Durchschnittliche NVIDIA GeForce RTX 2060 Max-Q
  (51.2 - 62.9, n=4)
57.2 fps -13%
Durchschnittliche NVIDIA GeForce GTX 1660 Ti Mobile
  (51.6 - 65.1, n=21)
56.2 fps -15%
Durchschnittliche AMD Radeon RX 5500M
  (43.6 - 45.5, n=5)
44.7 fps -32%
Borderlands 3
1920x1080 Badass Overall Quality (DX11)
Durchschnittliche NVIDIA GeForce RTX 2060 (Desktop)
  ()
64 fps +34%
Durchschnittliche NVIDIA GeForce RTX 2070 Mobile
  (61 - 64.5, n=3)
62.9 fps +32%
Durchschnittliche NVIDIA GeForce RTX 2070 Max-Q
  (51.1 - 63.3, n=4)
56.2 fps +18%
Durchschnittliche NVIDIA GeForce RTX 2060 Mobile
  (47.5 - 57.3, n=7)
50.7 fps +6%
Durchschnittliche NVIDIA GeForce RTX 2060 Max-Q
  ()
48.3 fps +1%
Dell G5 15 SE 5505 P89F
AMD Ryzen 7 4800H, AMD Radeon RX 5600M
47.8 fps
Durchschnittliche NVIDIA GeForce GTX 1660 Ti Mobile
  (46.6 - 48.6, n=3)
47.7 fps 0%
Durchschnittliche AMD Radeon RX 5500M
  (34.2 - 36.2, n=4)
35.5 fps -26%
1920x1080 High Overall Quality (DX11)
Durchschnittliche NVIDIA GeForce RTX 2060 (Desktop)
  ()
82.8 fps +35%
Durchschnittliche NVIDIA GeForce RTX 2070 Mobile
  (71 - 83, n=3)
78.5 fps +28%
Durchschnittliche NVIDIA GeForce RTX 2070 Max-Q
  (65.3 - 74.4, n=3)
69.7 fps +14%
Durchschnittliche NVIDIA GeForce RTX 2060 Mobile
  (61 - 69.6, n=6)
64.5 fps +5%
Durchschnittliche NVIDIA GeForce GTX 1660 Ti Mobile
  (61.7 - 64.2, n=3)
62.5 fps +2%
Durchschnittliche NVIDIA GeForce RTX 2060 Max-Q
  ()
61.9 fps +1%
Dell G5 15 SE 5505 P89F
AMD Ryzen 7 4800H, AMD Radeon RX 5600M
61.2 fps
Durchschnittliche AMD Radeon RX 5500M
  (45 - 47.9, n=3)
46.7 fps -24%
Assassin´s Creed Odyssey
1920x1080 High Preset
Durchschnittliche NVIDIA GeForce RTX 2070 Mobile
  ()
84 fps +40%
Durchschnittliche NVIDIA GeForce RTX 2060 (Desktop)
  ()
78 fps +30%
Durchschnittliche NVIDIA GeForce RTX 2060 Mobile
  (68 - 76, n=2)
72 fps +20%
Durchschnittliche NVIDIA GeForce GTX 1660 Ti Mobile
  ()
69 fps +15%
Durchschnittliche NVIDIA GeForce RTX 2060 Max-Q
  ()
65 fps +8%
Durchschnittliche NVIDIA GeForce RTX 2070 Max-Q
  (58 - 67, n=2)
62.5 fps +4%
Dell G5 15 SE 5505 P89F
AMD Ryzen 7 4800H, AMD Radeon RX 5600M
60 (12min - 93max) fps
Durchschnittliche AMD Radeon RX 5500M
  ()
40 fps -33%
1920x1080 Ultra High Preset
Durchschnittliche NVIDIA GeForce RTX 2070 Mobile
  ()
58 fps +18%
Durchschnittliche NVIDIA GeForce RTX 2060 (Desktop)
  ()
56 fps +14%
Durchschnittliche NVIDIA GeForce GTX 1660 Ti Mobile
  (47 - 59, n=2)
53 fps +8%
Durchschnittliche NVIDIA GeForce RTX 2060 Mobile
  (49 - 50, n=2)
49.5 fps +1%
Durchschnittliche NVIDIA GeForce RTX 2070 Max-Q
  (48 - 51, n=2)
49.5 fps +1%
Dell G5 15 SE 5505 P89F
AMD Ryzen 7 4800H, AMD Radeon RX 5600M
49 (6min - 86max) fps
Durchschnittliche NVIDIA GeForce RTX 2060 Max-Q
  ()
45 fps -8%
Durchschnittliche AMD Radeon RX 5500M
  ()
31 fps -37%
Apex Legends
1920x1080 High Settings AA:TS AF:8x
Durchschnittliche NVIDIA GeForce RTX 2060 (Desktop)
  ()
141 fps +27%
Durchschnittliche NVIDIA GeForce RTX 2070 Mobile
  (128 - 134, n=2)
131 fps +18%
Durchschnittliche NVIDIA GeForce RTX 2060 Max-Q
  ()
126.2 fps +14%
Durchschnittliche NVIDIA GeForce RTX 2070 Max-Q
  (106 - 124, n=4)
117 fps +6%
Dell G5 15 SE 5505 P89F
AMD Ryzen 7 4800H, AMD Radeon RX 5600M
110.7 (102min - 125max) fps
Durchschnittliche NVIDIA GeForce RTX 2060 Mobile
  (105.2 - 116, n=2)
110.6 fps 0%
Durchschnittliche NVIDIA GeForce GTX 1660 Ti Mobile
  (102 - 108, n=2)
105 fps -5%
1920x1080 Maximum Settings AA:TS AF:16x
Durchschnittliche NVIDIA GeForce RTX 2060 (Desktop)
  ()
139 fps +34%
Durchschnittliche NVIDIA GeForce RTX 2070 Mobile
  (126 - 132, n=2)
129 fps +24%
Durchschnittliche NVIDIA GeForce RTX 2070 Max-Q
  (105 - 143, n=5)
121.8 fps +17%
Durchschnittliche NVIDIA GeForce RTX 2060 Mobile
  (104.4 - 134, n=3)
117.5 fps +13%
Durchschnittliche NVIDIA GeForce RTX 2060 Max-Q
  ()
116.6 fps +12%
Dell G5 15 SE 5505 P89F
AMD Ryzen 7 4800H, AMD Radeon RX 5600M
104.1 (95min - 120max) fps
Durchschnittliche NVIDIA GeForce GTX 1660 Ti Mobile
  (98.6 - 107, n=2)
102.8 fps -1%
Durchschnittliche AMD Radeon RX 5500M
  ()
72 fps -31%
Far Cry New Dawn
1920x1080 High Preset
Durchschnittliche NVIDIA GeForce RTX 2060 (Desktop)
  ()
97 fps +31%
Durchschnittliche NVIDIA GeForce RTX 2070 Mobile
  (91 - 92, n=2)
91.5 fps +24%
Durchschnittliche NVIDIA GeForce RTX 2070 Max-Q
  (86 - 94, n=5)
89.6 fps +21%
Durchschnittliche NVIDIA GeForce GTX 1660 Ti Mobile
  (79 - 89, n=7)
84.4 fps +14%
Durchschnittliche NVIDIA GeForce RTX 2060 Mobile
  (77 - 93, n=3)
83 fps +12%
Dell G5 15 SE 5505 P89F
AMD Ryzen 7 4800H, AMD Radeon RX 5600M
74 (61min - 99max) fps
Durchschnittliche NVIDIA GeForce RTX 2060 Max-Q
  ()
70 fps -5%
1920x1080 Ultra Preset
Durchschnittliche NVIDIA GeForce RTX 2060 (Desktop)
  ()
88 fps +31%
Durchschnittliche NVIDIA GeForce RTX 2070 Mobile
  (82 - 83, n=2)
82.5 fps +23%
Durchschnittliche NVIDIA GeForce RTX 2070 Max-Q
  (78 - 84, n=5)
80.4 fps +20%
Durchschnittliche NVIDIA GeForce GTX 1660 Ti Mobile
  (73 - 81, n=7)
76.4 fps +14%
Durchschnittliche NVIDIA GeForce RTX 2060 Mobile
  (69 - 83, n=3)
74.7 fps +11%
Dell G5 15 SE 5505 P89F
AMD Ryzen 7 4800H, AMD Radeon RX 5600M
67 (48min - 97max) fps
Durchschnittliche NVIDIA GeForce RTX 2060 Max-Q
  ()
63 fps -6%
Durchschnittliche AMD Radeon RX 5500M
  ()
51 fps -24%
Metro Exodus
1920x1080 High Quality AF:16x
Durchschnittliche NVIDIA GeForce RTX 2070 Mobile
  (66 - 66.4, n=3)
66.2 fps +20%
Durchschnittliche NVIDIA GeForce RTX 2060 (Desktop)
  ()
63.9 fps +16%
Durchschnittliche NVIDIA GeForce RTX 2070 Max-Q
  (56.3 - 58.9, n=5)
57.6 fps +4%
Dell G5 15 SE 5505 P89F
AMD Ryzen 7 4800H, AMD Radeon RX 5600M
55.2 (27.3min - 85.2max) fps
Durchschnittliche NVIDIA GeForce RTX 2060 Max-Q
  ()
55.2 fps 0%
Durchschnittliche NVIDIA GeForce RTX 2060 Mobile
  (50.7 - 56.6, n=6)
54.1 fps -2%
Durchschnittliche NVIDIA GeForce GTX 1660 Ti Mobile
  (47.2 - 54.9, n=4)
51.3 fps -7%
Durchschnittliche AMD Radeon RX 5500M
  ()
38.1 fps -31%
1920x1080 Ultra Quality AF:16x
Durchschnittliche NVIDIA GeForce RTX 2070 Mobile
  (53.3 - 54.6, n=5)
53.9 fps +20%
Durchschnittliche NVIDIA GeForce RTX 2060 (Desktop)
  ()
52.7 fps +17%
Durchschnittliche NVIDIA GeForce RTX 2070 Max-Q
  (46 - 47.7, n=7)
47 fps +5%
Dell G5 15 SE 5505 P89F
AMD Ryzen 7 4800H, AMD Radeon RX 5600M
44.9 (24.5min - 66.6max) fps
Durchschnittliche NVIDIA GeForce RTX 2060 Max-Q
  ()
43.8 fps -2%
Durchschnittliche NVIDIA GeForce RTX 2060 Mobile
  (41.6 - 46, n=6)
43.5 fps -3%
Durchschnittliche NVIDIA GeForce GTX 1660 Ti Mobile
  (38.2 - 43.1, n=4)
40.9 fps -9%
Durchschnittliche AMD Radeon RX 5500M
  ()
32.2 fps -28%
Dirt Rally 2.0
1920x1080 High Preset AA:T AF:8x
Durchschnittliche NVIDIA GeForce RTX 2060 (Desktop)
  ()
138.2 fps +22%
Durchschnittliche NVIDIA GeForce RTX 2070 Max-Q
  (112 - 129, n=3)
122.6 fps +8%
Durchschnittliche NVIDIA GeForce RTX 2060 Mobile
  (112.5 - 127, n=3)
121.2 fps +7%
Durchschnittliche NVIDIA GeForce RTX 2070 Mobile
  (117 - 121, n=2)
119 fps +5%
Durchschnittliche NVIDIA GeForce GTX 1660 Ti Mobile
  (107 - 123, n=2)
115 fps +1%
Dell G5 15 SE 5505 P89F
AMD Ryzen 7 4800H, AMD Radeon RX 5600M
113.6 (95min - 124max) fps
Durchschnittliche NVIDIA GeForce RTX 2060 Max-Q
  ()
105.3 fps -7%
1920x1080 Ultra Preset AA:T AF:16x
Durchschnittliche NVIDIA GeForce RTX 2060 (Desktop)
  ()
84.4 fps +9%
Dell G5 15 SE 5505 P89F
AMD Ryzen 7 4800H, AMD Radeon RX 5600M
77.3 (70min - 87max) fps
Durchschnittliche NVIDIA GeForce RTX 2070 Mobile
  (75 - 75.2, n=2)
75.1 fps -3%
Durchschnittliche NVIDIA GeForce RTX 2070 Max-Q
  (68.8 - 79.1, n=4)
74.4 fps -4%
Durchschnittliche NVIDIA GeForce RTX 2060 Mobile
  (66.3 - 74, n=3)
70.1 fps -9%
Durchschnittliche NVIDIA GeForce GTX 1660 Ti Mobile
  (62.3 - 65.6, n=2)
64 fps -17%
Durchschnittliche NVIDIA GeForce RTX 2060 Max-Q
  ()
60.5 fps -22%
Durchschnittliche AMD Radeon RX 5500M
  ()
58.4 fps -24%
Anno 1800
1920x1080 High Graphics Quality (DX11)
Durchschnittliche NVIDIA GeForce RTX 2070 Mobile
  (68.5 - 76.8, n=2)
72.7 fps +14%
Durchschnittliche NVIDIA GeForce RTX 2060 (Desktop)
  ()
72 fps +13%
Durchschnittliche NVIDIA GeForce GTX 1660 Ti Mobile
  (69.2 - 75.9, n=3)
71.8 fps +13%
Durchschnittliche NVIDIA GeForce RTX 2070 Max-Q
  (58.5 - 70.6, n=4)
67 fps +6%
Durchschnittliche NVIDIA GeForce RTX 2060 Mobile
  (60.8 - 67.1, n=3)
63.7 fps 0%
Dell G5 15 SE 5505 P89F
AMD Ryzen 7 4800H, AMD Radeon RX 5600M
63.5 (59min - 70max) fps
Durchschnittliche NVIDIA GeForce RTX 2060 Max-Q
  ()
61.4 fps -3%
Durchschnittliche AMD Radeon RX 5500M
  ()
46.3 fps -27%
1920x1080 Ultra Graphics Quality (DX11)
Durchschnittliche NVIDIA GeForce RTX 2060 (Desktop)
  ()
40.3 fps +1%
Durchschnittliche NVIDIA GeForce RTX 2070 Mobile
  (39.5 - 41.1, n=2)
40.3 fps +1%
Durchschnittliche NVIDIA GeForce GTX 1660 Ti Mobile
  (31.1 - 54, n=4)
40.1 fps 0%
Dell G5 15 SE 5505 P89F
AMD Ryzen 7 4800H, AMD Radeon RX 5600M
40 (33min - 48max) fps
Durchschnittliche NVIDIA GeForce RTX 2060 Mobile
  (35.7 - 37.3, n=3)
36.6 fps -8%
Durchschnittliche NVIDIA GeForce RTX 2060 Max-Q
  ()
36.5 fps -9%
Durchschnittliche NVIDIA GeForce RTX 2070 Max-Q
  (28.5 - 40, n=5)
35.7 fps -11%
Durchschnittliche AMD Radeon RX 5500M
  ()
23.9 fps -40%
Total War: Three Kingdoms
1920x1080 High (incl textures)
Durchschnittliche NVIDIA GeForce RTX 2070 Mobile
  ()
88.5 fps +36%
Durchschnittliche NVIDIA GeForce RTX 2070 Max-Q
  ()
80 fps +23%
Durchschnittliche NVIDIA GeForce RTX 2060 Mobile
  (66.9 - 73.4, n=3)
70.7 fps +9%
Durchschnittliche NVIDIA GeForce RTX 2060 Max-Q
  ()
69.2 fps +7%
Dell G5 15 SE 5505 P89F
AMD Ryzen 7 4800H, AMD Radeon RX 5600M
64.9 (53min - 77max) fps
Durchschnittliche NVIDIA GeForce GTX 1660 Ti Mobile
  ()
63.9 fps -2%
Durchschnittliche AMD Radeon RX 5500M
  ()
48.7 fps -25%
1920x1080 Ultra (incl textures)
Durchschnittliche NVIDIA GeForce RTX 2070 Mobile
  ()
63.1 fps +43%
Durchschnittliche NVIDIA GeForce RTX 2070 Max-Q
  ()
54 fps +22%
Durchschnittliche NVIDIA GeForce RTX 2060 Max-Q
  ()
50.7 fps +15%
Durchschnittliche NVIDIA GeForce RTX 2060 Mobile
  (46.3 - 53.7, n=3)
50.2 fps +14%
Durchschnittliche NVIDIA GeForce GTX 1660 Ti Mobile
  ()
46.1 fps +4%
Dell G5 15 SE 5505 P89F
AMD Ryzen 7 4800H, AMD Radeon RX 5600M
44.2 (37min - 54max) fps
Durchschnittliche AMD Radeon RX 5500M
  ()
35.8 fps -19%
F1 2019
1920x1080 High Preset AA:T AF:16x
Durchschnittliche NVIDIA GeForce RTX 2060 (Desktop)
  ()
154 fps +35%
Durchschnittliche NVIDIA GeForce RTX 2070 Mobile
  (139 - 162, n=2)
150.5 fps +32%
Durchschnittliche NVIDIA GeForce RTX 2070 Max-Q
  (130 - 147, n=4)
136.8 fps +20%
Durchschnittliche NVIDIA GeForce RTX 2060 Mobile
  (122 - 149, n=4)
136.5 fps +20%
Durchschnittliche NVIDIA GeForce GTX 1660 Ti Mobile
  (121 - 141, n=4)
128.8 fps +13%
Durchschnittliche NVIDIA GeForce RTX 2060 Max-Q
  ()
116 fps +2%
Dell G5 15 SE 5505 P89F
AMD Ryzen 7 4800H, AMD Radeon RX 5600M
114 (98min - 124max) fps
Durchschnittliche AMD Radeon RX 5500M
  (64 - 82, n=2)
73 fps -36%
1920x1080 Ultra High Preset AA:T AF:16x
Durchschnittliche NVIDIA GeForce RTX 2060 (Desktop)
  ()
127 fps +20%
Durchschnittliche NVIDIA GeForce RTX 2070 Mobile
  (95 - 123, n=2)
109 fps +3%
Durchschnittliche NVIDIA GeForce RTX 2060 Mobile
  (97 - 127, n=4)
106.8 fps +1%
Dell G5 15 SE 5505 P89F
AMD Ryzen 7 4800H, AMD Radeon RX 5600M
106 (94min - 114max) fps
Durchschnittliche NVIDIA GeForce RTX 2070 Max-Q
  (97 - 112, n=5)
104.4 fps -2%
Durchschnittliche NVIDIA GeForce RTX 2060 Max-Q
  ()
101 fps -5%
Durchschnittliche NVIDIA GeForce GTX 1660 Ti Mobile
  (91 - 99, n=4)
93.8 fps -12%
Durchschnittliche AMD Radeon RX 5500M
  (64 - 68, n=2)
66 fps -38%
Control
1920x1080 Medium Quality Preset (DX11)
Durchschnittliche NVIDIA GeForce RTX 2060 (Desktop)
  ()
96.2 fps +33%
Durchschnittliche NVIDIA GeForce RTX 2070 Mobile
  (90 - 97.3, n=3)
93.4 fps +29%
Durchschnittliche NVIDIA GeForce RTX 2070 Max-Q
  ()
81 fps +12%
Durchschnittliche NVIDIA GeForce RTX 2060 Mobile
  (74.9 - 80, n=3)
77.5 fps +7%
Dell G5 15 SE 5505 P89F
AMD Ryzen 7 4800H, AMD Radeon RX 5600M
72.3 (65min - 81max) fps
Durchschnittliche NVIDIA GeForce GTX 1660 Ti Mobile
  (69.2 - 72.3, n=2)
70.8 fps -2%
Durchschnittliche NVIDIA GeForce RTX 2060 Max-Q
  ()
67.1 fps -7%
Durchschnittliche AMD Radeon RX 5500M
  (47.5 - 50.1, n=2)
48.8 fps -33%
1920x1080 High Quality Preset (DX11)
Durchschnittliche NVIDIA GeForce RTX 2060 (Desktop)
  ()
72.7 fps +37%
Durchschnittliche NVIDIA GeForce RTX 2070 Mobile
  (68 - 72.3, n=3)
69.4 fps +31%
Durchschnittliche NVIDIA GeForce RTX 2070 Max-Q
  (57.4 - 71.2, n=4)
61.8 fps +16%
Durchschnittliche NVIDIA GeForce RTX 2060 Mobile
  (54.3 - 64, n=5)
57.9 fps +9%
Dell G5 15 SE 5505 P89F
AMD Ryzen 7 4800H, AMD Radeon RX 5600M
53.1 (44min - 61max) fps
Durchschnittliche NVIDIA GeForce GTX 1660 Ti Mobile
  (50.7 - 52.8, n=2)
51.8 fps -2%
Durchschnittliche NVIDIA GeForce RTX 2060 Max-Q
  ()
50.4 fps -5%
Durchschnittliche AMD Radeon RX 5500M
  (34.2 - 36.9, n=2)
35.6 fps -33%
Ghost Recon Breakpoint
1920x1080 High Preset AA:T
Durchschnittliche NVIDIA GeForce RTX 2060 (Desktop)
  ()
96 fps +41%
Durchschnittliche NVIDIA GeForce RTX 2070 Mobile
  (89 - 98, n=2)
93.5 fps +38%
Durchschnittliche NVIDIA GeForce RTX 2060 Mobile
  (74 - 82, n=3)
78.3 fps +15%
Durchschnittliche NVIDIA GeForce RTX 2060 Max-Q
  ()
75 fps +10%
Durchschnittliche NVIDIA GeForce RTX 2070 Max-Q
  (70 - 78, n=2)
74 fps +9%
Durchschnittliche NVIDIA GeForce GTX 1660 Ti Mobile
  (70 - 76, n=2)
73 fps +7%
Dell G5 15 SE 5505 P89F
AMD Ryzen 7 4800H, AMD Radeon RX 5600M
68 (53min - 103max) fps
Durchschnittliche AMD Radeon RX 5500M
  ()
48 fps -29%
1920x1080 Ultra Preset AA:T
Durchschnittliche NVIDIA GeForce RTX 2060 (Desktop)
  ()
71 fps +42%
Durchschnittliche NVIDIA GeForce RTX 2070 Mobile
  (67 - 71, n=2)
69 fps +38%
Durchschnittliche NVIDIA GeForce RTX 2070 Max-Q
  (52 - 66, n=3)
58.3 fps +17%
Durchschnittliche NVIDIA GeForce RTX 2060 Mobile
  (54 - 62, n=4)
58 fps +16%
Durchschnittliche NVIDIA GeForce RTX 2060 Max-Q
  ()
55 fps +10%
Durchschnittliche NVIDIA GeForce GTX 1660 Ti Mobile
  (51 - 55, n=2)
53 fps +6%
Dell G5 15 SE 5505 P89F
AMD Ryzen 7 4800H, AMD Radeon RX 5600M
50 (36min - 74max) fps
Durchschnittliche AMD Radeon RX 5500M
  ()
26 fps -48%
GRID 2019
1920x1080 High Preset
Dell G5 15 SE 5505 P89F
AMD Ryzen 7 4800H, AMD Radeon RX 5600M
116.6 (94.9min - 134.5max) fps
Durchschnittliche NVIDIA GeForce RTX 2070 Mobile
  (104 - 124, n=2)
114 fps -2%
Durchschnittliche NVIDIA GeForce RTX 2060 (Desktop)
  ()
111 fps -5%
Durchschnittliche NVIDIA GeForce RTX 2060 Max-Q
  ()
103.4 fps -11%
Durchschnittliche NVIDIA GeForce GTX 1660 Ti Mobile
  (90.5 - 94.3, n=2)
92.4 fps -21%
Durchschnittliche NVIDIA GeForce RTX 2070 Max-Q
  (72.4 - 107, n=3)
90.7 fps -22%
Durchschnittliche NVIDIA GeForce RTX 2060 Mobile
  (64.8 - 101, n=3)
86.8 fps -26%
Durchschnittliche AMD Radeon RX 5500M
  ()
67 fps -43%
1920x1080 Ultra High Preset
Dell G5 15 SE 5505 P89F
AMD Ryzen 7 4800H, AMD Radeon RX 5600M
88.6 (75.1min - 98.2max) fps
Durchschnittliche NVIDIA GeForce RTX 2060 (Desktop)
  ()
79.5 fps -10%
Durchschnittliche NVIDIA GeForce RTX 2070 Mobile
  (75.4 - 83.5, n=2)
79.5 fps -10%
Durchschnittliche NVIDIA GeForce RTX 2060 Max-Q
  ()
73.5 fps -17%
Durchschnittliche NVIDIA GeForce RTX 2070 Max-Q
  (65.1 - 79.4, n=4)
69.4 fps -22%
Durchschnittliche NVIDIA GeForce RTX 2060 Mobile
  (58.2 - 70.3, n=4)
65.1 fps -27%
Durchschnittliche NVIDIA GeForce GTX 1660 Ti Mobile
  (61.7 - 64.1, n=2)
62.9 fps -29%
Durchschnittliche AMD Radeon RX 5500M
  ()
36.7 fps -59%
Need for Speed Heat
1920x1080 High Preset
Durchschnittliche NVIDIA GeForce RTX 2060 (Desktop)
  ()
103 fps +47%
Durchschnittliche NVIDIA GeForce RTX 2070 Mobile
  (83.5 - 88, n=2)
85.8 fps +22%
Durchschnittliche NVIDIA GeForce RTX 2070 Max-Q
  ()
84.7 fps +21%
Durchschnittliche NVIDIA GeForce GTX 1660 Ti Mobile
  (79.7 - 86.2, n=2)
83 fps +18%
Durchschnittliche NVIDIA GeForce RTX 2060 Max-Q
  ()
82.2 fps +17%
Durchschnittliche NVIDIA GeForce RTX 2060 Mobile
  (62.8 - 87.7, n=2)
75.3 fps +7%
Dell G5 15 SE 5505 P89F
AMD Ryzen 7 4800H, AMD Radeon RX 5600M
70.1 (61min - 83max) fps
Durchschnittliche AMD Radeon RX 5500M
  ()
52.3 fps -25%
1920x1080 Ultra Preset
Durchschnittliche NVIDIA GeForce RTX 2060 (Desktop)
  ()
86.9 fps +45%
Durchschnittliche NVIDIA GeForce RTX 2060 Max-Q
  ()
79 fps +31%
Durchschnittliche NVIDIA GeForce RTX 2070 Mobile
  (78.1 - 78.3, n=2)
78.2 fps +30%
Durchschnittliche NVIDIA GeForce RTX 2070 Max-Q
  ()
75.5 fps +26%
Durchschnittliche NVIDIA GeForce GTX 1660 Ti Mobile
  (67.4 - 70.3, n=2)
68.9 fps +15%
Durchschnittliche NVIDIA GeForce RTX 2060 Mobile
  (57.8 - 74.9, n=2)
66.4 fps +10%
Dell G5 15 SE 5505 P89F
AMD Ryzen 7 4800H, AMD Radeon RX 5600M
60.1 (49min - 74max) fps
Durchschnittliche AMD Radeon RX 5500M
  ()
45.8 fps -24%
Star Wars Jedi Fallen Order
1920x1080 High Preset
Durchschnittliche NVIDIA GeForce RTX 2060 (Desktop)
  ()
105 fps +54%
Durchschnittliche NVIDIA GeForce RTX 2070 Mobile
  (92.2 - 98.7, n=2)
95.5 fps +40%
Durchschnittliche NVIDIA GeForce RTX 2070 Max-Q
  ()
91.8 fps +34%
Durchschnittliche NVIDIA GeForce GTX 1660 Ti Mobile
  (84.9 - 91.4, n=2)
88.2 fps +29%
Durchschnittliche NVIDIA GeForce RTX 2060 Max-Q
  ()
88 fps +29%
Durchschnittliche NVIDIA GeForce RTX 2060 Mobile
  (65.8 - 93.8, n=3)
82.5 fps +21%
Dell G5 15 SE 5505 P89F
AMD Ryzen 7 4800H, AMD Radeon RX 5600M
68.4 (53min - 84max) fps
Durchschnittliche AMD Radeon RX 5500M
  ()
52.8 fps -23%
1920x1080 Epic Preset
Durchschnittliche NVIDIA GeForce RTX 2060 (Desktop)
  ()
96 fps +43%
Durchschnittliche NVIDIA GeForce RTX 2070 Mobile
  (90.7 - 93, n=2)
91.9 fps +37%
Durchschnittliche NVIDIA GeForce RTX 2070 Max-Q
  ()
84.4 fps +26%
Durchschnittliche NVIDIA GeForce GTX 1660 Ti Mobile
  (77.7 - 82.9, n=2)
80.3 fps +20%
Durchschnittliche NVIDIA GeForce RTX 2060 Max-Q
  ()
77.8 fps +16%
Durchschnittliche NVIDIA GeForce RTX 2060 Mobile
  (65.4 - 87.6, n=3)
77.3 fps +15%
Dell G5 15 SE 5505 P89F
AMD Ryzen 7 4800H, AMD Radeon RX 5600M
67.1 (51min - 85max) fps
Durchschnittliche AMD Radeon RX 5500M
  (50.1 - 58.6, n=2)
54.4 fps -19%
Hunt Showdown
1920x1080 Medium Preset
Durchschnittliche NVIDIA GeForce RTX 2070 Mobile
  (123 - 124, n=2)
123.5 fps +35%
Durchschnittliche NVIDIA GeForce RTX 2060 (Desktop)
  ()
120 fps +31%
Durchschnittliche NVIDIA GeForce RTX 2060 Mobile
  (94.2 - 109, n=2)
101.6 fps +11%
Durchschnittliche NVIDIA GeForce RTX 2060 Max-Q
  ()
96.3 fps +5%
Dell G5 15 SE 5505 P89F
AMD Ryzen 7 4800H, AMD Radeon RX 5600M
91.3 (78min - 103max) fps
Durchschnittliche NVIDIA GeForce GTX 1660 Ti Mobile
  ()
89.3 fps -2%
Durchschnittliche NVIDIA GeForce RTX 2070 Max-Q
  ()
72.5 fps -21%
Durchschnittliche AMD Radeon RX 5500M
  ()
72.4 fps -21%
1920x1080 High Preset
Durchschnittliche NVIDIA GeForce RTX 2060 (Desktop)
  ()
104 fps +57%
Durchschnittliche NVIDIA GeForce RTX 2070 Mobile
  (101 - 105, n=3)
102.6 fps +55%
Durchschnittliche NVIDIA GeForce RTX 2060 Mobile
  (75 - 87.4, n=2)
81.2 fps +23%
Durchschnittliche NVIDIA GeForce RTX 2060 Max-Q
  ()
75.7 fps +14%
Durchschnittliche NVIDIA GeForce GTX 1660 Ti Mobile
  (69.1 - 73.5, n=2)
71.3 fps +8%
Dell G5 15 SE 5505 P89F
AMD Ryzen 7 4800H, AMD Radeon RX 5600M
66.2 (56min - 75max) fps
Durchschnittliche NVIDIA GeForce RTX 2070 Max-Q
  ()
64 fps -3%
Durchschnittliche AMD Radeon RX 5500M
  (56.5 - 58.1, n=2)
57.3 fps -13%
Doom Eternal
1920x1080 High Preset
Durchschnittliche NVIDIA GeForce RTX 2060 (Desktop)
  ()
167 fps +35%
Durchschnittliche NVIDIA GeForce RTX 2070 Mobile
  (148.9 - 161, n=3)
155.6 fps +25%
Durchschnittliche NVIDIA GeForce GTX 1660 Ti Mobile
  ()
133 fps +7%
Durchschnittliche NVIDIA GeForce RTX 2070 Max-Q
  (127.8 - 136.4, n=3)
132.1 fps +7%
Durchschnittliche NVIDIA GeForce RTX 2060 Mobile
  (112.4 - 145, n=7)
125.8 fps +1%
Dell G5 15 SE 5505 P89F
AMD Ryzen 7 4800H, AMD Radeon RX 5600M
124 fps
Durchschnittliche NVIDIA GeForce RTX 2060 Max-Q
  ()
95.7 fps -23%
Durchschnittliche AMD Radeon RX 5500M
  ()
44.9 fps -64%
1920x1080 Ultra Preset
Durchschnittliche NVIDIA GeForce RTX 2060 (Desktop)
  ()
162 fps +41%
Durchschnittliche NVIDIA GeForce RTX 2070 Mobile
  (145.1 - 157, n=3)
152 fps +33%
Durchschnittliche NVIDIA GeForce RTX 2070 Max-Q
  (125.6 - 137.9, n=4)
130.4 fps +14%
Durchschnittliche NVIDIA GeForce GTX 1660 Ti Mobile
  (120 - 129, n=2)
124.5 fps +9%
Durchschnittliche NVIDIA GeForce RTX 2060 Mobile
  (98.7 - 138, n=10)
121.7 fps +6%
Dell G5 15 SE 5505 P89F
AMD Ryzen 7 4800H, AMD Radeon RX 5600M
114.6 fps
Durchschnittliche NVIDIA GeForce RTX 2060 Max-Q
  ()
93.3 fps -19%
Gears Tactics
1920x1080 High Preset
Durchschnittliche NVIDIA GeForce RTX 2070 Mobile
  (115.2 - 128, n=3)
120.7 fps +26%
Durchschnittliche NVIDIA GeForce RTX 2060 (Desktop)
  ()
120 fps +25%
Durchschnittliche NVIDIA GeForce RTX 2060 Mobile
  (93.3 - 105, n=7)
97.9 fps +2%
Dell G5 15 SE 5505 P89F
AMD Ryzen 7 4800H, AMD Radeon RX 5600M
96.1 (84min - 127.6max) fps
Durchschnittliche NVIDIA GeForce RTX 2070 Max-Q
  (91.4 - 100.8, n=2)
96.1 fps 0%
Durchschnittliche NVIDIA GeForce GTX 1660 Ti Mobile
  (90.2 - 101, n=2)
95.6 fps -1%
Durchschnittliche AMD Radeon RX 5500M
  (78.5 - 80, n=2)
79.3 fps -17%
Durchschnittliche NVIDIA GeForce RTX 2060 Max-Q
  ()
76.4 fps -20%
1920x1080 Ultra Preset
Durchschnittliche NVIDIA GeForce RTX 2070 Mobile
  (85 - 90.9, n=3)
87.2 fps +24%
Durchschnittliche NVIDIA GeForce RTX 2070 Max-Q
  (72 - 100.8, n=2)
86.4 fps +22%
Durchschnittliche NVIDIA GeForce RTX 2060 (Desktop)
  ()
82.9 fps +17%
Dell G5 15 SE 5505 P89F
AMD Ryzen 7 4800H, AMD Radeon RX 5600M
70.6 (62.5min - 98.6max) fps
Durchschnittliche NVIDIA GeForce GTX 1660 Ti Mobile
  (63.6 - 70.1, n=2)
66.9 fps -5%
Durchschnittliche NVIDIA GeForce RTX 2060 Mobile
  (60.7 - 71.3, n=7)
65.8 fps -7%
Durchschnittliche NVIDIA GeForce RTX 2060 Max-Q
  ()
56.9 fps -19%
Durchschnittliche AMD Radeon RX 5500M
  (55.1 - 58.4, n=2)
56.8 fps -20%
min. mittel hoch max.
The Witcher 3 (2015) 266.4 103.6 66.1
Dota 2 Reborn (2015) 124 119 106 102
X-Plane 11.11 (2018) 48.2 37.6 33.7
Shadow of the Tomb Raider (2018) 122 89 83 68
Assassin´s Creed Odyssey (2018) 78 67 60 49
Apex Legends (2019) 143.7 137.1 110.7 104.1
Far Cry New Dawn (2019) 91 77 74 67
Metro Exodus (2019) 146.4 75.5 55.2 44.9
Dirt Rally 2.0 (2019) 215 135 113.6 77.3
The Division 2 (2019) 129 93 75 57
Anno 1800 (2019) 80.4 79.1 63.5 40
Total War: Three Kingdoms (2019) 196.8 96.9 64.9 44.2
F1 2019 (2019) 191 140 114 106
Control (2019) 176.7 72.3 53.1
Borderlands 3 (2019) 105.2 81.7 61.2 47.8
Ghost Recon Breakpoint (2019) 96 76 68 50
GRID 2019 (2019) 186.2 134.3 116.6 88.6
Need for Speed Heat (2019) 86.9 76.6 70.1 60.1
Star Wars Jedi Fallen Order (2019) 76 68.4 67.1
Hunt Showdown (2020) 150.7 91.3 66.2
Doom Eternal (2020) 232.3 144.7 124 114.6
Gears Tactics (2020) 137.8 135.7 96.1 70.6
Dell G5 15 SE 5505 P89F
R7 4800H, Radeon RX 5600M, Samsung PM991 MZ9LQ512HALU, WVA, 1920x1080, 15.60
Asus TUF Gaming A15 FA506IV-HN172
R7 4800H, GeForce RTX 2060 Mobile, Kingston OM8PCP3512F-AB, IPS, 1920x1080, 15.60
Xiaomi Mi Gaming Laptop 2019
i7-9750H, GeForce RTX 2060 Mobile, Toshiba XG6 KXG60ZNV512G, IPS, 1920x1080, 15.60
Dell G7 7590
i7-9750H, GeForce RTX 2060 Mobile, Toshiba BG3 KBG30ZMS256G, IPS, 1920x1080, 15.60
MSI GL65 9SEK
i7-9750H, GeForce RTX 2060 Mobile, WDC PC SN520 SDAPNUW-512G, IPS, 1920x1080, 15.60
MSI GP65 Leopard 9SE-225US
i7-9750H, GeForce RTX 2060 Mobile, Toshiba KBG30ZMT512G, IPS, 1920x1080, 15.60
Asus Strix GL531GV-PB74
i7-9750H, GeForce RTX 2060 Mobile, Intel SSD 660p SSDPEKNW512G8, IPS, 1920x1080, 15.60
Aorus 15 W9
i7-8750H, GeForce RTX 2060 Mobile, Intel SSD 760p SSDPEKKW512G8, IPS, 1920x1080, 15.60
Dell G5 15 5590
i7-8750H, GeForce RTX 2060 Mobile, KBG30ZMS128G, IPS, 1920x1080, 15.60
Lenovo Legion Y540-15IRH
i7-9750H, GeForce RTX 2060 Mobile, Samsung PM981a MZVLB1T0HBLR, IPS, 1920x1080, 15.60
Eluktronics RP-15
R7 4800H, GeForce RTX 2060 Mobile, Phison PM81000GPMQCN28BTF-E12S4 M.2 NVM SSD, IPS, 1920x1080, 15.60
Stromverbrauch
-1%
-32%
-81%
-203%
-50%
-60%
-68%
11%
-71%
-112%
Idle min *
6.5
5.4
17%
10
-54%
11.2
-72%
41
-531%
13.6
-109%
10.9
-68%
18
-177%
3.5
46%
15
-131%
21.7
-234%
Idle avg *
10.6
10
6%
13
-23%
16.3
-54%
45.3
-327%
17.9
-69%
14.7
-39%
20
-89%
6.9
35%
20
-89%
30.1
-184%
Idle max *
11
10.5
5%
20
-82%
46.2
-320%
47.1
-328%
20.6
-87%
32.4
-195%
28
-155%
8.5
23%
33
-200%
35
-218%
Last avg *
84.1
135
-61%
100
-19%
123.3
-47%
94.9
-13%
96
-14%
121.9
-45%
87
-3%
127
-51%
88
-5%
112.6
-34%
Witcher 3 ultra *
152.9
144
6%
159
-4%
135.6
11%
149.4
2%
154.6
-1%
143.5
6%
135
12%
128
16%
134.4
12%
Last max *
180.4
147
19%
196
-9%
181.5
-1%
214.2
-19%
218.6
-21%
209.6
-16%
175
3%
179
1%
213
-18%
201.5
-12%

* ... kleinere Werte sind besser

Preisvergleich

Alle 2 Beträge lesen / Antworten
static version load dynamic
Loading Comments
Diesen Artikel kommentieren / Antworten
Teilen Sie diesen Artikel, um uns zu unterstützen. Jeder Link hilft!
> Notebook Test, Laptop Test und News > News > Newsarchiv > News 2020-06 > Radeon RX 5600M vs. GeForce RTX 2060: AMD ist so verdammt nahe dran
Autor: Allen Ngo,  1.07.2020 (Update:  6.10.2022)