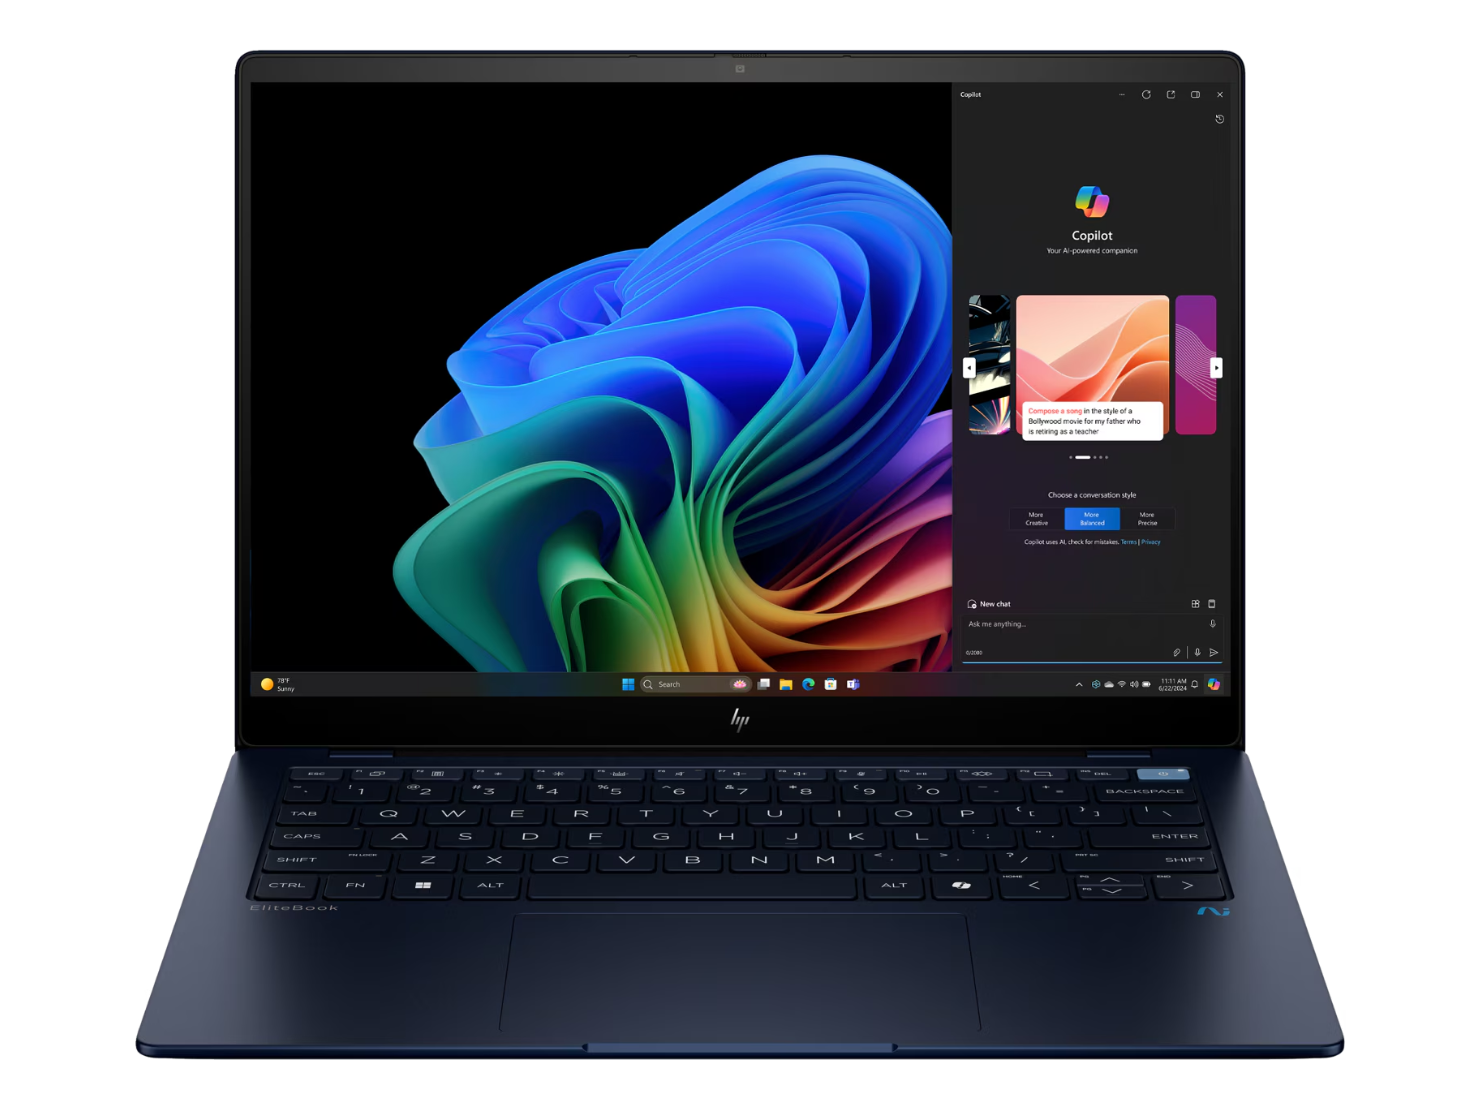
HP EliteBook Ultra G1q 14 im Laptop-Test: Hohe Erwartungen an Windows on ARM

Das HP EliteBook Ultra G1p 14 wurde neben einer ganzen Reihe anderer Modelle im Rahmen des Microsoft Surface Events letzten Monat in Seattle vorgestellt. Die diesjährige Ankündigung war von besonderer Bedeutung, da es den Beginn des dritten Anlaufs markiert, um Windows auf ARM-Plattformen zu bringen. Dieses Mal sicherten sich die Windows-Macher allerdings die Unterstützung von Qualcomms KI-ready-Snapdragon-Prozessor sowie von Herstellern wie HP, Dell, Lenovo und Asus zu, um das Vorhaben ordentlich anzuschieben.
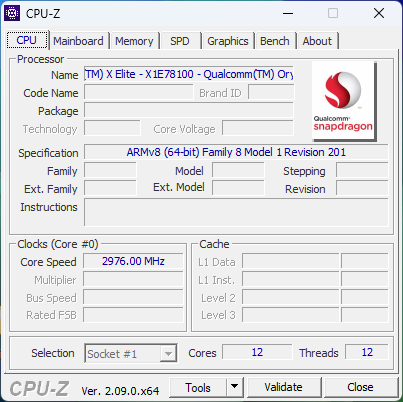
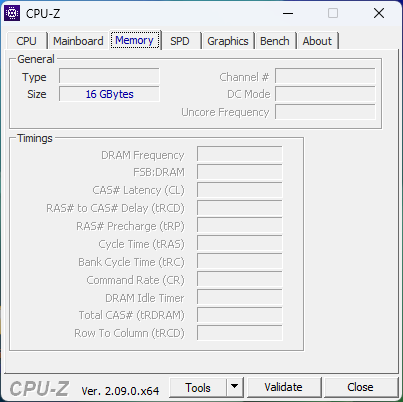
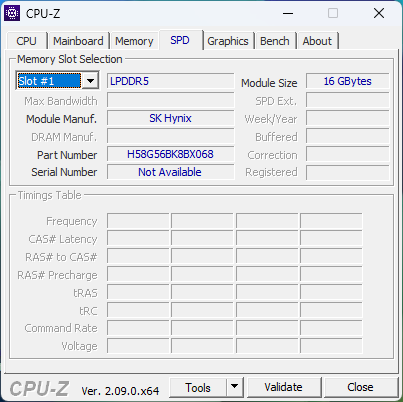
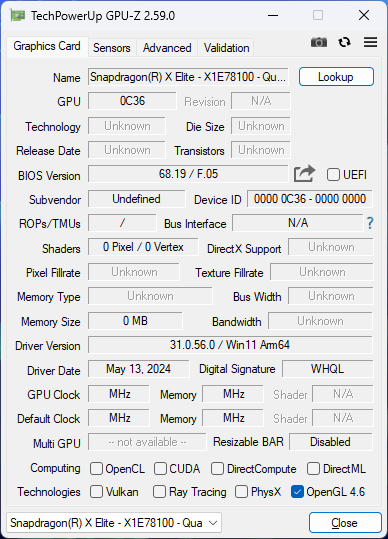
Unsere heutige Testeinheit ist das auf Business fokussierte EliteBook Ultra G1p 14 mit dem Snapdragon X Elite X1E-78-100 SoC, 16 GB verlötetem LPDDR5x-8400-RAM und einer 512 GB großen SSD für etwa 2.029 Euro (nur rund $1700 in den USA!). Zum aktuellen Zeitpunkt gibt es keine weiteren Konfigurationen des Modells. Ein verwandtes jedoch separates Modell ist das OmniBook X 14, welches mit ähnlicher Ausstattung etwa 700 Euro weniger kostet und sich vom Design her eher an Consumer richtet.
Wir empfehlen an dieser Stelle auch unseren Testbericht zum Asus Vivobook S 15, welches mit dem gleichen Qualcomm-ARM-Prozessor ausgestattet ist, wie unser HP. Unsere Erfahrungen hinsichtlich der Software sind bei beiden Laptops daher sehr ähnlich.
Weitere HP-Tests:
Preisvergleich
Potentielle Konkurrenten im Vergleich
Bew. | Version | Datum | Modell | Gewicht | Dicke | Größe | Auflösung | Preis ab |
|---|---|---|---|---|---|---|---|---|
| 82.3 % | v8 | 07 / 2024 | HP EliteBook Ultra G1q 14 SD X Elite X1E-78-100, Adreno X1-85 3.8 TFLOPS | 1.3 kg | 11.2 mm | 14.00" | 2240x1400 | |
| 83.3 % | v8 | 06 / 2024 | Asus Vivobook S 15 OLED Snapdragon SD X Elite X1E-78-100, Adreno X1-85 3.8 TFLOPS | 1.4 kg | 15.9 mm | 15.60" | 2880x1620 | |
| 89.4 % v7 (old) | v7 (old) | 03 / 2023 | HP Dragonfly Pro 2023 R7 7736U, Radeon 680M | 1.5 kg | 18.3 mm | 14.00" | 1920x1200 | |
| 88.3 % v7 (old) | v7 (old) | 04 / 2024 | Dell Latitude 9450 2-in-1 Ultra 7 165U, Graphics 4-Core iGPU (Arrow Lake) | 1.6 kg | 16.28 mm | 14.00" | 2560x1600 | |
| 90.8 % v7 (old) | v7 (old) | 02 / 2024 | Lenovo ThinkPad X1 Carbon G12 Ultra 7 155H, Arc 8-Core | 1.1 kg | 14.96 mm | 14.00" | 2880x1800 | |
| 92.8 % v7 (old) | v7 (old) | 11 / 2023 | Apple MacBook Pro 14 2023 M3 Max Apple M3 Max 16-Core, M3 Max 40-Core GPU | 1.6 kg | 15.5 mm | 14.20" | 3024x1964 |
Hinweis: Wir haben unser Rating-System aktualisiert und die Ergebnisse von Version 8 sind nicht vergleichbar mit den Ergebnissen von Version 7. Weitere Informationen dazu sind hier verfügbar.
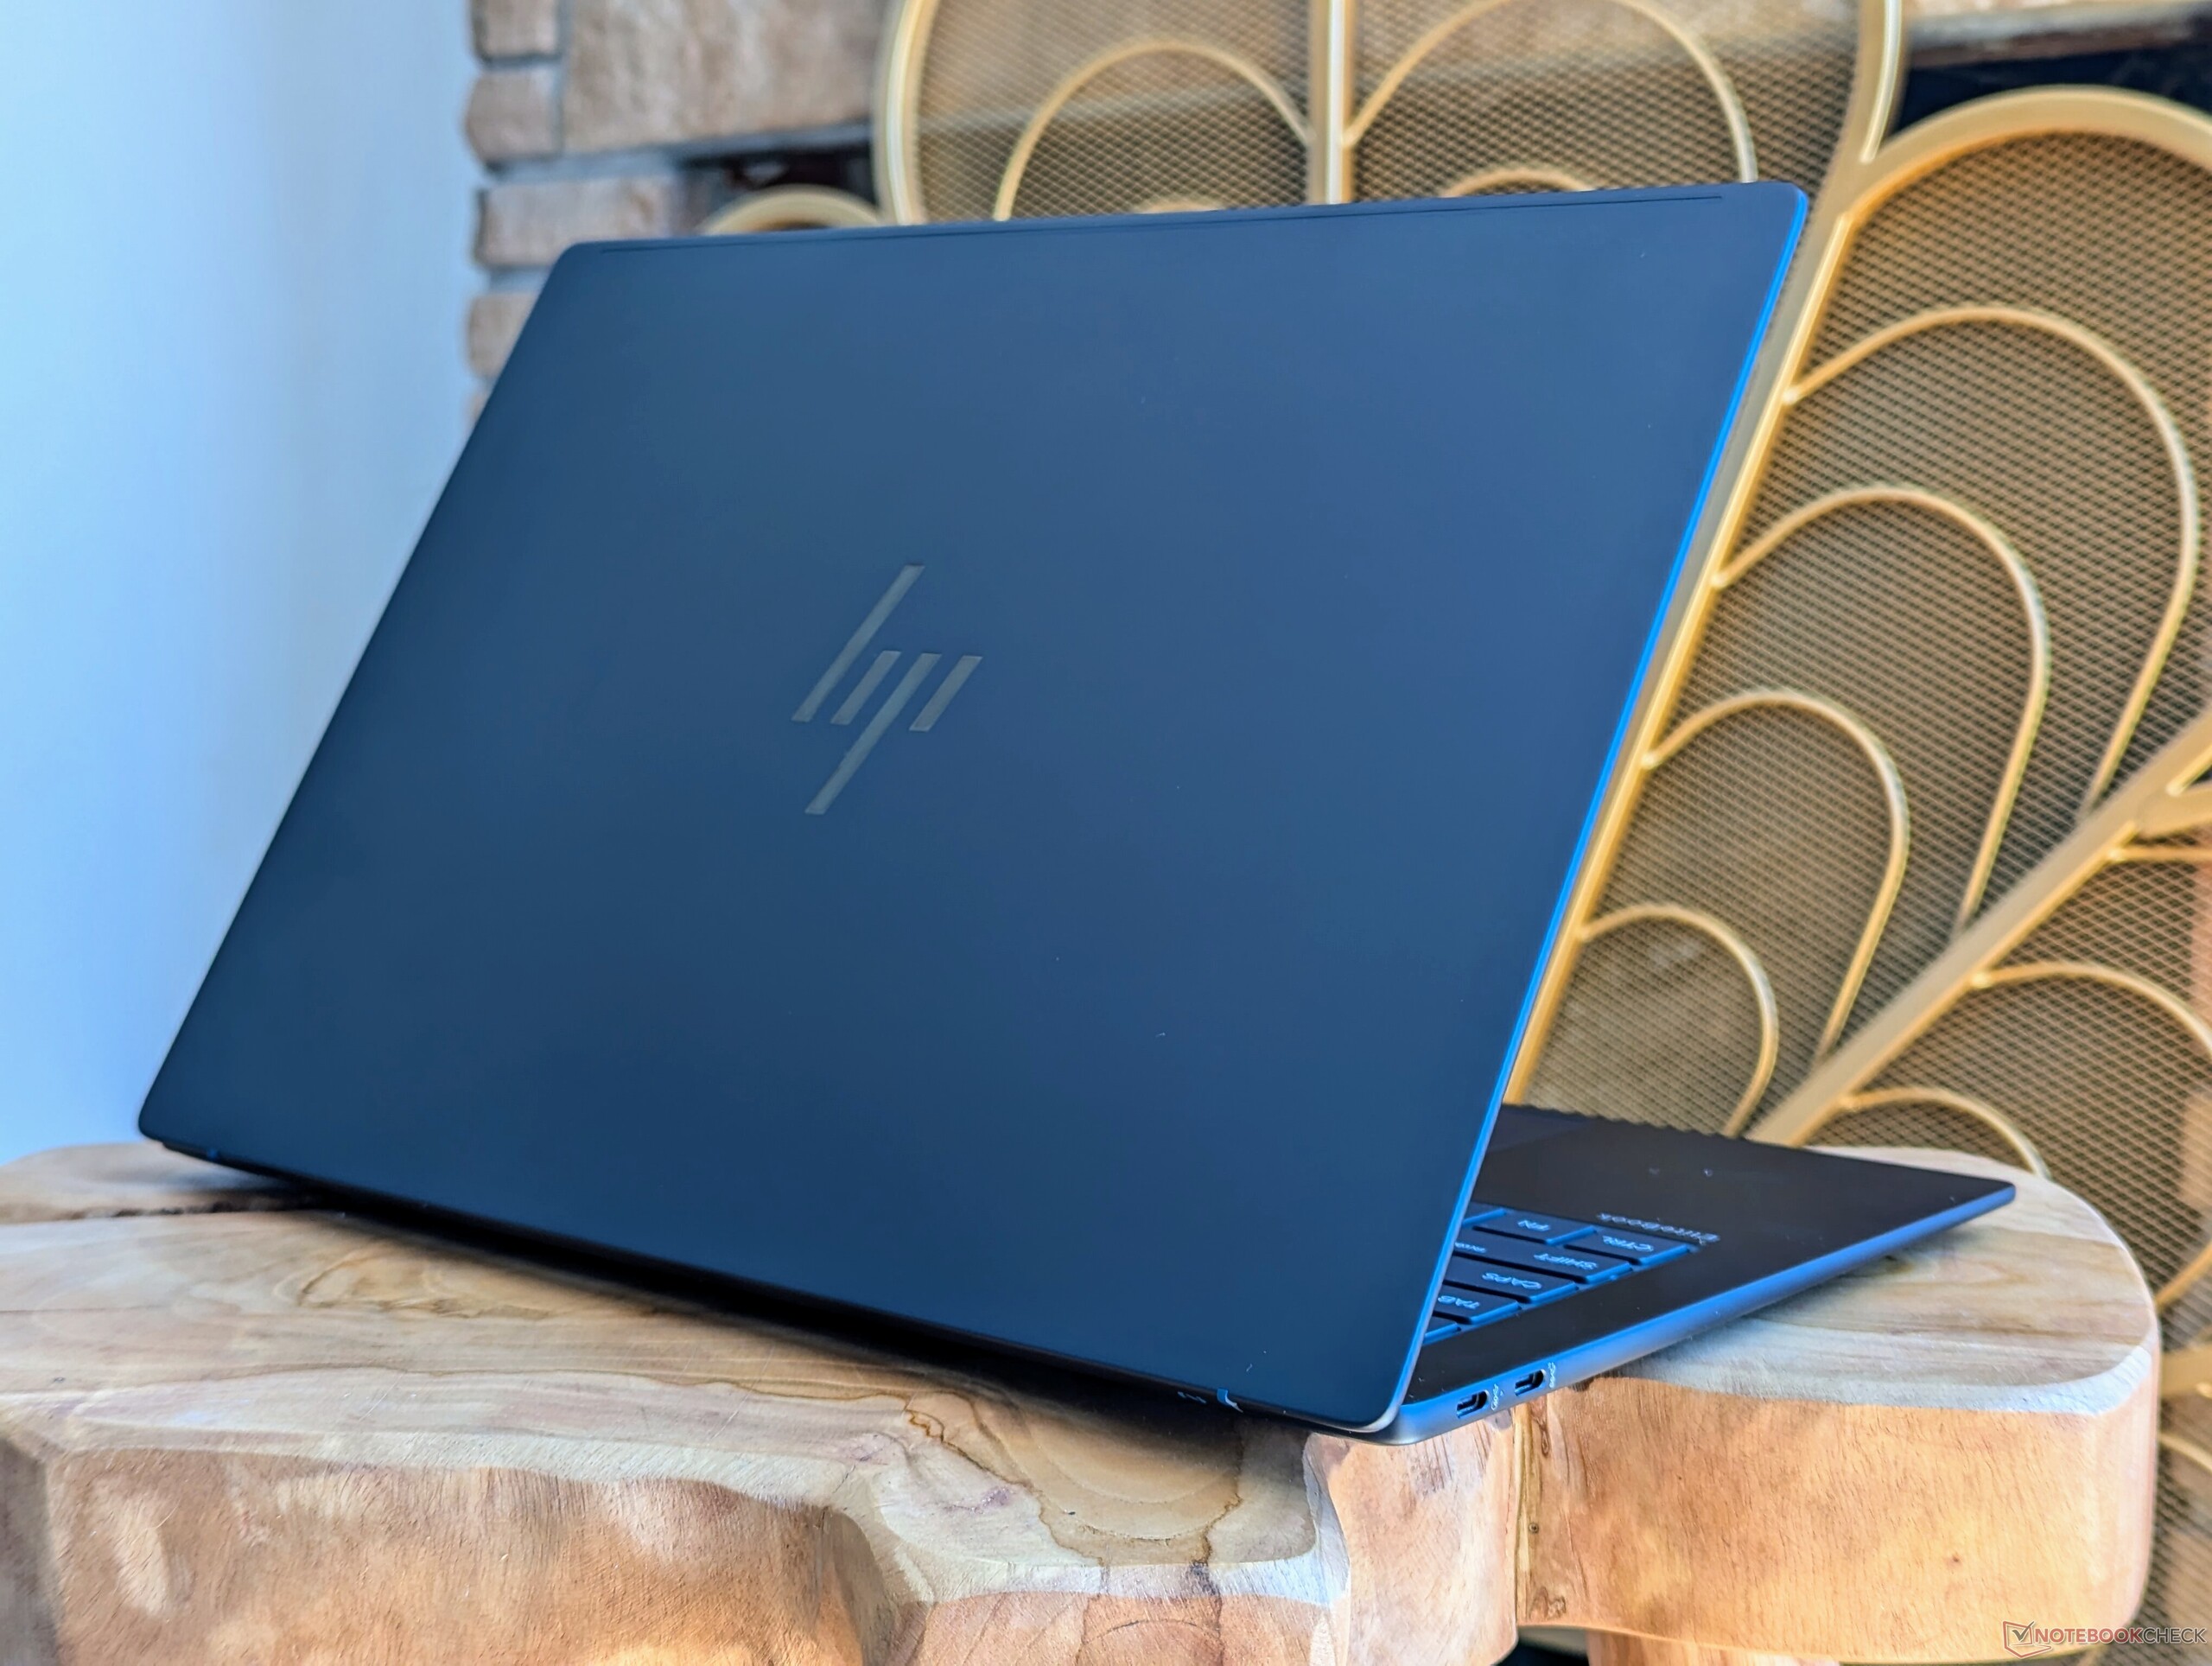
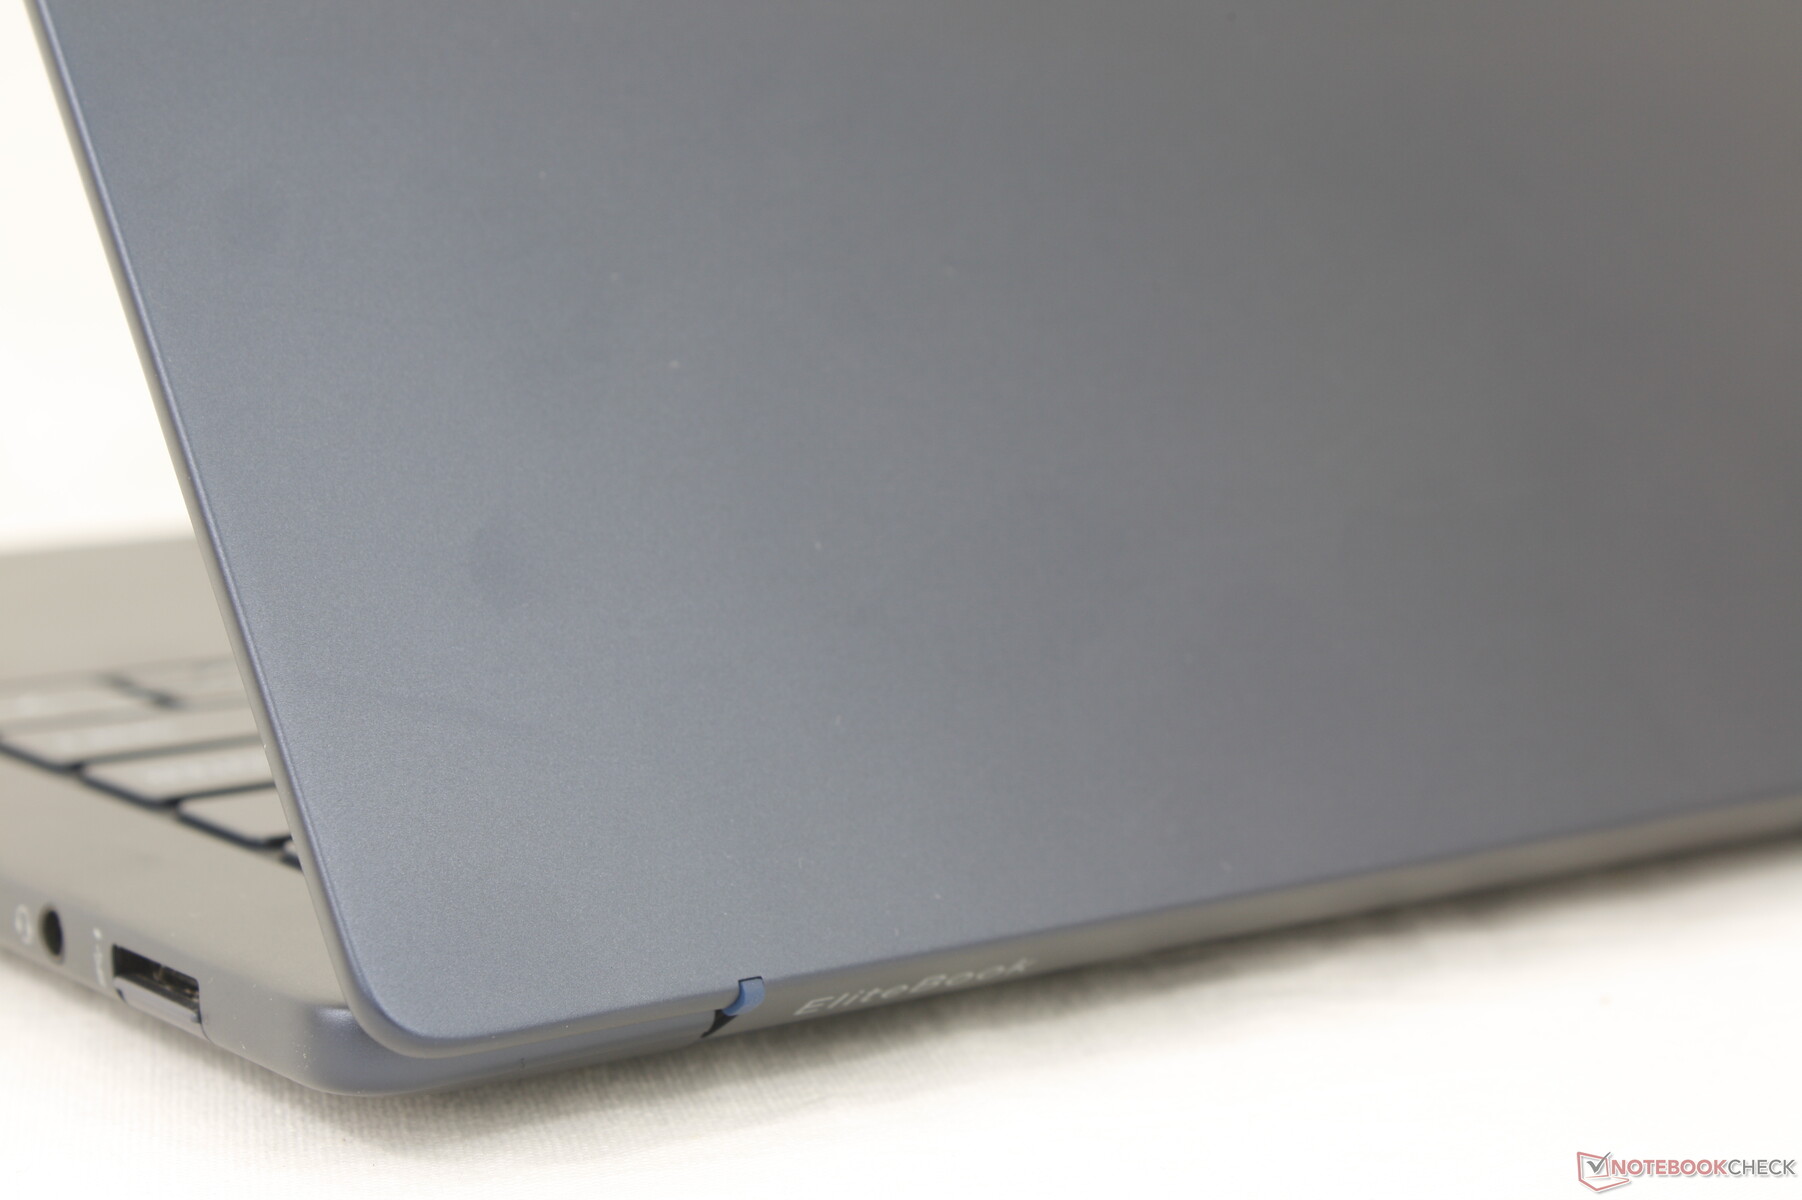
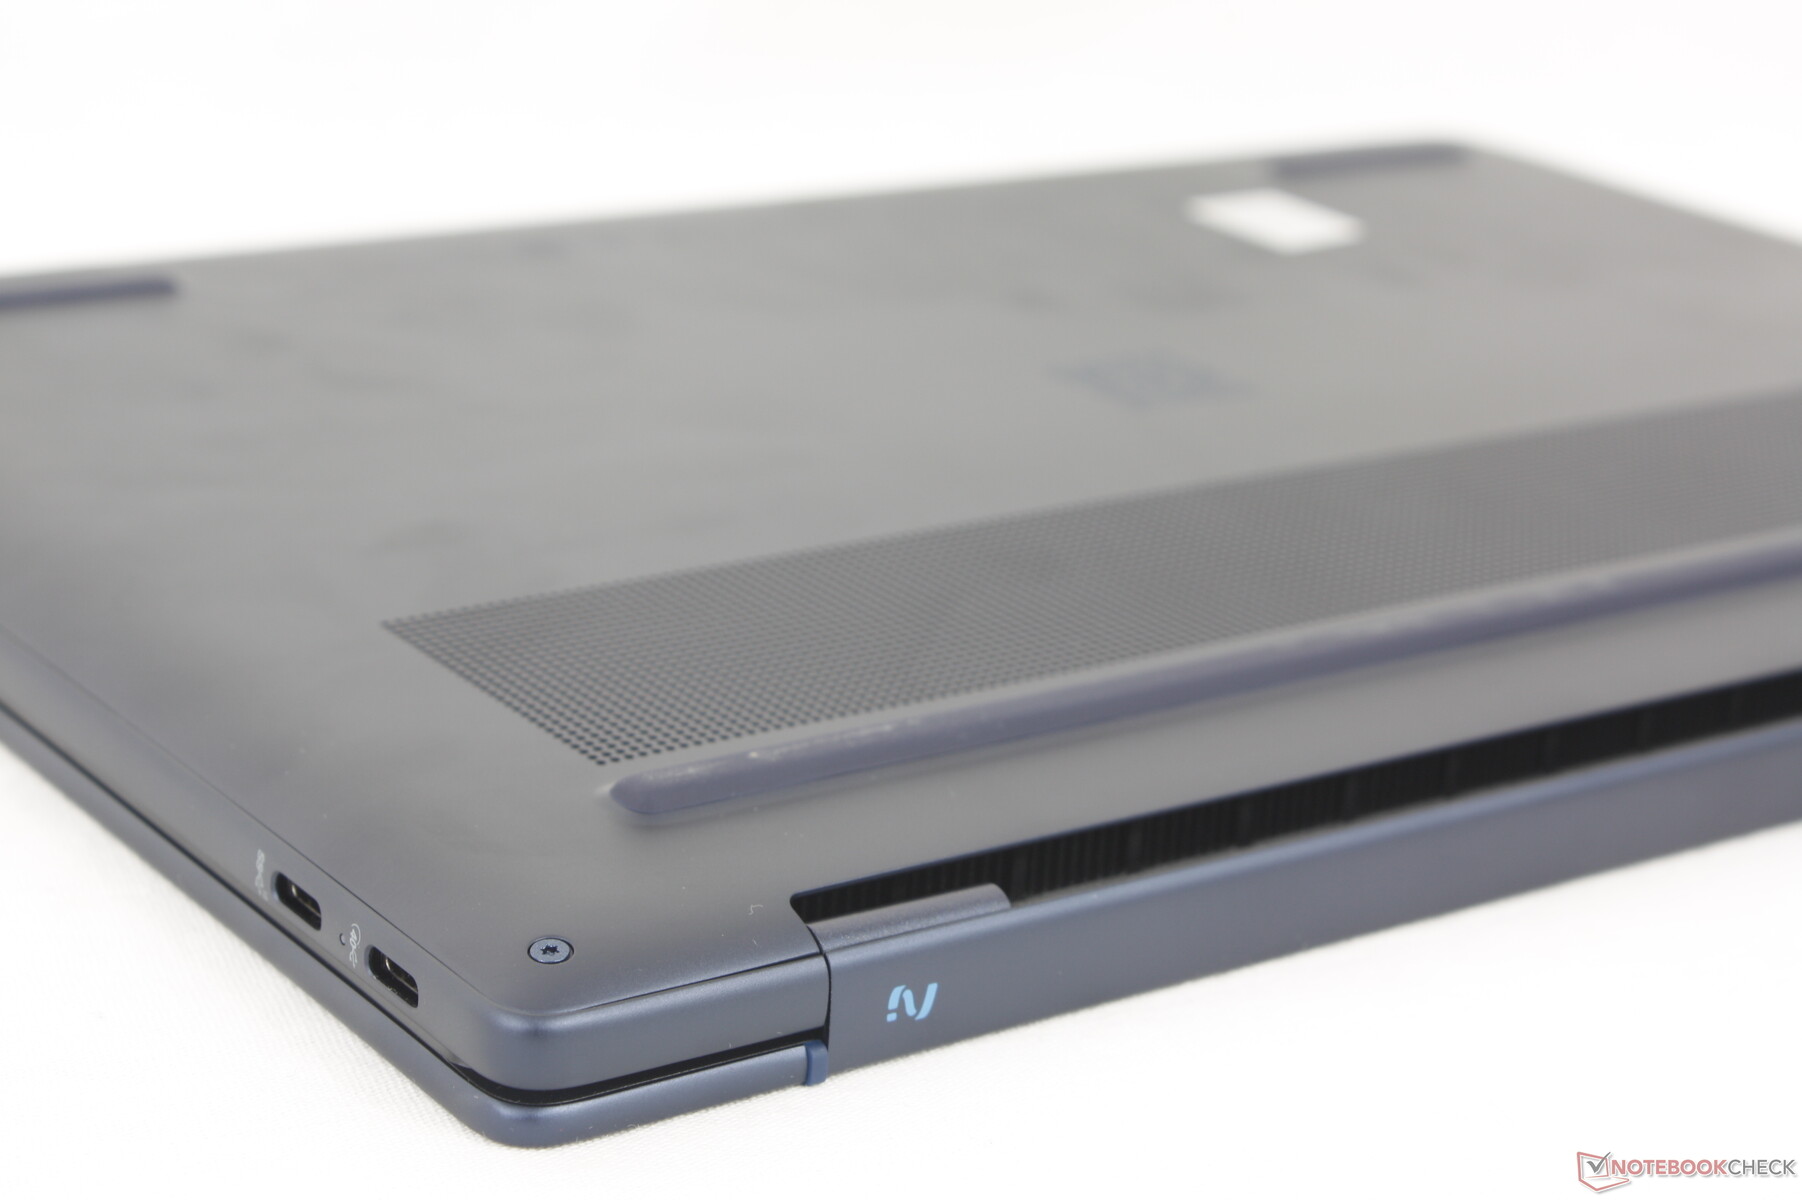
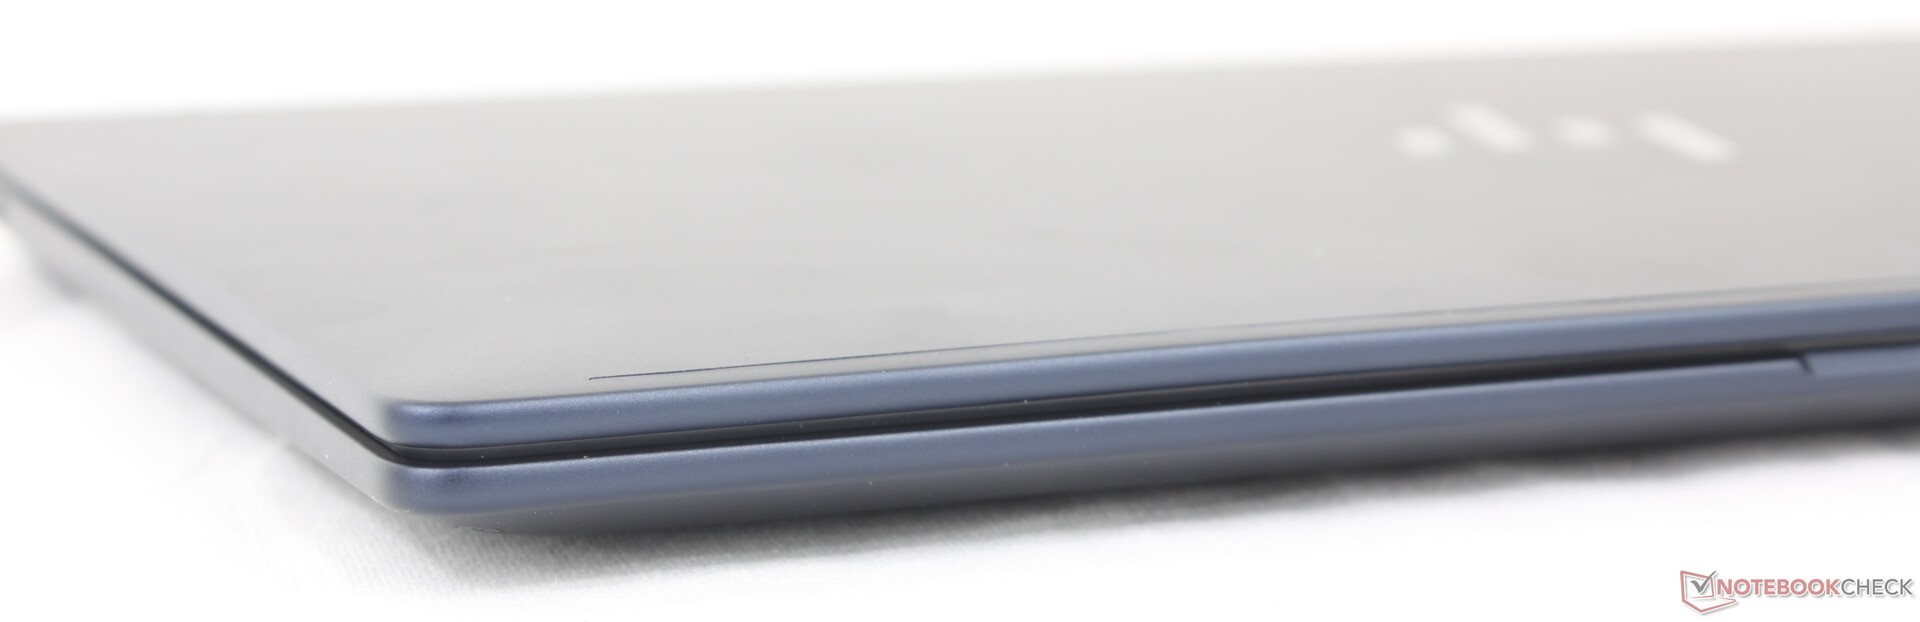
Gehäuse — Verantwortungsvoll aus recyceltem Aluminium und Plastik hergestellt
Zwar setzt das EliteBook Ultra G1q 14 auf einen feschen, neuen ARM-Prozessor, aber die Hülle scheint ihre Inspiration doch deutlich vom letztjährigen Dragonfly Pro mit AMD-CPU zu beziehen. Quasi alles, angefangen von der Gehäusefarbe über das Tastaturlayout bis hin zum Scharnierdesign und dem allgemeinen Look, orientiert sich eher am 14-Zoll-Dragonfly als an der 14-Zoll-EliteBook 1040-Serie. Das führt dazu, dass sich die Qualcomm-Maschine trotz des super-leichten und dünnen Designs voll nach Premium anfühlt.
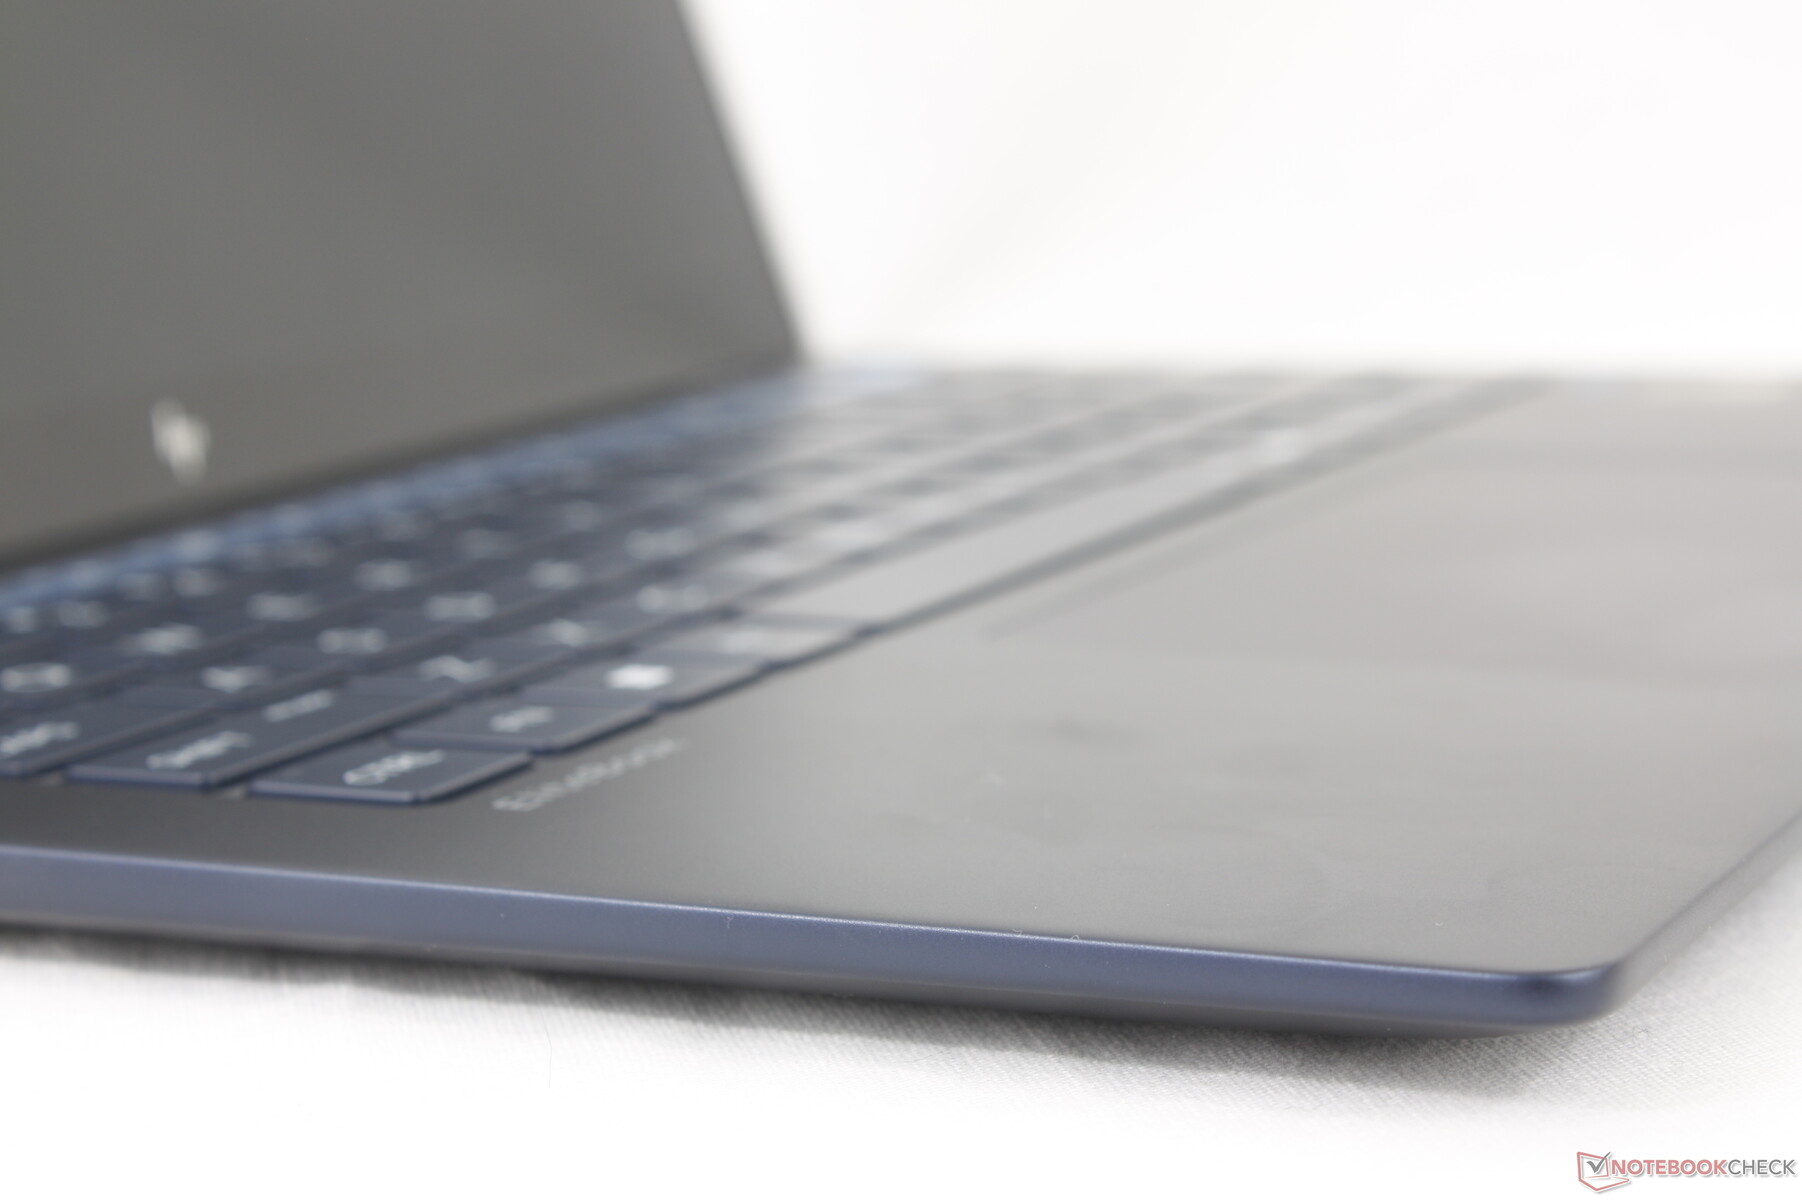
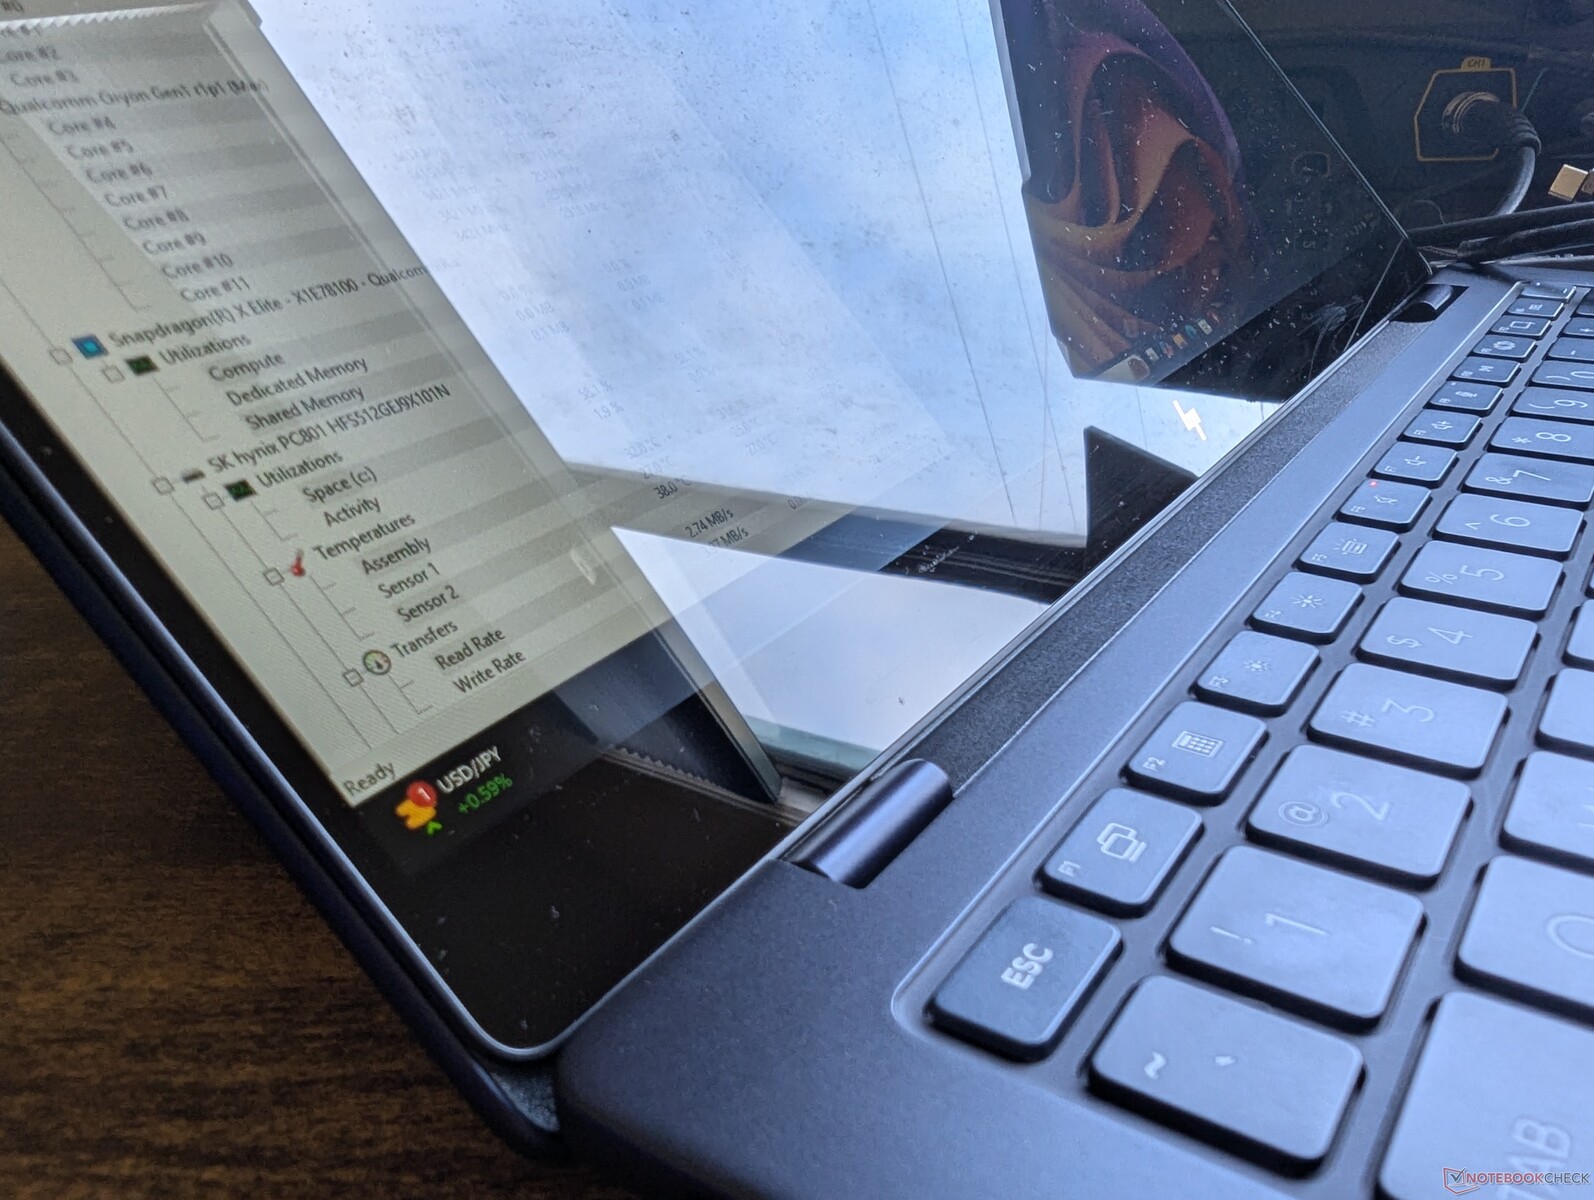
Leider sind die die kleinen Scharniere das schwächste Glied in einem ansonsten stabilen Gehäuse. Das haben wir bereits in unserem Test des Dragonfly Pro festgestellt und es ist etwas bedauerlich, den gleichen Schwachpunkt beim EliteBook Ultra G1q 14 wiederzutreffen. Besonders bei weiten Öffnungswinkeln sind die Scharniere nicht fest genug, zudem neigen sie beim Verstellen zum spürbaren Nachwippen. Beispielsweise haben wir bei den Scharnieren eines Dell Latitude 9450 ein deutlich besseres Vertrauen in deren Langlebigkeit.
Größe und Gewicht sind definitiv Highlights des EliteBook Ultra G1q 14, immerhin ist das Modell merklich dünner und leichter als viele seiner Konkurrenten, darunter das Latitude 9450 2-in-1, das XPS 14 9440 oder auch das MacBook Pro 14. Andererseits geht es auch noch leichter, beispielsweise mit dem ThinkPad X1 Carbon G12 oder dem LG Gram 14, sodass unsere Qualcomm-Maschine nicht notwendigerweise auch die leichteste ist.
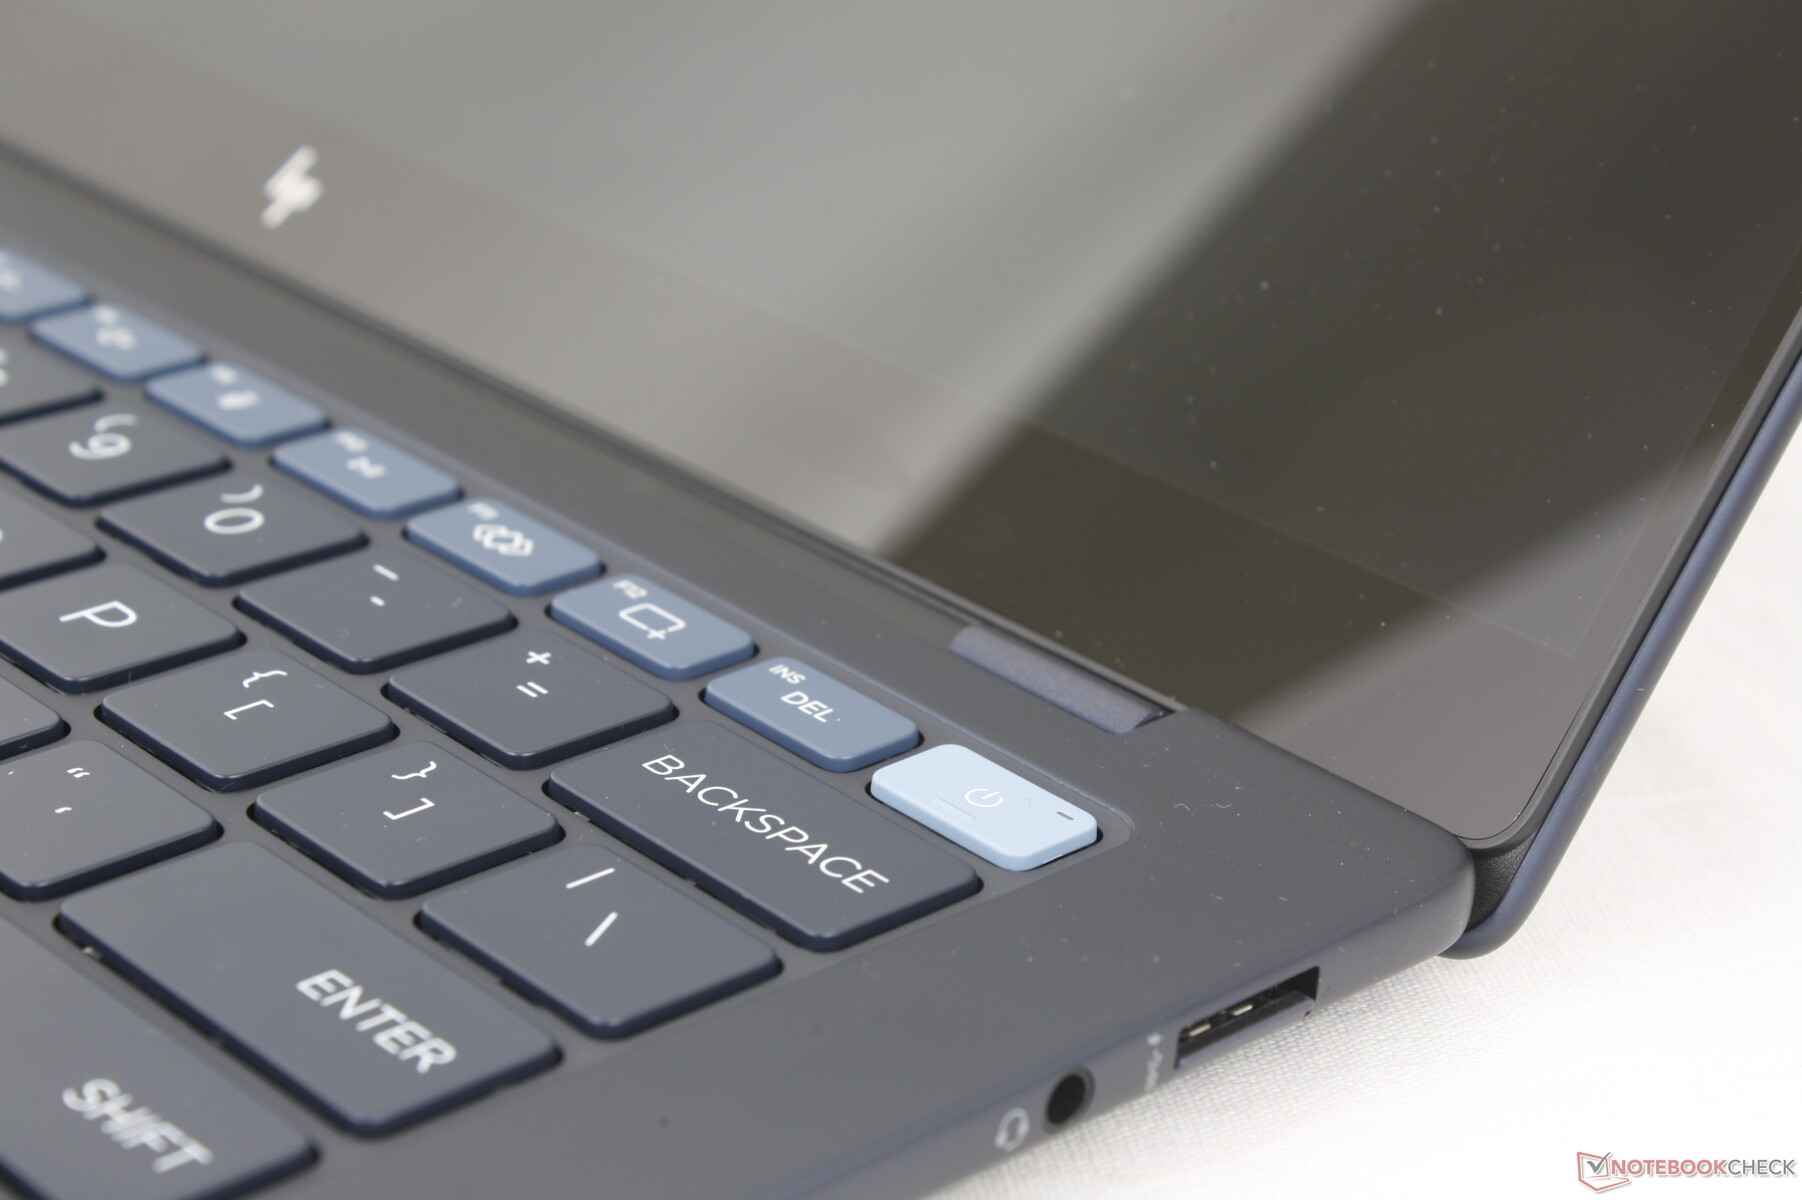
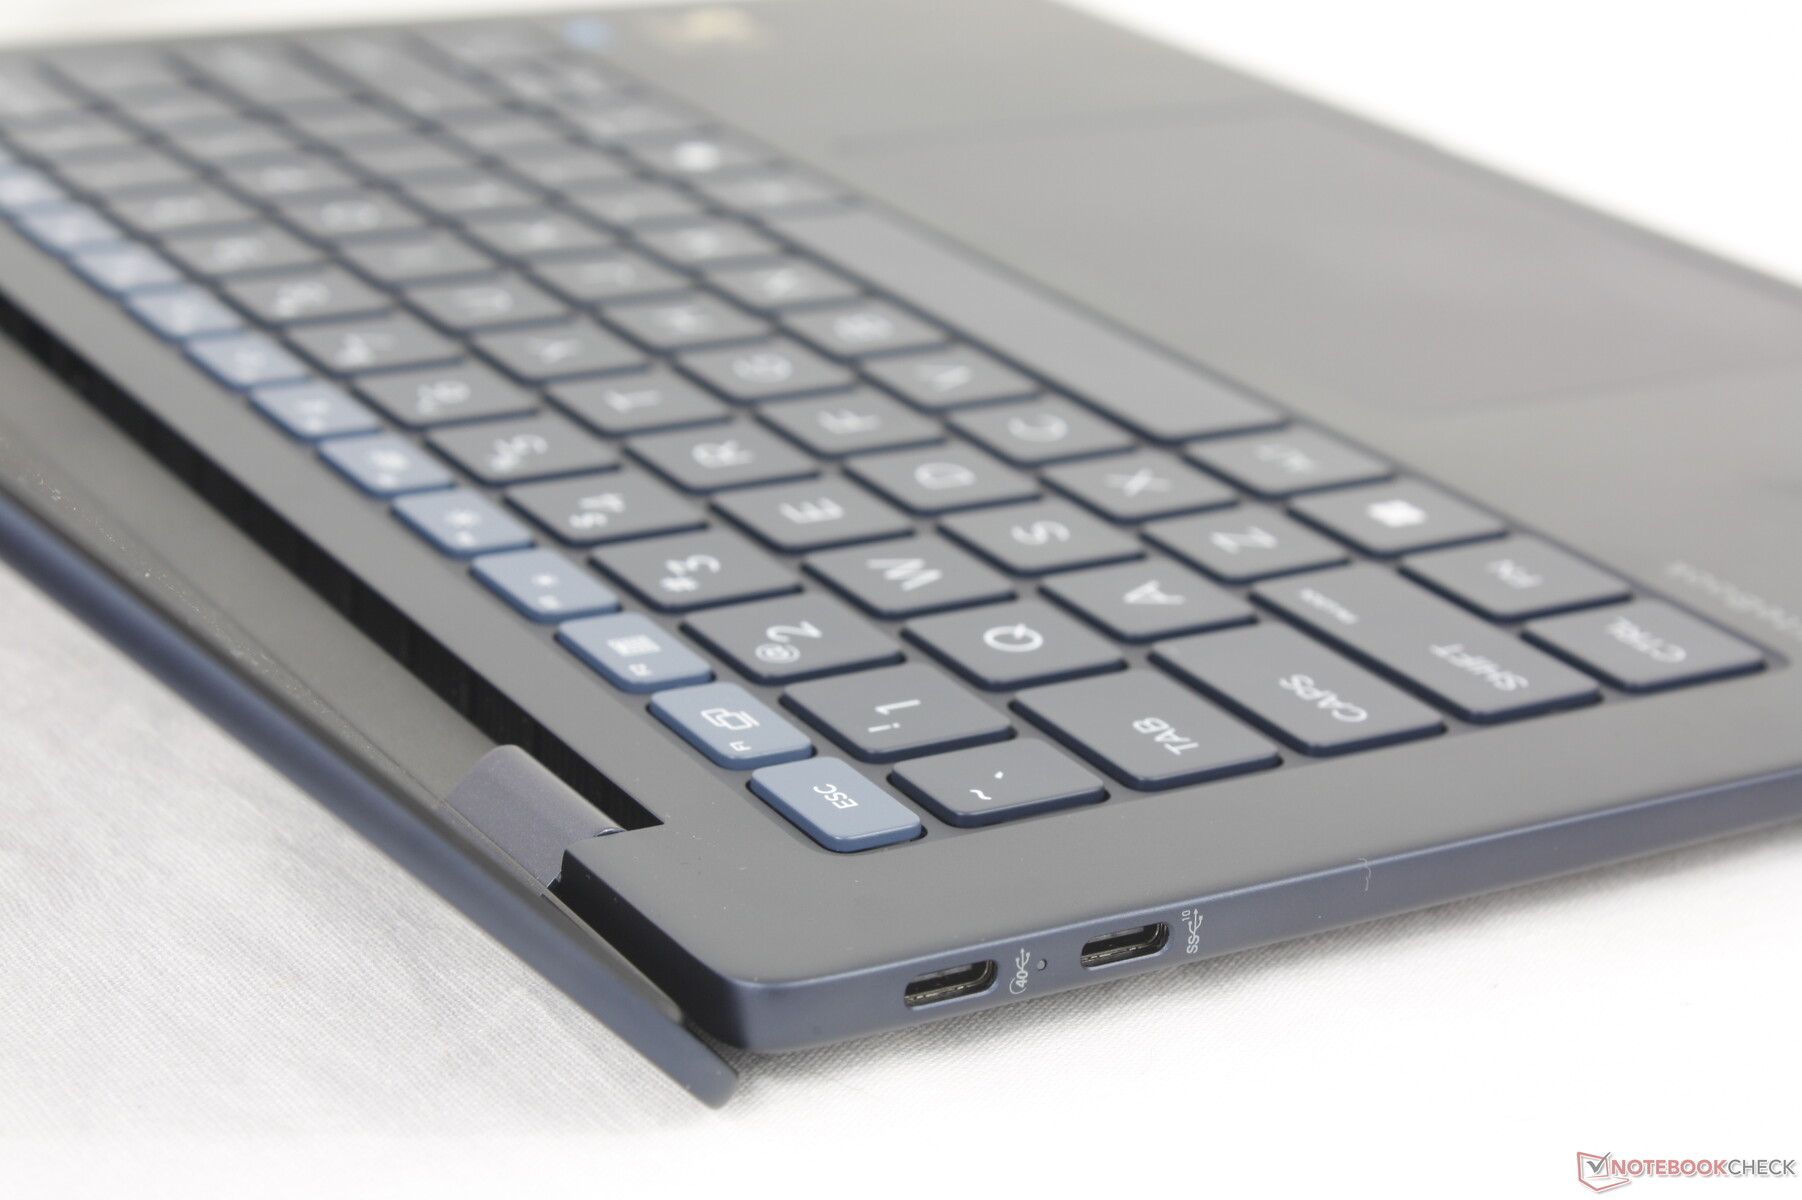
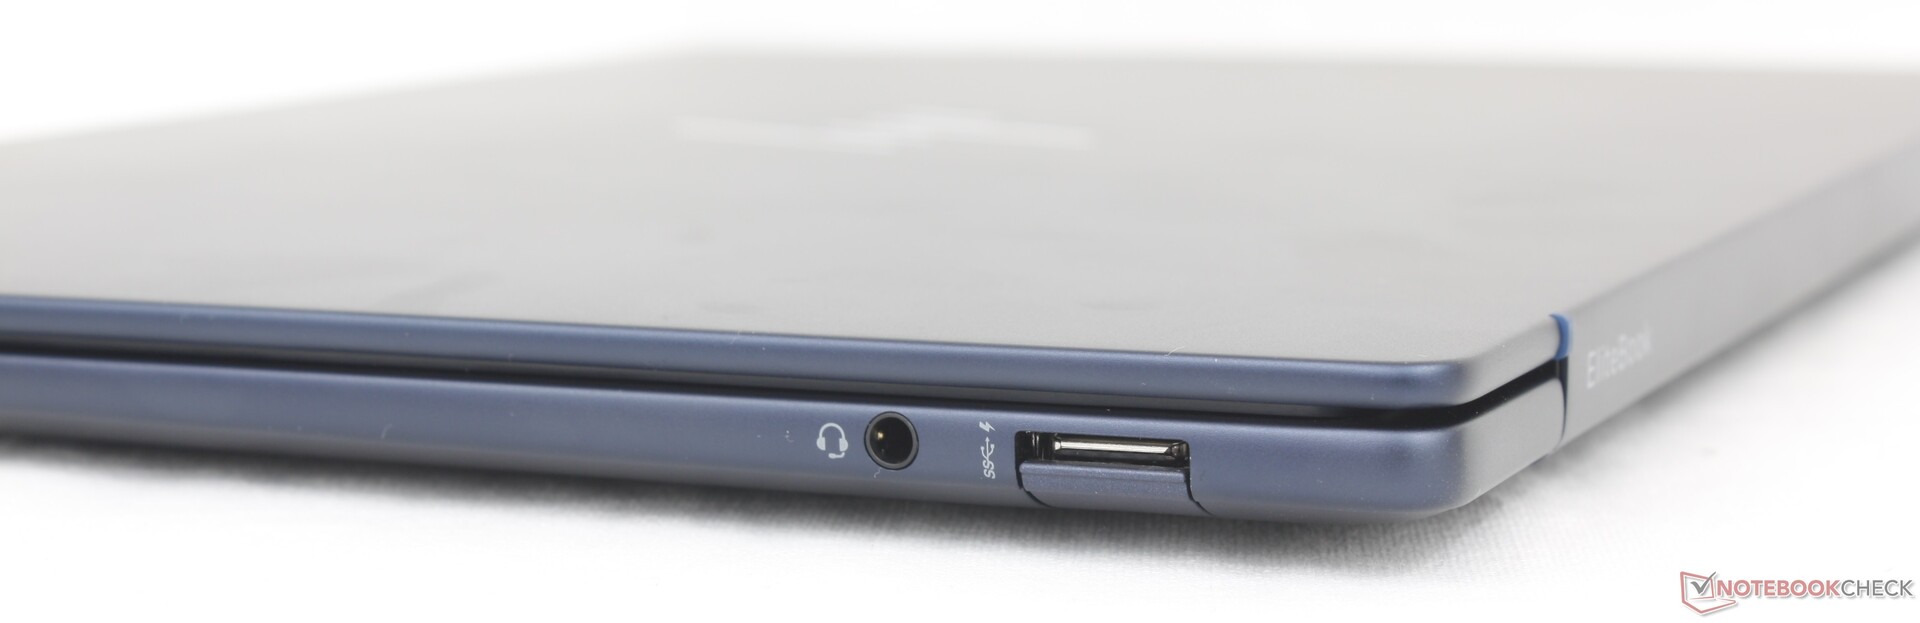
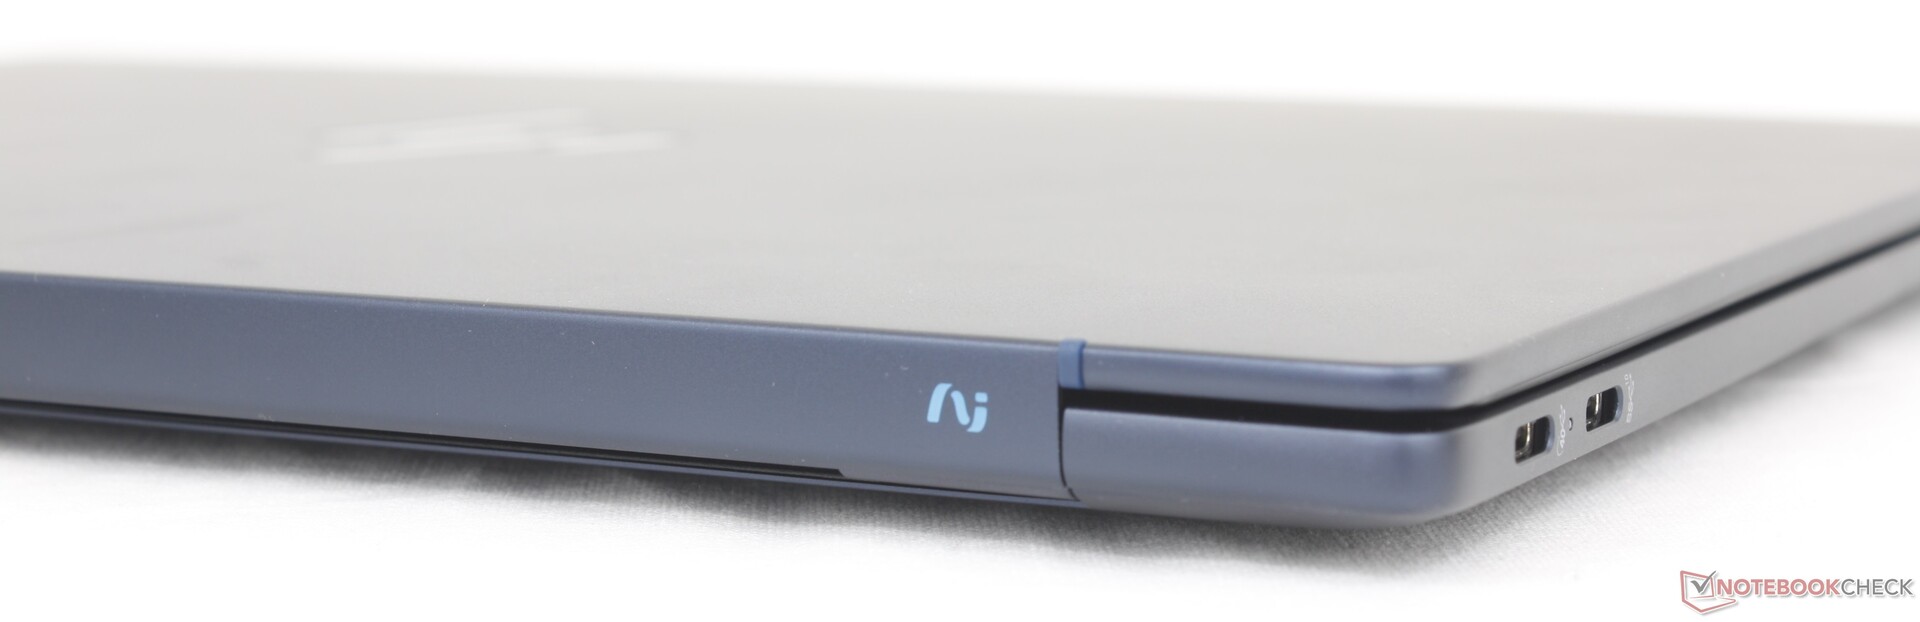
Anschlüsse - Inklusive USB-A
Das System bietet u.a. auch einen USB-A-Port, den die meisten anderen 14-Zoll-Subnotebooks eher weglassen, inklusive HPs eigener Dragonfly-Serie. USB4 wird glücklicherweise ebenso unterstützt, was den Anschluss einer Vielzahl an Docking Stations und Monitore ermöglicht.
Einen Kensington-Anschluss gibt es im Gegensatz zum Latitude 9440 2-in-1 oder dem ThinkPad X1 Carbon G12 leider nicht.

Webcam
Standardmäßig kommt ein 5-MP-Sensor zum Einsatz, zusammen mit IR für einen freihändigen Login sowie einen physischen Kamera-Slider für die Privatsphäre. Zum Vergleich: Einige HP-Laptops wie das Dragonfly Folio G3 verfügen bereits über 8-MP-Webcams.


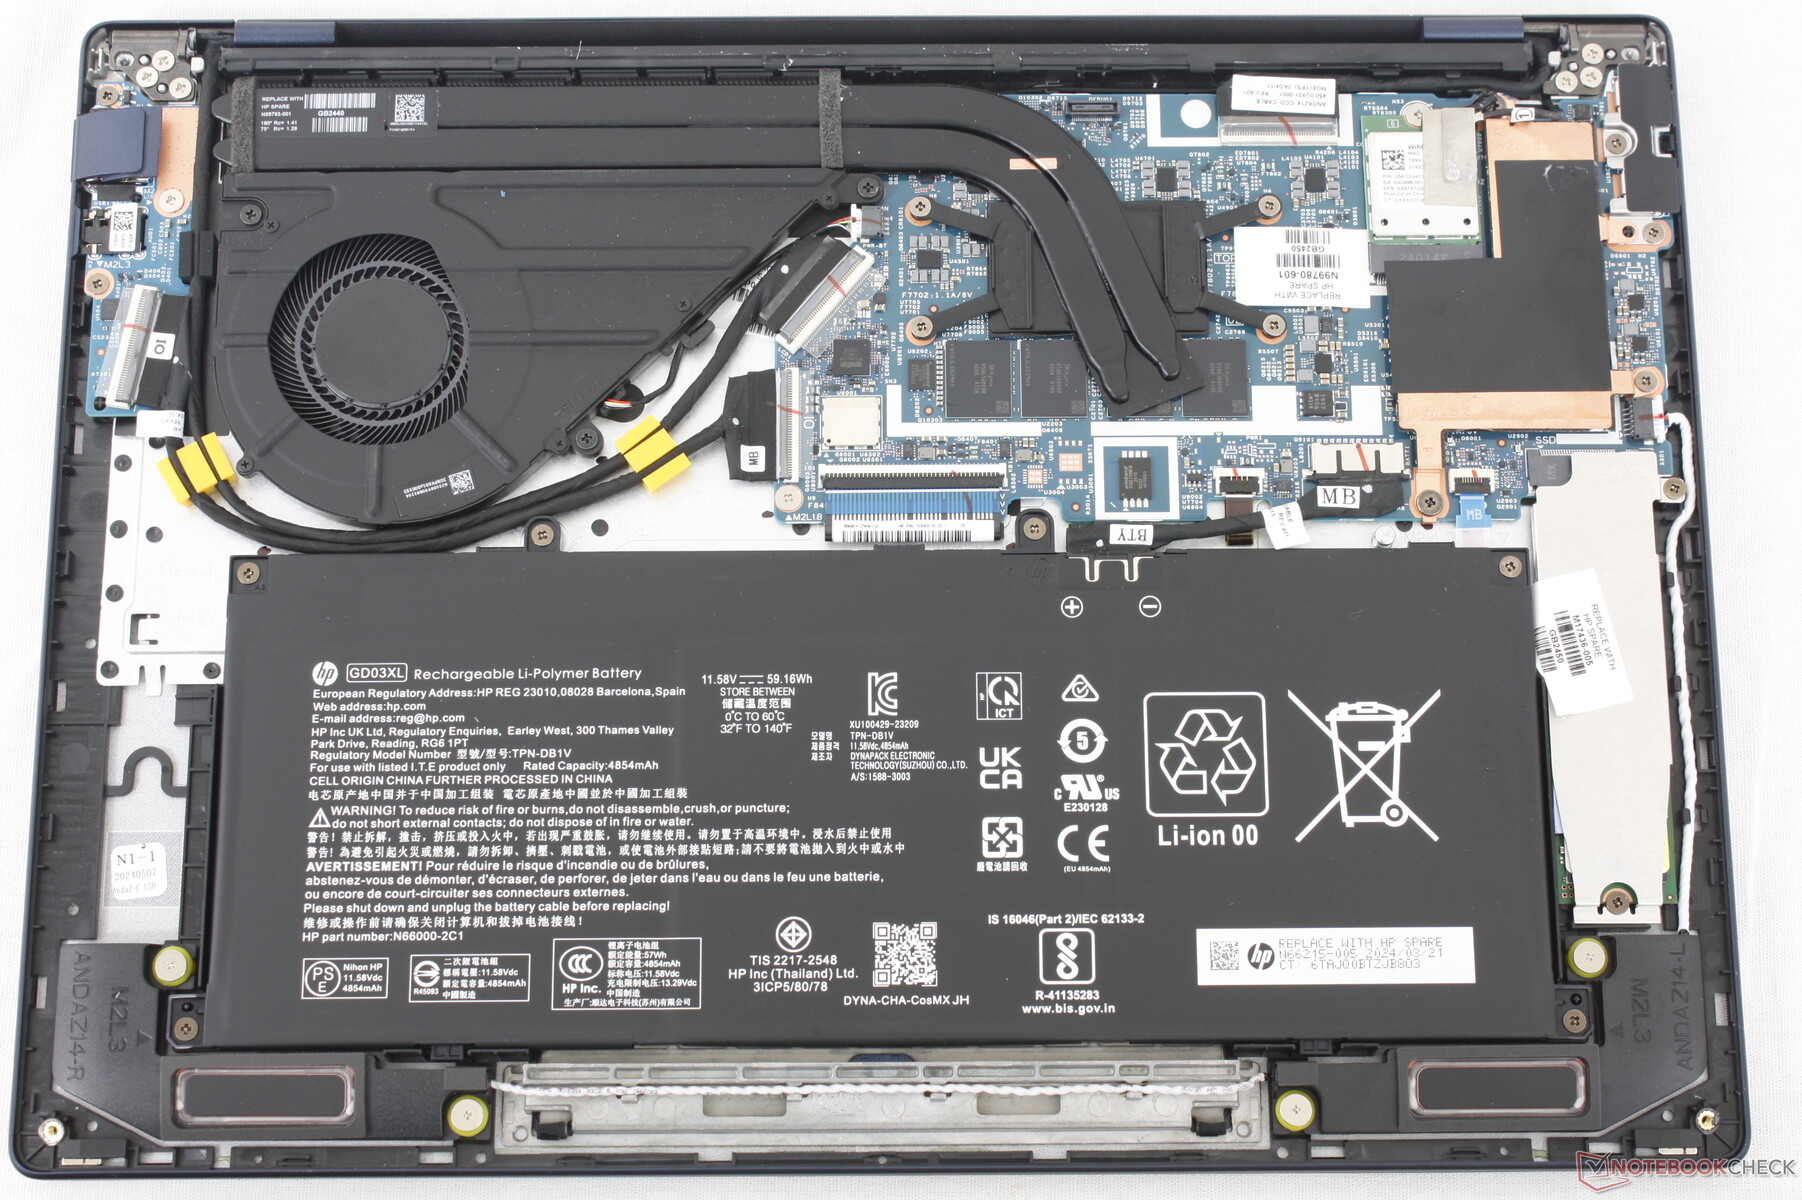
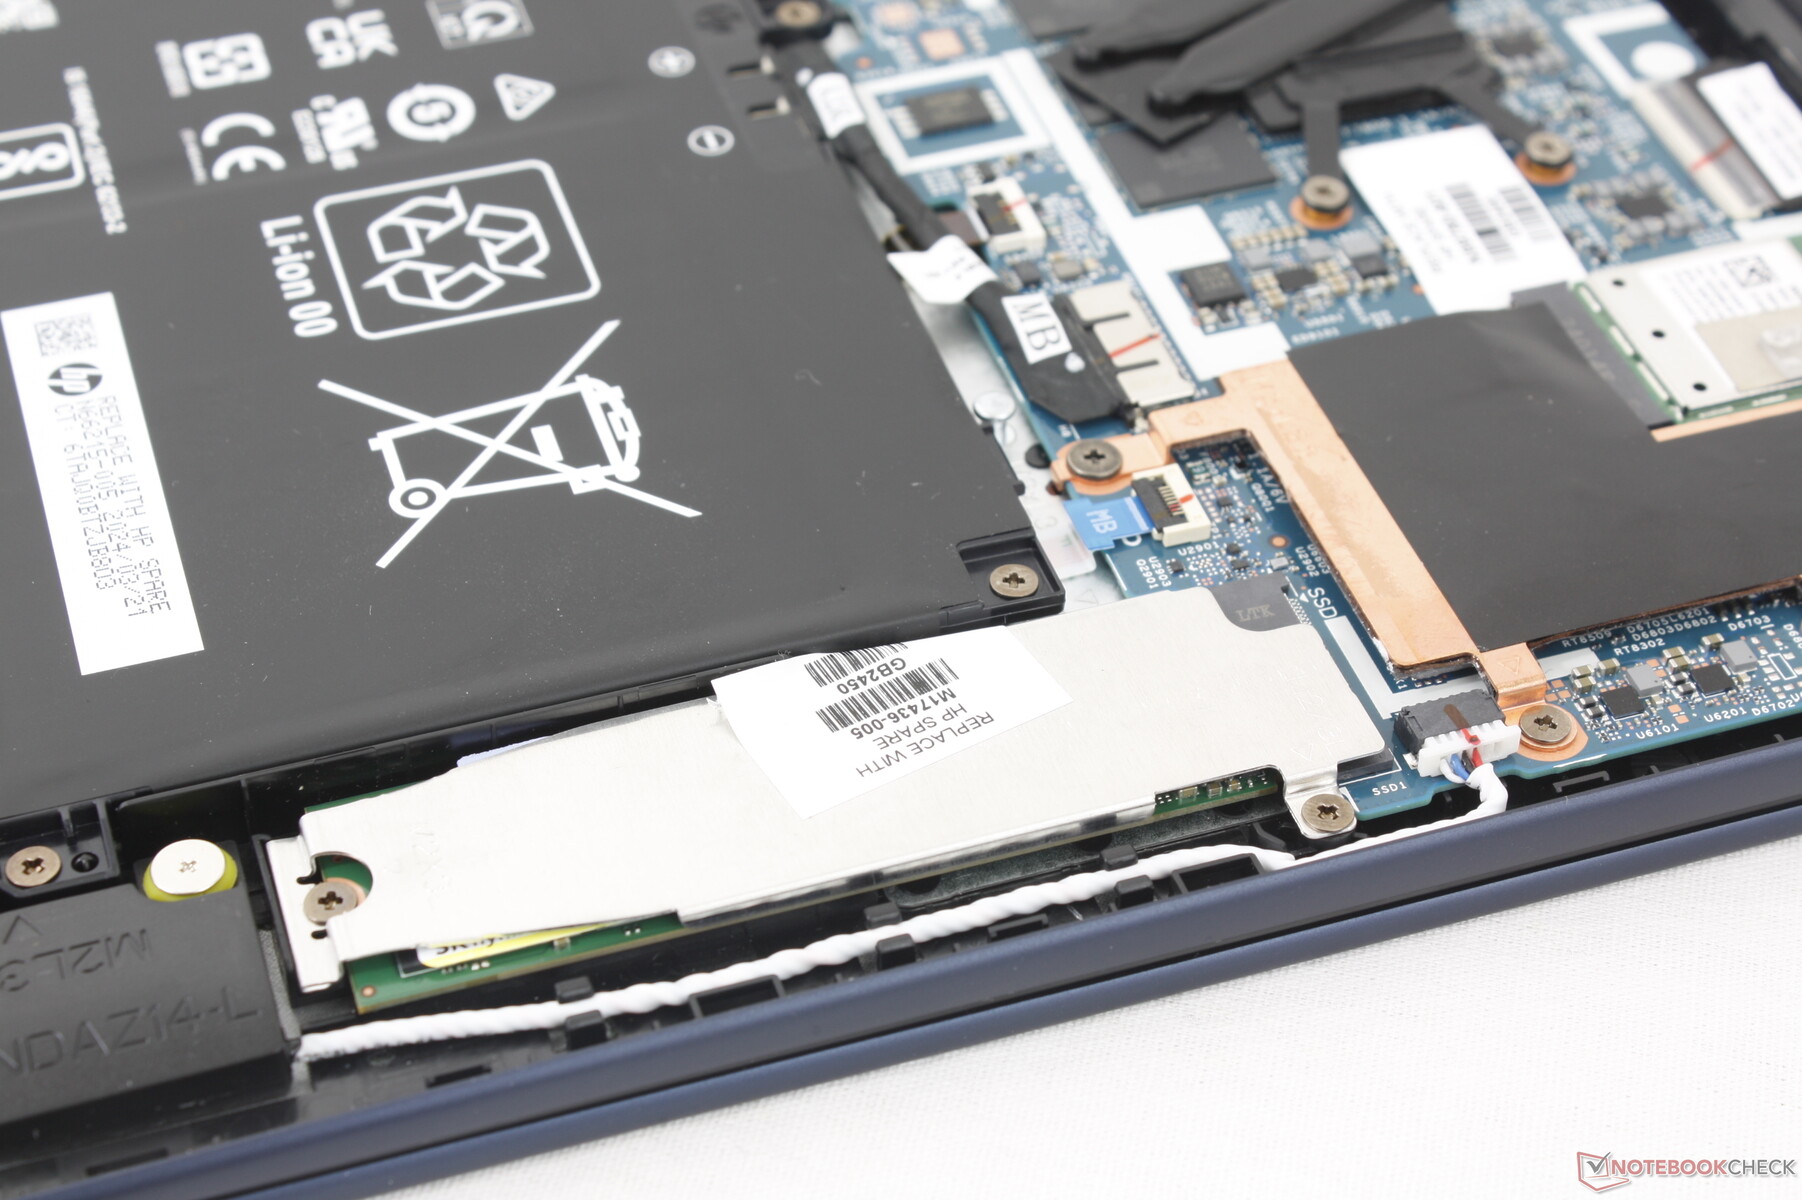
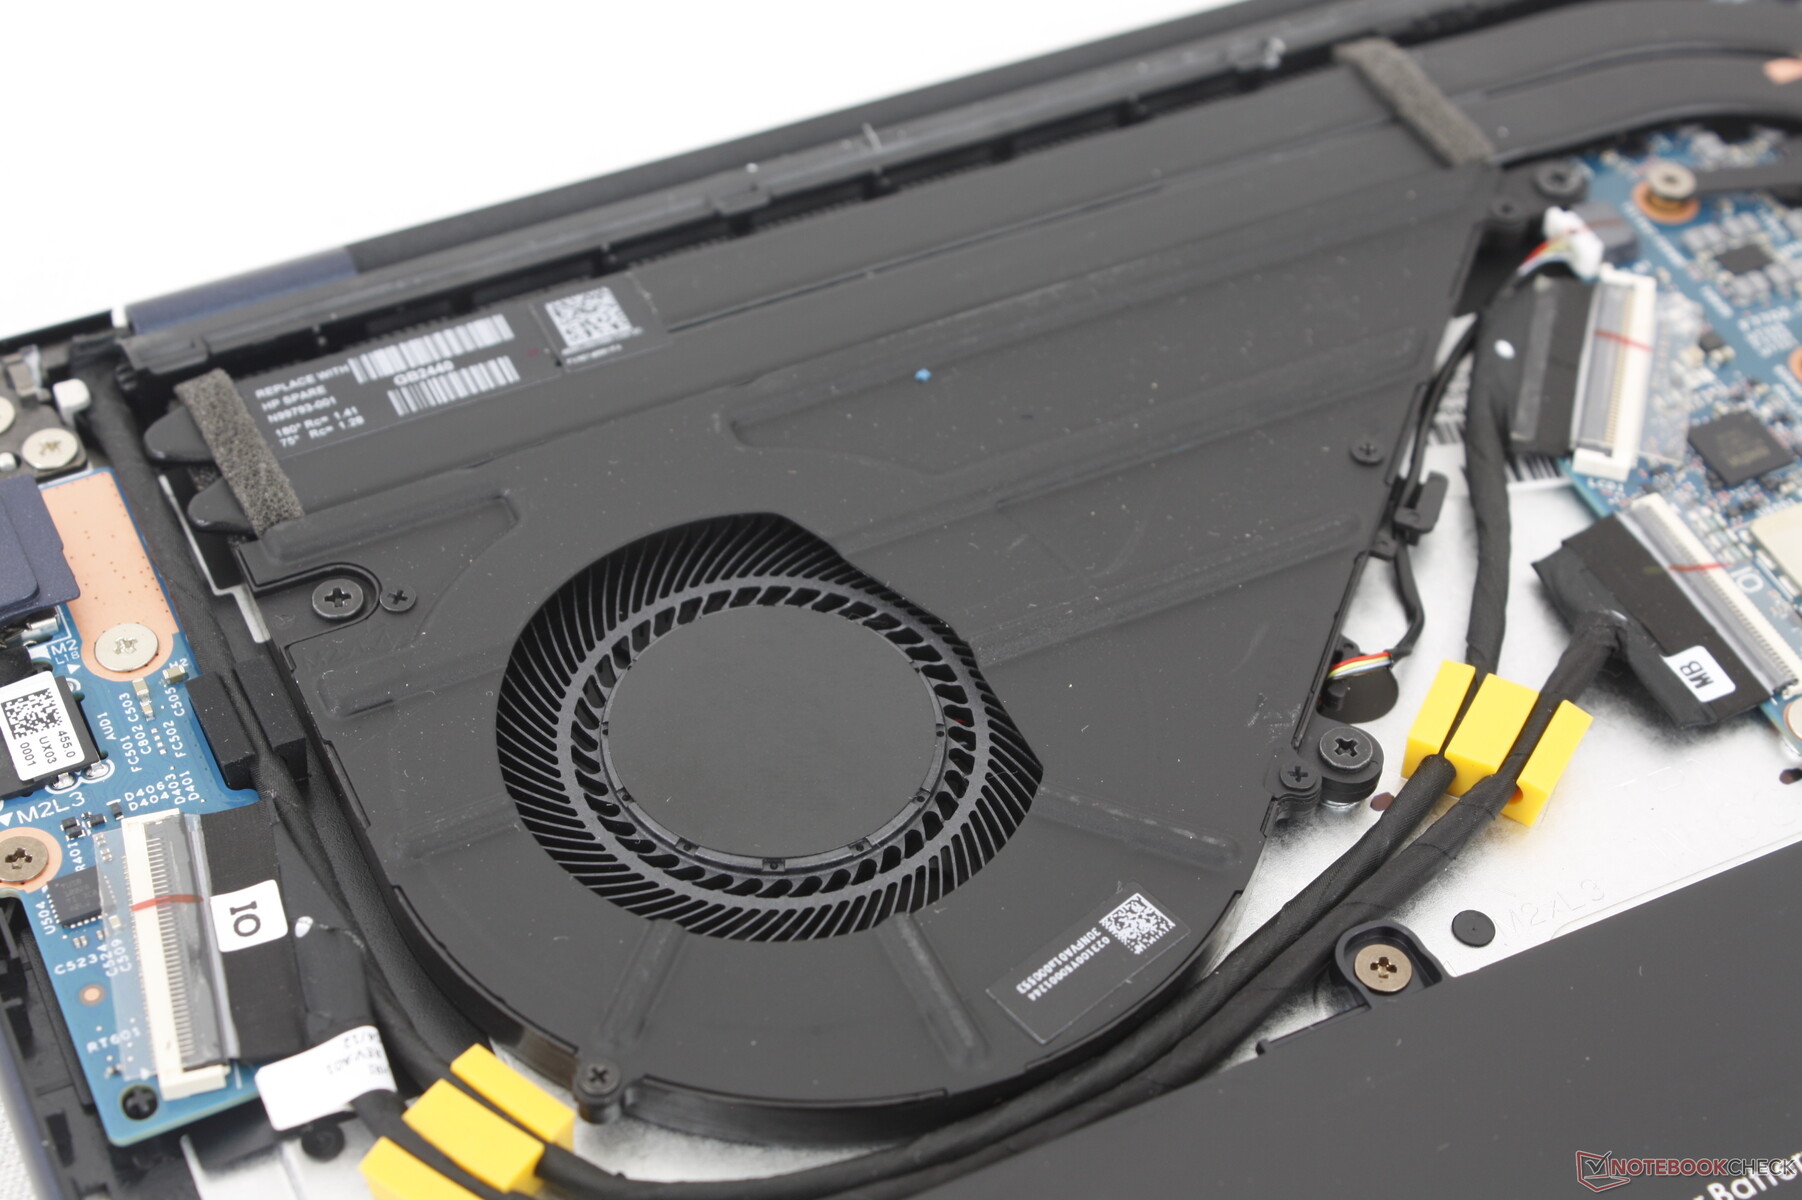
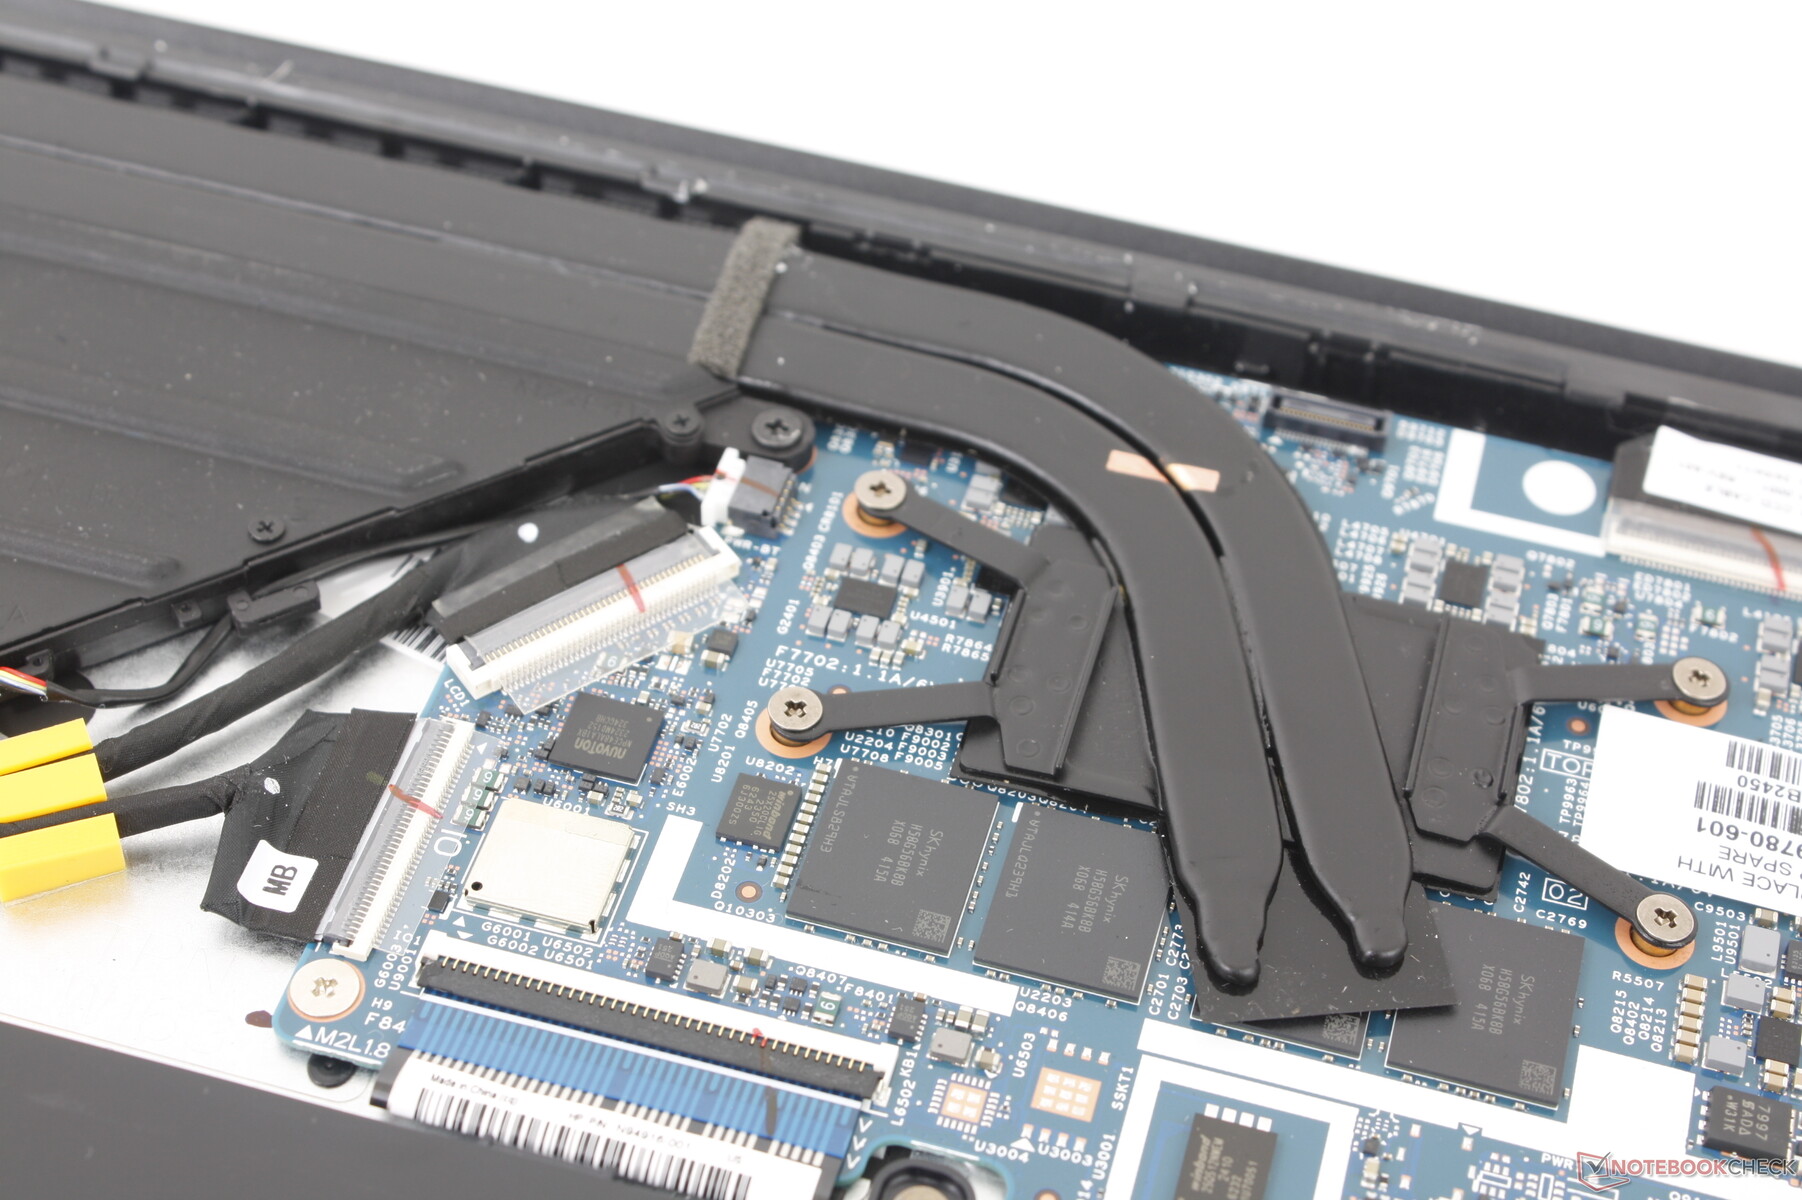
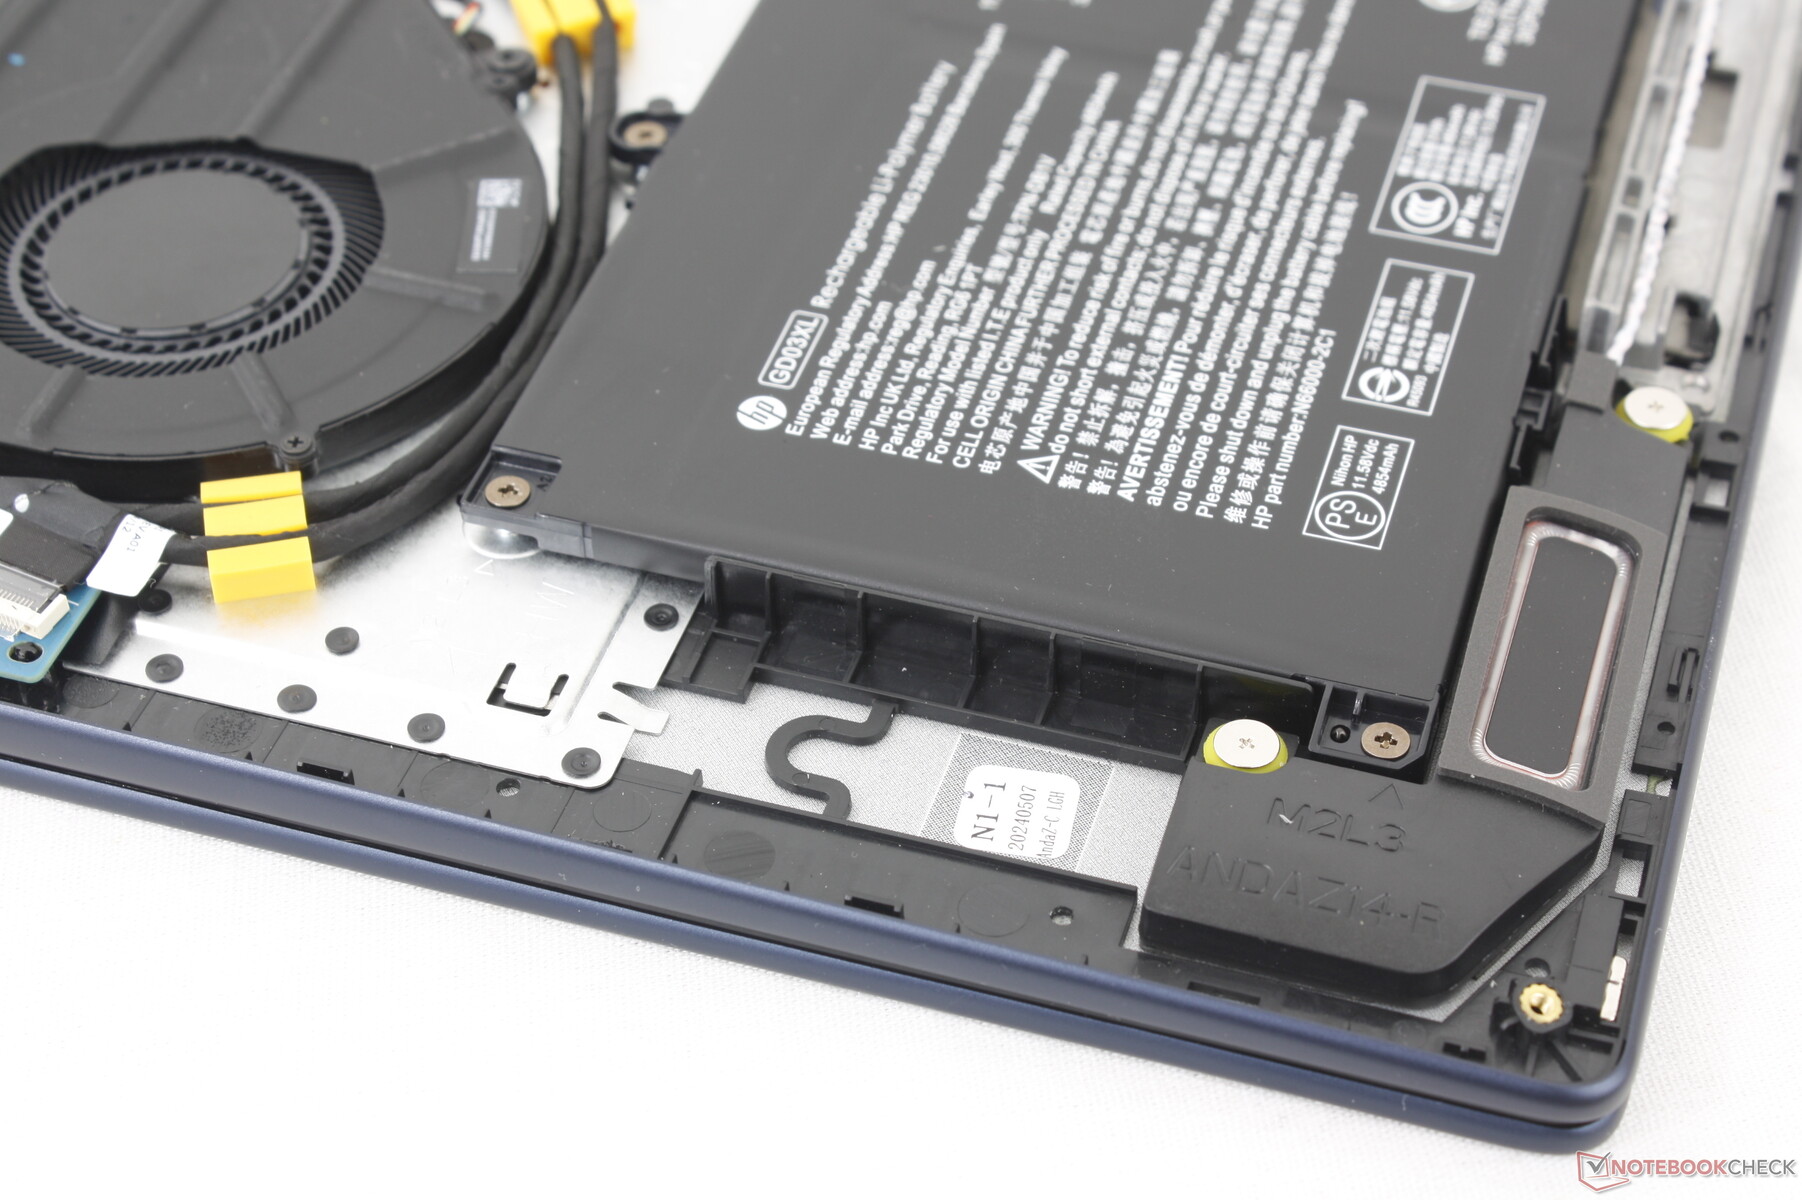
Wartung
Die Unterseite ist nur durch vier Torx-Schrauben gesichert, der Zugang zur Wartung ist also recht leicht. Allerdings ist das Austauschen von Teilen auf den M.2-2280-PCIe4-SSD-Slot sowie das M.2-WLAN-Modul limitiert, der RAM ist verlötet. Das Kühlsystem ist mit seinem einen Lüfter ähnlich zu dem der meisten anderen EliteBook-Modelle wie dem EliteBook 845, während die Dragonfly-Modelle auf ein duales Lüfterdesign setzen.
Zubehör und Garantie
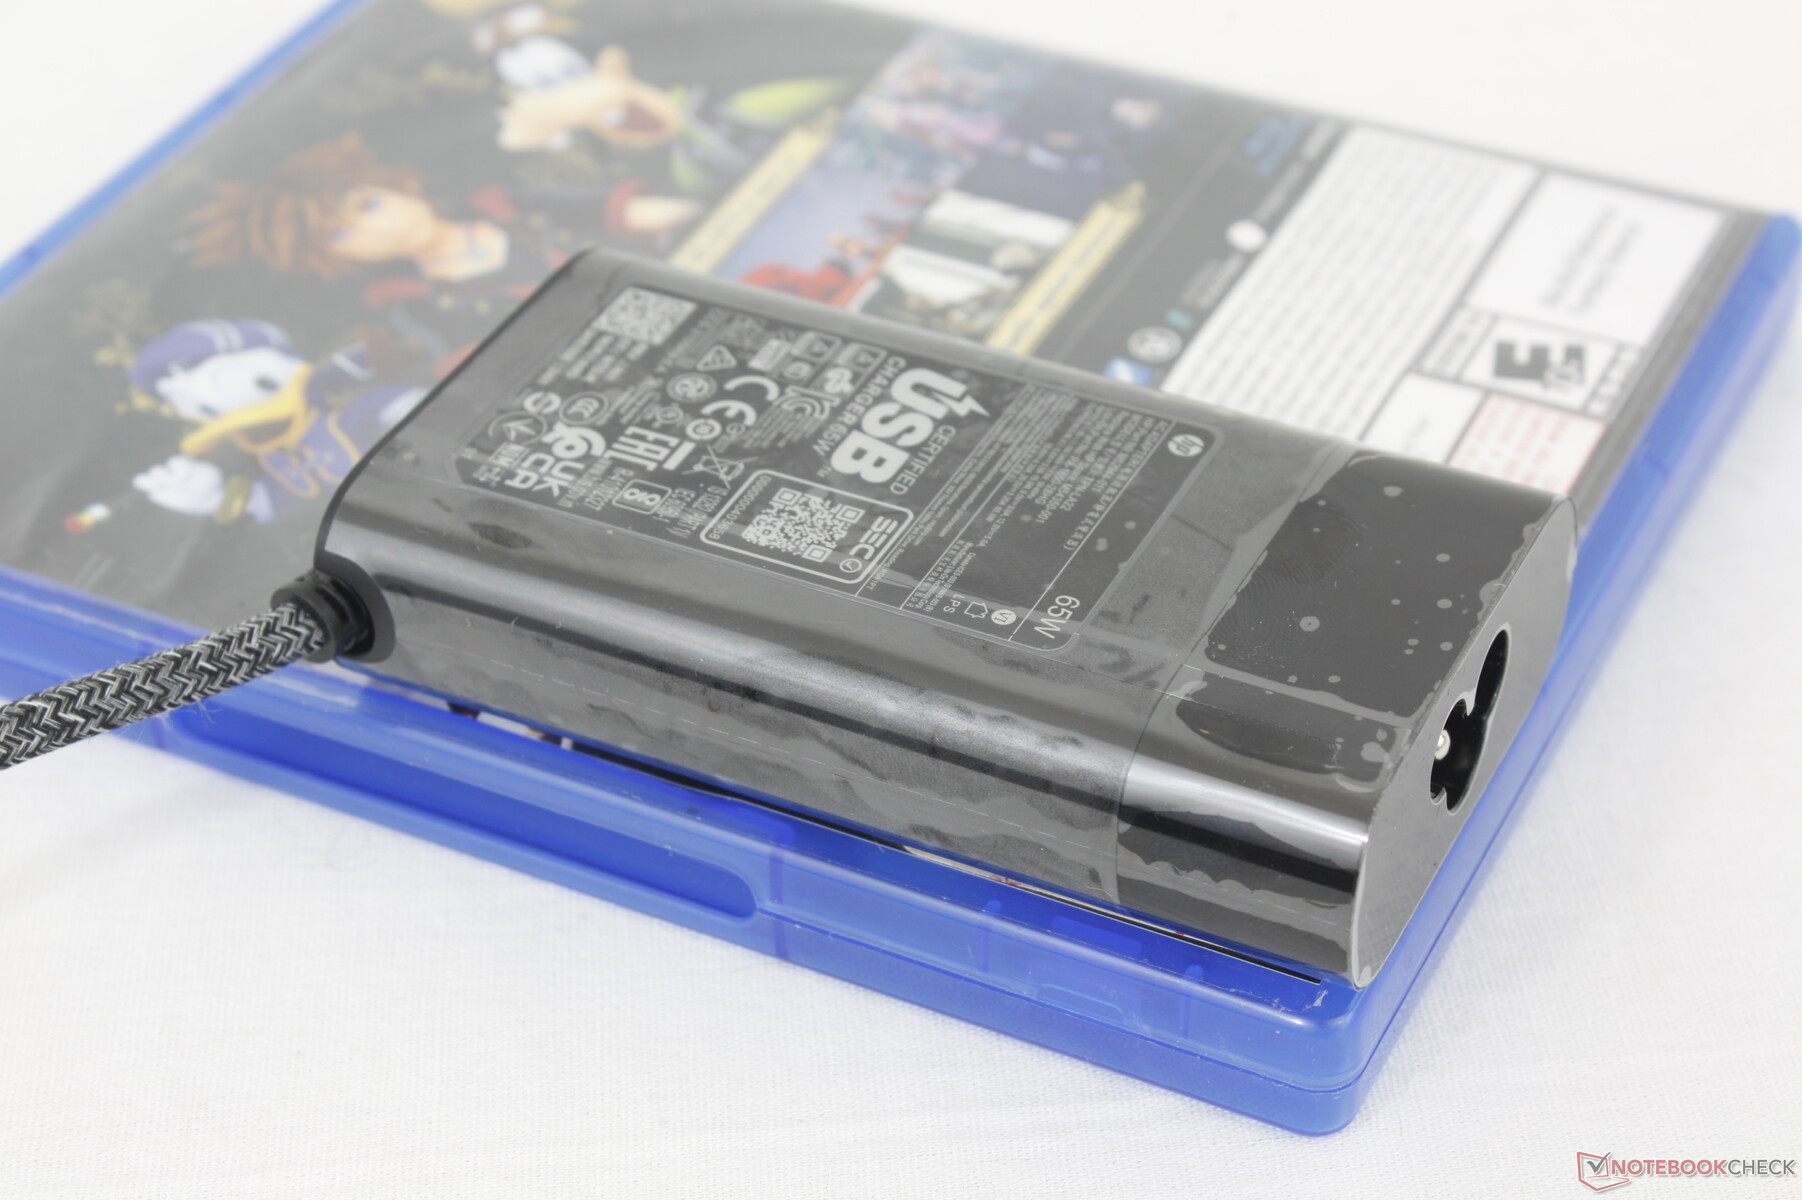
Abgesehen vom Netzteil und etwas Papierkram gibt es keine Extras in der Verpackung. Angesichts des hohen Preises wäre zumindest eine Schutzhülle wünschenswert.
Als Garantie bietet der Hersteller 3 Jahre, dazu gibt es ein Jahr lang die Schutzsoftware HP Wolf Security Pro. Die längere Standardgarantie ist einer der Unterscheidungsmerkmale zum Consumer-orientierten OmniBook X 14 und dem Business-fokussierten EliteBook Ultra G1q 14.
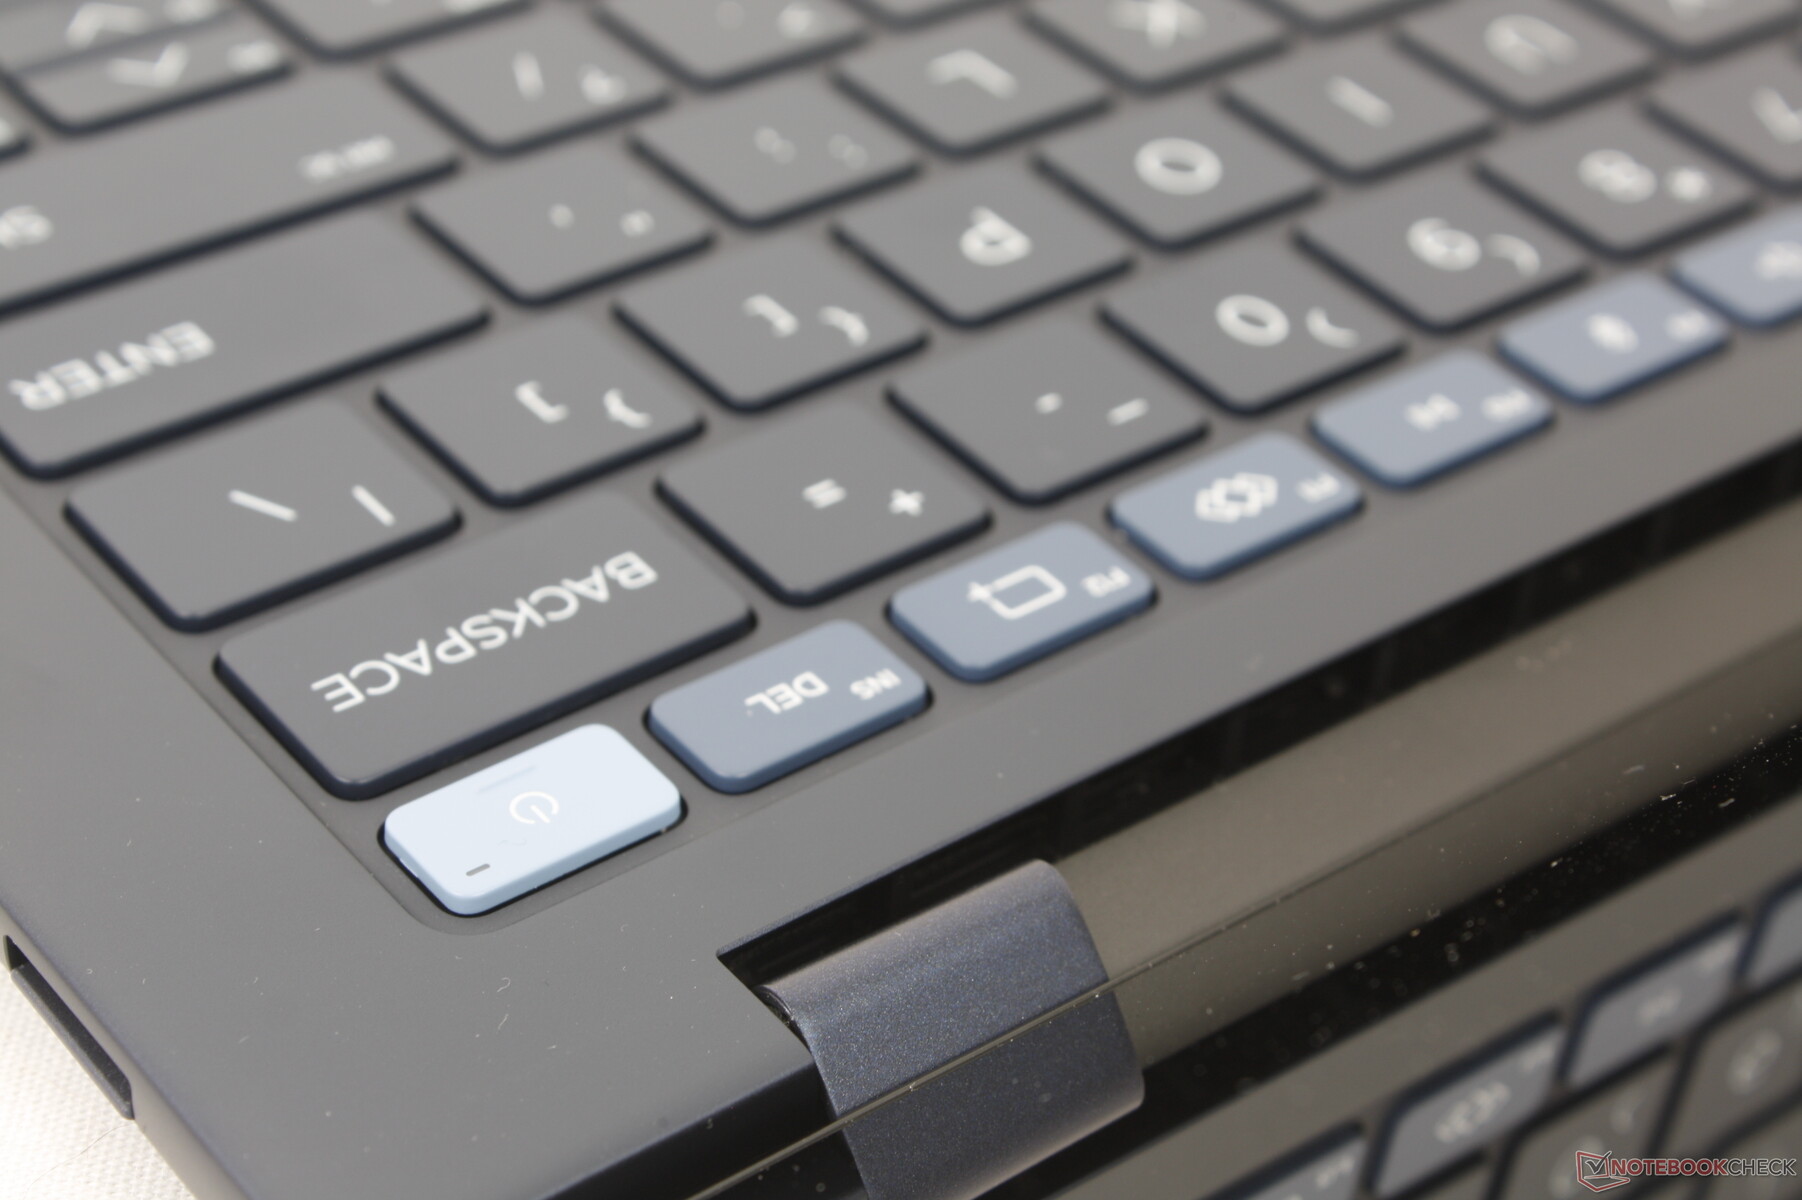
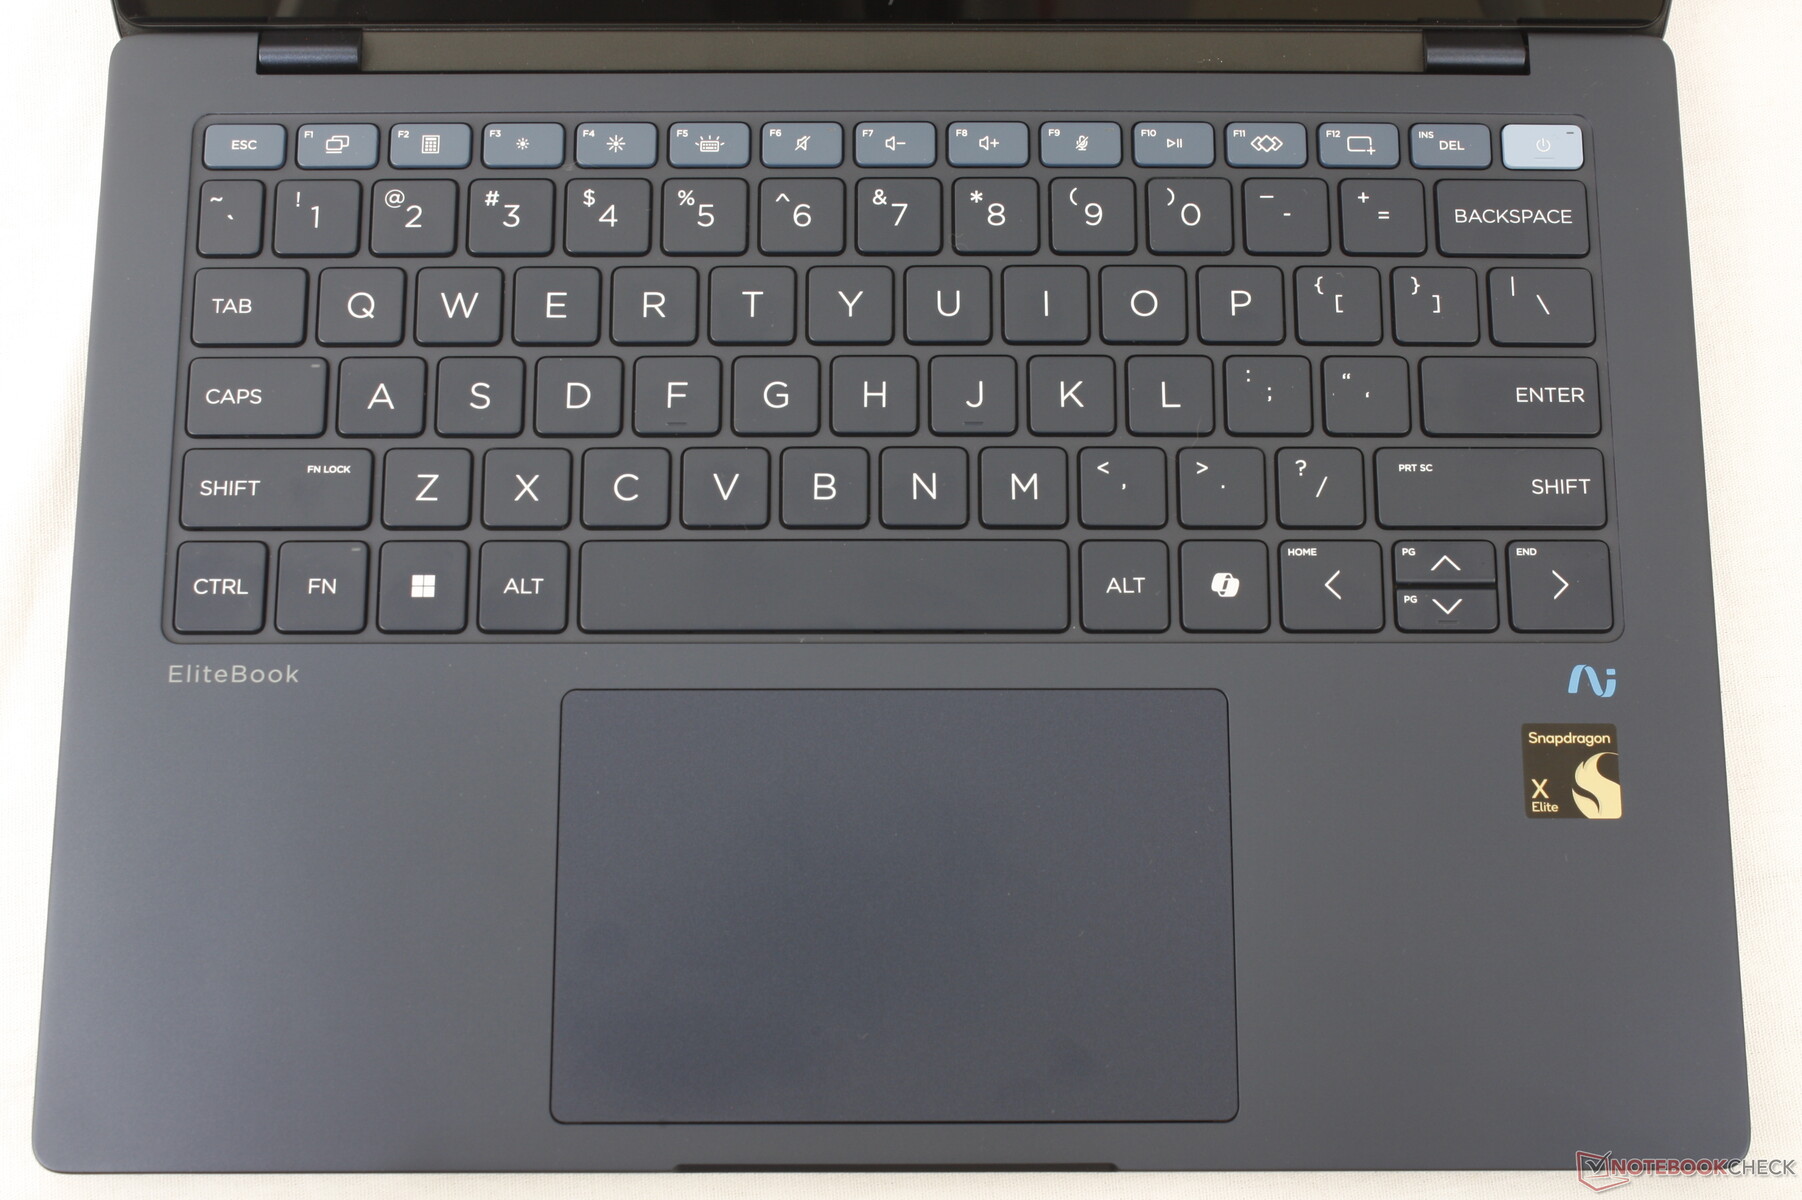
Eingabegeräte — Bekanntes Dragonfly-Feeling
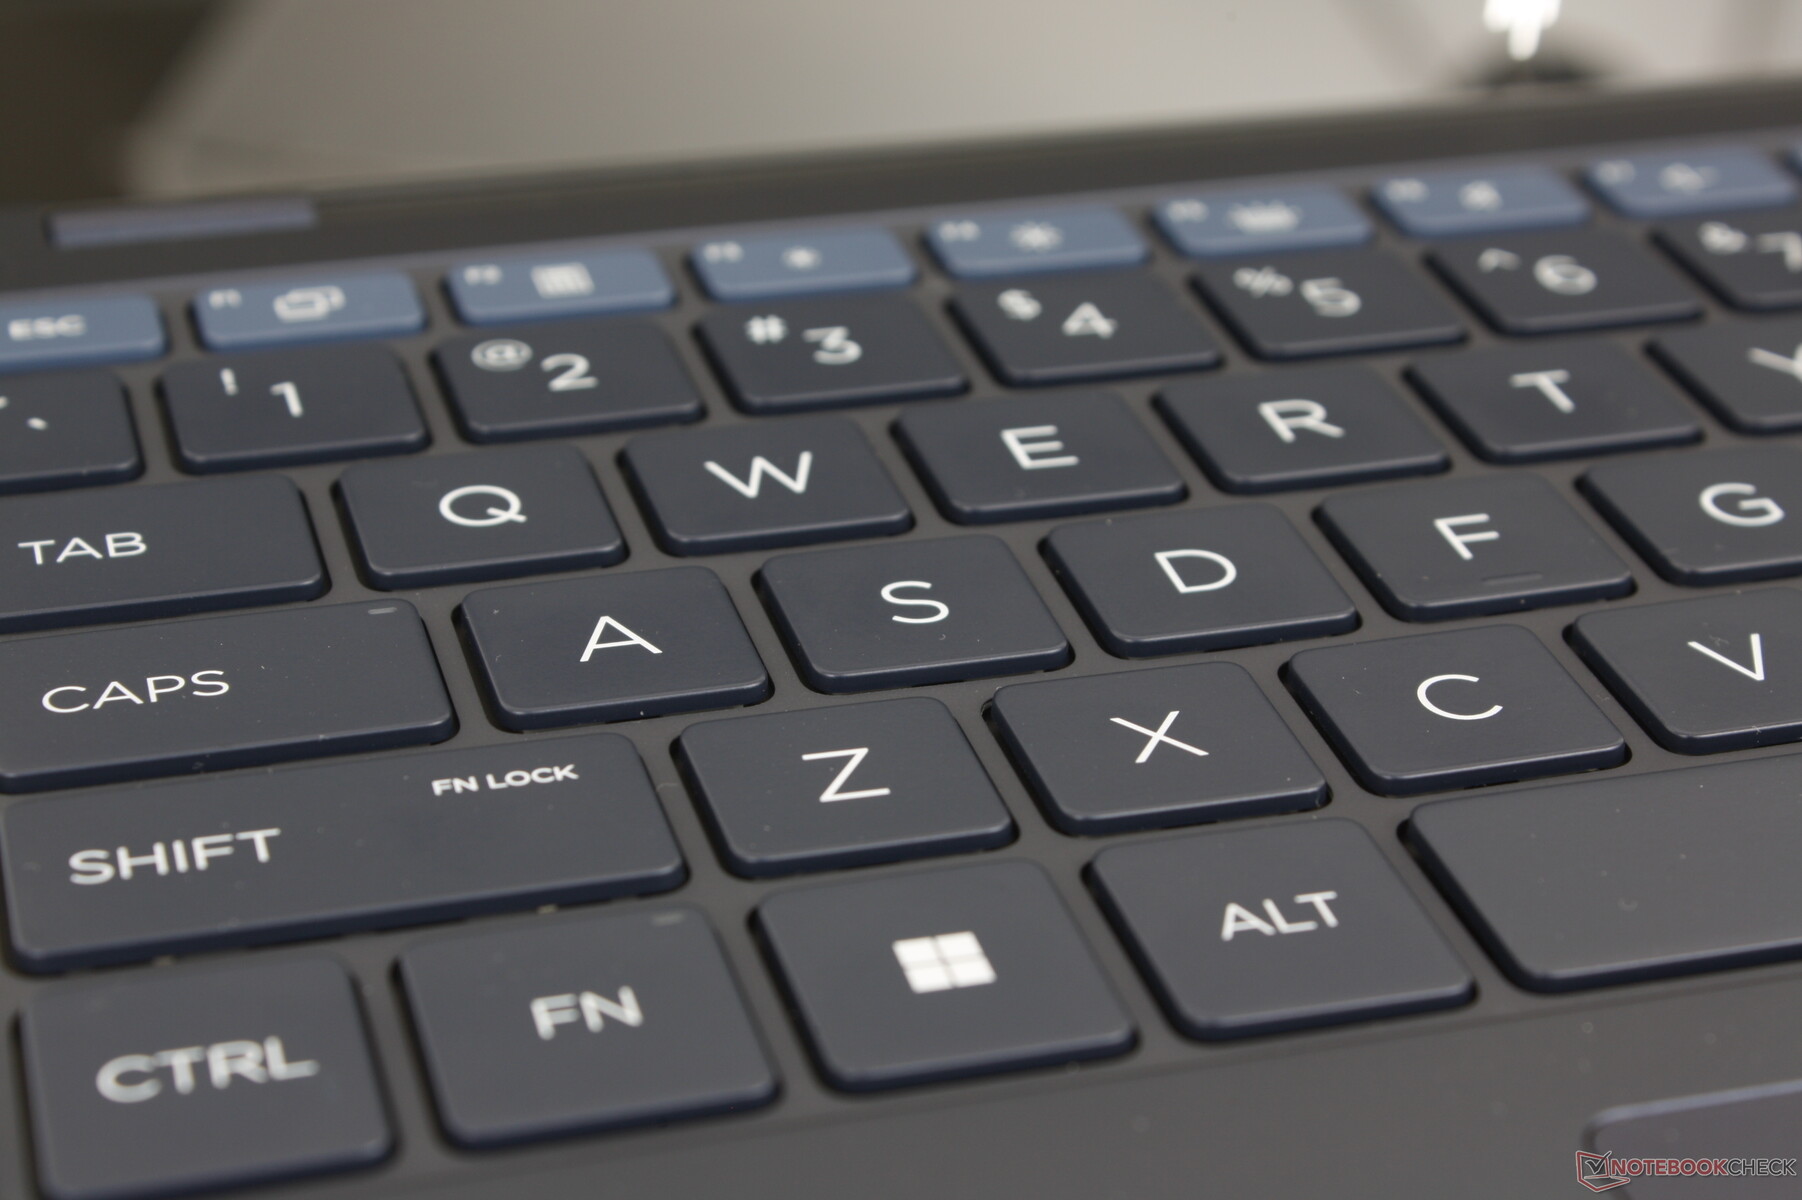
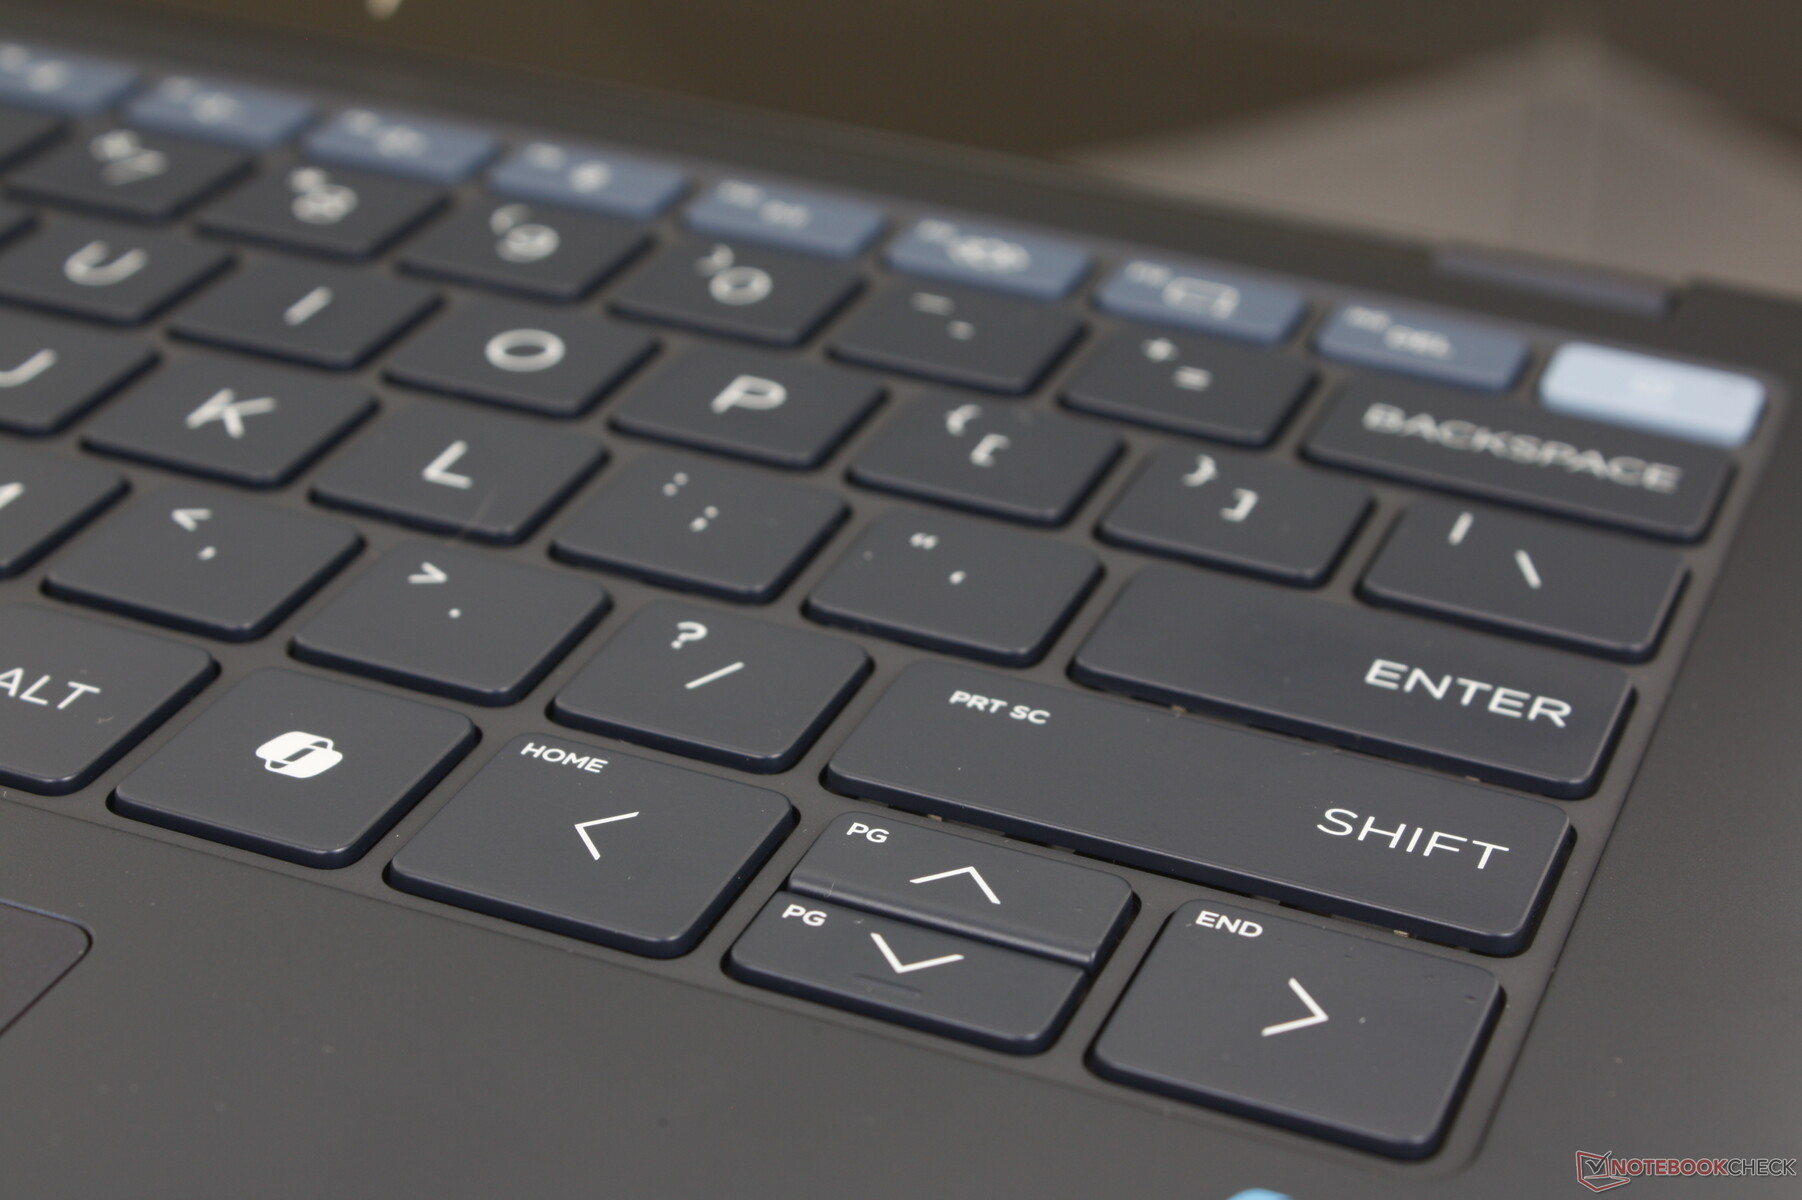
Tastatur
Gerade in Bezug auf die Tastengröße und Beschriftung gleicht das Layout mehr dem Dragonfly Pro als dem EliteBook 845. Der Hub ist sehr seicht, was auch die Leer- und Eingabetaste betrifft, beide könnten ein stärkeres Feedback vertragen.
Alle Tasten und Symbole werden bei aktiviertem Tastaturlicht beleuchtet.
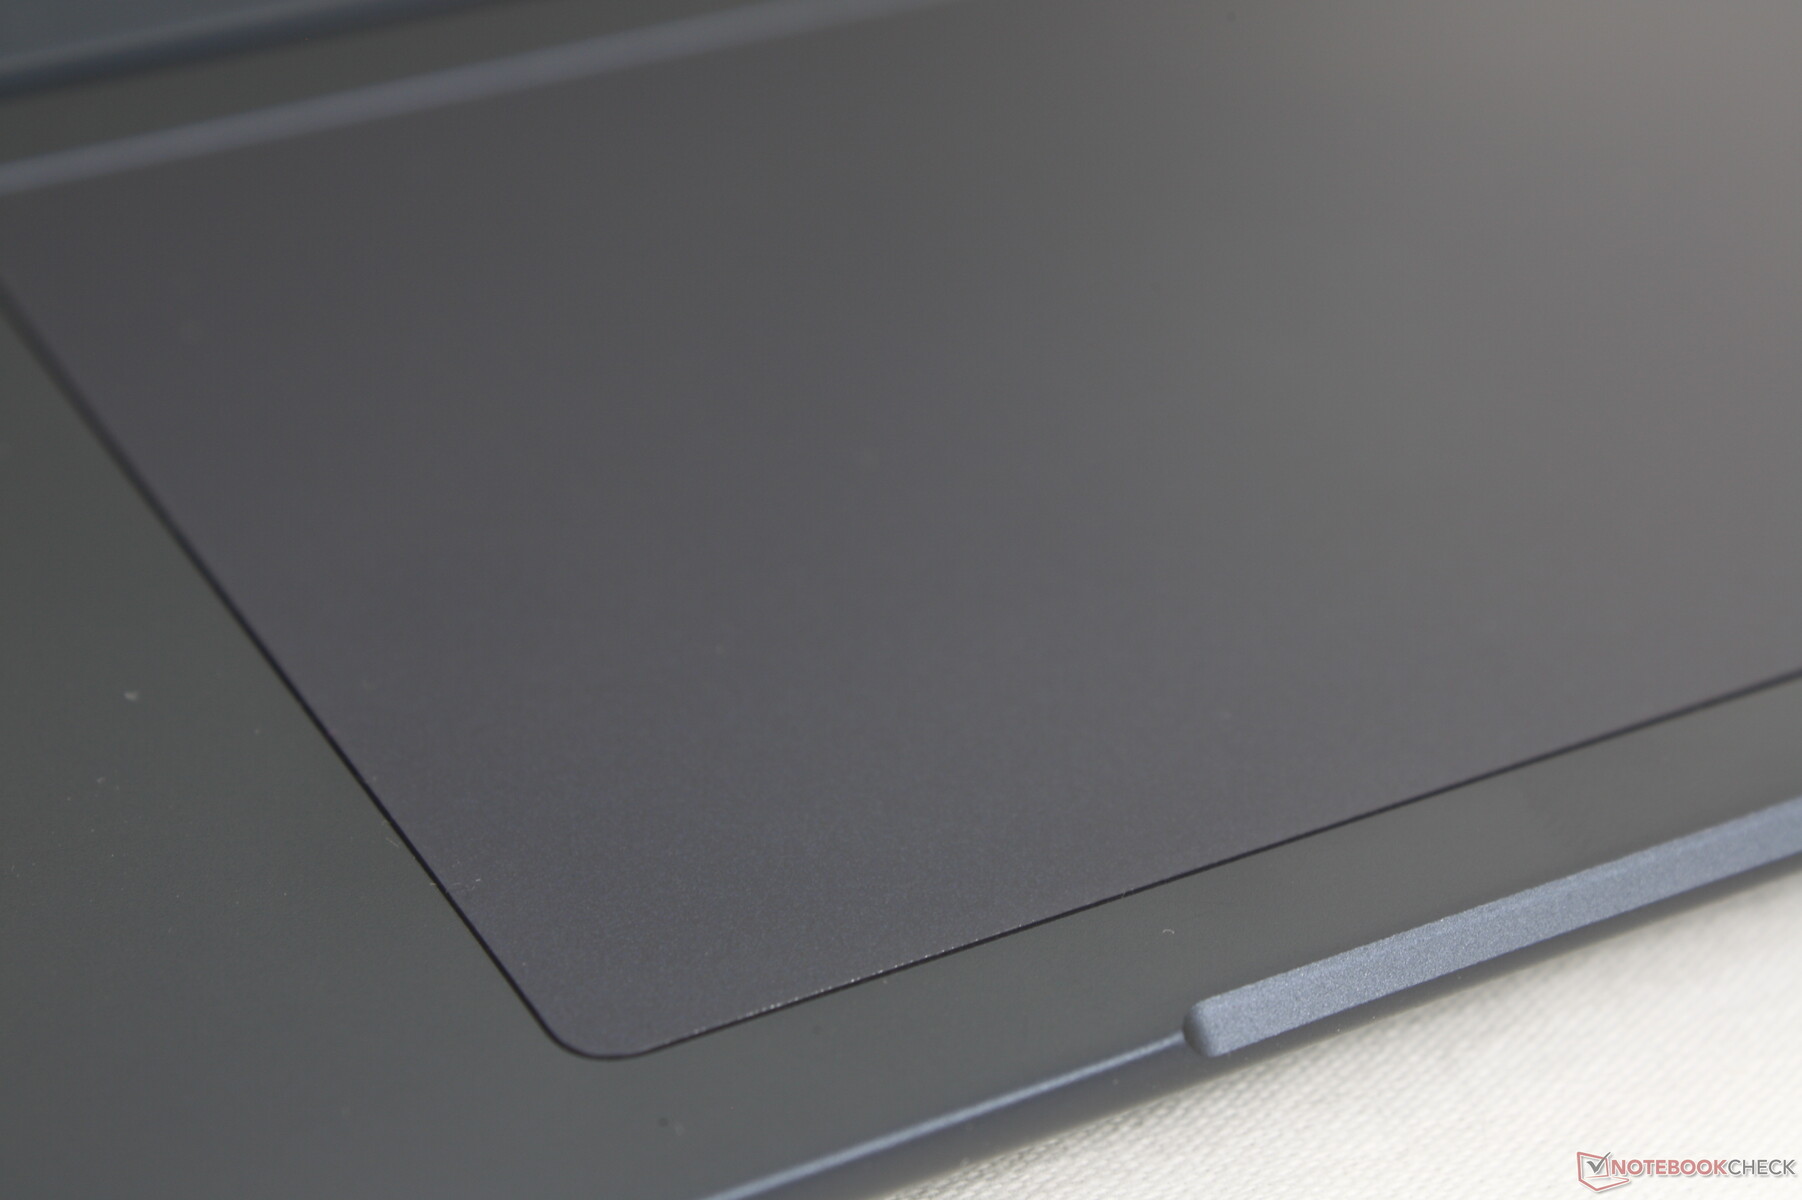
Touchpad
Die Touchpad-Oberfläche ist nur minimal größer als beim Dragonfly Pro (12.5 x 8 cm vs. 12.0 x 8 cm) und dadurch noch etwas geräumiger und komfortabler für Multi-Touch-Eingaben. Das Material ist sehr glatt und gleitfreudig, nur bei sehr langsamen Bewegungen stockt es ein wenig, was der Genauigkeit zugute kommt. Das Drücken der integrierten Tasten fühlt sich schärfer, fester und lauter an als auf der XPS- oder Lenovo-IdeaPad-Serie. Wir haben hier eines der hochwertigeren und zuverlässigeren Touchpads auf dem Markt, ausgenommen sind nur Trackpads mit separaten Buttons.
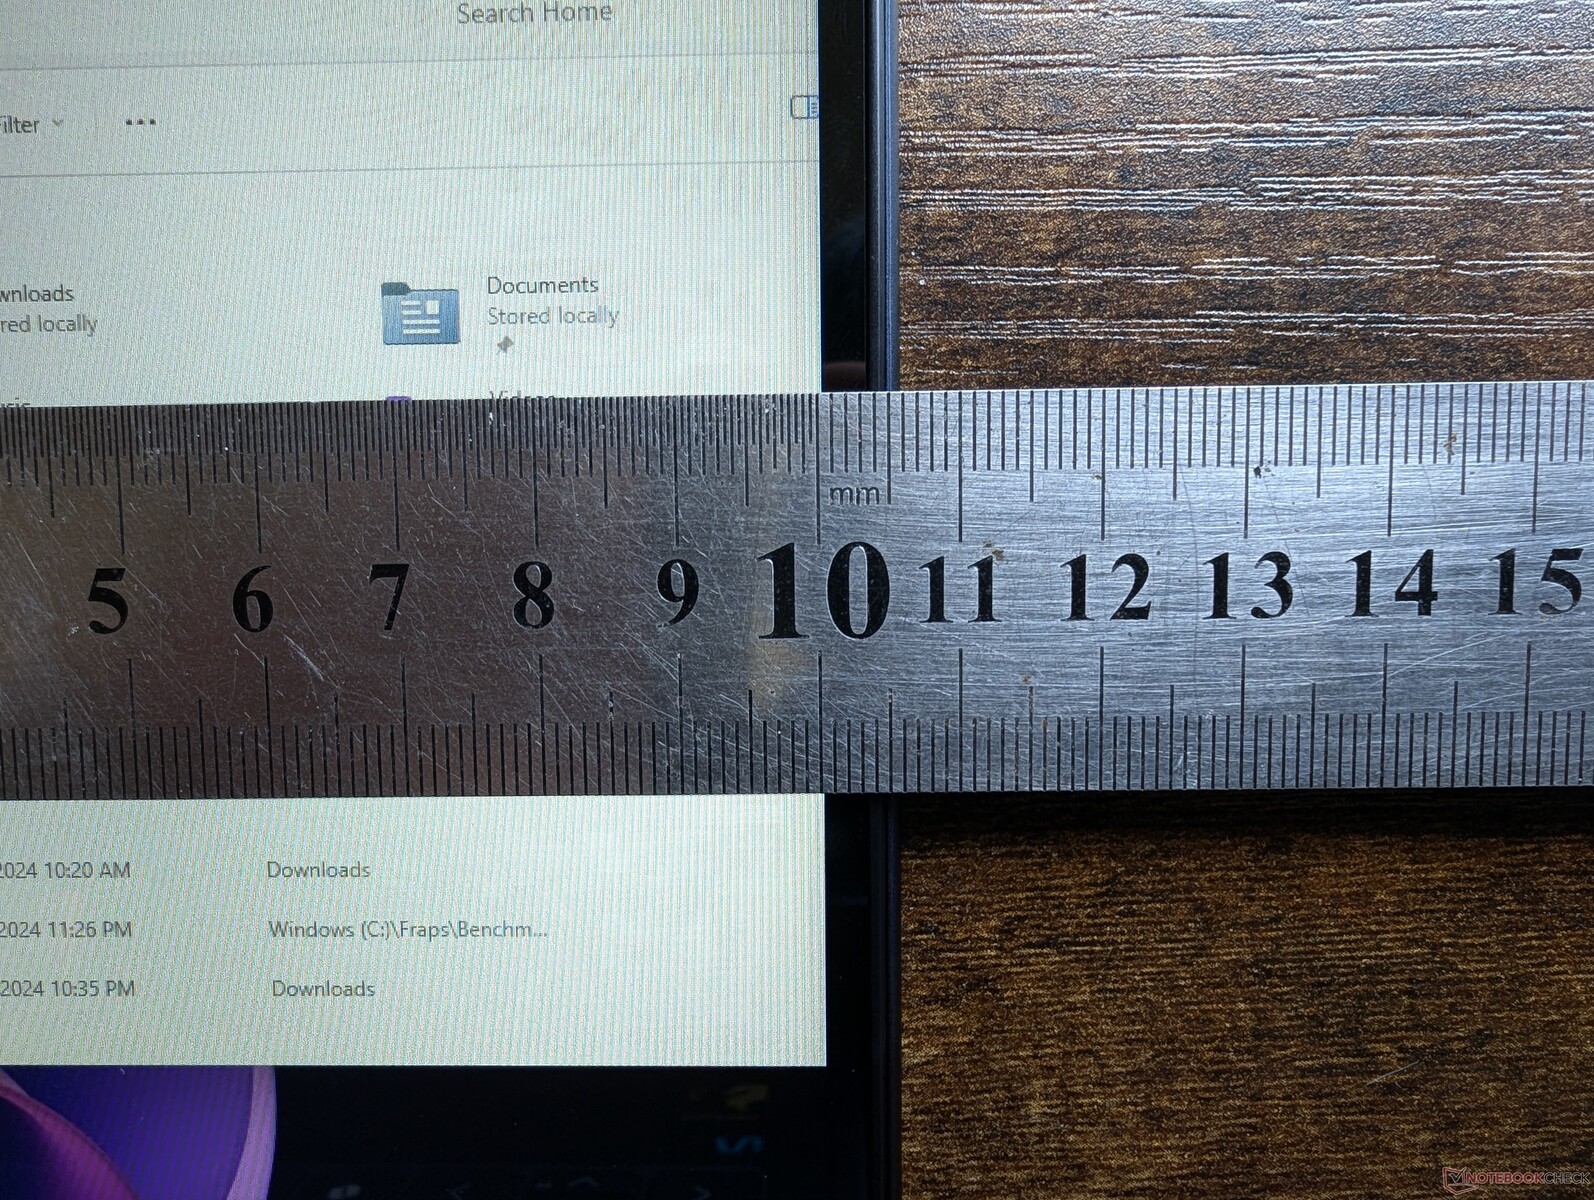
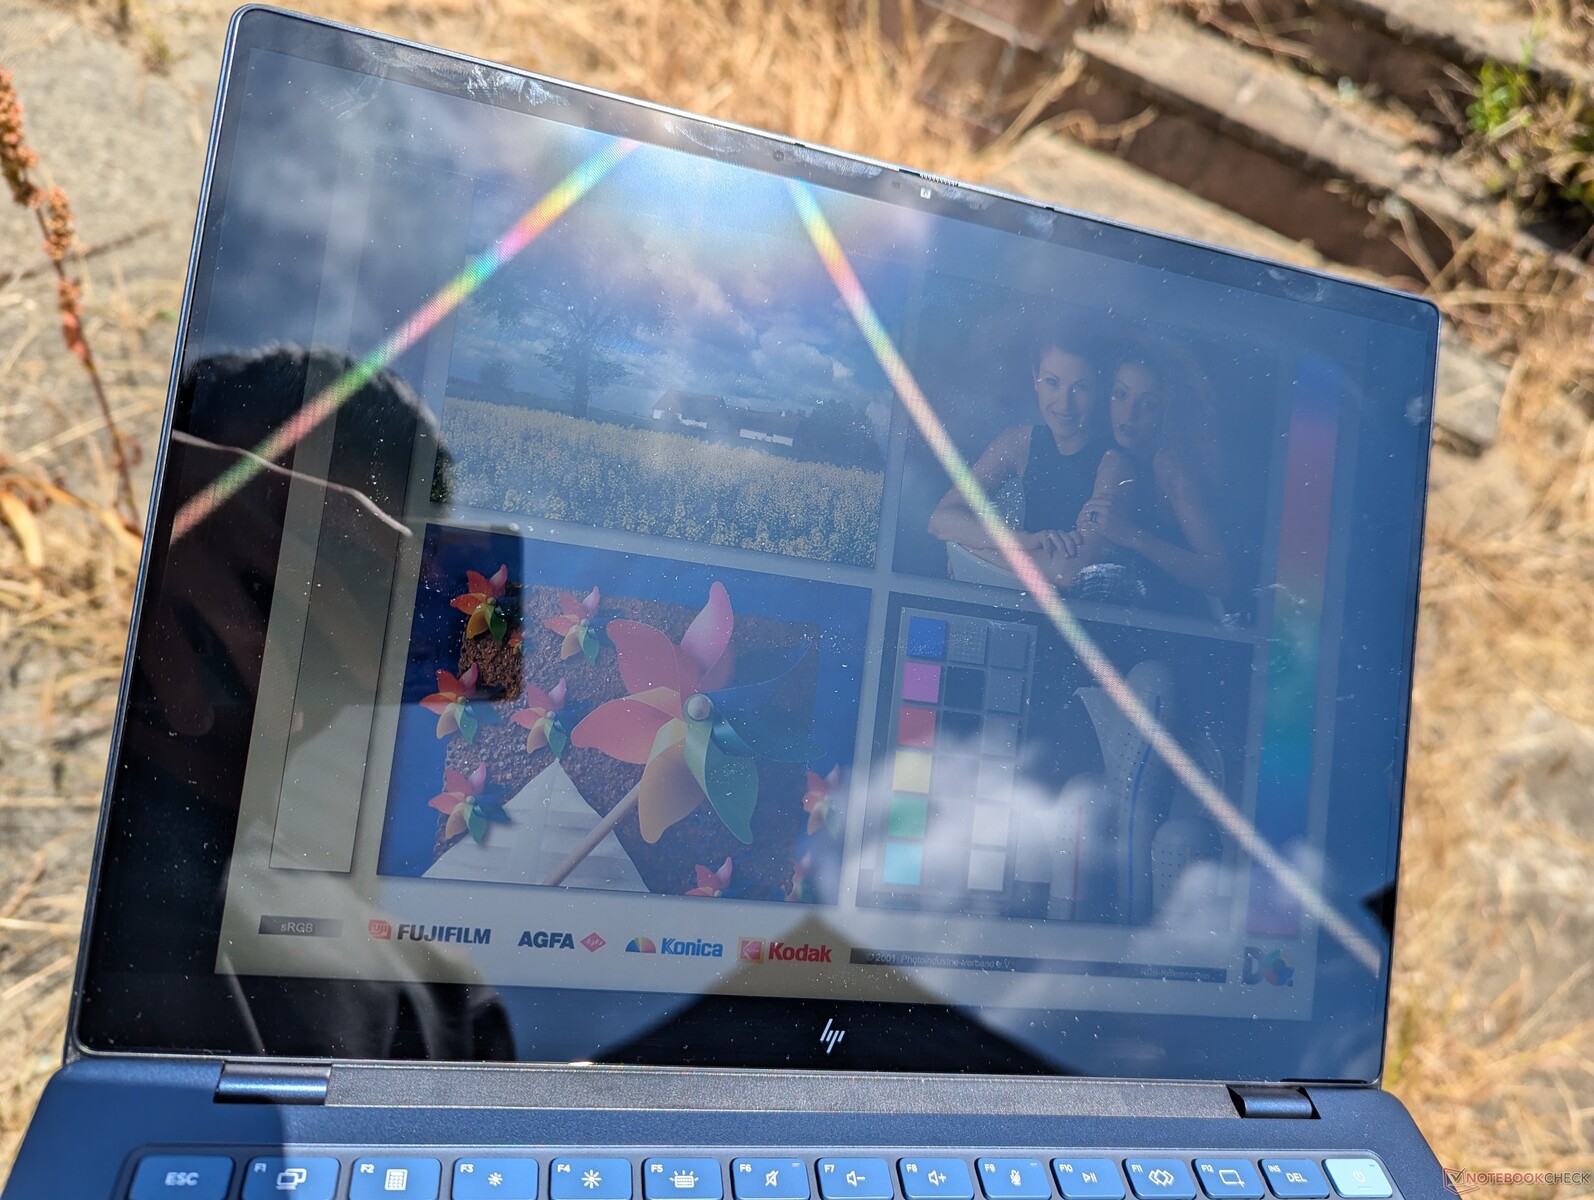
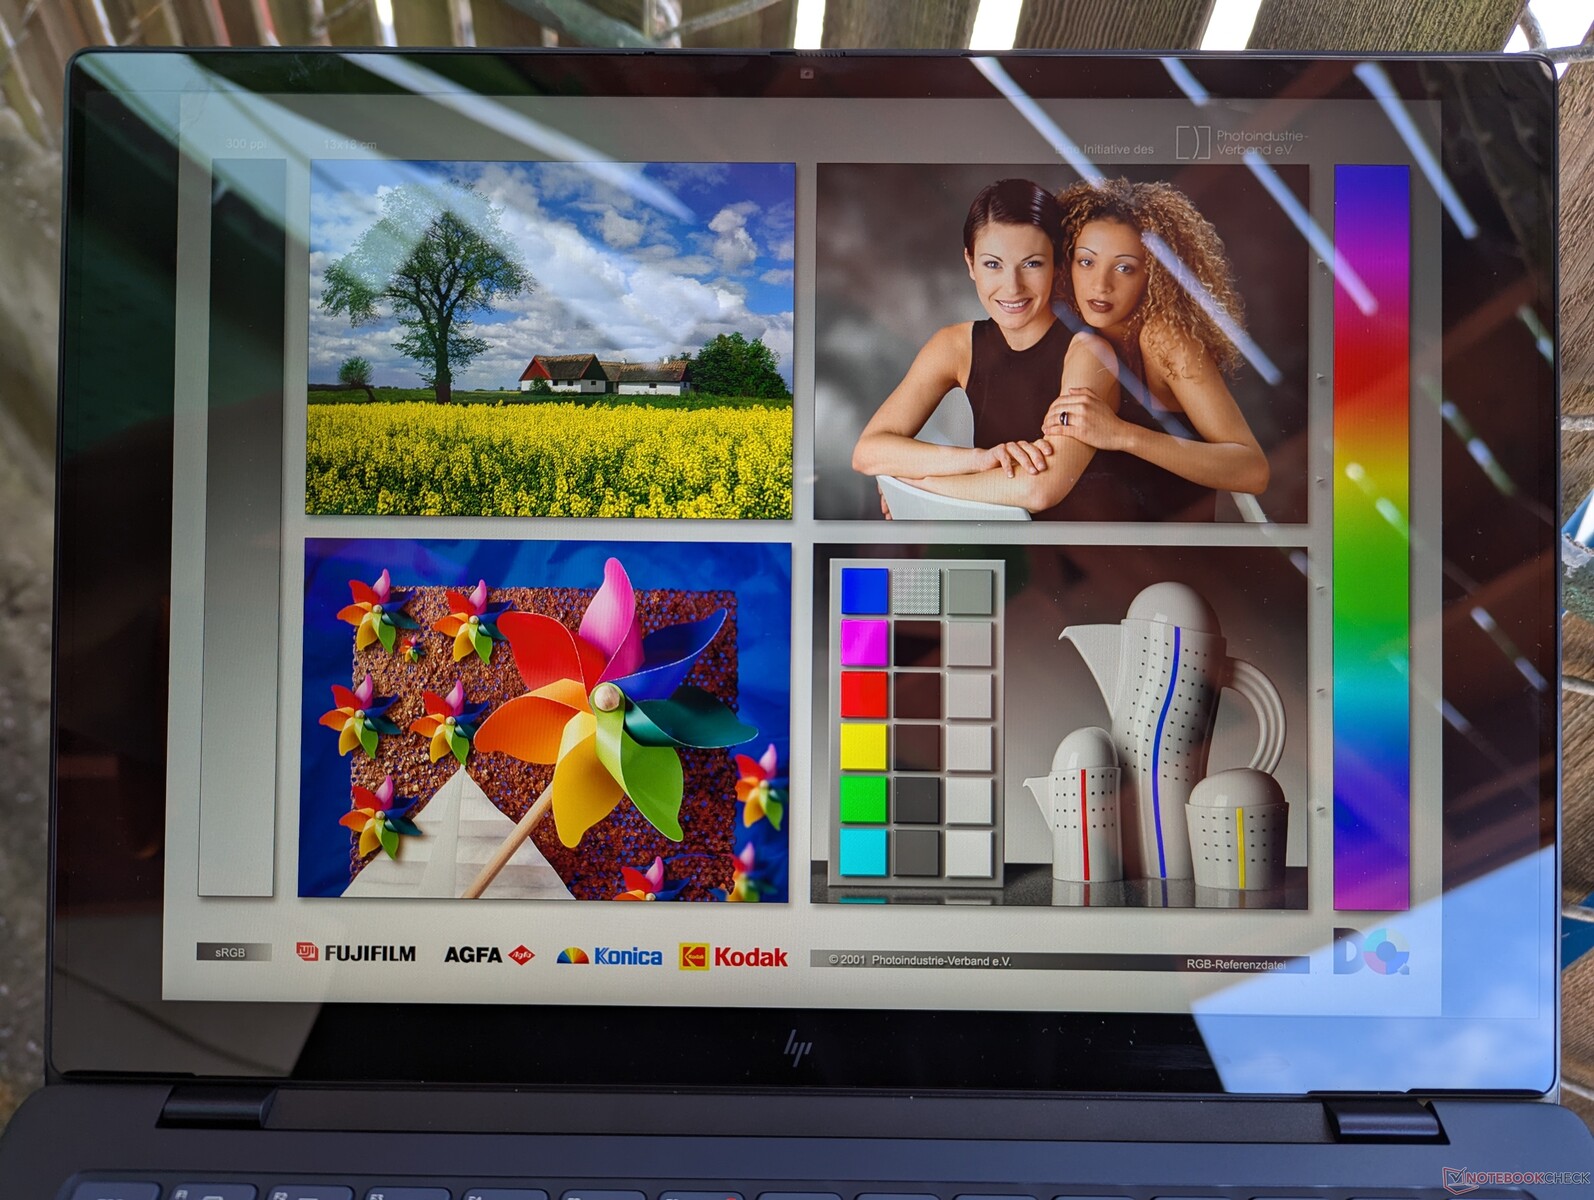
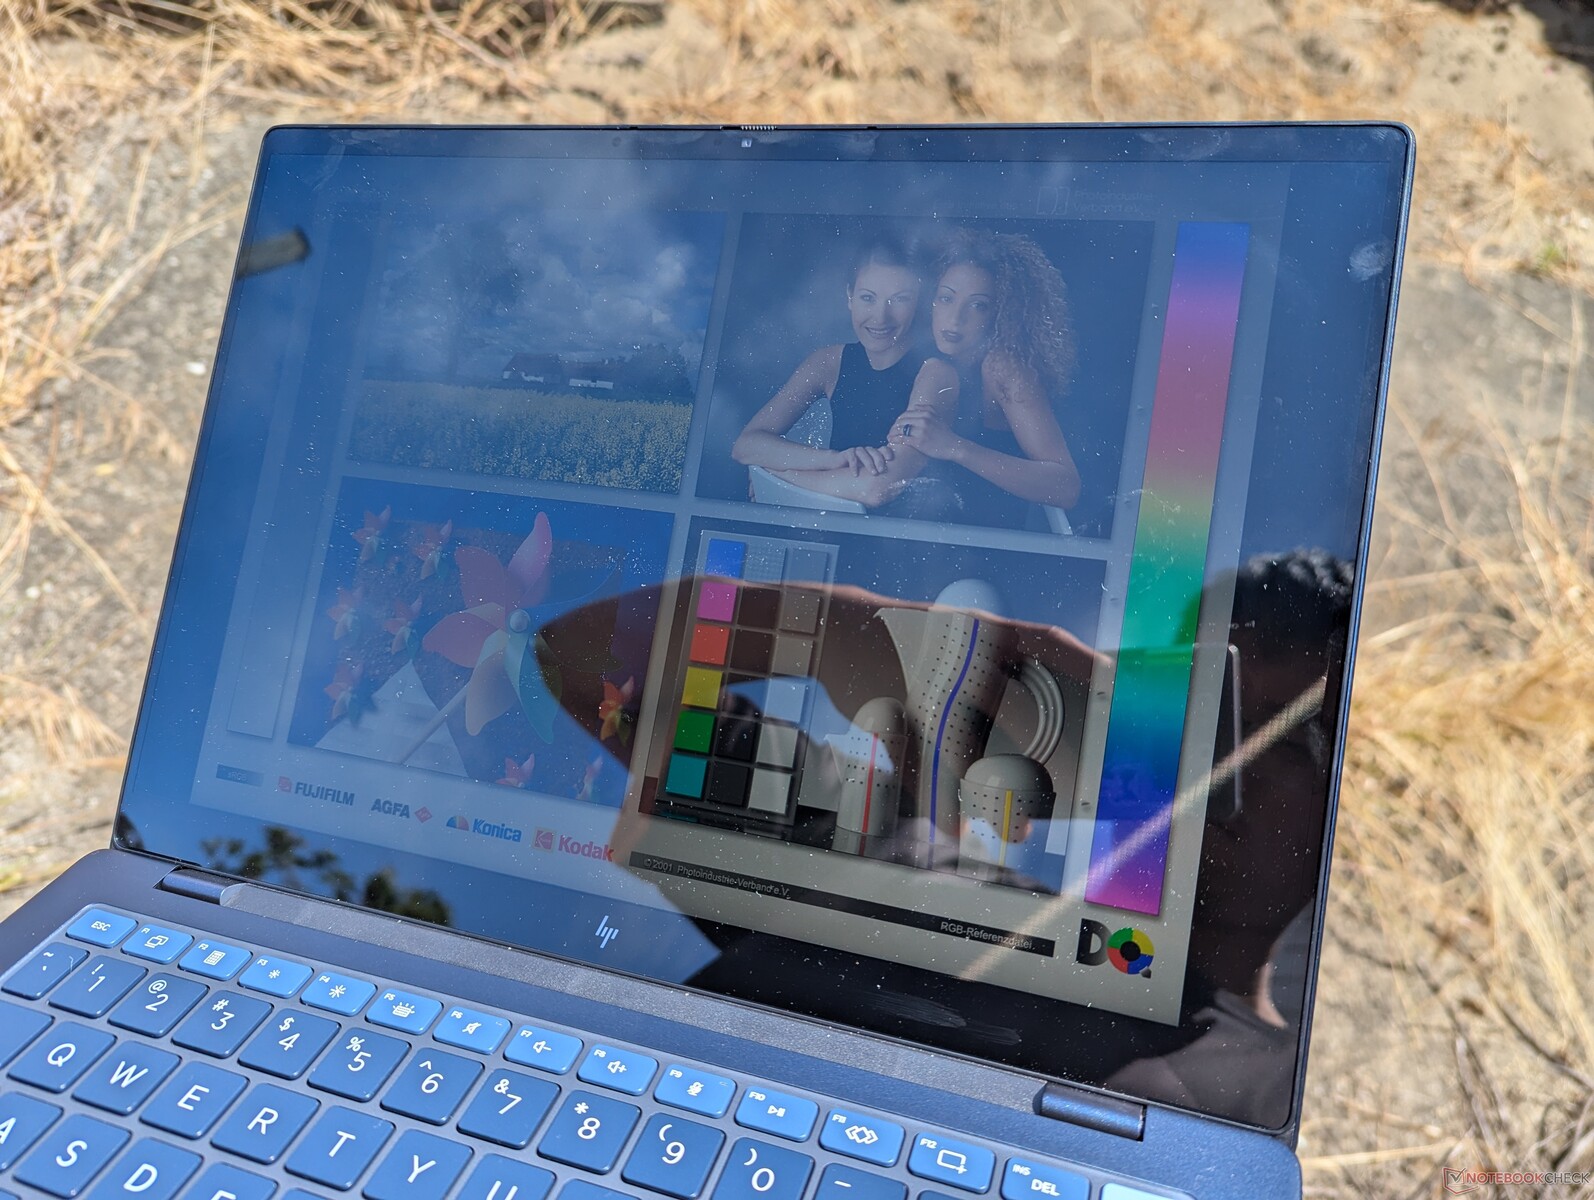
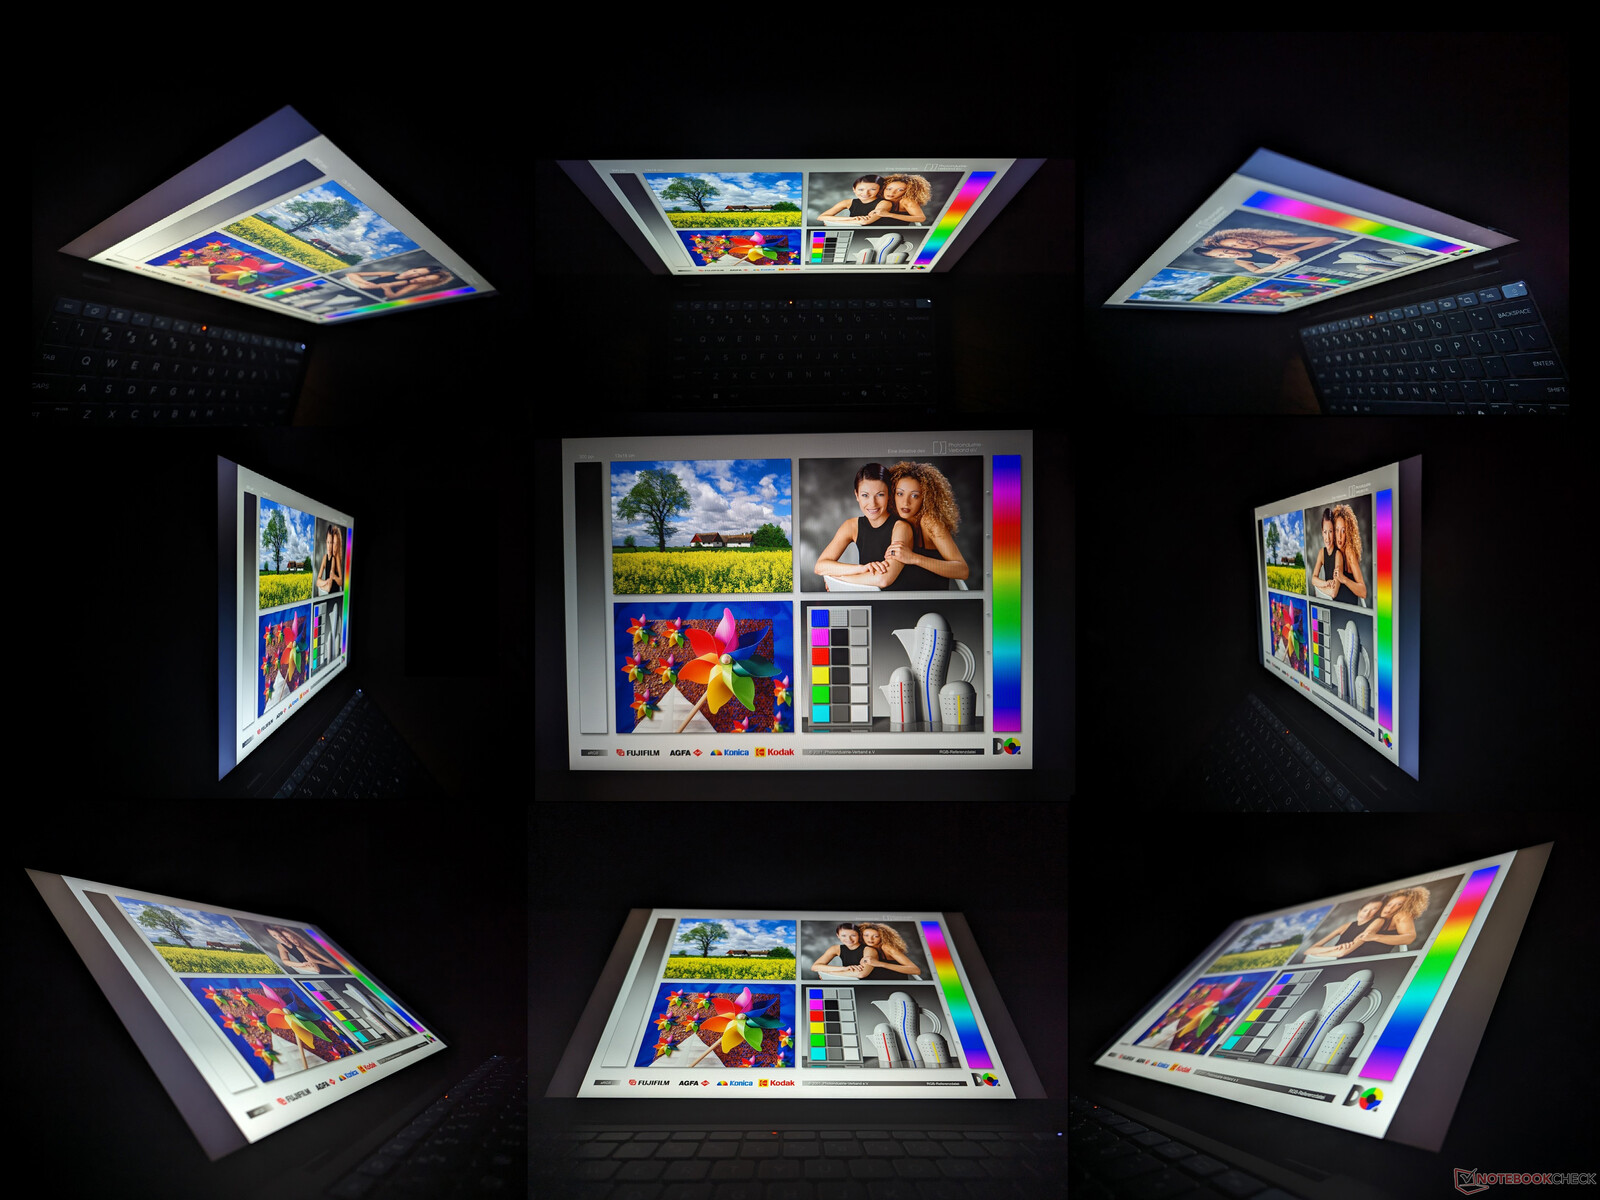
Display — Standard-IPS mit 60 Hz
So besonders die CPU auch sein mag, der Touchscreen gehört eher zur Allerweltskategorie. Das IPS-Panel bietet die vollen sRGB-Farben, 1.400p und immerhin schnellere Reaktionszeiten als das 14-Zoll-Panel im Dragonfly Pro. Ansonsten fehlen aber Funktionen fortschrittlicherer Panels wie HDR, höhere Bildwiederholraten oder Windows VRR.

| |||||||||||||||||||||||||
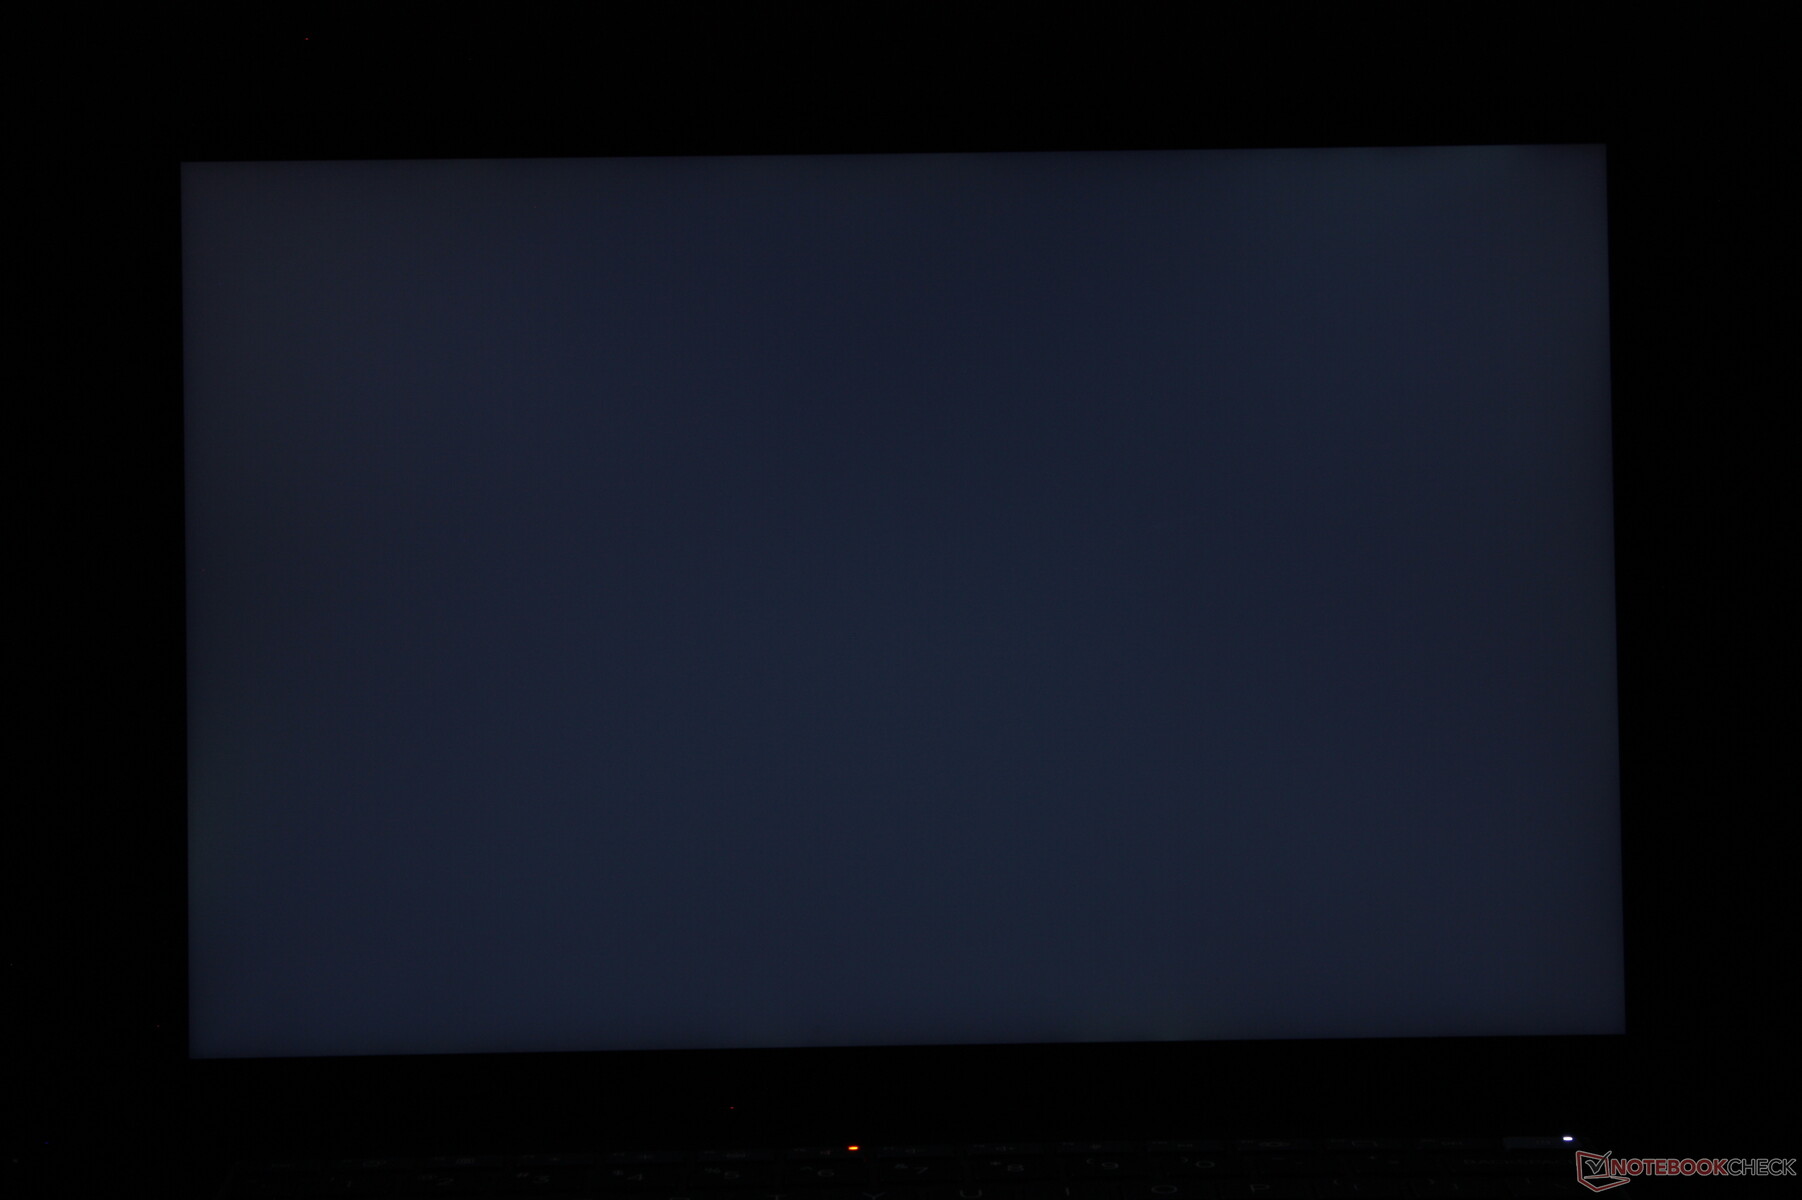
Ausleuchtung: 87 %
Helligkeit Akku: 341.4 cd/m²
Kontrast: 875:1 (Schwarzwert: 0.39 cd/m²)
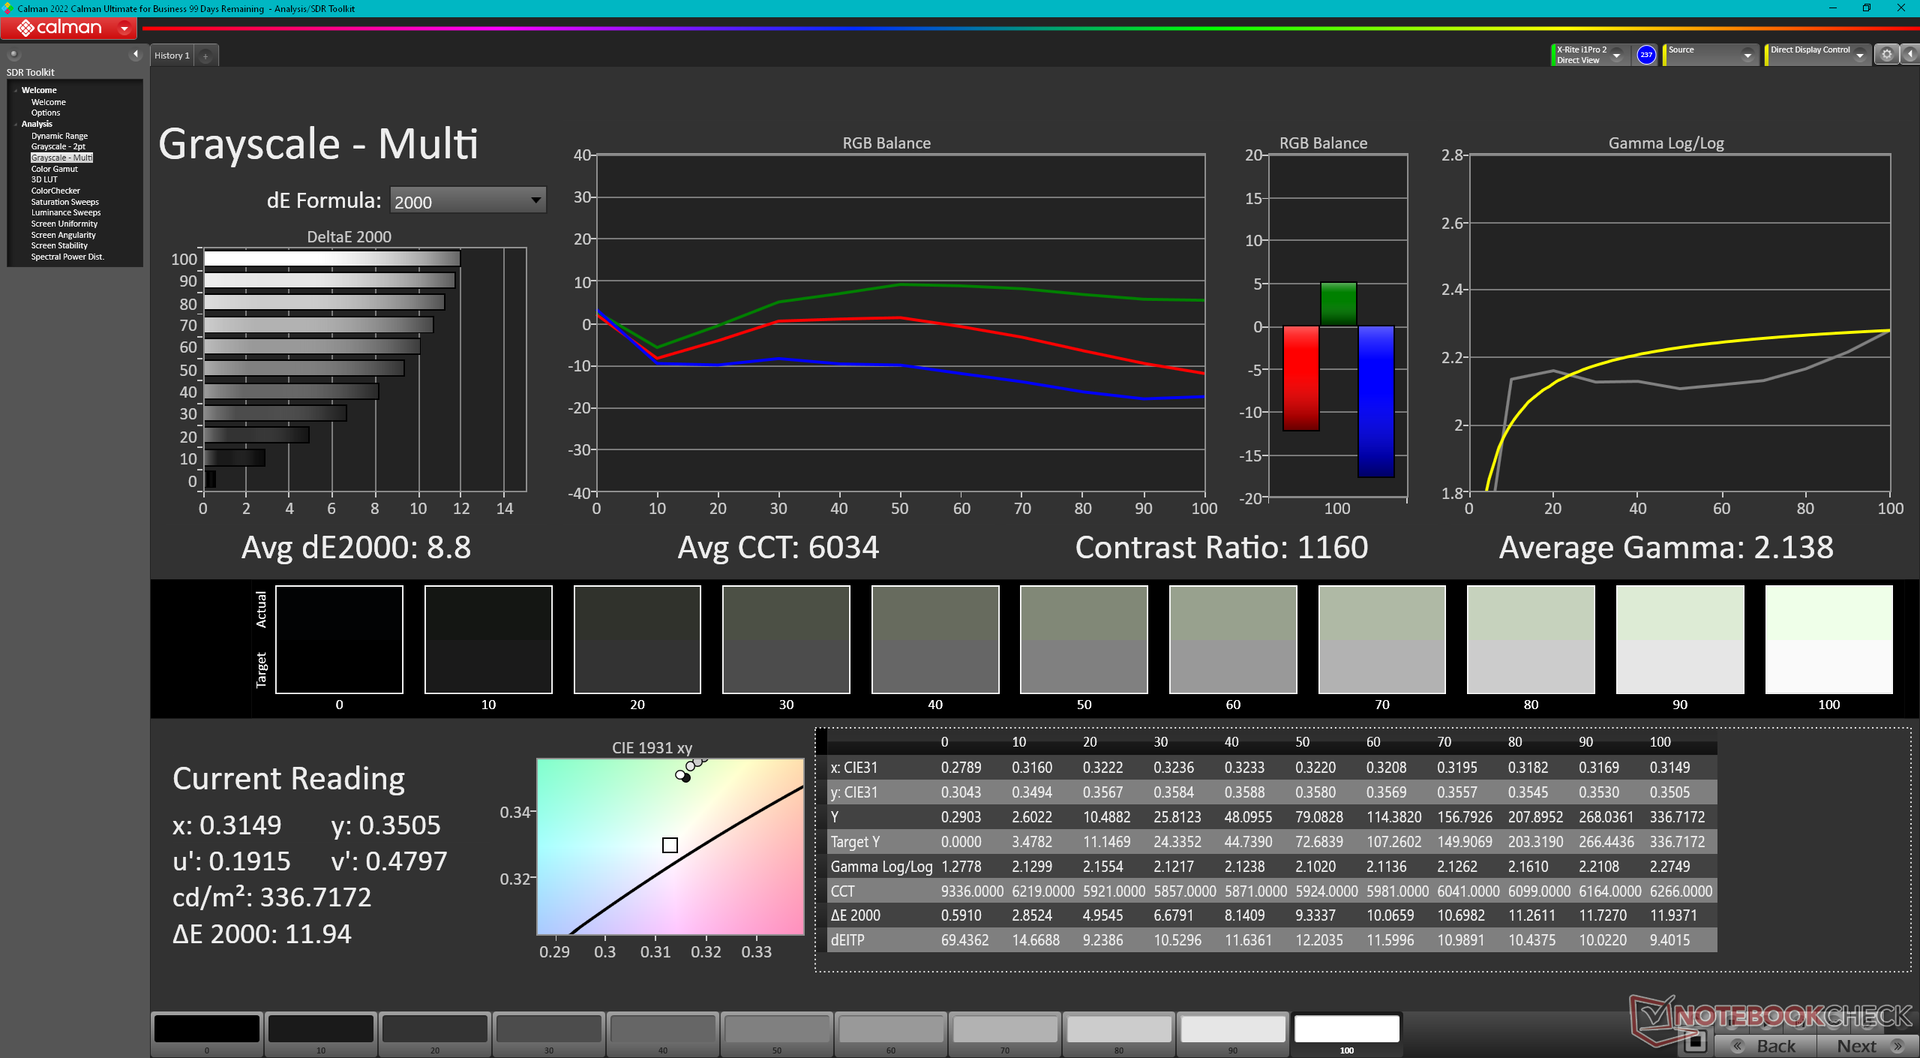
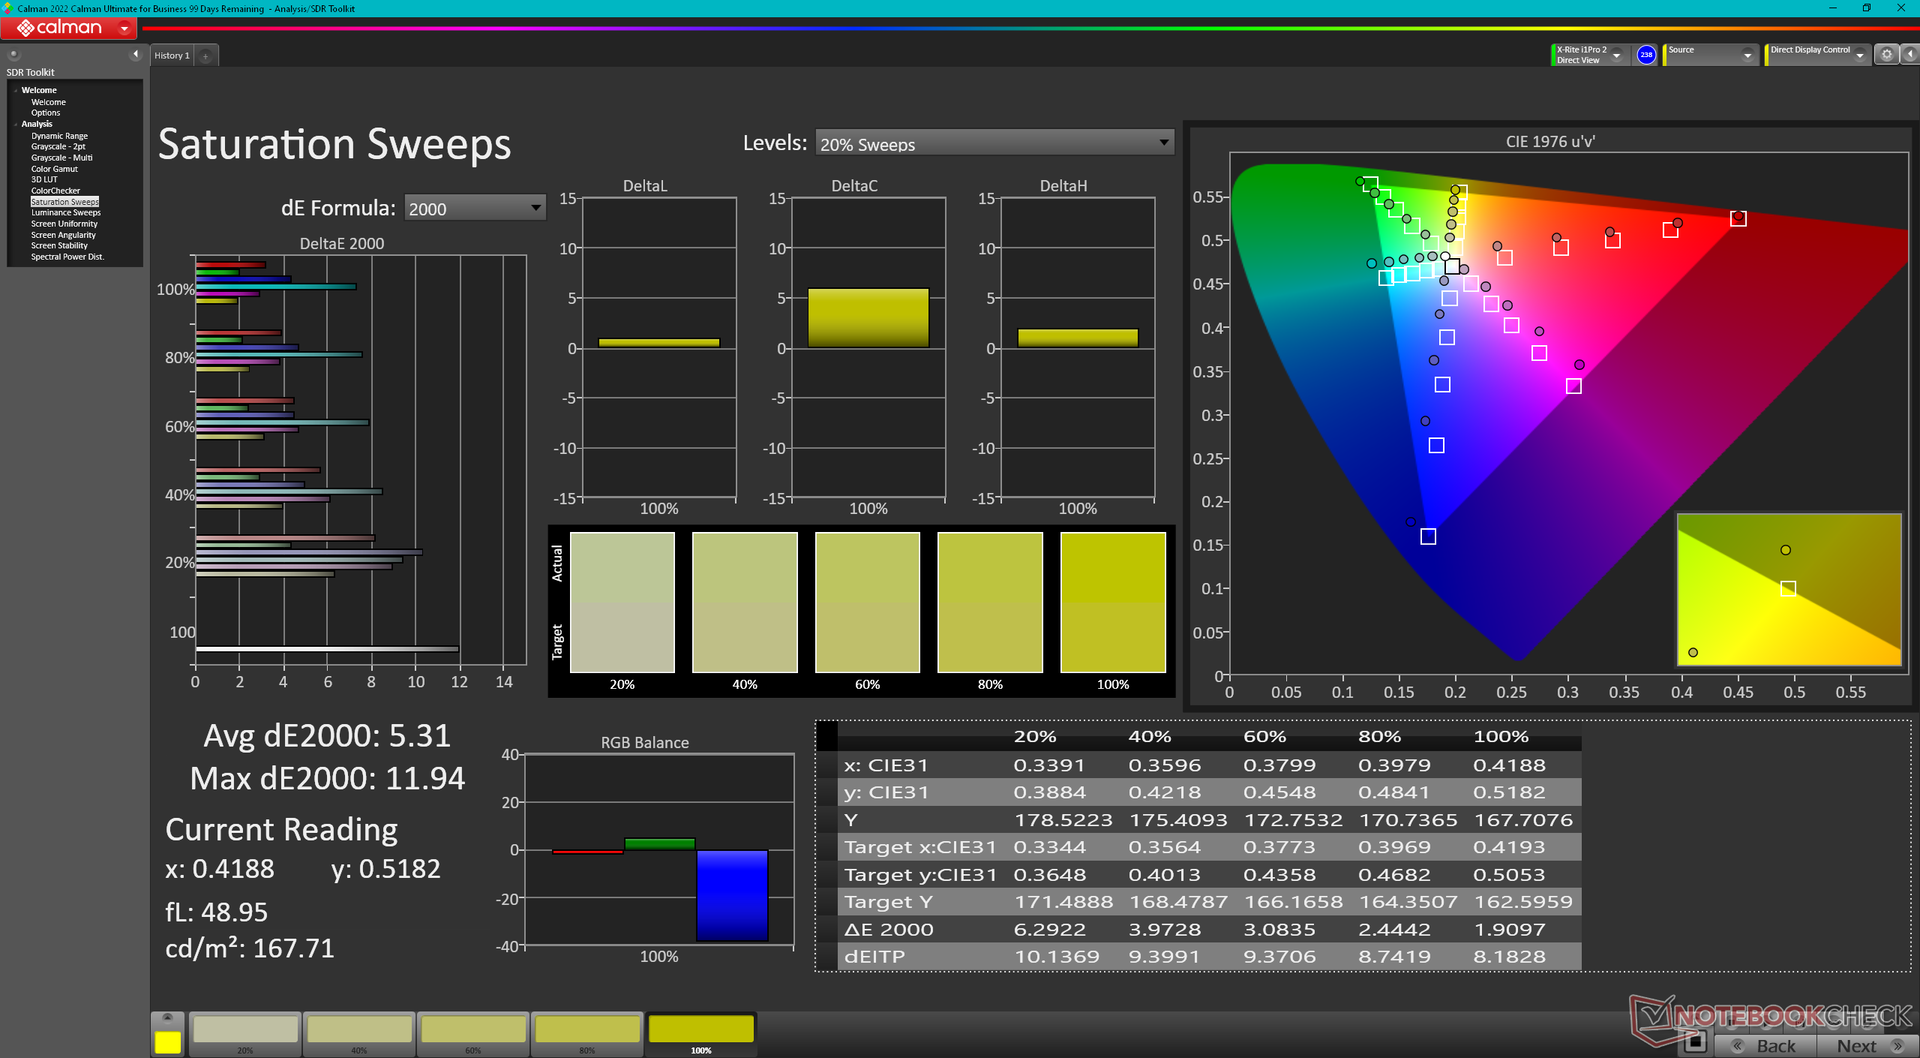
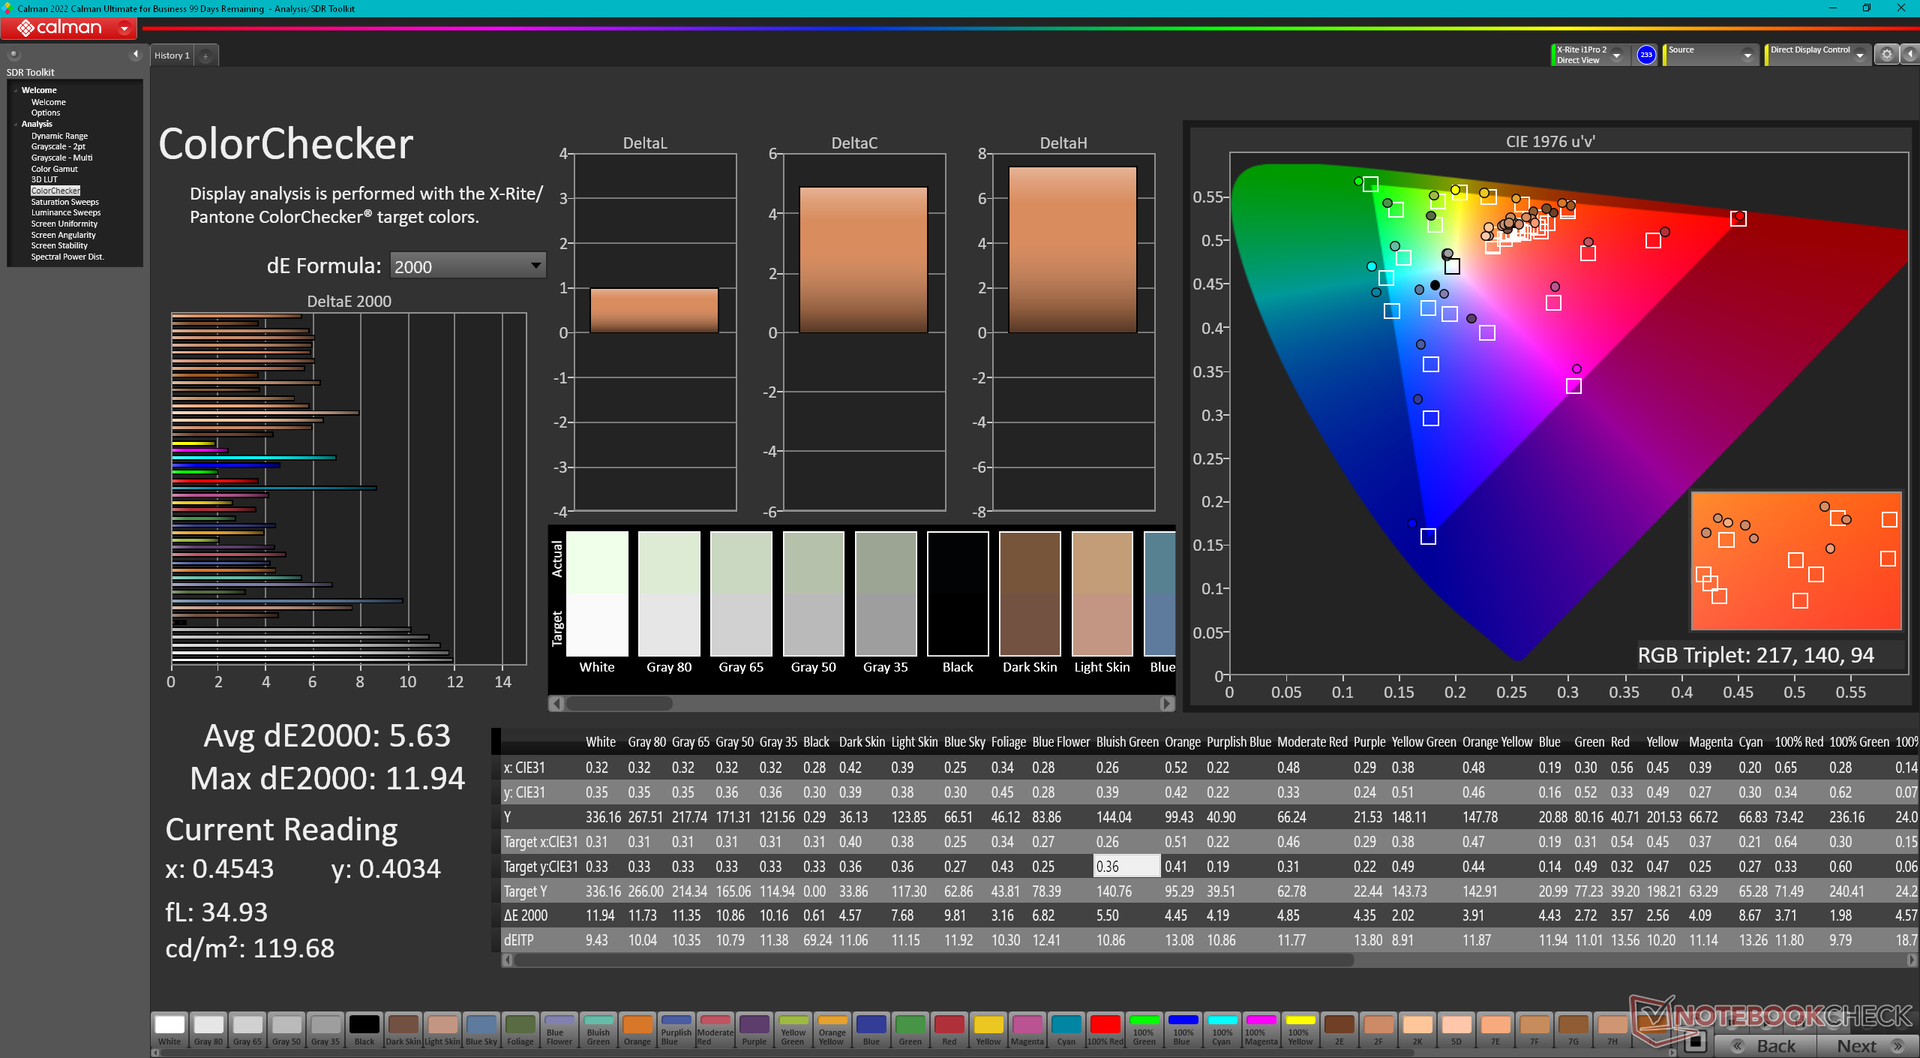
ΔE ColorChecker Calman: 5.63 | ∀{0.5-29.43 Ø4.72}
ΔE Greyscale Calman: 8.8 | ∀{0.09-98 Ø4.97}
Gamma: 2.14
CCT: 6034 K
| HP EliteBook Ultra G1q 14 IPS, 2240x1400, 14" | Asus Vivobook S 15 OLED Snapdragon ATNA56AC03-0, OLED, 2880x1620, 15.6" | HP Dragonfly Pro 2023 AU Optronics AUOA49A, IPS, 1920x1200, 14" | Dell Latitude 9450 2-in-1 AU Optronics B140QAN, IPS, 2560x1600, 14" | Lenovo ThinkPad X1 Carbon G12 Samsung ATNA40YK20-0, OLED, 2880x1800, 14" | Apple MacBook Pro 14 2023 M3 Max Mini-LED, 3024x1964, 14.2" | |
|---|---|---|---|---|---|---|
| Display | ||||||
| Display P3 Coverage (%) | 76.6 | 80.6 | 99.7 | 99.2 | ||
| sRGB Coverage (%) | 100 | 100 | 100 | |||
| AdobeRGB 1998 Coverage (%) | 77.4 | 80.1 | 98.2 | |||
| Response Times | 97% | -145% | -130% | 96% | -297% | |
| Response Time Grey 50% / Grey 80% * (ms) | 22.8 ? | 0.61 ? 97% | 65.6 ? -188% | 59.6 ? -161% | 0.91 ? 96% | 80.8 ? -254% |
| Response Time Black / White * (ms) | 17.9 ? | 0.67 ? 96% | 36 ? -101% | 35.6 ? -99% | 0.76 ? 96% | 78.8 ? -340% |
| PWM Frequency (Hz) | 240 ? | 240.3 | 14878 ? | |||
| Bildschirm | 306% | 45% | 48% | 50% | 68% | |
| Helligkeit Bildmitte (cd/m²) | 341.4 | 378 11% | 425.9 25% | 501.4 47% | 417 22% | 610 79% |
| Brightness (cd/m²) | 315 | 379 20% | 405 29% | 491 56% | 417 32% | 600 90% |
| Brightness Distribution (%) | 87 | 98 13% | 87 0% | 88 1% | 98 13% | 96 10% |
| Schwarzwert * (cd/m²) | 0.39 | 0.02 95% | 0.26 33% | 0.32 18% | ||
| Kontrast (:1) | 875 | 18900 2060% | 1638 87% | 1567 79% | ||
| Delta E Colorchecker * | 5.63 | 1 82% | 2.81 50% | 2.52 55% | 1.26 78% | 1.7 70% |
| Colorchecker dE 2000 max. * | 11.94 | 2.6 78% | 4.91 59% | 4.87 59% | 3.6 70% | 2.3 81% |
| Delta E Graustufen * | 8.8 | 1.2 86% | 2.2 75% | 2.8 68% | 1.3 85% | 2.1 76% |
| Gamma | 2.14 103% | 2.19 100% | 2.04 108% | 2.17 101% | 2.27 97% | 2.22 99% |
| CCT | 6034 108% | 6460 101% | 6688 97% | 6270 104% | 6355 102% | 6874 95% |
| Colorchecker dE 2000 calibrated * | 0.49 | 0.45 | 0.68 | |||
| Durchschnitt gesamt (Programm / Settings) | 202% /
264% | -50% /
7% | -41% /
12% | 73% /
62% | -115% /
-24% |
* ... kleinere Werte sind besser
Ab Werk könnten die Graustufen- und Farb-DeltaE-Werte besser ausfallen (8,8 und 5,63), was auf das Fehlen einer Werkskalibrierung hinweist. Die Farbtemperatur ist mit ca. 6000K etwas zu warm geraten. Eine Kalibrierung durch den Endnutzer kann sich als schwierig erweisen, da die Farbsoftware wie i1Profiler aktuell nicht vollständig auf ARM funktioniert.
Reaktionszeiten (Response Times) des Displays
| ↔ Reaktionszeiten Schwarz zu Weiß | ||
|---|---|---|
| 17.9 ms ... steigend ↗ und fallend ↘ kombiniert | ↗ 10.3 ms steigend | 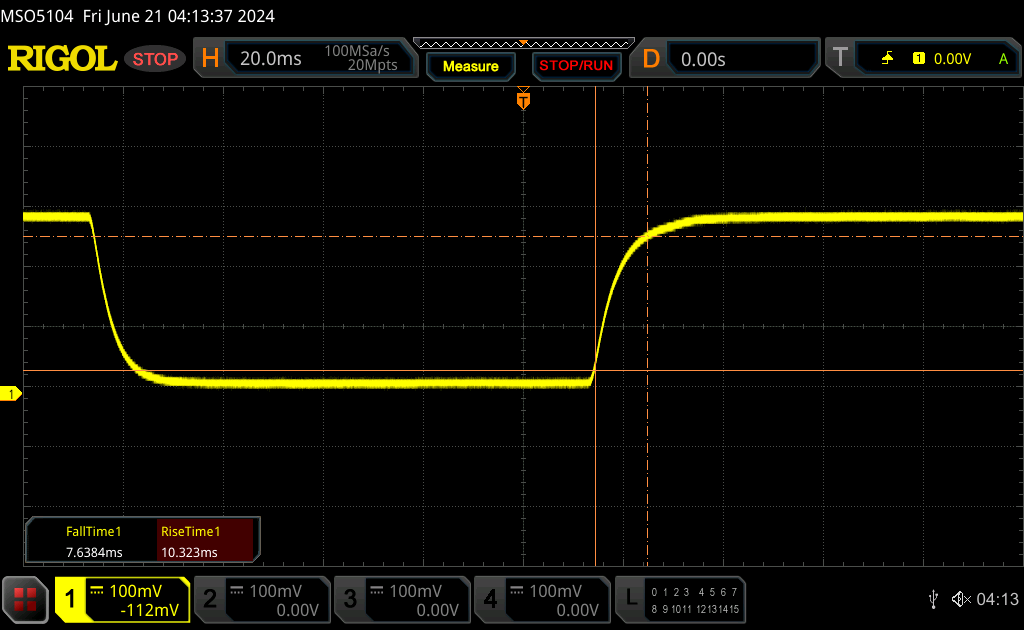 |
| ↘ 7.6 ms fallend | ||
| Die gemessenen Reaktionszeiten sind gut, für anspruchsvolle Spieler könnten der Bildschirm jedoch zu langsam sein. Im Vergleich rangierten die bei uns getesteten Geräte von 0.1 (Minimum) zu 240 (Maximum) ms. » 40 % aller Screens waren schneller als der getestete. Daher sind die gemessenen Reaktionszeiten durchschnittlich (19.8 ms). | ||
| ↔ Reaktionszeiten 50% Grau zu 80% Grau | ||
| 22.8 ms ... steigend ↗ und fallend ↘ kombiniert | ↗ 9.3 ms steigend | 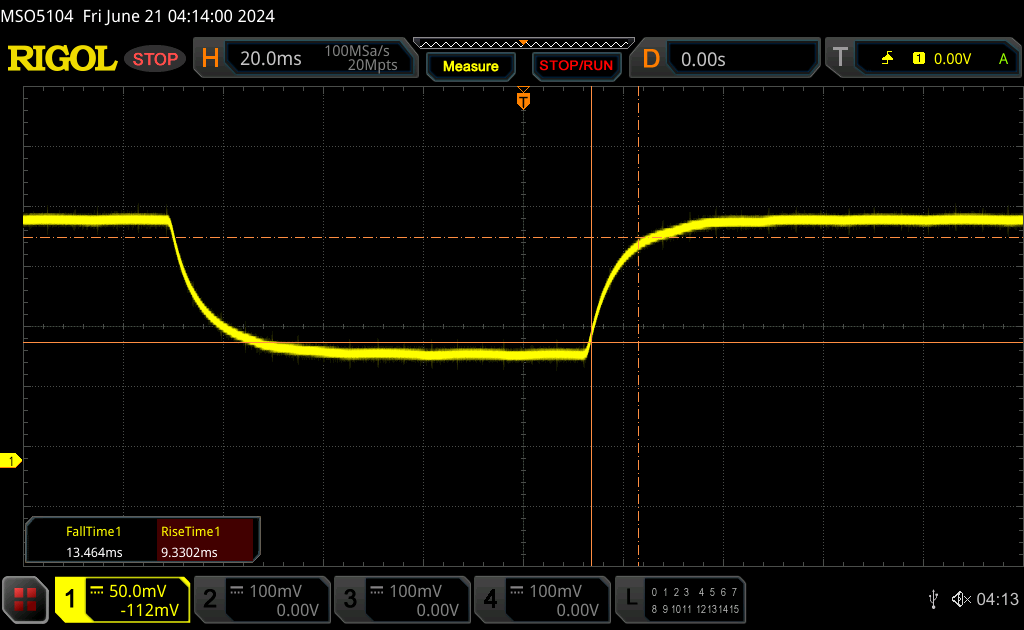 |
| ↘ 13.5 ms fallend | ||
| Die gemessenen Reaktionszeiten sind gut, für anspruchsvolle Spieler könnten der Bildschirm jedoch zu langsam sein. Im Vergleich rangierten die bei uns getesteten Geräte von 0.165 (Minimum) zu 636 (Maximum) ms. » 34 % aller Screens waren schneller als der getestete. Daher sind die gemessenen Reaktionszeiten besser als der Durchschnitt aller vermessenen Geräte (31 ms). | ||
Bildschirm-Flackern / PWM (Pulse-Width Modulation)
| Flackern / PWM nicht festgestellt | 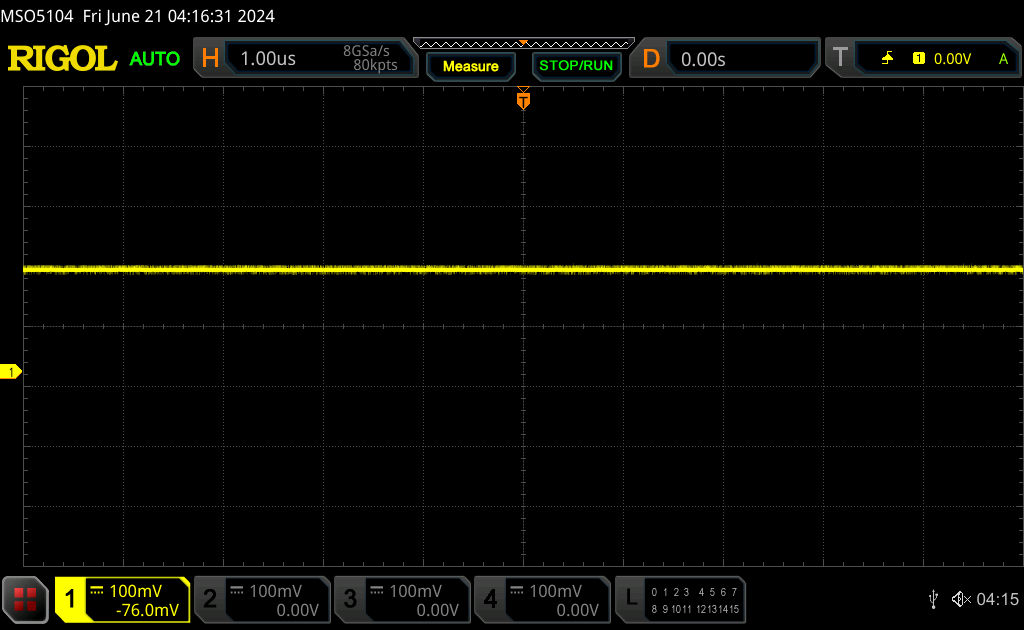 | ||
Im Vergleich: 52 % aller getesteten Geräte nutzten kein PWM um die Helligkeit zu reduzieren. Wenn PWM eingesetzt wurde, dann bei einer Frequenz von durchschnittlich 7772 (Minimum 5, Maximum 343500) Hz. | |||
Die maximale Helligkeit fällt mit 350 bis 400 Nits schwächer aus als beim Macbook Pro 14 oder EliteBook 830 mit ihren 600 bis 1000 Nits. 350 Nits reichen für Innenräume locker aus, bei äußeren Lichtbedingungen könnte der Bildschirm des EliteBook Ultra aber überfordert sein.
Leistung — Anfangs gut, aber nicht gut genug
Testbedingungen
Wir haben Windows vor unseren Benchmarktests in den Leistungsmodus versetzt. Viele der Benchmarks mussten allerdings emuliert werden, um auf dem ARM-System überhaupt lauffähig zu sein, darunter auch 3DMark, was einen direkten Vergleich zu Intel- oder AMD-Chips sehr erschwert. Nur wenige Benchmarks laufen nativ, darunter CineBench R24, GeekBench 6 und PCMark 10, diese ordnen das HP auf das Niveau einer Core-i7-Meteor-Lake-U-CPU ein. Ansonsten kommt das System aus den genannten Gründen eher auf reduzierte Werte, besonders aber in Single-Thread-Anwendungen, wenn der Benchmark emuliert werden muss.
Prozessor
(Update 3. Juli 2024: Der Abschnitt wurde überarbeitet, um besser zwischen emulierten und nativen Benchmarks unterscheiden zu können.)
Die reine Multi-Core Leistung liegt bestenfalls Kopf-an-Kopf mit den konkurrierenden Core Ultra 7 165U und Ryzen 7 7840U oder 8840U, sofern der Benchmark nativ auf ARM läuft. Muss der Benchmark emuliert werden, so sind die Werte meist um die 20 Prozent schwächer. Die Ergebnisse der emulierten Tests werden noch schlechter wenn es um Single-Core-Operationen geht, bei denen unser Snapdragon X Elite X1E-78-100 zwischen 35 und 40 Prozent langsamer rechnet als die zuvor erwähnten Intel- und AMD-Alternativen. Ähnliche Ergebnisse treten beim Vergleich des Qualcomm-Chips mit dem Apple M2 oder neueren Apple-M-Chips zutage.
Die Leistung sinkt über die Zeit ab, die Taktraten sind über längeren Stress hinweg also nicht konstant. Das ist zwar nicht untypisch, aber der Leistungsabfall ist steiler als bei vielen Core-U- oder Ryzen-U-Alternativen. Beispielsweise fällt der Score im CineBench-R15-xT-Loop nach sechs Durchgängen um ganze 27 Prozent, während das letztjährige Dragonfly Pro mit AMD-CPU nur 12 Prozent an Leistung verliert. Wir vermuten, dass dies auch an der kleineren Kühllösung im EliteBook Ultra G1q liegt, da das größere Vivobook S 15 OLED mit der gleichen Qualcomm-CPU unter gleichen Testbedingungen höhere Werte aufrecht erhalten kann.
Cinebench R15 Multi Loop
Cinebench 2024: CPU Multi Core | CPU Single Core
Cinebench R23: Multi Core | Single Core
Cinebench R20: CPU (Multi Core) | CPU (Single Core)
Cinebench R15: CPU Multi 64Bit | CPU Single 64Bit
Blender: v2.79 BMW27 CPU
7-Zip 18.03: 7z b 4 | 7z b 4 -mmt1
Geekbench 6.7: Multi-Core | Single-Core
Geekbench 5.5: Multi-Core | Single-Core
HWBOT x265 Benchmark v2.2: 4k Preset
LibreOffice : 20 Documents To PDF
R Benchmark 2.5: Overall mean
| CPU Performance Rating | |
| Apple MacBook Pro 14 2023 M3 Max -5! | |
| Asus ZenBook 14X UX3404VC -4! | |
| Lenovo Yoga Pro 7 14APH G8 | |
| MSI Stealth 14 Studio A13V -4! | |
| Apple MacBook Pro 14 2023 M3 Pro -5! | |
| Huawei MateBook X Pro 2024 | |
| Apple MacBook Pro 14 2023 M2 Pro -10! | |
| Dell Inspiron 14 7445 2-in-1 -2! | |
| Asus Zenbook 14 OLED UM3406HA | |
| Lenovo ThinkPad X1 Carbon G12 -1! | |
| Lenovo ThinkPad T14 G3-21AJS00400 -4! | |
| HP Dragonfly Pro 2023 -6! | |
| Dell Latitude 9450 2-in-1 -2! | |
| Apple MacBook Pro 14 2021 M1 Max 24-Core GPU -9! | |
| Asus Vivobook S 15 OLED Snapdragon | |
| Acer TravelMate P4 TMP414-53-58XQ -2! | |
| Durchschnittliche Qualcomm Snapdragon X Elite X1E-78-100 | |
| HP EliteBook Ultra G1q 14 | |
| HP EliteBook 1040 G10 818N7EA -2! | |
| Cinebench 2024 / CPU Multi Core | |
| Apple MacBook Pro 14 2023 M3 Max | |
| Asus Vivobook S 15 OLED Snapdragon | |
| Apple MacBook Pro 14 2023 M3 Pro | |
| Durchschnittliche Qualcomm Snapdragon X Elite X1E-78-100 (746 - 1132, n=9) | |
| Lenovo Yoga Pro 7 14APH G8 | |
| Huawei MateBook X Pro 2024 | |
| HP EliteBook Ultra G1q 14 | |
| Lenovo ThinkPad X1 Carbon G12 | |
| Asus Zenbook 14 OLED UM3406HA | |
| Cinebench 2024 / CPU Single Core | |
| Apple MacBook Pro 14 2023 M3 Pro | |
| Apple MacBook Pro 14 2023 M3 Max | |
| Huawei MateBook X Pro 2024 | |
| Asus Vivobook S 15 OLED Snapdragon | |
| Durchschnittliche Qualcomm Snapdragon X Elite X1E-78-100 (102.8 - 108, n=6) | |
| HP EliteBook Ultra G1q 14 | |
| Lenovo Yoga Pro 7 14APH G8 | |
| Asus Zenbook 14 OLED UM3406HA | |
Cinebench 2024: CPU Multi Core | CPU Single Core
Cinebench R23: Multi Core | Single Core
Cinebench R20: CPU (Multi Core) | CPU (Single Core)
Cinebench R15: CPU Multi 64Bit | CPU Single 64Bit
Blender: v2.79 BMW27 CPU
7-Zip 18.03: 7z b 4 | 7z b 4 -mmt1
Geekbench 6.7: Multi-Core | Single-Core
Geekbench 5.5: Multi-Core | Single-Core
HWBOT x265 Benchmark v2.2: 4k Preset
LibreOffice : 20 Documents To PDF
R Benchmark 2.5: Overall mean
* ... kleinere Werte sind besser
AIDA64: FP32 Ray-Trace | FPU Julia | CPU SHA3 | CPU Queen | FPU SinJulia | FPU Mandel | CPU AES | CPU ZLib | FP64 Ray-Trace | CPU PhotoWorxx
| Performance Rating | |
| Lenovo ThinkPad X1 Carbon G12 | |
| Dell Latitude 9450 2-in-1 | |
| Asus Vivobook S 15 OLED Snapdragon | |
| Durchschnittliche Qualcomm Snapdragon X Elite X1E-78-100 | |
| HP EliteBook Ultra G1q 14 | |
| AIDA64 / FP32 Ray-Trace | |
| Dell Latitude 9450 2-in-1 | |
| Lenovo ThinkPad X1 Carbon G12 | |
| HP EliteBook Ultra G1q 14 | |
| Asus Vivobook S 15 OLED Snapdragon | |
| Durchschnittliche Qualcomm Snapdragon X Elite X1E-78-100 (6943 - 8203, n=6) | |
| AIDA64 / FPU Julia | |
| Dell Latitude 9450 2-in-1 | |
| Lenovo ThinkPad X1 Carbon G12 | |
| HP EliteBook Ultra G1q 14 | |
| Durchschnittliche Qualcomm Snapdragon X Elite X1E-78-100 (20304 - 27958, n=6) | |
| Asus Vivobook S 15 OLED Snapdragon | |
| AIDA64 / CPU SHA3 | |
| Asus Vivobook S 15 OLED Snapdragon | |
| Durchschnittliche Qualcomm Snapdragon X Elite X1E-78-100 (3036 - 3319, n=6) | |
| HP EliteBook Ultra G1q 14 | |
| Dell Latitude 9450 2-in-1 | |
| Lenovo ThinkPad X1 Carbon G12 | |
| AIDA64 / CPU Queen | |
| Lenovo ThinkPad X1 Carbon G12 | |
| Durchschnittliche Qualcomm Snapdragon X Elite X1E-78-100 (67909 - 68494, n=6) | |
| Asus Vivobook S 15 OLED Snapdragon | |
| HP EliteBook Ultra G1q 14 | |
| Dell Latitude 9450 2-in-1 | |
| AIDA64 / FPU SinJulia | |
| Lenovo ThinkPad X1 Carbon G12 | |
| Dell Latitude 9450 2-in-1 | |
| Asus Vivobook S 15 OLED Snapdragon | |
| Durchschnittliche Qualcomm Snapdragon X Elite X1E-78-100 (1321 - 2303, n=6) | |
| HP EliteBook Ultra G1q 14 | |
| AIDA64 / FPU Mandel | |
| Dell Latitude 9450 2-in-1 | |
| Lenovo ThinkPad X1 Carbon G12 | |
| Asus Vivobook S 15 OLED Snapdragon | |
| HP EliteBook Ultra G1q 14 | |
| Durchschnittliche Qualcomm Snapdragon X Elite X1E-78-100 (11546 - 14598, n=6) | |
| AIDA64 / CPU AES | |
| HP EliteBook Ultra G1q 14 | |
| Lenovo ThinkPad X1 Carbon G12 | |
| Durchschnittliche Qualcomm Snapdragon X Elite X1E-78-100 (53201 - 66840, n=6) | |
| Asus Vivobook S 15 OLED Snapdragon | |
| Dell Latitude 9450 2-in-1 | |
| AIDA64 / CPU ZLib | |
| Lenovo ThinkPad X1 Carbon G12 | |
| HP EliteBook Ultra G1q 14 | |
| Durchschnittliche Qualcomm Snapdragon X Elite X1E-78-100 (658 - 794, n=6) | |
| Dell Latitude 9450 2-in-1 | |
| Asus Vivobook S 15 OLED Snapdragon | |
| AIDA64 / FP64 Ray-Trace | |
| Dell Latitude 9450 2-in-1 | |
| Lenovo ThinkPad X1 Carbon G12 | |
| Asus Vivobook S 15 OLED Snapdragon | |
| Durchschnittliche Qualcomm Snapdragon X Elite X1E-78-100 (2955 - 4271, n=6) | |
| HP EliteBook Ultra G1q 14 | |
| AIDA64 / CPU PhotoWorxx | |
| Dell Latitude 9450 2-in-1 | |
| Lenovo ThinkPad X1 Carbon G12 | |
| Asus Vivobook S 15 OLED Snapdragon | |
| Durchschnittliche Qualcomm Snapdragon X Elite X1E-78-100 (27950 - 39220, n=6) | |
| HP EliteBook Ultra G1q 14 | |
Systemleistung
Wie zu erwarten versagt diverse Benchmark-Software den Dienst auf der ARM-Umgebung:
- Far Cry 5: startet nicht
- X-Plane: nur niedrige Einstellungen; stürzt auf Medium und Hohen Einstellungen ab
- Baldur's Gate 3: startet nicht in DX12
- HWiNFO64: ARM-Version kommt demnächst
- i1Profiler: erkennt unser Farbmessgerät nicht
- LatencyMon: keine ARM-Version
- 3DMark06: SysInfo Error; kann umgangen werden
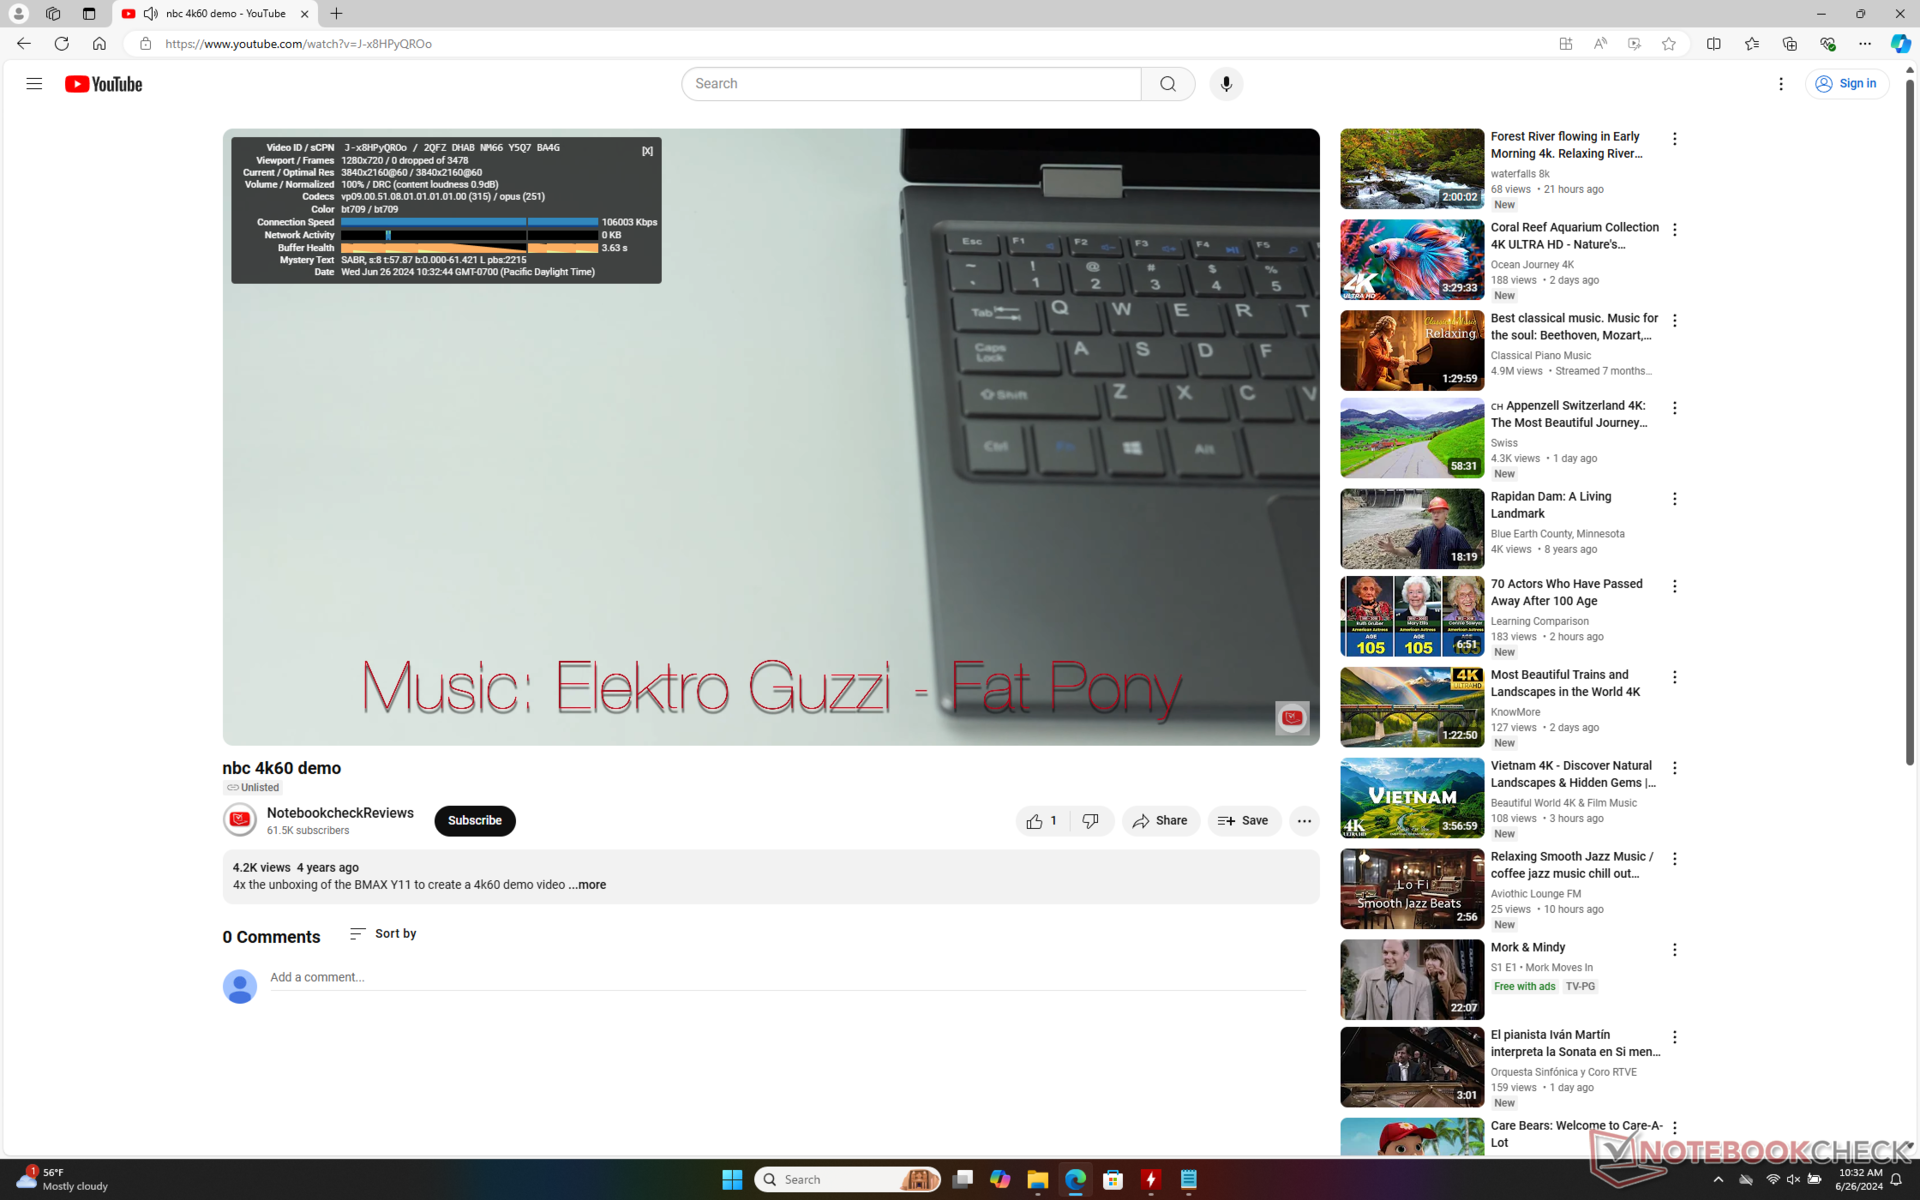
Wichtig ist noch, dass es sich bei den meisten obigen Anwendungen um Benchmark-Software handelt, welche für Normalnutzer eher irrelevant sind. Alltagsanwendungen wie Browsers, Videoplayer und Microsoft Office funktionieren problemlos.
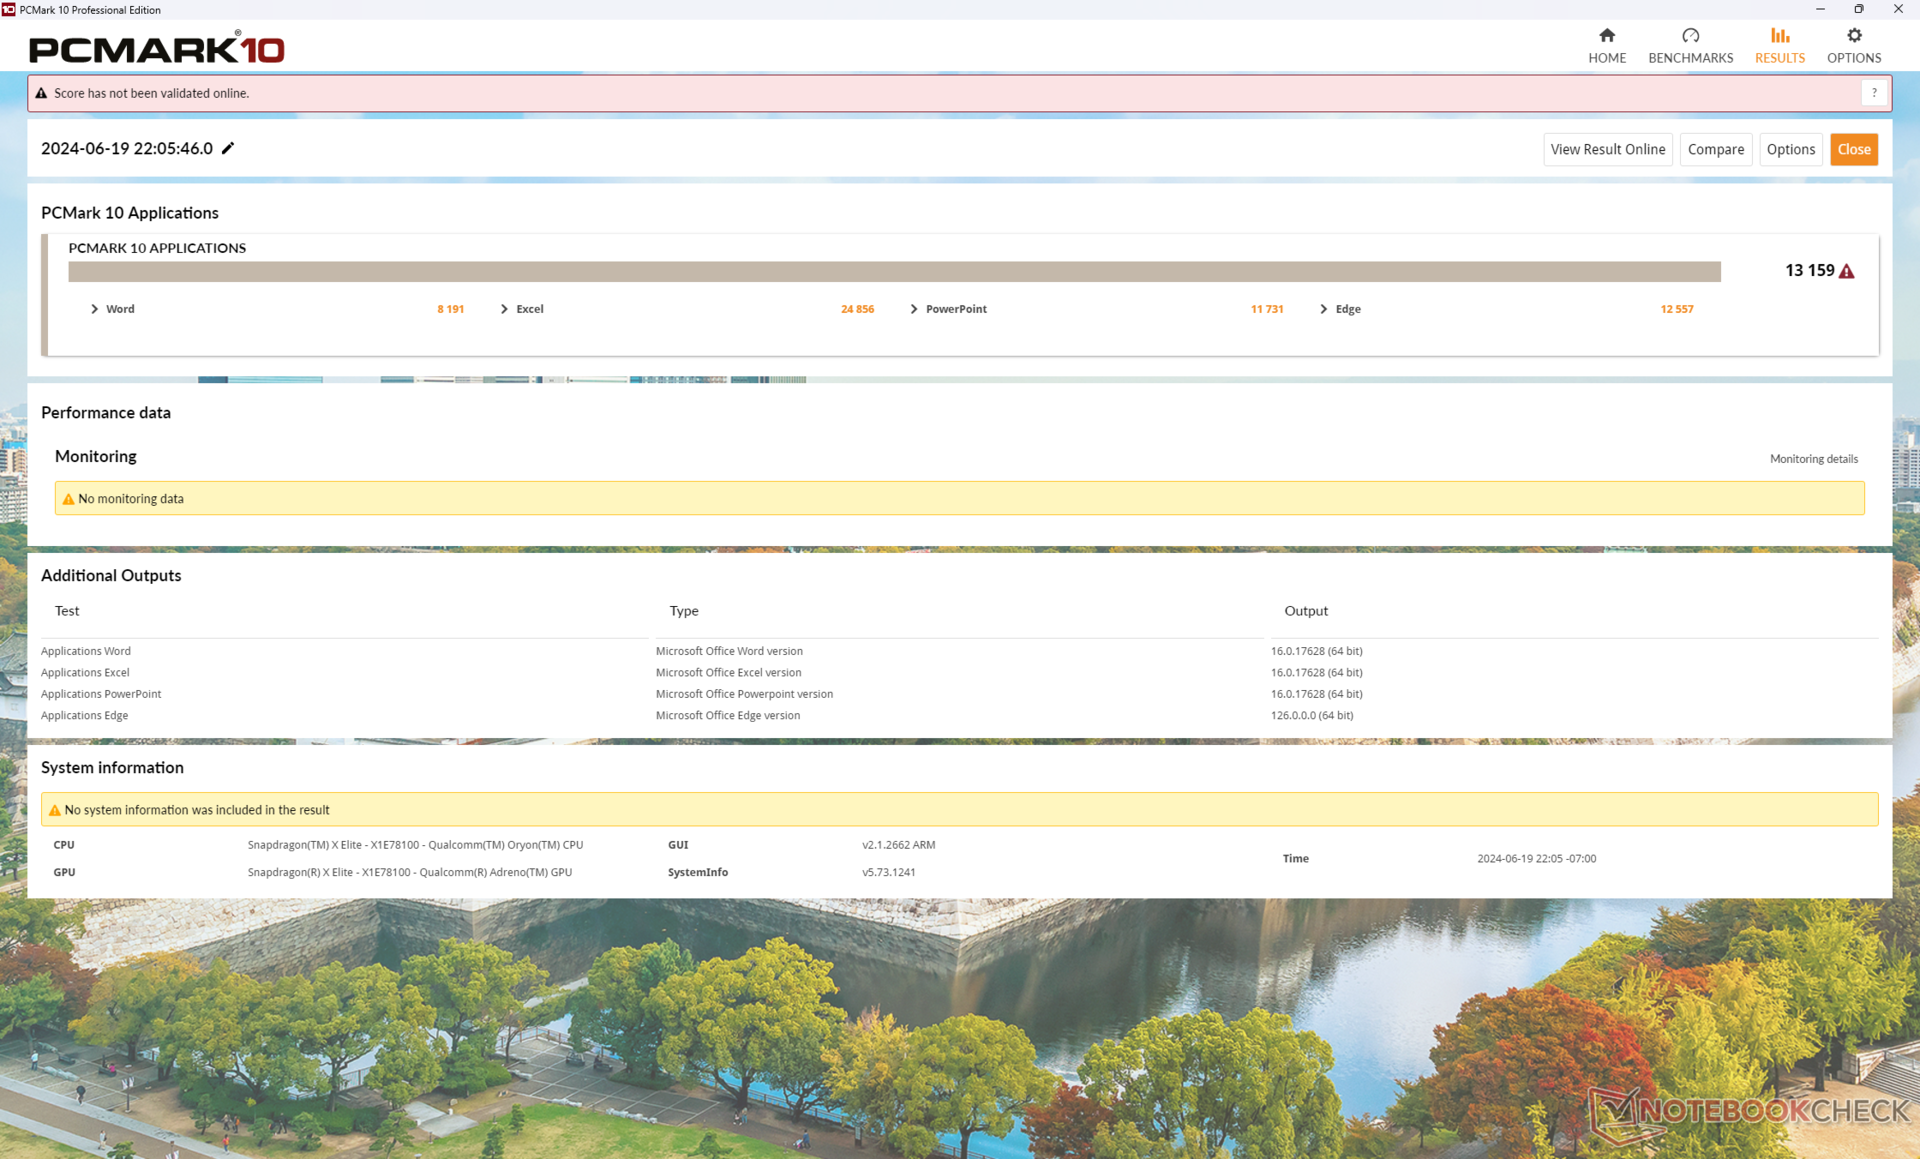
| Laptop-Modell | Word Score | Excel Score | PowerPoint Score | Edge Score | Combined Score |
| EliteBook Ultra G1q 14 (Snapdragon X Elite X1E-78-100) | 8191 | 24856 | 11731 | 12557 | 13159 |
| Latitude 7350 (Core Ultra 5 135U) | 5710 (-30%) | 18505 (-26%) | 10244 (-30%) | 12767 (-13%) | 10842 (-18%) |
Auch PCMark 10 Standard ist mit ARM inkompatibel, weshalb wir stattdessen PCMark 10 Applications gestartet haben. Unsere Ergebnisse in der obigen Tabelle fallen höher aus als auf dem Latitude 7350 mit Core Ultra 5 135U, sodass sich ein Vergleich der Qualcomm-Maschine mit der stärkeren Core-Ultra-7-Serie in Alltagsanwendungen eher anbietet als mit dem schwächeren Core Ultra 5.
Interessanterweise sind die Scores in WebXPRT und Kraken deutlich niedriger auf unserem HP als auf dem Asus-System, trotz mehrfacher Wiederholung. Ein Chrome-Update auf die aktuellste Version behebt das Problem. Die Leistungsunterschiede zwischen emulierter, nativer oder älterer Version kann daher recht groß bei Windows on ARM ausfallen.
| Browser-Version | WebXPRT 3 | WebXPRT 4 | Kraken 1.1 |
| Chrome 105.0.0.0 | 134 | 114 | 1065 ms |
| Chrome 126.0.6478.127 | 395 (+195%) | 286 (+151%) | 459.8 ms (-57%) |
WebXPRT 3: Overall
WebXPRT 4: Overall
Mozilla Kraken 1.1: Total
| CrossMark / Responsiveness | |
| Huawei MateBook X Pro 2024 | |
| Asus ZenBook 14X UX3404VC | |
| MSI Stealth 14 Studio A13V | |
| Apple MacBook Pro 14 2023 M3 Max | |
| Apple MacBook Pro 14 2023 M3 Pro | |
| Asus Zenbook 14 OLED UM3406HA | |
| Lenovo ThinkPad X1 Carbon G12 | |
| Lenovo Yoga Pro 7 14APH G8 | |
| Dell Latitude 9450 2-in-1 | |
| Dell Inspiron 14 7445 2-in-1 | |
| Apple MacBook Pro 14 2023 M2 Pro | |
| Lenovo ThinkPad T14 G3-21AJS00400 | |
| Acer TravelMate P4 TMP414-53-58XQ | |
| HP EliteBook 1040 G10 818N7EA | |
| HP Dragonfly Pro 2023 | |
| Durchschnittliche Qualcomm Snapdragon X Elite X1E-78-100, Qualcomm SD X Adreno X1-85 3.8 TFLOPS (869 - 1553, n=6) | |
| HP EliteBook Ultra G1q 14 | |
| Asus Vivobook S 15 OLED Snapdragon | |
| WebXPRT 3 / Overall | |
| Asus Zenbook 14 OLED UM3406HA | |
| Apple MacBook Pro 14 2023 M3 Pro | |
| Asus Vivobook S 15 OLED Snapdragon | |
| Apple MacBook Pro 14 2023 M3 Max | |
| Durchschnittliche Qualcomm Snapdragon X Elite X1E-78-100, Qualcomm SD X Adreno X1-85 3.8 TFLOPS (395 - 423, n=5) | |
| HP EliteBook Ultra G1q 14 | |
| Apple MacBook Pro 14 2023 M2 Pro | |
| Asus ZenBook 14X UX3404VC | |
| Dell Inspiron 14 7445 2-in-1 | |
| Lenovo Yoga Pro 7 14APH G8 | |
| Lenovo ThinkPad X1 Carbon G12 | |
| Huawei MateBook X Pro 2024 | |
| Lenovo ThinkPad T14 G3-21AJS00400 | |
| Dell Latitude 9450 2-in-1 | |
| MSI Stealth 14 Studio A13V | |
| HP EliteBook 1040 G10 818N7EA | |
| HP Dragonfly Pro 2023 | |
| WebXPRT 4 / Overall | |
| HP EliteBook Ultra G1q 14 | |
| Asus Vivobook S 15 OLED Snapdragon | |
| Durchschnittliche Qualcomm Snapdragon X Elite X1E-78-100, Qualcomm SD X Adreno X1-85 3.8 TFLOPS (271 - 297, n=6) | |
| Asus ZenBook 14X UX3404VC | |
| Huawei MateBook X Pro 2024 | |
| Lenovo ThinkPad X1 Carbon G12 | |
| Dell Inspiron 14 7445 2-in-1 | |
| Dell Latitude 9450 2-in-1 | |
| Apple MacBook Pro 14 2023 M2 Pro | |
| Lenovo Yoga Pro 7 14APH G8 | |
| Asus Zenbook 14 OLED UM3406HA | |
| Lenovo ThinkPad T14 G3-21AJS00400 | |
| MSI Stealth 14 Studio A13V | |
| HP EliteBook 1040 G10 818N7EA | |
| HP Dragonfly Pro 2023 | |
| Mozilla Kraken 1.1 / Total | |
| HP Dragonfly Pro 2023 | |
| Acer TravelMate P4 TMP414-53-58XQ | |
| MSI Stealth 14 Studio A13V | |
| HP EliteBook 1040 G10 818N7EA | |
| Lenovo ThinkPad T14 G3-21AJS00400 | |
| Lenovo Yoga Pro 7 14APH G8 | |
| Lenovo ThinkPad X1 Carbon G12 | |
| Dell Inspiron 14 7445 2-in-1 | |
| Huawei MateBook X Pro 2024 | |
| Dell Latitude 9450 2-in-1 | |
| Asus Zenbook 14 OLED UM3406HA | |
| Asus ZenBook 14X UX3404VC | |
| HP EliteBook Ultra G1q 14 | |
| Durchschnittliche Qualcomm Snapdragon X Elite X1E-78-100, Qualcomm SD X Adreno X1-85 3.8 TFLOPS (451 - 482, n=6) | |
| Asus Vivobook S 15 OLED Snapdragon | |
| Apple MacBook Pro 14 2023 M2 Pro | |
| Apple MacBook Pro 14 2023 M3 Max | |
| Apple MacBook Pro 14 2023 M3 Pro | |
WebXPRT 3: Overall
WebXPRT 4: Overall
Mozilla Kraken 1.1: Total
* ... kleinere Werte sind besser
| AIDA64 / Memory Copy | |
| Dell Latitude 9450 2-in-1 | |
| Lenovo ThinkPad X1 Carbon G12 | |
| Asus Vivobook S 15 OLED Snapdragon | |
| Durchschnittliche Qualcomm Snapdragon X Elite X1E-78-100 (45988 - 66715, n=6) | |
| HP EliteBook Ultra G1q 14 | |
| AIDA64 / Memory Read | |
| Asus Vivobook S 15 OLED Snapdragon | |
| Durchschnittliche Qualcomm Snapdragon X Elite X1E-78-100 (60078 - 122210, n=6) | |
| Lenovo ThinkPad X1 Carbon G12 | |
| HP EliteBook Ultra G1q 14 | |
| Dell Latitude 9450 2-in-1 | |
| AIDA64 / Memory Write | |
| Lenovo ThinkPad X1 Carbon G12 | |
| Dell Latitude 9450 2-in-1 | |
| Asus Vivobook S 15 OLED Snapdragon | |
| Durchschnittliche Qualcomm Snapdragon X Elite X1E-78-100 (35073 - 49282, n=6) | |
| HP EliteBook Ultra G1q 14 | |
| AIDA64 / Memory Latency | |
| Dell Latitude 9450 2-in-1 | |
| Lenovo ThinkPad X1 Carbon G12 | |
| Asus Vivobook S 15 OLED Snapdragon | |
| Durchschnittliche Qualcomm Snapdragon X Elite X1E-78-100 (7.2 - 8.9, n=6) | |
| HP EliteBook Ultra G1q 14 | |
* ... kleinere Werte sind besser
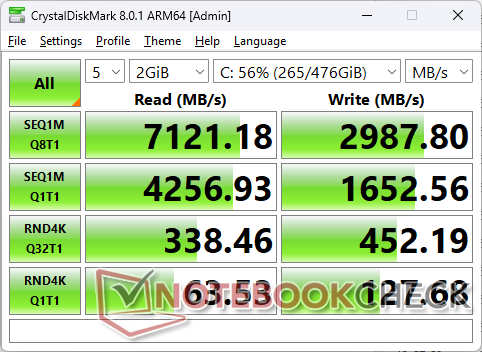
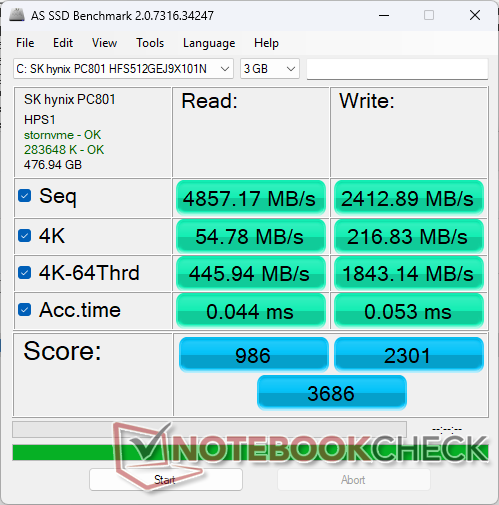
Massenspeicher
Verbaut ist eine SK hynix PC801 HFS512GEJ9X101N, ein typischer PCIe4-x4-Speicher, der auch bei anderen High-End-Modellen zu finden ist, darunter das Lenovo Yoga 9 14IRP G8 oder das EliteBook 840 G9. Leider tendiert das Modell in unserem EliteBook Ultra G1q 14 zum Drosseln, wie unser DiskSpd-Loop-Test weiter unten zeigt. Die Transferraten bleiben die ersten Minuten stabil, danach fallen sie auf 3500 MB/s.

| Drive Performance Rating - Percent | |
| HP EliteBook Ultra G1q 14 | |
| Lenovo ThinkPad X1 Carbon G12 | |
| HP Dragonfly Pro 2023 | |
| Dell Latitude 9450 2-in-1 | |
| Asus Vivobook S 15 OLED Snapdragon | |
* ... kleinere Werte sind besser
Disk Throttling: DiskSpd Read Loop, Queue Depth 8
Grafikleistung
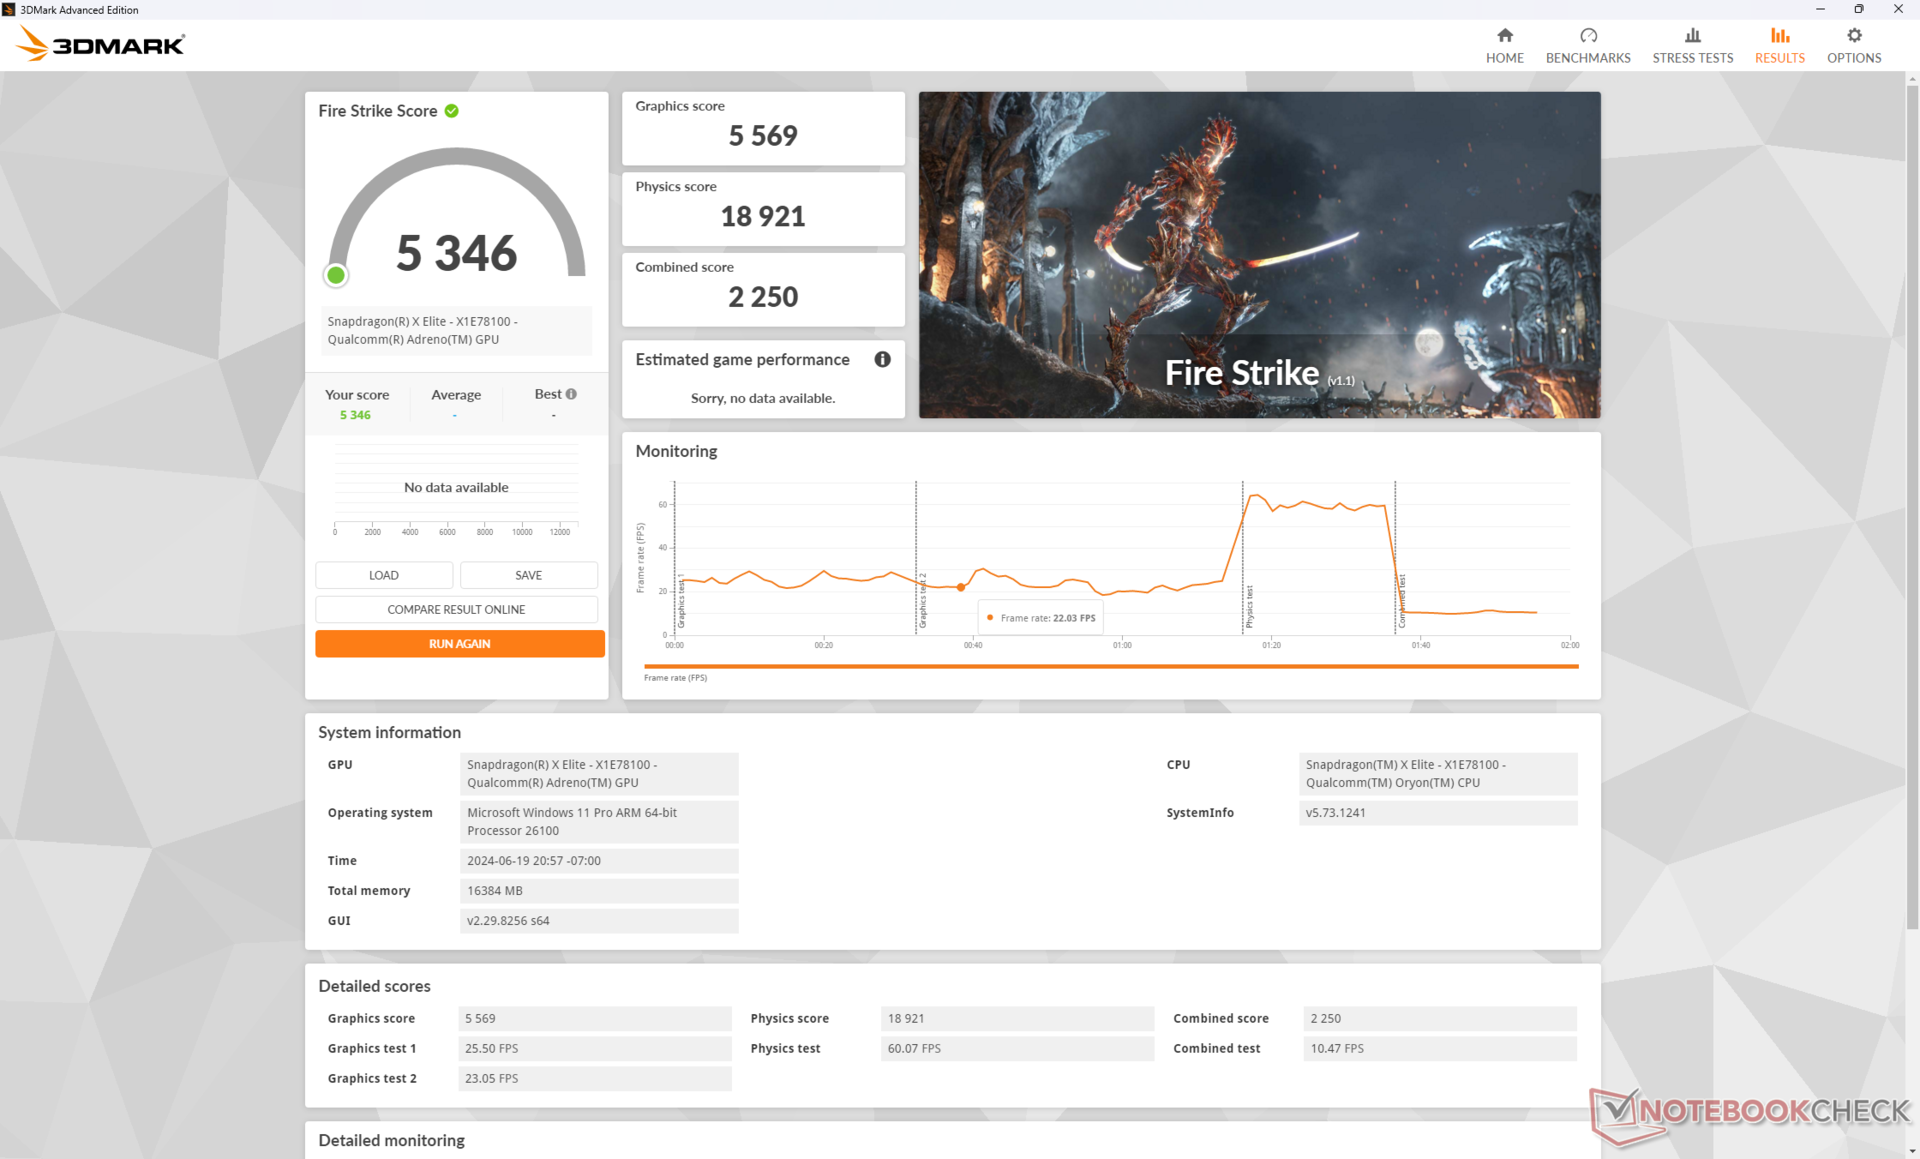
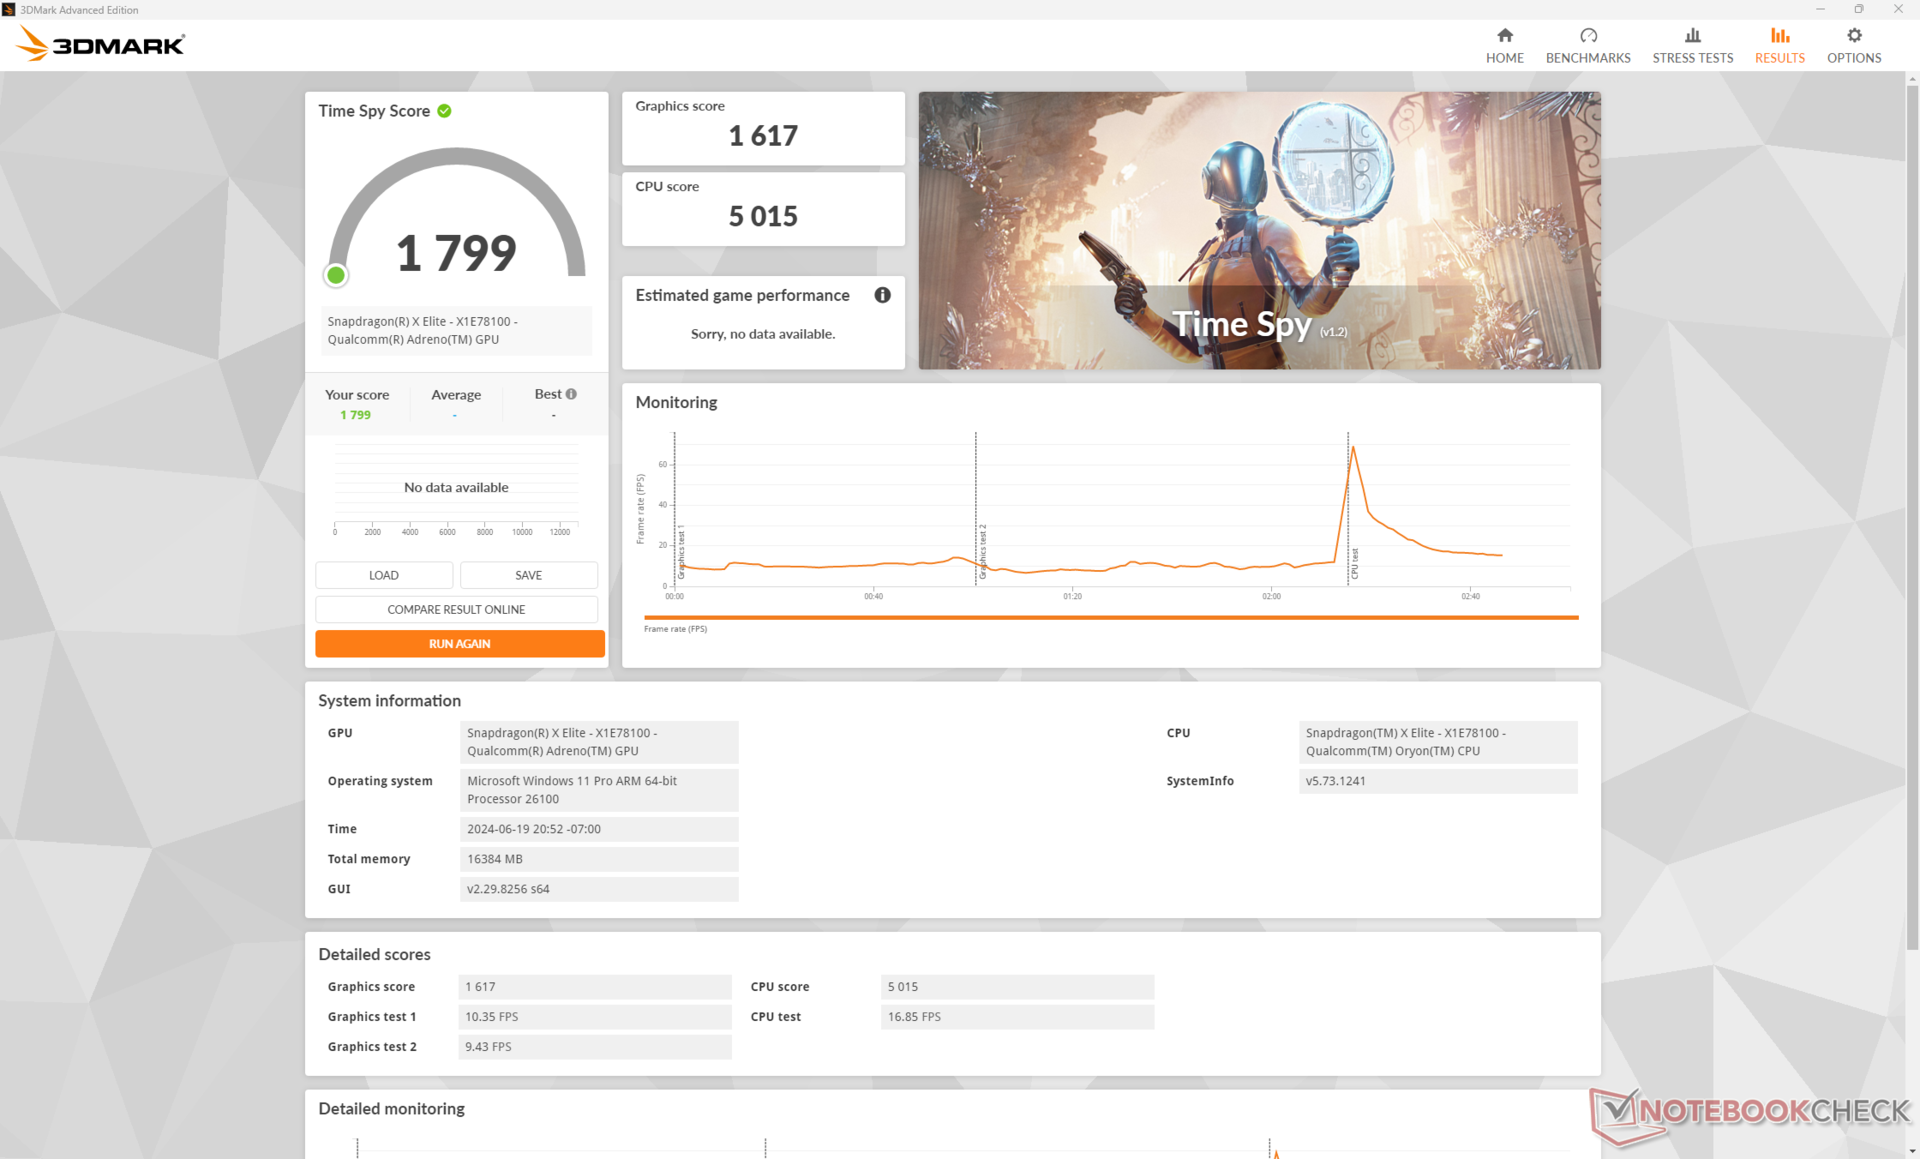
Die emulierten 3DMark-Ergebnisse unseres Snapdragon X Adreno liegen eher auf dem Niveau einer Arc 4 oder noch älteren Iris Xe 96 EUs anstelle einer Arc 8 oder Radeon 680M/780M. Das bedeutet, dass aktuelle integrierte GPUs von Intel und AMD bei der reinen 3D-Leistung in der Regel zwischen 50 und 80 Prozent schneller rechnen als unsere Qualcomm-Lösung.
| Leistungsprofil | Physics Score | Graphics Score | Combined Score |
| Performance Mode | 18921 | 5569 | 2250 |
| Balanced Mode | 18781 (-1%) | 5574 (-0%) | 2301 (-0%) |
| Battery Power | 6013 (-68%) | 5573 (-0%) | 1885 (-16%) |
Scheinbar gibt es kein Leistungsdefizit, wenn wir Fire Strike im Ausbalancierten Modus statt im Leistungsmodus laufen lassen. Allerdings beeinträchtigt der Akkumodus die Prozessorleistung deutlich stärker als auf den meisten Core-U- oder Ryzen-U-Subnotebooks, bei denen geringere Leistungsverluste typischer sind. Beispielsweise haben wir beim Lenovo ThinkBook 14 2-in-1 G4 gar keine Leistungsunterschiede zwischen dem Akku- und dem Leistungsmodus gemessen. Wir haben auch keine größeren Unterschiede beim ARM-betriebenen Asus VivoBook im Akkumodus festgestellt. HP sagt dazu, dass das BIOS-Update F.07 demnächst erscheint und sich des Problems annehmen soll.
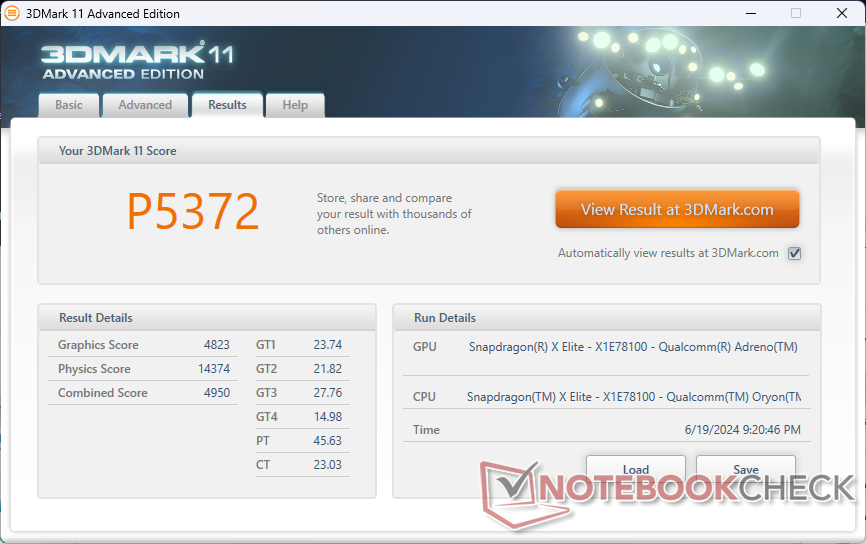
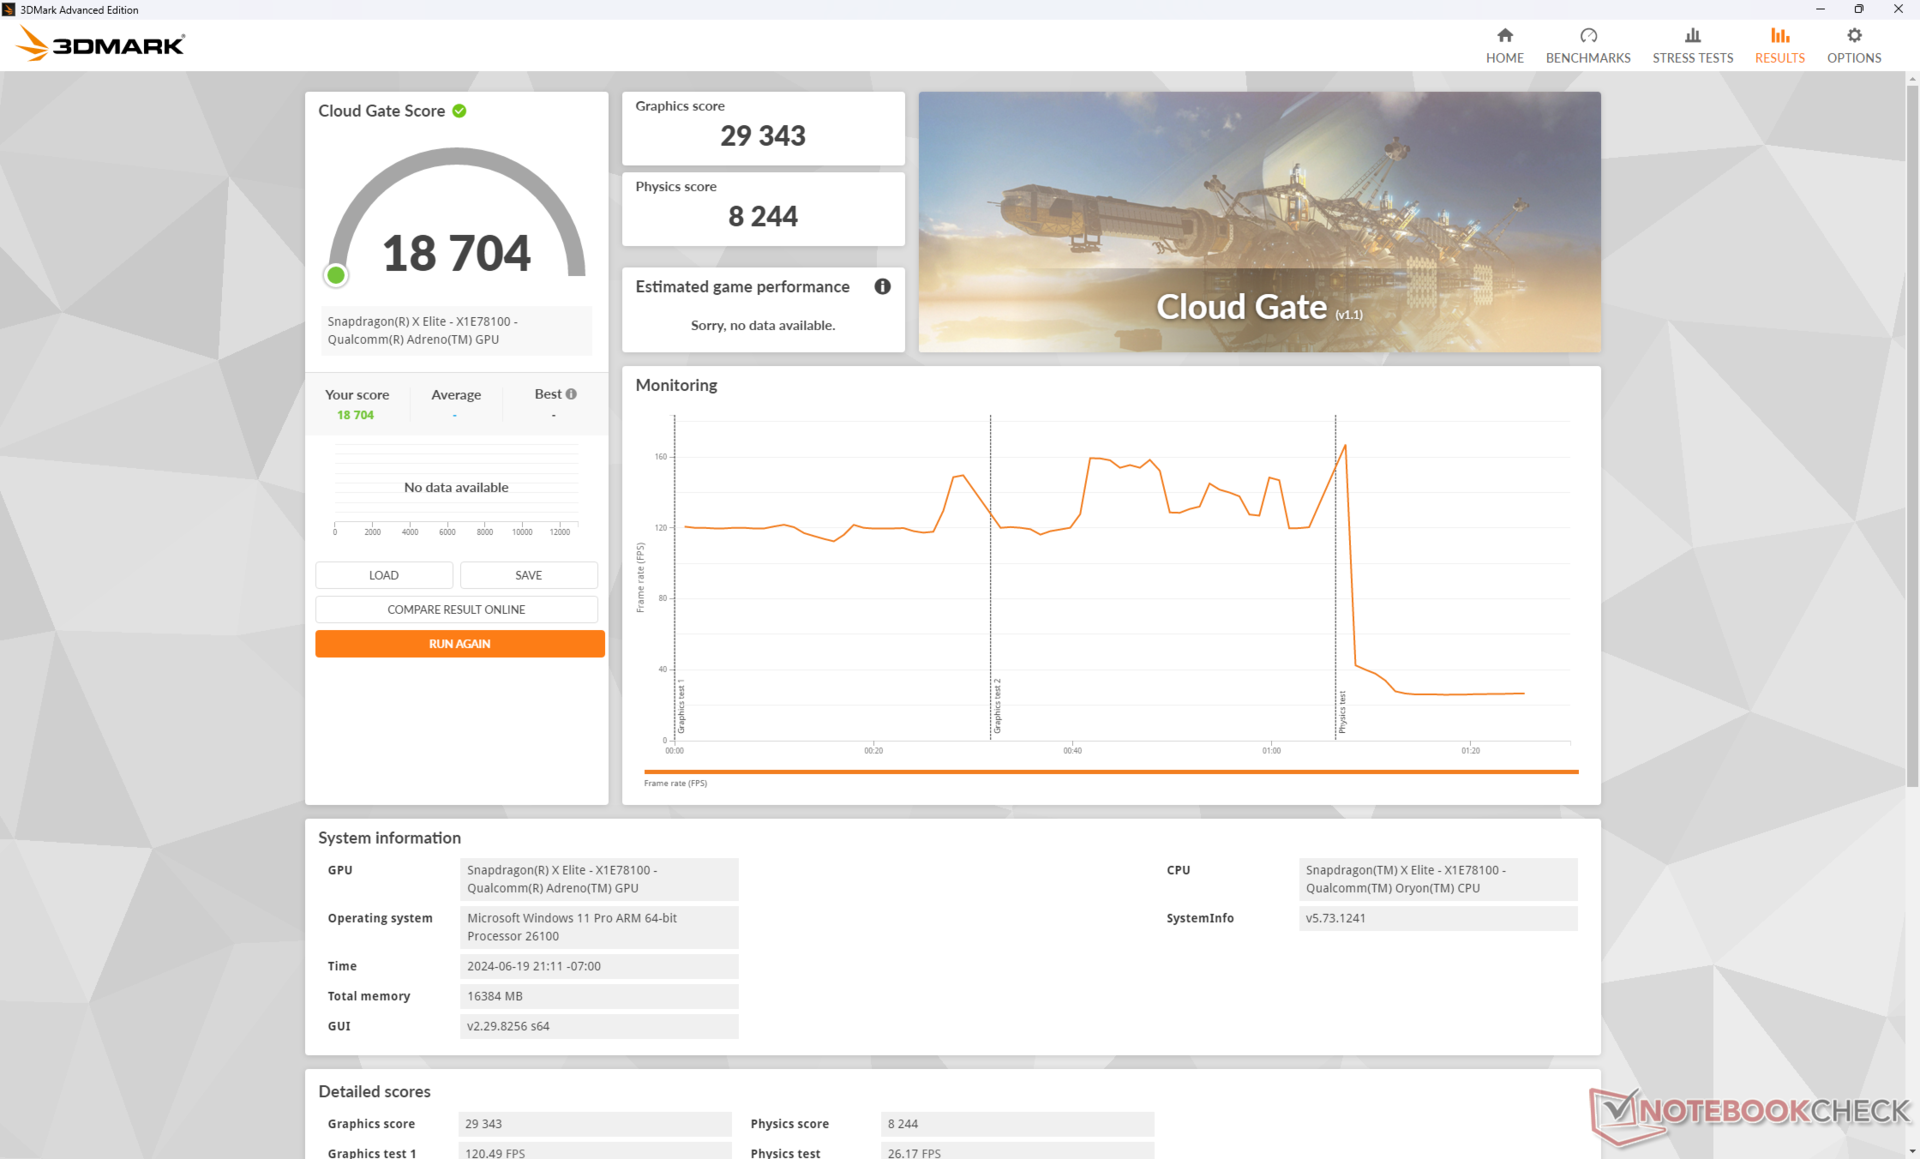
| 3DMark 11 Performance | 5372 Punkte | |
| 3DMark Cloud Gate Standard Score | 18704 Punkte | |
| 3DMark Fire Strike Score | 5346 Punkte | |
| 3DMark Time Spy Score | 1799 Punkte | |
Hilfe | ||
* ... kleinere Werte sind besser
Gaming Performance
Nutzer, die sich für einen Windows PC mit ARM-Chip für das Gaming interessieren, sollten woanders schauen, denn dieser Snapdragon-Chip wurde offensichtlich nicht fürs Gaming konzipiert. Allerdings hat Qualcomm durchaus notorisch damit geprahlt, dass Baldur's Gate 3 bei 1.080p mit 30 FPS laufen würde, was die Aufmerksamkeit der meisten Tester geweckt haben dürfte. Ohne die Hilfe von Techniken wie FSR messen wir allerdings nur 23 FPS bei 1.080p in niedrigen Details und 35 FPS in 720p und niedrigen Details. Die Ergebnisse in anderen Spielen sind ähnlich enttäuschend und deutlich niedriger als die der konkurrierenden Systeme mit Arc 8 oder Radeon 680M, was unsere synthetischen 3DMark-Ergebnisse weiter oben bereits vermutet haben lassen.
Da vielleicht größte Ärgernis ist zumindest momentan die ungleichmäßige Framerate oder auch das Frame Skipping, welches wir in den meisten Games feststellen mussten. Selbst wenn die durchschnittlichen FPS ganz ordentlich ausfallen, so wie in Tiny Tina's Wonderlands, fallen die Frame Skips deutlich häufiger aus als bei den Intel- oder AMD-Alternativen, sodass sie teils eine ablenkende Wirkung haben. Qualcomm hat hier noch einen langen Weg vor sich, um die Treiber derart optimieren und ausreifen zu lassen, wie es bei der Konkurrenz schon länger der Fall ist.
| Performance Rating - Percent | |
| Apple MacBook Pro 14 2023 M3 Max -4! | |
| Lenovo ThinkPad X1 Carbon G12 | |
| HP Dragonfly Pro 2023 -1! | |
| Dell Latitude 9450 2-in-1 -1! | |
| Asus Vivobook S 15 OLED Snapdragon -1! | |
| HP EliteBook Ultra G1q 14 | |
| The Witcher 3 - 1920x1080 Ultra Graphics & Postprocessing (HBAO+) | |
| Apple MacBook Pro 14 2023 M3 Max | |
| Lenovo ThinkPad X1 Carbon G12 | |
| HP Dragonfly Pro 2023 | |
| Asus Vivobook S 15 OLED Snapdragon | |
| Dell Latitude 9450 2-in-1 | |
| HP EliteBook Ultra G1q 14 | |
| Final Fantasy XV Benchmark - 1920x1080 High Quality | |
| Lenovo ThinkPad X1 Carbon G12 | |
| HP Dragonfly Pro 2023 | |
| Dell Latitude 9450 2-in-1 | |
| Asus Vivobook S 15 OLED Snapdragon | |
| HP EliteBook Ultra G1q 14 | |
| Strange Brigade - 1920x1080 ultra AA:ultra AF:16 | |
| Lenovo ThinkPad X1 Carbon G12 | |
| HP Dragonfly Pro 2023 | |
| Asus Vivobook S 15 OLED Snapdragon | |
| Dell Latitude 9450 2-in-1 | |
| HP EliteBook Ultra G1q 14 | |
| Dota 2 Reborn - 1920x1080 ultra (3/3) best looking | |
| Lenovo ThinkPad X1 Carbon G12 | |
| HP Dragonfly Pro 2023 | |
| Dell Latitude 9450 2-in-1 | |
| Asus Vivobook S 15 OLED Snapdragon | |
| HP EliteBook Ultra G1q 14 | |
| Tiny Tina's Wonderlands - 1920x1080 High Preset (DX12) | |
| Lenovo ThinkPad X1 Carbon G12 | |
| HP EliteBook Ultra G1q 14 | |
Witcher 3 FPS Chart
| min. | mittel | hoch | max. | |
|---|---|---|---|---|
| The Witcher 3 (2015) | 109.2 | 70.9 | 39.7 | 17.5 |
| Dota 2 Reborn (2015) | 77.9 | 60.9 | 55.9 | 49.3 |
| Final Fantasy XV Benchmark (2018) | 51 | 23 | 14.3 | |
| X-Plane 11.11 (2018) | 36.4 | |||
| Strange Brigade (2018) | 114.3 | 43.6 | 36.7 | 32 |
| Tiny Tina's Wonderlands (2022) | 41.5 | 30.8 | 20.6 | 16.8 |
| F1 22 (2022) | 57.6 | 51 | 36.2 | 27 |
| Baldur's Gate 3 (2023) | 23.1 | 19.6 | 17.1 | 16.6 |
| Cyberpunk 2077 (2023) | 22.1 | 18.3 |
Emissionen — Kaum hörbar
Systemlautstärke
Die Lüfterlautstärke fällt geringer aus als auf den meisten 14-Zoll-Subnotebooks. Der interne Lüfter stabilisiert sich beim Browsen oder Videostreaming bei etwa 25 dB(A), gegen einen ruhigen Hintergrund von 23.4 dB(A) und ist daher quasi nicht hörbar. Schlimmstenfalls drehen die Lüfter auf knapp unter 35 dB(A) beim Gaming oder anderen starken Lasten hoch, was noch immer deutlich ruhiger ist als die meisten traditionellen Alternativen wie das MacBook Pro 14 oder das ThinkPad X1 Carbon G12.
Lautstärkediagramm
| Idle |
| 23.4 / 23.4 / 24.3 dB(A) |
| Last |
| 25 / 34.8 dB(A) |
 | ||
30 dB leise 40 dB(A) deutlich hörbar 50 dB(A) störend |
||
min: | ||
| HP EliteBook Ultra G1q 14 Adreno X1-85 3.8 TFLOPS, SD X Elite X1E-78-100, SK hynix PC801 HFS512GEJ9X101N BF | Asus Vivobook S 15 OLED Snapdragon Adreno X1-85 3.8 TFLOPS, SD X Elite X1E-78-100, Micron 2400 MTFDKBA1T0QFM | HP Dragonfly Pro 2023 Radeon 680M, R7 7736U, PSEIB512GABBMC0 | Dell Latitude 9450 2-in-1 Graphics 4-Core iGPU (Arrow Lake), Ultra 7 165U | Lenovo ThinkPad X1 Carbon G12 Arc 8-Core, Ultra 7 155H, Kioxia XG8 KXG8AZNV1T02 | Apple MacBook Pro 14 2023 M3 Max M3 Max 40-Core GPU, Apple M3 Max 16-Core, Apple SSD AP2048Z | |
|---|---|---|---|---|---|---|
| Geräuschentwicklung | -11% | -7% | -18% | -9% | -13% | |
| aus / Umgebung * (dB) | 23.4 | 24.3 -4% | 23 2% | 23.9 -2% | 23.8 -2% | 24.8 -6% |
| Idle min * (dB) | 23.4 | 24.3 -4% | 23 2% | 23.9 -2% | 24 -3% | 24.8 -6% |
| Idle avg * (dB) | 23.4 | 24.3 -4% | 23 2% | 23.9 -2% | 24 -3% | 24.8 -6% |
| Idle max * (dB) | 24.3 | 26.2 -8% | 23 5% | 23.9 2% | 24 1% | 24.8 -2% |
| Last avg * (dB) | 25 | 32.5 -30% | 27.8 -11% | 36.4 -46% | 31.5 -26% | 25.8 -3% |
| Witcher 3 ultra * (dB) | 30.6 | 40.6 -33% | 44.7 -46% | 37.8 -24% | 43.4 -42% | |
| Last max * (dB) | 34.8 | 39.8 -14% | 40.3 -16% | 44.7 -28% | 37.8 -9% | 43.4 -25% |
| Cyberpunk 2077 ultra * (dB) | 35.2 |
* ... kleinere Werte sind besser
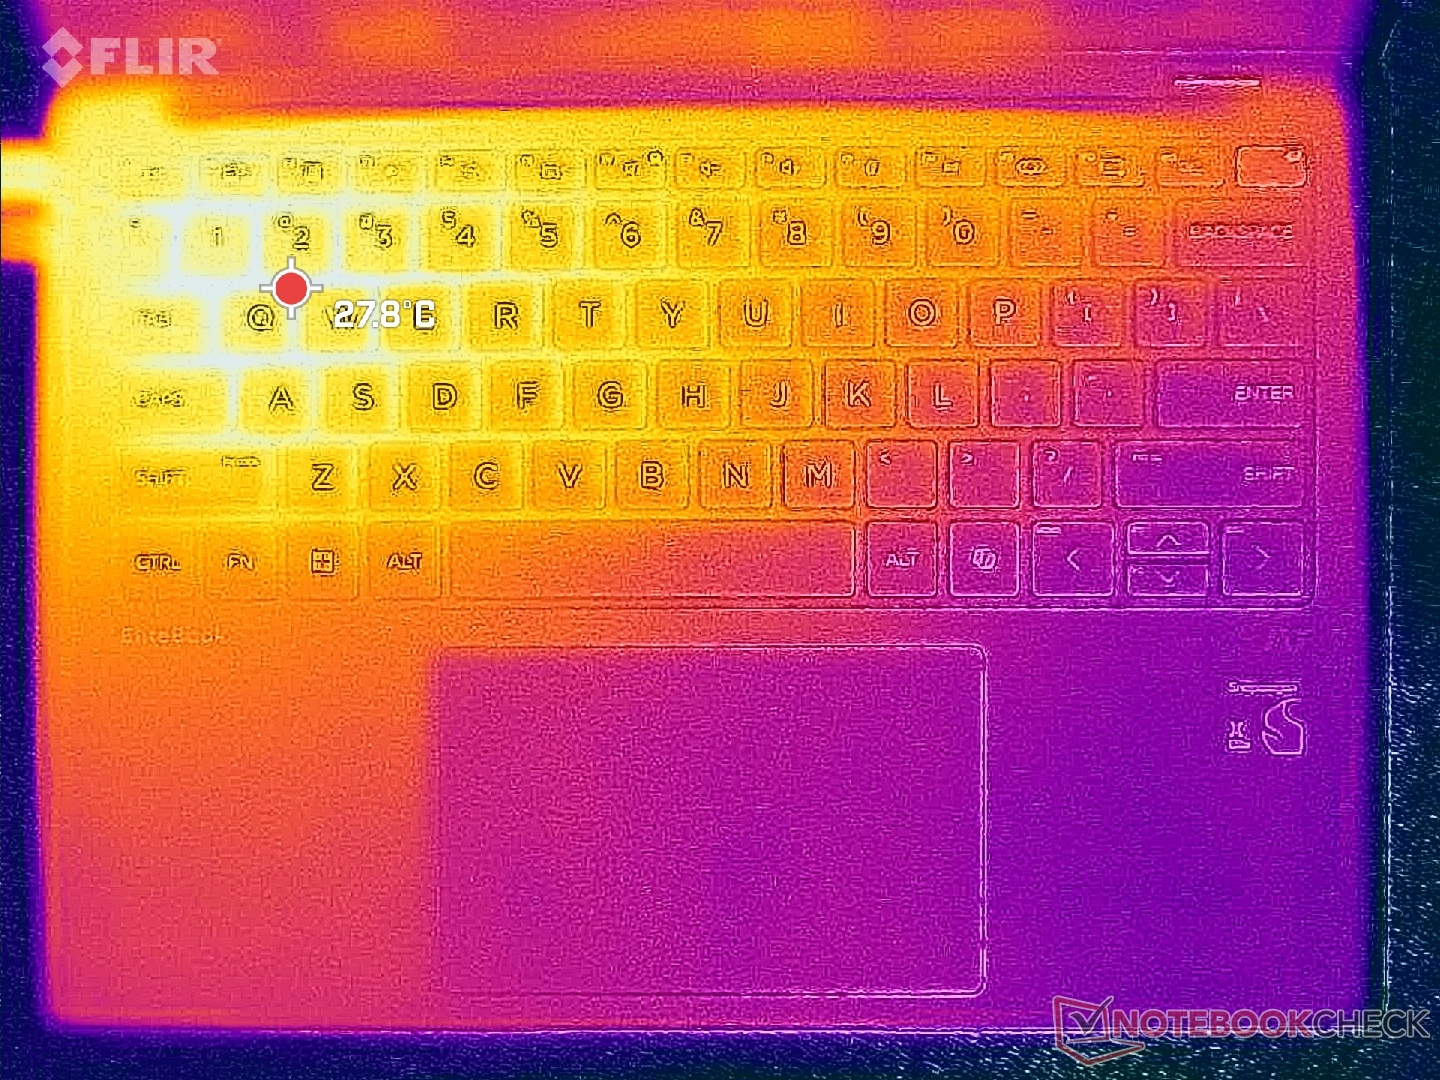
Temperatur
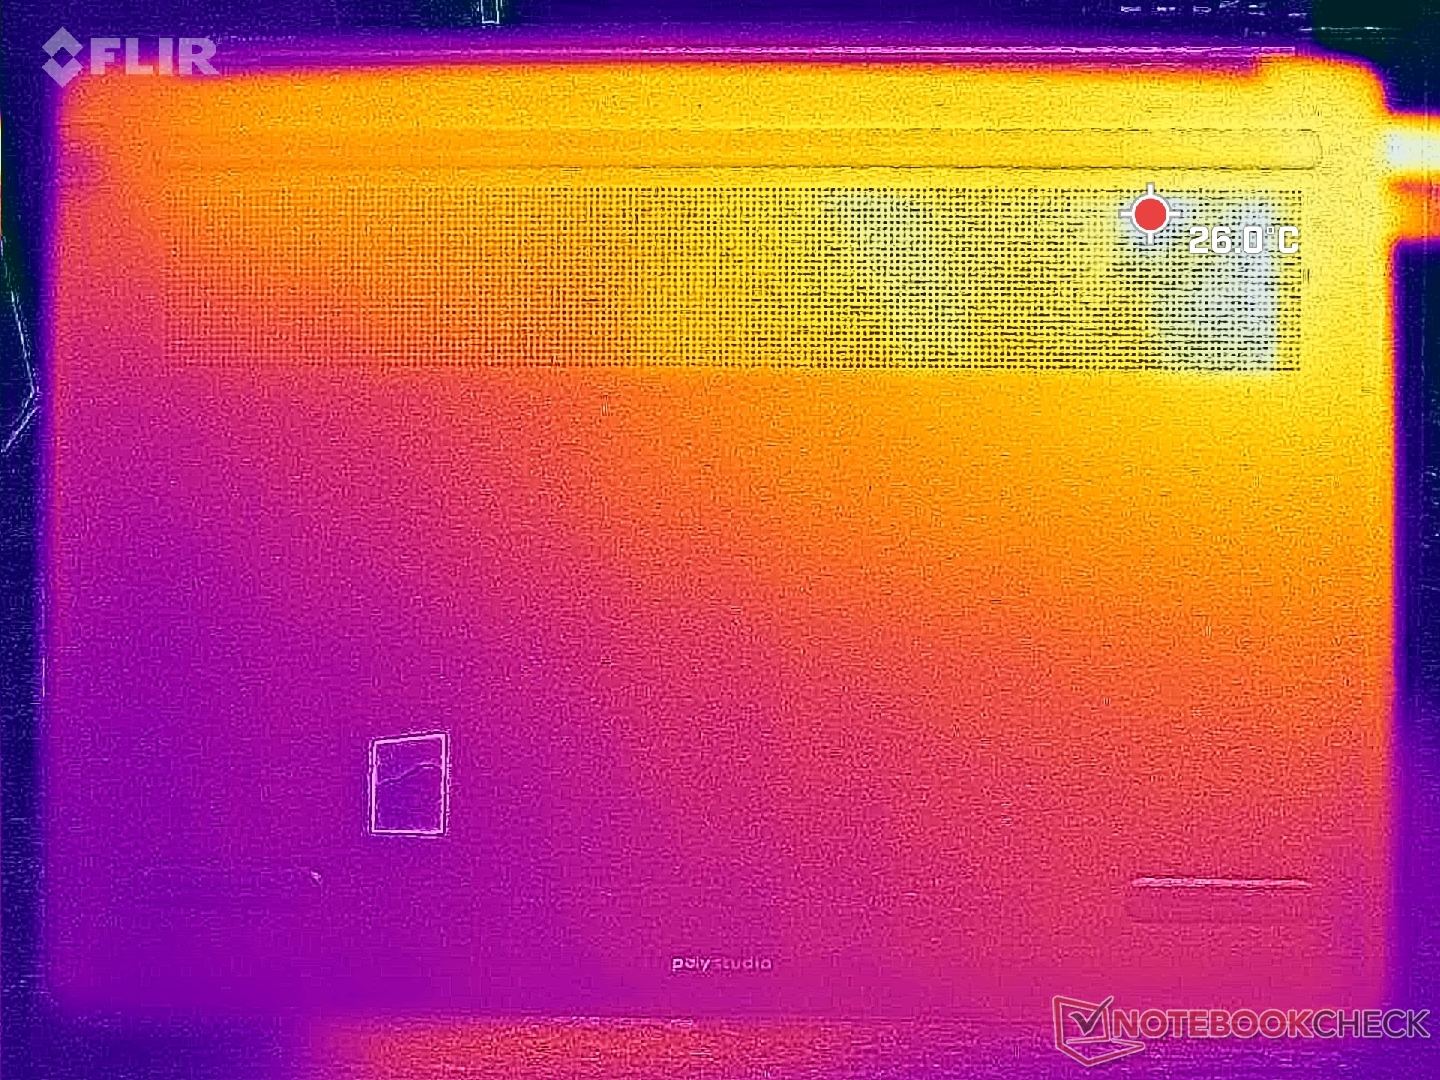
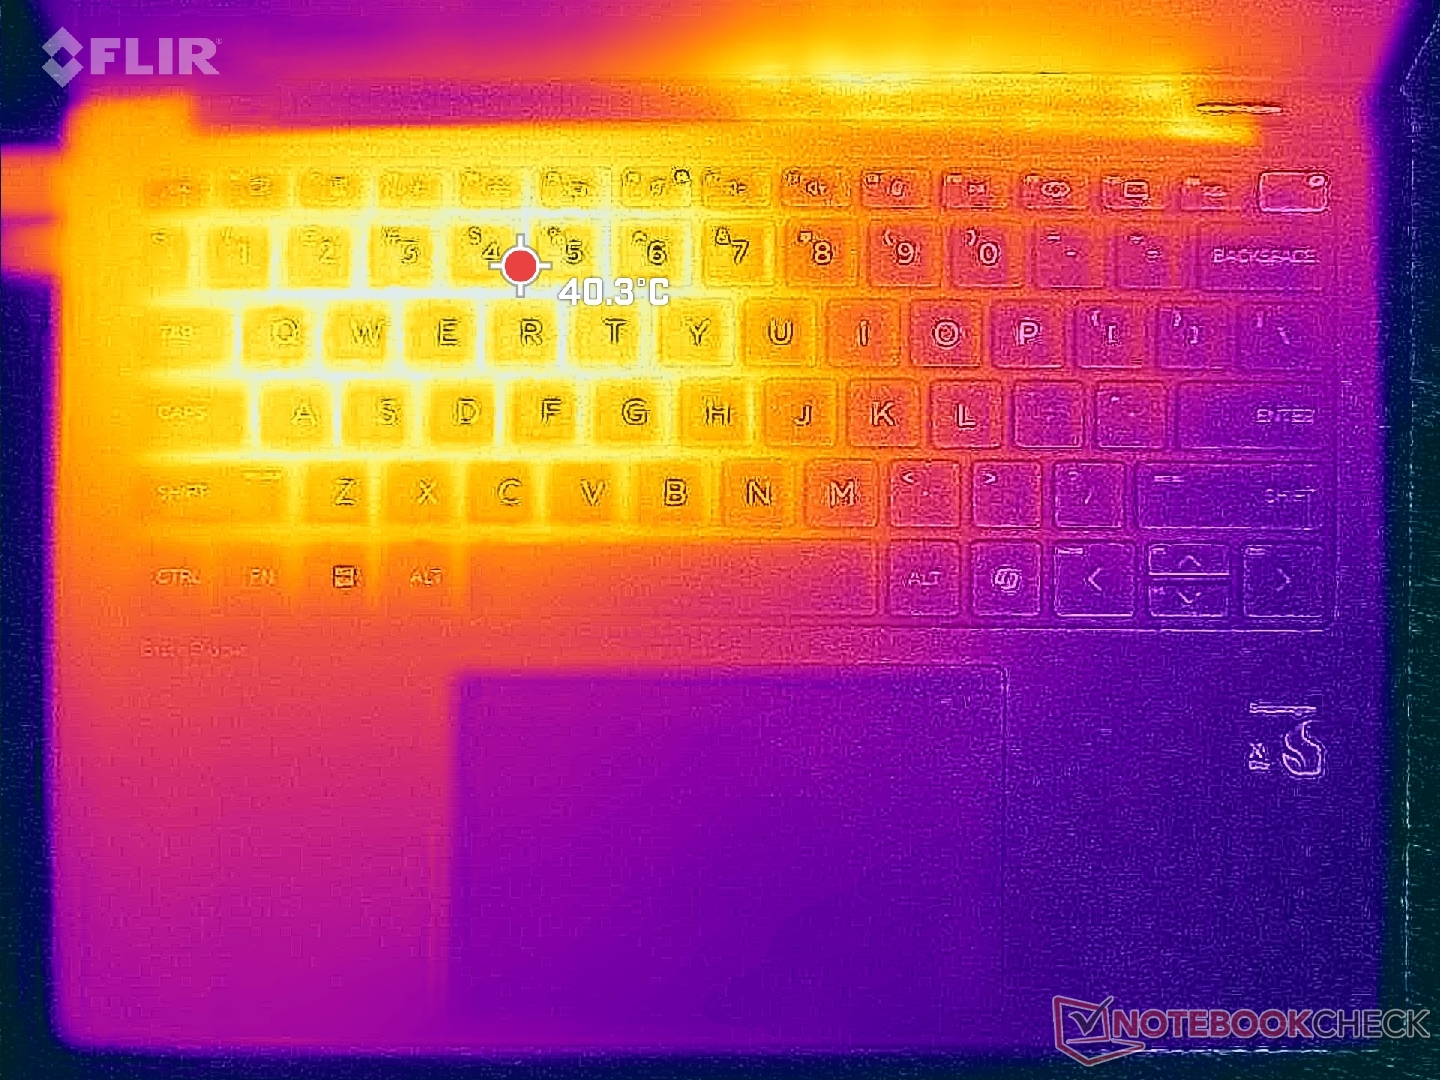
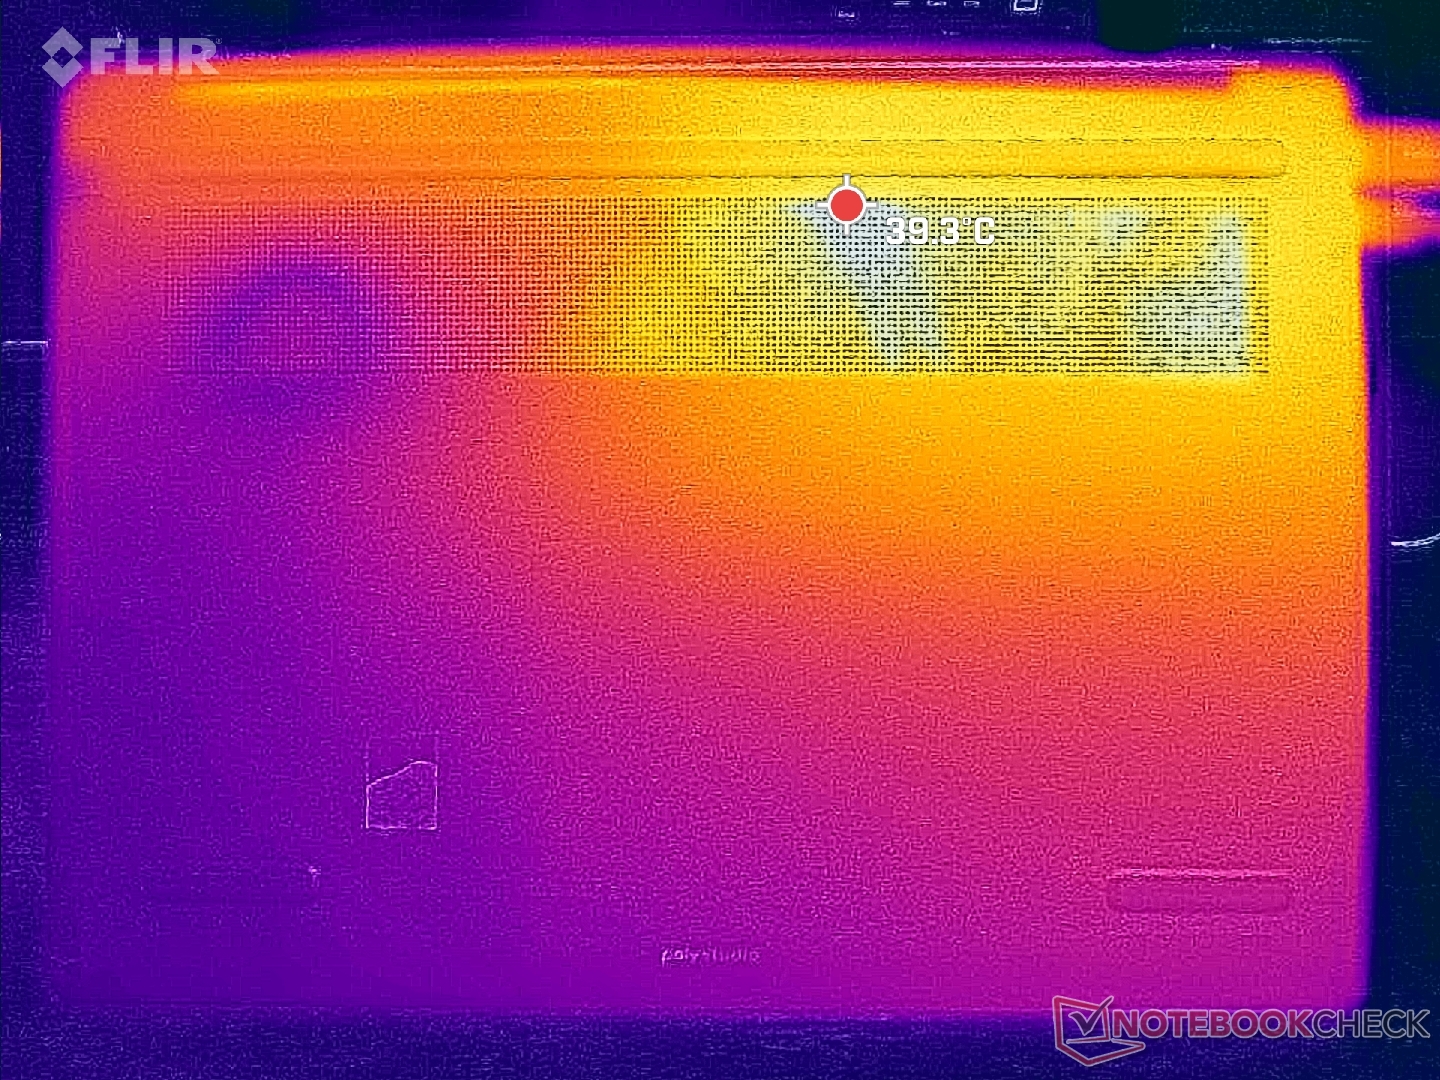
Die linke Systemseite ist durch das asymmetrische Kühlsystem immer wärmer als die rechte. Der Hot Spot nahe der WASD-Tasten kann sich unter starkem Stress auf über 40 °C erhitzen, während die rechte Tastaturhälfte beinahe 10 °C kühler bleibt. Die Temperaturunterschiede zwischen beiden Gehäusehälften sind spürbar, aber nie so, dass es unbequem wird.
Die durchschnittlichen Oberflächentemperaturen liegen nahe an denen des Dragonfly Pro, demnach läuft unser EliteBook Ultra G1q trotz eklatanter Unterschiede beim Mainboard weder kühler noch wärmer.
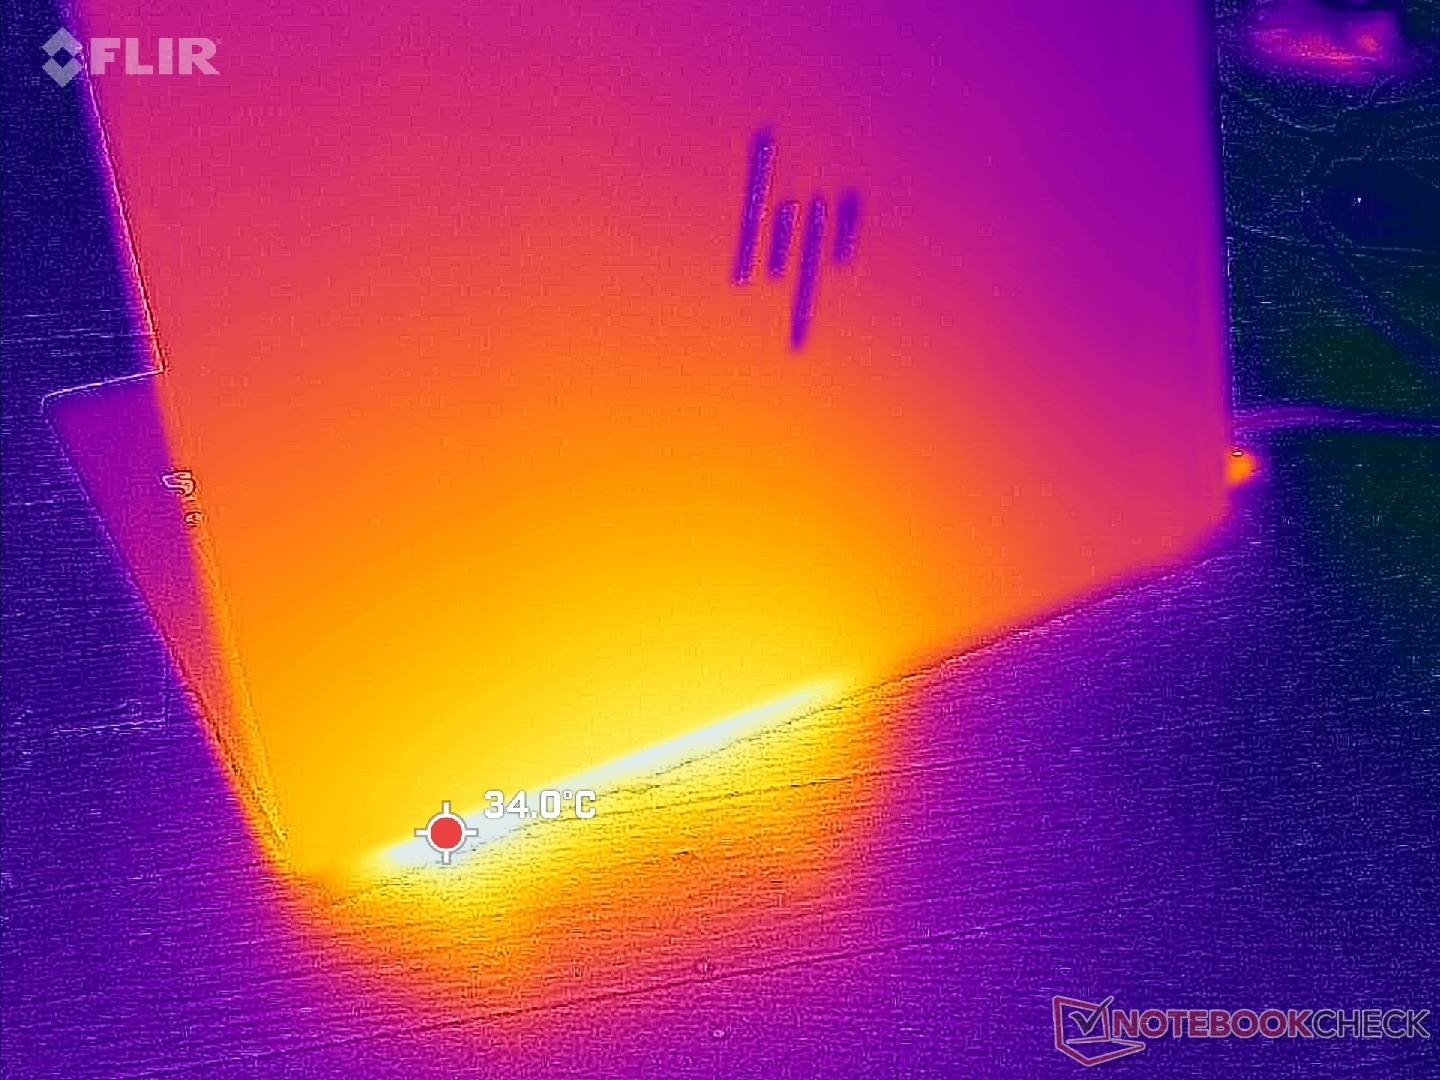
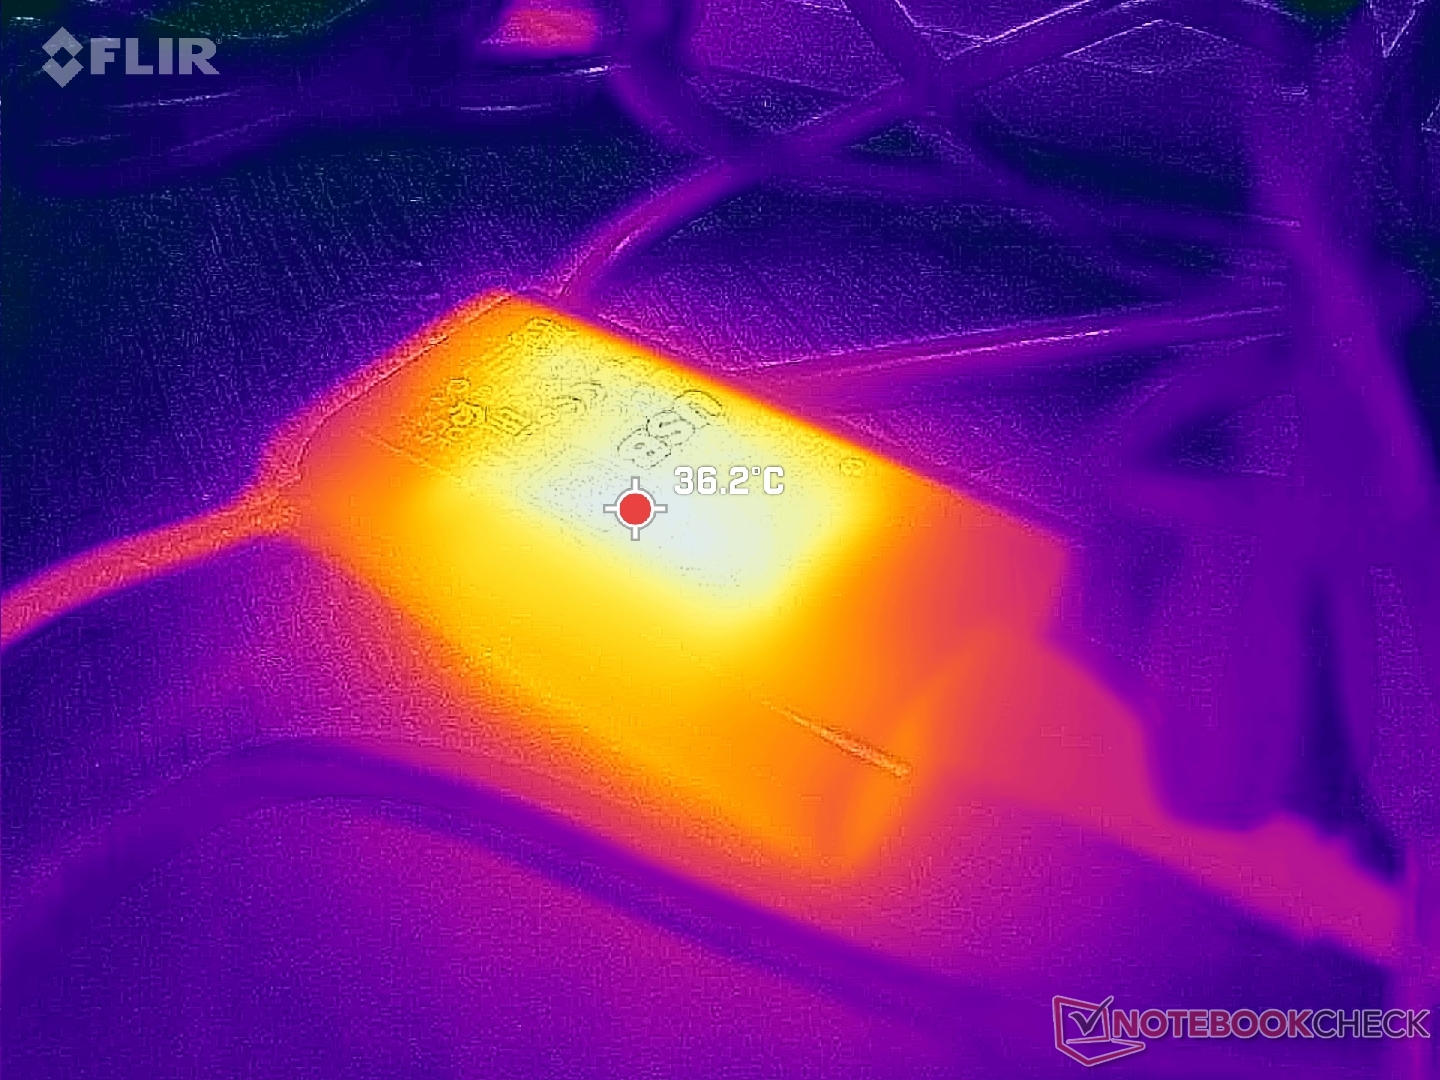
(±) Die maximale Temperatur auf der Oberseite ist 40.8 °C. Im Vergleich liegt der Klassendurchschnitt bei 35.9 °C (von 21.4 bis 59 °C für die Klasse Subnotebook).
(±) Auf der Unterseite messen wir eine maximalen Wert von 40.4 °C (im Vergleich zum Durchschnitt von 39.2 °C).
(+) Ohne Last messen wir eine durchschnittliche Temperatur von 27.8 °C auf der Oberseite. Der Klassendurchschnitt erreicht 30.8 °C.
(+) Die Handballen und der Touchpad-Bereich sind mit gemessenen 28.2 °C kühler als die typische Hauttemperatur und fühlen sich dadurch kühl an.
(±) Die durchschnittliche Handballen-Temperatur anderer getesteter Geräte war 28.2 °C (0 °C).
| HP EliteBook Ultra G1q 14 Qualcomm Snapdragon X Elite X1E-78-100, Qualcomm SD X Adreno X1-85 3.8 TFLOPS | Asus Vivobook S 15 OLED Snapdragon Qualcomm Snapdragon X Elite X1E-78-100, Qualcomm SD X Adreno X1-85 3.8 TFLOPS | HP Dragonfly Pro 2023 AMD Ryzen 7 7736U, AMD Radeon 680M | Dell Latitude 9450 2-in-1 Intel Core Ultra 7 165U, Intel Graphics 4-Core iGPU (Meteor / Arrow Lake) | Lenovo ThinkPad X1 Carbon G12 Intel Core Ultra 7 155H, Intel Arc 8-Core iGPU | Apple MacBook Pro 14 2023 M3 Max Apple M3 Max 16-Core, Apple M3 Max 40-Core GPU | |
|---|---|---|---|---|---|---|
| Hitze | -2% | 14% | 11% | -0% | 9% | |
| Last oben max * (°C) | 40.8 | 43.6 -7% | 38.6 5% | 35.4 13% | 44.2 -8% | 45.9 -13% |
| Last unten max * (°C) | 40.4 | 53.1 -31% | 42.8 -6% | 37.8 6% | 41.2 -2% | 42.1 -4% |
| Idle oben max * (°C) | 32.2 | 26.7 17% | 22.2 31% | 27.2 16% | 29.4 9% | 23.4 27% |
| Idle unten max * (°C) | 31.2 | 27.2 13% | 23.6 24% | 28.2 10% | 31.2 -0% | 23.8 24% |
* ... kleinere Werte sind besser
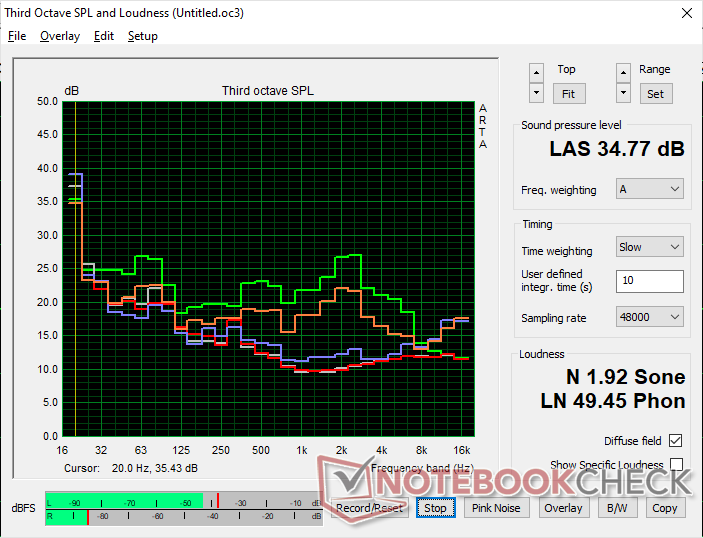
Lautsprecher
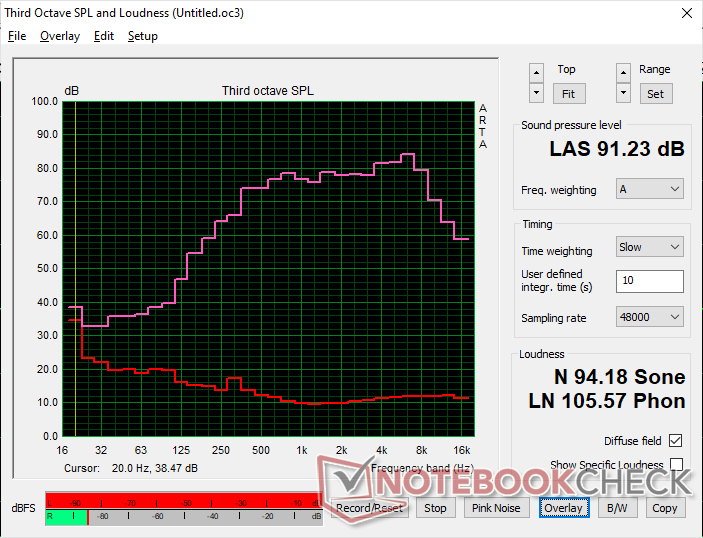
HP EliteBook Ultra G1q 14 Audio Analyse
(+) | Die Lautsprecher können relativ laut spielen (91.2 dB)
Bass 100 - 315 Hz
(-) | kaum Bass - 21.6% niedriger als der Median
(±) | durchschnittlich lineare Bass-Wiedergabe (7.1% Delta zum Vorgänger)
Mitteltöne 400 - 2000 Hz
(+) | ausgeglichene Mitten, vom Median nur 1.4% abweichend
(+) | lineare Mitten (3.6% Delta zum Vorgänger)
Hochtöne 2 - 16 kHz
(+) | ausgeglichene Hochtöne, vom Median nur 4.2% abweichend
(+) | sehr lineare Hochtöne (4.5% Delta zum Vorgänger)
Gesamt im hörbaren Bereich 100 - 16.000 Hz
(+) | hörbarer Bereich ist sehr linear (14.4% Abstand zum Median
Im Vergleich zu allen Geräten derselben Klasse
» 29% aller getesteten Geräte dieser Klasse waren besser, 6% vergleichbar, 66% schlechter
» Das beste Gerät hat einen Delta-Wert von 5%, durchschnittlich ist 18%, das schlechteste Gerät hat 53%
Im Vergleich zu allen Geräten im Test
» 18% aller getesteten Geräte waren besser, 4% vergleichbar, 78% schlechter
» Das beste Gerät hat einen Delta-Wert von 4%, durchschnittlich ist 24%, das schlechteste Gerät hat 134%
Apple MacBook Pro 16 2021 M1 Pro Audio Analyse
(+) | Die Lautsprecher können relativ laut spielen (84.7 dB)
Bass 100 - 315 Hz
(+) | guter Bass - nur 3.8% Abweichung vom Median
(+) | lineare Bass-Wiedergabe (5.2% Delta zum Vorgänger)
Mitteltöne 400 - 2000 Hz
(+) | ausgeglichene Mitten, vom Median nur 1.3% abweichend
(+) | lineare Mitten (2.1% Delta zum Vorgänger)
Hochtöne 2 - 16 kHz
(+) | ausgeglichene Hochtöne, vom Median nur 1.9% abweichend
(+) | sehr lineare Hochtöne (2.7% Delta zum Vorgänger)
Gesamt im hörbaren Bereich 100 - 16.000 Hz
(+) | hörbarer Bereich ist sehr linear (4.6% Abstand zum Median
Im Vergleich zu allen Geräten derselben Klasse
» 0% aller getesteten Geräte dieser Klasse waren besser, 0% vergleichbar, 100% schlechter
» Das beste Gerät hat einen Delta-Wert von 5%, durchschnittlich ist 17%, das schlechteste Gerät hat 45%
Im Vergleich zu allen Geräten im Test
» 0% aller getesteten Geräte waren besser, 0% vergleichbar, 100% schlechter
» Das beste Gerät hat einen Delta-Wert von 4%, durchschnittlich ist 24%, das schlechteste Gerät hat 134%
Energiemanagement - Geringer Snapdragon-Verbrauch
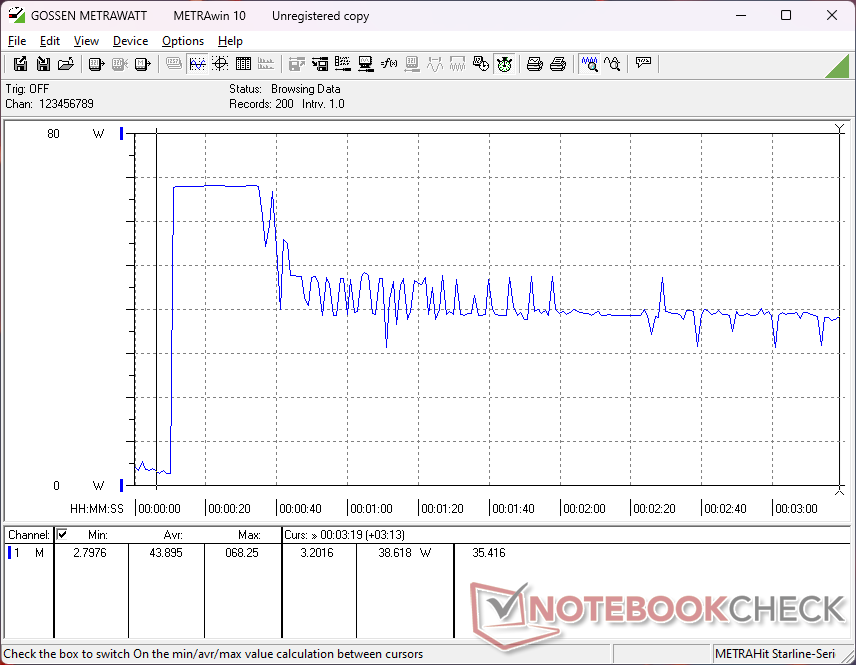
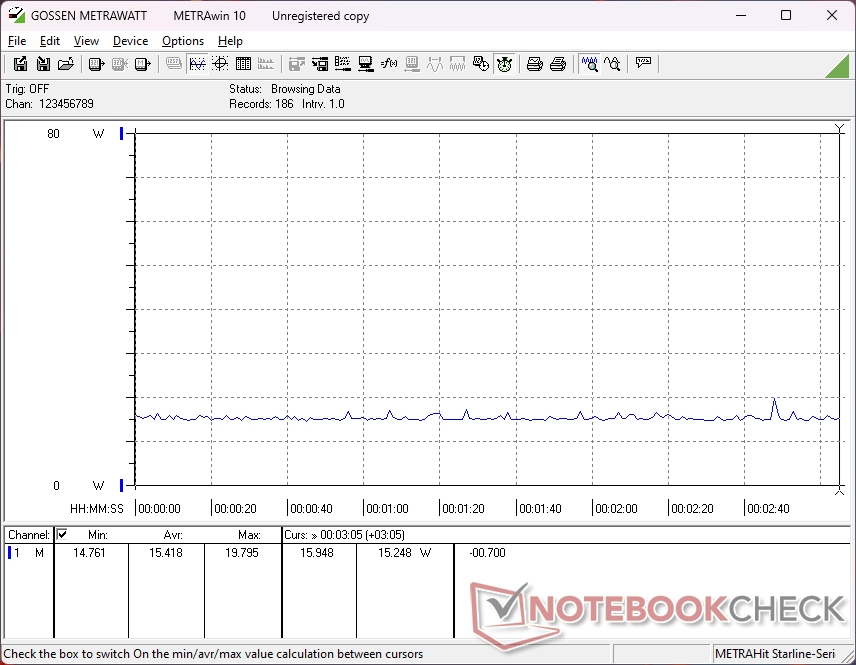
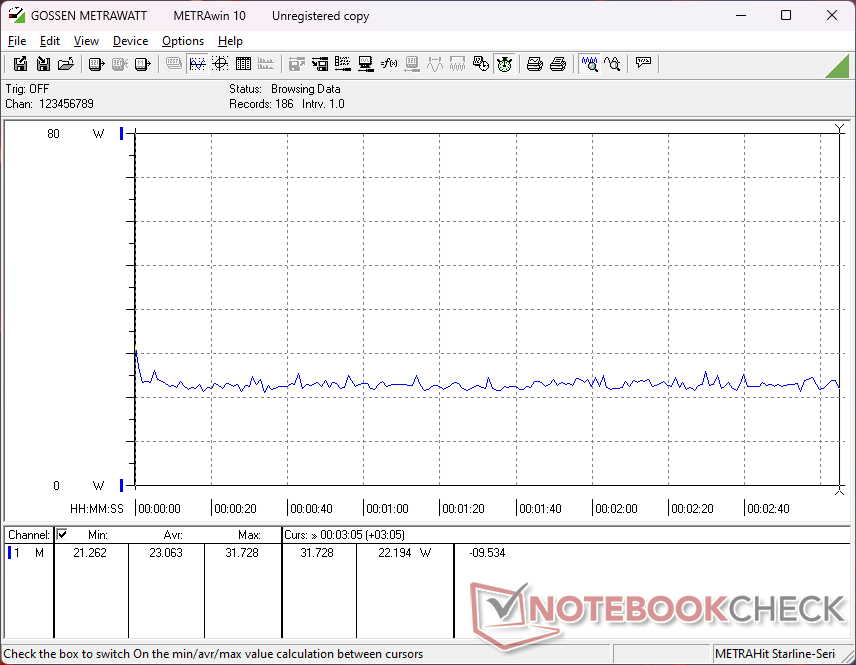
Energieverbrauch
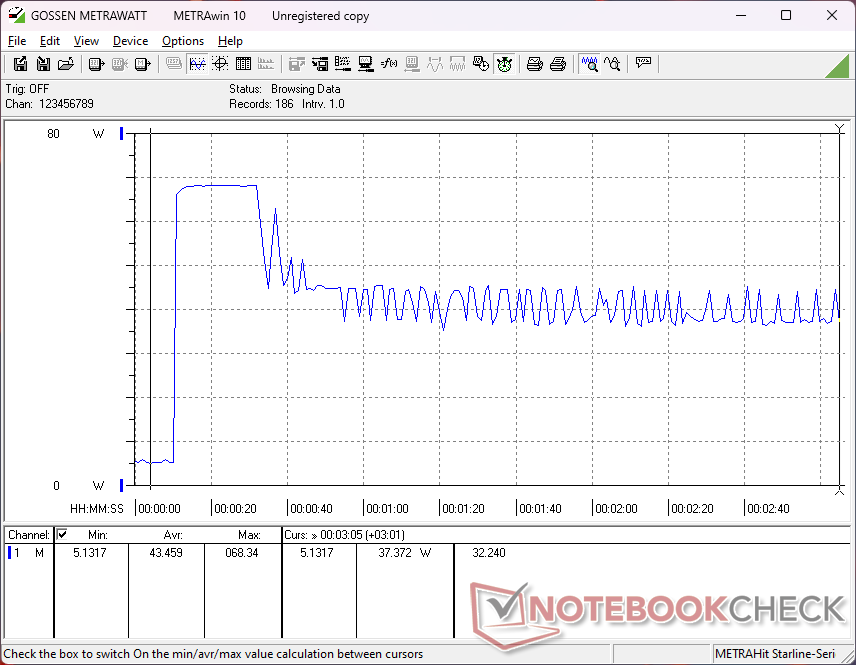
ARM-Systeme sind für ihr stromsparendes Verhalten bekannt und da bildet das EliteBook Ultra G1q 14 keine Ausnahme. Im Leerlauf auf dem Desktop verbraucht der Laptop nur 3 bis 6 W, je nach Helligkeitsstufe, was weniger ist als bei den meisten anderen Subnotebooks. Ähnlich verhält es sich unter starker Last, wir messen nur um die 24 W verglichen mit den 35 bis 55 W beim Core-U-betriebenen Latitude 9450 2-in-1. Generell mag das EliteBook Ultra G1q 14 eher eine langsamere Maschine zu sein, aber immerhin kompensiert der niedrige Verbrauch diesen Umstand.
| Aus / Standby | |
| Idle | |
| Last |
|
Legende:
min: | |
| HP EliteBook Ultra G1q 14 SD X Elite X1E-78-100, Adreno X1-85 3.8 TFLOPS, SK hynix PC801 HFS512GEJ9X101N BF, IPS, 2240x1400, 14" | Asus Vivobook S 15 OLED Snapdragon SD X Elite X1E-78-100, Adreno X1-85 3.8 TFLOPS, Micron 2400 MTFDKBA1T0QFM, OLED, 2880x1620, 15.6" | HP Dragonfly Pro 2023 R7 7736U, Radeon 680M, PSEIB512GABBMC0, IPS, 1920x1200, 14" | Dell Latitude 9450 2-in-1 Ultra 7 165U, Graphics 4-Core iGPU (Arrow Lake), , IPS, 2560x1600, 14" | Lenovo ThinkPad X1 Carbon G12 Ultra 7 155H, Arc 8-Core, Kioxia XG8 KXG8AZNV1T02, OLED, 2880x1800, 14" | Apple MacBook Pro 14 2023 M3 Max Apple M3 Max 16-Core, M3 Max 40-Core GPU, Apple SSD AP2048Z, Mini-LED, 3024x1964, 14.2" | |
|---|---|---|---|---|---|---|
| Stromverbrauch | -31% | -46% | -52% | -74% | -148% | |
| Idle min * (Watt) | 2.5 | 4.4 -76% | 3.2 -28% | 3.2 -28% | 3.9 -56% | 2.6 -4% |
| Idle avg * (Watt) | 5.7 | 6.2 -9% | 5.4 5% | 6.4 -12% | 5.8 -2% | 11.8 -107% |
| Idle max * (Watt) | 5.8 | 7.5 -29% | 5.6 3% | 10.8 -86% | 16 -176% | 12.2 -110% |
| Last avg * (Watt) | 24.2 | 33.6 -39% | 42.2 -74% | 54.6 -126% | 46.1 -90% | 99.9 -313% |
| Witcher 3 ultra * (Watt) | 23.1 | 29.9 -29% | 60 -160% | 35.5 -54% | 50.4 -118% | 92.5 -300% |
| Cyberpunk 2077 ultra external monitor * (Watt) | 26.8 | 38.9 -45% | ||||
| Cyberpunk 2077 ultra * (Watt) | 33.5 | 39 -16% | ||||
| Last max * (Watt) | 66.4 | 69.3 -4% | 82 -23% | 70.2 -6% | 67.4 -2% | 101.7 -53% |
* ... kleinere Werte sind besser
Energieverbrauch Witcher 3 / Stresstest
Energieverbrauch mit externem Monitor
Akkulaufzeit
Der Akku ist mit seinen 59 Wh ähnlich bemessen wie die Energiespeicher traditioneller Windows-Laptops wie dem Dell Latitude 9450 2-in-1 oder dem Lenovo ThinkPad X1 Carbon G12. Wie von einer ARM-Maschine zu erwarten, fällt die Laufzeit ausgezeichnet aus, Nutzer können mit 13 Stunden Browsing rechnen.
Eine komplette Aufladung von 0 auf 100 Prozent nimmt etwas mehr als 2 Stunden in Anspruch, ein durchschnittlicher Wert für ein Subnotebook.
| HP EliteBook Ultra G1q 14 SD X Elite X1E-78-100, Adreno X1-85 3.8 TFLOPS, 59 Wh | Asus Vivobook S 15 OLED Snapdragon SD X Elite X1E-78-100, Adreno X1-85 3.8 TFLOPS, 70 Wh | HP Dragonfly Pro 2023 R7 7736U, Radeon 680M, 65 Wh | Dell Latitude 9450 2-in-1 Ultra 7 165U, Graphics 4-Core iGPU (Arrow Lake), 60 Wh | Lenovo ThinkPad X1 Carbon G12 Ultra 7 155H, Arc 8-Core, 57 Wh | Apple MacBook Pro 14 2023 M3 Max Apple M3 Max 16-Core, M3 Max 40-Core GPU, 72.6 Wh | |
|---|---|---|---|---|---|---|
| Akkulaufzeit | -13% | 12% | 8% | -32% | -14% | |
| Idle (h) | 20.4 | 23.2 14% | 21.7 6% | 17.8 -13% | ||
| WLAN (h) | 13.2 | 13.1 -1% | 13 -2% | 13.6 3% | 7.8 -41% | 15.2 15% |
| Last (h) | 2.1 | 1.6 -24% | 2.6 24% | 2.4 14% | 1.2 -43% | 1.2 -43% |
| H.264 (h) | 14.8 | 18 |
Pro
Contra
Fazit — Ein guter Start, aber nicht gut genug
Wer einen Laien davon überzeugen möchte Windows on ARM traditionellen Alternativen von Apple und anderen vorzuziehen, sollte in diversen Kategorien überzeugen, darunter Leistung, Preis, Akkulaufzeit und Formfaktor. Schauen wir uns diese Bereiche zusammenfassend an:
Leistung. Die Leistung ist bestenfalls mit der eines Core Ultra 7 155U/165U vergleichbar, nämlich dann wenn die Anwendungen nativ laufen. Schlimmstenfalls ist der ARM-Chip so langsam wie ein alter Core i7-1165G7, nämlich dann wenn Anwendungen emuliert werden müssen, besonders bei Single-Core-Tasks. Die Grafikleistung ist indes enttäuschend im Vergleich zu den aktuellsten integrierten Arc- und Radeon-Lösungen von Intel und AMD.
Preis. Mit 2.029 Euro kostet das HP EliteBook Ultra G1q 14 in etwa so viel wie andere Business-zentrierten Core-Ultra-7-Subnotebooks wie das Dell Latitude 7350 oder das Lenovo ThinkPad X1 Carbon.
Akkulaufzeit. Die Laufzeiten sind ausgezeichnet und länger als die der meisten Intel- oder AMD-Subnotebooks durch das bessere Leistung-pro-Watt-Verhältnis. Dennoch existieren Intel- und AMD-Alternativen mit vergleichbaren Werten wie das 2023er Dragonfly Pro oder das Dell Latitude 9450 2-in-1.
Formfaktor. Das geringe Gewicht, die kleinen Abmessungen und die ruhigen Lüfter sind die Highlights der HP-Qualcomm-Maschine. Dennoch können Modelle wie das LG Gram 14, das Samsung Galaxy Book4 Pro oder auch das ThinkPad X1 Carbon G12 kleiner und sogar leichter sein.
Die Herausforderung beim EliteBook Ultra G1q 14 besteht nicht darin, dass es sich um ein schlechtes Gerät handelt, aber darin, dass die aktuelle Konkurrenz von Intel und AMD extrem schwer zu überbieten ist. Käufer haben bereits jetzt eine gute Auswahl an hervorragenden Subnotebooks (inklusive HPs eigenes Portfolio), die die Fähigkeiten und Funktionen des EliteBook Ultra G1q 14 entsprechen oder gar überbieten, vor allem in Sachen Kompatibilität. Daher ist es schwer das EliteBook Ultra G1q 14 einer großen Nutzermehrheit gegenüber den vielen Alternativen zu empfehlen.
Das EliteBook Ultra G1q 14 markiert einen guten Start für Qualcomm, aber es muss noch eine ganze Schippe drauf legen, denn Intel und AMD sind zum gleichen Preis noch einen Schritt voraus.
Viele seiner Schwachstellen könnte man dem EliteBook Ultra G1q 14 verzeihen, wäre der aufgerufene Preis deutlich niedriger als bei der Konkurrenz. Leider kostet es jedoch in etwa genauso viel und bietet dabei keine größeren Vorteile bei der Leistung oder den Funktionen. Es markiert einen guten Start, aber Qualcomm und die PC-Hersteller haben womöglich noch einen weiten Weg vor sich, um Anwender von einem Wechsel zu Windows on ARM zu überzeugen.
Preis und Verfügbarkeit
Bei HP kostet das EliteBook Ultra G1q 14 aktuell 2.029 Euro.
Hinweis: Wir haben unser Rating-System aktualisiert und die Ergebnisse von Version 8 sind nicht vergleichbar mit den Ergebnissen von Version 7. Weitere Informationen dazu sind hier verfügbar.
HP EliteBook Ultra G1q 14
- 02.07.2024 v8
Allen Ngo
 Total Sustainability Score:
 Transparenz
Die Auswahl der zu testenden Geräte erfolgt innerhalb der Redaktion. Das vorliegende Testmuster wurde dem Autor vom Hersteller oder einem Shop zu Testzwecken leihweise zur Verfügung gestellt. Eine Einflussnahme des Leihstellers auf den Testbericht gab es nicht, der Hersteller erhielt keine Version des Reviews vor der Veröffentlichung. Es bestand keine Verpflichtung zur Publikation. Als eigenständiges, unabhängiges Unternehmen unterliegt Notebookcheck keiner Diktion von Herstellern, Shops und Verlagen.
So testet Notebookcheck
Pro Jahr werden von Notebookcheck hunderte Laptops und Smartphones unabhängig in von uns standardisierten technischen Verfahren getestet, um eine Vergleichbarkeit aller Testergebnisse zu gewährleisten. Seit rund 20 Jahren entwickeln wir diese Testmethoden kontinuierlich weiter und setzen damit Branchenstandards. In unseren Testlaboren kommt ausschließlich hochwertiges Messequipment in die Hände erfahrener Techniker und Redakteure. Die Tests unterliegen einer mehrstufigen Kontrolle. Unsere komplexe Gesamtbewertung basiert auf hunderten fundierten Messergebnissen und Benchmarks, womit Ihnen Objektivität garantiert ist. Weitere Informationen zu unseren Testmethoden gibt es hier.
Preisvergleich

