Zotac ZBOX Magnus im Test: GeForce RTX 3070 Mobile und Tiger-Lake-SoC im 2,65 Liter Gehäuse
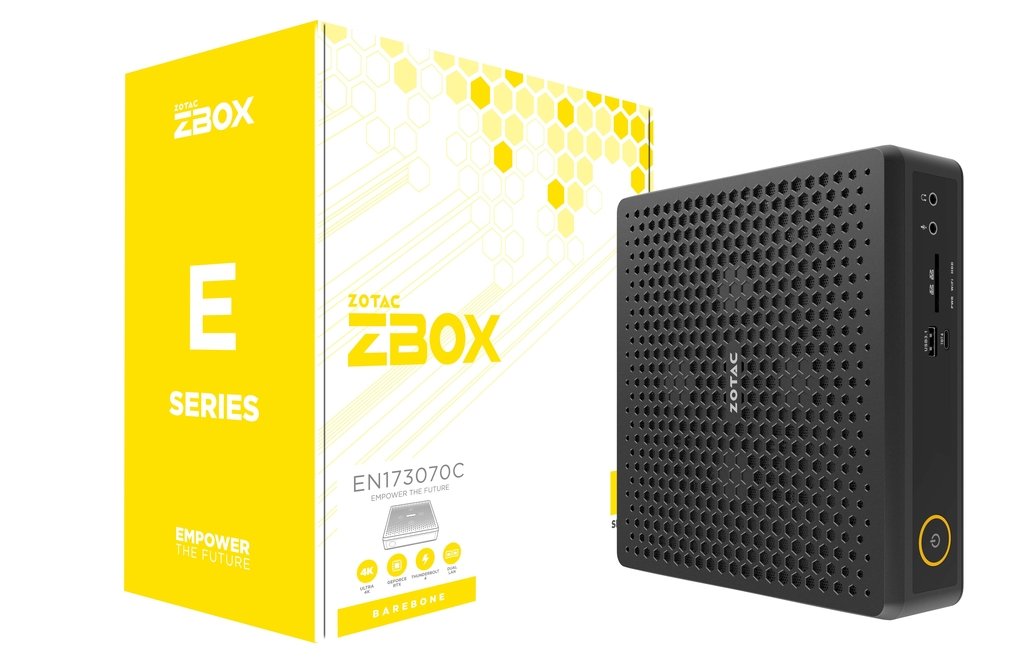
Mit der ZBOX von Zotac vermarktet der Hersteller eine Vielzahl an kompakten PC's welche für individuelle Einsatzzwecke vorgesehen sind. In Verbindung mit dem Namenzusatz Magnus geht es in die Richtung Gamin-PC, was sich auch an den verbauten Komponenten widerspiegelt. In der aktuellen Version des Maguns EN173070C steckt ein Intel Core i7-11800H, welcher in Verbindung mit der Nvidia GeForce RTX 3070 Laptop für rasanten Gamingbetrieb sorgen soll. Die grobe Konfiguration ist für uns als Notebook-Review-Plattform nicht fremd und somit kann man schon grob abschätzen welche Leistung zu erwarten ist.
In unserer Ausstattung kostet der Magnus EN173070C knapp 1.650 Euro. Da es sich aber immer um ein Barebone-System handelt, muss noch etwas für die SSD, den RAM und die Windows-Lizenz mit einkalkuliert werden. Je nach Komponentenauswahl kann man hier schnell die 2.000 Euro knacken. Wem die Leistung der Nvidia GeForce RTX 3070 Laptop nicht reicht kann den Magnus auch in der Version EN173080C bekommen. Hier gibt es dann mit der Nvidia GeForce RTX 3080 Laptop eine schnellere GPU. Die CPU bleibt mit dem Intel Core i7-11800H gleich. Mit etwas weniger Leistung gibt es den Magnus EN153060C. Hier kommt ein Intel Core i5-11400H und eine Nvidia GeForce RTX 3060 Laptop zum Einsatz.
Zotac ZBOX Magnus EN173070C im Detail
Gehäuse
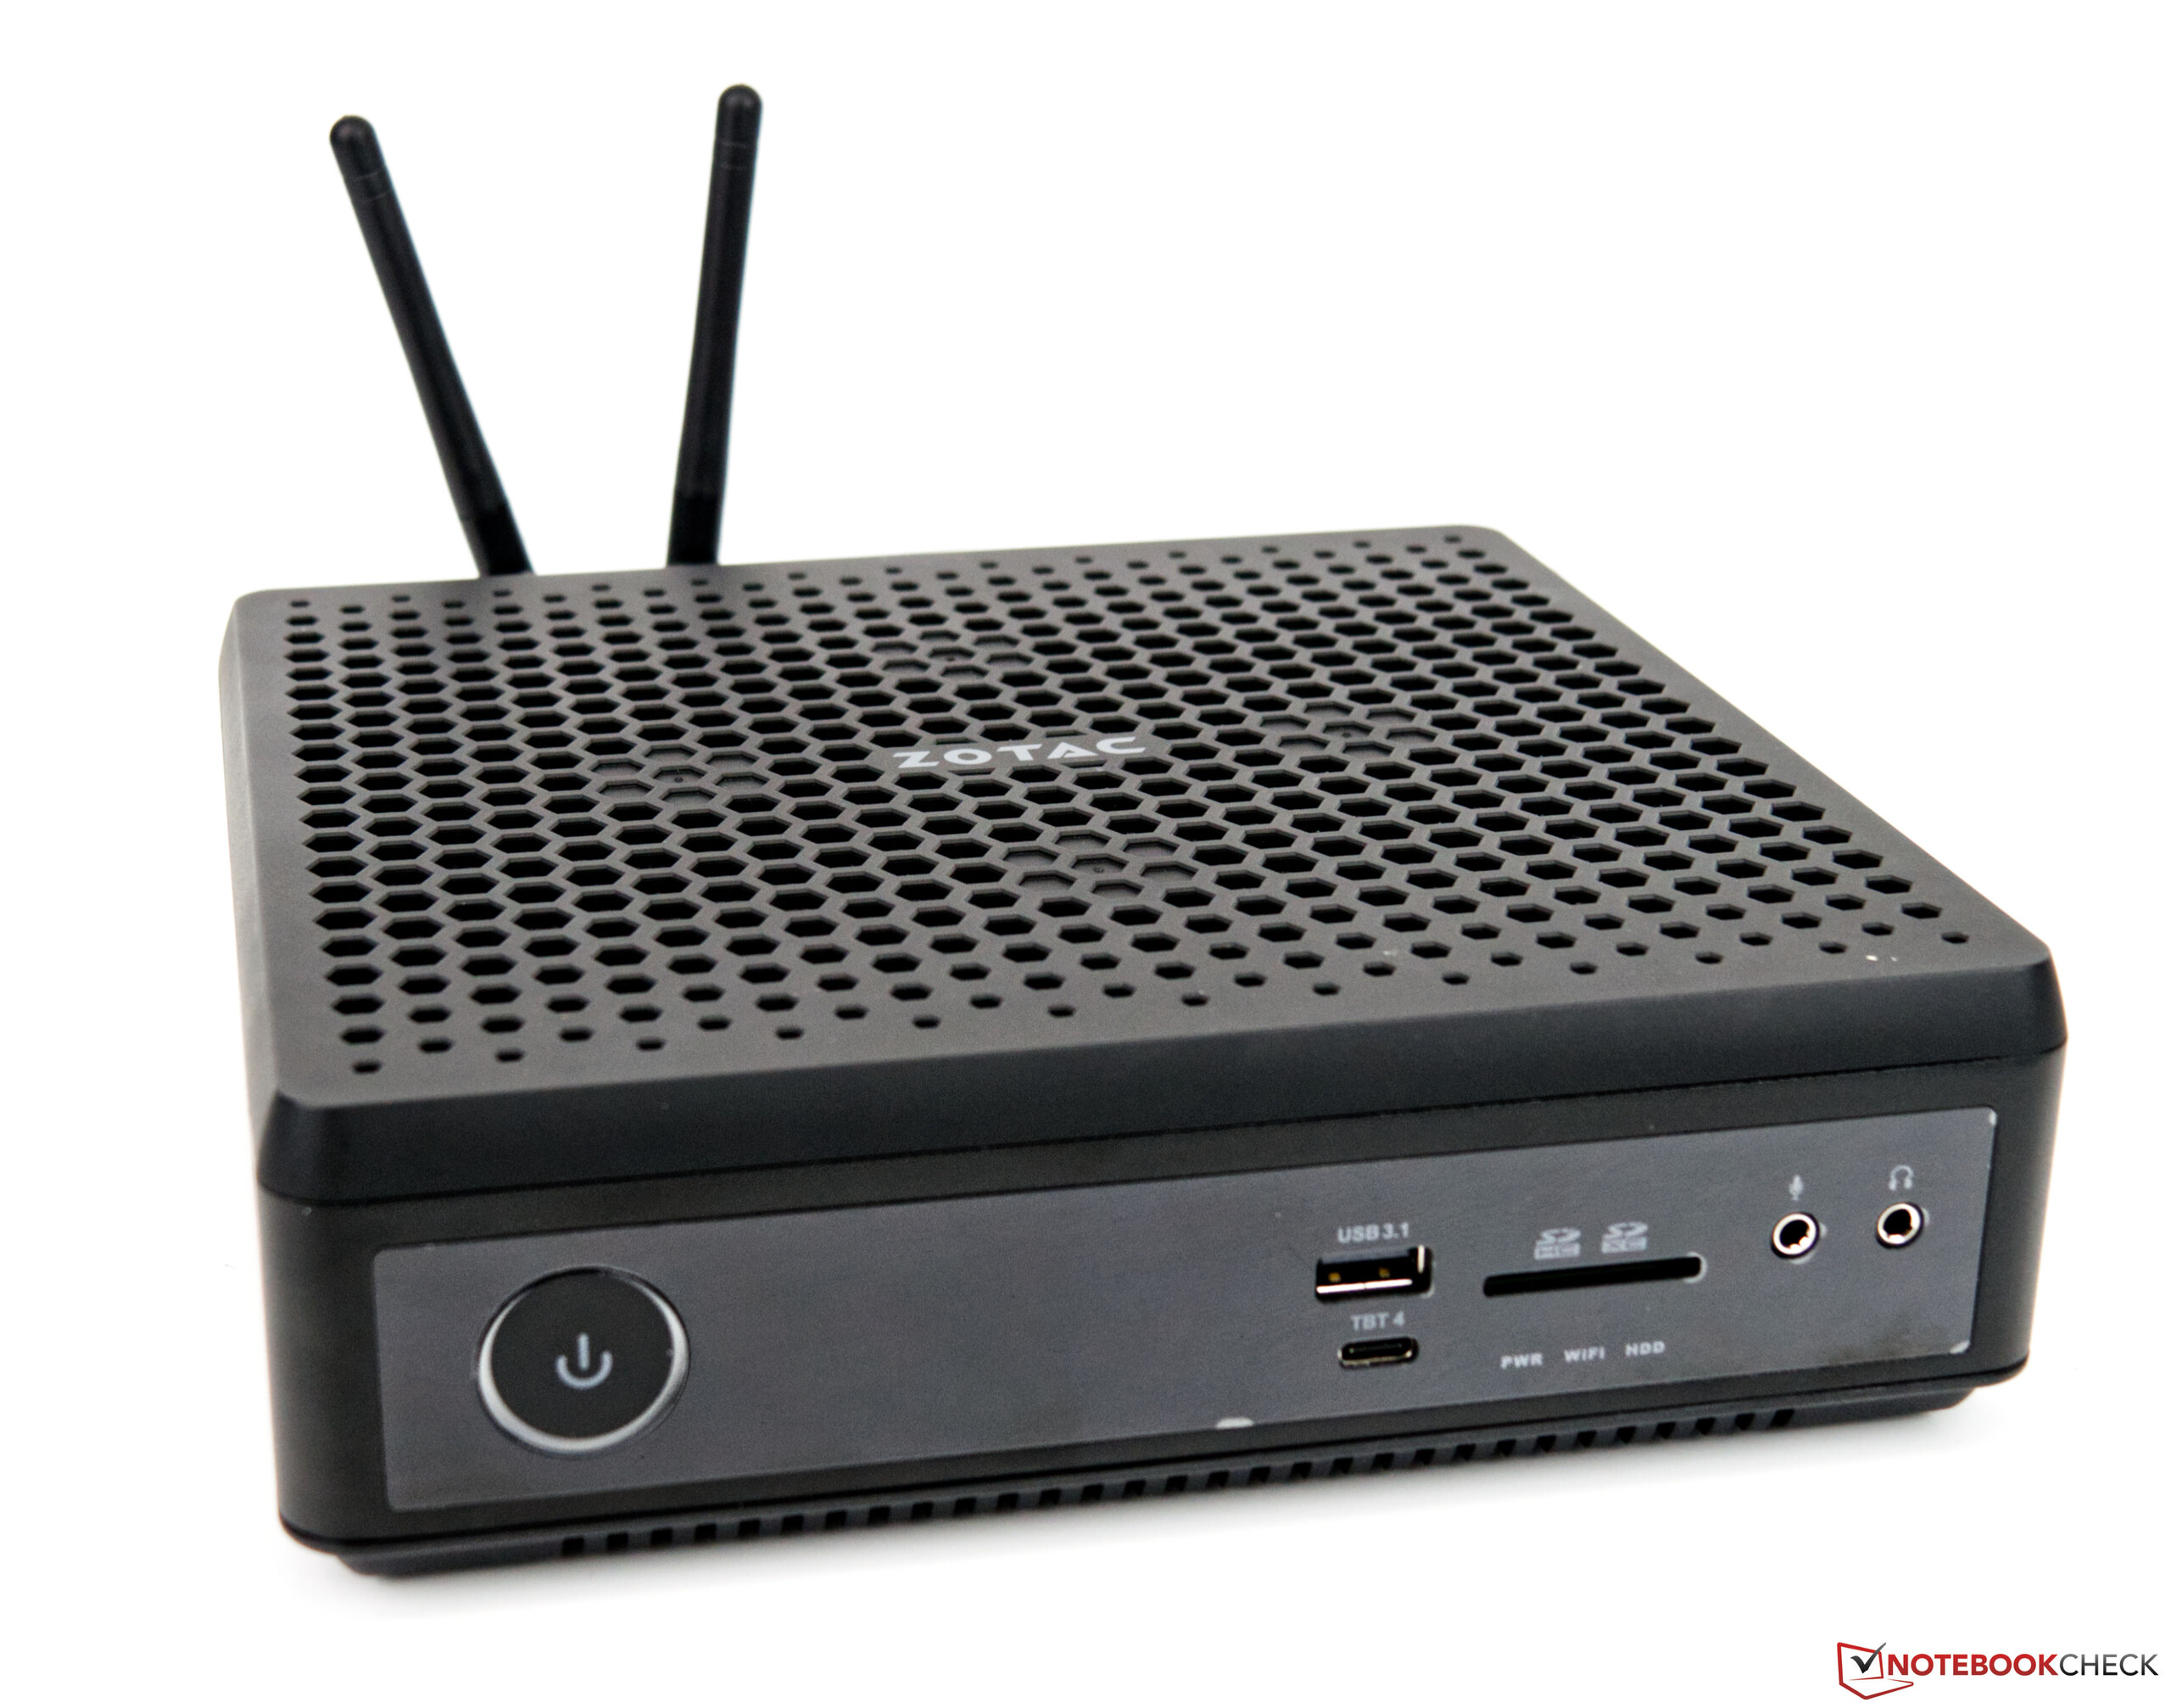
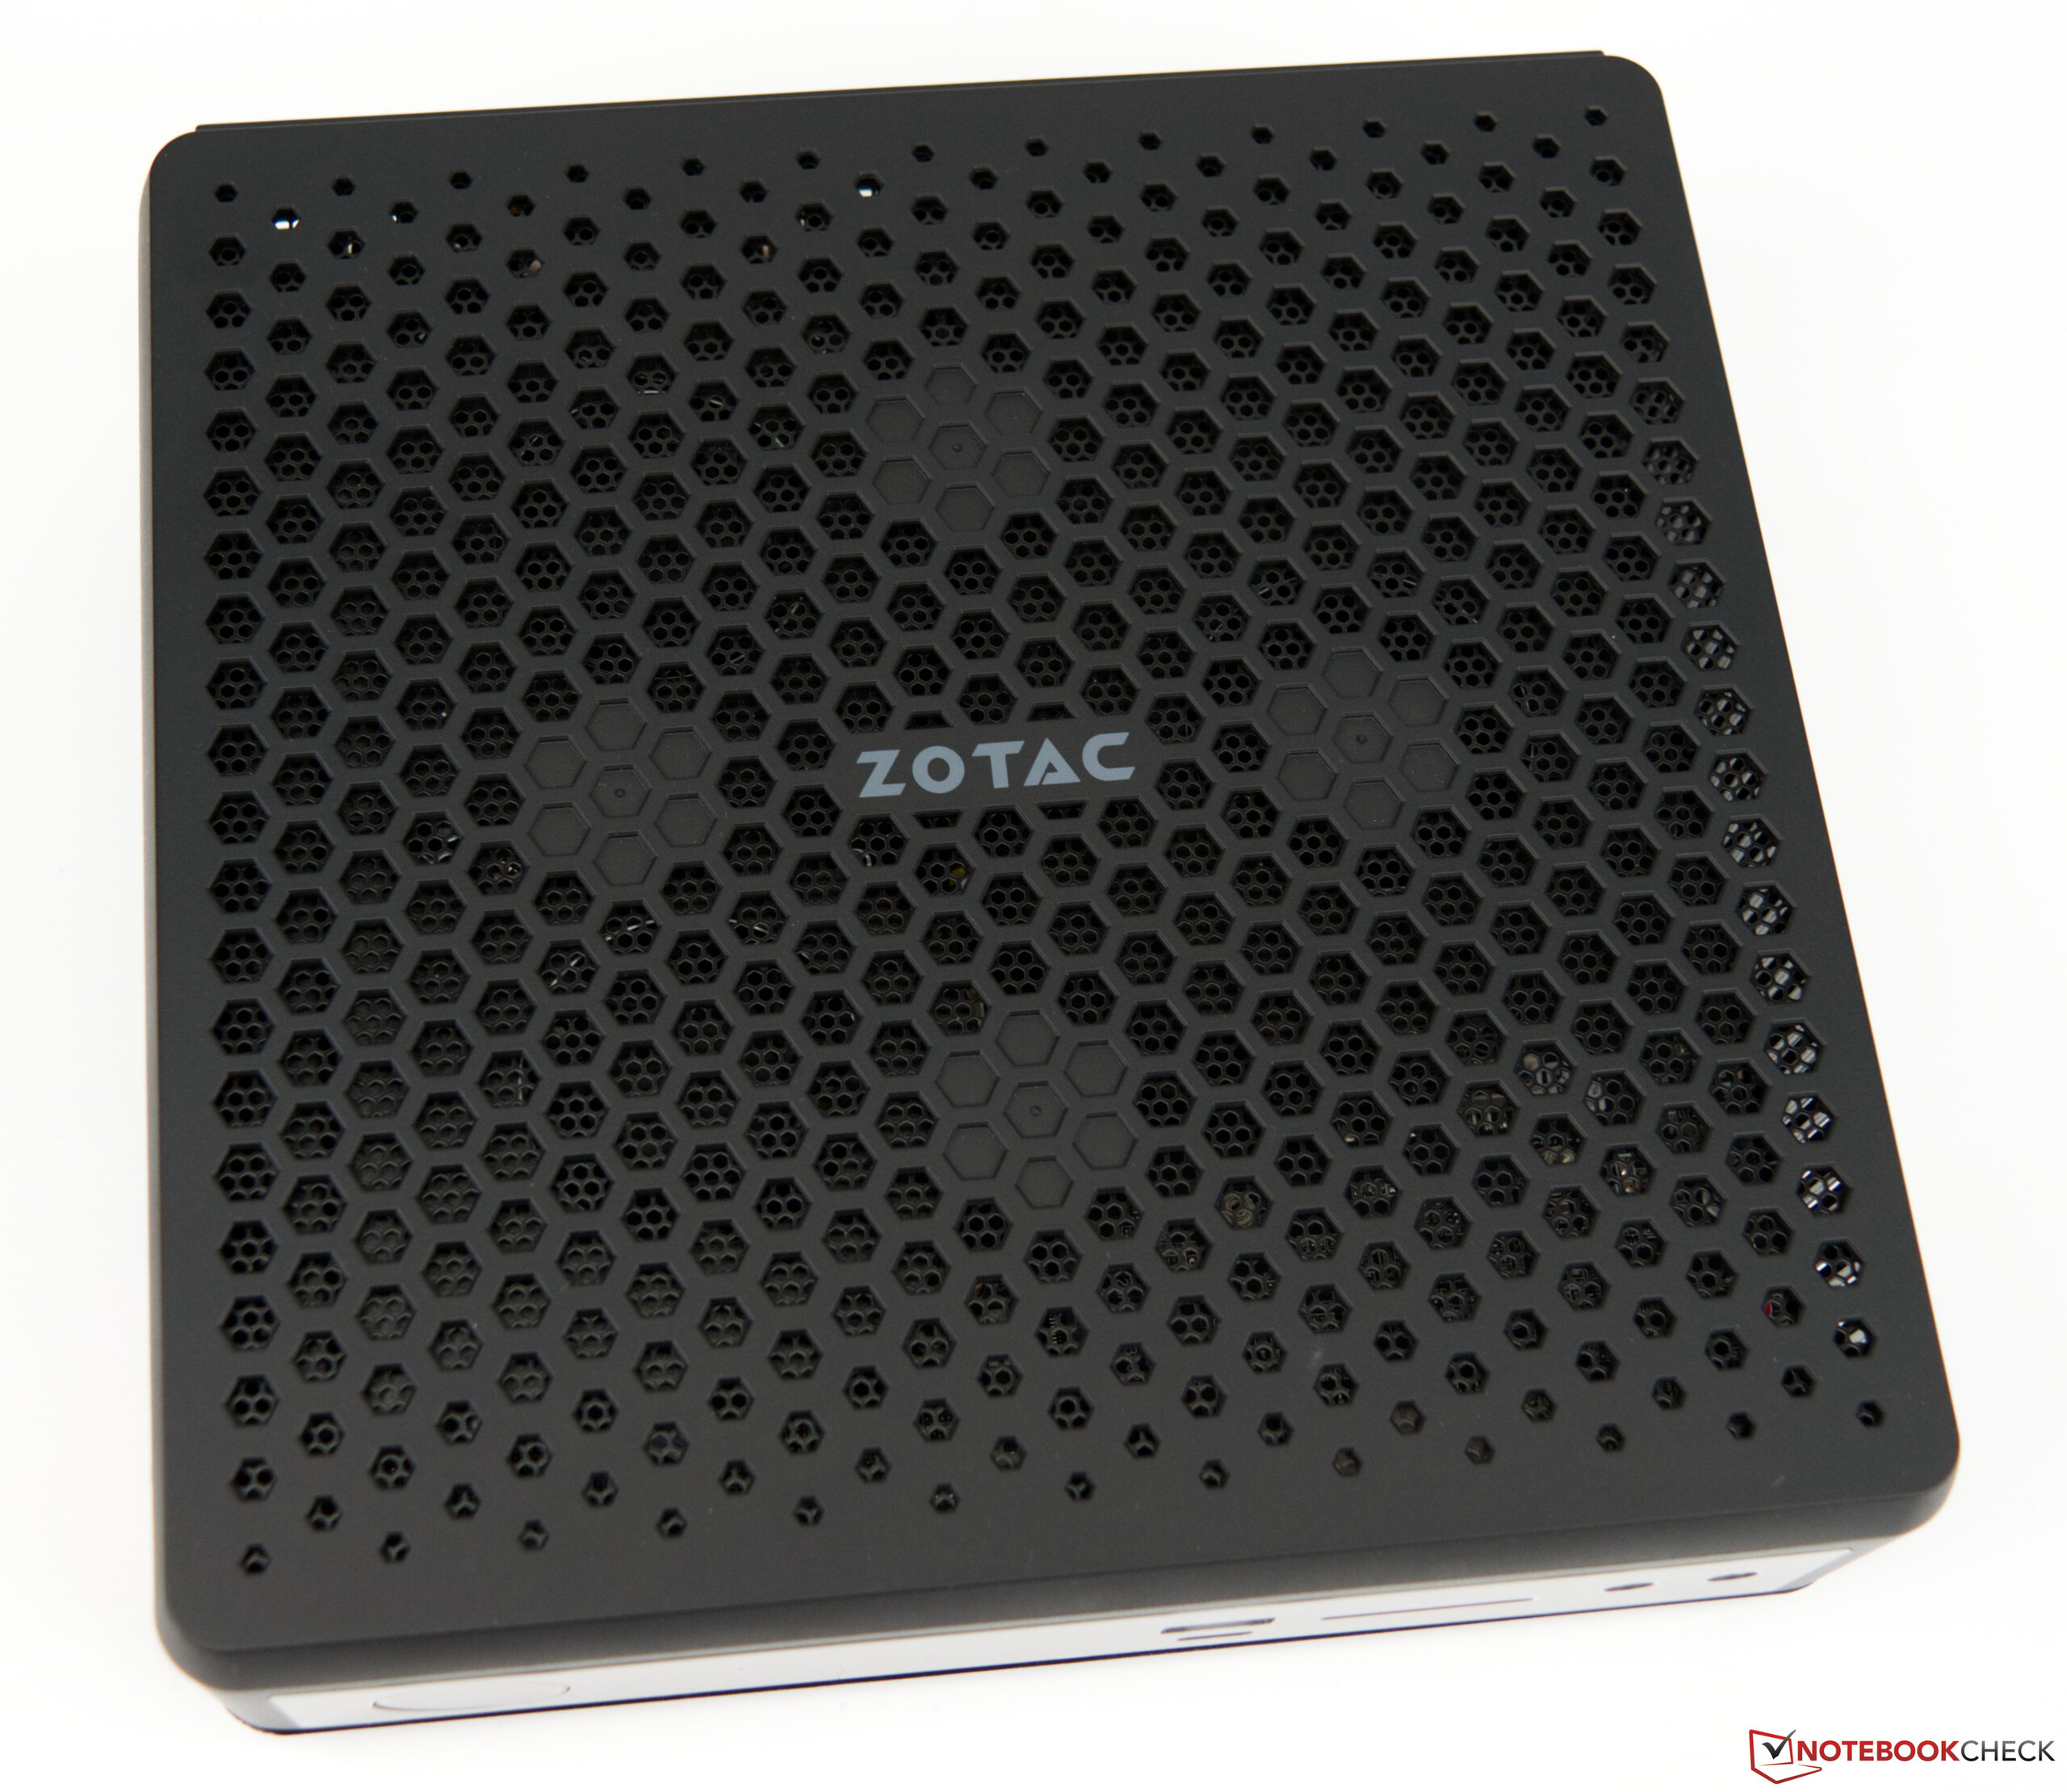
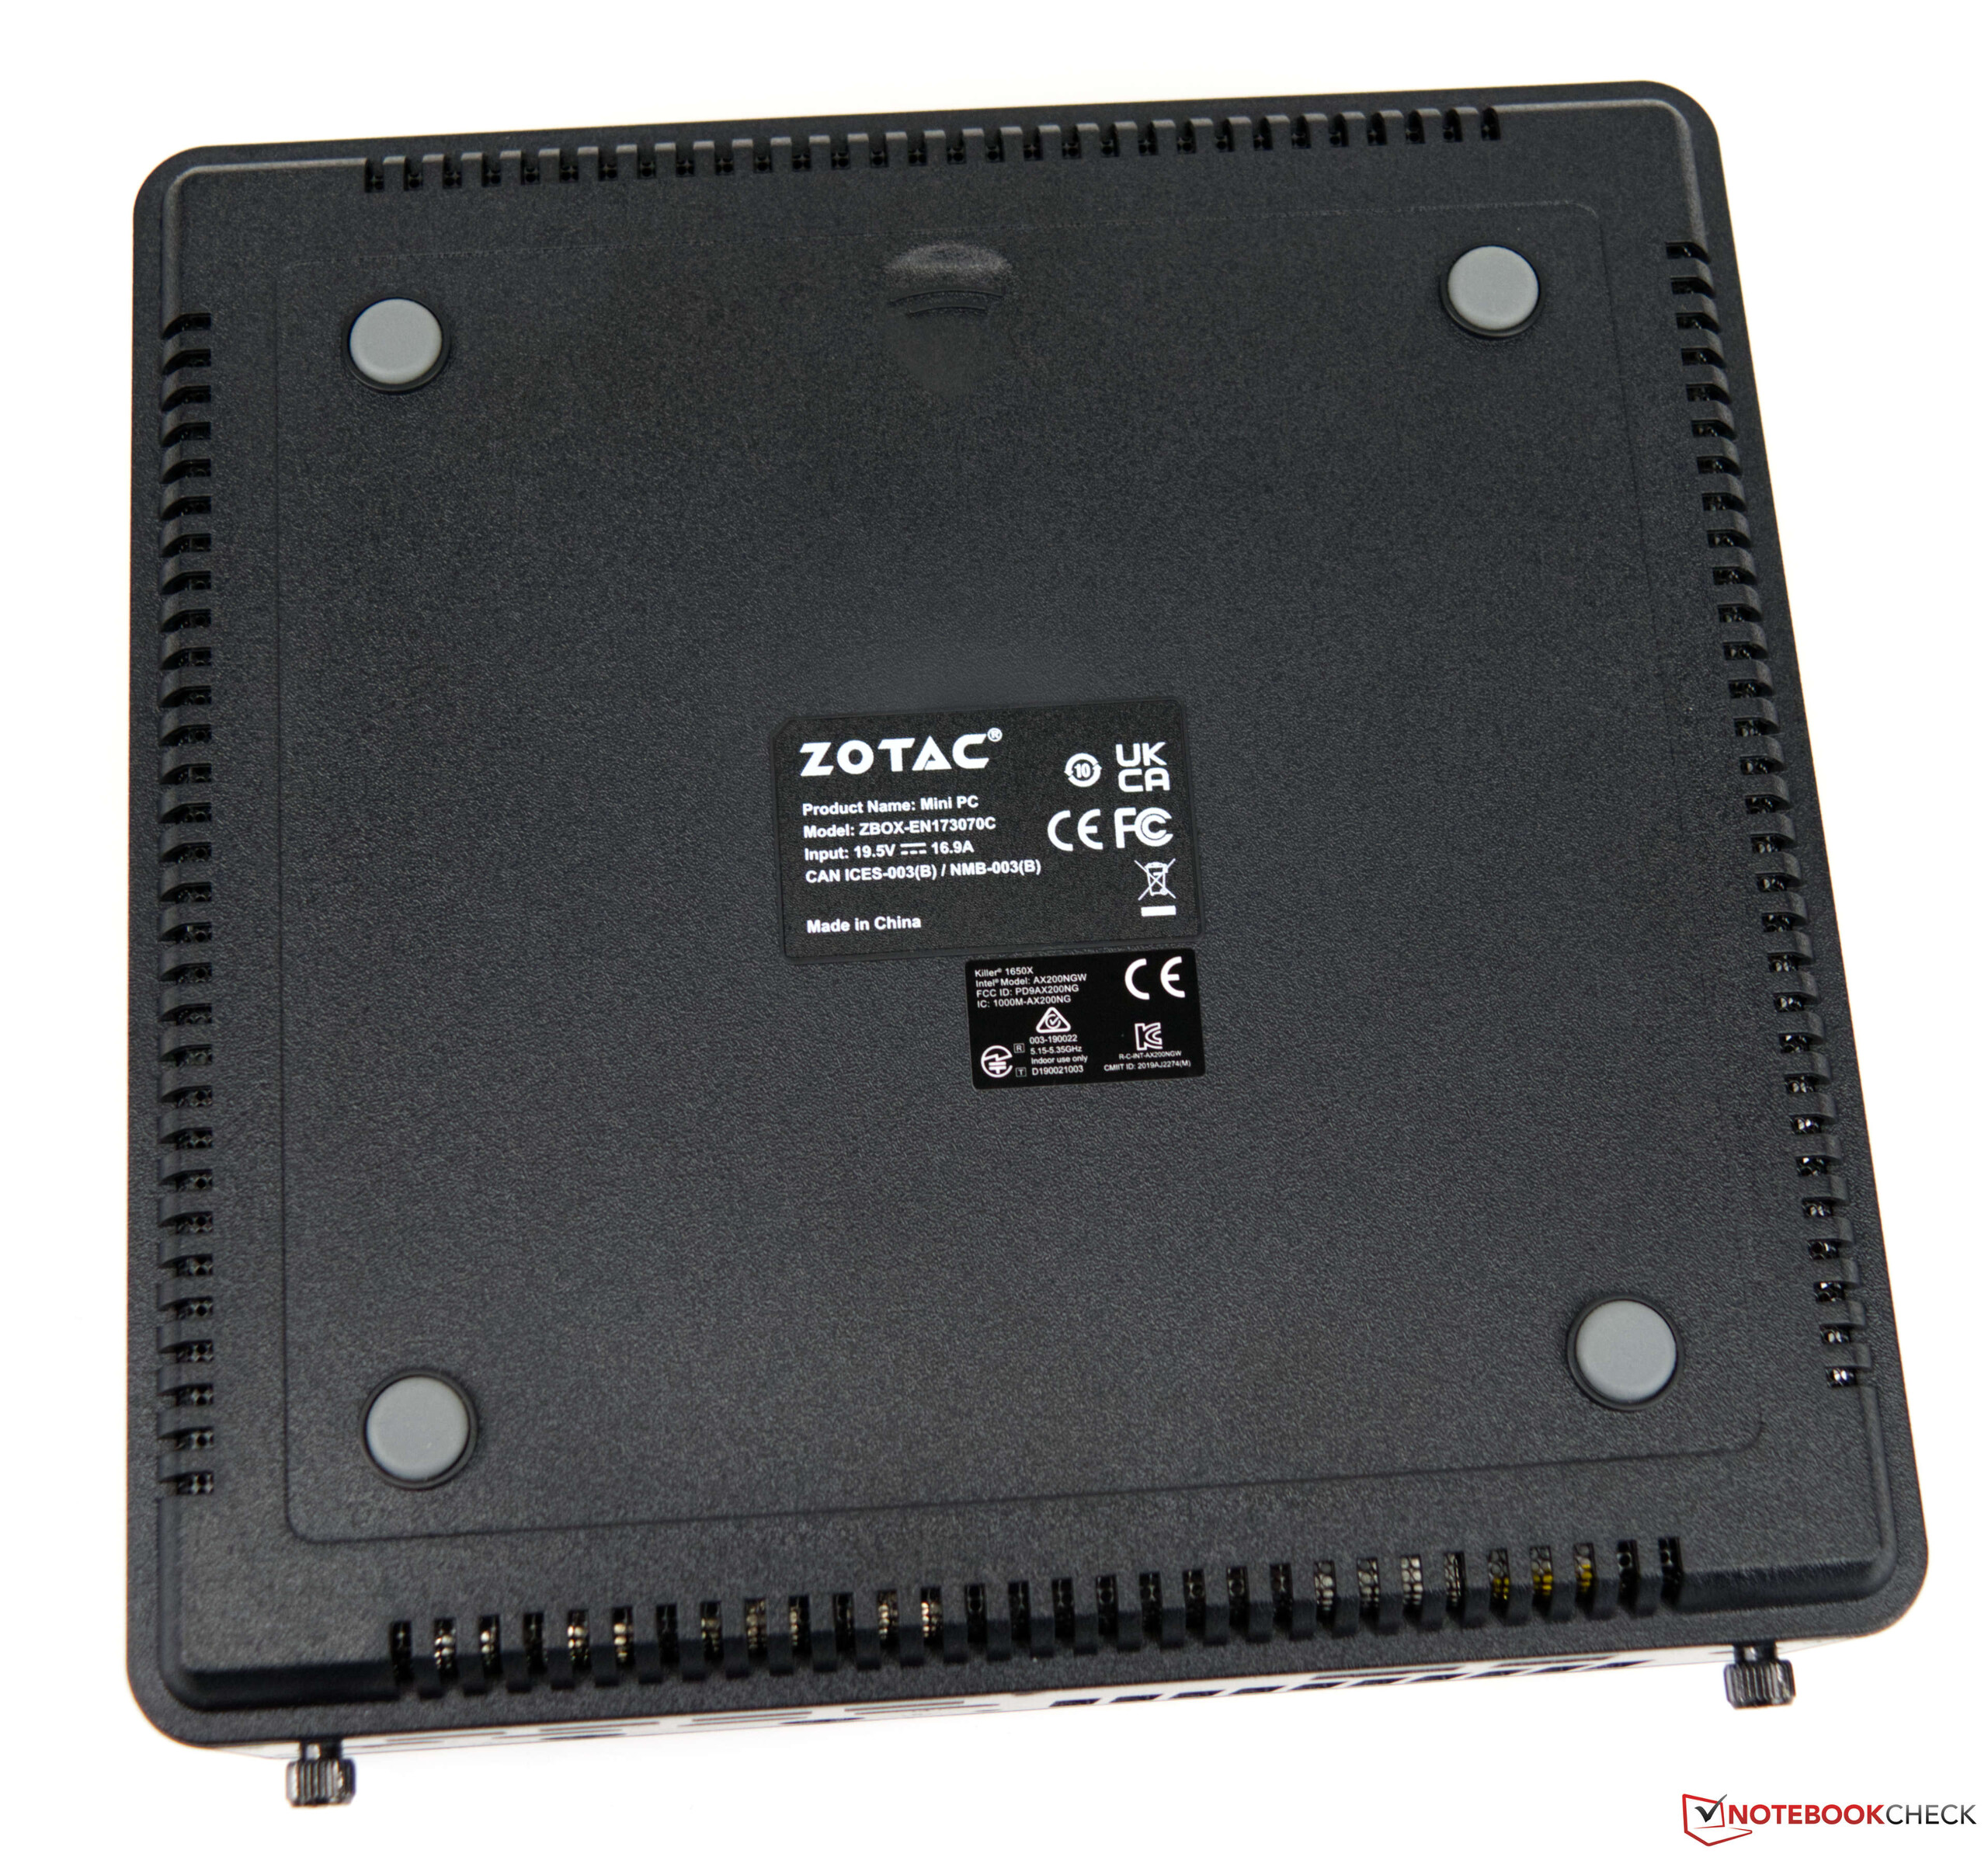
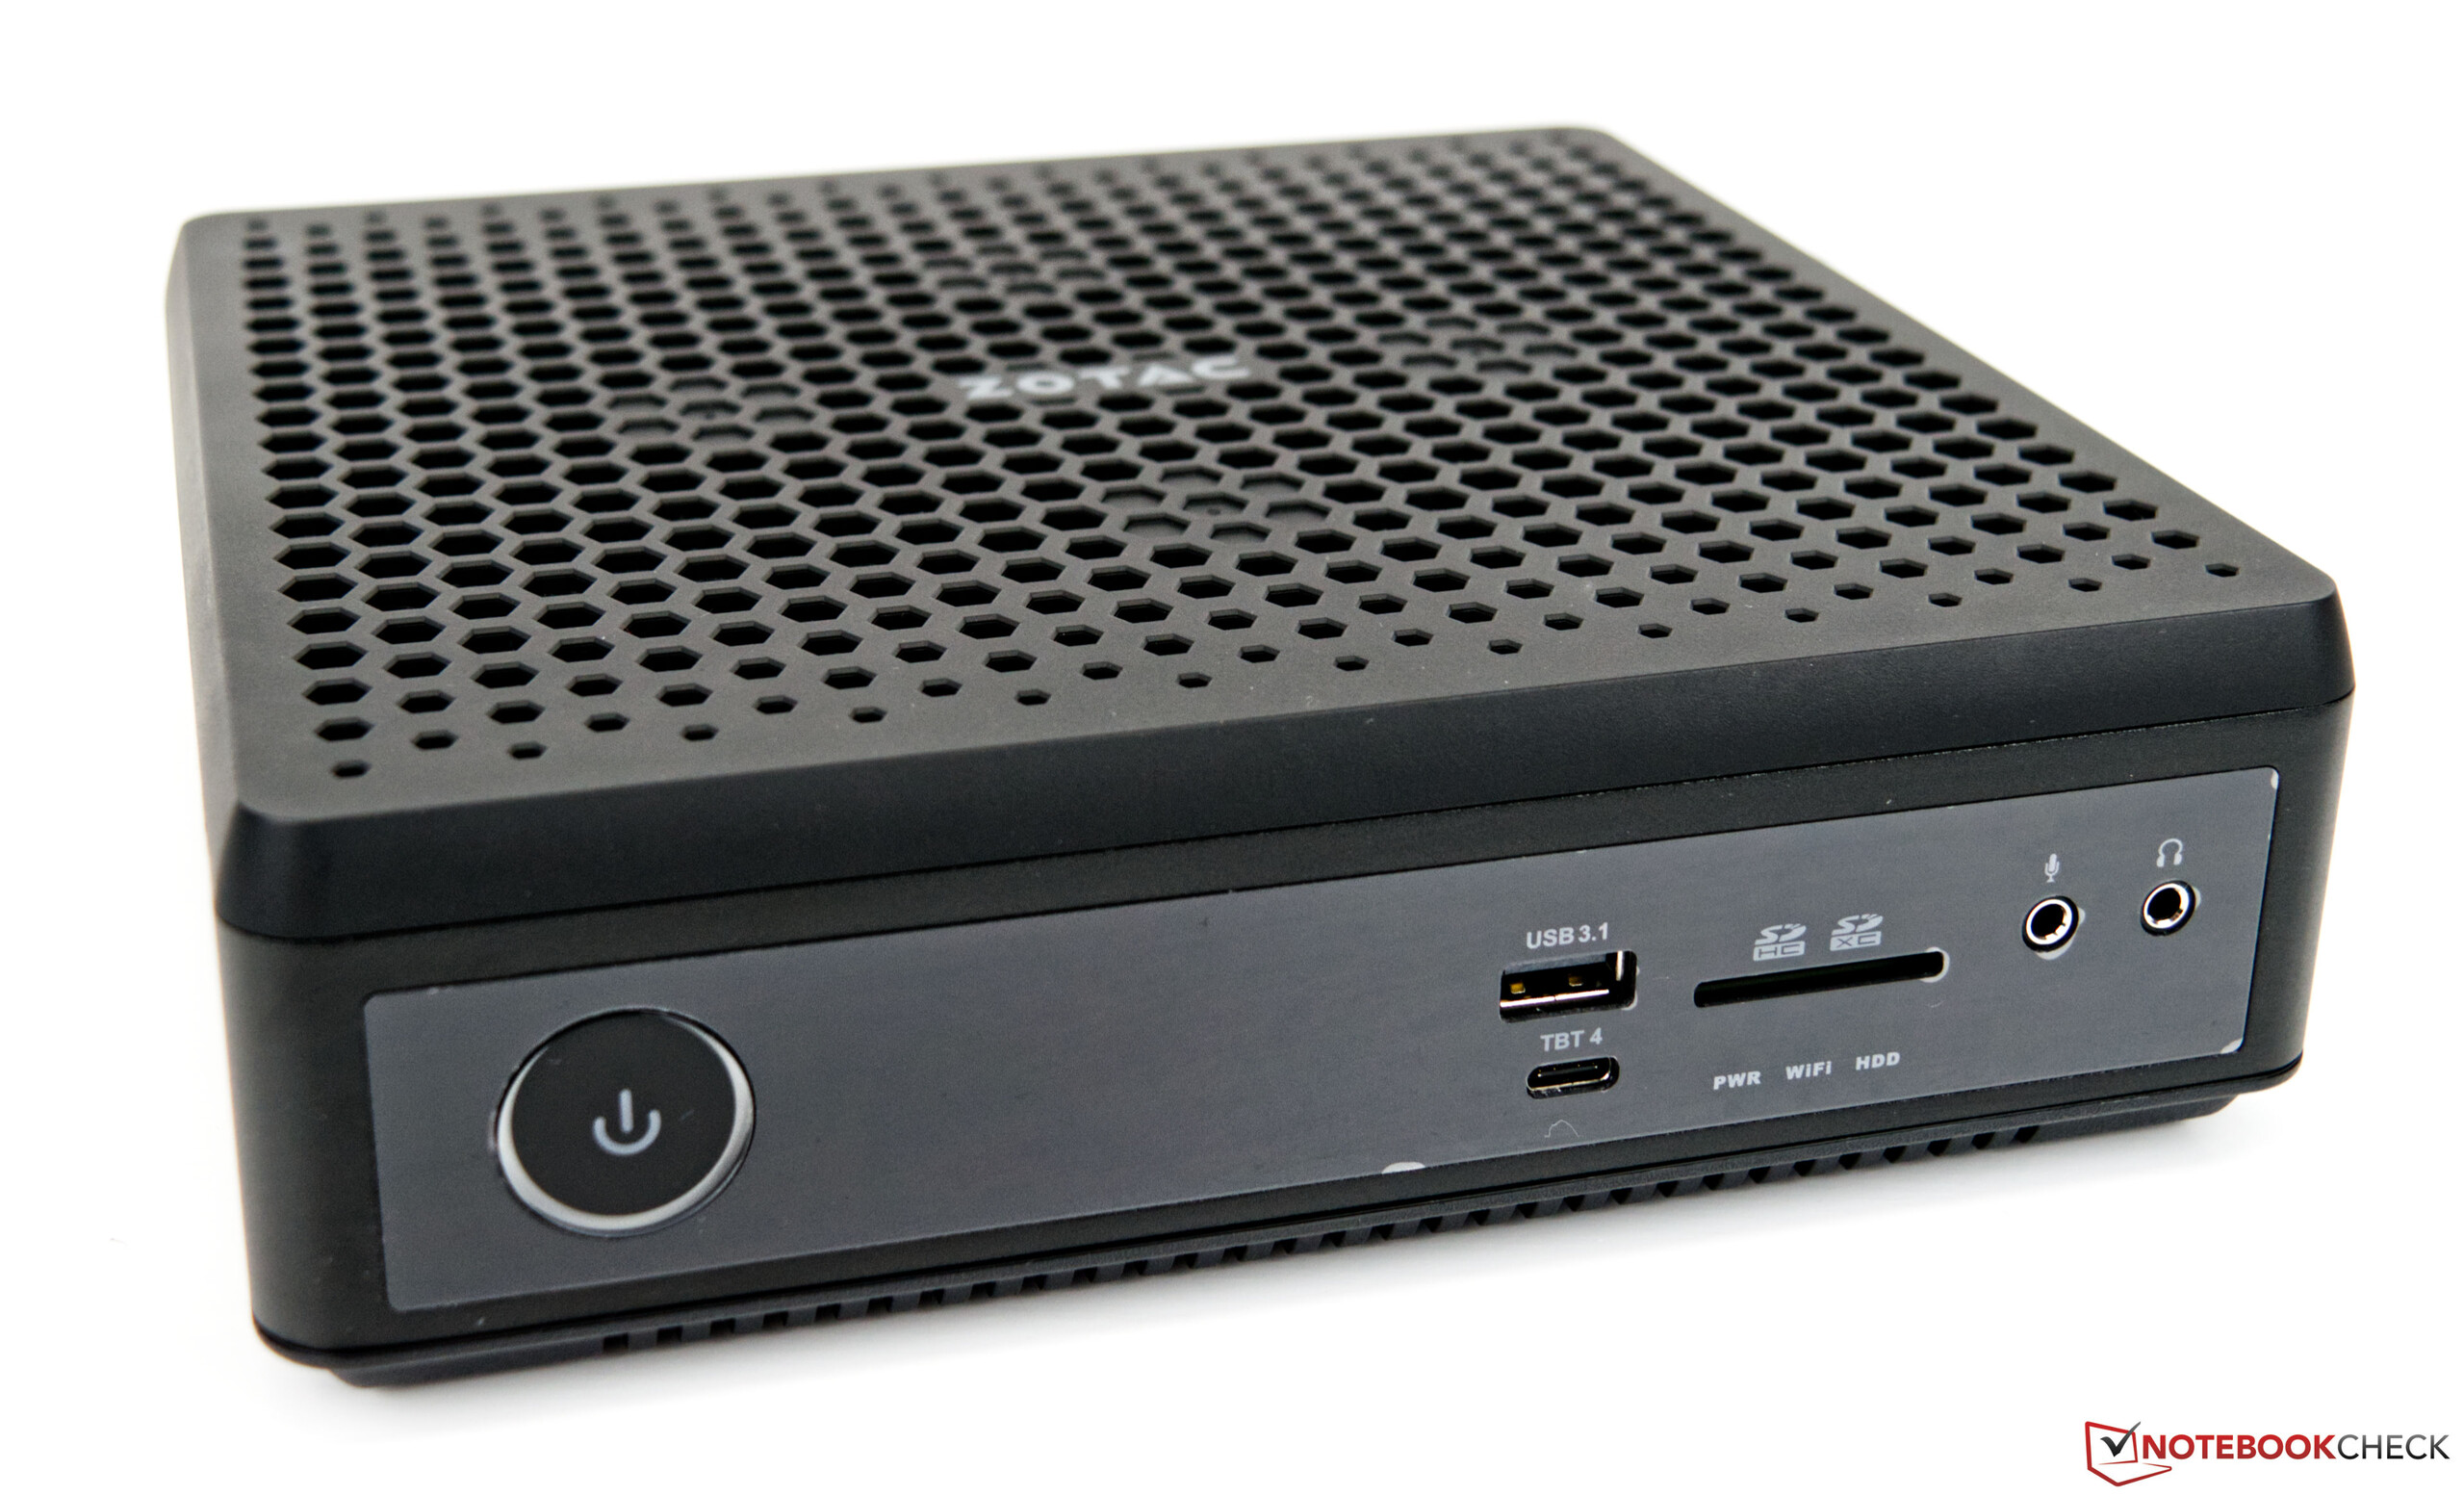
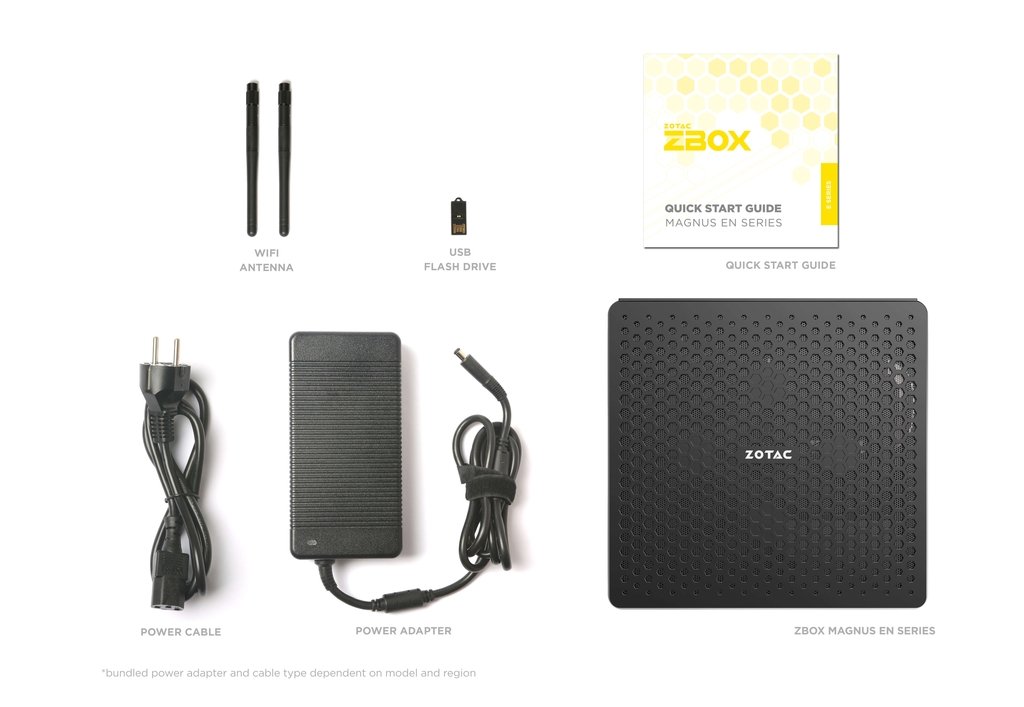
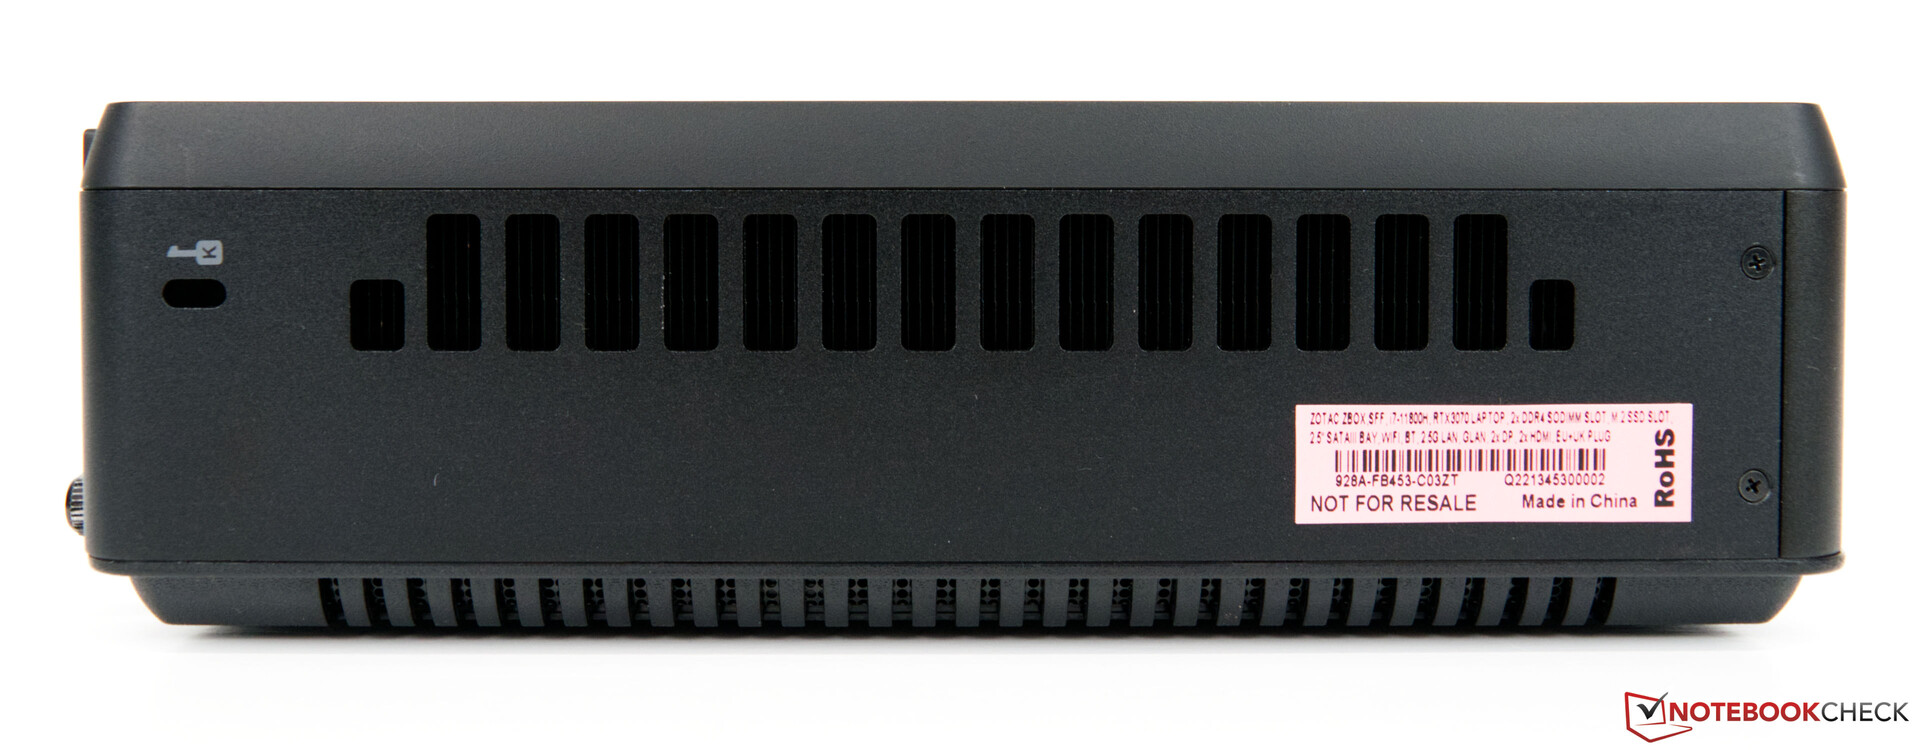
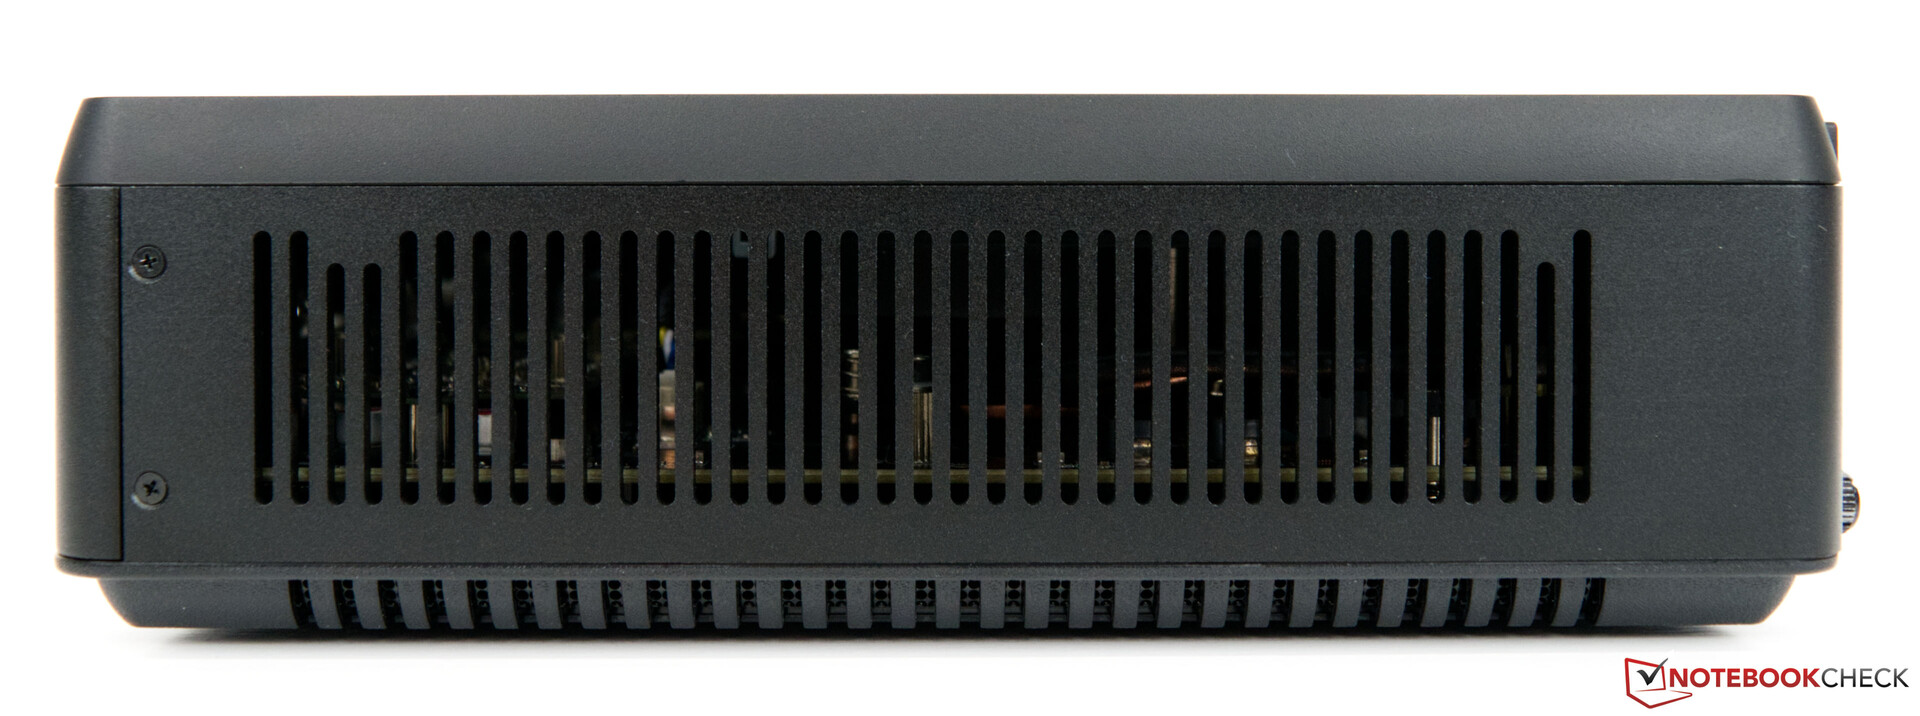
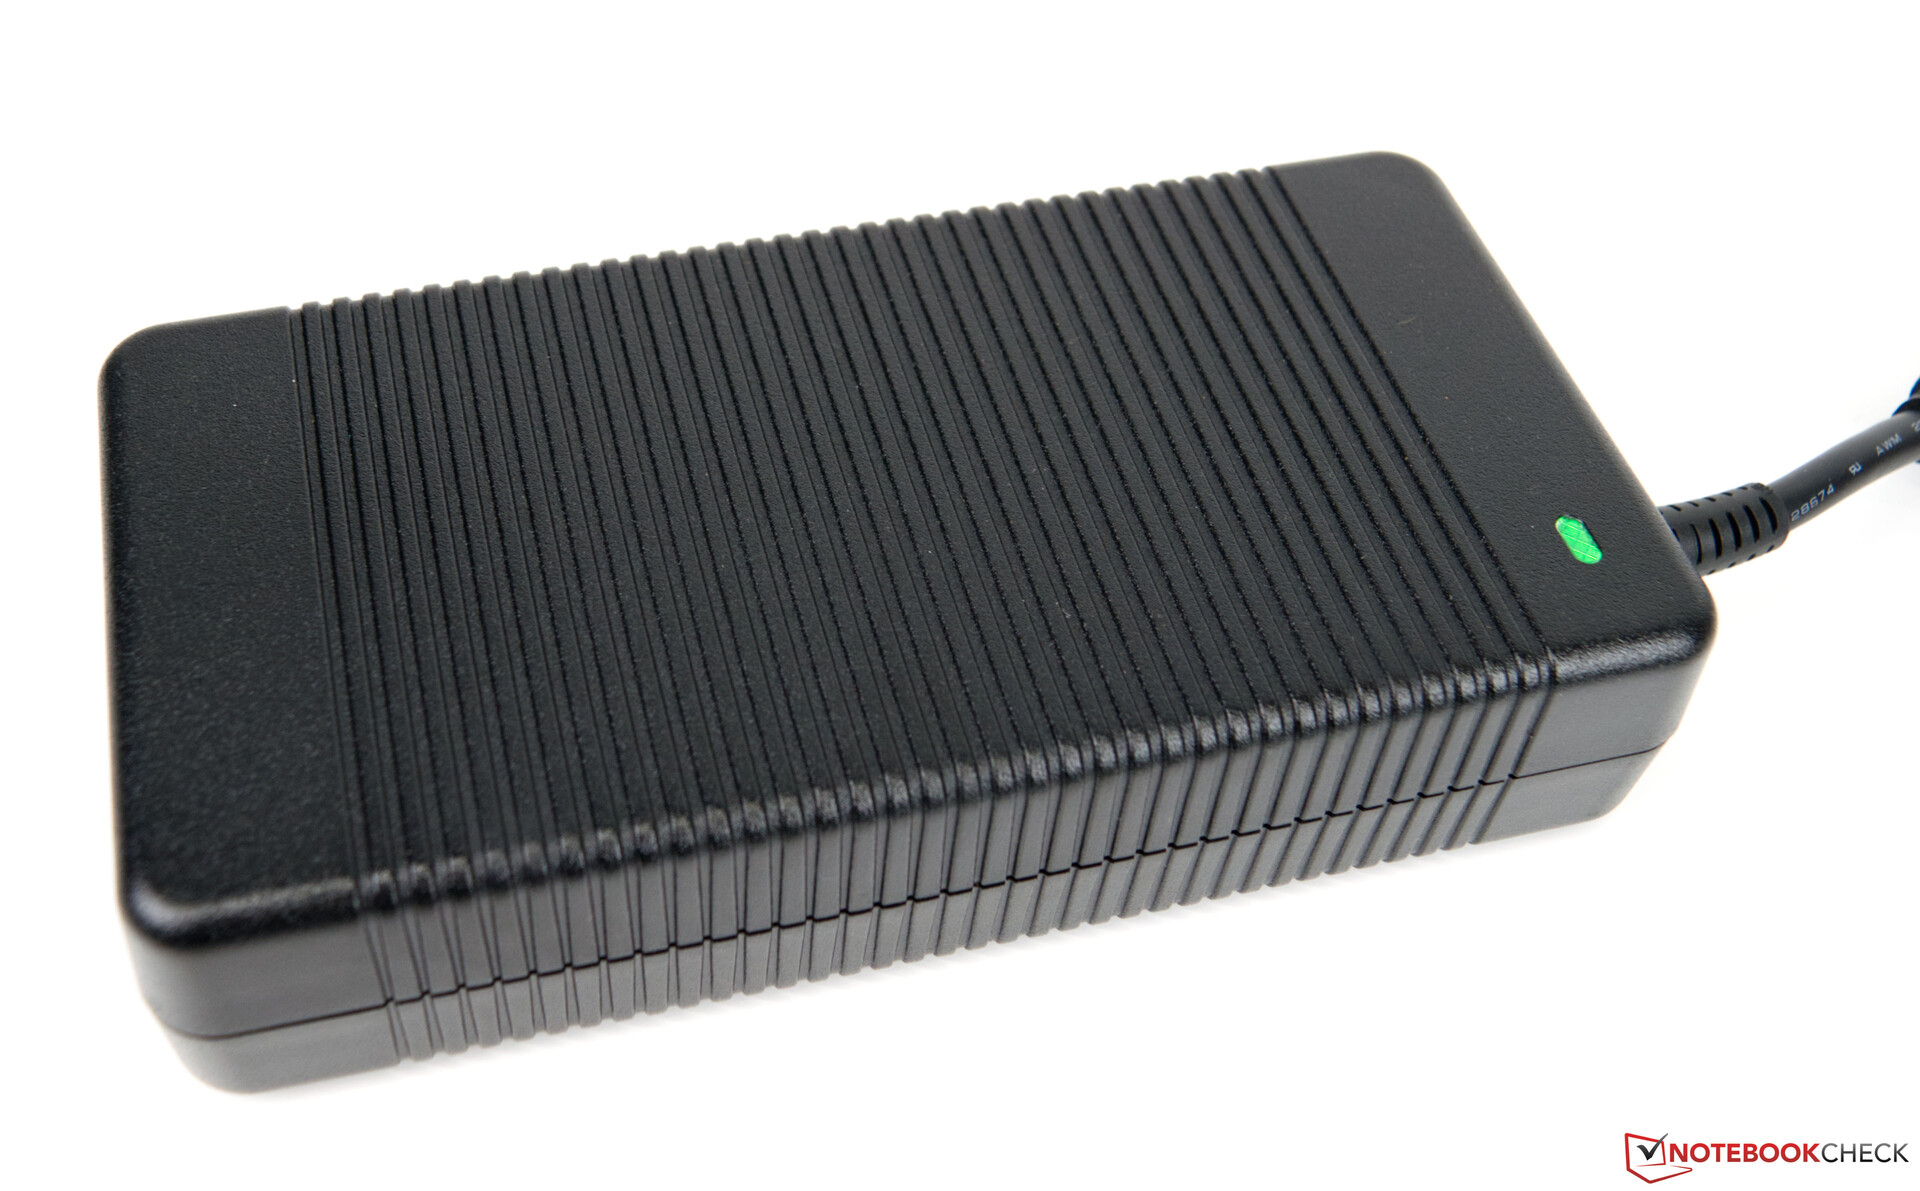
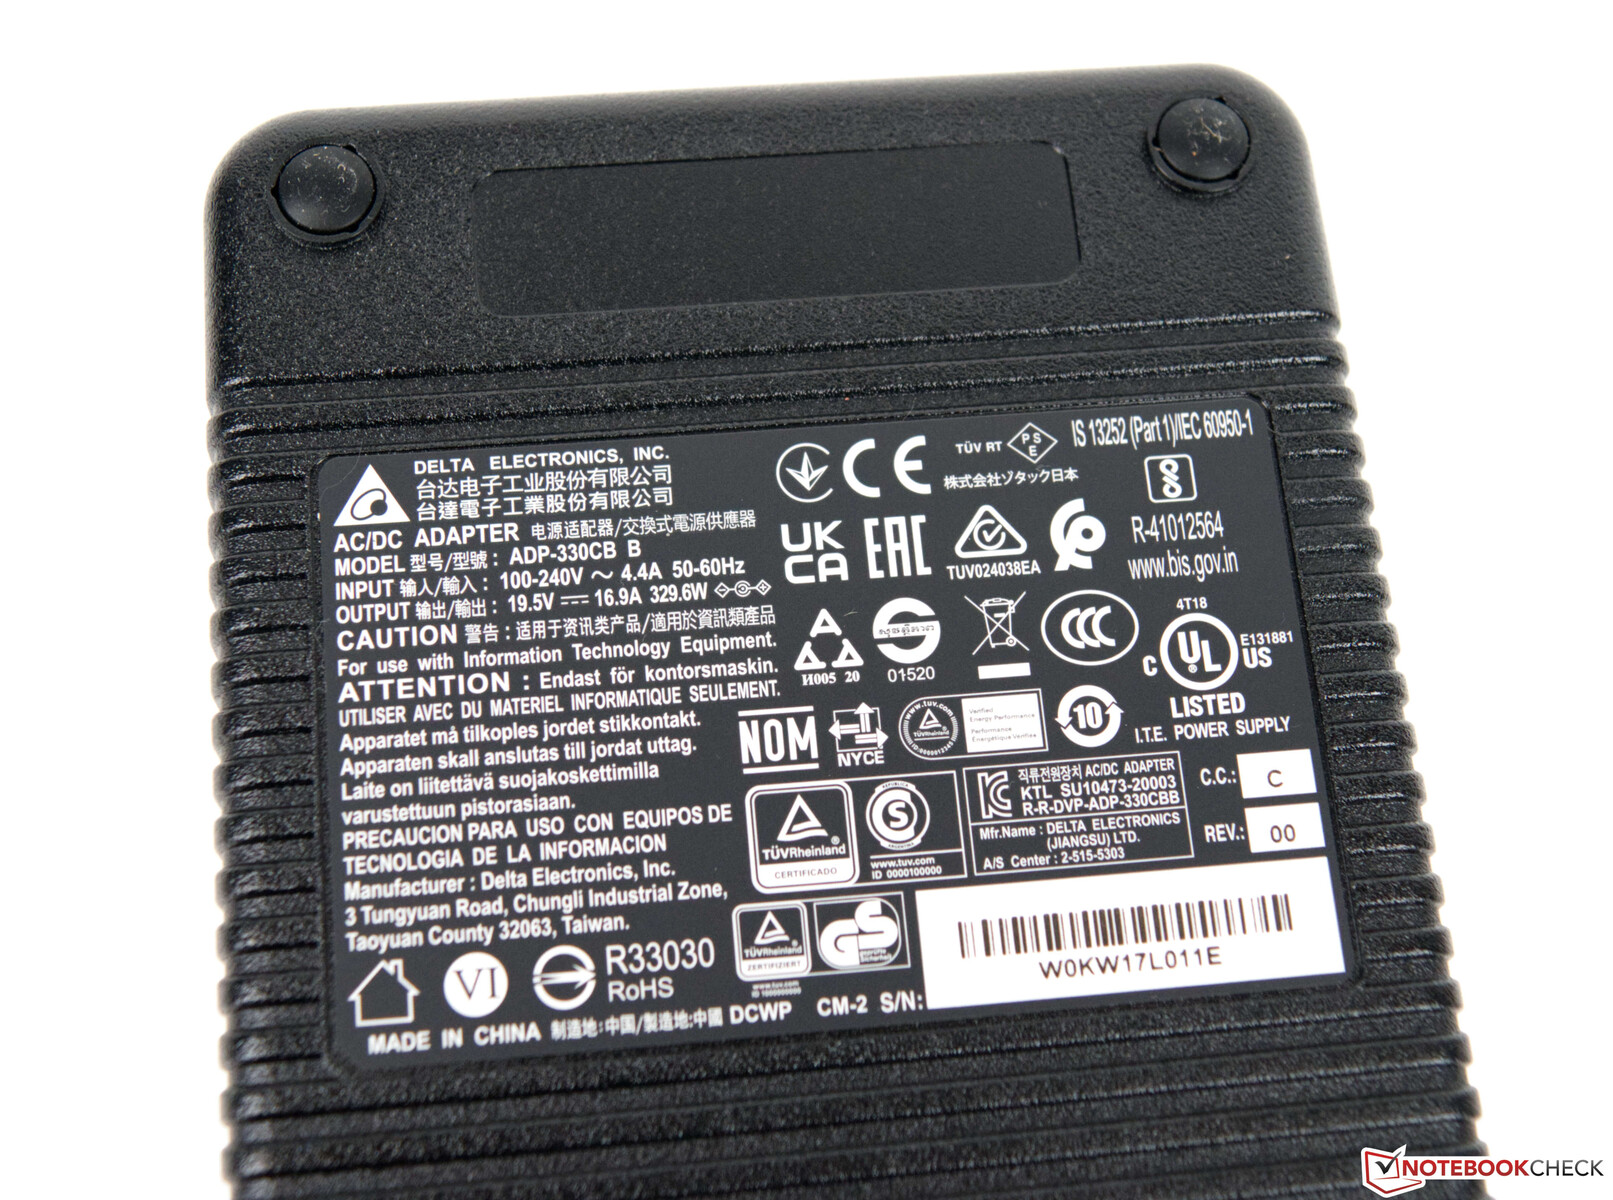
Optisch ist der Zotac ZBOX Magnus EN173070C klar als dieser zu erkennen. Schon der Zotac ZBOX Magnus EN72080V basierte auf dem kompakten Gehäuse, welches sich optisch nur an der Front minimal verändert hat. Ganz ohne RGB geht es auch, wie Zotac hier zeigt. Wer das schlichte und kompakte Design mag, wird sich freuen. Das Gehäuse ist aus Kunststoff gefertigt und bleibt uns mit einem sehr guten haptischen Eindruck im Hinterkopf. Zusammen mit dem verbauten RAM und den zwei M.2-SSDs bringt das System knapp 1,8 Kilogramm auf die Waage. Zudem kommt das wuchtige 330-Watt-Netzteil, welches ebenfalls mit 1,3 Kilogramm zu Buche schlägt. Größentechnisch ist das Netzteil etwas halb so groß wie der Magnus EN173070C selbst. Dieser benötigt mit 21 x 20,3 Zentimetern nicht sehr viel Platz. Mit nur 6,22 Zentimetern in der Höhe ist das Gerät zudem relativ flach.
Ausstattung
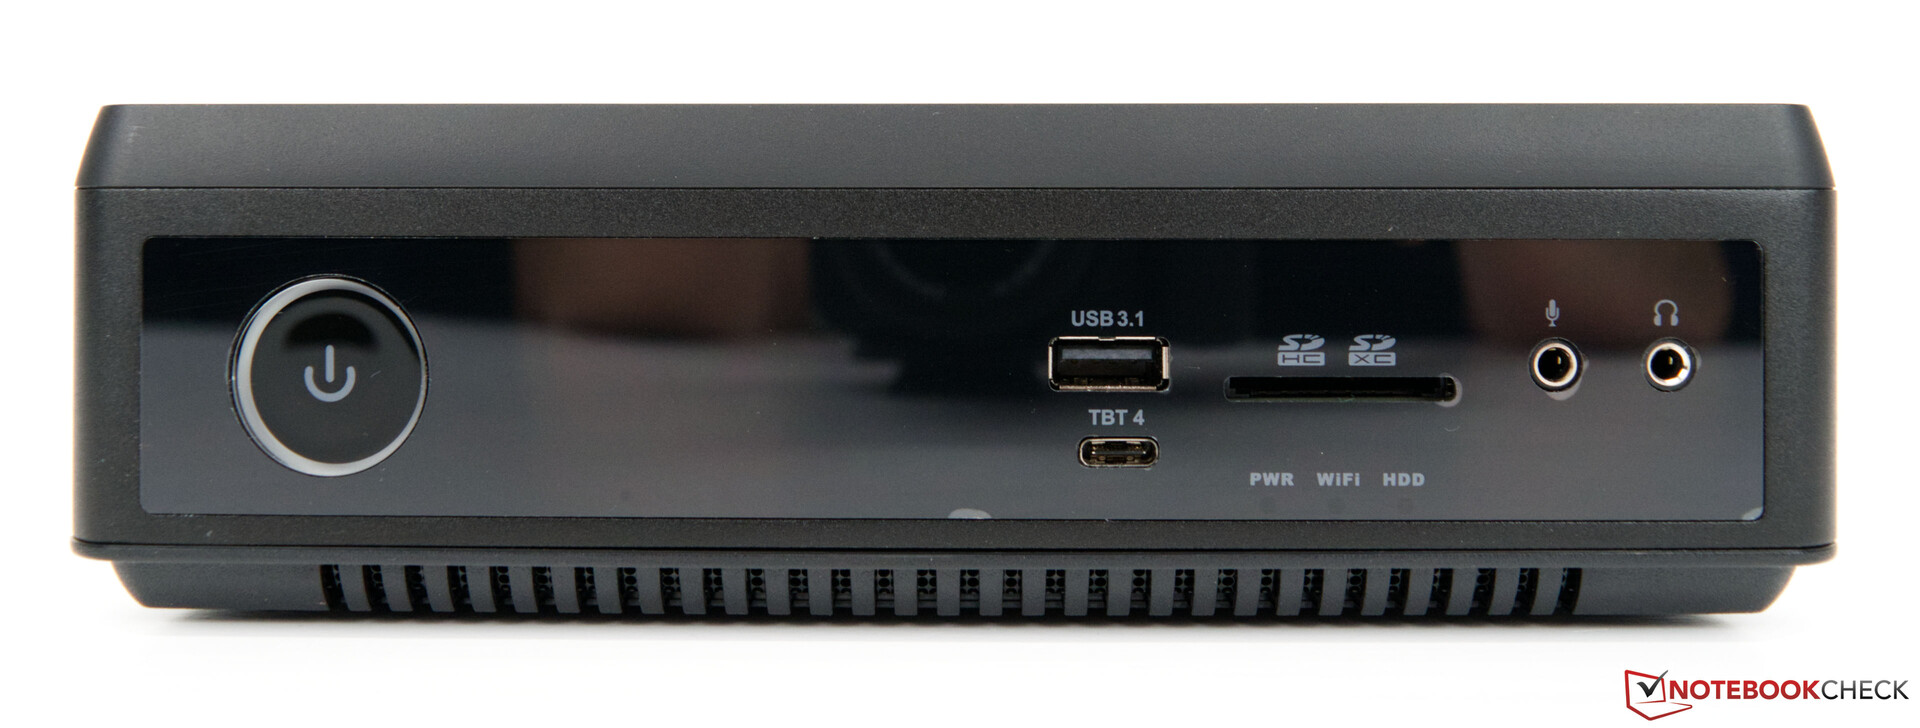
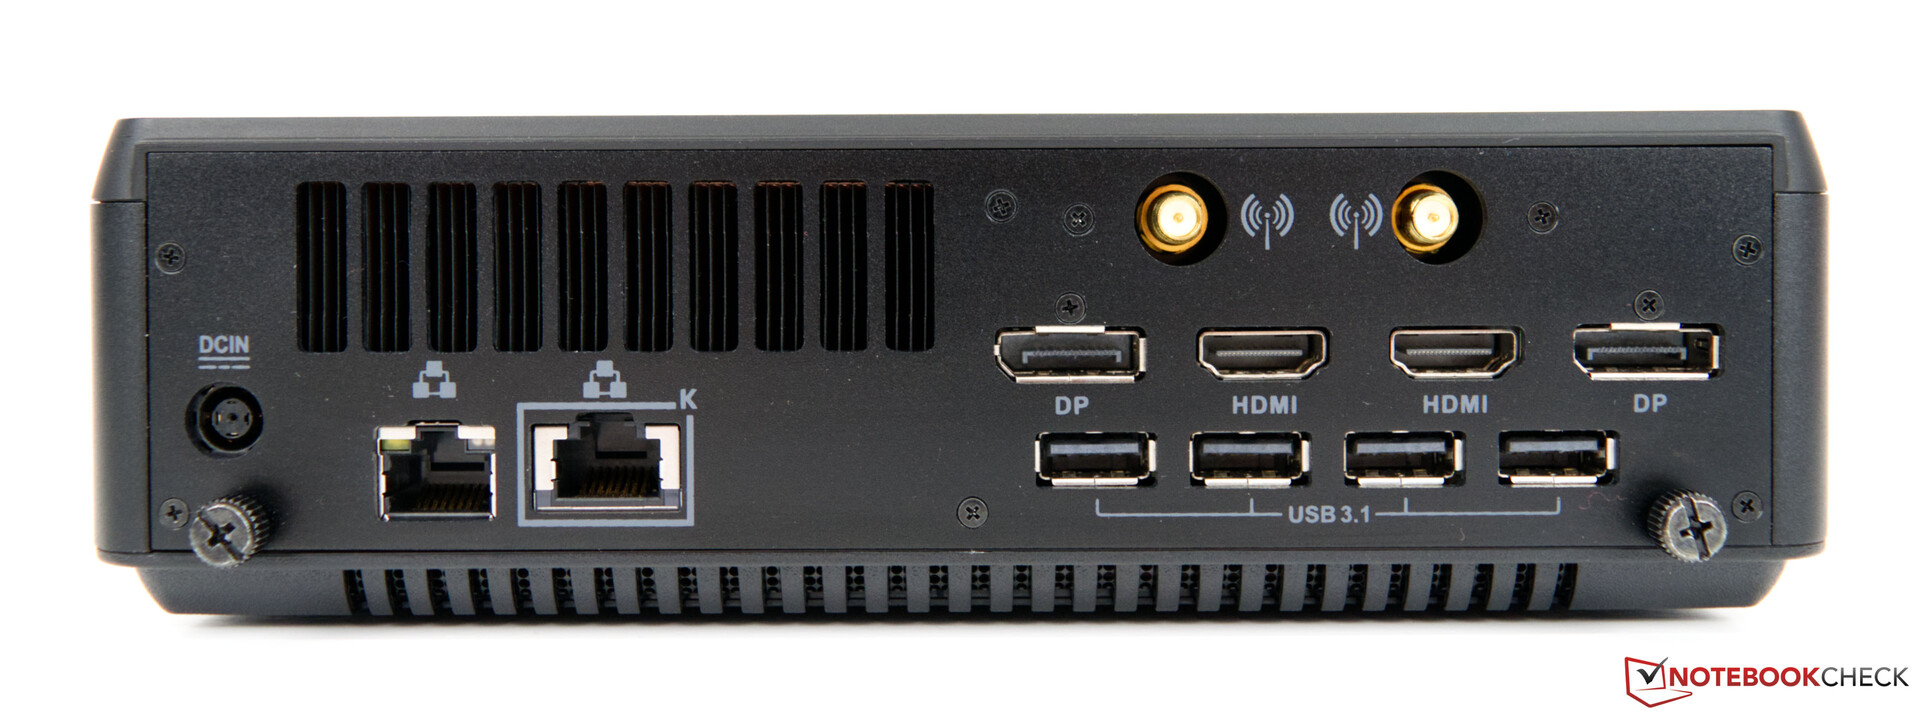
Der Zotac ZBOX Magnus EN173070C bietet eine breite Palette an externen Anschlüssen. Bei einem Desktop-PC ist das aber auch zu erwarten. Insgesamt gibt es fünfmal USB Typ A und einmal Typ C alias Thunderbolt 4. Hier gibt es aber die Einschränkung, dass dieser Port nur für Daten geeignet ist. Weiterhin können an dem PC bis zu vier Displays gleichzeitig betrieben werden. Zweimal DisplayPort und zweimal HDMI stehen dafür zur Wahl und auch auf einen SD-Kartenleser müssen die Nutzer nicht verzichten.
SD Card Reader
Der intern verbaute SD-Kartenleser bietet USB-3-Geschwindigkeit und kann die volle Leistung unserer Testkarte (AV Pro SD microSD 128 GB V60) nicht abbilden. Der Intel Dragon Canyon NUC zeigt was mit UHS II Support möglich ist.
| SD Card Reader | |
| average JPG Copy Test (av. of 3 runs) | |
| Intel Dragon Canyon NUC | |
| Zotac ZBOX Magnus EN173070C (AV Pro SD microSD 128 GB V60) | |
| maximum AS SSD Seq Read Test (1GB) | |
| Intel Dragon Canyon NUC | |
| Zotac ZBOX Magnus EN173070C (AV Pro SD microSD 128 GB V60) | |
Kommunikation
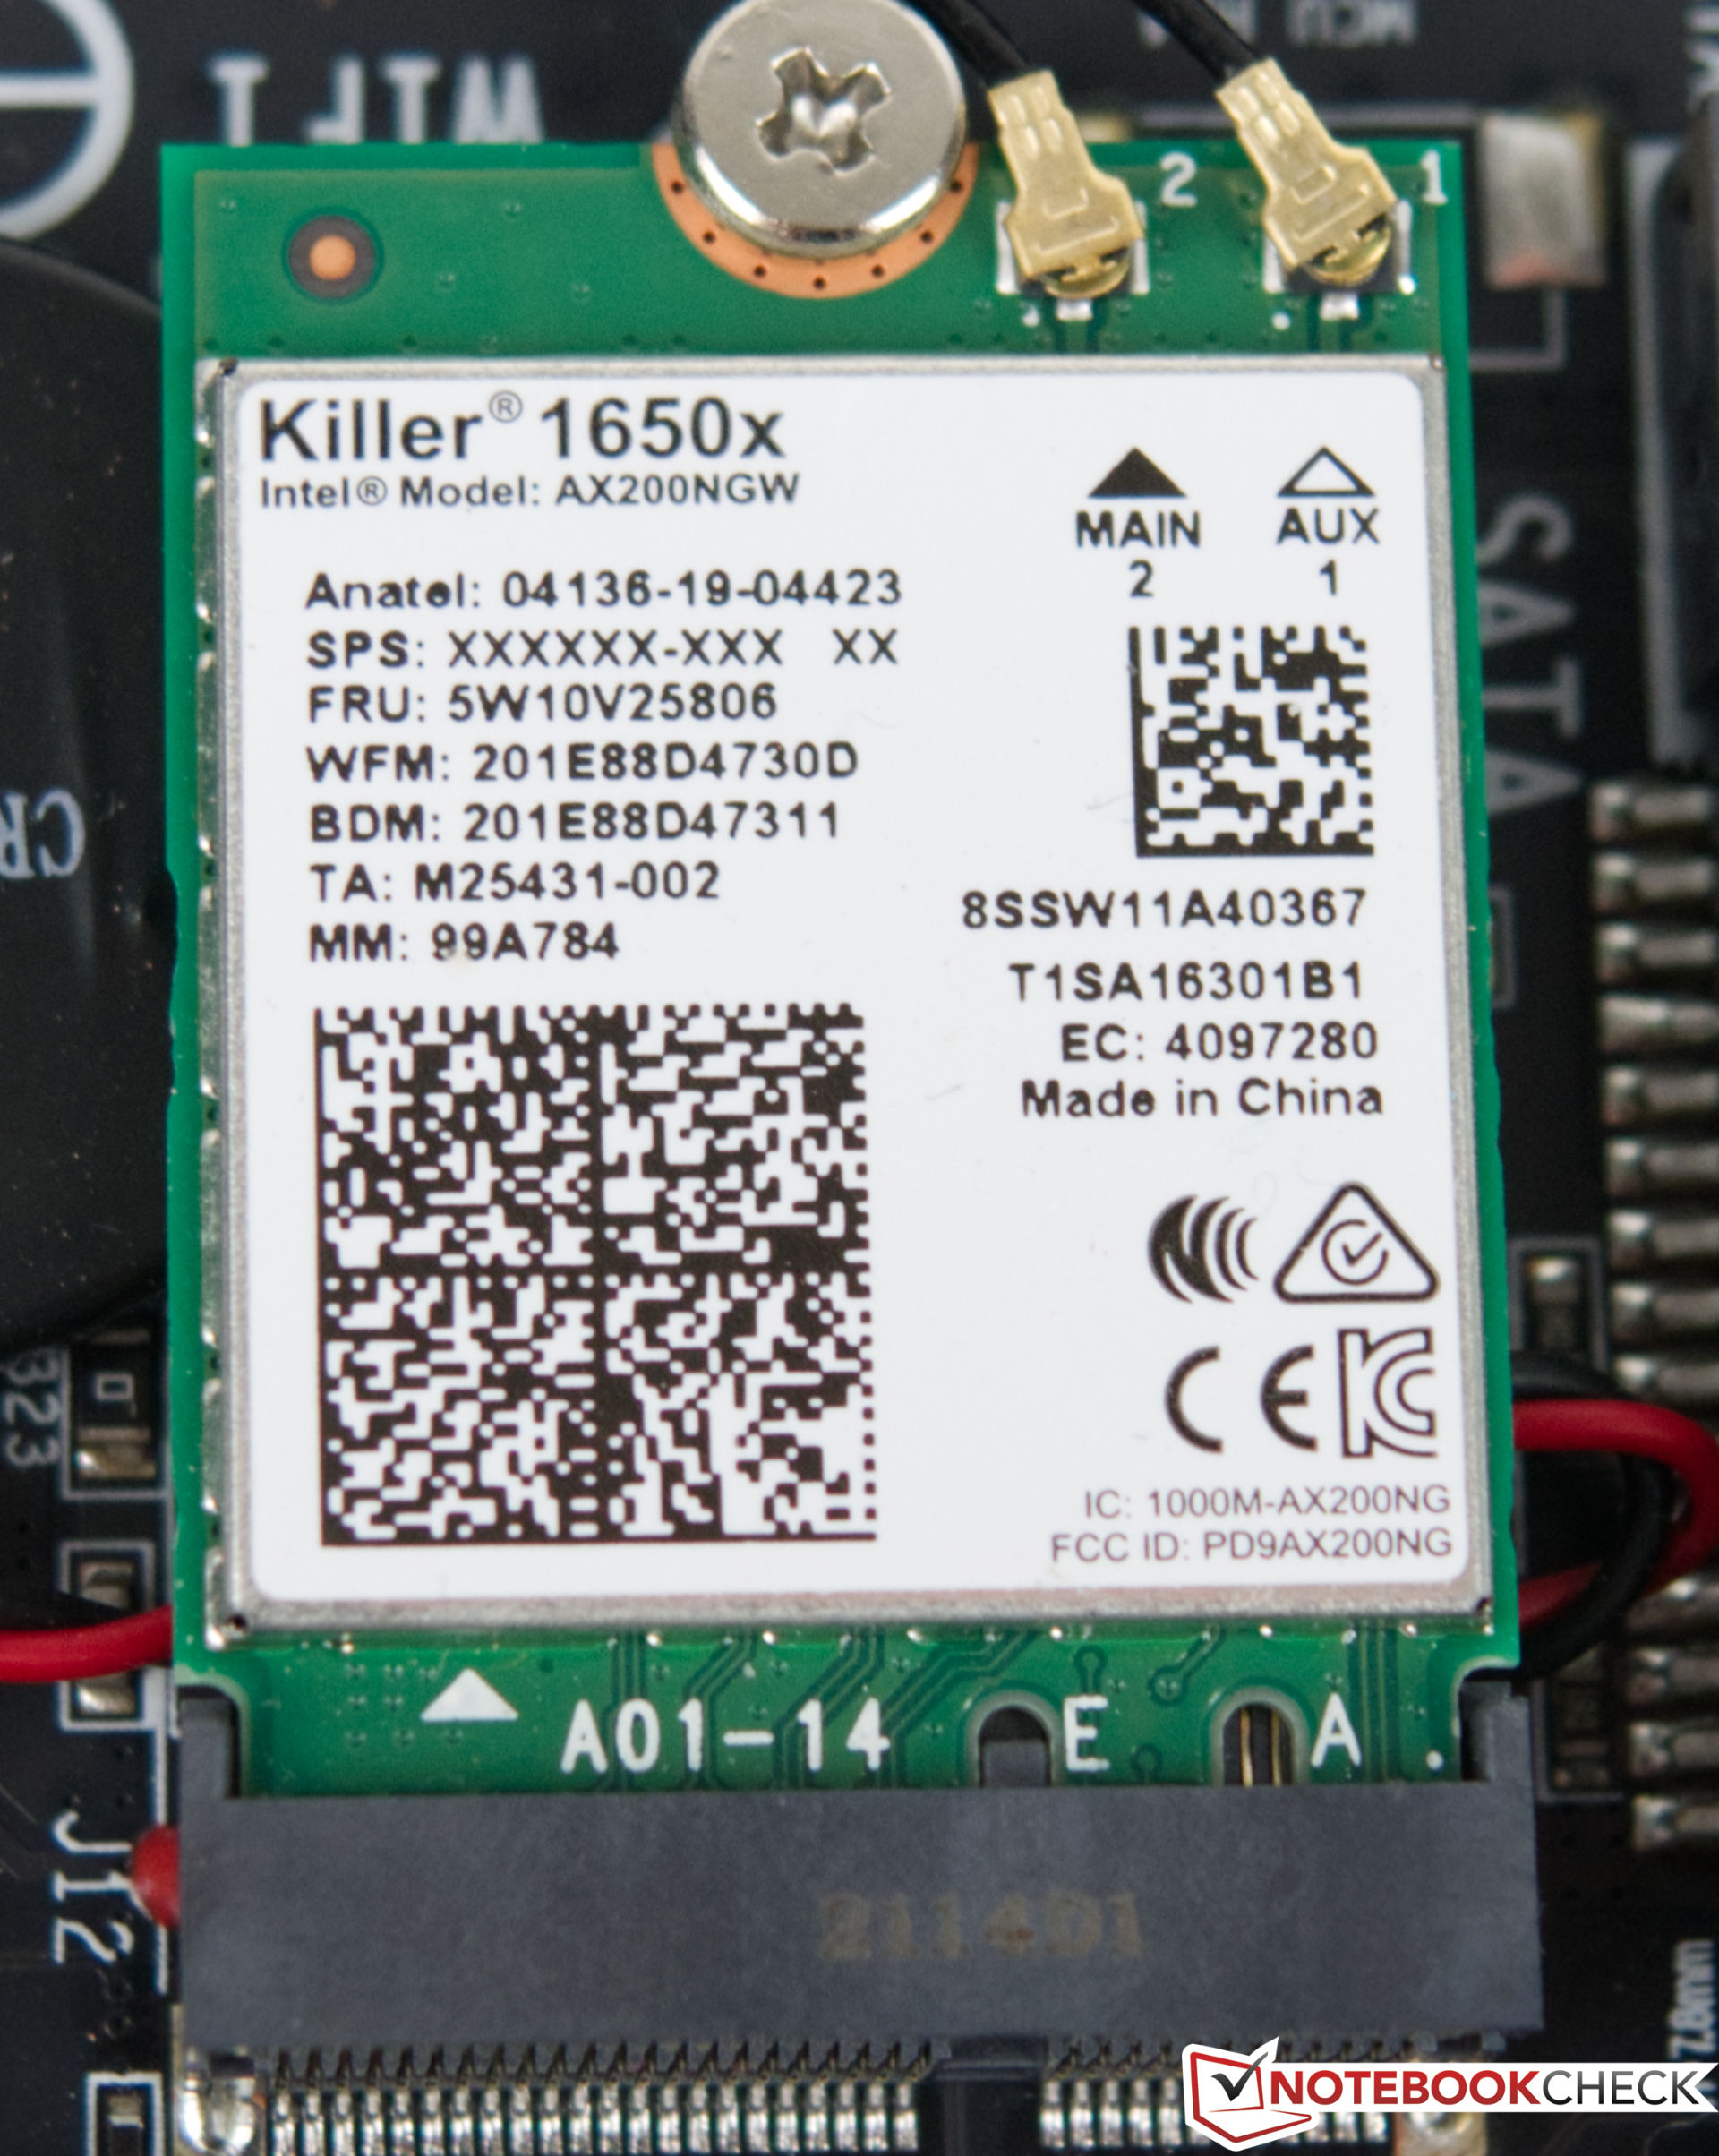
Zotac verbaut beim Magnus EN173070C ein WLAN-Modul von Killer. Das AX1650x bietet Wi-Fi 6 und schlägt sich im Test sehr gut. Auch über einen längeren Zeitraum bleibt die Leistung stabil und es gibt keine nennenswerten Schwankungen. Im direkten Vergleich konnte der Intel Dragon Canyon NUC mit dem Intel Wi-Fi 6E AX211 jedoch bessere Werte liefern. Den Test haben wir unter optimalen Bedingungen mit dem Asus GT-AXE1000WiFi-6E Gaming WLAN-Router durchgeführt.
Leistung
Prozessor
In dem Zotac ZBOX Magnus EN173070C steckt ein Intel Core i7-11800H. Dieser eigentlich für Laptops gedachte Prozessor bietet 8 Kerne und 16 Threads bei maximal 4,6 GHz. Das zur Tiger-Lake-Serie zugehörige SoC verrichtet in dem kompakten System eine gute Arbeit. Mit 55 Watt definiert Zotac hier den PL1, wenngleich das SoC kurzfristig bis zu 69 Watt verbrauchen darf. Die Leistung spiegelt sich jedoch nicht so richtig in den Ergebnissen wider. Dennoch arbeitet das SoC unseres Testsamples bei Single-Core-Last auf dem Level eines Intel Core i9-10900K. Stellenweise kann dieser sogar geschlagen werden. Gegen den AMD Ryzen 9 5900HX muss sich der Intel Core i7-11800H jedoch in vielen Tests geschlagen geben. Erst mit Intels Alder-Lake-P-SoCs sollte es hierbei einen spürbaren Leistungssprung geben. Vielleicht plant Zotac in naher Zukunft schon ein kleines Upgrade, was die Leistung in allen Bereichen verbessern würde.
* ... kleinere Werte sind besser
AIDA64: FP32 Ray-Trace | FPU Julia | CPU SHA3 | CPU Queen | FPU SinJulia | FPU Mandel | CPU AES | CPU ZLib | FP64 Ray-Trace | CPU PhotoWorxx
| Performance Rating | |
| Durchschnitt der Klasse Desktop | |
| Minisforum EliteMini HX90 | |
| AMD Ryzen 7 5800X | |
| Zotac ZBOX Magnus EN173070C | |
| Durchschnittliche Intel Core i7-11800H | |
| Intel Core i5-12600K | |
| AIDA64 / FP32 Ray-Trace | |
| Durchschnitt der Klasse Desktop (12248 - 84577, n=15, der letzten 2 Jahre) | |
| AMD Ryzen 7 5800X | |
| Minisforum EliteMini HX90 | |
| Durchschnittliche Intel Core i7-11800H (8772 - 15961, n=20) | |
| Zotac ZBOX Magnus EN173070C | |
| Intel Core i5-12600K | |
| AIDA64 / FPU Julia | |
| Durchschnitt der Klasse Desktop (65152 - 246125, n=15, der letzten 2 Jahre) | |
| Minisforum EliteMini HX90 | |
| AMD Ryzen 7 5800X | |
| Durchschnittliche Intel Core i7-11800H (39404 - 65636, n=20) | |
| Zotac ZBOX Magnus EN173070C | |
| Intel Core i5-12600K | |
| AIDA64 / CPU SHA3 | |
| Durchschnitt der Klasse Desktop (2982 - 10804, n=15, der letzten 2 Jahre) | |
| Durchschnittliche Intel Core i7-11800H (2599 - 4439, n=20) | |
| Zotac ZBOX Magnus EN173070C | |
| Minisforum EliteMini HX90 | |
| Intel Core i5-12600K | |
| AMD Ryzen 7 5800X | |
| AIDA64 / CPU Queen | |
| Durchschnitt der Klasse Desktop (76512 - 187912, n=15, der letzten 2 Jahre) | |
| AMD Ryzen 7 5800X | |
| Minisforum EliteMini HX90 | |
| Durchschnittliche Intel Core i7-11800H (85233 - 91941, n=20) | |
| Zotac ZBOX Magnus EN173070C | |
| Intel Core i5-12600K | |
| AIDA64 / FPU SinJulia | |
| Durchschnitt der Klasse Desktop (6443 - 35251, n=15, der letzten 2 Jahre) | |
| AMD Ryzen 7 5800X | |
| Minisforum EliteMini HX90 | |
| Intel Core i5-12600K | |
| Zotac ZBOX Magnus EN173070C | |
| Durchschnittliche Intel Core i7-11800H (6420 - 9792, n=20) | |
| AIDA64 / FPU Mandel | |
| Durchschnitt der Klasse Desktop (31697 - 129745, n=15, der letzten 2 Jahre) | |
| Minisforum EliteMini HX90 | |
| AMD Ryzen 7 5800X | |
| Durchschnittliche Intel Core i7-11800H (23365 - 39464, n=20) | |
| Zotac ZBOX Magnus EN173070C | |
| Intel Core i5-12600K | |
| AIDA64 / CPU AES | |
| Durchschnitt der Klasse Desktop (57777 - 513073, n=15, der letzten 2 Jahre) | |
| Minisforum EliteMini HX90 | |
| Zotac ZBOX Magnus EN173070C | |
| Durchschnittliche Intel Core i7-11800H (74617 - 149388, n=20) | |
| AMD Ryzen 7 5800X | |
| Intel Core i5-12600K | |
| AIDA64 / CPU ZLib | |
| Durchschnitt der Klasse Desktop (887 - 2674, n=15, der letzten 2 Jahre) | |
| Intel Core i5-12600K | |
| AMD Ryzen 7 5800X | |
| Minisforum EliteMini HX90 | |
| Zotac ZBOX Magnus EN173070C | |
| Durchschnittliche Intel Core i7-11800H (461 - 830, n=43) | |
| AIDA64 / FP64 Ray-Trace | |
| Durchschnitt der Klasse Desktop (6471 - 44013, n=15, der letzten 2 Jahre) | |
| AMD Ryzen 7 5800X | |
| Minisforum EliteMini HX90 | |
| Durchschnittliche Intel Core i7-11800H (4545 - 8717, n=21) | |
| Zotac ZBOX Magnus EN173070C | |
| Intel Core i5-12600K | |
| AIDA64 / CPU PhotoWorxx | |
| Intel Core i5-12600K | |
| Durchschnitt der Klasse Desktop (38071 - 55966, n=15, der letzten 2 Jahre) | |
| AMD Ryzen 7 5800X | |
| Zotac ZBOX Magnus EN173070C | |
| Durchschnittliche Intel Core i7-11800H (11898 - 26757, n=21) | |
| Minisforum EliteMini HX90 | |
Zotac ZBOX Magnus bei der Cinebench-R15-Multi-Schleife
Die kompakte Bauweise erfordert ein ausgeklügeltes und effektives Kühlsystem. Genau dieses Zotac hier, denn bei der Cinebench-R15-Dauerschleife ist auch bei anhaltender Belastung kein starker Leistungsverlust zu verzeichnen.
Anwendungsleistung und Massenspeicher
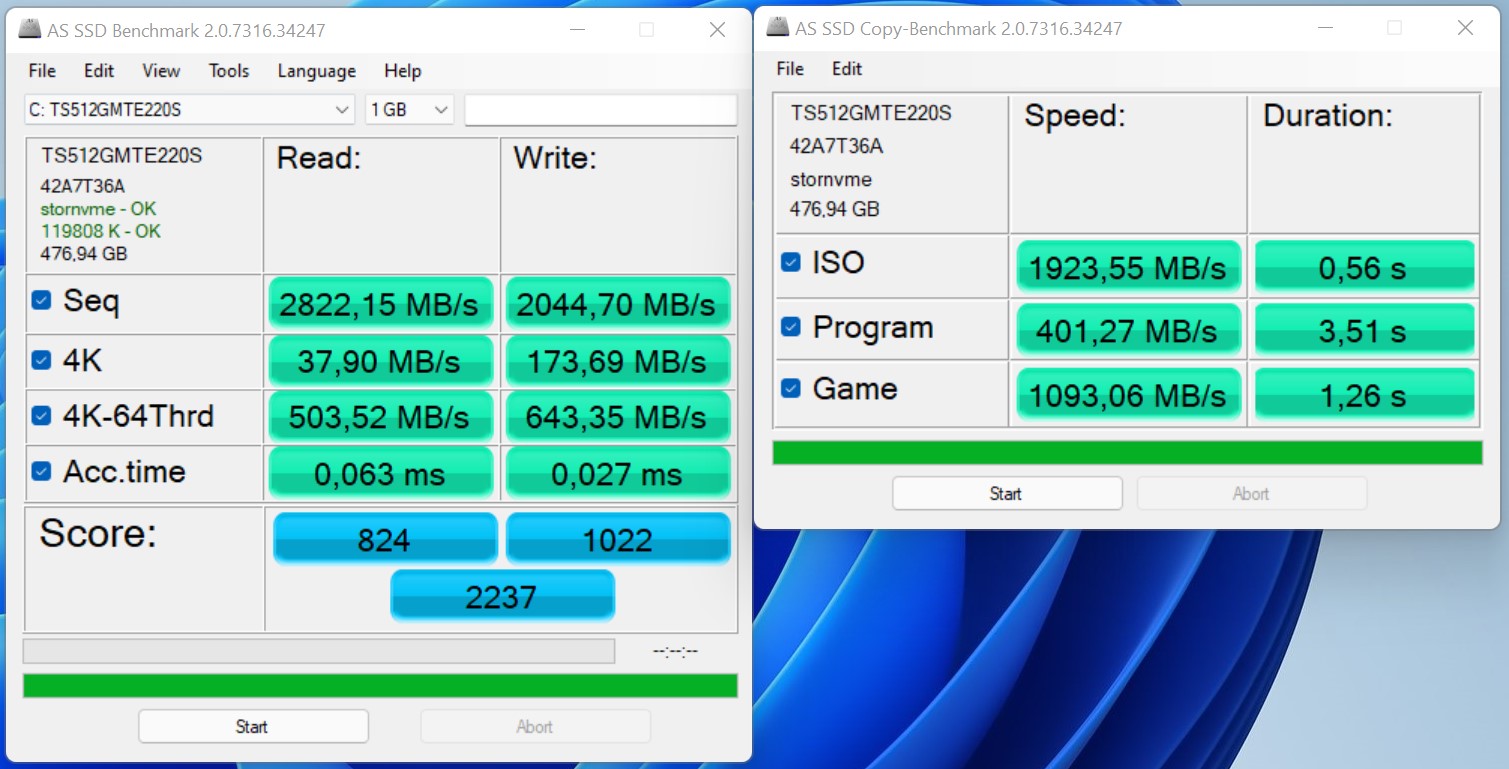
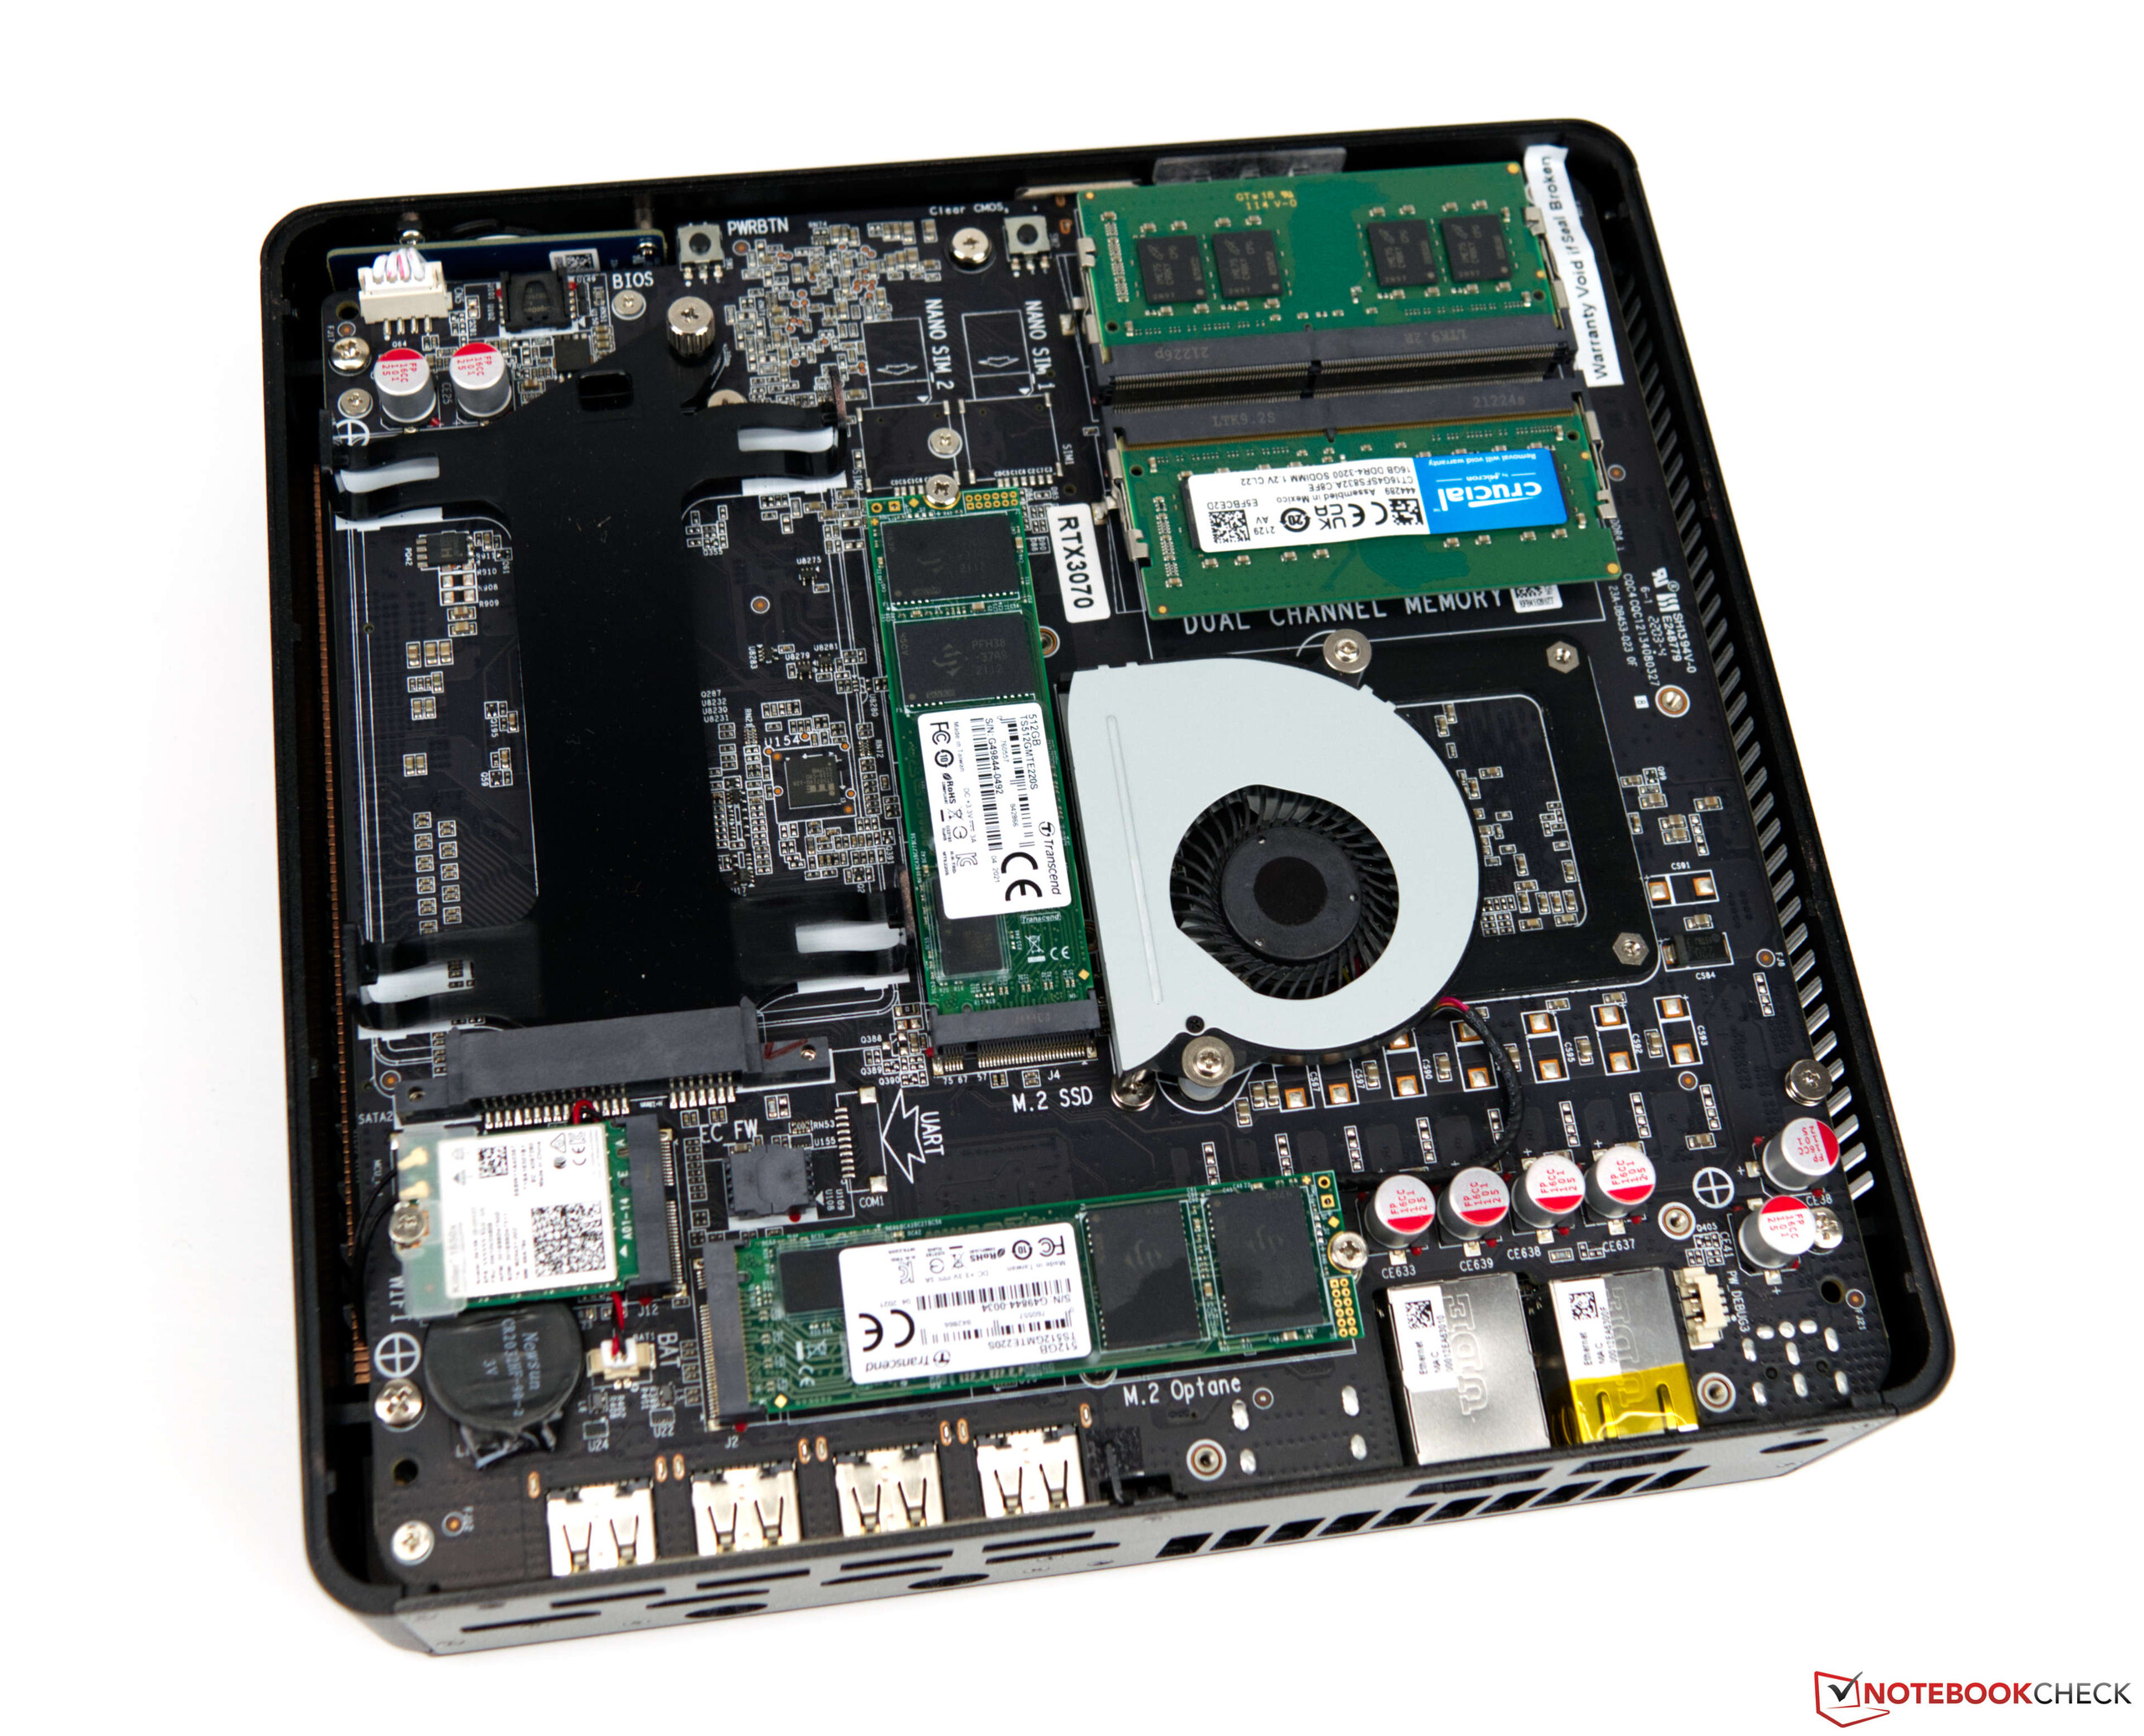
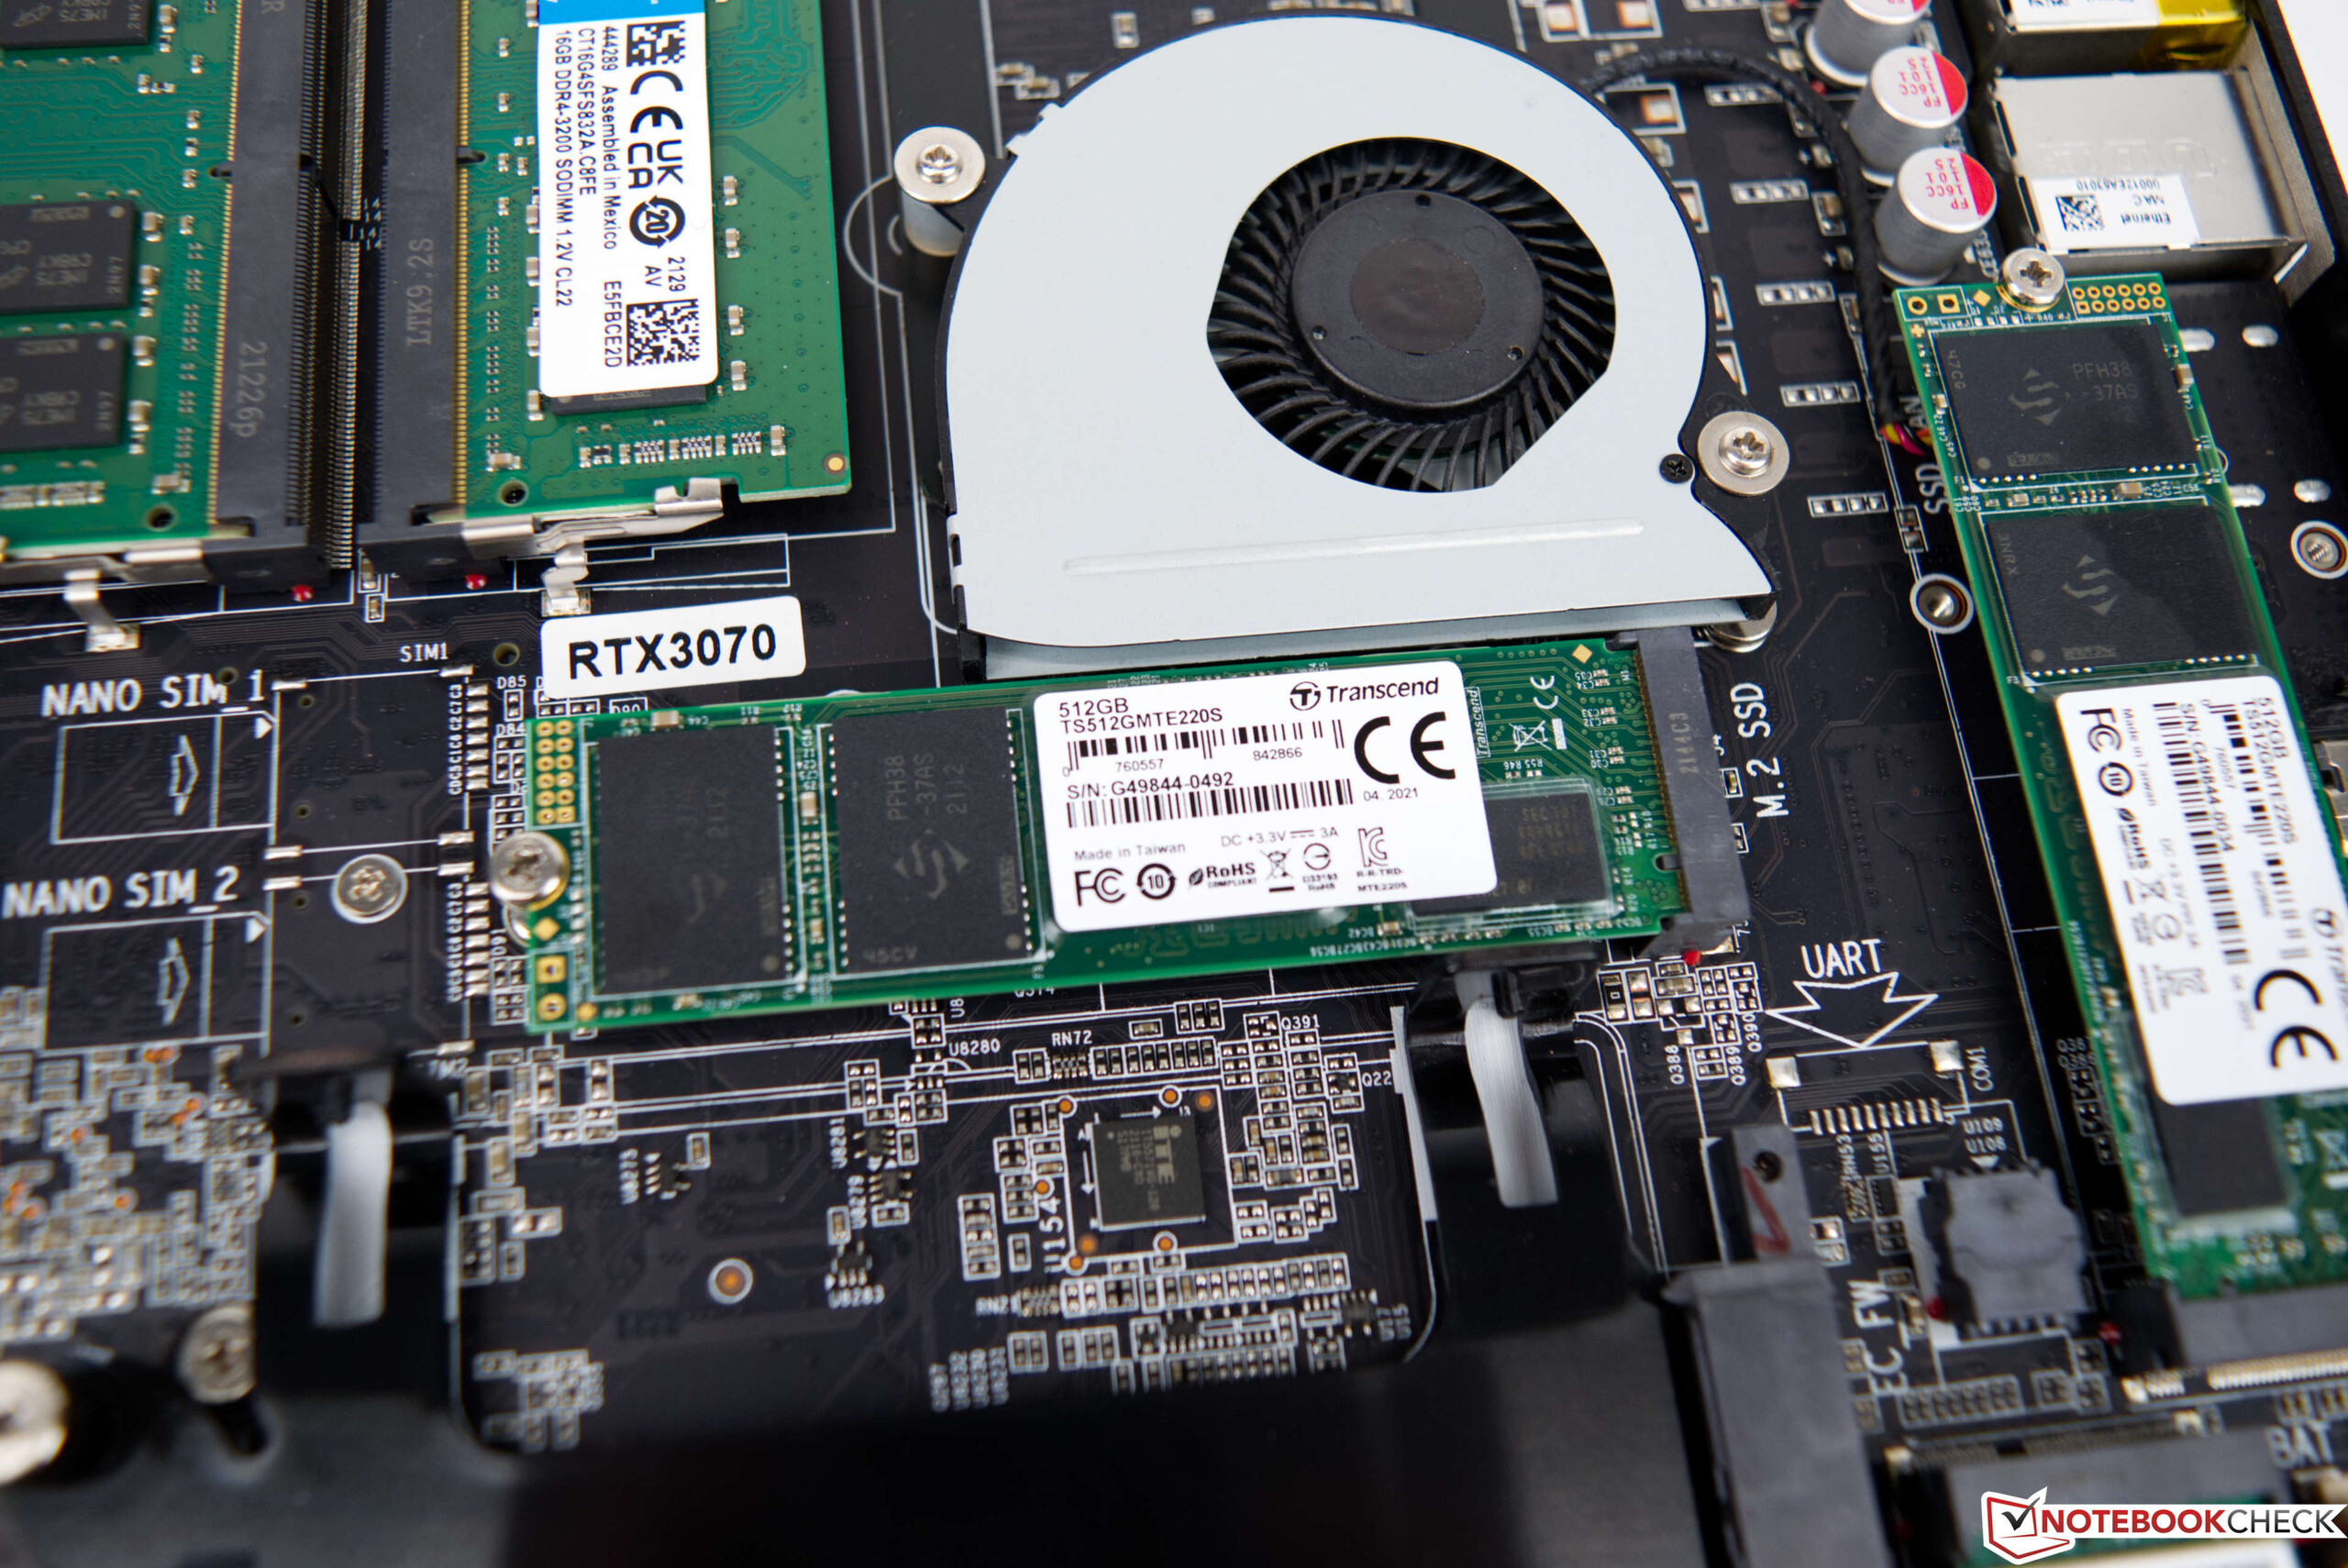
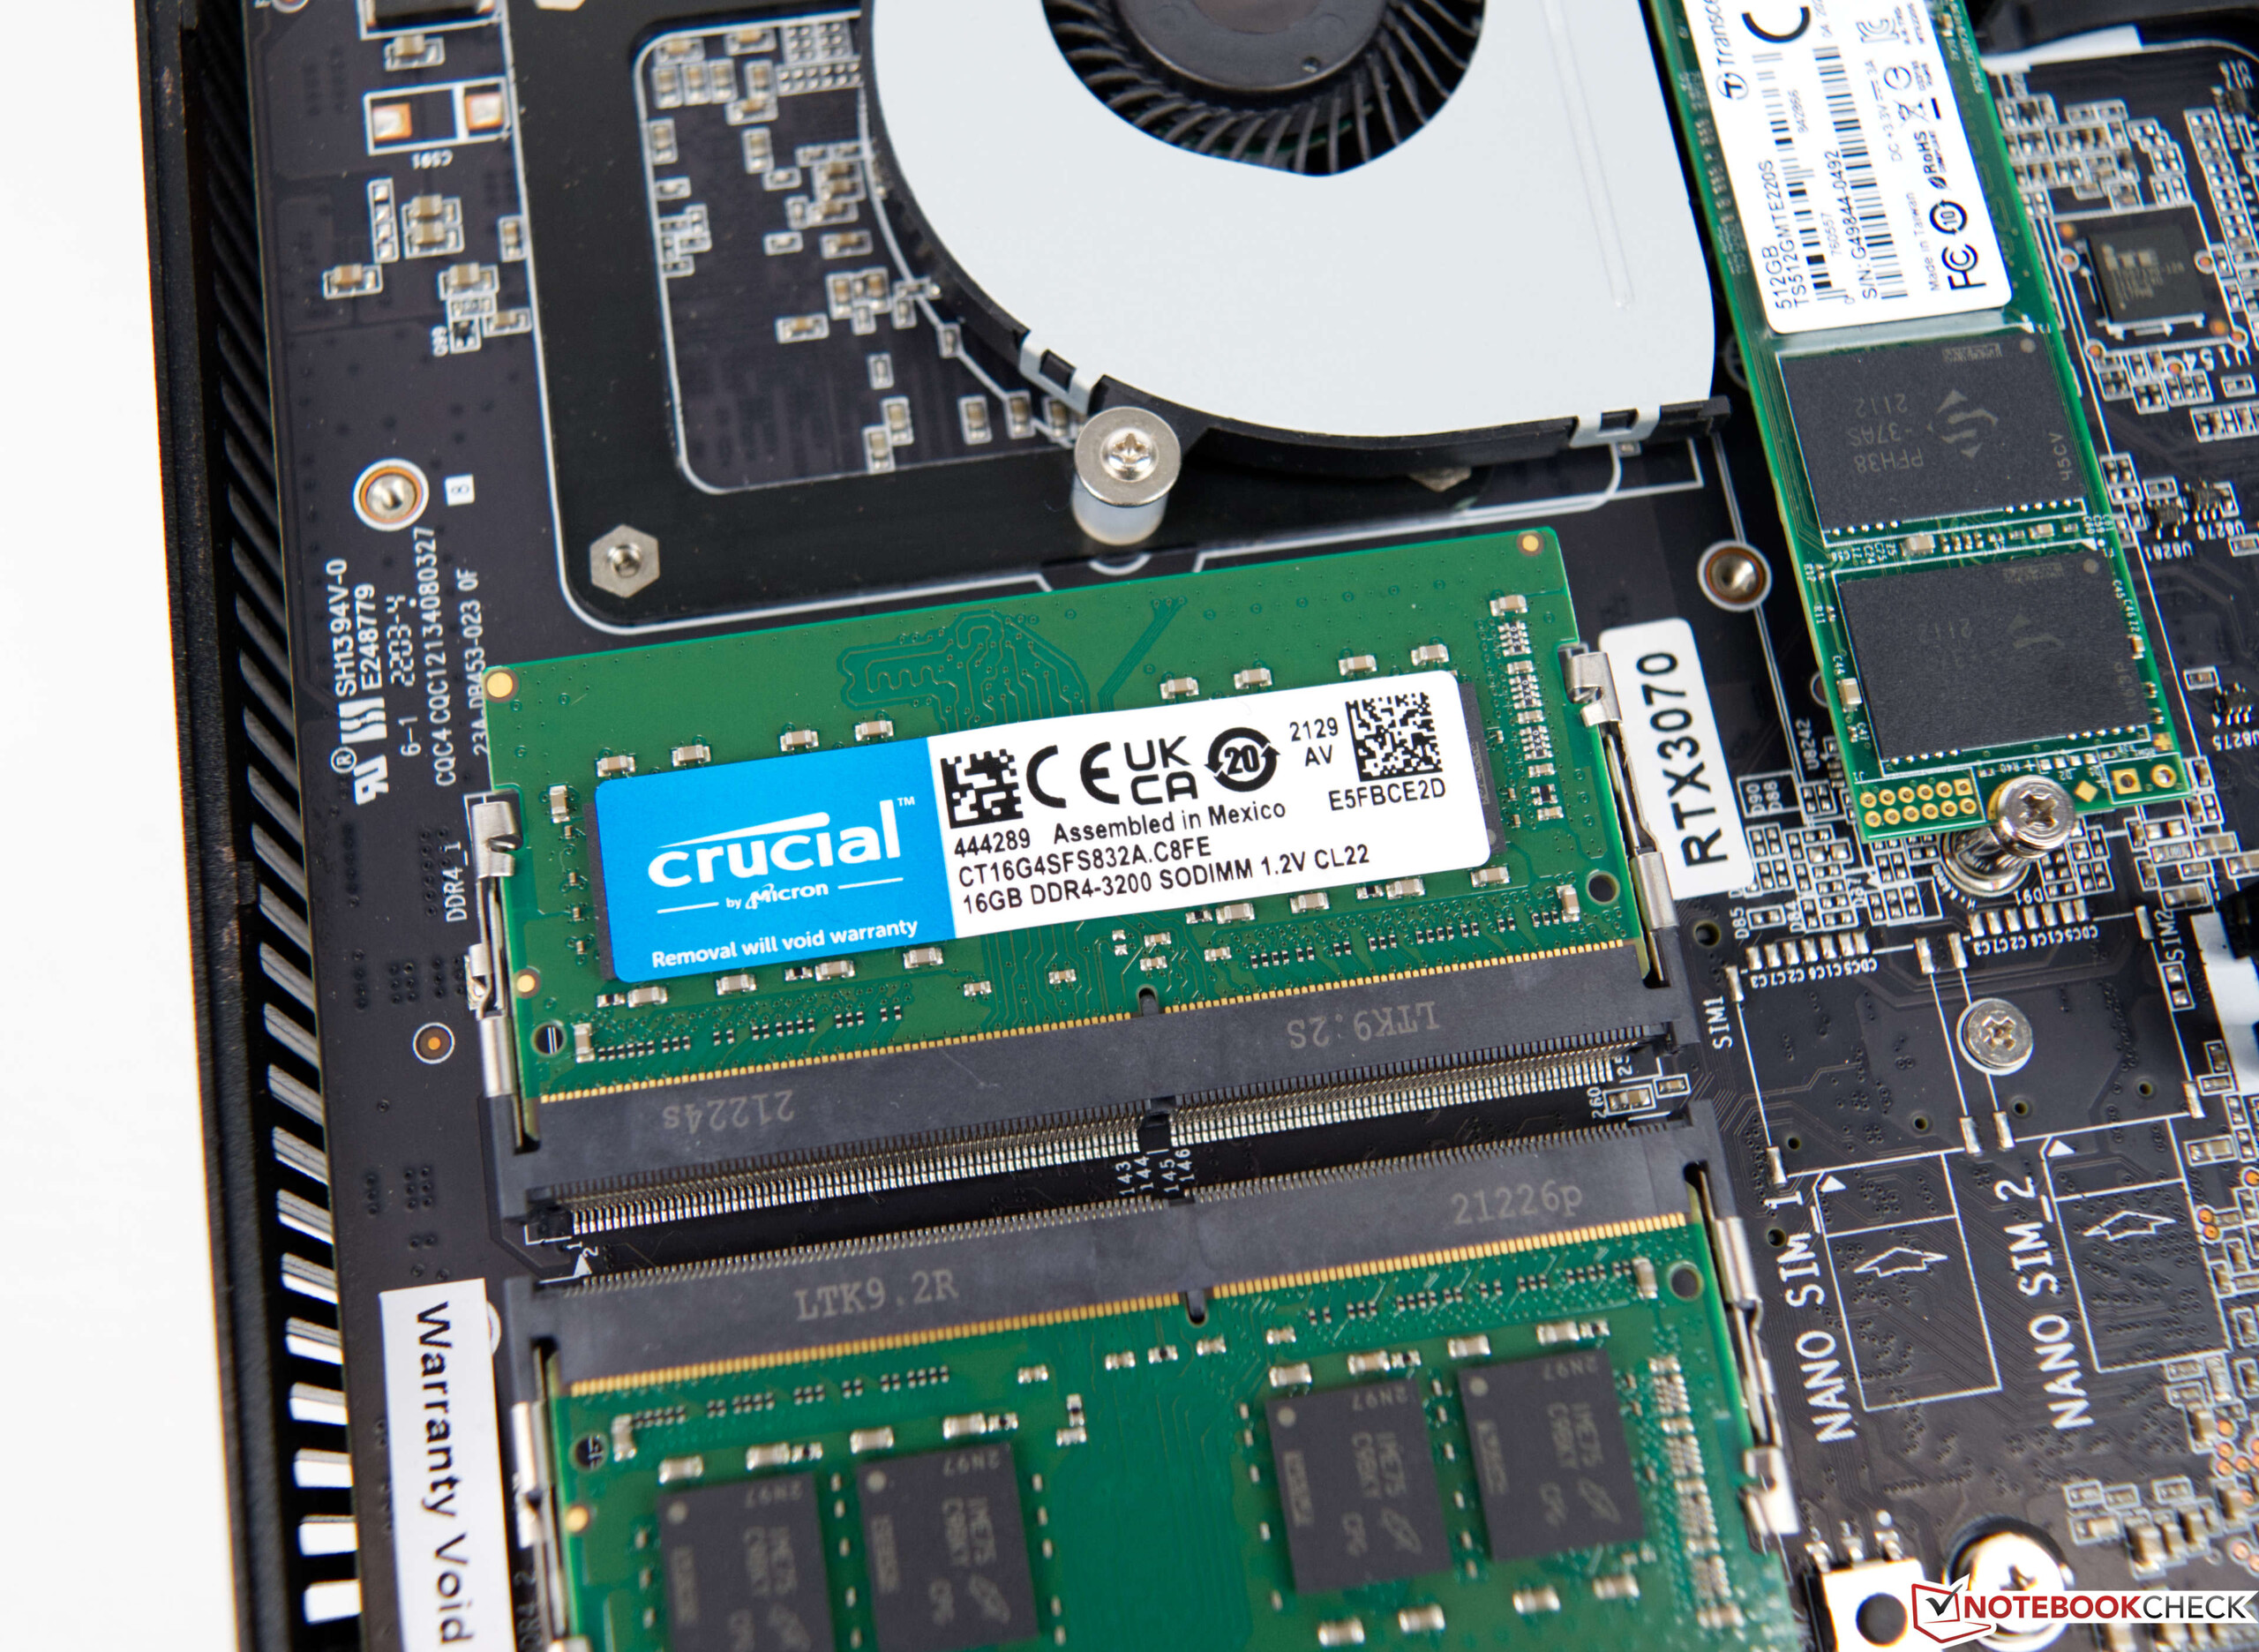
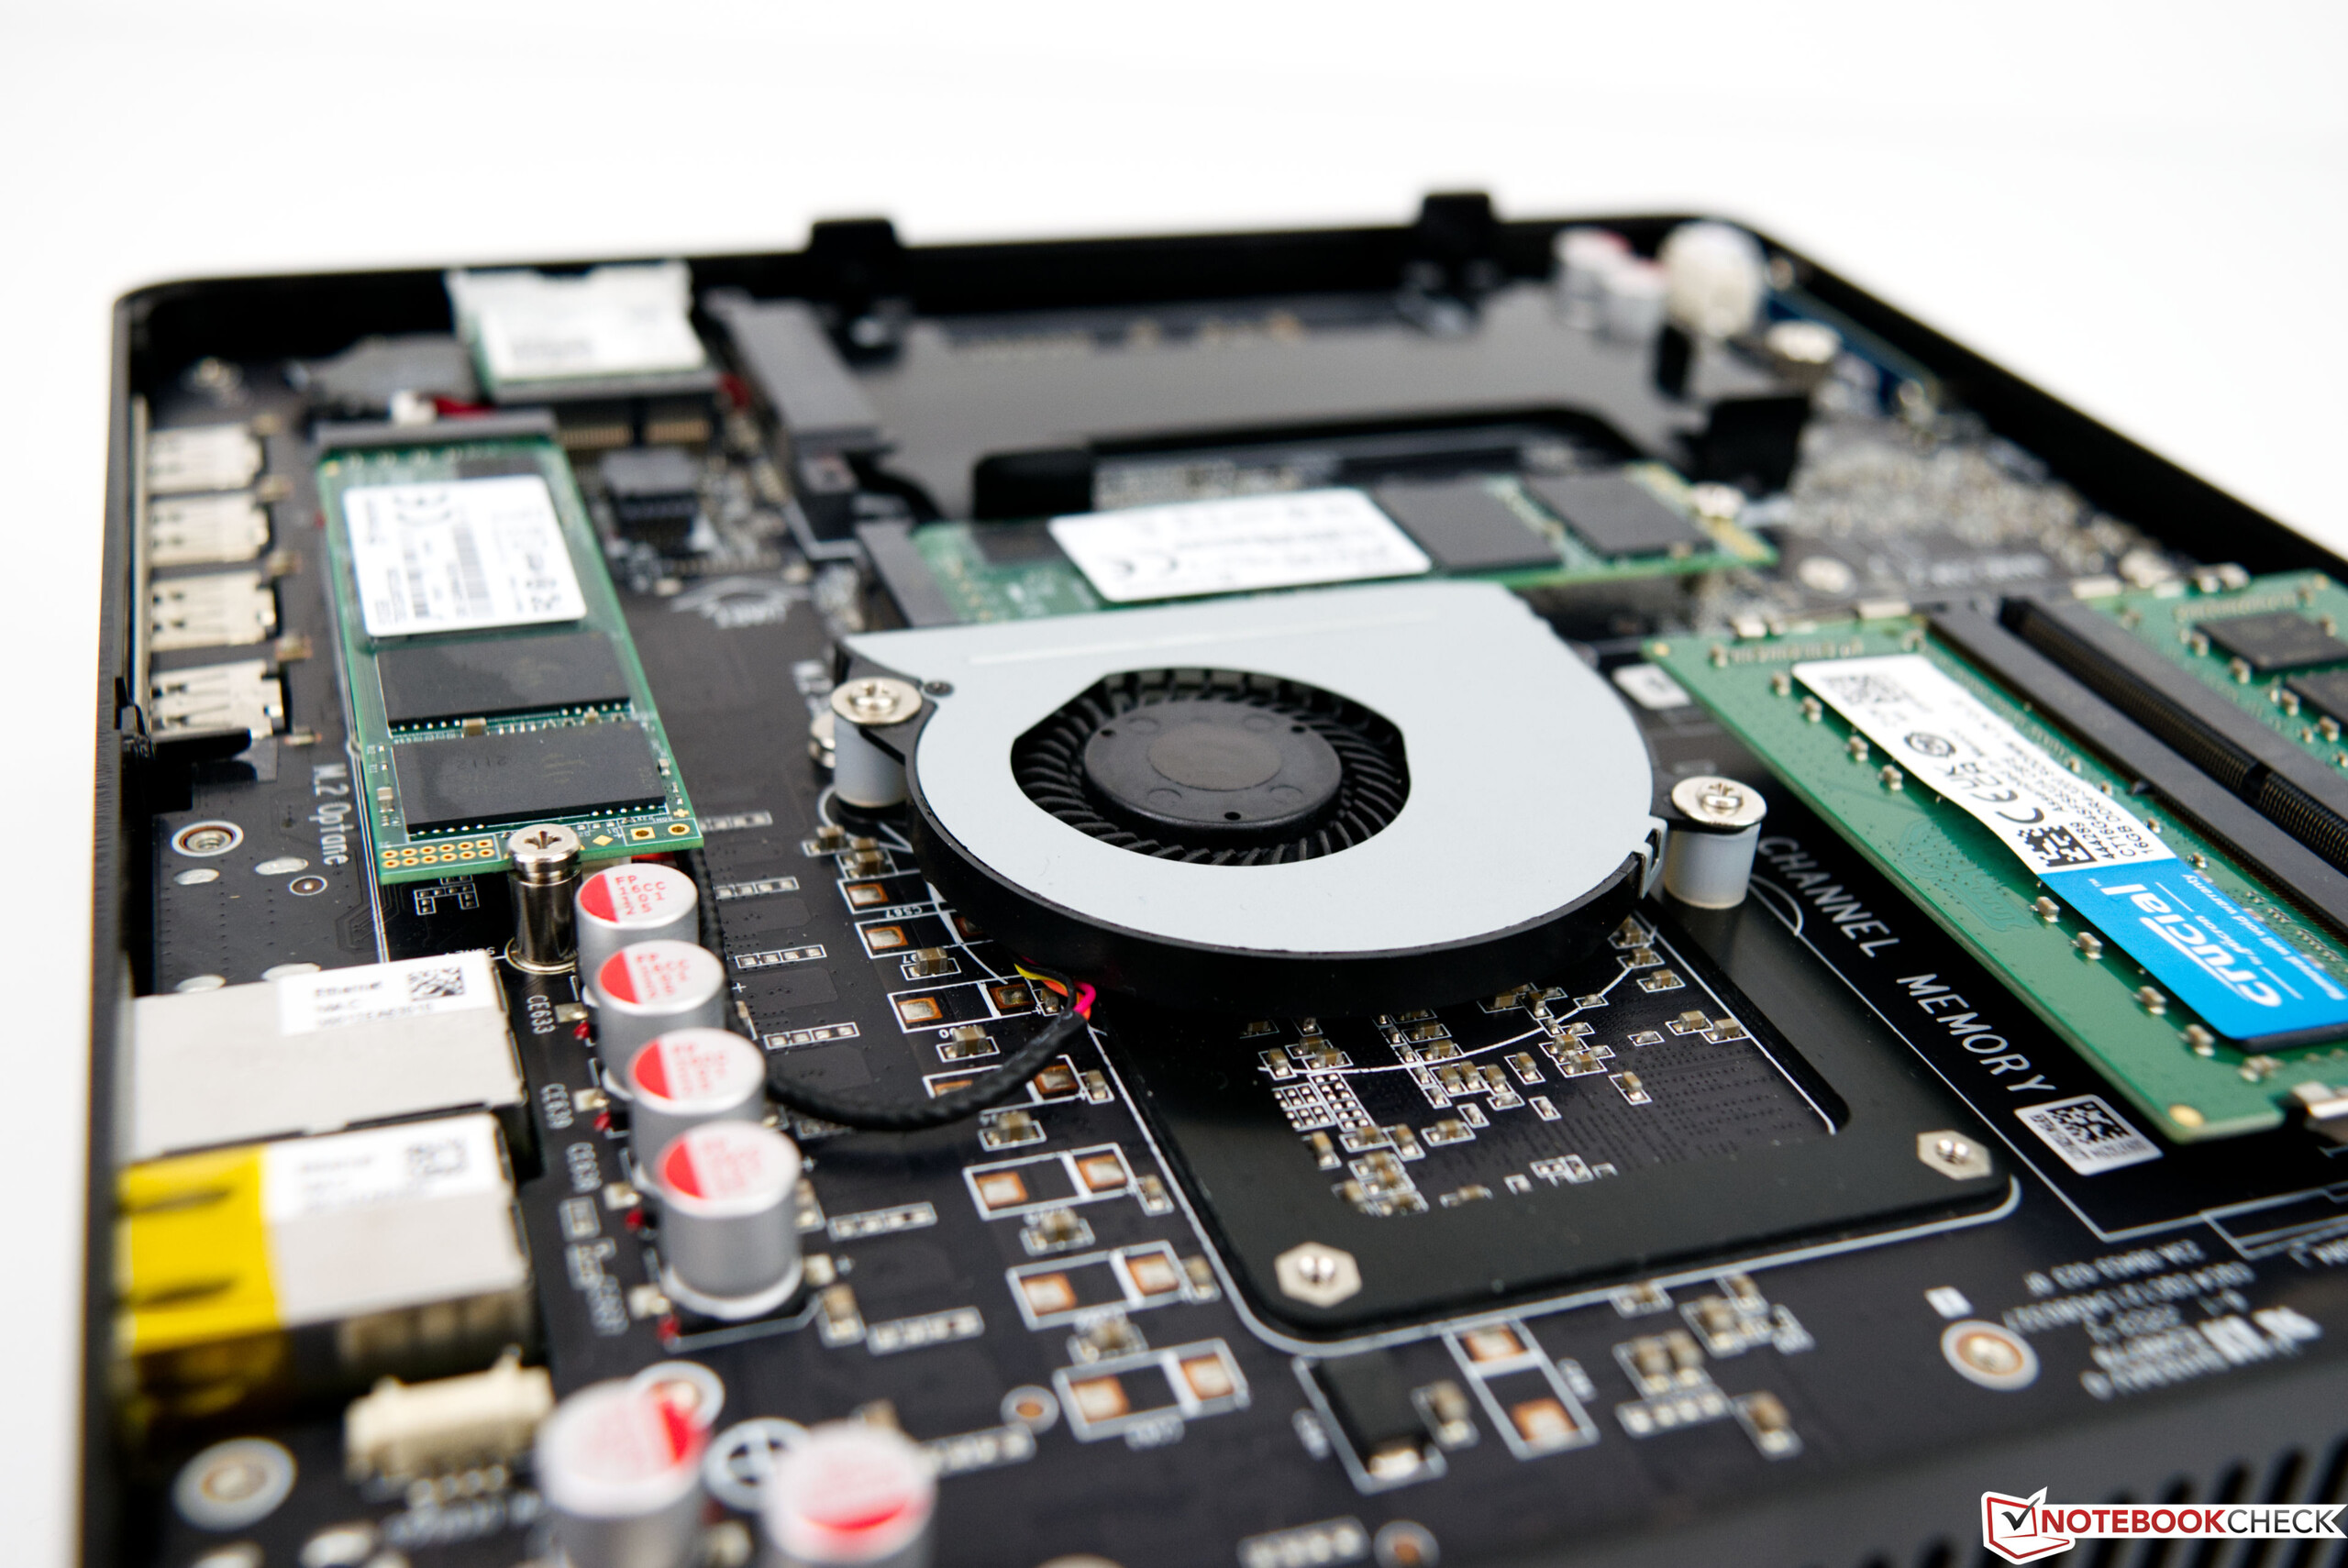
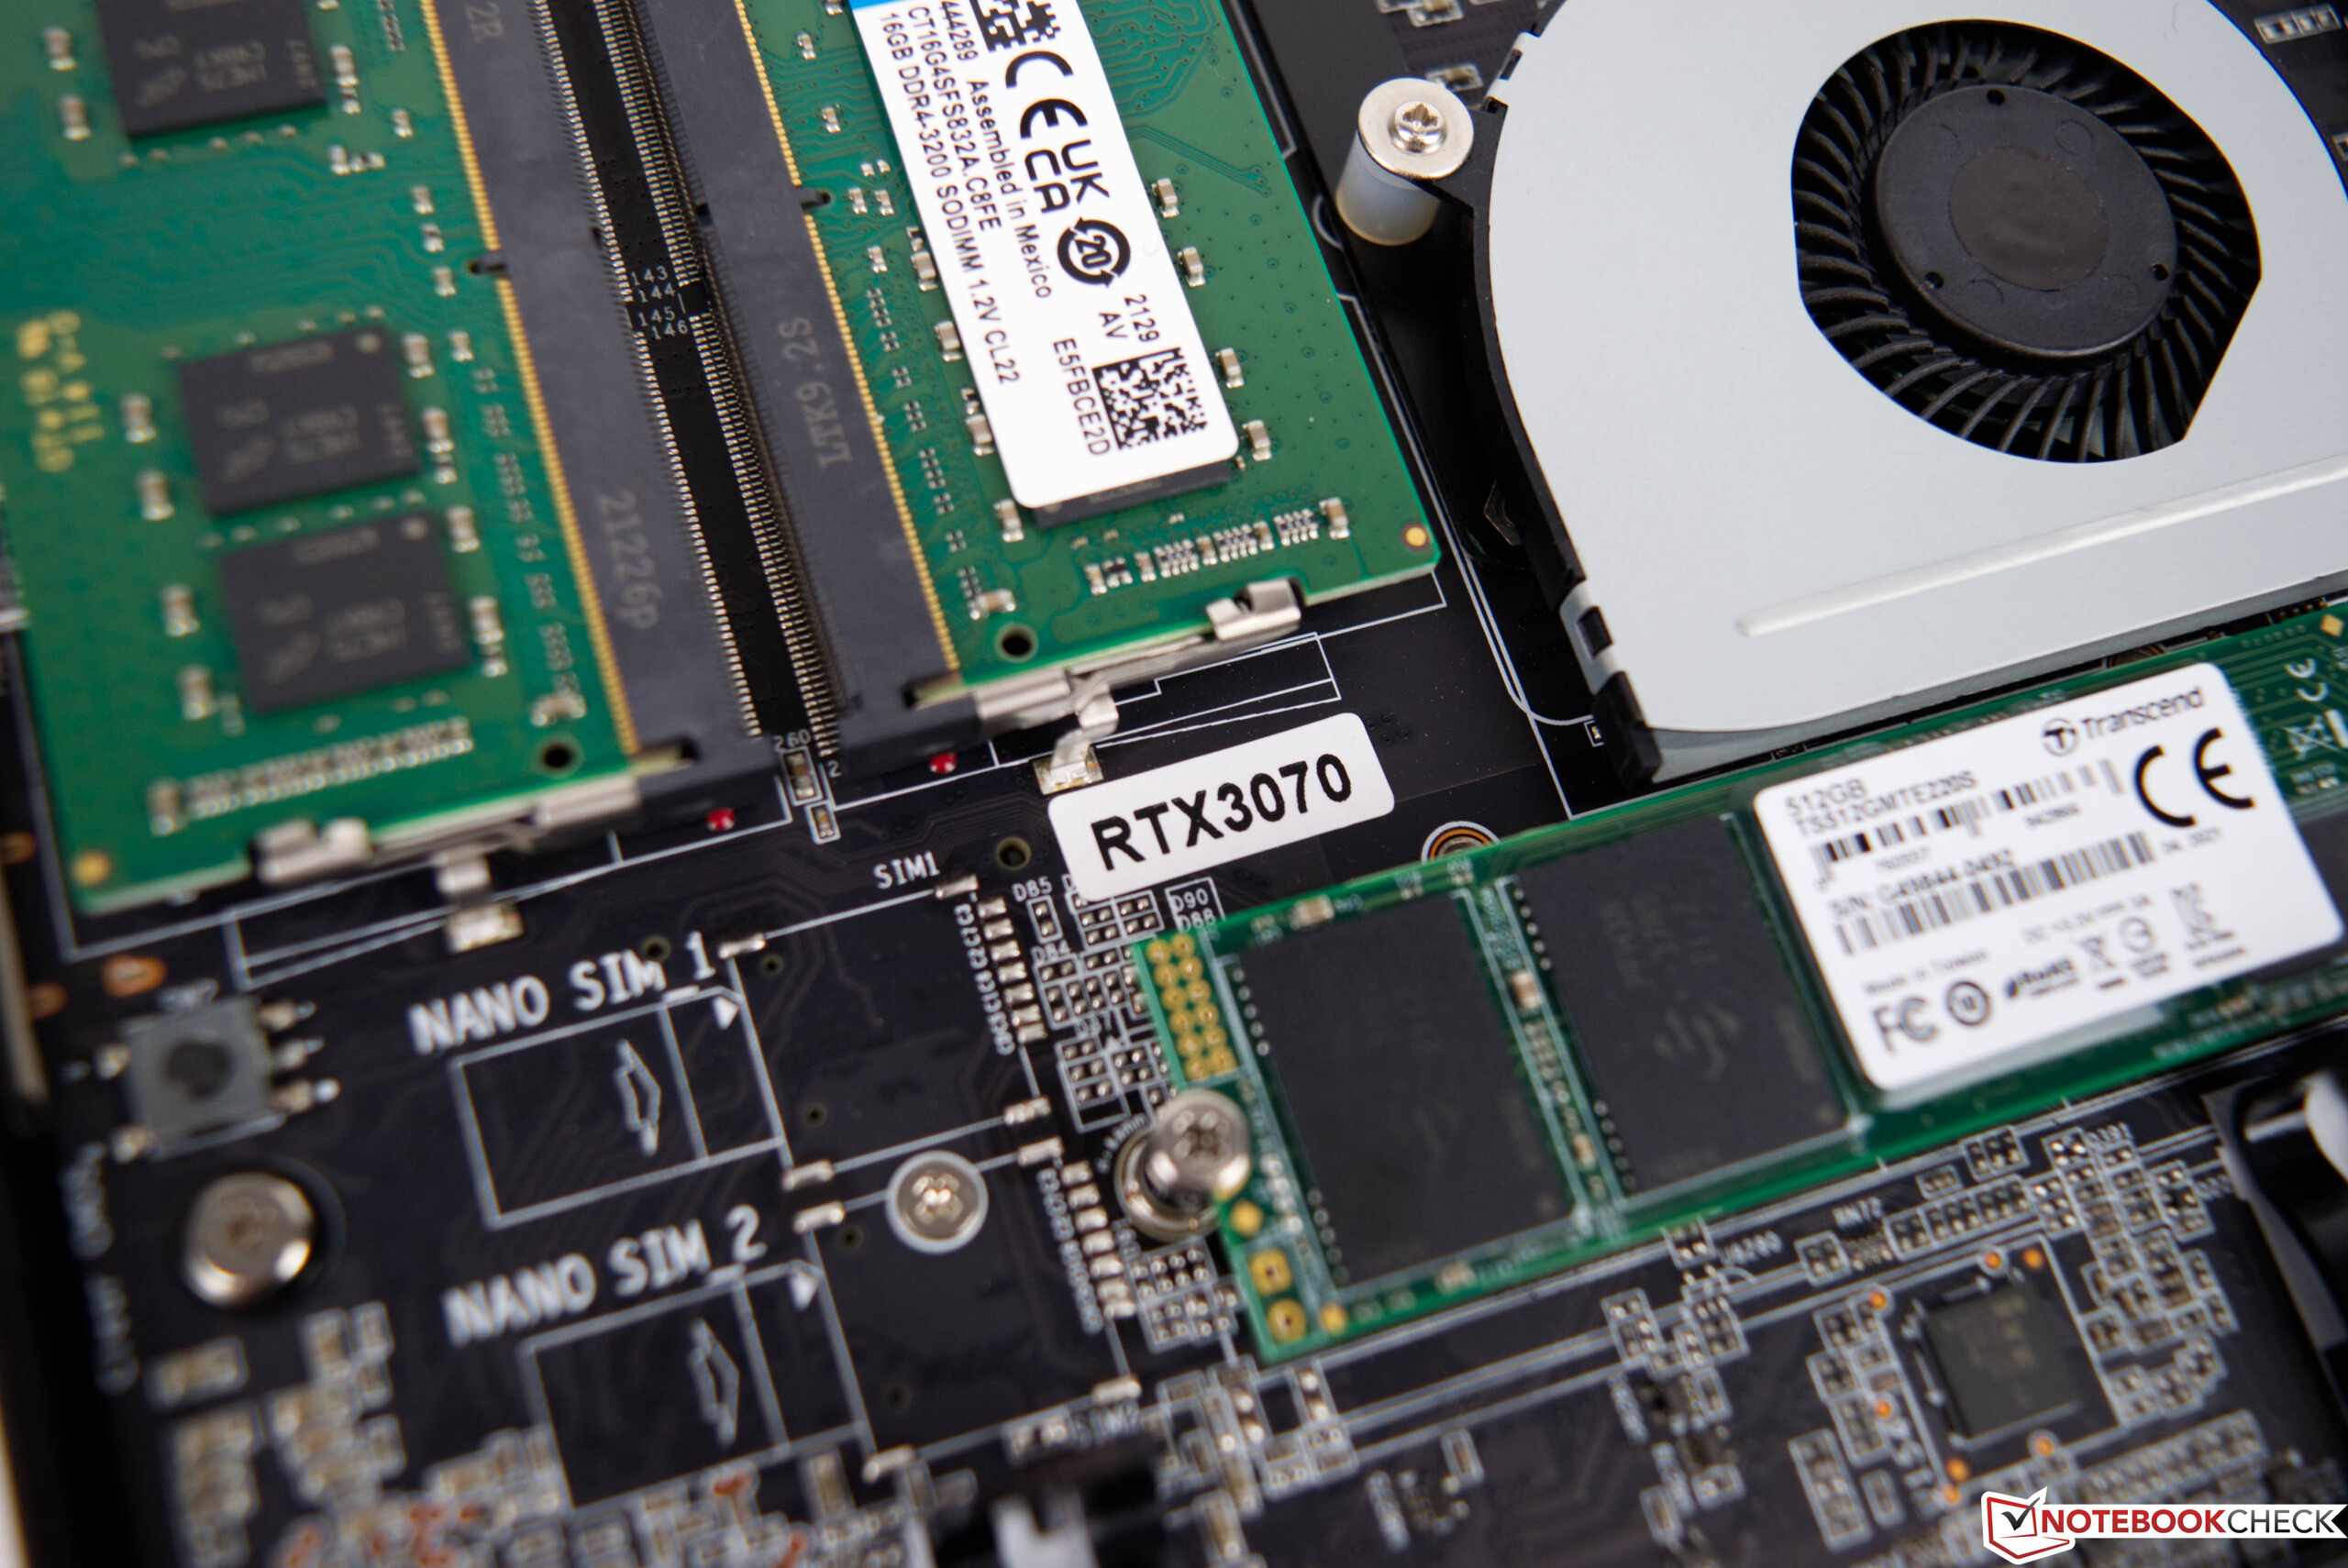
Bei den Anwendungsbenchmarks gibt es einen deutlichen Leistungsgewinn gegenüber der Zotac ZBOX Magus EN72080V. Das neuere SoC und die deutlich schnellere Grafikkarte sorgen zusammen für das gute Ergebnis. Unterm Strich ist der Zotac ZBOX Magnus EN173070C sogar etwas schneller als der Intel Dragon Canyon NUC mit vollwertiger Desktop-GPU und aktueller Alder-Lake-CPU. Bei den Rendertests kann die GeForce RTX 3070 Mobile gegenüber der GeForce RTX 3060 die entscheidenden Prozente gutmachen. Subjektiv betrachtet ist das Arbeitstempo im Alltag sehr gut. Ob im Internet Surfen, Videos schauen, oder Spielen, all das meistert der Zotac ZBOX Magnus EN173070C problemlos. Für das Review haben wir den Mini-PC mit 32 GB DDR4-RAM und zwei 512 GB SSD bestückt. Die Modelle aus dem Hause Transcend bieten eine solide Leistung. Gleichwohl lässt sich hier aber mit noch schnelleren SSDs das ein oder andere Prozent mehr an Leistung aus dem System quetschen. Insgesamt lassen sich sogar drei Massenspeicher im Gehäuse unterbringen. Nebst den beiden M.2-Schnittstellen, die unter anderem nicht nur auf 80 Millimeter Länge beschränkt sind, kann auch ein 2,5-Zoll-Datenträger installiert werden.
| DPC Latencies / LatencyMon - interrupt to process latency (max), Web, Youtube, Prime95 | |
| Zotac ZBOX Magnus EN173070C, Intel Core i7-11800H | |
| Minisforum EliteMini HX90, AMD Ryzen 9 5900HX | |
* ... kleinere Werte sind besser
3D-Leistung und Gaming Performance
Bei einem Gaming-PC ist eine schnelle Grafikkarte unerlässlich, um flüssige Frameraten zu erreichen. In unserem Fall gibt es mit der Nvidia GeForce RTX 3070 Mobile eine schnelle Grafikkarte mit 8-GB-VRAM. Gleichwohl kann man diese nicht mit den Desktop-Ablegern der Nomenklatur vergleichen. Vielmehr erreicht der mobile Ableger der GeForce RTX 3070 etwa die Leistung einer Nvidia GeForce RTX 3060. Der direkte Vergleich mit dem Intel Beast Canyon NUC spiegelt das sehr gut wider.
Bei der TDP-Klassifizierung gibt Zotac Vollgas und lässt unter Last bis zu 125 Watt zu. Damit wird die Leistung der dedizierten Grafikkarte nicht künstlich beschnitten, wie es oftmals in kompakten Laptops der Fall ist. Daraus resultiert auch das mitunter gute Ergebnis im Vergleich zur durchschnittlichen Performance des Grafikadapters. Die von uns getesteten Spiele lassen sich problemlos mit maximalen Details in FHD und QHD widergeben. Wenn es dann Richtung 4K-Auflösung geht kann es mitunter eng werden. Trotzdem gibt es viele Spiele die aber auch in dieser hohen Auflösung flüssig dargestellt werden können.
Für weitere Vergleiche und Benchmarks verweisen wir daher auf unsere GPU-Vergleichstabelle.
| min. | mittel | hoch | max. | QHD | 4K | |
|---|---|---|---|---|---|---|
| GTA V (2015) | 182.7 | 177.1 | 167.5 | 104.9 | 94.4 | 100.8 |
| The Witcher 3 (2015) | 435 | 331 | 190.1 | 105.5 | 70.7 | |
| Dota 2 Reborn (2015) | 164.4 | 148.3 | 142.9 | 133.9 | 127.7 | |
| Rise of the Tomb Raider (2016) | 302 | 216 | 141.9 | 116.2 | 55.4 | |
| Final Fantasy XV Benchmark (2018) | 190.1 | 139 | 101 | 75.3 | 43.5 | |
| X-Plane 11.11 (2018) | 136.6 | 121.2 | 95.7 | 82.3 | ||
| Far Cry 5 (2018) | 159 | 136 | 129 | 120 | 101 | 55 |
| Strange Brigade (2018) | 437 | 267 | 216 | 186.7 | 137.3 | 78.1 |
| Shadow of the Tomb Raider (2018) | 169.6 | 146.4 | 142.5 | 133.7 | 95.1 | 50.8 |
| Far Cry New Dawn (2019) | 134 | 116 | 112 | 100 | 91 | 57 |
| Metro Exodus (2019) | 177.1 | 123 | 94 | 74.6 | 58.7 | 36.6 |
| Control (2019) | 240 | 128 | 93.7 | 60.9 | 30.3 | |
| Borderlands 3 (2019) | 135.5 | 117.3 | 101 | 84.6 | 62.2 | 34.2 |
| F1 2020 (2020) | 315 | 267 | 238 | 165.8 | 123.6 | 68.3 |
| Dirt 5 (2020) | 227 | 153 | 123 | 96 | 75 | 49 |
| F1 2021 (2021) | 367 | 309 | 246 | 122.7 | 88.3 | 49.8 |
| Alan Wake Remastered (2021) | 119.2 | 118.2 | 118.2 | 113.1 | ||
| Far Cry 6 (2021) | 127.5 | 109.5 | 99 | 99.8 | 79.2 | 41 |
| Guardians of the Galaxy (2021) | 123 | 124 | 122 | 120 | 102 | 55 |
| Riders Republic (2021) | 174 | 144 | 118 | 107 | 77 | 40 |
| Forza Horizon 5 (2021) | 213 | 141 | 129 | 82 | 70 | 48 |
| Farming Simulator 22 (2021) | 205 | 161.1 | 138.8 | 132.8 | 124.8 | 79.2 |
| God of War (2022) | 122.2 | 109.4 | 88.1 | 61.7 | 50.7 | 33.8 |
| Rainbow Six Extraction (2022) | 241 | 182 | 181 | 149 | 97 | 49 |
| GRID Legends (2022) | 194 | 189 | 158 | 123 | 95 | 62 |
| Cyberpunk 2077 1.6 (2022) | 139 | 116 | 92 | 76 | 47 | 22 |
| Elex 2 (2022) | 98.4 | 95.1 | 87.3 | 79.5 | 61.8 | 34.5 |
Emissionen
Geräuschemissionen
Bei einem Gaming-Laptop weis man in der Regel, worauf man sich bei Kauf einlässt, wenn es um die Betriebslautstärke geht. Bei einem Desktop-PC ist dies allerdings oftmals anders, denn größere Kühler können hier die Wärme effektiver und leiser abführen. Da Zotac aber selbst ein sehr kompaktes Gehäuse verwendet. müssen die verbauten Lüfter unter Last auch ordentlich ackern. Der Lautstärkepegel unter Last erinnert sehr an ein durchschnittliches Gaming-Notebook. Mit 45 dB(A) ist das Gerät allerdings deutlich hörbar. Bei geringer Last sind es immerhin noch 41 dB(A), die wir gemessen haben. Im 2D-Betrieb säuseln die Lüfter leise vor sich hin und sind kaum wahrnehmbar.
Lautstärkediagramm
| Idle |
| 32.7 / 32.8 / 32.8 dB(A) |
| Last |
| 41.7 / 45.4 dB(A) |
 | ||
30 dB leise 40 dB(A) deutlich hörbar 50 dB(A) störend |
||
min: | ||
| Zotac ZBOX Magnus EN173070C GeForce RTX 3070 Laptop GPU, i7-11800H, Transcend M.2 SSD 2200S TS512GMTE220S | Zotac Magnus One (ECM73070C) GeForce RTX 3070, i7-10700, Phison 512GB PA6620060U | Minisforum EliteMini HX90 Vega 8, R9 5900HX, Kingston OM8PCP3512F-AB | |
|---|---|---|---|
| Geräuschentwicklung | -4% | 10% | |
| aus / Umgebung * (dB) | 30.7 | 30 2% | 30.8 -0% |
| Idle min * (dB) | 32.7 | 33.58 -3% | |
| Idle avg * (dB) | 32.8 | 31.6 4% | |
| Idle max * (dB) | 32.8 | ||
| Last avg * (dB) | 41.7 | 44.25 -6% | |
| Last max * (dB) | 45.4 | 48.72 -7% | 33.4 26% |
* ... kleinere Werte sind besser
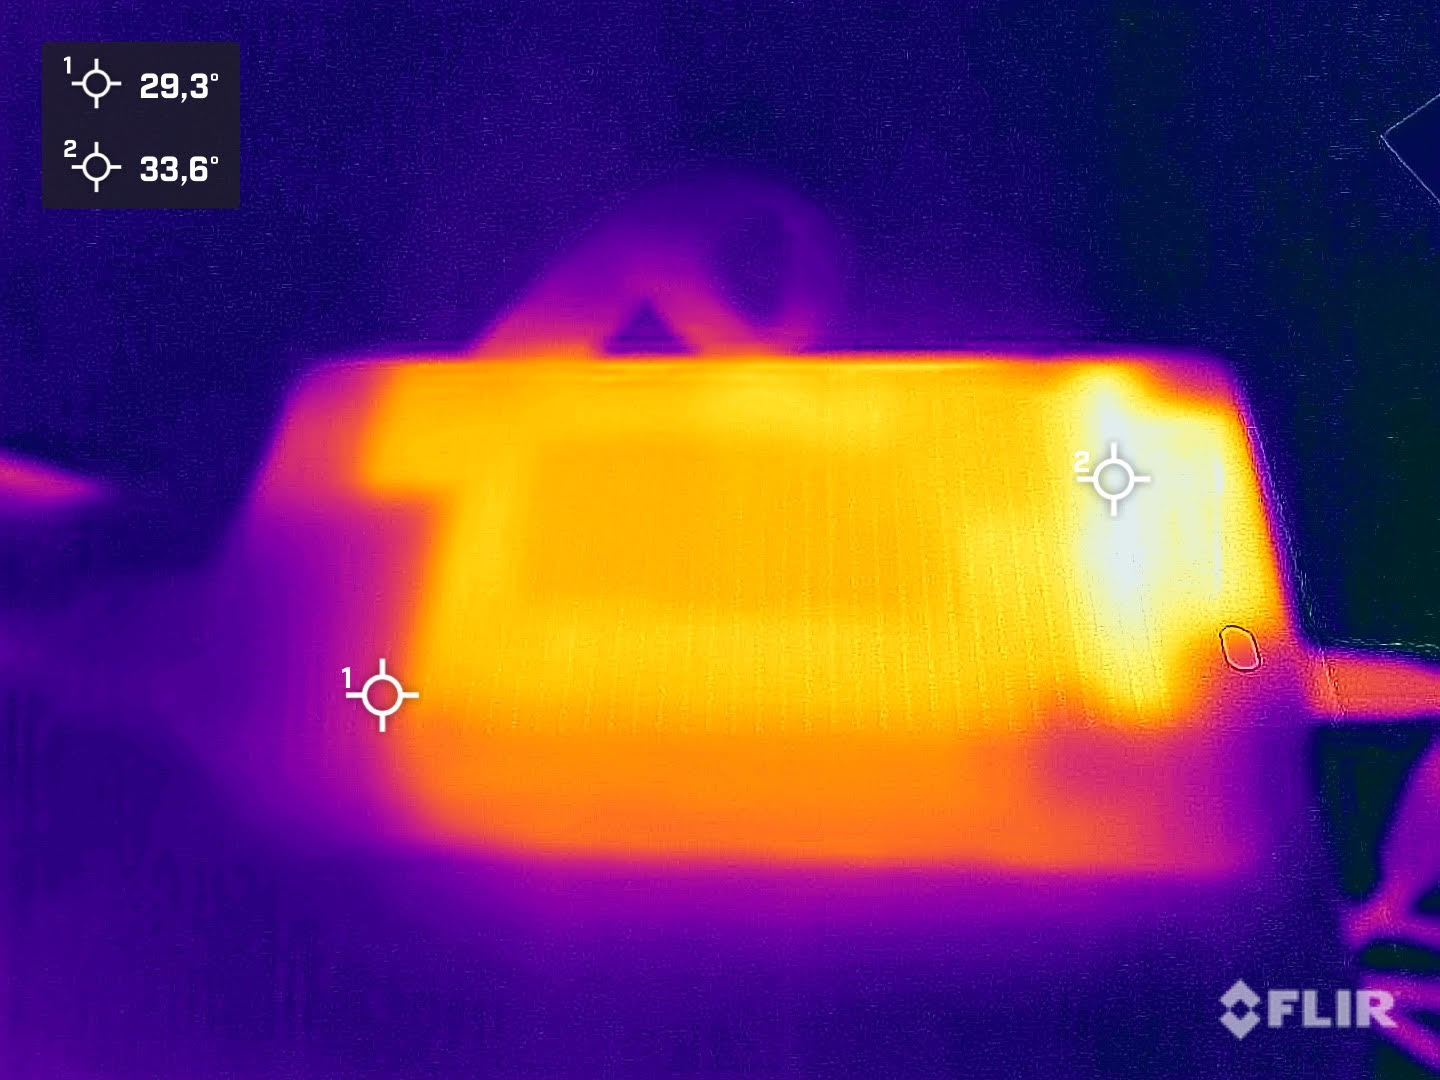
Temperatur
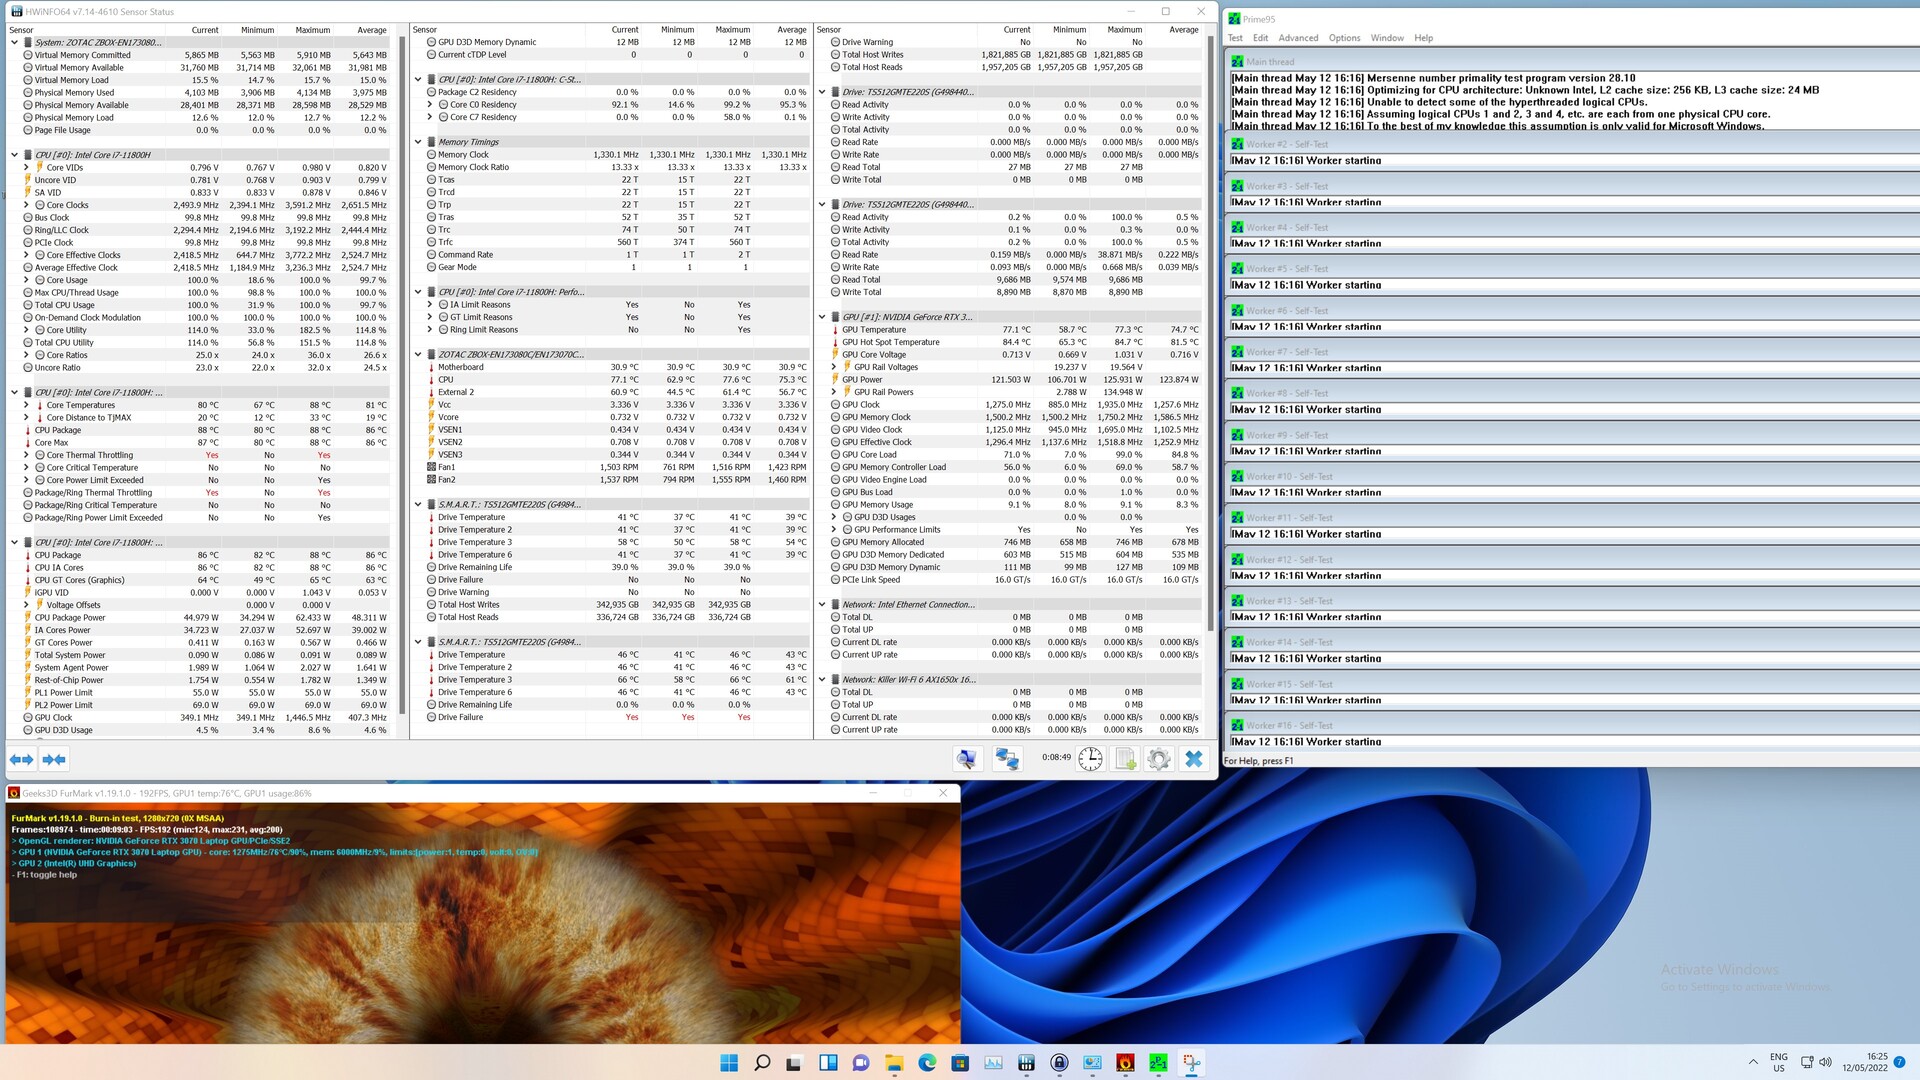
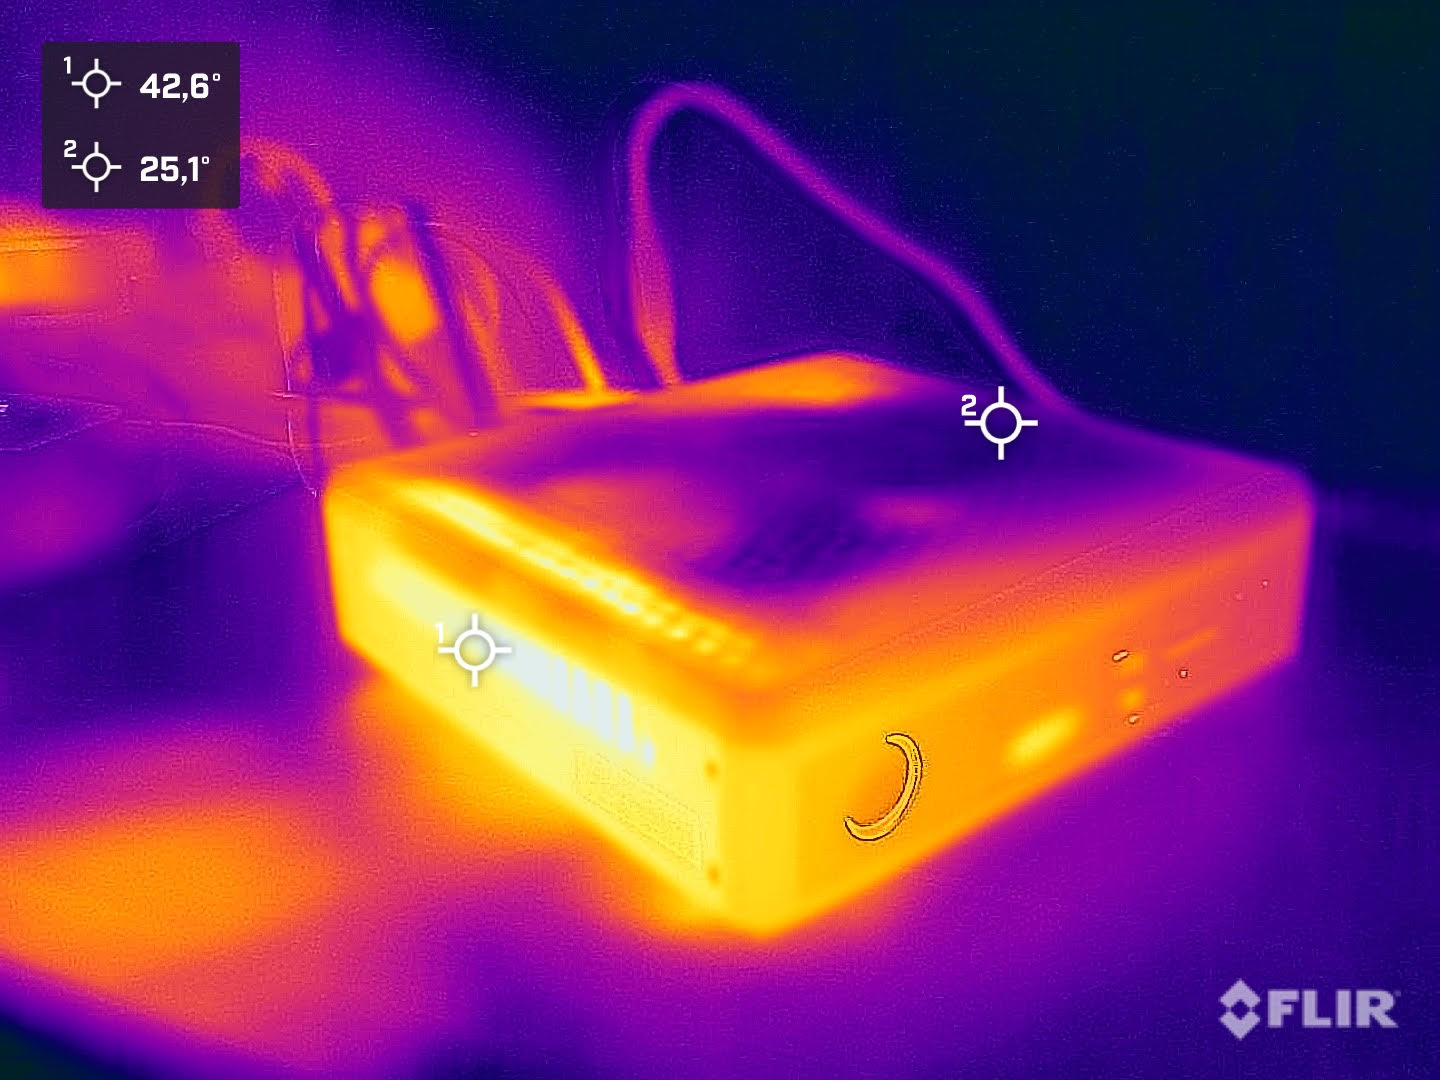
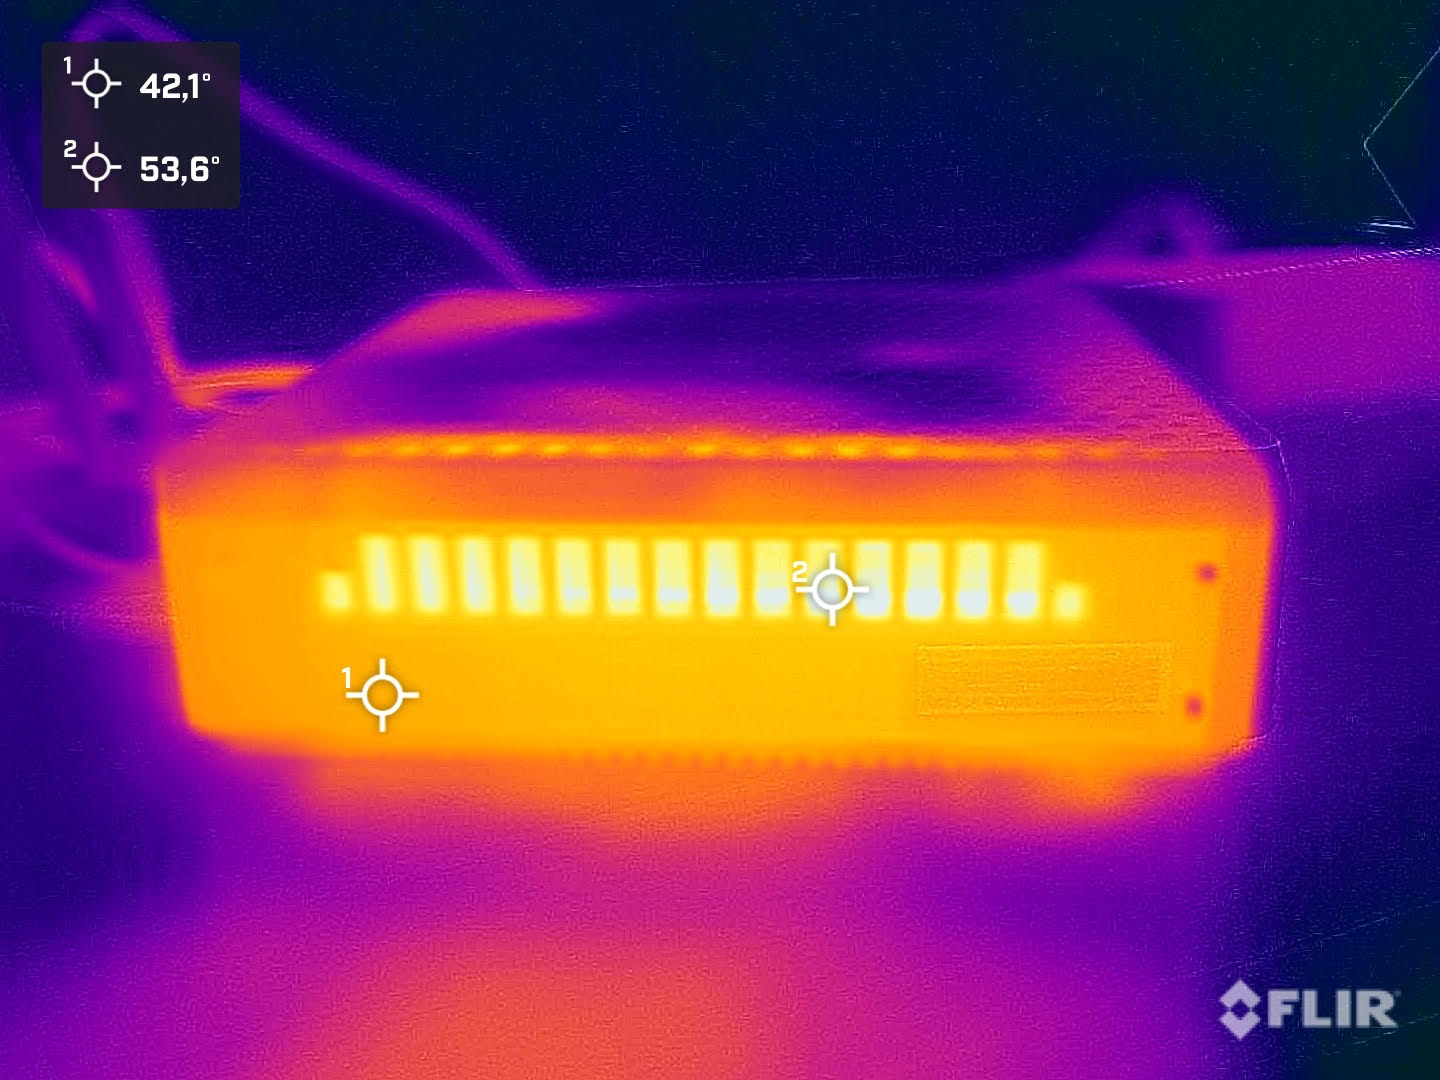
Beim Stresstest verlangen wir dem System mit Prime95 und FurMark alles ob. Bei diesem Worst-Case-Szenario erhitzt sich der Intel Core i7-11800H auf maximal 88 °C. Bei der Grafikkarte notieren wir mit 77 °C einen etwas geringeren Wert. Der durchschnittliche CPU-Takt liegt bei 2,6 GHz, was über dem Basistakt von 2,3 GHz liegt. Einen nachteiligen Einfluss hatte die Dauerbelastung der gesamten Komponenten allerdings nicht. Ein anschließender 3D-Benchmark zeigte ein identisches Ergebnis im Vergleich zum Kaltstart.
Energieaufnahme
Die Leistungsaufnahme der Zotac ZBOX Magnus EN173070C beträgt im Leerlauf 31 bis 41 Watt. Für ein Desktop-System sind das sehr gute Werten. Im Vergleich zu vergleichbar ausgestatteten Laptops sind diese Werte allerdings deutlich zu hoch. Unter Last zeigt unser Messgerät durchschnittlich 231 Watt an. Gleichwohl haben wir in Spitzen nur 231 Watt messen können. Damit wird das wuchtige 33-Watt-Netzteil spielen fertig.
| Idle | |
| Last |
|
Legende:
min: | |
Energieaufnahme mit externem Monitor
Pro
Contra
Fazit - Ultrakompakter Gaming-PC

Zotac betreibt mit der ZBOX Magnus EN173070C gute Produktpflege. Der schnelle Intel Core i7-11800H bietet ein sehr gutes Arbeitstempo und die Nvidia GeForce RTX 3070 Mobile kann ebenso eine gute Leistung abliefern und künstlich gedrosselt zu werden. Die vollen 125 Watt stehen hier zur Verfügung, was bedeutet, dass oftmals sogar die Nvidia GeForce RTX 3080 Mobile ins Hintertreffen geriet. Dennoch muss bedacht werden, dass wir hier im Leistungsbereich einer Nvidia GeForce RTX 3060 Desktop rangieren. In Anbetracht der Kompaktheit und des nur 2,65 Liter fassenden Gehäuses ist es aber schon erstaunlich, was Zotac hier mit seinen ZBOXen auf die Beine stellt.
Das alles hat natürlich auch seinen Preis. Vergleichen mit preiswerten Gaming-Laptops, wie beispielsweise dem Acer Nitro5 AN515, liegt man preislich auf einem ähnlichen Level. Teilweise muss man sogar noch tiefer in die Tasche greifen, denn eine SSD und der RAM gehören nicht zur Grundausstattung. Mit 1.650 Euro verlangt Zotac einen stolzen Preis. Dafür gibt es aber auch einen ultrakompakten Gaming-PC, der ebenso schnell wie ein Laptop verstaut und mitgenommen werden kann.
Die Gaming-Leistung konnte überzeugen und auch die Anschlussvielfalt ist ausreichend. Gleichwohl muss man aber beachten, dass per Thunderbolt 4 nur Daten übertragen werden können. Eine externe Grafikkarte lässt sich darüber leider nicht verwenden. Schade, wie wir finden, denn somit könnte man in der Zukunft, ohne gleich ein komplett neues Gerät zu kaufen, die 3D-Leistung erhöhen.
Der Zotac ZBOX Magnus EN173070C ist ein sehr schneller Gaming-PC auf Basis mobiler Komponenten. Vor dem Kauf sollte man sich aber mit den Eigenheiten eines Barebone-Systems vertraut machen.
Bei der Lautstärke verliert der Zotac ZBOX Magnus EN173070C gegenüber herkömmlichen Desktop-PCs. Unter Last müssen die Lüfter ordentlich arbeiten. Dennoch ist das Lüftergeräusch relativ angenehm und noch zu hoch. Als weiter Alternative bietet sich Intel mit dem Dragon Canyon NUC an. Genauso wie bei der ZBOX Magnus EN173070C handelt es sich hierbei um ein Barebone-System. Allerdings ist das Gerät nicht so kompakt, kann aber dafür mit herkömmlichen Desktop-Grafikkarten bestückt werden. Wie immer hat der Kunde die Qual der Wahl und muss selbst entscheiden, welche Parameter beim Kauf überwiegen.
Preis und Verfügbarkeit
Der Zotac ZBOX Magnus EN173070C ist ab 1.650 Euro zu bekommen. Allerdings ist teilweise mit etwas Wartezeit zu rechnen. Bei Notebook.de gibt es das gute Stück sofort für 1.660 Euro. Auch bei Computer Universe steht das Gerät im Regal. Hier muss man derzeit aber mit 1.740 Euro rechnen.
