

Notebookcheck Logo
Teaser

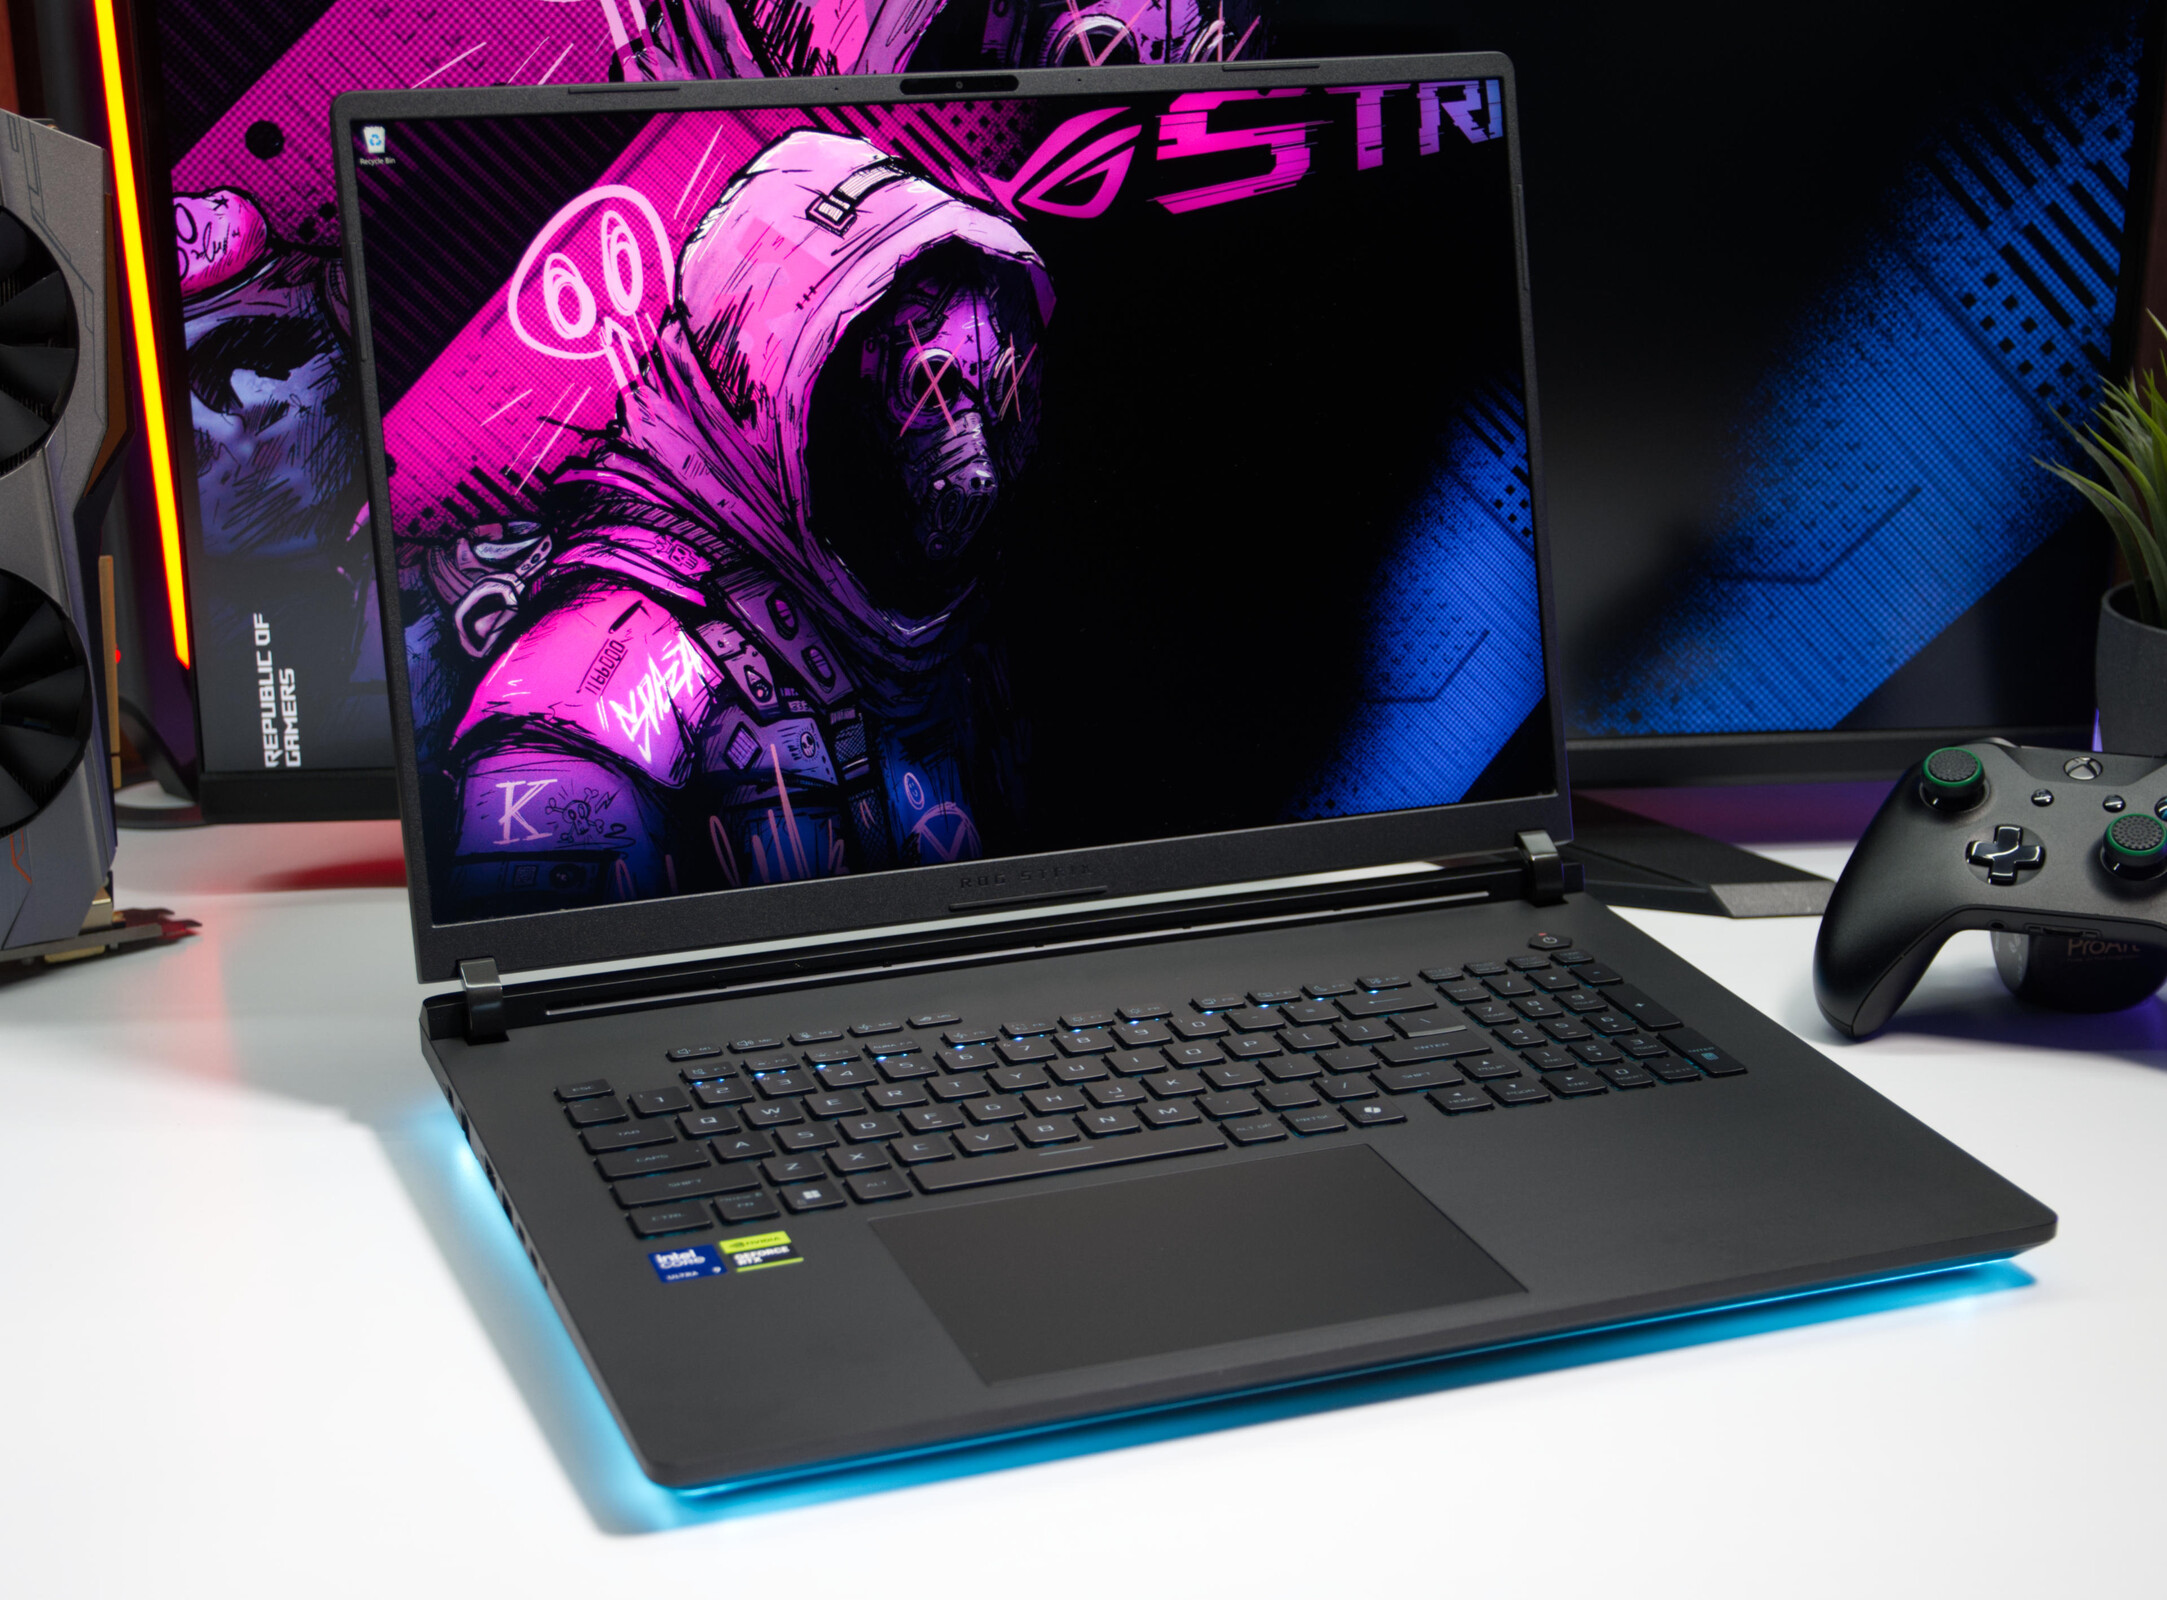
4K-Mini-LED trifft auf GeForce RTX 5090 Laptop - Asus ROG Strix SCAR 18 G835LXG im Test

Premium-Gaming mit kompromissloser Performance.

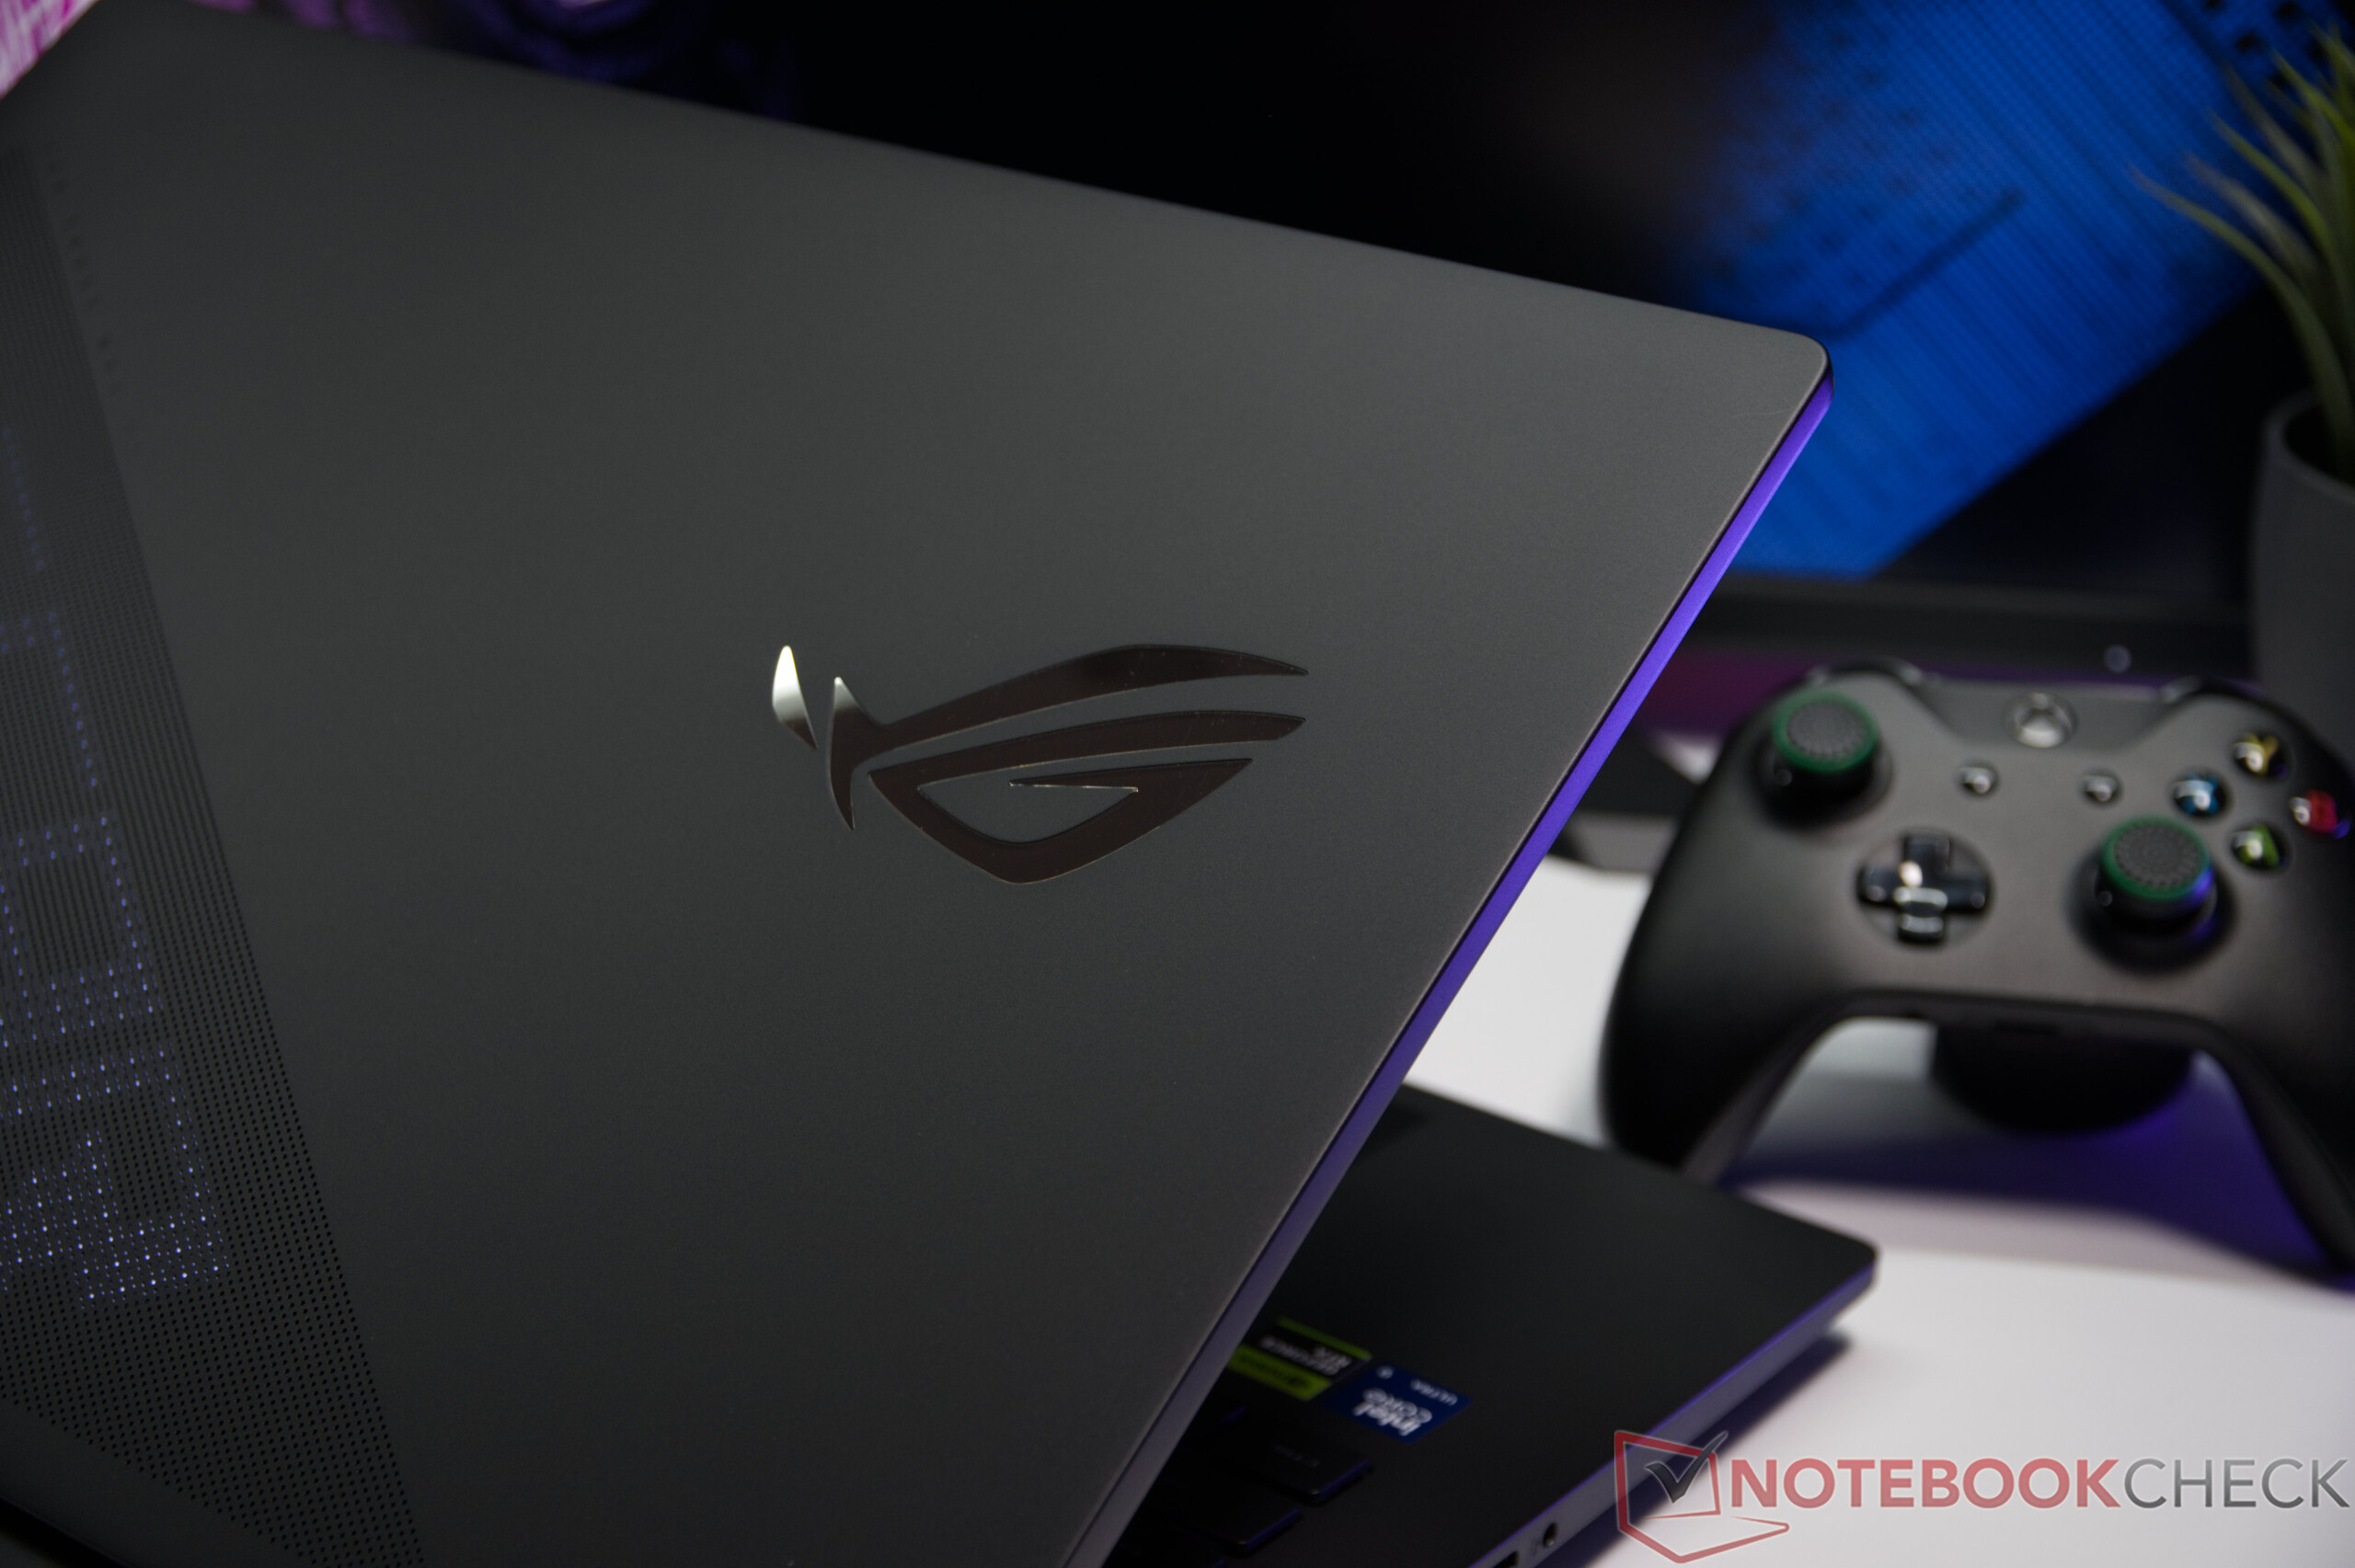
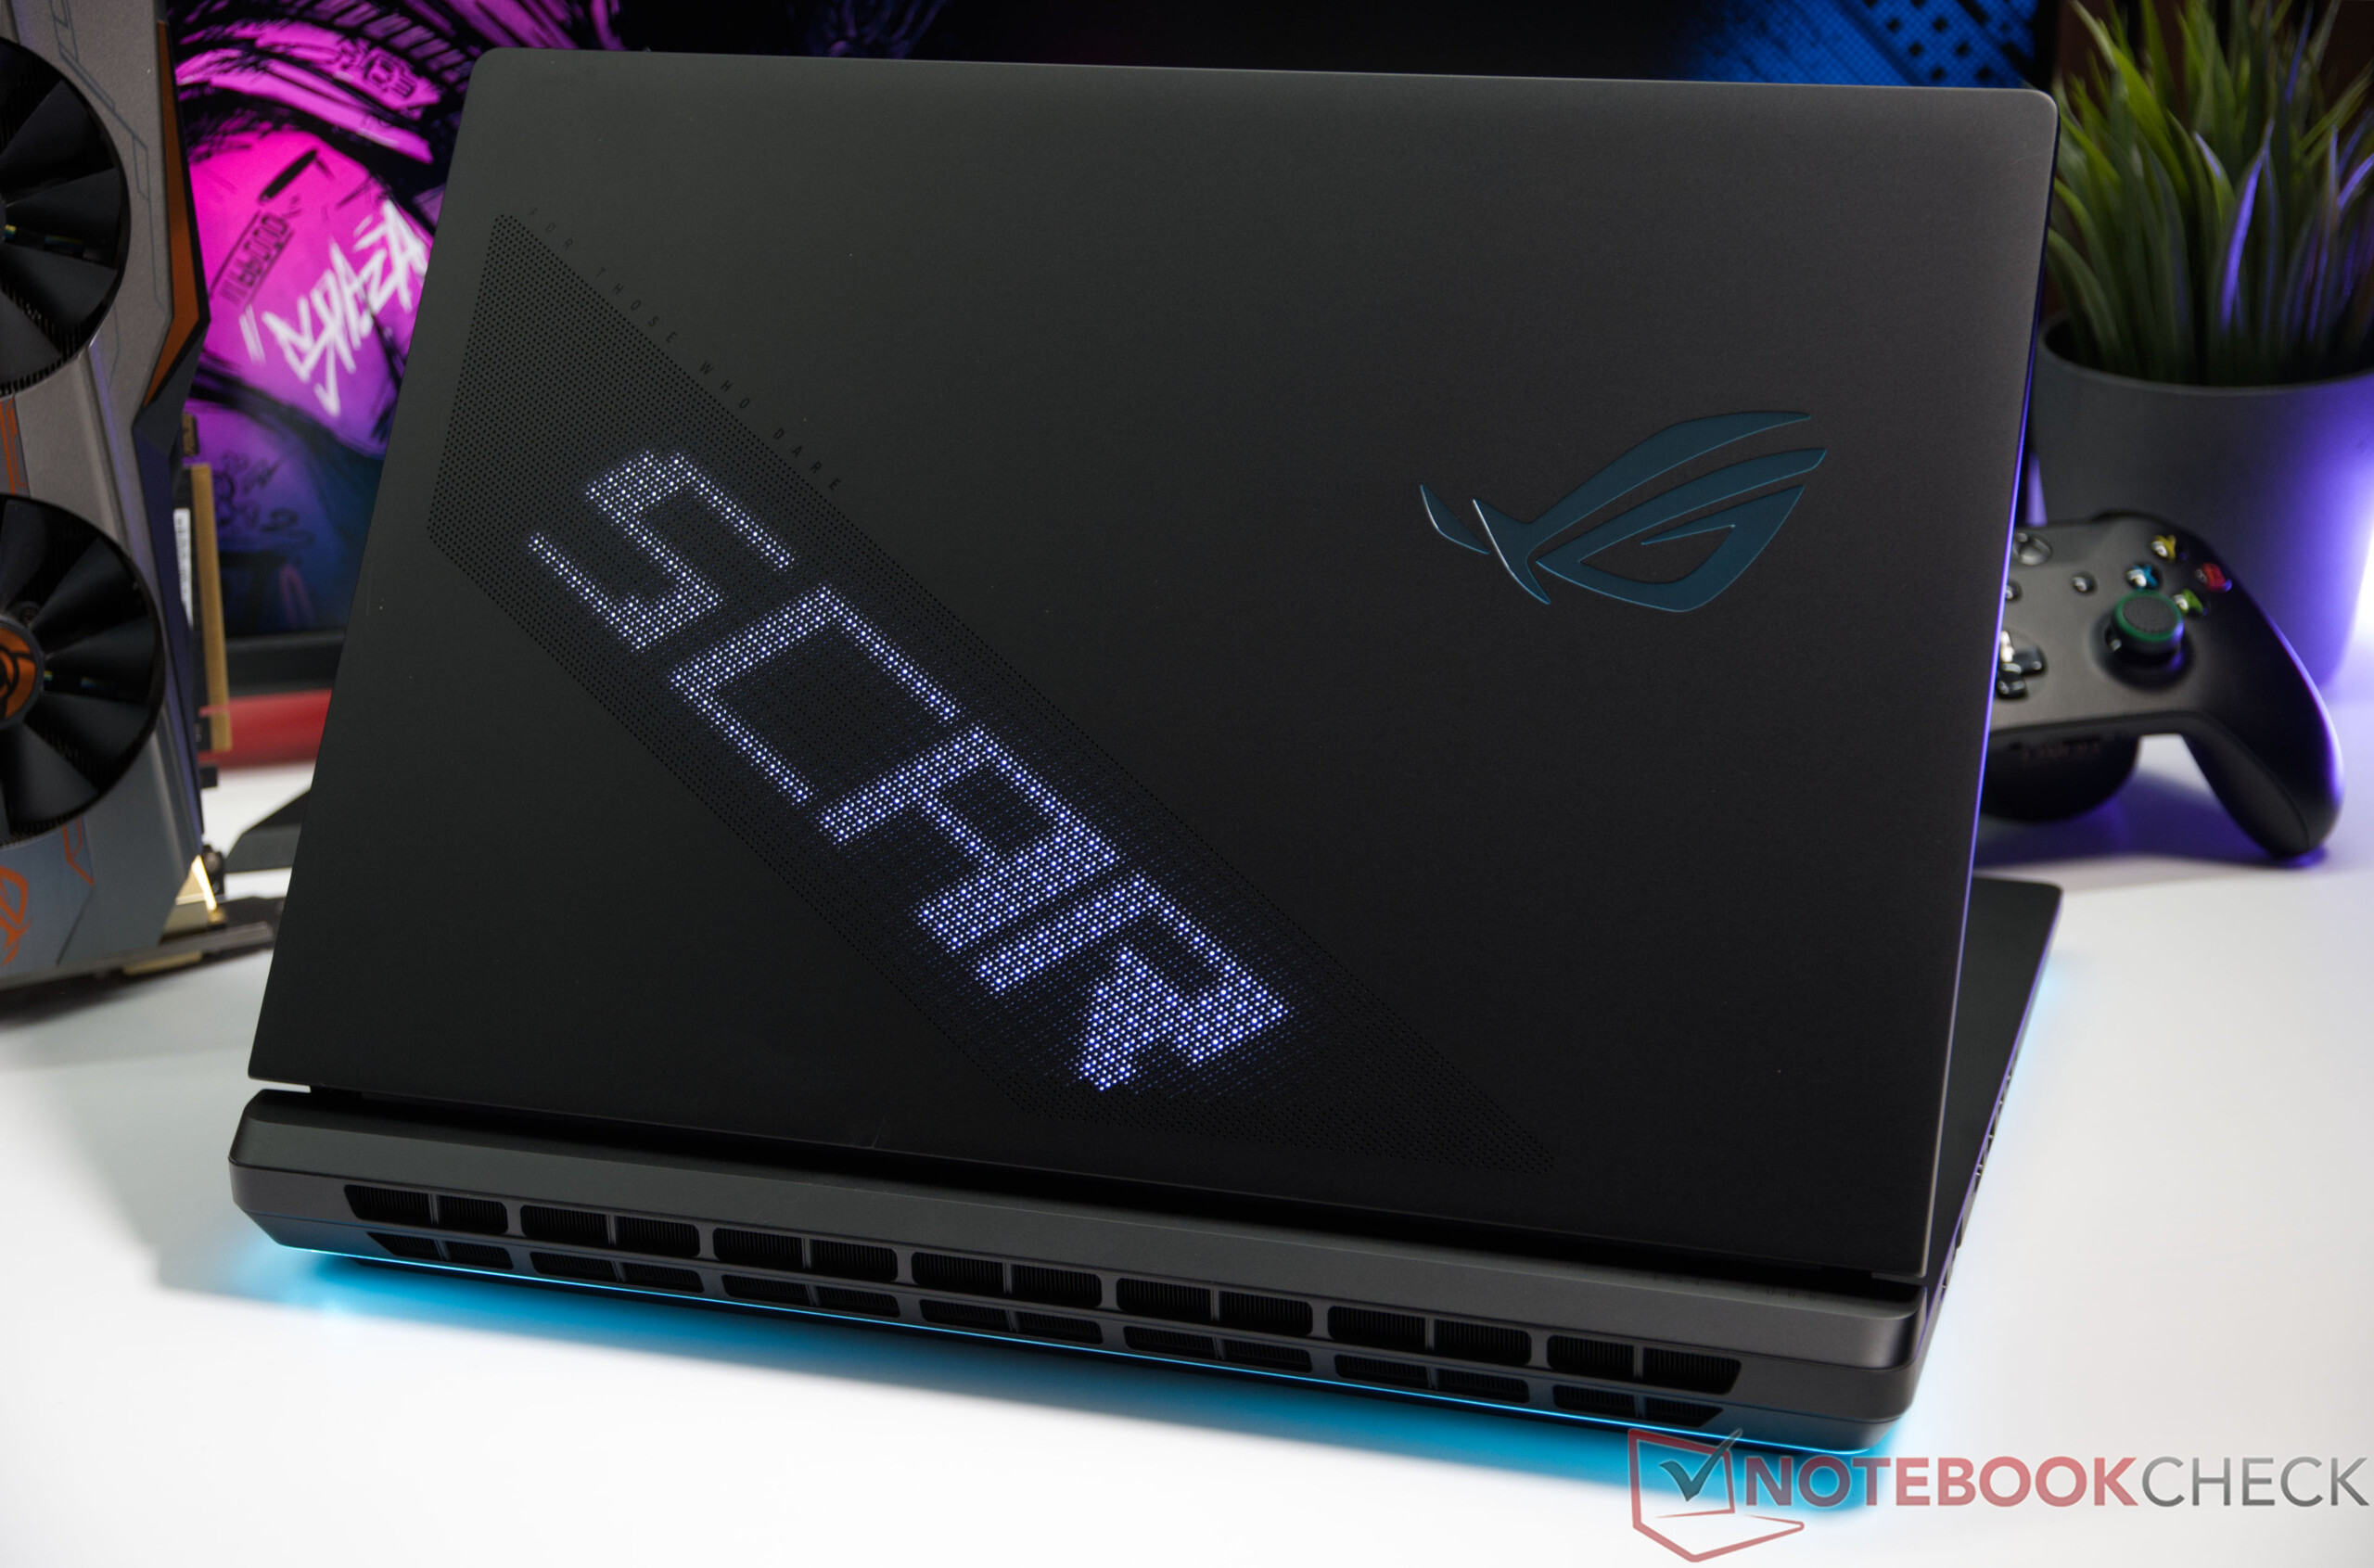
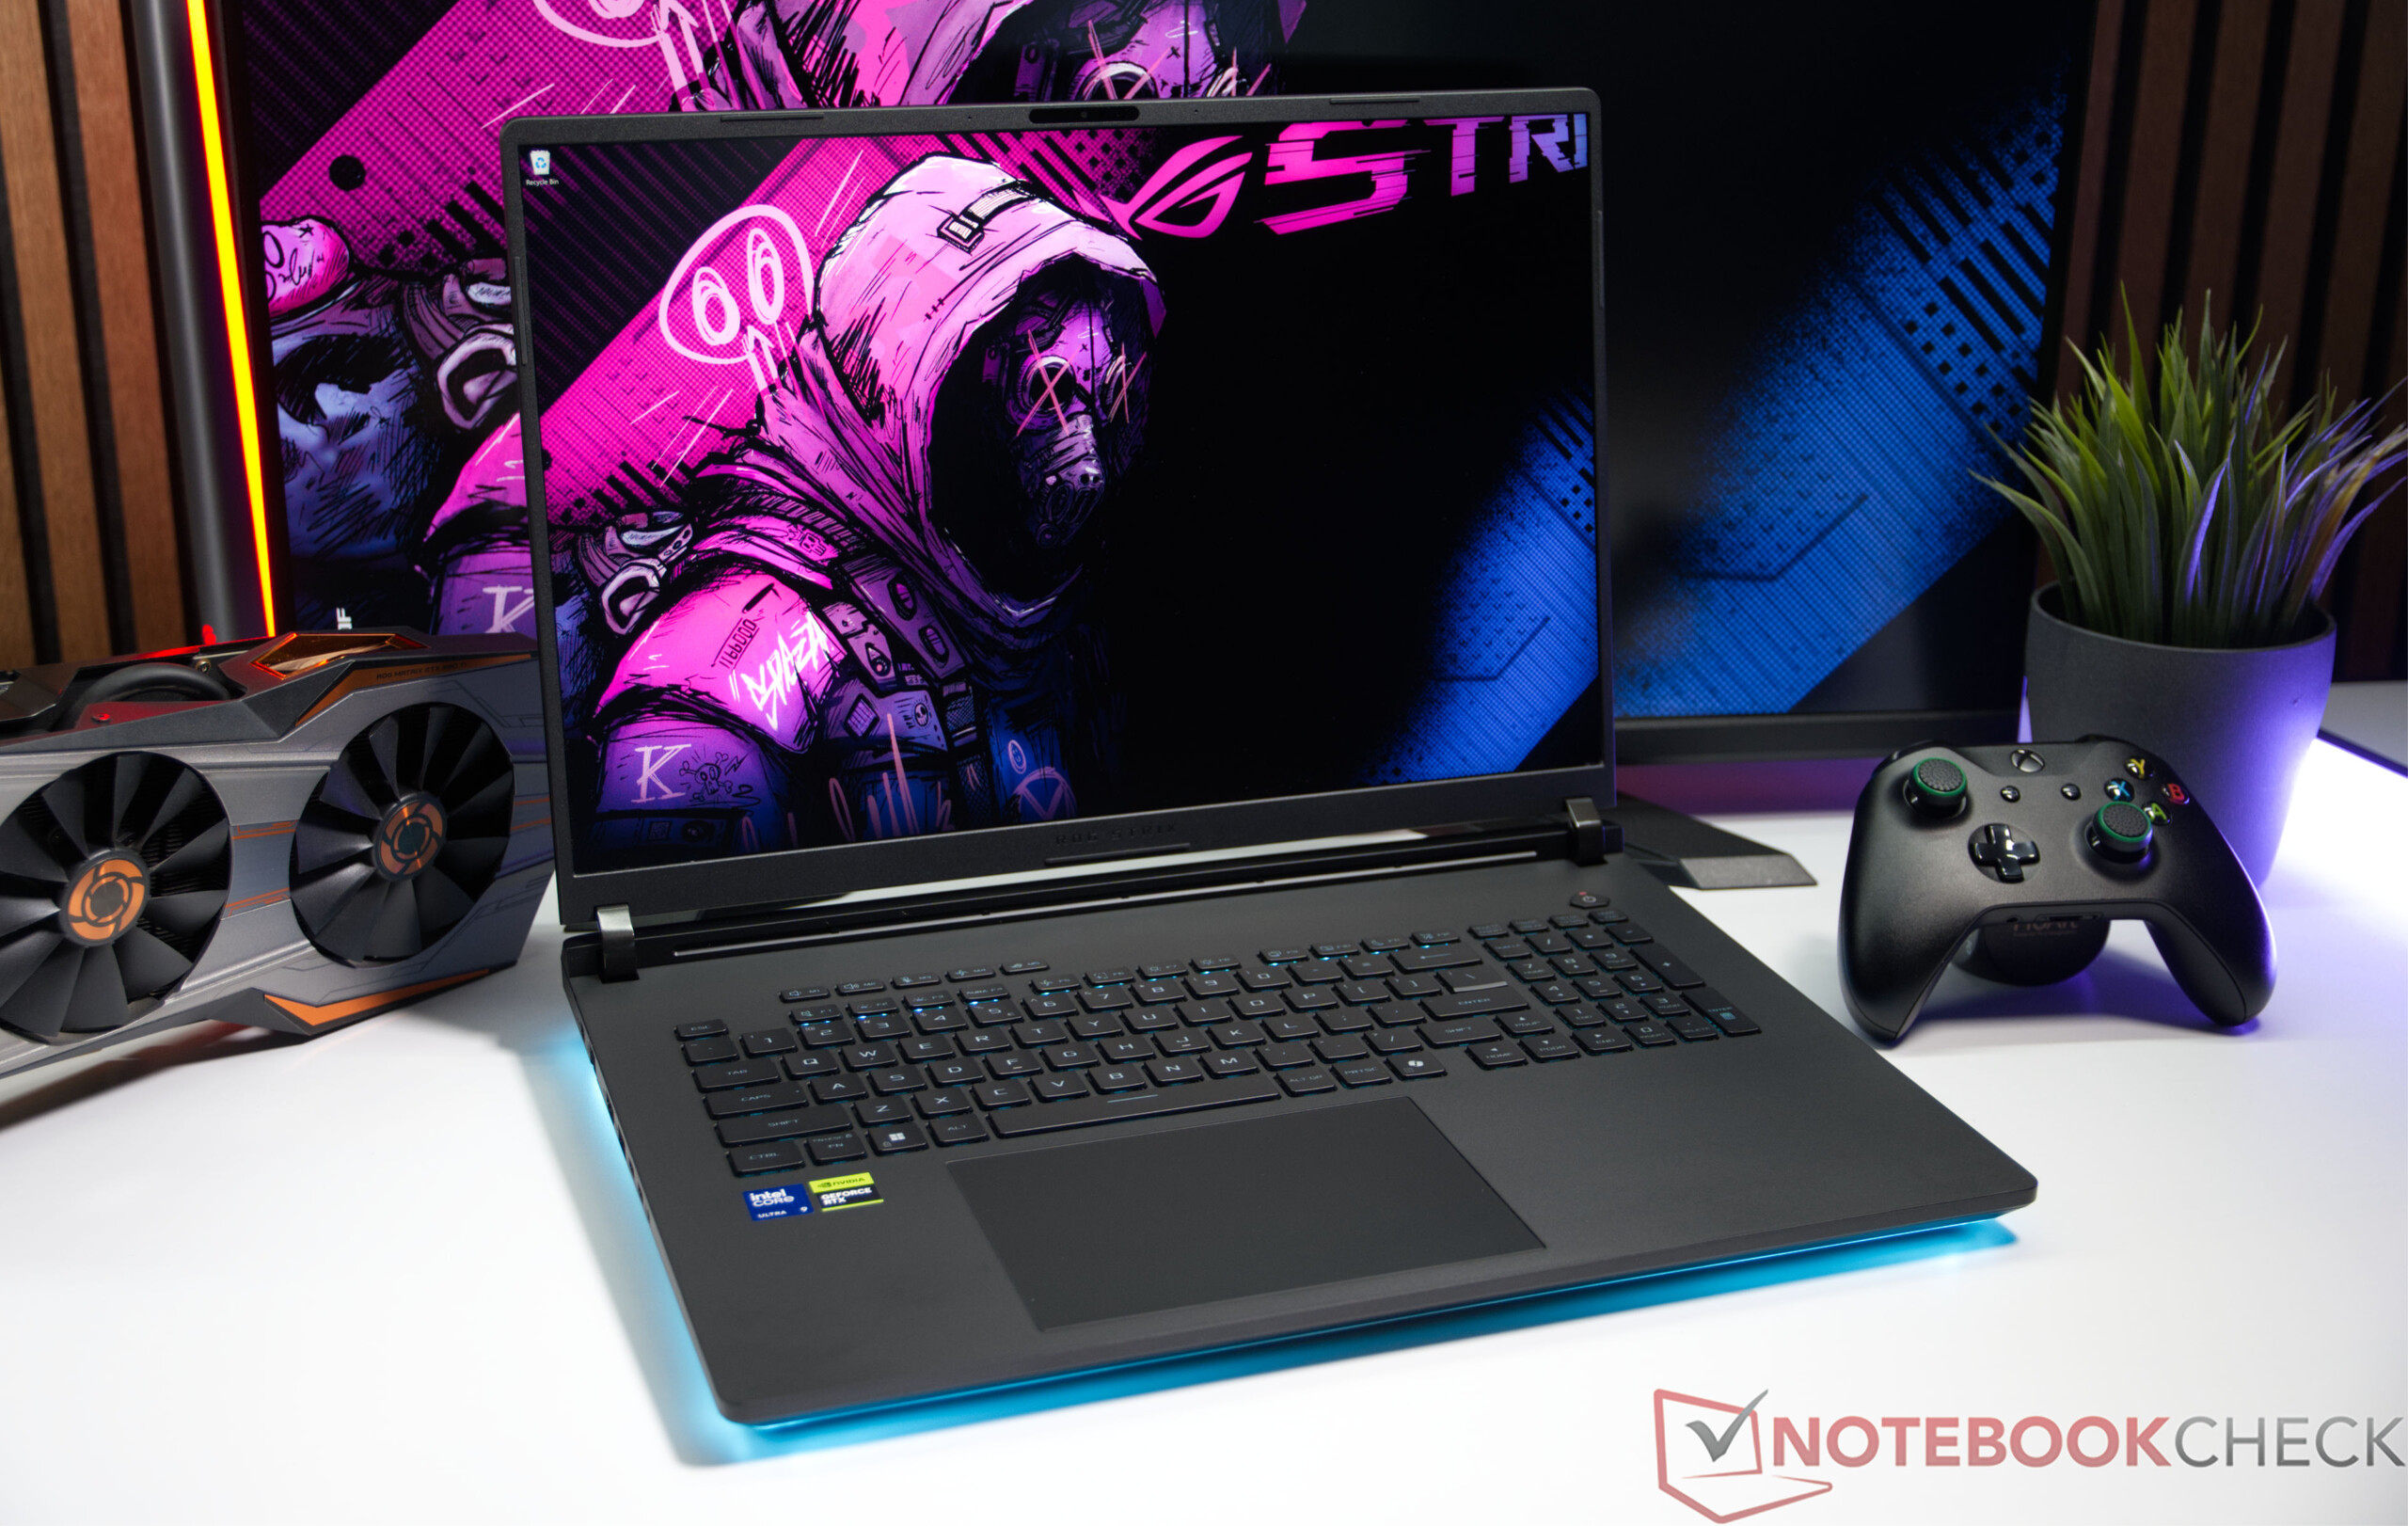
Asus aktualisiert sein ROG Strix SCAR 18 G835LXG mit dem Intel Core Ultra 9 290HX, einer Nvidia GeForce RTX 5090 Laptop und einem 18 Zoll großen 4K-Mini-LED-Display mit 240 Hz sowie 2.000 Dimming-Zonen. Hinzu kommen sehr gute Wartungsmöglichkeiten durch den vereinfachten Zugang zu den Komponenten und umfangreiche Individualisierungsoptionen mit AniME Vision und der vielseitigen RGB-Beleuchtung.
Sebastian Bade 👁 Veröffentlicht am
AI Blackwell RTX 5000 Nvidia Arrow Lake Intel Laptop / Notebook Windows Gaming Wi-Fi 7 Thunderbolt

Fazit - Maximale Gaming-Leistung mit wenigen Schwächen

Das Asus ROG Strix SCAR 18 G835LXG gehört zu den derzeit leistungsstärksten Gaming-Notebooks auf dem Markt. Mit dem Intel Core Ultra 9 290HX, der Nvidia GeForce RTX 5090 Laptop mit 175 Watt TGP und 128 GB Arbeitsspeicher bietet das Testgerät enorme Leistungsreserven für aktuelle AAA-Spiele, professionelle Content-Erstellung und anspruchsvolle KI-Workloads. Auch unter anhaltender Last bleibt die CPU- und GPU-Performance stabil.

Das 18 Zoll große Mini-LED-Display mit 4K-Auflösung, 2.000 Dimming-Zonen und 240 Hz zählt zu den größten Stärken des Notebooks. Es überzeugt mit hoher Schärfe, exzellenten HDR-Eigenschaften und einer hohen Maximalhelligkeit. Einschränkungen gibt es lediglich bei der Farbabstimmung im Auslieferungszustand, die sich durch eine Kalibrierung jedoch deutlich verbessern lässt. Zudem stehen die 240 Hz ausschließlich im GPU Ultimate Mode zur Verfügung – in allen anderen Grafikmodi sind immerhin 120 Hz möglich.

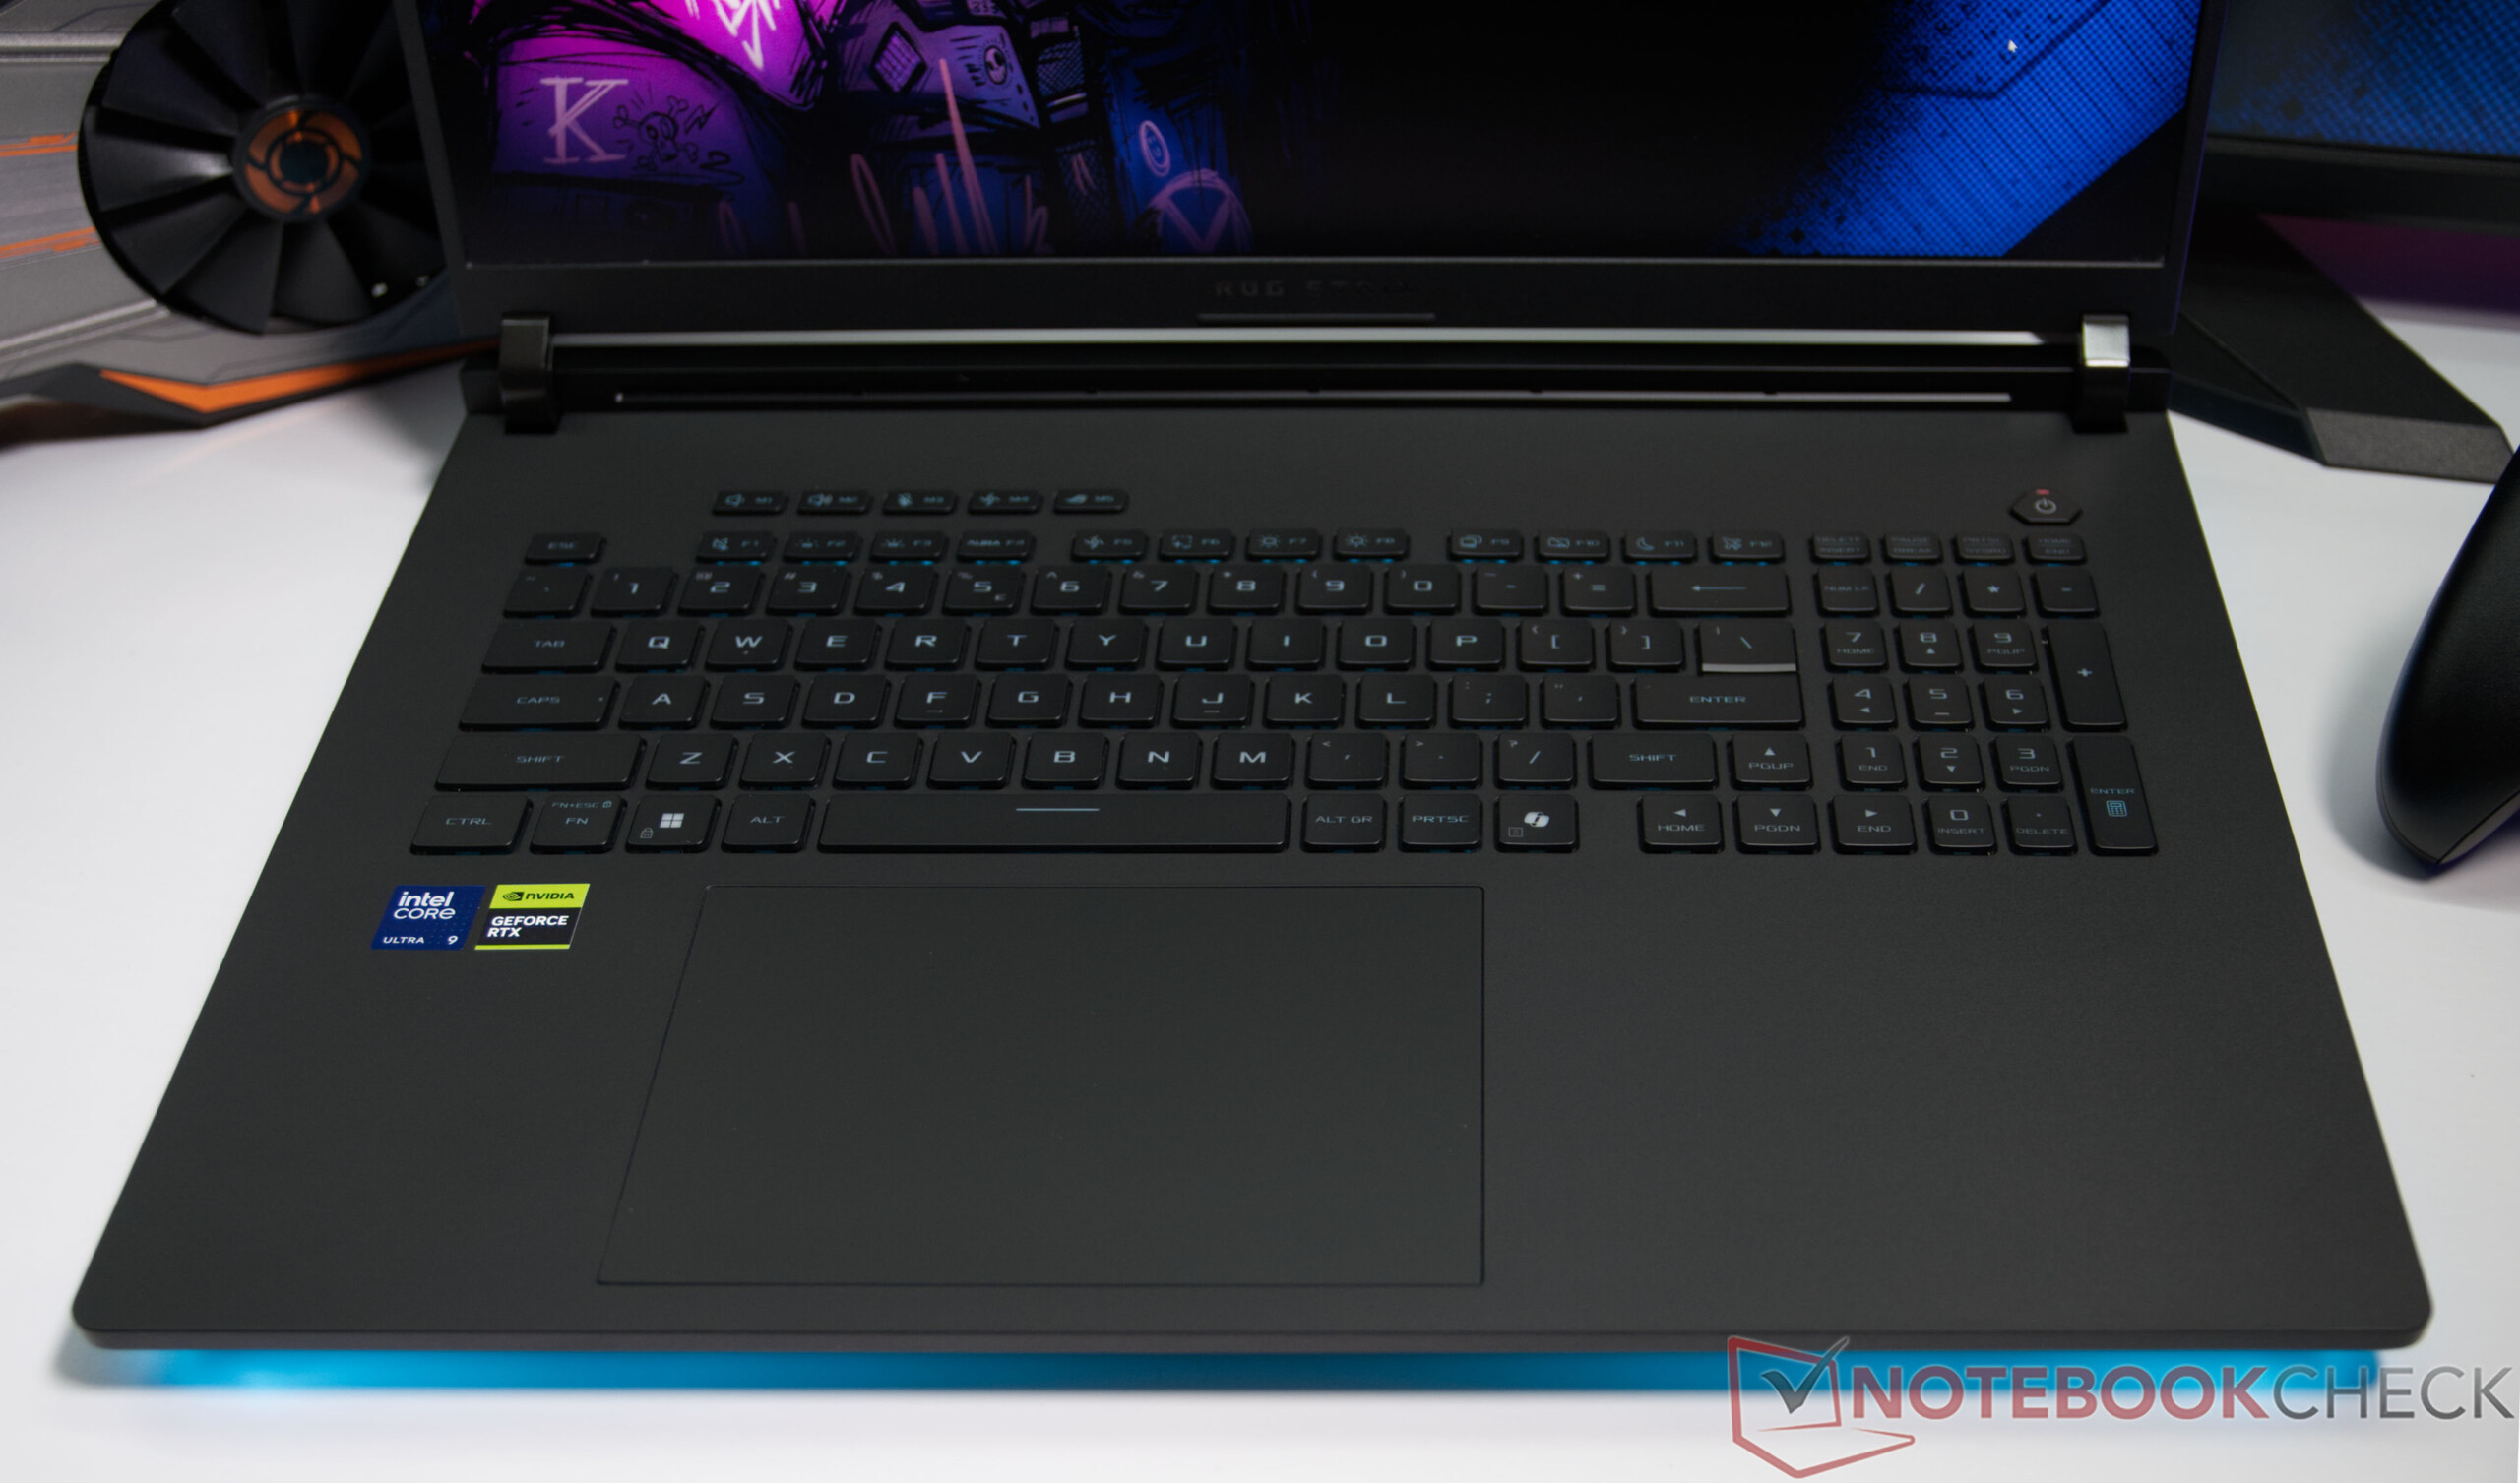
Auch das Gehäuse hinterlässt einen hochwertigen Eindruck. Die umfangreiche RGB-Beleuchtung inklusive AniME Vision sowie die einfache Wartung unterstreichen den Premium-Anspruch. Weniger gelungen sind die empfindliche Kunststoffoberfläche der Baseunit, die schnell Fingerabdrücke annimmt, sowie die unter Last deutlich hörbare Kühlung. Hinzu kommen die hohe Leistungsaufnahme und die für diese Leistungsklasse lediglich durchschnittlichen Akkulaufzeiten.

Wer auf der Suche nach einem kompromisslosen Desktop-Ersatz mit maximaler Gaming- und Anwendungsleistung ist, erhält mit dem Asus ROG Strix SCAR 18 G835LXG eines der aktuell stärksten 18-Zoll-Gaming-Notebooks. Dem stehen allerdings ein sehr hoher Anschaffungspreis sowie eine hohe Geräusch- und Leistungsaufnahme gegenüber – typische Begleiterscheinungen dieser Leistungsklasse.

Pro

+ überragende Gaming- und Systemleistung
+ GeForce RTX 5090 Laptop mit 175 Watt TGP
+ 128-GB-DDR5-RAM
+ insgesamt 8 TB Speicherplatz (2x 4 TB RAID 0)
+ exzellentes 18-Zoll-Mini-LED-Display
+ zwei Thunderbolt-5-Anschlüsse
+ hervorragende Wartungs- und Aufrüstungsmöglichkeiten
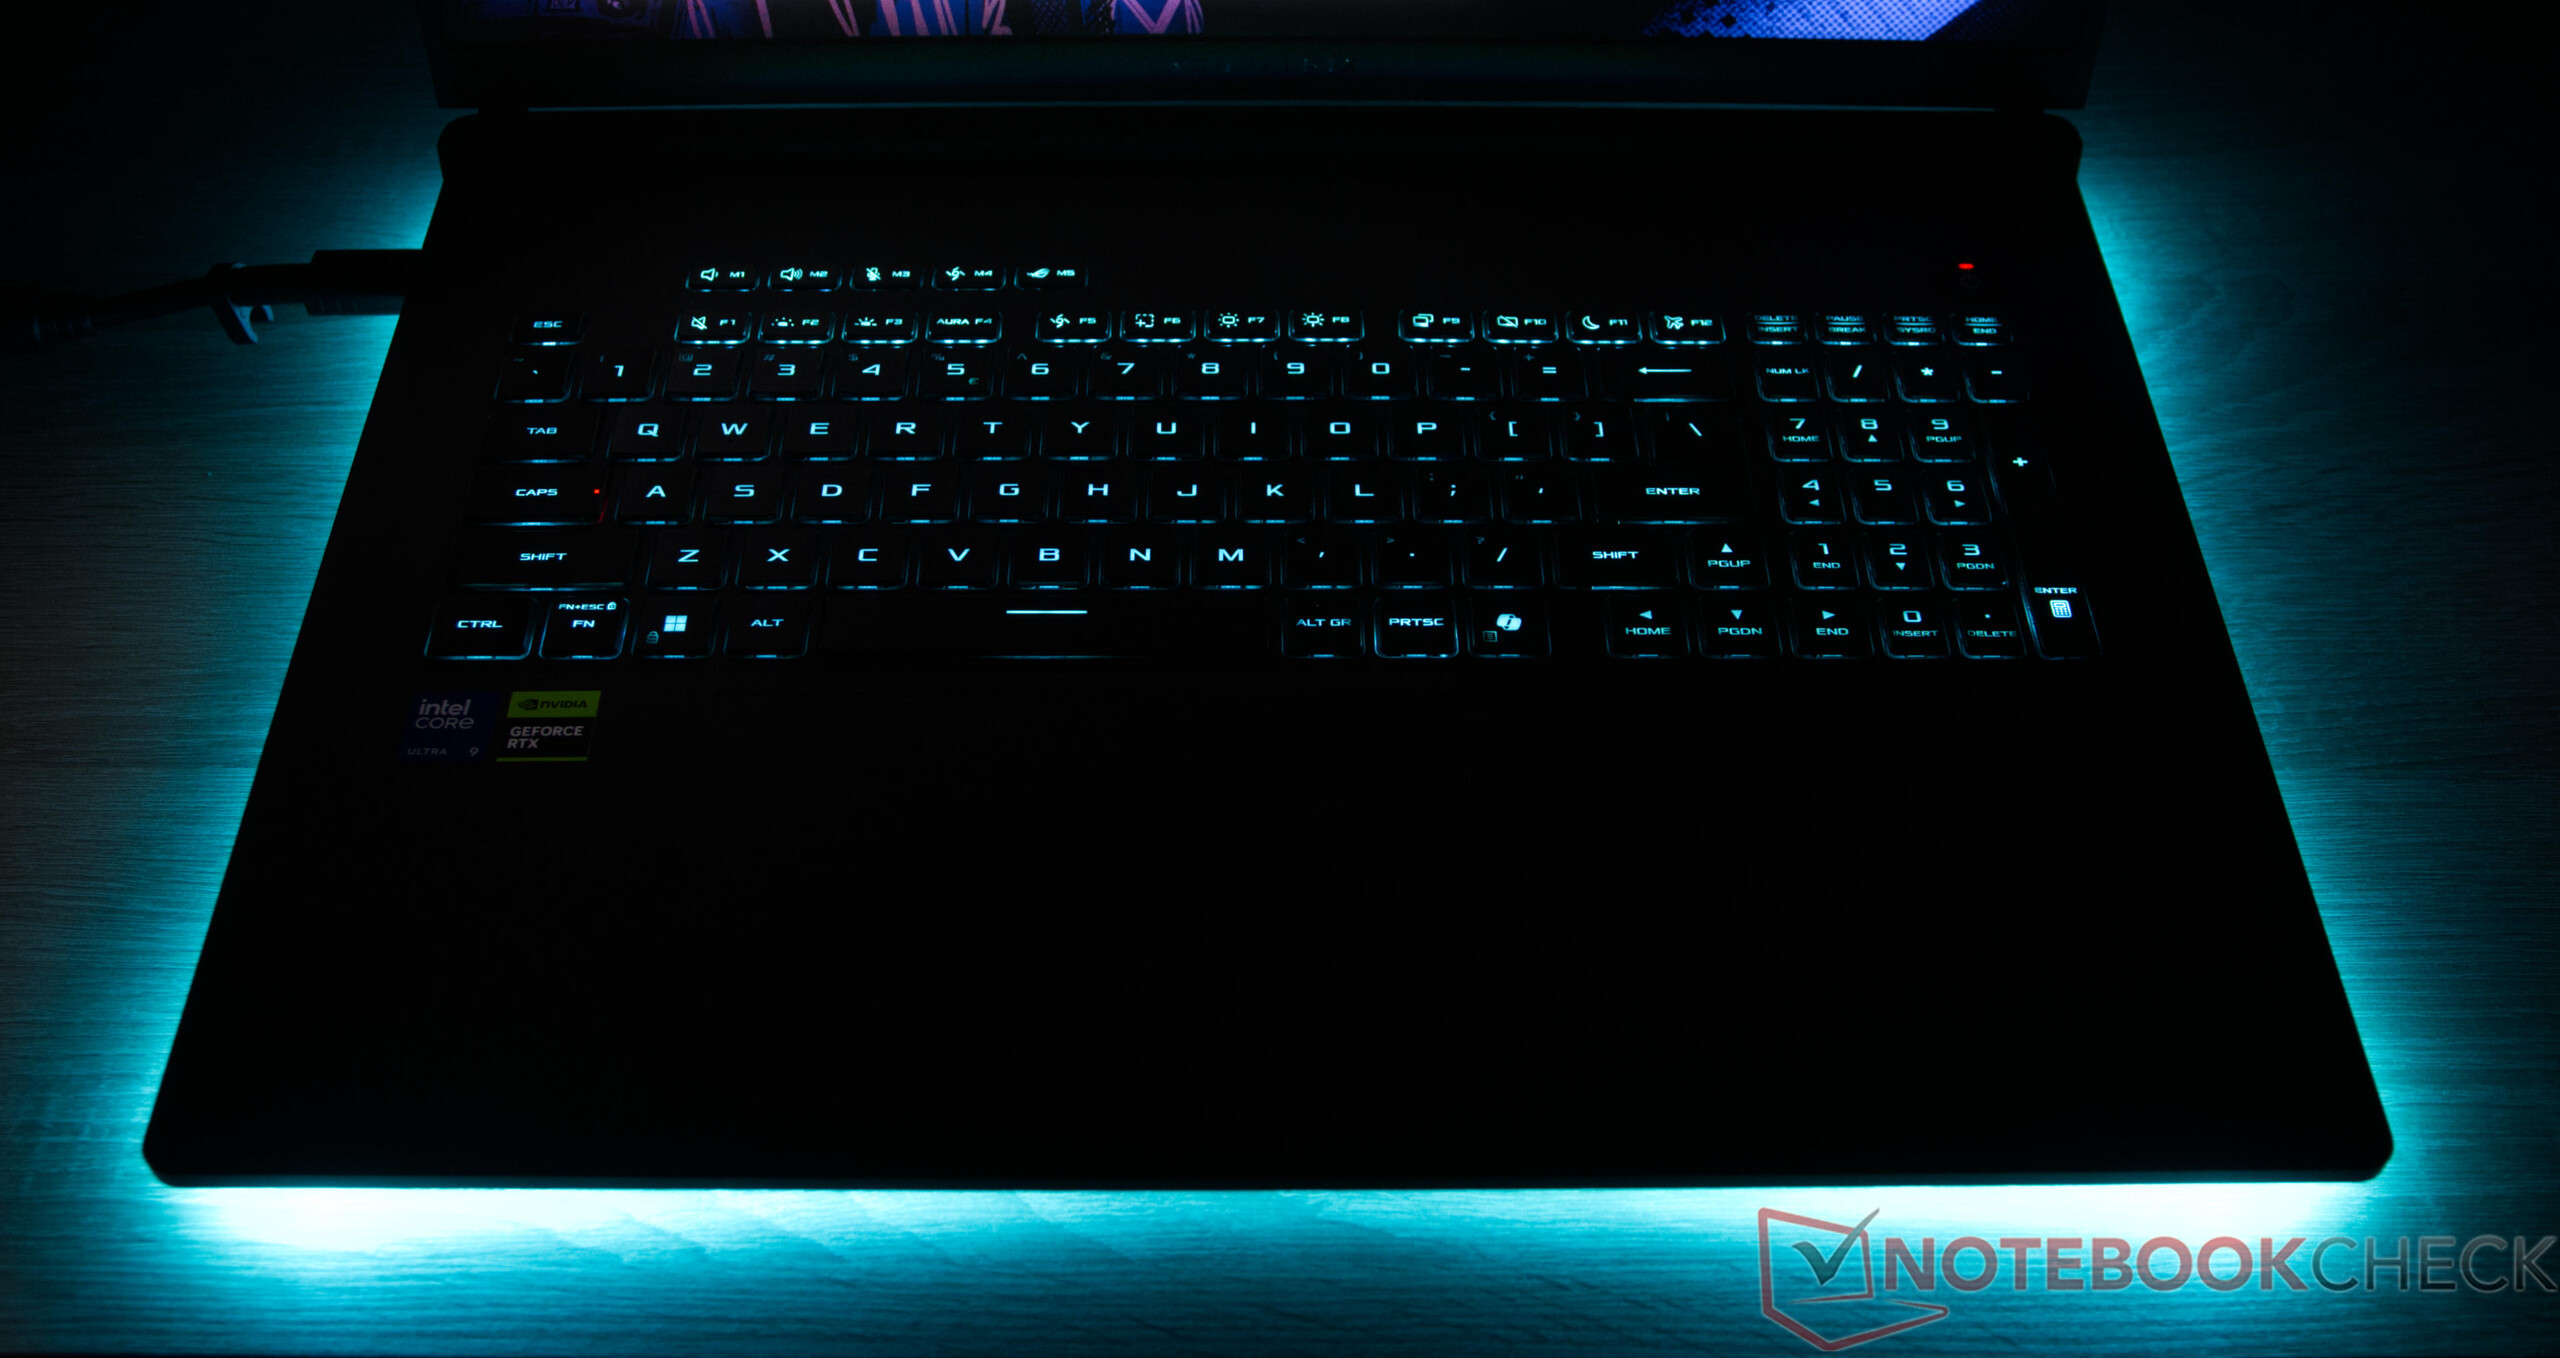
+ vielseitig konfigurierbare RGB- und AniME-Vision-Beleuchtung
+ komfortable Tastatur mit präzisem Anschlag

Contra

- hohe Geräuschentwicklung unter Gaming-Last
- Kunststoff-Baseunit sehr anfällig für Fingerabdrücke
- hoher Energieverbrauch unter Last
- keine Anschlüsse an der Gehäuserückseite

Preis und Verfügbarkeit

Das neue Asus ROG Strix SCAR 18 ist voraussichtlich in Kürze im Handel verfügbar.

Amazon Logo
  • 3.076,79 €
    ASUS ROG Strix Scar 18 (2025) Gaming Laptop, 18 Zoll ROG Nebula HDR 16:10 2.5K 240Hz/3ms, NVIDIA GeForce RTX 5070 Ti, Intel Core Ultra 9 275HX, 32GB DDR5, 1TB PCIe SSD, Wi-Fi 7, Win 11 Pro, G833
  • 3.603,76 €
    ASUS ROG Strix Scar 18 G835LR Laptop | 18" WQXGA 240Hz/3ms 16:10 MiniLED Display | Intel Core Ultra 9 275HX | 32GB RAM | 1TB SSD | RTX 5070 Ti | Win11 Home | QWERTZ | Off Black | 3Monate GamePass
  • 4.066,93 €
    ASUS ROG Strix Scar 18 G835LX Laptop; 18" WQXGA 240Hz/3ms 16:10 MiniLED Display; Intel Core Ultra 9 275HX; 64GB RAM; 2TB SSD; NVIDIA RTX 5090; Win11 Home; QWERTZ; Off Black; 3Monate GamePass

Das Asus ROG Strix SCAR 18 G835LXG ist das Gaming-Flaggschiff von Asus und richtet sich an Nutzer mit höchsten Leistungsansprüchen. Unser Testgerät kombiniert den Intel Core Ultra 9 290HX mit einer Nvidia GeForce RTX 5090 Laptop GPU und bietet zudem 128 GB Arbeitsspeicher, zwei schnelle 4-TB-SSDs im Raid-0-Verbund sowie ein 18 Zoll großes Mini-LED-Display mit 240 Hz. Damit eignet sich das High-End-Notebook gleichermaßen für anspruchsvolle Spiele wie auch professionelle Content-Erstellung.

Spezifikationen

Asus ROG Strix Scar 18 G835LXG (Strix Scar 18 Serie)
Prozessor
Intel Core Ultra 9 290HX Plus 24c/24t, 8 x 5.5 GHz Intel Lion Cove P-Core, 16 x 4.7 GHz Intel Skymont E-Core, 200 W PL2 / Short Burst, 180 W PL1 / Sustained, Arrow Lake-HX
Grafikkarte
NVIDIA GeForce RTX 5090 Laptop - 24 GB VRAM, Kerntakt: 1597 MHz, Speichertakt: 1750 MHz, 175 W TDP ( beinhaltet 25 W Dynamic Boost), GDDR7, Nvidia 610.62, Advanced Optimus
RAM
128 GB 
, DDR5-6400, 2x SO-DIMM, Dual-Channel
Bildschirm
18.00 Zoll 16:10, 3840 x 2400 Pixel 252 PPI, NE180QA1-MM0, Mini LED, spiegelnd: nein, HDR, 240 Hz, Adaptive Sync
Mainboard
Intel HM870 (Arrow Lake-HX PCH)
Massenspeicher
2x Samsung PM9E1 MZVLC4T0HBL1 (RAID 0), 8192 GB 
, M.2 PCIe, RAID 0, 7280 GB verfügbar
Soundkarte
Intel Arrow Lake-S PCH - ACE (Audio Context Engine)
Anschlüsse
3 USB 3.1 Gen2, 2 Thunderbolt 5, USB-C Power Delivery (PD), 1 HDMI, 2 DisplayPort, 1 Docking Station Anschluss, Audio Anschlüsse: 3.5 mm Stereo
Netzwerk
Realtek RTL8125 2.5GBe Family Ethernet Controller (10/100/1000/2500MBit/s), Intel Wi-Fi 7 BE200 320MHz (a/b/g/n = Wi-Fi 4/ac = Wi-Fi 5/ax = Wi-Fi 6/ Wi-Fi 6E 6 GHz be = Wi-Fi 7), Bluetooth 5.4
Abmessungen
Höhe x Breite x Tiefe (in mm): 35 x 399 x 298
Akku
90 Wh Lithium-Polymer, 4-cell
Betriebssystem
Microsoft Windows 11 Home
Kamera
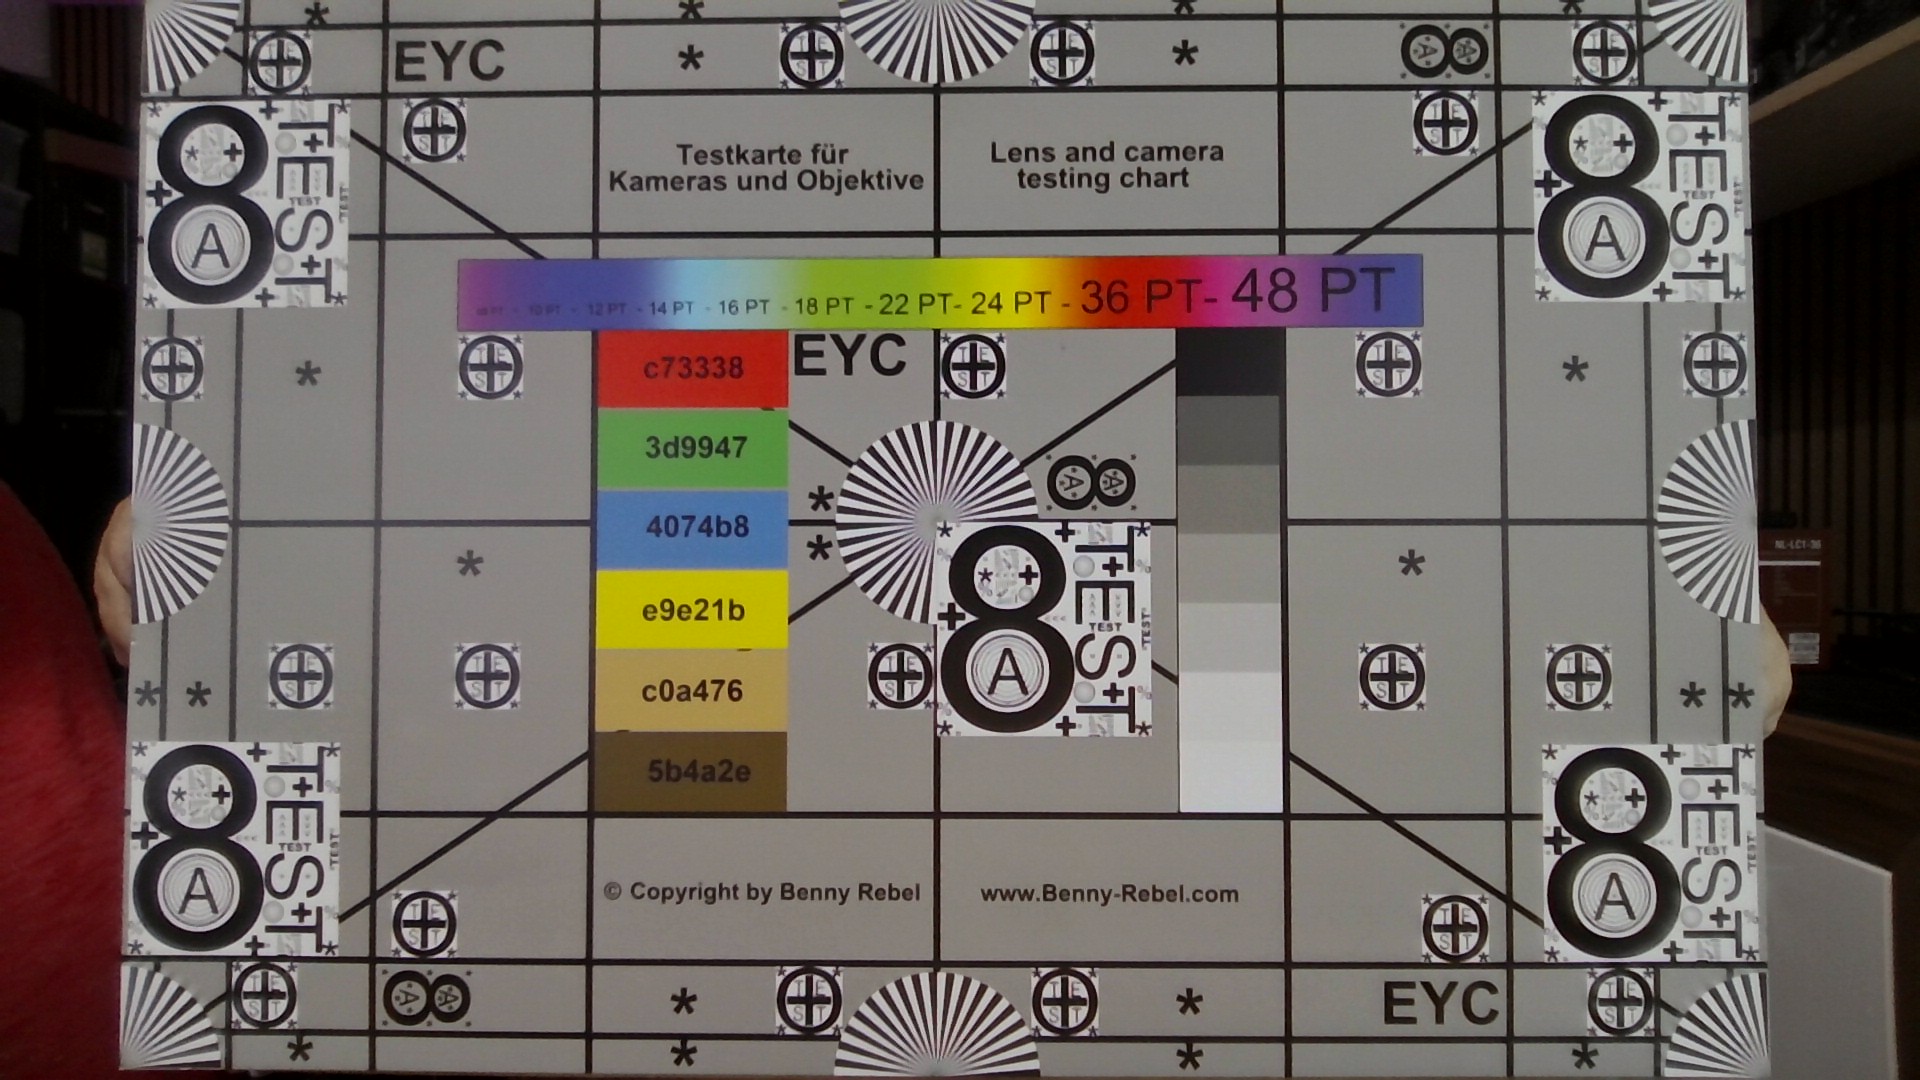
Webcam: 1080P FHD IR Camera for Windows Hello
Primary Camera: 2 MPix
Sonstiges
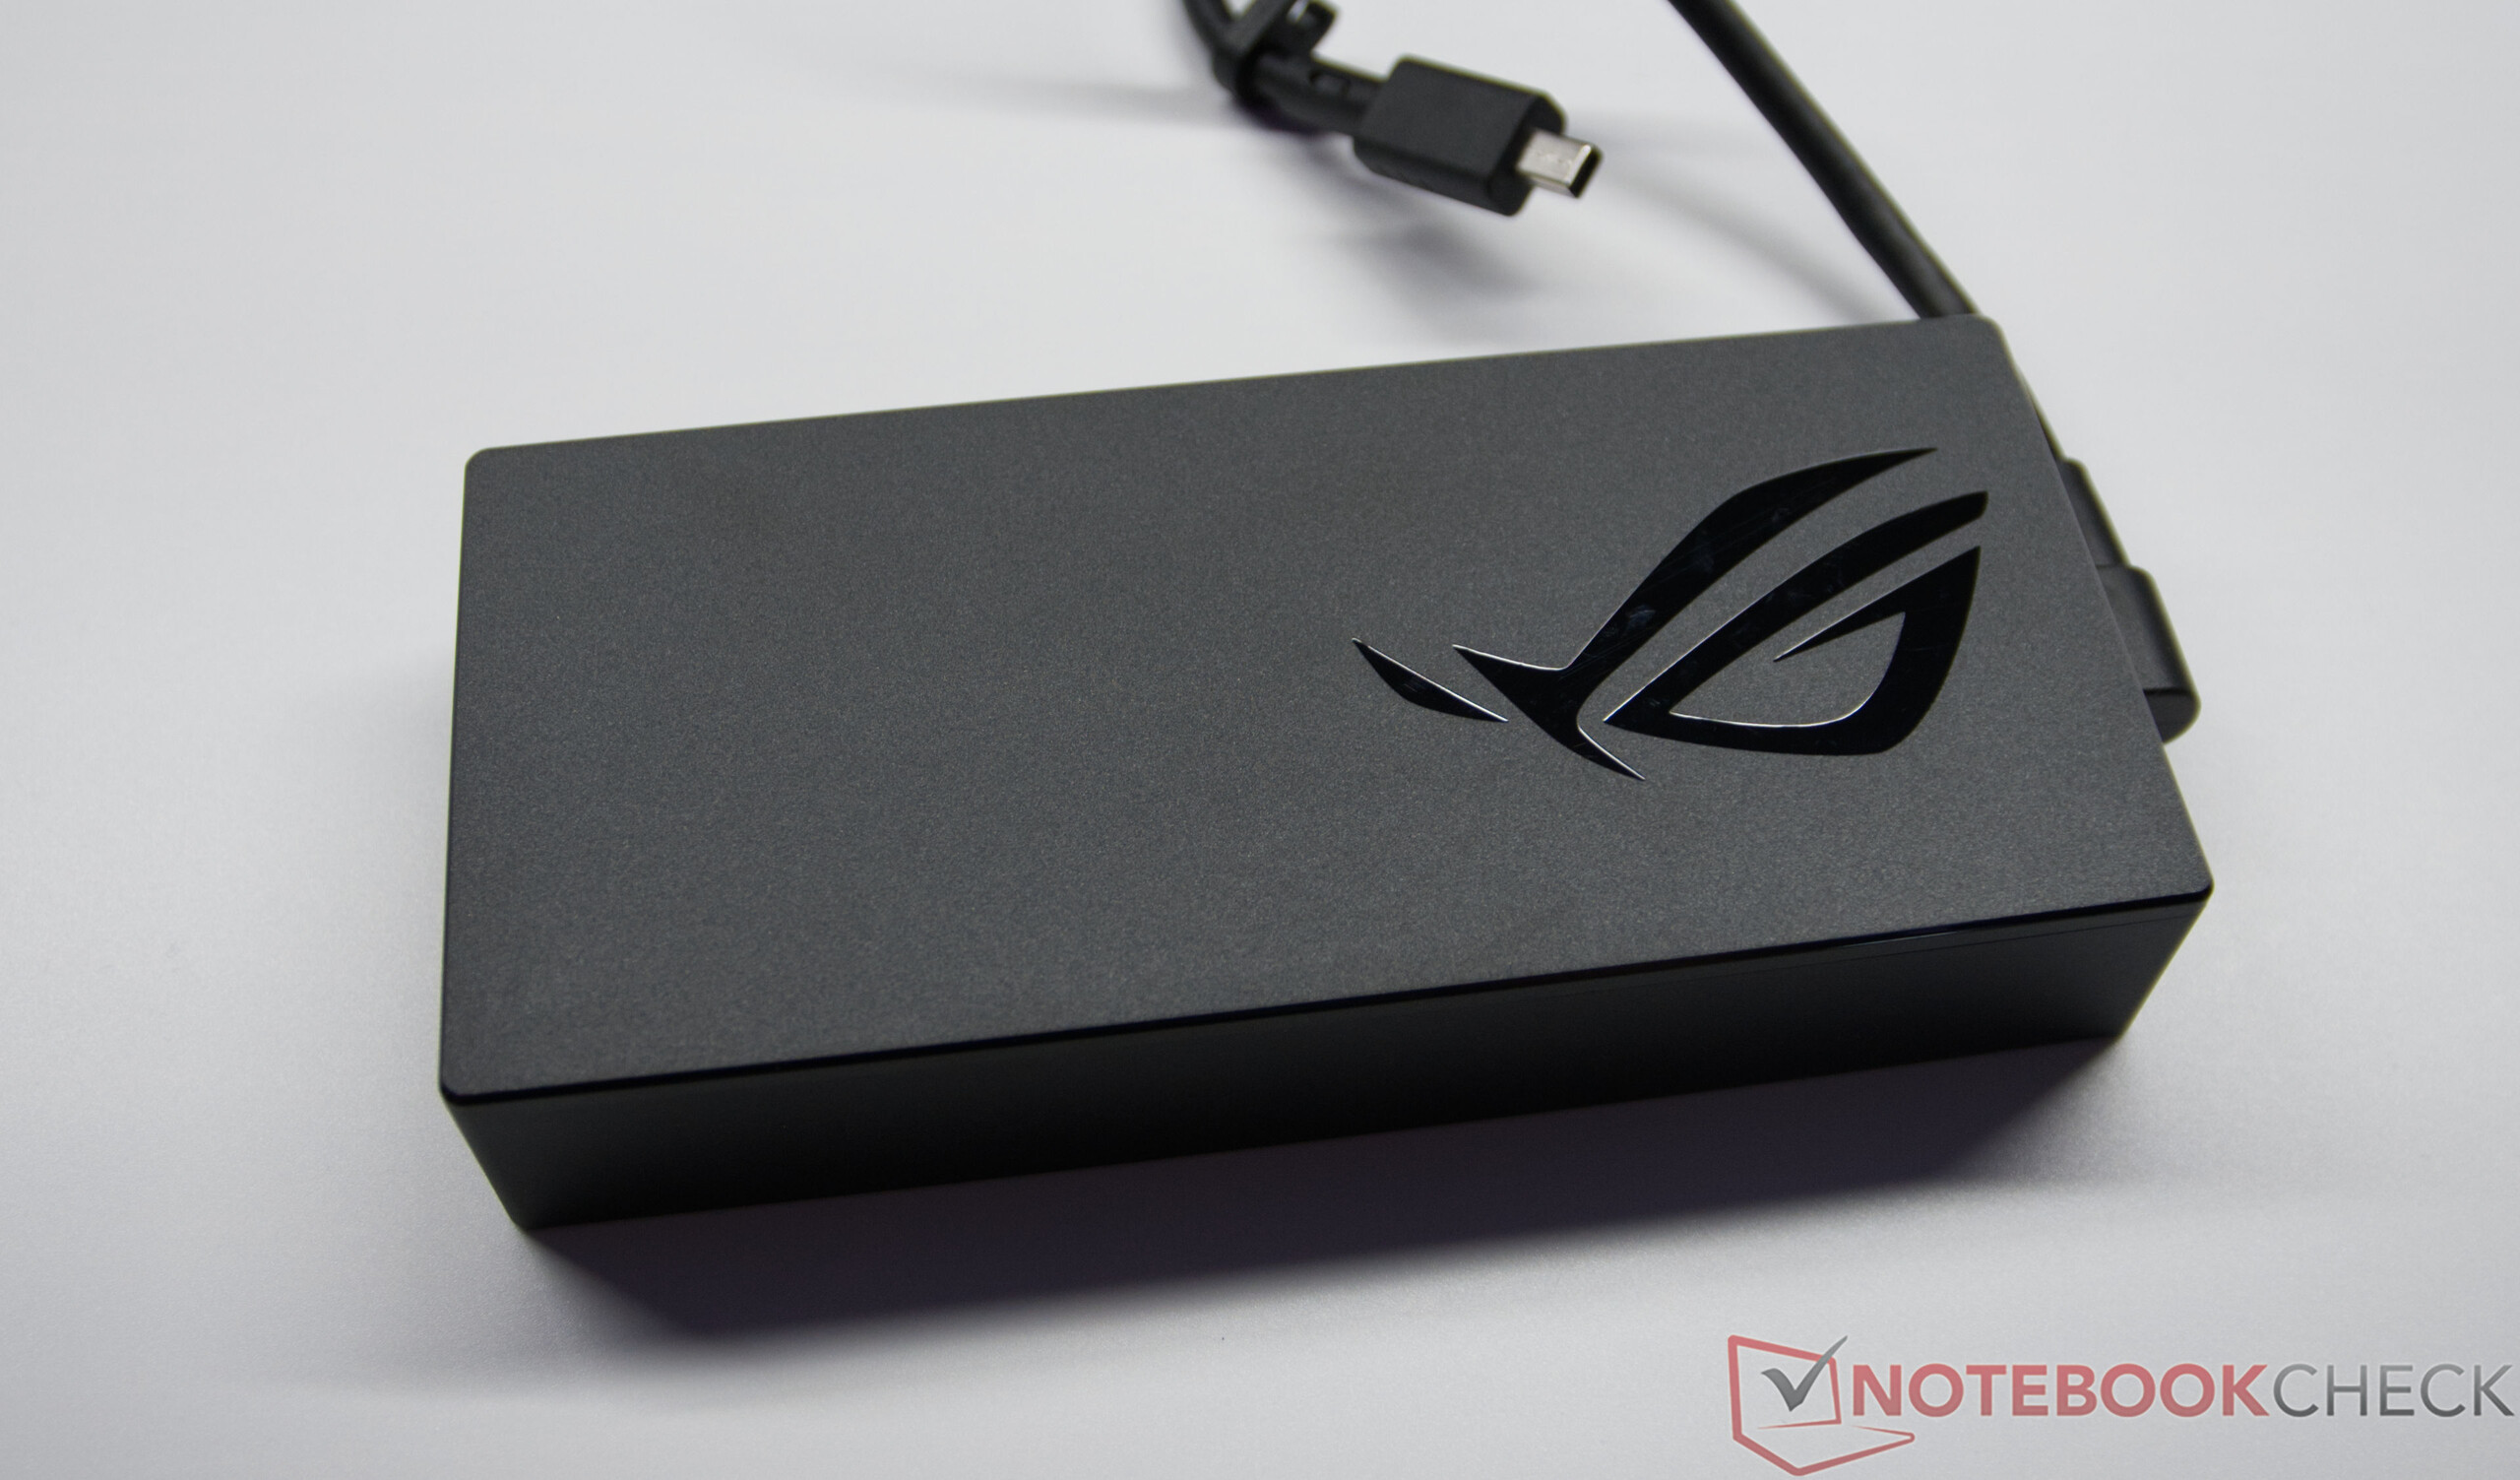
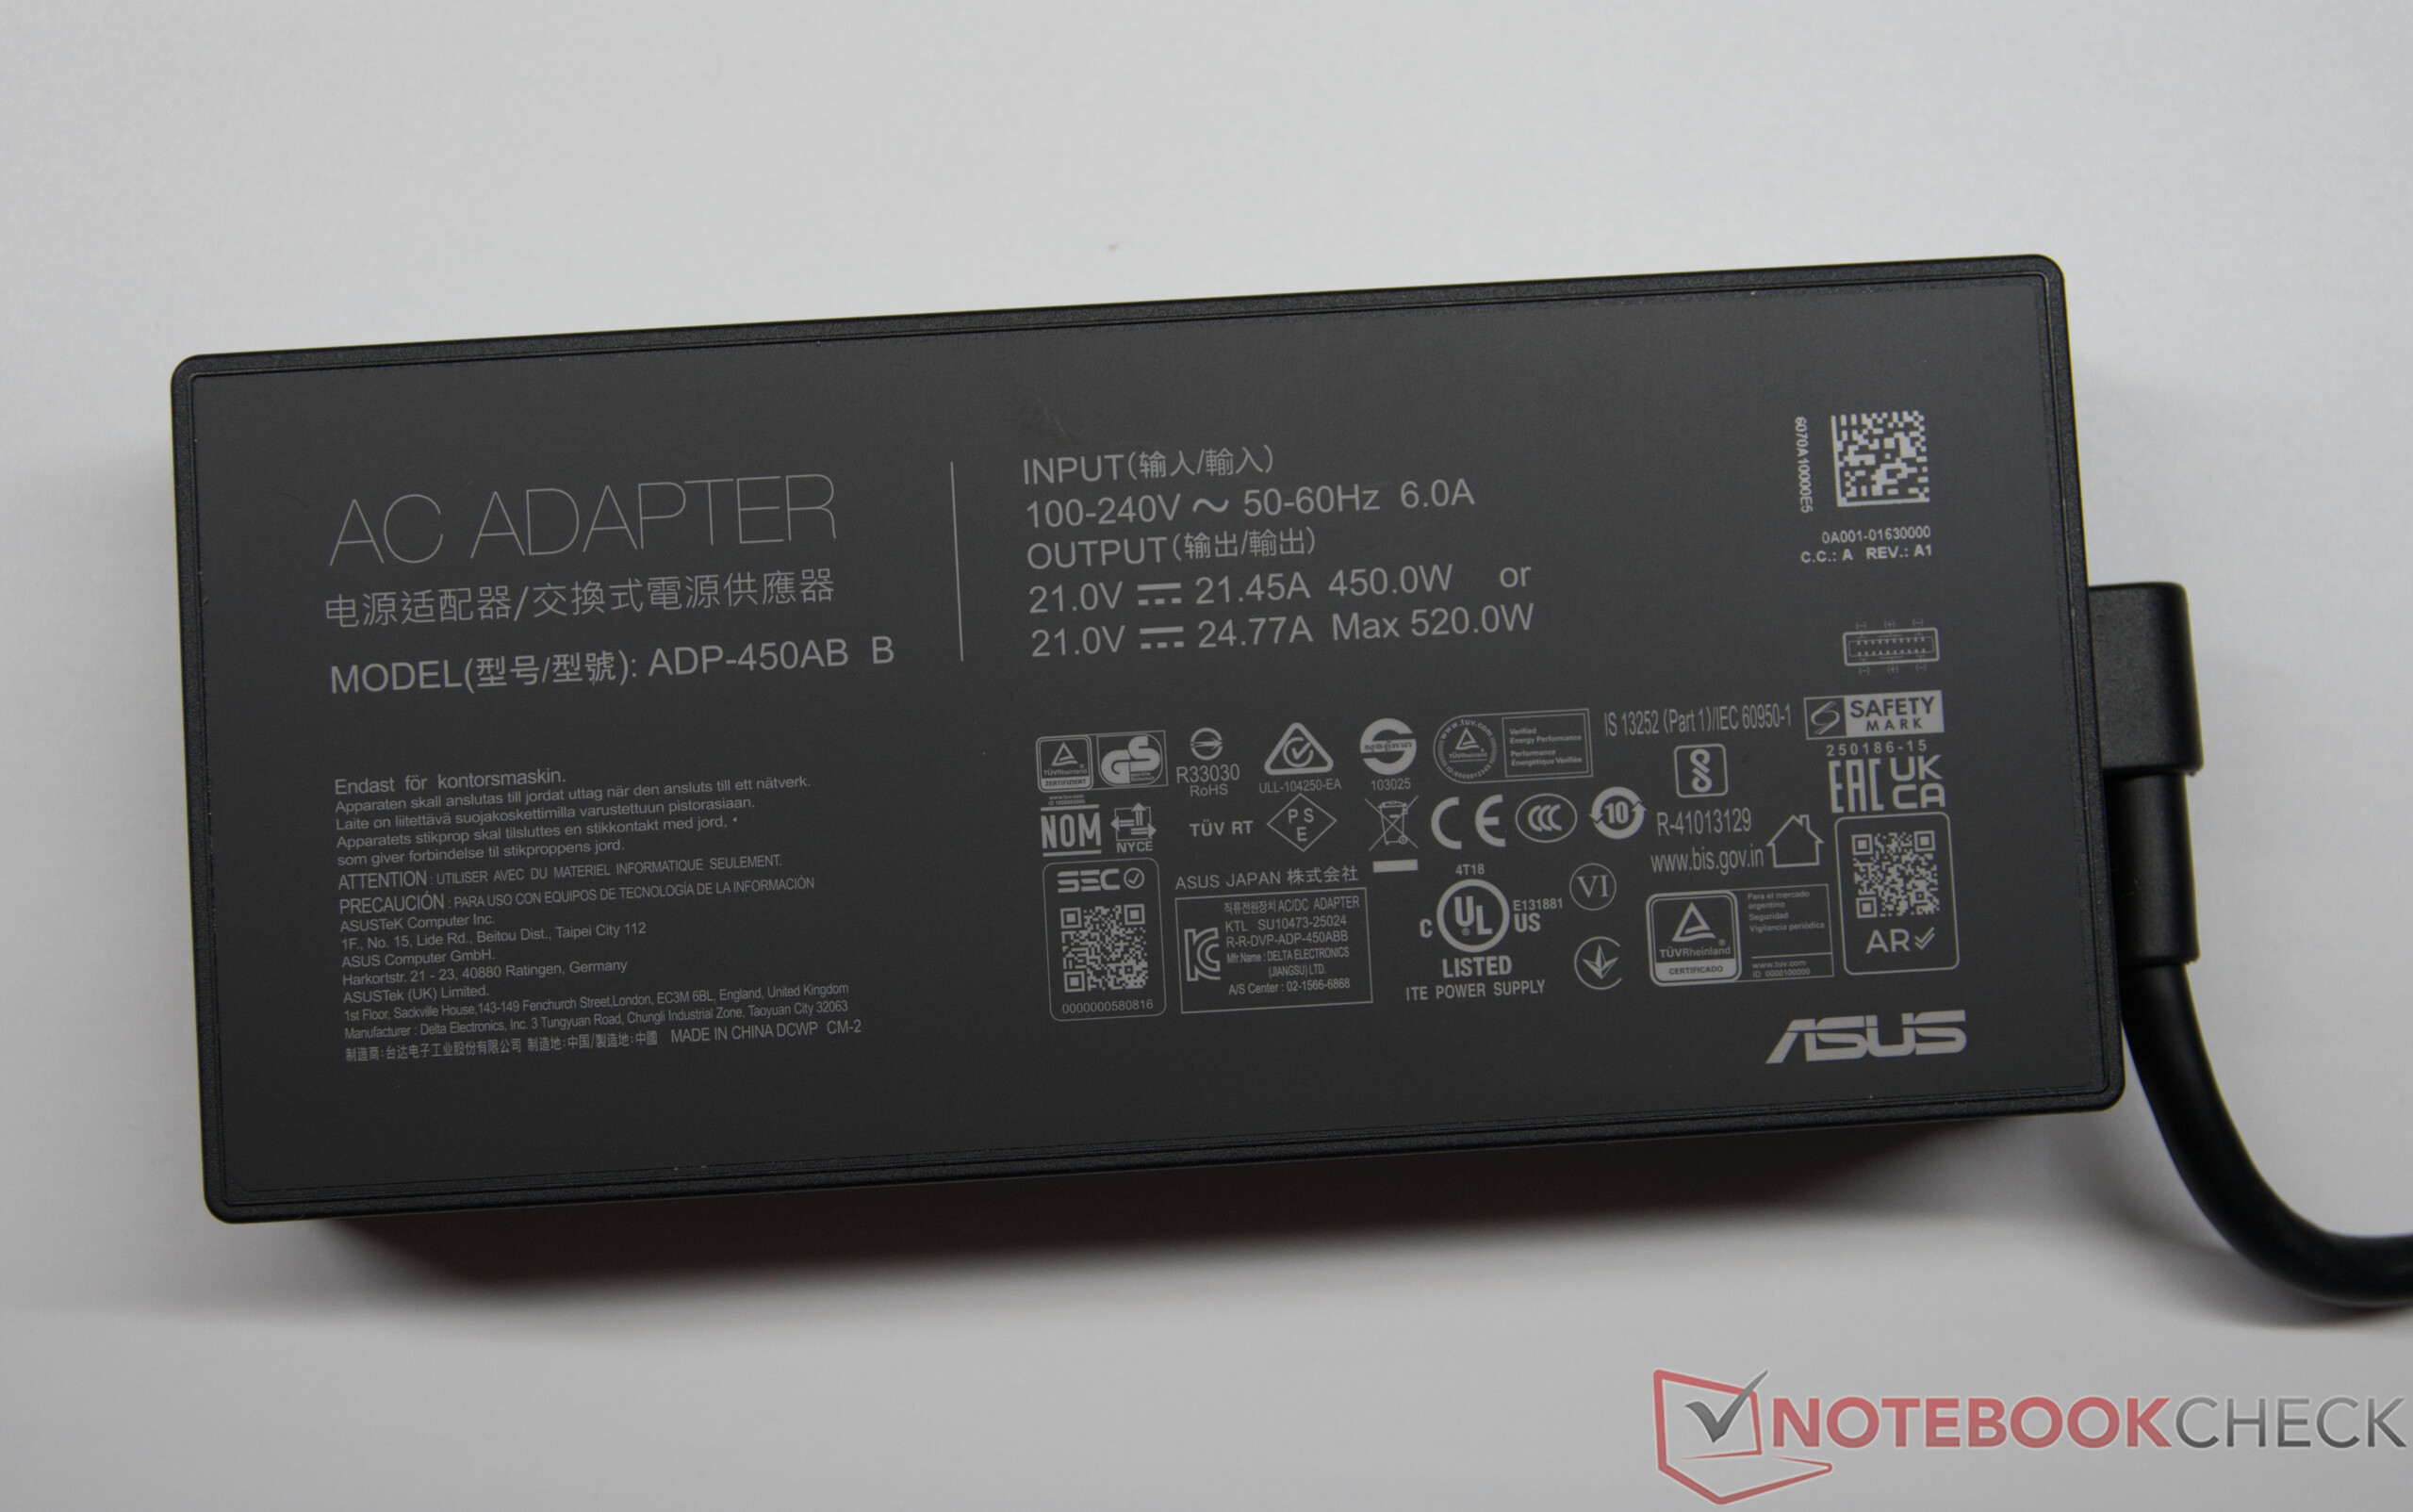
Lautsprecher: 4-speaker system, Tastatur: Chiclet, Tastatur-Beleuchtung: ja, 450W PSU, Armoury Crate, 24 Monate Garantie
Gewicht
3.605 kg, Netzteil: 821 g
Preis
8999 Euro
Hinweis: Der Hersteller kann abweichende Bauteile wie Bildschirme, Laufwerke und Speicherriegel mit ähnlichen Spezifikationen unter dem gleichen Modellnamen einsetzen.


Gehäuse, Ausstattung und Eingabegeräte

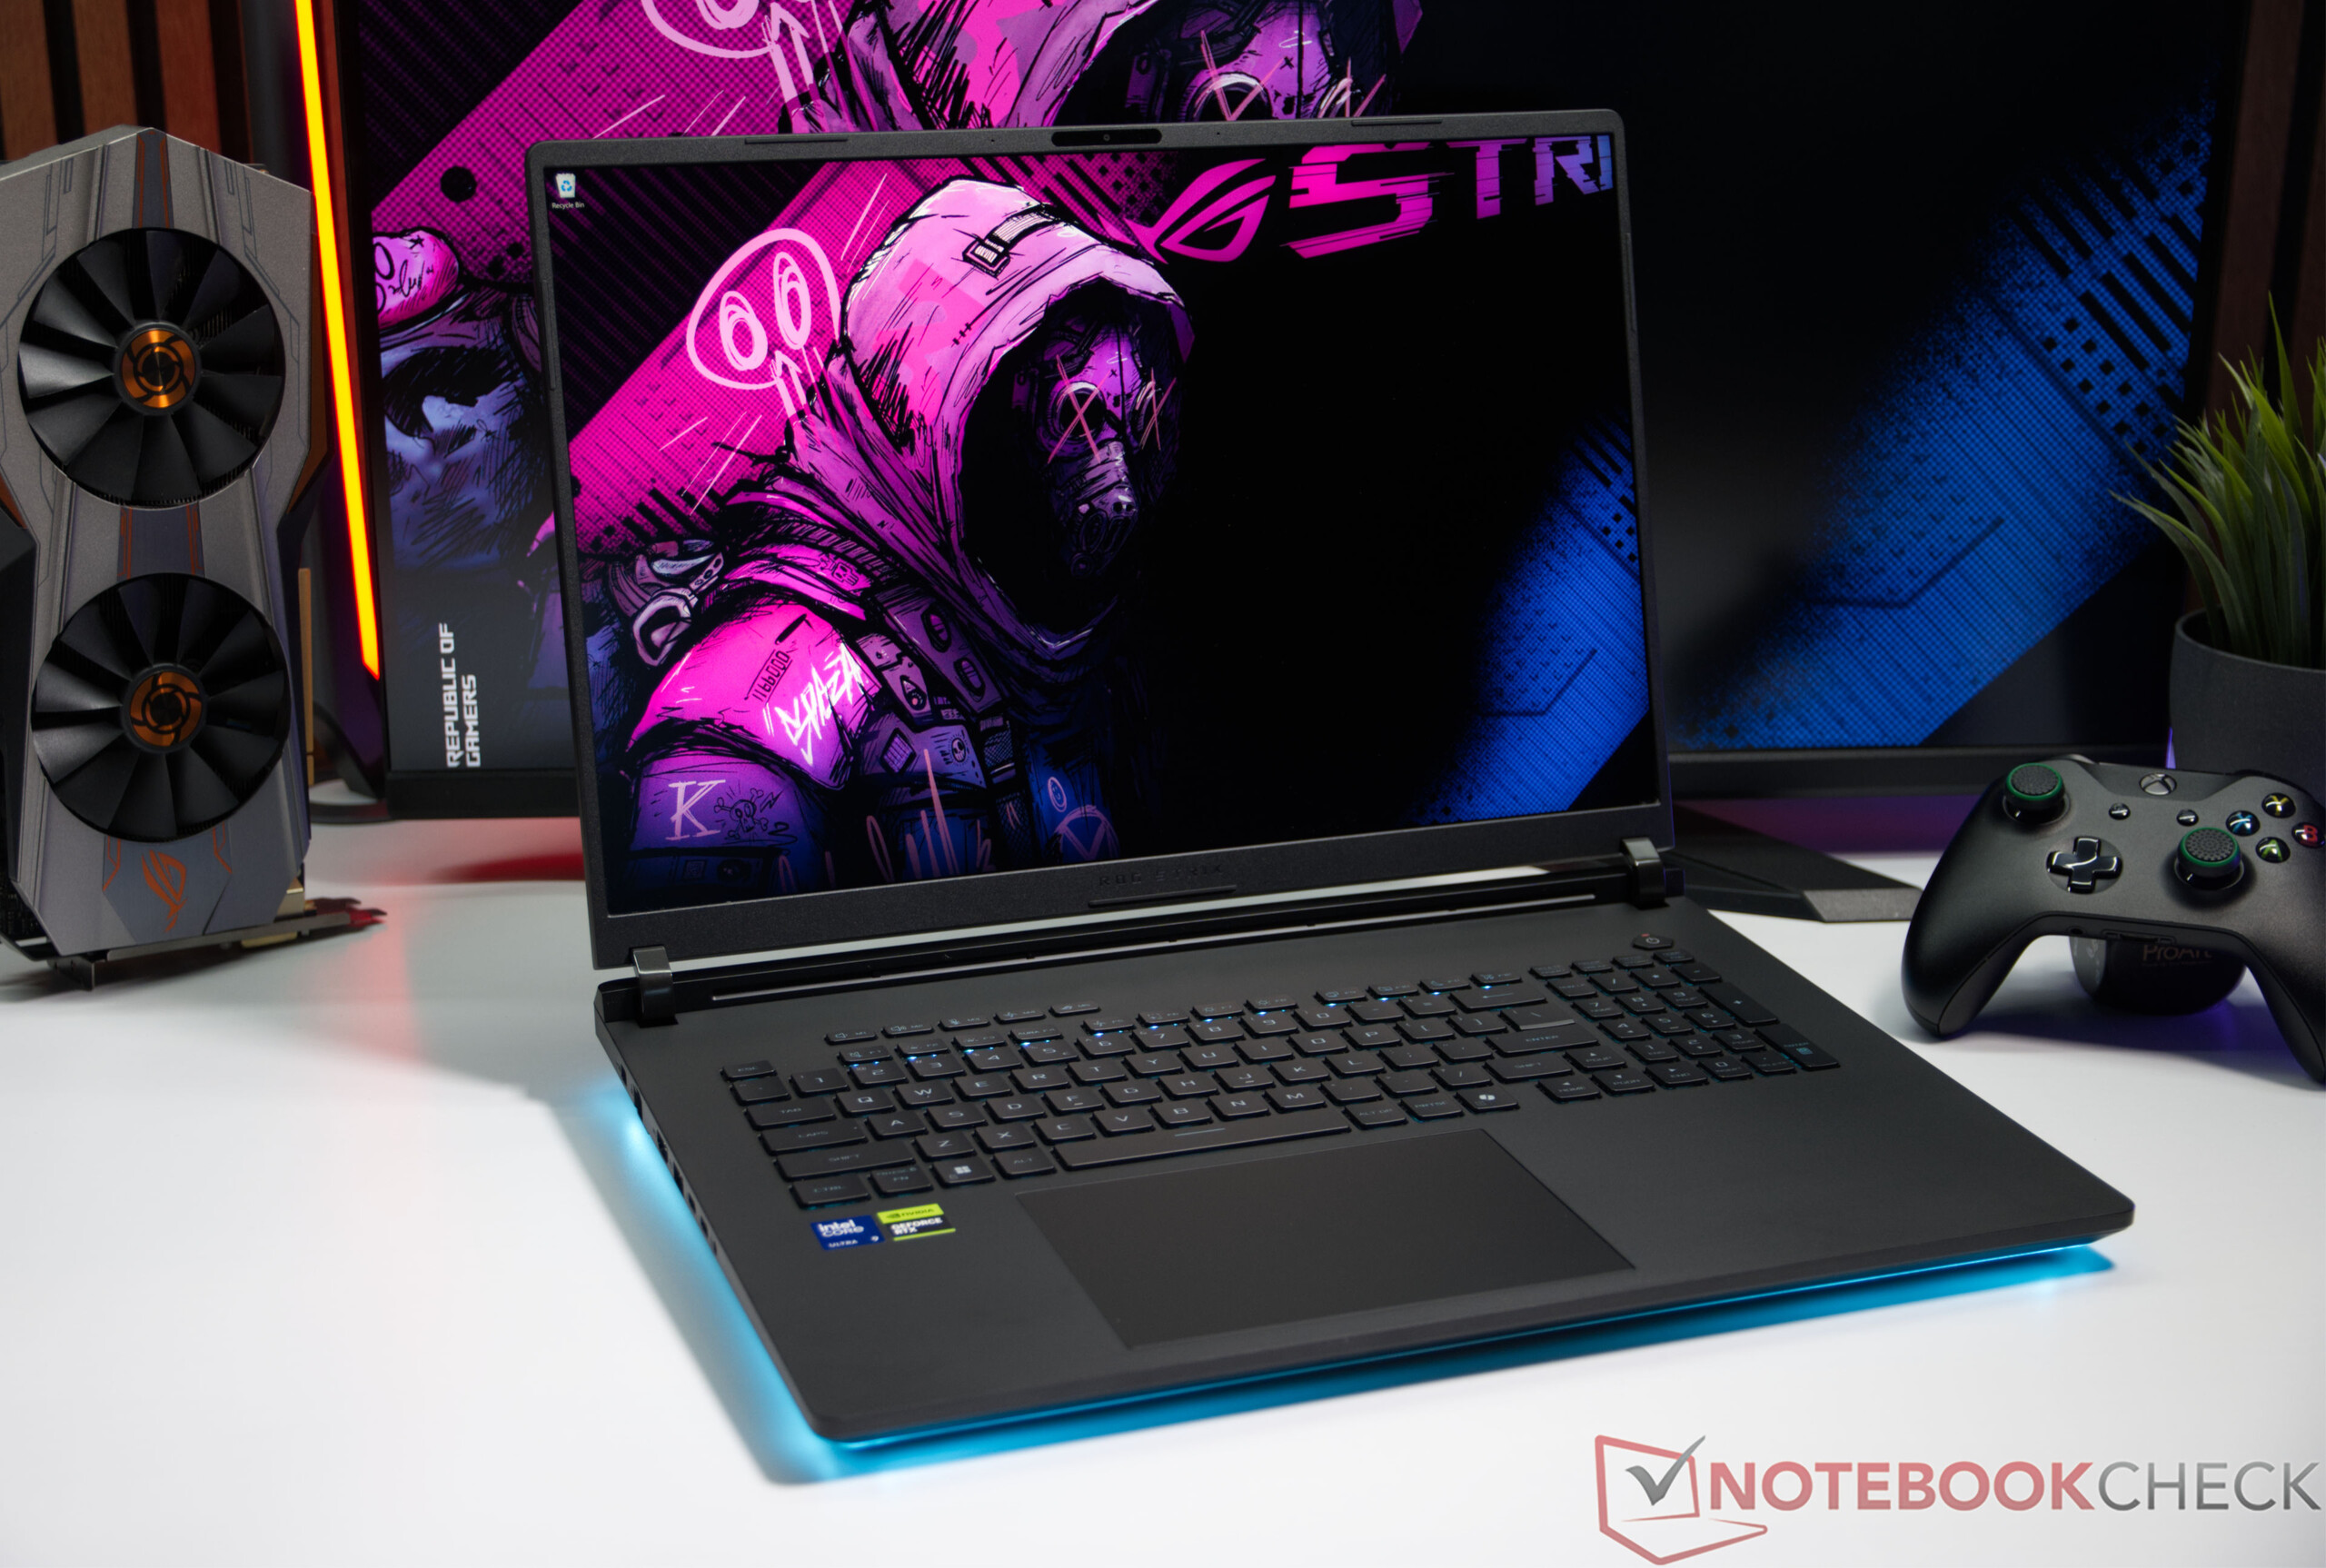
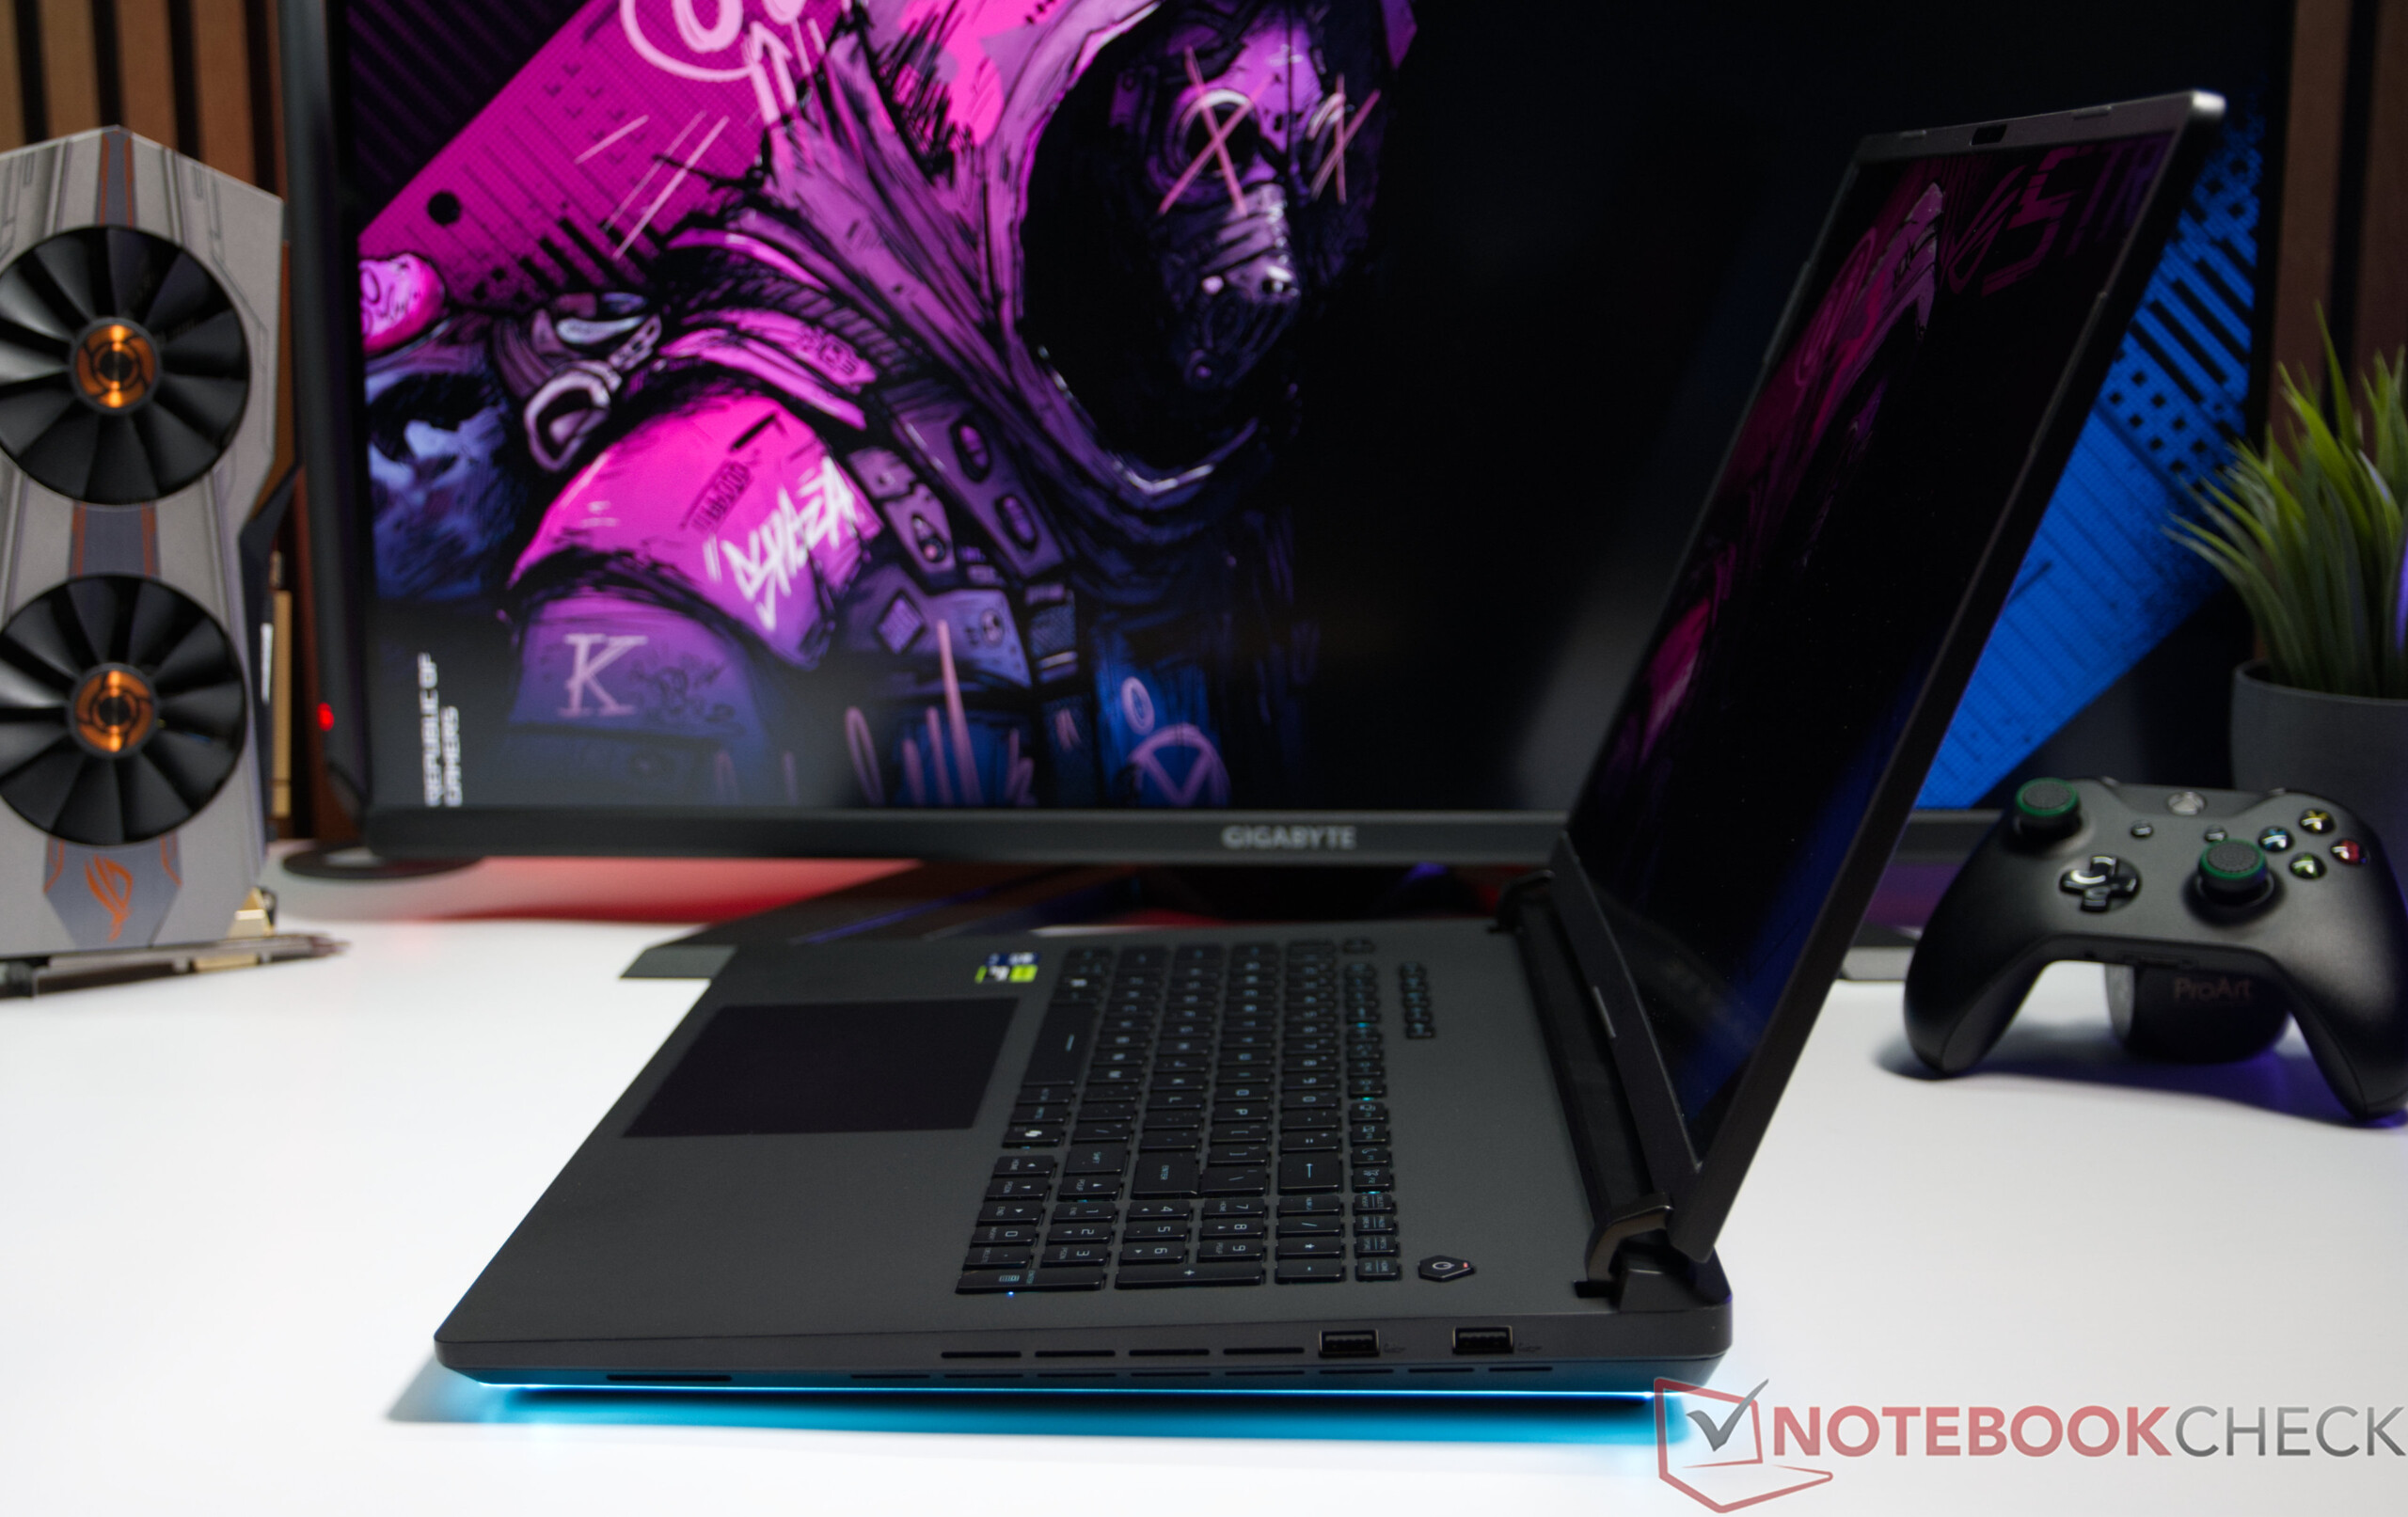
Da das Asus ROG Strix SCAR 18 G835LXG auf dem gleichen Gehäuse wie das bereits getestete ROG Strix SCAR 18 G835LX basiert, bleiben Verarbeitung und Design unverändert. Einen ausführlichen Blick auf das Chassis, die Anschlüsse und die Eingabegeräte gibt es daher in unserem separaten Test des Schwestermodells.
Größenvergleich

410.3 mm 319.9 mm 26.7 mm 4 kg404 mm 307.5 mm 32.1 mm 3.6 kg405 mm 312 mm 29.5 mm 3.3 kg399 mm 298 mm 35 mm 3.6 kg399 mm 298 mm 32 mm 3.3 kg399.9 mm 275.4 mm 21.9 mm 3.1 kg396 mm 278 mm 24.9 mm 3.4 kg297 mm 210 mm 1 mm 5.7 g
Links: Netzteil, 2.5G LAN, HDMI 2.1, USB-A 3.2 Gen.2 (10 Gbit/s), 2x Thunderbolt 5 (DisplayPort, power delivery, G-SYNC (data speed up to 120Gbps), 3,5-mm-Audio
Rechts: 2x USB-A 3.2 Gen.2 (10 Gbit/s)
Networking
iperf3 transmit Wi-Fi6/7 RT-BE96U
Durchschnittliche Intel Wi-Fi 7 BE200 320MHz
  (3270 - 3587, n=2)
3429 MBit/s +5%
Asus ROG Strix Scar 18 G835LXG
Intel Wi-Fi 7 BE200 320MHz
3270 (3115min - 3471max) MBit/s
Durchschnitt der Klasse Gaming
  (872 - 4473, n=6, der letzten 2 Jahre)
2376 MBit/s -27%
iperf3 receive Wi-Fi6/7 RT-BE96U
Durchschnittliche Intel Wi-Fi 7 BE200 320MHz
  (3047 - 3487, n=2)
3267 MBit/s +7%
Asus ROG Strix Scar 18 G835LXG
Intel Wi-Fi 7 BE200 320MHz
3047 (2765min - 3114max) MBit/s
Durchschnitt der Klasse Gaming
  (788 - 3208, n=6, der letzten 2 Jahre)
2082 MBit/s -32%
iperf3 receive AXE11000 6GHz
Schenker Key 17 Pro (M24)
Intel Wi-Fi 7 BE200 320MHz
1714 (853min - 1741max) MBit/s
Durchschnitt der Klasse Gaming
  (975 - 1775, n=35, der letzten 2 Jahre)
1556 MBit/s
Durchschnittliche Intel Wi-Fi 7 BE200 320MHz
  (725 - 1770, n=29)
1483 MBit/s
MSI Titan 18 HX A14VIG
Intel Killer Wi-Fi 7 BE1750x BE200NGW
1379 (709min - 1426max) MBit/s
Razer Blade 18 2024 RZ09-0509
Intel Wi-Fi 7 BE200 320MHz
1315 (1269min - 1369max) MBit/s
Alienware m18 R2
Intel Killer Wi-Fi 7 BE1750x BE200NGW
1292 (1215min - 1327max) MBit/s
iperf3 transmit AXE11000 6GHz
Schenker Key 17 Pro (M24)
Intel Wi-Fi 7 BE200 320MHz
1634 (812min - 1725max) MBit/s
Durchschnitt der Klasse Gaming
  (723 - 1868, n=36, der letzten 2 Jahre)
1449 MBit/s
Durchschnittliche Intel Wi-Fi 7 BE200 320MHz
  (693 - 1653, n=29)
1293 MBit/s
Razer Blade 18 2024 RZ09-0509
Intel Wi-Fi 7 BE200 320MHz
1199 (1057min - 1319max) MBit/s
MSI Titan 18 HX A14VIG
Intel Killer Wi-Fi 7 BE1750x BE200NGW
1096 (900min - 1242max) MBit/s
Alienware m18 R2
Intel Killer Wi-Fi 7 BE1750x BE200NGW
648 (595min - 759max) MBit/s
01002003004005006007008009001000110012001300140015001600170018001900200021002200230024002500260027002800290030003100320033003400Tooltip
Asus ROG Strix Scar 18 G835LXG; iperf3 transmit Wi-Fi6/7 RT-BE96U; iperf 3.1.3: Ø3270 (3115-3471) MBit/s
Asus ROG Strix Scar 18 G835LXG; iperf3 receive Wi-Fi6/7 RT-BE96U; iperf 3.1.3: Ø3046 (2765-3114) MBit/s
ColorChecker
7.7 ∆E
3.5 ∆E
9.6 ∆E
12.7 ∆E
7.5 ∆E
7.8 ∆E
5.1 ∆E
10.1 ∆E
3.8 ∆E
2.6 ∆E
8.5 ∆E
6.4 ∆E
3.1 ∆E
13.4 ∆E
10.5 ∆E
3.1 ∆E
2.6 ∆E
14.3 ∆E
6.7 ∆E
2.4 ∆E
3.1 ∆E
5.2 ∆E
2.1 ∆E
5.9 ∆E
ColorChecker Asus ROG Strix Scar 18 G835LXG: 6.57 ∆E min: 2.09 - max: 14.27 ∆E

Display

Subpixelstruktur
Subpixelstruktur
keine Lichthöfe erkennbar

Das 18 Zoll große Mini-LED-Display des Asus ROG Strix SCAR 18 G835LXG löst mit 3.840 x 2.400 Pixeln im 16:10-Format auf und bietet 2.000 Dimming-Zonen sowie eine Bildwiederholrate von 240 Hz. Die Bildqualität überzeugt mit einer hohen Schärfe, kräftigen Farben und einer homogenen Ausleuchtung. Dank der hohen Bildfrequenz werden Bewegungen äußerst flüssig dargestellt, was insbesondere beim Gaming von Vorteil ist. Die maximale Bildwiederholrate von 240 Hz steht nur im GPU Ultimate Mode zur Verfügung, der über Armoury Crate aktiviert werden kann. In allen anderen GPU-Modi ist das Display auf 120 Hz begrenzt.

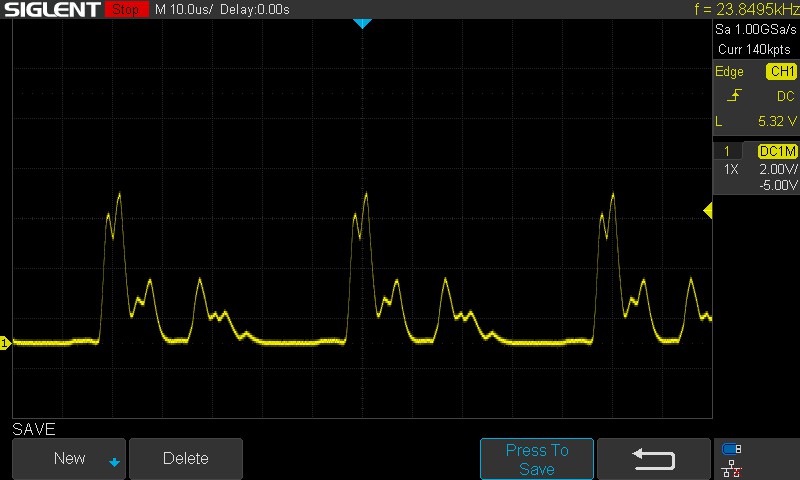
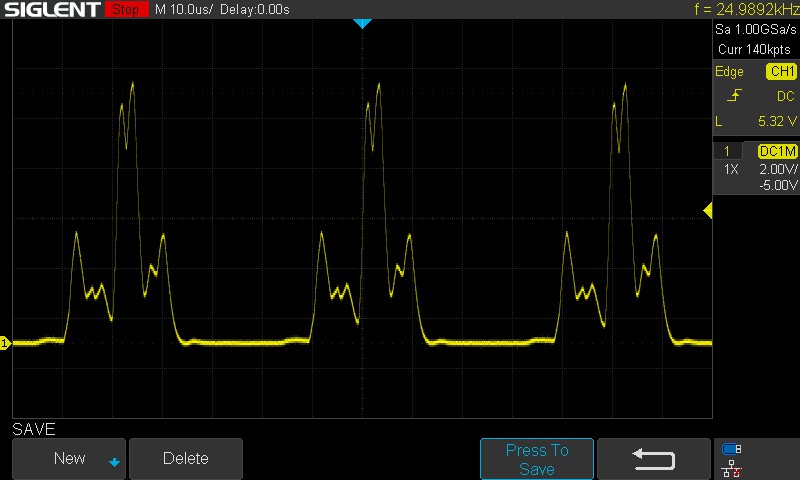
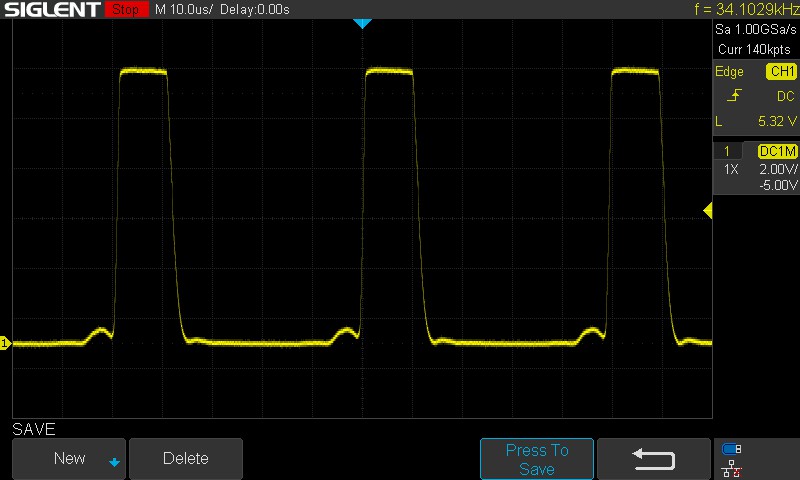
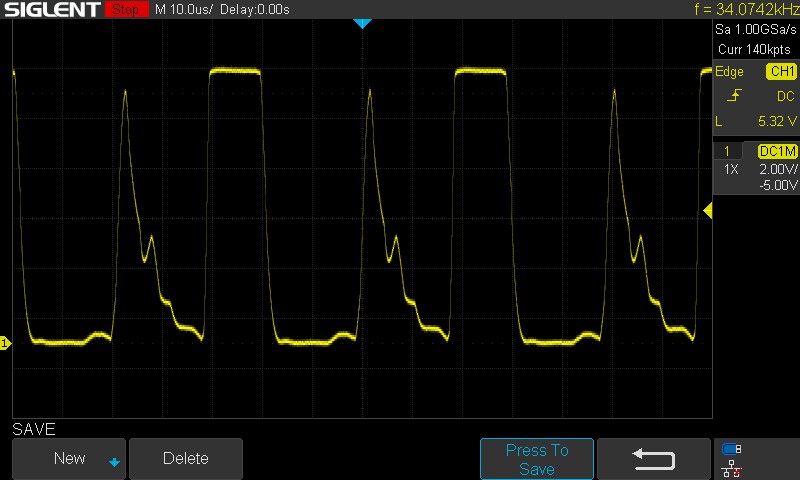
Asus bietet verschiedene Anzeigeprofile mit und ohne Local Dimming, sodass sich das Panel sowohl für Spiele als auch für die Bildbearbeitung anpassen lässt. Im HDR-Betrieb erreicht das Display eine sehr hohe Spitzenhelligkeit und profitiert von einem exzellenten Kontrast mit tiefen Schwarzwerten. Mit einer maximalen SDR-Helligkeit von rund 600 cd/m² gehört das Panel weiterhin zu den hellsten seiner Klasse und eignet sich problemlos für helle Umgebungen. Im Akkubetrieb steht die volle Helligkeit ebenfalls zur Verfügung. Wie bei Mini-LED-Panels üblich arbeitet die Hintergrundbeleuchtung per PWM, die sehr hohe Frequenz von rund 30 kHz dürfte in der Praxis jedoch selbst für empfindliche Nutzer keine Probleme verursachen.

662
cd/m²
624
cd/m²
595
cd/m²
613
cd/m²
600
cd/m²
581
cd/m²
618
cd/m²
588
cd/m²
559
cd/m²
Ausleuchtung des Bildschirms
NE180QA1-MM0 getestet mit X-Rite i1Pro 3
Maximal: 662 cd/m² (Nits) Durchschnitt: 604.4 cd/m² Minimum: 44.1 cd/m²
Ausleuchtung: 84 %
Helligkeit Akku: 589 cd/m²
Kontrast: ∞:1 (Schwarzwert: 0 cd/m²)
ΔE ColorChecker Calman: 7.12 | ∀{0.5-29.43 Ø4.71}
calibrated: 4.92
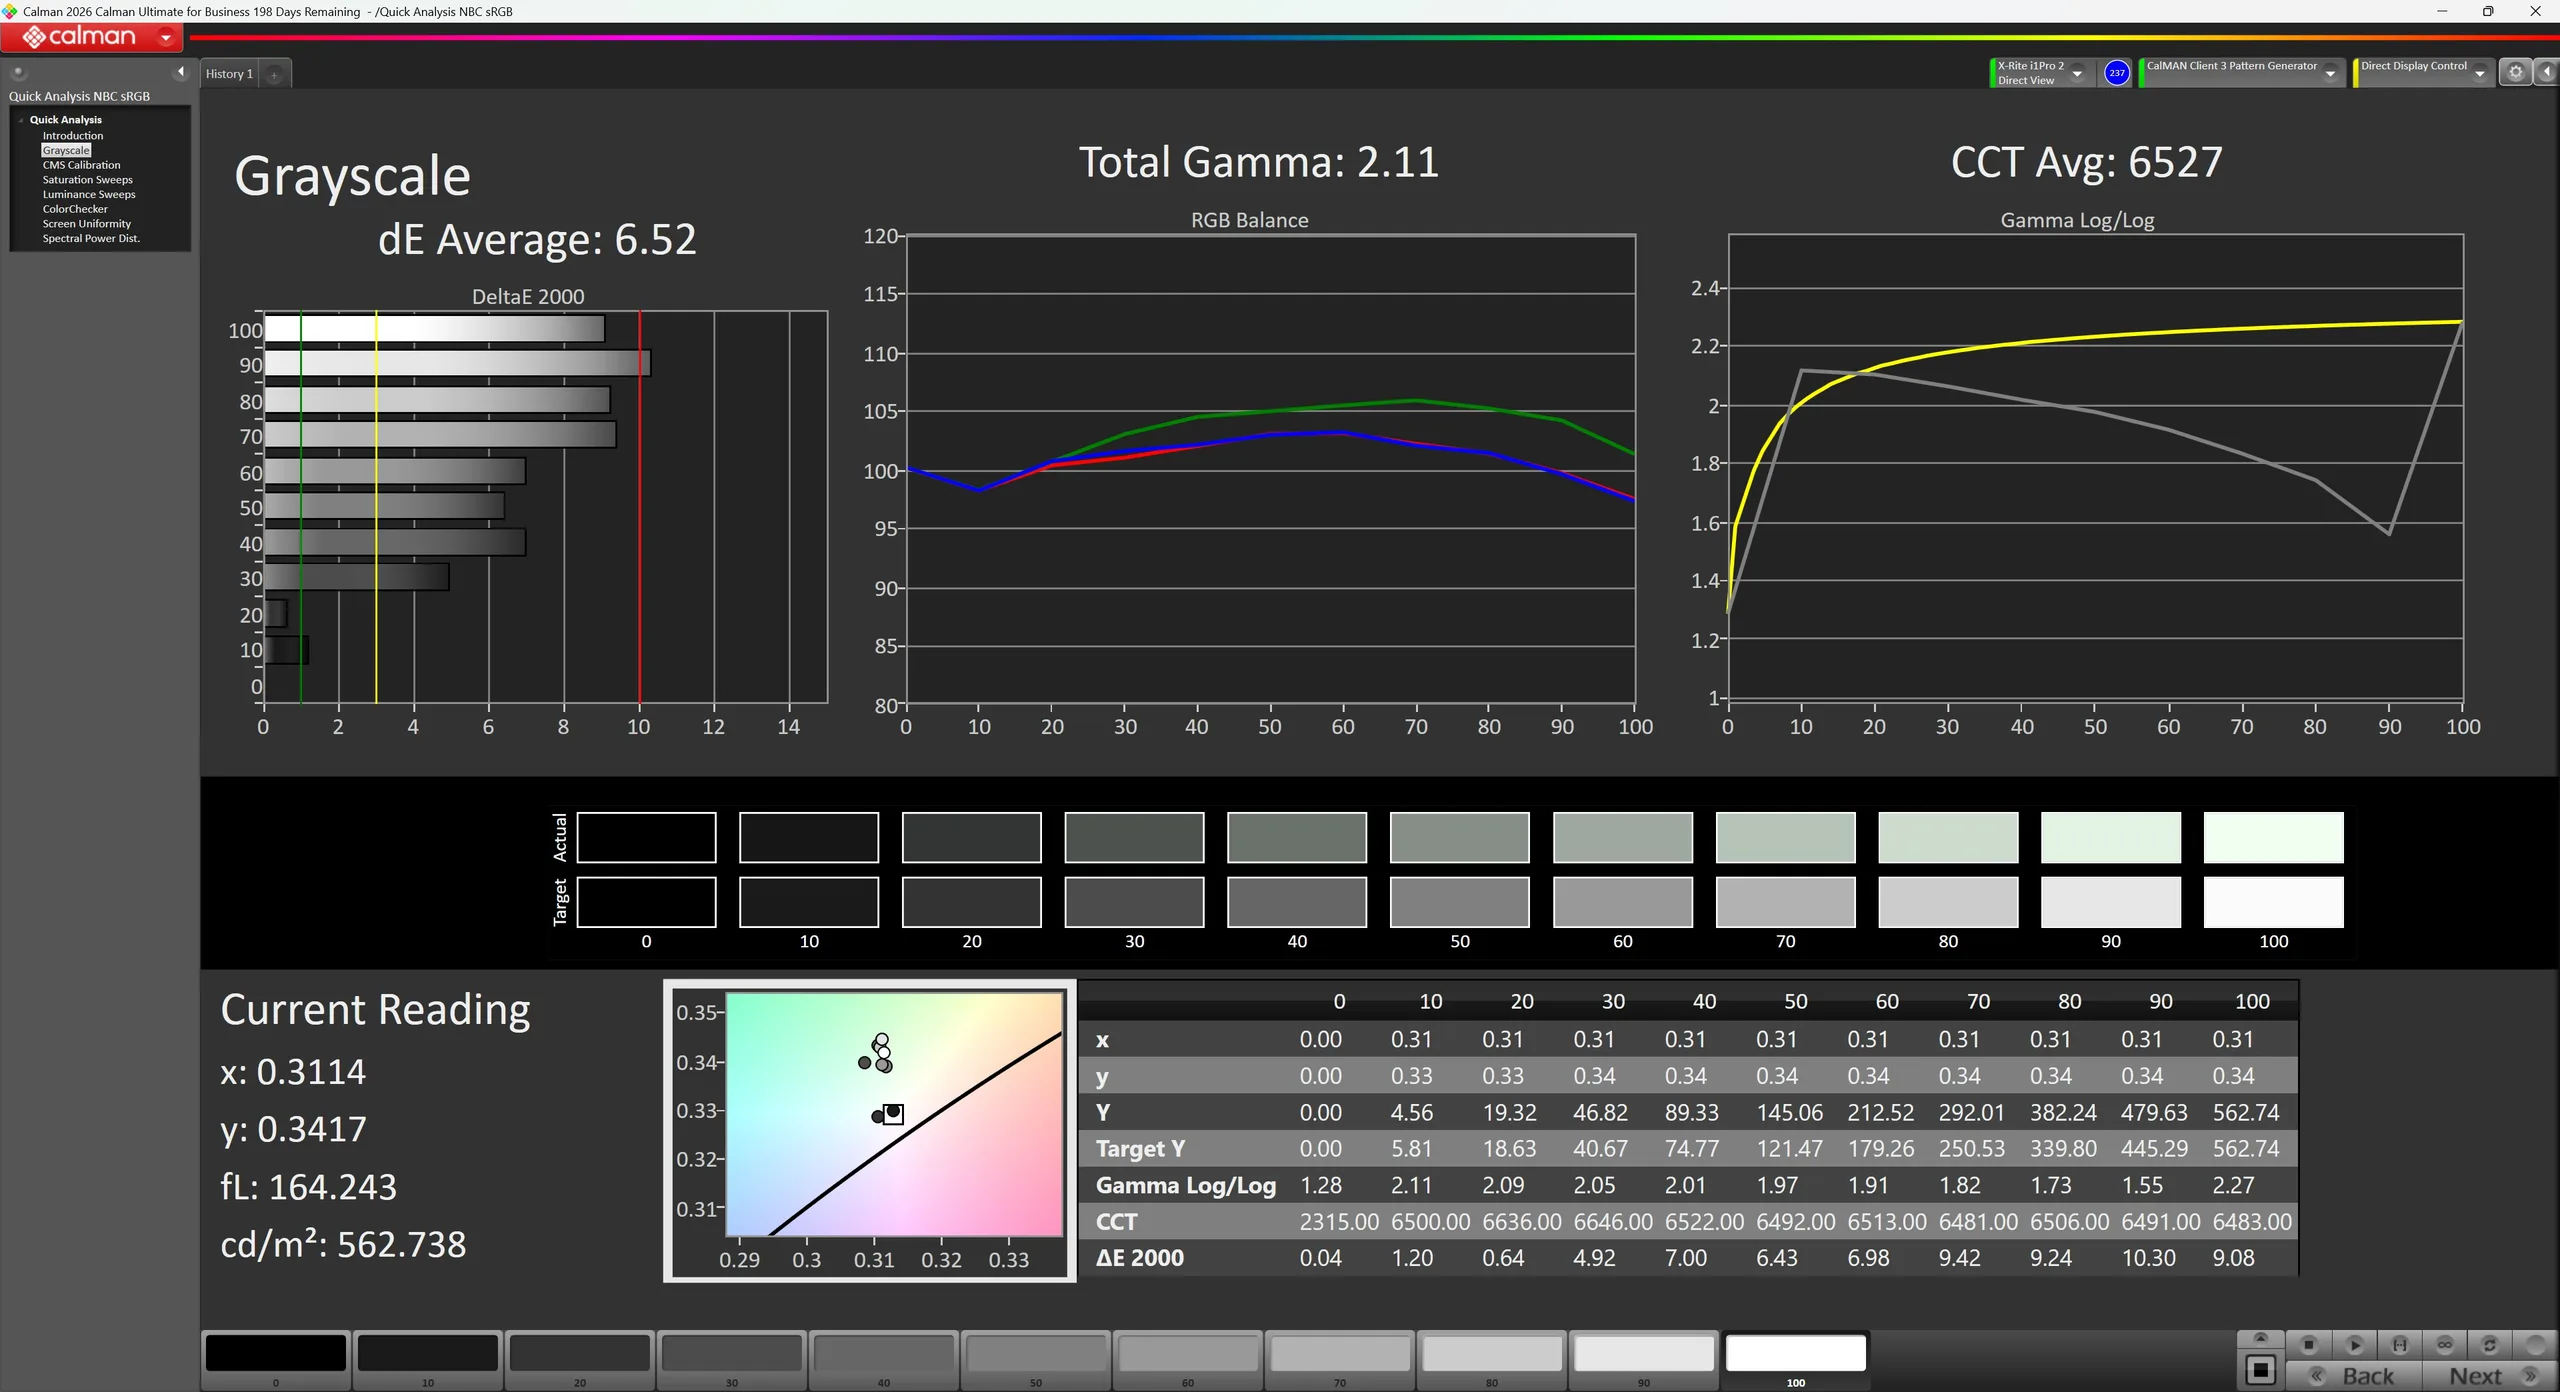
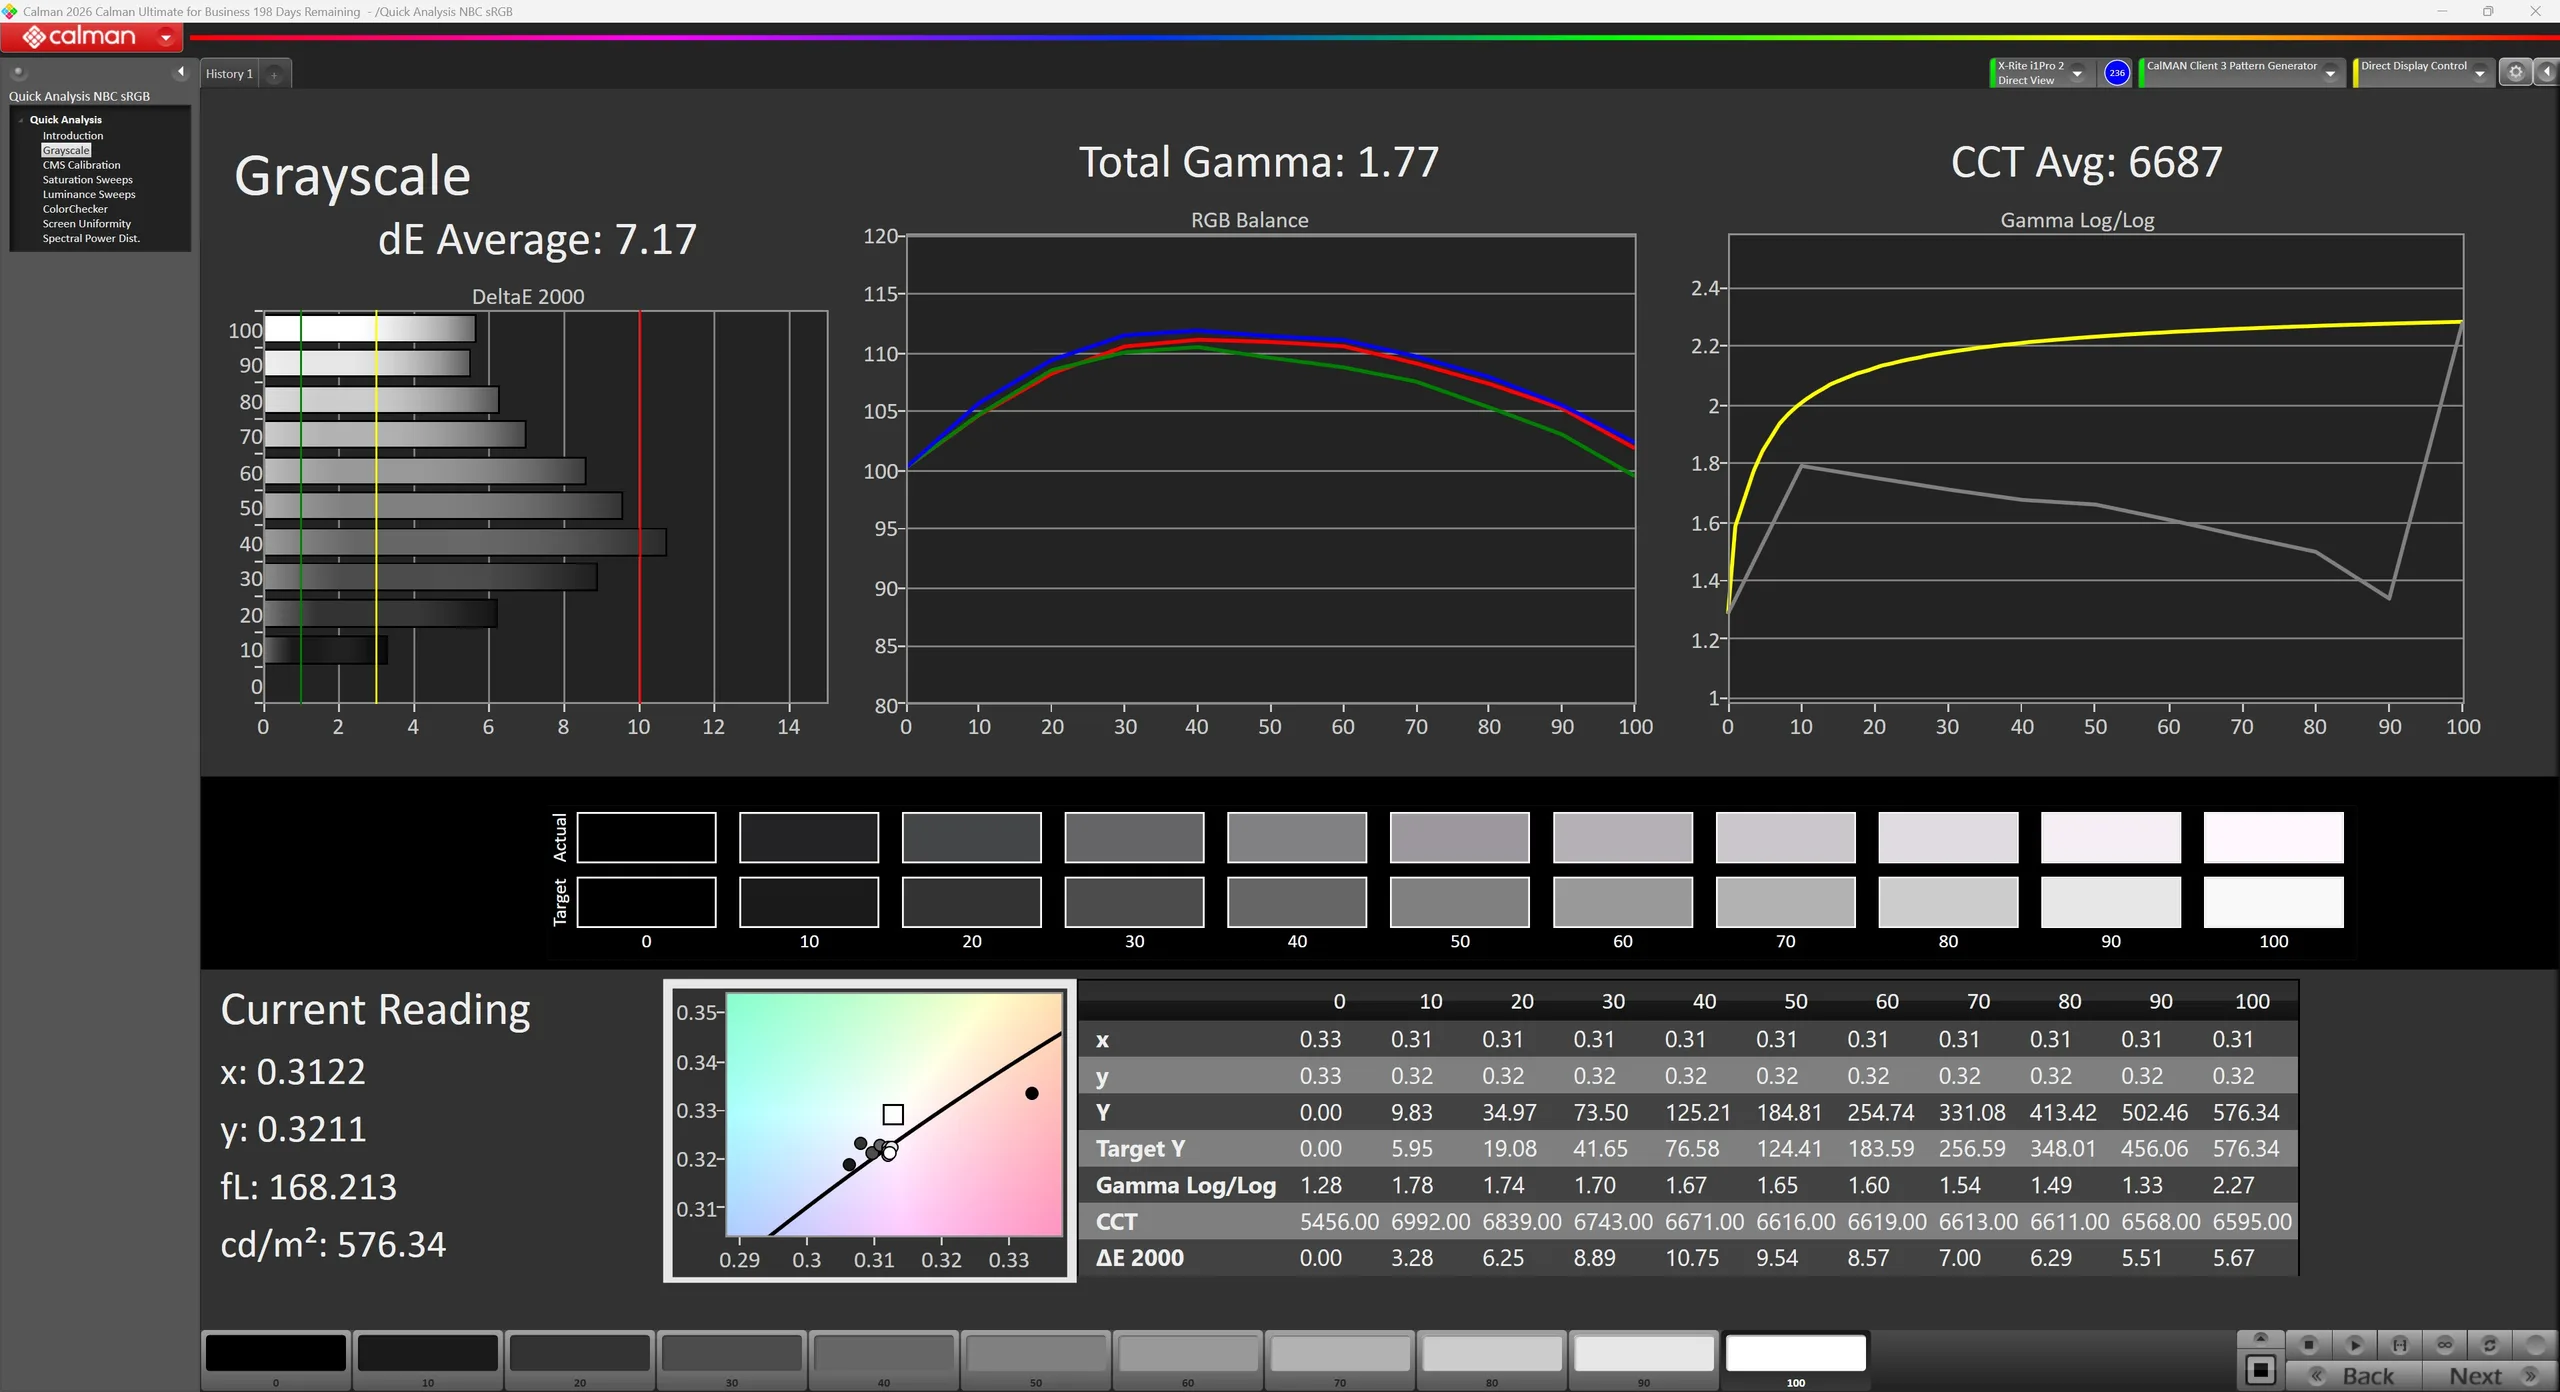
ΔE Greyscale Calman: 7.17 | ∀{0.09-98 Ø4.96}
92.8% AdobeRGB 1998 (Argyll 3D)
99.9% sRGB (Argyll 3D)
99.9% Display P3 (Argyll 3D)
Gamma: 1.77
CCT: 6687 K
Asus ROG Strix Scar 18 G835LXG
NE180QA1-MM0, Mini LED, 3840x2400, 18", 240 Hz
Asus Strix Scar 18 G835LX
N180QDM-NM2, Mini-LED, 2560x1600, 18", 240 Hz
Razer Blade 18 2024 RZ09-0509
BOE NE180QDM-NM1, Mini-LED, 2560x1600, 18", 300 Hz
Alienware m18 R2
BOE NE18NZ1, IPS, 2560x1600, 18", 165 Hz
Acer Predator Helios 18 PH18-72-98MW
B180QAN01.2 (AUO45A8), Mini-LED, 2560x1600, 18", 250 Hz
MSI Titan 18 HX A14VIG
AU Optronics B180ZAN01.0, Mini-LED, 3840x2400, 18", 120 Hz
Schenker Key 17 Pro (M24)
BOE, IPS, 3840x2160, 17.3", 144 Hz
Display
-2%
-2%
-2%
-0%
-3%
-5%
HDR Peak Brightness (cd/m²)
1264
Display P3 Coverage (%)
99.9
99
-1%
99
-1%
97.8
-2%
99.7
0%
98.1
-2%
93.51
-6%
sRGB Coverage (%)
99.9
100
0%
100
0%
99.5
0%
100
0%
99.8
0%
99.86
0%
AdobeRGB 1998 Coverage (%)
92.8
87.2
-6%
86.9
-6%
88.9
-4%
91.6
-1%
86.2
-7%
84.33
-9%
Response Times
-19%
-53%
-11%
-79%
-486%
-38%
Response Time Grey 50% / Grey 80% * (ms)
5.8 ?(2.1, 3.7)
7.4 ?(2.4, 5)
-28%
7.6 ?(3.6, 4)
-31%
5.3 ?(2.2, 3.1)
9%
8 ?(4.9, 3.1)
-38%
8.6 ?(4.2, 4.4)
-48%
11.593 ?(5.307, 6.286)
-100%
Response Time Black / White * (ms)
8 ?(4, 4)
10.4 ?(0.6, 9.8)
-30%
14 ?(6.6, 7.4)
-75%
10.4 ?(4.8, 5.6)
-30%
17.6 ?(15.2, 2.4)
-120%
81.8 ?(76, 5.8)
-923%
6 ?(1.5, 4.5)
25%
PWM Frequency (Hz)
30589
20610 ?(100)
26444 ?(100)
4832 ?(100)
2592 ?(100)
PWM Amplitude * (%)
100
100
-0%
Bildschirm
50%
36%
19%
38%
21%
17%
Helligkeit Bildmitte (cd/m²)
600
764
27%
605.4
1%
271.8
-55%
722
20%
467.5
-22%
548
-9%
Brightness (cd/m²)
604
747
24%
600
-1%
275
-54%
724
20%
459
-24%
505
-16%
Brightness Distribution (%)
84
93
11%
97
15%
78
-7%
93
11%
90
7%
86
2%
Schwarzwert * (cd/m²)
0.1
0.62
0.27
0.04
0.54
Delta E Colorchecker *
7.12
1.2
83%
1.53
79%
2.48
65%
3.4
52%
3.77
47%
3.81
46%
Colorchecker dE 2000 max. *
10.42
2.8
73%
4.15
60%
5.59
46%
5.32
49%
6.12
41%
7.9
24%
Colorchecker dE 2000 calibrated *
4.92
0.56
89%
1.6
67%
2.94
40%
2.54
48%
Delta E Graustufen *
7.17
1.5
79%
2.6
64%
3.7
48%
3.8
47%
3.2
55%
5.4
25%
Gamma
1.77 124%
2.17 101%
2.22 99%
2.2 100%
2.383 92%
2.43 91%
2.062 107%
CCT
6687 97%
6556 99%
6843 95%
6355 102%
7051 92%
6478 100%
7224 90%
Kontrast (:1)
7640
976
1007
18050
1015
Durchschnitt gesamt (Programm / Settings)
10% / 19%
-6% / 10%
2% / 9%
-14% / 9%
-156% / -70%
-9% / 3%

* ... kleinere Werte sind besser

CalMAN Graustufen (Profil: Display P3)
CalMAN Sättigung (Profil: Display P3)
CalMAN ColorChecker (Profil: Display P3)
CalMAN Graustufen (Profil: Nativ)
CalMAN Sättigung (Profil: Nativ)
CalMAN ColorChecker (Profil: Nativ)

Farbraumabdeckungen

sRGB
sRGB
AdobeRGB
AdobeRGB
DCI-P3
DCI-P3

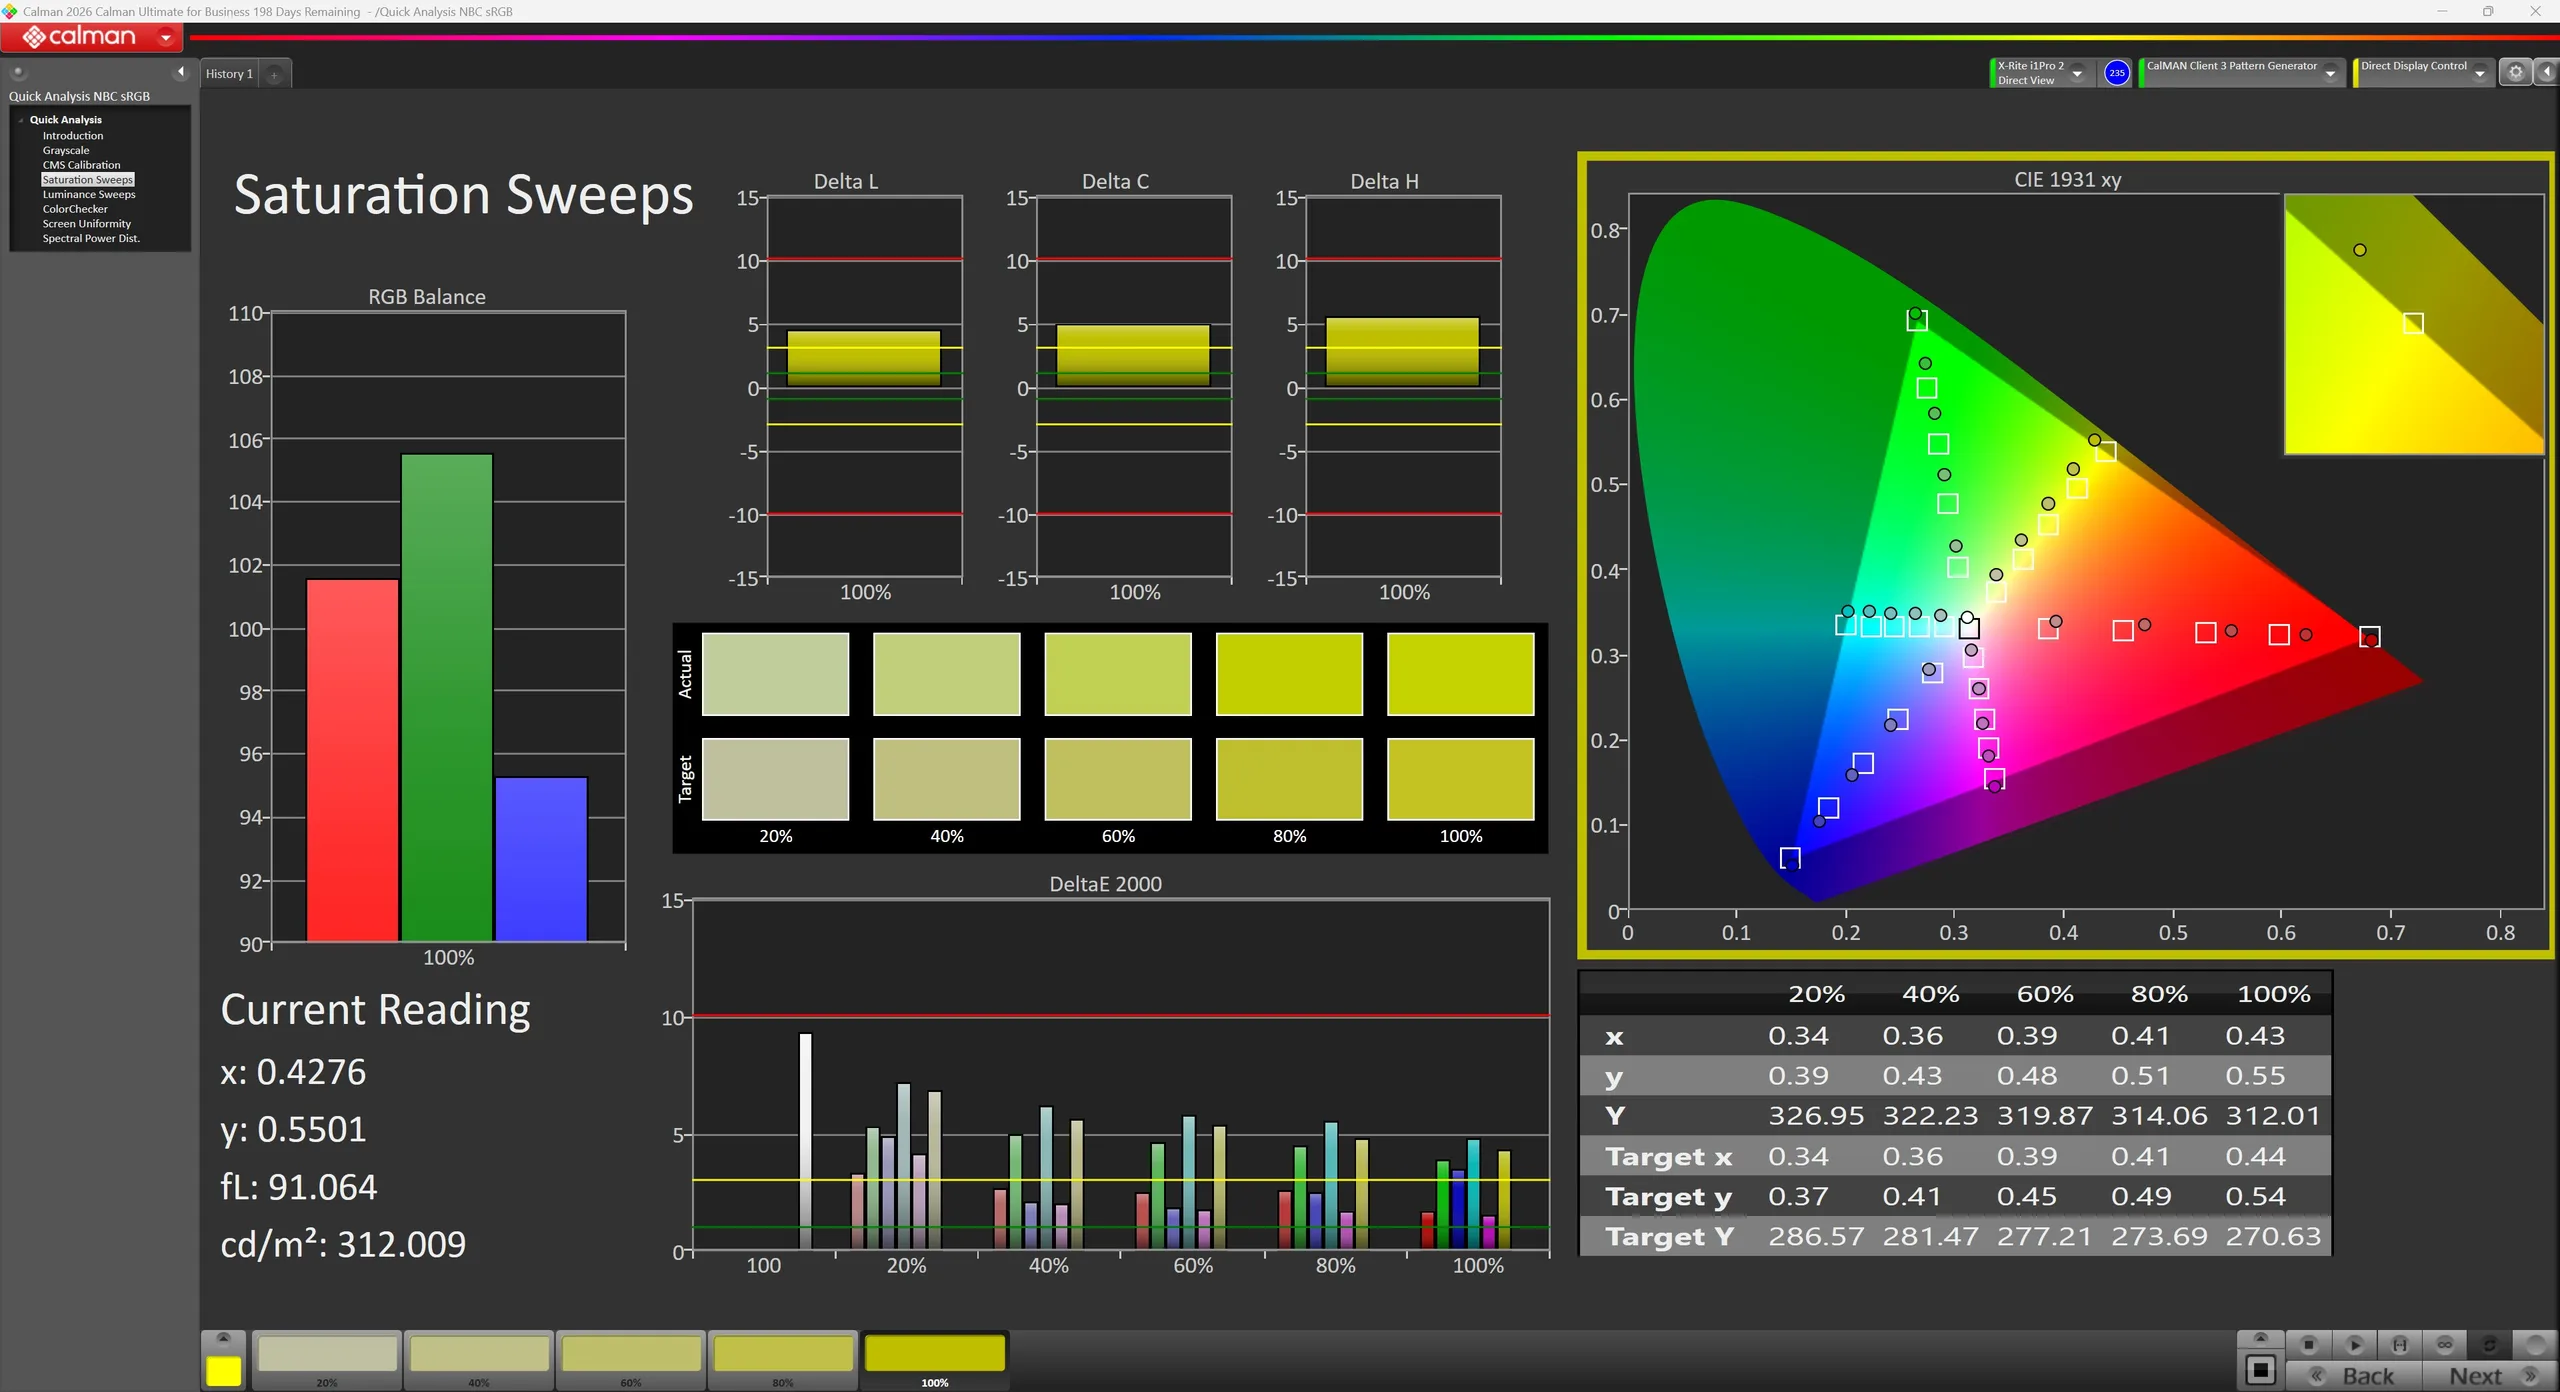
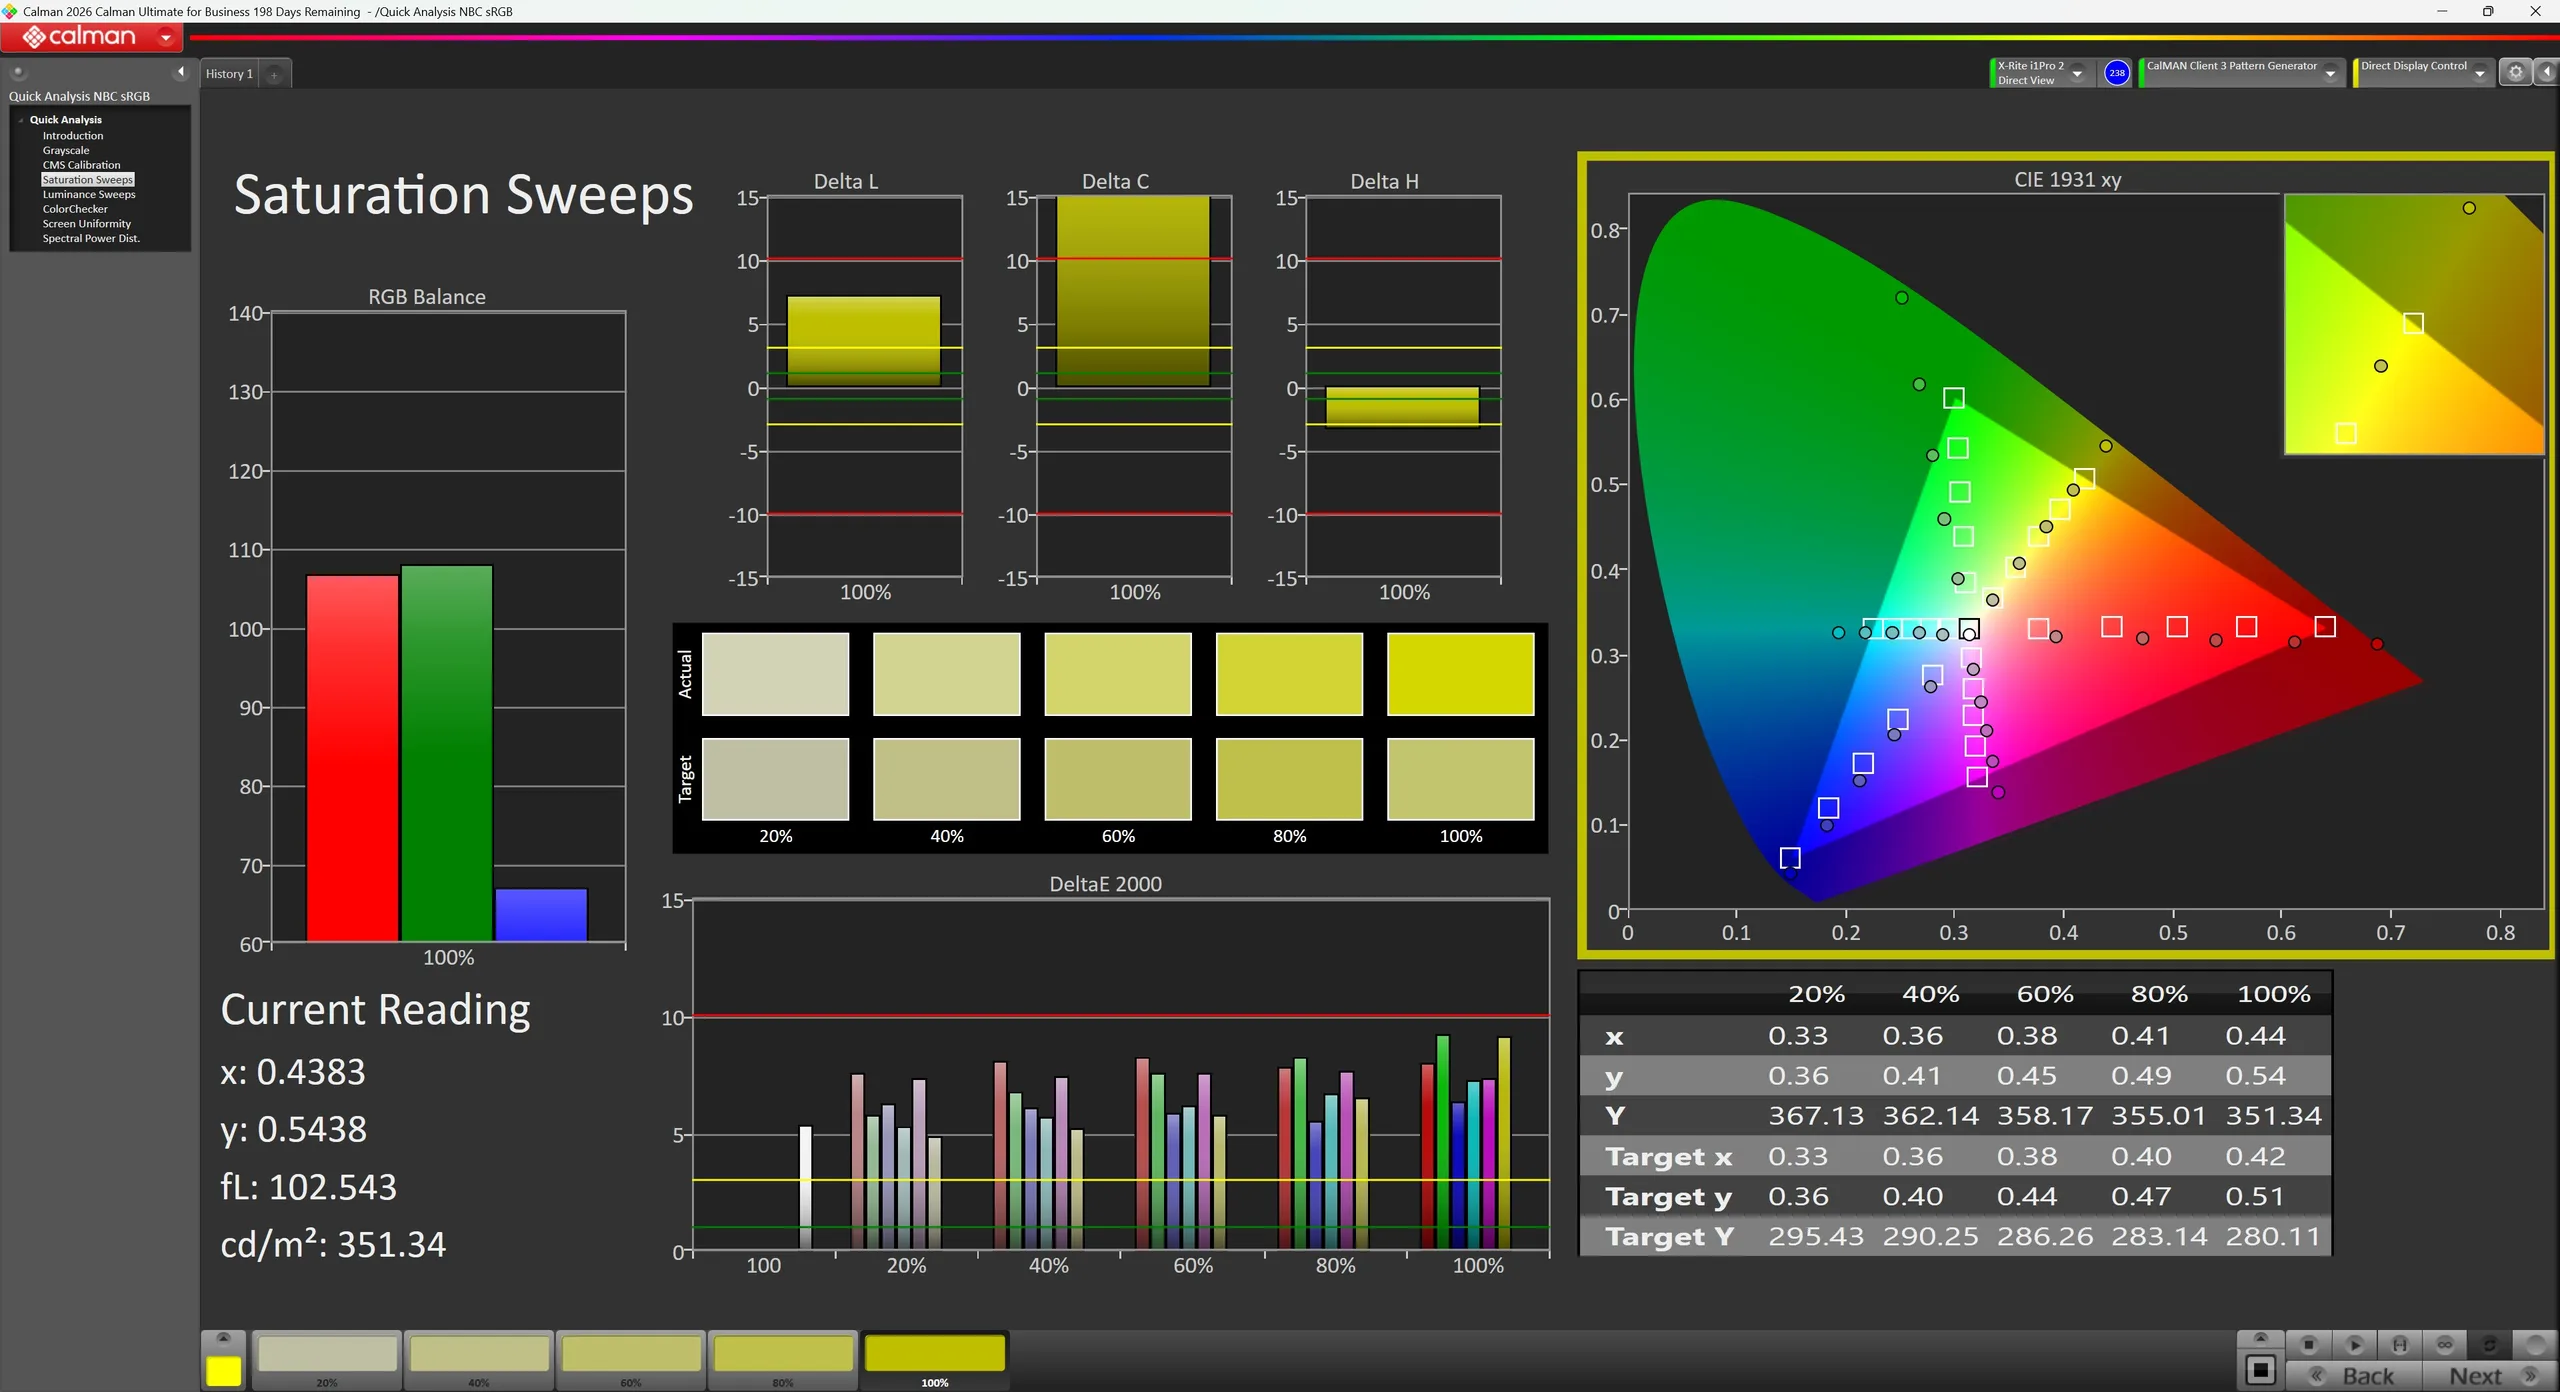
Asus bietet auch beim ROG Strix SCAR 18 verschiedene Farbprofile an. Im Auslieferungszustand zeigt unser Testgerät jedoch vergleichsweise hohe Farbabweichungen, sodass die Farbtreue hinter den Erwartungen an ein High-End-Notebook zurückbleibt. Erst nach einer Kalibrierung verbessert sich die Darstellung deutlich und die Farbabweichungen werden spürbar reduziert, wodurch sich das Panel auch für farbkritische Anwendungen deutlich besser eignet.

Reaktionszeiten (Response Times) des Displays

Die Reaktionszeiten (Response Times) beschreiben wie schnell zwischen zwei Farben eines Pixels umgeschaltet werden kann. Langsame Response Times können zu einer verschwommenen Darstellung, Schlieren und Geisterbilder führen. Besonders bei schnellen 3D-Spielen sind kurze Umschaltzeiten wichtig.
       Reaktionszeiten Schwarz zu Weiß
8 ms ... steigend ↗ und fallend ↘ kombiniert↗ 4 ms steigend
↘ 4 ms fallend
Die gemessenen Reaktionszeiten sind kurz wodurch sich der Bildschirm auch für Spiele gut eignen sollte.
Im Vergleich rangierten die bei uns getesteten Geräte von 0.1 (Minimum) zu 240 (Maximum) ms. » 22 % aller Screens waren schneller als der getestete.
Daher sind die gemessenen Reaktionszeiten besser als der Durchschnitt aller vermessenen Geräte (19.8 ms).
       Reaktionszeiten 50% Grau zu 80% Grau
5.8 ms ... steigend ↗ und fallend ↘ kombiniert↗ 2.1 ms steigend
↘ 3.7 ms fallend
Die gemessenen Reaktionszeiten sind sehr kurz, wodurch sich der Bildschirm auch für schnelle 3D Spiele eignen sollte.
Im Vergleich rangierten die bei uns getesteten Geräte von 0.165 (Minimum) zu 636 (Maximum) ms. » 19 % aller Screens waren schneller als der getestete.
Daher sind die gemessenen Reaktionszeiten besser als der Durchschnitt aller vermessenen Geräte (31 ms).

Bildschirm-Flackern / PWM (Pulse-Width Modulation)

Eine günstige Methode um die Helligkeit eines Bildschirms zu steuern, ist die Beleuchtung periodisch ein- und auszuschalten. Dies nennt sich PWM (Pulsweitenmodulation) Diese Umschaltung sollte mit einer hohen Frequenz stattfinden damit das menschliche Auge kein Flimmern wahrnimmt. Wenn die Frequenz zu niedrig ist, kann dies zu Ermüdungserscheinungen, Augenbrennen, Kopfweh und auch sichtbaren Flackern führen.
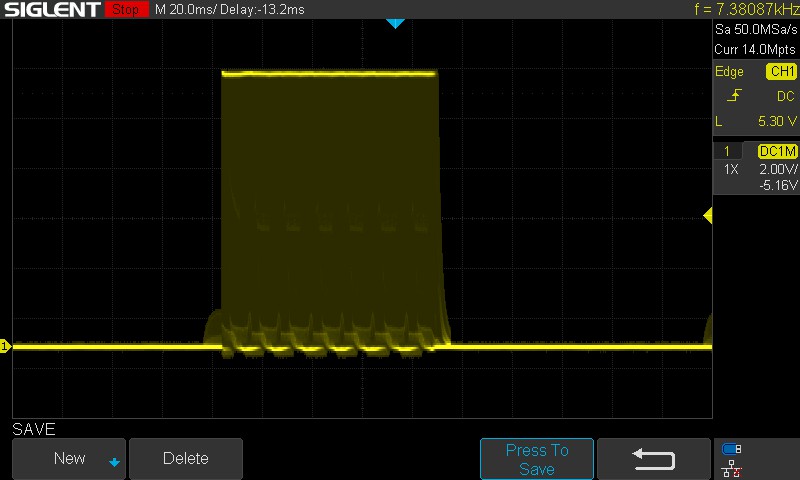
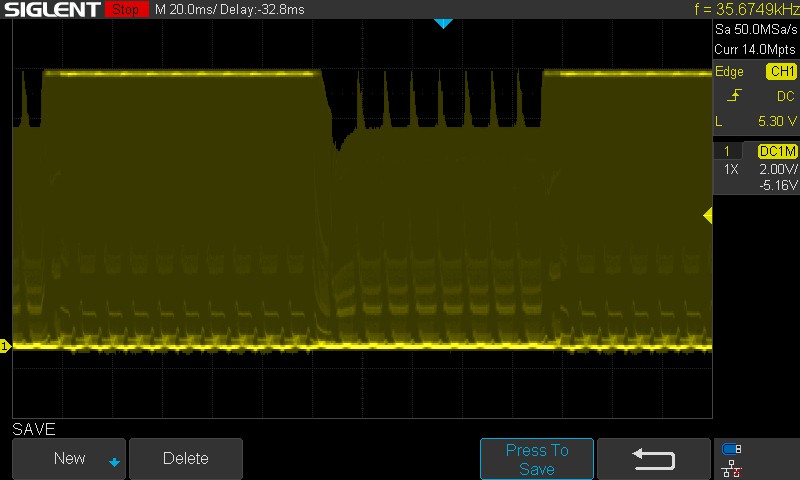
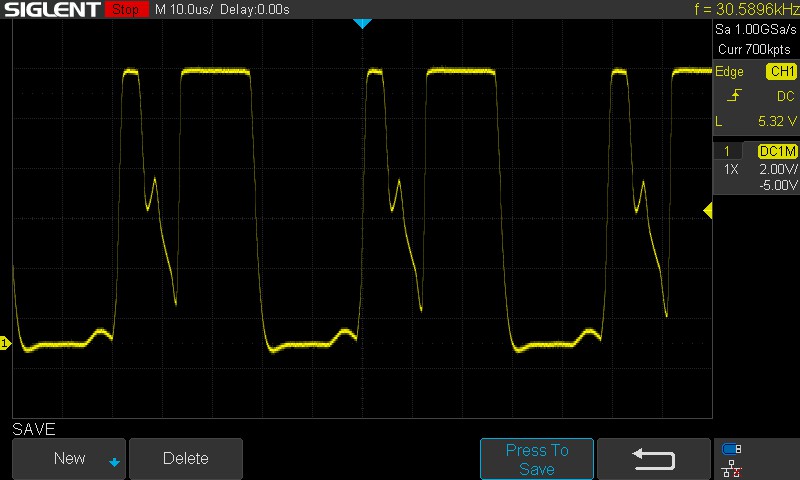
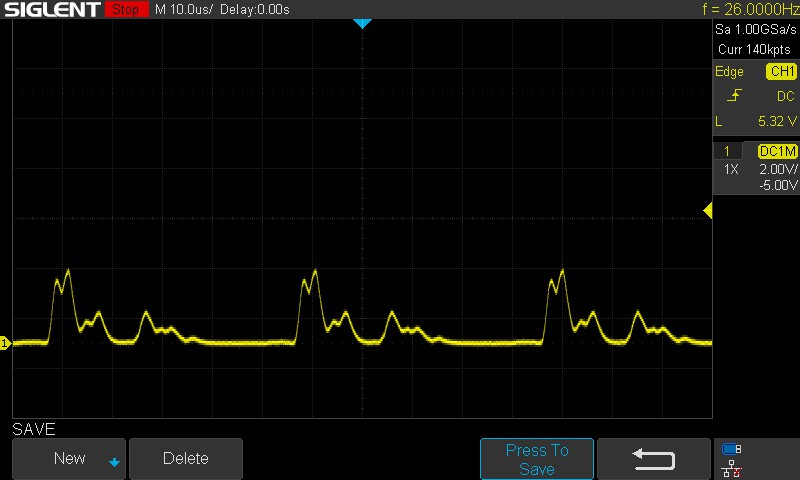
Flackern / PWM festgestellt 30589 Hz
Amplitude: 100 %

Das Display flackert mit 30589 Hz (im schlimmsten Fall, eventuell durch Pulsweitenmodulation PWM) .

Die Frequenz von 30589 Hz ist sehr hoch und sollte daher auch bei empfindlichen Personen zu keinen Problemen führen.

Im Vergleich: 52 % aller getesteten Geräte nutzten kein PWM um die Helligkeit zu reduzieren. Wenn PWM eingesetzt wurde, dann bei einer Frequenz von durchschnittlich 7757 (Minimum 5, Maximum 343500) Hz.

PWM-Flackern (0 % Helligkeit)
PWM-Flackern (20 % Helligkeit)
PWM-Flackern (40 % Helligkeit)
PWM-Flackern (60 % Helligkeit)
PWM-Flackern (80 % Helligkeit)
PWM-Flackern (100 % Helligkeit)
Bei becktem Himmel
Bei becktem Himmel
Bei Sonnenschein
Bei Sonnenschein
Bei Sonnenschein
Bei Sonnenschein
Blickwinkelstabilität

Leistung

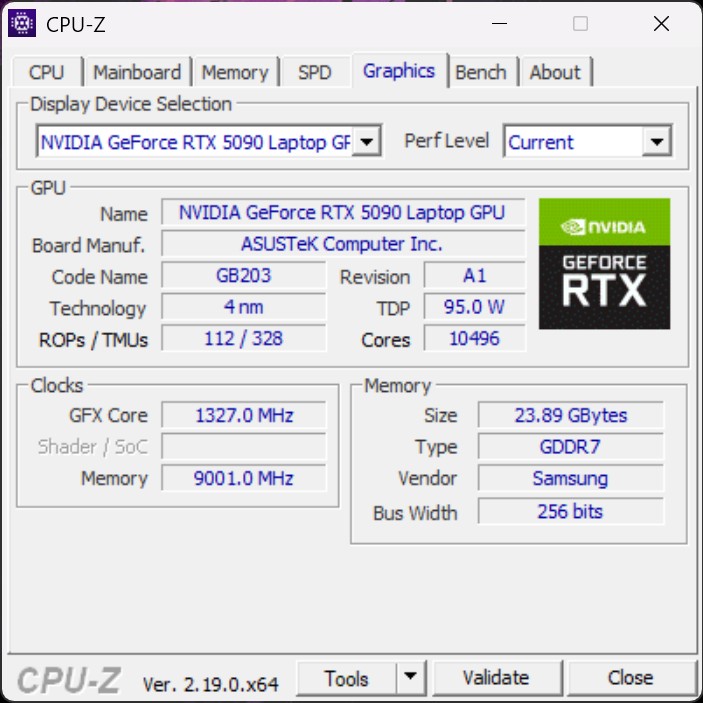
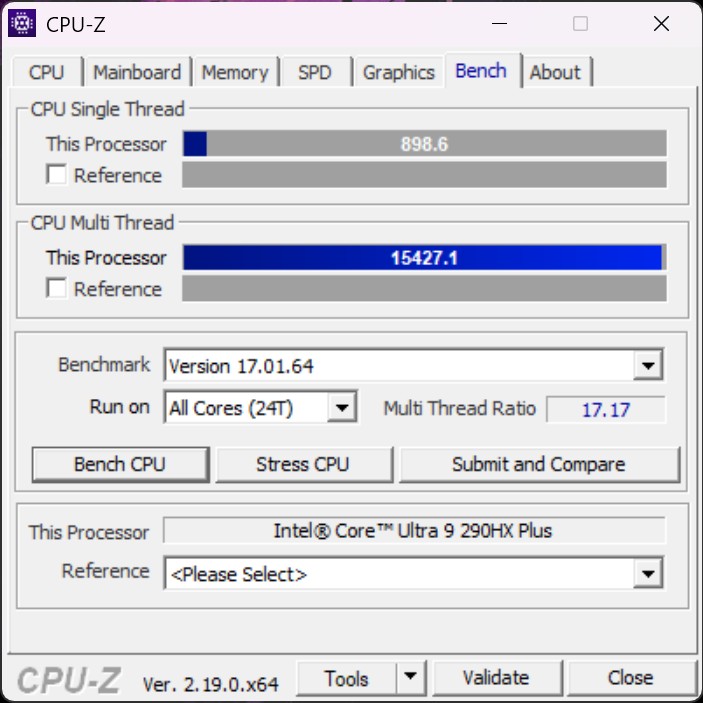
CPU-Z
CPU-Z
CPU-Z
CPU-Z
CPU-Z
CPU-Z
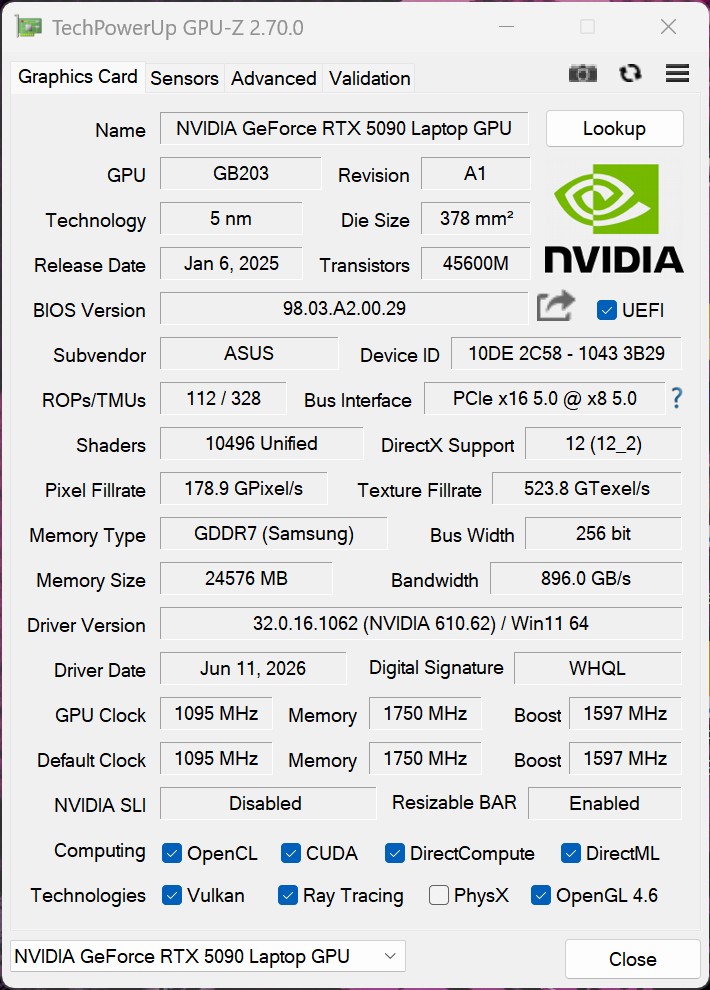
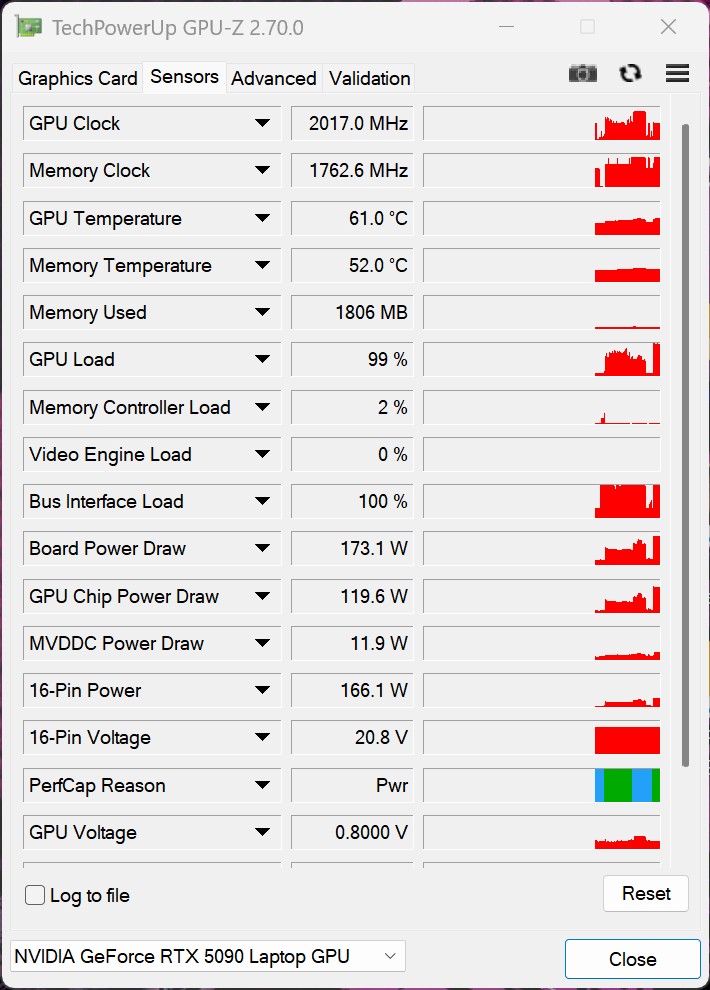
GPU-Z
GPU-Z
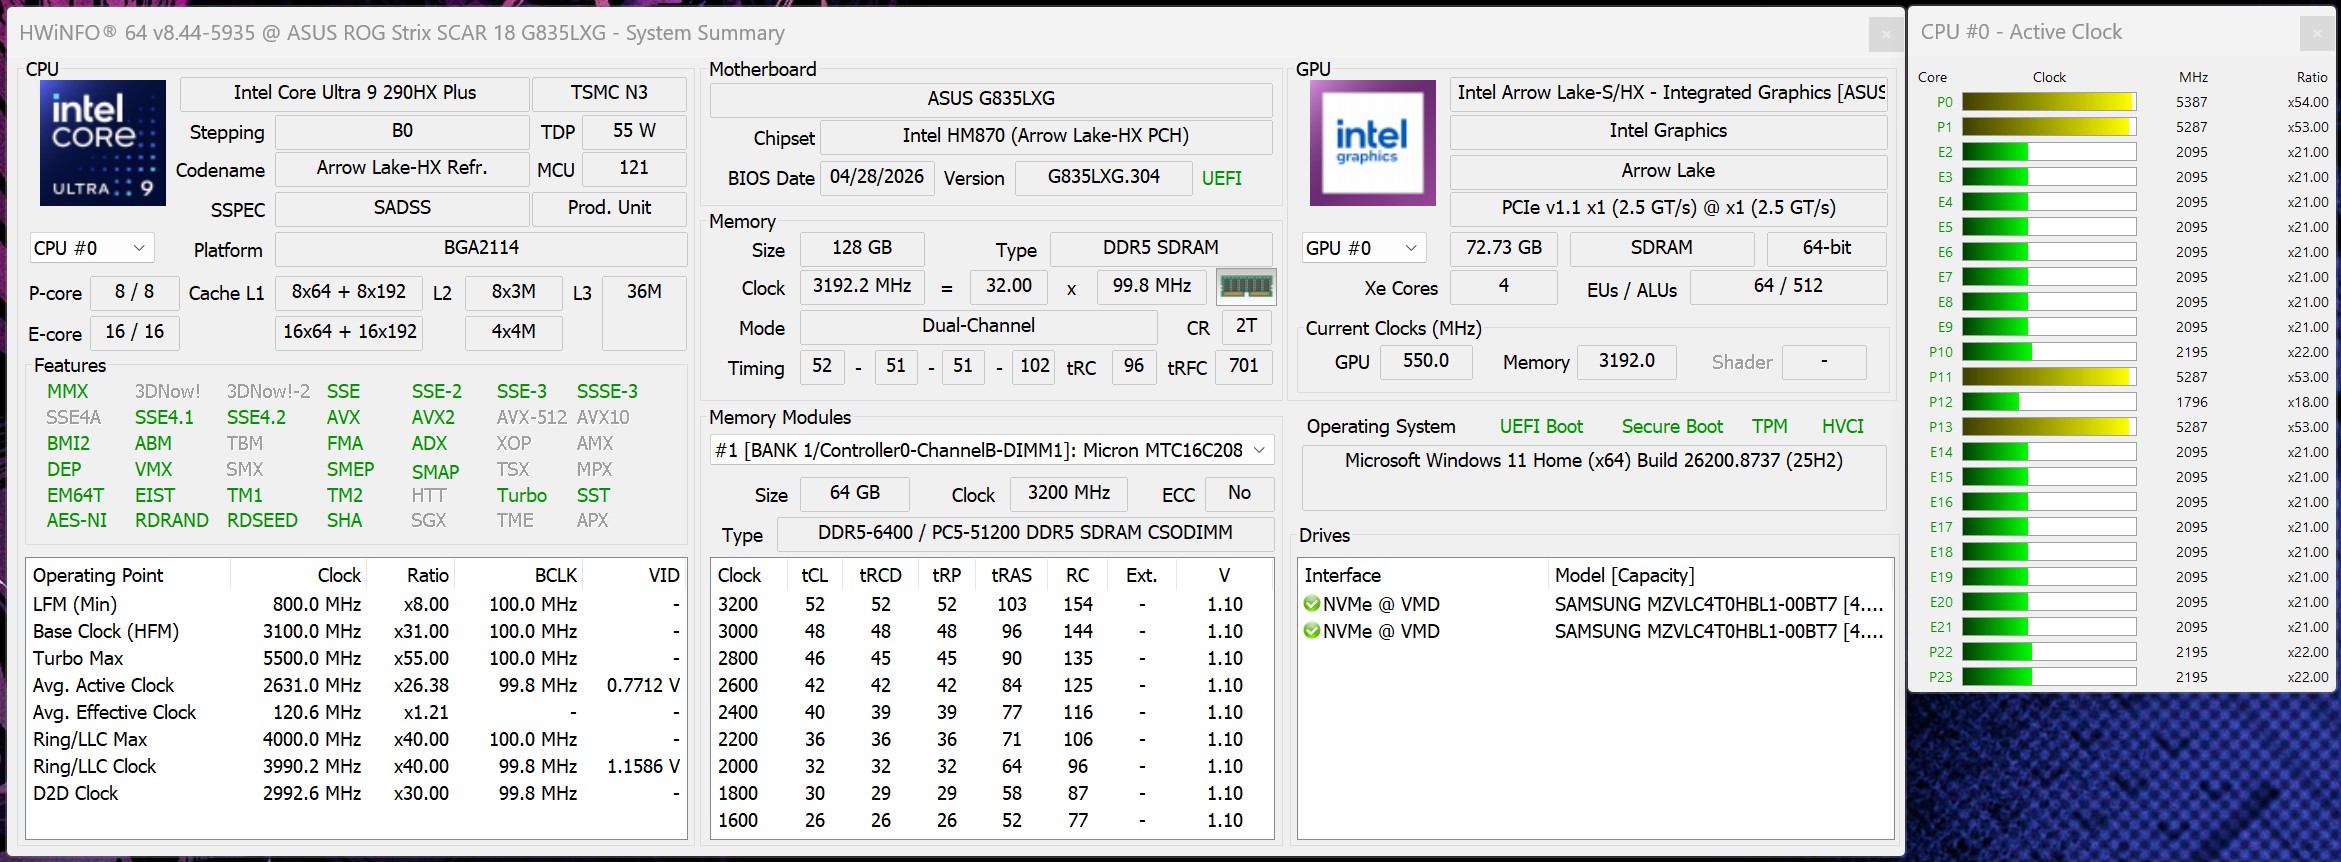
HWiNFO

Testbedingungen

Das Asus ROG Strix SCAR 18 bietet die drei bekannten Energieprofile leise, Leistung und Turbo. Für sämtliche Benchmarks und Messungen kam der Turbo-Modus zum Einsatz, der die maximale Performance freigibt. Zusätzlich steht ein manueller Modus zur Verfügung, in dem sich unter anderem die GPU-Taktraten sowie die Lüftersteuerung individuell anpassen lassen. Im Akkubetrieb ist der Turbo-Modus hingegen nicht verfügbar.

Energieprofil CPU TDP CB R24 Multi GPU TGP Time Spy Graphics CP 2077 QHD max. Lüfterlautstärke
Leise 100/80 Watt 1.953 Punkte 95 Watt 16.321 Punkte 80,2 FPS 34,8 dB(A)
Leistung 125/100 Watt 2.133 Punkte 150 Watt 23.177 Punkte 110,0 FPS 49 dB(A)
Turbo 200/180 Watt 2.318 Punkte 175 Watt 25.256 Punkte 118,7 FPS 53,7 dB(A)

Prozessor - Core Ultra 9 290HX Plus

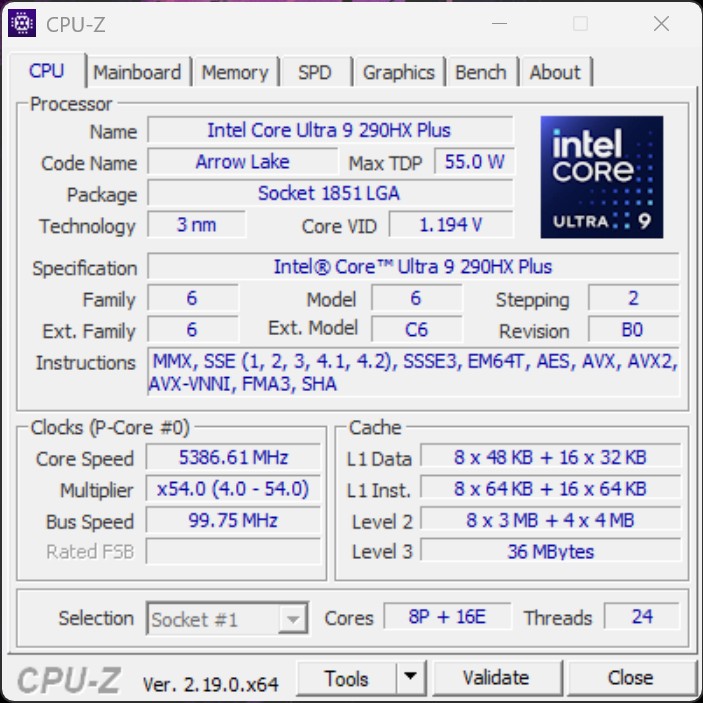
Der Intel Core Ultra 9 290HX zählt zu den schnellsten mobilen Prozessoren der aktuellen Arrow-Lake-HX-Generation und richtet sich an High-End-Gaming-Notebooks sowie mobile Workstations. Mit seiner hohen Multi-Core-Leistung bewältigt er anspruchsvolle Anwendungen wie Rendering, Videobearbeitung oder Softwareentwicklung ebenso souverän wie aktuelle Spiele. Im Test liefert der Prozessor eine konstant hohe Performance und ordnet sich im Spitzenfeld der derzeit verfügbaren Notebook-CPUs ein. Im Asus ROG Strix SCAR 18 biete der Hersteller gleich drei vordefinierte Leistungsmodi mit bis zu 200 Watt Spitzenleistung an. Wer manuelle Einstellungen vornehmen möchte, kann dem mobilen Prozessor sogar bis zu 240 Watt einräumen.

Cinebench R15 Multi Dauertest

0125250375500625750875100011251250137515001625175018752000212522502375250026252750287530003125325033753500362537503875400041254250437545004625475048755000512552505375550056255750587560006125Tooltip
Asus ROG Strix Scar 18 G835LXG Intel Core Ultra 9 290HX Plus: Ø6190 (6119.95-6230.53) Points
Asus Strix Scar 18 G835LX Intel Core Ultra 9 275HX: Ø5942 (5879.76-6059.69) Points
Razer Blade 18 2024 RZ09-0509 Intel Core i9-14900HX: Ø4163 (3956.09-4227.88) Points
Alienware m18 R2 Intel Core i9-14900HX: Ø4743 (4458.81-4807.11) Points
Acer Predator Helios 18 PH18-72-98MW Intel Core i9-14900HX: Ø4064 (3787.52-4673.44) Points
MSI Titan 18 HX A14VIG Intel Core i9-14900HX: Ø4753 (4700.35-4782.4) Points
Schenker Key 17 Pro (M24) Intel Core i9-14900HX: Ø3786 (3488.57-4363) Points
CPU Performance Rating: Percent
Cinebench R23: Multi Core | Single Core
Cinebench R20: CPU (Multi Core) | CPU (Single Core)
Cinebench R15: CPU Multi 64Bit | CPU Single 64Bit
Blender: v2.79 BMW27 CPU
7-Zip 18.03: 7z b 4 | 7z b 4 -mmt1
Geekbench 6.7: Multi-Core | Single-Core
Geekbench 5.5: Multi-Core | Single-Core
HWBOT x265 Benchmark v2.2: 4k Preset
LibreOffice : 20 Documents To PDF
R Benchmark 2.5: Overall mean
CPU Performance Rating
Asus ROG Strix Scar 18 G835LXG
Intel Core Ultra 9 290HX Plus
86 pt
Asus Strix Scar 18 G835LX
Intel Core Ultra 9 275HX
83.4 pt
Durchschnittliche Intel Core Ultra 9 290HX Plus
 
83.3 pt
Alienware m18 R2
Intel Core i9-14900HX
74.8 pt
MSI Titan 18 HX A14VIG
Intel Core i9-14900HX
71.6 pt
Razer Blade 18 2024 RZ09-0509
Intel Core i9-14900HX
67.9 pt
Schenker Key 17 Pro (M24)
Intel Core i9-14900HX
66.1 pt
Acer Predator Helios 18 PH18-72-98MW
Intel Core i9-14900HX
65.2 pt
Durchschnitt der Klasse Gaming
 
63.4 pt
Cinebench R23 / Multi Core
Asus ROG Strix Scar 18 G835LXG
Intel Core Ultra 9 290HX Plus
42661 Points
Durchschnittliche Intel Core Ultra 9 290HX Plus
  (37038 - 42661, n=5)
39891 Points -6%
Asus Strix Scar 18 G835LX
Intel Core Ultra 9 275HX
39001 Points -9%
MSI Titan 18 HX A14VIG
Intel Core i9-14900HX
32428 (29693.8min - 32428.3max) Points -24%
Alienware m18 R2
Intel Core i9-14900HX
31391 (28656min - 31390.7max) Points -26%
Razer Blade 18 2024 RZ09-0509
Intel Core i9-14900HX
27657 (23328.1min - 27657.5max) Points -35%
Schenker Key 17 Pro (M24)
Intel Core i9-14900HX
27338 Points -36%
Durchschnitt der Klasse Gaming
  (10488 - 42661, n=107, der letzten 2 Jahre)
26304 Points -38%
Acer Predator Helios 18 PH18-72-98MW
Intel Core i9-14900HX
26171 Points -39%
Cinebench R23 / Single Core
Asus ROG Strix Scar 18 G835LXG
Intel Core Ultra 9 290HX Plus
2415 Points
Durchschnittliche Intel Core Ultra 9 290HX Plus
  (2319 - 2415, n=5)
2361 Points -2%
Asus Strix Scar 18 G835LX
Intel Core Ultra 9 275HX
2252 Points -7%
Alienware m18 R2
Intel Core i9-14900HX
2235 Points -7%
Acer Predator Helios 18 PH18-72-98MW
Intel Core i9-14900HX
2176 Points -10%
MSI Titan 18 HX A14VIG
Intel Core i9-14900HX
2143 Points -11%
Razer Blade 18 2024 RZ09-0509
Intel Core i9-14900HX
2088 Points -14%
Schenker Key 17 Pro (M24)
Intel Core i9-14900HX
2028 Points -16%
Durchschnitt der Klasse Gaming
  (1166 - 2415, n=107, der letzten 2 Jahre)
2015 Points -17%
Cinebench R20 / CPU (Multi Core)
Asus ROG Strix Scar 18 G835LXG
Intel Core Ultra 9 290HX Plus
16433 Points
Asus Strix Scar 18 G835LX
Intel Core Ultra 9 275HX
15517 Points -6%
Durchschnittliche Intel Core Ultra 9 290HX Plus
  (14397 - 16433, n=5)
15445 Points -6%
MSI Titan 18 HX A14VIG
Intel Core i9-14900HX
12103 Points -26%
Alienware m18 R2
Intel Core i9-14900HX
11816 Points -28%
Razer Blade 18 2024 RZ09-0509
Intel Core i9-14900HX
10871 Points -34%
Schenker Key 17 Pro (M24)
Intel Core i9-14900HX
10276 Points -37%
Durchschnitt der Klasse Gaming
  (4029 - 16433, n=106, der letzten 2 Jahre)
10226 Points -38%
Acer Predator Helios 18 PH18-72-98MW
Intel Core i9-14900HX
9881 Points -40%
Cinebench R20 / CPU (Single Core)
Asus ROG Strix Scar 18 G835LXG
Intel Core Ultra 9 290HX Plus
913 Points
Durchschnittliche Intel Core Ultra 9 290HX Plus
  (864 - 913, n=5)
891 Points -2%
Asus Strix Scar 18 G835LX
Intel Core Ultra 9 275HX
866 Points -5%
Alienware m18 R2
Intel Core i9-14900HX
853 Points -7%
Acer Predator Helios 18 PH18-72-98MW
Intel Core i9-14900HX
832 Points -9%
MSI Titan 18 HX A14VIG
Intel Core i9-14900HX
823 Points -10%
Razer Blade 18 2024 RZ09-0509
Intel Core i9-14900HX
814 Points -11%
Durchschnitt der Klasse Gaming
  (442 - 913, n=106, der letzten 2 Jahre)
780 Points -15%
Schenker Key 17 Pro (M24)
Intel Core i9-14900HX
779 Points -15%
Cinebench R15 / CPU Multi 64Bit
Asus ROG Strix Scar 18 G835LXG
Intel Core Ultra 9 290HX Plus
6330 Points
Asus Strix Scar 18 G835LX
Intel Core Ultra 9 275HX
6060 (5879.76min - 6059.69max) Points -4%
Durchschnittliche Intel Core Ultra 9 290HX Plus
  (5617 - 6330, n=5)
6002 Points -5%
Alienware m18 R2
Intel Core i9-14900HX
4807 (4458.81min - 4807.11max) Points -24%
MSI Titan 18 HX A14VIG
Intel Core i9-14900HX
4782 (4700.35min - 4782.4max) Points -24%
Acer Predator Helios 18 PH18-72-98MW
Intel Core i9-14900HX
4673 (3787.52min - 4673.44max) Points -26%
Schenker Key 17 Pro (M24)
Intel Core i9-14900HX
4363 (3488.57min - 4363max) Points -31%
Razer Blade 18 2024 RZ09-0509
Intel Core i9-14900HX
4228 (3956.09min - 4227.88max) Points -33%
Durchschnitt der Klasse Gaming
  (1578 - 6330, n=105, der letzten 2 Jahre)
4079 Points -36%
Cinebench R15 / CPU Single 64Bit
Asus ROG Strix Scar 18 G835LXG
Intel Core Ultra 9 290HX Plus
350 Points
Asus Strix Scar 18 G835LX
Intel Core Ultra 9 275HX
343 Points -2%
Durchschnittliche Intel Core Ultra 9 290HX Plus
  (324 - 350, n=5)
339 Points -3%
Alienware m18 R2
Intel Core i9-14900HX
318 Points -9%
Acer Predator Helios 18 PH18-72-98MW
Intel Core i9-14900HX
312 Points -11%
Razer Blade 18 2024 RZ09-0509
Intel Core i9-14900HX
304 Points -13%
MSI Titan 18 HX A14VIG
Intel Core i9-14900HX
300 Points -14%
Durchschnitt der Klasse Gaming
  (188.8 - 350, n=106, der letzten 2 Jahre)
297 Points -15%
Schenker Key 17 Pro (M24)
Intel Core i9-14900HX
288 Points -18%
Blender / v2.79 BMW27 CPU
Durchschnitt der Klasse Gaming
  (79 - 330, n=104, der letzten 2 Jahre)
149.9 Seconds * -90%
Acer Predator Helios 18 PH18-72-98MW
Intel Core i9-14900HX
125 Seconds * -58%
Schenker Key 17 Pro (M24)
Intel Core i9-14900HX
121 Seconds * -53%
Razer Blade 18 2024 RZ09-0509
Intel Core i9-14900HX
117 Seconds * -48%
MSI Titan 18 HX A14VIG
Intel Core i9-14900HX
104 Seconds * -32%
Alienware m18 R2
Intel Core i9-14900HX
102 Seconds * -29%
Asus Strix Scar 18 G835LX
Intel Core Ultra 9 275HX
87 Seconds * -10%
Durchschnittliche Intel Core Ultra 9 290HX Plus
  (79 - 94, n=5)
86.2 Seconds * -9%
Asus ROG Strix Scar 18 G835LXG
Intel Core Ultra 9 290HX Plus
79 Seconds *
7-Zip 18.03 / 7z b 4
Asus ROG Strix Scar 18 G835LXG
Intel Core Ultra 9 290HX Plus
131933 MIPS
Asus Strix Scar 18 G835LX
Intel Core Ultra 9 275HX
122818 MIPS -7%
Alienware m18 R2
Intel Core i9-14900HX
122772 MIPS -7%
MSI Titan 18 HX A14VIG
Intel Core i9-14900HX
121266 MIPS -8%
Durchschnittliche Intel Core Ultra 9 290HX Plus
  (103986 - 131933, n=5)
119559 MIPS -9%
Schenker Key 17 Pro (M24)
Intel Core i9-14900HX
109204 MIPS -17%
Razer Blade 18 2024 RZ09-0509
Intel Core i9-14900HX
107527 MIPS -18%
Acer Predator Helios 18 PH18-72-98MW
Intel Core i9-14900HX
106977 MIPS -19%
Durchschnitt der Klasse Gaming
  (33491 - 148086, n=105, der letzten 2 Jahre)
90547 MIPS -31%
7-Zip 18.03 / 7z b 4 -mmt1
Asus ROG Strix Scar 18 G835LXG
Intel Core Ultra 9 290HX Plus
7143 MIPS
Alienware m18 R2
Intel Core i9-14900HX
7103 MIPS -1%
Asus Strix Scar 18 G835LX
Intel Core Ultra 9 275HX
7027 MIPS -2%
Schenker Key 17 Pro (M24)
Intel Core i9-14900HX
6858 MIPS -4%
Durchschnittliche Intel Core Ultra 9 290HX Plus
  (6562 - 7143, n=5)
6850 MIPS -4%
MSI Titan 18 HX A14VIG
Intel Core i9-14900HX
6504 MIPS -9%
Razer Blade 18 2024 RZ09-0509
Intel Core i9-14900HX
6497 MIPS -9%
Durchschnitt der Klasse Gaming
  (4199 - 7436, n=105, der letzten 2 Jahre)
6417 MIPS -10%
Acer Predator Helios 18 PH18-72-98MW
Intel Core i9-14900HX
6206 MIPS -13%
Geekbench 6.7 / Multi-Core
Asus ROG Strix Scar 18 G835LXG
Intel Core Ultra 9 290HX Plus
22850 Points
Asus Strix Scar 18 G835LX
Intel Core Ultra 9 275HX
21668 Points -5%
Durchschnittliche Intel Core Ultra 9 290HX Plus
  (19855 - 22850, n=6)
21145 Points -7%
Alienware m18 R2
Intel Core i9-14900HX
18233 Points -20%
Acer Predator Helios 18 PH18-72-98MW
Intel Core i9-14900HX
17403 Points -24%
Razer Blade 18 2024 RZ09-0509
Intel Core i9-14900HX
17231 Points -25%
MSI Titan 18 HX A14VIG
Intel Core i9-14900HX
16652 Points -27%
Schenker Key 17 Pro (M24)
Intel Core i9-14900HX
16482 Points -28%
Durchschnitt der Klasse Gaming
  (6625 - 22850, n=106, der letzten 2 Jahre)
16010 Points -30%
Geekbench 6.7 / Single-Core
Asus ROG Strix Scar 18 G835LXG
Intel Core Ultra 9 290HX Plus
3228 Points
Durchschnittliche Intel Core Ultra 9 290HX Plus
  (3147 - 3228, n=6)
3186 Points -1%
Asus Strix Scar 18 G835LX
Intel Core Ultra 9 275HX
3158 Points -2%
Alienware m18 R2
Intel Core i9-14900HX
3057 Points -5%
Acer Predator Helios 18 PH18-72-98MW
Intel Core i9-14900HX
2965 Points -8%
Durchschnitt der Klasse Gaming
  (1490 - 3259, n=106, der letzten 2 Jahre)
2848 Points -12%
MSI Titan 18 HX A14VIG
Intel Core i9-14900HX
2843 Points -12%
Razer Blade 18 2024 RZ09-0509
Intel Core i9-14900HX
2842 Points -12%
Schenker Key 17 Pro (M24)
Intel Core i9-14900HX
2611 Points -19%
Geekbench 5.5 / Multi-Core
Asus ROG Strix Scar 18 G835LXG
Intel Core Ultra 9 290HX Plus
28263 Points
Asus Strix Scar 18 G835LX
Intel Core Ultra 9 275HX
25855 Points -9%
Durchschnittliche Intel Core Ultra 9 290HX Plus
  (23839 - 28263, n=5)
25396 Points -10%
Alienware m18 R2
Intel Core i9-14900HX
21284 Points -25%
Acer Predator Helios 18 PH18-72-98MW
Intel Core i9-14900HX
20029 Points -29%
Schenker Key 17 Pro (M24)
Intel Core i9-14900HX
19316 Points -32%
Razer Blade 18 2024 RZ09-0509
Intel Core i9-14900HX
19310 Points -32%
MSI Titan 18 HX A14VIG
Intel Core i9-14900HX
19137 Points -32%
Durchschnitt der Klasse Gaming
  (6460 - 28263, n=105, der letzten 2 Jahre)
17266 Points -39%
Geekbench 5.5 / Single-Core
Asus ROG Strix Scar 18 G835LXG
Intel Core Ultra 9 290HX Plus
2350 Points
Durchschnittliche Intel Core Ultra 9 290HX Plus
  (2282 - 2357, n=5)
2318 Points -1%
Asus Strix Scar 18 G835LX
Intel Core Ultra 9 275HX
2292 Points -2%
Alienware m18 R2
Intel Core i9-14900HX
2193 Points -7%
MSI Titan 18 HX A14VIG
Intel Core i9-14900HX
2098 Points -11%
Durchschnitt der Klasse Gaming
  (986 - 2474, n=105, der letzten 2 Jahre)
2060 Points -12%
Razer Blade 18 2024 RZ09-0509
Intel Core i9-14900HX
2015 Points -14%
Acer Predator Helios 18 PH18-72-98MW
Intel Core i9-14900HX
2009 Points -15%
Schenker Key 17 Pro (M24)
Intel Core i9-14900HX
1924 Points -18%
HWBOT x265 Benchmark v2.2 / 4k Preset
Asus ROG Strix Scar 18 G835LXG
Intel Core Ultra 9 290HX Plus
44.4 fps
Durchschnittliche Intel Core Ultra 9 290HX Plus
  (38.2 - 44.4, n=5)
41.4 fps -7%
Asus Strix Scar 18 G835LX
Intel Core Ultra 9 275HX
41.2 fps -7%
Alienware m18 R2
Intel Core i9-14900HX
32.1 fps -28%
MSI Titan 18 HX A14VIG
Intel Core i9-14900HX
30.9 fps -30%
Acer Predator Helios 18 PH18-72-98MW
Intel Core i9-14900HX
29.5 fps -34%
Durchschnitt der Klasse Gaming
  (11.5 - 44.4, n=105, der letzten 2 Jahre)
28.8 fps -35%
Razer Blade 18 2024 RZ09-0509
Intel Core i9-14900HX
27.7 fps -38%
Schenker Key 17 Pro (M24)
Intel Core i9-14900HX
27.1 fps -39%
LibreOffice / 20 Documents To PDF
Acer Predator Helios 18 PH18-72-98MW
Intel Core i9-14900HX
85.1 s * -25%
Asus ROG Strix Scar 18 G835LXG
Intel Core Ultra 9 290HX Plus
68.2 s *
Durchschnitt der Klasse Gaming
  (33.2 - 88.8, n=105, der letzten 2 Jahre)
49.7 s * +27%
Razer Blade 18 2024 RZ09-0509
Intel Core i9-14900HX
48.5 s * +29%
Schenker Key 17 Pro (M24)
Intel Core i9-14900HX
46.6 s * +32%
MSI Titan 18 HX A14VIG
Intel Core i9-14900HX
46.2 s * +32%
Durchschnittliche Intel Core Ultra 9 290HX Plus
  (38.9 - 68.2, n=5)
45.5 s * +33%
Alienware m18 R2
Intel Core i9-14900HX
44.8 s * +34%
Asus Strix Scar 18 G835LX
Intel Core Ultra 9 275HX
41.3 s * +39%
R Benchmark 2.5 / Overall mean
Durchschnitt der Klasse Gaming
  (0.3439 - 0.759, n=106, der letzten 2 Jahre)
0.4284 sec * -10%
Acer Predator Helios 18 PH18-72-98MW
Intel Core i9-14900HX
0.4225 sec * -8%
Schenker Key 17 Pro (M24)
Intel Core i9-14900HX
0.4143 sec * -6%
Asus Strix Scar 18 G835LX
Intel Core Ultra 9 275HX
0.3943 sec * -1%
Razer Blade 18 2024 RZ09-0509
Intel Core i9-14900HX
0.3937 sec * -1%
MSI Titan 18 HX A14VIG
Intel Core i9-14900HX
0.3919 sec * -1%
Asus ROG Strix Scar 18 G835LXG
Intel Core Ultra 9 290HX Plus
0.3899 sec *
Durchschnittliche Intel Core Ultra 9 290HX Plus
  (0.3788 - 0.3951, n=5)
0.3887 sec * -0%
Alienware m18 R2
Intel Core i9-14900HX
0.3767 sec * +3%

* ... kleinere Werte sind besser

Cinebench R10 Rendering Single 32Bit
12575
Cinebench R10 Shading 64Bit
13665 Points
Cinebench R10 Rendering Multiple CPUs 64Bit
165835 Points
Cinebench R10 Rendering Single CPUs 64Bit
19487 Points
Cinebench R10 Shading 32Bit
13696
Cinebench R10 Rendering Multiple CPUs 32Bit
102066
Cinebench R11.5 CPU Single 32Bit
3.66 Points
Cinebench R11.5 CPU Multi 32Bit
67.85 Points
Cinebench R11.5 OpenGL 32Bit
199.32 fps
Cinebench R11.5 CPU Single 64Bit
4.16 Points
Cinebench R11.5 CPU Multi 64Bit
76.69 Points
Cinebench R11.5 OpenGL 64Bit
220.23 fps
Cinebench R15 CPU Single 64Bit
350 Points
Cinebench R15 CPU Multi 64Bit
6330 Points
Cinebench R15 Ref. Match 64Bit
99.6 %
Cinebench R15 OpenGL 64Bit
321.54 fps
Cinebench R20 CPU (Single Core)
913 Points
Cinebench R20 CPU (Multi Core)
16433 Points
Cinebench R23 Multi Core
42661 Points
Cinebench R23 Single Core
2415 Points
Cinebench 2024 CPU Single Core
141 Points
Cinebench 2024 CPU Multi Core
2327 Points
Cinebench 2026 CPU Multi
9542 Points
Cinebench 2026 CPU Single Thread
581 Points
Hilfe
Performance Rating
Asus ROG Strix Scar 18 G835LXG
Intel Core Ultra 9 290HX Plus, GeForce RTX 5090 Laptop
97.5 pt
Durchschnittliche Intel Core Ultra 9 290HX Plus
 
91.7 pt
Asus Strix Scar 18 G835LX -1!
Intel Core Ultra 9 275HX, GeForce RTX 5090 Laptop
90.1 pt
MSI Titan 18 HX A14VIG -1!
Intel Core i9-14900HX, GeForce RTX 4090 Laptop GPU
77.8 pt
Alienware m18 R2 -1!
Intel Core i9-14900HX, GeForce RTX 4090 Laptop GPU
77.4 pt
Durchschnitt der Klasse Gaming
 
71.2 pt
Razer Blade 18 2024 RZ09-0509 -1!
Intel Core i9-14900HX, GeForce RTX 4090 Laptop GPU
69.8 pt
Acer Predator Helios 18 PH18-72-98MW -1!
Intel Core i9-14900HX, GeForce RTX 4090 Laptop GPU
67 pt
Schenker Key 17 Pro (M24) -1!
Intel Core i9-14900HX, GeForce RTX 4090 Laptop GPU
64.8 pt
AIDA64 / FP32 Ray-Trace
Asus ROG Strix Scar 18 G835LXG
Intel Core Ultra 9 290HX Plus, GeForce RTX 5090 Laptop (v6.92.6600)
43239 KRay/s
Asus ROG Strix Scar 18 G835LXG
Intel Core Ultra 9 290HX Plus, GeForce RTX 5090 Laptop (v8.20.8100)
43116 KRay/s 0%
Durchschnittliche Intel Core Ultra 9 290HX Plus
  (34761 - 43239, n=6)
40296 KRay/s -7%
Asus Strix Scar 18 G835LX
Intel Core Ultra 9 275HX, GeForce RTX 5090 Laptop (v6.92.6600)
39458 KRay/s -9%
Durchschnitt der Klasse Gaming
  (10227 - 85542, n=105, der letzten 2 Jahre)
32356 KRay/s -25%
MSI Titan 18 HX A14VIG
Intel Core i9-14900HX, GeForce RTX 4090 Laptop GPU (v6.92.6600)
29351 KRay/s -32%
Alienware m18 R2
Intel Core i9-14900HX, GeForce RTX 4090 Laptop GPU (v6.92.6600)
29280 KRay/s -32%
Razer Blade 18 2024 RZ09-0509
Intel Core i9-14900HX, GeForce RTX 4090 Laptop GPU (v6.85.6300)
25098 KRay/s -42%
Acer Predator Helios 18 PH18-72-98MW
Intel Core i9-14900HX, GeForce RTX 4090 Laptop GPU (v6.92.6600)
23862 KRay/s -45%
Schenker Key 17 Pro (M24)
Intel Core i9-14900HX, GeForce RTX 4090 Laptop GPU (v6.92.6600)
21858 KRay/s -49%
AIDA64 / FPU Julia
Asus ROG Strix Scar 18 G835LXG
Intel Core Ultra 9 290HX Plus, GeForce RTX 5090 Laptop (v8.20.8100)
218895 Points
Asus ROG Strix Scar 18 G835LXG
Intel Core Ultra 9 290HX Plus, GeForce RTX 5090 Laptop (v6.92.6600)
217175 Points -1%
Durchschnittliche Intel Core Ultra 9 290HX Plus
  (174665 - 218895, n=6)
204722 Points -6%
Asus Strix Scar 18 G835LX
Intel Core Ultra 9 275HX, GeForce RTX 5090 Laptop (v6.92.6600)
194867 Points -11%
MSI Titan 18 HX A14VIG
Intel Core i9-14900HX, GeForce RTX 4090 Laptop GPU (v6.92.6600)
148888 Points -32%
Alienware m18 R2
Intel Core i9-14900HX, GeForce RTX 4090 Laptop GPU (v6.92.6600)
142791 Points -35%
Durchschnitt der Klasse Gaming
  (51376 - 238426, n=105, der letzten 2 Jahre)
140193 Points -36%
Razer Blade 18 2024 RZ09-0509
Intel Core i9-14900HX, GeForce RTX 4090 Laptop GPU (v6.85.6300)
128369 Points -41%
Acer Predator Helios 18 PH18-72-98MW
Intel Core i9-14900HX, GeForce RTX 4090 Laptop GPU (v6.92.6600)
118469 Points -46%
Schenker Key 17 Pro (M24)
Intel Core i9-14900HX, GeForce RTX 4090 Laptop GPU (v6.92.6600)
113270 Points -48%
AIDA64 / CPU SHA3
Asus ROG Strix Scar 18 G835LXG
Intel Core Ultra 9 290HX Plus, GeForce RTX 5090 Laptop (v8.20.8100)
10115 MB/s
Asus ROG Strix Scar 18 G835LXG
Intel Core Ultra 9 290HX Plus, GeForce RTX 5090 Laptop (v6.92.6600)
10055 MB/s -1%
Durchschnittliche Intel Core Ultra 9 290HX Plus
  (8352 - 10115, n=6)
9565 MB/s -5%
Asus Strix Scar 18 G835LX
Intel Core Ultra 9 275HX, GeForce RTX 5090 Laptop (v6.92.6600)
9482 MB/s -6%
MSI Titan 18 HX A14VIG
Intel Core i9-14900HX, GeForce RTX 4090 Laptop GPU (v6.92.6600)
7229 MB/s -29%
Alienware m18 R2
Intel Core i9-14900HX, GeForce RTX 4090 Laptop GPU (v6.92.6600)
7095 MB/s -30%
Durchschnitt der Klasse Gaming
  (2180 - 10115, n=105, der letzten 2 Jahre)
6367 MB/s -37%
Razer Blade 18 2024 RZ09-0509
Intel Core i9-14900HX, GeForce RTX 4090 Laptop GPU (v6.85.6300)
6159 MB/s -39%
Acer Predator Helios 18 PH18-72-98MW
Intel Core i9-14900HX, GeForce RTX 4090 Laptop GPU (v6.92.6600)
5804 MB/s -43%
Schenker Key 17 Pro (M24)
Intel Core i9-14900HX, GeForce RTX 4090 Laptop GPU (v6.92.6600)
5598 MB/s -45%
AIDA64 / CPU Queen
MSI Titan 18 HX A14VIG
Intel Core i9-14900HX, GeForce RTX 4090 Laptop GPU (v6.92.6600)
148773 Points +5%
Asus ROG Strix Scar 18 G835LXG
Intel Core Ultra 9 290HX Plus, GeForce RTX 5090 Laptop (v6.92.6600)
141622 Points
Durchschnittliche Intel Core Ultra 9 290HX Plus
  (n=1)
141622 Points 0%
Asus Strix Scar 18 G835LX
Intel Core Ultra 9 275HX, GeForce RTX 5090 Laptop (v6.92.6600)
139608 Points -1%
Alienware m18 R2
Intel Core i9-14900HX, GeForce RTX 4090 Laptop GPU (v6.92.6600)
139323 Points -2%
Acer Predator Helios 18 PH18-72-98MW
Intel Core i9-14900HX, GeForce RTX 4090 Laptop GPU (v6.92.6600)
139146 Points -2%
Schenker Key 17 Pro (M24)
Intel Core i9-14900HX, GeForce RTX 4090 Laptop GPU (v6.92.6600)
138708 Points -2%
Razer Blade 18 2024 RZ09-0509
Intel Core i9-14900HX, GeForce RTX 4090 Laptop GPU (v6.85.6300)
136621 Points -4%
Durchschnitt der Klasse Gaming
  (49785 - 173351, n=90, der letzten 2 Jahre)
116544 Points -18%
AIDA64 / FPU SinJulia
MSI Titan 18 HX A14VIG
Intel Core i9-14900HX, GeForce RTX 4090 Laptop GPU (v6.92.6600)
18256 Points +23%
Alienware m18 R2
Intel Core i9-14900HX, GeForce RTX 4090 Laptop GPU (v6.92.6600)
16279 Points +9%
Razer Blade 18 2024 RZ09-0509
Intel Core i9-14900HX, GeForce RTX 4090 Laptop GPU (v6.85.6300)
15500 Points +4%
Acer Predator Helios 18 PH18-72-98MW
Intel Core i9-14900HX, GeForce RTX 4090 Laptop GPU (v6.92.6600)
15099 Points +2%
Asus ROG Strix Scar 18 G835LXG
Intel Core Ultra 9 290HX Plus, GeForce RTX 5090 Laptop (v8.20.8100)
14874 Points
Asus ROG Strix Scar 18 G835LXG
Intel Core Ultra 9 290HX Plus, GeForce RTX 5090 Laptop (v6.92.6600)
14857 Points 0%
Durchschnitt der Klasse Gaming
  (4424 - 33636, n=105, der letzten 2 Jahre)
14619 Points -2%
Durchschnittliche Intel Core Ultra 9 290HX Plus
  (13612 - 14874, n=6)
14247 Points -4%
Asus Strix Scar 18 G835LX
Intel Core Ultra 9 275HX, GeForce RTX 5090 Laptop (v6.92.6600)
14112 Points -5%
Schenker Key 17 Pro (M24)
Intel Core i9-14900HX, GeForce RTX 4090 Laptop GPU (v6.92.6600)
13903 Points -7%
AIDA64 / FPU Mandel
Asus ROG Strix Scar 18 G835LXG
Intel Core Ultra 9 290HX Plus, GeForce RTX 5090 Laptop (v6.92.6600)
115371 Points
Asus ROG Strix Scar 18 G835LXG
Intel Core Ultra 9 290HX Plus, GeForce RTX 5090 Laptop (v8.20.8100)
115355 Points 0%
Durchschnittliche Intel Core Ultra 9 290HX Plus
  (91215 - 115371, n=6)
107382 Points -7%
Asus Strix Scar 18 G835LX
Intel Core Ultra 9 275HX, GeForce RTX 5090 Laptop (v6.92.6600)
104057 Points -10%
Durchschnitt der Klasse Gaming
  (25115 - 128721, n=105, der letzten 2 Jahre)
73608 Points -36%
Alienware m18 R2
Intel Core i9-14900HX, GeForce RTX 4090 Laptop GPU (v6.92.6600)
72594 Points -37%
MSI Titan 18 HX A14VIG
Intel Core i9-14900HX, GeForce RTX 4090 Laptop GPU (v6.92.6600)
72355 Points -37%
Razer Blade 18 2024 RZ09-0509
Intel Core i9-14900HX, GeForce RTX 4090 Laptop GPU (v6.85.6300)
62867 Points -46%
Acer Predator Helios 18 PH18-72-98MW
Intel Core i9-14900HX, GeForce RTX 4090 Laptop GPU (v6.92.6600)
59005 Points -49%
Schenker Key 17 Pro (M24)
Intel Core i9-14900HX, GeForce RTX 4090 Laptop GPU (v6.92.6600)
54428 Points -53%
AIDA64 / CPU AES
Asus ROG Strix Scar 18 G835LXG
Intel Core Ultra 9 290HX Plus, GeForce RTX 5090 Laptop (v6.92.6600)
143205 MB/s
Asus ROG Strix Scar 18 G835LXG
Intel Core Ultra 9 290HX Plus, GeForce RTX 5090 Laptop (v8.20.8100)
143046 MB/s 0%
MSI Titan 18 HX A14VIG
Intel Core i9-14900HX, GeForce RTX 4090 Laptop GPU (v6.92.6600)
138830 MB/s -3%
Durchschnittliche Intel Core Ultra 9 290HX Plus
  (127585 - 143205, n=6)
136036 MB/s -5%
Asus Strix Scar 18 G835LX
Intel Core Ultra 9 275HX, GeForce RTX 5090 Laptop (v6.92.6600)
134920 MB/s -6%
Alienware m18 R2
Intel Core i9-14900HX, GeForce RTX 4090 Laptop GPU (v6.92.6600)
134675 MB/s -6%
Razer Blade 18 2024 RZ09-0509
Intel Core i9-14900HX, GeForce RTX 4090 Laptop GPU (v6.85.6300)
117887 MB/s -18%
Acer Predator Helios 18 PH18-72-98MW
Intel Core i9-14900HX, GeForce RTX 4090 Laptop GPU (v6.92.6600)
112197 MB/s -22%
Durchschnitt der Klasse Gaming
  (39258 - 247074, n=105, der letzten 2 Jahre)
108017 MB/s -25%
Schenker Key 17 Pro (M24)
Intel Core i9-14900HX, GeForce RTX 4090 Laptop GPU (v6.92.6600)
106371 MB/s -26%
AIDA64 / CPU ZLib
Asus ROG Strix Scar 18 G835LXG
Intel Core Ultra 9 290HX Plus, GeForce RTX 5090 Laptop (v6.92.6600)
2340 MB/s
Asus ROG Strix Scar 18 G835LXG
Intel Core Ultra 9 290HX Plus, GeForce RTX 5090 Laptop (v8.20.8100)
2334 MB/s 0%
Asus Strix Scar 18 G835LX
Intel Core Ultra 9 275HX, GeForce RTX 5090 Laptop (v6.92.6600)
2220 MB/s -5%
Durchschnittliche Intel Core Ultra 9 290HX Plus
  (1967 - 2340, n=6)
2202 MB/s -6%
MSI Titan 18 HX A14VIG
Intel Core i9-14900HX, GeForce RTX 4090 Laptop GPU (v6.92.6600)
2149 MB/s -8%
Alienware m18 R2
Intel Core i9-14900HX, GeForce RTX 4090 Laptop GPU (v6.92.6600)
2053 MB/s -12%
Razer Blade 18 2024 RZ09-0509
Intel Core i9-14900HX, GeForce RTX 4090 Laptop GPU (v6.85.6300)
1794 MB/s -23%
Acer Predator Helios 18 PH18-72-98MW
Intel Core i9-14900HX, GeForce RTX 4090 Laptop GPU (v6.92.6600)
1696 MB/s -28%
Schenker Key 17 Pro (M24)
Intel Core i9-14900HX, GeForce RTX 4090 Laptop GPU (v6.92.6600)
1691 MB/s -28%
Durchschnitt der Klasse Gaming
  (574 - 2531, n=105, der letzten 2 Jahre)
1569 MB/s -33%
AIDA64 / FP64 Ray-Trace
Asus ROG Strix Scar 18 G835LXG
Intel Core Ultra 9 290HX Plus, GeForce RTX 5090 Laptop (v6.92.6600)
23843 KRay/s
Asus ROG Strix Scar 18 G835LXG
Intel Core Ultra 9 290HX Plus, GeForce RTX 5090 Laptop (v8.20.8100)
23227 KRay/s -3%
Durchschnittliche Intel Core Ultra 9 290HX Plus
  (18611 - 23843, n=6)
21823 KRay/s -8%
Asus Strix Scar 18 G835LX
Intel Core Ultra 9 275HX, GeForce RTX 5090 Laptop (v6.92.6600)
21372 KRay/s -10%
Durchschnitt der Klasse Gaming
  (5509 - 45446, n=105, der letzten 2 Jahre)
17303 KRay/s -27%
Alienware m18 R2
Intel Core i9-14900HX, GeForce RTX 4090 Laptop GPU (v6.92.6600)
16128 KRay/s -32%
MSI Titan 18 HX A14VIG
Intel Core i9-14900HX, GeForce RTX 4090 Laptop GPU (v6.92.6600)
16104 KRay/s -32%
Razer Blade 18 2024 RZ09-0509
Intel Core i9-14900HX, GeForce RTX 4090 Laptop GPU (v6.85.6300)
13680 KRay/s -43%
Acer Predator Helios 18 PH18-72-98MW
Intel Core i9-14900HX, GeForce RTX 4090 Laptop GPU (v6.92.6600)
12565 KRay/s -47%
Schenker Key 17 Pro (M24)
Intel Core i9-14900HX, GeForce RTX 4090 Laptop GPU (v6.92.6600)
11838 KRay/s -50%
AIDA64 / CPU PhotoWorxx
Asus ROG Strix Scar 18 G835LXG
Intel Core Ultra 9 290HX Plus, GeForce RTX 5090 Laptop (v8.20.8100)
65272 MPixel/s
Asus ROG Strix Scar 18 G835LXG
Intel Core Ultra 9 290HX Plus, GeForce RTX 5090 Laptop (v6.92.6600)
62686 MPixel/s -4%
Durchschnittliche Intel Core Ultra 9 290HX Plus
  (51134 - 65272, n=6)
56956 MPixel/s -13%
Asus Strix Scar 18 G835LX
Intel Core Ultra 9 275HX, GeForce RTX 5090 Laptop (v6.92.6600)
56601 MPixel/s -13%
Schenker Key 17 Pro (M24)
Intel Core i9-14900HX, GeForce RTX 4090 Laptop GPU (v6.92.6600)
50465 MPixel/s -23%
Alienware m18 R2
Intel Core i9-14900HX, GeForce RTX 4090 Laptop GPU (v6.92.6600)
49716 MPixel/s -24%
Razer Blade 18 2024 RZ09-0509
Intel Core i9-14900HX, GeForce RTX 4090 Laptop GPU (v6.85.6300)
47472 MPixel/s -27%
Acer Predator Helios 18 PH18-72-98MW
Intel Core i9-14900HX, GeForce RTX 4090 Laptop GPU (v6.92.6600)
47343 MPixel/s -27%
Durchschnitt der Klasse Gaming
  (12271 - 89891, n=105, der letzten 2 Jahre)
44630 MPixel/s -32%
MSI Titan 18 HX A14VIG
Intel Core i9-14900HX, GeForce RTX 4090 Laptop GPU (v6.92.6600)
33960 MPixel/s -48%
AIDA64 / CPU CheckMate
Asus ROG Strix Scar 18 G835LXG
Intel Core Ultra 9 290HX Plus, GeForce RTX 5090 Laptop (v8.20.8100)
8765 MP/s
Durchschnittliche Intel Core Ultra 9 290HX Plus
  (7624 - 8765, n=5)
8207 MP/s -6%
Durchschnitt der Klasse Gaming
  (2930 - 11788, n=14, der letzten 2 Jahre)
6635 MP/s -24%

System und Speicherleistung

Das Asus ROG Strix SCAR 18 überzeugt im Alltag mit einer sehr hohen Systemgeschwindigkeit und kurzen Ladezeiten. Anwendungen und Spiele starten zügig, sodass das Notebook jederzeit einen äußerst reaktionsschnellen Eindruck hinterlässt. Die Umschaltung der Grafik über Nvidia Advanced Optimus führt beim Start einiger Spiele zu einer kurzen Verzögerung, was technisch bedingt ist und im Betrieb keine weiteren Einschränkungen verursacht.

Performance Rating: Percent
PCMark 10: Score | Essentials | Productivity | Digital Content Creation
CrossMark: Overall | Productivity | Creativity | Responsiveness
WebXPRT 3: Overall
WebXPRT 4: Overall
Mozilla Kraken 1.1: Total
Performance Rating
Asus ROG Strix Scar 18 G835LXG
GeForce RTX 5090 Laptop, Ultra 9 290HX Plus, 2x Samsung PM9E1 MZVLC4T0HBL1 (RAID 0)
91.6 pt
Durchschnittliche Intel Core Ultra 9 290HX Plus, NVIDIA GeForce RTX 5090 Laptop
 
89.1 pt
Asus Strix Scar 18 G835LX
GeForce RTX 5090 Laptop, Ultra 9 275HX, WD PC SN8000S 2TB
79.4 pt
Alienware m18 R2
GeForce RTX 4090 Laptop GPU, i9-14900HX, SK Hynix PC811 HFS002TEM9X152N
77.2 pt
Razer Blade 18 2024 RZ09-0509 -1!
GeForce RTX 4090 Laptop GPU, i9-14900HX
74.1 pt
MSI Titan 18 HX A14VIG
GeForce RTX 4090 Laptop GPU, i9-14900HX, 2x Samsung PM9A1a MZVL22T0HDLB (RAID 0)
72.3 pt
Durchschnitt der Klasse Gaming
 
72.1 pt
Schenker Key 17 Pro (M24) -4!
GeForce RTX 4090 Laptop GPU, i9-14900HX, Samsung 990 Pro 1 TB
63 pt
Acer Predator Helios 18 PH18-72-98MW -6!
GeForce RTX 4090 Laptop GPU, i9-14900HX, 2x SK Hynix HFS001TEJ9X115N (RAID 0)
56.2 pt
PCMark 10 / Score
Asus ROG Strix Scar 18 G835LXG
GeForce RTX 5090 Laptop, Ultra 9 290HX Plus, 2x Samsung PM9E1 MZVLC4T0HBL1 (RAID 0)
12414 Points
Durchschnittliche Intel Core Ultra 9 290HX Plus, NVIDIA GeForce RTX 5090 Laptop
  (11015 - 12414, n=3)
11720 Points -6%
Alienware m18 R2
GeForce RTX 4090 Laptop GPU, i9-14900HX, SK Hynix PC811 HFS002TEM9X152N
9234 Points -26%
MSI Titan 18 HX A14VIG
GeForce RTX 4090 Laptop GPU, i9-14900HX, 2x Samsung PM9A1a MZVL22T0HDLB (RAID 0)
8968 Points -28%
Razer Blade 18 2024 RZ09-0509
GeForce RTX 4090 Laptop GPU, i9-14900HX
8805 Points -29%
Asus Strix Scar 18 G835LX
GeForce RTX 5090 Laptop, Ultra 9 275HX, WD PC SN8000S 2TB
8623 Points -31%
Durchschnitt der Klasse Gaming
  (5828 - 12414, n=93, der letzten 2 Jahre)
8463 Points -32%
Schenker Key 17 Pro (M24)
GeForce RTX 4090 Laptop GPU, i9-14900HX, Samsung 990 Pro 1 TB
8277 Points -33%
Acer Predator Helios 18 PH18-72-98MW
GeForce RTX 4090 Laptop GPU, i9-14900HX, 2x SK Hynix HFS001TEJ9X115N (RAID 0)
8230 Points -34%
PCMark 10 / Essentials
MSI Titan 18 HX A14VIG
GeForce RTX 4090 Laptop GPU, i9-14900HX, 2x Samsung PM9A1a MZVL22T0HDLB (RAID 0)
11628 Points 0%
Asus ROG Strix Scar 18 G835LXG
GeForce RTX 5090 Laptop, Ultra 9 290HX Plus, 2x Samsung PM9E1 MZVLC4T0HBL1 (RAID 0)
11604 Points
Durchschnittliche Intel Core Ultra 9 290HX Plus, NVIDIA GeForce RTX 5090 Laptop
  (11316 - 11604, n=3)
11468 Points -1%
Alienware m18 R2
GeForce RTX 4090 Laptop GPU, i9-14900HX, SK Hynix PC811 HFS002TEM9X152N
11415 Points -2%
Razer Blade 18 2024 RZ09-0509
GeForce RTX 4090 Laptop GPU, i9-14900HX
11378 Points -2%
Acer Predator Helios 18 PH18-72-98MW
GeForce RTX 4090 Laptop GPU, i9-14900HX, 2x SK Hynix HFS001TEJ9X115N (RAID 0)
11032 Points -5%
Asus Strix Scar 18 G835LX
GeForce RTX 5090 Laptop, Ultra 9 275HX, WD PC SN8000S 2TB
10966 Points -5%
Schenker Key 17 Pro (M24)
GeForce RTX 4090 Laptop GPU, i9-14900HX, Samsung 990 Pro 1 TB
10778 Points -7%
Durchschnitt der Klasse Gaming
  (8810 - 11935, n=97, der letzten 2 Jahre)
10660 Points -8%
PCMark 10 / Productivity
Asus ROG Strix Scar 18 G835LXG
GeForce RTX 5090 Laptop, Ultra 9 290HX Plus, 2x Samsung PM9E1 MZVLC4T0HBL1 (RAID 0)
25323 Points
Durchschnittliche Intel Core Ultra 9 290HX Plus, NVIDIA GeForce RTX 5090 Laptop
  (16305 - 25323, n=3)
20246 Points -20%
Alienware m18 R2
GeForce RTX 4090 Laptop GPU, i9-14900HX, SK Hynix PC811 HFS002TEM9X152N
11415 Points -55%
Durchschnitt der Klasse Gaming
  (6845 - 25323, n=95, der letzten 2 Jahre)
11222 Points -56%
MSI Titan 18 HX A14VIG
GeForce RTX 4090 Laptop GPU, i9-14900HX, 2x Samsung PM9A1a MZVL22T0HDLB (RAID 0)
10225 Points -60%
Razer Blade 18 2024 RZ09-0509
GeForce RTX 4090 Laptop GPU, i9-14900HX
10186 Points -60%
Acer Predator Helios 18 PH18-72-98MW
GeForce RTX 4090 Laptop GPU, i9-14900HX, 2x SK Hynix HFS001TEJ9X115N (RAID 0)
9951 Points -61%
Schenker Key 17 Pro (M24)
GeForce RTX 4090 Laptop GPU, i9-14900HX, Samsung 990 Pro 1 TB
9458 Points -63%
Asus Strix Scar 18 G835LX
GeForce RTX 5090 Laptop, Ultra 9 275HX, WD PC SN8000S 2TB
9444 Points -63%
PCMark 10 / Digital Content Creation
Durchschnittliche Intel Core Ultra 9 290HX Plus, NVIDIA GeForce RTX 5090 Laptop
  (17665 - 19954, n=3)
19092 Points +8%
Asus ROG Strix Scar 18 G835LXG
GeForce RTX 5090 Laptop, Ultra 9 290HX Plus, 2x Samsung PM9E1 MZVLC4T0HBL1 (RAID 0)
17665 Points
Asus Strix Scar 18 G835LX
GeForce RTX 5090 Laptop, Ultra 9 275HX, WD PC SN8000S 2TB
16802 Points -5%
MSI Titan 18 HX A14VIG
GeForce RTX 4090 Laptop GPU, i9-14900HX, 2x Samsung PM9A1a MZVL22T0HDLB (RAID 0)
16462 Points -7%
Alienware m18 R2
GeForce RTX 4090 Laptop GPU, i9-14900HX, SK Hynix PC811 HFS002TEM9X152N
16398 Points -7%
Razer Blade 18 2024 RZ09-0509
GeForce RTX 4090 Laptop GPU, i9-14900HX
15985 Points -10%
Schenker Key 17 Pro (M24)
GeForce RTX 4090 Laptop GPU, i9-14900HX, Samsung 990 Pro 1 TB
15093 Points -15%
Durchschnitt der Klasse Gaming
  (7602 - 19954, n=95, der letzten 2 Jahre)
14060 Points -20%
Acer Predator Helios 18 PH18-72-98MW
GeForce RTX 4090 Laptop GPU, i9-14900HX, 2x SK Hynix HFS001TEJ9X115N (RAID 0)
13779 Points -22%
CrossMark / Overall
Asus ROG Strix Scar 18 G835LXG
GeForce RTX 5090 Laptop, Ultra 9 290HX Plus, 2x Samsung PM9E1 MZVLC4T0HBL1 (RAID 0)
2345 Points
Durchschnittliche Intel Core Ultra 9 290HX Plus, NVIDIA GeForce RTX 5090 Laptop
  (2177 - 2401, n=3)
2308 Points -2%
Asus Strix Scar 18 G835LX
GeForce RTX 5090 Laptop, Ultra 9 275HX, WD PC SN8000S 2TB
2221 Points -5%
Alienware m18 R2
GeForce RTX 4090 Laptop GPU, i9-14900HX, SK Hynix PC811 HFS002TEM9X152N
2073 Points -12%
Razer Blade 18 2024 RZ09-0509
GeForce RTX 4090 Laptop GPU, i9-14900HX
2048 Points -13%
Durchschnitt der Klasse Gaming
  (1366 - 2409, n=94, der letzten 2 Jahre)
1986 Points -15%
MSI Titan 18 HX A14VIG
GeForce RTX 4090 Laptop GPU, i9-14900HX, 2x Samsung PM9A1a MZVL22T0HDLB (RAID 0)
1877 Points -20%
CrossMark / Productivity
Asus ROG Strix Scar 18 G835LXG
GeForce RTX 5090 Laptop, Ultra 9 290HX Plus, 2x Samsung PM9E1 MZVLC4T0HBL1 (RAID 0)
2110 Points
Durchschnittliche Intel Core Ultra 9 290HX Plus, NVIDIA GeForce RTX 5090 Laptop
  (1994 - 2213, n=3)
2106 Points 0%
Asus Strix Scar 18 G835LX
GeForce RTX 5090 Laptop, Ultra 9 275HX, WD PC SN8000S 2TB
2025 Points -4%
Razer Blade 18 2024 RZ09-0509
GeForce RTX 4090 Laptop GPU, i9-14900HX
1902 Points -10%
Alienware m18 R2
GeForce RTX 4090 Laptop GPU, i9-14900HX, SK Hynix PC811 HFS002TEM9X152N
1881 Points -11%
Durchschnitt der Klasse Gaming
  (1386 - 2254, n=94, der letzten 2 Jahre)
1856 Points -12%
MSI Titan 18 HX A14VIG
GeForce RTX 4090 Laptop GPU, i9-14900HX, 2x Samsung PM9A1a MZVL22T0HDLB (RAID 0)
1738 Points -18%
CrossMark / Creativity
Asus ROG Strix Scar 18 G835LXG
GeForce RTX 5090 Laptop, Ultra 9 290HX Plus, 2x Samsung PM9E1 MZVLC4T0HBL1 (RAID 0)
2786 Points
Durchschnittliche Intel Core Ultra 9 290HX Plus, NVIDIA GeForce RTX 5090 Laptop
  (2548 - 2786, n=3)
2665 Points -4%
Asus Strix Scar 18 G835LX
GeForce RTX 5090 Laptop, Ultra 9 275HX, WD PC SN8000S 2TB
2606 Points -6%
Alienware m18 R2
GeForce RTX 4090 Laptop GPU, i9-14900HX, SK Hynix PC811 HFS002TEM9X152N
2393 Points -14%
Razer Blade 18 2024 RZ09-0509
GeForce RTX 4090 Laptop GPU, i9-14900HX
2316 Points -17%
Durchschnitt der Klasse Gaming
  (1343 - 2786, n=94, der letzten 2 Jahre)
2241 Points -20%
MSI Titan 18 HX A14VIG
GeForce RTX 4090 Laptop GPU, i9-14900HX, 2x Samsung PM9A1a MZVL22T0HDLB (RAID 0)
2195 Points -21%
CrossMark / Responsiveness
Durchschnittliche Intel Core Ultra 9 290HX Plus, NVIDIA GeForce RTX 5090 Laptop
  (1766 - 2249, n=3)
1979 Points +3%
Asus ROG Strix Scar 18 G835LXG
GeForce RTX 5090 Laptop, Ultra 9 290HX Plus, 2x Samsung PM9E1 MZVLC4T0HBL1 (RAID 0)
1922 Points
Asus Strix Scar 18 G835LX
GeForce RTX 5090 Laptop, Ultra 9 275HX, WD PC SN8000S 2TB
1813 Points -6%
Alienware m18 R2
GeForce RTX 4090 Laptop GPU, i9-14900HX, SK Hynix PC811 HFS002TEM9X152N
1806 Points -6%
Razer Blade 18 2024 RZ09-0509
GeForce RTX 4090 Laptop GPU, i9-14900HX
1765 Points -8%
Durchschnitt der Klasse Gaming
  (1226 - 2334, n=94, der letzten 2 Jahre)
1705 Points -11%
MSI Titan 18 HX A14VIG
GeForce RTX 4090 Laptop GPU, i9-14900HX, 2x Samsung PM9A1a MZVL22T0HDLB (RAID 0)
1478 Points -23%
WebXPRT 3 / Overall
Asus ROG Strix Scar 18 G835LXG
GeForce RTX 5090 Laptop, Ultra 9 290HX Plus, 2x Samsung PM9E1 MZVLC4T0HBL1 (RAID 0)
369 Points
Durchschnittliche Intel Core Ultra 9 290HX Plus, NVIDIA GeForce RTX 5090 Laptop
  (354 - 369, n=3)
361 Points -2%
Asus Strix Scar 18 G835LX
GeForce RTX 5090 Laptop, Ultra 9 275HX, WD PC SN8000S 2TB
346 Points -6%
Razer Blade 18 2024 RZ09-0509
GeForce RTX 4090 Laptop GPU, i9-14900HX
339 Points -8%
MSI Titan 18 HX A14VIG
GeForce RTX 4090 Laptop GPU, i9-14900HX, 2x Samsung PM9A1a MZVL22T0HDLB (RAID 0)
327 Points -11%
Alienware m18 R2
GeForce RTX 4090 Laptop GPU, i9-14900HX, SK Hynix PC811 HFS002TEM9X152N
326 Points -12%
Durchschnitt der Klasse Gaming
  (220 - 532, n=98, der letzten 2 Jahre)
318 Points -14%
Schenker Key 17 Pro (M24)
GeForce RTX 4090 Laptop GPU, i9-14900HX, Samsung 990 Pro 1 TB
308 Points -17%
WebXPRT 4 / Overall
Asus ROG Strix Scar 18 G835LXG
GeForce RTX 5090 Laptop, Ultra 9 290HX Plus, 2x Samsung PM9E1 MZVLC4T0HBL1 (RAID 0)
336 Points
Asus Strix Scar 18 G835LX
GeForce RTX 5090 Laptop, Ultra 9 275HX, WD PC SN8000S 2TB
335 Points 0%
Durchschnittliche Intel Core Ultra 9 290HX Plus, NVIDIA GeForce RTX 5090 Laptop
  (310 - 336, n=3)
327 Points -3%
Alienware m18 R2
GeForce RTX 4090 Laptop GPU, i9-14900HX, SK Hynix PC811 HFS002TEM9X152N
309 Points -8%
MSI Titan 18 HX A14VIG
GeForce RTX 4090 Laptop GPU, i9-14900HX, 2x Samsung PM9A1a MZVL22T0HDLB (RAID 0)
287 Points -15%
Durchschnitt der Klasse Gaming
  (165 - 354, n=98, der letzten 2 Jahre)
285 Points -15%
Schenker Key 17 Pro (M24)
GeForce RTX 4090 Laptop GPU, i9-14900HX, Samsung 990 Pro 1 TB
275 Points -18%
Mozilla Kraken 1.1 / Total
Schenker Key 17 Pro (M24)
GeForce RTX 4090 Laptop GPU, i9-14900HX, Samsung 990 Pro 1 TB
481 ms * -22%
Durchschnitt der Klasse Gaming
  (391 - 590, n=100, der letzten 2 Jahre)
459 ms * -17%
MSI Titan 18 HX A14VIG
GeForce RTX 4090 Laptop GPU, i9-14900HX, 2x Samsung PM9A1a MZVL22T0HDLB (RAID 0)
452 ms * -15%
Razer Blade 18 2024 RZ09-0509
GeForce RTX 4090 Laptop GPU, i9-14900HX
449 ms * -14%
Acer Predator Helios 18 PH18-72-98MW
GeForce RTX 4090 Laptop GPU, i9-14900HX, 2x SK Hynix HFS001TEJ9X115N (RAID 0)
441 ms * -12%
Alienware m18 R2
GeForce RTX 4090 Laptop GPU, i9-14900HX, SK Hynix PC811 HFS002TEM9X152N
430 ms * -9%
Asus Strix Scar 18 G835LX
GeForce RTX 5090 Laptop, Ultra 9 275HX, WD PC SN8000S 2TB
409 ms * -4%
Durchschnittliche Intel Core Ultra 9 290HX Plus, NVIDIA GeForce RTX 5090 Laptop
  (393 - 399, n=3)
395 ms * -1%
Asus ROG Strix Scar 18 G835LXG
GeForce RTX 5090 Laptop, Ultra 9 290HX Plus, 2x Samsung PM9E1 MZVLC4T0HBL1 (RAID 0)
393 ms *

* ... kleinere Werte sind besser

PCMark 10 Score
12414 Punkte
Hilfe
AIDA64 / Memory Copy
Asus ROG Strix Scar 18 G835LXG
Intel Core Ultra 9 290HX Plus, GeForce RTX 5090 Laptop (v8.20.8100)
93930 MB/s
Asus ROG Strix Scar 18 G835LXG
Intel Core Ultra 9 290HX Plus, GeForce RTX 5090 Laptop (v6.92.6600)
93592 MB/s 0%
Durchschnittliche Intel Core Ultra 9 290HX Plus
  (76912 - 93930, n=6)
85886 MB/s -9%
Asus Strix Scar 18 G835LX
Intel Core Ultra 9 275HX, GeForce RTX 5090 Laptop (v6.92.6600)
84432 MB/s -10%
Alienware m18 R2
Intel Core i9-14900HX, GeForce RTX 4090 Laptop GPU (v6.92.6600)
79243 MB/s -16%
Schenker Key 17 Pro (M24)
Intel Core i9-14900HX, GeForce RTX 4090 Laptop GPU (v6.92.6600)
78820 MB/s -16%
Acer Predator Helios 18 PH18-72-98MW
Intel Core i9-14900HX, GeForce RTX 4090 Laptop GPU (v6.92.6600)
78016 MB/s -17%
Razer Blade 18 2024 RZ09-0509
Intel Core i9-14900HX, GeForce RTX 4090 Laptop GPU (v6.85.6300)
76268 MB/s -19%
Durchschnitt der Klasse Gaming
  (21750 - 129946, n=105, der letzten 2 Jahre)
72521 MB/s -23%
MSI Titan 18 HX A14VIG
Intel Core i9-14900HX, GeForce RTX 4090 Laptop GPU (v6.92.6600)
56992 MB/s -39%
AIDA64 / Memory Read
Asus ROG Strix Scar 18 G835LXG
Intel Core Ultra 9 290HX Plus, GeForce RTX 5090 Laptop (v8.20.8100)
98574 MB/s
Asus ROG Strix Scar 18 G835LXG
Intel Core Ultra 9 290HX Plus, GeForce RTX 5090 Laptop (v6.92.6600)
98471 MB/s 0%
Durchschnittliche Intel Core Ultra 9 290HX Plus
  (84638 - 98574, n=6)
92870 MB/s -6%
Asus Strix Scar 18 G835LX
Intel Core Ultra 9 275HX, GeForce RTX 5090 Laptop (v6.92.6600)
86194 MB/s -13%
Alienware m18 R2
Intel Core i9-14900HX, GeForce RTX 4090 Laptop GPU (v6.92.6600)
85791 MB/s -13%
Schenker Key 17 Pro (M24)
Intel Core i9-14900HX, GeForce RTX 4090 Laptop GPU (v6.92.6600)
85763 MB/s -13%
Acer Predator Helios 18 PH18-72-98MW
Intel Core i9-14900HX, GeForce RTX 4090 Laptop GPU (v6.92.6600)
85323 MB/s -13%
Razer Blade 18 2024 RZ09-0509
Intel Core i9-14900HX, GeForce RTX 4090 Laptop GPU (v6.85.6300)
82992 MB/s -16%
Durchschnitt der Klasse Gaming
  (22956 - 118858, n=105, der letzten 2 Jahre)
74162 MB/s -25%
MSI Titan 18 HX A14VIG
Intel Core i9-14900HX, GeForce RTX 4090 Laptop GPU (v6.92.6600)
54443 MB/s -45%
AIDA64 / Memory Write
Asus ROG Strix Scar 18 G835LXG
Intel Core Ultra 9 290HX Plus, GeForce RTX 5090 Laptop (v6.92.6600)
100988 MB/s
Asus ROG Strix Scar 18 G835LXG
Intel Core Ultra 9 290HX Plus, GeForce RTX 5090 Laptop (v8.20.8100)
89856 MB/s -11%
Durchschnittliche Intel Core Ultra 9 290HX Plus
  (76094 - 100988, n=6)
85213 MB/s -16%
Asus Strix Scar 18 G835LX
Intel Core Ultra 9 275HX, GeForce RTX 5090 Laptop (v6.92.6600)
82198 MB/s -19%
Schenker Key 17 Pro (M24)
Intel Core i9-14900HX, GeForce RTX 4090 Laptop GPU (v6.92.6600)
77439 MB/s -23%
Alienware m18 R2
Intel Core i9-14900HX, GeForce RTX 4090 Laptop GPU (v6.92.6600)
77089 MB/s -24%
Durchschnitt der Klasse Gaming
  (22297 - 135096, n=105, der letzten 2 Jahre)
76303 MB/s -24%
Acer Predator Helios 18 PH18-72-98MW
Intel Core i9-14900HX, GeForce RTX 4090 Laptop GPU (v6.92.6600)
70089 MB/s -31%
Razer Blade 18 2024 RZ09-0509
Intel Core i9-14900HX, GeForce RTX 4090 Laptop GPU (v6.85.6300)
67801 MB/s -33%
MSI Titan 18 HX A14VIG
Intel Core i9-14900HX, GeForce RTX 4090 Laptop GPU (v6.92.6600)
51387 MB/s -49%
AIDA64 / Memory Latency
Asus Strix Scar 18 G835LX
Intel Core Ultra 9 275HX, GeForce RTX 5090 Laptop (v6.92.6600)
108.9 ns * -4%
Durchschnitt der Klasse Gaming
  (75.3 - 259, n=105, der letzten 2 Jahre)
107 ns * -2%
Asus ROG Strix Scar 18 G835LXG
Intel Core Ultra 9 290HX Plus, GeForce RTX 5090 Laptop (v6.92.6600)
105.2 ns *
Asus ROG Strix Scar 18 G835LXG
Intel Core Ultra 9 290HX Plus, GeForce RTX 5090 Laptop (v8.20.8100)
104.8 ns * -0%
MSI Titan 18 HX A14VIG
Intel Core i9-14900HX, GeForce RTX 4090 Laptop GPU (v6.92.6600)
105 ns * -0%
Durchschnittliche Intel Core Ultra 9 290HX Plus
  (100.7 - 108.4, n=6)
105 ns * -0%
Razer Blade 18 2024 RZ09-0509
Intel Core i9-14900HX, GeForce RTX 4090 Laptop GPU (v6.85.6300)
87.6 ns * +17%
Alienware m18 R2
Intel Core i9-14900HX, GeForce RTX 4090 Laptop GPU (v6.92.6600)
86.4 ns * +18%
Schenker Key 17 Pro (M24)
Intel Core i9-14900HX, GeForce RTX 4090 Laptop GPU (v6.92.6600)
84.5 ns * +20%
Acer Predator Helios 18 PH18-72-98MW
Intel Core i9-14900HX, GeForce RTX 4090 Laptop GPU (v6.92.6600)
83 ns * +21%

* ... kleinere Werte sind besser

DPC-Latenzen

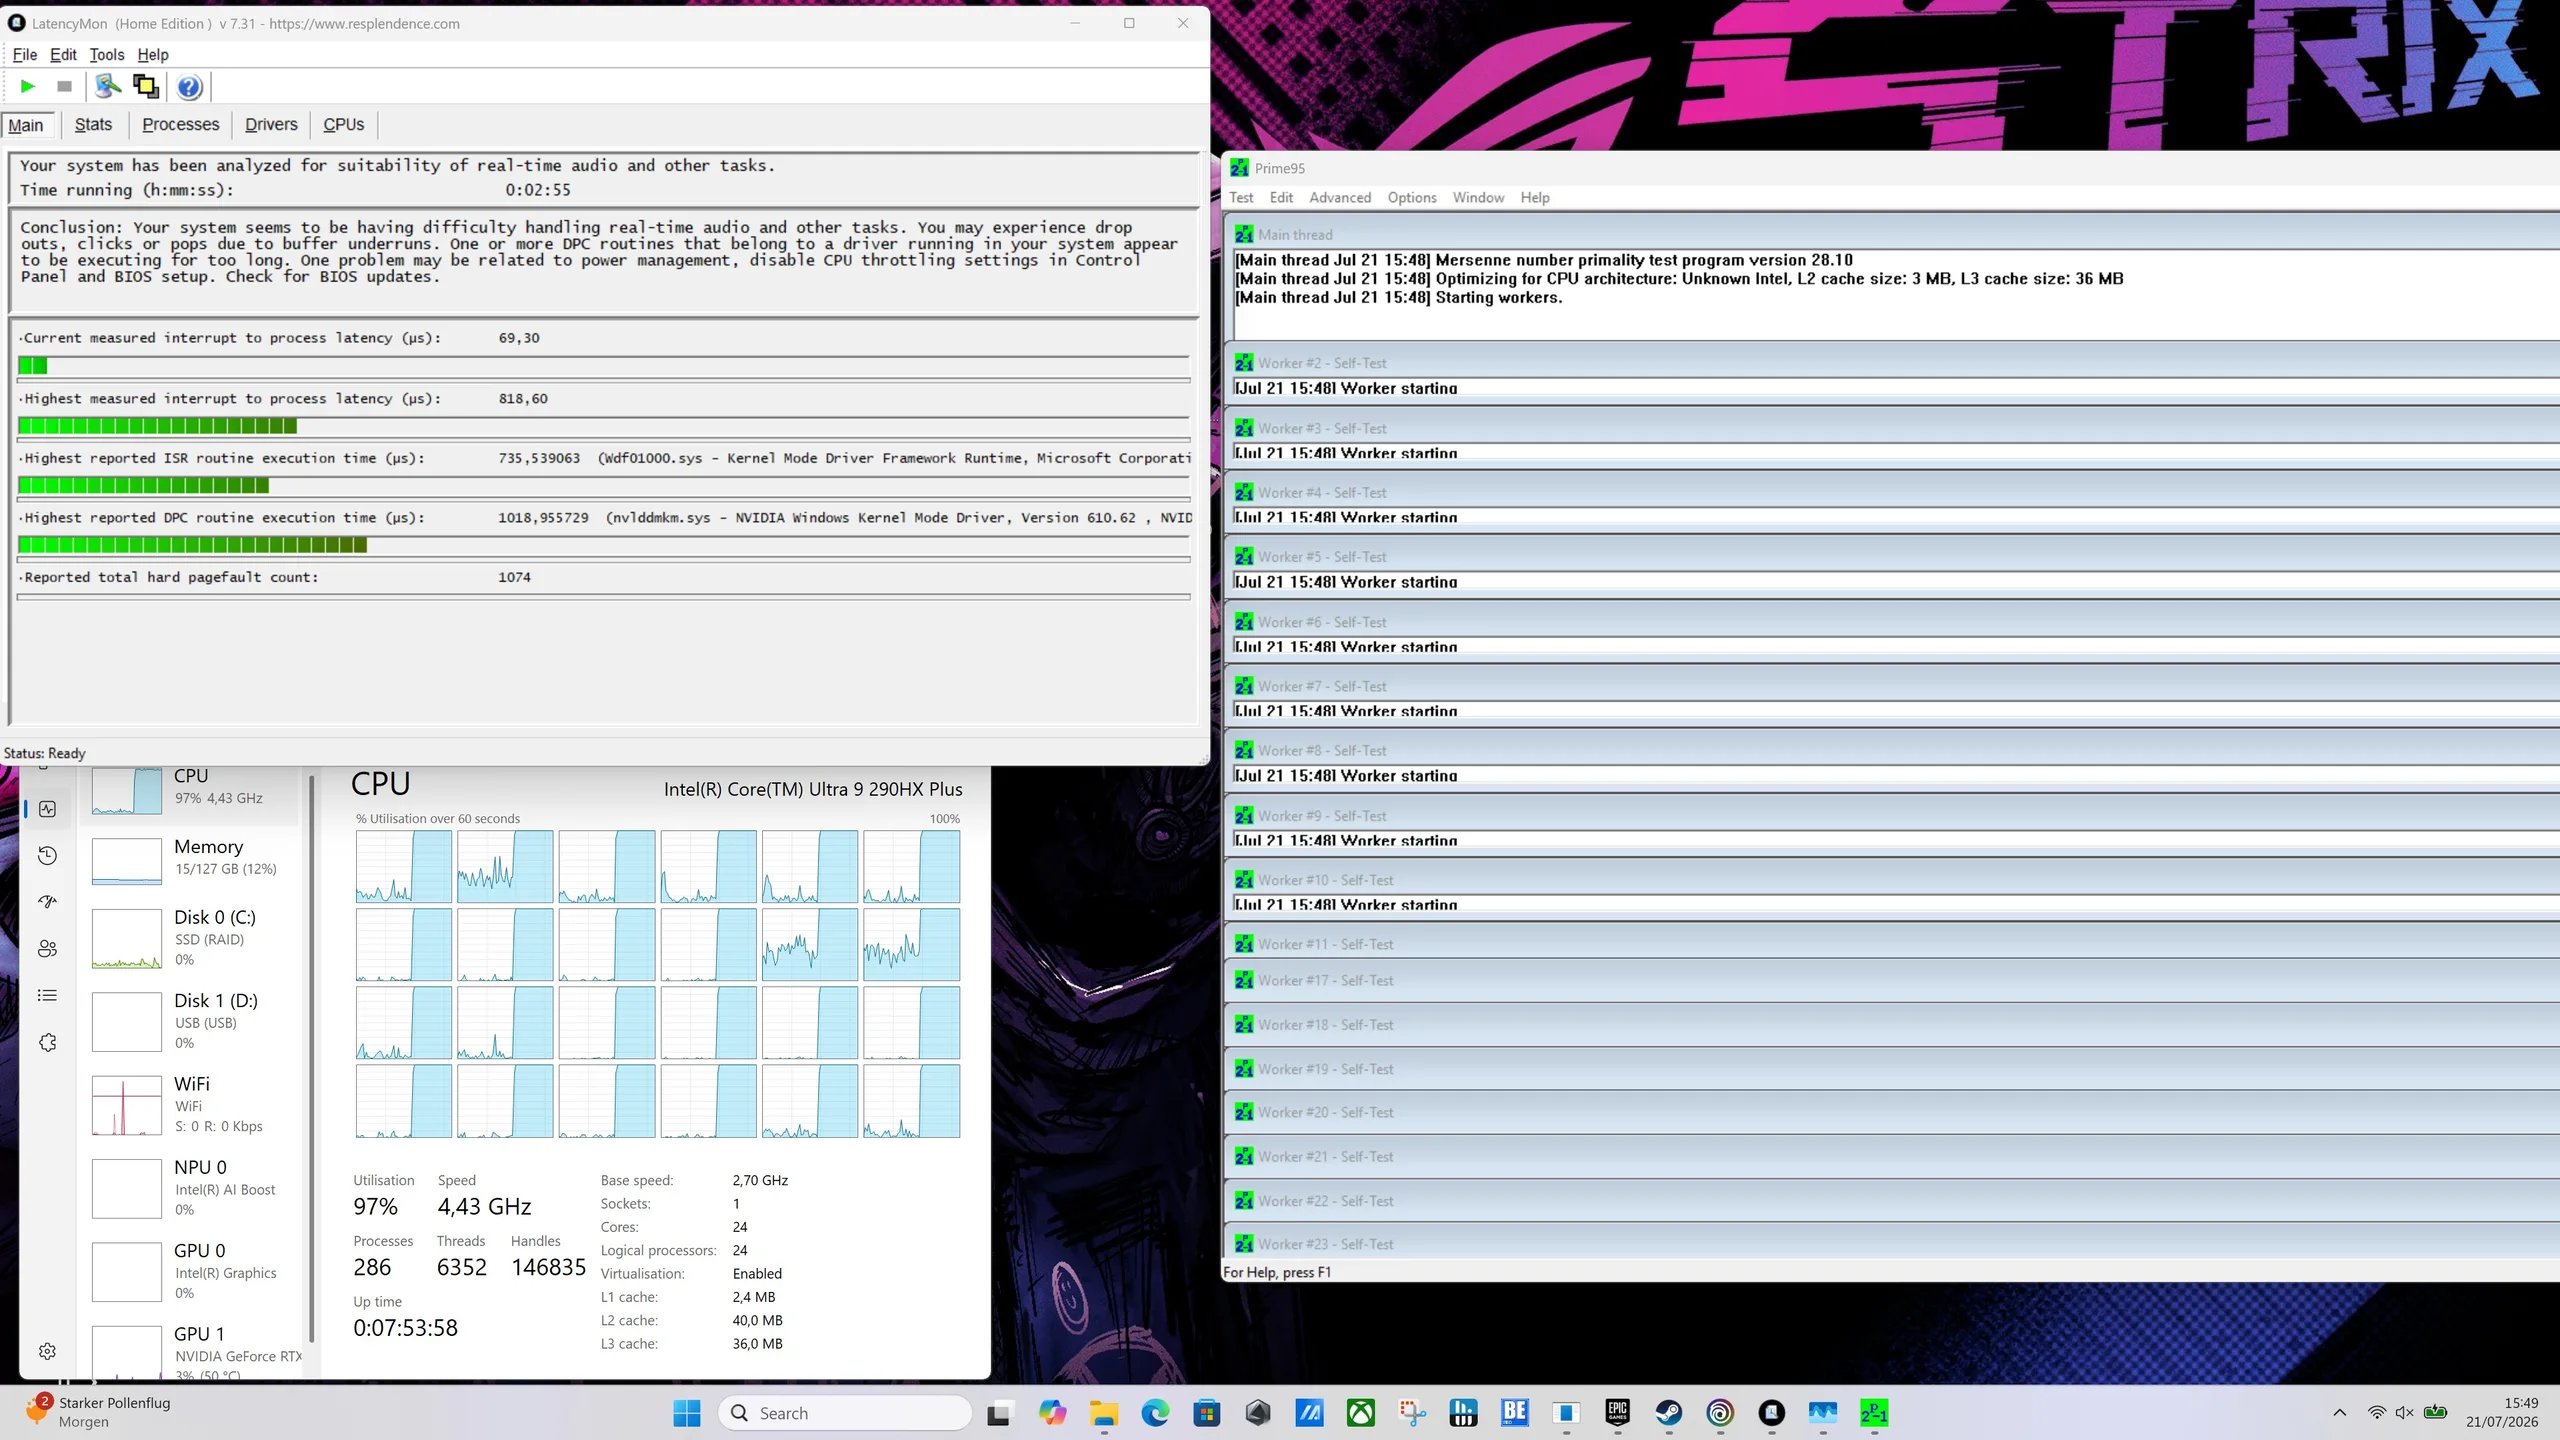
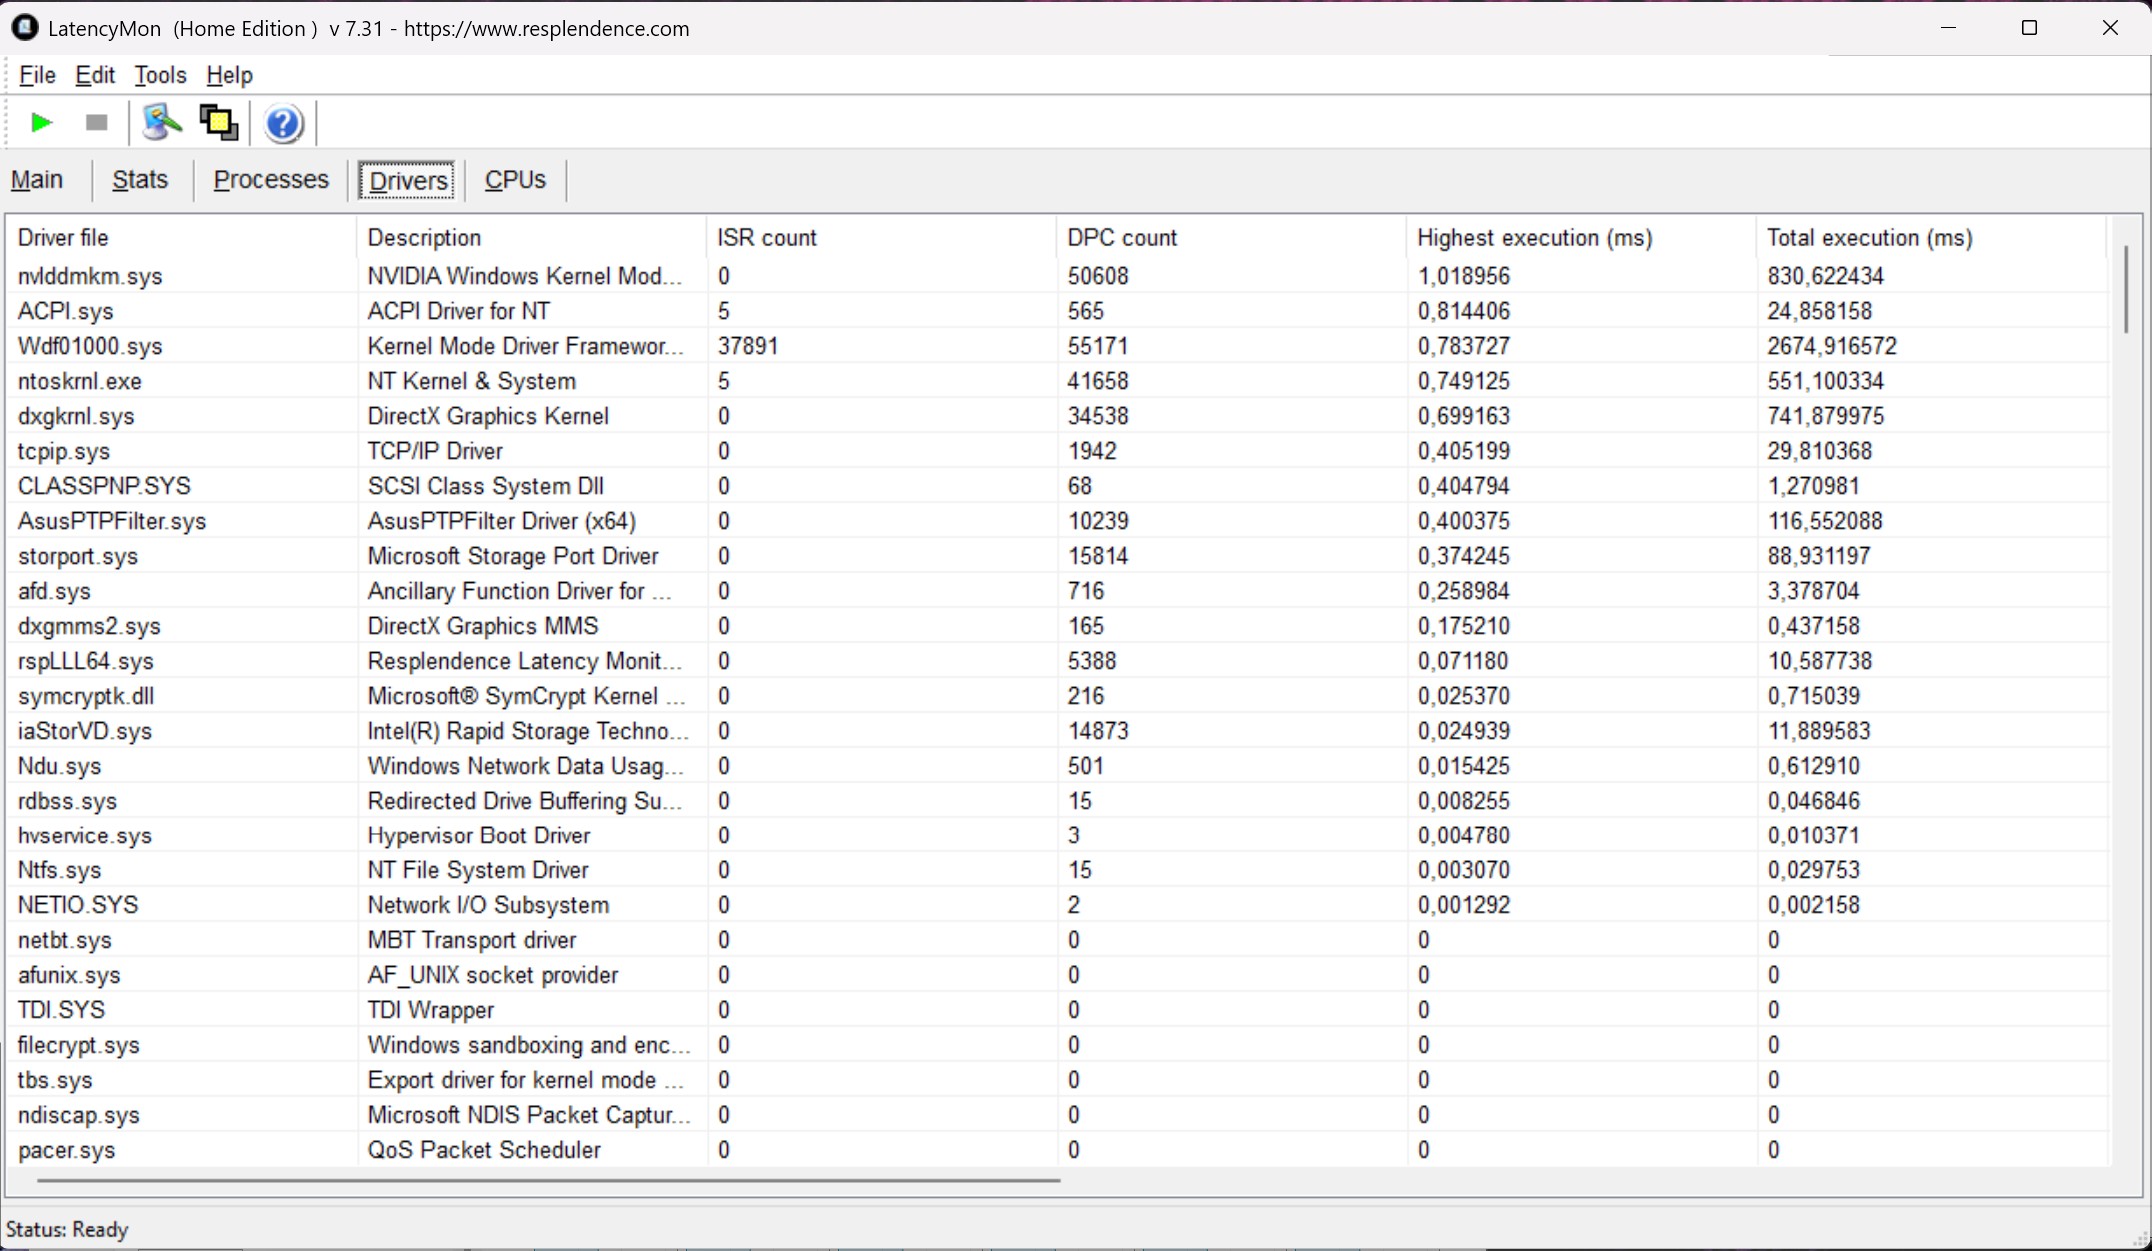
Im standardisierten LatencyMon-Test (Web-Browsing, 4K-YouTube-Wiedergabe und CPU-Last) zeigt das Asus ROG Strix SCAR 18 G835LXG insgesamt eine gute Leistung. Lediglich der Nvidia-Grafiktreiber (nvlddmkm.sys) sorgt während der Videowiedergabe für erhöhte Latenzen.
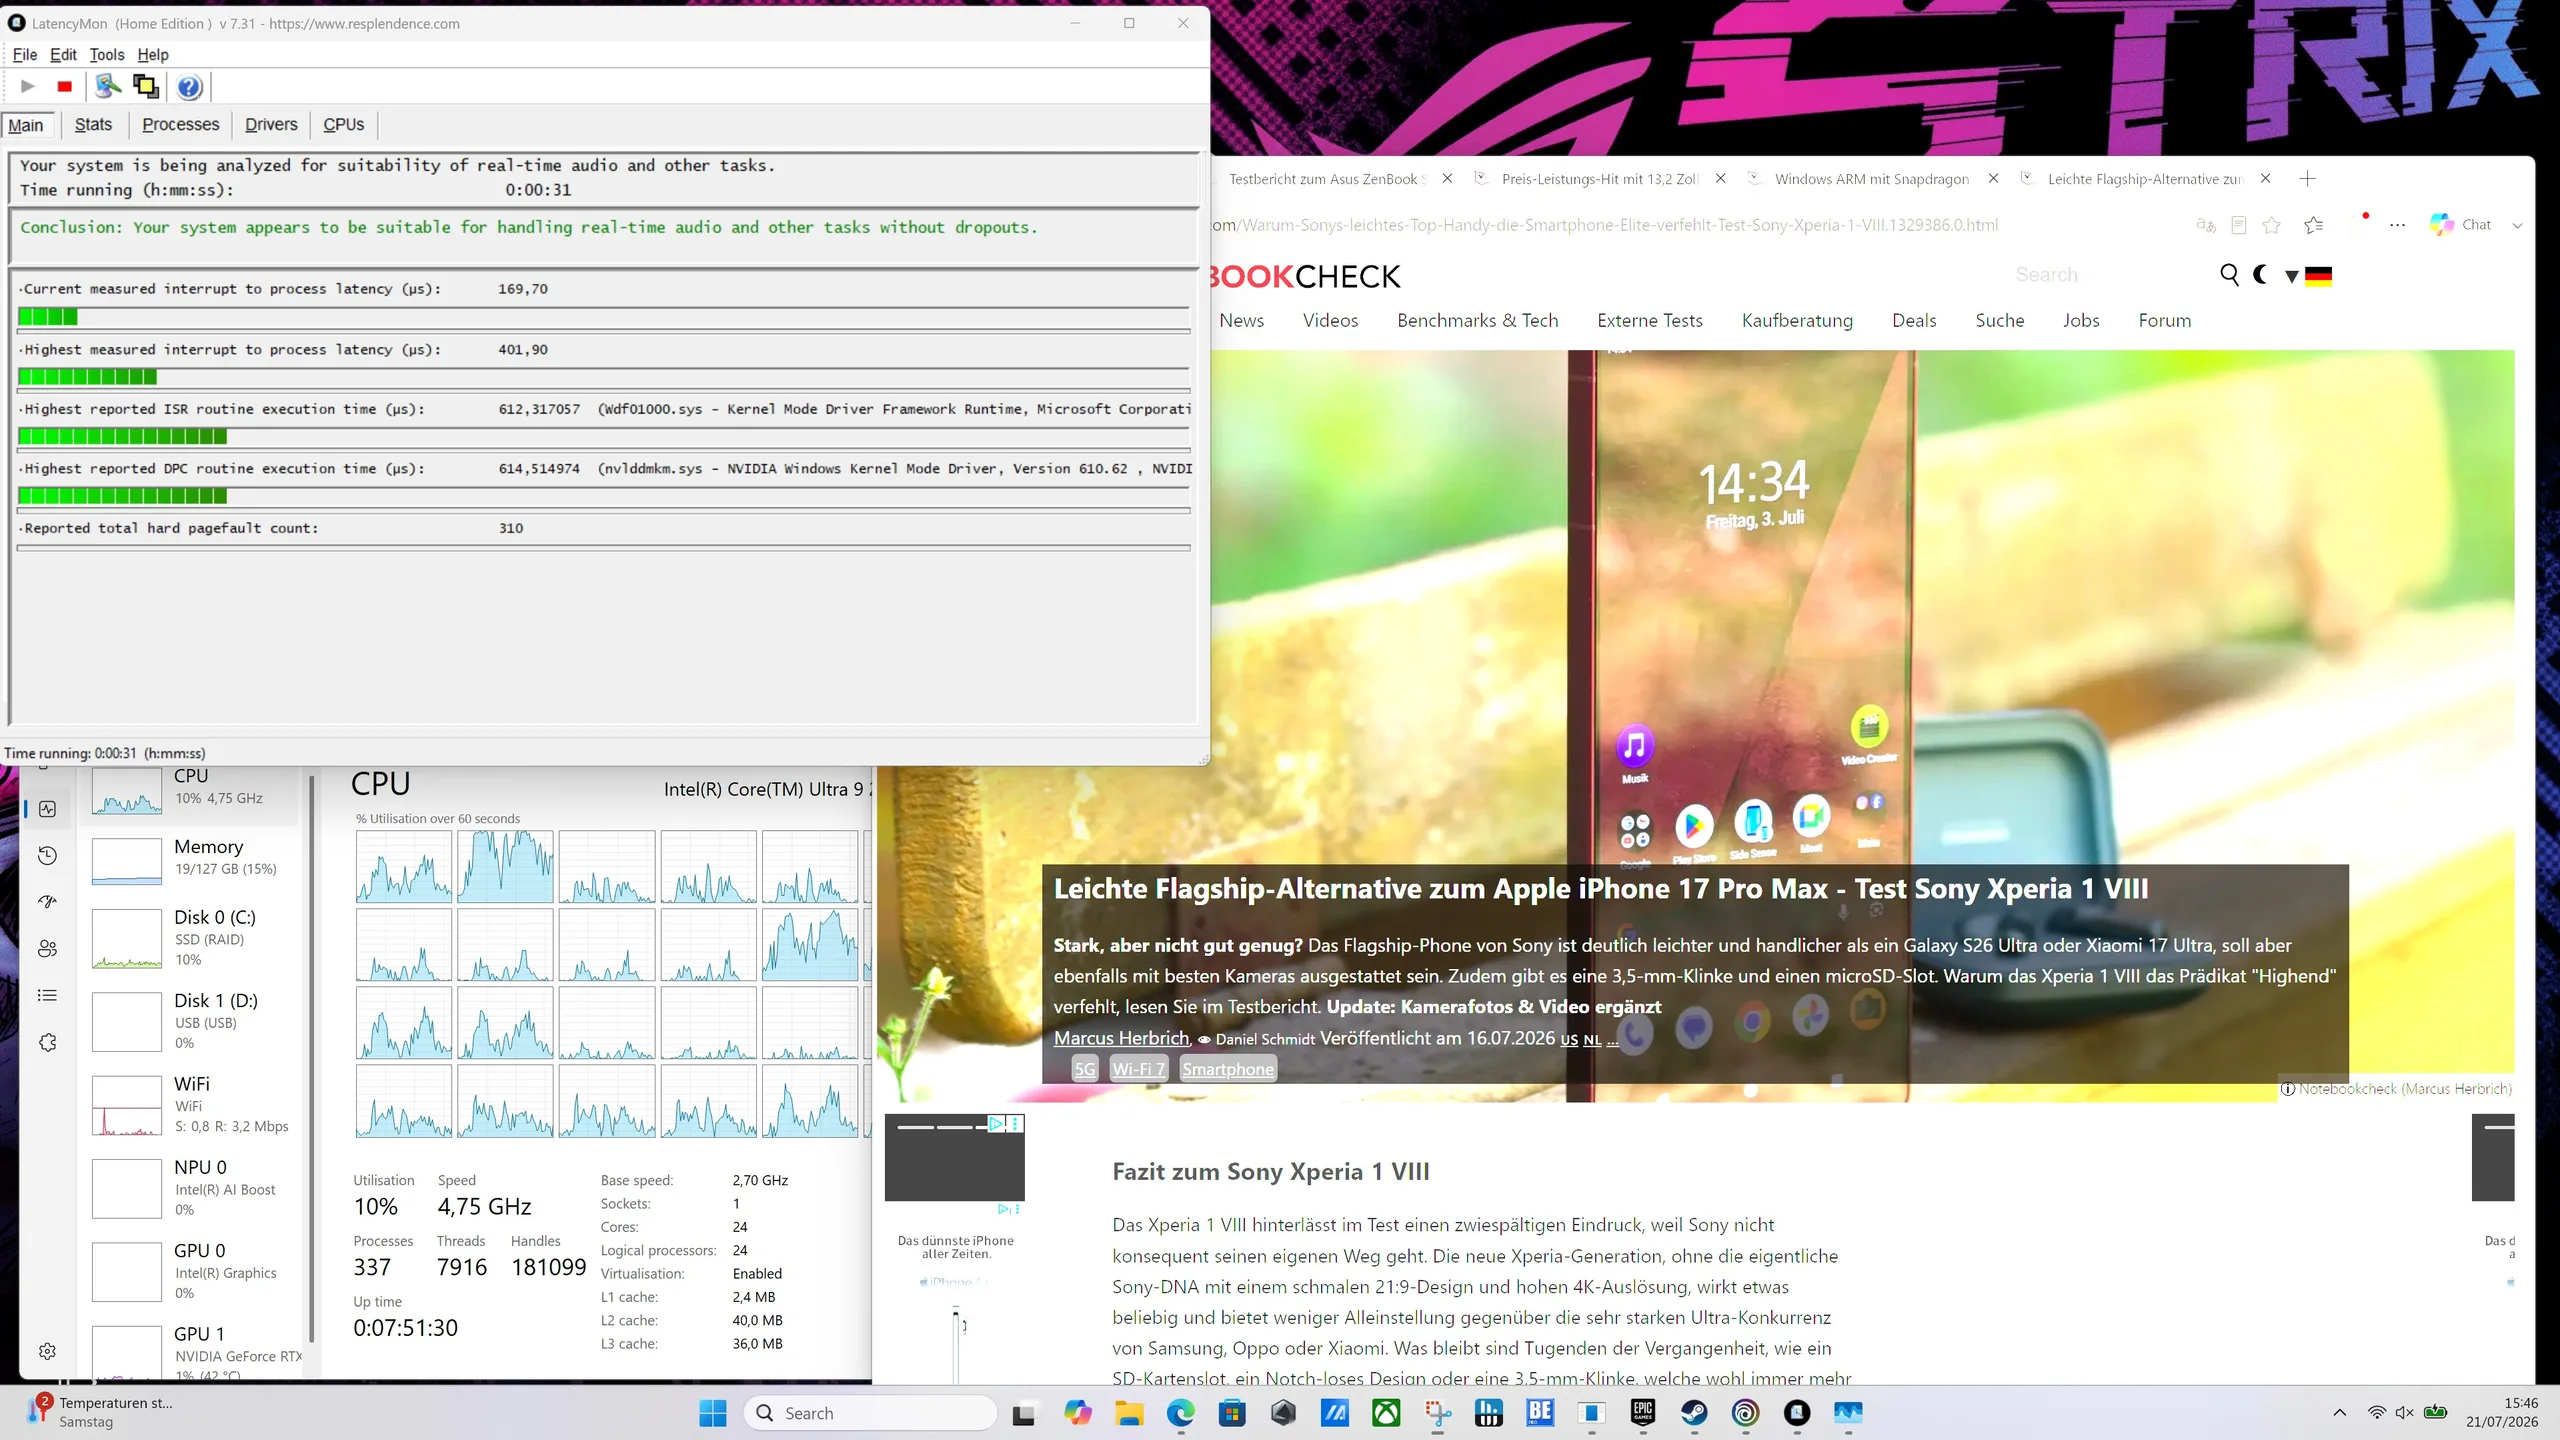
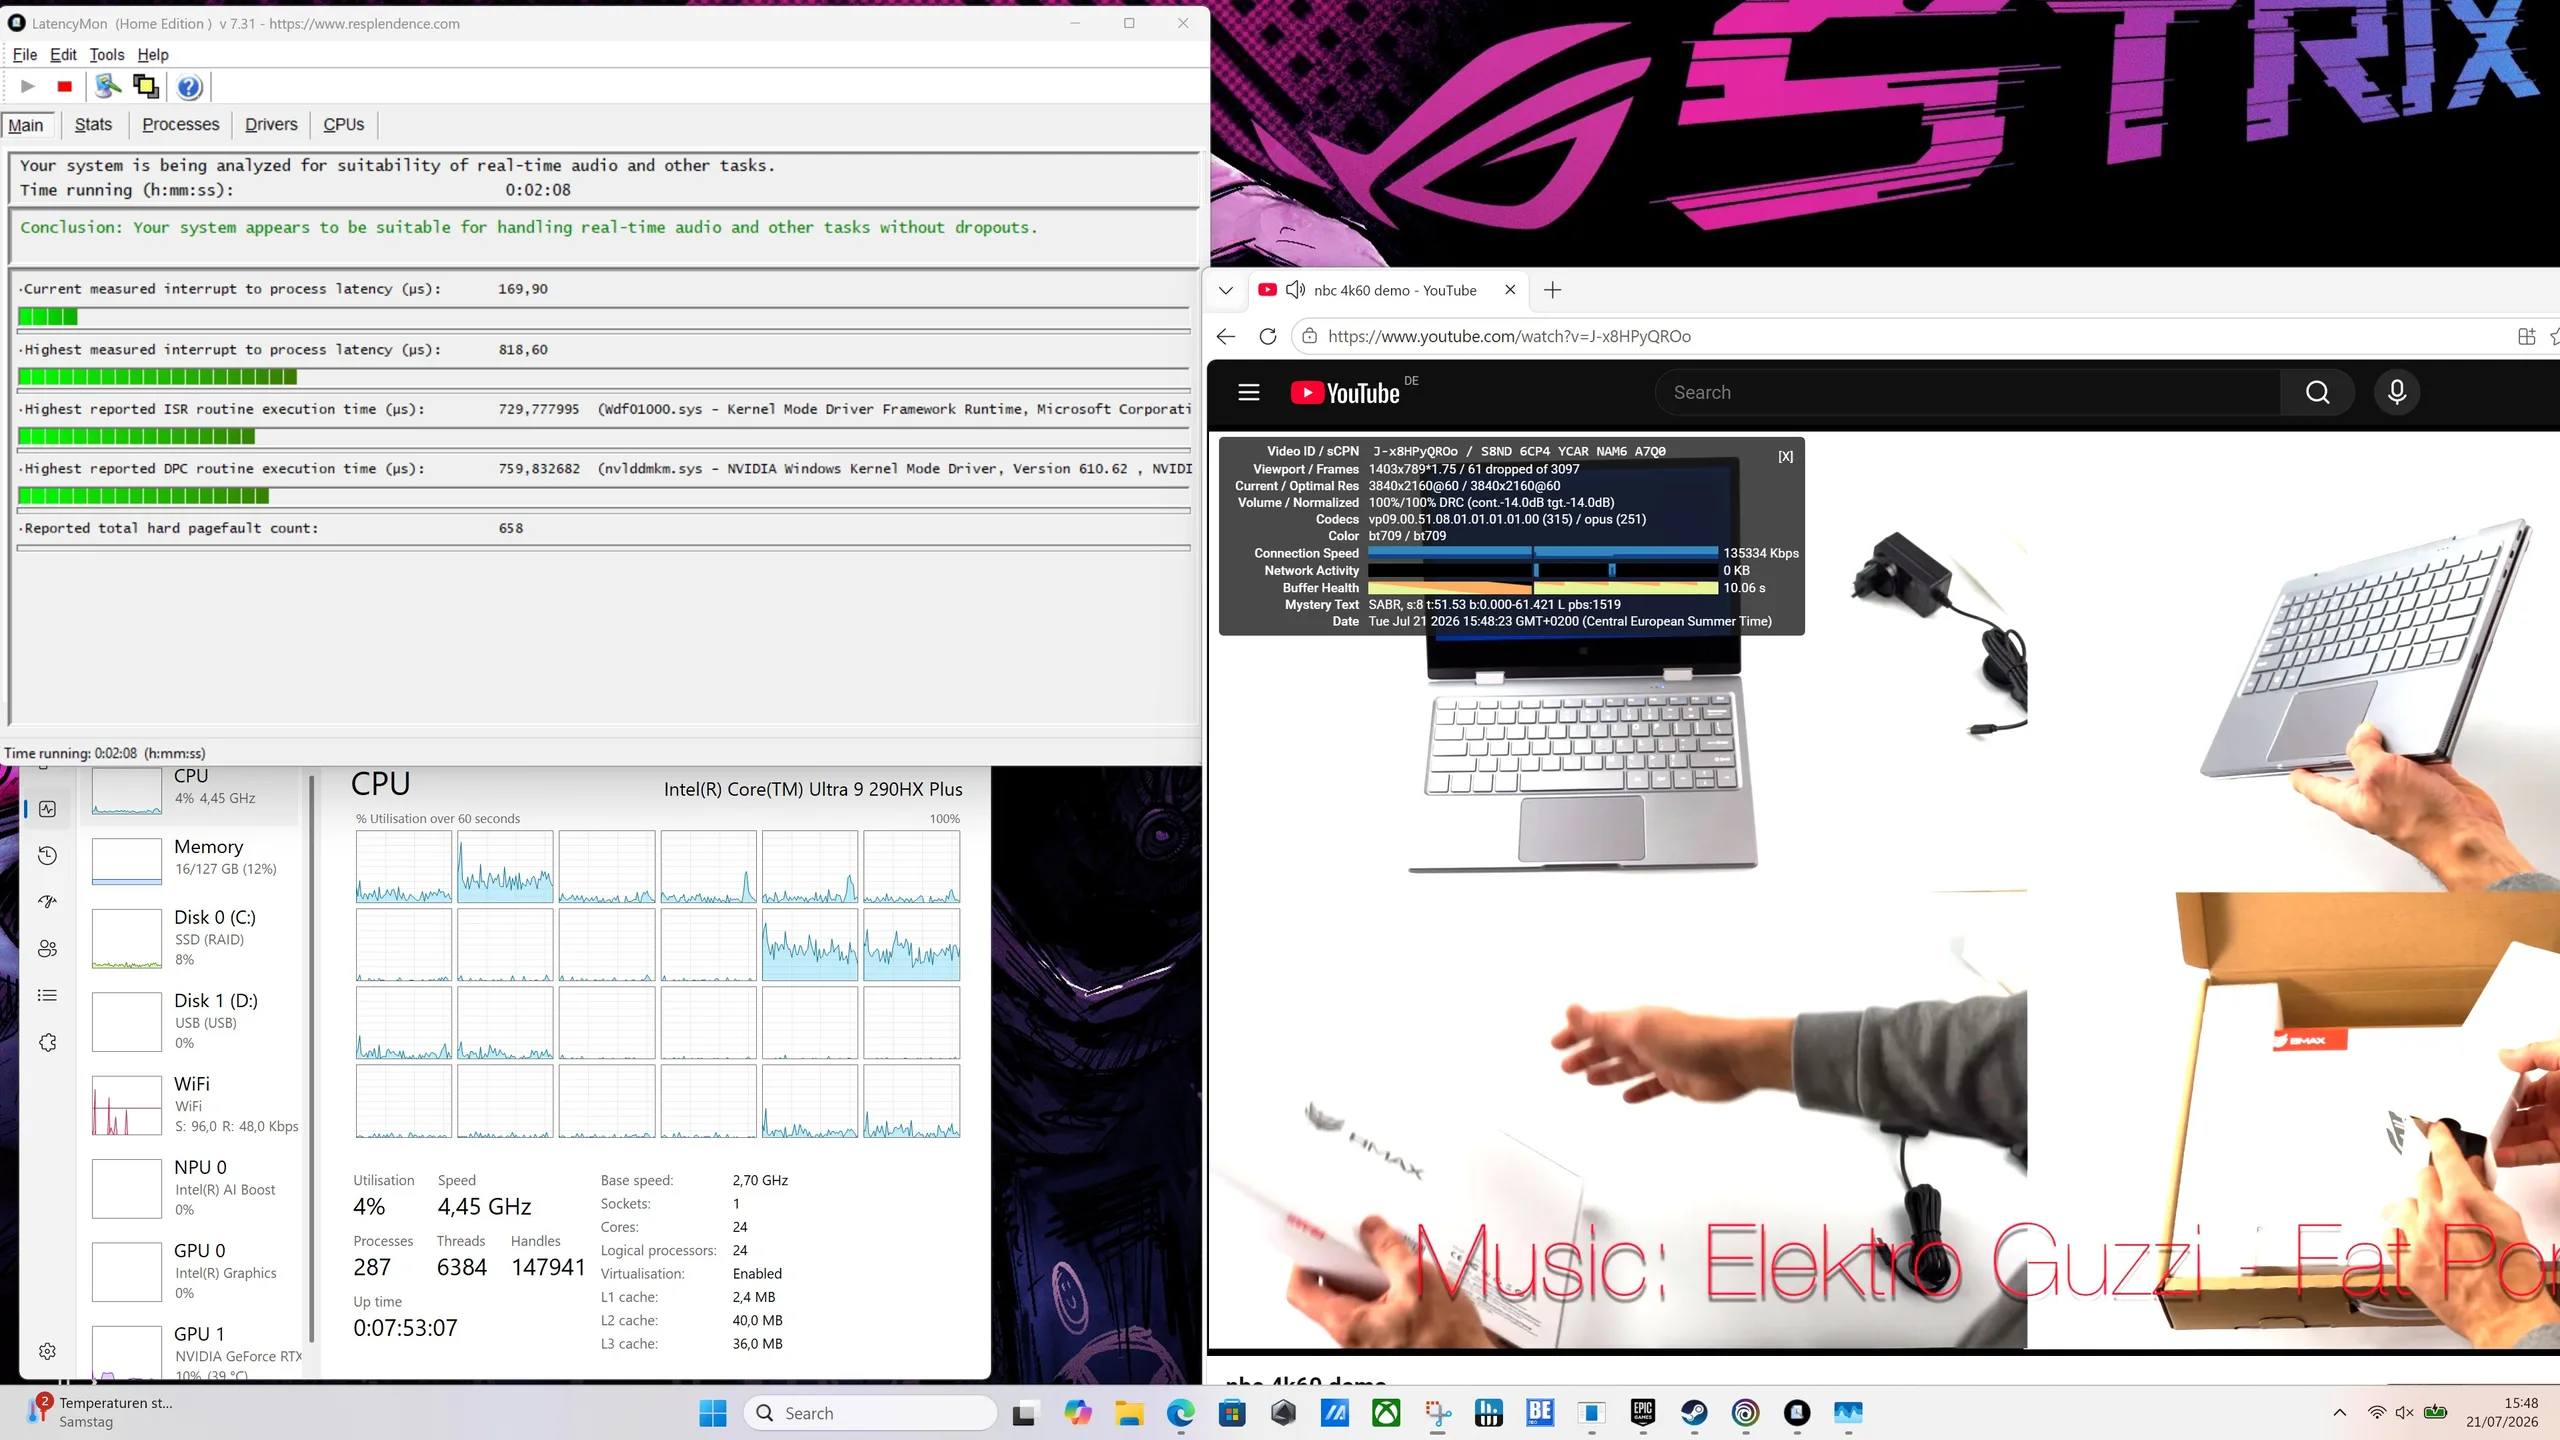
Maximale Latenz beim Öffnen mehrerer Browser Tabs
Maximale Latenz beim Abspielen von 4K-Videomaterial
Maximale Latenz nach zehn Sekunden Prime95
Treiber nach längster Ausführungsdauer gereiht
DPC Latencies / LatencyMon - interrupt to process latency (max), Web, Youtube, Prime95
Acer Predator Helios 18 PH18-72-98MW
GeForce RTX 4090 Laptop GPU, i9-14900HX, 2x SK Hynix HFS001TEJ9X115N (RAID 0)
3388 μs * -233%
Alienware m18 R2
GeForce RTX 4090 Laptop GPU, i9-14900HX, SK Hynix PC811 HFS002TEM9X152N
2815.1 μs * -177%
Durchschnitt der Klasse Gaming
  (410 - 11799, n=93, der letzten 2 Jahre)
2500 μs * -146%
MSI Titan 18 HX A14VIG
GeForce RTX 4090 Laptop GPU, i9-14900HX, 2x Samsung PM9A1a MZVL22T0HDLB (RAID 0)
2384.5 μs * -134%
Schenker Key 17 Pro (M24)
GeForce RTX 4090 Laptop GPU, i9-14900HX, Samsung 990 Pro 1 TB
1955.8 μs * -92%
Razer Blade 18 2024 RZ09-0509
GeForce RTX 4090 Laptop GPU, i9-14900HX
1479.7 μs * -45%
Asus ROG Strix Scar 18 G835LXG
GeForce RTX 5090 Laptop, Ultra 9 290HX Plus, 2x Samsung PM9E1 MZVLC4T0HBL1 (RAID 0)
1018 μs *
Asus Strix Scar 18 G835LX
GeForce RTX 5090 Laptop, Ultra 9 275HX, WD PC SN8000S 2TB
810 μs * +20%

* ... kleinere Werte sind besser

Massenspeicher

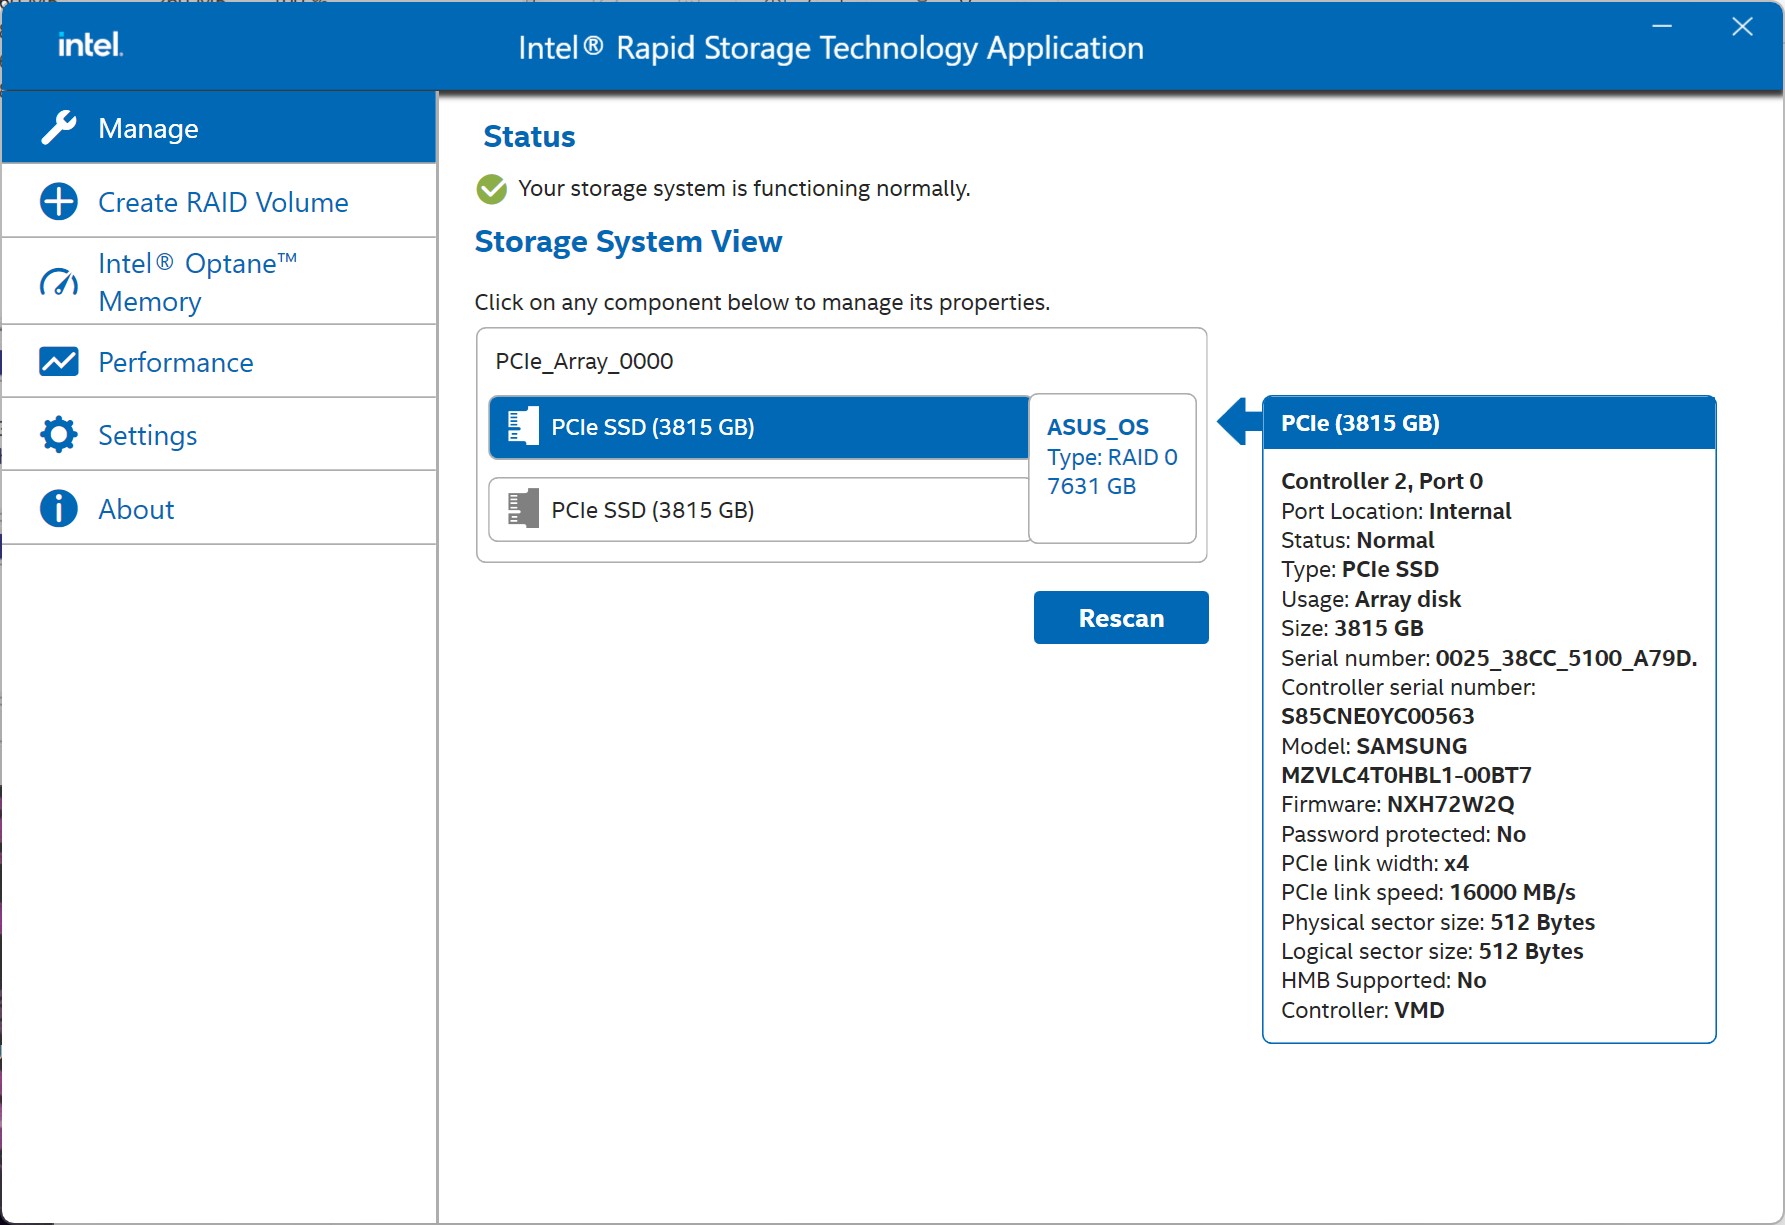
Unsere Testkonfiguration ist mit zwei 4-TB-PCIe-5.0-SSDs (Samsung PM9E1) ausgestattet und bietet damit insgesamt 8 TB schnellen Massenspeicher. Die Laufwerke überzeugen mit sehr hohen Transferraten und kurzen Zugriffszeiten, wodurch Programme, Spiele und große Dateien besonders schnell geladen werden. Unter anhaltender Last lässt die Performance nach einiger Zeit jedoch nach, sodass bei längeren Kopier- oder Installationsvorgängen mit spürbaren Leistungseinbußen zu rechnen ist.
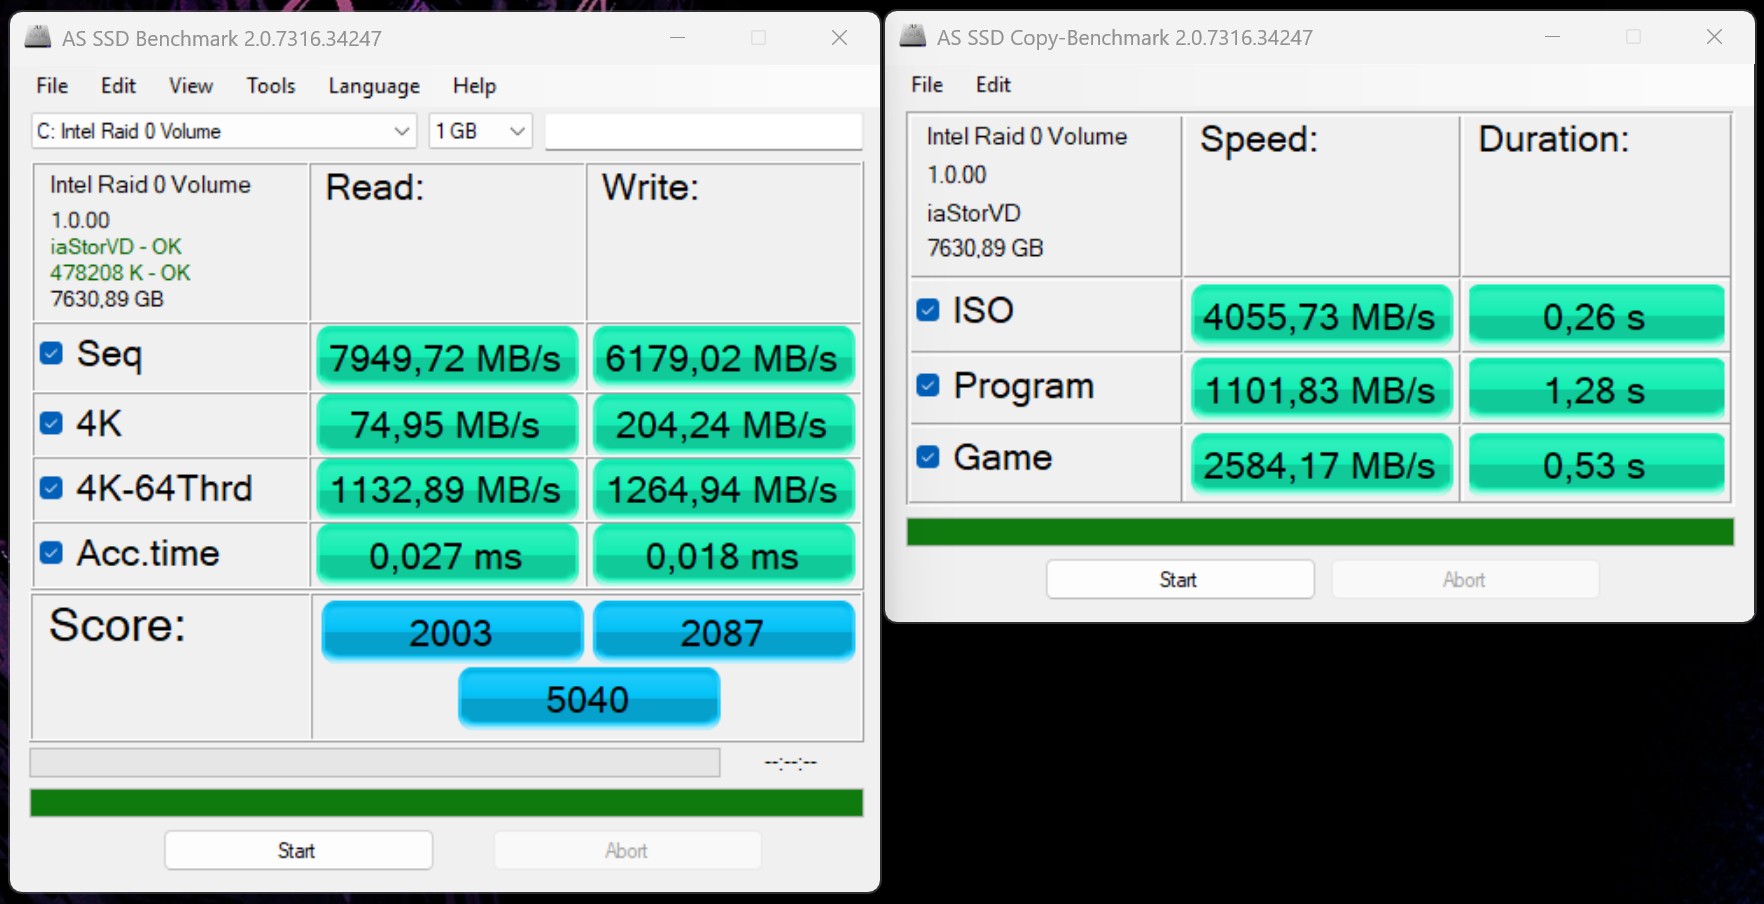
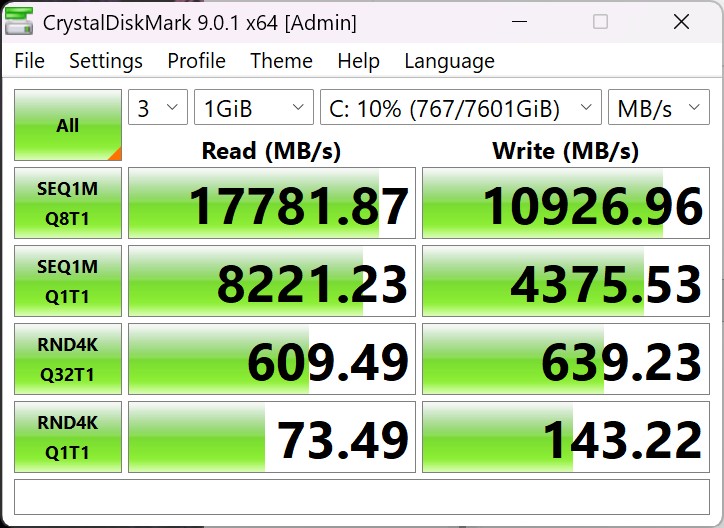
AS SSD
AS SSD
CDM9
CDM9
SSD Konfiguration
SSD Konfiguration
2x Samsung PM9E1 MZVLC4T0HBL1 (RAID 0)
Sequential Read: 7949MB/s
Sequential Write: 6179MB/s
4K Read: 75MB/s
4K Write: 204MB/s
4K-64 Read: 1133MB/s
4K-64 Write: 1265MB/s
Access Time Read: 0.027ms
Access Time Write: 0.018ms
Copy ISO: 4055.73MB/s
Copy Program: 1101.83MB/s
Copy Game: 2584.17MB/s
Score Read: 2003Points
Score Write: 2087Points
Score Total: 5040Points
Drive Performance Rating - Percent
Alienware m18 R2
SK Hynix PC811 HFS002TEM9X152N
78.1 pt
Schenker Key 17 Pro (M24)
Samsung 990 Pro 1 TB
78 pt
Acer Predator Helios 18 PH18-72-98MW
2x SK Hynix HFS001TEJ9X115N (RAID 0)
64.2 pt
Asus ROG Strix Scar 18 G835LXG
2x Samsung PM9E1 MZVLC4T0HBL1 (RAID 0)
63.2 pt
Durchschnittliche 2x Samsung PM9E1 MZVLC4T0HBL1 (RAID 0)
 
63.2 pt
MSI Titan 18 HX A14VIG
2x Samsung PM9A1a MZVL22T0HDLB (RAID 0)
56.8 pt
Durchschnitt der Klasse Gaming
 
54.9 pt
Asus Strix Scar 18 G835LX
WD PC SN8000S 2TB
48.3 pt
Razer Blade 18 2024 RZ09-0509
 
46.1 pt
DiskSpd
seq read
Asus ROG Strix Scar 18 G835LXG
2x Samsung PM9E1 MZVLC4T0HBL1 (RAID 0)
7917 (7533.6min - 7917.48max) MB/s
Durchschnittliche 2x Samsung PM9E1 MZVLC4T0HBL1 (RAID 0)
  (n=1)
7917 MB/s 0%
Acer Predator Helios 18 PH18-72-98MW
2x SK Hynix HFS001TEJ9X115N (RAID 0)
7045 (6975.86min - 7044.54max) MB/s -11%
Alienware m18 R2
SK Hynix PC811 HFS002TEM9X152N
5588 (5540.05min - 5587.65max) MB/s -29%
MSI Titan 18 HX A14VIG
2x Samsung PM9A1a MZVL22T0HDLB (RAID 0)
5424 (5395.57min - 5423.86max) MB/s -31%
Asus Strix Scar 18 G835LX
WD PC SN8000S 2TB
3799 (23.02min - 3799.36max) MB/s -52%
Razer Blade 18 2024 RZ09-0509
 
3560 (3002.28min - 3559.93max) MB/s -55%
Durchschnitt der Klasse Gaming
  (281 - 9494, n=99, der letzten 2 Jahre)
3556 MB/s -55%
Schenker Key 17 Pro (M24)
Samsung 990 Pro 1 TB
3142 (3005.43min - 3141.53max) MB/s -60%
seq write
Acer Predator Helios 18 PH18-72-98MW
2x SK Hynix HFS001TEJ9X115N (RAID 0)
8992 (8801.75min - 8992.01max) MB/s +53%
MSI Titan 18 HX A14VIG
2x Samsung PM9A1a MZVL22T0HDLB (RAID 0)
7291 (7191.64min - 7291.38max) MB/s +24%
Asus ROG Strix Scar 18 G835LXG
2x Samsung PM9E1 MZVLC4T0HBL1 (RAID 0)
5867 (5141.17min - 5866.57max) MB/s
Durchschnittliche 2x Samsung PM9E1 MZVLC4T0HBL1 (RAID 0)
  (n=1)
5867 MB/s 0%
Alienware m18 R2
SK Hynix PC811 HFS002TEM9X152N
5153 (5139.7min - 5152.91max) MB/s -12%
Schenker Key 17 Pro (M24)
Samsung 990 Pro 1 TB
4891 (4759.07min - 4890.56max) MB/s -17%
Asus Strix Scar 18 G835LX
WD PC SN8000S 2TB
4437 (4373.88min - 4437.36max) MB/s -24%
Durchschnitt der Klasse Gaming
  (1057 - 9832, n=99, der letzten 2 Jahre)
3957 MB/s -33%
Razer Blade 18 2024 RZ09-0509
 
3367 (3255.82min - 3366.95max) MB/s -43%
seq q8 t1 read
Asus ROG Strix Scar 18 G835LXG
2x Samsung PM9E1 MZVLC4T0HBL1 (RAID 0)
17459 (12476.6min - 17459.1max) MB/s
Durchschnittliche 2x Samsung PM9E1 MZVLC4T0HBL1 (RAID 0)
  (n=1)
17459 MB/s 0%
MSI Titan 18 HX A14VIG
2x Samsung PM9A1a MZVL22T0HDLB (RAID 0)
13588 (10727.3min - 13588.3max) MB/s -22%
Asus Strix Scar 18 G835LX
WD PC SN8000S 2TB
12470 (11207.2min - 12469.7max) MB/s -29%
Acer Predator Helios 18 PH18-72-98MW
2x SK Hynix HFS001TEJ9X115N (RAID 0)
11019 (9854.1min - 11018.8max) MB/s -37%
Durchschnitt der Klasse Gaming
  (3772 - 17459, n=99, der letzten 2 Jahre)
7552 MB/s -57%
Alienware m18 R2
SK Hynix PC811 HFS002TEM9X152N
7110 (6256.85min - 7110.18max) MB/s -59%
Schenker Key 17 Pro (M24)
Samsung 990 Pro 1 TB
7033 (6025.44min - 7033.01max) MB/s -60%
Razer Blade 18 2024 RZ09-0509
 
6797 (5573.18min - 6797.33max) MB/s -61%
seq q8 t1 write
Acer Predator Helios 18 PH18-72-98MW
2x SK Hynix HFS001TEJ9X115N (RAID 0)
11472 (11391min - 11471.6max) MB/s 0%
Asus ROG Strix Scar 18 G835LXG
2x Samsung PM9E1 MZVLC4T0HBL1 (RAID 0)
11431 (10787.1min - 11430.9max) MB/s
Durchschnittliche 2x Samsung PM9E1 MZVLC4T0HBL1 (RAID 0)
  (n=1)
11431 MB/s 0%
MSI Titan 18 HX A14VIG
2x Samsung PM9A1a MZVL22T0HDLB (RAID 0)
10571 (10519.3min - 10571.3max) MB/s -8%
Asus Strix Scar 18 G835LX
WD PC SN8000S 2TB
8696 (8611.54min - 8696.26max) MB/s -24%
Alienware m18 R2
SK Hynix PC811 HFS002TEM9X152N
6779 (6710.47min - 6778.83max) MB/s -41%
Schenker Key 17 Pro (M24)
Samsung 990 Pro 1 TB
6620 (6576.94min - 6620.29max) MB/s -42%
Durchschnitt der Klasse Gaming
  (1218 - 13519, n=99, der letzten 2 Jahre)
5961 MB/s -48%
Razer Blade 18 2024 RZ09-0509
 
4902 (4309.42min - 4901.73max) MB/s -57%
4k q1 t1 read
Schenker Key 17 Pro (M24)
Samsung 990 Pro 1 TB
99 (97.84min - 99.01max) MB/s +21%
Acer Predator Helios 18 PH18-72-98MW
2x SK Hynix HFS001TEJ9X115N (RAID 0)
81.6 (81.02min - 81.62max) MB/s 0%
Asus ROG Strix Scar 18 G835LXG
2x Samsung PM9E1 MZVLC4T0HBL1 (RAID 0)
81.6 (80.95min - 81.61max) MB/s
Durchschnittliche 2x Samsung PM9E1 MZVLC4T0HBL1 (RAID 0)
  (n=1)
81.6 MB/s 0%
Alienware m18 R2
SK Hynix PC811 HFS002TEM9X152N
75.4 (73.49min - 75.43max) MB/s -8%
Durchschnitt der Klasse Gaming
  (32.2 - 111.2, n=99, der letzten 2 Jahre)
70.3 MB/s -14%
MSI Titan 18 HX A14VIG
2x Samsung PM9A1a MZVL22T0HDLB (RAID 0)
69.6 (68.6min - 69.57max) MB/s -15%
Asus Strix Scar 18 G835LX
WD PC SN8000S 2TB
63.4 (62.2min - 63.4max) MB/s -22%
Razer Blade 18 2024 RZ09-0509
 
61.8 (61.2min - 61.81max) MB/s -24%
4k q1 t1 write
Schenker Key 17 Pro (M24)
Samsung 990 Pro 1 TB
316 (303.92min - 316.48max) MB/s +61%
Alienware m18 R2
SK Hynix PC811 HFS002TEM9X152N
300 (297.27min - 299.6max) MB/s +53%
Acer Predator Helios 18 PH18-72-98MW
2x SK Hynix HFS001TEJ9X115N (RAID 0)
259 (250.68min - 258.82max) MB/s +32%
Durchschnitt der Klasse Gaming
  (78 - 345, n=99, der letzten 2 Jahre)
195.9 MB/s 0%
Asus ROG Strix Scar 18 G835LXG
2x Samsung PM9E1 MZVLC4T0HBL1 (RAID 0)
195.8 (125.81min - 195.77max) MB/s
Durchschnittliche 2x Samsung PM9E1 MZVLC4T0HBL1 (RAID 0)
  (n=1)
195.8 MB/s 0%
Razer Blade 18 2024 RZ09-0509
 
164 (110.95min - 164max) MB/s -16%
MSI Titan 18 HX A14VIG
2x Samsung PM9A1a MZVL22T0HDLB (RAID 0)
152.1 (149.74min - 152.09max) MB/s -22%
Asus Strix Scar 18 G835LX
WD PC SN8000S 2TB
136.4 (134.95min - 136.4max) MB/s -30%
4k q32 t16 read
Alienware m18 R2
SK Hynix PC811 HFS002TEM9X152N
6067 (5596.15min - 6066.73max) MB/s +626%
Schenker Key 17 Pro (M24)
Samsung 990 Pro 1 TB
4926 (4895.9min - 4926.27max) MB/s +489%
Durchschnitt der Klasse Gaming
  (539 - 8067, n=99, der letzten 2 Jahre)
2264 MB/s +171%
MSI Titan 18 HX A14VIG
2x Samsung PM9A1a MZVL22T0HDLB (RAID 0)
1623 (1464.8min - 1623.24max) MB/s +94%
Acer Predator Helios 18 PH18-72-98MW
2x SK Hynix HFS001TEJ9X115N (RAID 0)
1385 (1275.7min - 1385.11max) MB/s +66%
Razer Blade 18 2024 RZ09-0509
 
1005 (964.75min - 1004.59max) MB/s +20%
Asus ROG Strix Scar 18 G835LXG
2x Samsung PM9E1 MZVLC4T0HBL1 (RAID 0)
836 (795.8min - 835.68max) MB/s
Durchschnittliche 2x Samsung PM9E1 MZVLC4T0HBL1 (RAID 0)
  (n=1)
836 MB/s 0%
Asus Strix Scar 18 G835LX
WD PC SN8000S 2TB
746 (519.37min - 746.01max) MB/s -11%
4k q32 t16 write
Alienware m18 R2
SK Hynix PC811 HFS002TEM9X152N
4176 (3805.57min - 4175.9max) MB/s +551%
Schenker Key 17 Pro (M24)
Samsung 990 Pro 1 TB
3579 (3433.86min - 3579.4max) MB/s +458%
Durchschnitt der Klasse Gaming
  (227 - 5653, n=99, der letzten 2 Jahre)
1832 MB/s +186%
MSI Titan 18 HX A14VIG
2x Samsung PM9A1a MZVL22T0HDLB (RAID 0)
1377 (1306.51min - 1377.05max) MB/s +115%
Acer Predator Helios 18 PH18-72-98MW
2x SK Hynix HFS001TEJ9X115N (RAID 0)
1330 (1184.45min - 1330.4max) MB/s +107%
Asus ROG Strix Scar 18 G835LXG
2x Samsung PM9E1 MZVLC4T0HBL1 (RAID 0)
641 (632.54min - 640.8max) MB/s
Durchschnittliche 2x Samsung PM9E1 MZVLC4T0HBL1 (RAID 0)
  (n=1)
641 MB/s 0%
Razer Blade 18 2024 RZ09-0509
 
442 (336.87min - 441.83max) MB/s -31%
Asus Strix Scar 18 G835LX
WD PC SN8000S 2TB
284 (254.39min - 283.58max) MB/s -56%
AS SSD
Score Total
Alienware m18 R2
SK Hynix PC811 HFS002TEM9X152N
10655 Points +111%
Schenker Key 17 Pro (M24)
Samsung 990 Pro 1 TB
10591 Points +110%
Durchschnitt der Klasse Gaming
  (2912 - 14159, n=97, der letzten 2 Jahre)
6872 Points +36%
MSI Titan 18 HX A14VIG
2x Samsung PM9A1a MZVL22T0HDLB (RAID 0)
5369 Points +7%
Acer Predator Helios 18 PH18-72-98MW
2x SK Hynix HFS001TEJ9X115N (RAID 0)
5102 Points +1%
Asus ROG Strix Scar 18 G835LXG
2x Samsung PM9E1 MZVLC4T0HBL1 (RAID 0)
5040 Points
Durchschnittliche 2x Samsung PM9E1 MZVLC4T0HBL1 (RAID 0)
  (n=1)
5040 Points 0%
Razer Blade 18 2024 RZ09-0509
 
4927 Points -2%
Asus Strix Scar 18 G835LX
WD PC SN8000S 2TB
4764 Points -5%
Score Read
Schenker Key 17 Pro (M24)
Samsung 990 Pro 1 TB
3807 Points +90%
Alienware m18 R2
SK Hynix PC811 HFS002TEM9X152N
3753 Points +87%
Durchschnitt der Klasse Gaming
  (953 - 5082, n=97, der letzten 2 Jahre)
2248 Points +12%
MSI Titan 18 HX A14VIG
2x Samsung PM9A1a MZVL22T0HDLB (RAID 0)
2194 Points +10%
Acer Predator Helios 18 PH18-72-98MW
2x SK Hynix HFS001TEJ9X115N (RAID 0)
2049 Points +2%
Asus ROG Strix Scar 18 G835LXG
2x Samsung PM9E1 MZVLC4T0HBL1 (RAID 0)
2003 Points
Durchschnittliche 2x Samsung PM9E1 MZVLC4T0HBL1 (RAID 0)
  (n=1)
2003 Points 0%
Razer Blade 18 2024 RZ09-0509
 
1667 Points -17%
Asus Strix Scar 18 G835LX
WD PC SN8000S 2TB
1653 Points -17%
Score Write
Alienware m18 R2
SK Hynix PC811 HFS002TEM9X152N
4993 Points +139%
Schenker Key 17 Pro (M24)
Samsung 990 Pro 1 TB
4852 Points +132%
Durchschnitt der Klasse Gaming
  (1136 - 6457, n=97, der letzten 2 Jahre)
3547 Points +70%
Razer Blade 18 2024 RZ09-0509
 
2518 Points +21%
Asus Strix Scar 18 G835LX
WD PC SN8000S 2TB
2267 Points +9%
MSI Titan 18 HX A14VIG
2x Samsung PM9A1a MZVL22T0HDLB (RAID 0)
2092 Points 0%
Asus ROG Strix Scar 18 G835LXG
2x Samsung PM9E1 MZVLC4T0HBL1 (RAID 0)
2087 Points
Durchschnittliche 2x Samsung PM9E1 MZVLC4T0HBL1 (RAID 0)
  (n=1)
2087 Points 0%
Acer Predator Helios 18 PH18-72-98MW
2x SK Hynix HFS001TEJ9X115N (RAID 0)
2038 Points -2%
Seq Read
MSI Titan 18 HX A14VIG
2x Samsung PM9A1a MZVL22T0HDLB (RAID 0)
9576.8 MB/s +20%
Acer Predator Helios 18 PH18-72-98MW
2x SK Hynix HFS001TEJ9X115N (RAID 0)
8496.25 MB/s +7%
Asus ROG Strix Scar 18 G835LXG
2x Samsung PM9E1 MZVLC4T0HBL1 (RAID 0)
7949 MB/s
Durchschnittliche 2x Samsung PM9E1 MZVLC4T0HBL1 (RAID 0)
  (n=1)
7949 MB/s 0%
Alienware m18 R2
SK Hynix PC811 HFS002TEM9X152N
5916.27 MB/s -26%
Asus Strix Scar 18 G835LX
WD PC SN8000S 2TB
5595 MB/s -30%
Durchschnitt der Klasse Gaming
  (2346 - 10091, n=97, der letzten 2 Jahre)
5591 MB/s -30%
Razer Blade 18 2024 RZ09-0509
 
5476.6 MB/s -31%
Schenker Key 17 Pro (M24)
Samsung 990 Pro 1 TB
5346 MB/s -33%
Seq Write
MSI Titan 18 HX A14VIG
2x Samsung PM9A1a MZVL22T0HDLB (RAID 0)
8685.54 MB/s +41%
Acer Predator Helios 18 PH18-72-98MW
2x SK Hynix HFS001TEJ9X115N (RAID 0)
7597.23 MB/s +23%
Asus ROG Strix Scar 18 G835LXG
2x Samsung PM9E1 MZVLC4T0HBL1 (RAID 0)
6179 MB/s
Durchschnittliche 2x Samsung PM9E1 MZVLC4T0HBL1 (RAID 0)
  (n=1)
6179 MB/s 0%
Alienware m18 R2
SK Hynix PC811 HFS002TEM9X152N
5929.42 MB/s -4%
Asus Strix Scar 18 G835LX
WD PC SN8000S 2TB
5305 MB/s -14%
Schenker Key 17 Pro (M24)
Samsung 990 Pro 1 TB
5012 MB/s -19%
Durchschnitt der Klasse Gaming
  (114.5 - 10726, n=97, der letzten 2 Jahre)
3972 MB/s -36%
Razer Blade 18 2024 RZ09-0509
 
2995.22 MB/s -52%
4K Read
Schenker Key 17 Pro (M24)
Samsung 990 Pro 1 TB
90.9 MB/s +21%
Asus ROG Strix Scar 18 G835LXG
2x Samsung PM9E1 MZVLC4T0HBL1 (RAID 0)
75 MB/s
Durchschnittliche 2x Samsung PM9E1 MZVLC4T0HBL1 (RAID 0)
  (n=1)
75 MB/s 0%
Durchschnitt der Klasse Gaming
  (36.4 - 108.4, n=97, der letzten 2 Jahre)
71.1 MB/s -5%
Acer Predator Helios 18 PH18-72-98MW
2x SK Hynix HFS001TEJ9X115N (RAID 0)
69.86 MB/s -7%
Razer Blade 18 2024 RZ09-0509
 
65.49 MB/s -13%
Asus Strix Scar 18 G835LX
WD PC SN8000S 2TB
65.1 MB/s -13%
Alienware m18 R2
SK Hynix PC811 HFS002TEM9X152N
64.97 MB/s -13%
MSI Titan 18 HX A14VIG
2x Samsung PM9A1a MZVL22T0HDLB (RAID 0)
63.69 MB/s -15%
4K Write
Schenker Key 17 Pro (M24)
Samsung 990 Pro 1 TB
260 MB/s +27%
Alienware m18 R2
SK Hynix PC811 HFS002TEM9X152N
238.28 MB/s +17%
Razer Blade 18 2024 RZ09-0509
 
219.58 MB/s +8%
Durchschnitt der Klasse Gaming
  (75.6 - 307, n=97, der letzten 2 Jahre)
215 MB/s +5%
Asus ROG Strix Scar 18 G835LXG
2x Samsung PM9E1 MZVLC4T0HBL1 (RAID 0)
204 MB/s
Durchschnittliche 2x Samsung PM9E1 MZVLC4T0HBL1 (RAID 0)
  (n=1)
204 MB/s 0%
Acer Predator Helios 18 PH18-72-98MW
2x SK Hynix HFS001TEJ9X115N (RAID 0)
200.92 MB/s -2%
Asus Strix Scar 18 G835LX
WD PC SN8000S 2TB
189.8 MB/s -7%
MSI Titan 18 HX A14VIG
2x Samsung PM9A1a MZVL22T0HDLB (RAID 0)
134.66 MB/s -34%
4K-64 Read
Schenker Key 17 Pro (M24)
Samsung 990 Pro 1 TB
3182 MB/s +181%
Alienware m18 R2
SK Hynix PC811 HFS002TEM9X152N
3096 MB/s +173%
Durchschnitt der Klasse Gaming
  (517 - 3977, n=97, der letzten 2 Jahre)
1618 MB/s +43%
MSI Titan 18 HX A14VIG
2x Samsung PM9A1a MZVL22T0HDLB (RAID 0)
1172.14 MB/s +3%
Asus ROG Strix Scar 18 G835LXG
2x Samsung PM9E1 MZVLC4T0HBL1 (RAID 0)
1133 MB/s
Durchschnittliche 2x Samsung PM9E1 MZVLC4T0HBL1 (RAID 0)
  (n=1)
1133 MB/s 0%
Acer Predator Helios 18 PH18-72-98MW
2x SK Hynix HFS001TEJ9X115N (RAID 0)
1129.76 MB/s 0%
Razer Blade 18 2024 RZ09-0509
 
1053.83 MB/s -7%
Asus Strix Scar 18 G835LX
WD PC SN8000S 2TB
1029 MB/s -9%
4K-64 Write
Alienware m18 R2
SK Hynix PC811 HFS002TEM9X152N
4161.9 MB/s +229%
Schenker Key 17 Pro (M24)
Samsung 990 Pro 1 TB
4090 MB/s +223%
Durchschnitt der Klasse Gaming
  (850 - 5356, n=97, der letzten 2 Jahre)
2935 MB/s +132%
Razer Blade 18 2024 RZ09-0509
 
1998.53 MB/s +58%
Asus Strix Scar 18 G835LX
WD PC SN8000S 2TB
1546 MB/s +22%
Asus ROG Strix Scar 18 G835LXG
2x Samsung PM9E1 MZVLC4T0HBL1 (RAID 0)
1265 MB/s
Durchschnittliche 2x Samsung PM9E1 MZVLC4T0HBL1 (RAID 0)
  (n=1)
1265 MB/s 0%
MSI Titan 18 HX A14VIG
2x Samsung PM9A1a MZVL22T0HDLB (RAID 0)
1088.59 MB/s -14%
Acer Predator Helios 18 PH18-72-98MW
2x SK Hynix HFS001TEJ9X115N (RAID 0)
1077.68 MB/s -15%
Access Time Read
Asus Strix Scar 18 G835LX
WD PC SN8000S 2TB
0.067 ms * -148%
Durchschnitt der Klasse Gaming
  (0.017 - 0.623, n=97, der letzten 2 Jahre)
0.06364 ms * -136%
Schenker Key 17 Pro (M24)
Samsung 990 Pro 1 TB
0.046 ms * -70%
Acer Predator Helios 18 PH18-72-98MW
2x SK Hynix HFS001TEJ9X115N (RAID 0)
0.044 ms * -63%
MSI Titan 18 HX A14VIG
2x Samsung PM9A1a MZVL22T0HDLB (RAID 0)
0.036 ms * -33%
Alienware m18 R2
SK Hynix PC811 HFS002TEM9X152N
0.029 ms * -7%
Asus ROG Strix Scar 18 G835LXG
2x Samsung PM9E1 MZVLC4T0HBL1 (RAID 0)
0.027 ms *
Durchschnittliche 2x Samsung PM9E1 MZVLC4T0HBL1 (RAID 0)
  (n=1)
0.027 ms * -0%
Razer Blade 18 2024 RZ09-0509
 
0.025 ms * +7%
Access Time Write
MSI Titan 18 HX A14VIG
2x Samsung PM9A1a MZVL22T0HDLB (RAID 0)
0.091 ms * -406%
Razer Blade 18 2024 RZ09-0509
 
0.057 ms * -217%
Alienware m18 R2
SK Hynix PC811 HFS002TEM9X152N
0.055 ms * -206%
Durchschnitt der Klasse Gaming
  (0.012 - 0.277, n=97, der letzten 2 Jahre)
0.03794 ms * -111%
Acer Predator Helios 18 PH18-72-98MW
2x SK Hynix HFS001TEJ9X115N (RAID 0)
0.019 ms * -6%
Asus Strix Scar 18 G835LX
WD PC SN8000S 2TB
0.019 ms * -6%
Asus ROG Strix Scar 18 G835LXG
2x Samsung PM9E1 MZVLC4T0HBL1 (RAID 0)
0.018 ms *
Durchschnittliche 2x Samsung PM9E1 MZVLC4T0HBL1 (RAID 0)
  (n=1)
0.018 ms * -0%
Schenker Key 17 Pro (M24)
Samsung 990 Pro 1 TB
0.015 ms * +17%

* ... kleinere Werte sind besser

Dauerleistung Lesen: DiskSpd Read Loop, Queue Depth 8

035571010651420177521302485284031953550390542604615497053255680603563906745710074557810816585208875923095859940102951065011005113601171512070124251278013135134901384514200145551491015265156201597516330166851704017395Tooltip
Asus ROG Strix Scar 18 G835LXG; diskspd 2.0.17 f: Ø17083 (13259.78-17590.28) MB/s

GPU und Gaming Performance

Das Asus ROG Strix SCAR 18 ist mit einer Nvidia GeForce RTX 5090 Laptop samt 24 GB GDDR7-VRAM ausgestattet. In unserem Test arbeitet die GPU mit einer maximalen TGP von 175 Watt (150 Watt + 25 Watt Dynamic Boost) und stellt damit die schnellste verfügbare Ausbaustufe dar. Die Gaming- und Anwendungsleistung bewegt sich entsprechend auf einem sehr hohen Niveau und bietet selbst für anspruchsvolle Titel in hohen Auflösungen reichlich Leistungsreserven.

Im manuellen Modus lassen sich GPU- und Speichertakt zusätzlich anheben, wodurch sich die Grafikleistung nochmals leicht steigern lässt. Positiv ist zudem, dass die Performance der RTX 5090 Laptop auch unter anhaltender Last stabil bleibt und keine nennenswerten Einbrüche zeigt. Im Akkubetrieb steht hingegen nur ein deutlich geringeres Leistungsbudget zur Verfügung, weshalb die GPU-Performance spürbar sinkt.

3DMark Performance Rating - Percent
Asus ROG Strix Scar 18 G835LXG
NVIDIA GeForce RTX 5090 Laptop, Intel Core Ultra 9 290HX Plus
100 pt
Durchschnittliche NVIDIA GeForce RTX 5090 Laptop
 
91.3 pt
Asus Strix Scar 18 G835LX
NVIDIA GeForce RTX 5090 Laptop, Intel Core Ultra 9 275HX
90.4 pt
MSI Titan 18 HX A14VIG
NVIDIA GeForce RTX 4090 Laptop GPU, Intel Core i9-14900HX
87.4 pt
Alienware m18 R2
NVIDIA GeForce RTX 4090 Laptop GPU, Intel Core i9-14900HX
86 pt
Razer Blade 18 2024 RZ09-0509
NVIDIA GeForce RTX 4090 Laptop GPU, Intel Core i9-14900HX
82.9 pt
Schenker Key 17 Pro (M24)
NVIDIA GeForce RTX 4090 Laptop GPU, Intel Core i9-14900HX
79.2 pt
Acer Predator Helios 18 PH18-72-98MW
NVIDIA GeForce RTX 4090 Laptop GPU, Intel Core i9-14900HX
76.6 pt
Durchschnitt der Klasse Gaming
 
65.8 pt
3DMark 11 - 1280x720 Performance GPU
Asus ROG Strix Scar 18 G835LXG
NVIDIA GeForce RTX 5090 Laptop, Intel Core Ultra 9 290HX Plus
77229 Points
Alienware m18 R2
NVIDIA GeForce RTX 4090 Laptop GPU, Intel Core i9-14900HX
69254 Points -10%
Durchschnittliche NVIDIA GeForce RTX 5090 Laptop
  (26378 - 80022, n=24)
66542 Points -14%
Asus Strix Scar 18 G835LX
NVIDIA GeForce RTX 5090 Laptop, Intel Core Ultra 9 275HX
66337 Points -14%
Razer Blade 18 2024 RZ09-0509
NVIDIA GeForce RTX 4090 Laptop GPU, Intel Core i9-14900HX
64952 Points -16%
MSI Titan 18 HX A14VIG
NVIDIA GeForce RTX 4090 Laptop GPU, Intel Core i9-14900HX
63978 Points -17%
Acer Predator Helios 18 PH18-72-98MW
NVIDIA GeForce RTX 4090 Laptop GPU, Intel Core i9-14900HX
59871 Points -22%
Schenker Key 17 Pro (M24)
NVIDIA GeForce RTX 4090 Laptop GPU, Intel Core i9-14900HX
59715 Points -23%
Durchschnitt der Klasse Gaming
  (21841 - 80022, n=104, der letzten 2 Jahre)
50006 Points -35%
3DMark
2560x1440 Time Spy Graphics
Asus ROG Strix Scar 18 G835LXG
NVIDIA GeForce RTX 5090 Laptop, Intel Core Ultra 9 290HX Plus
25562 Points
Asus Strix Scar 18 G835LX
NVIDIA GeForce RTX 5090 Laptop, Intel Core Ultra 9 275HX
24599 Points -4%
Durchschnittliche NVIDIA GeForce RTX 5090 Laptop
  (19216 - 26212, n=27)
23833 Points -7%
Alienware m18 R2
NVIDIA GeForce RTX 4090 Laptop GPU, Intel Core i9-14900HX
22290 Points -13%
MSI Titan 18 HX A14VIG
NVIDIA GeForce RTX 4090 Laptop GPU, Intel Core i9-14900HX
22256 Points -13%
Razer Blade 18 2024 RZ09-0509
NVIDIA GeForce RTX 4090 Laptop GPU, Intel Core i9-14900HX
21246 Points -17%
Schenker Key 17 Pro (M24)
NVIDIA GeForce RTX 4090 Laptop GPU, Intel Core i9-14900HX
19741 Points -23%
Acer Predator Helios 18 PH18-72-98MW
NVIDIA GeForce RTX 4090 Laptop GPU, Intel Core i9-14900HX
18814 Points -26%
Durchschnitt der Klasse Gaming
  (5012 - 26212, n=115, der letzten 2 Jahre)
15813 Points -38%
1920x1080 Fire Strike Graphics
Asus ROG Strix Scar 18 G835LXG
NVIDIA GeForce RTX 5090 Laptop, Intel Core Ultra 9 290HX Plus
54821 Points
Durchschnittliche NVIDIA GeForce RTX 5090 Laptop
  (42175 - 62849, n=29)
51817 Points -5%
MSI Titan 18 HX A14VIG
NVIDIA GeForce RTX 4090 Laptop GPU, Intel Core i9-14900HX
50532 Points -8%
Asus Strix Scar 18 G835LX
NVIDIA GeForce RTX 5090 Laptop, Intel Core Ultra 9 275HX
48863 Points -11%
Schenker Key 17 Pro (M24)
NVIDIA GeForce RTX 4090 Laptop GPU, Intel Core i9-14900HX
45600 Points -17%
Razer Blade 18 2024 RZ09-0509
NVIDIA GeForce RTX 4090 Laptop GPU, Intel Core i9-14900HX
44702 Points -18%
Alienware m18 R2
NVIDIA GeForce RTX 4090 Laptop GPU, Intel Core i9-14900HX
44492 Points -19%
Acer Predator Helios 18 PH18-72-98MW
NVIDIA GeForce RTX 4090 Laptop GPU, Intel Core i9-14900HX
43140 Points -21%
Durchschnitt der Klasse Gaming
  (12242 - 62849, n=115, der letzten 2 Jahre)
38781 Points -29%
3DMark 06 Standard Score
69318 Punkte
3DMark Vantage P Result
145142 Punkte
3DMark 11 Performance
54427 Punkte
3DMark Ice Storm Standard Score
328157 Punkte
3DMark Cloud Gate Standard Score
79173 Punkte
3DMark Fire Strike Score
42509 Punkte
3DMark Fire Strike Extreme Score
30184 Punkte
3DMark Time Spy Score
24092 Punkte
3DMark Steel Nomad Score
6277 Punkte
Hilfe
Blender
v3.3 Classroom OPTIX/RTX
Durchschnitt der Klasse Gaming
  (9 - 32, n=106, der letzten 2 Jahre)
18.3 Seconds * -31%
Razer Blade 18 2024 RZ09-0509
NVIDIA GeForce RTX 4090 Laptop GPU, Intel Core i9-14900HX
14 Seconds * -0%
Asus ROG Strix Scar 18 G835LXG
NVIDIA GeForce RTX 5090 Laptop, Intel Core Ultra 9 290HX Plus
14 Seconds *
Acer Predator Helios 18 PH18-72-98MW
NVIDIA GeForce RTX 4090 Laptop GPU, Intel Core i9-14900HX
13 Seconds * +7%
Schenker Key 17 Pro (M24)
NVIDIA GeForce RTX 4090 Laptop GPU, Intel Core i9-14900HX
13 Seconds * +7%
Alienware m18 R2
NVIDIA GeForce RTX 4090 Laptop GPU, Intel Core i9-14900HX
12 Seconds * +14%
Durchschnittliche NVIDIA GeForce RTX 5090 Laptop
  (9 - 18, n=23)
11.8 Seconds * +16%
MSI Titan 18 HX A14VIG
NVIDIA GeForce RTX 4090 Laptop GPU, Intel Core i9-14900HX
10 Seconds * +29%
Asus Strix Scar 18 G835LX
NVIDIA GeForce RTX 5090 Laptop, Intel Core Ultra 9 275HX
10 Seconds * +29%
v3.3 Classroom CUDA
Durchschnitt der Klasse Gaming
  (15 - 228, n=106, der letzten 2 Jahre)
32.4 Seconds * -91%
Razer Blade 18 2024 RZ09-0509
NVIDIA GeForce RTX 4090 Laptop GPU, Intel Core i9-14900HX
19 Seconds * -12%
MSI Titan 18 HX A14VIG
NVIDIA GeForce RTX 4090 Laptop GPU, Intel Core i9-14900HX
18 Seconds * -6%
Acer Predator Helios 18 PH18-72-98MW
NVIDIA GeForce RTX 4090 Laptop GPU, Intel Core i9-14900HX
18 Seconds * -6%
Alienware m18 R2
NVIDIA GeForce RTX 4090 Laptop GPU, Intel Core i9-14900HX
18 Seconds * -6%
Schenker Key 17 Pro (M24)
NVIDIA GeForce RTX 4090 Laptop GPU, Intel Core i9-14900HX
18 Seconds * -6%
Durchschnittliche NVIDIA GeForce RTX 5090 Laptop
  (15 - 37, n=22)
17.6 Seconds * -4%
Asus ROG Strix Scar 18 G835LXG
NVIDIA GeForce RTX 5090 Laptop, Intel Core Ultra 9 290HX Plus
17 Seconds *
Asus Strix Scar 18 G835LX
NVIDIA GeForce RTX 5090 Laptop, Intel Core Ultra 9 275HX
16 Seconds * +6%
v3.3 Classroom CPU
Durchschnitt der Klasse Gaming
  (122 - 565, n=102, der letzten 2 Jahre)
247 Seconds * -96%
Acer Predator Helios 18 PH18-72-98MW
NVIDIA GeForce RTX 4090 Laptop GPU, Intel Core i9-14900HX
225 Seconds * -79%
Schenker Key 17 Pro (M24)
NVIDIA GeForce RTX 4090 Laptop GPU, Intel Core i9-14900HX
218 Seconds * -73%
Razer Blade 18 2024 RZ09-0509
NVIDIA GeForce RTX 4090 Laptop GPU, Intel Core i9-14900HX
207 Seconds * -64%
Alienware m18 R2
NVIDIA GeForce RTX 4090 Laptop GPU, Intel Core i9-14900HX
180 Seconds * -43%
MSI Titan 18 HX A14VIG
NVIDIA GeForce RTX 4090 Laptop GPU, Intel Core i9-14900HX
179 Seconds * -42%
Durchschnittliche NVIDIA GeForce RTX 5090 Laptop
  (123 - 282, n=23)
164.3 Seconds * -30%
Asus Strix Scar 18 G835LX
NVIDIA GeForce RTX 5090 Laptop, Intel Core Ultra 9 275HX
137 Seconds * -9%
Asus ROG Strix Scar 18 G835LXG
NVIDIA GeForce RTX 5090 Laptop, Intel Core Ultra 9 290HX Plus
126 Seconds *

* ... kleinere Werte sind besser

Performance Rating - Percent
Asus ROG Strix Scar 18 G835LXG
Intel Core Ultra 9 290HX Plus, NVIDIA GeForce RTX 5090 Laptop
98 pt
Asus Strix Scar 18 G835LX
Intel Core Ultra 9 275HX, NVIDIA GeForce RTX 5090 Laptop
91.6 pt
Alienware m18 R2
Intel Core i9-14900HX, NVIDIA GeForce RTX 4090 Laptop GPU
87.8 pt
MSI Titan 18 HX A14VIG
Intel Core i9-14900HX, NVIDIA GeForce RTX 4090 Laptop GPU
86.6 pt
Schenker Key 17 Pro (M24)
Intel Core i9-14900HX, NVIDIA GeForce RTX 4090 Laptop GPU
82.4 pt
Acer Predator Helios 18 PH18-72-98MW -2!
Intel Core i9-14900HX, NVIDIA GeForce RTX 4090 Laptop GPU
78.1 pt
Razer Blade 18 2024 RZ09-0509
Intel Core i9-14900HX, NVIDIA GeForce RTX 4090 Laptop GPU
75.9 pt
Durchschnitt der Klasse Gaming
 
70 pt
Cyberpunk 2077 - 1920x1080 Ultra Preset (FSR off)
Asus ROG Strix Scar 18 G835LXG
Intel Core Ultra 9 290HX Plus, NVIDIA GeForce RTX 5090 Laptop
169.4 (133.9min) fps
Asus Strix Scar 18 G835LX
Intel Core Ultra 9 275HX, NVIDIA GeForce RTX 5090 Laptop
154.9 (126.3min) fps -9%
Alienware m18 R2
Intel Core i9-14900HX, NVIDIA GeForce RTX 4090 Laptop GPU
133.9 (67.5min) fps -21%
MSI Titan 18 HX A14VIG
Intel Core i9-14900HX, NVIDIA GeForce RTX 4090 Laptop GPU
129.8 (26.2min) fps -23%
Schenker Key 17 Pro (M24)
Intel Core i9-14900HX, NVIDIA GeForce RTX 4090 Laptop GPU
113.5 (84.3min) fps -33%
Durchschnitt der Klasse Gaming
  (17.7 - 169.9, n=115, der letzten 2 Jahre)
108.4 fps -36%
Razer Blade 18 2024 RZ09-0509
Intel Core i9-14900HX, NVIDIA GeForce RTX 4090 Laptop GPU
101.25 (77.2min) fps -40%
Baldur's Gate 3 - 1920x1080 Ultra Preset AA:T
MSI Titan 18 HX A14VIG
Intel Core i9-14900HX, NVIDIA GeForce RTX 4090 Laptop GPU
207.7 fps 0%
Asus ROG Strix Scar 18 G835LXG
Intel Core Ultra 9 290HX Plus, NVIDIA GeForce RTX 5090 Laptop
207 (90.2min, 154.6P0.1, 186.9P1) fps
Alienware m18 R2
Intel Core i9-14900HX, NVIDIA GeForce RTX 4090 Laptop GPU
202 fps -2%
Asus Strix Scar 18 G835LX
Intel Core Ultra 9 275HX, NVIDIA GeForce RTX 5090 Laptop
193.7 fps -6%
Schenker Key 17 Pro (M24)
Intel Core i9-14900HX, NVIDIA GeForce RTX 4090 Laptop GPU
177 fps -14%
Razer Blade 18 2024 RZ09-0509
Intel Core i9-14900HX, NVIDIA GeForce RTX 4090 Laptop GPU
160.5 (65P0.1, 99.5P1) fps -22%
Durchschnitt der Klasse Gaming
  (59.4 - 246, n=104, der letzten 2 Jahre)
139.9 fps -32%
GTA V - 1920x1080 Highest AA:4xMSAA + FX AF:16x
Asus ROG Strix Scar 18 G835LXG
Intel Core Ultra 9 290HX Plus, NVIDIA GeForce RTX 5090 Laptop
173 (3.12min, 125P1) fps
Asus Strix Scar 18 G835LX
Intel Core Ultra 9 275HX, NVIDIA GeForce RTX 5090 Laptop
161.9 (2.78min, 111.1P1) fps -6%
MSI Titan 18 HX A14VIG
Intel Core i9-14900HX, NVIDIA GeForce RTX 4090 Laptop GPU
139.2 (3.73min, 90.9P1) fps -20%
Alienware m18 R2
Intel Core i9-14900HX, NVIDIA GeForce RTX 4090 Laptop GPU
137 (7.81min, 83.3P1) fps -21%
Acer Predator Helios 18 PH18-72-98MW
Intel Core i9-14900HX, NVIDIA GeForce RTX 4090 Laptop GPU
134 (22.7min, 90.9P1) fps -23%
Durchschnitt der Klasse Gaming
  (48.3 - 186.9, n=94, der letzten 2 Jahre)
132.3 fps -24%
Razer Blade 18 2024 RZ09-0509
Intel Core i9-14900HX, NVIDIA GeForce RTX 4090 Laptop GPU
129.8 (16.1min, 90.9P1) fps -25%
Schenker Key 17 Pro (M24)
Intel Core i9-14900HX, NVIDIA GeForce RTX 4090 Laptop GPU
126.7 (8.43min, 83.3P1) fps -27%
Final Fantasy XV Benchmark - 1920x1080 High Quality
Asus ROG Strix Scar 18 G835LXG
Intel Core Ultra 9 290HX Plus, NVIDIA GeForce RTX 5090 Laptop
214 fps
Asus Strix Scar 18 G835LX
Intel Core Ultra 9 275HX, NVIDIA GeForce RTX 5090 Laptop
199.3 fps -7%
Alienware m18 R2
Intel Core i9-14900HX, NVIDIA GeForce RTX 4090 Laptop GPU
193.2 fps -10%
MSI Titan 18 HX A14VIG
Intel Core i9-14900HX, NVIDIA GeForce RTX 4090 Laptop GPU
184 fps -14%
Schenker Key 17 Pro (M24)
Intel Core i9-14900HX, NVIDIA GeForce RTX 4090 Laptop GPU
174.6 fps -18%
Acer Predator Helios 18 PH18-72-98MW
Intel Core i9-14900HX, NVIDIA GeForce RTX 4090 Laptop GPU
157.1 fps -27%
Razer Blade 18 2024 RZ09-0509
Intel Core i9-14900HX, NVIDIA GeForce RTX 4090 Laptop GPU
156.9 fps -27%
Durchschnitt der Klasse Gaming
  (41 - 215, n=95, der letzten 2 Jahre)
150.1 fps -30%
Strange Brigade - 1920x1080 ultra AA:ultra AF:16
Asus ROG Strix Scar 18 G835LXG
Intel Core Ultra 9 290HX Plus, NVIDIA GeForce RTX 5090 Laptop
458 (143.1min, 329P1) fps
Asus Strix Scar 18 G835LX
Intel Core Ultra 9 275HX, NVIDIA GeForce RTX 5090 Laptop
401 (103.4min, 236P1) fps -12%
MSI Titan 18 HX A14VIG
Intel Core i9-14900HX, NVIDIA GeForce RTX 4090 Laptop GPU
385 (27.2min, 274P1) fps -16%
Alienware m18 R2
Intel Core i9-14900HX, NVIDIA GeForce RTX 4090 Laptop GPU
369 (31.4min, 266P1) fps -19%
Schenker Key 17 Pro (M24)
Intel Core i9-14900HX, NVIDIA GeForce RTX 4090 Laptop GPU
360 (22.5min, 268P1) fps -21%
Razer Blade 18 2024 RZ09-0509
Intel Core i9-14900HX, NVIDIA GeForce RTX 4090 Laptop GPU
325 (49.1min, 213P1) fps -29%
Acer Predator Helios 18 PH18-72-98MW
Intel Core i9-14900HX, NVIDIA GeForce RTX 4090 Laptop GPU
305 (14.5min, 223P1) fps -33%
Durchschnitt der Klasse Gaming
  (76.3 - 458, n=87, der letzten 2 Jahre)
288 fps -37%
Dota 2 Reborn - 1920x1080 ultra (3/3) best looking
Asus ROG Strix Scar 18 G835LXG
Intel Core Ultra 9 290HX Plus, NVIDIA GeForce RTX 5090 Laptop
194.7 (163.7min) fps
Asus Strix Scar 18 G835LX
Intel Core Ultra 9 275HX, NVIDIA GeForce RTX 5090 Laptop
186.6 (157.4min) fps -4%
Schenker Key 17 Pro (M24)
Intel Core i9-14900HX, NVIDIA GeForce RTX 4090 Laptop GPU
178.4 (149.2min) fps -8%
Acer Predator Helios 18 PH18-72-98MW
Intel Core i9-14900HX, NVIDIA GeForce RTX 4090 Laptop GPU
178.3 (150.2min) fps -8%
MSI Titan 18 HX A14VIG
Intel Core i9-14900HX, NVIDIA GeForce RTX 4090 Laptop GPU
174.5 (151.1min) fps -10%
Alienware m18 R2
Intel Core i9-14900HX, NVIDIA GeForce RTX 4090 Laptop GPU
171.8 (143.6min) fps -12%
Razer Blade 18 2024 RZ09-0509
Intel Core i9-14900HX, NVIDIA GeForce RTX 4090 Laptop GPU
164 (140min) fps -16%
Durchschnitt der Klasse Gaming
  (84.8 - 248, n=107, der letzten 2 Jahre)
153.7 fps -21%
X-Plane 11.11 - 1920x1080 high (fps_test=3)
Alienware m18 R2
Intel Core i9-14900HX, NVIDIA GeForce RTX 4090 Laptop GPU
140.6 fps +15%
Schenker Key 17 Pro (M24)
Intel Core i9-14900HX, NVIDIA GeForce RTX 4090 Laptop GPU
139.7 fps +15%
Razer Blade 18 2024 RZ09-0509
Intel Core i9-14900HX, NVIDIA GeForce RTX 4090 Laptop GPU
127.2 fps +4%
MSI Titan 18 HX A14VIG
Intel Core i9-14900HX, NVIDIA GeForce RTX 4090 Laptop GPU
126.1 fps +4%
Asus ROG Strix Scar 18 G835LXG
Intel Core Ultra 9 290HX Plus, NVIDIA GeForce RTX 5090 Laptop
121.8 fps
Asus Strix Scar 18 G835LX
Intel Core Ultra 9 275HX, NVIDIA GeForce RTX 5090 Laptop
121.7 fps 0%
Acer Predator Helios 18 PH18-72-98MW
Intel Core i9-14900HX, NVIDIA GeForce RTX 4090 Laptop GPU
114.5 fps -6%
Durchschnitt der Klasse Gaming
  (55.5 - 143.5, n=109, der letzten 2 Jahre)
98.7 fps -19%
The Witcher 3
1024x768 Low Graphics & Postprocessing
MSI Titan 18 HX A14VIG
Intel Core i9-14900HX, NVIDIA GeForce RTX 4090 Laptop GPU
595.3 (554min) fps +33%
Alienware m18 R2
Intel Core i9-14900HX, NVIDIA GeForce RTX 4090 Laptop GPU
585.5 (526min) fps +31%
Durchschnitt der Klasse Gaming
  (447 - 686, n=2, der letzten 2 Jahre)
567 fps +27%
Asus ROG Strix Scar 18 G835LXG
Intel Core Ultra 9 290HX Plus, NVIDIA GeForce RTX 5090 Laptop
447 (29.3min, 93.2P0.1, 271P1) fps
Durchschnittliche NVIDIA GeForce RTX 5090 Laptop
  (n=1)
447 fps 0%
1366x768 Medium Graphics & Postprocessing
Alienware m18 R2
Intel Core i9-14900HX, NVIDIA GeForce RTX 4090 Laptop GPU
525.8 (493min) fps +23%
MSI Titan 18 HX A14VIG
Intel Core i9-14900HX, NVIDIA GeForce RTX 4090 Laptop GPU
506.6 (447min) fps +18%
Durchschnitt der Klasse Gaming
  (428 - 517, n=2, der letzten 2 Jahre)
473 fps +11%
Asus ROG Strix Scar 18 G835LXG
Intel Core Ultra 9 290HX Plus, NVIDIA GeForce RTX 5090 Laptop
428 (15.6min, 153P0.1, 268P1) fps
Durchschnittliche NVIDIA GeForce RTX 5090 Laptop
  (n=1)
428 fps 0%
1920x1080 High Graphics & Postprocessing (Nvidia HairWorks Off)
MSI Titan 18 HX A14VIG
Intel Core i9-14900HX, NVIDIA GeForce RTX 4090 Laptop GPU
412.2 (387min) fps +2%
Alienware m18 R2
Intel Core i9-14900HX, NVIDIA GeForce RTX 4090 Laptop GPU
405.6 (374min) fps 0%
Asus ROG Strix Scar 18 G835LXG
Intel Core Ultra 9 290HX Plus, NVIDIA GeForce RTX 5090 Laptop
404 (88.1min, 153.9P0.1, 264P1) fps
Durchschnittliche NVIDIA GeForce RTX 5090 Laptop
  (n=1)
404 fps 0%
Durchschnitt der Klasse Gaming
  (341 - 404, n=2, der letzten 2 Jahre)
373 fps -8%
1920x1080 Ultra Graphics & Postprocessing (HBAO+)
Asus ROG Strix Scar 18 G835LXG
Intel Core Ultra 9 290HX Plus, NVIDIA GeForce RTX 5090 Laptop
234 (14.7min, 99.6P0.1, 147.5P1) fps
Durchschnittliche NVIDIA GeForce RTX 5090 Laptop
  (192 - 240, n=5)
222 fps -5%
MSI Titan 18 HX A14VIG
Intel Core i9-14900HX, NVIDIA GeForce RTX 4090 Laptop GPU
211.2 (165min) fps -10%
Alienware m18 R2
Intel Core i9-14900HX, NVIDIA GeForce RTX 4090 Laptop GPU
205.7 (193min) fps -12%
Durchschnitt der Klasse Gaming
  (104.7 - 240, n=7, der letzten 2 Jahre)
196.3 fps -16%
Razer Blade 18 2024 RZ09-0509
Intel Core i9-14900HX, NVIDIA GeForce RTX 4090 Laptop GPU
193 (53.6P0.1, 119.7P1) fps -18%
Acer Predator Helios 18 PH18-72-98MW
Intel Core i9-14900HX, NVIDIA GeForce RTX 4090 Laptop GPU
180 fps -23%

Cyberpunk 2077 ultra FPS-Diagramm

05101520253035404550556065707580859095100105110115120125130135140145150155160165Tooltip
Asus ROG Strix Scar 18 G835LXG Ultra 9 290HX Plus, GeForce RTX 5090 Laptop: Ø163.1 (152.9-166.7) fps
Asus Strix Scar 18 G835LX Ultra 9 275HX, GeForce RTX 5090 Laptop: Ø144.2 (124.3-147.1) fps
CPU/GPU-Daten Cyberpunk 2077
min.mittelhochmax.QHD4K
GTA V (2015) 187.7 187.1 186.8 173 173.7 186.6
The Witcher 3 (2015) 447 428 404 234 193.5 170.9
Dota 2 Reborn (2015) 238.8 217.9 207.9 194.7 193.1
Final Fantasy XV Benchmark (2018) 234 231 214 174 107
X-Plane 11.11 (2018) 149.3 150.3 121.8 97.6
Strange Brigade (2018) 654 500 494 458 354 184.5
Baldur's Gate 3 (2023) 229 240 212 207 152.8 87.4
Cyberpunk 2077 (2023) 209 194.8 173.3 169.4 118.7 56.1
Alan Wake 2 (2023) 145.3 143.5 132.7 88.3 46
F1 24 (2024) 363 391 372 163.6 109.4 54.3
Black Myth: Wukong (2024) 182 135 107 65 49 29
Indiana Jones and the Great Circle (2024) 217 183.2 164.5 152.5 122.8 75
Kingdom Come Deliverance 2 (2025) 252 206 177.7 126.8 94.4 54.7
Assassin's Creed Shadows (2025) 113 111 96 75 64 46
F1 25 (2025) 286 266 255 65.3 39.1 18.8
Anno 117: Pax Romana (2025) 191.3 149.4 121.6 69.8 49.5 28.2
Call of Duty Black Ops 7 (2025) 216 208 170 69 47 31
Pragmata (2026) 257 199.9 164.9 125 71.4
007 First Light (2026) 135 128 111.8 108.2 78.6 45.9

Emissionen & Energie

Geräuschemissionen

Die Geräuschentwicklung des Asus ROG Strix SCAR 18 hängt stark vom gewählten Energieprofil ab. Für den Alltag empfiehlt sich der Leise-Modus, da die Lüfter bei geringer Last häufig stillstehen und das Notebook angenehm leise arbeitet. Auch weniger anspruchsvolle Spiele lassen sich in diesem Profil mit einer moderaten Geräuschkulisse spielen.

Im Turbo-Modus laufen die Lüfter dagegen dauerhaft und erreichen unter hoher Last beziehungsweise beim Spielen bis zu 55,1 dB(A). Für längere Gaming-Sessions sind Kopfhörer daher empfehlenswert. Positiv fällt auf, dass die Kühlleistung auch bei dieser hohen Lautstärke konstant bleibt. Leichte elektronische Nebengeräusche traten lediglich in einzelnen synthetischen GPU-Benchmarks auf und waren im normalen Betrieb sowie beim Spielen nicht wahrnehmbar.

Lautstärkediagramm

Idle
30.9 / 31 / 31.1 dB(A)
Last
47.8 / 55.1 dB(A)
  red to green bar
 
 
30 dB
leise
40 dB(A)
deutlich hörbar
50 dB(A)
störend
 
min: dark, med: mid, max: light   Earthworks M23R (aus 15 cm gemessen)   Umgebungsgeräusche: 25 dB(A)
dB(A) 0102030405060708090Deep BassMiddle BassHigh BassLower RangeMidsHigher MidsLower HighsMid HighsUpper HighsSuper Highs2032.634.834.632.728.344.72529.728.528.624.828.833.43131.926.428.1263035.94022.922.119.92223.532.15022.525.219.919.218.933.36321.219.216.817.915.732.98023.617.515.314.511.431.710022.616.416.315.512.334.212526.516.316.316.111.432.116026.416.717.517.51332.72002817.418.518.110.431.72503018.419.418.31038.531530.819.218.218.89.236.140035.124.624.223.610.142.650032.520.120.420.110.644.363036.322.922.822.81038.180036.621.421.621.910.437.2100036.82120.620.611.939.3125037.520.319.919.61242.5160038.120.720.420.411.942.8200039.220.1202011.938.2250037.518.718.218.212.437.531503516.516.616.313.236.44000341514.91513.838.150003314.714.614.614.134.3630031.215.114.914.914.533.8800026151514.914.732.81000024.815.715.715.61534.51250025.415.11515.114.630.41600025.516.416.516.214.224.7SPL47.831.13130.92551N5.91.41.41.40.68median 32.5median 17.4median 18.2median 18.1median 12median 36.4Delta5.32.32.42.41.83.2hearing rangehide median Fan NoiseAsus ROG Strix Scar 18 G835LXG
Asus ROG Strix Scar 18 G835LXG
Ultra 9 290HX Plus, GeForce RTX 5090 Laptop
Asus Strix Scar 18 G835LX
Ultra 9 275HX, GeForce RTX 5090 Laptop
Razer Blade 18 2024 RZ09-0509
i9-14900HX, GeForce RTX 4090 Laptop GPU
Alienware m18 R2
i9-14900HX, GeForce RTX 4090 Laptop GPU
Acer Predator Helios 18 PH18-72-98MW
i9-14900HX, GeForce RTX 4090 Laptop GPU
MSI Titan 18 HX A14VIG
i9-14900HX, GeForce RTX 4090 Laptop GPU
Schenker Key 17 Pro (M24)
i9-14900HX, GeForce RTX 4090 Laptop GPU
Geräuschentwicklung
5%
8%
12%
-5%
10%
9%
aus / Umgebung * (dB)
25
23.3
7%
23.4
6%
23.6
6%
25
-0%
22.8
9%
23.41
6%
Idle min * (dB)
30.9
29.8
4%
23.9
23%
23.8
23%
30
3%
23.8
23%
25.33
18%
Idle avg * (dB)
31
29.8
4%
28.2
9%
26.1
16%
36
-16%
23.8
23%
25.33
18%
Idle max * (dB)
31.1
29.8
4%
29
7%
31.5
-1%
44
-41%
28
10%
25.33
19%
Last avg * (dB)
47.8
42.9
10%
36.8
23%
31.5
34%
48
-0%
38
21%
33.57
30%
Witcher 3 ultra * (dB)
55.2
54.1
2%
52.1
6%
49
11%
57.3
-4%
Cyberpunk 2077 ultra * (dB)
55.1
53.7
3%
61.97
-12%
Last max * (dB)
55.1
53.7
3%
61.1
-11%
56.6
-3%
51
7%
62.8
-14%
62.14
-13%

* ... kleinere Werte sind besser

Temperatur

Die Oberflächentemperaturen des Asus ROG Strix SCAR 18 bleiben selbst unter hoher Last gut kontrollierbar. Lediglich an einzelnen Bereichen der Unterseite messen wir Temperaturen von bis zu 45 °C. Die Tastatur erwärmt sich dagegen nur leicht, sodass insbesondere der WASD-Bereich auch während längerer Gaming-Sessions angenehm kühl bleibt.

Im Stresstest priorisiert das Kühlsystem die GeForce RTX 5090 Laptop, die sich nach kurzer Zeit bei einer TGP von ca. 175 Watt einpendelt. Der Intel Core Ultra 9 290HX arbeitet parallel mit rund 95 Watt. Trotz der hohen Leistungsaufnahme bleiben die Temperaturen von CPU und GPU jederzeit im unkritischen Bereich.
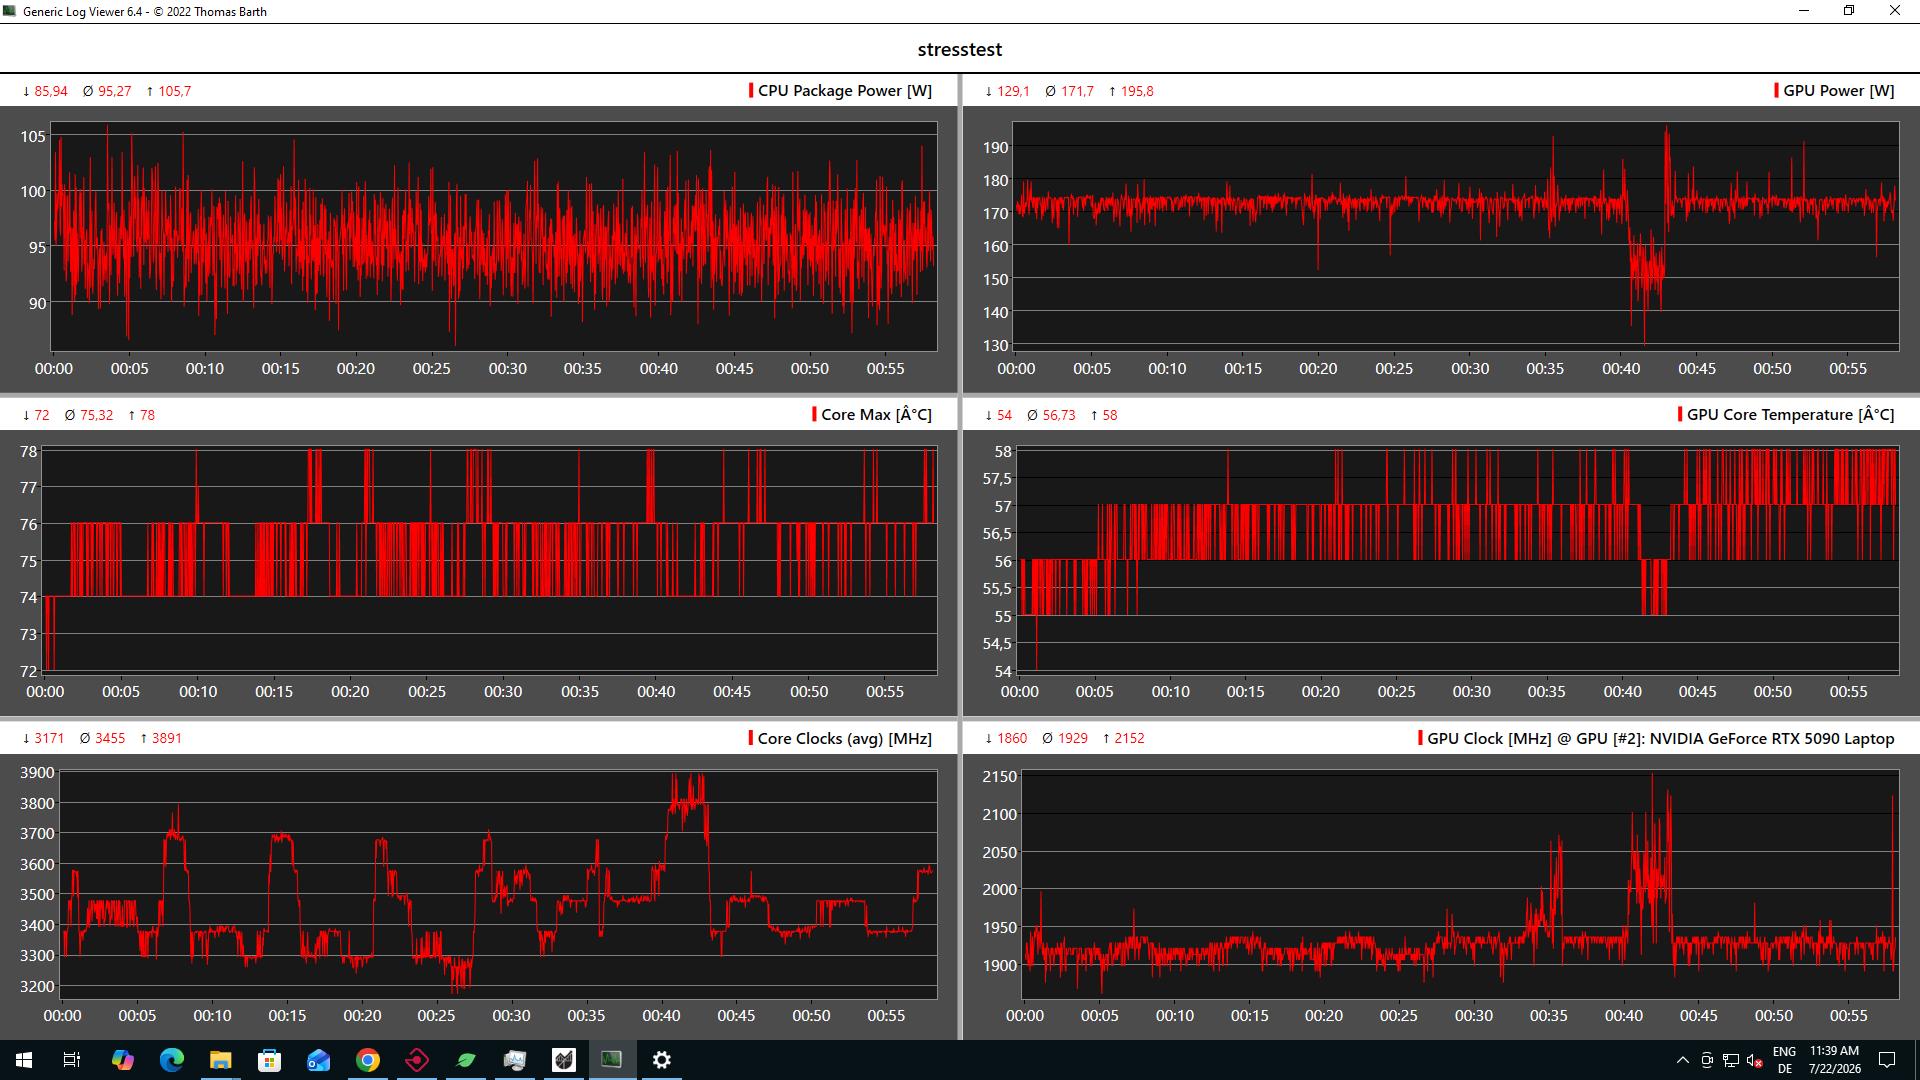
CPU/GPU-Daten Stresstest
Max. Last
 34.3 °C37.5 °C32.6 °C 
 29.2 °C34.6 °C27.7 °C 
 26.8 °C28.6 °C27.3 °C 
Maximal: 37.5 °C
Durchschnitt: 31 °C
25.8 °C40.9 °C28.5 °C
25.7 °C26.1 °C26.4 °C
26.3 °C27.5 °C27.4 °C
Maximal: 40.9 °C
Durchschnitt: 28.3 °C
Netzteil (max.)  53.9 °C | Raumtemperatur 22.7 °C | Fluke t3000FC (calibrated)
(+) Die Durchschnittstemperatur auf der Oberseite unter extremer Last ist 31 °C. Im Vergleich erhitzte sich der Durchschnitt der Geräteklasse Gaming auf 33.9 °C.
(+) Die maximale Temperatur auf der Oberseite ist 37.5 °C. Im Vergleich liegt der Klassendurchschnitt bei 40.4 °C (von 21.2 bis 68.8 °C für die Klasse Gaming).
(±) Auf der Unterseite messen wir eine maximalen Wert von 40.9 °C (im Vergleich zum Durchschnitt von 43.2 °C).
(+) Ohne Last messen wir eine durchschnittliche Temperatur von 28 °C auf der Oberseite. Der Klassendurchschnitt erreicht 33.9 °C.
(±) 3: The average temperature for the upper side is 32.7 °C / 91 F, compared to the average of 33.9 °C / 93 F for the class Gaming.
(+) Die Handballen und der Touchpad-Bereich sind mit gemessenen 30.7 °C kühler als die typische Hauttemperatur und fühlen sich dadurch kühl an.
(±) Die durchschnittliche Handballen-Temperatur anderer getesteter Geräte war 28.8 °C (-1.9 °C).
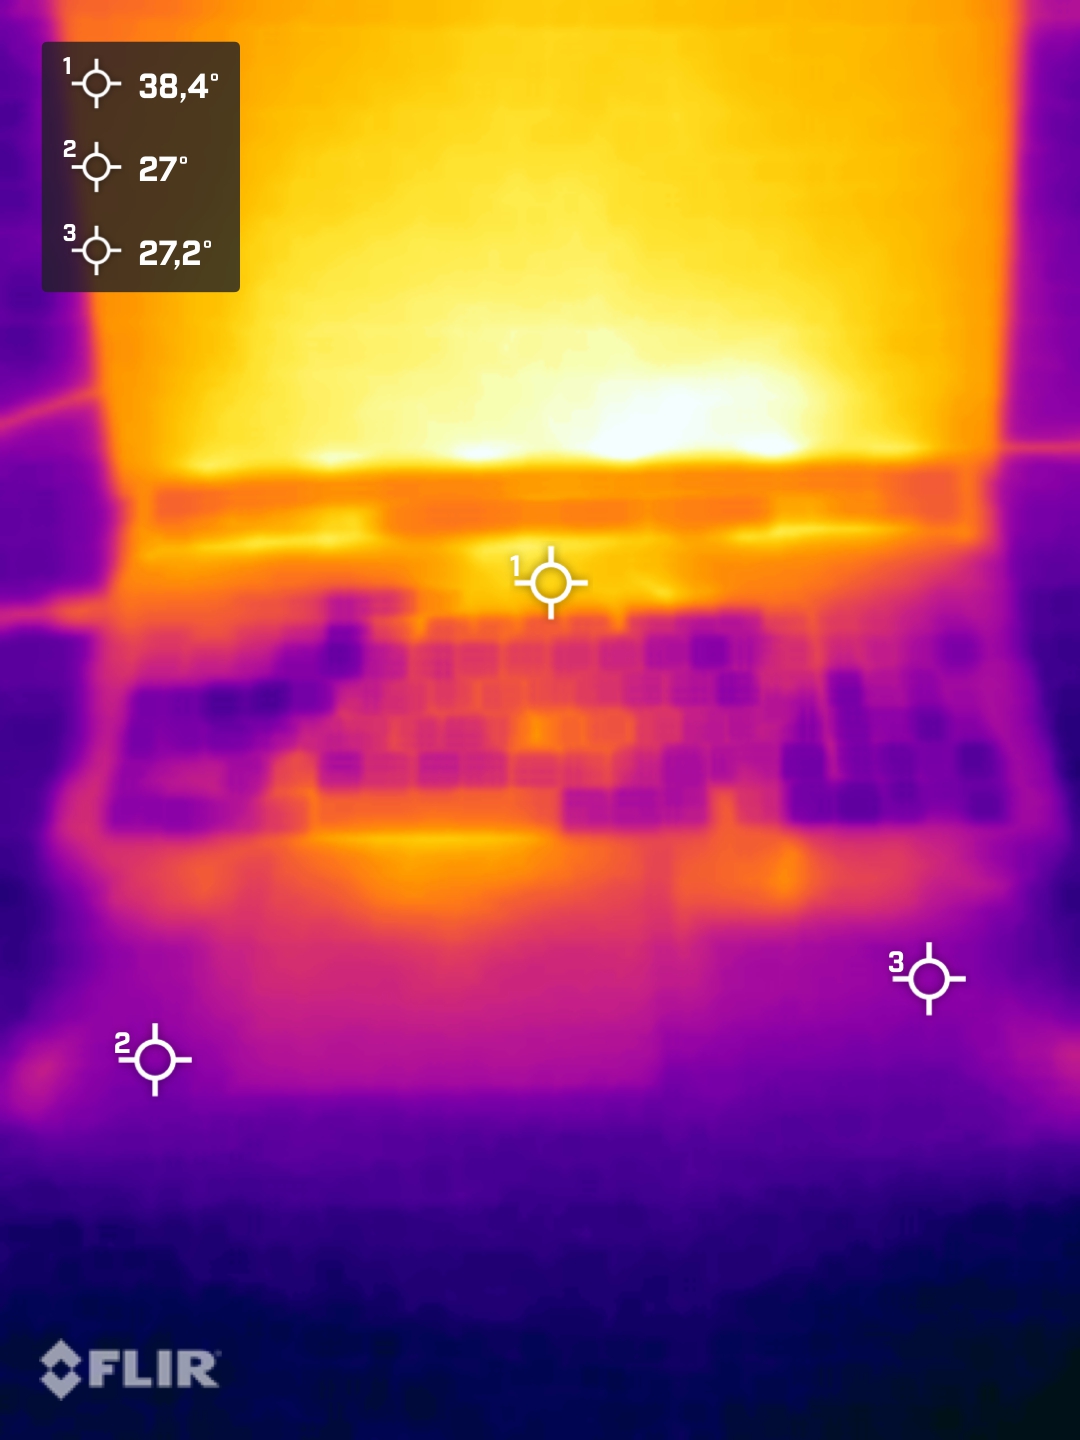
Oberflächentemperaturen Stresstest (Oberseite)
Oberflächentemperaturen Stresstest (Unterseite)
Netzteil beim Stresstest
Asus ROG Strix Scar 18 G835LXG
Ultra 9 290HX Plus, GeForce RTX 5090 Laptop
Asus Strix Scar 18 G835LX
Ultra 9 275HX, GeForce RTX 5090 Laptop
Razer Blade 18 2024 RZ09-0509
i9-14900HX, GeForce RTX 4090 Laptop GPU
Alienware m18 R2
i9-14900HX, GeForce RTX 4090 Laptop GPU
Acer Predator Helios 18 PH18-72-98MW
i9-14900HX, GeForce RTX 4090 Laptop GPU
MSI Titan 18 HX A14VIG
i9-14900HX, GeForce RTX 4090 Laptop GPU
Schenker Key 17 Pro (M24)
i9-14900HX, GeForce RTX 4090 Laptop GPU
Hitze
-6%
-14%
-19%
-19%
-6%
-45%
Last oben max * (°C)
37.5
45.6
-22%
43.2
-15%
41.2
-10%
43
-15%
37.8
-1%
51
-36%
Last unten max * (°C)
40.9
46
-12%
42.6
-4%
34.6
15%
59
-44%
37.6
8%
64
-56%
Idle oben max * (°C)
31.1
28.9
7%
36
-16%
42.8
-38%
32
-3%
34.8
-12%
42.3
-36%
Idle unten max * (°C)
30.2
29.2
3%
36.4
-21%
43.6
-44%
34
-13%
36
-19%
46
-52%

* ... kleinere Werte sind besser

Lautsprecher

Das Asus ROG Strix SCAR 18 verfügt über ein Vier-Lautsprecher-System, das mit einer insgesamt guten Klangqualität überzeugt. Stimmen werden klar wiedergegeben und auch Musik sowie Filme profitieren von einer ausgewogenen Abstimmung. Im direkten Vergleich mit einigen High-End-Konkurrenten gibt es jedoch Systeme mit noch kräftigerem Klang und mehr Tiefton. Für Gaming empfiehlt sich ohnehin die Nutzung eines Headsets, da die Lüfter unter hoher Last deutlich hörbar sind.

dB(A) 0102030405060708090Deep BassMiddle BassHigh BassLower RangeMidsHigher MidsLower HighsMid HighsUpper HighsSuper Highs2028.333.42528.828.63130294023.522.65018.933.56315.722.88011.434.710012.342.812511.446.61601351.620010.455.825010603159.263.440010.165.950010.668.66301073.980010.476.1100011.973.712501275.5160011.974.1200011.967250012.464.6315013.262.6400013.858500014.153.6630014.553.4800014.759.5100001573.41250014.667.91600014.259.9SPL2582.6N0.651.8median 12median 63.4Delta1.89.426.325.821.422.12624.925.127.622.532.523.448.72655.818.860.922.167.2267019.372.317.674.217.774.319.575.31571.711.871.311.27410.574.21072.710.17210.67210.97511.374.811.671.71269.71269.612.371.112.669.61270.111.269.824.784.70.666.6median 12median 71.73.42.2hearing rangehide median Pink NoiseAsus ROG Strix Scar 18 G835LXGApple MacBook Pro 16 2021 M1 Pro
Frequenzdiagramm (für Vergleiche die Checkboxen oben an-/abwählen)
Asus ROG Strix Scar 18 G835LXG Audio Analyse

(+) | Die Lautsprecher können relativ laut spielen (82.6 dB)
Bass 100 - 315 Hz
(±) | abgesenkter Bass - 10% geringer als der Median
(±) | durchschnittlich lineare Bass-Wiedergabe (9.3% Delta zum Vorgänger)
Mitteltöne 400 - 2000 Hz
(±) | zu hohe Mitten, vom Median 8.5% abweichend
(+) | lineare Mitten (6.2% Delta zum Vorgänger)
Hochtöne 2 - 16 kHz
(±) | verringerte Hochtöne, 5.8% geringer als der Median
(±) | durchschnittlich lineare Hochtöne (9.4% Delta zum Vorgänger)
Gesamt im hörbaren Bereich 100 - 16.000 Hz
(±) | hörbarer Bereich ist durchschnittlich linear (16.2% Abstand zum Median)
Im Vergleich zu allen Geräten derselben Klasse
» 40% aller getesteten Geräte dieser Klasse waren besser, 7% vergleichbar, 53% schlechter
» Das beste Gerät hat einen Delta-Wert von 6%, durchschnittlich ist 18%, das schlechteste Gerät hat 132%
Im Vergleich zu allen Geräten im Test
» 26% aller getesteten Geräte waren besser, 6% vergleichbar, 68% schlechter
» Das beste Gerät hat einen Delta-Wert von 4%, durchschnittlich ist 23%, das schlechteste Gerät hat 134%

Apple MacBook Pro 16 2021 M1 Pro Audio Analyse

(+) | Die Lautsprecher können relativ laut spielen (84.7 dB)
Bass 100 - 315 Hz
(+) | guter Bass - nur 3.8% Abweichung vom Median
(+) | lineare Bass-Wiedergabe (5.2% Delta zum Vorgänger)
Mitteltöne 400 - 2000 Hz
(+) | ausgeglichene Mitten, vom Median nur 1.3% abweichend
(+) | lineare Mitten (2.1% Delta zum Vorgänger)
Hochtöne 2 - 16 kHz
(+) | ausgeglichene Hochtöne, vom Median nur 1.9% abweichend
(+) | sehr lineare Hochtöne (2.7% Delta zum Vorgänger)
Gesamt im hörbaren Bereich 100 - 16.000 Hz
(+) | hörbarer Bereich ist sehr linear (4.6% Abstand zum Median
Im Vergleich zu allen Geräten derselben Klasse
» 0% aller getesteten Geräte dieser Klasse waren besser, 0% vergleichbar, 100% schlechter
» Das beste Gerät hat einen Delta-Wert von 5%, durchschnittlich ist 17%, das schlechteste Gerät hat 45%
Im Vergleich zu allen Geräten im Test
» 0% aller getesteten Geräte waren besser, 0% vergleichbar, 100% schlechter
» Das beste Gerät hat einen Delta-Wert von 4%, durchschnittlich ist 23%, das schlechteste Gerät hat 134%

Energieaufnahme

Das Asus ROG Strix SCAR 18 zählt nicht zu den sparsamsten Gaming-Notebooks. Bereits im Leerlauf fällt der Energiebedarf aufgrund der leistungsstarken Hardware und des hellen Mini-LED-Displays vergleichsweise hoch aus. Unter Volllast erreicht das System kurzzeitig eine Leistungsaufnahme von bis zu 354 Watt, pendelt sich anschließend jedoch bei rund 230 Watt ein. Das mitgelieferte 450-Watt-Netzteil bietet damit ausreichende Reserven. Der Standby-Verbrauch fällt mit 19 Watt unnötig hoch aus.

Asus ROG Strix SCAR 18 mit 450-Watt-Netzteil
450-Watt-Netzteil
450-Watt-Netzteil

Energieaufnahme und Akkulaufzeit

Der 90-Wh-Akku des Asus ROG Strix SCAR 18 kann die hohe Leistungsaufnahme des Systems naturgemäß nur begrenzt kompensieren. Im praxisnahen WLAN-Test erreicht das Gaming-Notebook eine Laufzeit von lediglich 4 Stunden. Die Konkurrenz bietet hier mitunter bessere Werte.

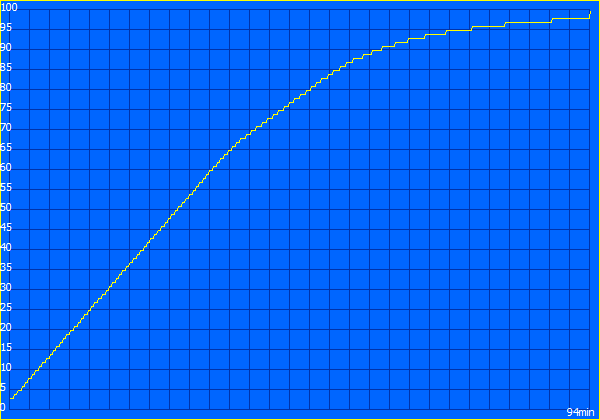
Akku-Informationen
Akku-Informationen
Ladevorgang
Ladevorgang
Stromverbrauch
Aus / Standbydarklight 0.8 / 19.4 Watt
Idledarkmidlight 15.5 / 43.2 / 47.6 Watt
Last midlight 163.9 / 354 Watt
 color bar
Legende: min: dark, med: mid, max: light        Metrahit Energy

Energieaufnahme Cyberpunk / Stresstest

0102030405060708090100110120130140150160170180190200210220230240250260270280290300310320330340350Tooltip
Asus ROG Strix Scar 18 G835LXG; 1280x720 Prime95 28.10 and Furmark 1.25: Ø229 (160.4-354) Watt
Asus ROG Strix Scar 18 G835LXG; Idle 150cd/m2: Ø37.3 (22.4-50.4) Watt
Asus ROG Strix Scar 18 G835LXG; Cyberpunk 2077 FHD ultra no FSR 150cd: Ø254 (249-269) Watt

Energieaufnahme mit externem Monitor

05101520253035404550556065707580859095100105110115120125130135140145150155160165170175180185190195200205210215220225230235240245Tooltip
Asus ROG Strix Scar 18 G835LXG; Prime95 V2810 Stress (external Monitor): Ø190.3 (177.2-205) Watt
Asus ROG Strix Scar 18 G835LXG; Cinebench R15 Multi (external Monitor): Ø190.3 (189.5-191.1) Watt
Asus ROG Strix Scar 18 G835LXG; Cinebench R23 Single (external Monitor): Ø73.8 (69.2-99.1) Watt
Asus ROG Strix Scar 18 G835LXG; Cinebench R23 Multi (external Monitor): Ø189 (187.4-190.8) Watt
Asus ROG Strix Scar 18 G835LXG; 1280x720 FurMark 1.19 GPU Stress Test (external Monitor): Ø209 (192.1-223) Watt
Asus ROG Strix Scar 18 G835LXG; Idle 1min (external Monitor): Ø33.4 (17.6-51.5) Watt
Asus ROG Strix Scar 18 G835LXG; Cyberpunk 2077 FHD ultra no FSR (external Monitor): Ø241 (237-249) Watt
Akkulaufzeit
Idle (ohne WLAN, min Helligkeit)
2h 58min
WiFi Websurfing
4h 00min
WiFi Websurfing max. Brightness
2h 16min
Big Buck Bunny H.264 1080p
2h 08min
Last (volle Helligkeit)
1h 31min
Asus ROG Strix Scar 18 G835LXG
Ultra 9 290HX Plus, GeForce RTX 5090 Laptop, 90 Wh
Asus Strix Scar 18 G835LX
Ultra 9 275HX, GeForce RTX 5090 Laptop, 90 Wh
Razer Blade 18 2024 RZ09-0509
i9-14900HX, GeForce RTX 4090 Laptop GPU, 91.7 Wh
Alienware m18 R2
i9-14900HX, GeForce RTX 4090 Laptop GPU, 97 Wh
Acer Predator Helios 18 PH18-72-98MW
i9-14900HX, GeForce RTX 4090 Laptop GPU, 90 Wh
MSI Titan 18 HX A14VIG
i9-14900HX, GeForce RTX 4090 Laptop GPU, 99.9 Wh
Schenker Key 17 Pro (M24)
i9-14900HX, GeForce RTX 4090 Laptop GPU, 99 Wh
Durchschnitt der Klasse Gaming
 
Akkulaufzeit
65%
32%
20%
-24%
27%
-21%
138%
Idle (h)
3
6.6
120%
5.9
97%
H.264 (h)
2.1
5.8
176%
WLAN (h)
4
5.5
38%
4.4
10%
4.8
20%
3.2
-20%
4.2
5%
3.4
-15%
Last (h)
1.5
1.2
-20%
1
-33%
1.1
-27%
1.2
-20%
1.1
-27%
Cyberpunk 2077 ultra 150cd (h)
0.7
1.1

Notebookcheck Gesamtbewertung

Asus ROG Strix Scar 18 G835LXG - 24.07.2026 v8
Sebastian Bade

Gehäuse
85 / 98 → 86%
Tastatur
91%
Pointing Device
86%
Konnektivität
75 / 80 → 94%
Gewicht
53 / 10-68 → 73%
Akkulaufzeit
55 / 95 → 58%
Display
87%
Leistung Spiele
96%
Leistung Anwendungen
97%
Workstation
81%
Temperatur
93 / 95 → 97%
Lautstärke
59 / 90 → 65%
Audio
78%
Kamera
33 / 75 → 43%
Durchschnitt
59%
87%
Gaming - gewichteter Durchschnitt
Weitere Informationen über unsere Bewertung finden Sie hier.
CO2 Emissions
No Data
Materials
0%
Packaging
50%
Power Use
41.8%
Repairability
40%
Software Updates
22.3%
Recycle Logo Total Sustainability Score: 25.7%

Mögliche Alternativen im Vergleich

Bild
Modell / Test
Preis ab
Gewicht
Dicke
Display
1.
87.4%
Asus ROG Strix Scar 18 G835LXG
Intel Core Ultra 9 290HX Plus ⎘
NVIDIA GeForce RTX 5090 Laptop ⎘
128 GB RAM, 8192 GB SSD
Amazon:
1. 3.076,79 €
ASUS ROG Strix Scar 18 (2025...
2. 3.603,76 €
ASUS ROG Strix Scar 18 G835L...
3. 4.066,93 €
ASUS ROG Strix Scar 18 G835L...
Listenpreis: 8999€
3.6 kg35 mm18.00"
3840x2400
252 PPI
Mini LED
2.
88%
Asus Strix Scar 18 G835LX
Intel Core Ultra 9 275HX ⎘
NVIDIA GeForce RTX 5090 Laptop ⎘
64 GB RAM, 2048 GB SSD
Amazon: 5.496,89 €
Geizhals Suche
3.3 kg32 mm18.00"
2560x1600
168 PPI
Mini-LED
3.
90.5% v7 (old)
Razer Blade 18 2024 RZ09-0509
Intel Core i9-14900HX ⎘
NVIDIA GeForce RTX 4090 Laptop GPU ⎘
32 GB RAM
Amazon:
Geizhals Suche
3.1 kg21.9 mm18.00"
2560x1600
168 PPI
Mini-LED
4.
89.5% v7 (old)
Alienware m18 R2
Alienware m18 R2
Intel Core i9-14900HX ⎘
NVIDIA GeForce RTX 4090 Laptop GPU ⎘
32 GB RAM, 2048 GB SSD
Amazon:
1. 1.868,76 €
Alienware m18 R2 Gaming Lapt...
2. 1.399,00 €
Alienware m16 R2 Gaming Lapt...
3. 35,99 €
240W Netzteil Ladegerät Kom...
Listenpreis: 3300 USD
4 kg26.7 mm18.00"
2560x1600
168 PPI
IPS
5.
87.1% v7 (old)
Acer Predator Helios 18 PH18-72-98MW
Intel Core i9-14900HX ⎘
NVIDIA GeForce RTX 4090 Laptop GPU ⎘
32 GB RAM, 2048 GB SSD
Amazon:
1. 2.564,74 €
Acer Predator Helios 18 (PH1...
2. 2.949,00 €
Acer Predator Helios Neo 18 ...
3. 2.478,66 €
Acer Predator Helios 18 (PH1...
3.3 kg29.5 mm18.00"
2560x1600
168 PPI
Mini-LED
6.
88.8% v7 (old)
MSI Titan 18 HX A14VIG
Intel Core i9-14900HX ⎘
NVIDIA GeForce RTX 4090 Laptop GPU ⎘
128 GB RAM, 4096 GB SSD
Amazon:
1. 3.168,95 €
MSI Titan 18 HX A14VIG-080ES...
2. 7.799,00 €
MSI Titan 18 HX Draco Epic G...
3. 5.001,59 €
MSI Titan 18 HX AI A2XWIG-24...
Listenpreis: 5000 USD
3.6 kg32.1 mm18.00"
3840x2400
252 PPI
Mini-LED
7.
85.1%
Schenker Key 17 Pro (M24)
Intel Core i9-14900HX ⎘
NVIDIA GeForce RTX 4090 Laptop GPU ⎘
32 GB RAM, 1024 GB SSD
Amazon:
Listenpreis: 4273€
3.4 kg24.9 mm17.30"
3840x2160
255 PPI
IPS

Transparenz

Die Auswahl der zu testenden Geräte erfolgt innerhalb der Redaktion. Das vorliegende Testmuster wurde dem Autor vom Hersteller oder einem Shop zu Testzwecken leihweise zur Verfügung gestellt. Eine Einflussnahme des Leihstellers auf den Testbericht gab es nicht, der Hersteller erhielt keine Version des Reviews vor der Veröffentlichung. Es bestand keine Verpflichtung zur Publikation. Als eigenständiges, unabhängiges Unternehmen unterliegt Notebookcheck keiner Diktion von Herstellern, Shops und Verlagen.

So testet Notebookcheck

Pro Jahr werden von Notebookcheck hunderte Laptops und Smartphones unabhängig in von uns standardisierten technischen Verfahren getestet, um eine Vergleichbarkeit aller Testergebnisse zu gewährleisten. Seit rund 20 Jahren entwickeln wir diese Testmethoden kontinuierlich weiter und setzen damit Branchenstandards. In unseren Testlaboren kommt ausschließlich hochwertiges Messequipment in die Hände erfahrener Techniker und Redakteure. Die Tests unterliegen einer mehrstufigen Kontrolle. Unsere komplexe Gesamtbewertung basiert auf hunderten fundierten Messergebnissen und Benchmarks, womit Ihnen Objektivität garantiert ist. Weitere Informationen zu unseren Testmethoden gibt es hier.

Google LogoAls bevorzugte Quelle auf Google hinzufügen
Mail Logo
static version load dynamic
Loading Comments
Diesen Artikel kommentieren / Antworten
> Notebook Test, Laptop Test und News > Tests > Notebook Testberichte > 4K-Mini-LED trifft auf GeForce RTX 5090 Laptop - Asus ROG Strix SCAR 18 G835LXG im Test
Autor: Sebastian Bade, 24.07.2026 (Update: 24.07.2026)