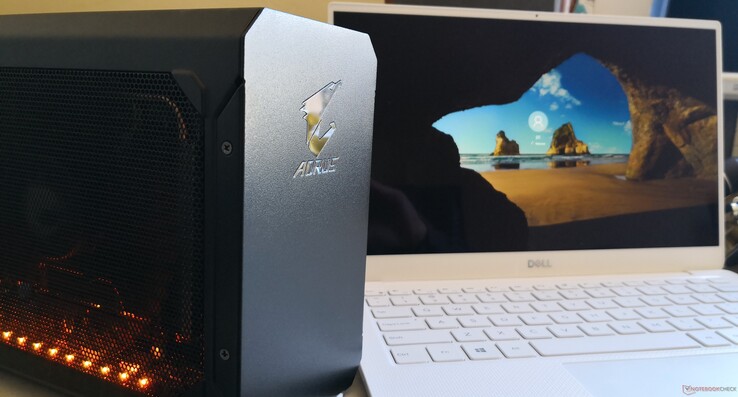
Test Aorus RTX 2070 Gaming Box with Dell XPS 13 9380
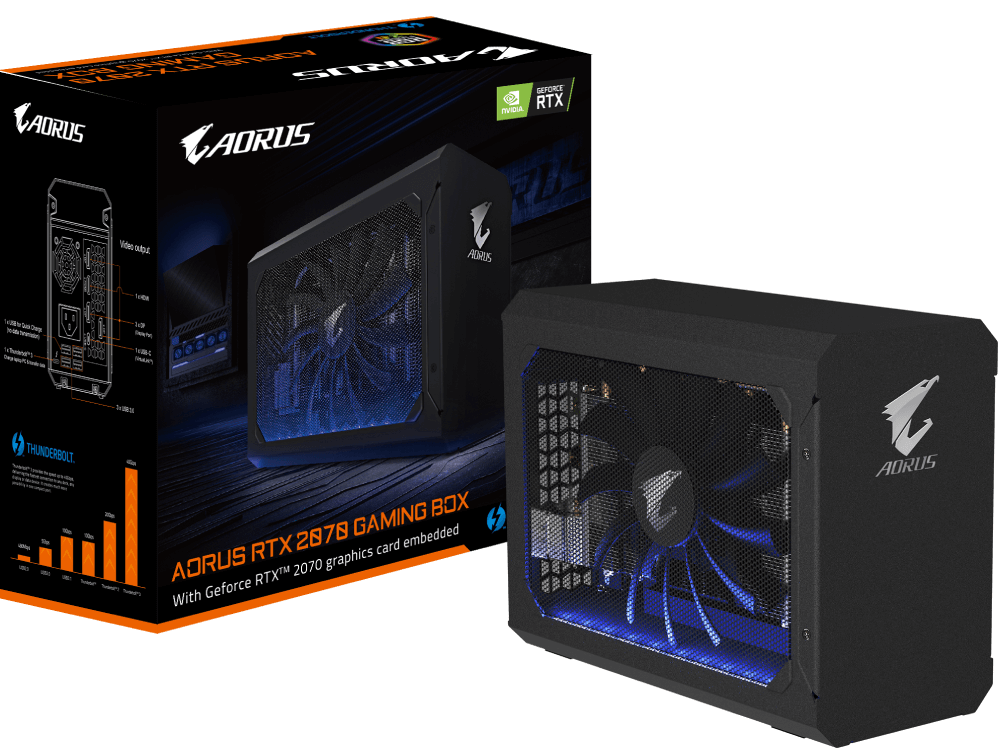
Im letzten Jahr gab es die Aorus Gaming Box bereits mit GeForce GTX 1070 und GTX 1080. Dank Thunderbolt 3 konnte man damit jedes Windows-10-Notebook in einen waschechten Gamer verwandeln. Im aktuellen Modell steckt nun bei identischem Gehäuse und Abmessungen eine RTX 2070. Für mehr Informationen zum Gehäuse und seinen Eigenheiten empfehlen wir daher unser ursprüngliches Review der Gaming Box GTX 1080. Die dort getroffenen Aussagen zu diesem Aspekt gelten unverändert weiter.
Im aktuellen Artikel wollen wir uns der Frage widmen, wie die Performance der Gaming Box im Vergleich mit einer Desktop-RTX-2070 ist. Daher liegt der Fokus des vorliegenden Berichts folglich auch auf den Ergebnissen der Benchmarks.
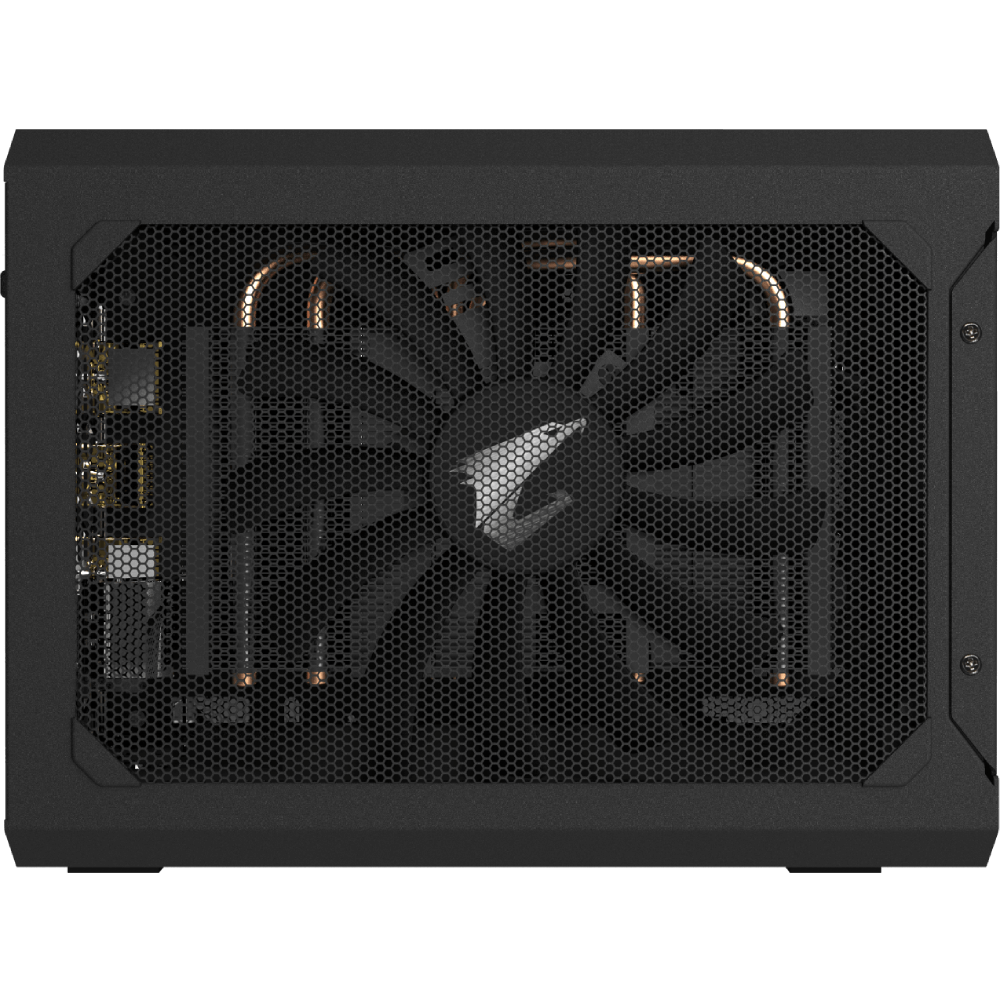
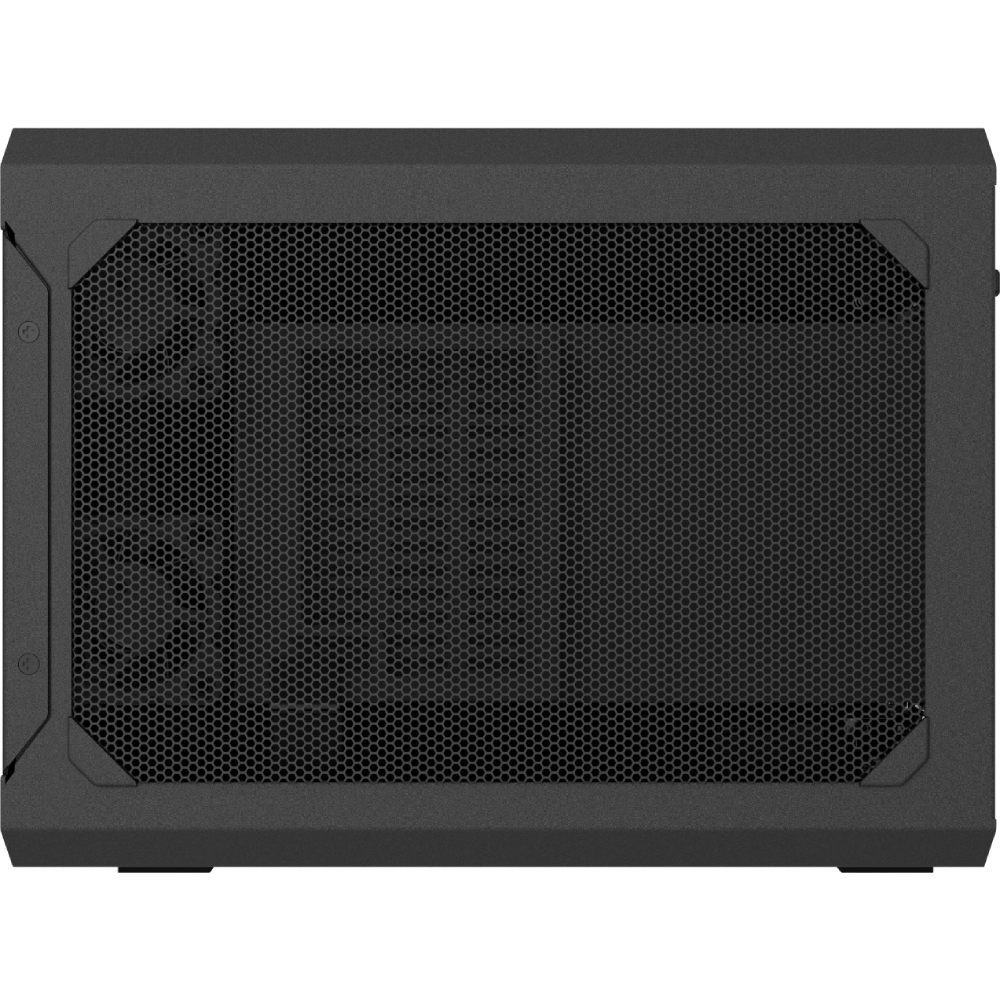
Gehäuse
Anschlüsse
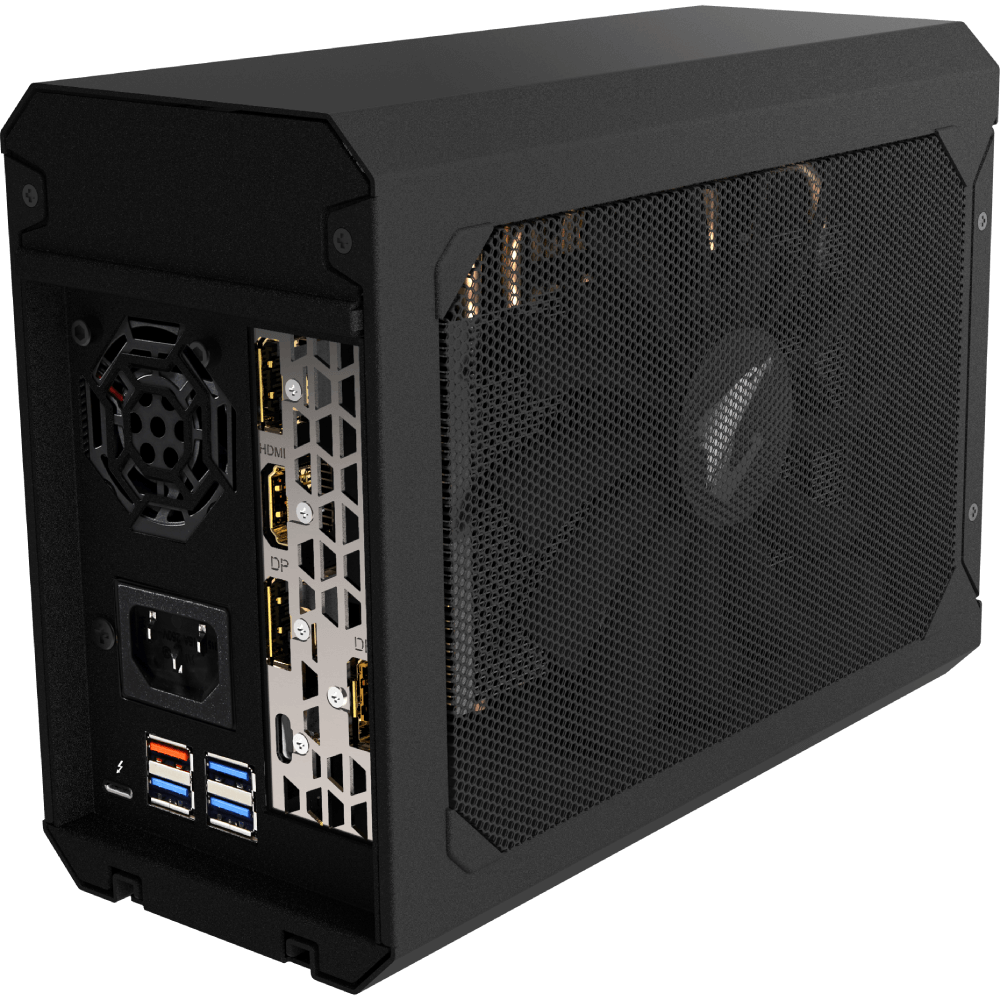
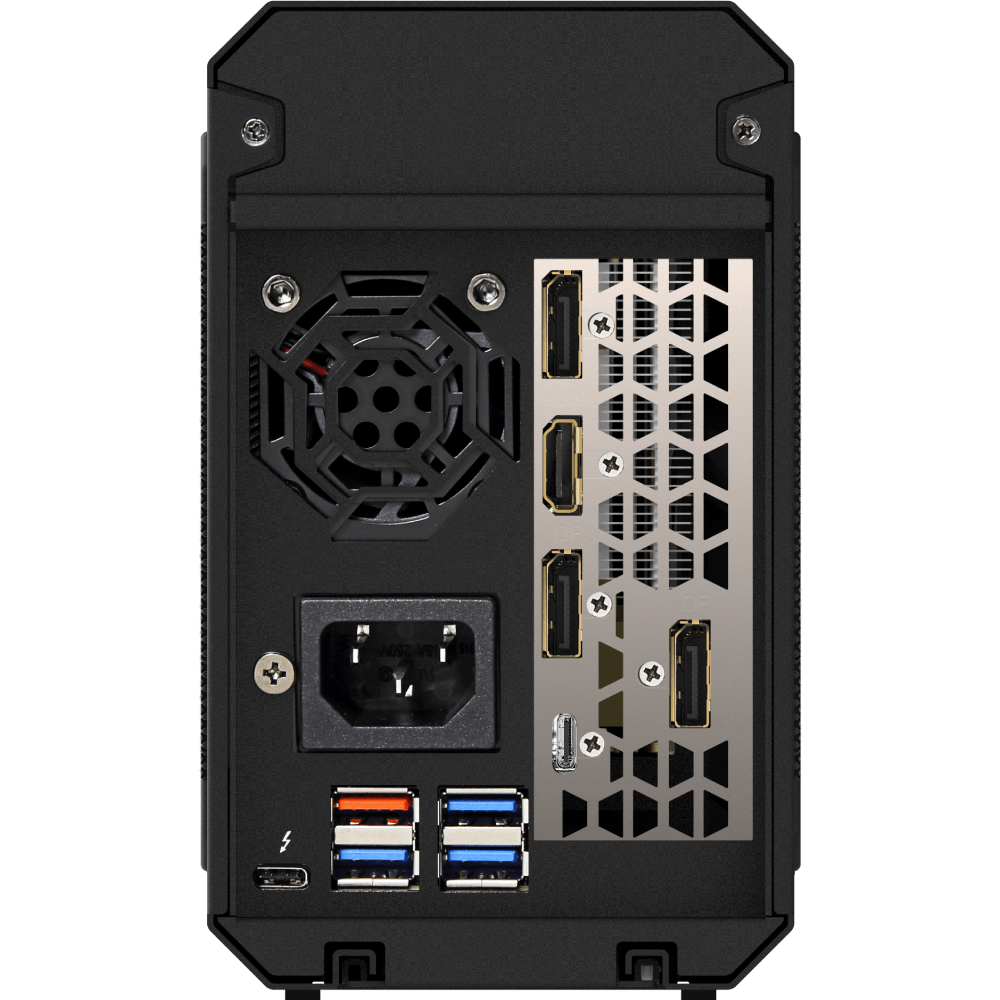
3x DisplayPort 1.4, 1x HDMI 2.0b, 4x USB 3.0, 1x USB-C (für VirtualLink), 1x Thunderbolt 3 (zum Anschluss an den PC). Der DVI-Port des Vorjahresmodells fehlt.
Test-Setup
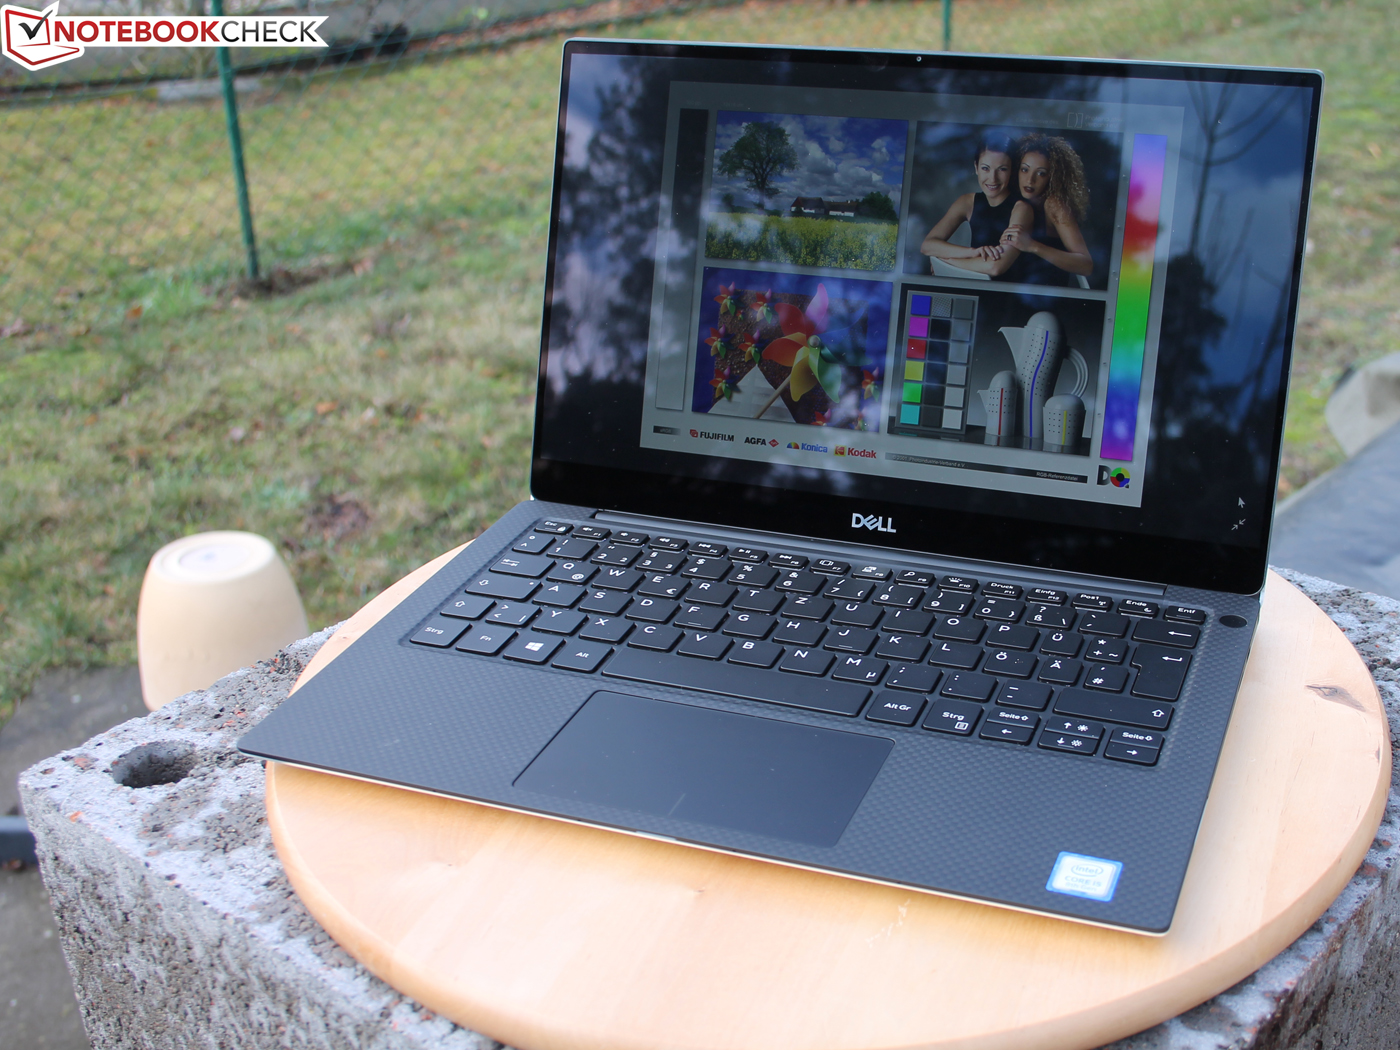
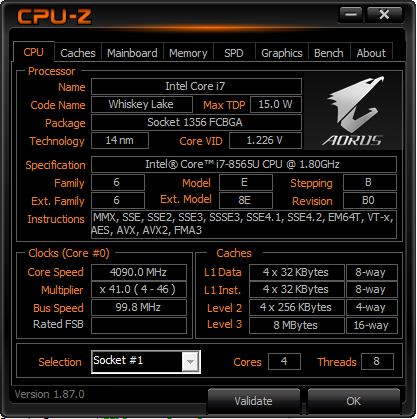
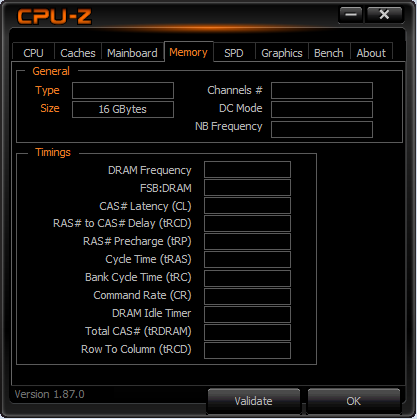
Letztes Jahr haben wir die Gaming Box GTX 1080 an ein Dell XPS 15 9575 mit Kaby Lake-G angeschlossen. Dieses Jahr fiel die Wahl auf ein weniger exotisches Ultrabook, das XPS 13 9380 mit 16 GB RAM und einem Core i7-8565U.
Installation und Inbetriebnahme sind denkbar einfach. Unser Dell-Notebook erkannte die externe GPU auf Anhieb und lud die benötigten Treiber automatisch nach. Nach einem Neustart ist die Gaming Box bereit. Da dem Gerät der bereits etwas angestaubte Nvidia-Treiber in Version 416.34 beilag, mussten wir die aktuelle 419.35 manuell herunterladen und einspielen. Um ein zum Razer Core möglichst identisches Setup zu haben, war der externe, an die Gaming Box angeschlossene Bildschirm auf 1080p eingestellt. Bei höherer Auflösung wäre die Performance möglicherweise drastisch reduziert gewesen. Die initiale Einrichtung dauert nur ein paar Minuten, man sollte allerdings nicht vergessen, dass ein Abstecken der Gaming Box ohne vorheriges Herunterfahren von Windows unweigerlich zu einem Absturz führt.
Die Stabilität und Zuverlässigkeit des Systems lassen noch zu wünschen übrig. Sollte ein Spiel abstürzen, einfrieren, gar nicht erst starten oder einen soft Reboot benötigen, kann das System die eGPU anschließend durchaus nicht mehr erkennen. Abstecken, wieder anstecken und ein hard Reboot lösen das Problem in der Regel. Das eGPU-Konzept hat noch einen weiten Weg vor sich, bis es echtes Plug-and-Play beherrscht.
Performance
System Performance
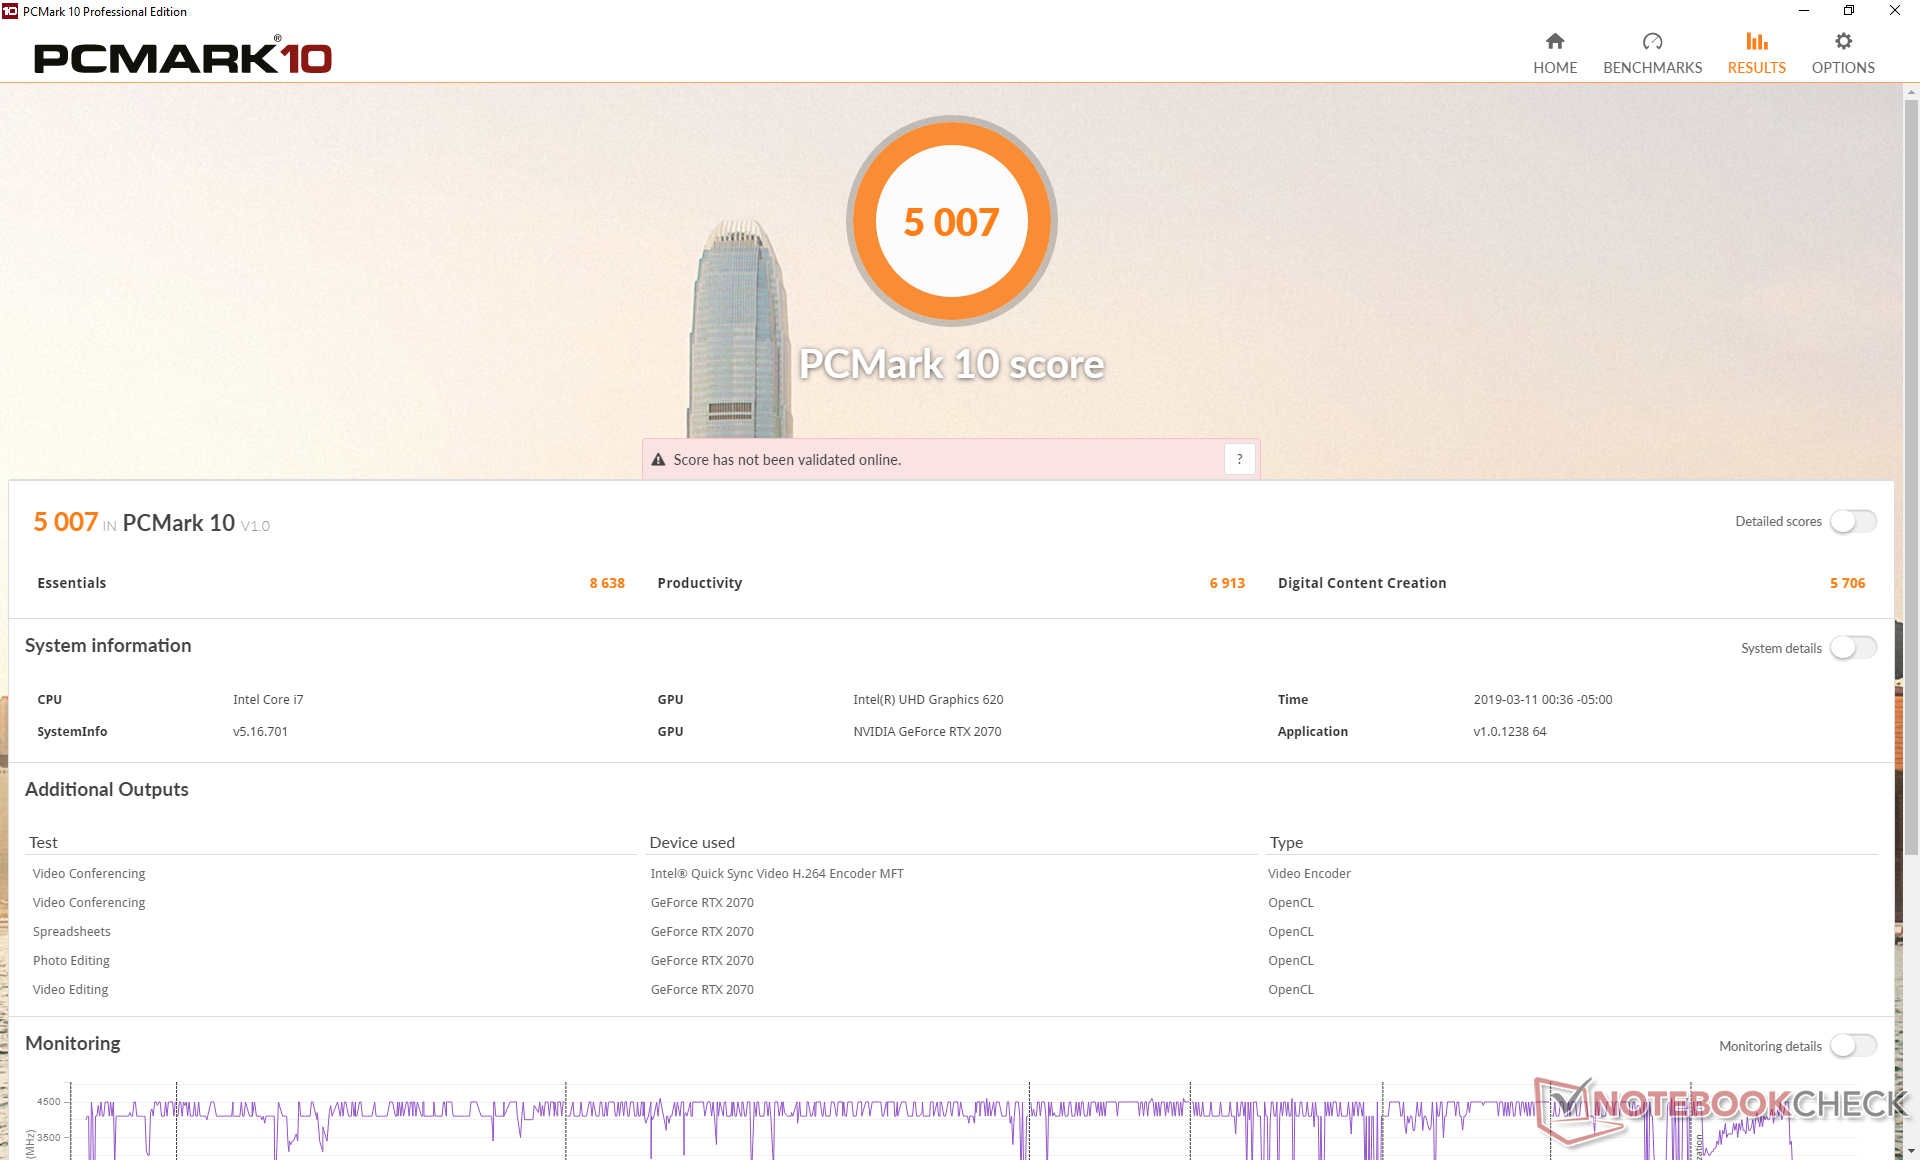
Im PCMark 10 sind die Ergebnisse mit oder ohne Gaming Box nahezu identisch. Der Laptop wird bei Aufgaben wie dem Surfen im Internet oder Office-Anwendungen also nicht nennenswert beschleunigt. Einzig in Digital Content Creation gab es einen spürbaren Boost zu verzeichnen, hier kann die eGPU ihre Muskeln erstmals spielen lassen. Verglichen mit dem MSI GE75 mit exakt der gleichen RTX 2070 lag unser XPS 13 mit eGPU um gerade mal 7 % zurück.
Grafikkarte
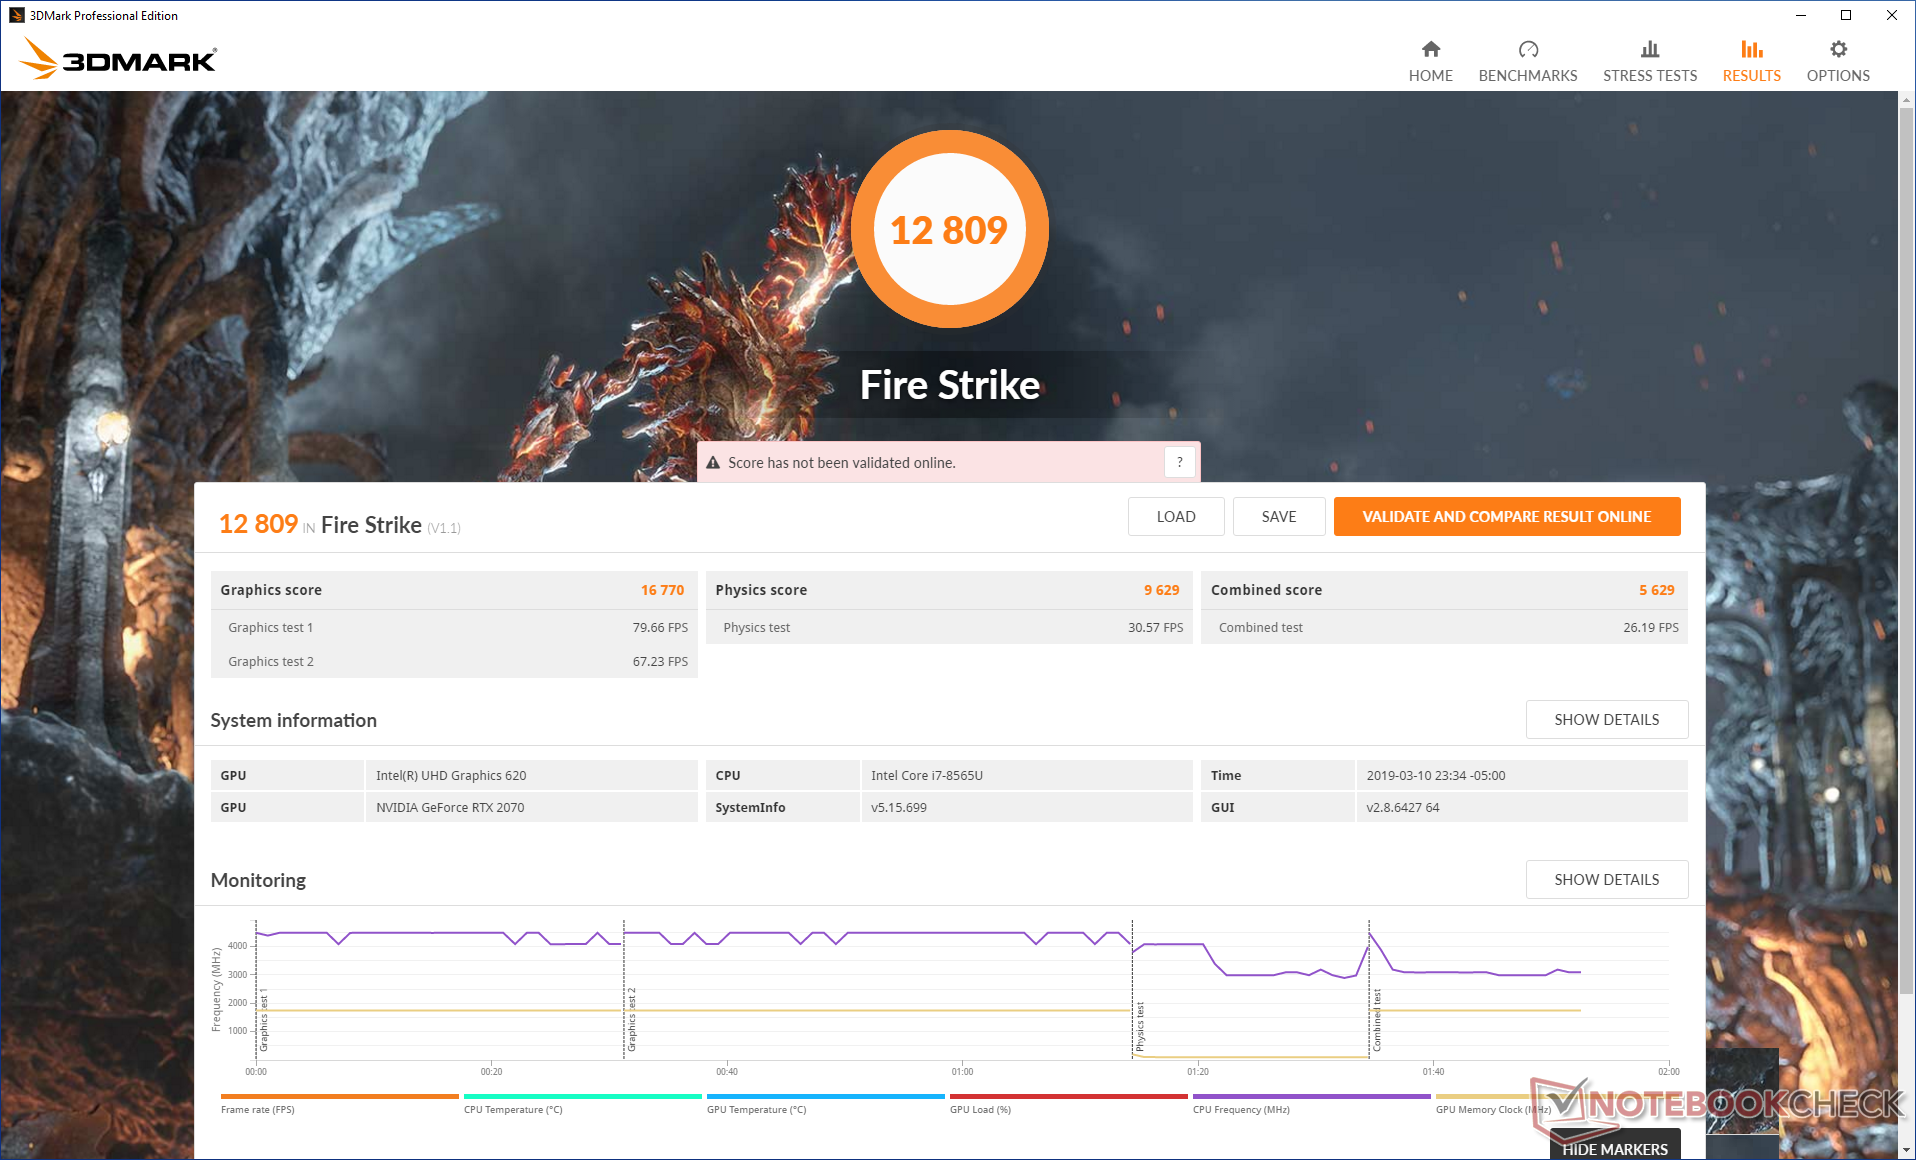
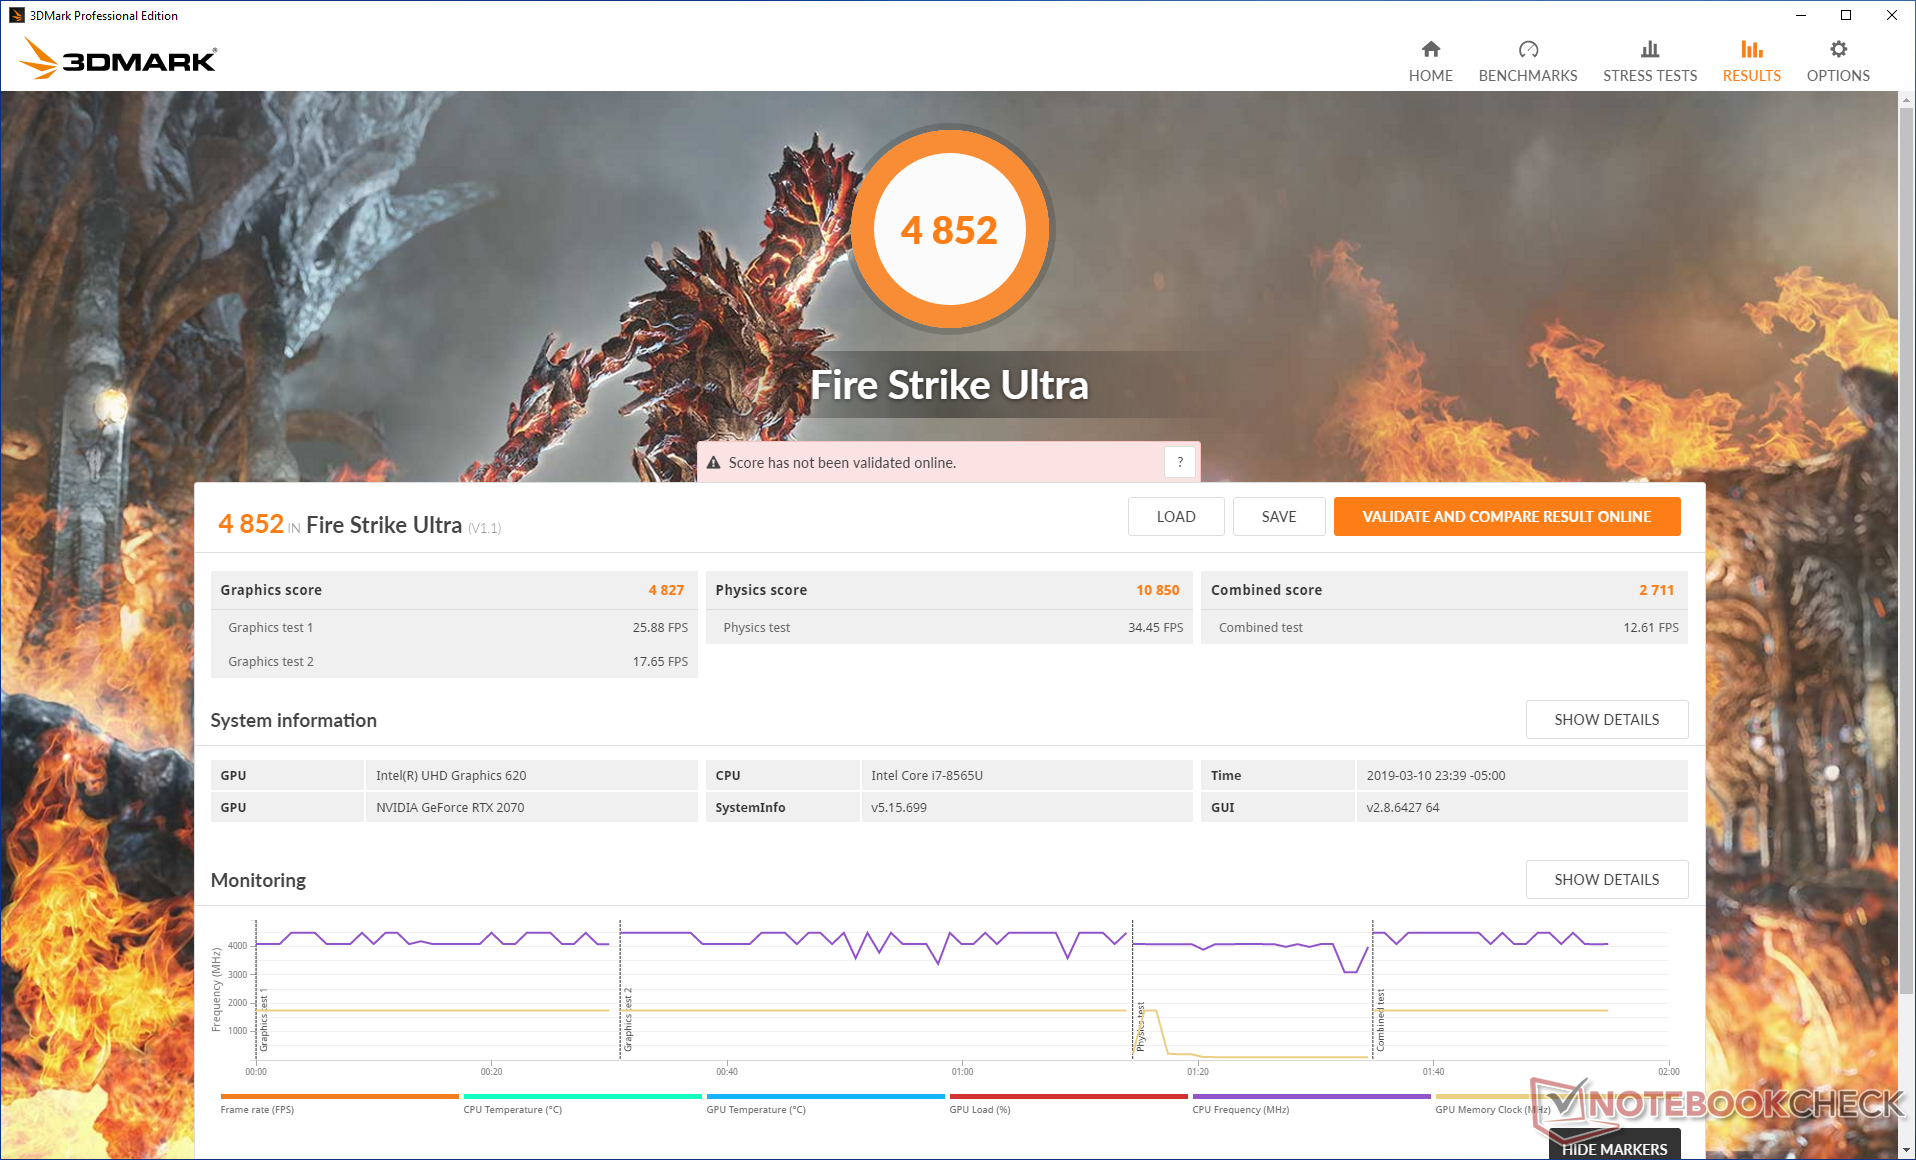
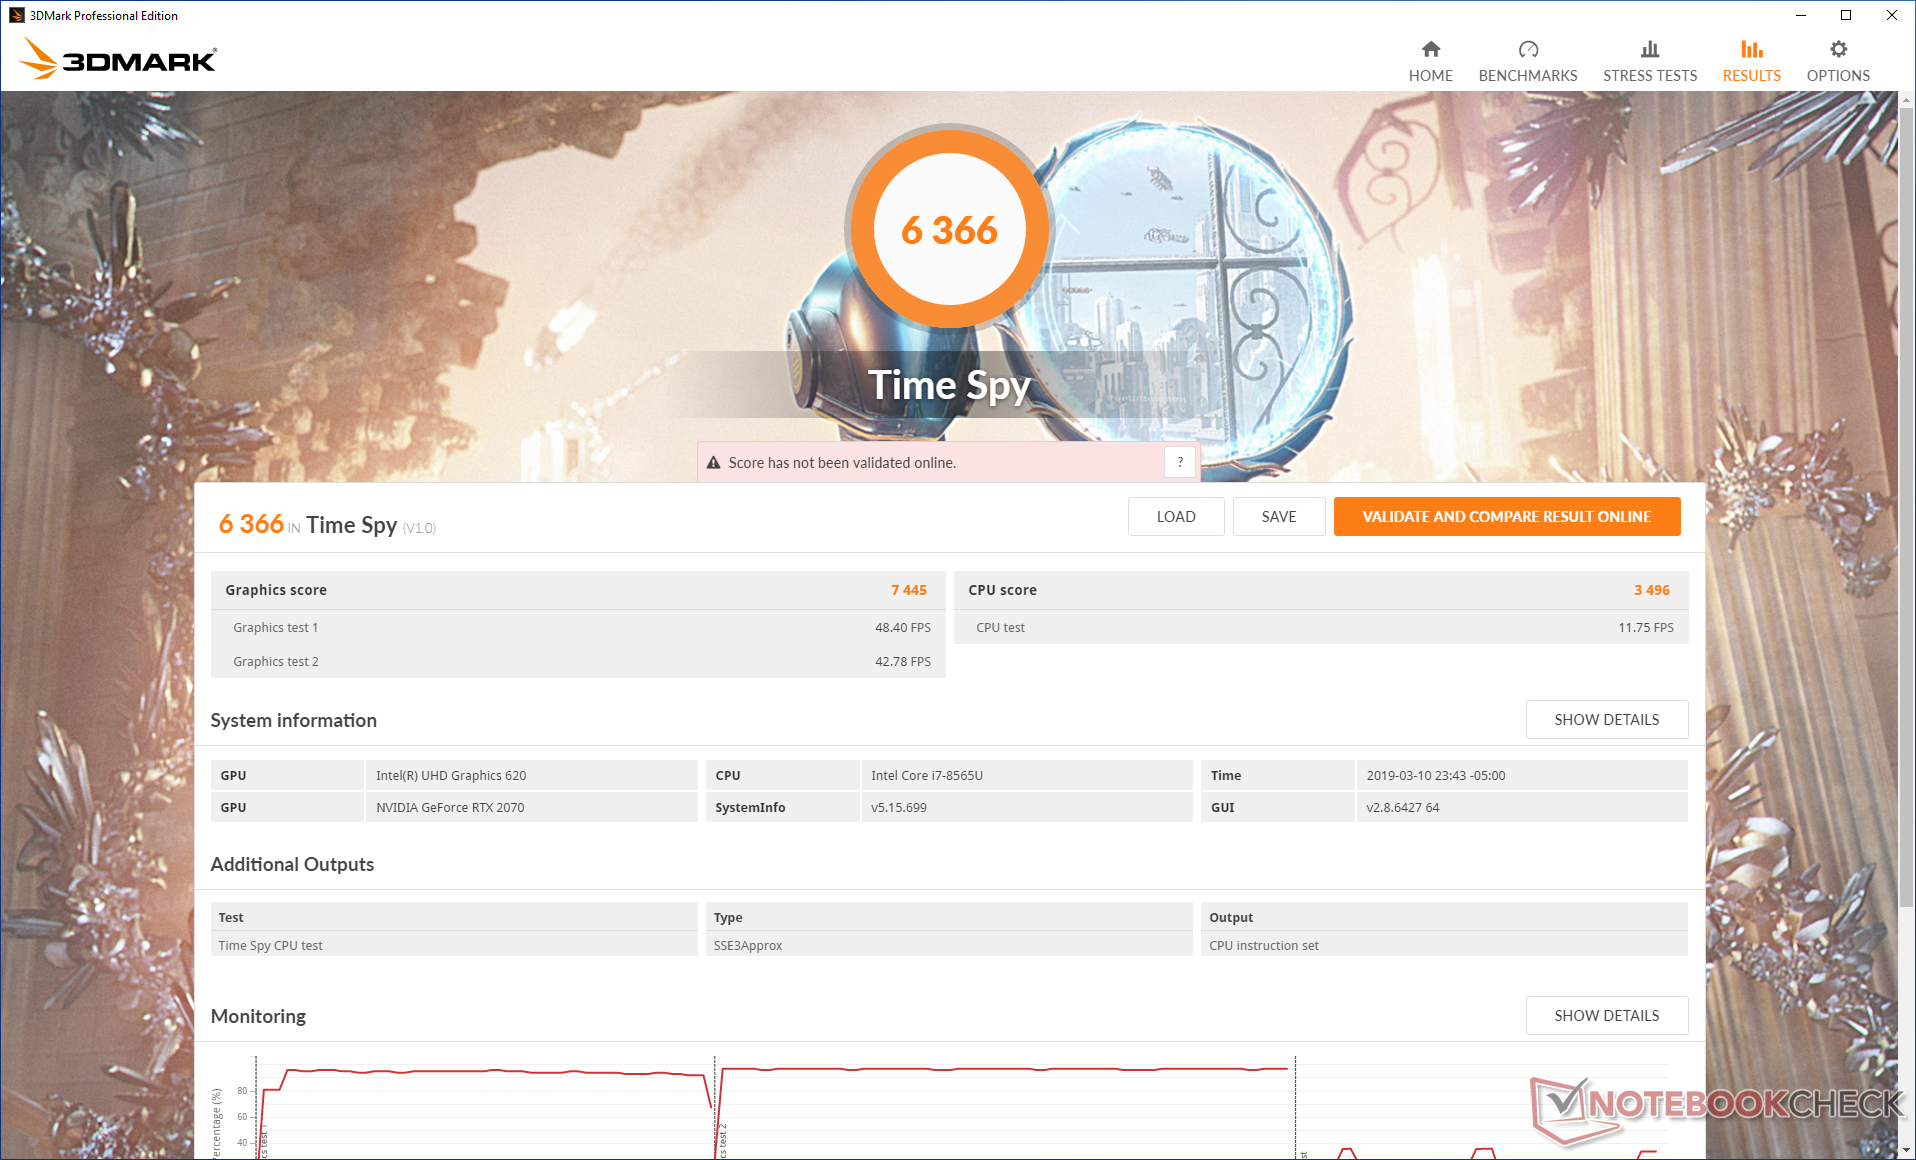
Die Ergebnisse im 3DMark entsprachen weitestgehend denen, die wir vergangenes Jahr mit der Gaming BOX GTX 1080 ermittelt haben: In 1080p ist die Performance schlechter als erwartet, in 4K UHD kommt unser System dagegen deutlich näher ein eine “echte” RTX 2070 ran. So war Fire Strike in 1080p beispielsweise um 17 % langsamer als auf dem MSI GE75 RTX 2070, in Ultra 4K dagegen nur noch 3 %. Ein Notebook mit eGPU profitiert also spürbar von GPU-limitierten Szenarien wie sie unter anderem durch eine hohe Auflösung erzeugt werden.
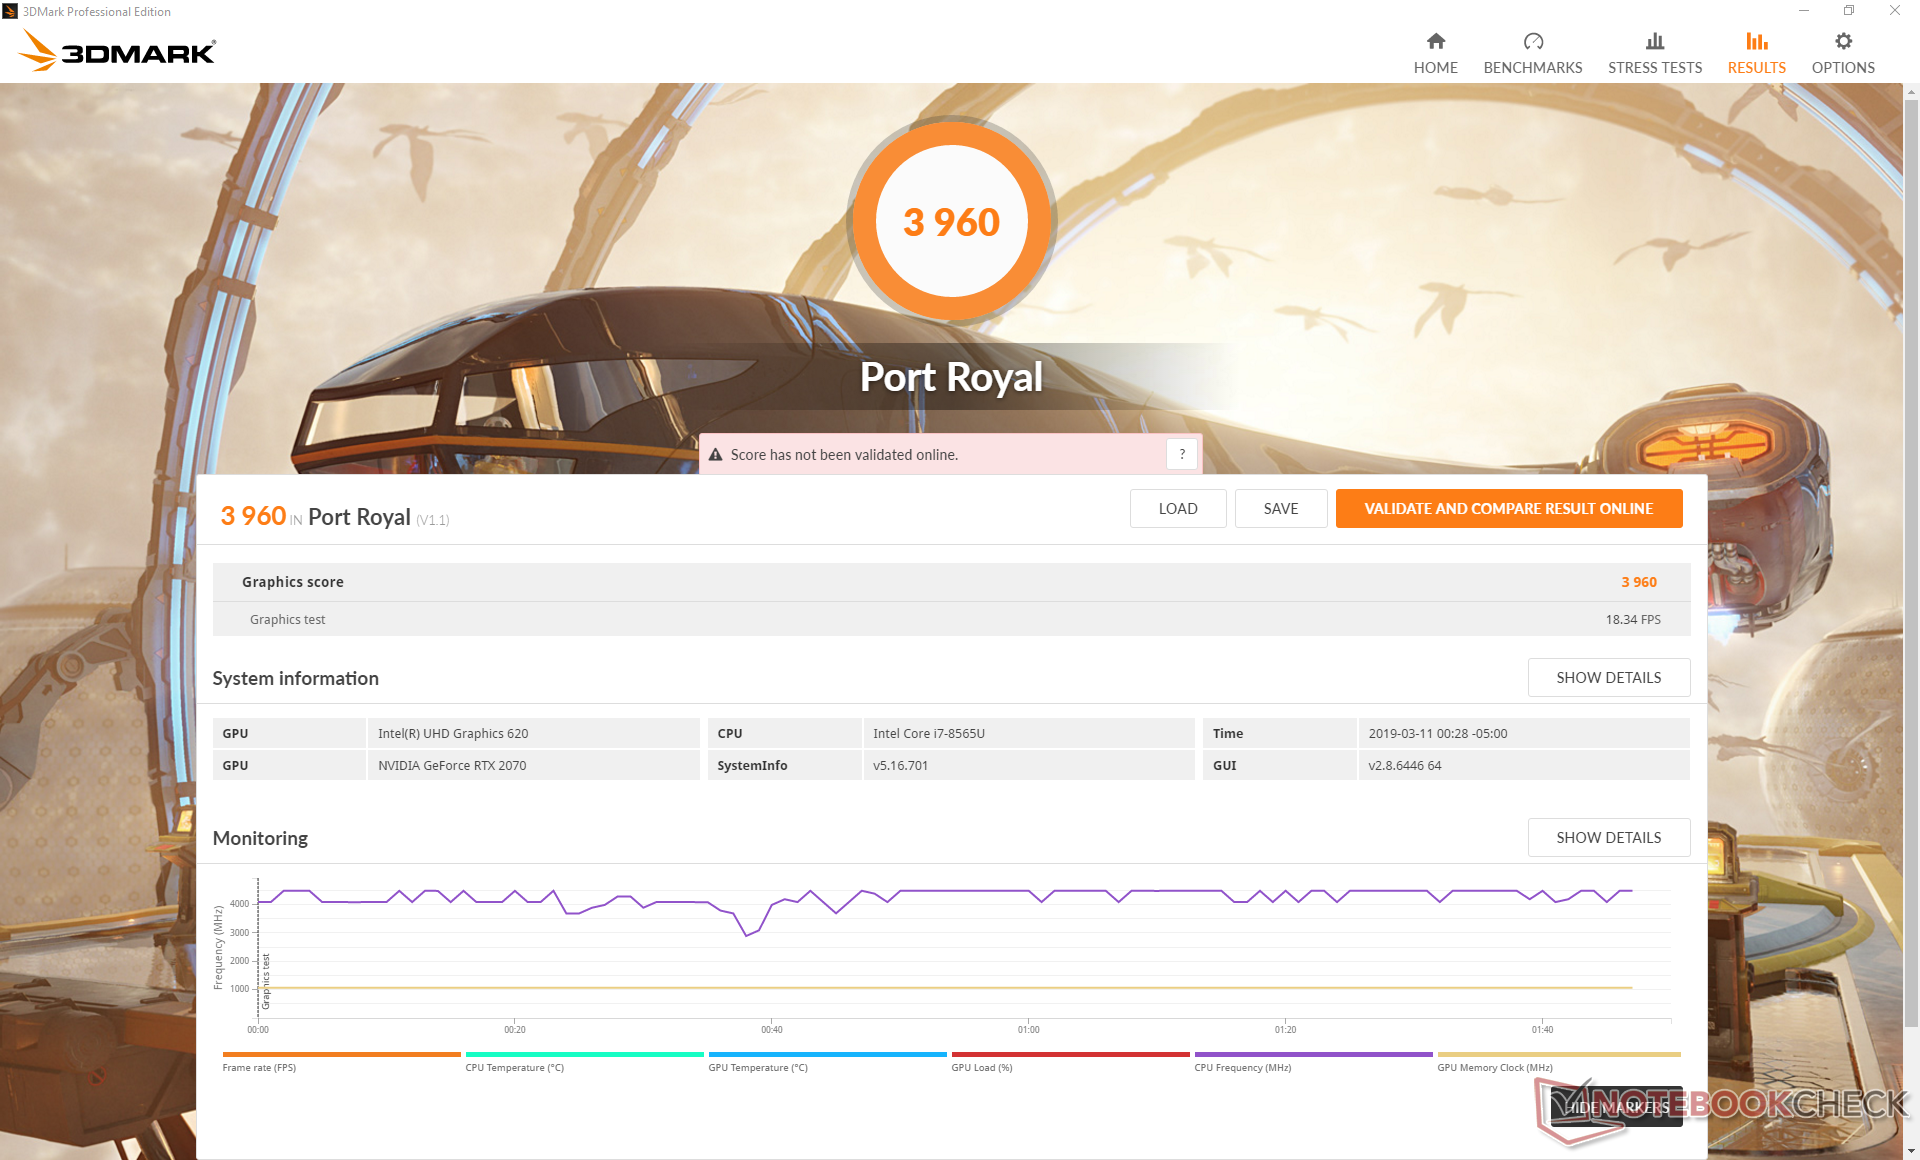
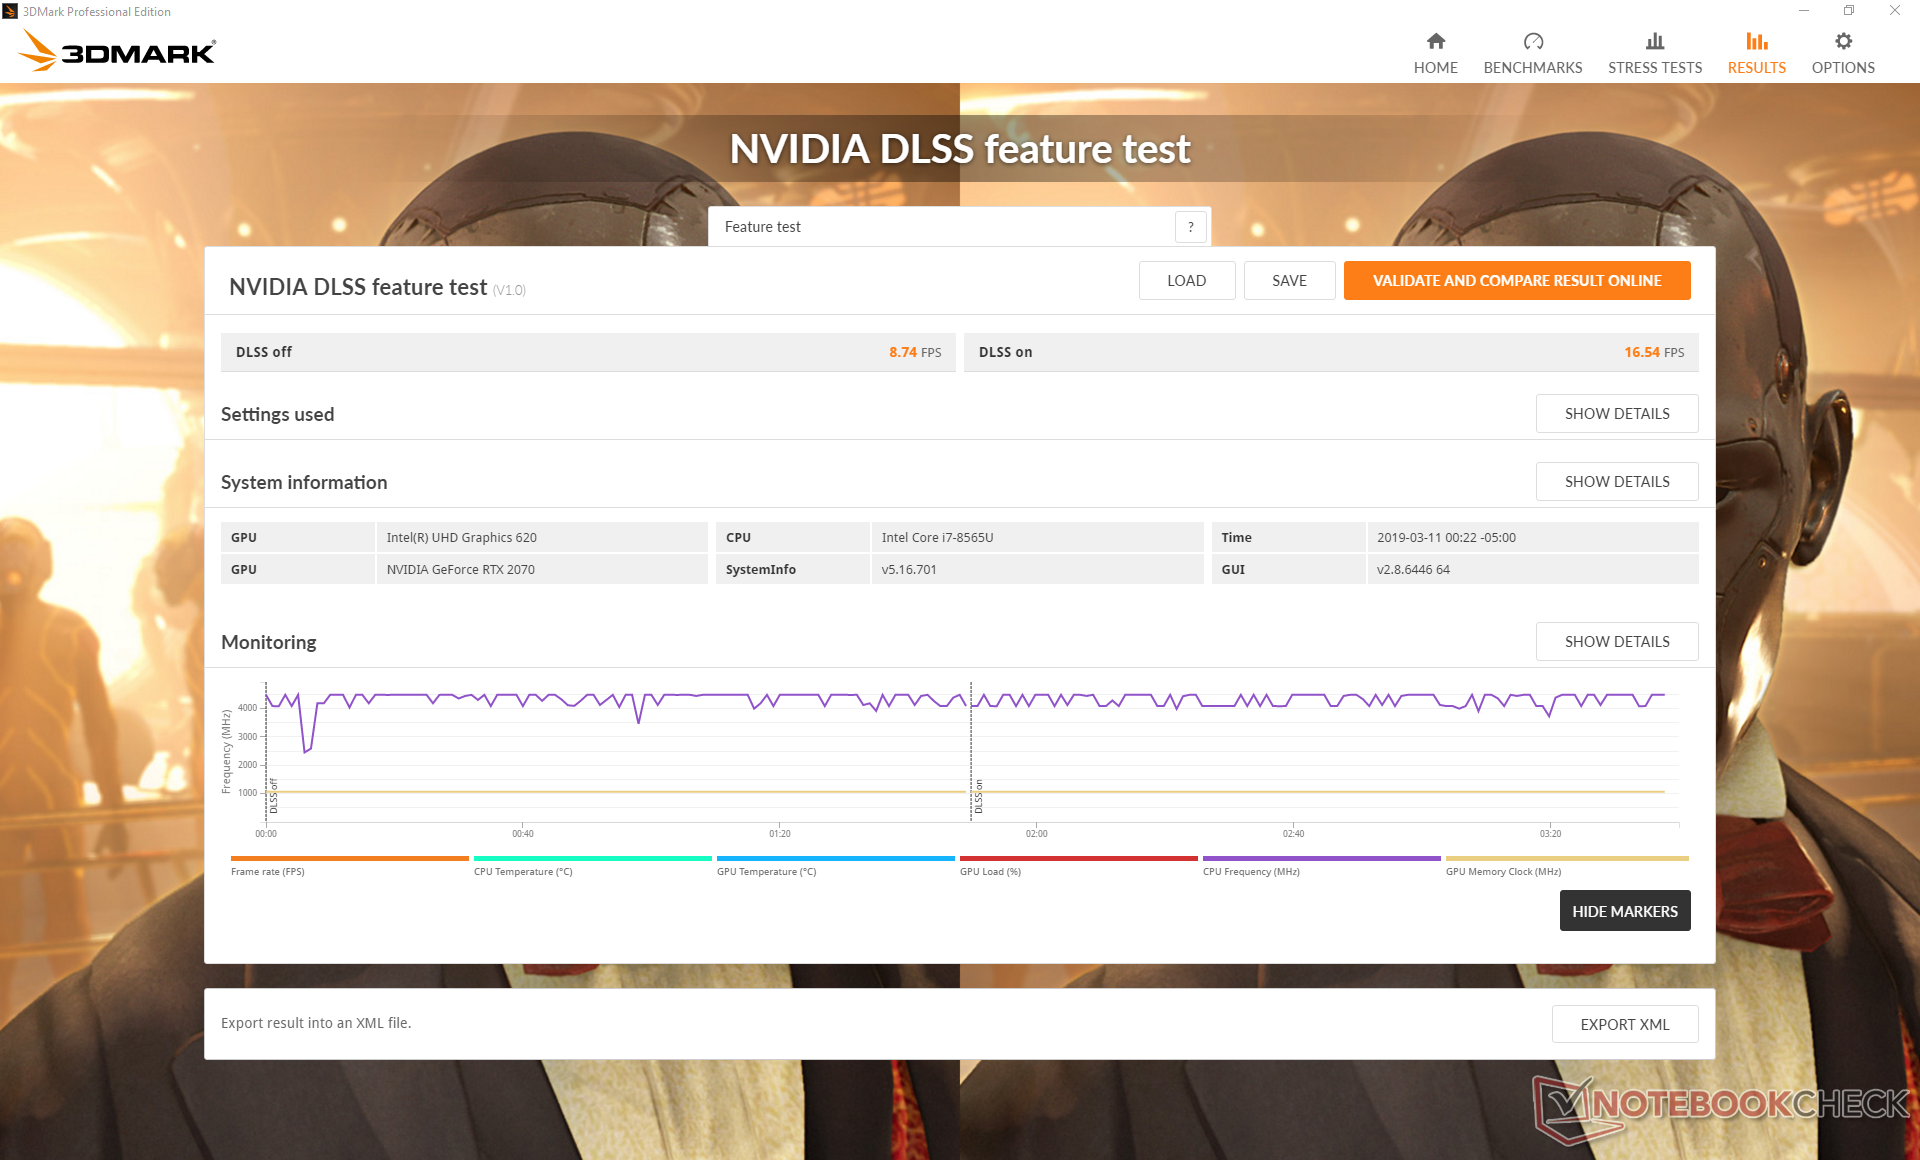
Bemerkenswert ist zudem, dass die 3DMark-Ergebnisse sich von jenen des Vorjahres, die noch mit der Gaming Box GTX 1080 ermittelt wurden, kaum unterscheiden. In Fire Strike liegt der Unterschied im einstelligen Prozentbereich. Der Hauptgrund, der somit für eine Gaming Box RTX 2070 gegenüber dem Vorgänger Gaming Box GTX 1080 spricht, sind die DLSS- und Ray-Tracing-Fähigkeiten des aktuellen Modells.
Verglichen mit einem klassischen Desktop-PC mit GeForce RTX 2070 liegt die Aorus eGPU in 3DMark um rund 10 bis 15 % zurück.
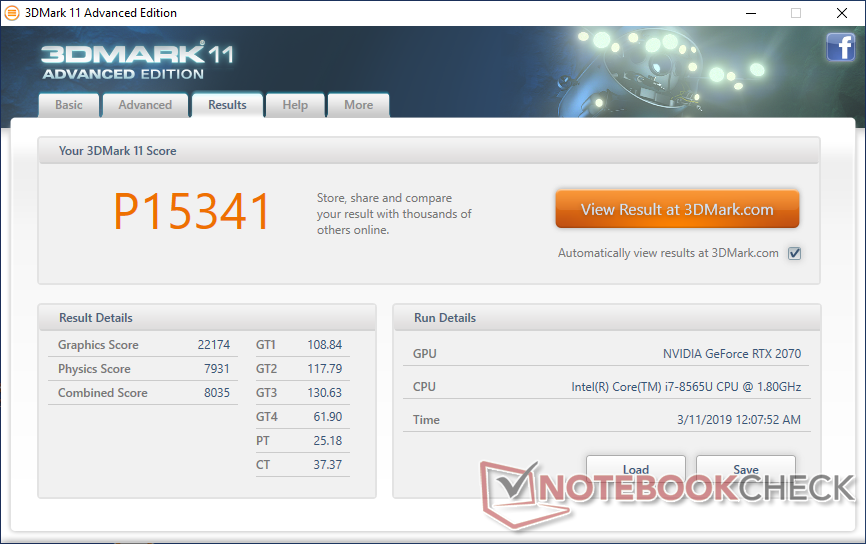
| 3DMark 11 Performance | 15341 Punkte | |
| 3DMark Cloud Gate Standard Score | 22847 Punkte | |
| 3DMark Fire Strike Score | 12809 Punkte | |
| 3DMark Time Spy Score | 6366 Punkte | |
Hilfe | ||
Gaming Performance
Die tatsächliche Gaming-Performance schwankt etwas stärker und ist insgesamt auch geringer, als die 3DMark-Ergebnisse vermuten lassen. Anspruchsvolle Spiele, wie Rise of the Tomb Raider, Witcher 3 oder Final Fantasy 15, laufen um etwa 40 % langsamer als auf einem Desktop-PC mit GeForce RTX 2070. Insgesamt liegt die echte Leistung nicht viel höher als mit bei der Gaming Box GTX 1080 und ist damit am ehesten mit einem GTX-1060-Laptop vergleichbar. Bestenfalls kann das Konstrukt aus RTX-2070-eGPU und Low-Power-Core-i7-8565U mit einem RTX-2060-Laptop gleichziehen.
Metro Exodus lief in 1080p Ultra mit aktiviertem Ray-Tracing, was an sich schon überraschend war. Die Performance litt allerdings erheblich und das Spiel lief nur mit rund 40-45 % der Performance eines Desktop-PCs mit RTX 2070. Selbst verglichen mit einem gut ausgestatteten GTX-1070-Notebook lag unser System um rund 30 % zurück.
Unser Witcher-3-Test zeigt keine wiederkehrenden Einbrüche der Framerate, was auf ein Fehlen jeglicher störender Hintergrundaktivität hindeutet.
| Middle-earth: Shadow of War | |
| 1280x720 Lowest Preset | |
| Asus G752VS | |
| Aorus Gaming Box RTX 2070 | |
| Durchschnittliche NVIDIA GeForce RTX 2070 (Desktop) (n=1) | |
| 1920x1080 Medium Preset AA:T | |
| Asus Zephyrus S GX701GX | |
| Asus G752VS | |
| Aorus Gaming Box RTX 2070 | |
| Durchschnittliche NVIDIA GeForce RTX 2070 (Desktop) (n=1) | |
| 1920x1080 High Preset AA:T | |
| Asus Zephyrus S GX701GX | |
| Asus G752VS | |
| Aorus Gaming Box RTX 2070 | |
| Durchschnittliche NVIDIA GeForce RTX 2070 (Desktop) (n=1) | |
| Aorus GTX 1080 Gaming Box (XPS 15 9575) | |
| 1920x1080 Ultra Preset AA:T | |
| Asus Zephyrus S GX701GX | |
| Asus G752VS | |
| Aorus Gaming Box RTX 2070 | |
| Durchschnittliche NVIDIA GeForce RTX 2070 (Desktop) (n=1) | |
| Aorus GTX 1080 Gaming Box (XPS 15 9575) | |
| 3840x2160 Ultra Preset AA:T | |
| Asus Zephyrus S GX701GX | |
| Aorus Gaming Box RTX 2070 | |
| Durchschnittliche NVIDIA GeForce RTX 2070 (Desktop) (n=1) | |
| Asus G752VS | |
| Overwatch | |
| 1280x720 Low (Render Scale 100 %) AA:FX AF:1x | |
| MSI RTX 2070 Gaming Z 8G | |
| Durchschnittliche NVIDIA GeForce RTX 2070 (Desktop) (297 - 300, n=4) | |
| Aorus Gaming Box RTX 2070 | |
| MSI RTX 2060 Gaming Z 6G | |
| 1366x768 Medium (Render Scale 100 %) AA:FX AF:2x | |
| MSI RTX 2070 Gaming Z 8G | |
| Durchschnittliche NVIDIA GeForce RTX 2070 (Desktop) (290 - 300, n=4) | |
| Aorus Gaming Box RTX 2070 | |
| MSI RTX 2060 Gaming Z 6G | |
| 1920x1080 High (Render Scale 100 %) AA:SM AF:4x | |
| Asus Zephyrus S GX701GX | |
| MSI RTX 2060 Gaming Z 6G | |
| MSI RTX 2070 Gaming Z 8G | |
| Durchschnittliche NVIDIA GeForce RTX 2070 (Desktop) (201 - 228, n=4) | |
| Aorus Gaming Box RTX 2070 | |
| 1920x1080 Epic (Render Scale 100 %) AA:SM AF:16x | |
| MSI RTX 2070 Gaming Z 8G | |
| Asus Zephyrus S GX701GX | |
| Durchschnittliche NVIDIA GeForce RTX 2070 (Desktop) (141 - 206, n=4) | |
| Aorus GTX 1080 Gaming Box (XPS 15 9575) | |
| Aorus Gaming Box RTX 2070 | |
| MSI RTX 2060 Gaming Z 6G | |
| min. | mittel | hoch | max. | 4K | |
|---|---|---|---|---|---|
| BioShock Infinite (2013) | 267.5 | 226.3 | 213.6 | 123 | |
| Metro: Last Light (2013) | 117.2 | 114.1 | 110.5 | 89.6 | |
| The Witcher 3 (2015) | 151.4 | 112.3 | 80 | 40.9 | |
| Batman: Arkham Knight (2015) | 122 | 119 | 101 | 45 | |
| Metal Gear Solid V (2015) | 60 | 60 | 60 | 60 | |
| Fallout 4 (2015) | 141.5 | 109.9 | 101.1 | ||
| Rise of the Tomb Raider (2016) | 147.9 | 117.8 | 90.4 | 79.1 | |
| Ashes of the Singularity (2016) | 64.9 | 53 | 52.4 | ||
| Overwatch (2016) | 296.9 | 290.1 | 200.6 | 147.8 | |
| Middle-earth: Shadow of War (2017) | 137 | 111 | 96 | 77 | 40 |
| Final Fantasy XV Benchmark (2018) | 106.5 | 83.9 | 60.8 | ||
| Monster Hunter World (2018) | 90.7 | 81.4 | 77.3 | 64.6 | |
| Shadow of the Tomb Raider (2018) | 88 | 63 | 61 | 58 | |
| Metro Exodus (2019) | 82.7 | 53.4 | 41 | 33.4 |
Emissionen
Geräuschemissionen
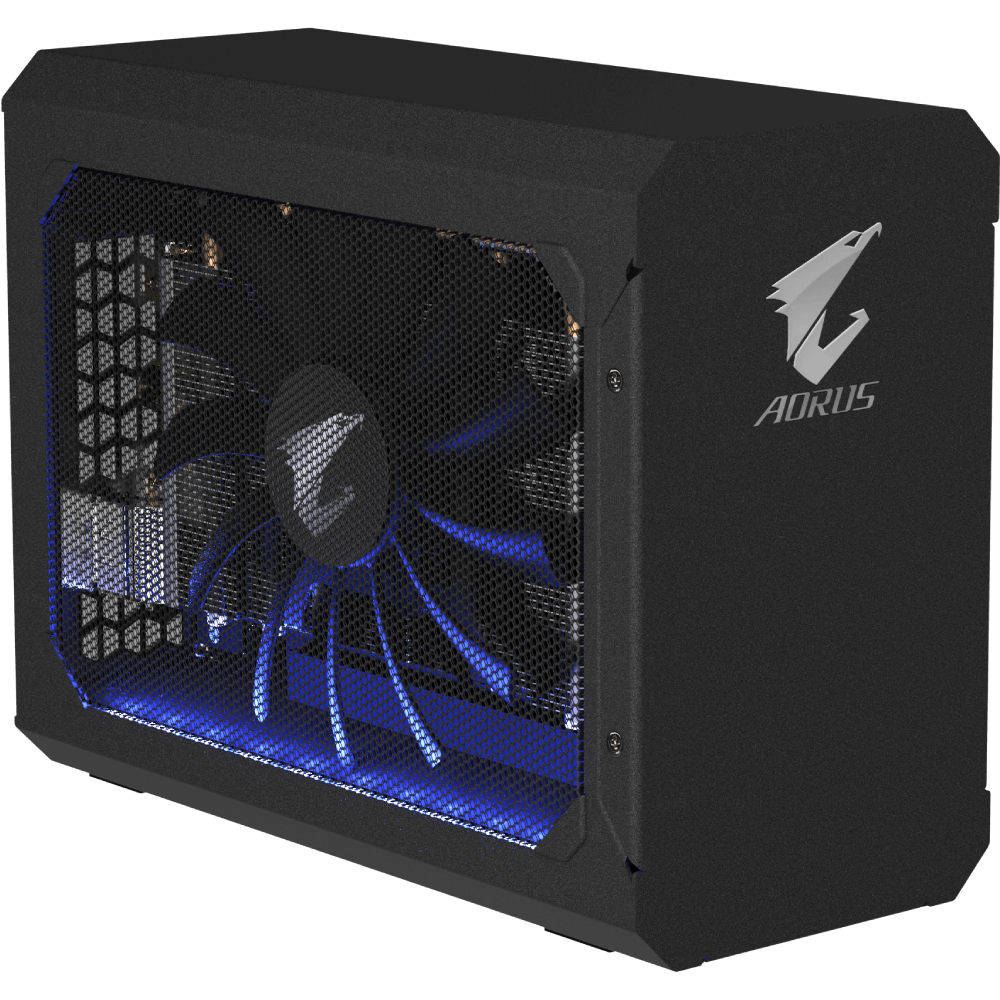
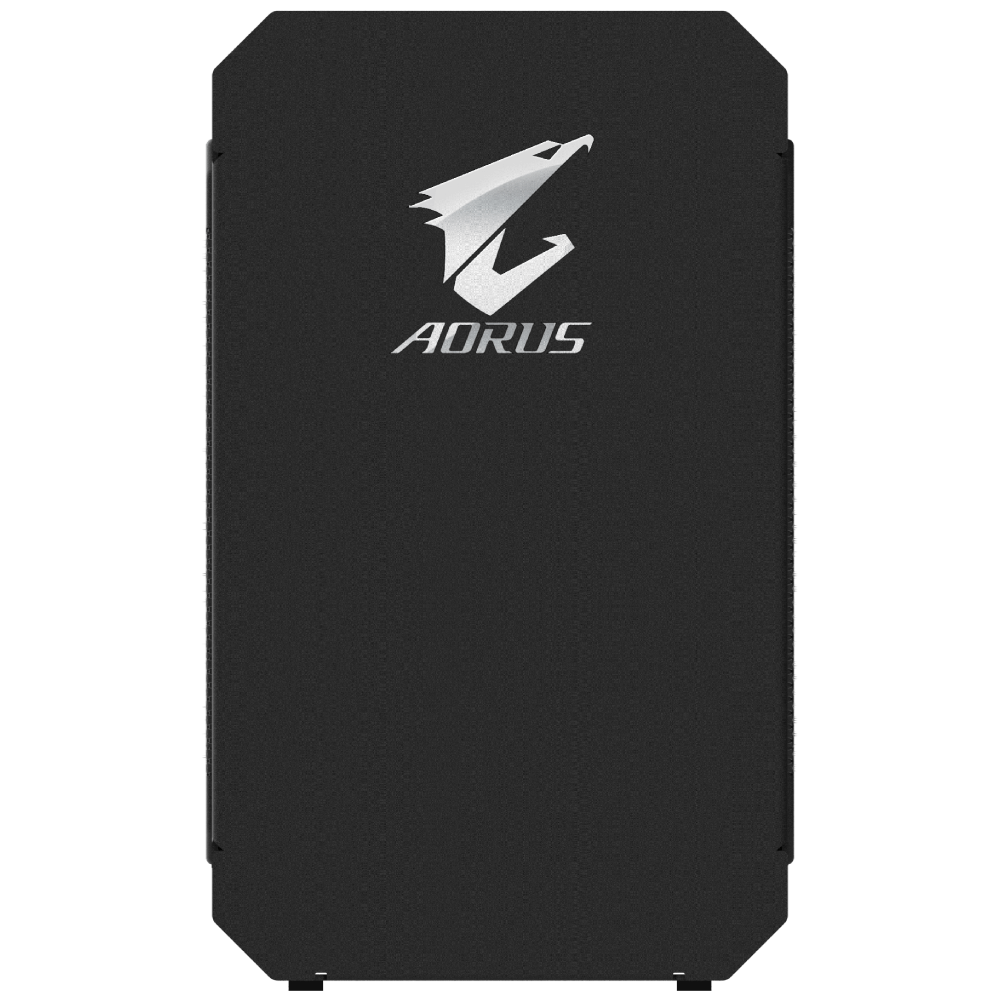
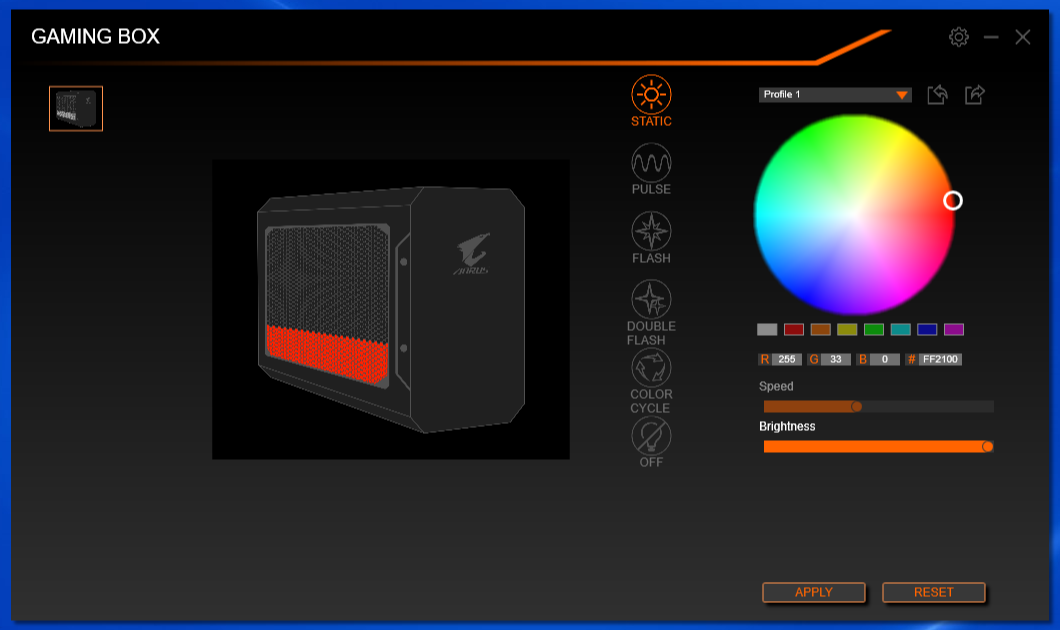
Um die Geräuschemissionen zu messen, haben wir die Front der Gaming Box - also die Seite mit Aorus-Logo - etwa 15 cm vom Mikrofon entfernt ausgerichtet. Da der Lüfter niemals still steht, ist das Gerät auch nie wirklich lautlos. Kurioserweise pulsierte der Lüfter bei niedriger und mittlerer Last sogar noch mehr und vor allem ausgeprägter als bei der Gaming Box GTX 1080. Glücklicherweise enthält die Aorus Engine eine Lüftersteuerung, mittels der sich das Verhalten anpassen lässt.
Bei der Ausführung von Witcher 3 als repräsentativer Titel für durchschnittliche Gaming-Last lag der Geräuschpegel im Rahmen dessen, was wir auch bei der Gaming Box GTX 1080 gemessen hatten: 41-42 dB(A). Insgesamt liegt der Schallpegel unterhalb der meisten Gaming-Notebooks, da deren Lüfter meistens kleiner und somit wesentlich hochfrequenter sind.
| Aorus Gaming Box RTX 2070 GeForce RTX 2070 (Desktop), i7-8565U, Samsung SSD PM981 MZVLB512HAJQ | Asus ROG G703GX GeForce RTX 2080 Mobile, i7-8750H, Samsung SSD PM981 MZVLB512HAJQ | MSI GT75 8RG-090 Titan GeForce GTX 1080 Mobile, i9-8950HK, 2x Samsung PM961 MZVLW256HEHP (RAID 0) | Lenovo Legion Y740-17ICH GeForce RTX 2080 Max-Q, i7-8750H, Samsung SSD PM981 MZVLB256HAHQ | MSI GE75 8SF GeForce RTX 2070 Mobile, i7-8750H, Kingston RBUSNS8154P3256GJ1 | Aorus GTX 1080 Gaming Box (XPS 15 9575) GeForce GTX 1080 (Desktop), | |
|---|---|---|---|---|---|---|
| Geräuschentwicklung | -7% | -11% | 8% | -4% | 4% | |
| aus / Umgebung * (dB) | 30 | 30 -0% | 30 -0% | 28.3 6% | 28.3 6% | 28 7% |
| Idle min * (dB) | 32.7 | 30 8% | 32 2% | 31.5 4% | 33.5 -2% | 32.6 -0% |
| Idle avg * (dB) | 37 | 35 5% | 34 8% | 31.6 15% | 33.6 9% | 32.6 12% |
| Idle max * (dB) | 38.9 | 41 -5% | 37 5% | 31.6 19% | 35 10% | 32.7 16% |
| Last avg * (dB) | 39.6 | 44 -11% | 43 -9% | 32.3 18% | 38 4% | 32.7 17% |
| Witcher 3 ultra * (dB) | 41.6 | 51 -23% | 57 -37% | 43 -3% | 50 -20% | 42.2 -1% |
| Last max * (dB) | 43 | 52 -21% | 62 -44% | 45.5 -6% | 56.9 -32% | 54.2 -26% |
* ... kleinere Werte sind besser
Lautstärkediagramm
| Idle |
| 32.7 / 37 / 38.9 dB(A) |
| Last |
| 39.6 / 43 dB(A) |
 | ||
30 dB leise 40 dB(A) deutlich hörbar 50 dB(A) störend |
||
min: | ||
Temperatur
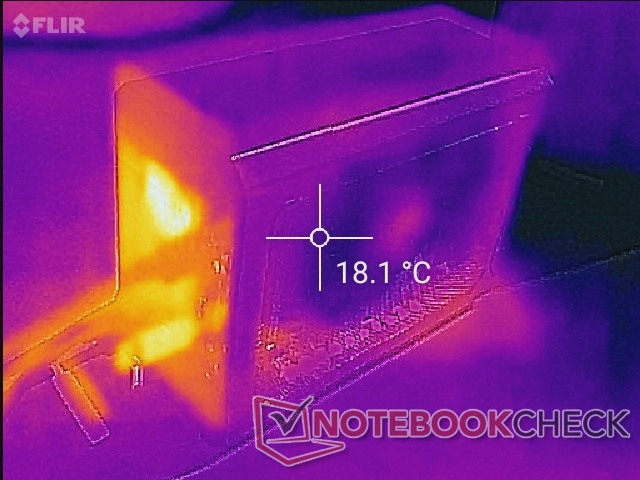
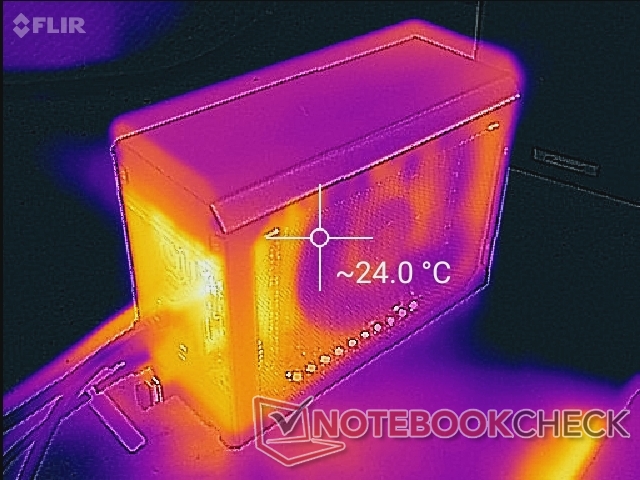
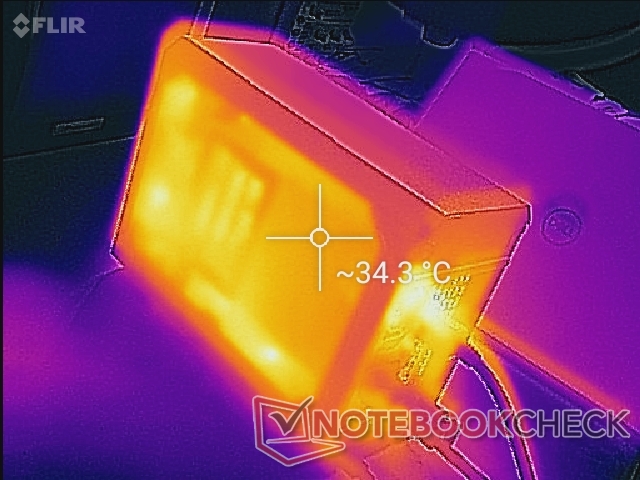
Die Oberflächentemperaturen waren bei der Gaming Box unauffällig. Man sollte allerdings darauf achten, das Gerät niemals liegend oder direkt an einer Wand zu betreiben, da der Luftfluss ansonsten blockiert werden könnte.

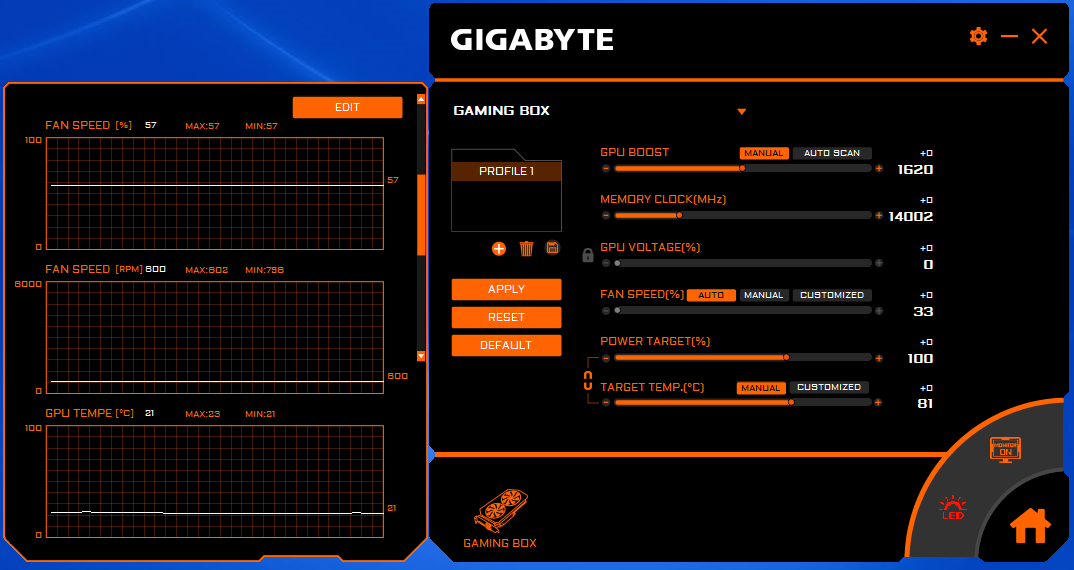
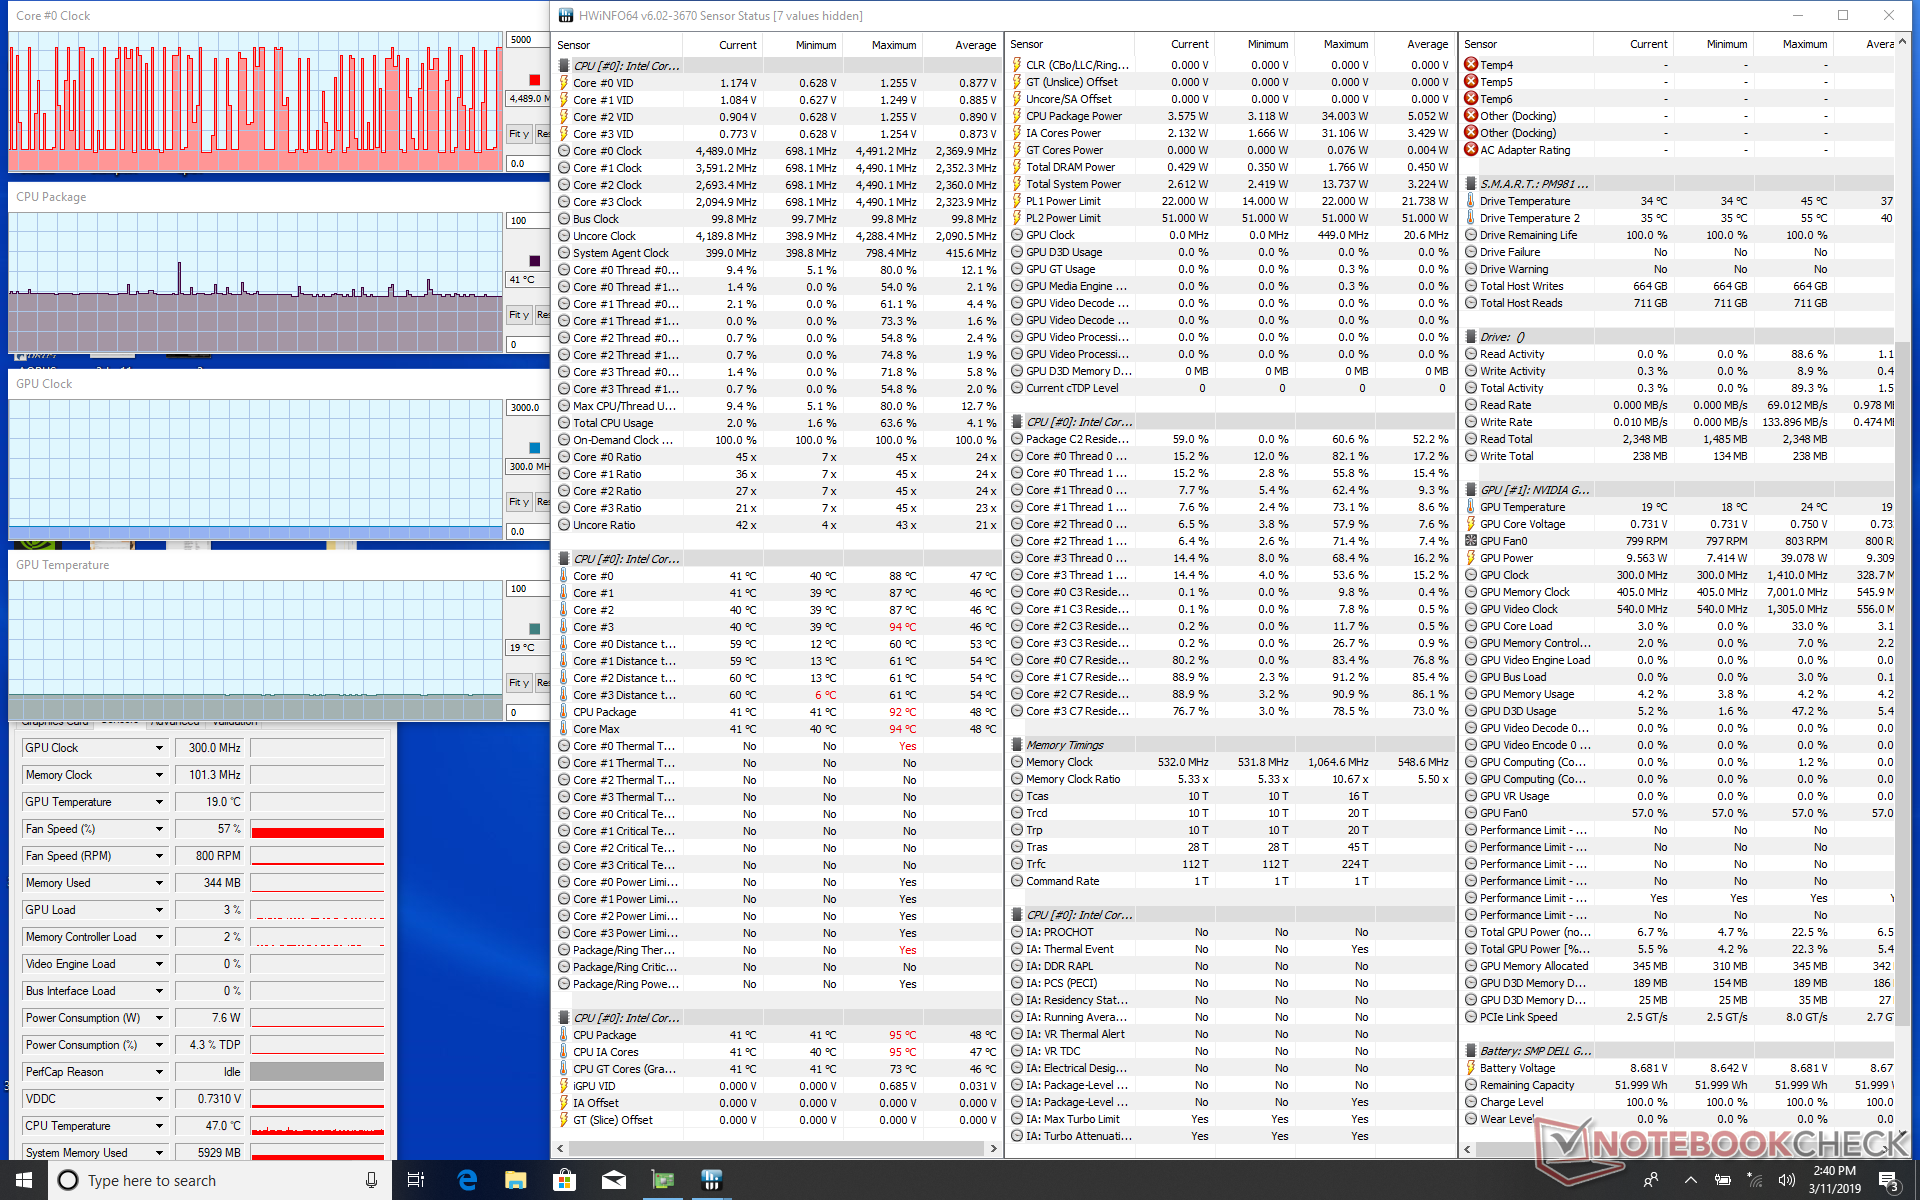
Stresstest
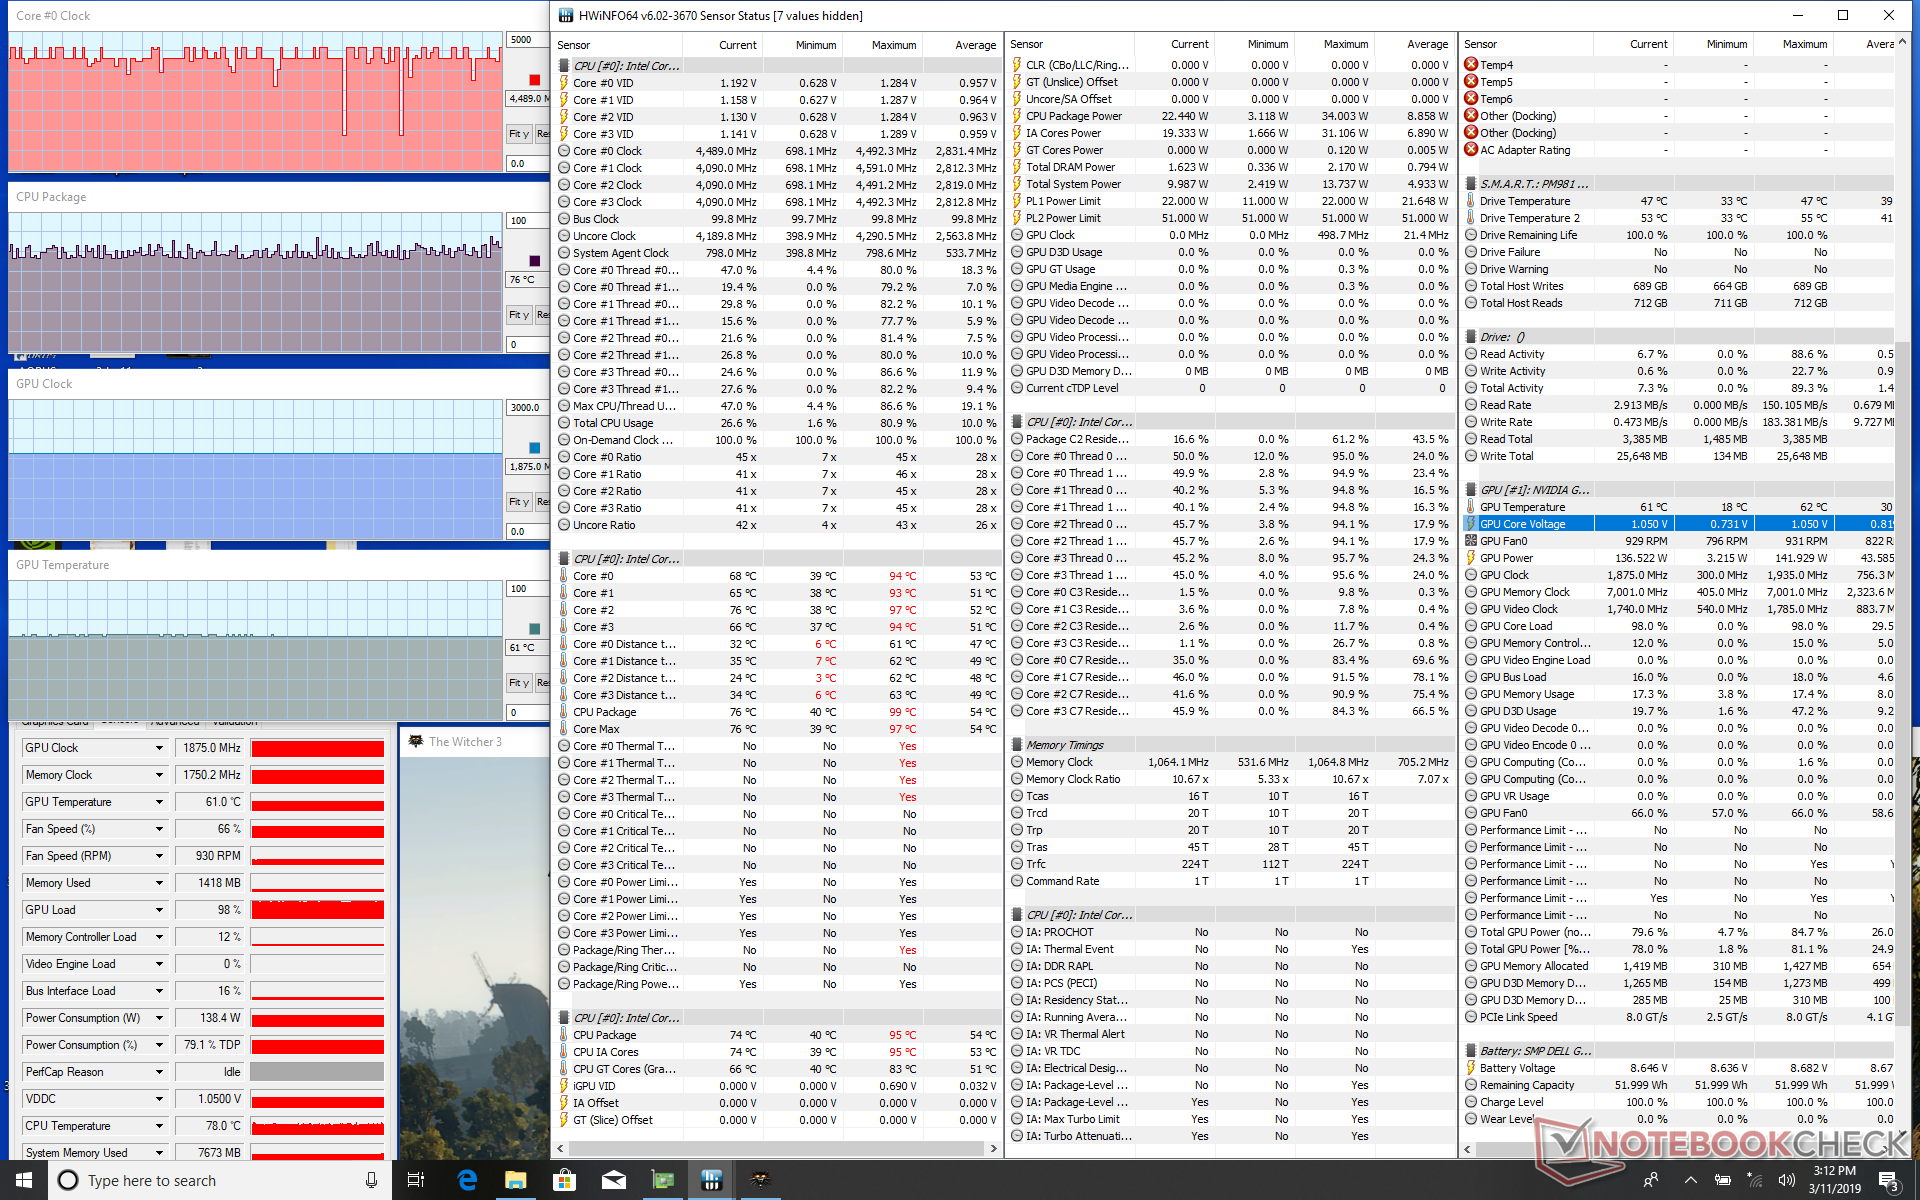
Bei der Ausführung von FurMark stabilisierten sich die GPU-Temperaturen nach einer Weile bei 66 °C und lagen somit über denen der Gaming Box GTX 1080. Verglichen mit Laptop-GPUs ist dies allerdings noch immer ein sehr niedriger wert. Bei Witcher 3 lag die Temperatur bei konstanten 61 °C bei einem stabilen Takt von 1.875 MHz. Das MSI GE75 mit mobiler RTX 2070 schaffte in der gleichen Situation nur 1.560 MHz bei rund 71 °C. In der Theorie sollte die Aorus Gaming Box also schneller sein, trotzdem lag in der Praxis der MSI-Laptop vorne. Wir vermuten hier einen Engpass bei der CPU-Leistung oder der Thunderbolt-3-Schnittstelle der eGPU.
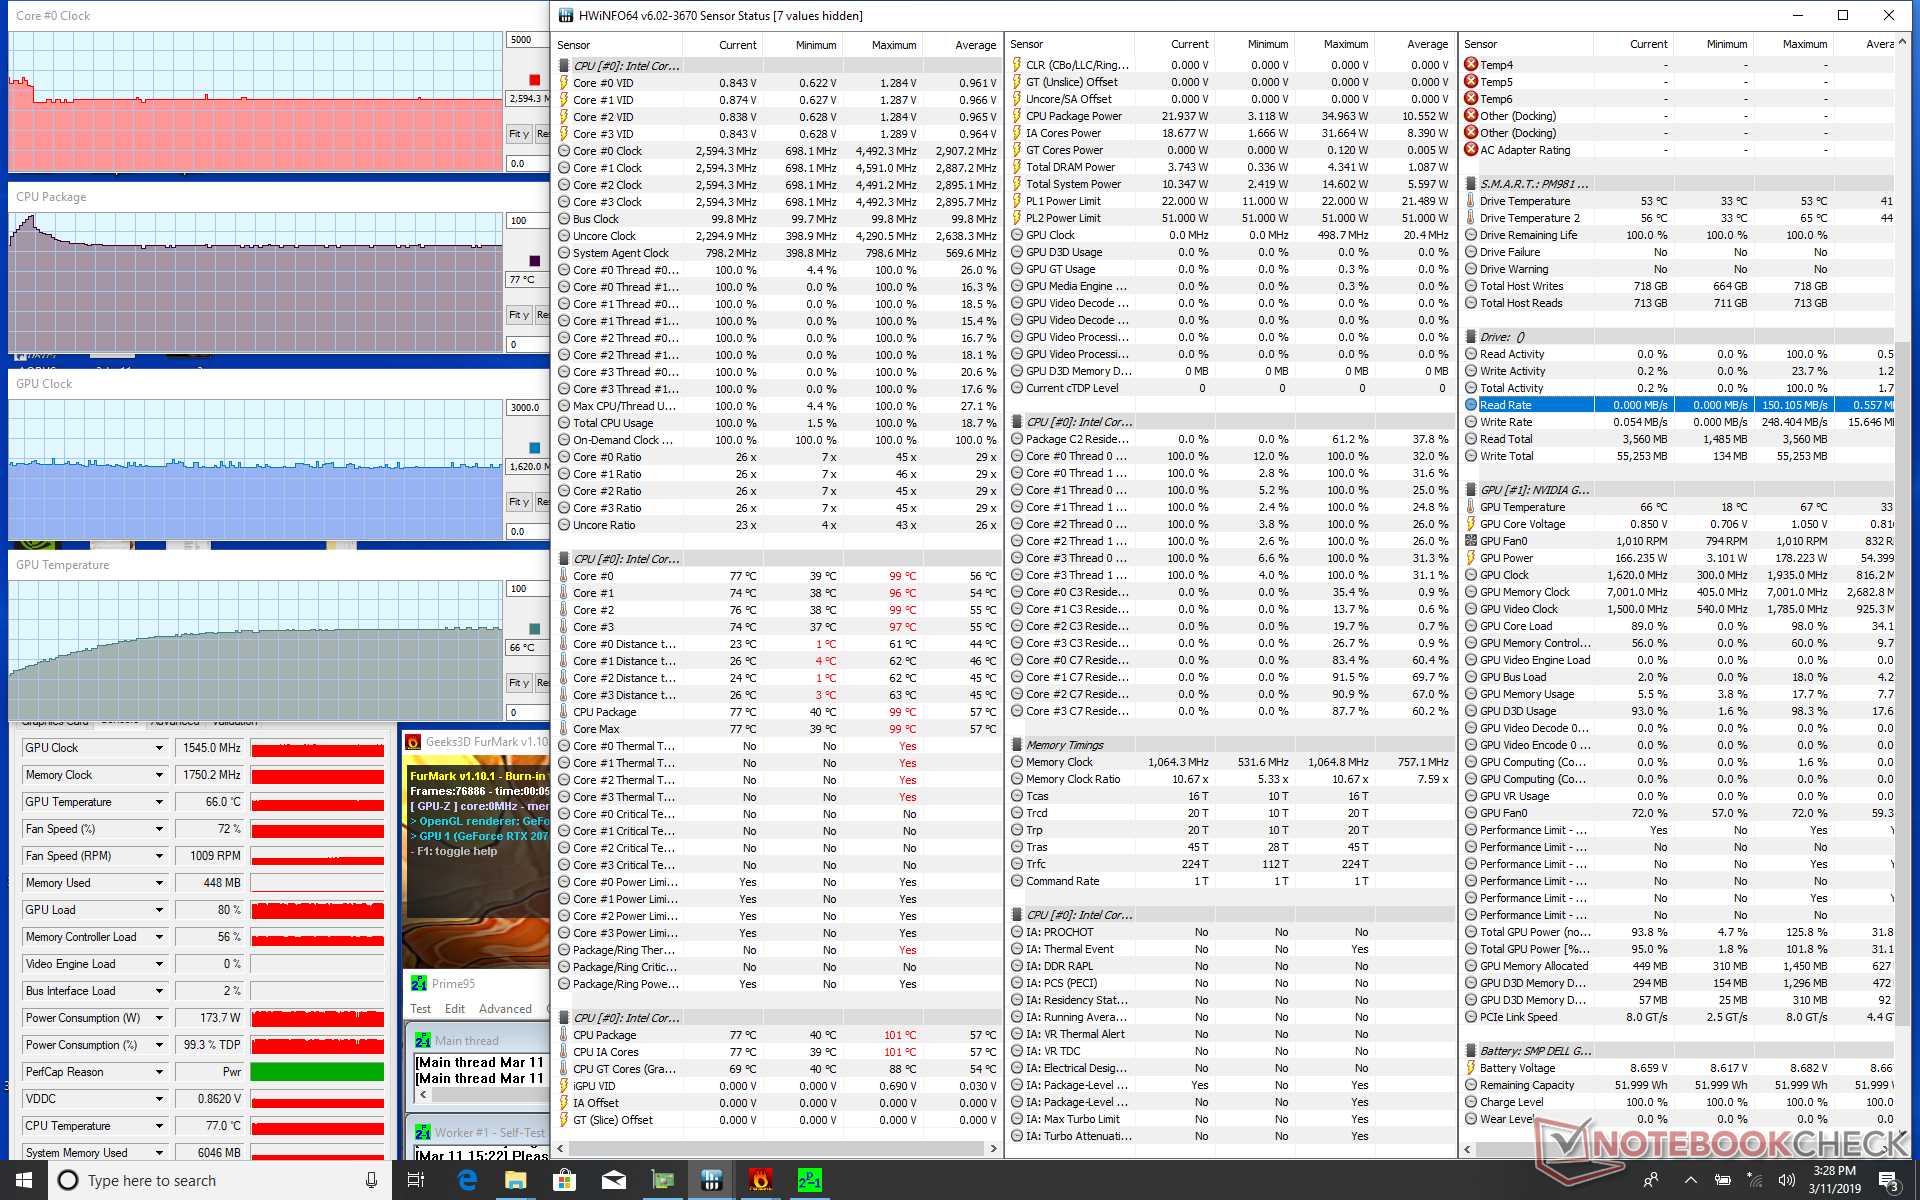
| CPU-Takt (GHz) | GPU-Takt (MHz) | Durchschnittliche CPU-Temperatur (°C) | Durchschnittliche GPU-Temperatur (°C) | |
| System Idle | -- | 300 | 41 | 19 |
| Prime95 + FurMark Stress | 2,6 | 1.545 | 77 | 66 |
| Witcher 3 Stress | 4,4 | 1.875 | 76 | 61 |
Energieverwaltung
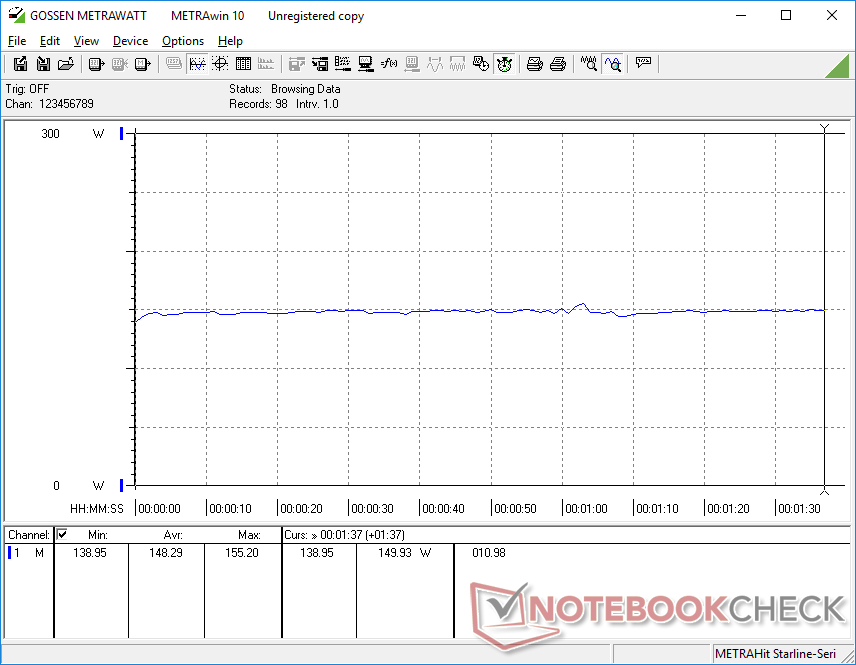
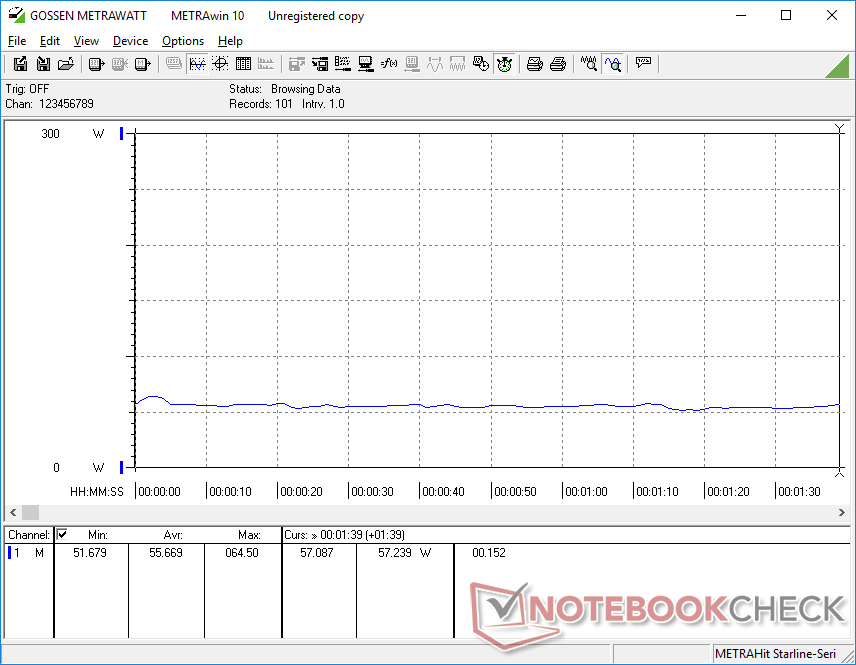
Energiebedarf
Bei mittlerer Last war die Gaming Box RTX 2070 effizienter als ihr direkter Vorgänger mit GTX 1080. Bei typischer Spielelast und bei maximaler Auslastung lagen die beiden Systeme dann aber wieder gleichauf. Letztlich entspricht dies aufgrund der nahezu identischen Performance in den meisten Situationen unserer Erwartungshaltung.
| Aus / Standby | |
| Idle | |
| Last |
|
Legende:
min: | |
| Aorus Gaming Box RTX 2070 i7-8565U, GeForce RTX 2070 (Desktop), Samsung SSD PM981 MZVLB512HAJQ, , 3840x2160, 13.3" | Asus Zephyrus S GX701GX i7-8750H, GeForce RTX 2080 Max-Q, Samsung SSD PM981 MZVLB1T0HALR, IPS, 1920x1080, 17.3" | MSI GE75 8SF i7-8750H, GeForce RTX 2070 Mobile, Kingston RBUSNS8154P3256GJ1, IPS, 1920x1080, 17.3" | Razer Blade 15 RTX 2070 Max-Q i7-8750H, GeForce RTX 2070 Max-Q, Samsung SSD PM981 MZVLB512HAJQ, IPS, 1920x1080, 15.6" | Dell XPS 13 9380 i7 4K i7-8565U, UHD Graphics 620, Samsung SSD PM981 MZVLB512HAJQ, IPS, 3840x2160, 13.3" | Aorus GTX 1080 Gaming Box (XPS 15 9575) GeForce GTX 1080 (Desktop), , , x, | |
|---|---|---|---|---|---|---|
| Stromverbrauch | -28% | -23% | 5% | 54% | -16% | |
| Idle min * (Watt) | 19.3 | 19 2% | 16.4 15% | 10.4 46% | 5.2 73% | 21.1 -9% |
| Idle avg * (Watt) | 19.3 | 22 -14% | 21.9 -13% | 14.6 24% | 8.6 55% | 21.1 -9% |
| Idle max * (Watt) | 19.3 | 30 -55% | 25.4 -32% | 16.3 16% | 10.5 46% | 21.1 -9% |
| Last avg * (Watt) | 55.7 | 104 -87% | 90.7 -63% | 88.5 -59% | 44.2 21% | 92.1 -65% |
| Witcher 3 ultra * (Watt) | 148.3 | 167 -13% | 203.3 -37% | 155.4 -5% | 150.3 -1% | |
| Last max * (Watt) | 203 | 203 -0% | 222.9 -10% | 182.4 10% | 47.5 77% | 206 -1% |
* ... kleinere Werte sind besser
Pro
Contra
Fazit

Die Aorus Gaming Box RTX 2070 verwandelt ein kompatibles Ultrabook in einen echten Gamer, allerdings mit der Einschränkung einer etwas geringeren Performance aufgrund der schwächeren CPU und des Thunderbolt-3-Ports. Aber allein schon die Möglichkeit, aktuelle anspruchsvolle Spiele auf einem Ultrabook überhaupt spielen zu können, wird bereits für erhebliches Interesse sorgen. Leider liegt die Performance in der Praxis eher zwischen einer GTX 1060 und einer RTX 2060, obwohl in dem Gerät eine vollwertige RTX 2070 steckt. Die Nützlichkeit der Ray-Tracing-Engine kann somit aufgrund ihres negativen Einflusses auf die Framerate durchaus in Frage gestellt werden.
Vielleicht wäre die Performance näher an einer Desktop-RTX-2070 wenn die Gaming Box an einen Core i7-8750H oder i9-8950HK anstelle des von uns verwendeten XPS 13 angeschlossen gewesen wäre. Zumindest die Ergebnisse des 3DMark sprechen dafür, schließlich liegen sie nahezu gleichauf mit einem normalen RTX-2070-Gaming-Laptop. Dummerweise sind die meisten Notebooks, die auf Intels kraftvolle H-Klasse-CPUs setzen, bereits mit einer schnellen dedizierten GPU ausgestattet.
Außerdem darf auch nicht unerwähnt bleiben, dass wir diverse Abstürze, Freezes und Probleme bei der Erkennung der eGPU durchleben mussten. Wenn sie funktioniert, ist die Gaming Box super, aber man sollte sich bei Problemen besser auf häufige Reboots sowie regelmäßiges An- und wieder Abstecken gefasst machen. Wirklich problemlos waren unsere Erfahrungen also nicht.
Man kauft zwar eine Gaming Box RTX 2070, aber erhält nur die Gaming-Performance einer RTX 2060. Der wahre Wert liegt in der Möglichkeit, aktuelle und anspruchsvolle Spiele auf einem Ultrabook zu spielen, was ohne die eGPU auf die integrierte Intel-GPU eingeschränkt wäre. Vielleicht bringt Aorus zukünftig auch eine Gaming Box RTX 2060 auf den Markt. Für aktuelle ULV-CPUs würde diese Karte mit Sicherheit eine bessere Paarung darstellen.
Preisvergleich

