Fazit - Die Messlatte wird höher gelegt
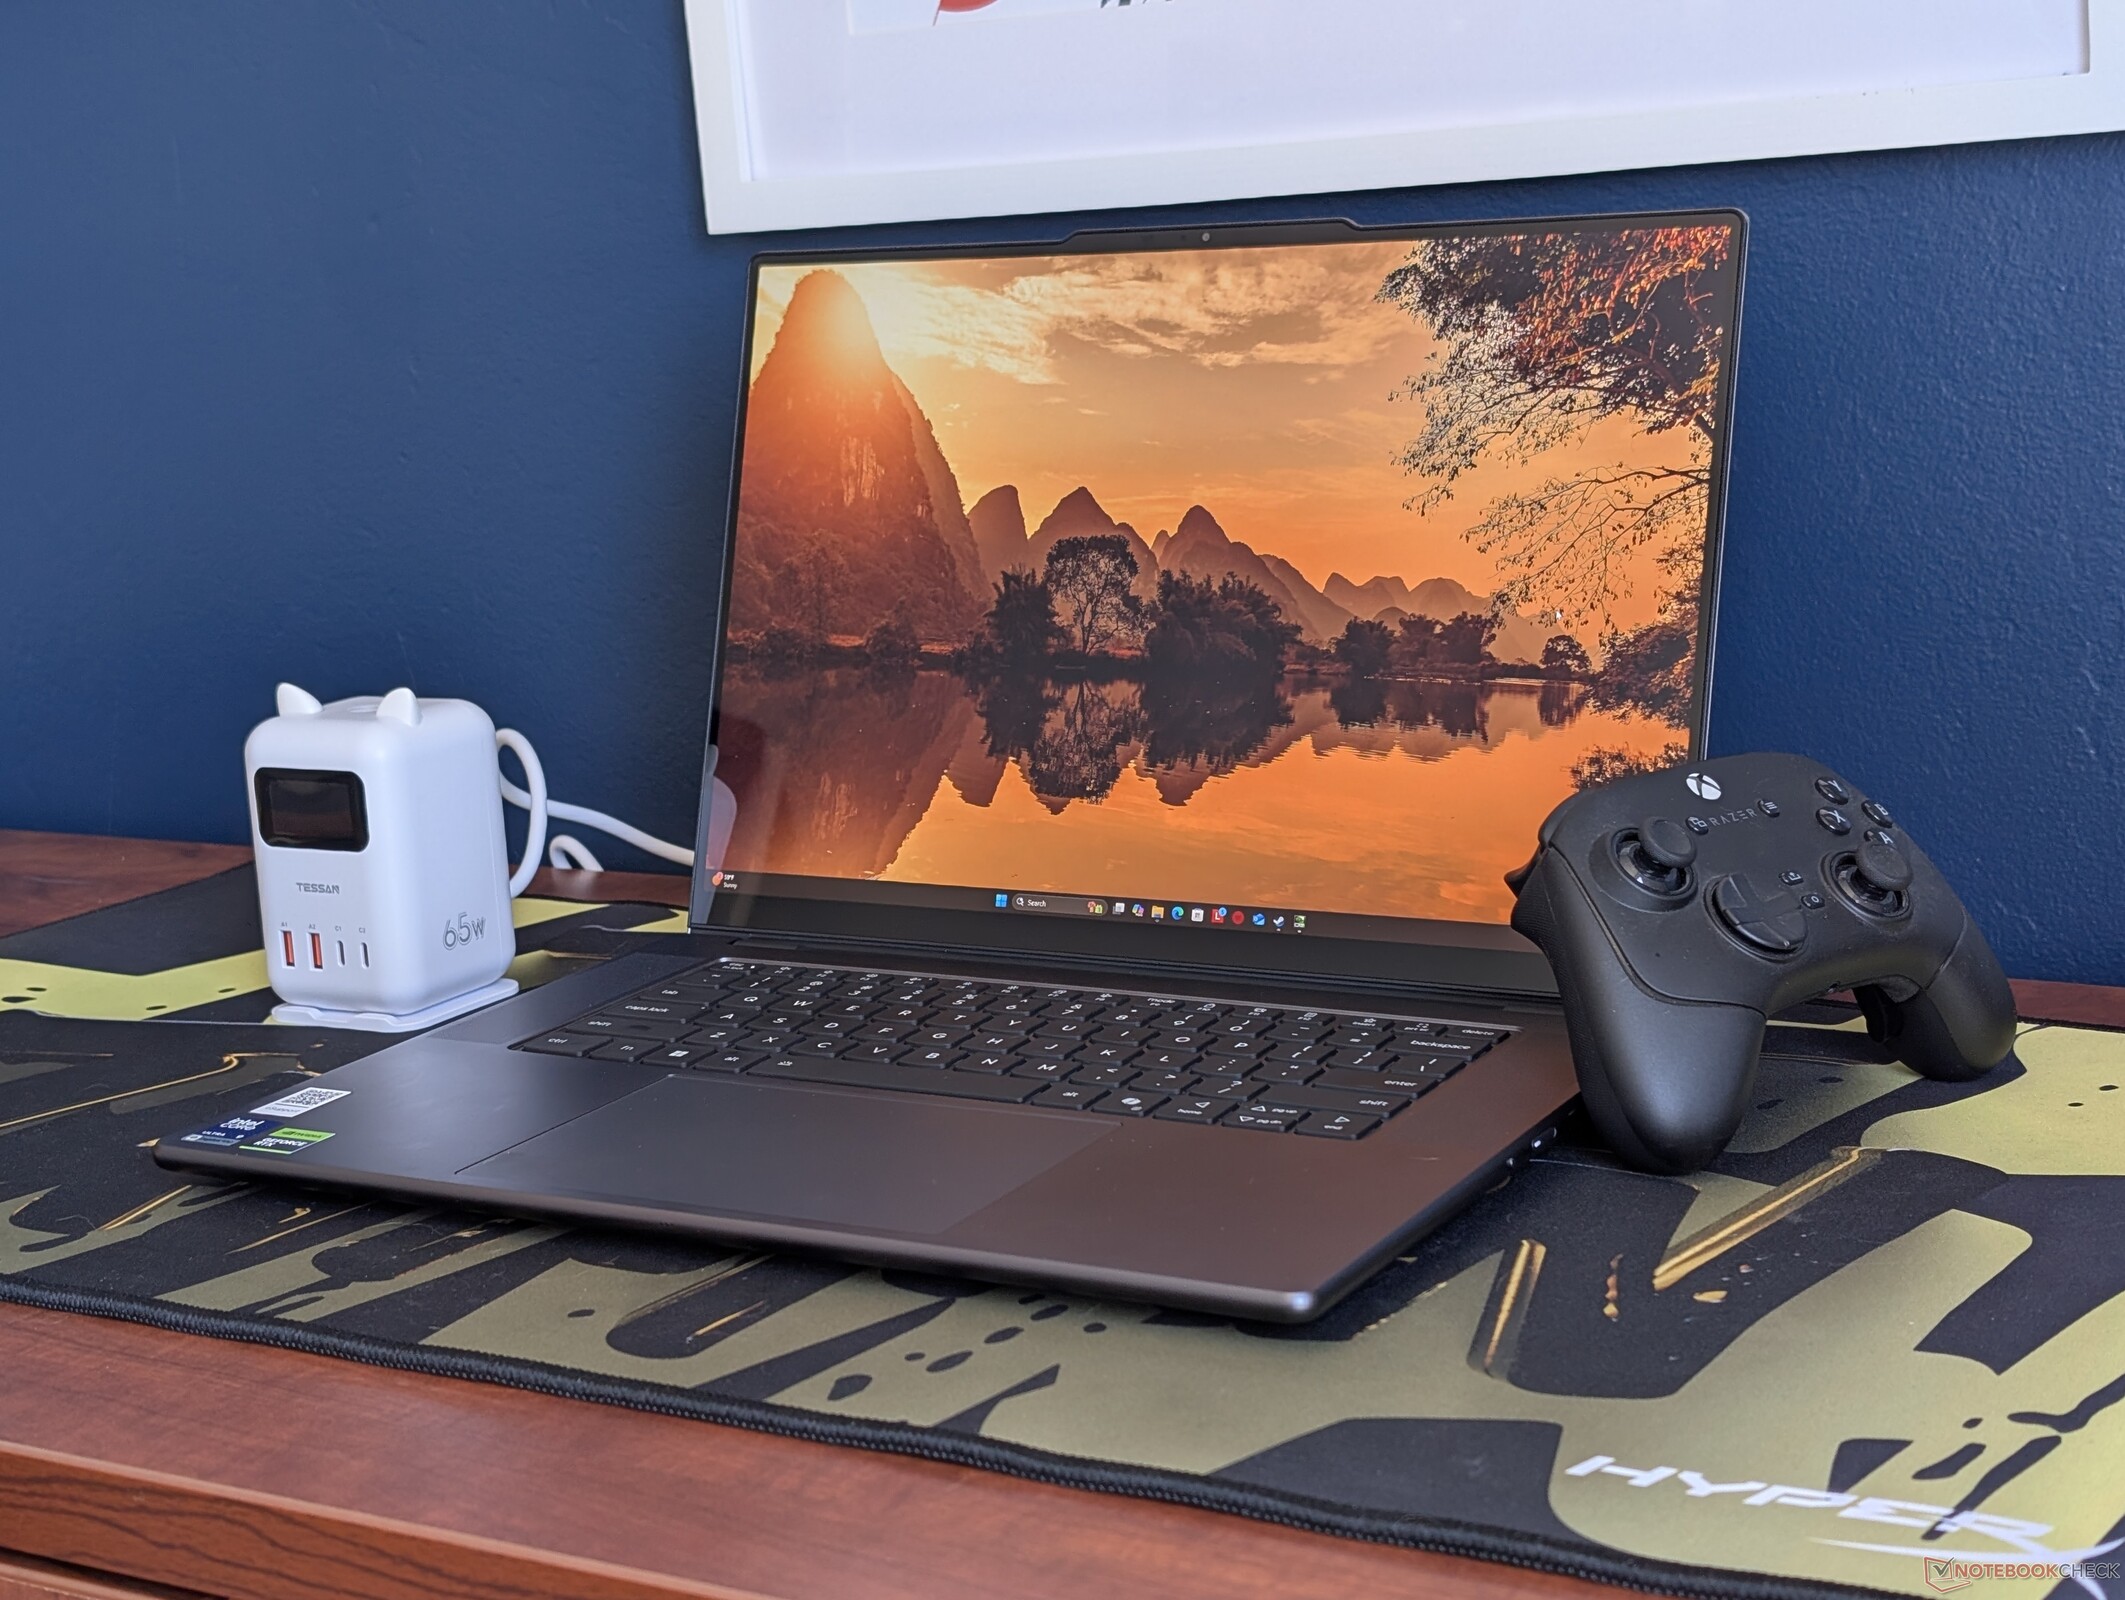
Im Gegensatz zu vielen klassischen Clamshell-Notebooks auf dem Markt ist das Lenovo Pro 9 16 G11 Aura mit nicht weniger als einer Core-Ultra-9-CPU, GeForce-RTX-GPU und einem OLED-Touchscreen für ein erstklassiges Benutzererlebnis ausgestattet, unabhängig von der Konfigurationsstufe. Es bietet einen der hellsten Touchscreens in seiner Größenklasse und erfüllt scheinbar alle Anforderungen, die man an ein Multimedia-Kraftpaket stellen kann, darunter ein integrierter Kartenleser, eine große Auswahl an Anschlüssen, großartiges Audio und Unterstützung für mehrere interne SSDs. Das können wir nicht über das neue Dell XPS 16 berichten, das bei seiner jüngsten Überarbeitung auf einige dieser Funktionen verzichtet hat.
Auch wenn wir anerkennen, dass das 2026er Modell etwas dünner und leichter ist als das 2025er Modell, bietet es nicht viele Leistungsverbesserungen, da der neue Core Ultra 9 386H fast die gleiche Leistung wie der letztjährige Core Ultra 9 285H bietet. Sowohl die GPU als auch die Display-Optionen bleiben gleich, so dass sich auch das Benutzererlebnis nicht verbessert. Der Verzicht auf den Ziffernblock zugunsten größerer Lautsprechergitter könnte sich auch auf bestimmte Nutzungsszenarien auswirken, die darauf angewiesen sind.
Die größten Nachteile des Modells sind die Lüftergeräusche im Performance-Modus sowie das höhere Gewicht und die kürzere Akkulaufzeit im Vergleich zur Konkurrenz, trotz dem größeren Akku. Die vielen Funktionen und Anschlüsse haben offenbar ihren Preis bei der Portabilität. Wer ohne dedizierte Grafik oder ein OLED-Display auskommt, findet im Panther Lake XPS 16 oder im MSI Prestige 16 leisere, schlankere und reisefreundlichere Alternativen. Wenn man jedoch wirklich diskrete Grafik braucht, bleibt dieses vielseitige Lenovo eines unserer liebsten 16-Zoll-Multimedia-Geräte – und das schon im zweiten Jahr in Folge.
Pro
Contra
Preis und Verfügbarkeit
Das Lenovo Pro 9 16IPH11 wird ab sofort ab 3.099 Euro für die Basiskonfiguration mit 1.800p RTX 5050 bis zu über 3.669 Euro für die 2.000p-RTX-5060-Konfiguration (siehe Test) ausgeliefert. Im deutschsprachigen Raum wird es weiterhin als YPro 9i Aura Edition vermarktet.
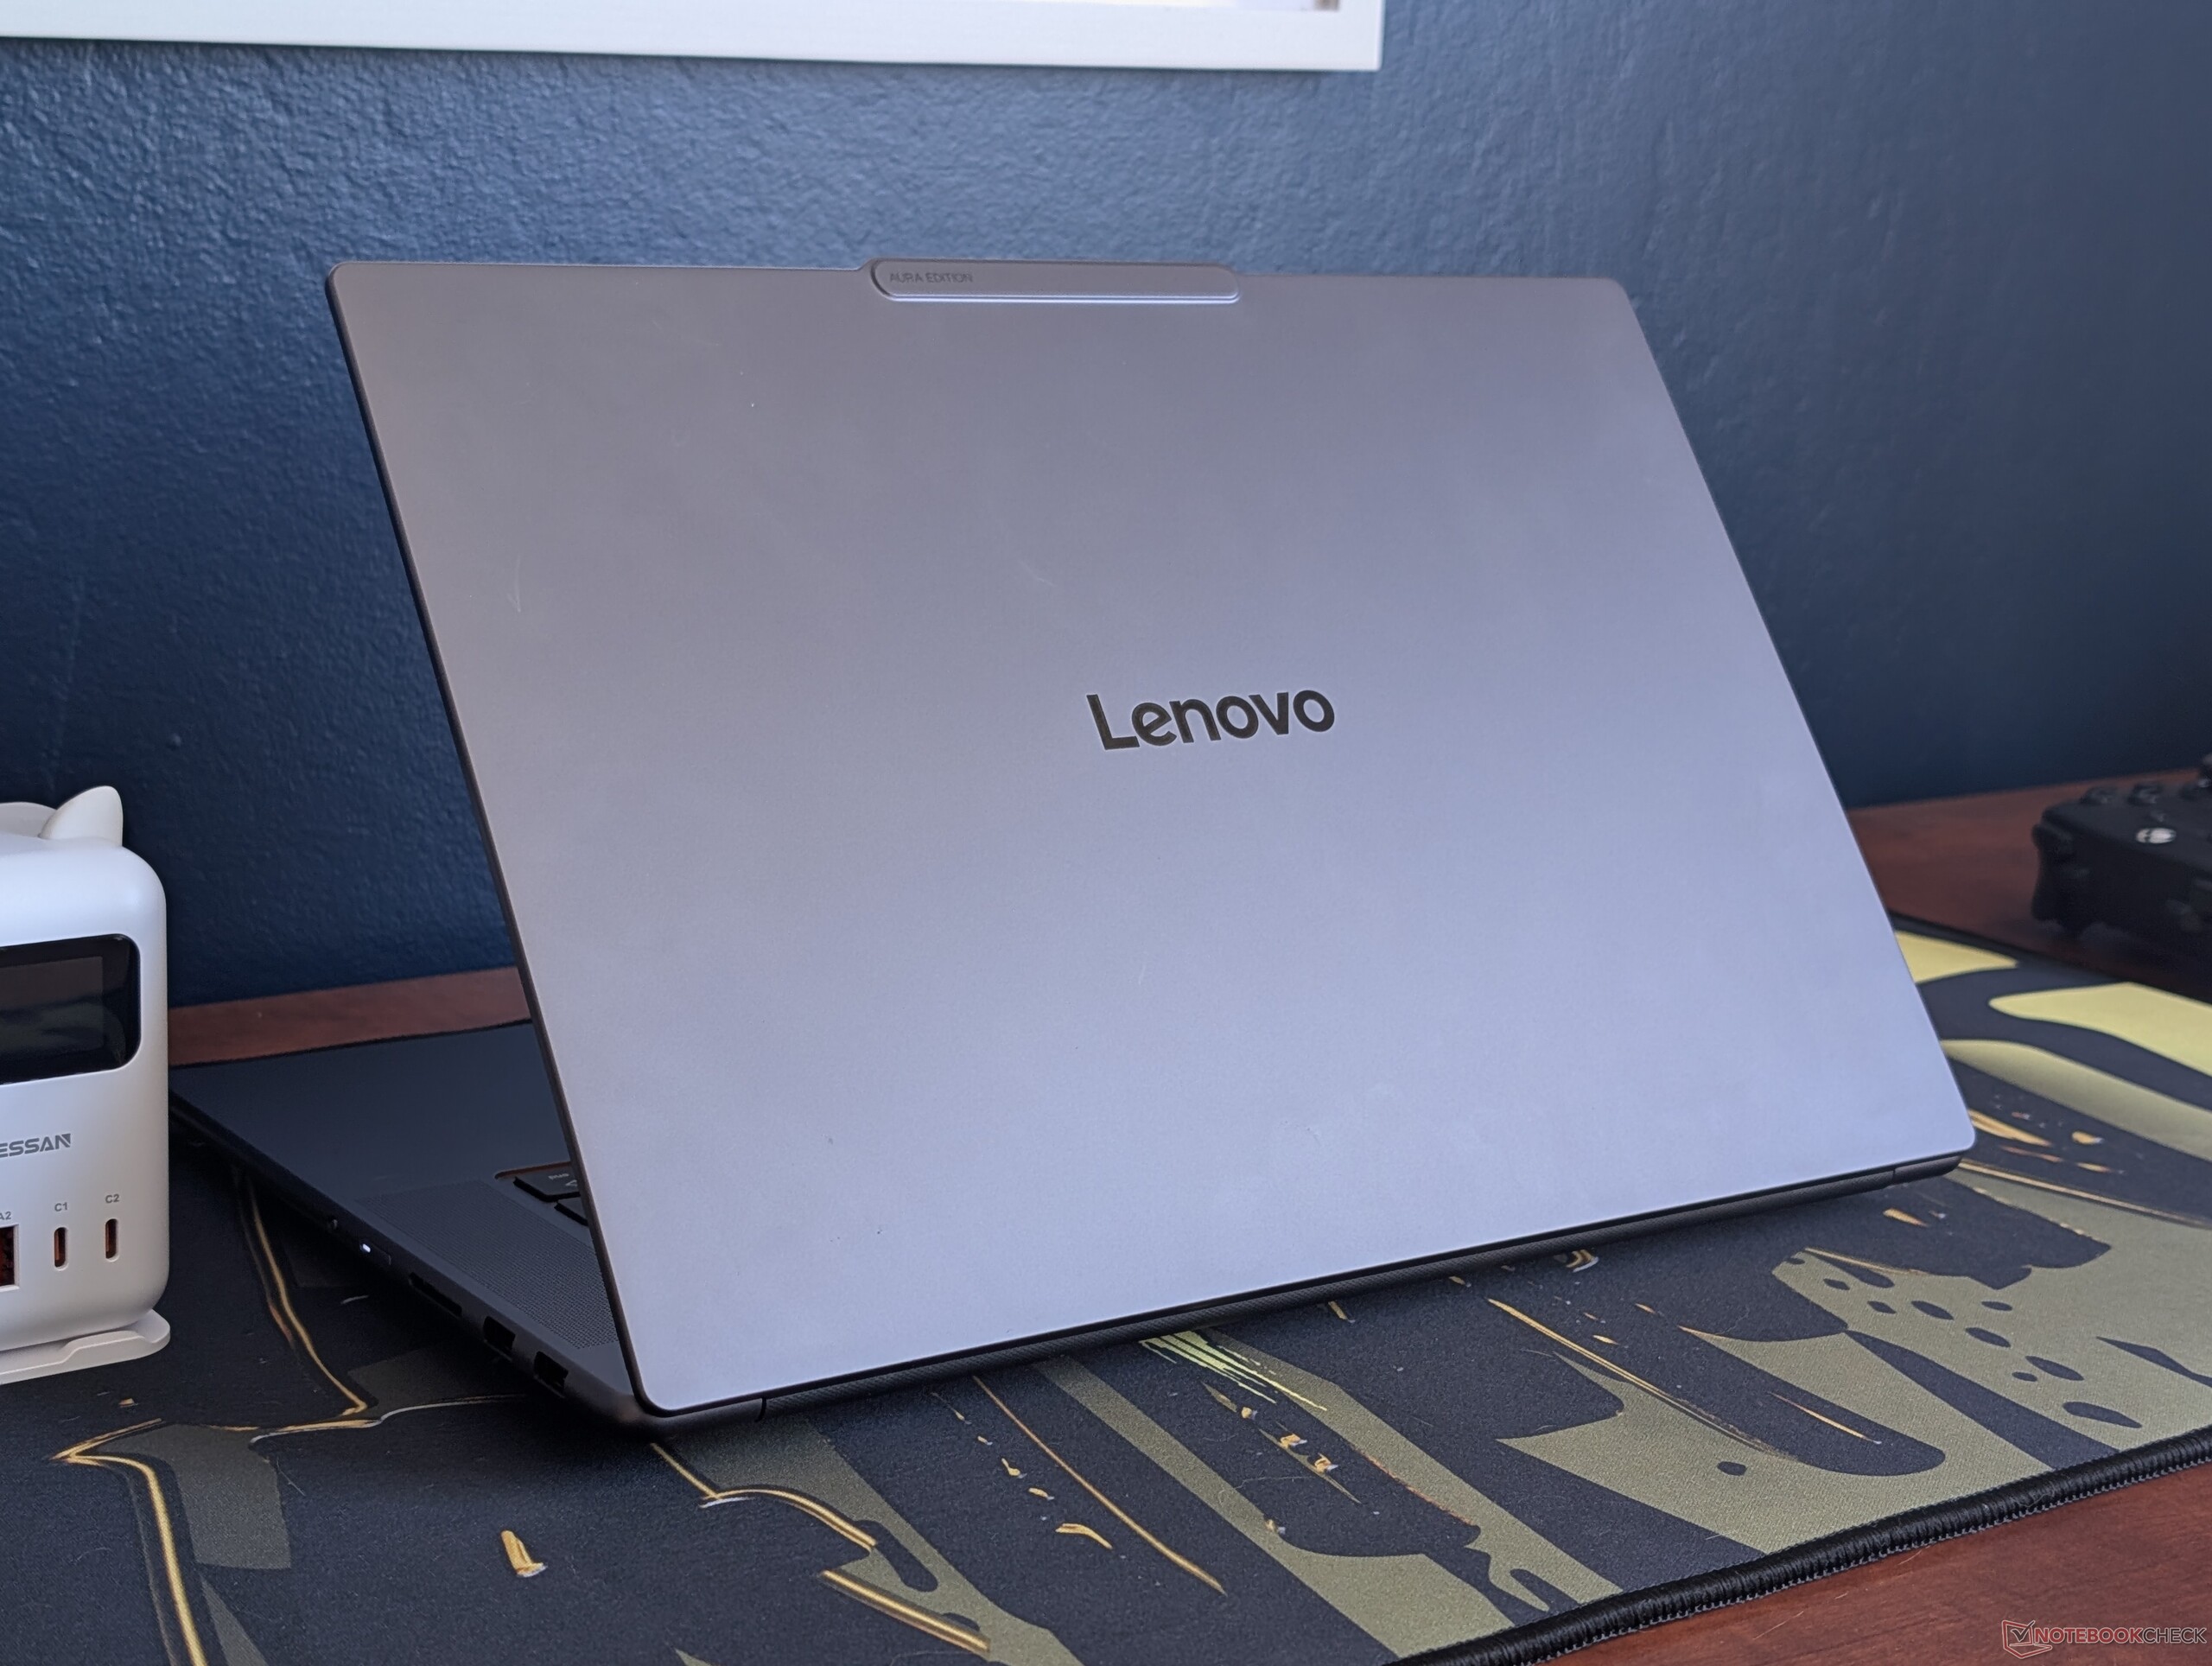
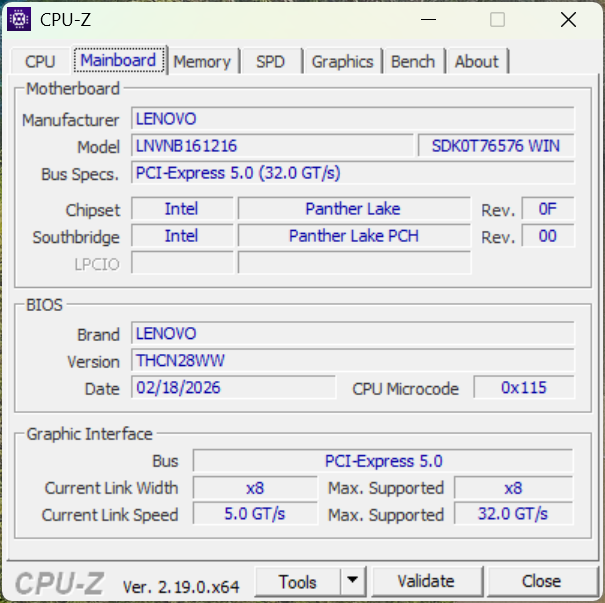
Das Lenovo Pro 9 16IPH11 (vermarktet als Lenovo Pro 9i Aura Edition 16 G11 bzw. Pro 9i Aura Edition im deutschsprachigen Raum) ist der direkte Nachfolger des Pro 9i 16IAH G10 Aura vom letzten Jahr. Der Hersteller hat sowohl den Namen Yoga weggelassen als auch das äußere Design aufgefrischt.
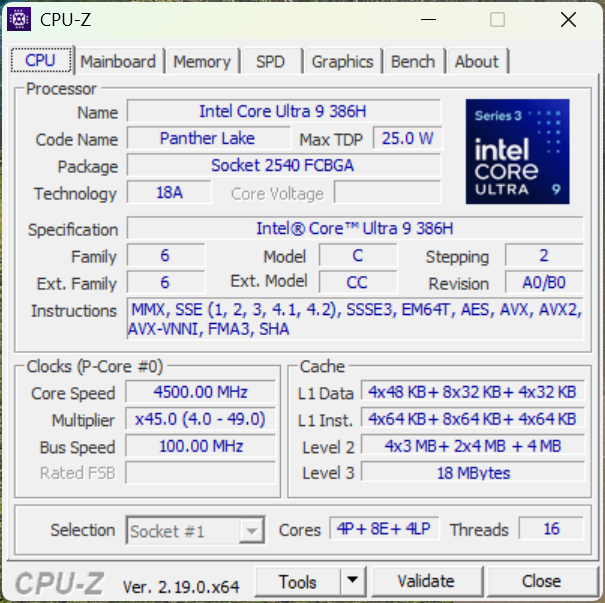
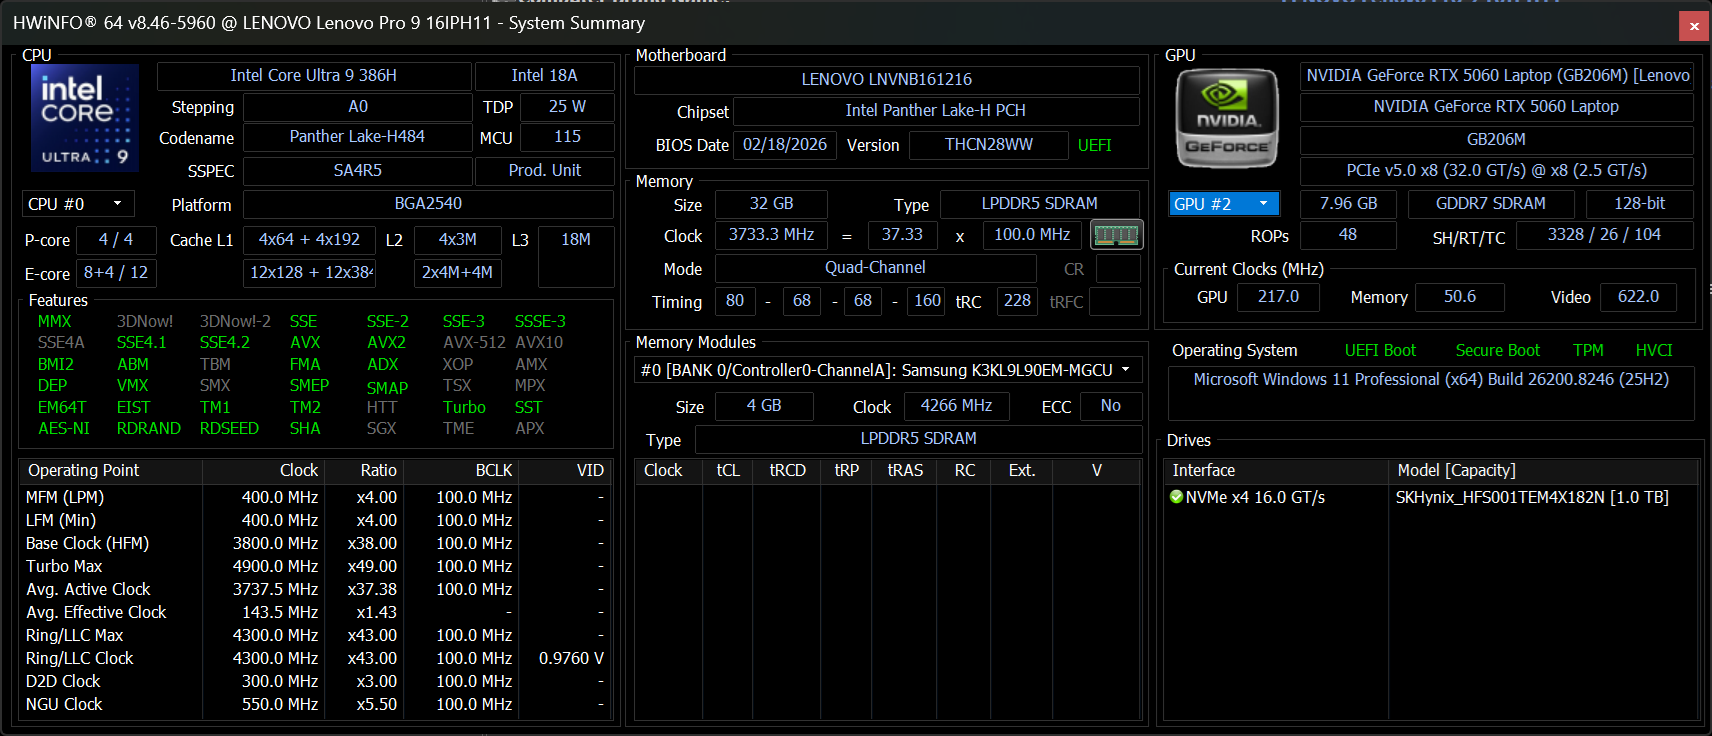
Bei unserem Testgerät handelt es sich um die Top-Konfiguration mit der 100-W-GeForce-RTX-5060-GPU und dem 3.200 x 2.000 Tandem OLED-Touchscreen für ca. 3.100 US-Dollar. Niedrigere SKUs sind stattdessen mit der RTX 5050 oder 2.880 x 1.800 OLED ausgestattet, aber alle Optionen werden mit der gleichen Core Ultra 9 386H Panther Lake CPU geliefert.
Dieses Lenovo Flaggschiff konkurriert direkt mit anderen High-End-Multimedia-Geräten im 16-Zoll-Format wie dem MSI Prestige 16 AI Evo, der Asus-ZenBook-16-Serie und dem neuen Dell XPS 16.
Weitere Lenovo Testberichte:
Spezifikationen
Preisvergleich
Gehäuse
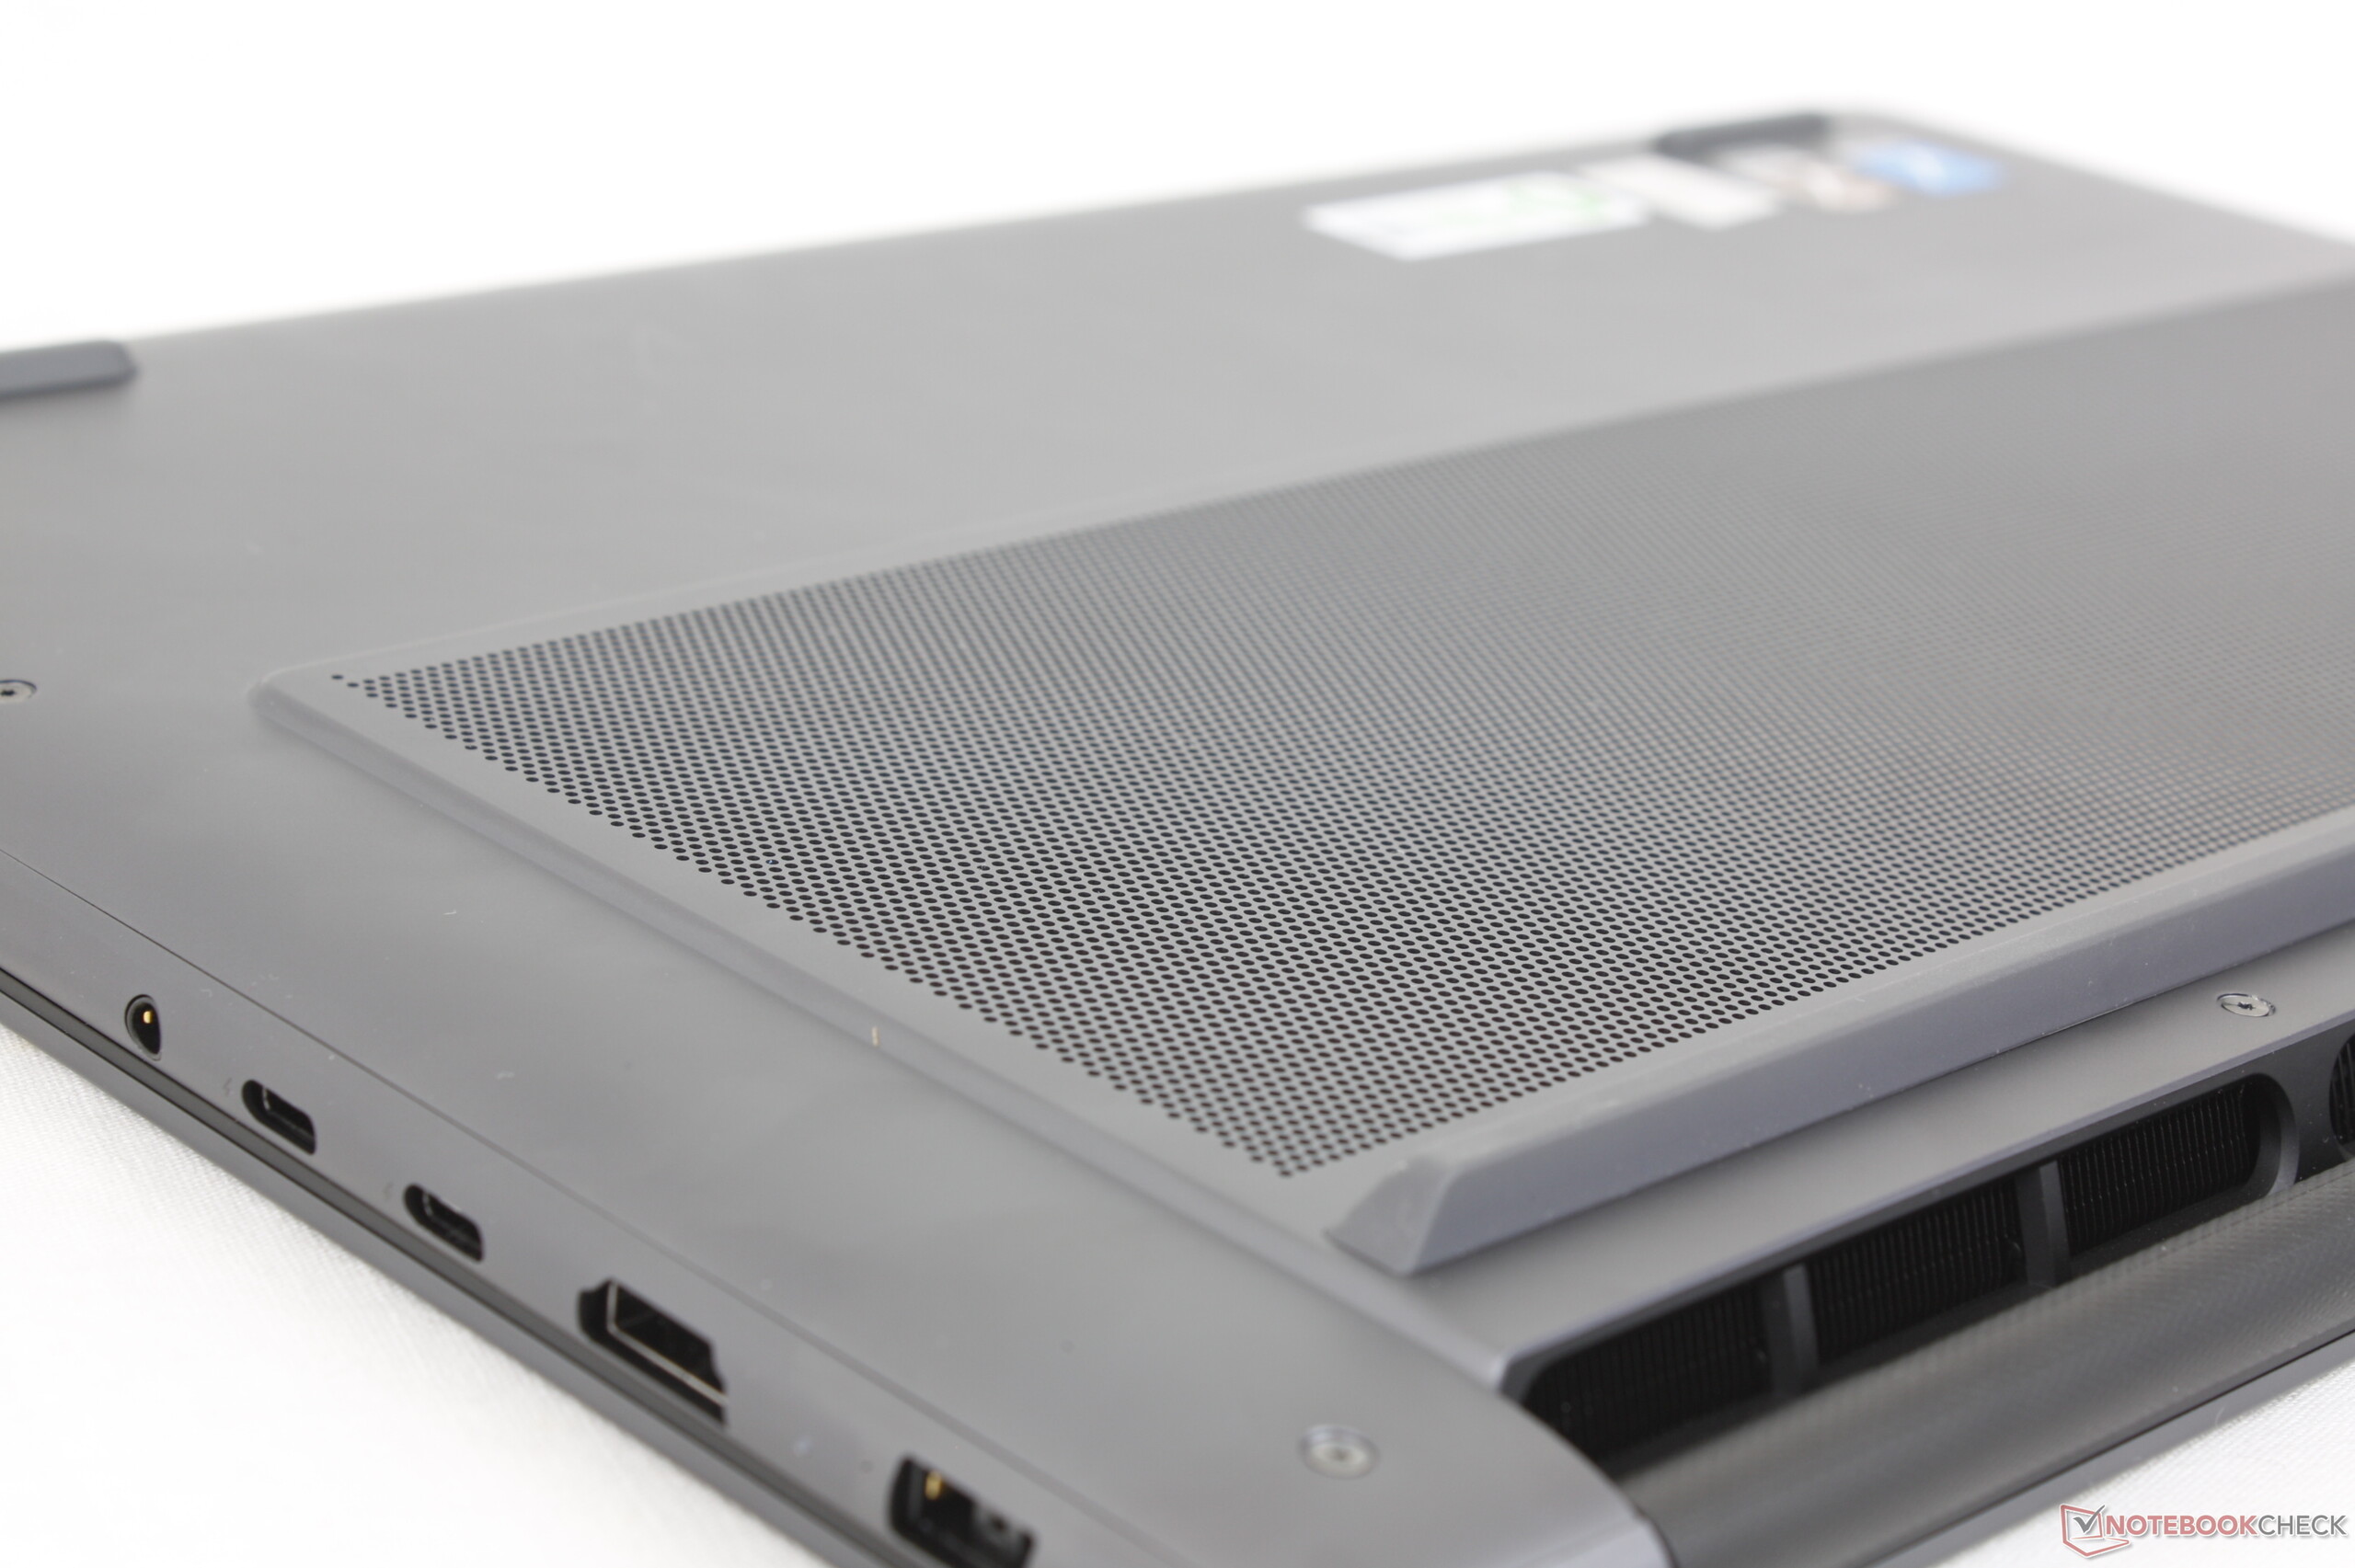
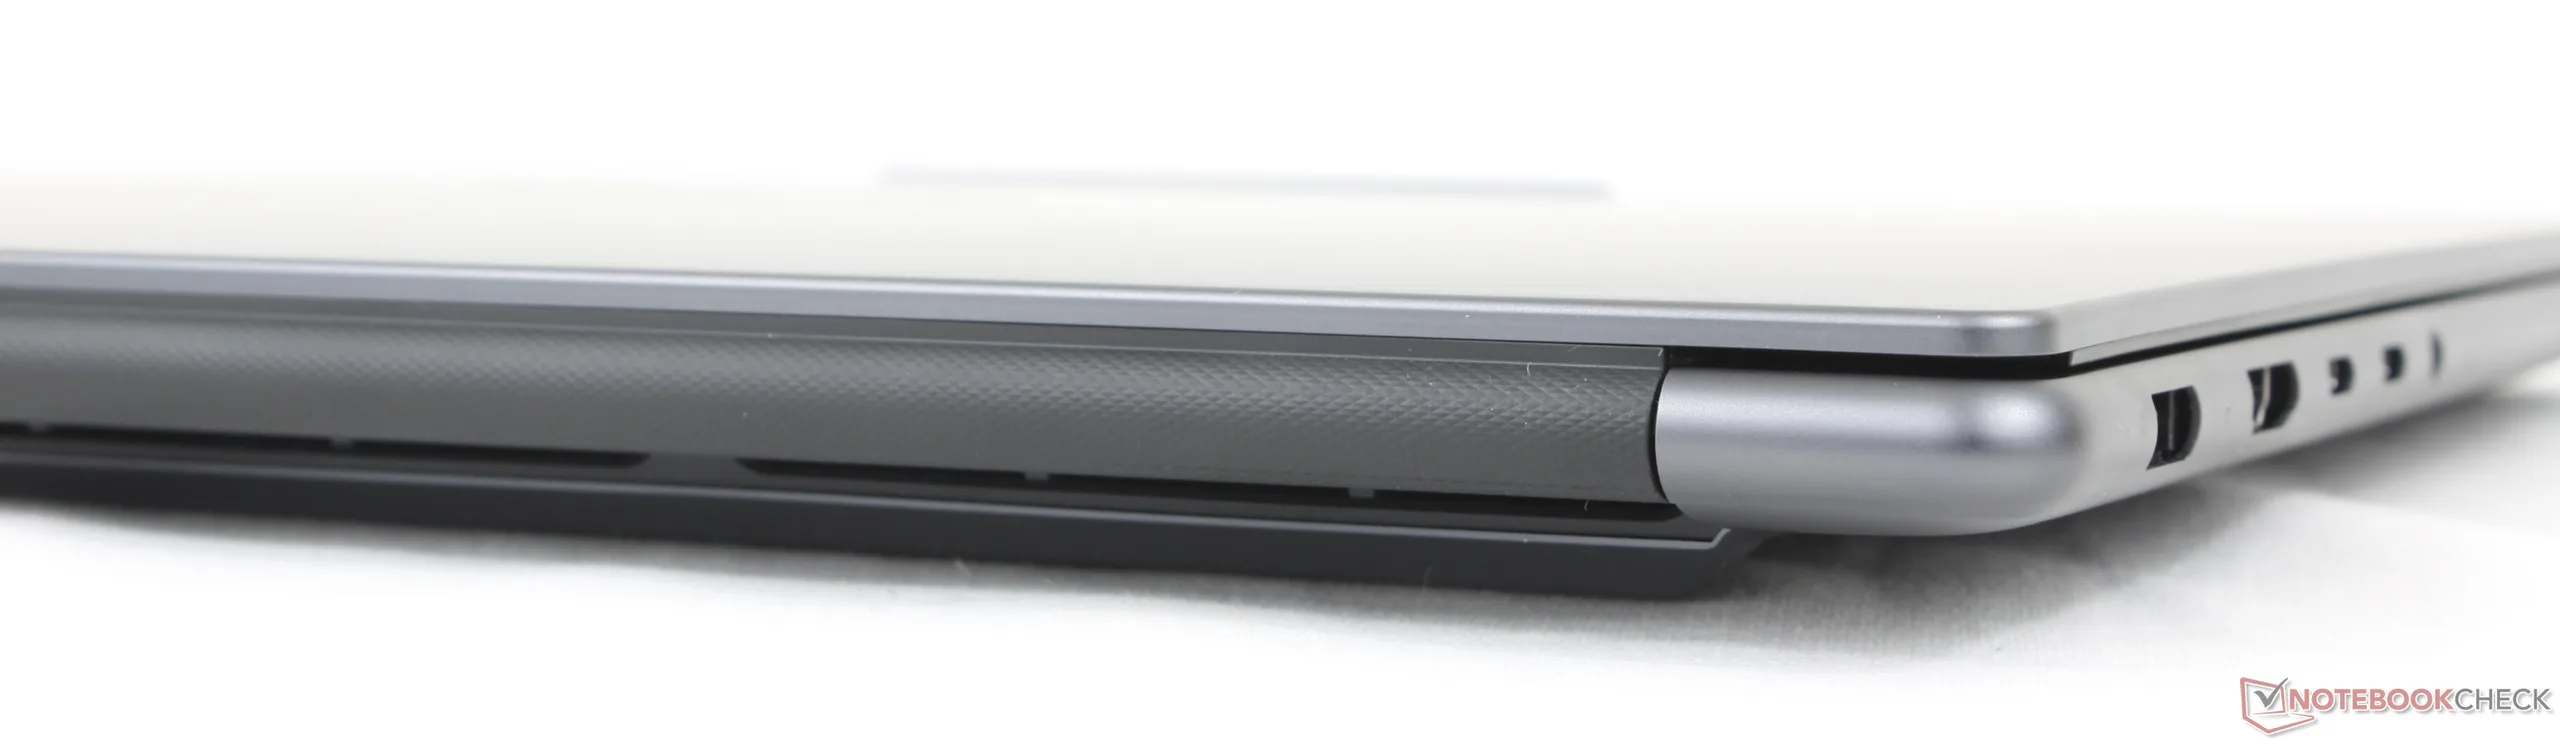
Lenovo hat einige äußere Änderungen gegenüber dem letztjährigen Design vorgenommen. Am auffälligsten ist der Wegfall des Nummernblocks zugunsten größerer, nach oben gerichteter Lautsprechergitter an den Seiten der Tastatur. Außerdem ist das untere D-Cover nicht mehr ganz flach, da die Lüftungsgitter jetzt leicht erhöht sind. Das lasergravierte "Yoga"-Label, das auf dem letztjährigen Modell so prominent war, wurde ebenfalls entfernt, da Lenovo stattdessen die "Pro"-Bezeichnung hervorheben möchte.
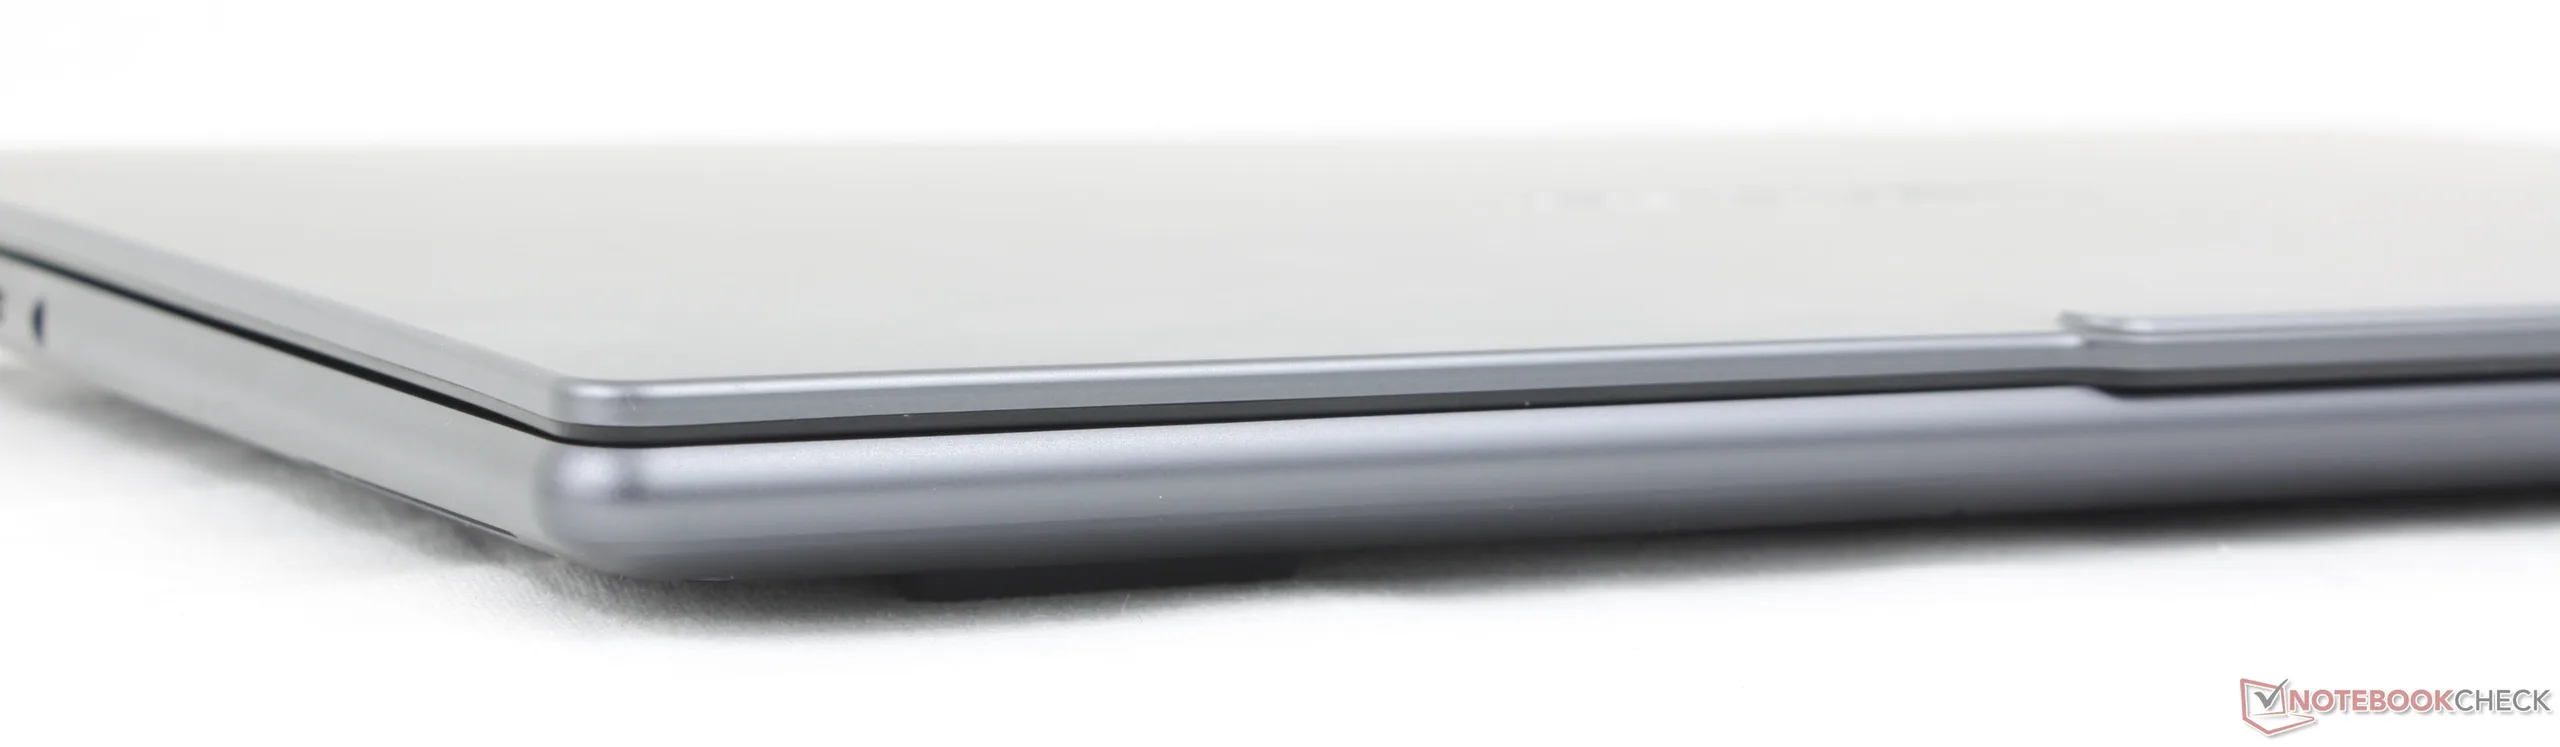
Das neue Modell ist etwas dünner, kleiner und leichter als die vorherige Generation, aber mit den gleichen eloxierten Aluminiummaterialien für ein ähnliches Qualitätsniveau.
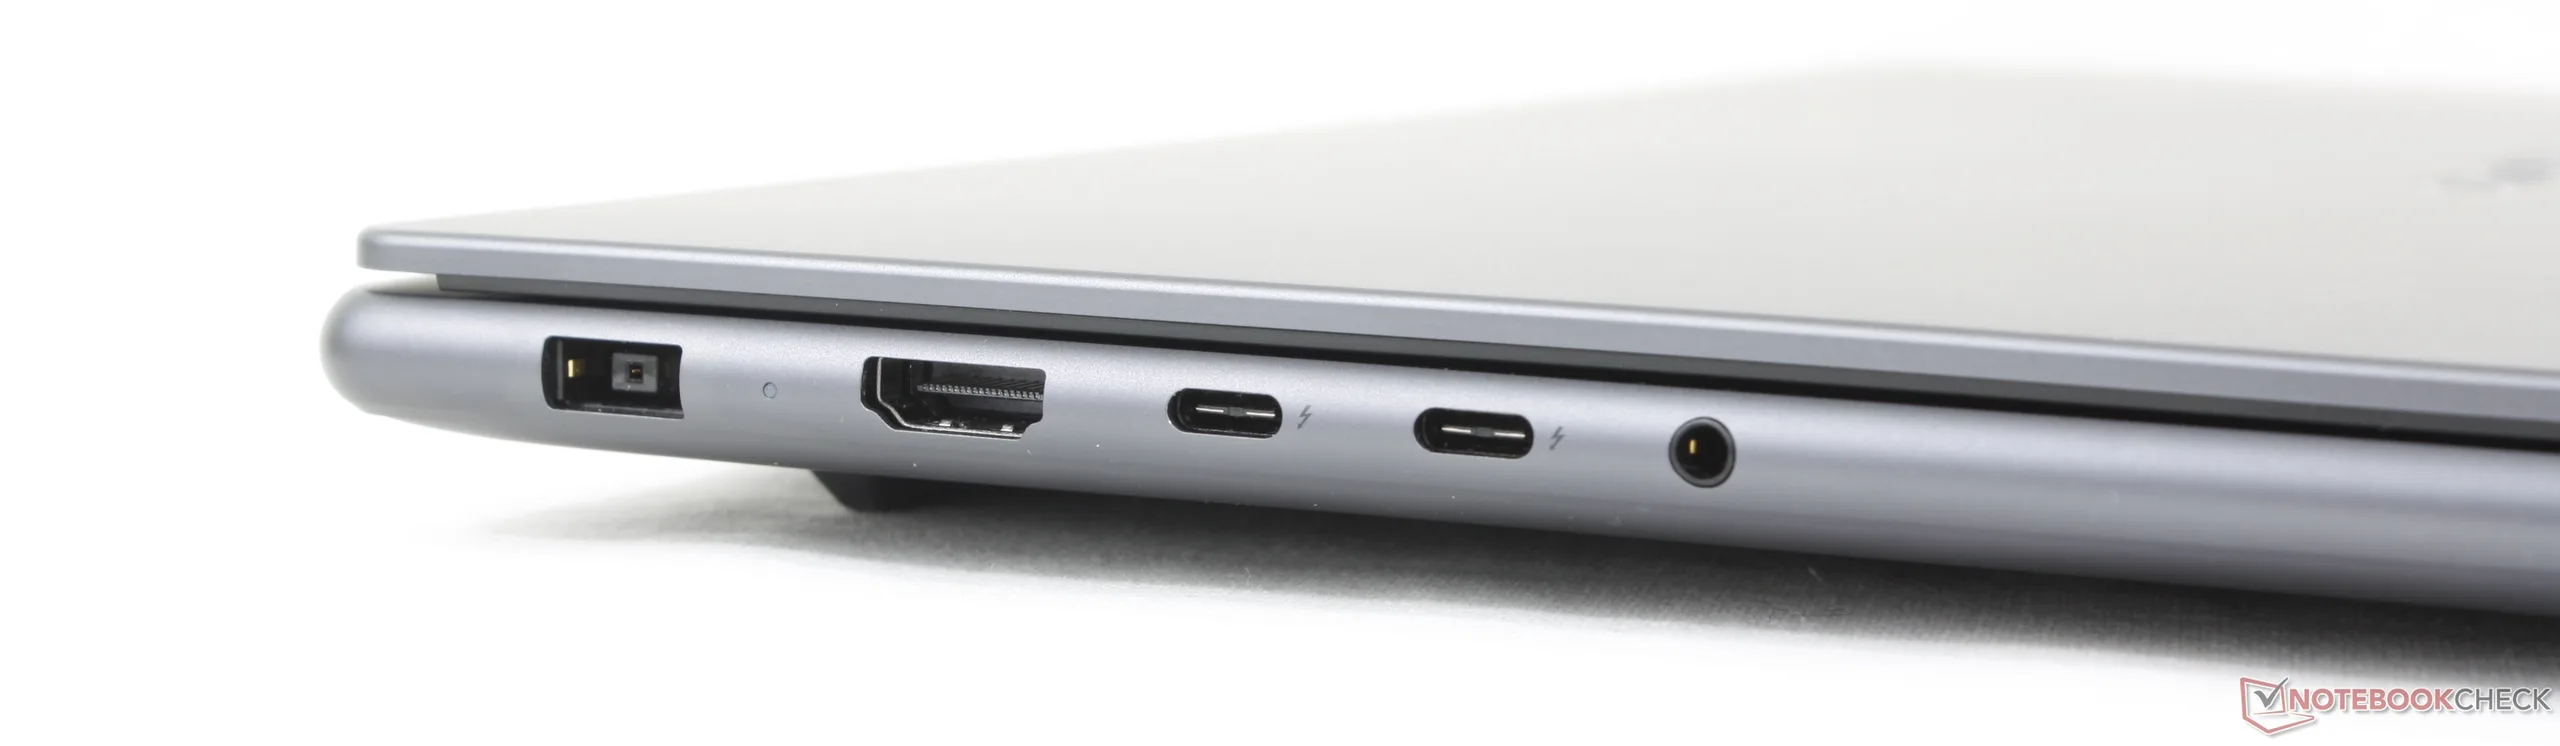
Anschlussausstattung
Trotz all der oben erwähnten physischen Veränderungen sind die Ports die gleichen wie zuvor.
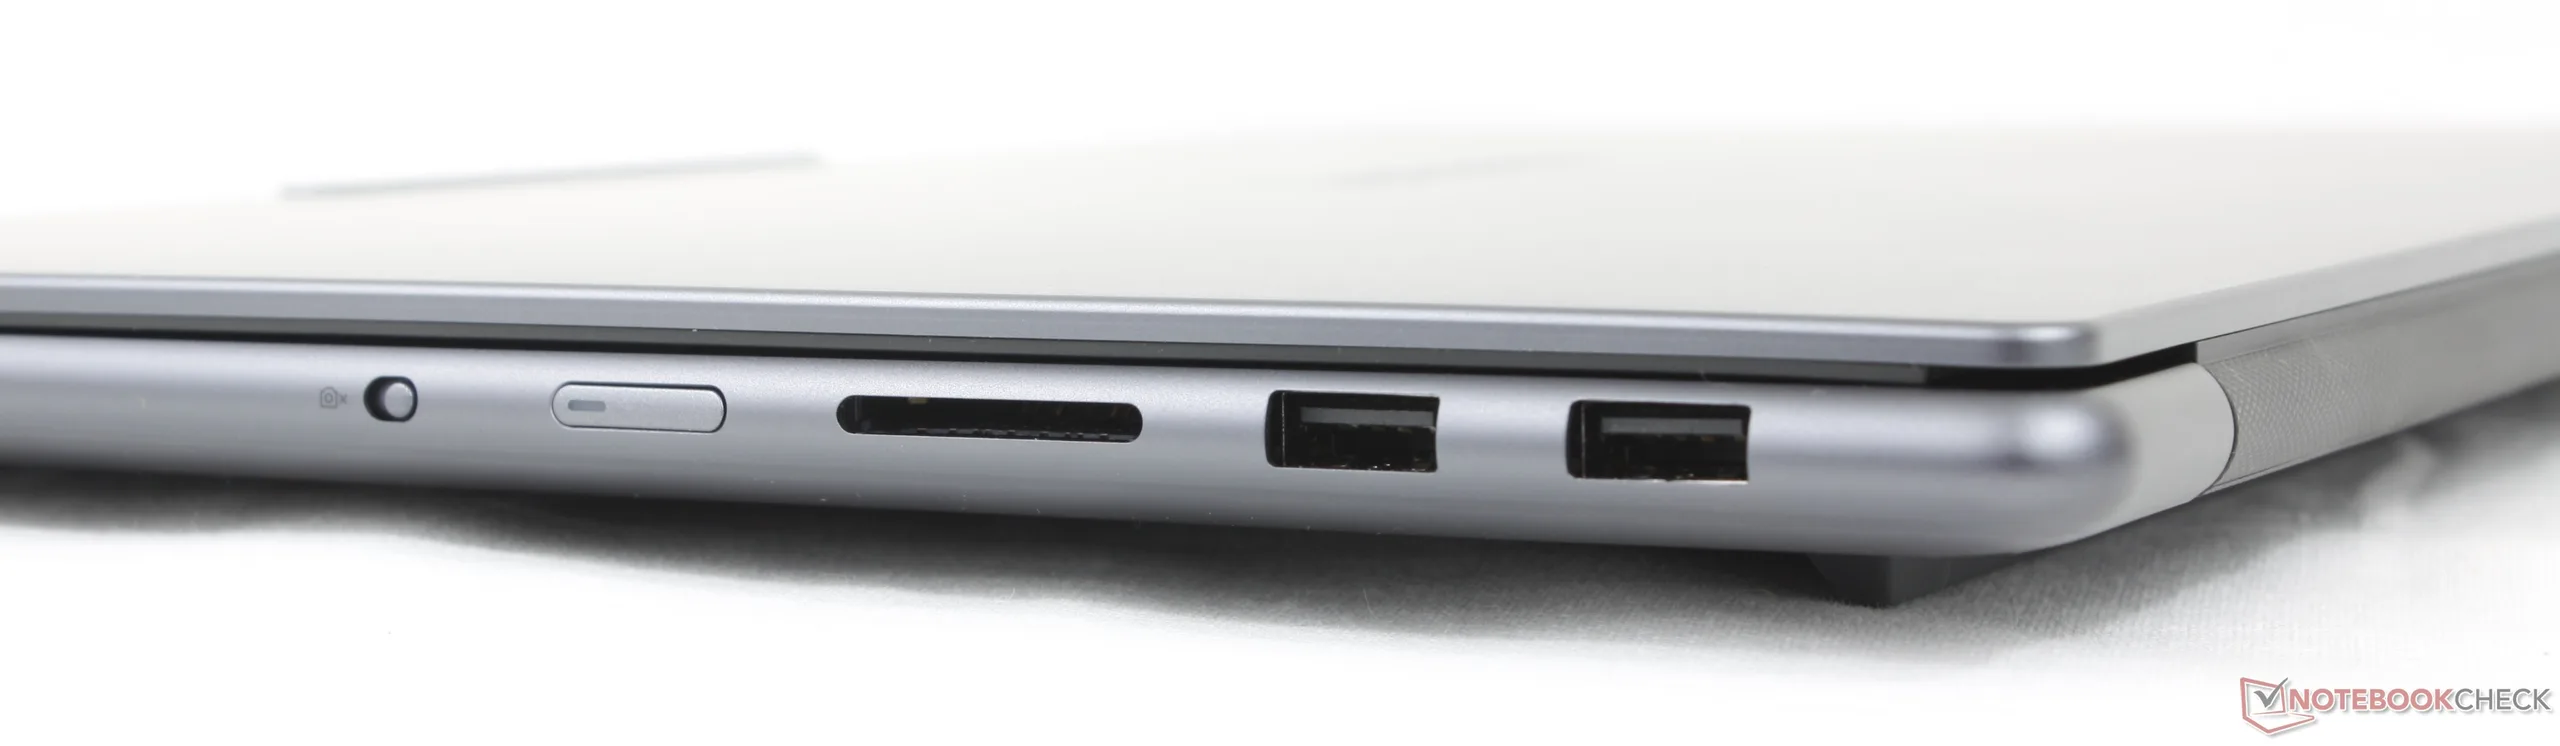
SD-Kartenleser
| SD Card Reader | |
| average JPG Copy Test (av. of 3 runs) | |
| Lenovo Pro 9 16IPH11 (Toshiba Exceria Pro SDXC 64 GB UHS-II) | |
| Asus ProArt P16 H7606WP (Angelbird AV Pro V60) | |
| MSI Prestige 16 AI Evo B2HMG (Angelbird AV Pro V60) | |
| Lenovo Yoga Pro 9 16IAH10 RTX 5050 (Angelbird AV Pro V60) | |
| maximum AS SSD Seq Read Test (1GB) | |
| Asus ProArt P16 H7606WP (Angelbird AV Pro V60) | |
| Lenovo Pro 9 16IPH11 (Toshiba Exceria Pro SDXC 64 GB UHS-II) | |
| Lenovo Yoga Pro 9 16IAH10 RTX 5050 (Angelbird AV Pro V60) | |
| MSI Prestige 16 AI Evo B2HMG (Angelbird AV Pro V60) | |
Kommunikation
Webcam


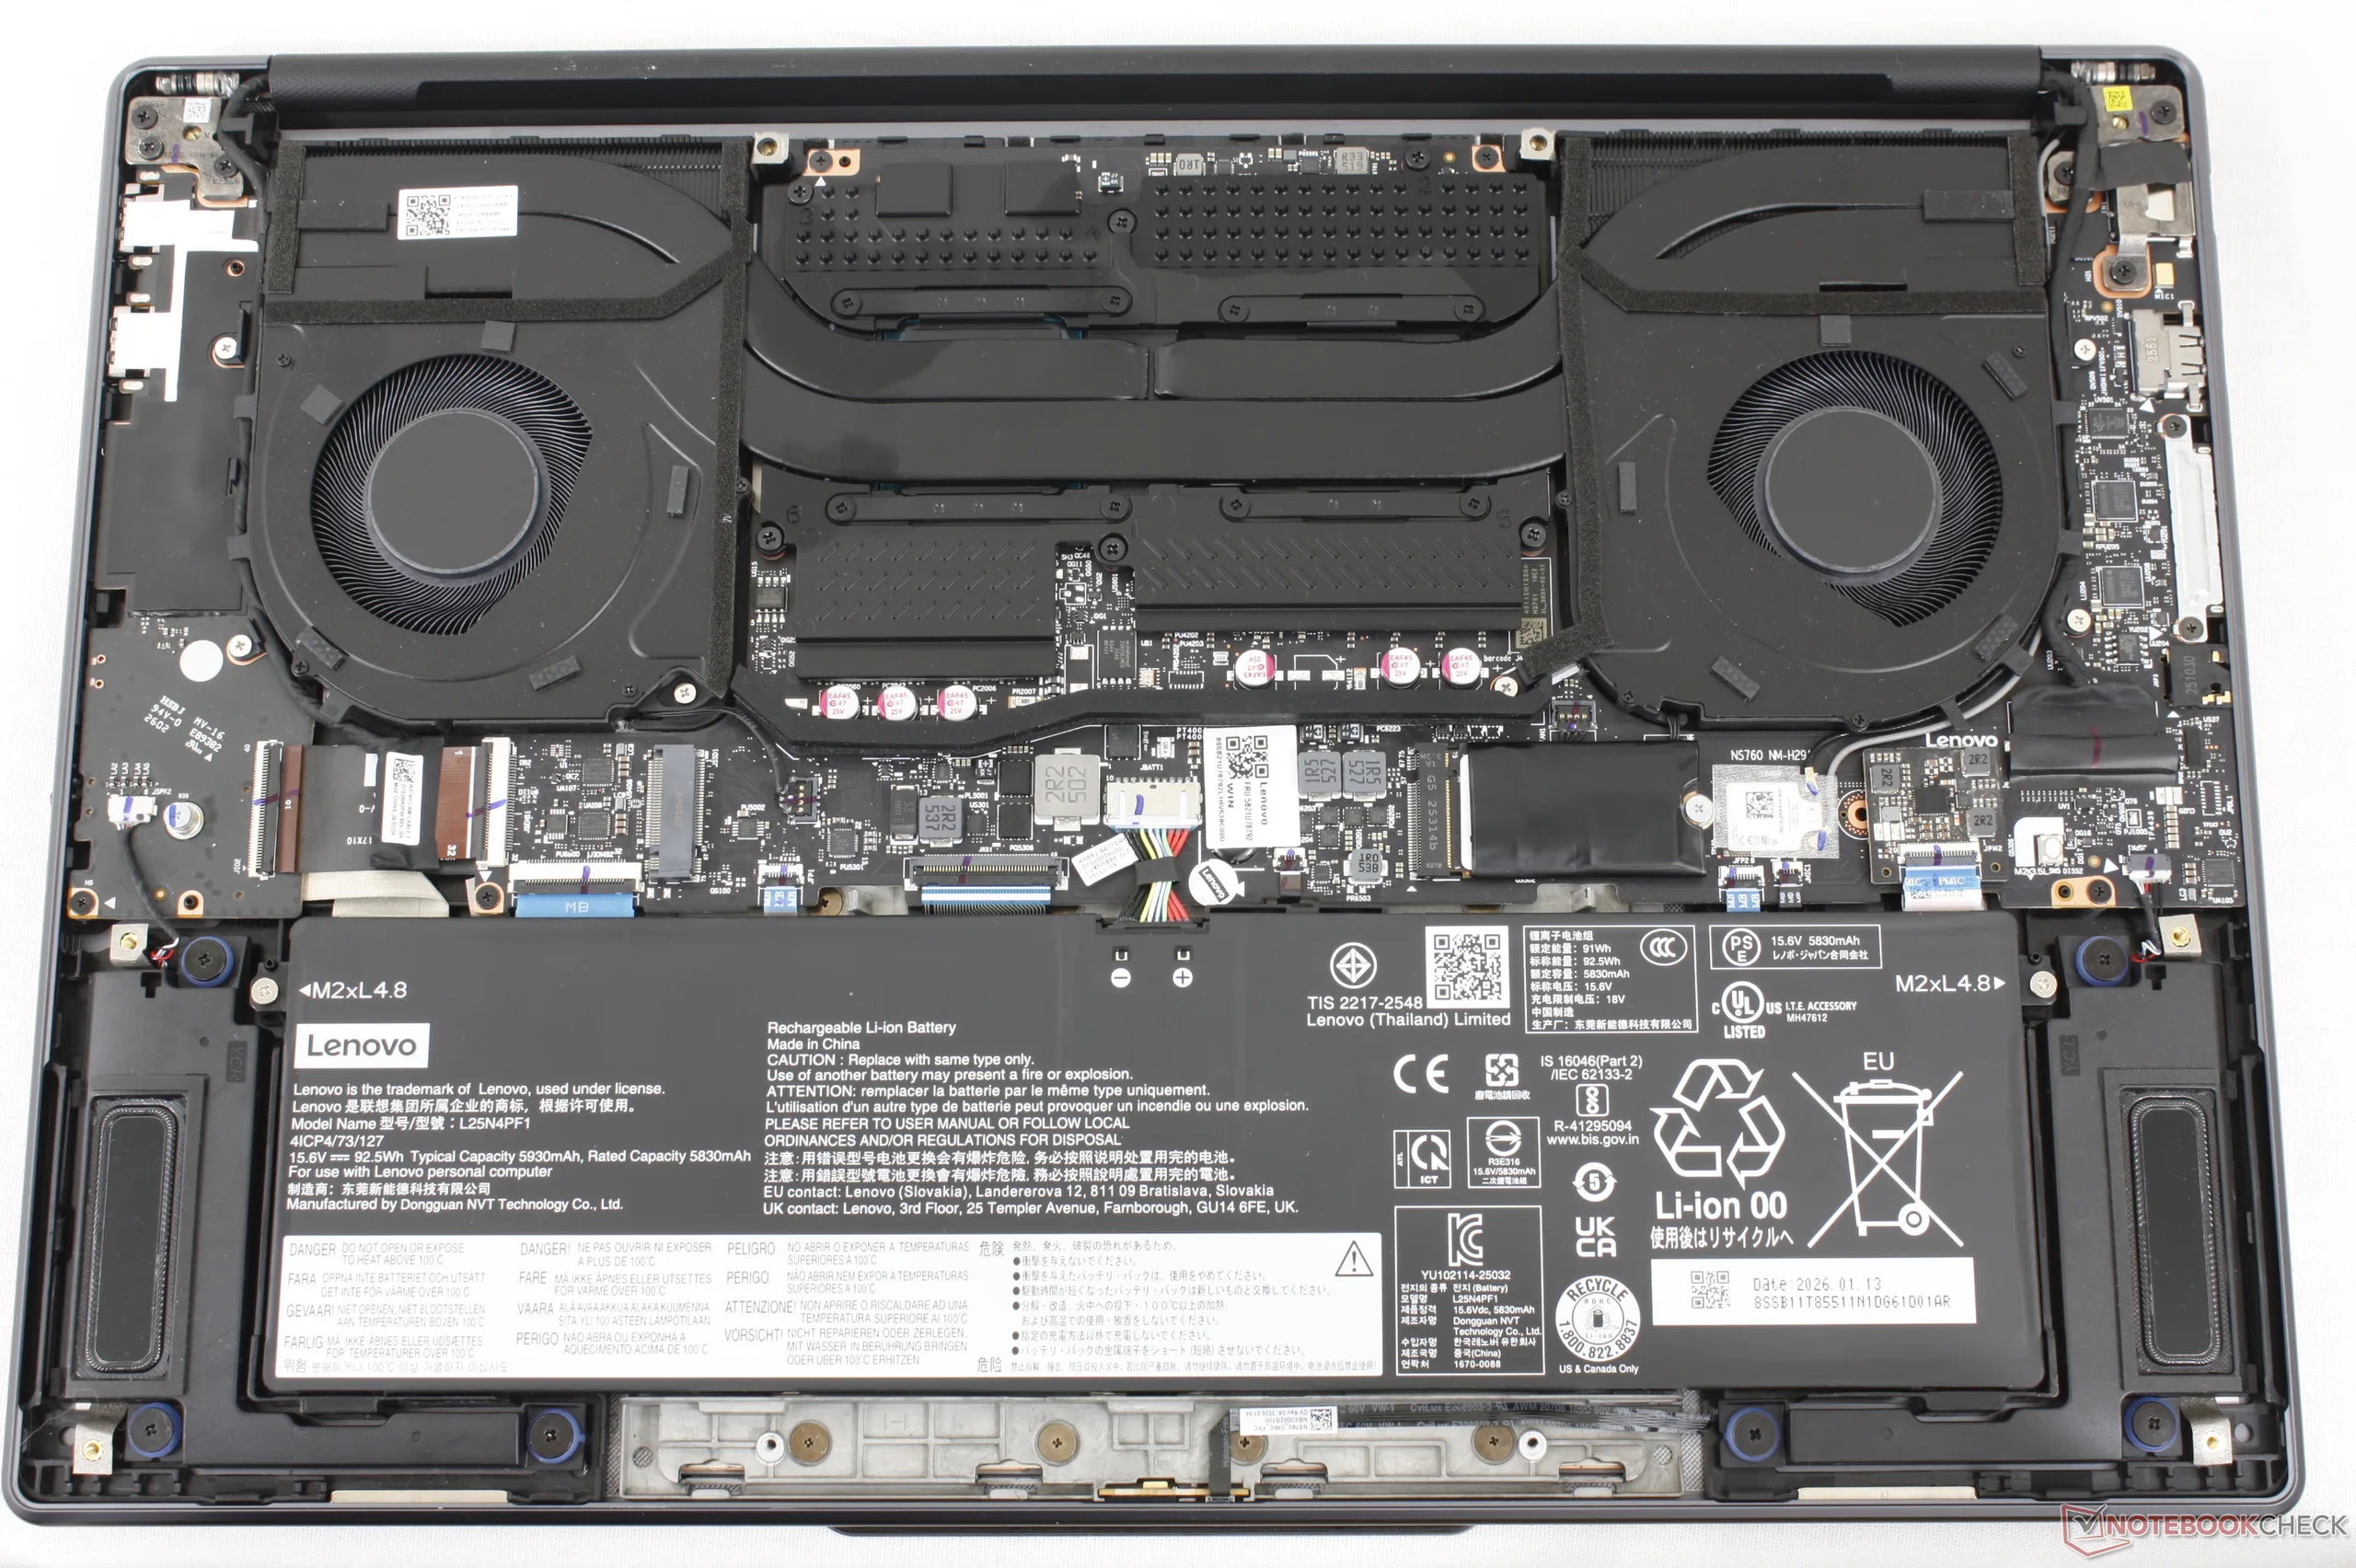
Wartung
Das Innenleben wurde leicht verändert. Am auffälligsten ist die etwas größere Akkukapazität (84 zu 93 Wh), aber ansonsten sind die SSD-Upgrade-Optionen dieselben wie zuvor.

Nachhaltigkeit
Lenovo macht keine Angaben zu den bei der Herstellung verwendeten recycelten Materialien. Die Verpackung ist ansonsten frei von Kunststoffen und vollständig recycelbar.
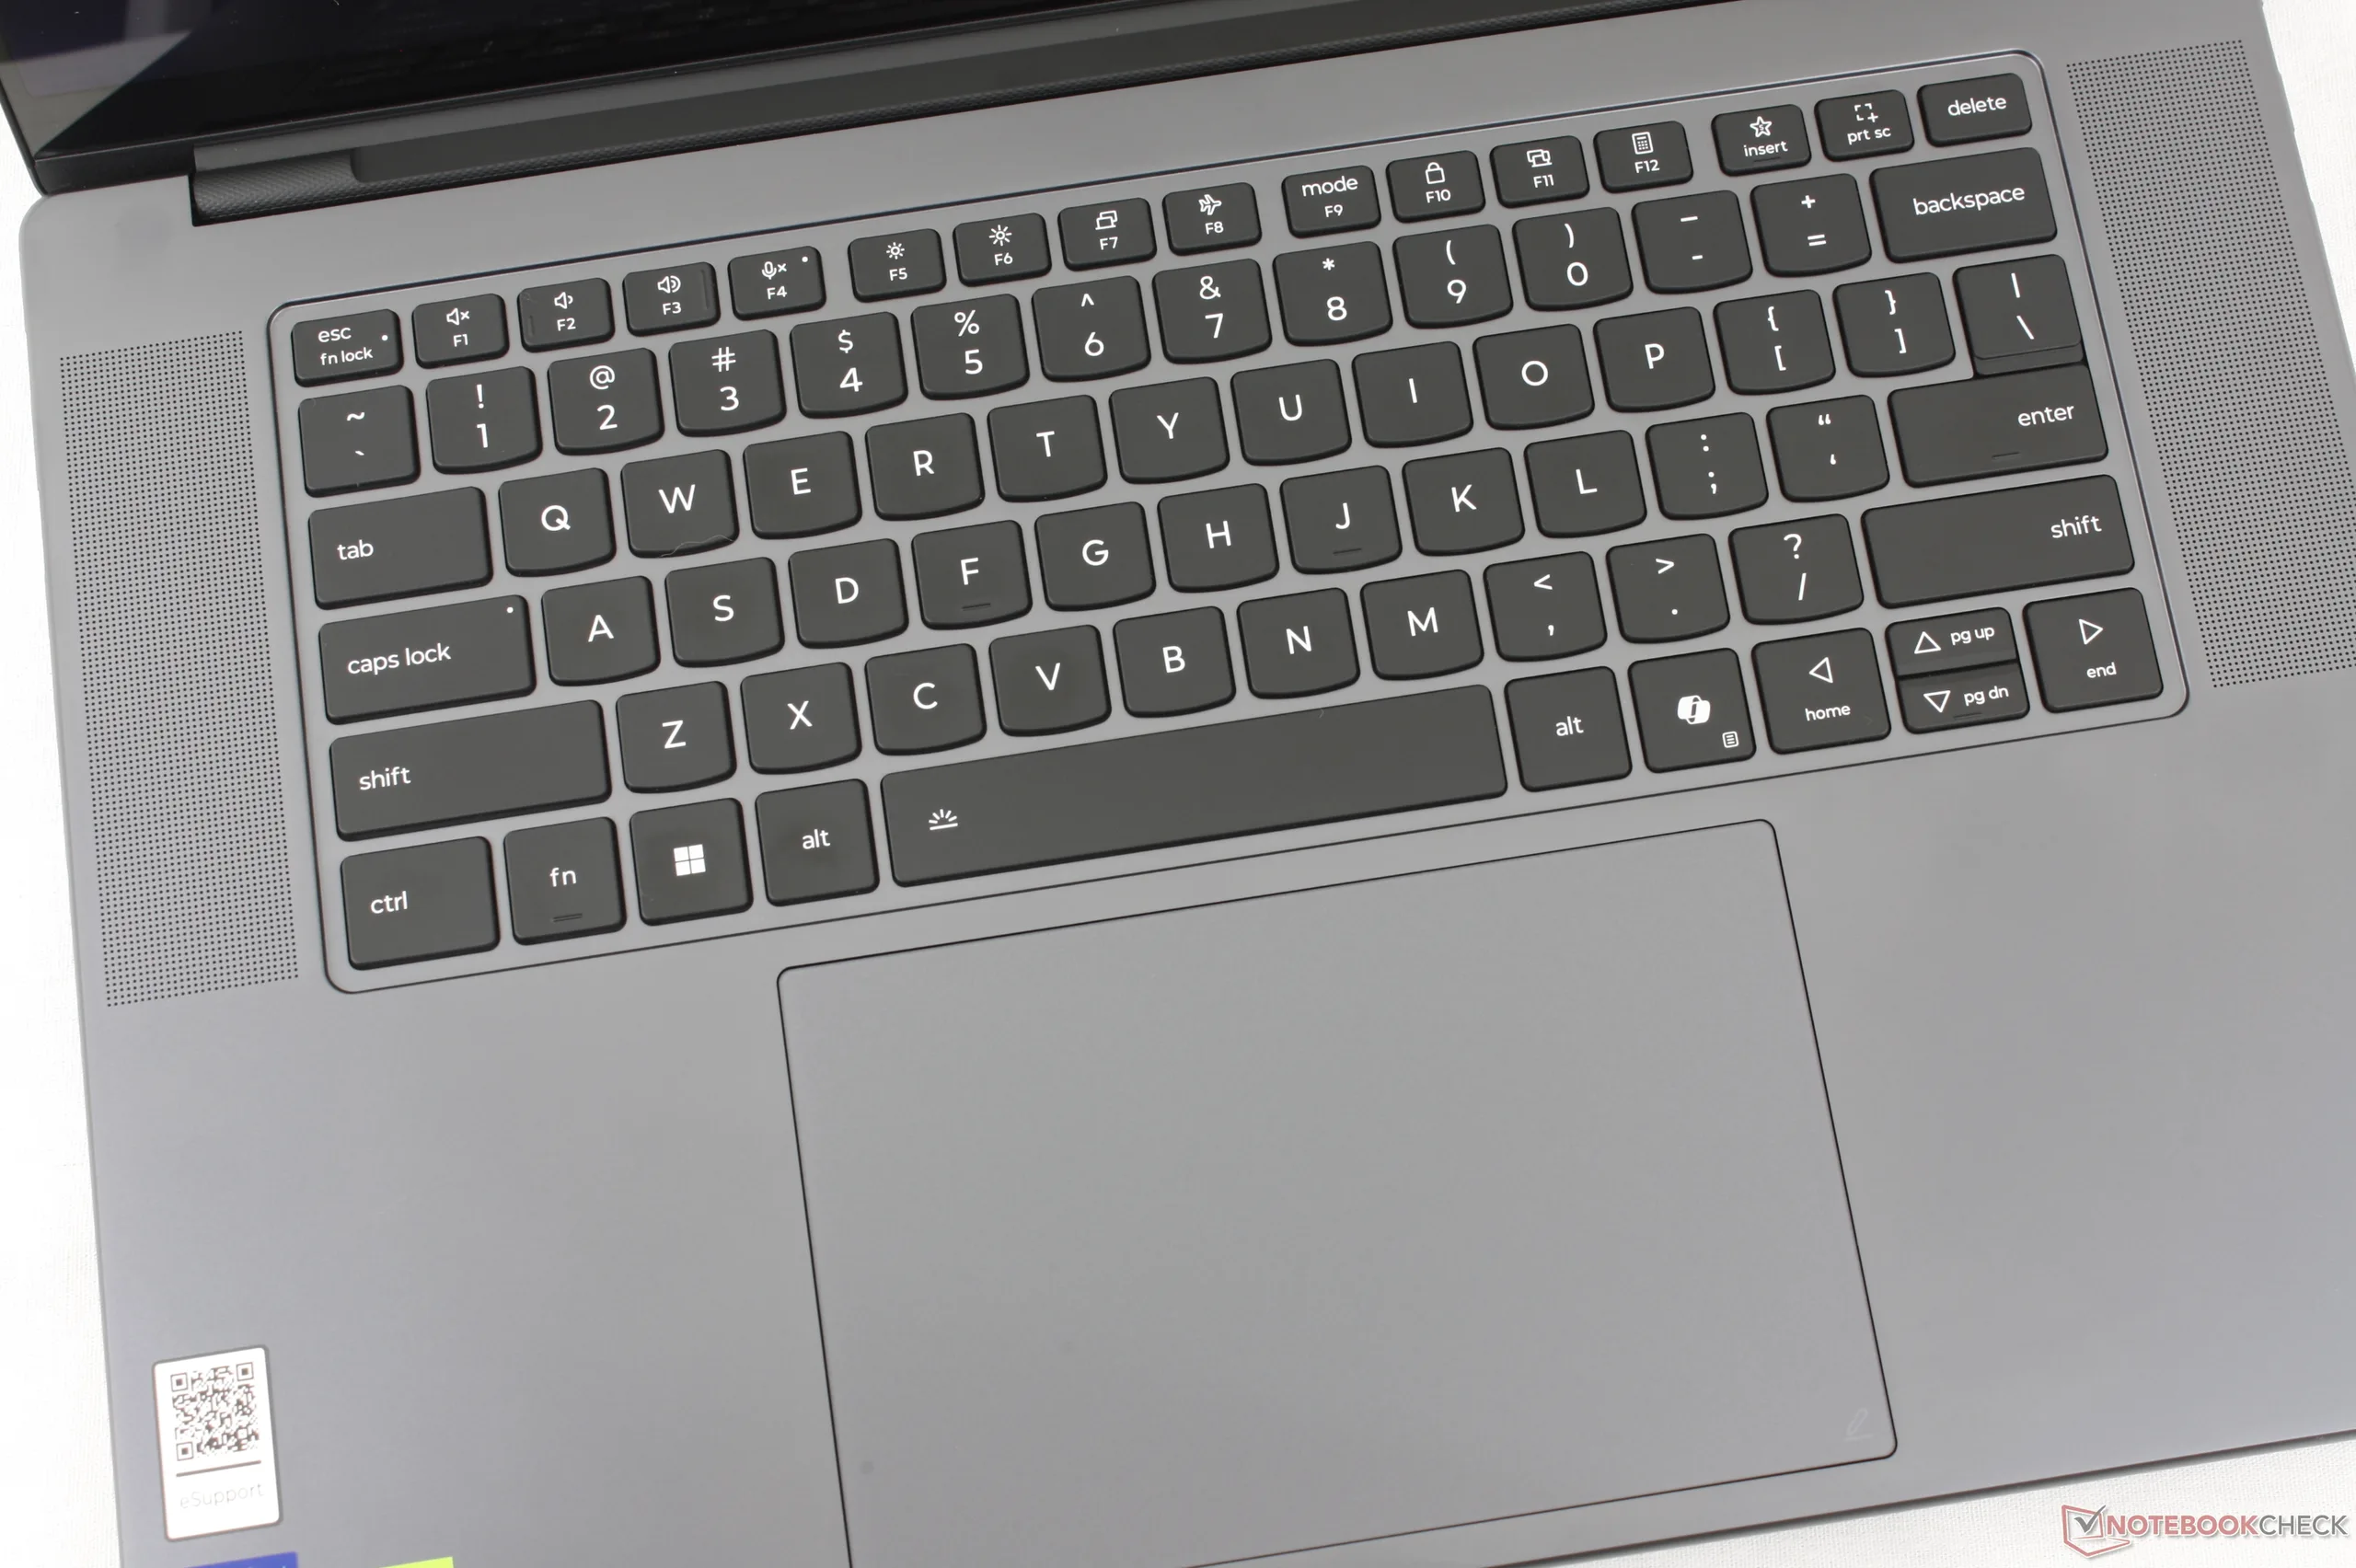
Eingabegeräte
Die Schriftart und der Aufdruck der Tasten haben sich gegenüber dem Vorjahresmodell geändert. Sie sind nun größer, zentriert und generell besser zu erkennen. Die Tasten fühlen sich ansonsten gleich an, einschließlich des 1,5-mm-Weges und des relativ klaren Feedbacks für ein ähnliches Tipperlebnis trotz des fehlenden Ziffernblocks.
Display

Die beiden Touchscreen-Optionen bleiben die gleichen wie zuvor:
- 2.880 x 1.800, OLED, 500 nits SDR (1.100 nits HDR), 100 % DCI-P3, 120 Hz, Gorilla Glass 3
- 3.200 x 2.000, Tandem OLED, 1.000 nits SDR (1.600 nits HDR), 100 % DCI-P3, 120 Hz, Gorilla Glass 3
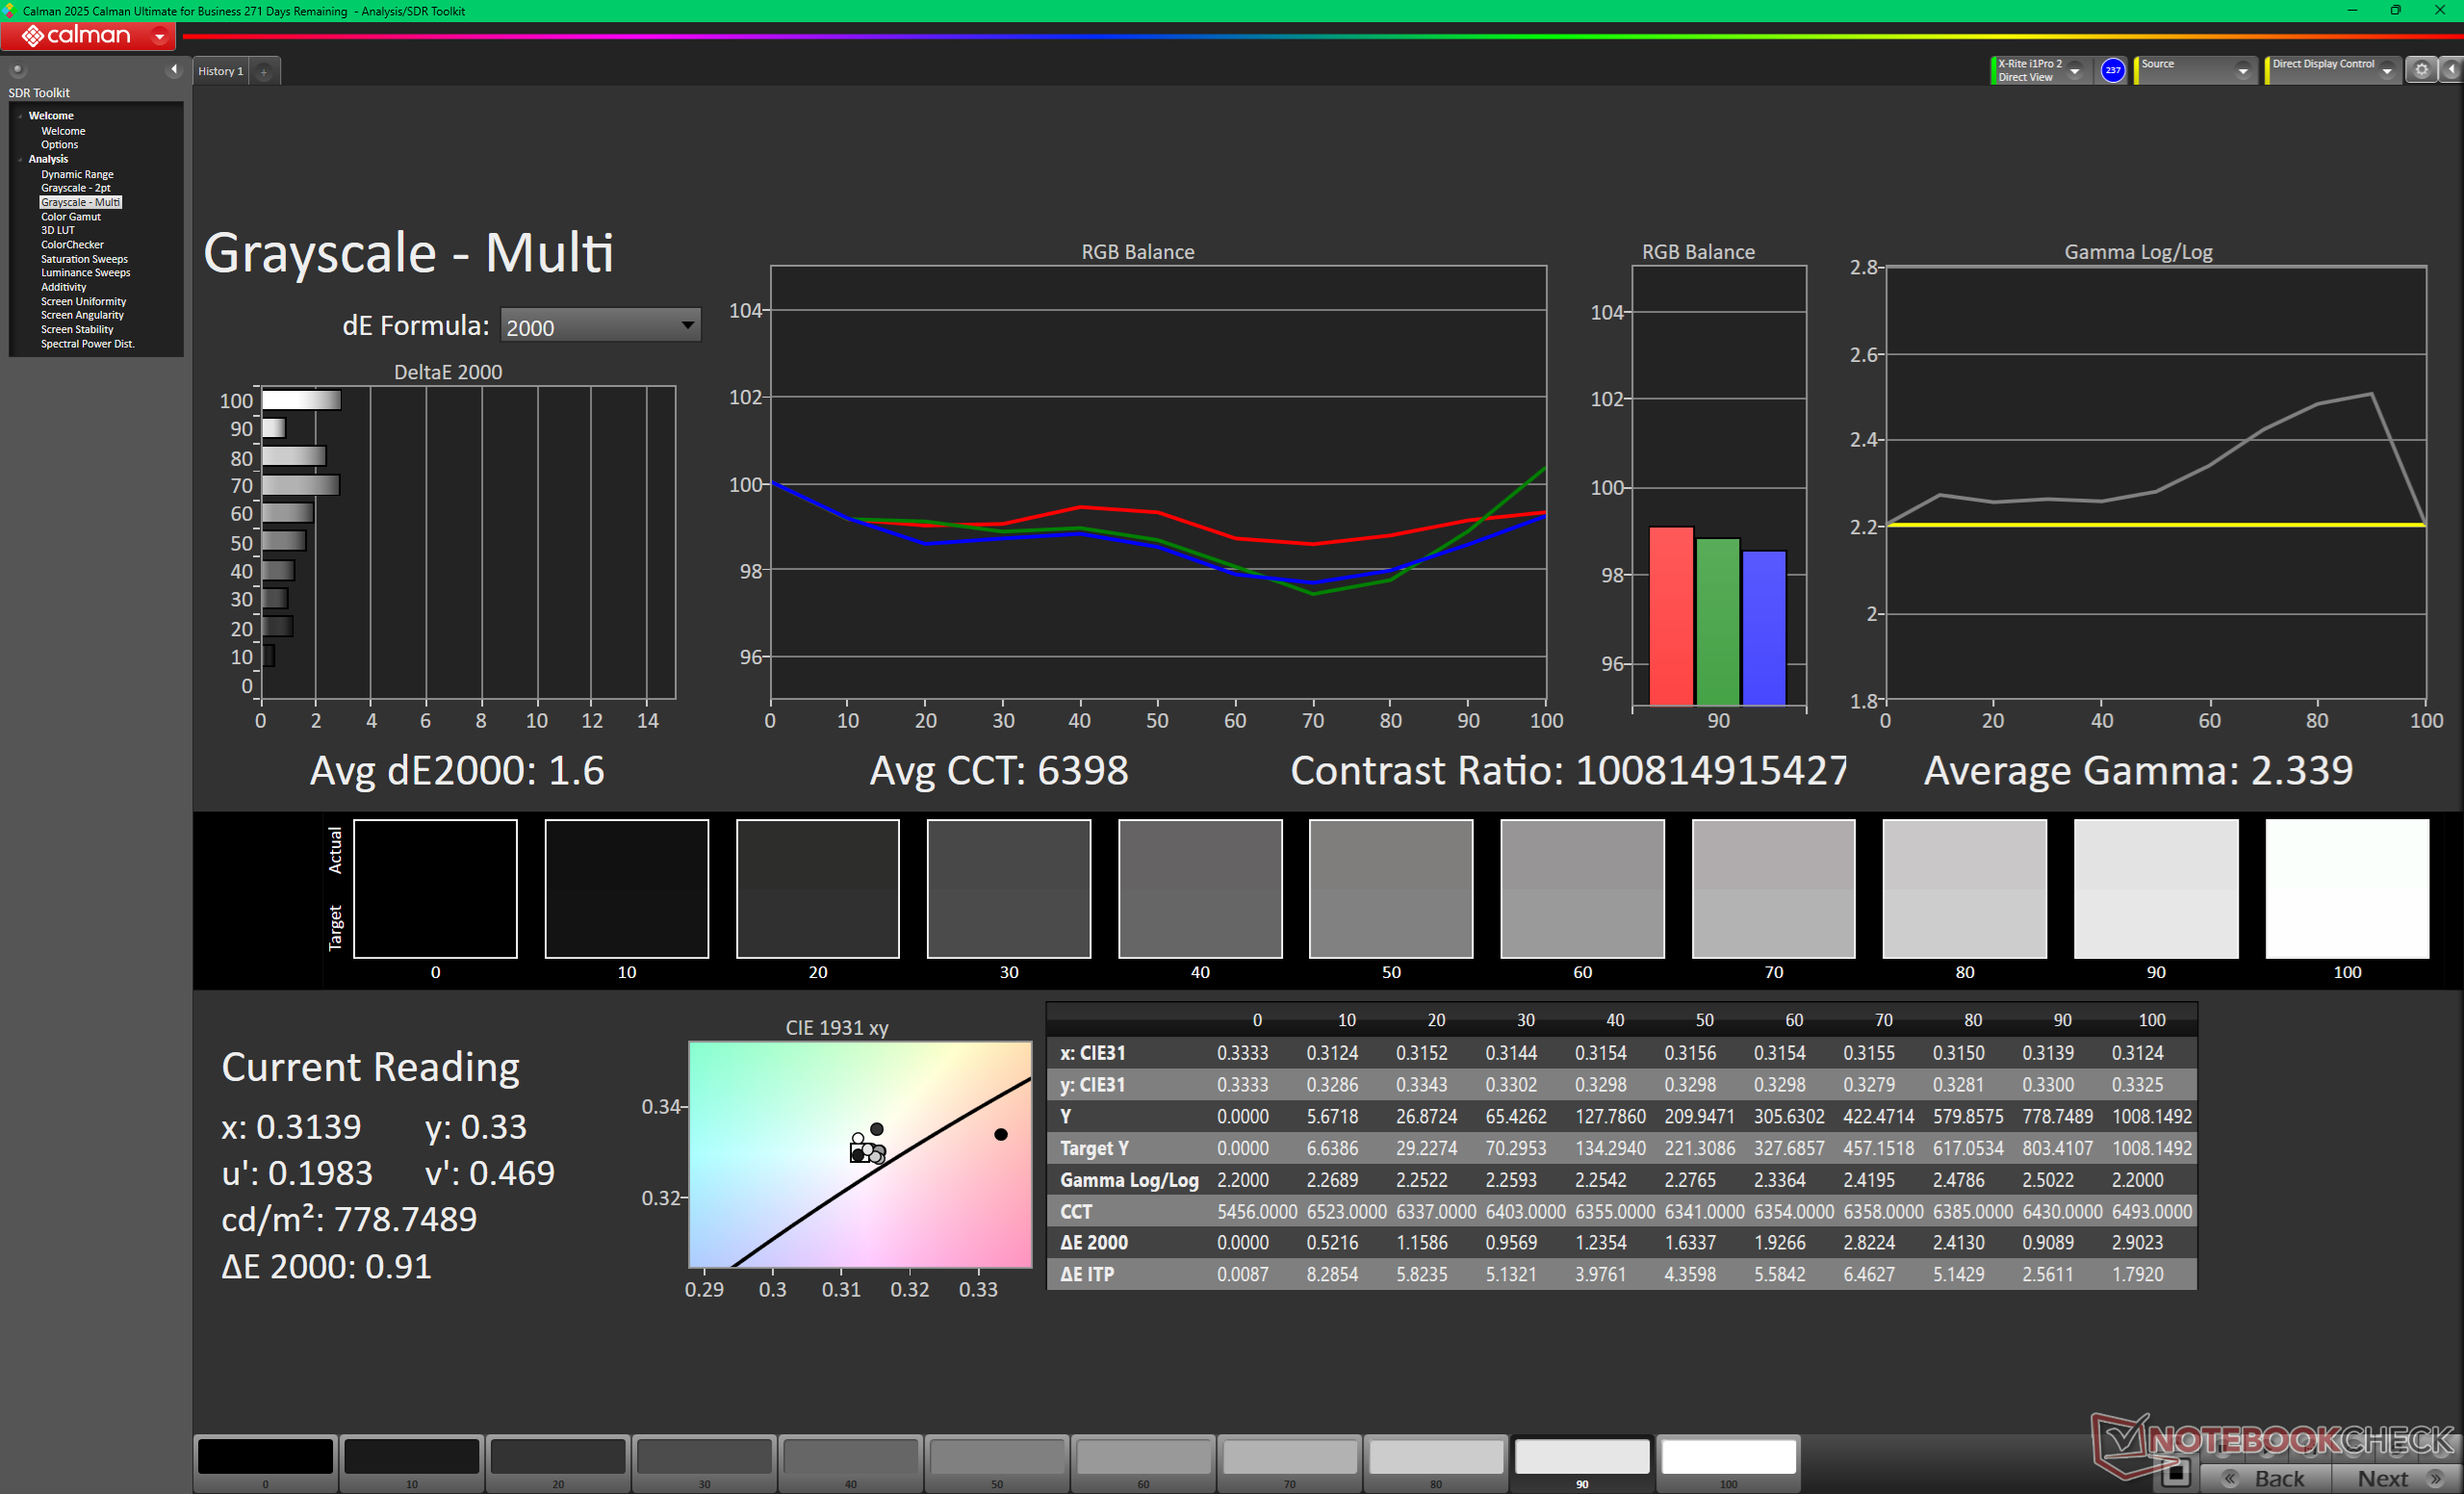
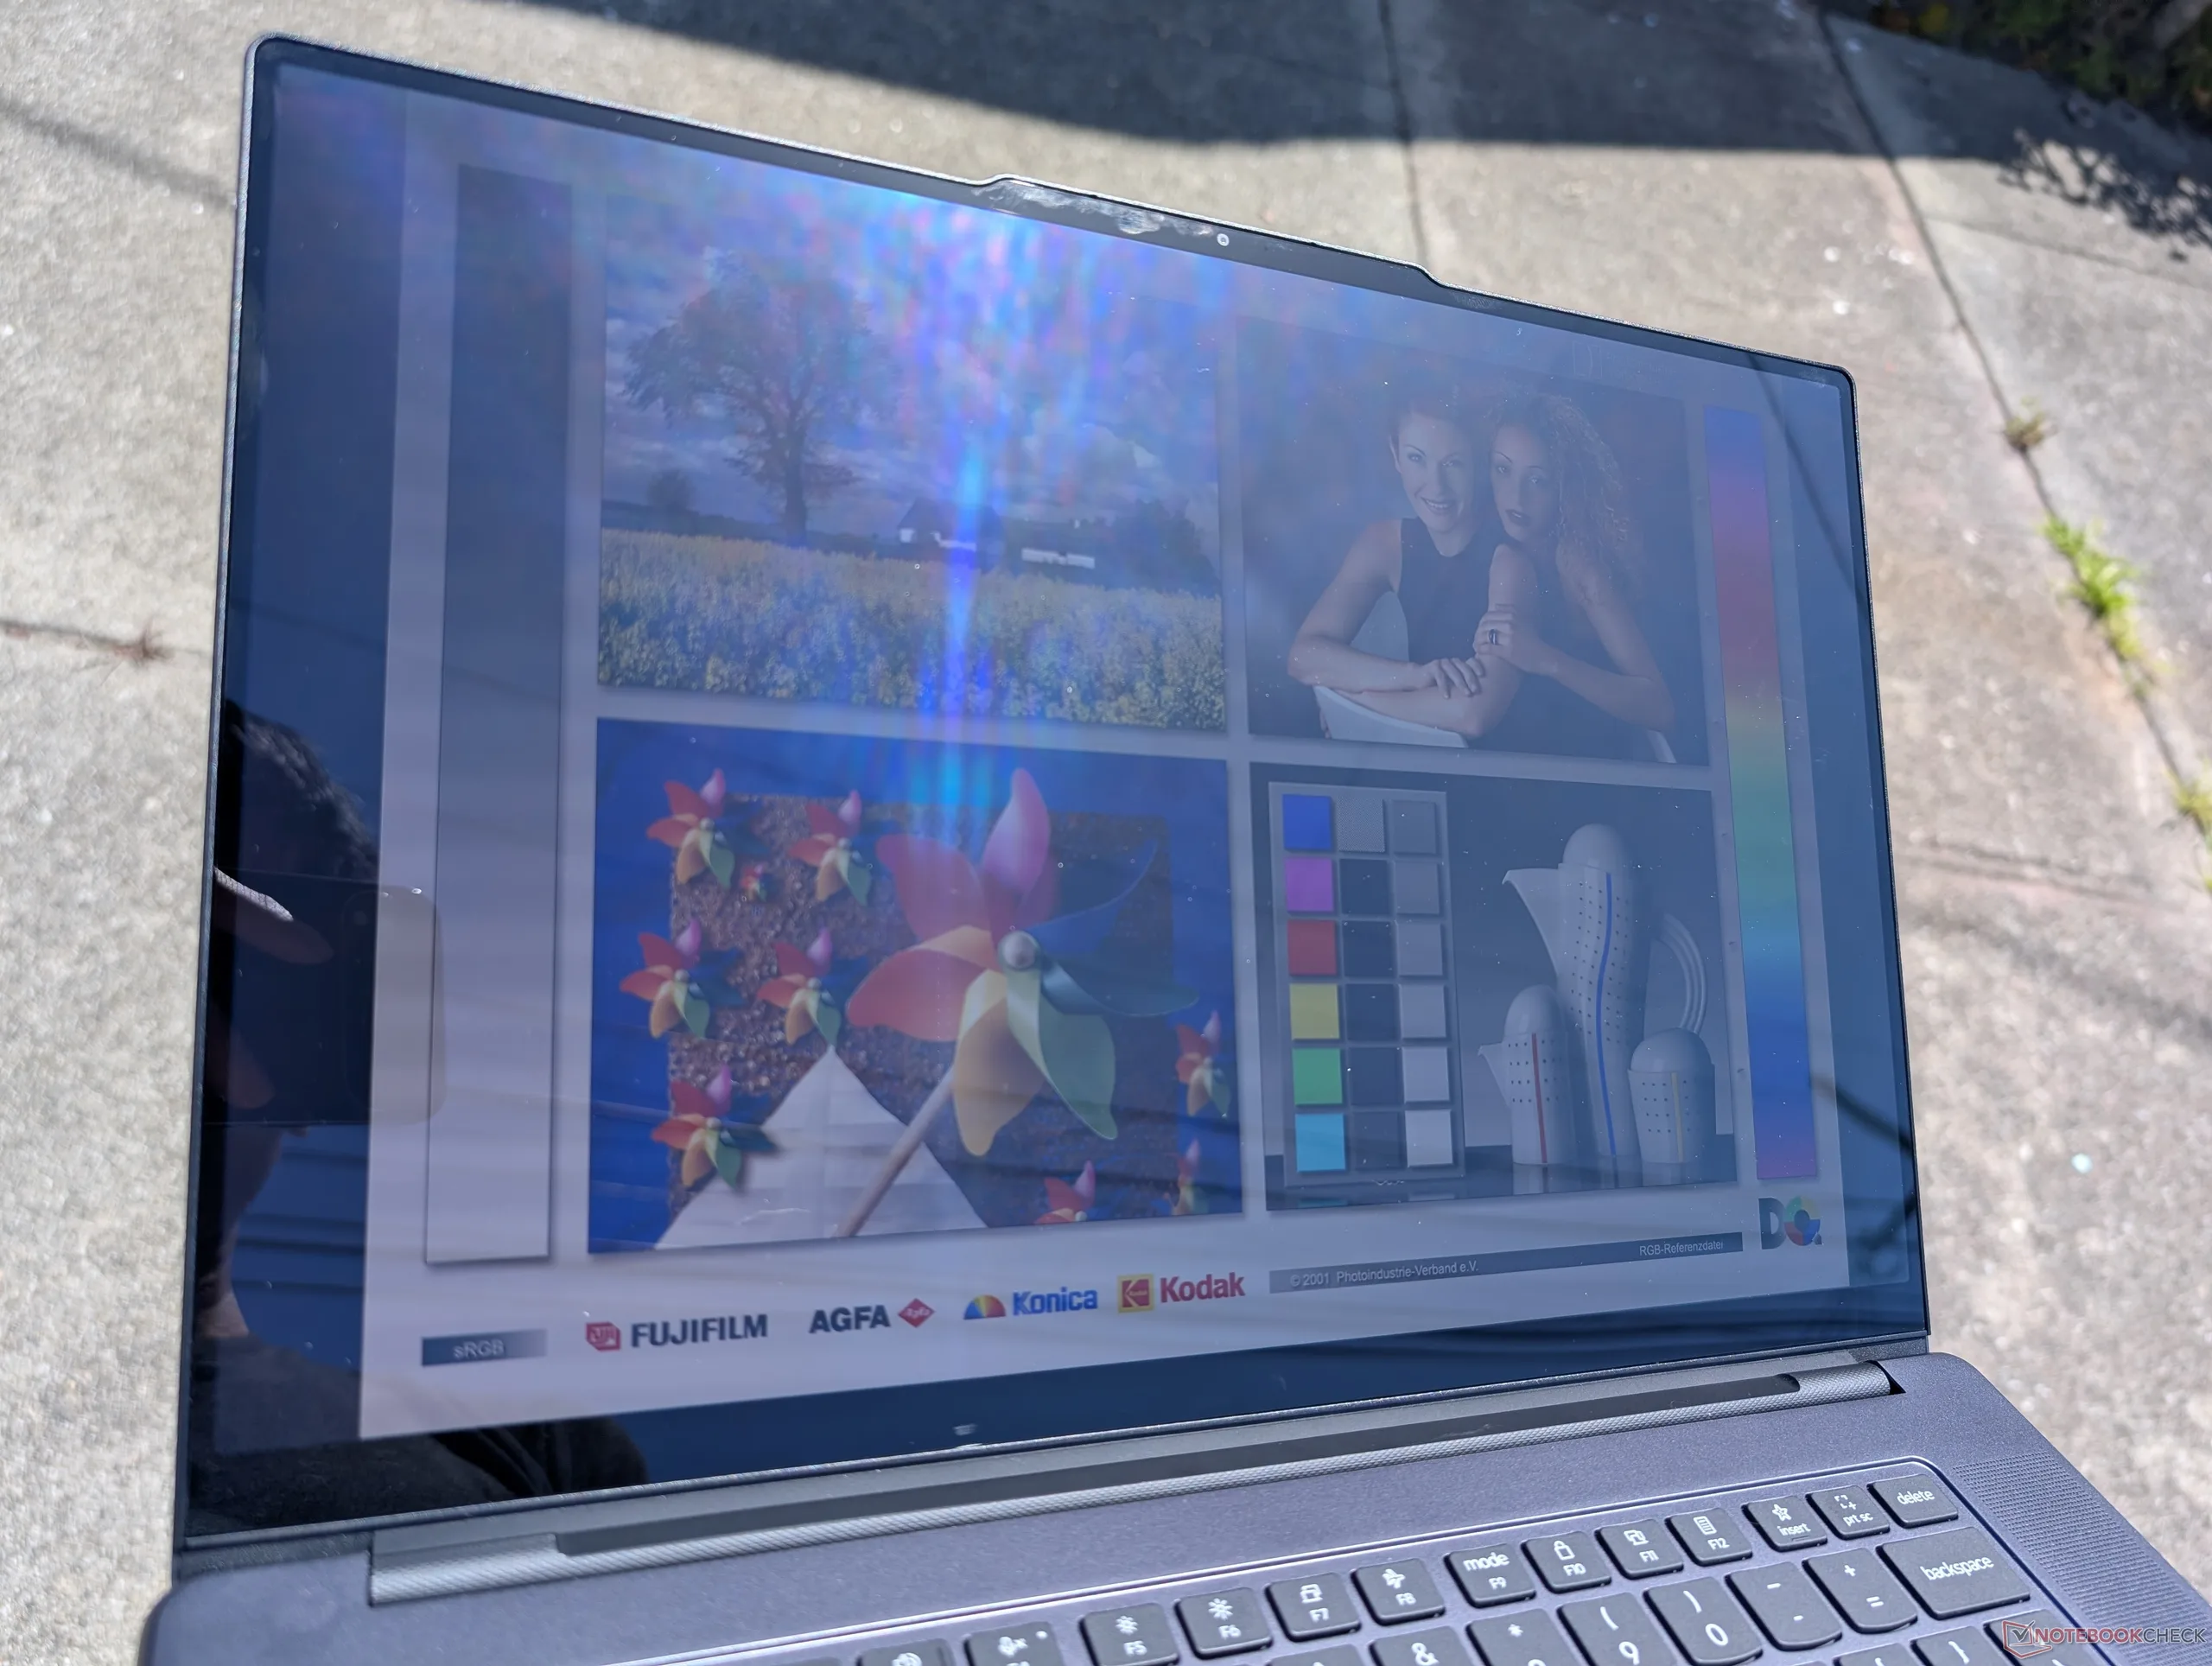
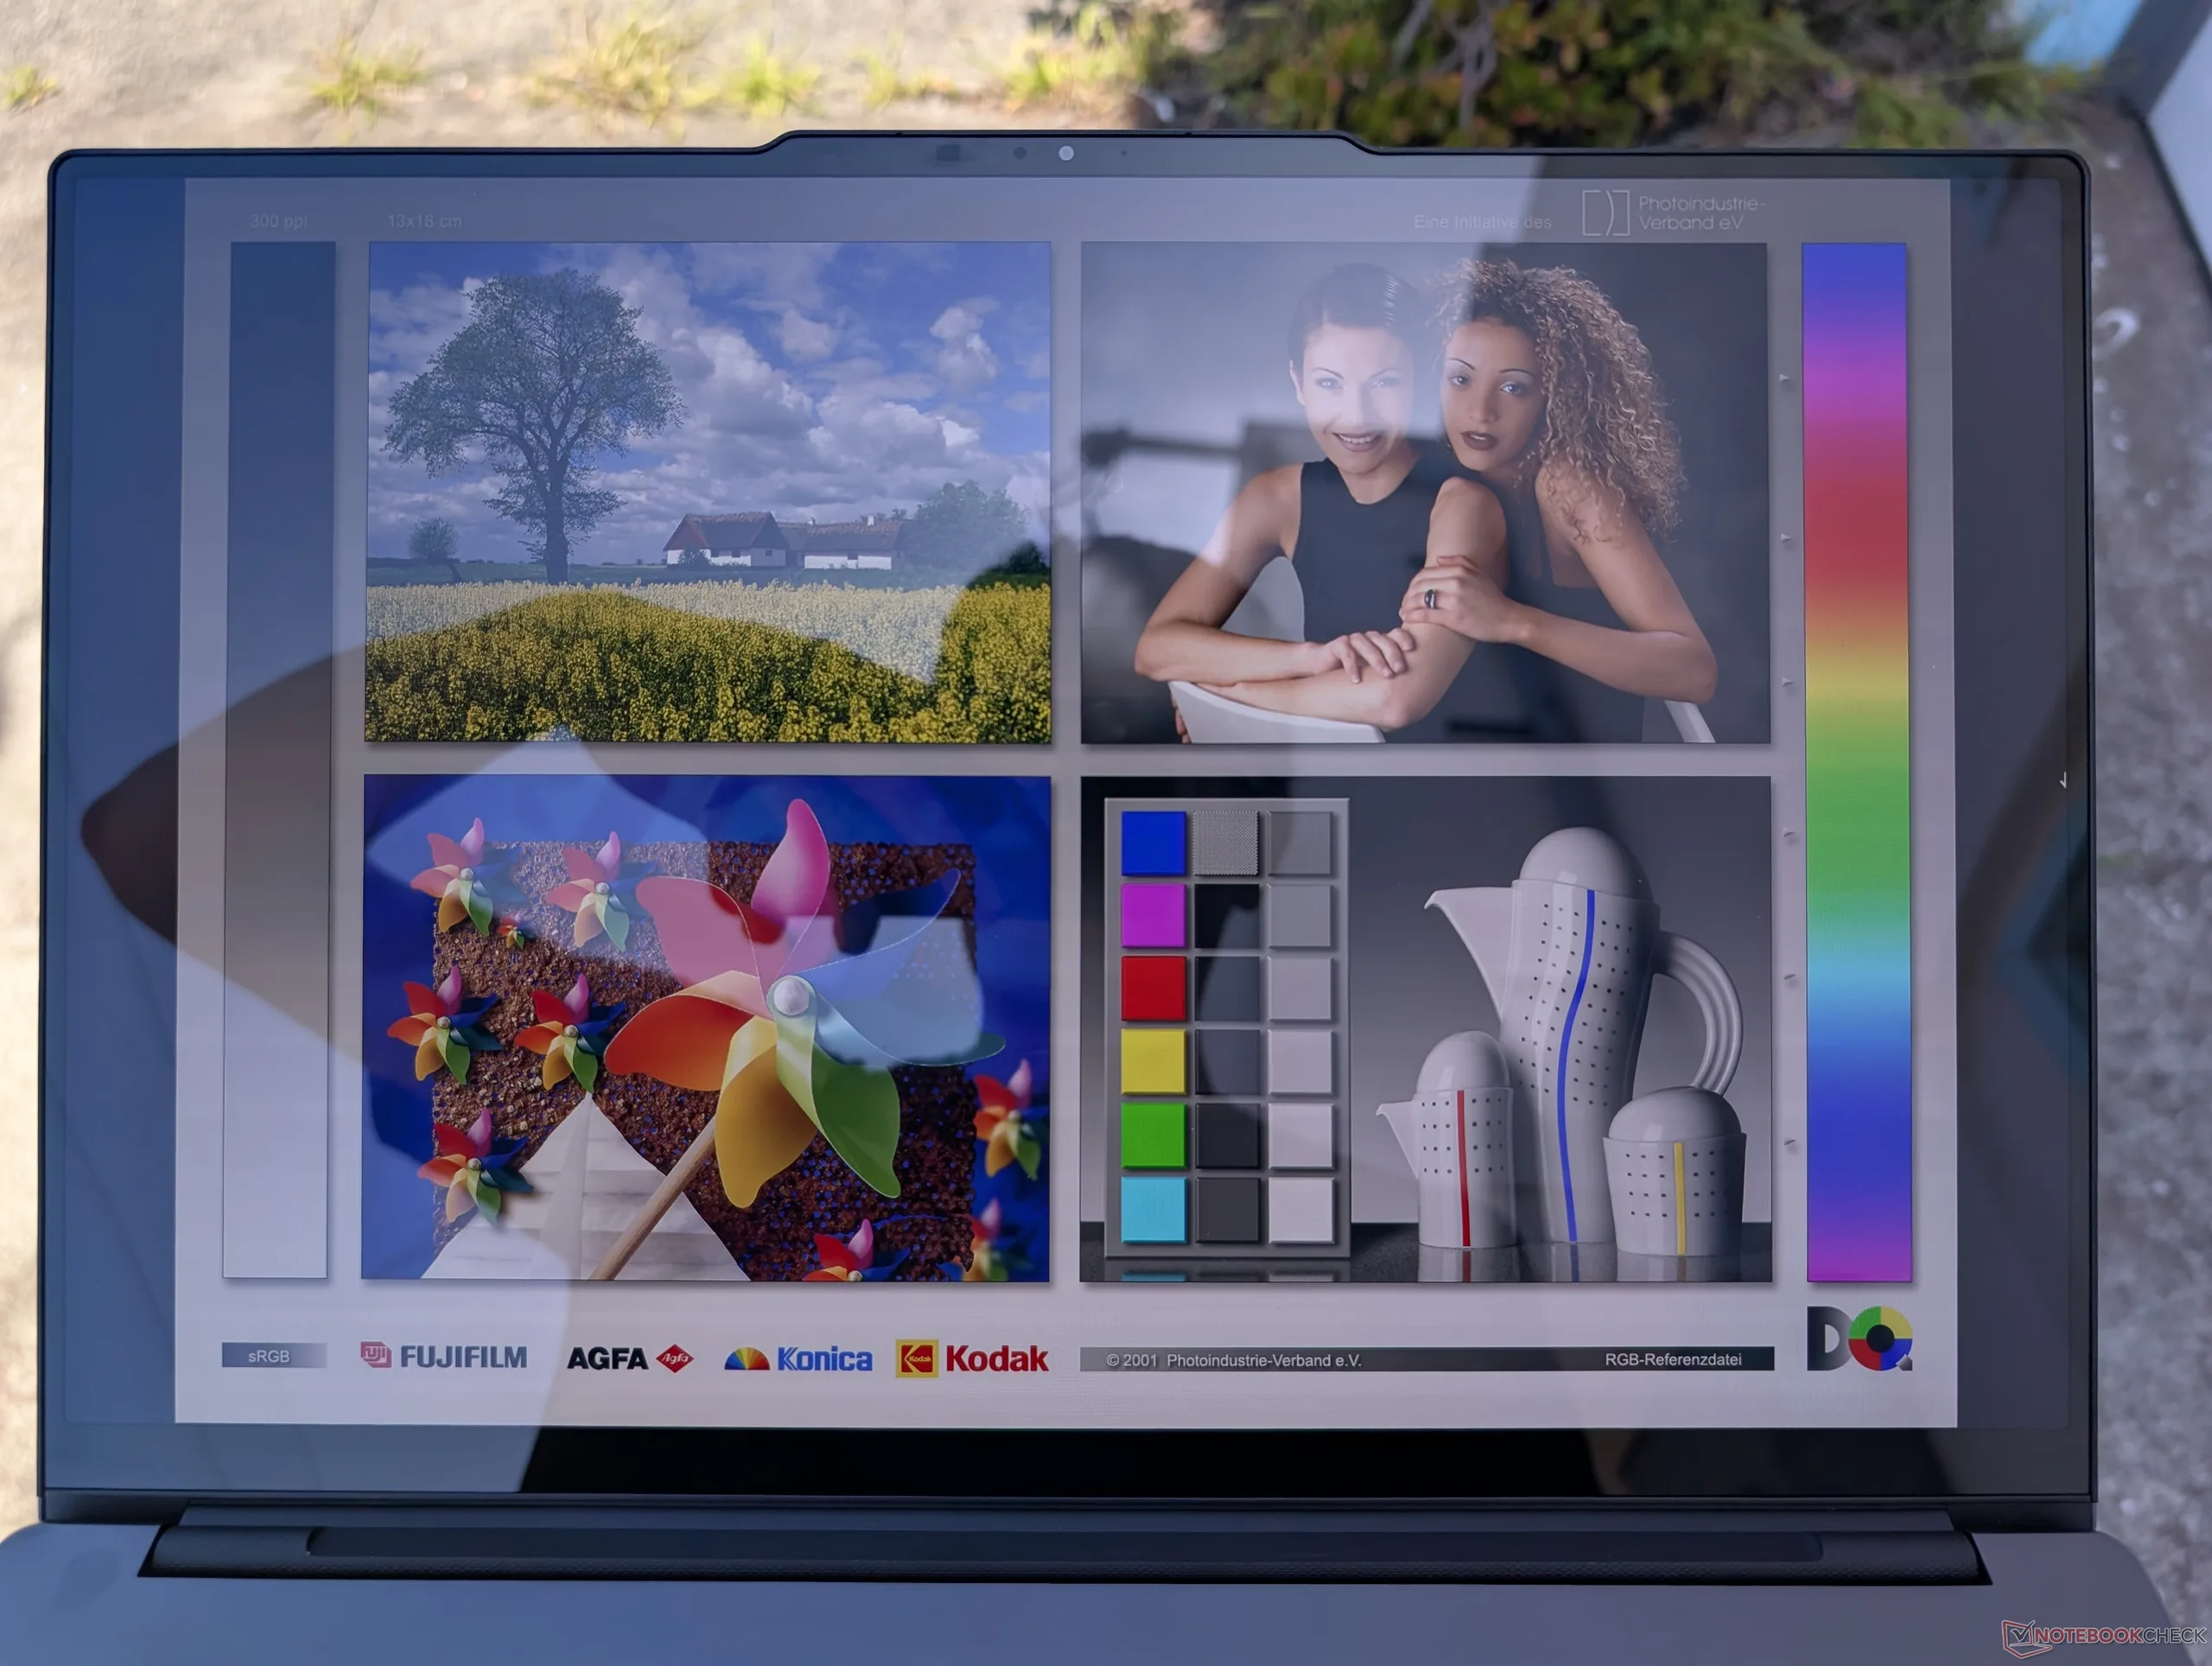
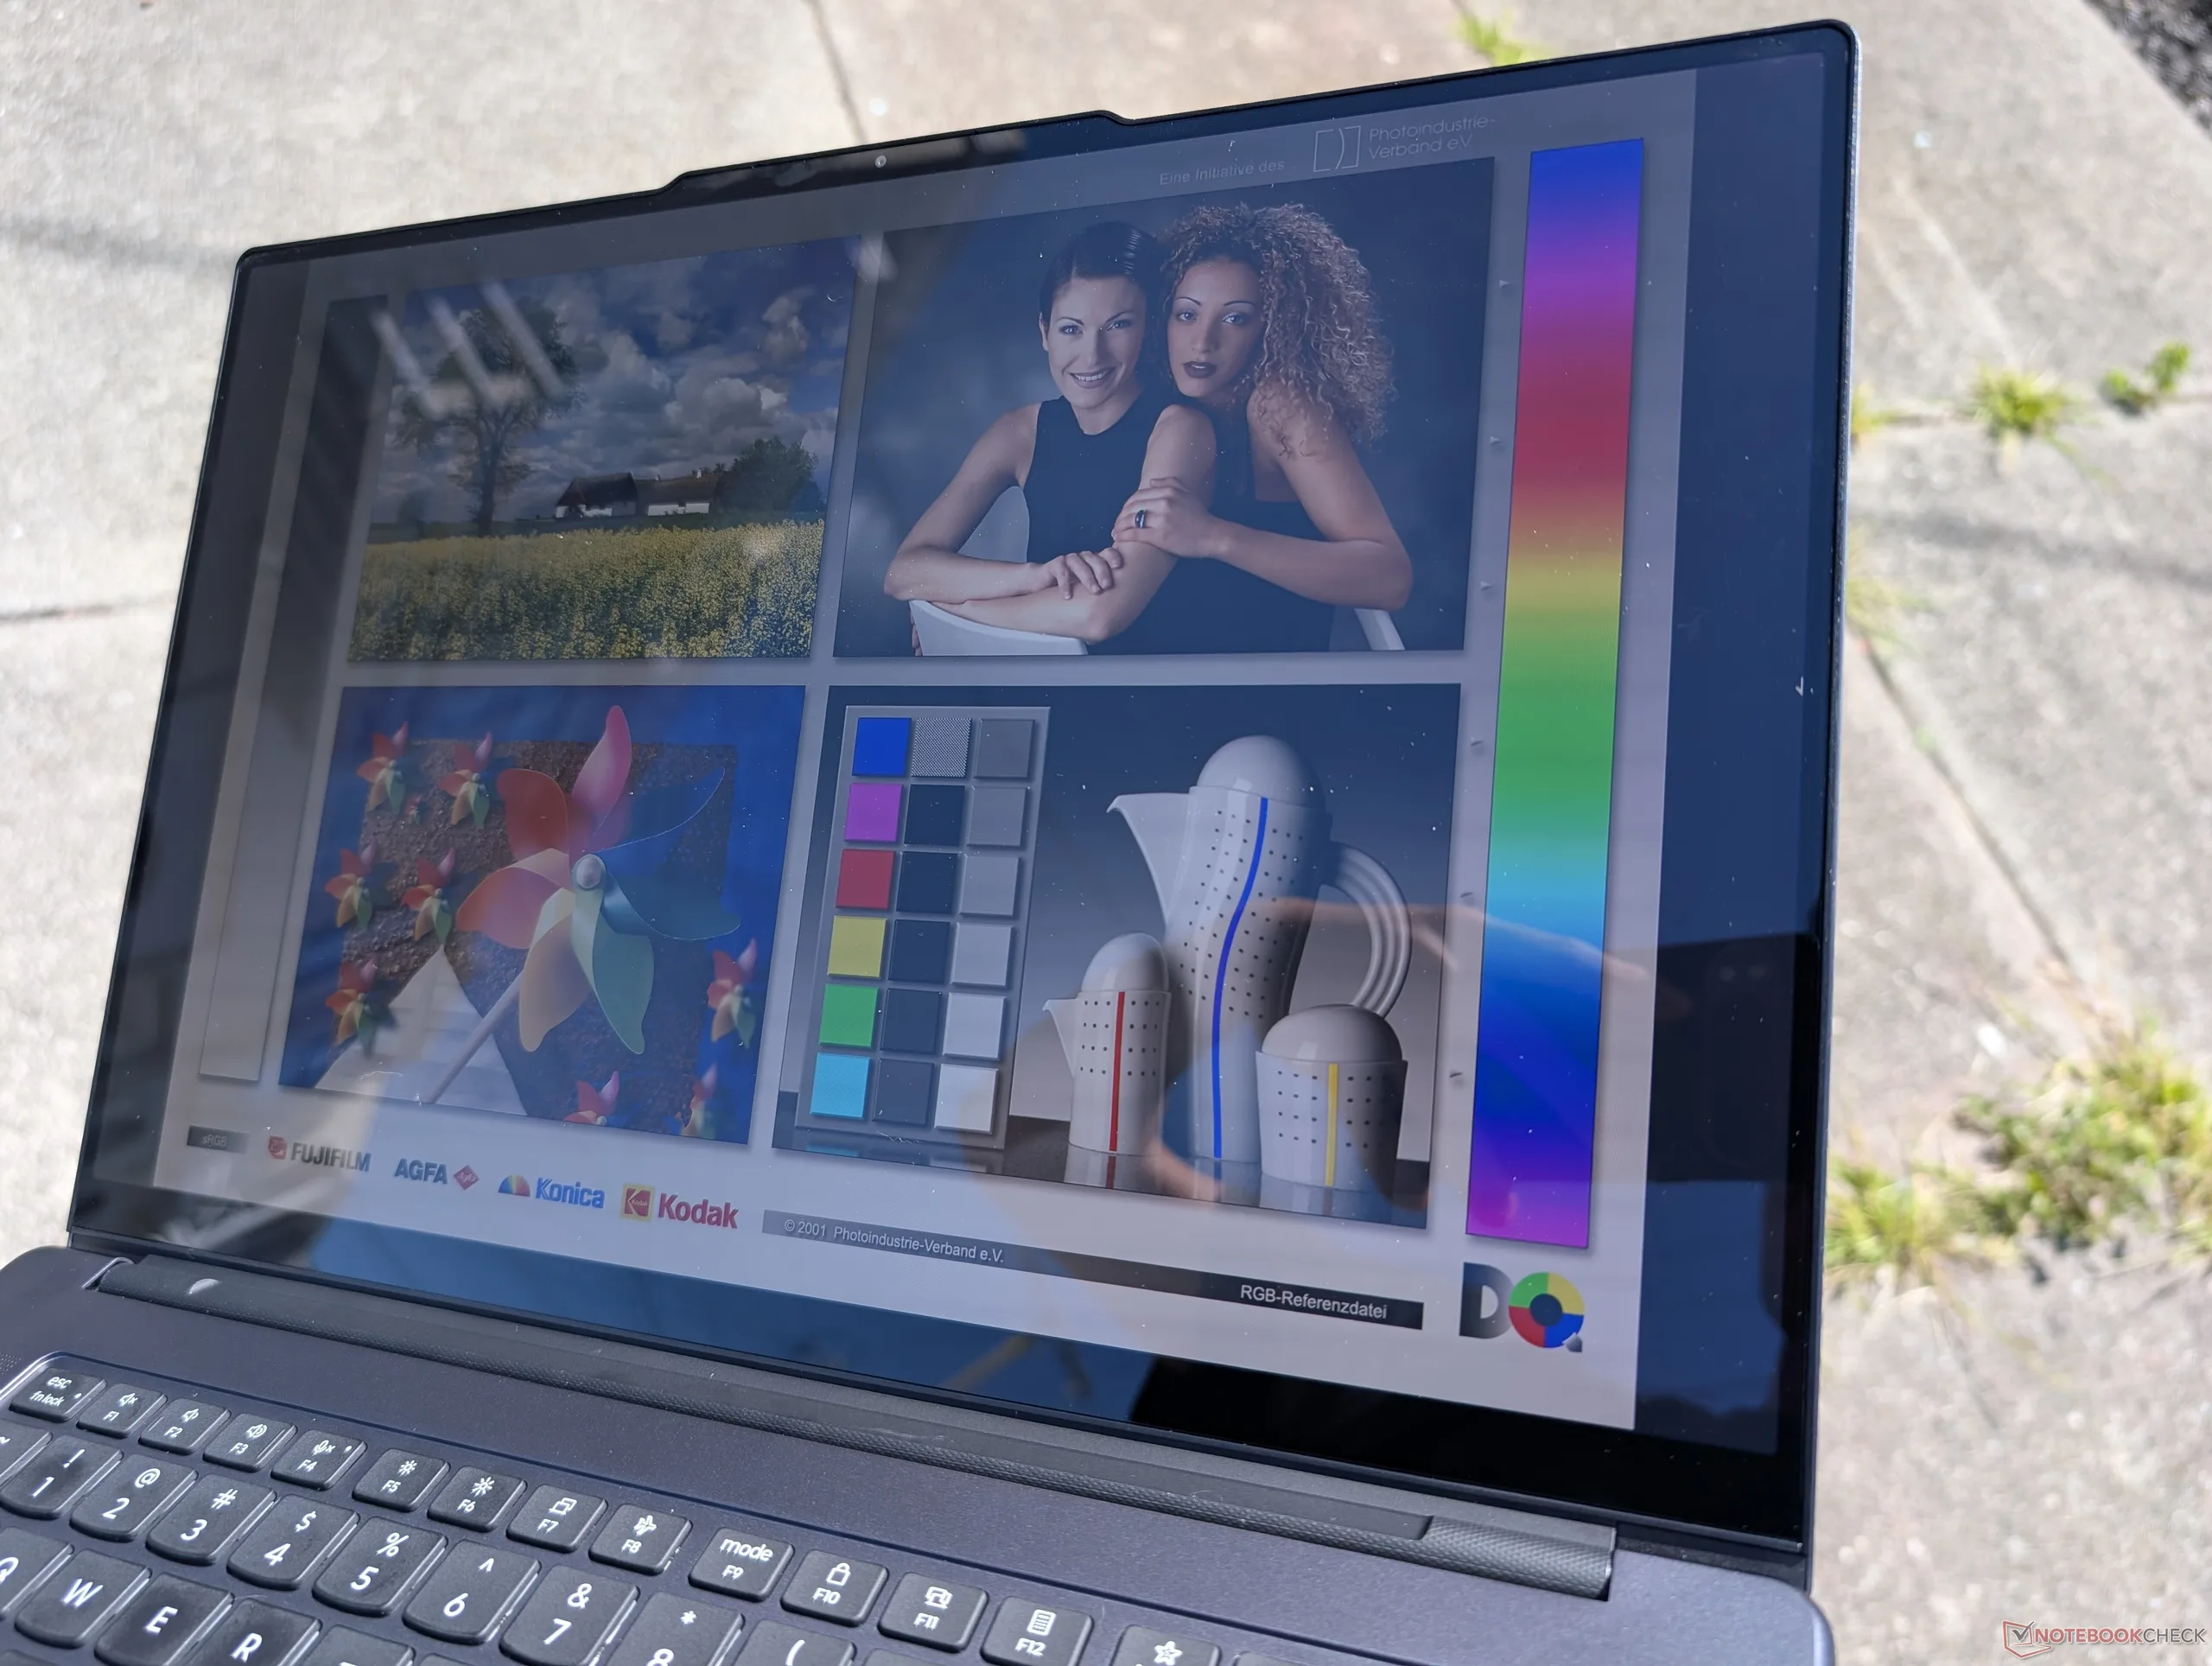
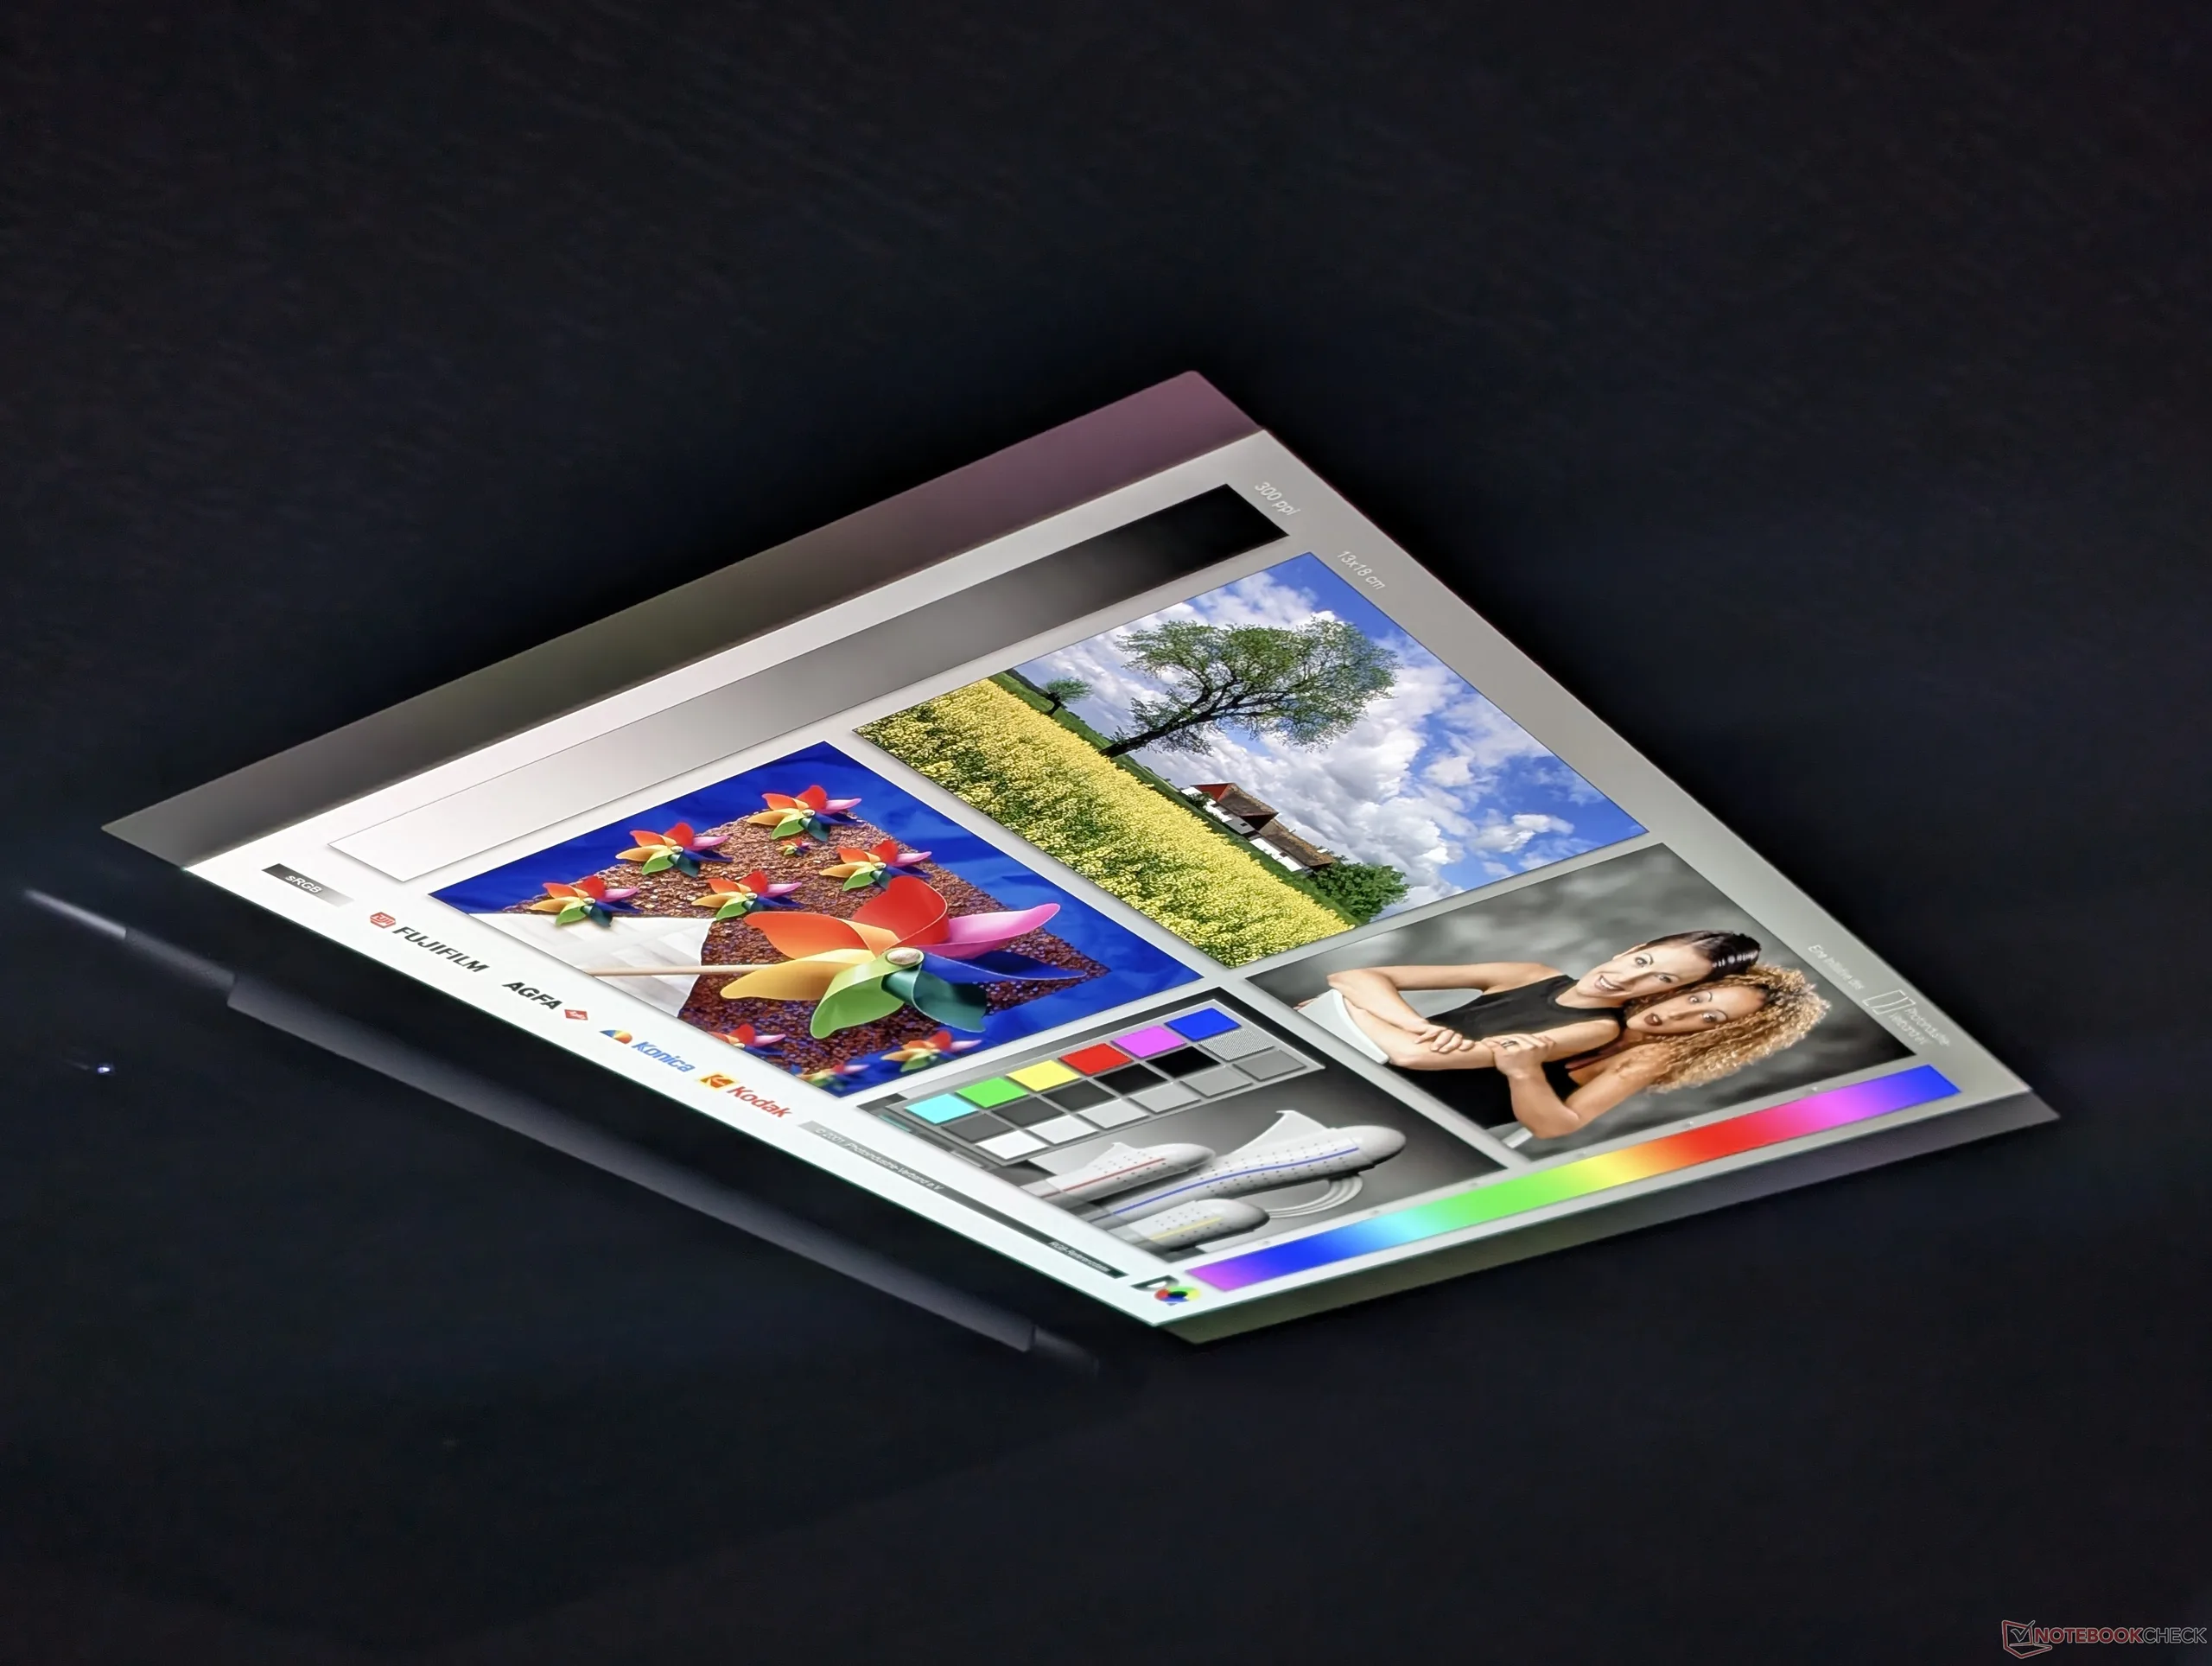
Das Tandem-OLED-Display auf unserem Gerät ist genau das gleiche Samsung ATNA60KA04-0-Panel, das auch im 2025 Yoga Pro 9i 16 für dasselbe Seherlebnis sorgte. Unsere eigenen Messungen haben eine maximale Helligkeit von 931 nits im SDR-Modus und 1.480 nits im HDR-Modus ergeben. Damit ist dies eines der hellsten Displays in einem 16-Zoll-Laptop.
Zu beachten ist, dass Advanced Optimus zwar unterstützt wird, G-Sync aber weiterhin wegfällt, da die Pro-9-Serie nicht primär für Spiele gedacht ist.
| |||||||||||||||||||||||||
Ausleuchtung: 94 %
Helligkeit Akku: 930.9 cd/m²
Kontrast: ∞:1 (Schwarzwert: 0 cd/m²)
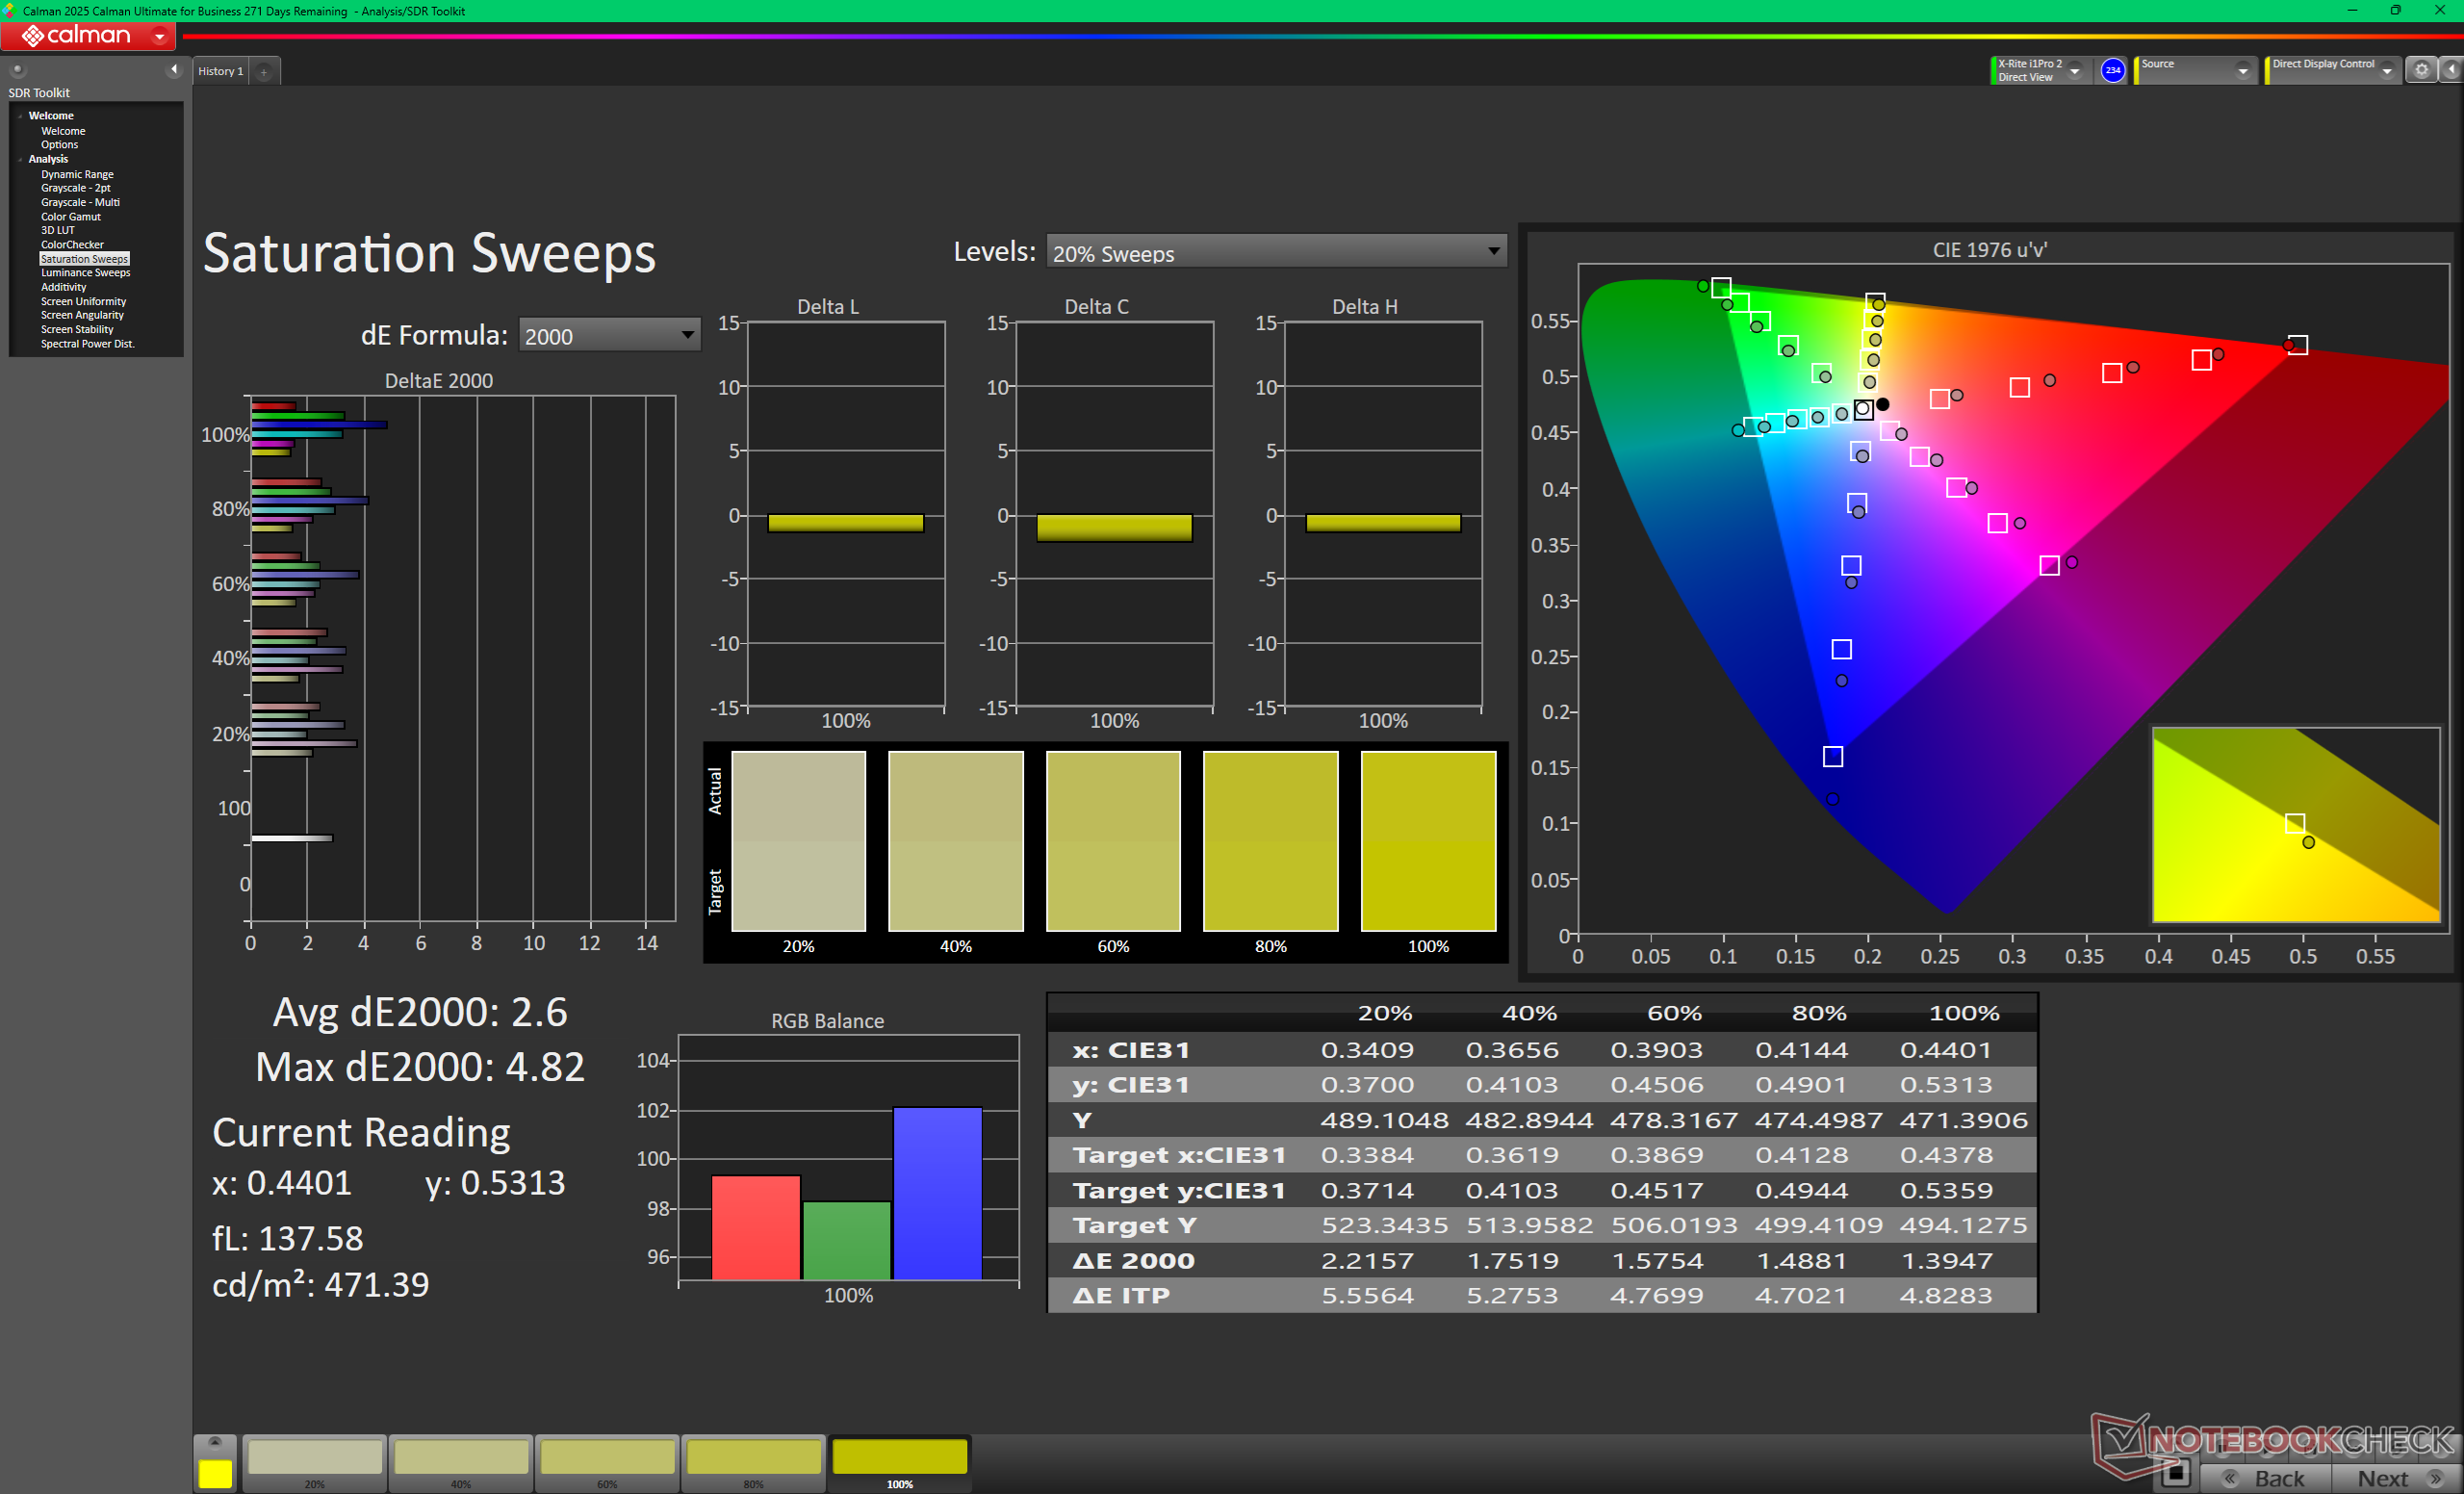
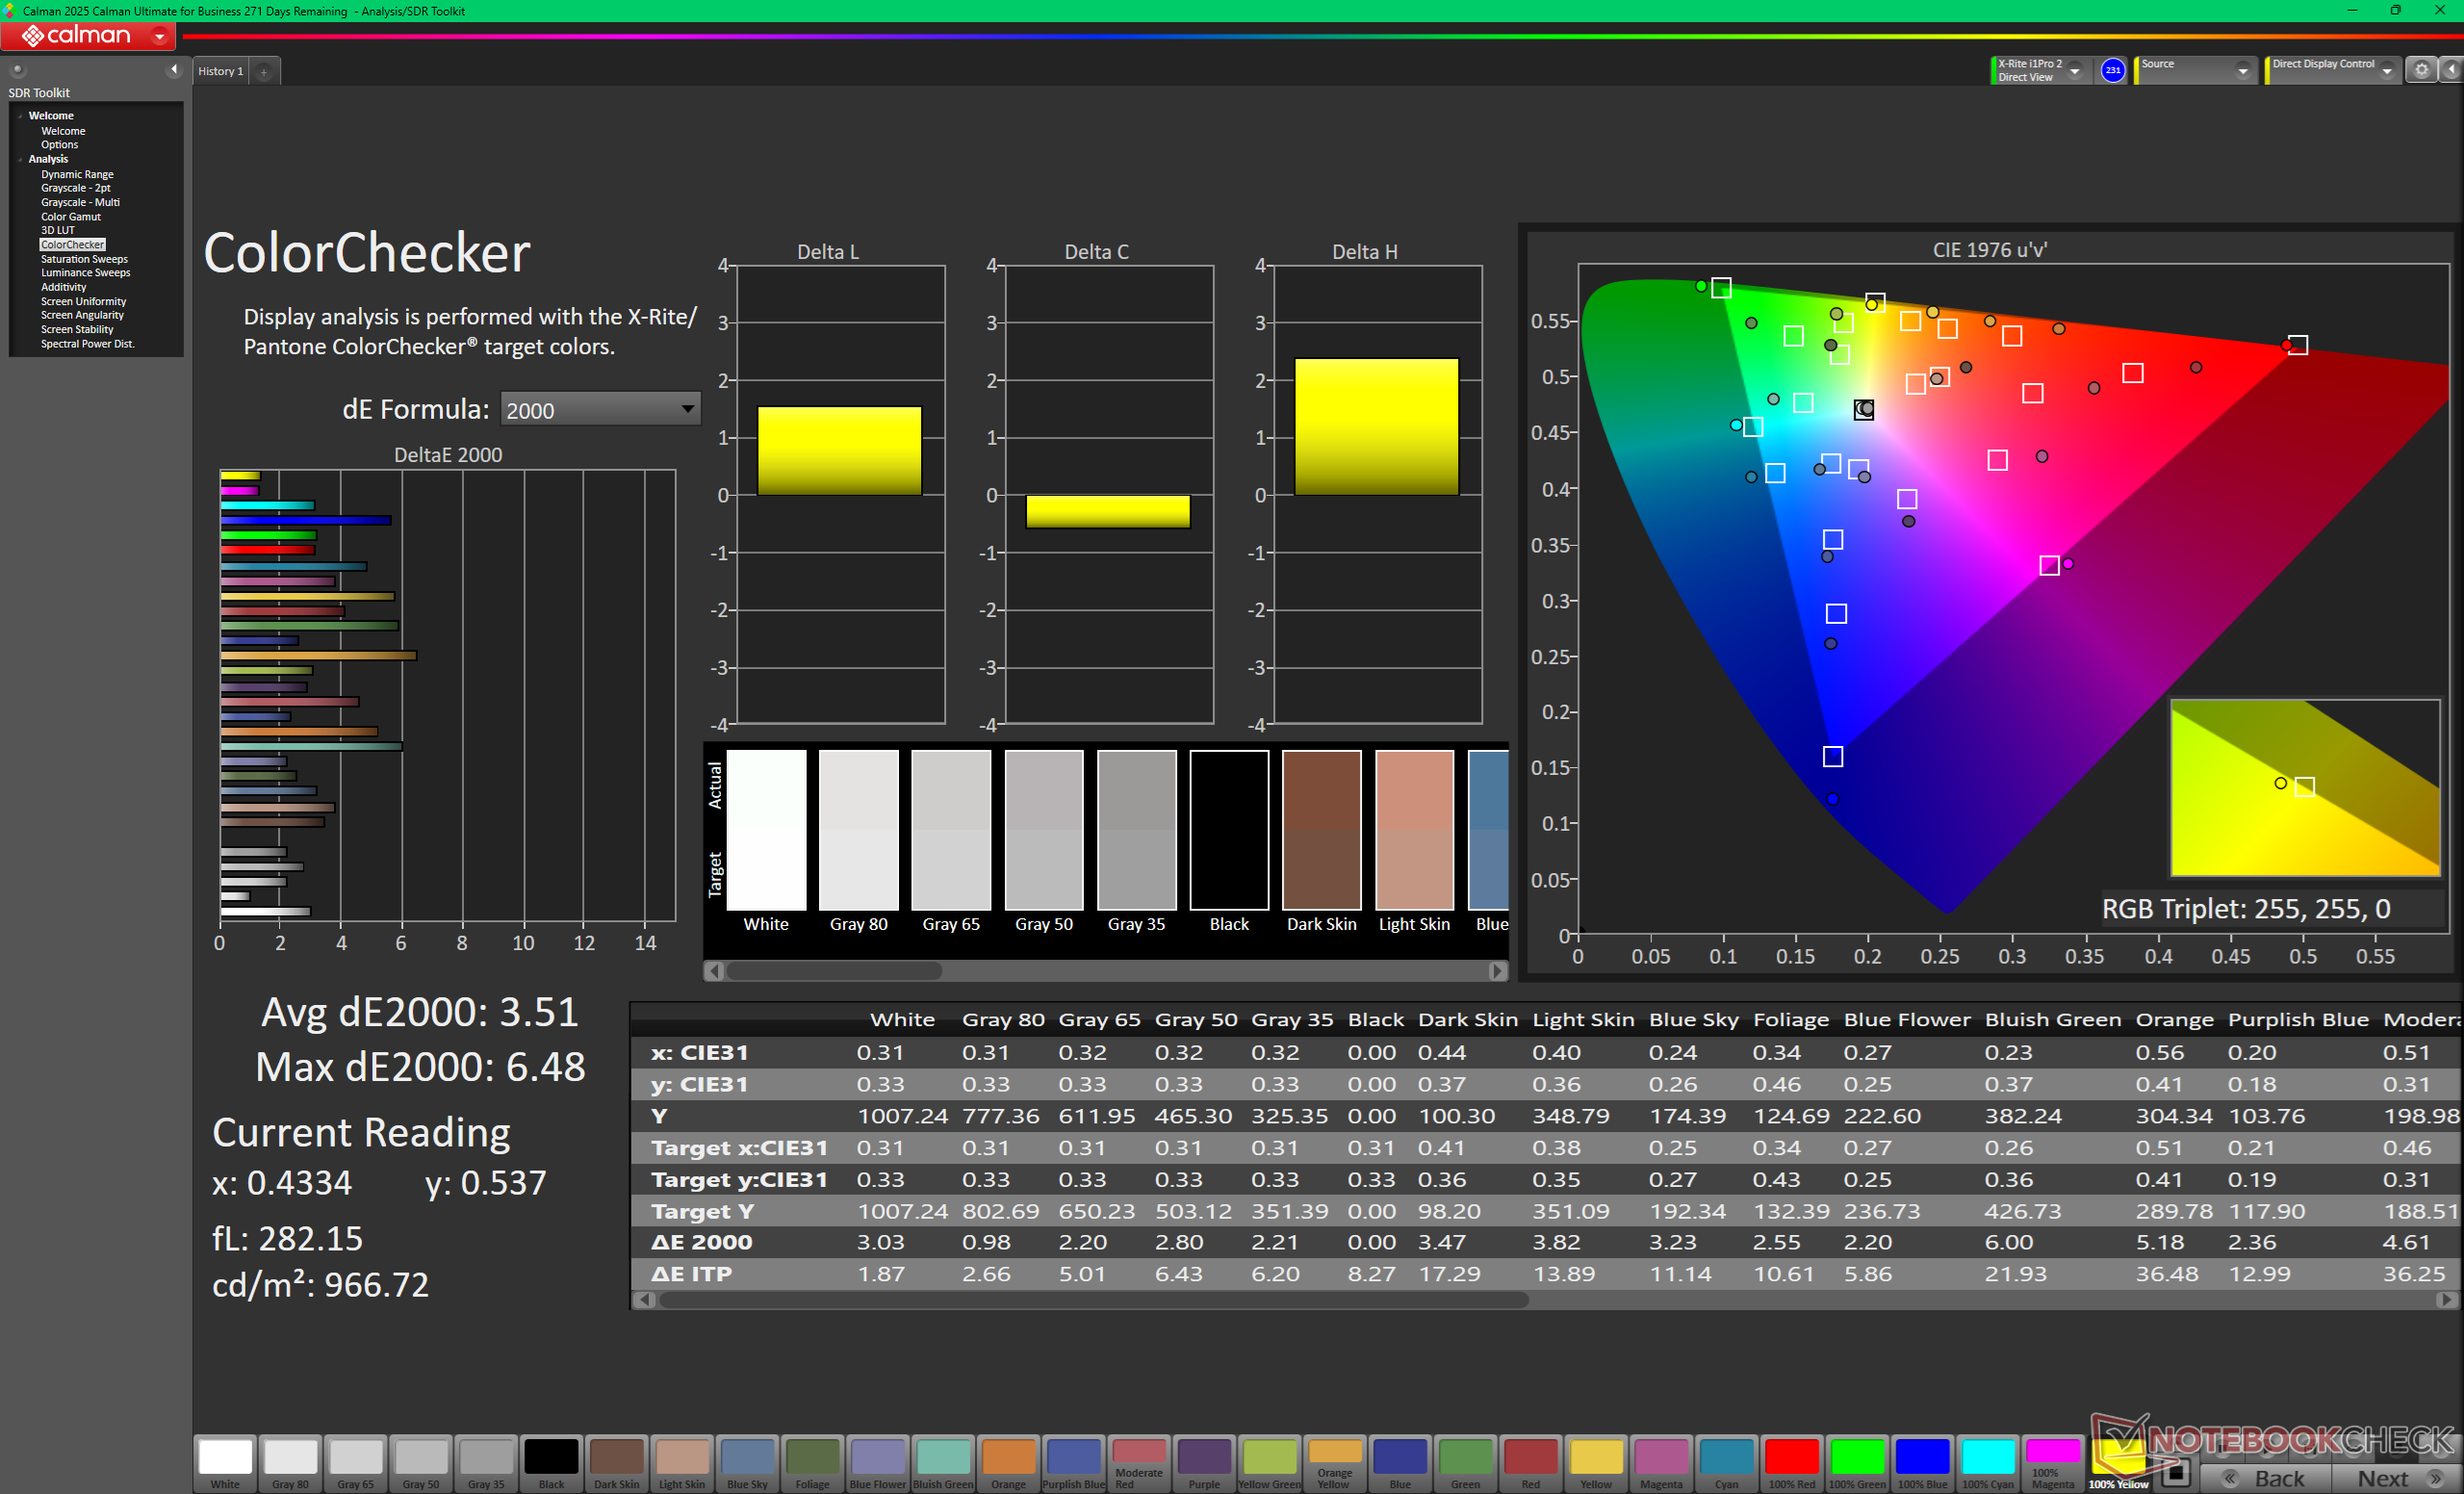
ΔE ColorChecker Calman: 3.51 | ∀{0.5-29.43 Ø4.71}
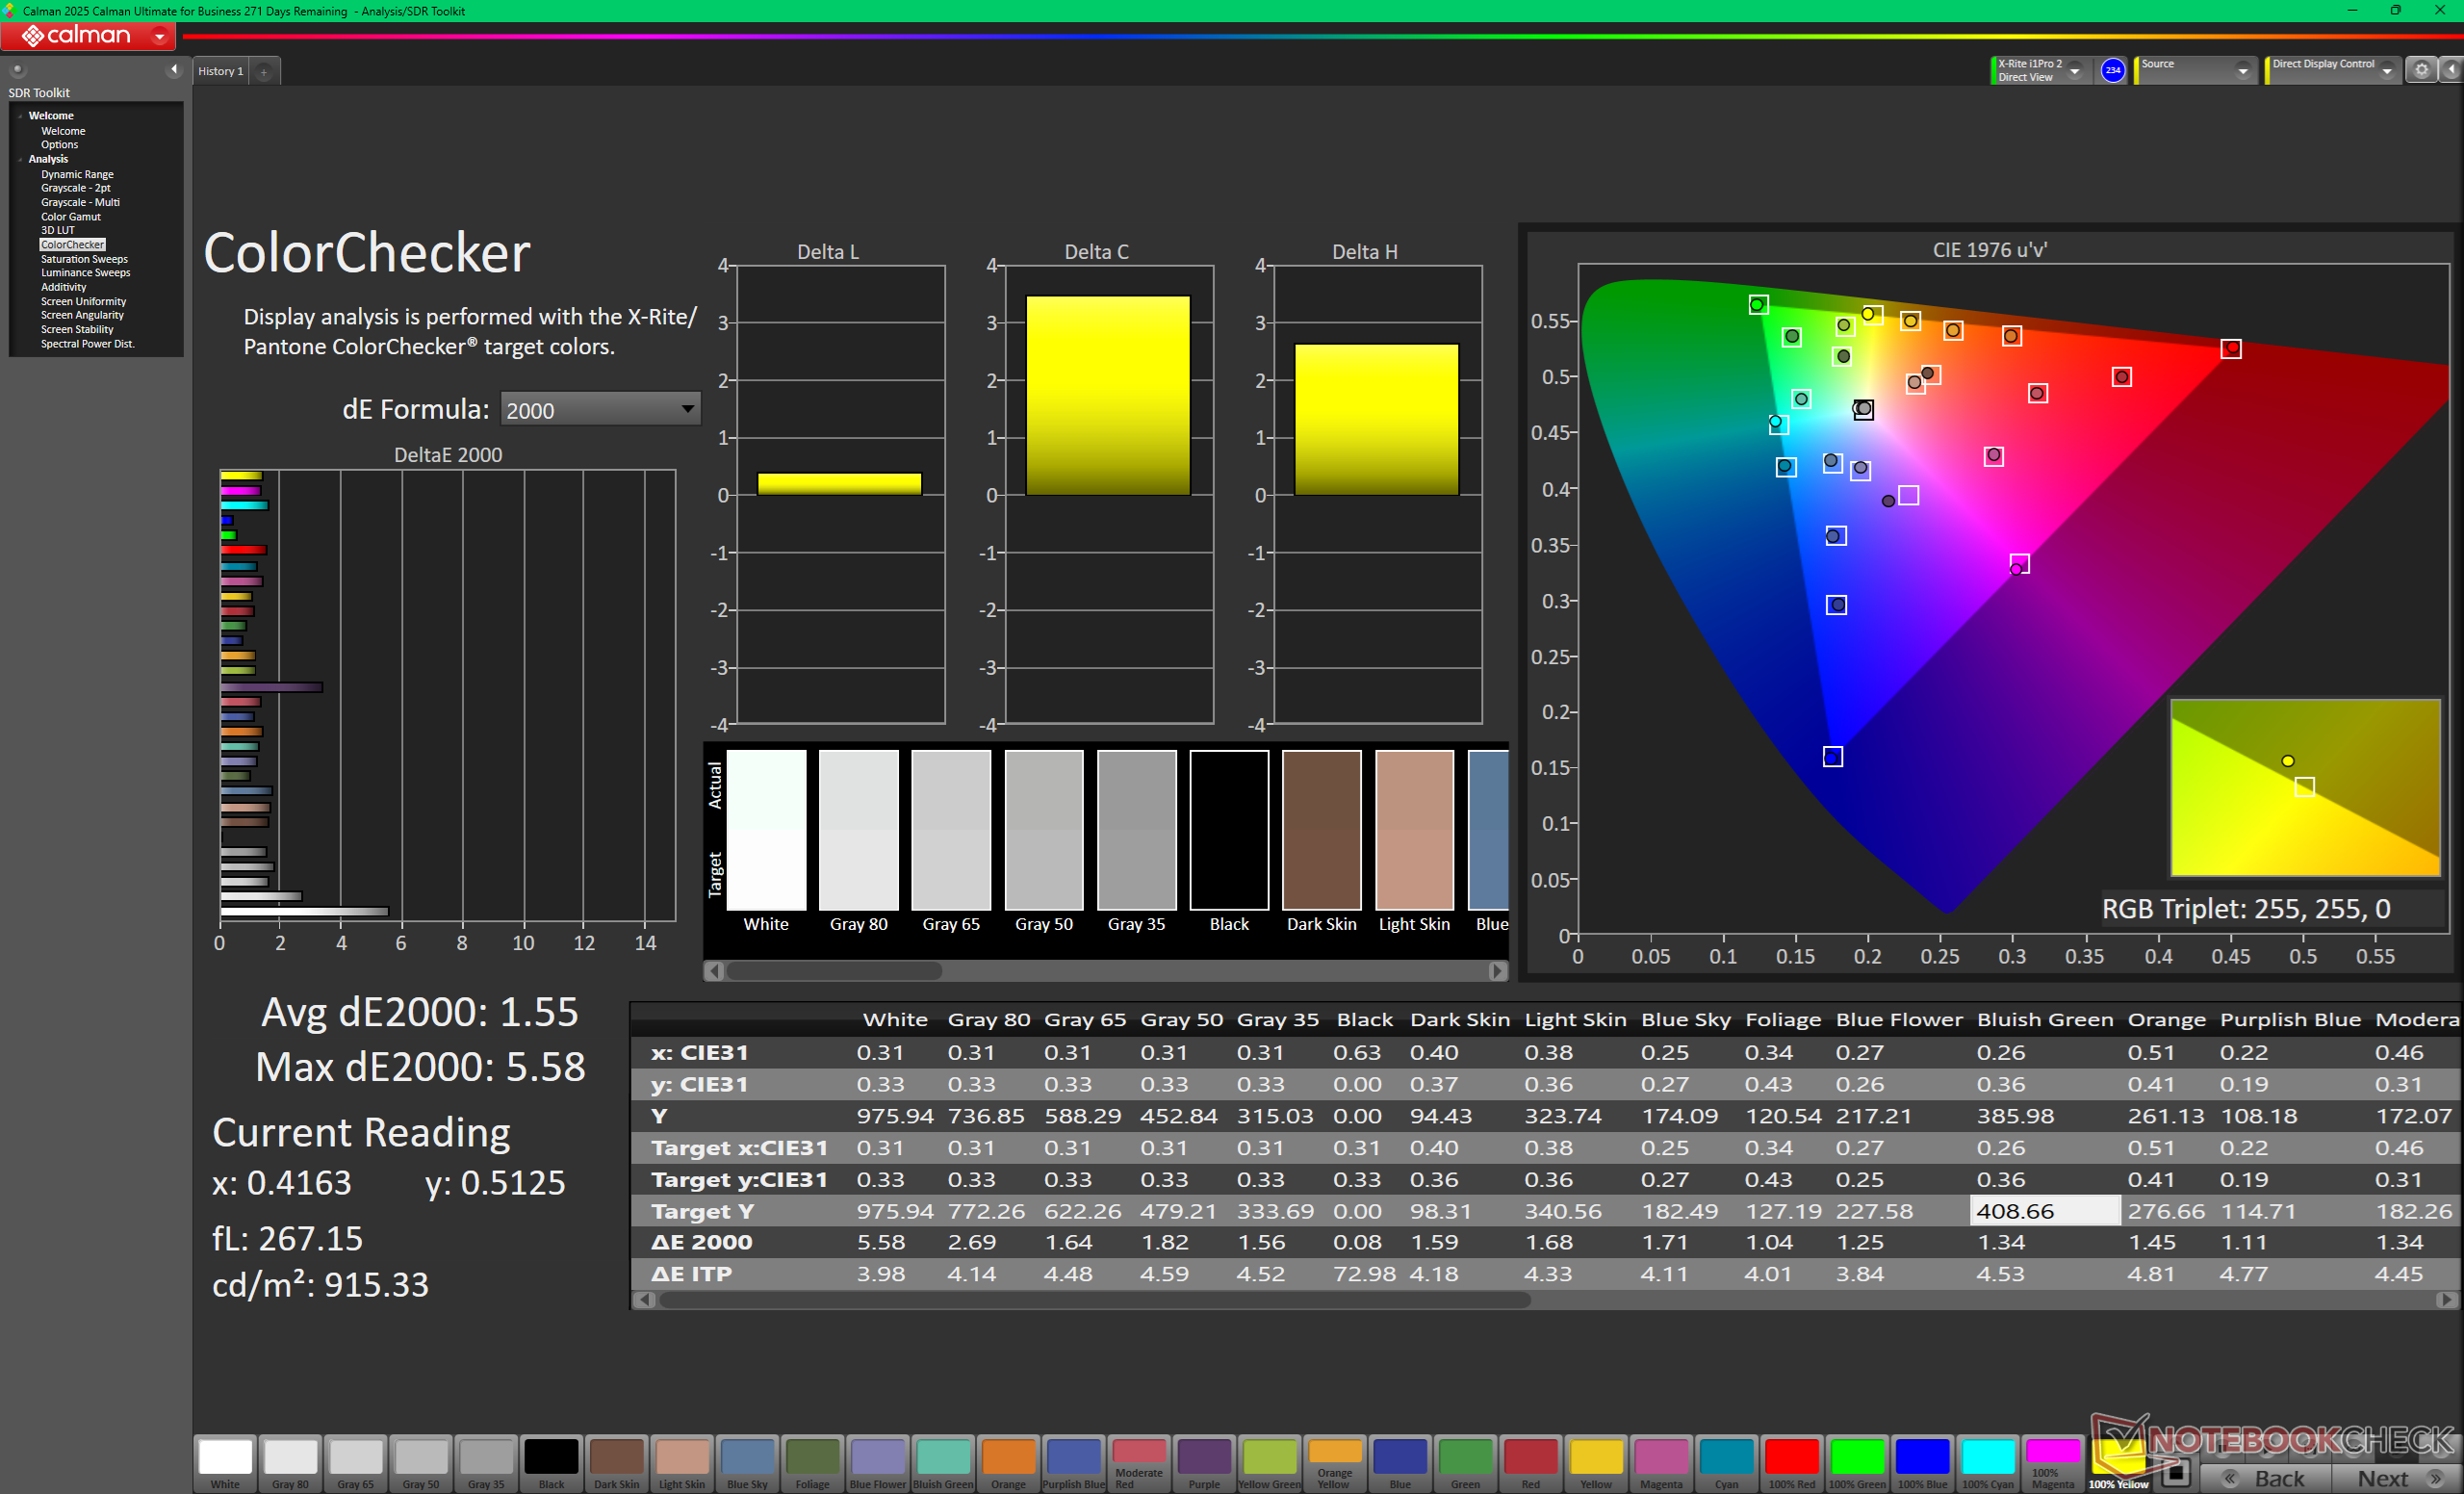
calibrated: 1.55
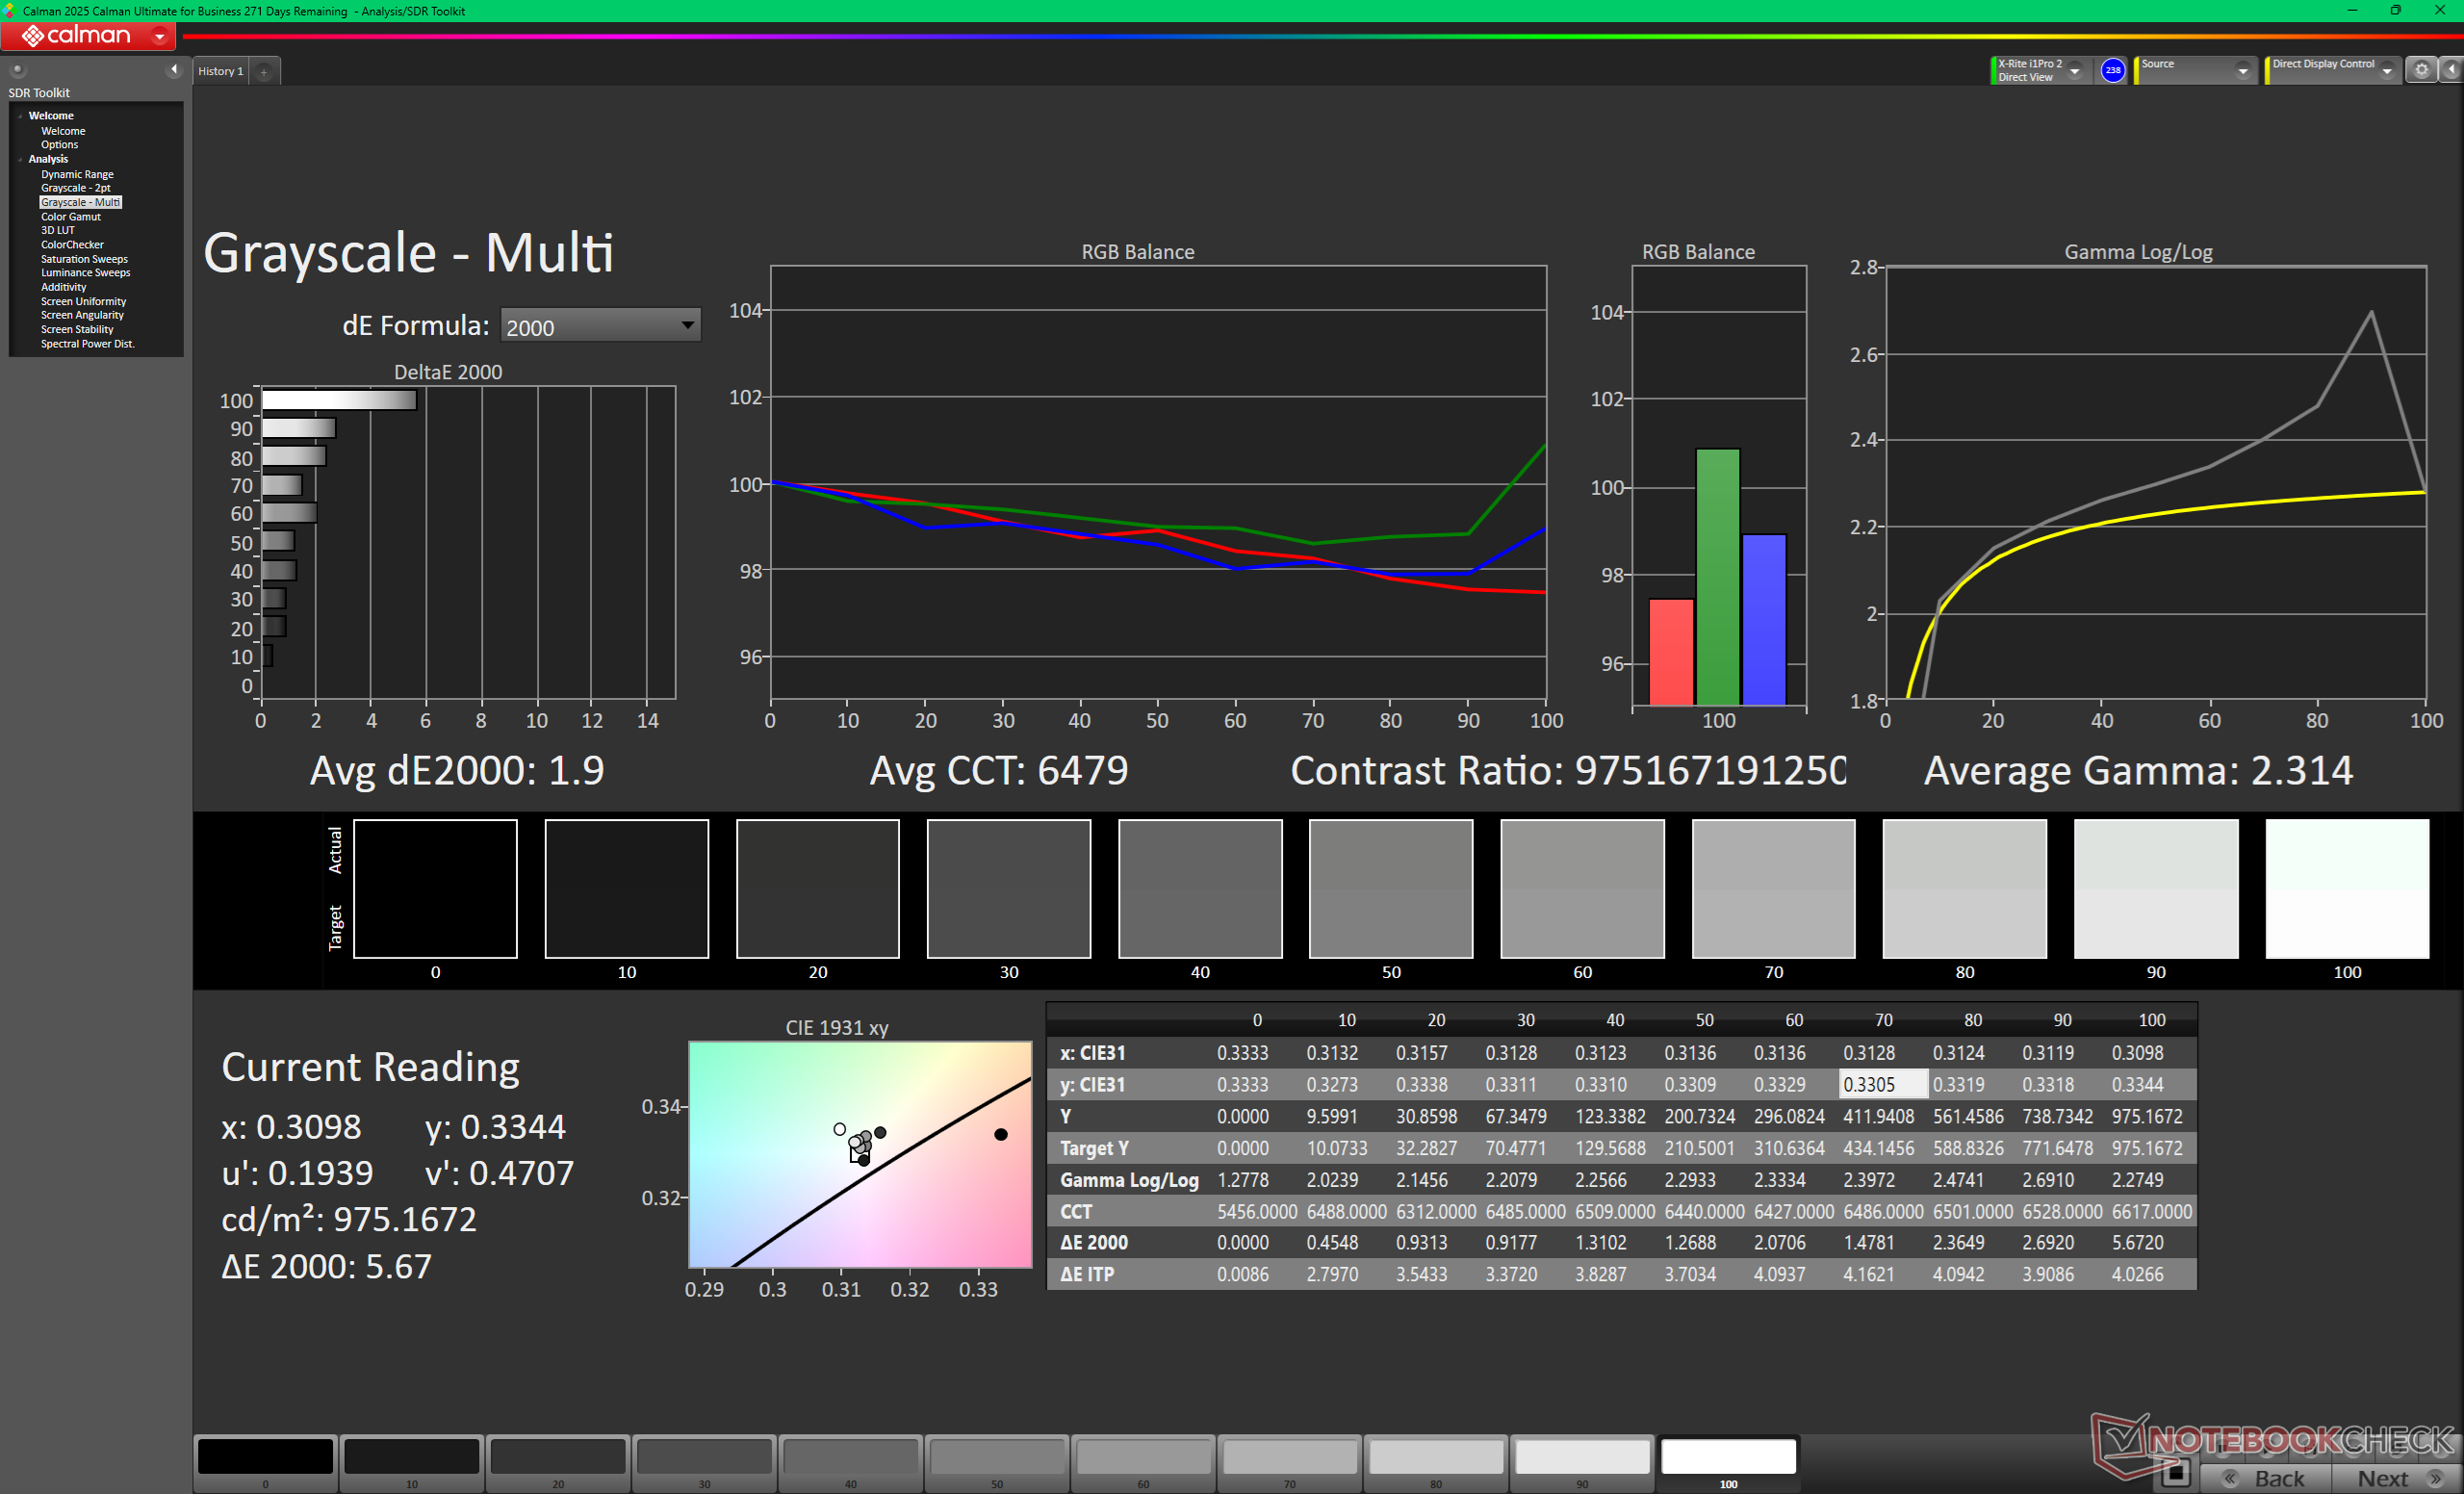
ΔE Greyscale Calman: 1.6 | ∀{0.09-98 Ø4.96}
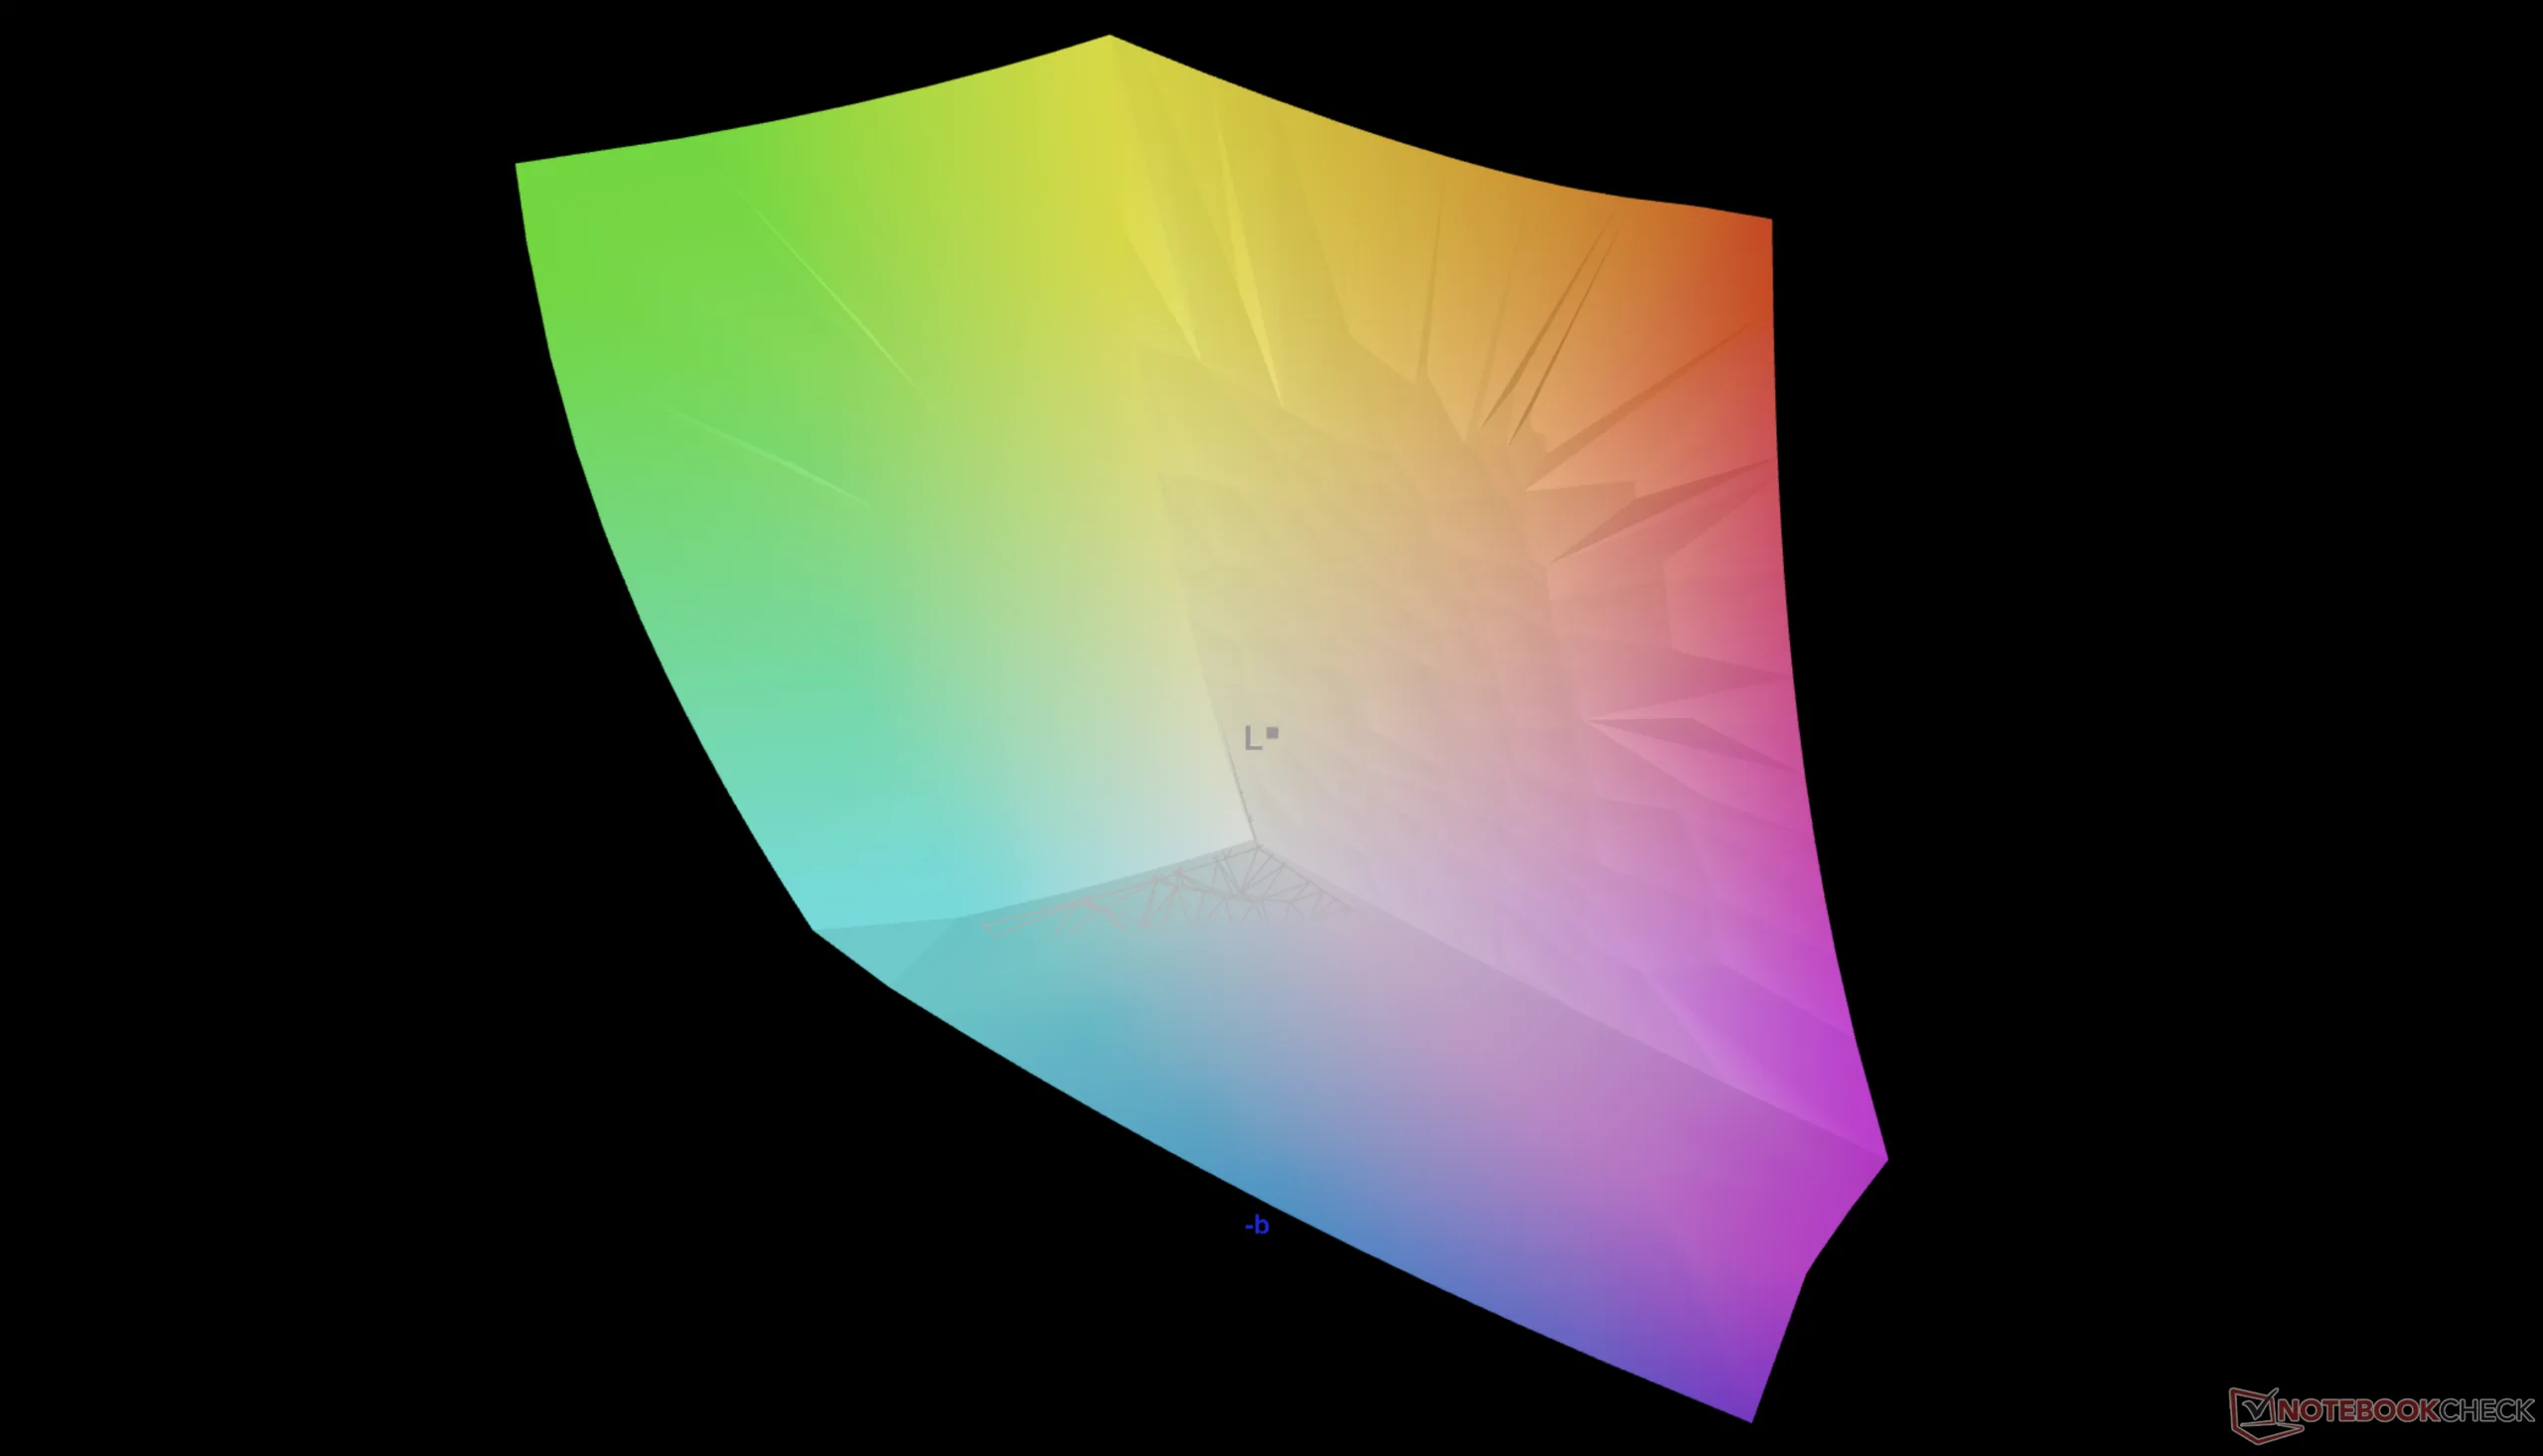
95.7% AdobeRGB 1998 (Argyll 3D)
100% sRGB (Argyll 3D)
98.8% Display P3 (Argyll 3D)
Gamma: 2.34
CCT: 6398 K
| Lenovo Pro 9 16IPH11 Samsung ATNA60KA04-0, Tandem OLED, 3200x2000, 16", 120 Hz | Lenovo Yoga Pro 9 16IAH10 RTX 5050 ATNA60HR04-0, OLED, 2880x1800, 16", 120 Hz | Dell XPS 16 Core Ultra X7 358H LG Philips 160WV1, OLED, 3200x2000, 16", 120 Hz | MSI Prestige 16 AI Evo B2HMG B160QAN03_R, IPS, 2560x1600, 16", 60 Hz | HP Omen Transcend 16-u1095ng ATNA60DL02-0 (SDC41A4), OLED, 2560x1600, 16", 240 Hz | Asus ProArt P16 H7606WP ATNA60CL10-0, OLED, 2880x1800, 16", 120 Hz | |
|---|---|---|---|---|---|---|
| Display | 1% | -5% | 1% | -2% | ||
| Display P3 Coverage (%) | 98.8 | 99.5 1% | 96.4 -2% | 99.8 1% | 99.5 1% | |
| sRGB Coverage (%) | 100 | 100 0% | 99.7 0% | 100 0% | 100 0% | |
| AdobeRGB 1998 Coverage (%) | 95.7 | 96.5 1% | 84.3 -12% | 97 1% | 89.5 -6% | |
| Response Times | -131% | -39% | -5878% | 71% | -17% | |
| Response Time Grey 50% / Grey 80% * (ms) | 0.58 ? | 0.65 ? -12% | 51.5 ? -8779% | 0.2 ? 66% | 0.63 ? -9% | |
| Response Time Black / White * (ms) | 0.79 ? | 0.87 ? -10% | 24.3 ? -2976% | 0.2 ? 75% | 0.63 ? 20% | |
| PWM Frequency (Hz) | 1173.2 | 1200 | 240.2 ? | 120 ? | 480 ? | |
| PWM Amplitude * (%) | 16 | 37 -131% | 31 -94% | 26 -63% | ||
| Bildschirm | -26% | -15% | -92% | -29% | 8% | |
| Helligkeit Bildmitte (cd/m²) | 930.9 | 471.7 -49% | 395.4 -58% | 471 -49% | 390 -58% | 362 -61% |
| Brightness (cd/m²) | 947 | 474 -50% | 392 -59% | 455 -52% | 392 -59% | 363 -62% |
| Brightness Distribution (%) | 94 | 98 4% | 95 1% | 92 -2% | 98 4% | 99 5% |
| Schwarzwert * (cd/m²) | 0.2 | 0.02 | ||||
| Delta E Colorchecker * | 3.51 | 3.53 -1% | 3.69 -5% | 5.8 -65% | 1.94 45% | 0.8 77% |
| Colorchecker dE 2000 max. * | 6.48 | 6.31 3% | 7.94 -23% | 10.8 -67% | 4.26 34% | 1.8 72% |
| Colorchecker dE 2000 calibrated * | 1.55 | 0.68 56% | 1.9 -23% | 4.21 -172% | ||
| Delta E Graustufen * | 1.6 | 2.6 -63% | 1.9 -19% | 7.8 -388% | 1.5 6% | 1.3 19% |
| Gamma | 2.34 94% | 2.24 98% | 2.28 96% | 2.07 106% | 2.221 99% | 2.2 100% |
| CCT | 6398 102% | 6292 103% | 6274 104% | 7262 90% | 6395 102% | 6741 96% |
| Kontrast (:1) | 2355 | 19500 | ||||
| Durchschnitt gesamt (Programm / Settings) | -79% /
-41% | -18% /
-17% | -1992% /
-1035% | 14% /
-5% | -4% /
-1% |
* ... kleinere Werte sind besser

Reaktionszeiten (Response Times) des Displays
| ↔ Reaktionszeiten Schwarz zu Weiß | ||
|---|---|---|
| 0.79 ms ... steigend ↗ und fallend ↘ kombiniert | ↗ 0.37 ms steigend | 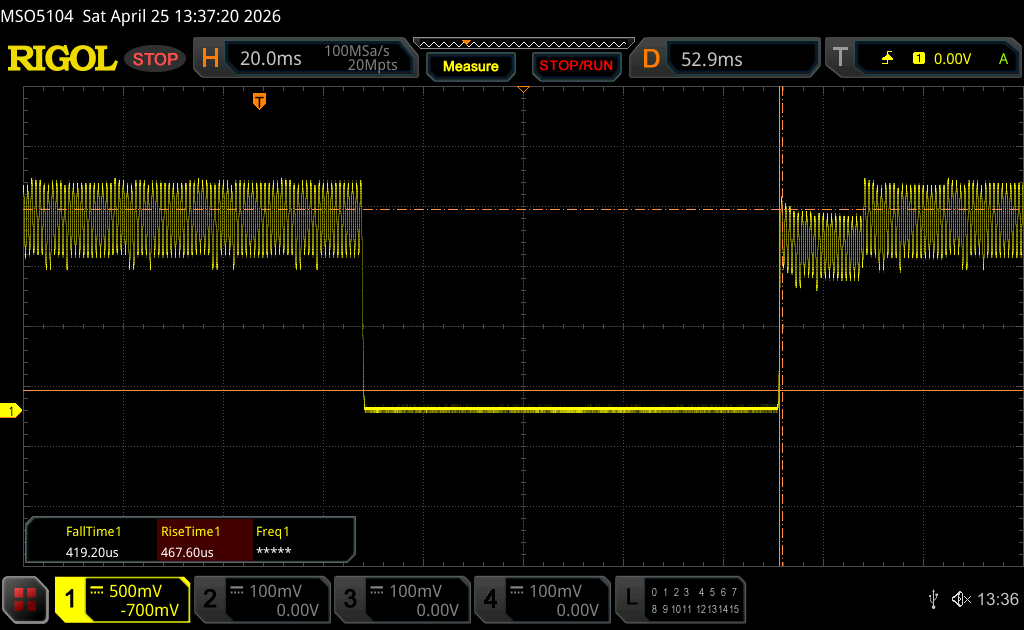 |
| ↘ 0.42 ms fallend | ||
| Die gemessenen Reaktionszeiten sind sehr kurz, wodurch sich der Bildschirm auch für schnelle 3D Spiele eignen sollte. Im Vergleich rangierten die bei uns getesteten Geräte von 0.1 (Minimum) zu 240 (Maximum) ms. » 2 % aller Screens waren schneller als der getestete. Daher sind die gemessenen Reaktionszeiten besser als der Durchschnitt aller vermessenen Geräte (19.8 ms). | ||
| ↔ Reaktionszeiten 50% Grau zu 80% Grau | ||
| 0.58 ms ... steigend ↗ und fallend ↘ kombiniert | ↗ 0.3 ms steigend | 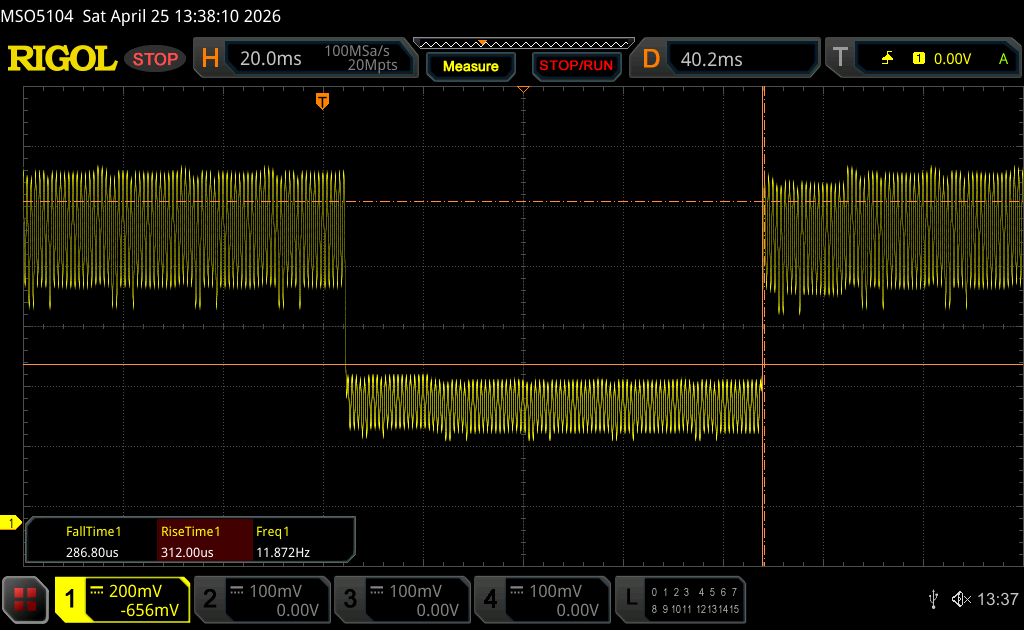 |
| ↘ 0.28 ms fallend | ||
| Die gemessenen Reaktionszeiten sind sehr kurz, wodurch sich der Bildschirm auch für schnelle 3D Spiele eignen sollte. Im Vergleich rangierten die bei uns getesteten Geräte von 0.165 (Minimum) zu 636 (Maximum) ms. » 1 % aller Screens waren schneller als der getestete. Daher sind die gemessenen Reaktionszeiten besser als der Durchschnitt aller vermessenen Geräte (31 ms). | ||
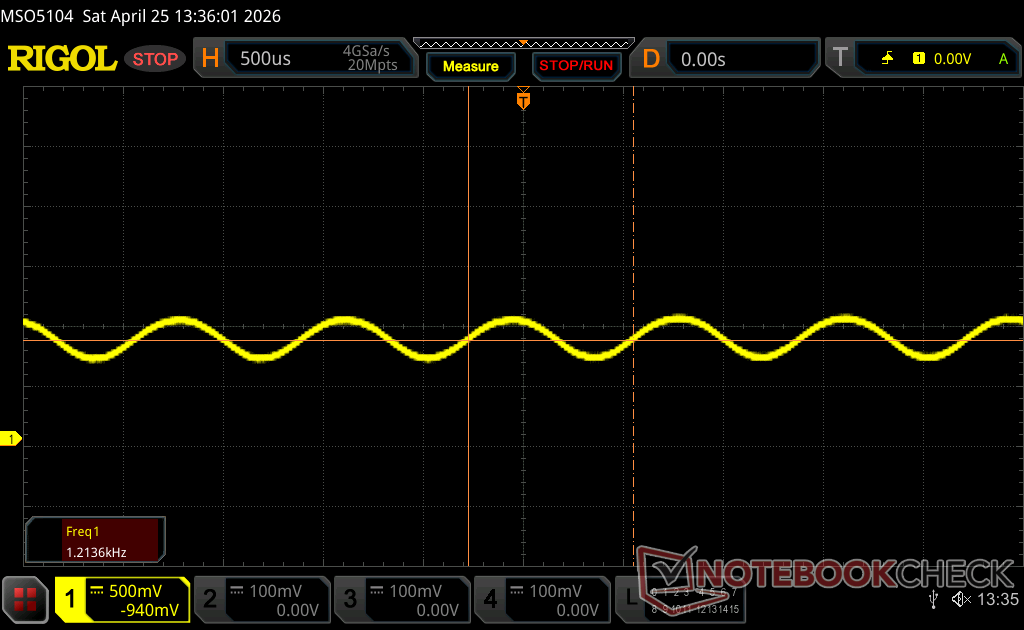
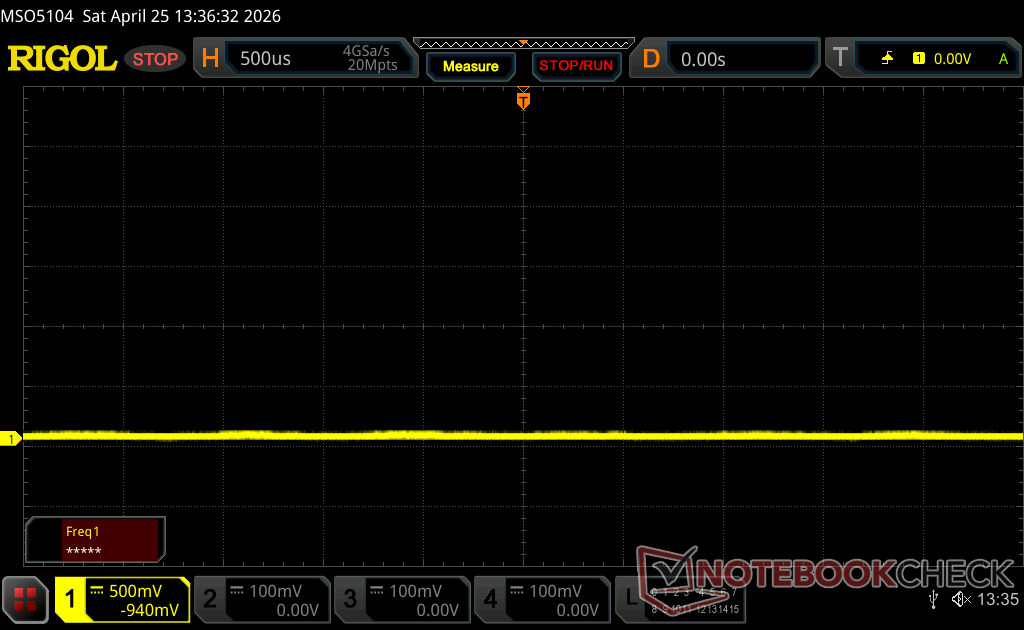
Bildschirm-Flackern / PWM (Pulse-Width Modulation)
| Flackern / PWM festgestellt | 1173.2 Hz Amplitude: 16 % | 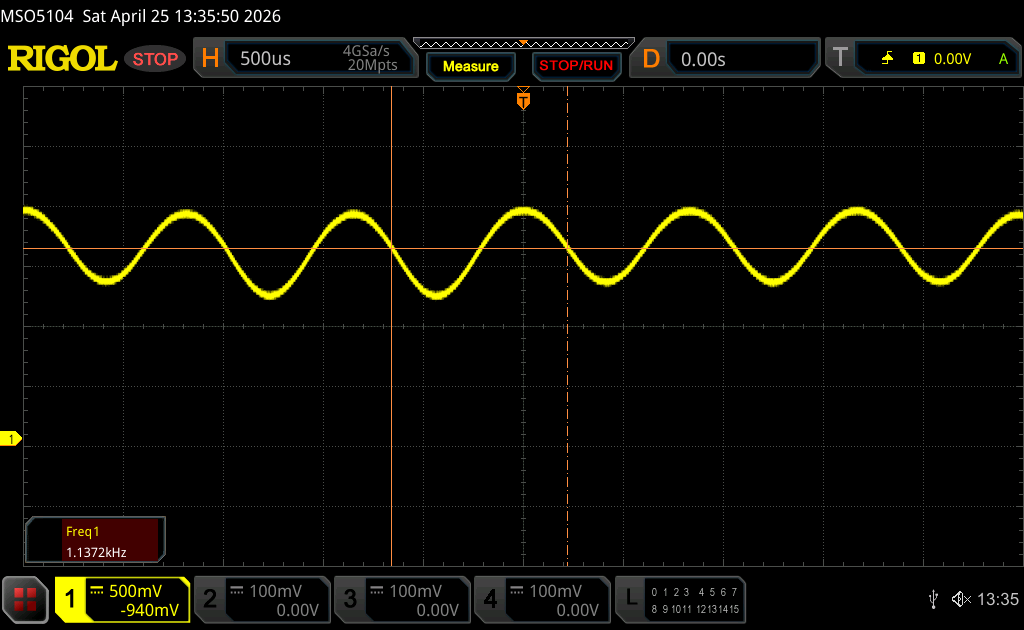 | |
Das Display flackert mit 1173.2 Hz (im schlimmsten Fall, eventuell durch Pulsweitenmodulation PWM) . Die Frequenz von 1173.2 Hz ist sehr hoch und sollte daher auch bei empfindlichen Personen zu keinen Problemen führen. Im Vergleich: 52 % aller getesteten Geräte nutzten kein PWM um die Helligkeit zu reduzieren. Wenn PWM eingesetzt wurde, dann bei einer Frequenz von durchschnittlich 7757 (Minimum 5, Maximum 343500) Hz. | |||


Performance
Testbedingungen
Wir haben Windows auf den Modus Performance und den diskreten Grafikmodus eingestellt, bevor wir die folgenden Benchmarks durchgeführt haben.
Prozessor
Der neue Core Ultra 9 386H bietet leider wenig bis gar keine Leistungsvorteile gegenüber der vorherigen Generation Core Ultra 9 285H, wie unsere Vergleichstabellen unten zeigen. Tatsächlich verfügt die neue CPU sogar über weniger L2- und L3-Cache als ihr Vorgänger. Allerdings macht sie dies durch eine verbesserte Fertigungseffizienz (1,8 vs. 5 nm) und eine schnellere integrierte NPU-Leistung (50 vs. 13 TOPS) wieder wett.
Cinebench R15 Mehrfachschleife
Cinebench R23: Multi Core | Single Core
Cinebench R20: CPU (Multi Core) | CPU (Single Core)
Cinebench R15: CPU Multi 64Bit | CPU Single 64Bit
Blender: v2.79 BMW27 CPU
7-Zip 18.03: 7z b 4 | 7z b 4 -mmt1
Geekbench 6.7: Multi-Core | Single-Core
Geekbench 5.5: Multi-Core | Single-Core
HWBOT x265 Benchmark v2.2: 4k Preset
LibreOffice : 20 Documents To PDF
R Benchmark 2.5: Overall mean
| Cinebench R20 / CPU (Multi Core) | |
| Acer Predator Helios Neo 16S AI PHN16S-71-94L9 | |
| Asus ProArt P16 H7606WP | |
| Lenovo Legion 7 16 AGP11 | |
| HP Omen Transcend 16-u1095ng | |
| Lenovo Yoga Pro 9 16IAH10 RTX 5050 | |
| Lenovo Pro 9 16IPH11 | |
| Alienware m16 R1 Intel | |
| Acer Predator Triton Neo 16 PTN16-51-978P | |
| Durchschnittliche Intel Core Ultra 9 386H (4757 - 8405, n=8) | |
| Dell XPS 16 Core Ultra X7 358H | |
| MSI Venture 16 AI A2HMTG | |
| Cinebench R20 / CPU (Single Core) | |
| Acer Predator Helios Neo 16S AI PHN16S-71-94L9 | |
| HP Omen Transcend 16-u1095ng | |
| Lenovo Yoga Pro 9 16IAH10 RTX 5050 | |
| Lenovo Legion 7 16 AGP11 | |
| Asus ProArt P16 H7606WP | |
| Lenovo Pro 9 16IPH11 | |
| Durchschnittliche Intel Core Ultra 9 386H (762 - 796, n=8) | |
| Dell XPS 16 Core Ultra X7 358H | |
| MSI Venture 16 AI A2HMTG | |
| Alienware m16 R1 Intel | |
| Acer Predator Triton Neo 16 PTN16-51-978P | |
| Cinebench R15 / CPU Single 64Bit | |
| Acer Predator Helios Neo 16S AI PHN16S-71-94L9 | |
| Lenovo Pro 9 16IPH11 | |
| Lenovo Yoga Pro 9 16IAH10 RTX 5050 | |
| Dell XPS 16 Core Ultra X7 358H | |
| HP Omen Transcend 16-u1095ng | |
| MSI Venture 16 AI A2HMTG | |
| Durchschnittliche Intel Core Ultra 9 386H (249 - 314, n=8) | |
| Alienware m16 R1 Intel | |
| Acer Predator Triton Neo 16 PTN16-51-978P | |
| Lenovo Legion 7 16 AGP11 | |
| Asus ProArt P16 H7606WP | |
| HWBOT x265 Benchmark v2.2 / 4k Preset | |
| Acer Predator Helios Neo 16S AI PHN16S-71-94L9 | |
| Lenovo Legion 7 16 AGP11 | |
| Asus ProArt P16 H7606WP | |
| Lenovo Yoga Pro 9 16IAH10 RTX 5050 | |
| Lenovo Pro 9 16IPH11 | |
| HP Omen Transcend 16-u1095ng | |
| Alienware m16 R1 Intel | |
| Durchschnittliche Intel Core Ultra 9 386H (13.2 - 25.1, n=8) | |
| MSI Venture 16 AI A2HMTG | |
| Dell XPS 16 Core Ultra X7 358H | |
| Acer Predator Triton Neo 16 PTN16-51-978P | |
| LibreOffice / 20 Documents To PDF | |
| Acer Predator Triton Neo 16 PTN16-51-978P | |
| Lenovo Legion 7 16 AGP11 | |
| HP Omen Transcend 16-u1095ng | |
| Asus ProArt P16 H7606WP | |
| Dell XPS 16 Core Ultra X7 358H | |
| Durchschnittliche Intel Core Ultra 9 386H (38.5 - 56.1, n=8) | |
| Alienware m16 R1 Intel | |
| Acer Predator Helios Neo 16S AI PHN16S-71-94L9 | |
| MSI Venture 16 AI A2HMTG | |
| Lenovo Pro 9 16IPH11 | |
| Lenovo Yoga Pro 9 16IAH10 RTX 5050 | |
* ... kleinere Werte sind besser
AIDA64: FP32 Ray-Trace | FPU Julia | CPU SHA3 | CPU Queen | FPU SinJulia | FPU Mandel | CPU AES | CPU ZLib | FP64 Ray-Trace | CPU PhotoWorxx | CPU CheckMate
| Performance Rating | |
| Asus ProArt P16 H7606WP -1! | |
| Lenovo Pro 9 16IPH11 -1! | |
| Lenovo Yoga Pro 9 16IAH10 RTX 5050 -1! | |
| HP Omen Transcend 16-u1095ng -1! | |
| Durchschnittliche Intel Core Ultra 9 386H -1! | |
| Dell XPS 16 Core Ultra X7 358H -1! | |
| MSI Prestige 16 AI Evo B2HMG -1! | |
| AIDA64 / FP32 Ray-Trace | |
| Asus ProArt P16 H7606WP (v6.92.6600) | |
| Lenovo Yoga Pro 9 16IAH10 RTX 5050 (v6.92.6600) | |
| Lenovo Pro 9 16IPH11 (v8.20.8100) | |
| MSI Prestige 16 AI Evo B2HMG (v6.92.6600) | |
| Durchschnittliche Intel Core Ultra 9 386H (10001 - 21727, n=8) | |
| HP Omen Transcend 16-u1095ng (v6.92.6600) | |
| Dell XPS 16 Core Ultra X7 358H (v8.20.8100) | |
| AIDA64 / FPU Julia | |
| Asus ProArt P16 H7606WP (v6.92.6600) | |
| Lenovo Yoga Pro 9 16IAH10 RTX 5050 (v6.92.6600) | |
| Lenovo Pro 9 16IPH11 (v8.20.8100) | |
| Durchschnittliche Intel Core Ultra 9 386H (53370 - 113595, n=8) | |
| MSI Prestige 16 AI Evo B2HMG (v6.92.6600) | |
| HP Omen Transcend 16-u1095ng (v6.92.6600) | |
| Dell XPS 16 Core Ultra X7 358H (v8.20.8100) | |
| AIDA64 / CPU SHA3 | |
| Asus ProArt P16 H7606WP (v6.92.6600) | |
| Lenovo Pro 9 16IPH11 (v8.20.8100) | |
| Lenovo Yoga Pro 9 16IAH10 RTX 5050 (v6.92.6600) | |
| Durchschnittliche Intel Core Ultra 9 386H (2776 - 5604, n=8) | |
| MSI Prestige 16 AI Evo B2HMG (v6.92.6600) | |
| HP Omen Transcend 16-u1095ng (v6.92.6600) | |
| Dell XPS 16 Core Ultra X7 358H (v8.20.8100) | |
| AIDA64 / CPU Queen | |
| HP Omen Transcend 16-u1095ng (v6.92.6600) | |
| Asus ProArt P16 H7606WP (v6.92.6600) | |
| MSI Prestige 16 AI Evo B2HMG (v6.92.6600) | |
| Lenovo Yoga Pro 9 16IAH10 RTX 5050 (v6.92.6600) | |
| AIDA64 / FPU SinJulia | |
| Asus ProArt P16 H7606WP (v6.92.6600) | |
| HP Omen Transcend 16-u1095ng (v6.92.6600) | |
| Lenovo Yoga Pro 9 16IAH10 RTX 5050 (v6.92.6600) | |
| MSI Prestige 16 AI Evo B2HMG (v6.92.6600) | |
| Lenovo Pro 9 16IPH11 (v8.20.8100) | |
| Dell XPS 16 Core Ultra X7 358H (v8.20.8100) | |
| Durchschnittliche Intel Core Ultra 9 386H (5314 - 7332, n=8) | |
| AIDA64 / FPU Mandel | |
| Asus ProArt P16 H7606WP (v6.92.6600) | |
| Lenovo Yoga Pro 9 16IAH10 RTX 5050 (v6.92.6600) | |
| Lenovo Pro 9 16IPH11 (v8.20.8100) | |
| Durchschnittliche Intel Core Ultra 9 386H (28414 - 61578, n=8) | |
| MSI Prestige 16 AI Evo B2HMG (v6.92.6600) | |
| Dell XPS 16 Core Ultra X7 358H (v8.20.8100) | |
| HP Omen Transcend 16-u1095ng (v6.92.6600) | |
| AIDA64 / CPU AES | |
| Asus ProArt P16 H7606WP (v6.92.6600) | |
| HP Omen Transcend 16-u1095ng (v6.92.6600) | |
| Lenovo Yoga Pro 9 16IAH10 RTX 5050 (v6.92.6600) | |
| Lenovo Pro 9 16IPH11 (v8.20.8100) | |
| MSI Prestige 16 AI Evo B2HMG (v6.92.6600) | |
| Durchschnittliche Intel Core Ultra 9 386H (46362 - 72112, n=8) | |
| Dell XPS 16 Core Ultra X7 358H (v8.20.8100) | |
| AIDA64 / CPU ZLib | |
| Asus ProArt P16 H7606WP (v6.92.6600) | |
| HP Omen Transcend 16-u1095ng (v6.92.6600) | |
| Lenovo Yoga Pro 9 16IAH10 RTX 5050 (v6.92.6600) | |
| Lenovo Pro 9 16IPH11 (v8.20.8100) | |
| Durchschnittliche Intel Core Ultra 9 386H (669 - 1271, n=8) | |
| MSI Prestige 16 AI Evo B2HMG (v6.92.6600) | |
| Dell XPS 16 Core Ultra X7 358H (v8.20.8100) | |
| AIDA64 / FP64 Ray-Trace | |
| Asus ProArt P16 H7606WP (v6.92.6600) | |
| Lenovo Yoga Pro 9 16IAH10 RTX 5050 (v6.92.6600) | |
| Lenovo Pro 9 16IPH11 (v8.20.8100) | |
| MSI Prestige 16 AI Evo B2HMG (v6.92.6600) | |
| Durchschnittliche Intel Core Ultra 9 386H (5138 - 11627, n=8) | |
| HP Omen Transcend 16-u1095ng (v6.92.6600) | |
| Dell XPS 16 Core Ultra X7 358H (v8.20.8100) | |
| AIDA64 / CPU PhotoWorxx | |
| Dell XPS 16 Core Ultra X7 358H (v8.20.8100) | |
| Durchschnittliche Intel Core Ultra 9 386H (54042 - 89891, n=8) | |
| Lenovo Pro 9 16IPH11 (v8.20.8100) | |
| Lenovo Yoga Pro 9 16IAH10 RTX 5050 (v6.92.6600) | |
| MSI Prestige 16 AI Evo B2HMG (v6.92.6600) | |
| HP Omen Transcend 16-u1095ng (v6.92.6600) | |
| Asus ProArt P16 H7606WP (v6.92.6600) | |
| AIDA64 / CPU CheckMate | |
| Lenovo Pro 9 16IPH11 (v8.20.8100) | |
| Durchschnittliche Intel Core Ultra 9 386H (4051 - 4858, n=7) | |
| Dell XPS 16 Core Ultra X7 358H (v8.20.8100) | |
Systemleistung
PCMark 10: Score | Essentials | Productivity | Digital Content Creation
CrossMark: Overall | Productivity | Creativity | Responsiveness
WebXPRT 3: Overall
WebXPRT 4: Overall
Mozilla Kraken 1.1: Total
Geekbench AI: Half Precision GPU 1.7 | Single Precision GPU 1.7 | Quantized GPU 1.7
| Performance Rating | |
| Durchschnittliche Intel Core Ultra 9 386H, NVIDIA GeForce RTX 5060 Laptop | |
| Lenovo Pro 9 16IPH11 | |
| Lenovo Yoga Pro 9 16IAH10 RTX 5050 | |
| MSI Prestige 16 AI Evo B2HMG -3! | |
| Dell XPS 16 Core Ultra X7 358H | |
| Asus ProArt P16 H7606WP -3! | |
| HP Omen Transcend 16-u1095ng -8! | |
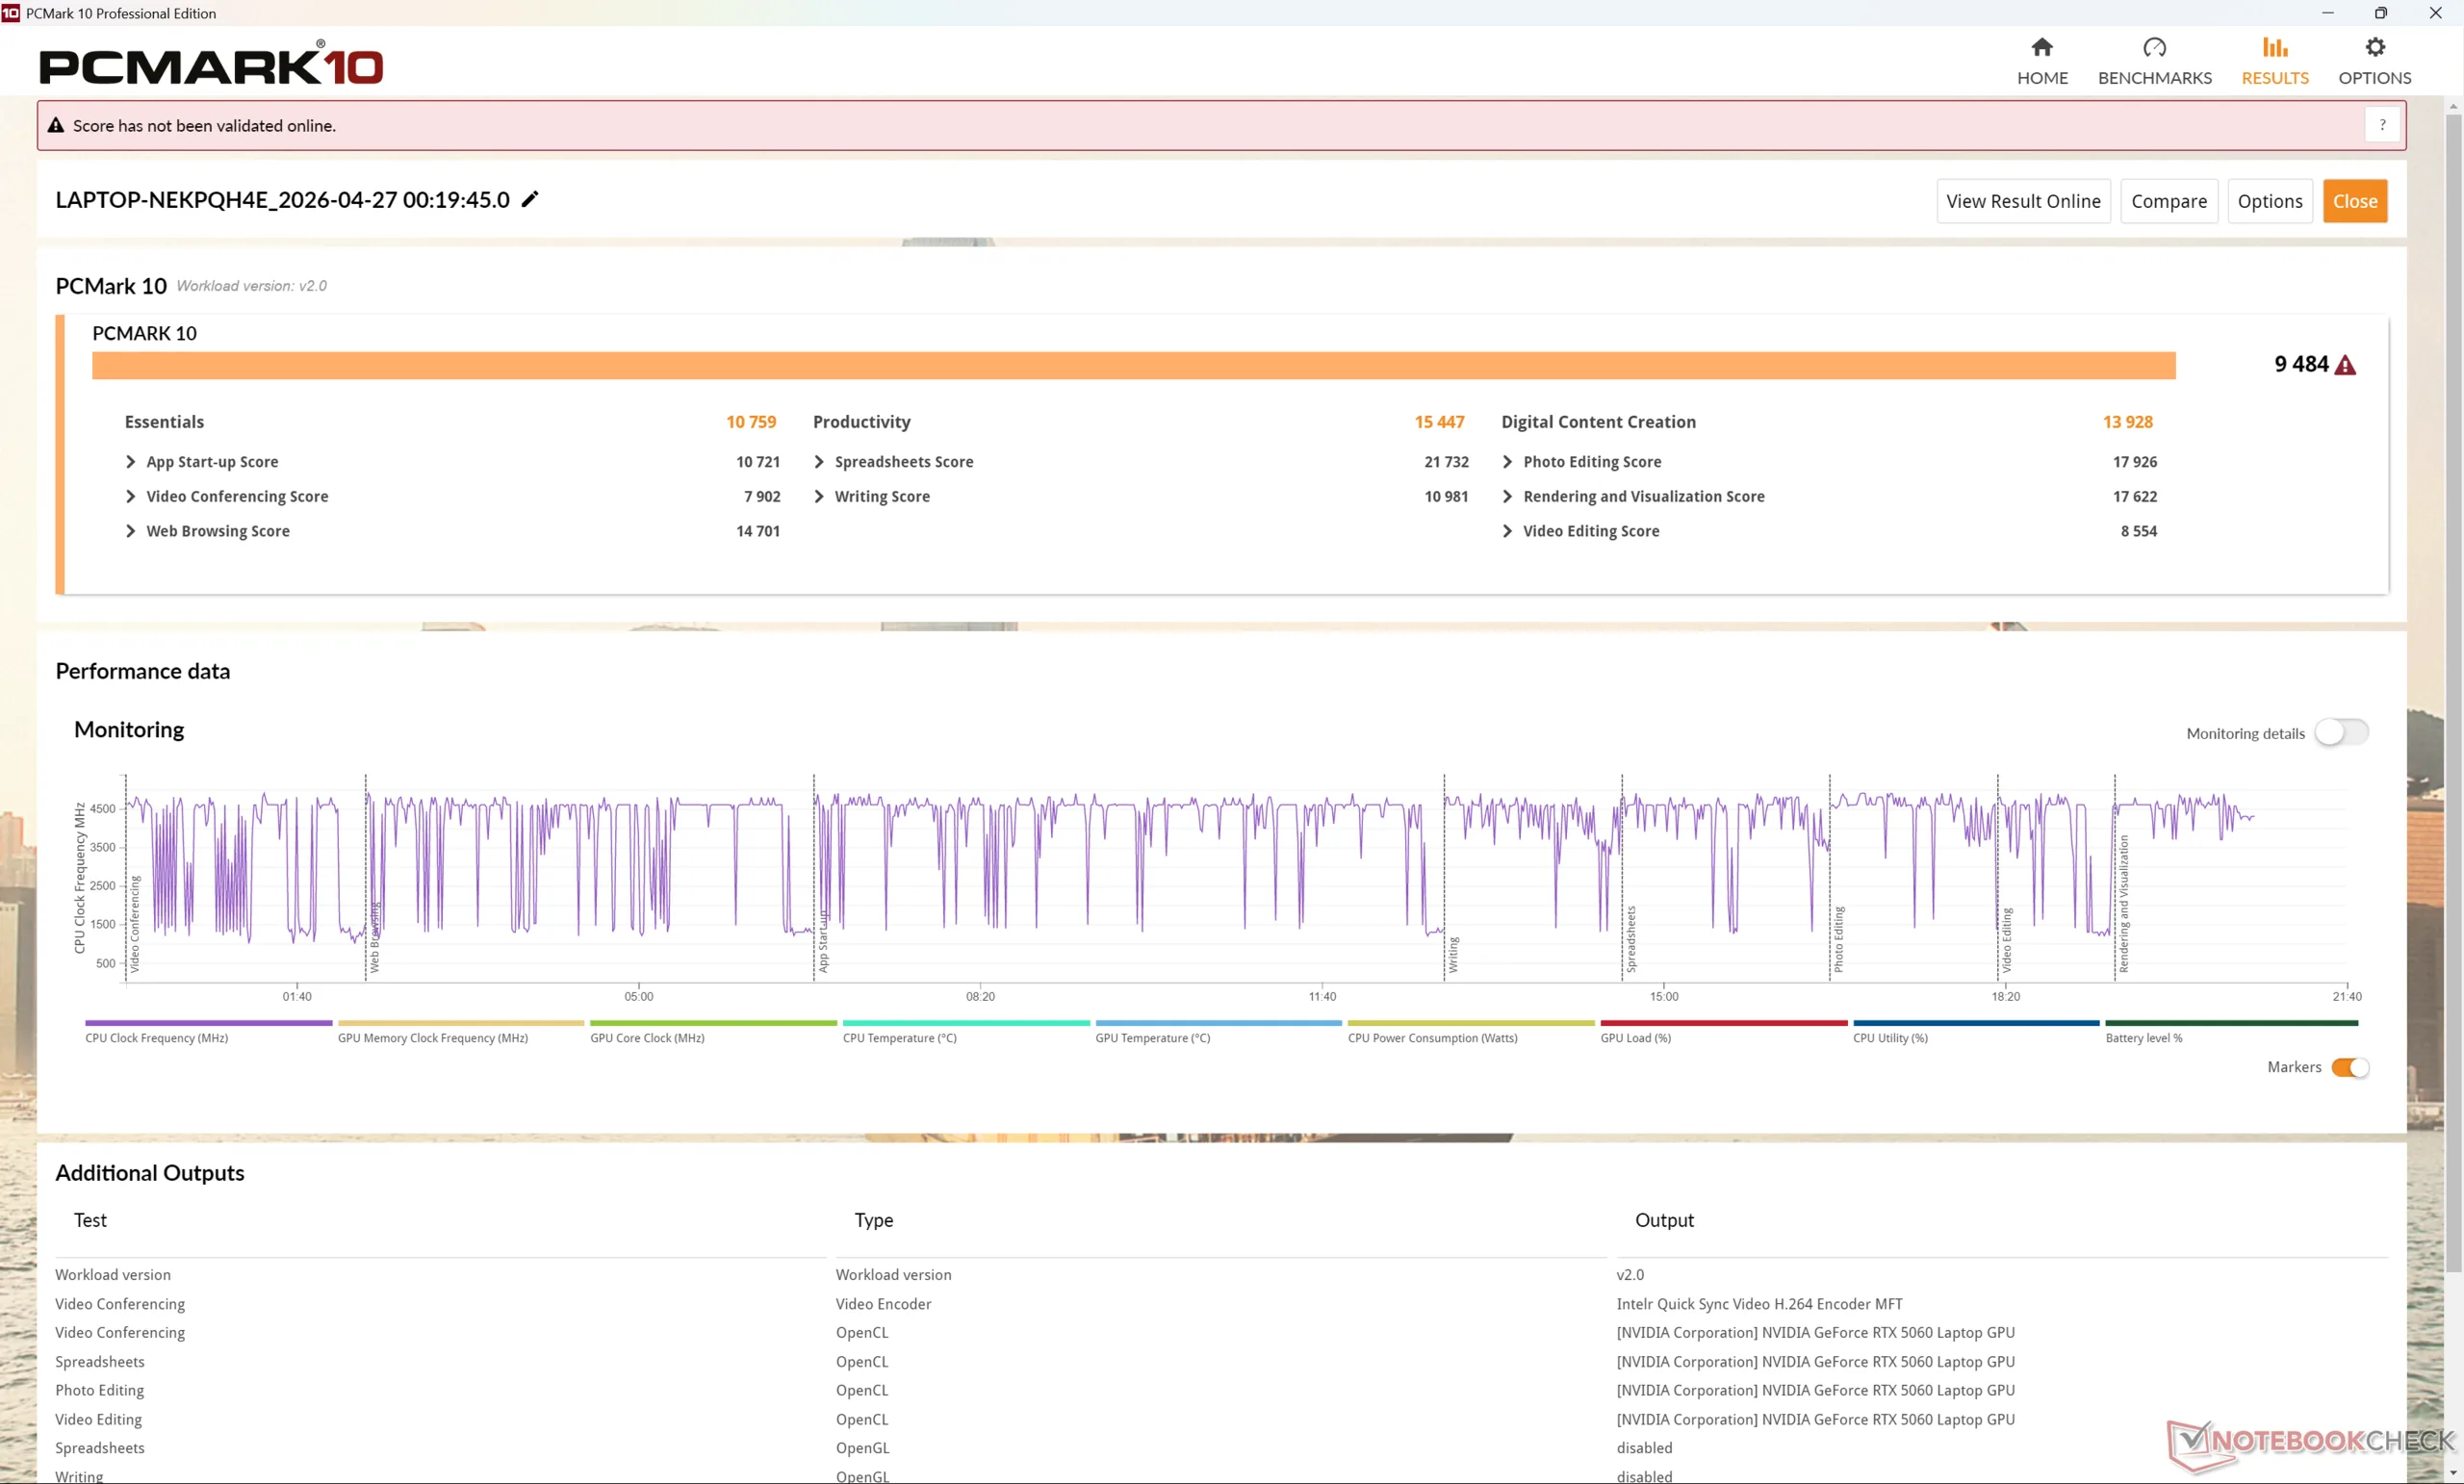
| PCMark 10 / Score | |
| Dell XPS 16 Core Ultra X7 358H | |
| Lenovo Yoga Pro 9 16IAH10 RTX 5050 | |
| Lenovo Pro 9 16IPH11 | |
| Durchschnittliche Intel Core Ultra 9 386H, NVIDIA GeForce RTX 5060 Laptop (9465 - 9484, n=2) | |
| Asus ProArt P16 H7606WP | |
| HP Omen Transcend 16-u1095ng | |
| MSI Prestige 16 AI Evo B2HMG | |
| PCMark 10 / Essentials | |
| MSI Prestige 16 AI Evo B2HMG | |
| Dell XPS 16 Core Ultra X7 358H | |
| Durchschnittliche Intel Core Ultra 9 386H, NVIDIA GeForce RTX 5060 Laptop (10759 - 10841, n=2) | |
| Lenovo Yoga Pro 9 16IAH10 RTX 5050 | |
| Lenovo Pro 9 16IPH11 | |
| Asus ProArt P16 H7606WP | |
| HP Omen Transcend 16-u1095ng | |
| PCMark 10 / Productivity | |
| Lenovo Yoga Pro 9 16IAH10 RTX 5050 | |
| Dell XPS 16 Core Ultra X7 358H | |
| Lenovo Pro 9 16IPH11 | |
| Durchschnittliche Intel Core Ultra 9 386H, NVIDIA GeForce RTX 5060 Laptop (15199 - 15447, n=2) | |
| HP Omen Transcend 16-u1095ng | |
| MSI Prestige 16 AI Evo B2HMG | |
| Asus ProArt P16 H7606WP | |
| PCMark 10 / Digital Content Creation | |
| Asus ProArt P16 H7606WP | |
| Durchschnittliche Intel Core Ultra 9 386H, NVIDIA GeForce RTX 5060 Laptop (13928 - 13963, n=2) | |
| Lenovo Pro 9 16IPH11 | |
| Dell XPS 16 Core Ultra X7 358H | |
| Lenovo Yoga Pro 9 16IAH10 RTX 5050 | |
| MSI Prestige 16 AI Evo B2HMG | |
| HP Omen Transcend 16-u1095ng | |
| CrossMark / Overall | |
| MSI Prestige 16 AI Evo B2HMG | |
| Durchschnittliche Intel Core Ultra 9 386H, NVIDIA GeForce RTX 5060 Laptop (2108 - 2164, n=2) | |
| Dell XPS 16 Core Ultra X7 358H | |
| Lenovo Pro 9 16IPH11 | |
| Lenovo Yoga Pro 9 16IAH10 RTX 5050 | |
| Asus ProArt P16 H7606WP | |
| CrossMark / Productivity | |
| MSI Prestige 16 AI Evo B2HMG | |
| Durchschnittliche Intel Core Ultra 9 386H, NVIDIA GeForce RTX 5060 Laptop (1917 - 1973, n=2) | |
| Lenovo Pro 9 16IPH11 | |
| Dell XPS 16 Core Ultra X7 358H | |
| Lenovo Yoga Pro 9 16IAH10 RTX 5050 | |
| Asus ProArt P16 H7606WP | |
| CrossMark / Creativity | |
| Dell XPS 16 Core Ultra X7 358H | |
| Lenovo Pro 9 16IPH11 | |
| Durchschnittliche Intel Core Ultra 9 386H, NVIDIA GeForce RTX 5060 Laptop (2442 - 2500, n=2) | |
| MSI Prestige 16 AI Evo B2HMG | |
| Lenovo Yoga Pro 9 16IAH10 RTX 5050 | |
| Asus ProArt P16 H7606WP | |
| CrossMark / Responsiveness | |
| MSI Prestige 16 AI Evo B2HMG | |
| Durchschnittliche Intel Core Ultra 9 386H, NVIDIA GeForce RTX 5060 Laptop (1682 - 1988, n=2) | |
| Dell XPS 16 Core Ultra X7 358H | |
| Lenovo Pro 9 16IPH11 | |
| Lenovo Yoga Pro 9 16IAH10 RTX 5050 | |
| Asus ProArt P16 H7606WP | |
| WebXPRT 3 / Overall | |
| MSI Prestige 16 AI Evo B2HMG | |
| HP Omen Transcend 16-u1095ng | |
| Asus ProArt P16 H7606WP | |
| Lenovo Pro 9 16IPH11 | |
| Lenovo Yoga Pro 9 16IAH10 RTX 5050 | |
| Durchschnittliche Intel Core Ultra 9 386H, NVIDIA GeForce RTX 5060 Laptop (310 - 326, n=2) | |
| Dell XPS 16 Core Ultra X7 358H | |
| WebXPRT 4 / Overall | |
| MSI Prestige 16 AI Evo B2HMG | |
| Lenovo Yoga Pro 9 16IAH10 RTX 5050 | |
| Lenovo Pro 9 16IPH11 | |
| Dell XPS 16 Core Ultra X7 358H | |
| Durchschnittliche Intel Core Ultra 9 386H, NVIDIA GeForce RTX 5060 Laptop (298 - 302, n=2) | |
| Asus ProArt P16 H7606WP | |
| Mozilla Kraken 1.1 / Total | |
| Dell XPS 16 Core Ultra X7 358H | |
| Asus ProArt P16 H7606WP | |
| Durchschnittliche Intel Core Ultra 9 386H, NVIDIA GeForce RTX 5060 Laptop (442 - 446, n=2) | |
| Lenovo Pro 9 16IPH11 | |
| HP Omen Transcend 16-u1095ng | |
| Lenovo Yoga Pro 9 16IAH10 RTX 5050 | |
| MSI Prestige 16 AI Evo B2HMG | |
| Geekbench AI / Half Precision GPU 1.7 | |
| Lenovo Yoga Pro 9 16IAH10 RTX 5050 | |
| Lenovo Pro 9 16IPH11 | |
| Durchschnittliche Intel Core Ultra 9 386H, NVIDIA GeForce RTX 5060 Laptop (n=1) | |
| Dell XPS 16 Core Ultra X7 358H | |
| Geekbench AI / Single Precision GPU 1.7 | |
| Lenovo Pro 9 16IPH11 | |
| Durchschnittliche Intel Core Ultra 9 386H, NVIDIA GeForce RTX 5060 Laptop (n=1) | |
| Lenovo Yoga Pro 9 16IAH10 RTX 5050 | |
| Dell XPS 16 Core Ultra X7 358H | |
| Geekbench AI / Quantized GPU 1.7 | |
| Lenovo Pro 9 16IPH11 | |
| Durchschnittliche Intel Core Ultra 9 386H, NVIDIA GeForce RTX 5060 Laptop (n=1) | |
| Lenovo Yoga Pro 9 16IAH10 RTX 5050 | |
| Dell XPS 16 Core Ultra X7 358H | |
* ... kleinere Werte sind besser
| PCMark 10 Score | 9484 Punkte | |
Hilfe | ||
| AIDA64 / Memory Copy | |
| Dell XPS 16 Core Ultra X7 358H | |
| Durchschnittliche Intel Core Ultra 9 386H (75437 - 129946, n=8) | |
| Lenovo Pro 9 16IPH11 | |
| Lenovo Yoga Pro 9 16IAH10 RTX 5050 | |
| MSI Prestige 16 AI Evo B2HMG | |
| Asus ProArt P16 H7606WP | |
| HP Omen Transcend 16-u1095ng | |
| AIDA64 / Memory Read | |
| Dell XPS 16 Core Ultra X7 358H | |
| Durchschnittliche Intel Core Ultra 9 386H (81021 - 118858, n=8) | |
| Lenovo Pro 9 16IPH11 | |
| Asus ProArt P16 H7606WP | |
| Lenovo Yoga Pro 9 16IAH10 RTX 5050 | |
| HP Omen Transcend 16-u1095ng | |
| MSI Prestige 16 AI Evo B2HMG | |
| AIDA64 / Memory Write | |
| Dell XPS 16 Core Ultra X7 358H | |
| Durchschnittliche Intel Core Ultra 9 386H (75959 - 135096, n=8) | |
| Lenovo Yoga Pro 9 16IAH10 RTX 5050 | |
| Lenovo Pro 9 16IPH11 | |
| Asus ProArt P16 H7606WP | |
| HP Omen Transcend 16-u1095ng | |
| MSI Prestige 16 AI Evo B2HMG | |
| AIDA64 / Memory Latency | |
| MSI Prestige 16 AI Evo B2HMG | |
| Lenovo Yoga Pro 9 16IAH10 RTX 5050 | |
| Asus ProArt P16 H7606WP | |
| Lenovo Pro 9 16IPH11 | |
| Durchschnittliche Intel Core Ultra 9 386H (87.2 - 116.9, n=8) | |
| HP Omen Transcend 16-u1095ng | |
| Dell XPS 16 Core Ultra X7 358H | |
* ... kleinere Werte sind besser
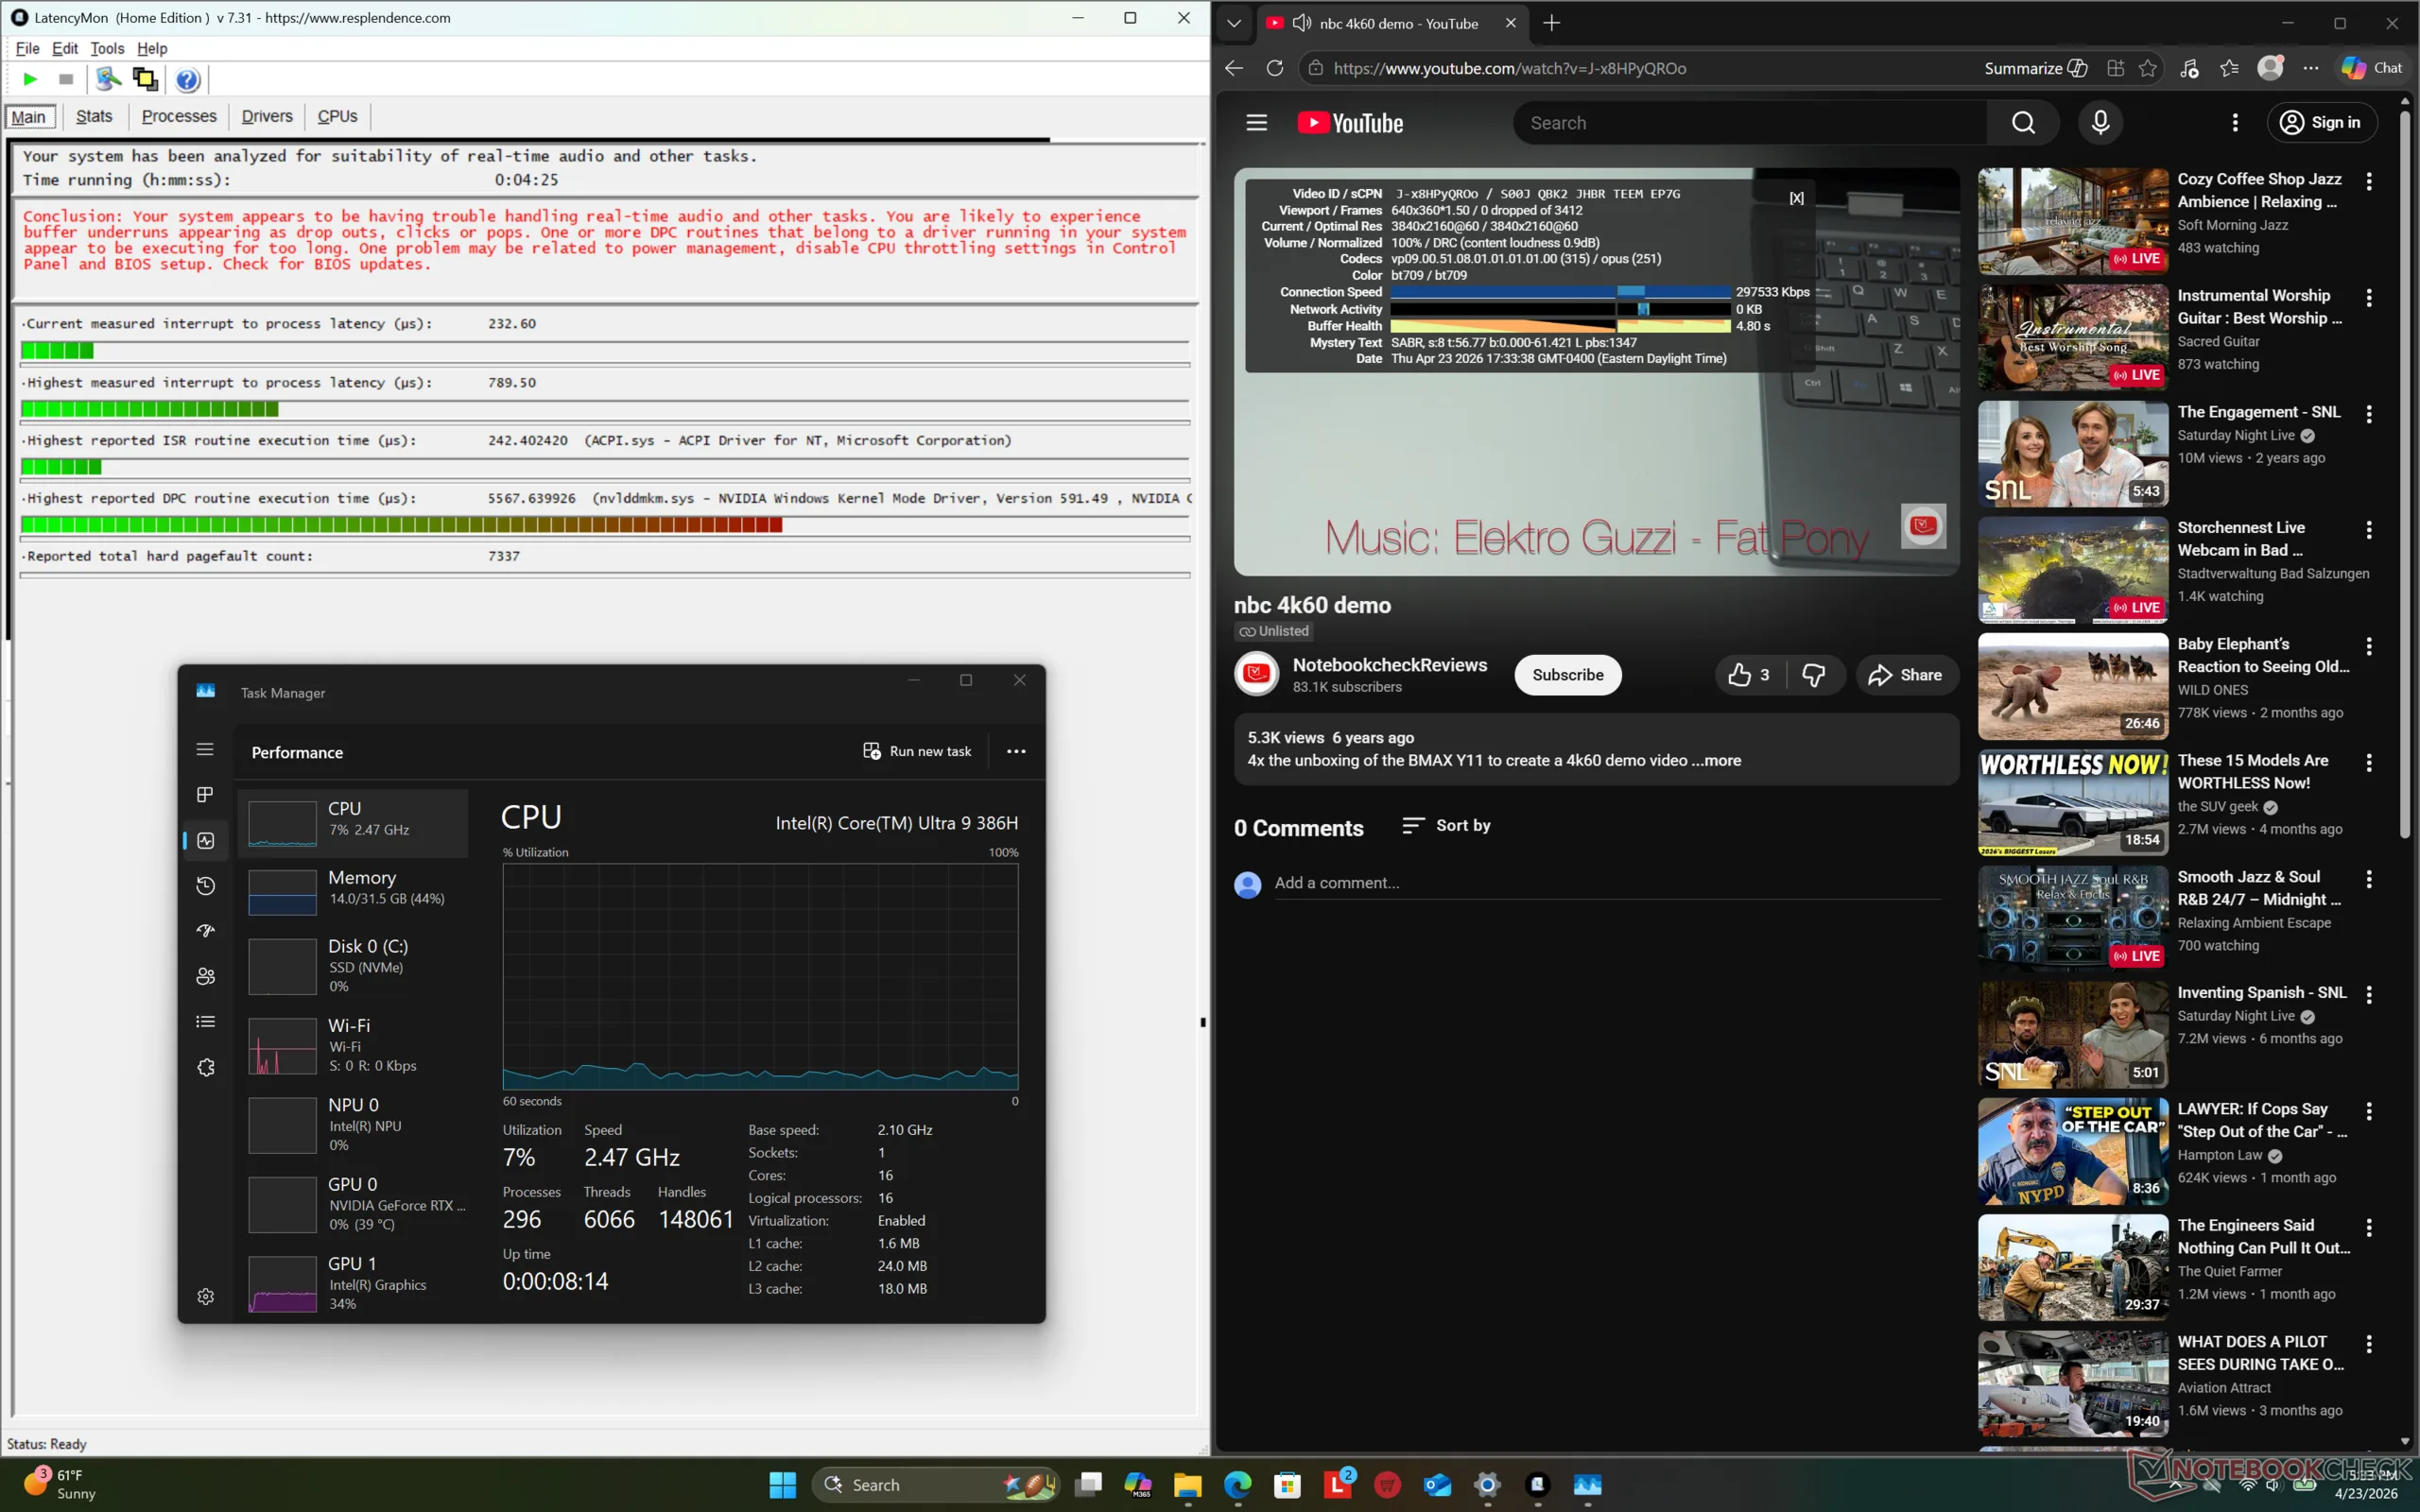
DPC-Latenzzeit
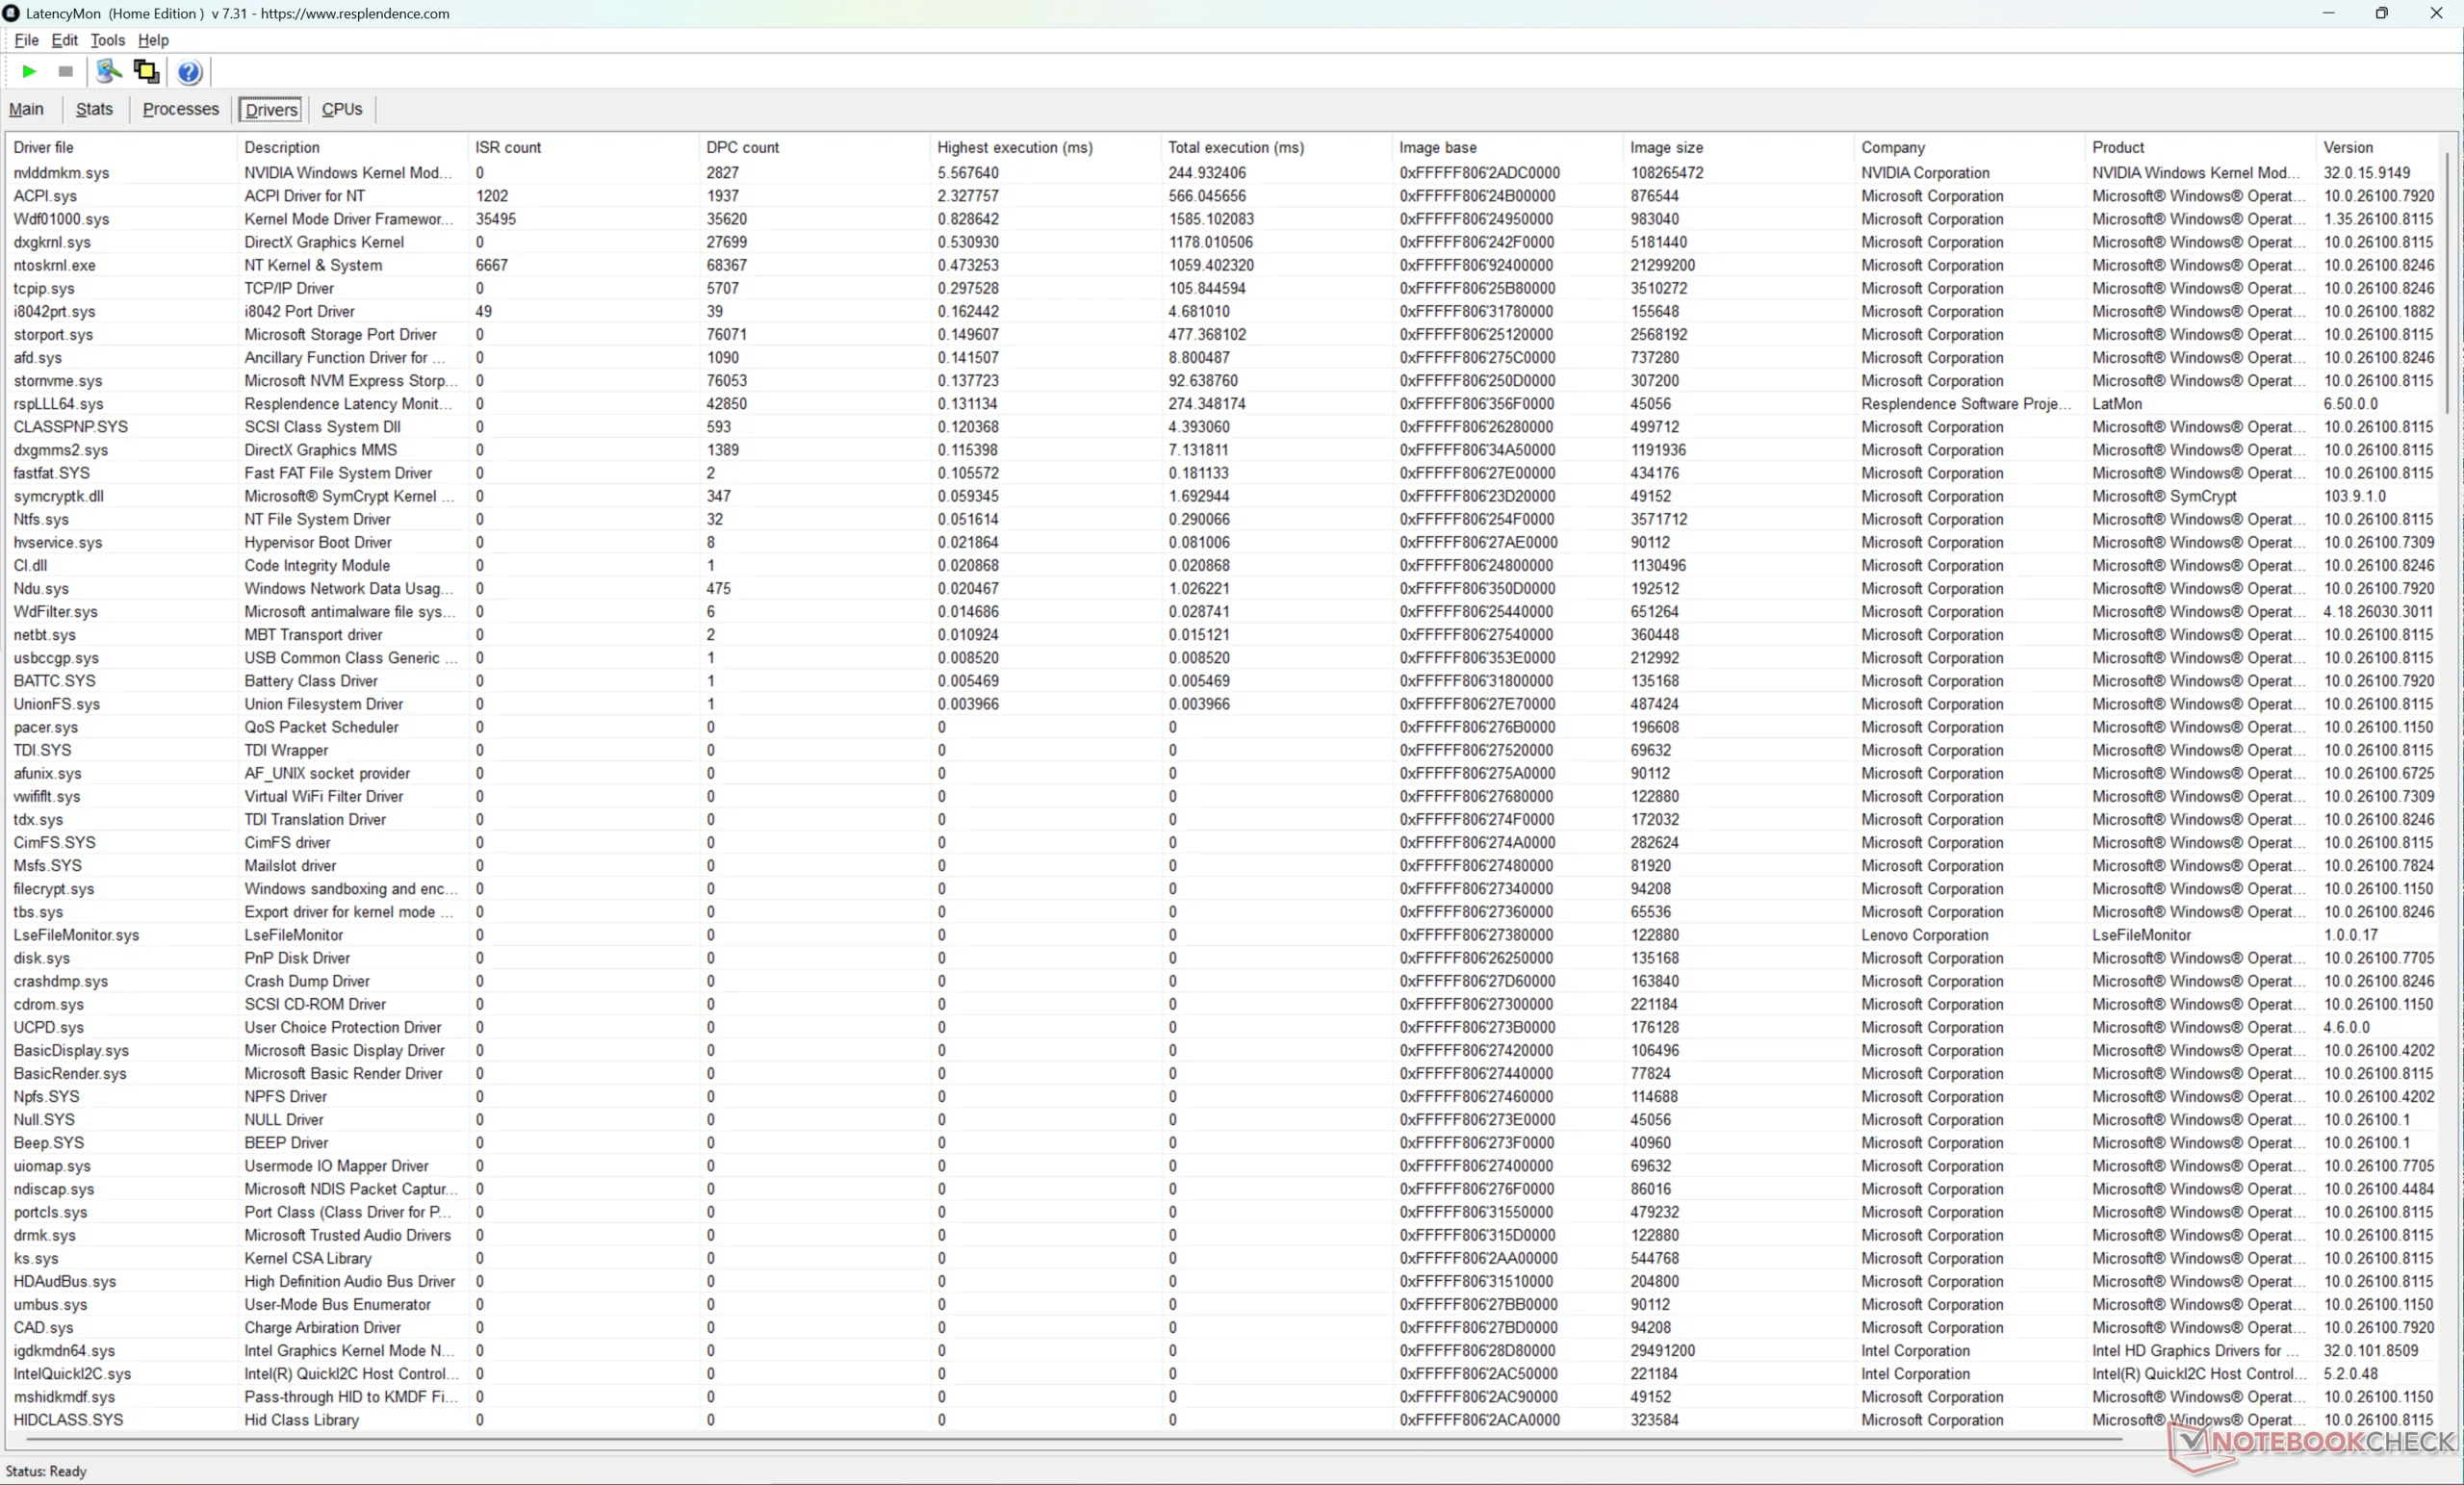
| DPC Latencies / LatencyMon - interrupt to process latency (max), Web, Youtube, Prime95 | |
| Lenovo Yoga Pro 9 16IAH10 RTX 5050 | |
| MSI Prestige 16 AI Evo B2HMG | |
| HP Omen Transcend 16-u1095ng | |
| Lenovo Pro 9 16IPH11 | |
| Asus ProArt P16 H7606WP | |
| Dell XPS 16 Core Ultra X7 358H | |
* ... kleinere Werte sind besser
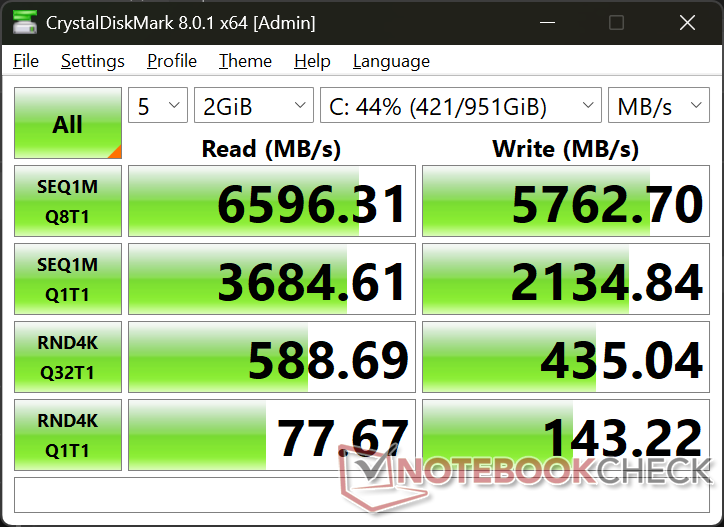
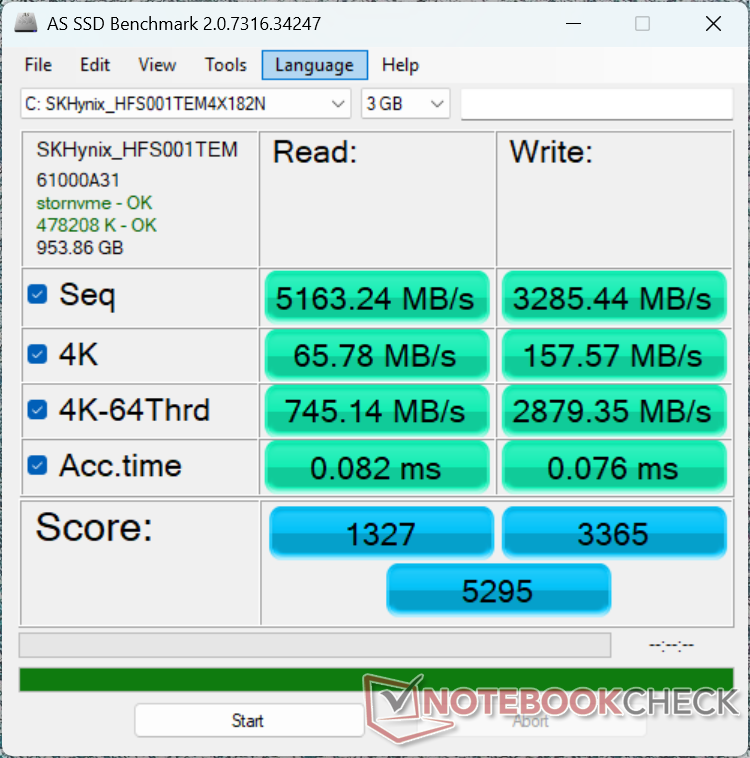
Speichergeräte
Das System unterstützt bis zu zwei PCIe4-x4-NVMe-SSDs ohne Drosselungsprobleme. Beachten Sie, dass PCIe5-SSD-Geschwindigkeiten nicht unterstützt werden und dass eine der beiden M.2-SSDs von der kürzeren 2242-Variante sein muss.

| Drive Performance Rating - Percent | |
| MSI Prestige 16 AI Evo B2HMG | |
| HP Omen Transcend 16-u1095ng | |
| Lenovo Yoga Pro 9 16IAH10 RTX 5050 | |
| Asus ProArt P16 H7606WP | |
| Lenovo Pro 9 16IPH11 | |
| Dell XPS 16 Core Ultra X7 358H | |
* ... kleinere Werte sind besser
Disk Throttling: DiskSpd Read Loop, Queue Depth 8
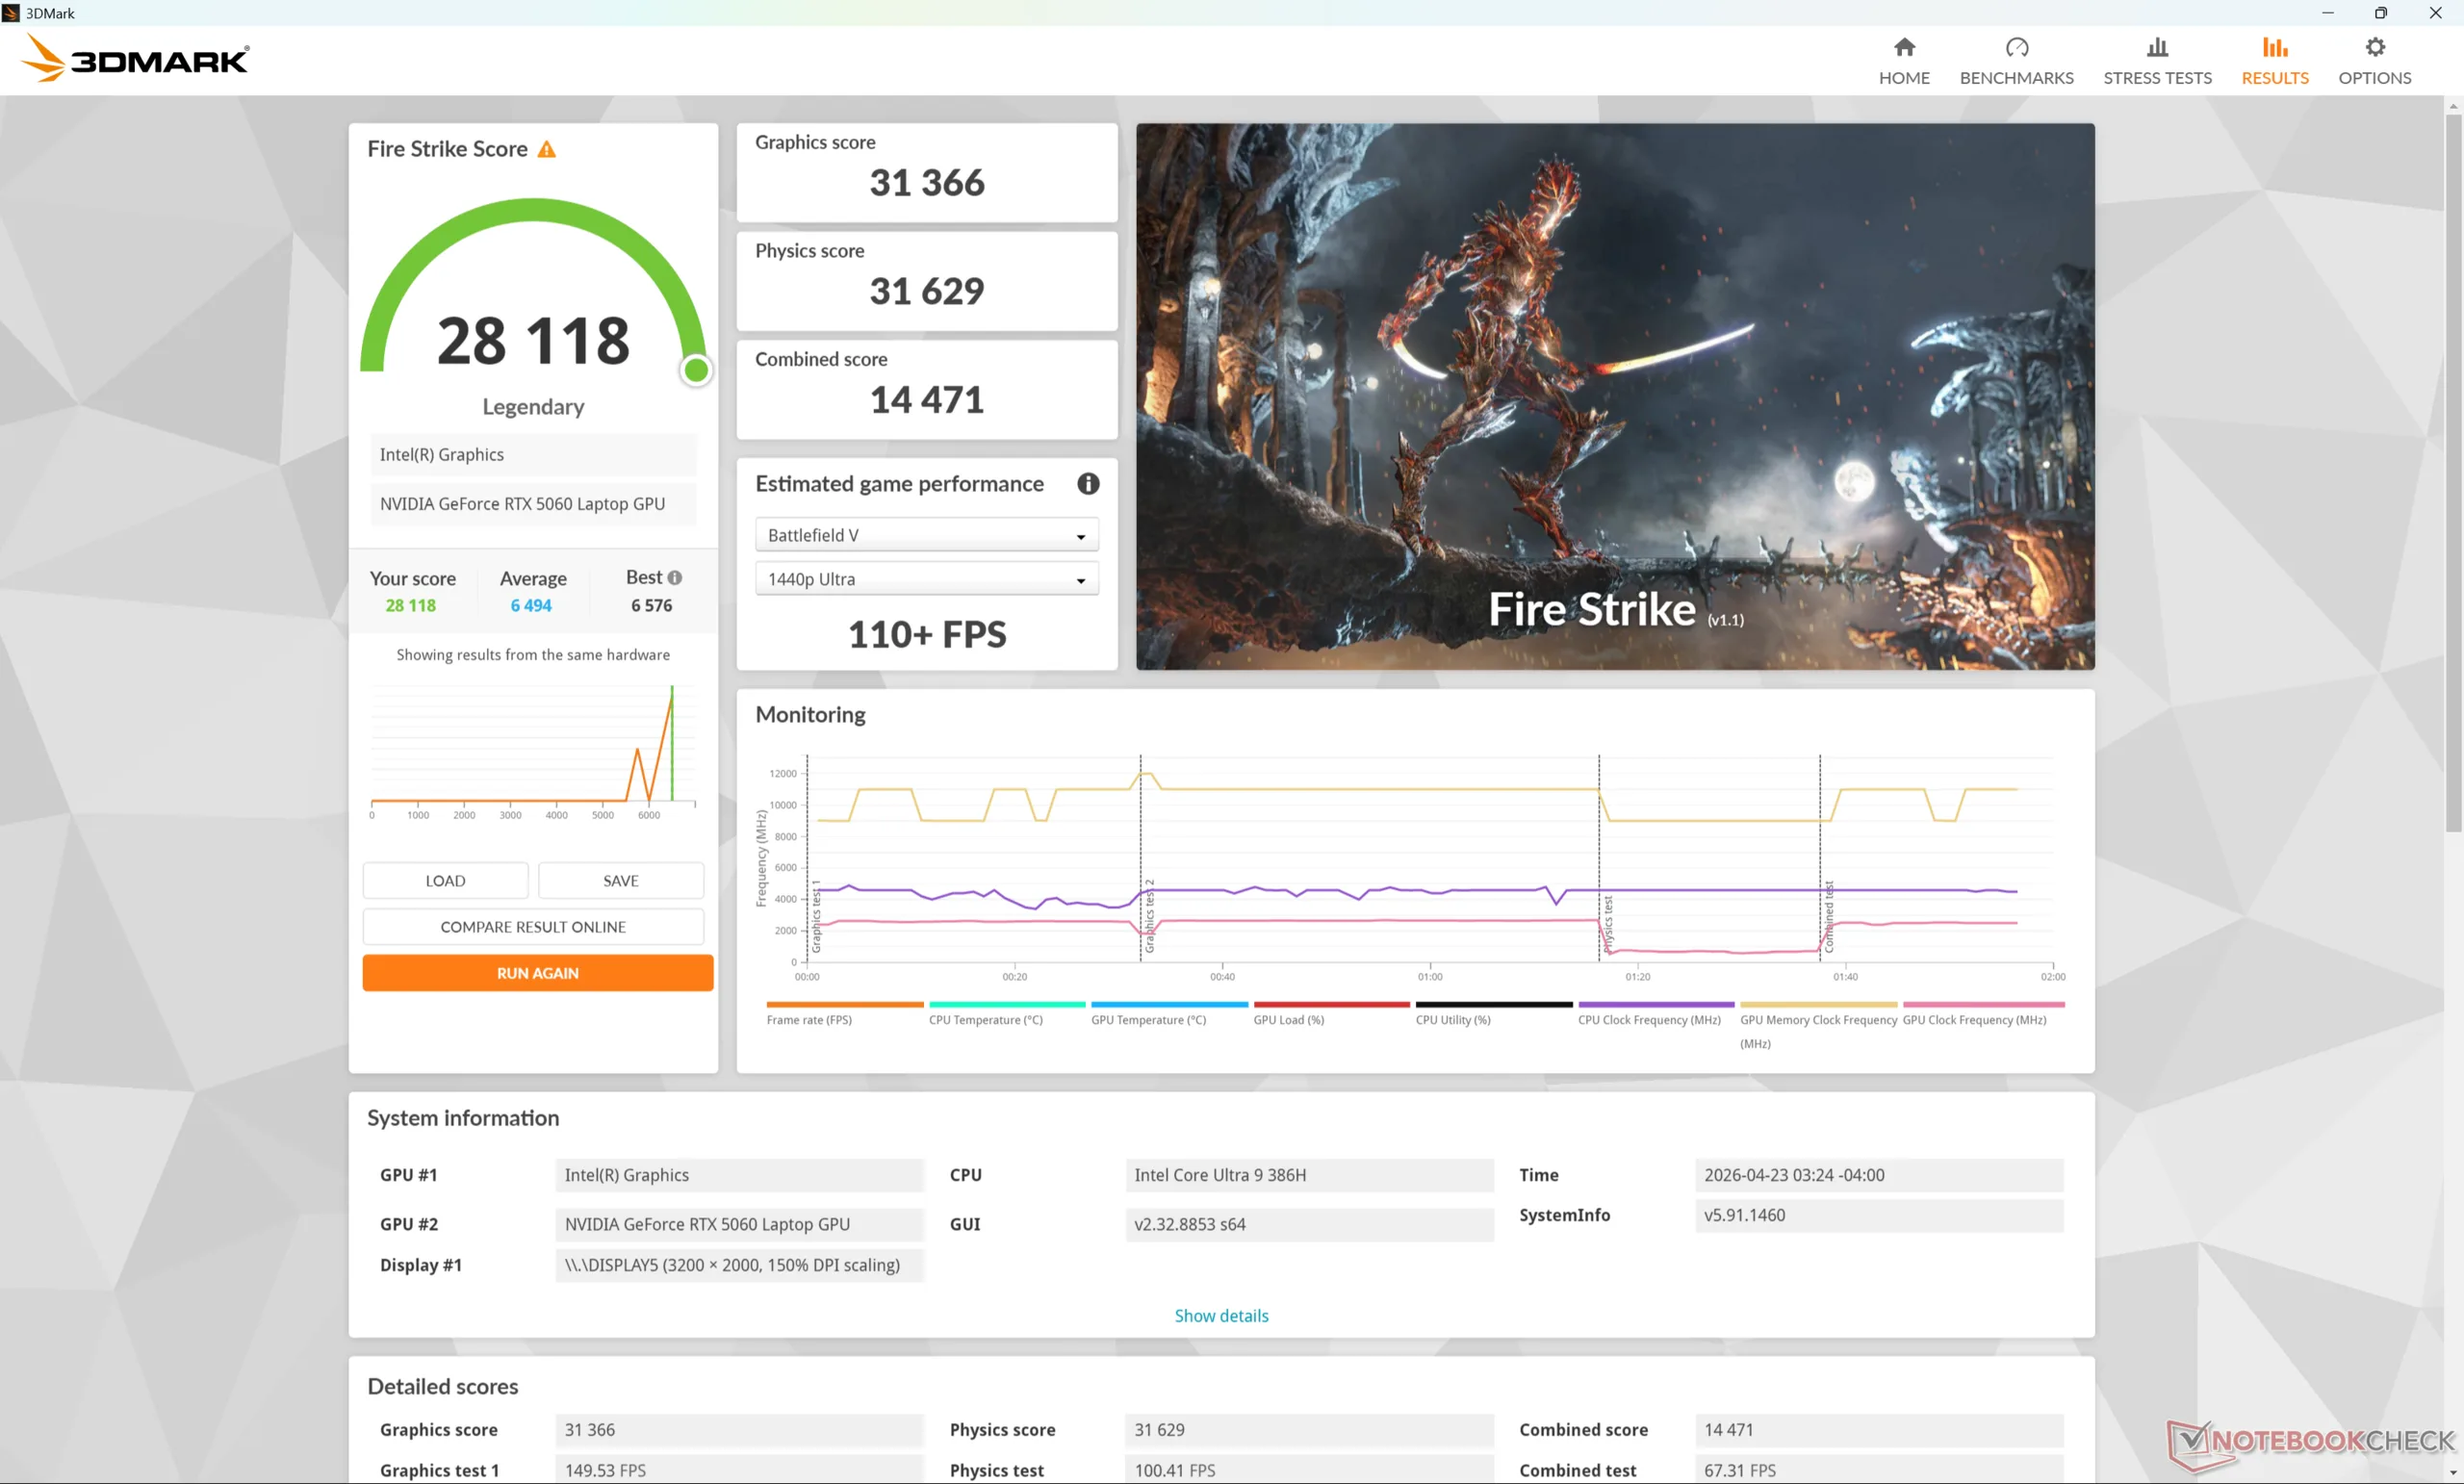
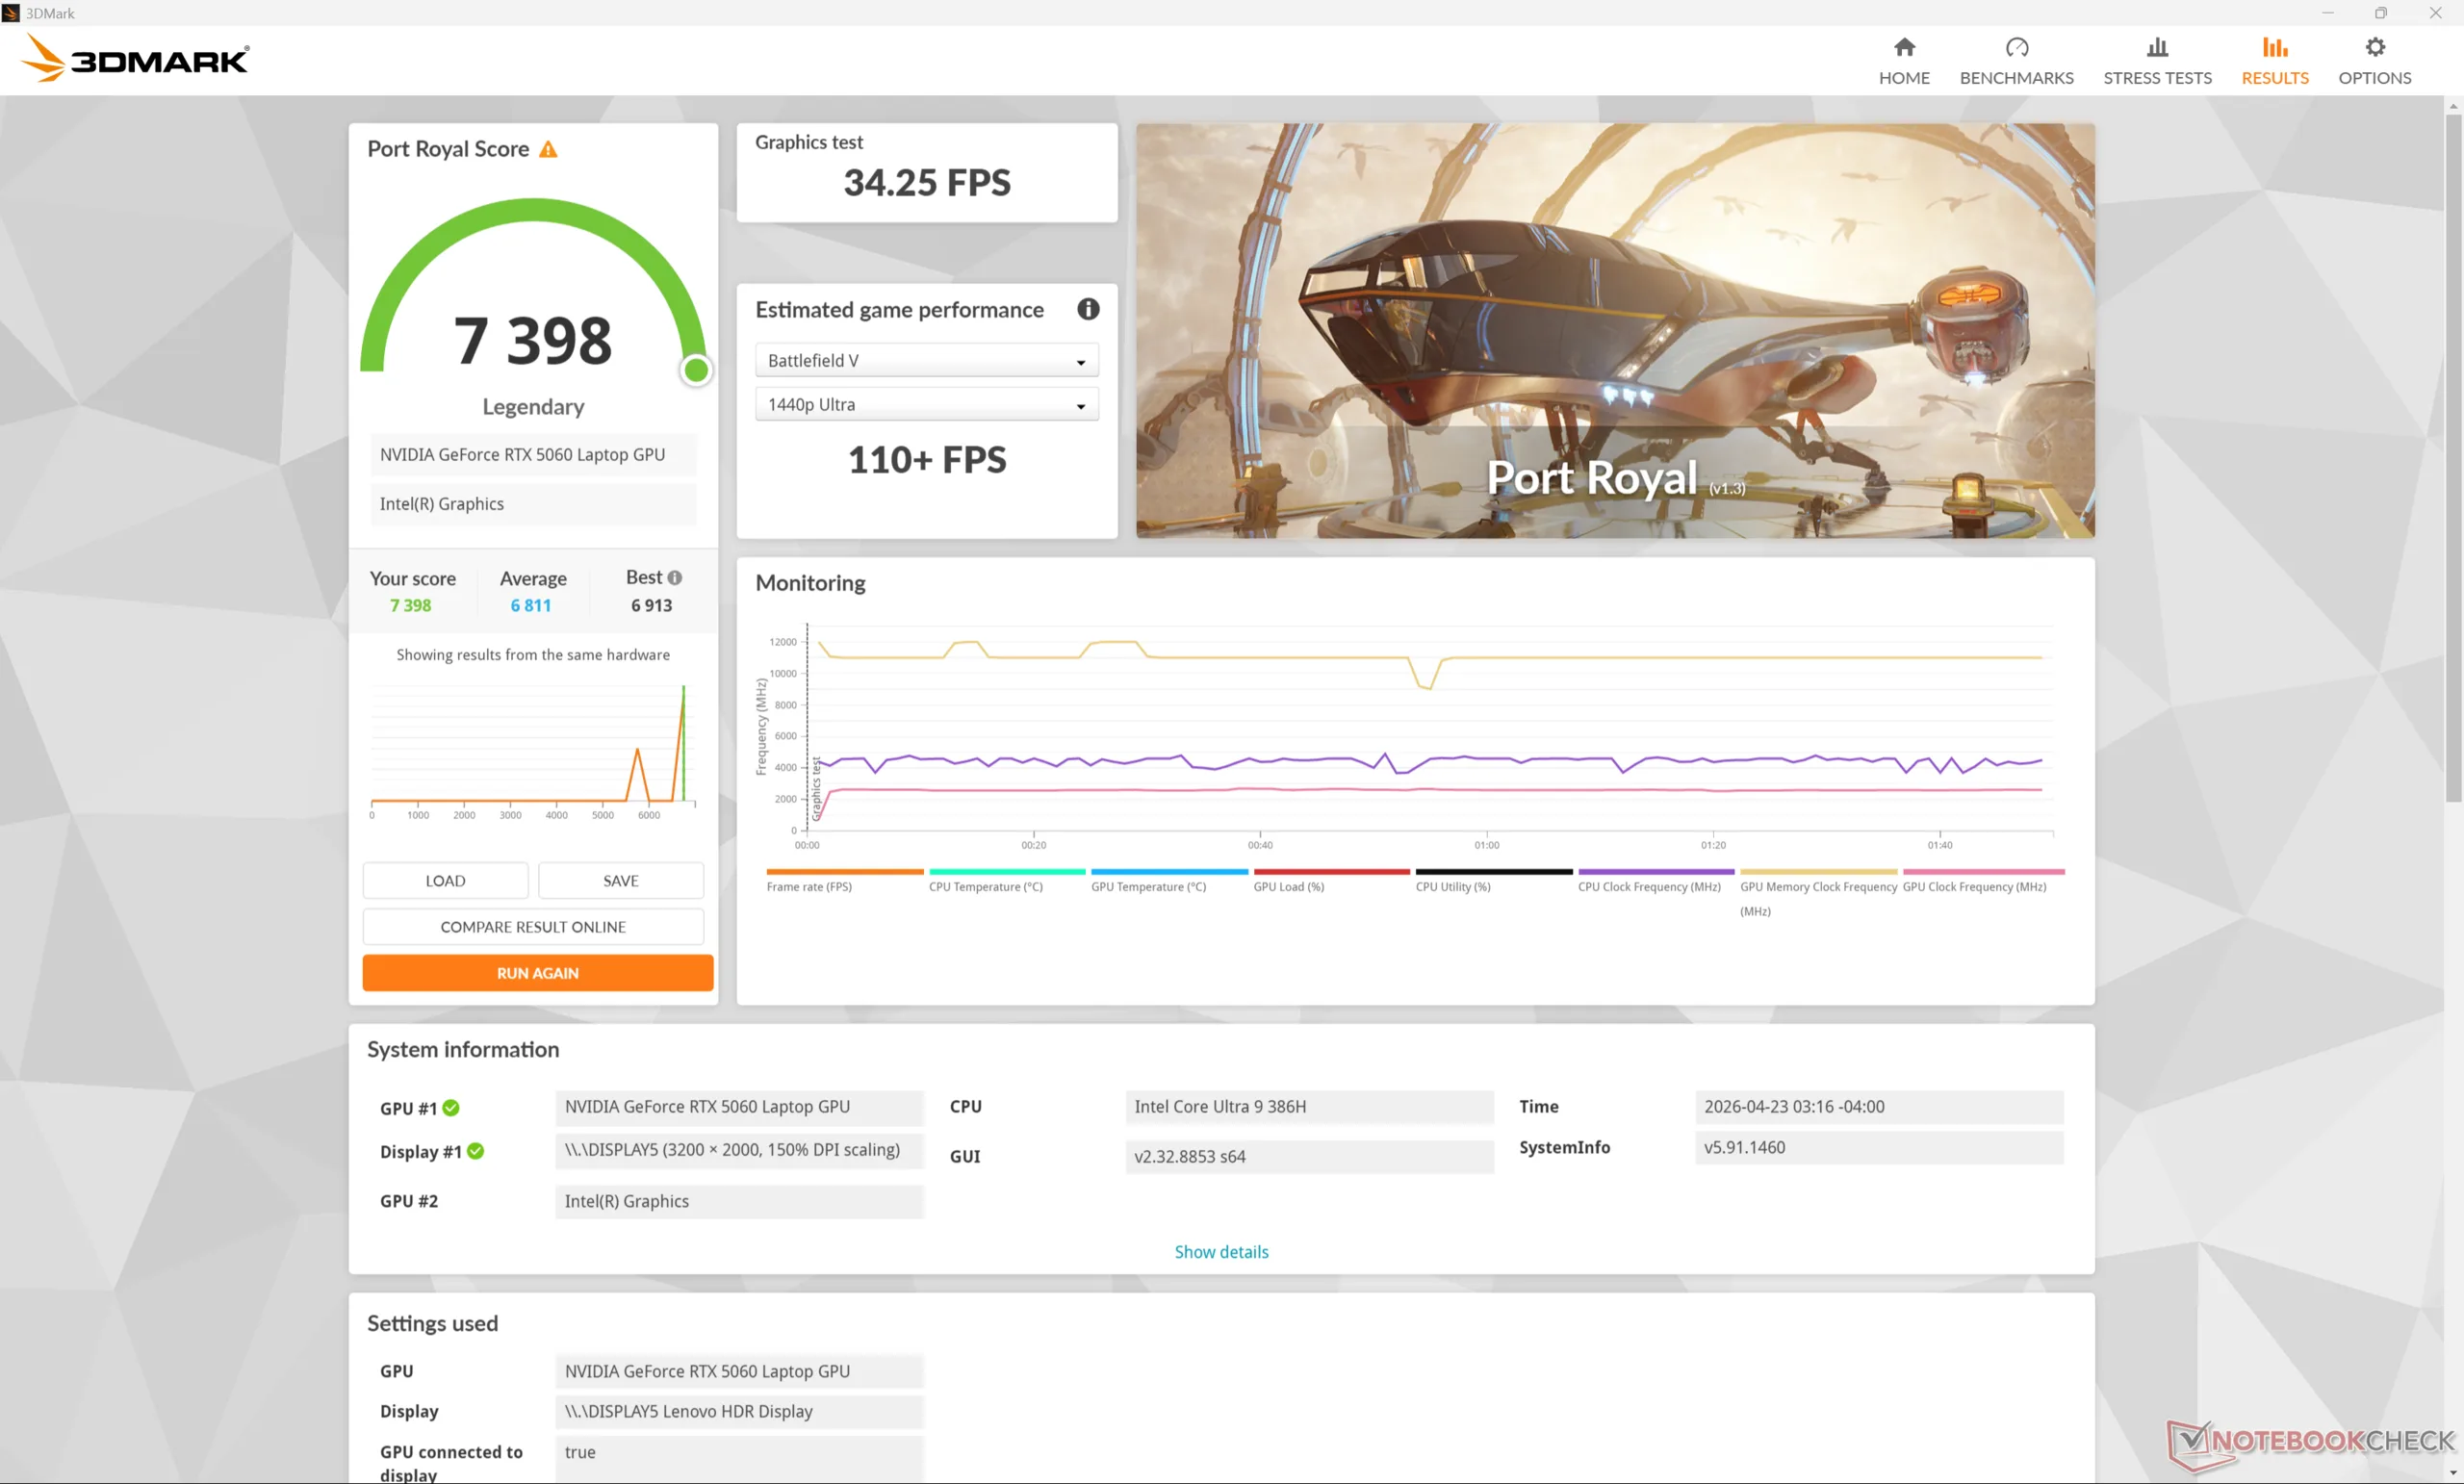
GPU-Leistung
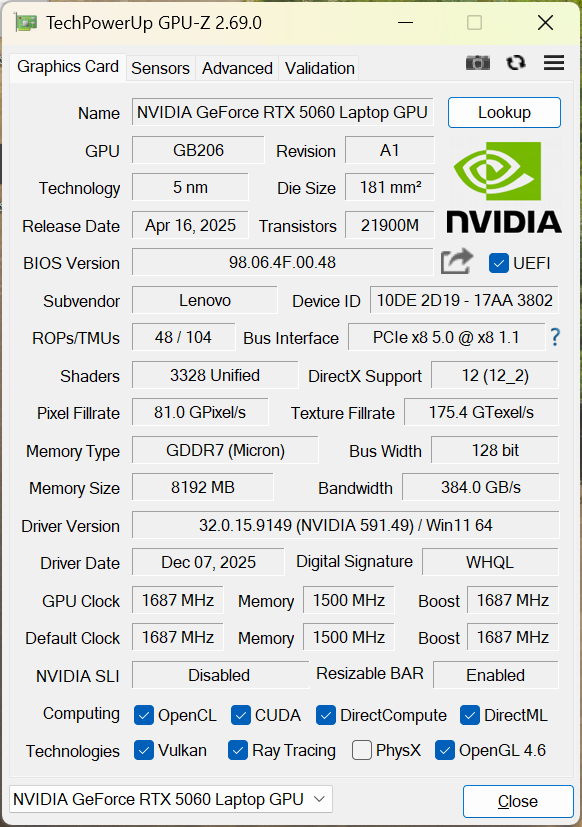
Die mobile GeForce RTX 5060 befindet sich im Vergleich zu anderen Laptops mit der gleichen GPU dort, wo wir sie erwarten. Die Rohleistung der Grafik bleibt mit nur wenigen Prozentpunkten knapp hinter dem auf Gaming ausgerichteten Legion 7 16 AGP11 mit derselben RTX 5060 zurück.
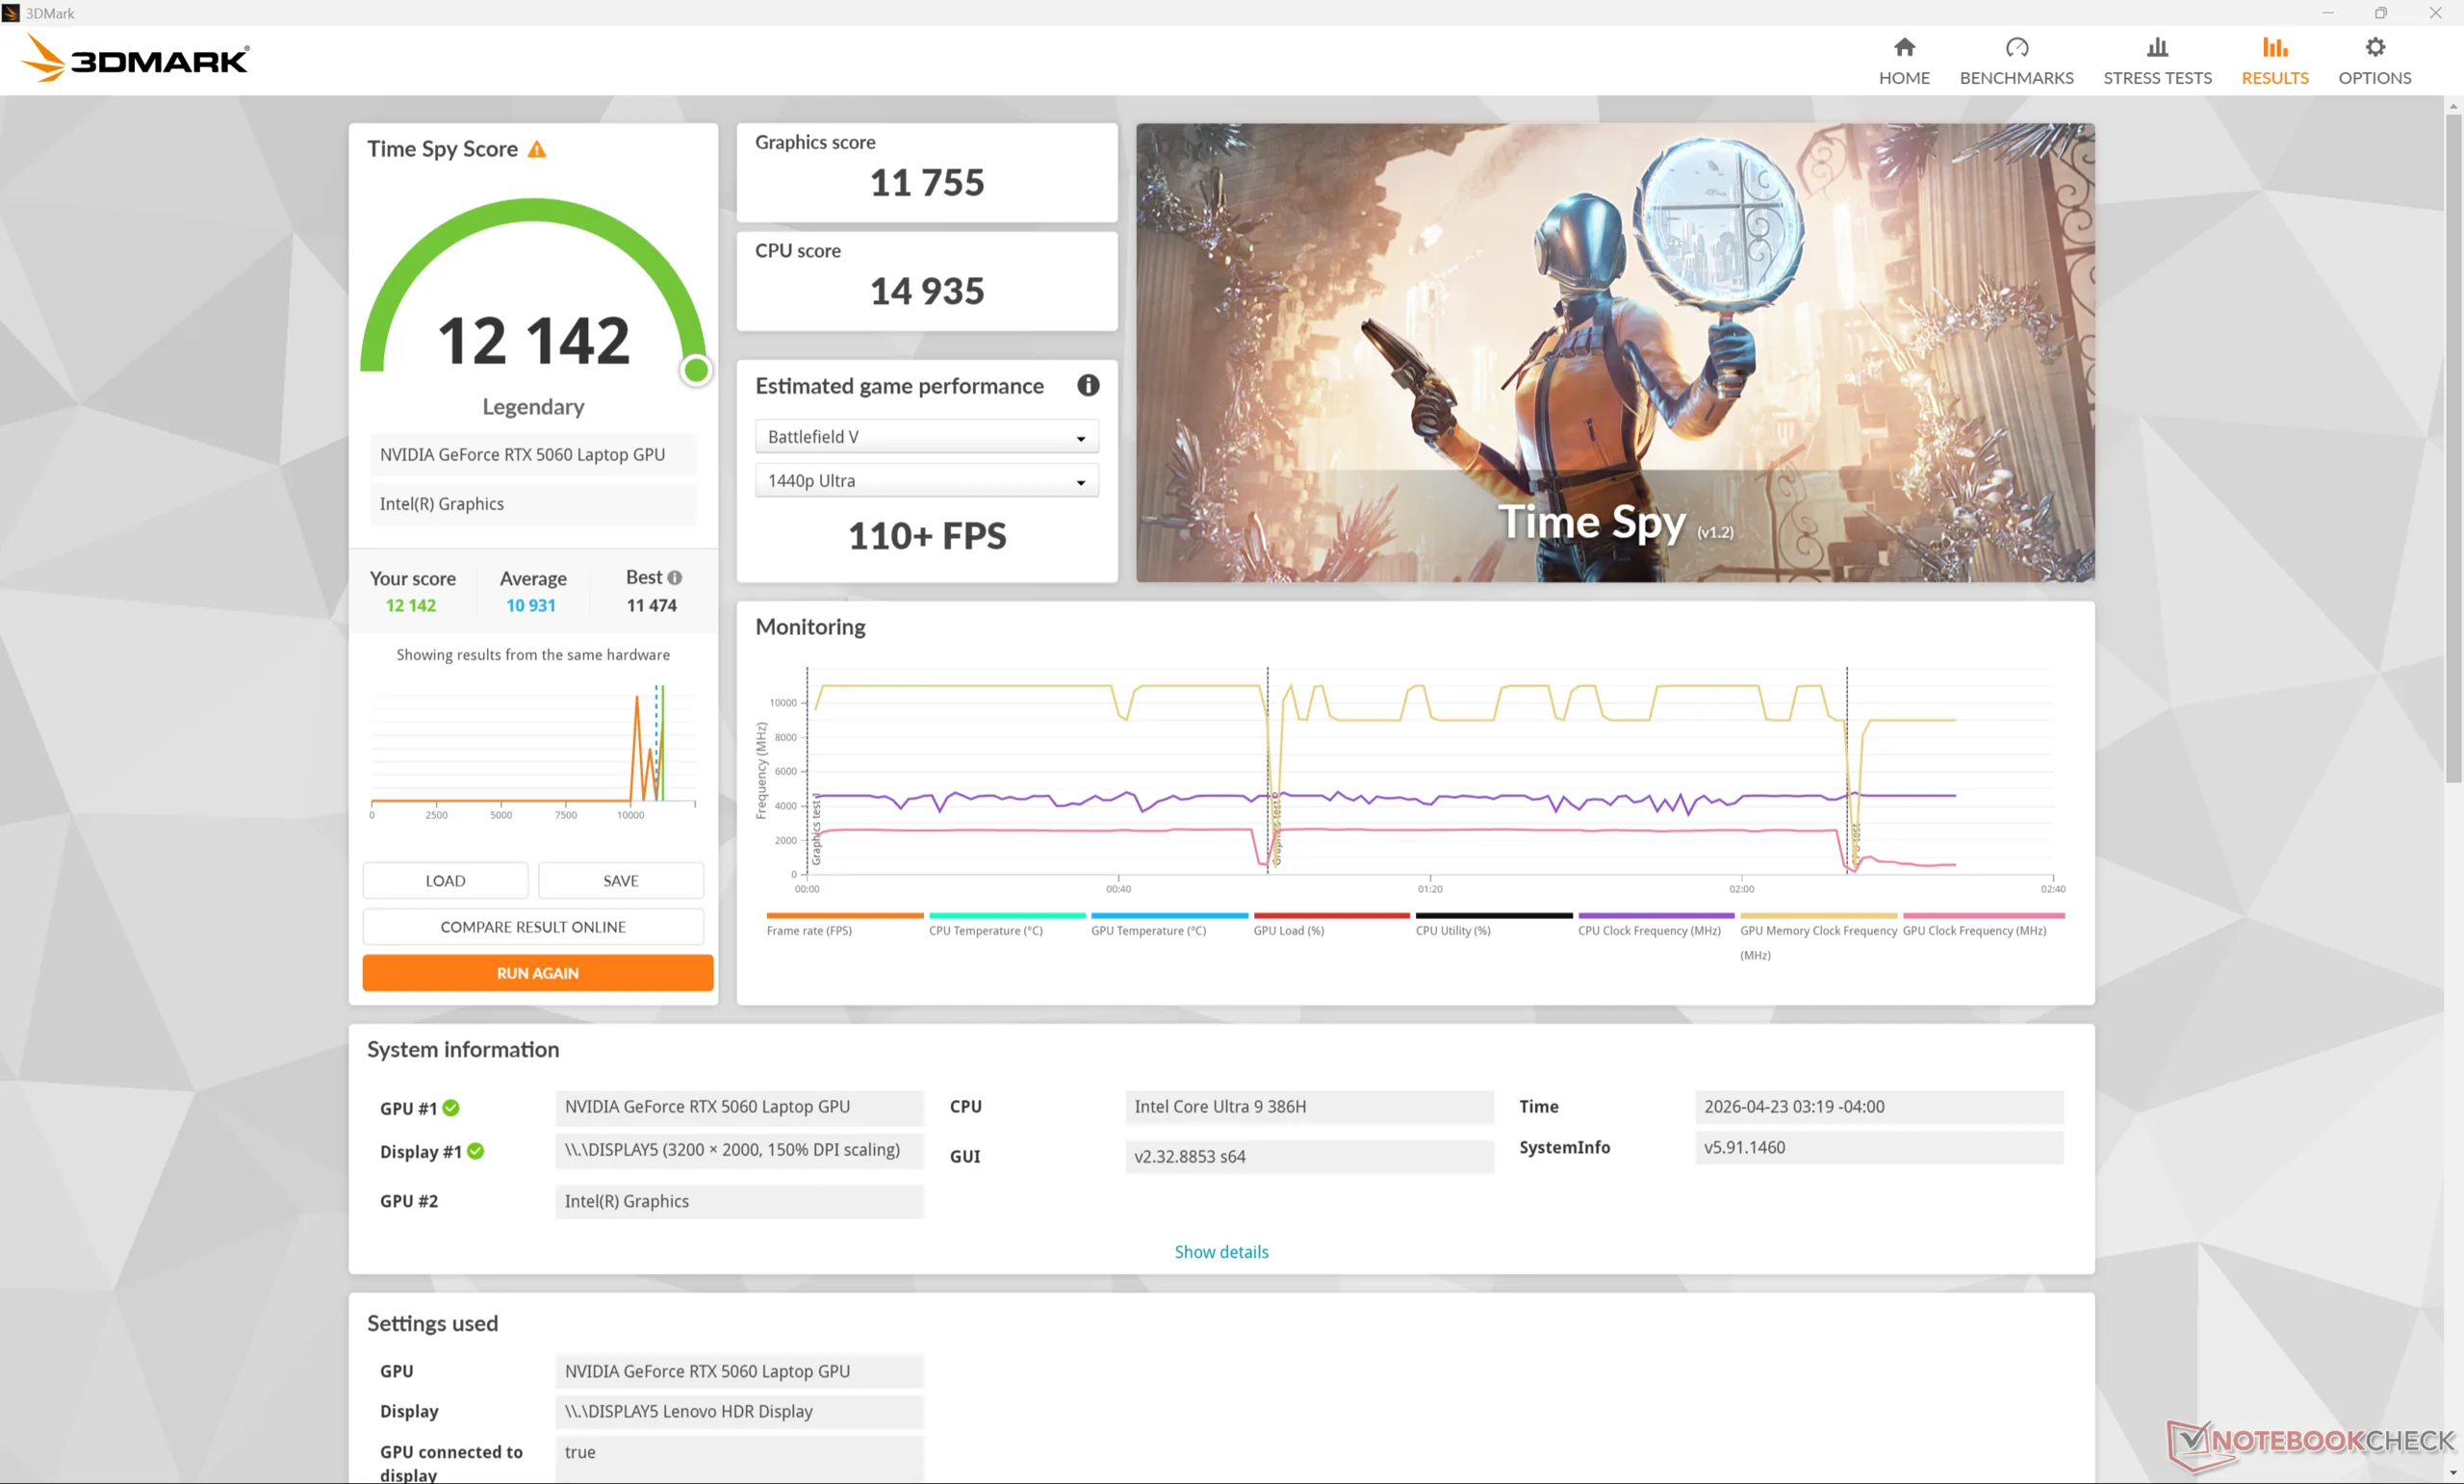
Wenn man das System im Modus "Ausgewogen" statt "Performance" betreibt, wird die Grafikleistung um bis zu zehn Prozent beeinträchtigt, wie unsere Time-Spy-Ergebnistabelle unten zeigt.
Ein Downgrade von unserer RTX 5060 auf die RTX-5050-Konfiguration dürfte die Grafikleistung um bis zu 20 bis 25 Prozent verringern.
| Leistungsprofil | Graphics-Punktzahl | Physics-Punktzahl | Kombinierte Punktzahl |
| Performance-Modus | 11.755 | 14.935 | 12.142 |
| Ausgeglichener Modus | 10.676 (-9 %) | 15.025 (-0 %) | 11.160 (-8 %) |
| Akku-Leistung | 9.886 (-16 %) | 12.811 (-14 %) | 10.236 (-16 %) |
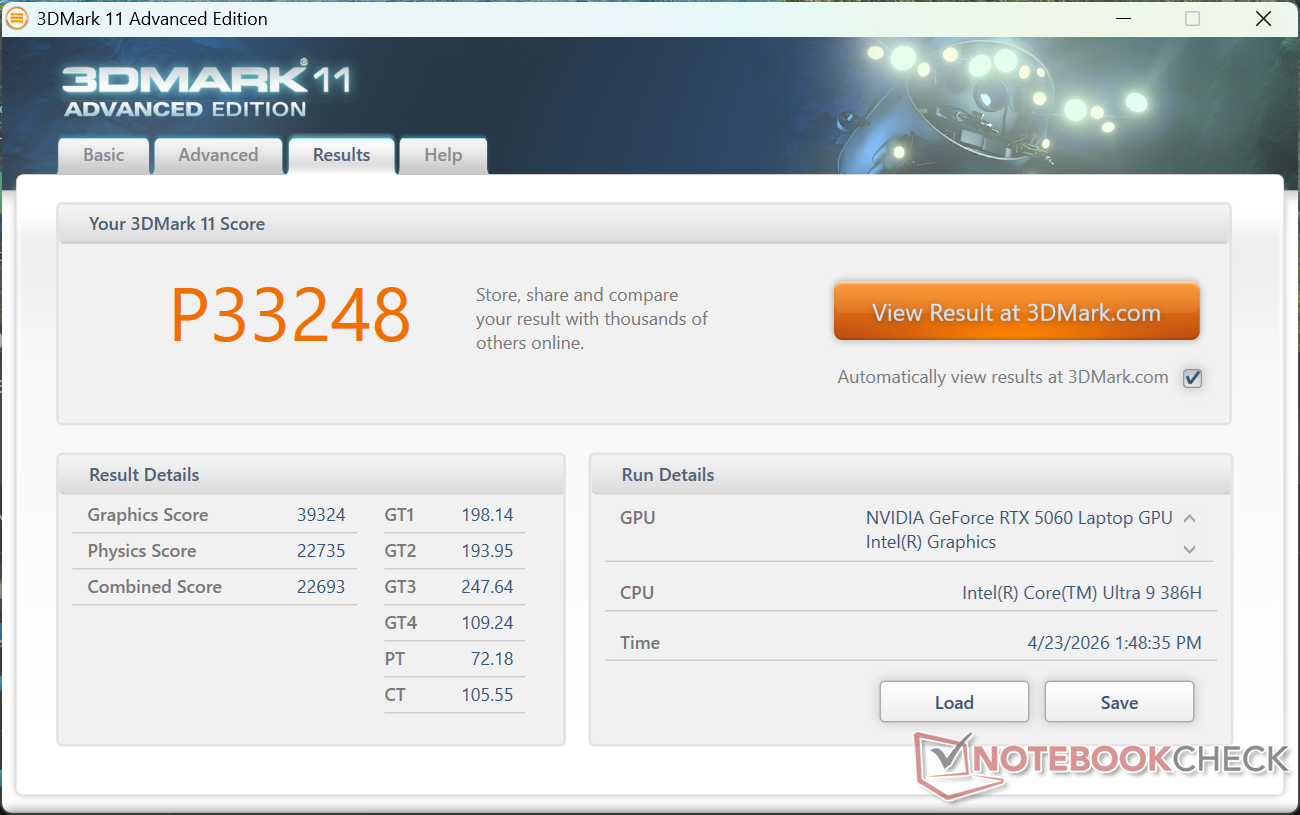
| 3DMark 11 Performance | 33248 Punkte | |
| 3DMark Cloud Gate Standard Score | 61799 Punkte | |
| 3DMark Fire Strike Score | 28118 Punkte | |
| 3DMark Time Spy Score | 12142 Punkte | |
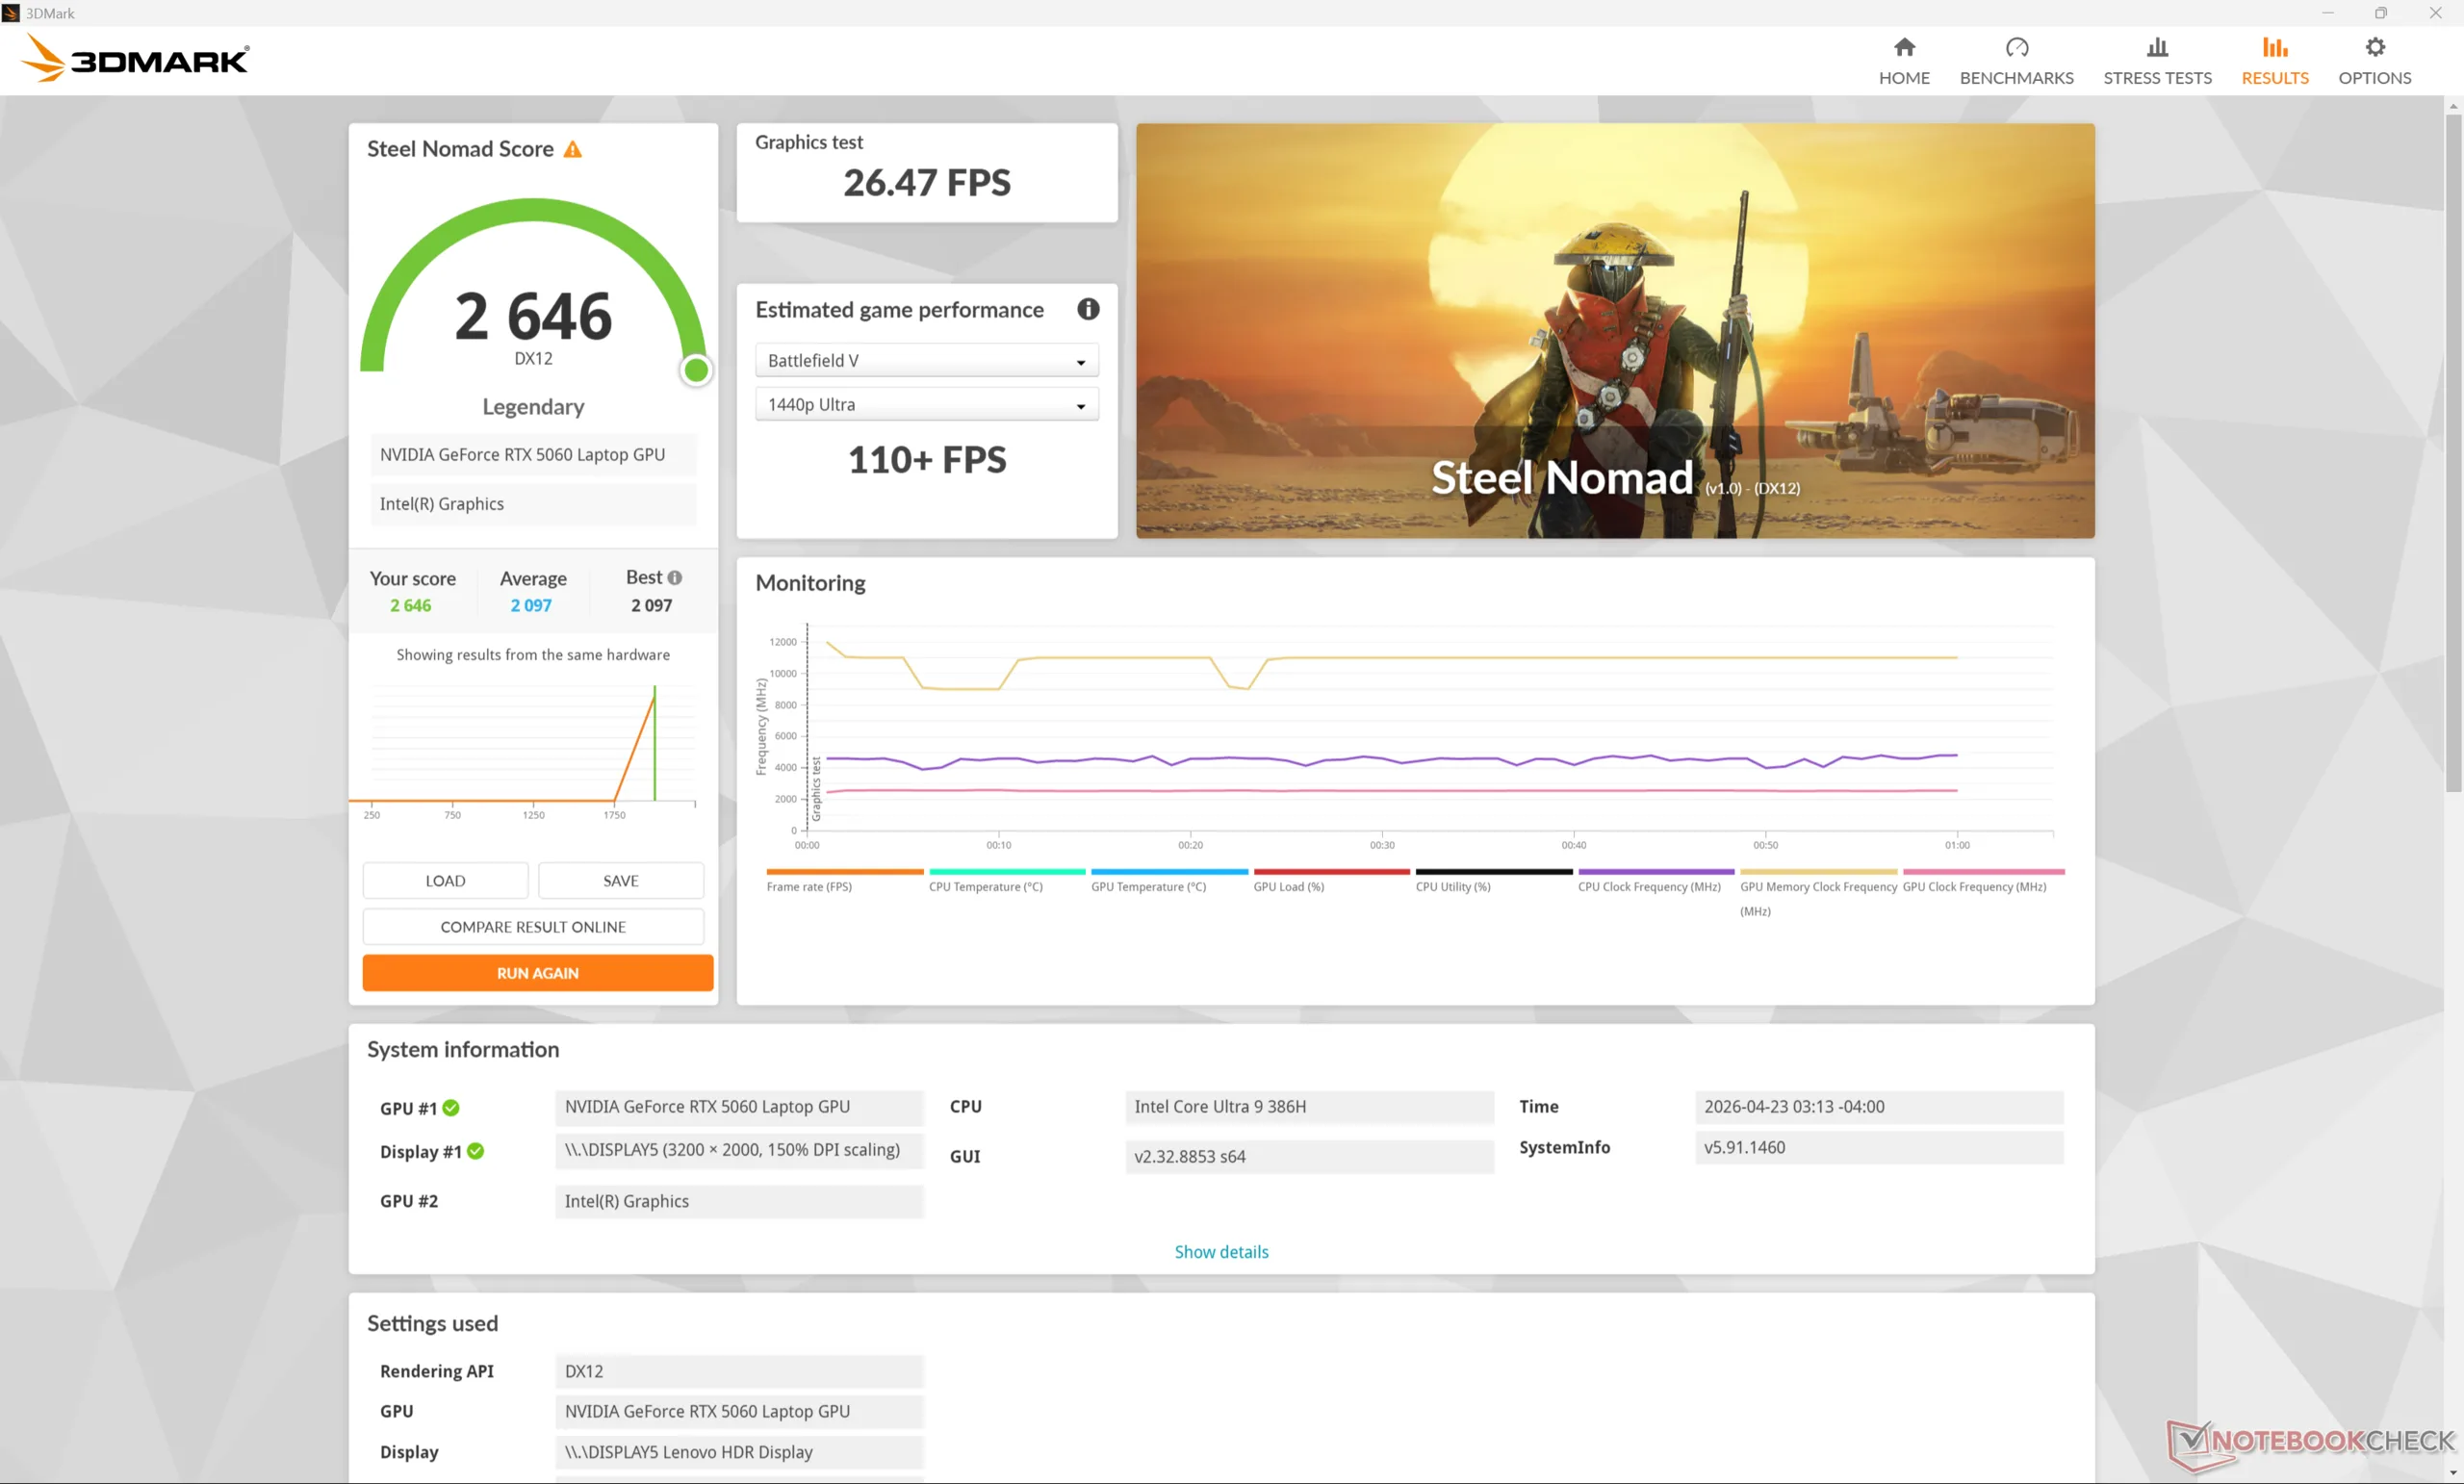
| 3DMark Steel Nomad Score | 2646 Punkte | |
Hilfe | ||
* ... kleinere Werte sind besser
| Cyberpunk 2077 - 1920x1080 Ultra Preset (FSR off) | |
| Asus ProArt P16 H7606WP | |
| Lenovo Pro 9 16IPH11 | |
| Lenovo Yoga Pro 9 16IAH10 RTX 5050 | |
| Dell XPS 16 Core Ultra X7 358H | |
| MSI Prestige 16 AI Evo B2HMG | |
| Baldur's Gate 3 - 1920x1080 Ultra Preset AA:T | |
| Asus ProArt P16 H7606WP | |
| Lenovo Pro 9 16IPH11 | |
| Lenovo Yoga Pro 9 16IAH10 RTX 5050 | |
| Dell XPS 16 Core Ultra X7 358H | |
| MSI Prestige 16 AI Evo B2HMG | |
| GTA V - 1920x1080 Highest AA:4xMSAA + FX AF:16x | |
| Lenovo Pro 9 16IPH11 | |
| Lenovo Yoga Pro 9 16IAH10 RTX 5050 | |
| Asus ProArt P16 H7606WP | |
| HP Omen Transcend 16-u1095ng | |
| Dell XPS 16 Core Ultra X7 358H | |
| MSI Prestige 16 AI Evo B2HMG | |
| Final Fantasy XV Benchmark - 1920x1080 High Quality | |
| Asus ProArt P16 H7606WP | |
| Lenovo Pro 9 16IPH11 | |
| Lenovo Yoga Pro 9 16IAH10 RTX 5050 | |
| HP Omen Transcend 16-u1095ng | |
| Dell XPS 16 Core Ultra X7 358H | |
| MSI Prestige 16 AI Evo B2HMG | |
| Strange Brigade - 1920x1080 ultra AA:ultra AF:16 | |
| Asus ProArt P16 H7606WP | |
| Lenovo Pro 9 16IPH11 | |
| HP Omen Transcend 16-u1095ng | |
| Lenovo Yoga Pro 9 16IAH10 RTX 5050 | |
| Dell XPS 16 Core Ultra X7 358H | |
| MSI Prestige 16 AI Evo B2HMG | |
| Dota 2 Reborn - 1920x1080 ultra (3/3) best looking | |
| HP Omen Transcend 16-u1095ng | |
| Lenovo Yoga Pro 9 16IAH10 RTX 5050 | |
| Lenovo Pro 9 16IPH11 | |
| Asus ProArt P16 H7606WP | |
| Dell XPS 16 Core Ultra X7 358H | |
| MSI Prestige 16 AI Evo B2HMG | |
| X-Plane 11.11 - 1920x1080 high (fps_test=3) | |
| HP Omen Transcend 16-u1095ng | |
| Lenovo Yoga Pro 9 16IAH10 RTX 5050 | |
| Asus ProArt P16 H7606WP | |
| Dell XPS 16 Core Ultra X7 358H | |
| MSI Prestige 16 AI Evo B2HMG | |
| Black Myth: Wukong | |
| 1920x1080 high TSR 100 | |
| Durchschnittliche NVIDIA GeForce RTX 5060 Laptop (50 - 58, n=2) | |
| Lenovo Pro 9 16IPH11 | |
| Dell XPS 16 Core Ultra X7 358H | |
| 1920x1080 cinematic TSR 100 | |
| Durchschnittliche NVIDIA GeForce RTX 5060 Laptop (28 - 32, n=3) | |
| Lenovo Pro 9 16IPH11 | |
| Dell XPS 16 Core Ultra X7 358H | |
| 2560x1440 cinematic TSR 100 | |
| Durchschnittliche NVIDIA GeForce RTX 5060 Laptop (21 - 23, n=3) | |
| Lenovo Pro 9 16IPH11 | |
| 2560x1440 cinematic DLSS 68 | |
| Durchschnittliche NVIDIA GeForce RTX 5060 Laptop (32 - 36, n=2) | |
| Lenovo Pro 9 16IPH11 | |
| 2560x1440 cinematic RT: Very High DLSS 68 FG | |
| Lenovo Pro 9 16IPH11 | |
| Durchschnittliche NVIDIA GeForce RTX 5060 Laptop (31 - 37, n=2) | |
| F1 24 | |
| 1920x1080 Ultra High Preset AA:T AF:16x | |
| Asus ProArt P16 H7606WP | |
| Lenovo Legion 7 16 AGP11 | |
| Durchschnittliche NVIDIA GeForce RTX 5060 Laptop (68.2 - 77.5, n=8) | |
| Lenovo Pro 9 16IPH11 | |
| Lenovo Yoga Pro 9 16IAH10 RTX 5050 | |
| Dell XPS 16 Core Ultra X7 358H | |
| MSI Venture 16 AI A2HMTG | |
| 2560x1440 Ultra High Preset AA:T AF:16x | |
| Asus ProArt P16 H7606WP | |
| Lenovo Legion 7 16 AGP11 | |
| Durchschnittliche NVIDIA GeForce RTX 5060 Laptop (39 - 49.1, n=8) | |
| Lenovo Pro 9 16IPH11 | |
| Lenovo Yoga Pro 9 16IAH10 RTX 5050 | |
| 2560x1440 Ultra High Preset + Quality DLSS AF:16x | |
| Lenovo Legion 7 16 AGP11 | |
| Lenovo Pro 9 16IPH11 | |
| Durchschnittliche NVIDIA GeForce RTX 5060 Laptop (65 - 74.5, n=7) | |
| Lenovo Yoga Pro 9 16IAH10 RTX 5050 | |
| Monster Hunter Wilds | |
| 1920x1080 high, no upscaling | |
| Lenovo Pro 9 16IPH11 | |
| Durchschnittliche NVIDIA GeForce RTX 5060 Laptop (49.7 - 58.8, n=2) | |
| 1920x1080 ultra, RT: high, no upscaling | |
| Lenovo Pro 9 16IPH11 | |
| Durchschnittliche NVIDIA GeForce RTX 5060 Laptop (16.6 - 36.5, n=3) | |
| 2560x1440 ultra, RT: high, no upscaling | |
| Lenovo Pro 9 16IPH11 | |
| Durchschnittliche NVIDIA GeForce RTX 5060 Laptop (13.9 - 20.9, n=2) | |
Cyberpunk 2077 ultra fps Grafik
| min. | mittel | hoch | max. | QHD DLSS | QHD | |
|---|---|---|---|---|---|---|
| GTA V (2015) | 185.8 | 183.5 | 179.4 | 133.6 | 110.7 | |
| Dota 2 Reborn (2015) | 172.5 | 156.7 | 151.6 | 142.4 | ||
| Final Fantasy XV Benchmark (2018) | 187.9 | 170.4 | 124.1 | 92.3 | ||
| X-Plane 11.11 (2018) | 113 | 102.9 | ||||
| Strange Brigade (2018) | 482 | 314 | 214 | 217 | 125.5 | |
| Baldur's Gate 3 (2023) | 164.6 | 137.8 | 119.9 | 117.8 | 117.5 | 79.4 |
| Cyberpunk 2077 (2023) | 132.3 | 108.2 | 92.3 | 83.3 | 63.2 | 53.4 |
| F1 24 (2024) | 249 | 249 | 207 | 69.5 | 69.3 | 42.8 |
| Black Myth: Wukong (2024) | 85 | 64 | 50 | 28 | 32 | 21 |
| Monster Hunter Wilds (2025) | 74.2 | 63 | 58.8 | 34.8 | 20.9 |
Emissionen
Systemgeräusche
Die Obergrenze für das Lüftergeräusch und das Verhalten des Lüfters entspricht weitgehend der des Pro 9 16IAH10 vom letzten Jahr, da es keine größeren Änderungen am Motherboard gibt. Am wichtigsten ist vielleicht, dass die Lüftergeräusche beim Spielen von Cyberpunk 2077 im Modus "Ausbalanciert" bei 41 dB(A) und im Modus "Performance" bei 50 dB(A) liegen. Die erwähnten zehn Prozent Einbußen bei der Grafikleistung beim Spielen im Balanced-Modus könnten ein vernünftiger Kompromiss für die viel leiseren Lüfter sein.
Lautstärkediagramm
| Idle |
| 23.5 / 24 / 24 dB(A) |
| Last |
| 32.3 / 50.1 dB(A) |
 | ||
30 dB leise 40 dB(A) deutlich hörbar 50 dB(A) störend |
||
min: | ||
| Lenovo Pro 9 16IPH11 Ultra 9 386H, GeForce RTX 5060 Laptop | Lenovo Yoga Pro 9 16IAH10 RTX 5050 Ultra 9 285H, GeForce RTX 5050 Laptop | Dell XPS 16 Core Ultra X7 358H Ultra X7 358H, Arc B390 Panther Lake iGPU | MSI Prestige 16 AI Evo B2HMG Ultra 9 285H, Arc 140T | HP Omen Transcend 16-u1095ng i9-14900HX, GeForce RTX 4070 Laptop GPU | Asus ProArt P16 H7606WP Ryzen AI 9 HX 370, GeForce RTX 5070 Laptop | |
|---|---|---|---|---|---|---|
| Geräuschentwicklung | -5% | 0% | 1% | -19% | -16% | |
| aus / Umgebung * (dB) | 23 | 24.6 -7% | 23.3 -1% | 23.6 -3% | 24 -4% | 23.5 -2% |
| Idle min * (dB) | 23.5 | 24.6 -5% | 23.4 -0% | 23.6 -0% | 29 -23% | 26.7 -14% |
| Idle avg * (dB) | 24 | 24.6 -3% | 23.4 2% | 23.6 2% | 30 -25% | 26.7 -11% |
| Idle max * (dB) | 24 | 26.8 -12% | 25.8 -8% | 26.2 -9% | 31 -29% | 31.1 -30% |
| Last avg * (dB) | 32.3 | 32.8 -2% | 38 -18% | 37.1 -15% | 45 -39% | 44.8 -39% |
| Cyberpunk 2077 ultra * (dB) | 50.1 | 51.8 -3% | 38.1 24% | 42.1 16% | 53.7 -7% | |
| Last max * (dB) | 50.1 | 51.8 -3% | 48.6 3% | 42.1 16% | 47 6% | 53.7 -7% |
| Witcher 3 ultra * (dB) | 44 |
* ... kleinere Werte sind besser
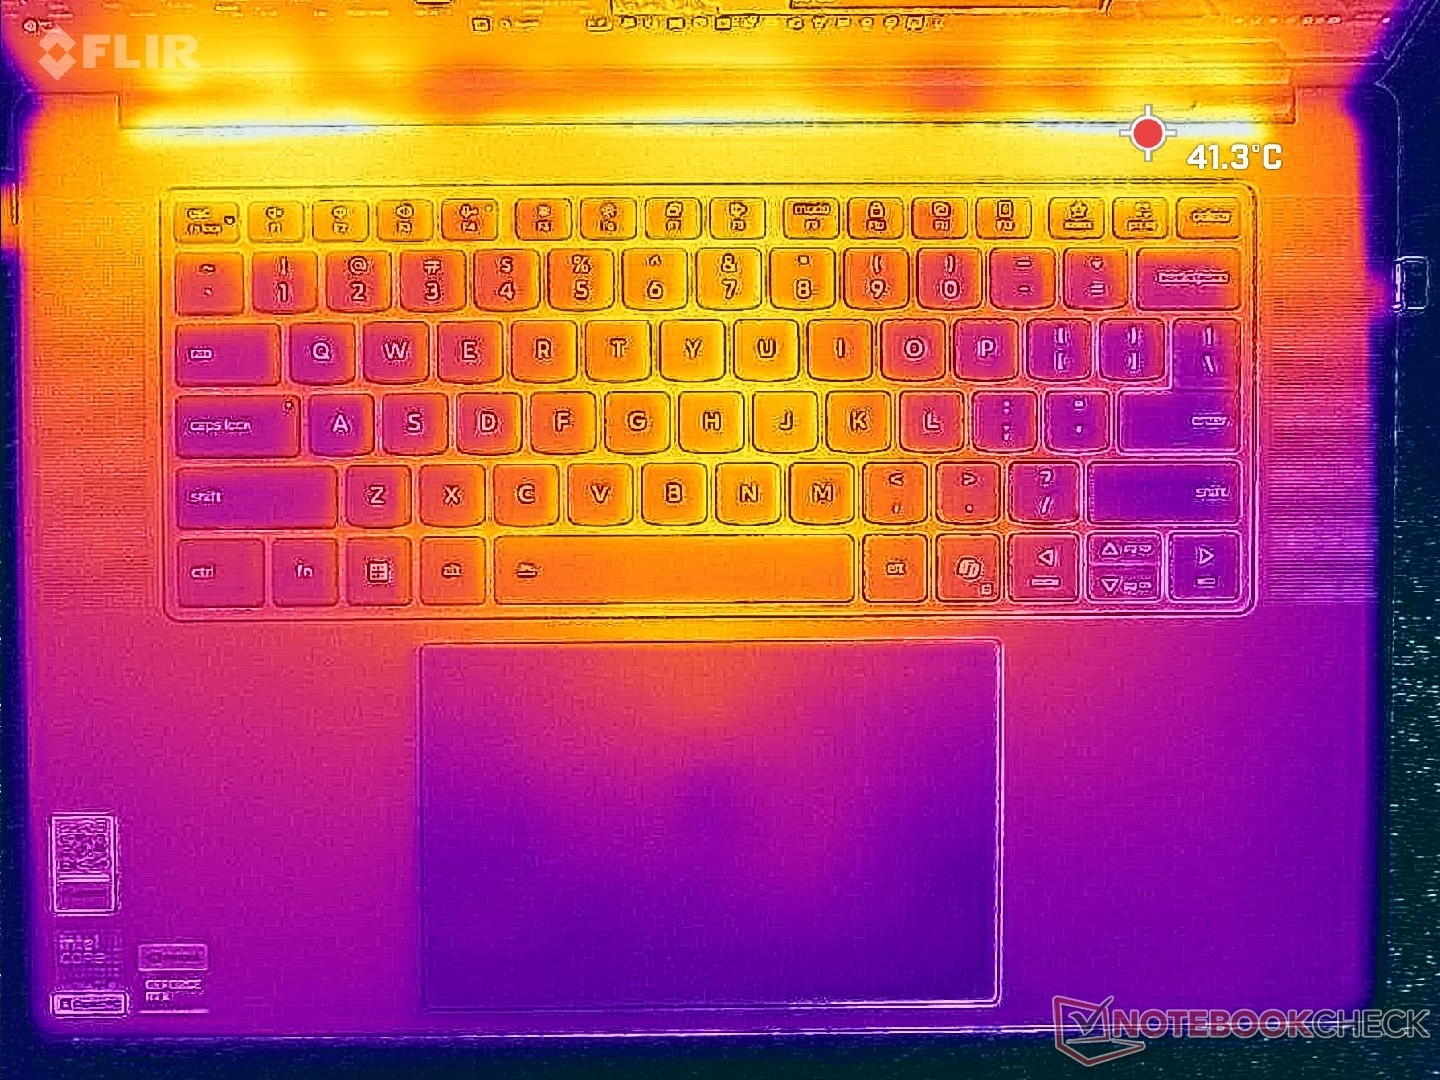
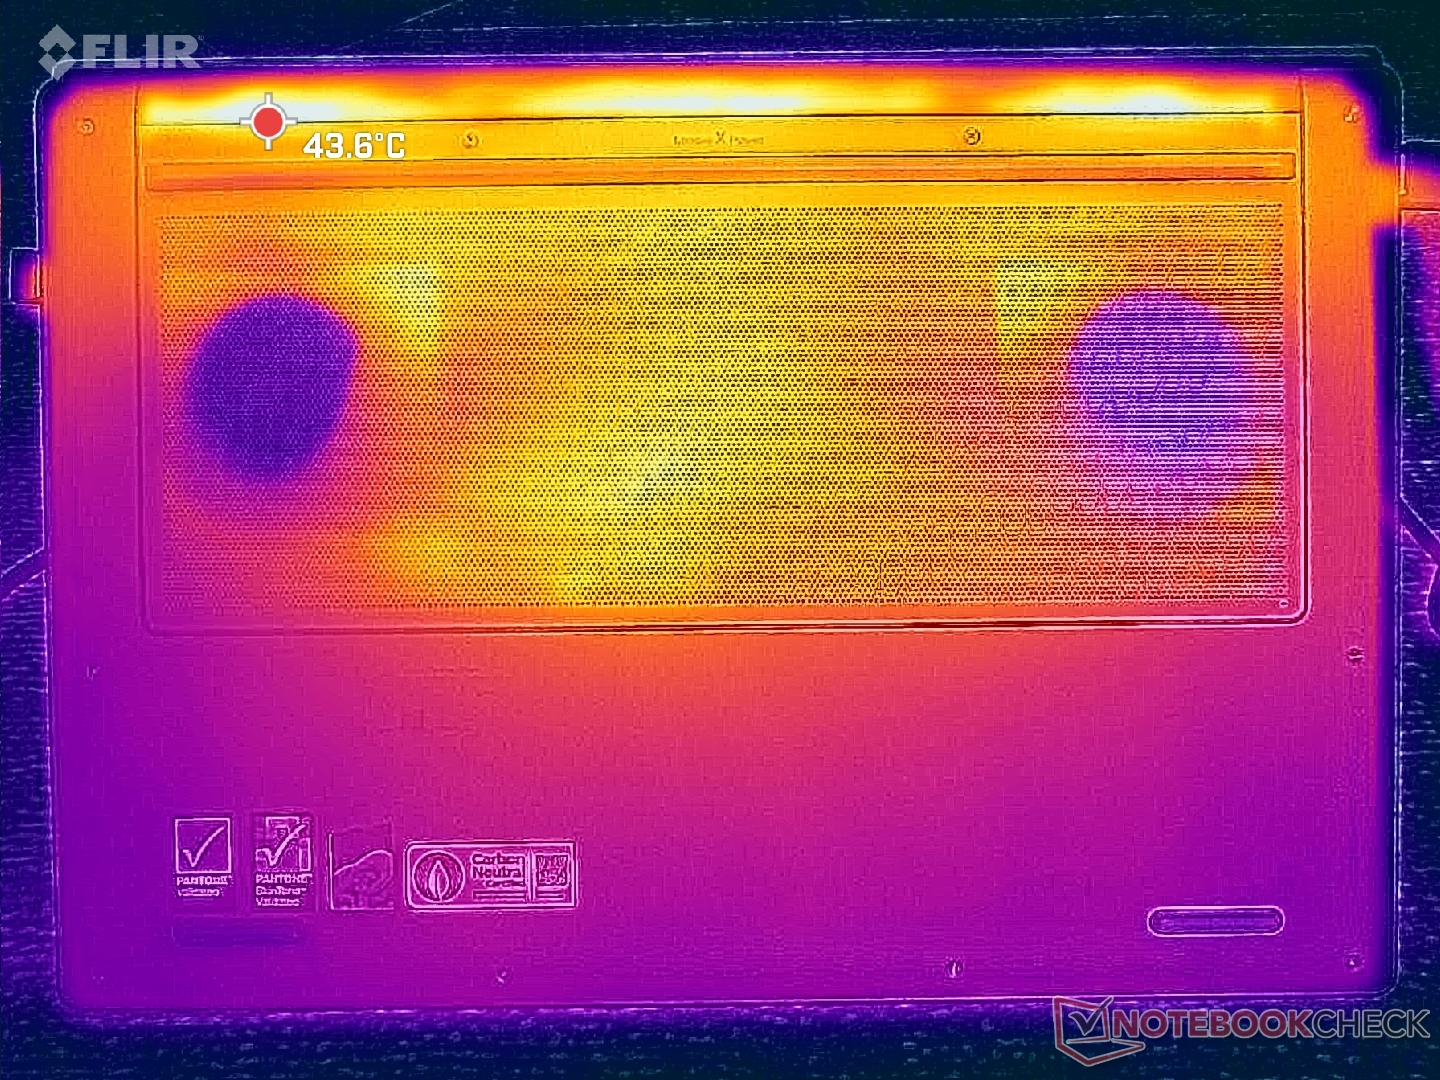
Temperatur
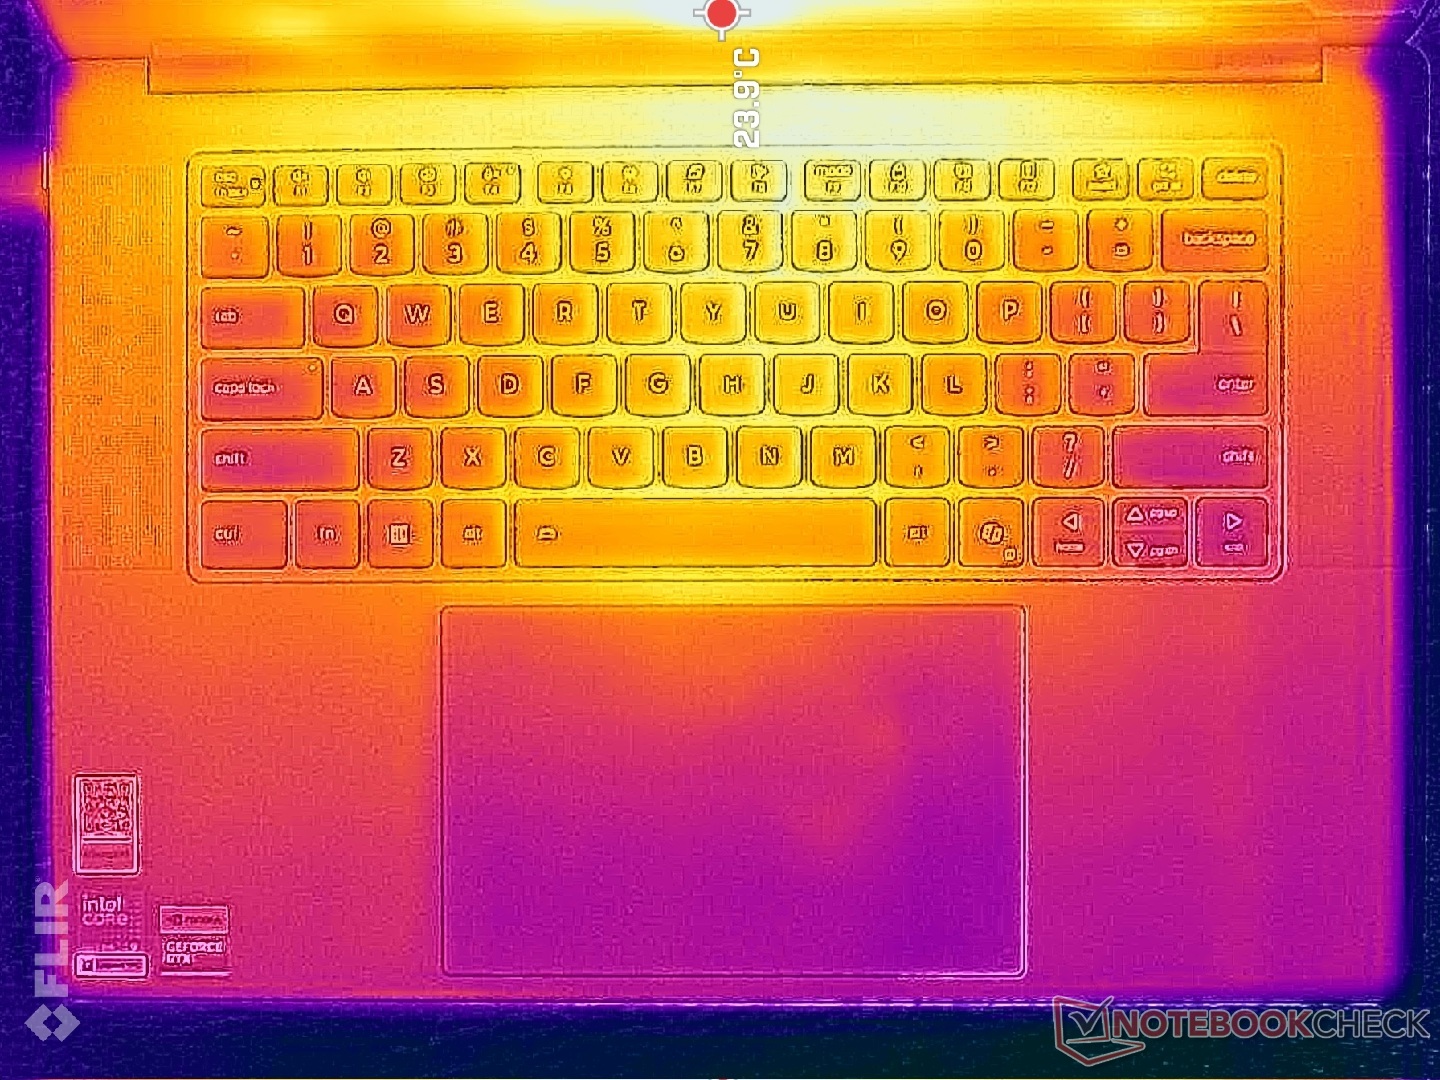
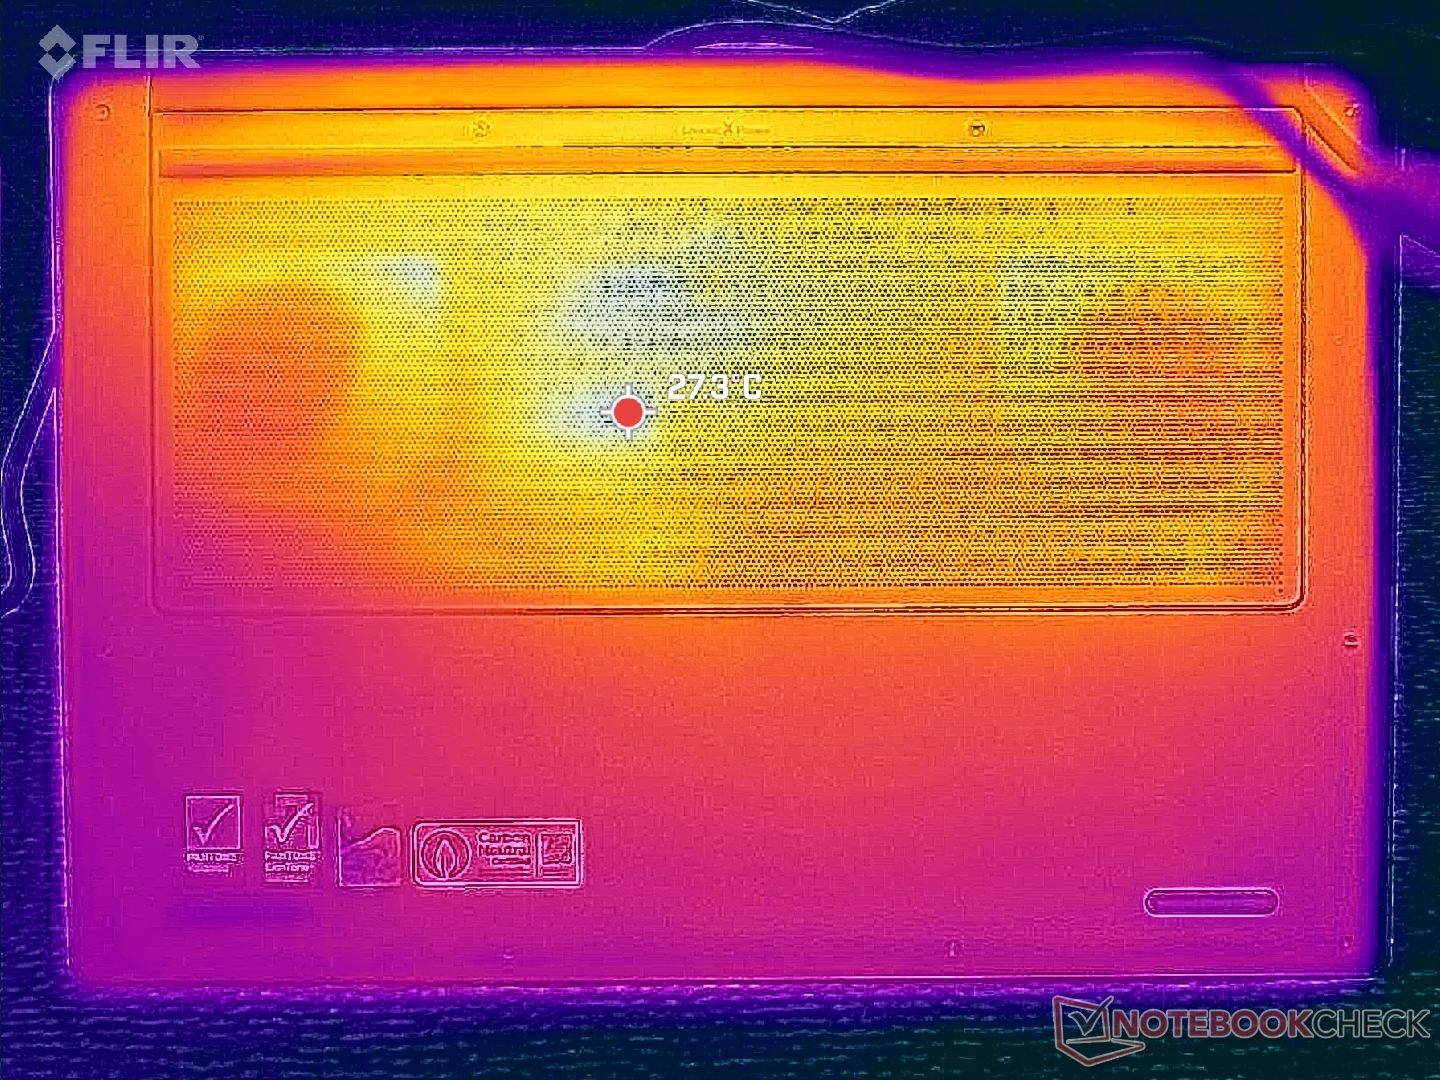
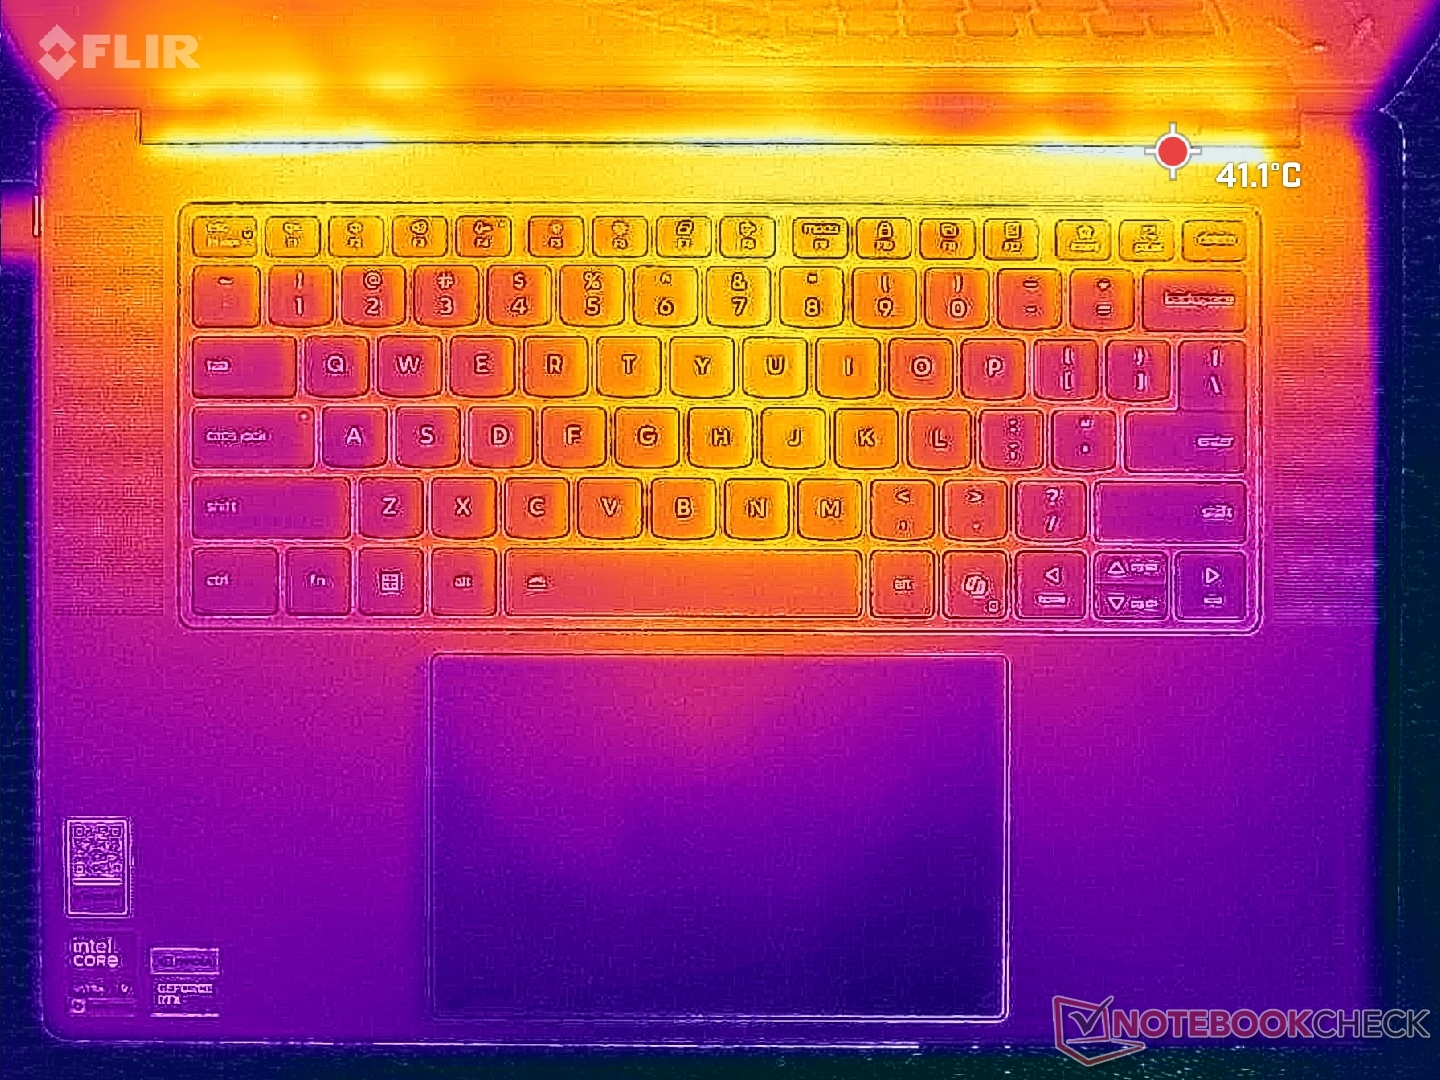
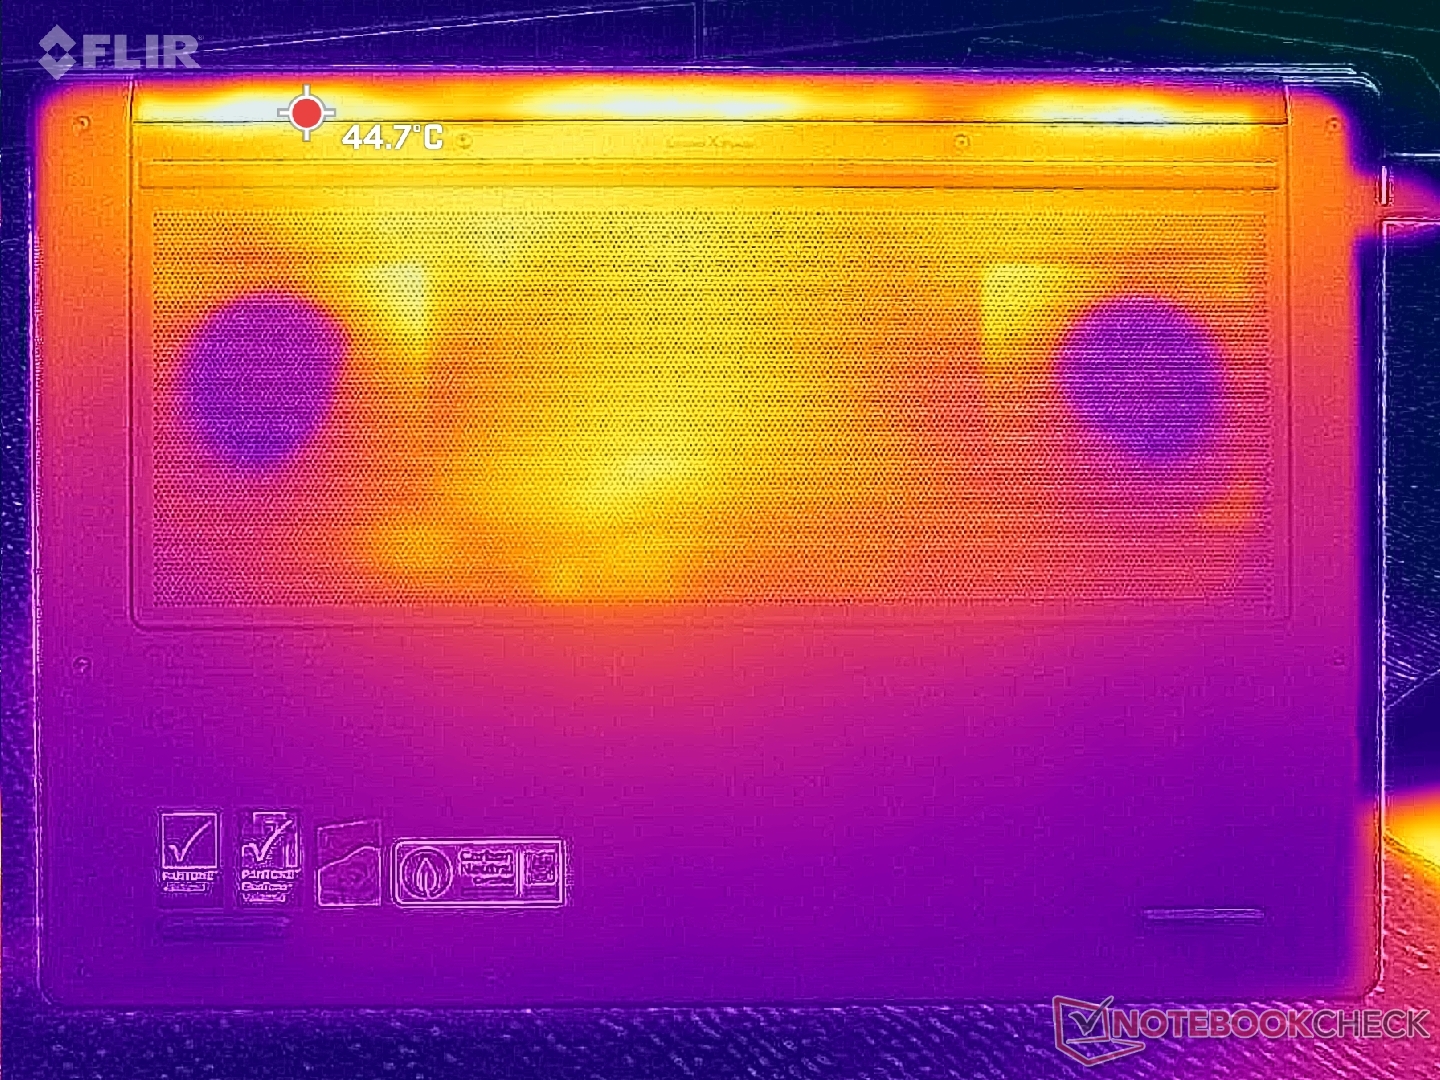
Die Oberflächentemperaturen sind trotz der geringeren Abmessungen spürbar kühler als beim Vorgängermodell. Bei der Ausführung von Cyberpunk 2077 erreichten die Hotspots auf unserem Gerät beispielsweise nur 38 und 41 °C im Vergleich zu 42 und 49 °C auf dem Pro 9i 16IAH G10 Aura mit der gleichen Nvidia GPU.
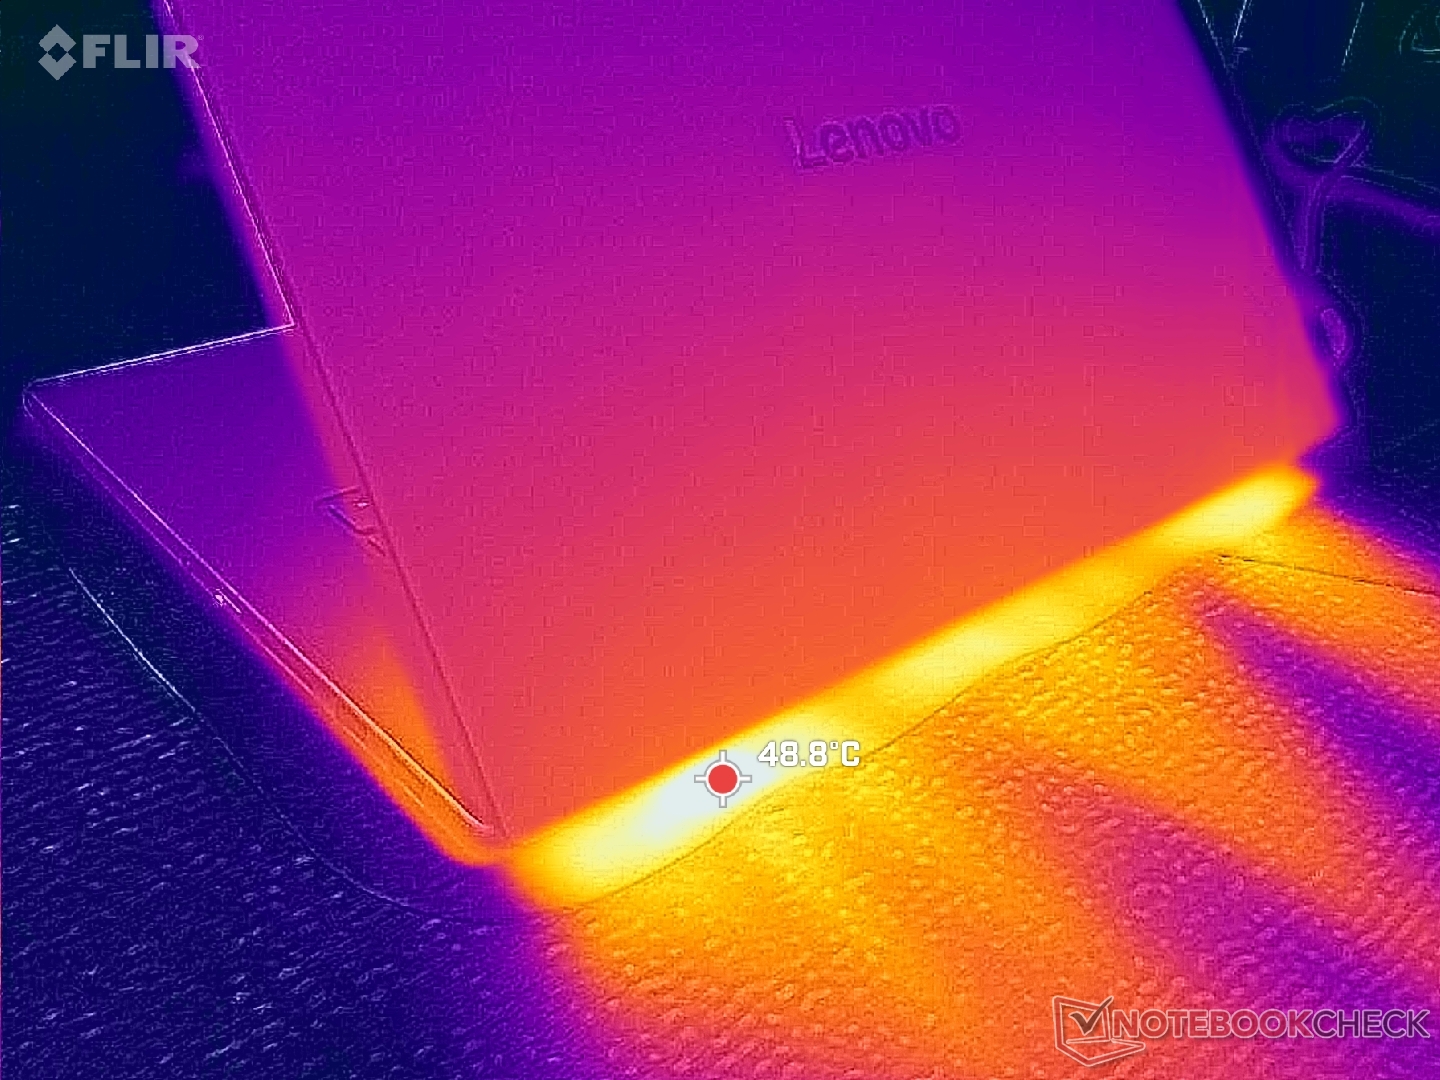
(+) Die maximale Temperatur auf der Oberseite ist 37.8 °C. Im Vergleich liegt der Klassendurchschnitt bei 36.8 °C (von 21 bis 71 °C für die Klasse Multimedia).
(+) Auf der Unterseite messen wir eine maximalen Wert von 38.2 °C (im Vergleich zum Durchschnitt von 39.1 °C).
(+) Ohne Last messen wir eine durchschnittliche Temperatur von 27.1 °C auf der Oberseite. Der Klassendurchschnitt erreicht 31.3 °C.
(+) 3: The average temperature for the upper side is 31.7 °C / 89 F, compared to the average of 31.3 °C / 88 F for the class Multimedia.
(+) Die Handballen und der Touchpad-Bereich sind mit gemessenen 29.4 °C kühler als die typische Hauttemperatur und fühlen sich dadurch kühl an.
(±) Die durchschnittliche Handballen-Temperatur anderer getesteter Geräte war 28.7 °C (-0.7 °C).
| Lenovo Pro 9 16IPH11 Ultra 9 386H, GeForce RTX 5060 Laptop | Lenovo Yoga Pro 9 16IAH10 RTX 5050 Ultra 9 285H, GeForce RTX 5050 Laptop | Dell XPS 16 Core Ultra X7 358H Ultra X7 358H, Arc B390 Panther Lake iGPU | MSI Prestige 16 AI Evo B2HMG Ultra 9 285H, Arc 140T | HP Omen Transcend 16-u1095ng i9-14900HX, GeForce RTX 4070 Laptop GPU | Asus ProArt P16 H7606WP Ryzen AI 9 HX 370, GeForce RTX 5070 Laptop | |
|---|---|---|---|---|---|---|
| Hitze | 1% | 9% | -7% | -22% | -5% | |
| Last oben max * (°C) | 37.8 | 34.4 9% | 40.6 -7% | 48.1 -27% | 49 -30% | 47 -24% |
| Last unten max * (°C) | 38.2 | 41.4 -8% | 39.8 -4% | 51.6 -35% | 63 -65% | 47.4 -24% |
| Idle oben max * (°C) | 30.4 | 28.6 6% | 23.2 24% | 25.9 15% | 30 1% | 26.1 14% |
| Idle unten max * (°C) | 31 | 31.8 -3% | 23.8 23% | 25.2 19% | 29 6% | 26.4 15% |
* ... kleinere Werte sind besser
Stresstest
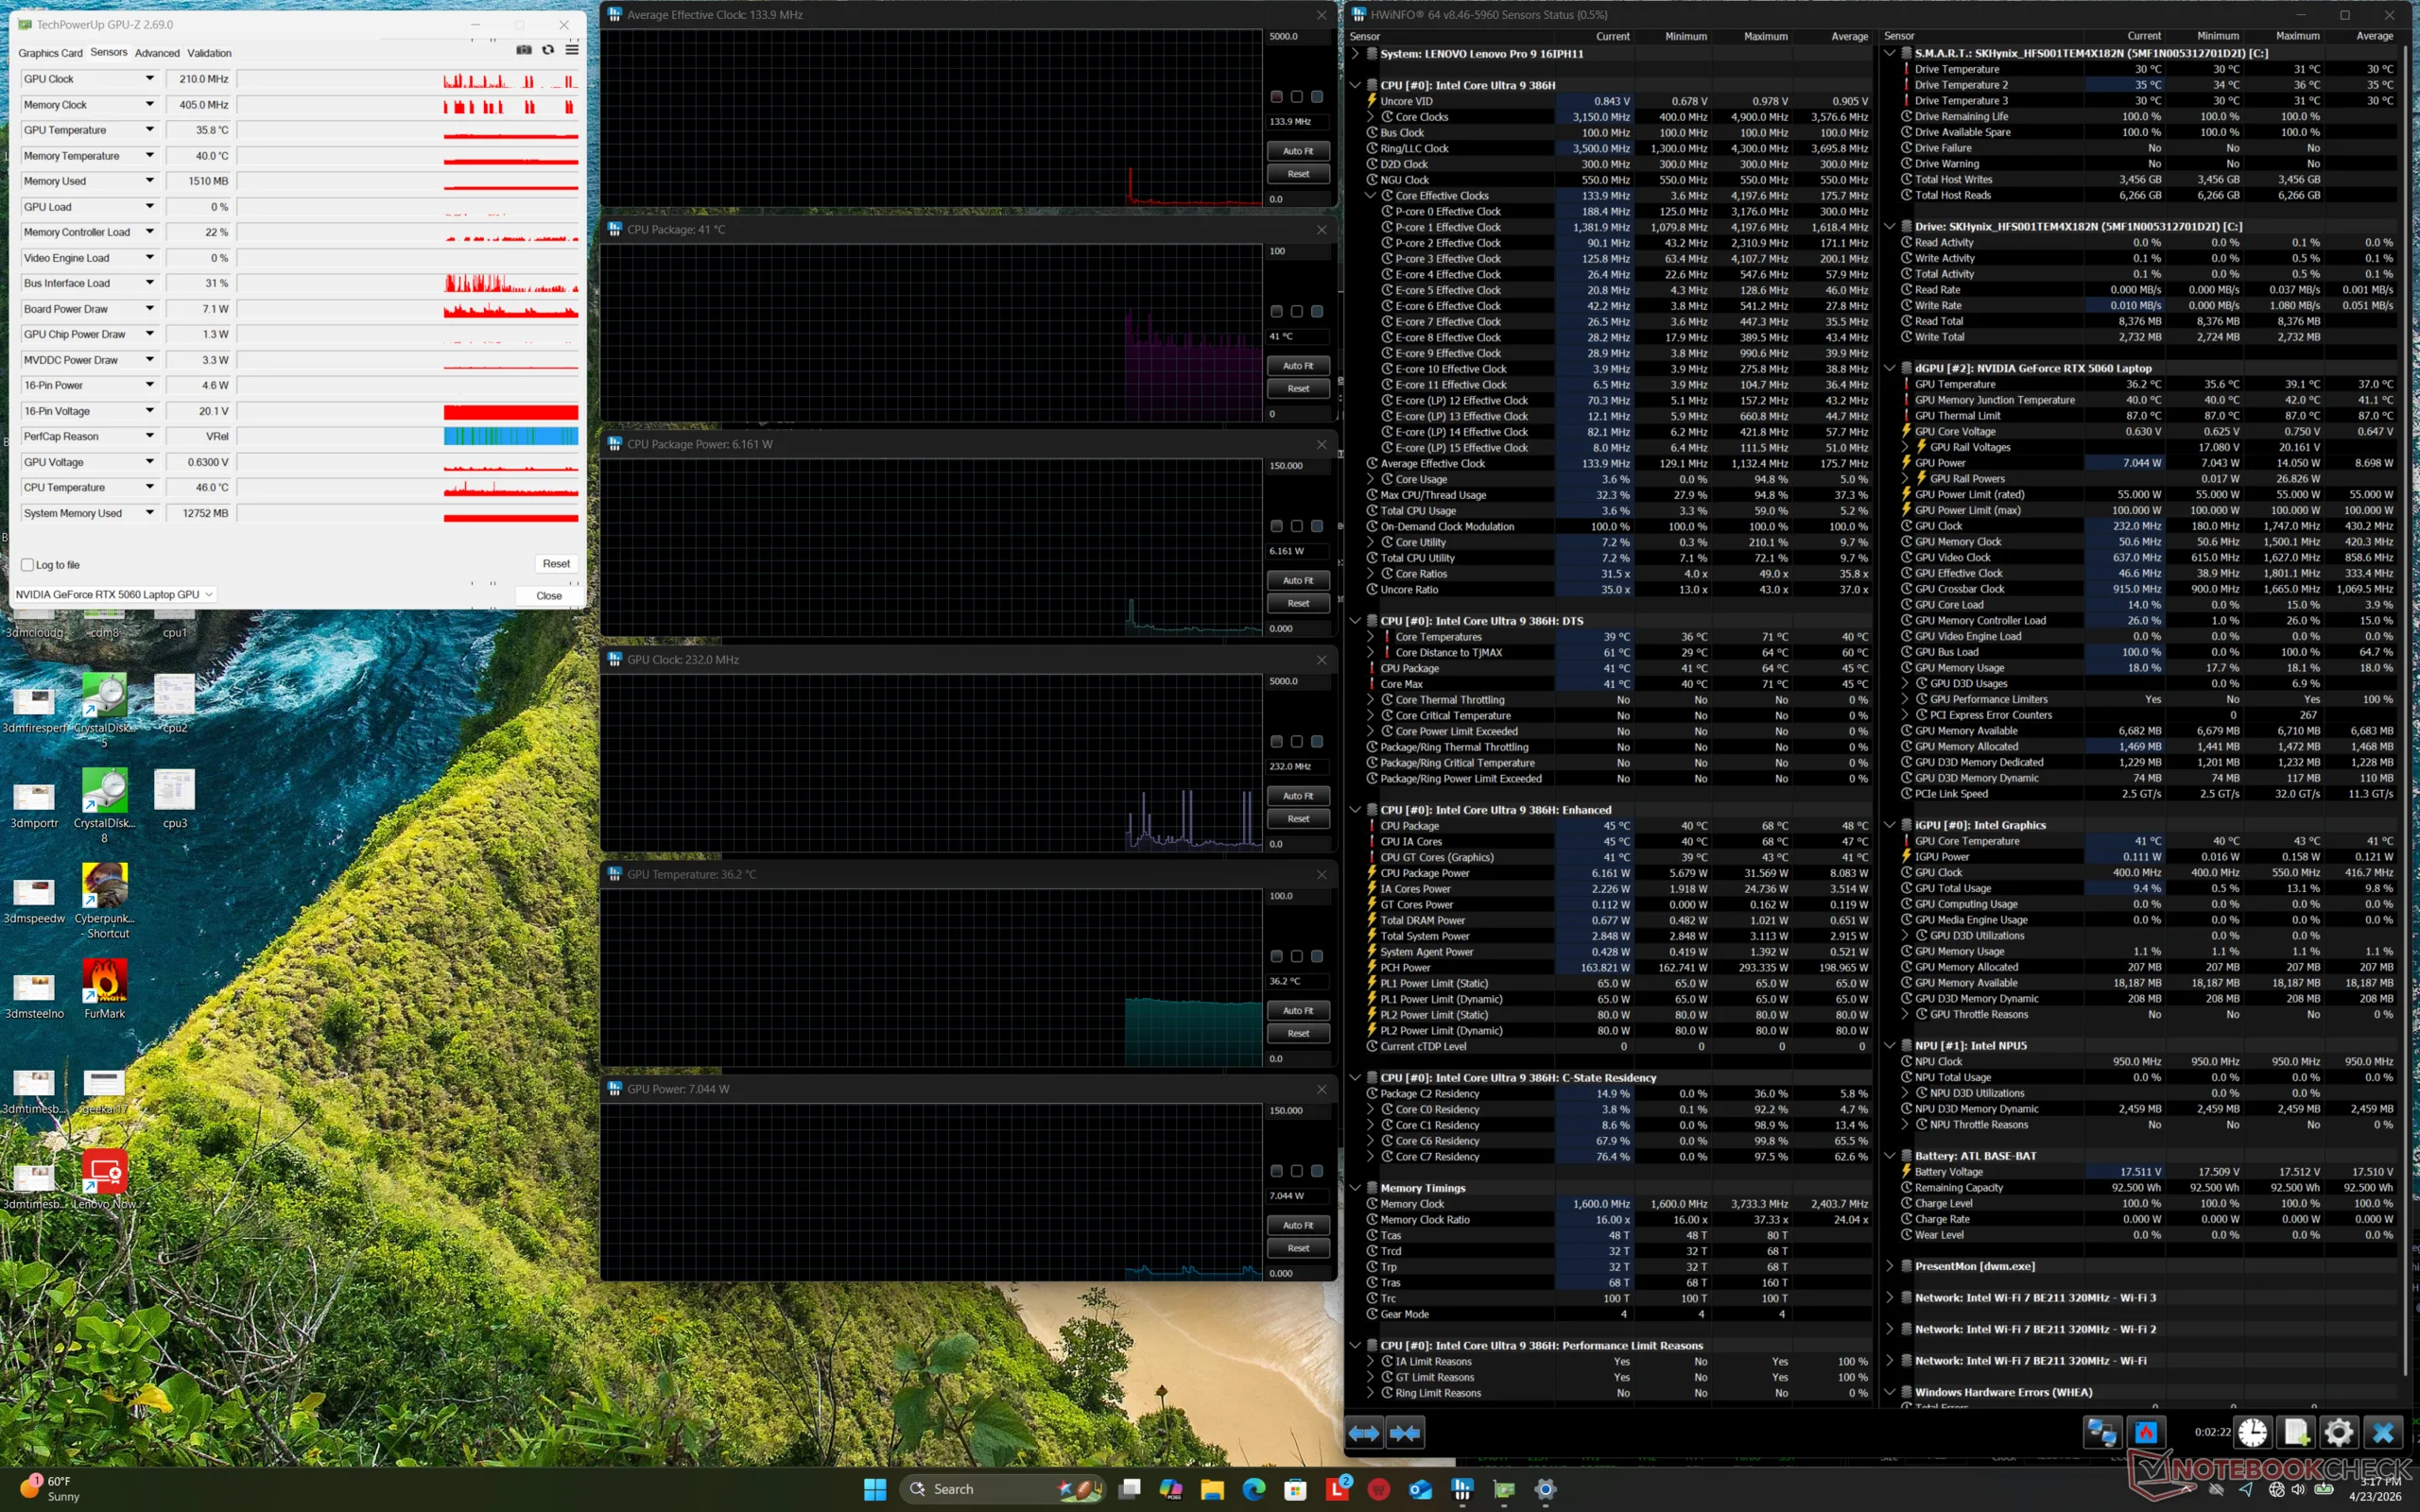
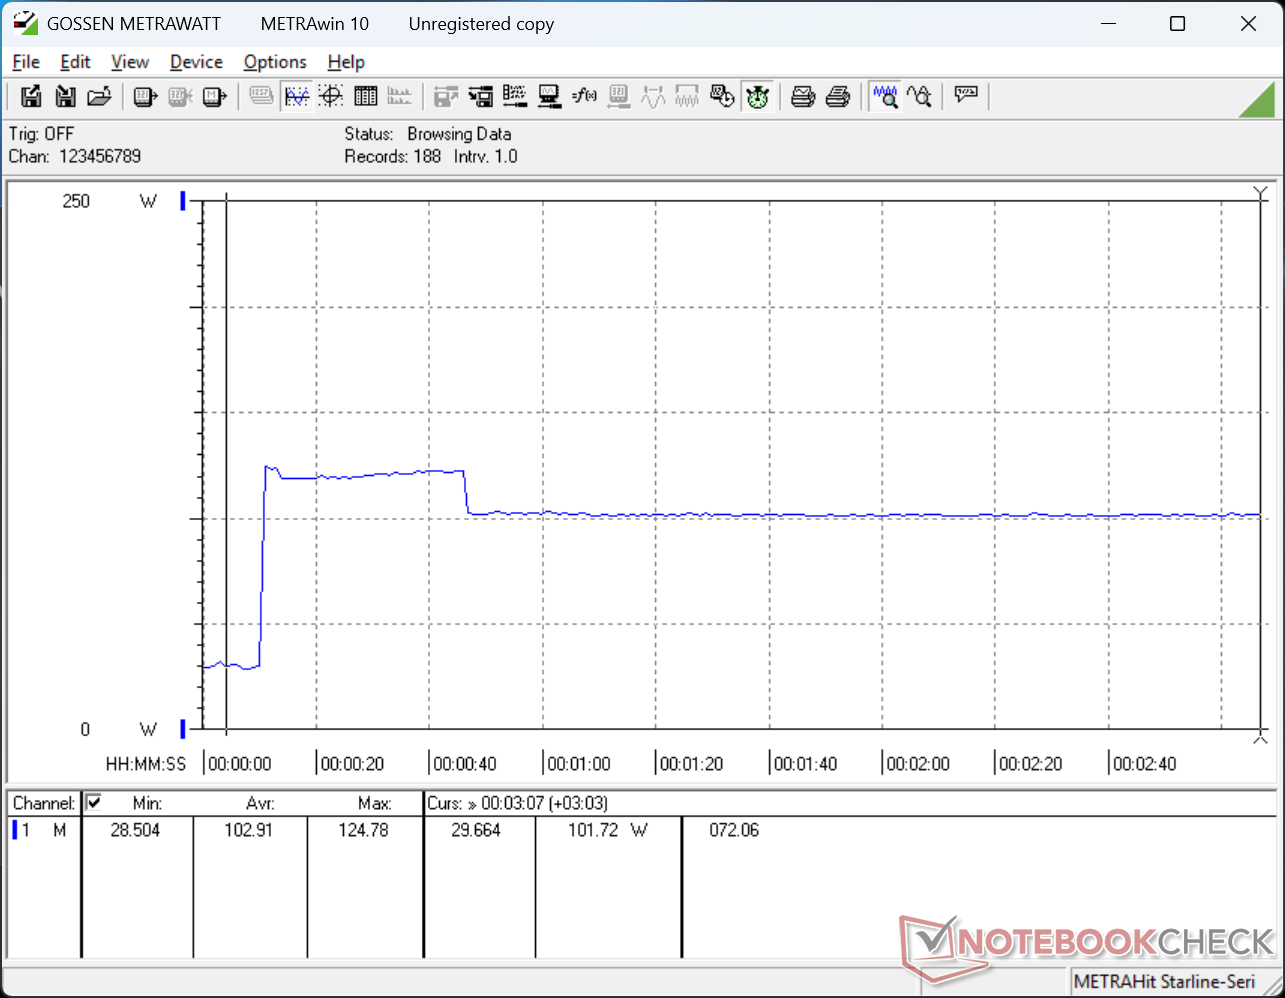
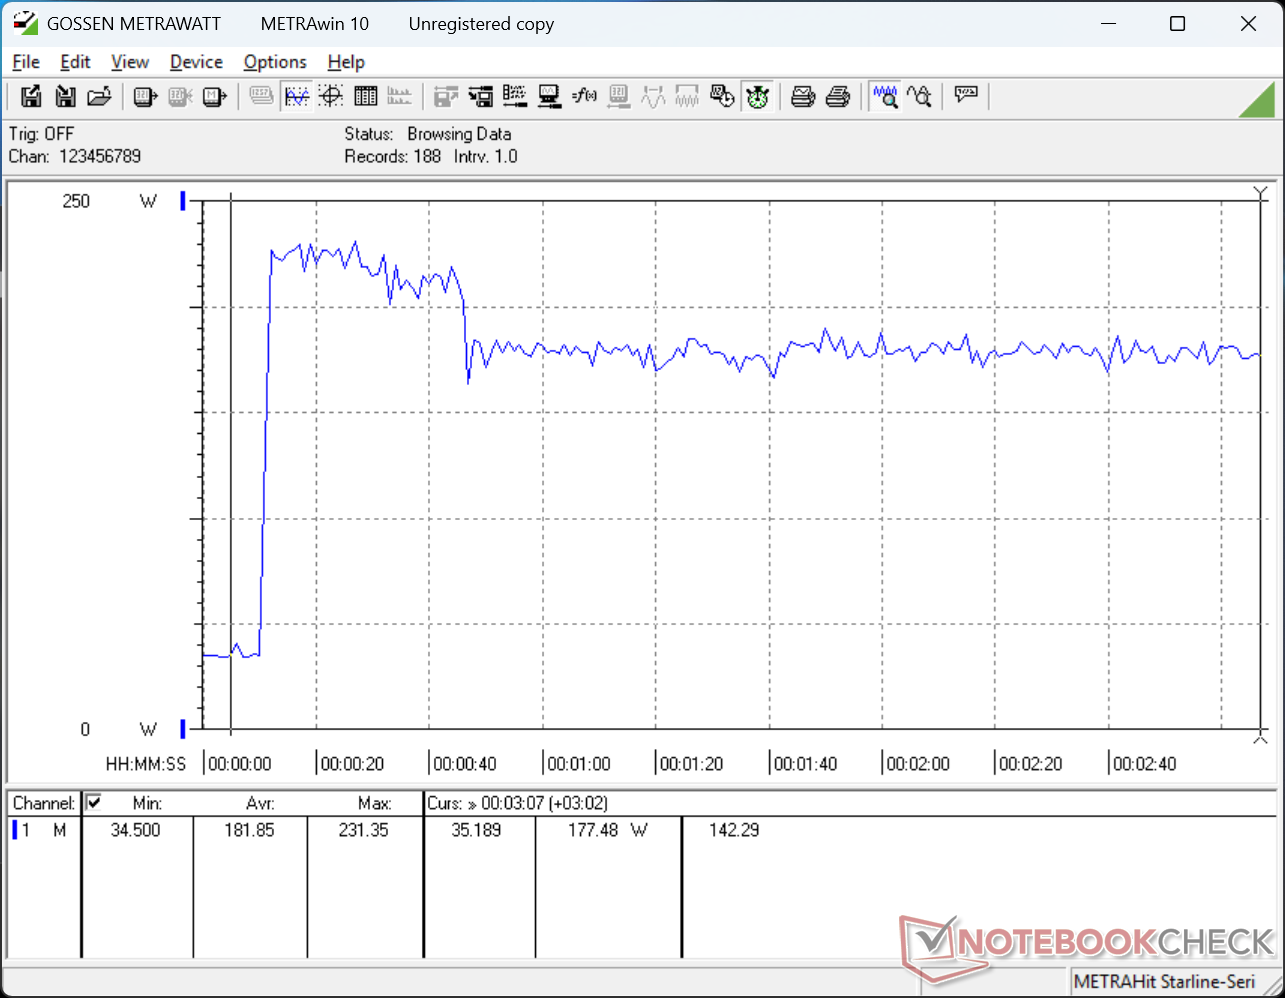
Die CPU stieg beim Starten von Prime95 Stress auf 3,3 GHz, 98 °C und 86 W, bevor sie etwa 30 Sekunden später auf 3,0 GHz, 90 °C und 62 W fiel und sich stabilisierte.
Die Kerntemperatur und die Taktraten änderten sich drastisch zwischen den Modi Balanced und Performance, wie die untenstehenden Screenshots zeigen. Bei der Ausführung von Cyberpunk 2077 beispielsweise erreichte die GPU im Durchschnitt 2647 MHz, 75 °C und 91 W, wenn sie auf den Modus Performance eingestellt war, oder 2.340 MHz, 68 °C und 67 W bei Einstellung auf den Balanced-Modus. Die insgesamt langsamere Leistung im Modus "Ausgewogen" deckt sich mit unseren Beobachtungen zu Time SPy im obigen Abschnitt über die GPU.
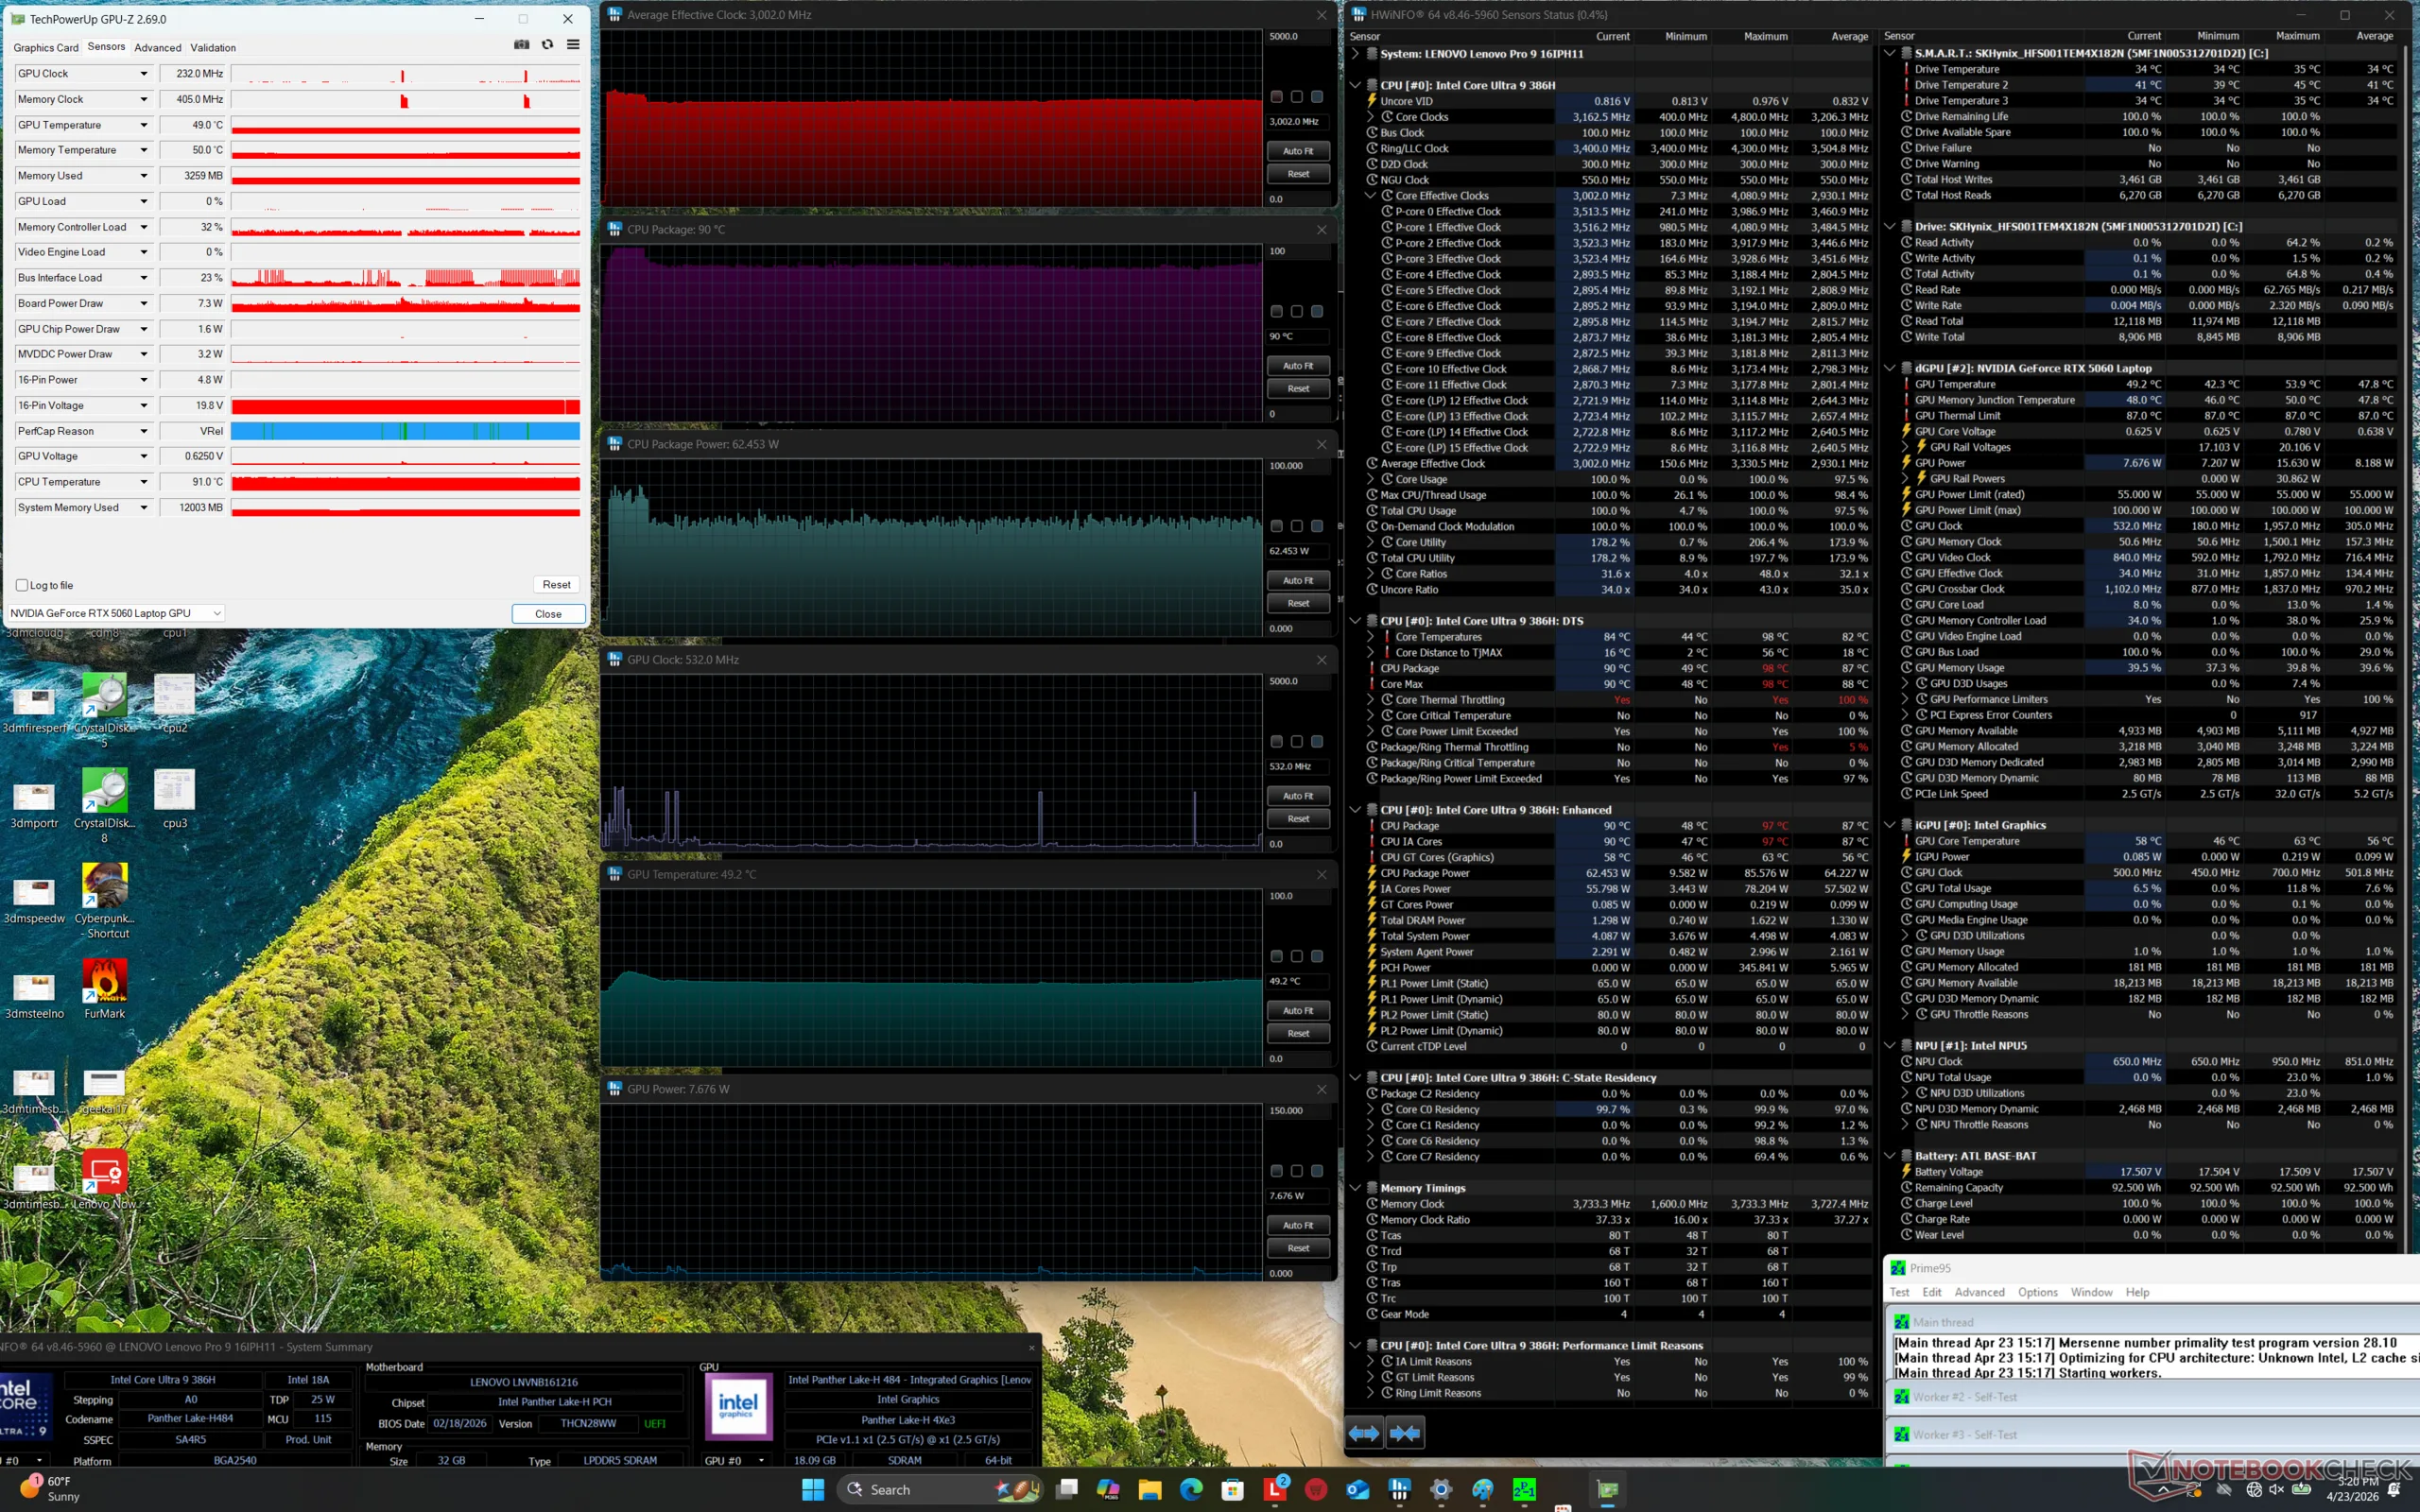
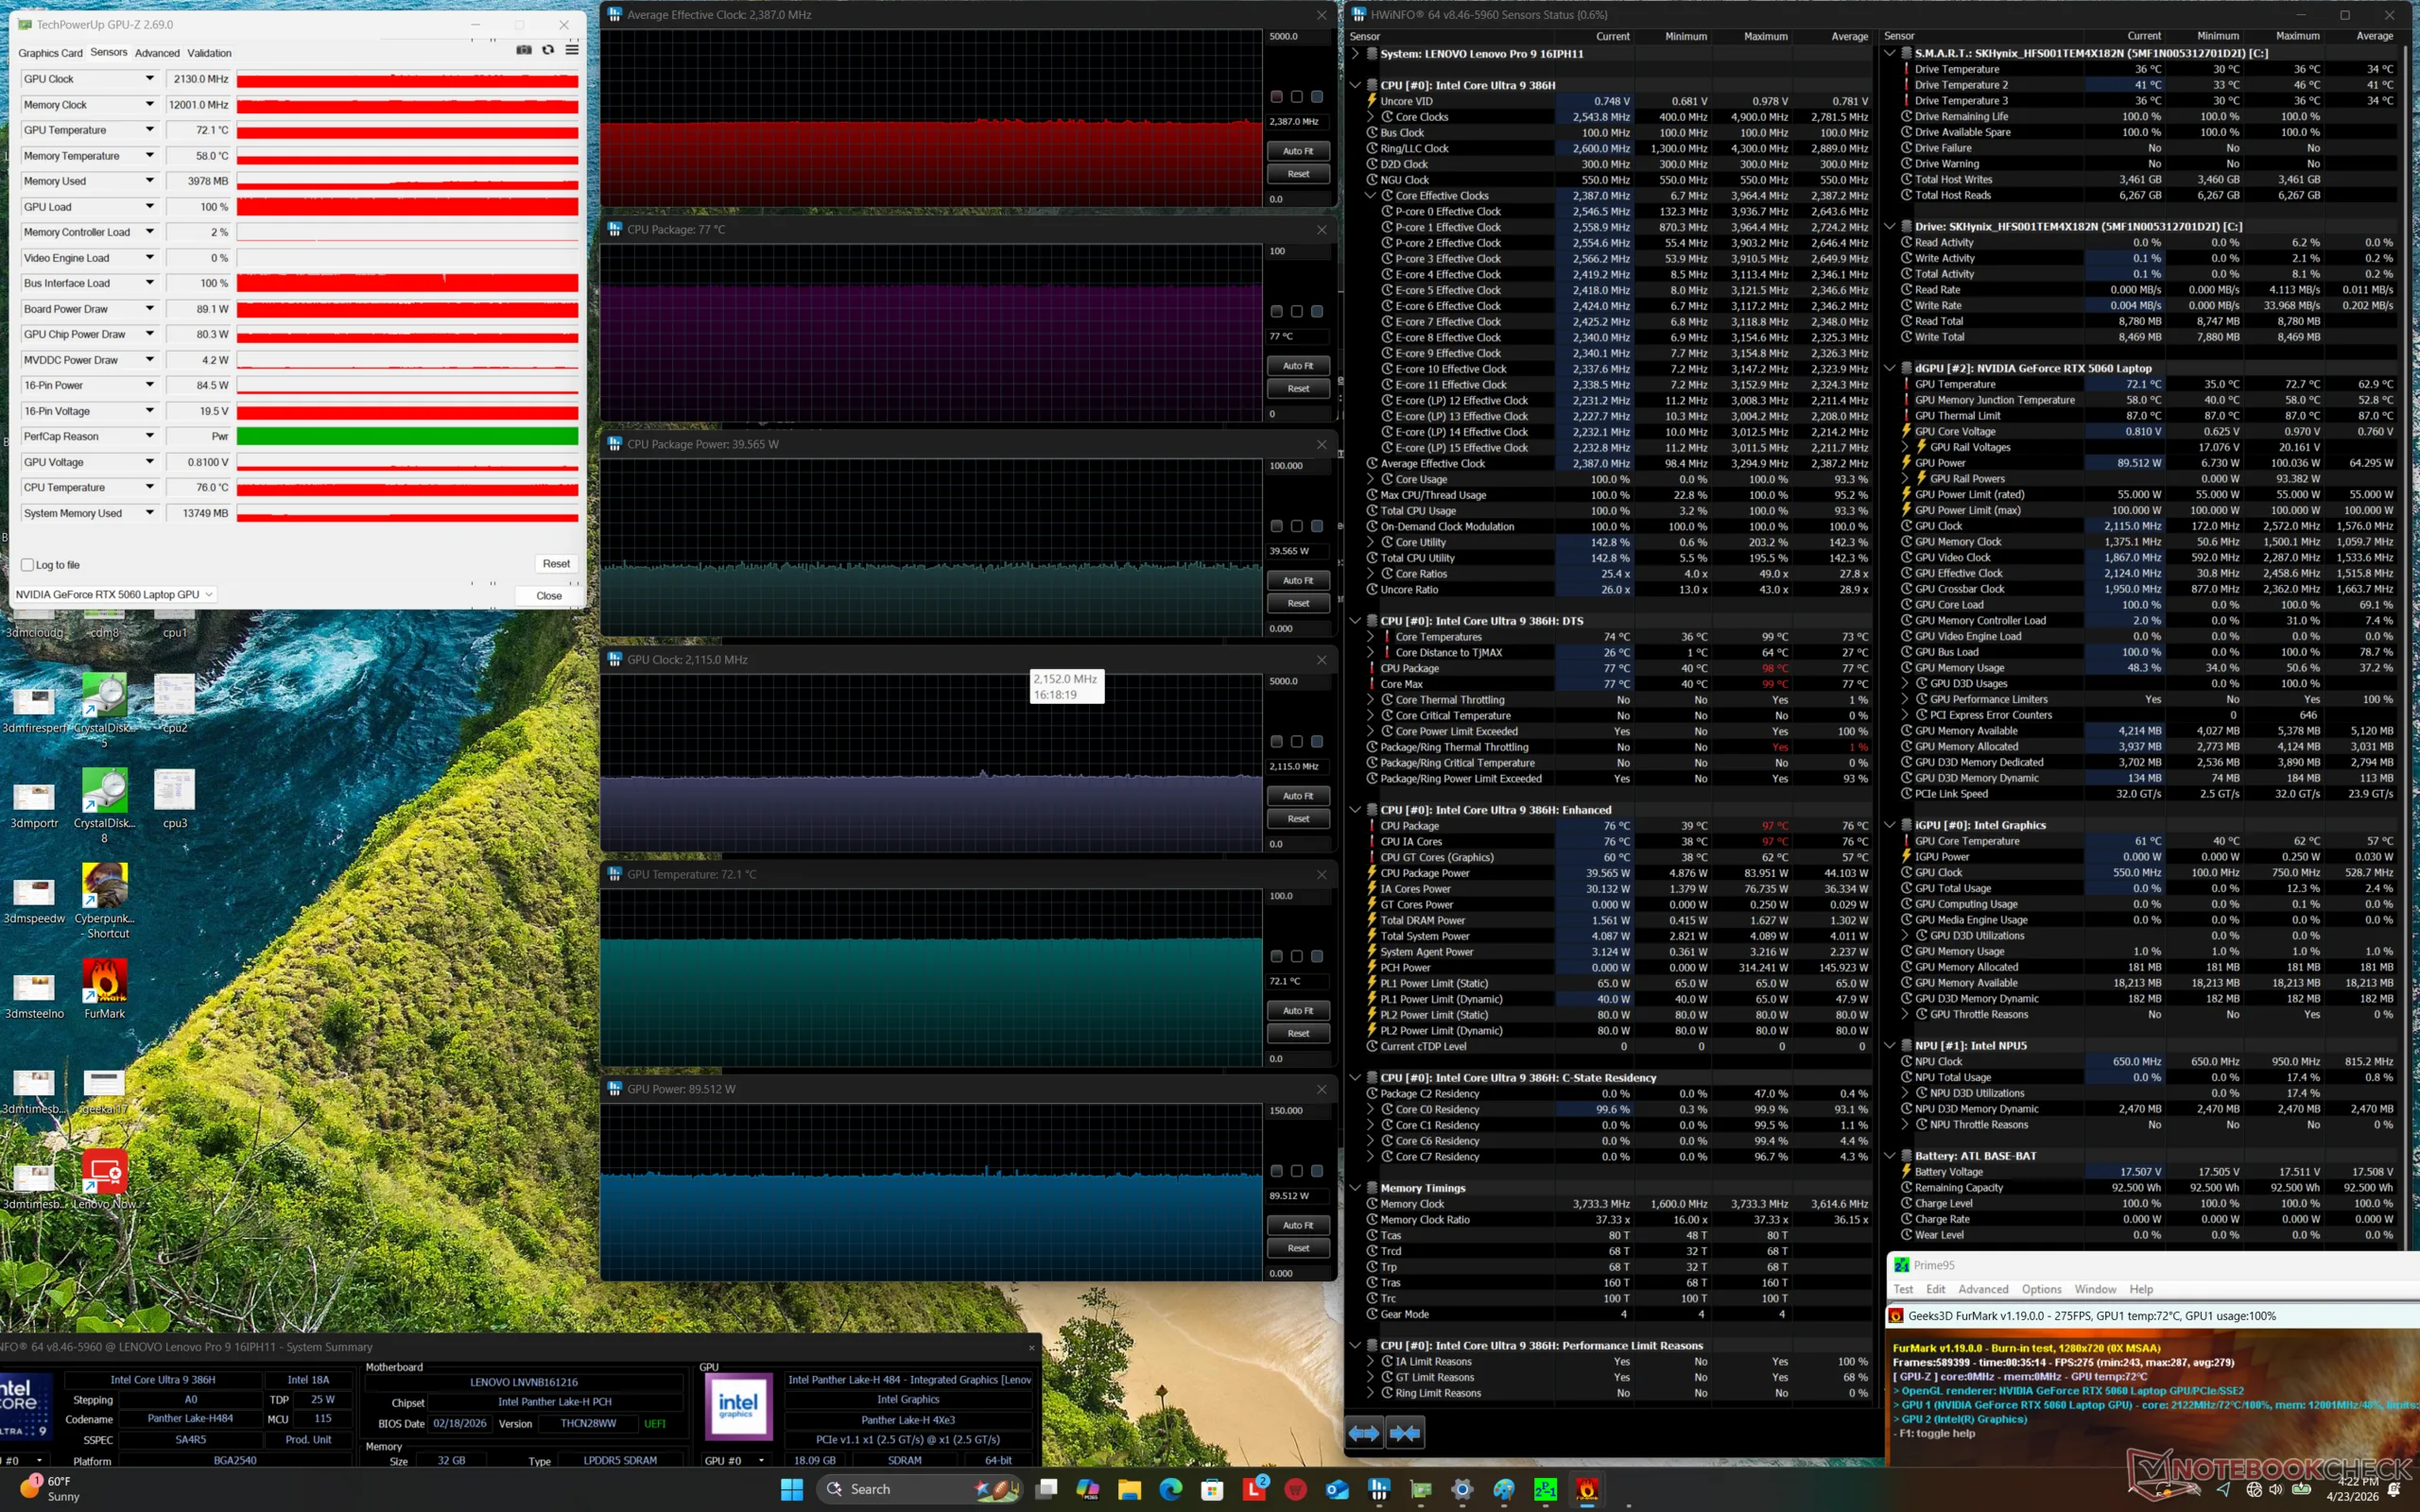
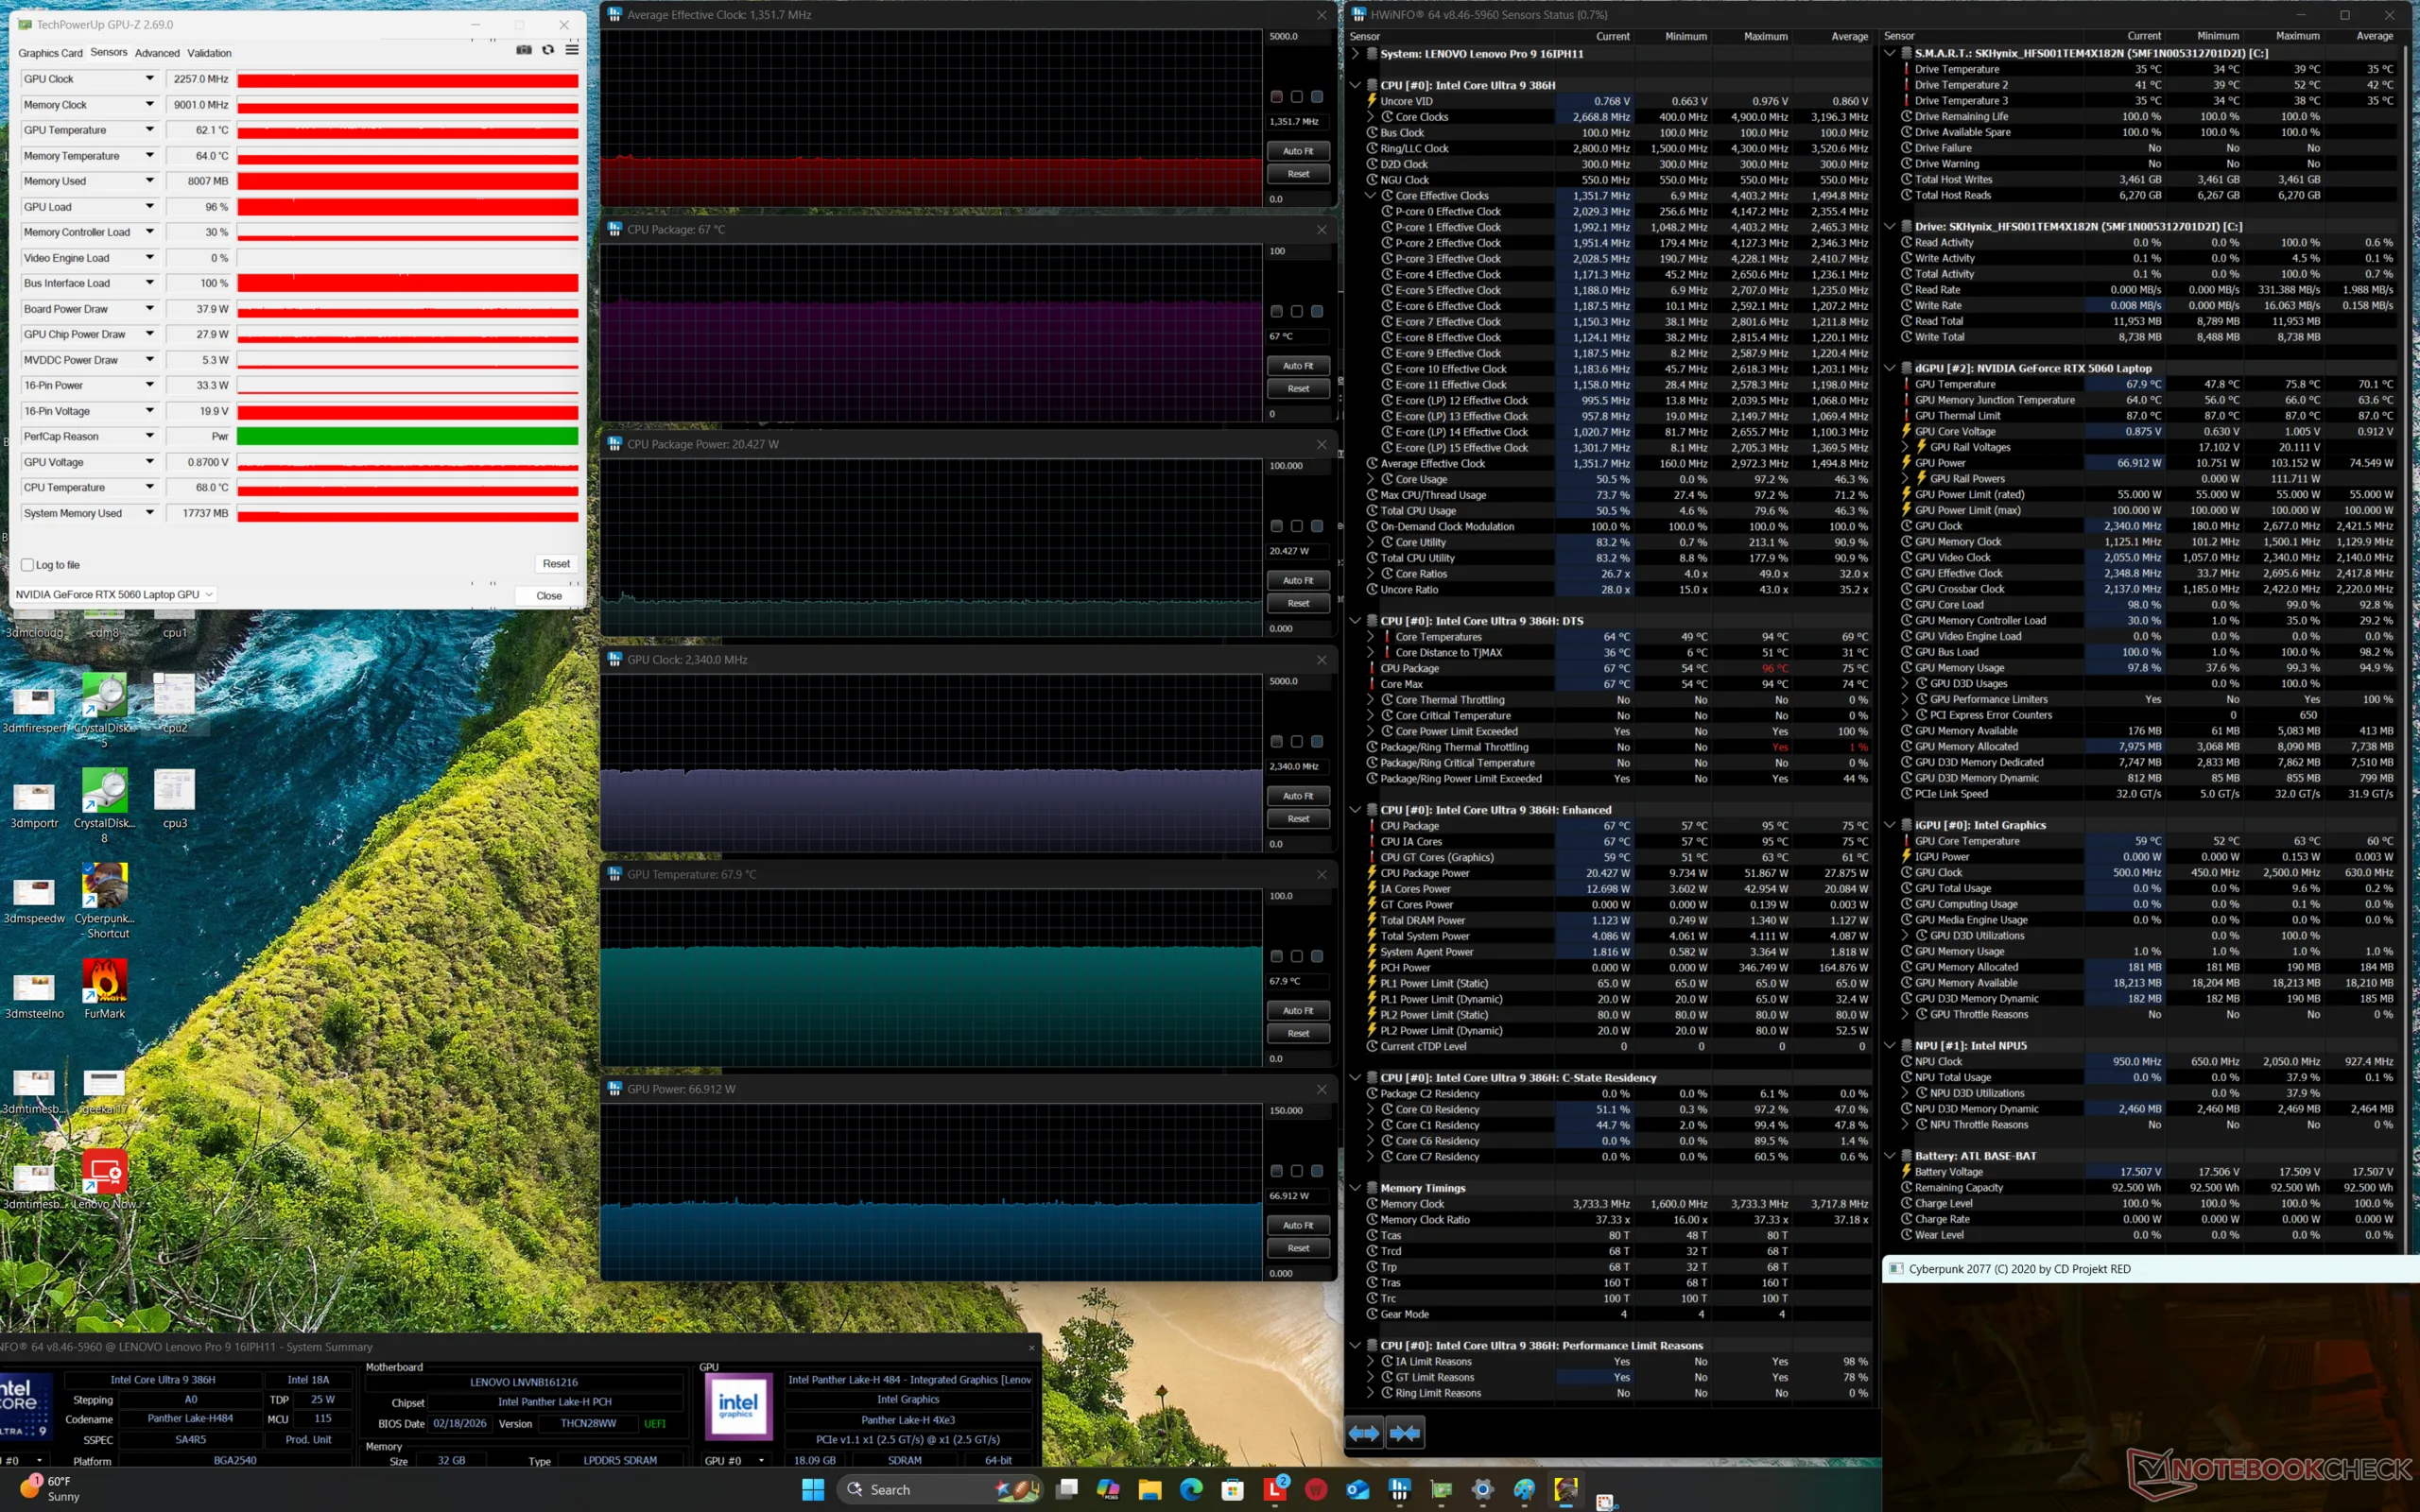
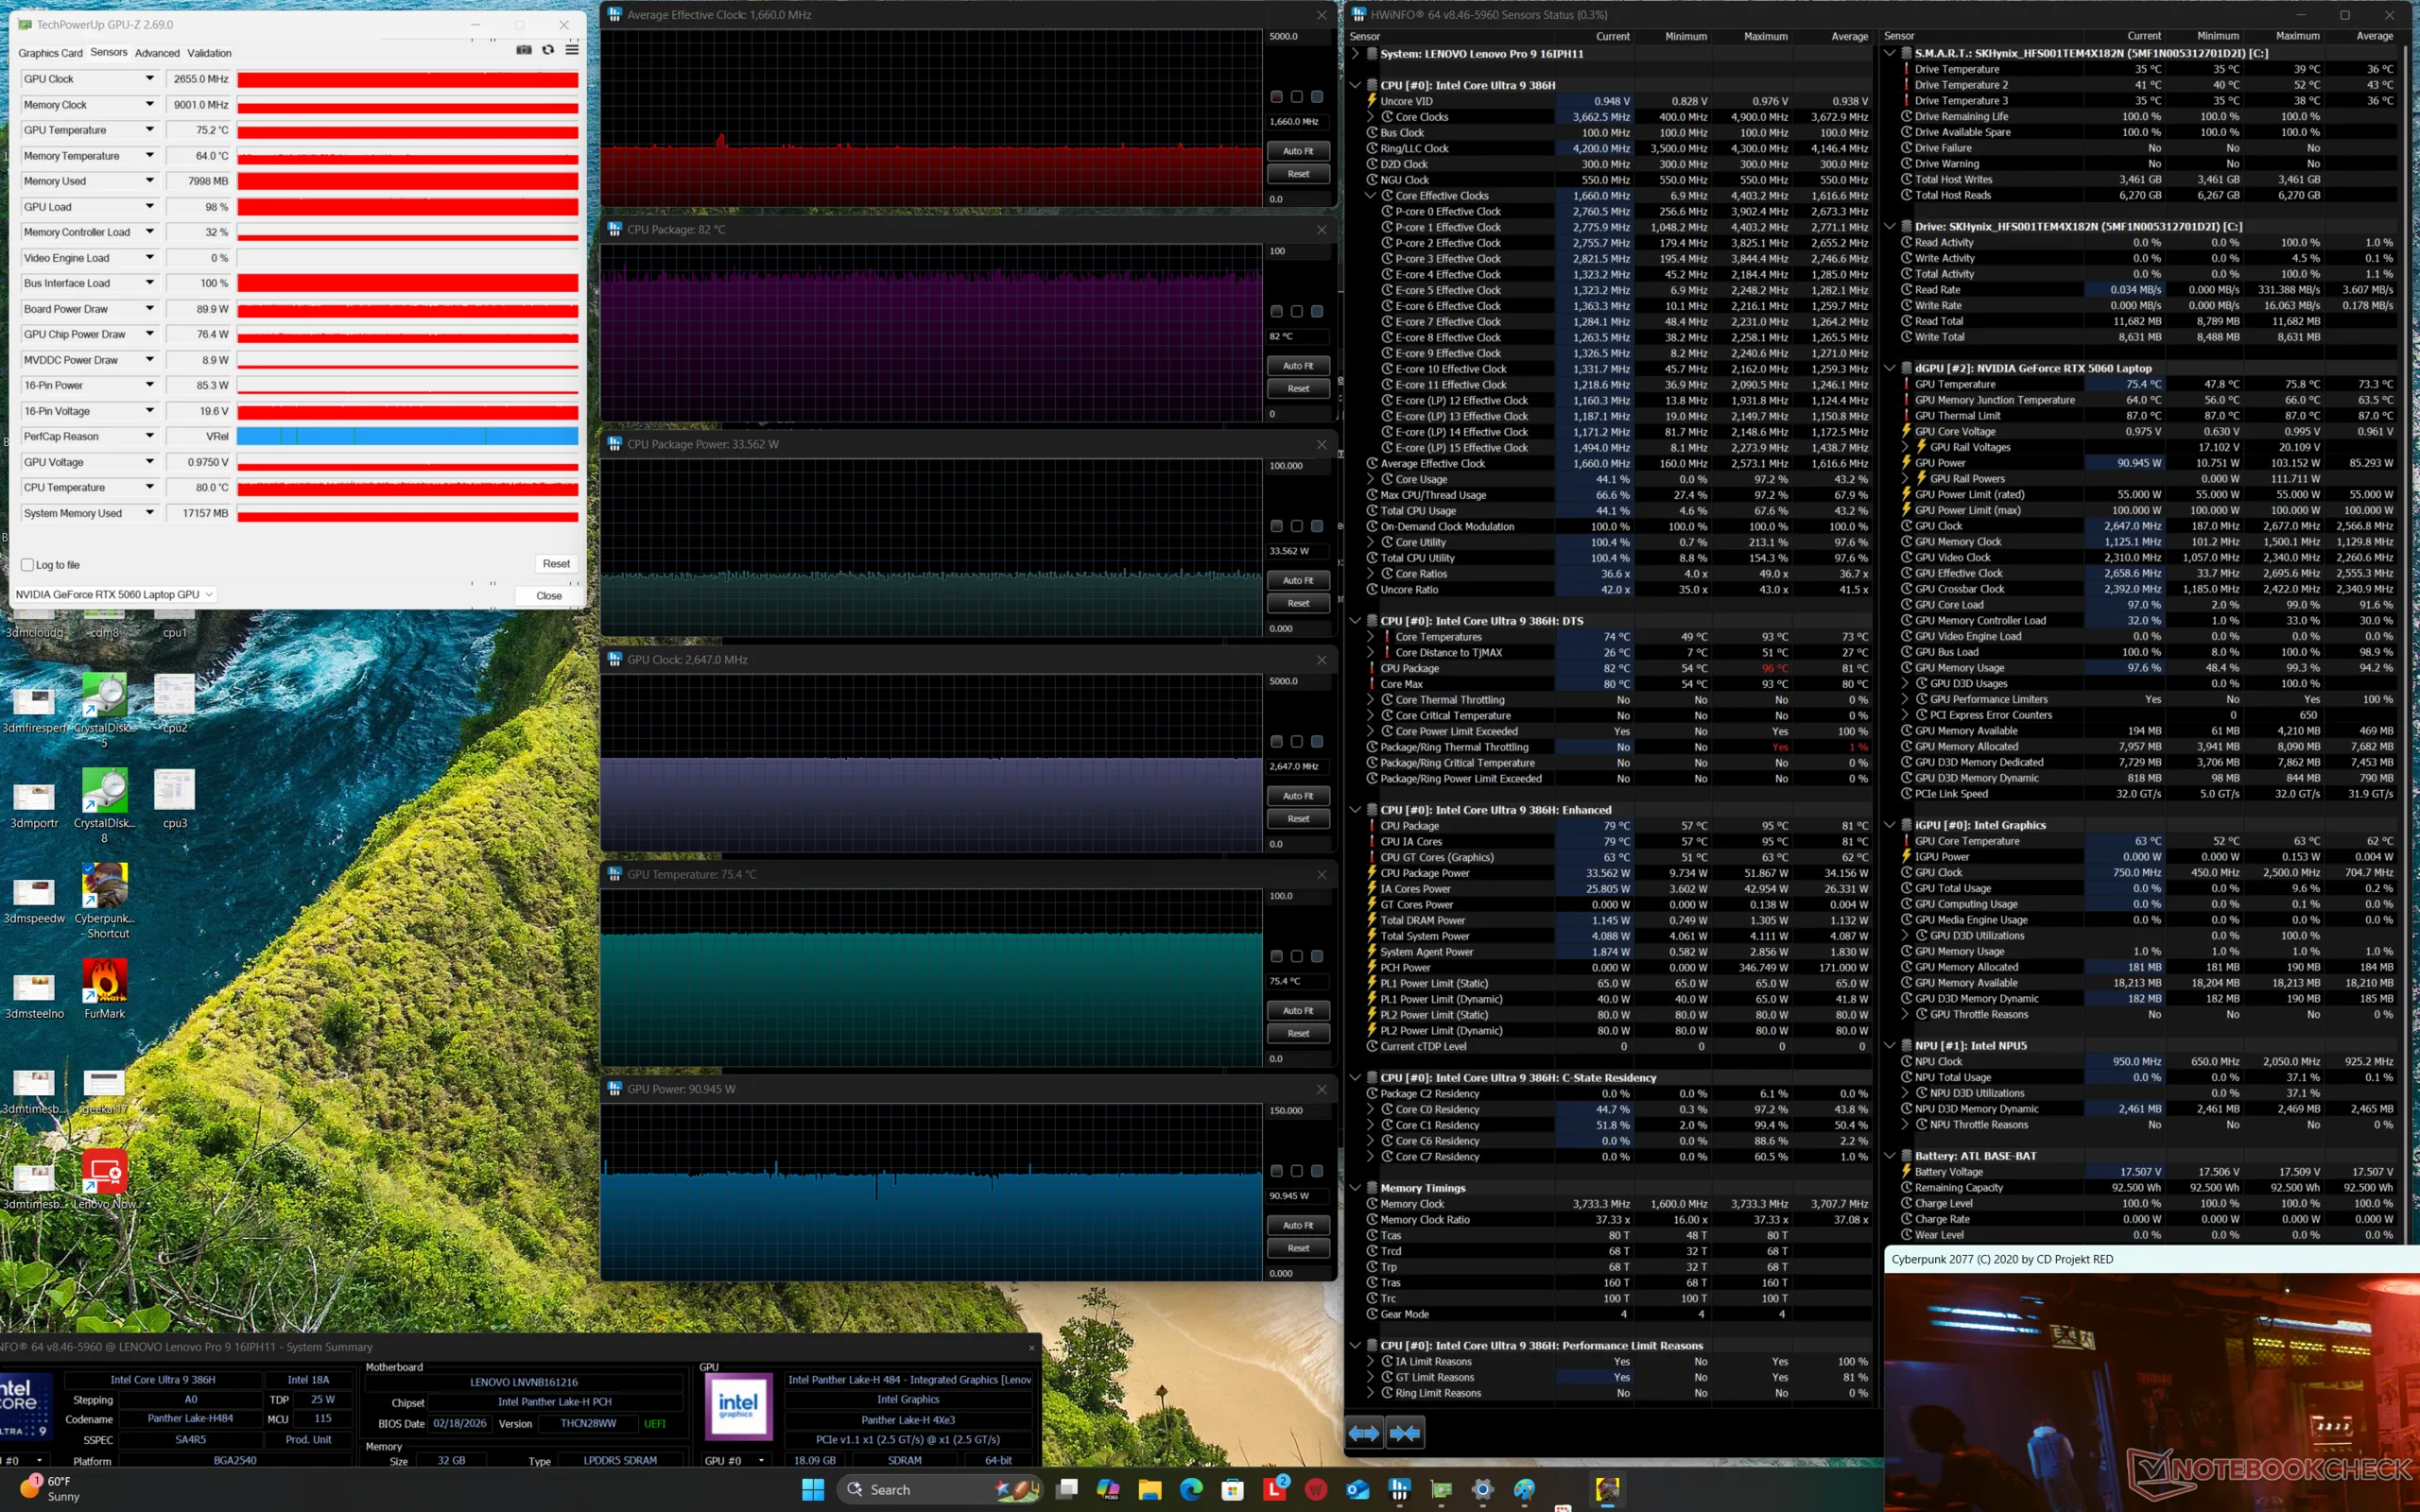
| durchschnittlicher CPU-Takt (GHz) | GPU-Takt (MHz) | durchschnittliche CPU-Temperatur (°C) | durchschnittliche GPU-Temperatur (°C) | |
| System Leerlauf | -- | 232 | 41 | 36 |
| Prime95 Stress | 3,0 | -- | 90 | 49 |
| Prime95 + FurMark Stress | 2,4 | 2.115 | 77 | 72 |
| Cyberpunk 2077 Stress (Ausgewogener Modus) | 1,4 | 2.340 | 67 | 68 |
| Cyberpunk 2077 Stress (Performance-Modus) | 1,7 | 2.647 | 82 | 75 |
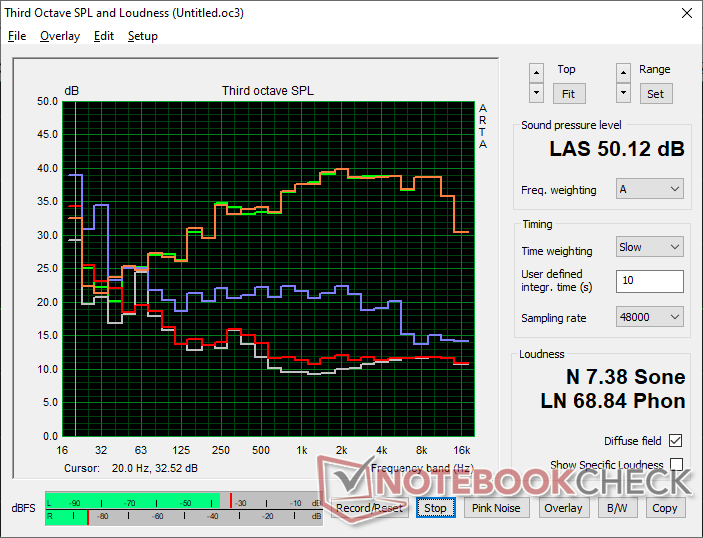
Lautsprecher
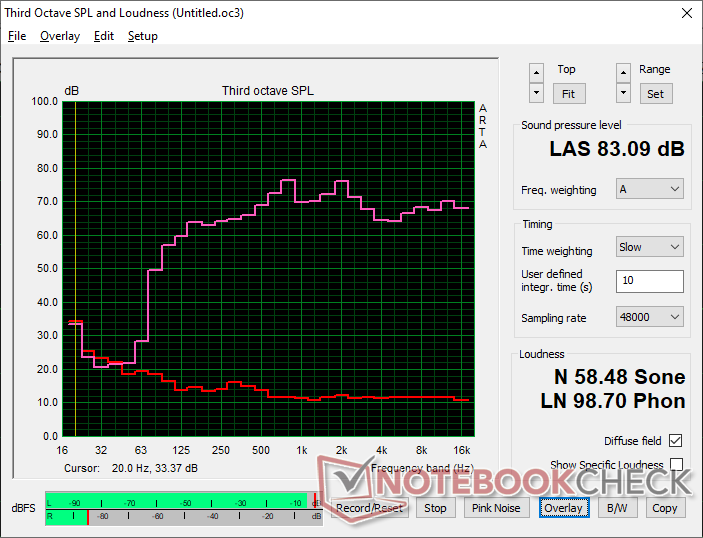
Lenovo Pro 9 16IPH11 Audio Analyse
(+) | Die Lautsprecher können relativ laut spielen (83.1 dB)
Bass 100 - 315 Hz
(±) | abgesenkter Bass - 5.7% geringer als der Median
(+) | lineare Bass-Wiedergabe (5.1% Delta zum Vorgänger)
Mitteltöne 400 - 2000 Hz
(+) | ausgeglichene Mitten, vom Median nur 4.2% abweichend
(+) | lineare Mitten (5.4% Delta zum Vorgänger)
Hochtöne 2 - 16 kHz
(+) | ausgeglichene Hochtöne, vom Median nur 1.8% abweichend
(+) | sehr lineare Hochtöne (4.4% Delta zum Vorgänger)
Gesamt im hörbaren Bereich 100 - 16.000 Hz
(+) | hörbarer Bereich ist sehr linear (7.7% Abstand zum Median
Im Vergleich zu allen Geräten derselben Klasse
» 6% aller getesteten Geräte dieser Klasse waren besser, 2% vergleichbar, 91% schlechter
» Das beste Gerät hat einen Delta-Wert von 5%, durchschnittlich ist 17%, das schlechteste Gerät hat 45%
Im Vergleich zu allen Geräten im Test
» 1% aller getesteten Geräte waren besser, 0% vergleichbar, 98% schlechter
» Das beste Gerät hat einen Delta-Wert von 4%, durchschnittlich ist 23%, das schlechteste Gerät hat 134%
Apple MacBook Pro 16 2021 M1 Pro Audio Analyse
(+) | Die Lautsprecher können relativ laut spielen (84.7 dB)
Bass 100 - 315 Hz
(+) | guter Bass - nur 3.8% Abweichung vom Median
(+) | lineare Bass-Wiedergabe (5.2% Delta zum Vorgänger)
Mitteltöne 400 - 2000 Hz
(+) | ausgeglichene Mitten, vom Median nur 1.3% abweichend
(+) | lineare Mitten (2.1% Delta zum Vorgänger)
Hochtöne 2 - 16 kHz
(+) | ausgeglichene Hochtöne, vom Median nur 1.9% abweichend
(+) | sehr lineare Hochtöne (2.7% Delta zum Vorgänger)
Gesamt im hörbaren Bereich 100 - 16.000 Hz
(+) | hörbarer Bereich ist sehr linear (4.6% Abstand zum Median
Im Vergleich zu allen Geräten derselben Klasse
» 0% aller getesteten Geräte dieser Klasse waren besser, 0% vergleichbar, 100% schlechter
» Das beste Gerät hat einen Delta-Wert von 5%, durchschnittlich ist 17%, das schlechteste Gerät hat 45%
Im Vergleich zu allen Geräten im Test
» 0% aller getesteten Geräte waren besser, 0% vergleichbar, 100% schlechter
» Das beste Gerät hat einen Delta-Wert von 4%, durchschnittlich ist 23%, das schlechteste Gerät hat 134%
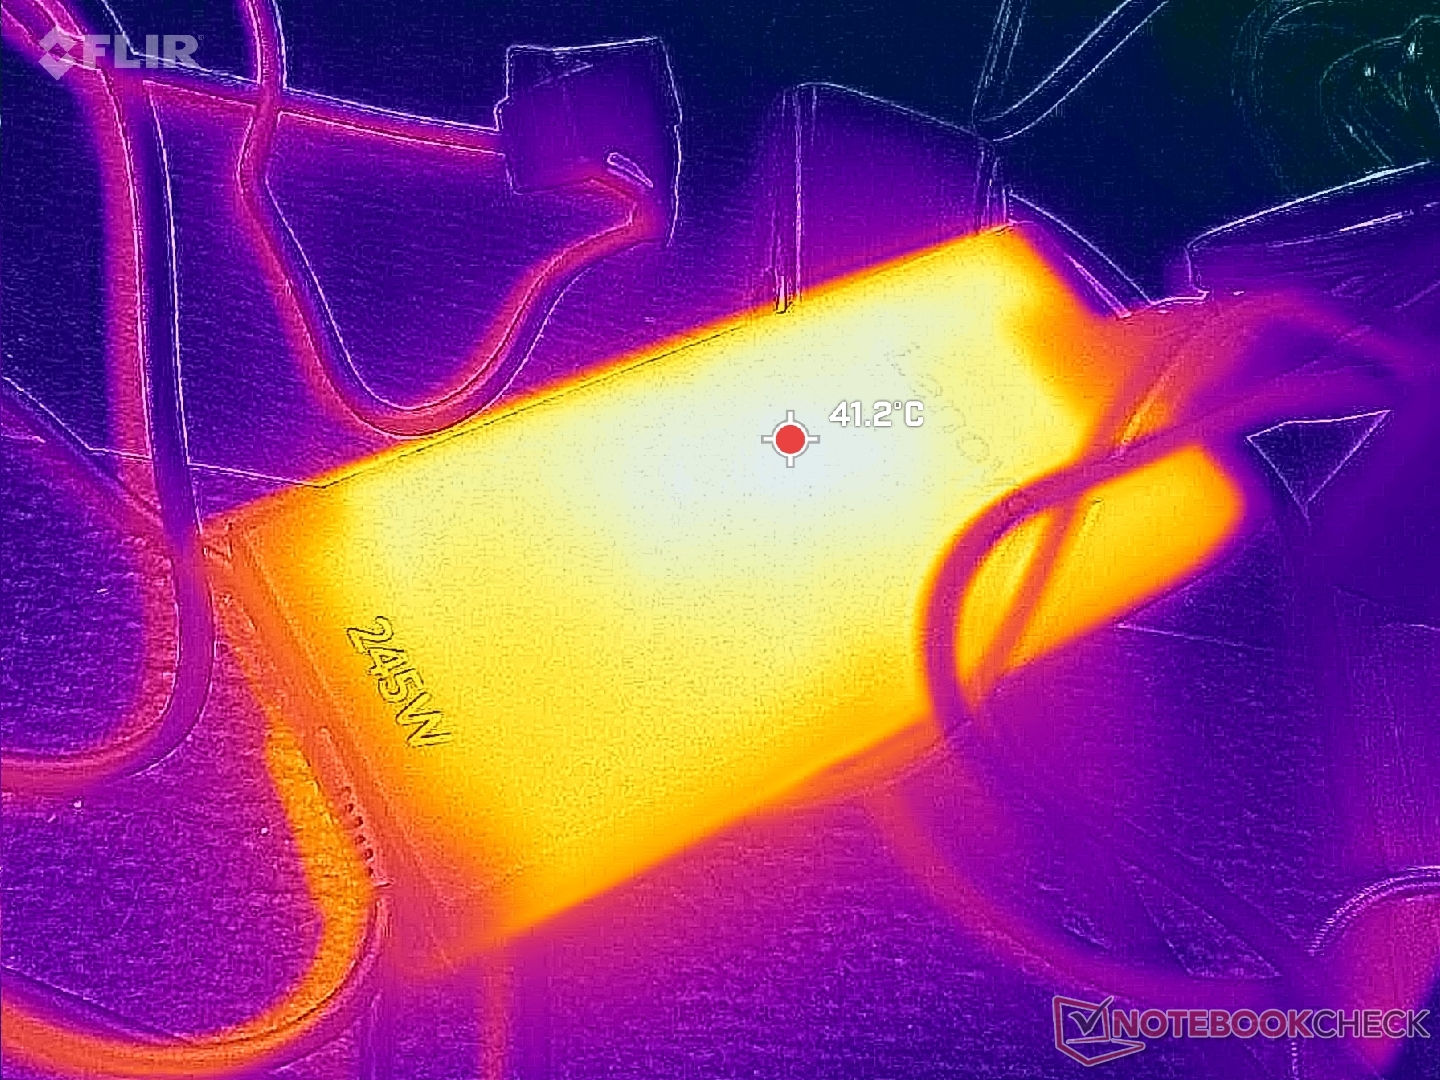
Energieverwaltung
Stromverbrauch
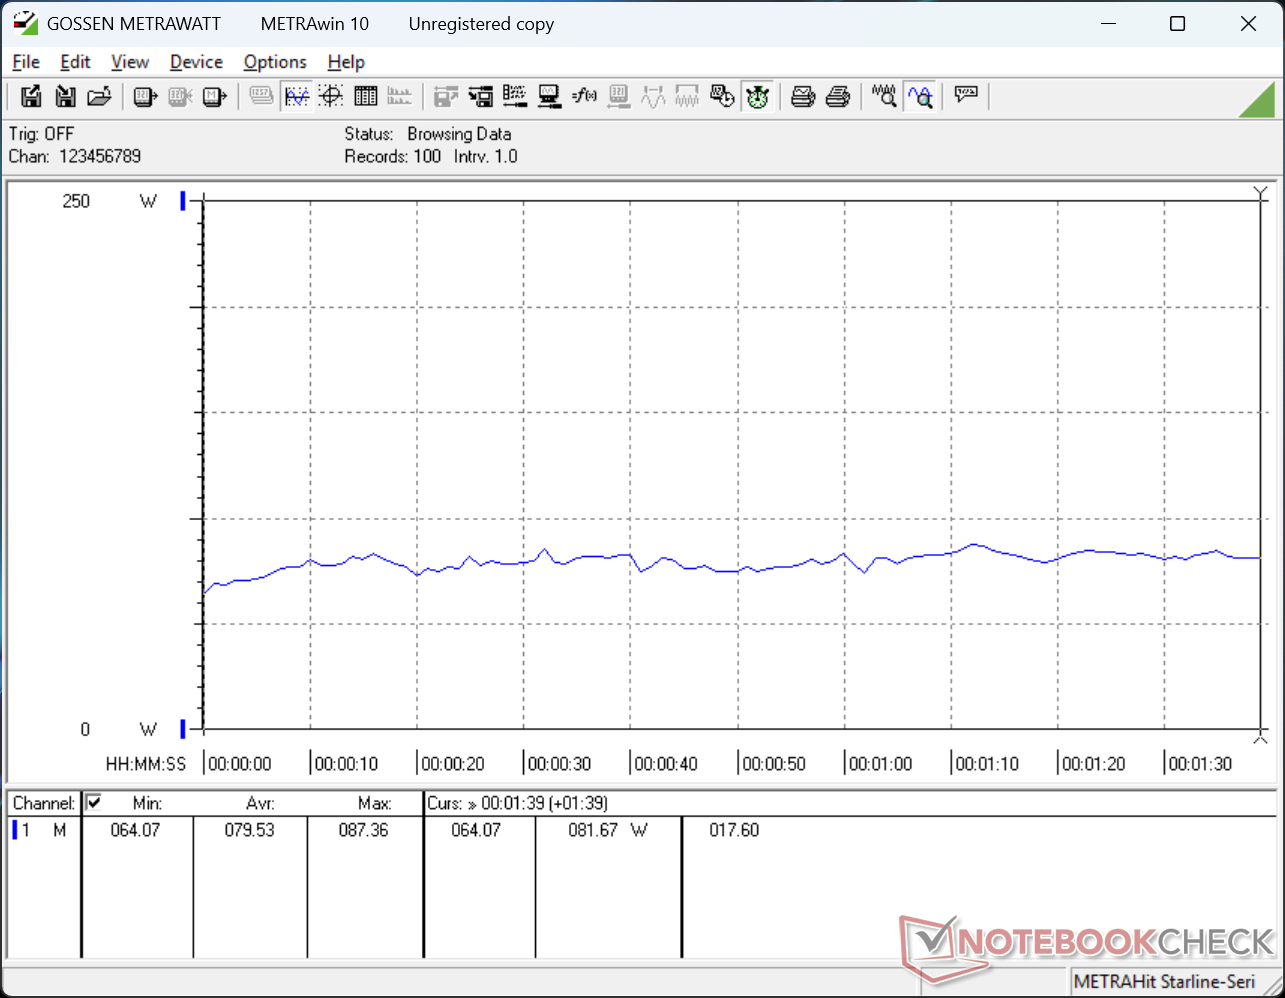
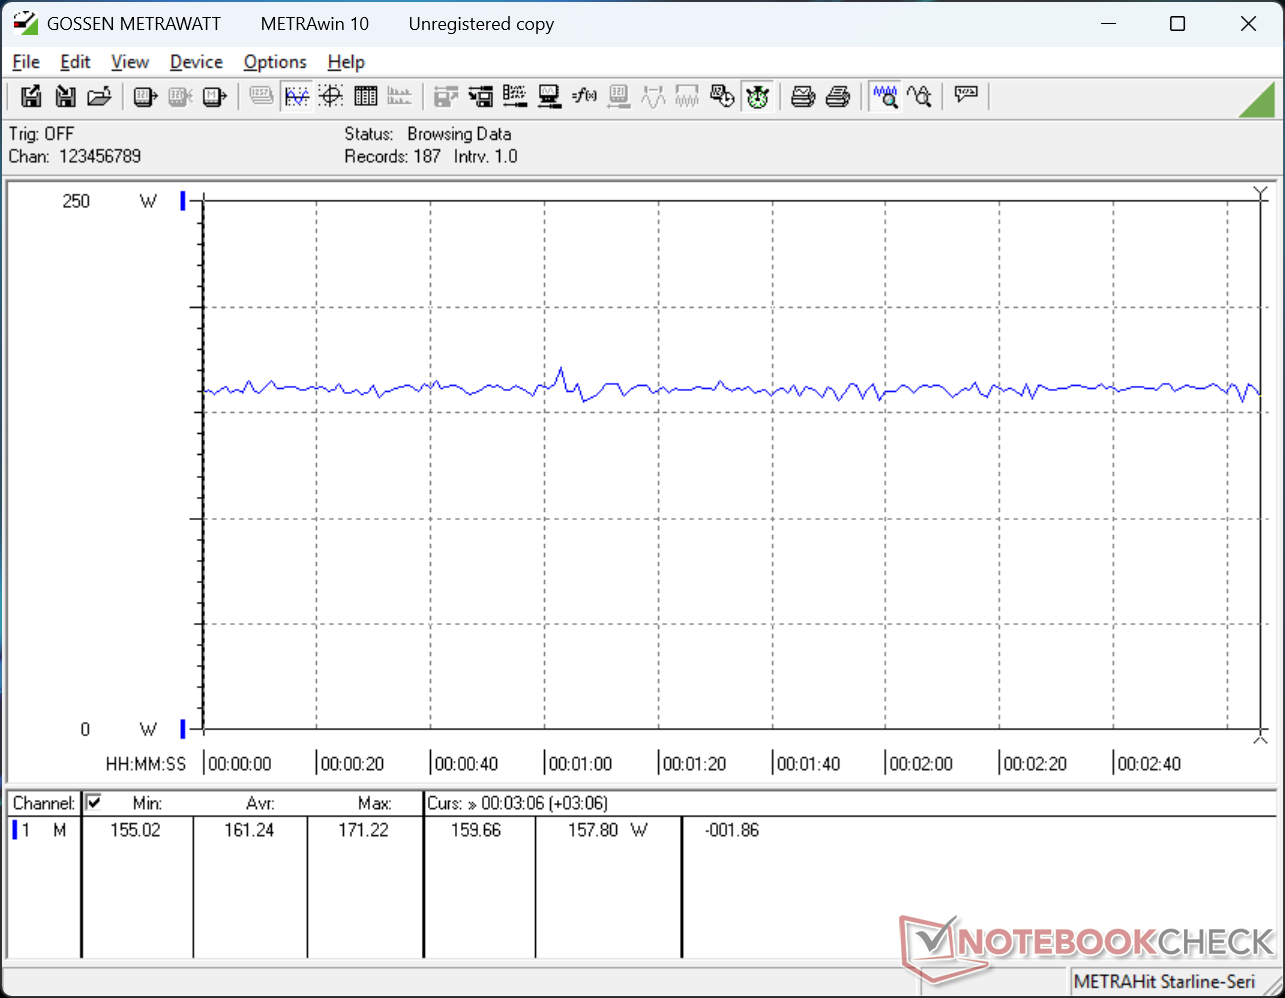
Das Lenovo System ist ein sehr anspruchsvoller Rechner mit einer hohen Mindestaufnahme von 15 W selbst bei der dunkelsten Helligkeitsstufe und aktivem Optimus; bei höchster Helligkeit und aktivierter dGPU steigt der Verbrauch auf bis zu 46 W. Unter höherer Last, etwa in Spielen, verbrauchte unser Testgerät ähnlich viel Strom wie das Asus ProArt P16 mit dem schnelleren Ryzen AI 9 HX 370 und der RTX-5070-GPU.
| Aus / Standby | |
| Idle | |
| Last |
|
Legende:
min: | |
| Lenovo Pro 9 16IPH11 Ultra 9 386H, GeForce RTX 5060 Laptop, SK hynix PVC10 HFS001TEM4X182N, Tandem OLED, 3200x2000, 16" | Lenovo Yoga Pro 9 16IAH10 RTX 5050 Ultra 9 285H, GeForce RTX 5050 Laptop, WD PC SN7100S SDFPMSL-1T00-1101, OLED, 2880x1800, 16" | Dell XPS 16 Core Ultra X7 358H Ultra X7 358H, Arc B390 Panther Lake iGPU, , OLED, 3200x2000, 16" | MSI Prestige 16 AI Evo B2HMG Ultra 9 285H, Arc 140T, Micron 2500 1TB MTFDKBA1T0QGN, IPS, 2560x1600, 16" | HP Omen Transcend 16-u1095ng i9-14900HX, GeForce RTX 4070 Laptop GPU, Kioxia XG8 KXG80ZNV1T02, OLED, 2560x1600, 16" | Asus ProArt P16 H7606WP Ryzen AI 9 HX 370, GeForce RTX 5070 Laptop, WD PC SN740 SDDPNQE-2T00, OLED, 2880x1800, 16" | |
|---|---|---|---|---|---|---|
| Stromverbrauch | 25% | 66% | 58% | 8% | 20% | |
| Idle min * (Watt) | 15.1 | 6.8 55% | 4 74% | 4.4 71% | 10 34% | 9.9 34% |
| Idle avg * (Watt) | 30.4 | 20.1 34% | 4.4 86% | 9.2 70% | 18 41% | 13.6 55% |
| Idle max * (Watt) | 46.2 | 21.6 53% | 10.2 78% | 9.5 79% | 32 31% | 14 70% |
| Last avg * (Watt) | 79.5 | 87.6 -10% | 44.2 44% | 66.9 16% | 128 -61% | 93.8 -18% |
| Cyberpunk 2077 ultra * (Watt) | 161.2 | 148.2 8% | 62.6 61% | 68.8 57% | 162.1 -1% | |
| Cyberpunk 2077 ultra external monitor * (Watt) | 160.7 | 147.9 8% | 62.4 61% | 67.4 58% | 158.3 1% | |
| Last max * (Watt) | 231.4 | 173.5 25% | 94.6 59% | 102.9 56% | 242 -5% | 229 1% |
| Witcher 3 ultra * (Watt) | 148.4 |
* ... kleinere Werte sind besser
Stromverbrauch Cyberpunk/Stresstest
Stromverbrauch externer Monitor
Akkulaufzeit
Die Laufzeiten sind relativ kurz, selbst wenn der Modus "Ausbalanciert" und die iGPU aktiv sind. Der relativ große 93-Wh-Akku schafft nur 5,5 Stunden WLAN-Surfen, bevor er sich automatisch abschaltet. Das ist einige Stunden kürzer als bei vielen anderen Multimedia-Modellen, einschließlich Lenovos eigenem Pro 9i 16IAH G10 Aura.
(Update vom 3. Mai 2026: Die WLAN-Akkulaufzeit wurde erneut getestet, wobei die Displayhelligkeit auf 150 Nits, die Bildwiederholfrequenz auf 60 Hz und die Nvidia-Grafikeinstellung auf „Automatisch“ eingestellt wurden, um Ergebnisse zu erzielen, die näher an denen des letztjährigen Yoga Pro 9i 16IAH G10 Aura mit ca. 10 Stunden liegen. Die Gesamtbewertung wurde ebenfalls aktualisiert, um die längere Laufzeit widerzuspiegeln.)
| Lenovo Pro 9 16IPH11 Ultra 9 386H, GeForce RTX 5060 Laptop, 92.5 Wh | Lenovo Yoga Pro 9 16IAH10 RTX 5050 Ultra 9 285H, GeForce RTX 5050 Laptop, 84 Wh | Dell XPS 16 Core Ultra X7 358H Ultra X7 358H, Arc B390 Panther Lake iGPU, 70 Wh | MSI Prestige 16 AI Evo B2HMG Ultra 9 285H, Arc 140T, 99.9 Wh | HP Omen Transcend 16-u1095ng i9-14900HX, GeForce RTX 4070 Laptop GPU, 97 Wh | Asus ProArt P16 H7606WP Ryzen AI 9 HX 370, GeForce RTX 5070 Laptop, 90 Wh | |
|---|---|---|---|---|---|---|
| Akkulaufzeit | 8% | 4% | 67% | -51% | -7% | |
| WLAN (h) | 9.9 | 10.7 8% | 10.3 4% | 16.5 67% | 4.9 -51% | 9.2 -7% |
| H.264 (h) | 20.8 | |||||
| Last (h) | 2.4 |
Notebookcheck Bewertung
Ein High-End-Multimediagerät mit viel Leistung und einem superhellen OLED-Touchscreen, dem es aber an Akkulaufzeit fehlt.
Lenovo Pro 9 16IPH11
- 03.05.2026 v8
Allen Ngo
 Total Sustainability Score:
 Potenzielle Wettbewerber im Vergleich
Bild | Modell / Test | Preis ab | Gewicht | Dicke | Display |
|---|---|---|---|---|---|
1. 91%  | Lenovo Pro 9 16IPH11 Intel Core Ultra 9 386H ⎘ NVIDIA GeForce RTX 5060 Laptop ⎘ 32 GB RAM, 1024 GB SSD | Amazon: 2.938,06 € Bestpreis 2938.06€ Cyberport.de 2. 2938.06€ computeruniverse.net 3. 2962.76€ computeruniverse.at | 1.9 kg | 17.3 mm | 16.00" 3200x2000 236 PPI Tandem OLED |
2. 88.8%  | Lenovo Yoga Pro 9 16IAH10 RTX 5050 Intel Core Ultra 9 285H ⎘ NVIDIA GeForce RTX 5050 Laptop ⎘ 32 GB RAM, 1024 GB SSD | Amazon: Geizhals Suche | 2 kg | 17.9 mm | 16.00" 2880x1800 212 PPI OLED |
3. 87.2%  | Dell XPS 16 Core Ultra X7 358H Intel Core Ultra X7 358H ⎘ Intel Arc B390 12 Xe3 Panther Lake iGPU ⎘ 32 GB RAM | Amazon: 1. 2.549,00 € Dell XPS 16 9640 Laptop 16.3... 2. 1.279,00 € Dell XPS 16 9640 Laptop 16.3... 3. 2.055,96 € Dell XPS 16 (9640) Laptop 16... Geizhals Suche | 1.7 kg | 14.62 mm | 16.00" 3200x2000 236 PPI OLED |
4. 82.8%  | MSI Prestige 16 AI Evo B2HMG Intel Core Ultra 9 285H ⎘ Intel Arc Graphics 140T ⎘ 32 GB RAM, 1024 GB SSD | Amazon: 1. 1.533,60 € MSI Prestige 16 AI+ Evo B2VM... 2. 1.269,32 € MSI Prestige A16 AI+ A3HMG-0... 3. 1.153,64 € MSI Prestige 13 AI Evo Busin... | 1.6 kg | 18.95 mm | 16.00" 2560x1600 189 PPI IPS |
5. 88.4% v7 (old)  | HP Omen Transcend 16-u1095ng Intel Core i9-14900HX ⎘ NVIDIA GeForce RTX 4070 Laptop GPU ⎘ 32 GB RAM, 1024 GB SSD | Amazon: Geizhals Suche | 2.3 kg | 20 mm | 16.00" 2560x1600 189 PPI OLED |
6. 89.1%  | Asus ProArt P16 H7606WP AMD Ryzen AI 9 HX 370 ⎘ NVIDIA GeForce RTX 5070 Laptop ⎘ 64 GB RAM, 2048 GB SSD | Amazon: 1. 4.305,99 € ASUS ProArt P16 H7606WX Lapt... 2. 3.478,00 € ASUS ProArt P16 H7606WP-RJ09... 3. 3.843,78 € ASUS ProArt P16 R9 HX 370 32... Geizhals Suche | 1.8 kg | 17.3 mm | 16.00" 2880x1800 212 PPI OLED |
Transparenz
Die Auswahl der zu testenden Geräte erfolgt innerhalb der Redaktion. Das vorliegende Testmuster wurde dem Autor vom Hersteller oder einem Shop zu Testzwecken leihweise zur Verfügung gestellt. Eine Einflussnahme des Leihstellers auf den Testbericht gab es nicht, der Hersteller erhielt keine Version des Reviews vor der Veröffentlichung. Es bestand keine Verpflichtung zur Publikation. Als eigenständiges, unabhängiges Unternehmen unterliegt Notebookcheck keiner Diktion von Herstellern, Shops und Verlagen.
So testet Notebookcheck
Pro Jahr werden von Notebookcheck hunderte Laptops und Smartphones unabhängig in von uns standardisierten technischen Verfahren getestet, um eine Vergleichbarkeit aller Testergebnisse zu gewährleisten. Seit rund 20 Jahren entwickeln wir diese Testmethoden kontinuierlich weiter und setzen damit Branchenstandards. In unseren Testlaboren kommt ausschließlich hochwertiges Messequipment in die Hände erfahrener Techniker und Redakteure. Die Tests unterliegen einer mehrstufigen Kontrolle. Unsere komplexe Gesamtbewertung basiert auf hunderten fundierten Messergebnissen und Benchmarks, womit Ihnen Objektivität garantiert ist. Weitere Informationen zu unseren Testmethoden gibt es hier.

