Fazit — Neuer professioneller Auftritt
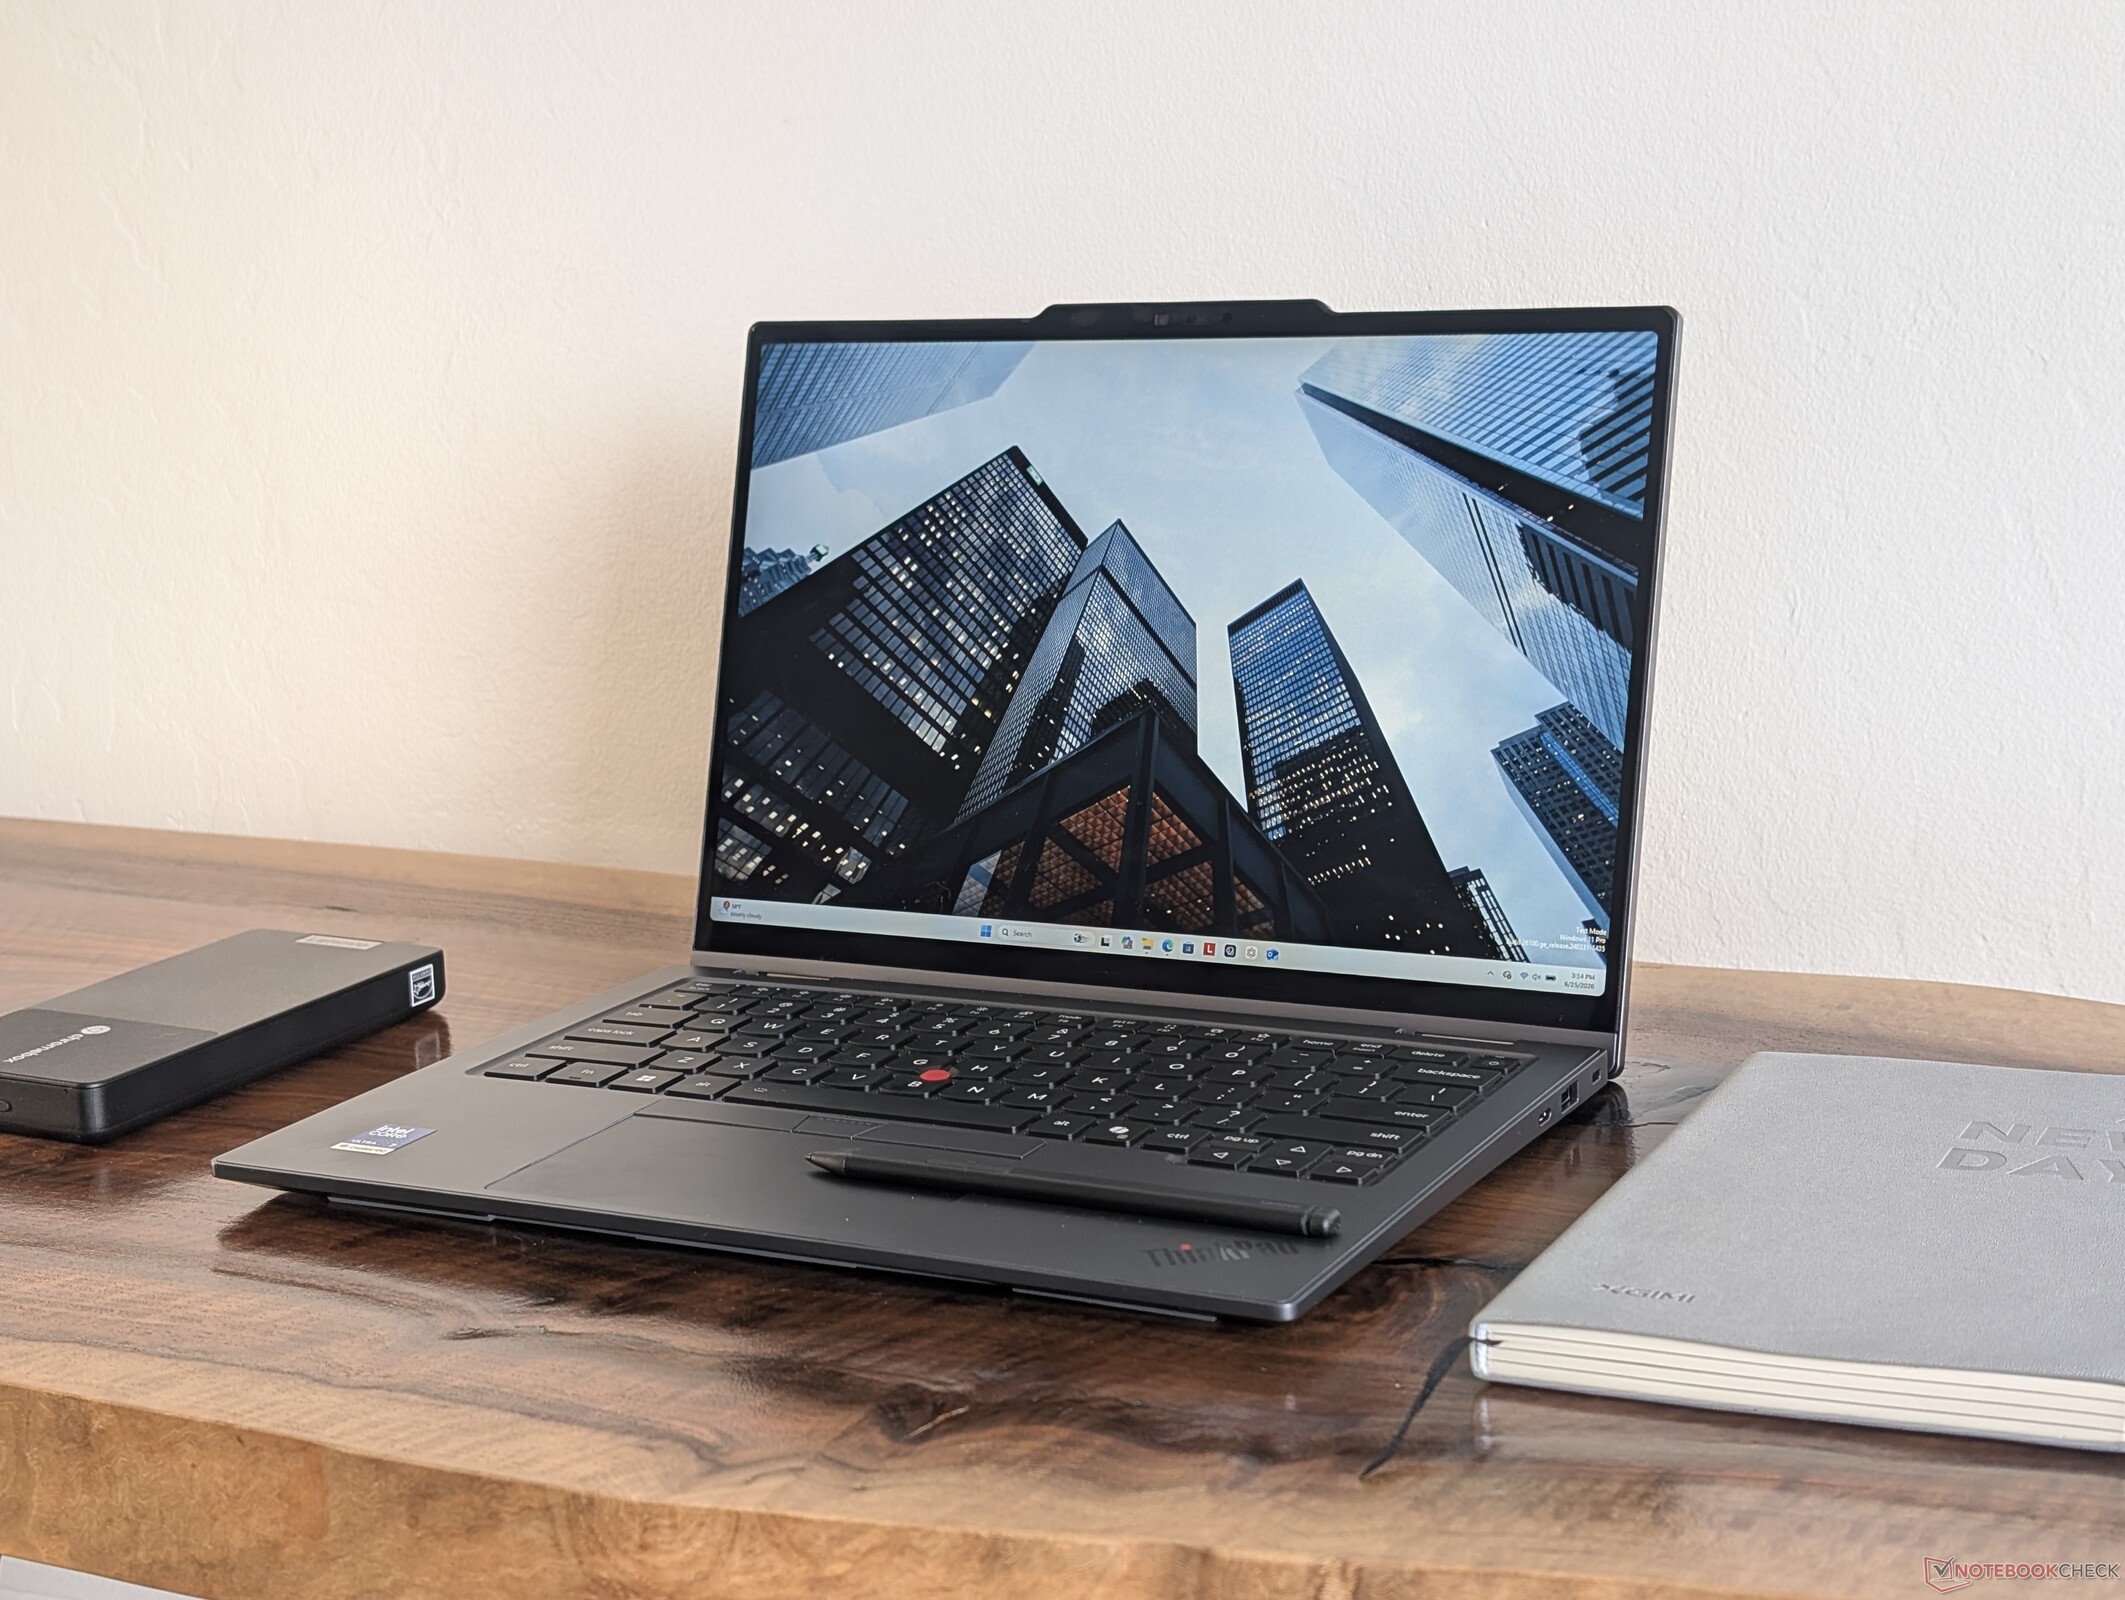
Während das ThinkPad X1 2-in-1 der 10. Generation aus dem letzten Jahr noch zu sehr wie ein IdeaPad oder Yoga aussah, weist das überarbeitete ThinkPad X1 2-in-1 der 11. Generation mehr typische ThinkPad Designelemente auf und vermittelt so einen professionelleren Eindruck. Die Änderungen am Netzschalter, am Clickpad, an der Stiftladestation sowie an Größe und Gewicht insgesamt machen das ThinkPad X1 2-in-1 Gen 11 in seinen verschiedenen Betriebsmodi benutzerfreundlicher.
Die neue Aussparung zum Aufladen des Stifts ist jedoch ein zweischneidiges Schwert: Zwar handelt es sich um eine ästhetisch ansprechendere und sicherere Lösung als beim Vorjahresmodell, doch muss der neue Stift dafür dünner sein. Der kleine „Slim Pen 2“ lässt sich daher möglicherweise weniger angenehm in der Hand halten als der dickere „Yoga Pen“, der im Lieferumfang des ThinkPad X1 2-in-1 Gen 10 enthalten war. Mit anderen Worten: Während wir das Gehäusedesign der Gen 11 gegenüber dem der Gen 10 bevorzugen, gilt bei den Stiften das Gegenteil.
Was die Leistung angeht, sollte man nicht davon ausgehen, dass das diesjährige Modell wesentlich schneller ist als das Vorjahresmodell, es sei denn, es ist mit der Spitzenkonfiguration „Core Ultra X7“ ausgestattet, die über die deutlich leistungsstärkere Arc-B390-GPU verfügt.
Pro
Contra
Preis und Verfügbarkeit
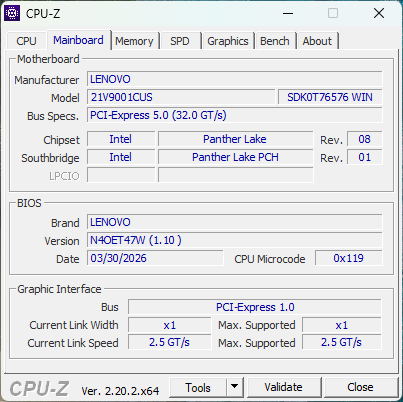
Das ThinkPad X1 2-in-1 der 11. Generation ist der direkte Nachfolger des Vorjahresmodells ThinkPad X1 2-in-1 Gen 10. Während die beiden Vorgängermodelle optisch identisch waren, handelt es sich bei der diesjährigen Gen 11 um eine komplette Neugestaltung, die sowohl neue Intel-Panther-Lake-CPU-Optionen als auch ein überarbeitetes Design umfasst.
Unser Testgerät ist eine Mittelklasse-Konfiguration mit dem Core Ultra 7 355 und einem 1.200p60-IPS-Touchscreen für etwa 2.700 US-Dollar. Günstigere Modelle sind mit dem Core Ultra 5 325 ausgestattet, während die Top-Variante über den deutlich schnelleren Core Ultra X7 368H und einen 1.800p120-OLED-Touchscreen verfügt.
Zu den Mitbewerbern in diesem Segment zählen andere businessorientierte Convertibles wie das Latitude 7450 2-in-1 von Dell, HP EliteBook X Flip G1i 14 oder die MSI-Prestige-14-Flip-Serie.
Weitere Lenovo Testberichte:
Technische Daten
Preisvergleich
Gehäuse
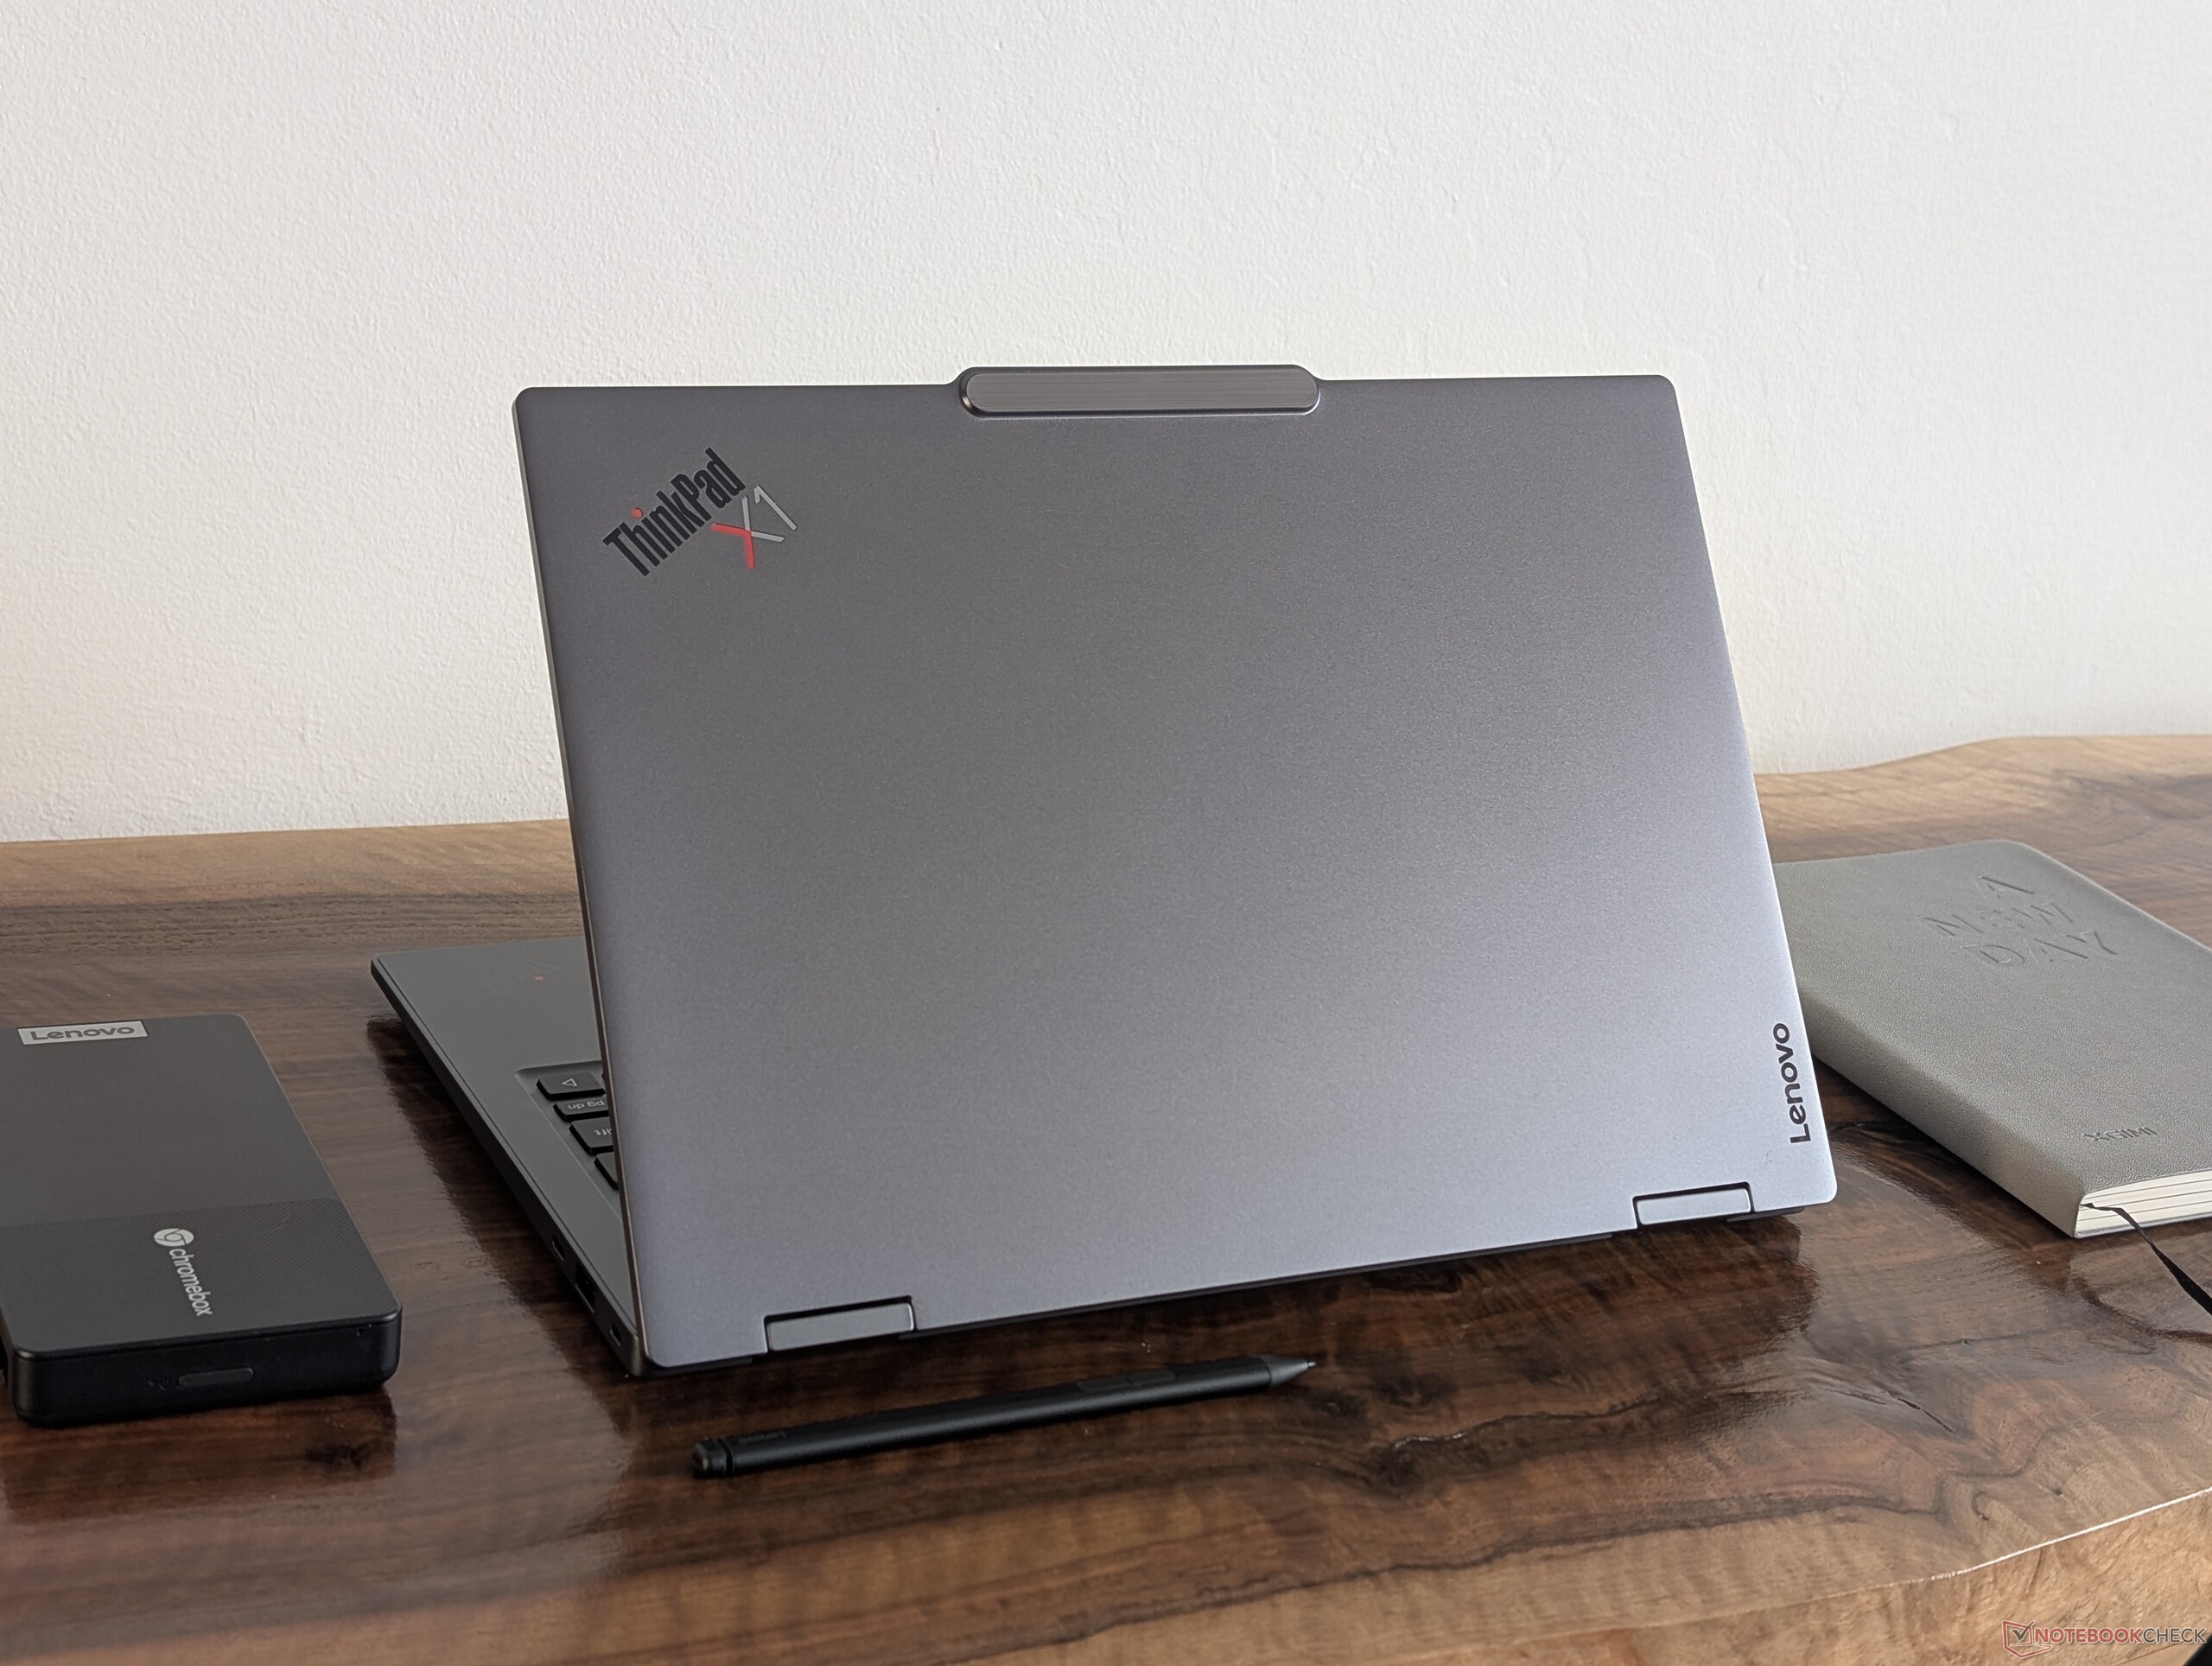
Das neue Gehäuse ist um etwa 100 Gramm bzw. einen Bruchteil eines Millimeters dünner und leichter als zuvor, ohne dabei weniger stabil oder minderwertig zu wirken. Tatsächlich wirken viele der äußerlichen Veränderungen – von den Logos bis hin zu den insgesamt dunkleren Farbtönen – ästhetisch professioneller, während das ältere ThinkPad X1 2-in-1 der 10. Generation eher verbraucherorientiert oder im Stil eines IdeaPad erscheint.
Die auffälligste Neuerung bei der Neugestaltung ist die Aussparung an der Unterseite nahe der Vorderkante zum Verstauen und Aufladen des Slim Pen 2. Die Aussparung hält den Stift sicherer fest als die üblichen Magnete an den Außenkanten der meisten anderen Convertibles, einschließlich des Vorjahresmodells.
Anschlussausstattung
Die Anschlussmöglichkeiten entsprechen denen des Vorjahresmodells, allerdings gibt es einen USB-A-Anschluss weniger. Durch die neue Position des Ein-/Aus-Schalters wird zudem das versehentliche Betätigen dieses Schalters bei der Bedienung im Tablet-Modus weniger problematisch.


Kommunikation
Webcam
Standardmäßig ist eine Webcam mit 5 MP enthalten, die auf 10 MP aufgerüstet werden kann.


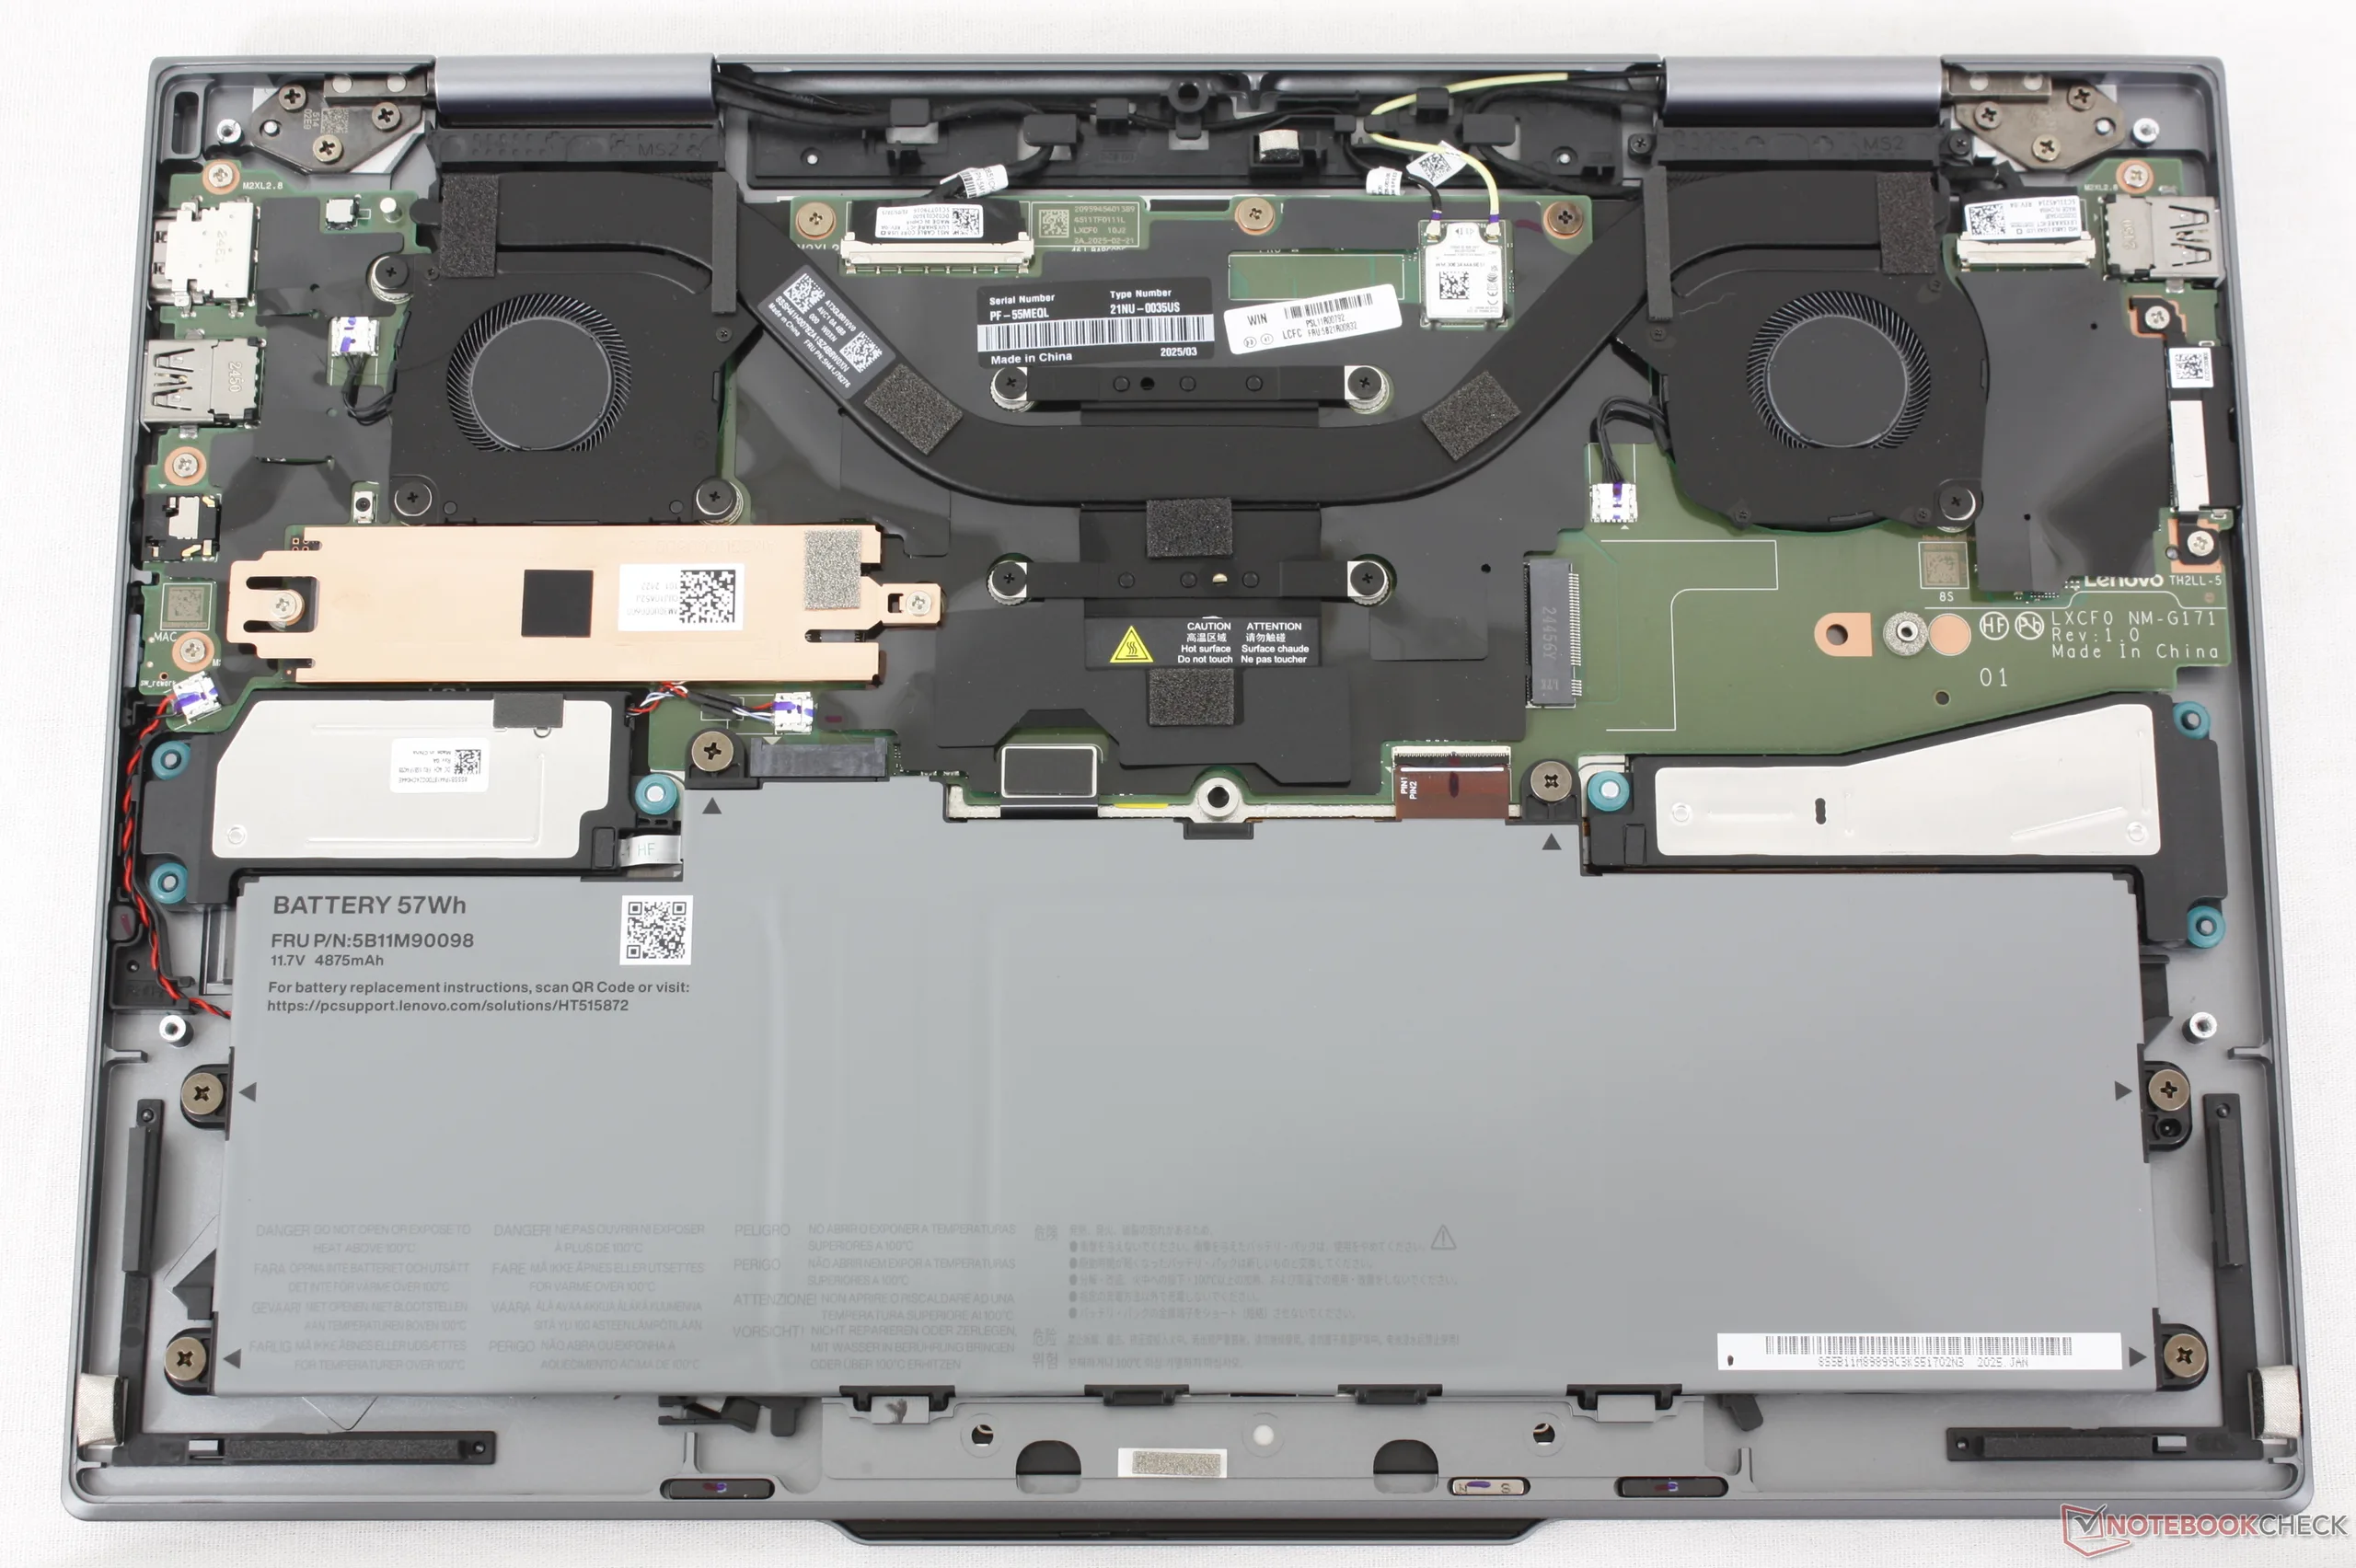
Wartung
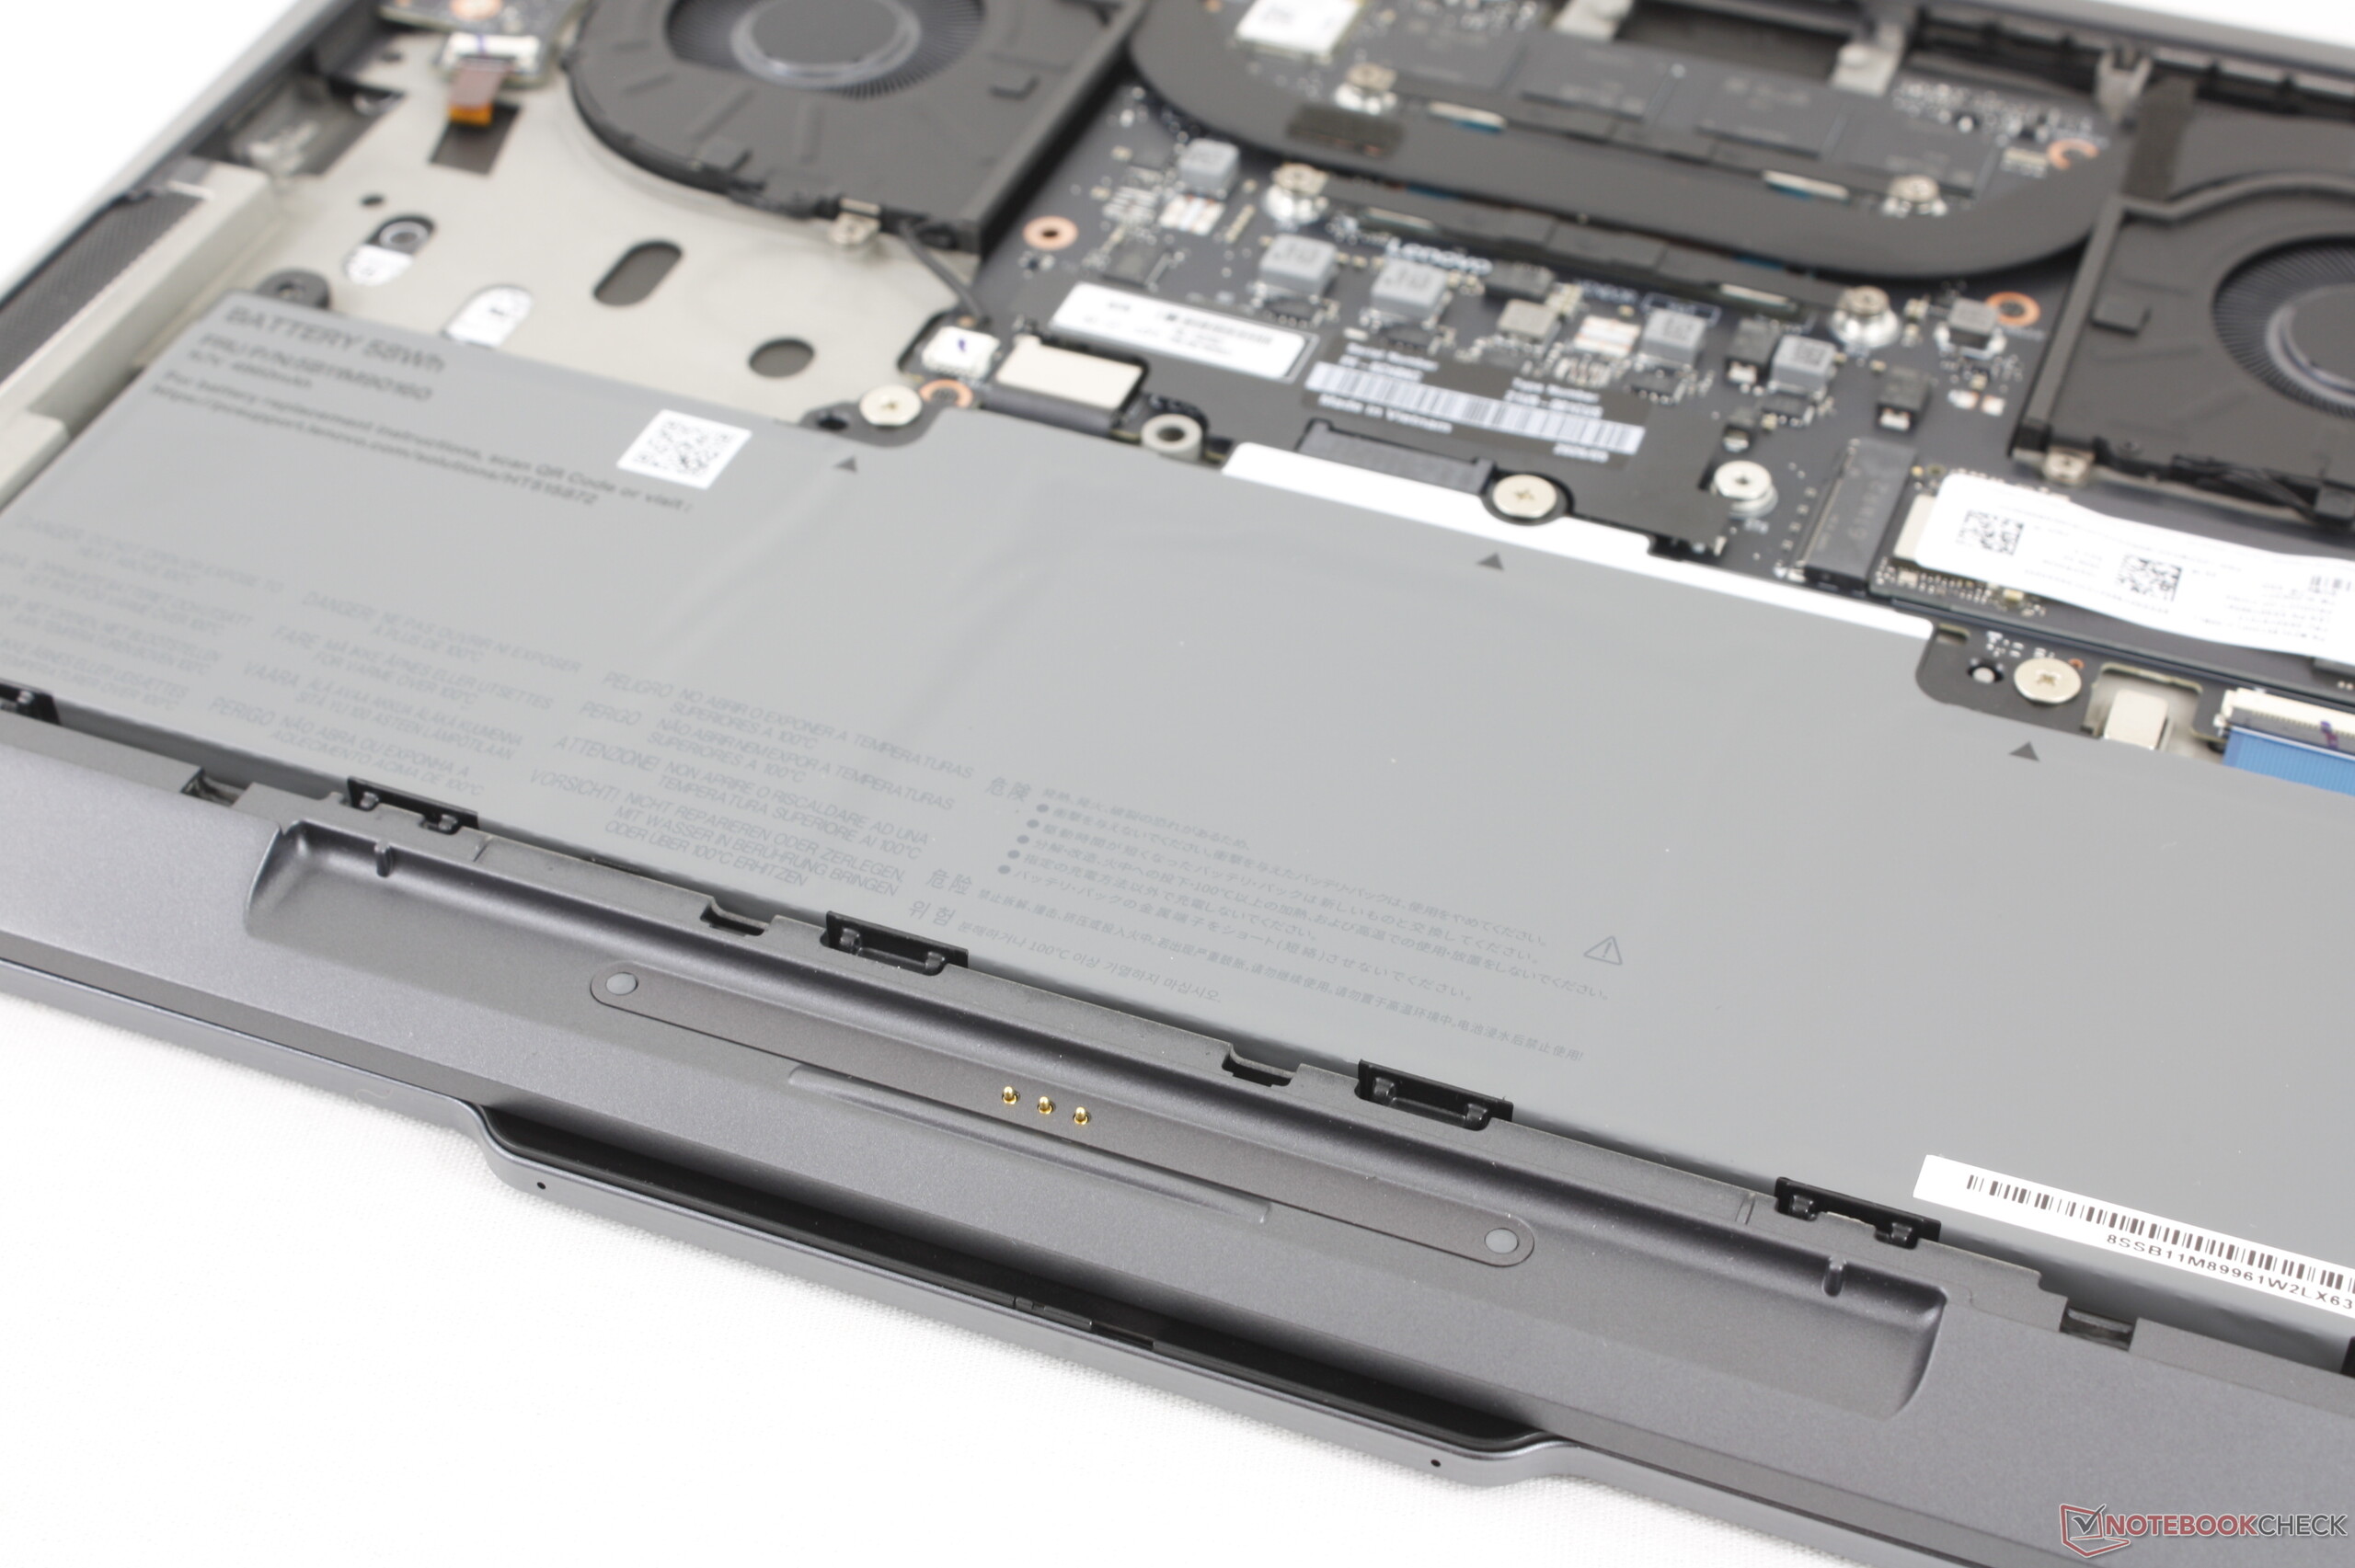
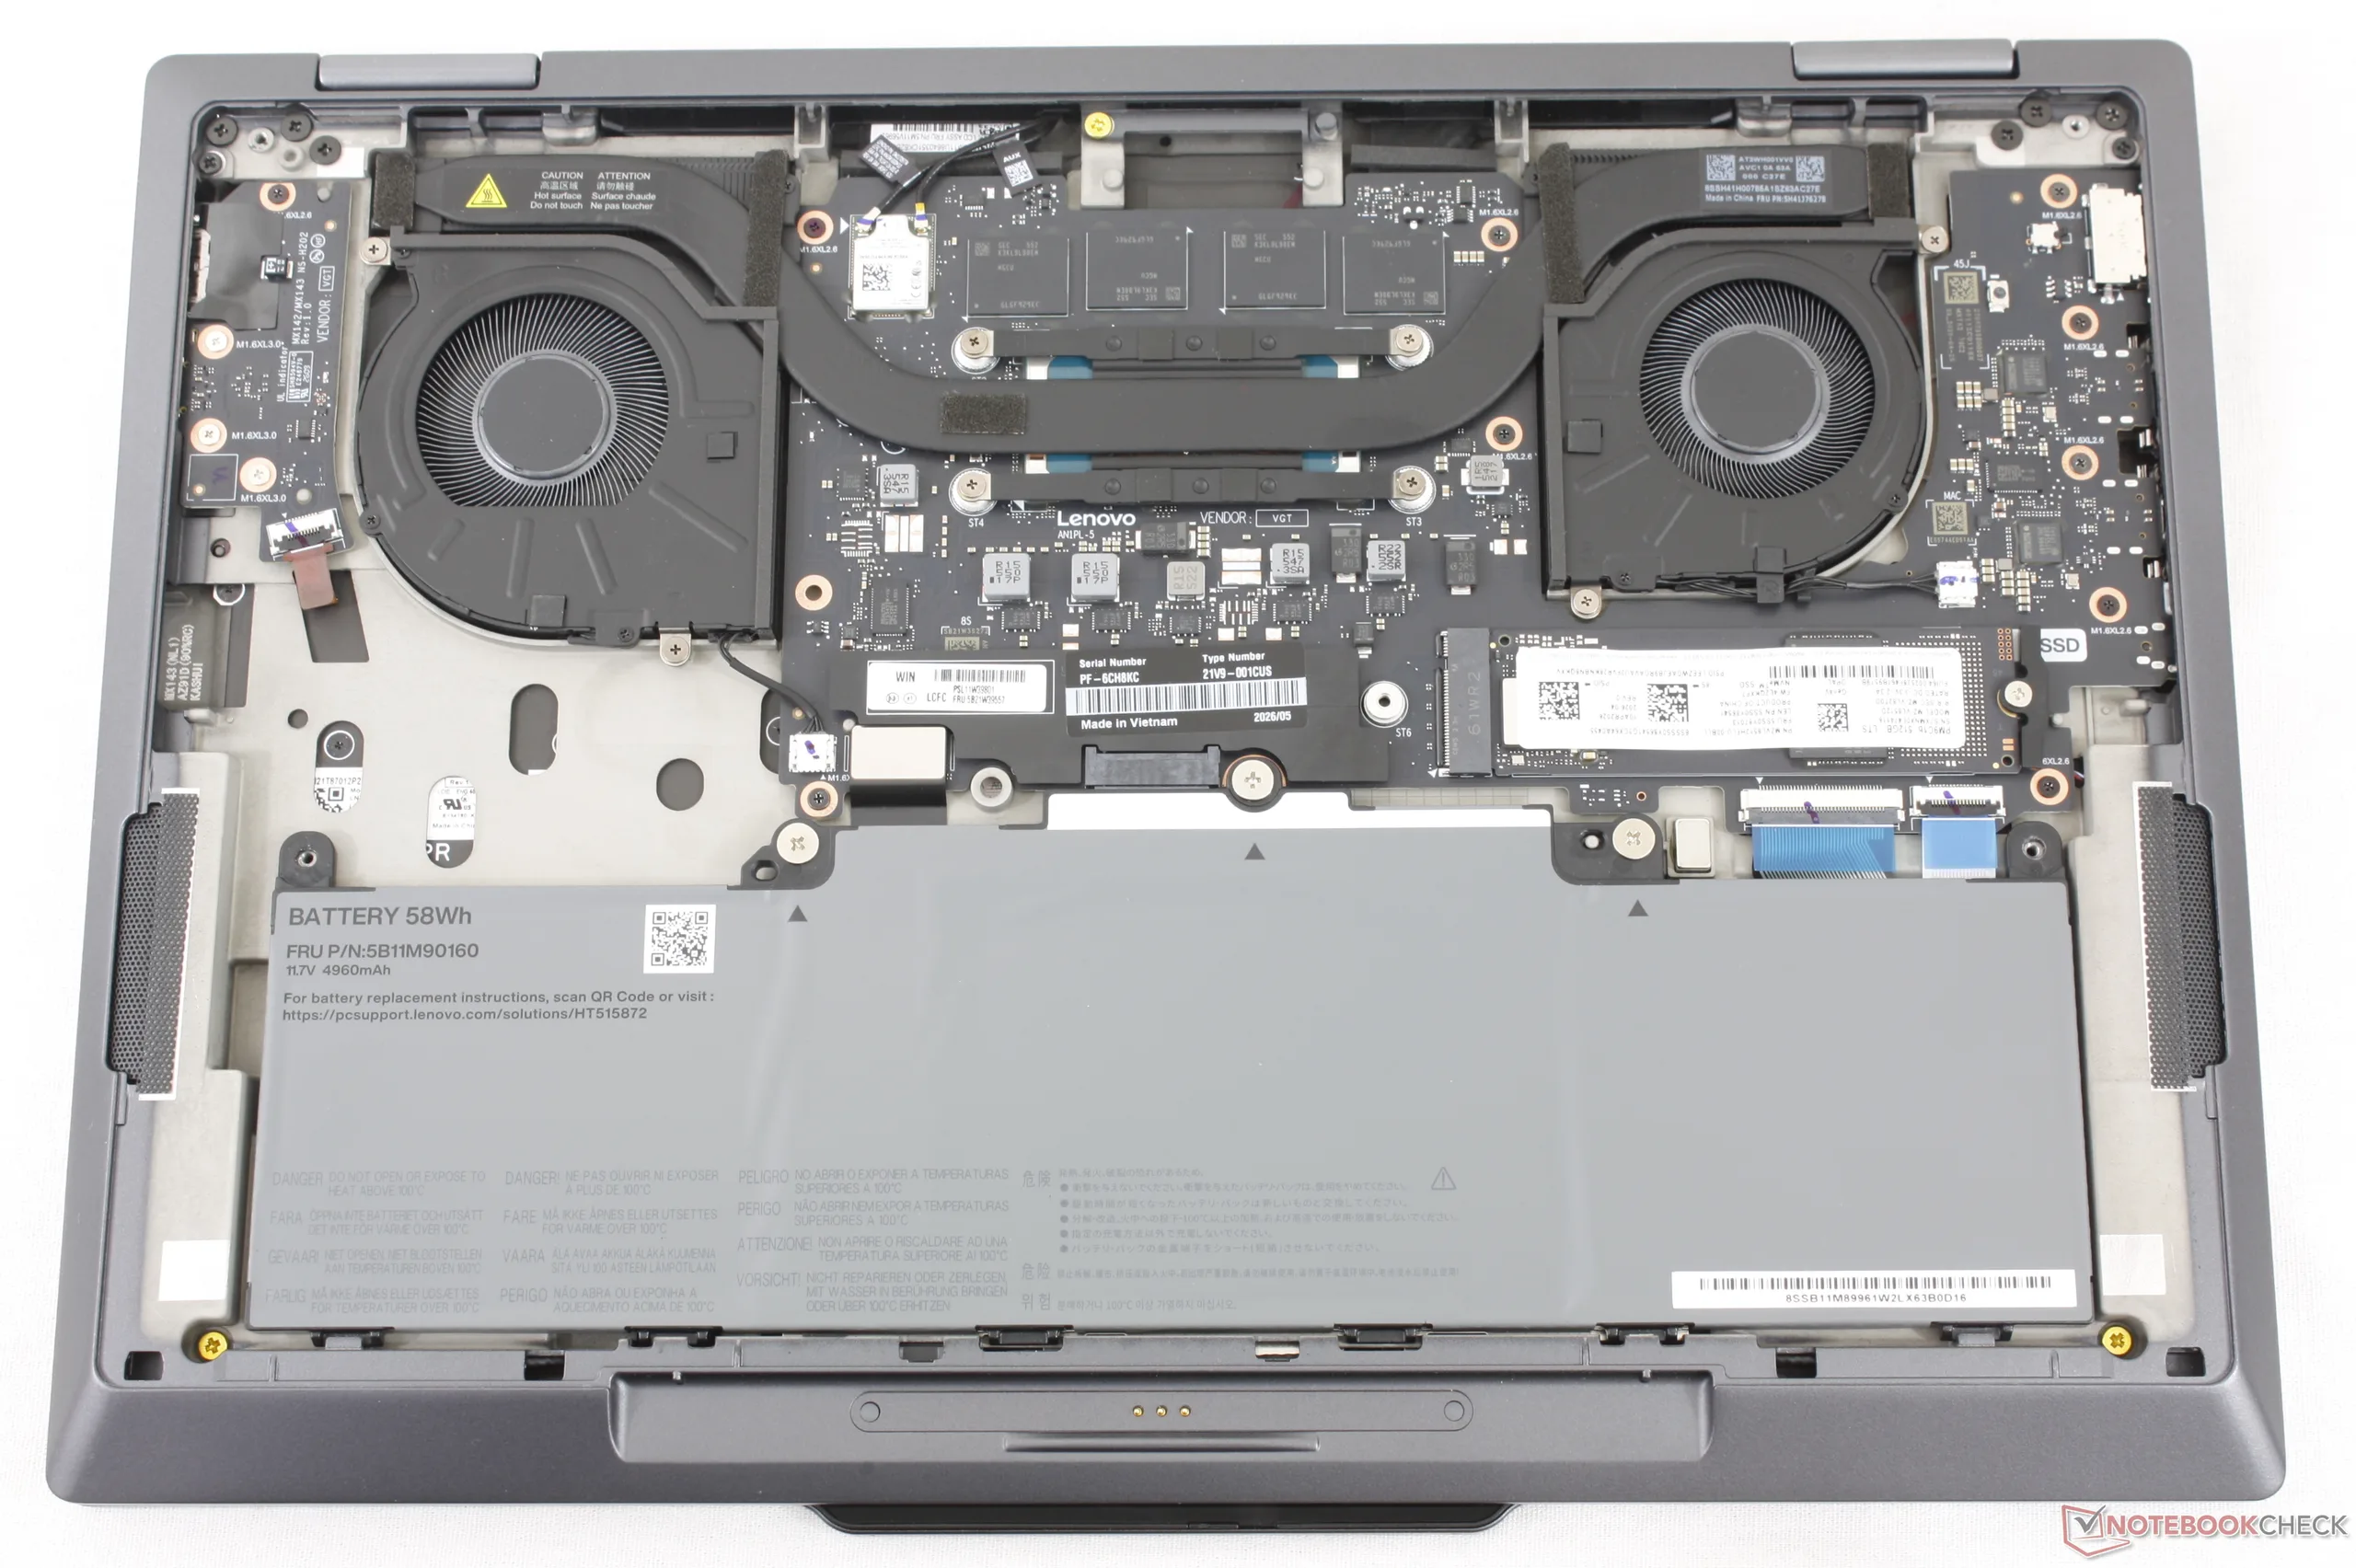
Die untere Abdeckung lässt sich ganz einfach mit einem Kreuzschlitzschraubendreher öffnen. Aufrüstungsmöglichkeiten beschränken sich auf den einzigen M.2-2280-SSD-Steckplatz.
Nachhaltigkeit
Bei diesem Modell kommen in großem Umfang recycelte Materialien zum Einsatz, darunter je nach Bauteil bis zu 90 Prozent recyceltes Aluminium, Stahl und Magnesium sowie bis zu 65 Prozent PCC-Kunststoffe. Die Batterie selbst besteht zu 100 Prozent aus recyceltem Kobalt, und die Verpackung ist kunststofffrei.
Zubehör und Garantie
Der optionale Lenovo Slim Pen 2 ist schlanker als der Yoga Pen, der im Lieferumfang des ThinkPad X1 2-in-1 Gen 10 aus dem letzten Jahr enthalten war. Die integrierte Aussparung zum Aufladen des Slim Pen 2 ist daher nicht mit dem Stift aus dem letzten Jahr kompatibel.
Es gilt die einjährige beschränkte Herstellergarantie.
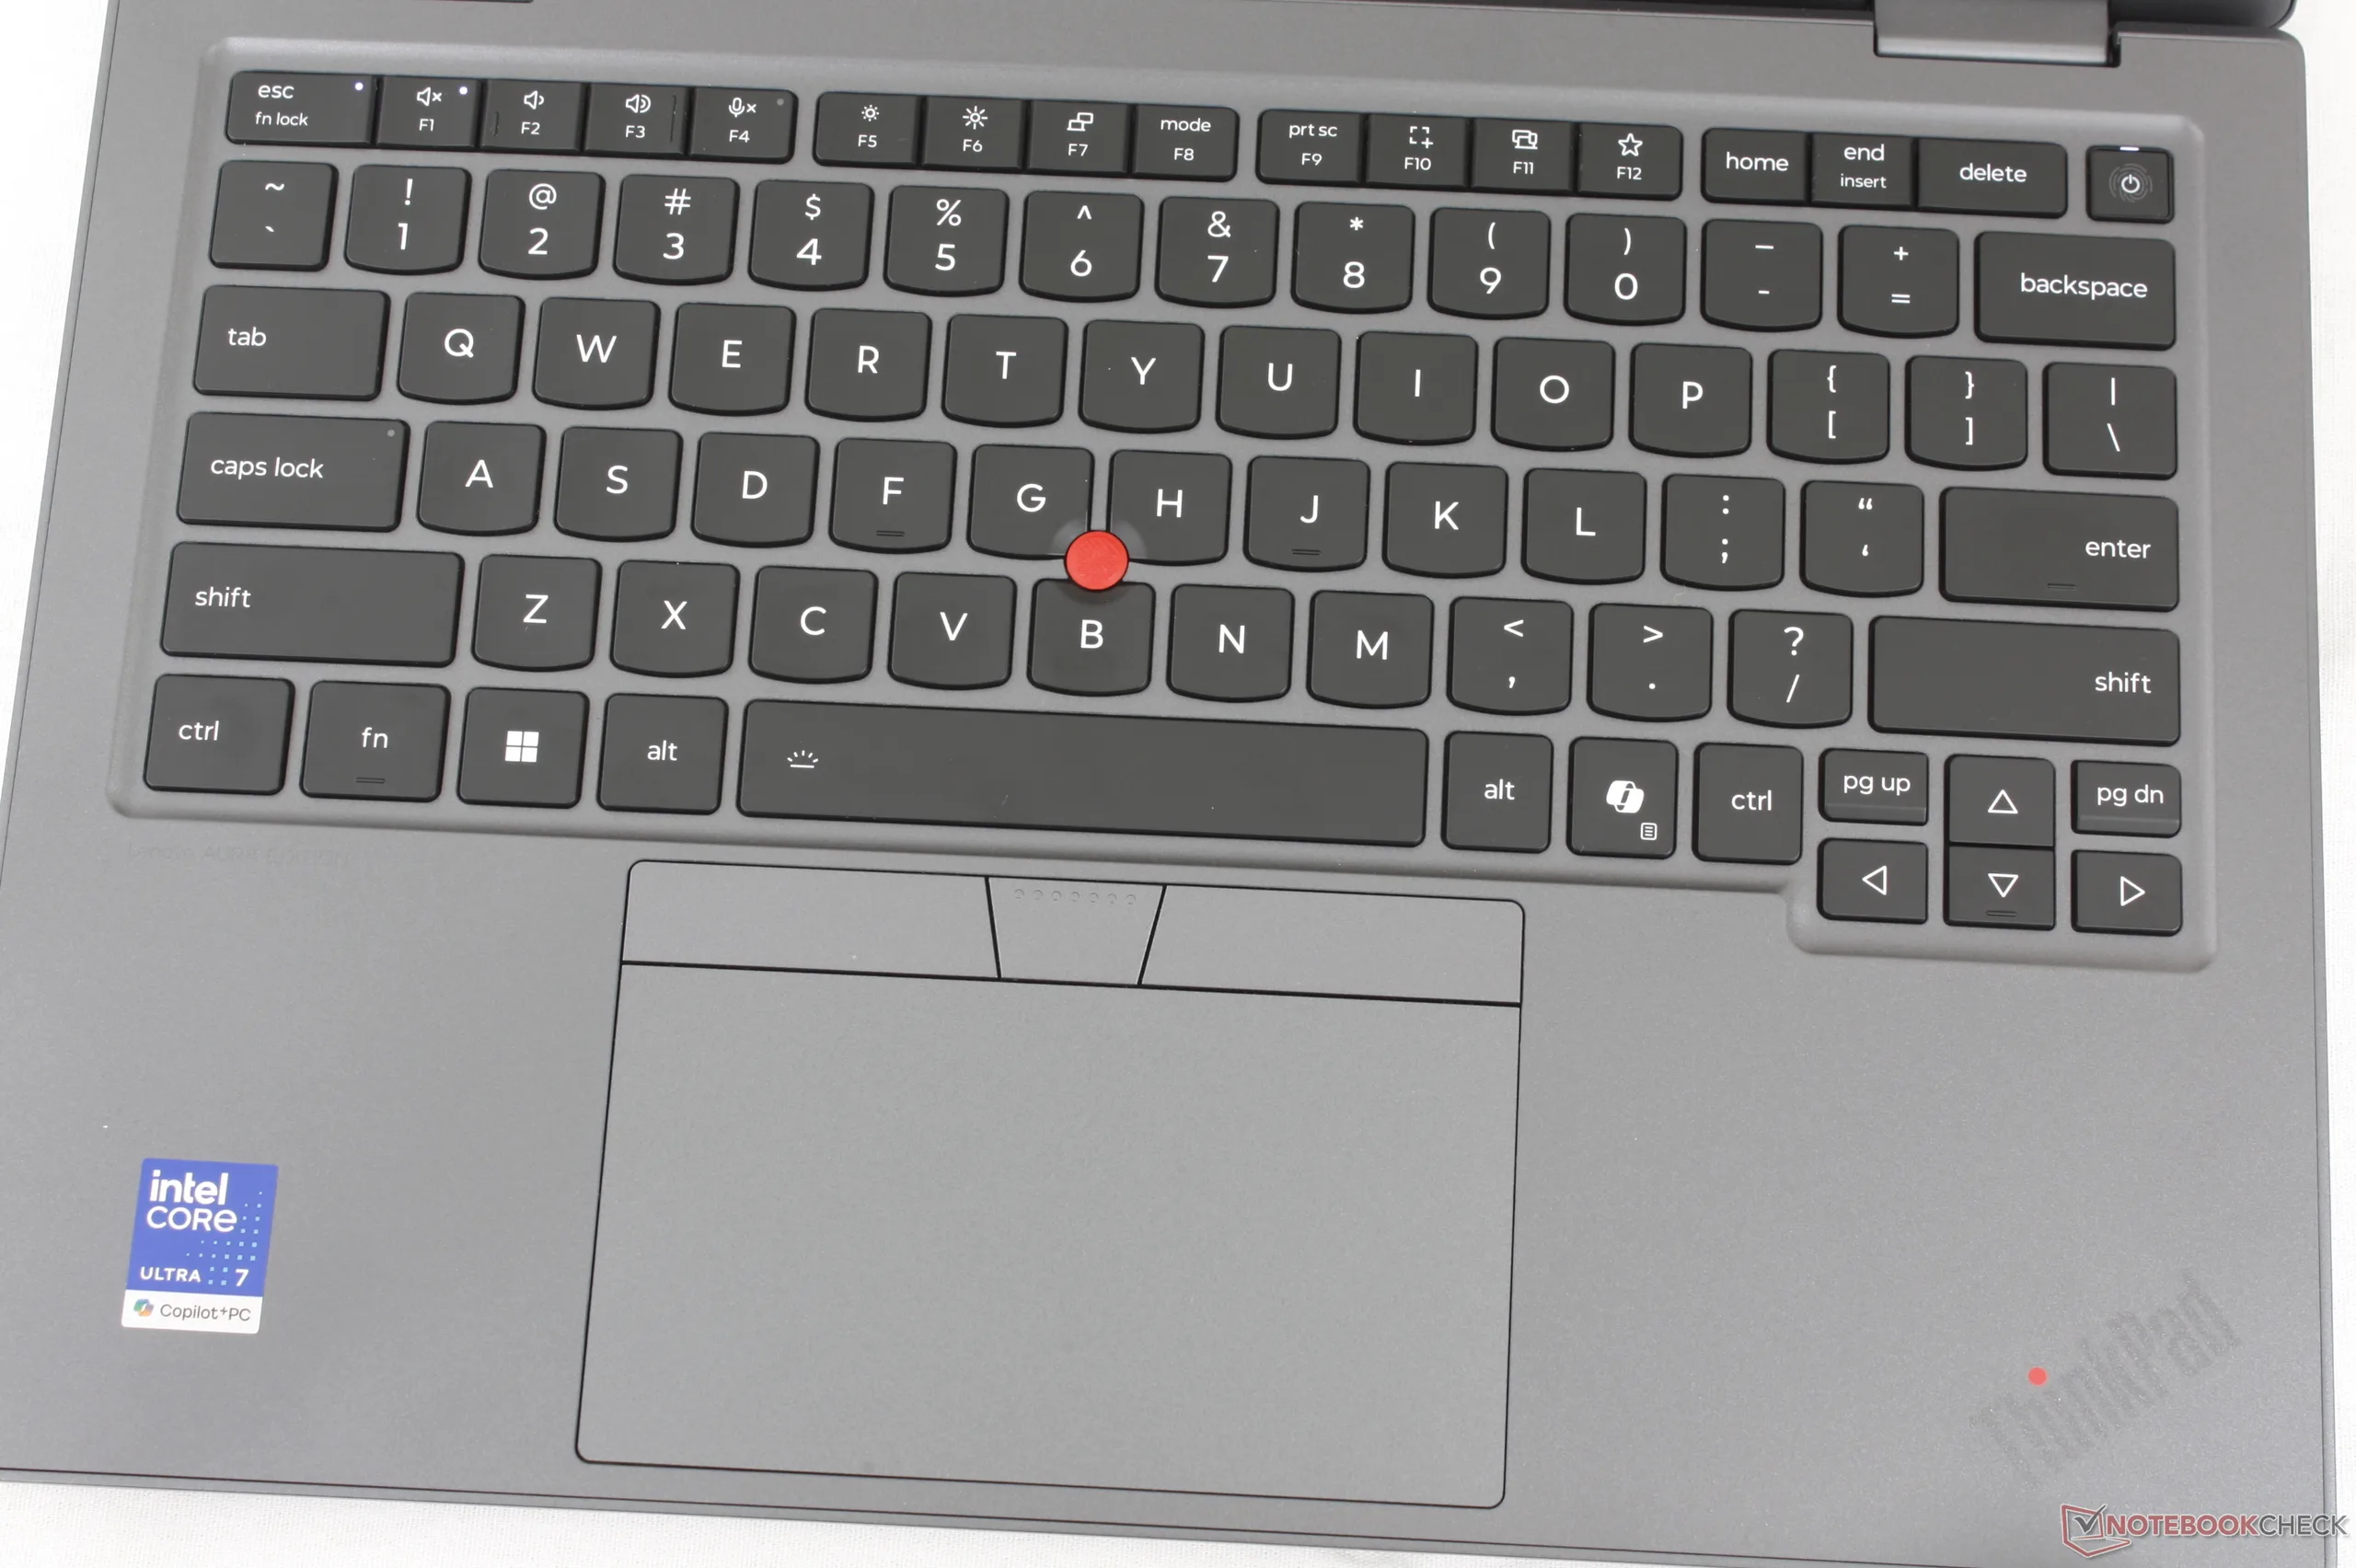
Eingabegeräte
Der spezielle Fingerabdruckleser des Vorjahresmodells wurde bei dieser aktuellen Neugestaltung zugunsten eines kleinen fingerabdruckfähigen Ein-/Aus-Schalters entfernt.
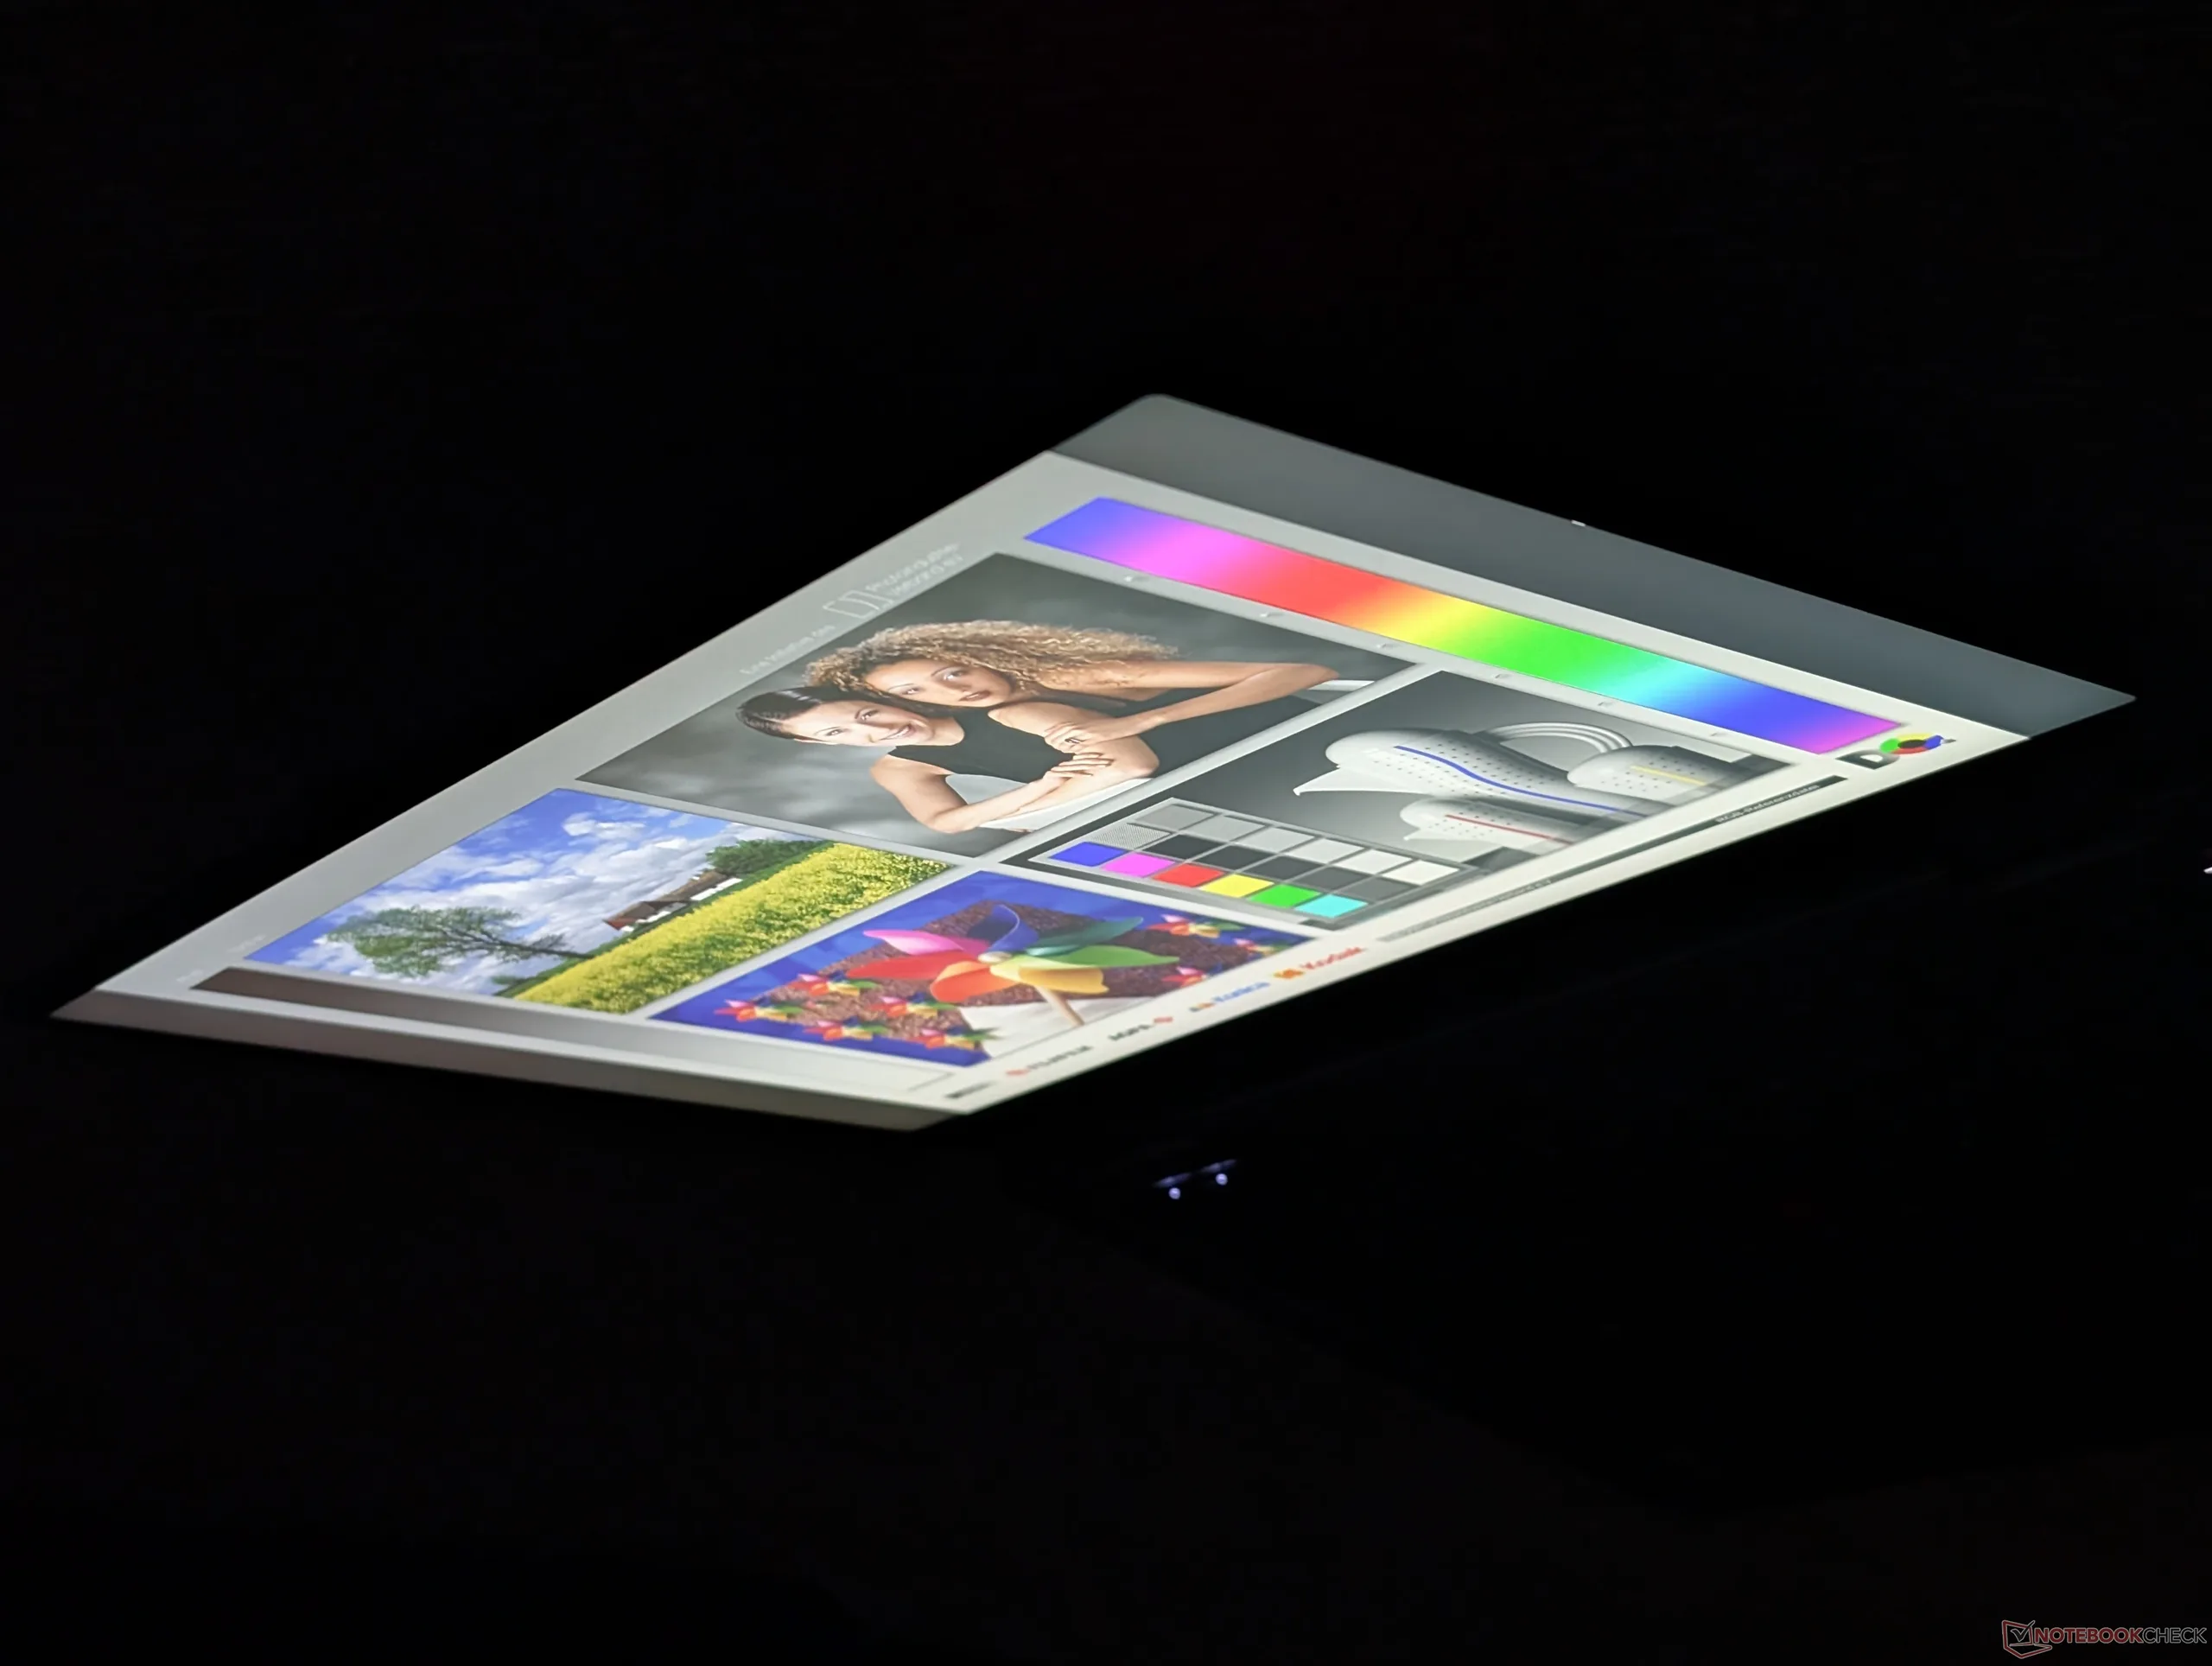
Display

Lenovo bietet – ähnlich wie beim Vorgängermodell – zwei wichtige Touchscreen-Optionen an:
- 1.920 x 1.200, IPS, 60 Hz, 100 % sRGB, 500 nits, matt oder glänzend
- 2.880 x 1.800, OLED, 120 Hz, 100 % DCI-P3, 500 nits, glänzend
Bei unserem 1.200p-Testgerät ist Lenovo vom Innolux N140JLG-GT3 des Vorjahresmodells auf das AUO B140UAN10.0 umgestiegen. Die Kernmerkmale sind ansonsten nahezu identisch, einschließlich der soliden Reaktionszeiten und Kontrastverhältnisse.
| |||||||||||||||||||||||||
Ausleuchtung: 86 %
Helligkeit Akku: 527.7 cd/m²
Kontrast: 1885:1 (Schwarzwert: 0.28 cd/m²)
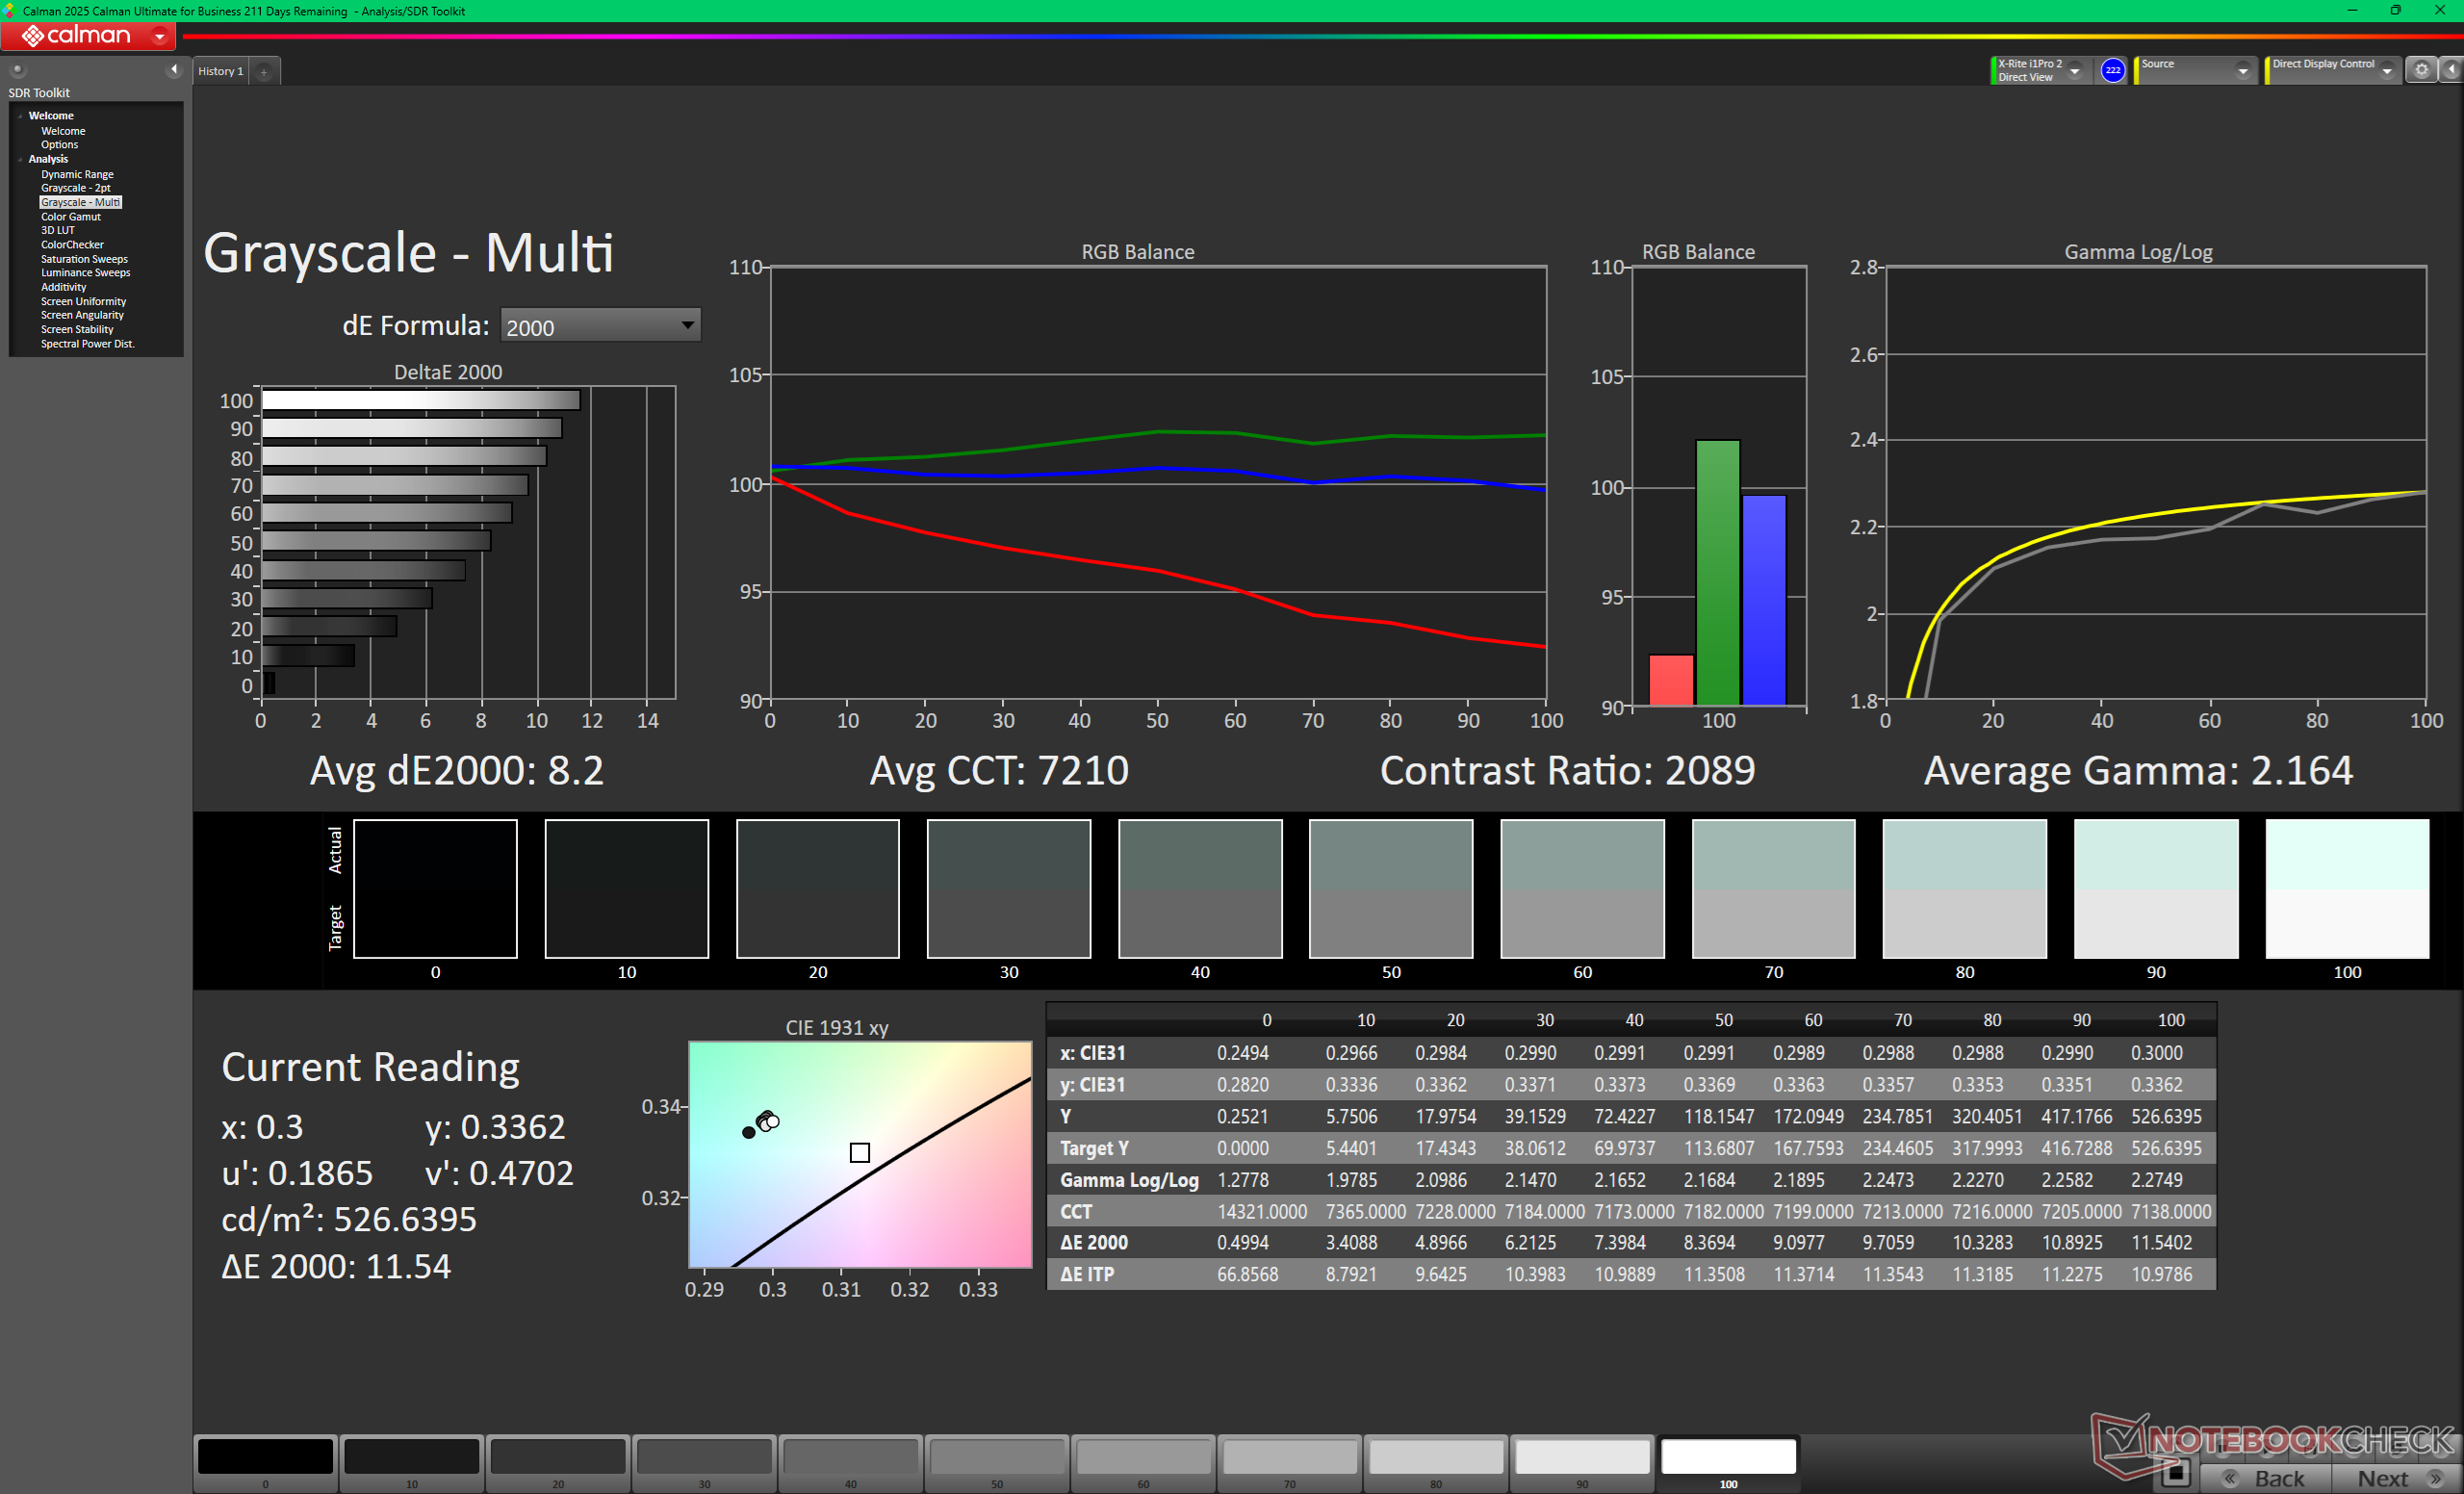
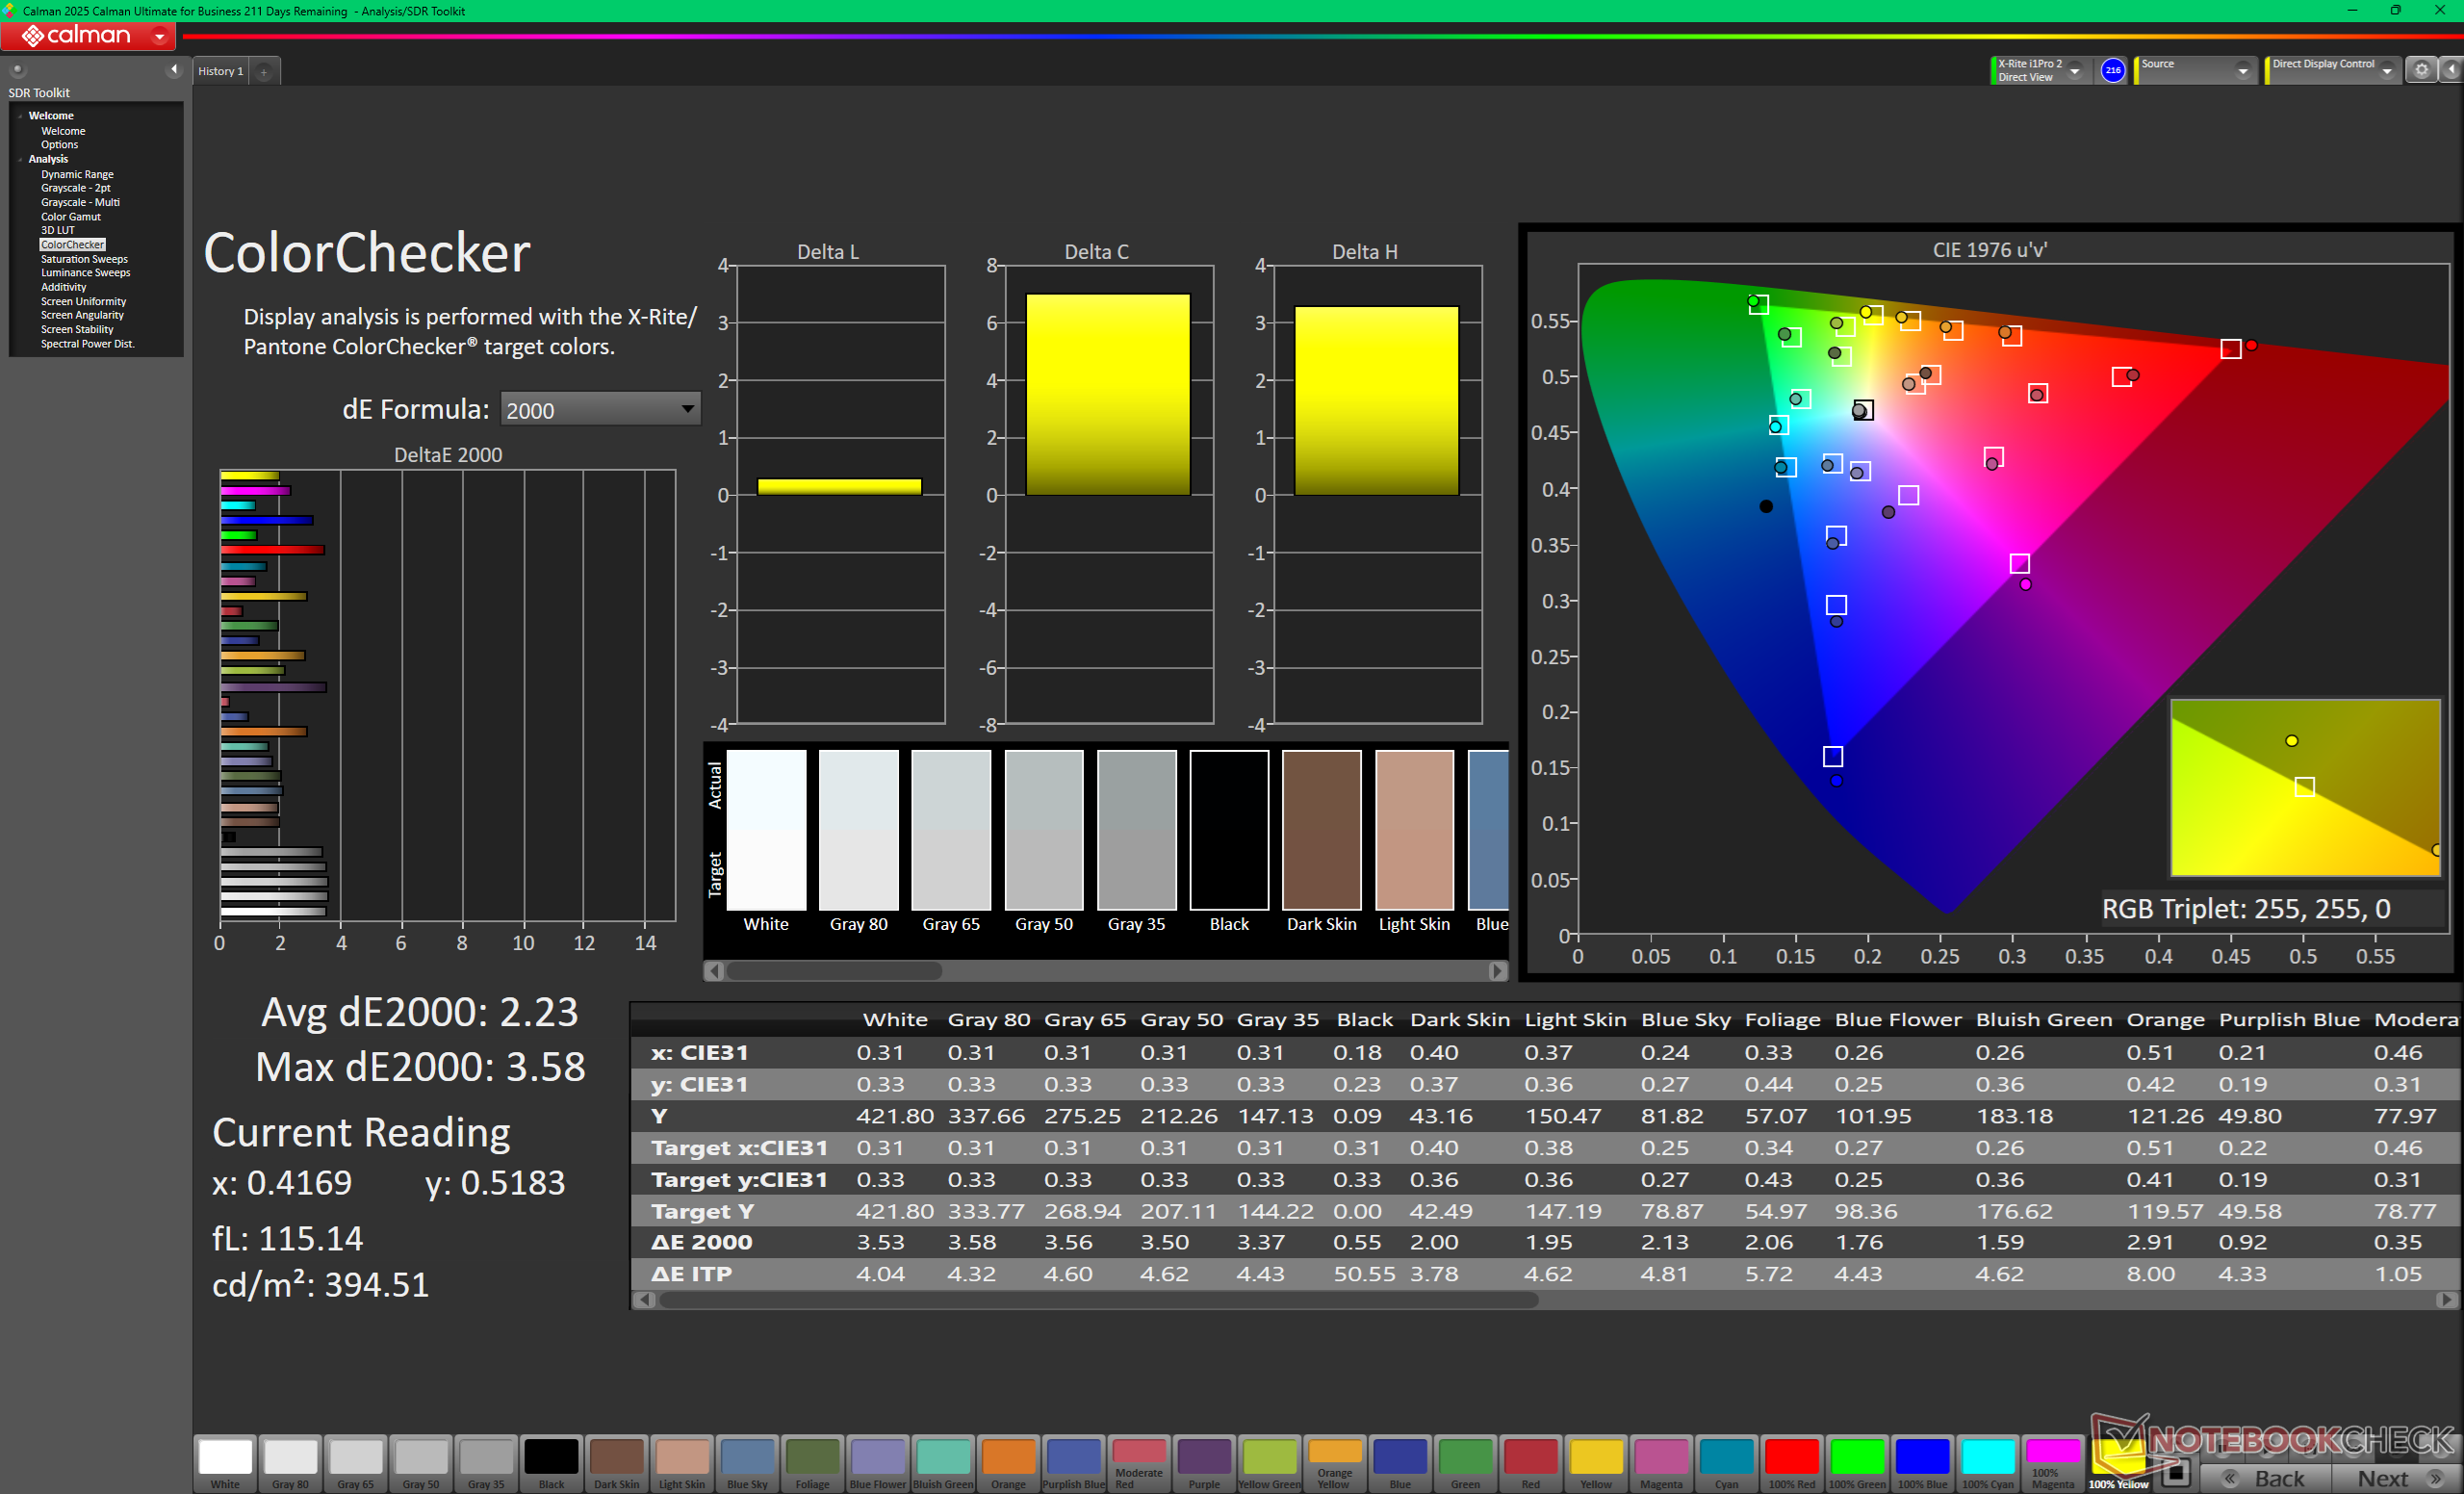
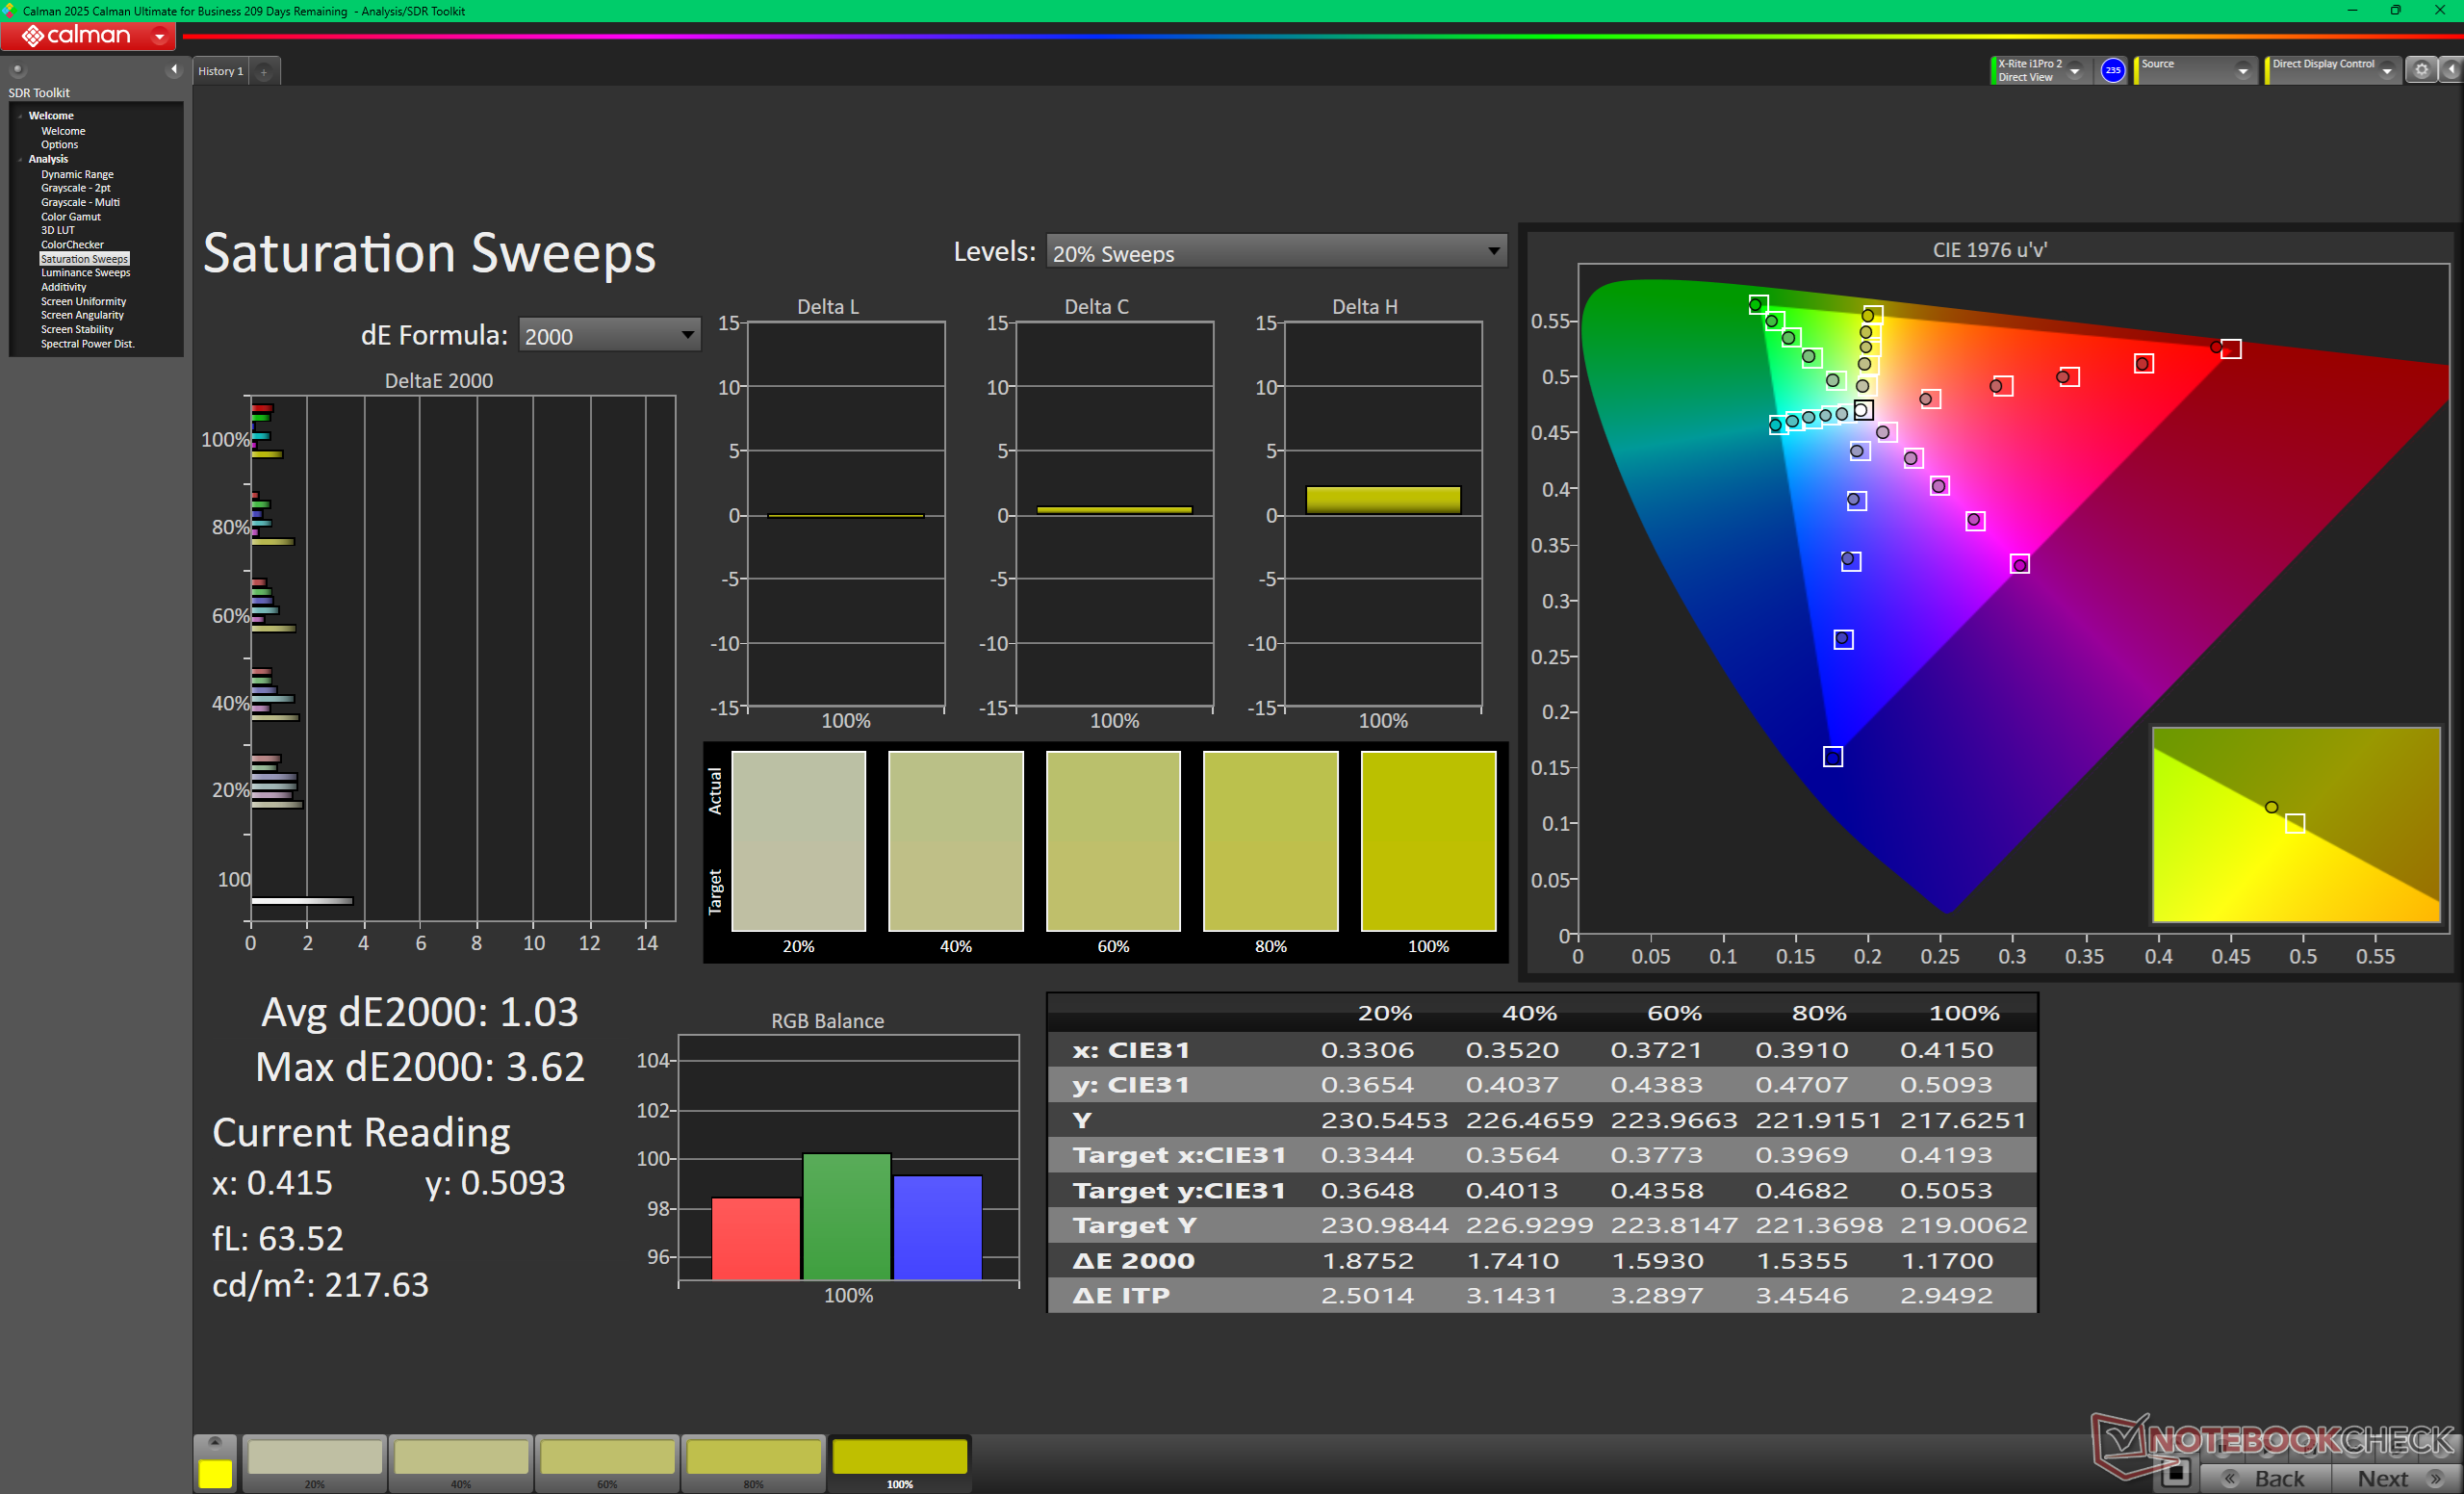
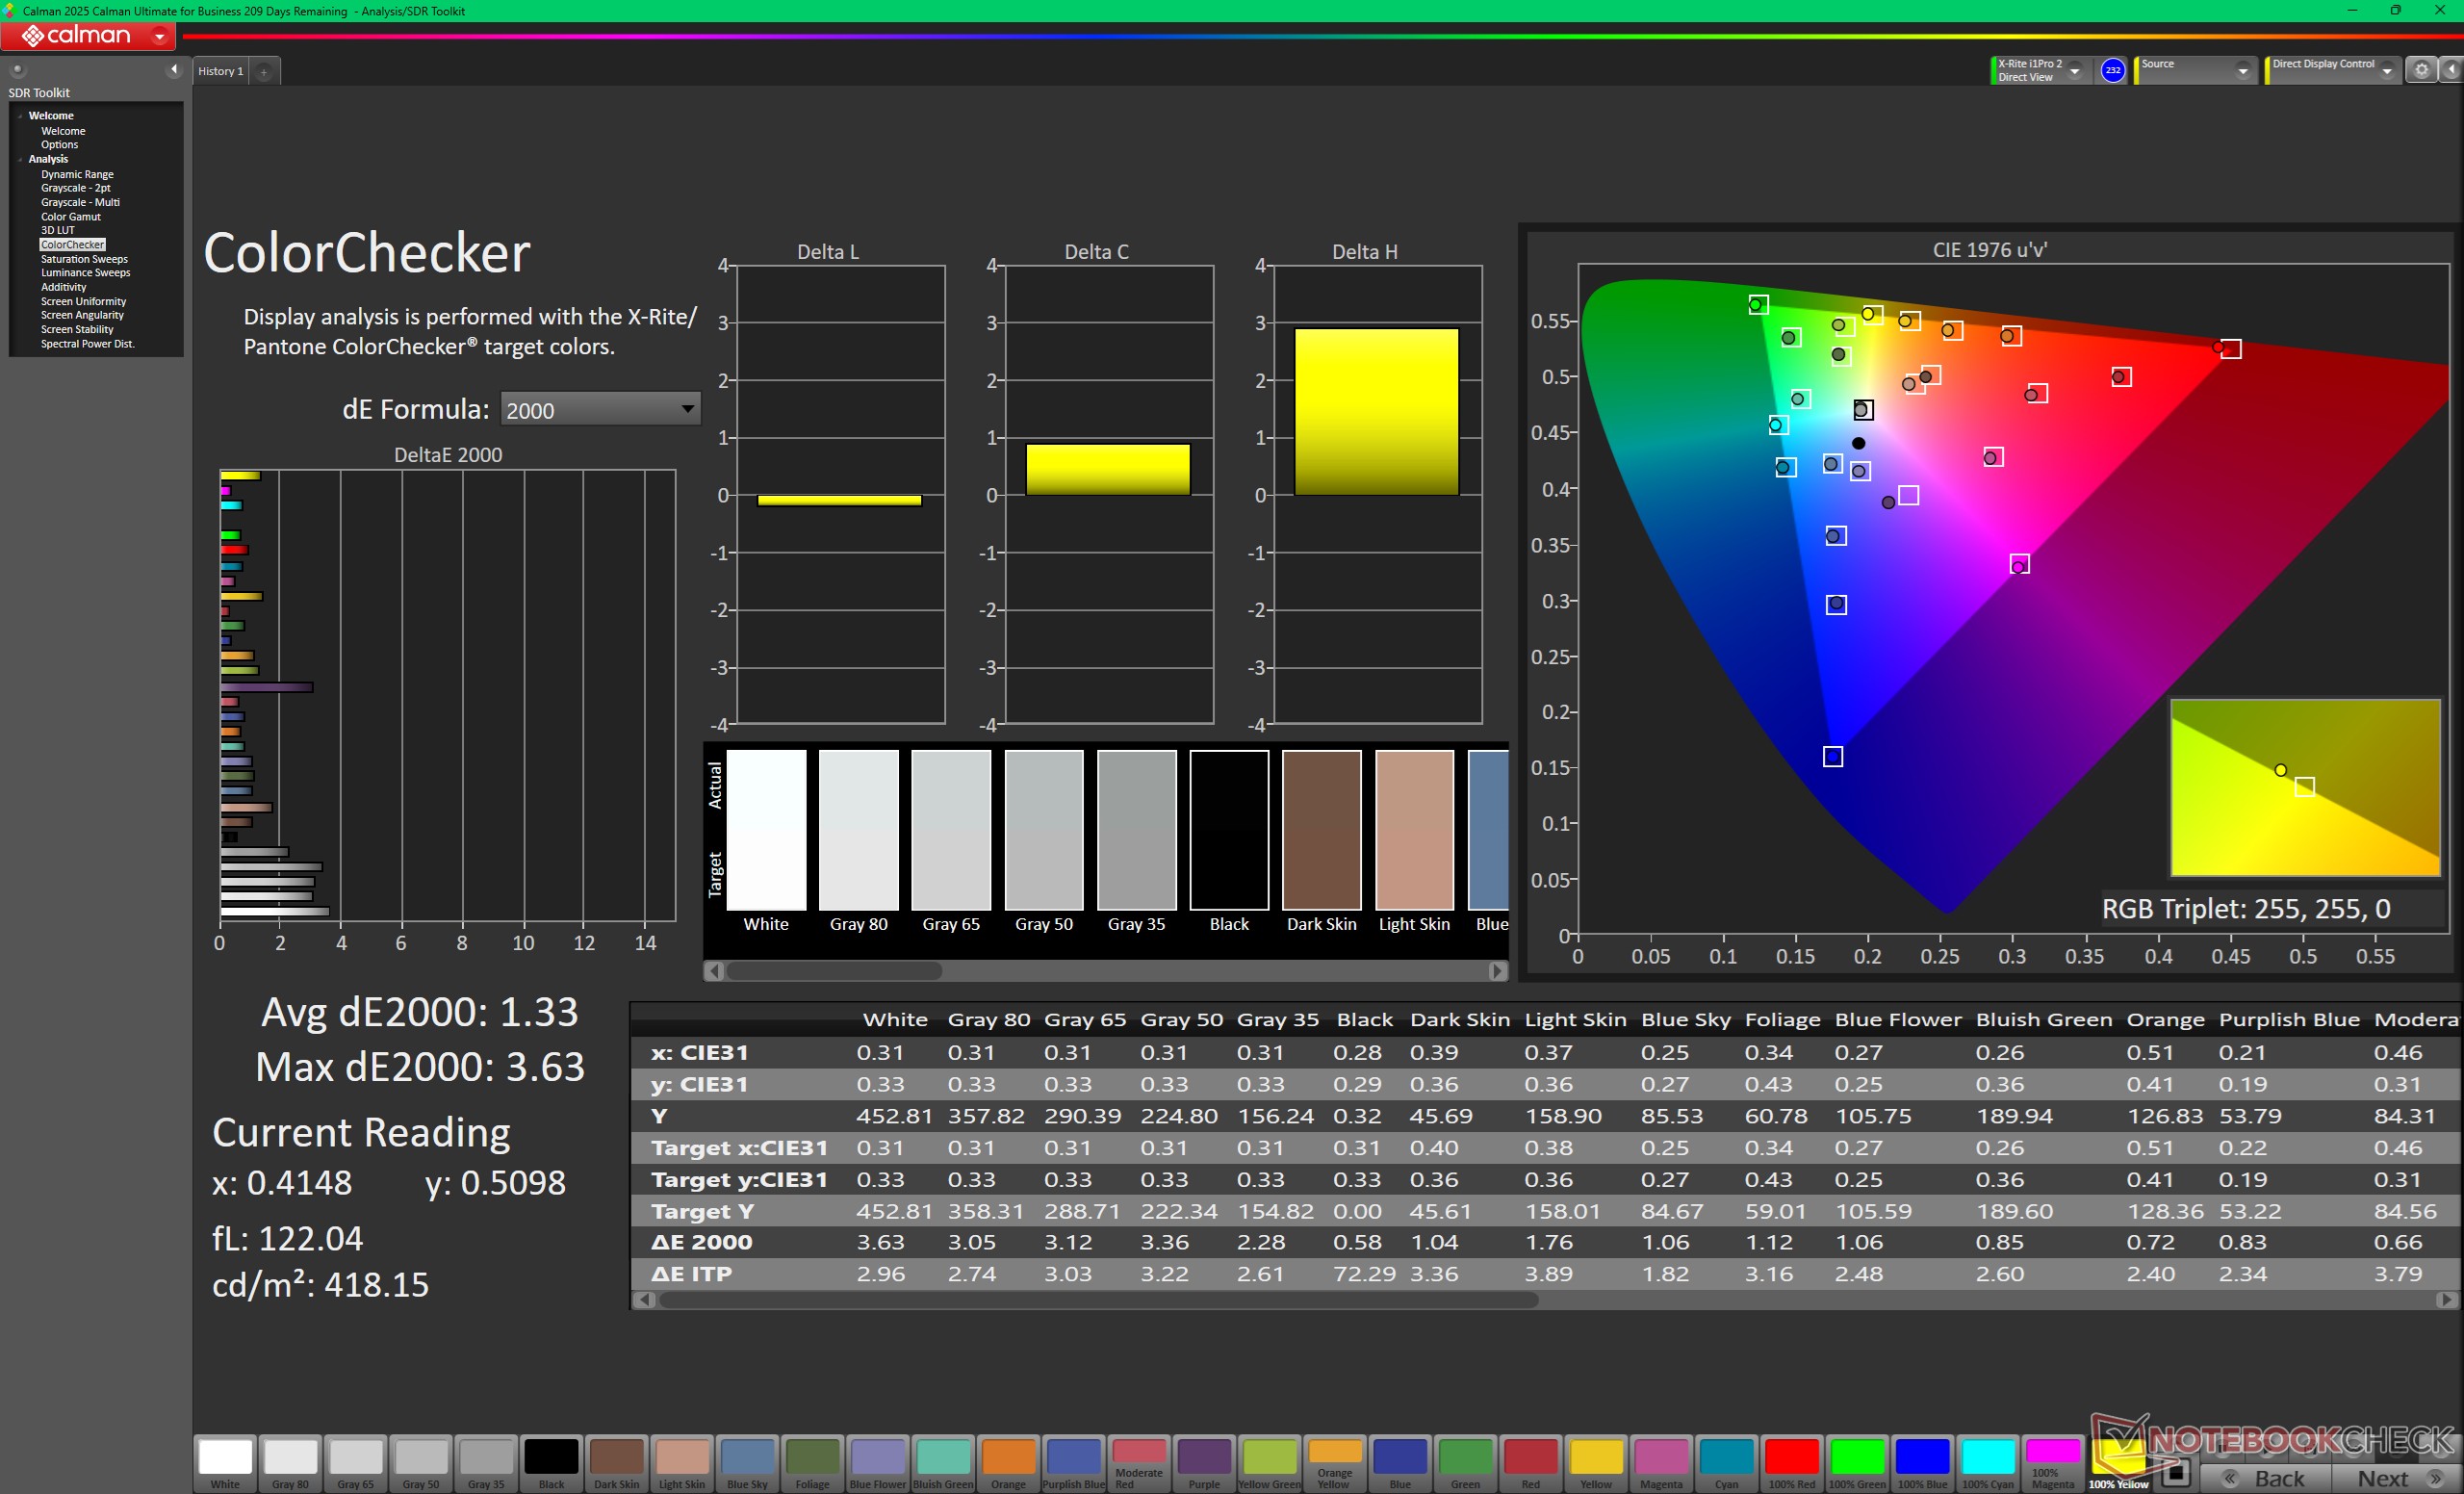
ΔE ColorChecker Calman: 2.23 | ∀{0.5-29.43 Ø4.72}
calibrated: 1.33
ΔE Greyscale Calman: 8.2 | ∀{0.09-98 Ø4.97}
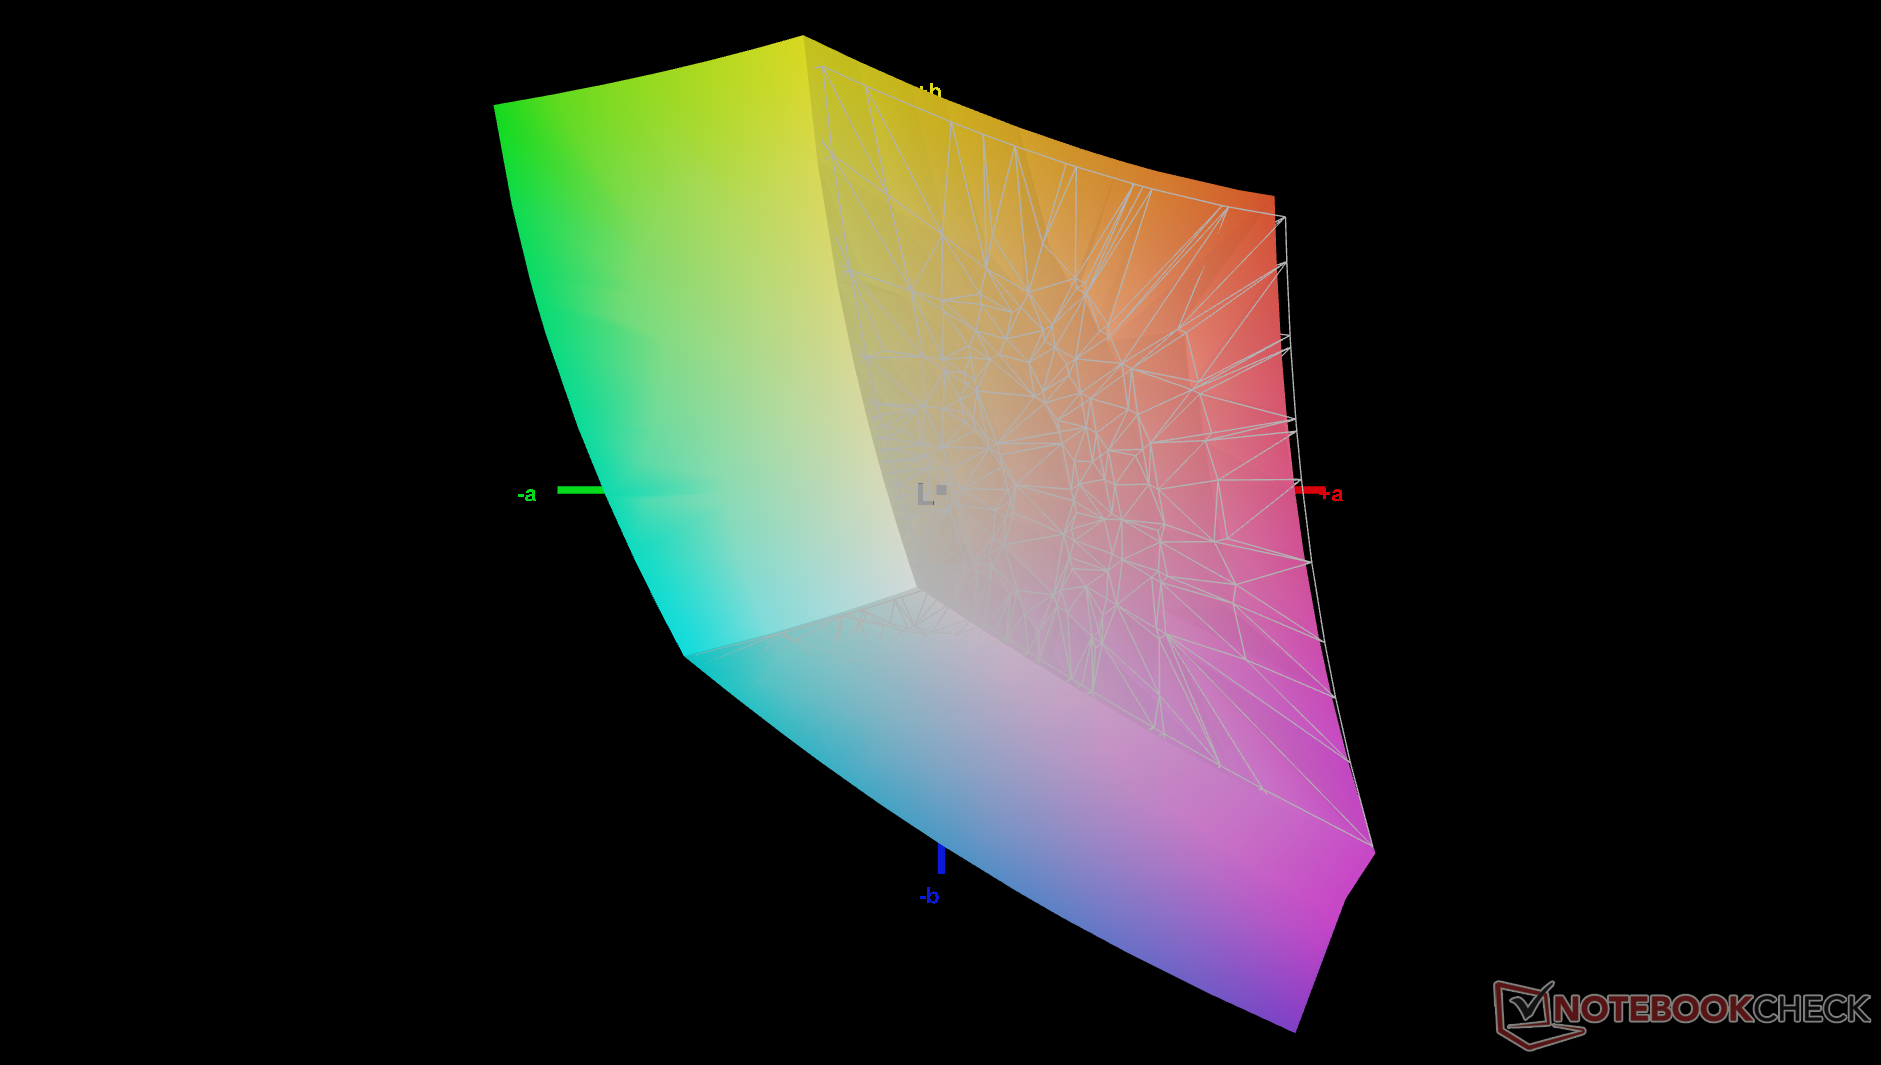
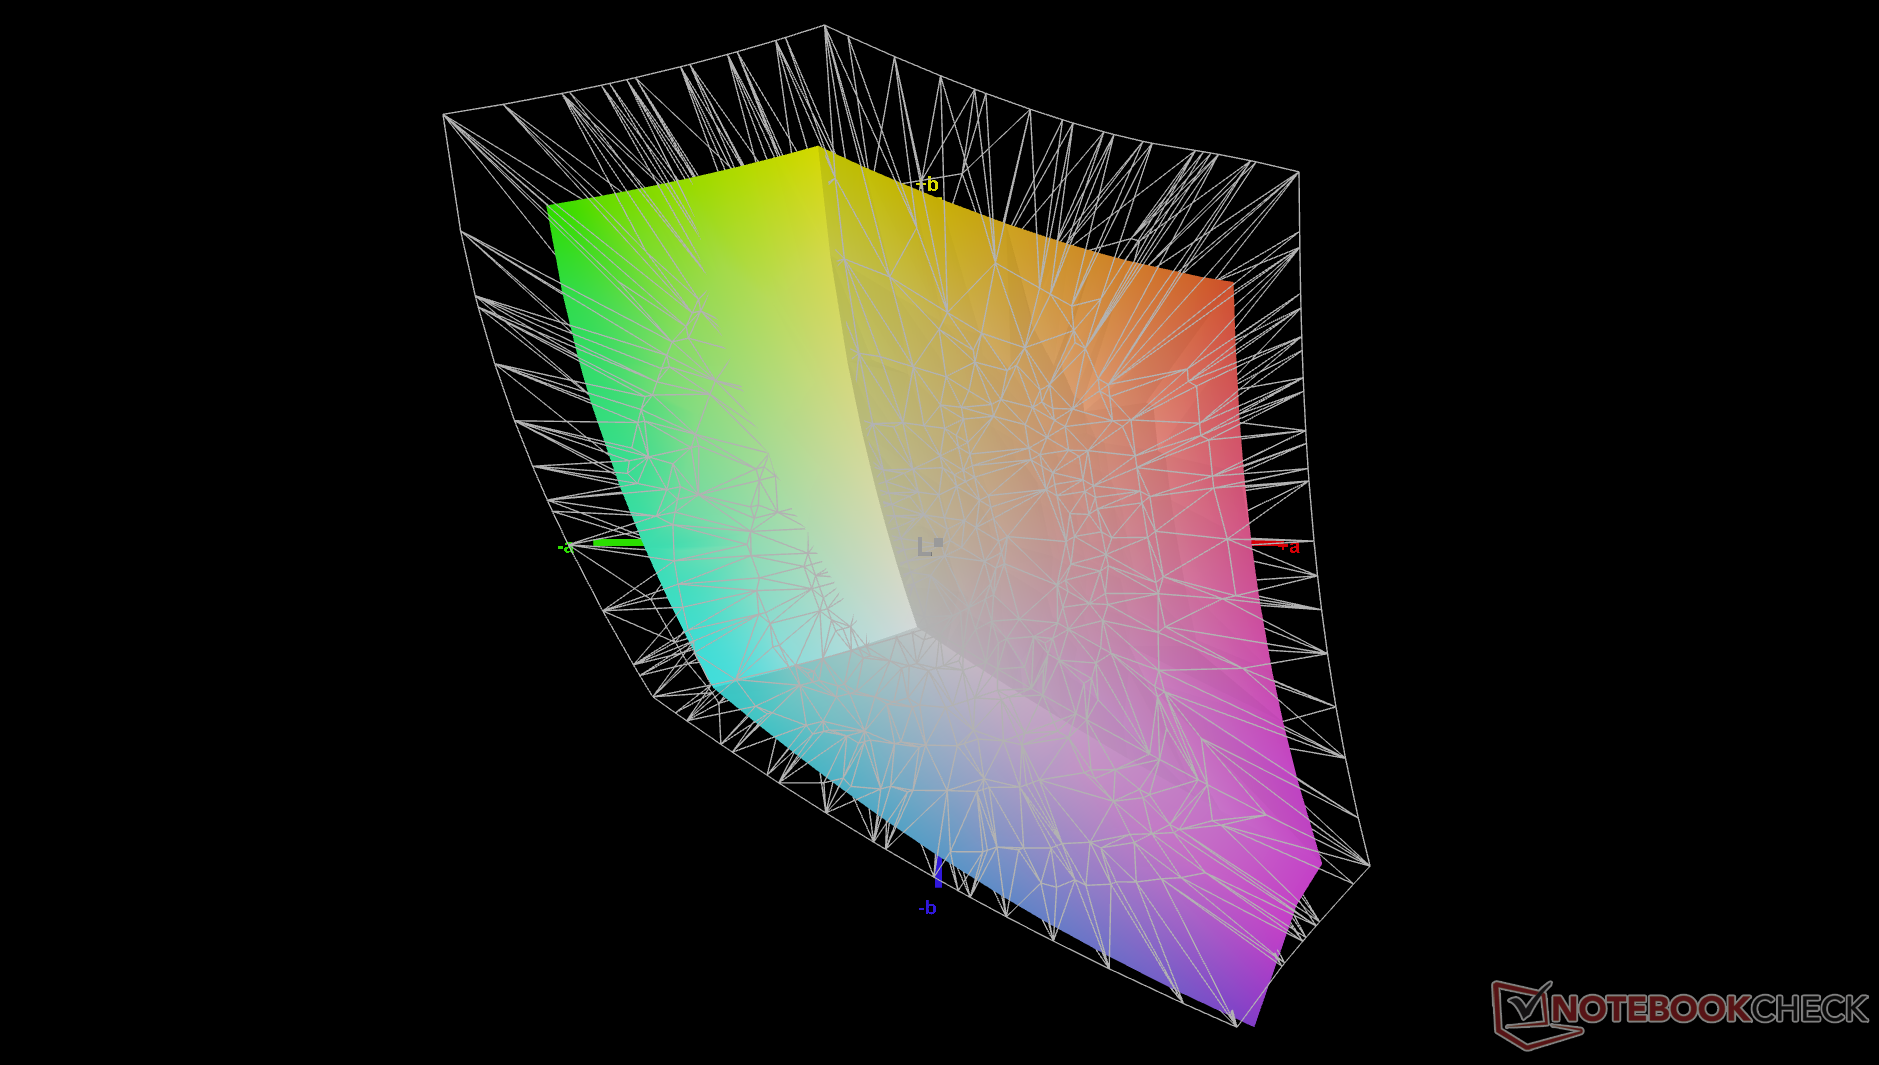
71.3% AdobeRGB 1998 (Argyll 3D)
98.5% sRGB (Argyll 3D)
69.8% Display P3 (Argyll 3D)
Gamma: 2.16
CCT: 7210 K
| Lenovo ThinkPad X1 2-in-1 Gen 11 AUO B140UAN10.0, IPS, 1920x1200, 14", 60 Hz | Lenovo ThinkPad X1 2-in-1 Gen 10 N140JLG-GT3, IPS, 1920x1200, 14", 60 Hz | Lenovo Yoga Book 9 14IAH10 LEN140WQ+, 2x, OLED, 2880x1800, 14", 120 Hz | HP EliteBook X Flip G1i 14 AI AUO8FB5, IPS, 1920x1200, 14", 60 Hz | Dell Latitude 7450 2-in-1 BOE NV140WU, IPS, 1920x1200, 14", 60 Hz | Asus ExpertBook Ultra B9406CAA Samsung ATNA40LE01-0, OLED, 2880x1800, 14", 120 Hz | |
|---|---|---|---|---|---|---|
| Display | -2% | 25% | 7% | 6% | 21% | |
| Display P3 Coverage (%) | 69.8 | 67.8 -3% | 99.9 43% | 76.7 10% | 76.5 10% | 96.2 38% |
| sRGB Coverage (%) | 98.5 | 97.2 -1% | 100 2% | 98.2 0% | 100 2% | 100 2% |
| AdobeRGB 1998 Coverage (%) | 71.3 | 69.8 -2% | 92.2 29% | 78.2 10% | 76 7% | 86.7 22% |
| Response Times | -17% | 97% | -17% | 3% | 97% | |
| Response Time Grey 50% / Grey 80% * (ms) | 41.2 ? | 44.6 ? -8% | 0.6 ? 99% | 49.2 ? -19% | 35.65 ? 13% | 0.71 ? 98% |
| Response Time Black / White * (ms) | 21.6 ? | 27.1 ? -25% | 1 ? 95% | 24.8 ? -15% | 23.35 ? -8% | 0.94 ? 96% |
| PWM Frequency (Hz) | 480 ? | 968.8 ? | ||||
| PWM Amplitude * (%) | 43 | 20 | ||||
| Bildschirm | -2% | 1% | -19% | -7% | 34% | |
| Helligkeit Bildmitte (cd/m²) | 527.7 | 459 -13% | 381.7 -28% | 572 8% | 333 -37% | 600.5 14% |
| Brightness (cd/m²) | 490 | 455 -7% | 398 -19% | 541 10% | 326 -33% | 612 25% |
| Brightness Distribution (%) | 86 | 89 3% | 94 9% | 78 -9% | 85 -1% | 96 12% |
| Schwarzwert * (cd/m²) | 0.28 | 0.24 14% | 0.2 29% | 0.27 4% | ||
| Kontrast (:1) | 1885 | 1913 1% | 2860 52% | 1233 -35% | ||
| Delta E Colorchecker * | 2.23 | 3.14 -41% | 2.93 -31% | 4.19 -88% | 2.46 -10% | 1.18 47% |
| Colorchecker dE 2000 max. * | 3.58 | 6.55 -83% | 5.93 -66% | 8.65 -142% | 4.58 -28% | 3.4 5% |
| Colorchecker dE 2000 calibrated * | 1.33 | 0.58 56% | 0.61 54% | 2.11 -59% | 1.31 2% | 0.73 45% |
| Delta E Graustufen * | 8.2 | 3.9 52% | 0.8 90% | 5.65 31% | 2.1 74% | 1 88% |
| Gamma | 2.16 102% | 2.16 102% | 2.16 102% | 2.45 90% | 2.2 100% | 2.27 97% |
| CCT | 7210 90% | 5867 111% | 6404 101% | 5959 109% | 6578 99% | 6567 99% |
| Durchschnitt gesamt (Programm / Settings) | -7% /
-4% | 41% /
23% | -10% /
-13% | 1% /
-3% | 51% /
41% |
* ... kleinere Werte sind besser
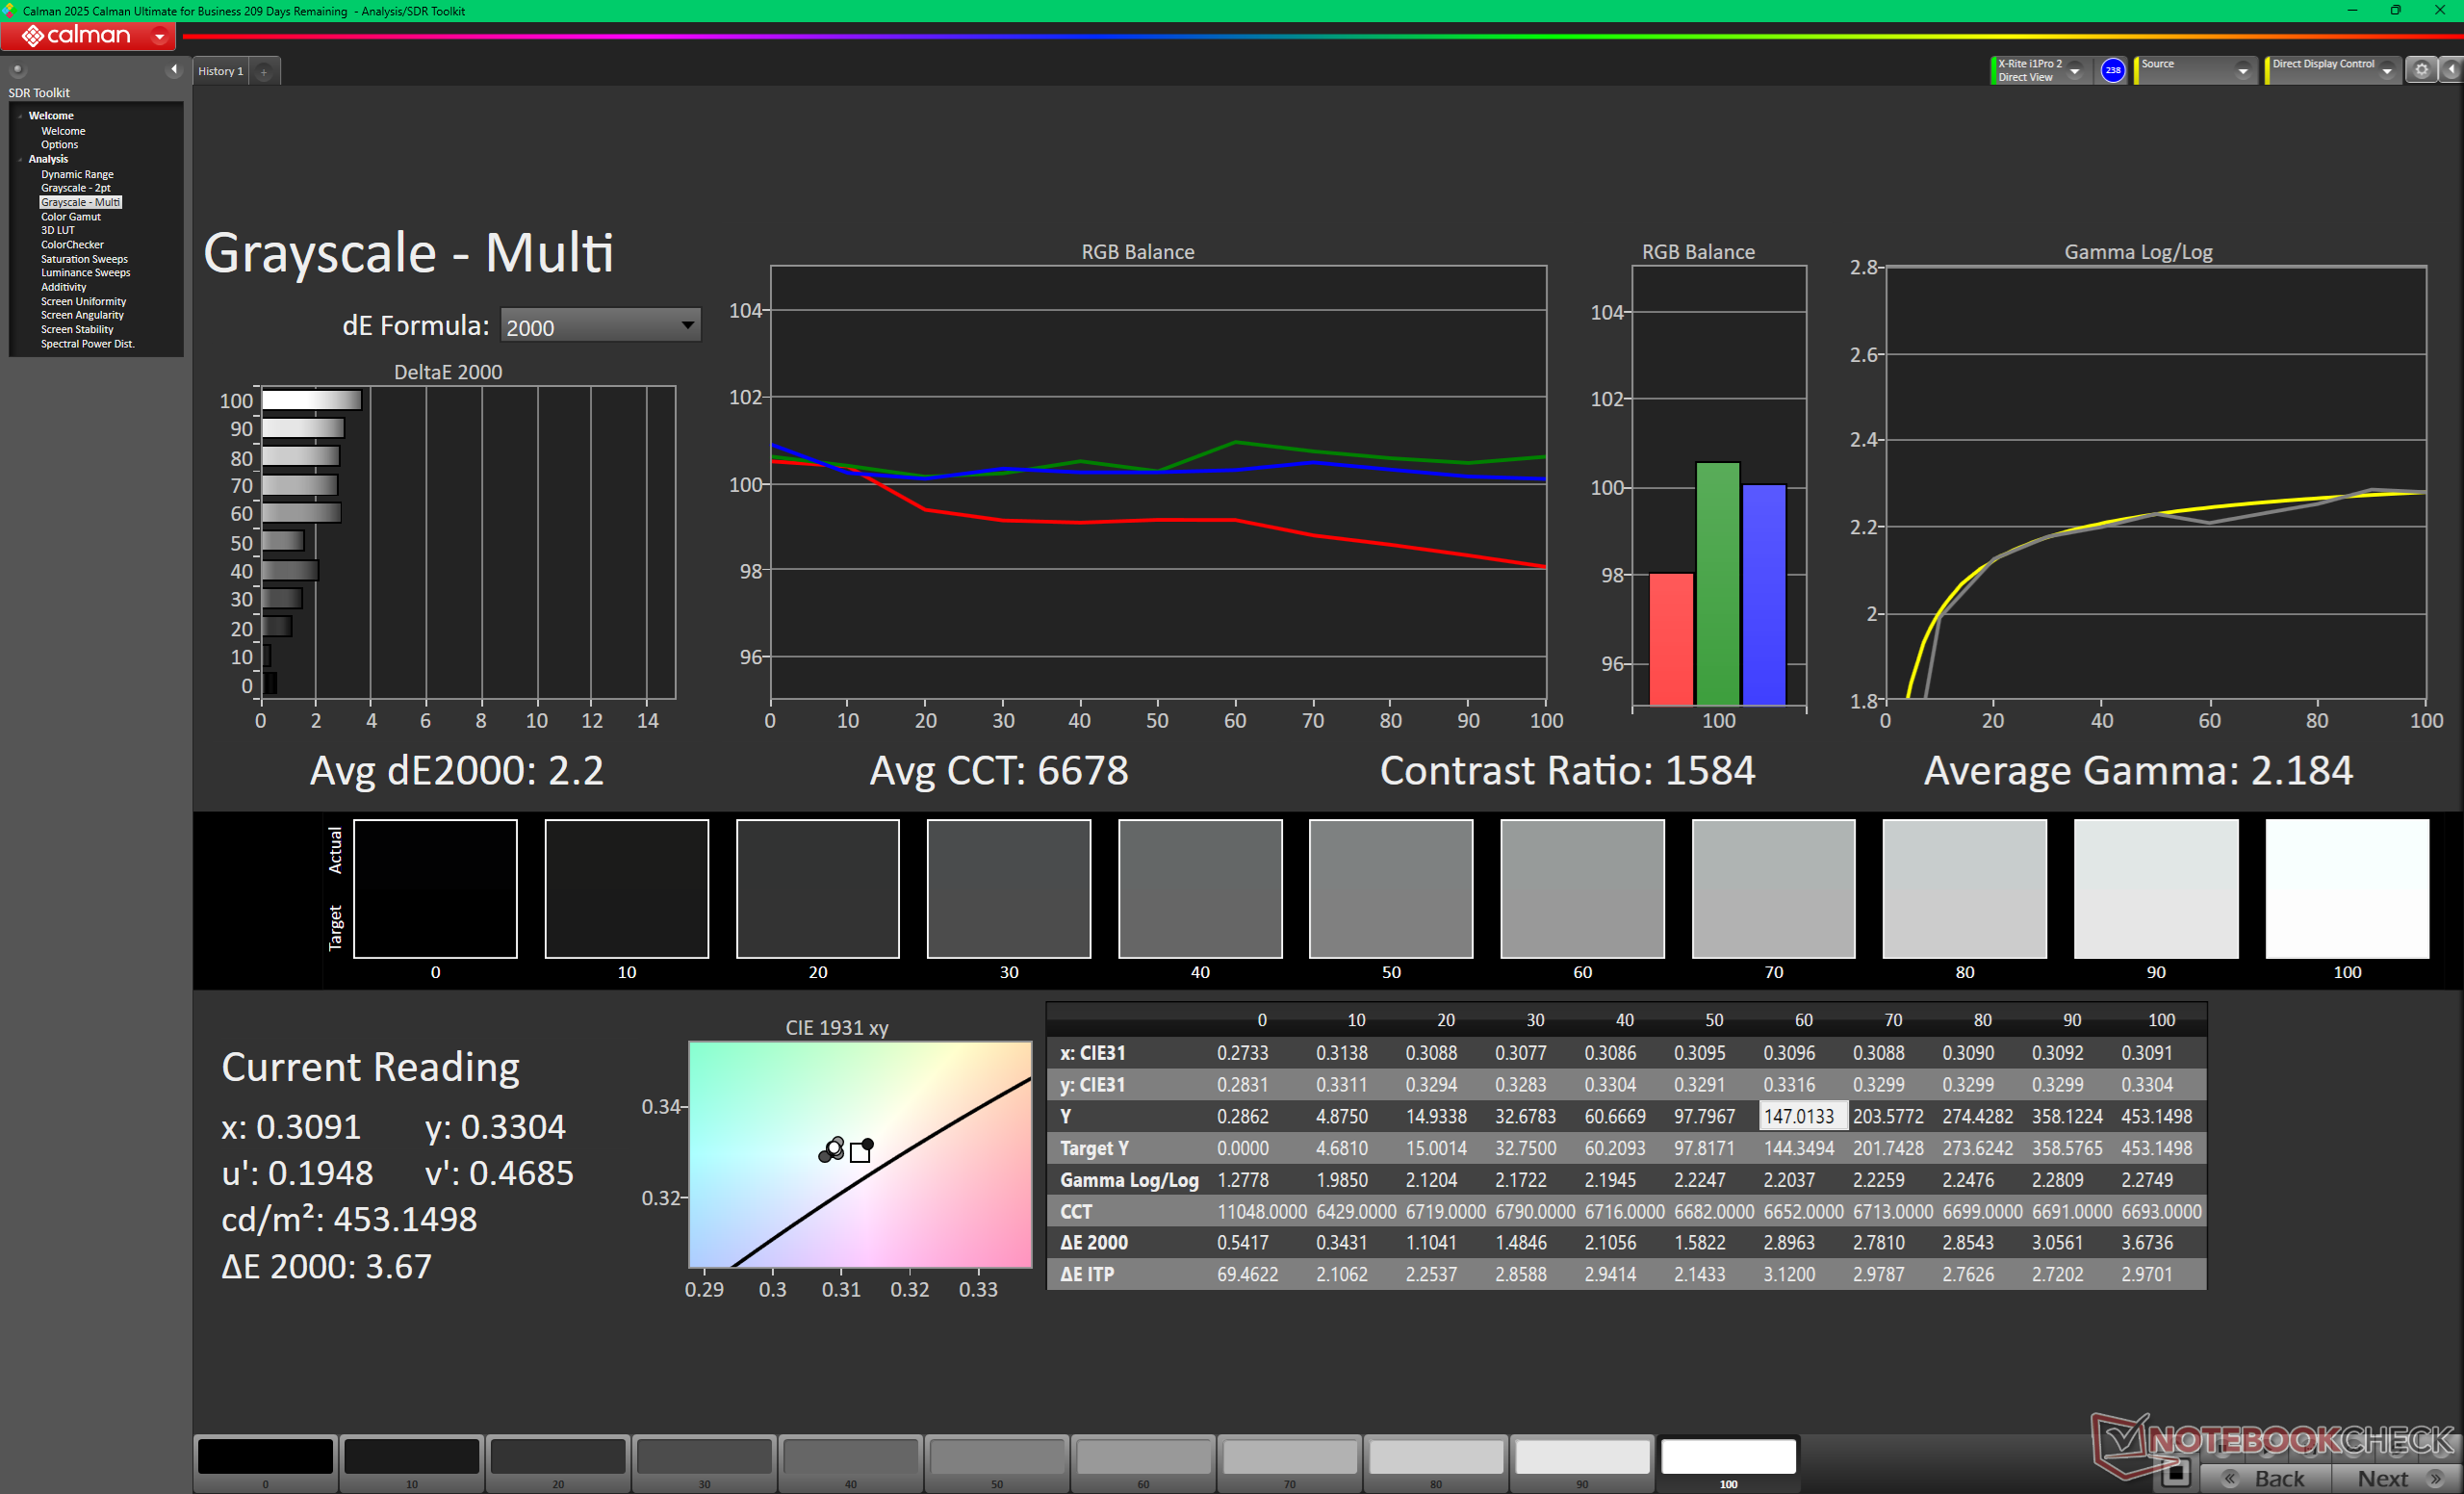
Die Farbtemperatur ist mit 7.200 K viel zu kühl ab Werk. Eine Kalibrierung des Displays mit unserem X-Rite-Farbmessgerät verbessert die durchschnittlichen DeltaE-Werte für Graustufen und Farben deutlich – von 8,2 bzw. 2,23 auf nur noch 2,2 bzw. 1,33.
Reaktionszeiten (Response Times) des Displays
| ↔ Reaktionszeiten Schwarz zu Weiß | ||
|---|---|---|
| 21.6 ms ... steigend ↗ und fallend ↘ kombiniert | ↗ 10.7 ms steigend | 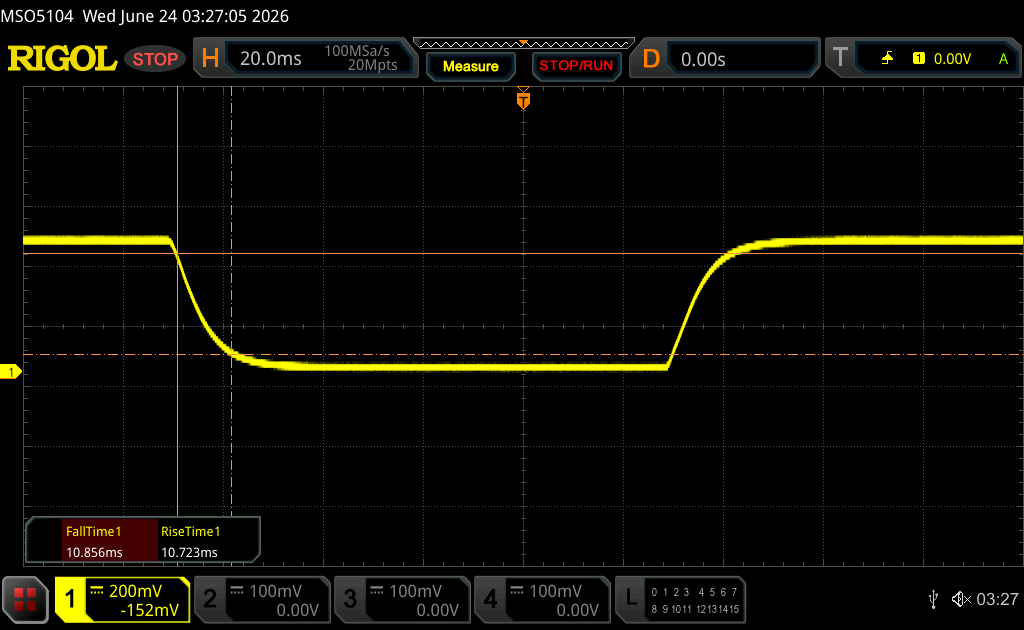 |
| ↘ 10.9 ms fallend | ||
| Die gemessenen Reaktionszeiten sind gut, für anspruchsvolle Spieler könnten der Bildschirm jedoch zu langsam sein. Im Vergleich rangierten die bei uns getesteten Geräte von 0.1 (Minimum) zu 240 (Maximum) ms. » 48 % aller Screens waren schneller als der getestete. Daher sind die gemessenen Reaktionszeiten durchschnittlich (19.8 ms). | ||
| ↔ Reaktionszeiten 50% Grau zu 80% Grau | ||
| 41.2 ms ... steigend ↗ und fallend ↘ kombiniert | ↗ 18.8 ms steigend | 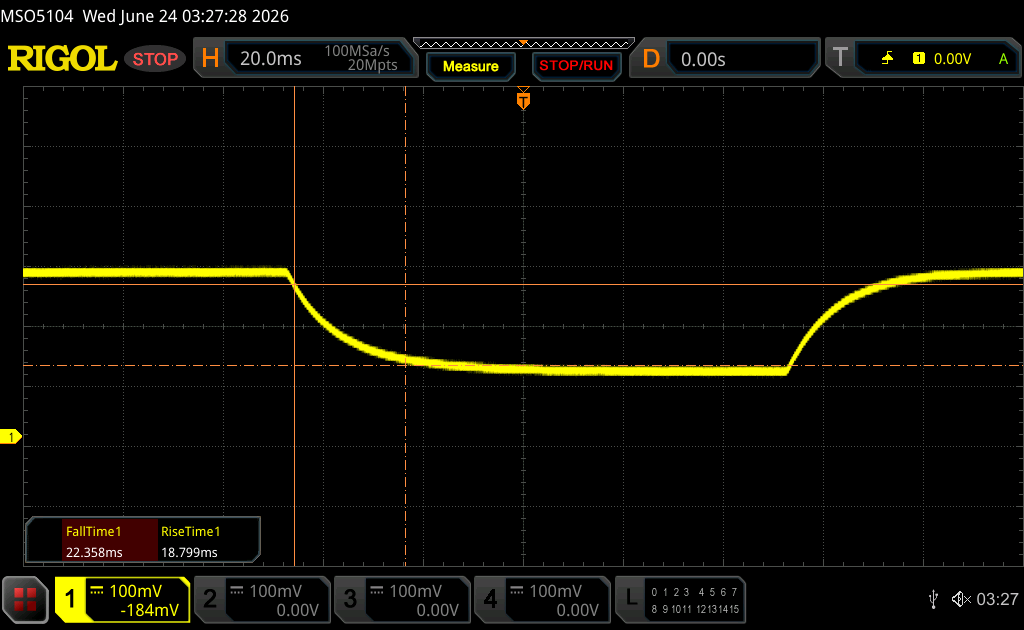 |
| ↘ 22.4 ms fallend | ||
| Die gemessenen Reaktionszeiten sind langsam und dadurch für viele Spieler wahrscheinlich zu langsam. Im Vergleich rangierten die bei uns getesteten Geräte von 0.165 (Minimum) zu 636 (Maximum) ms. » 66 % aller Screens waren schneller als der getestete. Daher sind die gemessenen Reaktionszeiten schlechter als der Durchschnitt aller vermessenen Geräte (31 ms). | ||
Bildschirm-Flackern / PWM (Pulse-Width Modulation)
| Flackern / PWM nicht festgestellt |  | ||
Im Vergleich: 52 % aller getesteten Geräte nutzten kein PWM um die Helligkeit zu reduzieren. Wenn PWM eingesetzt wurde, dann bei einer Frequenz von durchschnittlich 7781 (Minimum 5, Maximum 343500) Hz. | |||


Leistung
Testbedingungen
Vor der Durchführung der nachstehenden Benchmarks haben wir Windows in den Performance-Modus versetzt.
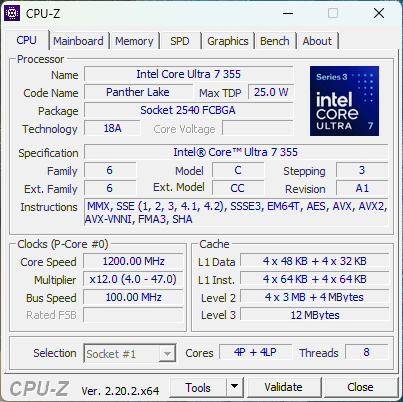
Prozessorleistung
Der Core Ultra 7 355 ist etwa zehn bis 15 Prozent schneller und bietet eine stabilere Leistung als der Core Ultra 7 258V im Vorjahresmodell. Ein Upgrade auf das Spitzenmodell Core Ultra X7 368H kann die Multithread-Leistung um bis zu 70 Prozent steigern. Die NPU-Leistung bleibt jedoch bei allen aktuellen SKUs des ThinkPad X1 2-in-1 Gen 11 nahezu unverändert.
Cinebench R15 Multi-Loop
Cinebench R23: Multi Core | Single Core
Cinebench R20: CPU (Multi Core) | CPU (Single Core)
Cinebench R15: CPU Multi 64Bit | CPU Single 64Bit
Blender: v2.79 BMW27 CPU
7-Zip 18.03: 7z b 4 | 7z b 4 -mmt1
Geekbench 6.7: Multi-Core | Single-Core
Geekbench 5.5: Multi-Core | Single-Core
HWBOT x265 Benchmark v2.2: 4k Preset
LibreOffice : 20 Documents To PDF
R Benchmark 2.5: Overall mean
* ... kleinere Werte sind besser
AIDA64: FP32 Ray-Trace | FPU Julia | CPU SHA3 | CPU Queen | FPU SinJulia | FPU Mandel | CPU AES | CPU ZLib | FP64 Ray-Trace | CPU PhotoWorxx | CPU CheckMate
| Performance Rating | |
| Lenovo Yoga Book 9 14IAH10 -1! | |
| Lenovo ThinkPad X1 2-in-1 Gen 11 -1! | |
| Durchschnittliche Intel Core Ultra 7 355 | |
| Lenovo ThinkPad X1 2-in-1 Gen 10 -1! | |
| HP EliteBook X Flip G1i 14 AI -1! | |
| Dell Latitude 7450 2-in-1 -1! | |
| Asus ExpertBook Ultra B9406CAA -1! | |
| AIDA64 / FP32 Ray-Trace | |
| Lenovo Yoga Book 9 14IAH10 (v6.92.6600) | |
| Lenovo ThinkPad X1 2-in-1 Gen 11 (v8.20.8100) | |
| Durchschnittliche Intel Core Ultra 7 355 (12228 - 12838, n=3) | |
| Asus ExpertBook Ultra B9406CAA (v6.92.6600) | |
| Lenovo ThinkPad X1 2-in-1 Gen 10 (v6.92.6600) | |
| HP EliteBook X Flip G1i 14 AI (v6.92.6600) | |
| Dell Latitude 7450 2-in-1 (v6.92.6600) | |
| AIDA64 / FPU Julia | |
| Lenovo Yoga Book 9 14IAH10 (v6.92.6600) | |
| Lenovo ThinkPad X1 2-in-1 Gen 11 (v8.20.8100) | |
| Durchschnittliche Intel Core Ultra 7 355 (60741 - 65963, n=3) | |
| Lenovo ThinkPad X1 2-in-1 Gen 10 (v6.92.6600) | |
| HP EliteBook X Flip G1i 14 AI (v6.92.6600) | |
| Dell Latitude 7450 2-in-1 (v6.92.6600) | |
| Asus ExpertBook Ultra B9406CAA (v6.92.6600) | |
| AIDA64 / CPU SHA3 | |
| Asus ExpertBook Ultra B9406CAA (v6.92.6600) | |
| Lenovo Yoga Book 9 14IAH10 (v6.92.6600) | |
| Lenovo ThinkPad X1 2-in-1 Gen 11 (v8.20.8100) | |
| Durchschnittliche Intel Core Ultra 7 355 (2763 - 2845, n=3) | |
| Dell Latitude 7450 2-in-1 (v6.92.6600) | |
| Lenovo ThinkPad X1 2-in-1 Gen 10 (v6.92.6600) | |
| HP EliteBook X Flip G1i 14 AI (v6.92.6600) | |
| AIDA64 / CPU Queen | |
| Asus ExpertBook Ultra B9406CAA (v6.92.6600) | |
| Lenovo Yoga Book 9 14IAH10 (v6.92.6600) | |
| Lenovo ThinkPad X1 2-in-1 Gen 10 (v6.92.6600) | |
| HP EliteBook X Flip G1i 14 AI (v6.92.6600) | |
| Dell Latitude 7450 2-in-1 (v6.92.6600) | |
| Durchschnittliche Intel Core Ultra 7 355 (n=1) | |
| AIDA64 / FPU SinJulia | |
| Lenovo Yoga Book 9 14IAH10 (v6.92.6600) | |
| Dell Latitude 7450 2-in-1 (v6.92.6600) | |
| Asus ExpertBook Ultra B9406CAA (v6.92.6600) | |
| Lenovo ThinkPad X1 2-in-1 Gen 11 (v8.20.8100) | |
| Durchschnittliche Intel Core Ultra 7 355 (4597 - 4601, n=3) | |
| Lenovo ThinkPad X1 2-in-1 Gen 10 (v6.92.6600) | |
| HP EliteBook X Flip G1i 14 AI (v6.92.6600) | |
| AIDA64 / FPU Mandel | |
| Lenovo Yoga Book 9 14IAH10 (v6.92.6600) | |
| Lenovo ThinkPad X1 2-in-1 Gen 11 (v8.20.8100) | |
| Durchschnittliche Intel Core Ultra 7 355 (32404 - 35293, n=3) | |
| HP EliteBook X Flip G1i 14 AI (v6.92.6600) | |
| Lenovo ThinkPad X1 2-in-1 Gen 10 (v6.92.6600) | |
| Dell Latitude 7450 2-in-1 (v6.92.6600) | |
| Asus ExpertBook Ultra B9406CAA (v6.92.6600) | |
| AIDA64 / CPU AES | |
| Lenovo Yoga Book 9 14IAH10 (v6.92.6600) | |
| Dell Latitude 7450 2-in-1 (v6.92.6600) | |
| Lenovo ThinkPad X1 2-in-1 Gen 10 (v6.92.6600) | |
| Lenovo ThinkPad X1 2-in-1 Gen 11 (v8.20.8100) | |
| Durchschnittliche Intel Core Ultra 7 355 (39050 - 39424, n=3) | |
| HP EliteBook X Flip G1i 14 AI (v6.92.6600) | |
| Asus ExpertBook Ultra B9406CAA (v6.92.6600) | |
| AIDA64 / CPU ZLib | |
| Asus ExpertBook Ultra B9406CAA (v6.92.6600) | |
| Lenovo Yoga Book 9 14IAH10 (v6.92.6600) | |
| Dell Latitude 7450 2-in-1 (v6.92.6600) | |
| Lenovo ThinkPad X1 2-in-1 Gen 11 (v8.20.8100) | |
| Durchschnittliche Intel Core Ultra 7 355 (635 - 646, n=3) | |
| Lenovo ThinkPad X1 2-in-1 Gen 10 (v6.92.6600) | |
| HP EliteBook X Flip G1i 14 AI (v6.92.6600) | |
| AIDA64 / FP64 Ray-Trace | |
| Lenovo Yoga Book 9 14IAH10 (v6.92.6600) | |
| Lenovo ThinkPad X1 2-in-1 Gen 11 (v8.20.8100) | |
| Durchschnittliche Intel Core Ultra 7 355 (6147 - 6833, n=3) | |
| Asus ExpertBook Ultra B9406CAA (v6.92.6600) | |
| Lenovo ThinkPad X1 2-in-1 Gen 10 (v6.92.6600) | |
| HP EliteBook X Flip G1i 14 AI (v6.92.6600) | |
| Dell Latitude 7450 2-in-1 (v6.92.6600) | |
| AIDA64 / CPU PhotoWorxx | |
| Lenovo ThinkPad X1 2-in-1 Gen 11 (v8.20.8100) | |
| Lenovo Yoga Book 9 14IAH10 (v6.92.6600) | |
| Durchschnittliche Intel Core Ultra 7 355 (57998 - 60440, n=3) | |
| Lenovo ThinkPad X1 2-in-1 Gen 10 (v6.92.6600) | |
| HP EliteBook X Flip G1i 14 AI (v6.92.6600) | |
| Dell Latitude 7450 2-in-1 (v6.92.6600) | |
| Asus ExpertBook Ultra B9406CAA (v6.92.6600) | |
| AIDA64 / CPU CheckMate | |
| Lenovo ThinkPad X1 2-in-1 Gen 11 (v8.20.8100) | |
| Durchschnittliche Intel Core Ultra 7 355 (2790 - 2813, n=3) | |
Systemleistung
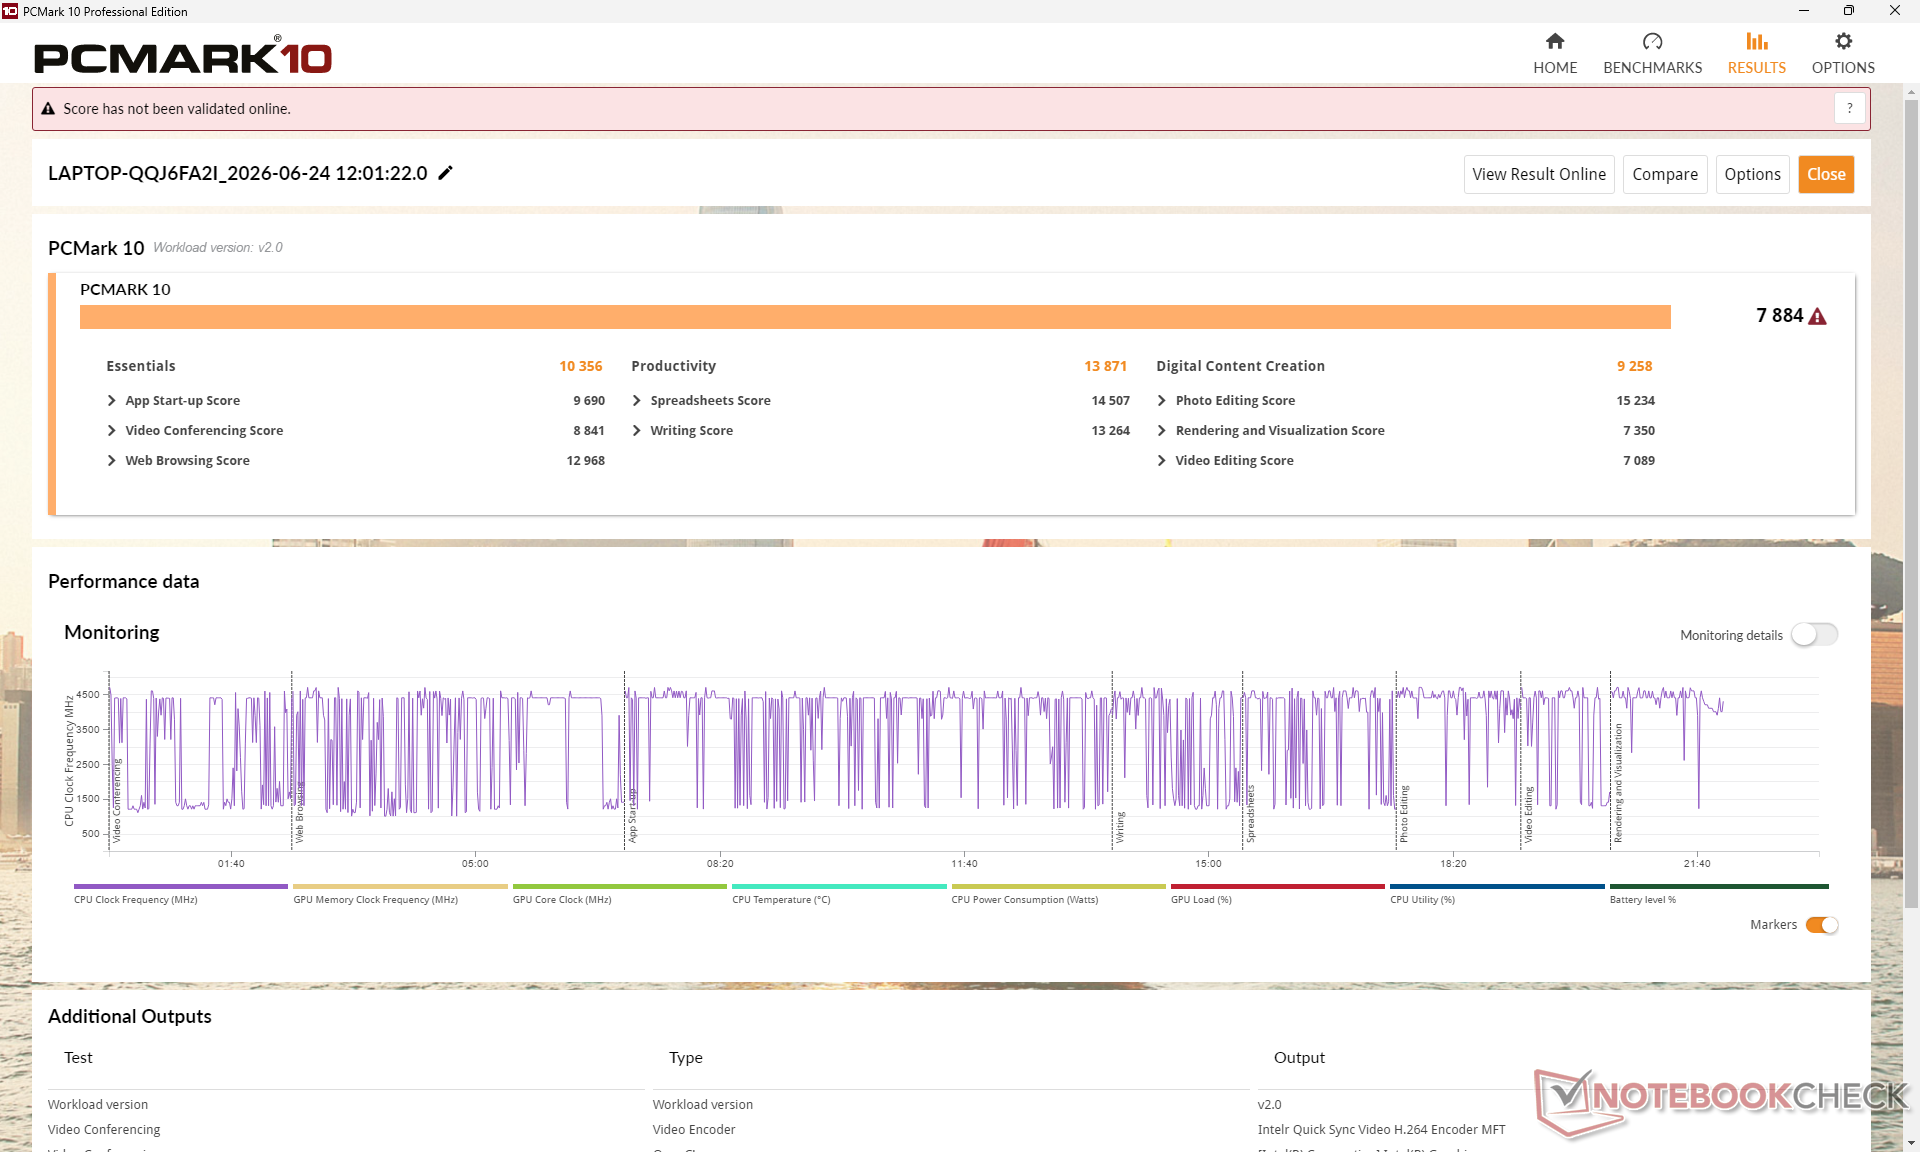
PCMark 10: Score | Essentials | Productivity | Digital Content Creation
CrossMark: Overall | Productivity | Creativity | Responsiveness
WebXPRT 3: Overall
WebXPRT 4: Overall
Mozilla Kraken 1.1: Total
Geekbench AI: Quantized GPU 1.7 | Half Precision GPU 1.7 | Single Precision GPU 1.7
| Performance Rating | |
| Asus ExpertBook Ultra B9406CAA | |
| Lenovo Yoga Book 9 14IAH10 | |
| Lenovo ThinkPad X1 2-in-1 Gen 11 | |
| Dell Latitude 7450 2-in-1 -3! | |
| Durchschnittliche Intel Core Ultra 7 355, Intel Graphics 4 Xe3 Panther Lake iGPU | |
| Lenovo ThinkPad X1 2-in-1 Gen 10 -1! | |
| HP EliteBook X Flip G1i 14 AI -3! | |
| PCMark 10 / Score | |
| Asus ExpertBook Ultra B9406CAA | |
| Durchschnittliche Intel Core Ultra 7 355, Intel Graphics 4 Xe3 Panther Lake iGPU (7884 - 8185, n=3) | |
| Lenovo ThinkPad X1 2-in-1 Gen 11 | |
| Lenovo Yoga Book 9 14IAH10 | |
| Lenovo ThinkPad X1 2-in-1 Gen 10 | |
| HP EliteBook X Flip G1i 14 AI | |
| Dell Latitude 7450 2-in-1 | |
| PCMark 10 / Essentials | |
| Lenovo Yoga Book 9 14IAH10 | |
| Dell Latitude 7450 2-in-1 | |
| Lenovo ThinkPad X1 2-in-1 Gen 10 | |
| Asus ExpertBook Ultra B9406CAA | |
| Durchschnittliche Intel Core Ultra 7 355, Intel Graphics 4 Xe3 Panther Lake iGPU (10356 - 10820, n=3) | |
| HP EliteBook X Flip G1i 14 AI | |
| Lenovo ThinkPad X1 2-in-1 Gen 11 | |
| PCMark 10 / Productivity | |
| Asus ExpertBook Ultra B9406CAA | |
| Durchschnittliche Intel Core Ultra 7 355, Intel Graphics 4 Xe3 Panther Lake iGPU (13871 - 14685, n=3) | |
| Lenovo ThinkPad X1 2-in-1 Gen 11 | |
| HP EliteBook X Flip G1i 14 AI | |
| Lenovo Yoga Book 9 14IAH10 | |
| Lenovo ThinkPad X1 2-in-1 Gen 10 | |
| Dell Latitude 7450 2-in-1 | |
| PCMark 10 / Digital Content Creation | |
| Asus ExpertBook Ultra B9406CAA | |
| Lenovo Yoga Book 9 14IAH10 | |
| Lenovo ThinkPad X1 2-in-1 Gen 10 | |
| HP EliteBook X Flip G1i 14 AI | |
| Durchschnittliche Intel Core Ultra 7 355, Intel Graphics 4 Xe3 Panther Lake iGPU (9258 - 9368, n=3) | |
| Lenovo ThinkPad X1 2-in-1 Gen 11 | |
| Dell Latitude 7450 2-in-1 | |
| CrossMark / Overall | |
| Lenovo Yoga Book 9 14IAH10 | |
| Asus ExpertBook Ultra B9406CAA | |
| Lenovo ThinkPad X1 2-in-1 Gen 11 | |
| Durchschnittliche Intel Core Ultra 7 355, Intel Graphics 4 Xe3 Panther Lake iGPU (1627 - 1818, n=3) | |
| Lenovo ThinkPad X1 2-in-1 Gen 10 | |
| HP EliteBook X Flip G1i 14 AI | |
| Dell Latitude 7450 2-in-1 | |
| CrossMark / Productivity | |
| Lenovo Yoga Book 9 14IAH10 | |
| Lenovo ThinkPad X1 2-in-1 Gen 11 | |
| Durchschnittliche Intel Core Ultra 7 355, Intel Graphics 4 Xe3 Panther Lake iGPU (1561 - 1755, n=3) | |
| Asus ExpertBook Ultra B9406CAA | |
| Lenovo ThinkPad X1 2-in-1 Gen 10 | |
| HP EliteBook X Flip G1i 14 AI | |
| Dell Latitude 7450 2-in-1 | |
| CrossMark / Creativity | |
| Lenovo Yoga Book 9 14IAH10 | |
| Asus ExpertBook Ultra B9406CAA | |
| Lenovo ThinkPad X1 2-in-1 Gen 11 | |
| Lenovo ThinkPad X1 2-in-1 Gen 10 | |
| Durchschnittliche Intel Core Ultra 7 355, Intel Graphics 4 Xe3 Panther Lake iGPU (1761 - 2045, n=3) | |
| HP EliteBook X Flip G1i 14 AI | |
| Dell Latitude 7450 2-in-1 | |
| CrossMark / Responsiveness | |
| Asus ExpertBook Ultra B9406CAA | |
| Lenovo ThinkPad X1 2-in-1 Gen 11 | |
| Lenovo Yoga Book 9 14IAH10 | |
| Durchschnittliche Intel Core Ultra 7 355, Intel Graphics 4 Xe3 Panther Lake iGPU (1458 - 1543, n=3) | |
| Dell Latitude 7450 2-in-1 | |
| Lenovo ThinkPad X1 2-in-1 Gen 10 | |
| HP EliteBook X Flip G1i 14 AI | |
| WebXPRT 3 / Overall | |
| Dell Latitude 7450 2-in-1 | |
| Lenovo Yoga Book 9 14IAH10 | |
| Lenovo ThinkPad X1 2-in-1 Gen 10 | |
| Asus ExpertBook Ultra B9406CAA | |
| Lenovo ThinkPad X1 2-in-1 Gen 11 | |
| Durchschnittliche Intel Core Ultra 7 355, Intel Graphics 4 Xe3 Panther Lake iGPU (302 - 303, n=3) | |
| HP EliteBook X Flip G1i 14 AI | |
| WebXPRT 4 / Overall | |
| Dell Latitude 7450 2-in-1 | |
| Lenovo Yoga Book 9 14IAH10 | |
| Lenovo ThinkPad X1 2-in-1 Gen 11 | |
| Durchschnittliche Intel Core Ultra 7 355, Intel Graphics 4 Xe3 Panther Lake iGPU (279 - 284, n=3) | |
| Asus ExpertBook Ultra B9406CAA | |
| HP EliteBook X Flip G1i 14 AI | |
| Mozilla Kraken 1.1 / Total | |
| HP EliteBook X Flip G1i 14 AI | |
| Durchschnittliche Intel Core Ultra 7 355, Intel Graphics 4 Xe3 Panther Lake iGPU (474 - 487, n=3) | |
| Lenovo ThinkPad X1 2-in-1 Gen 11 | |
| Lenovo ThinkPad X1 2-in-1 Gen 10 | |
| Asus ExpertBook Ultra B9406CAA | |
| Lenovo Yoga Book 9 14IAH10 | |
| Dell Latitude 7450 2-in-1 | |
| Geekbench AI / Quantized GPU 1.7 | |
| Asus ExpertBook Ultra B9406CAA | |
| Lenovo ThinkPad X1 2-in-1 Gen 10 | |
| Lenovo Yoga Book 9 14IAH10 | |
| Durchschnittliche Intel Core Ultra 7 355, Intel Graphics 4 Xe3 Panther Lake iGPU (4302 - 4449, n=3) | |
| Lenovo ThinkPad X1 2-in-1 Gen 11 | |
| Geekbench AI / Half Precision GPU 1.7 | |
| Asus ExpertBook Ultra B9406CAA | |
| Lenovo ThinkPad X1 2-in-1 Gen 10 | |
| Durchschnittliche Intel Core Ultra 7 355, Intel Graphics 4 Xe3 Panther Lake iGPU (12274 - 12681, n=3) | |
| Lenovo ThinkPad X1 2-in-1 Gen 11 | |
| Lenovo Yoga Book 9 14IAH10 | |
| Geekbench AI / Single Precision GPU 1.7 | |
| Asus ExpertBook Ultra B9406CAA | |
| Lenovo ThinkPad X1 2-in-1 Gen 10 | |
| Lenovo Yoga Book 9 14IAH10 | |
| Durchschnittliche Intel Core Ultra 7 355, Intel Graphics 4 Xe3 Panther Lake iGPU (6316 - 6555, n=3) | |
| Lenovo ThinkPad X1 2-in-1 Gen 11 | |
* ... kleinere Werte sind besser
| PCMark 10 Score | 7884 Punkte | |
Hilfe | ||
| AIDA64 / Memory Copy | |
| HP EliteBook X Flip G1i 14 AI | |
| Lenovo ThinkPad X1 2-in-1 Gen 10 | |
| Lenovo ThinkPad X1 2-in-1 Gen 11 | |
| Durchschnittliche Intel Core Ultra 7 355 (97301 - 105135, n=3) | |
| Lenovo Yoga Book 9 14IAH10 | |
| Dell Latitude 7450 2-in-1 | |
| AIDA64 / Memory Read | |
| Asus ExpertBook Ultra B9406CAA | |
| Lenovo ThinkPad X1 2-in-1 Gen 10 | |
| HP EliteBook X Flip G1i 14 AI | |
| Lenovo ThinkPad X1 2-in-1 Gen 11 | |
| Lenovo Yoga Book 9 14IAH10 | |
| Durchschnittliche Intel Core Ultra 7 355 (79551 - 85021, n=3) | |
| Dell Latitude 7450 2-in-1 | |
| AIDA64 / Memory Write | |
| Asus ExpertBook Ultra B9406CAA | |
| Lenovo ThinkPad X1 2-in-1 Gen 10 | |
| HP EliteBook X Flip G1i 14 AI | |
| Lenovo ThinkPad X1 2-in-1 Gen 11 | |
| Durchschnittliche Intel Core Ultra 7 355 (103056 - 108621, n=3) | |
| Lenovo Yoga Book 9 14IAH10 | |
| Dell Latitude 7450 2-in-1 | |
| AIDA64 / Memory Latency | |
| Dell Latitude 7450 2-in-1 | |
| Lenovo Yoga Book 9 14IAH10 | |
| Durchschnittliche Intel Core Ultra 7 355 (99.7 - 105.8, n=3) | |
| Lenovo ThinkPad X1 2-in-1 Gen 11 | |
| HP EliteBook X Flip G1i 14 AI | |
| Lenovo ThinkPad X1 2-in-1 Gen 10 | |
* ... kleinere Werte sind besser
DPC-Latenz
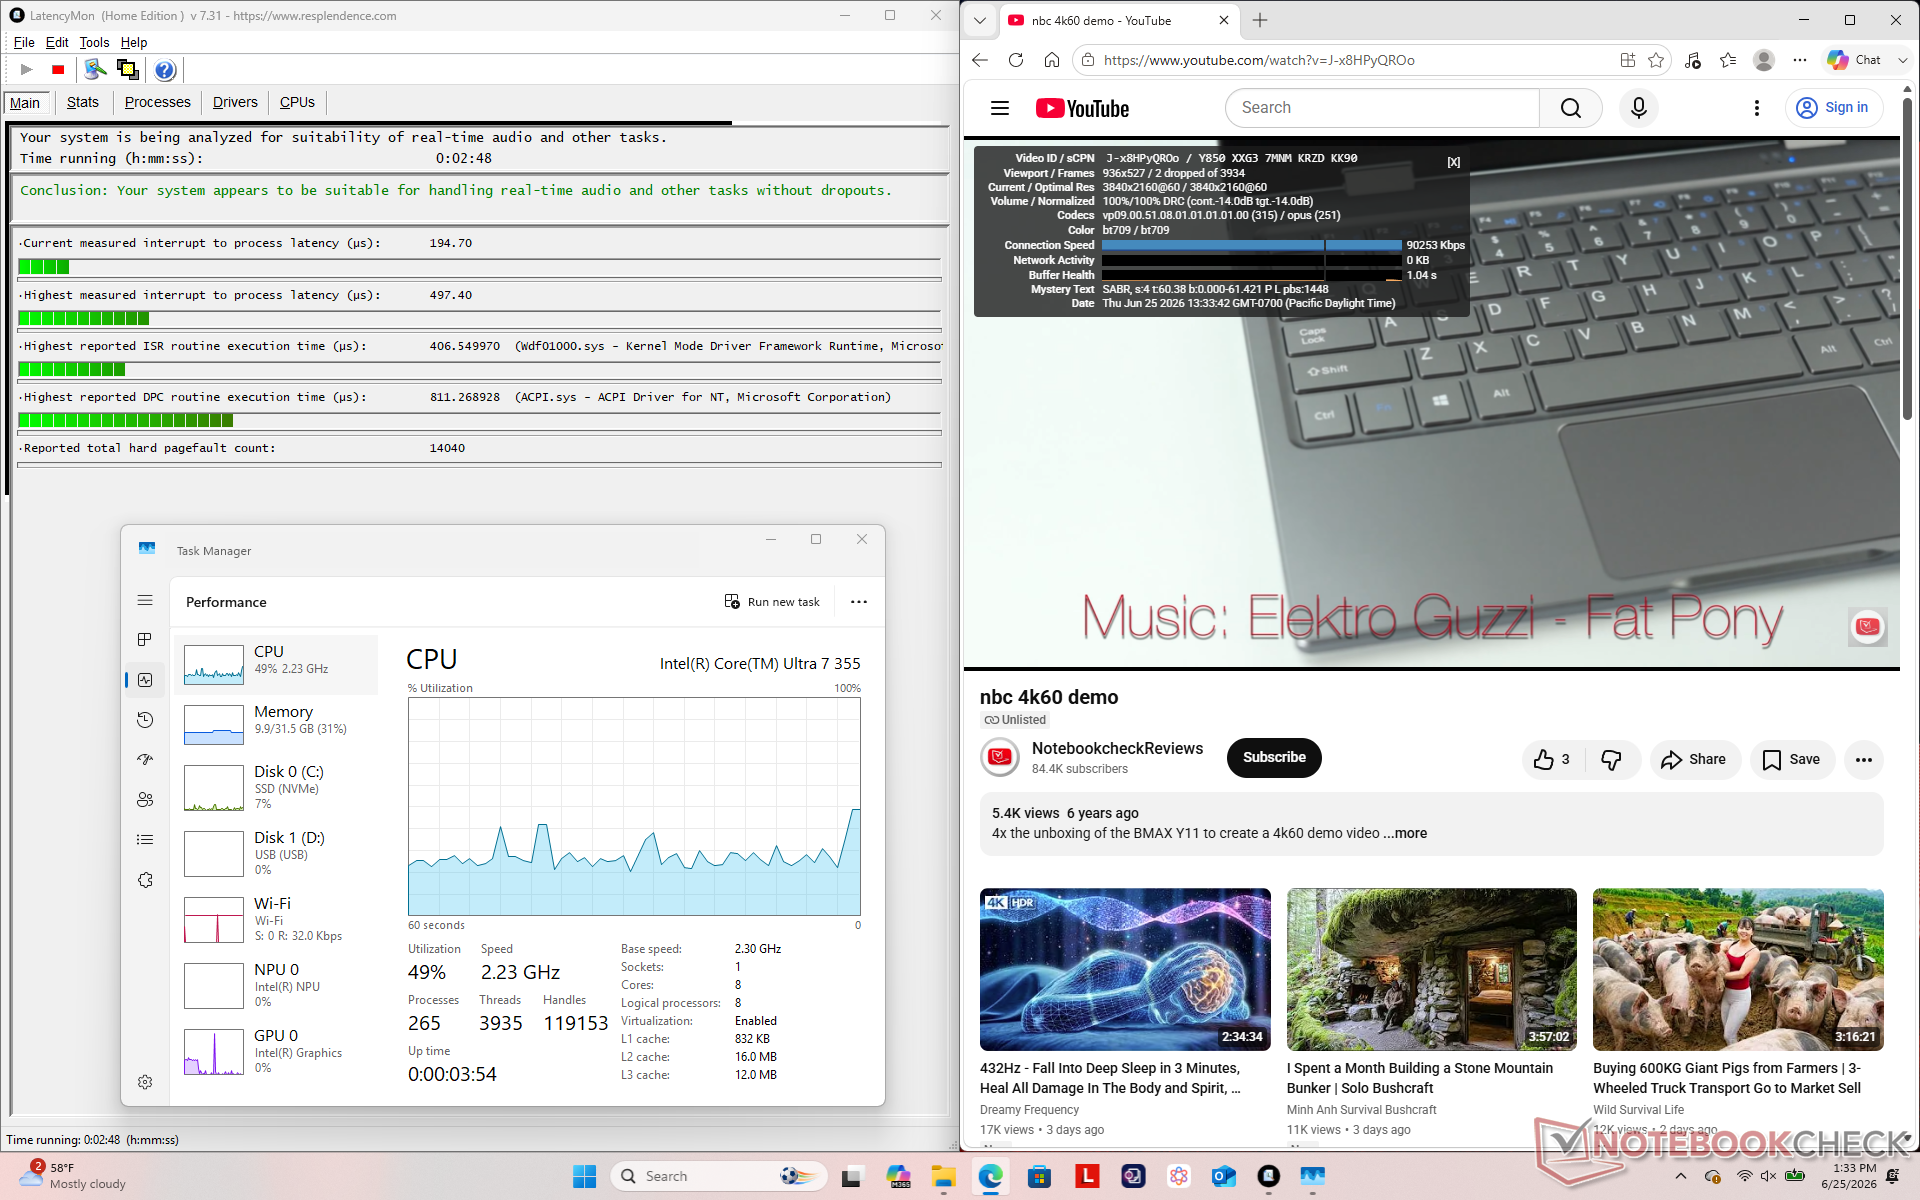
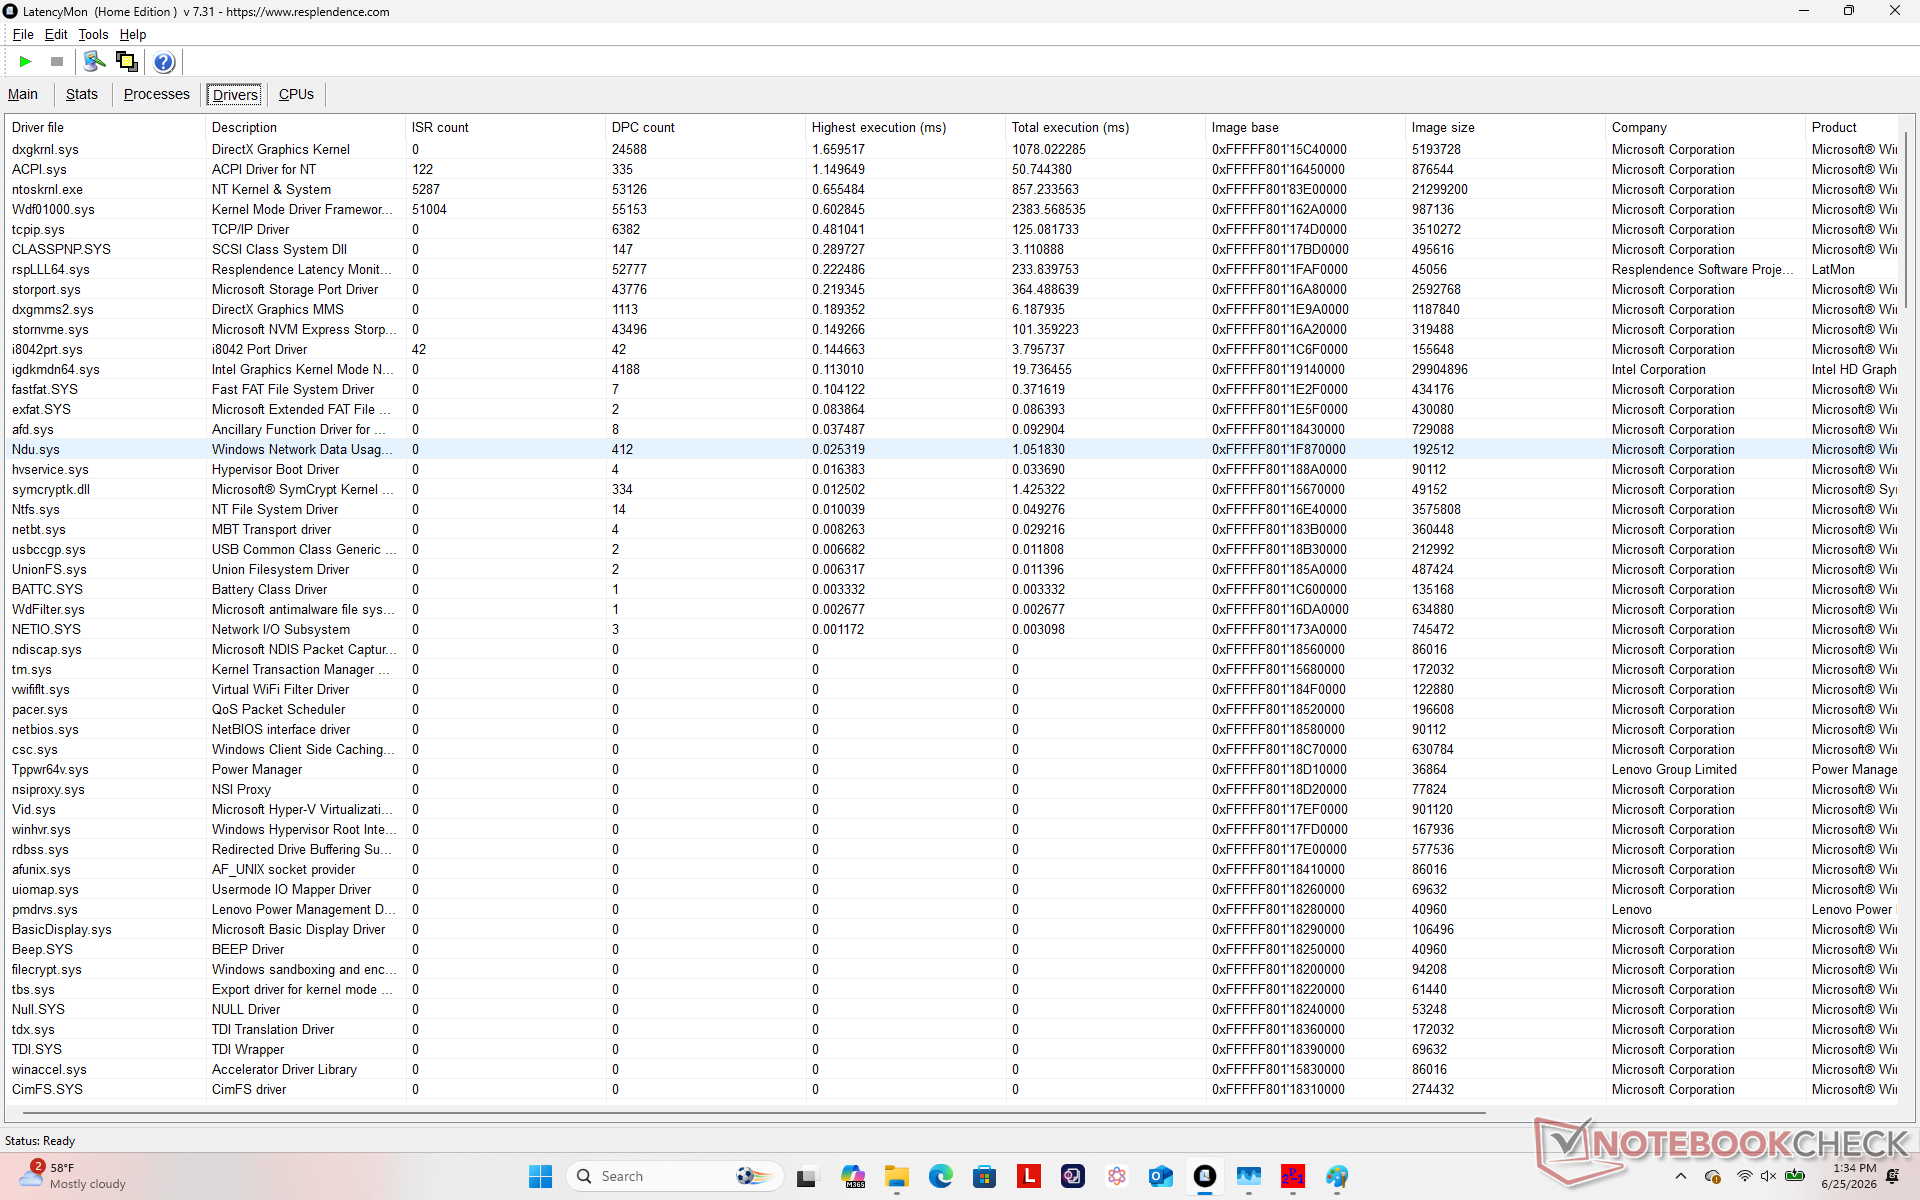
| DPC Latencies / LatencyMon - interrupt to process latency (max), Web, Youtube, Prime95 | |
| Lenovo Yoga Book 9 14IAH10 | |
| HP EliteBook X Flip G1i 14 AI | |
| Dell Latitude 7450 2-in-1 | |
| Lenovo ThinkPad X1 2-in-1 Gen 10 | |
| Asus ExpertBook Ultra B9406CAA | |
* ... kleinere Werte sind besser
Speichergeräte
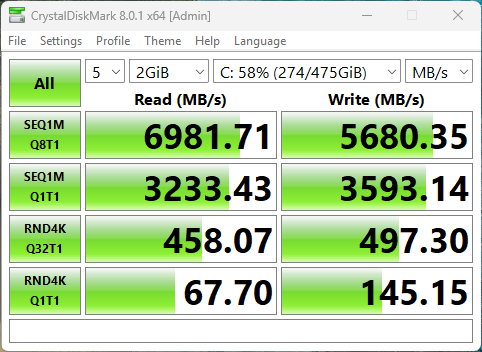
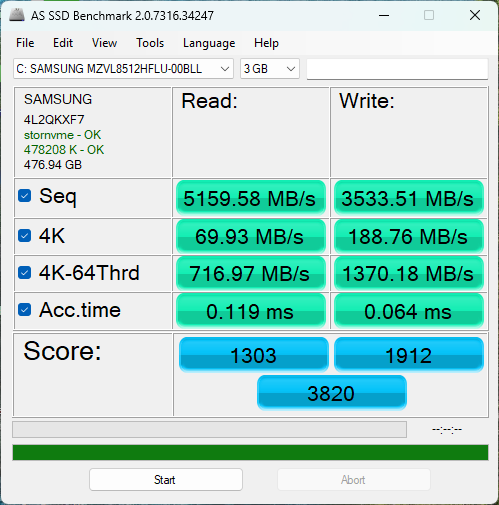

* ... kleinere Werte sind besser
Disk Throttling: DiskSpd Read Loop, Queue Depth 8
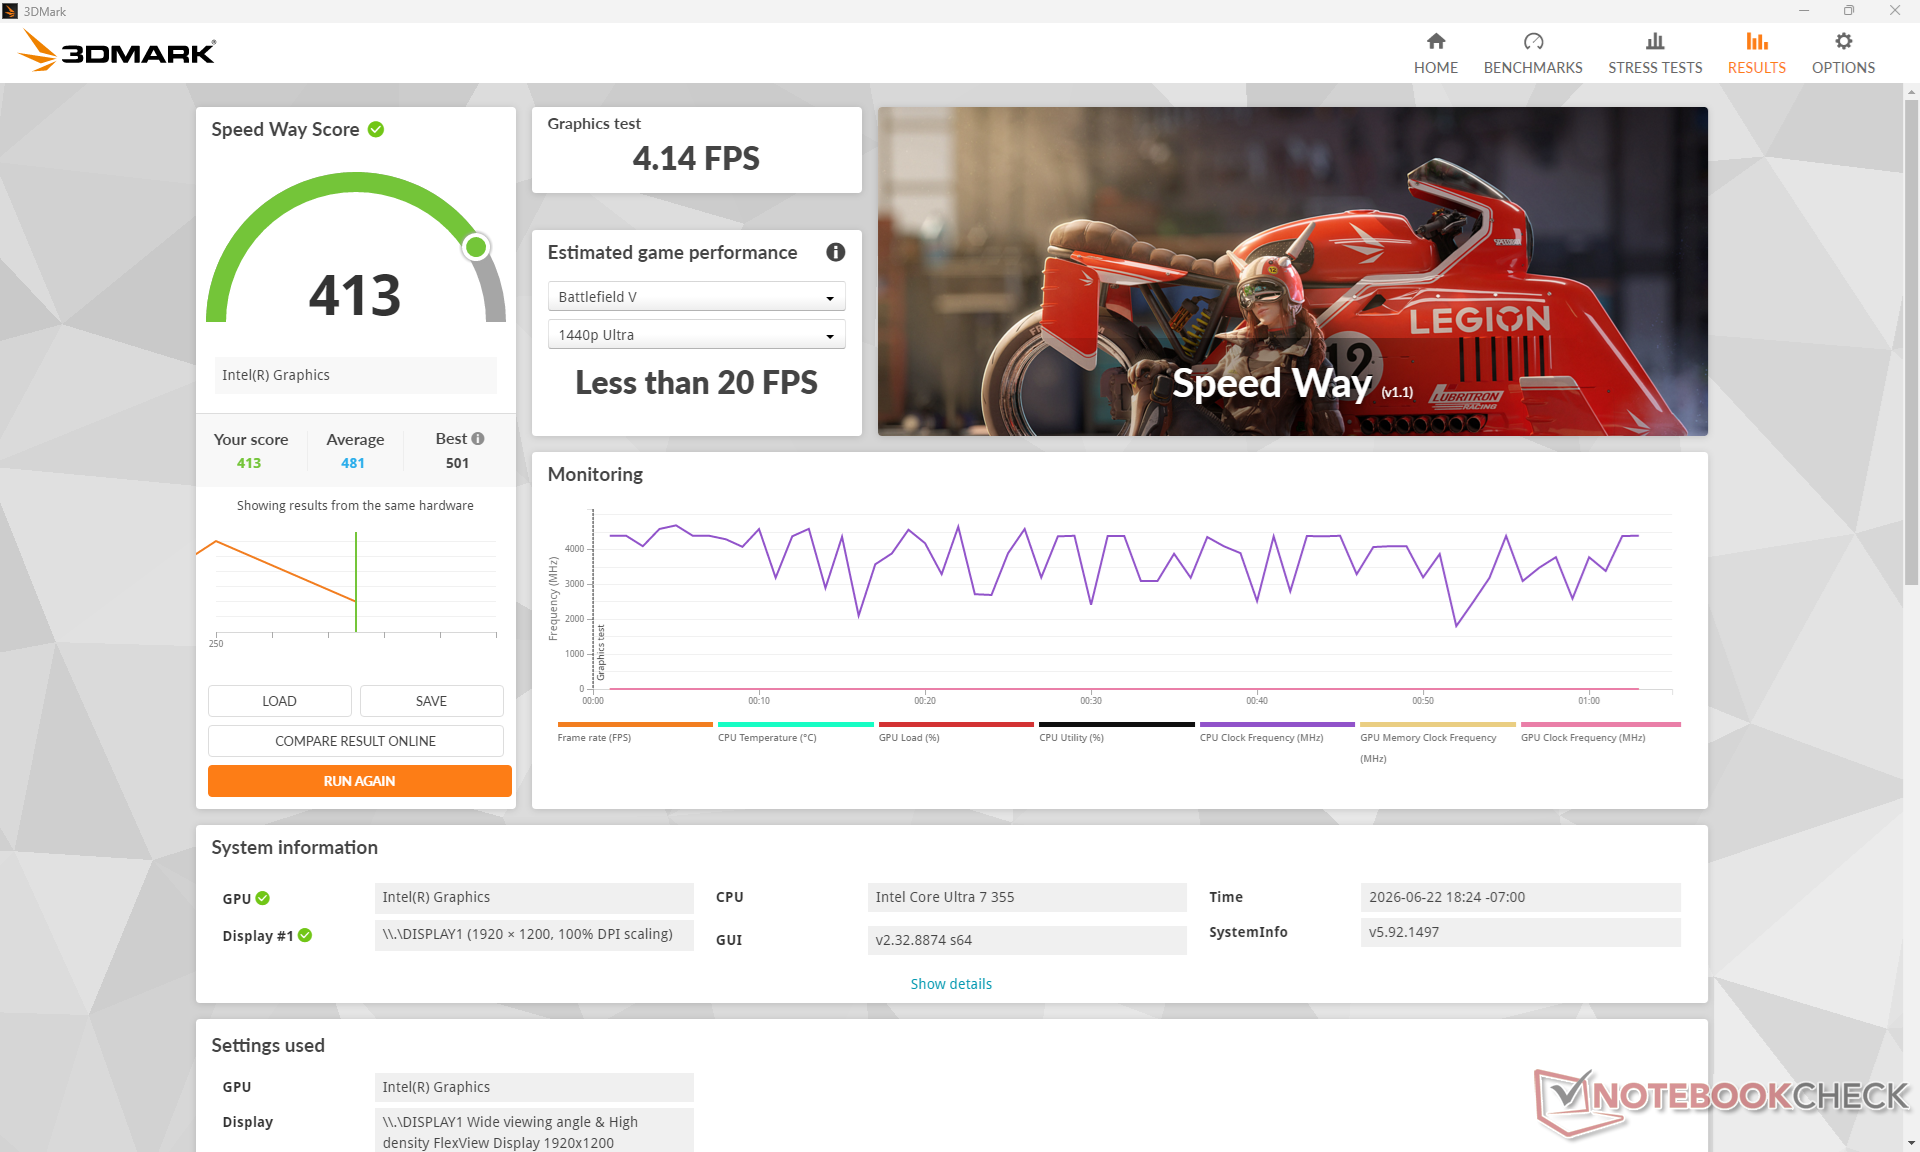
GPU-Leistung
Die integrierte Intel Graphics 4 Xe3 ist langsamer als die Arc 140V im Vorjahresmodell, doch die Gesamtleistung ist konstanter, wie unsere untenstehende Grafik zu Cyberpunk 2077 zeigt. Nutzer, die eine mehr als doppelt so hohe Grafikleistung benötigen, können auf die Core-Ultra-X7-368H-Variante umsteigen, die mit der hochgelobten Arc B390 ausgestattet ist.
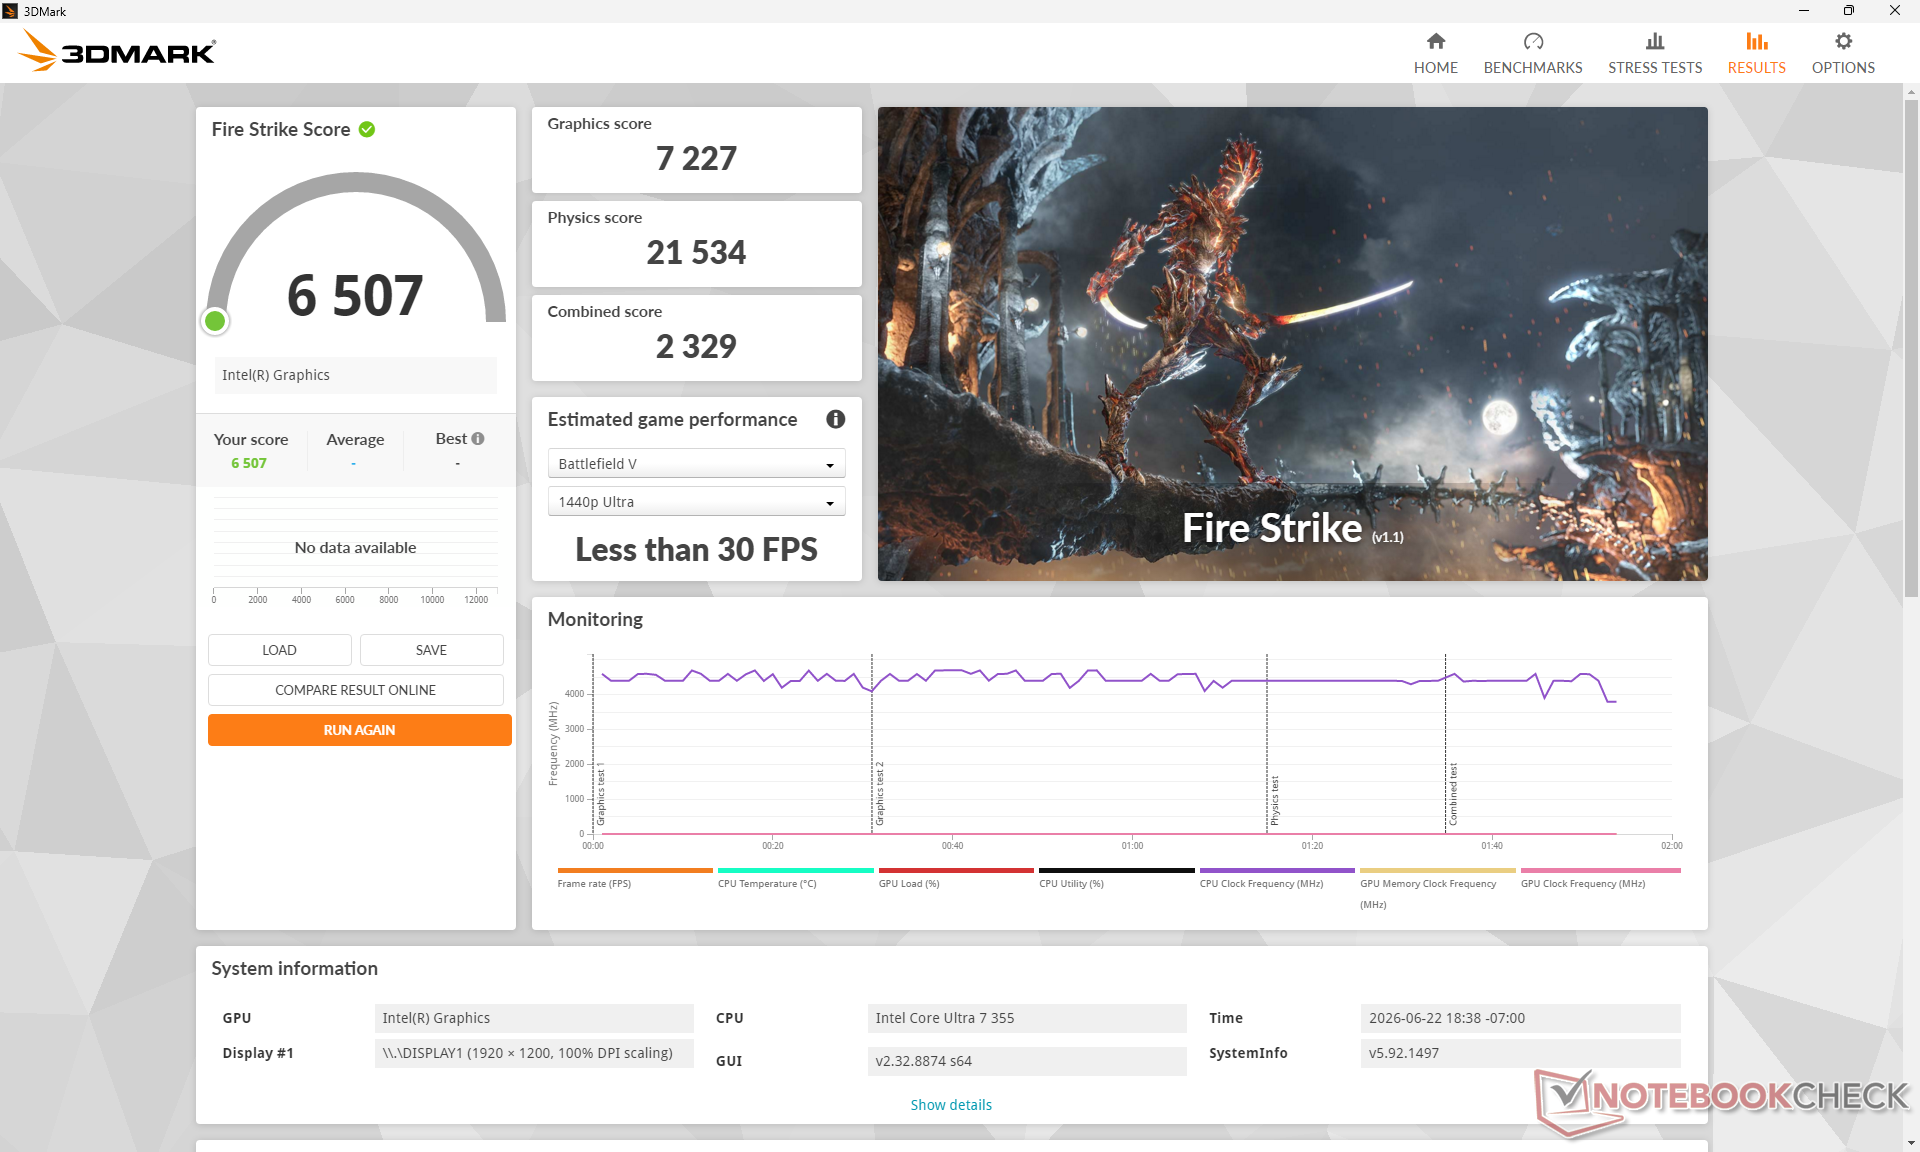
| Leistungsprofil | Grafics-Ergebnis | Physics-Ergebnis | Gesamtpunktzahl |
| Performance-Modus | 7.227 | 21.534 | 2.329 |
| Ausgewogener Modus | 7.093 (-2 %) | 21.207 (-2 %) | 2.351 |
| Batterie-Modus | 7.003 (-3 %) | 21.193 (-2 %) | 2.336 |
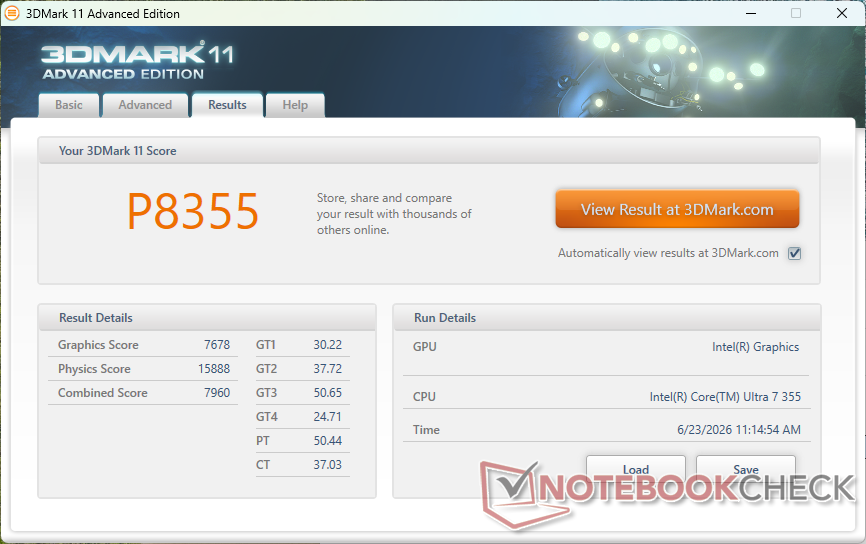
| 3DMark 11 Performance | 8355 Punkte | |
| 3DMark Cloud Gate Standard Score | 29665 Punkte | |
| 3DMark Fire Strike Score | 6507 Punkte | |
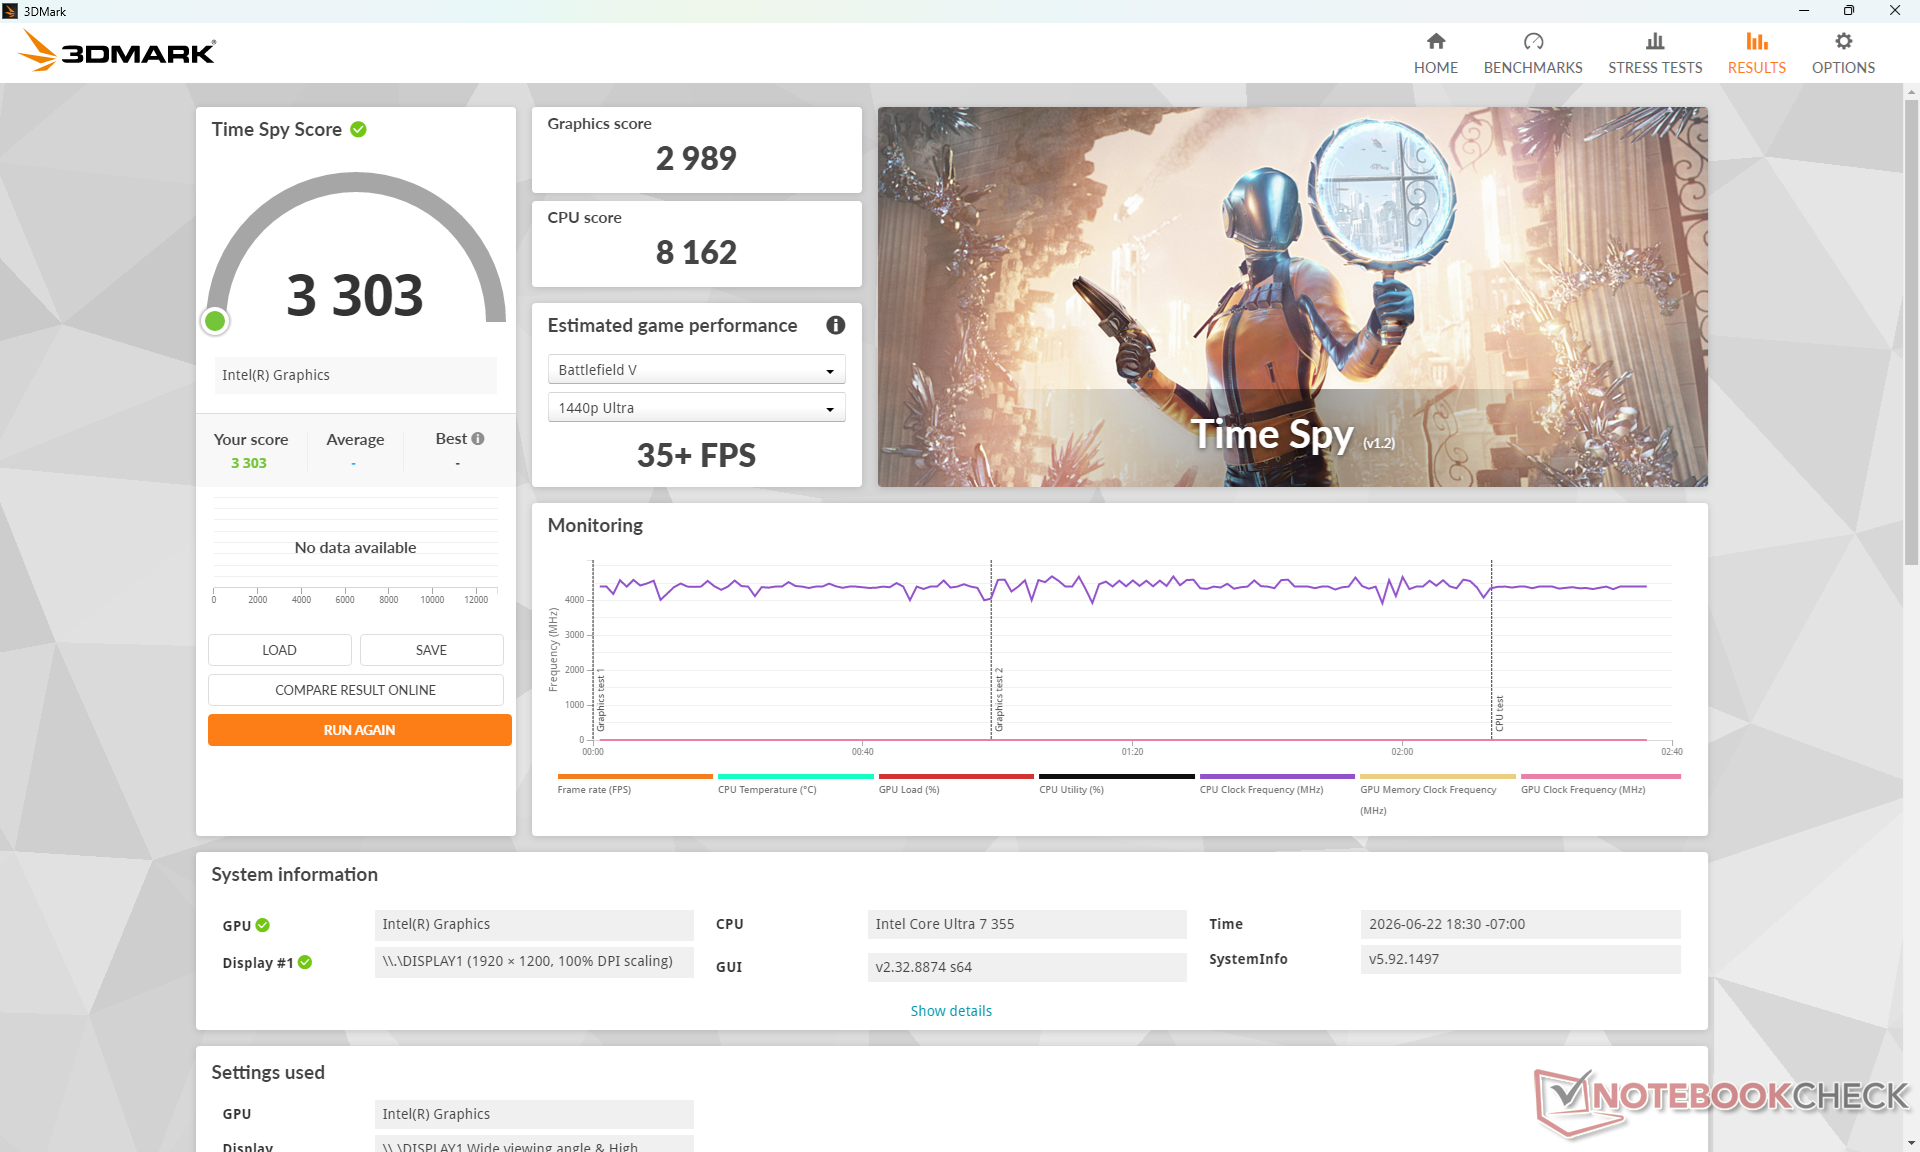
| 3DMark Time Spy Score | 3303 Punkte | |
Hilfe | ||
* ... kleinere Werte sind besser
| Cyberpunk 2077 - 1920x1080 Ultra Preset (FSR off) | |
| Asus ExpertBook Ultra B9406CAA | |
| HP EliteBook X Flip G1i 14 AI | |
| Lenovo ThinkPad X1 2-in-1 Gen 10 | |
| Lenovo Yoga Book 9 14IAH10 | |
| Lenovo ThinkPad X1 2-in-1 Gen 11 | |
| Dell Latitude 7450 2-in-1 | |
| Baldur's Gate 3 - 1920x1080 Ultra Preset AA:T | |
| Asus ExpertBook Ultra B9406CAA | |
| HP EliteBook X Flip G1i 14 AI | |
| Lenovo ThinkPad X1 2-in-1 Gen 10 | |
| Lenovo Yoga Book 9 14IAH10 | |
| Lenovo ThinkPad X1 2-in-1 Gen 11 | |
| Dell Latitude 7450 2-in-1 | |
| Final Fantasy XV Benchmark - 1920x1080 High Quality | |
| Asus ExpertBook Ultra B9406CAA | |
| HP EliteBook X Flip G1i 14 AI | |
| Lenovo ThinkPad X1 2-in-1 Gen 10 | |
| Lenovo Yoga Book 9 14IAH10 | |
| Lenovo ThinkPad X1 2-in-1 Gen 11 | |
| Dell Latitude 7450 2-in-1 | |
| Strange Brigade - 1920x1080 ultra AA:ultra AF:16 | |
| Asus ExpertBook Ultra B9406CAA | |
| Lenovo ThinkPad X1 2-in-1 Gen 10 | |
| HP EliteBook X Flip G1i 14 AI | |
| Lenovo ThinkPad X1 2-in-1 Gen 11 | |
| Lenovo Yoga Book 9 14IAH10 | |
| Dell Latitude 7450 2-in-1 | |
| Dota 2 Reborn - 1920x1080 ultra (3/3) best looking | |
| Asus ExpertBook Ultra B9406CAA | |
| Lenovo ThinkPad X1 2-in-1 Gen 11 | |
| HP EliteBook X Flip G1i 14 AI | |
| Lenovo Yoga Book 9 14IAH10 | |
| Lenovo ThinkPad X1 2-in-1 Gen 10 | |
| Dell Latitude 7450 2-in-1 | |
| X-Plane 11.11 - 1920x1080 high (fps_test=3) | |
| Asus ExpertBook Ultra B9406CAA | |
| Lenovo Yoga Book 9 14IAH10 | |
| Lenovo ThinkPad X1 2-in-1 Gen 10 | |
| HP EliteBook X Flip G1i 14 AI | |
| Dell Latitude 7450 2-in-1 | |
| Lenovo ThinkPad X1 2-in-1 Gen 11 | |
Cyberpunk 2077 – Ultra-fps-Diagramm
| min. | mittel | hoch | max. | |
|---|---|---|---|---|
| GTA V (2015) | 169.3 | 161.6 | 54.8 | 21.8 |
| Dota 2 Reborn (2015) | 128.1 | 99.2 | 82.1 | 84.9 |
| Final Fantasy XV Benchmark (2018) | 69 | 36.3 | 25.9 | |
| X-Plane 11.11 (2018) | 33 | 27.2 | 24.7 | |
| Strange Brigade (2018) | 192.1 | 76.2 | 62.1 | 53 |
| Baldur's Gate 3 (2023) | 32.5 | 27 | 23.7 | 23.1 |
| Cyberpunk 2077 (2023) | 39.4 | 29.8 | 26.1 | 21.8 |
| F1 24 (2024) | 68 | 63.8 | 46.7 | 14.8 |
Emissionen
Systemgeräusche
Die Geräuschentwicklung und das Verhalten des Lüfters haben sich gegenüber dem Vorjahresmodell mit ähnlichen Deckenkonstruktionen kaum verändert.
Lautstärkediagramm
| Idle |
| 23.3 / 23.3 / 23.3 dB(A) |
| Last |
| 38.1 / 38.1 dB(A) |
 | ||
30 dB leise 40 dB(A) deutlich hörbar 50 dB(A) störend |
||
min: | ||
| Lenovo ThinkPad X1 2-in-1 Gen 11 Ultra 7 355, Intel Graphics 4 Xe3 PTL | Lenovo ThinkPad X1 2-in-1 Gen 10 Core Ultra 7 258V, Arc 140V | Lenovo Yoga Book 9 14IAH10 Ultra 7 255H, Arc 140T | HP EliteBook X Flip G1i 14 AI Core Ultra 7 258V, Arc 140V | Dell Latitude 7450 2-in-1 Ultra 7 165U, Graphics 4-Core iGPU (Arrow Lake) | Asus ExpertBook Ultra B9406CAA Ultra X7 358H, Arc B390 Panther Lake iGPU | |
|---|---|---|---|---|---|---|
| Geräuschentwicklung | -1% | -6% | 10% | -0% | -1% | |
| aus / Umgebung * (dB) | 23.3 | 23.3 -0% | 23.9 -3% | 23 1% | 23.03 1% | 22.9 2% |
| Idle min * (dB) | 23.3 | 23.3 -0% | 23.9 -3% | 23 1% | 23.53 -1% | 23.4 -0% |
| Idle avg * (dB) | 23.3 | 23.3 -0% | 23.9 -3% | 23 1% | 23.53 -1% | 23.4 -0% |
| Idle max * (dB) | 23.3 | 23.3 -0% | 23.9 -3% | 23 1% | 23.53 -1% | 23.4 -0% |
| Last avg * (dB) | 38.1 | 38 -0% | 39.1 -3% | 27.14 29% | 38.54 -1% | 28.6 25% |
| Cyberpunk 2077 ultra * (dB) | 38.1 | 37.8 1% | 42 -10% | 31.65 17% | 38.2 -0% | 42.8 -12% |
| Last max * (dB) | 38.1 | 40.6 -7% | 44.5 -17% | 31.65 17% | 38.21 -0% | 45.2 -19% |
* ... kleinere Werte sind besser
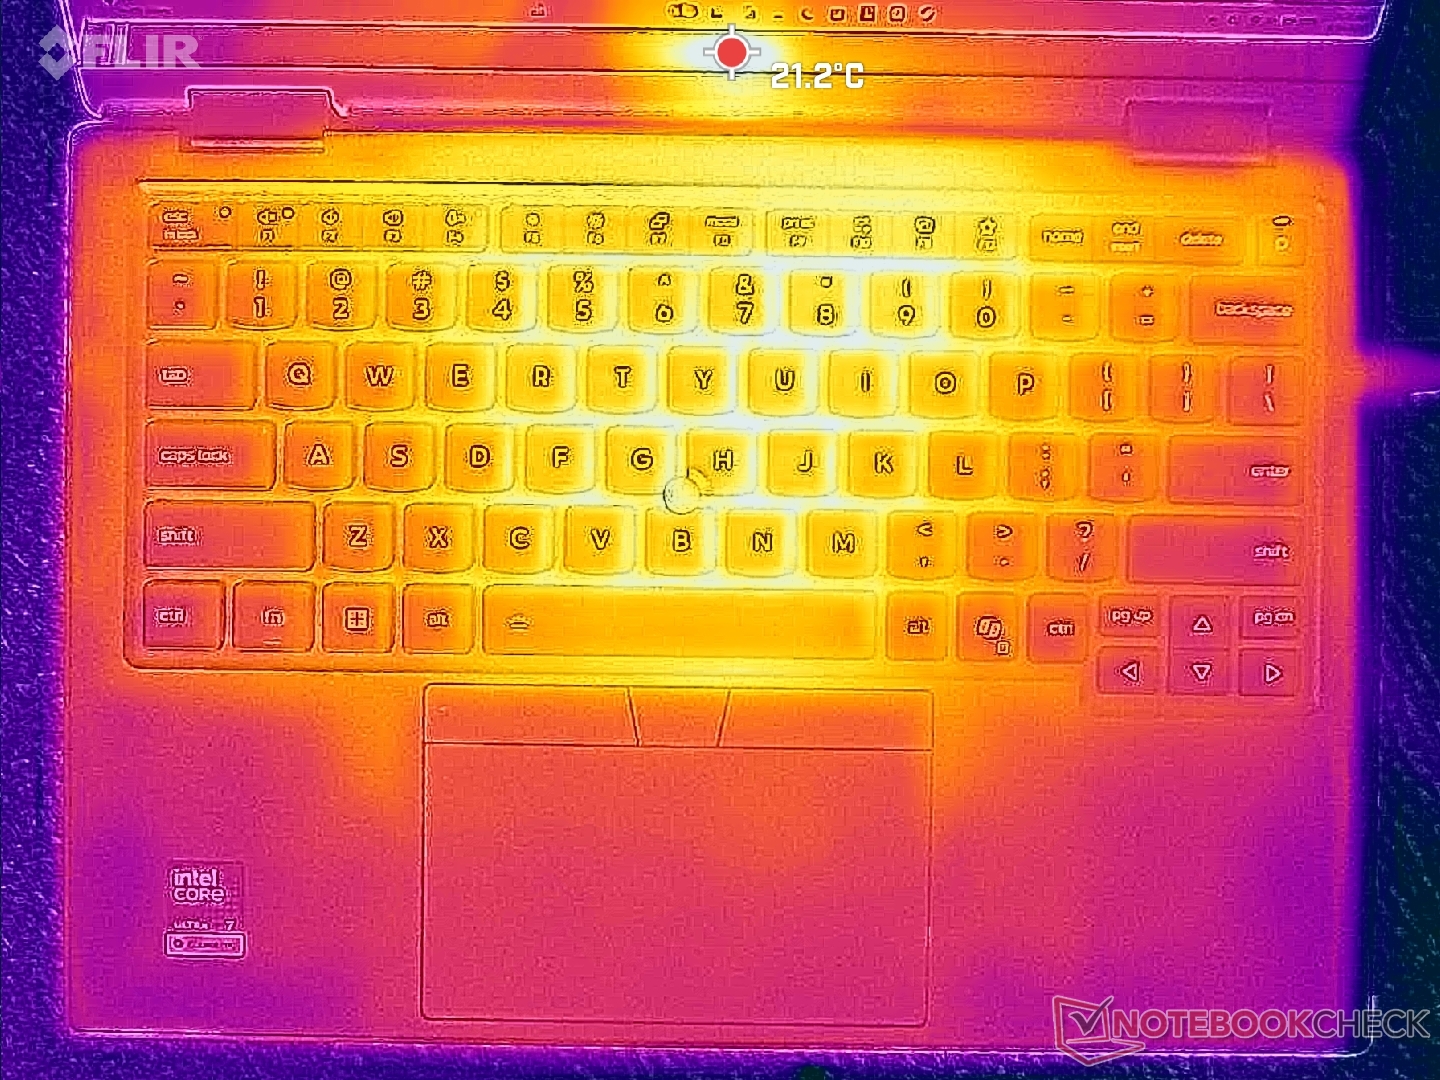
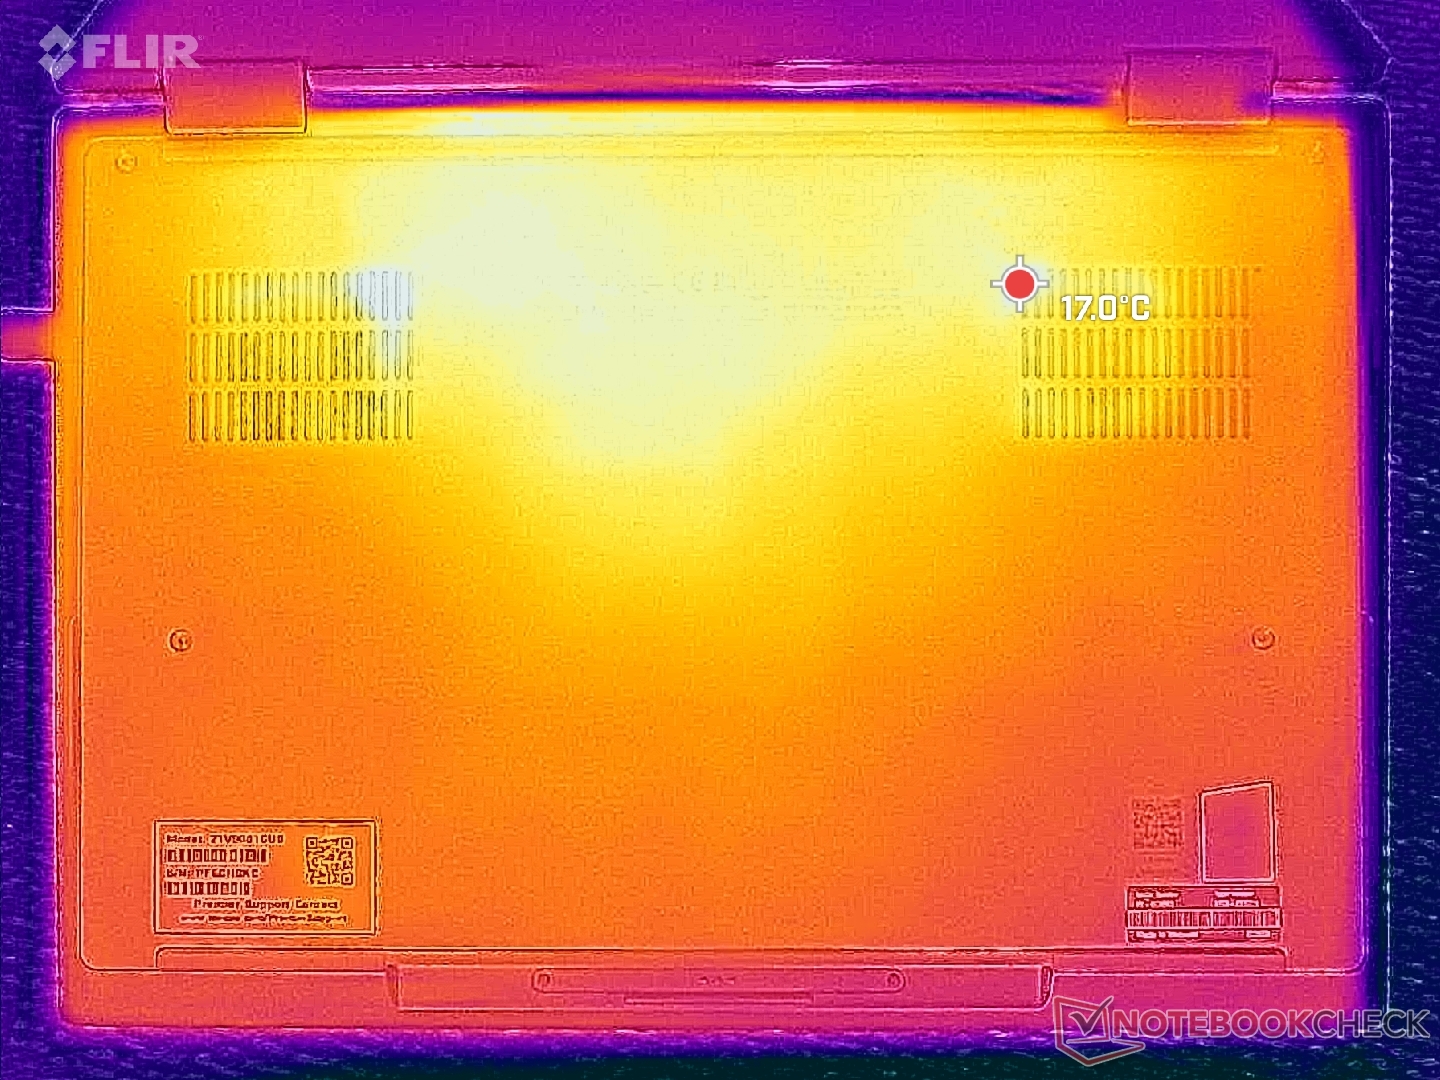
Temperatur
Die Oberflächentemperaturen sind trotz der äußerlichen und inneren Überarbeitungen erneut sehr ähnlich wie beim Vorjahresmodell.
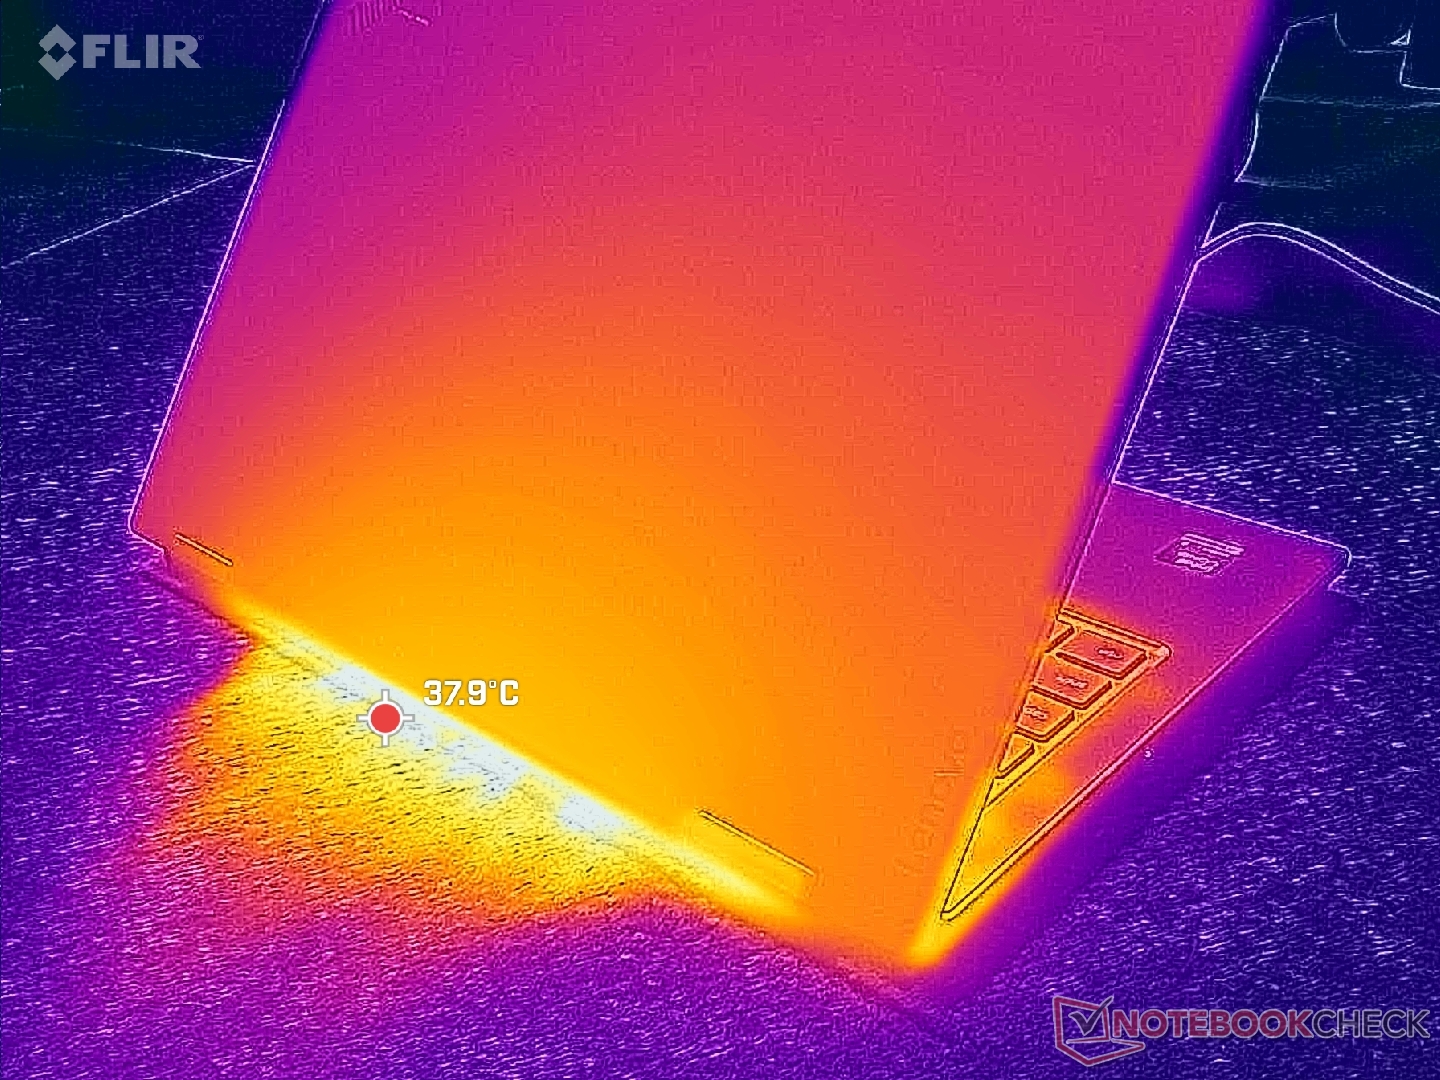
(±) Die maximale Temperatur auf der Oberseite ist 44.2 °C. Im Vergleich liegt der Klassendurchschnitt bei 35.4 °C (von 19.6 bis 60 °C für die Klasse Convertible).
(+) Auf der Unterseite messen wir eine maximalen Wert von 34.6 °C (im Vergleich zum Durchschnitt von 36.9 °C).
(+) Ohne Last messen wir eine durchschnittliche Temperatur von 24.7 °C auf der Oberseite. Der Klassendurchschnitt erreicht 30.3 °C.
(+) Die Handballen und der Touchpad-Bereich sind mit gemessenen 28 °C kühler als die typische Hauttemperatur und fühlen sich dadurch kühl an.
(±) Die durchschnittliche Handballen-Temperatur anderer getesteter Geräte war 28 °C (0 °C).
| Lenovo ThinkPad X1 2-in-1 Gen 11 Ultra 7 355, Intel Graphics 4 Xe3 PTL | Lenovo ThinkPad X1 2-in-1 Gen 10 Core Ultra 7 258V, Arc 140V | Lenovo Yoga Book 9 14IAH10 Ultra 7 255H, Arc 140T | HP EliteBook X Flip G1i 14 AI Core Ultra 7 258V, Arc 140V | Dell Latitude 7450 2-in-1 Ultra 7 165U, Graphics 4-Core iGPU (Arrow Lake) | Asus ExpertBook Ultra B9406CAA Ultra X7 358H, Arc B390 Panther Lake iGPU | |
|---|---|---|---|---|---|---|
| Hitze | 2% | -11% | 1% | -5% | 4% | |
| Last oben max * (°C) | 44.2 | 40 10% | 38.2 14% | 36 19% | 41.2 7% | 38.6 13% |
| Last unten max * (°C) | 34.6 | 38.6 -12% | 38.8 -12% | 41 -18% | 45 -30% | 38.4 -11% |
| Idle oben max * (°C) | 26.2 | 25 5% | 32.6 -24% | 26 1% | 27.2 -4% | 24.6 6% |
| Idle unten max * (°C) | 27.8 | 26.6 4% | 33.8 -22% | 27 3% | 26.2 6% | 26 6% |
* ... kleinere Werte sind besser
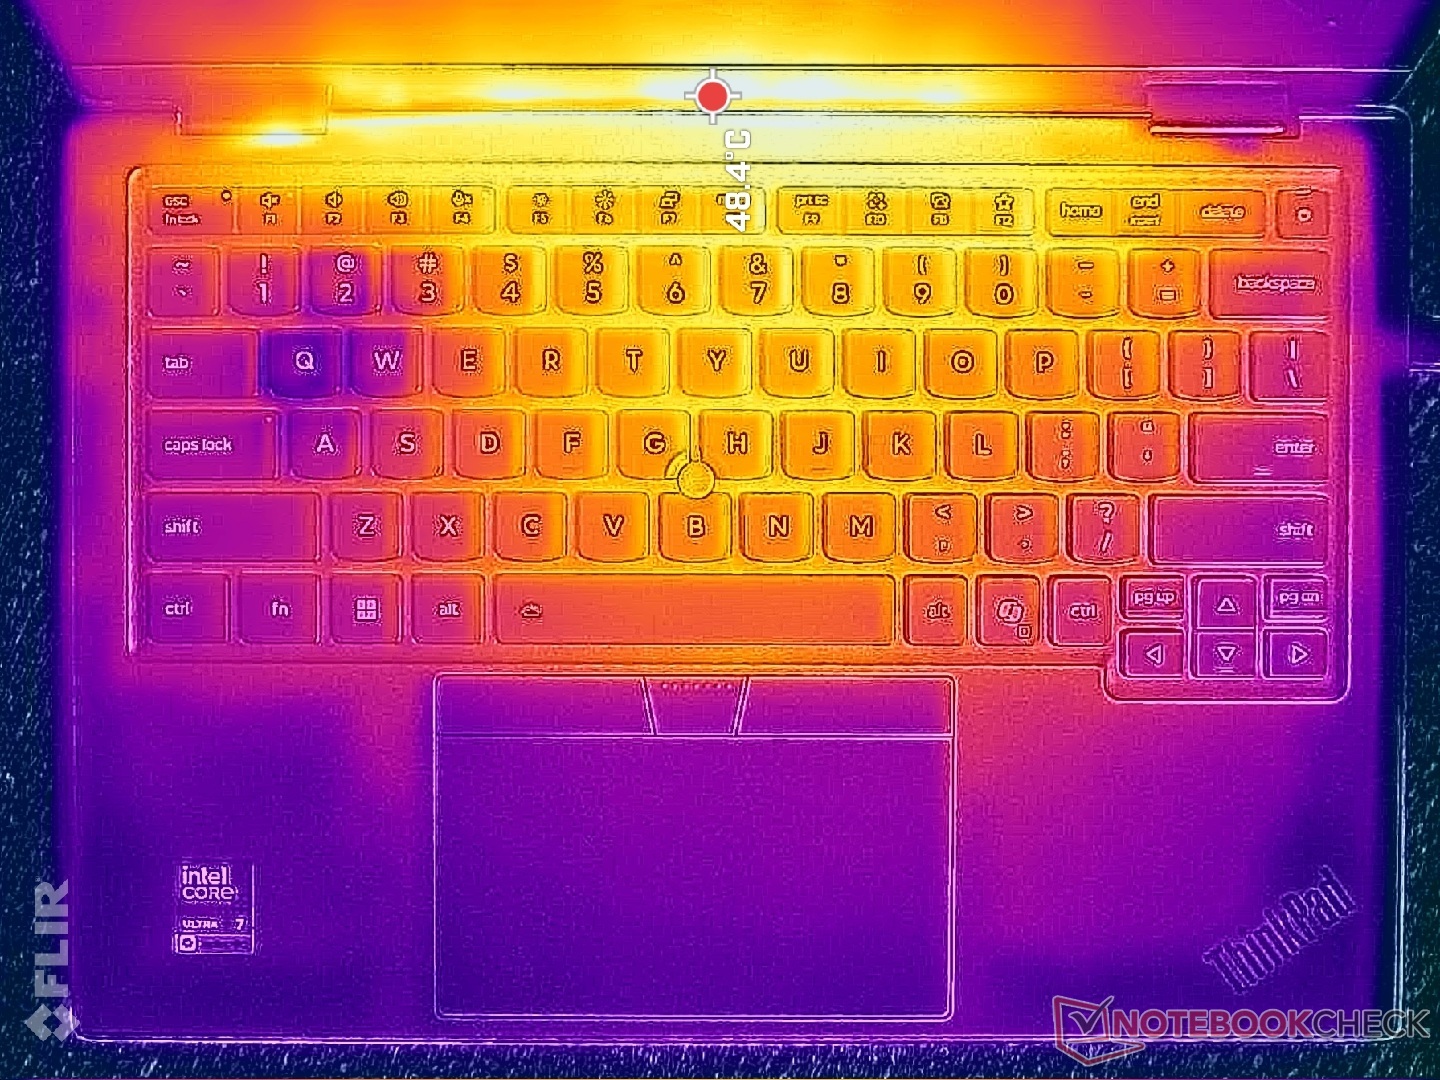
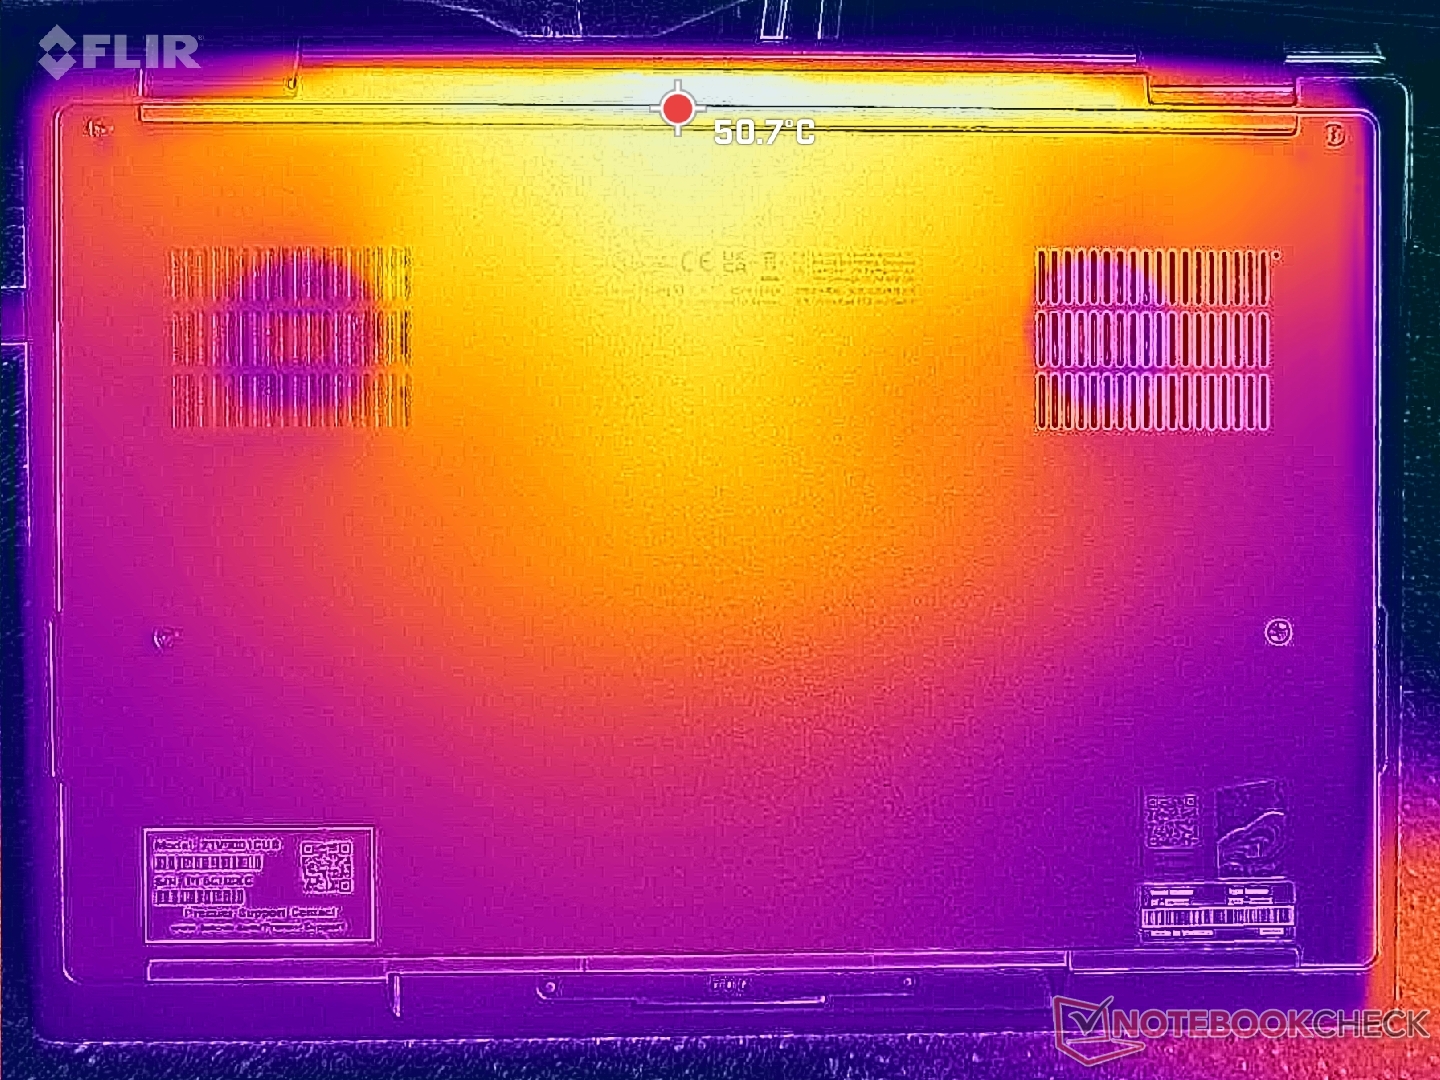
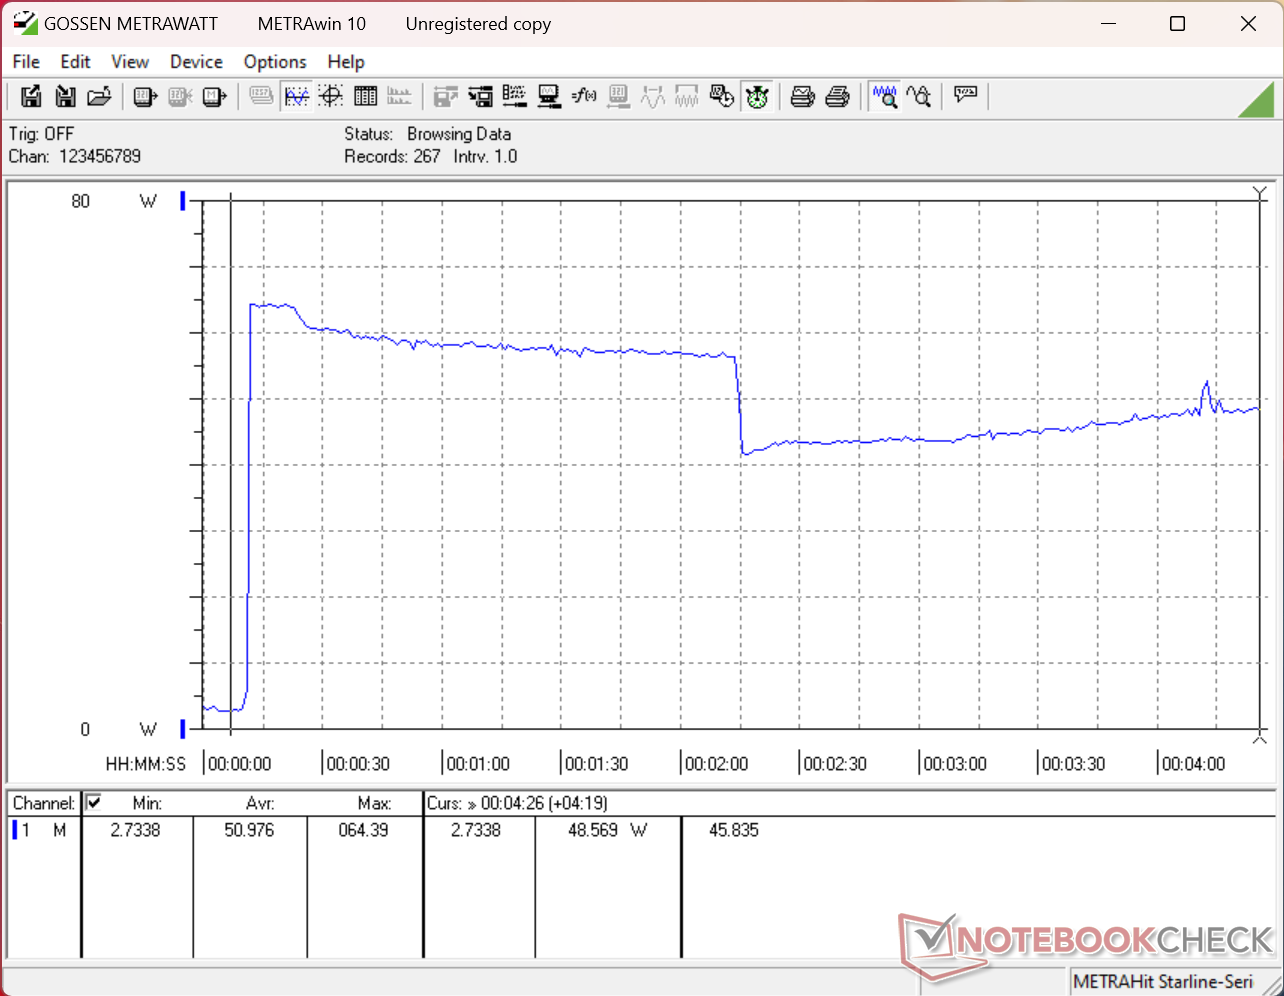
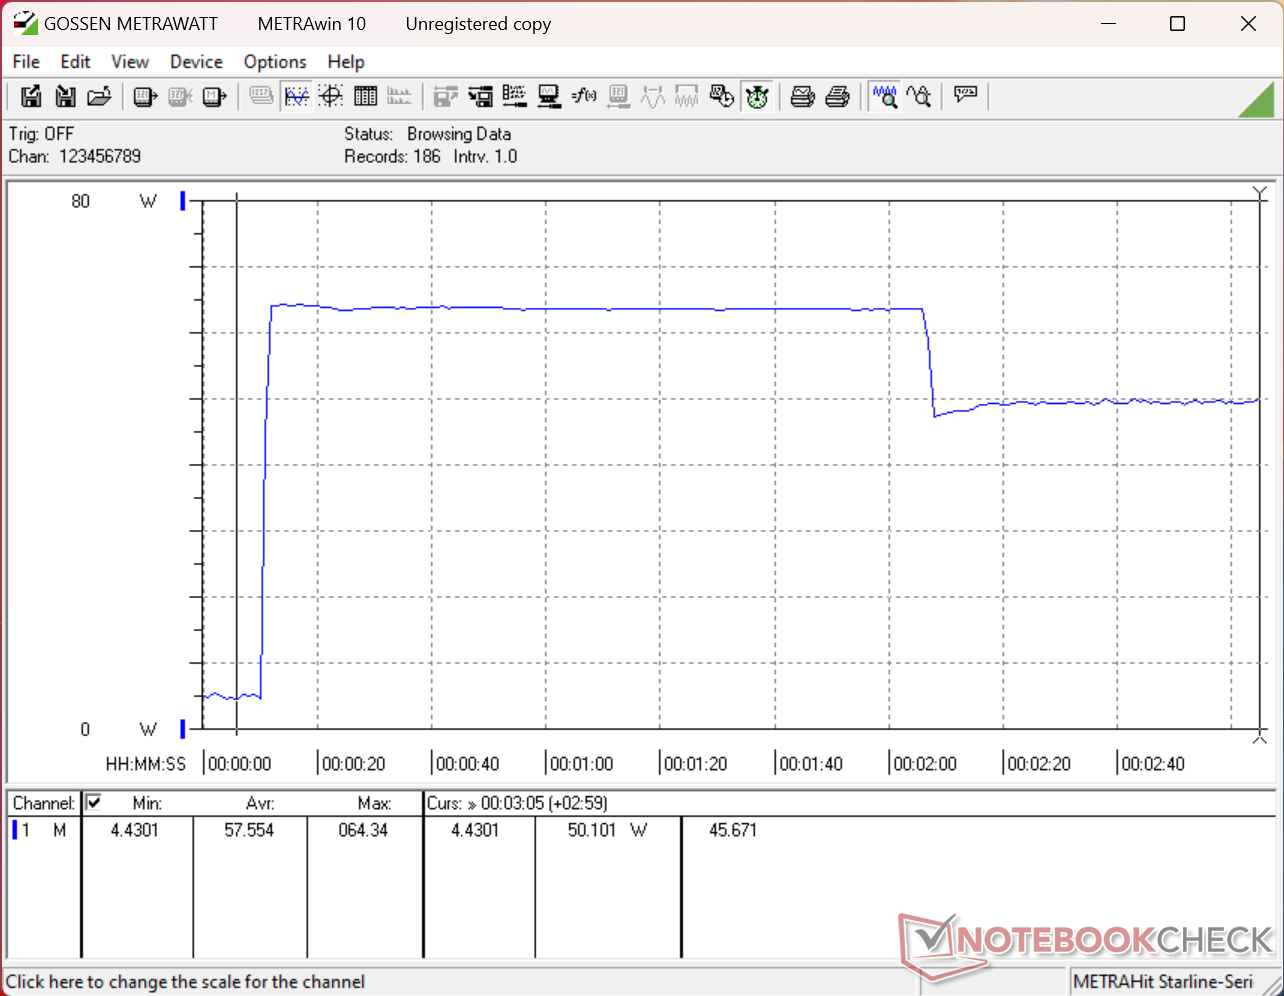
Stresstest
Die CPU taktet für einige Sekunden auf 3,7 GHz, 64 W und 96 °C hoch, bevor sie leicht auf 3,5 GHz und 45 W zurückfällt. Die Kerntemperatur schwankt unter Last im Bereich von hohen 80 bis 90 °C.
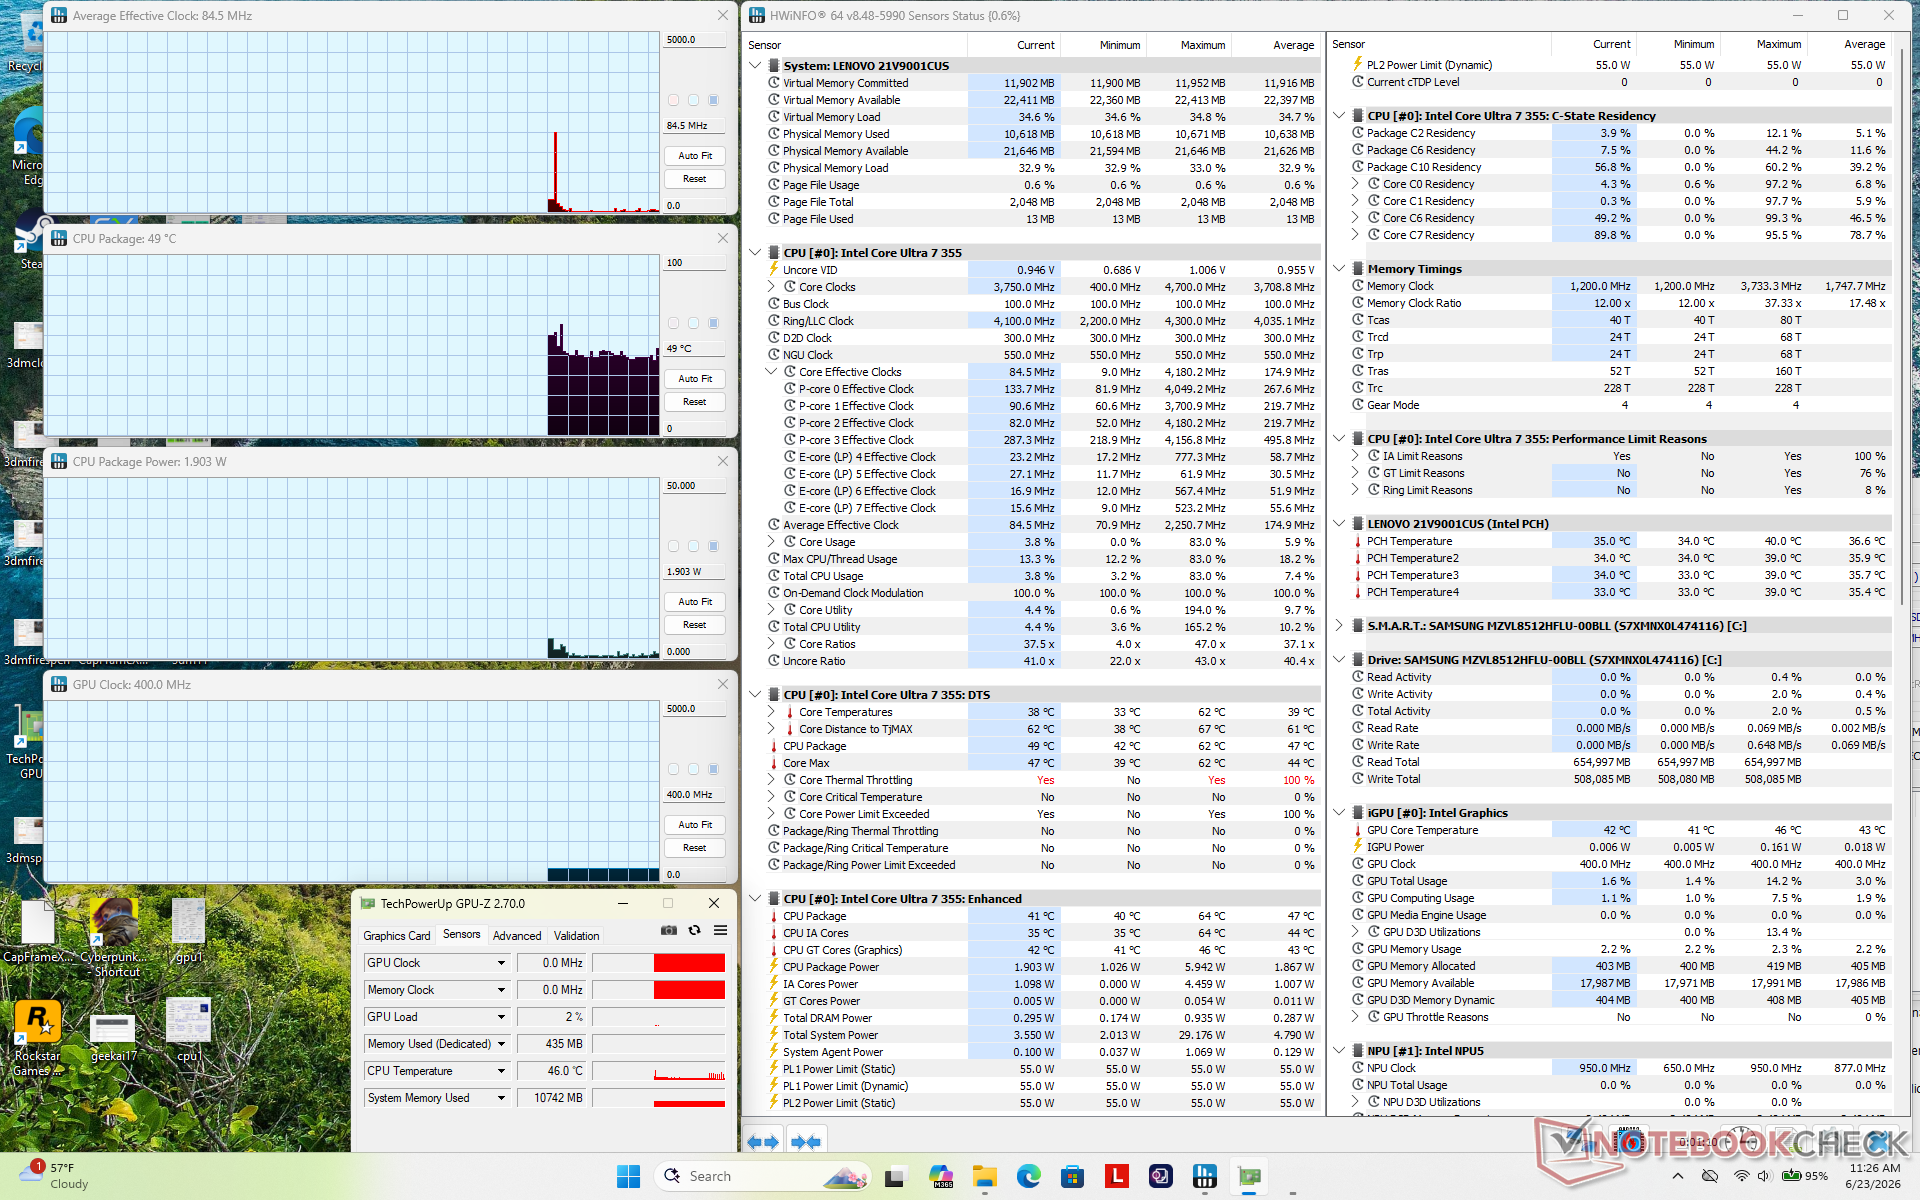
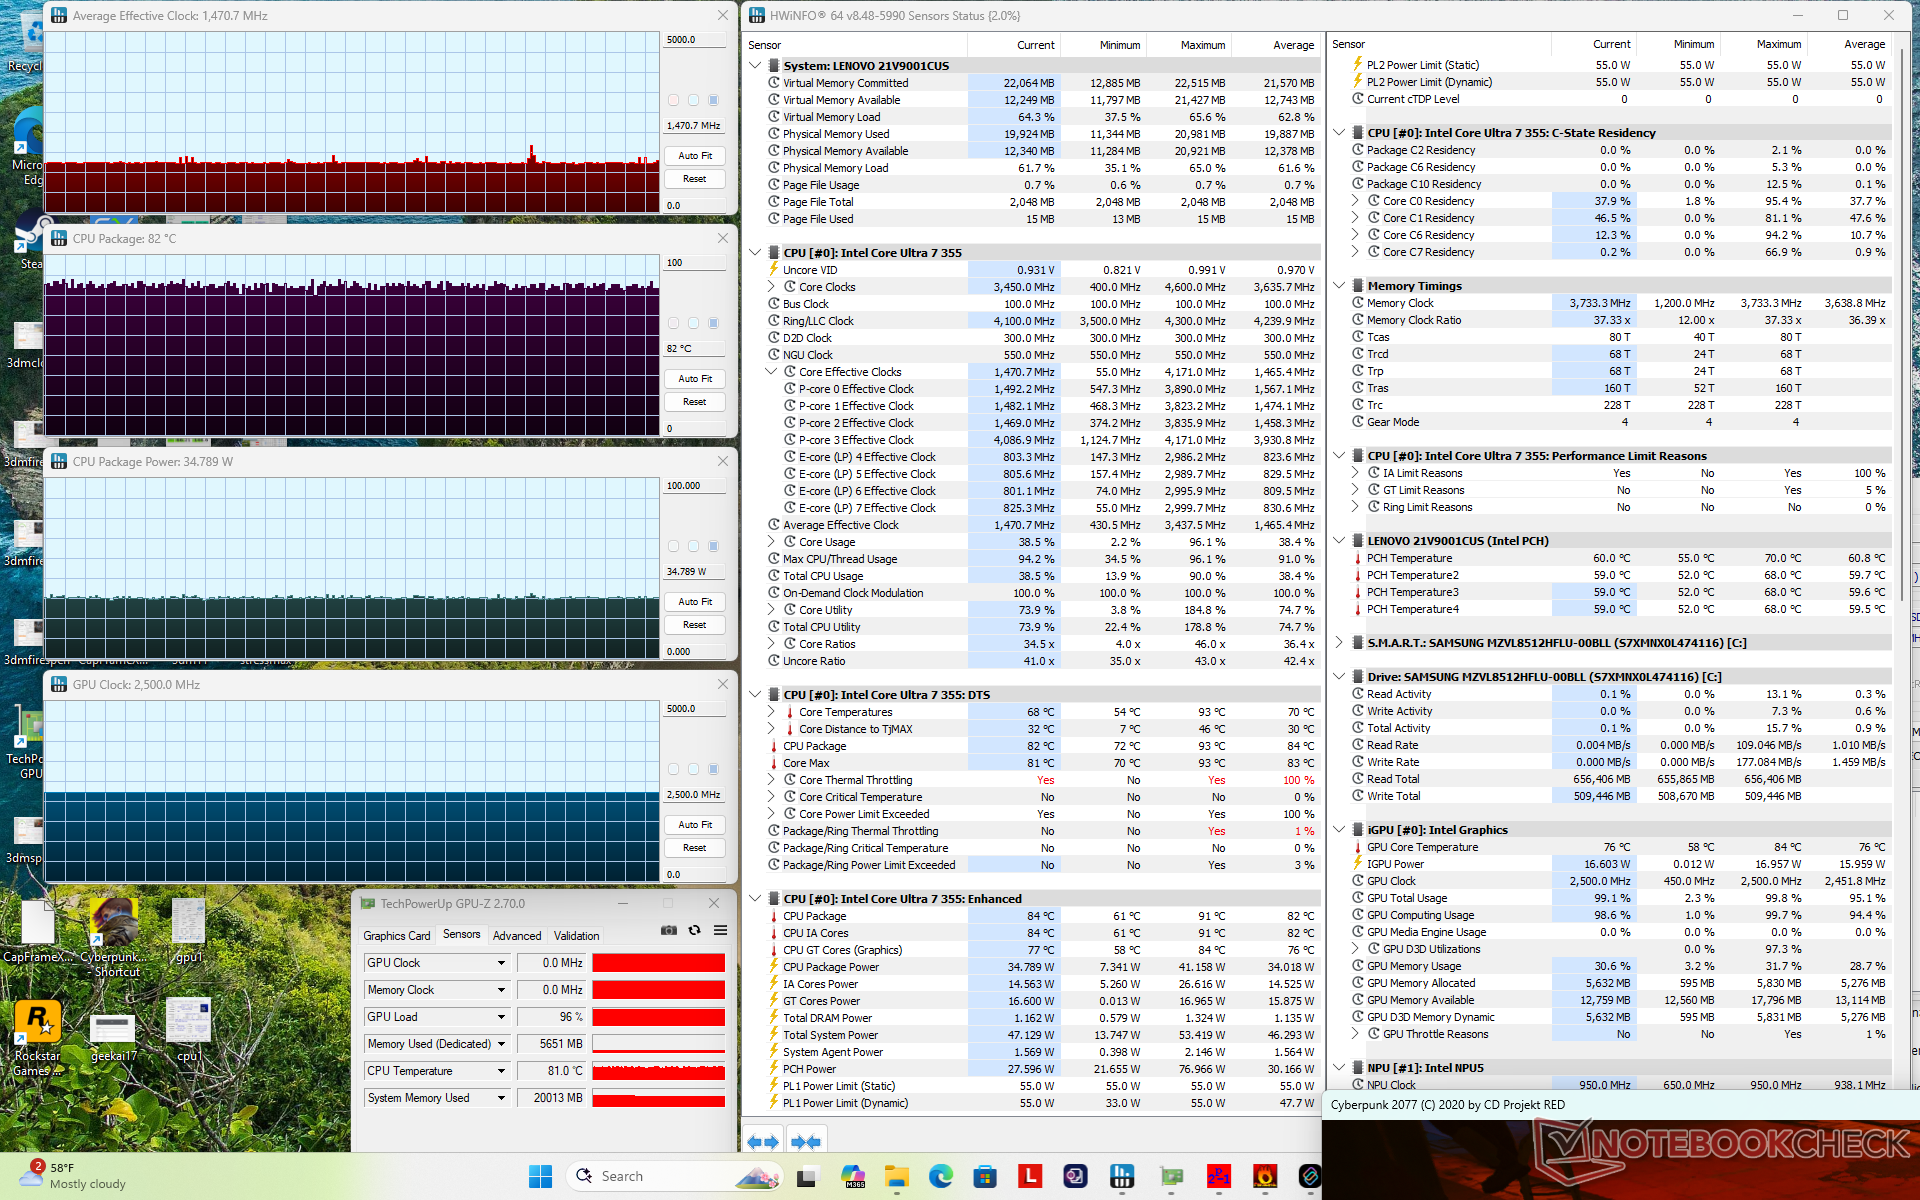
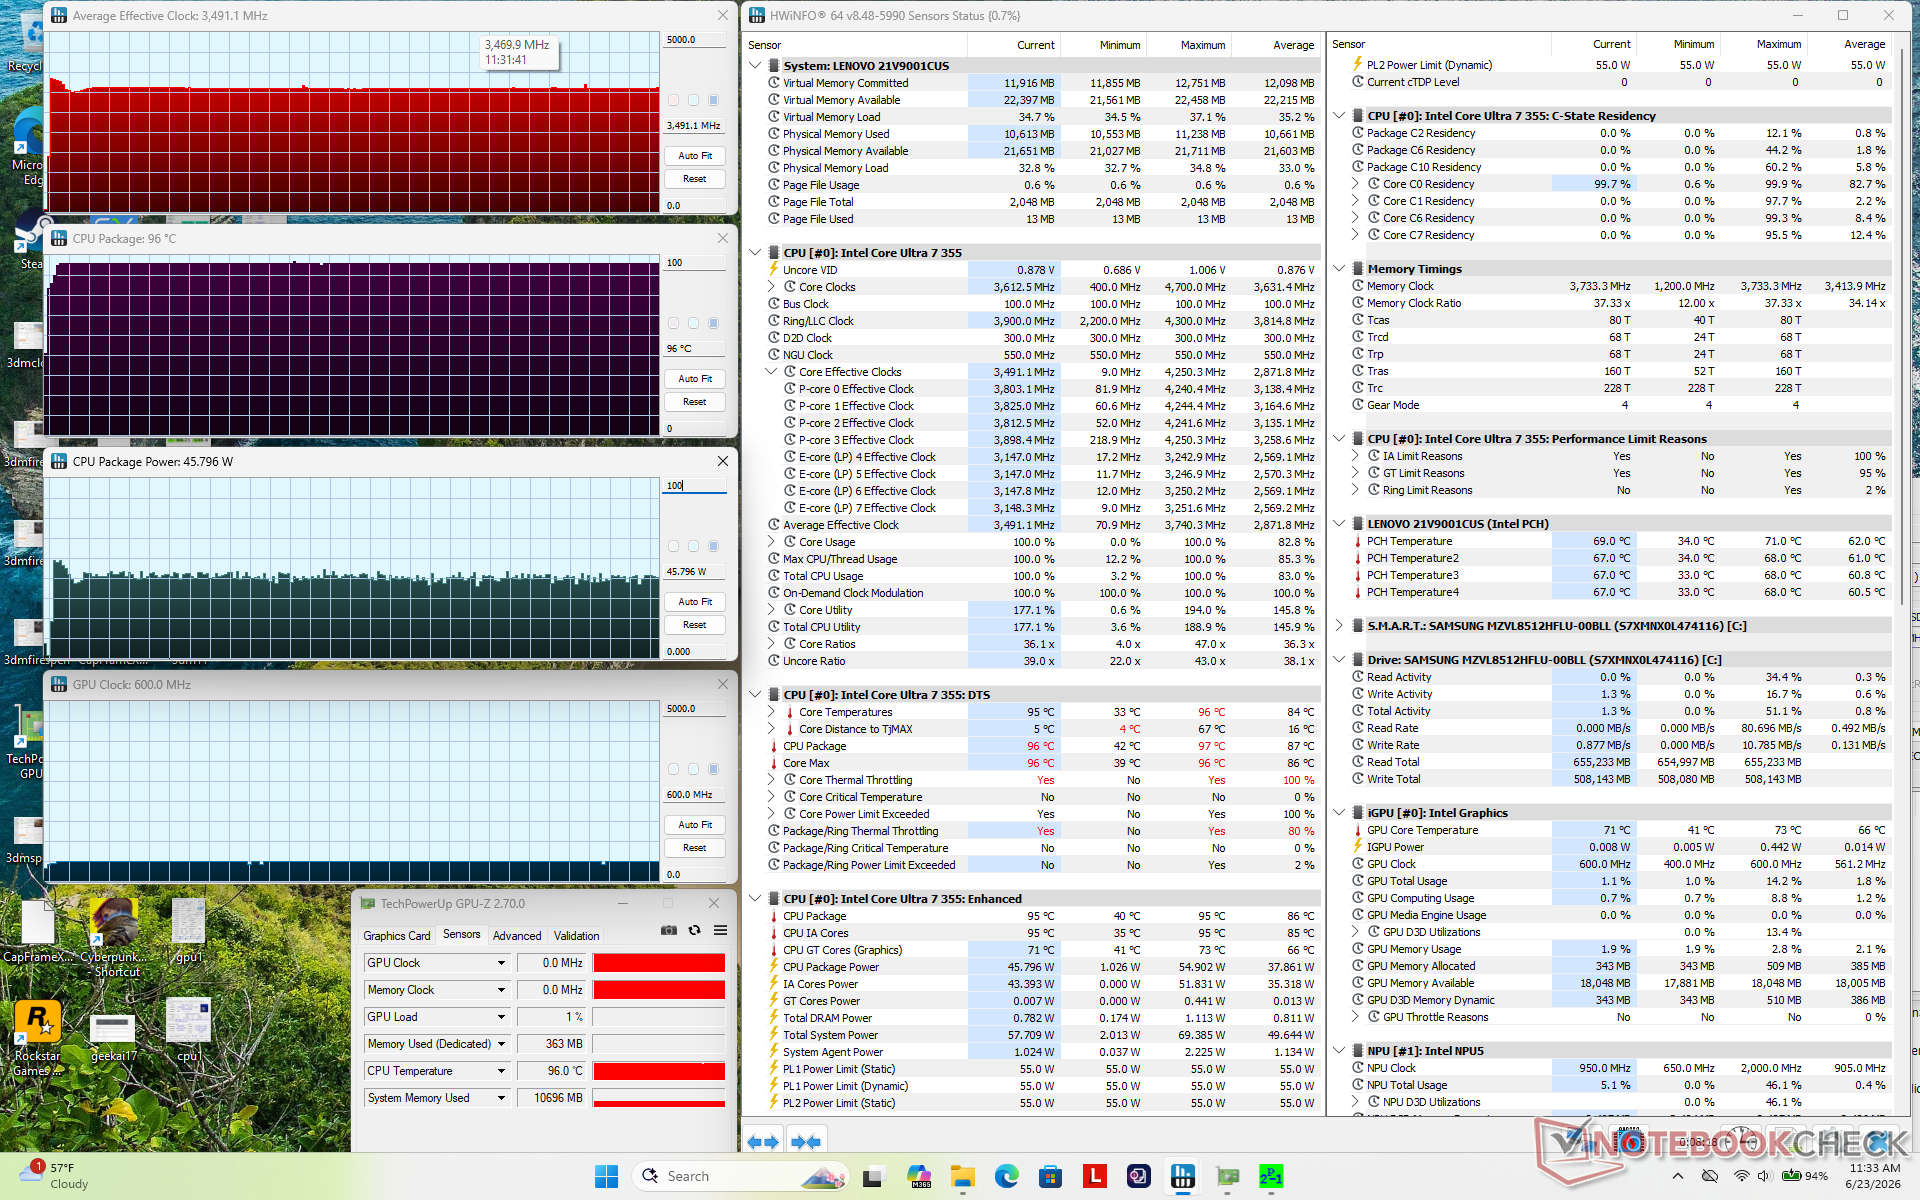
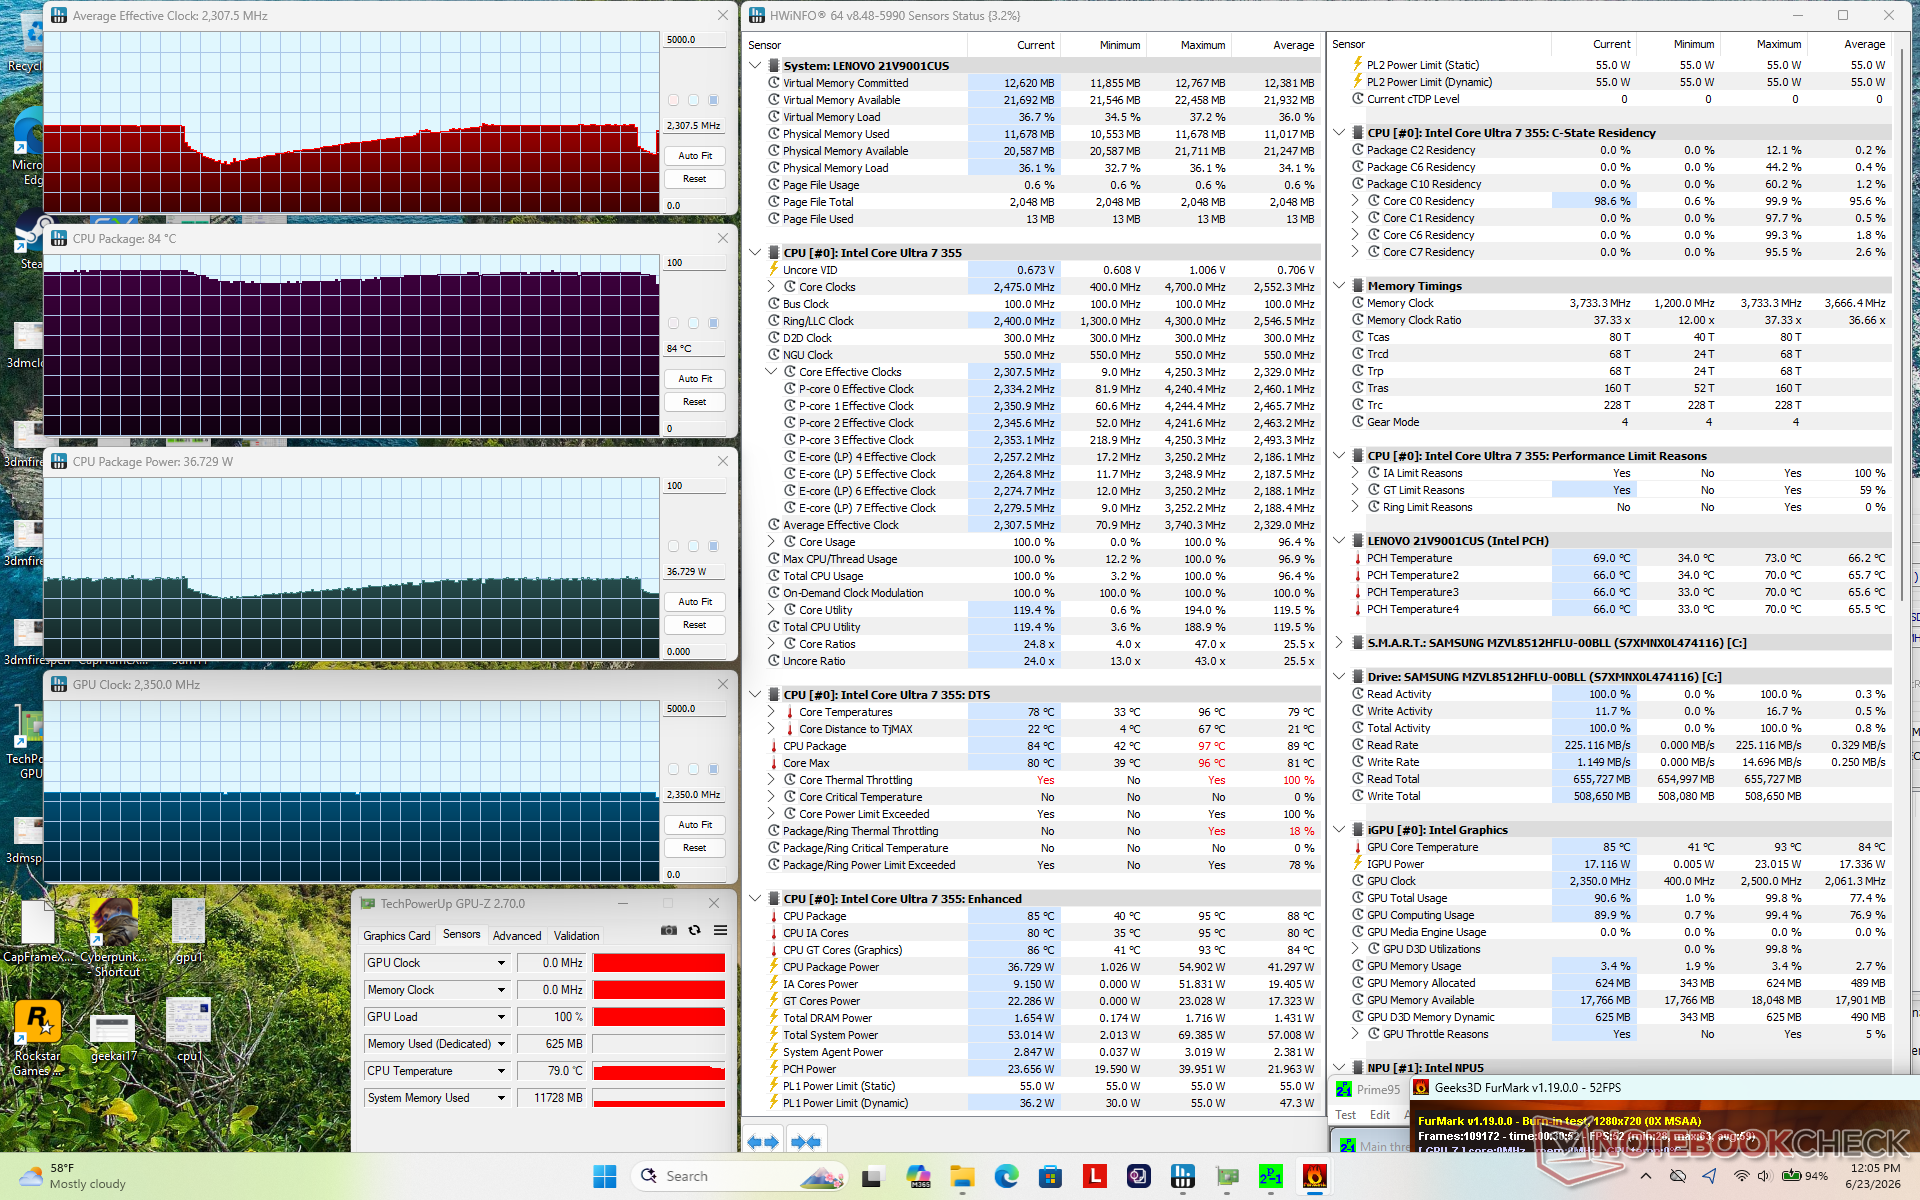
| durchschnittliche CPU-Taktfrequenz (GHz) | GPU-Taktfrequenz (MHz) | durchschnittliche CPU-Temperatur (°C) | |
| System im Leerlauf | -- | -- | 49 |
| Prime95 Stress | 3,5 | -- | 96 |
| Prime95 + FurMark Stress | 1,4–2,5 | 2.500 | 84–91 |
| Cyberpunk 2077 Stress | 1,5 | 2.500 | 82 |
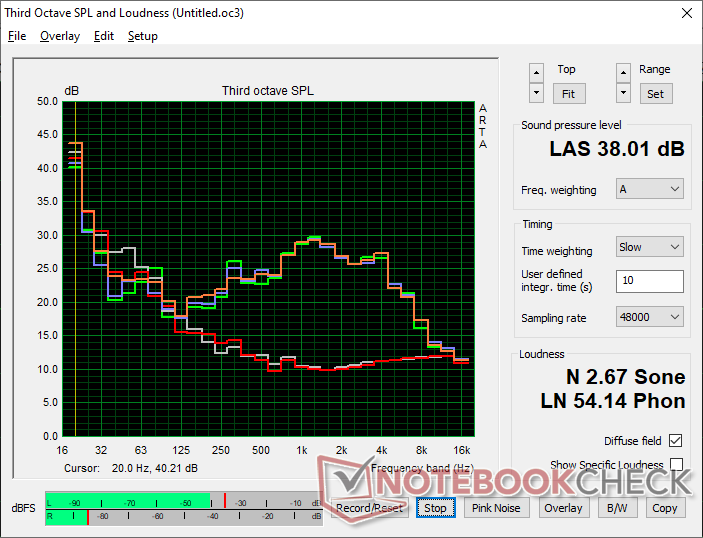
Lautsprecher
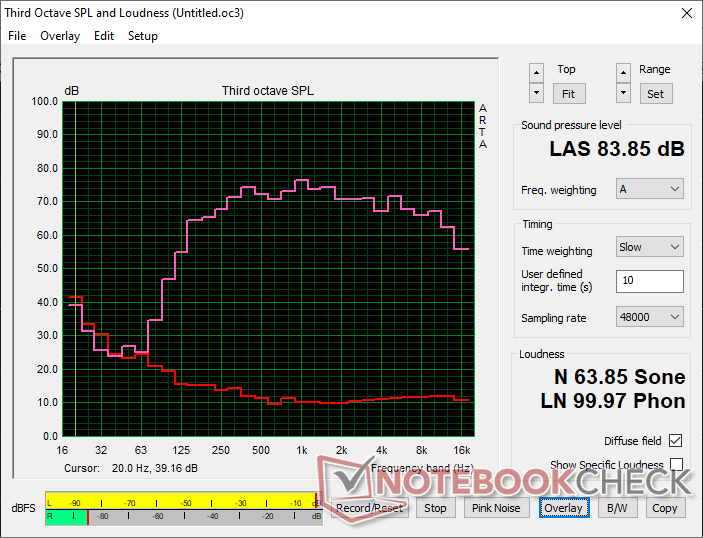
Lenovo ThinkPad X1 2-in-1 Gen 11 Audio Analyse
(+) | Die Lautsprecher können relativ laut spielen (83.9 dB)
Bass 100 - 315 Hz
(±) | abgesenkter Bass - 9.2% geringer als der Median
(±) | durchschnittlich lineare Bass-Wiedergabe (10.3% Delta zum Vorgänger)
Mitteltöne 400 - 2000 Hz
(+) | ausgeglichene Mitten, vom Median nur 2.5% abweichend
(+) | lineare Mitten (4.1% Delta zum Vorgänger)
Hochtöne 2 - 16 kHz
(+) | ausgeglichene Hochtöne, vom Median nur 2.3% abweichend
(+) | sehr lineare Hochtöne (3.7% Delta zum Vorgänger)
Gesamt im hörbaren Bereich 100 - 16.000 Hz
(+) | hörbarer Bereich ist sehr linear (9% Abstand zum Median
Im Vergleich zu allen Geräten derselben Klasse
» 4% aller getesteten Geräte dieser Klasse waren besser, 1% vergleichbar, 95% schlechter
» Das beste Gerät hat einen Delta-Wert von 6%, durchschnittlich ist 20%, das schlechteste Gerät hat 57%
Im Vergleich zu allen Geräten im Test
» 3% aller getesteten Geräte waren besser, 1% vergleichbar, 96% schlechter
» Das beste Gerät hat einen Delta-Wert von 4%, durchschnittlich ist 24%, das schlechteste Gerät hat 134%
Apple MacBook Pro 16 2021 M1 Pro Audio Analyse
(+) | Die Lautsprecher können relativ laut spielen (84.7 dB)
Bass 100 - 315 Hz
(+) | guter Bass - nur 3.8% Abweichung vom Median
(+) | lineare Bass-Wiedergabe (5.2% Delta zum Vorgänger)
Mitteltöne 400 - 2000 Hz
(+) | ausgeglichene Mitten, vom Median nur 1.3% abweichend
(+) | lineare Mitten (2.1% Delta zum Vorgänger)
Hochtöne 2 - 16 kHz
(+) | ausgeglichene Hochtöne, vom Median nur 1.9% abweichend
(+) | sehr lineare Hochtöne (2.7% Delta zum Vorgänger)
Gesamt im hörbaren Bereich 100 - 16.000 Hz
(+) | hörbarer Bereich ist sehr linear (4.6% Abstand zum Median
Im Vergleich zu allen Geräten derselben Klasse
» 0% aller getesteten Geräte dieser Klasse waren besser, 0% vergleichbar, 100% schlechter
» Das beste Gerät hat einen Delta-Wert von 5%, durchschnittlich ist 17%, das schlechteste Gerät hat 45%
Im Vergleich zu allen Geräten im Test
» 0% aller getesteten Geräte waren besser, 0% vergleichbar, 100% schlechter
» Das beste Gerät hat einen Delta-Wert von 4%, durchschnittlich ist 24%, das schlechteste Gerät hat 134%
Energieverwaltung
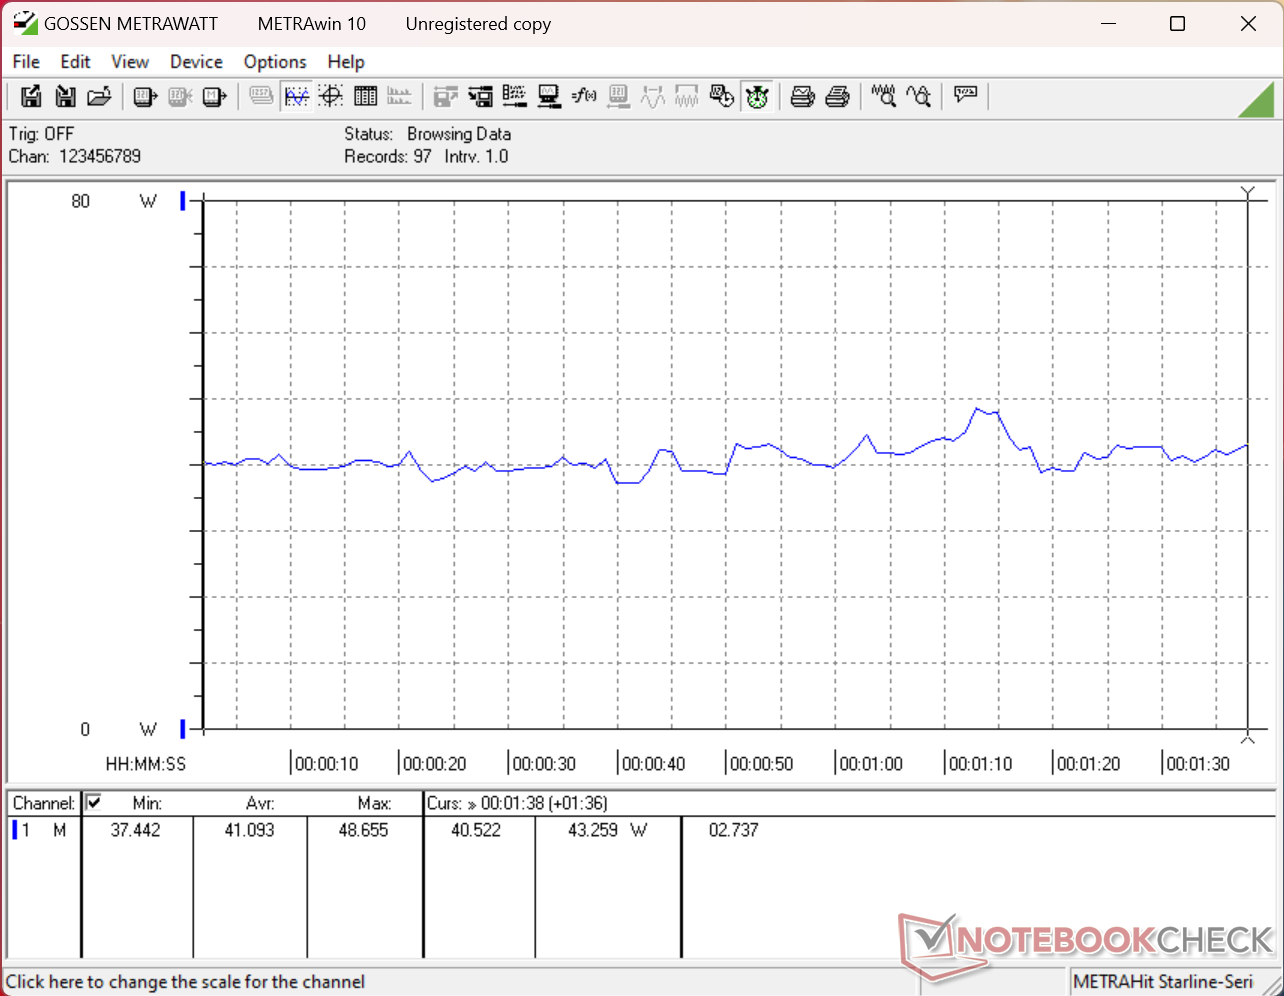
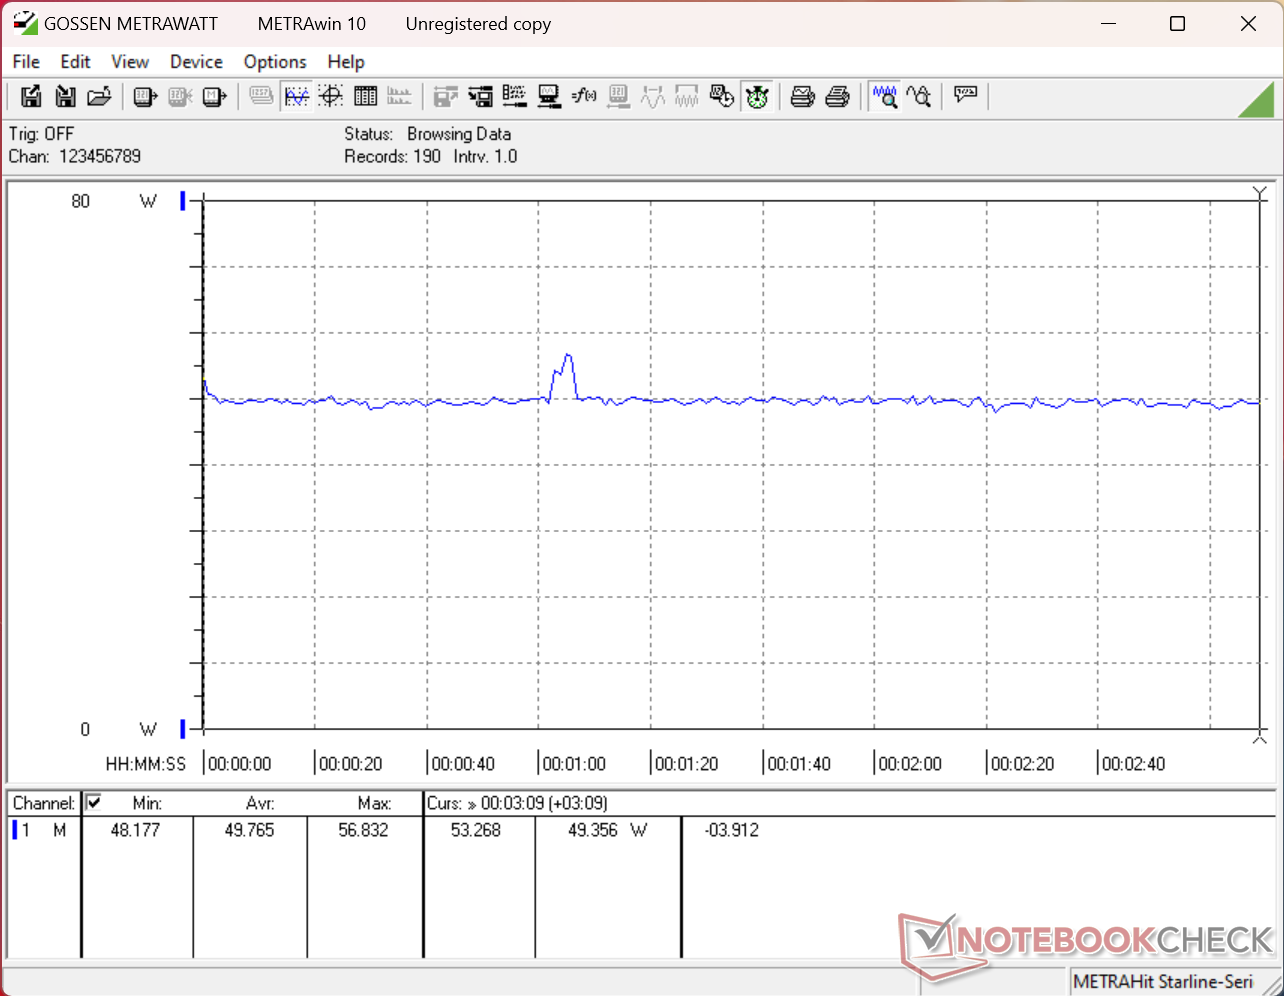
Stromverbrauch
Der Stromverbrauch unter Last ist zwar höher, aber gleichmäßiger als bei dem Vorjahresmodell, was mit den oben erwähnten schnelleren und stabileren CPU- und GPU-Ergebnissen im Einklang steht. Bei geringem Rechenaufwand und vergleichbaren WLAN-Betriebszeiten ist der durchschnittliche Verbrauch dennoch recht ähnlich.
| Aus / Standby | |
| Idle | |
| Last |
|
Legende:
min: | |
| Lenovo ThinkPad X1 2-in-1 Gen 11 Ultra 7 355, Intel Graphics 4 Xe3 PTL, Samsung PM9C1b MZVL8512HFLU-00BLL, IPS, 1920x1200, 14" | Lenovo ThinkPad X1 2-in-1 Gen 10 Core Ultra 7 258V, Arc 140V, , IPS, 1920x1200, 14" | Lenovo Yoga Book 9 14IAH10 Ultra 7 255H, Arc 140T, Samsung PM9C1a MZAL81T0HDLB, OLED, 2880x1800, 14" | HP EliteBook X Flip G1i 14 AI Core Ultra 7 258V, Arc 140V, Western Digital PC SN5000S SDEPNSJ-1T00-1006, IPS, 1920x1200, 14" | Dell Latitude 7450 2-in-1 Ultra 7 165U, Graphics 4-Core iGPU (Arrow Lake), Micron 2550 512GB, IPS, 1920x1200, 14" | Asus ExpertBook Ultra B9406CAA Ultra X7 358H, Arc B390 Panther Lake iGPU, Samsung PM9E1 MZVLC2T0HBLD, OLED, 2880x1800, 14" | |
|---|---|---|---|---|---|---|
| Stromverbrauch | 5% | -146% | -24% | -5% | -19% | |
| Idle min * (Watt) | 1.9 | 1.5 21% | 9.9 -421% | 2.9 -53% | 2.23 -17% | 3.5 -84% |
| Idle avg * (Watt) | 4.7 | 4.8 -2% | 11.6 -147% | 8.2 -74% | 5.36 -14% | 4 15% |
| Idle max * (Watt) | 5 | 5 -0% | 23.2 -364% | 8.6 -72% | 6.8 -36% | 5.3 -6% |
| Last avg * (Watt) | 41 | 44.2 -8% | 58.5 -43% | 39.6 3% | 51.2 -25% | 43.7 -7% |
| Cyberpunk 2077 ultra * (Watt) | 49.8 | 47.8 4% | 58.5 -17% | 41.9 16% | 29.5 41% | 61.3 -23% |
| Cyberpunk 2077 ultra external monitor * (Watt) | 47.4 | 39.3 17% | 56.6 -19% | 36.4 23% | 34.6 27% | 61.4 -30% |
| Last max * (Watt) | 64.3 | 60.2 6% | 70.1 -9% | 70 -9% | 69.9 -9% | 63.4 1% |
* ... kleinere Werte sind besser
Stromverbrauch Cyberpunk/Stresstest
Stromverbrauch des externen Monitors
Akkulaufzeit
| Lenovo ThinkPad X1 2-in-1 Gen 11 Ultra 7 355, Intel Graphics 4 Xe3 PTL, 58 Wh | Lenovo ThinkPad X1 2-in-1 Gen 10 Core Ultra 7 258V, Arc 140V, 57 Wh | Lenovo Yoga Book 9 14IAH10 Ultra 7 255H, Arc 140T, 88 Wh | HP EliteBook X Flip G1i 14 AI Core Ultra 7 258V, Arc 140V, 68 Wh | Dell Latitude 7450 2-in-1 Ultra 7 165U, Graphics 4-Core iGPU (Arrow Lake), 57 Wh | Asus ExpertBook Ultra B9406CAA Ultra X7 358H, Arc B390 Panther Lake iGPU, 70 Wh | |
|---|---|---|---|---|---|---|
| Akkulaufzeit | 0% | -72% | -16% | -50% | -26% | |
| WLAN (h) | 21.9 | 22 0% | 6.1 -72% | 18.4 -16% | 11 -50% | 16.1 -26% |
| H.264 (h) | 20.6 | 12.4 | ||||
| Last (h) | 2.1 |
Notebookcheck Bewertung
Das überarbeitete ThinkPad X1 2-in-1 der 11. Generation wirkt optisch professioneller und kann je nach Konfiguration deutlich schneller sein als zuvor. Der dünne Stift ist jedoch aus ergonomischer Sicht nicht optimal.
Lenovo ThinkPad X1 2-in-1 Gen 11
- 27.06.2026 v8
Allen Ngo
 Total Sustainability Score:
 Potenzielle Wettbewerber im Vergleich
Bild | Modell / Test | Preis ab | Gewicht | Dicke | Display |
|---|---|---|---|---|---|
1. 89.5%  | Lenovo ThinkPad X1 2-in-1 Gen 11 Intel Core Ultra 7 355 ⎘ Intel Graphics 4 Xe3 Panther Lake iGPU ⎘ 32 GB RAM, 512 GB SSD | Amazon: 2.735,60 € Bestpreis 2533.63€ Klarsicht IT 2. 2533.64€ TechnikDeals24 3. 2533.64€ HEINZSOFT | 1.3 kg | 17.9 mm | 14.00" 1920x1200 162 PPI IPS |
2. 88.8%  | Lenovo ThinkPad X1 2-in-1 Gen 10 Intel Core Ultra 7 258V ⎘ Intel Arc Graphics 140V ⎘ 32 GB RAM | Amazon: 3.008,42 € Bestpreis 2639.88€ Klarsicht IT 2. 2640€ lapstars 3. 2640€ notebookstore | 1.4 kg | 18.3 mm | 14.00" 1920x1200 162 PPI IPS |
3. 83.4%  | Lenovo Yoga Book 9 14IAH10 Intel Core Ultra 7 255H ⎘ Intel Arc Graphics 140T ⎘ 16 GB RAM, 1024 GB SSD | Amazon: Geizhals Suche | 1.2 kg | 15.5 mm | 14.00" 2880x1800 243 PPI OLED |
4. 89.9%  | HP EliteBook X Flip G1i 14 AI Intel Core Ultra 7 258V ⎘ Intel Arc Graphics 140V ⎘ 32 GB RAM, 1000 GB SSD | Amazon: Bestpreis 2349€ MetaComp 2. 2435.99€ NordElettronics 3. 2510€ CNW IT-Systeme | 1.5 kg | 14.7 mm | 14.00" 1920x1200 162 PPI IPS |
5. 87.7%  | Dell Latitude 7450 2-in-1 Intel Core Ultra 7 165U ⎘ Intel Graphics 4-Core iGPU (Meteor / Arrow Lake) ⎘ 32 GB RAM, 512 GB SSD | Amazon: Bestpreis 1513.3€ MetaComp 2. 1533€ ms-it-beratung 3. 1544.85€ Jacob Elektronik direkt | 1.5 kg | 17.1 mm | 14.00" 1920x1200 162 PPI IPS |
6. 87.6%  | Asus ExpertBook Ultra B9406CAA Intel Core Ultra X7 358H ⎘ Intel Arc B390 12 Xe3 Panther Lake iGPU ⎘ 32 GB RAM, 2048 GB SSD | Amazon: Bestpreis 3536.29€ playox.de 2. 3536.3€ office-partner.de 3. 3536.3€ Cyberport.de | 1.1 kg | 15.9 mm | 14.00" 2880x1800 243 PPI OLED |
Transparenz
Die Auswahl der zu testenden Geräte erfolgt innerhalb der Redaktion. Das vorliegende Testmuster wurde dem Autor vom Hersteller oder einem Shop zu Testzwecken leihweise zur Verfügung gestellt. Eine Einflussnahme des Leihstellers auf den Testbericht gab es nicht, der Hersteller erhielt keine Version des Reviews vor der Veröffentlichung. Es bestand keine Verpflichtung zur Publikation. Als eigenständiges, unabhängiges Unternehmen unterliegt Notebookcheck keiner Diktion von Herstellern, Shops und Verlagen.
So testet Notebookcheck
Pro Jahr werden von Notebookcheck hunderte Laptops und Smartphones unabhängig in von uns standardisierten technischen Verfahren getestet, um eine Vergleichbarkeit aller Testergebnisse zu gewährleisten. Seit rund 20 Jahren entwickeln wir diese Testmethoden kontinuierlich weiter und setzen damit Branchenstandards. In unseren Testlaboren kommt ausschließlich hochwertiges Messequipment in die Hände erfahrener Techniker und Redakteure. Die Tests unterliegen einer mehrstufigen Kontrolle. Unsere komplexe Gesamtbewertung basiert auf hunderten fundierten Messergebnissen und Benchmarks, womit Ihnen Objektivität garantiert ist. Weitere Informationen zu unseren Testmethoden gibt es hier.
Keine Kommentare zum Artikel

