Notebookcheck Logo

Intel Arc 7-Core iGPU vs Qualcomm SD X Adreno X1-45 2.1 TFLOPS vs Qualcomm SD X Adreno X1-85 4.6 TFLOPS

Intel Arc 7-Core iGPU

► remove from comparison Intel Arc 7-Core

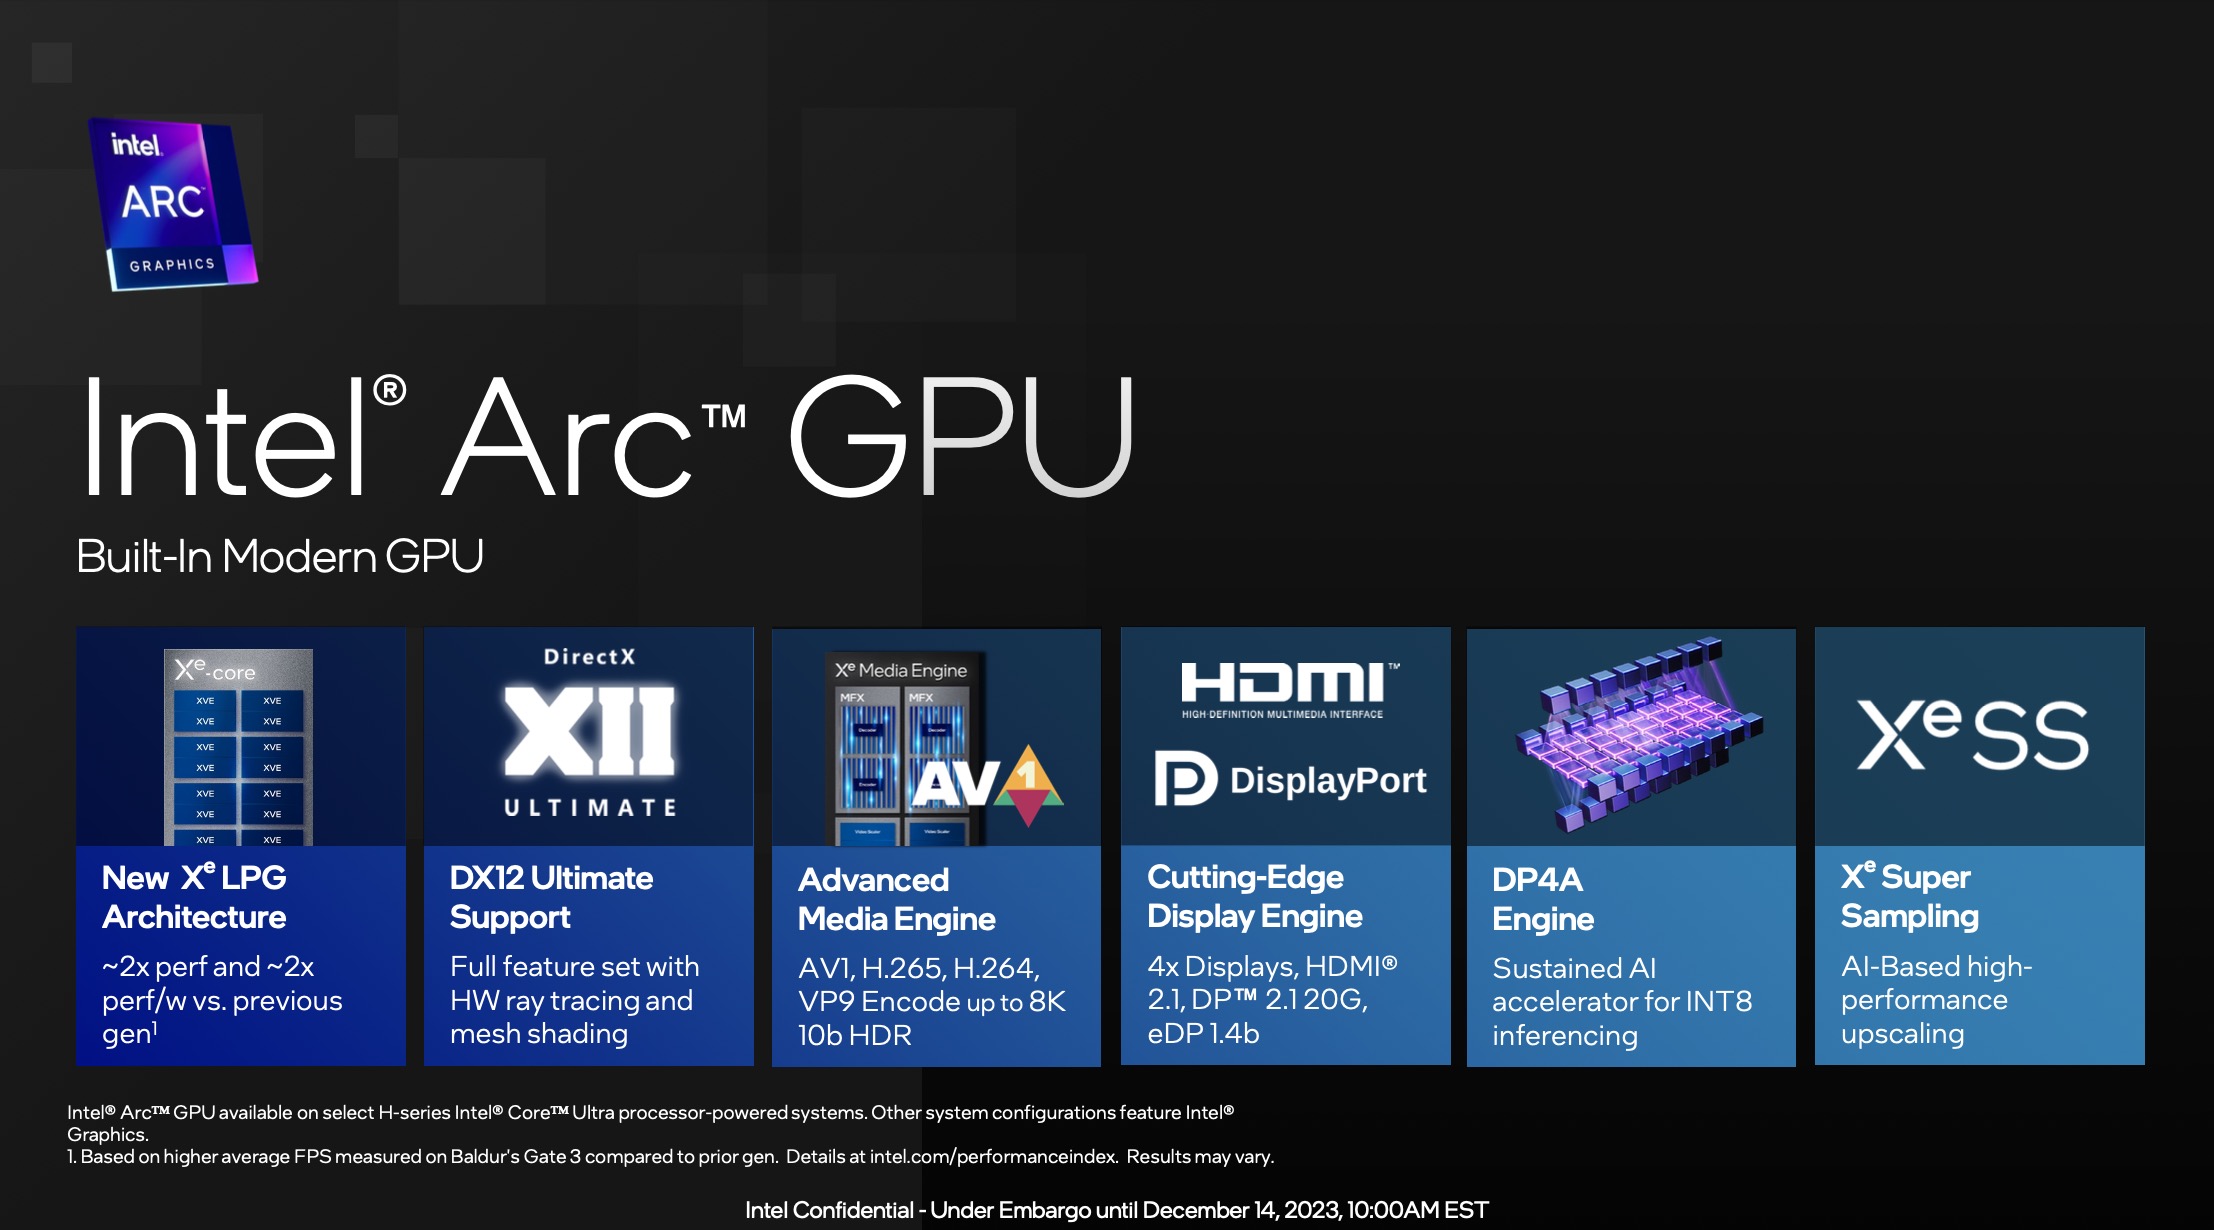
Die Intel Arc iGPU mit 7 Kernen ist eine integrierte Grafikkarte basierend auf die Xe LPG Architektur (ähnlich zu den dedizierten Arc GPUs, jedoch mit Fokus auf Effizienz). Sie bietet 7 der 8 Xe Kerne (112 Xe Vector Engines), 7 Raytracing Einheiten, 7 Sampler und wahrscheinlich auch 4 Pixel Backends.

Der Arc Name darf nur genutzt werden, wenn mindestens 16 GB RAM im Dual Channel Modus verwendet werden. Sonst heisst die nur iGPU "Intel Graphics" und ist ebenfalls deutlich langsamer.

Laut Intel konnte die Performance im Vergleich zur Vorgängergeneration (wahrscheinlich noch in Alder Lake) verdoppelt werden.

Die iGPU unterstützt DirectX 12 Ultimate (wahrscheinlich DX 12_2 wie die Desktop Arc GPUs). Weiters unterstützt die Grafikeinheit XeSS AI Super Sampling.

Die Media Engine ist bei Meteor Lake im SOC Tile und unterstützt bis zu 8k60 10-bit HDR Encode und Deccode von MPEG2, AVC, VP9, HEVC und AV1. Die Display Engine ist ebenfalls im SoC Tile und unterstützt HDMI 2.1 und DisplayPort 2.1 20G mit bis zu 8K60 HDR.

Der GPU Tile des Meteor Lake Chips wird bei TSMC in 5nm (5N Prozess) gefertigt.

Qualcomm SD X Adreno X1-45 2.1 TFLOPS

► remove from comparison Qualcomm Adreno X1-45 2.1 TFLOPS

Die Qualcomm Adreno X1-45 2,1 TFLOPS-Version ist eine integrierte Grafikkarte, welche in Snapdragon X Plus 8-Kern-SoCs ab September 2024 verbaut ist. Im Vergleich zu den 3,8 TFLOPS und den 4,6 TFLOPS X1-85 iGPUs läuft die kleine Version nicht nur mit niedrigeren Taktraten, sondern hat auch weniger Unified Shader zur Verfügung, wobei 768 die wahrscheinlichste Zahl ist.

Architektur

Die zugrundeliegende Architektur ist Berichten zufolge (Chips and Cheese) in vielerlei Hinsicht die gleiche wie die der Adreno 730, was die iGPU DirectX 12-kompatibel, aber nicht DirectX 12 Ultimate-kompatibel macht. Raytracing wird nur über Vulcan 1.3 unterstützt. Die höchste unterstützte OpenGL-Version ist ES 3.2. Die iGPU kann auf ausreichend schnellen Arbeitsspeicher zugreifen, hat aber vergleichsweise kleine und langsame Caches, mit denen sie arbeiten muss. AVC-, HEVC- und AV1-Videocodecs können sowohl hardware-decodiert als auch hardware-encodiert werden; bei VP9 ist nur die Decodierung möglich.

Die höchste unterstützte Bildschirmauflösung ist UHD 2160p und nicht SUHD 4320p.

Leistung

Genau wie bei AMD-, Intel- und Nvidia-Produkten hängt viel von den Leistungszielen eines bestimmten Systems ab. Durch höhere Taktraten, sollte die 2,1 TFLOPS-Variante knapp besser als die 1,7 TFLOPS-Variante performen.

Es ist auch erwähnenswert, dass Qualcomms Grafiktreiber nicht ganz so ausgefeilt sind wie die von AMD, Intel und vor allem Nvidia, was zu starken visuellen Artefakten in bestimmten Spielen führt. Viele Spiele laufen aktuell auch gar nicht.

Stromverbrauch

Snapdragon X Plus 8-Kern-Chips verbrauchen normalerweise nicht mehr als 30 W, einschließlich des integrierten RAMs. Daher ist es höchst unwahrscheinlich, dass die iGPU jemals mehr als 20 W verbrauchen wird.

Da der N4P-Prozess von TSMC verwendet wird, kann man davon ausgehen, dass die Energieeffizienz dieser iGPU ab Ende 2024 überdurchschnittlich gut sein wird. Sie liegt natürlich immer noch weit hinter Apples Chips der M-Serie zurück, wie unser ausführlicher Analyseartikel zeigt.

Qualcomm SD X Adreno X1-85 4.6 TFLOPS

► remove from comparison Qualcomm Adreno X1-85 4.6 TFLOPS

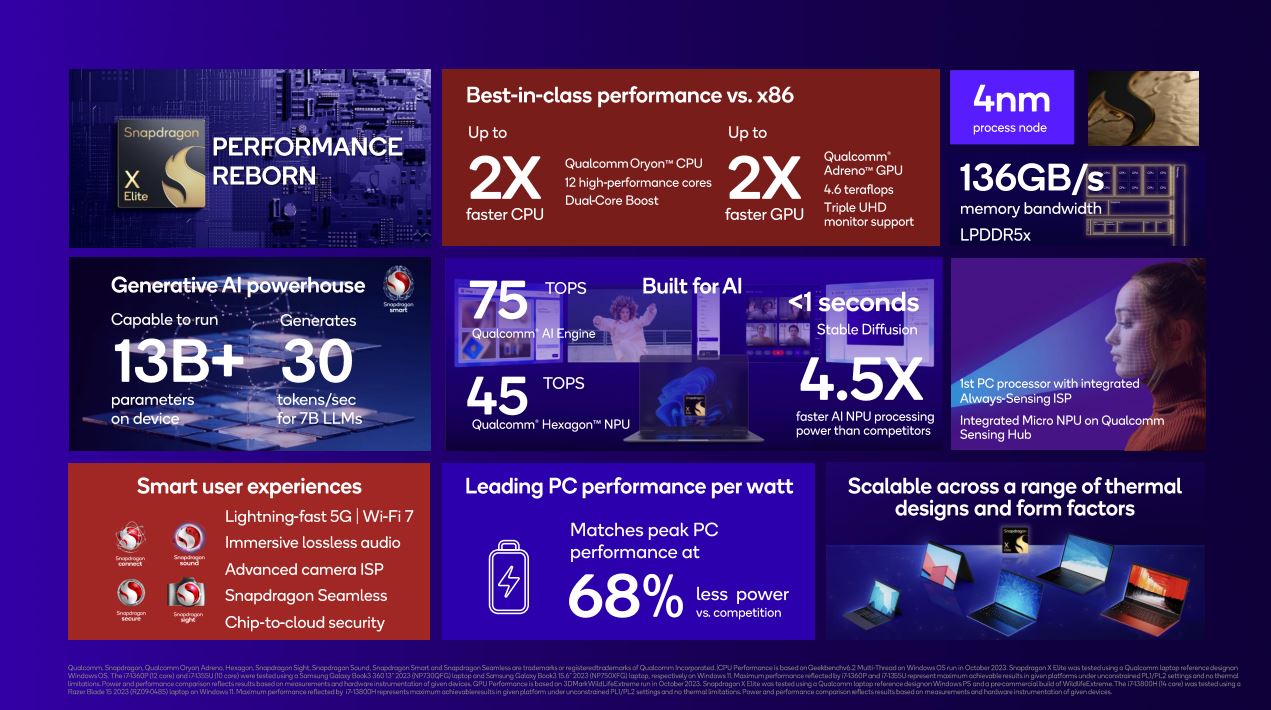
Qualcomm Snapdragon X Adreno X1-85 (4.6 TFLOPS) ist die stärkste GPU in the Snapdragon X Elite SoCs mit 4,6 TFLOPS an Leistung. Die GPU nutzt 1.536 Unified Shader und taktet diese mit bis zu 1.500 MHz.

Durch aktuell eingeschränkten Treibersupport und Spieleunterstüztung ist die 3D-Leistung und Kompabilität in Spielen jedoch nicht vergleichbar mit Nvidia und AMD iGPUs.

Die Architektur is laut Chips and Cheese vergleichbar mit der alten Adreno 730. Daher ist die GPU DirectX 12 kompatibel, aber unterstützt nicht alle "Ultimate" Features.

Die iGPU ist im Snapdragon X SoC integriert und wird daher wie dieser in dem modernen 4nm Prozess bei TSMC gefertigt.

Intel Arc 7-Core iGPUQualcomm SD X Adreno X1-45 2.1 TFLOPSQualcomm SD X Adreno X1-85 4.6 TFLOPS
Snapdragon X Serie
Arc 8-Core 8 @ 2.3 GHz
Arc 7-Core 7 @ 2.2 GHz
Graphics 4-Core iGPU (Arrow Lake) 64 @ 0.3 - 1.95 GHz
Adreno X1-85 4.6 TFLOPS 1536 @ 1.5 GHz? Bit @ 8448 MHz
Adreno X1-85 3.8 TFLOPS 1536 @ 1.25 GHz? Bit @ 8448 MHz
Adreno X1-45 2.1 TFLOPS 768 128 Bit @ 8448 MHz
Adreno X1-45 1.7 TFLOPS 768 128 Bit @ 8448 MHz
Adreno X1-85 4.6 TFLOPS 1536 @ 1.5 GHz? Bit @ 8448 MHz
Adreno X1-85 3.8 TFLOPS 1536 @ 1.25 GHz? Bit @ 8448 MHz
Adreno X1-45 2.1 TFLOPS 768 128 Bit @ 8448 MHz
Adreno X1-45 1.7 TFLOPS 768 128 Bit @ 8448 MHz
CodenameMeteor Lake iGPU
ArchitekturXe LPG
iGPUintegrated graphicsintegrated graphics
Pipelines7 - unified768 - unified1536 - unified
Raytracing Cores7
Kerntakt2200 (Boost) MHz1500 (Boost) MHz
CacheL1: 1.3 MB
Shared Memoryjajaja
APIDirectX 12_2, OpenGL 4.6, Vulkan 1.3DirectX 12_1, OpenGL ES 3.2, OpenCL 3.0, Vulkan 1.3DirectX 12_1, OpenGL ES 3.2, OpenCL 3.0, Vulkan 1.3
Herstellungsprozess5 nm4 nm4 nm
DisplaysHDMI 2.1, DisplayPort 2.1 20G3 Displays (max.)3 Displays (max.)
Erscheinungsdatum14.12.2023 03.09.2024 26.10.2023
Speichertakt8448 MHz8448 MHz
Speicherbandbreite128 Bit
SpeichertypLPDDR5xLPDDR5x
Stromverbrauch20 Watt40 Watt
FeaturesSUHD 2160p60 resolution support, AVC/HEVC/AV1 encoding and decodingSUHD 2160p60 resolution support, AVC/HEVC/AV1 encoding and decoding
CPU in Arc 7-CoreGPU Base SpeedGPU Boost / Turbo
Intel Core Ultra 5 125H14 x 3600 MHz, 28 W? MHz2200 MHz
CPU in Adreno X1-85 4.6 TFLOPSGPU Base SpeedGPU Boost / Turbo
Qualcomm Snapdragon X Elite X1E-00-1DE12 x 3800 MHz? MHz? MHz
Qualcomm Snapdragon X Elite X1E-84-10012 x 3800 MHz? MHz? MHz
min. - max.? MHz? MHz

Benchmarks

Performance Rating - 3DMark 11 + Fire Strike + Time Spy - Arc 7-Core
3 pt (9%)
Restrict / Search: Model: Max. age: years
3DMark - 3DMark Speed Way Score
min: 345     avg: 411     median: 399 (3%)     max: 489 Points
3DMark - 3DMark Steel Nomad
min: 581     avg: 626     median: 598 (4%)     max: 699 Points
3DMark - 3DMark Steel Nomad Light
min: 2436     avg: 2617     median: 2617 (6%)     max: 2798 Points
3DMark - 3DMark Wild Life Extreme Unlimited
min: 5654     avg: 5699     median: 5699 (7%)     max: 5744 Points
3DMark - 3DMark Solar Bay
min: 10005     avg: 11091     median: 11091 (5%)     max: 12177 Points
3DMark - 3DMark Fire Strike Standard Score
min: 4214     avg: 6801     median: 7302 (11%)     max: 7929 Points
3DMark - 3DMark Fire Strike Standard Graphics
min: 4575     avg: 7464     median: 7900 (7%)     max: 8531 Points
3DMark - 3DMark Ice Storm Graphics
min: 158643     avg: 181910     median: 159017 (18%)     max: 228069 Points
3DMark - 3DMark Time Spy Score
min: 2351     avg: 3232     median: 3259 (8%)     max: 3658 Points
3DMark - 3DMark Time Spy Graphics
min: 2090     avg: 2934     median: 3000 (6%)     max: 3319 Points
3DMark - 3DMark Ice Storm Unlimited Graphics
396714 Points (40%)
3DMark - 3DMark Ice Storm Extreme Graphics
min: 145414     avg: 146731     median: 146731 (17%)     max: 148048 Points
3DMark - 3DMark Cloud Gate Score
min: 23725     avg: 28484     median: 29186 (28%)     max: 30553 Points
3DMark - 3DMark Cloud Gate Graphics
min: 28658     avg: 39212     median: 40086 (10%)     max: 45644 Points
3DMark - 3DMark Night Raid
min: 25271     avg: 25991     median: 25990.5 (25%)     max: 26710 Points
3DMark - 3DMark Night Raid Graphics Score
min: 30252     avg: 31507     median: 31507 (12%)     max: 32762 Points
3DMark 11 - 3DM11 Performance Score
min: 5911     avg: 10571     median: 11161 (14%)     max: 12140 Points
3DMark 11 - 3DM11 Performance GPU
min: 5549     avg: 10490     median: 11467 (9%)     max: 12061 Points
3DMark Vantage
3DM Vant. Perf. total + Intel Arc 7-Core iGPU
3DMark Vantage - 3DM Vant. Perf. total
min: 35885     avg: 38156     median: 37719 (11%)     max: 41299 Points
3DM Vant. Perf. total + Qualcomm SD X Adreno X1-85 4.6 TFLOPS
3DM Vant. Perf. GPU no PhysX + Intel Arc 7-Core iGPU
3DMark Vantage - 3DM Vant. Perf. GPU no PhysX
min: 30937     avg: 33936     median: 34042 (19%)     max: 36721 Points
3DM Vant. Perf. GPU no PhysX + Qualcomm SD X Adreno X1-85 4.6 TFLOPS
3DMark 05 - 3DMark 05 - Standard
min: 41203     avg: 44877     median: 44876.5 (49%)     max: 48550 Points
3DMark 06 3DMark 06 - Standard 1280x1024 + Intel Arc 7-Core iGPU
3DMark 06
min: 38905     avg: 40397     median: 40216 (53%)     max: 42252 Points
Unigine Valley 1.0 - Unigine Valley 1.0 DX
min: 16.9     avg: 18.8     median: 18.8 (6%)     max: 20.7 fps
SPECviewperf 2020 specvp2020 snx-04 1080p + Intel Arc 7-Core iGPU
SPECviewperf 2020 - specvp2020 snx-04 1080p
min: 5.65     avg: 5.8     median: 5.8 (1%)     max: 5.97 fps
specvp2020 medical-03 1080p + Intel Arc 7-Core iGPU
SPECviewperf 2020 - specvp2020 medical-03 1080p
min: 12.3     avg: 13.5     median: 13.5 (4%)     max: 14.6 fps
specvp2020 maya-06 1080p + Intel Arc 7-Core iGPU
SPECviewperf 2020 - specvp2020 maya-06 1080p
min: 68.4     avg: 71.8     median: 71.8 (8%)     max: 75.1 fps
specvp2020 energy-03 1080p + Intel Arc 7-Core iGPU
SPECviewperf 2020 - specvp2020 energy-03 1080p
min: 4.61     avg: 4.8     median: 4.8 (1%)     max: 5.08 fps
specvp2020 creo-03 1080p + Intel Arc 7-Core iGPU
SPECviewperf 2020 - specvp2020 creo-03 1080p
min: 20.2     avg: 20.3     median: 20.3 (7%)     max: 20.3 fps
specvp2020 catia-06 1080p + Intel Arc 7-Core iGPU
SPECviewperf 2020 - specvp2020 catia-06 1080p
min: 15.5     avg: 16.1     median: 16.1 (8%)     max: 16.6 fps
specvp2020 3dsmax-07 1080p + Intel Arc 7-Core iGPU
SPECviewperf 2020 - specvp2020 3dsmax-07 1080p
min: 19.8     avg: 20.5     median: 20.5 (5%)     max: 21.1 fps
specvp2020 snx-04 4k + Intel Arc 7-Core iGPU
SPECviewperf 2020 - specvp2020 snx-04 4k
min: 5.54     avg: 5.7     median: 5.7 (1%)     max: 5.82 fps
specvp2020 medical-03 4k + Intel Arc 7-Core iGPU
SPECviewperf 2020 - specvp2020 medical-03 4k
min: 4.8     avg: 5.3     median: 5.3 (3%)     max: 5.87 fps
specvp2020 maya-06 4k + Intel Arc 7-Core iGPU
SPECviewperf 2020 - specvp2020 maya-06 4k
min: 32.8     avg: 33.8     median: 33.8 (5%)     max: 34.7 fps
specvp2020 energy-03 4k + Intel Arc 7-Core iGPU
SPECviewperf 2020 - specvp2020 energy-03 4k
min: 3.38     avg: 3.6     median: 3.6 (1%)     max: 3.81 fps
specvp2020 creo-03 4k + Intel Arc 7-Core iGPU
SPECviewperf 2020 - specvp2020 creo-03 4k
min: 15.3     avg: 15.4     median: 15.4 (7%)     max: 15.4 fps
specvp2020 catia-06 4k + Intel Arc 7-Core iGPU
SPECviewperf 2020 - specvp2020 catia-06 4k
min: 9.7     avg: 10.1     median: 10.1 (7%)     max: 10.4 fps
specvp2020 3dsmax-07 4k + Intel Arc 7-Core iGPU
SPECviewperf 2020 - specvp2020 3dsmax-07 4k
min: 13.2     avg: 13.9     median: 13.9 (5%)     max: 14.5 fps
Cinebench R10 Cinebench R10 Shading (32bit) + Intel Arc 7-Core iGPU
Cinebench R10 - Cinebench R10 Shading (32bit)
min: 15394     avg: 15881     median: 15688.5 (11%)     max: 16752 Points
Cinebench R10 Shading (32bit) + Qualcomm SD X Adreno X1-85 4.6 TFLOPS
Cinebench R11.5 Cinebench R11.5 OpenGL 64 Bit + Intel Arc 7-Core iGPU
Cinebench R11.5 - Cinebench R11.5 OpenGL 64 Bit
min: 92.81     avg: 95.4     median: 95.6 (31%)     max: 97.61 fps
Cinebench R15
Cinebench R15 OpenGL 64 Bit + Intel Arc 7-Core iGPU
Cinebench R15 - Cinebench R15 OpenGL 64 Bit
min: 116.8     avg: 136.1     median: 138 (8%)     max: 145.06 fps
Cinebench R15 OpenGL 64 Bit + Qualcomm SD X Adreno X1-85 4.6 TFLOPS
Cinebench R15 OpenGL Ref. Match 64 Bit + Intel Arc 7-Core iGPU
Cinebench R15 - Cinebench R15 OpenGL Ref. Match 64 Bit
97.8 % (98%)
Cinebench R15 OpenGL Ref. Match 64 Bit + Qualcomm SD X Adreno X1-85 4.6 TFLOPS
GFXBench - GFXBench 5.0 4K Aztec Ruins High Tier Offscreen
min: 25.5     avg: 29.7     median: 29.7 (11%)     max: 33.9 fps
GFXBench - GFXBench 5.0 Aztec Ruins High Tier Offscreen
min: 77.4     avg: 78.8     median: 78.8 (14%)     max: 80.1 fps
GFXBench - GFXBench 5.0 Aztec Ruins Normal Tier Offscreen
193.7 fps (14%)
GFXBench - GFXBench Car Chase Offscreen
155.8 fps (15%)
Basemark GPU 1.2 - Basemark GPU 1.2 Vulkan Official Medium Offscreen 1080
min: 104.6     avg: 203.3     median: 196.8 (5%)     max: 315 fps
Basemark GPU 1.2 - Basemark GPU 1.2 Vulkan Official High Offscreen 2160
3.6 fps (1%)
Geekbench 6.5 - Geekbench 6.5 GPU OpenCL
min: 26624     avg: 29363     median: 29263 (7%)     max: 33039 Points
Geekbench 6.5 - Geekbench 6.5 GPU Vulkan
min: 26482     avg: 30465     median: 29526 (7%)     max: 34230 Points
LuxMark v2.0 64Bit - LuxMark v2.0 Room GPU
min: 708     avg: 757     median: 755.5 (3%)     max: 809 Samples/s
LuxMark v2.0 64Bit - LuxMark v2.0 Sala GPU
min: 1926     avg: 2453     median: 2538.5 (4%)     max: 2807 Samples/s
ComputeMark v2.1 - ComputeMark v2.1 Result
min: 5613     avg: 6364     median: 6471.5 (5%)     max: 6899 Points
Power Consumption - Furmark Stress Test Power Consumption - external Monitor *
min: 43.1     avg: 49.9     median: 48.3 (6%)     max: 57.4 Watt
Power Consumption - The Witcher 3 Power Consumption - external Monitor *
min: 39.7     avg: 42.6     median: 41.9 (6%)     max: 46.3 Watt
Power Consumption - Witcher 3 Power Consumption *
min: 44.4     avg: 46     median: 45.9 (10%)     max: 47.7 Watt
Power Consumption - Power Efficiency - Witcher 3 ultra
min: 0.3987     avg: 0.5     median: 0.5 (48%)     max: 0.545 fps per Watt
Power Consumption - Power Efficiency - Witcher 3 ultra external Monitor
min: 0.4368     avg: 0.5     median: 0.6 (47%)     max: 0.589 fps per Watt
Power Consumption - Cyberpunk 2077 Power Consumption 150cd *
45 Watt (13%)
Power Consumption - Cyberpunk 2077 Power Consumption - external Monitor *
min: 52.7     avg: 56.3     median: 57.1 (7%)     max: 59.1 Watt
Emissions Witcher 3 Fan Noise + Intel Arc 7-Core iGPU
Emissions - Witcher 3 Fan Noise
min: 36.8     avg: 38.4     median: 38.5 (55%)     max: 40 dB(A)

Average Benchmarks Intel Arc 7-Core iGPU → 0% n=0

Average Benchmarks Qualcomm SD X Adreno X1-85 4.6 TFLOPS → 0% n=0

- Bereich der Benchmarkergebnisse für diese Grafikkarte
red legend - Durchschnittliche Benchmarkergebnisse für diese Grafikkarte
* Smaller numbers mean a higher performance
1 This benchmark is not used for the average calculation

Spiele-Benchmarks

Die folgenden Benchmarks basieren auf unseren Spieletests mit Testnotebooks. Die Performance dieser Grafikkarte bei den gelisteten Spielen ist abhängig von der verwendeten CPU, Speicherausstattung, Treiber und auch Betriebssystem. Dadurch müssen die untenstehenden Werte nicht repräsentativ sein. Detaillierte Informationen über das verwendete System sehen Sie nach einem Klick auf den fps-Wert.

F1 24

F1 24

2024
low 1920x1080
100%
Arc 7-Core:
64.3 66.2 ~ 65 fps
med. 1920x1080
100%
Arc 7-Core:
56.6 57.6 ~ 57 fps
high 1920x1080
100%
Arc 7-Core:
41.7 43.4 ~ 43 fps
ultra 1920x1080
100%
Arc 7-Core:
11.4  fps
low 1920x1080
100%
Arc 7-Core:
53.8  fps
med. 1920x1080
100%
Arc 7-Core:
38.7  fps
high 1920x1080
100%
Arc 7-Core:
33  fps
ultra 1920x1080
100%
Arc 7-Core:
25.3  fps
low 1920x1080
100%
Arc 7-Core:
33  fps
med. 1920x1080
100%
Arc 7-Core:
31  fps
high 1920x1080
100%
Arc 7-Core:
24  fps
ultra 1920x1080
100%
Arc 7-Core:
18  fps
low 1920x1080
100%
Arc 7-Core:
32.1  fps
med. 1920x1080
100%
Arc 7-Core:
25  fps
high 1920x1080
100%
Arc 7-Core:
22.7  fps
ultra 1920x1080
100%
Arc 7-Core:
21.7  fps
low 1920x1080
100%
Arc 7-Core:
21.5  fps
med. 1920x1080
100%
Arc 7-Core:
18  fps
high 1920x1080
Arc 7-Core:
0 (!)  fps
ultra 1920x1080
Arc 7-Core:
0 (!)  fps
Palworld

Palworld

2024
low 1920x1080
100%
Arc 7-Core:
34.8  fps
med. 1920x1080
100%
Arc 7-Core:
32.6  fps
high 1920x1080
100%
Arc 7-Core:
25.2  fps
ultra 1920x1080
100%
Arc 7-Core:
23.4  fps
med. 1920x1080
100%
Arc 7-Core:
215  fps
high 1920x1080
100%
Arc 7-Core:
127  fps
ultra 1920x1080
100%
Arc 7-Core:
120  fps
low 1920x1080
100%
Arc 7-Core:
62.7  fps
med. 1920x1080
100%
Arc 7-Core:
48.3  fps
high 1920x1080
100%
Arc 7-Core:
44.5  fps
ultra 1920x1080
100%
Arc 7-Core:
34.5  fps
low 1920x1080
100%
Arc 7-Core:
70  fps
med. 1920x1080
100%
Arc 7-Core:
47.7  fps
high 1920x1080
100%
Arc 7-Core:
39.7  fps
ultra 1920x1080
100%
Arc 7-Core:
34.6  fps
low 1920x1080
100%
Arc 7-Core:
15  fps
med. 1920x1080
100%
Arc 7-Core:
14  fps
high 1920x1080
100%
Arc 7-Core:
12  fps
ultra 1920x1080
100%
Arc 7-Core:
9  fps
low 1920x1080
100%
Arc 7-Core:
28.6  fps
med. 1920x1080
100%
Arc 7-Core:
21  fps
high 1920x1080
100%
Arc 7-Core:
19.2  fps
ultra 1920x1080
100%
Arc 7-Core:
17.9  fps
low 1920x1080
100%
Arc 7-Core:
15.8  fps
med. 1920x1080
Arc 7-Core:
0 (!)  fps
high 1920x1080
Arc 7-Core:
0 (!)  fps
low 1920x1080
100%
Arc 7-Core:
17.1  fps
med. 1920x1080
100%
Arc 7-Core:
11.7  fps
high 1920x1080
100%
Arc 7-Core:
11.4  fps
ultra 1920x1080
100%
Arc 7-Core:
10.8  fps
low 1920x1080
100%
Arc 7-Core:
95.5  fps
95%
Adreno X1-85 4.6 TFLOPS:
91.1  fps
med. 1920x1080
100%
Arc 7-Core:
56.8  fps
112%
Adreno X1-85 4.6 TFLOPS:
63.6  fps
high 1920x1080
100%
Arc 7-Core:
35.6  fps
ultra 1920x1080
100%
Arc 7-Core:
28.1  fps
low 1920x1080
100%
Arc 7-Core:
33  fps
med. 1920x1080
100%
Arc 7-Core:
31  fps
high 1920x1080
100%
Arc 7-Core:
27  fps
ultra 1920x1080
Arc 7-Core:
0 (!)  fps
low 1920x1080
100%
Arc 7-Core:
90.2  fps
med. 1920x1080
100%
Arc 7-Core:
57.9  fps
high 1920x1080
100%
Arc 7-Core:
37.6  fps
ultra 1920x1080
100%
Arc 7-Core:
24.7  fps
low 1920x1080
100%
Arc 7-Core:
23.2 29.2 29.5 30.1 30.9 ~ 29 fps
80%
Adreno X1-85 4.6 TFLOPS:
23.1  fps
med. 1920x1080
100%
Arc 7-Core:
19.8 21.7 24.3 25.2 25.2 ~ 23 fps
95%
Adreno X1-85 4.6 TFLOPS:
21.8  fps
high 1920x1080
100%
Arc 7-Core:
16.6 19.1 20.6 21.3 21.7 ~ 20 fps
94%
Adreno X1-85 4.6 TFLOPS:
18.8  fps
ultra 1920x1080
100%
Arc 7-Core:
14.8 16.4 18.8 18.8 19.6 ~ 18 fps
92%
Adreno X1-85 4.6 TFLOPS:
16.6  fps
low 1920x1080
100%
Arc 7-Core:
29.9 30.2 33.5 33.7 ~ 32 fps
84%
Adreno X1-85 4.6 TFLOPS:
27  fps
med. 1920x1080
100%
Arc 7-Core:
23.2 25.9 26.4 27.9 ~ 26 fps
85%
Adreno X1-85 4.6 TFLOPS:
22  fps
high 1920x1080
100%
Arc 7-Core:
19.5 22.4 22.8 24.2 ~ 22 fps
88%
Adreno X1-85 4.6 TFLOPS:
19.3  fps
ultra 1920x1080
100%
Arc 7-Core:
19.5 21.5 21.8 23.1 ~ 21 fps
90%
Adreno X1-85 4.6 TFLOPS:
19  fps
Lies of P

Lies of P

2023
low 1920x1080
100%
Arc 7-Core:
46  fps
med. 1920x1080
100%
Arc 7-Core:
33.8  fps
high 1920x1080
100%
Arc 7-Core:
32.6  fps
ultra 1920x1080
100%
Arc 7-Core:
27.1  fps
low 1920x1080
100%
Arc 7-Core:
26  fps
med. 1920x1080
100%
Arc 7-Core:
24  fps
high 1920x1080
100%
Arc 7-Core:
20  fps
ultra 1920x1080
100%
Arc 7-Core:
17  fps
Starfield

Starfield

2023
low 1920x1080
100%
Arc 7-Core:
19.1  fps
med. 1920x1080
100%
Arc 7-Core:
16.5  fps
high 1920x1080
100%
Arc 7-Core:
13.2  fps
ultra 1920x1080
100%
Arc 7-Core:
10.7  fps
low 1920x1080
100%
Arc 7-Core:
39.7  fps
med. 1920x1080
100%
Arc 7-Core:
32.6  fps
high 1920x1080
100%
Arc 7-Core:
28.5  fps
ultra 1920x1080
100%
Arc 7-Core:
23.5  fps
low 1920x1080
100%
Arc 7-Core:
40.5  fps
med. 1920x1080
100%
Arc 7-Core:
40.3  fps
high 1920x1080
100%
Arc 7-Core:
36.6  fps
ultra 1920x1080
100%
Arc 7-Core:
26.4  fps
low 1920x1080
Arc 7-Core:
0 (!)  fps
med. 1920x1080
Arc 7-Core:
0 (!)  fps
high 1920x1080
Arc 7-Core:
0 (!)  fps
ultra 1920x1080
Arc 7-Core:
0 (!)  fps
F1 23

F1 23

2023
low 1920x1080
100%
Arc 7-Core:
58.7 68 ~ 63 fps
med. 1920x1080
100%
Arc 7-Core:
53.5 60 ~ 57 fps
high 1920x1080
100%
Arc 7-Core:
37.3 40 ~ 39 fps
ultra 1920x1080
Arc 7-Core:
0 (!)  fps
low 1920x1080
100%
Arc 7-Core:
36.1  fps
med. 1920x1080
100%
Arc 7-Core:
25.1  fps
high 1920x1080
100%
Arc 7-Core:
23.6  fps
ultra 1920x1080
Arc 7-Core:
0 (!)  fps
low 1920x1080
100%
Arc 7-Core:
51.5  fps
med. 1920x1080
100%
Arc 7-Core:
45.4  fps
high 1920x1080
100%
Arc 7-Core:
33.9  fps
ultra 1920x1080
100%
Arc 7-Core:
33.3  fps
low 1920x1080
100%
Arc 7-Core:
24.9  fps
med. 1920x1080
100%
Arc 7-Core:
17.3  fps
high 1920x1080
100%
Arc 7-Core:
15.5  fps
ultra 1920x1080
100%
Arc 7-Core:
15.2  fps
low 1920x1080
100%
Arc 7-Core:
40.7  fps
med. 1920x1080
100%
Arc 7-Core:
31.9  fps
high 1920x1080
100%
Arc 7-Core:
22.8  fps
ultra 1920x1080
100%
Arc 7-Core:
16.4  fps
Returnal

Returnal

2023
low 1920x1080
100%
Arc 7-Core:
30  fps
med. 1920x1080
100%
Arc 7-Core:
29  fps
high 1920x1080
100%
Arc 7-Core:
27  fps
ultra 1920x1080
100%
Arc 7-Core:
23  fps
low 1920x1080
100%
Arc 7-Core:
31  fps
med. 1920x1080
100%
Arc 7-Core:
26.5  fps
high 1920x1080
100%
Arc 7-Core:
17.3  fps
ultra 1920x1080
100%
Arc 7-Core:
13.2  fps
F1 22

F1 22

2022
low 1920x1080
100%
Arc 7-Core:
79.4  fps
83%
Adreno X1-85 4.6 TFLOPS:
65.9  fps
med. 1920x1080
100%
Arc 7-Core:
71.9  fps
83%
Adreno X1-85 4.6 TFLOPS:
60  fps
high 1920x1080
100%
Arc 7-Core:
52.9  fps
82%
Adreno X1-85 4.6 TFLOPS:
43.3  fps
ultra 1920x1080
Adreno X1-85 4.6 TFLOPS:
32  fps
low 1920x1080
100%
Arc 7-Core:
50.7  fps
med. 1920x1080
100%
Arc 7-Core:
39.4  fps
high 1920x1080
100%
Arc 7-Core:
26.8  fps
ultra 1920x1080
100%
Arc 7-Core:
22.4  fps
low 1920x1080
100%
Arc 7-Core:
31.6  fps
med. 1920x1080
100%
Arc 7-Core:
27  fps
high 1920x1080
100%
Arc 7-Core:
22.6  fps
ultra 1920x1080
100%
Arc 7-Core:
21.6  fps
low 1280x720
Adreno X1-85 4.6 TFLOPS:
66  fps
med. 1920x1080
Adreno X1-85 4.6 TFLOPS:
28  fps
high 1920x1080
Adreno X1-85 4.6 TFLOPS:
26  fps
ultra 1920x1080
Adreno X1-85 4.6 TFLOPS:
23  fps
Strange Brigade

Strange Brigade

2018
low 1280x720
100%
Arc 7-Core:
133 141 148.6 149 ~ 143 fps
100%
Adreno X1-85 4.6 TFLOPS:
143  fps
med. 1920x1080
100%
Arc 7-Core:
63 63.9 68 69.5 ~ 66 fps
85%
Adreno X1-85 4.6 TFLOPS:
56  fps
high 1920x1080
100%
Arc 7-Core:
50 53.5 54 57.7 ~ 54 fps
89%
Adreno X1-85 4.6 TFLOPS:
48  fps
ultra 1920x1080
100%
Arc 7-Core:
40 43.5 44 47.3 ~ 44 fps
93%
Adreno X1-85 4.6 TFLOPS:
41  fps
Far Cry 5

Far Cry 5

2018
low 1280x720
100%
Arc 7-Core:
37 64 71 74 ~ 62 fps
60%
Adreno X1-85 4.6 TFLOPS:
37  fps
med. 1920x1080
100%
Arc 7-Core:
34 37 40 41 ~ 38 fps
82%
Adreno X1-85 4.6 TFLOPS:
31  fps
high 1920x1080
100%
Arc 7-Core:
31 35 37 37 ~ 35 fps
86%
Adreno X1-85 4.6 TFLOPS:
30  fps
ultra 1920x1080
100%
Arc 7-Core:
31 35 35 ~ 34 fps
79%
Adreno X1-85 4.6 TFLOPS:
27  fps
low 1280x720
100%
Arc 7-Core:
41 47.1 47.5 47.5 52 52.2 57 ~ 49 fps
74%
Adreno X1-85 4.6 TFLOPS:
36.2  fps
med. 1920x1080
100%
Arc 7-Core:
31.4 35.9 38.3 38.5 40.1 40.3 44.8 ~ 38 fps
high 1920x1080
100%
Arc 7-Core:
27.8 31.3 31.5 32.9 33.4 34.2 37.3 ~ 33 fps
low 1280x720
100%
Arc 7-Core:
40.8 52.1 58.3 59.6 59.8 60.6 64.8 ~ 57 fps
100%
Adreno X1-85 4.6 TFLOPS:
56.8  fps
med. 1920x1080
100%
Arc 7-Core:
21.8 32.4 32.9 33.3 33.4 35.4 35.8 ~ 32 fps
87%
Adreno X1-85 4.6 TFLOPS:
27.8  fps
high 1920x1080
100%
Arc 7-Core:
16.1 22.2 22.3 23.4 25.3 25.3 25.3 ~ 23 fps
77%
Adreno X1-85 4.6 TFLOPS:
17.8  fps
low 1280x720
100%
Arc 7-Core:
90.4 93.5 93.8 94.3 95.5 97.1 97.7 ~ 95 fps
93%
Adreno X1-85 4.6 TFLOPS:
88.2  fps
med. 1366x768
100%
Arc 7-Core:
64.5 70.5 77.8 79.2 83 83.1 89.2 ~ 78 fps
88%
Adreno X1-85 4.6 TFLOPS:
68.8  fps
high 1920x1080
100%
Arc 7-Core:
59.2 66.3 68.4 73.6 75.6 75.8 75.9 ~ 71 fps
86%
Adreno X1-85 4.6 TFLOPS:
61  fps
ultra 1920x1080
100%
Arc 7-Core:
54.5 58.7 64.9 70.5 72.9 73 73.3 ~ 67 fps
79%
Adreno X1-85 4.6 TFLOPS:
52.8  fps
low 1024x768
100%
Arc 7-Core:
126 136 138 ~ 133 fps
80%
Adreno X1-85 4.6 TFLOPS:
107  fps
med. 1366x768
100%
Arc 7-Core:
80 85 88 ~ 84 fps
87%
Adreno X1-85 4.6 TFLOPS:
73  fps
high 1920x1080
100%
Arc 7-Core:
45 51 52 ~ 49 fps
84%
Adreno X1-85 4.6 TFLOPS:
41  fps
ultra 1920x1080
100%
Arc 7-Core:
18.3 23.4 26 ~ 23 fps
96%
Adreno X1-85 4.6 TFLOPS:
22  fps
GTA V

GTA V

2015
low 1024x768
100%
Arc 7-Core:
116.9 127.2 132.4 143.6 153 156.3 ~ 138 fps
75%
Adreno X1-85 4.6 TFLOPS:
103  fps
med. 1366x768
100%
Arc 7-Core:
106.4 119.9 125.5 143.3 148.8 151.6 ~ 133 fps
72%
Adreno X1-85 4.6 TFLOPS:
95.4  fps
high 1920x1080
100%
Arc 7-Core:
31 32.4 33.6 34.1 38.9 39.9 ~ 35 fps
141%
Adreno X1-85 4.6 TFLOPS:
49.5  fps
ultra 1920x1080
100%
Arc 7-Core:
12.7 13.7 13.7 14.8 15.3 16.6 ~ 14 fps
160%
Adreno X1-85 4.6 TFLOPS:
22.4  fps

Average Gaming Intel Arc 7-Core iGPU → 100%

Average Gaming 30-70 fps → 100%

Average Gaming Qualcomm SD X Adreno X1-85 4.6 TFLOPS → 90%

Average Gaming 30-70 fps → 89%

Intel Arc 7-Core iGPUQualcomm SD X Adreno X1-45 2.1 TFLOPSQualcomm SD X Adreno X1-85 4.6 TFLOPS
lowmed.highultraQHD4Klowmed.highultraQHD4Klowmed.highultraQHD4K
F1 2465574311.4
Last Epoch53.838.73325.3
Skull & Bones33312418
Helldivers 232.12522.721.7
Enshrouded21.518
Palworld34.832.625.223.4
Prince of Persia The Lost Crown215127120
Ready or Not62.748.344.534.5
The Finals7047.739.734.6
Avatar Frontiers of Pandora1514129
EA Sports WRC28.62119.217.9
Alan Wake 215.8
Lords of the Fallen17.111.711.410.8
Total War Pharaoh95.556.835.628.191.163.6
Assassin's Creed Mirage333127
Counter-Strike 290.257.937.624.7
Cyberpunk 20772923201823.121.818.816.6
Baldur's Gate 332262221272219.319
Lies of P4633.832.627.1
The Crew Motorfest26242017
Starfield19.116.513.210.7
Armored Core 639.732.628.523.5
Atlas Fallen40.540.336.626.4
Ratchet & Clank Rift Apart
F1 236357390
Resident Evil 4 Remake36.125.123.6
Company of Heroes 351.545.433.933.3
Sons of the Forest24.917.315.515.2
Atomic Heart40.731.922.816.4
Returnal30292723
Hogwarts Legacy3126.517.313.2
F1 2279.471.952.965.96043.332
Tiny Tina's Wonderlands50.739.426.822.4
Cyberpunk 2077 1.631.62722.621.6
Strange Brigade143665444143564841
Far Cry 56238353437313027
X-Plane 11.1149383336.2
Final Fantasy XV Benchmark57322356.827.817.8
Dota 2 Reborn9578716788.268.86152.8
The Witcher 3133844923107734122
GTA V138133351410395.449.522.4
Intel Arc 7-Core iGPUQualcomm SD X Adreno X1-45 2.1 TFLOPSQualcomm SD X Adreno X1-85 4.6 TFLOPS
lowmed.highultraQHD4Klowmed.highultraQHD4Klowmed.highultraQHD4K
< 30 fps
< 60 fps
< 120 fps
≥ 120 fps
9
18
9
3
14
19
4
2
20
16
1
1
25
5
1
1


< 30 fps
< 60 fps
< 120 fps
≥ 120 fps


< 30 fps
< 60 fps
< 120 fps
≥ 120 fps
2
3
5
1
3
2
5
3
5
1
5
3


Eine Liste mit weiteren Spielen und allen Grafikkarten finden Sie auf unserer Seite: Welches Spiel ist mit welcher Grafikkarte spielbar?

Amazon Logo
  • Sparkle Intel ARC A770 ROC 16GB Black
  • Sparkle Intel ARC A770 ROC Luna 16GB White
  • ASUS Vivobook 15 Laptop | 15,6" Full-HD 16:9 IPS Display | Intel i3-1215U | 8 GB RAM | 512 GB SSD | Intel UHD Graphics | Windows 11 | QWERTZ Tastatur| Quiet Blue

v1.35
log 20. 12:17:43

#0 ran 0s before starting gpusingle class +0s ... 0s

#1 checking url part for id 12257 +0s ... 0s

#2 checking url part for id 12780 +0s ... 0s

#3 checking url part for id 12659 +0s ... 0s

#4 redirected to Ajax server, took 1771586262s time from redirect:0 +0s ... 0s

#5 did not recreate cache, as it is less than 5 days old! Created at Thu, 19 Feb 2026 05:15:53 +0100 +0s ... 0s

#6 composed specs +0.019s ... 0.019s

#7 did output specs +0s ... 0.019s

#8 start showIntegratedCPUs +0s ... 0.019s

#9 getting avg benchmarks for device 12257 +0.026s ... 0.045s

#10 got single benchmarks 12257 +0.013s ... 0.058s

#11 getting avg benchmarks for device 12780 +0s ... 0.059s

#12 got single benchmarks 12780 +0s ... 0.059s

#13 getting avg benchmarks for device 12659 +0s ... 0.059s

#14 got single benchmarks 12659 +0.004s ... 0.063s

#15 got avg benchmarks for devices +0s ... 0.063s

#16 min, max, avg, median took s +0.043s ... 0.106s

#17 before gaming benchmark output +0s ... 0.106s

#18 Got 346 rows for game benchmarks. +0.015s ... 0.121s

#19 composed SQL query for gamebenchmarks +0s ... 0.121s

#20 got data and put it in $dataArray +0.003s ... 0.124s

#21 benchmarks composed for output. +0.014s ... 0.139s

#22 calculated avg scores. +0s ... 0.139s

#23 return log +0.41s ... 0.548s

Teilen Sie diesen Artikel, um uns zu unterstützen. Jeder Link hilft!
Mail Logo
> Notebook Test, Laptop Test und News > Benchmarks & Tech > Benchmarks / Technik > Grafikkarten Vergleich - Head 2 Head
Autor: Klaus Hinum,  8.09.2017 (Update:  1.07.2023)