

Notebookcheck Logo
Teaser

MSI Stealth 16 AI B3WH im Test: Teils Gamer, teils Creator, durch und durch professionell

Für Gamer mit Bürojob.

Anders als das aktuelle Razer Blade 16 oder Lenovo Yoga Pro 9 16 bietet das MSI Stealth 16 von 2026 einen austauschbaren Arbeitsspeicher mit bis zu 128 GB und ist damit ein Multitasking-Monster für Gaming, Videobearbeitung, KI und mehr.
Allen Ngo, 👁 Allen Ngo, ✓ Stefanie Voigt (übersetzt von NBC / Ninh Duy) Veröffentlicht am 🇺🇸 🇳🇱 ...
Laptop / Notebook Gaming Geforce MSI

Fazit — In vielerlei Hinsicht ein aufgerüstetes Prestige 16

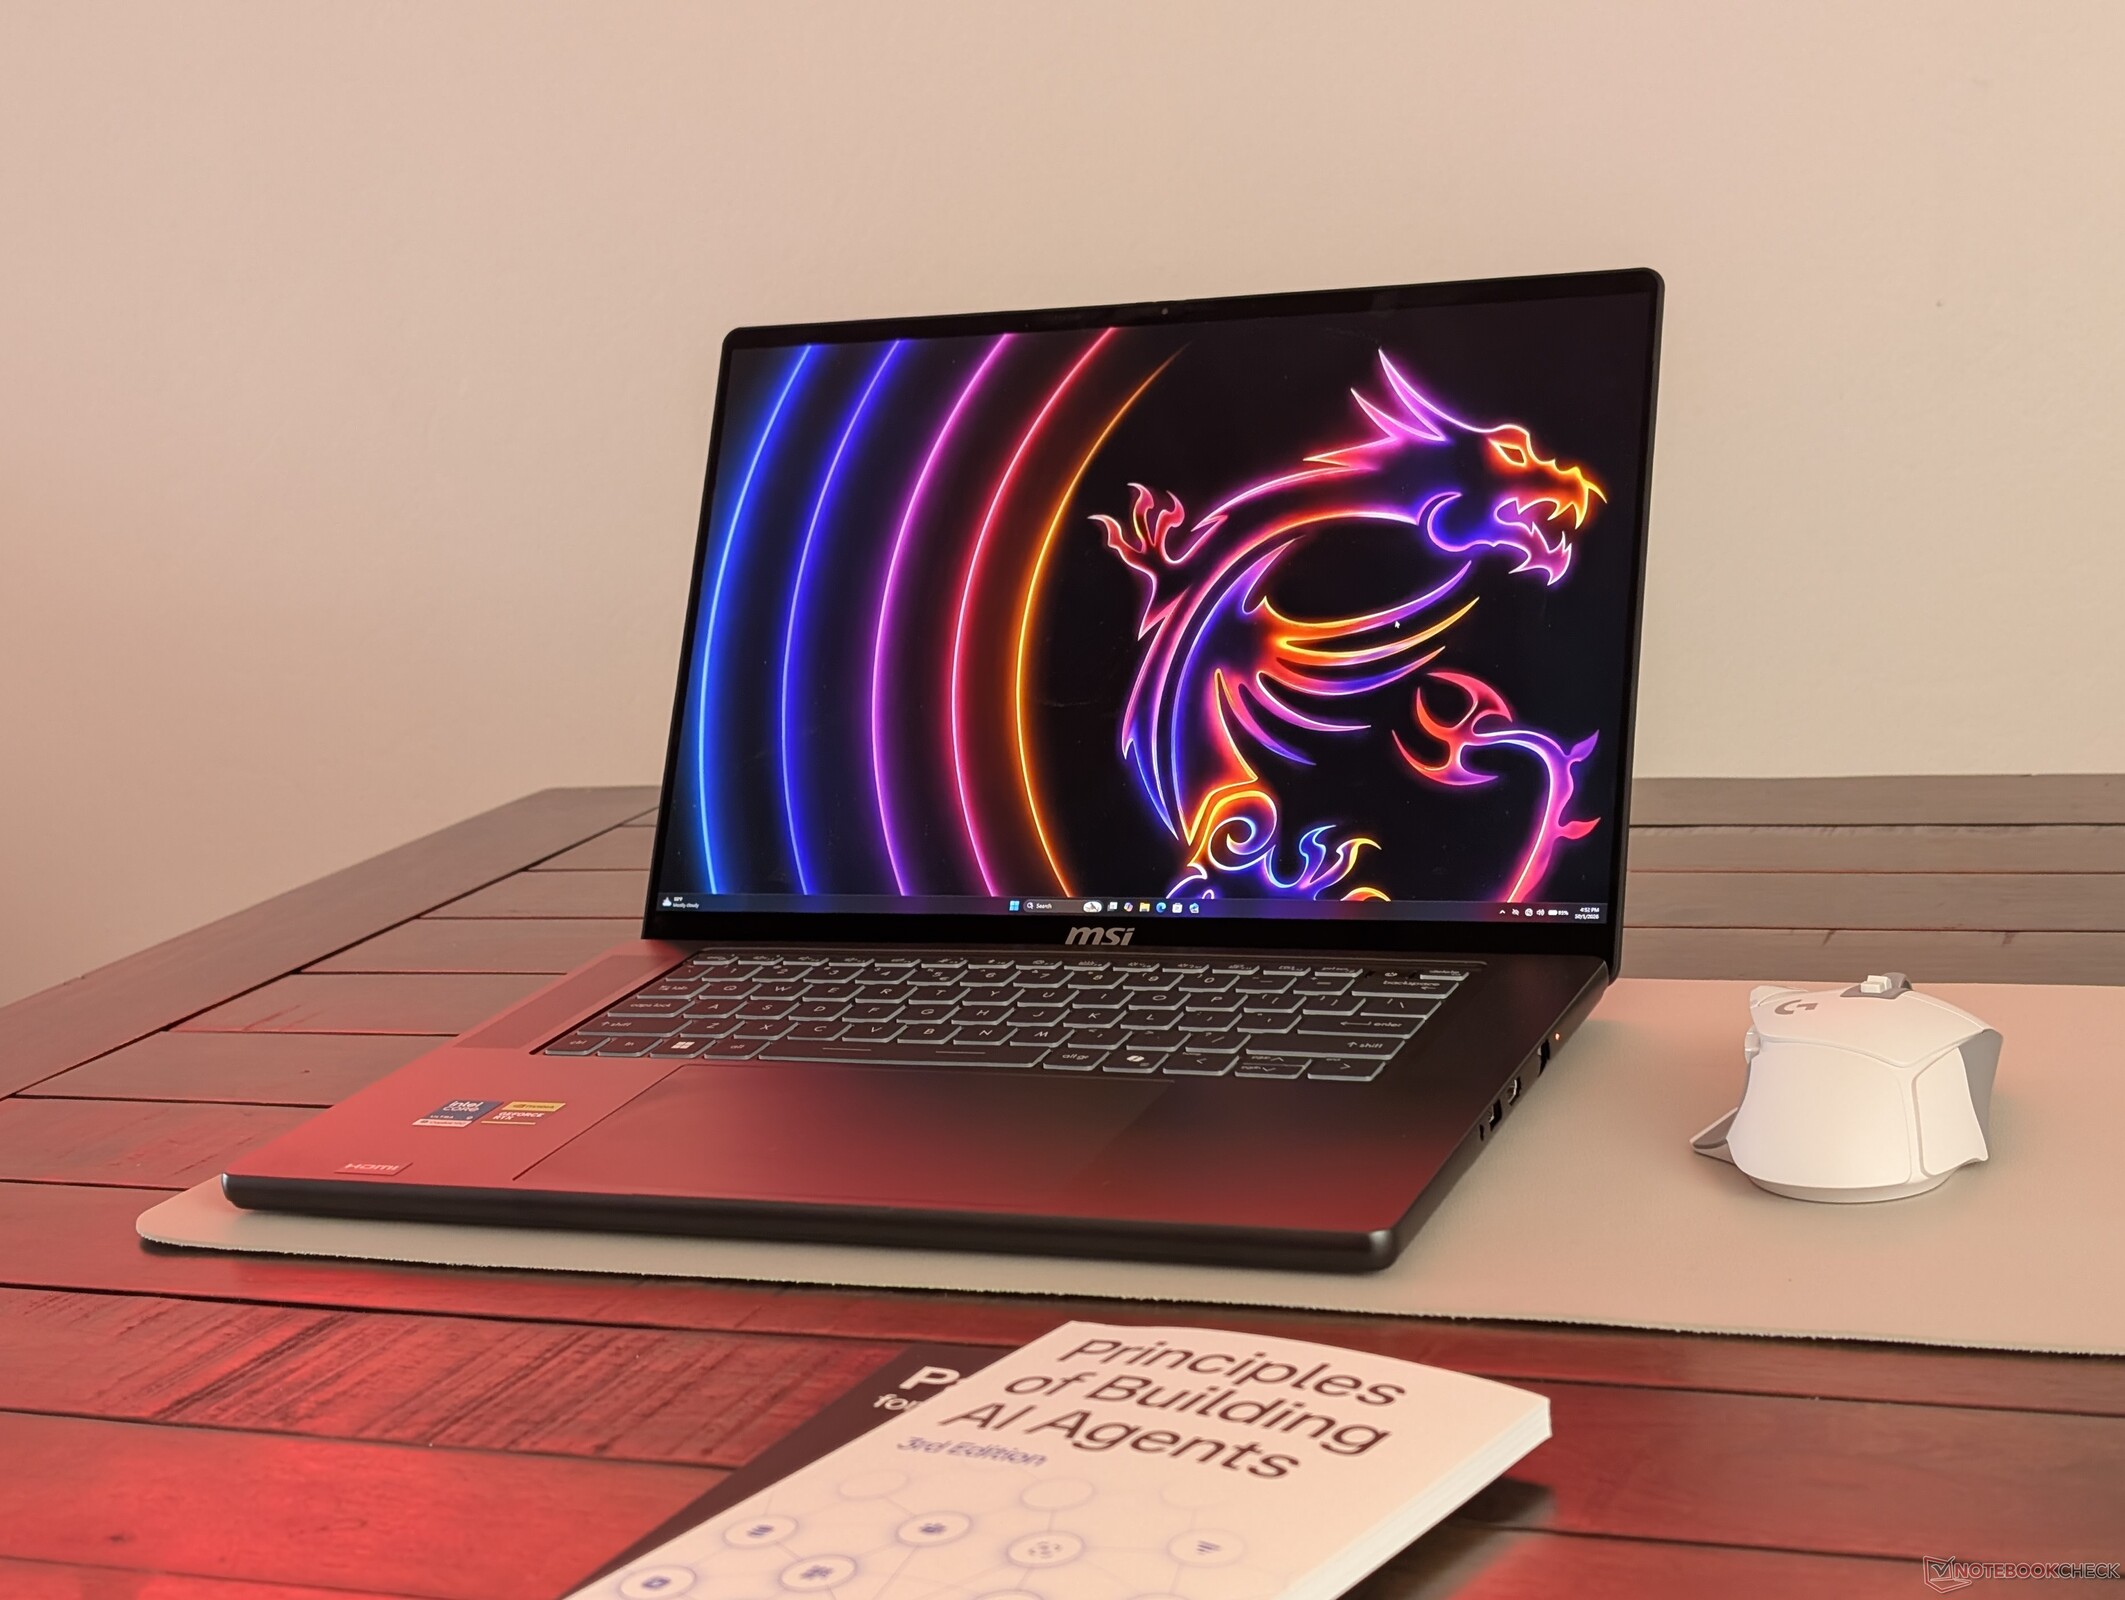
Das Stealth 16 AI von 2026 lässt sich am besten als ein aufgerüstetes Prestige 16 mit der Leistung eines klassischen Gaming-Laptops beschreiben. Wer für Gaming, Content-Erstellung oder lokale agentenbasierte Aufgaben mehr Leistung benötigt, als die aktuelle Prestige Serie bietet, findet im Stealth 16 eine sehr gute Wahl. Das gilt insbesondere, da es dedizierte GeForce-RTX-5080-Grafik und bis zu 128 GB austauschbaren Arbeitsspeicher unterstützt. Das neue äußere Design mag sich von den Gaming-Wurzeln der Stealth Serie entfernen, wirkt aber dennoch eleganter und fühlt sich robuster an.

Der hybride Ansatz aus Gaming- und Studio-Laptop hat einige Nachteile. Vor allem fehlen dem MSI Modell trotz der leistungsstarken Hardware bestimmte Funktionen, die bei den meisten Gaming- oder Prosumer-Laptops üblich sind, etwa G-Sync, ein Touchscreen oder Advanced Optimus. Die Lautsprecher sind angesichts der Größe relativ schwach, während die Tastatur zu Lasten des Gamings auf das Tippen optimiert wurde. Damit die GPU mit der beworbenen TGP von 125 W läuft, muss das System zudem in den Apex-Modus versetzt werden, der nicht zufällig auch der lauteste Modus ist.

Alternativen wie das Razer Blade 16 sind etwas schwerer und bieten eine bessere Anschlussausstattung sowie zusätzliche Gaming-Funktionen, darunter eine höhere TGP-Obergrenze von 160 W. Sein nicht aufrüstbarer Arbeitsspeicher dürfte für viele professionelle Anwender allerdings ein Ausschlusskriterium sein.

Pro

+ hochwertiges OLED-Panel mit DisplayHDR600-Unterstützung
+ aufrüstbar: 2x M.2-SSD und 2x DDR5-SODIMM
+ lange Akkulaufzeit für einen leistungsstarken Laptop
+ robusteres, auf professionelle Anwender ausgerichtetes Design
+ großzügiges Clickpad

Contra

- integrierte Lautsprecher könnten kräftiger klingen
- kein Ziffernblock mehr; kleinere Pfeiltasten
- ein Leistungsmodus zu viel
- Anschlusspositionierung könnte besser sein
- kein G-Sync oder Touchscreen

Preis und Verfügbarkeit

Das MSI Stealth 16 AI B3WH ist im deutschsprachigen Raum derzeit nicht unter der exakten Bezeichnung und mit identischer Ausstattung verfügbar. Vergleichbare Modelle tragen geringfügig andere Bezeichnungen und haben verschiedene Konfigurationen. So gibt es zum Beispiel das MSI Stealth A16 AI+ A3XWHG-044 mit GeForce RTX 5070 Ti und Ryzen AI 9 HX 370 direkt bei MSI aktuell zum Sonderpreis von 3.199 Euro.
Bei Amazon wird das MSI Stealth A16 AI+ A3XWIG-043 mit RTX 5080 und Ryzen AI 9 HX 370 für 4.895 Euro angeboten.

Amazon Logo
Amazon
MSI Stealth A16 AI+ A3XWIG-043・16" QHD+ 240Hz・Ryzen AI 9 HX 370・32GB RAM・2TB SSD・RTX5080・W11H (0015FL-043)

Die ultradünne MSI-Stealth-Serie startete bereits 2014 als vollwertiger Gaming-Laptop. Seitdem hat sich die Serie weiterentwickelt und vereint nun Gaming- und Studio-Eigenschaften, um eine breitere Zielgruppe von Content-Erstellern anzusprechen. Das aktuelle Stealth 16 von 2026 ist somit ein Hybrid mit Merkmalen sowohl der MSI-Gaming-Serie als auch der auf professionelle Anwender ausgerichteten Prestige Serie.

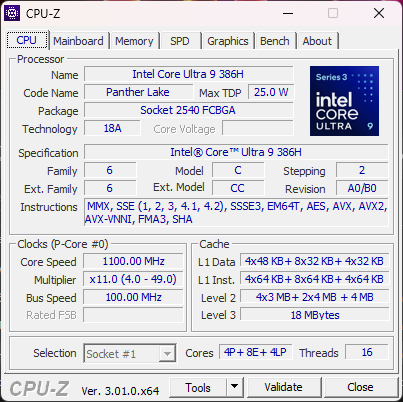
Unser Testgerät ist eine mittlere Konfiguration mit einer Panther-Lake-CPU vom Typ Core Ultra 9 386H, einer GeForce RTX 5070 Ti mit 125 W und einem OLED-Display mit 1.600p und 240 Hz für rund 3.100 US-Dollar. Günstigere beziehungsweise höherwertige Konfigurationen können stattdessen eine RTX 5060 oder RTX 5080 enthalten, das OLED-Display bleibt jedoch bei allen Varianten gleich.

Zu den Konkurrenten in diesem Segment gehören andere ultradünne Gaming-Laptops oder leistungsorientierte Studio-Laptops wie das Razer Blade 16, das Asus ZenBook 16 oder die Lenovo-Yoga-Pro-Serie.

Weitere MSI Tests:

Technische Daten

MSI Stealth 16 AI B3WH (Stealth 16 Serie)
Prozessor
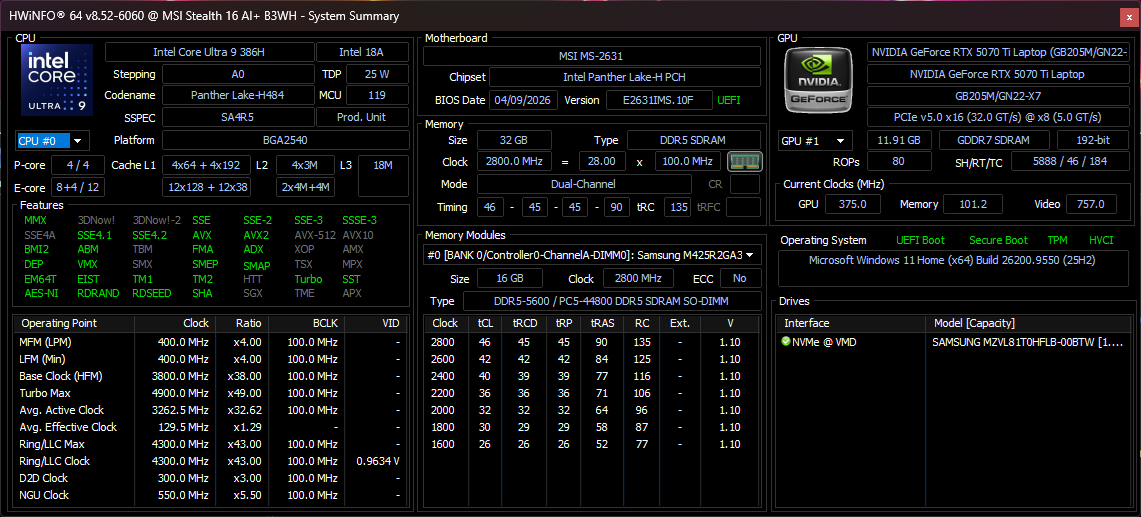
Intel Core Ultra 9 386H 16c/16t, 4 x 4.9 GHz Intel Cougar Cove P-Core, 8 x 3.9 GHz Intel Darkmont E-Core, 4 x 3.5 GHz Intel Darkmont LP E-Core, 97 W PL2 / Short Burst, 88 W PL1 / Sustained, Panther Lake
Grafikkarte
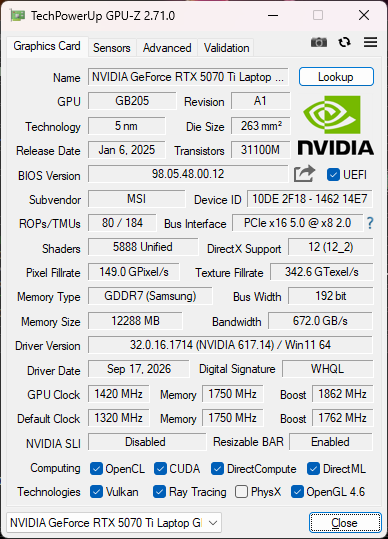
NVIDIA GeForce RTX 5070 Ti Laptop - 12 GB VRAM, Kerntakt: 1862 MHz, Speichertakt: 1750 MHz, 125 W TDP, GDDR7, 617.14, Optimus
RAM
32 GB 
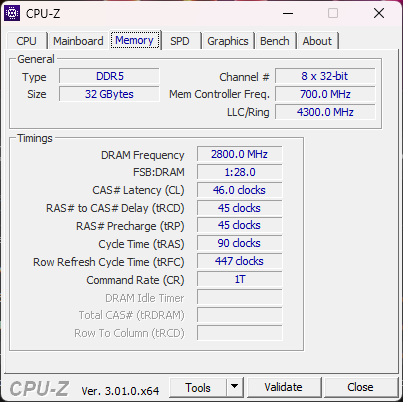
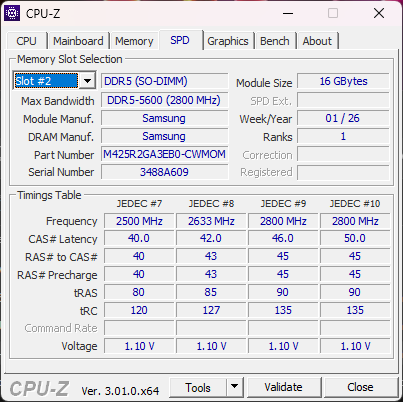
, DDR5-5600, Dual-Channel, 46-45-45-90
Bildschirm
16.00 Zoll 16:10, 2560 x 1600 Pixel 189 PPI, Samsung ATNA60DL07-0, OLED, DisplayHDR600, spiegelnd: ja, HDR, 240 Hz
Mainboard
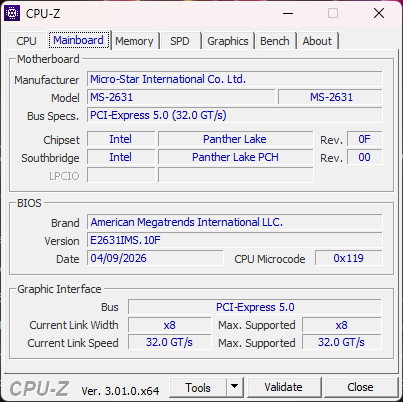
Intel Panther Lake-H PCH
Massenspeicher
Samsung PM9C1b MZVL81T0HFLB-00BTW, 1000 GB 
Soundkarte
Intel Panther Lake-H PCH - High Definition Audio - AVS (Audio, Voice, Speech)
Anschlüsse
2 USB 3.1 Gen2, 2 USB4 40 Gbps, 2 Thunderbolt 4, USB-C Power Delivery (PD), 1 HDMI, 2 DisplayPort, Audio Anschlüsse: 3.5 mm combo, 1 Fingerprint Reader
Netzwerk
Realtek RTL8125 2.5GBe Family Ethernet Controller (10/100/1000/2500MBit/s), Intel Wi-Fi 7 BE213 160MHz ( be = Wi-Fi 7), Bluetooth 6
Abmessungen
Höhe x Breite x Tiefe (in mm): 19.99 x 354 x 246
Akku
90 Wh Lithium-Polymer, 4-cell
Betriebssystem
Microsoft Windows 11 Home
Kamera
Webcam: 1080p30, IR + privacy shutter
Primary Camera: 2.1 MPix
Sonstiges
Lautsprecher: 2x 2 W tweeters, 2x 2 W subwoofers, Tastatur: Chiclet, Tastatur-Beleuchtung: ja, MSI Center, App Player, True Color, 12 Monate Garantie
Gewicht
2.033 kg, Netzteil: 740 g
Preis
3100 USD
Amazon
Geizhals
Preisvergleich
Geizhals Bestpreis 4029€ (Historischer Bestpreis: €)
Hinweis: Der Hersteller kann abweichende Bauteile wie Bildschirme, Laufwerke und Speicherriegel mit ähnlichen Spezifikationen unter dem gleichen Modellnamen einsetzen.


Gehäuse

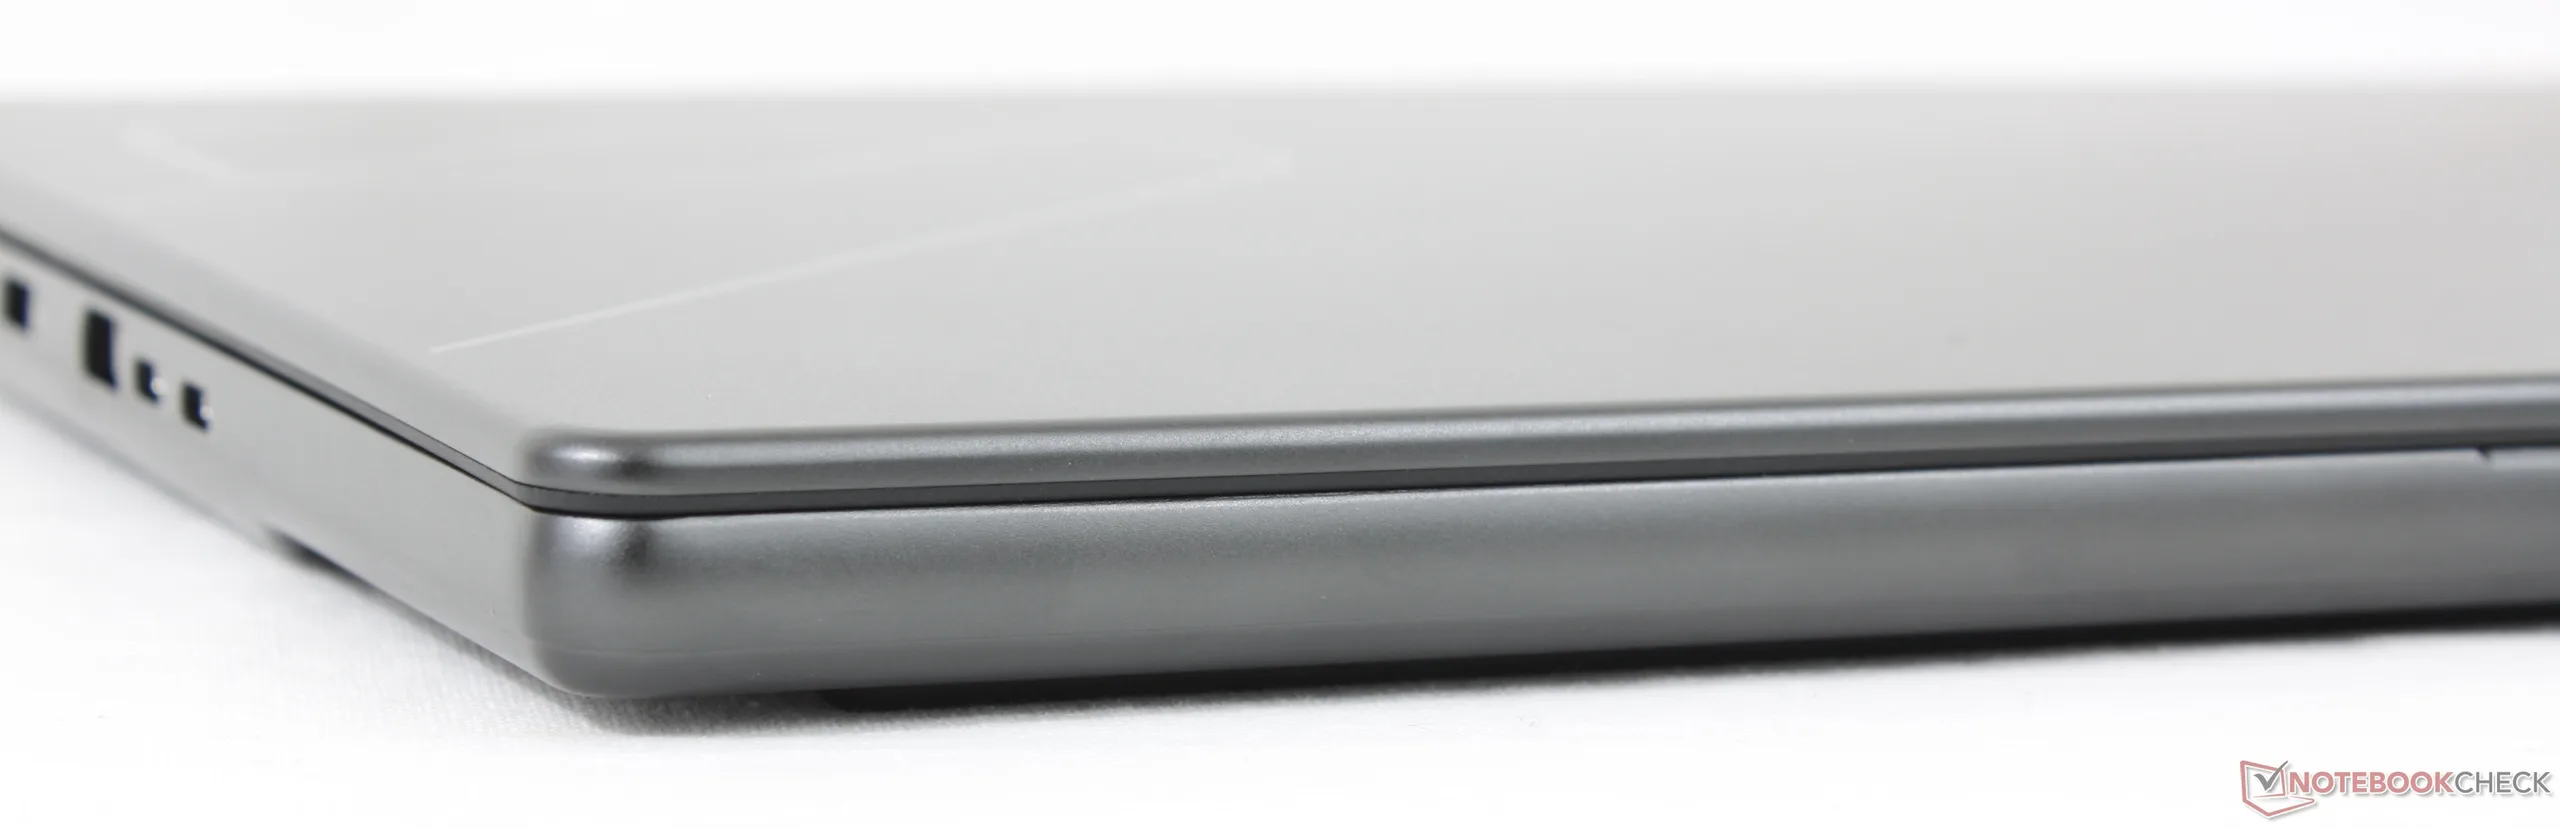
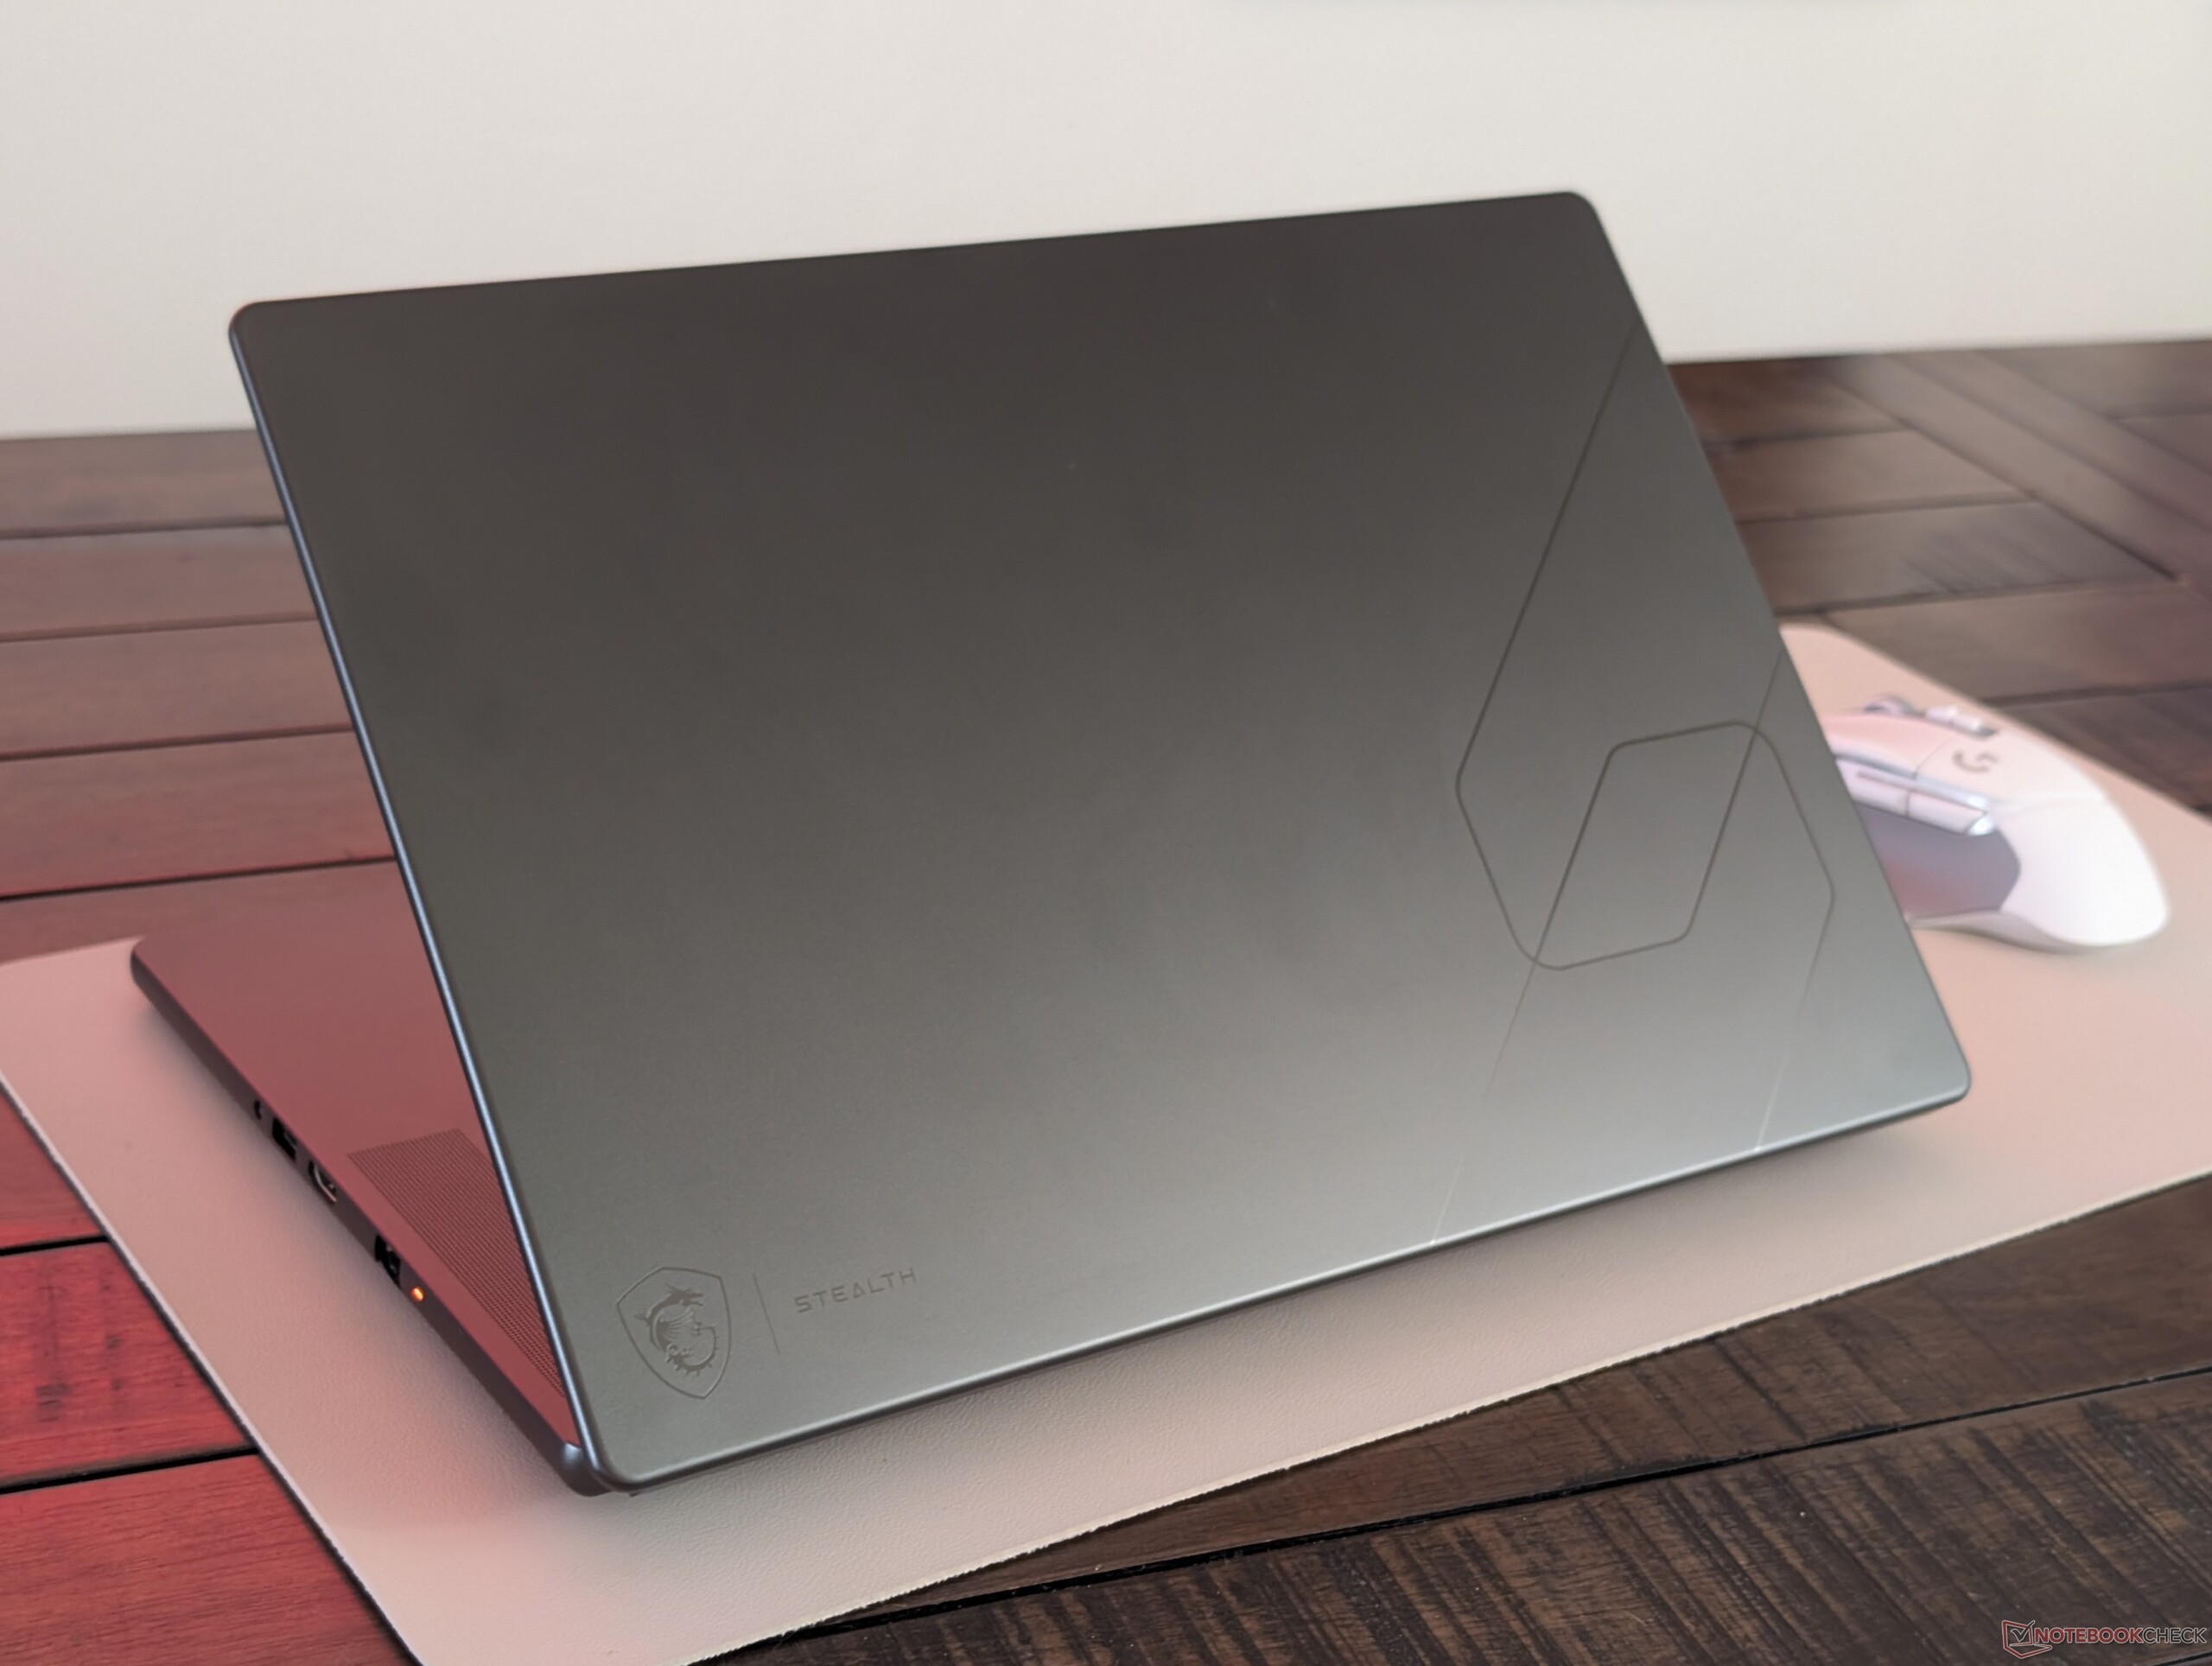
Das graue Gehäuse aus einer Aluminiumlegierung steht im Kontrast zu den dunkleren, auf Gaming ausgerichteten Farbtönen des Stealth Designs der vorherigen Generation. In professionellen Umgebungen könnte man es leicht mit einem Prestige Laptop oder einer mobilen Workstation verwechseln.

Die Oberflächen fühlen sich dicker und robuster an als beim Stealth 16 von 2023, geben aber etwas stärker nach als beim Razer Blade 16 von 2025. Zu beachten ist, dass die Scharniere zwar etwas straffer sind als beim bisherigen Design, der maximale Öffnungswinkel jedoch von 180 Grad auf nur noch 140 Grad reduziert wurde.
Größenvergleich

❌
357 mm 255 mm 24.5 mm 2.3 kg361.4 mm 254.2 mm 16.9 mm 1.8 kg356 mm 260 mm 19.95 mm 2 kg354 mm 246 mm 19.99 mm 2 kg355 mm 250.5 mm 17.4 mm 2.1 kg354 mm 246 mm 17.9 mm 1.9 kg297 mm 210 mm 1 mm 5.7 g

Anschlüsse

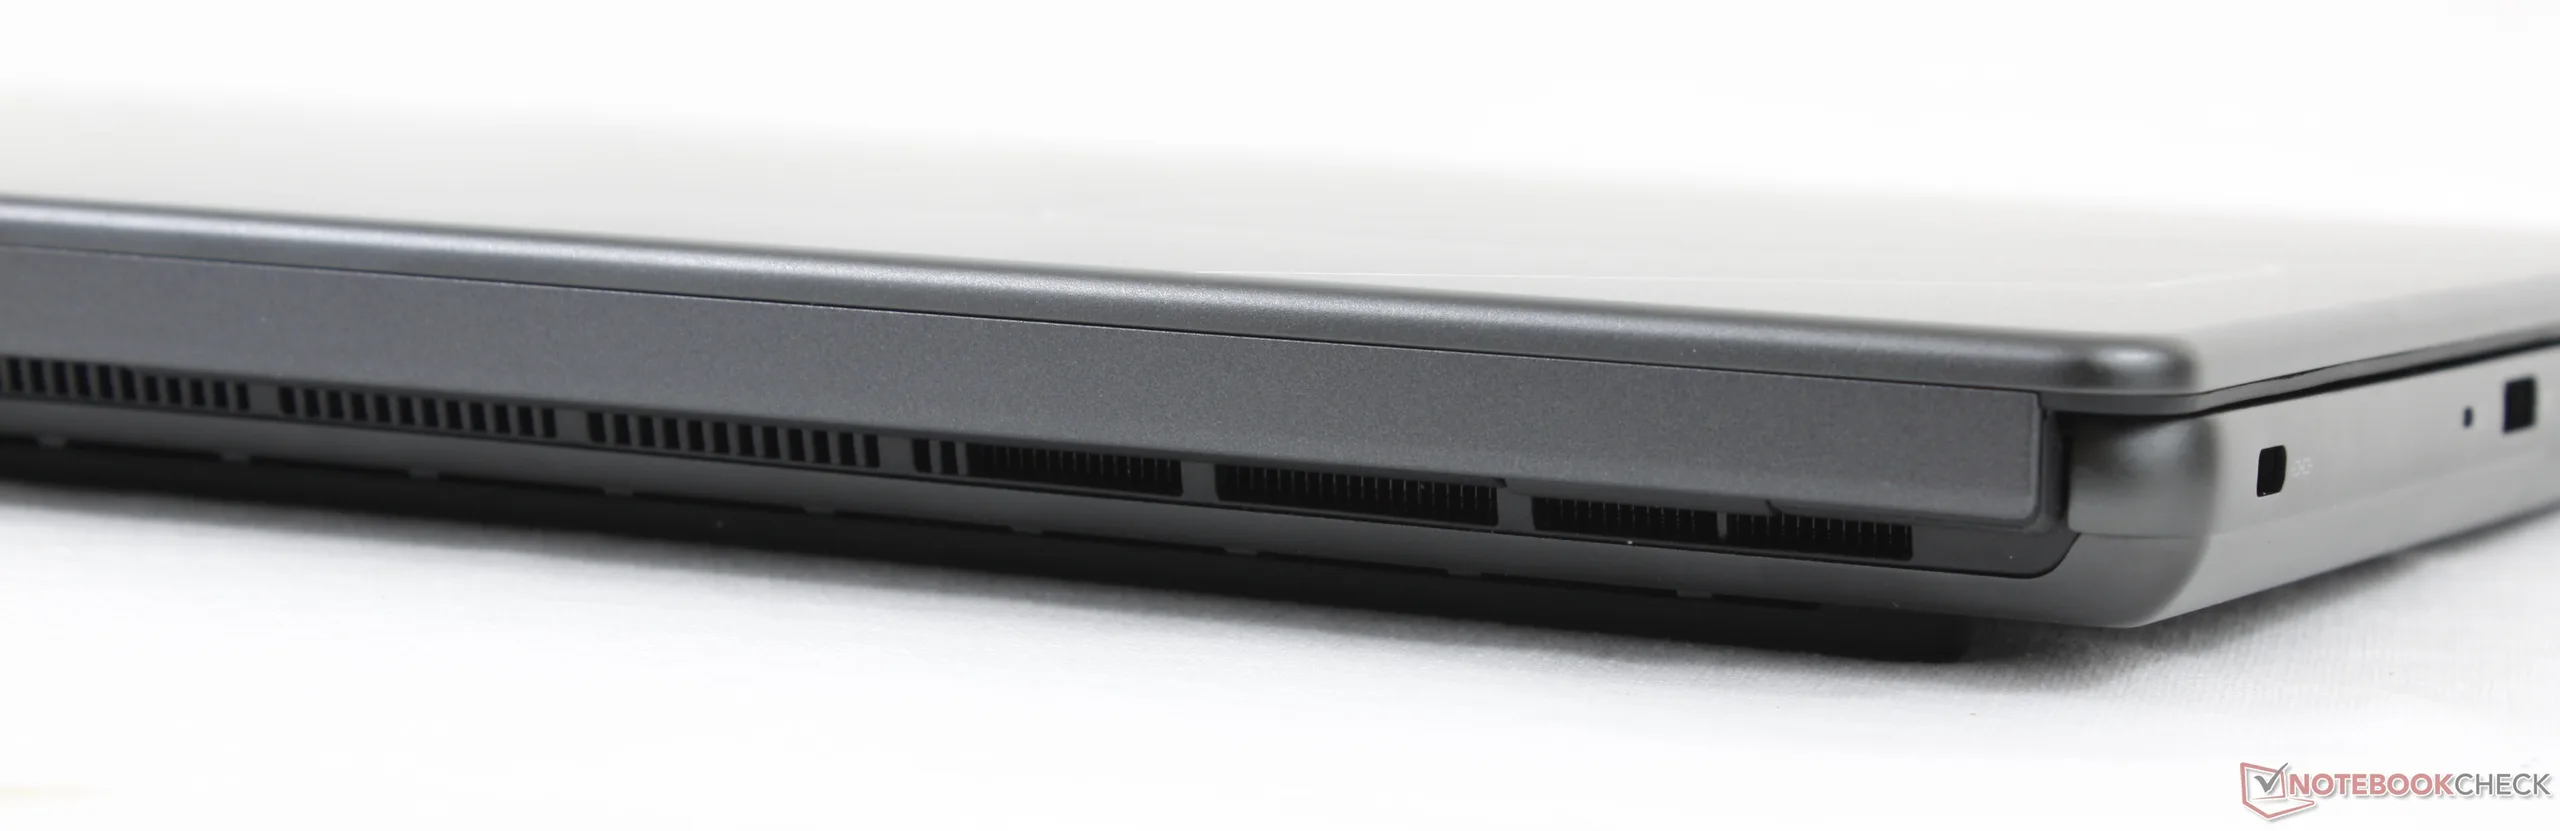
Vorderseite: keine Anschlüsse
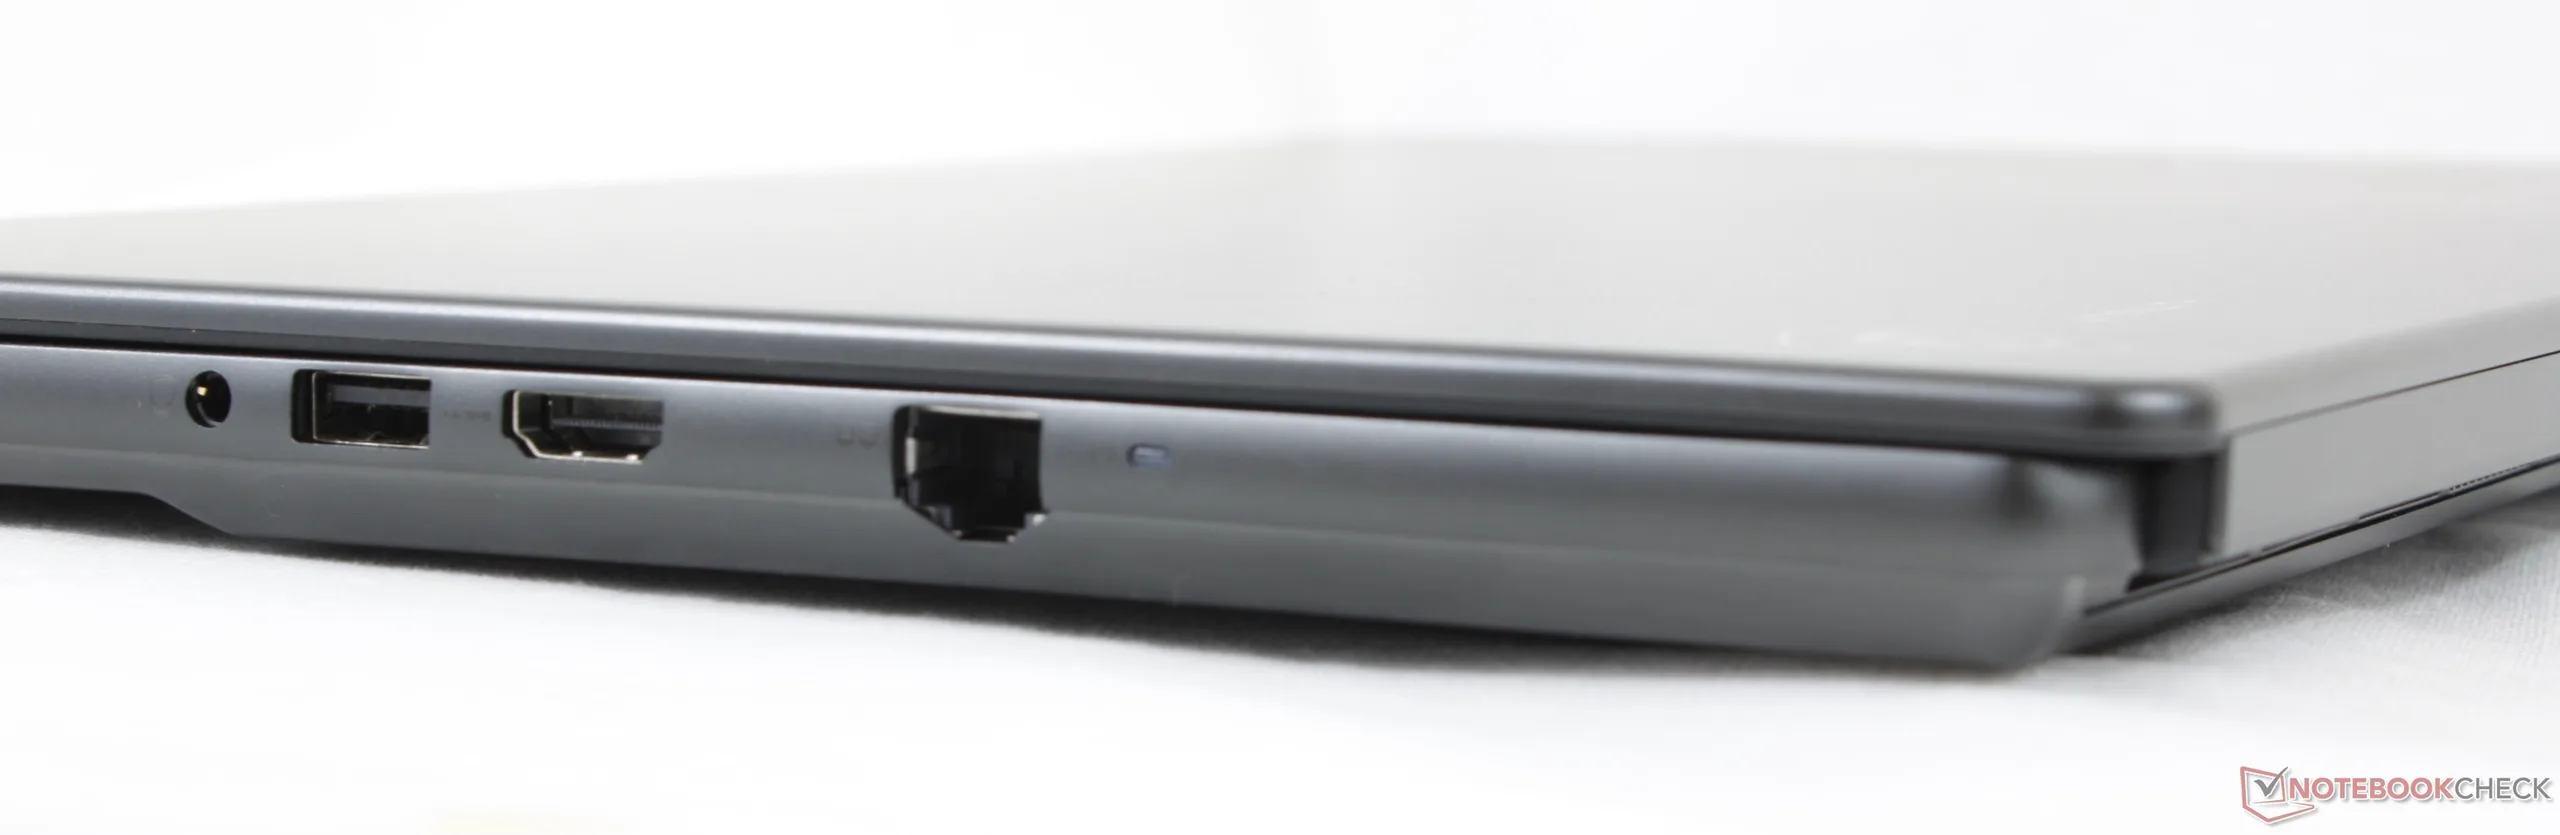
Rechts: 3,5-mm-Headset-Anschluss, USB-A 3.2 Gen. 2, HDMI 2.1, RJ-45 (2,5 Gbit/s)
Rückseite: keine Anschlüsse
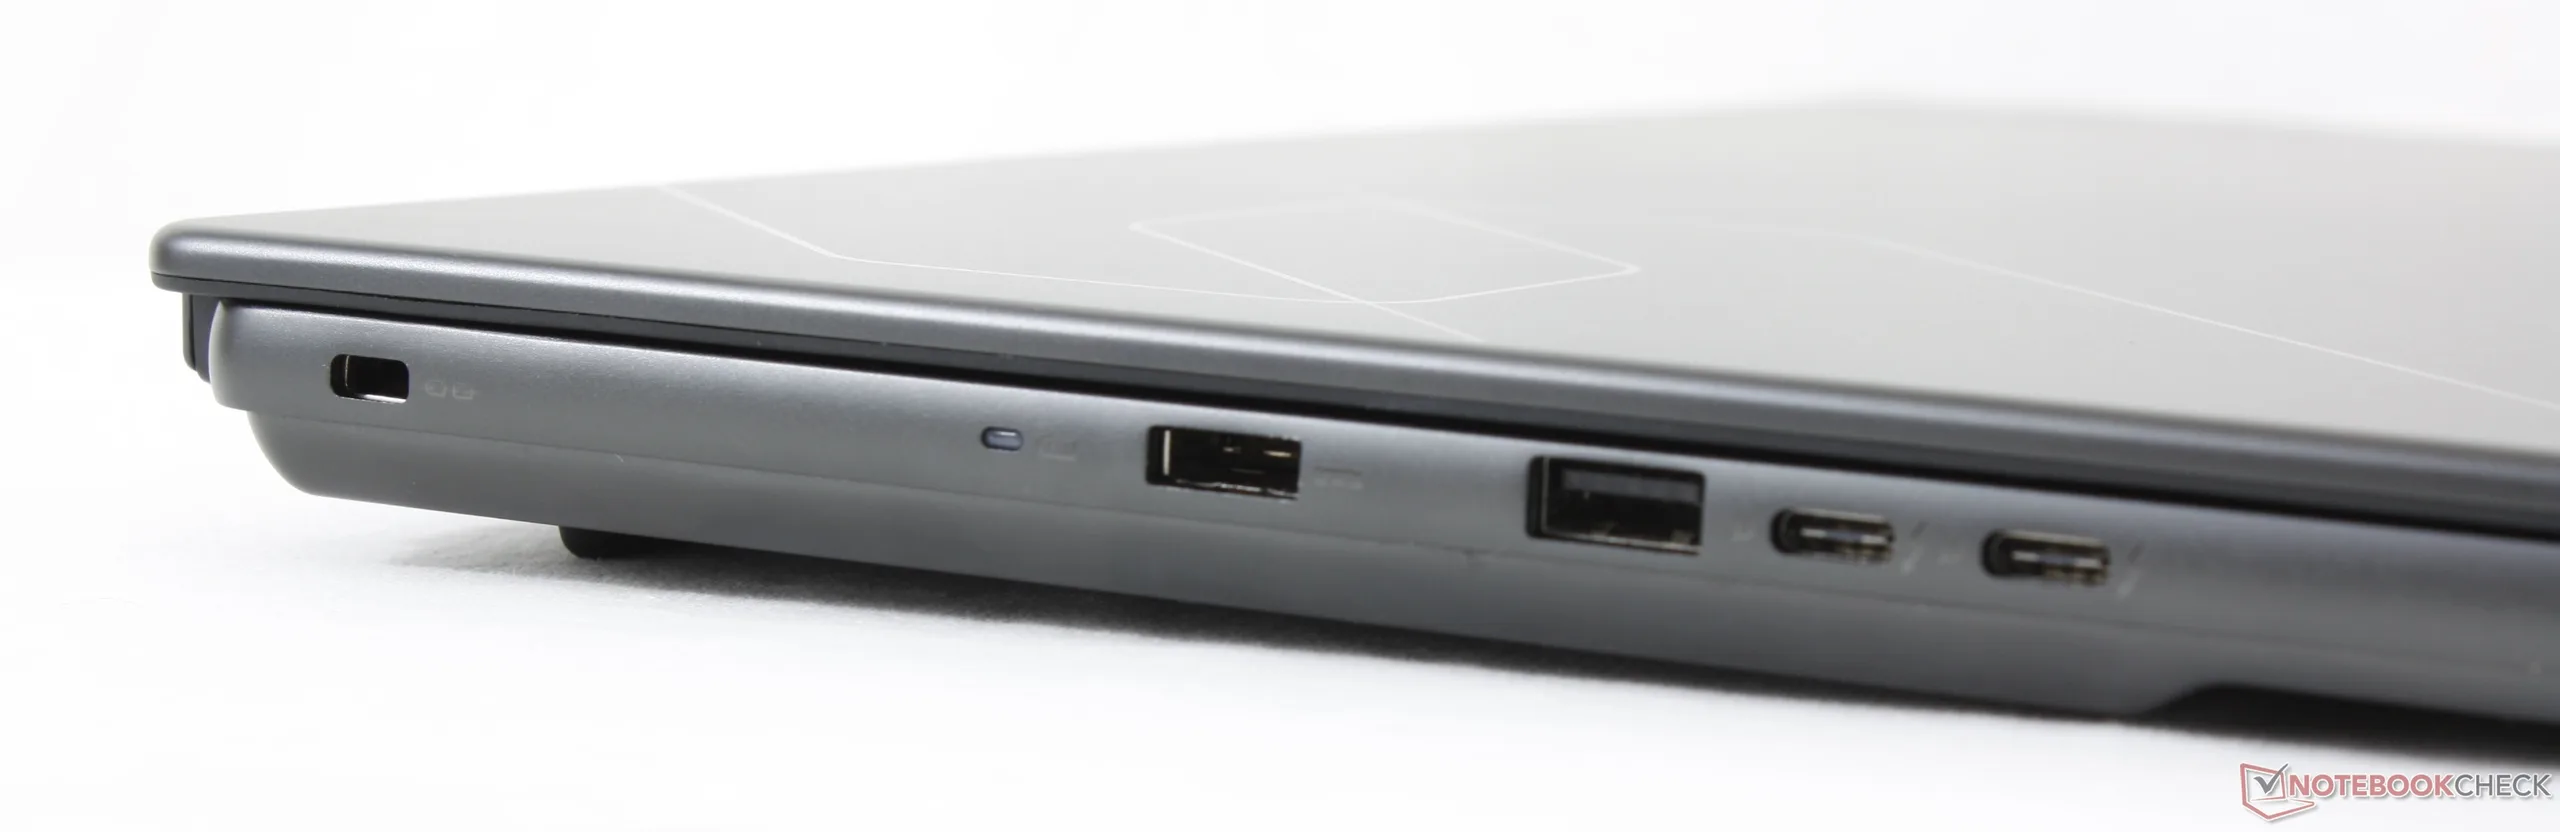
Links: Kensington Schloss, Netzteilanschluss, USB-A 3.2 Gen. 2, 2x USB-C Thunderbolt 4 mit DisplayPort 2.1 + Power Delivery 3.0

Kommunikation

Networking
iperf3 transmit Wi-Fi6/7 RT-BE96U
Asus ROG Zephyrus G16 GU606AW
Intel Wi-Fi 7 BE211 320MHz
2341 (1210min - 2548max) MBit/s +9%
MSI Stealth 16 AI B3WH
Intel Wi-Fi 7 BE213 160MHz
2147 (1998min - 2242max) MBit/s
Aorus Master 16 AM6J
Realtek 8922AE WiFi 7 PCI-E NIC
718 (672min - 755max) MBit/s -67%
iperf3 receive Wi-Fi6/7 RT-BE96U
Asus ROG Zephyrus G16 GU606AW
Intel Wi-Fi 7 BE211 320MHz
1998 (1004min - 2049max) MBit/s +1%
MSI Stealth 16 AI B3WH
Intel Wi-Fi 7 BE213 160MHz
1980 (1639min - 2107max) MBit/s
Aorus Master 16 AM6J
Realtek 8922AE WiFi 7 PCI-E NIC
1642 (1406min - 1855max) MBit/s -17%
iperf3 receive AXE11000 6GHz
Razer Blade 16 Core Ultra 9 386H
Intel Wi-Fi 7 BE213 160MHz
1736 (1708min - 1755max) MBit/s
MSI Stealth 16 Studio A13VG
Killer Wi-Fi 6E AX1675i 160MHz Wireless Network Adapter
1446 (731min - 1469max) MBit/s
iperf3 transmit AXE11000 6GHz
MSI Stealth 16 Studio A13VG
Killer Wi-Fi 6E AX1675i 160MHz Wireless Network Adapter
1612 (1573min - 1655max) MBit/s
Razer Blade 16 Core Ultra 9 386H
Intel Wi-Fi 7 BE213 160MHz
1597 (1410min - 1661max) MBit/s
01002003004005006007008009001000110012001300140015001600170018001900200021002200Tooltip
MSI Stealth 16 AI B3WH; iperf3 transmit Wi-Fi6/7 RT-BE96U; iperf 3.1.3: Ø2147 (1998-2242) MBit/s
MSI Stealth 16 AI B3WH; iperf3 receive Wi-Fi6/7 RT-BE96U; iperf 3.1.3: Ø1980 (1639-2107) MBit/s

Webcam

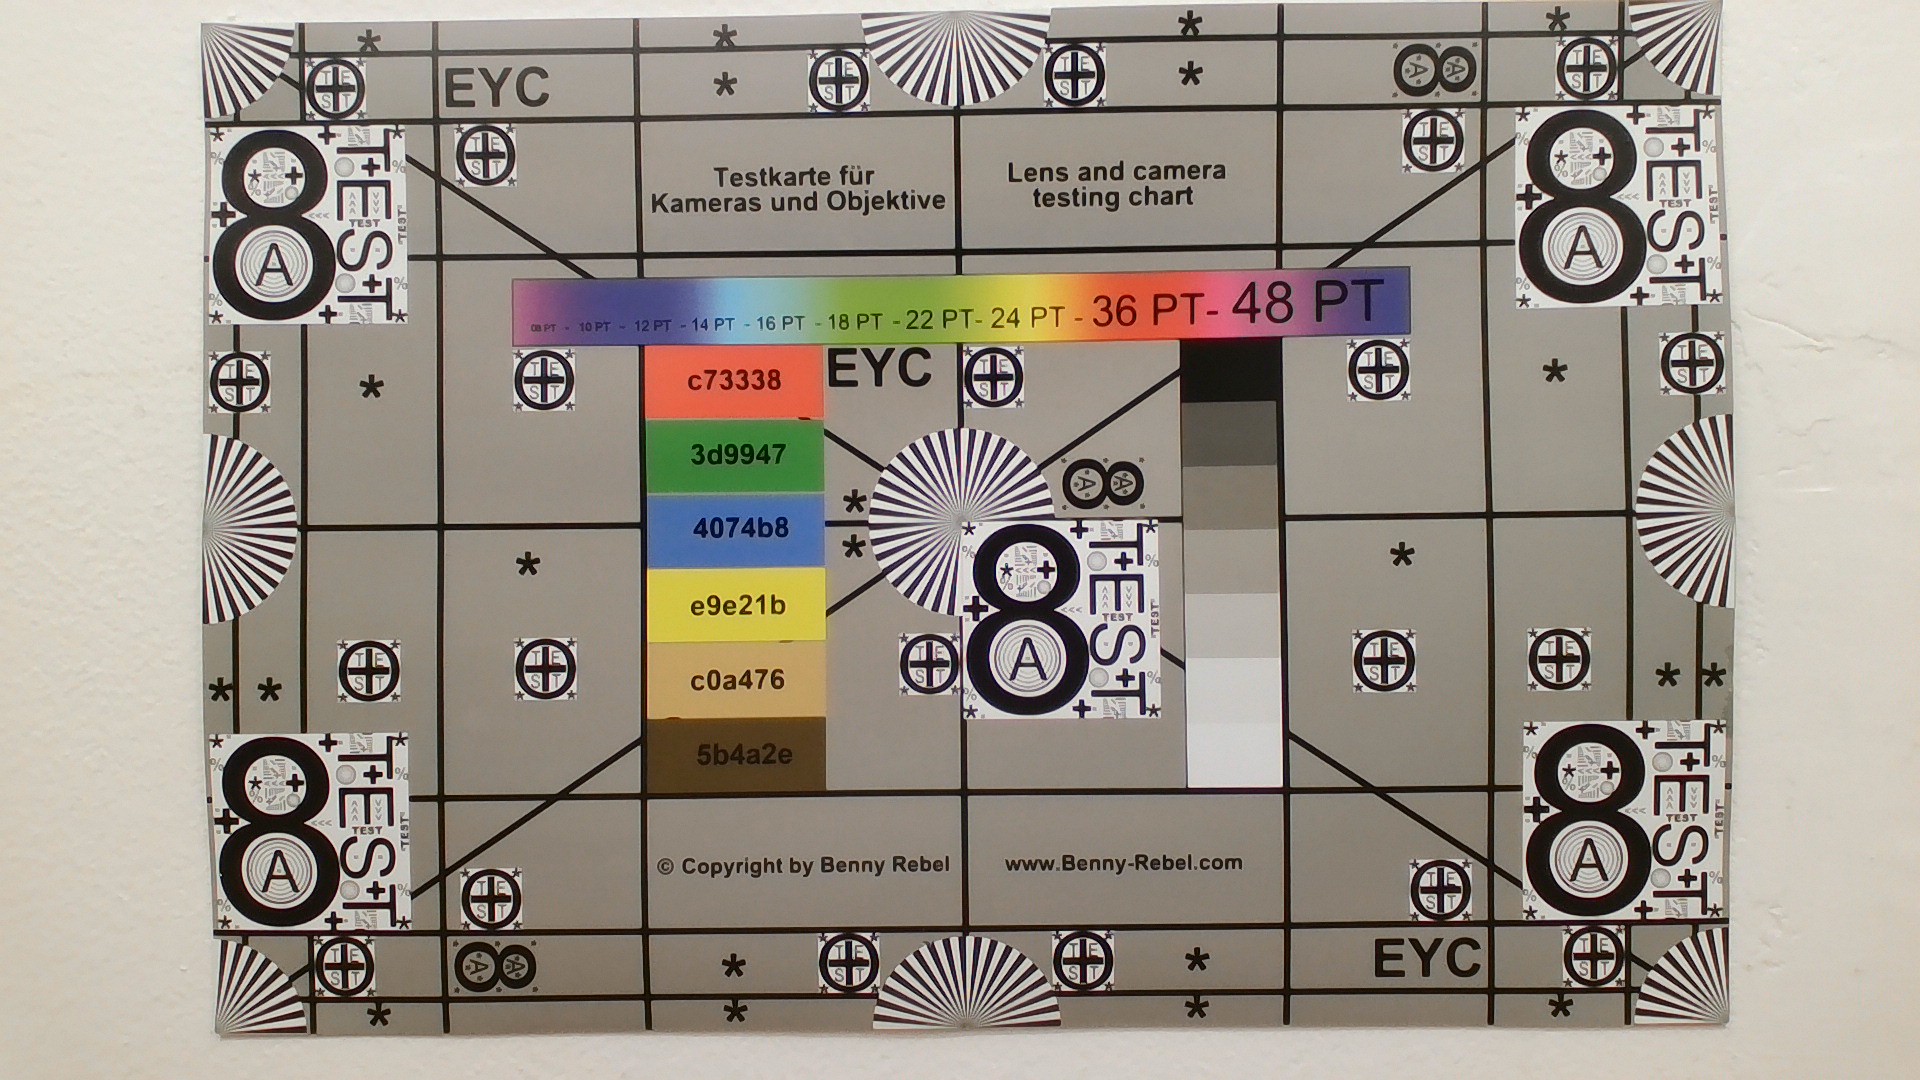
ColorChecker
8.3 ∆E
12.2 ∆E
19.2 ∆E
22.4 ∆E
21 ∆E
12.6 ∆E
11 ∆E
17.1 ∆E
20 ∆E
21.9 ∆E
12.4 ∆E
13 ∆E
2.5 ∆E
14.3 ∆E
26 ∆E
13.4 ∆E
20.6 ∆E
18.4 ∆E
6.9 ∆E
7 ∆E
12.9 ∆E
17.4 ∆E
15.1 ∆E
1.4 ∆E
ColorChecker MSI Stealth 16 AI B3WH: 14.45 ∆E min: 1.43 - max: 25.96 ∆E

Wartung

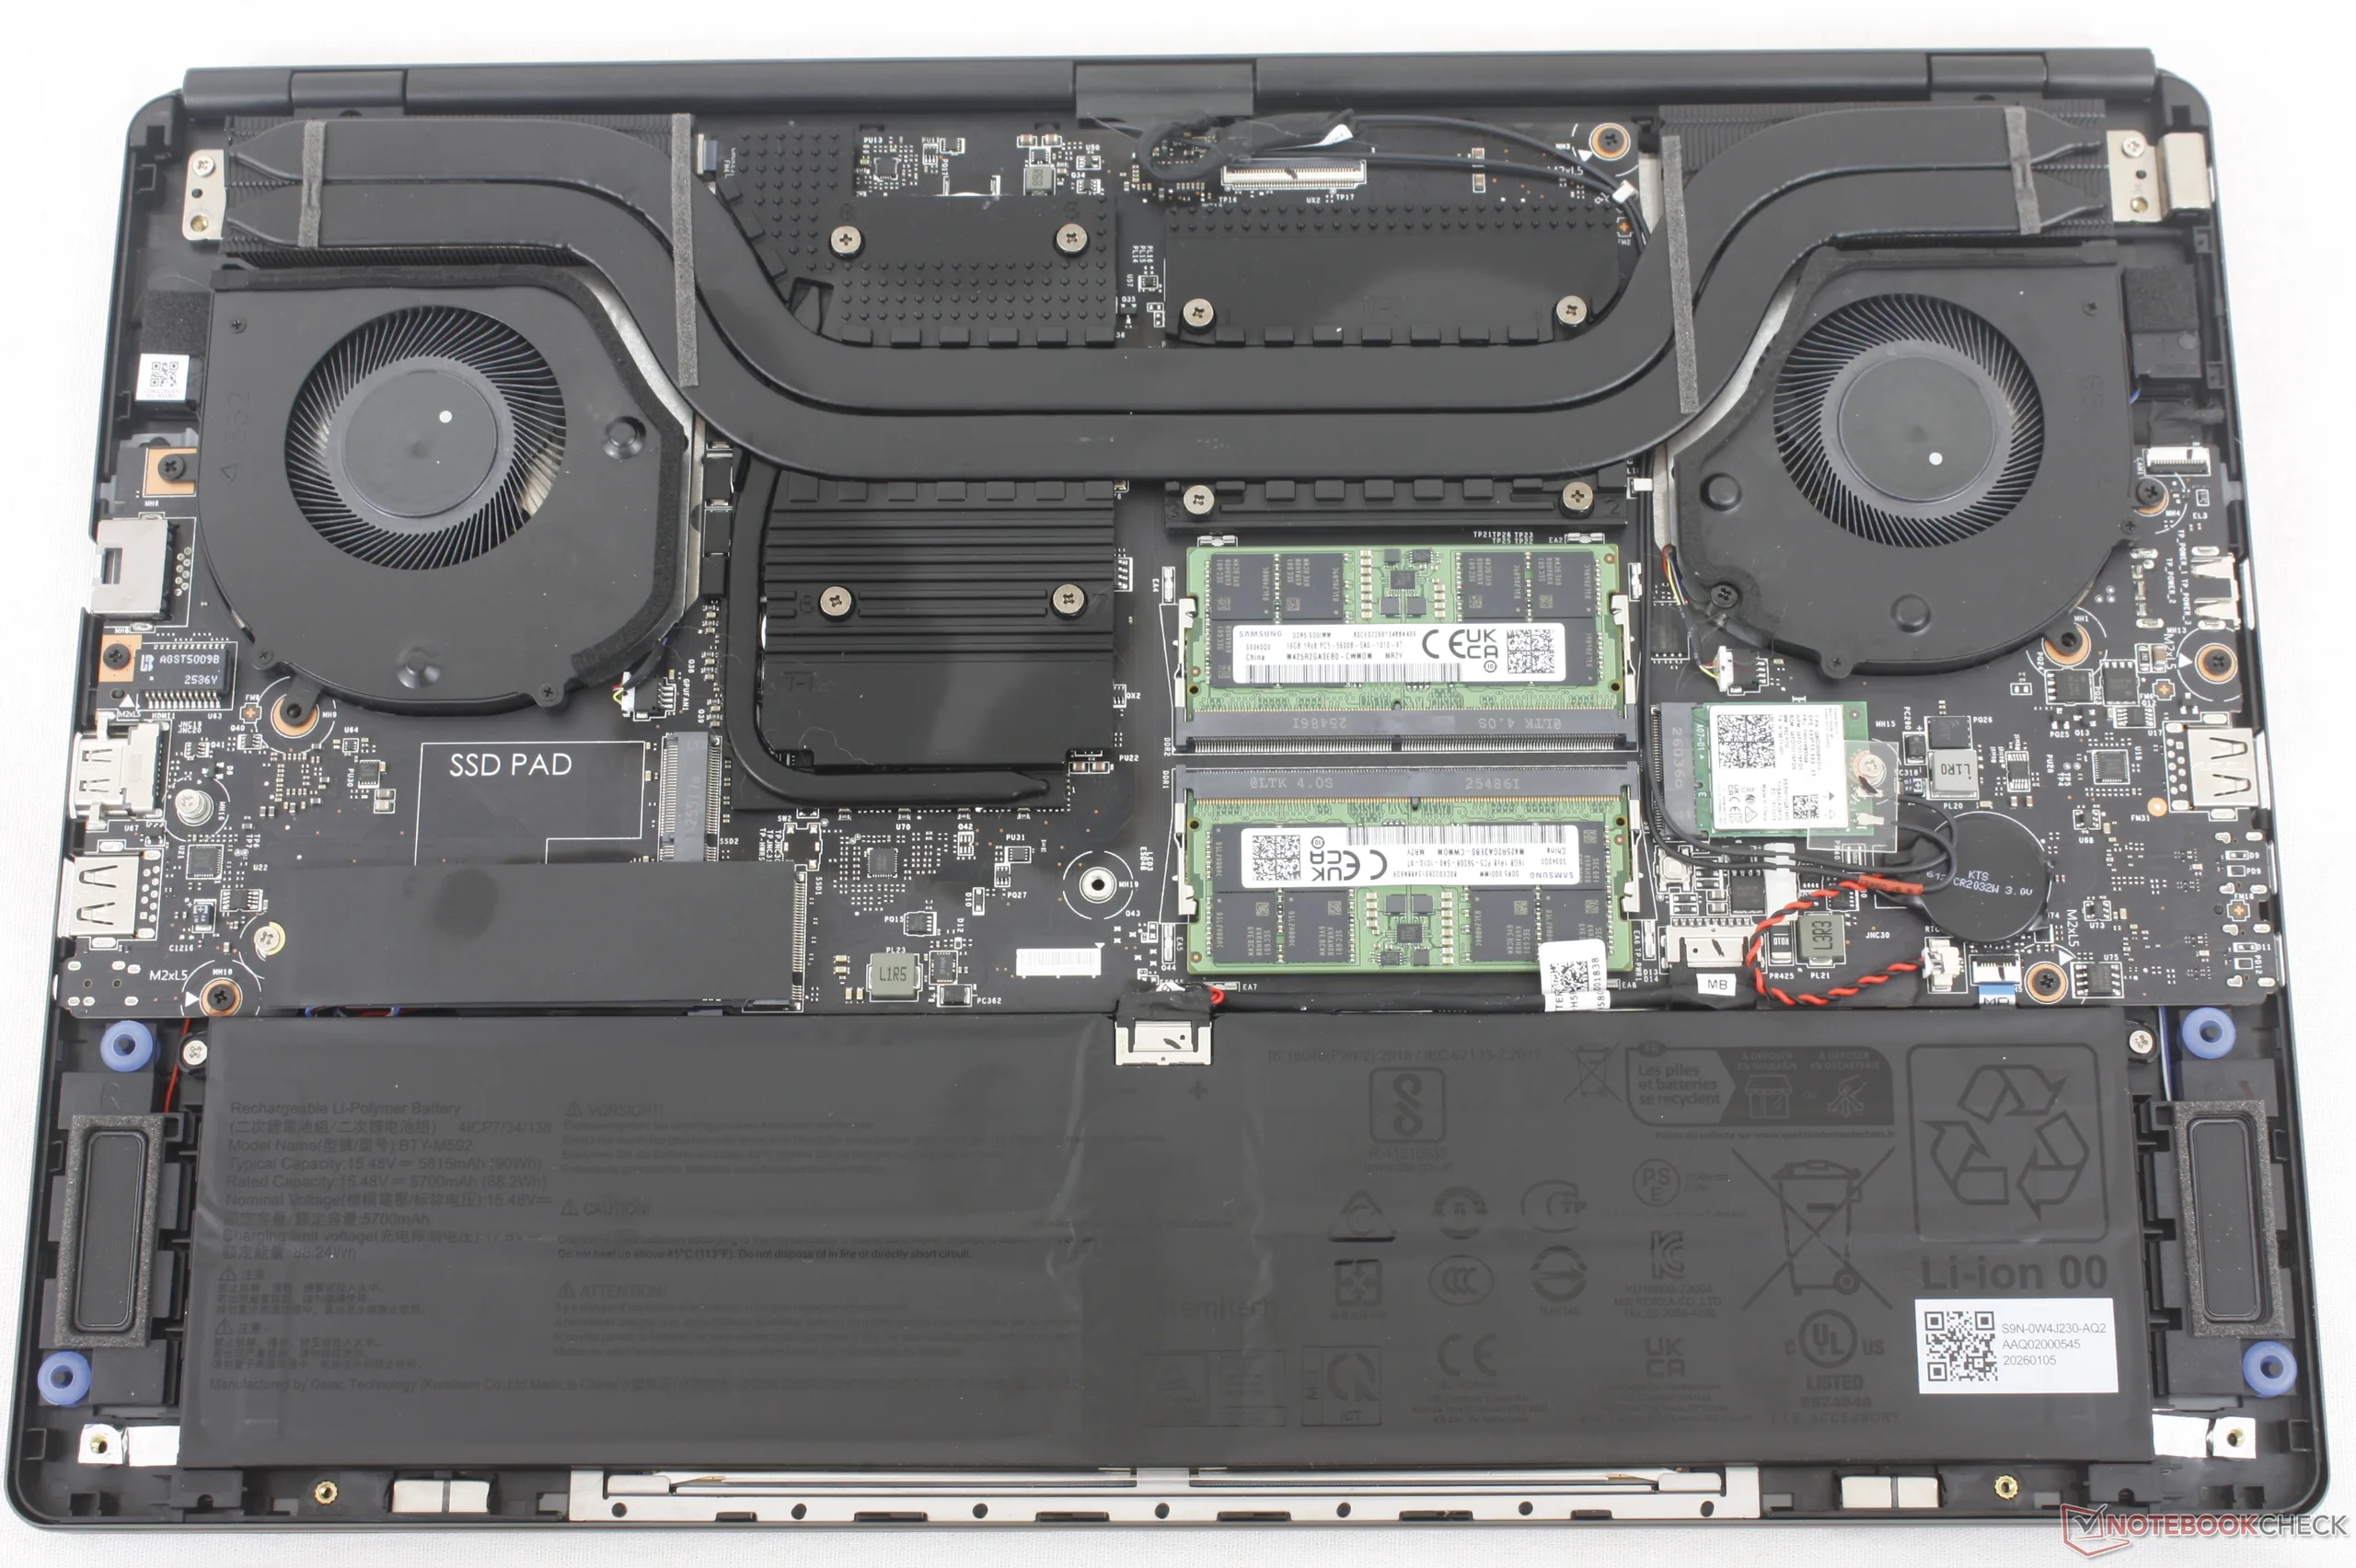
Das Stealth 16 von 2026 unterstützt bis zu zwei PCIe-4-x4-NVMe-SSDs im 2280-Format und zwei DDR5-SODIMM-Module
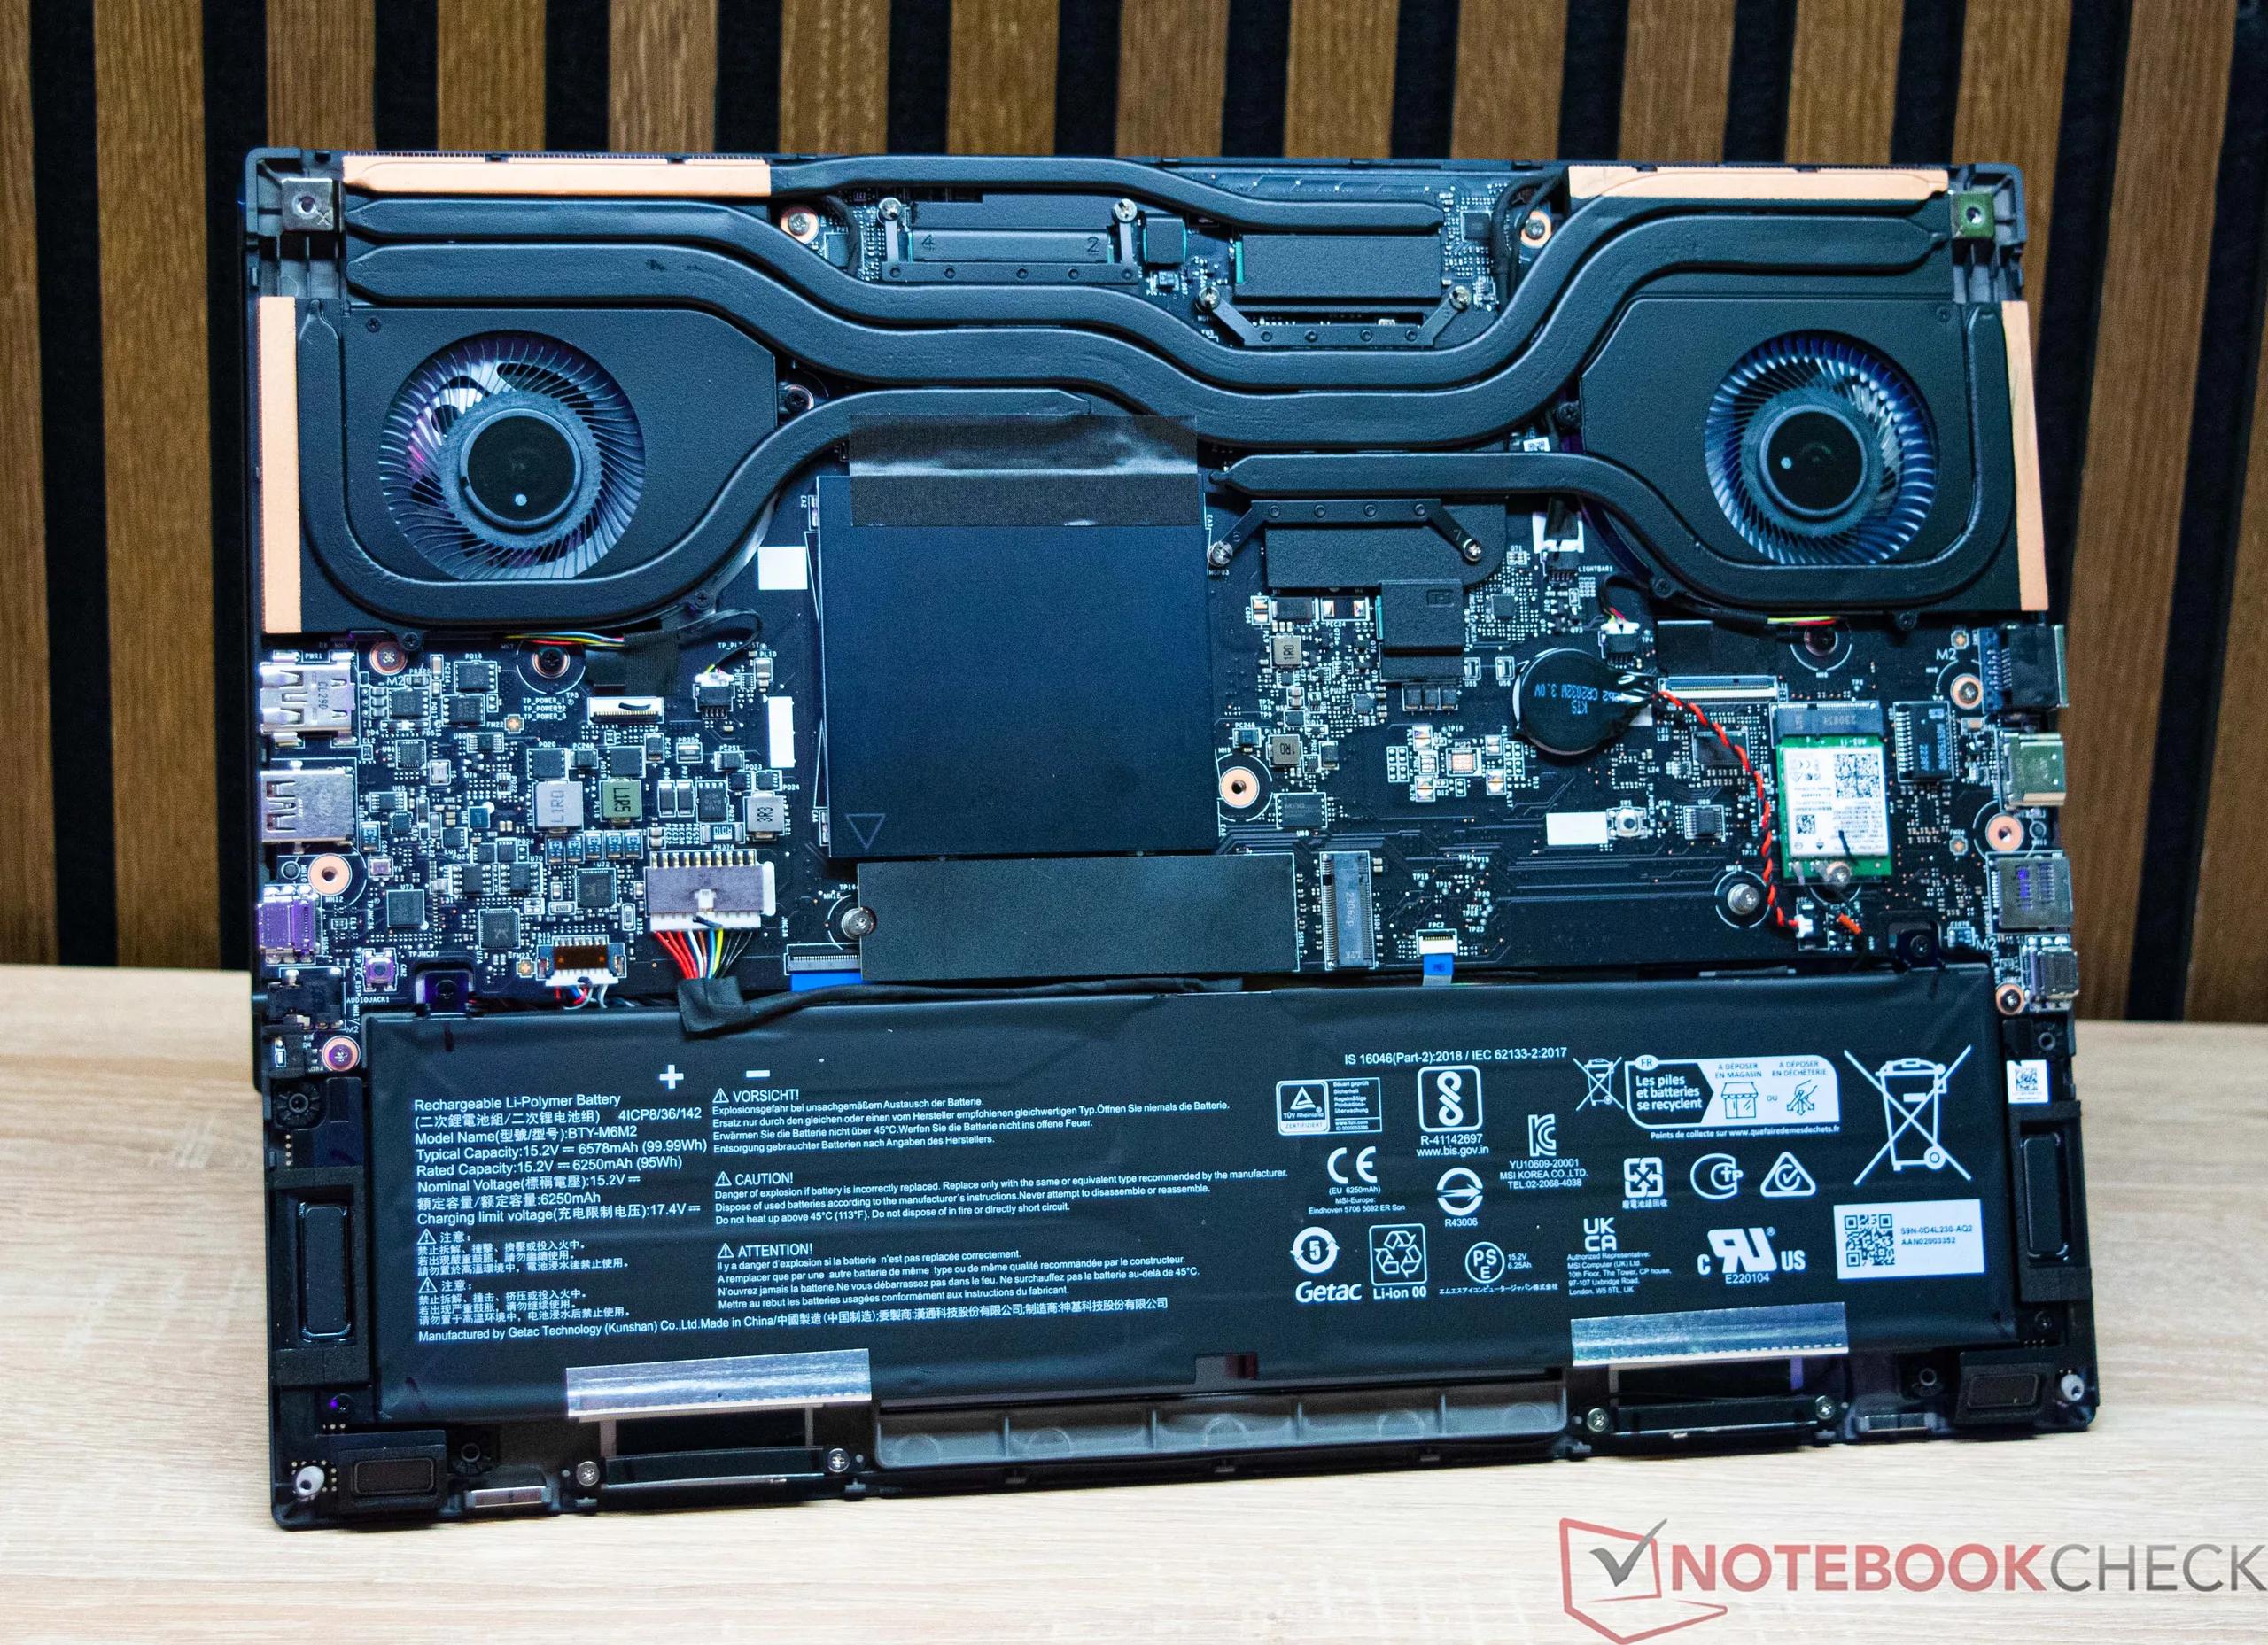
Stealth 16 von 2023 zum Vergleich

Eingabegeräte

Passend zur stärker auf professionelle Anwender ausgerichteten Stealth Serie übernimmt das Modell das Tastaturdesign des Prestige 16 statt das eines stärker auf Gaming ausgerichteten Modells wie des Crosshair 16. Eine RGB-Beleuchtung mit vier Zonen wird unterstützt.
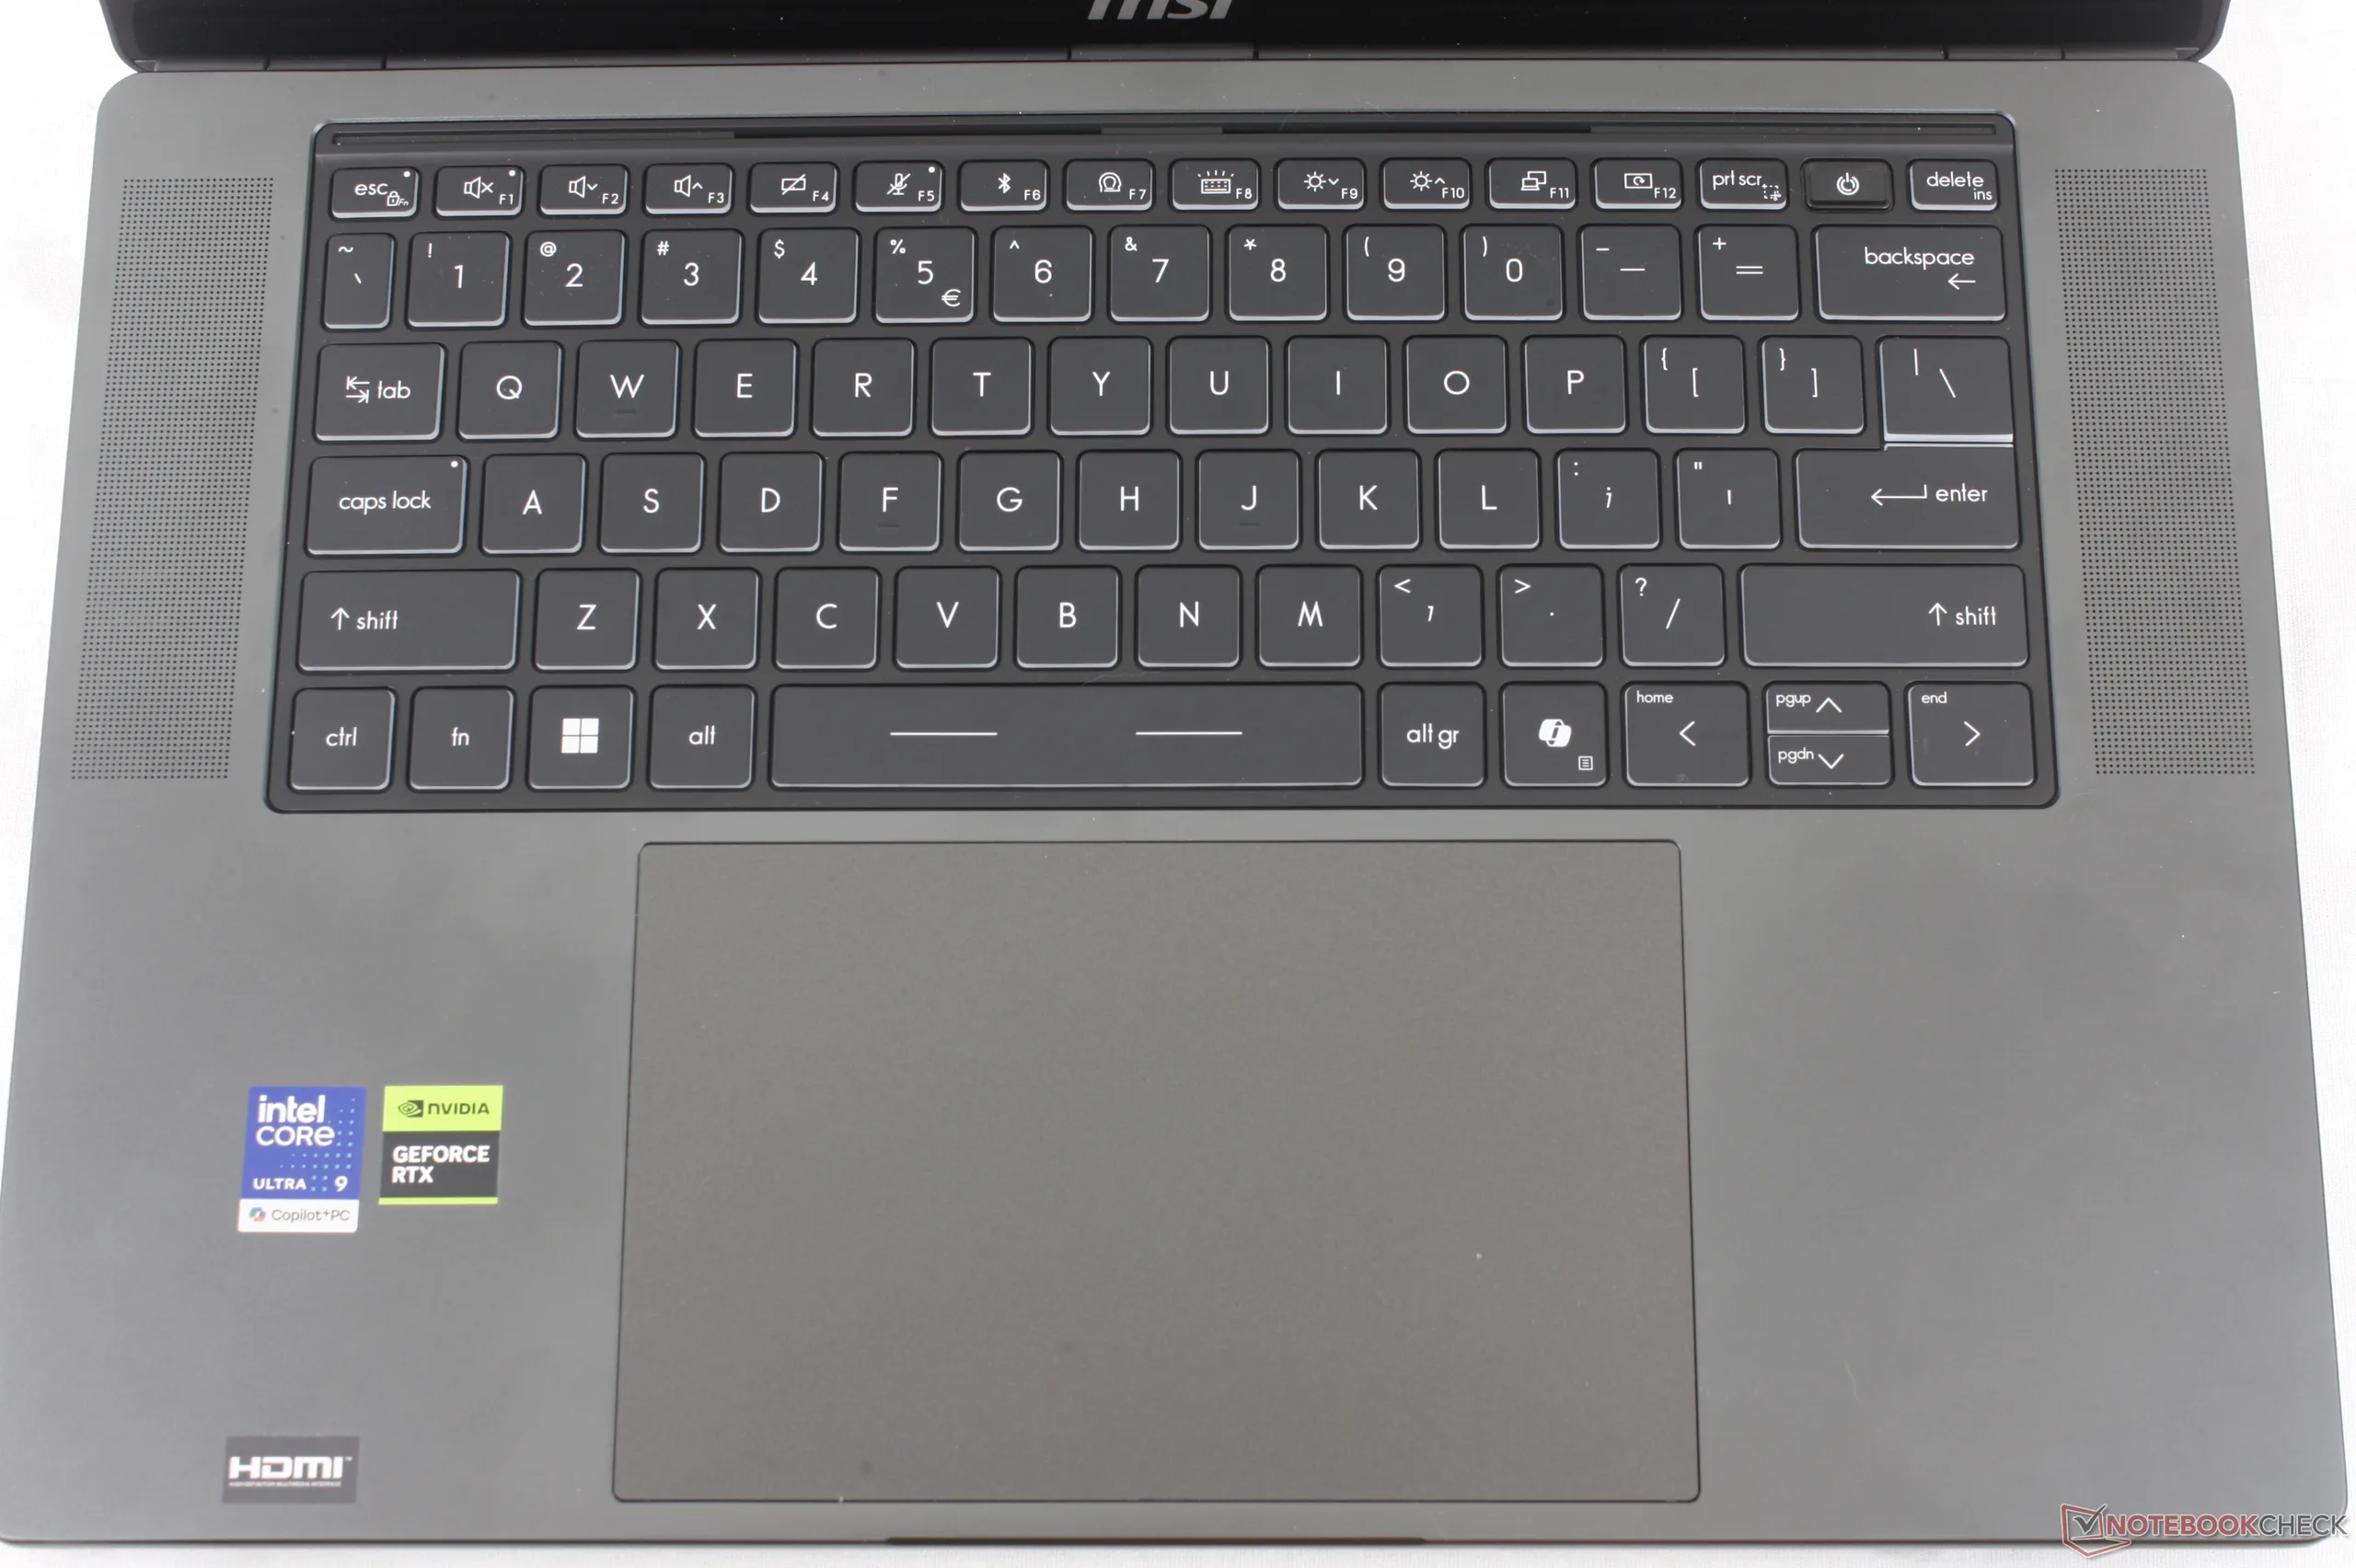
Das Clickpad ist deutlich gewachsen: von 13,1 x 8,2 cm beim Stealth 16 von 2023 auf 16,1 x 10 cm bei der aktuellen Version

Display

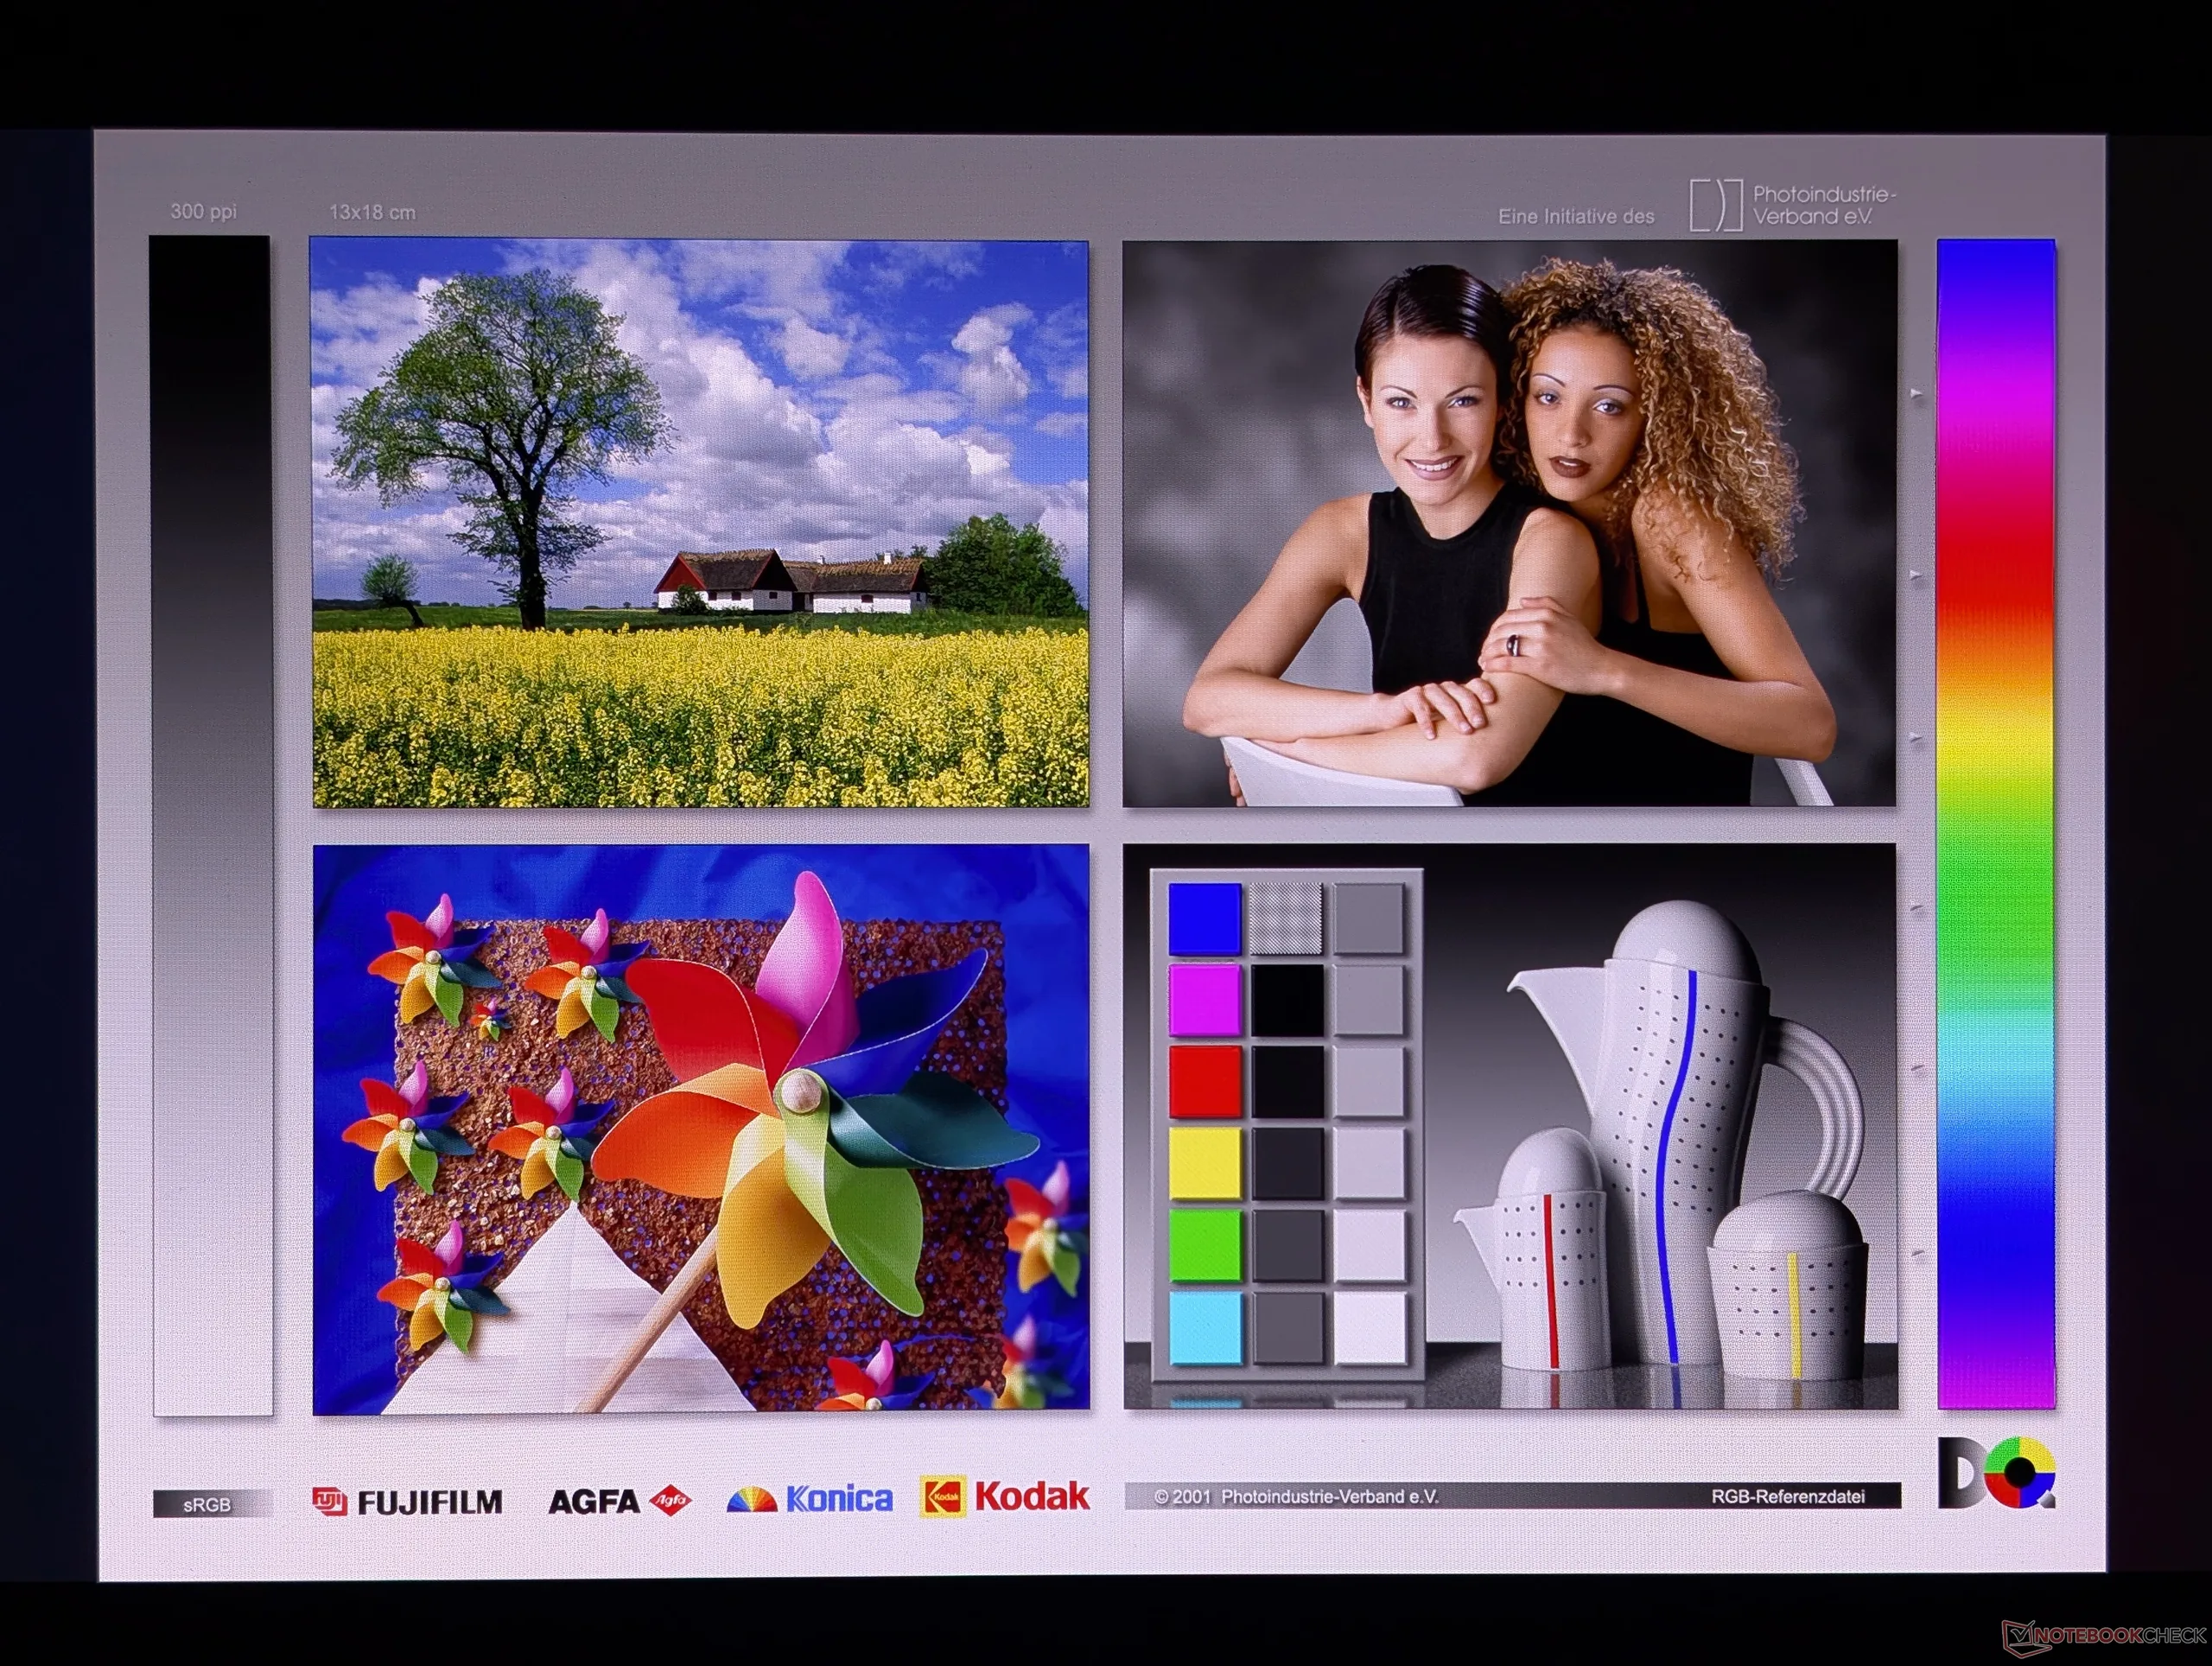
Scharfe RGB-Pixelstruktur unter der glänzenden Oberfläche

Der QHD+-OLED-Bildschirm mit 240 Hz ähnelt den Panels im aktuellen Razer Blade 16 oder Asus ROG Zephyrus G16. Allerdings unterstützt er weder G-Sync noch Advanced Optimus, weshalb das System beim Wechsel zwischen dGPU-, iGPU- und MSHybrid-Modus neu gestartet werden muss.

Die maximale Helligkeit erreicht im HDR-Modus 634 Nits und erfüllt damit den DisplayHDR600-Standard. Im SDR-Modus sind es hingegen bis zu 385 Nits.

390
cd/m²
387.5
cd/m²
385
cd/m²
390.9
cd/m²
384.8
cd/m²
384.6
cd/m²
393.7
cd/m²
391.4
cd/m²
389.8
cd/m²
Ausleuchtung des Bildschirms
Samsung ATNA60DL07-0 getestet mit X-Rite i1Pro 3
Maximal: 393.7 cd/m² (Nits) Durchschnitt: 388.6 cd/m² Minimum: 4.34 cd/m²
Ausleuchtung: 98 %
Helligkeit Akku: 384.8 cd/m²
Kontrast: ∞:1 (Schwarzwert: 0 cd/m²)
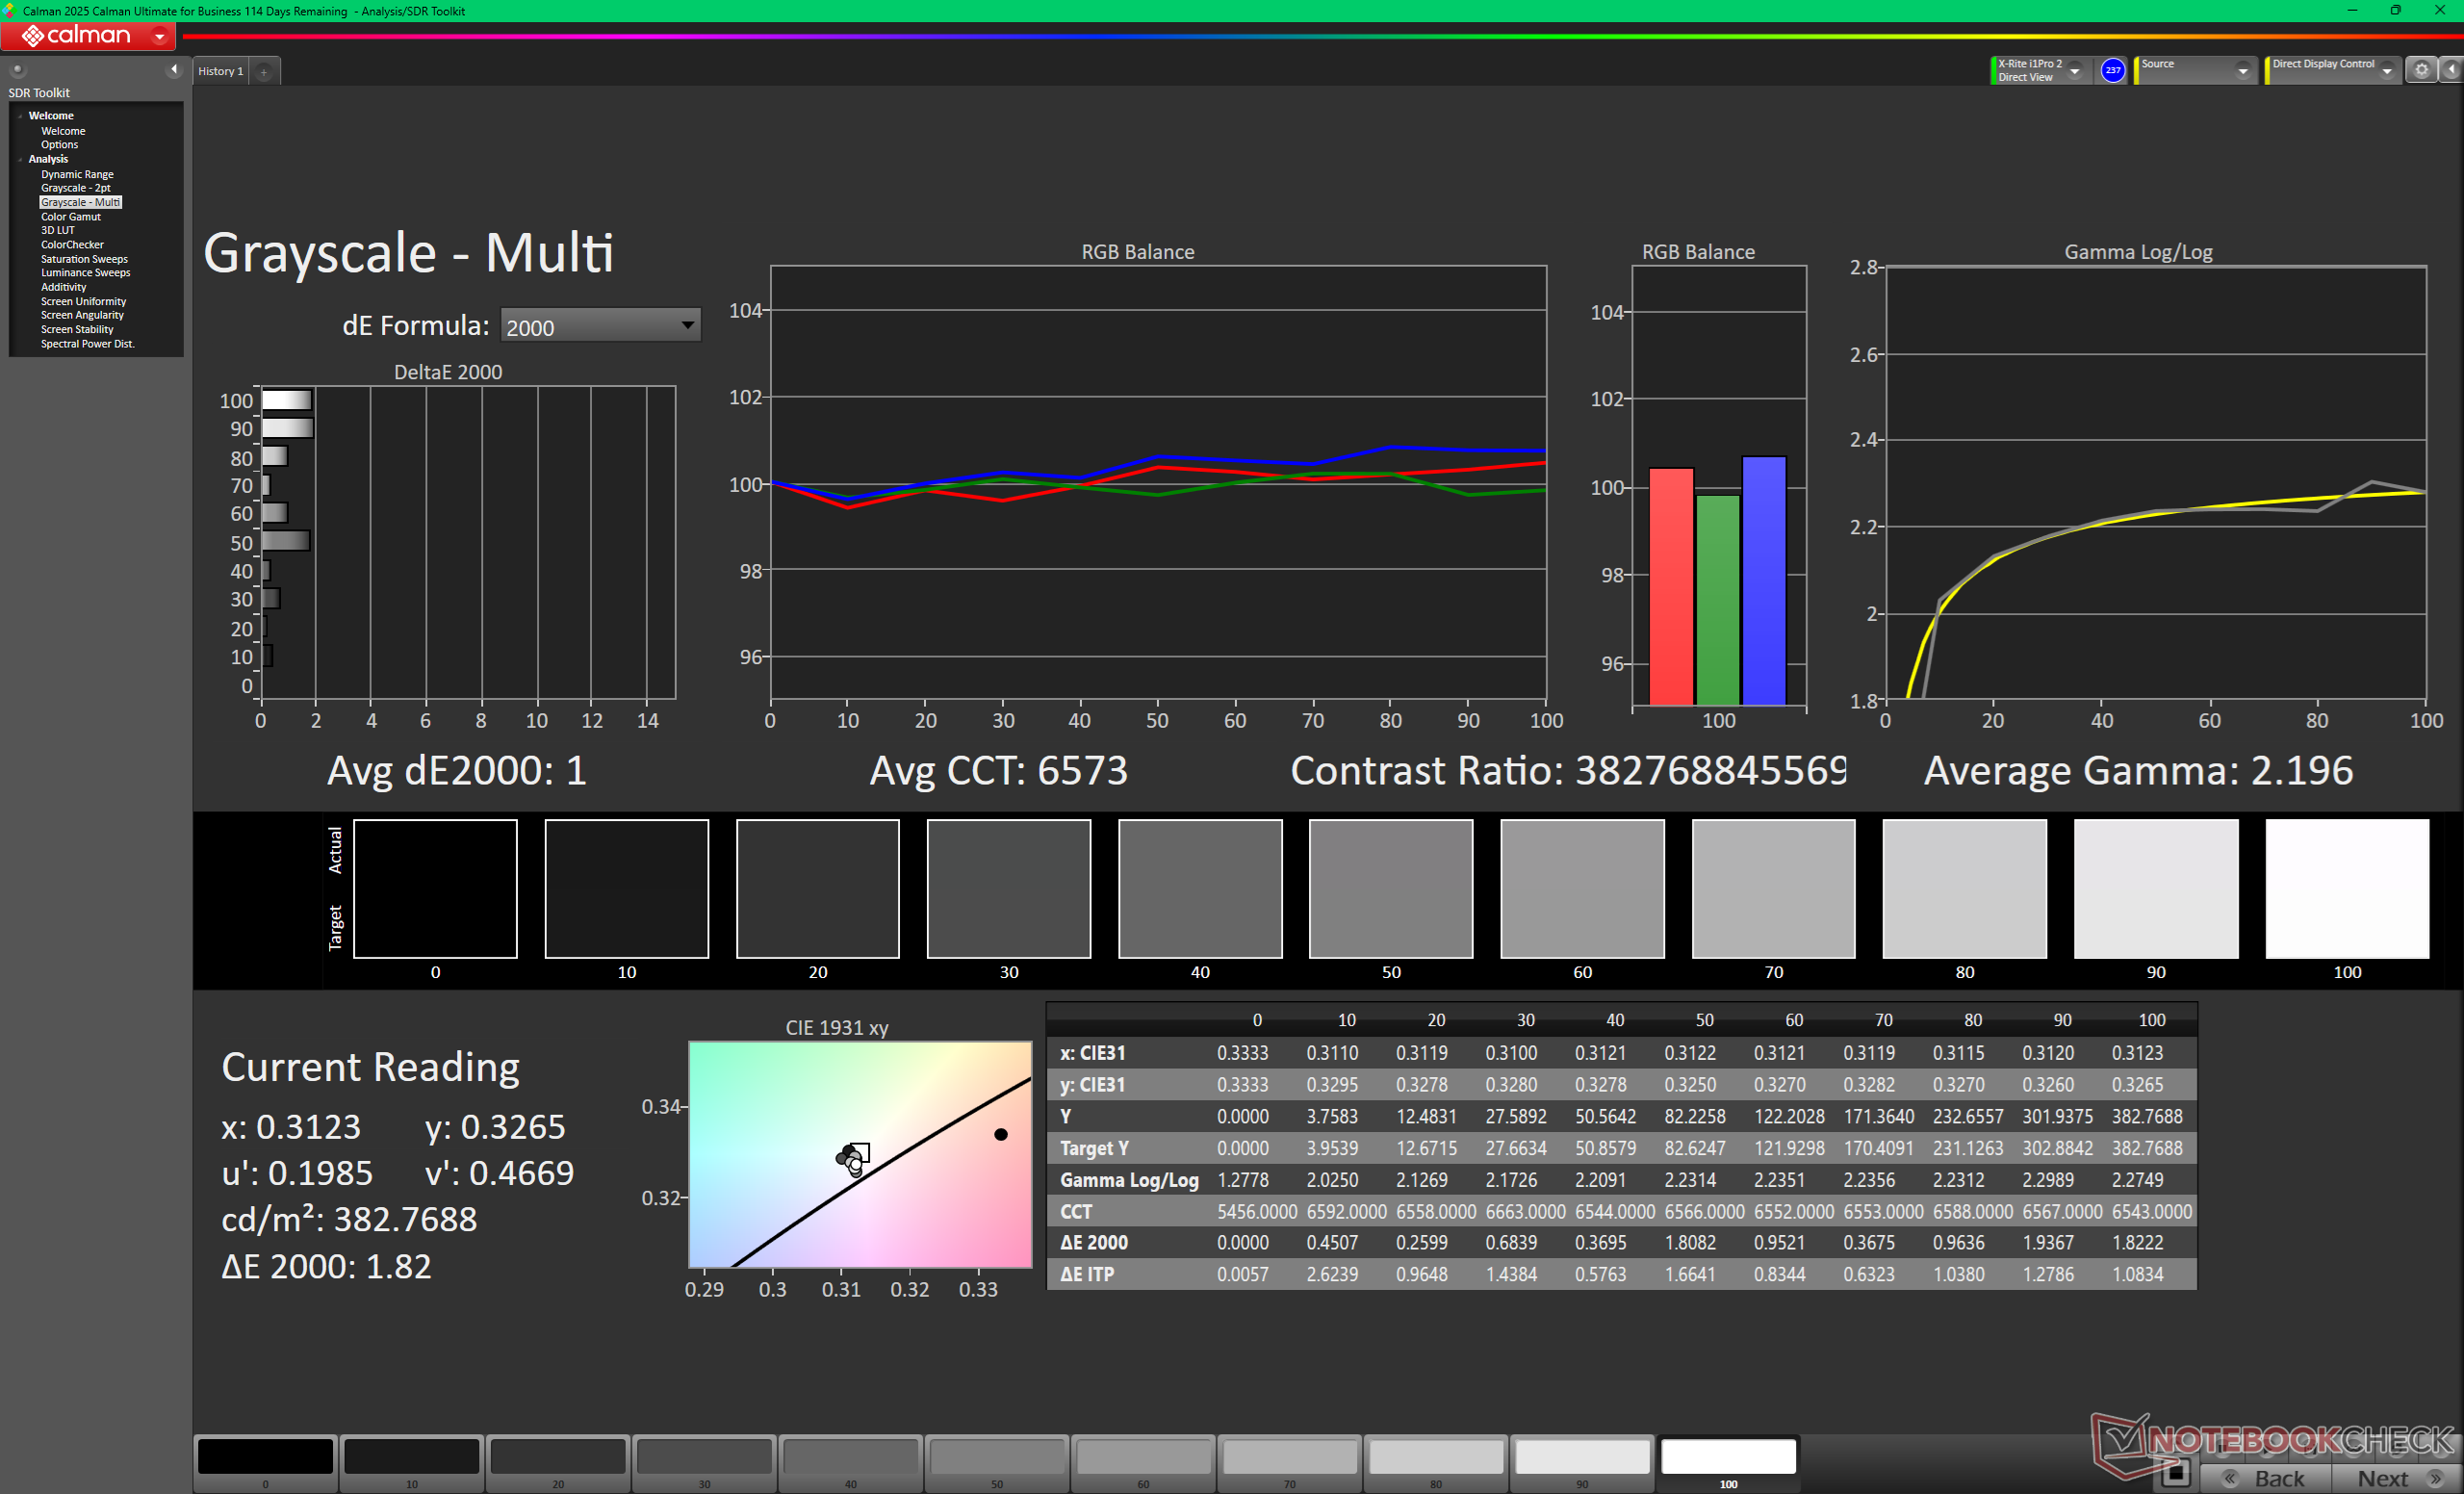
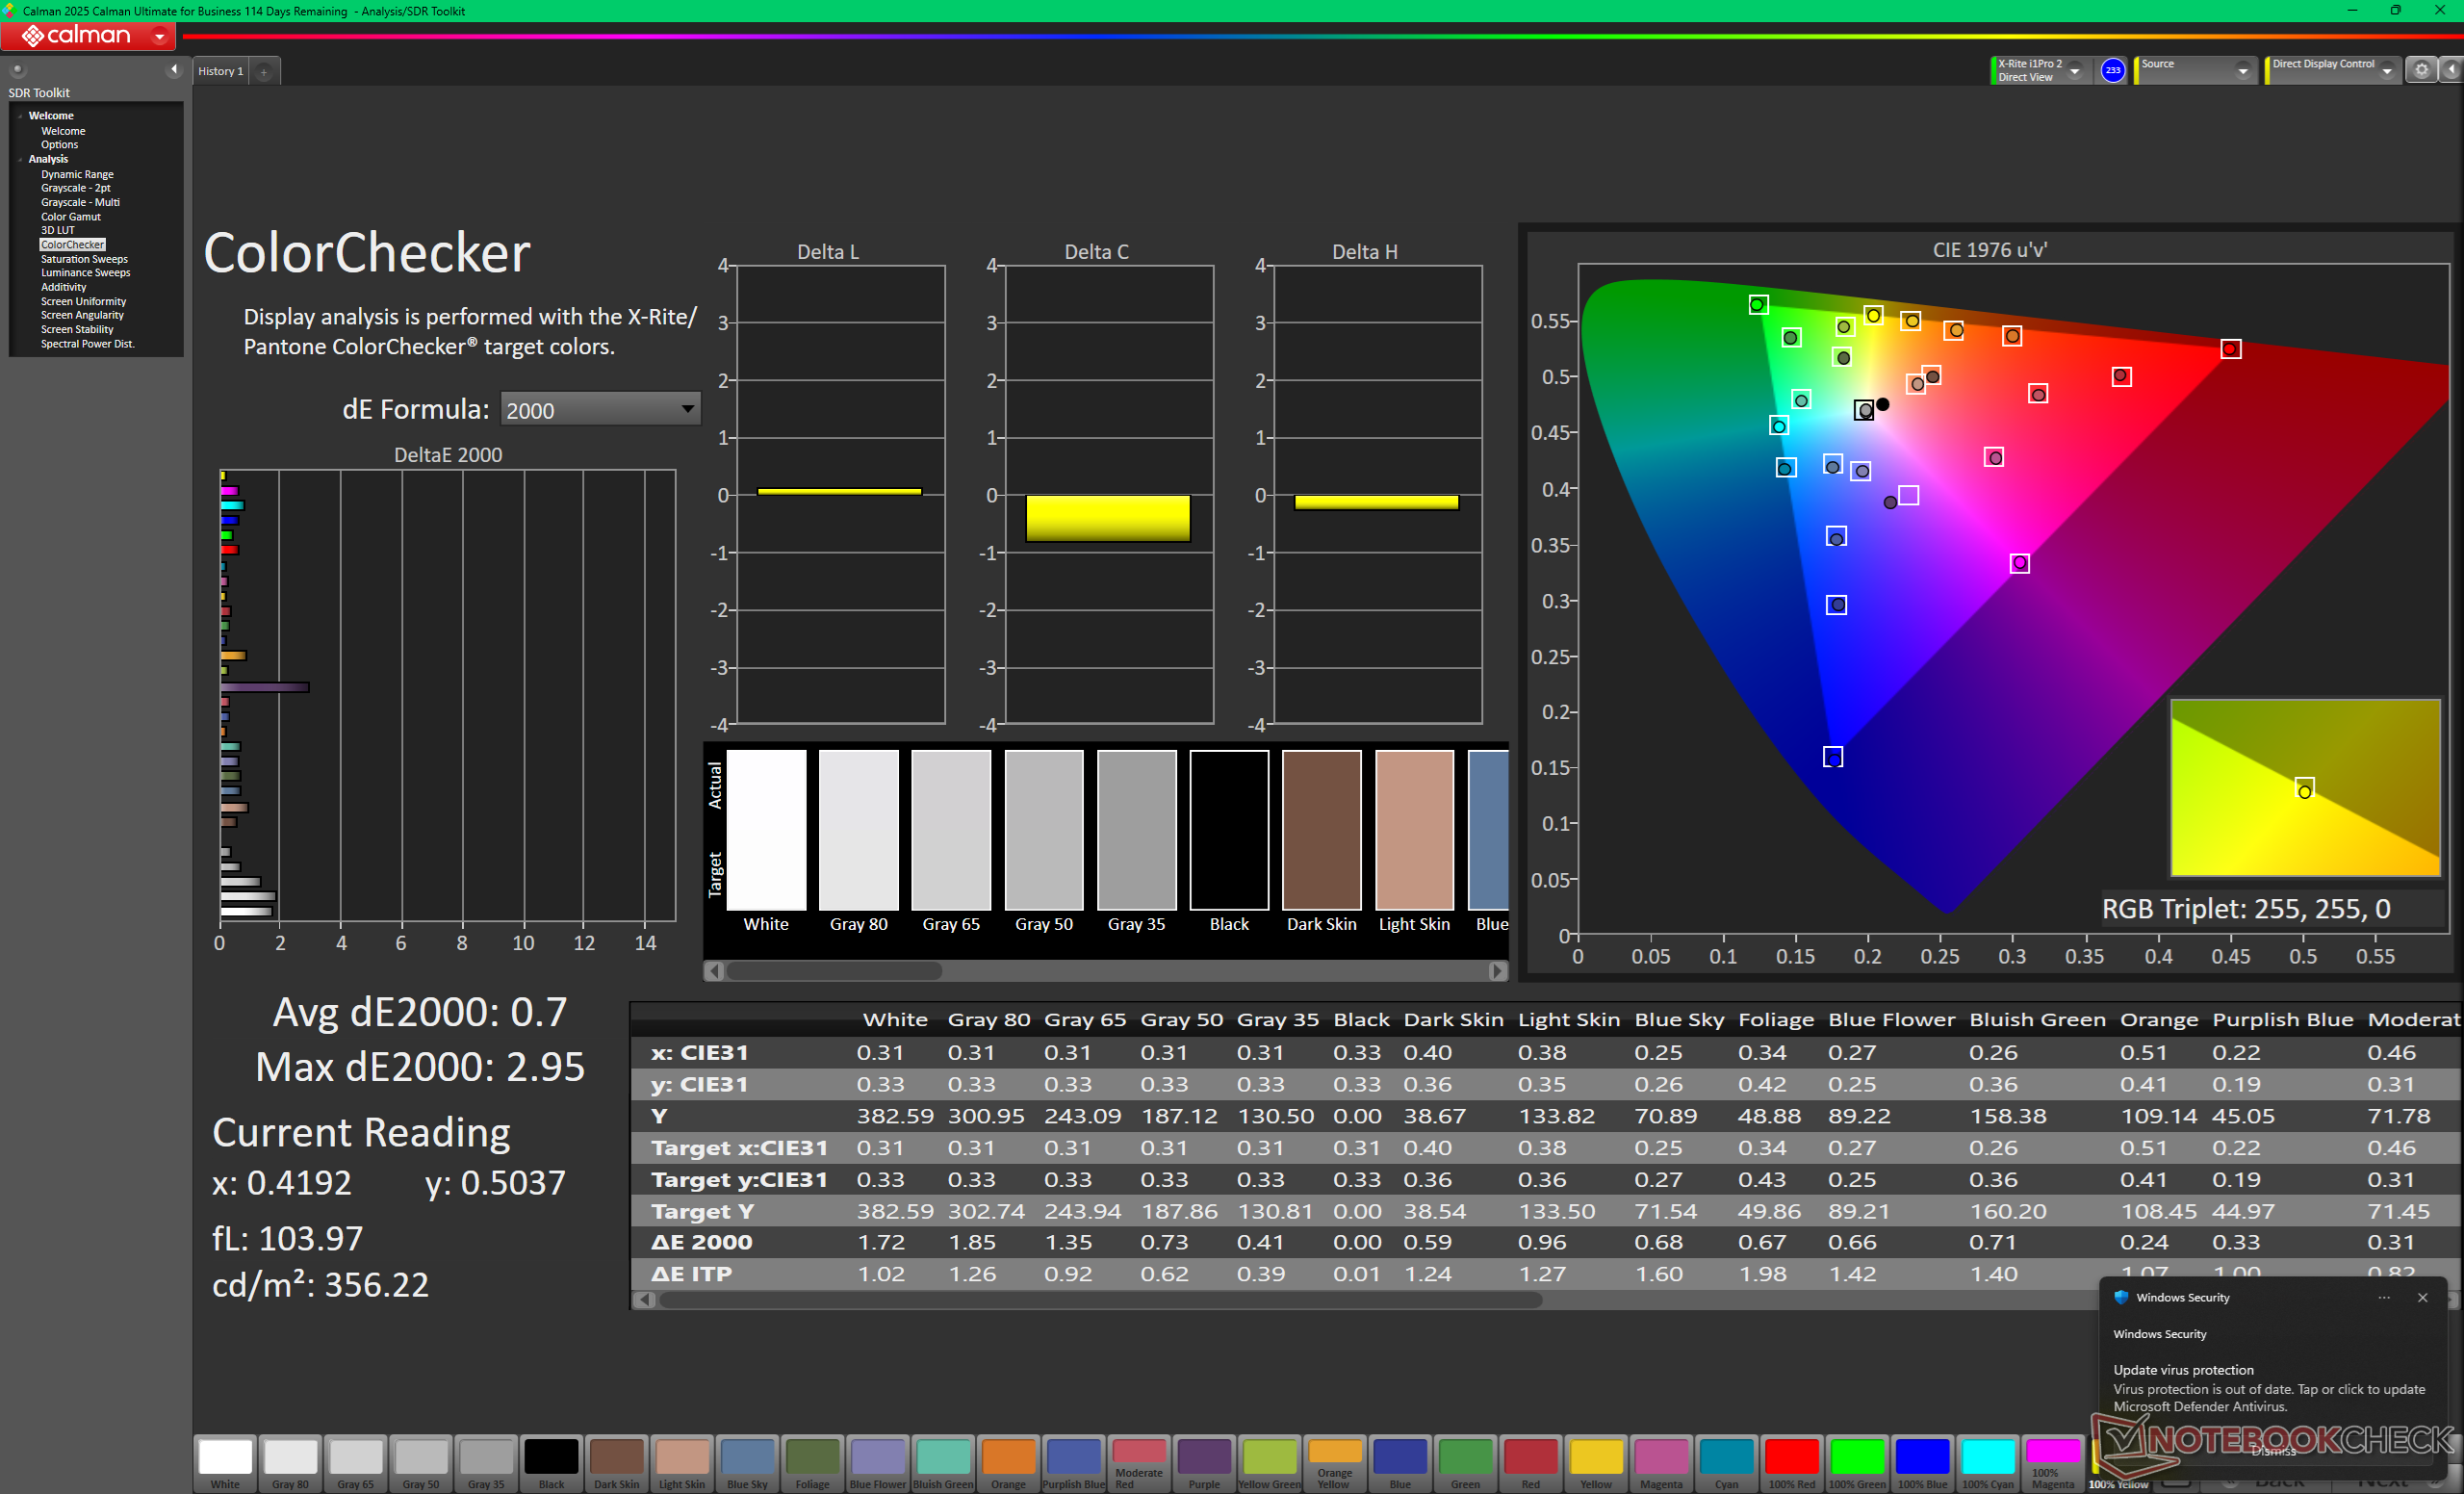
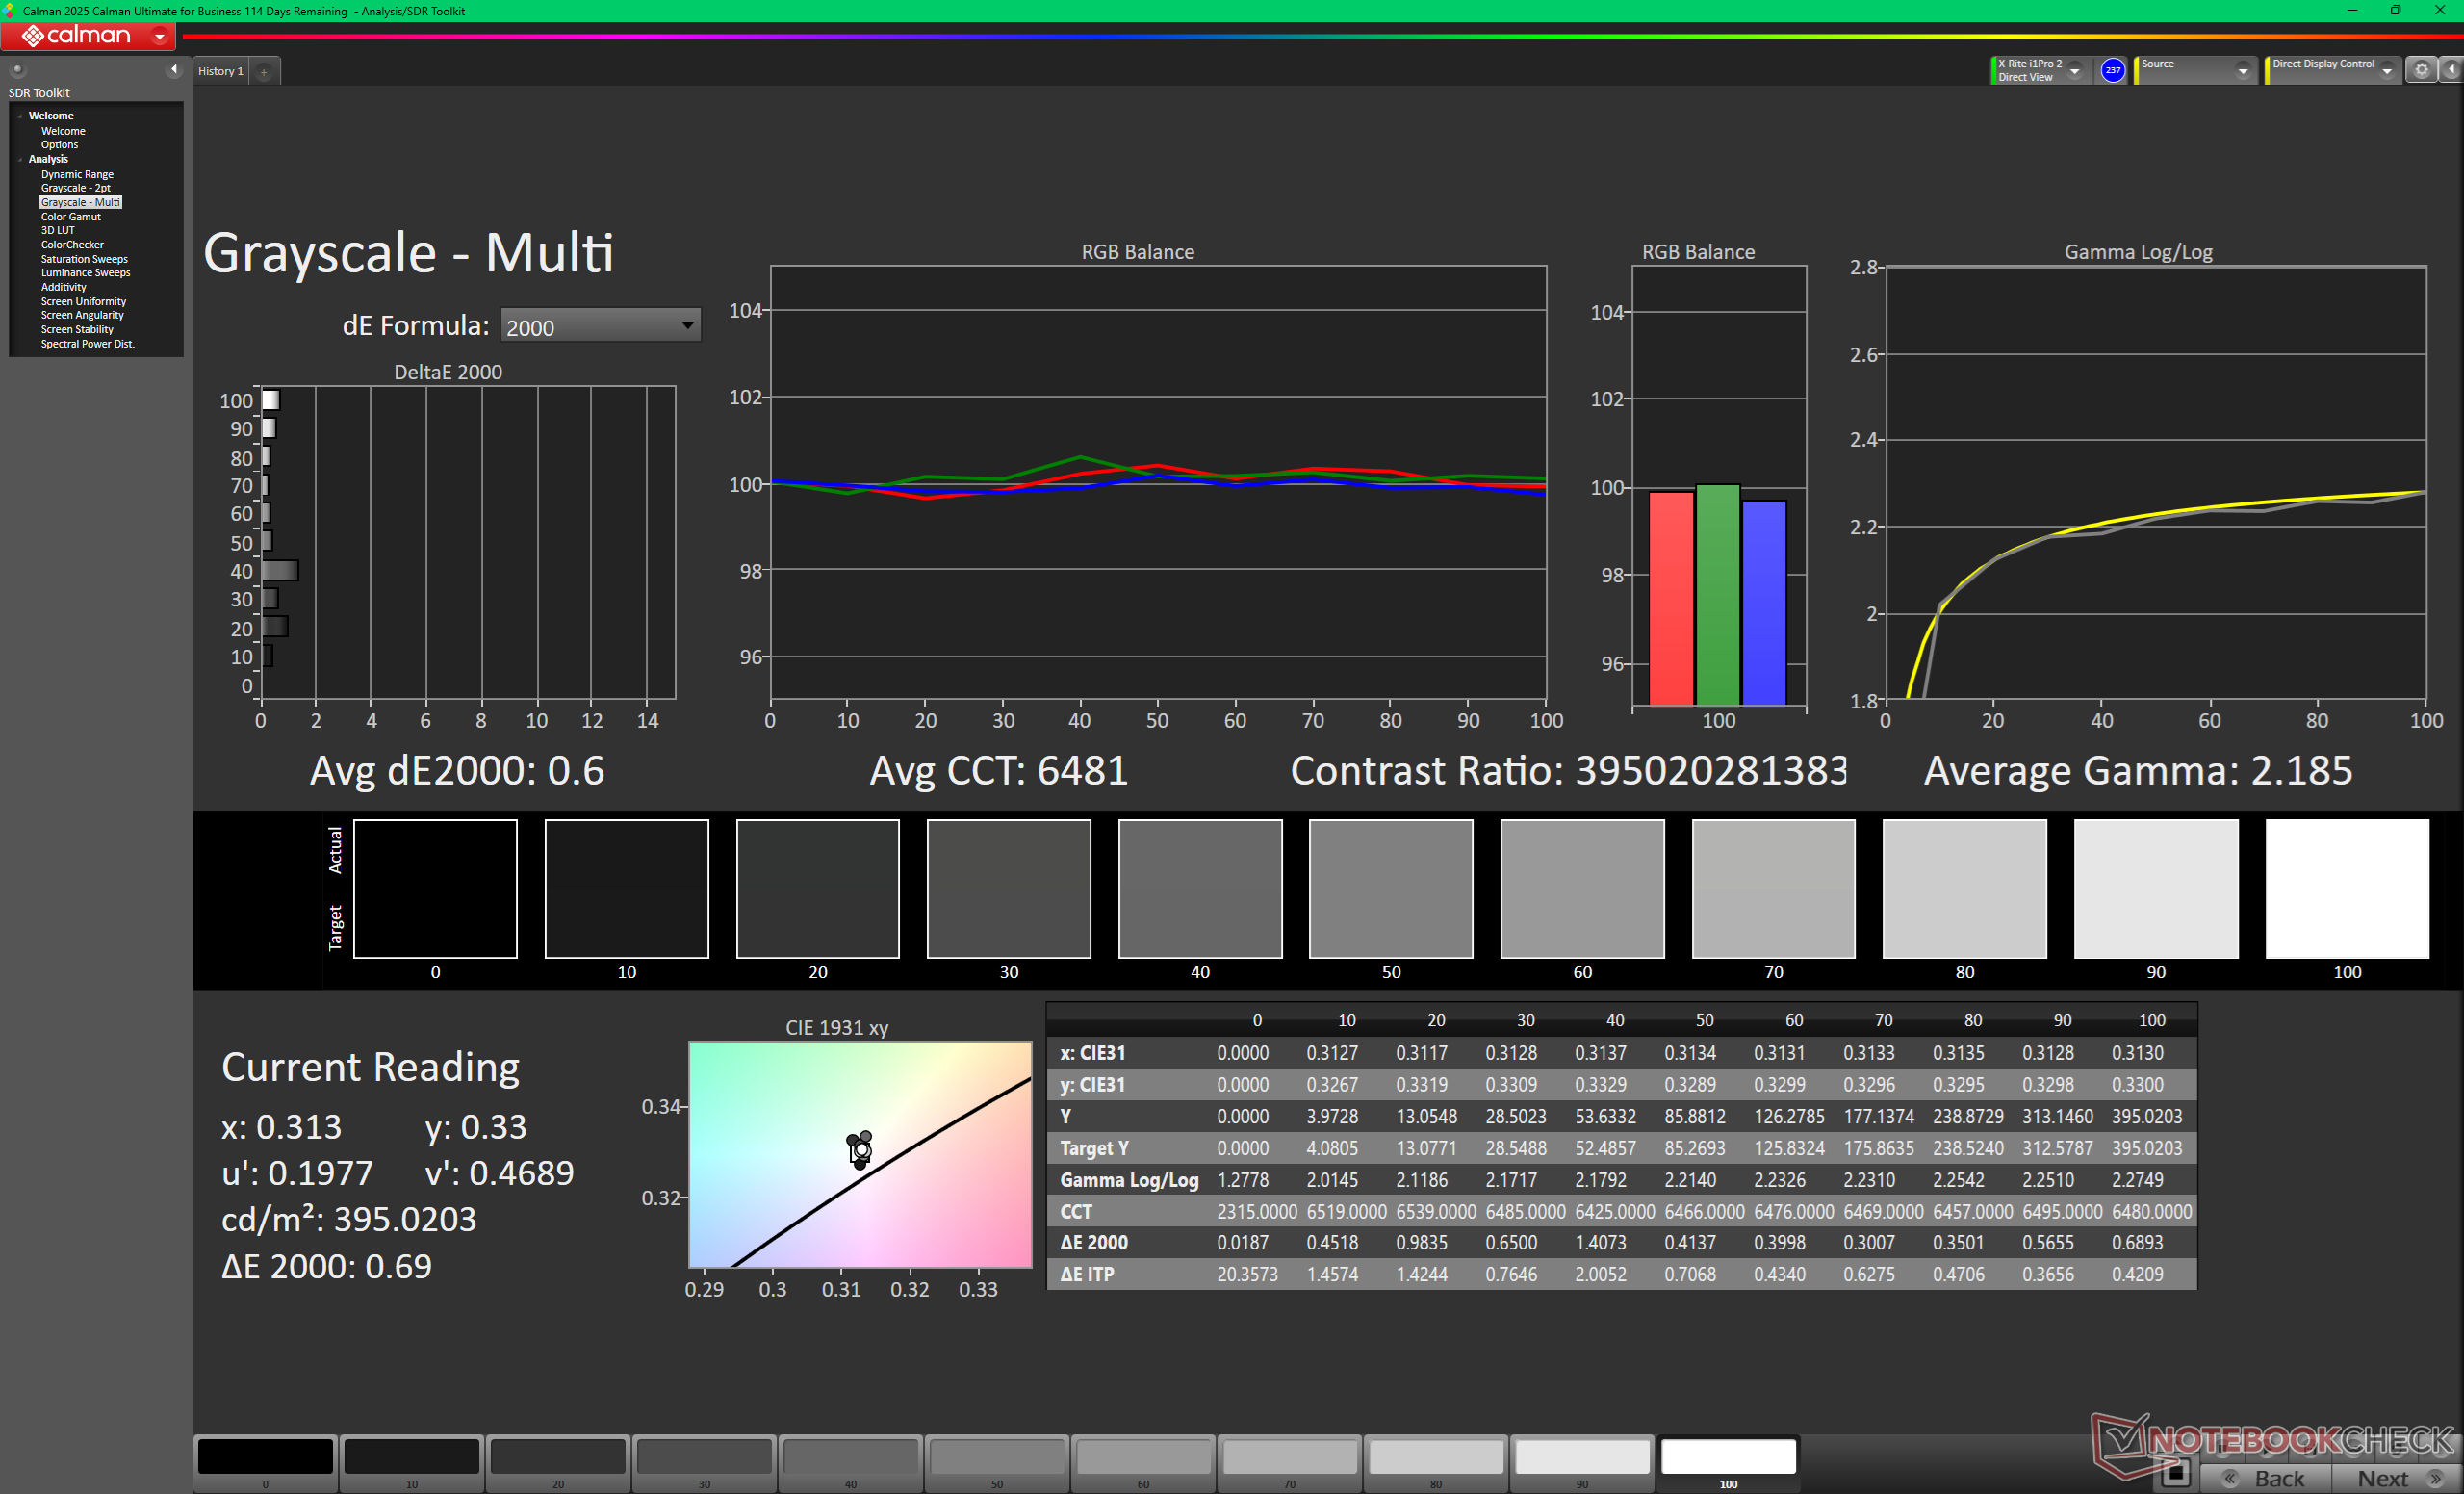
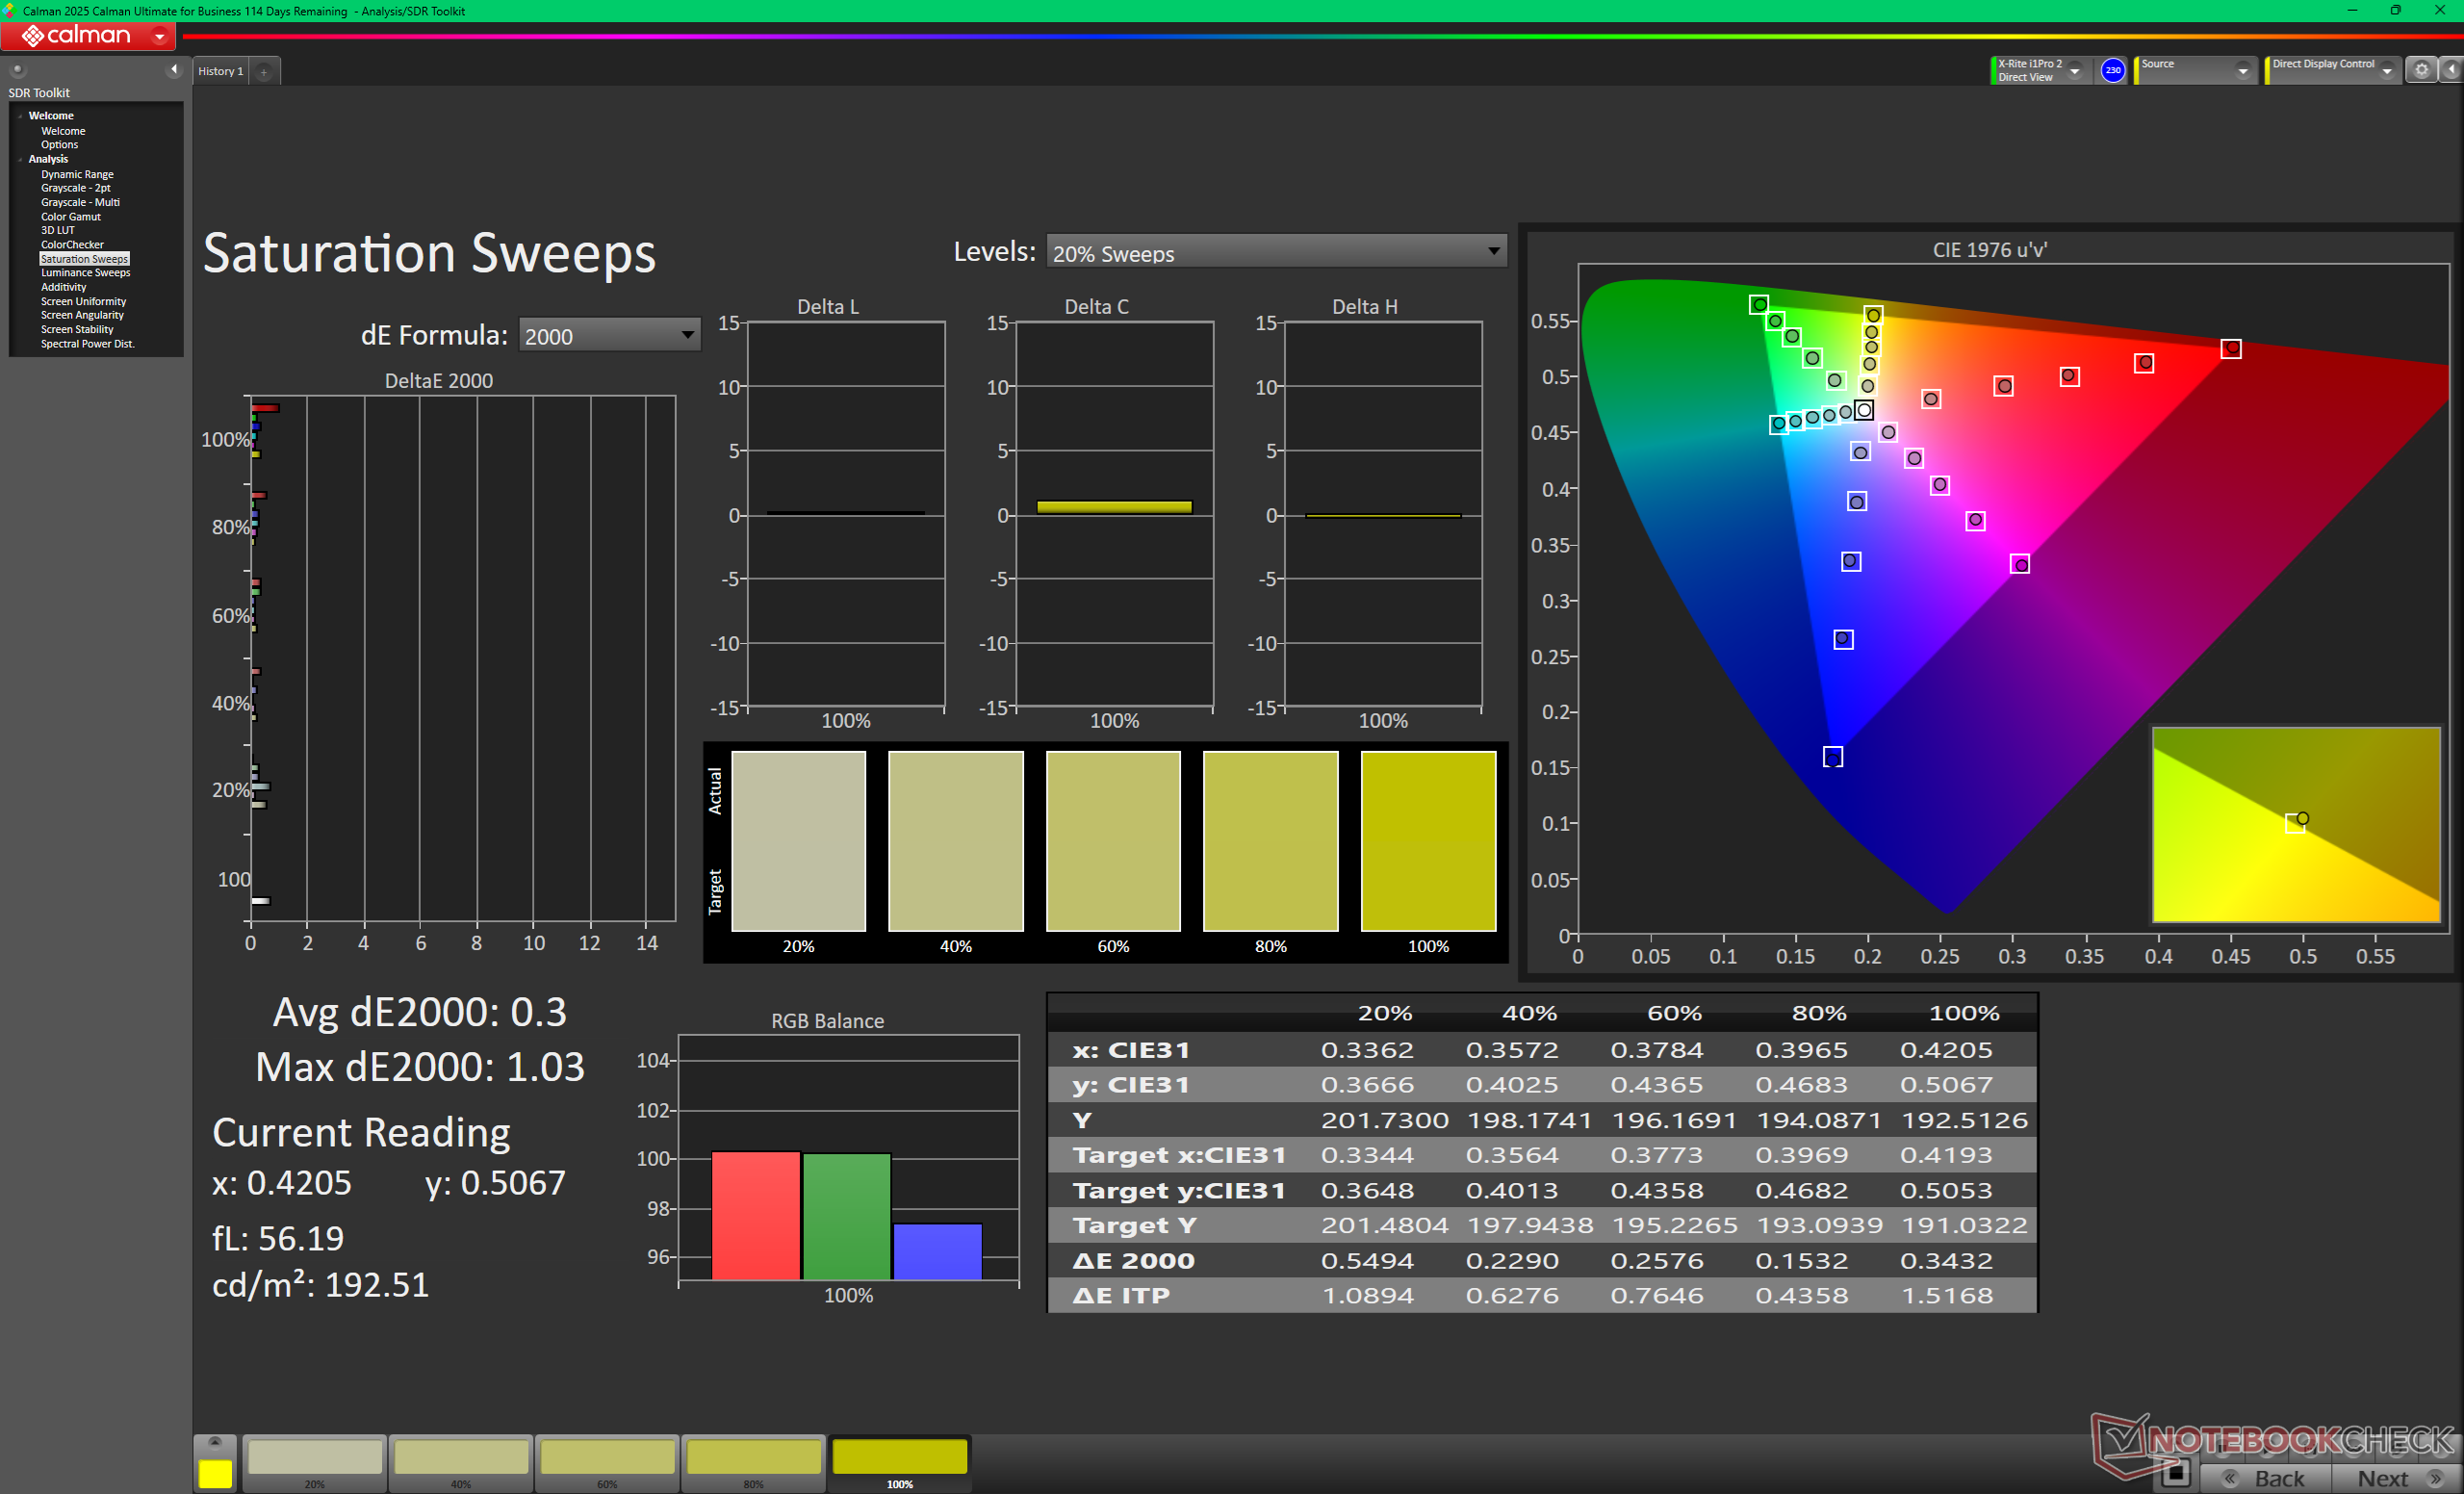
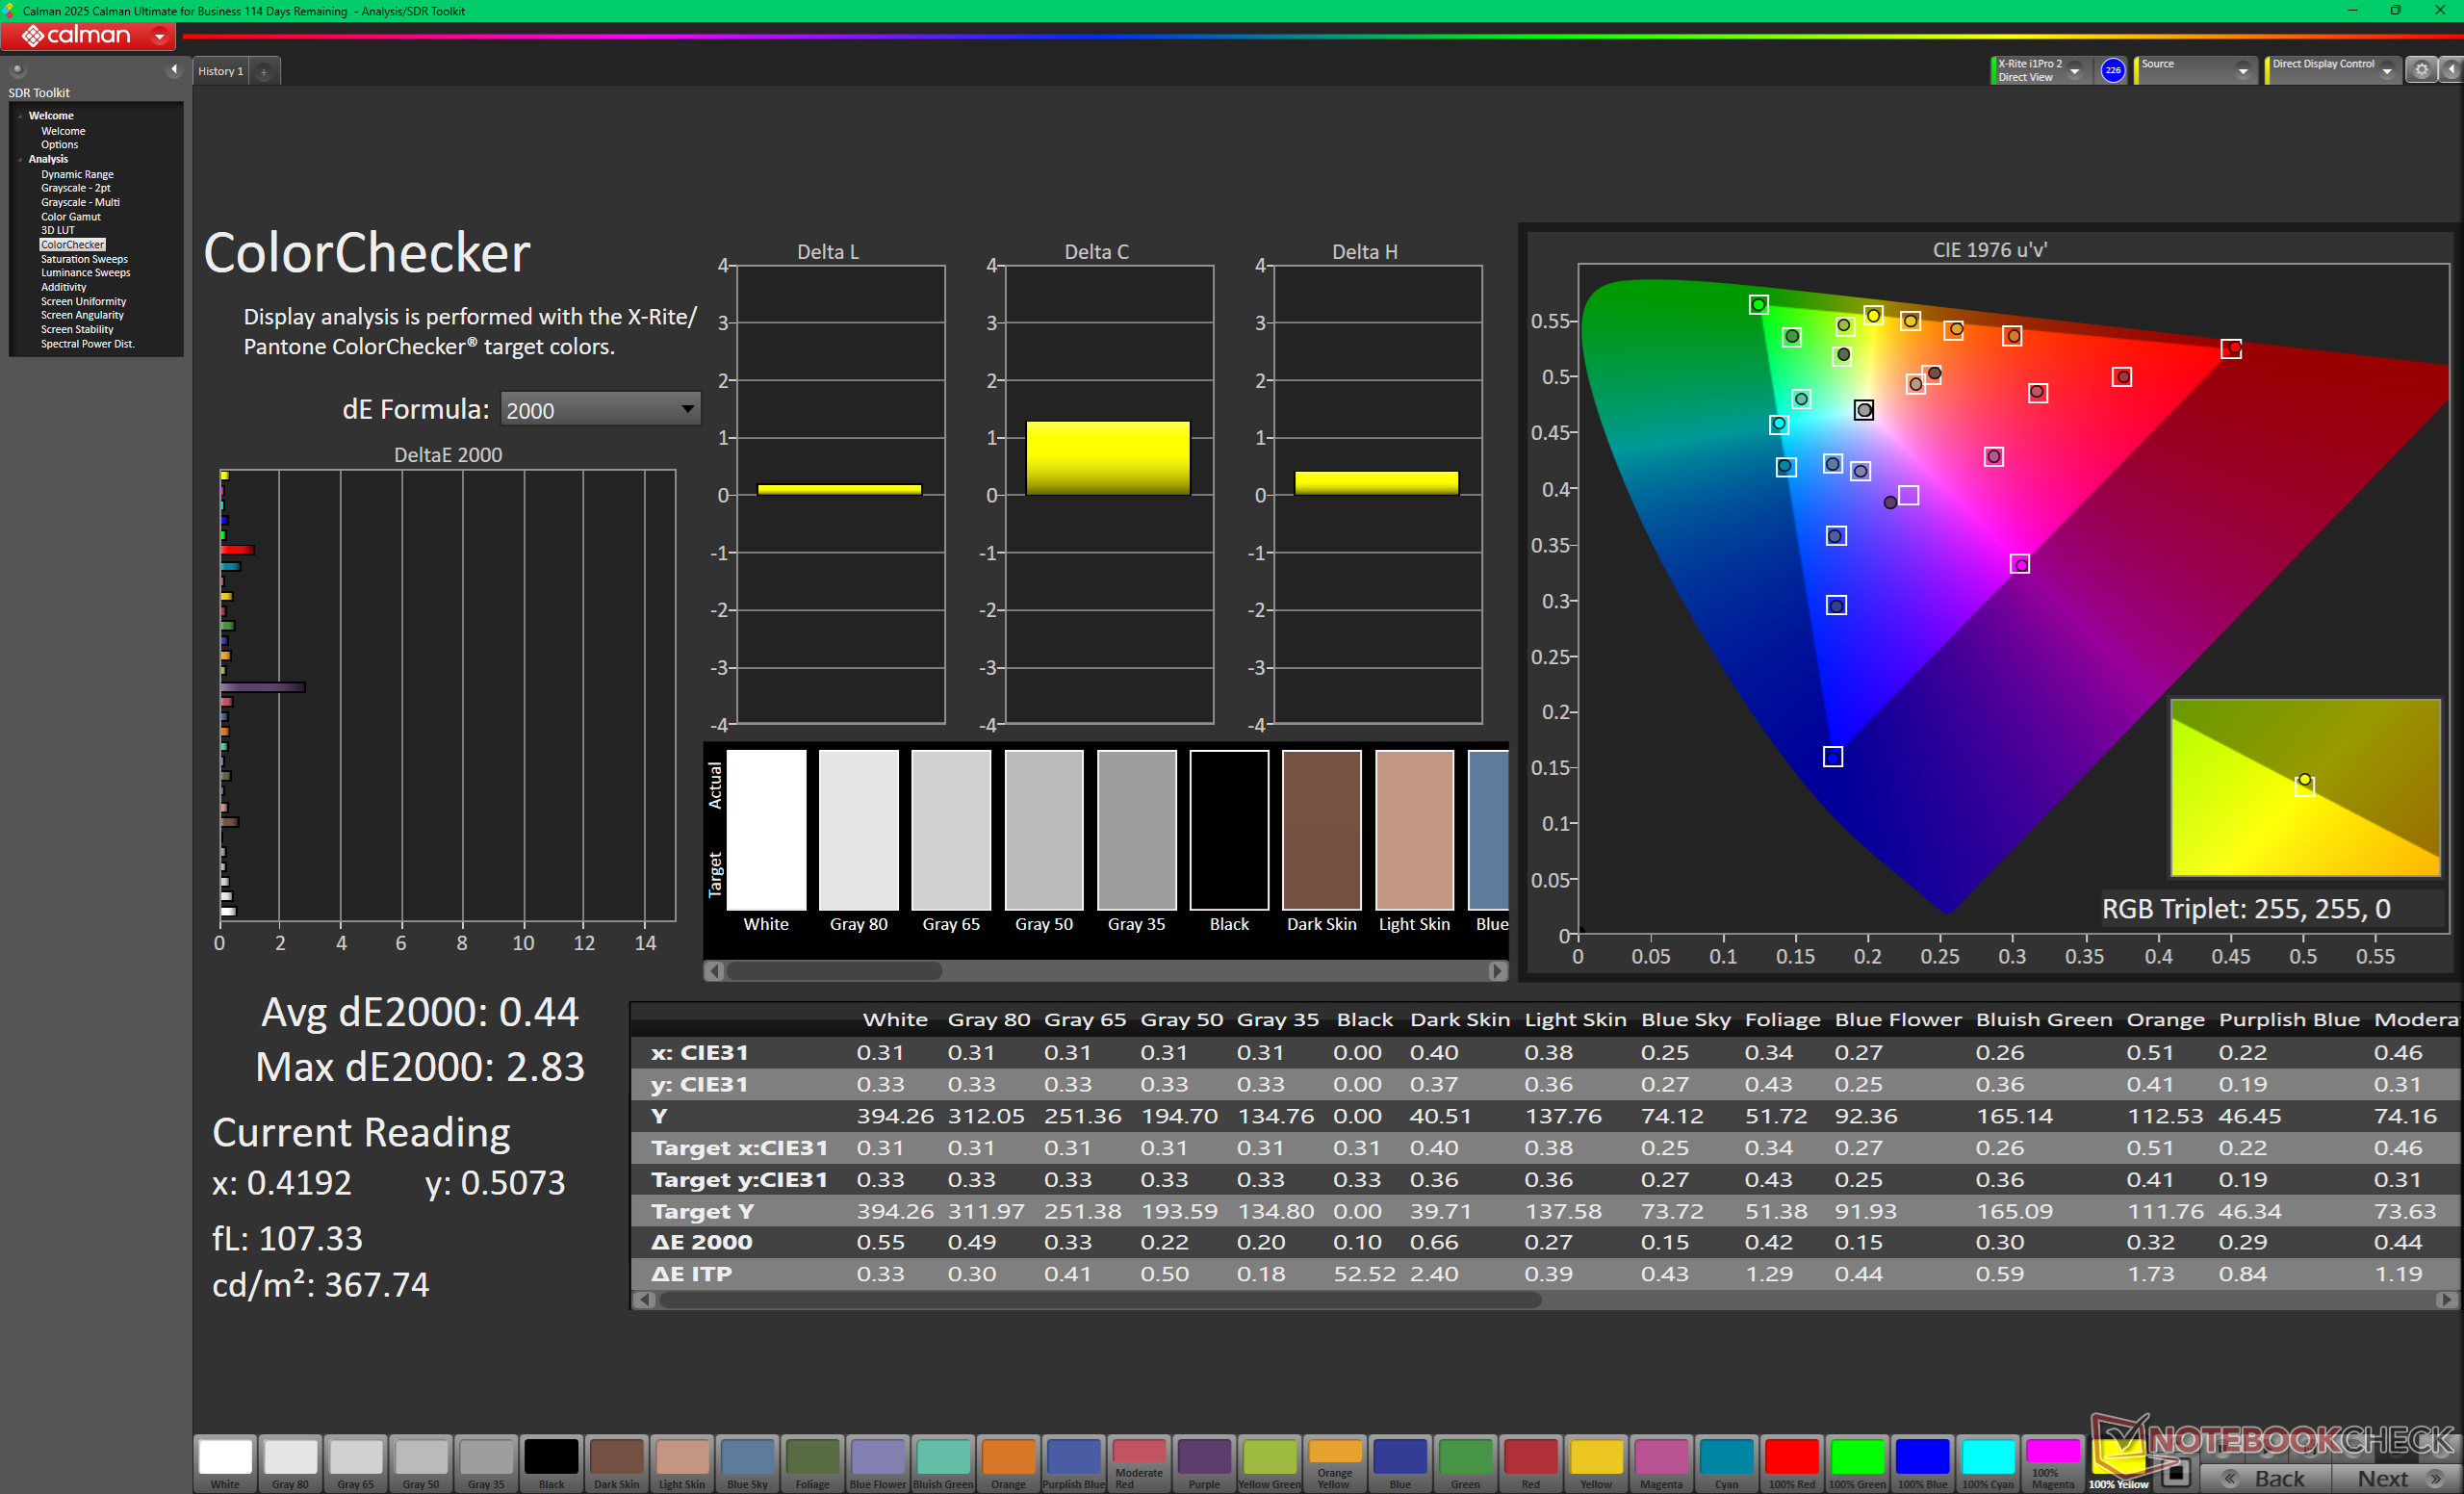
ΔE ColorChecker Calman: 0.7 | ∀{0.5-29.43 Ø4.69}
calibrated: 0.44
ΔE Greyscale Calman: 1 | ∀{0.09-98 Ø4.94}
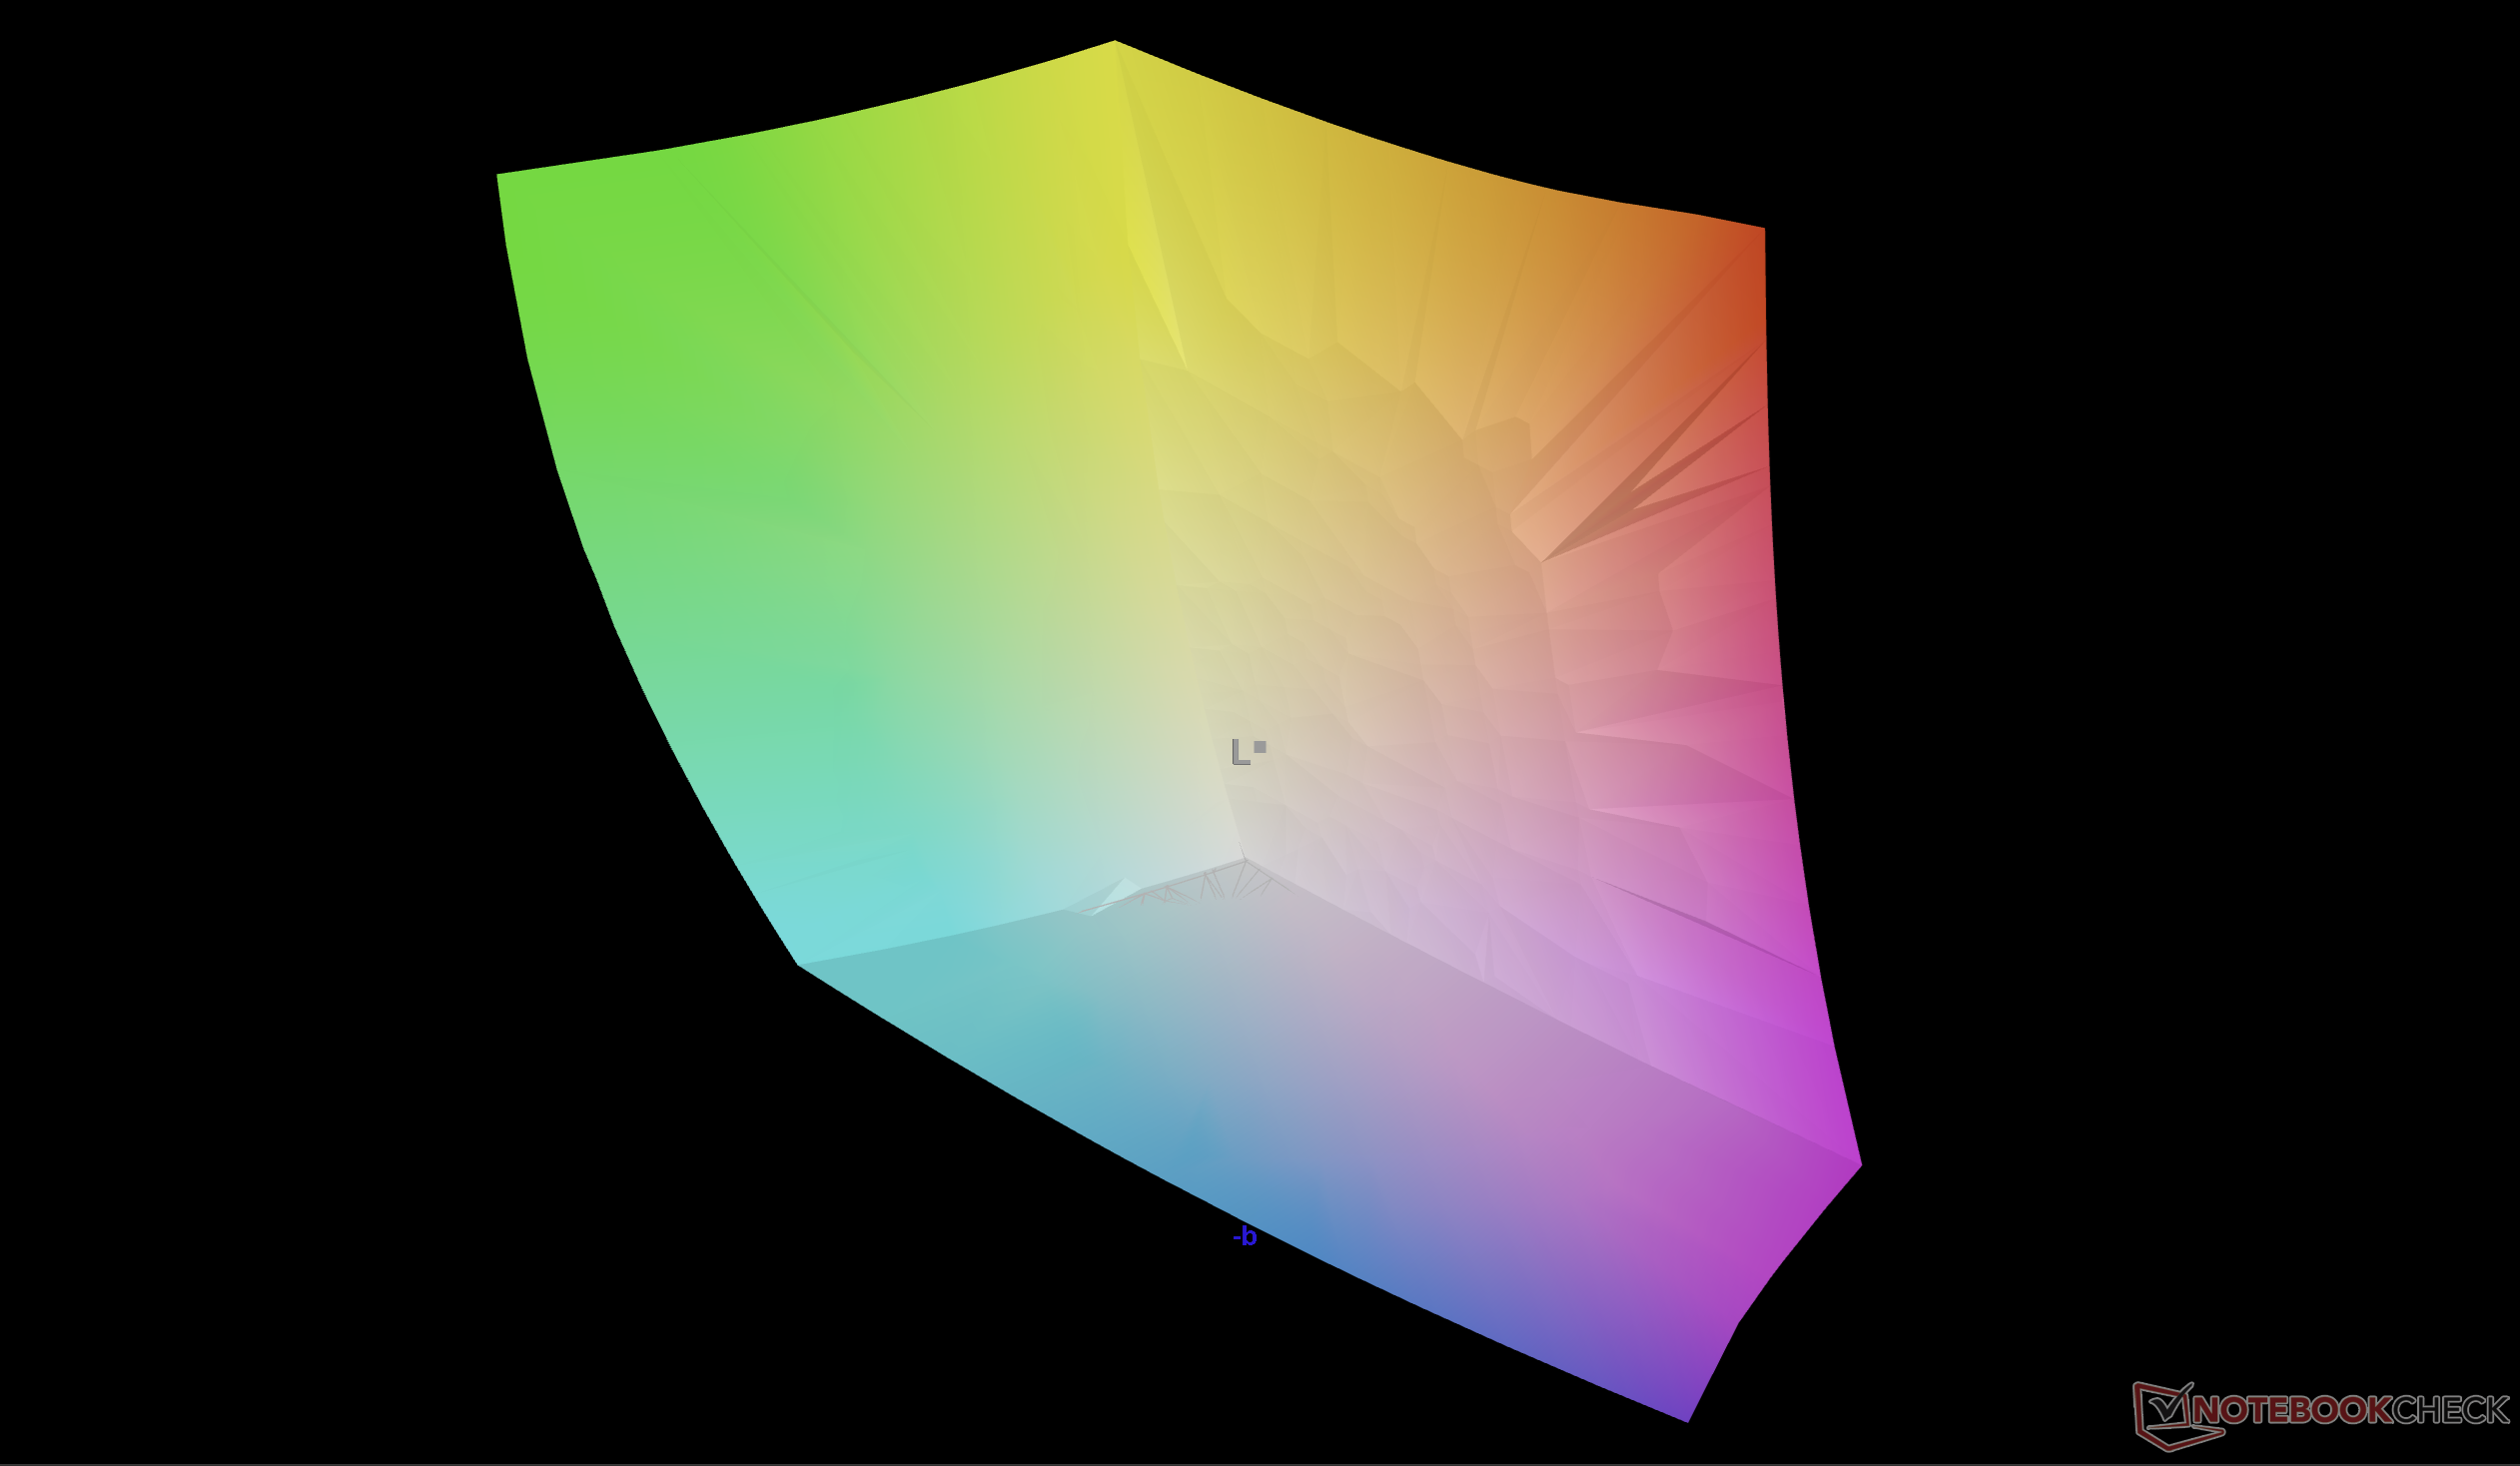
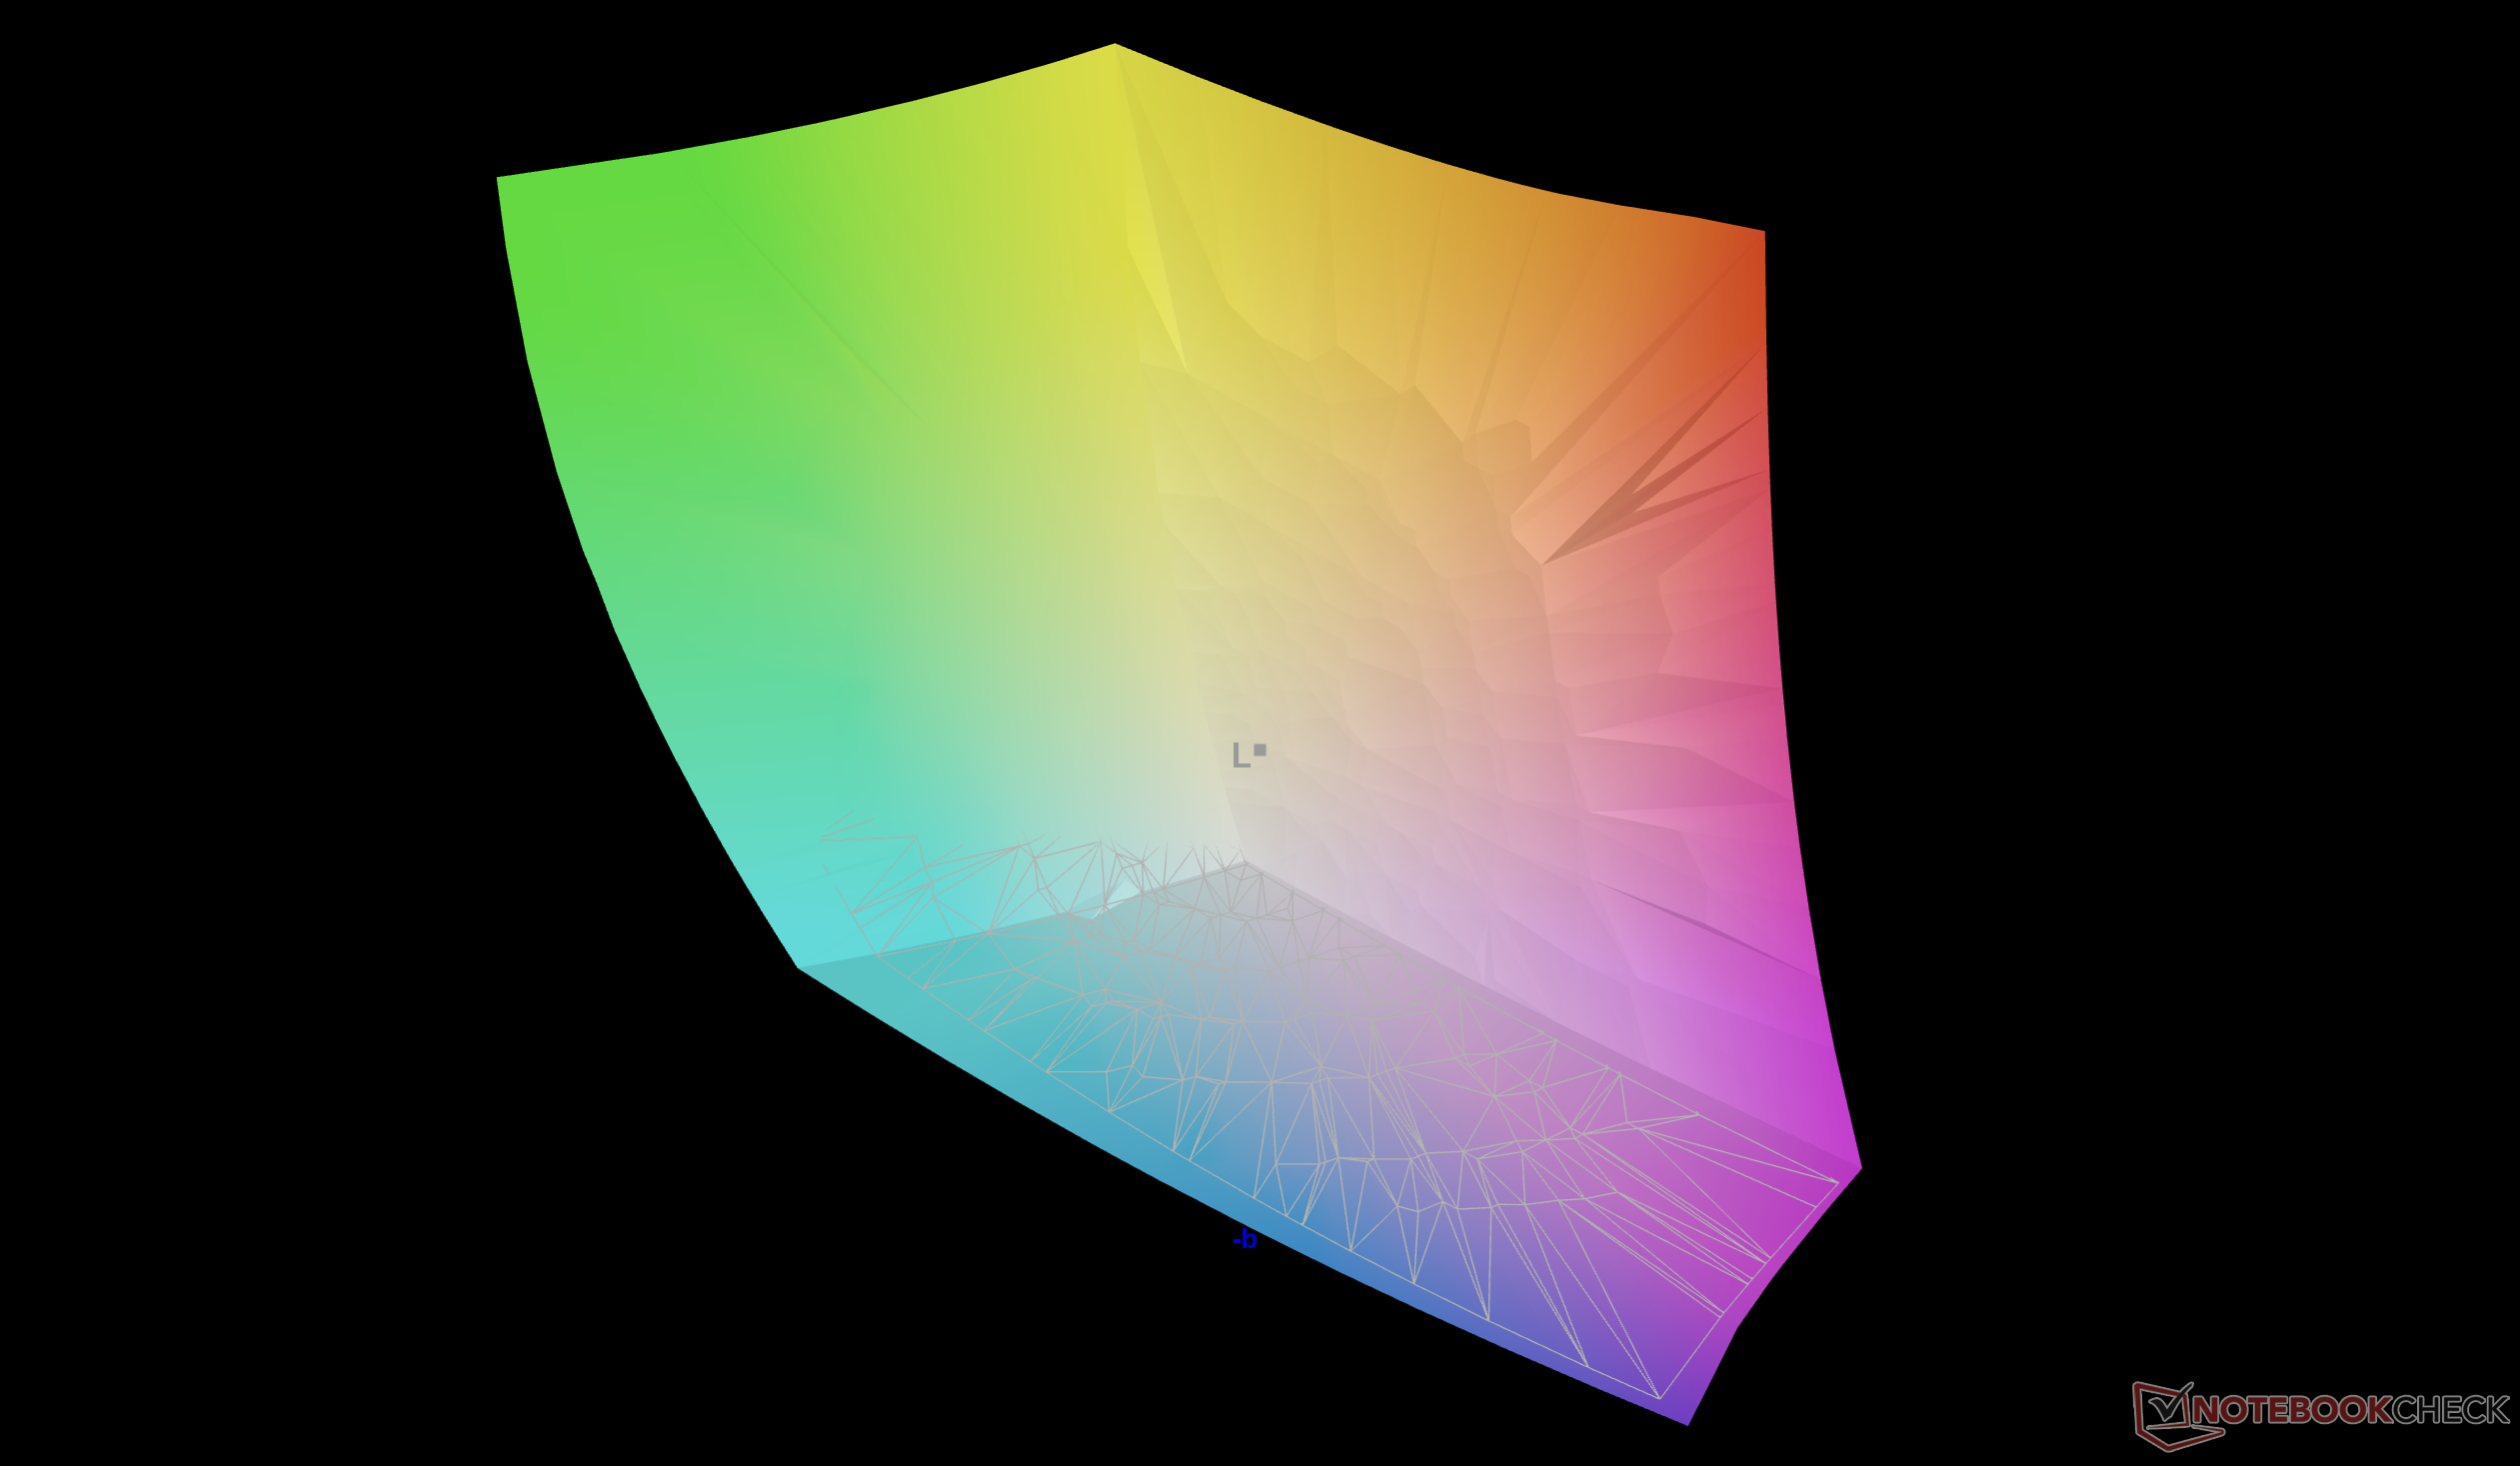
97.8% AdobeRGB 1998 (Argyll 3D)
100% sRGB (Argyll 3D)
99.5% Display P3 (Argyll 3D)
Gamma: 2.2
CCT: 6573 K
MSI Stealth 16 AI B3WH
Samsung ATNA60DL07-0, OLED, 2560x1600, 16", 240 Hz
MSI Stealth 16 Studio A13VG
AUO26A9, IPS, 2560x1600, 16", 240 Hz
Razer Blade 16 Core Ultra 9 386H
Samsung ATNA60HU06-0, OLED, 2560x1600, 16", 240 Hz
Lenovo Legion 7 16 AGP11
ATNA60HU02-0, OLED, 2560x1600, 16", 240 Hz
Aorus Master 16 AM6J
Samsung ATNA60HU02-0, OLED, 2560x1600, 16", 240 Hz
Asus ROG Zephyrus G16 GU606AW
ATNA60HU06-0, OLED, 2560x1600, 16", 240 Hz
Display
-5%
-1%
-3%
-5%
-8%
HDR Peak Brightness (cd/m²)
1138
Display P3 Coverage (%)
99.5
96.4
-3%
99.7
0%
99.2
0%
95.9
-4%
91.7
-8%
sRGB Coverage (%)
100
99.7
0%
100
0%
100
0%
100
0%
97.5
-2%
AdobeRGB 1998 Coverage (%)
97.8
84.8
-13%
93.5
-4%
90.2
-8%
88.2
-10%
84.8
-13%
Response Times
-1267%
2%
-131%
-4%
-73%
Response Time Grey 50% / Grey 80% * (ms)
0.29 ?(0.15, 0.14)
4.4 ?(2.2, 2.2)
-1417%
0.28 ?(0.15, 0.13)
3%
1.41 ?(0.7, 0.71)
-386%
0.371 ?(0.289, 0.082)
-28%
0.81 ?(0.7, 0.11)
-179%
Response Time Black / White * (ms)
0.46 ?(0.22, 0.24)
5.6 ?(2.2, 3.4)
-1117%
0.4 ?(0.2, 0.2)
13%
0.25 ?(0.13, 0.12)
46%
0.206 ?(0.112, 0.094)
55%
0.22 ?(0.12, 0.1)
52%
PWM Frequency (Hz)
960.2
1441
1440 ?(90)
1158 ?(99)
1440 ?(95)
PWM Amplitude * (%)
29
32
-10%
44
-52%
40
-38%
56
-93%
Bildschirm
-201%
-55%
-122%
-139%
-32%
Helligkeit Bildmitte (cd/m²)
384.8
424
10%
462.2
20%
499
30%
468
22%
512
33%
Brightness (cd/m²)
389
411
6%
465
20%
502
29%
467
20%
515
32%
Brightness Distribution (%)
98
88
-10%
97
-1%
98
0%
96
-2%
98
0%
Schwarzwert * (cd/m²)
0.37
0.02
0.03
0.01
Delta E Colorchecker *
0.7
3.04
-334%
3.03
-333%
2.5
-257%
4
-471%
1.5
-114%
Colorchecker dE 2000 max. *
2.95
7.5
-154%
5.84
-98%
7.8
-164%
6.59
-123%
3.4
-15%
Colorchecker dE 2000 calibrated *
0.44
3.04
-591%
0.6
-36%
Delta E Graustufen *
1
4.34
-334%
0.6
40%
4.7
-370%
3.8
-280%
2.3
-130%
Gamma
2.2 100%
2.32 95%
2.2 100%
2.21 100%
2.597 85%
2.16 102%
CCT
6573 99%
6952 93%
6452 101%
6715 97%
6626 98%
6589 99%
Kontrast (:1)
1146
24950
15600
51200
Durchschnitt gesamt (Programm / Settings)
-491% / -330%
-18% / -30%
-85% / -94%
-49% / -72%
-38% / -36%

* ... kleinere Werte sind besser
Im Vergleich zu sRGB
Im Vergleich zu P3
Im Vergleich zu P3
Graustufen vor der Kalibrierung (sRGB)
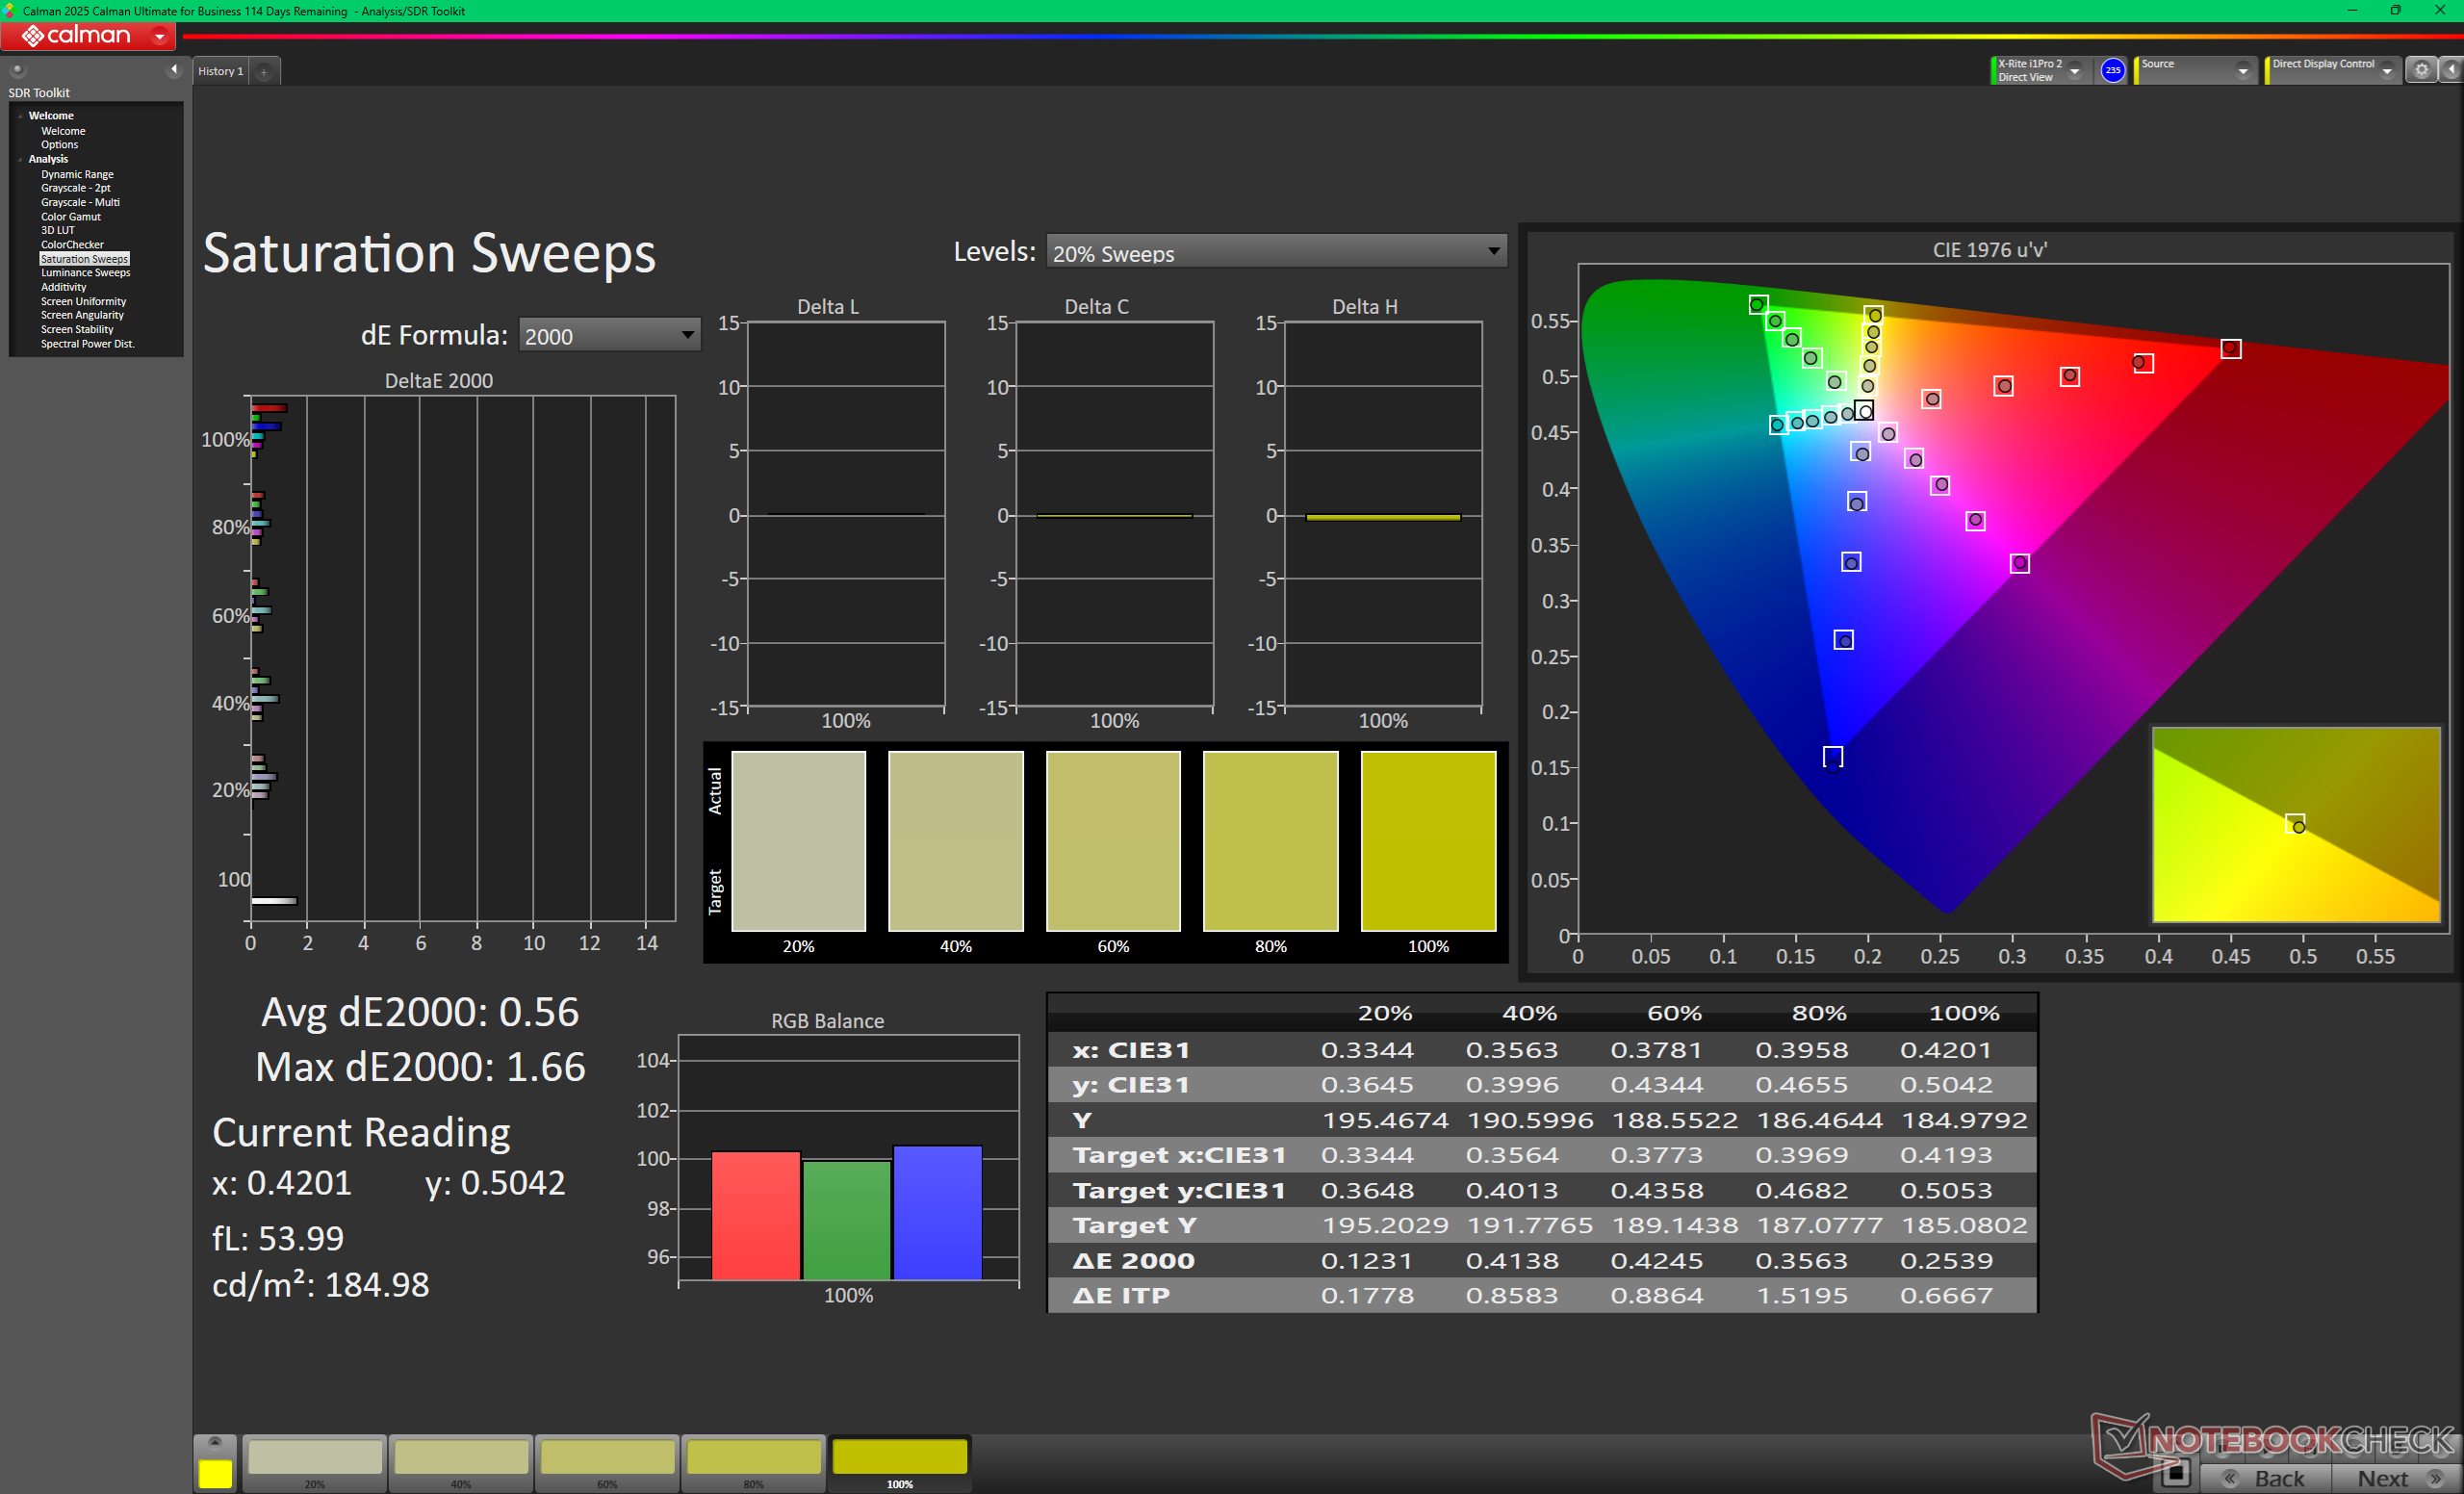
Sättigungsverläufe vor der Kalibrierung (sRGB)
ColorChecker vor der Kalibrierung (sRGB)
Graustufen nach der Kalibrierung
Sättigungsverläufe nach der Kalibrierung
ColorChecker nach der Kalibrierung

Reaktionszeiten (Response Times) des Displays

ℹ
Die Reaktionszeiten (Response Times) beschreiben wie schnell zwischen zwei Farben eines Pixels umgeschaltet werden kann. Langsame Response Times können zu einer verschwommenen Darstellung, Schlieren und Geisterbilder führen. Besonders bei schnellen 3D-Spielen sind kurze Umschaltzeiten wichtig.
   ↔    Reaktionszeiten Schwarz zu Weiß
0.46 ms ... steigend ↗ und fallend ↘ kombiniert↗ 0.22 ms steigend
↘ 0.24 ms fallend
Die gemessenen Reaktionszeiten sind sehr kurz, wodurch sich der Bildschirm auch für schnelle 3D Spiele eignen sollte.
Im Vergleich rangierten die bei uns getesteten Geräte von 0.1 (Minimum) zu 240 (Maximum) ms. » 1 % aller Screens waren schneller als der getestete.
Daher sind die gemessenen Reaktionszeiten besser als der Durchschnitt aller vermessenen Geräte (19.7 ms).
   ↔    Reaktionszeiten 50% Grau zu 80% Grau
0.29 ms ... steigend ↗ und fallend ↘ kombiniert↗ 0.15 ms steigend
↘ 0.14 ms fallend
Die gemessenen Reaktionszeiten sind sehr kurz, wodurch sich der Bildschirm auch für schnelle 3D Spiele eignen sollte.
Im Vergleich rangierten die bei uns getesteten Geräte von 0.13 (Minimum) zu 636 (Maximum) ms. » 0 % aller Screens waren schneller als der getestete.
Daher sind die gemessenen Reaktionszeiten besser als der Durchschnitt aller vermessenen Geräte (30.7 ms).

Bildschirm-Flackern / PWM (Pulse-Width Modulation)

ℹ
Eine günstige Methode um die Helligkeit eines Bildschirms zu steuern, ist die Beleuchtung periodisch ein- und auszuschalten. Dies nennt sich PWM (Pulsweitenmodulation) Diese Umschaltung sollte mit einer hohen Frequenz stattfinden damit das menschliche Auge kein Flimmern wahrnimmt. Wenn die Frequenz zu niedrig ist, kann dies zu Ermüdungserscheinungen, Augenbrennen, Kopfweh und auch sichtbaren Flackern führen.
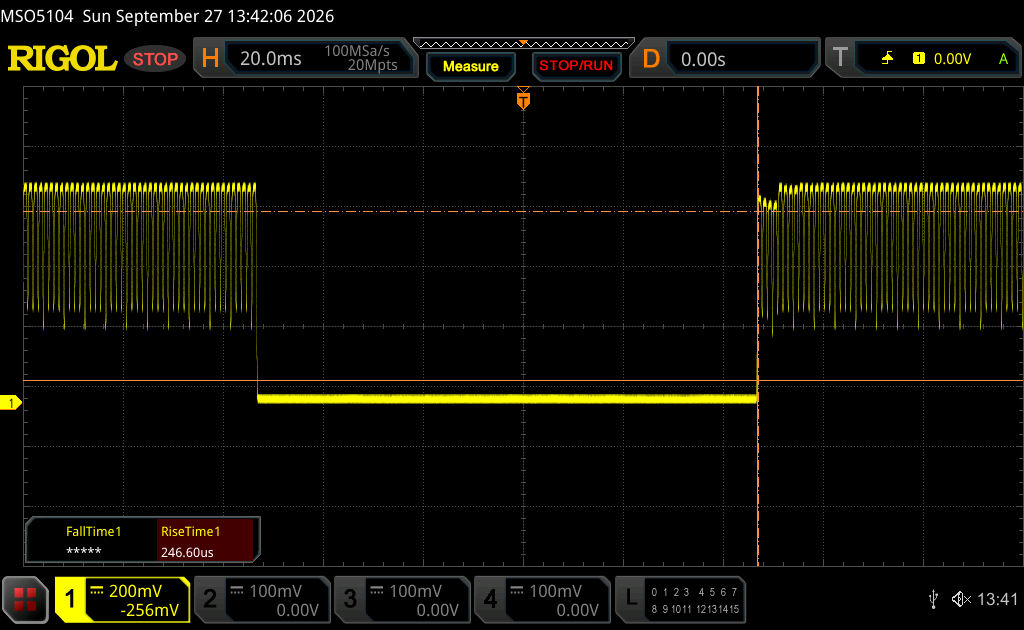
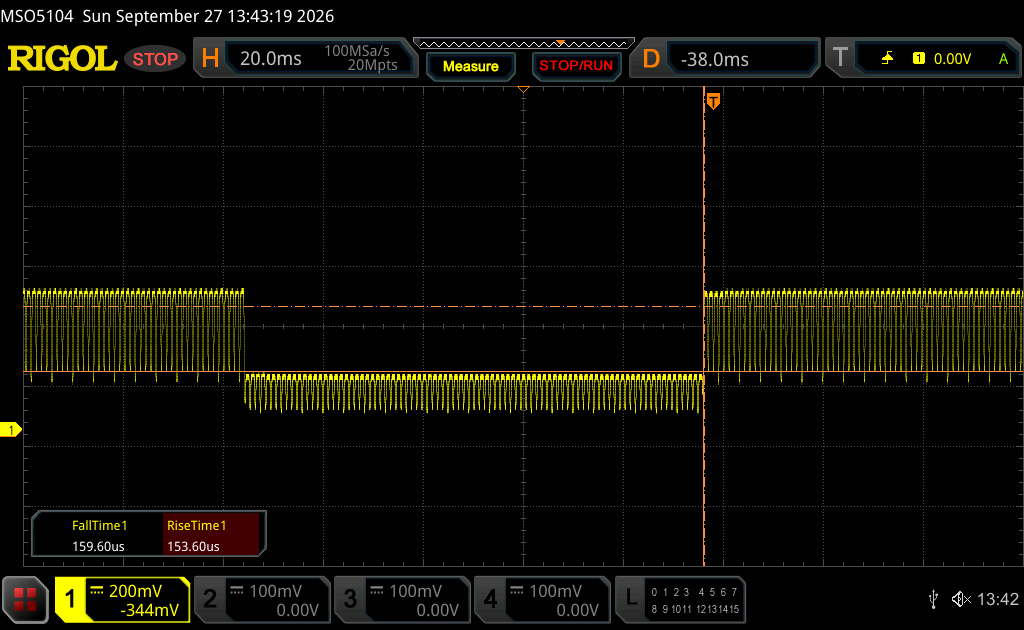
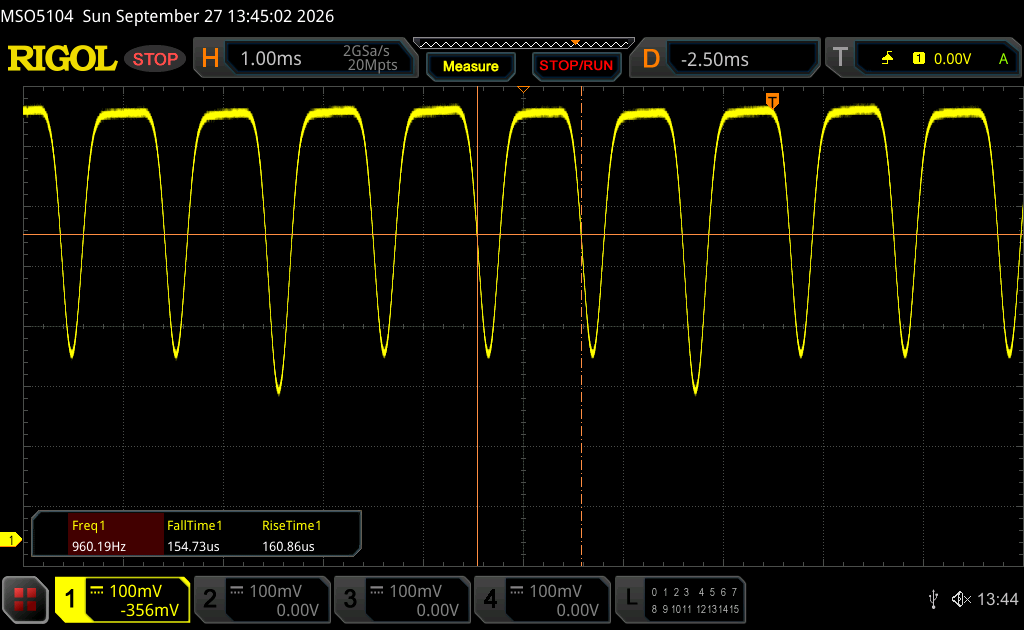
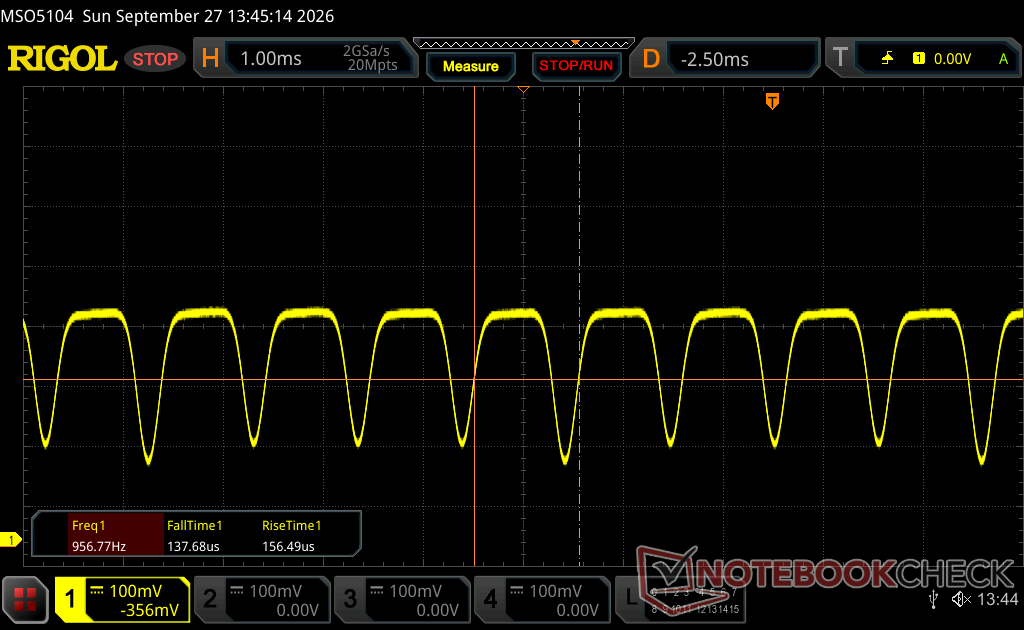
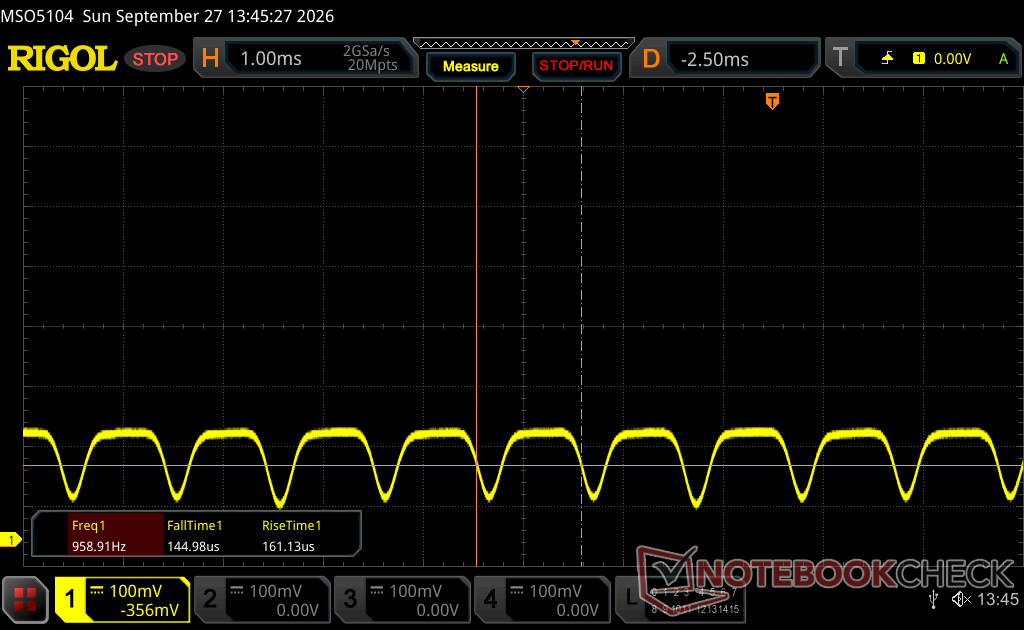
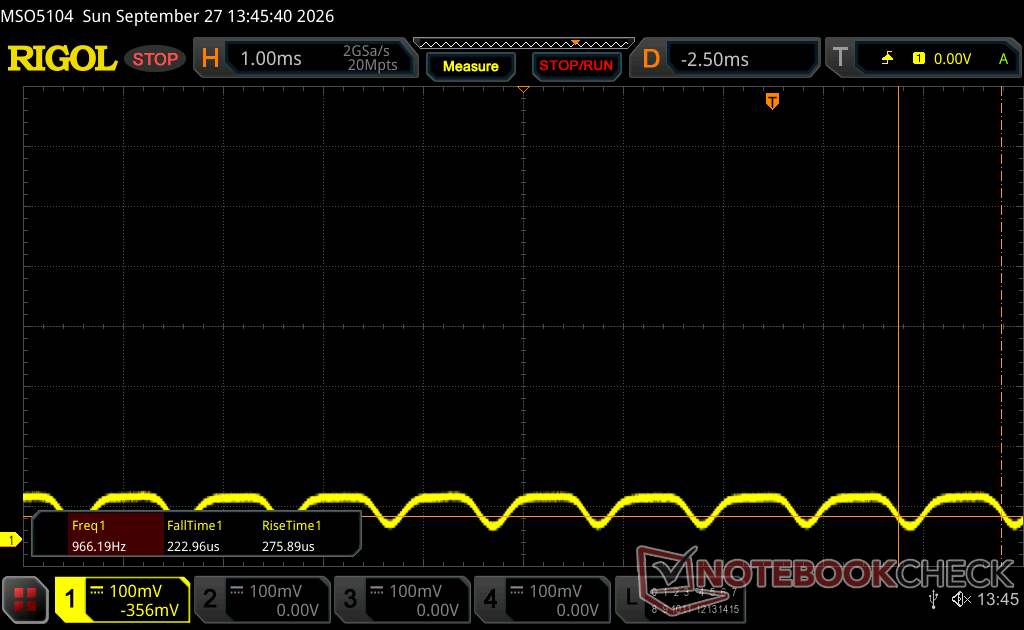
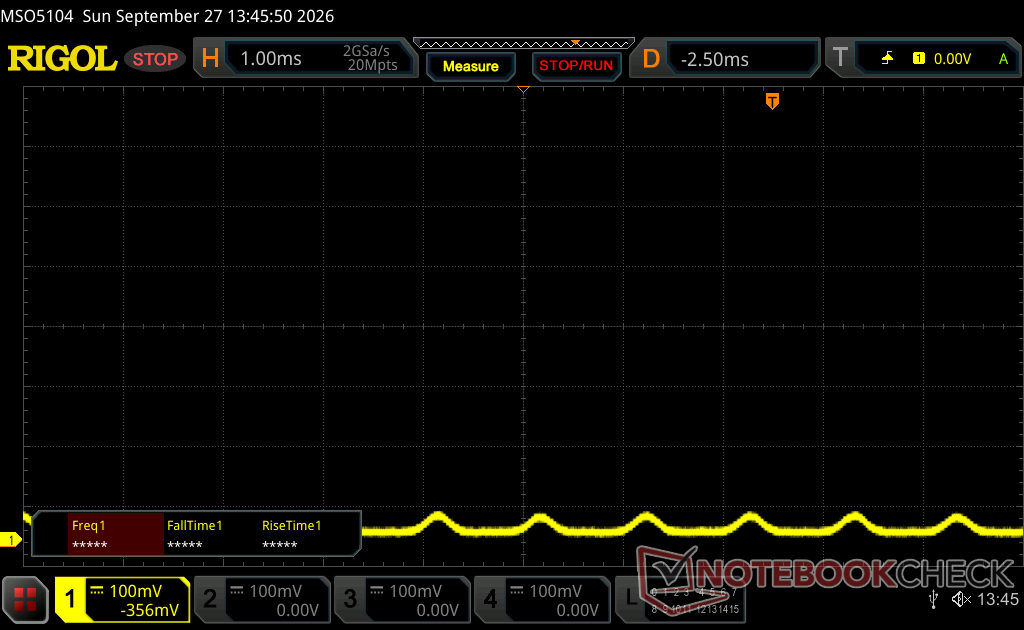
Flackern / PWM festgestellt 960.2 Hz
Amplitude: 29 %

Das Display flackert mit 960.2 Hz (im schlimmsten Fall, eventuell durch Pulsweitenmodulation PWM) .

Die Frequenz von 960.2 Hz ist sehr hoch und sollte daher auch bei empfindlichen Personen zu keinen Problemen führen.

Im Vergleich: 52 % aller getesteten Geräte nutzten kein PWM um die Helligkeit zu reduzieren. Wenn PWM eingesetzt wurde, dann bei einer Frequenz von durchschnittlich 7611 (Minimum 5, Maximum 343500) Hz.

100 Prozent Helligkeit
75 Prozent Helligkeit
50 Prozent Helligkeit
25 Prozent Helligkeit
0 Prozent Helligkeit
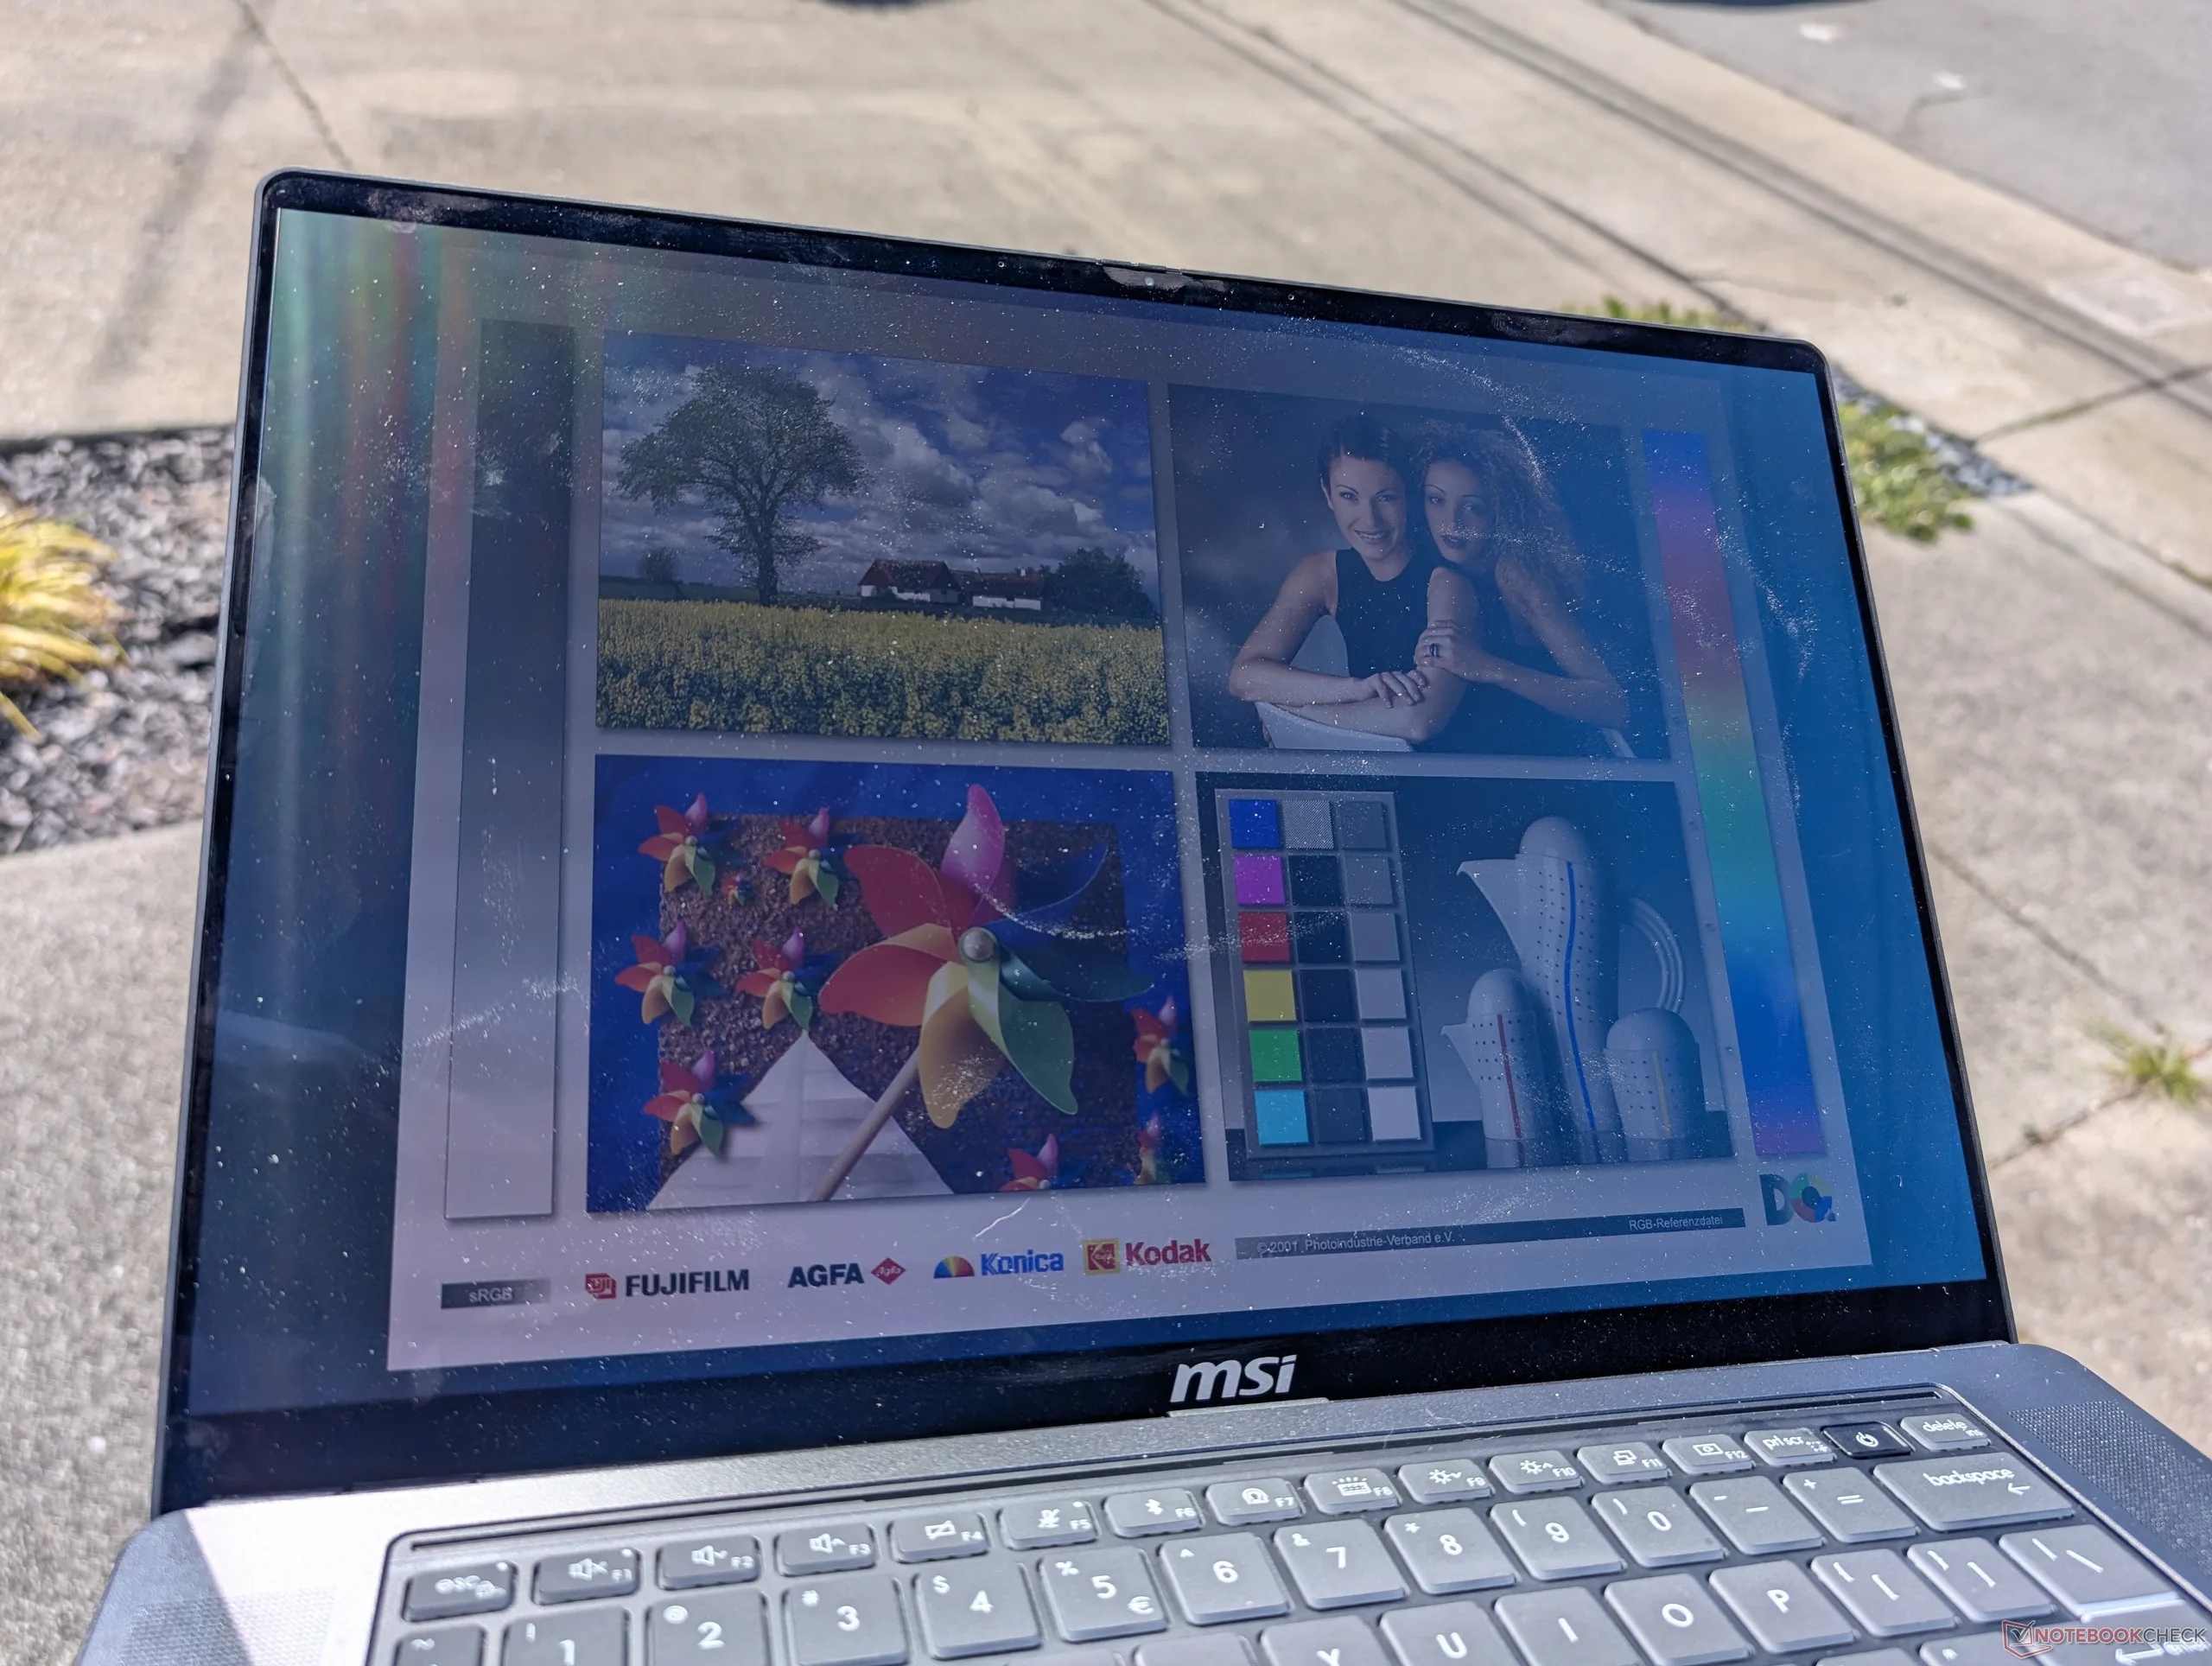
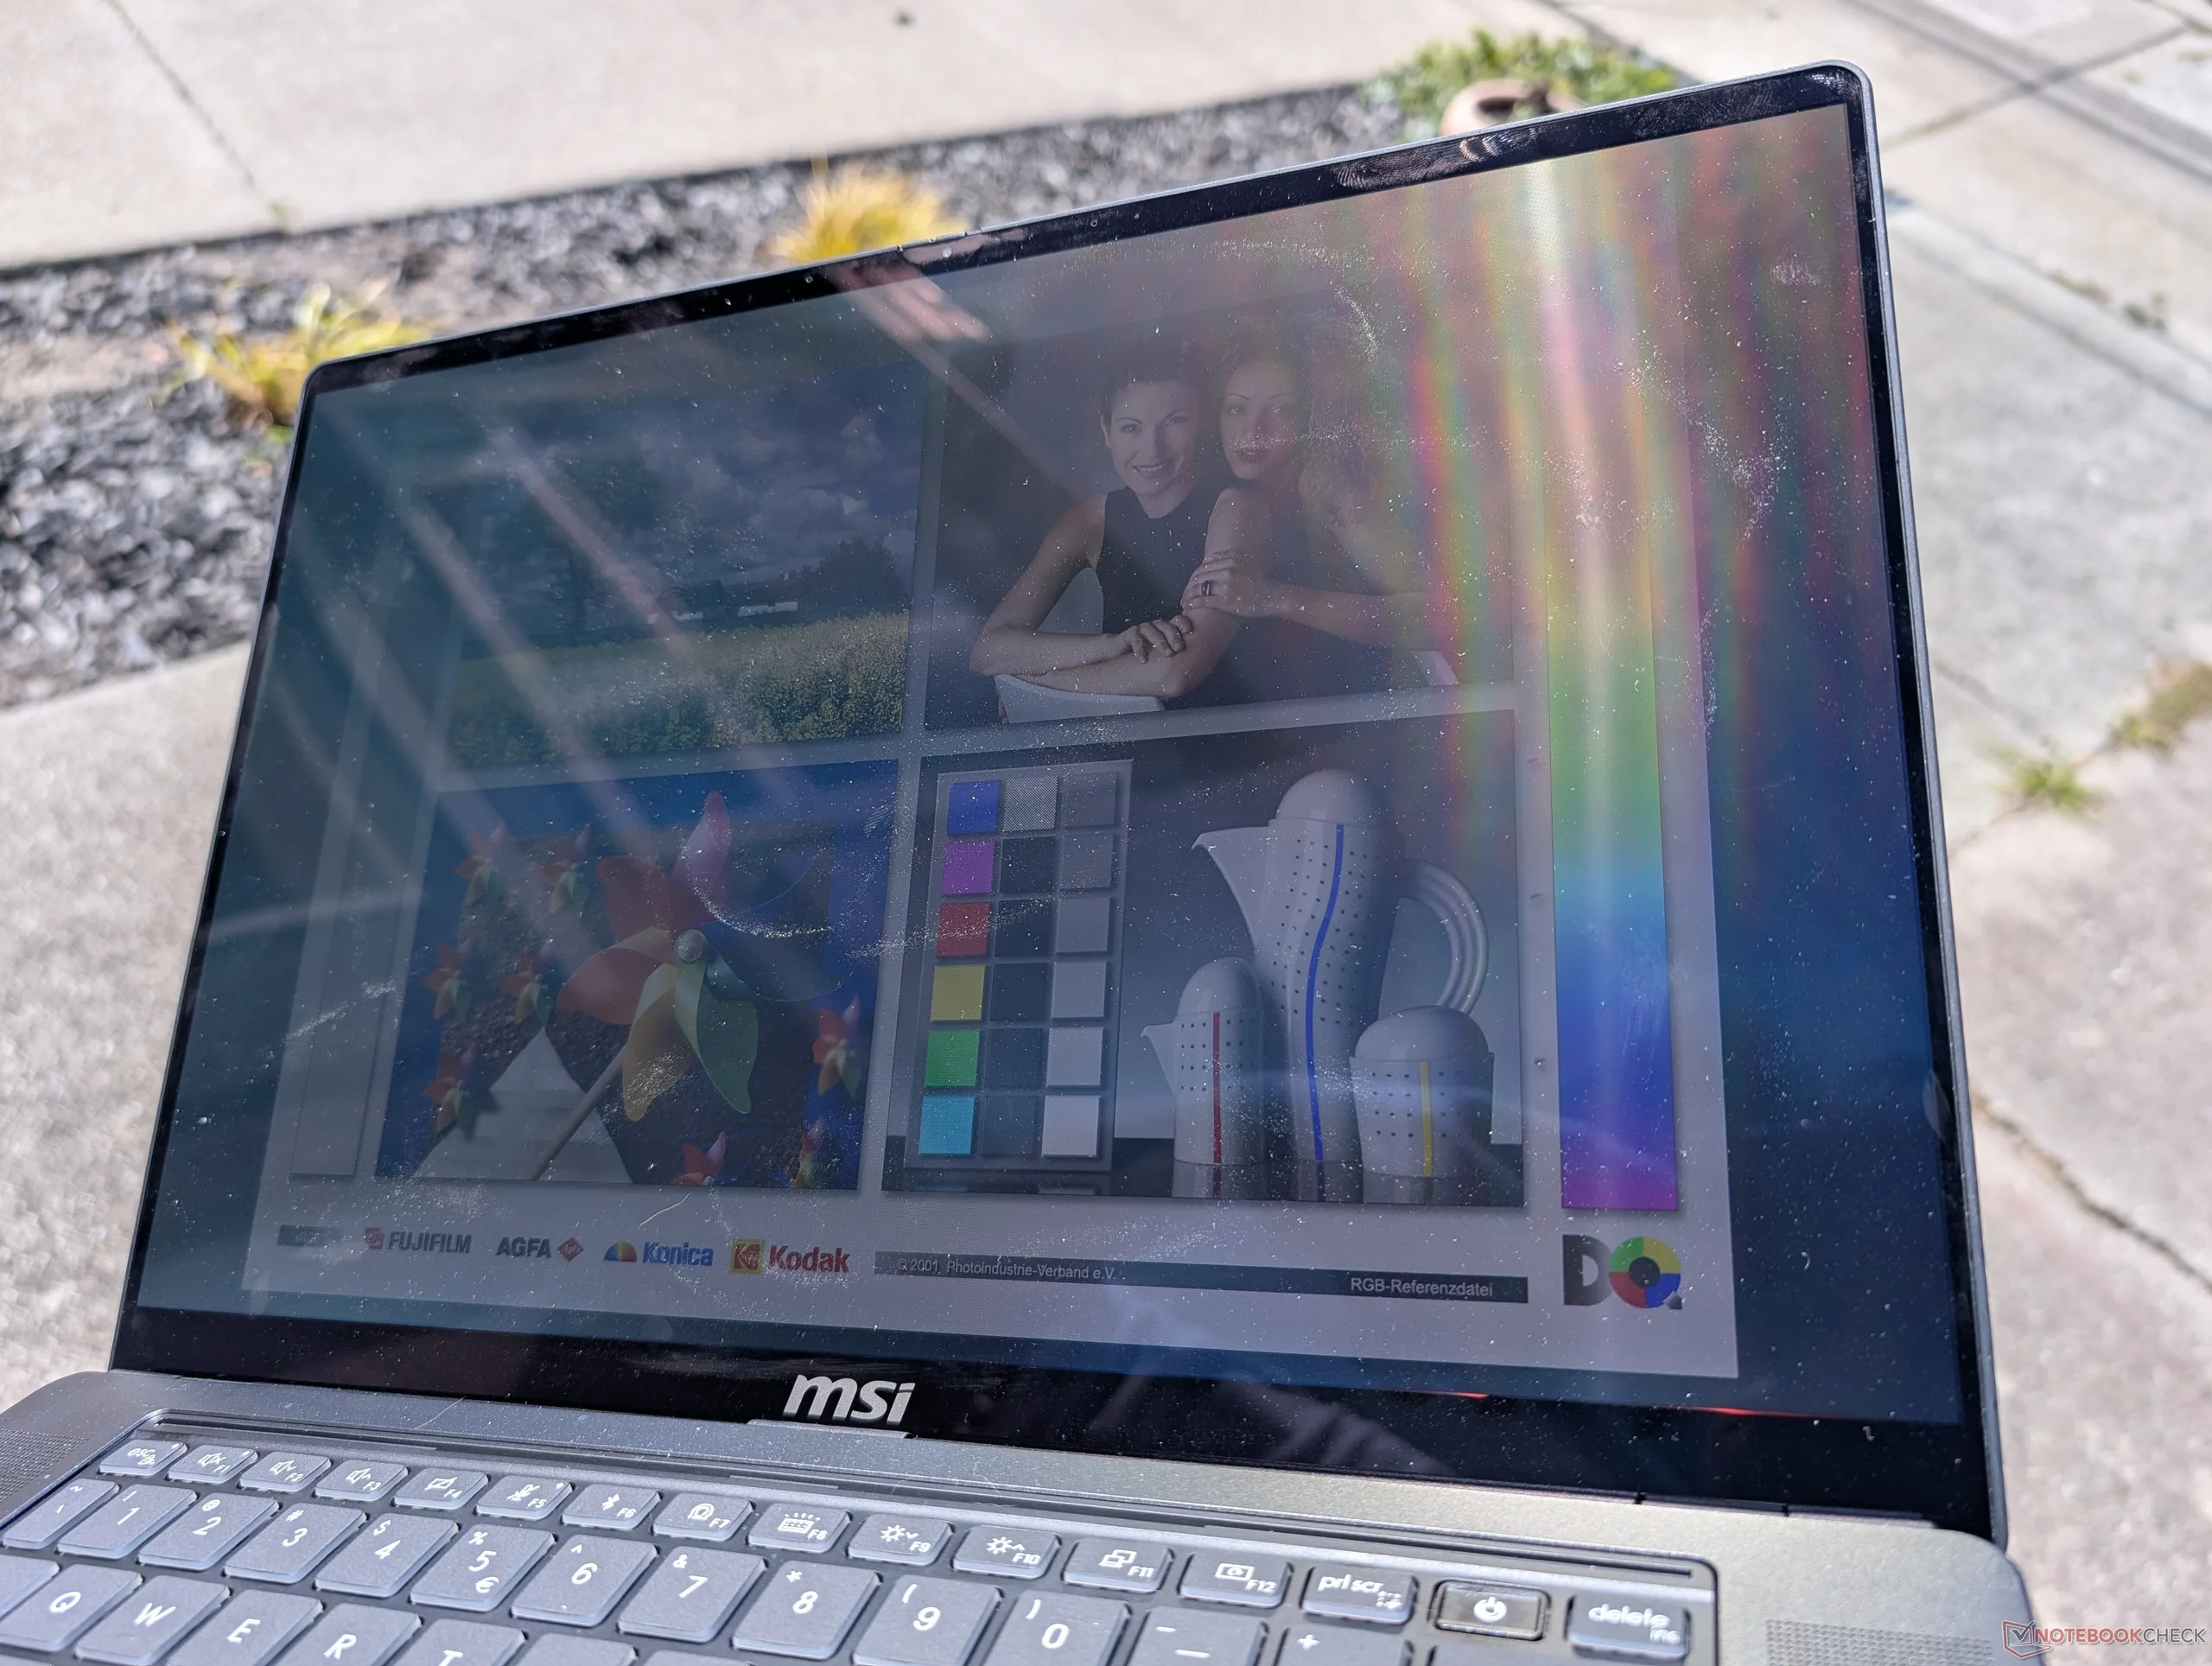
Im Freien bei direkter Sonneneinstrahlung
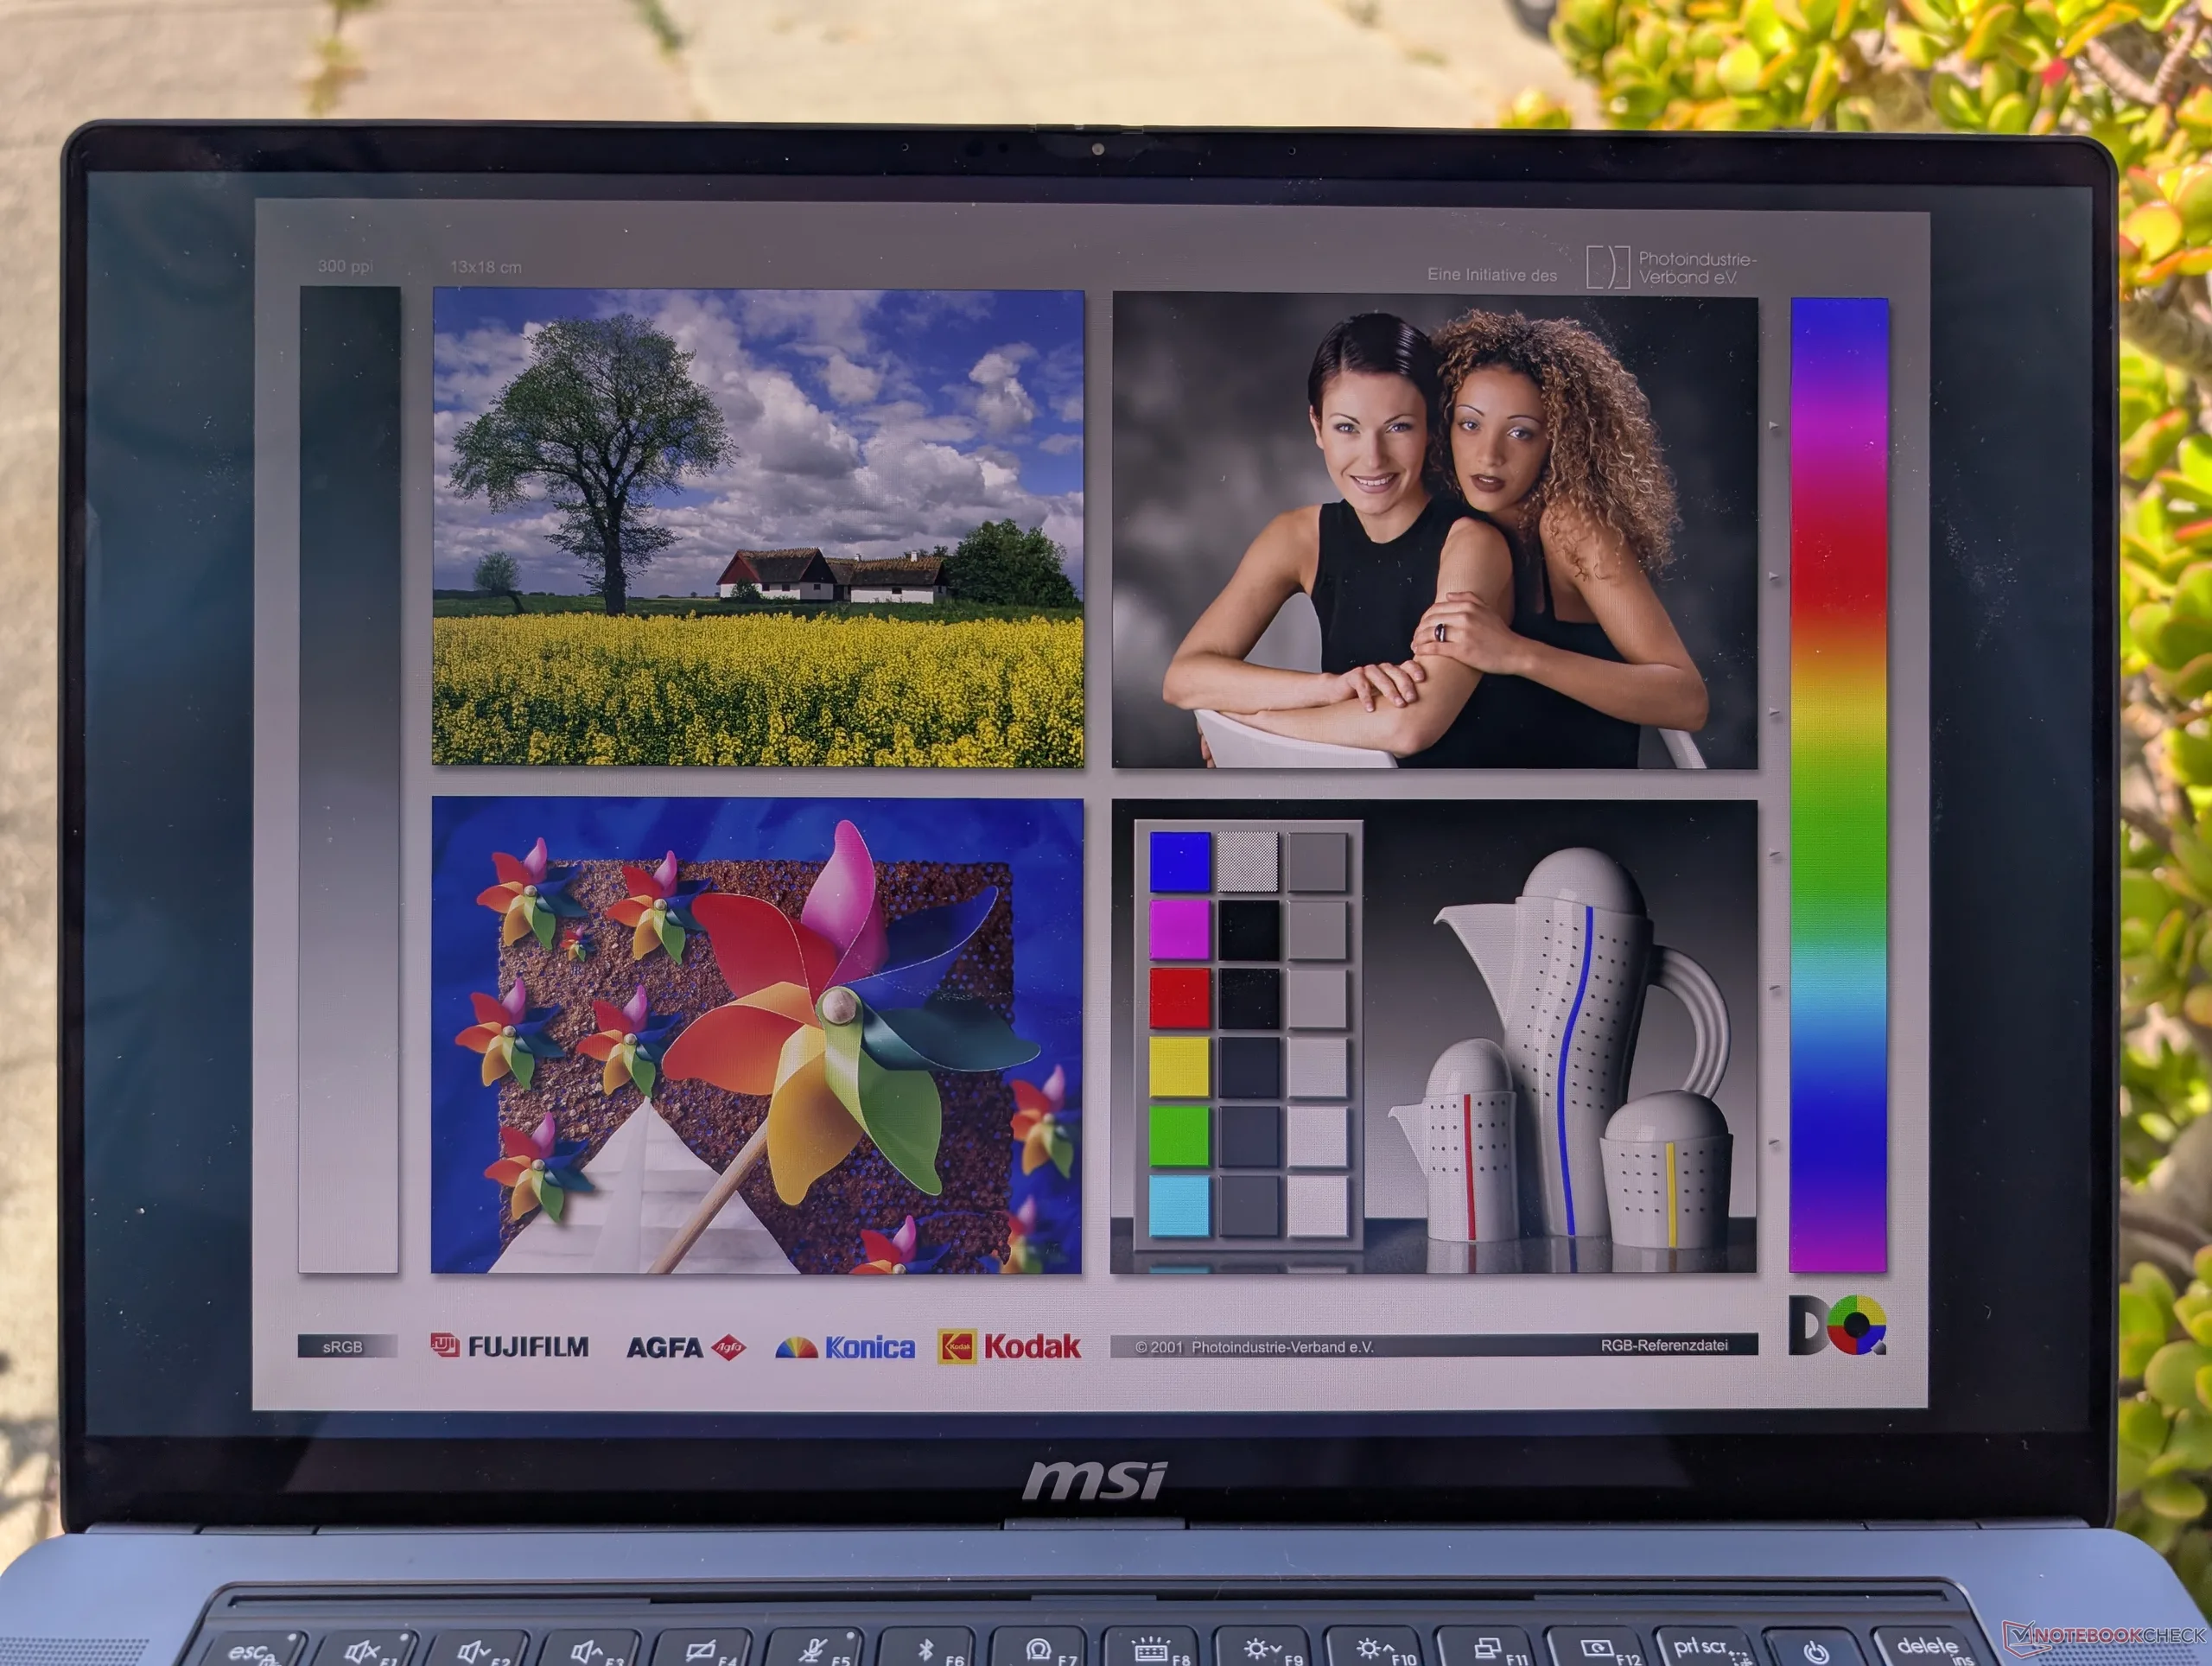
Im Freien im Schatten
Im Freien bei direkter Sonneneinstrahlung
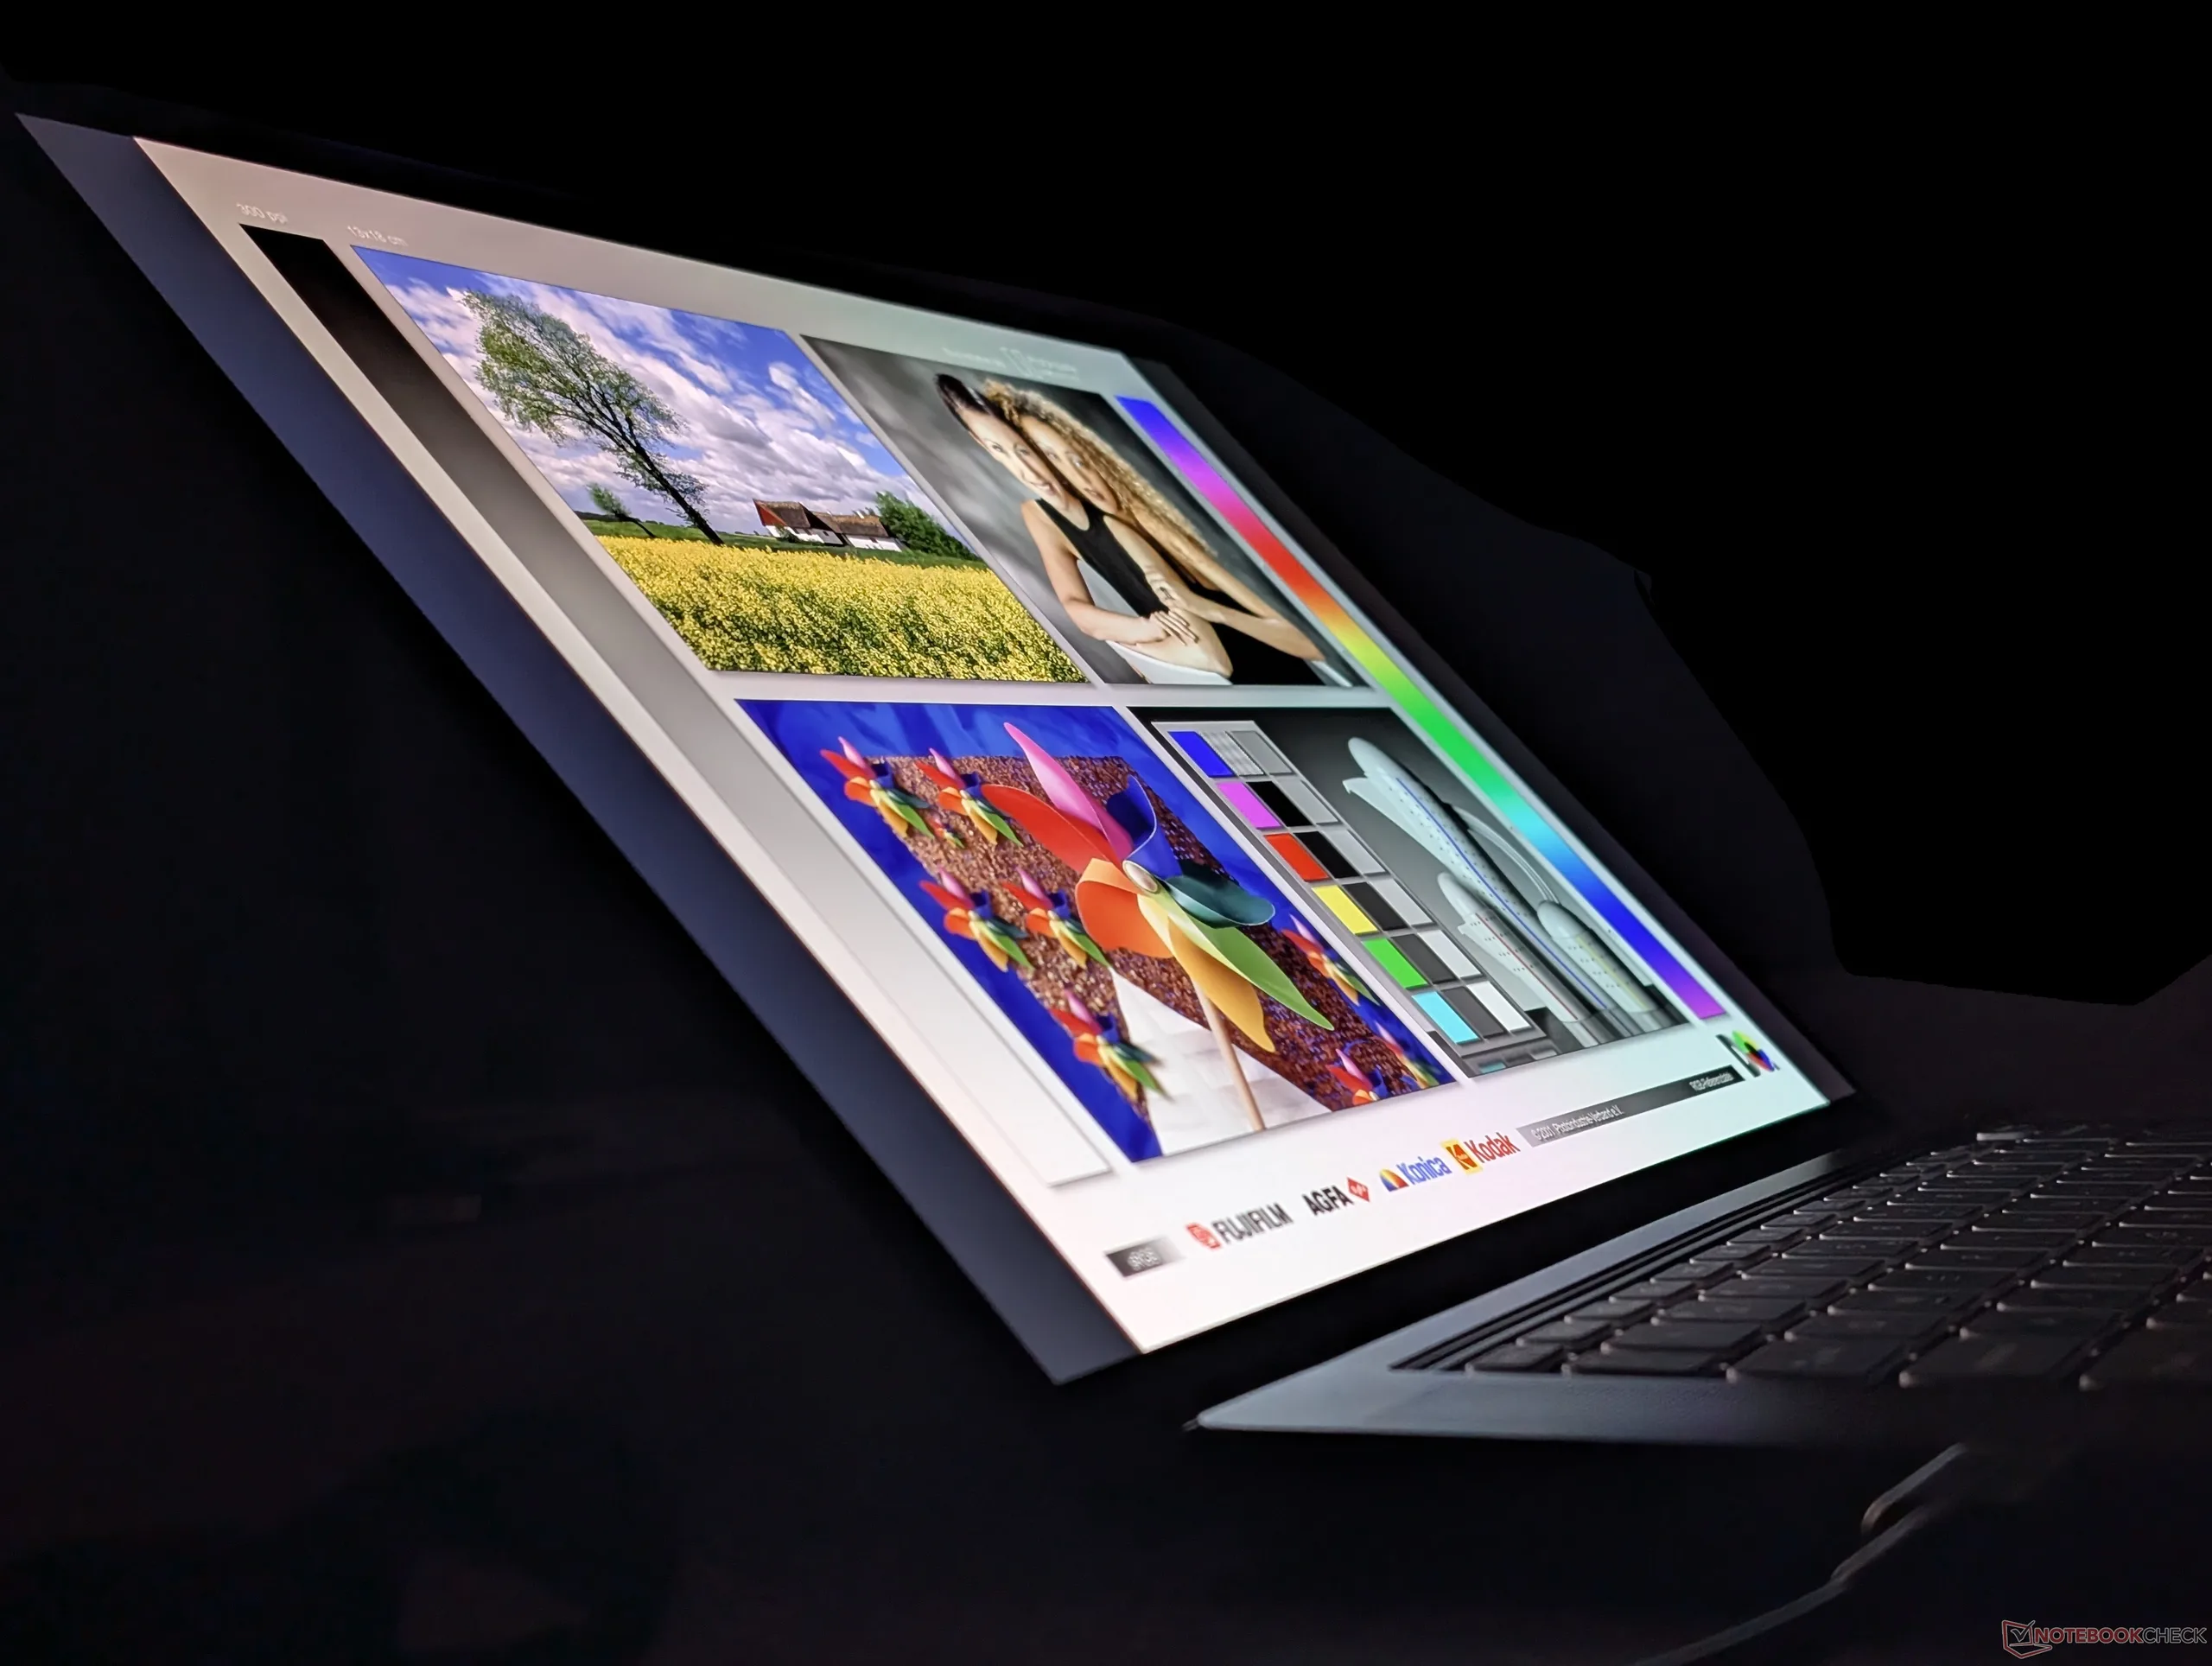
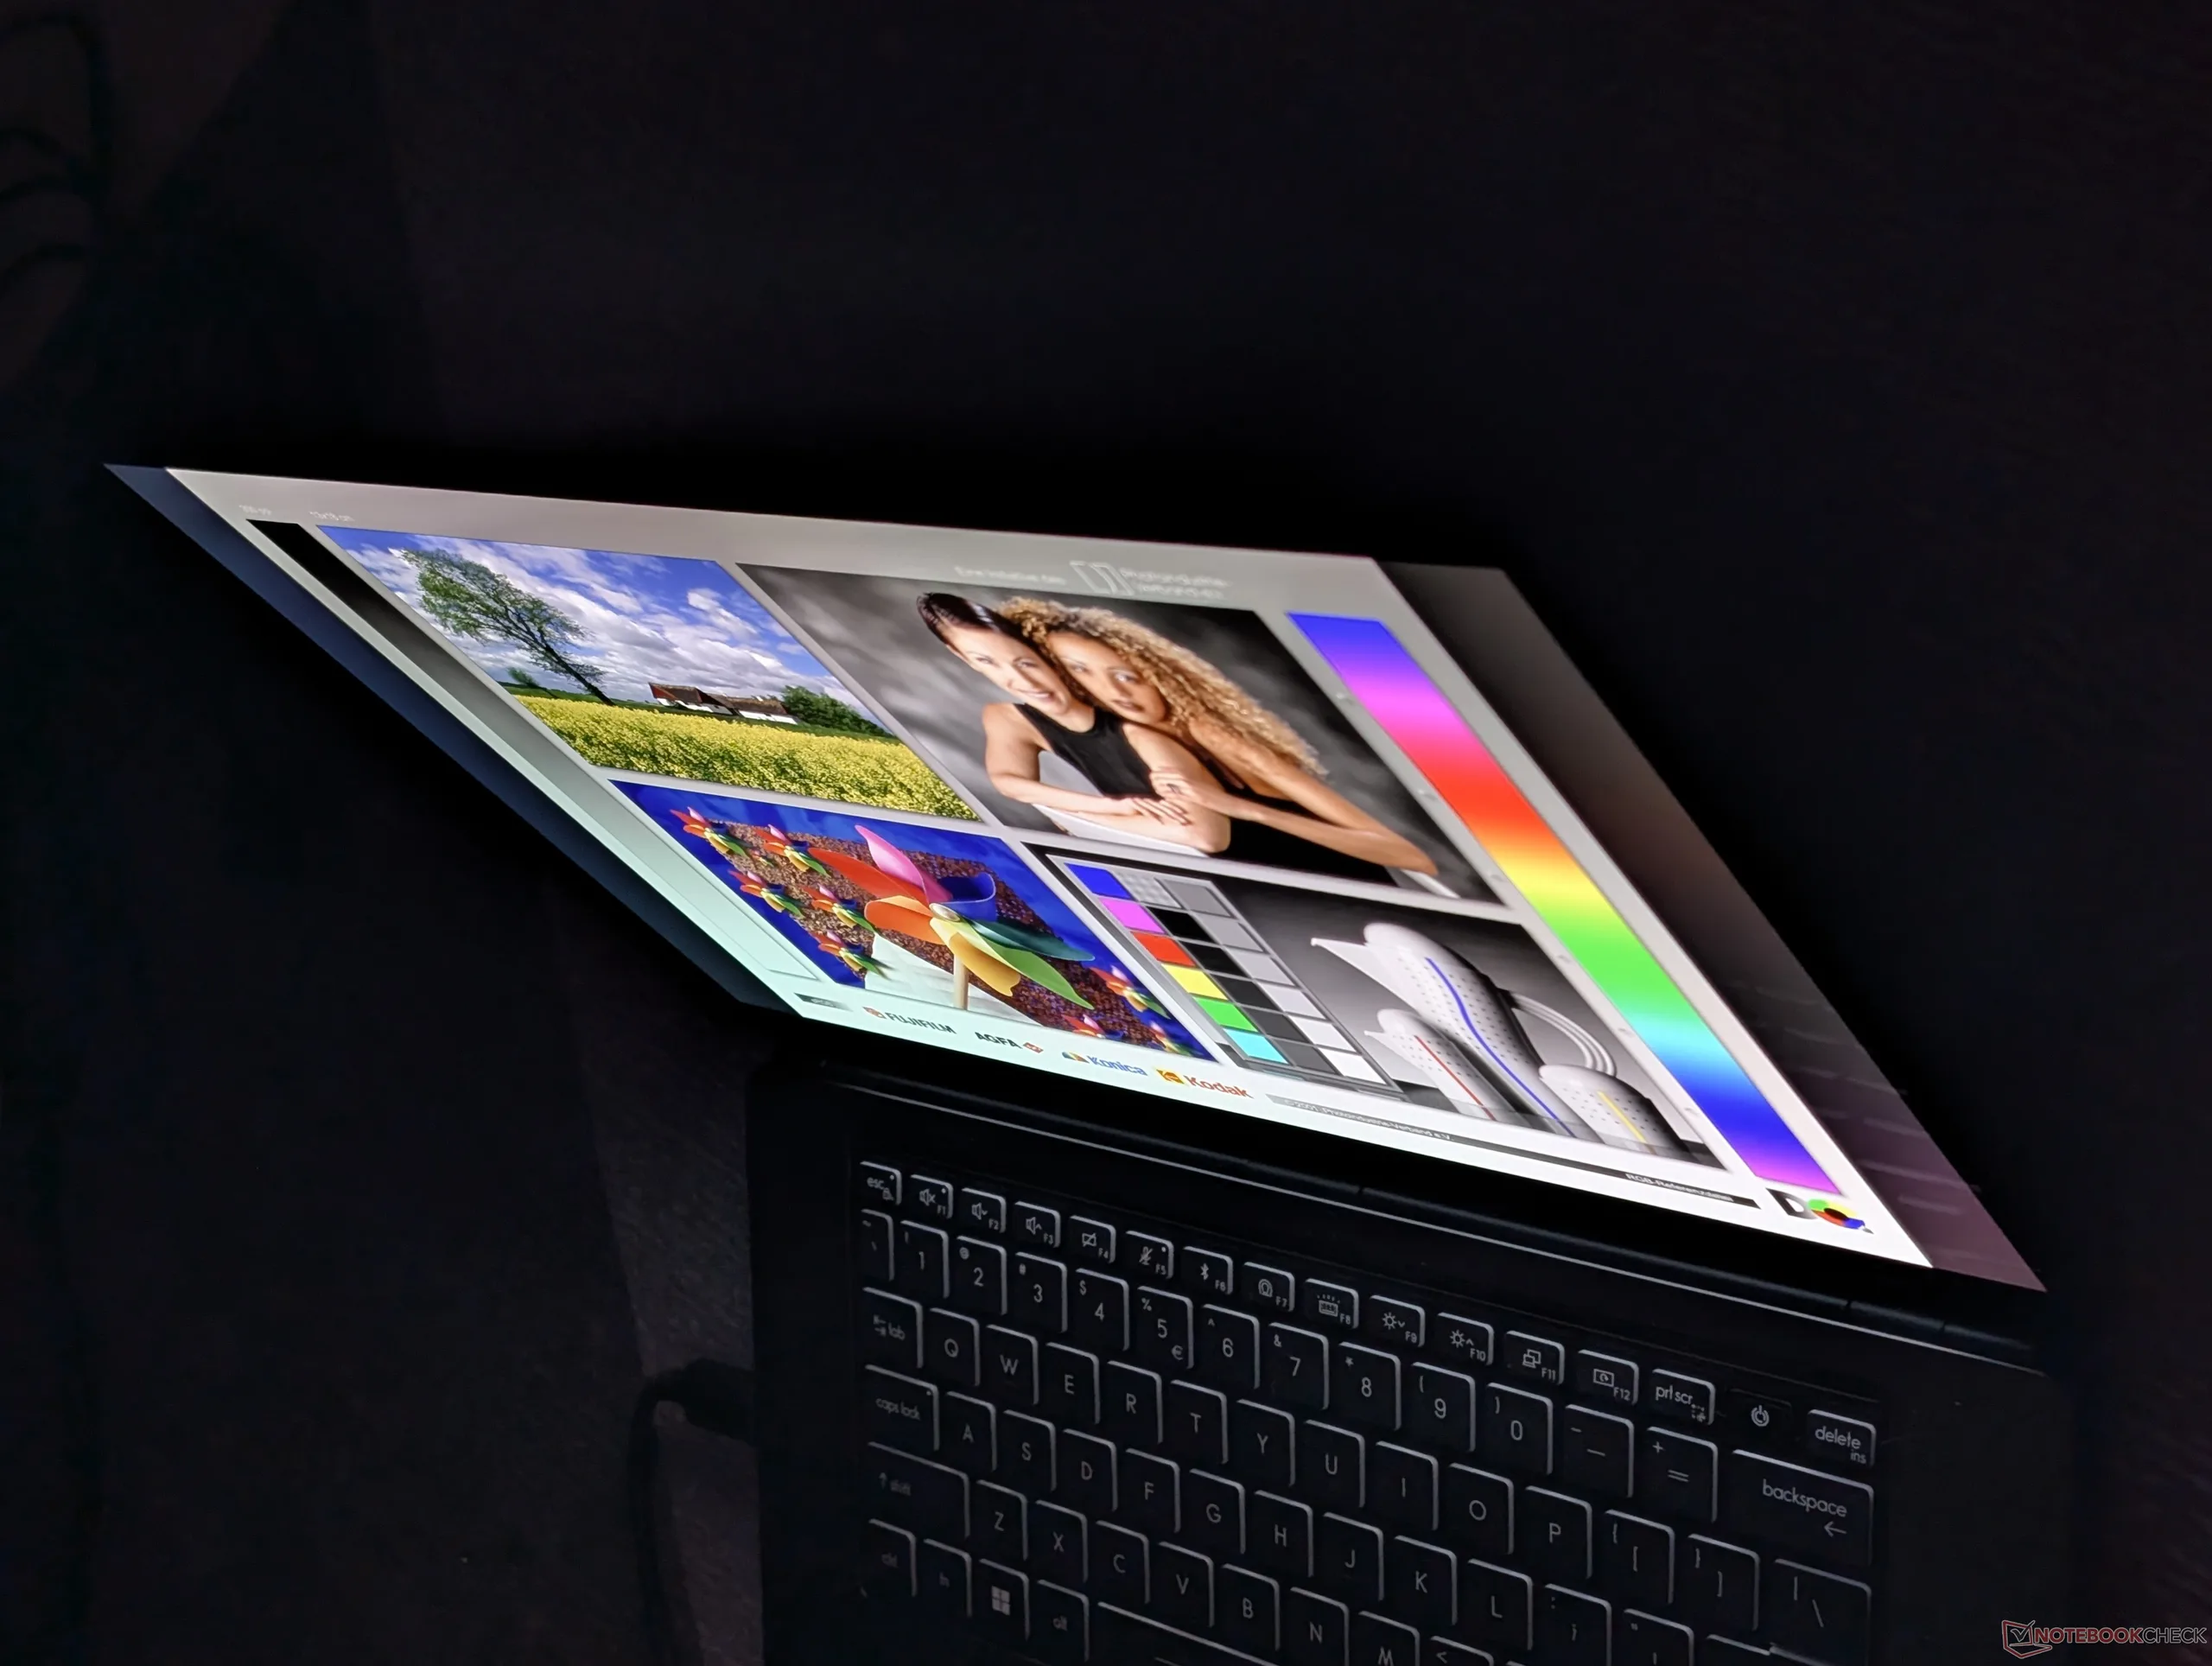
Große OLED-Blickwinkel

Leistung

Testbedingungen

Vor der Durchführung der folgenden Benchmarks stellten wir MSI Center auf den Modus für dedizierte Grafik und den Leistungsmodus mit aktiviertem Apex ein. Dies waren auch die Standardeinstellungen bei Erhalt unseres Testgeräts.

Prozessorleistung

Die reine Prozessorleistung des Core Ultra 9 386H ist in etwa mit der des Ryzen AI 9 HX 470 vergleichbar. 

Cinebench-R15-Multi-Dauertest

012525037550062575087510001125125013751500162517501875200021252250237525002625275028753000312532503375350036253750387540004125425043754500462547504875500051255250537555005625575058756000Tooltip
MSI Stealth 16 AI B3WH Intel Core Ultra 9 386H: Ø3222 (3176.62-3317.02) Points
MSI Stealth 16 Studio A13VG Intel Core i7-13700H: Ø2552 (2375.16-3030.99) Points
Razer Blade 16 Core Ultra 9 386H Intel Core Ultra 9 386H: Ø2941 (2806.23-3172.09) Points
Lenovo Legion 7 16 AGP11 AMD Ryzen AI 9 HX 470: Ø3496 (3345.88-3542.33) Points
Aorus Master 16 AM6J AMD Ryzen 9 9955HX3D: Ø5951 (5802.15-6067.96) Points
Asus ROG Zephyrus G16 GU606AW Intel Core Ultra 9 386H: Ø3281 (3216.99-3316.47) Points
CPU Performance Rating: Percent
Cinebench 2024: CPU Multi Core | CPU Single Core
Cinebench 2026: CPU Multi
Cinebench R23: Multi Core | Single Core
Cinebench R20: CPU (Multi Core) | CPU (Single Core)
Cinebench R15: CPU Multi 64Bit | CPU Single 64Bit
Blender: v2.79 BMW27 CPU
7-Zip 18.03: 7z b 4 | 7z b 4 -mmt1
Geekbench 6.7: Multi-Core | Single-Core
Geekbench 5.5: Multi-Core | Single-Core
HWBOT x265 Benchmark v2.2: 4k Preset
LibreOffice : 20 Documents To PDF
R Benchmark 2.5: Overall mean
CPU Performance Rating
Aorus Master 16 AM6J -1!
AMD Ryzen 9 9955HX3D
87.6 pt
HP Omen Max 16-ah1932nr
Intel Core Ultra 9 290HX Plus
87 pt
MSI Crosshair A16 HX E8WGK
AMD Ryzen 9 8940HX
78.9 pt
Lenovo Legion Pro 5 16IRX9 -3!
Intel Core i9-14900HX
76.7 pt
Razer Blade 16 Core Ultra 9 386H
Intel Core Ultra 9 386H
66.9 pt
Schenker XMG Core 16 M25 -1!
AMD Ryzen AI 9 HX 370
66.5 pt
Lenovo Legion 7 16 AGP11
AMD Ryzen AI 9 HX 470
66.4 pt
MSI Stealth 16 AI B3WH -2!
Intel Core Ultra 9 386H
64.9 pt
Durchschnittliche Intel Core Ultra 9 386H
 
64.1 pt
Lenovo Legion Slim 5 16APH8 -5!
AMD Ryzen 7 7840HS
56.4 pt
MSI Stealth 16 Studio A13VG -5!
Intel Core i7-13700H
56.1 pt
Asus ROG Zephyrus M16 GU603H -7!
Intel Core i9-11900H
42.7 pt
Cinebench 2024 / CPU Multi Core
HP Omen Max 16-ah1932nr
Intel Core Ultra 9 290HX Plus
2096 Points +70%
Aorus Master 16 AM6J
AMD Ryzen 9 9955HX3D
2090 Points +70%
MSI Crosshair A16 HX E8WGK
AMD Ryzen 9 8940HX
1736 Points +41%
Schenker XMG Core 16 M25
AMD Ryzen AI 9 HX 370
1299 Points +5%
Lenovo Legion 7 16 AGP11
AMD Ryzen AI 9 HX 470
1241 Points +1%
MSI Stealth 16 AI B3WH
Intel Core Ultra 9 386H
1233 Points
Razer Blade 16 Core Ultra 9 386H
Intel Core Ultra 9 386H
1172 Points -5%
Durchschnittliche Intel Core Ultra 9 386H
  (873 - 1271, n=10)
1142 Points -7%
Cinebench 2024 / CPU Single Core
HP Omen Max 16-ah1932nr
Intel Core Ultra 9 290HX Plus
137.5 Points +12%
Aorus Master 16 AM6J
AMD Ryzen 9 9955HX3D
130 Points +6%
Razer Blade 16 Core Ultra 9 386H
Intel Core Ultra 9 386H
126.8 Points +3%
MSI Stealth 16 AI B3WH
Intel Core Ultra 9 386H
122.8 Points
Durchschnittliche Intel Core Ultra 9 386H
  (118.1 - 126.8, n=10)
122.5 Points 0%
Lenovo Legion 7 16 AGP11
AMD Ryzen AI 9 HX 470
119.1 Points -3%
Schenker XMG Core 16 M25
AMD Ryzen AI 9 HX 370
118.4 Points -4%
MSI Crosshair A16 HX E8WGK
AMD Ryzen 9 8940HX
113.2 Points -8%
Cinebench 2026 / CPU Multi
HP Omen Max 16-ah1932nr
Intel Core Ultra 9 290HX Plus
8490 Points +71%
MSI Crosshair A16 HX E8WGK
AMD Ryzen 9 8940HX
7138 Points +44%
Lenovo Legion 7 16 AGP11
AMD Ryzen AI 9 HX 470
5087 Points +3%
MSI Stealth 16 AI B3WH
Intel Core Ultra 9 386H
4951 Points
Durchschnittliche Intel Core Ultra 9 386H
  (3799 - 5151, n=6)
4779 Points -3%
Razer Blade 16 Core Ultra 9 386H
Intel Core Ultra 9 386H
4730 Points -4%
Cinebench R23 / Multi Core
HP Omen Max 16-ah1932nr
Intel Core Ultra 9 290HX Plus
38242 (36217.9min - 38242.1max) Points +73%
Aorus Master 16 AM6J
AMD Ryzen 9 9955HX3D
37459 Points +70%
MSI Crosshair A16 HX E8WGK
AMD Ryzen 9 8940HX
32745 (32277.9min - 32745.3max) Points +48%
Lenovo Legion Pro 5 16IRX9
Intel Core i9-14900HX
29686 (26317.7min - 29686max) Points +34%
Lenovo Legion 7 16 AGP11
AMD Ryzen AI 9 HX 470
23946 Points +8%
Schenker XMG Core 16 M25
AMD Ryzen AI 9 HX 370
22187 Points 0%
MSI Stealth 16 AI B3WH
Intel Core Ultra 9 386H
22084 (21312.9min - 22083.8max) Points
Razer Blade 16 Core Ultra 9 386H
Intel Core Ultra 9 386H
20750 (18849.5min - 20749.6max) Points -6%
MSI Stealth 16 Studio A13VG
Intel Core i7-13700H
20034 Points -9%
Durchschnittliche Intel Core Ultra 9 386H
  (12144 - 22084, n=10)
19585 Points -11%
Lenovo Legion Slim 5 16APH8
AMD Ryzen 7 7840HS
17088 (16600.7min - 17088.2max) Points -23%
Cinebench R23 / Single Core
HP Omen Max 16-ah1932nr
Intel Core Ultra 9 290HX Plus
2231 Points +6%
Aorus Master 16 AM6J
AMD Ryzen 9 9955HX3D
2150 Points +2%
Lenovo Legion Pro 5 16IRX9
Intel Core i9-14900HX
2122 Points +1%
MSI Stealth 16 AI B3WH
Intel Core Ultra 9 386H
2111 Points
Razer Blade 16 Core Ultra 9 386H
Intel Core Ultra 9 386H
2087 Points -1%
Durchschnittliche Intel Core Ultra 9 386H
  (2010 - 2123, n=10)
2073 Points -2%
Lenovo Legion 7 16 AGP11
AMD Ryzen AI 9 HX 470
2061 Points -2%
Schenker XMG Core 16 M25
AMD Ryzen AI 9 HX 370
2019 Points -4%
MSI Crosshair A16 HX E8WGK
AMD Ryzen 9 8940HX
1886 Points -11%
MSI Stealth 16 Studio A13VG
Intel Core i7-13700H
1854 Points -12%
Lenovo Legion Slim 5 16APH8
AMD Ryzen 7 7840HS
1793 Points -15%
Cinebench R20 / CPU (Multi Core)
Aorus Master 16 AM6J
AMD Ryzen 9 9955HX3D
14793 Points +75%
HP Omen Max 16-ah1932nr
Intel Core Ultra 9 290HX Plus
14722 Points +74%
MSI Crosshair A16 HX E8WGK
AMD Ryzen 9 8940HX
12785 Points +51%
Lenovo Legion Pro 5 16IRX9
Intel Core i9-14900HX
11319 Points +34%
Lenovo Legion 7 16 AGP11
AMD Ryzen AI 9 HX 470
9225 Points +9%
Schenker XMG Core 16 M25
AMD Ryzen AI 9 HX 370
8504 Points +1%
MSI Stealth 16 AI B3WH
Intel Core Ultra 9 386H
8447 Points
Razer Blade 16 Core Ultra 9 386H
Intel Core Ultra 9 386H
8162 Points -3%
MSI Stealth 16 Studio A13VG
Intel Core i7-13700H
7674 Points -9%
Durchschnittliche Intel Core Ultra 9 386H
  (4757 - 8447, n=10)
7657 Points -9%
Lenovo Legion Slim 5 16APH8
AMD Ryzen 7 7840HS
6674 Points -21%
Asus ROG Zephyrus M16 GU603H
Intel Core i9-11900H
5160 Points -39%
Cinebench R20 / CPU (Single Core)
HP Omen Max 16-ah1932nr
Intel Core Ultra 9 290HX Plus
840 Points +4%
Lenovo Legion Pro 5 16IRX9
Intel Core i9-14900HX
812 Points +1%
Lenovo Legion 7 16 AGP11
AMD Ryzen AI 9 HX 470
806 Points 0%
MSI Stealth 16 AI B3WH
Intel Core Ultra 9 386H
806 Points
Schenker XMG Core 16 M25
AMD Ryzen AI 9 HX 370
795 Points -1%
Razer Blade 16 Core Ultra 9 386H
Intel Core Ultra 9 386H
795 Points -1%
Aorus Master 16 AM6J
AMD Ryzen 9 9955HX3D
790 Points -2%
Durchschnittliche Intel Core Ultra 9 386H
  (762 - 806, n=10)
789 Points -2%
MSI Crosshair A16 HX E8WGK
AMD Ryzen 9 8940HX
736 Points -9%
MSI Stealth 16 Studio A13VG
Intel Core i7-13700H
719 Points -11%
Lenovo Legion Slim 5 16APH8
AMD Ryzen 7 7840HS
698 Points -13%
Asus ROG Zephyrus M16 GU603H
Intel Core i9-11900H
603 Points -25%
Cinebench R15 / CPU Multi 64Bit
Aorus Master 16 AM6J
AMD Ryzen 9 9955HX3D
6068 (5802.15min - 6067.96max) Points +83%
HP Omen Max 16-ah1932nr
Intel Core Ultra 9 290HX Plus
5628 (5175.31min - 5628.25max) Points +70%
MSI Crosshair A16 HX E8WGK
AMD Ryzen 9 8940HX
5355 (5233.55min - 5355.47max) Points +61%
Lenovo Legion Pro 5 16IRX9
Intel Core i9-14900HX
4591 (4151.1min - 4590.84max) Points +38%
Schenker XMG Core 16 M25
AMD Ryzen AI 9 HX 370
3543 (3290.01min - 3542.96max) Points +7%
Lenovo Legion 7 16 AGP11
AMD Ryzen AI 9 HX 470
3542 (3345.88min - 3542.33max) Points +7%
MSI Stealth 16 AI B3WH
Intel Core Ultra 9 386H
3317 (3176.62min - 3317.02max) Points
Razer Blade 16 Core Ultra 9 386H
Intel Core Ultra 9 386H
3172 (2806.23min - 3172.09max) Points -4%
Durchschnittliche Intel Core Ultra 9 386H
  (2197 - 3347, n=10)
3097 Points -7%
MSI Stealth 16 Studio A13VG
Intel Core i7-13700H
2854 Points -14%
Lenovo Legion Slim 5 16APH8
AMD Ryzen 7 7840HS
2706 (2627.26min - 2706.36max) Points -18%
Asus ROG Zephyrus M16 GU603H
Intel Core i9-11900H
2211 (1875.21min - 2210.56max) Points -33%
Cinebench R15 / CPU Single 64Bit
Aorus Master 16 AM6J
AMD Ryzen 9 9955HX3D
331 Points +4%
MSI Stealth 16 AI B3WH
Intel Core Ultra 9 386H
319 Points
Razer Blade 16 Core Ultra 9 386H
Intel Core Ultra 9 386H
313 Points -2%
HP Omen Max 16-ah1932nr
Intel Core Ultra 9 290HX Plus
303 Points -5%
MSI Crosshair A16 HX E8WGK
AMD Ryzen 9 8940HX
301 Points -6%
Durchschnittliche Intel Core Ultra 9 386H
  (249 - 319, n=10)
300 Points -6%
Lenovo Legion Pro 5 16IRX9
Intel Core i9-14900HX
299 Points -6%
Lenovo Legion Slim 5 16APH8
AMD Ryzen 7 7840HS
280 Points -12%
MSI Stealth 16 Studio A13VG
Intel Core i7-13700H
273 Points -14%
Asus ROG Zephyrus M16 GU603H
Intel Core i9-11900H
236 Points -26%
Lenovo Legion 7 16 AGP11
AMD Ryzen AI 9 HX 470
192.7 Points -40%
Schenker XMG Core 16 M25
AMD Ryzen AI 9 HX 370
188.8 Points -41%
Blender / v2.79 BMW27 CPU
Asus ROG Zephyrus M16 GU603H
Intel Core i9-11900H
243 Seconds * -54%
Lenovo Legion Slim 5 16APH8
AMD Ryzen 7 7840HS
185 Seconds * -17%
Durchschnittliche Intel Core Ultra 9 386H
  (156 - 299, n=10)
183.3 Seconds * -16%
Razer Blade 16 Core Ultra 9 386H
Intel Core Ultra 9 386H
171 Seconds * -8%
MSI Stealth 16 Studio A13VG
Intel Core i7-13700H
169 Seconds * -7%
MSI Stealth 16 AI B3WH
Intel Core Ultra 9 386H
158 Seconds *
Lenovo Legion 7 16 AGP11
AMD Ryzen AI 9 HX 470
140 Seconds * +11%
Schenker XMG Core 16 M25
AMD Ryzen AI 9 HX 370
139 Seconds * +12%
Lenovo Legion Pro 5 16IRX9
Intel Core i9-14900HX
113 Seconds * +28%
MSI Crosshair A16 HX E8WGK
AMD Ryzen 9 8940HX
96 Seconds * +39%
HP Omen Max 16-ah1932nr
Intel Core Ultra 9 290HX Plus
92 Seconds * +42%
Aorus Master 16 AM6J
AMD Ryzen 9 9955HX3D
82 Seconds * +48%
7-Zip 18.03 / 7z b 4
Aorus Master 16 AM6J
AMD Ryzen 9 9955HX3D
145000 MIPS +111%
MSI Crosshair A16 HX E8WGK
AMD Ryzen 9 8940HX
137645 MIPS +101%
Lenovo Legion Pro 5 16IRX9
Intel Core i9-14900HX
115585 MIPS +68%
HP Omen Max 16-ah1932nr
Intel Core Ultra 9 290HX Plus
103072 MIPS +50%
Schenker XMG Core 16 M25
AMD Ryzen AI 9 HX 370
84735 MIPS +23%
Lenovo Legion 7 16 AGP11
AMD Ryzen AI 9 HX 470
83161 MIPS +21%
MSI Stealth 16 Studio A13VG
Intel Core i7-13700H
76344 MIPS +11%
Razer Blade 16 Core Ultra 9 386H
Intel Core Ultra 9 386H
71655 MIPS +4%
Lenovo Legion Slim 5 16APH8
AMD Ryzen 7 7840HS
68815 MIPS 0%
MSI Stealth 16 AI B3WH
Intel Core Ultra 9 386H
68649 MIPS
Durchschnittliche Intel Core Ultra 9 386H
  (44980 - 72882, n=10)
66189 MIPS -4%
Asus ROG Zephyrus M16 GU603H
Intel Core i9-11900H
54156 MIPS -21%
7-Zip 18.03 / 7z b 4 -mmt1
Aorus Master 16 AM6J
AMD Ryzen 9 9955HX3D
7382 MIPS +21%
MSI Crosshair A16 HX E8WGK
AMD Ryzen 9 8940HX
7220 MIPS +18%
HP Omen Max 16-ah1932nr
Intel Core Ultra 9 290HX Plus
6802 MIPS +11%
Lenovo Legion Pro 5 16IRX9
Intel Core i9-14900HX
6776 MIPS +11%
Lenovo Legion Slim 5 16APH8
AMD Ryzen 7 7840HS
6516 MIPS +7%
Schenker XMG Core 16 M25
AMD Ryzen AI 9 HX 370
6487 MIPS +6%
Razer Blade 16 Core Ultra 9 386H
Intel Core Ultra 9 386H
6367 MIPS +4%
Lenovo Legion 7 16 AGP11
AMD Ryzen AI 9 HX 470
6244 MIPS +2%
Durchschnittliche Intel Core Ultra 9 386H
  (5488 - 6493, n=10)
6167 MIPS +1%
MSI Stealth 16 Studio A13VG
Intel Core i7-13700H
6125 MIPS 0%
MSI Stealth 16 AI B3WH
Intel Core Ultra 9 386H
6114 MIPS
Asus ROG Zephyrus M16 GU603H
Intel Core i9-11900H
5582 MIPS -9%
Geekbench 6.7 / Multi-Core
HP Omen Max 16-ah1932nr
Intel Core Ultra 9 290HX Plus
20585 Points
Aorus Master 16 AM6J
AMD Ryzen 9 9955HX3D
20023 Points
Lenovo Legion Pro 5 16IRX9
Intel Core i9-14900HX
18126 Points
Razer Blade 16 Core Ultra 9 386H
Intel Core Ultra 9 386H
16903 Points
MSI Crosshair A16 HX E8WGK
AMD Ryzen 9 8940HX
16483 Points
Schenker XMG Core 16 M25
AMD Ryzen AI 9 HX 370
16311 Points
Durchschnittliche Intel Core Ultra 9 386H
  (13776 - 17405, n=11)
16298 Points
Lenovo Legion 7 16 AGP11
AMD Ryzen AI 9 HX 470
16116 Points
Geekbench 6.7 / Single-Core
Aorus Master 16 AM6J
AMD Ryzen 9 9955HX3D
3203 Points
HP Omen Max 16-ah1932nr
Intel Core Ultra 9 290HX Plus
3100 Points
Lenovo Legion 7 16 AGP11
AMD Ryzen AI 9 HX 470
2958 Points
Schenker XMG Core 16 M25
AMD Ryzen AI 9 HX 370
2930 Points
Lenovo Legion Pro 5 16IRX9
Intel Core i9-14900HX
2889 Points
Razer Blade 16 Core Ultra 9 386H
Intel Core Ultra 9 386H
2886 Points
Durchschnittliche Intel Core Ultra 9 386H
  (2778 - 2947, n=11)
2876 Points
MSI Crosshair A16 HX E8WGK
AMD Ryzen 9 8940HX
2839 Points
Geekbench 5.5 / Multi-Core
HP Omen Max 16-ah1932nr
Intel Core Ultra 9 290HX Plus
24695 Points +59%
Aorus Master 16 AM6J
AMD Ryzen 9 9955HX3D
23661 Points +52%
Lenovo Legion Pro 5 16IRX9
Intel Core i9-14900HX
21299 Points +37%
MSI Crosshair A16 HX E8WGK
AMD Ryzen 9 8940HX
19054 Points +23%
Razer Blade 16 Core Ultra 9 386H
Intel Core Ultra 9 386H
17017 Points +9%
Schenker XMG Core 16 M25
AMD Ryzen AI 9 HX 370
16322 Points +5%
Durchschnittliche Intel Core Ultra 9 386H
  (13098 - 17557, n=9)
16194 Points +4%
Lenovo Legion 7 16 AGP11
AMD Ryzen AI 9 HX 470
16002 Points +3%
MSI Stealth 16 AI B3WH
Intel Core Ultra 9 386H
15541 Points
MSI Stealth 16 Studio A13VG
Intel Core i7-13700H
13239 Points -15%
Lenovo Legion Slim 5 16APH8
AMD Ryzen 7 7840HS
11651 Points -25%
Asus ROG Zephyrus M16 GU603H
Intel Core i9-11900H
9663 Points -38%
Geekbench 5.5 / Single-Core
Aorus Master 16 AM6J
AMD Ryzen 9 9955HX3D
2406 Points +16%
HP Omen Max 16-ah1932nr
Intel Core Ultra 9 290HX Plus
2251 Points +9%
Lenovo Legion 7 16 AGP11
AMD Ryzen AI 9 HX 470
2178 Points +5%
Razer Blade 16 Core Ultra 9 386H
Intel Core Ultra 9 386H
2109 Points +2%
Durchschnittliche Intel Core Ultra 9 386H
  (1992 - 2162, n=9)
2099 Points +1%
Schenker XMG Core 16 M25
AMD Ryzen AI 9 HX 370
2076 Points 0%
MSI Stealth 16 AI B3WH
Intel Core Ultra 9 386H
2070 Points
Lenovo Legion Pro 5 16IRX9
Intel Core i9-14900HX
2046 Points -1%
MSI Crosshair A16 HX E8WGK
AMD Ryzen 9 8940HX
2025 Points -2%
Lenovo Legion Slim 5 16APH8
AMD Ryzen 7 7840HS
1989 Points -4%
MSI Stealth 16 Studio A13VG
Intel Core i7-13700H
1829 Points -12%
Asus ROG Zephyrus M16 GU603H
Intel Core i9-11900H
1624 Points -22%
HWBOT x265 Benchmark v2.2 / 4k Preset
Aorus Master 16 AM6J
AMD Ryzen 9 9955HX3D
43 fps +75%
MSI Crosshair A16 HX E8WGK
AMD Ryzen 9 8940HX
35.7 fps +45%
HP Omen Max 16-ah1932nr
Intel Core Ultra 9 290HX Plus
32.6 fps +33%
Lenovo Legion Pro 5 16IRX9
Intel Core i9-14900HX
30.1 fps +22%
Lenovo Legion 7 16 AGP11
AMD Ryzen AI 9 HX 470
28.5 fps +16%
Schenker XMG Core 16 M25
AMD Ryzen AI 9 HX 370
28.4 fps +15%
MSI Stealth 16 AI B3WH
Intel Core Ultra 9 386H
24.6 fps
Razer Blade 16 Core Ultra 9 386H
Intel Core Ultra 9 386H
24.5 fps 0%
Durchschnittliche Intel Core Ultra 9 386H
  (13.2 - 25.8, n=10)
22.8 fps -7%
Lenovo Legion Slim 5 16APH8
AMD Ryzen 7 7840HS
21.8 fps -11%
MSI Stealth 16 Studio A13VG
Intel Core i7-13700H
19.7 fps -20%
Asus ROG Zephyrus M16 GU603H
Intel Core i9-11900H
15 fps -39%
LibreOffice / 20 Documents To PDF
Aorus Master 16 AM6J
AMD Ryzen 9 9955HX3D
71.8 s * -81%
MSI Stealth 16 Studio A13VG
Intel Core i7-13700H
54.6 s * -38%
Lenovo Legion 7 16 AGP11
AMD Ryzen AI 9 HX 470
53.8 s * -36%
Schenker XMG Core 16 M25
AMD Ryzen AI 9 HX 370
52.1 s * -32%
Durchschnittliche Intel Core Ultra 9 386H
  (38.5 - 56.1, n=10)
45.7 s * -15%
MSI Crosshair A16 HX E8WGK
AMD Ryzen 9 8940HX
43.6 s * -10%
Lenovo Legion Pro 5 16IRX9
Intel Core i9-14900HX
40.7 s * -3%
Asus ROG Zephyrus M16 GU603H
Intel Core i9-11900H
40.5 s * -2%
MSI Stealth 16 AI B3WH
Intel Core Ultra 9 386H
39.6 s *
Razer Blade 16 Core Ultra 9 386H
Intel Core Ultra 9 386H
38.5 s * +3%
Lenovo Legion Slim 5 16APH8
AMD Ryzen 7 7840HS
38.3 s * +3%
HP Omen Max 16-ah1932nr
Intel Core Ultra 9 290HX Plus
37 s * +7%
R Benchmark 2.5 / Overall mean
Asus ROG Zephyrus M16 GU603H
Intel Core i9-11900H
0.544 sec * -31%
MSI Stealth 16 Studio A13VG
Intel Core i7-13700H
0.4498 sec * -8%
Lenovo Legion Slim 5 16APH8
AMD Ryzen 7 7840HS
0.4336 sec * -5%
MSI Crosshair A16 HX E8WGK
AMD Ryzen 9 8940HX
0.4286 sec * -3%
Durchschnittliche Intel Core Ultra 9 386H
  (0.4055 - 0.4384, n=10)
0.4231 sec * -2%
Lenovo Legion 7 16 AGP11
AMD Ryzen AI 9 HX 470
0.4157 sec * -0%
MSI Stealth 16 AI B3WH
Intel Core Ultra 9 386H
0.4148 sec *
Razer Blade 16 Core Ultra 9 386H
Intel Core Ultra 9 386H
0.4096 sec * +1%
Schenker XMG Core 16 M25
AMD Ryzen AI 9 HX 370
0.3974 sec * +4%
Lenovo Legion Pro 5 16IRX9
Intel Core i9-14900HX
0.3917 sec * +6%
HP Omen Max 16-ah1932nr
Intel Core Ultra 9 290HX Plus
0.3899 sec * +6%
Aorus Master 16 AM6J
AMD Ryzen 9 9955HX3D
0.3566 sec * +14%

* ... kleinere Werte sind besser
Cinebench R15 CPU Multi 64Bit
3317 Points
Cinebench R15 OpenGL 64Bit
258 fps
Cinebench R15 Ref. Match 64Bit
99.6 %
Cinebench R15 CPU Single 64Bit
319 Points
Cinebench R20 CPU (Single Core)
806 Points
Cinebench R20 CPU (Multi Core)
8447 Points
Cinebench R23 Single Core
2111 Points
Cinebench R23 Multi Core
22084 Points
Cinebench 2024 CPU Single Core
122.8 Points
Cinebench 2024 CPU Multi Core
1233 Points
Cinebench 2026 CPU Multi
4951 Points
Cinebench 2026 CPU Single Thread
507 Points
Hilfe
Performance Rating
Aorus Master 16 AM6J -1!
AMD Ryzen 9 9955HX3D, GeForce RTX 5080 Laptop
94.9 pt
Lenovo Legion 7 16 AGP11 -1!
AMD Ryzen AI 9 HX 470, GeForce RTX 5060 Laptop
52.6 pt
MSI Stealth 16 Studio A13VG -1!
Intel Core i7-13700H, GeForce RTX 4070 Laptop GPU
41 pt
Asus ROG Zephyrus G16 GU606AW -1!
Intel Core Ultra 9 386H, GeForce RTX 5080 Laptop
40.8 pt
Razer Blade 16 Core Ultra 9 386H -1!
Intel Core Ultra 9 386H, GeForce RTX 5090 Laptop
40.7 pt
MSI Stealth 16 AI B3WH -1!
Intel Core Ultra 9 386H, GeForce RTX 5070 Ti Laptop
37 pt
Durchschnittliche Intel Core Ultra 9 386H -1!
 
36.7 pt
AIDA64 / FP32 Ray-Trace
Aorus Master 16 AM6J
AMD Ryzen 9 9955HX3D, GeForce RTX 5080 Laptop (v8.20.8100)
81070 KRay/s +277%
Lenovo Legion 7 16 AGP11
AMD Ryzen AI 9 HX 470, GeForce RTX 5060 Laptop (v8.20.8100)
38491 KRay/s +79%
Asus ROG Zephyrus G16 GU606AW
Intel Core Ultra 9 386H, GeForce RTX 5080 Laptop (v8.20.8100)
21921 KRay/s +2%
MSI Stealth 16 AI B3WH
Intel Core Ultra 9 386H, GeForce RTX 5070 Ti Laptop (v8.20.8100)
21481 KRay/s
Razer Blade 16 Core Ultra 9 386H
Intel Core Ultra 9 386H, GeForce RTX 5090 Laptop (v8.20.8100)
20588 KRay/s -4%
Durchschnittliche Intel Core Ultra 9 386H
  (10001 - 21921, n=10)
18779 KRay/s -13%
MSI Stealth 16 Studio A13VG
Intel Core i7-13700H, GeForce RTX 4070 Laptop GPU (v6.85.6300)
17934 KRay/s -17%
AIDA64 / FPU Julia
Aorus Master 16 AM6J
AMD Ryzen 9 9955HX3D, GeForce RTX 5080 Laptop (v8.20.8100)
372155 Points +240%
Lenovo Legion 7 16 AGP11
AMD Ryzen AI 9 HX 470, GeForce RTX 5060 Laptop (v8.20.8100)
146502 Points +34%
Asus ROG Zephyrus G16 GU606AW
Intel Core Ultra 9 386H, GeForce RTX 5080 Laptop (v8.20.8100)
112784 Points +3%
Razer Blade 16 Core Ultra 9 386H
Intel Core Ultra 9 386H, GeForce RTX 5090 Laptop (v8.20.8100)
110173 Points +1%
MSI Stealth 16 AI B3WH
Intel Core Ultra 9 386H, GeForce RTX 5070 Ti Laptop (v8.20.8100)
109571 Points
Durchschnittliche Intel Core Ultra 9 386H
  (53370 - 113595, n=10)
98600 Points -10%
MSI Stealth 16 Studio A13VG
Intel Core i7-13700H, GeForce RTX 4070 Laptop GPU (v6.85.6300)
81656 Points -25%
AIDA64 / CPU SHA3
Aorus Master 16 AM6J
AMD Ryzen 9 9955HX3D, GeForce RTX 5080 Laptop (v8.20.8100)
9630 MB/s +78%
Lenovo Legion 7 16 AGP11
AMD Ryzen AI 9 HX 470, GeForce RTX 5060 Laptop (v8.20.8100)
5821 MB/s +8%
Razer Blade 16 Core Ultra 9 386H
Intel Core Ultra 9 386H, GeForce RTX 5090 Laptop (v8.20.8100)
5516 MB/s +2%
Asus ROG Zephyrus G16 GU606AW
Intel Core Ultra 9 386H, GeForce RTX 5080 Laptop (v8.20.8100)
5508 MB/s +2%
MSI Stealth 16 AI B3WH
Intel Core Ultra 9 386H, GeForce RTX 5070 Ti Laptop (v8.20.8100)
5407 MB/s
Durchschnittliche Intel Core Ultra 9 386H
  (2776 - 5604, n=10)
4908 MB/s -9%
MSI Stealth 16 Studio A13VG
Intel Core i7-13700H, GeForce RTX 4070 Laptop GPU (v6.85.6300)
4080 MB/s -25%
AIDA64 / CPU Queen
MSI Stealth 16 Studio A13VG
Intel Core i7-13700H, GeForce RTX 4070 Laptop GPU (v6.85.6300)
105597 Points
AIDA64 / FPU SinJulia
Aorus Master 16 AM6J
AMD Ryzen 9 9955HX3D, GeForce RTX 5080 Laptop (v8.20.8100)
32252 Points +340%
Lenovo Legion 7 16 AGP11
AMD Ryzen AI 9 HX 470, GeForce RTX 5060 Laptop (v8.20.8100)
19201 Points +162%
MSI Stealth 16 Studio A13VG
Intel Core i7-13700H, GeForce RTX 4070 Laptop GPU (v6.85.6300)
11050 Points +51%
Asus ROG Zephyrus G16 GU606AW
Intel Core Ultra 9 386H, GeForce RTX 5080 Laptop (v8.20.8100)
7333 Points 0%
MSI Stealth 16 AI B3WH
Intel Core Ultra 9 386H, GeForce RTX 5070 Ti Laptop (v8.20.8100)
7322 Points
Razer Blade 16 Core Ultra 9 386H
Intel Core Ultra 9 386H, GeForce RTX 5090 Laptop (v8.20.8100)
7267 Points -1%
Durchschnittliche Intel Core Ultra 9 386H
  (5314 - 7333, n=10)
6947 Points -5%
AIDA64 / FPU Mandel
Aorus Master 16 AM6J
AMD Ryzen 9 9955HX3D, GeForce RTX 5080 Laptop (v8.20.8100)
196829 Points +236%
Lenovo Legion 7 16 AGP11
AMD Ryzen AI 9 HX 470, GeForce RTX 5060 Laptop (v8.20.8100)
74636 Points +27%
Asus ROG Zephyrus G16 GU606AW
Intel Core Ultra 9 386H, GeForce RTX 5080 Laptop (v8.20.8100)
61540 Points +5%
MSI Stealth 16 AI B3WH
Intel Core Ultra 9 386H, GeForce RTX 5070 Ti Laptop (v8.20.8100)
58598 Points
Razer Blade 16 Core Ultra 9 386H
Intel Core Ultra 9 386H, GeForce RTX 5090 Laptop (v8.20.8100)
58275 Points -1%
Durchschnittliche Intel Core Ultra 9 386H
  (28414 - 61578, n=10)
52659 Points -10%
MSI Stealth 16 Studio A13VG
Intel Core i7-13700H, GeForce RTX 4070 Laptop GPU (v6.85.6300)
44154 Points -25%
AIDA64 / CPU AES
Aorus Master 16 AM6J
AMD Ryzen 9 9955HX3D, GeForce RTX 5080 Laptop (v8.20.8100)
160619 MB/s +128%
Lenovo Legion 7 16 AGP11
AMD Ryzen AI 9 HX 470, GeForce RTX 5060 Laptop (v8.20.8100)
117375 MB/s +67%
MSI Stealth 16 Studio A13VG
Intel Core i7-13700H, GeForce RTX 4070 Laptop GPU (v6.85.6300)
81504 MB/s +16%
Asus ROG Zephyrus G16 GU606AW
Intel Core Ultra 9 386H, GeForce RTX 5080 Laptop (v8.20.8100)
70454 MB/s 0%
Razer Blade 16 Core Ultra 9 386H
Intel Core Ultra 9 386H, GeForce RTX 5090 Laptop (v8.20.8100)
70408 MB/s 0%
MSI Stealth 16 AI B3WH
Intel Core Ultra 9 386H, GeForce RTX 5070 Ti Laptop (v8.20.8100)
70307 MB/s
Durchschnittliche Intel Core Ultra 9 386H
  (46362 - 72112, n=10)
65978 MB/s -6%
AIDA64 / CPU ZLib
Aorus Master 16 AM6J
AMD Ryzen 9 9955HX3D, GeForce RTX 5080 Laptop (v8.20.8100)
2436 MB/s +91%
Lenovo Legion 7 16 AGP11
AMD Ryzen AI 9 HX 470, GeForce RTX 5060 Laptop (v8.20.8100)
1549 MB/s +22%
MSI Stealth 16 AI B3WH
Intel Core Ultra 9 386H, GeForce RTX 5070 Ti Laptop (v8.20.8100)
1273 MB/s
Razer Blade 16 Core Ultra 9 386H
Intel Core Ultra 9 386H, GeForce RTX 5090 Laptop (v8.20.8100)
1271 MB/s 0%
Asus ROG Zephyrus G16 GU606AW
Intel Core Ultra 9 386H, GeForce RTX 5080 Laptop (v8.20.8100)
1267 MB/s 0%
Durchschnittliche Intel Core Ultra 9 386H
  (669 - 1273, n=10)
1152 MB/s -10%
MSI Stealth 16 Studio A13VG
Intel Core i7-13700H, GeForce RTX 4070 Laptop GPU (v6.85.6300)
1032 MB/s -19%
AIDA64 / FP64 Ray-Trace
Aorus Master 16 AM6J
AMD Ryzen 9 9955HX3D, GeForce RTX 5080 Laptop (v8.20.8100)
43081 KRay/s +277%
Lenovo Legion 7 16 AGP11
AMD Ryzen AI 9 HX 470, GeForce RTX 5060 Laptop (v8.20.8100)
19610 KRay/s +72%
Asus ROG Zephyrus G16 GU606AW
Intel Core Ultra 9 386H, GeForce RTX 5080 Laptop (v8.20.8100)
11672 KRay/s +2%
MSI Stealth 16 AI B3WH
Intel Core Ultra 9 386H, GeForce RTX 5070 Ti Laptop (v8.20.8100)
11432 KRay/s
Razer Blade 16 Core Ultra 9 386H
Intel Core Ultra 9 386H, GeForce RTX 5090 Laptop (v8.20.8100)
10023 KRay/s -12%
Durchschnittliche Intel Core Ultra 9 386H
  (5138 - 11672, n=10)
9814 KRay/s -14%
MSI Stealth 16 Studio A13VG
Intel Core i7-13700H, GeForce RTX 4070 Laptop GPU (v6.85.6300)
9680 KRay/s -15%
AIDA64 / CPU PhotoWorxx
Razer Blade 16 Core Ultra 9 386H
Intel Core Ultra 9 386H, GeForce RTX 5090 Laptop (v8.20.8100)
89891 MPixel/s +65%
Asus ROG Zephyrus G16 GU606AW
Intel Core Ultra 9 386H, GeForce RTX 5080 Laptop (v8.20.8100)
84002 MPixel/s +54%
Durchschnittliche Intel Core Ultra 9 386H
  (54042 - 89891, n=10)
76111 MPixel/s +40%
MSI Stealth 16 AI B3WH
Intel Core Ultra 9 386H, GeForce RTX 5070 Ti Laptop (v8.20.8100)
54493 MPixel/s
Lenovo Legion 7 16 AGP11
AMD Ryzen AI 9 HX 470, GeForce RTX 5060 Laptop (v8.20.8100)
54302 MPixel/s 0%
MSI Stealth 16 Studio A13VG
Intel Core i7-13700H, GeForce RTX 4070 Laptop GPU (v6.85.6300)
46114 MPixel/s -15%
Aorus Master 16 AM6J
AMD Ryzen 9 9955HX3D, GeForce RTX 5080 Laptop (v8.20.8100)
44266 MPixel/s -19%
AIDA64 / CPU CheckMate
Aorus Master 16 AM6J
AMD Ryzen 9 9955HX3D, GeForce RTX 5080 Laptop (v8.20.8100)
20751 MP/s +341%
Lenovo Legion 7 16 AGP11
AMD Ryzen AI 9 HX 470, GeForce RTX 5060 Laptop (v8.20.8100)
8080 MP/s +72%
Asus ROG Zephyrus G16 GU606AW
Intel Core Ultra 9 386H, GeForce RTX 5080 Laptop (v8.20.8100)
4839 MP/s +3%
Razer Blade 16 Core Ultra 9 386H
Intel Core Ultra 9 386H, GeForce RTX 5090 Laptop (v8.20.8100)
4811 MP/s +2%
MSI Stealth 16 AI B3WH
Intel Core Ultra 9 386H, GeForce RTX 5070 Ti Laptop (v8.20.8100)
4708 MP/s
Durchschnittliche Intel Core Ultra 9 386H
  (4051 - 4858, n=9)
4645 MP/s -1%

Systemleistung

PCMark 10 Standard
PCMark 10 Standard
Performance Rating
Razer Blade 16 Core Ultra 9 386H
GeForce RTX 5090 Laptop, Ultra 9 386H, Lexar NM790 2TB
91.1 pt
Aorus Master 16 AM6J -3!
GeForce RTX 5080 Laptop, R9 9955HX3D, Samsung PM9C1b MZVL81T0HFLB-00BTW
90.3 pt
Asus ROG Zephyrus G16 GU606AW
GeForce RTX 5080 Laptop, Ultra 9 386H, Samsung PM9C1b MZVL82T0HBL1
88.7 pt
MSI Stealth 16 AI B3WH
GeForce RTX 5070 Ti Laptop, Ultra 9 386H, Samsung PM9C1b MZVL81T0HFLB-00BTW
86.6 pt
Durchschnittliche Intel Core Ultra 9 386H, NVIDIA GeForce RTX 5070 Ti Laptop
 
84.6 pt
Lenovo Legion 7 16 AGP11 -3!
GeForce RTX 5060 Laptop, Ryzen AI 9 HX 470, Lenovo UMIS AM541 1TB
76.8 pt
MSI Stealth 16 Studio A13VG -3!
GeForce RTX 4070 Laptop GPU, i7-13700H, Micron 3400 2TB MTFDKBA2T0TFH
71 pt
PCMark 10 / Score
Aorus Master 16 AM6J
GeForce RTX 5080 Laptop, R9 9955HX3D, Samsung PM9C1b MZVL81T0HFLB-00BTW
10636 Points +4%
MSI Stealth 16 AI B3WH
GeForce RTX 5070 Ti Laptop, Ultra 9 386H, Samsung PM9C1b MZVL81T0HFLB-00BTW
10211 Points
Razer Blade 16 Core Ultra 9 386H
GeForce RTX 5090 Laptop, Ultra 9 386H, Lexar NM790 2TB
10164 Points 0%
Asus ROG Zephyrus G16 GU606AW
GeForce RTX 5080 Laptop, Ultra 9 386H, Samsung PM9C1b MZVL82T0HBL1
9827 Points -4%
Durchschnittliche Intel Core Ultra 9 386H, NVIDIA GeForce RTX 5070 Ti Laptop
  (9049 - 10211, n=2)
9630 Points -6%
Lenovo Legion 7 16 AGP11
GeForce RTX 5060 Laptop, Ryzen AI 9 HX 470, Lenovo UMIS AM541 1TB
9485 Points -7%
MSI Stealth 16 Studio A13VG
GeForce RTX 4070 Laptop GPU, i7-13700H, Micron 3400 2TB MTFDKBA2T0TFH
7329 Points -28%
PCMark 10 / Essentials
Aorus Master 16 AM6J
GeForce RTX 5080 Laptop, R9 9955HX3D, Samsung PM9C1b MZVL81T0HFLB-00BTW
11564 Points +9%
Razer Blade 16 Core Ultra 9 386H
GeForce RTX 5090 Laptop, Ultra 9 386H, Lexar NM790 2TB
10840 Points +2%
MSI Stealth 16 AI B3WH
GeForce RTX 5070 Ti Laptop, Ultra 9 386H, Samsung PM9C1b MZVL81T0HFLB-00BTW
10648 Points
MSI Stealth 16 Studio A13VG
GeForce RTX 4070 Laptop GPU, i7-13700H, Micron 3400 2TB MTFDKBA2T0TFH
10491 Points -1%
Lenovo Legion 7 16 AGP11
GeForce RTX 5060 Laptop, Ryzen AI 9 HX 470, Lenovo UMIS AM541 1TB
10430 Points -2%
Durchschnittliche Intel Core Ultra 9 386H, NVIDIA GeForce RTX 5070 Ti Laptop
  (10068 - 10648, n=2)
10358 Points -3%
Asus ROG Zephyrus G16 GU606AW
GeForce RTX 5080 Laptop, Ultra 9 386H, Samsung PM9C1b MZVL82T0HBL1
10124 Points -5%
PCMark 10 / Productivity
Aorus Master 16 AM6J
GeForce RTX 5080 Laptop, R9 9955HX3D, Samsung PM9C1b MZVL81T0HFLB-00BTW
19653 Points +9%
MSI Stealth 16 AI B3WH
GeForce RTX 5070 Ti Laptop, Ultra 9 386H, Samsung PM9C1b MZVL81T0HFLB-00BTW
18000 Points
Asus ROG Zephyrus G16 GU606AW
GeForce RTX 5080 Laptop, Ultra 9 386H, Samsung PM9C1b MZVL82T0HBL1
16800 Points -7%
Razer Blade 16 Core Ultra 9 386H
GeForce RTX 5090 Laptop, Ultra 9 386H, Lexar NM790 2TB
16063 Points -11%
Lenovo Legion 7 16 AGP11
GeForce RTX 5060 Laptop, Ryzen AI 9 HX 470, Lenovo UMIS AM541 1TB
15691 Points -13%
Durchschnittliche Intel Core Ultra 9 386H, NVIDIA GeForce RTX 5070 Ti Laptop
  (13132 - 18000, n=2)
15566 Points -14%
MSI Stealth 16 Studio A13VG
GeForce RTX 4070 Laptop GPU, i7-13700H, Micron 3400 2TB MTFDKBA2T0TFH
9376 Points -48%
PCMark 10 / Digital Content Creation
Razer Blade 16 Core Ultra 9 386H
GeForce RTX 5090 Laptop, Ultra 9 386H, Lexar NM790 2TB
16364 Points +9%
Asus ROG Zephyrus G16 GU606AW
GeForce RTX 5080 Laptop, Ultra 9 386H, Samsung PM9C1b MZVL82T0HBL1
15144 Points 0%
Durchschnittliche Intel Core Ultra 9 386H, NVIDIA GeForce RTX 5070 Ti Laptop
  (15074 - 15207, n=2)
15141 Points 0%
MSI Stealth 16 AI B3WH
GeForce RTX 5070 Ti Laptop, Ultra 9 386H, Samsung PM9C1b MZVL81T0HFLB-00BTW
15074 Points
Aorus Master 16 AM6J
GeForce RTX 5080 Laptop, R9 9955HX3D, Samsung PM9C1b MZVL81T0HFLB-00BTW
14368 Points -5%
Lenovo Legion 7 16 AGP11
GeForce RTX 5060 Laptop, Ryzen AI 9 HX 470, Lenovo UMIS AM541 1TB
14151 Points -6%
MSI Stealth 16 Studio A13VG
GeForce RTX 4070 Laptop GPU, i7-13700H, Micron 3400 2TB MTFDKBA2T0TFH
10860 Points -28%
CrossMark / Overall
Razer Blade 16 Core Ultra 9 386H
GeForce RTX 5090 Laptop, Ultra 9 386H, Lexar NM790 2TB
2185 Points +6%
Asus ROG Zephyrus G16 GU606AW
GeForce RTX 5080 Laptop, Ultra 9 386H, Samsung PM9C1b MZVL82T0HBL1
2180 Points +6%
Aorus Master 16 AM6J
GeForce RTX 5080 Laptop, R9 9955HX3D, Samsung PM9C1b MZVL81T0HFLB-00BTW
2126 Points +3%
MSI Stealth 16 AI B3WH
GeForce RTX 5070 Ti Laptop, Ultra 9 386H, Samsung PM9C1b MZVL81T0HFLB-00BTW
2061 Points
Durchschnittliche Intel Core Ultra 9 386H, NVIDIA GeForce RTX 5070 Ti Laptop
  (2029 - 2061, n=2)
2045 Points -1%
MSI Stealth 16 Studio A13VG
GeForce RTX 4070 Laptop GPU, i7-13700H, Micron 3400 2TB MTFDKBA2T0TFH
1789 Points -13%
Lenovo Legion 7 16 AGP11
GeForce RTX 5060 Laptop, Ryzen AI 9 HX 470, Lenovo UMIS AM541 1TB
1570 Points -24%
CrossMark / Productivity
Asus ROG Zephyrus G16 GU606AW
GeForce RTX 5080 Laptop, Ultra 9 386H, Samsung PM9C1b MZVL82T0HBL1
1977 Points +3%
Razer Blade 16 Core Ultra 9 386H
GeForce RTX 5090 Laptop, Ultra 9 386H, Lexar NM790 2TB
1972 Points +2%
MSI Stealth 16 AI B3WH
GeForce RTX 5070 Ti Laptop, Ultra 9 386H, Samsung PM9C1b MZVL81T0HFLB-00BTW
1926 Points
Aorus Master 16 AM6J
GeForce RTX 5080 Laptop, R9 9955HX3D, Samsung PM9C1b MZVL81T0HFLB-00BTW
1914 Points -1%
Durchschnittliche Intel Core Ultra 9 386H, NVIDIA GeForce RTX 5070 Ti Laptop
  (1802 - 1926, n=2)
1864 Points -3%
MSI Stealth 16 Studio A13VG
GeForce RTX 4070 Laptop GPU, i7-13700H, Micron 3400 2TB MTFDKBA2T0TFH
1705 Points -11%
Lenovo Legion 7 16 AGP11
GeForce RTX 5060 Laptop, Ryzen AI 9 HX 470, Lenovo UMIS AM541 1TB
1430 Points -26%
CrossMark / Creativity
Razer Blade 16 Core Ultra 9 386H
GeForce RTX 5090 Laptop, Ultra 9 386H, Lexar NM790 2TB
2558 Points +11%
Asus ROG Zephyrus G16 GU606AW
GeForce RTX 5080 Laptop, Ultra 9 386H, Samsung PM9C1b MZVL82T0HBL1
2558 Points +11%
Aorus Master 16 AM6J
GeForce RTX 5080 Laptop, R9 9955HX3D, Samsung PM9C1b MZVL81T0HFLB-00BTW
2547 Points +11%
Durchschnittliche Intel Core Ultra 9 386H, NVIDIA GeForce RTX 5070 Ti Laptop
  (2300 - 2404, n=2)
2352 Points +2%
MSI Stealth 16 AI B3WH
GeForce RTX 5070 Ti Laptop, Ultra 9 386H, Samsung PM9C1b MZVL81T0HFLB-00BTW
2300 Points
MSI Stealth 16 Studio A13VG
GeForce RTX 4070 Laptop GPU, i7-13700H, Micron 3400 2TB MTFDKBA2T0TFH
1936 Points -16%
Lenovo Legion 7 16 AGP11
GeForce RTX 5060 Laptop, Ryzen AI 9 HX 470, Lenovo UMIS AM541 1TB
1764 Points -23%
CrossMark / Responsiveness
Razer Blade 16 Core Ultra 9 386H
GeForce RTX 5090 Laptop, Ultra 9 386H, Lexar NM790 2TB
1854 Points +2%
MSI Stealth 16 AI B3WH
GeForce RTX 5070 Ti Laptop, Ultra 9 386H, Samsung PM9C1b MZVL81T0HFLB-00BTW
1818 Points
Asus ROG Zephyrus G16 GU606AW
GeForce RTX 5080 Laptop, Ultra 9 386H, Samsung PM9C1b MZVL82T0HBL1
1810 Points 0%
Durchschnittliche Intel Core Ultra 9 386H, NVIDIA GeForce RTX 5070 Ti Laptop
  (1745 - 1818, n=2)
1782 Points -2%
Aorus Master 16 AM6J
GeForce RTX 5080 Laptop, R9 9955HX3D, Samsung PM9C1b MZVL81T0HFLB-00BTW
1691 Points -7%
MSI Stealth 16 Studio A13VG
GeForce RTX 4070 Laptop GPU, i7-13700H, Micron 3400 2TB MTFDKBA2T0TFH
1635 Points -10%
Lenovo Legion 7 16 AGP11
GeForce RTX 5060 Laptop, Ryzen AI 9 HX 470, Lenovo UMIS AM541 1TB
1463 Points -20%
WebXPRT 3 / Overall
Aorus Master 16 AM6J
GeForce RTX 5080 Laptop, R9 9955HX3D, Samsung PM9C1b MZVL81T0HFLB-00BTW
335 Points +2%
Lenovo Legion 7 16 AGP11
GeForce RTX 5060 Laptop, Ryzen AI 9 HX 470, Lenovo UMIS AM541 1TB
329 Points +1%
MSI Stealth 16 AI B3WH
GeForce RTX 5070 Ti Laptop, Ultra 9 386H, Samsung PM9C1b MZVL81T0HFLB-00BTW
327 Points
Razer Blade 16 Core Ultra 9 386H
GeForce RTX 5090 Laptop, Ultra 9 386H, Lexar NM790 2TB
325 Points -1%
Durchschnittliche Intel Core Ultra 9 386H, NVIDIA GeForce RTX 5070 Ti Laptop
  (309 - 327, n=2)
318 Points -3%
Asus ROG Zephyrus G16 GU606AW
GeForce RTX 5080 Laptop, Ultra 9 386H, Samsung PM9C1b MZVL82T0HBL1
313 Points -4%
MSI Stealth 16 Studio A13VG
GeForce RTX 4070 Laptop GPU, i7-13700H, Micron 3400 2TB MTFDKBA2T0TFH
297 Points -9%
WebXPRT 4 / Overall
Aorus Master 16 AM6J
GeForce RTX 5080 Laptop, R9 9955HX3D, Samsung PM9C1b MZVL81T0HFLB-00BTW
309 Points +2%
MSI Stealth 16 AI B3WH
GeForce RTX 5070 Ti Laptop, Ultra 9 386H, Samsung PM9C1b MZVL81T0HFLB-00BTW
304 Points
Razer Blade 16 Core Ultra 9 386H
GeForce RTX 5090 Laptop, Ultra 9 386H, Lexar NM790 2TB
301 Points -1%
Asus ROG Zephyrus G16 GU606AW
GeForce RTX 5080 Laptop, Ultra 9 386H, Samsung PM9C1b MZVL82T0HBL1
300 Points -1%
Durchschnittliche Intel Core Ultra 9 386H, NVIDIA GeForce RTX 5070 Ti Laptop
  (292 - 304, n=2)
298 Points -2%
Lenovo Legion 7 16 AGP11
GeForce RTX 5060 Laptop, Ryzen AI 9 HX 470, Lenovo UMIS AM541 1TB
282.5 Points -7%
MSI Stealth 16 Studio A13VG
GeForce RTX 4070 Laptop GPU, i7-13700H, Micron 3400 2TB MTFDKBA2T0TFH
268 Points -12%
Mozilla Kraken 1.1 / Total
MSI Stealth 16 Studio A13VG
GeForce RTX 4070 Laptop GPU, i7-13700H, Micron 3400 2TB MTFDKBA2T0TFH
509 ms * -13%
Asus ROG Zephyrus G16 GU606AW
GeForce RTX 5080 Laptop, Ultra 9 386H, Samsung PM9C1b MZVL82T0HBL1
457 ms * -2%
Asus ROG Zephyrus G16 GU606AW
GeForce RTX 5080 Laptop, Ultra 9 386H, Samsung PM9C1b MZVL82T0HBL1
442 ms * +2%
Razer Blade 16 Core Ultra 9 386H
GeForce RTX 5090 Laptop, Ultra 9 386H, Lexar NM790 2TB
456 ms * -1%
Durchschnittliche Intel Core Ultra 9 386H, NVIDIA GeForce RTX 5070 Ti Laptop
  (450 - 461, n=2)
456 ms * -1%
MSI Stealth 16 AI B3WH
GeForce RTX 5070 Ti Laptop, Ultra 9 386H, Samsung PM9C1b MZVL81T0HFLB-00BTW
450 ms *
Lenovo Legion 7 16 AGP11
GeForce RTX 5060 Laptop, Ryzen AI 9 HX 470, Lenovo UMIS AM541 1TB
422 ms * +6%
Aorus Master 16 AM6J
GeForce RTX 5080 Laptop, R9 9955HX3D, Samsung PM9C1b MZVL81T0HFLB-00BTW
405 ms * +10%
Geekbench AI / Quantized GPU 1.7
Razer Blade 16 Core Ultra 9 386H
GeForce RTX 5090 Laptop, Ultra 9 386H, Lexar NM790 2TB
19400 Points +15%
Asus ROG Zephyrus G16 GU606AW
GeForce RTX 5080 Laptop, Ultra 9 386H, Samsung PM9C1b MZVL82T0HBL1
19062 Points +13%
Durchschnittliche Intel Core Ultra 9 386H, NVIDIA GeForce RTX 5070 Ti Laptop
  (16823 - 16842, n=2)
16833 Points 0%
MSI Stealth 16 AI B3WH
GeForce RTX 5070 Ti Laptop, Ultra 9 386H, Samsung PM9C1b MZVL81T0HFLB-00BTW
16823 Points
Geekbench AI / Half Precision GPU 1.7
Razer Blade 16 Core Ultra 9 386H
GeForce RTX 5090 Laptop, Ultra 9 386H, Lexar NM790 2TB
42258 Points +17%
Asus ROG Zephyrus G16 GU606AW
GeForce RTX 5080 Laptop, Ultra 9 386H, Samsung PM9C1b MZVL82T0HBL1
40285 Points +12%
Durchschnittliche Intel Core Ultra 9 386H, NVIDIA GeForce RTX 5070 Ti Laptop
  (36110 - 37148, n=2)
36629 Points +1%
MSI Stealth 16 AI B3WH
GeForce RTX 5070 Ti Laptop, Ultra 9 386H, Samsung PM9C1b MZVL81T0HFLB-00BTW
36110 Points
Geekbench AI / Single Precision GPU 1.7
Razer Blade 16 Core Ultra 9 386H
GeForce RTX 5090 Laptop, Ultra 9 386H, Lexar NM790 2TB
26380 Points +24%
Asus ROG Zephyrus G16 GU606AW
GeForce RTX 5080 Laptop, Ultra 9 386H, Samsung PM9C1b MZVL82T0HBL1
24018 Points +13%
Durchschnittliche Intel Core Ultra 9 386H, NVIDIA GeForce RTX 5070 Ti Laptop
  (21236 - 21341, n=2)
21289 Points 0%
MSI Stealth 16 AI B3WH
GeForce RTX 5070 Ti Laptop, Ultra 9 386H, Samsung PM9C1b MZVL81T0HFLB-00BTW
21236 Points

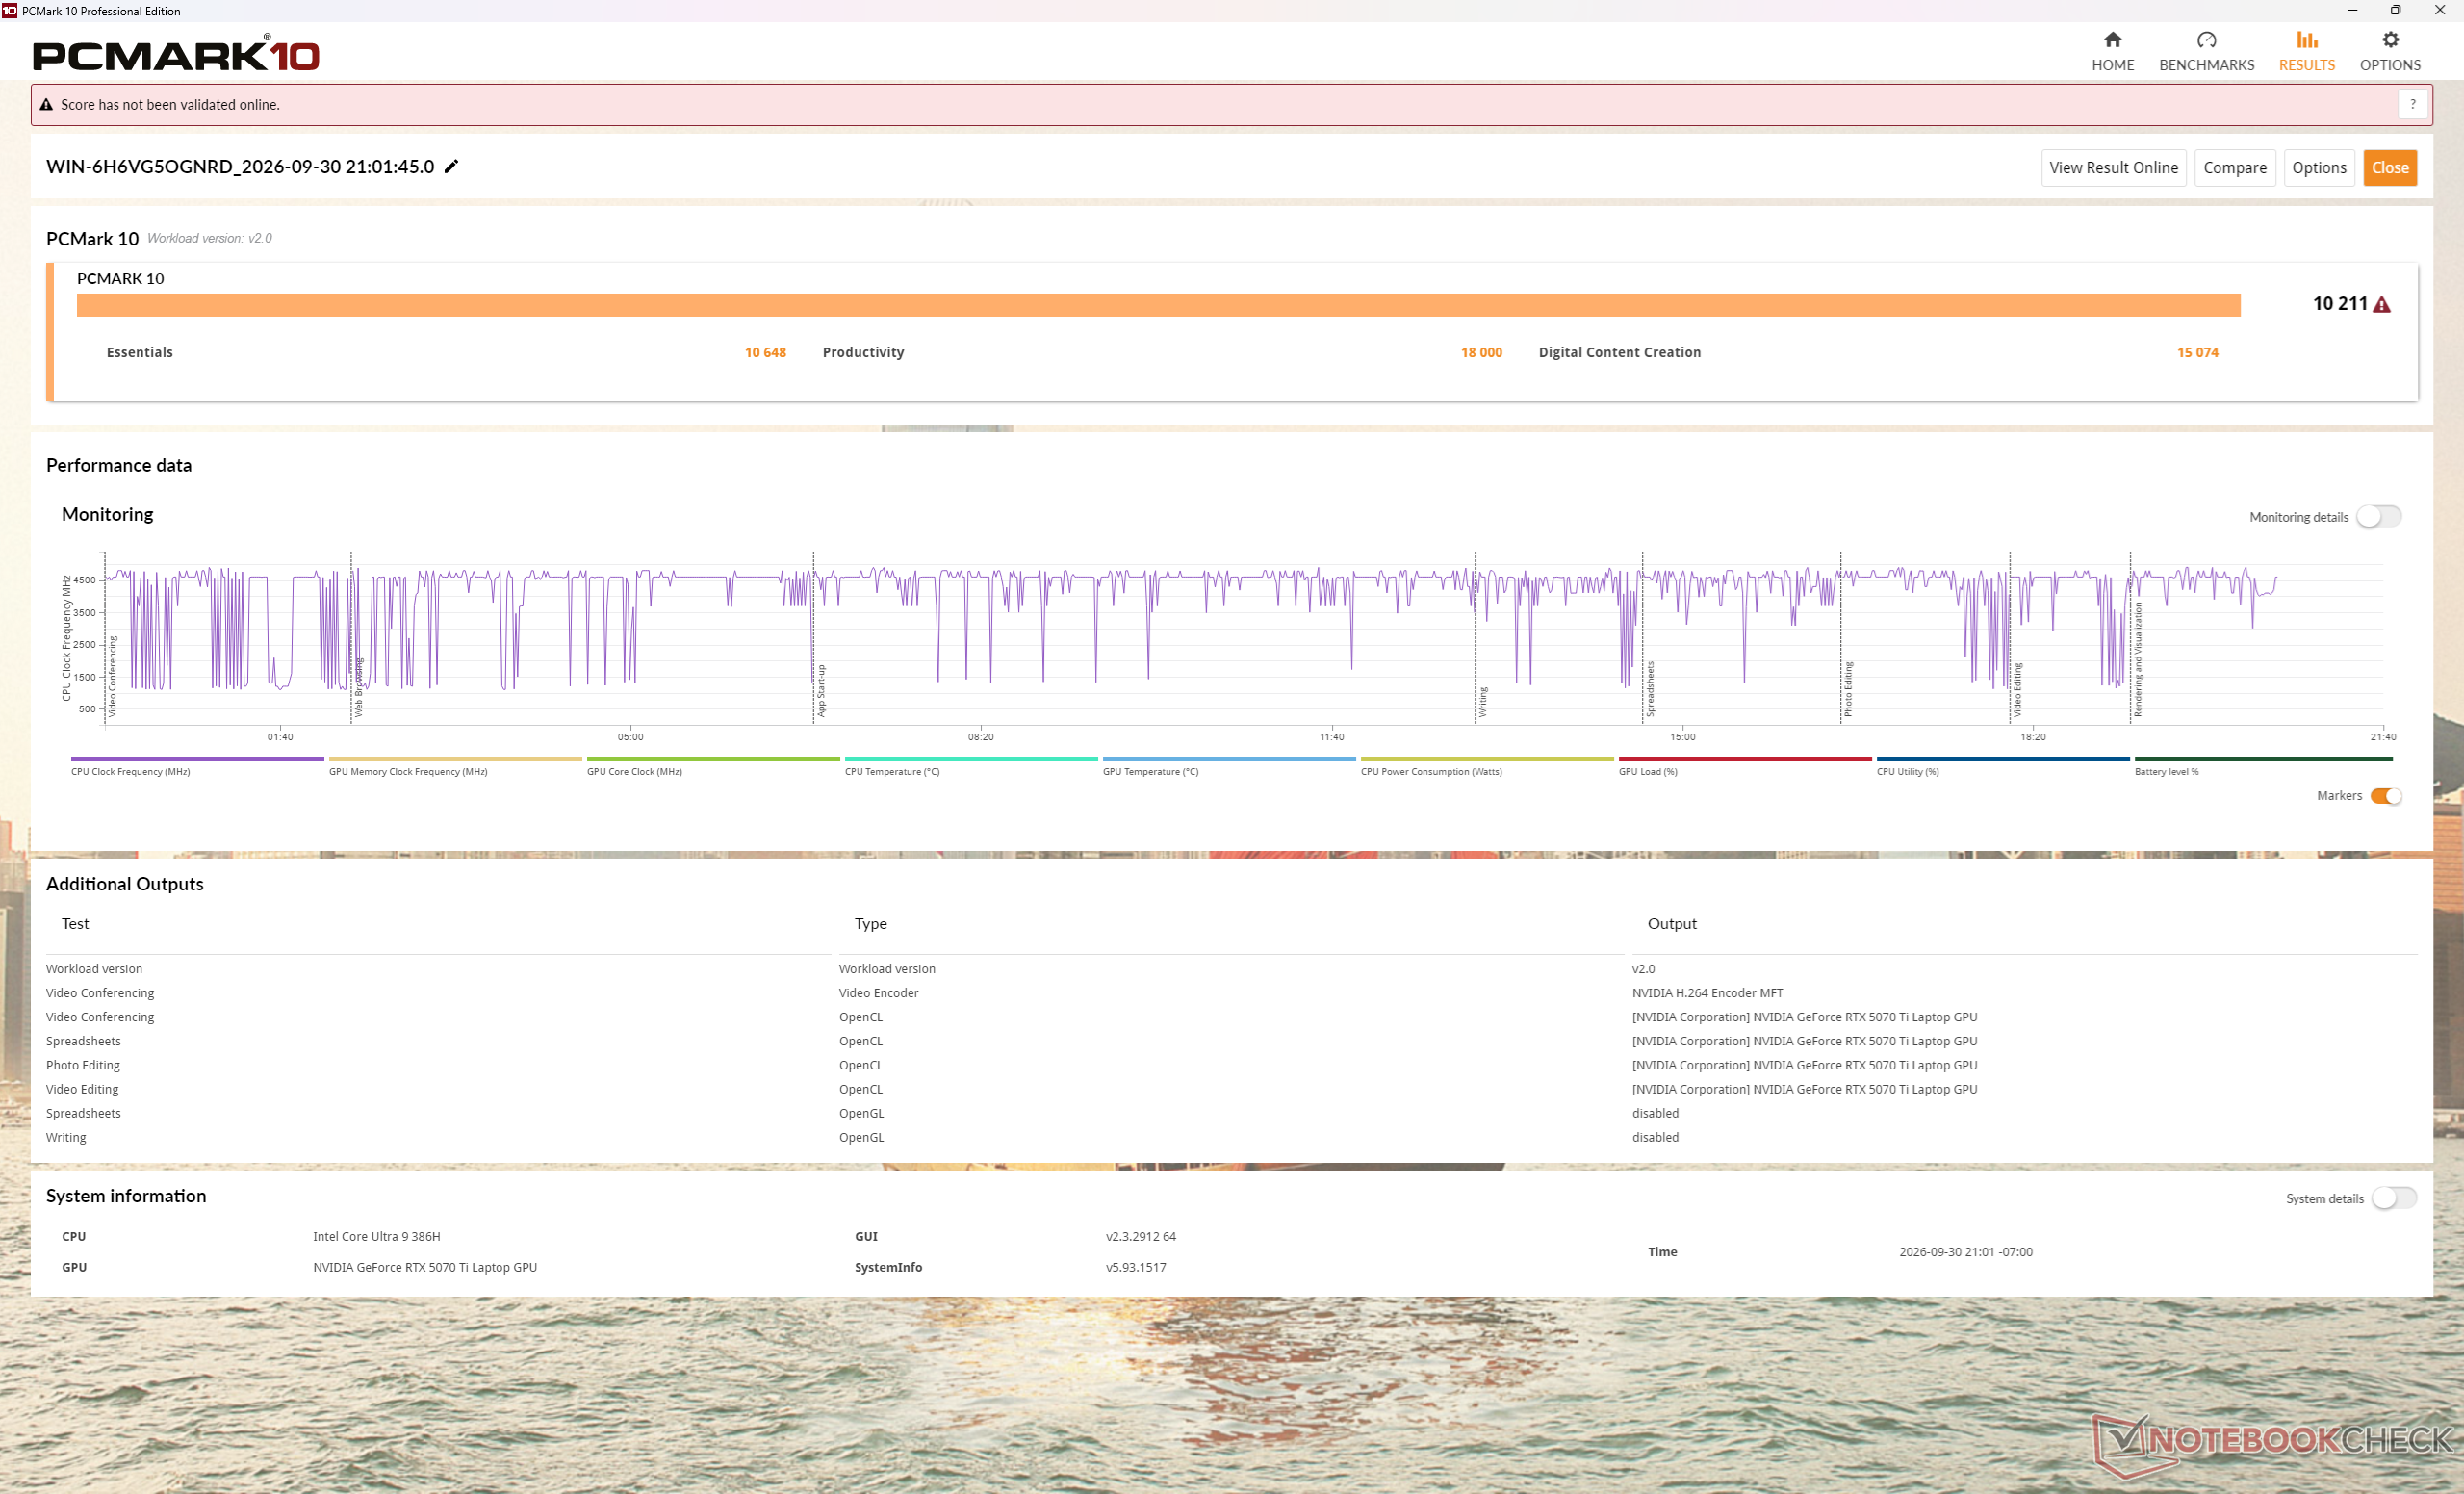
* ... kleinere Werte sind besser

PCMark 10 Score
10211 Punkte
Hilfe
AIDA64 / Memory Copy
Razer Blade 16 Core Ultra 9 386H
Intel Core Ultra 9 386H, GeForce RTX 5090 Laptop
129946 MB/s +60%
Asus ROG Zephyrus G16 GU606AW
Intel Core Ultra 9 386H, GeForce RTX 5080 Laptop
118166 MB/s +45%
Durchschnittliche Intel Core Ultra 9 386H
  (75437 - 129946, n=10)
109277 MB/s +34%
Lenovo Legion 7 16 AGP11
AMD Ryzen AI 9 HX 470, GeForce RTX 5060 Laptop
86767 MB/s +7%
MSI Stealth 16 AI B3WH
Intel Core Ultra 9 386H, GeForce RTX 5070 Ti Laptop
81326 MB/s
MSI Stealth 16 Studio A13VG
Intel Core i7-13700H, GeForce RTX 4070 Laptop GPU
69289 MB/s -15%
Aorus Master 16 AM6J
AMD Ryzen 9 9955HX3D, GeForce RTX 5080 Laptop
63173 MB/s -22%
AIDA64 / Memory Read
Razer Blade 16 Core Ultra 9 386H
Intel Core Ultra 9 386H, GeForce RTX 5090 Laptop
118858 MB/s +43%
Asus ROG Zephyrus G16 GU606AW
Intel Core Ultra 9 386H, GeForce RTX 5080 Laptop
112707 MB/s +35%
Durchschnittliche Intel Core Ultra 9 386H
  (81021 - 118858, n=10)
103803 MB/s +25%
Lenovo Legion 7 16 AGP11
AMD Ryzen AI 9 HX 470, GeForce RTX 5060 Laptop
93860 MB/s +13%
MSI Stealth 16 AI B3WH
Intel Core Ultra 9 386H, GeForce RTX 5070 Ti Laptop
83346 MB/s
MSI Stealth 16 Studio A13VG
Intel Core i7-13700H, GeForce RTX 4070 Laptop GPU
73950 MB/s -11%
Aorus Master 16 AM6J
AMD Ryzen 9 9955HX3D, GeForce RTX 5080 Laptop
66539 MB/s -20%
AIDA64 / Memory Write
Razer Blade 16 Core Ultra 9 386H
Intel Core Ultra 9 386H, GeForce RTX 5090 Laptop
135096 MB/s +73%
Asus ROG Zephyrus G16 GU606AW
Intel Core Ultra 9 386H, GeForce RTX 5080 Laptop
120757 MB/s +54%
Lenovo Legion 7 16 AGP11
AMD Ryzen AI 9 HX 470, GeForce RTX 5060 Laptop
118364 MB/s +51%
Durchschnittliche Intel Core Ultra 9 386H
  (75959 - 135096, n=10)
110651 MB/s +41%
MSI Stealth 16 AI B3WH
Intel Core Ultra 9 386H, GeForce RTX 5070 Ti Laptop
78270 MB/s
MSI Stealth 16 Studio A13VG
Intel Core i7-13700H, GeForce RTX 4070 Laptop GPU
71464 MB/s -9%
Aorus Master 16 AM6J
AMD Ryzen 9 9955HX3D, GeForce RTX 5080 Laptop
69431 MB/s -11%
AIDA64 / Memory Latency
MSI Stealth 16 AI B3WH
Intel Core Ultra 9 386H, GeForce RTX 5070 Ti Laptop
118.6 ns *
Lenovo Legion 7 16 AGP11
AMD Ryzen AI 9 HX 470, GeForce RTX 5060 Laptop
104.1 ns * +12%
Aorus Master 16 AM6J
AMD Ryzen 9 9955HX3D, GeForce RTX 5080 Laptop
100.4 ns * +15%
Durchschnittliche Intel Core Ultra 9 386H
  (87.2 - 118.6, n=10)
98.2 ns * +17%
Asus ROG Zephyrus G16 GU606AW
Intel Core Ultra 9 386H, GeForce RTX 5080 Laptop
90 ns * +24%
MSI Stealth 16 Studio A13VG
Intel Core i7-13700H, GeForce RTX 4070 Laptop GPU
87.6 ns * +26%
Razer Blade 16 Core Ultra 9 386H
Intel Core Ultra 9 386H, GeForce RTX 5090 Laptop
87.2 ns * +26%

* ... kleinere Werte sind besser

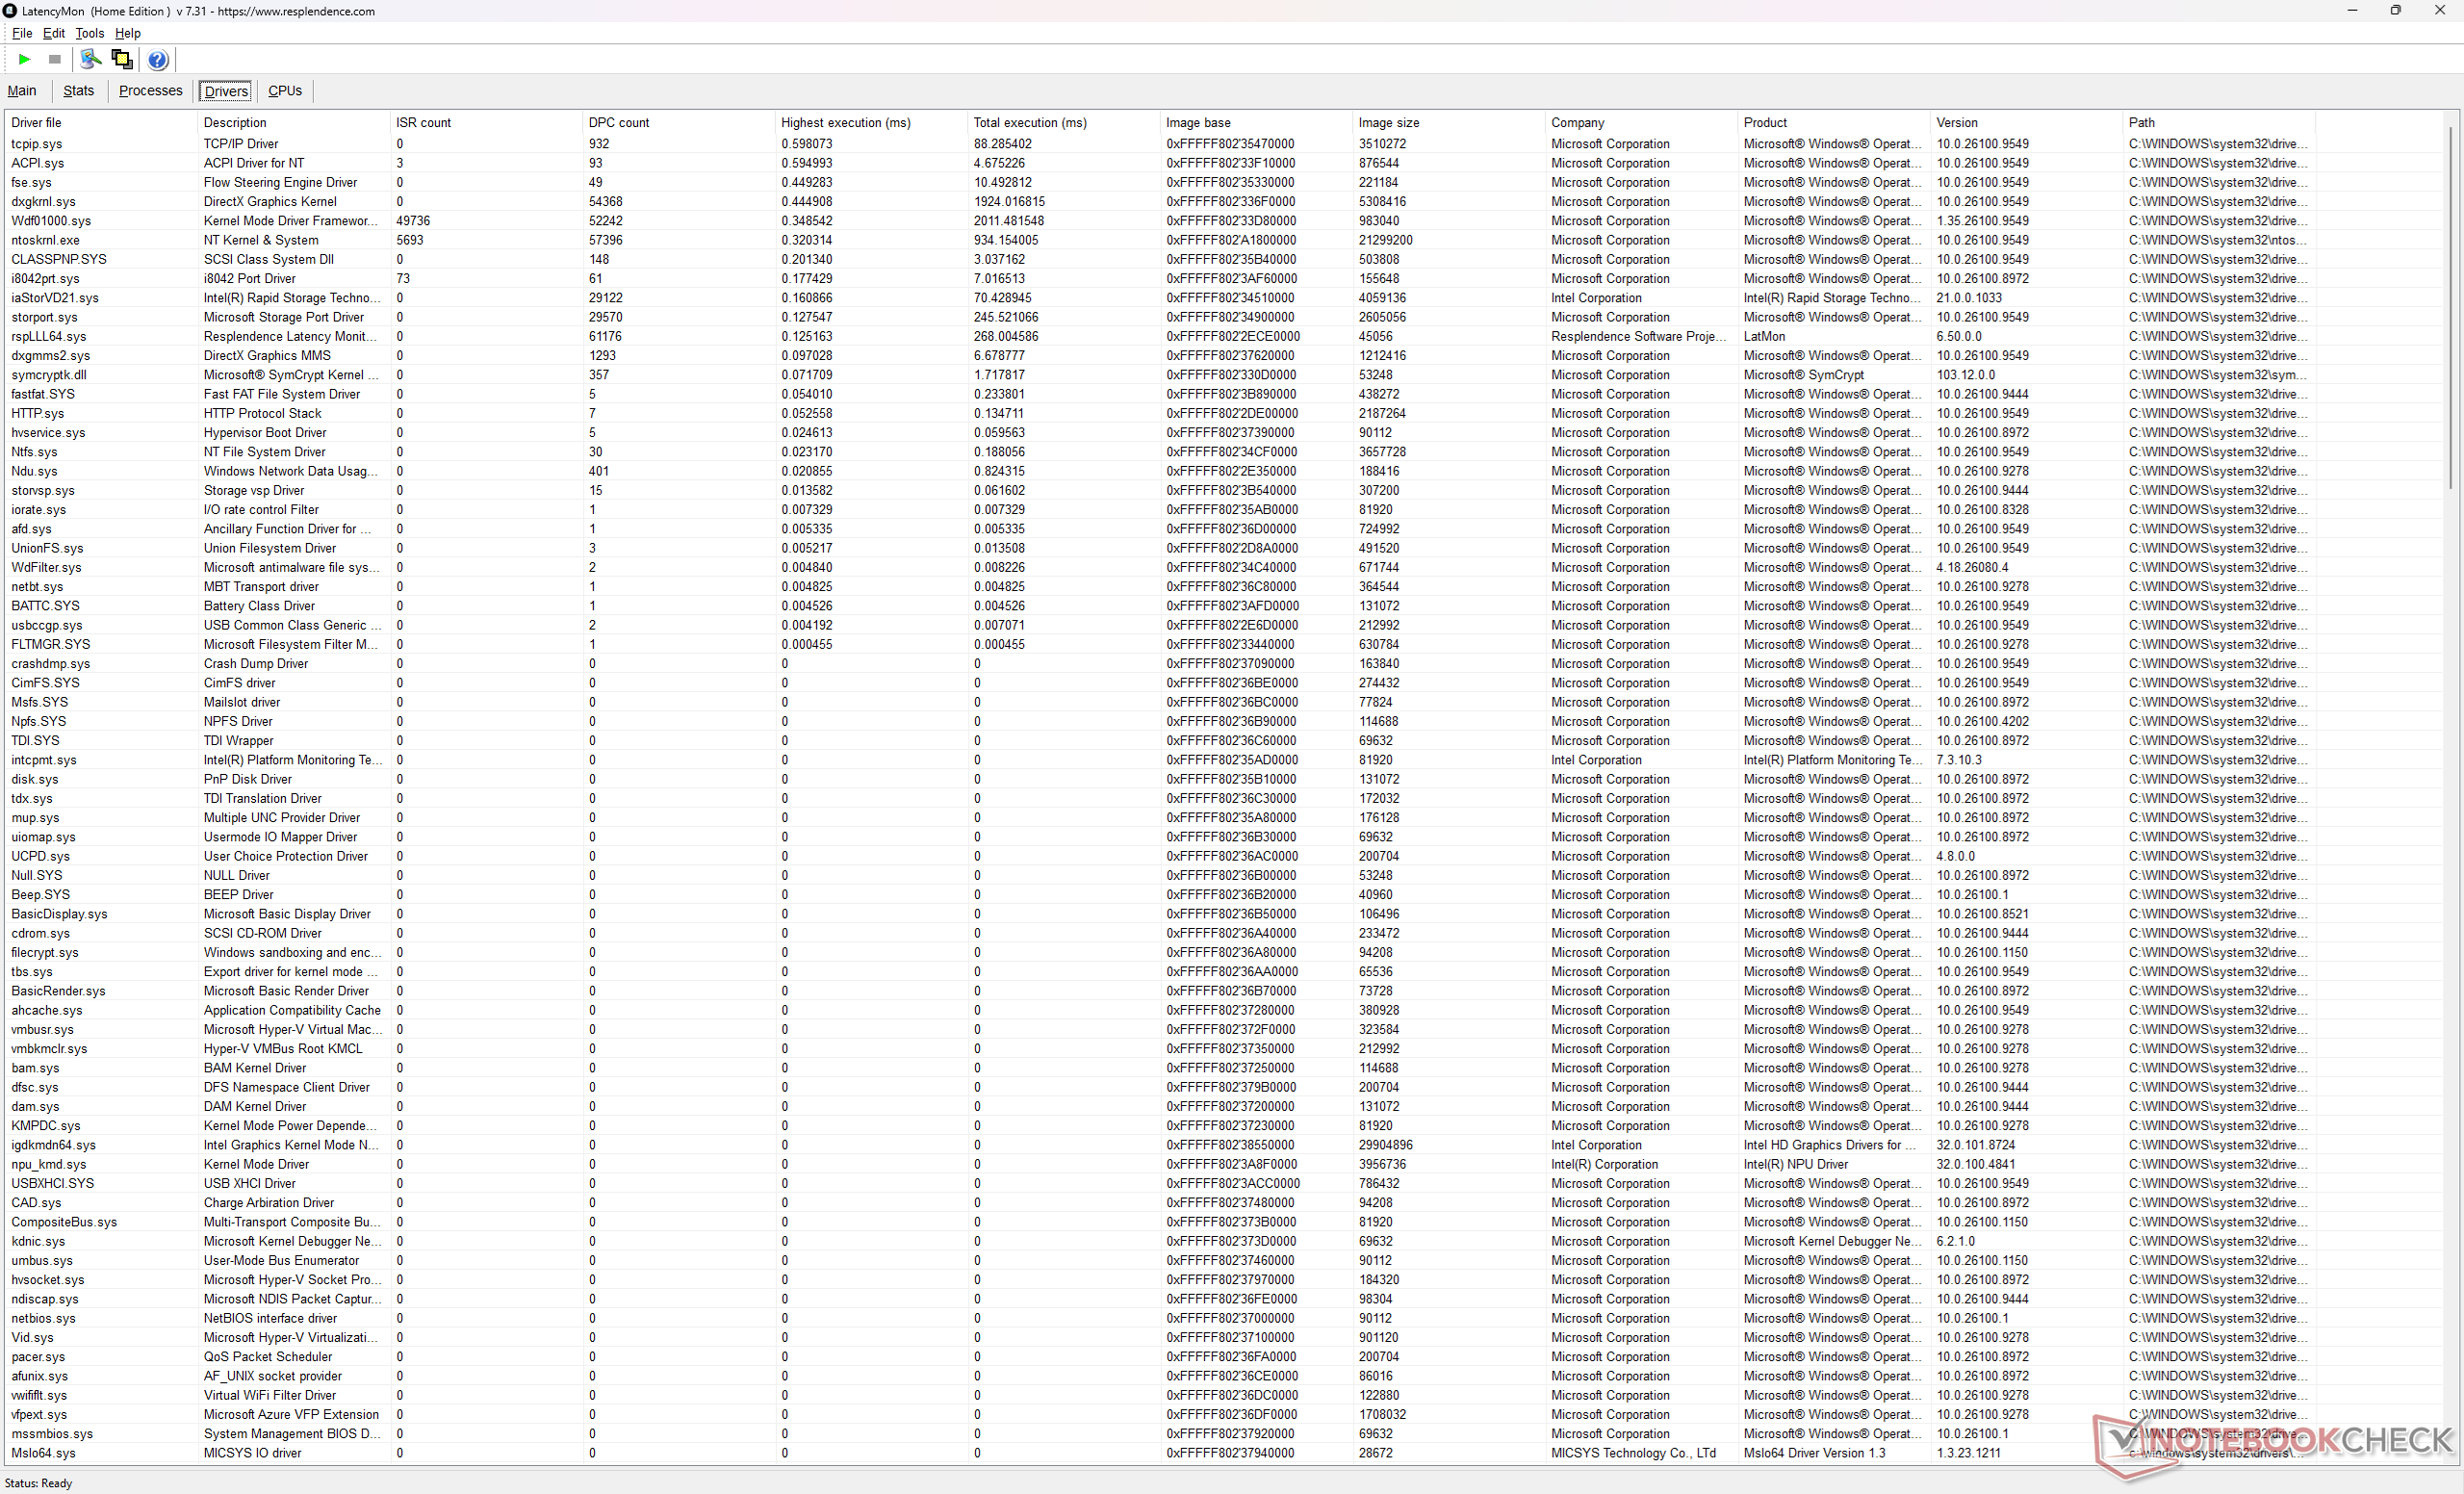
DPC-Latenzen
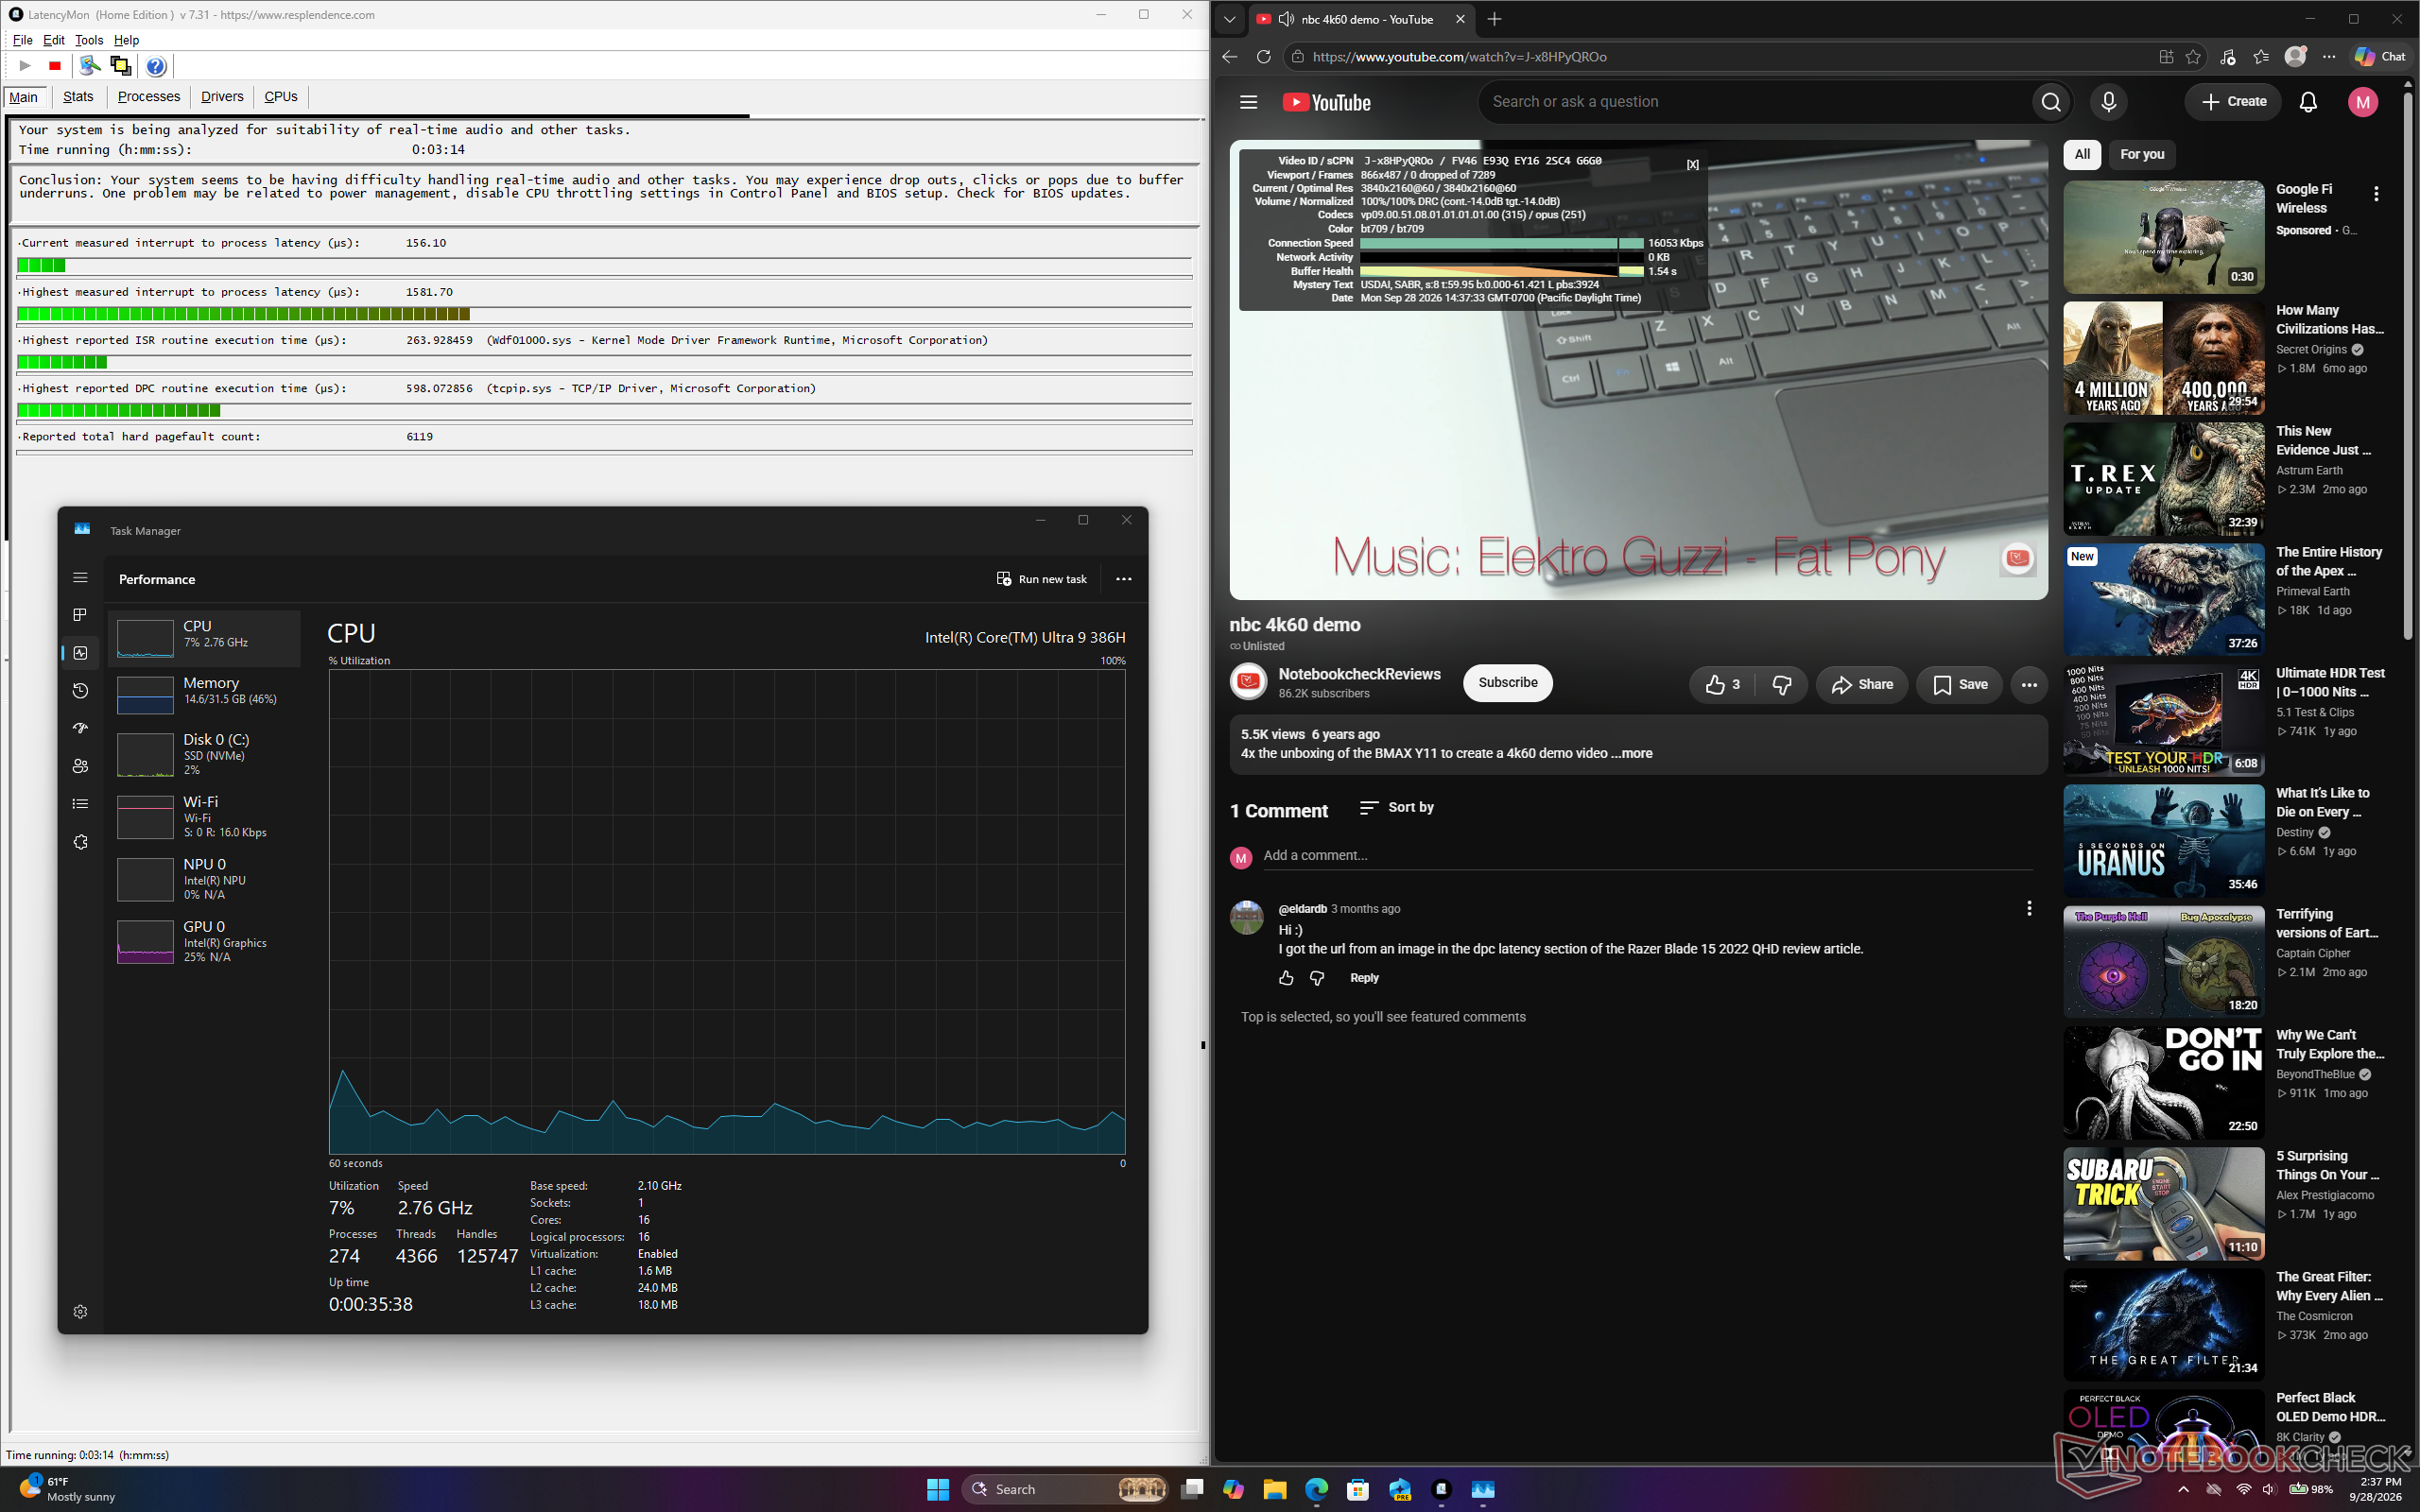
LatencyMon zeigt nur geringfügige DPC-Probleme und keine ausgelassenen Frames bei der 4K60-Videowiedergabe
Liste der Treiber
Liste der Treiber
DPC Latencies / LatencyMon - interrupt to process latency (max), Web, Youtube, Prime95
MSI Stealth 16 Studio A13VG
GeForce RTX 4070 Laptop GPU, i7-13700H, Micron 3400 2TB MTFDKBA2T0TFH
18226.8 μs * -1052%
Lenovo Legion 7 16 AGP11
GeForce RTX 5060 Laptop, Ryzen AI 9 HX 470, Lenovo UMIS AM541 1TB
7645.7 μs * -383%
Razer Blade 16 Core Ultra 9 386H
GeForce RTX 5090 Laptop, Ultra 9 386H, Lexar NM790 2TB
1826.3 μs * -15%
MSI Stealth 16 AI B3WH
GeForce RTX 5070 Ti Laptop, Ultra 9 386H, Samsung PM9C1b MZVL81T0HFLB-00BTW
1581.7 μs *
Asus ROG Zephyrus G16 GU606AW
GeForce RTX 5080 Laptop, Ultra 9 386H, Samsung PM9C1b MZVL82T0HBL1
365.8 μs * +77%

* ... kleinere Werte sind besser

Massenspeicher

Die Samsung PM9C1b in unserem System zeigt nicht die Drosselungsprobleme, die wir beim Stealth 16 von 2023 festgestellt hatten.
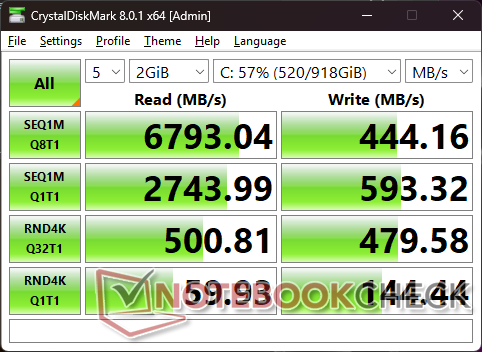
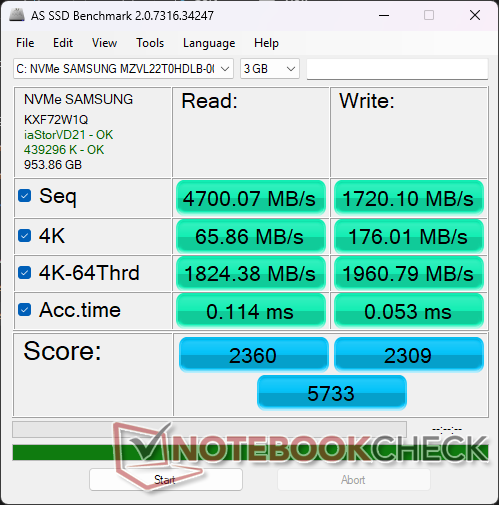
CDM 8
CDM 8
AS SSD
AS SSD
Samsung PM9C1b MZVL81T0HFLB-00BTW
CDM 5/6 Read Seq Q32T1: 7001 MB/s
CDM 5/6 Write Seq Q32T1: 5415 MB/s
CDM 5/6 Read 4K Q32T1: 511.6 MB/s
CDM 5/6 Write 4K Q32T1: 580.2 MB/s
CDM 5 Read Seq: 2611 MB/s
CDM 5 Write Seq: 734.5 MB/s
CDM 5/6 Read 4K: 67.31 MB/s
CDM 5/6 Write 4K: 127.9 MB/s
Drive Performance Rating - Percent
Aorus Master 16 AM6J
Samsung PM9C1b MZVL81T0HFLB-00BTW
88.9 pt
MSI Stealth 16 Studio A13VG
Micron 3400 2TB MTFDKBA2T0TFH
87.2 pt
Lenovo Legion 7 16 AGP11
Lenovo UMIS AM541 1TB
81.3 pt
Asus ROG Zephyrus G16 GU606AW
Samsung PM9C1b MZVL82T0HBL1
78.7 pt
MSI Stealth 16 AI B3WH
Samsung PM9C1b MZVL81T0HFLB-00BTW
67.6 pt
Razer Blade 16 Core Ultra 9 386H
Lexar NM790 2TB
56.6 pt
DiskSpd
seq read
Lenovo Legion 7 16 AGP11
Lenovo UMIS AM541 1TB
3703 (3682.83min - 3703.01max) MB/s +73%
Aorus Master 16 AM6J
Samsung PM9C1b MZVL81T0HFLB-00BTW
3378 (3230.45min - 3378.26max) MB/s +57%
MSI Stealth 16 Studio A13VG
Micron 3400 2TB MTFDKBA2T0TFH
3349 (938.07min - 3349.15max) MB/s +56%
Asus ROG Zephyrus G16 GU606AW
Samsung PM9C1b MZVL82T0HBL1
3085 (3064.52min - 3085max) MB/s +44%
Razer Blade 16 Core Ultra 9 386H
Lexar NM790 2TB
2184 (2156.5min - 2184.39max) MB/s +2%
MSI Stealth 16 AI B3WH
Samsung PM9C1b MZVL81T0HFLB-00BTW
2145 (1598.45min - 2144.66max) MB/s
seq write
MSI Stealth 16 Studio A13VG
Micron 3400 2TB MTFDKBA2T0TFH
4485 (775.32min - 4484.81max) MB/s +131%
Aorus Master 16 AM6J
Samsung PM9C1b MZVL81T0HFLB-00BTW
3491 (3110.85min - 3490.71max) MB/s +80%
Lenovo Legion 7 16 AGP11
Lenovo UMIS AM541 1TB
3446 (2891.25min - 3446.25max) MB/s +77%
Razer Blade 16 Core Ultra 9 386H
Lexar NM790 2TB
3302 (1890.37min - 3302.39max) MB/s +70%
Asus ROG Zephyrus G16 GU606AW
Samsung PM9C1b MZVL82T0HBL1
2775 (2677.43min - 2774.74max) MB/s +43%
MSI Stealth 16 AI B3WH
Samsung PM9C1b MZVL81T0HFLB-00BTW
1943 (1502.96min - 1942.59max) MB/s
seq q8 t1 read
MSI Stealth 16 AI B3WH
Samsung PM9C1b MZVL81T0HFLB-00BTW
7078 (5389.68min - 7077.89max) MB/s
Asus ROG Zephyrus G16 GU606AW
Samsung PM9C1b MZVL82T0HBL1
7068 (5262.59min - 7067.7max) MB/s 0%
Razer Blade 16 Core Ultra 9 386H
Lexar NM790 2TB
6991 (6203.59min - 6991.49max) MB/s -1%
Lenovo Legion 7 16 AGP11
Lenovo UMIS AM541 1TB
6510 (5026.26min - 6509.54max) MB/s -8%
MSI Stealth 16 Studio A13VG
Micron 3400 2TB MTFDKBA2T0TFH
6460 (6020.84min - 6459.94max) MB/s -9%
Aorus Master 16 AM6J
Samsung PM9C1b MZVL81T0HFLB-00BTW
5597 (4952.59min - 5597.43max) MB/s -21%
seq q8 t1 write
Razer Blade 16 Core Ultra 9 386H
Lexar NM790 2TB
6384 (2633.81min - 6383.97max) MB/s +12%
Asus ROG Zephyrus G16 GU606AW
Samsung PM9C1b MZVL82T0HBL1
5755 (5615.64min - 5755max) MB/s +1%
MSI Stealth 16 AI B3WH
Samsung PM9C1b MZVL81T0HFLB-00BTW
5692 (1799.95min - 5692.24max) MB/s
MSI Stealth 16 Studio A13VG
Micron 3400 2TB MTFDKBA2T0TFH
4803 (4344.79min - 4802.73max) MB/s -16%
Aorus Master 16 AM6J
Samsung PM9C1b MZVL81T0HFLB-00BTW
3705 (3255.83min - 3704.62max) MB/s -35%
Lenovo Legion 7 16 AGP11
Lenovo UMIS AM541 1TB
3485 (3346.01min - 3484.63max) MB/s -39%
4k q1 t1 read
Aorus Master 16 AM6J
Samsung PM9C1b MZVL81T0HFLB-00BTW
77.4 (74.48min - 77.41max) MB/s +6%
Asus ROG Zephyrus G16 GU606AW
Samsung PM9C1b MZVL82T0HBL1
73.3 (72.62min - 73.28max) MB/s 0%
MSI Stealth 16 AI B3WH
Samsung PM9C1b MZVL81T0HFLB-00BTW
73.2 (72.71min - 73.2max) MB/s
MSI Stealth 16 Studio A13VG
Micron 3400 2TB MTFDKBA2T0TFH
67.9 (64.79min - 67.93max) MB/s -7%
Lenovo Legion 7 16 AGP11
Lenovo UMIS AM541 1TB
65.7 (64.97min - 65.69max) MB/s -10%
Razer Blade 16 Core Ultra 9 386H
Lexar NM790 2TB
60.5 (59.31min - 60.47max) MB/s -17%
4k q1 t1 write
MSI Stealth 16 Studio A13VG
Micron 3400 2TB MTFDKBA2T0TFH
253 (250.9min - 252.85max) MB/s +22%
Lenovo Legion 7 16 AGP11
Lenovo UMIS AM541 1TB
248 (245.65min - 248.33max) MB/s +20%
Aorus Master 16 AM6J
Samsung PM9C1b MZVL81T0HFLB-00BTW
226 (220.4min - 226.16max) MB/s +9%
MSI Stealth 16 AI B3WH
Samsung PM9C1b MZVL81T0HFLB-00BTW
207 (157.18min - 206.55max) MB/s
Razer Blade 16 Core Ultra 9 386H
Lexar NM790 2TB
192.1 (191.3min - 192.14max) MB/s -7%
Asus ROG Zephyrus G16 GU606AW
Samsung PM9C1b MZVL82T0HBL1
170.6 (169.75min - 170.57max) MB/s -18%
4k q32 t16 read
Aorus Master 16 AM6J
Samsung PM9C1b MZVL81T0HFLB-00BTW
4063 (4026.11min - 4063.09max) MB/s +43%
Asus ROG Zephyrus G16 GU606AW
Samsung PM9C1b MZVL82T0HBL1
3084 (3064.93min - 3084.36max) MB/s +8%
MSI Stealth 16 Studio A13VG
Micron 3400 2TB MTFDKBA2T0TFH
3013 (755.04min - 3013.06max) MB/s +6%
MSI Stealth 16 AI B3WH
Samsung PM9C1b MZVL81T0HFLB-00BTW
2851 (2824.97min - 2851.18max) MB/s
Lenovo Legion 7 16 AGP11
Lenovo UMIS AM541 1TB
1925 (1917.76min - 1925.46max) MB/s -32%
Razer Blade 16 Core Ultra 9 386H
Lexar NM790 2TB
886 (853.99min - 885.71max) MB/s -69%
4k q32 t16 write
MSI Stealth 16 Studio A13VG
Micron 3400 2TB MTFDKBA2T0TFH
2736 (1172min - 2736.15max) MB/s +22%
Aorus Master 16 AM6J
Samsung PM9C1b MZVL81T0HFLB-00BTW
2590 (2147.15min - 2589.9max) MB/s +16%
MSI Stealth 16 AI B3WH
Samsung PM9C1b MZVL81T0HFLB-00BTW
2238 (2173.54min - 2237.9max) MB/s
Asus ROG Zephyrus G16 GU606AW
Samsung PM9C1b MZVL82T0HBL1
2193 (2143.73min - 2192.91max) MB/s -2%
Lenovo Legion 7 16 AGP11
Lenovo UMIS AM541 1TB
1848 (1263.19min - 1848.28max) MB/s -17%
Razer Blade 16 Core Ultra 9 386H
Lexar NM790 2TB
504 (484.83min - 503.6max) MB/s -77%
AS SSD
Score Total
Aorus Master 16 AM6J
Samsung PM9C1b MZVL81T0HFLB-00BTW
9344 Points +63%
MSI Stealth 16 Studio A13VG
Micron 3400 2TB MTFDKBA2T0TFH
7774 Points +36%
Asus ROG Zephyrus G16 GU606AW
Samsung PM9C1b MZVL82T0HBL1
7687 Points +34%
Lenovo Legion 7 16 AGP11
Lenovo UMIS AM541 1TB
7527 Points +31%
MSI Stealth 16 AI B3WH
Samsung PM9C1b MZVL81T0HFLB-00BTW
5733 Points
Razer Blade 16 Core Ultra 9 386H
Lexar NM790 2TB
4107 Points -28%
Score Read
Aorus Master 16 AM6J
Samsung PM9C1b MZVL81T0HFLB-00BTW
3427 Points +45%
MSI Stealth 16 Studio A13VG
Micron 3400 2TB MTFDKBA2T0TFH
2959 Points +25%
Asus ROG Zephyrus G16 GU606AW
Samsung PM9C1b MZVL82T0HBL1
2957 Points +25%
Lenovo Legion 7 16 AGP11
Lenovo UMIS AM541 1TB
2608 Points +11%
MSI Stealth 16 AI B3WH
Samsung PM9C1b MZVL81T0HFLB-00BTW
2360 Points
Razer Blade 16 Core Ultra 9 386H
Lexar NM790 2TB
1379 Points -42%
Score Write
Aorus Master 16 AM6J
Samsung PM9C1b MZVL81T0HFLB-00BTW
4249 Points +84%
Lenovo Legion 7 16 AGP11
Lenovo UMIS AM541 1TB
3606 Points +56%
MSI Stealth 16 Studio A13VG
Micron 3400 2TB MTFDKBA2T0TFH
3331 Points +44%
Asus ROG Zephyrus G16 GU606AW
Samsung PM9C1b MZVL82T0HBL1
3314 Points +44%
MSI Stealth 16 AI B3WH
Samsung PM9C1b MZVL81T0HFLB-00BTW
2309 Points
Razer Blade 16 Core Ultra 9 386H
Lexar NM790 2TB
2100 Points -9%
Seq Read
Aorus Master 16 AM6J
Samsung PM9C1b MZVL81T0HFLB-00BTW
5721.12 MB/s +22%
Lenovo Legion 7 16 AGP11
Lenovo UMIS AM541 1TB
5701 MB/s +21%
Asus ROG Zephyrus G16 GU606AW
Samsung PM9C1b MZVL82T0HBL1
5510 MB/s +17%
MSI Stealth 16 Studio A13VG
Micron 3400 2TB MTFDKBA2T0TFH
5126 MB/s +9%
Razer Blade 16 Core Ultra 9 386H
Lexar NM790 2TB
4970.9 MB/s +6%
MSI Stealth 16 AI B3WH
Samsung PM9C1b MZVL81T0HFLB-00BTW
4700.07 MB/s
Seq Write
Lenovo Legion 7 16 AGP11
Lenovo UMIS AM541 1TB
5115 MB/s +197%
MSI Stealth 16 Studio A13VG
Micron 3400 2TB MTFDKBA2T0TFH
4546 MB/s +164%
Aorus Master 16 AM6J
Samsung PM9C1b MZVL81T0HFLB-00BTW
4108.74 MB/s +139%
Asus ROG Zephyrus G16 GU606AW
Samsung PM9C1b MZVL82T0HBL1
3602 MB/s +109%
Razer Blade 16 Core Ultra 9 386H
Lexar NM790 2TB
3179.74 MB/s +85%
MSI Stealth 16 AI B3WH
Samsung PM9C1b MZVL81T0HFLB-00BTW
1720.1 MB/s
4K Read
Lenovo Legion 7 16 AGP11
Lenovo UMIS AM541 1TB
74.7 MB/s +13%
Aorus Master 16 AM6J
Samsung PM9C1b MZVL81T0HFLB-00BTW
70.8 MB/s +8%
MSI Stealth 16 Studio A13VG
Micron 3400 2TB MTFDKBA2T0TFH
67.7 MB/s +3%
Asus ROG Zephyrus G16 GU606AW
Samsung PM9C1b MZVL82T0HBL1
67.2 MB/s +2%
MSI Stealth 16 AI B3WH
Samsung PM9C1b MZVL81T0HFLB-00BTW
65.86 MB/s
Razer Blade 16 Core Ultra 9 386H
Lexar NM790 2TB
56.96 MB/s -14%
4K Write
Lenovo Legion 7 16 AGP11
Lenovo UMIS AM541 1TB
221 MB/s +26%
MSI Stealth 16 Studio A13VG
Micron 3400 2TB MTFDKBA2T0TFH
207 MB/s +18%
Aorus Master 16 AM6J
Samsung PM9C1b MZVL81T0HFLB-00BTW
206.42 MB/s +17%
MSI Stealth 16 AI B3WH
Samsung PM9C1b MZVL81T0HFLB-00BTW
176.01 MB/s
Asus ROG Zephyrus G16 GU606AW
Samsung PM9C1b MZVL82T0HBL1
173.8 MB/s -1%
Razer Blade 16 Core Ultra 9 386H
Lexar NM790 2TB
155.96 MB/s -11%
4K-64 Read
Aorus Master 16 AM6J
Samsung PM9C1b MZVL81T0HFLB-00BTW
2784.09 MB/s +53%
MSI Stealth 16 Studio A13VG
Micron 3400 2TB MTFDKBA2T0TFH
2378 MB/s +30%
Asus ROG Zephyrus G16 GU606AW
Samsung PM9C1b MZVL82T0HBL1
2339 MB/s +28%
Lenovo Legion 7 16 AGP11
Lenovo UMIS AM541 1TB
1964 MB/s +8%
MSI Stealth 16 AI B3WH
Samsung PM9C1b MZVL81T0HFLB-00BTW
1824.38 MB/s
Razer Blade 16 Core Ultra 9 386H
Lexar NM790 2TB
824.7 MB/s -55%
4K-64 Write
Aorus Master 16 AM6J
Samsung PM9C1b MZVL81T0HFLB-00BTW
3631.52 MB/s +85%
Lenovo Legion 7 16 AGP11
Lenovo UMIS AM541 1TB
2873 MB/s +47%
Asus ROG Zephyrus G16 GU606AW
Samsung PM9C1b MZVL82T0HBL1
2780 MB/s +42%
MSI Stealth 16 Studio A13VG
Micron 3400 2TB MTFDKBA2T0TFH
2669 MB/s +36%
MSI Stealth 16 AI B3WH
Samsung PM9C1b MZVL81T0HFLB-00BTW
1960.79 MB/s
Razer Blade 16 Core Ultra 9 386H
Lexar NM790 2TB
1625.98 MB/s -17%
Access Time Read
MSI Stealth 16 AI B3WH
Samsung PM9C1b MZVL81T0HFLB-00BTW
0.114 ms *
Asus ROG Zephyrus G16 GU606AW
Samsung PM9C1b MZVL82T0HBL1
0.103 ms * +10%
Aorus Master 16 AM6J
Samsung PM9C1b MZVL81T0HFLB-00BTW
0.068 ms * +40%
Lenovo Legion 7 16 AGP11
Lenovo UMIS AM541 1TB
0.067 ms * +41%
Razer Blade 16 Core Ultra 9 386H
Lexar NM790 2TB
0.062 ms * +46%
MSI Stealth 16 Studio A13VG
Micron 3400 2TB MTFDKBA2T0TFH
0.027 ms * +76%
Access Time Write
Razer Blade 16 Core Ultra 9 386H
Lexar NM790 2TB
0.231 ms * -336%
MSI Stealth 16 AI B3WH
Samsung PM9C1b MZVL81T0HFLB-00BTW
0.053 ms *
Asus ROG Zephyrus G16 GU606AW
Samsung PM9C1b MZVL82T0HBL1
0.023 ms * +57%
Aorus Master 16 AM6J
Samsung PM9C1b MZVL81T0HFLB-00BTW
0.021 ms * +60%
MSI Stealth 16 Studio A13VG
Micron 3400 2TB MTFDKBA2T0TFH
0.02 ms * +62%
Lenovo Legion 7 16 AGP11
Lenovo UMIS AM541 1TB
0.019 ms * +64%

* ... kleinere Werte sind besser

Laufwerksdrosselung: DiskSpd-Lesedauertest, Warteschlangentiefe 8

0145290435580725870101511601305145015951740188520302175232024652610275529003045319033353480362537703915406042054350449546404785493050755220536555105655580059456090623563806525667068156960Tooltip
MSI Stealth 16 AI B3WH Samsung PM9C1b MZVL81T0HFLB-00BTW; diskspd 2.0.17 f: Ø7081 (6318.66-7102.48) MB/s
MSI Stealth 16 Studio A13VG Micron 3400 2TB MTFDKBA2T0TFH: Ø1946 (1623.72-6448.85) MB/s

GPU-Leistung

Im Vergleich zu einem typischen RTX-5070-Laptop können Anwender mit der 125-W-RTX 5070 Ti im Stealth 16 einen Leistungszuwachs von 15 bis 20 Prozent erwarten. Zu beachten ist allerdings, dass ein Desktop-PC mit der gleichen RTX 5070 Ti immer noch fast 70 Prozent schneller wäre.

LeistungsprofilGrafics-ScorePhysics-ScoreGesamtpunktzahl (Time Spy)
Leistungsmodus mit aktiviertem Apex und CoolerBoost17.09014.55916.655
Leistungsmodus mit aktiviertem Apex16.726 (-2 %)14.266 (-2 %)16.304 (-2 %)
Leistungsmodus16.508 (-3 %)14.690 (+1 %)16.207 (-3 %)
Ausgewogener Modus14.186 (-17 %)12.209 (-16 %)13.849 (-17 %)
Fire Strike
Fire Strike
Time Spy
Time Spy
Port Royal
Port Royal
Speed Way
Speed Way
3DMark Performance Rating - Percent
KFA2 GeForce RTX 5070 Ti HoF Gaming
NVIDIA GeForce RTX 5070 Ti, AMD Ryzen 7 9800X3D
99.4 pt
Razer Blade 16 Core Ultra 9 386H
NVIDIA GeForce RTX 5090 Laptop, Intel Core Ultra 9 386H
70.4 pt
Aorus Master 16 AM6J -2!
NVIDIA GeForce RTX 5080 Laptop, AMD Ryzen 9 9955HX3D
70.1 pt
Durchschnittliche NVIDIA GeForce RTX 5070 Ti Laptop
 
59.5 pt
MSI Stealth 16 AI B3WH
NVIDIA GeForce RTX 5070 Ti Laptop, Intel Core Ultra 9 386H
58.9 pt
MSI Crosshair A16 HX E8WGK
NVIDIA GeForce RTX 5070 Laptop, AMD Ryzen 9 8940HX
50.1 pt
MSI Stealth 16 Studio A13VG -2!
NVIDIA GeForce RTX 4070 Laptop GPU, Intel Core i7-13700H
44.9 pt
Lenovo Legion 7 16 AGP11
NVIDIA GeForce RTX 5060 Laptop, AMD Ryzen AI 9 HX 470
42.4 pt
Lenovo Legion Slim 5 16APH8 -1!
NVIDIA GeForce RTX 4060 Laptop GPU, AMD Ryzen 7 7840HS
32.5 pt
Asus ROG Zephyrus M16 GU603H -2!
NVIDIA GeForce RTX 3070 Laptop GPU, Intel Core i9-11900H
23.1 pt
3DMark 11 - 1280x720 Performance GPU
KFA2 GeForce RTX 5070 Ti HoF Gaming
NVIDIA GeForce RTX 5070 Ti, AMD Ryzen 7 9800X3D
84914 Points +52%
Aorus Master 16 AM6J
NVIDIA GeForce RTX 5080 Laptop, AMD Ryzen 9 9955HX3D
61571 Points +10%
MSI Stealth 16 AI B3WH
NVIDIA GeForce RTX 5070 Ti Laptop, Intel Core Ultra 9 386H
55888 Points
Durchschnittliche NVIDIA GeForce RTX 5070 Ti Laptop
  (49092 - 61651, n=16)
55548 Points -1%
MSI Crosshair A16 HX E8WGK
NVIDIA GeForce RTX 5070 Laptop, AMD Ryzen 9 8940HX
45691 Points -18%
MSI Stealth 16 Studio A13VG
NVIDIA GeForce RTX 4070 Laptop GPU, Intel Core i7-13700H
41302 Points -26%
Lenovo Legion 7 16 AGP11
NVIDIA GeForce RTX 5060 Laptop, AMD Ryzen AI 9 HX 470
41285 Points -26%
Lenovo Legion Slim 5 16APH8
NVIDIA GeForce RTX 4060 Laptop GPU, AMD Ryzen 7 7840HS
31864 Points -43%
Razer Blade 16 Core Ultra 9 386H
NVIDIA GeForce RTX 5090 Laptop, Intel Core Ultra 9 386H
26378 Points -53%
Asus ROG Zephyrus M16 GU603H
NVIDIA GeForce RTX 3070 Laptop GPU, Intel Core i9-11900H
20039 Points -64%
3DMark
1920x1080 Fire Strike Graphics
KFA2 GeForce RTX 5070 Ti HoF Gaming
NVIDIA GeForce RTX 5070 Ti, AMD Ryzen 7 9800X3D
70373 Points +62%
Razer Blade 16 Core Ultra 9 386H
NVIDIA GeForce RTX 5090 Laptop, Intel Core Ultra 9 386H
52405 Points +21%
Aorus Master 16 AM6J
NVIDIA GeForce RTX 5080 Laptop, AMD Ryzen 9 9955HX3D
46816 Points +8%
MSI Stealth 16 AI B3WH
NVIDIA GeForce RTX 5070 Ti Laptop, Intel Core Ultra 9 386H
43346 Points
Durchschnittliche NVIDIA GeForce RTX 5070 Ti Laptop
  (36184 - 47933, n=17)
43231 Points 0%
MSI Crosshair A16 HX E8WGK
NVIDIA GeForce RTX 5070 Laptop, AMD Ryzen 9 8940HX
38954 Points -10%
Lenovo Legion 7 16 AGP11
NVIDIA GeForce RTX 5060 Laptop, AMD Ryzen AI 9 HX 470
32851 Points -24%
MSI Stealth 16 Studio A13VG
NVIDIA GeForce RTX 4070 Laptop GPU, Intel Core i7-13700H
30051 Points -31%
Lenovo Legion Slim 5 16APH8
NVIDIA GeForce RTX 4060 Laptop GPU, AMD Ryzen 7 7840HS
23418 Points -46%
Asus ROG Zephyrus M16 GU603H
NVIDIA GeForce RTX 3070 Laptop GPU, Intel Core i9-11900H
16628 Points -62%
2560x1440 Time Spy Graphics
KFA2 GeForce RTX 5070 Ti HoF Gaming
NVIDIA GeForce RTX 5070 Ti, AMD Ryzen 7 9800X3D
27607 Points +65%
Razer Blade 16 Core Ultra 9 386H
NVIDIA GeForce RTX 5090 Laptop, Intel Core Ultra 9 386H
23470 Points +40%
Aorus Master 16 AM6J
NVIDIA GeForce RTX 5080 Laptop, AMD Ryzen 9 9955HX3D
19673 Points +18%
MSI Stealth 16 AI B3WH
NVIDIA GeForce RTX 5070 Ti Laptop, Intel Core Ultra 9 386H
16726 Points
Durchschnittliche NVIDIA GeForce RTX 5070 Ti Laptop
  (14615 - 17981, n=17)
16566 Points -1%
MSI Crosshair A16 HX E8WGK
NVIDIA GeForce RTX 5070 Laptop, AMD Ryzen 9 8940HX
14118 Points -16%
Lenovo Legion 7 16 AGP11
NVIDIA GeForce RTX 5060 Laptop, AMD Ryzen AI 9 HX 470
12071 Points -28%
MSI Stealth 16 Studio A13VG
NVIDIA GeForce RTX 4070 Laptop GPU, Intel Core i7-13700H
11955 Points -29%
Lenovo Legion Slim 5 16APH8
NVIDIA GeForce RTX 4060 Laptop GPU, AMD Ryzen 7 7840HS
8873 Points -47%
Asus ROG Zephyrus M16 GU603H
NVIDIA GeForce RTX 3070 Laptop GPU, Intel Core i9-11900H
6059 Points -64%
2560x1440 Speed Way Score
KFA2 GeForce RTX 5070 Ti HoF Gaming
NVIDIA GeForce RTX 5070 Ti, AMD Ryzen 7 9800X3D
7772 Points +85%
Razer Blade 16 Core Ultra 9 386H
NVIDIA GeForce RTX 5090 Laptop, Intel Core Ultra 9 386H
6189 Points +47%
Durchschnittliche NVIDIA GeForce RTX 5070 Ti Laptop
  (4135 - 4695, n=9)
4476 Points +6%
MSI Stealth 16 AI B3WH
NVIDIA GeForce RTX 5070 Ti Laptop, Intel Core Ultra 9 386H
4212 Points
MSI Crosshair A16 HX E8WGK
NVIDIA GeForce RTX 5070 Laptop, AMD Ryzen 9 8940HX
3682 Points -13%
Lenovo Legion 7 16 AGP11
NVIDIA GeForce RTX 5060 Laptop, AMD Ryzen AI 9 HX 470
2892 Points -31%
Lenovo Legion Slim 5 16APH8
NVIDIA GeForce RTX 4060 Laptop GPU, AMD Ryzen 7 7840HS
2118 Points -50%
Steel Nomad Score
KFA2 GeForce RTX 5070 Ti HoF Gaming
NVIDIA GeForce RTX 5070 Ti, AMD Ryzen 7 9800X3D
7249 Points +92%
KFA2 GeForce RTX 5070 Ti HoF Gaming
NVIDIA GeForce RTX 5070 Ti, AMD Ryzen 7 9800X3D
6825 Points +81%
Razer Blade 16 Core Ultra 9 386H
NVIDIA GeForce RTX 5090 Laptop, Intel Core Ultra 9 386H
5915 Points +56%
Durchschnittliche NVIDIA GeForce RTX 5070 Ti Laptop
  (3420 - 4283, n=13)
3859 Points +2%
MSI Stealth 16 AI B3WH
NVIDIA GeForce RTX 5070 Ti Laptop, Intel Core Ultra 9 386H
3781 Points
MSI Crosshair A16 HX E8WGK
NVIDIA GeForce RTX 5070 Laptop, AMD Ryzen 9 8940HX
3087 Points -18%
Lenovo Legion 7 16 AGP11
NVIDIA GeForce RTX 5060 Laptop, AMD Ryzen AI 9 HX 470
2605 Points -31%
3DMark 11 Performance
39497 Punkte
3DMark Cloud Gate Standard Score
54298 Punkte
3DMark Fire Strike Score
29948 Punkte
3DMark Time Spy Score
16304 Punkte
3DMark Steel Nomad Score
3781 Punkte
Hilfe
Blender
v3.3 Classroom OPTIX/RTX
MSI Stealth 16 Studio A13VG
NVIDIA GeForce RTX 4070 Laptop GPU, Intel Core i7-13700H
24 Seconds * -71%
Lenovo Legion Slim 5 16APH8
NVIDIA GeForce RTX 4060 Laptop GPU, AMD Ryzen 7 7840HS
22 Seconds * -57%
Lenovo Legion 7 16 AGP11
NVIDIA GeForce RTX 5060 Laptop, AMD Ryzen AI 9 HX 470
21 Seconds * -50%
MSI Crosshair A16 HX E8WGK
NVIDIA GeForce RTX 5070 Laptop, AMD Ryzen 9 8940HX
17 Seconds * -21%
Durchschnittliche NVIDIA GeForce RTX 5070 Ti Laptop
  (13 - 19, n=15)
15.5 Seconds * -11%
Aorus Master 16 AM6J
NVIDIA GeForce RTX 5080 Laptop, AMD Ryzen 9 9955HX3D
14 Seconds * -0%
MSI Stealth 16 AI B3WH
NVIDIA GeForce RTX 5070 Ti Laptop, Intel Core Ultra 9 386H
14 Seconds *
KFA2 GeForce RTX 5070 Ti HoF Gaming
NVIDIA GeForce RTX 5070 Ti, AMD Ryzen 7 9800X3D
11 Seconds * +21%
Razer Blade 16 Core Ultra 9 386H
NVIDIA GeForce RTX 5090 Laptop, Intel Core Ultra 9 386H
10 Seconds * +29%
v3.3 Classroom CUDA
Lenovo Legion Slim 5 16APH8
NVIDIA GeForce RTX 4060 Laptop GPU, AMD Ryzen 7 7840HS
44 Seconds * -76%
Lenovo Legion 7 16 AGP11
NVIDIA GeForce RTX 5060 Laptop, AMD Ryzen AI 9 HX 470
41 Seconds * -64%
MSI Stealth 16 Studio A13VG
NVIDIA GeForce RTX 4070 Laptop GPU, Intel Core i7-13700H
36 Seconds * -44%
MSI Crosshair A16 HX E8WGK
NVIDIA GeForce RTX 5070 Laptop, AMD Ryzen 9 8940HX
30 Seconds * -20%
Durchschnittliche NVIDIA GeForce RTX 5070 Ti Laptop
  (24 - 33, n=15)
26.1 Seconds * -4%
MSI Stealth 16 AI B3WH
NVIDIA GeForce RTX 5070 Ti Laptop, Intel Core Ultra 9 386H
25 Seconds *
Aorus Master 16 AM6J
NVIDIA GeForce RTX 5080 Laptop, AMD Ryzen 9 9955HX3D
22 Seconds * +12%
KFA2 GeForce RTX 5070 Ti HoF Gaming
NVIDIA GeForce RTX 5070 Ti, AMD Ryzen 7 9800X3D
17 Seconds * +32%
Razer Blade 16 Core Ultra 9 386H
NVIDIA GeForce RTX 5090 Laptop, Intel Core Ultra 9 386H
17 Seconds * +32%
v3.3 Classroom CPU
MSI Stealth 16 Studio A13VG
NVIDIA GeForce RTX 4070 Laptop GPU, Intel Core i7-13700H
299 Seconds * -19%
Lenovo Legion Slim 5 16APH8
NVIDIA GeForce RTX 4060 Laptop GPU, AMD Ryzen 7 7840HS
298 Seconds * -18%
Razer Blade 16 Core Ultra 9 386H
NVIDIA GeForce RTX 5090 Laptop, Intel Core Ultra 9 386H
282 Seconds * -12%
MSI Stealth 16 AI B3WH
NVIDIA GeForce RTX 5070 Ti Laptop, Intel Core Ultra 9 386H
252 Seconds *
Lenovo Legion 7 16 AGP11
NVIDIA GeForce RTX 5060 Laptop, AMD Ryzen AI 9 HX 470
210 Seconds * +17%
Durchschnittliche NVIDIA GeForce RTX 5070 Ti Laptop
  (122 - 361, n=15)
201 Seconds * +20%
MSI Crosshair A16 HX E8WGK
NVIDIA GeForce RTX 5070 Laptop, AMD Ryzen 9 8940HX
150 Seconds * +40%
Aorus Master 16 AM6J
NVIDIA GeForce RTX 5080 Laptop, AMD Ryzen 9 9955HX3D
124 Seconds * +51%
v4.3 Barbershop CPU
Razer Blade 16 Core Ultra 9 386H
NVIDIA GeForce RTX 5090 Laptop, Intel Core Ultra 9 386H
1400 Seconds * -10%
MSI Stealth 16 AI B3WH
NVIDIA GeForce RTX 5070 Ti Laptop, Intel Core Ultra 9 386H
1269 Seconds *
Lenovo Legion 7 16 AGP11
NVIDIA GeForce RTX 5060 Laptop, AMD Ryzen AI 9 HX 470
1119 Seconds * +12%
Durchschnittliche NVIDIA GeForce RTX 5070 Ti Laptop
  (628 - 1269, n=5)
914 Seconds * +28%
MSI Crosshair A16 HX E8WGK
NVIDIA GeForce RTX 5070 Laptop, AMD Ryzen 9 8940HX
716 Seconds * +44%
v4.3 Barbershop OPTIX
MSI Crosshair A16 HX E8WGK
NVIDIA GeForce RTX 5070 Laptop, AMD Ryzen 9 8940HX
86 Seconds * -18%
MSI Stealth 16 AI B3WH
NVIDIA GeForce RTX 5070 Ti Laptop, Intel Core Ultra 9 386H
73 Seconds *
Durchschnittliche NVIDIA GeForce RTX 5070 Ti Laptop
  (67 - 75, n=5)
71.2 Seconds * +2%
KFA2 GeForce RTX 5070 Ti HoF Gaming
NVIDIA GeForce RTX 5070 Ti, AMD Ryzen 7 9800X3D
49 Seconds * +33%
Razer Blade 16 Core Ultra 9 386H
NVIDIA GeForce RTX 5090 Laptop, Intel Core Ultra 9 386H
49 Seconds * +33%

* ... kleinere Werte sind besser

Performance Rating - Percent
Aorus Master 16 AM6J -3!
AMD Ryzen 9 9955HX3D, NVIDIA GeForce RTX 5080 Laptop
96.7 pt
Razer Blade 16 Core Ultra 9 386H
Intel Core Ultra 9 386H, NVIDIA GeForce RTX 5090 Laptop
85.2 pt
Asus ROG Zephyrus G16 GU606AW
Intel Core Ultra 9 386H, NVIDIA GeForce RTX 5080 Laptop
80.3 pt
MSI Stealth 16 AI B3WH
Intel Core Ultra 9 386H, NVIDIA GeForce RTX 5070 Ti Laptop
76.7 pt
MSI Stealth 16 Studio A13VG -2!
Intel Core i7-13700H, NVIDIA GeForce RTX 4070 Laptop GPU
69.4 pt
Lenovo Legion 7 16 AGP11
AMD Ryzen AI 9 HX 470, NVIDIA GeForce RTX 5060 Laptop
65.5 pt
Cyberpunk 2077 - 1920x1080 Ultra Preset (FSR off)
Aorus Master 16 AM6J
AMD Ryzen 9 9955HX3D, NVIDIA GeForce RTX 5080 Laptop
144.5 (116min) fps +22%
Razer Blade 16 Core Ultra 9 386H
Intel Core Ultra 9 386H, NVIDIA GeForce RTX 5090 Laptop
139.5 (100.7min, 89.2P1) fps +18%
MSI Stealth 16 AI B3WH
Intel Core Ultra 9 386H, NVIDIA GeForce RTX 5070 Ti Laptop
118.7 (95.9min, 86P1) fps
Asus ROG Zephyrus G16 GU606AW
Intel Core Ultra 9 386H, NVIDIA GeForce RTX 5080 Laptop
114.2 (84.9min) fps -4%
Lenovo Legion 7 16 AGP11
AMD Ryzen AI 9 HX 470, NVIDIA GeForce RTX 5060 Laptop
90.5 (72.4min) fps -24%
Baldur's Gate 3 - 1920x1080 Ultra Preset AA:T
Razer Blade 16 Core Ultra 9 386H
Intel Core Ultra 9 386H, NVIDIA GeForce RTX 5090 Laptop
202 (12.2min, 112.6P0.1, 152.7P1) fps +31%
Aorus Master 16 AM6J
AMD Ryzen 9 9955HX3D, NVIDIA GeForce RTX 5080 Laptop
175 (65min) fps +13%
Asus ROG Zephyrus G16 GU606AW
Intel Core Ultra 9 386H, NVIDIA GeForce RTX 5080 Laptop
154.7 (87.8min, 112.2P0.1, 126.7P1) fps 0%
MSI Stealth 16 AI B3WH
Intel Core Ultra 9 386H, NVIDIA GeForce RTX 5070 Ti Laptop
154.5 (86.8min, 104.7P0.1, 124.9P1) fps
Lenovo Legion 7 16 AGP11
AMD Ryzen AI 9 HX 470, NVIDIA GeForce RTX 5060 Laptop
112.2 (90.4min, 93.5P0.1, 101.2P1) fps -27%
GTA V - 1920x1080 Highest AA:4xMSAA + FX AF:16x
Asus ROG Zephyrus G16 GU606AW
Intel Core Ultra 9 386H, NVIDIA GeForce RTX 5080 Laptop
141.8 (3.44min, 100P1) fps +8%
MSI Stealth 16 AI B3WH
Intel Core Ultra 9 386H, NVIDIA GeForce RTX 5070 Ti Laptop
131.8 (5.08min, 90.9P1) fps
Lenovo Legion 7 16 AGP11
AMD Ryzen AI 9 HX 470, NVIDIA GeForce RTX 5060 Laptop
129.7 (4.27min, 90.9P1) fps -2%
MSI Stealth 16 Studio A13VG
Intel Core i7-13700H, NVIDIA GeForce RTX 4070 Laptop GPU
119.7 (4.54min, 76.9P1) fps -9%
Razer Blade 16 Core Ultra 9 386H
Intel Core Ultra 9 386H, NVIDIA GeForce RTX 5090 Laptop
102.9 (8.02min, 55.6P1) fps -22%
Final Fantasy XV Benchmark - 1920x1080 High Quality
Razer Blade 16 Core Ultra 9 386H
Intel Core Ultra 9 386H, NVIDIA GeForce RTX 5090 Laptop
175.5 fps +17%
Asus ROG Zephyrus G16 GU606AW
Intel Core Ultra 9 386H, NVIDIA GeForce RTX 5080 Laptop
153.9 fps +2%
MSI Stealth 16 AI B3WH
Intel Core Ultra 9 386H, NVIDIA GeForce RTX 5070 Ti Laptop
150.3 fps
Lenovo Legion 7 16 AGP11
AMD Ryzen AI 9 HX 470, NVIDIA GeForce RTX 5060 Laptop
121.7 fps -19%
MSI Stealth 16 Studio A13VG
Intel Core i7-13700H, NVIDIA GeForce RTX 4070 Laptop GPU
115 fps -23%
Strange Brigade - 1920x1080 ultra AA:ultra AF:16
Razer Blade 16 Core Ultra 9 386H
Intel Core Ultra 9 386H, NVIDIA GeForce RTX 5090 Laptop
326 (72.8min, 230P1) fps +15%
Asus ROG Zephyrus G16 GU606AW
Intel Core Ultra 9 386H, NVIDIA GeForce RTX 5080 Laptop
300 (171.8min, 213P1) fps +6%
MSI Stealth 16 AI B3WH
Intel Core Ultra 9 386H, NVIDIA GeForce RTX 5070 Ti Laptop
284 (174.7min, 201P1) fps
Lenovo Legion 7 16 AGP11
AMD Ryzen AI 9 HX 470, NVIDIA GeForce RTX 5060 Laptop
223 (114.1min, 165.2P1) fps -21%
MSI Stealth 16 Studio A13VG
Intel Core i7-13700H, NVIDIA GeForce RTX 4070 Laptop GPU
200 (31.2min, 147.4P1) fps -30%
Dota 2 Reborn - 1920x1080 ultra (3/3) best looking
Aorus Master 16 AM6J
AMD Ryzen 9 9955HX3D, NVIDIA GeForce RTX 5080 Laptop
252 (201.5min) fps +80%
MSI Stealth 16 Studio A13VG
Intel Core i7-13700H, NVIDIA GeForce RTX 4070 Laptop GPU
154.7 (131.1min) fps +11%
Razer Blade 16 Core Ultra 9 386H
Intel Core Ultra 9 386H, NVIDIA GeForce RTX 5090 Laptop
153.8 (132.8min) fps +10%
Lenovo Legion 7 16 AGP11
AMD Ryzen AI 9 HX 470, NVIDIA GeForce RTX 5060 Laptop
147.8 (124.9min) fps +6%
Asus ROG Zephyrus G16 GU606AW
Intel Core Ultra 9 386H, NVIDIA GeForce RTX 5080 Laptop
146.4 (125.8min) fps +5%
MSI Stealth 16 AI B3WH
Intel Core Ultra 9 386H, NVIDIA GeForce RTX 5070 Ti Laptop
140 (120.7min) fps
X-Plane 11.11 - 1920x1080 high (fps_test=3)
Aorus Master 16 AM6J
AMD Ryzen 9 9955HX3D, NVIDIA GeForce RTX 5080 Laptop
148.5 fps +75%
MSI Stealth 16 Studio A13VG
Intel Core i7-13700H, NVIDIA GeForce RTX 4070 Laptop GPU
110.2 fps +30%
Asus ROG Zephyrus G16 GU606AW
Intel Core Ultra 9 386H, NVIDIA GeForce RTX 5080 Laptop
101.9 fps +20%
Razer Blade 16 Core Ultra 9 386H
Intel Core Ultra 9 386H, NVIDIA GeForce RTX 5090 Laptop
98.5 fps +16%
MSI Stealth 16 AI B3WH
Intel Core Ultra 9 386H, NVIDIA GeForce RTX 5070 Ti Laptop
84.9 fps
Lenovo Legion 7 16 AGP11
AMD Ryzen AI 9 HX 470, NVIDIA GeForce RTX 5060 Laptop
78.4 fps -8%
Black Myth: Wukong
1920x1080 cinematic TSR 100
KFA2 GeForce RTX 5070 Ti HoF Gaming
AMD Ryzen 7 9800X3D, NVIDIA GeForce RTX 5070 Ti
67 fps +68%
Razer Blade 16 Core Ultra 9 386H
Intel Core Ultra 9 386H, NVIDIA GeForce RTX 5090 Laptop
57 (47min) fps +43%
MSI Stealth 16 AI B3WH
Intel Core Ultra 9 386H, NVIDIA GeForce RTX 5070 Ti Laptop
40 (14min) fps
2560x1440 cinematic TSR 100
KFA2 GeForce RTX 5070 Ti HoF Gaming
AMD Ryzen 7 9800X3D, NVIDIA GeForce RTX 5070 Ti
52 fps +68%
Razer Blade 16 Core Ultra 9 386H
Intel Core Ultra 9 386H, NVIDIA GeForce RTX 5090 Laptop
43 (38min) fps +39%
MSI Stealth 16 AI B3WH
Intel Core Ultra 9 386H, NVIDIA GeForce RTX 5070 Ti Laptop
31 (26min) fps
3840x2160 cinematic TSR 100
KFA2 GeForce RTX 5070 Ti HoF Gaming
AMD Ryzen 7 9800X3D, NVIDIA GeForce RTX 5070 Ti
32 fps +78%
Razer Blade 16 Core Ultra 9 386H
Intel Core Ultra 9 386H, NVIDIA GeForce RTX 5090 Laptop
26 (21min) fps +44%
MSI Stealth 16 AI B3WH
Intel Core Ultra 9 386H, NVIDIA GeForce RTX 5070 Ti Laptop
18 (14min) fps
2560x1440 cinematic DLSS 68
KFA2 GeForce RTX 5070 Ti HoF Gaming
AMD Ryzen 7 9800X3D, NVIDIA GeForce RTX 5070 Ti
73 fps +62%
Razer Blade 16 Core Ultra 9 386H
Intel Core Ultra 9 386H, NVIDIA GeForce RTX 5090 Laptop
64 (47min) fps +42%
MSI Stealth 16 AI B3WH
Intel Core Ultra 9 386H, NVIDIA GeForce RTX 5070 Ti Laptop
45 (38min) fps
3840x2160 cinematic DLSS 68
KFA2 GeForce RTX 5070 Ti HoF Gaming
AMD Ryzen 7 9800X3D, NVIDIA GeForce RTX 5070 Ti
53 fps +71%
Razer Blade 16 Core Ultra 9 386H
Intel Core Ultra 9 386H, NVIDIA GeForce RTX 5090 Laptop
45 (38min) fps +45%
MSI Stealth 16 AI B3WH
Intel Core Ultra 9 386H, NVIDIA GeForce RTX 5070 Ti Laptop
31 (27min) fps
3840x2160 cinematic RT: Very High DLSS 68 FG
KFA2 GeForce RTX 5070 Ti HoF Gaming
AMD Ryzen 7 9800X3D, NVIDIA GeForce RTX 5070 Ti
51 fps +82%
Razer Blade 16 Core Ultra 9 386H
Intel Core Ultra 9 386H, NVIDIA GeForce RTX 5090 Laptop
45 (38min) fps +61%
MSI Stealth 16 AI B3WH
Intel Core Ultra 9 386H, NVIDIA GeForce RTX 5070 Ti Laptop
28 (26min) fps
2560x1440 cinematic RT: Very High DLSS 68 FG
KFA2 GeForce RTX 5070 Ti HoF Gaming
AMD Ryzen 7 9800X3D, NVIDIA GeForce RTX 5070 Ti
89 fps +89%
Razer Blade 16 Core Ultra 9 386H
Intel Core Ultra 9 386H, NVIDIA GeForce RTX 5090 Laptop
81 (58min) fps +72%
MSI Stealth 16 AI B3WH
Intel Core Ultra 9 386H, NVIDIA GeForce RTX 5070 Ti Laptop
47 (38min) fps
3840x2160 cinematic RT: Very High
Razer Blade 16 Core Ultra 9 386H
Intel Core Ultra 9 386H, NVIDIA GeForce RTX 5090 Laptop
13 (10min) fps +63%
MSI Stealth 16 AI B3WH
Intel Core Ultra 9 386H, NVIDIA GeForce RTX 5070 Ti Laptop
8 (7min) fps
GTA V
3840x2160 Highest AA:4xMSAA + FX AF:16x
Razer Blade 16 Core Ultra 9 386H
Intel Core Ultra 9 386H, NVIDIA GeForce RTX 5090 Laptop
107.5 (3.67min, 76.9P1) fps +44%
MSI Stealth 16 AI B3WH
Intel Core Ultra 9 386H, NVIDIA GeForce RTX 5070 Ti Laptop
74.4 (20.2min, 55.6P1) fps
Lenovo Legion Slim 5 16APH8
AMD Ryzen 7 7840HS, NVIDIA GeForce RTX 4060 Laptop GPU
38.1 (14.2min, 27P1) fps -49%
3840x2160 High/On (Advanced Graphics Off) AA:FX AF:8x
Razer Blade 16 Core Ultra 9 386H
Intel Core Ultra 9 386H, NVIDIA GeForce RTX 5090 Laptop
178.6 (3.08min, 125P1) fps +32%
MSI Stealth 16 AI B3WH
Intel Core Ultra 9 386H, NVIDIA GeForce RTX 5070 Ti Laptop
135.2 (10.4min, 100P1) fps
Lenovo Legion Slim 5 16APH8
AMD Ryzen 7 7840HS, NVIDIA GeForce RTX 4060 Laptop GPU
76.3 (21min, 55.6P1) fps -44%
Final Fantasy XV Benchmark
1920x1080 High Quality
KFA2 GeForce RTX 5070 Ti HoF Gaming
AMD Ryzen 7 9800X3D, NVIDIA GeForce RTX 5070 Ti
232 fps +54%
Razer Blade 16 Core Ultra 9 386H
Intel Core Ultra 9 386H, NVIDIA GeForce RTX 5090 Laptop
175.5 fps +17%
MSI Stealth 16 AI B3WH
Intel Core Ultra 9 386H, NVIDIA GeForce RTX 5070 Ti Laptop
150.3 fps
MSI Crosshair A16 HX E8WGK
AMD Ryzen 9 8940HX, NVIDIA GeForce RTX 5070 Laptop
140 fps -7%
Lenovo Legion 7 16 AGP11
AMD Ryzen AI 9 HX 470, NVIDIA GeForce RTX 5060 Laptop
121.7 fps -19%
MSI Stealth 16 Studio A13VG
Intel Core i7-13700H, NVIDIA GeForce RTX 4070 Laptop GPU
115 fps -23%
Lenovo Legion Slim 5 16APH8
AMD Ryzen 7 7840HS, NVIDIA GeForce RTX 4060 Laptop GPU
94.3 fps -37%
Asus ROG Zephyrus M16 GU603H
Intel Core i9-11900H, NVIDIA GeForce RTX 3070 Laptop GPU
65.7 fps -56%
2560x1440 High Quality
KFA2 GeForce RTX 5070 Ti HoF Gaming
AMD Ryzen 7 9800X3D, NVIDIA GeForce RTX 5070 Ti
193.1 fps +63%
Razer Blade 16 Core Ultra 9 386H
Intel Core Ultra 9 386H, NVIDIA GeForce RTX 5090 Laptop
154.1 fps +30%
MSI Stealth 16 AI B3WH
Intel Core Ultra 9 386H, NVIDIA GeForce RTX 5070 Ti Laptop
118.8 fps
MSI Crosshair A16 HX E8WGK
AMD Ryzen 9 8940HX, NVIDIA GeForce RTX 5070 Laptop
102 fps -14%
Lenovo Legion 7 16 AGP11
AMD Ryzen AI 9 HX 470, NVIDIA GeForce RTX 5060 Laptop
89.2 fps -25%
MSI Stealth 16 Studio A13VG
Intel Core i7-13700H, NVIDIA GeForce RTX 4070 Laptop GPU
83.8 fps -29%
Lenovo Legion Slim 5 16APH8
AMD Ryzen 7 7840HS, NVIDIA GeForce RTX 4060 Laptop GPU
67.7 fps -43%
Asus ROG Zephyrus M16 GU603H
Intel Core i9-11900H, NVIDIA GeForce RTX 3070 Laptop GPU
49.1 fps -59%
3840x2160 High Quality
KFA2 GeForce RTX 5070 Ti HoF Gaming
AMD Ryzen 7 9800X3D, NVIDIA GeForce RTX 5070 Ti
118.1 fps +80%
Razer Blade 16 Core Ultra 9 386H
Intel Core Ultra 9 386H, NVIDIA GeForce RTX 5090 Laptop
95.5 fps +45%
MSI Stealth 16 AI B3WH
Intel Core Ultra 9 386H, NVIDIA GeForce RTX 5070 Ti Laptop
65.7 fps
Lenovo Legion Slim 5 16APH8
AMD Ryzen 7 7840HS, NVIDIA GeForce RTX 4060 Laptop GPU
37.6 fps -43%
X-Plane 11.11 - 3840x2160 high (fps_test=3)
KFA2 GeForce RTX 5070 Ti HoF Gaming
AMD Ryzen 7 9800X3D, NVIDIA GeForce RTX 5070 Ti
150.5 fps +109%
Razer Blade 16 Core Ultra 9 386H
Intel Core Ultra 9 386H, NVIDIA GeForce RTX 5090 Laptop
84.6 fps +18%
MSI Stealth 16 AI B3WH
Intel Core Ultra 9 386H, NVIDIA GeForce RTX 5070 Ti Laptop
71.9 fps
Lenovo Legion Slim 5 16APH8
AMD Ryzen 7 7840HS, NVIDIA GeForce RTX 4060 Laptop GPU
70.9 fps -1%
Strange Brigade
1920x1080 ultra AA:ultra AF:16
Razer Blade 16 Core Ultra 9 386H
Intel Core Ultra 9 386H, NVIDIA GeForce RTX 5090 Laptop
326 (72.8min, 230P1) fps +15%
MSI Stealth 16 AI B3WH
Intel Core Ultra 9 386H, NVIDIA GeForce RTX 5070 Ti Laptop
284 (174.7min, 201P1) fps
MSI Crosshair A16 HX E8WGK
AMD Ryzen 9 8940HX, NVIDIA GeForce RTX 5070 Laptop
258 (159.7min, 195.8P1) fps -9%
Lenovo Legion 7 16 AGP11
AMD Ryzen AI 9 HX 470, NVIDIA GeForce RTX 5060 Laptop
223 (114.1min, 165.2P1) fps -21%
MSI Stealth 16 Studio A13VG
Intel Core i7-13700H, NVIDIA GeForce RTX 4070 Laptop GPU
200 (31.2min, 147.4P1) fps -30%
Lenovo Legion Slim 5 16APH8
AMD Ryzen 7 7840HS, NVIDIA GeForce RTX 4060 Laptop GPU
168.2 (38.3min, 126.4P1) fps -41%
Asus ROG Zephyrus M16 GU603H
Intel Core i9-11900H, NVIDIA GeForce RTX 3070 Laptop GPU
105 (66.4min, 72.1P1) fps -63%
2560x1440 ultra AA:ultra AF:16
Razer Blade 16 Core Ultra 9 386H
Intel Core Ultra 9 386H, NVIDIA GeForce RTX 5090 Laptop
310 (68.5min, 220P1) fps +50%
MSI Stealth 16 AI B3WH
Intel Core Ultra 9 386H, NVIDIA GeForce RTX 5070 Ti Laptop
207 (141.1min, 158.8P1) fps
MSI Crosshair A16 HX E8WGK
AMD Ryzen 9 8940HX, NVIDIA GeForce RTX 5070 Laptop
170.4 (127.2min, 139P1) fps -18%
Lenovo Legion 7 16 AGP11
AMD Ryzen AI 9 HX 470, NVIDIA GeForce RTX 5060 Laptop
155.2 (116.7min, 126.8P1) fps -25%
MSI Stealth 16 Studio A13VG
Intel Core i7-13700H, NVIDIA GeForce RTX 4070 Laptop GPU
132 (23min, 107.4P1) fps -36%
Lenovo Legion Slim 5 16APH8
AMD Ryzen 7 7840HS, NVIDIA GeForce RTX 4060 Laptop GPU
115.1 (28.9min, 94.1P1) fps -44%
Asus ROG Zephyrus M16 GU603H
Intel Core i9-11900H, NVIDIA GeForce RTX 3070 Laptop GPU
82.3 (25.9min, 58.7P1) fps -60%
3840x2160 ultra AA:ultra AF:16
Razer Blade 16 Core Ultra 9 386H
Intel Core Ultra 9 386H, NVIDIA GeForce RTX 5090 Laptop
174.9 (59.8min, 146.3P1) fps +55%
MSI Stealth 16 AI B3WH
Intel Core Ultra 9 386H, NVIDIA GeForce RTX 5070 Ti Laptop
112.7 (88.1min, 95.4P1) fps
Lenovo Legion Slim 5 16APH8
AMD Ryzen 7 7840HS, NVIDIA GeForce RTX 4060 Laptop GPU
61.8 (32.2min, 53.3P1) fps -45%
Baldur's Gate 3
1920x1080 Ultra Preset AA:T
KFA2 GeForce RTX 5070 Ti HoF Gaming
AMD Ryzen 7 9800X3D, NVIDIA GeForce RTX 5070 Ti
234 (199.9min, 205P0.1, 215P1) fps +51%
Razer Blade 16 Core Ultra 9 386H
Intel Core Ultra 9 386H, NVIDIA GeForce RTX 5090 Laptop
202 (12.2min, 112.6P0.1, 152.7P1) fps +31%
Aorus Master 16 AM6J
AMD Ryzen 9 9955HX3D, NVIDIA GeForce RTX 5080 Laptop
175 (65min) fps +13%
MSI Stealth 16 AI B3WH
Intel Core Ultra 9 386H, NVIDIA GeForce RTX 5070 Ti Laptop
154.5 (86.8min, 104.7P0.1, 124.9P1) fps
MSI Crosshair A16 HX E8WGK
AMD Ryzen 9 8940HX, NVIDIA GeForce RTX 5070 Laptop
133.2 (79.7min, 79.7P0.1, 79.9P1) fps -14%
Lenovo Legion 7 16 AGP11
AMD Ryzen AI 9 HX 470, NVIDIA GeForce RTX 5060 Laptop
112.2 (90.4min, 93.5P0.1, 101.2P1) fps -27%
2560x1440 Ultra Preset + Quality DLSS
KFA2 GeForce RTX 5070 Ti HoF Gaming
AMD Ryzen 7 9800X3D, NVIDIA GeForce RTX 5070 Ti
234 (172.7min, 204P0.1, 213P1) fps +54%
Razer Blade 16 Core Ultra 9 386H
Intel Core Ultra 9 386H, NVIDIA GeForce RTX 5090 Laptop
199.8 (14.6min, 122P0.1, 150.7P1) fps +32%
MSI Stealth 16 AI B3WH
Intel Core Ultra 9 386H, NVIDIA GeForce RTX 5070 Ti Laptop
151.9 (123.8min, 124.8P0.1, 130.1P1) fps
MSI Crosshair A16 HX E8WGK
AMD Ryzen 9 8940HX, NVIDIA GeForce RTX 5070 Laptop
129.6 (79.7min, 79.7P0.1, 79.9P1) fps -15%
2560x1440 Ultra Preset AA:T
KFA2 GeForce RTX 5070 Ti HoF Gaming
AMD Ryzen 7 9800X3D, NVIDIA GeForce RTX 5070 Ti
175.8 (153.6min, 156.7P0.1, 160.9P1) fps +69%
Razer Blade 16 Core Ultra 9 386H
Intel Core Ultra 9 386H, NVIDIA GeForce RTX 5090 Laptop
157.3 (113.3min, 121.2P0.1, 137.3P1) fps +52%
Aorus Master 16 AM6J
AMD Ryzen 9 9955HX3D, NVIDIA GeForce RTX 5080 Laptop
123 (79min) fps +18%
MSI Stealth 16 AI B3WH
Intel Core Ultra 9 386H, NVIDIA GeForce RTX 5070 Ti Laptop
103.8 (33.8min, 86.7P0.1, 88.5P1) fps
MSI Crosshair A16 HX E8WGK
AMD Ryzen 9 8940HX, NVIDIA GeForce RTX 5070 Laptop
90.3 (60min, 60P0.1, 79.6P1) fps -13%
Lenovo Legion 7 16 AGP11
AMD Ryzen AI 9 HX 470, NVIDIA GeForce RTX 5060 Laptop
76.4 (65.3min, 66.4P0.1, 68.8P1) fps -26%
3840x2160 Ultra Preset + Quality DLSS
KFA2 GeForce RTX 5070 Ti HoF Gaming
AMD Ryzen 7 9800X3D, NVIDIA GeForce RTX 5070 Ti
151.7 (134.6min, 137.5P0.1, 141.7P1) fps +63%
Razer Blade 16 Core Ultra 9 386H
Intel Core Ultra 9 386H, NVIDIA GeForce RTX 5090 Laptop
134.9 (106.5min, 113P0.1, 123.8P1) fps +45%
MSI Stealth 16 AI B3WH
Intel Core Ultra 9 386H, NVIDIA GeForce RTX 5070 Ti Laptop
92.8 (75.6min, 78.6P0.1, 80.5P1) fps
Cyberpunk 2077
1920x1080 Ultra Preset (FSR off)
KFA2 GeForce RTX 5070 Ti HoF Gaming
AMD Ryzen 7 9800X3D, NVIDIA GeForce RTX 5070 Ti
202 (163.6min) fps +70%
Aorus Master 16 AM6J
AMD Ryzen 9 9955HX3D, NVIDIA GeForce RTX 5080 Laptop
144.5 (116min) fps +22%
Razer Blade 16 Core Ultra 9 386H
Intel Core Ultra 9 386H, NVIDIA GeForce RTX 5090 Laptop
139.5 (100.7min, 89.2P1) fps +18%
MSI Stealth 16 AI B3WH
Intel Core Ultra 9 386H, NVIDIA GeForce RTX 5070 Ti Laptop
118.7 (95.9min, 86P1) fps
MSI Crosshair A16 HX E8WGK
AMD Ryzen 9 8940HX, NVIDIA GeForce RTX 5070 Laptop
112.1 (90.9min, 85.1P1) fps -6%
Lenovo Legion 7 16 AGP11
AMD Ryzen AI 9 HX 470, NVIDIA GeForce RTX 5060 Laptop
90.5 (72.4min) fps -24%
1920x1080 Ray Tracing Ultra Preset (DLSS off)
Razer Blade 16 Core Ultra 9 386H
Intel Core Ultra 9 386H, NVIDIA GeForce RTX 5090 Laptop
72.5 (61.9min, 56.4P1) fps +32%
MSI Stealth 16 AI B3WH
Intel Core Ultra 9 386H, NVIDIA GeForce RTX 5070 Ti Laptop
55.1 (48.5min, 45.8P1) fps
MSI Crosshair A16 HX E8WGK
AMD Ryzen 9 8940HX, NVIDIA GeForce RTX 5070 Laptop
48.5 (42.4min, 40.5P1) fps -12%
3840x2160 Ray Tracing Overdrive Preset + DLSS 4 Transformer Quality + Frame Generation MFG 4x
KFA2 GeForce RTX 5070 Ti HoF Gaming
AMD Ryzen 7 9800X3D, NVIDIA GeForce RTX 5070 Ti
113.2 (100.4min) fps +81%
Razer Blade 16 Core Ultra 9 386H
Intel Core Ultra 9 386H, NVIDIA GeForce RTX 5090 Laptop
89.9 (81.3min) fps +44%
MSI Stealth 16 AI B3WH
Intel Core Ultra 9 386H, NVIDIA GeForce RTX 5070 Ti Laptop
62.4 (55.8min) fps
3840x2160 Ray Tracing Overdrive Preset + DLSS 4 Transformer Quality + Frame Generation (M)FG 2x
KFA2 GeForce RTX 5070 Ti HoF Gaming
AMD Ryzen 7 9800X3D, NVIDIA GeForce RTX 5070 Ti
61 (52.9min) fps +80%
Razer Blade 16 Core Ultra 9 386H
Intel Core Ultra 9 386H, NVIDIA GeForce RTX 5090 Laptop
49.1 (44.2min) fps +45%
MSI Stealth 16 AI B3WH
Intel Core Ultra 9 386H, NVIDIA GeForce RTX 5070 Ti Laptop
33.8 (29.1min) fps
3840x2160 Ray Tracing Overdrive Preset + DLSS 4 Transformer Quality (no FG)
KFA2 GeForce RTX 5070 Ti HoF Gaming
AMD Ryzen 7 9800X3D, NVIDIA GeForce RTX 5070 Ti
33.9 (28.4min) fps +78%
Razer Blade 16 Core Ultra 9 386H
Intel Core Ultra 9 386H, NVIDIA GeForce RTX 5090 Laptop
28 (24min, 22.7P1) fps +47%
MSI Stealth 16 AI B3WH
Intel Core Ultra 9 386H, NVIDIA GeForce RTX 5070 Ti Laptop
19 (16.7min, 16.1P1) fps
3840x2160 Ray Tracing Overdrive Preset (no DLSS, no FG)
KFA2 GeForce RTX 5070 Ti HoF Gaming
AMD Ryzen 7 9800X3D, NVIDIA GeForce RTX 5070 Ti
16.4 (13.3min) fps +93%
Razer Blade 16 Core Ultra 9 386H
Intel Core Ultra 9 386H, NVIDIA GeForce RTX 5090 Laptop
13.3 (11.3min, 10.9P1) fps +57%
MSI Stealth 16 AI B3WH
Intel Core Ultra 9 386H, NVIDIA GeForce RTX 5070 Ti Laptop
8.49 (7.54min, 7.12P1) fps
2560x1440 Ultra Preset DLSS4 quality no FG
KFA2 GeForce RTX 5070 Ti HoF Gaming
AMD Ryzen 7 9800X3D, NVIDIA GeForce RTX 5070 Ti
151.5 (130.4min) fps +71%
Razer Blade 16 Core Ultra 9 386H
Intel Core Ultra 9 386H, NVIDIA GeForce RTX 5090 Laptop
116.6 (94.5min, 85.9P1) fps +32%
MSI Stealth 16 AI B3WH
Intel Core Ultra 9 386H, NVIDIA GeForce RTX 5070 Ti Laptop
88.4 (74.8min, 71.1P1) fps
MSI Crosshair A16 HX E8WGK
AMD Ryzen 9 8940HX, NVIDIA GeForce RTX 5070 Laptop
81.9 (71.5min, 67.2P1) fps -7%
Lenovo Legion 7 16 AGP11
AMD Ryzen AI 9 HX 470, NVIDIA GeForce RTX 5060 Laptop
66.7 (57.2min) fps -25%
2560x1440 Ultra Preset (FSR off)
KFA2 GeForce RTX 5070 Ti HoF Gaming
AMD Ryzen 7 9800X3D, NVIDIA GeForce RTX 5070 Ti
133.2 (110.7min) fps +78%
Razer Blade 16 Core Ultra 9 386H
Intel Core Ultra 9 386H, NVIDIA GeForce RTX 5090 Laptop
105.8 (84.1min, 74.9P1) fps +41%
Aorus Master 16 AM6J
AMD Ryzen 9 9955HX3D, NVIDIA GeForce RTX 5080 Laptop
99.8 (84min) fps +33%
MSI Stealth 16 AI B3WH
Intel Core Ultra 9 386H, NVIDIA GeForce RTX 5070 Ti Laptop
75 (63.2min, 61.3P1) fps
MSI Crosshair A16 HX E8WGK
AMD Ryzen 9 8940HX, NVIDIA GeForce RTX 5070 Laptop
68.8 (58.4min, 56.1P1) fps -8%
Lenovo Legion 7 16 AGP11
AMD Ryzen AI 9 HX 470, NVIDIA GeForce RTX 5060 Laptop
56.2 (47.6min) fps -25%
F1 24
1920x1080 Ultra High Preset AA:T AF:16x
KFA2 GeForce RTX 5070 Ti HoF Gaming
AMD Ryzen 7 9800X3D, NVIDIA GeForce RTX 5070 Ti
172.4 (114min, 130P1) fps +64%
Razer Blade 16 Core Ultra 9 386H
Intel Core Ultra 9 386H, NVIDIA GeForce RTX 5090 Laptop
132.3 (59min, 70P1) fps +26%
MSI Stealth 16 AI B3WH
Intel Core Ultra 9 386H, NVIDIA GeForce RTX 5070 Ti Laptop
105.2 (59min, 73P1) fps
MSI Crosshair A16 HX E8WGK
AMD Ryzen 9 8940HX, NVIDIA GeForce RTX 5070 Laptop
94.7 (68min, 75P1) fps -10%
Lenovo Legion 7 16 AGP11
AMD Ryzen AI 9 HX 470, NVIDIA GeForce RTX 5060 Laptop
74.3 (51min, 59P1) fps -29%
2560x1440 Ultra High Preset AA:T AF:16x
KFA2 GeForce RTX 5070 Ti HoF Gaming
AMD Ryzen 7 9800X3D, NVIDIA GeForce RTX 5070 Ti
116.5 (91min, 94P1) fps +78%
Razer Blade 16 Core Ultra 9 386H
Intel Core Ultra 9 386H, NVIDIA GeForce RTX 5090 Laptop
94.7 (57min, 67P1) fps +45%
MSI Stealth 16 AI B3WH
Intel Core Ultra 9 386H, NVIDIA GeForce RTX 5070 Ti Laptop
65.3 (53min, 53P1) fps
MSI Crosshair A16 HX E8WGK
AMD Ryzen 9 8940HX, NVIDIA GeForce RTX 5070 Laptop
59.3 (47min, 47P1) fps -9%
Lenovo Legion 7 16 AGP11
AMD Ryzen AI 9 HX 470, NVIDIA GeForce RTX 5060 Laptop
47.2 (38min, 38P1) fps -28%
3840x2160 Ultra High Preset AA:T AF:16x
KFA2 GeForce RTX 5070 Ti HoF Gaming
AMD Ryzen 7 9800X3D, NVIDIA GeForce RTX 5070 Ti
59.3 (49min, 49P1) fps +76%
Razer Blade 16 Core Ultra 9 386H
Intel Core Ultra 9 386H, NVIDIA GeForce RTX 5090 Laptop
48.4 (36min, 39P1) fps +44%
MSI Stealth 16 AI B3WH
Intel Core Ultra 9 386H, NVIDIA GeForce RTX 5070 Ti Laptop
33.7 (28min, 28P1) fps
3840x2160 Ultra High Preset + Quality DLSS AF:16x
KFA2 GeForce RTX 5070 Ti HoF Gaming
AMD Ryzen 7 9800X3D, NVIDIA GeForce RTX 5070 Ti
99.4 (80min, 81P1) fps +79%
Razer Blade 16 Core Ultra 9 386H
Intel Core Ultra 9 386H, NVIDIA GeForce RTX 5090 Laptop
81 (56min, 65P1) fps +46%
MSI Stealth 16 AI B3WH
Intel Core Ultra 9 386H, NVIDIA GeForce RTX 5070 Ti Laptop
55.6 (46min, 46P1) fps
2560x1440 Ultra High Preset + Quality DLSS AF:16x
KFA2 GeForce RTX 5070 Ti HoF Gaming
AMD Ryzen 7 9800X3D, NVIDIA GeForce RTX 5070 Ti
175 (108min, 130P1) fps +71%
Razer Blade 16 Core Ultra 9 386H
Intel Core Ultra 9 386H, NVIDIA GeForce RTX 5090 Laptop
132.8 (57min, 72P1) fps +30%
MSI Stealth 16 AI B3WH
Intel Core Ultra 9 386H, NVIDIA GeForce RTX 5070 Ti Laptop
102.4 (58min, 71P1) fps
MSI Crosshair A16 HX E8WGK
AMD Ryzen 9 8940HX, NVIDIA GeForce RTX 5070 Laptop
93.1 (65min, 71P1) fps -9%
Lenovo Legion 7 16 AGP11
AMD Ryzen AI 9 HX 470, NVIDIA GeForce RTX 5060 Laptop
74.5 (51min, 58P1) fps -27%

Cyberpunk 2077: fps-Diagramm auf Ultra

05101520253035404550556065707580859095100105110Tooltip
MSI Stealth 16 AI B3WH Ultra 9 386H, GeForce RTX 5070 Ti Laptop: Ø104.7 (97.8-107.3) fps
Alienware 16X Aurora Core Ultra 9 290HX Plus Ultra 9 290HX Plus, GeForce RTX 5070 Ti Laptop: Ø105 (99.7-113) fps
min.mittelhochmax.QHD DLSSQHD4K DLSS4K
GTA V (2015) 131.8 127.2 135.2
Dota 2 Reborn (2015) 170.2 152.5 148.5 140 132
Final Fantasy XV Benchmark (2018) 215 196 150.3 118.8 65.7
X-Plane 11.11 (2018) 108.8 98.9 84.9 71.9
Strange Brigade (2018) 284 207 112.7
Baldur's Gate 3 (2023) 154.5 151.9 103.8 92.8 55.6
Cyberpunk 2077 (2023) 144.9 131.4 118.7 88.4 75 42.1 33.2
F1 24 (2024) 238 105.2 102.4 65.3 55.6 33.7
Black Myth: Wukong (2024) 71 40 45 31 31 18

Emissionen

Geräuschemissionen

Beim einfachen Surfen im Internet oder Videostreaming erreicht das Lüftergeräusch bei einem Hintergrundpegel von 23 dB(A) in der Regel höchstens 28 dB(A). Beim Gaming beträgt es hingegen durchschnittlich 47,1 dB(A) im ausgewogenen Modus, 50,8 dB(A) im Leistungsmodus mit deaktiviertem Apex, 52,3 dB(A) im Leistungsmodus mit aktiviertem Apex und 56,7 dB(A) im Leistungsmodus mit aktiviertem Apex und CoolerBoost. Werte im unteren bis mittleren 50-dB(A)-Bereich sind bei den meisten ultradünnen Gaming-Laptops üblich.
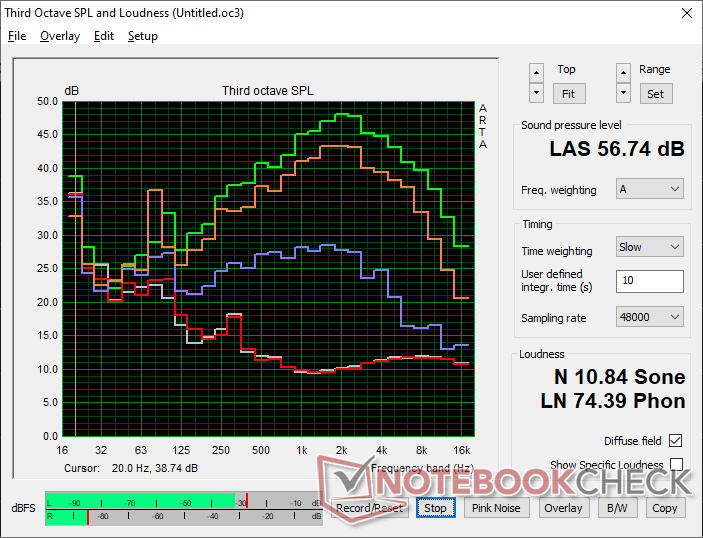
Lüftergeräuschprofil (Weiß: Hintergrund, Rot: System im Leerlauf, Blau:3DMark 11, Orange: Cyberpunk 2077, Grün: Prime95+FurMark-Stresstest)

Lautstärkediagramm

Idle
23.4 / 23.4 / 27.4 dB(A)
Last
37.8 / 56.7 dB(A)
  red to green bar
 
 
30 dB
leise
40 dB(A)
deutlich hörbar
50 dB(A)
störend
 
min: dark, med: mid, max: light   Earthworks M23R, Arta (aus 15 cm gemessen)   Umgebungsgeräusche: 23.4 dB(A)
dB(A) 0102030405060708090Deep BassMiddle BassHigh BassLower RangeMidsHigher MidsLower HighsMid HighsUpper HighsSuper Highs2032.835.736.136.339.42525.724.32525.728.63122.521.623.525.525.54023.223.220.220.322.35025.72522.921.525.26324.924.12122.327.18036.726.723.222.52910028.227.323.420.633.312525.521.618.116.627.716027.821.115.913.830.220029.422.314.514.731.525033.924.71515.935.831533.625.817.818.337.540034.2251312.537.650037.327.211.31240.863036.627.511.411.840.58003926.610.310.342100041.128.39.89.544.9125041.527.79.69.445.3160043.228.59.59.847.1200043.427.810.110.248.2250043.227.410.110.547.831504023.610.910.845.2400039.424.811.211.344.8500038.220.811.511.743.2630037.116.411.811.740.9800033.516.111.711.939.81000029.416.611.611.836.91250024.81311.511.532.71600020.613.610.810.928.4SPL52.337.823.323.456.7N8.12.70.50.510.8median 36.6median 24.8median 11.5median 11.7median 40.5Delta5.84.42.21.75.9hearing rangehide median Fan NoiseMSI Stealth 16 AI B3WH
MSI Stealth 16 AI B3WH
Ultra 9 386H, GeForce RTX 5070 Ti Laptop
MSI Stealth 16 Studio A13VG
i7-13700H, GeForce RTX 4070 Laptop GPU
Razer Blade 16 Core Ultra 9 386H
Ultra 9 386H, GeForce RTX 5090 Laptop
Lenovo Legion 7 16 AGP11
Ryzen AI 9 HX 470, GeForce RTX 5060 Laptop
Aorus Master 16 AM6J
R9 9955HX3D, GeForce RTX 5080 Laptop
Asus ROG Zephyrus G16 GU606AW
Ultra 9 386H, GeForce RTX 5080 Laptop
Geräuschentwicklung
3%
-4%
0%
-22%
-17%
aus / Umgebung * (dB)
23.4
24
-3%
23.1
1%
24.5
-5%
25
-7%
24.4
-4%
Idle min * (dB)
23.4
24
-3%
23.4
-0%
24.5
-5%
28
-20%
32.8
-40%
Idle avg * (dB)
23.4
24
-3%
25.4
-9%
24.5
-5%
29
-24%
32.8
-40%
Idle max * (dB)
27.4
24
12%
29.3
-7%
27.1
1%
35
-28%
32.8
-20%
Last avg * (dB)
37.8
34.81
8%
42.6
-13%
34.6
8%
58
-53%
42.6
-13%
Cyberpunk 2077 ultra * (dB)
52.3
53.6
-2%
53
-1%
59
-13%
54.8
-5%
Last max * (dB)
56.7
51.57
9%
53.7
5%
53
7%
60
-6%
54.8
3%
Witcher 3 ultra * (dB)
44.05

* ... kleinere Werte sind besser

Temperatur

Die Mitte der Tastatur und die obere Hälfte des Clickpads können beim Gaming merklich wärmer werden als bei den meisten anderen Laptops. Die besonders wichtigen WASD-Tasten bleiben hingegen deutlich kühler.
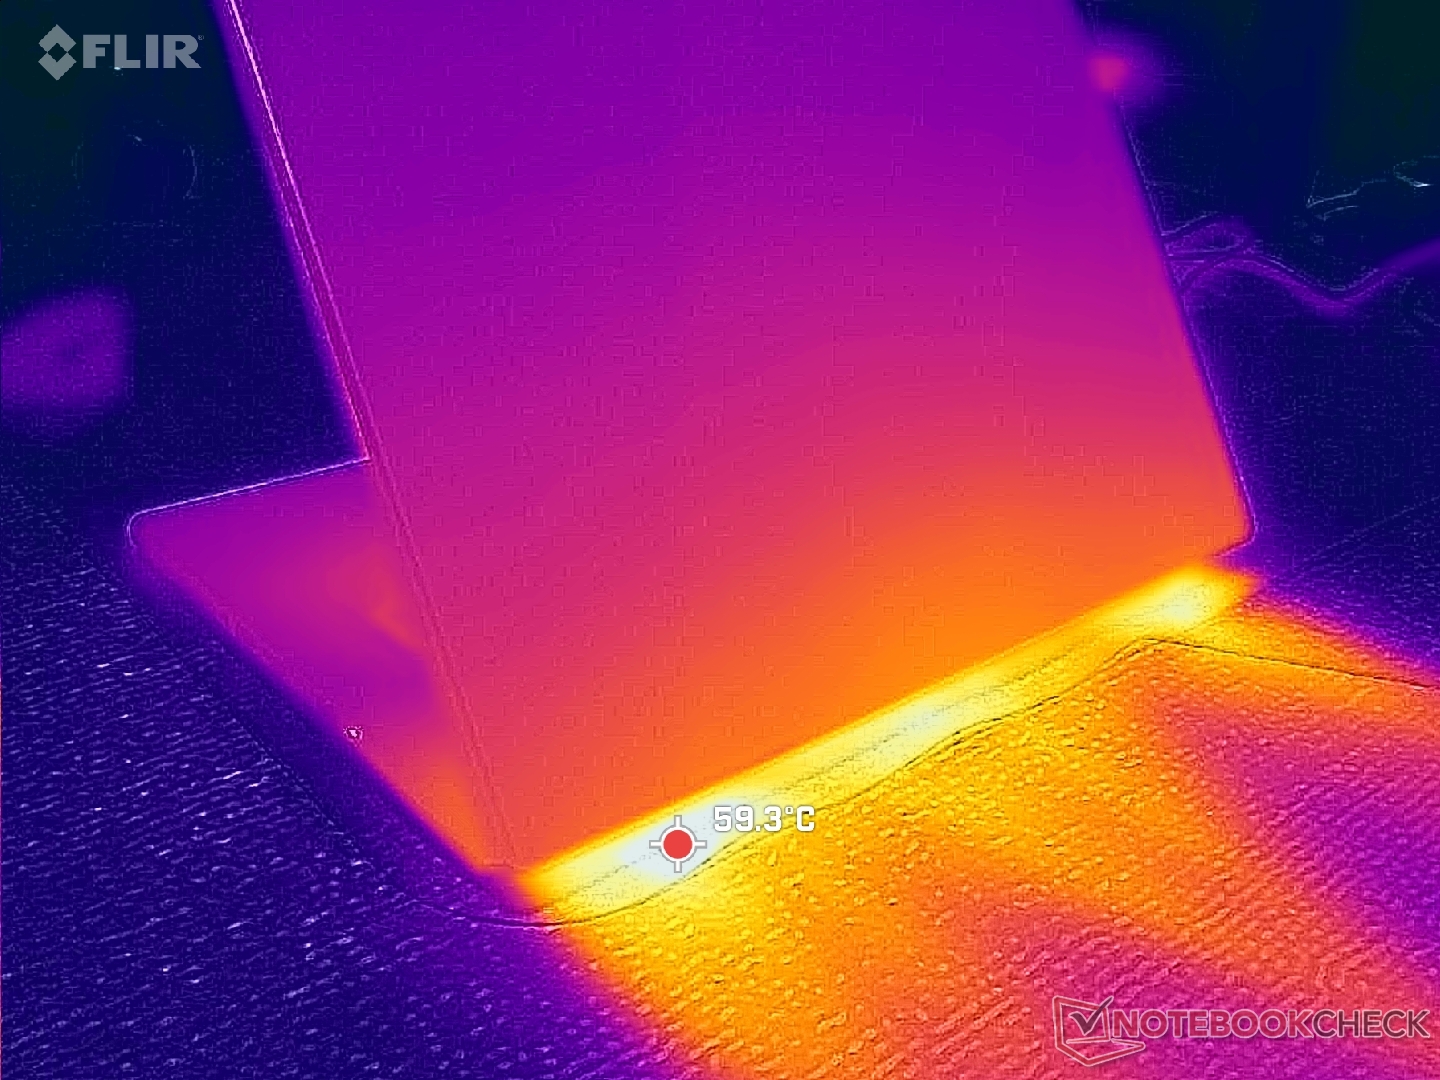
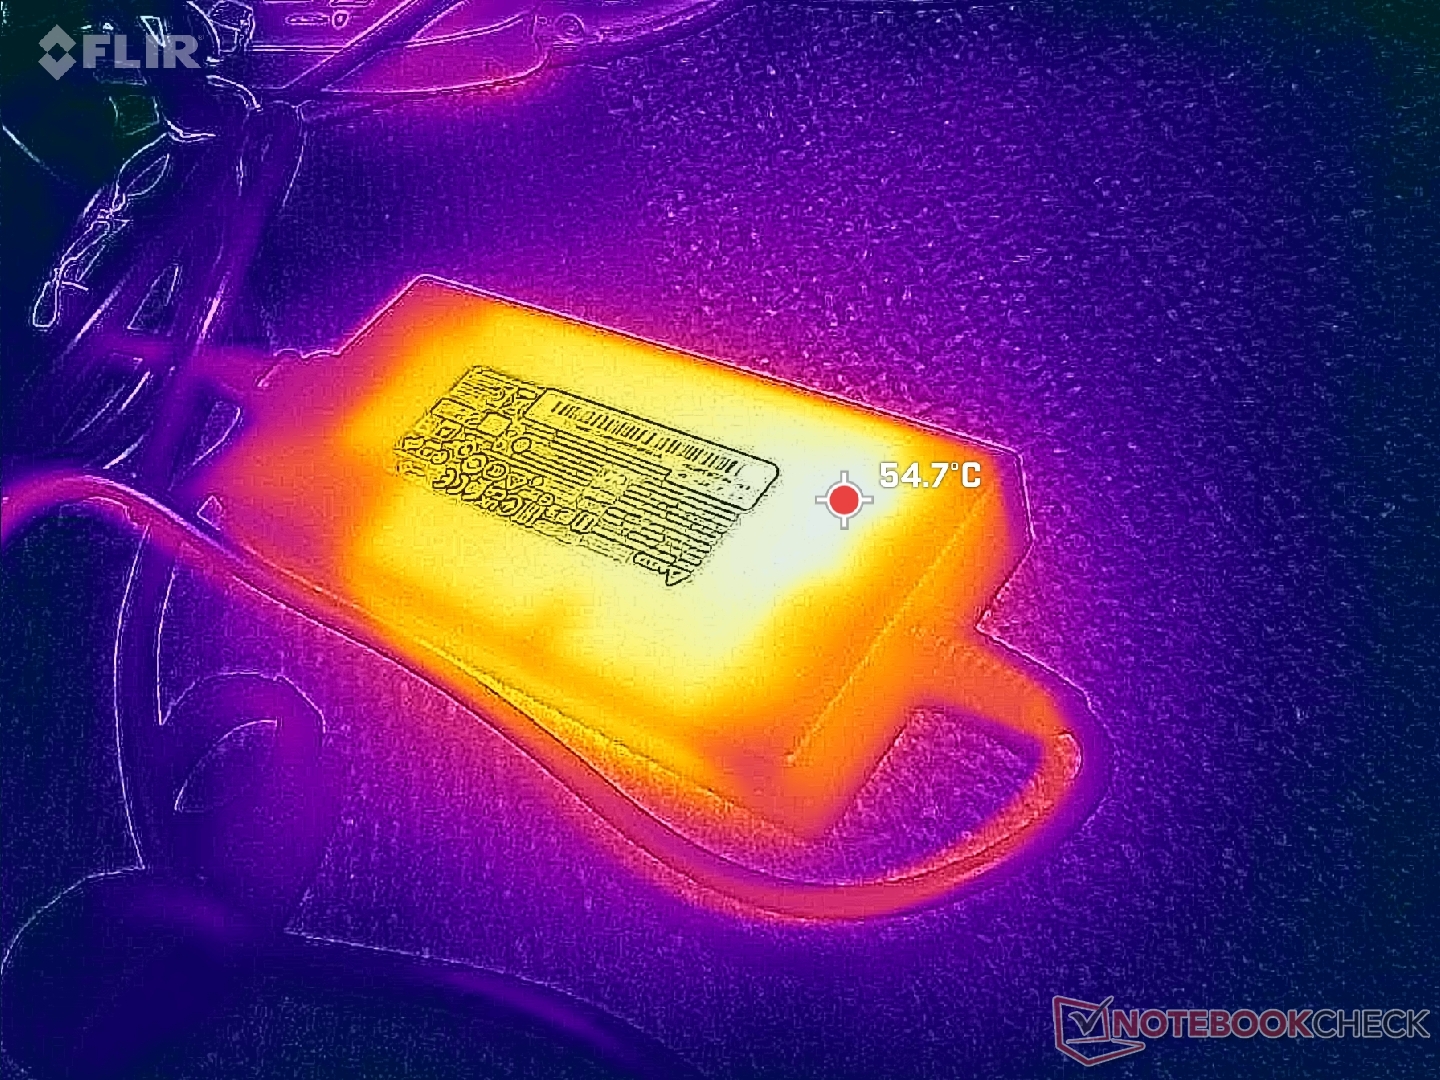
Hinterer Luftauslass
Das Netzteil erreicht beim Gaming über 55 °C
Max. Last
33.6 °C38.8 °C33 °C
32 °C34.6 °C32.2 °C
34.2 °C37.4 °C30 °C
Maximal: 38.8 °C
Durchschnitt: 34 °C
26.6 °C38.6 °C36.4 °C
28.8 °C33.8 °C33 °C
28.6 °C30.2 °C29.4 °C
Maximal: 38.6 °C
Durchschnitt: 31.7 °C
Netzteil (max.)  52 °C | Raumtemperatur 23 °C | Fluke 62 Mini IR Thermometer
(±) Die Durchschnittstemperatur auf der Oberseite unter extremer Last ist 34 °C. Im Vergleich erhitzte sich der Durchschnitt der Geräteklasse Gaming auf 33.9 °C.
(+) Die maximale Temperatur auf der Oberseite ist 38.8 °C. Im Vergleich liegt der Klassendurchschnitt bei 40.4 °C (von 21.2 bis 68.8 °C für die Klasse Gaming).
(+) Auf der Unterseite messen wir eine maximalen Wert von 38.6 °C (im Vergleich zum Durchschnitt von 43.2 °C).
(+) Ohne Last messen wir eine durchschnittliche Temperatur von 29.5 °C auf der Oberseite. Der Klassendurchschnitt erreicht 33.9 °C.
(±) 3: The average temperature for the upper side is 36.3 °C / 97 F, compared to the average of 33.9 °C / 93 F for the class Gaming.
(±) Die Handballen und der Touchpad-Bereich können sehr heiß werden mit maximal 39.4 °C.
(-) Die durchschnittliche Handballen-Temperatur anderer getesteter Geräte war 28.8 °C (-10.6 °C).
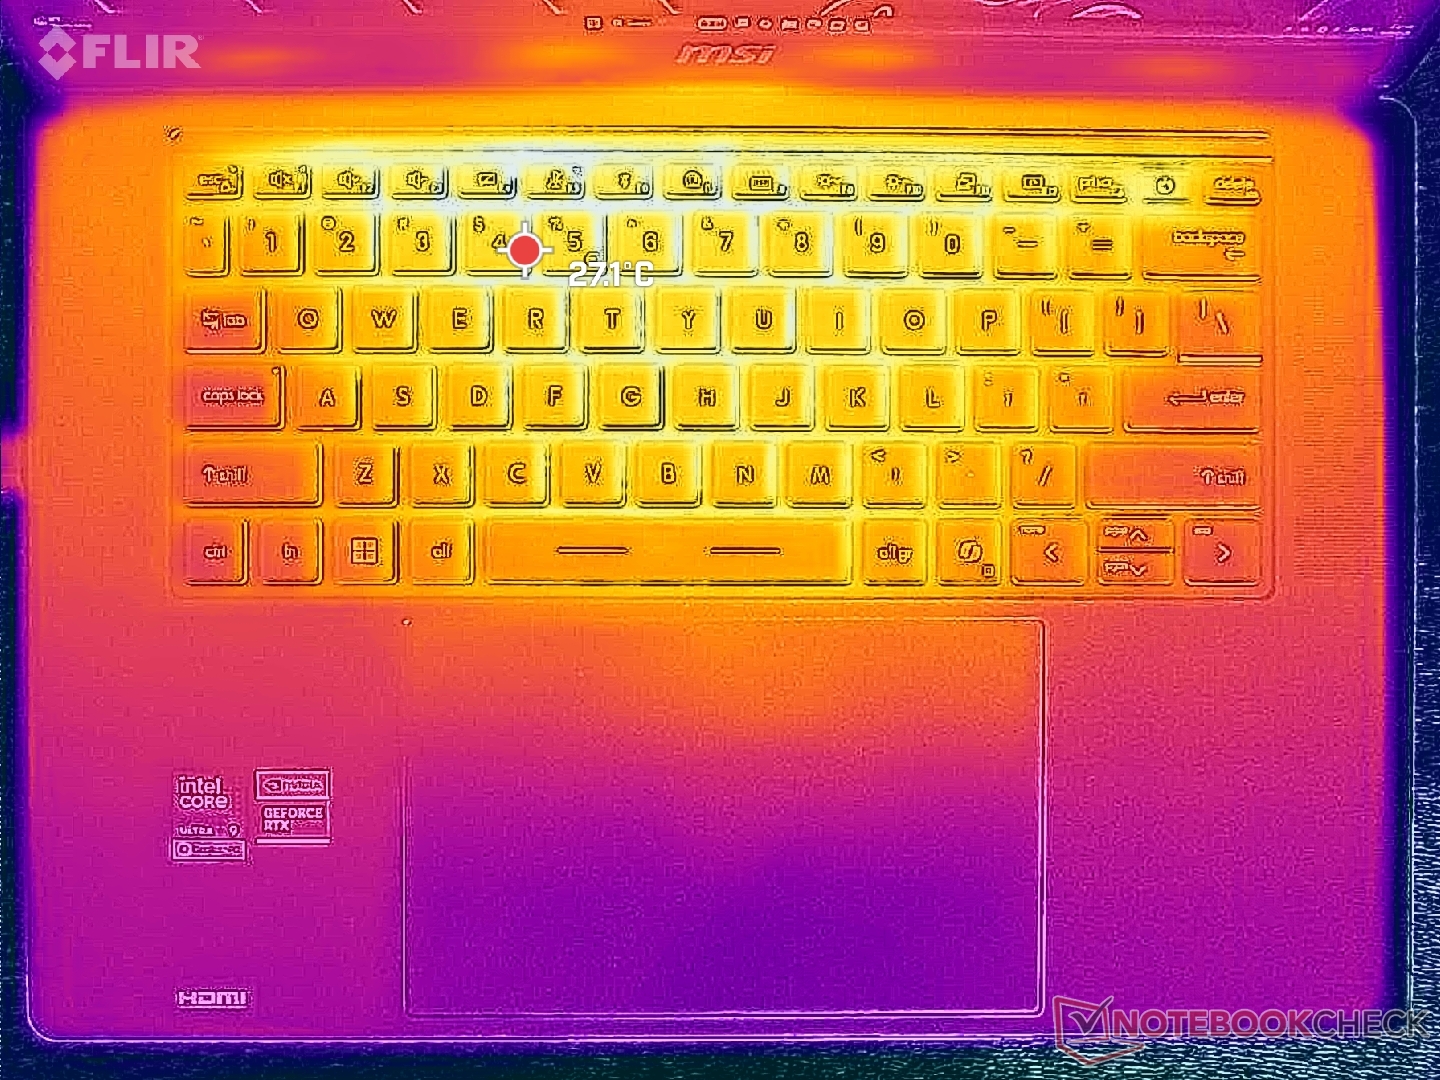
System im Leerlauf (C-Seite)
System im Leerlauf (D-Seite)
Cyberpunk-2077, Stresstest (C-Seite)
Cyberpunk-2077, Stresstest (D-Seite)
Prime95+FurMark, Stresstest (C-Seite)
Prime95+FurMark, Stresstest (D-Seite)
MSI Stealth 16 AI B3WH
Ultra 9 386H, GeForce RTX 5070 Ti Laptop
MSI Stealth 16 Studio A13VG
i7-13700H, GeForce RTX 4070 Laptop GPU
Razer Blade 16 Core Ultra 9 386H
Ultra 9 386H, GeForce RTX 5090 Laptop
Lenovo Legion 7 16 AGP11
Ryzen AI 9 HX 470, GeForce RTX 5060 Laptop
Aorus Master 16 AM6J
R9 9955HX3D, GeForce RTX 5080 Laptop
Asus ROG Zephyrus G16 GU606AW
Ultra 9 386H, GeForce RTX 5080 Laptop
Hitze
-33%
-13%
-2%
-32%
-8%
Last oben max * (°C)
38.8
60
-55%
45.6
-18%
44.9
-16%
50
-29%
46.3
-19%
Last unten max * (°C)
38.6
61
-58%
47
-22%
50.5
-31%
52
-35%
45.9
-19%
Idle oben max * (°C)
32.6
38.2
-17%
35.2
-8%
27.3
16%
32.1
2%
Idle unten max * (°C)
36.6
37.7
-3%
37.6
-3%
27.5
25%
34.5
6%

* ... kleinere Werte sind besser

Stresstest
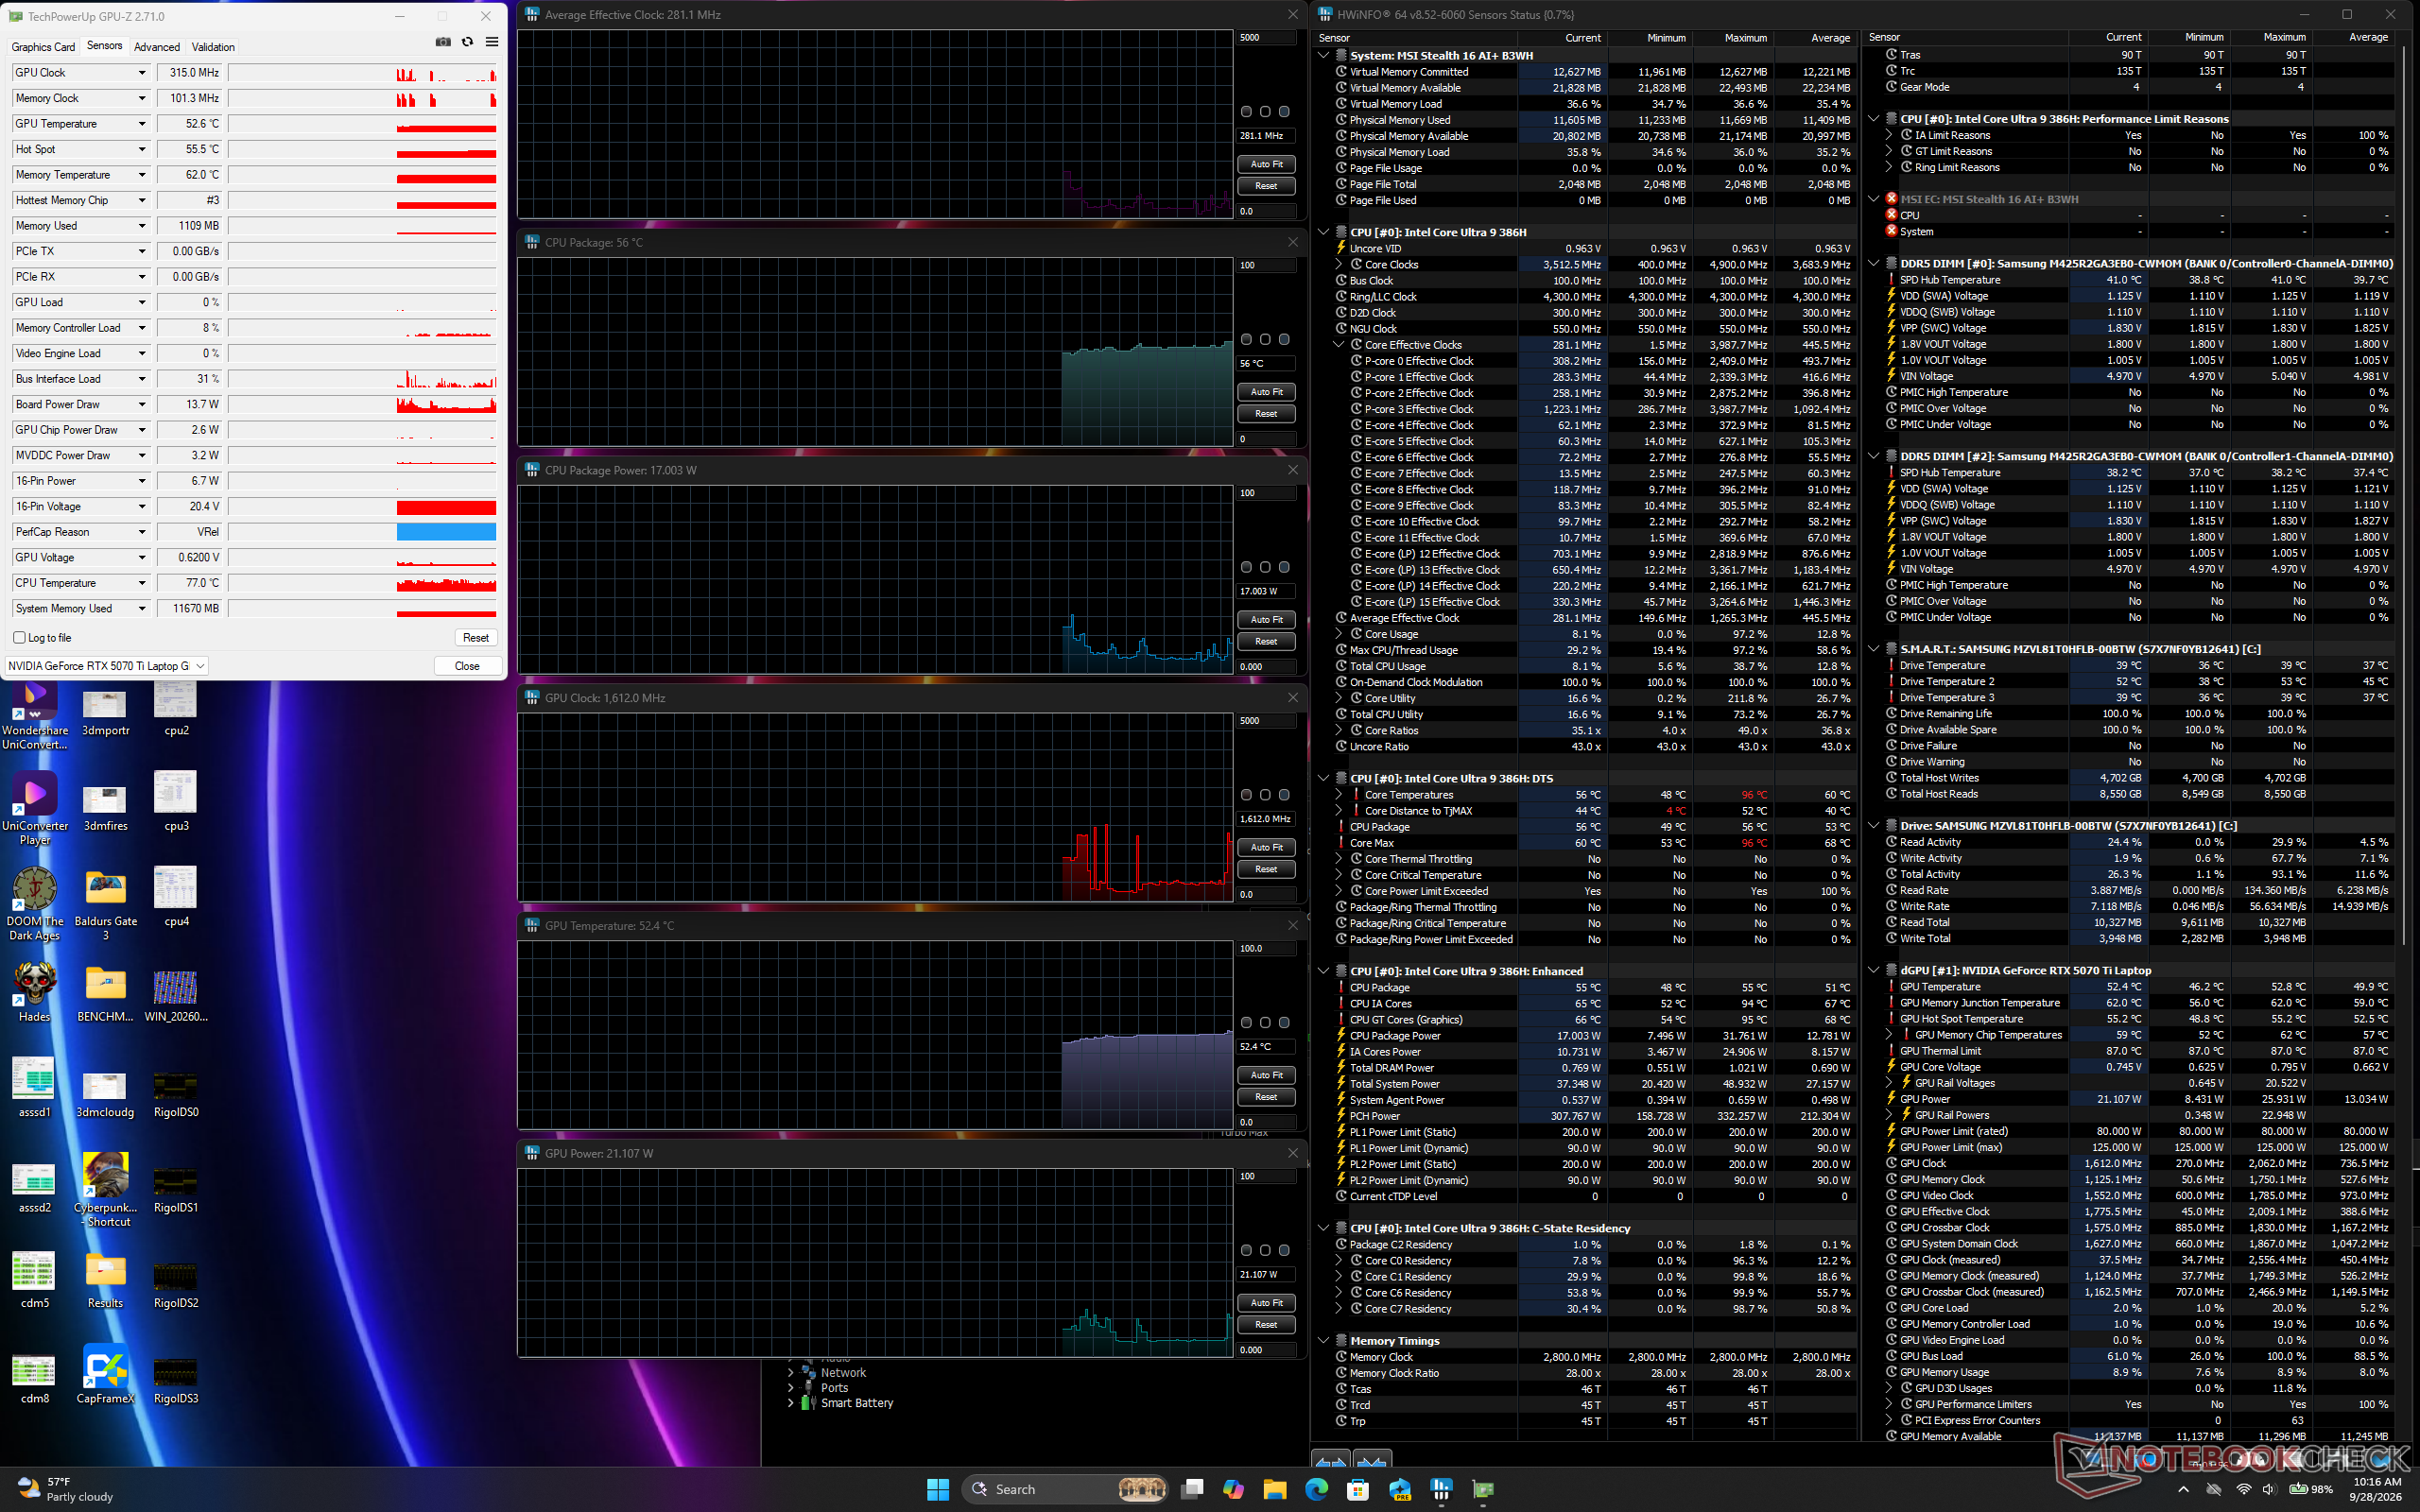
System im Leerlauf
System im Leerlauf

Unter Prime95 Last stabilisierte sich die CPU bei 3,6 GHz, 57 °C und 88 W.

Beim Ausführen von Cyberpunk 2077 betrug die TGP im Durchschnitt 79 W im ausgewogenen Modus, 96 W im Leistungsmodus mit deaktiviertem Apex und 123 W im Leistungsmodus mit aktiviertem Apex. Die Apex-Funktion muss also aktiviert sein, um die beworbene TGP-Obergrenze von 125 W zu erreichen. Zu beachten ist, dass die Leistung nicht nennenswert steigt, wenn sowohl Apex als auch Coolerboost aktiviert sind.
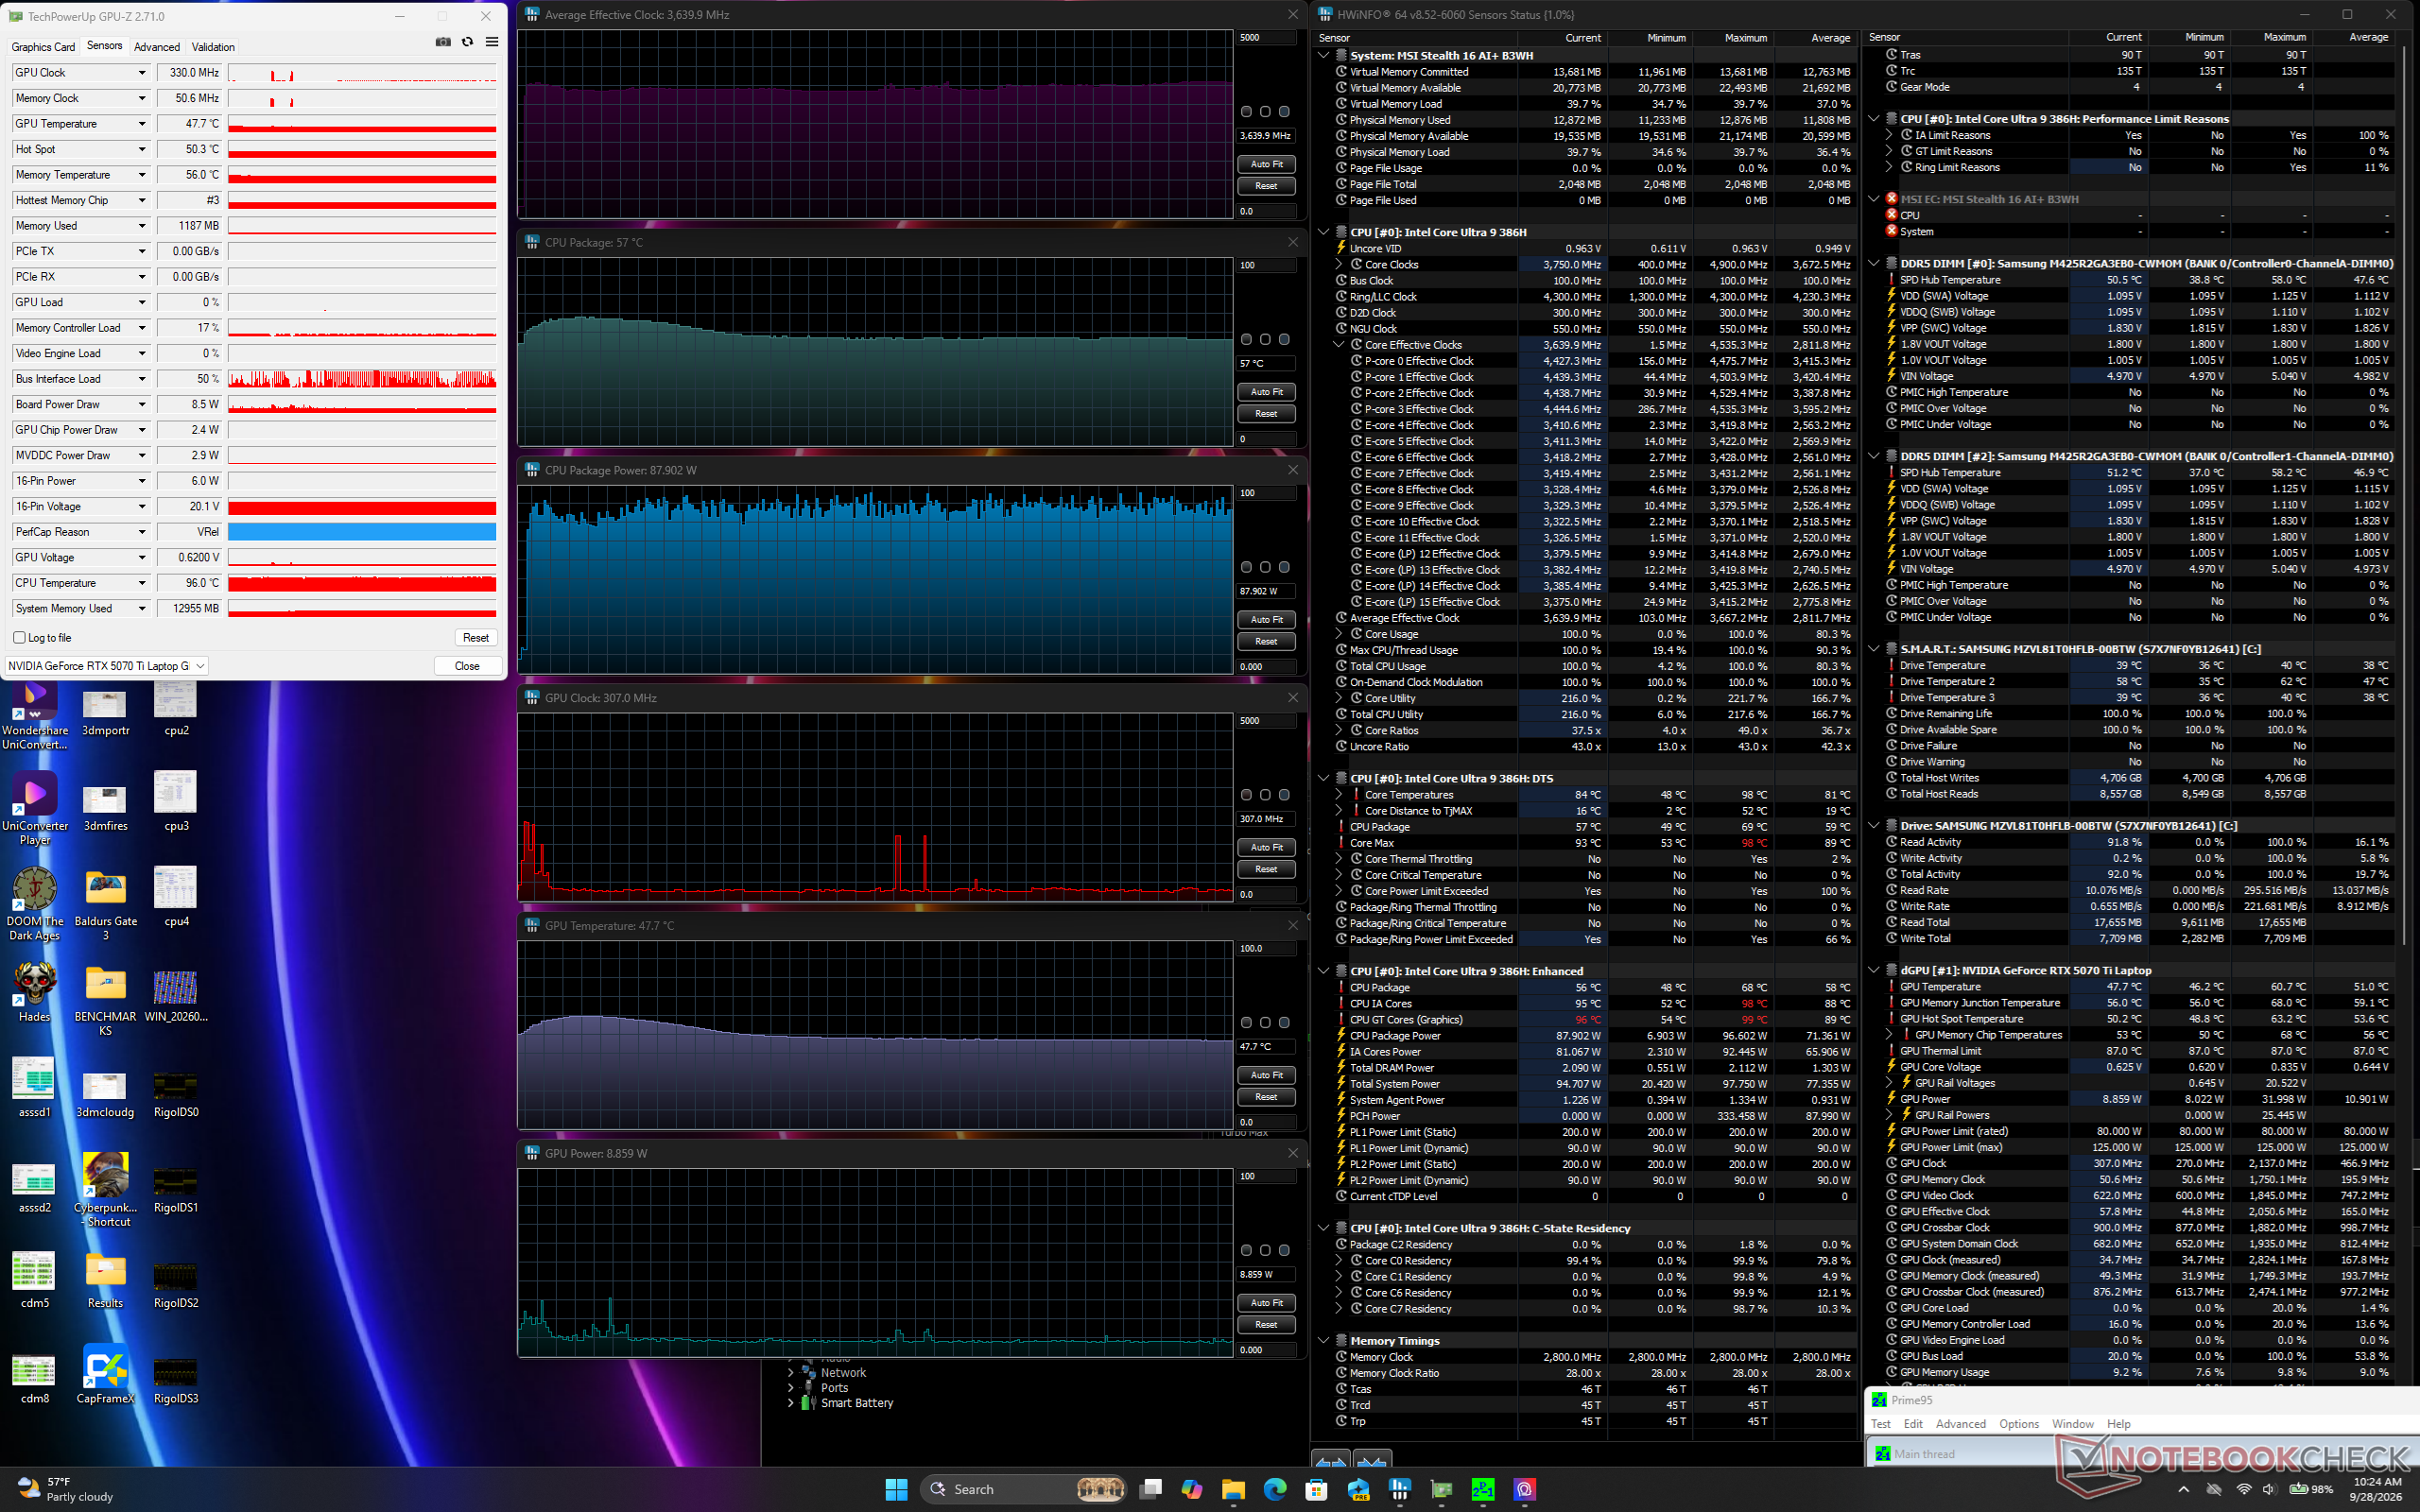
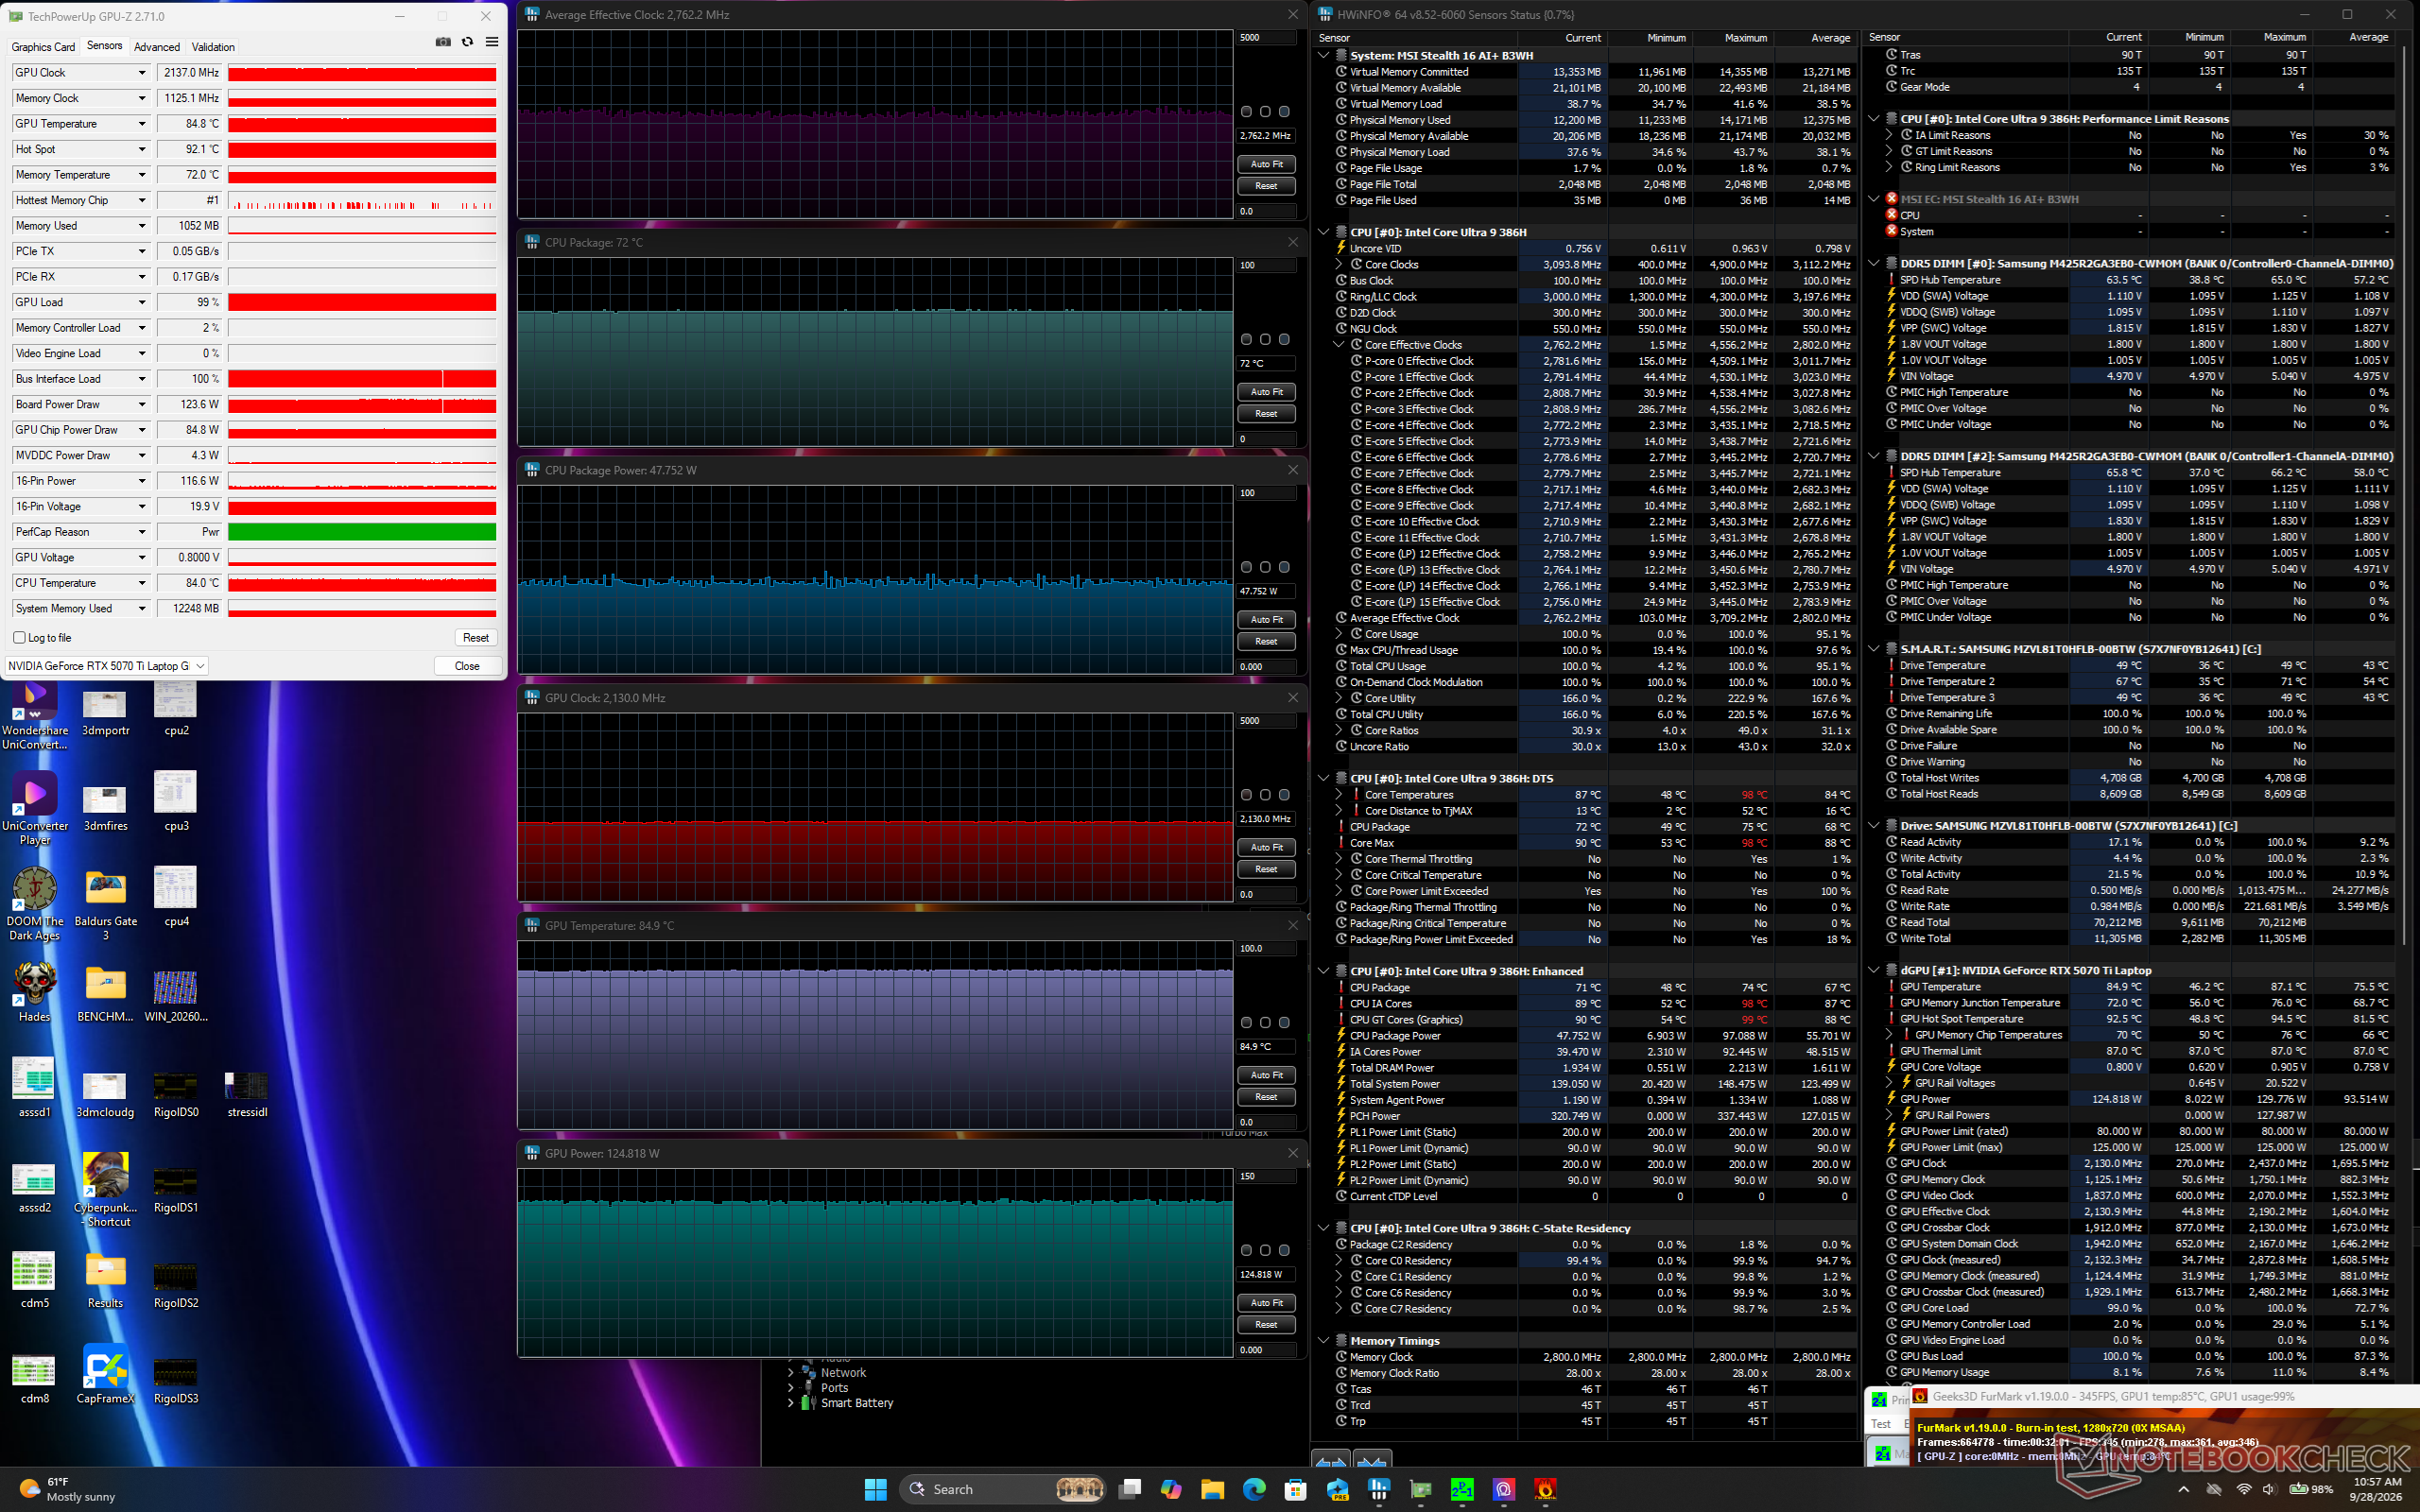
Prime95 Stresstest
Prime95 Stresstest
Prime95+FurMark Stresstest
Cyberpunk 2077 Stresstest (ausgewogener Modus)
Cyberpunk 2077 Stresstest (Leistungsmodus, Apex aus, CoolerBoost aus)
Cyberpunk 2077 Stresstest (Leistungsmodus, Apex an, CoolerBoost aus)
Cyberpunk 2077 Stresstest (Leistungsmodus, Apex an, CoolerBoost an)
CPU-Takt (GHz) GPU-Takt (MHz) curchschnittliche CPU-Temperatur (°C) curchschnittliche GPU-Temperatur (°C)
System im Leerlauf -- 270 56 52
Prime95 Stresstest 3,6 -- 57 48
Prime95- + FurMark Stresstest 2,8 2.130 72 85
Cyberpunk 2077 Stresstest (ausgewogener Modus) 2,2 1.935 67 74
Cyberpunk 2077 Stresstest (Leistungsmodus, Apex aus, CoolerBoost aus) 2,5 2.167 70 77
Cyberpunk 2077 Stresstest (Leistungsmodus, Apex an, CoolerBoost aus) 2,6 2.512 74 86
Cyberpunk 2077 Stresstest (Leistungsmodus, Apex an, CoolerBoost an) 2,5 2.437 73 85

Lautsprecher

Trotz vier Lautsprechern sind sowohl die maximale Lautstärke als auch die Basswiedergabe für einen Gaming-Laptop enttäuschend
dB(A) 0102030405060708090Deep BassMiddle BassHigh BassLower RangeMidsHigher MidsLower HighsMid HighsUpper HighsSuper Highs2036.134.2252523.73123.519.54020.220.15022.921632122.58023.227.510023.43612518.142.816015.950.620014.553.32501557.731517.860.54001365.350011.37063011.472.280010.372.810009.870.112509.66916009.570.4200010.169.8250010.170.9315010.971.6400011.267.1500011.563.8630011.867.1800011.7661000011.662.71250011.5611600010.860.2SPL23.381.4N0.552.7median 11.5median 66Delta2.2726.325.821.422.12624.925.127.622.532.523.448.72655.818.860.922.167.2267019.372.317.674.217.774.319.575.31571.711.871.311.27410.574.21072.710.17210.67210.97511.374.811.671.71269.71269.612.371.112.669.61270.111.269.824.784.70.666.6median 12median 71.73.42.2hearing rangehide median Pink NoiseMSI Stealth 16 AI B3WHApple MacBook Pro 16 2021 M1 Pro
Frequenzdiagramm (für Vergleiche die Checkboxen oben an-/abwählen)
MSI Stealth 16 AI B3WH Audio Analyse

(±) | Mittelmäßig laut spielende Lautsprecher (81.4 dB)
Bass 100 - 315 Hz
(-) | kaum Bass - 15.8% niedriger als der Median
(±) | durchschnittlich lineare Bass-Wiedergabe (10.1% Delta zum Vorgänger)
Mitteltöne 400 - 2000 Hz
(+) | ausgeglichene Mitten, vom Median nur 4.1% abweichend
(+) | lineare Mitten (4.2% Delta zum Vorgänger)
Hochtöne 2 - 16 kHz
(+) | ausgeglichene Hochtöne, vom Median nur 2.6% abweichend
(+) | sehr lineare Hochtöne (4.5% Delta zum Vorgänger)
Gesamt im hörbaren Bereich 100 - 16.000 Hz
(+) | hörbarer Bereich ist sehr linear (13.6% Abstand zum Median
Im Vergleich zu allen Geräten derselben Klasse
» 21% aller getesteten Geräte dieser Klasse waren besser, 7% vergleichbar, 72% schlechter
» Das beste Gerät hat einen Delta-Wert von 6%, durchschnittlich ist 18%, das schlechteste Gerät hat 132%
Im Vergleich zu allen Geräten im Test
» 15% aller getesteten Geräte waren besser, 4% vergleichbar, 81% schlechter
» Das beste Gerät hat einen Delta-Wert von 4%, durchschnittlich ist 23%, das schlechteste Gerät hat 136%

Apple MacBook Pro 16 2021 M1 Pro Audio Analyse

(+) | Die Lautsprecher können relativ laut spielen (84.7 dB)
Bass 100 - 315 Hz
(+) | guter Bass - nur 3.8% Abweichung vom Median
(+) | lineare Bass-Wiedergabe (5.2% Delta zum Vorgänger)
Mitteltöne 400 - 2000 Hz
(+) | ausgeglichene Mitten, vom Median nur 1.3% abweichend
(+) | lineare Mitten (2.1% Delta zum Vorgänger)
Hochtöne 2 - 16 kHz
(+) | ausgeglichene Hochtöne, vom Median nur 1.9% abweichend
(+) | sehr lineare Hochtöne (2.7% Delta zum Vorgänger)
Gesamt im hörbaren Bereich 100 - 16.000 Hz
(+) | hörbarer Bereich ist sehr linear (4.6% Abstand zum Median
Im Vergleich zu allen Geräten derselben Klasse
» 0% aller getesteten Geräte dieser Klasse waren besser, 0% vergleichbar, 100% schlechter
» Das beste Gerät hat einen Delta-Wert von 5%, durchschnittlich ist 17%, das schlechteste Gerät hat 45%
Im Vergleich zu allen Geräten im Test
» 0% aller getesteten Geräte waren besser, 0% vergleichbar, 100% schlechter
» Das beste Gerät hat einen Delta-Wert von 4%, durchschnittlich ist 23%, das schlechteste Gerät hat 136%

Energieverwaltung

Leistungsaufnahme

Mit rund 210 W beim Gaming liegt das Stealth 16 etwa im Durchschnitt eines RTX-basierten Gaming-Laptops. Das System ist deutlich effizienter als das AMD basierte Crosshair A16 HX, das mit der schwächeren RTX 5070 ausgestattet ist.
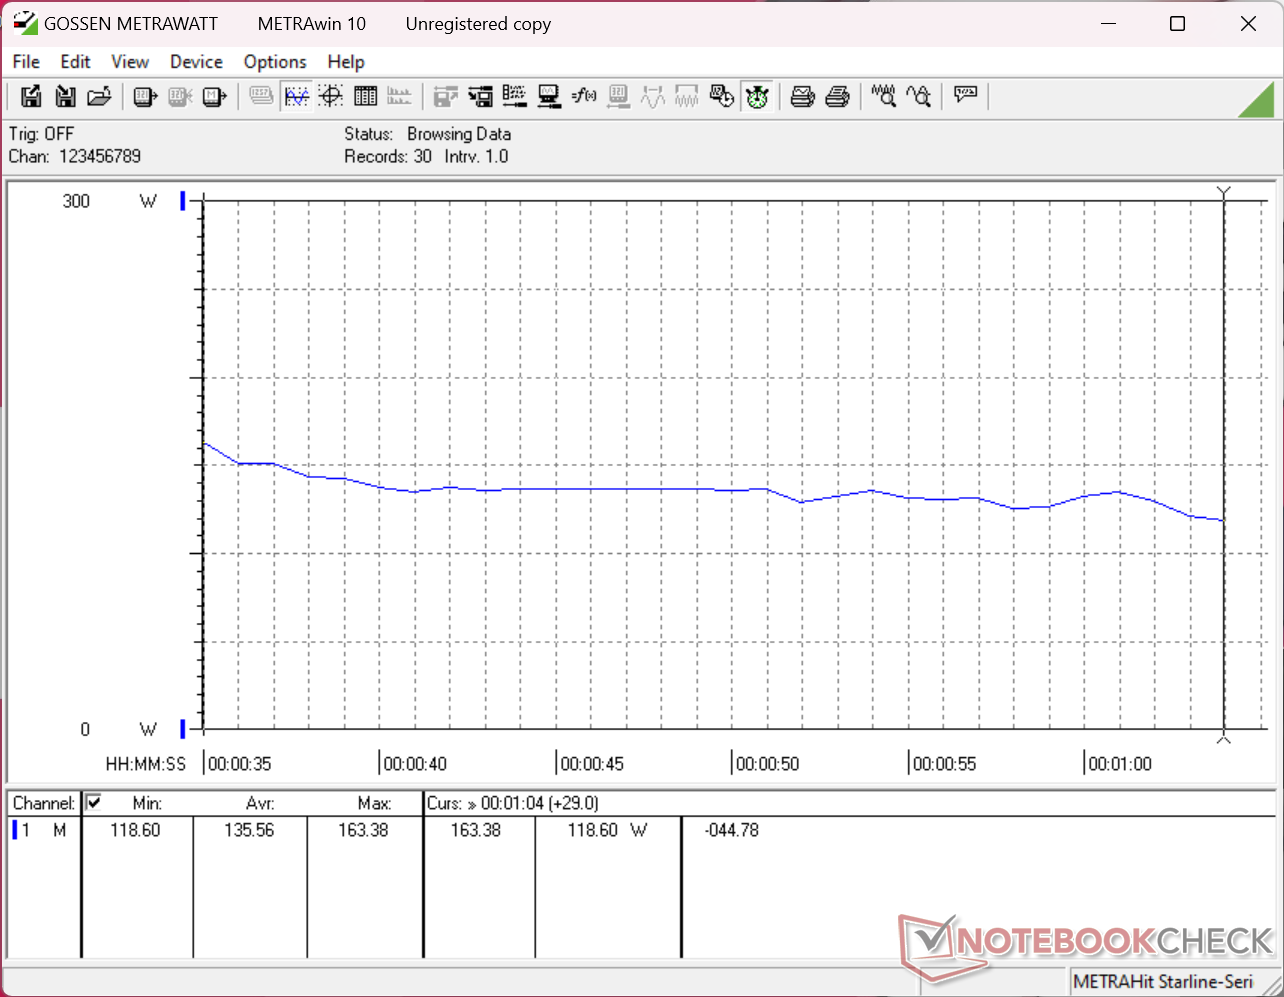
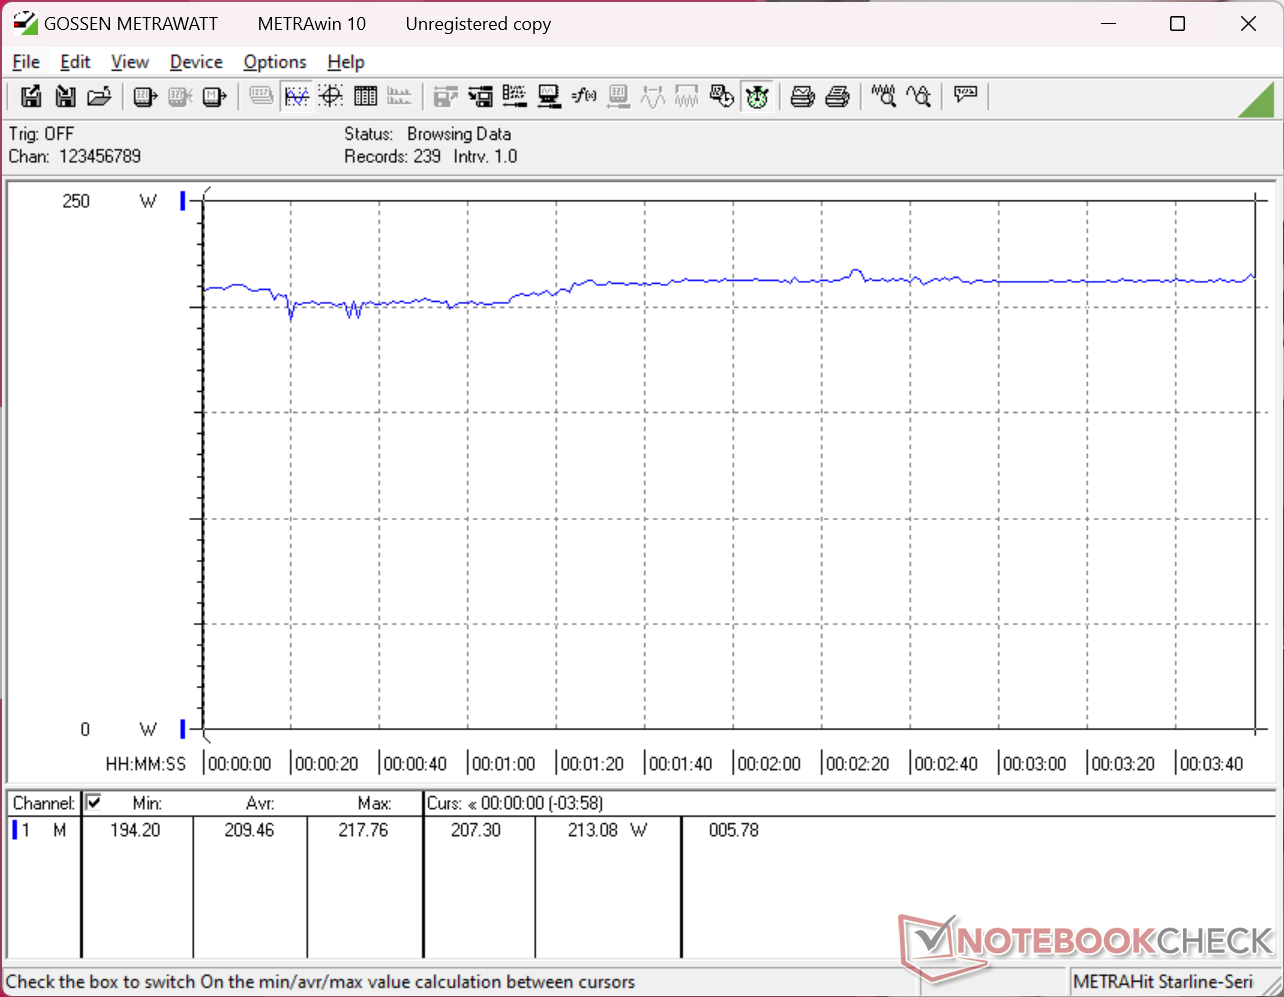
Leistungsaufnahme bei 3DMark 11
Leistungsaufnahme bei Cyberpunk 2077 in 1.080p auf Ultra
Beim Start des Prime95 Stresstests stieg die Leistungsaufnahme kurzzeitig auf 147 W
Prime95+FurMark Stresstest nach 10 Sekunden gestartet
Stromverbrauch
Aus / Standbydarklight 0.09 / 2.1 Watt
Idledarkmidlight 6.5 / 7.8 / 24.5 Watt
Last midlight 135.6 / 284.3 Watt
 color bar
Legende: min: dark, med: mid, max: light        Metrahit Energy
MSI Stealth 16 AI B3WH
Ultra 9 386H, GeForce RTX 5070 Ti Laptop, Samsung PM9C1b MZVL81T0HFLB-00BTW, OLED, 2560x1600, 16"
MSI Stealth 16 Studio A13VG
i7-13700H, GeForce RTX 4070 Laptop GPU, Micron 3400 2TB MTFDKBA2T0TFH, IPS, 2560x1600, 16"
Razer Blade 16 Core Ultra 9 386H
Ultra 9 386H, GeForce RTX 5090 Laptop, Lexar NM790 2TB, OLED, 2560x1600, 16"
Lenovo Legion 7 16 AGP11
Ryzen AI 9 HX 470, GeForce RTX 5060 Laptop, Lenovo UMIS AM541 1TB, OLED, 2560x1600, 16"
Aorus Master 16 AM6J
R9 9955HX3D, GeForce RTX 5080 Laptop, Samsung PM9C1b MZVL81T0HFLB-00BTW, OLED, 2560x1600, 16"
Asus ROG Zephyrus G16 GU606AW
Ultra 9 386H, GeForce RTX 5080 Laptop, Samsung PM9C1b MZVL82T0HBL1, OLED, 2560x1600, 16"
Stromverbrauch
-25%
-22%
23%
-46%
-1%
Idle min * (Watt)
6.5
11
-69%
4.4
32%
5.7
12%
14.4
-122%
7.8
-20%
Idle avg * (Watt)
7.8
18
-131%
22.3
-186%
8.7
-12%
16.8
-115%
13.3
-71%
Idle max * (Watt)
24.5
19
22%
30.4
-24%
9.1
63%
19.3
21%
13.6
44%
Last avg * (Watt)
135.6
91
33%
110.7
18%
88.7
35%
151
-11%
122.9
9%
Cyberpunk 2077 ultra external monitor * (Watt)
212
216
-2%
156.9
26%
188.1
11%
Cyberpunk 2077 ultra * (Watt)
209
216
-3%
160.3
23%
272
-30%
190
9%
Last max * (Watt)
284.3
228
20%
251.3
12%
234.9
17%
338
-19%
245.6
14%
Witcher 3 ultra * (Watt)
130

* ... kleinere Werte sind besser

Leistungsaufnahme bei Cyberpunk/Stresstest

0102030405060708090100110120130140150160170180190200210220230240250260270280Tooltip
MSI Stealth 16 AI B3WH Ultra 9 386H, GeForce RTX 5070 Ti Laptop; 1280x720 Prime95 28.10 and Furmark 1.25: Ø220 (205-284) Watt
Razer Blade 16 Core Ultra 9 386H Ultra 9 386H, GeForce RTX 5090 Laptop; 1280x720 Prime95 28.10 and Furmark 1.25: Ø161.4 (125.9-251) Watt
MSI Stealth 16 AI B3WH Ultra 9 386H, GeForce RTX 5070 Ti Laptop; Idle 150cd/m2: Ø7 (4.98-13.5) Watt
Razer Blade 16 Core Ultra 9 386H Ultra 9 386H, GeForce RTX 5090 Laptop; Idle 150cd/m2: Ø5.15 (0.0006-6.38) Watt
MSI Stealth 16 AI B3WH Ultra 9 386H, GeForce RTX 5070 Ti Laptop; Cyberpunk 2077 FHD ultra no FSR 150cd: Ø209 (194.2-218) Watt
Razer Blade 16 Core Ultra 9 386H Ultra 9 386H, GeForce RTX 5090 Laptop; Cyberpunk 2077 FHD ultra no FSR 150cd: Ø216 (205-221) Watt

Leistungsaufnahme mit externem Monitor

05101520253035404550556065707580859095100105110115120125130135140145150155160165170175180185190195200205210215220Tooltip
MSI Stealth 16 AI B3WH Ultra 9 386H, GeForce RTX 5070 Ti Laptop; Prime95 V2810 Stress (external Monitor): Ø138 (126.8-146.7) Watt
Razer Blade 16 Core Ultra 9 386H Ultra 9 386H, GeForce RTX 5090 Laptop; Prime95 V2810 Stress (external Monitor): Ø104.6 (91.3-134.1) Watt
Razer Blade 16 Core Ultra 9 386H Ultra 9 386H, GeForce RTX 5090 Laptop; Cinebench R15 Multi (external Monitor): Ø104.8 (103.4-105.8) Watt
MSI Stealth 16 AI B3WH Ultra 9 386H, GeForce RTX 5070 Ti Laptop; Cinebench R23 Multi (external Monitor): Ø107.7 (99.2-110.7) Watt
Razer Blade 16 Core Ultra 9 386H Ultra 9 386H, GeForce RTX 5090 Laptop; Cinebench R23 Multi (external Monitor): Ø120.7 (117.1-122.7) Watt
MSI Stealth 16 AI B3WH Ultra 9 386H, GeForce RTX 5070 Ti Laptop; 1280x720 FurMark 1.19 GPU Stress Test (external Monitor): Ø151.9 (133.4-179.5) Watt
Razer Blade 16 Core Ultra 9 386H Ultra 9 386H, GeForce RTX 5090 Laptop; 1280x720 FurMark 1.19 GPU Stress Test (external Monitor): Ø206 (179.6-214) Watt
MSI Stealth 16 AI B3WH Ultra 9 386H, GeForce RTX 5070 Ti Laptop; Idle 1min (external Monitor): Ø6.49 (4.8-9.09) Watt
Razer Blade 16 Core Ultra 9 386H Ultra 9 386H, GeForce RTX 5090 Laptop; Idle 1min (external Monitor): Ø4.54 (0.00227-6.34) Watt
MSI Stealth 16 AI B3WH Ultra 9 386H, GeForce RTX 5070 Ti Laptop; Cyberpunk 2077 FHD ultra no FSR (external Monitor): Ø212 (208-215) Watt
Razer Blade 16 Core Ultra 9 386H Ultra 9 386H, GeForce RTX 5090 Laptop; Cyberpunk 2077 FHD ultra no FSR (external Monitor): Ø216 (201-223) Watt

Akkulaufzeit

Die WLAN-Laufzeiten sind trotz der um zehn Prozent geringeren Akkukapazität sogar länger als die von uns beim Stealth 16 von 2023 gemessenen Werte. Für die längere Akkulaufzeit muss das System allerdings unbedingt in den iGPU-Modus versetzt werden.

Akkulaufzeit
WiFi Websurfing
9h 16min
MSI Stealth 16 AI B3WH
Ultra 9 386H, GeForce RTX 5070 Ti Laptop, 90 Wh
MSI Stealth 16 Studio A13VG
i7-13700H, GeForce RTX 4070 Laptop GPU, 99.9 Wh
Razer Blade 16 Core Ultra 9 386H
Ultra 9 386H, GeForce RTX 5090 Laptop, 90 Wh
Lenovo Legion 7 16 AGP11
Ryzen AI 9 HX 470, GeForce RTX 5060 Laptop, 84 Wh
Aorus Master 16 AM6J
R9 9955HX3D, GeForce RTX 5080 Laptop, 99 Wh
Asus ROG Zephyrus G16 GU606AW
Ultra 9 386H, GeForce RTX 5080 Laptop, 90 Wh
Akkulaufzeit
-16%
26%
-1%
-44%
33%
WLAN (h)
9.3
7.8
-16%
11.7
26%
9.2
-1%
5.2
-44%
12.4
33%
Idle (h)
11
H.264 (h)
7.7
Last (h)
2.4

Notebookcheck Bewertung

Ein Gaming-Laptop im Prestige-Gewand, konzipiert für professionelle Umgebungen und arbeitsspeicherintensive Aufgaben.

MSI Stealth 16 AI B3WH - 03.10.2026 v8
Allen Ngo

Gehäuse
88 / 98 → 89%
Tastatur
89%
Pointing Device
92%
Konnektivität
73 / 80 → 92%
Gewicht
63 / 10-68 → 91%
Akkulaufzeit
87 / 95 → 91%
Display
88%
Leistung Spiele
91%
Leistung Anwendungen
90%
AI Performance
96%
Temperatur
90 / 95 → 95%
Lautstärke
69 / 90 → 77%
Audio
78%
Kamera
36 / 75 → 47%
Durchschnitt
66%
88%
Gaming - gewichteter Durchschnitt
Weitere Informationen über unsere Bewertung finden Sie hier.
CO2 Emissions
No Data
Materials
0%
Packaging
75%
Power Use
80%
Repairability
40%
Software Updates
22.3%
Recycle Logo Total Sustainability Score: 36.2%

Mögliche Konkurrenten im Vergleich

Bild
Modell / Test
Preis ab
Gewicht
Dicke
Display
1.
87.7%
MSI Stealth 16 AI B3WH
Intel Core Ultra 9 386H ⎘
NVIDIA GeForce RTX 5070 Ti Laptop ⎘
32 GB RAM, 1000 GB SSD
Amazon:
Bestpreis 4029€ galaxus.at
2 kg19.99 mm16.00"
2560x1600
189 PPI
OLED
2.
88.8% v7 (old)
MSI Stealth 16 Studio A13VG
Intel Core i7-13700H ⎘
NVIDIA GeForce RTX 4070 Laptop GPU ⎘
32 GB RAM, 2048 GB SSD
Amazon:
1. 2.157,43 €
MSI Stealth 16 AI Studio A1V...
2. 46,99 €
WoskjXas 240W Laptop Ladeger...
3. 96,99 €
SLRIOYS 330W AC Adapter Komp...
Listenpreis: 3100 EUR
2 kg19.95 mm16.00"
2560x1600
189 PPI
IPS
3.
87.7%
Razer Blade 16 Core Ultra 9 386H
Intel Core Ultra 9 386H ⎘
NVIDIA GeForce RTX 5090 Laptop ⎘
32 GB RAM, 2048 GB SSD
Amazon:
1. 4.999,00 €
Razer Blade 16 (2026) - 16 Z...
2. 3.999,00 €
Razer Blade 16 (2026) - 16 Z...
3. 3.756,68 €
Razer Blade 16 (2026) Gaming...
Bestpreis 5196.99€ nullprozentshop.de
2. 5196.99€ notebooksbilliger.de
3. 5196.99€ Cyberport.de
2.1 kg17.4 mm16.00"
2560x1600
189 PPI
OLED
4.
86.4%
Lenovo Legion 7 16 AGP11
AMD Ryzen AI 9 HX 470 ⎘
NVIDIA GeForce RTX 5060 Laptop ⎘
32 GB RAM, 1024 GB SSD
Amazon: 3.005,99 €
Bestpreis 2999€ Cyberport Stores Deutschland
2. 2999€ Cyberport.de
3. 2999€ Cyberport Stores Österreich
1.8 kg16.9 mm16.00"
2560x1600
189 PPI
OLED
5.
83.5%
Aorus Master 16 AM6J
AMD Ryzen 9 9955HX3D ⎘
NVIDIA GeForce RTX 5080 Laptop ⎘
32 GB RAM, 1000 GB SSD
Amazon:
1. 3.199,00 €
Gigabyte AORUS Master 16 BYH...
2. 4.083,23 €
GIGABYTE AORUS Master 16 BYH...
3. 6.974,84 €
GIGABYTE AORUS Master 16 Gam...
Bestpreis 3299€ notebooksbilliger.de
2. 3326.72€ notebooksbilliger.at
2.3 kg24.5 mm16.00"
2560x1600
189 PPI
OLED
6.
90.4%
Asus ROG Zephyrus G16 GU606AW
Intel Core Ultra 9 386H ⎘
NVIDIA GeForce RTX 5080 Laptop ⎘
64 GB RAM, 2048 GB SSD
Amazon: 5.399,00 €
Bestpreis 5399€ Cyberport.de
2. 5399€ computeruniverse.net
3. 5399€ Cyberport.at
1.9 kg17.9 mm16.00"
2560x1600
189 PPI
OLED

Transparenz

Die Auswahl der zu testenden Geräte erfolgt innerhalb der Redaktion. Das vorliegende Testmuster wurde dem Autor vom Hersteller oder einem Shop zu Testzwecken leihweise zur Verfügung gestellt. Eine Einflussnahme des Leihstellers auf den Testbericht gab es nicht, der Hersteller erhielt keine Version des Reviews vor der Veröffentlichung. Es bestand keine Verpflichtung zur Publikation. Als eigenständiges, unabhängiges Unternehmen unterliegt Notebookcheck keiner Diktion von Herstellern, Shops und Verlagen.

So testet Notebookcheck

Pro Jahr werden von Notebookcheck hunderte Laptops und Smartphones unabhängig in von uns standardisierten technischen Verfahren getestet, um eine Vergleichbarkeit aller Testergebnisse zu gewährleisten. Seit rund 20 Jahren entwickeln wir diese Testmethoden kontinuierlich weiter und setzen damit Branchenstandards. In unseren Testlaboren kommt ausschließlich hochwertiges Messequipment in die Hände erfahrener Techniker und Redakteure. Die Tests unterliegen einer mehrstufigen Kontrolle. Unsere komplexe Gesamtbewertung basiert auf hunderten fundierten Messergebnissen und Benchmarks, womit Ihnen Objektivität garantiert ist. Weitere Informationen zu unseren Testmethoden gibt es hier.

Google LogoAls bevorzugte Quelle auf Google hinzufügen
Mail Logo
> Notebook Test, Laptop Test und News > Tests > Notebook Testberichte > MSI Stealth 16 AI B3WH im Test: Teils Gamer, teils Creator, durch und durch professionell
Autor: Allen Ngo,  5.10.2026 (Update:  5.10.2026)