Notebookcheck Logo

AMD Ryzen AI Max+ 395 in der Analyse - Strix Halo als Antwort auf Apples M4 Pro/Max mit 16 Zen-5-Kernen und iGPU auf Niveau der RTX 4070 Laptop

Strix Halo mit bis zu 96 GB Grafikspeicher.

Mit dem neuen Ryzen AI Max+ 395 bietet AMD einen neuen High-End-Prozessor für den Mobilbereich. Mit bis zu 16 Zen-5-Kernen, leistungsstarker Radeon-GPU, schneller NPU und bis zu 128 GB RAM soll sich der Ryzen AI Max+ ideal für das Gaming, Content Creation und AI-Entwicklung eignen. Update: Leistung bei verschiedenen TDP-Werten & RAM-Performance

AMD präsentiert mit den Ryzen-AI-Max-Chips neue Mobilprozessoren mit leistungsstarken Prozessoren und schnellen iGPUs, die auf gemeinsamen Arbeitsspeicher zurückgreifen. Je nach Konfiguration stehen bis zu 96 GB VRAM zur Verfügung, was vor allem bei anspruchsvoller Bild-/Videobearbeitung und AI-Entwicklung helfen kann. Wir testen den Ryzen AI Max+ 395, das Flagship der neuen Strix-Halo-Baureihe und vergleichen sowohl die CPU- als auch GPU-Leistung mit der Konkurrenz. Zusätzlich sehen wir uns an, wie sich die Monster-APU beim Spielen schlägt und ob es Effizienzvorteile gegenüber Geräten mit CPUs und dedizierten GPUs gibt.

Update 21.02.2025: Leistung bei verschiedenen TDP-Werten & RAM-Performance hinzugefügt

Überblick - AMD Ryzen AI Max

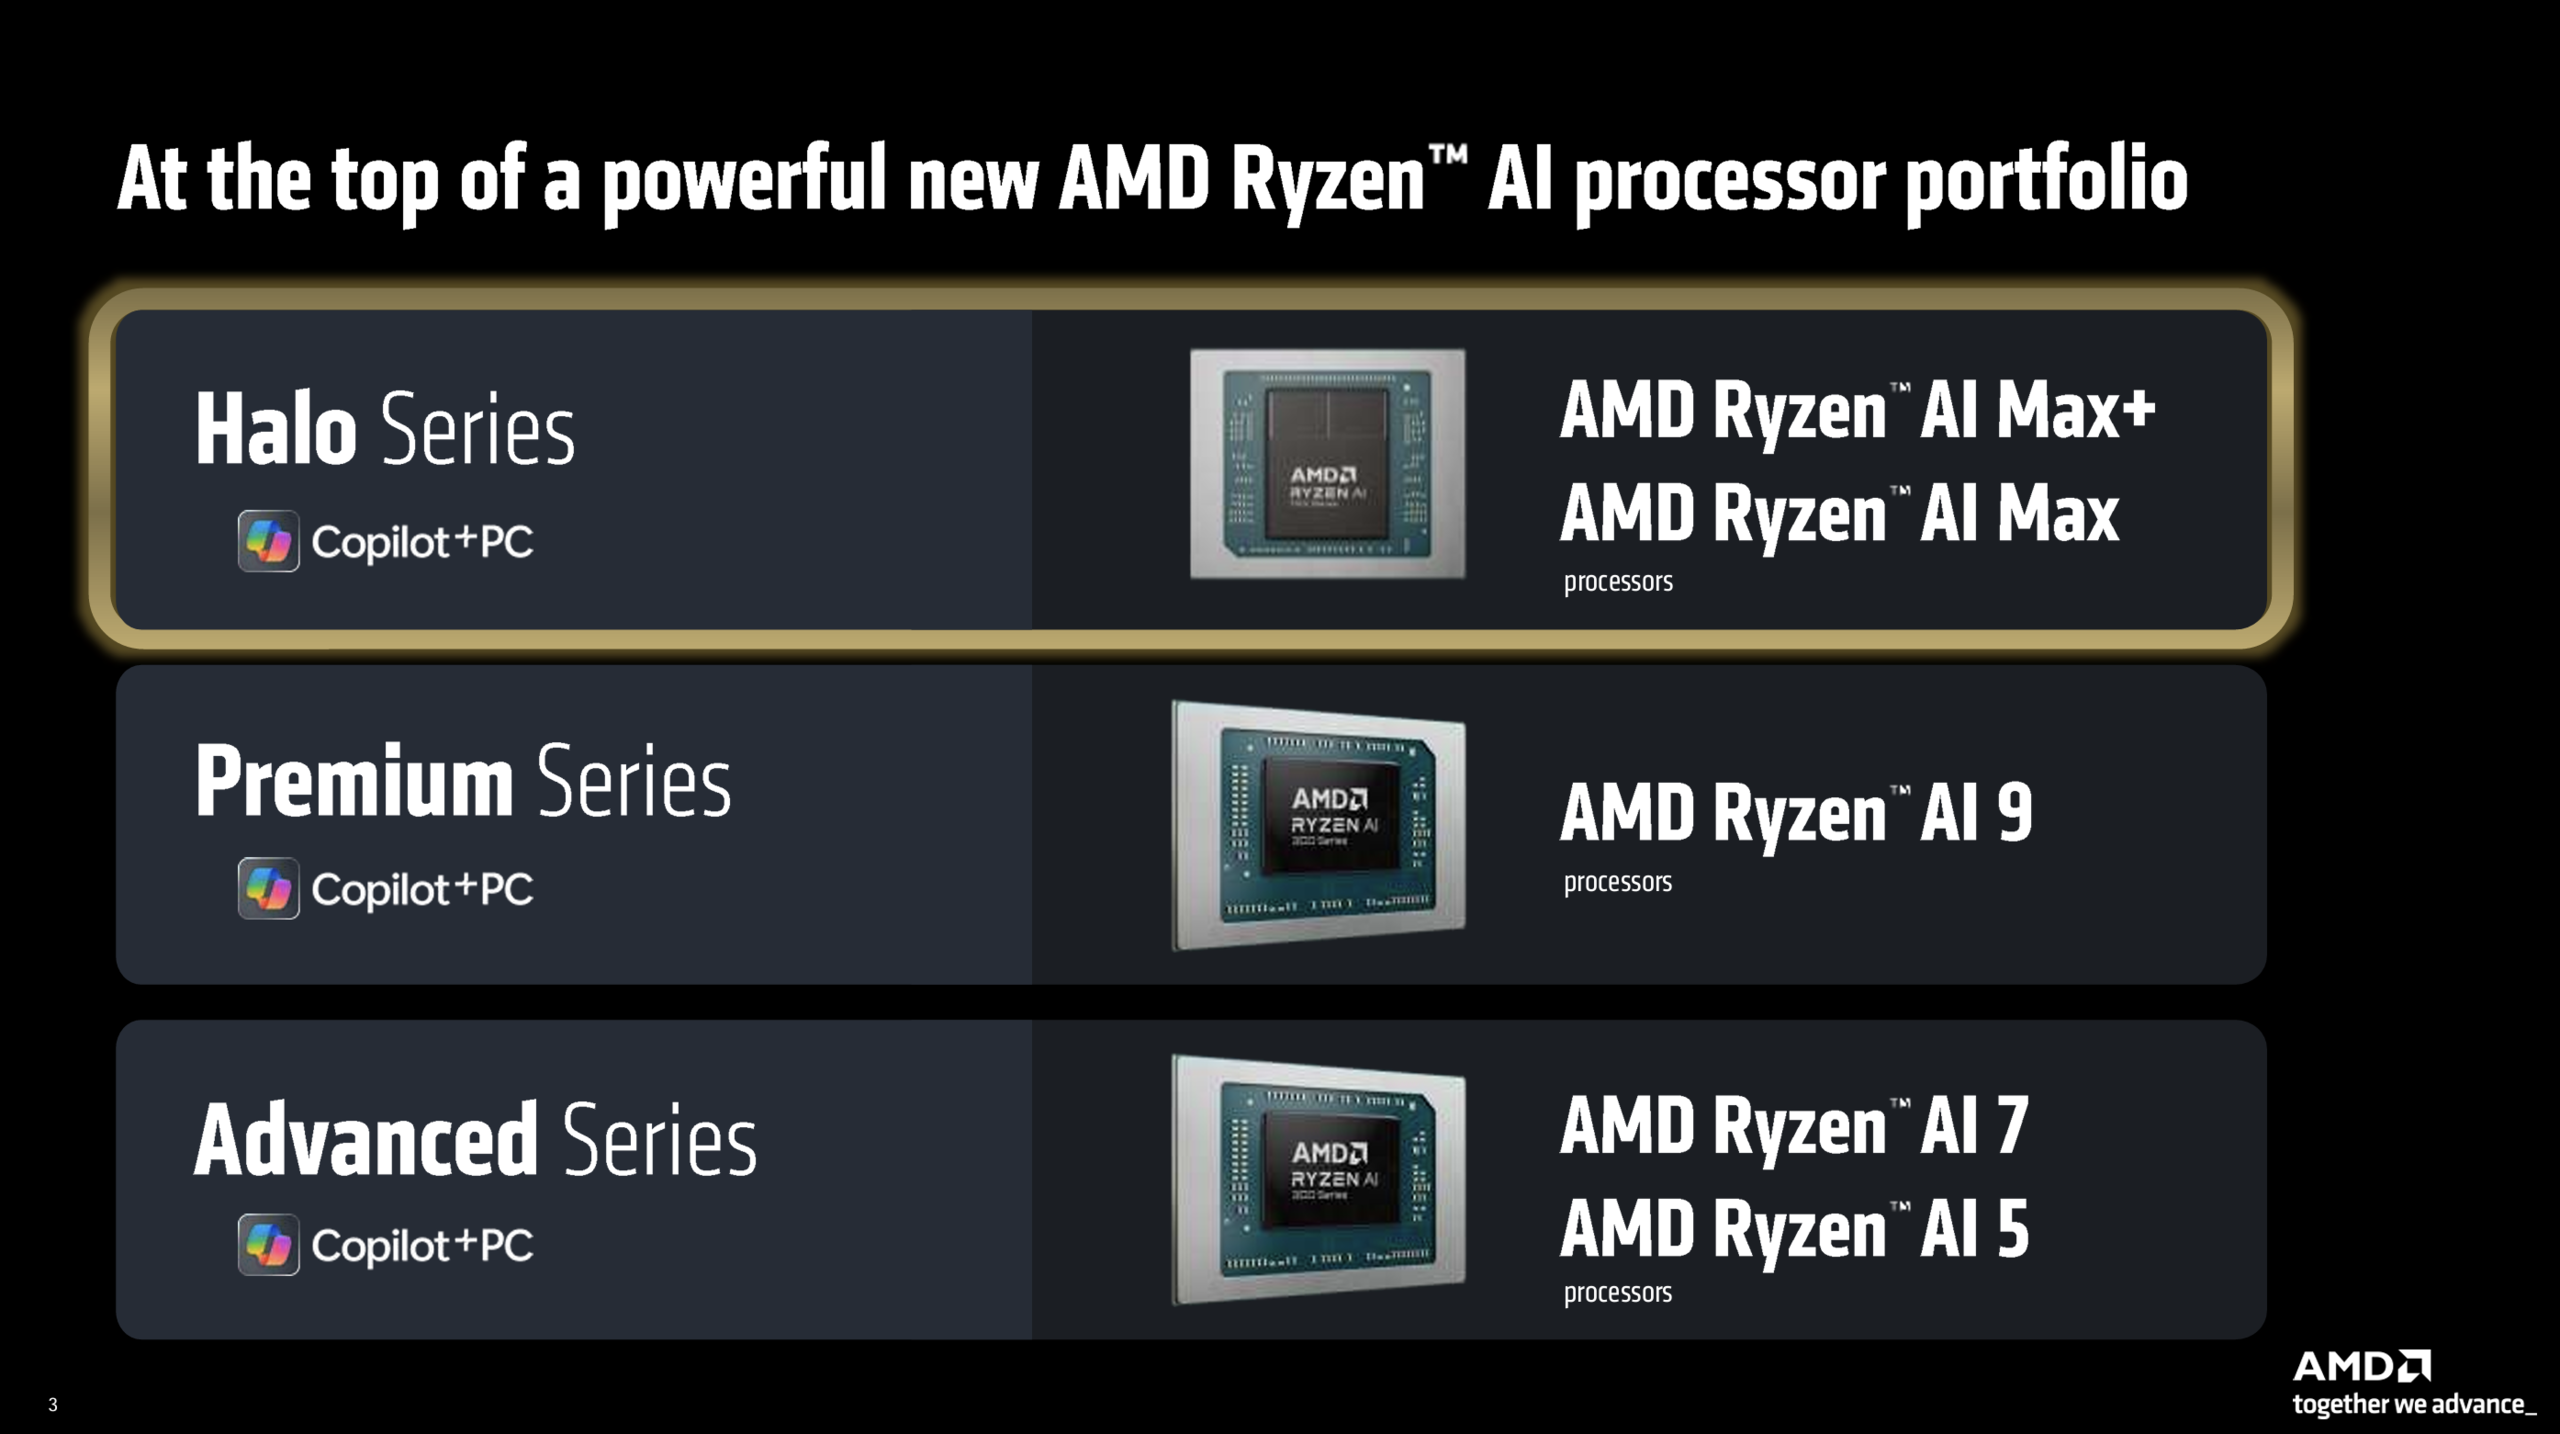
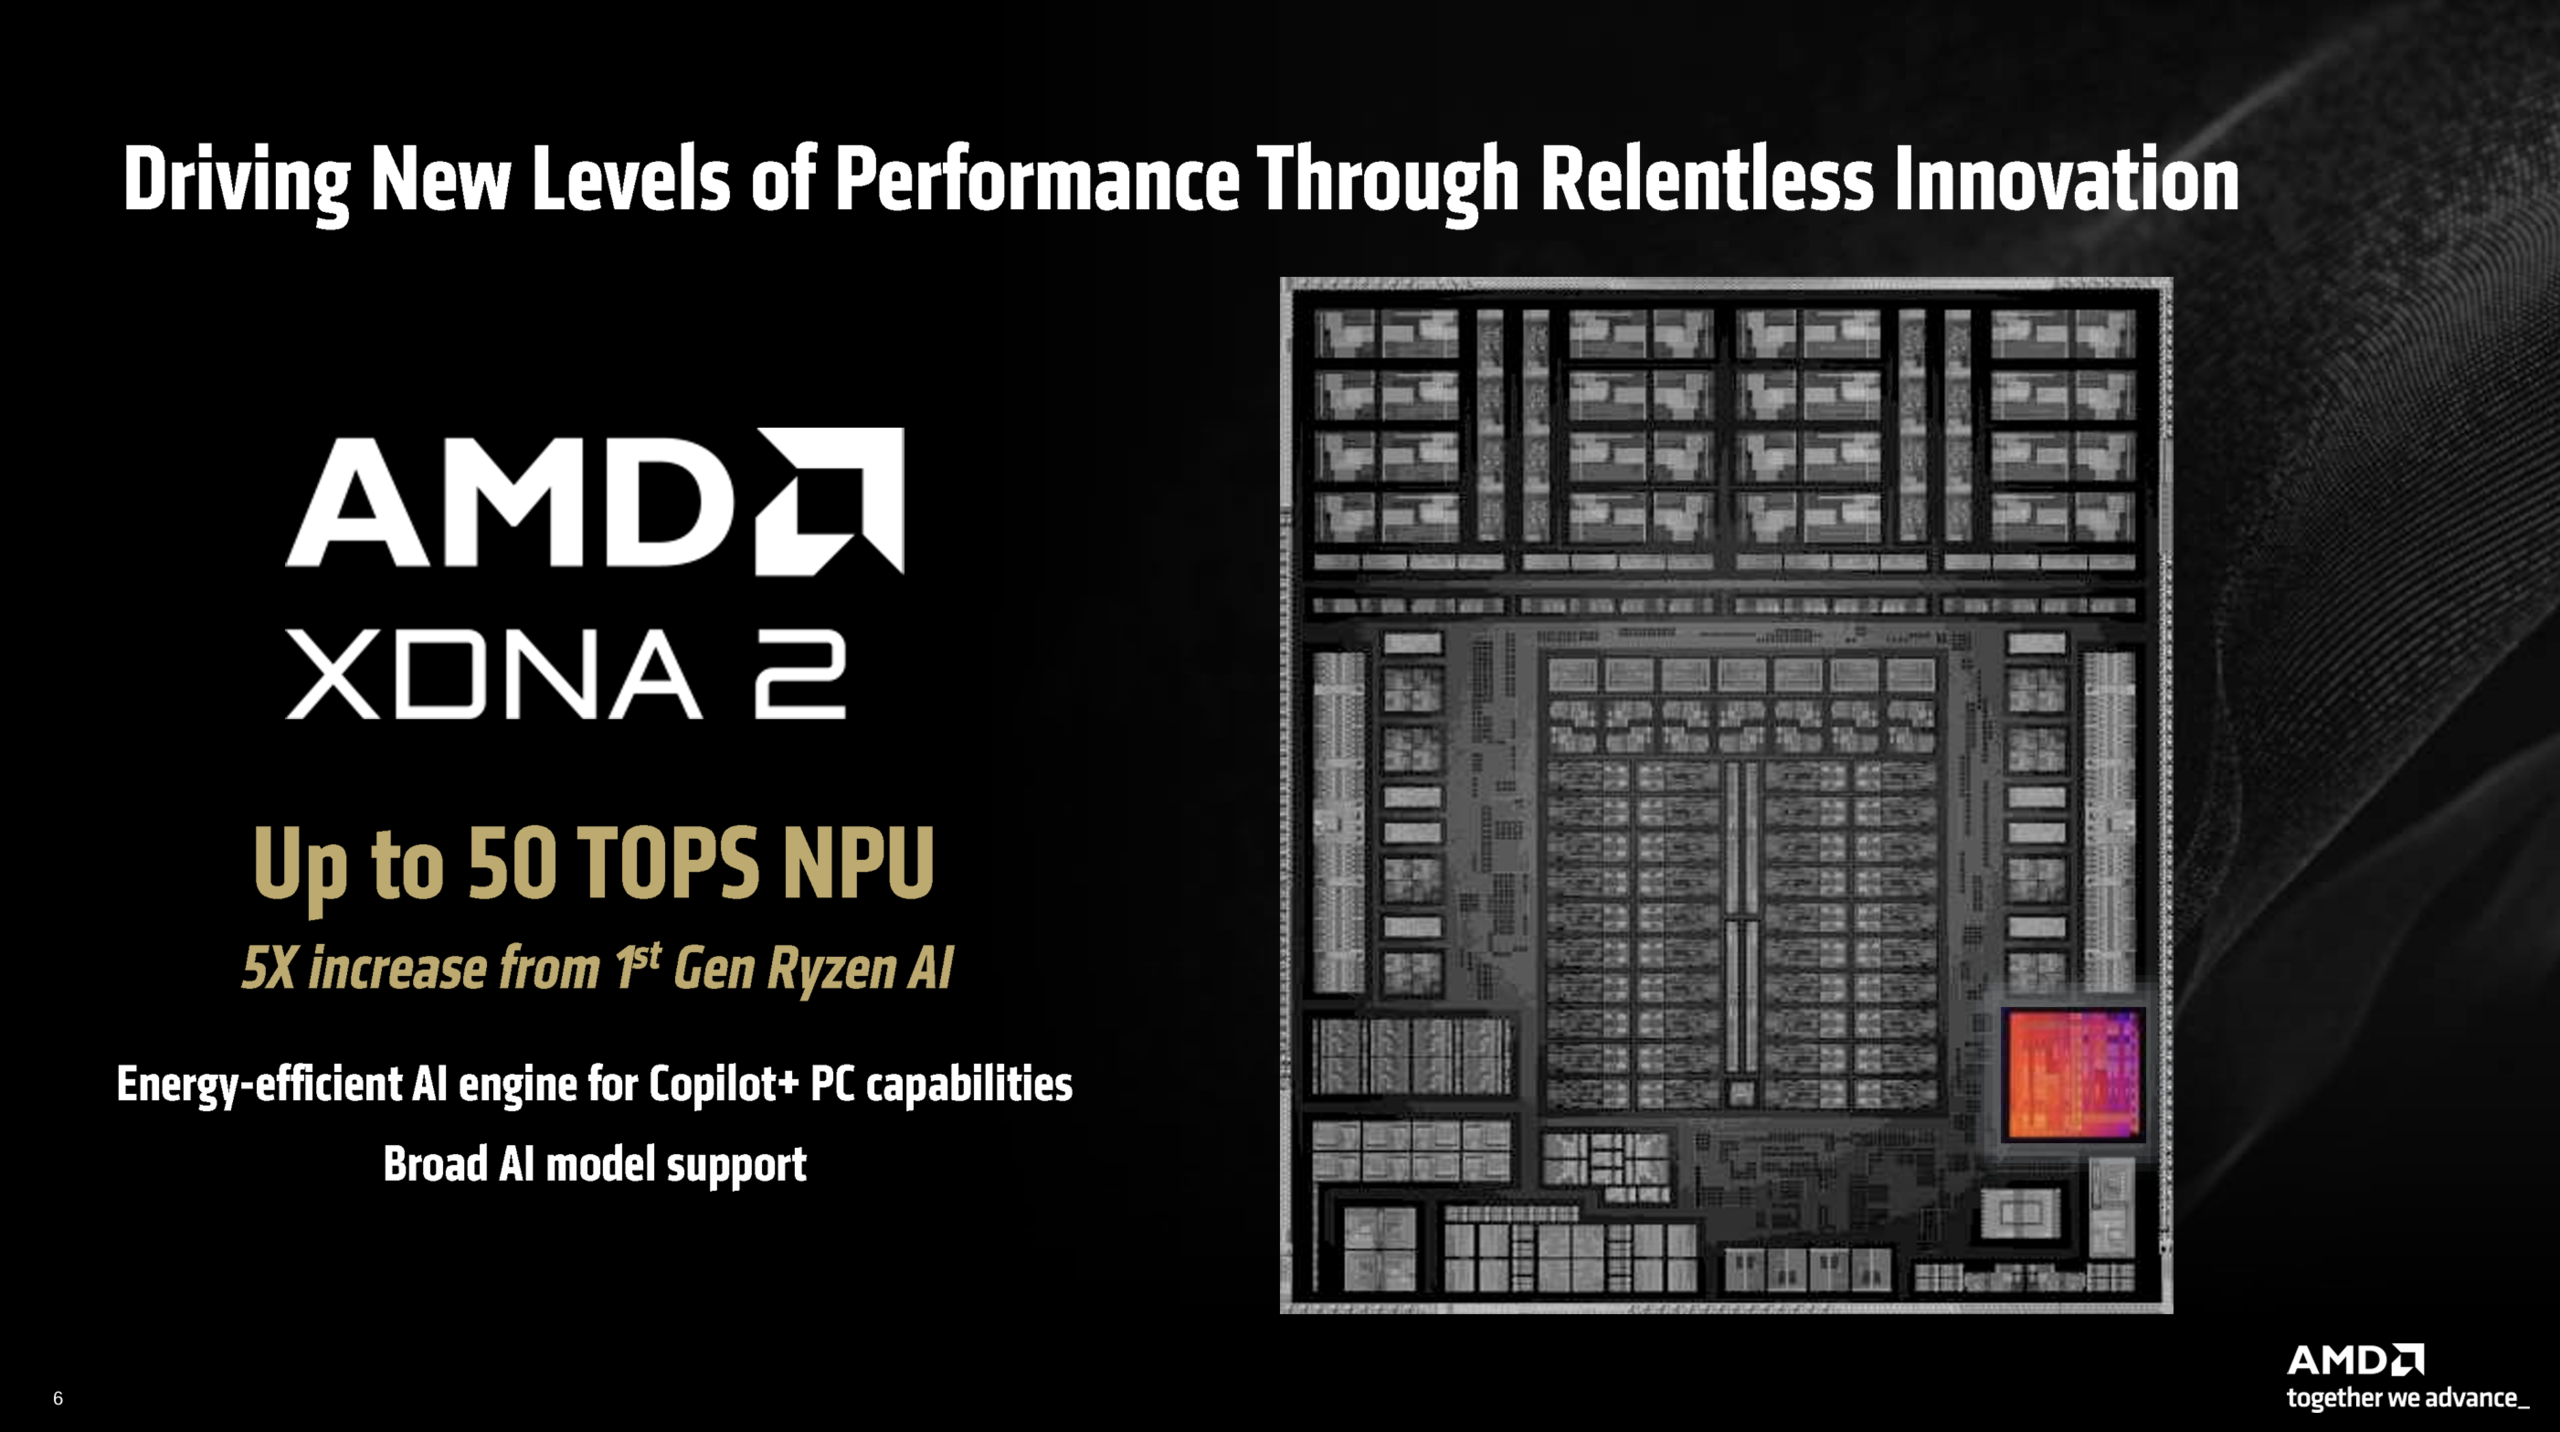
Mit den neuen Prozessoren der Ryzen-AI-Max-Serie erweitert AMD sein Portfolio an APUs um leistungsstarke Modelle, wobei die Chips weiterhin auf der bekannten Strix-Point-CPU-Architektur (4 nm TMSC) und RDNA-3.5-GPU-Architektur basieren. AMD selbst spricht bei den beiden neuen Ryzen-AI-Max-Modellen von der "Halo"-Serie, also den Flaggschiffen. Hieraus ist auch die Bezeichnung Strix Halo entstanden, die oftmals für den Ryzen AI Max verwendet wird. Darunter positionieren sich die Ryzen-AI-9-Modelle in der Premium-Serie (z. B. Ryzen AI 9 365) bzw. die Ryzen-AI-7/5-Modelle in der Advanced-Serie (z. B. Ryzen AI 7 Pro 360). Alle Ryzen-AI-APUs verwenden die XDNA-2-NPU mit einer Leistung von 50 TOPS, weshalb auch alle Modelle die Copilot+-Zertifizierung tragen.

Strix Halo Übersicht (Quelle: AMD)
Strix Halo Modellpalette (Quelle: AMD)
Strix Halo CPU (Quelle: AMD)
Strix Halo GPU (Quelle: AMD)
Strix Halo NPU (Quelle: AMD)
Strix Halo RAM (Quelle: AMD)

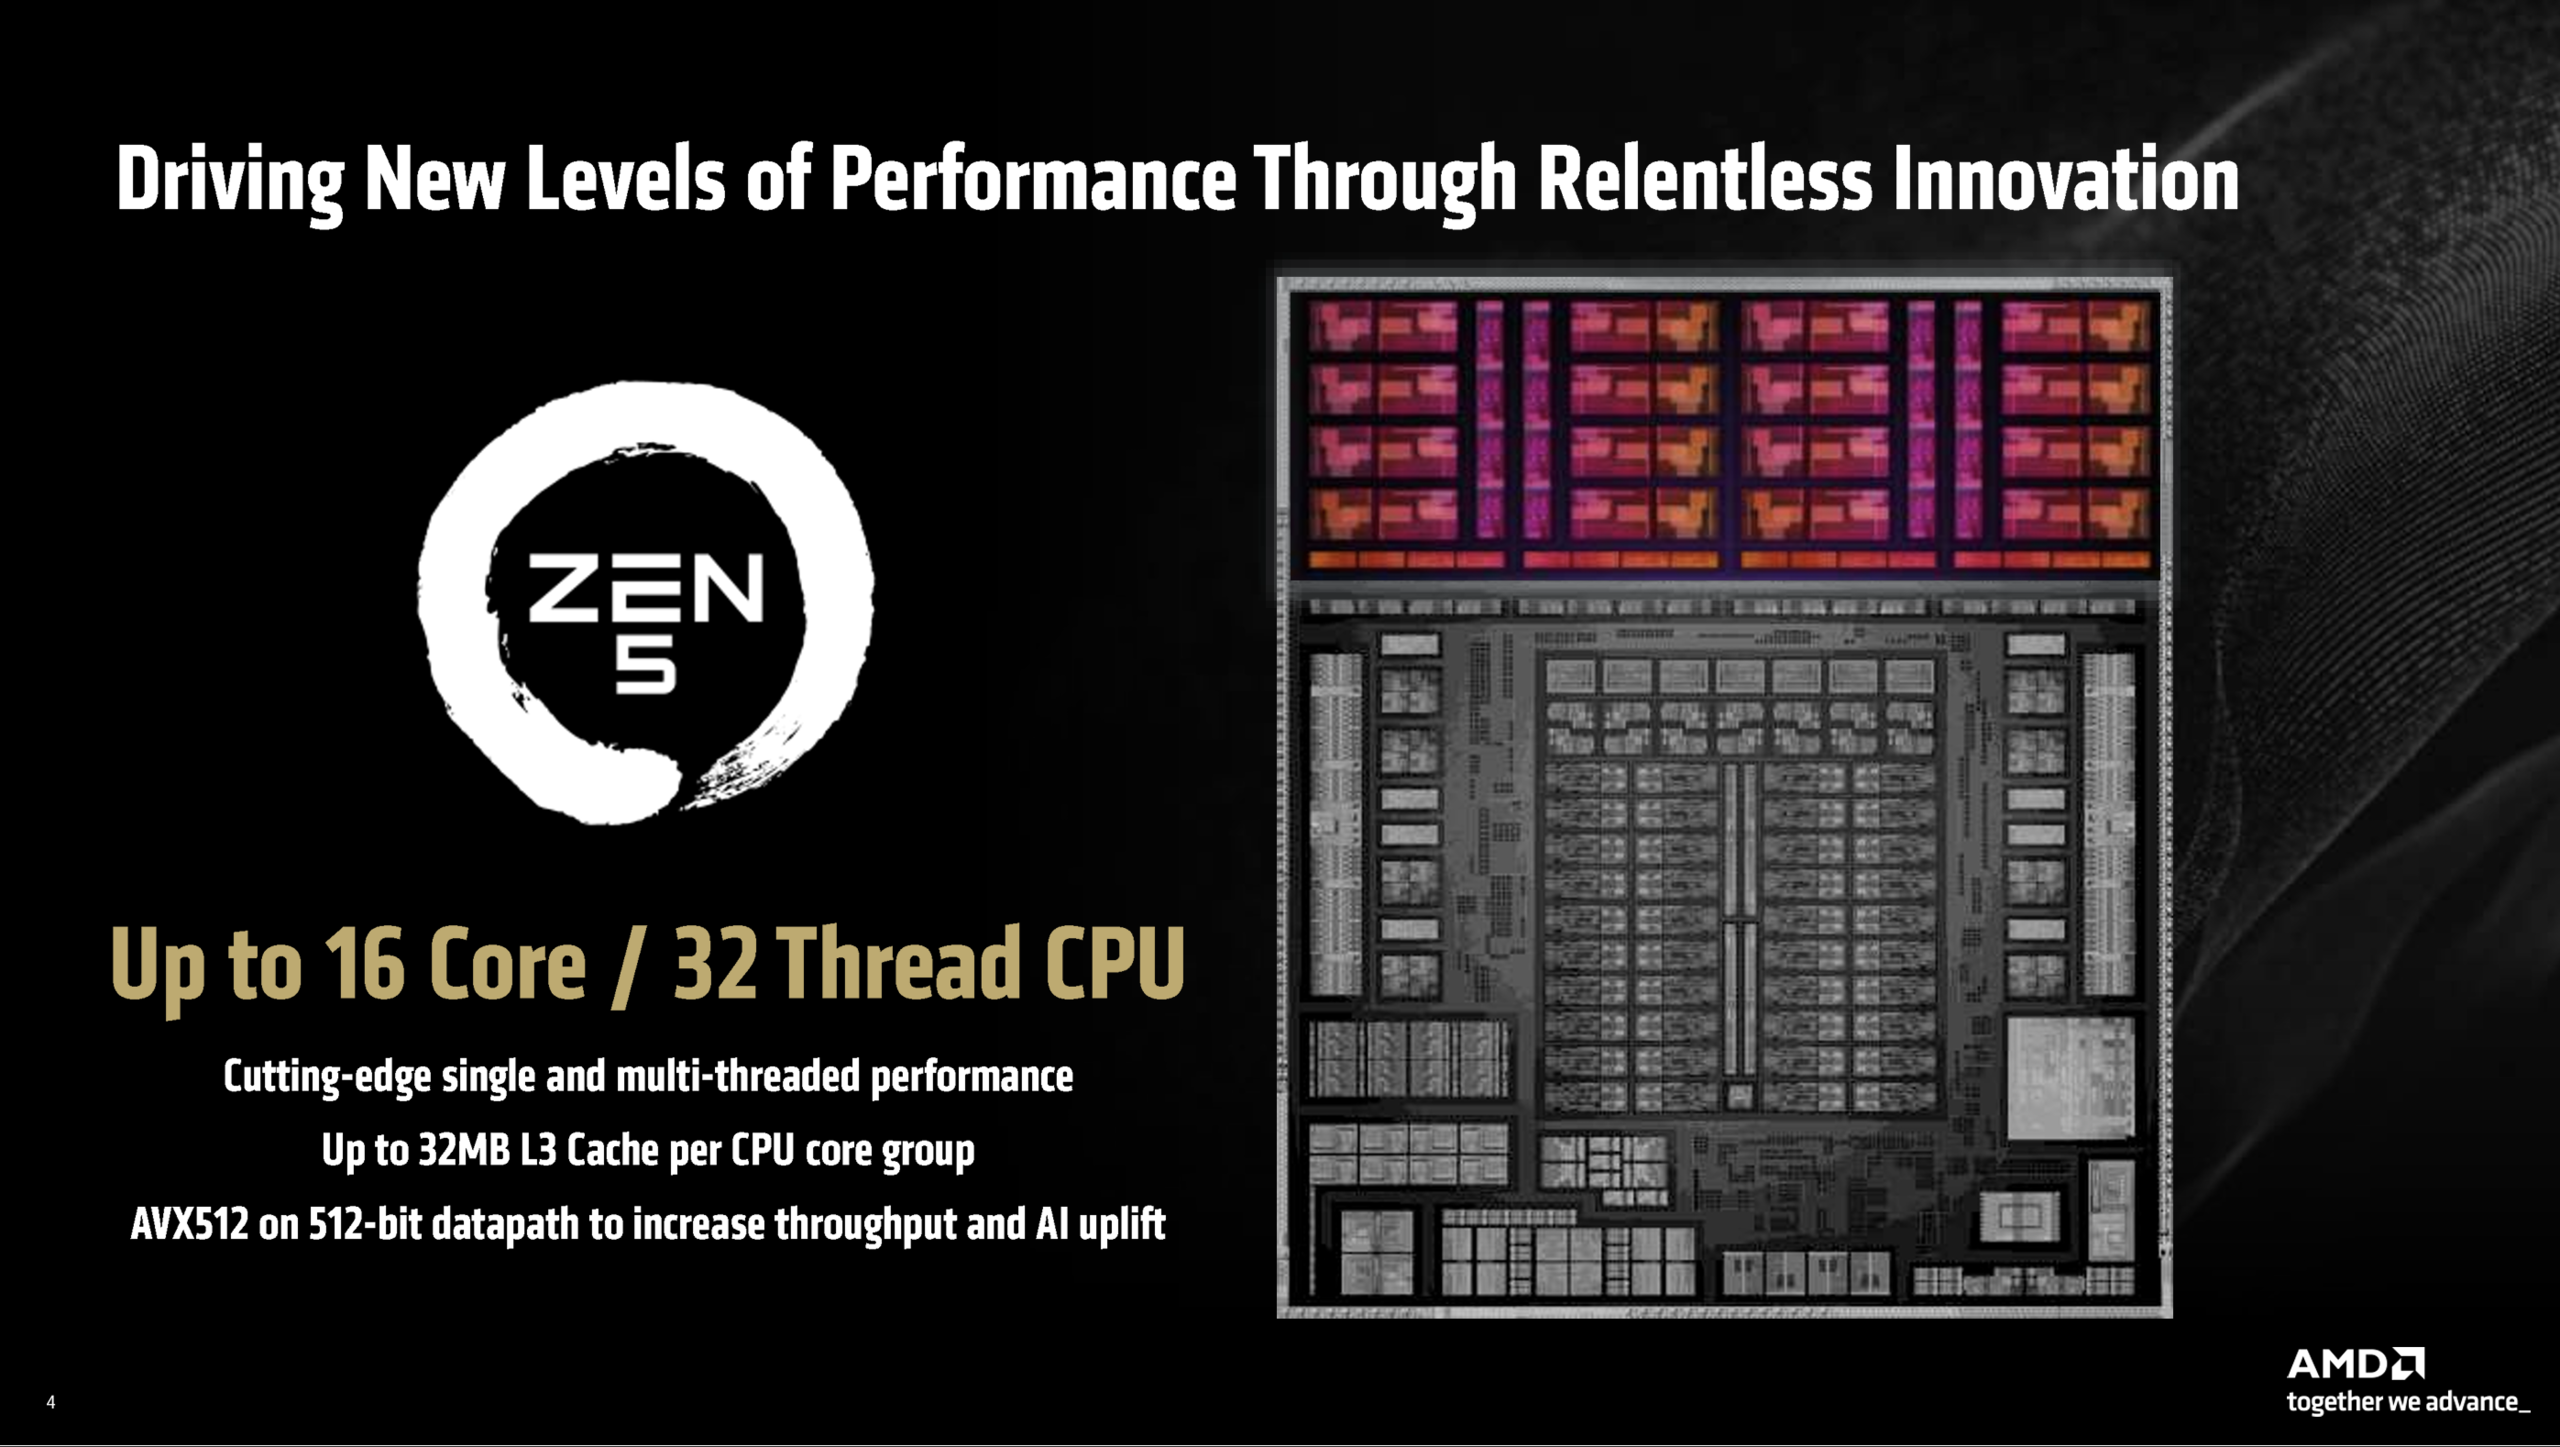
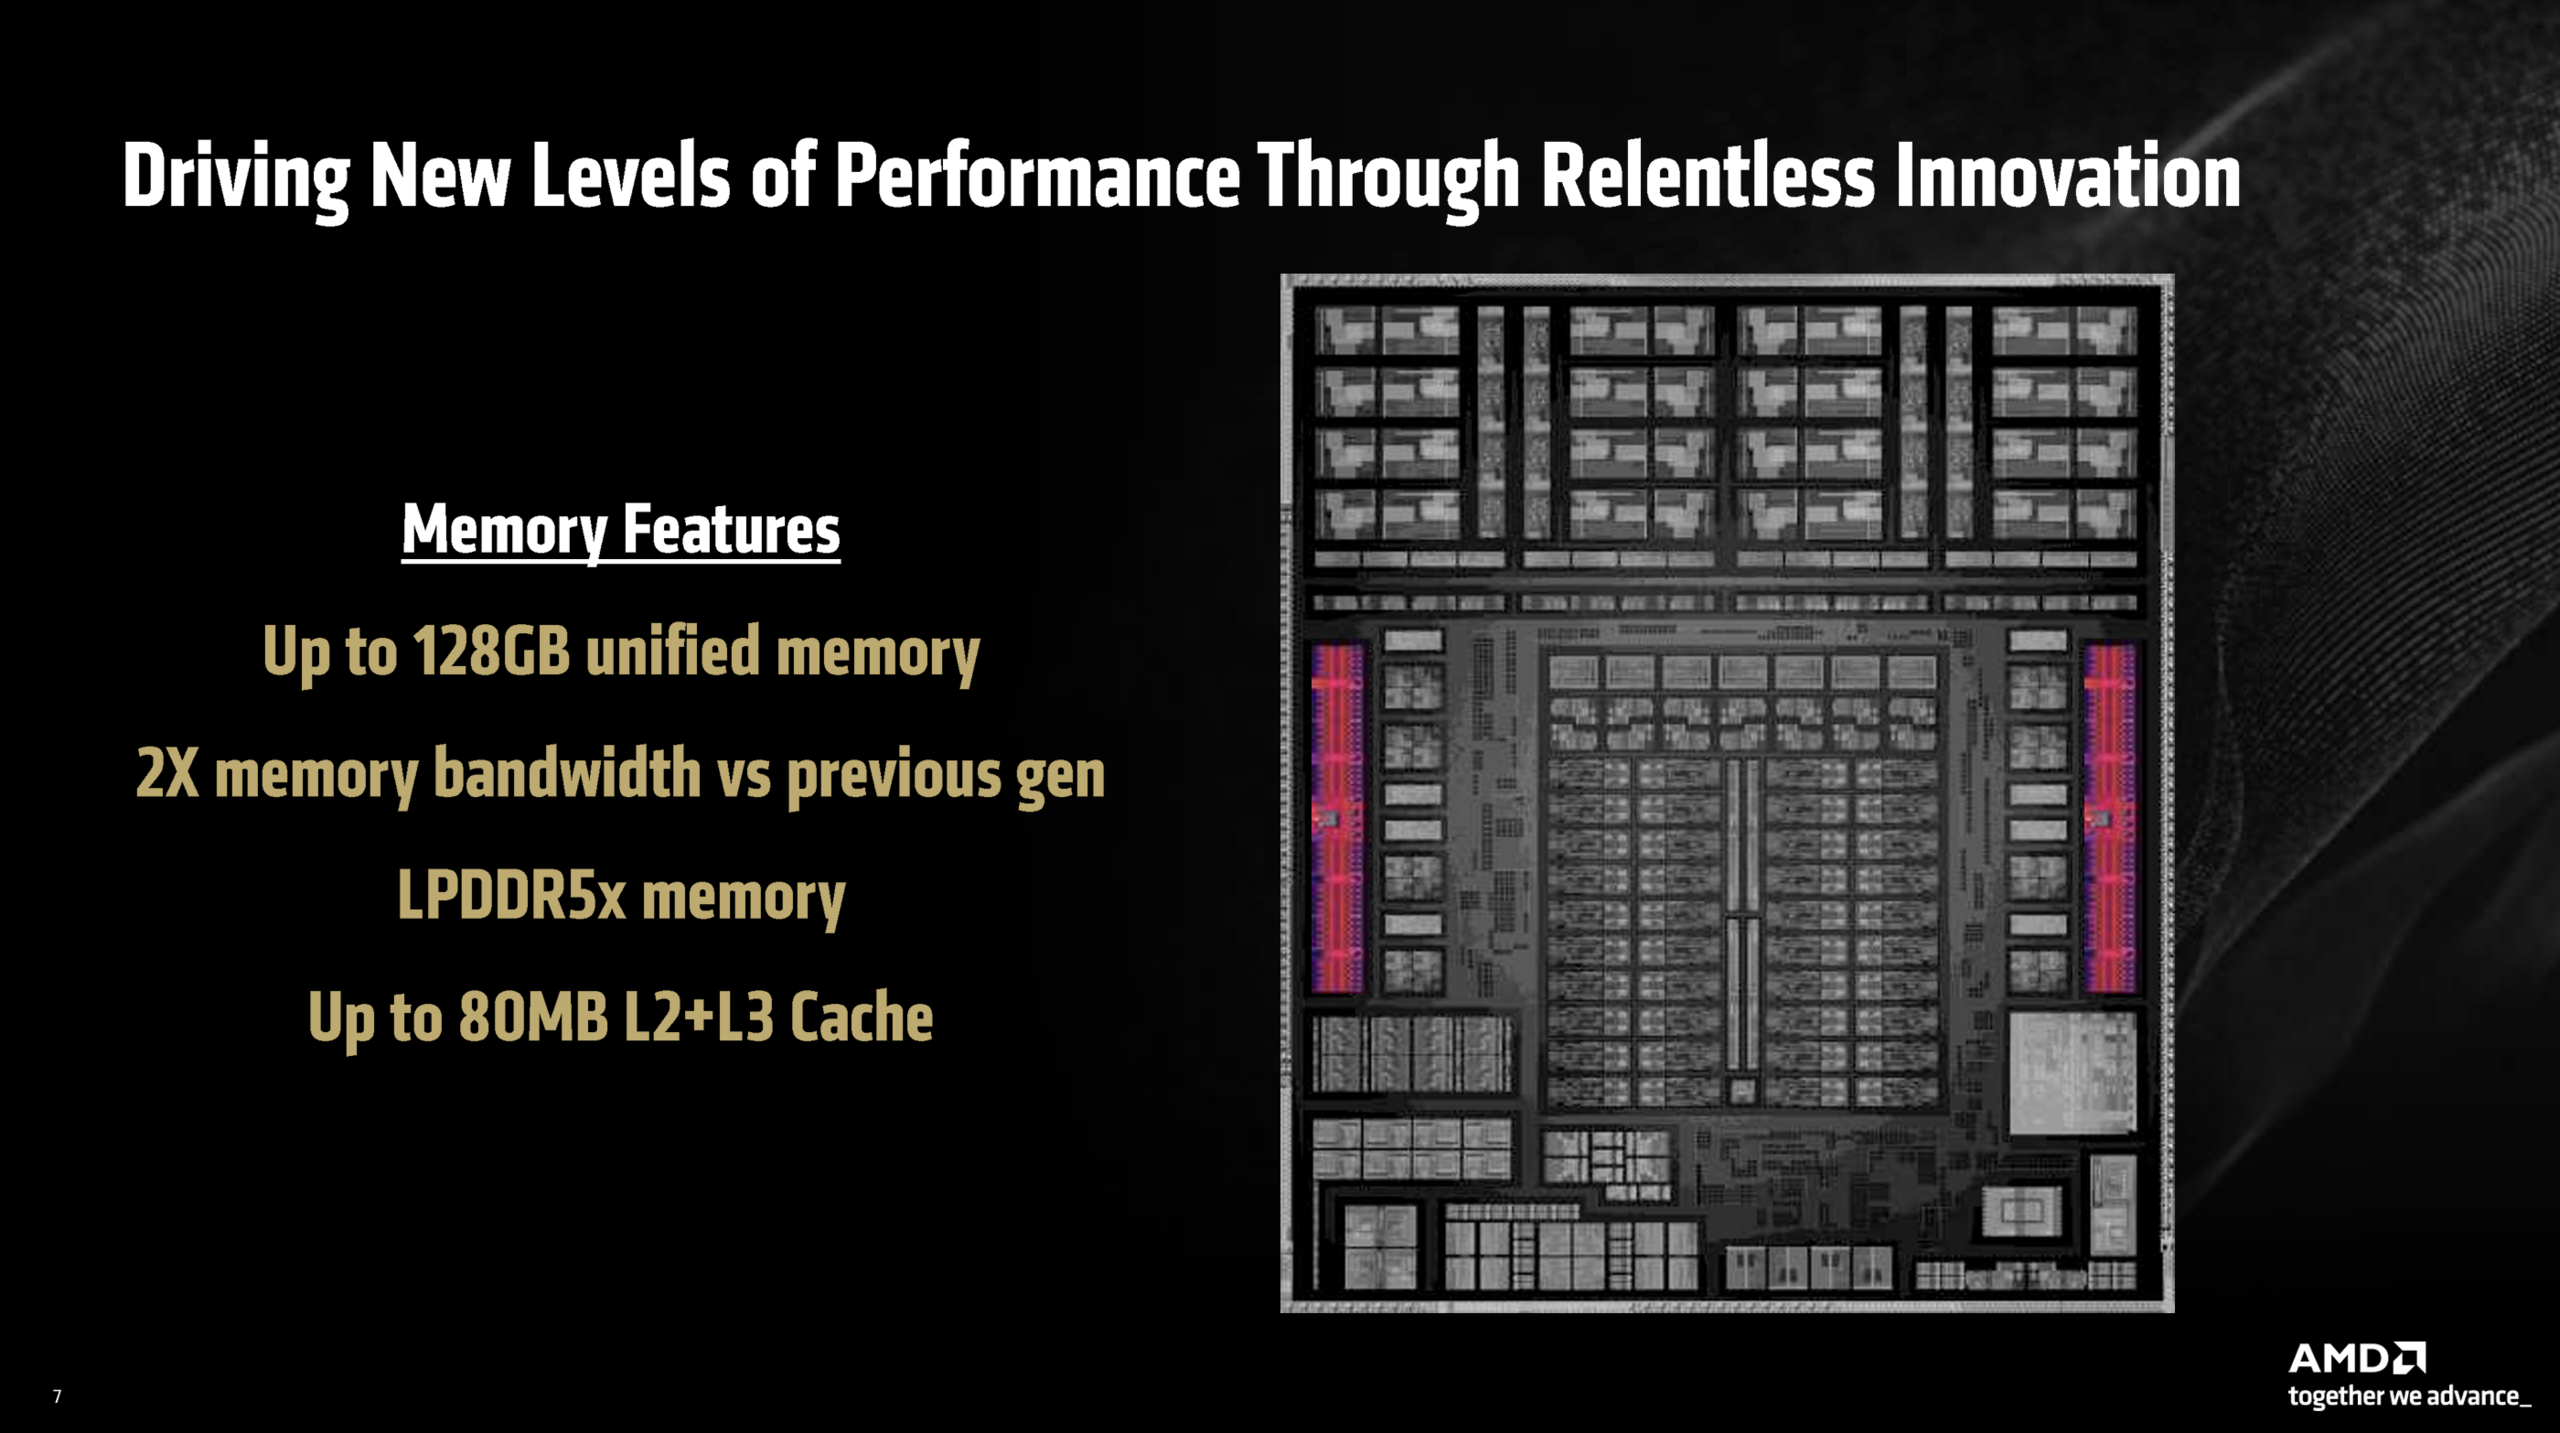
Während die bisherigen Strix-Point-Mobilprozessoren auf eine Kombination von Zen-5-Kernen und kompakteren Zen-5c-Kernen mit weniger Cache setzen, kommen bei den Strix-Halo-Chips ausschließlich die vollen Zen-5-Kerne zum Einsatz, wobei der maximale Takt bei weiterhin 5,1 GHz liegt. Im Top-Modell Ryzen AI Max+ 395 sind es 16 Kerne und 32 Threads (80 MB Cache), bei den anderen beiden Modellen Ryzen AI Max 390 sind es 12 Kerne/24 Threads (64 MB Cache) bzw. 8 Kerne/16 Threads (40 MB Cache) beim Ryzen AI Max 385. Der RAM (LPDDR5x-8000) ist ebenfalls Teil des Prozessors und hier stehen entweder 32, 64 oder 128 GB zur Verfügung.

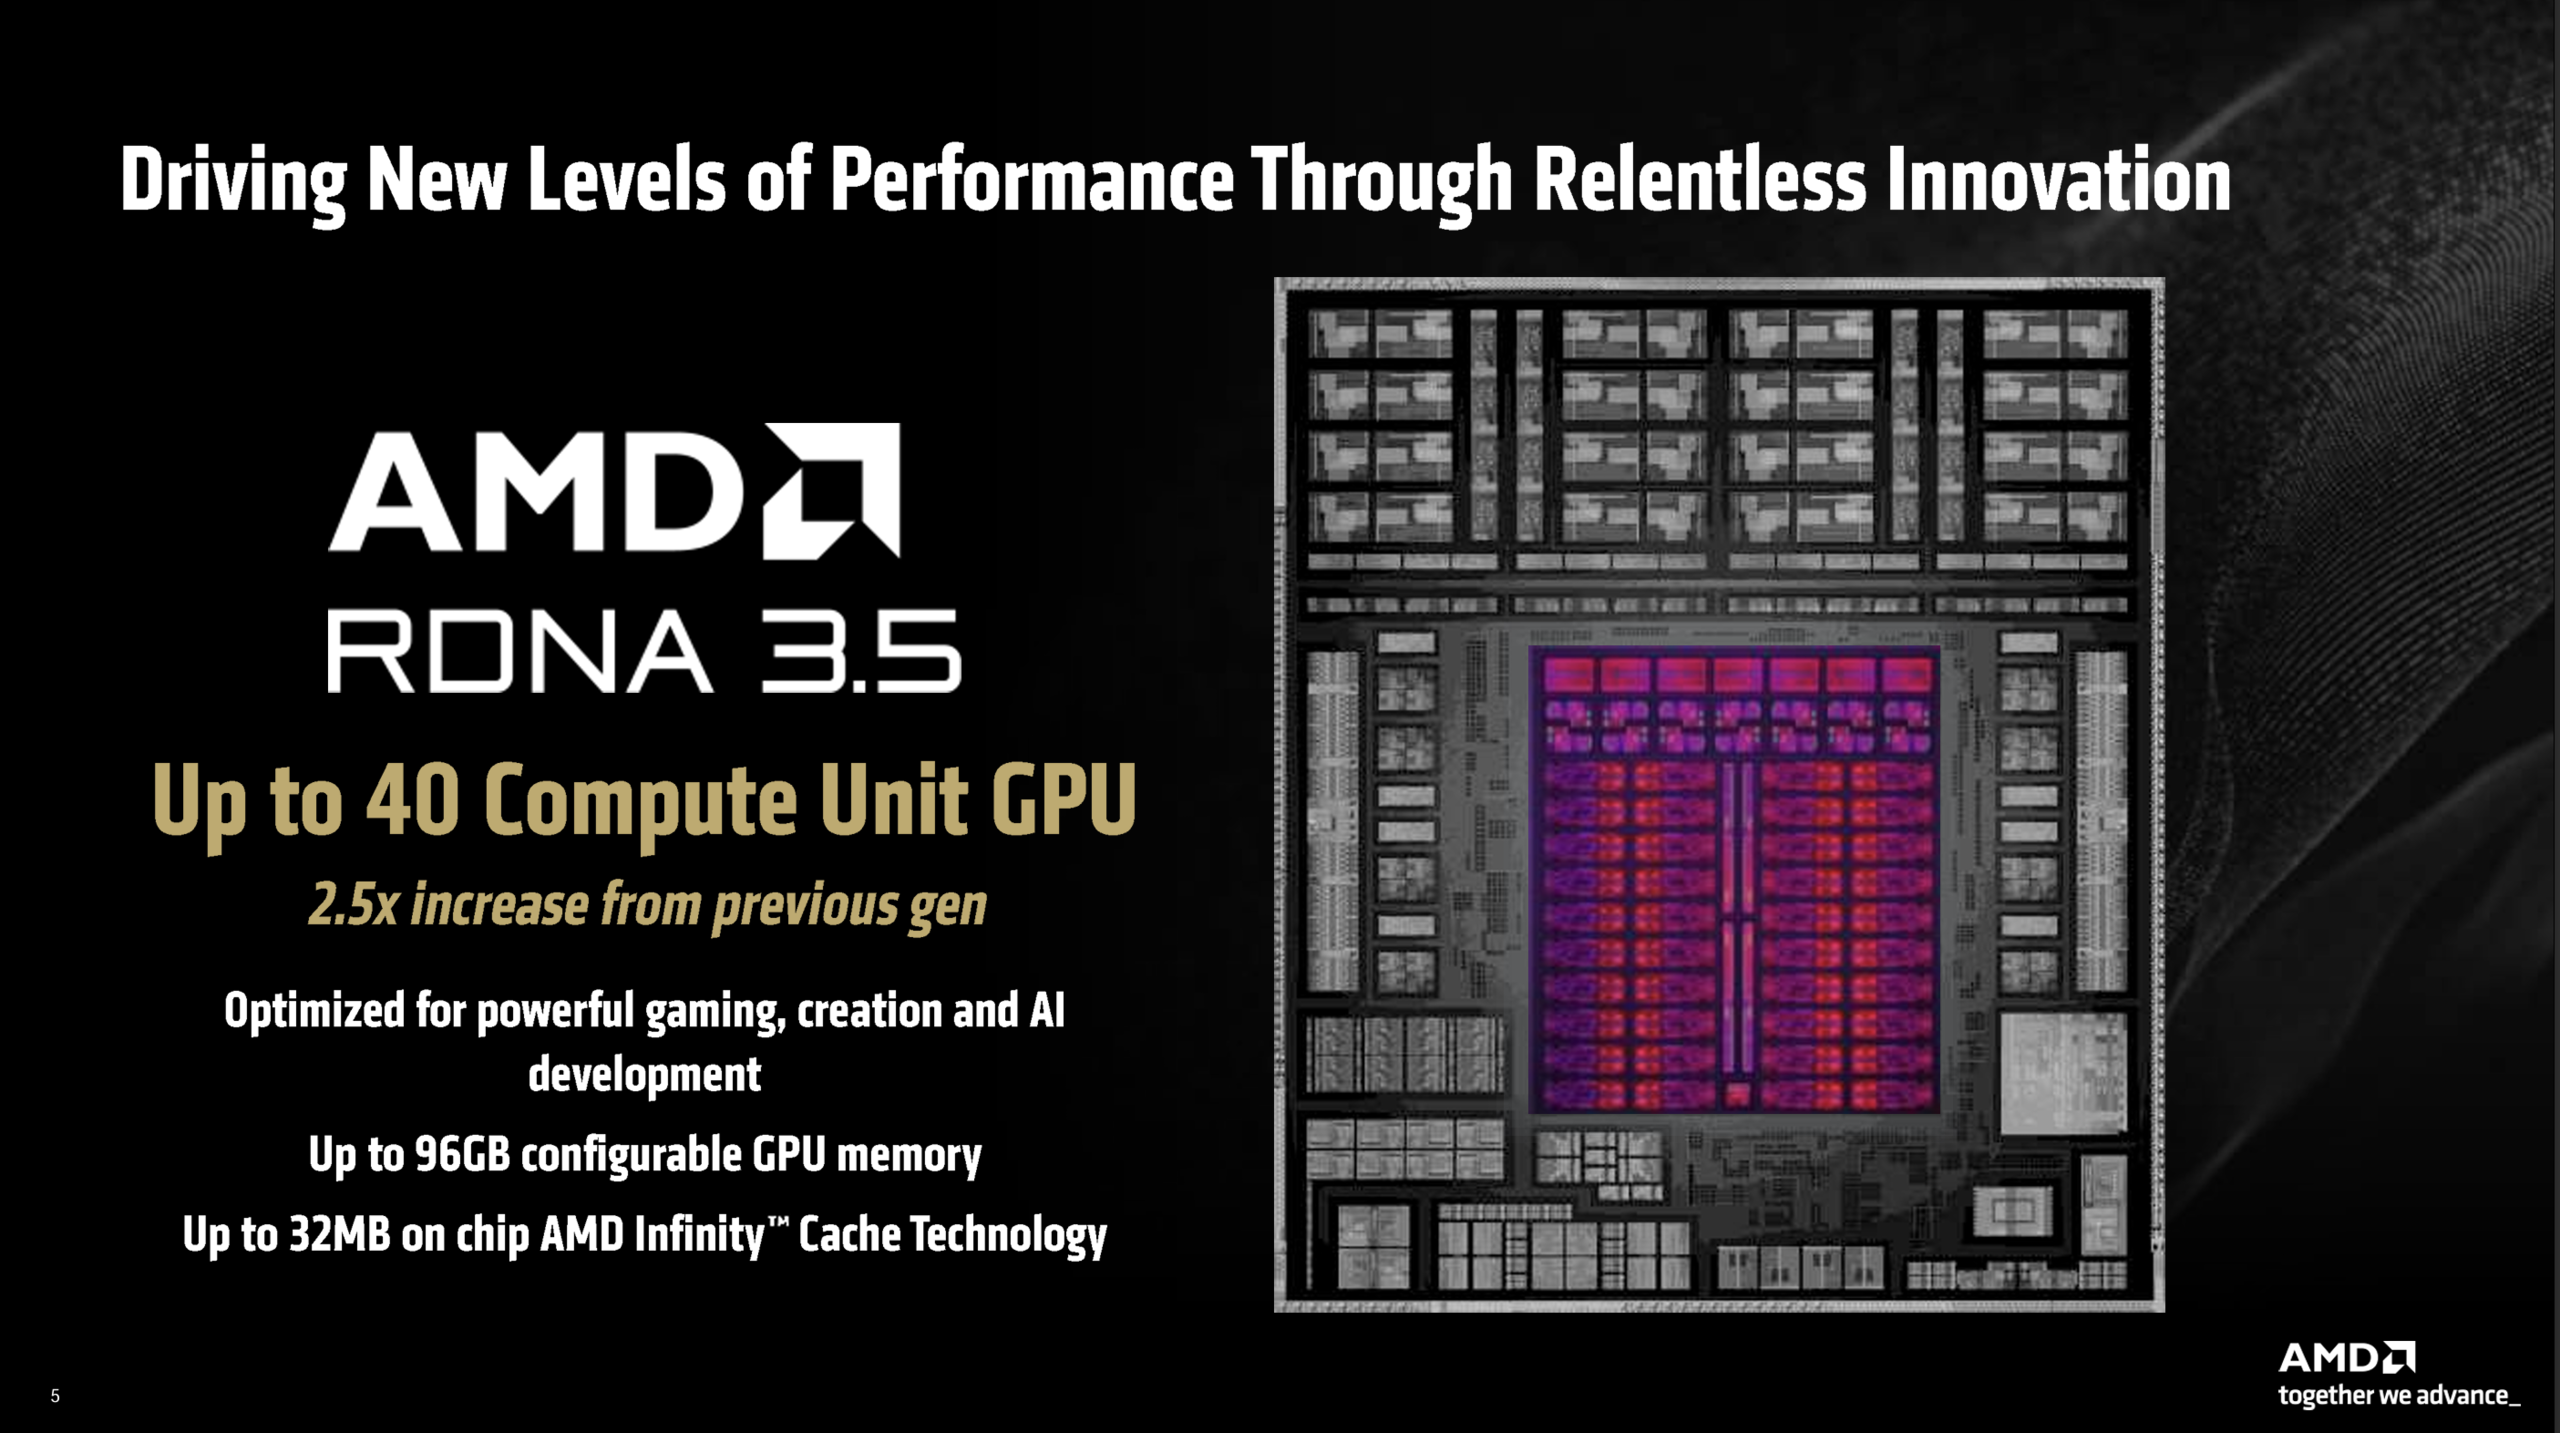
Die Strix-Halo-Chips sind zudem mit leistungsstarken integrierten Grafikkarten ausgestattet, die auf der RDNA-3.5-Architecktur basieren. Im Top-Modell Ryzen AI Max+ 395 kommt die Radeon 8060S mit 40 CUs zum Einsatz, bei den anderen beiden Max-Modellen ist es die Radeon 8050S mit 32 CUs. Je nach RAM-Konfiguration kann der iGPU eine bestimmte Menge des Arbeitsspeicher fest zugewiesen werden (max. 24 GB bei Modellen mit 32 GB RAM, 48 GB bei Modellen mit 64 GB RAM und 96 GB bei Modellen mit 128 GB).

Der TDP-Bereich wird von AMD zwischen 45-125 Watt beziffert, weshalb sich die neuen Strix-Halo-Chips vor allem für schnelle Multimedia-Laptops mit entsprechender Kühlleistung eignen. Laut dem Datenblatt des HP ZBook Ultra 14 wird es noch einen weiteren Strix-Halo-Chip mit der Bezeichnung Ryzen AI Max 380 geben, der aber nur 6 CPU-Kerne sowie eine nochmals schwächere iGPU (Radeon 8040S) nutzt.

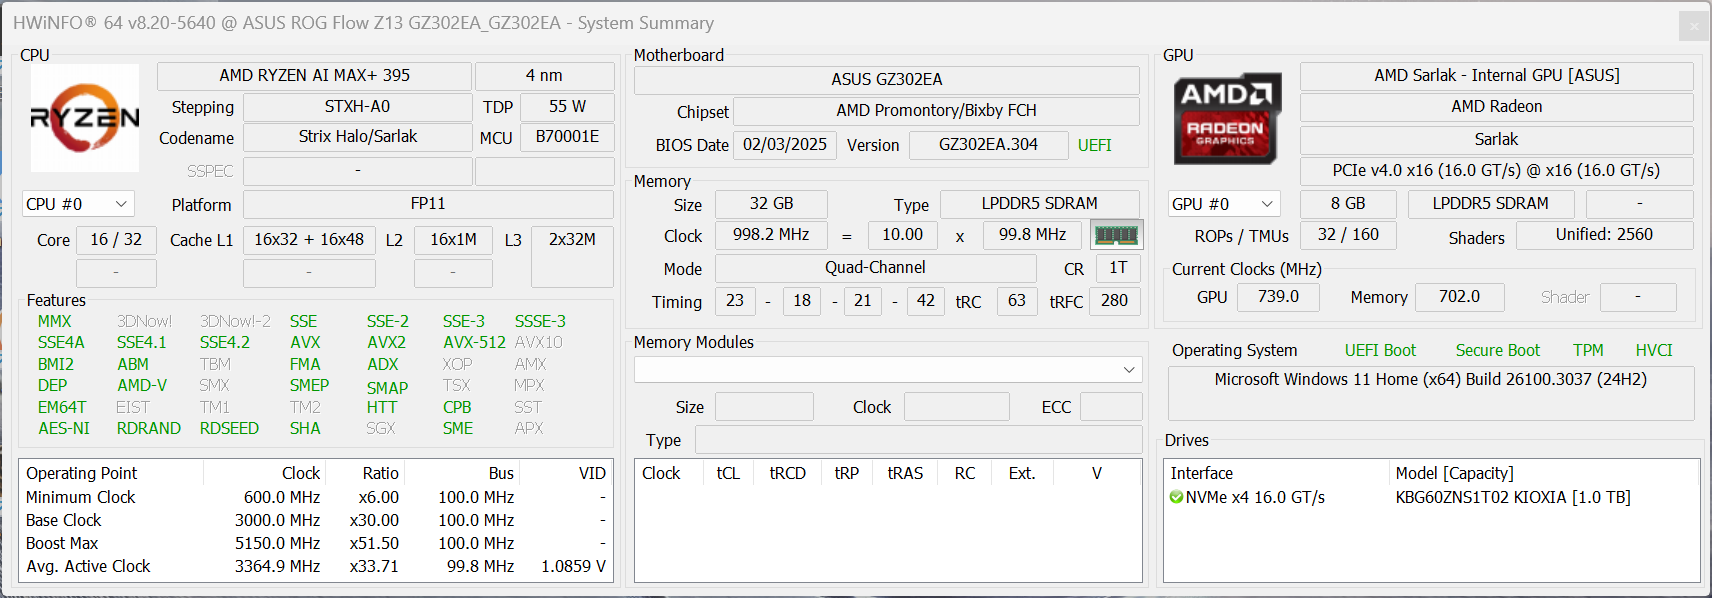
Testsystem - Asus ROG Flow Z13 GZ302

Asus ROG Flow Z13 GZ302EA

Als Testgerät steht uns die 2025er-Version des Gaming-Convertibles Asus ROG Flow Z13 GZ302EA zur Verfügung, die wir auch schon ausführlich testen konnten. Hier kommt der Ryzen AI Max+ 395 zum Einsatz, also der schnellste Chip der neuen Strix-Halo-Serie mit 16 Zen-5-Prozessorkernen und der Radeon 8060S mit 40 CUs. Als Arbeitsspeicher stehen 32 GB RAM (LPDDR5x-8000) zur Verfügung, worauf auch die GPU zugreifen kann. Zusätzlich ist es möglich, der GPU bis zu 24 GB RAM fest zuzuweisen. Gerade beim Spielen oder kreativen Apps kann dedizierter VRAM einen Vorteil bringen und auch der Auto-Modus funktioniert insgesamt gut. Entsprechend der Empfehlung von Asus haben wir die Benchmarks mit 8 GB fest zugewiesenem RAM durchgeführt. 

Im Turbo-Modus darf der Ryzen AI Max+ 395 kurzzeitig 86 Watt und dauerhaft 70 Watt verbrauchen, wenn man nur die CPU oder GPU belastet. Bei kombinierter Belastung pendelt sich der Wert dann bei 60 Watt ein.

HWiNFO Asus ROG Flow Z13 mit dem Ryzen AI Max+ 395

Testverfahren

Um die verschiedenen Prozessoren und Grafikkarten aussagekräftig miteinander vergleichen können, schauen wir uns neben der reinen Leistung in synthetischen Benchmarks auch den Stromverbrauch an, woraus wir dann die Effizienz ermitteln. Die Verbrauchsmessungen werden jeweils an einem externen Display durchgeführt, damit wir die unterschiedlichen internen Displays als Einflussfaktoren eliminieren können. Dennoch messen wir hier den Gesamtverbrauch des Systems und vergleichen nicht nur auf die reinen TDP-Werte.

CPU-Leistung

Bei der CPU-Leistung beginnen wir mit der Performance in Single-Core-Szenarien. Da hier die bekannten Zen-5-Kerne mit einem maximalen Takt von bis zu 5,1 GHz zum Einsatz kommen, überrascht es nicht, dass wir in den Cinebench-Tests auch vergleichbare Ergebnisse zu anderen Zen-5-Prozessoren wie dem Ryzen AI 9 HX 370 sehen. Damit liegt man auf dem Niveau der alten Dragon-Range-HX-Chips (wie dem Ryzen 9 7945HX3D), aber auch etwas hinter den aktuellen Intel-Mobilprozessoren der Arrow-Lake- bzw. Lunar-Lake-Generation (zumindest den schnellen Core-Ultra-9-Chips). Die schnellen Snapdragon-X-Elite-CPUs mit Dual-Core-Turbo (ab X1E-80-100) liegen ebenfalls vorne, ab dem X1E-78-100 sind die ARM-Chips aber langsamer. Apple spielt mit seinen M4-CPUs aktuell in einer ganz anderen Liga und auch die aktuellen Desktop-CPUs von AMD und Intel sind schneller als der Ryzen AI Max+ 395.

Im Geekbench-6-Test schneidet der neue Ryzen AI Max+ 395 aber insgesamt besser ab und kann alle aktuellen Mobilprozessoren von AMD, Intel und Qualcomm hinter sich lassen. Der alte Raptor Lake Core i9-14900HX ist vergleichbar, die aktuellen Desktop-CPUs und vor allem die Apple-M4-Chips haben aber Vorteile.

Cinebench 2024: CPU Single Core | Cinebench R23: Single Core | Geekbench 6.5: Single-Core
Cinebench 2024 / CPU Single Core
Apple M4 Pro (14 cores)
Apple MacBook Pro 16 2024 M4 Pro
178 Points +52%
Apple M4 Max (16 cores)
Apple MacBook Pro 16 M4 Max
178 Points +52%
Intel Core Ultra 9 285K
144 Points +23%
AMD Ryzen 9 9900X
AMD Ryzen 9 9900X
138 Points +18%
AMD Ryzen 7 9700X
AMD Ryzen 7 9700X
136 Points +16%
AMD Ryzen 9 9950X
AMD Ryzen 9 9950X
136 Points +16%
Intel Core i9-14900HX
Schenker XMG Neo 17 E24
130 Points +11%
Intel Core i9-14900HX
Asus ROG Strix Scar 16 G634JZR
128 Points +10%
Qualcomm Snapdragon X Elite X1E-84-100
Samsung Galaxy Book4 Edge 16 X1E-84-100
127 Points +9%
Intel Core Ultra 9 285H
MSI Prestige 16 AI Evo B2HMG
127 Points +9%
Intel Core i9-14900HX
Lenovo Legion 7 16 IRX G9
126.4 Points +8%
Qualcomm Snapdragon X Elite X1E-80-100
Microsoft Surface Laptop 15 Snapdragon X Elite
123 Points +5%
Intel Core i9-14900HX
Acer Predator Helios 16 PH16-72
122.9 Points +5%
Intel Core Ultra 9 288V
Asus Zenbook S 14 UX5406 Core Ultra 9
122 Points +4%
Intel Core i7-14650HX
Lenovo Legion 5 16IRX G9
117 Points 0%
AMD Ryzen AI Max+ 395
Asus ROG Flow Z13 GZ302EA-RU073W
116.8 Points
AMD Ryzen AI 9 HX 370
Asus ProArt P16 H7606WI
116 Points -1%
AMD Ryzen 9 7945HX3D
Asus ROG Strix Scar 17 G733PYV-LL053X
115 Points -2%
AMD Ryzen 9 7945HX
Minisforum BD790i
114 Points -2%
AMD Ryzen AI 9 365
Lenovo Yoga Pro 7 14ASP G9
113.5 Points -3%
AMD Ryzen 9 7945HX
Tuxedo Gemini 17 Gen3 AMD
111 Points -5%
AMD Ryzen AI 7 PRO 360
Lenovo ThinkPad T14s Gen 6 21M2S00G00
108.5 Points -7%
Qualcomm Snapdragon X Elite X1E-78-100
Lenovo Yoga Slim 7X 14Q8X9
108 Points -8%
Intel Core i9-13900H
Minisforum MS-01
101 Points -14%
Cinebench R23 / Single Core
Intel Core Ultra 9 285K
2353 Points +16%
Apple M4 Pro (14 cores)
Apple MacBook Pro 16 2024 M4 Pro
2290 Points +13%
AMD Ryzen 9 9900X
AMD Ryzen 9 9900X
2253 Points +11%
Intel Core i9-14900HX
Schenker XMG Neo 17 E24
2233 Points +10%
AMD Ryzen 7 9700X
AMD Ryzen 7 9700X
2211 Points +9%
Apple M4 Max (16 cores)
Apple MacBook Pro 16 M4 Max
2209 Points +9%
AMD Ryzen 9 9950X
AMD Ryzen 9 9950X
2202 Points +8%
Intel Core i9-14900HX
Lenovo Legion 7 16 IRX G9
2195 Points +8%
Intel Core i9-14900HX
Asus ROG Strix Scar 16 G634JZR
2193 Points +8%
Intel Core Ultra 9 285H
MSI Prestige 16 AI Evo B2HMG
2126 Points +5%
Intel Core i9-14900HX
Acer Predator Helios 16 PH16-72
2122 Points +4%
Intel Core i9-13980HX
Asus ProArt Studiobook 16 OLED H7604
2110 Points +4%
AMD Ryzen AI 9 HX 370
Asus ProArt P16 H7606WI
2049 Points +1%
AMD Ryzen AI Max+ 395
Asus ROG Flow Z13 GZ302EA-RU073W
2034 Points
AMD Ryzen AI 9 365
Lenovo Yoga Pro 7 14ASP G9
1992 Points -2%
Intel Core i7-14650HX
Lenovo Legion 5 16IRX G9
1963 Points -3%
AMD Ryzen AI 7 PRO 360
Lenovo ThinkPad T14s Gen 6 21M2S00G00
1958 Points -4%
AMD Ryzen 9 7945HX
Minisforum BD790i
1942 Points -5%
AMD Ryzen 9 7945HX3D
Asus ROG Strix Scar 17 G733PYV-LL053X
1935 Points -5%
AMD Ryzen 9 7945HX
Tuxedo Gemini 17 Gen3 AMD
1861 Points -9%
Intel Core i9-13900H
Minisforum MS-01
1806 Points -11%
Qualcomm Snapdragon X Elite X1E-84-100
Samsung Galaxy Book4 Edge 16 X1E-84-100
1350 Points -34%
Qualcomm Snapdragon X Elite X1E-80-100
Microsoft Surface Laptop 15 Snapdragon X Elite
1297 Points -36%
Qualcomm Snapdragon X Elite X1E-78-100
Lenovo Yoga Slim 7X 14Q8X9
1130 Points -44%
Geekbench 6.5 / Single-Core
Apple M4 Max (16 cores)
Apple MacBook Pro 16 M4 Max
3880 Points +30%
Apple M4 Pro (14 cores)
Apple MacBook Pro 16 2024 M4 Pro
3836 Points +29%
AMD Ryzen 9 9900X
AMD Ryzen 9 9900X
3429 Points +15%
AMD Ryzen 9 9950X
AMD Ryzen 9 9950X
3408 Points +14%
AMD Ryzen 7 9700X
AMD Ryzen 7 9700X
3373 Points +13%
Intel Core Ultra 9 285K
3306 Points +11%
Intel Core i9-14900HX
Schenker XMG Neo 17 E24
3074 Points +3%
Intel Core i9-14900HX
Asus ROG Strix Scar 16 G634JZR
3025 Points +2%
Intel Core i9-14900HX
Lenovo Legion 7 16 IRX G9
2980 Points 0%
AMD Ryzen AI Max+ 395
Asus ROG Flow Z13 GZ302EA-RU073W
2978 Points
Intel Core i9-14900HX
Acer Predator Helios 16 PH16-72
2970 Points 0%
AMD Ryzen 9 7945HX
Minisforum BD790i
2940 Points -1%
AMD Ryzen 9 7945HX3D
Asus ROG Strix Scar 17 G733PYV-LL053X
2916 Points -2%
Intel Core Ultra 9 285H
MSI Prestige 16 AI Evo B2HMG
2912 Points -2%
Intel Core Ultra 9 288V
Asus Zenbook S 14 UX5406 Core Ultra 9
2864 Points -4%
Intel Core Ultra 9 288V
Asus Zenbook S 14 UX5406 Core Ultra 9
2824 Points -5%
AMD Ryzen AI 9 HX 370
Asus ProArt P16 H7606WI
2857 Points -4%
Qualcomm Snapdragon X Elite X1E-84-100
Samsung Galaxy Book4 Edge 16 X1E-84-100
2834 Points -5%
AMD Ryzen AI 9 365
Lenovo Yoga Pro 7 14ASP G9
2815 Points -5%
Qualcomm Snapdragon X Elite X1E-80-100
Microsoft Surface Laptop 15 Snapdragon X Elite
2812 Points -6%
Qualcomm Snapdragon X Elite X1E-80-100
Microsoft Surface Laptop 15 Snapdragon X Elite
1896 Points -36%
Qualcomm Snapdragon X Elite X1E-80-100
Microsoft Surface Laptop 15 Snapdragon X Elite
1896 Points -36%
AMD Ryzen 9 7945HX
Tuxedo Gemini 17 Gen3 AMD
2797 Points -6%
Intel Core i7-14650HX
Lenovo Legion 5 16IRX G9
2761 Points -7%
AMD Ryzen AI 7 PRO 360
Lenovo ThinkPad T14s Gen 6 21M2S00G00
2699 Points -9%
Intel Core i9-13900H
Minisforum MS-01
2624 Points -12%
Qualcomm Snapdragon X Elite X1E-78-100
Lenovo Yoga Slim 7X 14Q8X9
2464 Points -17%
Cinebench 2024: CPU Single Core | Cinebench R23: Single Core | Geekbench 6.5: Single-Core

Bei der Single-Core-Effizienz nutzen wir Cinebench 2024 sowie den älteren Cinebench R23, da wir dort deutlich mehr Vergleichswerte (vor allem mit anderen HX-CPUs) haben. Im 2024er-Test muss sich der neue Ryzen AI Max+ 395 deutlich hinter den aktuellen Mobilprozessoren der Konkurrenz einordnen, sowohl den kleineren Ryzen-AI-Chips als auch den Intel-Modellen (Arrow Lake-H und Lunar Lake-V). Die ARM-Konkurrenz von Apple und Qualcomm ist in Single-Core-Szenarien ebenfalls deutlich effizienter. Lediglich die Desktop-CPUs schneiden noch schlechter ab.

Im älteren Cinebench-R23-Test haben die aktuellen Mobilprozessoren ebenfalls einen Vorteil, die älteren HX-Chips (die von der Gesamtleistung her deutlich besser zum Ryzen AI Max passen) werden aber deutlich geschlagen. Das gilt auch erneut für die aktuellen Desktop-CPUs von AMD sowie Intel.

Power Consumption / Cinebench 2024 Single Power Efficiency - external Monitor
Apple M4 Pro (14 cores)
Apple MacBook Pro 16 2024 M4 Pro
9.52 Points per Watt +263%
Apple M4 Max (16 cores)
Apple MacBook Pro 16 M4 Max
8.24 Points per Watt +215%
Qualcomm Snapdragon X Elite X1E-78-100
Lenovo Yoga Slim 7X 14Q8X9
6.84 Points per Watt +161%
Qualcomm Snapdragon X Elite X1E-84-100
Samsung Galaxy Book4 Edge 16 X1E-84-100
6.32 Points per Watt +141%
Qualcomm Snapdragon X Elite X1E-80-100
Microsoft Surface Laptop 7 13.8 Copilot+
5.89 Points per Watt +125%
Intel Core Ultra 9 288V
Asus Zenbook S 14 UX5406 Core Ultra 9
4.78 Points per Watt +82%
AMD Ryzen AI 9 365
Lenovo Yoga Pro 7 14ASP G9
4.01 Points per Watt +53%
Intel Core Ultra 9 285H
MSI Prestige 16 AI Evo B2HMG
3.76 Points per Watt +44%
AMD Ryzen AI 7 PRO 360
Lenovo ThinkPad T14s Gen 6 21M2S00G00
3.65 Points per Watt +39%
AMD Ryzen AI 9 HX 370
Asus ProArt P16 H7606WI
3.4 Points per Watt +30%
AMD Ryzen AI Max+ 395
Asus ROG Flow Z13 GZ302EA-RU073W
2.62 Points per Watt
Intel Core Ultra 9 285K
1.321 Points per Watt -50%
AMD Ryzen 7 9700X
AMD Ryzen 7 9700X
1.236 Points per Watt -53%
AMD Ryzen 9 9900X
AMD Ryzen 9 9900X
1.095 Points per Watt -58%
AMD Ryzen 9 9950X
AMD Ryzen 9 9950X
0.997 Points per Watt -62%
Power Consumption / Cinebench R23 Single Power Efficiency - external Monitor
Apple M4 Pro (14 cores)
Apple MacBook Pro 16 2024 M4 Pro
131.6 Points per Watt +188%
Apple M4 Max (16 cores)
Apple MacBook Pro 16 M4 Max
109.4 Points per Watt +139%
Qualcomm Snapdragon X Elite X1E-78-100
Lenovo Yoga Slim 7X 14Q8X9
70.6 Points per Watt +54%
AMD Ryzen AI 9 365
Lenovo Yoga Pro 7 14ASP G9
67.3 Points per Watt +47%
AMD Ryzen AI 7 PRO 360
Lenovo ThinkPad T14s Gen 6 21M2S00G00
66.4 Points per Watt +45%
Intel Core Ultra 9 285H
MSI Prestige 16 AI Evo B2HMG
63.7 Points per Watt +39%
Qualcomm Snapdragon X Elite X1E-80-100
Microsoft Surface Laptop 7 13.8 Copilot+
61.2 Points per Watt +34%
Qualcomm Snapdragon X Elite X1E-84-100
Samsung Galaxy Book4 Edge 16 X1E-84-100
59.2 Points per Watt +30%
AMD Ryzen AI 9 HX 370
Asus ProArt P16 H7606WI
58.9 Points per Watt +29%
AMD Ryzen AI Max+ 395
Asus ROG Flow Z13 GZ302EA-RU073W
45.7 Points per Watt
Intel Core i9-13900H
Minisforum MS-01
36.4 Points per Watt -20%
AMD Ryzen 9 7945HX
Minisforum BD790i
34 Points per Watt -26%
Intel Core i9-14900HX
Lenovo Legion 7 16 IRX G9
32.7 Points per Watt -28%
Intel Core i7-14650HX
Lenovo Legion 5 16IRX G9
31.9 Points per Watt -30%
Intel Core i9-14900HX
Schenker XMG Neo 17 E24
28.4 Points per Watt -38%
AMD Ryzen 9 7945HX
Tuxedo Gemini 17 Gen3 AMD
27.7 Points per Watt -39%
AMD Ryzen 9 7945HX3D
Asus ROG Strix Scar 17 G733PYV-LL053X
26.9 Points per Watt -41%
Intel Core i9-14900HX
Asus ROG Strix Scar 16 G634JZR
26.3 Points per Watt -42%
Intel Core i9-13980HX
Asus ProArt Studiobook 16 OLED H7604
25.4 Points per Watt -44%
Intel Core i9-14900HX
Acer Predator Helios 16 PH16-72
23.9 Points per Watt -48%
Intel Core Ultra 9 285K
21.2 Points per Watt -54%
AMD Ryzen 7 9700X
AMD Ryzen 7 9700X
19.7 Points per Watt -57%
AMD Ryzen 9 9900X
AMD Ryzen 9 9900X
17.6 Points per Watt -61%
AMD Ryzen 9 9950X
AMD Ryzen 9 9950X
15.8 Points per Watt -65%

In den Multi-Core-Tests schneidet der neue Ryzen AI Max+ 395 wie erwartet besser ab, wobei man sich hier klar machen muss, dass wir den Chip in einem 13-Zoll-Convertible getestet haben, wo die Power Limits mit 86/70 Watt natürlich eingeschränkt sind. Mit den vollen 125 Watt sollte die Multi-Core-Leistung noch deutlich besser ausfallen. Die aktuellen Mobilchips von AMD, Intel und Qualcomm werden klar geschlagen, lediglich die HX-CPUs liegen auf einem vergleichbaren Niveau (allerdings bei deutlich höherer Energieaufnahme, vor allem im Fall der Core-i9-14900HX-Modelle). Apple ist mit dem M4 Pro etwas im Vorteil, und die meisten aktuellen Desktop-Chips ebenfalls. 

Im Geekbench-6-Test schneidet der neue Ryzen AI Max erneut deutlich besser ab und gehört hier zu den schnellsten Prozessoren überhaupt. Apples M4-Pro- und M4-Max-CPUs bleiben vorne, dann folgt aber auch schon der Ryzen AI Max+ 395 sowie aktuelle Desktop-CPUs wie der Intel Core Ultra 9 285K oder der AMD Ryzen 9950X.

Cinebench 2024: CPU Multi Core | Cinebench R23: Multi Core | Geekbench 6.5: Multi-Core
Cinebench 2024 / CPU Multi Core
Intel Core Ultra 9 285K
2436 Points +48%
AMD Ryzen 9 9950X
AMD Ryzen 9 9950X
2254 Points +37%
Apple M4 Max (16 cores)
Apple MacBook Pro 16 M4 Max
2069 Points +26%
Apple M4 Max (16 cores)
Apple MacBook Pro 16 M4 Max
2015 Points +22%
AMD Ryzen 9 7945HX
Minisforum BD790i
1828 Points +11%
AMD Ryzen 9 9900X
AMD Ryzen 9 9900X
1818 Points +10%
AMD Ryzen 9 7945HX3D
Asus ROG Strix Scar 17 G733PYV-LL053X
1772 Points +8%
Intel Core i9-14900HX
Schenker XMG Neo 17 E24
1731 Points +5%
Apple M4 Pro (14 cores)
Apple MacBook Pro 16 2024 M4 Pro
1729 Points +5%
AMD Ryzen 9 7945HX
Tuxedo Gemini 17 Gen3 AMD
1677 Points +2%
AMD Ryzen AI Max+ 395
Asus ROG Flow Z13 GZ302EA-RU073W
1648 Points
Intel Core i9-14900HX
Asus ROG Strix Scar 16 G634JZR
1639 Points -1%
Intel Core i9-14900HX
Acer Predator Helios 16 PH16-72
1479 Points -10%
Intel Core i9-14900HX
Lenovo Legion 7 16 IRX G9
1450 Points -12%
AMD Ryzen 7 9800X3D
AMD Ryzen 7 9800X3D
1358 Points -18%
Intel Core i7-14650HX
Lenovo Legion 5 16IRX G9
1235 Points -25%
AMD Ryzen AI 9 HX 370
Asus ProArt P16 H7606WI
1213 Points -26%
AMD Ryzen 7 9700X
AMD Ryzen 7 9700X
1203 Points -27%
AMD Ryzen AI 9 365
Lenovo Yoga Pro 7 14ASP G9
996 Points -40%
Intel Core Ultra 9 285H
MSI Prestige 16 AI Evo B2HMG
991 Points -40%
Qualcomm Snapdragon X Elite X1E-84-100
Samsung Galaxy Book4 Edge 16 X1E-84-100
866 Points -47%
Intel Core i9-13900H
Minisforum MS-01
818 Points -50%
AMD Ryzen AI 7 PRO 360
Lenovo ThinkPad T14s Gen 6 21M2S00G00
708 Points -57%
Intel Core Ultra 9 288V
Asus Zenbook S 14 UX5406 Core Ultra 9
598 Points -64%
Cinebench R23 / Multi Core
Intel Core Ultra 9 285K
42705 Points +47%
AMD Ryzen 9 9950X
AMD Ryzen 9 9950X
40924 Points +41%
AMD Ryzen 9 7945HX
Minisforum BD790i
33459 Points +15%
AMD Ryzen 9 7945HX3D
Asus ROG Strix Scar 17 G733PYV-LL053X
32782 Points +13%
AMD Ryzen 9 9900X
AMD Ryzen 9 9900X
32172 Points +11%
Intel Core i9-14900HX
Schenker XMG Neo 17 E24
31740 Points +9%
Intel Core i9-14900HX
Lenovo Legion 7 16 IRX G9
31127 Points +7%
Intel Core i9-13980HX
Asus ProArt Studiobook 16 OLED H7604
30789 Points +6%
AMD Ryzen 9 7945HX
Tuxedo Gemini 17 Gen3 AMD
30783 Points +6%
Intel Core i9-14900HX
Asus ROG Strix Scar 16 G634JZR
30411 Points +5%
Intel Core i9-14900HX
Acer Predator Helios 16 PH16-72
30155 Points +4%
AMD Ryzen AI Max+ 395
Asus ROG Flow Z13 GZ302EA-RU073W
29063 Points
Apple M4 Max (16 cores)
Apple MacBook Pro 16 M4 Max
27595 Points -5%
Intel Core i7-14650HX
Lenovo Legion 5 16IRX G9
24455 Points -16%
AMD Ryzen AI 9 HX 370
Asus ProArt P16 H7606WI
23786 Points -18%
Apple M4 Pro (14 cores)
Apple MacBook Pro 16 2024 M4 Pro
23437 Points -19%
AMD Ryzen 7 9800X3D
AMD Ryzen 7 9800X3D
23230 Points -20%
AMD Ryzen 7 9700X
AMD Ryzen 7 9700X
20485 Points -30%
Intel Core Ultra 9 285H
MSI Prestige 16 AI Evo B2HMG
20442 Points -30%
AMD Ryzen AI 9 365
Lenovo Yoga Pro 7 14ASP G9
18748 Points -35%
Intel Core i9-13900H
Minisforum MS-01
16209 Points -44%
AMD Ryzen AI 7 PRO 360
Lenovo ThinkPad T14s Gen 6 21M2S00G00
13794 Points -53%
Qualcomm Snapdragon X Elite X1E-84-100
Samsung Galaxy Book4 Edge 16 X1E-84-100
9471 Points -67%
Geekbench 6.5 / Multi-Core
Apple M4 Max (16 cores)
Apple MacBook Pro 16 M4 Max
25760 Points +21%
Apple M4 Pro (14 cores)
Apple MacBook Pro 16 2024 M4 Pro
22509 Points +6%
Intel Core Ultra 9 285K
21688 Points +2%
AMD Ryzen 9 9950X
AMD Ryzen 9 9950X
21383 Points +1%
AMD Ryzen AI Max+ 395
Asus ROG Flow Z13 GZ302EA-RU073W
21269 Points
AMD Ryzen 9 9900X
AMD Ryzen 9 9900X
20380 Points -4%
Intel Core i9-14900HX
Asus ROG Strix Scar 16 G634JZR
18590 Points -13%
Intel Core i9-14900HX
Schenker XMG Neo 17 E24
18572 Points -13%
Intel Core i9-14900HX
Lenovo Legion 7 16 IRX G9
18079 Points -15%
AMD Ryzen 7 9800X3D
AMD Ryzen 7 9800X3D
18074 Points -15%
AMD Ryzen 9 7945HX
Minisforum BD790i
17892 Points -16%
Intel Core i9-14900HX
Acer Predator Helios 16 PH16-72
17654 Points -17%
Intel Core Ultra 9 285H
MSI Prestige 16 AI Evo B2HMG
17262 Points -19%
AMD Ryzen 9 7945HX3D
Asus ROG Strix Scar 17 G733PYV-LL053X
16957 Points -20%
AMD Ryzen 7 9700X
AMD Ryzen 7 9700X
16817 Points -21%
AMD Ryzen 9 7945HX
Tuxedo Gemini 17 Gen3 AMD
16223 Points -24%
Intel Core i7-14650HX
Lenovo Legion 5 16IRX G9
16010 Points -25%
Qualcomm Snapdragon X Elite X1E-84-100
Samsung Galaxy Book4 Edge 16 X1E-84-100
15665 Points -26%
AMD Ryzen AI 9 HX 370
Asus ProArt P16 H7606WI
15221 Points -28%
AMD Ryzen AI 9 365
Lenovo Yoga Pro 7 14ASP G9
14118 Points -34%
Intel Core i9-13900H
Minisforum MS-01
12677 Points -40%
AMD Ryzen AI 7 PRO 360
Lenovo ThinkPad T14s Gen 6 21M2S00G00
12344 Points -42%
Intel Core Ultra 9 288V
Asus Zenbook S 14 UX5406 Core Ultra 9
11069 Points -48%
Intel Core Ultra 9 288V
Asus Zenbook S 14 UX5406 Core Ultra 9
11049 Points -48%
Cinebench 2024: CPU Multi Core | Cinebench R23: Multi Core | Geekbench 6.5: Multi-Core

Bei der Effizienz werfen wir zunächst wieder einen Blick auf Cienbench 2024. Hier schneidet der Ryzen AI Max gut ab und muss sich gegenüber der x86-Konkurrenz lediglich dem neuen Arrow-Lake-H-Modell Core Ultra 9 285H geschlagen geben, alle anderen Modelle sind entweder auf einem vergleichbaren Niveau oder deutlich schlechter. Die ARM-Konkurrenz bleibt aber vorne.

Im älteren R23-Test interessiert uns vor allem der Vergleich mit den x86-Chips, da die ARM-CPUs den Test emulieren und daher an Leistung einbüßen. In diesem Test gehört der neue Ryzen-AI-Max-Chip zu den effizientesten Modellen und lässt die gesamte HX-Konkurrenz sowie die Desktop-Modelle klar hinter sich.

Power Consumption / Cinebench 2024 Multi Power Efficiency - external Monitor
Apple M4 Max (16 cores)
Apple MacBook Pro 16 M4 Max
22.4 Points per Watt +52%
Qualcomm Snapdragon X Elite X1E-80-100
Microsoft Surface Laptop 7 13.8 Copilot+
22.2 Points per Watt +51%
Qualcomm Snapdragon X Elite X1E-84-100
Samsung Galaxy Book4 Edge 16 X1E-84-100
22.1 Points per Watt +50%
Apple M4 Pro (14 cores)
Apple MacBook Pro 16 2024 M4 Pro
20.2 Points per Watt +37%
Intel Core Ultra 9 285H
MSI Prestige 16 AI Evo B2HMG
19.1 Points per Watt +30%
Qualcomm Snapdragon X Elite X1E-78-100
Lenovo Yoga Slim 7X 14Q8X9
18 Points per Watt +22%
AMD Ryzen AI 7 PRO 360
Lenovo ThinkPad T14s Gen 6 21M2S00G00
15 Points per Watt +2%
AMD Ryzen AI Max+ 395
Asus ROG Flow Z13 GZ302EA-RU073W
14.7 Points per Watt
Intel Core Ultra 9 288V
Asus Zenbook S 14 UX5406 Core Ultra 9
14 Points per Watt -5%
AMD Ryzen AI 9 365
Lenovo Yoga Pro 7 14ASP G9
12.5 Points per Watt -15%
AMD Ryzen AI 9 HX 370
Asus ProArt P16 H7606WI
10.2 Points per Watt -31%
Intel Core Ultra 9 285K
7.43 Points per Watt -49%
AMD Ryzen 9 9950X
AMD Ryzen 9 9950X
7.18 Points per Watt -51%
AMD Ryzen 7 9700X
AMD Ryzen 7 9700X
6.86 Points per Watt -53%
AMD Ryzen 9 9900X
AMD Ryzen 9 9900X
6.61 Points per Watt -55%
Power Consumption / Cinebench R23 Multi Power Efficiency - external Monitor
Apple M4 Pro (14 cores)
Apple MacBook Pro 16 2024 M4 Pro
296 Points per Watt +19%
Apple M4 Max (16 cores)
Apple MacBook Pro 16 M4 Max
281 Points per Watt +13%
AMD Ryzen AI 7 PRO 360
Lenovo ThinkPad T14s Gen 6 21M2S00G00
259 Points per Watt +4%
AMD Ryzen AI Max+ 395
Asus ROG Flow Z13 GZ302EA-RU073W
249 Points per Watt
Qualcomm Snapdragon X Elite X1E-80-100
Microsoft Surface Laptop 7 13.8 Copilot+
247 Points per Watt -1%
AMD Ryzen 9 7945HX
Minisforum BD790i
237 Points per Watt -5%
AMD Ryzen AI 9 365
Lenovo Yoga Pro 7 14ASP G9
235 Points per Watt -6%
Qualcomm Snapdragon X Elite X1E-84-100
Samsung Galaxy Book4 Edge 16 X1E-84-100
234 Points per Watt -6%
Intel Core Ultra 9 285H
MSI Prestige 16 AI Evo B2HMG
218 Points per Watt -12%
AMD Ryzen AI 9 HX 370
Asus ProArt P16 H7606WI
208 Points per Watt -16%
AMD Ryzen 9 7945HX3D
Asus ROG Strix Scar 17 G733PYV-LL053X
207 Points per Watt -17%
AMD Ryzen 9 7945HX
Tuxedo Gemini 17 Gen3 AMD
198 Points per Watt -20%
Qualcomm Snapdragon X Elite X1E-78-100
Lenovo Yoga Slim 7X 14Q8X9
173.7 Points per Watt -30%
Intel Core i9-13900H
Minisforum MS-01
164.2 Points per Watt -34%
Intel Core i9-14900HX
Lenovo Legion 7 16 IRX G9
158.6 Points per Watt -36%
Intel Core i9-14900HX
Asus ROG Strix Scar 16 G634JZR
144.8 Points per Watt -42%
Intel Core i7-14650HX
Lenovo Legion 5 16IRX G9
143.3 Points per Watt -42%
Intel Core i9-14900HX
Schenker XMG Neo 17 E24
142.3 Points per Watt -43%
Intel Core i9-14900HX
Acer Predator Helios 16 PH16-72
139.6 Points per Watt -44%
Intel Core i9-13980HX
Asus ProArt Studiobook 16 OLED H7604
135 Points per Watt -46%
AMD Ryzen 9 9950X
AMD Ryzen 9 9950X
129.5 Points per Watt -48%
Intel Core Ultra 9 285K
127.5 Points per Watt -49%
AMD Ryzen 9 9900X
AMD Ryzen 9 9900X
117 Points per Watt -53%
AMD Ryzen 7 9700X
AMD Ryzen 7 9700X
116.9 Points per Watt -53%
AMD Ryzen 7 9800X3D
AMD Ryzen 7 9800X3D
96.4 Points per Watt -61%

CPU-Leistung mit festgesetzten TDP-Werten

Da die endgültige Leistung massiv von dem jeweiligen Laptop-Modell und den Power Limits abhängt, haben wir zusätzlich den Cinebench-2024-Multi-Benchmark bei festgelegten Power Limits durchgeführt. Dazu haben wir entweder die Tools Throttle Stop oder Universal x86 Tuning Utility verwendet, wobei wir hier auf die Intel- und AMD-Prozessoren beschränkt sind.

Cinebench 2024 Multi
TDP Ryzen AI Max+ 395 Ryzen 9 7945HX3D Core Ultra 9-14900HX Ryzen AI 9 HX 370 Core Ultra 9 285H
45 Watt 1.310 Punkte 1.146 Punkte 1.107 Punkte 977 Punkte
55 Watt 1.494 Punkte 1.370 Punkte 1.012 Punkte 1.167 Punkte 1.042 Punkte
65 Watt 1.602 Punkte 1.492 Punkte 1.190 Punkte
80 Watt 1.731 Punkte 1.708 Punkte 1.407 Punkte

Um die Leistung gerade im Bereich von 45-55 Watt noch etwas besser einzuordnen, haben wir auch die Ergebnisse der beiden aktuellen Chips Ryzen 9 AI HX 370 sowie Core Ultra 9 285H in die Vergleichstabelle mit aufgenommen. In diesem Vergleich zeigt sich deutlich, dass der neue Ryzen AI Max+ 395 auch bei relativ geringen Power Limits schon sehr schnell ist und zudem einen deutlichen Leistungsvorteil gegenüber den anderen beiden mobilen Chips bietet. Der ältere Ryzen 9 7945HX3D ist erst ab 80 Watt vergleichbar, der Core i9-14900HX hingegen bleibt deutlich hinter den AMD-Chips zurück. Aus unseren Testberichten wissen wir, dass der 14900HX einfach sehr viel Strom benötigt (deutlich mehr als 100 Watt) um eine gute Leistung abzuliefern.

RAM-Performance

Memory Mark Apple M4 Pro MBP 16

In unseren Reviews testen wir mit dem Tool AIDA auch immer die Leistung des Arbeitsspeichers und hier hat der neue Ryzen AI Max+ 395 einen deutlichen Vorteil gegenüber dem Ryzen AI 9 HX 370 und auch den anderen Vergleichsgeräten. Die Lunar-Lake-Chips mit 32 GB RAM schlagen sich ebenfalls gut, die Snapdragon-Chips fallen aber etwas zurück. Interessant is zudem der Vergleich mit dem Apple M4 Pro, wo wir die RAM-Performance mit dem Tool AmorphousMemoryMark bestimmen. Hier zeigt sich, dass der M4 Pro bei Lesen einen deutlichen Vorsprung hat, beim Schreiben sind die beiden SoCs aber fast auf dem gleichen Niveau.

AIDA64 / Memory Copy
Asus ROG Flow Z13 GZ302EA-RU073W
AMD Ryzen AI Max+ 395, Radeon 8060S
158525 MB/s
Durchschnittliche AMD Ryzen AI Max+ 395
  (148904 - 163031, n=5)
155879 MB/s -2%
Lenovo Yoga Slim 9 14ILL10
Intel Core Ultra 7 258V, Arc 140V
107767 MB/s -32%
Asus ProArt PX13 HN7306
AMD Ryzen AI 9 HX 370, GeForce RTX 4070 Laptop GPU
89643 MB/s -43%
Acer Predator Helios Neo 14 (2024)
Intel Core Ultra 9 185H, GeForce RTX 4070 Laptop GPU
84317 MB/s -47%
Durchschnitt der Klasse Convertible
  (23880 - 158525, n=56, der letzten 2 Jahre)
80901 MB/s -49%
Schenker Key 17 Pro (M24)
Intel Core i9-14900HX, GeForce RTX 4090 Laptop GPU
78820 MB/s -50%
Asus ROG Zephyrus G14 2024 GA403U
AMD Ryzen 9 8945HS, GeForce RTX 4070 Laptop GPU
68976 MB/s -56%
Razer Blade 14 RZ09-0508
AMD Ryzen 9 8945HS, GeForce RTX 4070 Laptop GPU
68755 MB/s -57%
Asus ROG Flow Z13 ACRNM
Intel Core i9-13900H, GeForce RTX 4070 Laptop GPU
66769 MB/s -58%
Razer Blade 14 RTX 4070
AMD Ryzen 9 7940HS, GeForce RTX 4070 Laptop GPU
60919 MB/s -62%
Honor MagicBook Art 14 Snapdragon
Qualcomm Snapdragon X Elite X1E-80-100, Adreno X1-85 3.8 TFLOPS
60193 MB/s -62%
Asus ROG Strix Scar 17 G733PYV-LL053X
AMD Ryzen 9 7945HX3D, GeForce RTX 4090 Laptop GPU
50335 MB/s -68%
AIDA64 / Memory Read
Durchschnittliche AMD Ryzen AI Max+ 395
  (121931 - 123769, n=5)
122997 MB/s +1%
Asus ROG Flow Z13 GZ302EA-RU073W
AMD Ryzen AI Max+ 395, Radeon 8060S
121931 MB/s
Honor MagicBook Art 14 Snapdragon
Qualcomm Snapdragon X Elite X1E-80-100, Adreno X1-85 3.8 TFLOPS
101883 MB/s -16%
Asus ProArt PX13 HN7306
AMD Ryzen AI 9 HX 370, GeForce RTX 4070 Laptop GPU
100149 MB/s -18%
Lenovo Yoga Slim 9 14ILL10
Intel Core Ultra 7 258V, Arc 140V
87026 MB/s -29%
Schenker Key 17 Pro (M24)
Intel Core i9-14900HX, GeForce RTX 4090 Laptop GPU
85763 MB/s -30%
Acer Predator Helios Neo 14 (2024)
Intel Core Ultra 9 185H, GeForce RTX 4070 Laptop GPU
76163 MB/s -38%
Durchschnitt der Klasse Convertible
  (19931 - 126725, n=56, der letzten 2 Jahre)
71361 MB/s -41%
Asus ROG Flow Z13 ACRNM
Intel Core i9-13900H, GeForce RTX 4070 Laptop GPU
63054 MB/s -48%
Razer Blade 14 RZ09-0508
AMD Ryzen 9 8945HS, GeForce RTX 4070 Laptop GPU
61429 MB/s -50%
Razer Blade 14 RTX 4070
AMD Ryzen 9 7940HS, GeForce RTX 4070 Laptop GPU
60804 MB/s -50%
Asus ROG Strix Scar 17 G733PYV-LL053X
AMD Ryzen 9 7945HX3D, GeForce RTX 4090 Laptop GPU
59921 MB/s -51%
Asus ROG Zephyrus G14 2024 GA403U
AMD Ryzen 9 8945HS, GeForce RTX 4070 Laptop GPU
49966 MB/s -59%
AIDA64 / Memory Write
Asus ROG Flow Z13 GZ302EA-RU073W
AMD Ryzen AI Max+ 395, Radeon 8060S
216896 MB/s
Durchschnittliche AMD Ryzen AI Max+ 395
  (209816 - 216896, n=5)
211504 MB/s -2%
Lenovo Yoga Slim 9 14ILL10
Intel Core Ultra 7 258V, Arc 140V
117866 MB/s -46%
Asus ProArt PX13 HN7306
AMD Ryzen AI 9 HX 370, GeForce RTX 4070 Laptop GPU
98992 MB/s -54%
Asus ROG Zephyrus G14 2024 GA403U
AMD Ryzen 9 8945HS, GeForce RTX 4070 Laptop GPU
93153 MB/s -57%
Razer Blade 14 RZ09-0508
AMD Ryzen 9 8945HS, GeForce RTX 4070 Laptop GPU
87253 MB/s -60%
Durchschnitt der Klasse Convertible
  (17473 - 216896, n=56, der letzten 2 Jahre)
79682 MB/s -63%
Razer Blade 14 RTX 4070
AMD Ryzen 9 7940HS, GeForce RTX 4070 Laptop GPU
77647 MB/s -64%
Schenker Key 17 Pro (M24)
Intel Core i9-14900HX, GeForce RTX 4090 Laptop GPU
77439 MB/s -64%
Asus ROG Flow Z13 ACRNM
Intel Core i9-13900H, GeForce RTX 4070 Laptop GPU
73816 MB/s -66%
Asus ROG Strix Scar 17 G733PYV-LL053X
AMD Ryzen 9 7945HX3D, GeForce RTX 4090 Laptop GPU
58774 MB/s -73%
Acer Predator Helios Neo 14 (2024)
Intel Core Ultra 9 185H, GeForce RTX 4070 Laptop GPU
51880 MB/s -76%
Honor MagicBook Art 14 Snapdragon
Qualcomm Snapdragon X Elite X1E-80-100, Adreno X1-85 3.8 TFLOPS
44519 MB/s -79%
AIDA64 / Memory Latency
Acer Predator Helios Neo 14 (2024)
Intel Core Ultra 9 185H, GeForce RTX 4070 Laptop GPU
144.3 ns * -9%
Durchschnittliche AMD Ryzen AI Max+ 395
  (131.9 - 140.5, n=5)
136.6 ns * -4%
Asus ROG Flow Z13 GZ302EA-RU073W
AMD Ryzen AI Max+ 395, Radeon 8060S
131.9 ns *
Durchschnitt der Klasse Convertible
  (6.9 - 536, n=55, der letzten 2 Jahre)
129 ns * +2%
Asus ProArt PX13 HN7306
AMD Ryzen AI 9 HX 370, GeForce RTX 4070 Laptop GPU
111.4 ns * +16%
Asus ROG Zephyrus G14 2024 GA403U
AMD Ryzen 9 8945HS, GeForce RTX 4070 Laptop GPU
110.4 ns * +16%
Lenovo Yoga Slim 9 14ILL10
Intel Core Ultra 7 258V, Arc 140V
96.3 ns * +27%
Razer Blade 14 RZ09-0508
AMD Ryzen 9 8945HS, GeForce RTX 4070 Laptop GPU
95.4 ns * +28%
Razer Blade 14 RTX 4070
AMD Ryzen 9 7940HS, GeForce RTX 4070 Laptop GPU
89.9 ns * +32%
Asus ROG Flow Z13 ACRNM
Intel Core i9-13900H, GeForce RTX 4070 Laptop GPU
89.7 ns * +32%
Asus ROG Strix Scar 17 G733PYV-LL053X
AMD Ryzen 9 7945HX3D, GeForce RTX 4090 Laptop GPU
88.6 ns * +33%
Schenker Key 17 Pro (M24)
Intel Core i9-14900HX, GeForce RTX 4090 Laptop GPU
84.5 ns * +36%

* ... kleinere Werte sind besser

GPU-Leistung

Neben der starken CPU kommt mit der Radeon 8060S auch eine schnelle iGPU zum Einsatz, bei der es sich laut AMD um die schnellste x86-GPU auf dem Markt handelt. Hier können wir direkt vorwegnehmen, dass dieses Ziel mit Leichtigkeit erreicht wird, da weder die Radeon 890M noch die Intel Arc Graphics 140V/140T auch nur ansatzweise mit der neuen Radeon 8060S mithalten können.

Wir fangen zunächst mit den verschiedene Tests der 3DMark-Reihe an, wo sich ganz klar zeigt, dass die Radeon 8060S auf dem Niveau der RTX 4070 Laptop mit TGP-Werten von 65-75 Watt agiert. Das gilt für den 3DMark 11 sowie für die 3DMart-Benchmarks Fire Strike und Time Spy. In den Steel-Nomad-Tests sowie dem Speed-Way-Test muss die Radeon 8060S im Vergleich zur RTX 4070 Laptop aber Federn lassen.

3DMark 11 / Performance GPU
NVIDIA GeForce RTX 4070 Laptop GPU
Razer Blade 14 RZ09-0508, R9 8945HS, 140
44315 Points +9%
NVIDIA GeForce RTX 4070 Laptop GPU
Razer Blade 14 RTX 4070, R9 7940HS, 140
42318 Points +4%
AMD Radeon 8060S
Asus ROG Flow Z13 GZ302EA-RU073W, Ryzen AI Max+ 395, 80
40732 Points
NVIDIA GeForce RTX 4070 Laptop GPU
Asus ProArt PX13 HN7306, Ryzen AI 9 HX 370, 75
38156 Points -6%
NVIDIA GeForce RTX 4060 Laptop GPU
Acer Nitro 14 AN14-41-R3MX, R5 8645HS, 110
37827 Points -7%
NVIDIA GeForce RTX 4070 Laptop GPU
Asus ROG Zephyrus G14 2024 GA403U, R9 8945HS, 90
37023 Points -9%
NVIDIA GeForce RTX 4070 Laptop GPU
Acer Predator Helios Neo 14 (2024), Ultra 9 185H, 125
36209 Points -11%
NVIDIA GeForce RTX 4070 Laptop GPU
Asus ROG Flow Z13 ACRNM, i9-13900H, 65
32783 Points -20%
NVIDIA GeForce RTX 4060 Laptop GPU
Asus ROG Flow Z13 GZ301V, i9-13900H, 65
28200 Points -31%
AMD Radeon 890M
Beelink SER9, Ryzen AI 9 HX 370, 0
16800 Points -59%
Intel Arc Graphics 140V
Asus Zenbook S 14 UX5406 Core Ultra 9, Core Ultra 9 288V, 0
11102 Points -73%
3DMark / Fire Strike Graphics
NVIDIA GeForce RTX 4070 Laptop GPU
Razer Blade 14 RZ09-0508, R9 8945HS, 140
33451 Points +29%
NVIDIA GeForce RTX 4070 Laptop GPU
Razer Blade 14 RTX 4070, R9 7940HS, 140
30668 Points +18%
NVIDIA GeForce RTX 4060 Laptop GPU
Acer Nitro 14 AN14-41-R3MX, R5 8645HS, 110
28191 Points +8%
NVIDIA GeForce RTX 4070 Laptop GPU
Asus ProArt PX13 HN7306, Ryzen AI 9 HX 370, 75
28172 Points +8%
NVIDIA GeForce RTX 4070 Laptop GPU
Asus ROG Zephyrus G14 2024 GA403U, R9 8945HS, 90
27525 Points +6%
NVIDIA GeForce RTX 4070 Laptop GPU
Acer Predator Helios Neo 14 (2024), Ultra 9 185H, 125
26653 Points +3%
AMD Radeon 8060S
Asus ROG Flow Z13 GZ302EA-RU073W, Ryzen AI Max+ 395, 80
25992 Points
NVIDIA GeForce RTX 4070 Laptop GPU
Asus ROG Flow Z13 ACRNM, i9-13900H, 65
23000 Points -12%
NVIDIA GeForce RTX 4060 Laptop GPU
Asus ROG Flow Z13 GZ301V, i9-13900H, 65
20533 Points -21%
AMD Radeon 890M
Beelink SER9, Ryzen AI 9 HX 370, 0
10037 Points -61%
Intel Arc Graphics 140V
Asus Zenbook S 14 UX5406 Core Ultra 9, Core Ultra 9 288V, 0
9831 Points -62%
3DMark / Time Spy Graphics
NVIDIA GeForce RTX 4070 Laptop GPU
Razer Blade 14 RZ09-0508, R9 8945HS, 140
13215 Points +29%
NVIDIA GeForce RTX 4070 Laptop GPU
Razer Blade 14 RTX 4070, R9 7940HS, 140
12153 Points +19%
NVIDIA GeForce RTX 4060 Laptop GPU
Acer Nitro 14 AN14-41-R3MX, R5 8645HS, 110
10799 Points +6%
NVIDIA GeForce RTX 4070 Laptop GPU
Asus ProArt PX13 HN7306, Ryzen AI 9 HX 370, 75
10693 Points +5%
NVIDIA GeForce RTX 4070 Laptop GPU
Asus ROG Zephyrus G14 2024 GA403U, R9 8945HS, 90
10392 Points +2%
AMD Radeon 8060S
Asus ROG Flow Z13 GZ302EA-RU073W, Ryzen AI Max+ 395, 80
10224 Points
NVIDIA GeForce RTX 4070 Laptop GPU
Acer Predator Helios Neo 14 (2024), Ultra 9 185H, 125
10182 Points 0%
NVIDIA GeForce RTX 4070 Laptop GPU
Asus ROG Flow Z13 ACRNM, i9-13900H, 65
9513 Points -7%
NVIDIA GeForce RTX 4060 Laptop GPU
Asus ROG Flow Z13 GZ301V, i9-13900H, 65
7655 Points -25%
Intel Arc Graphics 140V
Asus Zenbook S 14 UX5406 Core Ultra 9, Core Ultra 9 288V, 0
4227 Points -59%
AMD Radeon 890M
Beelink SER9, Ryzen AI 9 HX 370, 0
3546 Points -65%
3DMark / Steel Nomad Light Score
NVIDIA GeForce RTX 4070 Laptop GPU
Asus ProArt PX13 HN7306, Ryzen AI 9 HX 370, 75
10952 Points +13%
NVIDIA GeForce RTX 4070 Laptop GPU
Asus ROG Flow Z13 ACRNM, i9-13900H, 65
9949 Points +3%
AMD Radeon 8060S
Asus ROG Flow Z13 GZ302EA-RU073W, Ryzen AI Max+ 395, 80
9653 Points
Intel Arc Graphics 140V
Asus Zenbook S 14 UX5406 Core Ultra 9, Core Ultra 9 288V, 0
3406 Points -65%
3DMark / Steel Nomad Score
NVIDIA GeForce RTX 4070 Laptop GPU
Razer Blade 14 RZ09-0508, R9 8945HS, 140
2795 Points +49%
NVIDIA GeForce RTX 4070 Laptop GPU
Asus ROG Zephyrus G14 2024 GA403U, R9 8945HS, 90
2442 Points +30%
NVIDIA GeForce RTX 4070 Laptop GPU
Asus ProArt PX13 HN7306, Ryzen AI 9 HX 370, 75
2386 Points +27%
NVIDIA GeForce RTX 4060 Laptop GPU
Acer Nitro 14 AN14-41-R3MX, R5 8645HS, 110
2351 Points +25%
NVIDIA GeForce RTX 4070 Laptop GPU
Acer Predator Helios Neo 14 (2024), Ultra 9 185H, 125
2230 Points +19%
NVIDIA GeForce RTX 4070 Laptop GPU
Asus ROG Flow Z13 ACRNM, i9-13900H, 65
2228 Points +19%
AMD Radeon 8060S
Asus ROG Flow Z13 GZ302EA-RU073W, Ryzen AI Max+ 395, 80
1874 Points
Intel Arc Graphics 140V
Asus Zenbook S 14 UX5406 Core Ultra 9, Core Ultra 9 288V, 0
915 Points -51%
AMD Radeon 890M
Beelink SER9, Ryzen AI 9 HX 370, 0
502 Points -73%
3DMark / Solar Bay Score
NVIDIA GeForce RTX 4070 Laptop GPU
Acer Predator Helios Neo 14 (2024), Ultra 9 185H, 125
44190 Points
3DMark / Speed Way Score
NVIDIA GeForce RTX 4070 Laptop GPU
Razer Blade 14 RZ09-0508, R9 8945HS, 140
3054 Points +127%
NVIDIA GeForce RTX 4070 Laptop GPU
Razer Blade 14 RTX 4070, R9 7940HS, 140
2913 Points +117%
NVIDIA GeForce RTX 4070 Laptop GPU
Asus ROG Zephyrus G14 2024 GA403U, R9 8945HS, 90
2566 Points +91%
NVIDIA GeForce RTX 4070 Laptop GPU
Acer Predator Helios Neo 14 (2024), Ultra 9 185H, 125
2515 Points +87%
NVIDIA GeForce RTX 4070 Laptop GPU
Asus ROG Flow Z13 ACRNM, i9-13900H, 65
2477 Points +84%
AMD Radeon 8060S
Asus ROG Flow Z13 GZ302EA-RU073W, Ryzen AI Max+ 395, 80
1343 Points
AMD Radeon 890M
Beelink SER9, Ryzen AI 9 HX 370, 0
328 Points -76%

Zusätzlich haben wir die neue Radeon 8060S noch mit der ARM-Konkurrenz von Apple sowie Qualcomm vergleichen. Die schnellste Version der Qualcomm Adreno X1-85 mit 4,6 TFLOPS ist komplett chancenlos und kommt nicht einmal ansatzweise an die neue Strix-Halo-iGPU heran. Beim Vergleich mit Apple sieht das schon anders aus, je nach Test kann sich die 8060S zwischen den beiden aktuellen M4-Pro-Chips bzw. davor positionieren. Die große M4-Max-GPU bleibt aber außer Reichweite.

3DMark / Wild Life Extreme Unlimited
Apple MacBook Pro 16 M4 Max
M4 Max 40-Core GPU, M4 Max (16 cores), Apple SSD AP1024Z
37434 Points +91%
Apple MacBook Pro 14 2023 M3 Max
M3 Max 40-Core GPU, Apple M3 Max 16-Core, Apple SSD AP2048Z
31403 Points +60%
Asus ROG Flow Z13 GZ302EA-RU073W
Radeon 8060S, Ryzen AI Max+ 395, Kioxia BG6 KBG60ZNS1T02
19615 Points
Apple MacBook Pro 16 2024 M4 Pro
M4 Pro 20-Core GPU, M4 Pro (14 cores), Apple SSD AP2048Z
19345 Points -1%
Apple MacBook Pro 16 2023 M3 Pro
M3 Pro 18-Core GPU, Apple M3 Pro 12-Core, Apple SSD AP0512Z
14545 Points -26%
Apple MacBook Pro 14 2023 M3 Pro
M3 Pro 14-Core GPU, Apple M3 Pro 11-Core, Apple SSD AP0512Z
12094 Points -38%
Samsung Galaxy Book4 Edge 16 X1E-84-100
Adreno X1-85 4.6 TFLOPS, SD X Elite X1E-84-100
6978 Points -64%
3DMark / Steel Nomad Light Score
Apple MacBook Pro 16 M4 Max
M4 Max 40-Core GPU, M4 Max (16 cores), Apple SSD AP1024Z
13989 Points +45%
Asus ROG Flow Z13 GZ302EA-RU073W
Radeon 8060S, Ryzen AI Max+ 395, Kioxia BG6 KBG60ZNS1T02
9653 Points
Apple MacBook Pro 16 2024 M4 Pro
M4 Pro 20-Core GPU, M4 Pro (14 cores), Apple SSD AP2048Z
7781 Points -19%
Apple MacBook Pro 14 2024 M4 Pro Entry
M4 Pro 16-Core GPU, M4 Pro (12 cores), Apple SSD AP1024Z
6739 Points -30%
Samsung Galaxy Book4 Edge 16 X1E-84-100
Adreno X1-85 4.6 TFLOPS, SD X Elite X1E-84-100
2467 Points -74%
GFXBench / 4K Aztec Ruins High Tier Offscreen
Apple MacBook Pro 16 M4 Max
M4 Max 40-Core GPU, M4 Max (16 cores), Apple SSD AP1024Z
231.7 fps +103%
Apple MacBook Pro 14 2023 M3 Max
M3 Max 40-Core GPU, Apple M3 Max 16-Core, Apple SSD AP2048Z
188.2 fps +65%
Apple MacBook Pro 16 2024 M4 Pro
M4 Pro 20-Core GPU, M4 Pro (14 cores), Apple SSD AP2048Z
125.8 fps +10%
Asus ROG Flow Z13 GZ302EA-RU073W
Radeon 8060S, Ryzen AI Max+ 395, Kioxia BG6 KBG60ZNS1T02
114.1 fps
Apple MacBook Pro 14 2024 M4 Pro Entry
M4 Pro 16-Core GPU, M4 Pro (12 cores), Apple SSD AP1024Z
103.3 fps -9%
Apple MacBook Pro 16 2023 M3 Pro
M3 Pro 18-Core GPU, Apple M3 Pro 12-Core, Apple SSD AP0512Z
97.8 fps -14%
Apple MacBook Pro 14 2023 M3 Pro
M3 Pro 14-Core GPU, Apple M3 Pro 11-Core, Apple SSD AP0512Z
79 fps -31%
GFXBench / Aztec Ruins High Tier Onscreen
Apple MacBook Pro 16 M4 Max
M4 Max 40-Core GPU, M4 Max (16 cores), Apple SSD AP1024Z
120 fps +5%
Apple MacBook Pro 14 2023 M3 Max
M3 Max 40-Core GPU, Apple M3 Max 16-Core, Apple SSD AP2048Z
119.8 fps +5%
Apple MacBook Pro 14 2024 M4 Pro Entry
M4 Pro 16-Core GPU, M4 Pro (12 cores), Apple SSD AP1024Z
119.8 fps +5%
Asus ROG Flow Z13 GZ302EA-RU073W
Radeon 8060S, Ryzen AI Max+ 395, Kioxia BG6 KBG60ZNS1T02
114.2 fps
Apple MacBook Pro 14 2023 M3 Pro
M3 Pro 14-Core GPU, Apple M3 Pro 11-Core, Apple SSD AP0512Z
109.2 fps -4%
Apple MacBook Pro 16 2023 M3 Pro
M3 Pro 18-Core GPU, Apple M3 Pro 12-Core, Apple SSD AP0512Z
104.9 fps -8%
Apple MacBook Pro 16 2024 M4 Pro
M4 Pro 20-Core GPU, M4 Pro (14 cores), Apple SSD AP2048Z
94.7 fps -17%
Geekbench 6.5 / GPU OpenCL
Apple MacBook Pro 16 M4 Max
M4 Max 40-Core GPU, M4 Max (16 cores), Apple SSD AP1024Z
116455 Points +29%
Apple MacBook Pro 14 2023 M3 Max
M3 Max 40-Core GPU, Apple M3 Max 16-Core, Apple SSD AP2048Z
91418 Points +1%
Asus ROG Flow Z13 GZ302EA-RU073W
Radeon 8060S, Ryzen AI Max+ 395, Kioxia BG6 KBG60ZNS1T02
90181 Points
Apple MacBook Pro 16 2024 M4 Pro
M4 Pro 20-Core GPU, M4 Pro (14 cores), Apple SSD AP2048Z
69778 Points -23%
Apple MacBook Pro 14 2024 M4 Pro Entry
M4 Pro 16-Core GPU, M4 Pro (12 cores), Apple SSD AP1024Z
60506 Points -33%
Apple MacBook Pro 16 2023 M3 Pro
M3 Pro 18-Core GPU, Apple M3 Pro 12-Core, Apple SSD AP0512Z
50373 Points -44%
Apple MacBook Pro 14 2023 M3 Pro
M3 Pro 14-Core GPU, Apple M3 Pro 11-Core, Apple SSD AP0512Z
42798 Points -53%
Samsung Galaxy Book4 Edge 16 X1E-84-100
Adreno X1-85 4.6 TFLOPS, SD X Elite X1E-84-100
23854 Points -74%

Gaming-Leistung

Bei unseren Gaming-Benchmarks, die wir standardmäßig für jeden Laptop-Test durchführen, liegt die Radeon 8060S auf dem Niveau der Radeon RX 7600M XT und knapp vor der schnellsten Variante der GeForce RTX 4050 Laptop (90 Watt TGP) im Lenovo IdeaPad Pro 5 16. Die beiden vergleichbaren RTX-4070-Laptop-Modelle Asus ROG Flow Z13 sowie Asus ProArt PX13 haben einen leichten Vorteil, was aber vor allen an den Ergebnissen in älteren Titeln wie GTA V liegt. Das gilt auch für schnelle Versionen der RTX 4060 Laptop. Bei den beiden aktuellen Titeln Cyberpunk 2077 bzw. Baldur's Gate 3 ist die Radeon 8060S auf Augenhöhe mit der 4070 Laptop. Grundsätzlich lassen sich fast alle modernen Titel flüssig in 1080p und maximalen Details spielen, bei QHD wird es vor allem bei anspruchsvollen Titeln schon knapper, dazu gleich aber noch mehr.

Performance Rating - Percent
NVIDIA RTX 3500 Ada Generation Laptop
HP ZBook Fury 16 G11, i9-14900HX, 105
100 pt
NVIDIA GeForce RTX 4060 Laptop GPU
Asus TUF Gaming A16 FA608WV, Ryzen AI 9 HX 370, 140
83.4 pt
NVIDIA GeForce RTX 4070 Laptop GPU
Acer Predator Helios Neo 14 (2024), Ultra 9 185H, 125
83.1 pt
NVIDIA GeForce RTX 4060 Laptop GPU
Acer Nitro 14 AN14-41-R3MX, R5 8645HS, 110
81.4 pt
NVIDIA GeForce RTX 4070 Laptop GPU
Asus ROG Flow Z13 ACRNM, i9-13900H, 65
81.1 pt
NVIDIA GeForce RTX 4070 Laptop GPU
Asus ProArt PX13 HN7306, Ryzen AI 9 HX 370, 75
77.5 pt
AMD Radeon RX 7600M XT
Minisforum MS-A1 (MGA1 Radeon RX 7600M XT @OCuLink) , R7 8700G, 120
76.8 pt
AMD Radeon 8060S
Asus ROG Flow Z13 GZ302EA-RU073W, Ryzen AI Max+ 395, 80
76.1 pt
NVIDIA GeForce RTX 4050 Laptop GPU
Lenovo IdeaPad Pro 5 16IMH G9 RTX 4050, Ultra 9 185H, 90
74.8 pt
NVIDIA GeForce RTX 4060 Laptop GPU
Schenker Key 14 (M24), Ultra 7 155H, 100
71.5 pt
NVIDIA RTX 2000 Ada Generation Laptop
HP ZBook Power 16 G11 A, R7 8845HS, 50
61.5 pt
NVIDIA GeForce RTX 3050 4GB Laptop GPU
HP Envy 17-da0076ng, Ultra 7 155U, 0
37.3 pt
Intel Arc Graphics 140T
MSI Prestige 16 AI Evo B2HMG, Ultra 9 285H, 0
29.7 pt
AMD Radeon 890M
Asus ProArt PX13 HN7306, Ryzen AI 9 HX 370, 0
29 pt
Intel Arc Graphics 140V
Asus Zenbook S 14 UX5406, Core Ultra 7 258V, 0
26 pt
Durchschnitt der Klasse Convertible
 
23.5 pt
Cyberpunk 2077 - 1920x1080 Ultra Preset (FSR off)
NVIDIA RTX 3500 Ada Generation Laptop
HP ZBook Fury 16 G11, i9-14900HX, 105
90.3 (73.1min) fps +19%
NVIDIA GeForce RTX 4060 Laptop GPU
Acer Nitro 14 AN14-41-R3MX, R5 8645HS, 110
75.8 (63.1min) fps 0%
NVIDIA GeForce RTX 4060 Laptop GPU
Asus TUF Gaming A16 FA608WV, Ryzen AI 9 HX 370, 140
75.6 (62.9min) fps 0%
AMD Radeon 8060S
Asus ROG Flow Z13 GZ302EA-RU073W, Ryzen AI Max+ 395, 80
75.6 (62min) fps
NVIDIA GeForce RTX 4070 Laptop GPU
Asus ProArt PX13 HN7306, Ryzen AI 9 HX 370, 75
74.1 (60.8min) fps -2%
AMD Radeon RX 7600M XT
Minisforum MS-A1 (MGA1 Radeon RX 7600M XT @OCuLink) , R7 8700G, 120
73.2 (60.3min) fps -3%
NVIDIA GeForce RTX 4070 Laptop GPU
Acer Predator Helios Neo 14 (2024), Ultra 9 185H, 125
72.4 (59.8min) fps -4%
NVIDIA GeForce RTX 4070 Laptop GPU
Asus ROG Flow Z13 ACRNM, i9-13900H, 65
66.79 (52.29min) fps -12%
NVIDIA GeForce RTX 4050 Laptop GPU
Lenovo IdeaPad Pro 5 16IMH G9 RTX 4050, Ultra 9 185H, 90
59.8 (49.3min) fps -21%
NVIDIA GeForce RTX 4060 Laptop GPU
Schenker Key 14 (M24), Ultra 7 155H, 100
56.4 (39.3min) fps -25%
NVIDIA RTX 2000 Ada Generation Laptop
HP ZBook Power 16 G11 A, R7 8845HS, 50
44.8 (37.6min) fps -41%
AMD Radeon 890M
Asus ProArt PX13 HN7306, Ryzen AI 9 HX 370, 0
27.8 (23.1min) fps -63%
Intel Arc Graphics 140T
MSI Prestige 16 AI Evo B2HMG, Ultra 9 285H, 0
27.3 (23.6min) fps -64%
NVIDIA GeForce RTX 3050 4GB Laptop GPU
HP Envy 17-da0076ng, Ultra 7 155U, 0
26.4 (10.2min) fps -65%
NVIDIA GeForce RTX 3050 4GB Laptop GPU
HP Envy 17-da0076ng, Ultra 7 155U, 0
21.1 (8.56min, 12.4P0.1, 18P1) fps -72%
Intel Arc Graphics 140V
Asus Zenbook S 14 UX5406, Core Ultra 7 258V, 0
24.3 (19.9min) fps -68%
Durchschnitt der Klasse Convertible
  (8.2 - 75.6, n=46, der letzten 2 Jahre)
19.4 fps -74%
Baldur's Gate 3 - 1920x1080 Ultra Preset AA:T
NVIDIA RTX 3500 Ada Generation Laptop
HP ZBook Fury 16 G11, i9-14900HX, 105
117.3 fps +38%
NVIDIA GeForce RTX 4070 Laptop GPU
Acer Predator Helios Neo 14 (2024), Ultra 9 185H, 125
107.9 (57.2min, 71.4P0.1, 87.3P1) fps +26%
NVIDIA GeForce RTX 4060 Laptop GPU
Acer Nitro 14 AN14-41-R3MX, R5 8645HS, 110
100.4 (33.6min, 83P0.1, 88.8P1) fps +18%
NVIDIA GeForce RTX 4060 Laptop GPU
Asus TUF Gaming A16 FA608WV, Ryzen AI 9 HX 370, 140
99 fps +16%
AMD Radeon RX 7600M XT
Minisforum MS-A1 (MGA1 Radeon RX 7600M XT @OCuLink) , R7 8700G, 120
87.7 (37.2min, 74.4P0.1, 79.1P1) fps +3%
NVIDIA GeForce RTX 4070 Laptop GPU
Asus ROG Flow Z13 ACRNM, i9-13900H, 65
86.1 (50.7P0.1, 70.2P1) fps +1%
AMD Radeon 8060S
Asus ROG Flow Z13 GZ302EA-RU073W, Ryzen AI Max+ 395, 80
85.3 fps
NVIDIA GeForce RTX 4050 Laptop GPU
Lenovo IdeaPad Pro 5 16IMH G9 RTX 4050, Ultra 9 185H, 90
78.6 fps -8%
NVIDIA GeForce RTX 4060 Laptop GPU
Schenker Key 14 (M24), Ultra 7 155H, 100
66.9 fps -22%
NVIDIA GeForce RTX 4070 Laptop GPU
Asus ProArt PX13 HN7306, Ryzen AI 9 HX 370, 75
66.7 fps -22%
NVIDIA RTX 2000 Ada Generation Laptop
HP ZBook Power 16 G11 A, R7 8845HS, 50
66.1 fps -23%
NVIDIA GeForce RTX 3050 4GB Laptop GPU
HP Envy 17-da0076ng, Ultra 7 155U, 0
35.7 fps -58%
AMD Radeon 890M
Asus ProArt PX13 HN7306, Ryzen AI 9 HX 370, 0
29.1 fps -66%
Intel Arc Graphics 140T
MSI Prestige 16 AI Evo B2HMG, Ultra 9 285H, 0
26.4 fps -69%
Intel Arc Graphics 140V
Asus Zenbook S 14 UX5406, Core Ultra 7 258V, 0
23 fps -73%
Durchschnitt der Klasse Convertible
  (9.2 - 85.3, n=39, der letzten 2 Jahre)
22.3 fps -74%
GTA V - 1920x1080 Highest AA:4xMSAA + FX AF:16x
NVIDIA RTX 3500 Ada Generation Laptop
HP ZBook Fury 16 G11, i9-14900HX, 105
115.5 (4.64min, 76.9P1) fps +38%
NVIDIA GeForce RTX 4060 Laptop GPU
Asus TUF Gaming A16 FA608WV, Ryzen AI 9 HX 370, 140
114 (4.02min, 71.4P1) fps +37%
NVIDIA GeForce RTX 4070 Laptop GPU
Acer Predator Helios Neo 14 (2024), Ultra 9 185H, 125
104.8 (4.53min, 71.4P1) fps +26%
NVIDIA GeForce RTX 4070 Laptop GPU
Asus ProArt PX13 HN7306, Ryzen AI 9 HX 370, 75
104.5 (9.04min, 66.7P1) fps +25%
NVIDIA GeForce RTX 4060 Laptop GPU
Acer Nitro 14 AN14-41-R3MX, R5 8645HS, 110
100.6 (7.3min, 71.4P1) fps +20%
NVIDIA GeForce RTX 4050 Laptop GPU
Lenovo IdeaPad Pro 5 16IMH G9 RTX 4050, Ultra 9 185H, 90
98.7 (4.28min, 66.7P1) fps +18%
AMD Radeon RX 7600M XT
Minisforum MS-A1 (MGA1 Radeon RX 7600M XT @OCuLink) , R7 8700G, 120
97.2 (8.06min, 62.5P1) fps +16%
NVIDIA GeForce RTX 4070 Laptop GPU
Asus ROG Flow Z13 ACRNM, i9-13900H, 65
94.8 (4.6min, 62.5P1) fps +14%
NVIDIA RTX 2000 Ada Generation Laptop
HP ZBook Power 16 G11 A, R7 8845HS, 50
90.3 (5.49min, 55.6P1) fps +8%
AMD Radeon 8060S
Asus ROG Flow Z13 GZ302EA-RU073W, Ryzen AI Max+ 395, 80
83.5 (7.23min, 55.6P1) fps
NVIDIA GeForce RTX 4060 Laptop GPU
Schenker Key 14 (M24), Ultra 7 155H, 100
79.7 (4.26min, 47.6P1) fps -5%
NVIDIA GeForce RTX 3050 4GB Laptop GPU
HP Envy 17-da0076ng, Ultra 7 155U, 0
48.3 (11.4min, 30.3P1) fps -42%
AMD Radeon 890M
Asus ProArt PX13 HN7306, Ryzen AI 9 HX 370, 0
31.6 (2.04min, 22.7P1) fps -62%
Intel Arc Graphics 140V
Asus Zenbook S 14 UX5406, Core Ultra 7 258V, 0
23.4 (2.44min, 13.3P1) fps -72%
Durchschnitt der Klasse Convertible
  (7.14 - 83.5, n=42, der letzten 2 Jahre)
19 fps -77%
Intel Arc Graphics 140T
MSI Prestige 16 AI Evo B2HMG, Ultra 9 285H, 0
17 (6.65min, 13P1) fps -80%
Final Fantasy XV Benchmark - 1920x1080 High Quality
NVIDIA RTX 3500 Ada Generation Laptop
HP ZBook Fury 16 G11, i9-14900HX, 105
128.9 fps +49%
NVIDIA GeForce RTX 4060 Laptop GPU
Acer Nitro 14 AN14-41-R3MX, R5 8645HS, 110
106 fps +22%
NVIDIA GeForce RTX 4070 Laptop GPU
Acer Predator Helios Neo 14 (2024), Ultra 9 185H, 125
104.6 fps +21%
NVIDIA GeForce RTX 4070 Laptop GPU
Asus ProArt PX13 HN7306, Ryzen AI 9 HX 370, 75
104 fps +20%
NVIDIA GeForce RTX 4060 Laptop GPU
Asus TUF Gaming A16 FA608WV, Ryzen AI 9 HX 370, 140
102.5 fps +18%
NVIDIA GeForce RTX 4060 Laptop GPU
Schenker Key 14 (M24), Ultra 7 155H, 100
94 fps +9%
AMD Radeon RX 7600M XT
Minisforum MS-A1 (MGA1 Radeon RX 7600M XT @OCuLink) , R7 8700G, 120
93.6 fps +8%
NVIDIA GeForce RTX 4070 Laptop GPU
Asus ROG Flow Z13 ACRNM, i9-13900H, 65
93.3 fps +8%
NVIDIA GeForce RTX 4050 Laptop GPU
Lenovo IdeaPad Pro 5 16IMH G9 RTX 4050, Ultra 9 185H, 90
87.8 fps +1%
AMD Radeon 8060S
Asus ROG Flow Z13 GZ302EA-RU073W, Ryzen AI Max+ 395, 80
86.6 fps
NVIDIA RTX 2000 Ada Generation Laptop
HP ZBook Power 16 G11 A, R7 8845HS, 50
66.3 fps -23%
NVIDIA GeForce RTX 3050 4GB Laptop GPU
HP Envy 17-da0076ng, Ultra 7 155U, 0
39.5 fps -54%
AMD Radeon 890M
Asus ProArt PX13 HN7306, Ryzen AI 9 HX 370, 0
33.2 fps -62%
Intel Arc Graphics 140T
MSI Prestige 16 AI Evo B2HMG, Ultra 9 285H, 0
30.6 fps -65%
Intel Arc Graphics 140V
Asus Zenbook S 14 UX5406, Core Ultra 7 258V, 0
30 fps -65%
Durchschnitt der Klasse Convertible
  (4.48 - 86.6, n=57, der letzten 2 Jahre)
24.3 fps -72%
Strange Brigade - 1920x1080 ultra AA:ultra AF:16
NVIDIA RTX 3500 Ada Generation Laptop
HP ZBook Fury 16 G11, i9-14900HX, 105
223 (52.5min, 159.8P1) fps +33%
NVIDIA GeForce RTX 4060 Laptop GPU
Acer Nitro 14 AN14-41-R3MX, R5 8645HS, 110
193.2 (28.8min, 141.1P1) fps +15%
NVIDIA GeForce RTX 4060 Laptop GPU
Asus TUF Gaming A16 FA608WV, Ryzen AI 9 HX 370, 140
191.9 (103.2min, 137.2P1) fps +14%
NVIDIA GeForce RTX 4070 Laptop GPU
Asus ProArt PX13 HN7306, Ryzen AI 9 HX 370, 75
191.7 (74.9min, 144.8P1) fps +14%
NVIDIA GeForce RTX 4060 Laptop GPU
Schenker Key 14 (M24), Ultra 7 155H, 100
186 fps +11%
NVIDIA GeForce RTX 4070 Laptop GPU
Acer Predator Helios Neo 14 (2024), Ultra 9 185H, 125
183 (33.8min, 138.5P1) fps +9%
AMD Radeon RX 7600M XT
Minisforum MS-A1 (MGA1 Radeon RX 7600M XT @OCuLink) , R7 8700G, 120
179.5 (125.3min, 133.7P1) fps +7%
NVIDIA GeForce RTX 4070 Laptop GPU
Asus ROG Flow Z13 ACRNM, i9-13900H, 65
174.8 (57min, 127.6P1) fps +4%
AMD Radeon 8060S
Asus ROG Flow Z13 GZ302EA-RU073W, Ryzen AI Max+ 395, 80
167.9 (68.9min, 108.1P1) fps
NVIDIA GeForce RTX 4050 Laptop GPU
Lenovo IdeaPad Pro 5 16IMH G9 RTX 4050, Ultra 9 185H, 90
149.4 (44.5min, 115.4P1) fps -11%
NVIDIA RTX 2000 Ada Generation Laptop
HP ZBook Power 16 G11 A, R7 8845HS, 50
138.5 (80.1min, 104.4P1) fps -18%
Intel Arc Graphics 140T
MSI Prestige 16 AI Evo B2HMG, Ultra 9 285H, 0
61.6 (45.2min, 49.5P1) fps -63%
NVIDIA GeForce RTX 3050 4GB Laptop GPU
HP Envy 17-da0076ng, Ultra 7 155U, 0
60.4 (44.9min, 47.5P1) fps -64%
AMD Radeon 890M
Asus ProArt PX13 HN7306, Ryzen AI 9 HX 370, 0
55.7 (36min, 42.8P1) fps -67%
Intel Arc Graphics 140V
Asus Zenbook S 14 UX5406, Core Ultra 7 258V, 0
54 (32min, 42.8P1) fps -68%
Durchschnitt der Klasse Convertible
  (10.8 - 167.9, n=53, der letzten 2 Jahre)
43.4 fps -74%
Dota 2 Reborn - 1920x1080 ultra (3/3) best looking
NVIDIA RTX 3500 Ada Generation Laptop
HP ZBook Fury 16 G11, i9-14900HX, 105
153.9 (131.9min) fps +8%
AMD Radeon 8060S
Asus ROG Flow Z13 GZ302EA-RU073W, Ryzen AI Max+ 395, 80
142 (123.4min) fps
NVIDIA GeForce RTX 4050 Laptop GPU
Lenovo IdeaPad Pro 5 16IMH G9 RTX 4050, Ultra 9 185H, 90
137.4 (115.6min) fps -3%
NVIDIA GeForce RTX 4060 Laptop GPU
Asus TUF Gaming A16 FA608WV, Ryzen AI 9 HX 370, 140
136.2 (117.8min) fps -4%
NVIDIA GeForce RTX 4070 Laptop GPU
Asus ROG Flow Z13 ACRNM, i9-13900H, 65
135 (117.4min) fps -5%
NVIDIA GeForce RTX 4070 Laptop GPU
Acer Predator Helios Neo 14 (2024), Ultra 9 185H, 125
130.8 (114.6min) fps -8%
NVIDIA GeForce RTX 4070 Laptop GPU
Asus ProArt PX13 HN7306, Ryzen AI 9 HX 370, 75
122.8 (106.2min) fps -14%
NVIDIA GeForce RTX 4060 Laptop GPU
Schenker Key 14 (M24), Ultra 7 155H, 100
122.6 (97.3min) fps -14%
AMD Radeon RX 7600M XT
Minisforum MS-A1 (MGA1 Radeon RX 7600M XT @OCuLink) , R7 8700G, 120
120.8 (106.1min) fps -15%
NVIDIA GeForce RTX 4060 Laptop GPU
Acer Nitro 14 AN14-41-R3MX, R5 8645HS, 110
120.5 (104.4min) fps -15%
NVIDIA RTX 2000 Ada Generation Laptop
HP ZBook Power 16 G11 A, R7 8845HS, 50
119.9 (104.6min) fps -16%
NVIDIA GeForce RTX 3050 4GB Laptop GPU
HP Envy 17-da0076ng, Ultra 7 155U, 0
90 (77.6min) fps -37%
Intel Arc Graphics 140T
MSI Prestige 16 AI Evo B2HMG, Ultra 9 285H, 0
83.8 (45.3min) fps -41%
Durchschnitt der Klasse Convertible
  (18.8 - 142, n=58, der letzten 2 Jahre)
63.2 fps -55%
Intel Arc Graphics 140V
Asus Zenbook S 14 UX5406, Core Ultra 7 258V, 0
62.9 fps -56%
AMD Radeon 890M
Asus ProArt PX13 HN7306, Ryzen AI 9 HX 370, 0
36 (20.4min) fps -75%
X-Plane 11.11 - 1920x1080 high (fps_test=3)
NVIDIA RTX 3500 Ada Generation Laptop
HP ZBook Fury 16 G11, i9-14900HX, 105
110.9 fps +45%
NVIDIA GeForce RTX 4070 Laptop GPU
Asus ROG Flow Z13 ACRNM, i9-13900H, 65
110.3 fps +44%
NVIDIA GeForce RTX 4050 Laptop GPU
Lenovo IdeaPad Pro 5 16IMH G9 RTX 4050, Ultra 9 185H, 90
89 fps +16%
NVIDIA GeForce RTX 4060 Laptop GPU
Schenker Key 14 (M24), Ultra 7 155H, 100
84.6 fps +10%
NVIDIA GeForce RTX 4070 Laptop GPU
Acer Predator Helios Neo 14 (2024), Ultra 9 185H, 125
78 fps +2%
AMD Radeon 8060S
Asus ROG Flow Z13 GZ302EA-RU073W, Ryzen AI Max+ 395, 80
76.7 fps
NVIDIA GeForce RTX 4070 Laptop GPU
Asus ProArt PX13 HN7306, Ryzen AI 9 HX 370, 75
74.1 fps -3%
NVIDIA GeForce RTX 4060 Laptop GPU
Acer Nitro 14 AN14-41-R3MX, R5 8645HS, 110
73.4 fps -4%
AMD Radeon RX 7600M XT
Minisforum MS-A1 (MGA1 Radeon RX 7600M XT @OCuLink) , R7 8700G, 120
73.2 fps -5%
NVIDIA GeForce RTX 4060 Laptop GPU
Asus TUF Gaming A16 FA608WV, Ryzen AI 9 HX 370, 140
69.9 fps -9%
NVIDIA RTX 2000 Ada Generation Laptop
HP ZBook Power 16 G11 A, R7 8845HS, 50
60.6 fps -21%
NVIDIA GeForce RTX 3050 4GB Laptop GPU
HP Envy 17-da0076ng, Ultra 7 155U, 0
51.6 fps -33%
AMD Radeon 890M
Asus ProArt PX13 HN7306, Ryzen AI 9 HX 370, 0
51.1 fps -33%
Intel Arc Graphics 140T
MSI Prestige 16 AI Evo B2HMG, Ultra 9 285H, 0
38.4 fps -50%
Durchschnitt der Klasse Convertible
  (12.8 - 76.7, n=56, der letzten 2 Jahre)
31.3 fps -59%
Intel Arc Graphics 140V
Asus Zenbook S 14 UX5406, Core Ultra 7 258V, 0
29.8 fps -61%

Da wir auch noch das Flow Z13 mit der RTX 4070 Laptop zur Hand hatten, haben wir direkte Vergleiche in verschiedenen aktuellen Titeln durchgeführt, wobei beide Tests jeweils im Turbo-Modus durchgeführt wurden. In 1080p und maximalen Details sieht die Sache grundsätzlich deutlich positiver für die neue Radeon 8060S aus. In Titeln wie Cyberpunk 2077 oder Call of Duty Black Ops 6 hat die AMD-GPU einen Vorteil von 13-17 %. In vielen Titeln sind die Ergebnisse sehr nah beieinander, es gibt aber auch einige negative Beispiele wie GTA V oder F1 24 (-12 bis -21 %). Alles in allem sind die beiden aber fast gleichauf. 

Gaming 1080p Ultra Performance Rating - Percent
Asus ROG Flow Z13 ACRNM
Intel Core i9-13900H, NVIDIA GeForce RTX 4070 Laptop GPU
97 pt
Asus ROG Flow Z13 GZ302EA-RU073W
AMD Ryzen AI Max+ 395, AMD Radeon 8060S
94.7 pt
Cyberpunk 2077 - 1920x1080 Ultra Preset (FSR off)
Asus ROG Flow Z13 GZ302EA-RU073W
AMD Ryzen AI Max+ 395, AMD Radeon 8060S
75.6 (62min - 97.7max) fps
Asus ROG Flow Z13 ACRNM
Intel Core i9-13900H, NVIDIA GeForce RTX 4070 Laptop GPU
66.79 (52.29min - 85.64max) fps -12%
Baldur's Gate 3 - 1920x1080 Ultra Preset AA:T
Asus ROG Flow Z13 ACRNM
Intel Core i9-13900H, NVIDIA GeForce RTX 4070 Laptop GPU
86.1 (50.7P0.1, 70.2P1) fps +1%
Asus ROG Flow Z13 GZ302EA-RU073W
AMD Ryzen AI Max+ 395, AMD Radeon 8060S
85.3 fps
GTA V - 1920x1080 Highest AA:4xMSAA + FX AF:16x
Asus ROG Flow Z13 ACRNM
Intel Core i9-13900H, NVIDIA GeForce RTX 4070 Laptop GPU
94.8 (4.6min, 62.5P1 - 170.5max) fps +14%
Asus ROG Flow Z13 GZ302EA-RU073W
AMD Ryzen AI Max+ 395, AMD Radeon 8060S
83.5 (7.23min, 55.6P1 - 146.4max) fps
Horizon Forbidden West - 1920x1080 Very High Preset AA:T
Asus ROG Flow Z13 ACRNM
Intel Core i9-13900H, NVIDIA GeForce RTX 4070 Laptop GPU
56.1 (39.5P0.1, 45.4P1) fps +15%
Asus ROG Flow Z13 GZ302EA-RU073W
AMD Ryzen AI Max+ 395, AMD Radeon 8060S
48.7 (34.9P0.1, 38.9P1) fps
F1 24 - 1920x1080 Ultra High Preset AA:T AF:16x
Asus ROG Flow Z13 ACRNM
Intel Core i9-13900H, NVIDIA GeForce RTX 4070 Laptop GPU
58.4 (48min, 47P1 - 70max) fps +27%
Asus ROG Flow Z13 GZ302EA-RU073W
AMD Ryzen AI Max+ 395, AMD Radeon 8060S
46 (34min - 56max) fps
Black Myth: Wukong - 1920x1080 cinematic TSR 100
Asus ROG Flow Z13 GZ302EA-RU073W
AMD Ryzen AI Max+ 395, AMD Radeon 8060S
27 (22min - 31max) fps
Asus ROG Flow Z13 ACRNM
Intel Core i9-13900H, NVIDIA GeForce RTX 4070 Laptop GPU
25 (7min - 28max) fps -7%
God of War Ragnarök - 1920x1080 Ultra Preset AA:T
Asus ROG Flow Z13 ACRNM
Intel Core i9-13900H, NVIDIA GeForce RTX 4070 Laptop GPU
76.2 (42.7P0.1, 51.2P1) fps 0%
Asus ROG Flow Z13 GZ302EA-RU073W
AMD Ryzen AI Max+ 395, AMD Radeon 8060S
76.1 fps
Call of Duty Black Ops 6 - 1920x1080 Extreme Preset
Asus ROG Flow Z13 GZ302EA-RU073W
AMD Ryzen AI Max+ 395, AMD Radeon 8060S
83 fps
Asus ROG Flow Z13 ACRNM
Intel Core i9-13900H, NVIDIA GeForce RTX 4070 Laptop GPU
71 (50P0.1) fps -14%
Ghost of Tsushima - 1920x1080 Very High Preset AA:T
Asus ROG Flow Z13 ACRNM
Intel Core i9-13900H, NVIDIA GeForce RTX 4070 Laptop GPU
55.3 (32.8P0.1, 41.6P1) fps +8%
Asus ROG Flow Z13 GZ302EA-RU073W
AMD Ryzen AI Max+ 395, AMD Radeon 8060S
51.2 fps
Monster Hunter Wilds - 1920x1080 ultra, RT: high, no upscaling
Asus ROG Flow Z13 ACRNM
Intel Core i9-13900H, NVIDIA GeForce RTX 4070 Laptop GPU
39.7 fps +1%
Asus ROG Flow Z13 GZ302EA-RU073W
AMD Ryzen AI Max+ 395, AMD Radeon 8060S
39.2 fps
Indiana Jones and the Great Circle - 1920x1080 Very Ultra Preset
Asus ROG Flow Z13 GZ302EA-RU073W
AMD Ryzen AI Max+ 395, AMD Radeon 8060S
40.3 (28.5P0.1, 33.3P1) fps
Asus ROG Flow Z13 ACRNM
Intel Core i9-13900H, NVIDIA GeForce RTX 4070 Laptop GPU
39.4 (24.9P0.1, 31.4P1) fps -2%
Star Wars Outlaws - 1920x1080 cinem. ultra
Asus ROG Flow Z13 ACRNM
Intel Core i9-13900H, NVIDIA GeForce RTX 4070 Laptop GPU
35.4 (18.1P0.1, 25.9P1) fps +8%
Asus ROG Flow Z13 GZ302EA-RU073W
AMD Ryzen AI Max+ 395, AMD Radeon 8060S
32.7 (11.7P0.1, 16P1) fps

In der QHD-Auflösung sind die Ergebnisse sehr ähnlich, wobei der Vorsprung für das Flow Z13 mit der RTX 4070 Laptop minimal größer ausfällt (+5 %). Grundsätzlich sind viele Titel in QHD und maximalen Details flüssig spielbar, nur sehr anspruchsvolle Titel wie Black Myth: Wukong, Star Wars Outlaws, Indiana Jones oder Monster Hunter Wilds fallen unter die Marke von 30 FPS.

Gaming QHD Ultra Performance Rating - Percent
Asus ROG Flow Z13 ACRNM
Intel Core i9-13900H, NVIDIA GeForce RTX 4070 Laptop GPU
96.2 pt
Asus ROG Flow Z13 GZ302EA-RU073W
AMD Ryzen AI Max+ 395, AMD Radeon 8060S
91.9 pt
Cyberpunk 2077 - 2560x1440 Ultra Preset (FSR off)
Asus ROG Flow Z13 GZ302EA-RU073W
AMD Ryzen AI Max+ 395, AMD Radeon 8060S
46.4 (39.2min - 60.2max) fps
Asus ROG Flow Z13 ACRNM
Intel Core i9-13900H, NVIDIA GeForce RTX 4070 Laptop GPU
40.1 (33.3min - 52.6max) fps -14%
Baldur's Gate 3 - 2560x1440 Ultra Preset AA:T
Asus ROG Flow Z13 ACRNM
Intel Core i9-13900H, NVIDIA GeForce RTX 4070 Laptop GPU
62.3 (48.5P0.1, 52P1) fps +13%
Asus ROG Flow Z13 GZ302EA-RU073W
AMD Ryzen AI Max+ 395, AMD Radeon 8060S
55.2 fps
GTA V - 2560x1440 Highest AA:4xMSAA + FX AF:16x
Asus ROG Flow Z13 ACRNM
Intel Core i9-13900H, NVIDIA GeForce RTX 4070 Laptop GPU
75.9 (3.4min, 43.5P1 - 128.1max) fps +18%
Asus ROG Flow Z13 GZ302EA-RU073W
AMD Ryzen AI Max+ 395, AMD Radeon 8060S
64.3 (8.92min, 45.5P1 - 110.8max) fps
Horizon Forbidden West - 2560x1440 Very High Preset AA:T
Asus ROG Flow Z13 ACRNM
Intel Core i9-13900H, NVIDIA GeForce RTX 4070 Laptop GPU
45.5 (33.7P0.1, 36.4P1) fps +19%
Asus ROG Flow Z13 GZ302EA-RU073W
AMD Ryzen AI Max+ 395, AMD Radeon 8060S
38.3 (27P0.1, 31.2P1) fps
F1 24 - 2560x1440 Ultra High Preset AA:T AF:16x
Asus ROG Flow Z13 ACRNM
Intel Core i9-13900H, NVIDIA GeForce RTX 4070 Laptop GPU
36.8 (31min, 30P1 - 44max) fps +28%
Asus ROG Flow Z13 GZ302EA-RU073W
AMD Ryzen AI Max+ 395, AMD Radeon 8060S
28.8 (19min, 14P1 - 36max) fps
Black Myth: Wukong - 2560x1440 cinematic TSR 100
Asus ROG Flow Z13 GZ302EA-RU073W
AMD Ryzen AI Max+ 395, AMD Radeon 8060S
20 (16min - 22max) fps
Asus ROG Flow Z13 ACRNM
Intel Core i9-13900H, NVIDIA GeForce RTX 4070 Laptop GPU
18 (15min - 20max) fps -10%
God of War Ragnarök - 2560x1440 Ultra Preset AA:T
Asus ROG Flow Z13 ACRNM
Intel Core i9-13900H, NVIDIA GeForce RTX 4070 Laptop GPU
60.5 (40.2P0.1, 47.1P1) fps +5%
Asus ROG Flow Z13 GZ302EA-RU073W
AMD Ryzen AI Max+ 395, AMD Radeon 8060S
57.5 fps
Call of Duty Black Ops 6 - 2560x1440 Extreme Preset
Asus ROG Flow Z13 GZ302EA-RU073W
AMD Ryzen AI Max+ 395, AMD Radeon 8060S
64 fps
Asus ROG Flow Z13 ACRNM
Intel Core i9-13900H, NVIDIA GeForce RTX 4070 Laptop GPU
52 (38P0.1) fps -19%
Ghost of Tsushima - 2560x1440 Very High Preset AA:T
Asus ROG Flow Z13 ACRNM
Intel Core i9-13900H, NVIDIA GeForce RTX 4070 Laptop GPU
43.6 (28.7P0.1, 36.2P1) fps +9%
Asus ROG Flow Z13 GZ302EA-RU073W
AMD Ryzen AI Max+ 395, AMD Radeon 8060S
40.1 fps
Monster Hunter Wilds - 2560x1440 ultra, RT: high, no upscaling
Asus ROG Flow Z13 ACRNM
Intel Core i9-13900H, NVIDIA GeForce RTX 4070 Laptop GPU
29 fps +1%
Asus ROG Flow Z13 GZ302EA-RU073W
AMD Ryzen AI Max+ 395, AMD Radeon 8060S
28.8 fps
Star Wars Outlaws - 2560x1440 cinem. ultra
Asus ROG Flow Z13 ACRNM
Intel Core i9-13900H, NVIDIA GeForce RTX 4070 Laptop GPU
25.9 (14.2P0.1, 19.3P1) fps +12%
Asus ROG Flow Z13 GZ302EA-RU073W
AMD Ryzen AI Max+ 395, AMD Radeon 8060S
23.1 (5.3P0.1, 12.4P1) fps

In unterstützen Titeln lässt sich die Performance zudem noch mit dem FSR-3-Upscaling steigern, wobei die Anzahl der Titel im Vergleich zu Nvidias DLSS-Technologie deutlich geringer ist. Wir haben das bei einigen Titeln getestet und obwohl FSR 3 in den meisten Fällen bereits spürbare Verbesserungen bringt, macht vor allem Frame Generation einen massiven Unterschied. Die nativen Ergebnisse können oftmals mehr als verdoppelt werden und auch anspruchsvolle Titel wie Black Myth: Wukong, Monster Hunter Wilds oder Star Wars Outlaws laufen dann flüssig in der QHD-Auflösung. Zumindest theoretisch, denn das tatsächliche Spielerlebnis kann variieren. In Star Wars Outlaws und Horizon Forbidden West kommt es beispielsweise zu einer deutlichen Artefakt-Bildung und Bildfehler, vor allem bei Bewegungen. 

Gaming-Leistung QHD Ultra-Settings
Spiel Nativ FSR 3 FSR3 + FG
Ghost of Tsushima 40,1 FPS 52,4 FPS 90,8 FPS
GoW Ragnarök 57,5 FPS 49,7 FPS 81,4 FPS
Cyberpunk 2077 46,4 FPS 64,5 FPS 109,7 FPS
Monster Hunter Wilds 28,4 FPS 36,4 FPS 59,3 FPS
Horizon Forbidden West 38,3 FPS 44,8 FPS 69 FPS
Black Myth: Wukong 16 FPS 25 FPS 48 FPS
Star Wars Outlaws 19,8 FPS 27,4 FPS 54,3 FPS
CoD Black Ops 6 64 FPS 79 FPS 114 FPS
min.mittelhochmax.QHD FSRQHD4K
GTA V (2015) 166.9 83.5 64.3 72.9
The Witcher 3 (2015) 101
Dota 2 Reborn (2015) 223 192.3 164.4 142 87
Final Fantasy XV Benchmark (2018) 182.7 117.6 86.6 63.6 34.7
X-Plane 11.11 (2018) 138.8 104.9 76.7 60.4
Strange Brigade (2018) 453 221 192.7 167.9 109.9 57.6
Baldur's Gate 3 (2023) 128.8 100.9 87.9 85.3 55.2 28.6
Cyberpunk 2077 (2023) 124.8 105.3 85 75.6 46.4 18.8
Horizon Forbidden West (2024) 48.7 44.8 38.3
Ghost of Tsushima (2024) 78.1 65.1 59.2 51.2 40.1 23
F1 24 (2024) 207 185.6 147.7 46 28.8 13
Black Myth: Wukong (2024) 27 28 20
Star Wars Outlaws (2024) 32.7 33.3 23.1
God of War Ragnarök (2024) 111.8 96.4 82.8 76.1 49.7 57.5 33.2
Call of Duty Black Ops 6 (2024) 83 79 64
Indiana Jones and the Great Circle (2024) 77.2 49.4 40.3 27.4
Monster Hunter Wilds (2025) 59.8 50.2 39.2 28.8 15.9
Doom: The Dark Ages (2025) 57.7 49.4 44.4 42.7

Für die Betrachtung der GPU-Effizienz setzen wir auf das Spiel Cyberpunk 2077 und wir haben hier für alle aktuellen Mobilplattformen Vergleichswerte, wobei man anmerken muss, dass das Spiel auf den ARM-Modellen emuliert wird, was Leistung kostet und somit nicht repräsentativ für die eigentliche Effizienz ist. Zumindest für die Apple-Prozessoren wird sich das in Kürze ändern, sobald die macOS-Version für Cyberpunk erscheint. Der Vollständigkeit halber haben wir die Ergebnisse aber dennoch eingeblendet.

Die Radeon 8060S iGPU gehört zu den effizientesten Modellen in unserer Datenbank und wird lediglich von einzelnen Varianten der Arc Graphics 140V überholt, die aber insgesamt ein deutlich geringeres Leistungsniveau erreichen. Die RTX 4070 im MSI Katana (mit AMD-CPU) ist ebenfalls auf einem vergleichbaren Niveau, die anderen GeForce-GPUs fallen aber weiter zurück, vor allem in Kombination mit Intel-CPUs.

Power Consumption / Cyberpunk 2077 ultra Efficiency
Intel Arc Graphics 140V
Asus Zenbook S 14 UX5406, Core Ultra 7 258V, 0
0.696 fps per Watt +24%
AMD Radeon 8060S
Asus ROG Flow Z13 GZ302EA-RU073W, Ryzen AI Max+ 395, 80
0.562 fps per Watt
NVIDIA GeForce RTX 4070 Laptop GPU
MSI Katana A17 AI B8VG, R7 8845HS, 105
0.552 fps per Watt -2%
Intel Arc Graphics 140V
MSI Prestige 13 AI Plus Evo A2VMG, Core Ultra 7 258V, 0
0.542 fps per Watt -4%
NVIDIA GeForce RTX 4070 Laptop GPU
MSI Katana A15 AI B8VG, R9 8945HS, 105
0.507 fps per Watt -10%
NVIDIA GeForce RTX 4050 Laptop GPU
Lenovo Yoga Pro 7 14IMH9, RTX 4050, Ultra 7 155H, 60
0.4984 fps per Watt -11%
Apple M4 Pro 20-Core GPU
Apple MacBook Pro 14 2024 M4 Pro, M4 Pro (14 cores), 32
0.4547 fps per Watt -19%
Apple M4 Max 40-Core GPU
Apple MacBook Pro 16 M4 Max, M4 Max (16 cores), 75
0.4496 fps per Watt -20%
NVIDIA RTX 4000 Ada Generation Laptop
Lenovo ThinkPad P16 Gen 2, i7-14700HX, 130
0.4466 fps per Watt -21%
NVIDIA GeForce RTX 4050 Laptop GPU
Lenovo IdeaPad Pro 5 16IMH G9 RTX 4050, Ultra 9 185H, 90
0.4205 fps per Watt -25%
AMD Radeon 890M
Asus Zenbook S 16 UM5606-RK333W, Ryzen AI 9 HX 370, 0
0.4176 fps per Watt -26%
NVIDIA GeForce RTX 4060 Laptop GPU
Gigabyte G5 KF5 2024, i7-13620H, 75
0.3965 fps per Watt -29%
NVIDIA GeForce RTX 4070 Laptop GPU
Tuxedo Gemini 17 Gen3 AMD, R9 7945HX, 125
0.3749 fps per Watt -33%
Intel Arc Graphics 140T
MSI Prestige 16 AI Evo B2HMG, Ultra 9 285H, 0
0.368 fps per Watt -35%
NVIDIA GeForce RTX 4080 Laptop GPU
Schenker XMG Neo 17 E24, i9-14900HX, 175
0.3616 fps per Watt -36%
AMD Radeon 880M
Lenovo ThinkBook 16 G7+ AMD, Ryzen AI 9 365, 0
0.3226 fps per Watt -43%
Qualcomm SD X Adreno X1-85 3.8 TFLOPS
Microsoft Surface Laptop 15 Snapdragon X Elite, SD X Elite X1E-80-100, 0
0.3171 fps per Watt -44%
NVIDIA GeForce RTX 4060 Laptop GPU
Lenovo ThinkBook 16p G5 IRX 21N50011GE, i9-14900HX, 115
0.3004 fps per Watt -47%
NVIDIA GeForce RTX 4060 Laptop GPU
Lenovo ThinkPad P1 Gen 7 21KV001SGE, Ultra 7 155H, 80
0.277 fps per Watt -51%

System Performance & Kreative Apps

Die System-Performance ist hervorragend, sowohl bei PCMark, dem plattformübergreifenden CrossMark, als auch den Browser-Tests. IM PCMark 10 sowie CrossMark kann sich das ROG Flow Z13 mit dem Ryzen AI Max+ 395 an die Spitze unseres Vergleichsfeldes setzen und dabei sogar das MacBook Pro 16 mit dem M4 Max hinter sich lassen. In den Browser-Tests schneiden die ARM-Konkurrenten von Apple und Qualcomm (zumindest die schnellen Versionen) aber etwas besser ab.

PCMark 10 / Score
Ryzen AI Max+ 395, Radeon 8060S
Asus ROG Flow Z13 GZ302EA-RU073W, 32768
9125 Points
Durchschnittliche AMD Ryzen AI Max+ 395, AMD Radeon 8060S
  (8732 - 9125, n=5)
8895 Points -3%
R9 8945HS, GeForce RTX 4070 Laptop GPU
Razer Blade 14 RZ09-0508, 32768
8312 Points -9%
R9 7940HS, GeForce RTX 4070 Laptop GPU
Razer Blade 14 RTX 4070, 16384
8205 Points -10%
i9-13900H, GeForce RTX 4070 Laptop GPU
Asus ROG Flow Z13 ACRNM, 32768
8018 Points -12%
Ryzen AI 9 HX 370, GeForce RTX 4070 Laptop GPU
Asus ProArt PX13 HN7306, 32768
7696 Points -16%
Ultra 9 185H, GeForce RTX 4070 Laptop GPU
Acer Predator Helios Neo 14 (2024), 32768
7490 Points -18%
R5 8645HS, GeForce RTX 4060 Laptop GPU
Acer Nitro 14 AN14-41-R3MX, 16384
7453 Points -18%
R9 8945HS, GeForce RTX 4070 Laptop GPU
Asus ROG Zephyrus G14 2024 GA403U, 32768
7436 Points -19%
i7-13700H, GeForce RTX 4060 Laptop GPU
Microsoft Surface Laptop Studio 2 RTX 4060, 65536
7351 Points -19%
Durchschnitt der Klasse Convertible
  (3229 - 9125, n=54, der letzten 2 Jahre)
6529 Points -28%
PCMark 10 / Essentials
Ryzen AI Max+ 395, Radeon 8060S
Asus ROG Flow Z13 GZ302EA-RU073W, 32768
12005 Points
Durchschnittliche AMD Ryzen AI Max+ 395, AMD Radeon 8060S
  (10949 - 12005, n=5)
11448 Points -5%
R9 8945HS, GeForce RTX 4070 Laptop GPU
Razer Blade 14 RZ09-0508, 32768
11290 Points -6%
i9-13900H, GeForce RTX 4070 Laptop GPU
Asus ROG Flow Z13 ACRNM, 32768
11088 Points -8%
R9 7940HS, GeForce RTX 4070 Laptop GPU
Razer Blade 14 RTX 4070, 16384
10952 Points -9%
Ultra 9 185H, GeForce RTX 4070 Laptop GPU
Acer Predator Helios Neo 14 (2024), 32768
10752 Points -10%
i7-13700H, GeForce RTX 4060 Laptop GPU
Microsoft Surface Laptop Studio 2 RTX 4060, 65536
10696 Points -11%
Durchschnitt der Klasse Convertible
  (7233 - 12222, n=54, der letzten 2 Jahre)
10673 Points -11%
Ryzen AI 9 HX 370, GeForce RTX 4070 Laptop GPU
Asus ProArt PX13 HN7306, 32768
10144 Points -16%
R9 8945HS, GeForce RTX 4070 Laptop GPU
Asus ROG Zephyrus G14 2024 GA403U, 32768
9861 Points -18%
R5 8645HS, GeForce RTX 4060 Laptop GPU
Acer Nitro 14 AN14-41-R3MX, 16384
9861 Points -18%
PCMark 10 / Productivity
R9 7940HS, GeForce RTX 4070 Laptop GPU
Razer Blade 14 RTX 4070, 16384
10805 Points +4%
Ryzen AI Max+ 395, Radeon 8060S
Asus ROG Flow Z13 GZ302EA-RU073W, 32768
10377 Points
R9 8945HS, GeForce RTX 4070 Laptop GPU
Razer Blade 14 RZ09-0508, 32768
10332 Points 0%
Durchschnittliche AMD Ryzen AI Max+ 395, AMD Radeon 8060S
  (9762 - 10377, n=5)
10120 Points -2%
Ryzen AI 9 HX 370, GeForce RTX 4070 Laptop GPU
Asus ProArt PX13 HN7306, 32768
10027 Points -3%
R5 8645HS, GeForce RTX 4060 Laptop GPU
Acer Nitro 14 AN14-41-R3MX, 16384
9972 Points -4%
i9-13900H, GeForce RTX 4070 Laptop GPU
Asus ROG Flow Z13 ACRNM, 32768
9882 Points -5%
R9 8945HS, GeForce RTX 4070 Laptop GPU
Asus ROG Zephyrus G14 2024 GA403U, 32768
9502 Points -8%
i7-13700H, GeForce RTX 4060 Laptop GPU
Microsoft Surface Laptop Studio 2 RTX 4060, 65536
9364 Points -10%
Ultra 9 185H, GeForce RTX 4070 Laptop GPU
Acer Predator Helios Neo 14 (2024), 32768
9330 Points -10%
Durchschnitt der Klasse Convertible
  (5062 - 10643, n=54, der letzten 2 Jahre)
8639 Points -17%
PCMark 10 / Digital Content Creation
Ryzen AI Max+ 395, Radeon 8060S
Asus ROG Flow Z13 GZ302EA-RU073W, 32768
16551 Points
Durchschnittliche AMD Ryzen AI Max+ 395, AMD Radeon 8060S
  (16185 - 16755, n=5)
16493 Points 0%
R9 8945HS, GeForce RTX 4070 Laptop GPU
Razer Blade 14 RZ09-0508, 32768
13363 Points -19%
i9-13900H, GeForce RTX 4070 Laptop GPU
Asus ROG Flow Z13 ACRNM, 32768
12766 Points -23%
R9 7940HS, GeForce RTX 4070 Laptop GPU
Razer Blade 14 RTX 4070, 16384
12666 Points -23%
Ryzen AI 9 HX 370, GeForce RTX 4070 Laptop GPU
Asus ProArt PX13 HN7306, 32768
12165 Points -26%
R9 8945HS, GeForce RTX 4070 Laptop GPU
Asus ROG Zephyrus G14 2024 GA403U, 32768
11907 Points -28%
R5 8645HS, GeForce RTX 4060 Laptop GPU
Acer Nitro 14 AN14-41-R3MX, 16384
11428 Points -31%
Ultra 9 185H, GeForce RTX 4070 Laptop GPU
Acer Predator Helios Neo 14 (2024), 32768
11369 Points -31%
i7-13700H, GeForce RTX 4060 Laptop GPU
Microsoft Surface Laptop Studio 2 RTX 4060, 65536
10763 Points -35%
Durchschnitt der Klasse Convertible
  (2496 - 16551, n=54, der letzten 2 Jahre)
8314 Points -50%
CrossMark / Overall
Ryzen AI Max+ 395, Radeon 8060S
Asus ROG Flow Z13 GZ302EA-RU073W, 32768
2274 Points
M4 Max (16 cores), M4 Max 40-Core GPU
Apple MacBook Pro 16 M4 Max, 49152
2255 Points -1%
M4 Pro (14 cores), M4 Pro 20-Core GPU
Apple MacBook Pro 16 2024 M4 Pro, 49152
2148 Points -6%
M4 Pro (12 cores), M4 Pro 16-Core GPU
Apple MacBook Pro 14 2024 M4 Pro Entry, 24576
2123 Points -7%
Durchschnittliche AMD Ryzen AI Max+ 395, AMD Radeon 8060S
  (1948 - 2274, n=5)
2089 Points -8%
M4 (10 cores), M4 10-Core GPU
Apple MacBook Pro 14 2024 M4, 16384
2066 Points -9%
i9-13900H, GeForce RTX 4070 Laptop GPU
Asus ROG Flow Z13 ACRNM, 32768
1937 Points -15%
Ultra 9 185H, GeForce RTX 4070 Laptop GPU
Acer Predator Helios Neo 14 (2024), 32768
1917 Points -16%
R9 8945HS, GeForce RTX 4070 Laptop GPU
Razer Blade 14 RZ09-0508, 32768
1830 Points -20%
R9 7940HS, GeForce RTX 4070 Laptop GPU
Razer Blade 14 RTX 4070, 16384
1812 Points -20%
Ryzen AI 9 HX 370, GeForce RTX 4070 Laptop GPU
Asus ProArt PX13 HN7306, 32768
1785 Points -22%
R9 8945HS, GeForce RTX 4070 Laptop GPU
Asus ROG Zephyrus G14 2024 GA403U, 32768
1767 Points -22%
R5 8645HS, GeForce RTX 4060 Laptop GPU
Acer Nitro 14 AN14-41-R3MX, 16384
1765 Points -22%
i7-13700H, GeForce RTX 4060 Laptop GPU
Microsoft Surface Laptop Studio 2 RTX 4060, 65536
1733 Points -24%
Durchschnitt der Klasse Convertible
  (524 - 2274, n=57, der letzten 2 Jahre)
1549 Points -32%
SD X Elite X1E-84-100, Adreno X1-85 4.6 TFLOPS
Samsung Galaxy Book4 Edge 16 X1E-84-100, 16384
1416 Points -38%
SD X Elite X1E-80-100, Adreno X1-85 3.8 TFLOPS
Microsoft Surface Laptop 15 Snapdragon X Elite, 16384
1385 Points -39%
SD X Elite X1E-78-100, Adreno X1-85 3.8 TFLOPS
Lenovo Yoga Slim 7X 14Q8X9, 32768
1255 Points -45%
CrossMark / Productivity
M4 Max (16 cores), M4 Max 40-Core GPU
Apple MacBook Pro 16 M4 Max, 49152
2042 Points +6%
Durchschnittliche AMD Ryzen AI Max+ 395, AMD Radeon 8060S
  (1701 - 2790, n=5)
2000 Points +4%
M4 Pro (14 cores), M4 Pro 20-Core GPU
Apple MacBook Pro 16 2024 M4 Pro, 49152
1980 Points +3%
M4 Pro (12 cores), M4 Pro 16-Core GPU
Apple MacBook Pro 14 2024 M4 Pro Entry, 24576
1936 Points +1%
M4 (10 cores), M4 10-Core GPU
Apple MacBook Pro 14 2024 M4, 16384
1933 Points 0%
Ryzen AI Max+ 395, Radeon 8060S
Asus ROG Flow Z13 GZ302EA-RU073W, 32768
1925 Points
Ultra 9 185H, GeForce RTX 4070 Laptop GPU
Acer Predator Helios Neo 14 (2024), 32768
1849 Points -4%
i9-13900H, GeForce RTX 4070 Laptop GPU
Asus ROG Flow Z13 ACRNM, 32768
1820 Points -5%
R9 8945HS, GeForce RTX 4070 Laptop GPU
Razer Blade 14 RZ09-0508, 32768
1783 Points -7%
R9 7940HS, GeForce RTX 4070 Laptop GPU
Razer Blade 14 RTX 4070, 16384
1762 Points -8%
R5 8645HS, GeForce RTX 4060 Laptop GPU
Acer Nitro 14 AN14-41-R3MX, 16384
1736 Points -10%
R9 8945HS, GeForce RTX 4070 Laptop GPU
Asus ROG Zephyrus G14 2024 GA403U, 32768
1686 Points -12%
i7-13700H, GeForce RTX 4060 Laptop GPU
Microsoft Surface Laptop Studio 2 RTX 4060, 65536
1618 Points -16%
Ryzen AI 9 HX 370, GeForce RTX 4070 Laptop GPU
Asus ProArt PX13 HN7306, 32768
1611 Points -16%
Durchschnitt der Klasse Convertible
  (554 - 1925, n=57, der letzten 2 Jahre)
1487 Points -23%
SD X Elite X1E-84-100, Adreno X1-85 4.6 TFLOPS
Samsung Galaxy Book4 Edge 16 X1E-84-100, 16384
1330 Points -31%
SD X Elite X1E-80-100, Adreno X1-85 3.8 TFLOPS
Microsoft Surface Laptop 15 Snapdragon X Elite, 16384
1303 Points -32%
SD X Elite X1E-78-100, Adreno X1-85 3.8 TFLOPS
Lenovo Yoga Slim 7X 14Q8X9, 32768
1152 Points -40%
CrossMark / Creativity
Ryzen AI Max+ 395, Radeon 8060S
Asus ROG Flow Z13 GZ302EA-RU073W, 32768
2949 Points
M4 Max (16 cores), M4 Max 40-Core GPU
Apple MacBook Pro 16 M4 Max, 49152
2795 Points -5%
Durchschnittliche AMD Ryzen AI Max+ 395, AMD Radeon 8060S
  (2331 - 2949, n=5)
2635 Points -11%
M4 Pro (12 cores), M4 Pro 16-Core GPU
Apple MacBook Pro 14 2024 M4 Pro Entry, 24576
2594 Points -12%
M4 Pro (14 cores), M4 Pro 20-Core GPU
Apple MacBook Pro 16 2024 M4 Pro, 49152
2590 Points -12%
M4 (10 cores), M4 10-Core GPU
Apple MacBook Pro 14 2024 M4, 16384
2420 Points -18%
Ryzen AI 9 HX 370, GeForce RTX 4070 Laptop GPU
Asus ProArt PX13 HN7306, 32768
2212 Points -25%
i9-13900H, GeForce RTX 4070 Laptop GPU
Asus ROG Flow Z13 ACRNM, 32768
2172 Points -26%
Ultra 9 185H, GeForce RTX 4070 Laptop GPU
Acer Predator Helios Neo 14 (2024), 32768
2008 Points -32%
i7-13700H, GeForce RTX 4060 Laptop GPU
Microsoft Surface Laptop Studio 2 RTX 4060, 65536
2001 Points -32%
R9 8945HS, GeForce RTX 4070 Laptop GPU
Asus ROG Zephyrus G14 2024 GA403U, 32768
1960 Points -34%
R9 7940HS, GeForce RTX 4070 Laptop GPU
Razer Blade 14 RTX 4070, 16384
1952 Points -34%
R9 8945HS, GeForce RTX 4070 Laptop GPU
Razer Blade 14 RZ09-0508, 32768
1935 Points -34%
R5 8645HS, GeForce RTX 4060 Laptop GPU
Acer Nitro 14 AN14-41-R3MX, 16384
1823 Points -38%
Durchschnitt der Klasse Convertible
  (550 - 2949, n=57, der letzten 2 Jahre)
1709 Points -42%
SD X Elite X1E-84-100, Adreno X1-85 4.6 TFLOPS
Samsung Galaxy Book4 Edge 16 X1E-84-100, 16384
1595 Points -46%
SD X Elite X1E-80-100, Adreno X1-85 3.8 TFLOPS
Microsoft Surface Laptop 15 Snapdragon X Elite, 16384
1496 Points -49%
SD X Elite X1E-78-100, Adreno X1-85 3.8 TFLOPS
Lenovo Yoga Slim 7X 14Q8X9, 32768
1423 Points -52%
CrossMark / Responsiveness
Ultra 9 185H, GeForce RTX 4070 Laptop GPU
Acer Predator Helios Neo 14 (2024), 32768
1856 Points +8%
Ryzen AI Max+ 395, Radeon 8060S
Asus ROG Flow Z13 GZ302EA-RU073W, 32768
1719 Points
R5 8645HS, GeForce RTX 4060 Laptop GPU
Acer Nitro 14 AN14-41-R3MX, 16384
1681 Points -2%
R9 8945HS, GeForce RTX 4070 Laptop GPU
Razer Blade 14 RZ09-0508, 32768
1672 Points -3%
i9-13900H, GeForce RTX 4070 Laptop GPU
Asus ROG Flow Z13 ACRNM, 32768
1654 Points -4%
Durchschnittliche AMD Ryzen AI Max+ 395, AMD Radeon 8060S
  (1541 - 1719, n=5)
1633 Points -5%
M4 Max (16 cores), M4 Max 40-Core GPU
Apple MacBook Pro 16 M4 Max, 49152
1595 Points -7%
R9 7940HS, GeForce RTX 4070 Laptop GPU
Razer Blade 14 RTX 4070, 16384
1575 Points -8%
M4 (10 cores), M4 10-Core GPU
Apple MacBook Pro 14 2024 M4, 16384
1569 Points -9%
M4 Pro (14 cores), M4 Pro 20-Core GPU
Apple MacBook Pro 16 2024 M4 Pro, 49152
1566 Points -9%
M4 Pro (12 cores), M4 Pro 16-Core GPU
Apple MacBook Pro 14 2024 M4 Pro Entry, 24576
1533 Points -11%
R9 8945HS, GeForce RTX 4070 Laptop GPU
Asus ROG Zephyrus G14 2024 GA403U, 32768
1489 Points -13%
i7-13700H, GeForce RTX 4060 Laptop GPU
Microsoft Surface Laptop Studio 2 RTX 4060, 65536
1381 Points -20%
SD X Elite X1E-80-100, Adreno X1-85 3.8 TFLOPS
Microsoft Surface Laptop 15 Snapdragon X Elite, 16384
1320 Points -23%
Durchschnitt der Klasse Convertible
  (381 - 1719, n=57, der letzten 2 Jahre)
1280 Points -26%
Ryzen AI 9 HX 370, GeForce RTX 4070 Laptop GPU
Asus ProArt PX13 HN7306, 32768
1274 Points -26%
SD X Elite X1E-84-100, Adreno X1-85 4.6 TFLOPS
Samsung Galaxy Book4 Edge 16 X1E-84-100, 16384
1197 Points -30%
SD X Elite X1E-78-100, Adreno X1-85 3.8 TFLOPS
Lenovo Yoga Slim 7X 14Q8X9, 32768
1116 Points -35%
WebXPRT 3 / Overall
M4 Max (16 cores), M4 Max 40-Core GPU
Apple MacBook Pro 16 M4 Max, 49152
543 Points +52%
M4 Pro (12 cores), M4 Pro 16-Core GPU
Apple MacBook Pro 14 2024 M4 Pro Entry, 24576
525 Points +47%
M4 Pro (14 cores), M4 Pro 20-Core GPU
Apple MacBook Pro 16 2024 M4 Pro, 49152
525 Points +47%
SD X Elite X1E-84-100, Adreno X1-85 4.6 TFLOPS
Samsung Galaxy Book4 Edge 16 X1E-84-100, 16384
476 Points +33%
M4 (10 cores), M4 10-Core GPU
Apple MacBook Pro 14 2024 M4, 16384
469 Points +31%
SD X Elite X1E-80-100, Adreno X1-85 3.8 TFLOPS
Microsoft Surface Laptop 15 Snapdragon X Elite, 16384
444 Points +24%
SD X Elite X1E-78-100, Adreno X1-85 3.8 TFLOPS
Lenovo Yoga Slim 7X 14Q8X9, 32768
421 Points +18%
Ryzen AI Max+ 395, Radeon 8060S
Asus ROG Flow Z13 GZ302EA-RU073W, 32768
358 Points
Durchschnittliche AMD Ryzen AI Max+ 395, AMD Radeon 8060S
  (302 - 358, n=5)
325 Points -9%
R9 8945HS, GeForce RTX 4070 Laptop GPU
Razer Blade 14 RZ09-0508, 32768
324 Points -9%
R9 7940HS, GeForce RTX 4070 Laptop GPU
Razer Blade 14 RTX 4070, 16384
317 Points -11%
i9-13900H, GeForce RTX 4070 Laptop GPU
Asus ROG Flow Z13 ACRNM, 32768
314 Points -12%
i7-13700H, GeForce RTX 4060 Laptop GPU
Microsoft Surface Laptop Studio 2 RTX 4060, 65536
303 Points -15%
R9 8945HS, GeForce RTX 4070 Laptop GPU
Asus ROG Zephyrus G14 2024 GA403U, 32768
303 Points -15%
R5 8645HS, GeForce RTX 4060 Laptop GPU
Acer Nitro 14 AN14-41-R3MX, 16384
295 Points -18%
Ultra 9 185H, GeForce RTX 4070 Laptop GPU
Acer Predator Helios Neo 14 (2024), 32768
287 Points -20%
Durchschnitt der Klasse Convertible
  (171 - 426, n=58, der letzten 2 Jahre)
285 Points -20%
Ryzen AI 9 HX 370, GeForce RTX 4070 Laptop GPU
Asus ProArt PX13 HN7306, 32768
282 Points -21%
WebXPRT 4 / Overall
M4 Max (16 cores), M4 Max 40-Core GPU
Apple MacBook Pro 16 M4 Max, 49152
353 Points +11%
M4 Pro (12 cores), M4 Pro 16-Core GPU
Apple MacBook Pro 14 2024 M4 Pro Entry, 24576
338 Points +7%
M4 Pro (14 cores), M4 Pro 20-Core GPU
Apple MacBook Pro 16 2024 M4 Pro, 49152
337 Points +6%
SD X Elite X1E-84-100, Adreno X1-85 4.6 TFLOPS
Samsung Galaxy Book4 Edge 16 X1E-84-100, 16384
334 Points +5%
M4 (10 cores), M4 10-Core GPU
Apple MacBook Pro 14 2024 M4, 16384
333 Points +5%
Ryzen AI Max+ 395, Radeon 8060S
Asus ROG Flow Z13 GZ302EA-RU073W, 32768
317 Points
SD X Elite X1E-80-100, Adreno X1-85 3.8 TFLOPS
Microsoft Surface Laptop 15 Snapdragon X Elite, 16384
313 Points -1%
SD X Elite X1E-78-100, Adreno X1-85 3.8 TFLOPS
Lenovo Yoga Slim 7X 14Q8X9, 32768
291 Points -8%
i9-13900H, GeForce RTX 4070 Laptop GPU
Asus ROG Flow Z13 ACRNM, 32768
288 Points -9%
Durchschnittliche AMD Ryzen AI Max+ 395, AMD Radeon 8060S
  (252 - 317, n=5)
274 Points -14%
i7-13700H, GeForce RTX 4060 Laptop GPU
Microsoft Surface Laptop Studio 2 RTX 4060, 65536
272 Points -14%
R9 8945HS, GeForce RTX 4070 Laptop GPU
Razer Blade 14 RZ09-0508, 32768
269 Points -15%
R9 7940HS, GeForce RTX 4070 Laptop GPU
Razer Blade 14 RTX 4070, 16384
260 Points -18%
Ultra 9 185H, GeForce RTX 4070 Laptop GPU
Acer Predator Helios Neo 14 (2024), 32768
260 Points -18%
R9 8945HS, GeForce RTX 4070 Laptop GPU
Asus ROG Zephyrus G14 2024 GA403U, 32768
250 Points -21%
R5 8645HS, GeForce RTX 4060 Laptop GPU
Acer Nitro 14 AN14-41-R3MX, 16384
248 Points -22%
Ryzen AI 9 HX 370, GeForce RTX 4070 Laptop GPU
Asus ProArt PX13 HN7306, 32768
247 Points -22%
Durchschnitt der Klasse Convertible
  (91.2 - 317, n=56, der letzten 2 Jahre)
246 Points -22%
Mozilla Kraken 1.1 / Total
R5 8645HS, GeForce RTX 4060 Laptop GPU
Acer Nitro 14 AN14-41-R3MX, 16384
547 ms * -29%
Durchschnitt der Klasse Convertible
  (407 - 1089, n=60, der letzten 2 Jahre)
543 ms * -28%
R9 8945HS, GeForce RTX 4070 Laptop GPU
Asus ROG Zephyrus G14 2024 GA403U, 32768
509 ms * -20%
Ultra 9 185H, GeForce RTX 4070 Laptop GPU
Acer Predator Helios Neo 14 (2024), 32768
508 ms * -20%
R9 7940HS, GeForce RTX 4070 Laptop GPU
Razer Blade 14 RTX 4070, 16384
499 ms * -17%
i7-13700H, GeForce RTX 4060 Laptop GPU
Microsoft Surface Laptop Studio 2 RTX 4060, 65536
495 ms * -16%
R9 8945HS, GeForce RTX 4070 Laptop GPU
Razer Blade 14 RZ09-0508, 32768
488 ms * -15%
i9-13900H, GeForce RTX 4070 Laptop GPU
Asus ROG Flow Z13 ACRNM, 32768
469 ms * -10%
Ryzen AI 9 HX 370, GeForce RTX 4070 Laptop GPU
Asus ProArt PX13 HN7306, 32768
460 ms * -8%
SD X Elite X1E-78-100, Adreno X1-85 3.8 TFLOPS
Lenovo Yoga Slim 7X 14Q8X9, 32768
453.1 ms * -7%
Durchschnittliche AMD Ryzen AI Max+ 395, AMD Radeon 8060S
  (424 - 453, n=5)
432 ms * -2%
Ryzen AI Max+ 395, Radeon 8060S
Asus ROG Flow Z13 GZ302EA-RU073W, 32768
425 ms *
SD X Elite X1E-80-100, Adreno X1-85 3.8 TFLOPS
Microsoft Surface Laptop 15 Snapdragon X Elite, 16384
399.4 ms * +6%
SD X Elite X1E-84-100, Adreno X1-85 4.6 TFLOPS
Samsung Galaxy Book4 Edge 16 X1E-84-100, 16384
381.2 ms * +10%
M4 (10 cores), M4 10-Core GPU
Apple MacBook Pro 14 2024 M4, 16384
263.7 ms * +38%
M4 Max (16 cores), M4 Max 40-Core GPU
Apple MacBook Pro 16 M4 Max, 49152
256.2 ms * +40%
M4 Pro (12 cores), M4 Pro 16-Core GPU
Apple MacBook Pro 14 2024 M4 Pro Entry, 24576
256 ms * +40%
M4 Pro (14 cores), M4 Pro 20-Core GPU
Apple MacBook Pro 16 2024 M4 Pro, 49152
254.3 ms * +40%

* ... kleinere Werte sind besser

In den PugetBench-Tests für die beiden Adobe-Apps Photoshop sowie Premiere Pro ist die Leistung ebenfalls ordentlich, bei DaVinci Resolve gab es aber Einschränkungen. Obwohl das Benchmark-Ergebnis im Basic-Test vor den beiden Vergleichsgeräten mit der RTX 4070 Laptop liegt, kam es beim Bearbeiten von einem unserer YouTube-Videos zweimal zu einem Absturz des Programms, was mit Nvidia-GPUs fast nie vorkommt. Ob das Problem an der Software oder dem Treiber liegt können wir aktuell nicht verifizieren.

Photoshop PugetBench: Overall Score 1.01 | Premiere Pro PugetBench: Overall Score 1.1 | DaVinci Resolve PugetBench: Basic Score 1.1
Photoshop PugetBench / Overall Score 1.01
M4 Max (16 cores), M4 Max 40-Core GPU
Apple MacBook Pro 16 M4 Max, 49152
13859 Points +27%
M4 Pro (14 cores), M4 Pro 20-Core GPU
Apple MacBook Pro 16 2024 M4 Pro, 49152
12494 Points +15%
Ryzen AI Max+ 395, Radeon 8060S
Asus ROG Flow Z13 GZ302EA-RU073W, 32768
10901 Points
M4 (10 cores), M4 10-Core GPU
Apple MacBook Pro 14 2024 M4, 16384
10502 Points -4%
i9-14900HX, GeForce RTX 4090 Laptop GPU
Razer Blade 16 2024, RTX 4090, 32768
8353 Points -23%
R9 7945HX, GeForce RTX 4070 Laptop GPU
Tuxedo Gemini 17 Gen3 AMD, 32768
8197 Points -25%
Ultra 9 285H, Arc 140T
Asus ZenBook Duo OLED UX8406CA, 32768
7934 Points -27%
i9-13900H, GeForce RTX 4070 Laptop GPU
Asus ROG Flow Z13 ACRNM, 32768
7829 Points -28%
Ryzen AI 7 PRO 360, Radeon 880M
Lenovo ThinkPad T14s Gen 6 21M2S00G00, 32768
7343 Points -33%
Core Ultra 7 256V, Arc 140V
Dell XPS 13 9350, 16384
6854 Points -37%
Premiere Pro PugetBench / Overall Score 1.1
M4 Max (16 cores), M4 Max 40-Core GPU
Apple MacBook Pro 16 M4 Max, 49152
12412 Points +63%
i9-14900HX, GeForce RTX 4090 Laptop GPU
Razer Blade 16 2024, RTX 4090, 32768
11855 Points +55%
R9 7945HX, GeForce RTX 4070 Laptop GPU
Tuxedo Gemini 17 Gen3 AMD, 32768
9303 Points +22%
M4 Pro (14 cores), M4 Pro 20-Core GPU
Apple MacBook Pro 16 2024 M4 Pro, 49152
8835 Points +16%
Ryzen AI Max+ 395, Radeon 8060S
Asus ROG Flow Z13 GZ302EA-RU073W, 32768
7632 Points
i9-13900H, GeForce RTX 4070 Laptop GPU
Asus ROG Flow Z13 ACRNM, 32768
7436 Points -3%
M4 (10 cores), M4 10-Core GPU
Apple MacBook Pro 14 2024 M4, 16384
4903 Points -36%
Ultra 9 285H, Arc 140T
Asus ZenBook Duo OLED UX8406CA, 32768
3627 Points -52%
Core Ultra 7 256V, Arc 140V
Dell XPS 13 9350, 16384
3330 Points -56%
Ryzen AI 7 PRO 360, Radeon 880M
Lenovo ThinkPad T14s Gen 6 21M2S00G00, 32768
2661 Points -65%
DaVinci Resolve PugetBench / Basic Score 1.1
i9-14900HX, GeForce RTX 4090 Laptop GPU
Razer Blade 16 2024, RTX 4090, 32768
8573 Points +16%
Ryzen AI Max+ 395, Radeon 8060S
Asus ROG Flow Z13 GZ302EA-RU073W, 32768
7387 Points
Ryzen AI 9 HX 370, GeForce RTX 4070 Laptop GPU
Asus ROG Zephyrus G16 GA605WI, 32768
6998 Points -5%
i9-13900H, GeForce RTX 4070 Laptop GPU
Asus ROG Flow Z13 ACRNM, 32768
6659 Points -10%
Ultra 9 285H, Arc 140T
Asus ZenBook Duo OLED UX8406CA, 32768
2762 Points -63%
Photoshop PugetBench: Overall Score 1.01 | Premiere Pro PugetBench: Overall Score 1.1 | DaVinci Resolve PugetBench: Basic Score 1.1

Fazit - Beeindruckende Leistung, aber Fragen bei der Verfügbarkeit sowie dem Preis

Der AMD Ryzen AI Max+ 395 ist ein beeindruckendes Stück Hardware und es handelt sich hier ganz klar um die schnellste APU im x86-Bereich. Vor allem die Multi-Core-Leistung beeindruckt und die Radeon 8060S kann es beim Spielen mit der GeForce RTX 4070 Laptop aufnehmen, wenn die Power Limits vergleichbar sind. Zudem eignet sich der neue Chip auch für kompaktere Geräte und auf dem Mainboard muss nur ein Prozessor verbaut werden. Dank gemeinsamen RAM ergeben sich auch Vorteile für die Bild/Videobearbeitung, bei denen man mit 8-12 GB VRAM von vielen aktuellen dedizierten Grafikkarten schnell am Limit ist. Im vergleich mit Apples aktueller M4-Generation kann das Topmodell Ryzen AI Max+ 395 ganz gut mit dem großen M4 Pro mithalten (abgesehen von der Single-Core-CPU-Leistung, wo Apple aktuell allen Konkurrenten enteilt ist), der M4 Max bleibt aber außer Reichweite.

Es bleiben aber auch Fragen, denn die anderen beiden Chips der neuen Strix-Halo-Serie bieten weniger CPU-Kerne und auch eine schwächere Radeon-8050S-iGPU. Wie viel Sinn diese Modelle dann noch machen, vor allem in Anbetracht der Preise, muss sich erst noch zeigen. Das ROG Flow Z13 mit dem Ryzen AI Max+ 395 und 32 GB RAM kostet 2.499 Euro, obwohl hier nur die kleinste RAM-Konfiguration mit 32 GB verbaut ist. Preisinformationen zu anderen RAM-Konfigurationen liegen uns aktuell noch nicht vor. 

Das bringt uns zum nächsten Problem, der Verfügbarkeit. Bisher wurden mit dem Asus ROG Flow Z13 GZ302 sowie dem HP ZBook Ultra 14 G1a lediglich zwei Geräte angekündigt, die auf die neuen Strix-Halo-APUs setzen. Kombiniert man diese Faktoren werden die Strix-Halo-Chips zumindest in dieser Generation vermutlich die Ausnahmen bleiben und vor allem im Multimedia-Bereich werden Intel- oder AMD-CPUs wohl weiterhin hauptsächlich mit dedizierten Nvidia-GPUs angeboten. 

Alle 12 Beträge lesen / Antworten
static version load dynamic
Die Kommentare zum Artikel werden geladen
Diesen Artikel kommentieren / Antworten
Teilen Sie diesen Artikel, um uns zu unterstützen. Jeder Link hilft!
Mail Logo
> Notebook Test, Laptop Test und News > Tests > Sonstige Tests > AMD Ryzen AI Max+ 395 in der Analyse - Strix Halo als Antwort auf Apples M4 Pro/Max mit 16 Zen-5-Kernen und iGPU auf Niveau der RTX 4070 Laptop
Autor: Andreas Osthoff, 18.02.2025 (Update: 24.02.2025)