Notebookcheck Logo

Intel HD Graphics P530 vs Intel HD Graphics 405 (Braswell)

Intel HD Graphics P530

► remove from comparison Intel HD Graphics P530

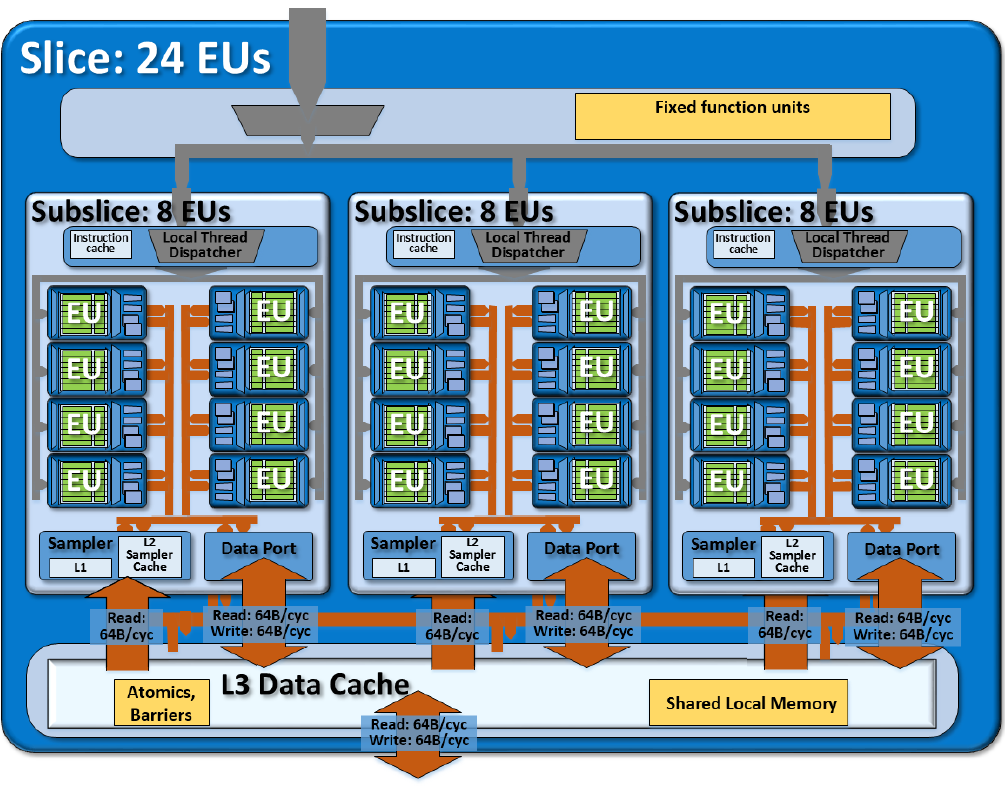
Die Intel HD Graphics P530 (GT2) ist eine integrierte Grafikeinheit, die in Skylake-Prozessoren der Xeon-Baureihe für Workstation-Notebooks verbaut wird. Die mittlere, auch "GT2" genannte Ausbaustufe verfügt über 24 EUs (Execution Units bzw. Ausführungseinheiten) und taktet je nach Modell mit bis zu 1.050 MHz (Turbo). Mangels eigenem Grafikspeicher oder eDRAM-Cache greift die HD Graphics P530 über das Interface des Prozessors auf den System-RAM zu (2x 64 Bit DDR3L-1600/DDR4-2133).

Performance

Die Leistung der HD Graphics P530 dürfte entsprechend der identischen technischen Daten genau auf dem Niveau der HD Graphics 530 liegen. Je nach Spiel kann die GPU damit in etwa mit einer dedizierten GeForce 920M konkurrieren und aktuelle Spiele (Stand 2015) zumeist in niedrigen, selten auch mittleren Einstellungen flüssig darstellen.

Features

Der überarbeitete Videodecoder decodiert nun auch H.265-/HEVC-Videos vollständig in Hardware und arbeitet dadurch deutlich effizienter als bislang. Die Bildausgabe erfolgt über DP 1.2/eDP 1.3 (max. 3.840 x 2.160 @ 60 Hz), wohingegen HDMI nur in der älteren Version 1.4a angeboten wird. Ein HDMI-2.0-Anschluss kann aber mittels Konverter von DisplayPort ergänzt werden. Maximal lassen sich drei Displays parallel angesteuern.

Leistungsaufnahme

Mobile Xeon-Modelle wie der E3-1535M v5 werden von Intel mit einer TDP von 45 Watt spezifiziert, sodass die HD Graphics P530 vor allem in größeren Notebooks ab etwa 15 Zoll zu finden ist.

Intel HD Graphics 405 (Braswell)

► remove from comparison Intel HD Graphics 405 (Braswell)

Die Intel HD Graphics 405 ist eine in den Low-End-SoCs der Braswell-Serie (z.B. Pentium N3710) integrierte Grafikeinheit. Sie basiert auf der gleichen Architektur wie die GPU verschiedener Broadwell-Prozessoren (z.B. HD Graphics 5300), bietet allerdings deutlich weniger Shadereinheiten und geringere Taktraten. Die genauen Spezifikationen hängen vom jeweiligen SoC ab: Die schnellste Variante mit 16 EUs und maximal 700 MHz schlägt die ältere HD Graphics (Bay Trail) um etwa Faktor zwei. Vor 2016 war die Grafikkarte nur unter Intel HD Graphics (Braswell) bekannt und beinhaltete 12 und 16-Kern-Modelle.

Anwender müssen sich deshalb insbesondere bei den Celeron-Modellen, die zusätzlich durch die Beschneidung auf nur zwei CPU-Kerne ausgebremst werden, auf ältere und anspruchslose Spiele beschränken. Videos werden dagegen auch in 4K/H.265 flüssig wiedergeben.

Weitere Benchmarks sind daher auch auf unserer Seite der Intel HD Graphics (Braswell) zu finden.

Intel HD Graphics P530Intel HD Graphics 405 (Braswell)
HD Graphics Serie
HD Graphics P530 24 @ 0.35 - 1.05 GHz64/128 Bit
HD Graphics 5600 compare 24 @ 0.3 - 1.05 GHz64/128 Bit
HD Graphics 6000 compare 48 @ 0.3 - 1 GHz64/128 Bit
HD Graphics 4600 compare 20 @ 0.2 - 1.35 GHz64/128 Bit
HD Graphics 5500 compare 24 @ 0.3 - 0.95 GHz64/128 Bit
HD Graphics 5000 compare 40 @ 0.2 - 1.1 GHz64/128 Bit
HD Graphics 4400 compare 20 @ 0.2 - 1.1 GHz64/128 Bit
HD Graphics 5300 compare 24 @ 0.1 - 0.9 GHz64/128 Bit
HD Graphics 4000 compare 16 @ 0.35 - 1.35 GHz64/128 Bit
HD Graphics (Broadwell) compare 12 @ 0.1 - 0.85 GHz64/128 Bit
HD Graphics 4200 compare 20 @ 0.2 - 0.85 GHz64/128 Bit
HD Graphics (Skylake) compare 12 @ 0.3 - 0.8 GHz64/128 Bit
HD Graphics 405 (Braswell) 16 @ 0.32 - 0.7 GHz64/128 Bit
HD Graphics (Braswell) compare 16 @ 0.32 - 0.7 GHz64/128 Bit
HD Graphics 400 (Braswell) compare 12 @ 0.32 - 0.64 GHz64/128 Bit
HD Graphics (Haswell) compare 10 @ 0.2 - 1 GHz64/128 Bit
HD Graphics (Cherry Trail) compare 16 @ 0.2 - 0.6 GHz64/128 Bit
HD Graphics 3000 compare 12 @ 0.35 - 1.35 GHz64/128 Bit
HD Graphics 2500 compare 6 @ 0.65 - 1.15 GHz64/128 Bit
HD Graphics (Ivy Bridge) compare 6 @ 0.35 - 1.1 GHz64/128 Bit
HD Graphics 2000 compare 6 @ 0.85 - 1.35 GHz64/128 Bit
HD Graphics (Sandy Bridge) compare 6 @ 0.35 - 1.1 GHz64/128 Bit
HD Graphics (Bay Trail) compare 4 @ 0.31 - 0.9 GHz32/64/128 Bit
CodenameSkylake GT2Braswell
ArchitekturGen. 9 SkylakeGen. 8
Pipelines24 - unified16 - unified
Kerntakt350 - 1050 (Boost) MHz320 - 700 (Boost) MHz
Speicherbandbreite64/128 Bit64/128 Bit
SpeichertypDDR3/DDR4
Shared Memoryjaja
APIDirectX 12_1, OpenGL 4.4DirectX 11.2, Shader 5.0
Herstellungsprozess14 nm14 nm
FeaturesQuickSync
Erscheinungsdatum01.09.2015 01.04.2016
CPU in HD Graphics P530GPU Base SpeedGPU Boost / Turbo
Intel Xeon E3-1535M v54 x 2900 MHz, 45 W350 MHz1050 MHz
Intel Xeon E3-1505M v54 x 2800 MHz, 45 W350 MHz1050 MHz
min. - max.350 MHz1050 MHz
CPU in HD Graphics 405 (Braswell)GPU Base SpeedGPU Boost / Turbo
Intel Pentium N37104 x 1600 MHz, 6 W400 MHz700 MHz
Intel Atom x7-Z87504 x 1600 MHz400 MHz600 MHz
min. - max.350 - 400 MHz600 - 1050 MHz

Benchmarks

Performance Rating - 3DMark 11 + Fire Strike + Time Spy - HD Graphics 405 (Braswell)
0.1 pt (0%)
3DMark - 3DMark Ice Storm Unlimited Graphics
min: 19812     avg: 23763     median: 23763 (3%)     max: 27714 Points
3DMark - 3DMark Ice Storm Extreme Graphics
min: 12601     avg: 14069     median: 14068.5 (2%)     max: 15536 Points
3DMark - 3DMark Cloud Gate Score
min: 1743     avg: 2000     median: 1933 (2%)     max: 2392 Points
3DMark - 3DMark Cloud Gate Graphics
min: 1767     avg: 2206     median: 2113 (1%)     max: 2831 Points
3DMark - 3DMark Fire Strike Standard Score
min: 216     avg: 237.5     median: 237.5 (0%)     max: 259 Points
3DMark - 3DMark Fire Strike Standard Graphics
min: 231     avg: 254.5     median: 254.5 (0%)     max: 278 Points
3DMark - 3DMark Ice Storm Graphics
min: 26056     avg: 28119     median: 28119 (3%)     max: 30182 Points
3DMark 11 - 3DM11 Performance Score
min: 451     avg: 523     median: 537 (1%)     max: 565 Points
3DMark 11 - 3DM11 Performance GPU
min: 408     avg: 469.1     median: 473 (0%)     max: 496 Points
3DMark Vantage
3DM Vant. Perf. total + Intel HD Graphics 405 (Braswell)
3DMark Vantage - 3DM Vant. Perf. total
2081 Points (1%)
3DM Vant. Perf. GPU no PhysX + Intel HD Graphics 405 (Braswell)
3DMark Vantage - 3DM Vant. Perf. GPU no PhysX
1730 Points (1%)
3DMark 06 3DMark 06 - Standard 1280x1024 + Intel HD Graphics 405 (Braswell)
3DMark 06
min: 2274     avg: 2920     median: 2920 (4%)     max: 3566 Points
Unigine Heaven 2.1 - Heaven 2.1 high
7.4 fps (1%)
Cinebench R10 Cinebench R10 Shading (32bit) + Intel HD Graphics 405 (Braswell)
Cinebench R10 - Cinebench R10 Shading (32bit)
min: 2412     avg: 2685     median: 2753 (2%)     max: 2822 Points
Cinebench R11.5 Cinebench R11.5 OpenGL 64 Bit + Intel HD Graphics 405 (Braswell)
Cinebench R11.5 - Cinebench R11.5 OpenGL 64 Bit
min: 10.24     avg: 11.7     median: 11.7 (4%)     max: 13.06 fps
Cinebench R15
Cinebench R15 OpenGL 64 Bit + Intel HD Graphics 405 (Braswell)
Cinebench R15 - Cinebench R15 OpenGL 64 Bit
min: 10.3     avg: 13.8     median: 14.1 (1%)     max: 15.74 fps
Cinebench R15 OpenGL Ref. Match 64 Bit + Intel HD Graphics 405 (Braswell)
GFXBench - GFXBench Car Chase Offscreen
9.9 fps (1%)
GFXBench 3.1 - GFXBench Manhattan ES 3.1 Offscreen
20.3 fps (0%)
GFXBench 3.0 - GFXBench 3.0 Manhattan Offscreen
20.3 fps (1%)
GFXBench (DX / GLBenchmark) 2.7
GFXBench T-Rex HD Offscreen C24Z16 + Intel HD Graphics 405 (Braswell)
GFXBench (DX / GLBenchmark) 2.7 - GFXBench T-Rex HD Offscreen C24Z16
41.3 fps (0%)
LuxMark v2.0 64Bit - LuxMark v2.0 Room GPU
min: 56     avg: 68     median: 68 (0%)     max: 80 Samples/s
LuxMark v2.0 64Bit - LuxMark v2.0 Sala GPU
min: 81     avg: 102.5     median: 102.5 (0%)     max: 124 Samples/s
ComputeMark v2.1 - ComputeMark v2.1 Result
min: 388     avg: 390.5     median: 390.5 (0%)     max: 393 Points
Power Consumption - Furmark Stress Test Power Consumption - external Monitor *
9.8 Watt (1%)

Average Benchmarks Intel HD Graphics 405 (Braswell) → 0% n=

- Bereich der Benchmarkergebnisse für diese Grafikkarte
- Durchschnittliche Benchmarkergebnisse für diese Grafikkarte
* Smaller numbers mean a higher performance
1 This benchmark is not used for the average calculation

Spiele-Benchmarks

Die folgenden Benchmarks basieren auf unseren Spieletests mit Testnotebooks. Die Performance dieser Grafikkarte bei den gelisteten Spielen ist abhängig von der verwendeten CPU, Speicherausstattung, Treiber und auch Betriebssystem. Dadurch müssen die untenstehenden Werte nicht repräsentativ sein. Detaillierte Informationen über das verwendete System sehen Sie nach einem Klick auf den fps-Wert.

low 1920x1080
HD Graphics 405 (Braswell):
17.8  fps
med. 1920x1080
HD Graphics 405 (Braswell):
18  fps
high 1920x1080
HD Graphics 405 (Braswell):
9.9  fps
low 1280x720
HD Graphics 405 (Braswell):
23.6  fps
med. 1920x1080
HD Graphics 405 (Braswell):
18  fps
high 1920x1080
HD Graphics 405 (Braswell):
13.9  fps
PUBG Mobile

PUBG Mobile

2018
low
HD Graphics 405 (Braswell):
0 (!)  fps
World of Tanks Blitz

World of Tanks Blitz

2018
low
HD Graphics 405 (Braswell):
37  fps
high
HD Graphics 405 (Braswell):
24  fps
Arena of Valor

Arena of Valor

2018
low
HD Graphics 405 (Braswell):
25  fps
Shadow Fight 3

Shadow Fight 3

2018
low
HD Graphics 405 (Braswell):
30  fps
Battle Bay

Battle Bay

2018
high
HD Graphics 405 (Braswell):
37  fps
low 1280x720
HD Graphics 405 (Braswell):
19.6  fps
low 1280x720
HD Graphics 405 (Braswell):
18.7  fps
low 1280x720
HD Graphics 405 (Braswell):
13.5  fps
med. 1920x1080
HD Graphics 405 (Braswell):
11  fps
low 1280x720
HD Graphics 405 (Braswell):
14.4  fps
med. 1366x768
HD Graphics 405 (Braswell):
10.5  fps
low 1280x720
HD Graphics 405 (Braswell):
17.6 31.3 ~ 24 fps
med. 1366x768
HD Graphics 405 (Braswell):
21.3  fps
low 1024x768
HD Graphics 405 (Braswell):
12.2  fps
med. 1366x768
HD Graphics 405 (Braswell):
5.2  fps
low 1280x720
HD Graphics 405 (Braswell):
10.5  fps
med. 1366x768
HD Graphics 405 (Braswell):
6.1  fps
low 1024x768
HD Graphics 405 (Braswell):
7.1  fps
med. 1366x768
HD Graphics 405 (Braswell):
4.2  fps
low 1024x768
HD Graphics 405 (Braswell):
15.3  fps
med. 1366x768
HD Graphics 405 (Braswell):
8.9  fps
Anno 2205

Anno 2205

2015
low 1024x768
HD Graphics 405 (Braswell):
10.8  fps
med. 1366x768
HD Graphics 405 (Braswell):
6.9  fps
low 1366x768
HD Graphics 405 (Braswell):
15 21.8 ~ 18 fps
med. 1366x768
HD Graphics 405 (Braswell):
16.2  fps
low 1024x768
HD Graphics 405 (Braswell):
18.8  fps
med. 1366x768
HD Graphics 405 (Braswell):
13  fps
low 1280x720
HD Graphics 405 (Braswell):
22.1 35.2 ~ 29 fps
med. 1366x768
HD Graphics 405 (Braswell):
13.7 22.8 ~ 18 fps
low 1024x768
HD Graphics 405 (Braswell):
41.5  fps
med. 1366x768
HD Graphics 405 (Braswell):
12.5  fps
low 1024x768
HD Graphics 405 (Braswell):
12.1  fps
med. 1366x768
HD Graphics 405 (Braswell):
7.6  fps
F1 2014

F1 2014

2014
low 1024x768
HD Graphics 405 (Braswell):
28  fps
med. 1366x768
HD Graphics 405 (Braswell):
17  fps
low 1024x768
HD Graphics 405 (Braswell):
18.9  fps
med. 1366x768
HD Graphics 405 (Braswell):
13.6  fps
Sims 4

Sims 4

2014
low 1024x768
HD Graphics 405 (Braswell):
77.5  fps
med. 1366x768
HD Graphics 405 (Braswell):
19.6  fps
low 1024x768
HD Graphics 405 (Braswell):
14  fps
med. 1366x768
HD Graphics 405 (Braswell):
9.1  fps
low 1024x768
HD Graphics 405 (Braswell):
50.5  fps
med. 1366x768
HD Graphics 405 (Braswell):
15  fps
Thief

Thief

2014
low 1024x768
HD Graphics 405 (Braswell):
6  fps
low 1024x768
HD Graphics 405 (Braswell):
16.5  fps
med. 1366x768
HD Graphics 405 (Braswell):
12.5  fps
high 1366x768
HD Graphics 405 (Braswell):
8.3  fps
low 1280x720
HD Graphics 405 (Braswell):
16.4 17.7 22.2 23.2 ~ 20 fps
med. 1366x768
HD Graphics 405 (Braswell):
9.3 11.4 11.8 ~ 11 fps
high 1366x768
HD Graphics 405 (Braswell):
9.2 10 ~ 10 fps
low 1024x768
HD Graphics 405 (Braswell):
27.8  fps
med. 1366x768
HD Graphics 405 (Braswell):
12.8  fps
high 1366x768
HD Graphics 405 (Braswell):
9.5  fps
low 1024x768
HD Graphics 405 (Braswell):
43.2  fps
med. 1366x768
HD Graphics 405 (Braswell):
19.6  fps
high 1366x768
HD Graphics 405 (Braswell):
14.3  fps
low 1024x768
HD Graphics 405 (Braswell):
42.6  fps
med. 1366x768
HD Graphics 405 (Braswell):
32  fps
high 1366x768
HD Graphics 405 (Braswell):
20.4  fps
low 1024x768
HD Graphics 405 (Braswell):
32  fps
med. 1366x768
HD Graphics 405 (Braswell):
19.1  fps
high 1366x768
HD Graphics 405 (Braswell):
14.4  fps
low 1280x720
HD Graphics 405 (Braswell):
21.8  fps
med. 1366x768
HD Graphics 405 (Braswell):
10.4  fps
high 1366x768
HD Graphics 405 (Braswell):
6.5  fps
low 1024x768
HD Graphics 405 (Braswell):
35.4  fps
high 1366x768
HD Graphics 405 (Braswell):
14.7  fps
Intel HD Graphics 405 (Braswell)lowmed.highultraQHD4K
Hearthstone17.8189.91
League of Legends23.61813.9
PUBG Mobile
World of Tanks Blitz3724
Arena of Valor25
Shadow Fight 330
Battle Bay37
Team Fortress 219.6
Rocket League18.7
Resident Evil 713.511
Titanfall 214.410.5
Farming Simulator 172421.3
Civilization VI12.25.2
Mirror's Edge Catalyst10.56.1
Rise of the Tomb Raider7.14.2
Rainbow Six Siege15.38.9
Anno 220510.86.9
World of Warships1816.2
Metal Gear Solid V18.813
Dota 2 Reborn2918
Dirt Rally41.512.5
Dragon Age: Inquisition12.17.6
F1 20142817
Alien: Isolation18.913.6
Sims 477.519.6
Risen 3: Titan Lords149.1
GRID: Autosport50.515
Thief6
Battlefield 416.512.58.3
BioShock Infinite201110
Tomb Raider27.812.89.5
Dead Space 343.219.614.3
Counter-Strike: GO42.63220.4
Diablo III3219.114.4
The Elder Scrolls V: Skyrim21.810.46.5
Deus Ex Human Revolution35.414.7
< 30 fps
< 60 fps
< 120 fps
≥ 120 fps
25
8
1
26
1

11
1


Eine Liste mit weiteren Spielen und allen Grafikkarten finden Sie auf unserer Seite: Welches Spiel ist mit welcher Grafikkarte spielbar?

Add one or more devices and compare

In the following list you can select (and also search for) devices that should be added to the comparison. You can select more than one device.

restrict list:

show all (including archived), 2024, 2023
v1.26
log 29. 08:48:02

#0 checking url part for id 6452 +0s ... 0s

#1 checking url part for id 7348 +0s ... 0s

#2 not redirecting to Ajax server +0s ... 0s

#3 did not recreate cache, as it is less than 5 days old! Created at Thu, 28 Mar 2024 05:37:00 +0100 +0.001s ... 0.001s

#4 composed specs +0.133s ... 0.134s

#5 did output specs +0s ... 0.134s

#6 start showIntegratedCPUs +0s ... 0.134s

#7 getting avg benchmarks for device 6452 +0.028s ... 0.162s

#8 got single benchmarks 6452 +0s ... 0.162s

#9 getting avg benchmarks for device 7348 +0.017s ... 0.179s

#10 got single benchmarks 7348 +0.026s ... 0.205s

#11 got avg benchmarks for devices +0s ... 0.205s

#12 min, max, avg, median took s +0.131s ... 0.337s

#13 before gaming benchmark output +0s ... 0.337s

#14 Got 84 rows for game benchmarks. +0.01s ... 0.346s

#15 composed SQL query for gamebenchmarks +0s ... 0.346s

#16 got data and put it in $dataArray +0.028s ... 0.374s

#17 benchmarks composed for output. +0.084s ... 0.458s

#18 calculated avg scores. +0s ... 0.458s

#19 return log +0.044s ... 0.502s

Teilen Sie diesen Artikel, um uns zu unterstützen. Jeder Link hilft!
> Notebook Test, Laptop Test und News > Benchmarks / Technik > Benchmarks / Technik > Grafikkarten Vergleich - Head 2 Head
Autor: Klaus Hinum,  8.09.2017 (Update:  1.07.2023)