Notebookcheck Logo

Intel Graphics 4-Cores iGPU (Arc) vs Intel UHD Graphics 617 vs Intel Iris Plus Graphics 640

Intel Graphics 4-Cores iGPU (Arc)

► remove from comparison Intel Graphics 4-Core

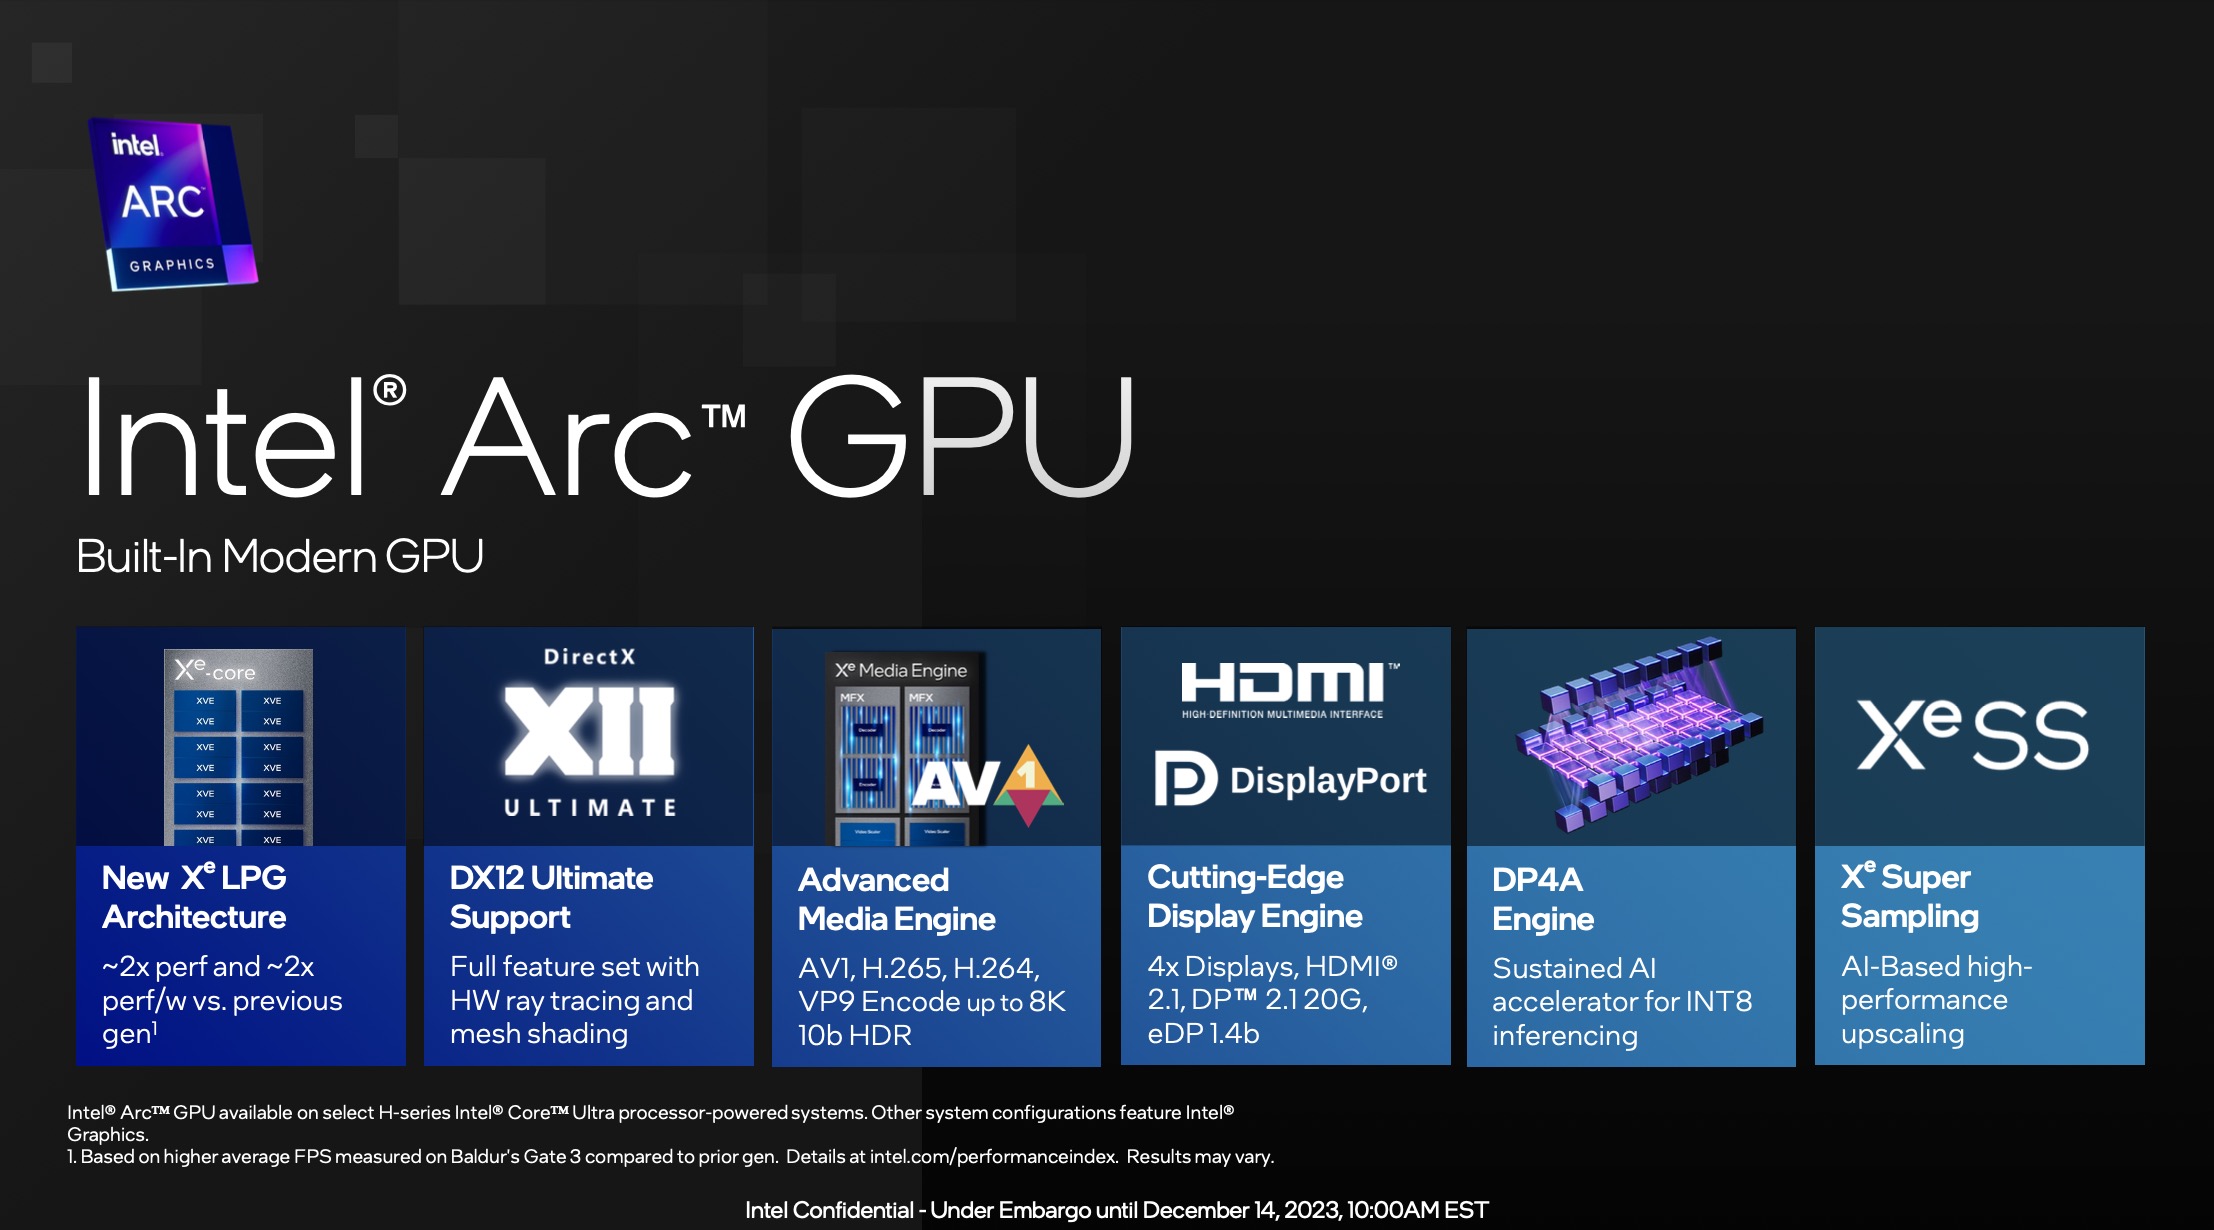
Die Intel Graphics iGPU mit 4 Kernen ist eine integrierte Grafikkarte basierend auf die Xe LPG Architektur (ähnlich zu den dedizierten Arc GPUs, jedoch mit Fokus auf Effizienz). Sie bietet 4 Xe Kerne (64 Xe Vector Engines), 4 Raytracing Einheiten, 4 Sampler und 2 Pixel Backends.

Im Gegensatz zu der stärkeren Variante mit 8 Kernen in den H Meteor Lake CPUs, darf die kleine Variante nicht den Arc Namen nutzen.

Die iGPU unterstützt DirectX 12 Ultimate (wahrscheinlich DX 12_2 wie die Desktop Arc GPUs). Weiters unterstützt die Grafikeinheit XeSS AI Super Sampling.

Die Media Engine ist bei Meteor Lake im SOC Tile und unterstützt bis zu 8k60 10-bit HDR Encode und Deccode von MPEG2, AVC, VP9, HEVC und AV1. Die Display Engine ist ebenfalls im SoC Tile und unterstützt HDMI 2.1 und DisplayPort 2.1 20G mit bis zu 8K60 HDR.

Der GPU Tile des Meteor Lake Chips wird bei TSMC in 5nm (5N Prozess) gefertigt.

Intel UHD Graphics 617

► remove from comparison Intel UHD Graphics 617

Die Intel UHD Graphics 617 (GT2) ist eine Prozessorgrafikkarte der im Sommer 2018 vorgestellten Amber-Lake-Generation. Als Nachfolger der Intel HD Graphics 615 (Kaby-Lake-Y) ist die UHD 615 und 617 dabei in der besonders sparsamen Y-Serie mit 5-7 Watt TDP zu finden. Die sogenannte GT2-Ausbaustufe der GPU verfügt über 24 Ausführungseinheiten (EUs) und taktet je nach Modell mit bis zu 1.050 MHz. Technisch gibt es keine Unterschiede zur alten HD Graphics 615, nur die Taktraten wurden leicht abgeändert und durch den verbesserten 14nm++ Prozess könnte der Turbo etwas länger gehalten werden. Im Vergleich zur UHD Graphics 615 in anderen Amber Lake Modellen, bietet die 617 einen höheren Boost-Takt und 7 Watt TDP.

Mangels eigenem Grafikspeicher oder eDRAM-Cache greift die UHD Graphics 617 über das Interface des Prozessors auf den System-RAM zu (2x 64 Bit DDR3L/LPDDR3).

Performance

Die exakte Leistung der UHD Graphics 617 hängt stark vom jeweiligen CPU-Modell sowie dem konkreten Endgerät ab, da sich Maximaltaktrate sowie TDP-Konfiguration/Kühlung erheblich unterscheiden können. Zum anderen bestimmt auch der verwendete Speicher (DDR3L/LPDDR3) die Performance. Insgesamt dürfte die UHD 617 etwa das Niveau der alten Kaby-Lake HD Graphics 615 erreichen. Einige aktuelle anspruchslose Spiele wie Farming Simulator 17 oder Rocket League können so in niedrigsten Einstellungen flüssig dargestellt werden. Mit gelegentlichen Rucklern muss man jedoch immer rechnen. Detaillierte Benchmarks und viele Spieletests der gleich schnellen HD Graphics 615 finden sie hier.

Anders als Skylake kann Kaby Lake und damit auch Amber Lake nun auch H.265/HEVC im Main10-Profil mit 10 Bit Farbtiefe sowie Googles VP9-Codec in Hardware decodieren. HDCP 2.2 sollte unterstützt werden, was beispielsweise für die Ausgabe von Netflix-Videos in 4K benötigt wird. HDMI 2.0 unterstützt die UHD Graphics 615 jedoch weiterhin nur per Wandler (LSPCon) über den DisplayPort.

Leistungsaufnahme

Die UHD Graphics 617 ist in ULV-Prozessoren der 7-Watt-Klasse zu finden (TDP kann vom Gerätehersteller angepasst werden) und damit für passiv gekühlte Subnotebooks wie das MacBook Air geeignet.

Intel Iris Plus Graphics 640

► remove from comparison Intel Iris Plus Graphics 640

Die Intel Iris Plus Graphics 640 (GT3e) ist eine Prozessorgrafikkarte der im Jänner 2017 vorgestellten Kaby-Lake-Modelle. Als Nachfolger der Iris Graphics 540 (Skylake) ist die Iris Plus Graphics 640 dabei in den ULV-Modellen der 15-Watt-Klasse zu finden und besitzt einen dedizierten eDRAM-Cache mit 64 MB Kapazität. Die sogenannte GT3e-Ausbaustufe der Kaby-Lake-GPU verfügt weiterhin über 48 Execution Units (EUs), die je nach Modell mit bis zu 1.050 MHz takten.

Neben dem eDRAM-Cache kann die Iris 640 auch über das Interface des Prozessors auf den Hauptspeicher zugreifen (2x 64 Bit DDR3L-1600/LPDDR3-1866/DDR4-2133).

Von der Iris Plus 650 der 28-Watt-Modelle unterscheidet sich die Iris 640 lediglich durch ihren etwas geringeren Maximaltakt sowie die geringere TDP, wodurch der Turbo-Boost-Spielraum weniger lang ausgenutzt werden kann.

Performance

Die exakte Leistung der Iris Plus Graphics 640 hängt vom jeweiligen CPU-Modell ab, da sich die Maximaltaktrate leicht unterscheiden kann. Zum anderen beeinflusst auch der verwendete Speicher (DDR3/DDR4) die Performance.

Die höchste Leistung erreichen hochtaktende Core-i7-Ableger wie der Core i7-7660U. Je nach Spiel ordnet sich die Iris 640 wahrscheinlich wie der Vorgänger zwischen einer dedizierten GeForce 920M und GeForce 940M ein und kann aktuelle Spiele meist nur in niedrigen Einstellungen flüssig darstellen.

Features

Die überarbeitete Videoeinheit dekodiert H.265-/HEVC-Videos vollständig in Hardware. Anders als Skylake kann Kaby Lake nun auch H.265/HEVC im Main10-Profil mit 10 Bit Farbtiefe sowie Googles VP9-Codec in Hardware dekodieren. Die Bildausgabe erfolgt über DP 1.2/eDP 1.3 (max. 3.840 x 2.160 @ 60 Hz), wohingegen HDMI nur in der älteren Version 1.4a angeboten wird. Ein HDMI-2.0-Anschluss kann aber mittels Konverter von DisplayPort ergänzt werden. Maximal lassen sich drei Displays parallel angesteuern.

Leistungsaufnahme

Die Iris Graphics 640 ist in ULV-Prozessoren der 15-Watt-Klasse zu finden und damit für schlanke Note- und Ultrabooks geeignet.

Intel Graphics 4-Cores iGPU (Arc)Intel UHD Graphics 617Intel Iris Plus Graphics 640
Gen. 9.5 Serie
Arc 8-Core 8 @ 2.3 GHz
Arc 7-Core 7 @ 2.2 GHz
Graphics 4-Core 4 @ 1.95 GHz
Iris Plus Graphics 655 48 @ 0.3 - 1.2 GHz
Iris Plus Graphics 650 48 @ 0.3 - 1.1 GHz64/128 Bit
Iris Plus Graphics 645 48 @ 0.3 - 1.15 GHz
Iris Plus Graphics 640 48 @ 0.3 - 1.05 GHz64/128 Bit
UHD Graphics 630 24 @ 0.3 - 1.15 GHz64/128 Bit
UHD Graphics P630 24 @ 0.3 - 1.2 GHz64/128 Bit
HD Graphics 630 24 @ 0.3 - 1.15 GHz64/128 Bit
HD Graphics P630 24 64/128 Bit
UHD Graphics 620 24 @ 0.3 - 1.15 GHz
HD Graphics 620 24 @ 0.3 - 1.05 GHz64/128 Bit
UHD Graphics 617 24 @ 0.3 - 1.15 GHz64/128 Bit
UHD Graphics 615 24 @ 0.3 - 1 GHz64/128 Bit
HD Graphics 615 24 @ 0.3 - 1.05 GHz64/128 Bit
CodenameMeteor Lake iGPUKaby-Lake GT2Kaby Lake GT3e
ArchitekturXe LPGGen. 9 Amber LakeGen. 9.5 Kaby Lake
Pipelines4 - unified24 - unified48 - unified
Raytracing Cores4
Kerntakt1950 (Boost) MHz300 - 1150 (Boost) MHz300 - 1050 (Boost) MHz
CacheL1: 768 KB
Shared Memoryneinjaja
APIDirectX 12_2, OpenGL 4.6, Vulkan 1.3DirectX 12_1, OpenGL 4.4DirectX 12_1, OpenGL 4.4
Herstellungsprozess5 nm14 nm14 nm
DisplaysHDMI 2.1, DisplayPort 2.1 20G
Erscheinungsdatum14.12.2023 30.10.2018 03.01.2017
Speicherbandbreite64/128 Bit64/128 Bit
SpeichertypDDR3L/LPDDR3DDR3/DDR4
FeaturesQuickSyncQuickSync
Max. Speichergröße64 MB
CPU in Graphics 4-CoreGPU Base SpeedGPU Boost / Turbo
Intel Core Ultra 7 165U12 x 3800 MHz, 15 W? MHz2000 MHz
Intel Core Ultra 7 155U12 x 3800 MHz, 15 W? MHz1950 MHz
Intel Core Ultra 7 164U12 x 3800 MHz, 9 W? MHz1800 MHz
min. - max.? MHz1750 - 2000 MHz
CPU in UHD Graphics 617GPU Base SpeedGPU Boost / Turbo
Intel Core i7-10510Y4 x 1200 MHz, 7 W300 MHz1150 MHz
Intel Core i5-8210Y2 x 1600 MHz, 7 W300 MHz1050 MHz
min. - max.300 - ? MHz1050 - 2000 MHz
CPU in Iris Plus Graphics 640GPU Base SpeedGPU Boost / Turbo
Intel Core i7-7660U2 x 2500 MHz, 15 W300 MHz1050 MHz
Intel Core i7-7560U2 x 2400 MHz, 15 W300 MHz1050 MHz
Intel Core i5-7360U2 x 2300 MHz, 15 W300 MHz1000 MHz
Intel Core i5-7260U2 x 2200 MHz, 15 W300 MHz950 MHz
min. - max.300 - ? MHz950 - 2000 MHz

Benchmarks

3DMark - 3DMark Time Spy Score
min: 1876     avg: 2008     median: 1920.5 (6%)     max: 2315 Points
min: 322     avg: 338.3     median: 337 (1%)     max: 356 Points
min: 467     avg: 499.8     median: 494.5 (1%)     max: 543 Points
3DMark - 3DMark Time Spy Graphics
min: 1668     avg: 1788     median: 1708 (5%)     max: 2067 Points
min: 286     avg: 299     median: 300 (1%)     max: 311 Points
min: 413     avg: 442.5     median: 437 (1%)     max: 483 Points
3DMark - 3DMark Ice Storm Unlimited Graphics
77156 Points (9%)
min: 142163     avg: 147298     median: 145481 (16%)     max: 154251 Points
3DMark - 3DMark Cloud Gate Score
min: 20124     avg: 22079     median: 22433.5 (24%)     max: 23325 Points
4841 Points (5%)
min: 7558     avg: 8025     median: 8067 (9%)     max: 8711 Points
3DMark - 3DMark Cloud Gate Graphics
min: 25786     avg: 28204     median: 28416.5 (7%)     max: 30198 Points
7231 Points (2%)
min: 10486     avg: 11119     median: 11248 (3%)     max: 11495 Points
3DMark - 3DMark Fire Strike Standard Score
min: 3952     avg: 4666     median: 4766 (8%)     max: 5179 Points
min: 845     avg: 890     median: 889.5 (2%)     max: 934 Points
min: 1236     avg: 1349     median: 1310 (2%)     max: 1509 Points
3DMark - 3DMark Fire Strike Standard Graphics
min: 4284     avg: 4982     median: 5088 (6%)     max: 5468 Points
min: 947     avg: 997     median: 997 (1%)     max: 1047 Points
min: 1315     avg: 1411     median: 1393.5 (2%)     max: 1541 Points
3DMark - 3DMark Night Raid
3711 Points (4%)
3DMark - 3DMark Night Raid Graphics Score
4496 Points (2%)
3DMark 11 - 3DM11 Performance Score
min: 6340     avg: 7107     median: 7250.5 (10%)     max: 7588 Points
min: 1632     avg: 1672     median: 1671.5 (2%)     max: 1711 Points
min: 2136     avg: 2440     median: 2561 (4%)     max: 2664 Points
3DMark 11 - 3DM11 Performance GPU
min: 6007     avg: 6629     median: 6726 (6%)     max: 7055 Points
min: 1509     avg: 1541     median: 1540.5 (1%)     max: 1572 Points
min: 1980     avg: 2275     median: 2379 (2%)     max: 2493 Points
3DMark 06 3DMark 06 - Standard 1280x1024 + Intel UHD Graphics 617
3DMark 06
8662 Points (11%)
3DMark 06 - Standard 1280x1024 + Intel Iris Plus Graphics 640
min: 13164     avg: 14118     median: 14117.5 (18%)     max: 15071 Points
Unigine Valley 1.0 - Unigine Valley 1.0 DX
6.5 fps (2%)
Cinebench R10 Cinebench R10 Shading (32bit) + Intel Iris Plus Graphics 640
Cinebench R10 - Cinebench R10 Shading (32bit)
min: 8824     avg: 9678     median: 9703 (7%)     max: 10506 Points
Cinebench R11.5 Cinebench R11.5 OpenGL 64 Bit + Intel Iris Plus Graphics 640
Cinebench R11.5 - Cinebench R11.5 OpenGL 64 Bit
46.1 fps (16%)
Cinebench R15
Cinebench R15 OpenGL 64 Bit + Intel Graphics 4-Cores iGPU (Arc)
Cinebench R15 - Cinebench R15 OpenGL 64 Bit
min: 98.4     avg: 105.1     median: 105 (6%)     max: 112 fps
Cinebench R15 OpenGL 64 Bit + Intel UHD Graphics 617
min: 34.7     avg: 39.1     median: 39.1 (2%)     max: 43.5 fps
Cinebench R15 OpenGL 64 Bit + Intel Iris Plus Graphics 640
min: 41.32     avg: 54     median: 56.2 (3%)     max: 62.3 fps
Cinebench R15 OpenGL Ref. Match 64 Bit + Intel Graphics 4-Cores iGPU (Arc)
Cinebench R15 - Cinebench R15 OpenGL Ref. Match 64 Bit
97.8 % (98%)
Cinebench R15 OpenGL Ref. Match 64 Bit + Intel UHD Graphics 617
min: 97.8     avg: 98.6     median: 98.6 (99%)     max: 99.3 %
Cinebench R15 OpenGL Ref. Match 64 Bit + Intel Iris Plus Graphics 640
min: 97.8     avg: 98.2     median: 97.8 (98%)     max: 99.3 %
GFXBench - GFXBench Car Chase Offscreen
40.7 fps (5%)
GFXBench 3.1 - GFXBench Manhattan ES 3.1 Offscreen
56.1 fps (1%)
GFXBench 3.0 - GFXBench 3.0 Manhattan Offscreen
31.2 fps (2%)
GFXBench (DX / GLBenchmark) 2.7
GFXBench T-Rex HD Offscreen C24Z16 + Intel Iris Plus Graphics 640
GFXBench (DX / GLBenchmark) 2.7 - GFXBench T-Rex HD Offscreen C24Z16
171 fps (1%)
Basemark GPU 1.2 - Basemark GPU 1.2 Vulkan Official Medium Offscreen 1080
min: 104.6     avg: 127.7     median: 104.6 (1%)     max: 196.9 fps
Basemark GPU 1.2 - Basemark GPU 1.2 Vulkan Official High Offscreen 2160
3.6 fps (1%)
Geekbench 6.2 - Geekbench 6.2 GPU OpenCL
min: 15823     avg: 16921     median: 17012 (5%)     max: 17837 Points
Geekbench 6.2 - Geekbench 6.2 GPU Vulkan
min: 15598     avg: 17716     median: 17799.5 (6%)     max: 19667 Points
LuxMark v2.0 64Bit - LuxMark v2.0 Room GPU
min: 315     avg: 325     median: 325 (1%)     max: 335 Samples/s
LuxMark v2.0 64Bit - LuxMark v2.0 Sala GPU
min: 748     avg: 779     median: 778.5 (1%)     max: 809 Samples/s
ComputeMark v2.1 - ComputeMark v2.1 Result
min: 1575     avg: 1677     median: 1677 (2%)     max: 1779 Points
Power Consumption - Furmark Stress Test Power Consumption - external Monitor *
25.3 Watt (4%)
min: 30.8     avg: 33.6     median: 31.5 (4%)     max: 38.5 Watt
Power Consumption - The Witcher 3 Power Consumption - external Monitor *
24.4 Watt (3%)
min: 28     avg: 33.5     median: 33.5 (5%)     max: 38.9 Watt
Power Consumption - Witcher 3 Power Consumption *
min: 27.4     avg: 33.2     median: 30.7 (7%)     max: 41.5 Watt
min: 31.7     avg: 34.9     median: 34.9 (8%)     max: 38.1 Watt
Power Consumption - Witcher 3 ultra Power Efficiency
min: 0.4313     avg: 0.5     median: 0.4 (43%)     max: 0.4886 fps per Watt
Power Consumption - Witcher 3 ultra Power Efficiency - external Monitor
0.5 fps per Watt (40%)
0.1 fps per Watt (9%)
Emissions Witcher 3 Fan Noise + Intel Graphics 4-Cores iGPU (Arc)
Emissions - Witcher 3 Fan Noise
min: 27.3     avg: 34.3     median: 31 (50%)     max: 44.7 dB(A)
Witcher 3 Fan Noise + Intel Iris Plus Graphics 640
33.4 dB(A) (53%)
Clock Speed - GPU Clock Witcher 3 ultra
min: 748     avg: 823     median: 823 (32%)     max: 898 MHz
Clock Speed - GPU Clock Speed Furmark
min: 570     avg: 634     median: 634 (25%)     max: 698 MHz

Average Benchmarks Intel Graphics 4-Cores iGPU (Arc) → 100% n=10

Average Benchmarks Intel UHD Graphics 617 → 30% n=10

Average Benchmarks Intel Iris Plus Graphics 640 → 41% n=10

- Bereich der Benchmarkergebnisse für diese Grafikkarte
- Durchschnittliche Benchmarkergebnisse für diese Grafikkarte
* Smaller numbers mean a higher performance
1 This benchmark is not used for the average calculation

Spiele-Benchmarks

Die folgenden Benchmarks basieren auf unseren Spieletests mit Testnotebooks. Die Performance dieser Grafikkarte bei den gelisteten Spielen ist abhängig von der verwendeten CPU, Speicherausstattung, Treiber und auch Betriebssystem. Dadurch müssen die untenstehenden Werte nicht repräsentativ sein. Detaillierte Informationen über das verwendete System sehen Sie nach einem Klick auf den fps-Wert.

low 1920x1080
100%
Graphics 4-Core:
18.5 20.3 20.9 21.6 ~ 20 fps
med. 1920x1080
100%
Graphics 4-Core:
15 16.7 16.9 17.6 ~ 17 fps
high 1920x1080
100%
Graphics 4-Core:
12.4 14.3 14.4 14.9 ~ 14 fps
ultra 1920x1080
100%
Graphics 4-Core:
11.1 12.5 12.7 13 ~ 12 fps
low 1920x1080
100%
Graphics 4-Core:
15 15.4 16.2 17.7 ~ 16 fps
med. 1920x1080
100%
Graphics 4-Core:
12.3 12.6 14.5 ~ 13 fps
high 1920x1080
100%
Graphics 4-Core:
11  fps
ultra 1920x1080
100%
Graphics 4-Core:
10.6  fps
F1 22

F1 22

2022
low 1920x1080
100%
Graphics 4-Core:
39.9 41.7 43.8 46.3 ~ 43 fps
med. 1920x1080
100%
Graphics 4-Core:
35.9 39.7 40.5 42 ~ 40 fps
high 1920x1080
100%
Graphics 4-Core:
29.5  fps
ultra 1920x1080
100%
Graphics 4-Core:
7.6  fps
low 1920x1080
100%
Graphics 4-Core:
27.2 29.9 30.8 ~ 29 fps
med. 1920x1080
100%
Graphics 4-Core:
21.1 24 24.2 ~ 23 fps
high 1920x1080
100%
Graphics 4-Core:
14.1 16.1 16.3 ~ 16 fps
ultra 1920x1080
100%
Graphics 4-Core:
11.3 12.7 13.8 ~ 13 fps
Strange Brigade

Strange Brigade

2018
low 1280x720
100%
Graphics 4-Core:
73.7 118.1 120.4 121.1 ~ 108 fps
med. 1920x1080
100%
Graphics 4-Core:
32.9 50 50.8 52.1 ~ 46 fps
high 1920x1080
100%
Graphics 4-Core:
26.6 37.7 39.2 41.9 ~ 36 fps
ultra 1920x1080
100%
Graphics 4-Core:
22.9 30.2 30.3 33.3 ~ 29 fps
Far Cry 5

Far Cry 5

2018
low 1280x720
100%
Graphics 4-Core:
38 46 47 48 ~ 45 fps
med. 1920x1080
100%
Graphics 4-Core:
20 24 25 25 ~ 24 fps
high 1920x1080
100%
Graphics 4-Core:
19 23 24 25 ~ 23 fps
ultra 1920x1080
100%
Graphics 4-Core:
18 21 22 23 ~ 21 fps
low 1280x720
100%
Graphics 4-Core:
34.7 36.5 36.8 37.6 ~ 36 fps
56%
UHD Graphics 617:
20.2  fps
med. 1920x1080
100%
Graphics 4-Core:
28 28.2 28.3 30.1 ~ 29 fps
49%
UHD Graphics 617:
14.1  fps
high 1920x1080
100%
Graphics 4-Core:
23.4 23.4 23.6 25.3 ~ 24 fps
53%
UHD Graphics 617:
12.8  fps
low 1280x720
100%
Graphics 4-Core:
35.4 37.4 37.6 48.2 ~ 40 fps
med. 1920x1080
100%
Graphics 4-Core:
19.5 23 23.4 25.9 ~ 23 fps
high 1920x1080
100%
Graphics 4-Core:
15.7 16.3 16.3 18.2 ~ 17 fps
low 1280x720
Iris Plus Graphics 640:
13.8  fps
low 1280x720
Iris Plus Graphics 640:
28  fps
FIFA 18

FIFA 18

2017
low 1280x720
Iris Plus Graphics 640:
69.5 (!)  fps
med. 1920x1080
Iris Plus Graphics 640:
38.8 (!)  fps
F1 2017

F1 2017

2017
low 1280x720
Iris Plus Graphics 640:
33 38 ~ 36 fps
med. 1920x1080
Iris Plus Graphics 640:
15 15 ~ 15 fps
low 1280x720
Iris Plus Graphics 640:
22.9  fps
med. 1366x768
Iris Plus Graphics 640:
99  fps
high 1920x1080
Iris Plus Graphics 640:
48  fps
ultra 1920x1080
Iris Plus Graphics 640:
31.8  fps
Dirt 4

Dirt 4

2017
med. 1920x1080
Iris Plus Graphics 640:
27.5 (!)  fps
low 1280x720
UHD Graphics 617:
61.2  fps
Iris Plus Graphics 640:
69.3 96 101 103 ~ 92 fps
med. 1920x1080
UHD Graphics 617:
26  fps
Iris Plus Graphics 640:
33.9 35.8 42.6 48.2 ~ 40 fps
high 1920x1080
UHD Graphics 617:
18.3  fps
Iris Plus Graphics 640:
24.9 25.3 29.3 33.6 ~ 28 fps
Prey

Prey

2017
low 1280x720
Iris Plus Graphics 640:
39.9 45.4 ~ 43 fps
med. 1920x1080
Iris Plus Graphics 640:
17.9 18.1 ~ 18 fps
high 1920x1080
Iris Plus Graphics 640:
14.8  fps
low 1280x720
Iris Plus Graphics 640:
33.8  fps
low 1280x720
Iris Plus Graphics 640:
20.4  fps
low 1280x720
Iris Plus Graphics 640:
16 16.6 ~ 16 fps
For Honor

For Honor

2017
low 1280x720
Iris Plus Graphics 640:
30.8 33.5 ~ 32 fps
med. 1920x1080
Iris Plus Graphics 640:
11.8 12.7 ~ 12 fps
low 1280x720
Iris Plus Graphics 640:
42.9 45 ~ 44 fps
med. 1366x768
Iris Plus Graphics 640:
31.4  fps
high 1920x1080
Iris Plus Graphics 640:
22.9  fps
low 1280x720
Iris Plus Graphics 640:
121  fps
med. 1366x768
Iris Plus Graphics 640:
91  fps
high 1920x1080
Iris Plus Graphics 640:
31.6  fps
ultra 1920x1080
Iris Plus Graphics 640:
17.8  fps
low 1280x720
Iris Plus Graphics 640:
26.6 29.2 38.6 ~ 31 fps
med. 1366x768
Iris Plus Graphics 640:
19.6 24.2 ~ 22 fps
high 1920x1080
Iris Plus Graphics 640:
9.2 11.1 ~ 10 fps
low 1280x720
Iris Plus Graphics 640:
20.2  fps
Overwatch

Overwatch

2016
low 1280x720
Iris Plus Graphics 640:
53.6 56.1 63.3 67.3 ~ 60 fps
med. 1366x768
Iris Plus Graphics 640:
24.1 36.5 41 52.9 ~ 39 fps
high 1920x1080
Iris Plus Graphics 640:
15.9 29.9 36.5 ~ 27 fps
ultra 1920x1080
Iris Plus Graphics 640:
19.5  fps
low 1280x720
Iris Plus Graphics 640:
24.9  fps
low 1280x720
Iris Plus Graphics 640:
28  fps
med. 1920x1080
Iris Plus Graphics 640:
13  fps
low 1024x768
UHD Graphics 617:
16.1  fps
Iris Plus Graphics 640:
23.5 25.8 ~ 25 fps
med. 1366x768
Iris Plus Graphics 640:
16.7 19.4 ~ 18 fps
high 1920x1080
Iris Plus Graphics 640:
9.1  fps
low 1024x768
Iris Plus Graphics 640:
45.4 (!) 50.5 59.2 ~ 52 fps
med. 1366x768
Iris Plus Graphics 640:
29 30.7 (!) 32.9 ~ 31 fps
high 1920x1080
Iris Plus Graphics 640:
16.4 16.6 (!) 18.7 ~ 17 fps
ultra 1920x1080
Iris Plus Graphics 640:
14.2  fps
low 1024x768
Iris Plus Graphics 640:
44.7  fps
med. 1366x768
Iris Plus Graphics 640:
26.2  fps
high 1920x1080
Iris Plus Graphics 640:
12.9  fps
low 1280x720
100%
Graphics 4-Core:
82.6 91.4 93.8 101.9 ~ 92 fps
73%
UHD Graphics 617:
67.2  fps
87%
Iris Plus Graphics 640:
68 92 ~ 80 fps
med. 1366x768
100%
Graphics 4-Core:
52.2 59.7 60.7 69 ~ 60 fps
47%
UHD Graphics 617:
28.2  fps
98%
Iris Plus Graphics 640:
55 63.7 ~ 59 fps
high 1920x1080
100%
Graphics 4-Core:
52.8 57.2 61 61.1 ~ 58 fps
25%
UHD Graphics 617:
14.6  fps
50%
Iris Plus Graphics 640:
27.6 29.5 ~ 29 fps
ultra 1920x1080
100%
Graphics 4-Core:
50 54.2 57.3 57.6 ~ 55 fps
25%
UHD Graphics 617:
13.6  fps
38%
Iris Plus Graphics 640:
19.8 23 ~ 21 fps
low 1024x768
100%
Graphics 4-Core:
66.5 86.8 92.1 92.1 ~ 84 fps
23%
Iris Plus Graphics 640:
16.4 17.5 21 21.7 ~ 19 fps
med. 1366x768
100%
Graphics 4-Core:
41.3 49.6 57 57 ~ 51 fps
26%
Iris Plus Graphics 640:
13.4  fps
high 1920x1080
100%
Graphics 4-Core:
21.4 28.4 32.4 32.4 ~ 29 fps
ultra 1920x1080
100%
Graphics 4-Core:
11.9 15 17.9 17.9 ~ 16 fps
25%
Iris Plus Graphics 640:
4  fps
GTA V

GTA V

2015
low 1024x768
Iris Plus Graphics 640:
56.7  fps
med. 1366x768
Iris Plus Graphics 640:
28.9  fps
high 1920x1080
Iris Plus Graphics 640:
11.8  fps
Sims 4

Sims 4

2014
high 1920x1080
Iris Plus Graphics 640:
28.6  fps
ultra 1920x1080
Iris Plus Graphics 640:
20.2 20.8 ~ 21 fps
low 1024x768
Iris Plus Graphics 640:
43.1 60.3 ~ 52 fps
med. 1366x768
Iris Plus Graphics 640:
29.7 42 ~ 36 fps
high 1366x768
Iris Plus Graphics 640:
23.2 30.7 ~ 27 fps
ultra 1920x1080
Iris Plus Graphics 640:
8.2 9.9 ~ 9 fps
low 1280x720
UHD Graphics 617:
47.6  fps
Iris Plus Graphics 640:
61 68.2 ~ 65 fps
med. 1366x768
UHD Graphics 617:
27.9  fps
Iris Plus Graphics 640:
40.2 45.1 ~ 43 fps
high 1366x768
UHD Graphics 617:
25  fps
Iris Plus Graphics 640:
33.5 38.3 ~ 36 fps
ultra 1920x1080
UHD Graphics 617:
8.4  fps
Iris Plus Graphics 640:
10.7 12.5 ~ 12 fps
low 1024x768
Iris Plus Graphics 640:
103 132.6 ~ 118 fps
med. 1366x768
Iris Plus Graphics 640:
54.1 68.7 ~ 61 fps
high 1366x768
Iris Plus Graphics 640:
37 47.1 ~ 42 fps
ultra 1920x1080
Iris Plus Graphics 640:
17.2 21.6 ~ 19 fps
ultra 1920x1080
Iris Plus Graphics 640:
35.2  fps
World of Warcraft

World of Warcraft

2005
high 1280x1024
Iris Plus Graphics 640:
28.5  fps

Average Gaming Intel Graphics 4-Cores iGPU (Arc) → 100%

Average Gaming 30-70 fps → 100%

Average Gaming Intel UHD Graphics 617 → 47%

Average Gaming 30-70 fps → 73%

Average Gaming Intel Iris Plus Graphics 640 → 50%

Average Gaming 30-70 fps → 98%

Intel Graphics 4-Cores iGPU (Arc)lowmed.highultraQHD4K
Cyberpunk 2077 2.0 Phantom Liberty20171412
Baldur's Gate 316131110.6
F1 22434029.57.62
Tiny Tina's Wonderlands29231613
Strange Brigade108463629
Far Cry 545242321
X-Plane 11.11362924
Final Fantasy XV Benchmark402317
Dota 2 Reborn92605855
The Witcher 384512916
< 30 fps
< 60 fps
< 120 fps
≥ 120 fps
3
4
3
6
3
1
8
2

7
1


Intel UHD Graphics 617lowmed.highultraQHD4K
X-Plane 11.1120.214.112.8
Rocket League61.22618.3
Rise of the Tomb Raider16.1
Dota 2 Reborn67.228.214.613.6
BioShock Infinite47.627.9258.4
< 30 fps
< 60 fps
< 120 fps
≥ 120 fps
2
1
2
4


4


2


Intel Iris Plus Graphics 640lowmed.highultraQHD4K
The Evil Within 213.8
Middle-earth: Shadow of War28
FIFA 1869.538.8
F1 20173615
Playerunknown's Battlegrounds (PUBG)22.9
Team Fortress 2994831.8
Dirt 427.5
Rocket League924028
Prey431814.8
Warhammer 40.000: Dawn of War III33.8
Mass Effect Andromeda20.4
Ghost Recon Wildlands16
For Honor3212
Titanfall 24431.422.9
Farming Simulator 171219131.617.8
Battlefield 1312210
Deus Ex Mankind Divided20.2
Overwatch60392719.5
The Division24.9
Far Cry Primal2813
Rise of the Tomb Raider25189.1
Rainbow Six Siege52311714.2
Star Wars Battlefront44.726.212.9
Dota 2 Reborn80592921
The Witcher 31913.44
GTA V56.728.911.8
Sims 428.621
Battlefield 45236279
BioShock Infinite65433612
Tomb Raider118614219
Diablo III35.2
World of Warcraft28.5
< 30 fps
< 60 fps
< 120 fps
≥ 120 fps
10
10
6
1
10
8
3
13
4

9
2


Eine Liste mit weiteren Spielen und allen Grafikkarten finden Sie auf unserer Seite: Welches Spiel ist mit welcher Grafikkarte spielbar?

v1.26
log 18. 07:58:56

#0 checking url part for id 12259 +0s ... 0s

#1 checking url part for id 9356 +0s ... 0s

#2 checking url part for id 7656 +0s ... 0s

#3 not redirecting to Ajax server +0s ... 0s

#4 did not recreate cache, as it is less than 5 days old! Created at Thu, 16 May 2024 05:40:59 +0200 +0.001s ... 0.001s

#5 composed specs +0.134s ... 0.135s

#6 did output specs +0s ... 0.135s

#7 start showIntegratedCPUs +0s ... 0.135s

#8 getting avg benchmarks for device 12259 +0.045s ... 0.179s

#9 got single benchmarks 12259 +0.026s ... 0.205s

#10 getting avg benchmarks for device 9356 +0.002s ... 0.207s

#11 got single benchmarks 9356 +0.01s ... 0.217s

#12 getting avg benchmarks for device 7656 +0.002s ... 0.219s

#13 got single benchmarks 7656 +0.021s ... 0.24s

#14 got avg benchmarks for devices +0s ... 0.24s

#15 min, max, avg, median took s +0.346s ... 0.586s

#16 before gaming benchmark output +0s ... 0.586s

#17 Got 283 rows for game benchmarks. +0.084s ... 0.67s

#18 composed SQL query for gamebenchmarks +0s ... 0.67s

#19 got data and put it in $dataArray +0.027s ... 0.697s

#20 benchmarks composed for output. +0.088s ... 0.785s

#21 calculated avg scores. +0s ... 0.785s

#22 return log +0.002s ... 0.787s

Teilen Sie diesen Artikel, um uns zu unterstützen. Jeder Link hilft!
> Notebook Test, Laptop Test und News > Benchmarks / Technik > Benchmarks / Technik > Grafikkarten Vergleich - Head 2 Head
Autor: Klaus Hinum,  8.09.2017 (Update:  1.07.2023)