Nvidia GeForce GTX 1080 Ti im Test
Die GeForce GTX 1080 Ti basiert auf den selben großen GP102 Chip der Titan X. Im Vergleich zum kleineren GP104 der GTX 1080 steigt die Transistoranzahl von 7,2 auf beeindruckende 12 Milliarden Transistoren. Hergestellt werden beide Chips bei TSMC im 16-nm-FinFET-Prozess.
| GeForce GTX 1080 Ti | Titan X Pascal | GeForce GTX 1080 | |
|---|---|---|---|
| Chip | GP102 | GP102 | GP104 |
| Shader | 3584 | 3584 | 2560 |
| Kerntakt | 1481 - 1600 | 1418 - 1531 | 1607 - 1733 |
| Speichertakt | 11 GBps | 10 GBps | 10 GBps |
| Busbreite | 352 Bit | 384 Bit | 256 Bit |
| Speichertyp | GDDR5X | GDDR5X | GDDR5X |
| Speichergröße | 11 GB | 12 GB | 8 GB |
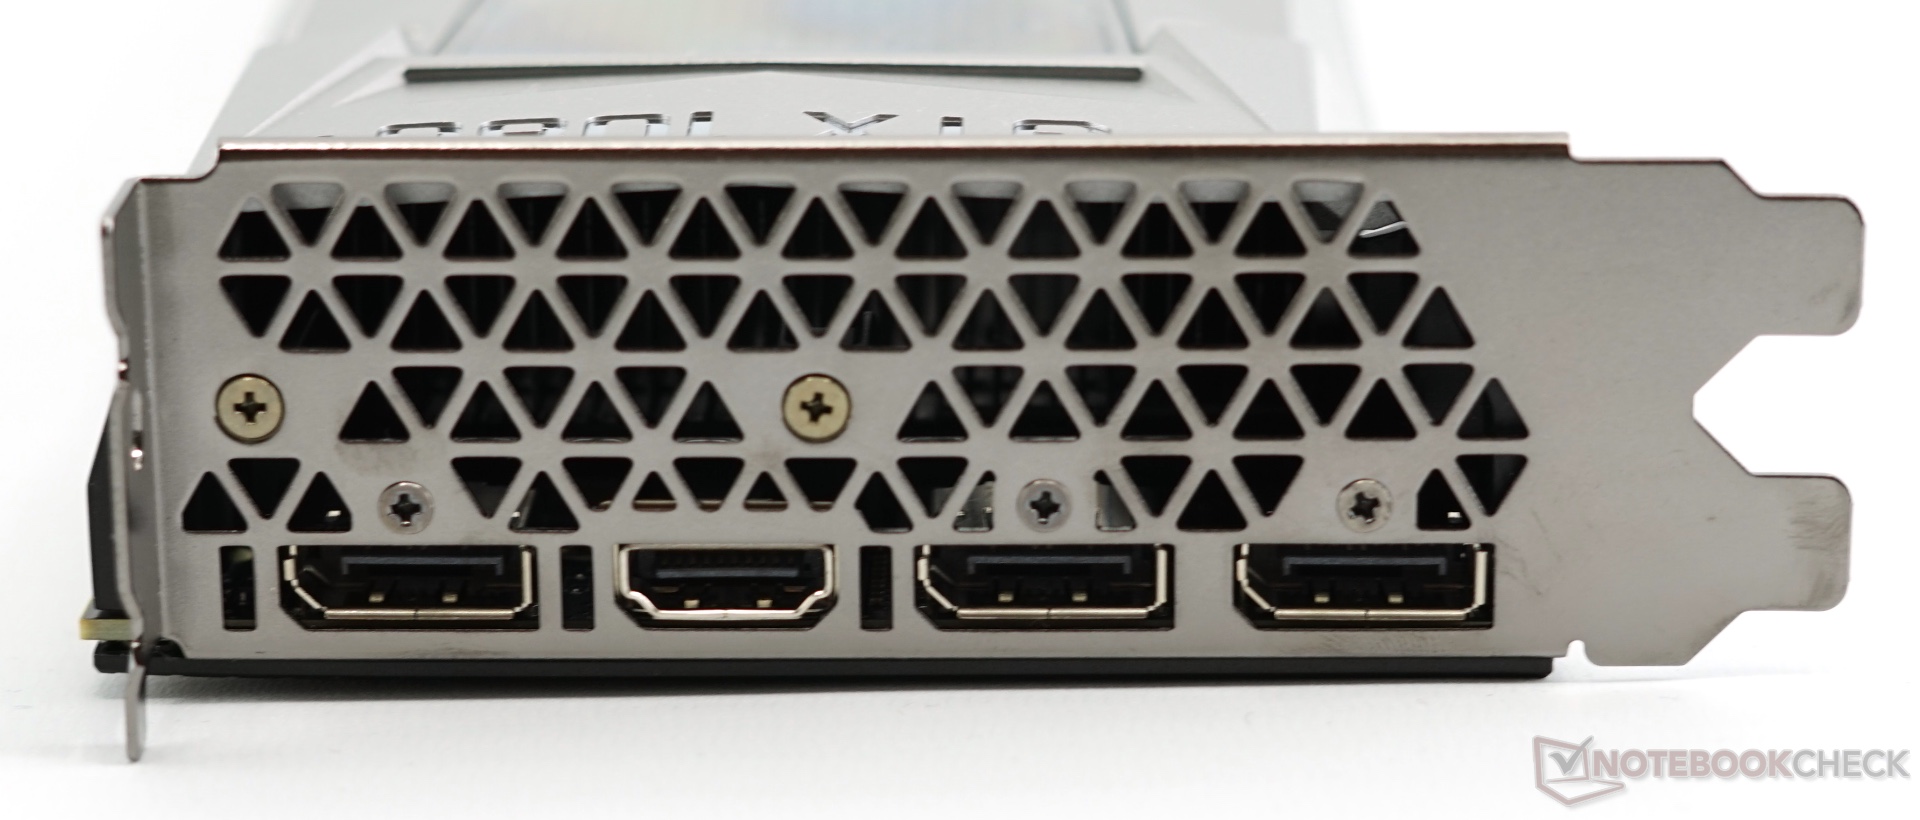
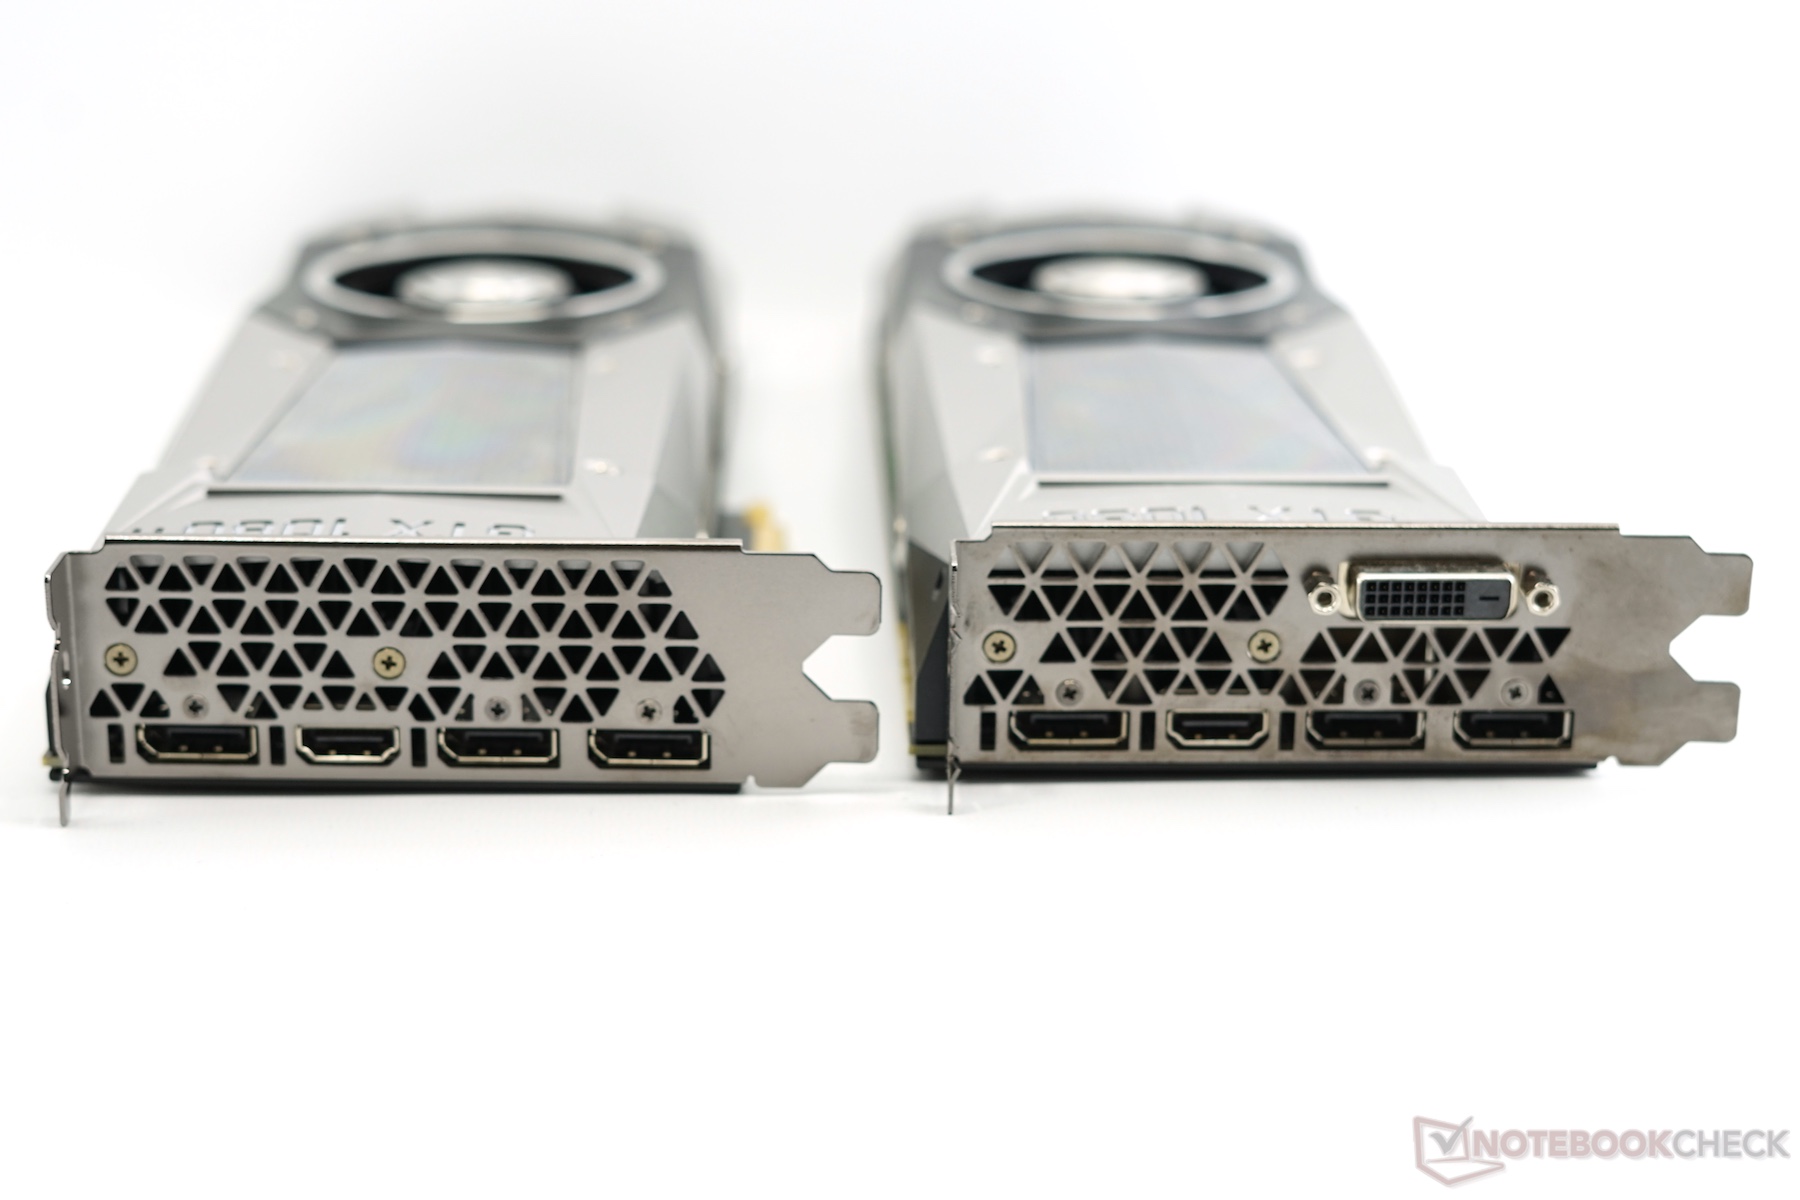
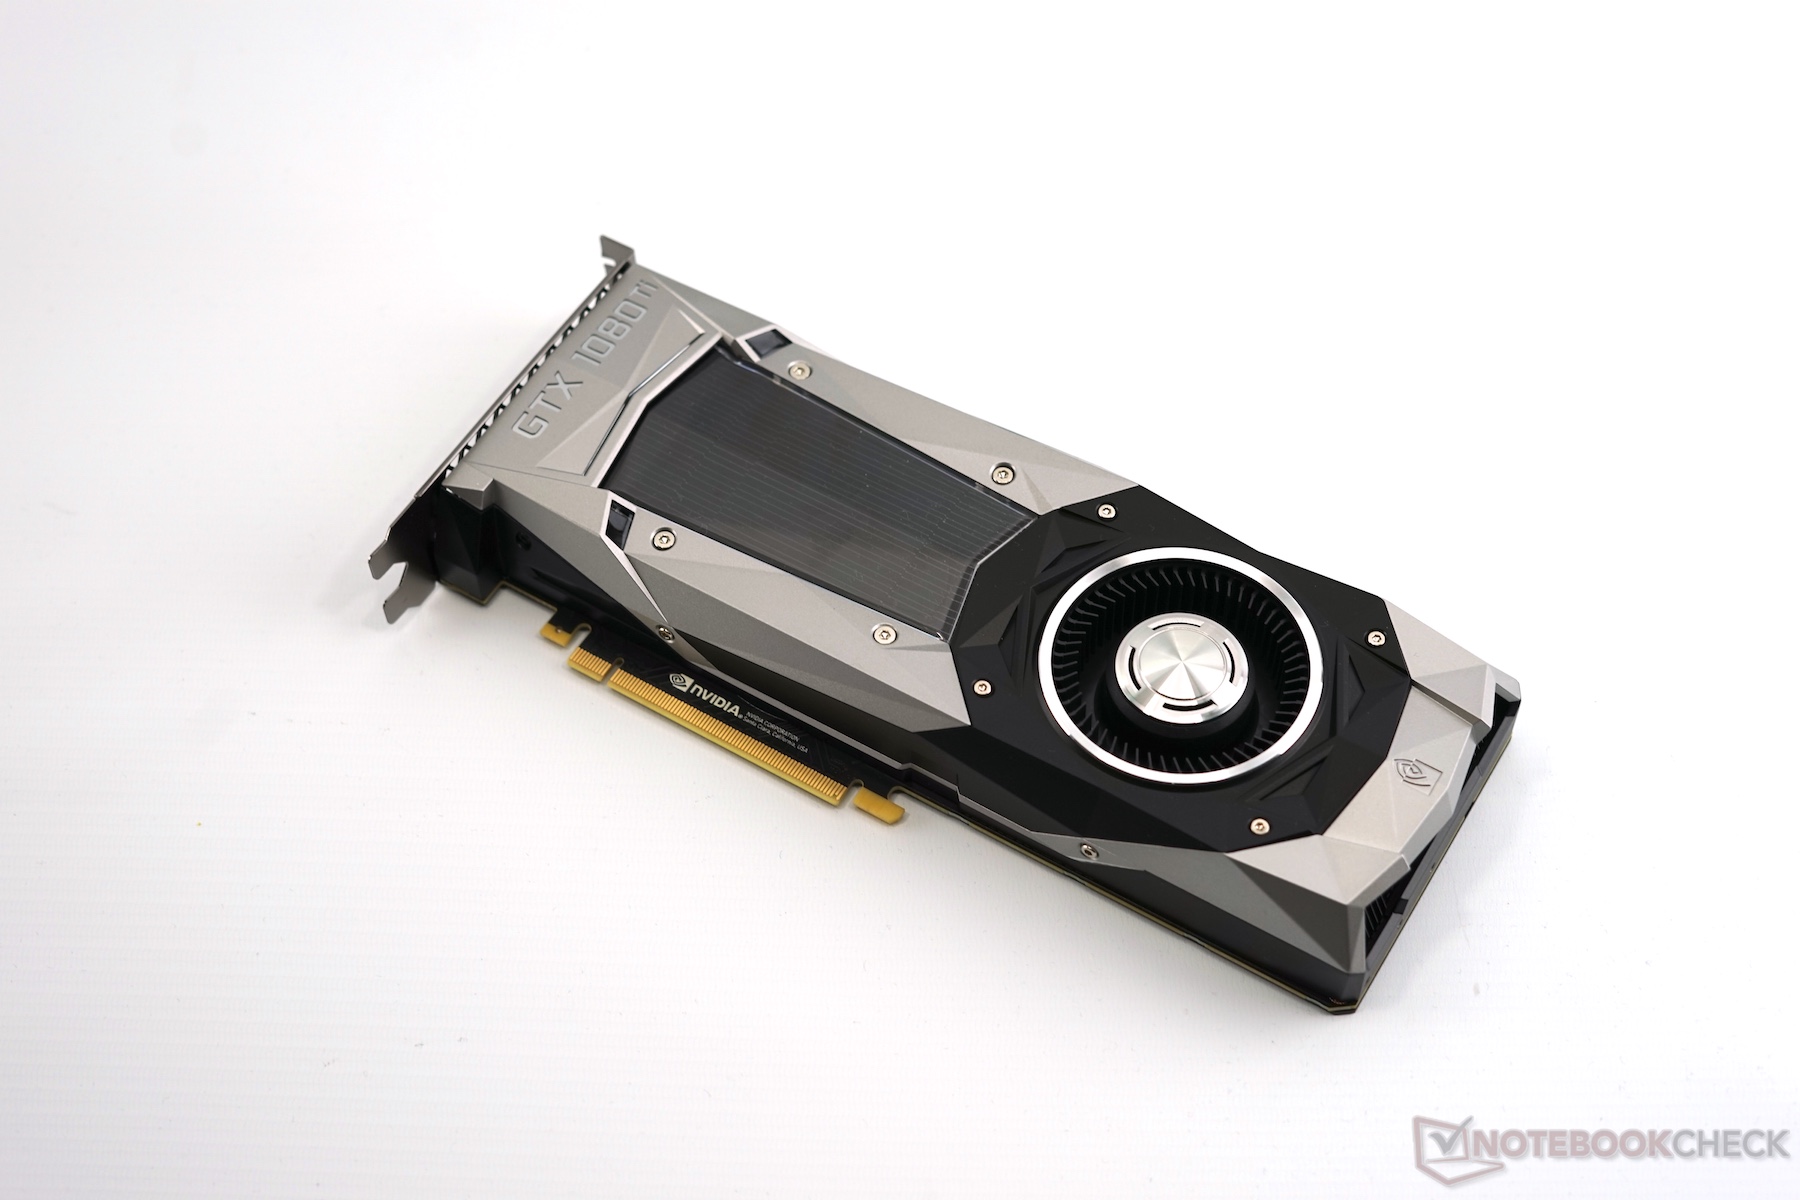
Wir testen die Founders Edition der GeForce GTX 1080 Ti, die über drei DisplayPort-1.4-Anschlüsse und einen HDMI-2.0-Ausgang verfügt. Einen Dual-Link-DVI Anschluss wie bei der Titan X sucht man jedoch vergeblich. Es befindet sich aber ein Adapter von DP auf DVI im Lieferumfang.
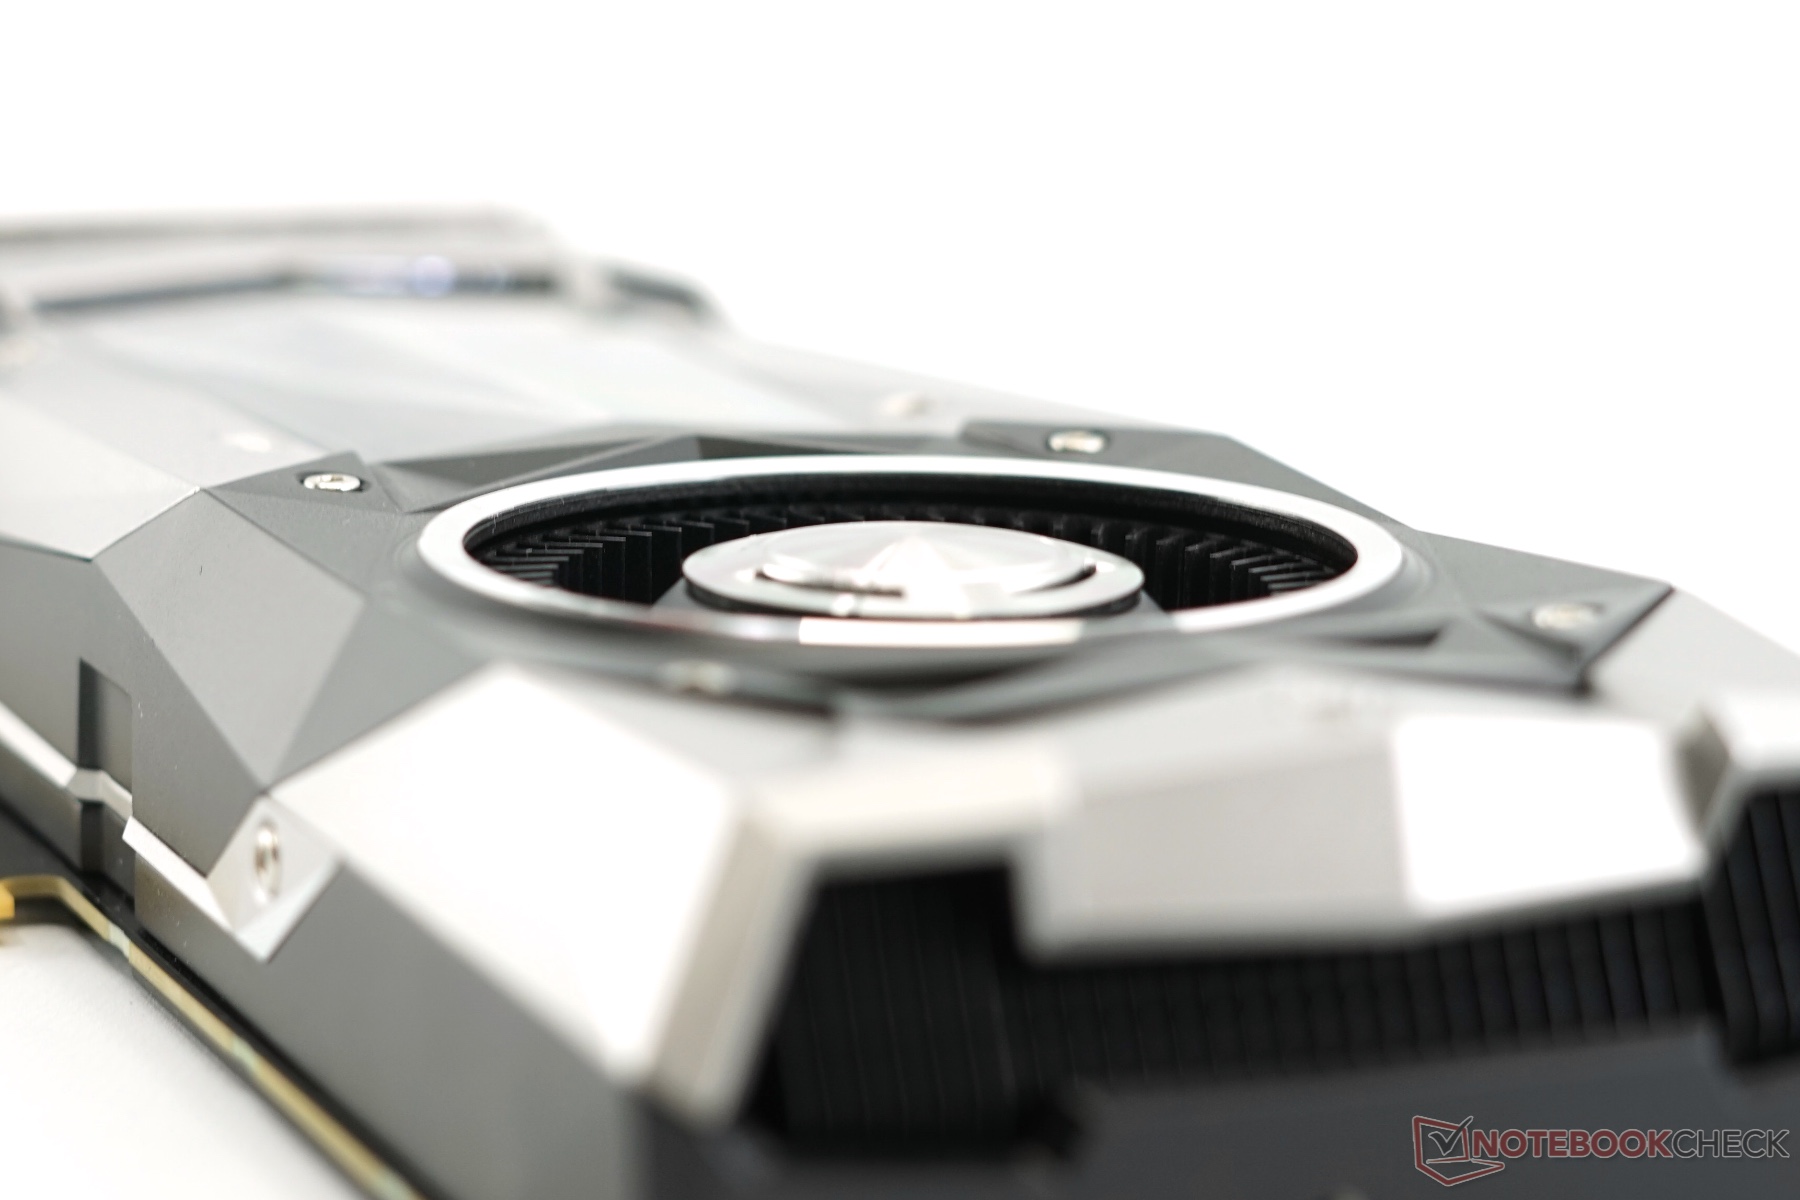
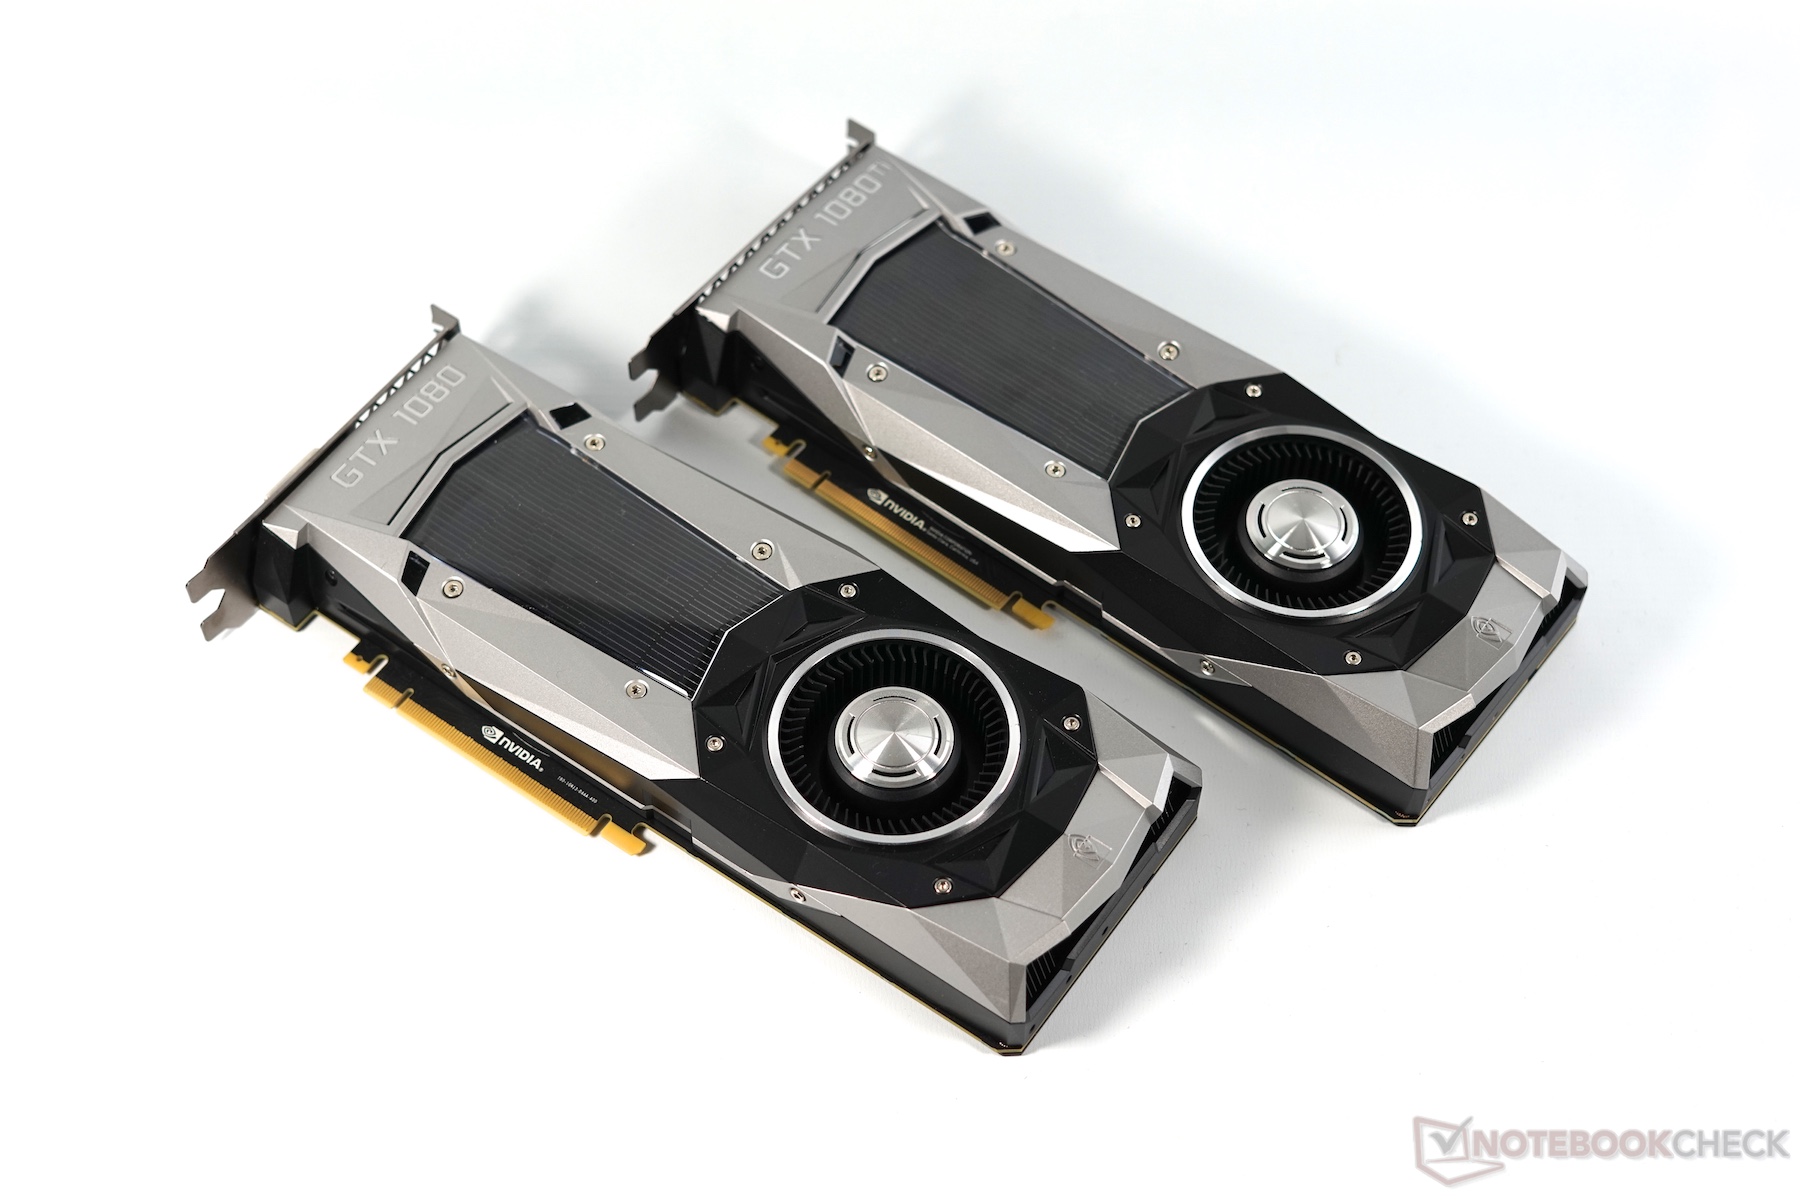
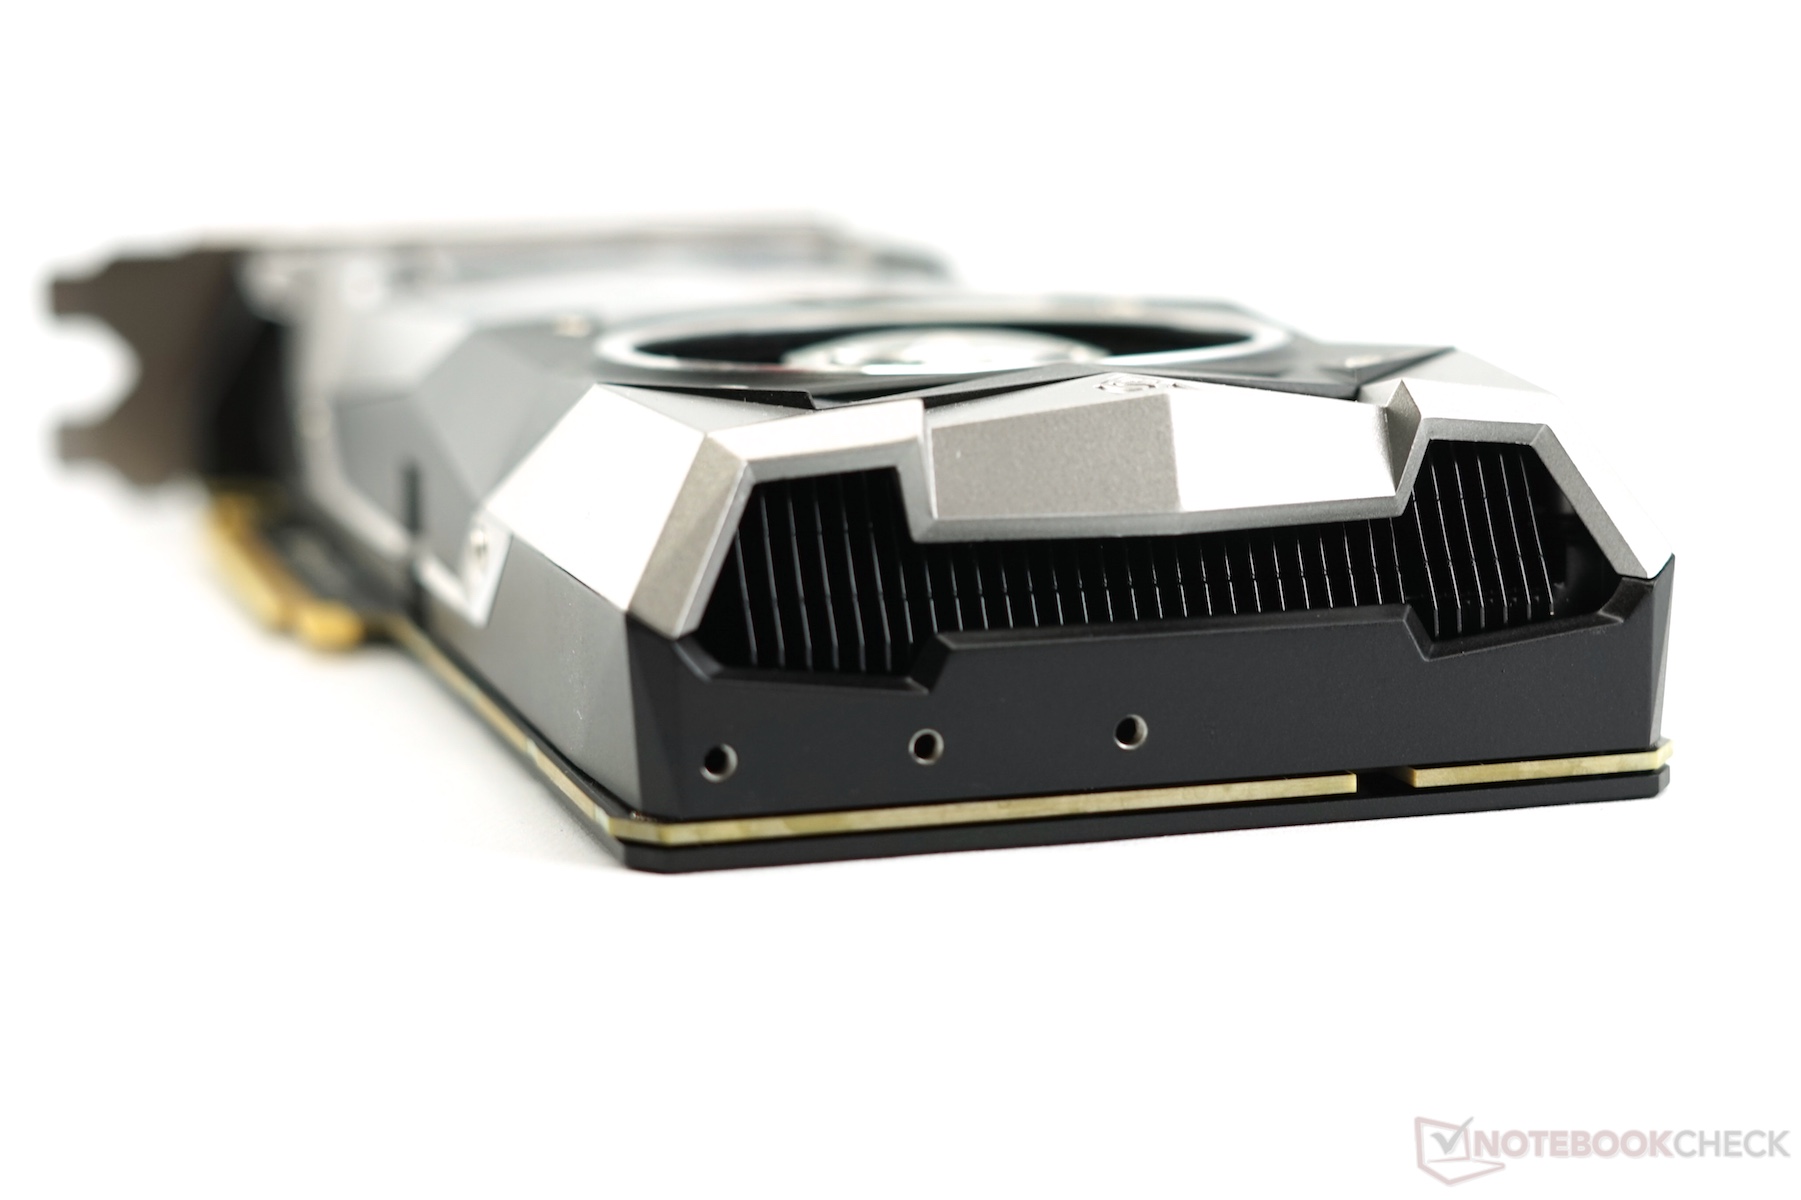
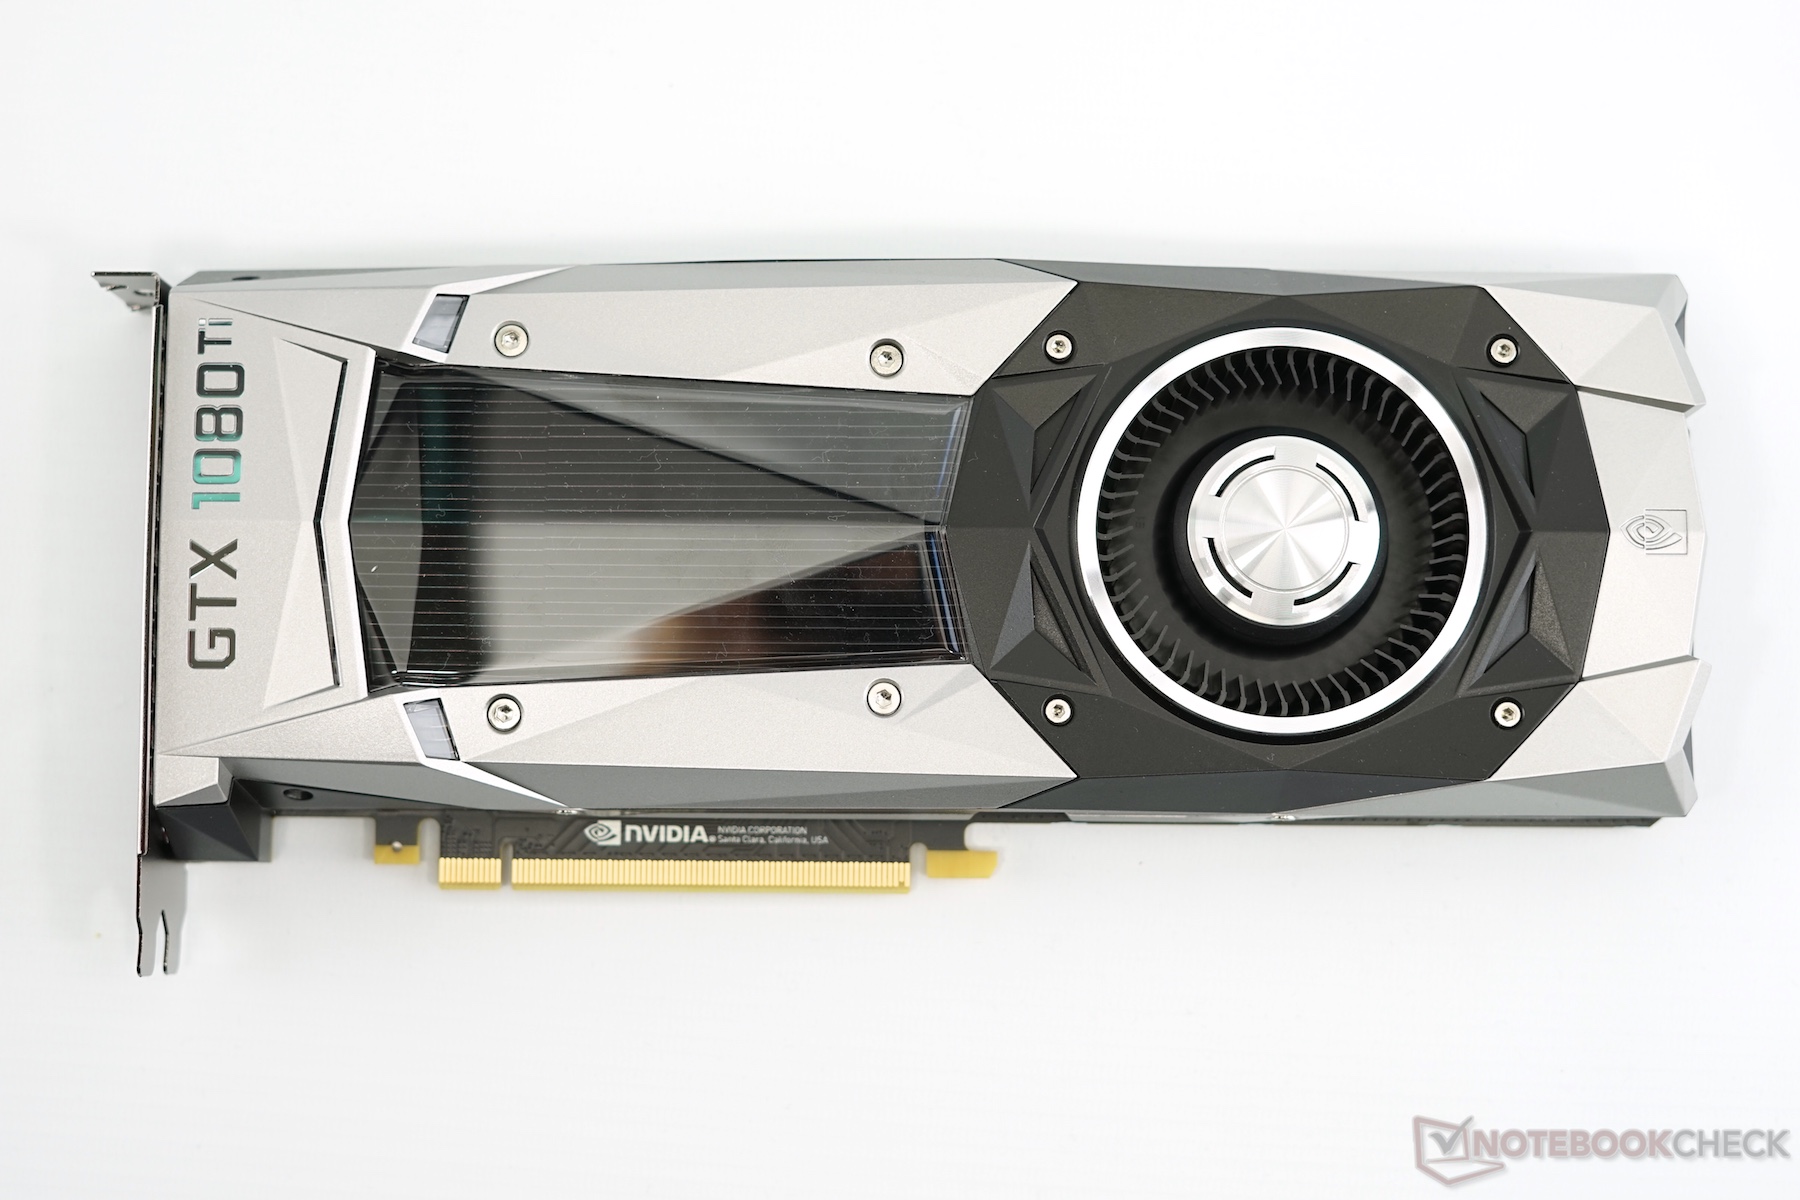
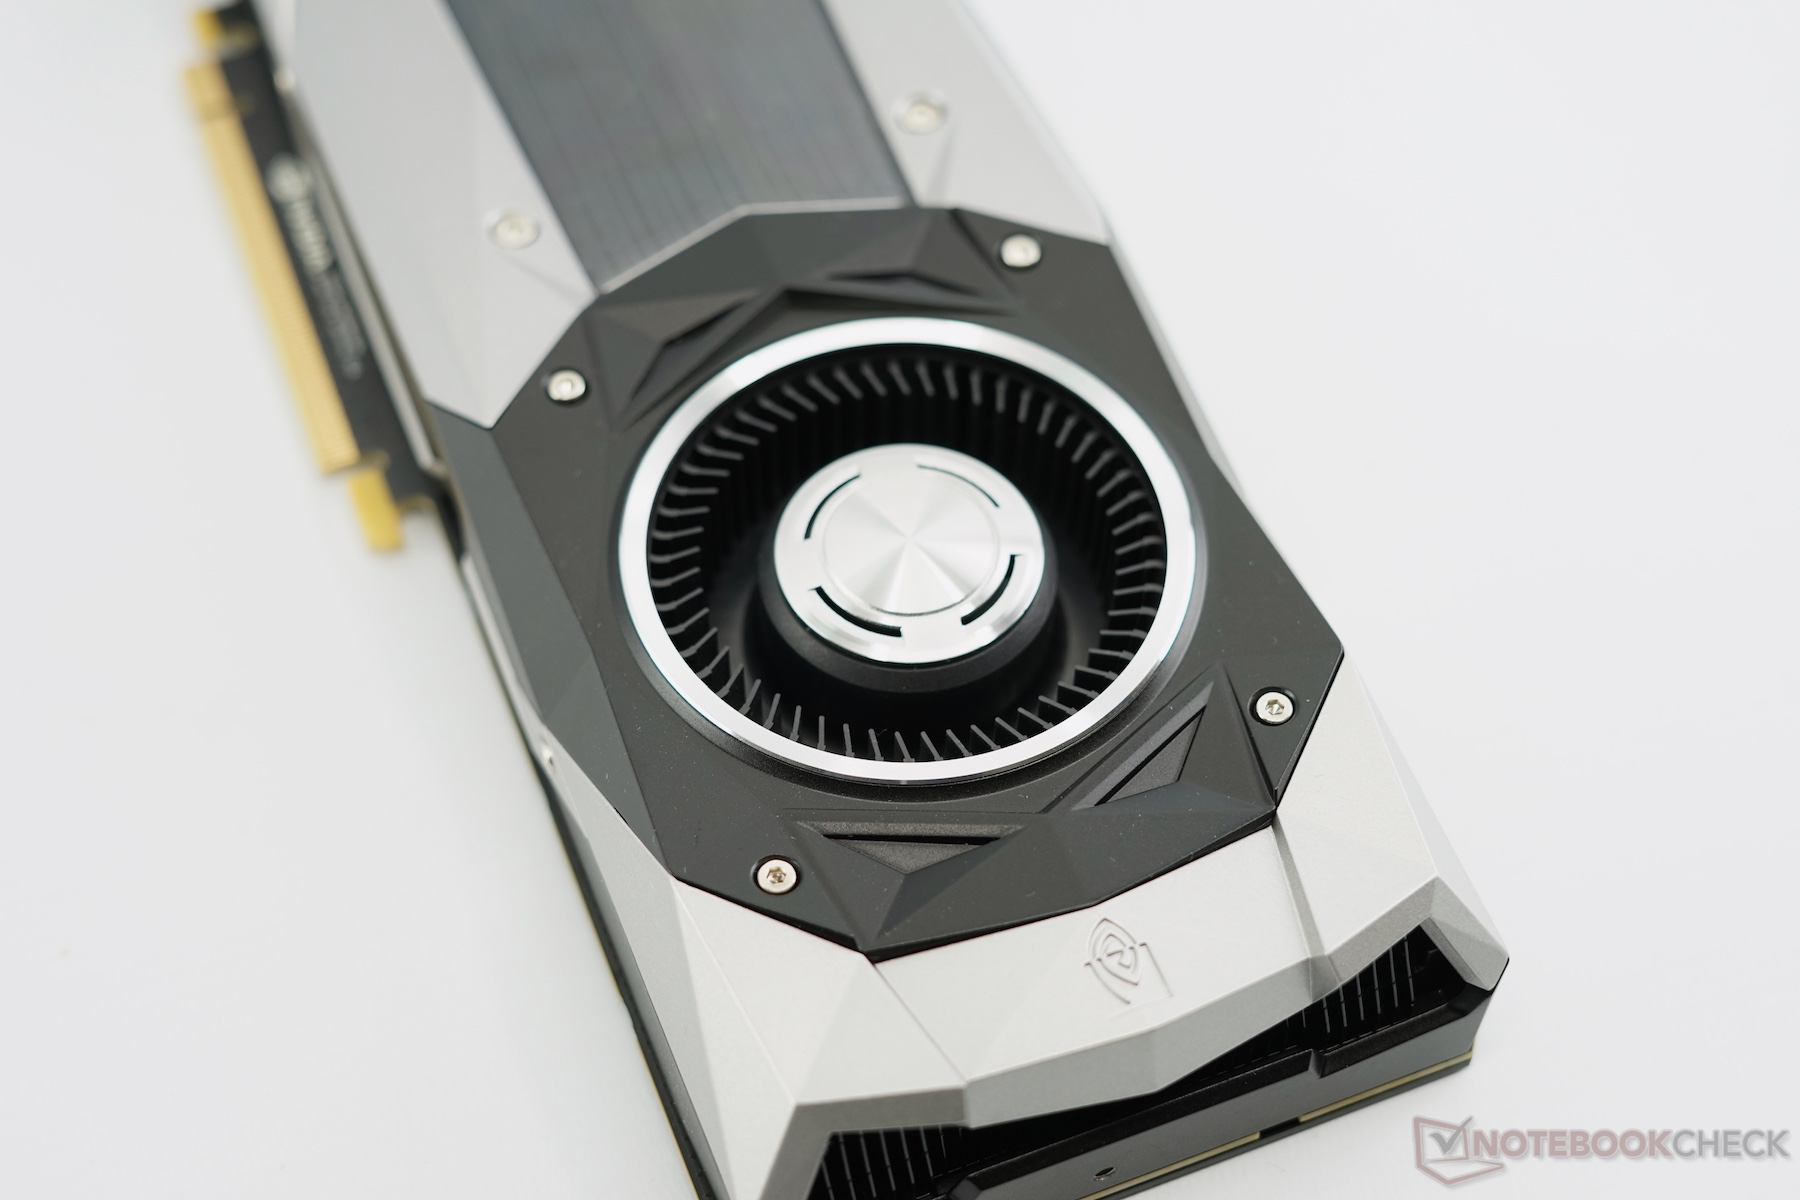
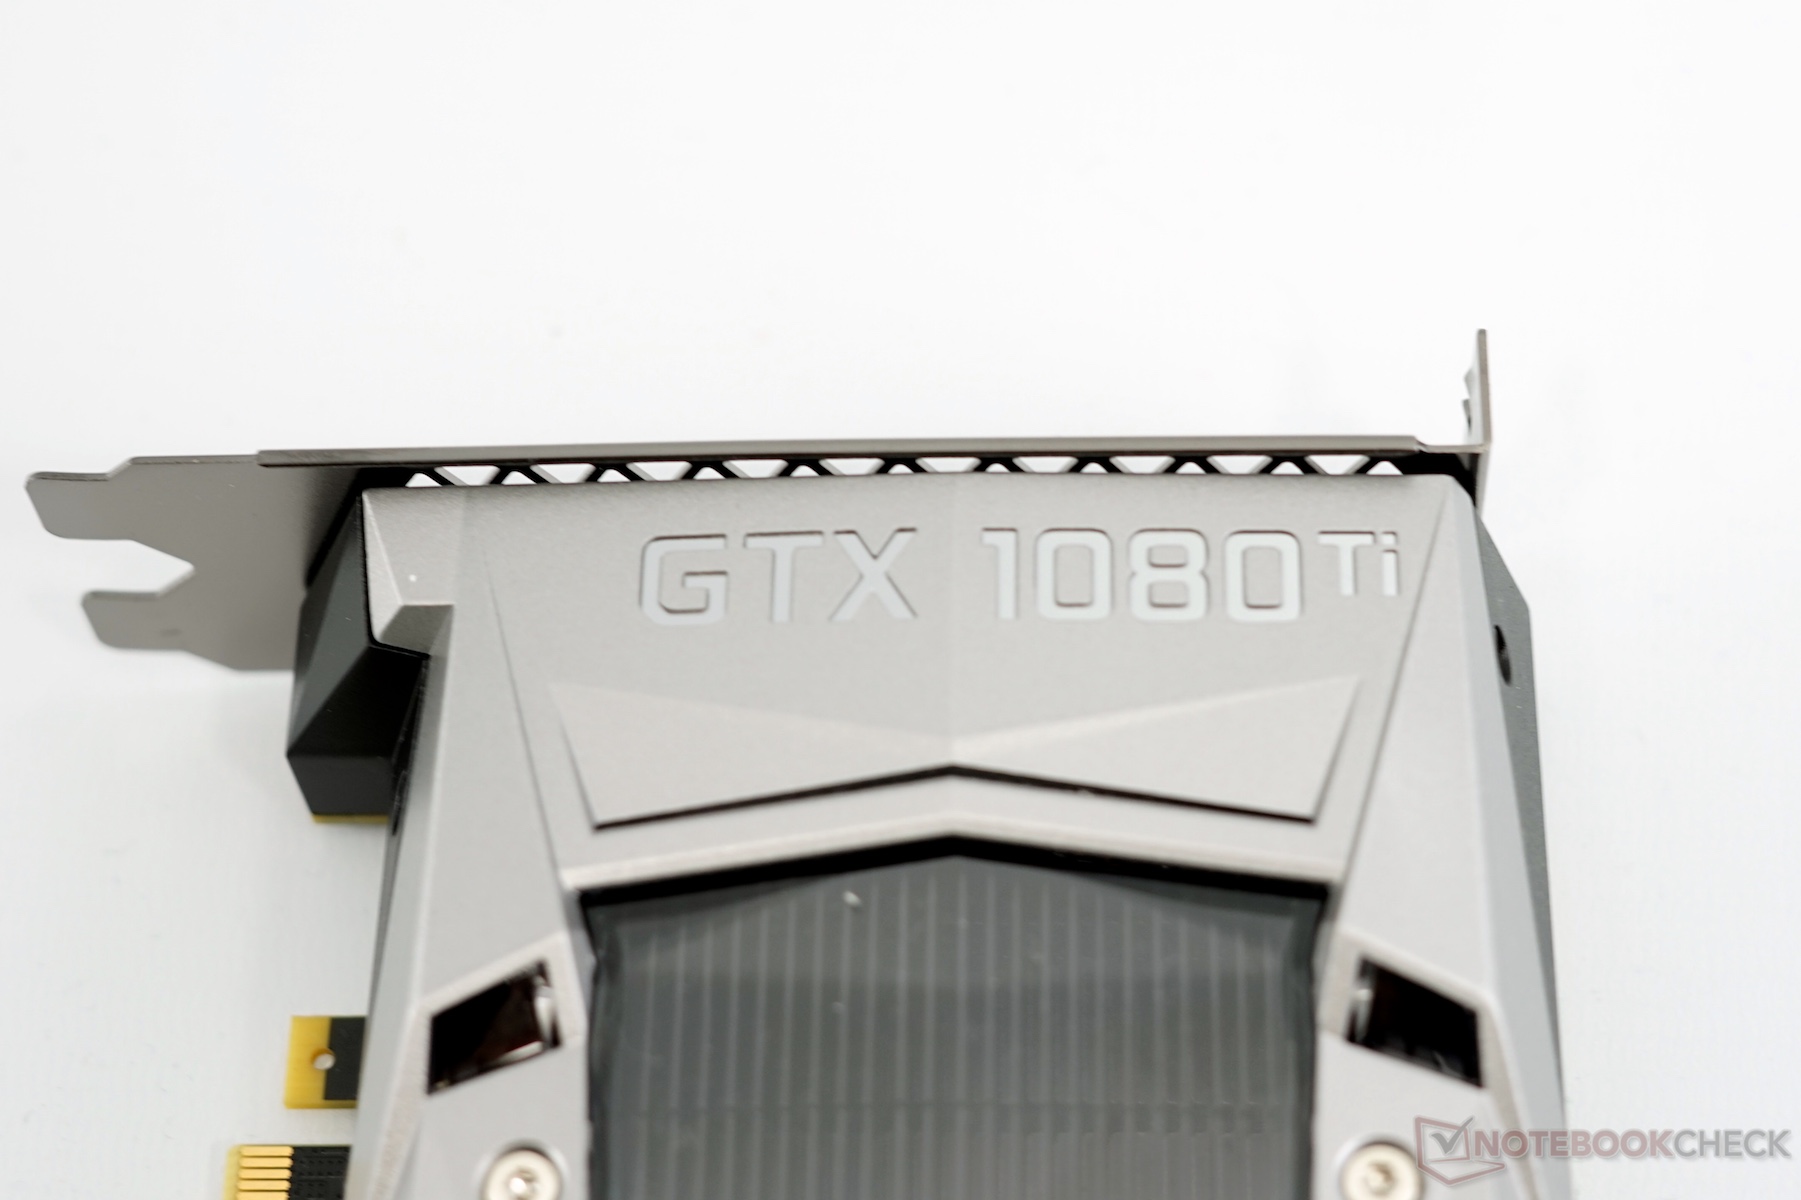
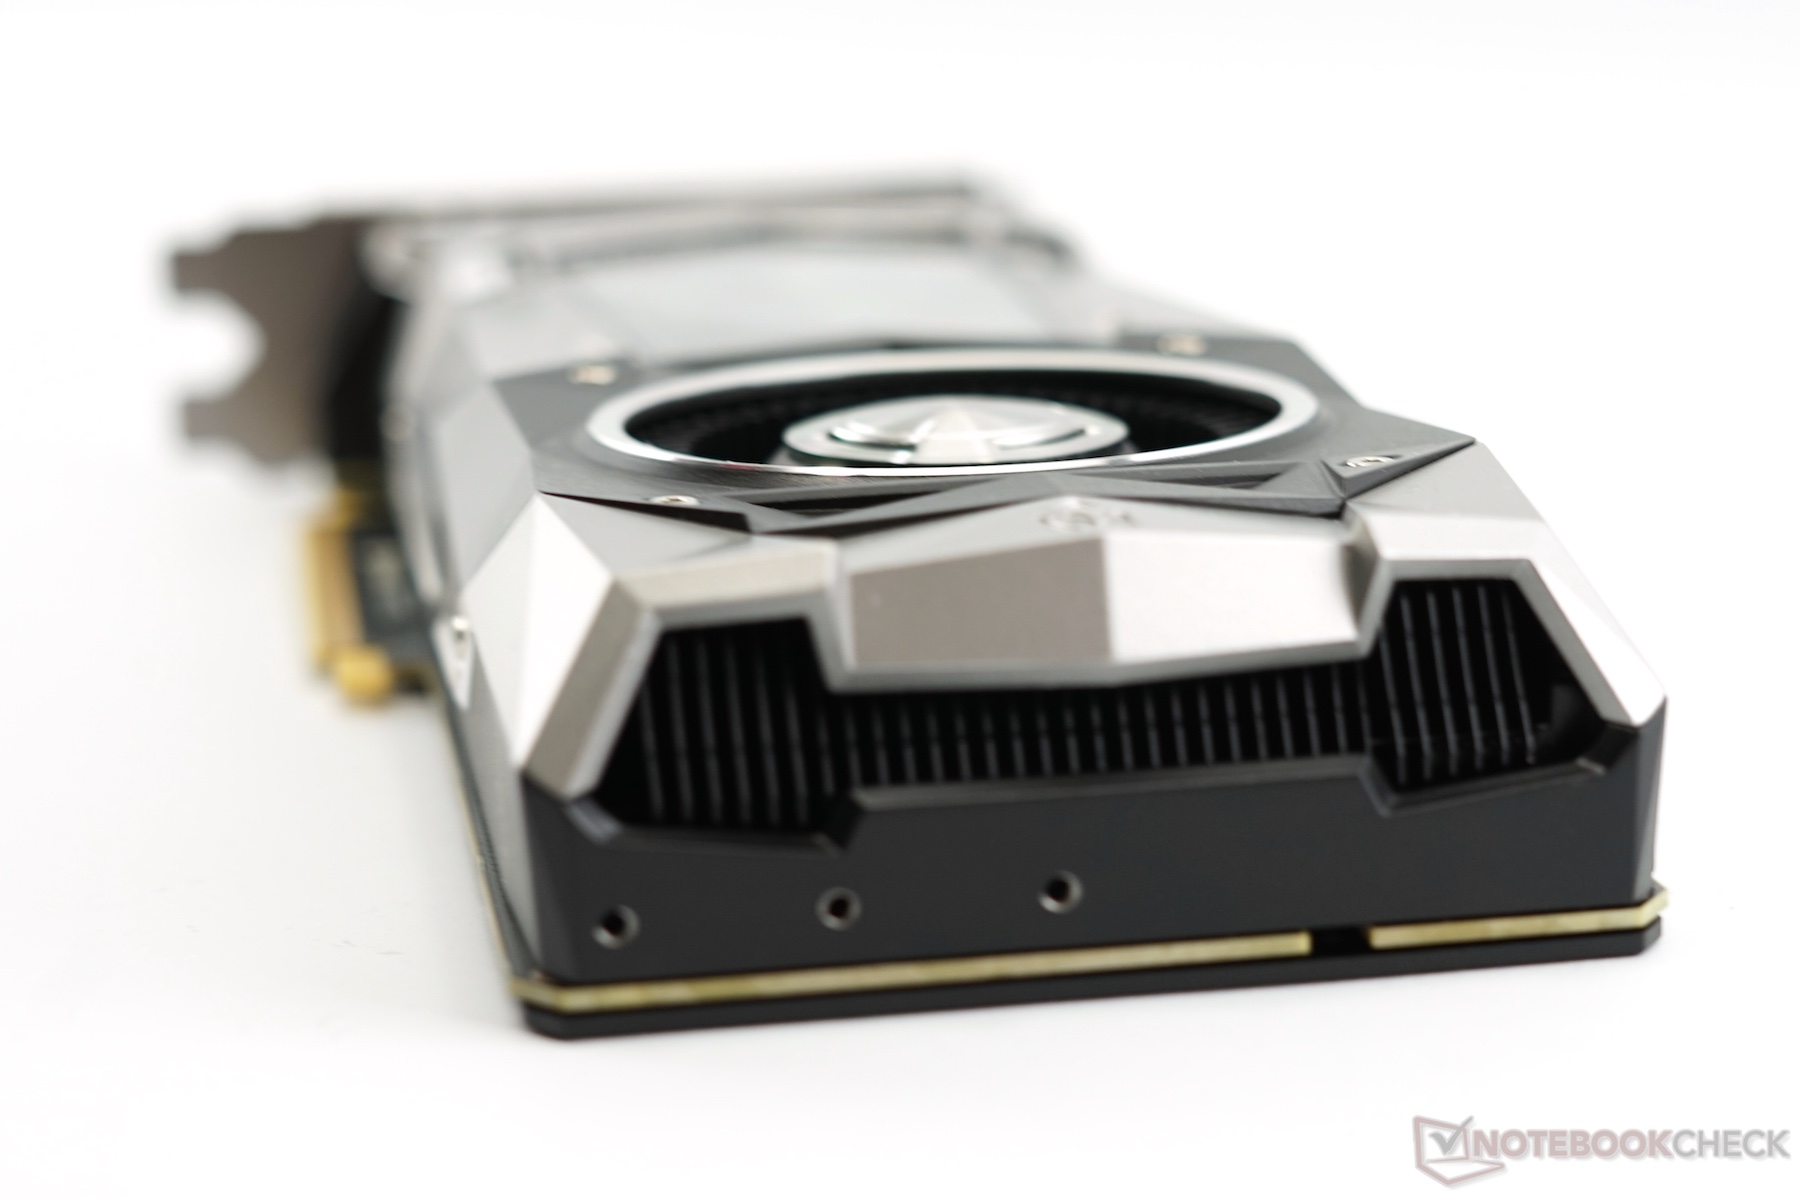
Das Design der Karte unterscheidet sich nicht sonderlich von den Founders Editions der 1080 und 1070 bzw von der Titan X Grafikkarten. Die Kombination aus silber und schwarz wirkt hochwertig und der grün leuchtende GeForce-GTX-Schriftzug peppt das Erscheinungsbild etwas auf.
Pascal Architektur
Wie die Titan X und alle anderen Karten der GTX-1000-Serie basiert die GTX 1080 Ti auf der aktuellen Pascal-Architektur von Nvidia. Einen detaillierten über die Pascal-Architektur und ihre Verbesserungen im Vergleich zu Maxwell finden Sie auf dieser Seite: Pascal Architektur
Das Testsystem
Als Testsystem kam hauptsächlich der nicht übertaktete Core i7-4790K (4 - 4,4 GHz Quad-Core), 16 GB DDR3, Asus Z97-Deluxe, Samsung 930 PRO SSD für System, Toshiba OCZ TR150 für Spiele zum Einsatz. Zusätzlich testeten wir die Grafikkarte auch mit den neuen AMD Ryzen-CPUs 1800X und 1700 in Verbindung mit einem Asus Crosshair VI Hero Mainboard und 16 GB DDR4-3000 Speicher von Corsair.
Als Grafiktreiber setzten wir bei der GeForce GTX 1080 Ti den von Nvidia zur Verfügung gestellten 378.78 ein.
Die Taktraten
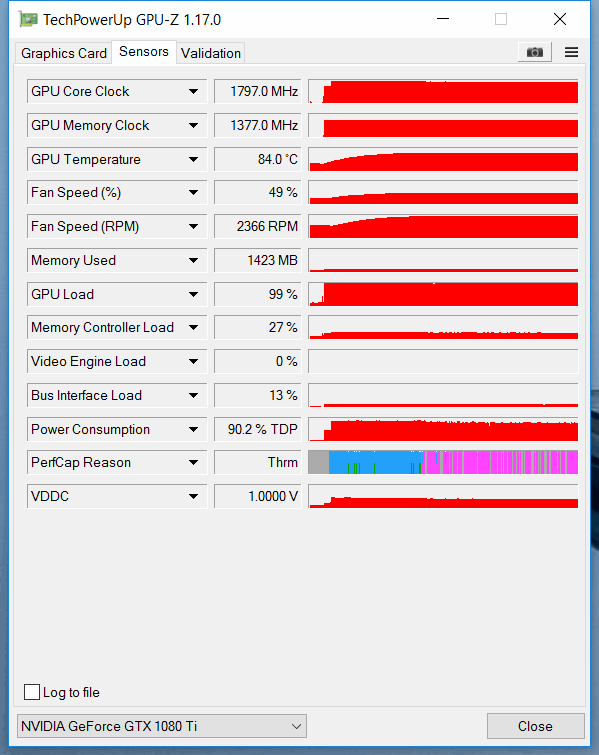
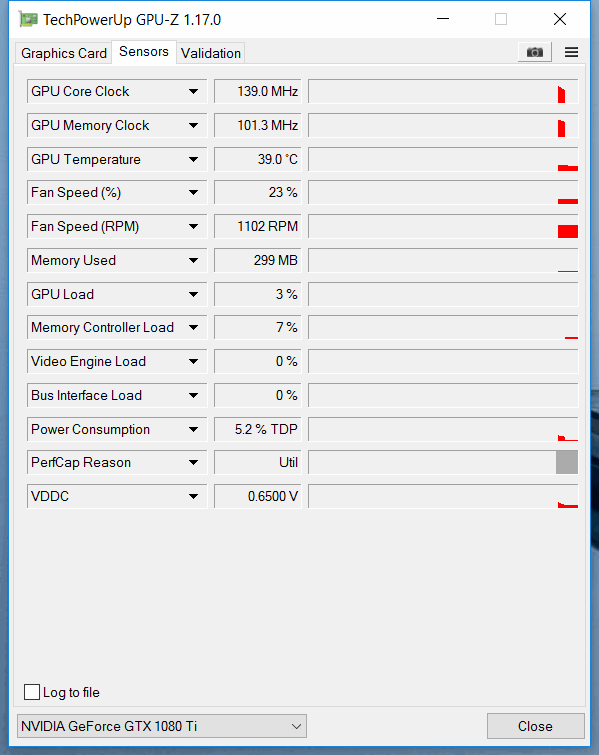
Die Nvidia Geforce GTX 1080 Ti taktet standardmäßig etwas höher als die Nvidia Titan X. GPU-Z gibt die Taktraten mit 1.481 MHz (Default) und 1.582 MHz (Boost) an. Beim GPU-Z-Render-Test haben wir eine maximale GPU-Taktfrequenz von 1.898 MHz ermittelt (Titan X 1.835 MHz). In The Witcher 3 taktet unser Testmuster mit 1.760 - 1.800 MHz. Das “Temperature Target“ der 1080 Ti liegt im Auslieferungszustand bei 84 °C. Wird diese Temperatur überschritten, so beginnt die GPU ihre Leistung zu drosseln.

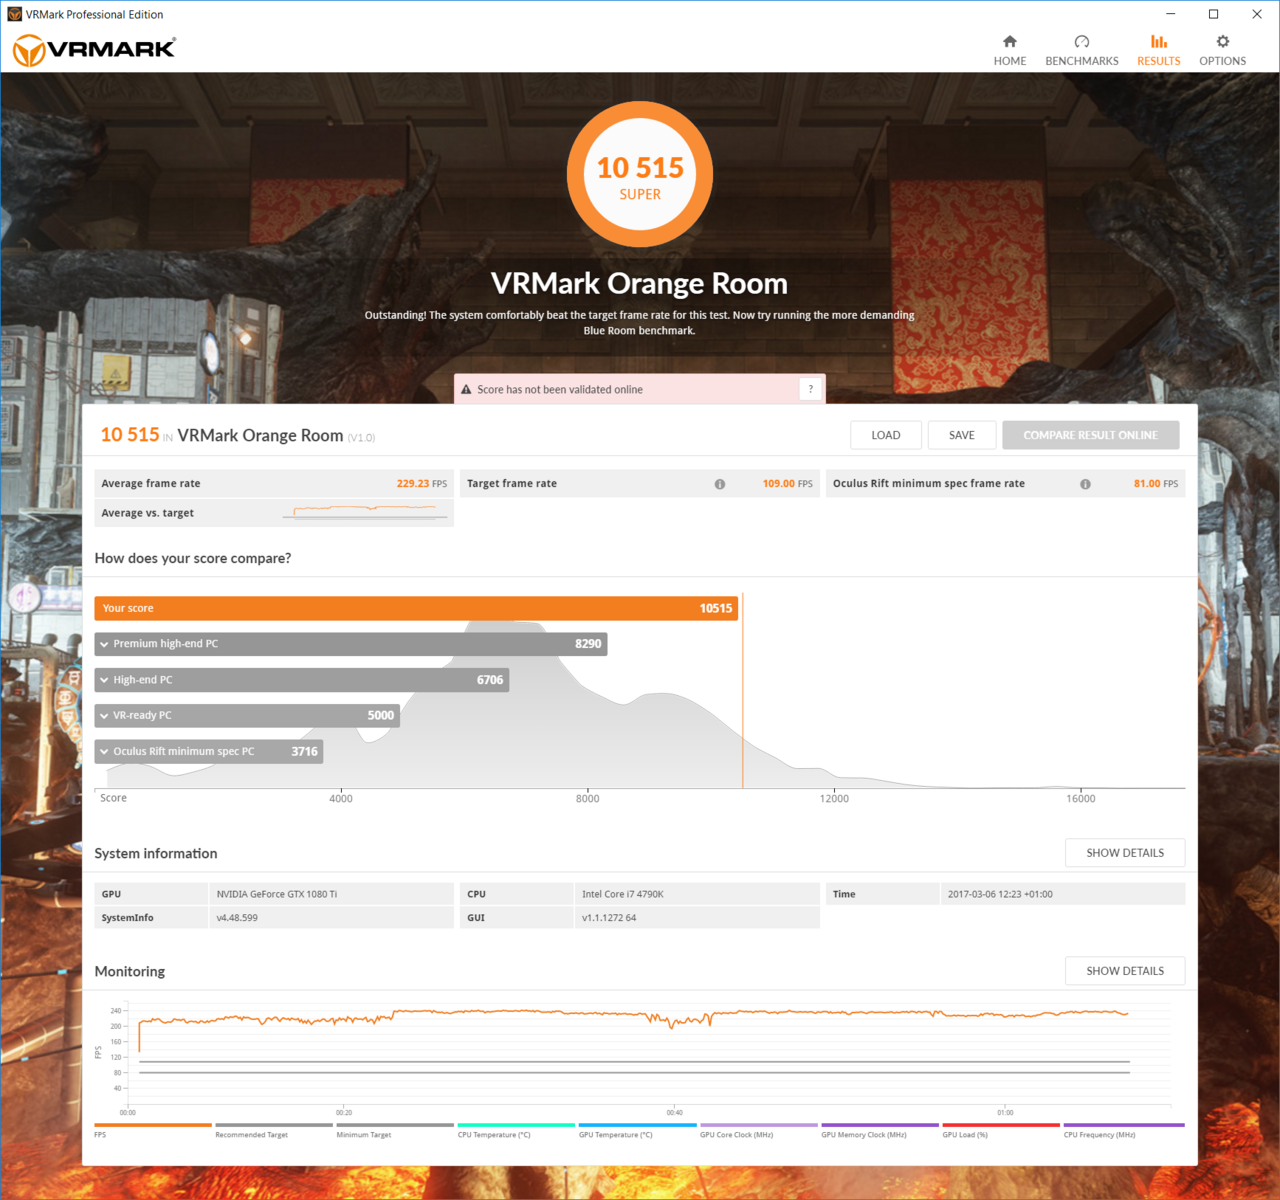
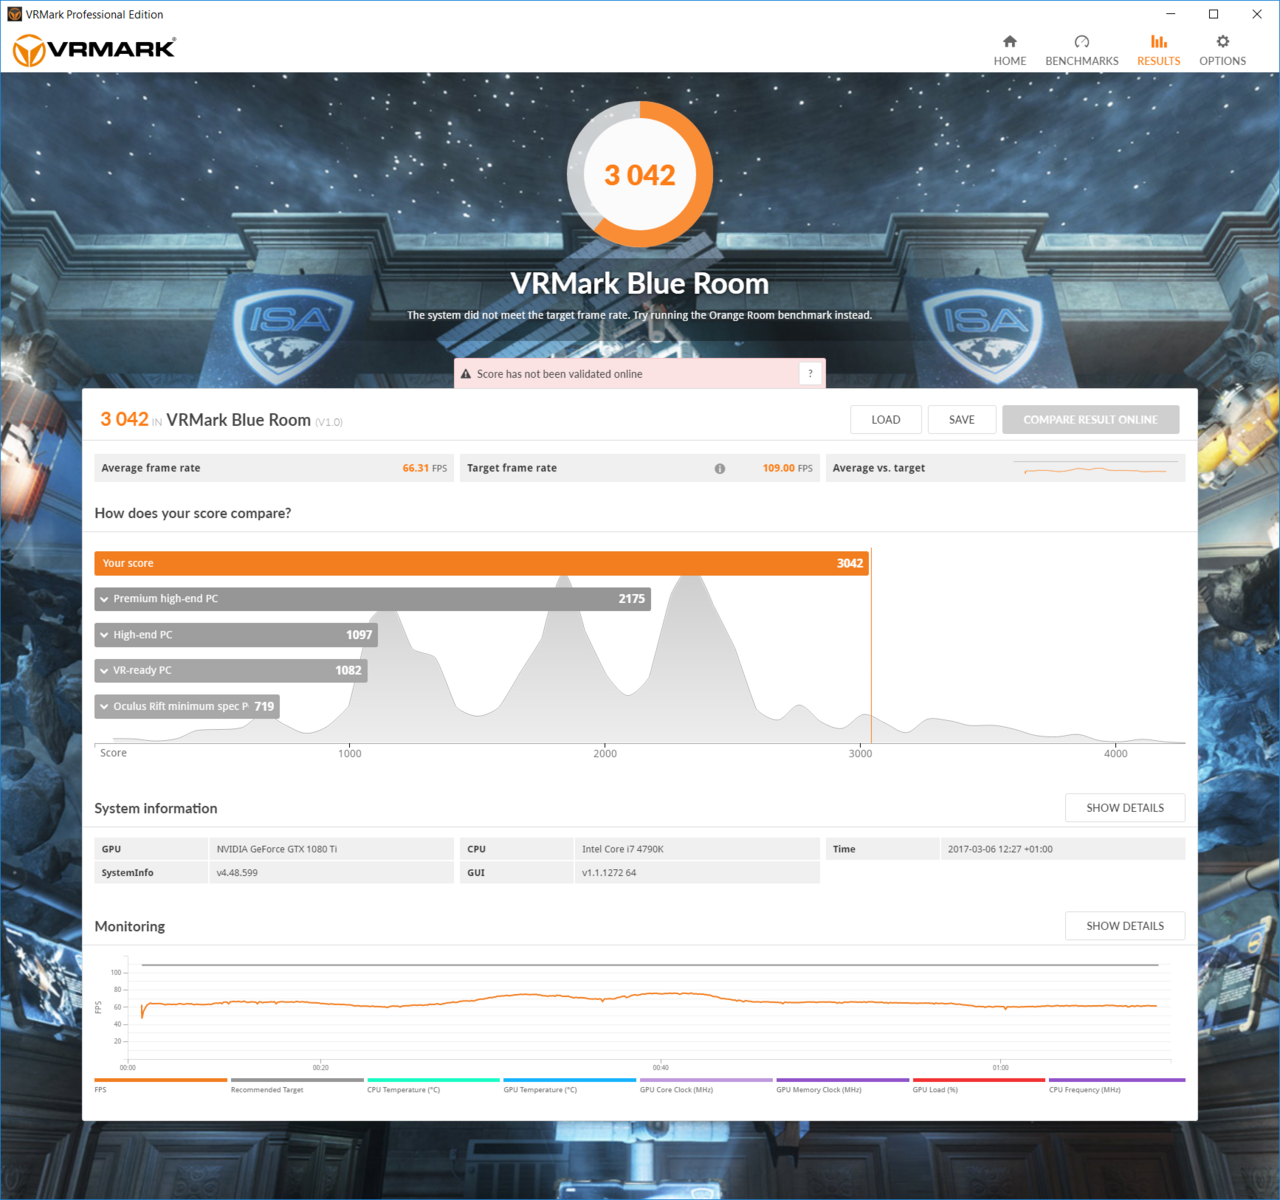
Synthetische Benchmarks
Die synthetischen Benchmarks von Futuremark und Unigine zeigen ganz klar den Trend, die schnellste Consumer-Grafikkarte zu sein. Der teilweise deutliche Abstand zur Titan X ist durch die unterschiedlichen Prozessoren zu erklären (besonders bei den Unigine Tests). Die Nvidia GeForce GTX 1080 Founders Edition ist 25 % langsamer als das "Titanium" Modell. Die Leistung zweier GTX 1080 im SLI Modus (jedoch im Notebook) erreicht die 1080 Ti nicht ganz. Die synthetischen Benchmarks skalieren mit SLI und Crossfire jedoch auch aussergewöhnlich gut.
| Performance Rating - Percent | |
| NVIDIA GeForce GTX 1080 SLI (Laptop) -1! | |
| NVIDIA GeForce GTX 1080 Ti (Desktop) | |
| NVIDIA GeForce GTX 1080 (Desktop) -1! | |
| NVIDIA GeForce GTX 1080 Mobile -3! | |
| NVIDIA Titan X Pascal | |
| NVIDIA GeForce GTX 1080 (Desktop) | |
| NVIDIA GeForce GTX 980 SLI (Laptop) -2! | |
| NVIDIA GeForce GTX 1070 (Desktop) | |
| NVIDIA GeForce GTX 980 Ti | |
| AMD Radeon R9 Fury | |
| 3DMark 11 - 1280x720 Performance GPU | |
| NVIDIA GeForce GTX 1080 SLI (Laptop) | |
| NVIDIA GeForce GTX 1080 Ti (Desktop) | |
| NVIDIA Titan X Pascal | |
| NVIDIA GeForce GTX 1080 (Desktop) | |
| NVIDIA GeForce GTX 1080 Mobile | |
| NVIDIA GeForce GTX 980 SLI (Laptop) | |
| NVIDIA GeForce GTX 1080 (Desktop) | |
| NVIDIA GeForce GTX 1070 (Desktop) | |
| NVIDIA GeForce GTX 980 Ti | |
| AMD Radeon R9 Fury | |
| 3DMark | |
| 2560x1440 Time Spy Graphics | |
| NVIDIA GeForce GTX 1080 SLI (Laptop) | |
| NVIDIA GeForce GTX 1080 Ti (Desktop) | |
| NVIDIA Titan X Pascal | |
| NVIDIA GeForce GTX 1080 (Desktop) | |
| NVIDIA GeForce GTX 1080 (Desktop) | |
| NVIDIA GeForce GTX 1070 (Desktop) | |
| NVIDIA GeForce GTX 980 Ti | |
| AMD Radeon R9 Fury | |
| 3840x2160 Fire Strike Ultra Graphics | |
| NVIDIA GeForce GTX 1080 SLI (Laptop) | |
| NVIDIA Titan X Pascal | |
| NVIDIA GeForce GTX 1080 Ti (Desktop) | |
| NVIDIA GeForce GTX 980 SLI (Laptop) | |
| NVIDIA GeForce GTX 1080 (Desktop) | |
| NVIDIA GeForce GTX 1070 (Desktop) | |
| NVIDIA GeForce GTX 980 Ti | |
| AMD Radeon R9 Fury | |
| Unigine Heaven 4.0 - Extreme Preset DX11 | |
| NVIDIA GeForce GTX 1080 SLI (Laptop) | |
| NVIDIA GeForce GTX 1080 Ti (Desktop) | |
| NVIDIA GeForce GTX 1080 (Desktop) | |
| NVIDIA Titan X Pascal | |
| NVIDIA GeForce GTX 1080 Mobile | |
| NVIDIA GeForce GTX 1080 (Desktop) | |
| NVIDIA GeForce GTX 980 SLI (Laptop) | |
| NVIDIA GeForce GTX 1070 (Desktop) | |
| NVIDIA GeForce GTX 980 Ti | |
| AMD Radeon R9 Fury | |
| Unigine Valley 1.0 - 1920x1080 Extreme HD DirectX AA:x8 | |
| NVIDIA GeForce GTX 1080 Ti (Desktop) | |
| NVIDIA GeForce GTX 1080 (Desktop) | |
| NVIDIA GeForce GTX 1080 (Desktop) | |
| NVIDIA GeForce GTX 1070 (Desktop) | |
| NVIDIA GeForce GTX 980 Ti | |
| NVIDIA Titan X Pascal | |
| AMD Radeon R9 Fury | |
Spiele-Benchmarks
Viel mehr Aussagekraft hat natürlich die tatsächliche Leistung in Spielen. Nach zahlreichen Spieletests in verschiedensten Settings zeigt die 1080 Ti eine vergleichbare Leistung zu der Titan X. Die versprochenen 5 % Vorsprung sind aufgrund der unterschiedlichen Hardwareplattformen von uns leider nicht nachvollziehbar. Da uns Nvidia kein Testmodell der Titan X zur Verfügung stellen konnte bzw. wollte, ist hier die Vergleichbarkeit leider nicht vollständig gewährleistet. Der Abstand zur GTX 1080 ist ähnlich wie bei den synthetischen Benchmarks 28 % (zur Founders Edition). Die übertakteten Partnermodelle sind etwas schneller. Eine ähnliche Leistungssteigerung ist auch zwischen der 1080 Ti und den entsprechenden Partnermodellen zu erwarten (die etwas später erscheinen).
| Performance Rating - Percent | |
| NVIDIA GeForce GTX 1080 Ti (Desktop) | |
| NVIDIA Titan X Pascal | |
| NVIDIA GeForce GTX 1080 (Desktop) -1! | |
| NVIDIA GeForce GTX 1080 (Desktop) -4! | |
| NVIDIA GeForce GTX 980 SLI (Laptop) -14! | |
| NVIDIA GeForce GTX 1070 (Desktop) -2! | |
| NVIDIA GeForce GTX 980 Ti | |
| NVIDIA GeForce GTX 1070 (Desktop) -4! | |
| AMD Radeon R9 Fury | |
| NVIDIA GeForce GTX 980 -4! | |
| NVIDIA GeForce GTX 980M -1! | |
| Hitman 2016 - 3840x2160 High / On AA:FX AF:8x | |
| NVIDIA GeForce GTX 1080 Ti (Desktop) | |
| NVIDIA GeForce GTX 1080 Ti (Desktop) | |
| NVIDIA Titan X Pascal | |
| NVIDIA GeForce GTX 1080 (Desktop) | |
| NVIDIA GeForce GTX 1080 (Desktop) | |
| NVIDIA GeForce GTX 1070 (Desktop) | |
| AMD Radeon R9 Fury | |
| AMD Radeon R9 Fury | |
| NVIDIA GeForce GTX 1070 (Desktop) | |
| NVIDIA GeForce GTX 980 Ti | |
| NVIDIA GeForce GTX 980 | |
| NVIDIA GeForce GTX 980M | |
| The Division - 3840x2160 High Preset AF:8x | |
| NVIDIA GeForce GTX 1080 Ti (Desktop) | |
| NVIDIA Titan X Pascal | |
| NVIDIA GeForce GTX 1080 (Desktop) | |
| NVIDIA GeForce GTX 1080 (Desktop) | |
| NVIDIA GeForce GTX 1070 (Desktop) | |
| NVIDIA GeForce GTX 980 Ti | |
| NVIDIA GeForce GTX 1070 (Desktop) | |
| AMD Radeon R9 Fury | |
| NVIDIA GeForce GTX 980 | |
| Far Cry Primal - 3840x2160 High Preset AA:SM | |
| NVIDIA GeForce GTX 1080 Ti (Desktop) | |
| NVIDIA Titan X Pascal | |
| NVIDIA GeForce GTX 1080 (Desktop) | |
| NVIDIA GeForce GTX 1080 (Desktop) | |
| NVIDIA GeForce GTX 1070 (Desktop) | |
| NVIDIA GeForce GTX 980 Ti | |
| NVIDIA GeForce GTX 1070 (Desktop) | |
| AMD Radeon R9 Fury | |
| NVIDIA GeForce GTX 980 | |
| NVIDIA GeForce GTX 980M | |
| Rise of the Tomb Raider - 3840x2160 High Preset AA:FX AF:4x | |
| NVIDIA GeForce GTX 1080 Ti (Desktop) | |
| NVIDIA GeForce GTX 1080 Ti (Desktop) | |
| NVIDIA Titan X Pascal | |
| NVIDIA GeForce GTX 1080 (Desktop) | |
| NVIDIA GeForce GTX 1080 (Desktop) | |
| NVIDIA GeForce GTX 1080 (Desktop) | |
| NVIDIA GeForce GTX 1070 (Desktop) | |
| NVIDIA GeForce GTX 980 Ti | |
| NVIDIA GeForce GTX 1070 (Desktop) | |
| AMD Radeon R9 Fury | |
| NVIDIA GeForce GTX 980 | |
| NVIDIA GeForce GTX 980M | |
| Fallout 4 - 3840x2160 High Preset AA:T AF:16x | |
| NVIDIA Titan X Pascal | |
| NVIDIA GeForce GTX 1080 Ti (Desktop) | |
| NVIDIA GeForce GTX 1080 (Desktop) | |
| NVIDIA GeForce GTX 980 SLI (Laptop) | |
| NVIDIA GeForce GTX 1080 (Desktop) | |
| NVIDIA GeForce GTX 1070 (Desktop) | |
| NVIDIA GeForce GTX 980 Ti | |
| NVIDIA GeForce GTX 1070 (Desktop) | |
| AMD Radeon R9 Fury | |
| NVIDIA GeForce GTX 980M | |
| GTA V - 3840x2160 High/On (Advanced Graphics Off) AA:FX AF:8x | |
| NVIDIA GeForce GTX 1080 Ti (Desktop) | |
| NVIDIA Titan X Pascal | |
| NVIDIA GeForce GTX 980 Ti | |
| NVIDIA GeForce GTX 1080 (Desktop) | |
| NVIDIA GeForce GTX 1080 (Desktop) | |
| NVIDIA GeForce GTX 1070 (Desktop) | |
| NVIDIA GeForce GTX 1070 (Desktop) | |
| AMD Radeon R9 Fury | |
| NVIDIA GeForce GTX 980M | |
| Battlefield 4 - 3840x2160 High Preset | |
| NVIDIA Titan X Pascal | |
| NVIDIA GeForce GTX 1080 Ti (Desktop) | |
| NVIDIA GeForce GTX 980 SLI (Laptop) | |
| NVIDIA GeForce GTX 1080 (Desktop) | |
| NVIDIA GeForce GTX 1070 (Desktop) | |
| NVIDIA GeForce GTX 980 Ti | |
| NVIDIA GeForce GTX 1070 (Desktop) | |
| AMD Radeon R9 Fury | |
| NVIDIA GeForce GTX 980M | |
| The Witcher 3 - 3840x2160 High Graphics & Postprocessing (Nvidia HairWorks Off) | |
| NVIDIA GeForce GTX 1080 Ti (Desktop) | |
| NVIDIA Titan X Pascal | |
| NVIDIA GeForce GTX 1080 (Desktop) | |
| NVIDIA GeForce GTX 1080 (Desktop) | |
| NVIDIA GeForce GTX 980 SLI (Laptop) | |
| NVIDIA GeForce GTX 1070 (Desktop) | |
| NVIDIA GeForce GTX 980 Ti | |
| NVIDIA GeForce GTX 1070 (Desktop) | |
| AMD Radeon R9 Fury | |
| NVIDIA GeForce GTX 980M | |
| Overwatch - 3840x2160 High (Render Scale 100 %) AA:SM AF:4x | |
| NVIDIA Titan X Pascal | |
| NVIDIA GeForce GTX 1080 Ti (Desktop) | |
| NVIDIA GeForce GTX 1080 (Desktop) | |
| NVIDIA GeForce GTX 1080 (Desktop) | |
| NVIDIA GeForce GTX 1070 (Desktop) | |
| NVIDIA GeForce GTX 980 Ti | |
| NVIDIA GeForce GTX 1070 (Desktop) | |
| AMD Radeon R9 Fury | |
| NVIDIA GeForce GTX 980 | |
| NVIDIA GeForce GTX 980M | |
| Deus Ex Mankind Divided - 3840x2160 High Preset AF:4x | |
| NVIDIA GeForce GTX 1080 Ti (Desktop) | |
| NVIDIA GeForce GTX 1080 Ti (Desktop) | |
| NVIDIA Titan X Pascal | |
| NVIDIA GeForce GTX 1080 (Desktop) | |
| NVIDIA GeForce GTX 1080 (Desktop) | |
| NVIDIA GeForce GTX 1070 (Desktop) | |
| NVIDIA GeForce GTX 1070 (Desktop) | |
| AMD Radeon R9 Fury | |
| NVIDIA GeForce GTX 980 Ti | |
| NVIDIA GeForce GTX 980 | |
| NVIDIA GeForce GTX 980M | |
| Rainbow Six Siege - 3840x2160 High Preset AA:T AF:4x | |
| NVIDIA GeForce GTX 1080 Ti (Desktop) | |
| NVIDIA Titan X Pascal | |
| NVIDIA GeForce GTX 1080 (Desktop) | |
| NVIDIA GeForce GTX 1080 (Desktop) | |
| NVIDIA GeForce GTX 1070 (Desktop) | |
| NVIDIA GeForce GTX 1070 (Desktop) | |
| NVIDIA GeForce GTX 980 Ti | |
| AMD Radeon R9 Fury | |
| NVIDIA GeForce GTX 980 SLI (Laptop) | |
| NVIDIA GeForce GTX 980 | |
| NVIDIA GeForce GTX 980M | |
| Doom - 3840x2160 High Preset AA:FX | |
| NVIDIA GeForce GTX 1080 Ti (Desktop) | |
| NVIDIA GeForce GTX 1080 Ti (Desktop) | |
| NVIDIA Titan X Pascal | |
| NVIDIA GeForce GTX 1080 (Desktop) | |
| NVIDIA GeForce GTX 1080 (Desktop) | |
| NVIDIA GeForce GTX 1070 (Desktop) | |
| NVIDIA GeForce GTX 1070 (Desktop) | |
| NVIDIA GeForce GTX 980 Ti | |
| AMD Radeon R9 Fury | |
| NVIDIA GeForce GTX 980 | |
| NVIDIA GeForce GTX 980M | |
| Battlefield 1 - 3840x2160 High Preset AA:T | |
| NVIDIA Titan X Pascal | |
| NVIDIA GeForce GTX 1080 Ti (Desktop) | |
| NVIDIA GeForce GTX 1080 (Desktop) | |
| NVIDIA GeForce GTX 1080 (Desktop) | |
| NVIDIA GeForce GTX 1070 (Desktop) | |
| NVIDIA GeForce GTX 980 Ti | |
| AMD Radeon R9 Fury | |
| NVIDIA GeForce GTX 980 | |
| NVIDIA GeForce GTX 980M | |
| Farming Simulator 17 - 3840x2160 High Preset AA:2xMS AF:2x | |
| NVIDIA GeForce GTX 1080 Ti (Desktop) | |
| NVIDIA Titan X Pascal | |
| NVIDIA GeForce GTX 1080 (Desktop) | |
| NVIDIA GeForce GTX 1070 (Desktop) | |
| NVIDIA GeForce GTX 980 Ti | |
| NVIDIA GeForce GTX 980 | |
| AMD Radeon R9 Fury | |
| NVIDIA GeForce GTX 980M | |
| Titanfall 2 - 3840x2160 High / Enabled AA:TS AF:8x | |
| NVIDIA Titan X Pascal | |
| NVIDIA GeForce GTX 1080 Ti (Desktop) | |
| NVIDIA GeForce GTX 1080 (Desktop) | |
| NVIDIA GeForce GTX 980 Ti | |
| AMD Radeon R9 Fury | |
| NVIDIA GeForce GTX 1080 (Desktop) | |
| NVIDIA GeForce GTX 1070 (Desktop) | |
| NVIDIA GeForce GTX 980 | |
| NVIDIA GeForce GTX 980M | |
| Call of Duty Infinite Warfare - 3840x2160 High / On AA:FX | |
| NVIDIA GeForce GTX 1080 Ti (Desktop) | |
| NVIDIA Titan X Pascal | |
| NVIDIA GeForce GTX 1080 (Desktop) | |
| NVIDIA GeForce GTX 1070 (Desktop) | |
| NVIDIA GeForce GTX 980 Ti | |
| AMD Radeon R9 Fury | |
| NVIDIA GeForce GTX 980 | |
| NVIDIA GeForce GTX 980M | |
| Dishonored 2 - 3840x2160 High Preset AA:TX | |
| NVIDIA GeForce GTX 1080 Ti (Desktop) | |
| NVIDIA Titan X Pascal | |
| NVIDIA GeForce GTX 1080 (Desktop) | |
| NVIDIA GeForce GTX 1070 (Desktop) | |
| NVIDIA GeForce GTX 980 Ti | |
| NVIDIA GeForce GTX 980 | |
| AMD Radeon R9 Fury | |
| NVIDIA GeForce GTX 980M | |
| Watch Dogs 2 - 3840x2160 High Preset | |
| NVIDIA GeForce GTX 1080 Ti (Desktop) | |
| NVIDIA Titan X Pascal | |
| NVIDIA GeForce GTX 1080 (Desktop) | |
| NVIDIA GeForce GTX 1070 (Desktop) | |
| NVIDIA GeForce GTX 980 Ti | |
| AMD Radeon R9 Fury | |
| NVIDIA GeForce GTX 980 | |
| NVIDIA GeForce GTX 980M | |
Generell eignet sich die Nvidia GeForce GTX 1080 Ti hervorragend für 4K Gaming und auch VR Anwendungen. Alle von uns getesteten Spiele waren in 4K und hohen Settings flüssig spielbar. Nur Mafia 3 und Deus Ex Mankind Divided boten nur wenig Spielraum. Die meisten anderen Titel waren auch mit "ultra" Settings und Antialiasing spielbar. Auch Nutzer von 120 Hz Monitoren mit etwas geringerer Auflösung können von der GeForce GTX 1080 Ti profitieren. In 1080p und ultra Settings waren in vielen Spielen dreistellige Frameraten messbar. Mit einer schnelleren CPU ist hier auch noch mehr herauszuholen.
| min. | mittel | hoch | max. | QHD | 4K | |
|---|---|---|---|---|---|---|
| Crysis 3 (2013) | 122 | |||||
| BioShock Infinite (2013) | 215 | |||||
| Metro: Last Light (2013) | 167 | 149 | ||||
| Battlefield 4 (2013) | 200 | 117 | ||||
| Dragon Age: Inquisition (2014) | 170 | |||||
| GTA V (2015) | 85 | 97.8 | ||||
| Dirt Rally (2015) | 129 | 135 | ||||
| The Witcher 3 (2015) | 322 | 98 | 72 | |||
| Dota 2 Reborn (2015) | 220 | 193 | 191 | 173 | 169 | |
| World of Warships (2015) | 162 | 124 | ||||
| Fallout 4 (2015) | 149 | 74 | ||||
| Rainbow Six Siege (2015) | 338 | 301 | 274 | 247 | 109 | |
| Rise of the Tomb Raider (2016) | 180 | 161 | 70.9 | |||
| Far Cry Primal (2016) | 157 | 136 | 129 | 121 | 64 | |
| The Division (2016) | 280 | 254 | 160 | 130 | 65 | |
| Hitman 2016 (2016) | 95 | 72 | ||||
| Ashes of the Singularity (2016) | 87.5 | 58.4 | ||||
| Doom (2016) | 200 | 99 | ||||
| Overwatch (2016) | 263 | 143 | ||||
| Deus Ex Mankind Divided (2016) | 151 | 139 | 121 | 73 | 46 | |
| FIFA 17 (2016) | 279 | |||||
| Mafia 3 (2016) | 91 | 36.7 | ||||
| Battlefield 1 (2016) | 200 | 196 | 169 | 158 | 76.7 | |
| Civilization 6 (2016) | 88 | 88 | ||||
| Farming Simulator 17 (2016) | 238 | 204 | ||||
| Titanfall 2 (2016) | 144 | 78 | ||||
| Call of Duty Infinite Warfare (2016) | 125 | 99 | ||||
| Dishonored 2 (2016) | 99 | 72 | ||||
| Watch Dogs 2 (2016) | 93 | 56.1 | ||||
| Resident Evil 7 (2017) | 222 | 76 | ||||
| For Honor (2017) | 318 | 239 | 229 | 173 | 77 | |
| Ghost Recon Wildlands (2017) | 203 | 133 | 125 | 70.3 | 52.2 | |
| Mass Effect Andromeda (2017) | 144 | 125 | 102 | 95 | 53.4 | |
| Warhammer 40.000: Dawn of War III (2017) | 192 | 120 | 98 | 89 | 33.8 | |
| Prey (2017) | 144 | 143 | 142 | 139 | 95 | |
| Rocket League (2017) | 250 | 244 | 214 | 132 | ||
| Dirt 4 (2017) | 177 | 109 | 77 | |||
| Team Fortress 2 (2017) | 171 | 166 | ||||
| Playerunknown's Battlegrounds (PUBG) (2017) | 127 | 125 | 115 | 110 | 46 | |
| Ark Survival Evolved (2017) | 58.5 | 22.5 | ||||
| Middle-earth: Shadow of War (2017) | 167 | 155 | 138 | 117 | 51 | |
| The Evil Within 2 (2017) | 87 | 40.6 | ||||
| ELEX (2017) | 120 | 44.4 | ||||
| Destiny 2 (2017) | 156 | 158 | 51.5 | |||
| Wolfenstein II: The New Colossus (2017) | 160 | 65.2 | ||||
| Assassin´s Creed Origins (2017) | 79 | 49 | ||||
| Call of Duty WWII (2017) | 160 | 131 | 82 | |||
| Need for Speed Payback (2017) | 134 | 117 | 65 | |||
| Star Wars Battlefront 2 (2017) | 179 | 167 | 142 | 155 | 110 | 56.4 |
| Fortnite (2018) | 203 | 163 | 107 | 51.4 | ||
| Final Fantasy XV Benchmark (2018) | 173 | 129 | 92 | 42.3 | ||
| Kingdom Come: Deliverance (2018) | 155 | 122 | 96 | 73 | 55.3 | 31 |
| X-Plane 11.11 (2018) | 101 | 90 | 74.5 | 67.6 |
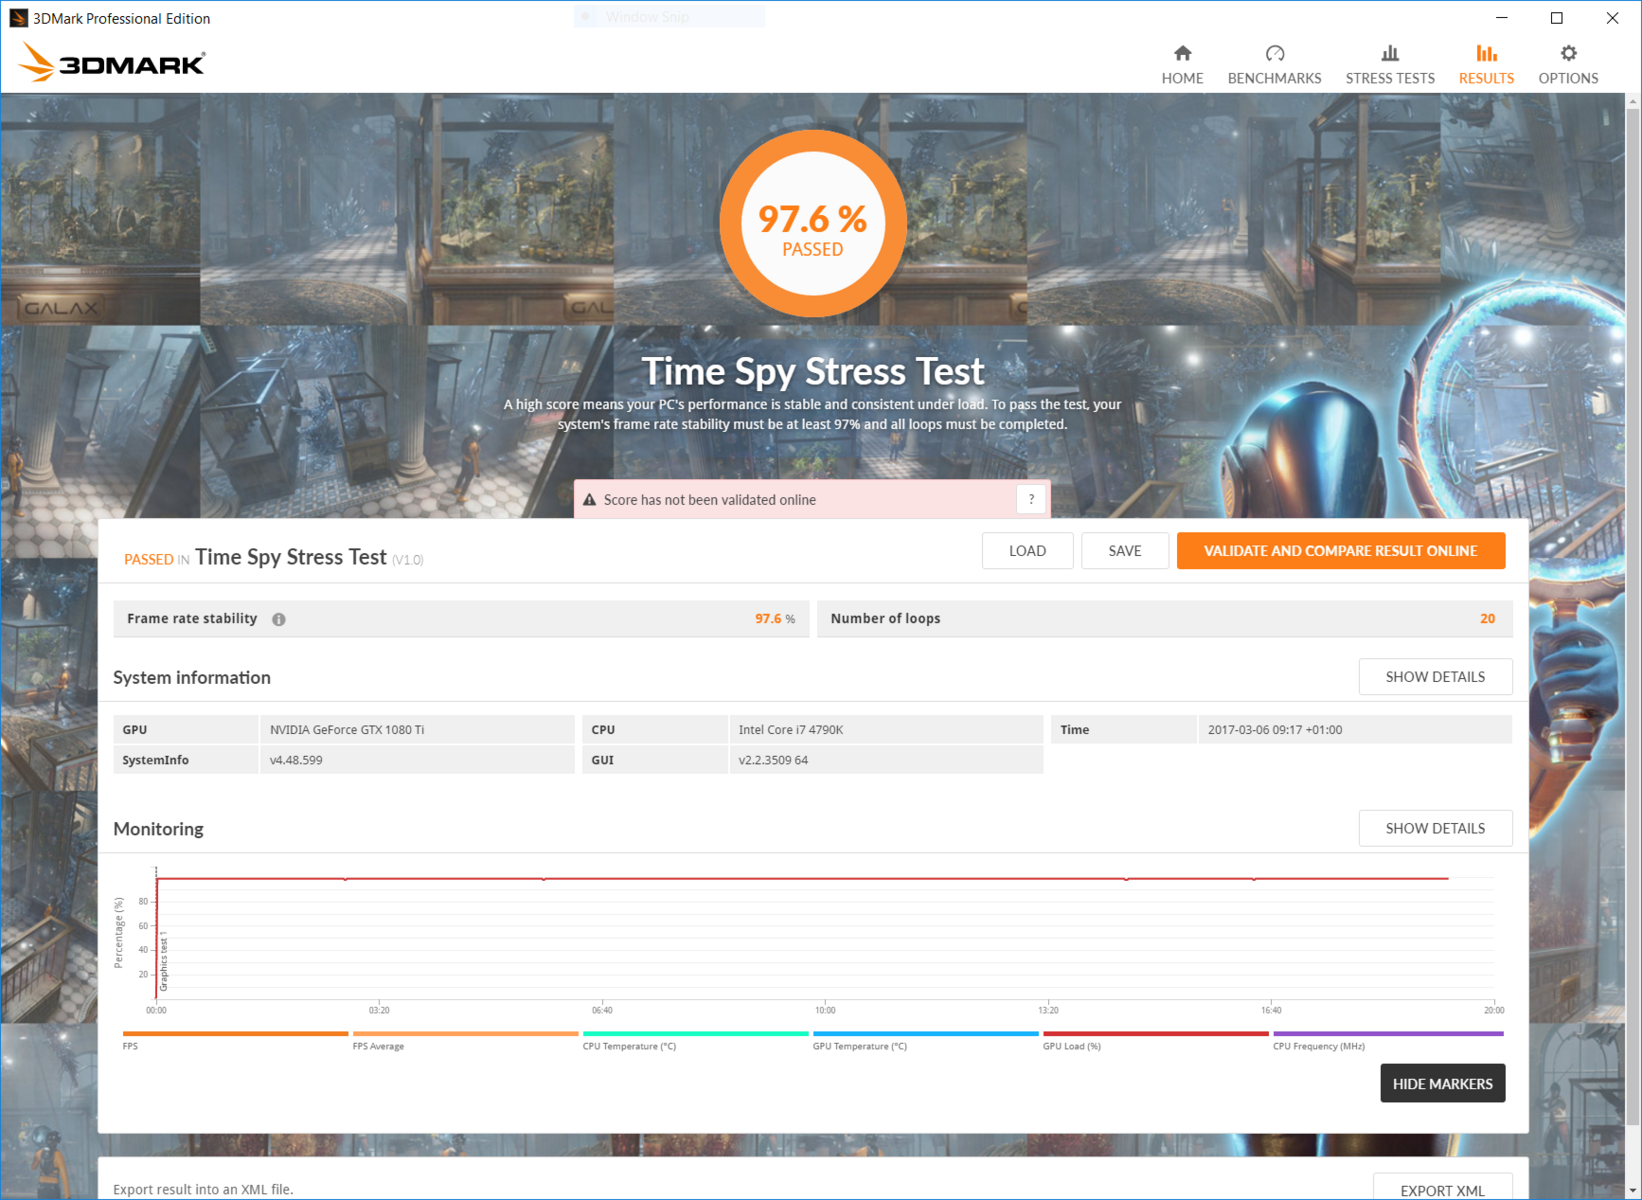
Boost-Takt und Leistung unter Last
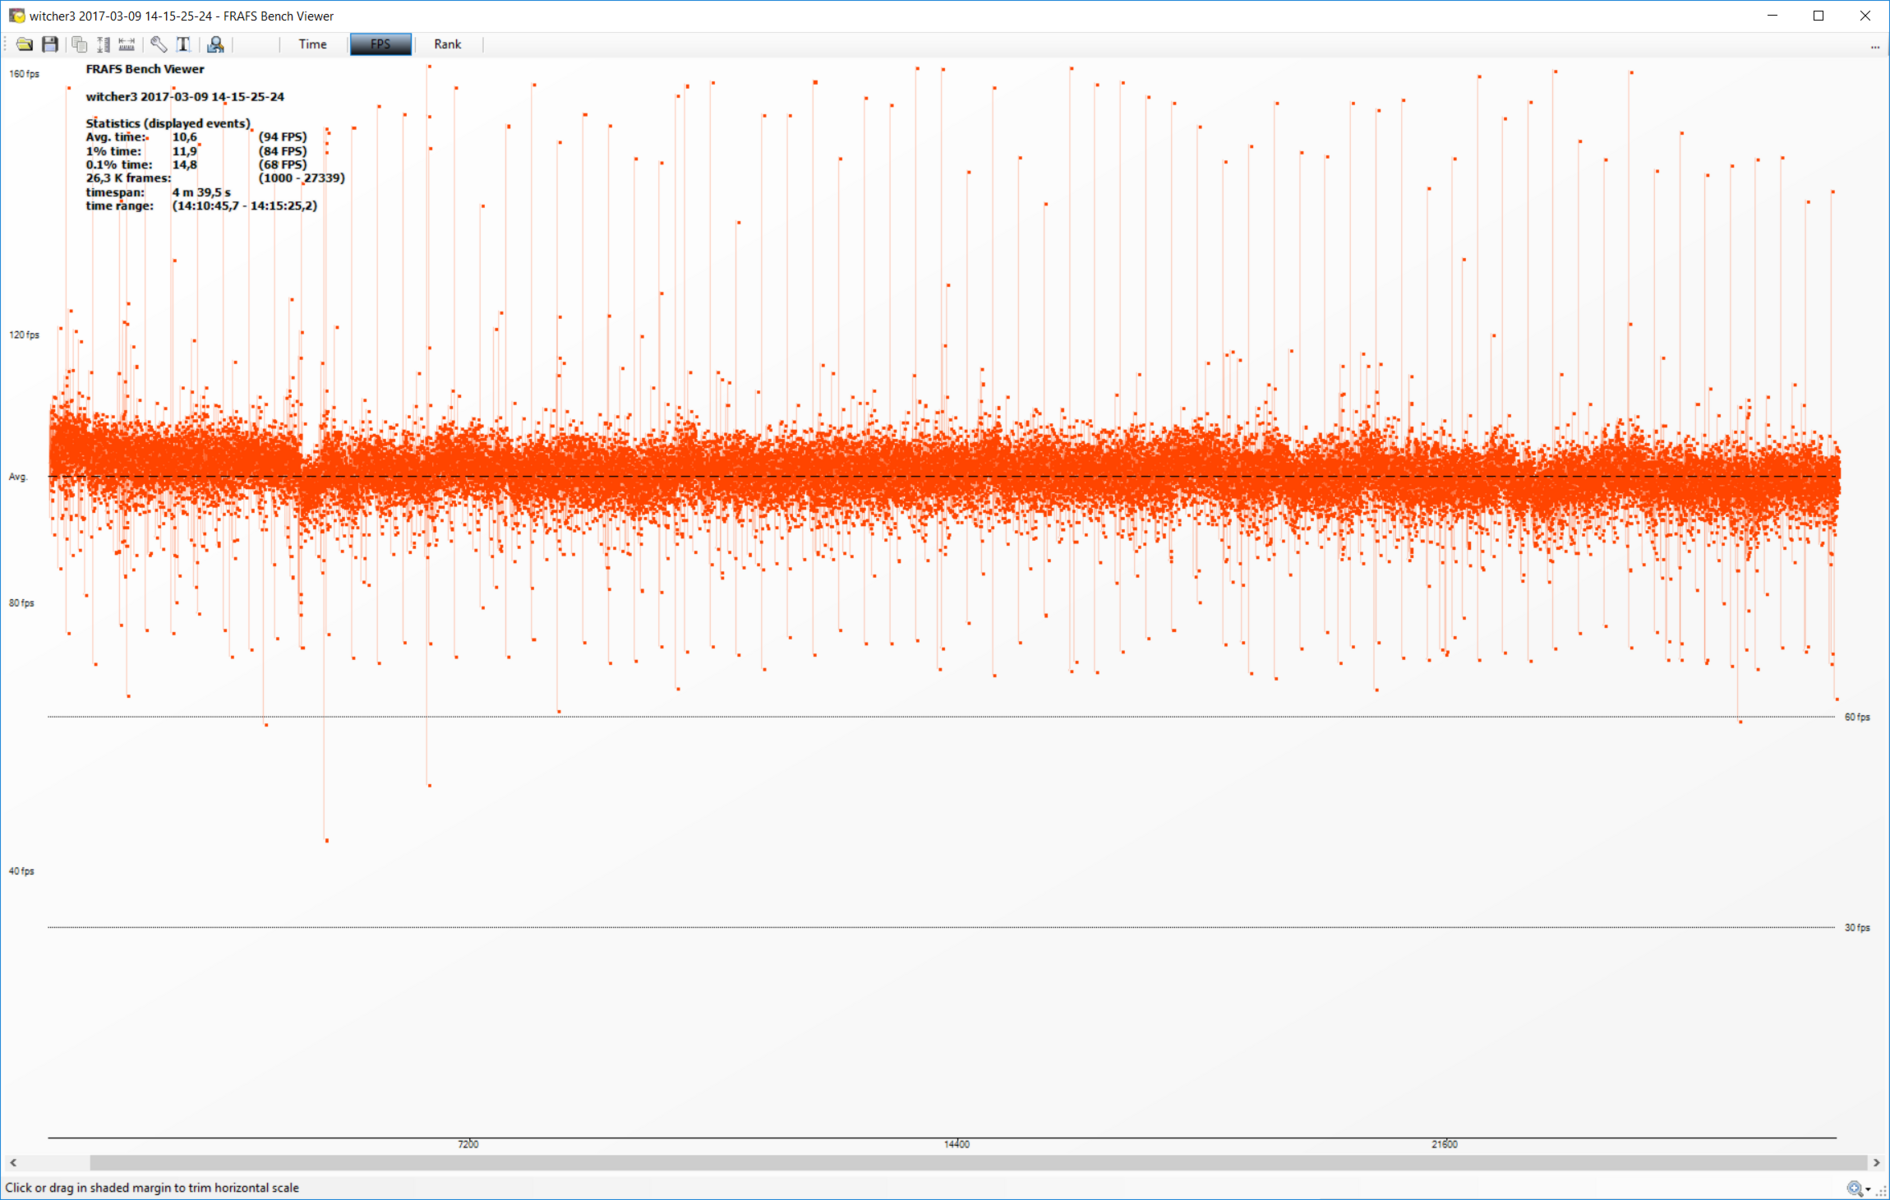
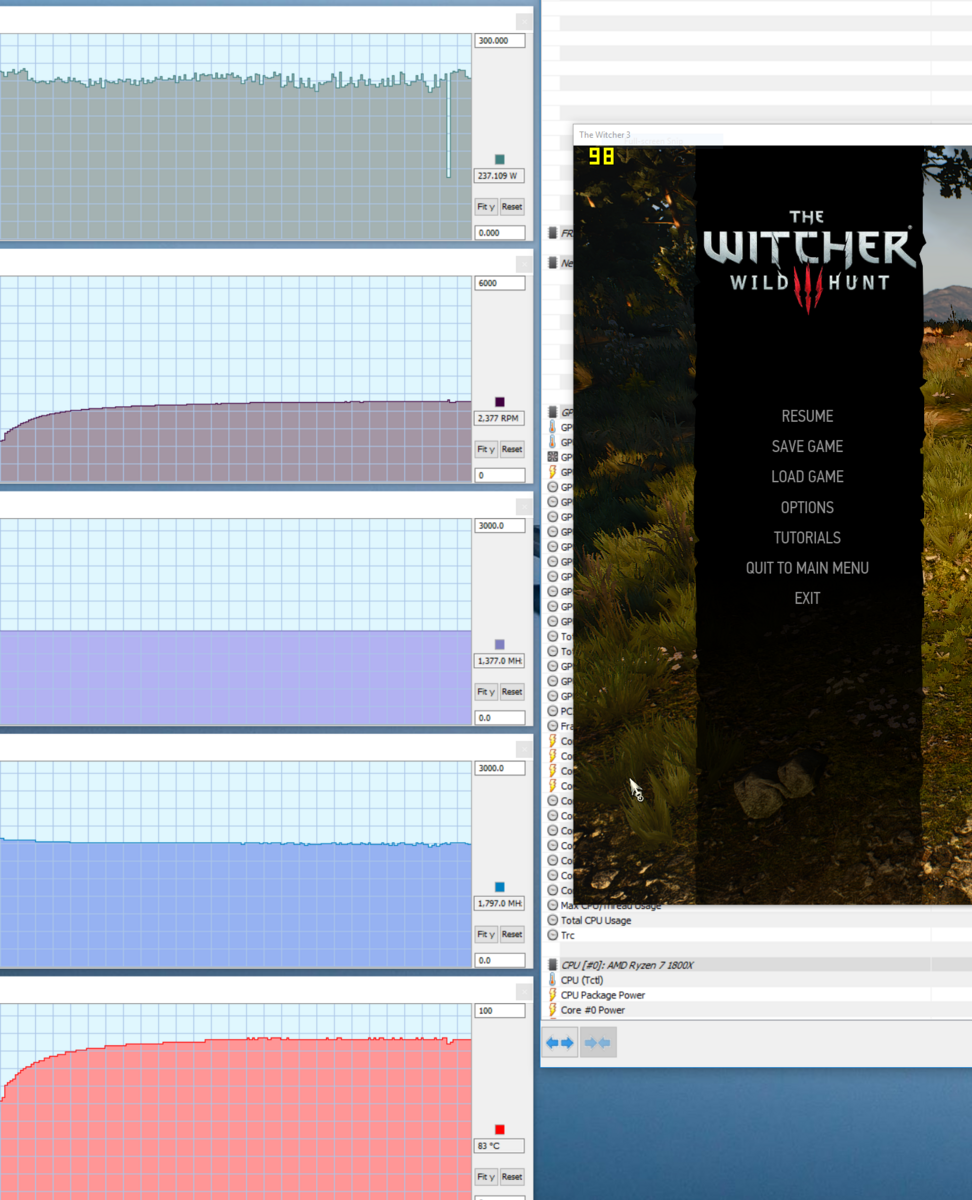
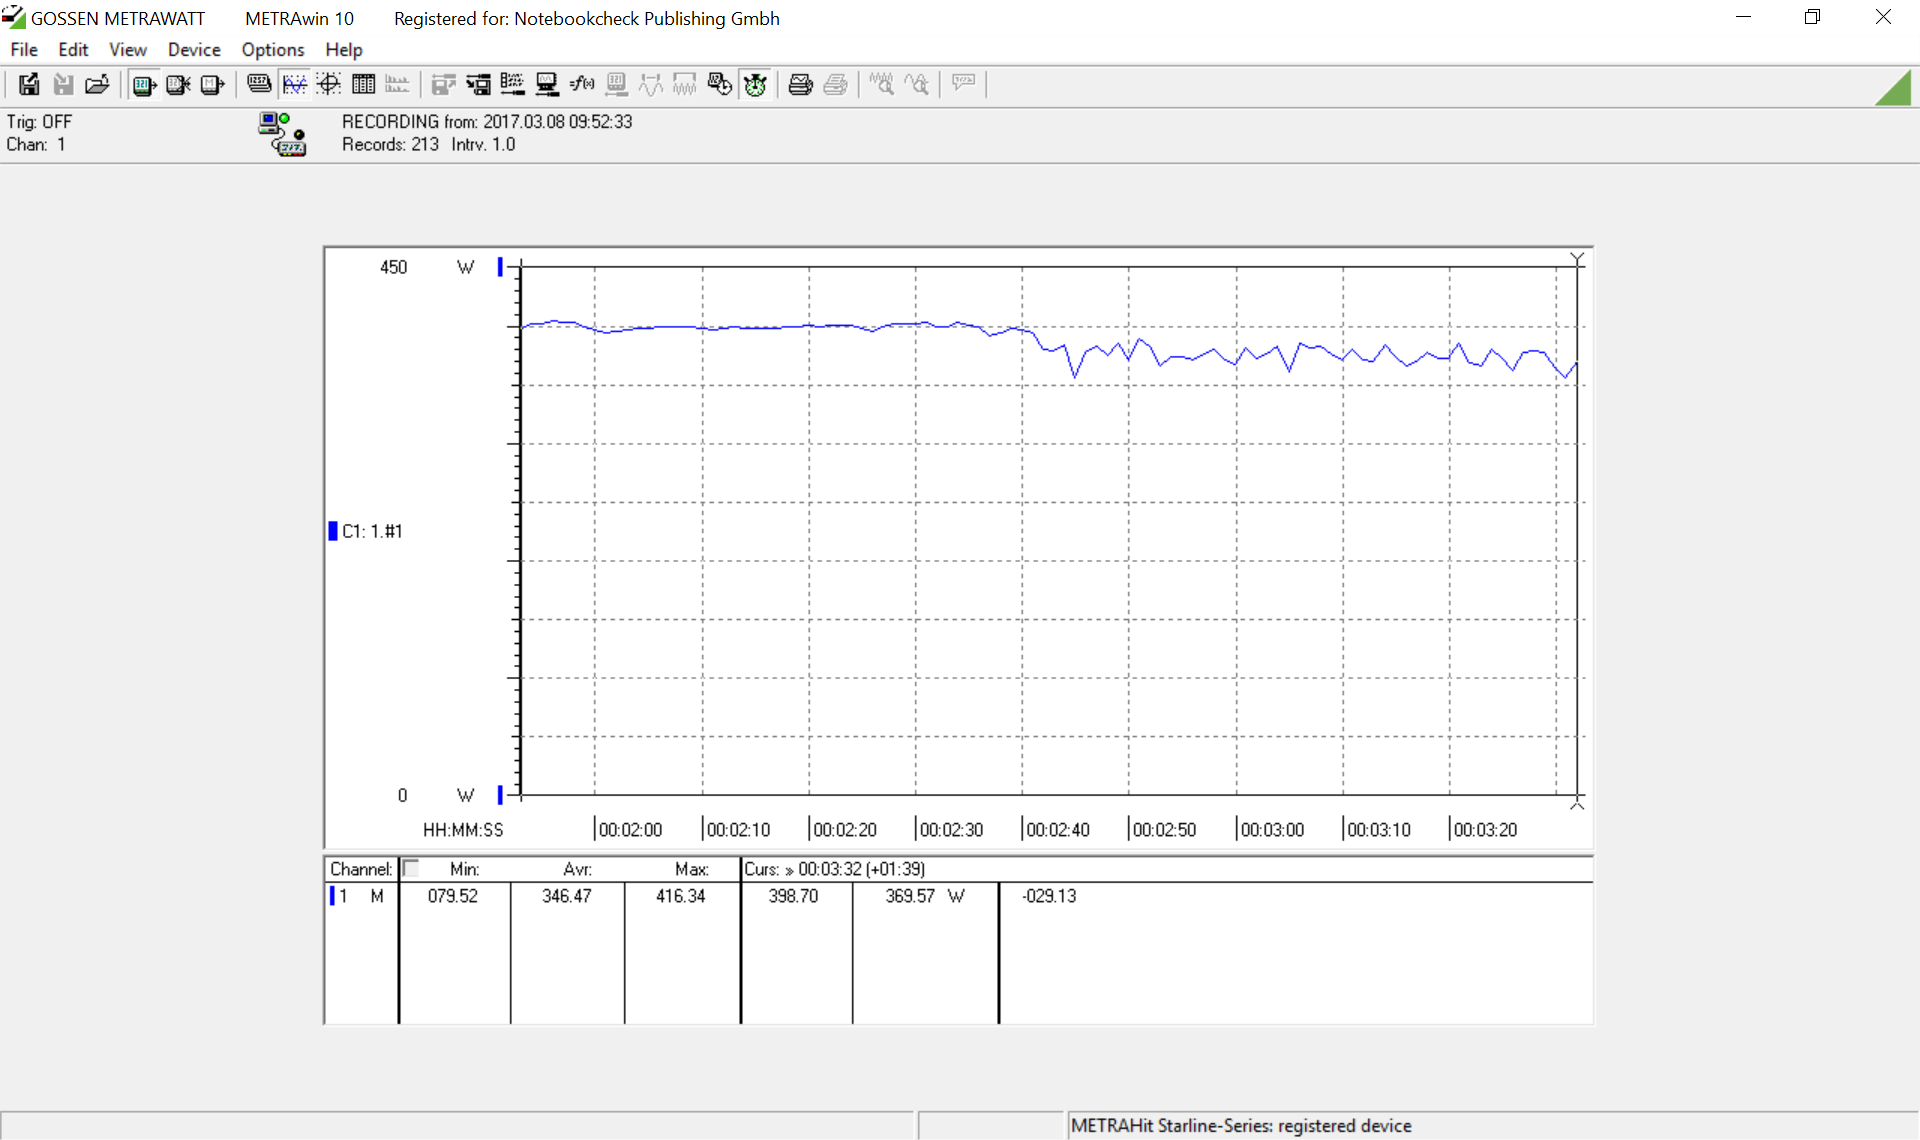
Widmen wir uns nun dem Thema Stresstest und der Leistungsentfaltung auf Dauer. Der 3DMark Time Spy Stress Test zeigt ein gutes aber nicht perfektes Ergebnis von 97,6 %. Die Titan X mit Luftkühlung erreichte hier nur 90,9 %. Unter Witcher 3 zeigt sich jedoch ein zwiegespaltenes Bild. In einem Test mit dem i7-4790K verringerte sich die Framerate von 96 auf 88 fps nach 3 Minuten. In späteren Tests zeigt sich zwar ein etwas reduzierter Stromverbrauch nach kurzer Zeit, die Framerate bleibt jedoch stabil. Mit dem Ryzen 1800X blieb sie bei 94 fps über 5 Minuten stabil.
Professionelle Anwendungen
Schaut man nur auf die technischen Daten und auf die Ergebnisse der GTX 1080 Ti bei den Spiele-Benchmarks, dann sollte auch theoretisch genügend Leistung für professionelle Applikationen bereitstehen. Hier zeigt sich jedoch das Nvidia die Treiber deutlich beschneidet. Die 1080 Ti ist im Schnitt nur knapp schneller als eine Quadro M2000M (GTX 960M) im Notebook. Betrachtet man die Benchmarks im Detail sieht man jedoch ein unterschiedliches Bild, welches auch von der CPU deutlich abhängt.
| NVIDIA GeForce GTX 1080 Ti (Desktop) Nvidia GeForce GTX 1080 Ti Founders Edition, Intel Core i7-4790K | NVIDIA Titan X Pascal Nvidia Titan X (Pascal), Intel Xeon E5-2680 v4 | NVIDIA GeForce GTX 1080 (Desktop) Nvidia GeForce GTX 1080 Founders Edition, Intel Core i7-4790K | NVIDIA Quadro P5000 no name, Intel Core i5-7440HQ | NVIDIA Quadro M5000M MSI WT72-6QM, Intel Xeon E3-1505M v5 | NVIDIA Quadro M3000M Schenker W706, Intel Core i7-6700 | NVIDIA Quadro M2000M Fujitsu Celsius H760, Intel Xeon E3-1505M v5 | |
|---|---|---|---|---|---|---|---|
| SPECviewperf 12 | -23% | -19% | 168% | 69% | 16% | -29% | |
| 1900x1060 Solidworks (sw-03) (fps) | 75.4 | 48.75 -35% | 67.7 -10% | 153 103% | 101 34% | 92 22% | 73 -3% |
| 1900x1060 Siemens NX (snx-02) (fps) | 10.2 | 8.58 -16% | 8.67 -15% | 155 1420% | 86.9 752% | 52 410% | 33.6 229% |
| 1900x1060 Showcase (showcase-01) (fps) | 155.2 | 126.4 -19% | 112 -28% | 73 -53% | 44.14 -72% | 37 -76% | 22.5 -86% |
| 1900x1060 Medical (medical-01) (fps) | 59.8 | 59.9 0% | 45.6 -24% | 55.6 -7% | 31.35 -48% | 22 -63% | 14.7 -75% |
| 1900x1060 Maya (maya-04) (fps) | 194.5 | 114.5 -41% | 163 -16% | 95 -51% | 69.6 -64% | 61 -69% | 35.5 -82% |
| 1900x1060 Energy (energy-01) (fps) | 14.8 | 13.16 -11% | 10.4 -30% | 12 -19% | 6.86 -54% | 4.8 -68% | 3.19 -78% |
| 1900x1060 Creo (creo-01) (fps) | 67.7 | 43.74 -35% | 60.9 -10% | 126 86% | 81.3 20% | 66 -3% | 40 -41% |
| 1900x1060 Catia (catia-04) (fps) | 109.1 | 83.5 -23% | 86.3 -21% | 145 33% | 94.4 -13% | 77 -29% | 47 -57% |
| 1900x1060 3ds Max (3dsmax-05) (fps) | 128.2 | 125 -2% | 40 -69% |
Compute Performance
Auch bei den Compute-Benchmarks Computemark und LuxMark zeigt sich die GeForce GTX 1080 Ti auf Augenhöhe mit der Titan X und kann den üblichen Abstand zur GTX 1080 halten.
| Performance Rating - Percent | |
| NVIDIA GeForce GTX 1080 Ti (Desktop) | |
| NVIDIA Titan X Pascal | |
| NVIDIA GeForce GTX 1080 (Desktop) | |
| NVIDIA GeForce GTX 1070 (Desktop) | |
| NVIDIA GeForce GTX 980 Ti | |
| AMD Radeon R9 Fury | |
| NVIDIA GeForce GTX 980 SLI (Laptop) | |
| NVIDIA GeForce GTX 980 (Laptop) | |
| NVIDIA GeForce GTX 980M | |
| LuxMark v2.0 64Bit | |
| Room GPUs-only | |
| NVIDIA GeForce GTX 980 SLI (Laptop) | |
| NVIDIA GeForce GTX 1080 Ti (Desktop) | |
| NVIDIA Titan X Pascal | |
| NVIDIA GeForce GTX 980 Ti | |
| NVIDIA GeForce GTX 1070 (Desktop) | |
| NVIDIA GeForce GTX 1080 (Desktop) | |
| NVIDIA GeForce GTX 980 (Laptop) | |
| AMD Radeon R9 Fury | |
| NVIDIA GeForce GTX 980M | |
| Sala GPUs-only | |
| NVIDIA Titan X Pascal | |
| NVIDIA GeForce GTX 1080 Ti (Desktop) | |
| NVIDIA GeForce GTX 980 SLI (Laptop) | |
| NVIDIA GeForce GTX 1070 (Desktop) | |
| NVIDIA GeForce GTX 1080 (Desktop) | |
| NVIDIA GeForce GTX 980 Ti | |
| AMD Radeon R9 Fury | |
| NVIDIA GeForce GTX 980 (Laptop) | |
| NVIDIA GeForce GTX 980M | |
Emissionen der GTX 1080Ti
Bei den Emissionen kann die Nvidia GeForce GTX 1080 Ti Founders Edition nicht vollends überzeugen. Der Lüfter läuft auch ohne Last permanent mit 1100 Umdrehungen pro Minute bei 139 MHz Kerntakt. Partnerkarten der GTX 1080 (wie z.B. MSI) schalten hier den Lüfter ab. Unter Last erreicht der für die 1080 Ti optimierte Kühler eine Lautstärke von etwa 51 dB aus 15 cm (offenes Gehäuse). Damit ist sie etwas lauter als unsere 1080 Founders Edition, die knapp unter 50 dB blieb. Das Geräusch des Lüfters selbst ist jedoch nicht unangenehm. Spulenfiepen konnten wir ebenfalls wahrnehmen, jedoch wie bei der 1080er nur bei sehr hohen Frameraten über 200 fps.
Nvidia GeForce GTX 1080 Ti Founders Edition Audio Analyse
(-) | Nicht sonderlich laut spielende Lautsprecher (50.9 dB)
Bass 100 - 315 Hz
(+) | guter Bass - nur 1.5% Abweichung vom Median
(±) | durchschnittlich lineare Bass-Wiedergabe (10.6% Delta zum Vorgänger)
Mitteltöne 400 - 2000 Hz
(+) | ausgeglichene Mitten, vom Median nur 2.7% abweichend
(±) | Linearität der Mitten ist durchschnittlich (11.9% Delta zum Vorgänger)
Hochtöne 2 - 16 kHz
(±) | verringerte Hochtöne, 9.2% geringer als der Median
(±) | durchschnittlich lineare Hochtöne (14% Delta zum Vorgänger)
Gesamt im hörbaren Bereich 100 - 16.000 Hz
(-) | hörbarer Bereich ist nur wenig linear (34.1% Abstand zum Median)
Im Vergleich zu allen Geräten derselben Klasse
» 93% aller getesteten Geräte dieser Klasse waren besser, 1% vergleichbar, 6% schlechter
» Das beste Gerät hat einen Delta-Wert von 4%, durchschnittlich ist 24%, das schlechteste Gerät hat 134%
Im Vergleich zu allen Geräten im Test
» 93% aller getesteten Geräte waren besser, 1% vergleichbar, 6% schlechter
» Das beste Gerät hat einen Delta-Wert von 4%, durchschnittlich ist 24%, das schlechteste Gerät hat 134%
Der Stromverbrauch ist laut Nvidia vergleichbar mit der Titan X Pascal und wird als TDP mit 250 Watt angegeben. Ohne Last messen wir bei unserem Testsystem 70,3 Watt am Desktop. Dies ist etwas mehr als die 1080 Founders Edition mit 68,3 und minimal unter der MSI GTX 1080 Gaming X 8G. Die sparsamste dedizierte GPU war in diesem Test übrigens die Zotac GeForce GTX 1050 mit nur 64,5 Watt. Die im Prozessor integrierte HD Graphics 4600 benötigte im Test etwa 61 Watt.
Unter Last benötigte die 1080 Ti zwischen 358 Watt (Witcher 3) und 367 Watt (FurMark) bzw. 399 Watt (kurzfristig bei Witcher 3). Dies entspricht einem Delta von 288 - 329 Watt an der Steckdose inklusive höherer CPU Last. Die 250 Watt TDP sind also keinesfalls unrealistisch.
Auffallend war jedoch die Leistungskurve bei Witcher 3. Nach einigen Minuten (1-3 Minuten je nach Durchlauf) fiel der Stromverbrauch des Systems deutlich ab. Einen Leistungsverlust konnten wir nur einmal mit dem Core i7-4790K erkennen (in weiteren Versuchen nicht mehr).
| Power Consumption | |
| 1280x720 FurMark 1.19 GPU Stress Test (external Monitor) | |
| Nvidia GeForce GTX 1080 Ti Founders Edition (252 fps, Idle: 70.3 W) | |
| MSI Gaming X GeForce GTX 1080 Desktop PC (242 fps, Idle: 71.1 W) | |
| XFX Radeon R9 Fury Pro (158 fps, Idle: 80 W) | |
| MSI Gaming Z GeForce GTX 1070 OC Bios Desktop PC (203 fps, Idle: 73.5 W) | |
| Nvidia GeForce GTX 1080 Founders Edition (228 fps, Idle: 68.3 W) | |
| Nvidia GeForce GTX 1070 Founders Edition (186 fps, Idle: 68 W) | |
| AMD Radeon RX 480 8 GB Reference (127 fps, Idle: 79.2 W) | |
| MSI GeForce GTX 1050 Ti (71 fps, Idle: 65.6 W) | |
| Zotac GeForce GTX 1050 2GB (15 fps, Idle: 64.5 W) | |
| 1920x1080 The Witcher 3 ultra (external Monitor) | |
| Nvidia GeForce GTX 1080 Ti Founders Edition (88 fps, Idle: 70.3 W) | |
| MSI Gaming X GeForce GTX 1080 Desktop PC (Idle: 71.1 W) | |
| Nvidia GeForce GTX 1080 Founders Edition (Idle: 68.3 W) | |
| MSI Gaming Z GeForce GTX 1070 OC Bios Desktop PC (Idle: 73.5 W) | |
| Nvidia GeForce GTX 1070 Founders Edition (Idle: 68 W) | |
| AMD Radeon RX 480 8 GB Reference (Idle: 79.2 W) | |
| MSI GeForce GTX 1050 Ti (Idle: 65.6 W) | |
| Zotac GeForce GTX 1050 2GB (22 fps, Idle: 64.5 W) | |
* ... kleinere Werte sind besser
Fazit zur Nvidia GeForce GTX 1080 Ti
Mit einem Preis von 819 Euro (UVP in Deutschland) ärgert die Geforce GTX 1080 Ti vor allem Käufer der deutlich teureren Nvidia Titan X (1.299 Euro), welche von der neuen Karte knapp auf den 2. Platz gesetzt wird. Durch den Preisnachlass bei der GTX 1080 (ab 579 Euro für Partnerkarten, 635 Euro für die Founders Edition) bleibt aber weiterhin ein spürbarer Preisunterschied zu den kleineren Pascal-Chips.
Mit etwa 25 % Leistungsvorsprung erhält man jedoch auch eine spürbar höhere Performance und damit die derzeit schnellste Consumer-Grafikkarte der Welt. Gerade für Spieler mit 4K Monitor oder mit VR-Equipment ist die 1080 Ti gedacht. Dank des gewaltigen 11-GB-GDDR5X-Grafikspeichers ist die 1080 Ti auch sehr zukunftssicher. User mit 60-Hz 1080p-Monitor haben jedoch keinen Grund, etwas schnelleres als die GeForce GTX 1080 zu nehmen.
Einzig die etwas hohe Lautstärkenentwicklung ist bei unserer Testkarte zu kritisieren. Hier werden die kommenden Partnerkarten jedoch wahrscheinlich Abhilfe schaffen.
Weitere Benchmarks zur Nvidia GeForce GTX 1080 Ti finden Sie auf unserer ständig aktualisierten Benchmarkseite.
