Notebookcheck Logo

Intel Atom Z3735F

Intel Z3735F

Der Intel Atom Z3735F ist ein sparsamer Quad-Core-SoC für Tablets (hauptsächlich Android), der Mitte 2014 vorgestellt wurde. Er taktet mit bis zu 1,83 GHz und gehört der Bay Trail-T Plattform an. Dank eines speziell für Low-Power-Chips optimierten 22-Nanometer-Prozesses (P1271) mit Tri-Gate-Transistoren konnte die Performance sowie die Energieeffizienz gegenüber dem Vorgänger deutlich gesteigert werden. Im Vergleich mit dem Z3735D besitzt der Z3735F einen anderen BGA-Sockel.

Architektur

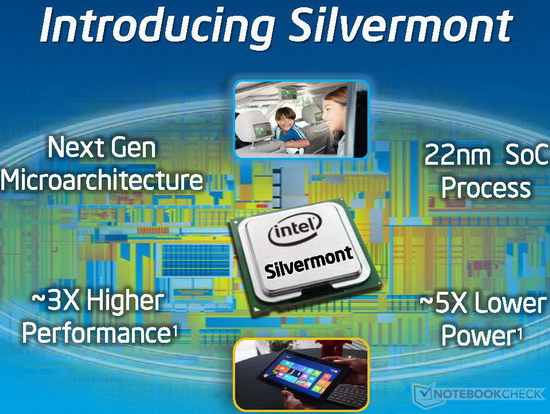
Die Prozessorkerne basieren auf der neuen Silvermont-Architektur, welche erstmals bei einem Atom-Prozessor als Out-of-order-Design ausgeführt wurde. Die dadurch erhöhte Auslastung der Pipeline sowie viele weitere Detailverbesserungen (optimierte Sprungvorhersage, vergrößerte Buffer, verbesserte Decoder) sollen die Pro-MHz-Leistung um etwa 50 Prozent steigern. Gleichzeitig entfällt allerdings das Hyper-Threading-Feature der Vorgängermodelle. Weitere wichtige Änderungen umfassen die Unterstützung neuer Befehlssatzerweiterungen wie SSE 4.1 und 4.2 sowie AES-NI (modellabhängig).

Performance

Dank 4 CPU-Kernen und einer Taktrate von bis zu 1,83 GHz übertrifft die Performance bisherige Atom-Modelle wie den Z2760 deutlich. Je nach Benchmark liegt der Z3735F damit in etwa zwischen den Kabini-APUs A6-1450 und AMD A4-5000, sodass ausreichende Leistungsreserven für die meisten Office- und Multimedia-Anwendungen bestehen. Lediglich anspruchsvollere Software überfordert den SoC, was insbesondere an der vergleichsweise niedrigen Pro-Thread-Leistung liegt. Im Android-Bereich zählt der Z3735F zum oberen Performance-Segment.

Grafik

Die HD Graphics (Bay Trail) basiert auf Intels-Gen7-Architektur, welche DirectX 11 unterstützt und auch bei den Grafiklösungen der Ivy-Bridge-Serie (z.B. HD Graphics 4000) zum Einsatz kommt. Mit nur 4 EUs und maximal 646 MHz Taktrate fällt die Leistung aber noch deutlich niedriger als bei der HD Graphics (Ivy Bridge) aus. Verglichen mit der Android-Konkurrenz entspricht die Performance etwa der Adreno 320 von Qualcomm.

Leistungsaufnahme

Der gesamte SoC wird von Intel mit einer SDP von 2,2 Watt spezifiziert, was eine TDP von unter 4 Watt impliziert. Damit kann der Chip in passiv gekühlten Tablets eingesetzt werden.

SeriesIntel AtomIntel AtomIntel Atom
CodenameBay Trail-TBay Trail-TBay Trail-T
Serie: Atom Bay Trail-T
Intel Atom Z3795 compare1.59 - 2.39 GHz4 / 4 cores
Intel Atom Z3785 compare1.49 - 2.41 GHz4 / 4 cores
Intel Atom Z3775 compare1.46 - 2.39 GHz4 / 4 cores
Intel Atom Z3775D compare1.49 - 2.41 GHz4 / 4 cores
Intel Atom Z3770 compare1.46 - 2.4 GHz4 / 4 cores
Intel Atom Z3770D compare1.5 - 2.41 GHz4 / 4 cores
Intel Atom Z3736F compare1.33 - 2.16 GHz4 / 4 cores
Intel Atom Z3736G compare1.33 - 2.16 GHz4 / 4 cores
Intel Atom Z3745 compare1.33 - 1.86 GHz4 / 4 cores
Intel Atom Z3745D compare1.33 - 1.83 GHz4 / 4 cores
Intel Atom Z3740 compare1.33 - 1.86 GHz4 / 4 cores
Intel Atom Z3740D compare1.33 - 1.83 GHz4 / 4 cores
Intel Atom Z3735D compare1.33 - 1.83 GHz4 / 4 cores
Intel Atom Z3735E compare1.33 - 1.83 GHz4 / 4 cores
Intel Atom Z3735F « 1.33 - 1.83 GHz4 / 4 cores
Intel Atom Z3735G compare1.33 - 1.83 GHz4 / 4 cores
Intel Atom Z3680 compare1.33 - 2 GHz2 / 2 cores
Intel Atom Z3680D compare1.33 - 2 GHz2 / 2 cores
Clock1330 - 1830 MHz1330 - 1830 MHz1330 - 1830 MHz
L1 Cache224 KB224 KB224 KB
L2 Cache2 MB2 MB2 MB
Cores / Threads4 / 44 / 44 / 4
TDP<4 Watt<4 Watt<4 Watt
Technology22 nm22 nm22 nm
SocketUTFCBGA592UTFCBGA592UTFCBGA592
FeaturesIntel HD Graphics (Bay Trail, 313 - 646 MHz), Quick Sync, Wireless Display, Clear Video HD, Intel 64, SSE 4.1, SSE 4.2, AES-NI, Secure Key, Anti-Theft, Identify-Protection, max. 2 GB Single-Channel DDR3L-RS 1333, Quick SyncIntel HD Graphics (Bay Trail, 313 - 646 MHz), Quick Sync, Wireless Display, Clear Video HD, Intel 64, SSE 4.1, SSE 4.2, AES-NI, Secure Key, Anti-Theft, Identify-Protection, max. 2 GB Single-Channel DDR3L-RS 1333, Quick SyncIntel HD Graphics (Bay Trail, 313 - 646 MHz), Quick Sync, Wireless Display, Clear Video HD, Intel 64, SSE 4.1, SSE 4.2, AES-NI, Secure Key, Anti-Theft, Identify-Protection, max. 2 GB Single-Channel DDR3L-RS 1333, Quick Sync
iGPUIntel HD Graphics (Bay Trail) (311 - 646 MHz)Intel HD Graphics (Bay Trail) (311 - 646 MHz)Intel HD Graphics (Bay Trail) (311 - 646 MHz)
Architecturex86x86x86
$17 U.S.$17 U.S.$17 U.S.
Announced
Manufacturerark.intel.comark.intel.comark.intel.com

Benchmarks

Cinebench R11.5 - Cinebench R11.5 CPU Multi 64 Bit
min: 0.72     avg: 0.9     median: 0.9 (1%)     max: 1.07 Points
Cinebench R11.5 - Cinebench R11.5 CPU Single 64 Bit
min: 0.27     avg: 0.3     median: 0.3 (8%)     max: 0.31 Points
Cinebench R10 - Cinebench R10 Rend. Single (32bit)
min: 696     avg: 957     median: 945 (6%)     max: 1829 Points
Cinebench R10 - Cinebench R10 Rend. Multi (32bit)
min: 822     avg: 2699     median: 2885.5 (2%)     max: 2935 Points
wPrime 2.10 - wPrime 2.0 1024m *
min: 1079     avg: 1115     median: 1100 (13%)     max: 1165 s
wPrime 2.10 - wPrime 2.0 32m *
min: 34.33     avg: 35.6     median: 35.7 (7%)     max: 36.89 s
WinRAR - WinRAR 4.0
min: 1595     avg: 1635     median: 1635 (3%)     max: 1675 Points
X264 HD Benchmark 4.0 - x264 Pass 1
min: 34.95     avg: 35.6     median: 35.9 (8%)     max: 36.06 fps
TrueCrypt - TrueCrypt Serpent
min: 0.0857     avg: 0.3     median: 0.1 (0%)     max: 0.876 GB/s
TrueCrypt - TrueCrypt Twofish
min: 0.133     avg: 0.1     median: 0.1 (2%)     max: 0.136 GB/s
TrueCrypt - TrueCrypt AES
min: 0.612     avg: 0.6     median: 0.6 (2%)     max: 0.622 GB/s
3DMark 06 - CPU - 3DMark 06 - CPU
min: 856     avg: 1164     median: 1164 (2%)     max: 1472 Points
Super Pi mod 1.5 XS 1M - Super Pi mod 1.5 XS 1M *
min: 27.45     avg: 36.1     median: 27.5 (6%)     max: 53.3 s
Super Pi mod 1.5 XS 2M - Super Pi mod 1.5 XS 2M *
min: 61.2     avg: 79.1     median: 61.2 (3%)     max: 114.9 s
Super Pi Mod 1.5 XS 32M - Super Pi mod 1.5 XS 32M *
min: 1566     avg: 1747     median: 1566 (7%)     max: 2109 s
3DMark 11 - 3DM11 Performance Physics
min: 745     avg: 1135     median: 1190 (3%)     max: 1207 Points
3DMark - 3DMark Ice Storm Physics
min: 11887     avg: 12817     median: 12912 (10%)     max: 13499 Points
3DMark - 3DMark Cloud Gate Physics
min: 853     avg: 1033     median: 1056 (3%)     max: 1084 Points
Geekbench 2 - 32 Bit - Geekbench Floating Point
min: 2059     avg: 2161     median: 2161 (4%)     max: 2263 Points
Mozilla Kraken 1.1 - Kraken 1.1 Total Score *
min: 5410     avg: 7761     median: 8832 (10%)     max: 9362 ms
Sunspider - Sunspider 1.0 Total Score *
min: 442.6     avg: 635     median: 511 (6%)     max: 923 ms
Octane V2 - Octane V2 Total Score
min: 3067     avg: 4539     median: 3524 (3%)     max: 6457 Points
- Bereich der Benchmarkergebnisse für diese Grafikkarte
- Durchschnittliche Benchmarkergebnisse für diese Grafikkarte
* Smaller numbers mean a higher performance

Add one or more devices and compare

In the following list you can select (and also search for) devices that should be added to the comparison. You can select more than one device.

restrict list:

show all (including archived), 2024, 2023
v1.26
log 02. 12:36:40

#0 checking url part for id 5966 +0s ... 0s

#1 checking url part for id 5966 +0s ... 0s

#2 checking url part for id 5966 +0s ... 0s

#3 not redirecting to Ajax server +0s ... 0s

#4 did not recreate cache, as it is less than 5 days old! Created at Sat, 01 Jun 2024 05:37:57 +0200 +0.001s ... 0.001s

#5 composed specs +0.036s ... 0.037s

#6 did output specs +0s ... 0.037s

#7 getting avg benchmarks for device 5966 +0.003s ... 0.04s

#8 got single benchmarks 5966 +0.05s ... 0.091s

#9 got avg benchmarks for devices +0s ... 0.091s

#10 min, max, avg, median took s +1.024s ... 1.114s

#11 return log +0.024s ... 1.139s

Teilen Sie diesen Artikel, um uns zu unterstützen. Jeder Link hilft!
> Notebook Test, Laptop Test und News > Benchmarks / Technik > Benchmarks / Technik > Prozessor Vergleich - Head 2 Head
Autor: Klaus Hinum,  8.09.2017 (Update:  1.07.2023)