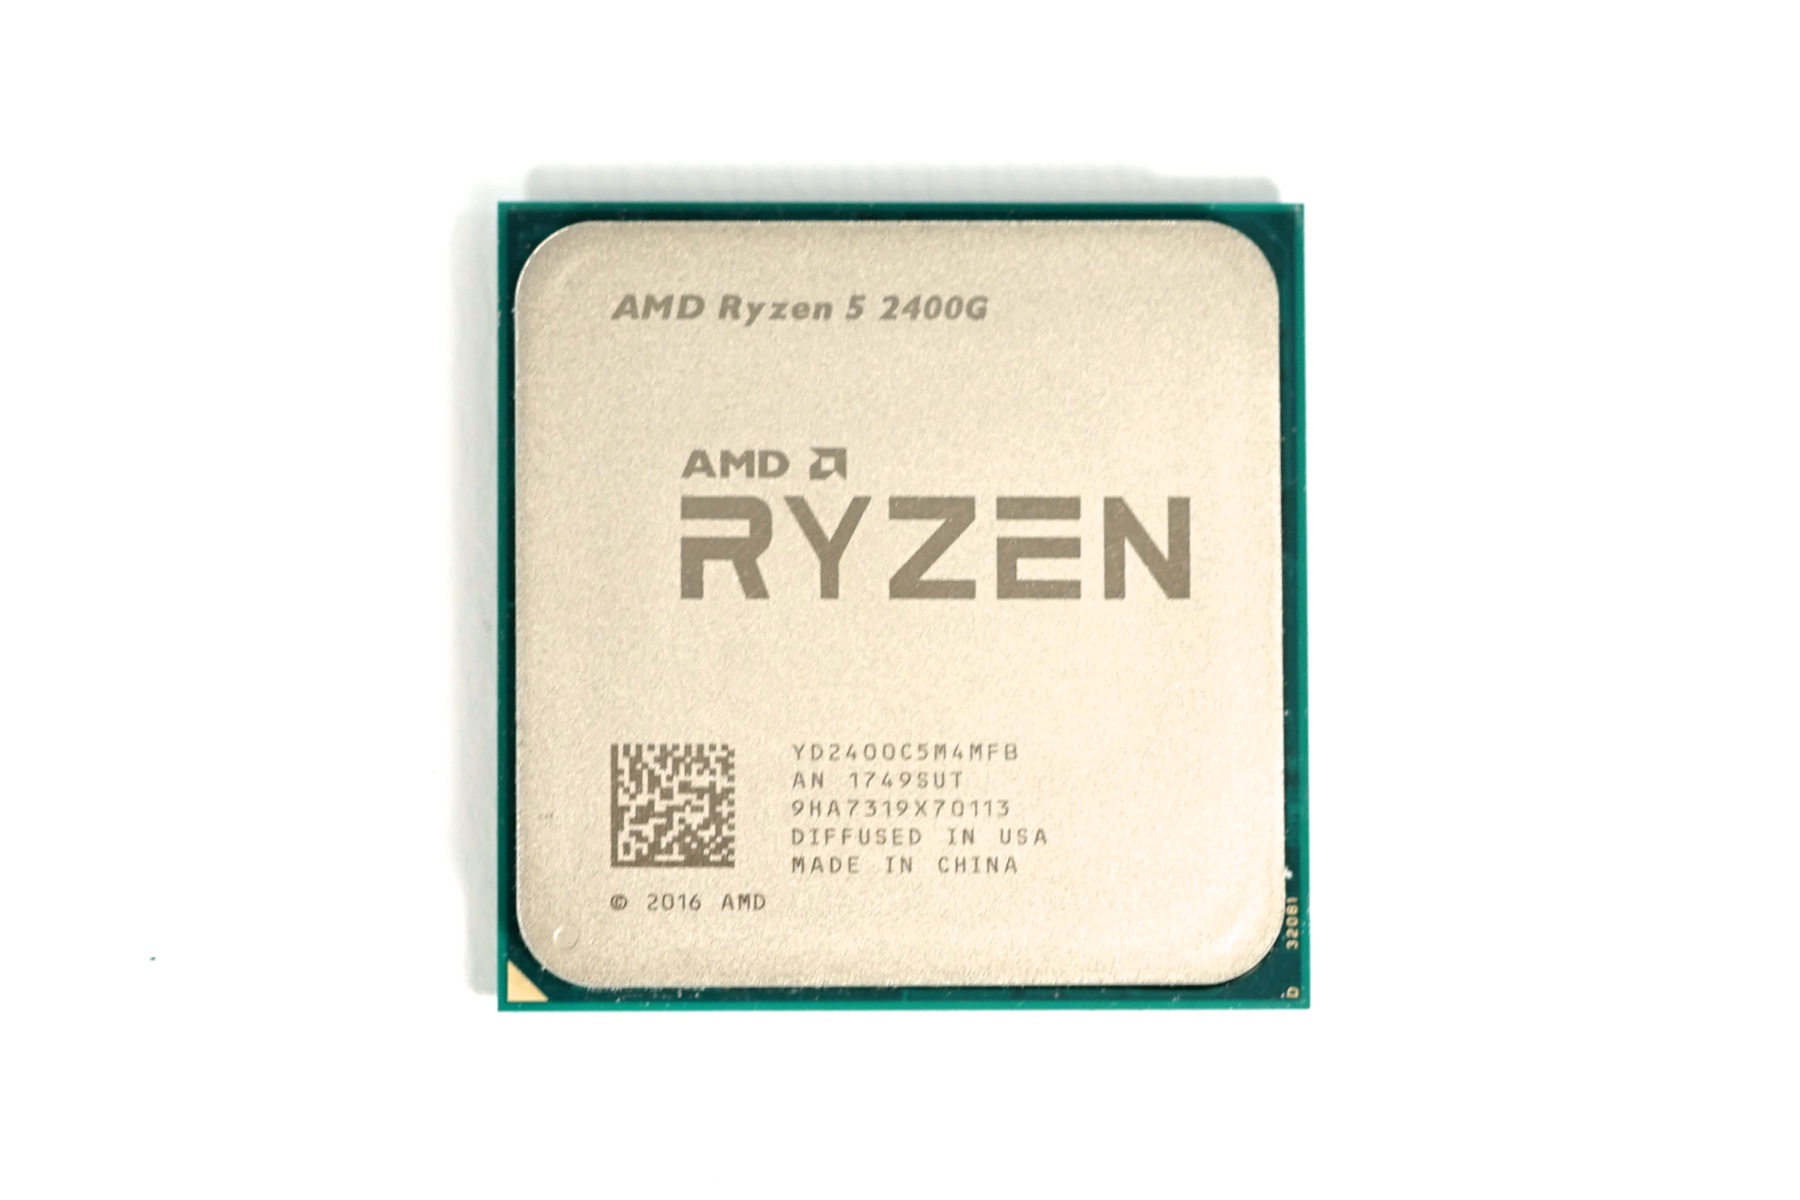
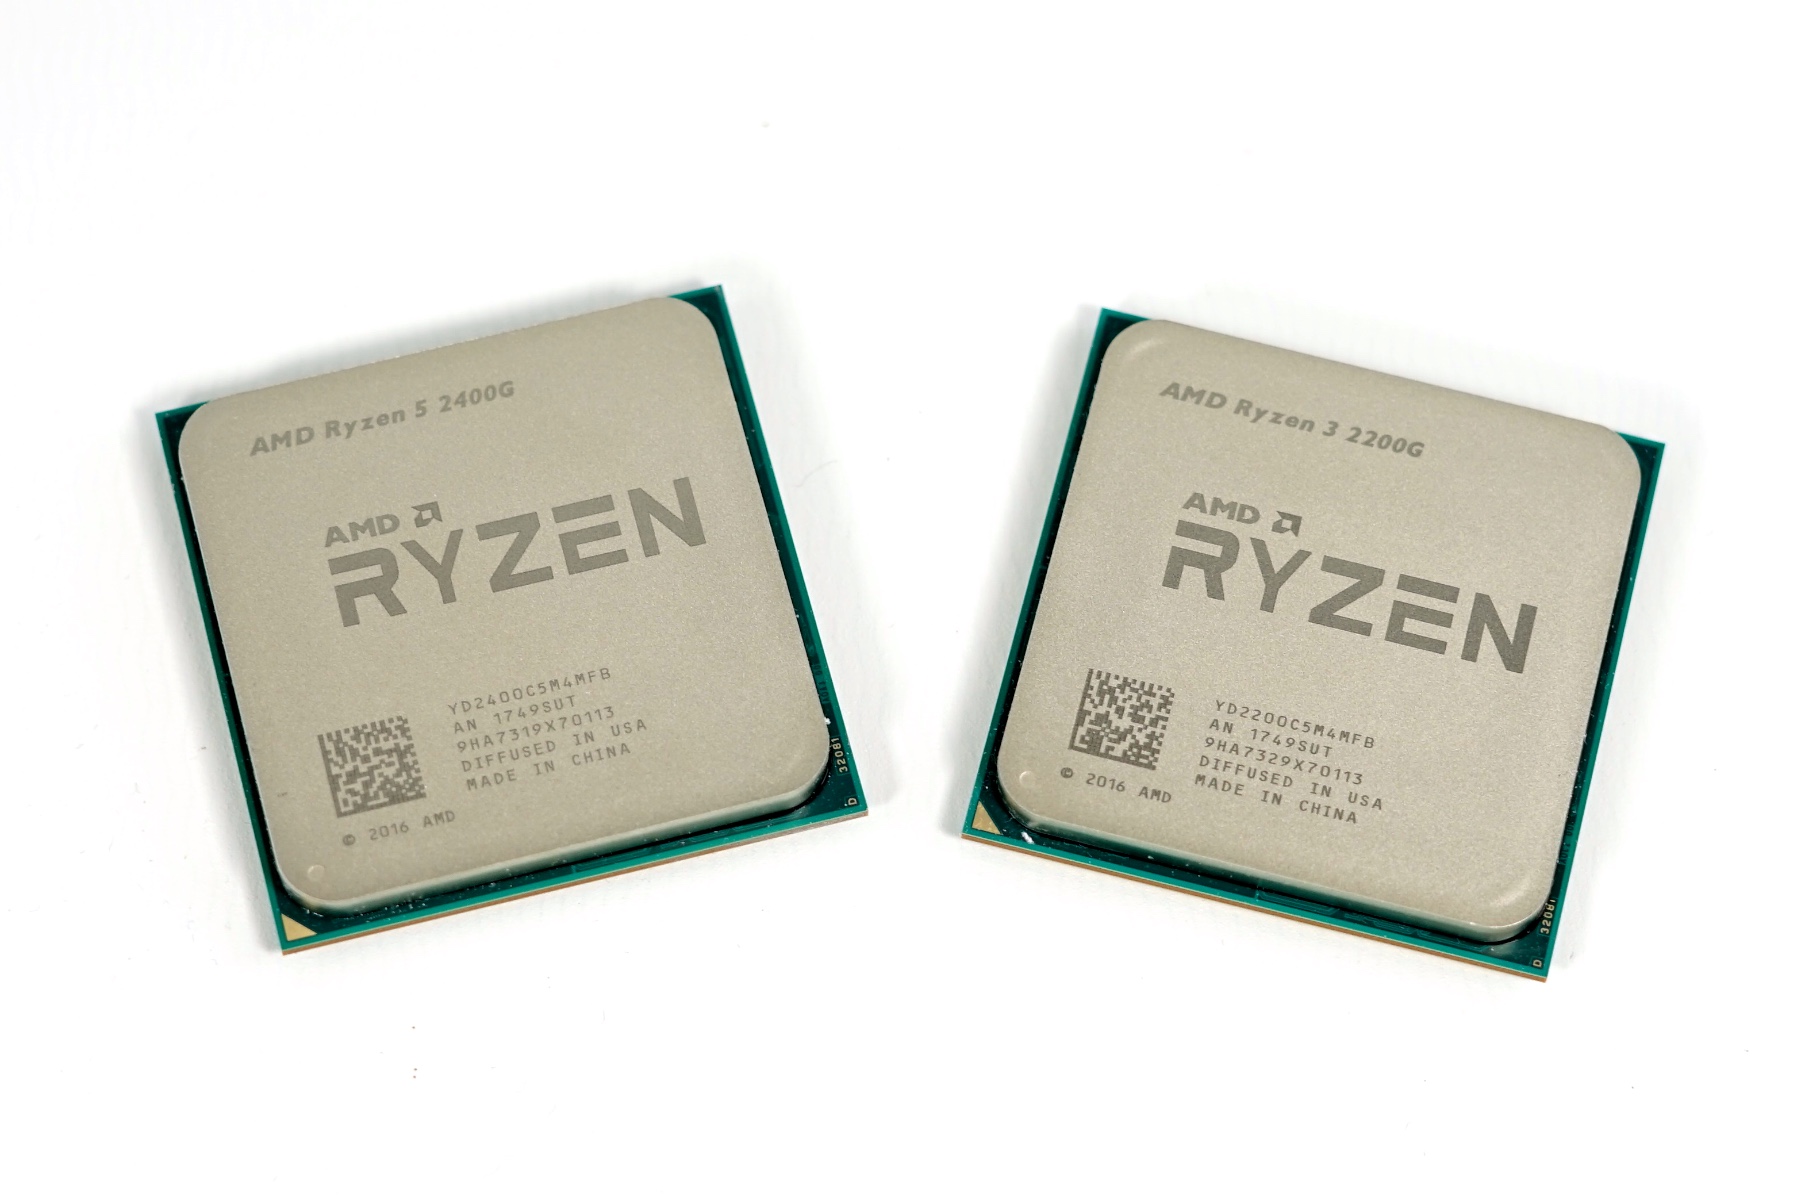
Ryzen 5 2400G und Ryzen 3 2200G im Test
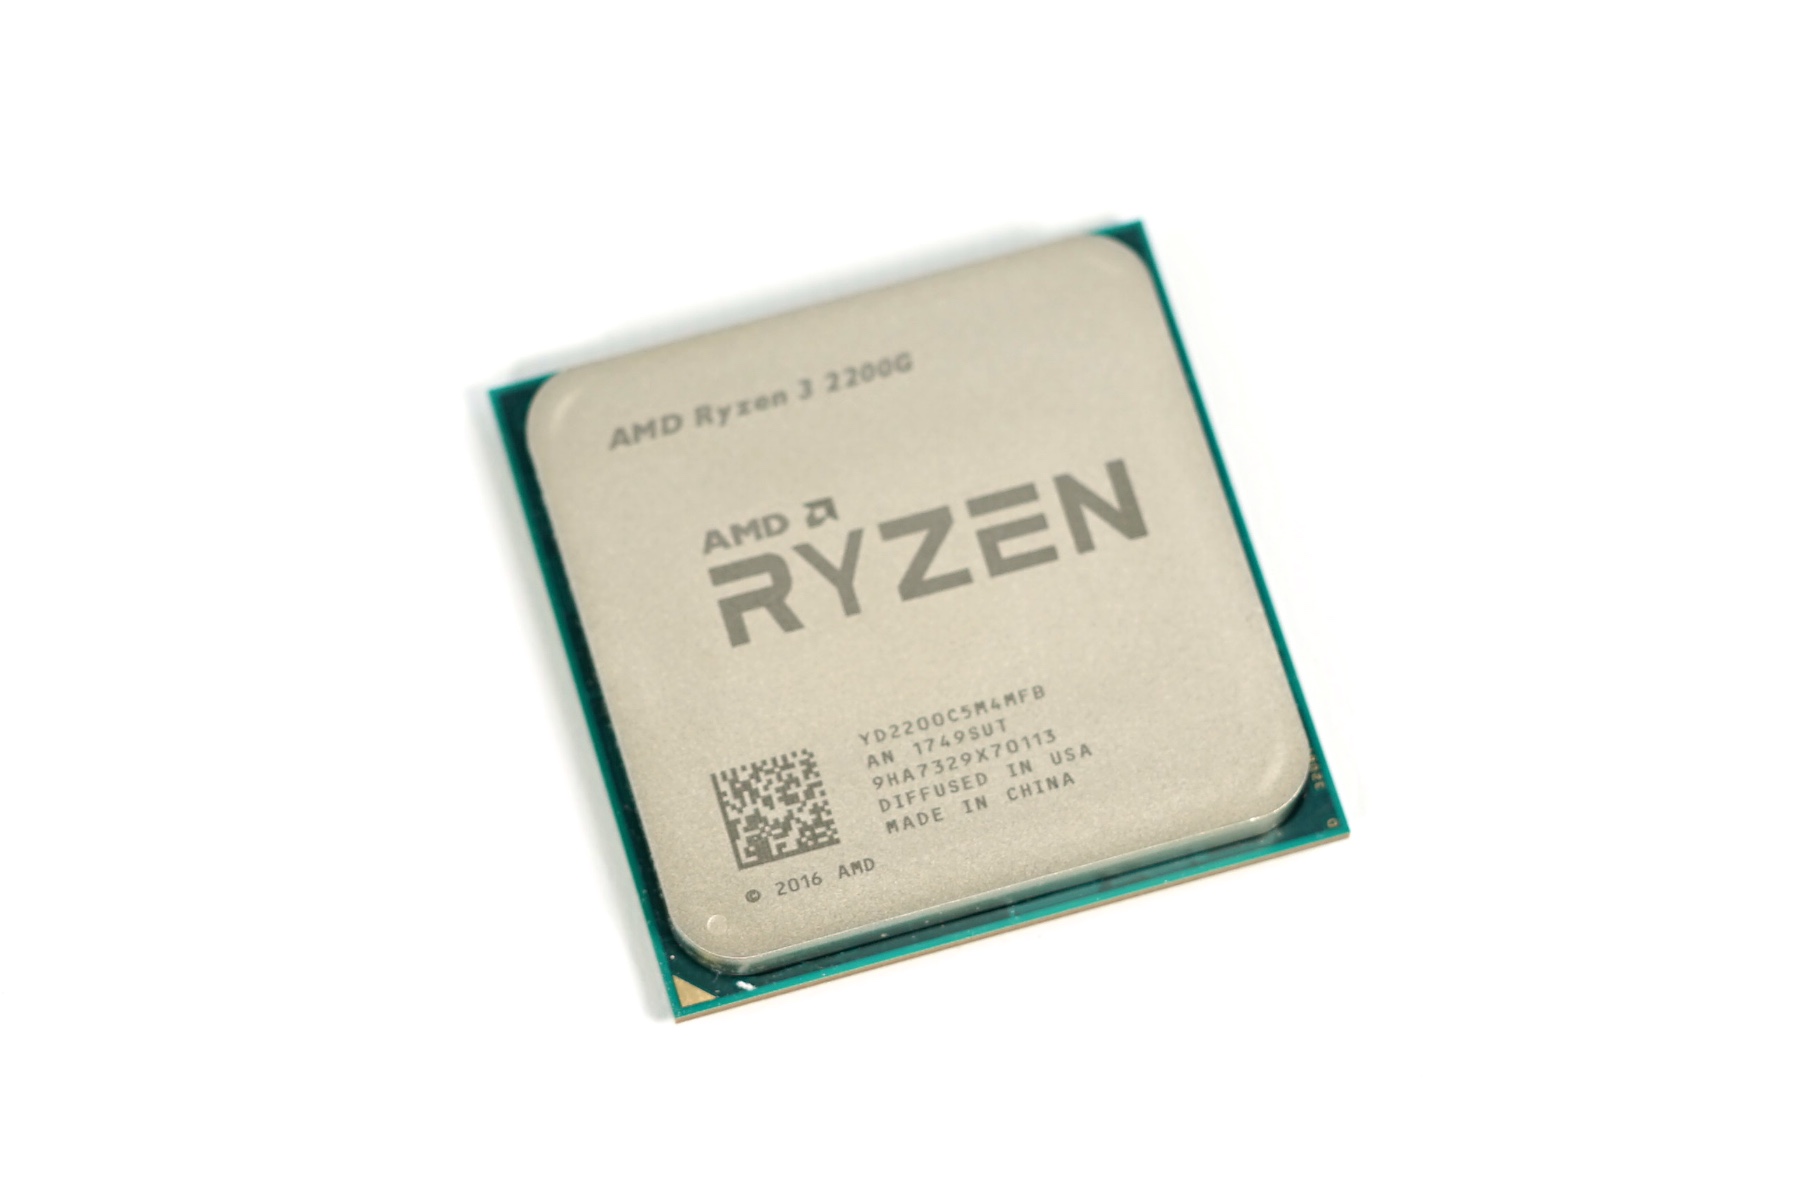
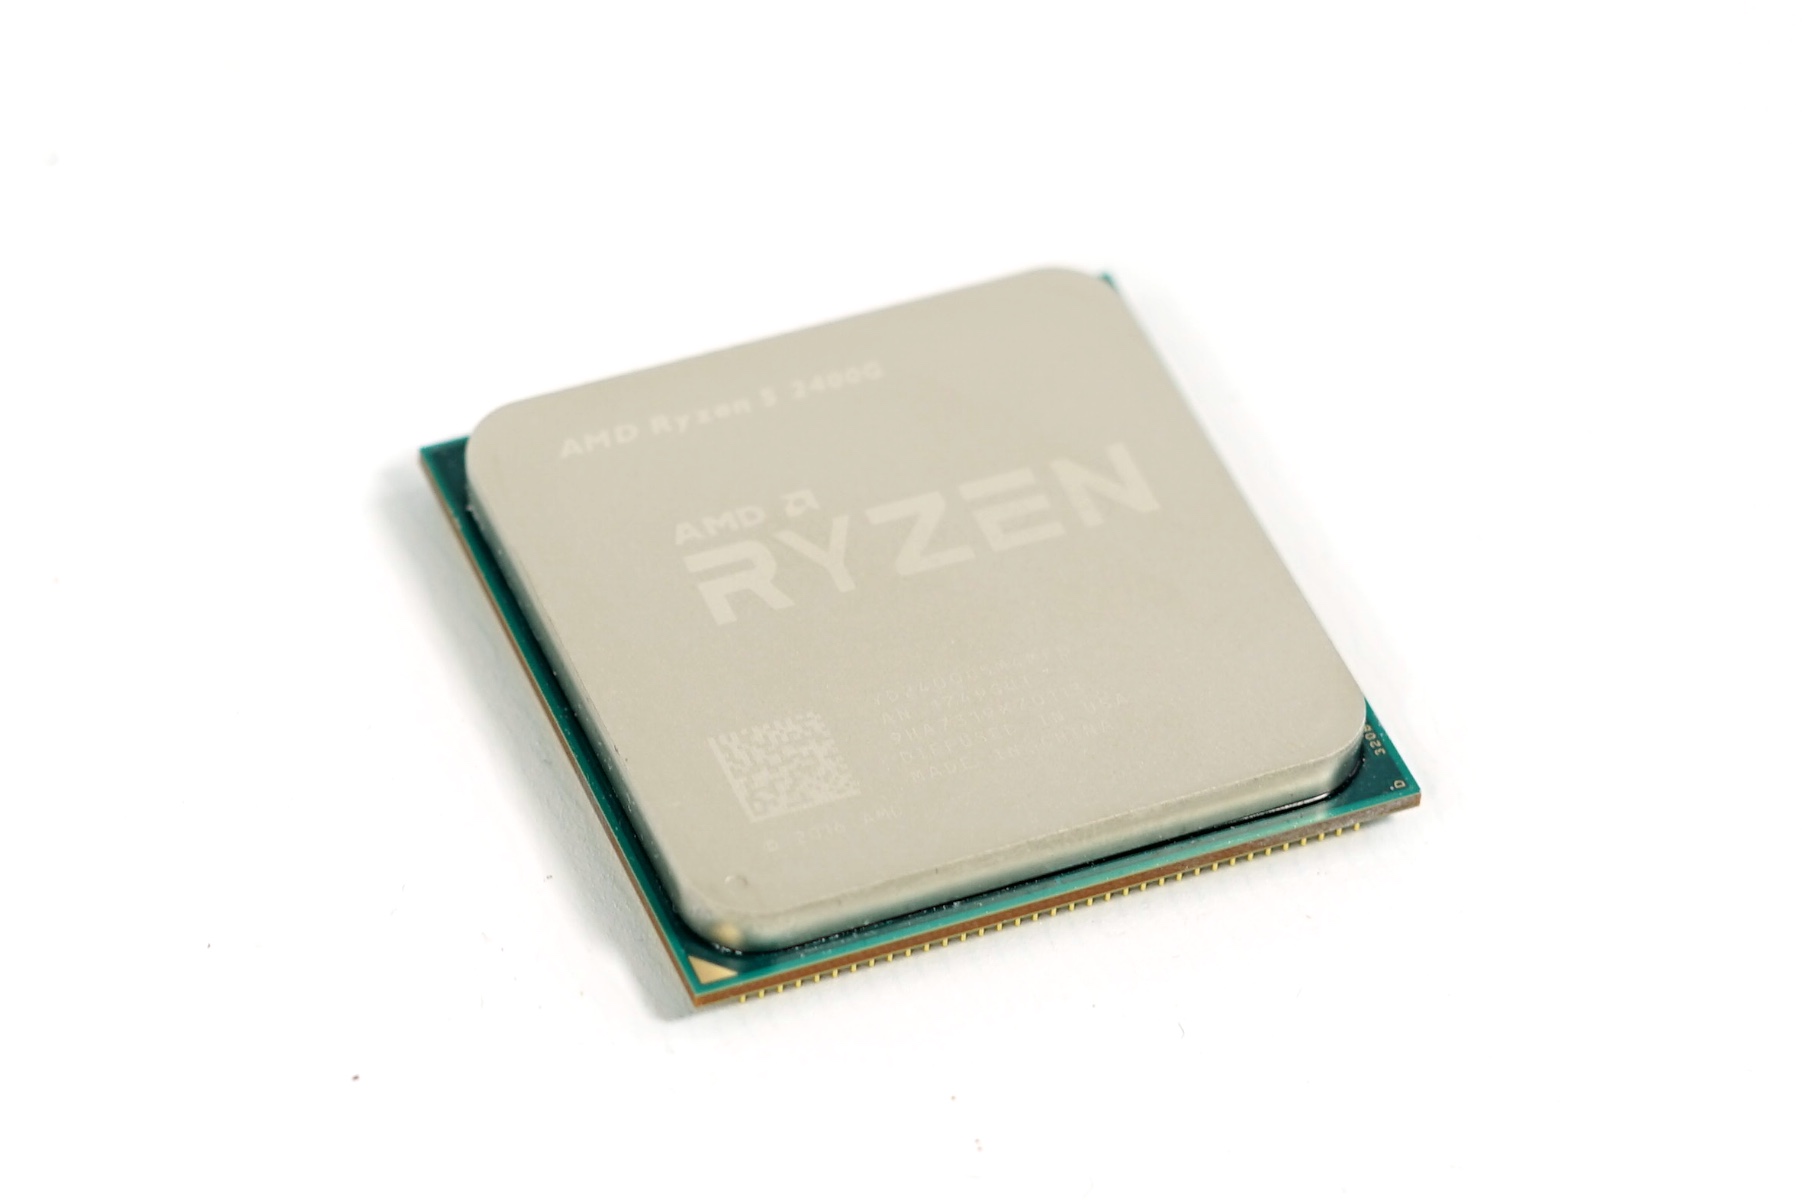
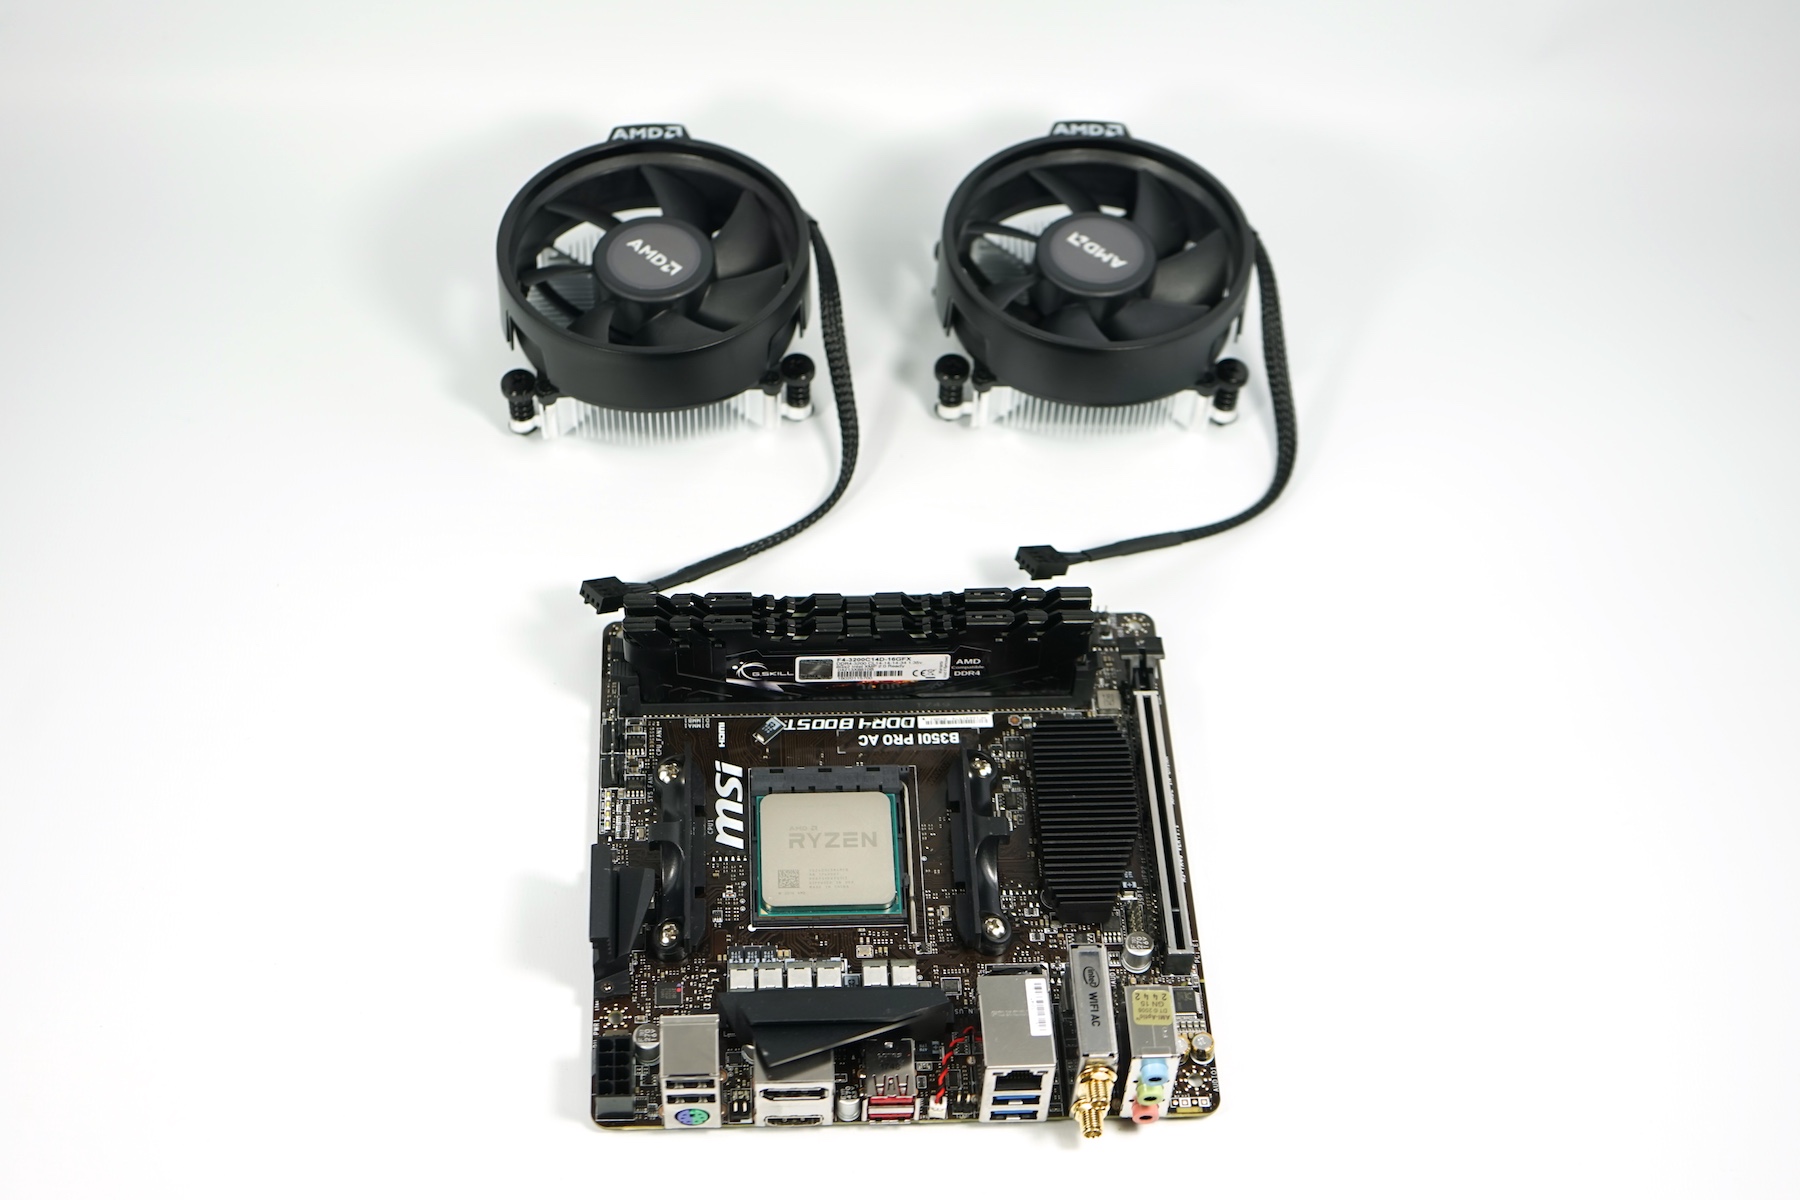
Nachdem AMD bereits die 15 Watt Modelle für Notebooks gegen Ende 2017 auf den Markt gebracht hat, kommen nun zwei 65 Watt APUs für die bekannte Desktop-AM4-Plattform. Der Ryzen 5 2400G bietet den Vollausbau des Chips mit 4 Prozessorkernen, SMT / Hyperthreading und 11 CUs der integrierten Vega Grafikkarte. Der kleinere Ryzen 3 2200G muss auf Hyperthreading verzichten und auch auf 3 CUs der Grafikkarte. Die Taktraten sind ebenfalls etwas geringer. Dafür ist der Einstiegspreis mit 96 versus 165 Euro deutlich geringer.
Technisch unterscheiden sich die Chips nicht von den Mobilmodellen (z.B. Ryzen 5 2500U). Die APU bietet also ebenfalls einen CCX mit vier Kernen, 4 MB Level-3-Cache (im Unterschied zu den 8 MB bei den Raven Ridge Desktop Ryzen CPUs), eine aktuelle Vega Grafikkarte und einen DDR4 Speicherkontroller mit offiziellem Support bis DDR4-2933. Die technischen Details und Neuerungen der Raven Ridge APUs haben wir hier zusammengetragen.
| Modell | Kerne | Threads | Takt | GPU | GPU Takt |
|---|---|---|---|---|---|
| Ryzen 5 2400G | 4 | 8 | 3,6 - 3,9 GHz | Vega 11 | 1250 MHz |
| Ryzen 3 2200G | 4 | 4 | 3,5 - 3,7 GHz | Vega 8 | 1100 MHz |
| Ryzen 7 2700U | 4 | 8 | 2,2 - 3,8 GHz | Vega 10 | 1300 MHz |
| Ryzen 5 2500U | 4 | 8 | 2,0 - 3,6 GHz | Vega 8 | 1100 MHz |
| Ryzen 3 2300U | 4 | 4 | 2,0 - 3,4 GHz | Vega 6 | 1100 MHz |
| Ryzen 3 2200U | 2 | 4 | 2,5 - 3,4 GHz | Vega 3 | 1000 MHz |
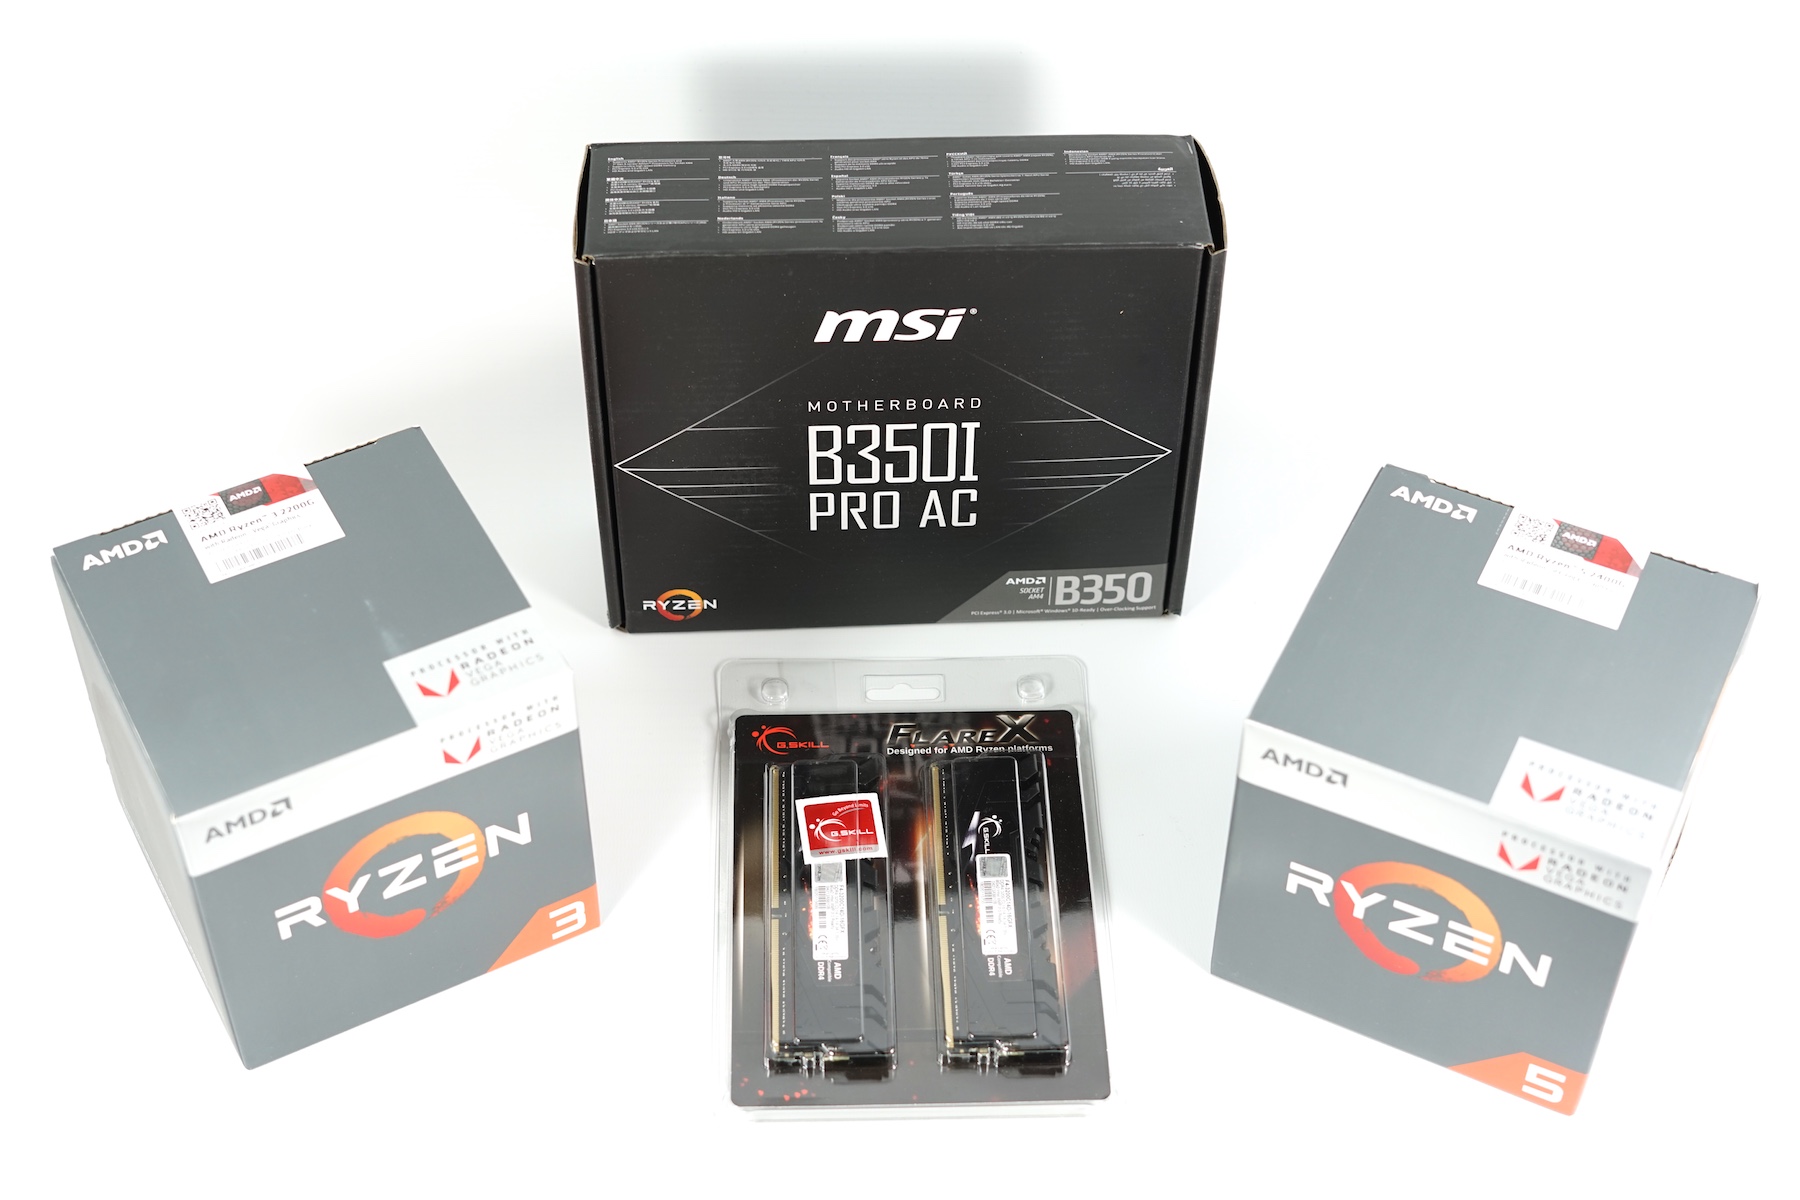
Für die folgenden Benchmarks und Tests nutzen wir folgendes System:
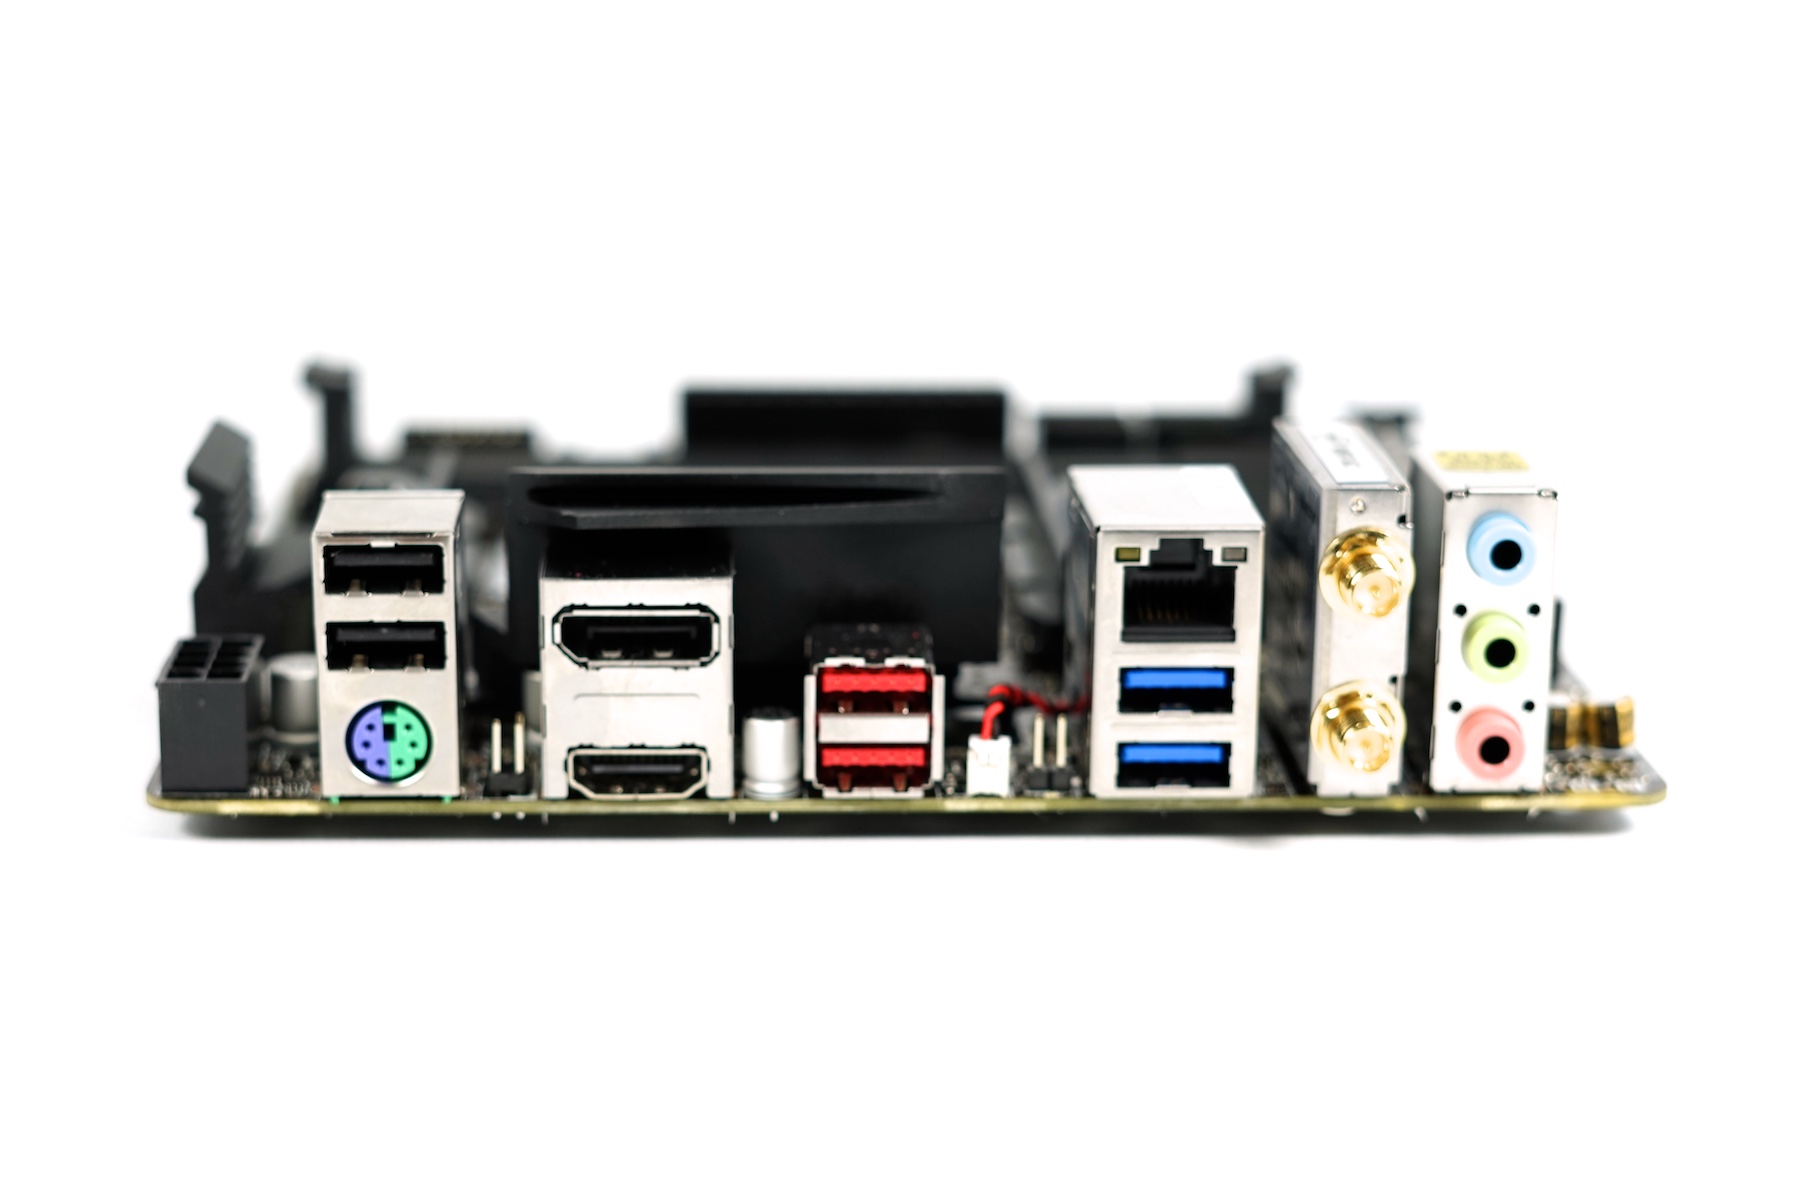
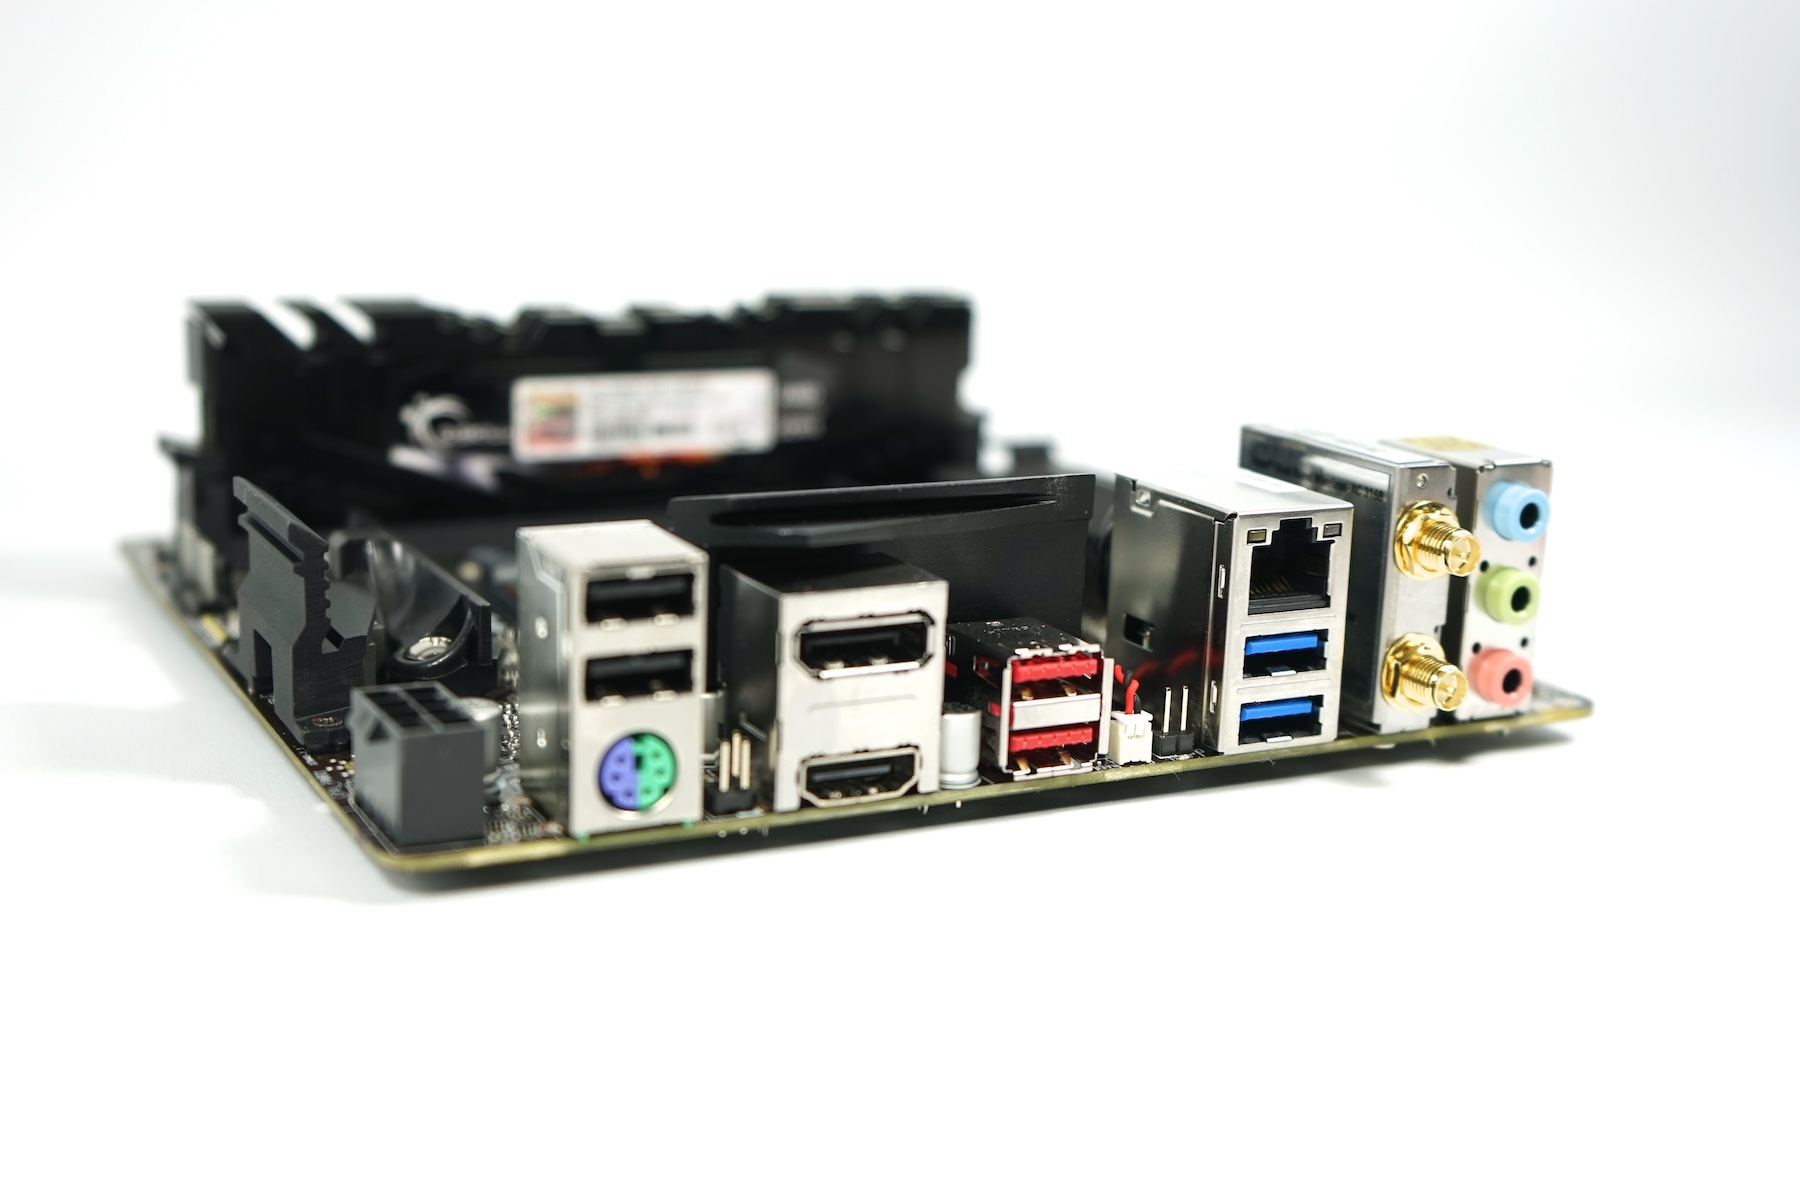
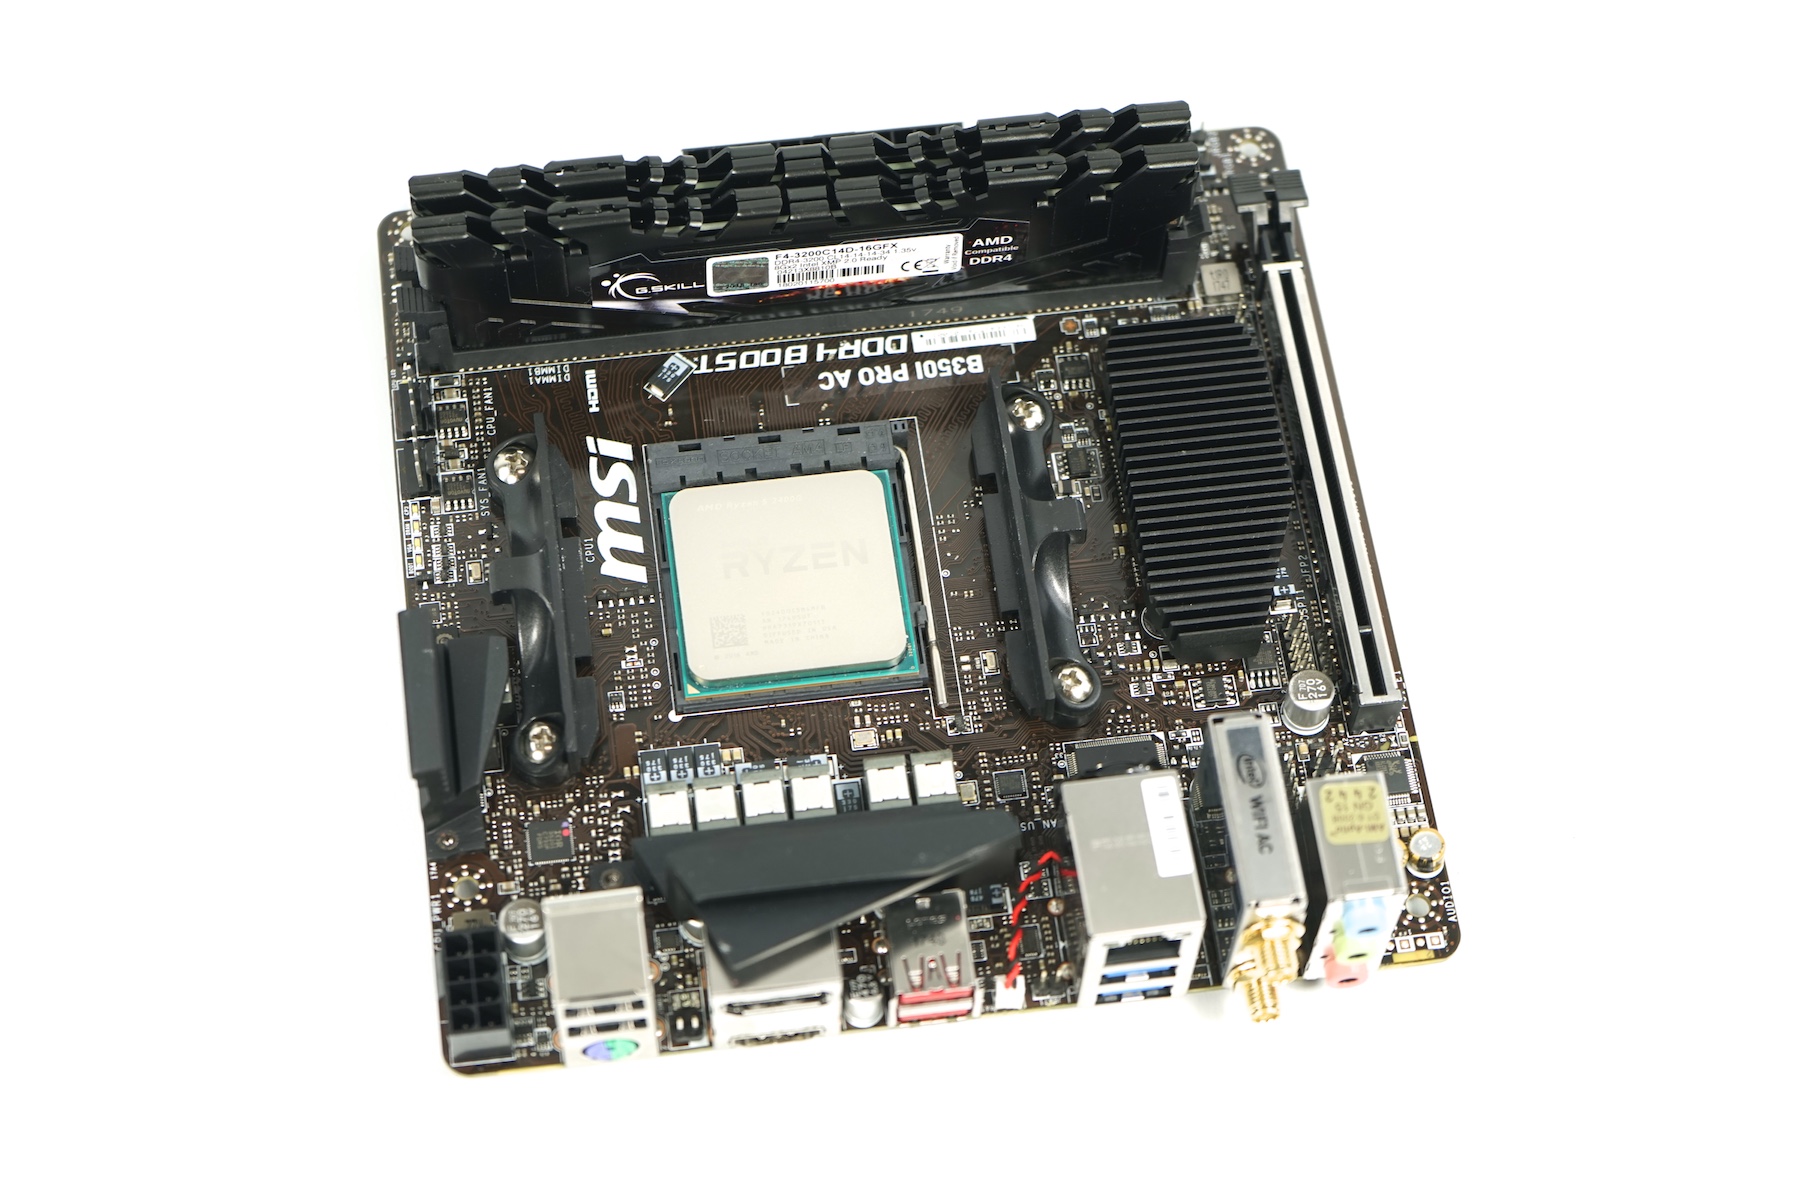
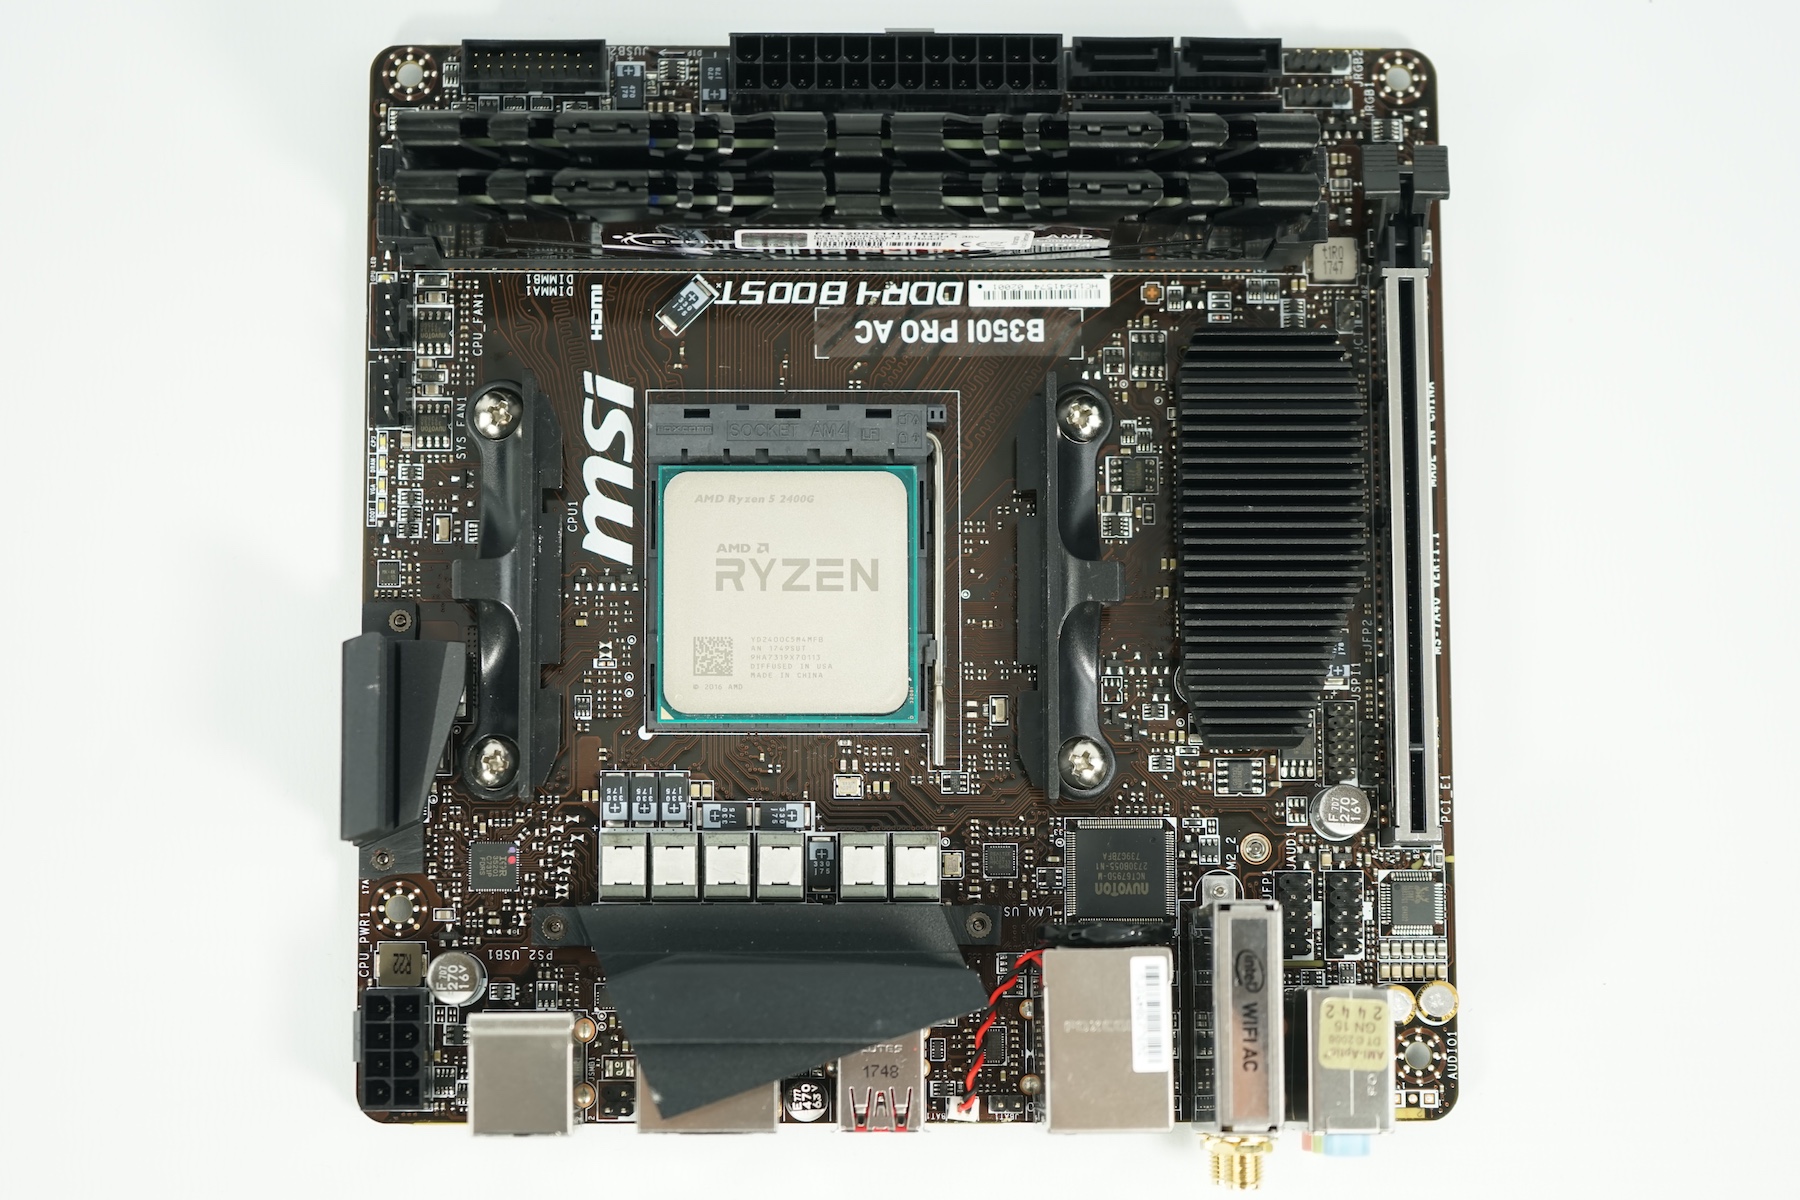
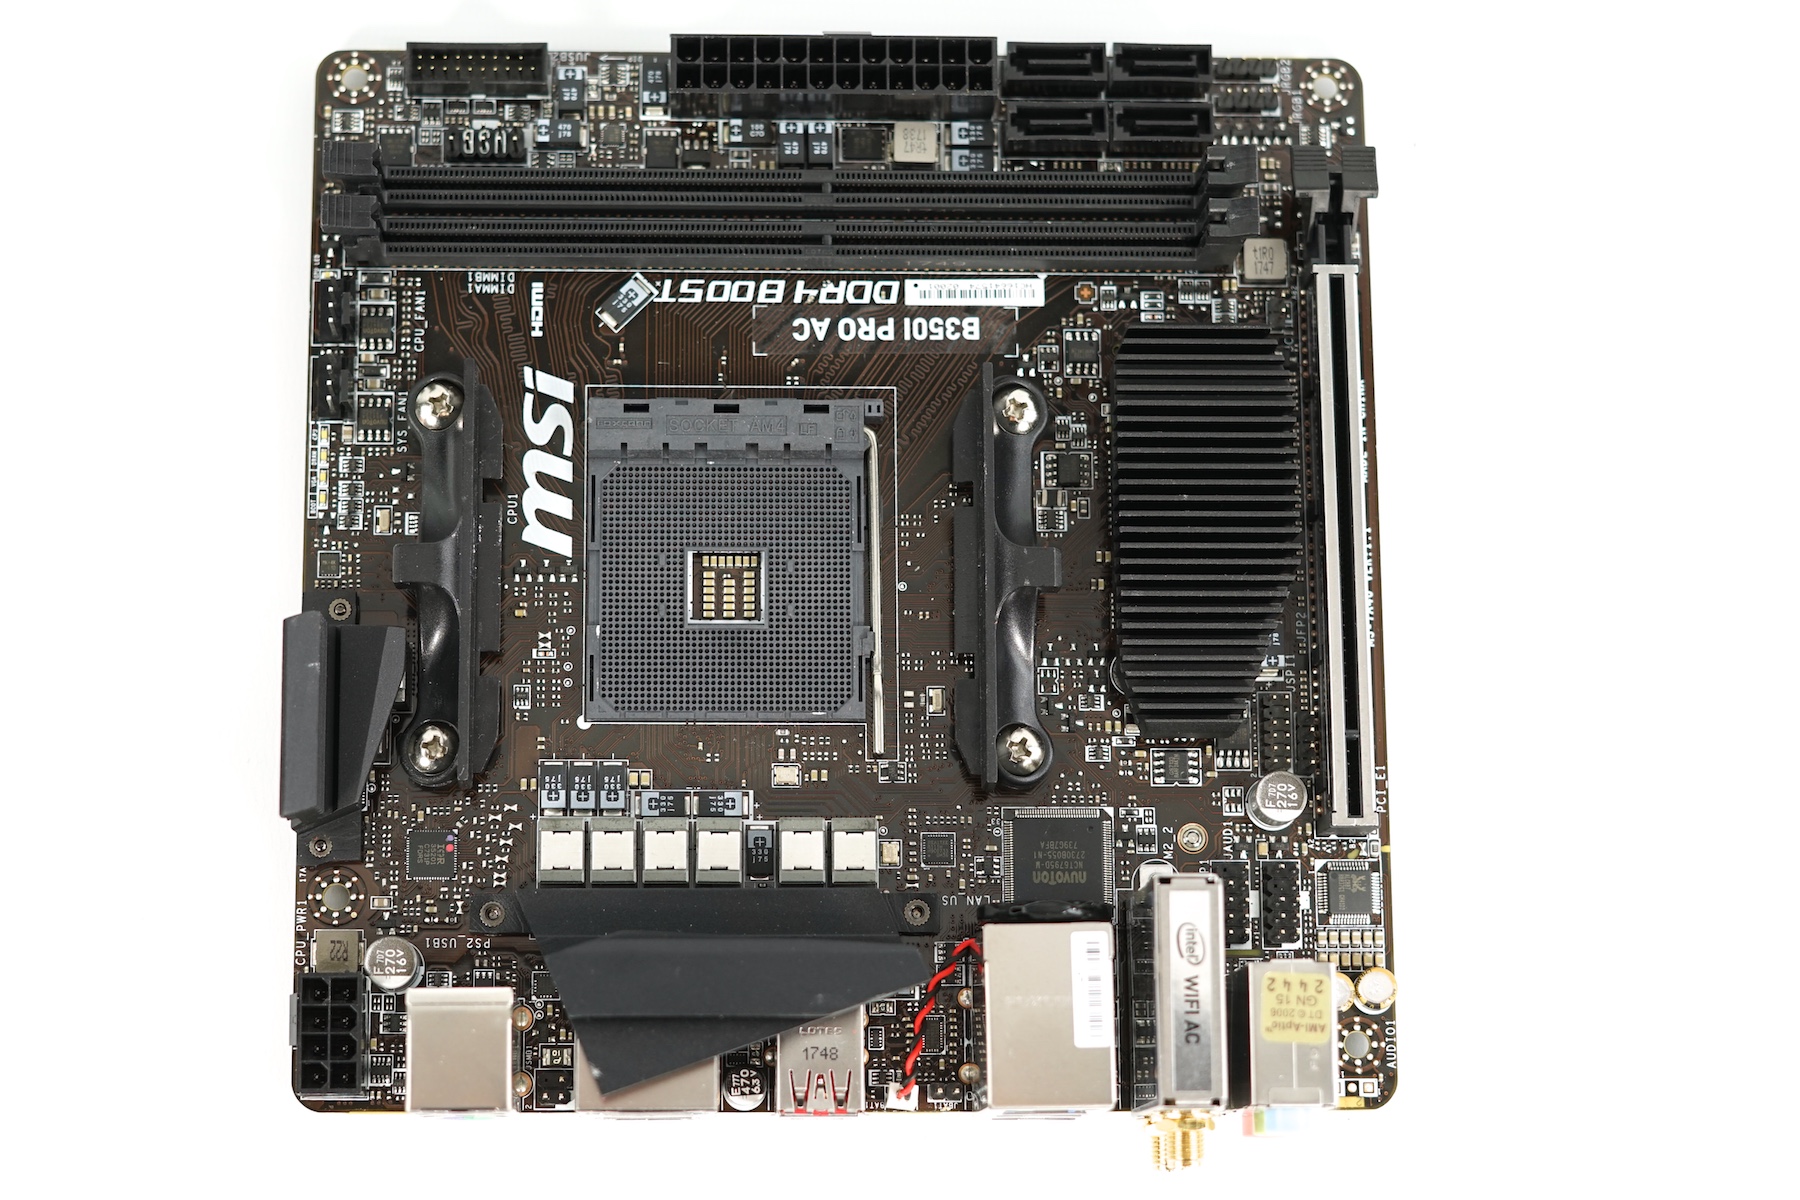
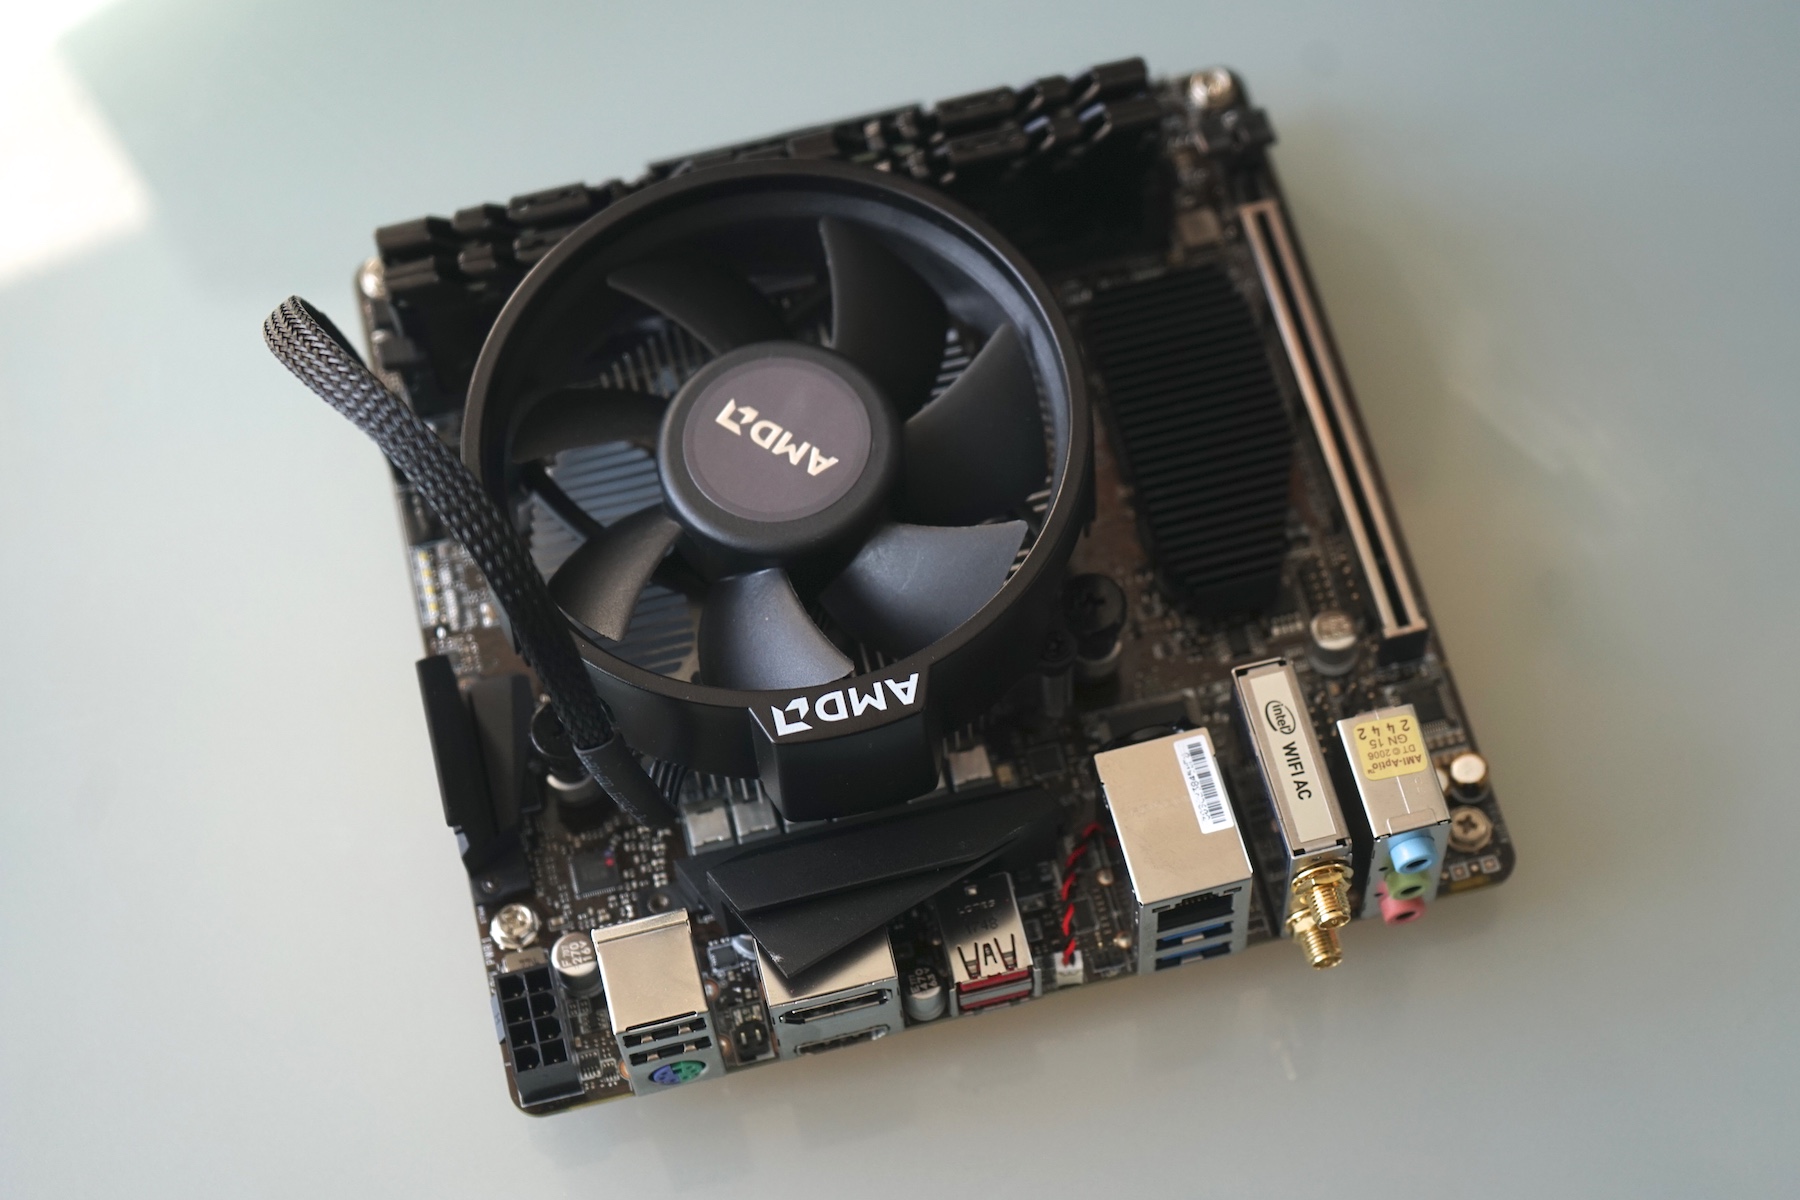
- MSI B350I Pro AC Micro-ATX Mainboard (BIOS 112PT5, Default Settings, XMP 1 für DDR4-2933)
- Seasonic Focus Platinum Plus 850 Watt Netzteil
- G-Skill Flare X DDR4-3200 Speicherkit 2 x 8 GB, eingestellt auf DDR4-2933
- Intel SSD 600p m.2 512 GB
Hiervon wurden Mainboard, Speicher und APUs von AMD zur Verfügung gestellt.


Prozessorbenchmarks
Bei den Einzelkernbenchmarks positioniert sich der Ryzen 5 2400G in etwa auf dem Niveau eines Ryzen 5 1500X (max. 3,7 GHz) bzw. Intel Core i7-7700HQ (mobil, max. 3,8 GHz). Hier kann er den hohen Takt von 3,9 GHz ausspielen. Der Ryzen 3 2200G ist je nach Benchmark nur knapp dahinter. Das fehlende Hyperthreading spielt hier keine Rolle, nur die 200 MHz geringere Taktfrequenz wirkt sich hier leicht aus.
Bei Mehrkernbenchmarks hingegen sehen wir größere Unterschiede zwischen den beiden APUs. Der 2400G kann sich diesmal etwas oberhalb des Core i7-7700HQ auf Niveau eines alten Core i7-4790K (Haswell, Desktop 4 - 4,4 GHz) und wiederum Ryzen 5 1500X einreihen. Der schwächere Ryzen 3 2200G positioniert sich unterschiedlich, je nach SMT Support des Benchmarks. Im Schnitt ist das Level in etwa mit einen Ryzen 3 1300X bzw. einen Desktop Core i5-7500 (Kaby Lake Quad-Core, kein Hyperthreading, 3,4 - 3,8 GHz) vergleichbar.
| Performance Rating - Percent | |
| Intel Core i7-8700K -2! | |
| AMD Ryzen 7 1800X -3! | |
| AMD Ryzen 5 1600 -5! | |
| Intel Core i7-4790K -12! | |
| AMD Ryzen 5 1600 -6! | |
| Intel Core i7-7700HQ -9! | |
| Intel Core i7-4790K -3! | |
| AMD Ryzen 5 1500X -1! | |
| Durchschnittliche Intel Core i7-7820HK -1! | |
| AMD Ryzen 5 2400G | |
| Durchschnittliche Intel Core i7-7700HQ | |
| Intel Core i5-7600K -4! | |
| AMD Ryzen 5 1400 -3! | |
| Intel Core i7-7700HQ -3! | |
| AMD Ryzen 5 2500U -5! | |
| Durchschnittliche Intel Core i5-8250U | |
| Intel Core i5-7500 -3! | |
| AMD Ryzen 3 2200G | |
| AMD Ryzen 5 2500U -6! | |
| AMD Ryzen 3 1300X | |
| AMD Ryzen 3 1200 | |
| Cinebench R15 | |
| CPU Single 64Bit | |
| Intel Core i7-8700K | |
| Intel Core i5-7600K | |
| Intel Core i7-4790K | |
| Durchschnittliche Intel Core i7-7820HK (156 - 185, n=16) | |
| AMD Ryzen 7 1800X | |
| Intel Core i5-7500 | |
| Intel Core i7-7700HQ | |
| AMD Ryzen 5 2400G | |
| AMD Ryzen 5 1500X | |
| Durchschnittliche Intel Core i7-7700HQ (120 - 162, n=110) | |
| AMD Ryzen 3 1300X | |
| AMD Ryzen 3 2200G | |
| AMD Ryzen 5 1600 | |
| AMD Ryzen 5 1600 | |
| Intel Core i7-7700HQ | |
| Durchschnittliche Intel Core i5-8250U (81 - 147, n=97) | |
| AMD Ryzen 5 2500U | |
| AMD Ryzen 5 2500U | |
| AMD Ryzen 3 1200 | |
| AMD Ryzen 5 1400 | |
| CPU Multi 64Bit | |
| AMD Ryzen 7 1800X | |
| Intel Core i7-8700K | |
| AMD Ryzen 5 1600 | |
| AMD Ryzen 5 1600 | |
| AMD Ryzen 5 2400G | |
| Intel Core i7-4790K | |
| AMD Ryzen 5 1500X | |
| Durchschnittliche Intel Core i7-7820HK (689 - 932, n=18) | |
| Intel Core i7-7700HQ | |
| Durchschnittliche Intel Core i7-7700HQ (603 - 747, n=111) | |
| Intel Core i7-7700HQ | |
| AMD Ryzen 5 1400 | |
| Intel Core i5-7600K | |
| AMD Ryzen 5 2500U | |
| Intel Core i5-7500 | |
| AMD Ryzen 3 2200G | |
| AMD Ryzen 5 2500U | |
| Durchschnittliche Intel Core i5-8250U (320 - 730, n=101) | |
| AMD Ryzen 3 1300X | |
| AMD Ryzen 3 1200 | |
| wPrime 2.10 | |
| 32m | |
| AMD Ryzen 3 1200 | |
| AMD Ryzen 3 1300X | |
| AMD Ryzen 3 2200G | |
| Intel Core i7-7700HQ | |
| Durchschnittliche Intel Core i7-7820HK (6.67 - 17.8, n=5) | |
| Intel Core i5-7500 | |
| Durchschnittliche Intel Core i5-8250U (7.39 - 13.8, n=13) | |
| Durchschnittliche Intel Core i7-7700HQ (6.93 - 20.1, n=48) | |
| Intel Core i5-7600K | |
| AMD Ryzen 5 2500U | |
| AMD Ryzen 5 1400 | |
| AMD Ryzen 5 1500X | |
| AMD Ryzen 5 2400G | |
| Intel Core i7-4790K | |
| AMD Ryzen 5 1600 | |
| Intel Core i7-8700K | |
| AMD Ryzen 7 1800X | |
| 1024m | |
| AMD Ryzen 3 1200 | |
| AMD Ryzen 3 1300X | |
| AMD Ryzen 3 2200G | |
| Intel Core i7-7700HQ | |
| Durchschnittliche Intel Core i5-8250U (243 - 402, n=13) | |
| Intel Core i5-7500 | |
| Intel Core i5-7600K | |
| Durchschnittliche Intel Core i7-7700HQ (210 - 379, n=48) | |
| Durchschnittliche Intel Core i7-7820HK (179.4 - 331, n=5) | |
| AMD Ryzen 5 2500U | |
| AMD Ryzen 5 1400 | |
| AMD Ryzen 5 1500X | |
| AMD Ryzen 5 2400G | |
| Intel Core i7-4790K | |
| AMD Ryzen 5 1600 | |
| Intel Core i7-8700K | |
| AMD Ryzen 7 1800X | |
| X264 HD Benchmark 4.0 | |
| Pass 1 | |
| Intel Core i7-8700K | |
| Intel Core i5-7600K | |
| AMD Ryzen 7 1800X | |
| AMD Ryzen 3 2200G | |
| Intel Core i5-7500 | |
| AMD Ryzen 3 1300X | |
| Intel Core i7-4790K | |
| Durchschnittliche Intel Core i7-7820HK (177 - 180.6, n=2) | |
| AMD Ryzen 5 1600 | |
| AMD Ryzen 5 1500X | |
| AMD Ryzen 5 2400G | |
| Intel Core i7-7700HQ | |
| Durchschnittliche Intel Core i7-7700HQ (156.9 - 175, n=22) | |
| AMD Ryzen 3 1200 | |
| AMD Ryzen 5 1400 | |
| Durchschnittliche Intel Core i5-8250U (124.6 - 157.6, n=4) | |
| AMD Ryzen 5 2500U | |
| Pass 2 | |
| AMD Ryzen 7 1800X | |
| Intel Core i7-8700K | |
| AMD Ryzen 5 1600 | |
| Intel Core i7-4790K | |
| AMD Ryzen 5 1500X | |
| AMD Ryzen 5 2400G | |
| Durchschnittliche Intel Core i7-7820HK (46 - 47.8, n=2) | |
| Intel Core i5-7600K | |
| Intel Core i7-7700HQ | |
| Durchschnittliche Intel Core i7-7700HQ (36.6 - 46.5, n=22) | |
| AMD Ryzen 5 1400 | |
| AMD Ryzen 3 2200G | |
| Intel Core i5-7500 | |
| AMD Ryzen 3 1300X | |
| AMD Ryzen 3 1200 | |
| AMD Ryzen 5 2500U | |
| Durchschnittliche Intel Core i5-8250U (29.5 - 37.7, n=4) | |
| WinRAR - Result | |
| Intel Core i7-8700K | |
| Intel Core i7-4790K | |
| Durchschnittliche Intel Core i7-7820HK (5114 - 5155, n=2) | |
| Durchschnittliche Intel Core i7-7700HQ (3763 - 4903, n=12) | |
| AMD Ryzen 7 1800X | |
| Durchschnittliche Intel Core i5-8250U (3632 - 4350, n=2) | |
| Intel Core i7-7700HQ | |
| AMD Ryzen 5 1500X | |
| AMD Ryzen 5 2400G | |
| AMD Ryzen 5 1600 | |
| Intel Core i5-7600K | |
| AMD Ryzen 3 2200G | |
| AMD Ryzen 5 1400 | |
| AMD Ryzen 5 1600 | |
| Intel Core i5-7500 | |
| AMD Ryzen 3 1300X | |
| AMD Ryzen 3 1200 | |
| AMD Ryzen 5 2500U | |
* ... kleinere Werte sind besser
Throttling ist im Gegensatz zu den mobilen Kollegen kein Thema - nicht einmal mit dem mitgelieferten Wraith Stealth Lüfter. Weder der Ryzen 5, noch der Ryzen 3 verlieren nach 20 Durchläufen Cinebench R15 an Leistung.
Grafikkartenbenchmarks
Wie für AMD üblich, brilliert die neue APU bei der integrierten Grafikkarte. Die Vega 11 im Ryzen 5 2400G kann in den 3DMark Benchmarks auch die alte Iris Pro 580 im NUC6i7 (Skull Trail) schlagen. Verglichen mit dedizierten Grafikkarten, positioniert sich die Vega 11 auf dem Niveau einer Desktop GTX 1030 / Nvidia GeForce MX150.
Die Vega 8 im Ryzen 3 2200G entspricht zwar der integrierten Grafikkarte in den Ryzen 5 und 7 mobil-APUs, durch den schneller getakteten Speicher (DDR4-2933) und höheren TDP ist die Performance jedoch deutlich besser. Die Auswirkung des schnellen Speichers, sehen wir, da z.B. Vega 11 mit DDR4-2400 ähnlich schnell ist wie Vega 8 mit DDR4-2933. Mit DDR4-2933 ist die Vega 8 in etwa vergleichbar mit einer dedizierten Radeon Pro 555 im MacBook Pro 15 bzw. zwischen 940MX und MX150.
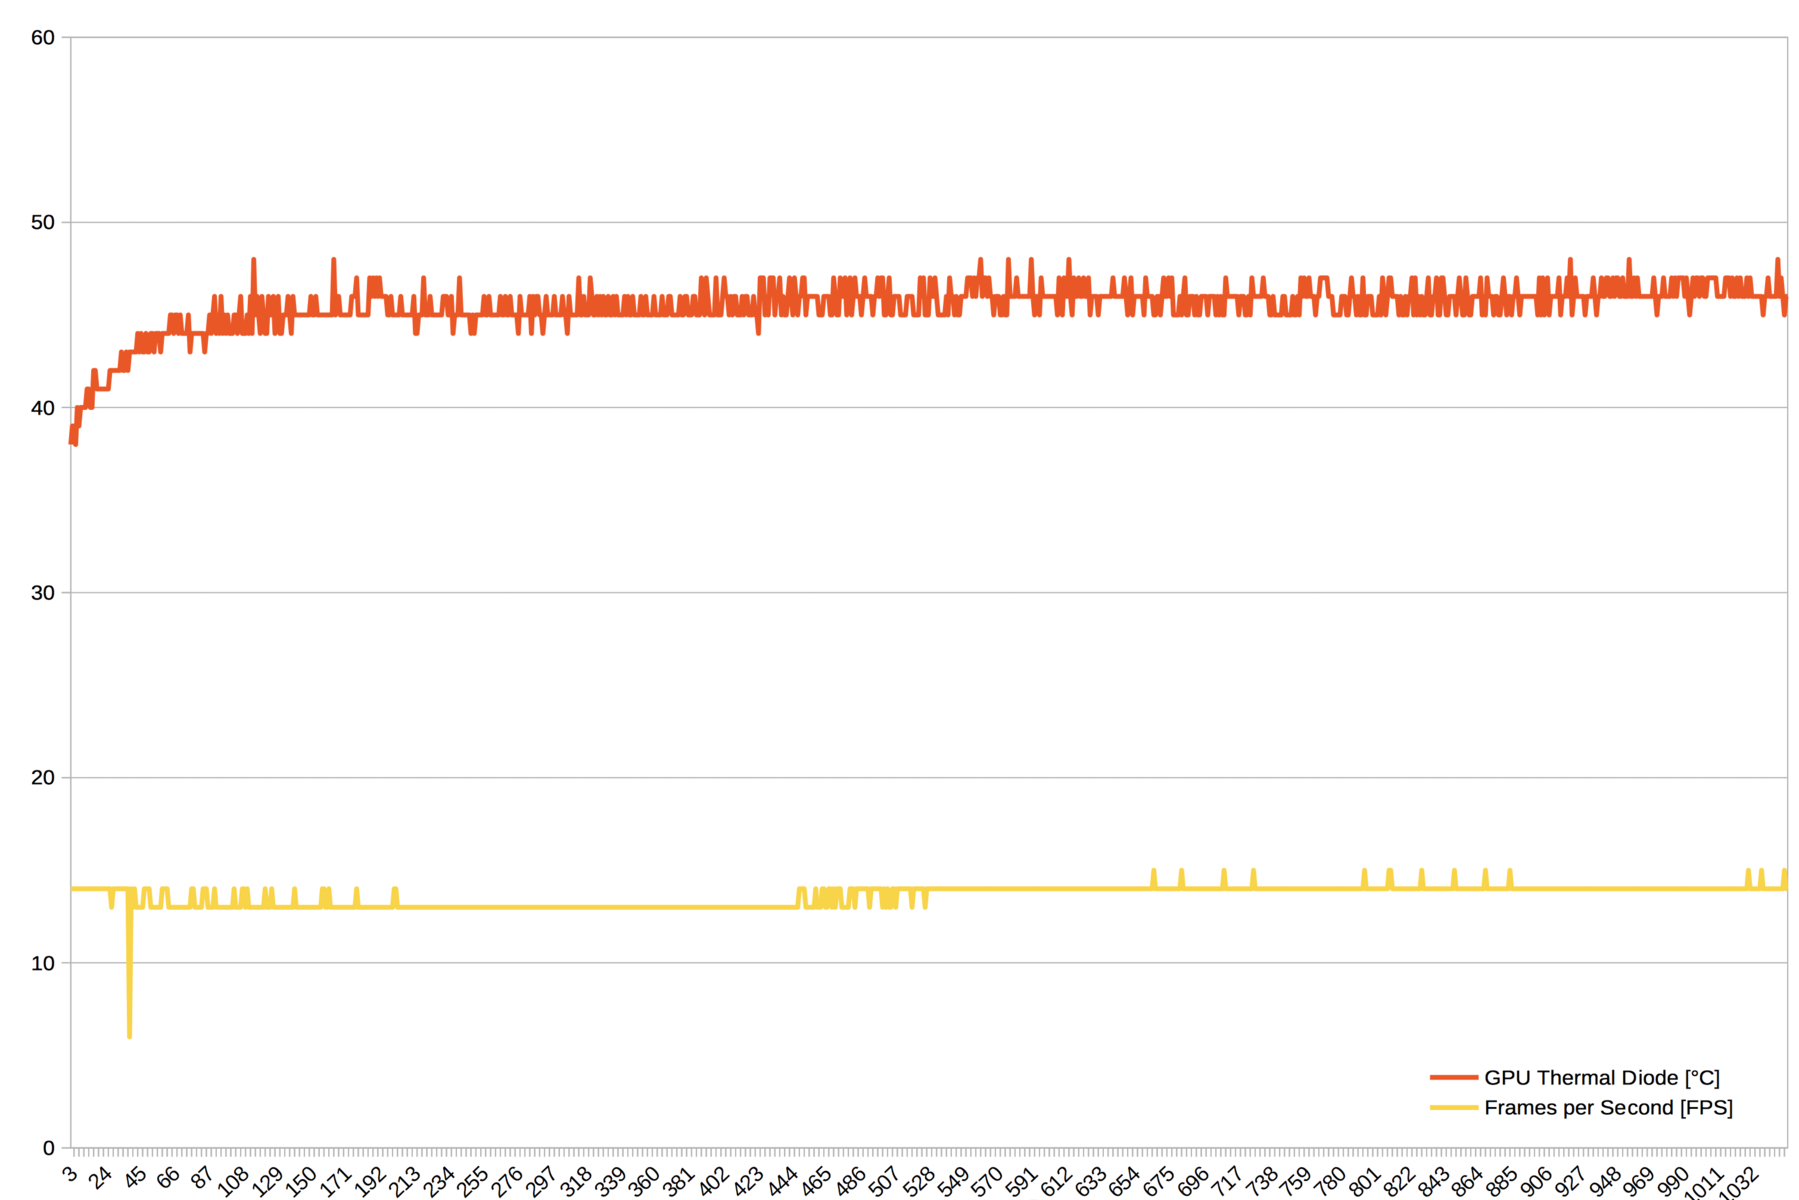
Auch bei Belastung der Grafikkarte können wir über längeren Zeitraum keinerlei Performance-Einbußen feststellen. Sowohl der 3DMark Sky Diver Stress Test als auch "The Witcher 3" verlieren nicht an Leistung.
| Performance Rating - Percent | |
| AMD Radeon RX 460 (Desktop) -1! | |
| Durchschnittliche NVIDIA GeForce GTX 1050 Mobile | |
| NVIDIA GeForce GTX 1050 Mobile -2! | |
| AMD Radeon Pro 555 -1! | |
| AMD Radeon RX Vega 11 | |
| NVIDIA GeForce GT 1030 (Desktop) | |
| AMD Radeon Pro 450 -1! | |
| Durchschnittliche NVIDIA GeForce MX150 | |
| NVIDIA GeForce MX150 -1! | |
| AMD Radeon RX Vega 8 (Ryzen 2000/3000) -1! | |
| Intel Iris Pro Graphics 580 -4! | |
| AMD Radeon RX Vega 8 (Ryzen 2000/3000) -2! | |
| AMD Radeon RX Vega 8 (Ryzen 2000/3000) -2! | |
| Intel Iris Pro Graphics 580 -2! | |
| Intel Iris Plus Graphics 650 -1! | |
| Durchschnittliche NVIDIA GeForce 940MX | |
| NVIDIA GeForce 940MX -1! | |
| Intel Iris Pro Graphics 5200 -2! | |
| Intel Iris Plus Graphics 640 -1! | |
| Intel UHD Graphics 630 -2! | |
| Durchschnittliche Intel UHD Graphics 630 | |
| Intel Iris Pro Graphics 5200 -3! | |
| Intel UHD Graphics 630 | |
| Intel UHD Graphics 620 -2! | |
Spieleleistung
In unseren Spieletests ist die Performance erwartungsgemäß etwas geringer als bei den synthetischen 3DMark Benchmarks. Trotz des fehlenden eigenen Speichers halten sich Vega 8 und 11 jedoch sehr gut. Im Schnitt ist die Performance vergleichbar mit der mobilen GeForce MX 150. Die schwächere GeForce 940 MX kann jedoch selbst von der Vega 8 immer abgehängt werden. Insgesamt empfiehlt sich die Leistung daher für niedrige Details bei aktuellen und anspruchsvollen Spielen. Weniger anspruchsvolle Spiele wie Rocket League sind sogar in hoher Detailstufe flüssig spielbar.
| Performance Rating - Percent | |
| NVIDIA GeForce GTX 1050 Mobile -2! | |
| NVIDIA GeForce GTX 1050 (Desktop) -5! | |
| NVIDIA GeForce MX150 -1! | |
| NVIDIA GeForce GT 1030 (Desktop) | |
| AMD Radeon RX Vega 11 | |
| Durchschnittliche NVIDIA GeForce MX150 | |
| AMD Radeon RX Vega 8 (Ryzen 2000/3000) | |
| NVIDIA GeForce 940MX -1! | |
| Durchschnittliche NVIDIA GeForce 940MX | |
| Durchschnittliche NVIDIA GeForce 940M | |
| Intel Iris Plus Graphics 640 -5! | |
| AMD Radeon RX Vega 8 (Ryzen 2000/3000) -2! | |
| Intel UHD Graphics 630 -5! | |
| Intel Iris Plus Graphics 650 -4! | |
| Durchschnittliche Intel Iris Plus Graphics 650 -4! | |
| Intel UHD Graphics 630 -5! | |
Ryzen 5 2400G
| min. | mittel | hoch | max. | 4K | |
|---|---|---|---|---|---|
| X-Plane 10.25 (2013) | 65.9 | 44.7 | 20.1 | 20 | |
| GTA V (2015) | 102 | 28.7 | 14.3 | ||
| Dota 2 Reborn (2015) | 103.3 | 80.5 | 54.2 | 50.2 | 20.7 |
| World of Warships (2015) | 70 | 52.9 | 15.9 | ||
| Deus Ex Mankind Divided (2016) | 50 | 18.1 | |||
| Rocket League (2017) | 215 | 71 | 47.1 | 15.2 | |
| Team Fortress 2 (2017) | 75.4 | 26.5 | |||
| F1 2017 (2017) | 101 | 45 | 35 | ||
| Middle-earth: Shadow of War (2017) | 48 | 24 | 18 | ||
| Assassin´s Creed Origins (2017) | 41 | 23 | 20 | ||
| Fortnite (2018) | 183 | 86 | 30.8 | ||
| Final Fantasy XV Benchmark (2018) | 31.3 | 16.4 | |||
| Kingdom Come: Deliverance (2018) | 50.6 | 22.3 | 18.7 | 14.1 | |
| X-Plane 11.11 (2018) | 44.8 | 34.6 | 31.8 | 18.1 | |
| Far Cry 5 (2018) | 49 | 23 | 22 | 20 | |
| The Crew 2 (2018) | 58.8 | 28.4 | 24.6 | 17.8 | 5.5 |
| Monster Hunter World (2018) | 43.5 | 19.9 | 18.3 | 13.9 | |
| F1 2018 (2018) | 71 | 38 | 29 | 19 | 10 |
| Shadow of the Tomb Raider (2018) | 49 | 19 | 17 | 14 | 4 |
| FIFA 19 (2018) | 123.6 | 89.3 | 77.6 | 76.6 | 25 |
| Forza Horizon 4 (2018) | 78 | 38 | 35 | 29 | 12 |
| Assassin´s Creed Odyssey (2018) | 37 | 20 | 16 | 11 | 5 |
| Call of Duty Black Ops 4 (2018) | 61.3 | 22.5 | |||
| Hitman 2 (2018) | 35.9 | 0 () | |||
| Fallout 76 (2018) | 44.5 | 24.2 | 22.3 | 21.6 | |
| Battlefield V (2018) | 66.9 | 30.9 | 26.1 | 25.1 | 8.4 |
| The Division 2 (2019) | 62 | 33 | 17 | ||
| Anno 1800 (2019) | 58.5 | 21.3 | 12.9 | ||
| Rage 2 (2019) | 37.5 | 31.9 | 31.1 | ||
| F1 2019 (2019) | 84 | 43 | 30 | ||
| Control (2019) | 41.2 | 12.5 | 7.1 | ||
| Borderlands 3 (2019) | 56.1 | 21.7 | 13.2 | 8.9 |
Ryzen 3 2200G
| min. | mittel | hoch | max. | 4K | |
|---|---|---|---|---|---|
| X-Plane 10.25 (2013) | 63.5 | 41.1 | 19.3 | 18.2 | |
| GTA V (2015) | 51.5 | 25.3 | 12.3 | ||
| Dota 2 Reborn (2015) | 97.2 | 76.3 | 47.8 | 44.8 | |
| World of Warships (2015) | 46 | 37.5 | 13.3 | ||
| Ashes of the Singularity (2016) | 16.3 | ||||
| Overwatch (2016) | 127 | 46.7 | 22.9 | ||
| Deus Ex Mankind Divided (2016) | 42.5 | 15.2 | |||
| Rocket League (2017) | 93 | 45.8 | 32.1 | 14.1 | |
| F1 2017 (2017) | 85 | 36 | 29 | ||
| Middle-earth: Shadow of War (2017) | 46 | 21 | 16 | ||
| Assassin´s Creed Origins (2017) | 38 | 20 | |||
| Star Wars Battlefront 2 (2017) | 70 | 23.1 | 20.2 | ||
| Fortnite (2018) | 198 | 62 | 24.1 | ||
| Final Fantasy XV Benchmark (2018) | 27 | 13.7 | |||
| Kingdom Come: Deliverance (2018) | 36.8 | 18.3 | |||
| Far Cry 5 (2018) | 43 | 20 | 18 | 17 | |
| The Crew 2 (2018) | 56.7 | 24.6 | 22.3 | 15.9 | 5 |
| Monster Hunter World (2018) | 38.7 | 16.2 | 14.7 | 10.7 | |
| F1 2018 (2018) | 64 | 33 | 25 | 16 | 9 |
| Shadow of the Tomb Raider (2018) | 46 | 17 | 15 | 12 | 3 |
| FIFA 19 (2018) | 110.5 | 81.7 | 73.1 | 70.6 | 20.1 |
| Forza Horizon 4 (2018) | 54 | 33 | 30 | 23 | 9 |
| Assassin´s Creed Odyssey (2018) | 34 | 18 | 13 | 9 | 4 |
| Call of Duty Black Ops 4 (2018) | 59.8 | 18.3 | |||
| Hitman 2 (2018) | 32.1 | ||||
| Fallout 76 (2018) | 41.9 | 22.5 | 17.9 | 16.2 | |
| Battlefield V (2018) | 62.1 | 27.5 | 23.7 | 22.5 | 5.6 |
| Farming Simulator 19 (2018) | 120.2 | 53.2 | 30.2 | 14 | |
| Darksiders III (2018) | 79 | 22.4 | 18 | 14.8 | |
| Just Cause 4 (2018) | 30.5 | 18.4 | 14.4 | 10.5 | |
| Apex Legends (2019) | 59.8 | 28.2 | 19.1 | ||
| Far Cry New Dawn (2019) | 37 | 20 | 18 | 16 | |
| Anthem (2019) | 0 Spiel startete nicht (unsupported gpu) | ||||
| Dirt Rally 2.0 (2019) | 115.8 | 41.2 | 30.6 | 15.3 | |
| The Division 2 (2019) | 51 | 29 | 15 | ||
| Anno 1800 (2019) | 55.4 | 19.4 | 11.6 | ||
| Rage 2 (2019) | 33.1 | 28.5 | 28.4 | ||
| F1 2019 (2019) | 82 | 41 | 26 | ||
| Control (2019) | 35.3 | 10.2 | 6 | ||
| Borderlands 3 (2019) | 49.1 | 18.7 | 11.8 | 7.5 |
Compute-Performance
Nutzt man die Grafikkarte für generelle Berechnungen, ist die Leistung anscheinend weniger Abhängig vom dedizierten Grafikspeicher. Daher können die beiden Vega Grafikkarten in den Ryzen APUs hier etwas besser abschneiden als bei den Spieletests.
Anwendungsleistung
Im aktuellen PCMark 10 können sich die beiden APUs gut behaupten. Sie befinden sich auf dem Niveau eines aktuellen Macbook Pro 15 mit dedizierter Radeon RX 555 Grafikkarte. Beim älteren PCMark 8 positionieren sich die beiden Neulinge etwas schlechter. Interessant ist jedoch, dass beide Ryzen SoCs sehr nahe beeinander liegen. Ist man nur an der Anwendungsperformance interessiert, ist also der günstige Ryzen 3 2200G die deutlich bessere Wahl.
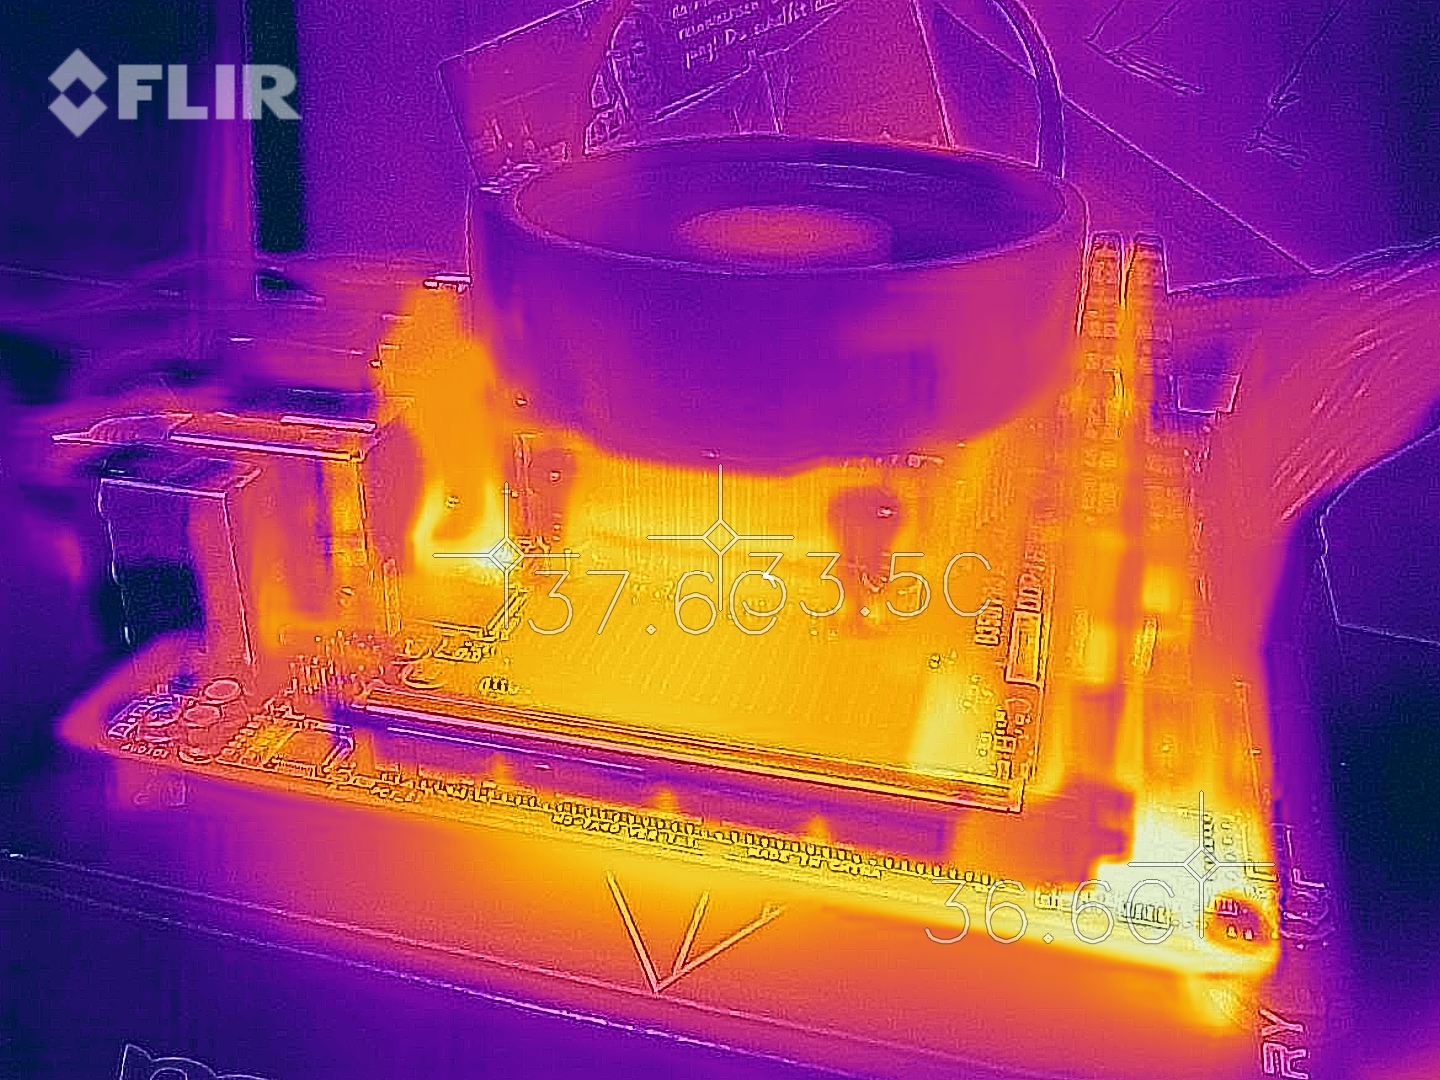
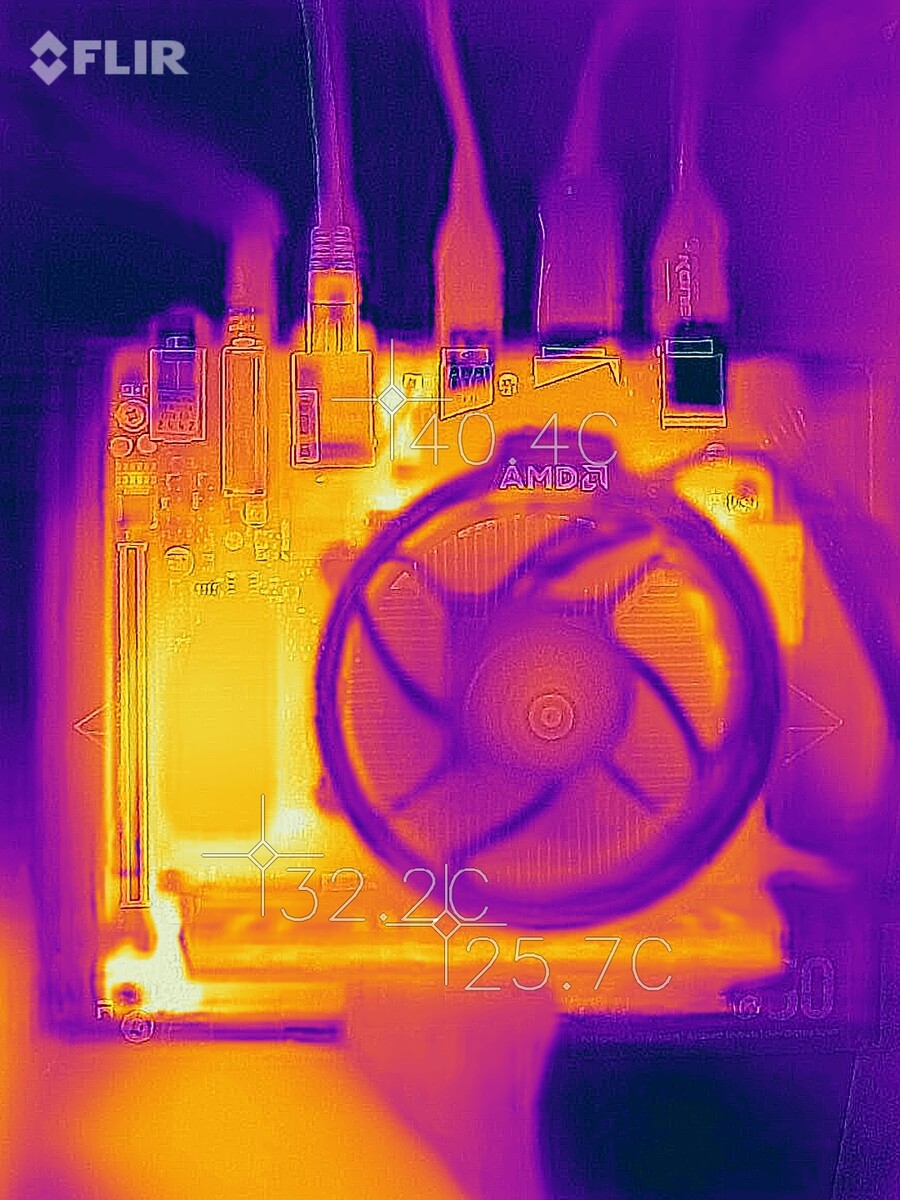
Temperaturen
Die internen Temperaturen halten sich bei unseren Tests in Grenzen. Bei "The Witcher 3" pendelt sich der Chip bei relativ kühlen 46°C ein und kann die Taktfrequenz der Grafikkarte halten. Die dedizierte GTX 1070 Ti Founders Edition im Vergleich erreichte 82°C. Bei starker Prozessorlast sehen wir jedoch etwas höhere Werte. HWInfo meldet 80 °C (Ryzen 3 2200G) bzw 84 °C (Ryzen 5 2400G) mit dem beigelegten Wraith Stealth Lüfter. Viel Spielraum für Übertaktung ist hier also nicht mehr vorhanden.
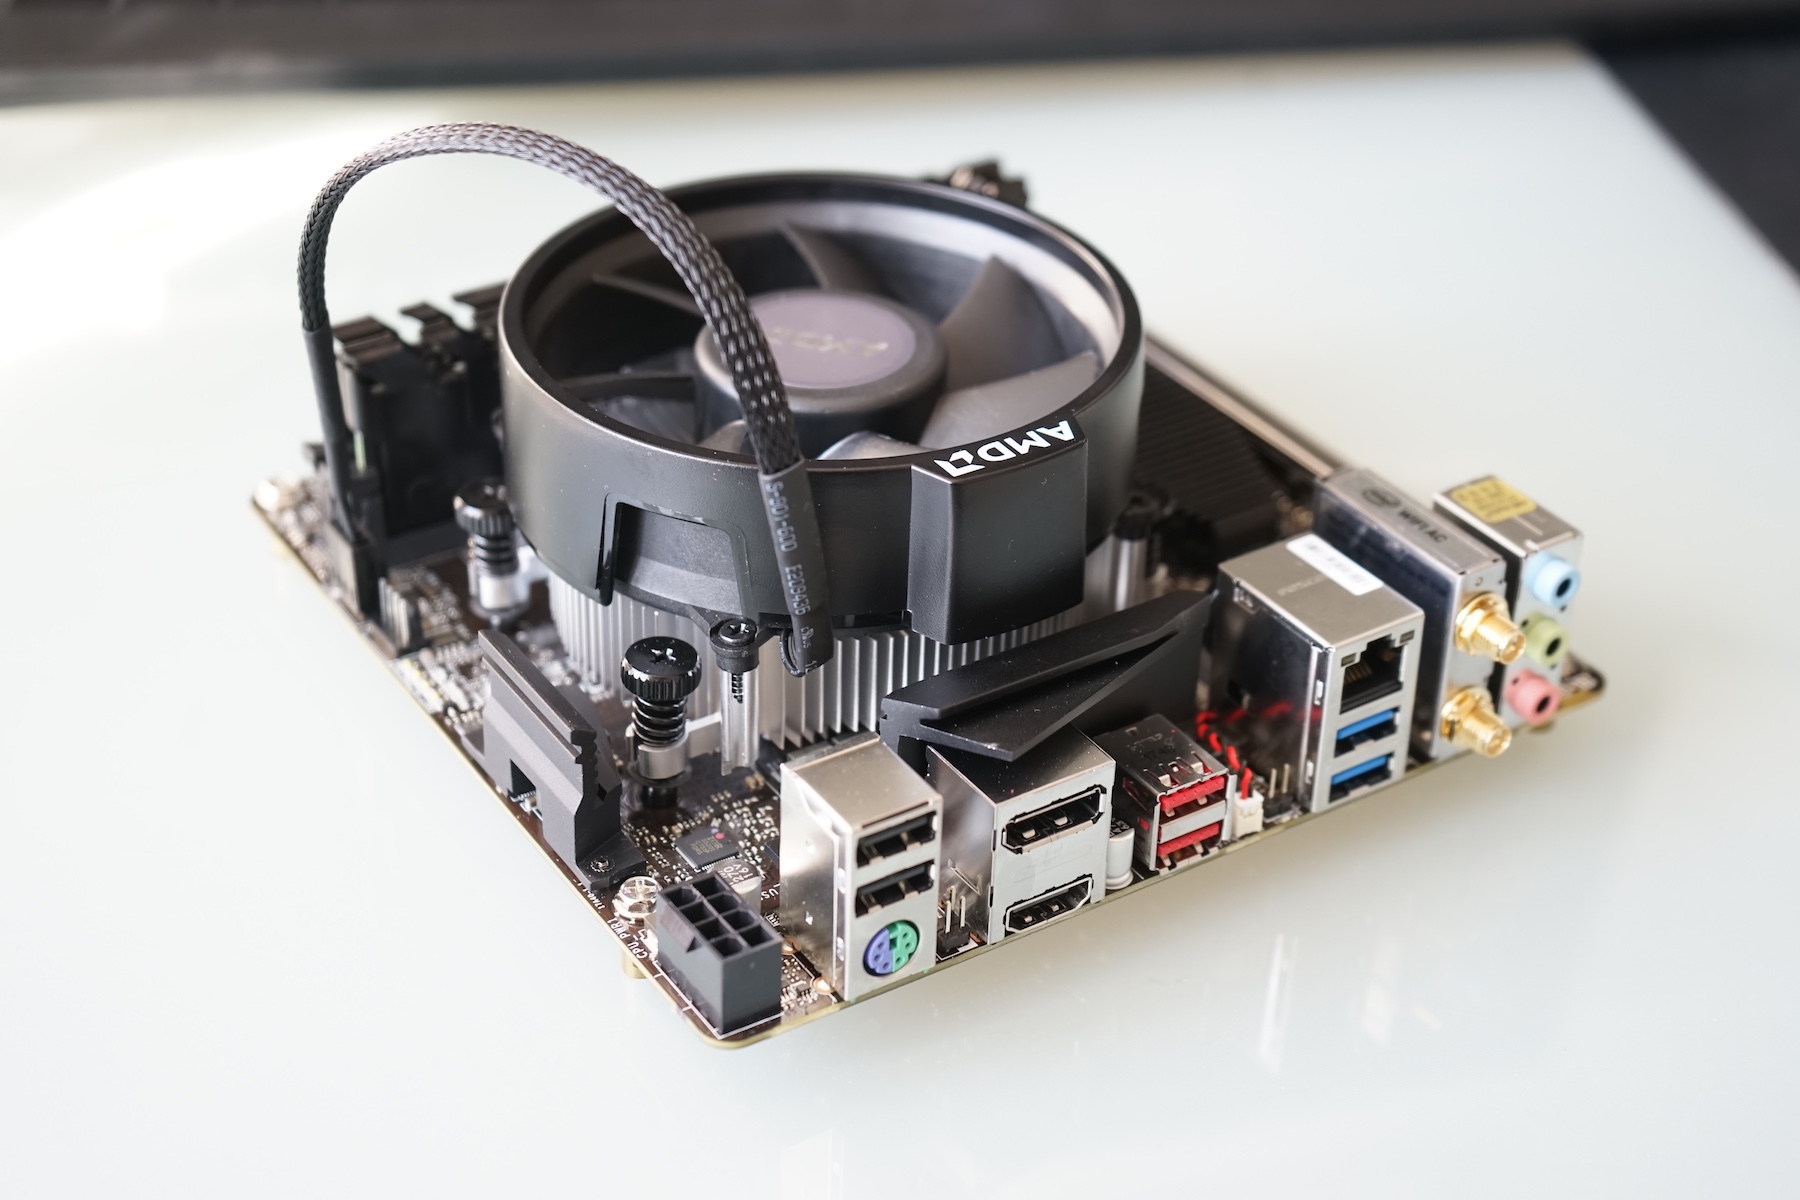
Lautstärke
Out of the Box ist der mitgelieferte Wraith Stealth Lüfter kein Leisetreter. Besonders im Idle war er mit dem MSI Board immer sehr präsent. Unter Last wird er nur geringfügig lauter, hält aber die Temperaturen dafür in Grenzen. Getestet haben wir ihn mit der mitgelieferten Wärmeleitpaste. Im BIOS war optional auch die Steuerung von PWM auf Stromstärke umstellbar, wodurch die minimale Lautstärke deutlich gesenkt werden konnte.
Stromverbrauch
Ohne Last sind die beiden Ryzen APUs sehr sparsam. Wir messen nur 22,7 Watt (Ryzen 3) bzw 23,5 Watt (Ryzen 5). Deutlich besser sind nur Notebooks, wo wir ohne Bildschirm 7 (Asus GL753V mit i7-7700HQ) - 17 Watt (Macbook Pro 15 2016 mit aktivierter Radeon Pro 455) messen. Diese nutzen jedoch auch genau auf die Leistung zugeschnittene Netzteile.
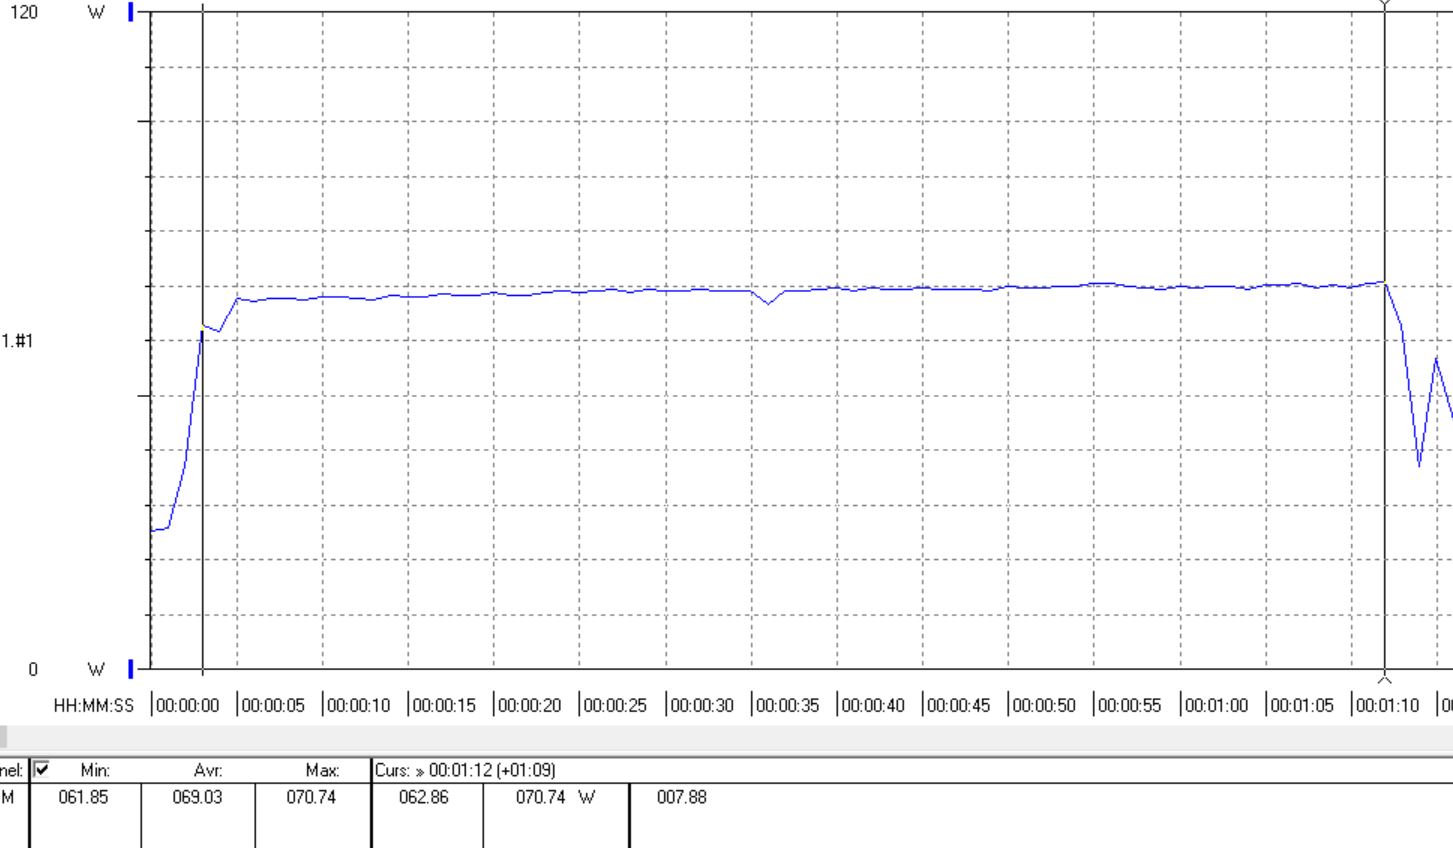
Bei "The Witcher 3" messen wir beim Ryzen 5 anfangs 84 Watt (etwa 60 Watt Differenz zu Idle) bei 14 fps. Nach kurzer Zeit fällt dies auf 74.7 W (etwa 51 Watt Differenz zu Idle) ab mit 13 fps. Damit ist der Verbrauch auf Augenhöhe mit dem alten A10-7850K, jedoch bei deutlich höherer Leistung (13 zu 6 fps). Im Notebook-Bereich ist eine dedizierte MX150 bei rund 39 - 53 Watt angesiedelt, GTX 1050 basierende Notebooks bei 73 - 99 Watt. Die GTX 1050 im Core i7-4790K Desktop nimmt dann aber bereits 155 Watt. Für einen Desktop also ein gutes Ergebnis. Die schwächere Ryzen 3 2200G APU benötigt 68 Watt für 12 fps und kann daher mit einer besseren Effizienz punkten.
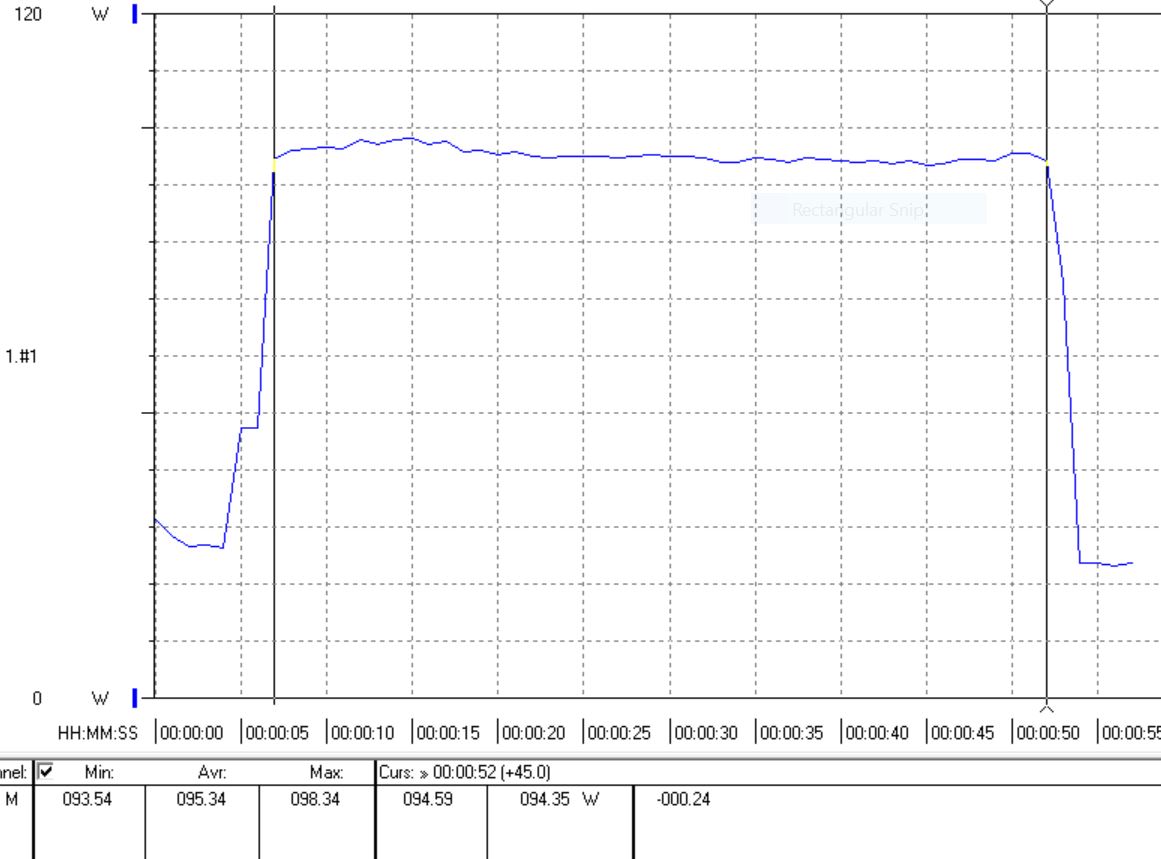
In Furmark nähern sich die beiden APUs einander an. Die 2400G braucht 79 Watt, die 2200G nur 4 Watt weniger mit 75 Watt. Beide liefern hierbei die selbe Framerate. Im Vergleich brauchte der alte A10-7850K mit 94 Watt nochmals deutlich mehr.
Belasten wir den Prozessorteil, braucht das System interessanterweise mehr Strom. Ein Cinebench R15 Durchlauf braucht 95 bzw 69 Watt. Rechnet man die erzielten Punkte ein, ist der Ryzen 5 2400G hier etwas effizienter (9 versus 8,4 Punkte pro Watt).
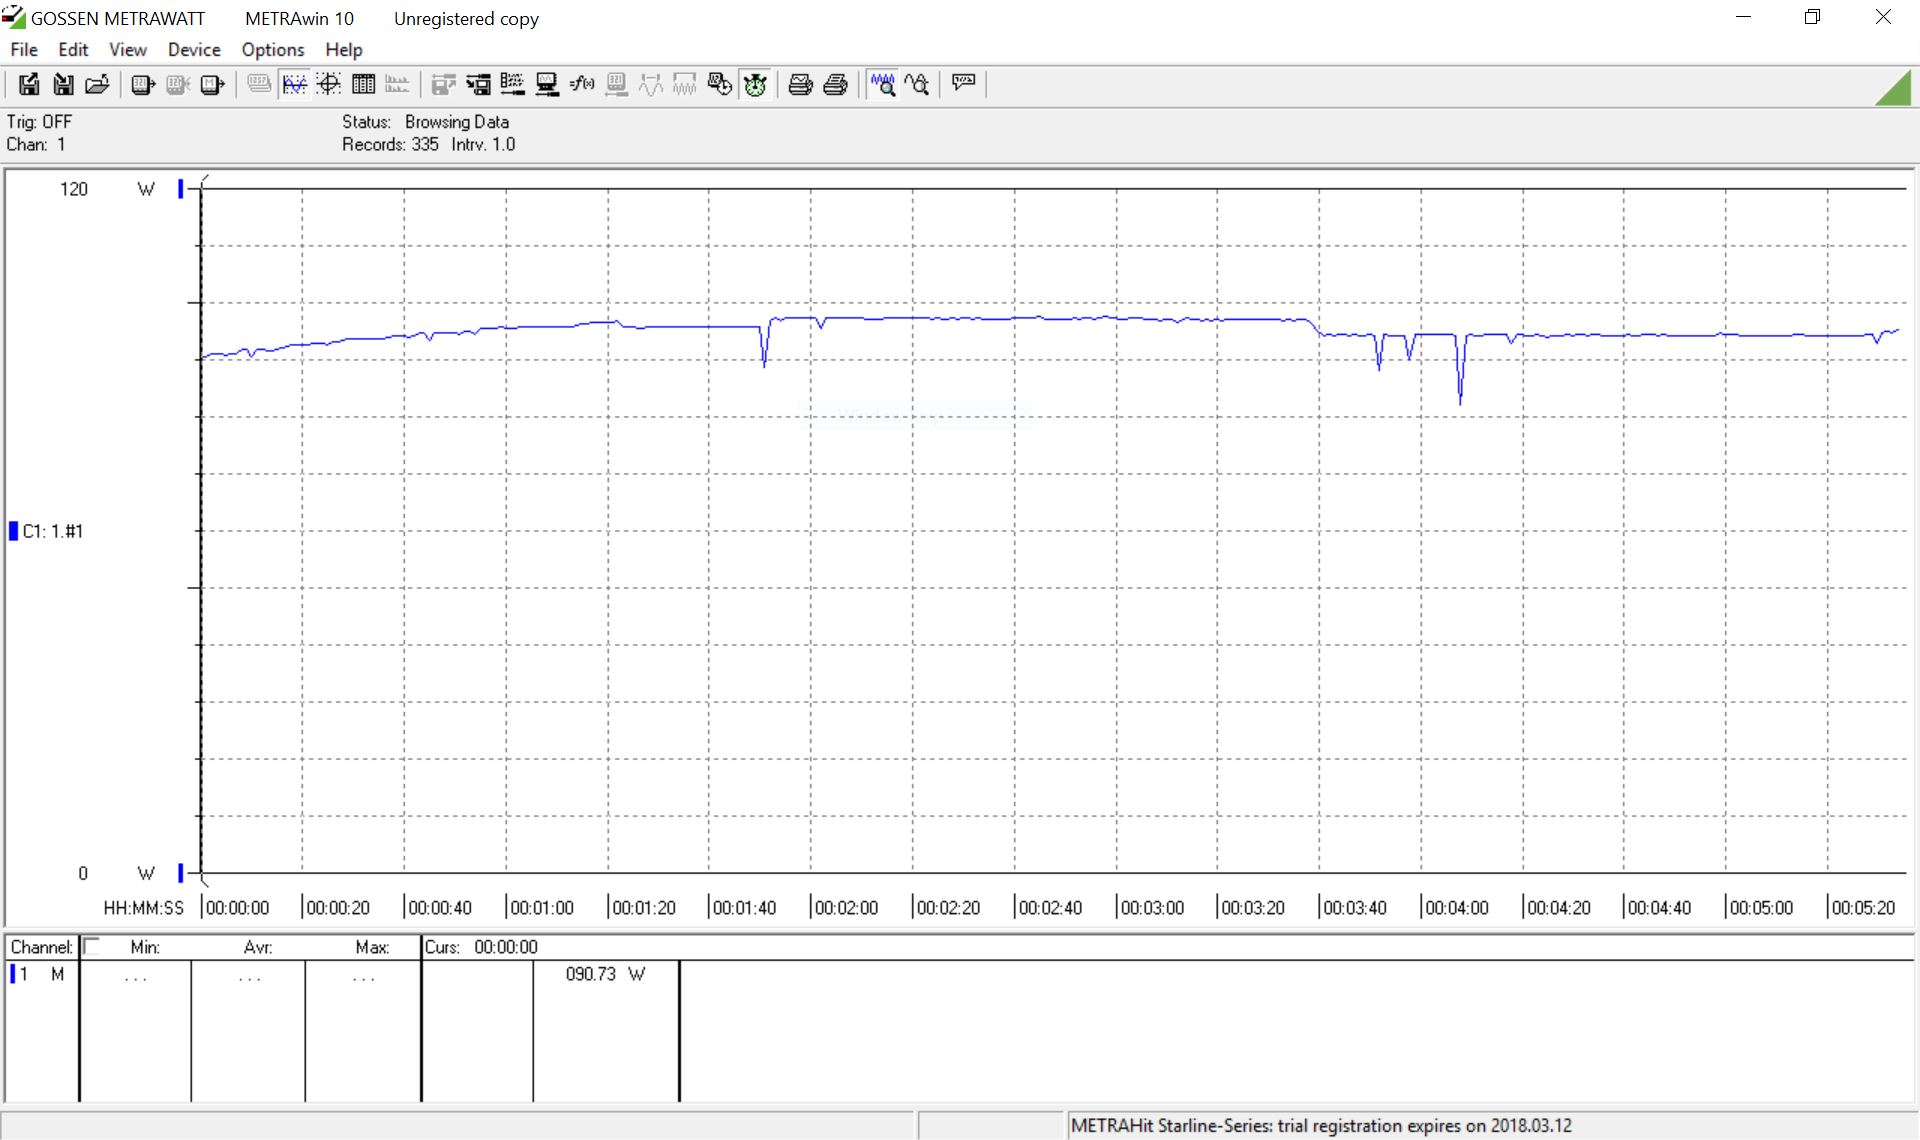
Unter maximaler Prozessorlast per Prime95 erreicht das System 107 Watt bzw. 96 Watt. Nehmen wir Furmark dazu erhöht sich der Wert auf 114 Watt (bei beiden APUs).
| Power Consumption | |
| Cinebench R15 Multi (external Monitor) | |
| AMD Ryzen 5 1500X (Idle: 51.8 W) | |
| Intel Core i5-7600K (Idle: 43.8 W) | |
| AMD Ryzen 5 2400G (Idle: 23.5 W) | |
| AMD A10-7850K (Idle: 26.4 W) | |
| AMD Ryzen 3 2200G (Idle: 22.7 W) | |
| Intel Core i7-7700HQ (Idle: 13.2 W) | |
| Intel Core i7-8550U (Idle: 6.2 W) | |
| Intel Core i5-8250U (Idle: 6.6 W) | |
| 1920x1080 The Witcher 3 ultra (external Monitor) | |
| AMD Ryzen 5 1500X (90 fps, Idle: 51.8 W) | |
| Intel Core i5-7600K (94 fps, Idle: 43.8 W) | |
| AMD A10-7850K (6.1 fps, Idle: 26.4 W) | |
| AMD Ryzen 5 2400G (13 fps, Idle: 23.5 W) | |
| AMD Ryzen 3 2200G (12 fps, Idle: 22.7 W) | |
| Intel Core i7-7700HQ (13 fps, Idle: 13.2 W) | |
| Intel Core i7-8550U (Idle: 3.8 W) | |
| Intel Core i7-8550U (3.5 fps, Idle: 6.2 W) | |
| Intel Core i5-8250U (3.4 fps, Idle: 6.6 W) | |
* ... kleinere Werte sind besser
Fazit
Wie schon im Notebook, kann auch im Desktop die Raven Ridge APU überzeugen. Mit 65 Watt und schnellem DDR4 Speicher sieht man vor allem bei den Grafikbenchmarks sehr gute Steigerungen im Vergleich zur mobilen Version. Bei der Prozessorleistung, muss man nun auch keine Einschränkungen mehr hinnehmen - dank der schnellen Zen-CPU-Kerne. Die Grafikleistung reicht an dedizierte Einstiegsgrafikkarten heran und kann daher auch Casual-Gamer durchaus glücklich machen. Mit der Kompatibilität zur AM4 Plattform und den günstigen Einstiegspreisen, bietet sich die APU auch gut für spätere Upgrades an.