Notebookcheck Logo

AMD Radeon 740M vs Intel Arc 7-Core iGPU

AMD Radeon 740M

► remove from comparison AMD Radeon 740M

Die AMD Radeon 740M (oder RX 740M) ist eine integrierte Grafikkarte (iGPU) für Notebooks. Sie befindet sich in den schwächeren Phoenix-U (Ryzen 7040) APUs und bietet 4 der 12 CUs (256 Shader). Sie nutzt die aktuelle RDNA 3 Architektur. Die Taktrate ist abhängig vom CPU-Modell und erreicht beim Launch bis 2,5 GHz (maximaler Boost-Takt). Die GPU hat keinen eigenen Grafikspeicher, sondern nutzt den gemeinsamen Hauptspeicher (bis zu LPDDR5 7500 MT/s oder DDR5 5600 MT/s). Die iGPU unterstützt Raytracing in Hardware, ist jedoch bei aktuellen Spielen zu langsam um dieses Feature sinnvoll nutzen zu können.

Die Leistung der GPU ist abhängig von der CPU, dem konfiguriertem TDP, der Kühlung und dem verbautem Hauptspeicher. Durch die geringere Kernanzahl, sollte die Performance aber deutlich unterhalb der Radeon 780M liegen.

Der integrierte Media-De- und Encoder unterstützt 8k60 AV1, 8k43 H.265 und 4k175 H.264.

Der Stromverbrauch ist dank modernen 4nm Prozess und ausgeklügelten Stromsparmechanismen relativ gering (laut AMD).

Intel Arc 7-Core iGPU

► remove from comparison Intel Arc 7-Core

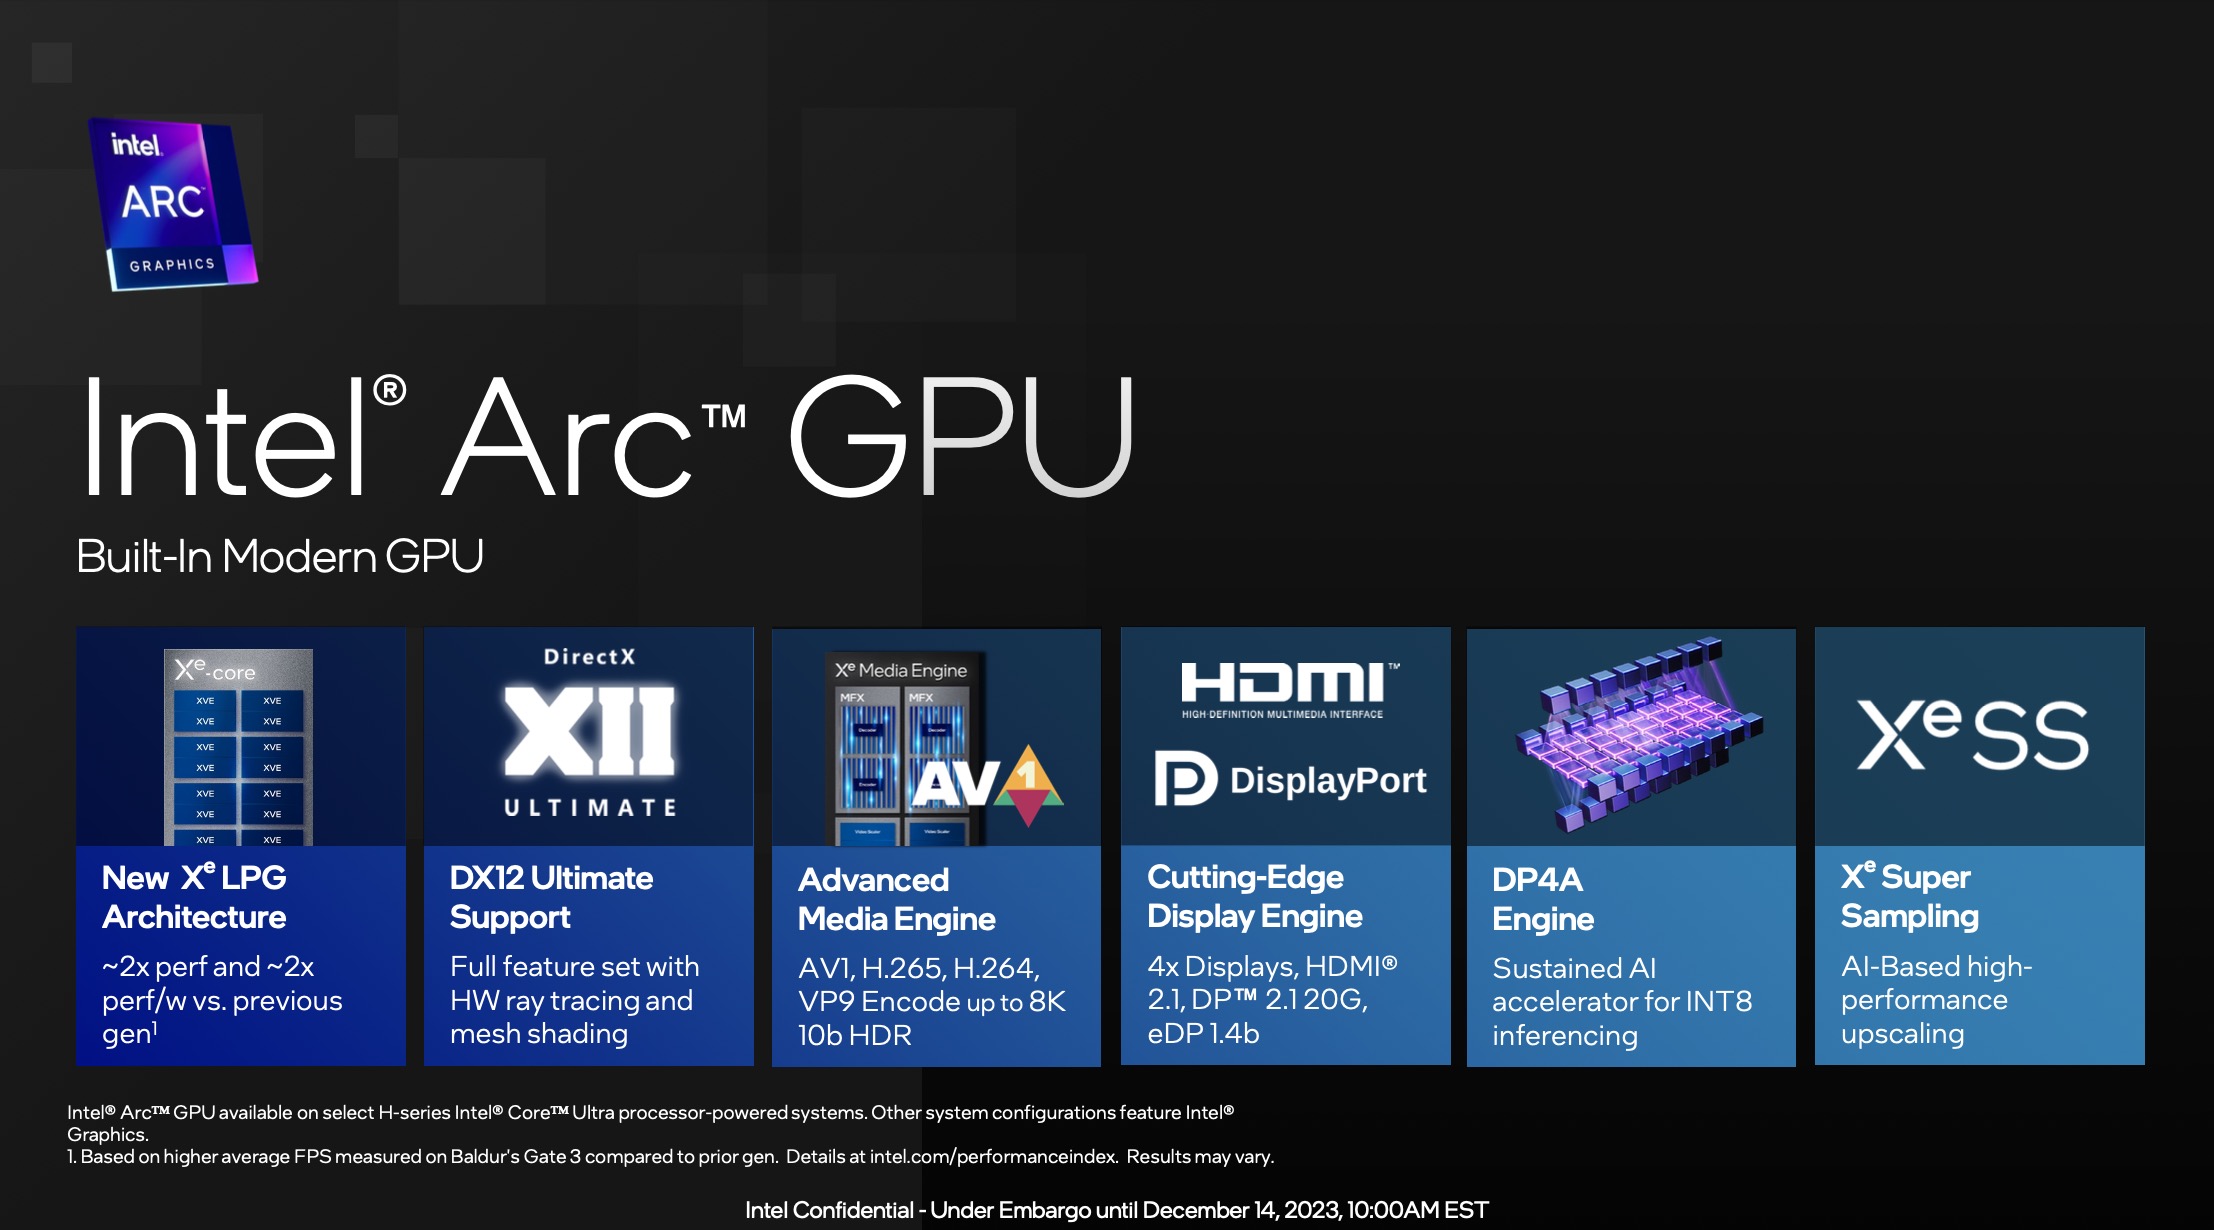
Die Intel Arc iGPU mit 7 Kernen ist eine integrierte Grafikkarte basierend auf die Xe LPG Architektur (ähnlich zu den dedizierten Arc GPUs, jedoch mit Fokus auf Effizienz). Sie bietet 7 der 8 Xe Kerne (112 Xe Vector Engines), 7 Raytracing Einheiten, 7 Sampler und wahrscheinlich auch 4 Pixel Backends.

Der Arc Name darf nur genutzt werden, wenn mindestens 16 GB RAM im Dual Channel Modus verwendet werden. Sonst heisst die nur iGPU "Intel Graphics" und ist ebenfalls deutlich langsamer.

Laut Intel konnte die Performance im Vergleich zur Vorgängergeneration (wahrscheinlich noch in Alder Lake) verdoppelt werden.

Die iGPU unterstützt DirectX 12 Ultimate (wahrscheinlich DX 12_2 wie die Desktop Arc GPUs). Weiters unterstützt die Grafikeinheit XeSS AI Super Sampling.

Die Media Engine ist bei Meteor Lake im SOC Tile und unterstützt bis zu 8k60 10-bit HDR Encode und Deccode von MPEG2, AVC, VP9, HEVC und AV1. Die Display Engine ist ebenfalls im SoC Tile und unterstützt HDMI 2.1 und DisplayPort 2.1 20G mit bis zu 8K60 HDR.

Der GPU Tile des Meteor Lake Chips wird bei TSMC in 5nm (5N Prozess) gefertigt.

AMD Radeon 740MIntel Arc 7-Core iGPU
Arc LPG Serie
Radeon 780M compare 768 @ 1.5 - 3 GHz
Radeon 760M compare 512 @ 1.5 - 2.8 GHz
Radeon 740M 256 @ 1.5 - 2.5 GHz
Arc 8-Core compare 8 @ 2.3 GHz
Arc 7-Core 7 @ 2.2 GHz
Graphics 4-Core iGPU (Arrow Lake) compare 64 @ 0.3 - 1.95 GHz
CodenamePhoenixMeteor Lake iGPU
ArchitekturRDNA 3Xe LPG
Pipelines256 - unified7 - unified
Raytracing Cores47
Kerntakt1500 - 2500 (Boost) MHz2200 (Boost) MHz
Shared Memoryjaja
APIDirectX 12_2, OpenGL 4.6, OpenCL 2.1, Vulkan 1.3DirectX 12_2, OpenGL 4.6, Vulkan 1.3
Stromverbrauch30 Watt (30 - 15 Watt TGP)
Herstellungsprozess4 nm5 nm
Displays4 Displays (max.), HDMI 2.1, DisplayPort 2.1HDMI 2.1, DisplayPort 2.1 20G
FeaturesMiracast, FreeSync, Adaptive-Sync, UHBR10, HDR Metadata, SmartShift MAX, SmartAccess Memory, 8k60 AV1, 8k43 H.265, 4k175 H.264 De- and Encode
Erscheinungsdatum23.05.2023 14.12.2023
CacheL1: 1.3 MB
CPU in Radeon 740MGPU Base SpeedGPU Boost / Turbo
AMD Ryzen Z16 x 3200 MHz, 30 W? MHz? MHz
AMD Ryzen 5 2206 x 3000 MHz, 28 W? MHz2800 MHz
AMD Ryzen 5 PRO 2206 x 3200 MHz, 28 W? MHz2800 MHz
min. - max.? MHz2500 - 2800 MHz
CPU in Arc 7-CoreGPU Base SpeedGPU Boost / Turbo
Intel Core Ultra 5 125H14 x 3600 MHz, 28 W? MHz2200 MHz

Benchmarks

Performance Rating - 3DMark 11 + Fire Strike + Time Spy - Radeon 740M
1.8 pt (5%)
Restrict / Search: Model: Max. age: years
Performance Rating - 3DMark 11 + Fire Strike + Time Spy - Arc 7-Core
3 pt (9%)
Restrict / Search: Model: Max. age: years
3DMark - 3DMark Speed Way Score
min: 345     avg: 411     median: 399 (3%)     max: 489 Points
3DMark - 3DMark Steel Nomad
min: 581     avg: 626     median: 598 (4%)     max: 699 Points
3DMark - 3DMark Steel Nomad Light
min: 2436     avg: 2617     median: 2617 (6%)     max: 2798 Points
3DMark - 3DMark Wild Life Extreme Unlimited
min: 5654     avg: 5699     median: 5699 (7%)     max: 5744 Points
3DMark - 3DMark Solar Bay
min: 10005     avg: 11091     median: 11091 (5%)     max: 12177 Points
3DMark - 3DMark Fire Strike Standard Score
min: 3123     avg: 4110     median: 4525 (7%)     max: 4681 Points
min: 4214     avg: 6801     median: 7302 (11%)     max: 7929 Points
3DMark - 3DMark Fire Strike Standard Graphics
min: 3421     avg: 4466     median: 4843 (4%)     max: 5135 Points
min: 4575     avg: 7464     median: 7900 (7%)     max: 8531 Points
3DMark - 3DMark Ice Storm Graphics
min: 182534     avg: 208348     median: 208348 (23%)     max: 234161 Points
min: 158643     avg: 181910     median: 159017 (18%)     max: 228069 Points
3DMark - 3DMark Time Spy Score
min: 1293     avg: 1668     median: 1802 (5%)     max: 1909 Points
min: 2351     avg: 3232     median: 3259 (8%)     max: 3658 Points
3DMark - 3DMark Time Spy Graphics
min: 1136     avg: 1478     median: 1600 (3%)     max: 1699 Points
min: 2090     avg: 2934     median: 3000 (6%)     max: 3319 Points
3DMark - 3DMark Ice Storm Unlimited Graphics
396714 Points (40%)
3DMark - 3DMark Ice Storm Extreme Graphics
min: 145414     avg: 146731     median: 146731 (17%)     max: 148048 Points
3DMark - 3DMark Cloud Gate Score
min: 21552     avg: 21931     median: 21931 (21%)     max: 22310 Points
min: 23725     avg: 28484     median: 29186 (28%)     max: 30553 Points
3DMark - 3DMark Cloud Gate Graphics
min: 30354     avg: 30557     median: 30557 (8%)     max: 30760 Points
min: 28658     avg: 39212     median: 40086 (10%)     max: 45644 Points
3DMark - 3DMark Night Raid
min: 25271     avg: 25991     median: 25990.5 (25%)     max: 26710 Points
3DMark - 3DMark Night Raid Graphics Score
min: 30252     avg: 31507     median: 31507 (12%)     max: 32762 Points
3DMark 11 - 3DM11 Performance Score
min: 5611     avg: 6946     median: 7334 (9%)     max: 7892 Points
min: 5911     avg: 10571     median: 11161 (14%)     max: 12140 Points
3DMark 11 - 3DM11 Performance GPU
min: 5457     avg: 6626     median: 6932 (5%)     max: 7490 Points
min: 5549     avg: 10490     median: 11467 (9%)     max: 12061 Points
3DMark Vantage
3DM Vant. Perf. total + AMD Radeon 740M
3DMark Vantage - 3DM Vant. Perf. total
24621 Points (7%)
3DM Vant. Perf. total + Intel Arc 7-Core iGPU
min: 35885     avg: 38156     median: 37719 (11%)     max: 41299 Points
3DM Vant. Perf. GPU no PhysX + AMD Radeon 740M
3DMark Vantage - 3DM Vant. Perf. GPU no PhysX
21237 Points (12%)
3DM Vant. Perf. GPU no PhysX + Intel Arc 7-Core iGPU
min: 30937     avg: 33936     median: 34042 (19%)     max: 36721 Points
3DMark 05 - 3DMark 05 - Standard
min: 41203     avg: 44877     median: 44876.5 (49%)     max: 48550 Points
3DMark 06 3DMark 06 - Standard 1280x1024 + AMD Radeon 740M
3DMark 06
min: 29777     avg: 30167     median: 30166.5 (39%)     max: 30556 Points
3DMark 06 - Standard 1280x1024 + Intel Arc 7-Core iGPU
min: 38905     avg: 40397     median: 40216 (53%)     max: 42252 Points
Unigine Valley 1.0 - Unigine Valley 1.0 DX
min: 16.9     avg: 18.8     median: 18.8 (6%)     max: 20.7 fps
SPECviewperf 2020 specvp2020 snx-04 1080p + Intel Arc 7-Core iGPU
SPECviewperf 2020 - specvp2020 snx-04 1080p
min: 5.65     avg: 5.8     median: 5.8 (1%)     max: 5.97 fps
specvp2020 medical-03 1080p + Intel Arc 7-Core iGPU
SPECviewperf 2020 - specvp2020 medical-03 1080p
min: 12.3     avg: 13.5     median: 13.5 (4%)     max: 14.6 fps
specvp2020 maya-06 1080p + Intel Arc 7-Core iGPU
SPECviewperf 2020 - specvp2020 maya-06 1080p
min: 68.4     avg: 71.8     median: 71.8 (8%)     max: 75.1 fps
specvp2020 energy-03 1080p + Intel Arc 7-Core iGPU
SPECviewperf 2020 - specvp2020 energy-03 1080p
min: 4.61     avg: 4.8     median: 4.8 (1%)     max: 5.08 fps
specvp2020 creo-03 1080p + Intel Arc 7-Core iGPU
SPECviewperf 2020 - specvp2020 creo-03 1080p
min: 20.2     avg: 20.3     median: 20.3 (7%)     max: 20.3 fps
specvp2020 catia-06 1080p + Intel Arc 7-Core iGPU
SPECviewperf 2020 - specvp2020 catia-06 1080p
min: 15.5     avg: 16.1     median: 16.1 (8%)     max: 16.6 fps
specvp2020 3dsmax-07 1080p + Intel Arc 7-Core iGPU
SPECviewperf 2020 - specvp2020 3dsmax-07 1080p
min: 19.8     avg: 20.5     median: 20.5 (5%)     max: 21.1 fps
specvp2020 snx-04 4k + Intel Arc 7-Core iGPU
SPECviewperf 2020 - specvp2020 snx-04 4k
min: 5.54     avg: 5.7     median: 5.7 (1%)     max: 5.82 fps
specvp2020 medical-03 4k + Intel Arc 7-Core iGPU
SPECviewperf 2020 - specvp2020 medical-03 4k
min: 4.8     avg: 5.3     median: 5.3 (3%)     max: 5.87 fps
specvp2020 maya-06 4k + Intel Arc 7-Core iGPU
SPECviewperf 2020 - specvp2020 maya-06 4k
min: 32.8     avg: 33.8     median: 33.8 (5%)     max: 34.7 fps
specvp2020 energy-03 4k + Intel Arc 7-Core iGPU
SPECviewperf 2020 - specvp2020 energy-03 4k
min: 3.38     avg: 3.6     median: 3.6 (1%)     max: 3.81 fps
specvp2020 creo-03 4k + Intel Arc 7-Core iGPU
SPECviewperf 2020 - specvp2020 creo-03 4k
min: 15.3     avg: 15.4     median: 15.4 (7%)     max: 15.4 fps
specvp2020 catia-06 4k + Intel Arc 7-Core iGPU
SPECviewperf 2020 - specvp2020 catia-06 4k
min: 9.7     avg: 10.1     median: 10.1 (7%)     max: 10.4 fps
specvp2020 3dsmax-07 4k + Intel Arc 7-Core iGPU
SPECviewperf 2020 - specvp2020 3dsmax-07 4k
min: 13.2     avg: 13.9     median: 13.9 (5%)     max: 14.5 fps
Cinebench R10 Cinebench R10 Shading (32bit) + AMD Radeon 740M
Cinebench R10 - Cinebench R10 Shading (32bit)
14024 Points (10%)
Cinebench R10 Shading (32bit) + Intel Arc 7-Core iGPU
min: 15394     avg: 15881     median: 15688.5 (11%)     max: 16752 Points
Cinebench R11.5 Cinebench R11.5 OpenGL 64 Bit + Intel Arc 7-Core iGPU
Cinebench R11.5 - Cinebench R11.5 OpenGL 64 Bit
min: 92.81     avg: 95.4     median: 95.6 (31%)     max: 97.61 fps
Cinebench R15
Cinebench R15 OpenGL 64 Bit + AMD Radeon 740M
Cinebench R15 - Cinebench R15 OpenGL 64 Bit
min: 100.8     avg: 136.1     median: 141.3 (8%)     max: 161.2 fps
Cinebench R15 OpenGL 64 Bit + Intel Arc 7-Core iGPU
min: 116.8     avg: 136.1     median: 138 (8%)     max: 145.06 fps
Cinebench R15 OpenGL Ref. Match 64 Bit + AMD Radeon 740M
Cinebench R15 - Cinebench R15 OpenGL Ref. Match 64 Bit
97.9 % (98%)
Cinebench R15 OpenGL Ref. Match 64 Bit + Intel Arc 7-Core iGPU
97.8 % (98%)
GFXBench - GFXBench 5.0 4K Aztec Ruins High Tier Offscreen
16.3 fps (6%)
min: 25.5     avg: 29.7     median: 29.7 (11%)     max: 33.9 fps
GFXBench - GFXBench 5.0 Aztec Ruins High Tier Offscreen
37.4 fps (7%)
min: 77.4     avg: 78.8     median: 78.8 (14%)     max: 80.1 fps
GFXBench - GFXBench 5.0 Aztec Ruins Normal Tier Offscreen
99.4 fps (7%)
193.7 fps (14%)
GFXBench - GFXBench Car Chase Offscreen
155.8 fps (15%)
Basemark GPU 1.2 - Basemark GPU 1.2 Vulkan Official Medium Offscreen 1080
104.6 fps (3%)
min: 104.6     avg: 203.3     median: 196.8 (5%)     max: 315 fps
Basemark GPU 1.2 - Basemark GPU 1.2 Vulkan Official High Offscreen 2160
3.6 fps (1%)
Geekbench 6.5 - Geekbench 6.5 GPU OpenCL
min: 10125     avg: 12229     median: 12657.5 (3%)     max: 13477 Points
min: 26624     avg: 29363     median: 29263 (7%)     max: 33039 Points
Geekbench 6.5 - Geekbench 6.5 GPU Vulkan
min: 12189     avg: 15434     median: 15447 (4%)     max: 18653 Points
min: 26482     avg: 30465     median: 29526 (7%)     max: 34230 Points
LuxMark v2.0 64Bit - LuxMark v2.0 Room GPU
364 Samples/s (1%)
min: 708     avg: 757     median: 755.5 (3%)     max: 809 Samples/s
LuxMark v2.0 64Bit - LuxMark v2.0 Sala GPU
739 Samples/s (1%)
min: 1926     avg: 2453     median: 2538.5 (4%)     max: 2807 Samples/s
ComputeMark v2.1 - ComputeMark v2.1 Result
4080 Points (3%)
min: 5613     avg: 6364     median: 6471.5 (5%)     max: 6899 Points
Power Consumption - Furmark Stress Test Power Consumption - external Monitor *
min: 36.8     avg: 39.3     median: 39.3 (5%)     max: 41.8 Watt
min: 43.1     avg: 49.9     median: 48.3 (6%)     max: 57.4 Watt
Power Consumption - The Witcher 3 Power Consumption - external Monitor *
min: 39.7     avg: 42.6     median: 41.9 (6%)     max: 46.3 Watt
Power Consumption - Witcher 3 Power Consumption *
min: 44.4     avg: 46     median: 45.9 (10%)     max: 47.7 Watt
Power Consumption - Power Efficiency - Witcher 3 ultra
min: 0.3987     avg: 0.5     median: 0.5 (48%)     max: 0.545 fps per Watt
Power Consumption - Power Efficiency - Witcher 3 ultra external Monitor
min: 0.4368     avg: 0.5     median: 0.6 (47%)     max: 0.589 fps per Watt
Power Consumption - Cyberpunk 2077 Power Consumption 150cd *
min: 39.1     avg: 41.5     median: 42.5 (12%)     max: 43 Watt
Power Consumption - Cyberpunk 2077 Power Consumption - external Monitor *
min: 39     avg: 39.1     median: 39.1 (5%)     max: 39.1 Watt
min: 52.7     avg: 56.3     median: 57.1 (7%)     max: 59.1 Watt
Power Consumption - Power Efficiency - Cyberpunk 2077 ultra
min: 0.2062     avg: 0.2     median: 0.2 (1%)     max: 0.2583 fps per Watt
Emissions Witcher 3 Fan Noise + Intel Arc 7-Core iGPU
Emissions - Witcher 3 Fan Noise
min: 36.8     avg: 38.4     median: 38.5 (55%)     max: 40 dB(A)

Average Benchmarks AMD Radeon 740M → 100% n=24

Average Benchmarks Intel Arc 7-Core iGPU → 167% n=24

- Bereich der Benchmarkergebnisse für diese Grafikkarte
red legend - Durchschnittliche Benchmarkergebnisse für diese Grafikkarte
* Smaller numbers mean a higher performance
1 This benchmark is not used for the average calculation

Spiele-Benchmarks

Die folgenden Benchmarks basieren auf unseren Spieletests mit Testnotebooks. Die Performance dieser Grafikkarte bei den gelisteten Spielen ist abhängig von der verwendeten CPU, Speicherausstattung, Treiber und auch Betriebssystem. Dadurch müssen die untenstehenden Werte nicht repräsentativ sein. Detaillierte Informationen über das verwendete System sehen Sie nach einem Klick auf den fps-Wert.

low 1920x1080
100%
Radeon 740M:
9.9  fps
Stalker 2

Stalker 2

2024
low 1920x1080
100%
Radeon 740M:
10.2  fps
med. 1920x1080
100%
Radeon 740M:
8.3  fps
high 1920x1080
100%
Radeon 740M:
6.7  fps
ultra 1920x1080
100%
Radeon 740M:
5.5  fps
low 1920x1080
100%
Radeon 740M:
27  fps
med. 1920x1080
100%
Radeon 740M:
23  fps
high 1920x1080
100%
Radeon 740M:
14  fps
ultra 1920x1080
100%
Radeon 740M:
13  fps
low 1920x1080
100%
Radeon 740M:
23.9  fps
med. 1920x1080
100%
Radeon 740M:
15.3  fps
high 1920x1080
100%
Radeon 740M:
9.8  fps
ultra 1920x1080
100%
Radeon 740M:
6.9  fps
low 1920x1080
100%
Radeon 740M:
46  fps
med. 1920x1080
100%
Radeon 740M:
35.7  fps
high 1920x1080
100%
Radeon 740M:
25.8  fps
ultra 1920x1080
100%
Radeon 740M:
24.4  fps
low 1920x1080
100%
Radeon 740M:
19.9  fps
med. 1920x1080
100%
Radeon 740M:
14.3  fps
high 1920x1080
100%
Radeon 740M:
11.9  fps
ultra 1920x1080
100%
Radeon 740M:
10.5  fps
low 1920x1080
100%
Radeon 740M:
10.1  fps
med. 1920x1080
100%
Radeon 740M:
9.6  fps
high 1920x1080
100%
Radeon 740M:
8.9  fps
ultra 1920x1080
100%
Radeon 740M:
7.8  fps
low 1920x1080
100%
Radeon 740M:
13.7  fps
med. 1920x1080
100%
Radeon 740M:
10.4  fps
high 1920x1080
100%
Radeon 740M:
9.7  fps
ultra 1920x1080
100%
Radeon 740M:
8.8  fps
low 1920x1080 cinem.
100%
Radeon 740M:
7  fps
med. 1920x1080 cinem.
100%
Radeon 740M:
6.4  fps
high 1920x1080 cinem.
100%
Radeon 740M:
4.9  fps
ultra 1920x1080 cinem.
100%
Radeon 740M:
3.9  fps
low 1920x1080
100%
Radeon 740M:
24.7  fps
med. 1920x1080
100%
Radeon 740M:
17.9  fps
high 1920x1080
100%
Radeon 740M:
13.4  fps
ultra 1920x1080
100%
Radeon 740M:
12.4  fps
low 1920x1080
100%
Radeon 740M:
30.6  fps
med. 1920x1080
100%
Radeon 740M:
18.4  fps
high 1920x1080
100%
Radeon 740M:
13.6  fps
ultra 1920x1080
100%
Radeon 740M:
11.5  fps
F1 24

F1 24

2024
low 1920x1080
100%
Radeon 740M:
33.5 41 ~ 37 fps
176%
Arc 7-Core:
64.3 66.2 ~ 65 fps
med. 1920x1080
100%
Radeon 740M:
29.3 35 ~ 32 fps
178%
Arc 7-Core:
56.6 57.6 ~ 57 fps
high 1920x1080
100%
Radeon 740M:
24  fps
179%
Arc 7-Core:
41.7 43.4 ~ 43 fps
ultra 1920x1080
100%
Radeon 740M:
2  fps
570%
Arc 7-Core:
11.4  fps
low 1920x1080
100%
Radeon 740M:
8.1  fps
med. 1920x1080
100%
Radeon 740M:
8  fps
high 1920x1080
100%
Radeon 740M:
5.8  fps
low 1920x1080
100%
Radeon 740M:
18.5  fps
med. 1920x1080
100%
Radeon 740M:
15.7  fps
high 1920x1080
100%
Radeon 740M:
12.9  fps
ultra 1920x1080
100%
Radeon 740M:
9.5  fps
low 1920x1080
100%
Radeon 740M:
18.1  fps
med. 1920x1080
100%
Radeon 740M:
15.4  fps
high 1920x1080
100%
Radeon 740M:
11  fps
ultra 1920x1080
100%
Radeon 740M:
10.6  fps
low 1920x1080
100%
Radeon 740M:
12.3  fps
high 1920x1080
100%
Radeon 740M:
11.5  fps
low 1920x1080
100%
Radeon 740M:
38.8  fps
139%
Arc 7-Core:
53.8  fps
med. 1920x1080
100%
Radeon 740M:
32.1  fps
121%
Arc 7-Core:
38.7  fps
high 1920x1080
100%
Radeon 740M:
25.1  fps
131%
Arc 7-Core:
33  fps
ultra 1920x1080
100%
Radeon 740M:
16.7  fps
151%
Arc 7-Core:
25.3  fps
low 1920x1080
Arc 7-Core:
33  fps
med. 1920x1080
Arc 7-Core:
31  fps
high 1920x1080
Arc 7-Core:
24  fps
ultra 1920x1080
Arc 7-Core:
18  fps
low 1920x1080
100%
Radeon 740M:
19.2  fps
167%
Arc 7-Core:
32.1  fps
med. 1920x1080
100%
Radeon 740M:
14.7  fps
170%
Arc 7-Core:
25  fps
high 1920x1080
100%
Radeon 740M:
12.9  fps
176%
Arc 7-Core:
22.7  fps
ultra 1920x1080
100%
Radeon 740M:
12.3  fps
176%
Arc 7-Core:
21.7  fps
low 1920x1080
100%
Radeon 740M:
11.4  fps
189%
Arc 7-Core:
21.5  fps
med. 1920x1080
100%
Radeon 740M:
10.5  fps
171%
Arc 7-Core:
18  fps
high 1920x1080
100%
Radeon 740M:
8.3  fps
0%
Arc 7-Core:
0 (!)  fps
ultra 1920x1080
100%
Radeon 740M:
5.8  fps
0%
Arc 7-Core:
0 (!)  fps
Palworld

Palworld

2024
low 1920x1080
100%
Radeon 740M:
42  fps
83%
Arc 7-Core:
34.8  fps
med. 1920x1080
100%
Radeon 740M:
35.2  fps
93%
Arc 7-Core:
32.6  fps
high 1920x1080
100%
Radeon 740M:
17.3  fps
146%
Arc 7-Core:
25.2  fps
ultra 1920x1080
100%
Radeon 740M:
15.4  fps
152%
Arc 7-Core:
23.4  fps
med. 1920x1080
100%
Radeon 740M:
129.5  fps
166%
Arc 7-Core:
215  fps
high 1920x1080
100%
Radeon 740M:
93.1  fps
136%
Arc 7-Core:
127  fps
ultra 1920x1080
100%
Radeon 740M:
87.4  fps
137%
Arc 7-Core:
120  fps
low 1920x1080
100%
Radeon 740M:
34.3  fps
183%
Arc 7-Core:
62.7  fps
med. 1920x1080
100%
Radeon 740M:
27.3  fps
177%
Arc 7-Core:
48.3  fps
high 1920x1080
100%
Radeon 740M:
18.2  fps
245%
Arc 7-Core:
44.5  fps
ultra 1920x1080
100%
Radeon 740M:
11.1  fps
311%
Arc 7-Core:
34.5  fps
low 1920x1080
100%
Radeon 740M:
32.9  fps
213%
Arc 7-Core:
70  fps
med. 1920x1080
100%
Radeon 740M:
29.6  fps
161%
Arc 7-Core:
47.7  fps
high 1920x1080
100%
Radeon 740M:
25.8  fps
154%
Arc 7-Core:
39.7  fps
ultra 1920x1080
100%
Radeon 740M:
19.5  fps
177%
Arc 7-Core:
34.6  fps
low 1920x1080
100%
Radeon 740M:
9.5  fps
158%
Arc 7-Core:
15  fps
med. 1920x1080
100%
Radeon 740M:
8.5  fps
165%
Arc 7-Core:
14  fps
high 1920x1080
100%
Radeon 740M:
7.1  fps
169%
Arc 7-Core:
12  fps
ultra 1920x1080
100%
Radeon 740M:
6.9  fps
130%
Arc 7-Core:
9  fps
low 1920x1080
Arc 7-Core:
28.6  fps
med. 1920x1080
Arc 7-Core:
21  fps
high 1920x1080
Arc 7-Core:
19.2  fps
ultra 1920x1080
Arc 7-Core:
17.9  fps
low 1920x1080
100%
Radeon 740M:
11  fps
144%
Arc 7-Core:
15.8  fps
med. 1920x1080
100%
Radeon 740M:
9.3  fps
0%
Arc 7-Core:
0 (!)  fps
high 1920x1080
100%
Radeon 740M:
8.5  fps
0%
Arc 7-Core:
0 (!)  fps
low 1920x1080
100%
Radeon 740M:
13.9  fps
123%
Arc 7-Core:
17.1  fps
med. 1920x1080
100%
Radeon 740M:
12.8  fps
91%
Arc 7-Core:
11.7  fps
high 1920x1080
100%
Radeon 740M:
10  fps
114%
Arc 7-Core:
11.4  fps
ultra 1920x1080
100%
Radeon 740M:
7.7  fps
141%
Arc 7-Core:
10.8  fps
low 1920x1080
100%
Radeon 740M:
58.2  fps
164%
Arc 7-Core:
95.5  fps
med. 1920x1080
100%
Radeon 740M:
41.1  fps
138%
Arc 7-Core:
56.8  fps
high 1920x1080
100%
Radeon 740M:
22  fps
162%
Arc 7-Core:
35.6  fps
ultra 1920x1080
100%
Radeon 740M:
16.7  fps
168%
Arc 7-Core:
28.1  fps
low 1920x1080
100%
Radeon 740M:
28  fps
118%
Arc 7-Core:
33  fps
med. 1920x1080
100%
Radeon 740M:
23  fps
135%
Arc 7-Core:
31  fps
high 1920x1080
100%
Radeon 740M:
22  fps
123%
Arc 7-Core:
27  fps
ultra 1920x1080
100%
Radeon 740M:
16  fps
0%
Arc 7-Core:
0 (!)  fps
low 1920x1080
100%
Radeon 740M:
72.7  fps
124%
Arc 7-Core:
90.2  fps
med. 1920x1080
100%
Radeon 740M:
59.9  fps
97%
Arc 7-Core:
57.9  fps
high 1920x1080
100%
Radeon 740M:
30.1  fps
125%
Arc 7-Core:
37.6  fps
ultra 1920x1080
100%
Radeon 740M:
20.9  fps
118%
Arc 7-Core:
24.7  fps
low 1920x1080
100%
Radeon 740M:
18.2 20.5 21.5 23.2 ~ 21 fps
138%
Arc 7-Core:
23.2 29.2 29.5 30.1 30.9 ~ 29 fps
med. 1920x1080
100%
Radeon 740M:
13.8 16 16.5 18.7 ~ 16 fps
144%
Arc 7-Core:
19.8 21.7 24.3 25.2 25.2 ~ 23 fps
high 1920x1080
100%
Radeon 740M:
10.3 13.3 13.8 ~ 12 fps
167%
Arc 7-Core:
16.6 19.1 20.6 21.3 21.7 ~ 20 fps
ultra 1920x1080
100%
Radeon 740M:
9.3 10.4 10.6 ~ 10 fps
180%
Arc 7-Core:
14.8 16.4 18.8 18.8 19.6 ~ 18 fps
low 1920x1080
100%
Radeon 740M:
16.3 20.2 21.7 ~ 19 fps
168%
Arc 7-Core:
29.9 30.2 33.5 33.7 ~ 32 fps
med. 1920x1080
100%
Radeon 740M:
12.5 16.4 16.4 ~ 15 fps
173%
Arc 7-Core:
23.2 25.9 26.4 27.9 ~ 26 fps
high 1920x1080
100%
Radeon 740M:
10.3 12 13.5 ~ 12 fps
183%
Arc 7-Core:
19.5 22.4 22.8 24.2 ~ 22 fps
ultra 1920x1080
100%
Radeon 740M:
10.1 10.8 12.8 ~ 11 fps
191%
Arc 7-Core:
19.5 21.5 21.8 23.1 ~ 21 fps
Lies of P

Lies of P

2023
low 1920x1080
100%
Radeon 740M:
27.3  fps
168%
Arc 7-Core:
46  fps
med. 1920x1080
100%
Radeon 740M:
23.7  fps
143%
Arc 7-Core:
33.8  fps
high 1920x1080
100%
Radeon 740M:
20.1  fps
162%
Arc 7-Core:
32.6  fps
ultra 1920x1080
100%
Radeon 740M:
19  fps
143%
Arc 7-Core:
27.1  fps
low 1920x1080
100%
Radeon 740M:
22  fps
118%
Arc 7-Core:
26  fps
med. 1920x1080
100%
Radeon 740M:
20  fps
120%
Arc 7-Core:
24  fps
high 1920x1080
100%
Radeon 740M:
16  fps
125%
Arc 7-Core:
20  fps
ultra 1920x1080
100%
Radeon 740M:
13  fps
131%
Arc 7-Core:
17  fps
Starfield

Starfield

2023
low 1920x1080
Arc 7-Core:
19.1  fps
med. 1920x1080
Arc 7-Core:
16.5  fps
high 1920x1080
Arc 7-Core:
13.2  fps
ultra 1920x1080
Arc 7-Core:
10.7  fps
low 1920x1080
100%
Radeon 740M:
33.3  fps
119%
Arc 7-Core:
39.7  fps
med. 1920x1080
100%
Radeon 740M:
25.1  fps
130%
Arc 7-Core:
32.6  fps
high 1920x1080
100%
Radeon 740M:
22.5  fps
127%
Arc 7-Core:
28.5  fps
ultra 1920x1080
100%
Radeon 740M:
17.8  fps
132%
Arc 7-Core:
23.5  fps
low 1920x1080
100%
Radeon 740M:
22.9  fps
177%
Arc 7-Core:
40.5  fps
med. 1920x1080
100%
Radeon 740M:
21.4  fps
188%
Arc 7-Core:
40.3  fps
high 1920x1080
100%
Radeon 740M:
19.2  fps
191%
Arc 7-Core:
36.6  fps
ultra 1920x1080
100%
Radeon 740M:
14.8  fps
178%
Arc 7-Core:
26.4  fps
low 1920x1080
100%
Radeon 740M:
18.5  fps
0%
Arc 7-Core:
0 (!)  fps
med. 1920x1080
Arc 7-Core:
0 (!)  fps
high 1920x1080
Arc 7-Core:
0 (!)  fps
ultra 1920x1080
Arc 7-Core:
0 (!)  fps
F1 23

F1 23

2023
low 1920x1080
Arc 7-Core:
58.7 68 ~ 63 fps
med. 1920x1080
Arc 7-Core:
53.5 60 ~ 57 fps
high 1920x1080
Arc 7-Core:
37.3 40 ~ 39 fps
ultra 1920x1080
Arc 7-Core:
0 (!)  fps
low 1920x1080
100%
Radeon 740M:
17.9  fps
202%
Arc 7-Core:
36.1  fps
med. 1920x1080
100%
Radeon 740M:
13.5  fps
186%
Arc 7-Core:
25.1  fps
high 1920x1080
100%
Radeon 740M:
11.4  fps
207%
Arc 7-Core:
23.6  fps
ultra 1920x1080
Arc 7-Core:
0 (!)  fps
low 1920x1080
100%
Radeon 740M:
37.1  fps
139%
Arc 7-Core:
51.5  fps
med. 1920x1080
100%
Radeon 740M:
29.4  fps
154%
Arc 7-Core:
45.4  fps
high 1920x1080
100%
Radeon 740M:
22.8  fps
149%
Arc 7-Core:
33.9  fps
ultra 1920x1080
100%
Radeon 740M:
22.6  fps
147%
Arc 7-Core:
33.3  fps
low 1920x1080
Arc 7-Core:
24.9  fps
med. 1920x1080
Arc 7-Core:
17.3  fps
high 1920x1080
Arc 7-Core:
15.5  fps
ultra 1920x1080
Arc 7-Core:
15.2  fps
low 1920x1080
100%
Radeon 740M:
31  fps
131%
Arc 7-Core:
40.7  fps
med. 1920x1080
100%
Radeon 740M:
22.8  fps
140%
Arc 7-Core:
31.9  fps
high 1920x1080
100%
Radeon 740M:
13.1  fps
174%
Arc 7-Core:
22.8  fps
ultra 1920x1080
100%
Radeon 740M:
12.9  fps
127%
Arc 7-Core:
16.4  fps
Returnal

Returnal

2023
low 1920x1080
100%
Radeon 740M:
18  fps
167%
Arc 7-Core:
30  fps
med. 1920x1080
100%
Radeon 740M:
17  fps
171%
Arc 7-Core:
29  fps
high 1920x1080
100%
Radeon 740M:
14  fps
193%
Arc 7-Core:
27  fps
ultra 1920x1080
100%
Radeon 740M:
11  fps
209%
Arc 7-Core:
23  fps
low 1920x1080
100%
Radeon 740M:
22.2  fps
140%
Arc 7-Core:
31  fps
med. 1920x1080
100%
Radeon 740M:
16.5  fps
161%
Arc 7-Core:
26.5  fps
high 1920x1080
100%
Radeon 740M:
12.8  fps
135%
Arc 7-Core:
17.3  fps
ultra 1920x1080
100%
Radeon 740M:
9.9  fps
133%
Arc 7-Core:
13.2  fps
F1 22

F1 22

2022
low 1920x1080
Arc 7-Core:
79.4  fps
med. 1920x1080
Arc 7-Core:
71.9  fps
high 1920x1080
Arc 7-Core:
52.9  fps
low 1920x1080
Arc 7-Core:
50.7  fps
med. 1920x1080
Arc 7-Core:
39.4  fps
high 1920x1080
Arc 7-Core:
26.8  fps
ultra 1920x1080
Arc 7-Core:
22.4  fps
low 1920x1080
Arc 7-Core:
31.6  fps
med. 1920x1080
Arc 7-Core:
27  fps
high 1920x1080
Arc 7-Core:
22.6  fps
ultra 1920x1080
Arc 7-Core:
21.6  fps
Strange Brigade

Strange Brigade

2018
low 1280x720
100%
Radeon 740M:
109.7 126.8 ~ 118 fps
121%
Arc 7-Core:
133 141 148.6 149 ~ 143 fps
med. 1920x1080
100%
Radeon 740M:
42.6 46.6 ~ 45 fps
147%
Arc 7-Core:
63 63.9 68 69.5 ~ 66 fps
high 1920x1080
100%
Radeon 740M:
34.5 36.9 ~ 36 fps
150%
Arc 7-Core:
50 53.5 54 57.7 ~ 54 fps
ultra 1920x1080
100%
Radeon 740M:
28.1 30.3 ~ 29 fps
152%
Arc 7-Core:
40 43.5 44 47.3 ~ 44 fps
Far Cry 5

Far Cry 5

2018
low 1280x720
Arc 7-Core:
37 64 71 74 ~ 62 fps
med. 1920x1080
Arc 7-Core:
34 37 40 41 ~ 38 fps
high 1920x1080
Arc 7-Core:
31 35 37 37 ~ 35 fps
ultra 1920x1080
Arc 7-Core:
31 35 35 ~ 34 fps
low 1280x720
100%
Radeon 740M:
32.6 32.9 35.8 36.3 ~ 34 fps
144%
Arc 7-Core:
41 47.1 47.5 47.5 52 52.2 57 ~ 49 fps
med. 1920x1080
100%
Radeon 740M:
25.1 25.7 27.3 30.4 ~ 27 fps
141%
Arc 7-Core:
31.4 35.9 38.3 38.5 40.1 40.3 44.8 ~ 38 fps
high 1920x1080
100%
Radeon 740M:
20.3 20.7 21.9 23.4 ~ 22 fps
150%
Arc 7-Core:
27.8 31.3 31.5 32.9 33.4 34.2 37.3 ~ 33 fps
low 1280x720
100%
Radeon 740M:
35.3 50.7 51.2 51.4 ~ 47 fps
121%
Arc 7-Core:
40.8 52.1 58.3 59.6 59.8 60.6 64.8 ~ 57 fps
med. 1920x1080
100%
Radeon 740M:
16.9 23.1 23.5 24.1 ~ 22 fps
145%
Arc 7-Core:
21.8 32.4 32.9 33.3 33.4 35.4 35.8 ~ 32 fps
high 1920x1080
100%
Radeon 740M:
12.6 17.4 17.6 17.9 ~ 16 fps
144%
Arc 7-Core:
16.1 22.2 22.3 23.4 25.3 25.3 25.3 ~ 23 fps
low 1280x720
100%
Radeon 740M:
116.7 118.1 120.9 136.1 ~ 123 fps
77%
Arc 7-Core:
90.4 93.5 93.8 94.3 95.5 97.1 97.7 ~ 95 fps
med. 1366x768
100%
Radeon 740M:
88.6 100.1 103.1 104.4 ~ 99 fps
79%
Arc 7-Core:
64.5 70.5 77.8 79.2 83 83.1 89.2 ~ 78 fps
high 1920x1080
100%
Radeon 740M:
52.2 63 66.5 68.2 ~ 62 fps
115%
Arc 7-Core:
59.2 66.3 68.4 73.6 75.6 75.8 75.9 ~ 71 fps
ultra 1920x1080
100%
Radeon 740M:
46.5 53.7 57.6 58.9 ~ 54 fps
124%
Arc 7-Core:
54.5 58.7 64.9 70.5 72.9 73 73.3 ~ 67 fps
low 1024x768
Arc 7-Core:
126 136 138 ~ 133 fps
med. 1366x768
Arc 7-Core:
80 85 88 ~ 84 fps
high 1920x1080
Arc 7-Core:
45 51 52 ~ 49 fps
ultra 1920x1080
Arc 7-Core:
18.3 23.4 26 ~ 23 fps
GTA V

GTA V

2015
low 1024x768
100%
Radeon 740M:
101.1 133.1 135.8 ~ 123 fps
112%
Arc 7-Core:
116.9 127.2 132.4 143.6 153 156.3 ~ 138 fps
med. 1366x768
100%
Radeon 740M:
88.6 118 124.4 ~ 110 fps
121%
Arc 7-Core:
106.4 119.9 125.5 143.3 148.8 151.6 ~ 133 fps
high 1920x1080
100%
Radeon 740M:
26.5 41.4 44.8 ~ 38 fps
92%
Arc 7-Core:
31 32.4 33.6 34.1 38.9 39.9 ~ 35 fps
ultra 1920x1080
100%
Radeon 740M:
10.2 13.1 18.5 ~ 14 fps
100%
Arc 7-Core:
12.7 13.7 13.7 14.8 15.3 16.6 ~ 14 fps

Average Gaming AMD Radeon 740M → 100%

Average Gaming 30-70 fps → 100%

Average Gaming Intel Arc 7-Core iGPU → 146%

Average Gaming 30-70 fps → 152%

AMD Radeon 740MIntel Arc 7-Core iGPU
lowmed.highultraQHD4Klowmed.highultraQHD4K
Indiana Jones and the Great Circle9.89
Stalker 210.28.276.675.5
Call of Duty Black Ops 627231413
Until Dawn23.915.39.826.94
EA Sports FC 254635.725.824.4
God of War Ragnarök19.914.311.910.5
Final Fantasy XVI10.19.638.897.82
Space Marine 213.710.49.718.78
Star Wars Outlaws7.046.354.863.92
Once Human24.717.913.412.4
The First Descendant30.618.413.611.5
F1 24373224265574311.4
Senua's Saga Hellblade 28.067.965.77
Ghost of Tsushima18.515.712.99.53
Horizon Forbidden West18.115.41110.6
Dragon's Dogma 212.311.5
Last Epoch38.832.125.116.753.838.73325.3
Helldivers 219.214.712.912.332.12522.721.7
Enshrouded11.410.58.345.7921.518
Palworld4235.217.315.434.832.625.223.4
Prince of Persia The Lost Crown129.593.187.4215127120
Ready or Not34.327.318.211.162.748.344.534.5
The Finals32.929.625.819.57047.739.734.6
Avatar Frontiers of Pandora9.58.57.16.91514129
Alan Wake 2119.318.4915.8
Lords of the Fallen13.912.8107.6517.111.711.410.8
Total War Pharaoh58.241.12216.795.556.835.628.1
Assassin's Creed Mirage28232216333127
Counter-Strike 272.759.930.120.990.257.937.624.7
Cyberpunk 20772116121029232018
Baldur's Gate 31915121132262221
Lies of P27.323.720.1194633.832.627.1
The Crew Motorfest2220161326242017
Armored Core 633.325.122.517.839.732.628.523.5
Atlas Fallen22.921.419.214.840.540.336.626.4
Ratchet & Clank Rift Apart18.5
Resident Evil 4 Remake17.913.511.436.125.123.6
Company of Heroes 337.129.422.822.651.545.433.933.3
Atomic Heart3122.813.112.940.731.922.816.4
Returnal1817141130292723
Hogwarts Legacy22.216.512.89.943126.517.313.2
Strange Brigade118453629143665444
X-Plane 11.11342722493833
Final Fantasy XV Benchmark472216573223
Dota 2 Reborn12399625495787167
GTA V12311038141381333514
AMD Radeon 740MIntel Arc 7-Core iGPU
lowmed.highultraQHD4Klowmed.highultraQHD4K
< 30 fps
< 60 fps
< 120 fps
≥ 120 fps
28
13
2
2
33
7
2
1
39
3
2
36
1
1


< 30 fps
< 60 fps
< 120 fps
≥ 120 fps
6
15
6
2
10
15
2
2
14
12
1
1
18
4
1
1


Eine Liste mit weiteren Spielen und allen Grafikkarten finden Sie auf unserer Seite: Welches Spiel ist mit welcher Grafikkarte spielbar?

Add one or more devices and compare

In the following list you can select (and also search for) devices that should be added to the comparison. You can select more than one device.

restrict list:
v1.35
log 19. 12:02:22

#0 ran 0s before starting gpusingle class +0s ... 0s

#1 checking url part for id 11588 +0s ... 0s

#2 checking url part for id 12257 +0s ... 0s

#3 redirected to Ajax server, took 1766142142s time from redirect:0 +0s ... 0s

#4 did not recreate cache, as it is less than 5 days old! Created at Fri, 19 Dec 2025 10:47:14 +0100 +0s ... 0s

#5 composed specs +0.021s ... 0.021s

#6 did output specs +0s ... 0.021s

#7 start showIntegratedCPUs +0s ... 0.021s

#8 getting avg benchmarks for device 11588 +0.019s ... 0.04s

#9 got single benchmarks 11588 +0.008s ... 0.048s

#10 getting avg benchmarks for device 12257 +0.004s ... 0.053s

#11 got single benchmarks 12257 +0.012s ... 0.065s

#12 got avg benchmarks for devices +0s ... 0.065s

#13 min, max, avg, median took s +0.038s ... 0.103s

#14 before gaming benchmark output +0s ... 0.103s

#15 Got 536 rows for game benchmarks. +0.027s ... 0.13s

#16 composed SQL query for gamebenchmarks +0s ... 0.13s

#17 got data and put it in $dataArray +0.004s ... 0.134s

#18 benchmarks composed for output. +0.02s ... 0.154s

#19 calculated avg scores. +0s ... 0.154s

#20 return log +0.002s ... 0.156s

Teilen Sie diesen Artikel, um uns zu unterstützen. Jeder Link hilft!
Mail Logo
> Notebook Test, Laptop Test und News > Benchmarks / Technik > Benchmarks / Technik > Grafikkarten Vergleich - Head 2 Head
Autor: Klaus Hinum,  8.09.2017 (Update:  1.07.2023)