Notebookcheck Logo

Intel HD Graphics P630 vs Intel HD Graphics (Cherry Trail)

Intel HD Graphics P630

► remove from comparison Intel HD Graphics P630

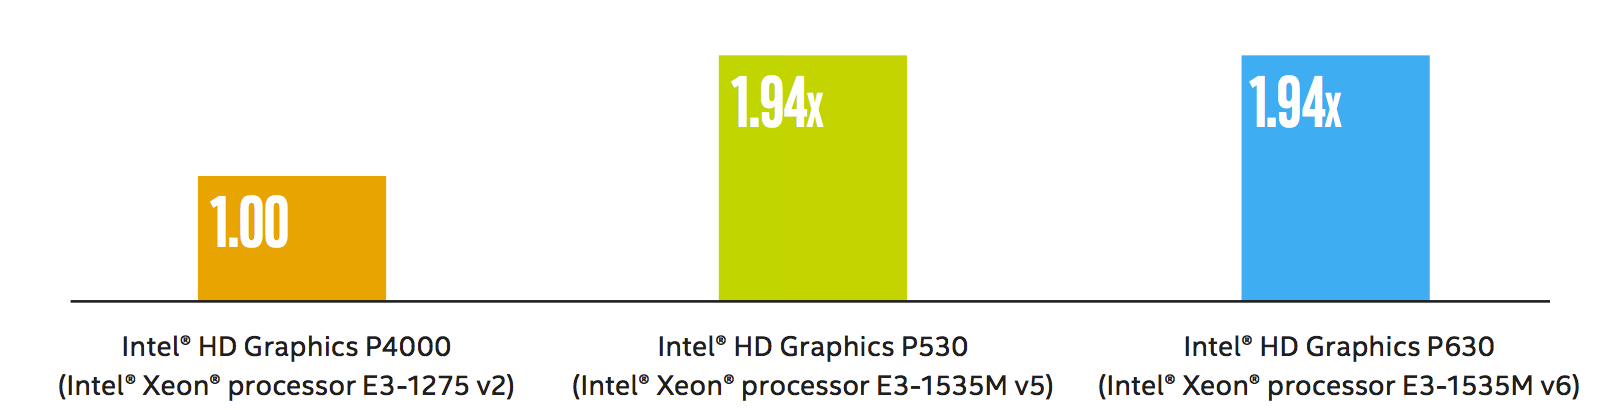
Die Intel HD Graphics P630 (GT2) ist eine integrierte Workstation-Grafikeinheit, die in verschiedenen Desktop- und Notebook-Prozessoren der 2017 vorgestellten Kaby-Lake-Generation zu finden ist (Xeon E3-1200 v6 und e3-1500M v6 Serien). Sie ist identisch mit der Intel HD Graphics 630, jedoch sind die Treiber für professionelle Software optimiert. Daher unterscheidet sie sich auch nicht von der Intel HD Graphics P530 und erreicht laut Intel auch die selbe Leistung im SPEC Viewperf12 (1.94x der alten Intel HD Graphics P4000). Die Grafikkarte ist derzeit für 15 CAD- und Workstation-Anwendungen zertifiziert.

Features

Neu bei der Kaby-Lake Generation ist die verbesserte Videoengine, welche nun auch H.265/HEVC im Main10-profil mit 10 Bit Farbtiefe sowie Googles VP9-Codec in Hardware dekodieren kann. Die Chips mit HD Graphics 530 sollten auch bereits HDCP 2.2 unterstützen und somit z.B. Netflix-Videos unter Windows 10 in 4K ausgeben können (im Gegensatz zu den ersten Kaby-Lake Dual-Core Chips mit Intel HD Graphics 620).

Leistungsaufnahme

Die HD Graphics P630 ist in Desktop- und Notebook-Prozessoren verschiedener TDP-Klassen zu finden. Die Quad-Core CPUs sind jedoch meistens in größeren und schwereren Notebooks verbaut. Der verbesserte 14nm+ Prozess verspricht jedoch eine etwas geringere Leistungsaufnahme im Vergleich zur Intel HD Graphics P530.

Quelle: http://www.intel.com/content/dam/www/public/us/en/documents/guides/hd-graphics-performance-guide.pdf

Intel HD Graphics (Cherry Trail)

► remove from comparison Intel HD Graphics (Cherry Trail)

Die Intel HD Graphics (Cherry Trail) ist eine in den Tablet-SoCs der Cherry-Trail-Serie (z.B. Atom x7-Z8700) integrierte Grafikeinheit. Sie basiert auf der gleichen Architektur wie die GPU verschiedener Broadwell-Prozessoren (z.B. HD Graphics 5300), bietet allerdings deutlich weniger Shadereinheiten und geringere Taktraten. Die genauen Spezifikationen hängen vom jeweiligen SoC ab:

Die schnellste Variante mit 16 EUs und maximal 600 MHz schlägt die ältere HD Graphics (Bay Trail) um Faktor zwei, womit sich die GPU etwas oberhalb einer Qualcomm Adreno 330 oder PowerVR G6430, jedoch deutlich unter einer Adreno 420 oder GX6450 einordnet. Auch Nvidias Tegra-SoCs K1 und X1 rechnen weitaus schneller.

Unter Windows werden sich Anwender deshalb weiter auf sehr alte und anspruchslose Spiele beschränken müssen, wohingegen moderne Android-Games auch in hohen Auflösungen zumeist flüssig dargestellt werden sollten. Der x7-Z8700 war z.B. nur knapp in der Lage Team Fortress 2 in minimalen Details und 1280x720 flüssig wiederzugeben (11 - 69 fps).

Videos kann die GPU auch in 4K/H.265 flüssig wiedergeben (je nach Bitrate und Farbtiefe).

Die Intel HD Graphics Grafikkarte in den Cherry Trail SoCs unterstützt nach unseren Tests mit dem MS Surface 3 mit Atom x7-Z8700 nur DisplayPort 1.1 und damit lediglich 30 Hz bei 4K (3.840 x 2.160).

Intel HD Graphics P630Intel HD Graphics (Cherry Trail)
HD Graphics Serie
Iris Plus Graphics 655 compare 48 @ 0.3 - 1.2 GHz
Iris Plus Graphics 650 compare 48 @ 0.3 - 1.1 GHz64/128 Bit
Iris Plus Graphics 645 compare 48 @ 0.3 - 1.15 GHz
Iris Plus Graphics 640 compare 48 @ 0.3 - 1.05 GHz64/128 Bit
UHD Graphics 630 compare 24 @ 0.3 - 1.15 GHz64/128 Bit
UHD Graphics P630 compare 24 @ 0.3 - 1.2 GHz64/128 Bit
HD Graphics 630 compare 24 @ 0.3 - 1.15 GHz64/128 Bit
HD Graphics P630 24 64/128 Bit
UHD Graphics 620 compare 24 @ 0.3 - 1.15 GHz
HD Graphics 620 compare 24 @ 0.3 - 1.05 GHz64/128 Bit
UHD Graphics 617 compare 24 @ 0.3 - 1.15 GHz64/128 Bit
UHD Graphics 615 compare 24 @ 0.3 - 1 GHz64/128 Bit
HD Graphics 615 compare 24 @ 0.3 - 1.05 GHz64/128 Bit
HD Graphics P530 compare 24 @ 0.35 - 1.05 GHz64/128 Bit
HD Graphics 5600 compare 24 @ 0.3 - 1.05 GHz64/128 Bit
HD Graphics 6000 compare 48 @ 0.3 - 1 GHz64/128 Bit
HD Graphics 4600 compare 20 @ 0.2 - 1.35 GHz64/128 Bit
HD Graphics 5500 compare 24 @ 0.3 - 0.95 GHz64/128 Bit
HD Graphics 5000 compare 40 @ 0.2 - 1.1 GHz64/128 Bit
HD Graphics 4400 compare 20 @ 0.2 - 1.1 GHz64/128 Bit
HD Graphics 5300 compare 24 @ 0.1 - 0.9 GHz64/128 Bit
HD Graphics 4000 compare 16 @ 0.35 - 1.35 GHz64/128 Bit
HD Graphics (Broadwell) compare 12 @ 0.1 - 0.85 GHz64/128 Bit
HD Graphics 4200 compare 20 @ 0.2 - 0.85 GHz64/128 Bit
HD Graphics (Skylake) compare 12 @ 0.3 - 0.8 GHz64/128 Bit
HD Graphics 405 (Braswell) compare 16 @ 0.32 - 0.7 GHz64/128 Bit
HD Graphics (Braswell) compare 16 @ 0.32 - 0.7 GHz64/128 Bit
HD Graphics 400 (Braswell) compare 12 @ 0.32 - 0.64 GHz64/128 Bit
HD Graphics (Haswell) compare 10 @ 0.2 - 1 GHz64/128 Bit
HD Graphics (Cherry Trail) 16 @ 0.2 - 0.6 GHz64/128 Bit
HD Graphics 3000 compare 12 @ 0.35 - 1.35 GHz64/128 Bit
HD Graphics 2500 compare 6 @ 0.65 - 1.15 GHz64/128 Bit
HD Graphics (Ivy Bridge) compare 6 @ 0.35 - 1.1 GHz64/128 Bit
HD Graphics 2000 compare 6 @ 0.85 - 1.35 GHz64/128 Bit
HD Graphics (Sandy Bridge) compare 6 @ 0.35 - 1.1 GHz64/128 Bit
HD Graphics (Bay Trail) compare 4 @ 0.31 - 0.9 GHz32/64/128 Bit
CodenameKaby-Lake-H-GT2Cherry Trail
ArchitekturGen. 9.5 Kaby LakeGen. 8
Pipelines24 - unified16 - unified
Speicherbandbreite64/128 Bit64/128 Bit
Shared Memoryjaja
APIDirectX 12_1, OpenGL 4.4DirectX 12 (FL 11_1), Shader 5.0, OpenGL 4.3
Herstellungsprozess14 nm14 nm
FeaturesQuickSync
Erscheinungsdatum05.08.2015 02.03.2015
Kerntakt200 - 600 (Boost) MHz
CPU in HD Graphics P630GPU Base SpeedGPU Boost / Turbo
Intel Xeon E3-1535M v64 x 3100 MHz, 45 W300 MHz1150 MHz
Intel Xeon E3-1505M v64 x 3000 MHz, 45 W300 MHz1150 MHz
min. - max.300 MHz1150 MHz
CPU in HD Graphics (Cherry Trail)GPU Base SpeedGPU Boost / Turbo
Intel Atom x7-Z87004 x 1600 MHz200 MHz600 MHz
Intel Atom x5-Z85004 x 1440 MHz200 MHz600 MHz
Intel Atom x5-Z83504 x 1440 MHz200 MHz500 MHz
min. - max.200 - 320 MHz? - 1150 MHz

Benchmarks

Performance Rating - 3DMark 11 + Fire Strike + Time Spy - HD Graphics (Cherry Trail)
0.1 pt (0%)
3DMark - 3DMark Time Spy Score
400 Points (1%)
3DMark - 3DMark Ice Storm Unlimited Graphics
min: 18563     avg: 20873     median: 19303 (2%)     max: 27537 Points
3DMark - 3DMark Cloud Gate Score
8280 Points (9%)
3DMark - 3DMark Fire Strike Standard Score
1040 Points (2%)
3DMark - 3DMark Fire Strike Standard Graphics
min: 193     avg: 233     median: 225 (0%)     max: 281 Points
3DMark - 3DMark Ice Storm Graphics
min: 7544     avg: 16078     median: 17063.5 (2%)     max: 23395 Points
3DMark - 3DMark Sling Shot (ES 3.0) Unlimited
min: 1445     avg: 1525     median: 1525 (7%)     max: 1605 Points
3DMark - 3DMark Sling Shot (ES 3.0) Unlimited Graphics
min: 1598     avg: 1684     median: 1684 (4%)     max: 1770 Points
3DMark - 3DMark Sling Shot Extreme (ES 3.1) Unlimited
min: 1072     avg: 1215     median: 1159 (6%)     max: 1414 Points
3DMark - 3DMark Sling Shot Extreme (ES 3.1) Unlimited Graphics
min: 1058     avg: 1251     median: 1142 (3%)     max: 1554 Points
3DMark 11 - 3DM11 Performance Score
min: 314     avg: 359.4     median: 343 (0%)     max: 562 Points
3DMark 11 - 3DM11 Performance GPU
min: 278     avg: 319.9     median: 298 (0%)     max: 494 Points
3DMark 06 3DMark 06 - Standard 1280x1024 + Intel HD Graphics (Cherry Trail)
3DMark 06
min: 2403     avg: 2833     median: 2595 (3%)     max: 3330 Points
3DMark 06 - Standard 1024x768 + Intel HD Graphics (Cherry Trail)
3DMark 06
2877 Points (4%)
Unigine Valley 1.0 - Unigine Valley 1.0 DX
1.2 fps (0%)
Unigine Heaven 2.1 - Heaven 2.1 high
5.7 fps (1%)
Cinebench R10 Cinebench R10 Shading (32bit) + Intel HD Graphics (Cherry Trail)
Cinebench R11.5 Cinebench R11.5 OpenGL 64 Bit + Intel HD Graphics (Cherry Trail)
Cinebench R15
Cinebench R15 OpenGL 64 Bit + Intel HD Graphics (Cherry Trail)
Cinebench R15 OpenGL Ref. Match 64 Bit + Intel HD Graphics (Cherry Trail)
GFXBench (DX / GLBenchmark) 2.7
GFXBench T-Rex HD Offscreen C24Z16 + Intel HD Graphics (Cherry Trail)
LuxMark v2.0 64Bit - LuxMark v2.0 Room GPU
min: 48     avg: 58.7     median: 59 (0%)     max: 69 Samples/s
LuxMark v2.0 64Bit - LuxMark v2.0 Sala GPU
min: 69     avg: 87.7     median: 89 (0%)     max: 105 Samples/s
ComputeMark v2.1 - ComputeMark v2.1 Result
277 Points (0%)

Average Benchmarks Intel HD Graphics P630 → 100% n=2

Average Benchmarks Intel HD Graphics (Cherry Trail) → 21% n=2

- Bereich der Benchmarkergebnisse für diese Grafikkarte
- Durchschnittliche Benchmarkergebnisse für diese Grafikkarte
* Smaller numbers mean a higher performance
1 This benchmark is not used for the average calculation

Spiele-Benchmarks

Die folgenden Benchmarks basieren auf unseren Spieletests mit Testnotebooks. Die Performance dieser Grafikkarte bei den gelisteten Spielen ist abhängig von der verwendeten CPU, Speicherausstattung, Treiber und auch Betriebssystem. Dadurch müssen die untenstehenden Werte nicht repräsentativ sein. Detaillierte Informationen über das verwendete System sehen Sie nach einem Klick auf den fps-Wert.

low 1280x720
HD Graphics (Cherry Trail):
21.4  fps
low 1280x720
HD Graphics (Cherry Trail):
15.5  fps
low 1280x720
HD Graphics (Cherry Trail):
22.6  fps
low 1024x768
HD Graphics (Cherry Trail):
11.5  fps
med. 1366x768
HD Graphics (Cherry Trail):
7  fps
low 1024x768
HD Graphics (Cherry Trail):
8.8  fps
med. 1366x768
HD Graphics (Cherry Trail):
4.8  fps
Anno 2205

Anno 2205

2015
low 1024x768
HD Graphics (Cherry Trail):
8.1  fps
med. 1366x768
HD Graphics (Cherry Trail):
3.9  fps
low 1366x768
HD Graphics (Cherry Trail):
13.9 16.8 ~ 15 fps
low 1024x768
HD Graphics (Cherry Trail):
15.1  fps
med. 1366x768
HD Graphics (Cherry Trail):
9.8  fps
low 1280x720
HD Graphics (Cherry Trail):
20  fps
med. 1366x768
HD Graphics (Cherry Trail):
15.2  fps
high 1920x1080
HD Graphics (Cherry Trail):
7.2  fps
low 1024x768
HD Graphics (Cherry Trail):
20.1  fps
med. 1366x768
HD Graphics (Cherry Trail):
12.5  fps
GTA V

GTA V

2015
low 1024x768
HD Graphics (Cherry Trail):
10.8 (!)  fps
low 1024x768
HD Graphics (Cherry Trail):
9.5  fps
med. 1366x768
HD Graphics (Cherry Trail):
5.7  fps
low 1024x768
HD Graphics (Cherry Trail):
16.2  fps
med. 1366x768
HD Graphics (Cherry Trail):
6.1  fps
F1 2014

F1 2014

2014
low 1024x768
HD Graphics (Cherry Trail):
16  fps
med. 1366x768
HD Graphics (Cherry Trail):
12  fps
Fifa 15

Fifa 15

2014
low 1280x720
HD Graphics (Cherry Trail):
15.6  fps
Sims 4

Sims 4

2014
low 1024x768
HD Graphics (Cherry Trail):
65.6 66.6 81.4 ~ 71 fps
med. 1366x768
HD Graphics (Cherry Trail):
9.4 16.9 21.2 ~ 16 fps
high 1920x1080
HD Graphics (Cherry Trail):
5.5 10 ~ 8 fps
low 1024x768
HD Graphics (Cherry Trail):
22 27.3 ~ 25 fps
med. 1366x768
HD Graphics (Cherry Trail):
12.5 13.5 ~ 13 fps
low 1024x768
HD Graphics (Cherry Trail):
13.3  fps
Asphalt 8: Airborne

Asphalt 8: Airborne

2013
low
HD Graphics (Cherry Trail):
58  fps
high
HD Graphics (Cherry Trail):
47  fps
Dota 2

Dota 2

2013
low 1024x768
HD Graphics (Cherry Trail):
29.7  fps
med. 1366x768
HD Graphics (Cherry Trail):
16.5  fps
GRID 2

GRID 2

2013
low 1024x768
HD Graphics (Cherry Trail):
24  fps
med. 1366x768
HD Graphics (Cherry Trail):
13.5  fps
low 1280x720
HD Graphics (Cherry Trail):
16 18 18.9 19.8 20.1 20.5 ~ 19 fps
med. 1366x768
HD Graphics (Cherry Trail):
6.4 7.9 9.3 9.8 10 10 ~ 9 fps
high 1366x768
HD Graphics (Cherry Trail):
5.6 5.7 6.7 7.6 7.9 8.4 ~ 7 fps
ultra 1920x1080
HD Graphics (Cherry Trail):
2.4 2.6 ~ 2 fps
low 1024x768
HD Graphics (Cherry Trail):
19.7 25.7 27.8 30.2 33.6 ~ 27 fps
med. 1366x768
HD Graphics (Cherry Trail):
10.5 12 13.2 13.5 14.8 ~ 13 fps
high 1366x768
HD Graphics (Cherry Trail):
7 8.3 9 ~ 8 fps
ultra 1920x1080
HD Graphics (Cherry Trail):
3.7 3.8 ~ 4 fps
Temple Run 2

Temple Run 2

2013
high
HD Graphics (Cherry Trail):
34  fps
low 1024x768
HD Graphics (Cherry Trail):
15.2  fps
med. 1366x768
HD Graphics (Cherry Trail):
11.6  fps
low 1024x768
HD Graphics (Cherry Trail):
0 (!)  fps
med. 1366x768
HD Graphics (Cherry Trail):
0 (!)  fps
low 1024x768
HD Graphics (Cherry Trail):
14.1 21.6 41.1 ~ 26 fps
med. 1366x768
HD Graphics (Cherry Trail):
4.8 18.6 35.1 ~ 20 fps
high 1366x768
HD Graphics (Cherry Trail):
20.3  fps
ultra 1920x1080
HD Graphics (Cherry Trail):
11.4  fps
low 1024x768
HD Graphics (Cherry Trail):
24.3 31.9 ~ 28 fps
med. 1366x768
HD Graphics (Cherry Trail):
16 19 ~ 18 fps
Anno 2070

Anno 2070

2011
low 1024x768
HD Graphics (Cherry Trail):
15.3 28.1 33.1 ~ 26 fps
med. 1366x768
HD Graphics (Cherry Trail):
12.8 13.4 13.7 ~ 13 fps
high 1366x768
HD Graphics (Cherry Trail):
8  fps
low 1280x720
HD Graphics (Cherry Trail):
15.5 18.9 ~ 17 fps
med. 1366x768
HD Graphics (Cherry Trail):
7.2 8.5 ~ 8 fps
low 1024x768
HD Graphics (Cherry Trail):
25.6  fps
high 1366x768
HD Graphics (Cherry Trail):
12  fps
Dirt 3

Dirt 3

2011
low 800x600
HD Graphics (Cherry Trail):
28.1  fps
med. 1024x768
HD Graphics (Cherry Trail):
12.5  fps
Civilization 5

Civilization 5

2010
low 1024x768
HD Graphics (Cherry Trail):
18.7  fps
low 1024x768
HD Graphics (Cherry Trail):
63.2 64 ~ 64 fps
med. 1360x768
HD Graphics (Cherry Trail):
18 18.8 ~ 18 fps
high 1360x768
HD Graphics (Cherry Trail):
14  fps
ultra 1920x1080
HD Graphics (Cherry Trail):
7  fps
Trackmania Nations Forever

Trackmania Nations Forever

2008
low 640x480
HD Graphics (Cherry Trail):
77.3 92.6 96.1 97.8 99.7 105 128 ~ 100 fps
high 1024x768
HD Graphics (Cherry Trail):
18.2 21.3 22.9 24.4 24.7 25 29.2 ~ 24 fps
ultra 1920x1080
HD Graphics (Cherry Trail):
9.6 15.5 16.8 ~ 14 fps
World of Warcraft

World of Warcraft

2005
low 800x600
HD Graphics (Cherry Trail):
44 50.9 ~ 47 fps
med. 1024x768
HD Graphics (Cherry Trail):
18.3  fps
Intel HD Graphics (Cherry Trail)lowmed.highultraQHD4K
Team Fortress 221.4
Rocket League15.5
Farming Simulator 1722.6
Rainbow Six Siege11.57
Star Wars Battlefront8.84.8
Anno 22058.13.9
World of Warships15
Metal Gear Solid V15.19.8
Dota 2 Reborn2015.27.2
Dirt Rally20.112.5
GTA V10.8
Dragon Age: Inquisition9.55.7
Civilization: Beyond Earth16.26.1
F1 20141612
Fifa 1515.6
Sims 471168
GRID: Autosport2513
Battlefield 413.3
Asphalt 8: Airborne5847
Dota 229.716.5
GRID 22413.5
BioShock Infinite19972
Tomb Raider271384
Temple Run 234
Dishonored15.211.6
Borderlands 200
Counter-Strike: GO262020.311.4
Diablo III2818
Anno 207026138
The Elder Scrolls V: Skyrim178
Deus Ex Human Revolution25.612
Dirt 328.112.5
Civilization 518.7
StarCraft 26418147
Trackmania Nations Forever1002414
World of Warcraft4718.3
< 30 fps
< 60 fps
< 120 fps
≥ 120 fps
29
2
3
23


9
2

5


Eine Liste mit weiteren Spielen und allen Grafikkarten finden Sie auf unserer Seite: Welches Spiel ist mit welcher Grafikkarte spielbar?

Add one or more devices and compare

In the following list you can select (and also search for) devices that should be added to the comparison. You can select more than one device.

restrict list:

show all (including archived), 2024, 2023
v1.26
log 02. 08:46:14

#0 checking url part for id 7657 +0s ... 0s

#1 checking url part for id 6197 +0s ... 0s

#2 not redirecting to Ajax server +0s ... 0s

#3 did not recreate cache, as it is less than 5 days old! Created at Sat, 01 Jun 2024 05:39:27 +0200 +0.001s ... 0.001s

#4 composed specs +0.177s ... 0.178s

#5 did output specs +0s ... 0.178s

#6 start showIntegratedCPUs +0s ... 0.178s

#7 getting avg benchmarks for device 7657 +0.037s ... 0.216s

#8 got single benchmarks 7657 +0.007s ... 0.223s

#9 getting avg benchmarks for device 6197 +0.02s ... 0.243s

#10 got single benchmarks 6197 +0.1s ... 0.343s

#11 got avg benchmarks for devices +0s ... 0.343s

#12 min, max, avg, median took s +0.262s ... 0.605s

#13 before gaming benchmark output +0s ... 0.605s

#14 Got 139 rows for game benchmarks. +0.038s ... 0.643s

#15 composed SQL query for gamebenchmarks +0s ... 0.643s

#16 got data and put it in $dataArray +0.028s ... 0.67s

#17 benchmarks composed for output. +0.091s ... 0.761s

#18 calculated avg scores. +0s ... 0.761s

#19 return log +0.06s ... 0.822s

Teilen Sie diesen Artikel, um uns zu unterstützen. Jeder Link hilft!
> Notebook Test, Laptop Test und News > Benchmarks / Technik > Benchmarks / Technik > Grafikkarten Vergleich - Head 2 Head
Autor: Klaus Hinum,  8.09.2017 (Update:  1.07.2023)