Notebookcheck Logo

Metro 2033 Benchmarks

Das gelungene Erstlingswerk des ukrainischen Entwicklers 4A Games bringt selbst High-End Desktop Grafikkarten an ihre Grenzen. Mit welchem Notebook und Desktop der Shooter flüssig spielbar ist, erfahren Sie in folgendem Artikel.

Wie wir testen

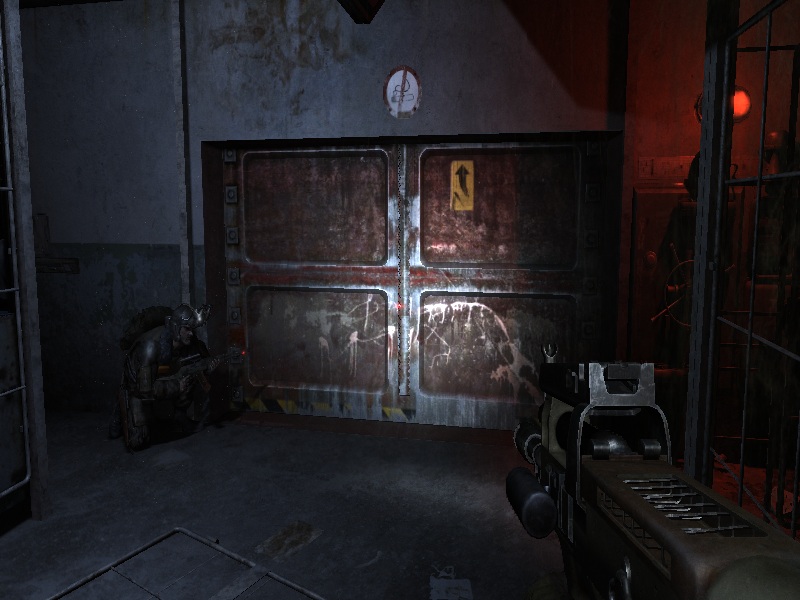
Getestet wird mittels Fraps die Intro-Mission. Start: Nachdem der Held die Leiter erklommen hat. Ende: Wenn das Auto angefahren kommt und die Videosequenz startet.

min:     800 x 600    DirectX 9    Low
min: 800 x 600 DirectX 9 Low
med:  1366 x 768    DirectX 10   Normal
med: 1366 x 768 DirectX 10 Normal
high:   1600 x 900   DirectX 10   High
high: 1600 x 900 DirectX 10 High
ultra: 1920 x 1080   DirectX 11   Very High
ultra: 1920 x 1080 DirectX 11 Very High
min:     800 x 600    DirectX 9    Low
min: 800 x 600 DirectX 9 Low
med:  1366 x 768    DirectX 10   Normal
med: 1366 x 768 DirectX 10 Normal
high:   1600 x 900   DirectX 10   High
high: 1600 x 900 DirectX 10 High
ultra: 1920 x 1080   DirectX 11   Very High
ultra: 1920 x 1080 DirectX 11 Very High

Analyse der Benchmarks

Metro 2033 ist sehr anspruchsvoll und läuft mit maximalen Einstellungen nur auf den schnellsten Desktop High-End Grafikkarten in SLI / Crossfire (z.B. GeForce GTX 590) flüssig.

Für hohe Details reicht auch eine mobile High-End Grafikkarte wie die Radeon HD 6970M.

In niedrigen Details reicht eine langsamere Mittelklasse Notebookgrafikkarte wie die Radeon HD 6630M für einen flüssigen Spielgenuss. Sehr ansehnlich ist das Spiel hiermit jedoch nicht mehr.

Einen Überblick über alle von uns getesteten Spiele finden Sie in unserer Spieleliste.

Einschränkungen anzeigen
PosModell< PrevNext >Metro 2033
 Metro 2033 (2010)
low
800x600
Low DX9
4xAF AAA
med.
1360x768
Normal DX10
4xAF AAA
high
1600x900
High DX10
4xAF AAA
ultra
1920x1080
Very High DX11
4xAF AAA
NVIDIA GeForce GTX 980M
172.9
67.2
NVIDIA GeForce GTX 1050 Ti (Desktop)
55.1
NVIDIA GeForce GTX 970M
172.7
136.4n3
48.1n3
NVIDIA GeForce GTX 680
37
AMD Radeon HD 7970
134.8
133.7
105.2
46.7
NVIDIA GeForce GTX 1050 Mobile
85.5
80.7
72.7
44.6
NVIDIA GeForce GTX 880M
171.7
135.2
41.2
AMD Radeon HD 7870
134.1
123.5
83.5
32.5
NVIDIA GeForce GTX 580
57
33.5n2
NVIDIA GeForce GTX 680M
139.2
128.35n2
67.1n3
24.1n4
AMD Radeon HD 7970M
133.9
128.35n2
83.8n2
29n3
NVIDIA GeForce GTX 960M
94.6n3
31.2n3
NVIDIA GeForce GTX 570
28
NVIDIA GeForce GTX 860M
161.45n4
91.4n4
30.6n4
NVIDIA GeForce GTX 850M
145.9
151.7n2
83.9n2
28.55n2
NVIDIA GeForce GTX 560 Ti
63
22.4
AMD Radeon HD 6870
70
23
NVIDIA GeForce GTX 470
61
23
NVIDIA GeForce GTX 765M
107.2
51.4
15.9
PosModell< PrevNext >Metro 2033
low med. high ultra
ATI Radeon HD 5850
82.8
82.9
58.5
21.4
NVIDIA GeForce GTX 675M
127.45n2
87n2
47.95n2
16.7n2
NVIDIA GeForce GTX 580M
129.1
95.6n2
52.3n2
17.3n2
AMD Radeon HD 6990M
139.7
86
54n3
19.6n3
AMD Radeon HD 7770
130.5
80.7
47.4
16.8
NVIDIA GeForce GT 650M SLI
79.1
19.9
NVIDIA GeForce GTX 485M
116.2
80.8
48.12
16.1
NVIDIA GeForce GTX 460 768MB
25
AMD Radeon HD 6790
52
16
NVIDIA GeForce GTX 760M
151.5
100.45n2
46.55n2
15.15n2
NVIDIA GeForce GTX 670M
117
72.3
39.3n3
14.1n3
AMD Radeon HD 6970M
119.15n2
77.2
52n3
18.3n3
AMD Radeon HD 8870M
70.5
41.8
14.9
NVIDIA GeForce GTX 570M
124.2n2
84.5n2
37n2
14.45n2
ATI Radeon HD 5770
87
24
13
NVIDIA GeForce GTX 550 Ti
38
13
NVIDIA GeForce GT 755M
138.9
112.8
55.7
18.9
NVIDIA GeForce GTX 660M
112n3
78.5n4
35n3
12n3
AMD Radeon HD 8850M
123.5
87
NVIDIA GeForce GTX 470M
97.2
65.7
34.4
11.95n2
PosModell< PrevNext >Metro 2033
low med. high ultra
NVIDIA GeForce GTX 480M
126
63.8n2
32.65n2
11.9n2
NVIDIA GeForce GT 650M
100.9n4
53.4n6
30.6n6
10.8n5
NVIDIA GeForce 840M
101.4
82.3n2
45.2n2
8.4
NVIDIA GeForce GT 745M
126.2
64.05n2
32.75n2
NVIDIA GeForce GTX 560M
116.3n2
71.7n2
30.6n3
11n3
NVIDIA GeForce GT 740M
85.9
42.5
NVIDIA GeForce GTS 450
33
11
NVIDIA GeForce GT 735M
33.9
16.8
ATI Mobility Radeon HD 5870
85.3
53.5
30.5
10.9
ATI Radeon HD 4850
33
NVIDIA GeForce GTX 460M
101.9n2
54n3
30n5
9.6n9
NVIDIA GeForce GT 645M
43.3
29.7
AMD Radeon HD 8750M
72
40
23
NVIDIA GeForce GTX 285M
66.3
40.8
21.37
13.67
NVIDIA GeForce GT 640M
69n3
48n3
32n2
10.7n2
AMD Radeon HD 7690M XT
115
47
25
9
NVIDIA GeForce GT 640M LE
58.4
37.5
19.1
6.6
AMD Radeon HD 8730M
72
41
22
AMD Radeon HD 6770M
106.45n4
54.35n4
23.3n2
8.05n2
NVIDIA GeForce GT 555M
66.7n5
39.2n5
19.15n2
6.9n2
PosModell< PrevNext >Metro 2033
low med. high ultra
ATI Radeon HD 5670
55
26
12
ATI Mobility Radeon HD 5850
66.6
32.75n2
19n3
5.5
AMD Radeon HD 6850M
34.5
19.5
NVIDIA GeForce GT 445M
37.7
19.4
6.8
NVIDIA GeForce GTS 360M
42.2
32.1
17.9
AMD Radeon HD 7690M
107
49
25
8.4
AMD Radeon HD 6750M
45.1
43.4n2
21n2
11.1n2
NVIDIA GeForce GT 550M
82.6n4
44.25n4
14.9
AMD Radeon HD 6730M
66
31.7
17
5.7
AMD Radeon HD 7670M
60.5
31.1
17.1
5.8
NVIDIA GeForce GT 630M
50.8n5
29.7n5
19.4n2
AMD Radeon R5 M255
89.3
37.4
21
Intel HD Graphics 520
31.33
19.67
9.67
NVIDIA GeForce GT 720M
66.8
36.3
AMD Radeon HD 8570M
46.1
27.1
NVIDIA GeForce GT 540M
50.7n9
34.92n10
16.15n4
5.2
AMD Radeon HD 6650M
70.95n4
28.9n3
19.3n3
5.2
Intel HD Graphics 4600
40.1
22.55n2
14.3n2
9
ATI Mobility Radeon HD 5730
63.5n2
30.5n2
13.9n2
Intel HD Graphics 5500
15
13.33
PosModell< PrevNext >Metro 2033
low med. high ultra
AMD Radeon HD 7660G
50
33
12
NVIDIA GeForce GT 435M
72.9
40
18.6
ATI Radeon HD 5570
63
31
14.7
AMD Radeon HD 6550M
56.8
26.1
13.9
4.6
AMD Radeon HD 6630M
47.8n2
25.9n2
AMD Radeon HD 7650M
65.3n2
43.9
17.9
AMD Radeon HD 7570M
46n2
21.3
13.6n2
ATI Mobility Radeon HD 5650
55.6n7
25n5
15.3n4
NVIDIA GeForce GT 525M
41.1
24.6
13.1
4.7
AMD Radeon HD 6550D
48
29n2
AMD Radeon HD 7610M
52.6
28.8
Intel HD Graphics 4400
35.5n3
20.4n4
11.5n3
5.05n2
NVIDIA GeForce GT 425M
40.7n3
26.45n4
11.4n2
4.95n2
NVIDIA GeForce GT 335M
29.1
24
NVIDIA GeForce GT 420M
38n2
23.55n2
12
4
NVIDIA GeForce GT 330M
34.7n4
23.2n3
10
Intel HD Graphics 5300
16
8.1
4.7
ATI Mobility Radeon HD 550v
32.6
20.3
Intel HD Graphics 4000
30n9
17.55n8
12.3n4
4.45n4
AMD Radeon HD 6620G
19.1
12.1
PosModell< PrevNext >Metro 2033
low med. high ultra
AMD Radeon HD 6450 GDDR5
46
22
AMD Radeon HD 7470M
26.6
13.3
AMD Radeon HD 6490M
36n2
21n2
AMD Radeon HD 7520G
29.2
20.6
NVIDIA GeForce GT 325M
35.5
24.4
AMD Radeon HD 7450M
34.2
17.5
NVIDIA GeForce 610M
29.25n2
17.3n2
AMD Radeon HD 6470M
29.2n3
18.7n3
9.7
4.1
NVIDIA GeForce GT 520M
31.1
17.1
8.8
3.6
AMD Radeon HD 7420G
27
16
AMD Radeon HD 6520G
29.3
14.2
7.7
2.4
NVIDIA GeForce 320M
25
13
NVIDIA GeForce 410M
22.85n2
15.15n2
ATI Mobility Radeon HD 5470
31.15n2
14.9n2
AMD Radeon HD 6450M
26.1
12.2
Intel HD Graphics 3000
24n7
12n3
NVIDIA GeForce G210M
24
14
AMD Radeon HD 8210
11.8
ATI Radeon HD 4350
19
Intel HD Graphics 2000
27
11
PosModell< PrevNext >Metro 2033
low med. high ultra
Intel HD Graphics (Bay Trail)
12
9
Intel Graphics Media Accelerator (GMA) HD Graphics
13
(-) * Geringere Werte sind besser. / n123 Anzahl der Benchmarks die zu diesem Wert beitragen / * Geschätzte Position


Legende
5ruckelt - Das Spiel wird in dieser Detailstufe wahrscheinlich nicht flüssig mit dieser Grafikkarte laufen. Mindestens ein Benchmarkwert ist kleiner als 25fps
könnte ruckeln - Interpolierte Information. Bei einer langsameren Grafikkarte wurde dieses Spiel als ruckelnd klassifiziert und daher wird dies auch bei dieser angenommen, da keine Benchmarkwerte eingetragen sind.
30flüssig - Dieses Spiel sollte in den betroffenen Einstellungen flüssig laufen, da kein Benchmarkwert eingetragen wird, der die Grenze unterschreitet: 25fps
40flüssig - Dieses Spiel sollte in den betroffenen Einstellungen flüssig laufen, da kein Benchmarkwert eingetragen wird, der die Grenze unterschreitet: 35fps
60flüssig - Dieses Spiel sollte in den betroffenen Einstellungen flüssig laufen, da kein Benchmarkwert eingetragen wird, der die Grenze unterschreitet: 58fps
könnte flüssig laufen - Eine langsamere Grafikkarte wurde als schnell genug klassifiziert und daher wird dies auch für diese geschätzt (da keine Benchmarkwerte eingetragen sind).
?unsicher - Zwei mögliche Fälle: Der kleinste gefundene Benchmarkwert ist zwar unter dem Grenzwert für eine flüssige Darstellung, jedoch ist der Durchschnitt darüber. Zweiter Fall, der Benchmarkwert ist unter der Grenze, jedoch ist die nächst-langsamere Karte als flüssig eingestuft.
unsicher vererbt - Die nächst-langsamere Karte ist als "unsicher" eingestuft und daher wird dieser Wert auch an schnellere Karten vererbt, die keine Benchmarkwerte haben.
Der Wert in den einzelnen Feldern beziffert die durchschnittlichen Bilder pro Sekunde. Bewegen Sie den Mauszeiger auf diesen Wert um eine detaillierte Auflistung aller Benchmarks zu sehen.
Teilen Sie diesen Artikel, um uns zu unterstützen. Jeder Link hilft!
Autor: Redaktion,  2.11.2011 (Update:  6.06.2013)