Minisforum NUCXi7 Desktop-PC im Test: Ultraflacher Gaming-PC mit GeForce RTX 3070 und Core i7-11800H

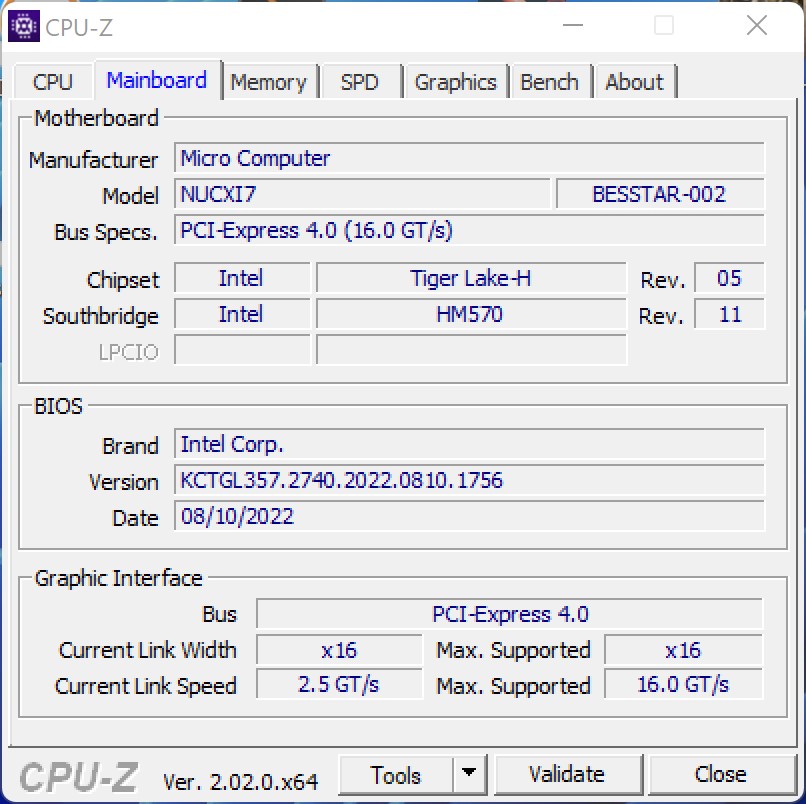
Minisforum ist hierzulande als Systemhersteller für Mini-PCs bekannt. Mit der NUCX Serie spricht der Hersteller jedoch eine etwas andere Zielgruppe an und bietet mit dem Modell einen vollwertigen Gaming-PC an. Dabei handelt es sich aber nicht um einen herkömmlichen Desktop-Computer, sondern um einen ultraflachen PC mit ordentlich Power. Als Basis dient hier ein Intel-NUCXi5-Laptop-Mainboard, welches auch in Notebooks verbaut wird.
Der NUCX ist derzeit in zwei Grundkonfigurationen auf dem Markt, die sich in der Bestückung der CPU sowie der GPU unterscheiden. Zum einen gibt es den Minisforum NUCXi5 auf Basis des Intel Core i5-11400H, welcher zusammen mit einer Nvidia GeForce RTX 3060 Laptop GPU bestückt ist, und zum anderen den MinisForum NUCXi7 mit Intel Core i7-11800H im Zusammenspiel mit einer Nvidia GeForce RTX 3070 Laptop GPU. Preislich starten die Modelle bei 1.199 respektive 1.449 Euro als Barebone-System. Unser Testsystem aka NUCXi7 mit 16-GB-RAM und einer 512-GB-SSD schlägt mit 1.629 Euro zu Buche. Windows 11 ist allerdings in der Pro-Version bereits vorinstalliert.
Als Vergleichsgeräte dienen in diesem Review ebenfalls kompakte Desktop-PCs. Um den direkten Leistungsvergleich der GPU-Leistung abzubilden, haben wir auch ein ähnlich ausgestattetes Gaming-Notebook mit aufgenommen.
mögliche Konkurrenten im Vergleich
Bew. | Datum | Modell | Gewicht | Dicke | Preis ab |
|---|---|---|---|---|---|
v7 (old) | 09 / 2022 | Minisforum NUCX i7 i7-11800H, GeForce RTX 3070 Laptop GPU | 2.4 kg | 393 mm | |
v (old) | 12 / 2021 | Intel Beast Canyon NUC i9-11900KB, GeForce RTX 3060 | 189 mm | ||
v (old) | 06 / 2021 | Zotac Magnus One (ECM73070C) i7-10700, GeForce RTX 3070 | |||
v (old) | 05 / 2022 | Zotac ZBOX Magnus EN173070C i7-11800H, GeForce RTX 3070 Laptop GPU | 1.8 kg | 62.2 mm | |
v (old) | 04 / 2022 | Intel Dragon Canyon NUC - RTX 3060 i9-12900, GeForce RTX 3060 | 189 mm | ||
v (old) | 06 / 2020 | Zotac MEK Mini (RTX 2070 Super) i7-9700, GeForce RTX 2070 Super (Desktop) | |||
| 83.2 % v7 (old) | 10 / 2021 | Gigabyte A7 X1 R9 5900HX, GeForce RTX 3070 Laptop GPU | 2.5 kg | 34 mm |
Minisforum NUCXi7 im Detail
Gehäuse
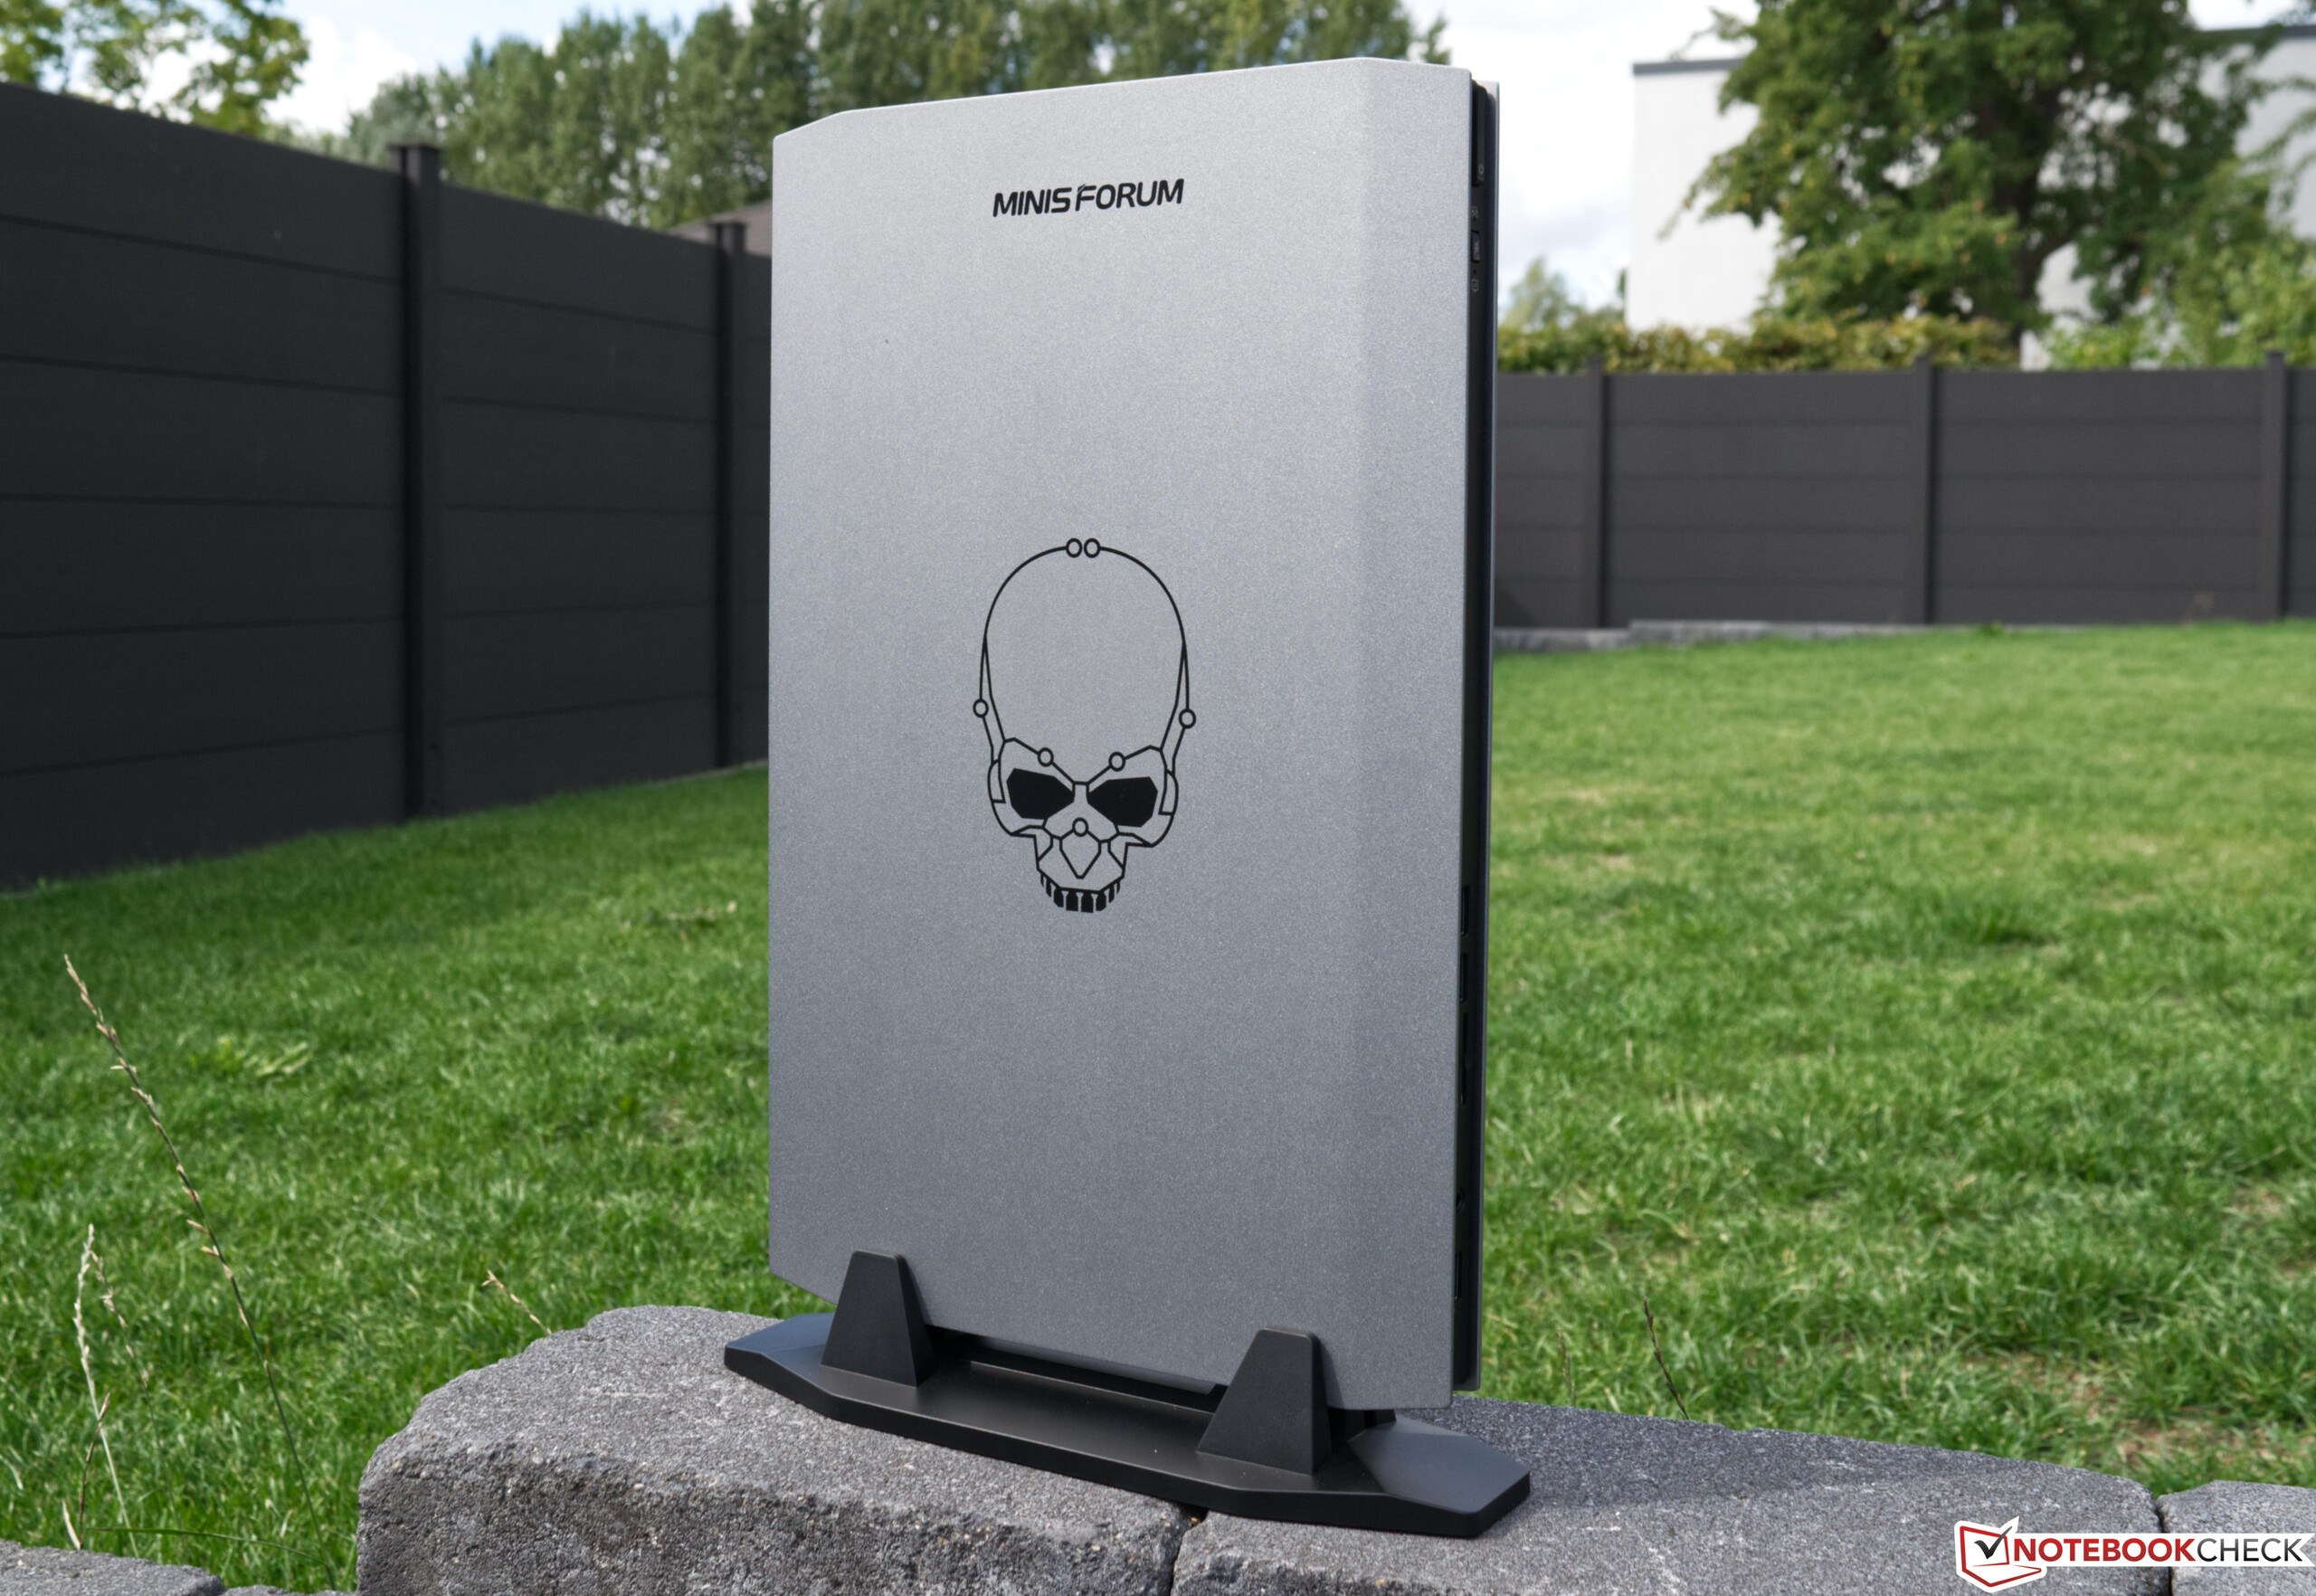
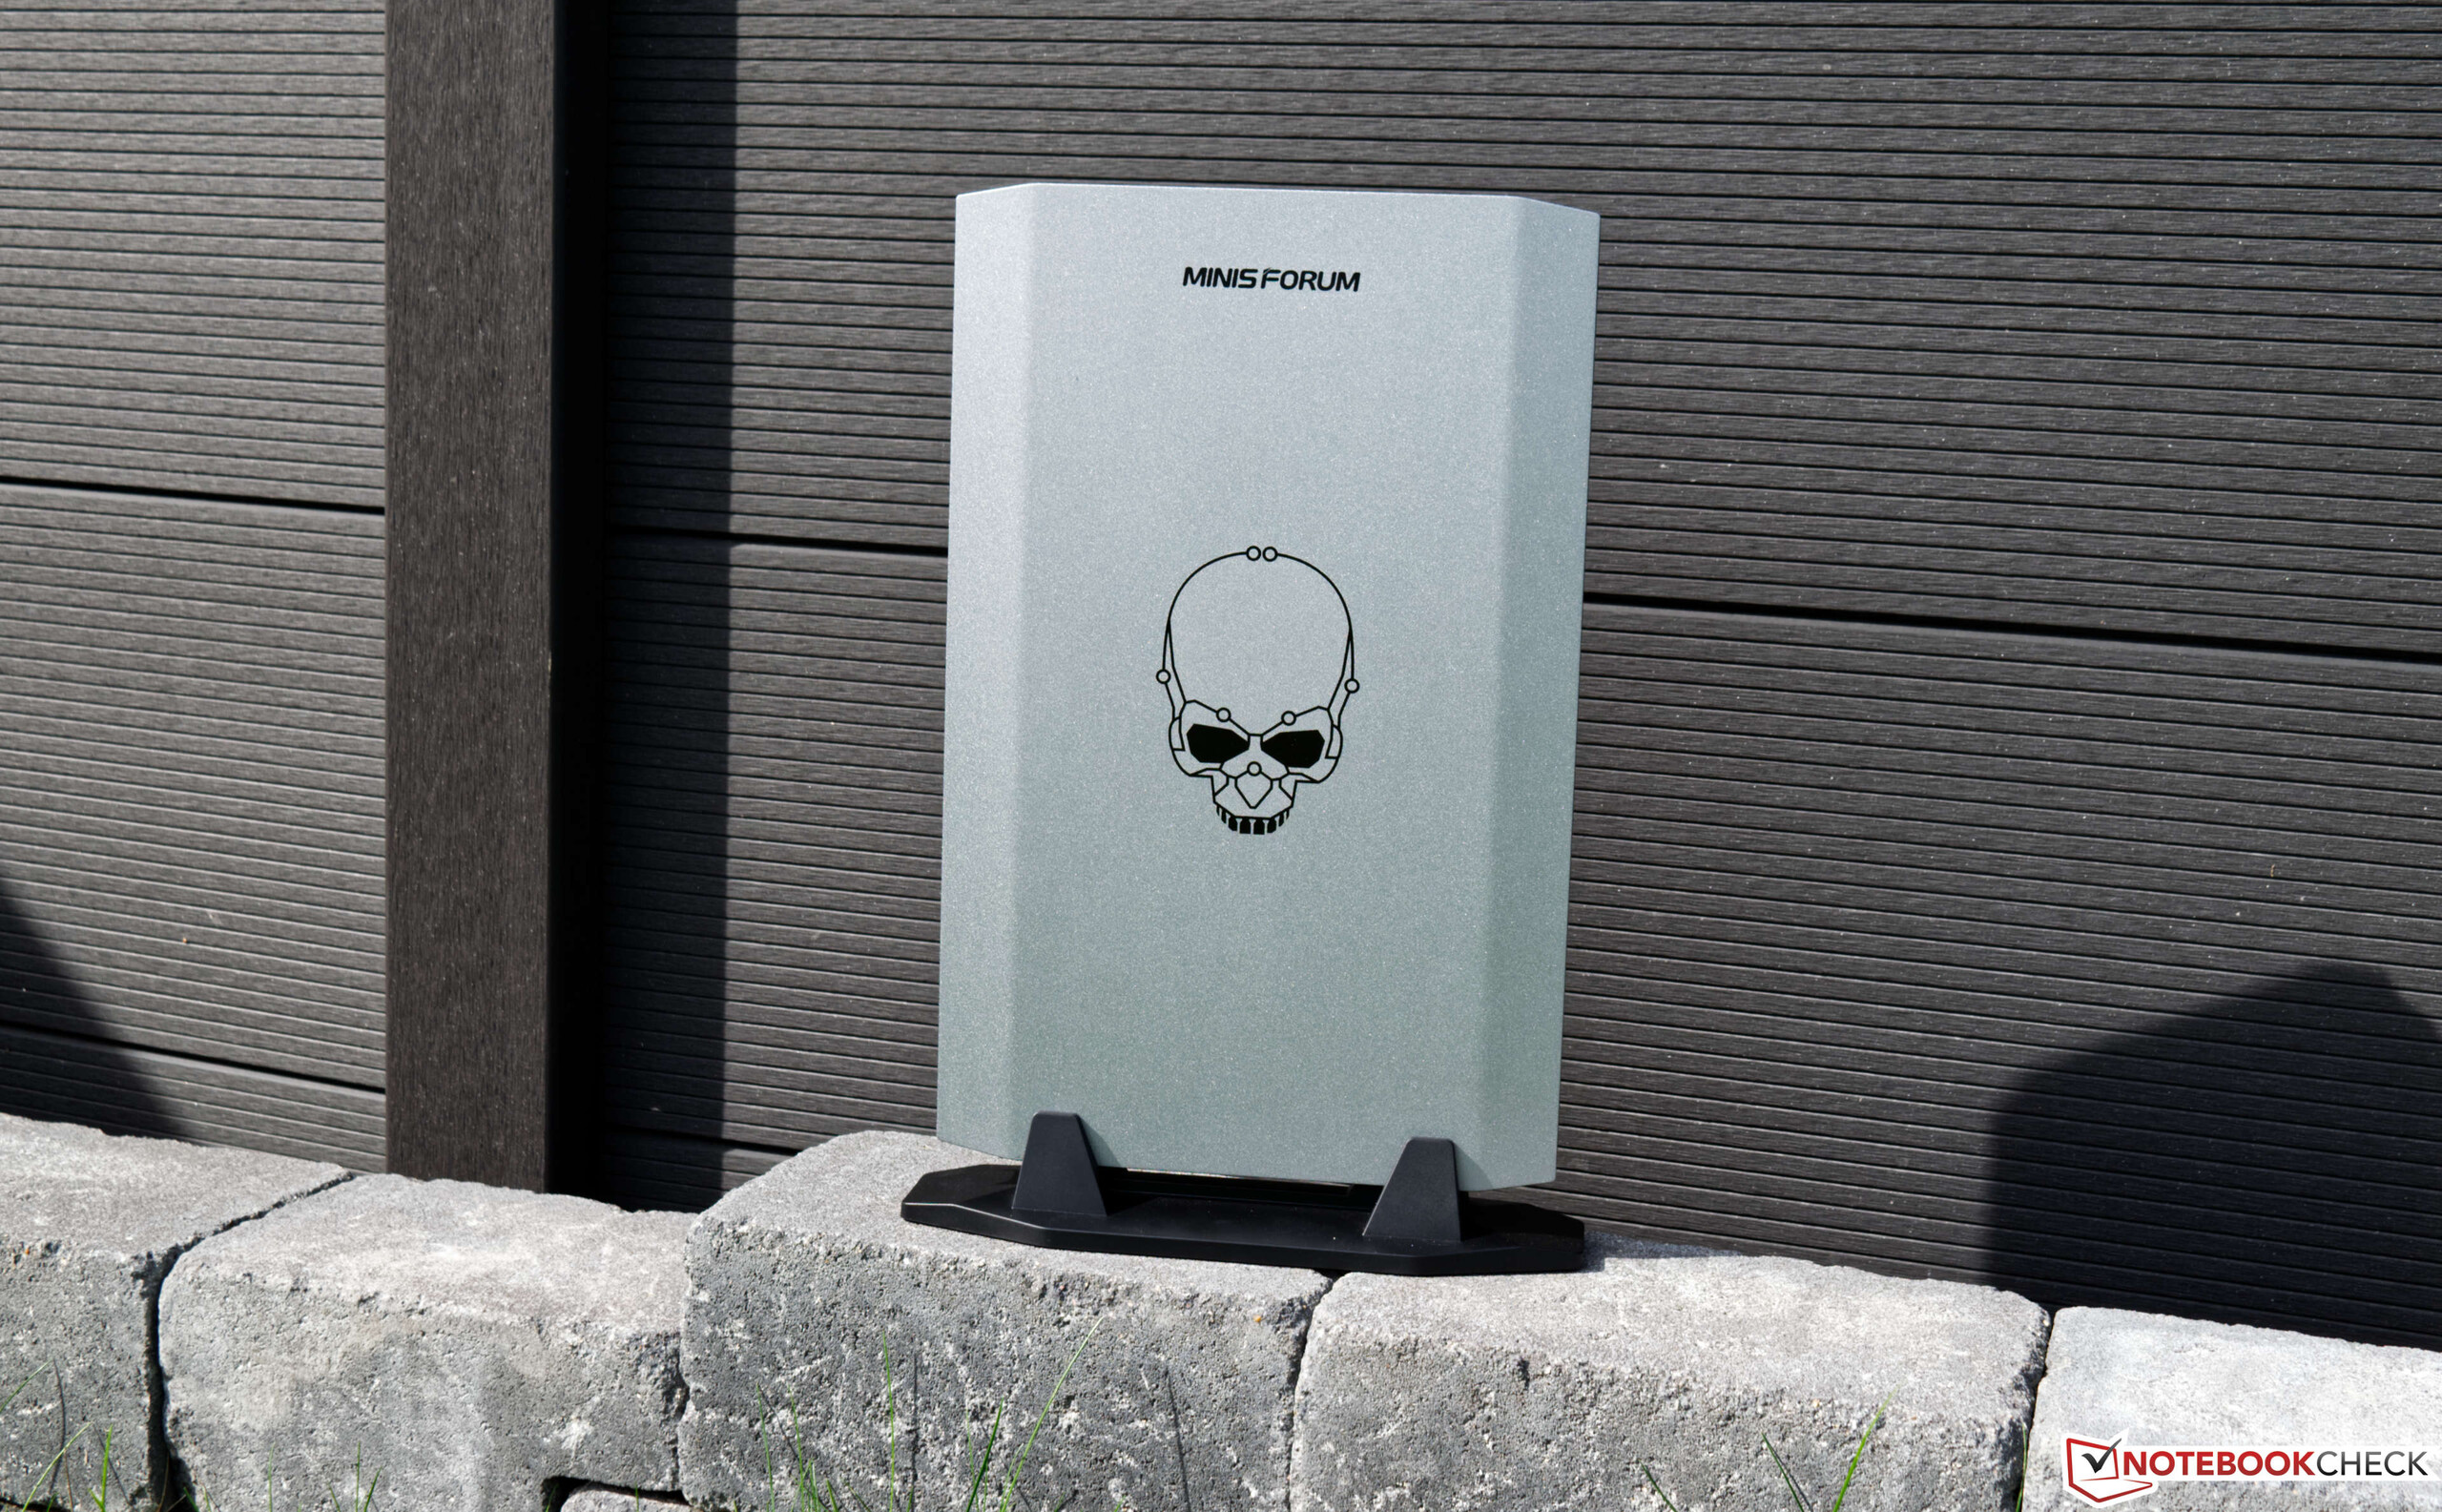
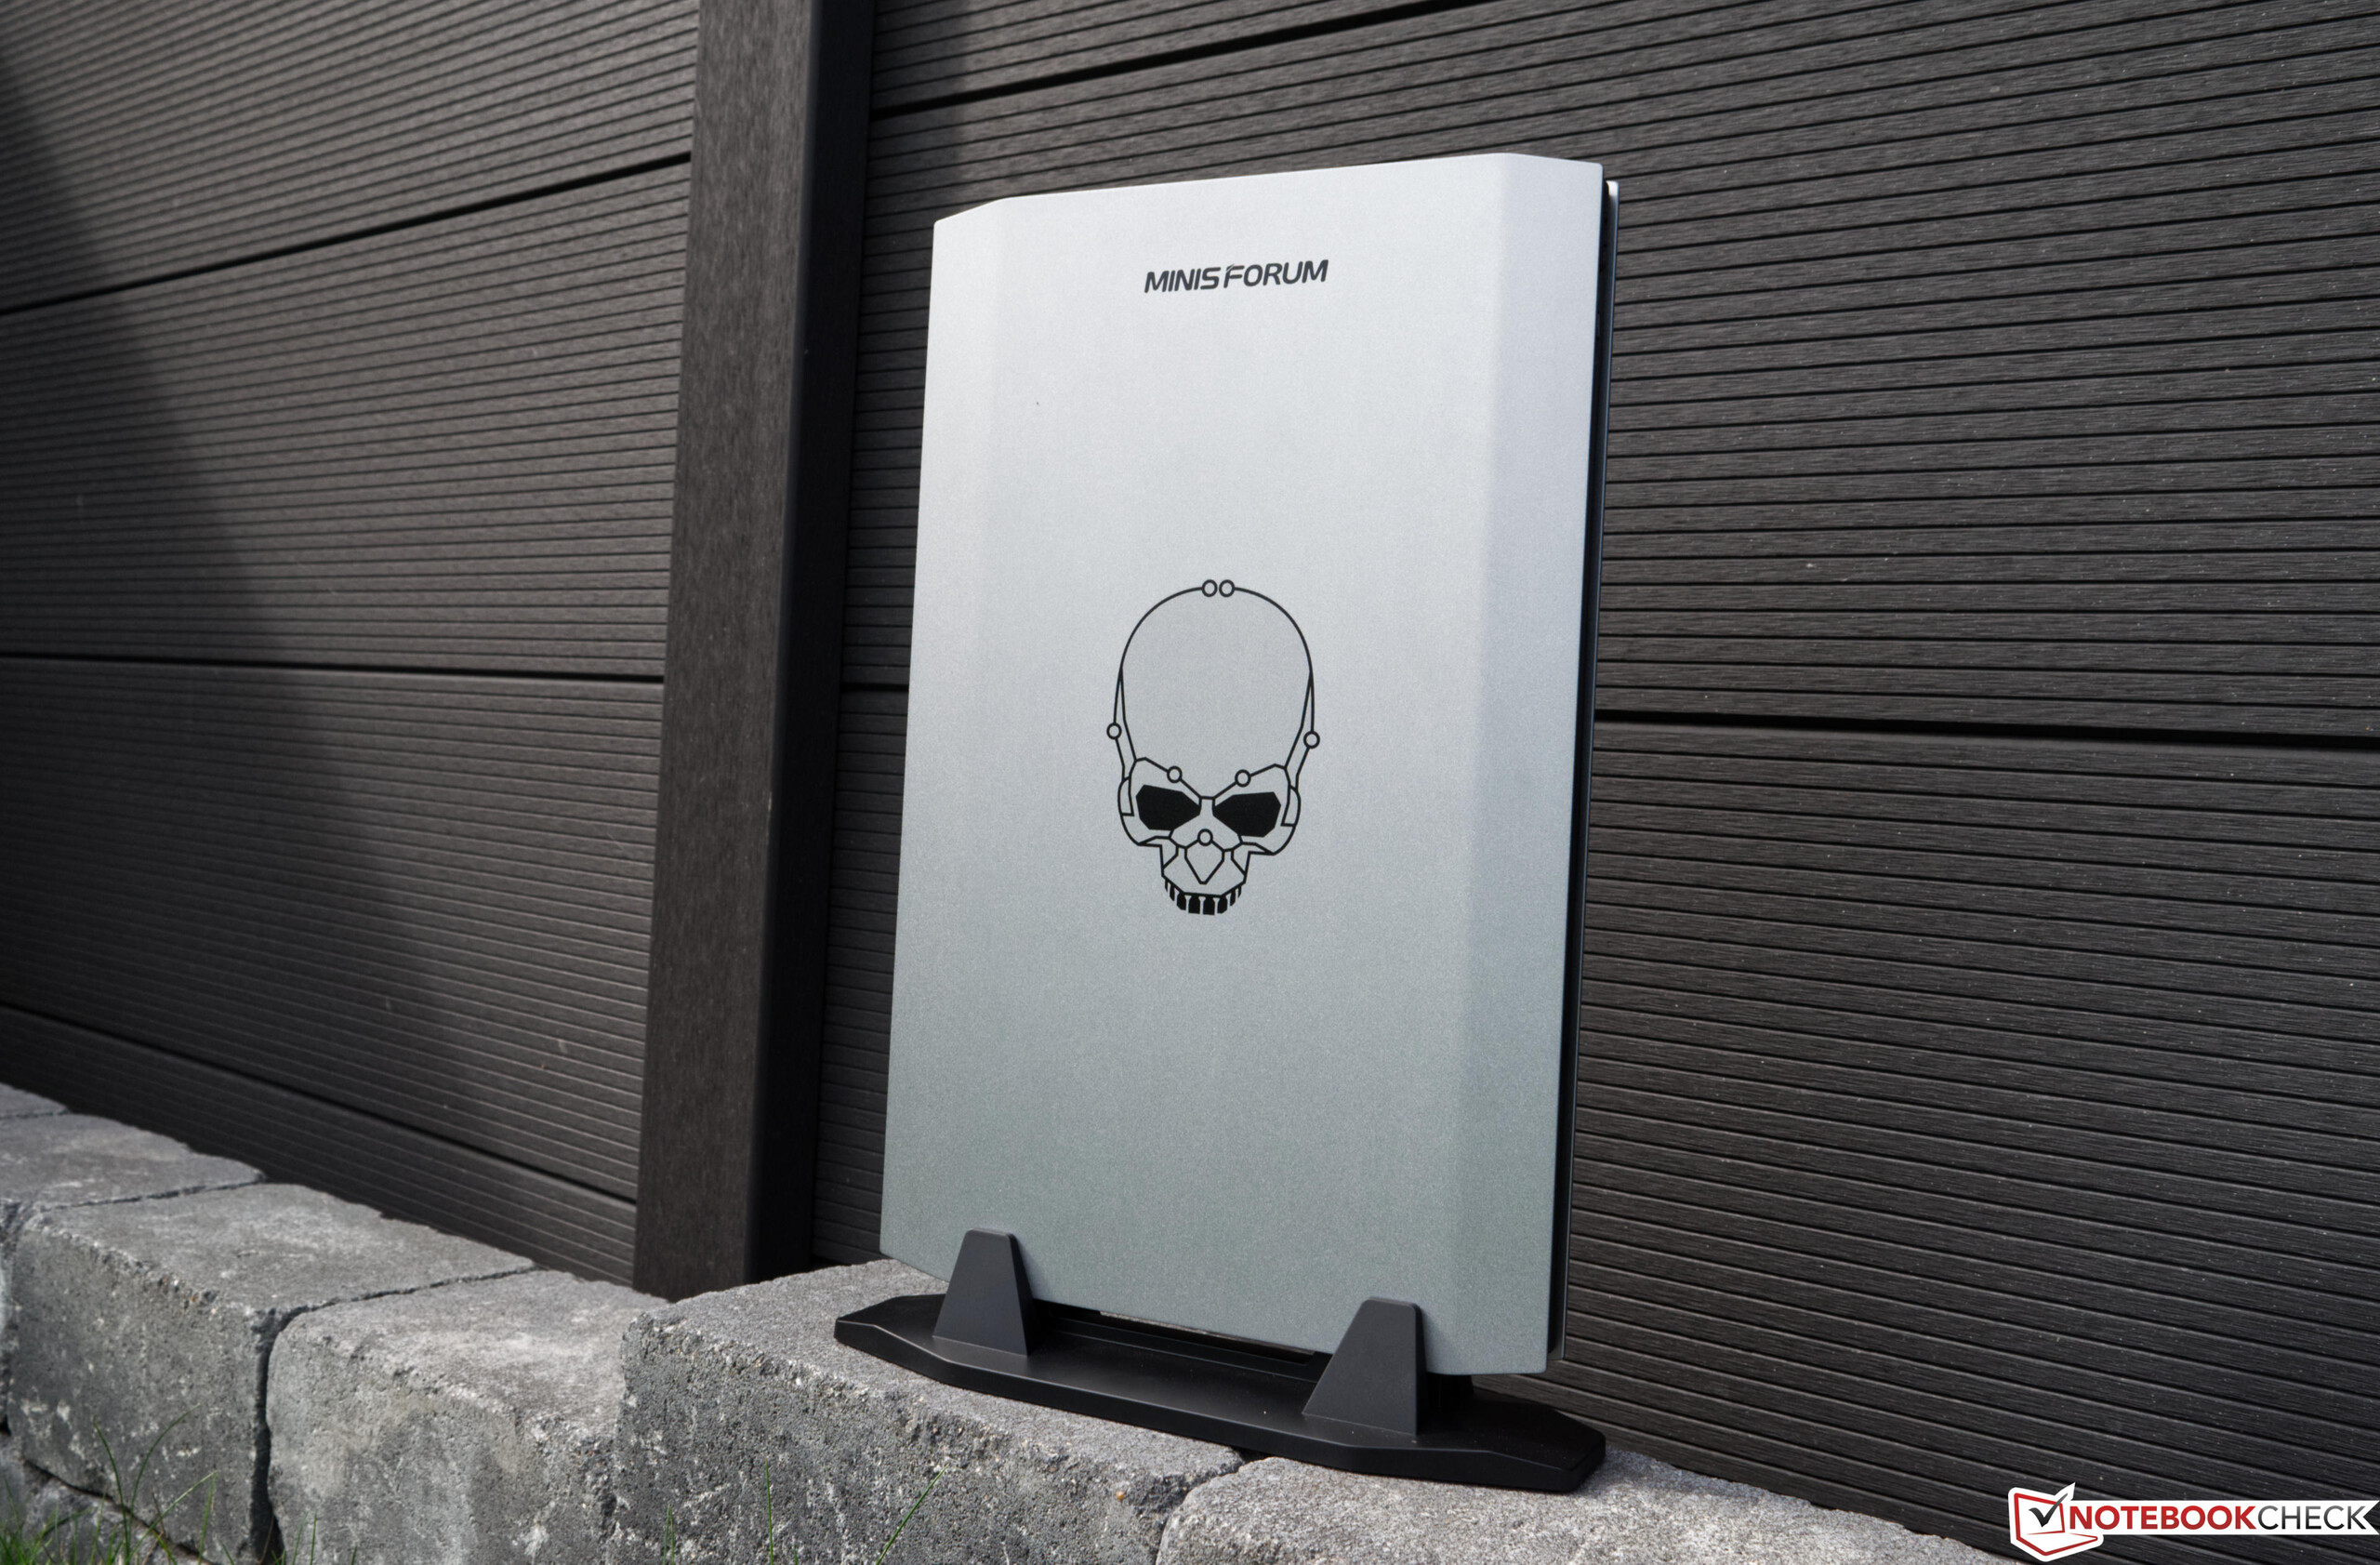
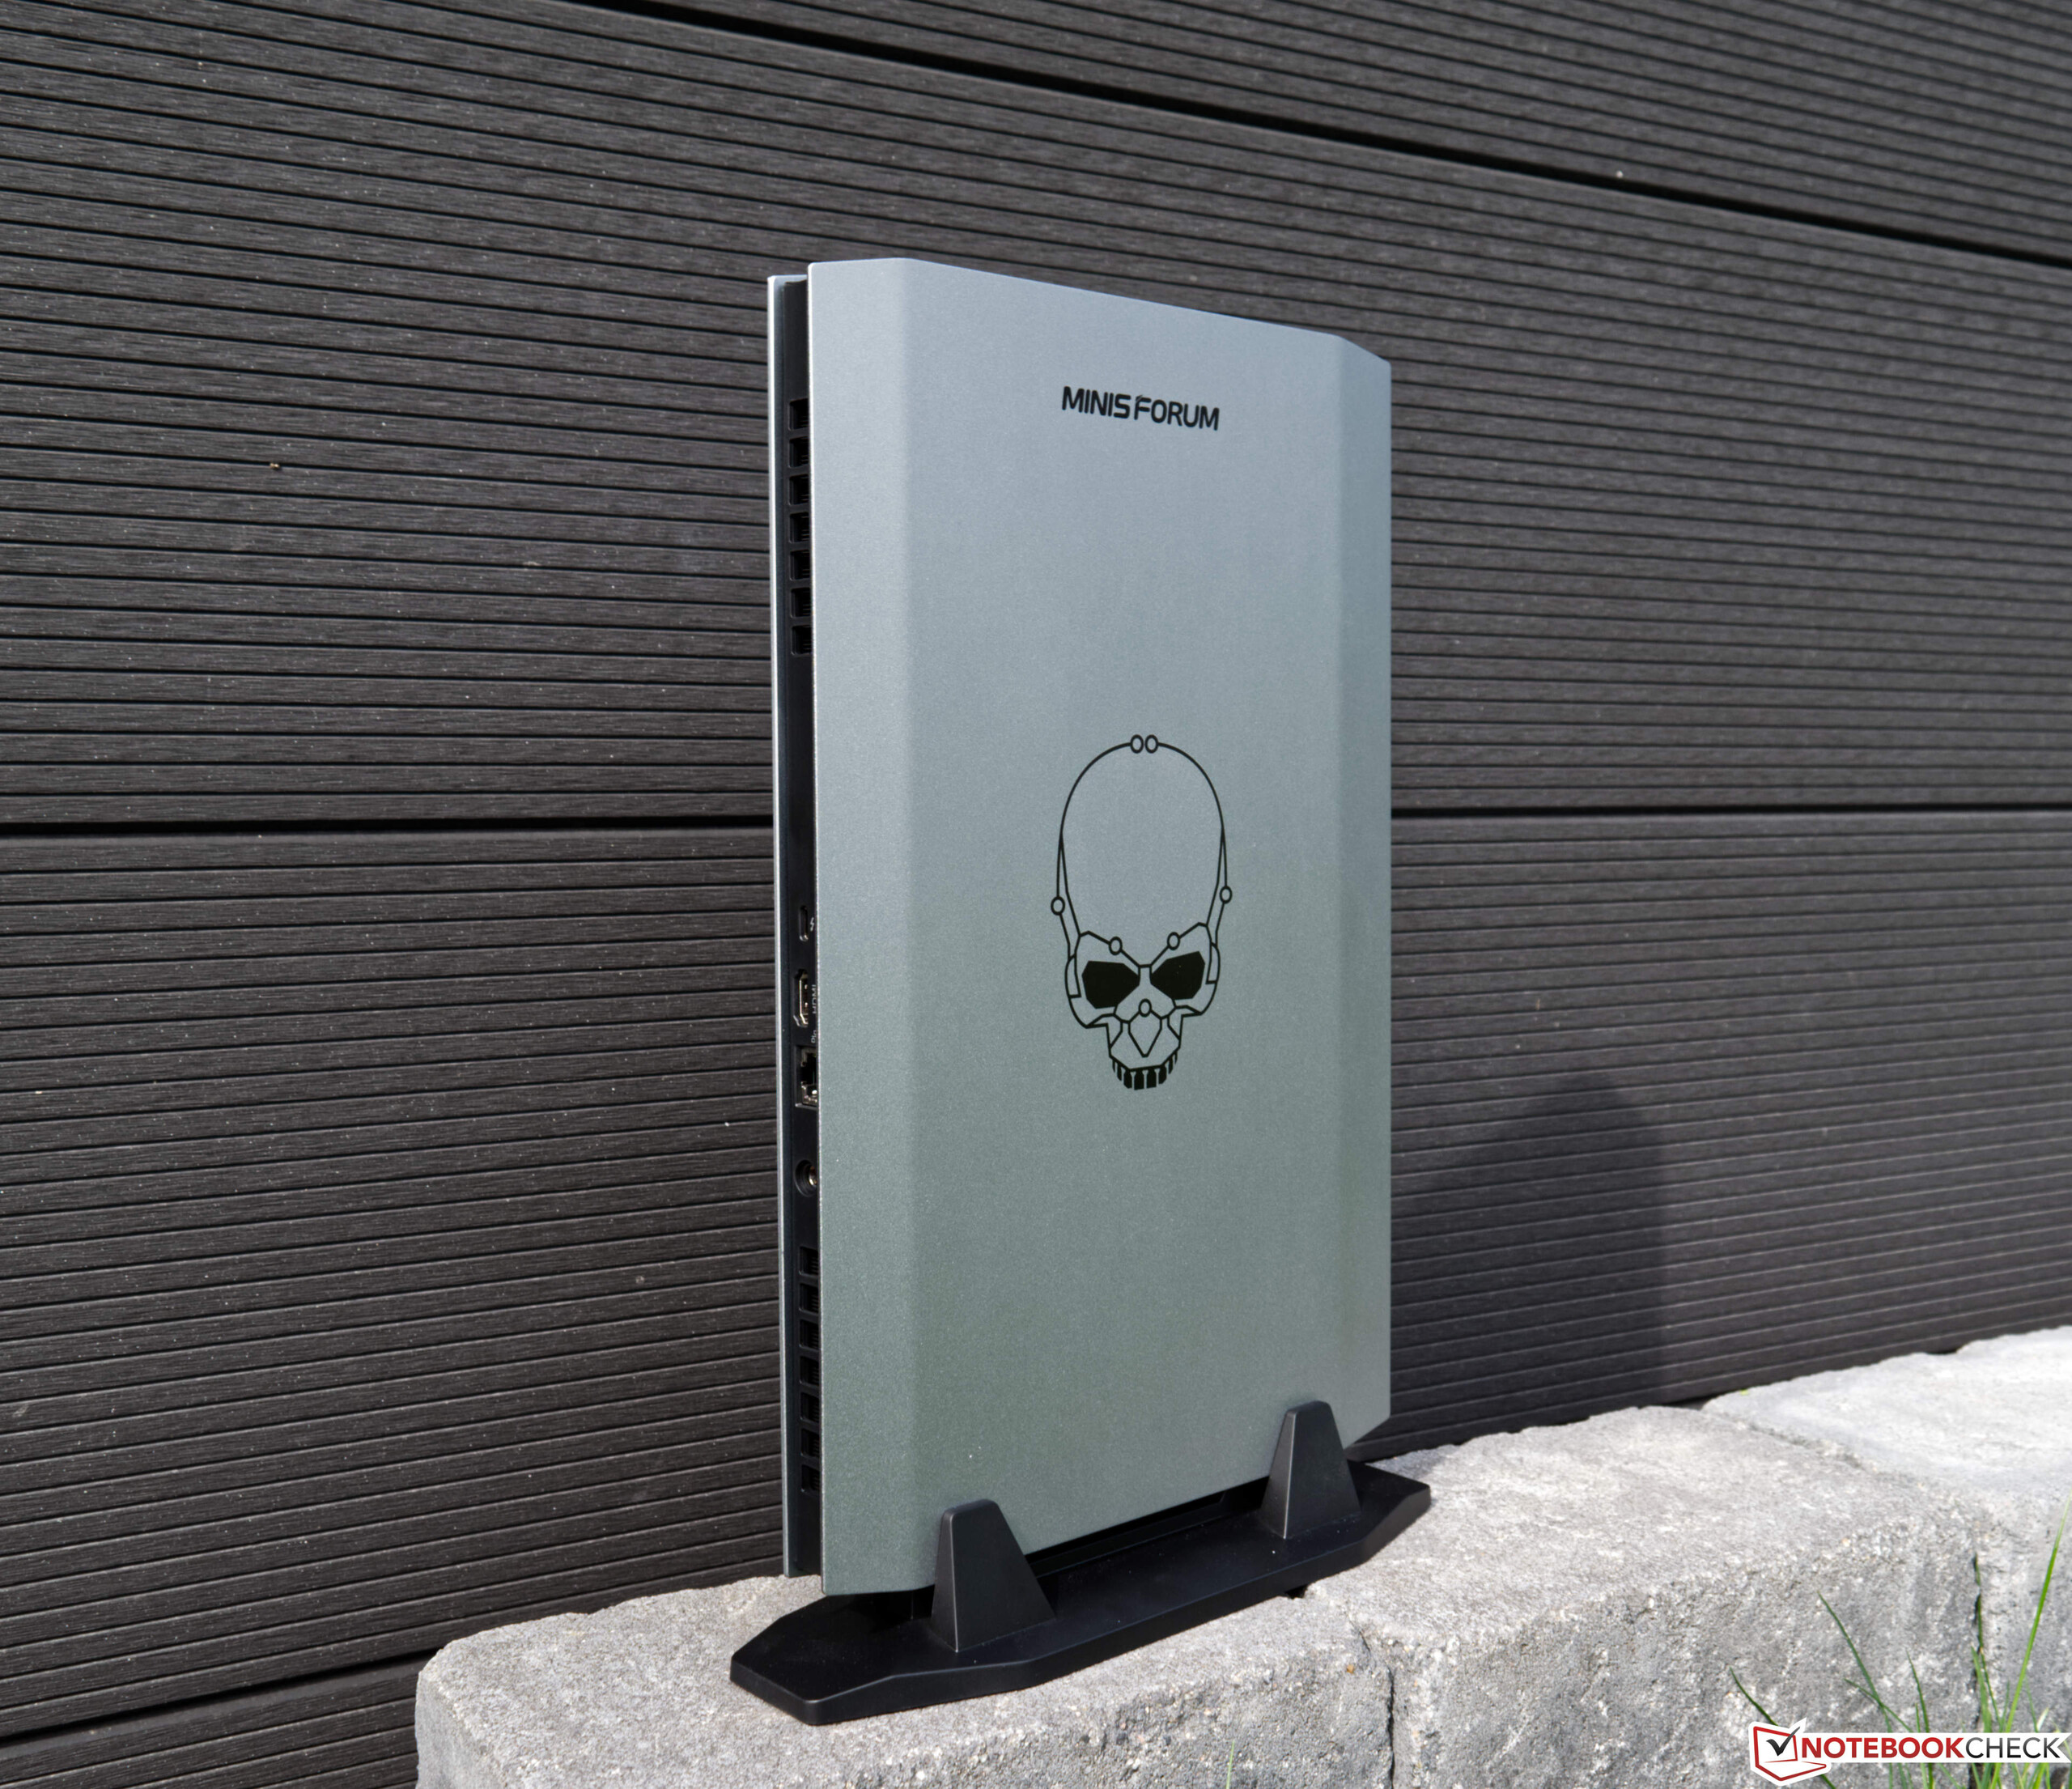
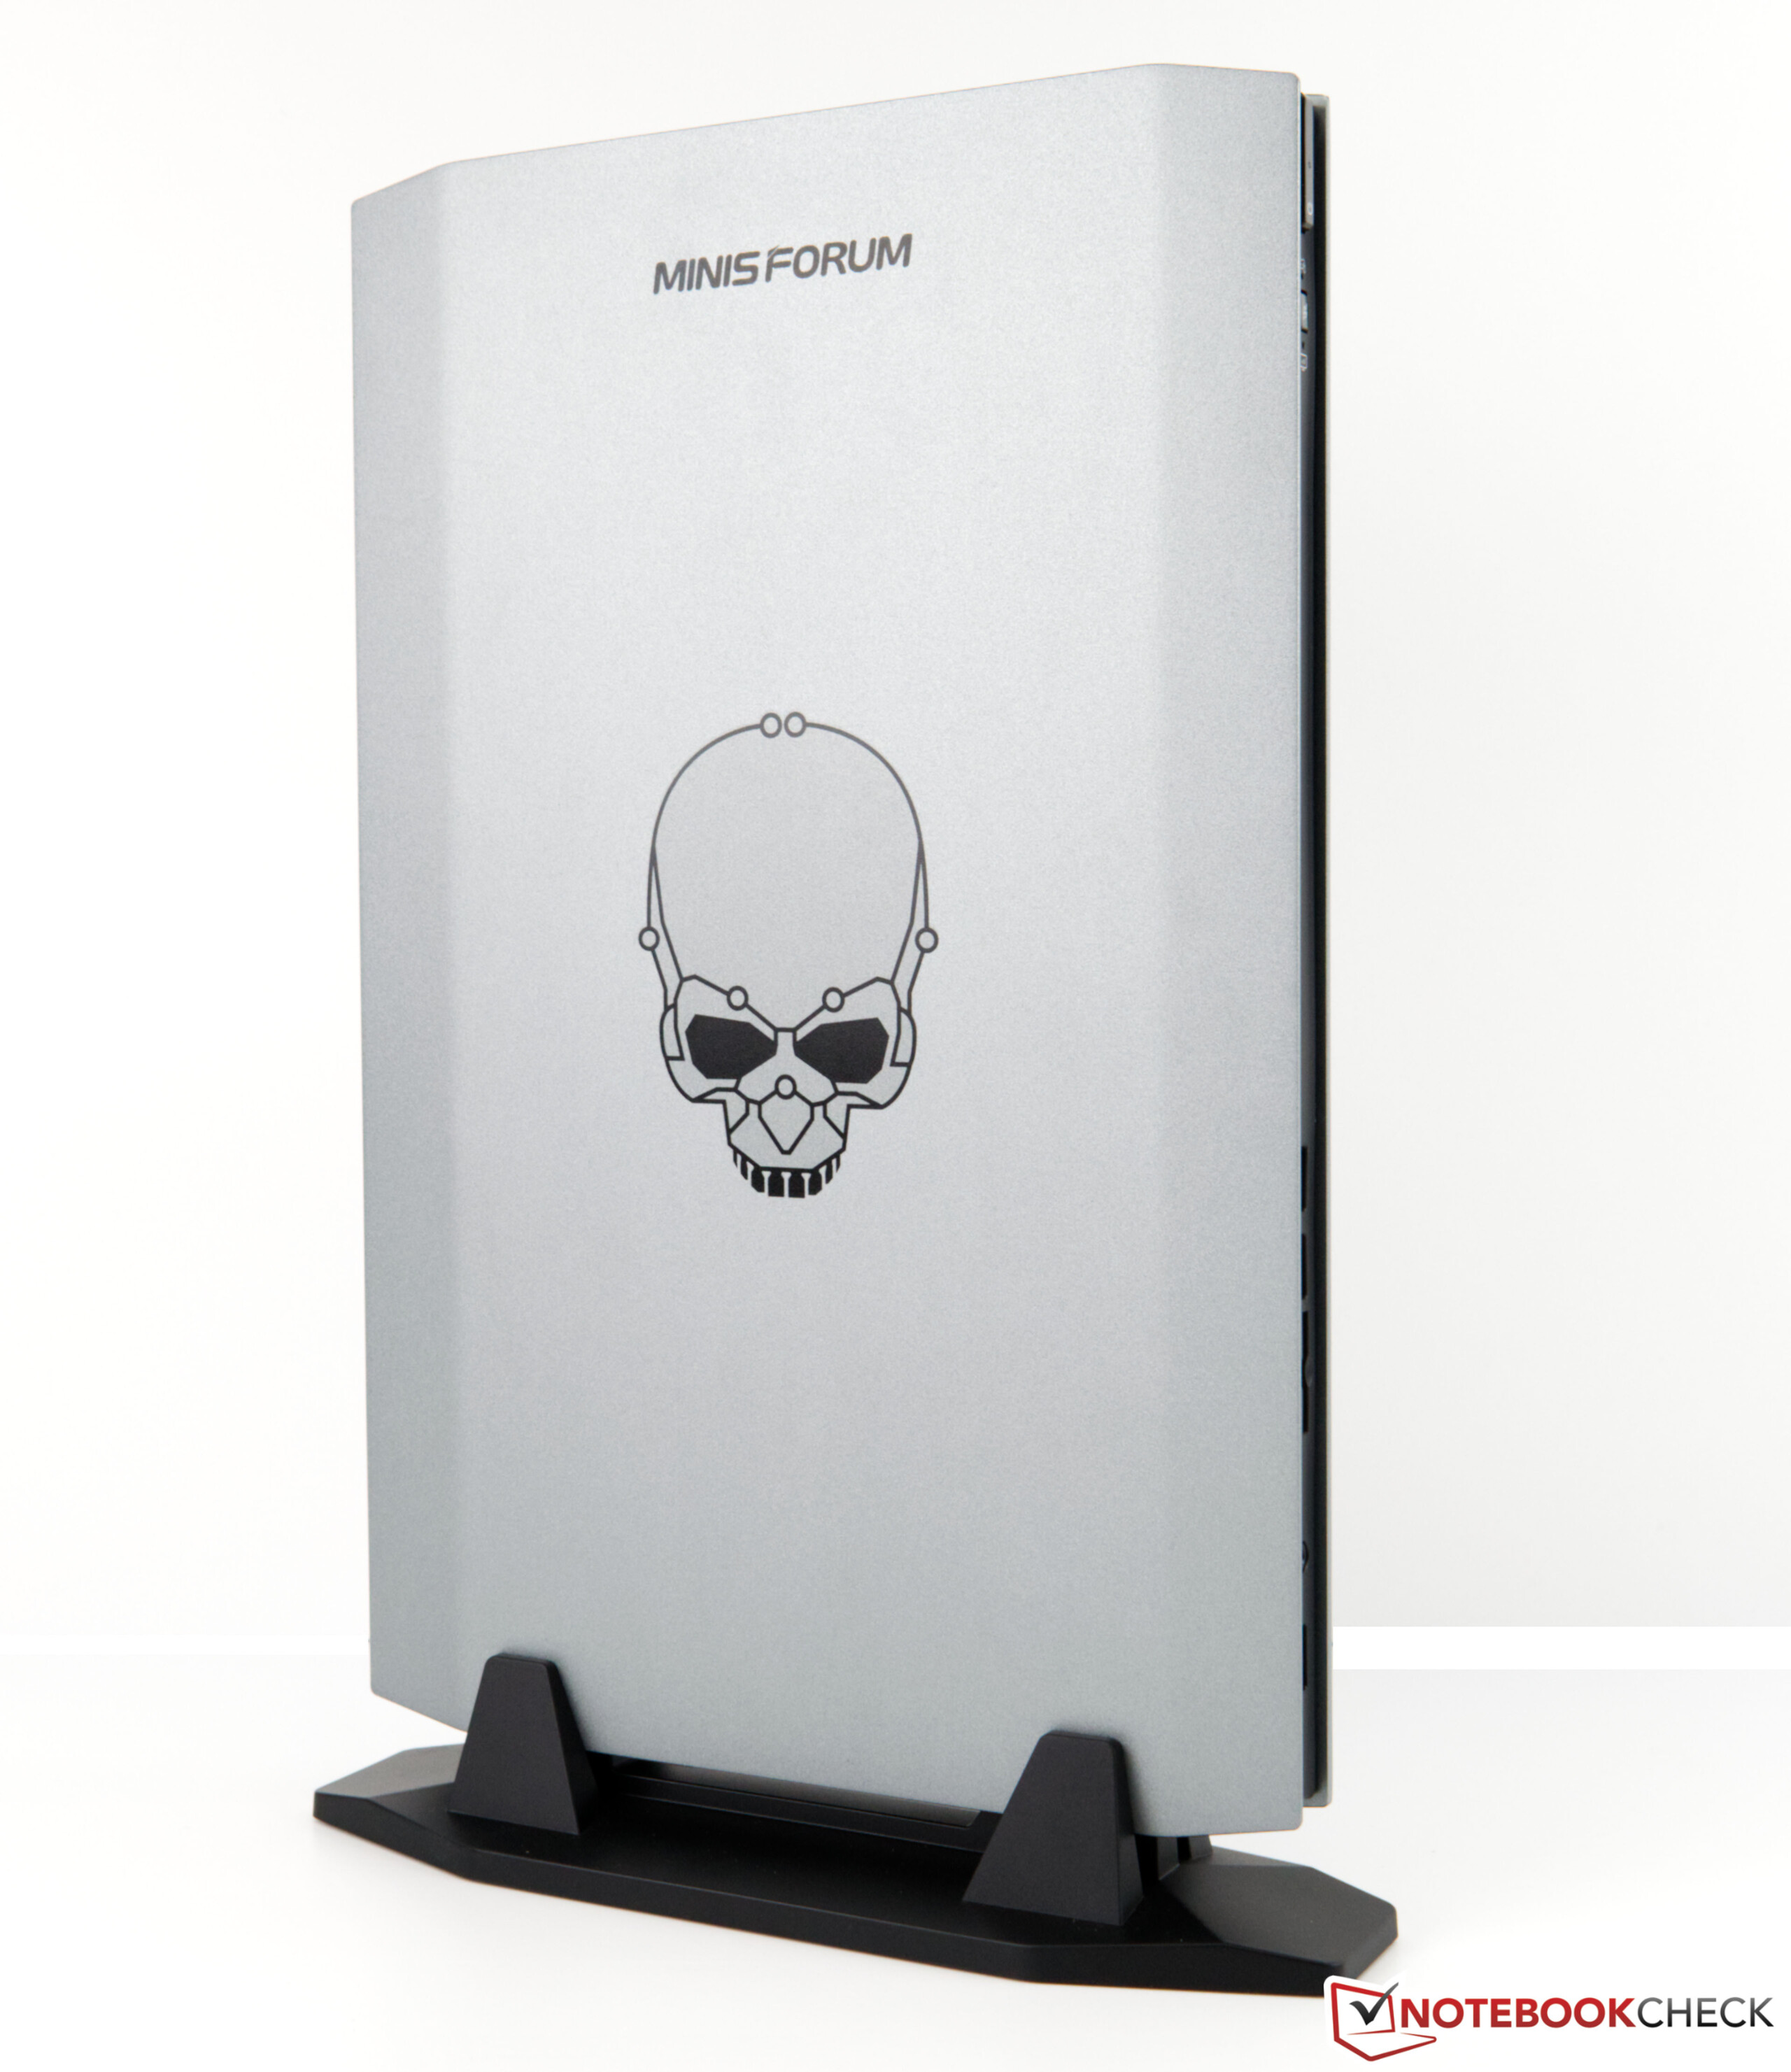
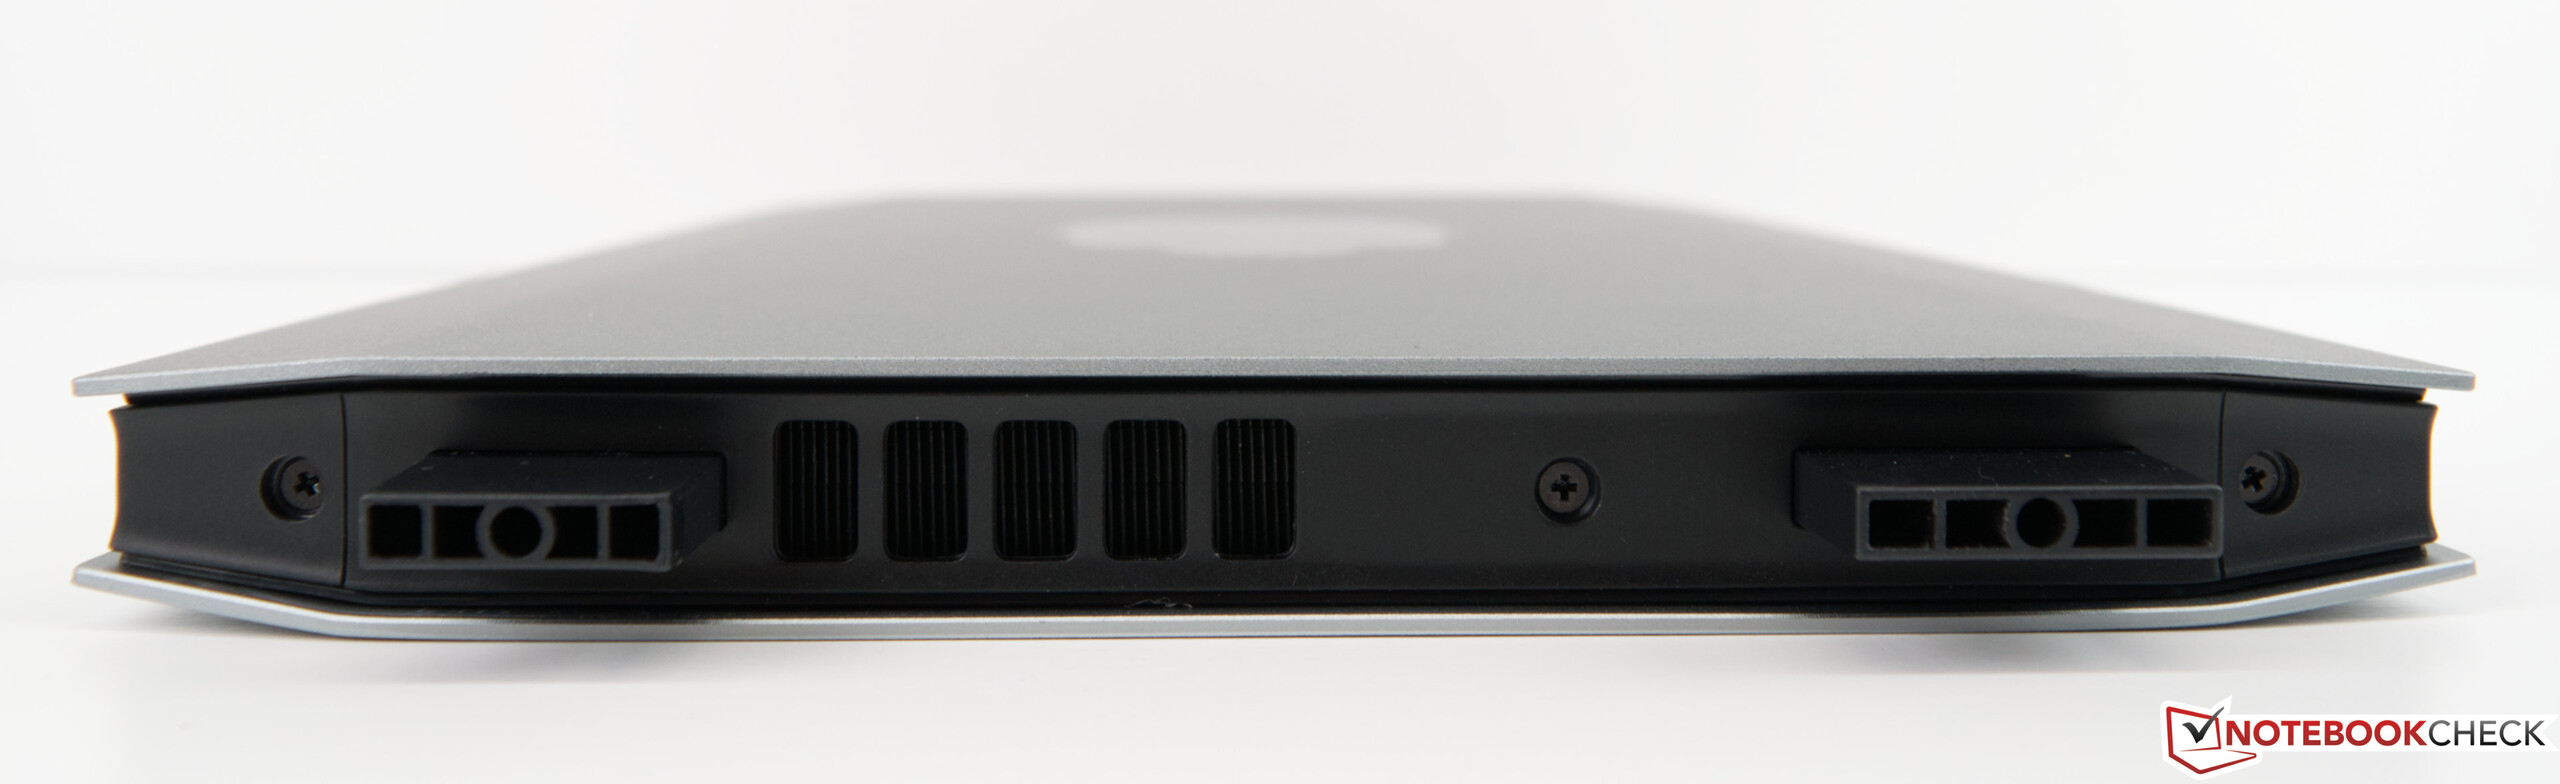
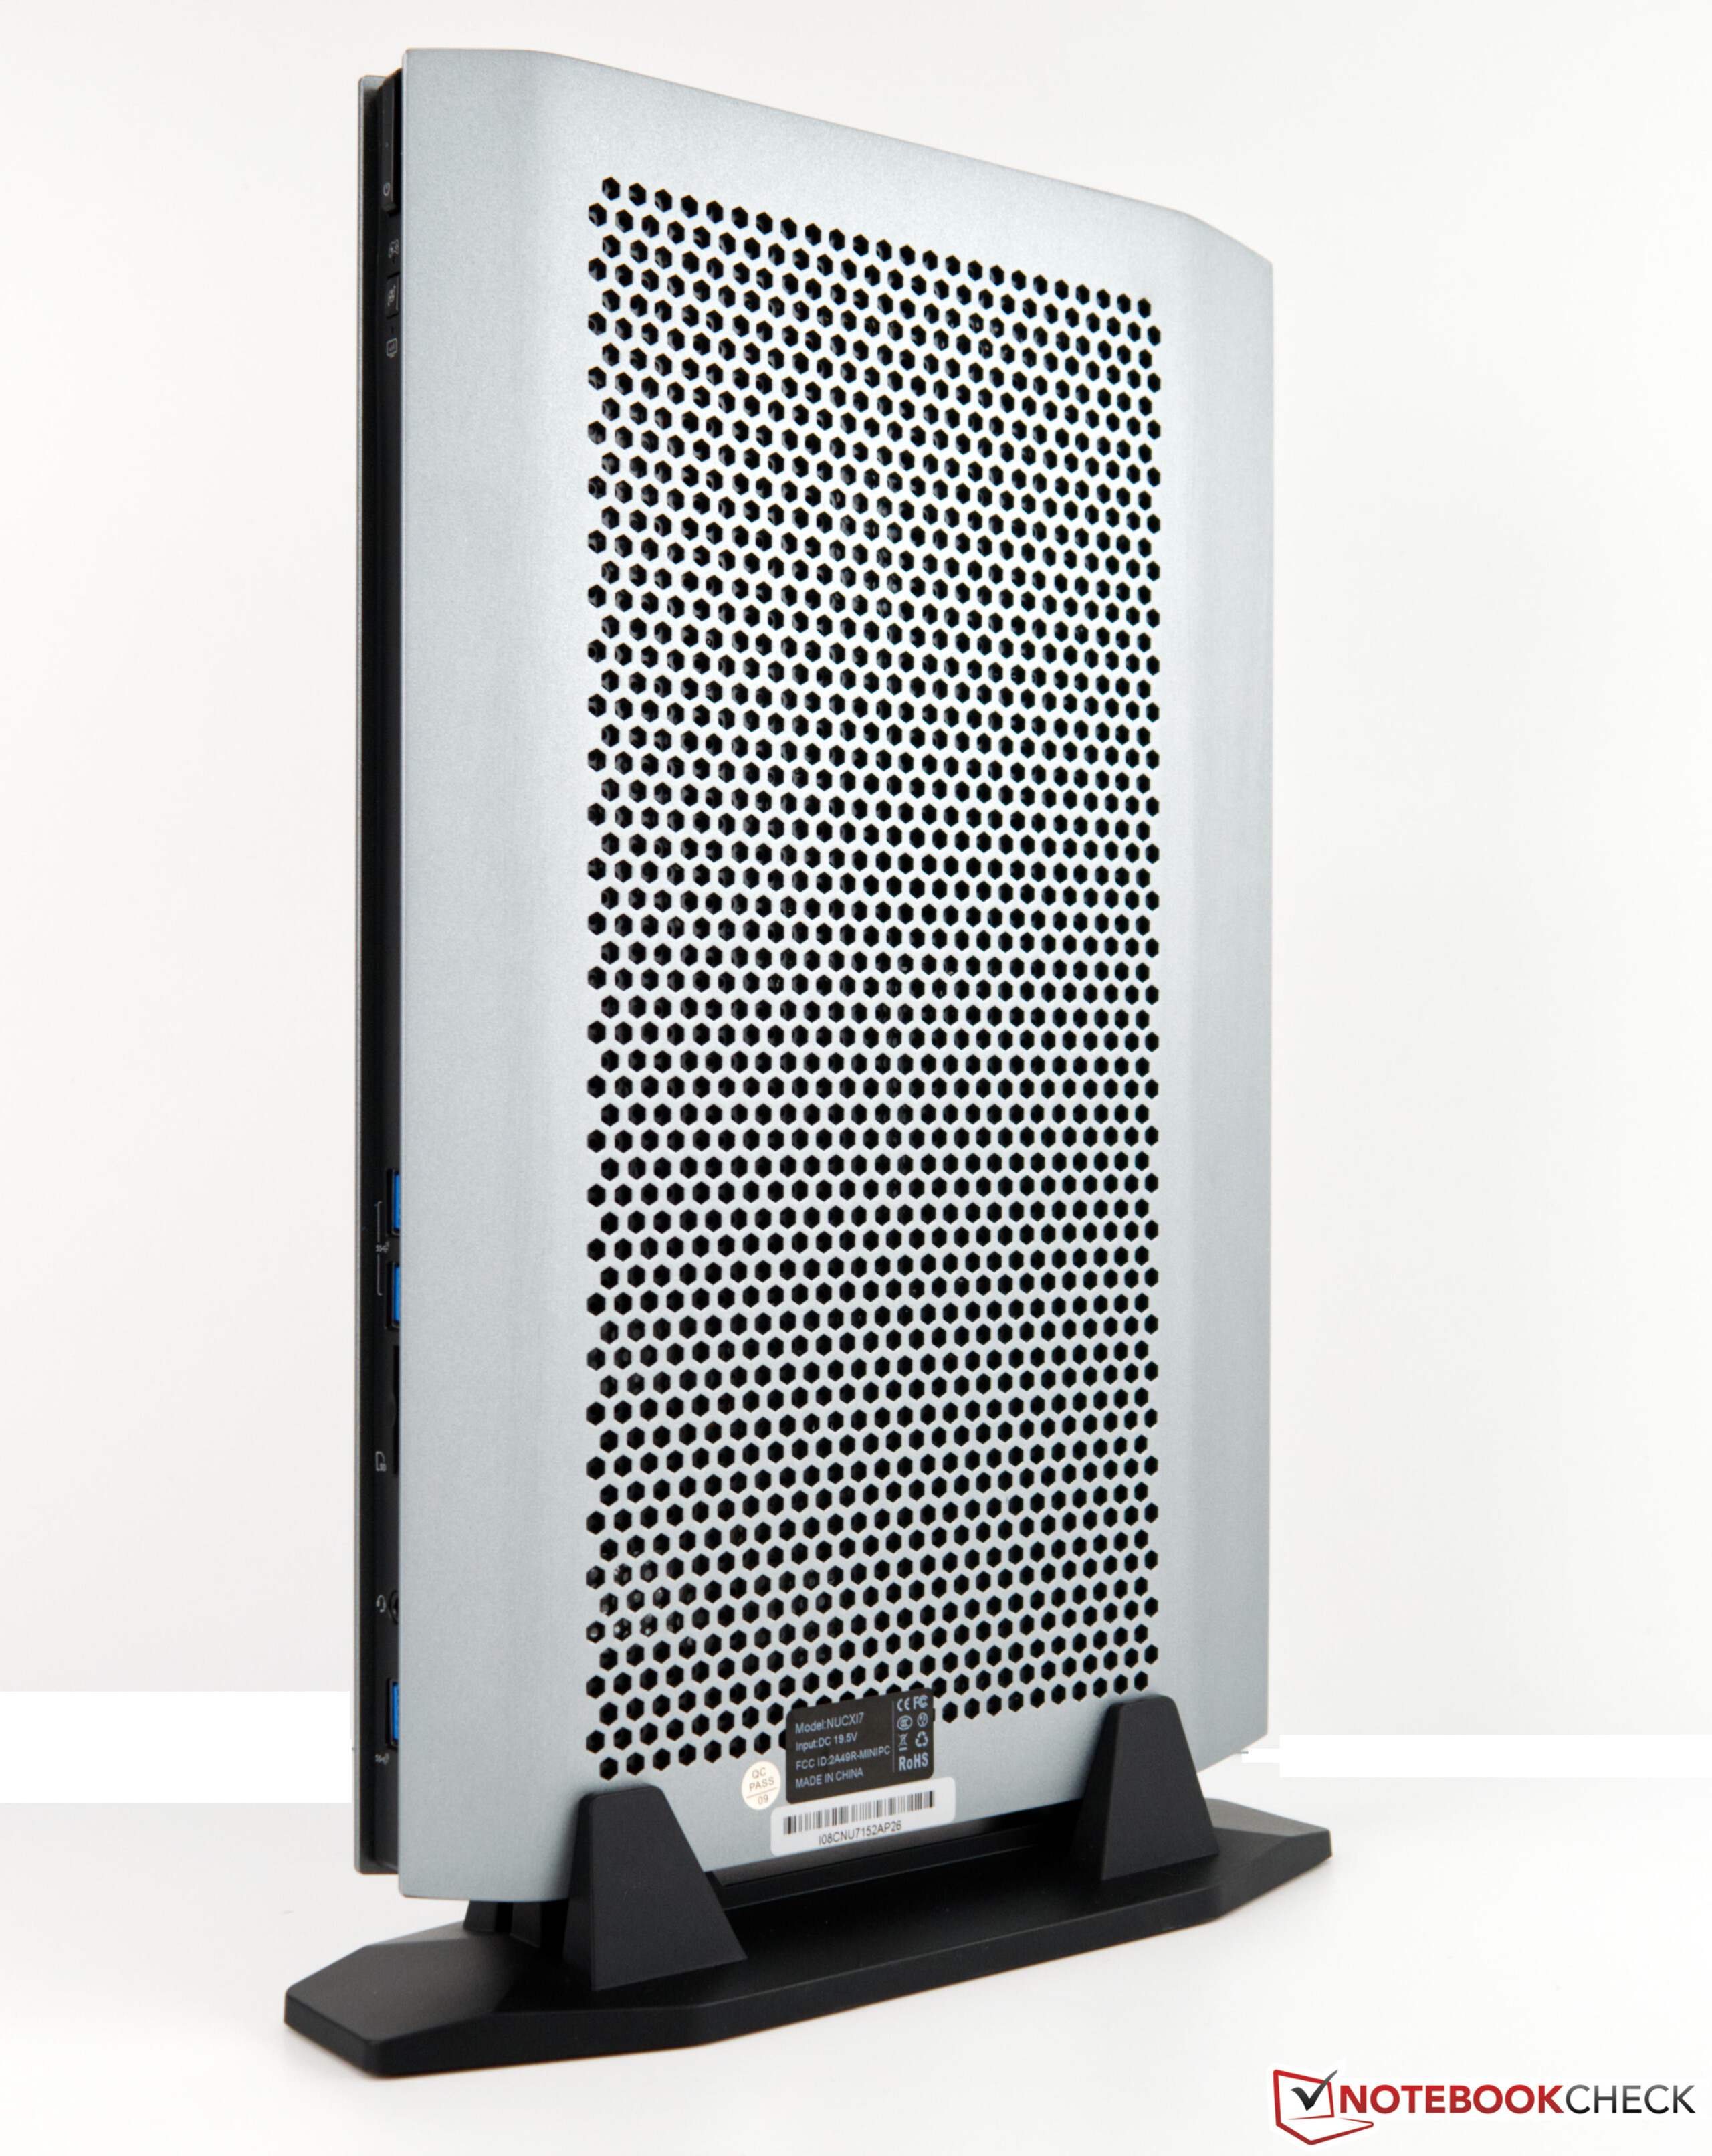
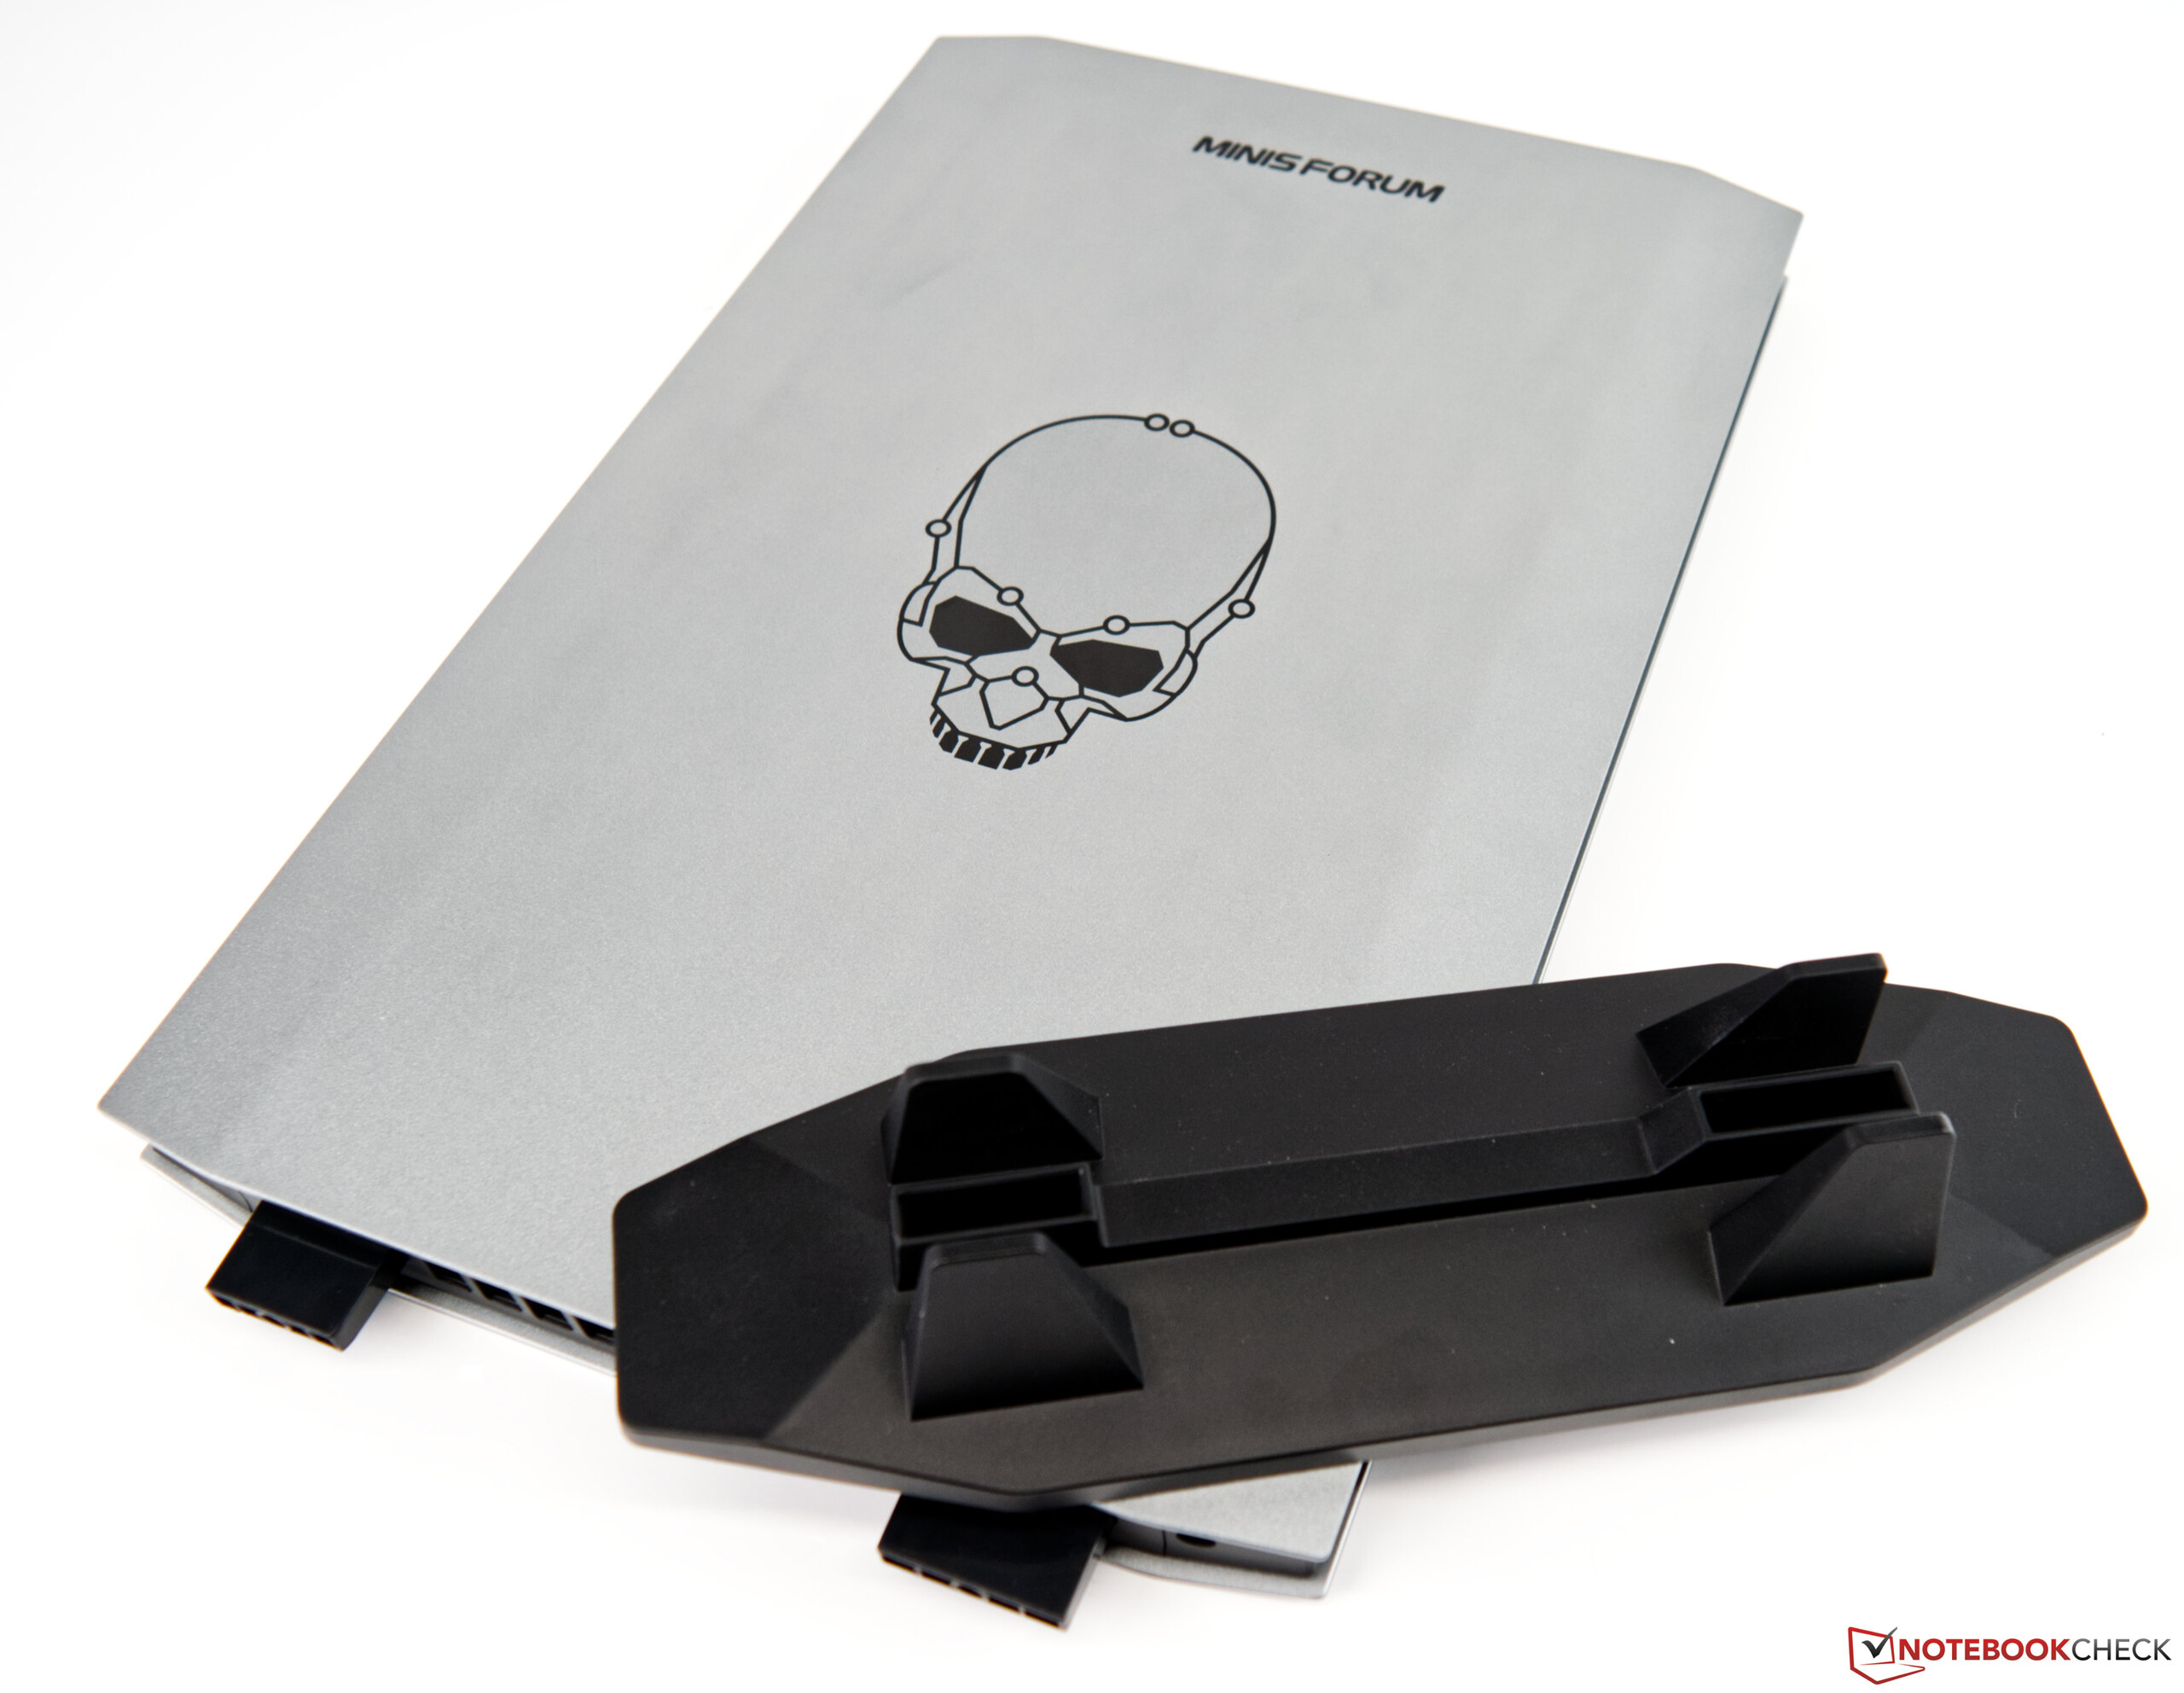
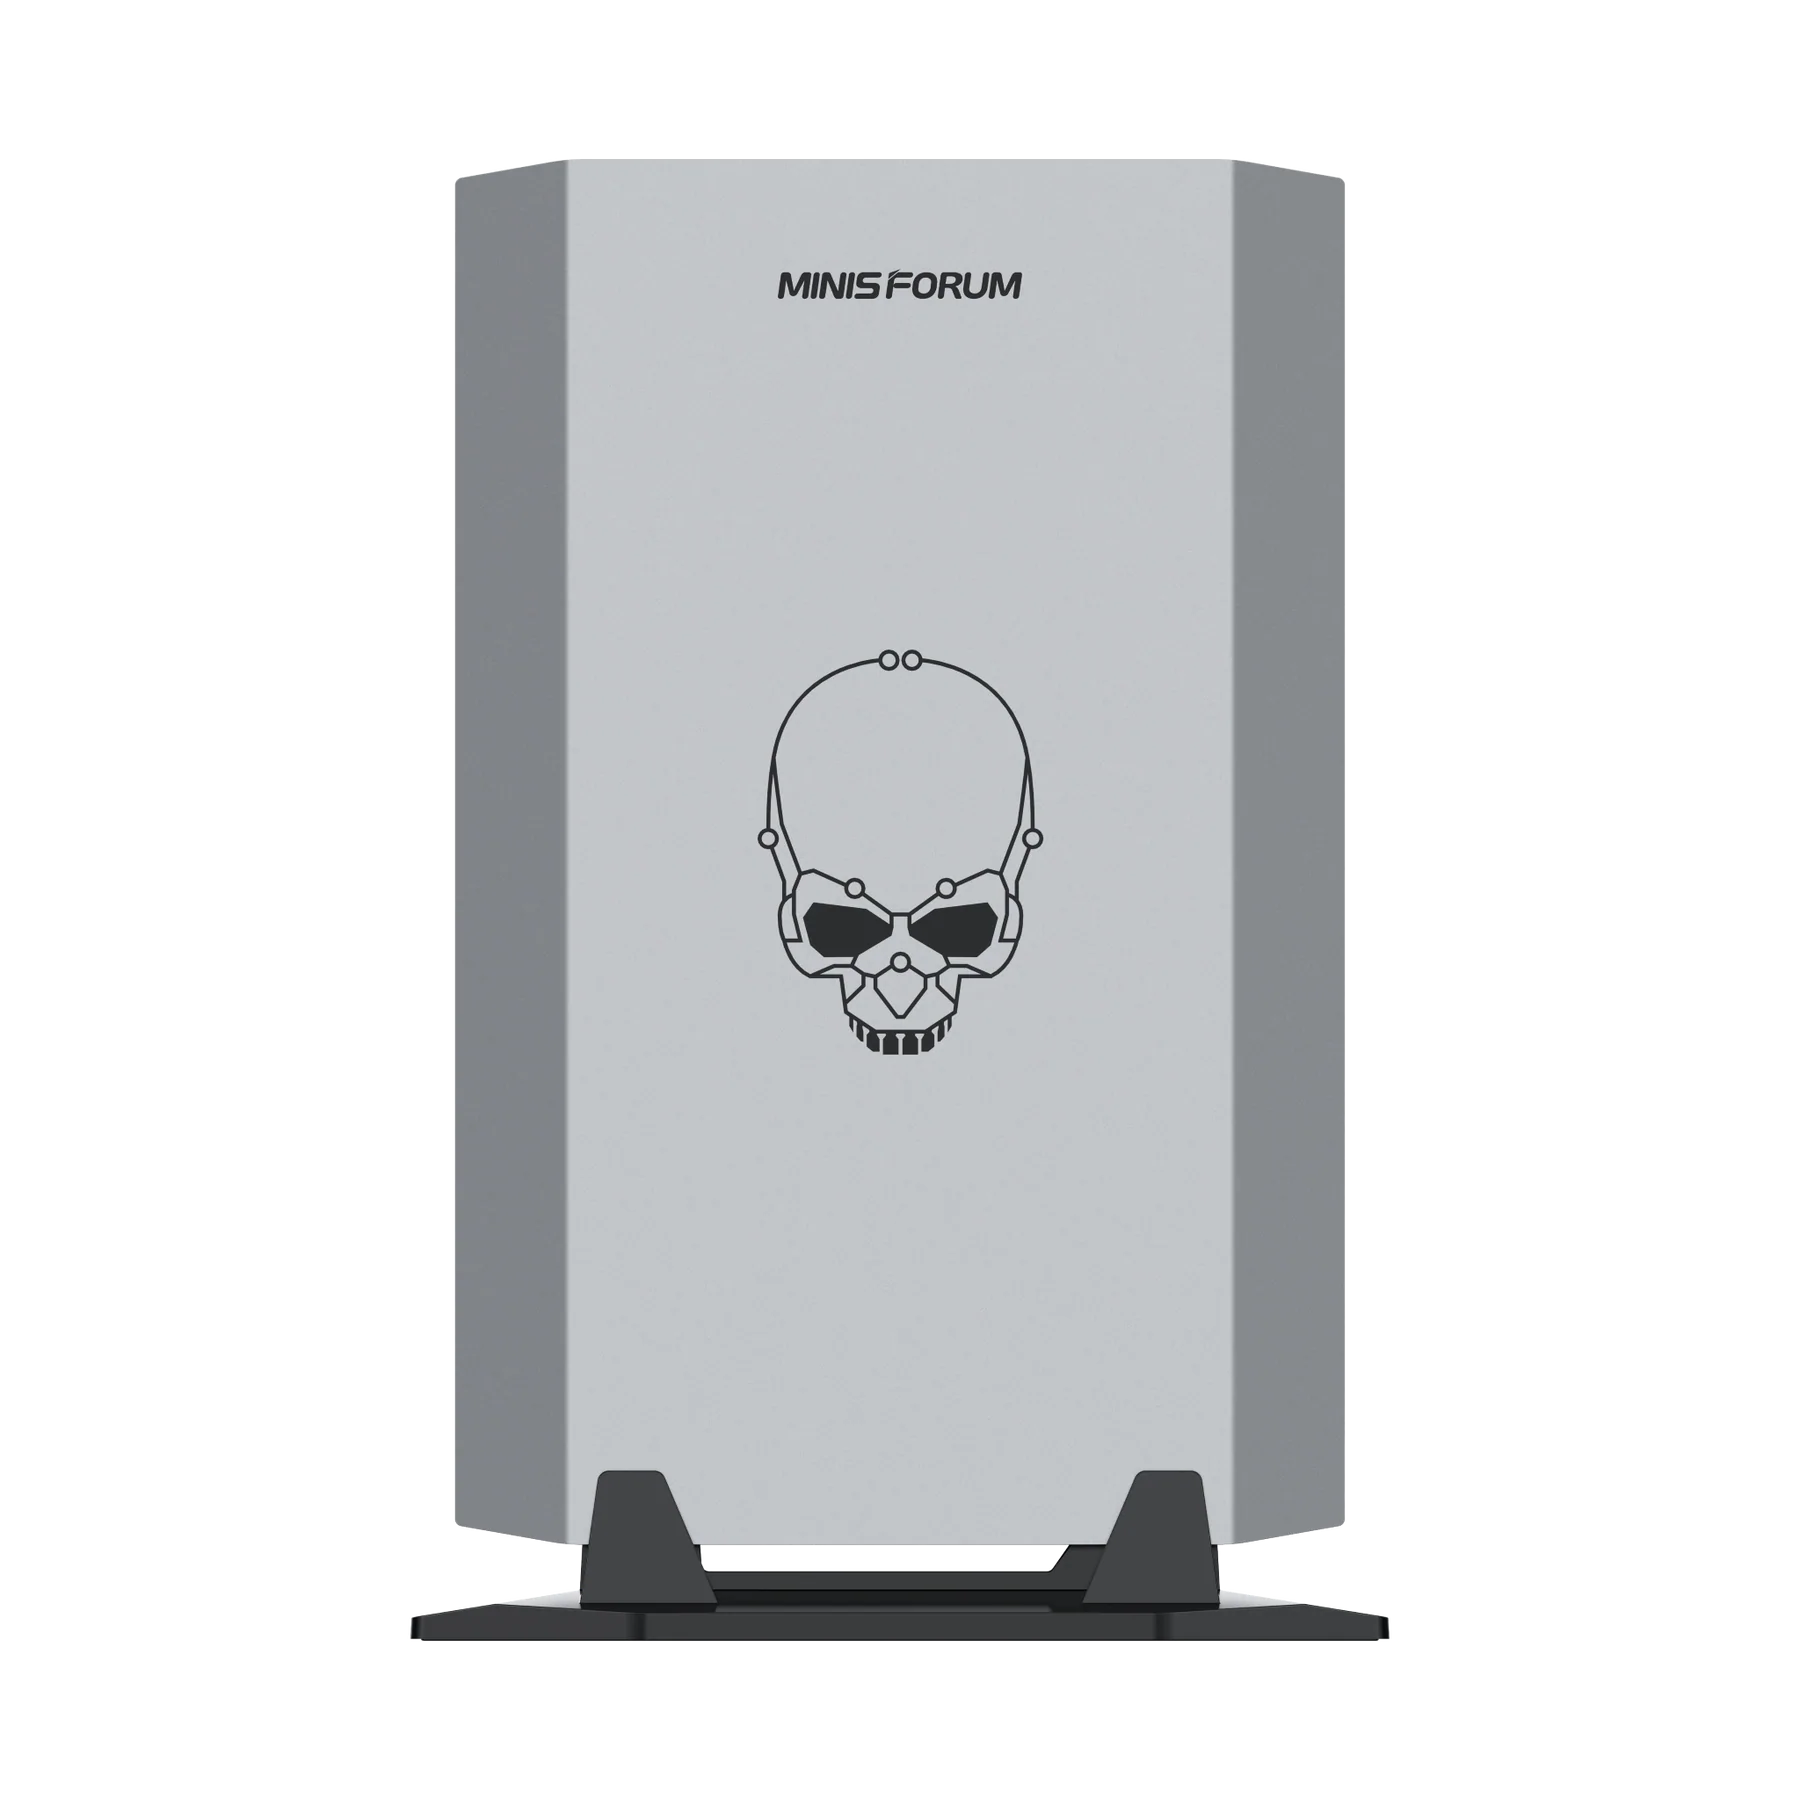
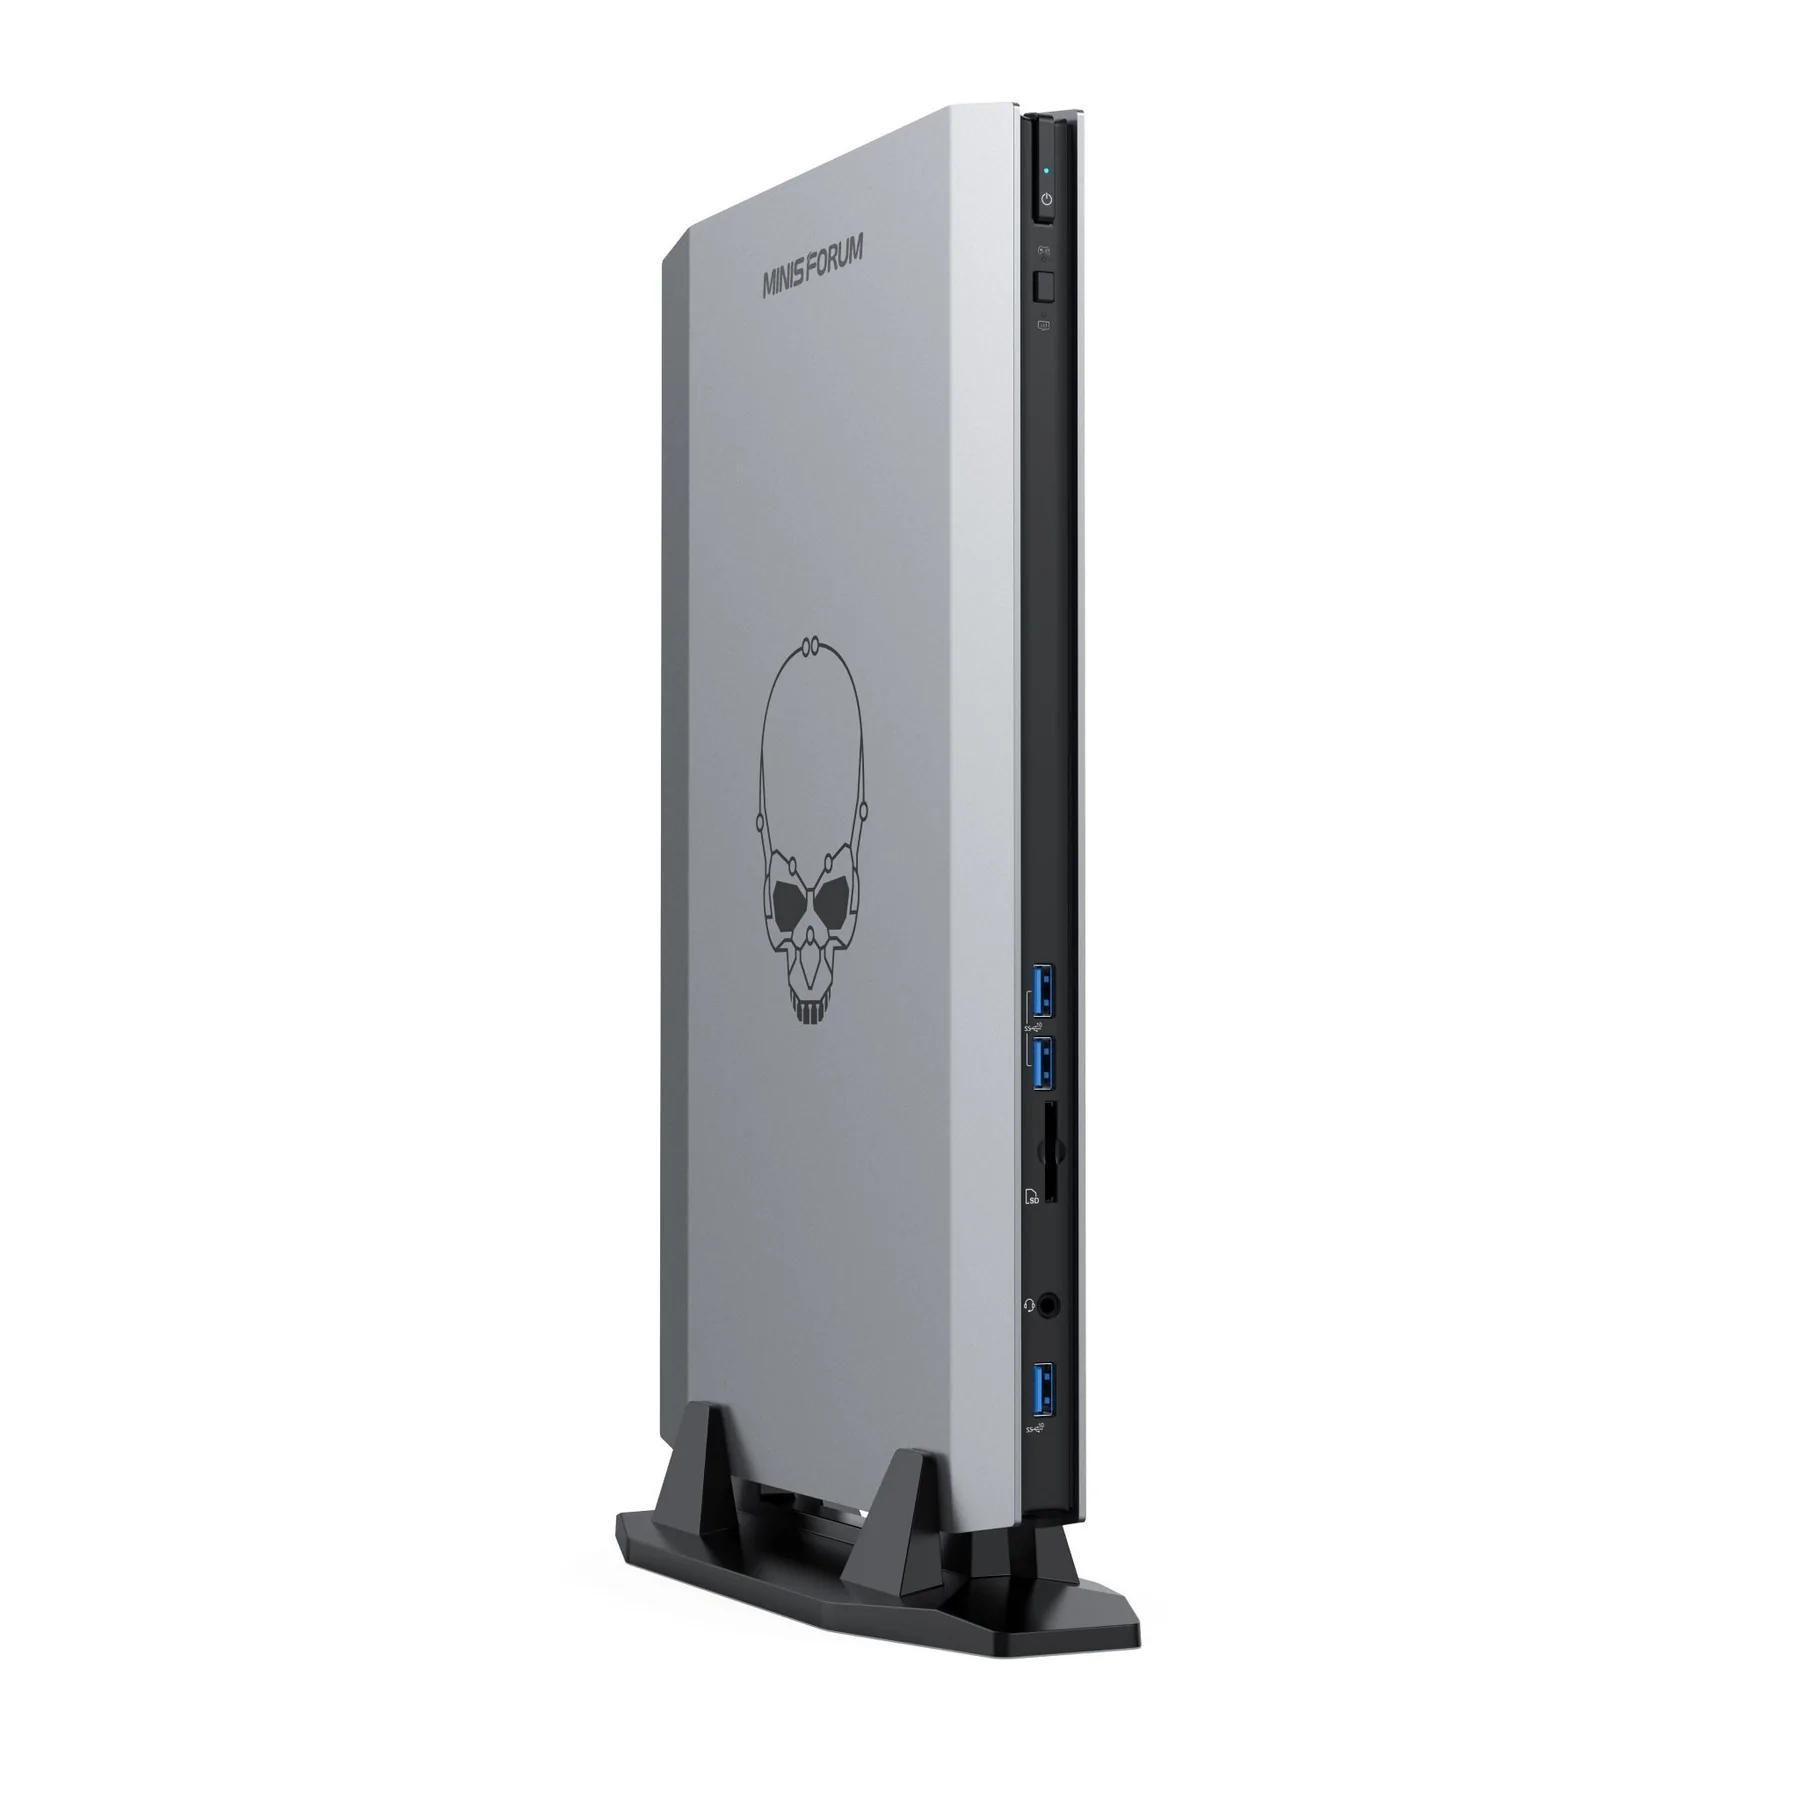
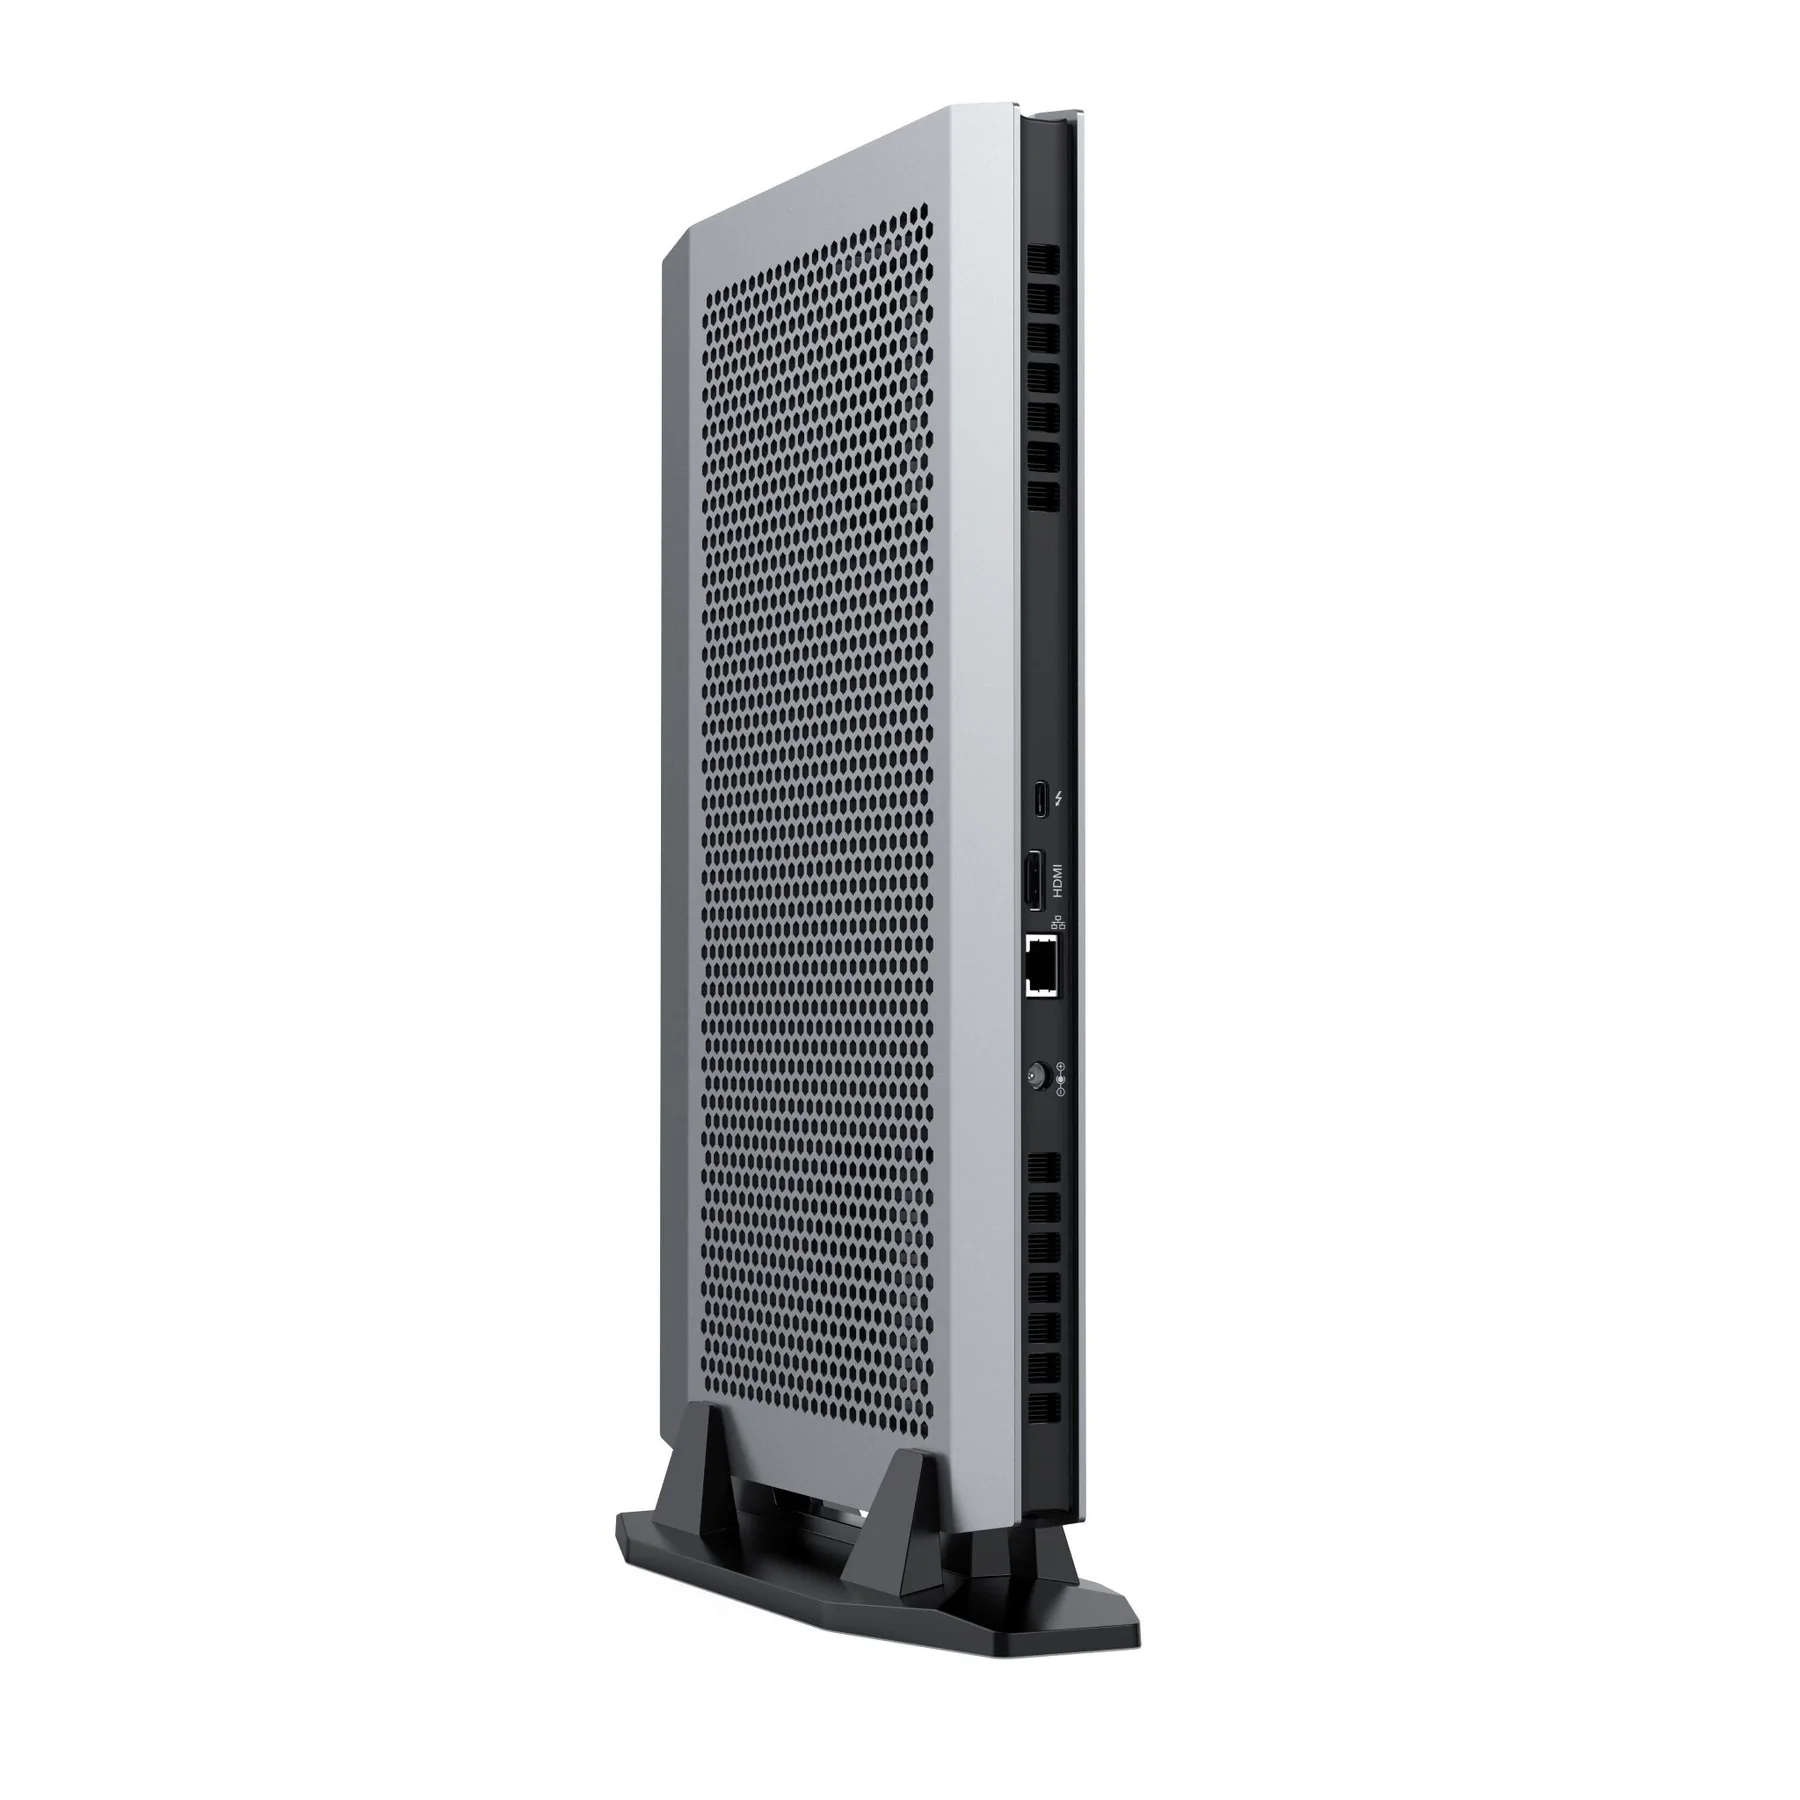
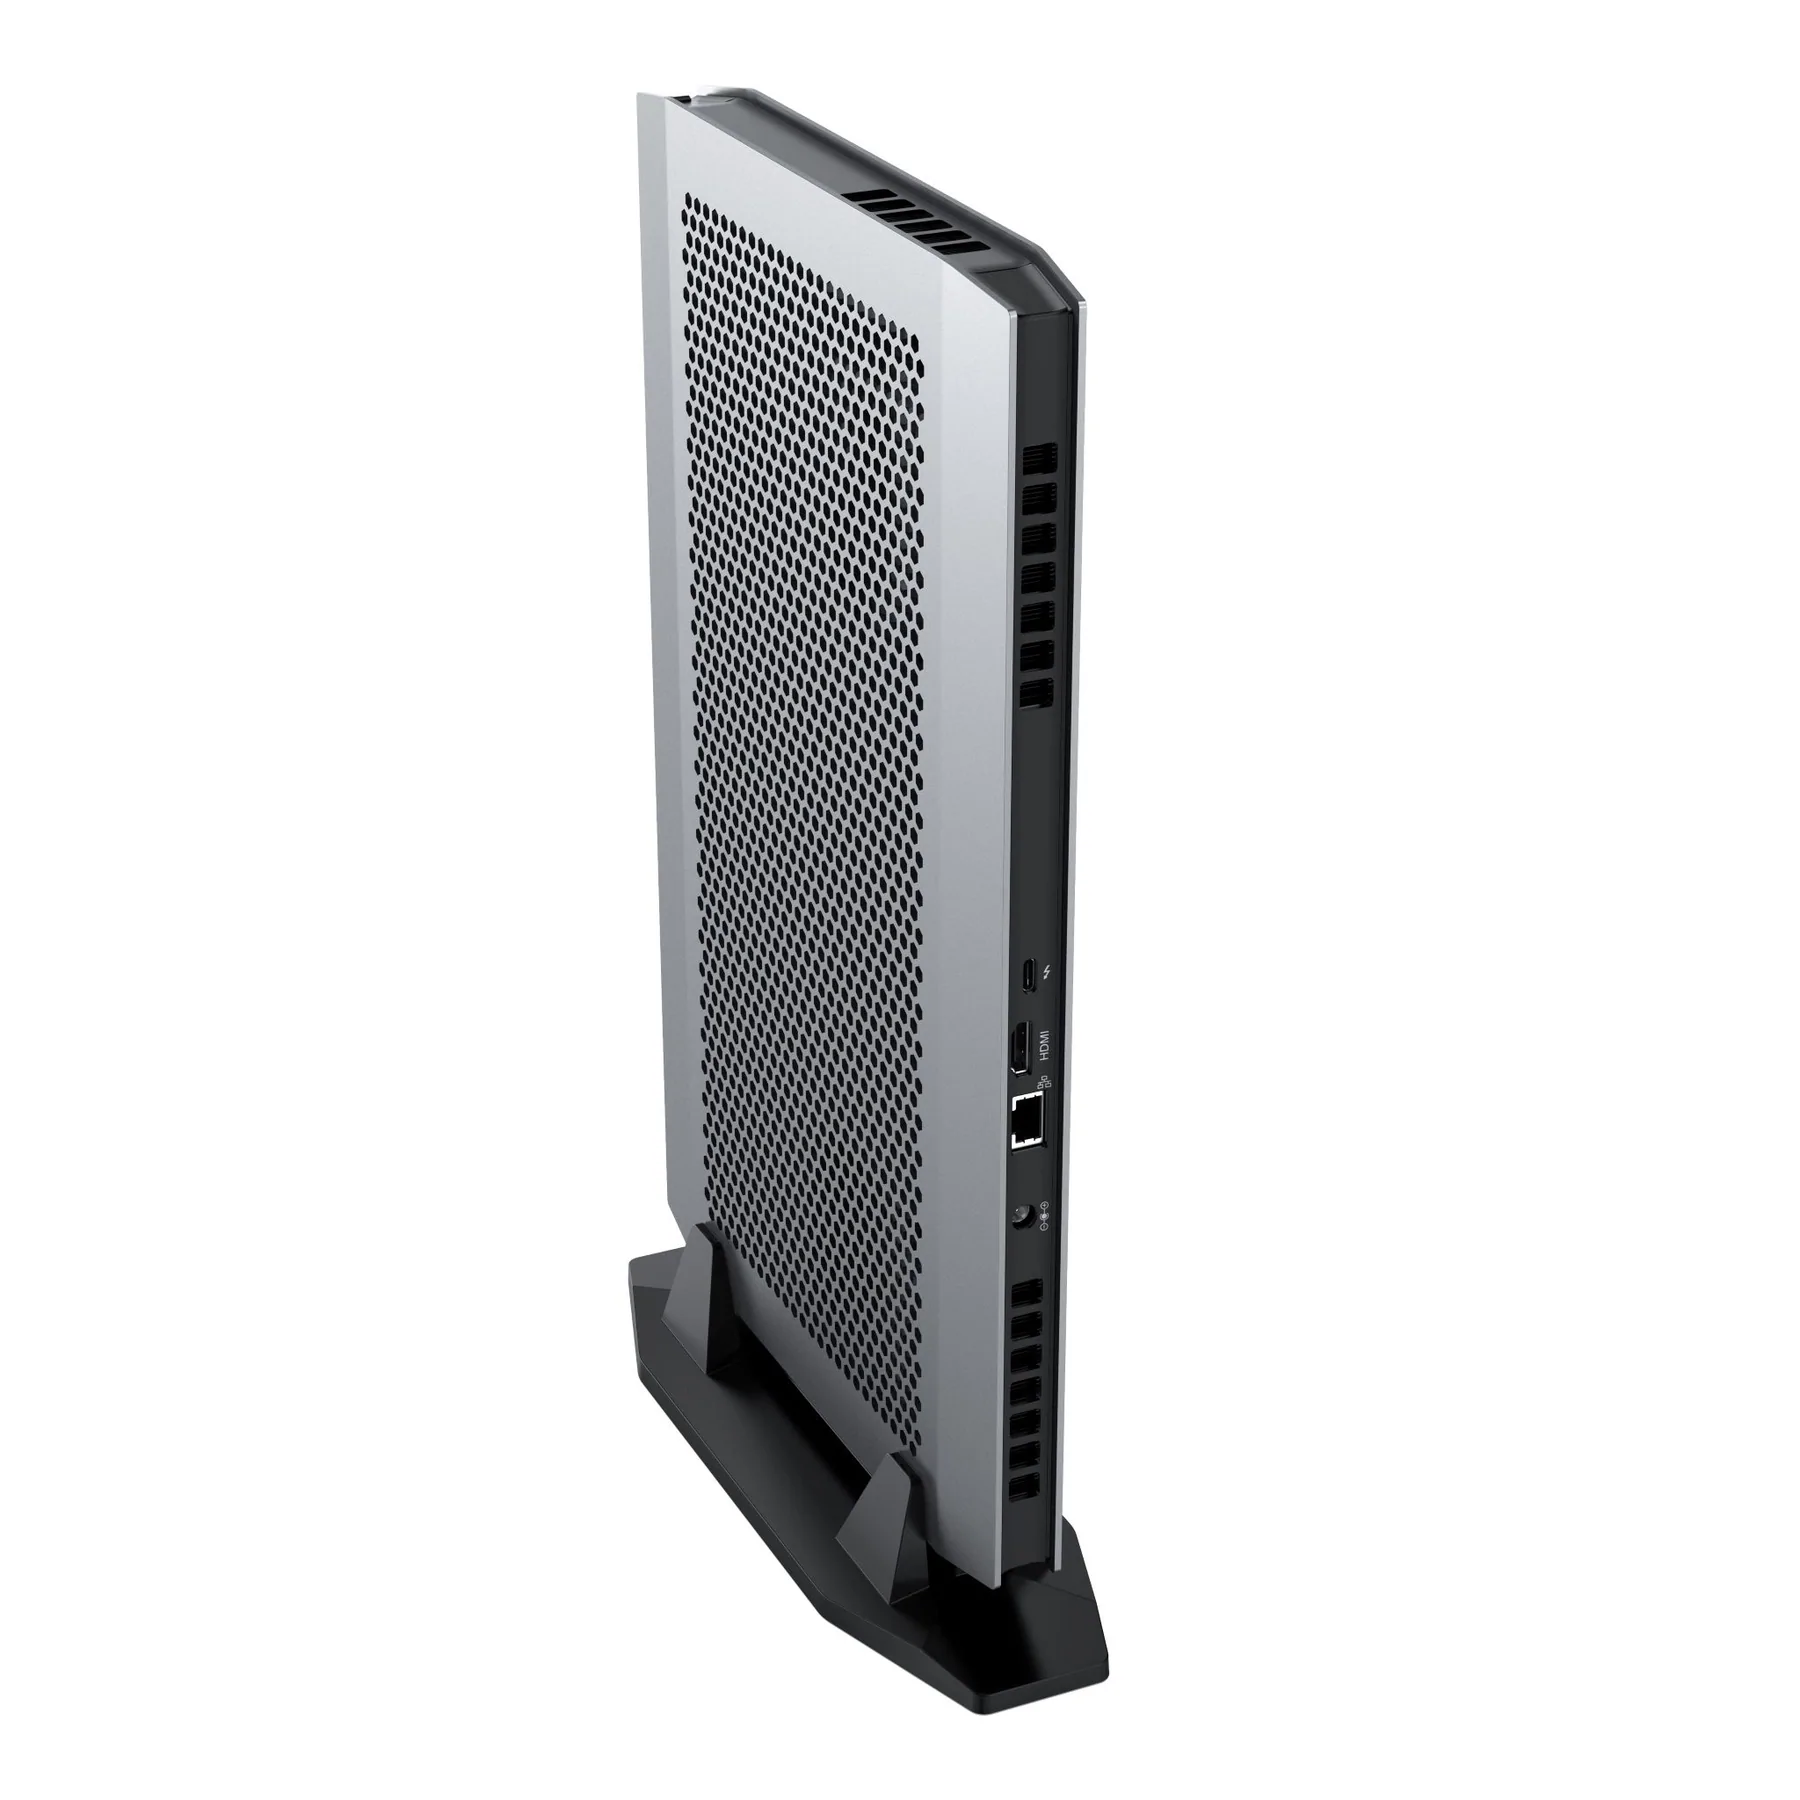
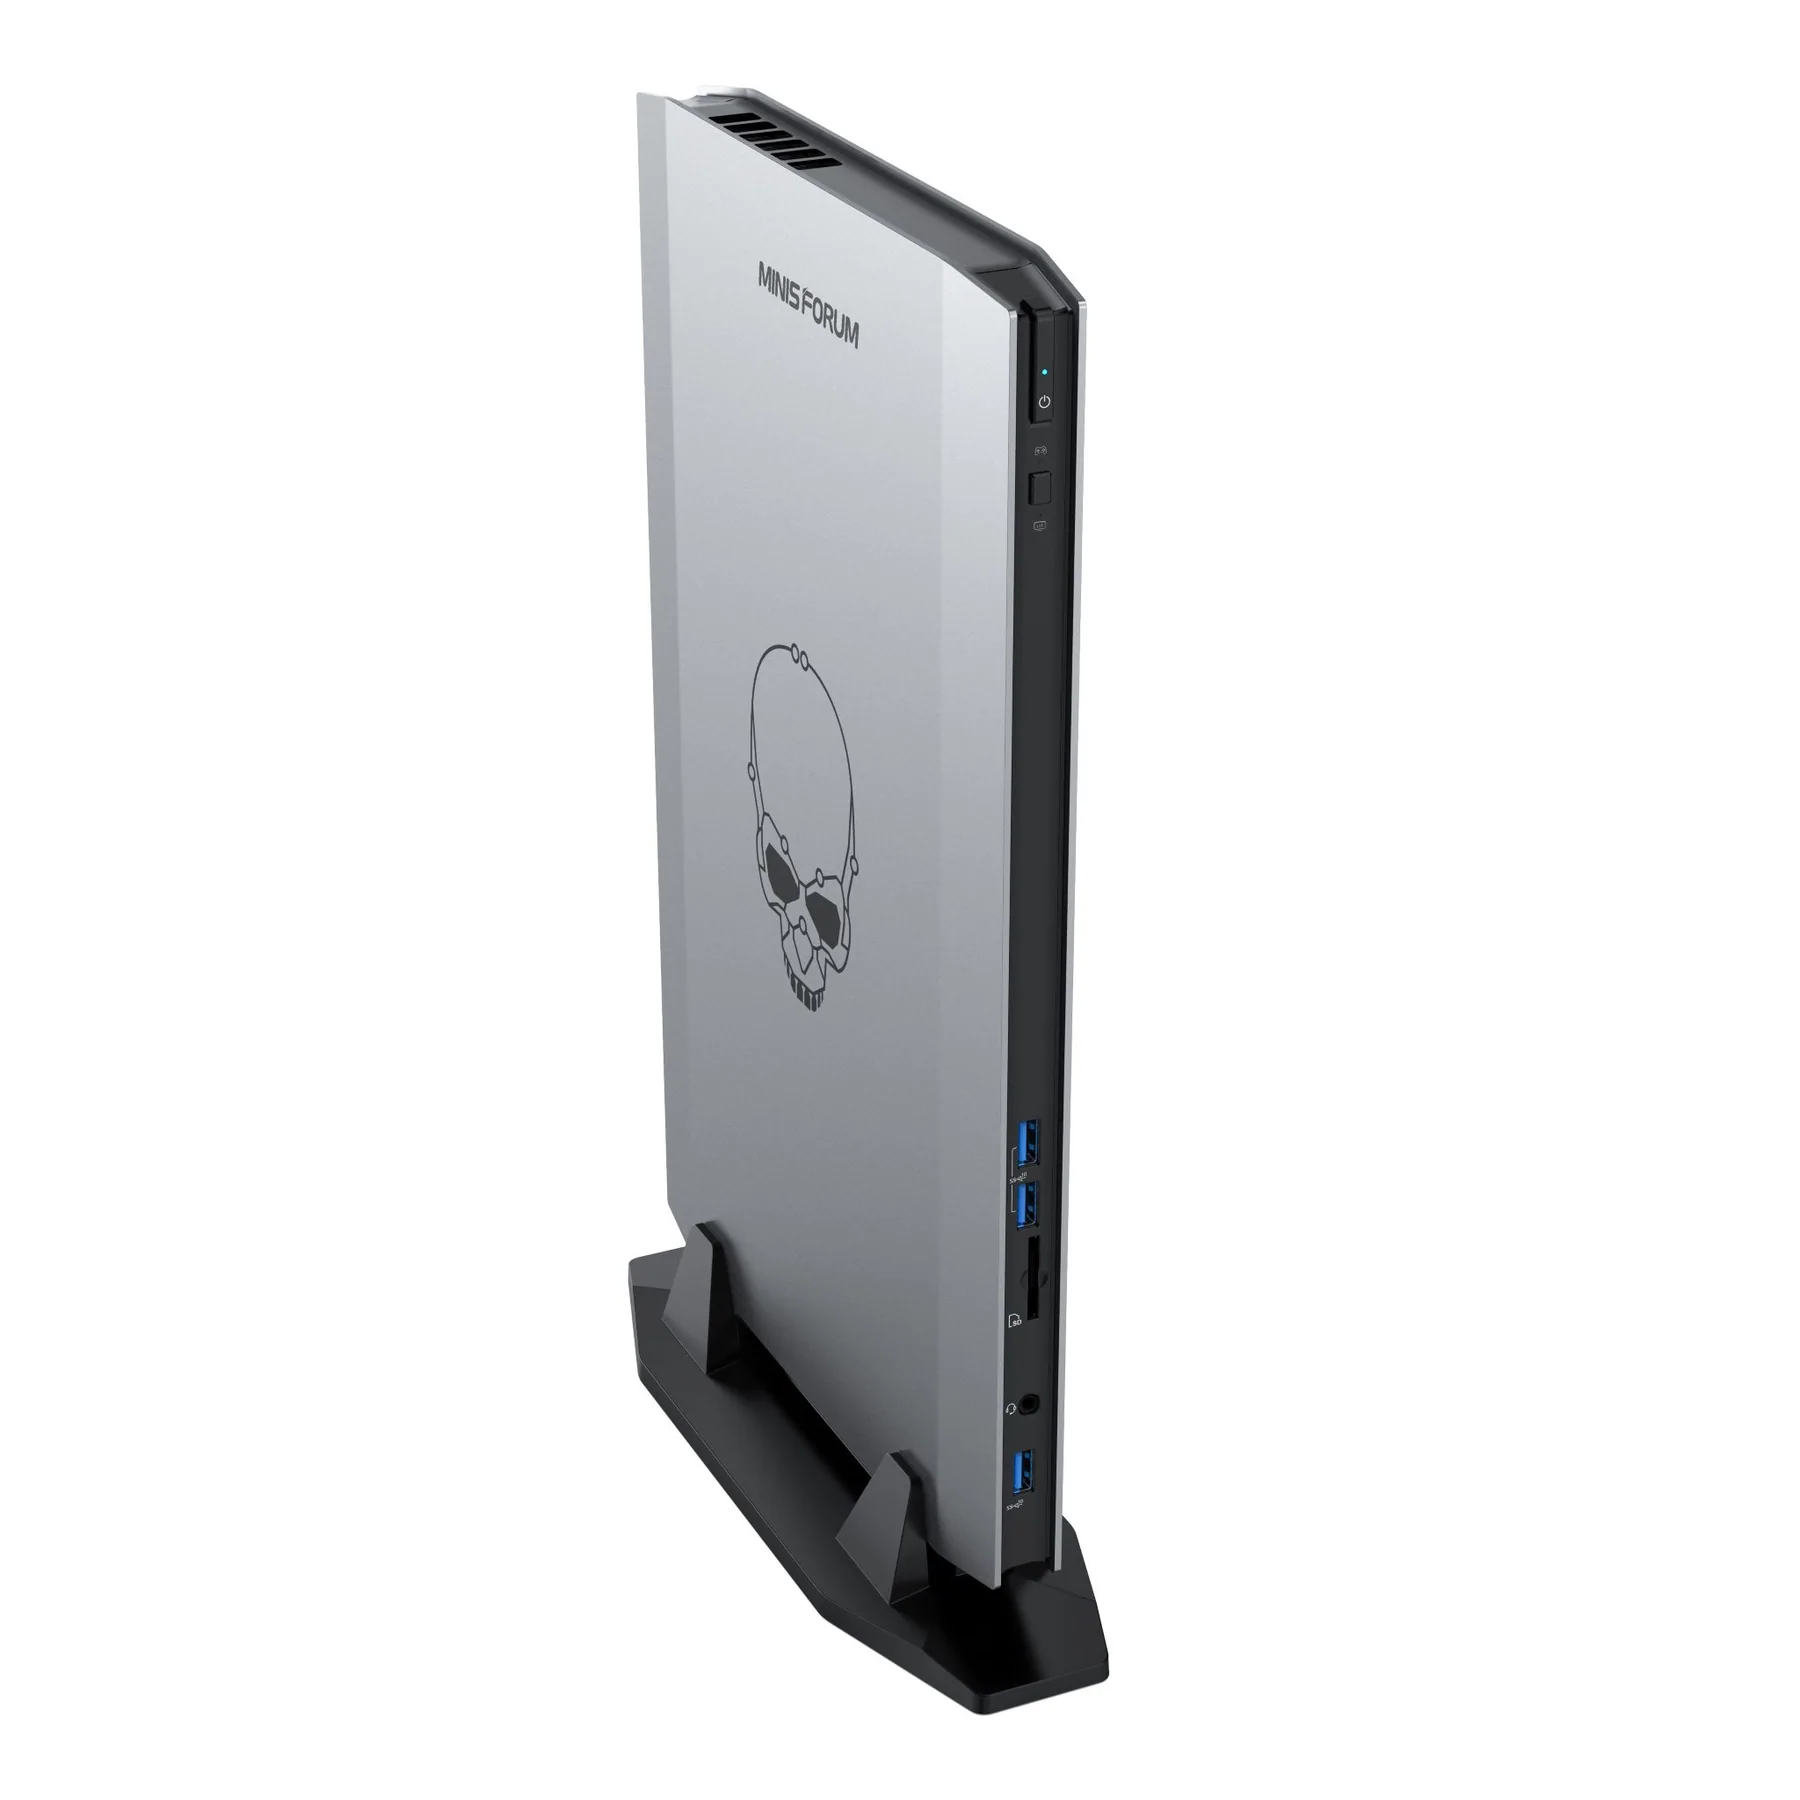
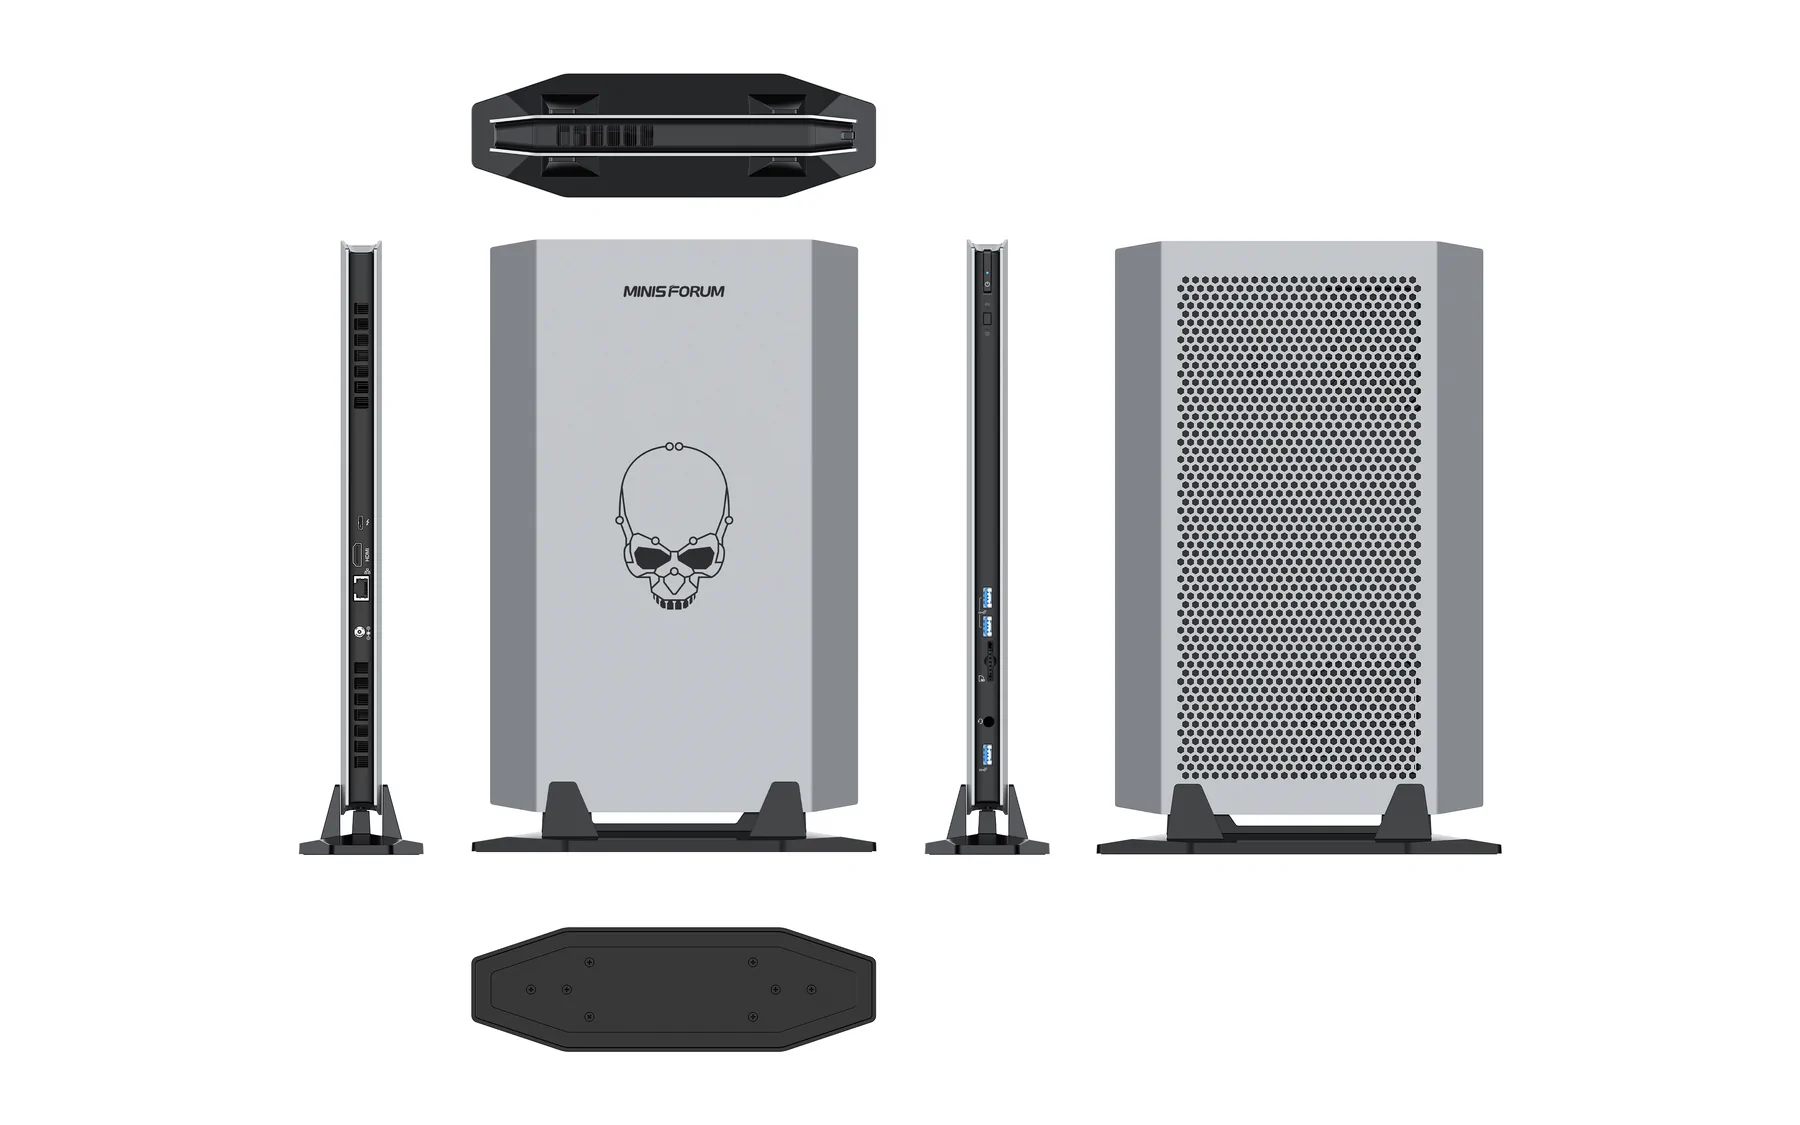
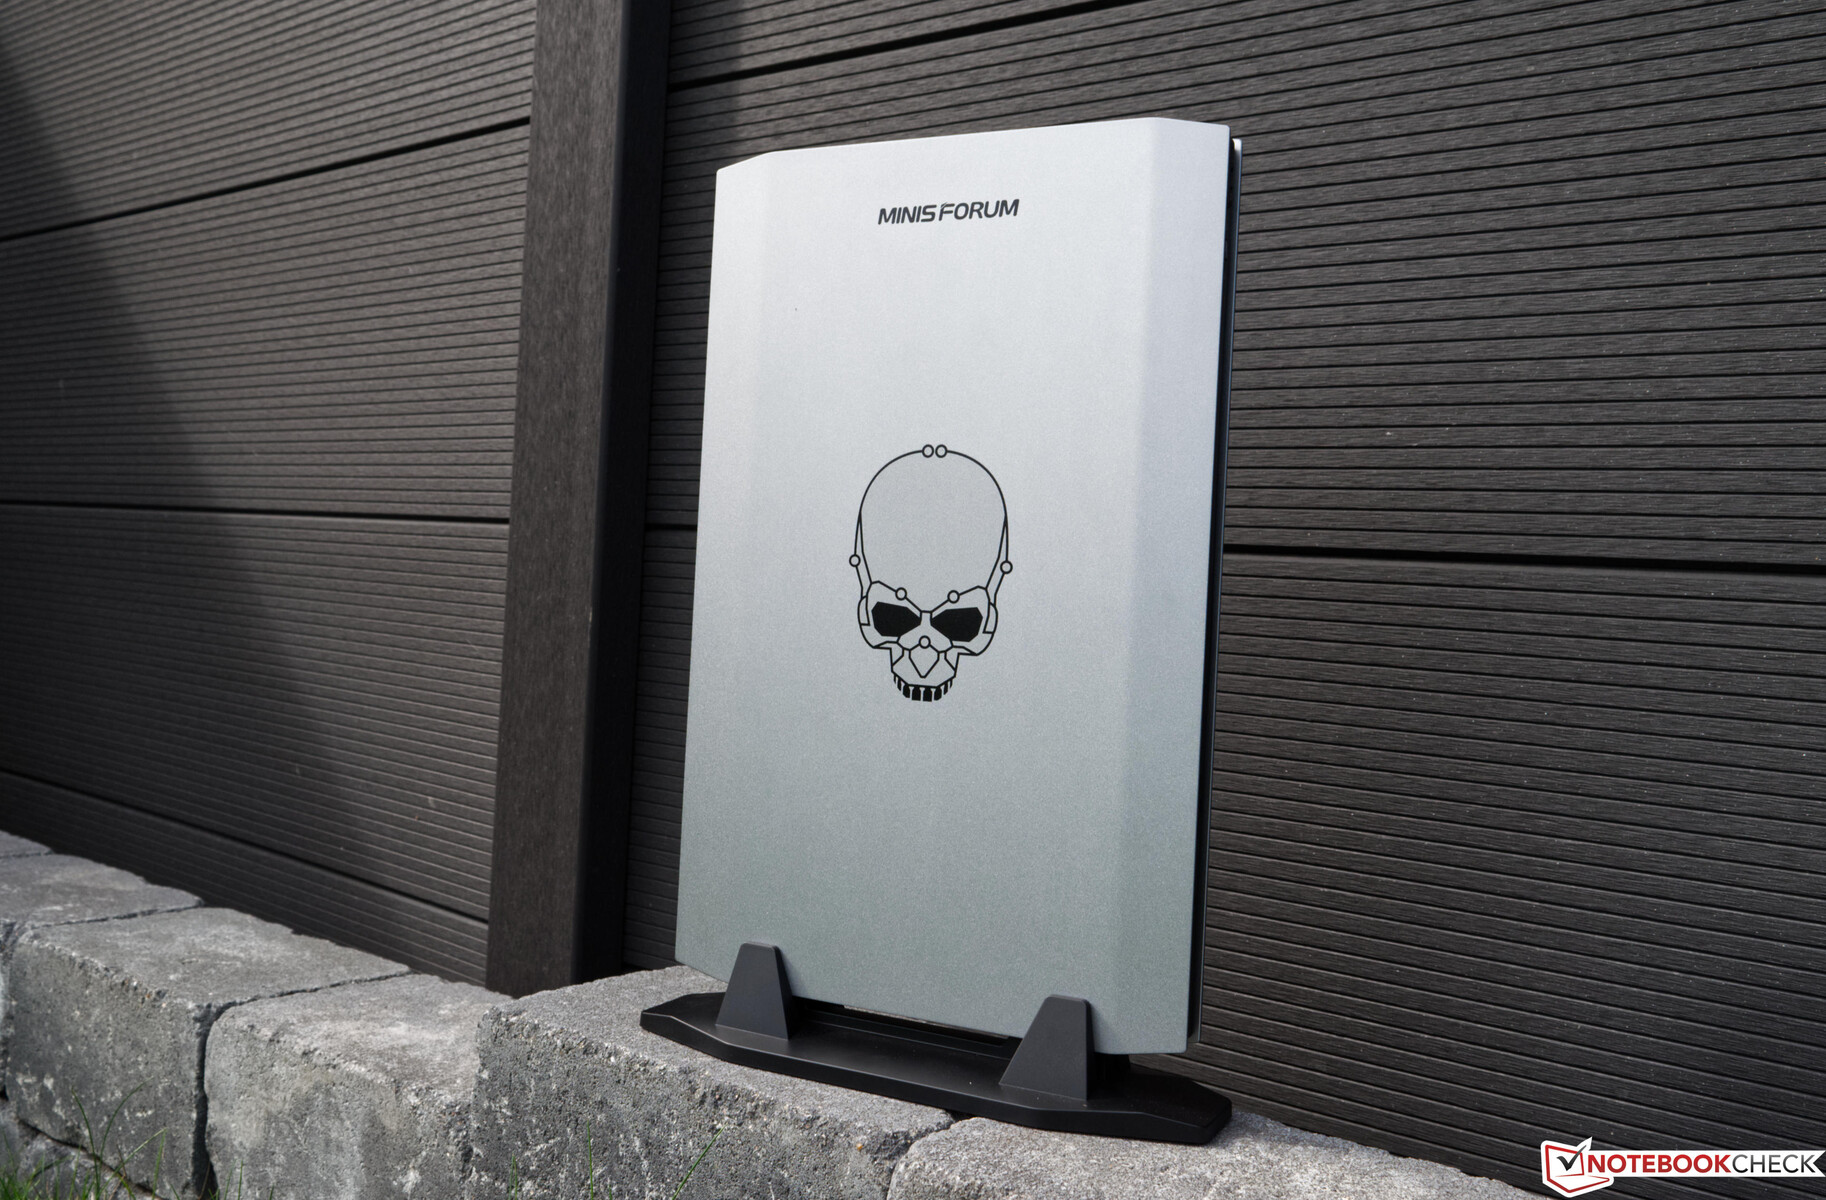
Der Minisforum NUCXi7 ist nicht klein und unserer Ansicht nach kein klassischer Mini-PC. Dennoch ist das Gerät sehr flach und erinnert an einen Laptop ohne Display und ohne Eingabegeräte. Das Gehäuse besteht zum Großteil aus Kunststoff, wirkt aber haptisch sehr hochwertig. Eine Aluminium-Base wäre vermutlich etwas schwerer, wenngleich das Gerät hierdurch deutlich an Wertigkeit dazugewinnen würde. Optisch ziert die linke Seite ein Totenkopf und lockert das sonst komplett silbernen Seitenteil etwas auf. Auf der Rückseite gibt es ein großflächiges Waben-Design, um eine gute Kühlung zu gewährleisten. Das Gerät wird auf einen stabilen Standfuß geschraubt und kann nur hochkant betrieben werden. Ein horizontaler Betrieb ist für den Minisforum NUCXi7 nicht vorgesehen und würde vermutlich auch die Kühleigenschaften deutlich verschlechtern.
Nur 2,4 Kilogramm bringt der Minisforum NUCXi7 inklusive Standfuß auf die Waage und ist damit sehr leicht. Das Eigengewicht des Standfußes sorgt unterdessen für einen sicheren Stand. Für das externe Netzteil muss man noch einmal etwa 0,5 Kilogramm einkalkulieren.
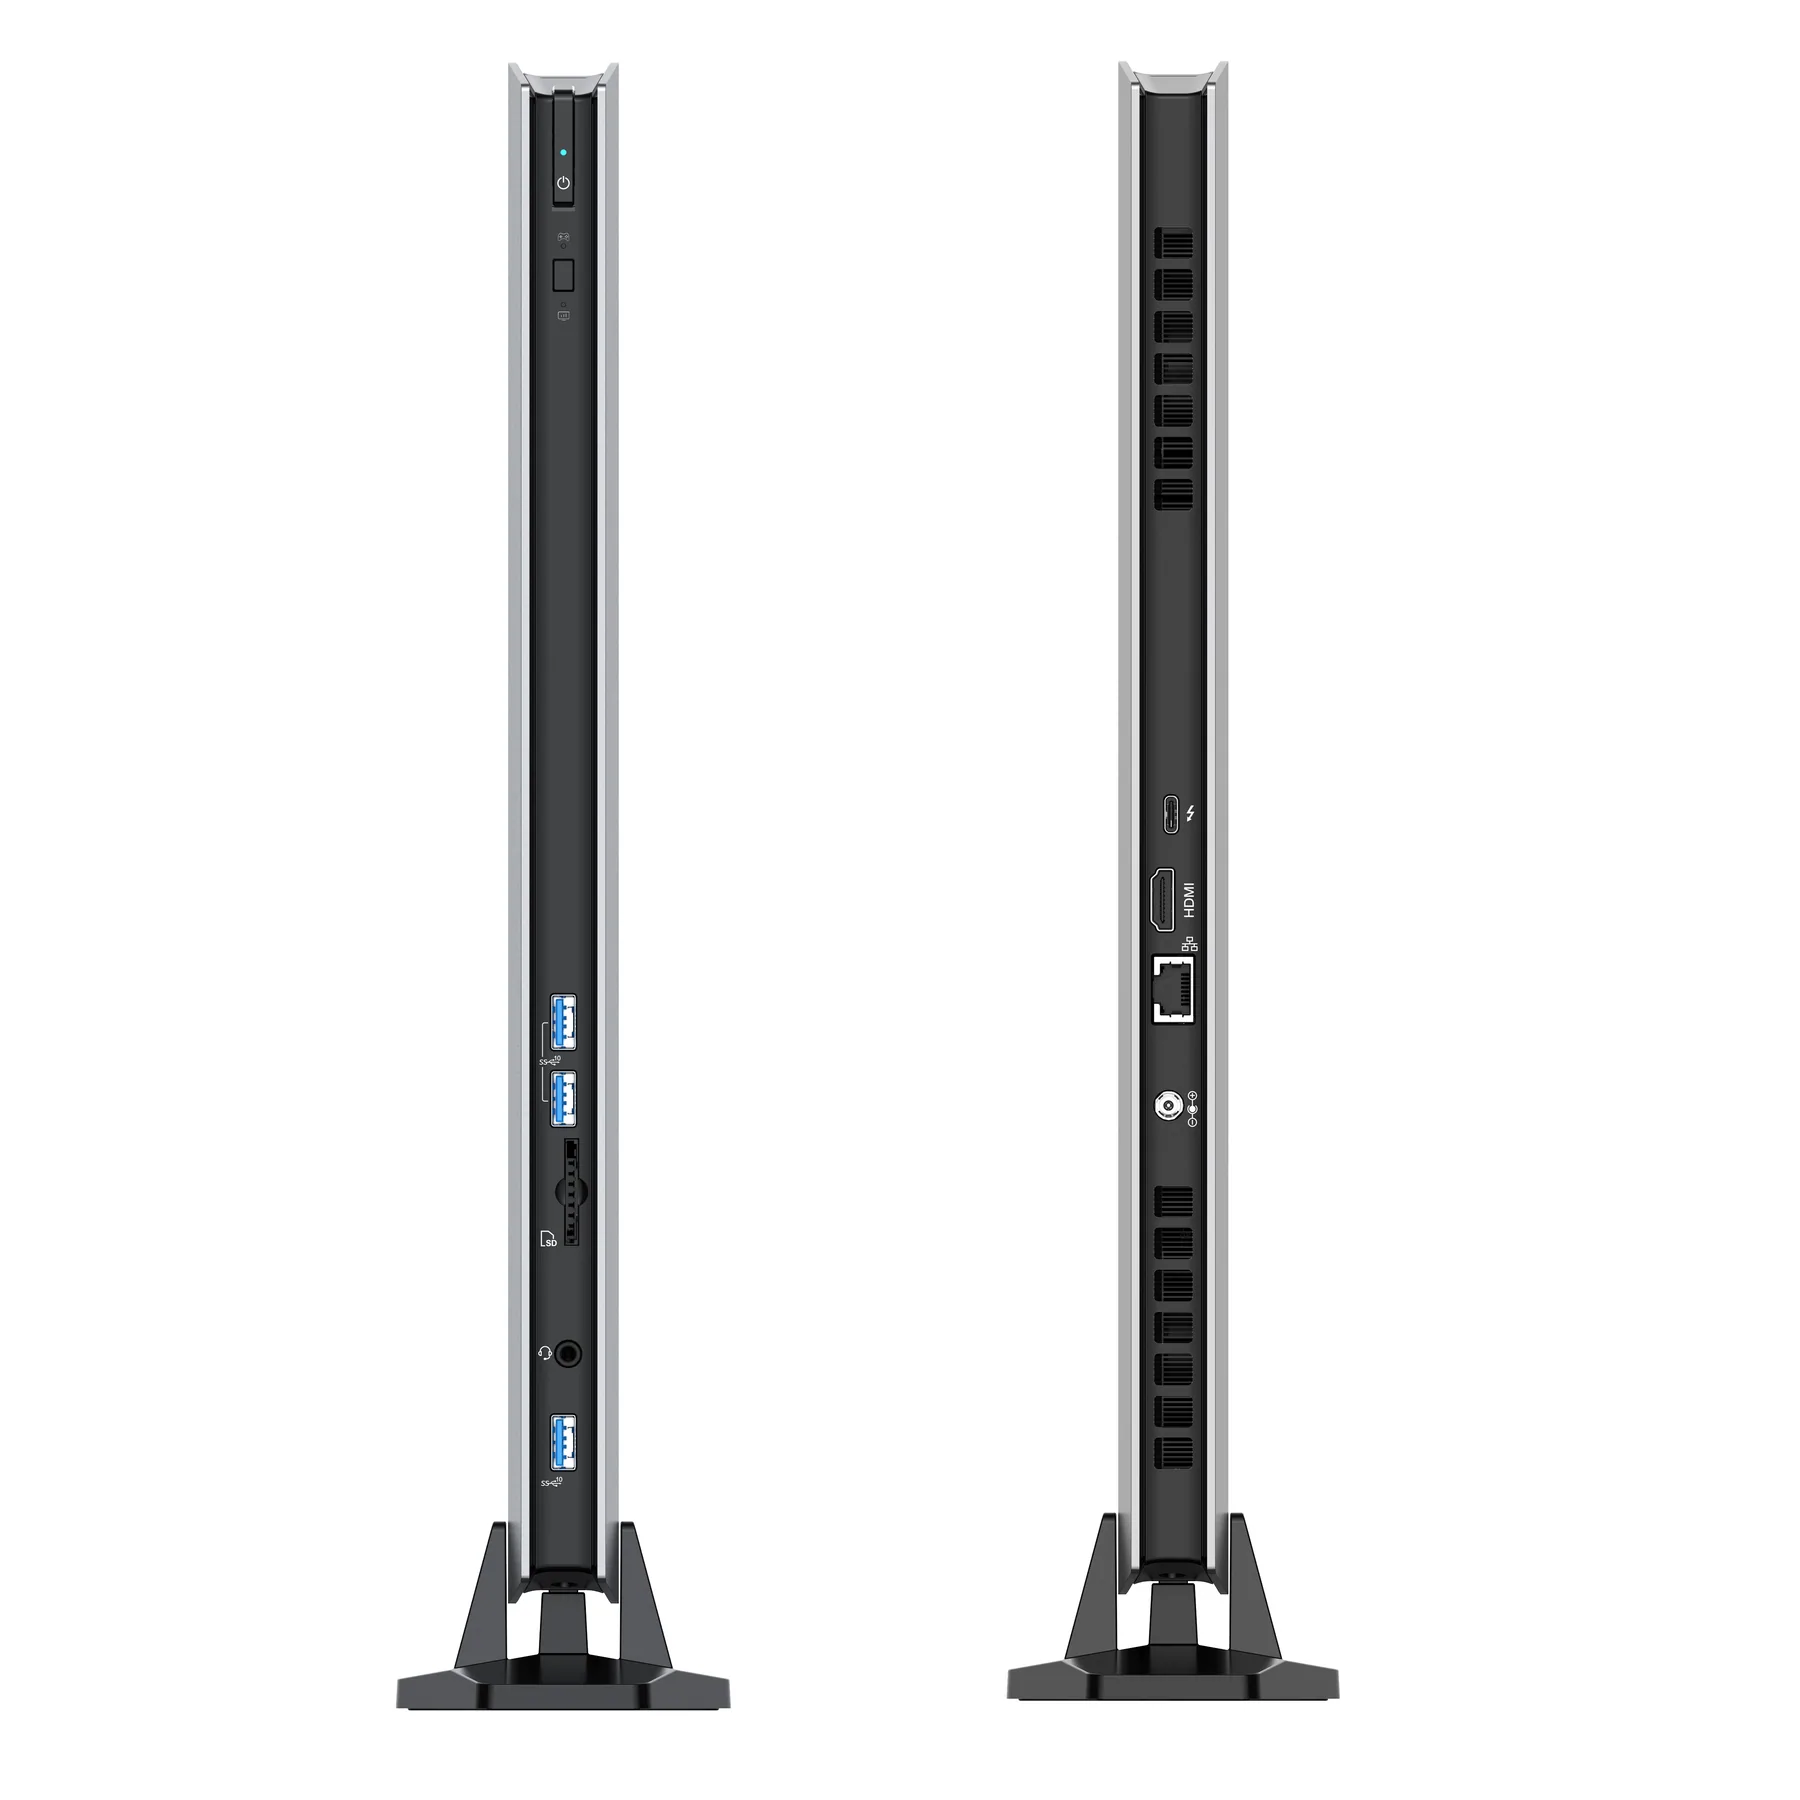
Ausstattung
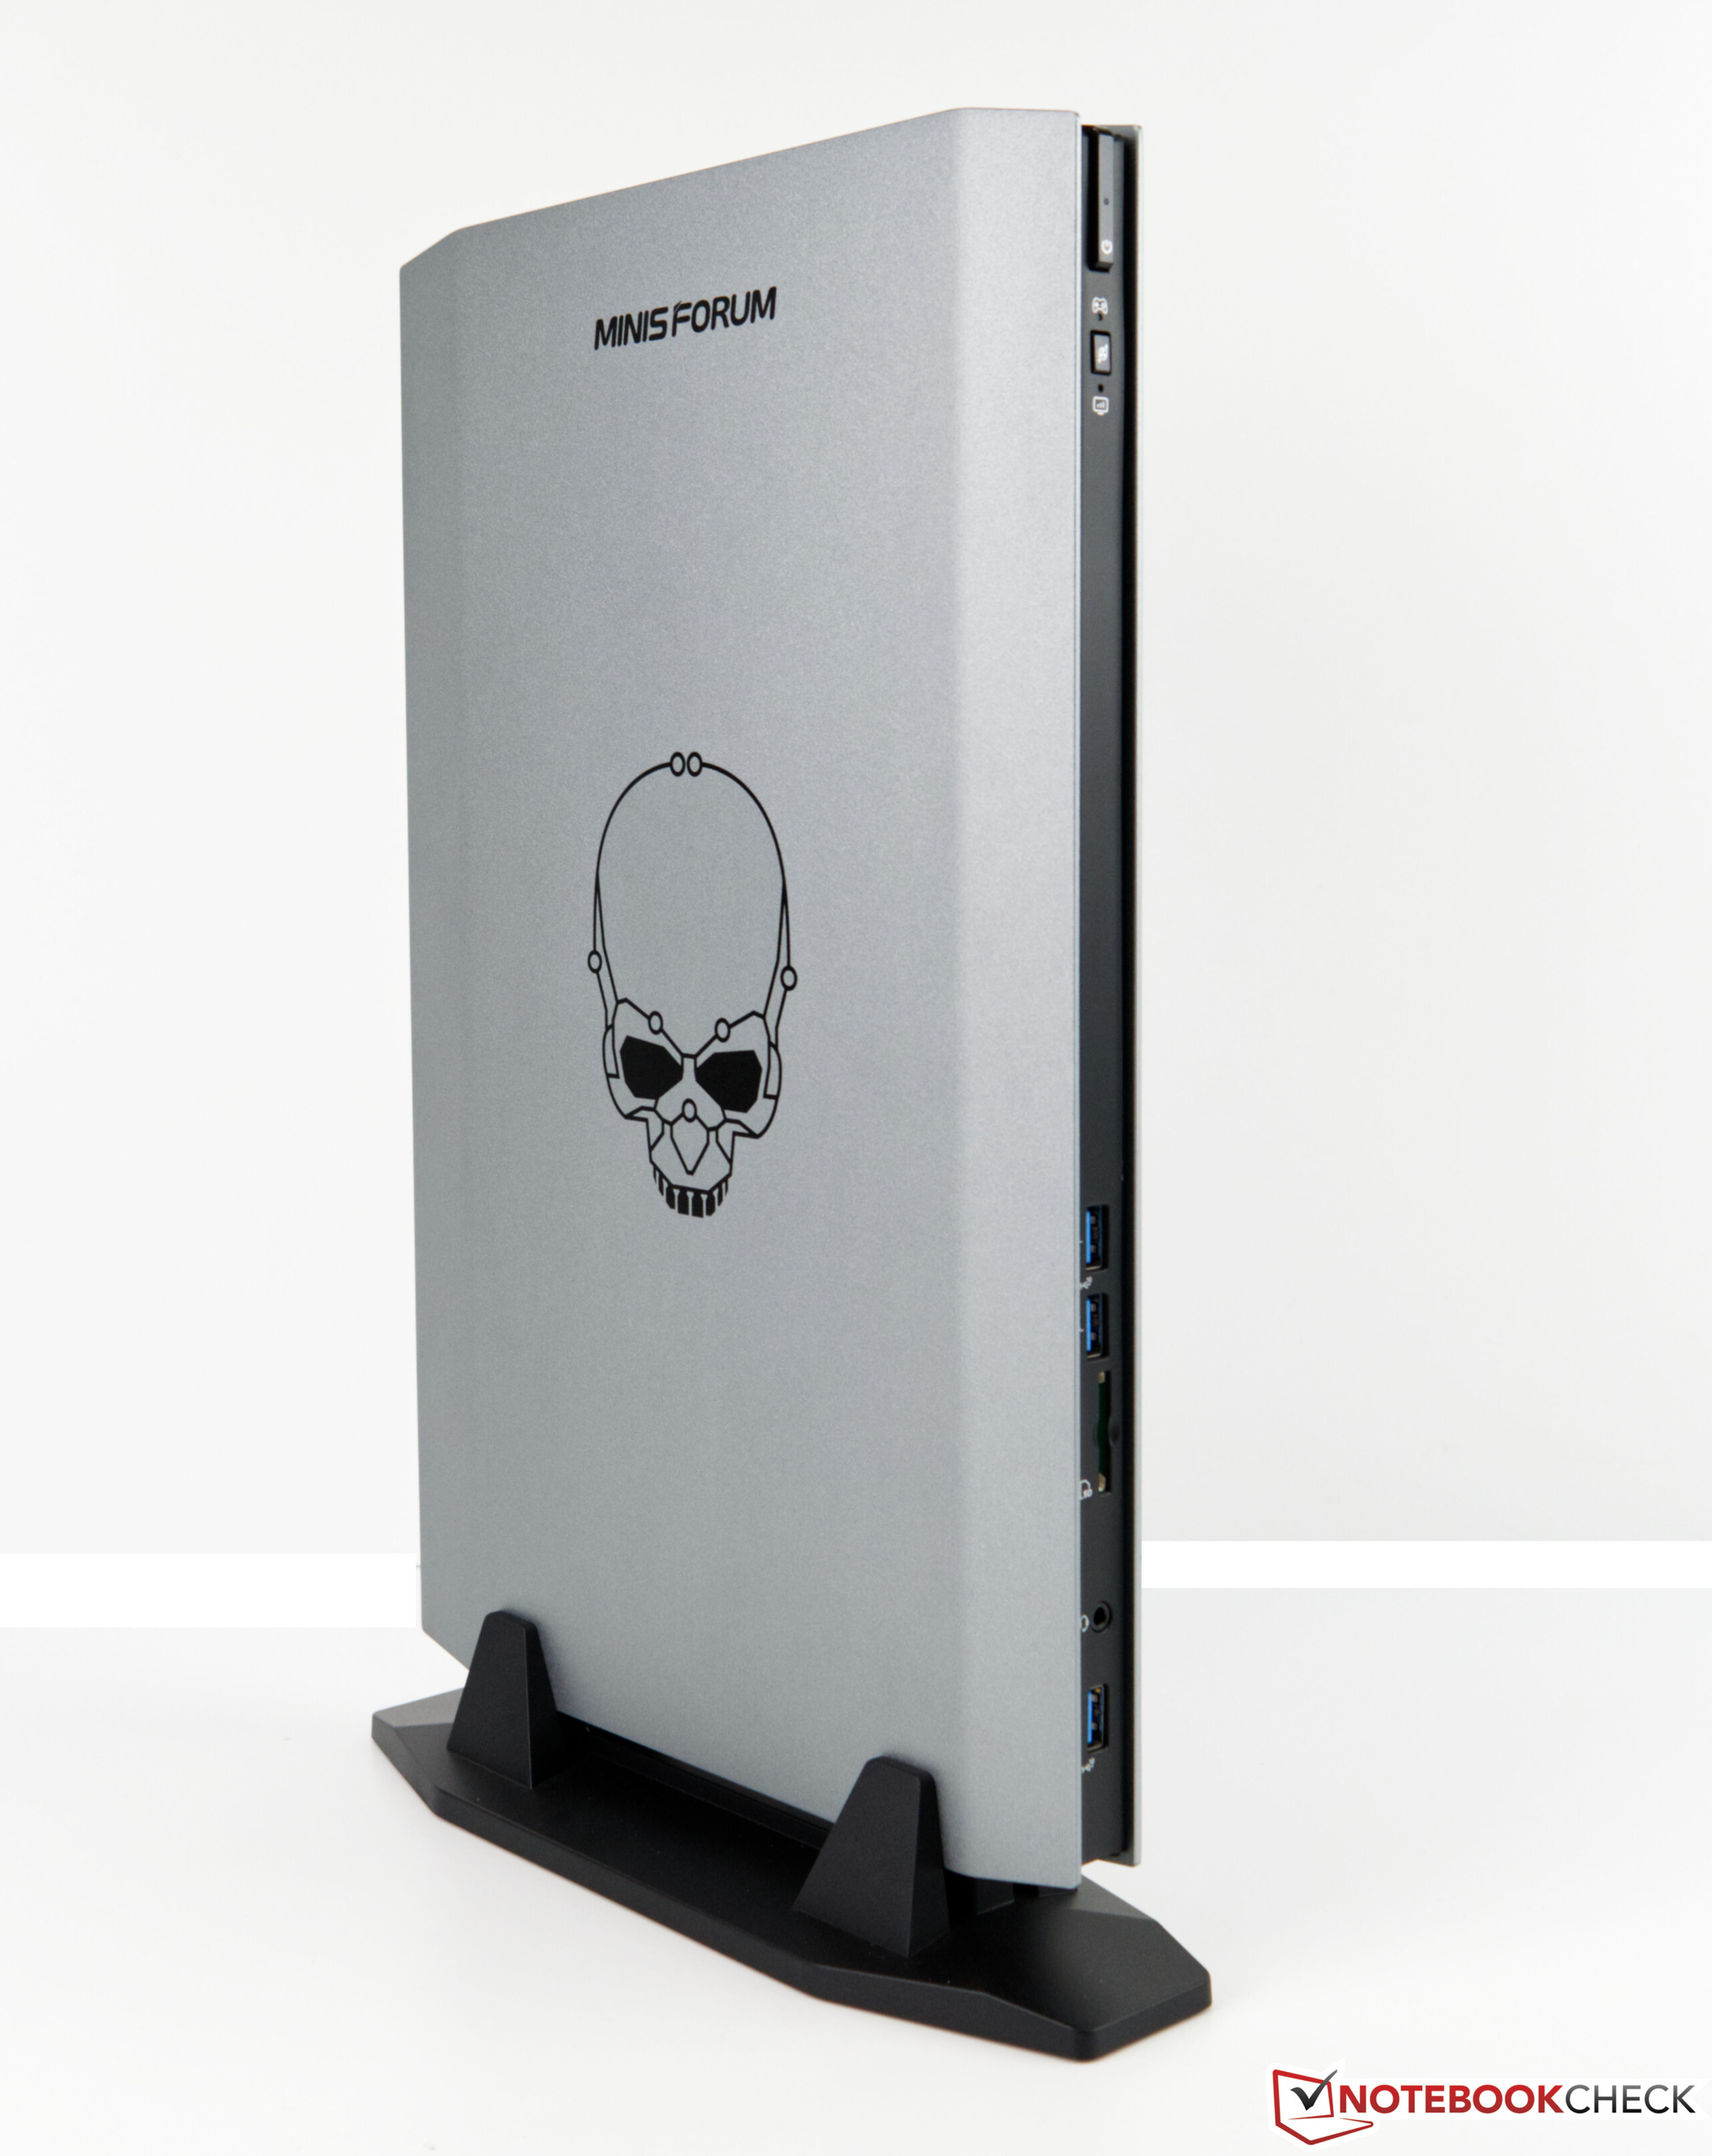
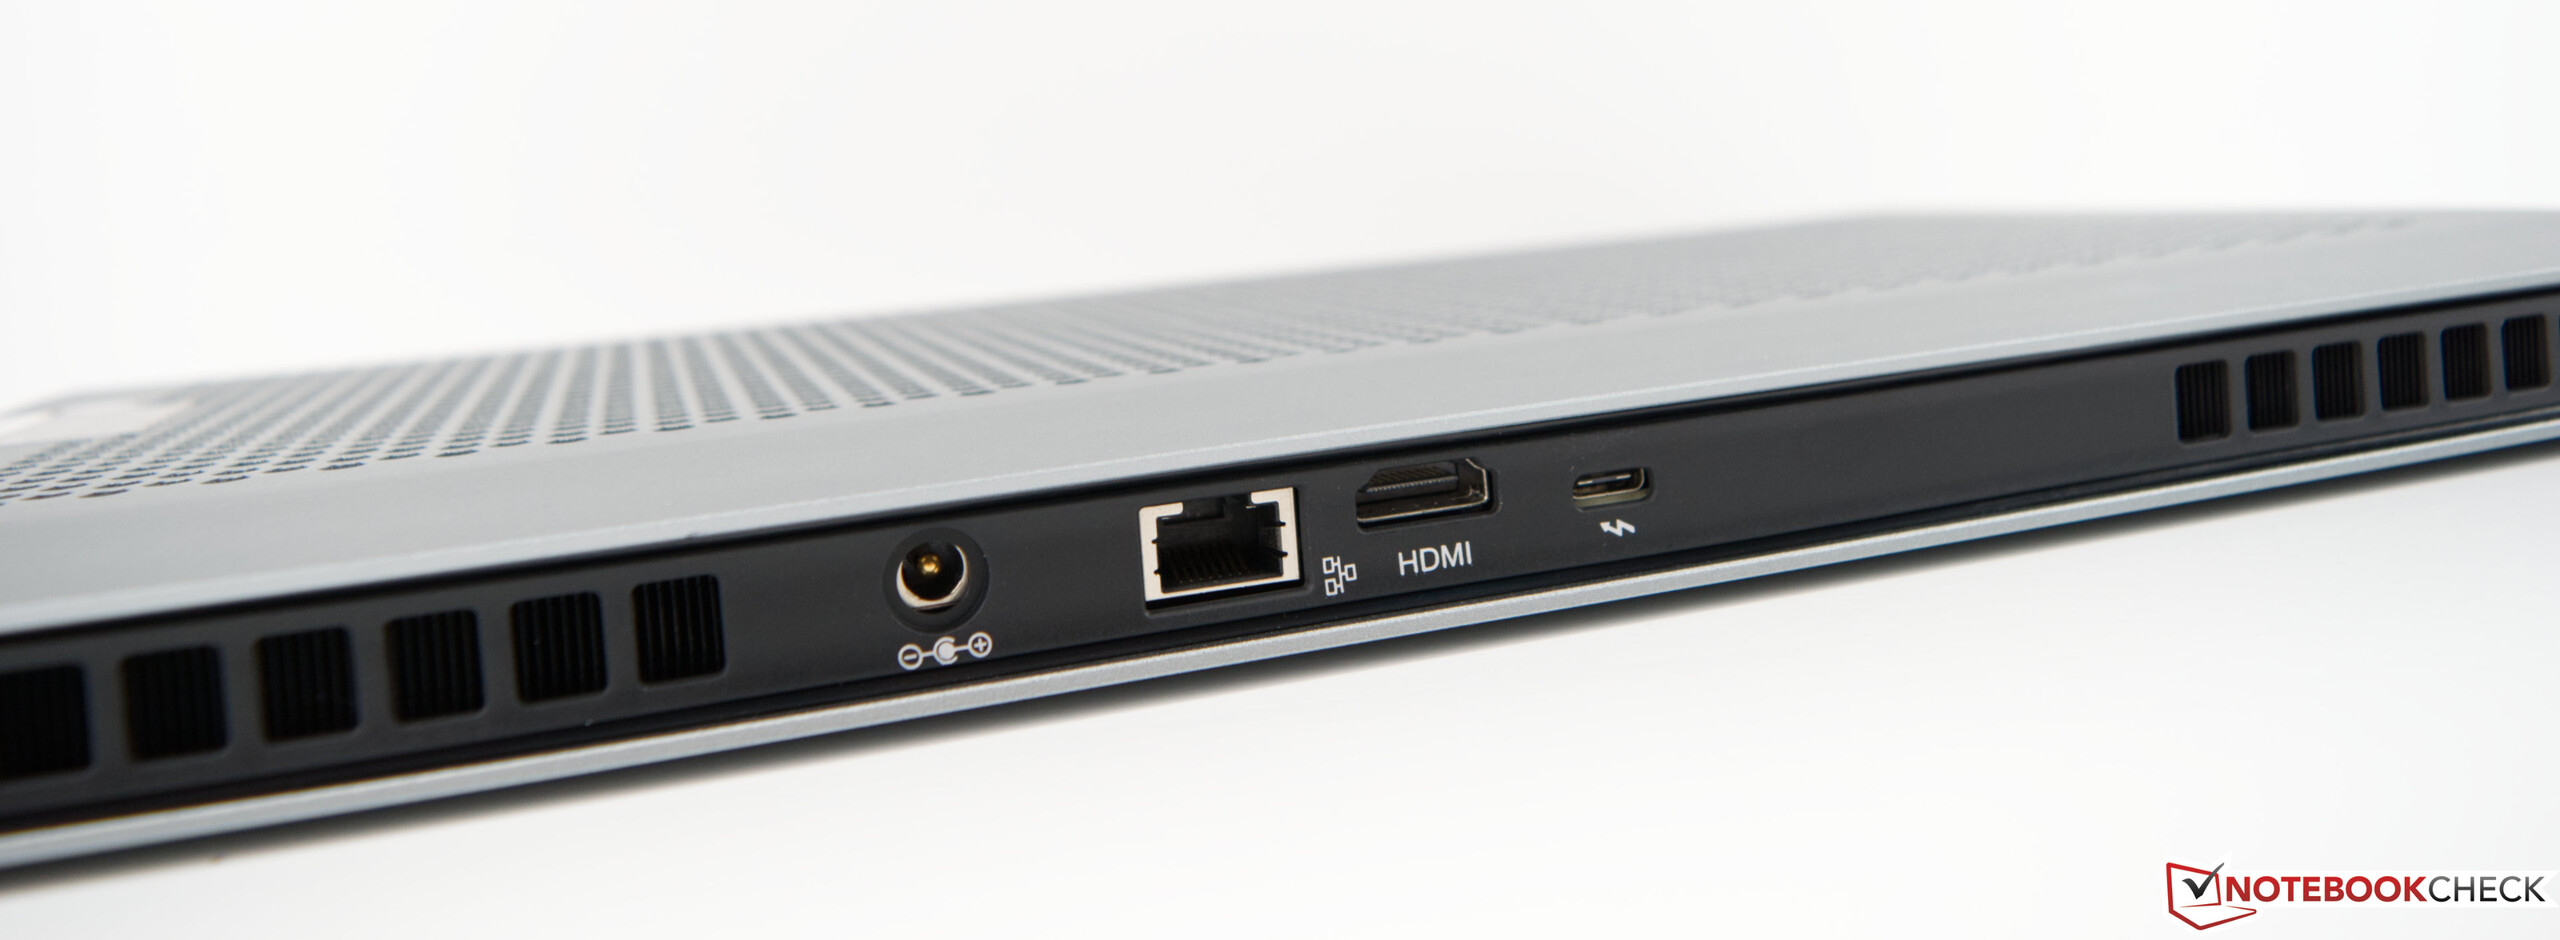
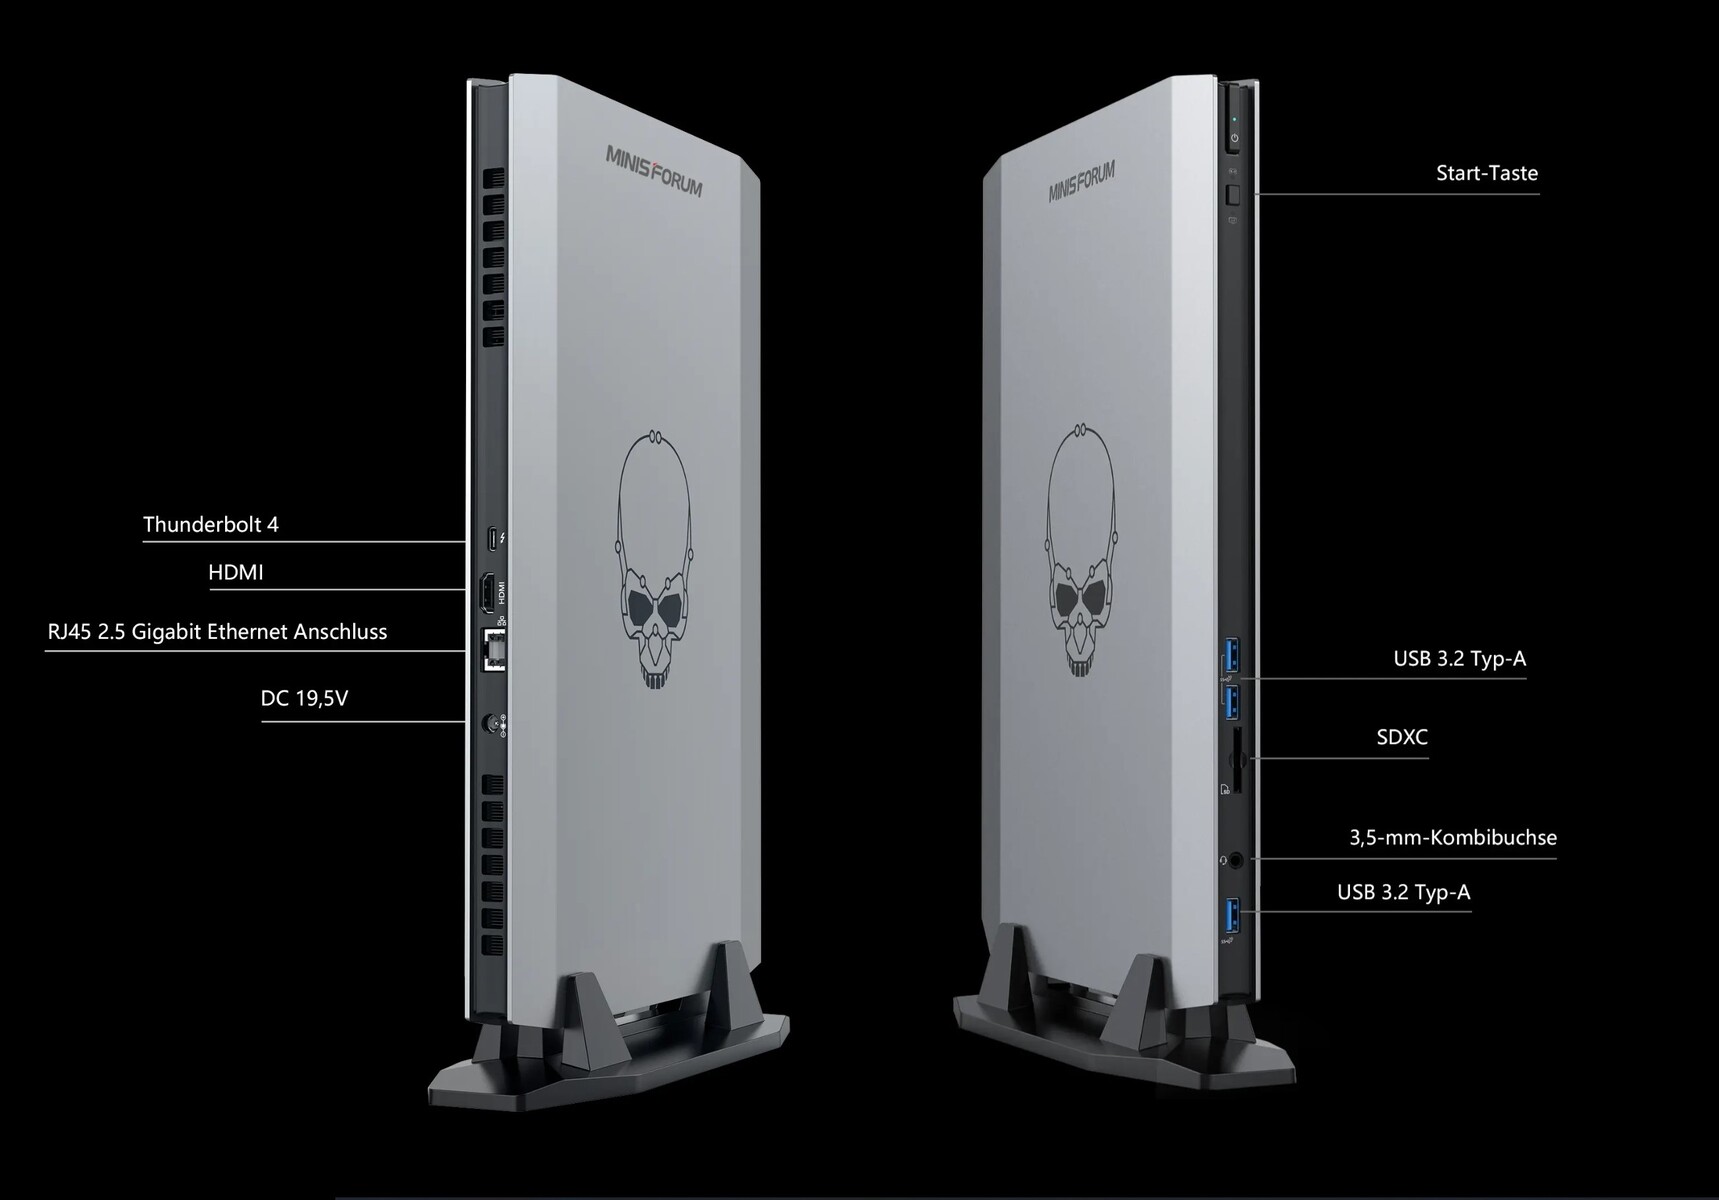
Bei den vorhandenen Anschlüssen ist auf den ersten Blick alles Wichtige vorhanden. Auch eine moderne Thunderbolt-Schnittstelle ist mit dabei. Gleichwohl kann man sich aber über die Anzahl der USB-3.2-Typ-A-Ports streiten. Nur drei von diesen befinden sich am Gerät und sind allesamt an der Vorderseite angebracht. Hier hätten wir uns wenigstens noch einen zusätzlichen Anschluss auf der Rückseite gewünscht. Leider ist der Hersteller hier jedoch an das Mainboard-Layout gebunden, welches das Unterfangen etwas schwieriger gestaltet. Bildschirme können über HDMI oder Thunderbolt angesprochen werden. Beide Optionen funktionierten im Test problemlos. Auf einen SD-Kartenleser muss übrigens nicht verzichtet werden.
SD CardReader
Der Minisforum NUCXi7 ist mit einem SD-Kartenleser ausgerüstet, welcher mit USB-3-Geschwindigkeit arbeitet. Angesichts der 76 MB/s bestätigt sich die USB-3-Geschwindigkeit auch in unserem Test, den wir mit unserer Referenzkarte (Angelbird AV Pro V60) mit UHS-II-Anbindung durchgeführt haben. Die Leistung ist aber dennoch schlechter als im Klassendurchschnitt.
| SD Card Reader - average JPG Copy Test (av. of 3 runs) | |
| Asus ROG Zephyrus Duo 16 GX650RX (AV PRO microSD 128 GB V60) | |
| Razer Blade 17 Early 2022 (AV PRO microSD 128 GB V60) | |
| Minisforum NUCX i7 (AV Pro SD microSD 128 GB V60) | |
| MSI Titan GT77 12UHS (AV PRO microSD 128 GB V60) | |
| Acer Predator Triton 500 SE PT516-52s-70KX (AV PRO microSD 128 GB V60) | |
| MSI Raider GE77 HX 12UHS (AV PRO microSD 128 GB V60) | |
Kommunikation
Minisforum verbaut im NUCXi7 ein Intel-Wi-Fi-6E-AX210-Modul. Im Test konnten wir mit unserem Testrouter ASUS ROG Rapture GT-AXE11000 nicht die gute Leistung der Vergleichsgeräte erreichen. Mit einem deutlichen Abstand rangiert der Minisforum NUCXi7 auf den hinteren Plätzen hier im Vergleich. Der integrierte LAN-Port ist eine gute Alternative zur Funkverbindung und unterstützt bis zu 2,5 GBit/s.
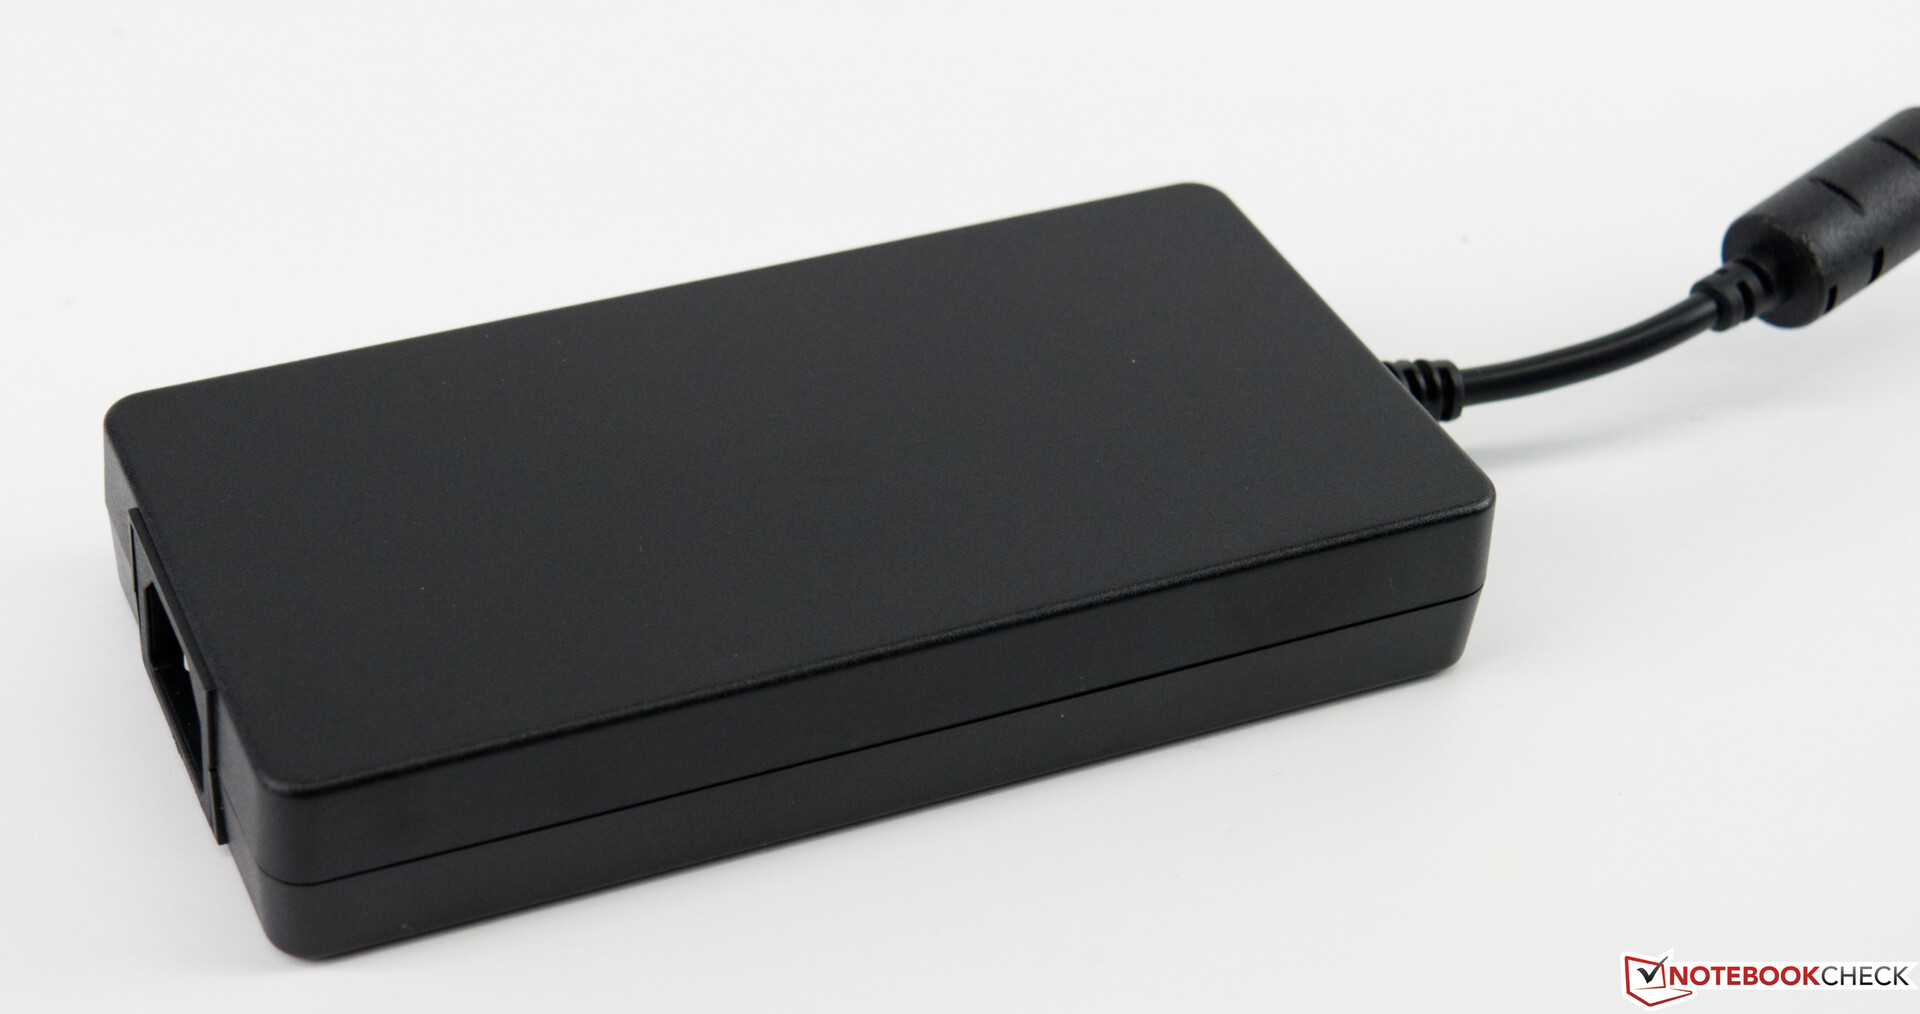
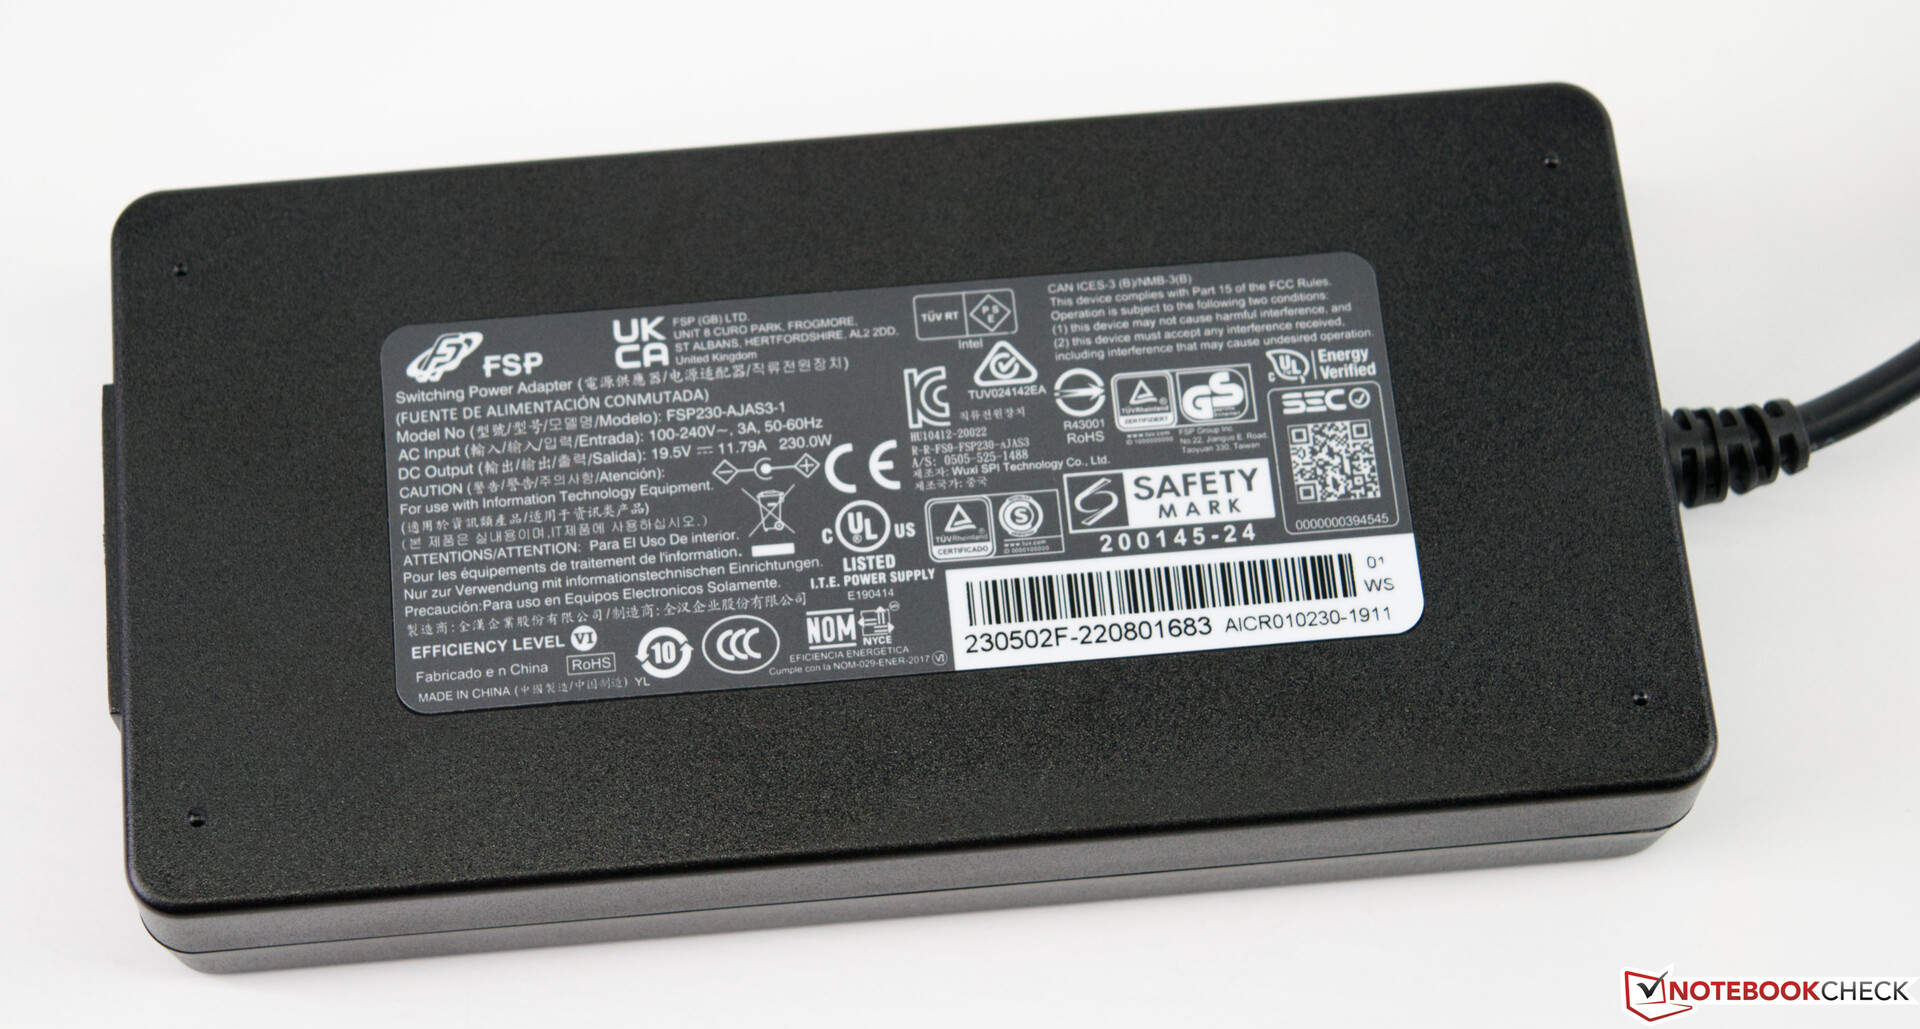
Zubehör
Zum Lieferumfang gehört nebst dem Gerät noch das 230-Watt-Netzteil sowie der Standfuß, um das Gerät horizontal aufzustellen.
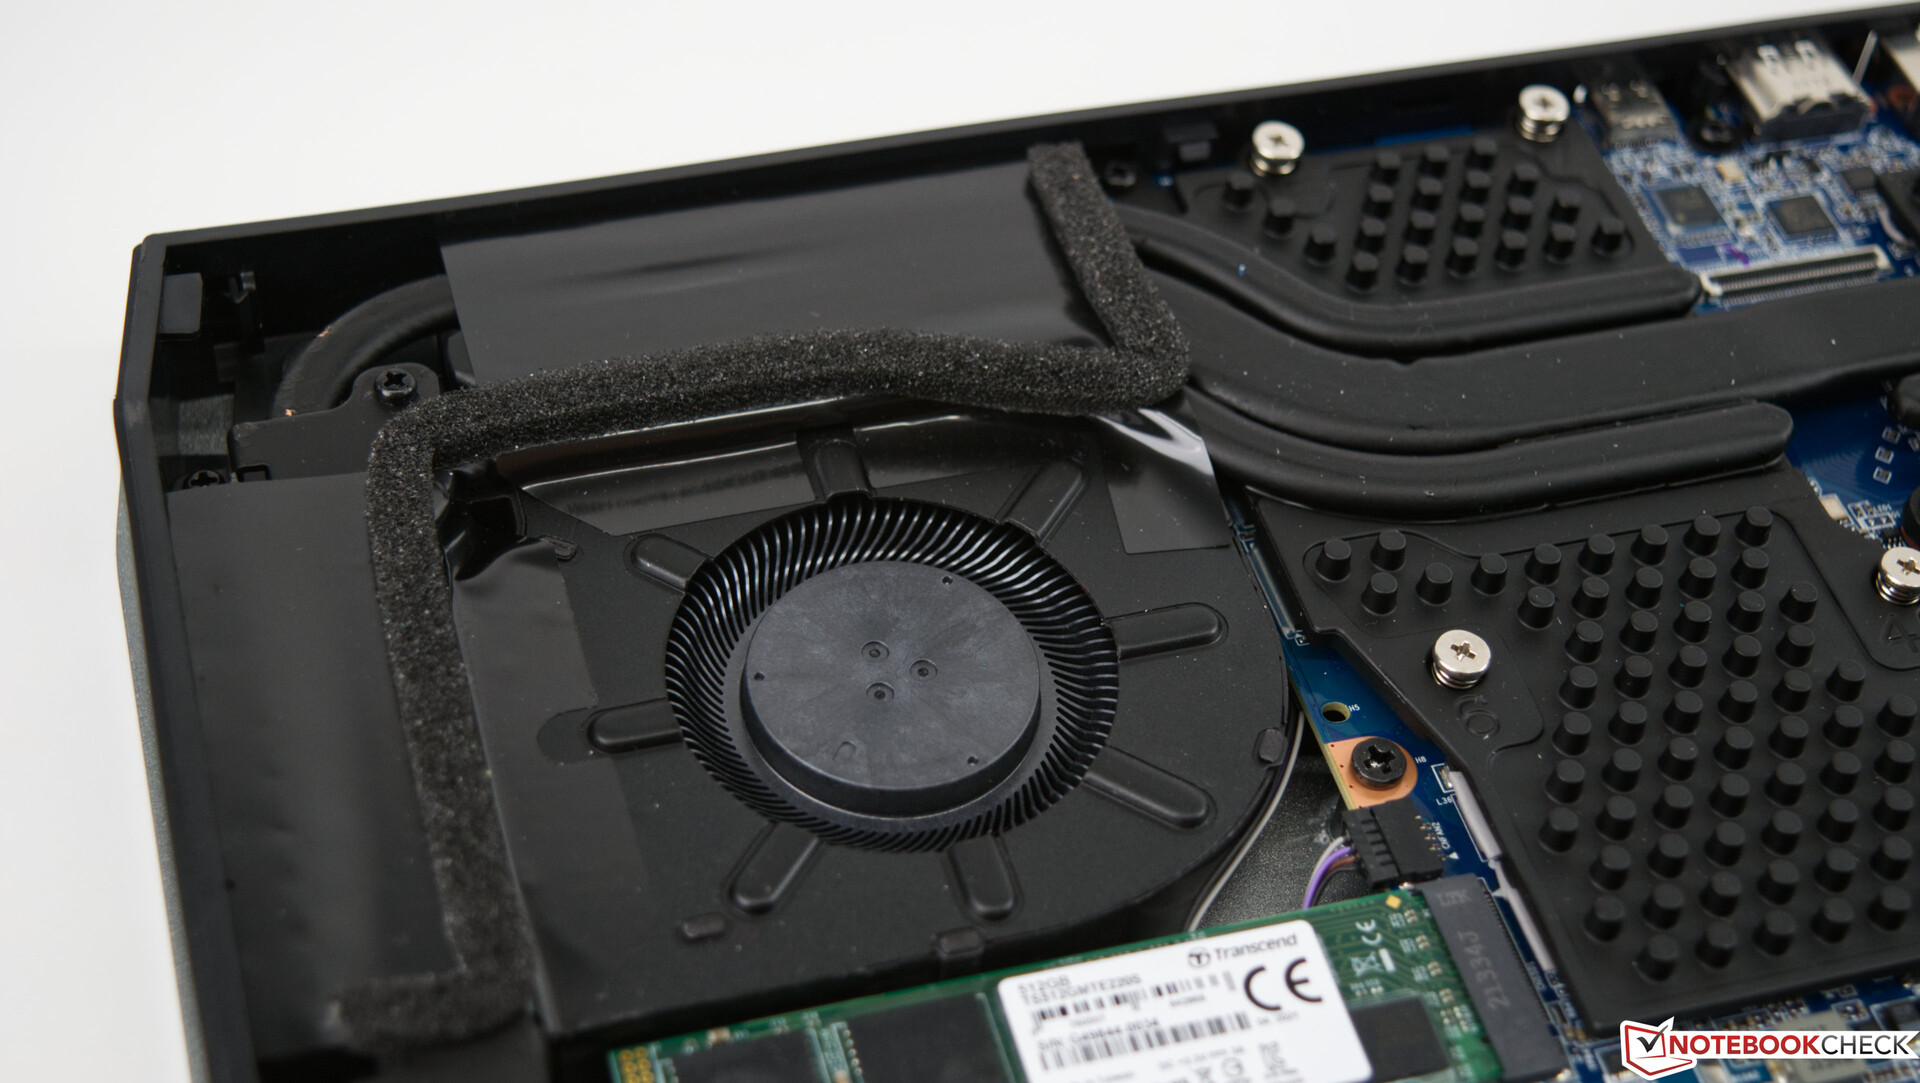
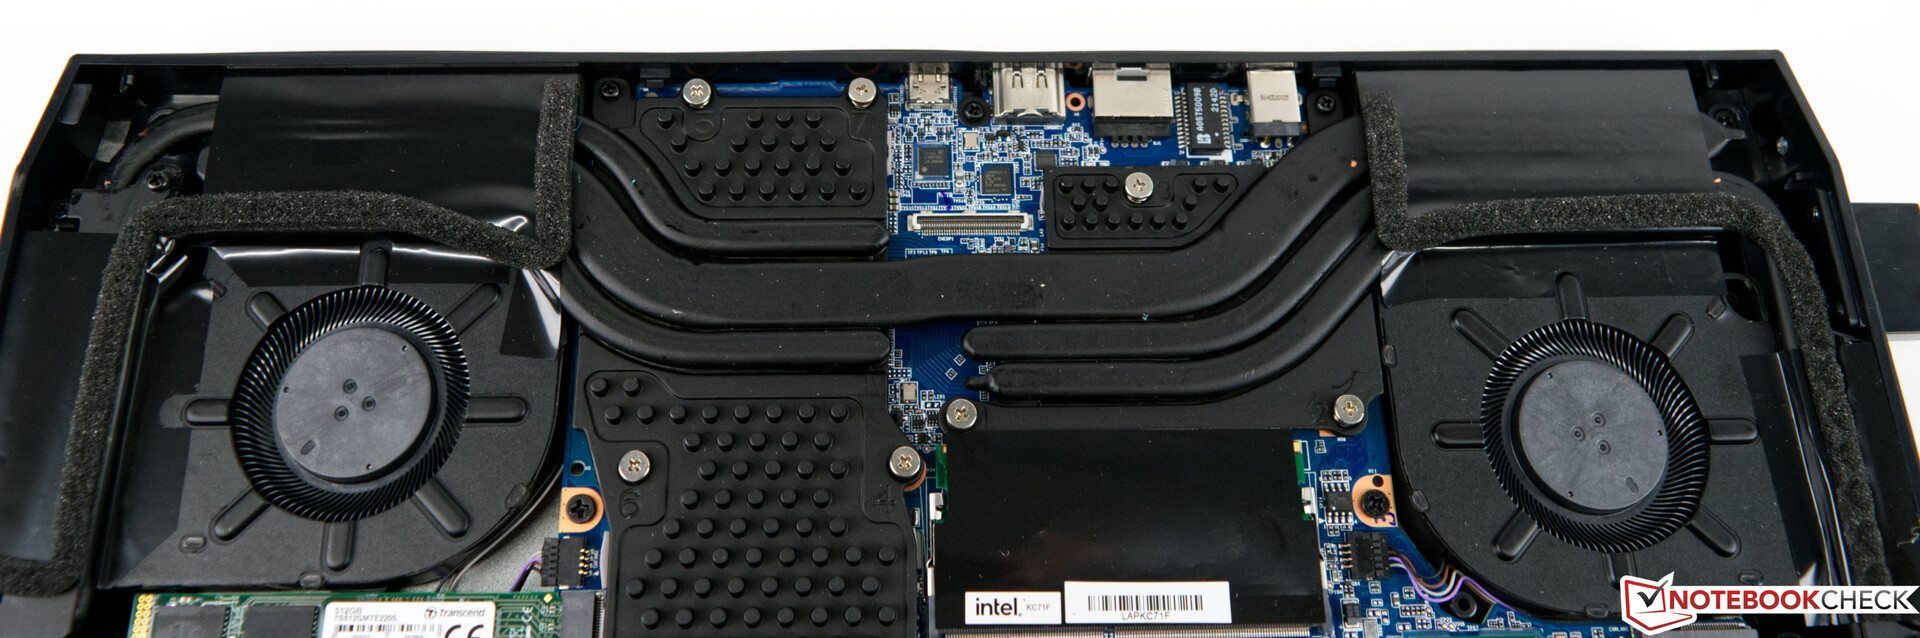
Wartung
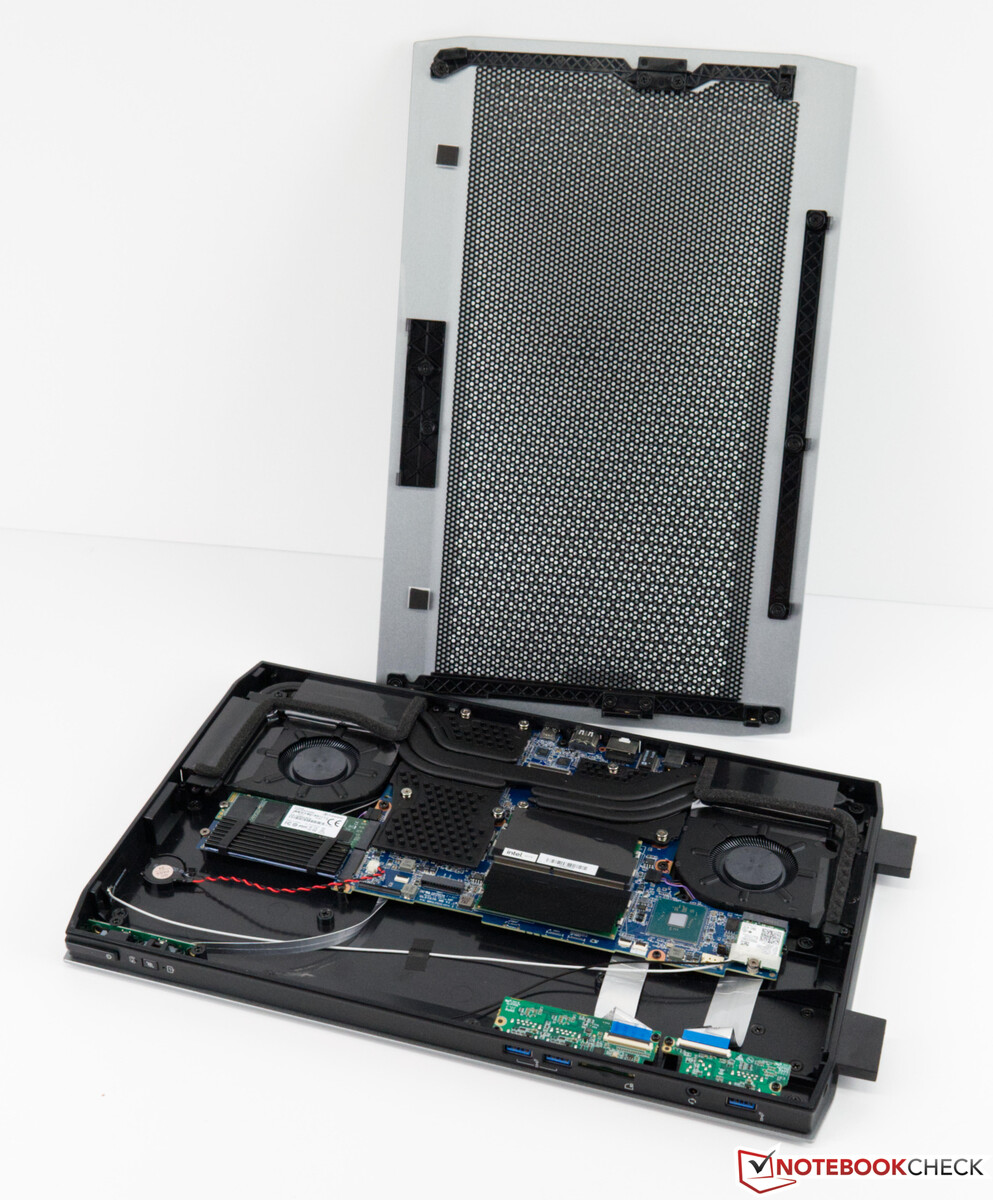
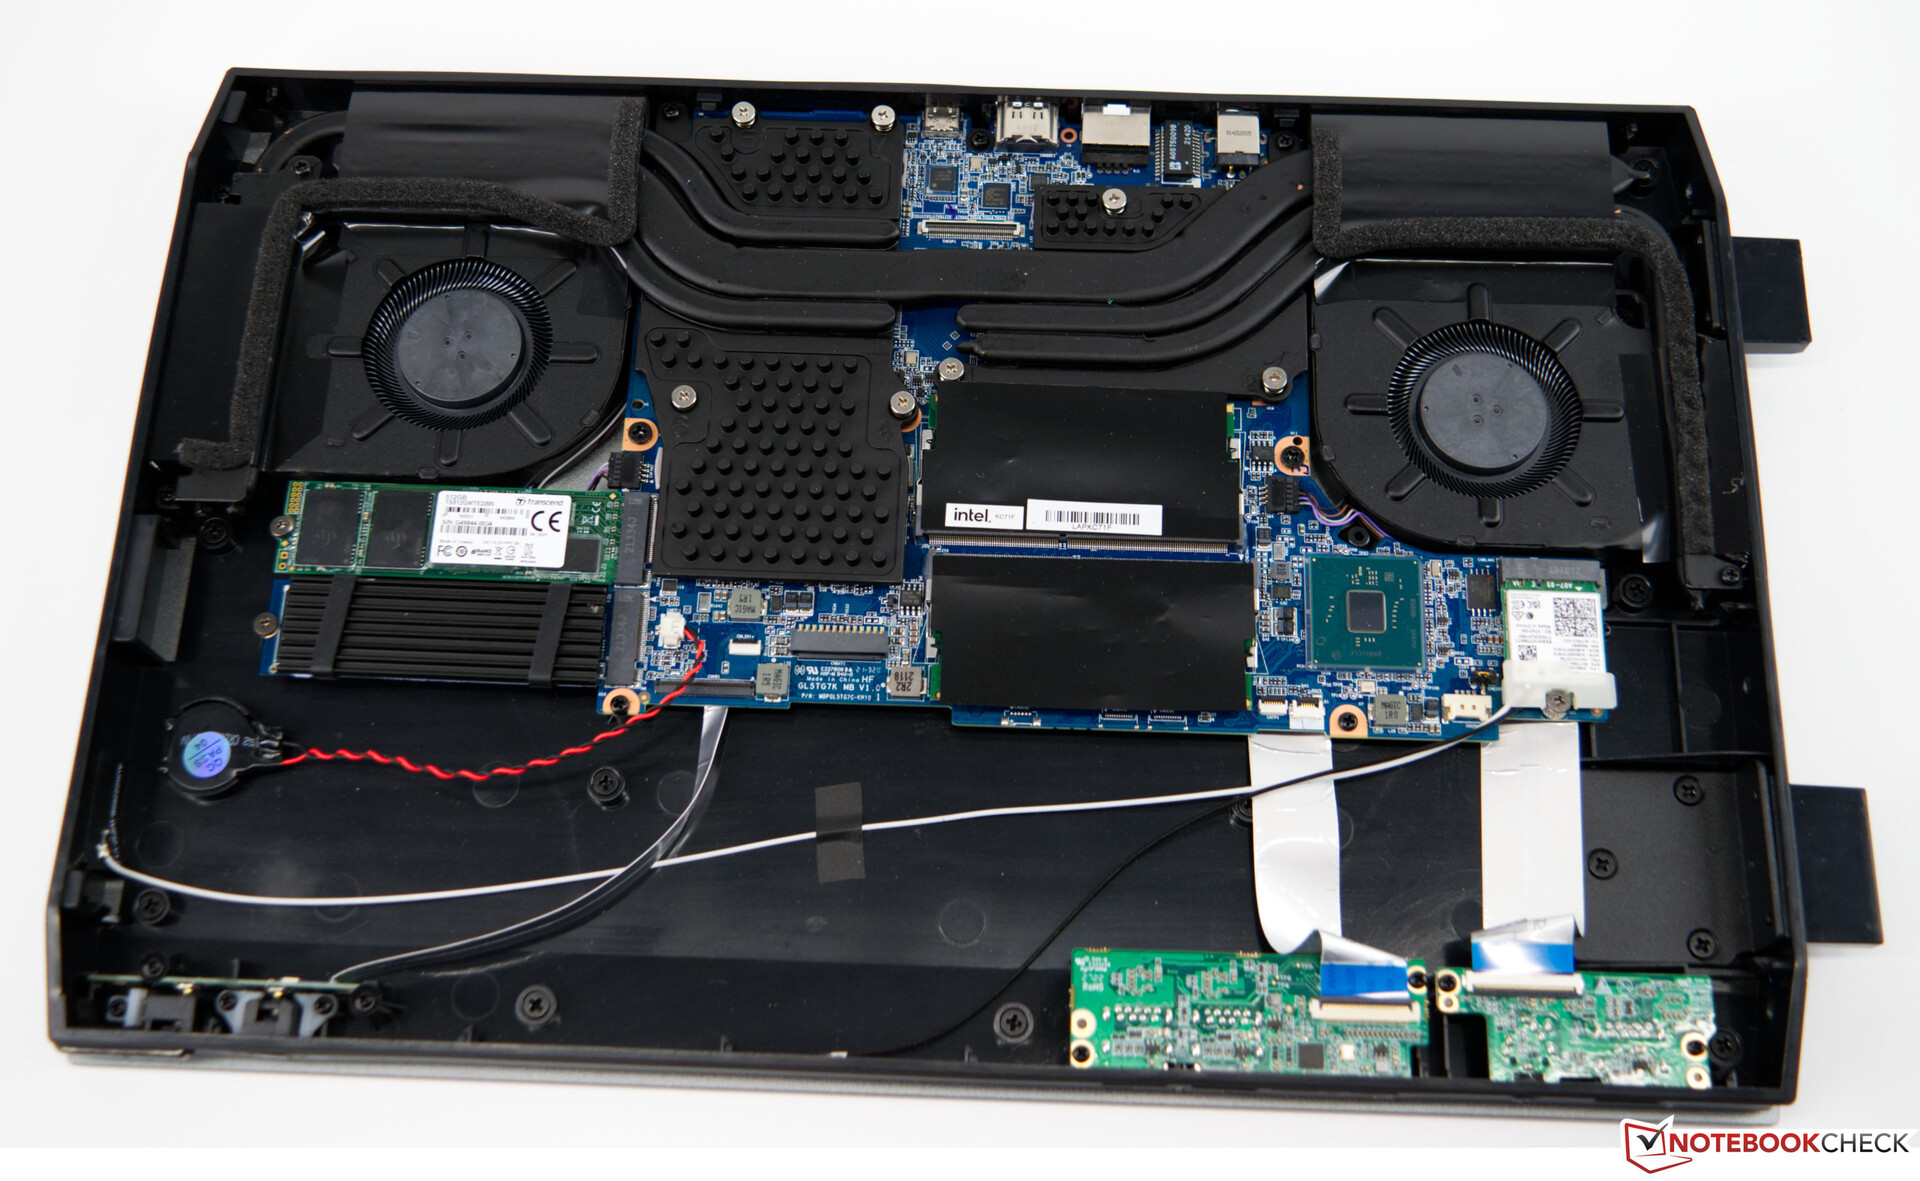
Für Aufrüstarbeiten oder Wartungen am Gerät lässt sich die Seitenabdeckung entfernen. Diese ist an der Unterseite mit drei Schrauben fixiert, und nach dem Entfernen dieser lässt sich die Abdeckung ohne großen Aufwand abnehmen. Ein How-to, wie man hier vorgehen soll, befindet sich übrigens in der beiliegenden Broschüre. Nach der Demontage könnte man glatt denken, dass man ein Notebook vor sich liegen hat. Dennoch gibt es viel ungenutzten Raum, welcher im Normalfall für einen Akku vorgesehen ist. Hier lässt sich auch gut erkennen, dass rückseitig nicht mal ebenso USB-Ports nachrüstbar sind. Einzig an der Front wäre noch Platz für mehr externe Schnittstellen.
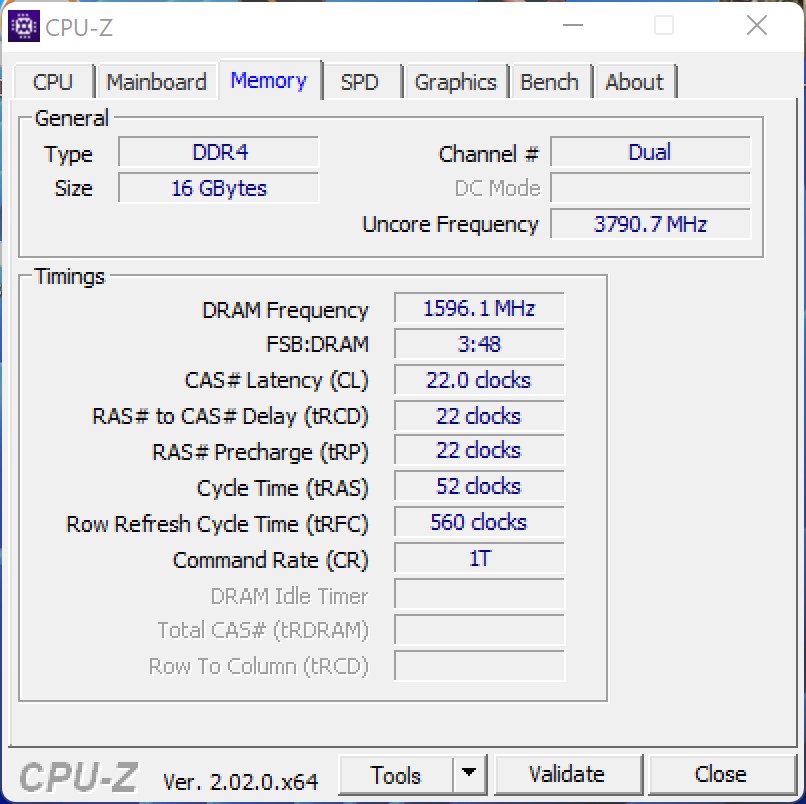
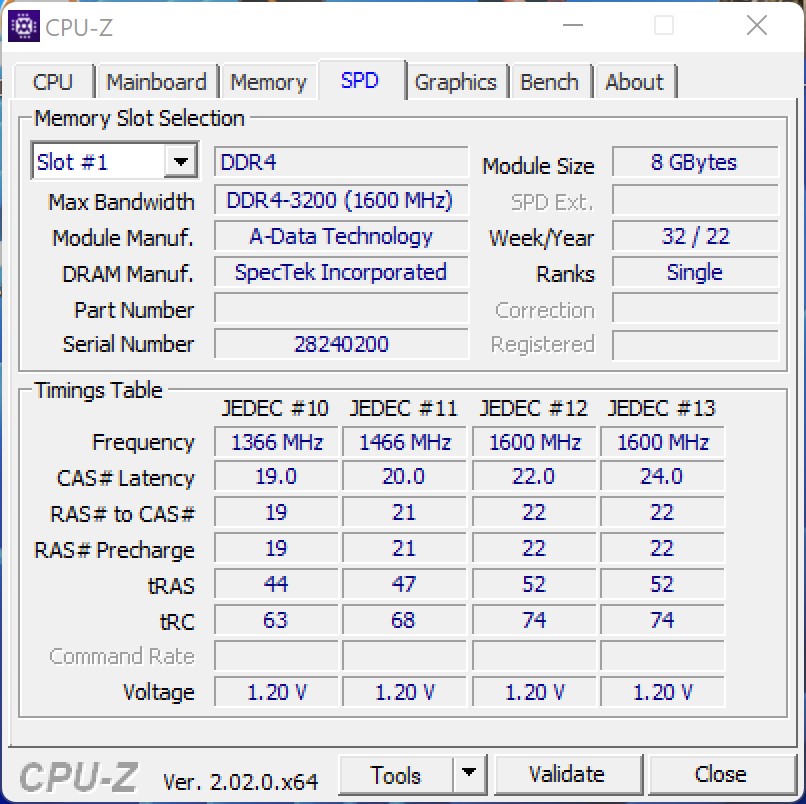
Insgesamt lassen sich zwei M.2-SSDs im Gerät verstauen, was wir für diesen Test auch getan haben. Beim Arbeitsspeicher bleibt nur die Option, diese zu ersetzen, denn die beiden SO-Dimm-Slots sind bereits mit zwei 8-GB-Modulen bestückt.
Leistung - schneller Core i7-11800H
Unser Testsample bietet als Basis mit dem Intel Core i7-11800H eine gute Grundlage für anspruchsvolle Anwendungen. Im Zusammenspiel mit der Nvidia GeForce RTX 3070 Laptop GPU kommt der Minisforum NUCXi7 wie ein gut ausgestatteter Gaming-Laptop daher. Die 16-GB-RAM reichen in der Regel für alle aktuellen Spiele aus, wenngleich es bei der SSD mit 512 GB schonmal eng werden kann. In dieser Ausstattung lassen sich aktuelle Spiele durchaus in 1.440p genießen. Wer nur in 1.080p zocken möchte, sollte sich den Minisforum NUCXi5 genauer anschauen.

Testbedingungen
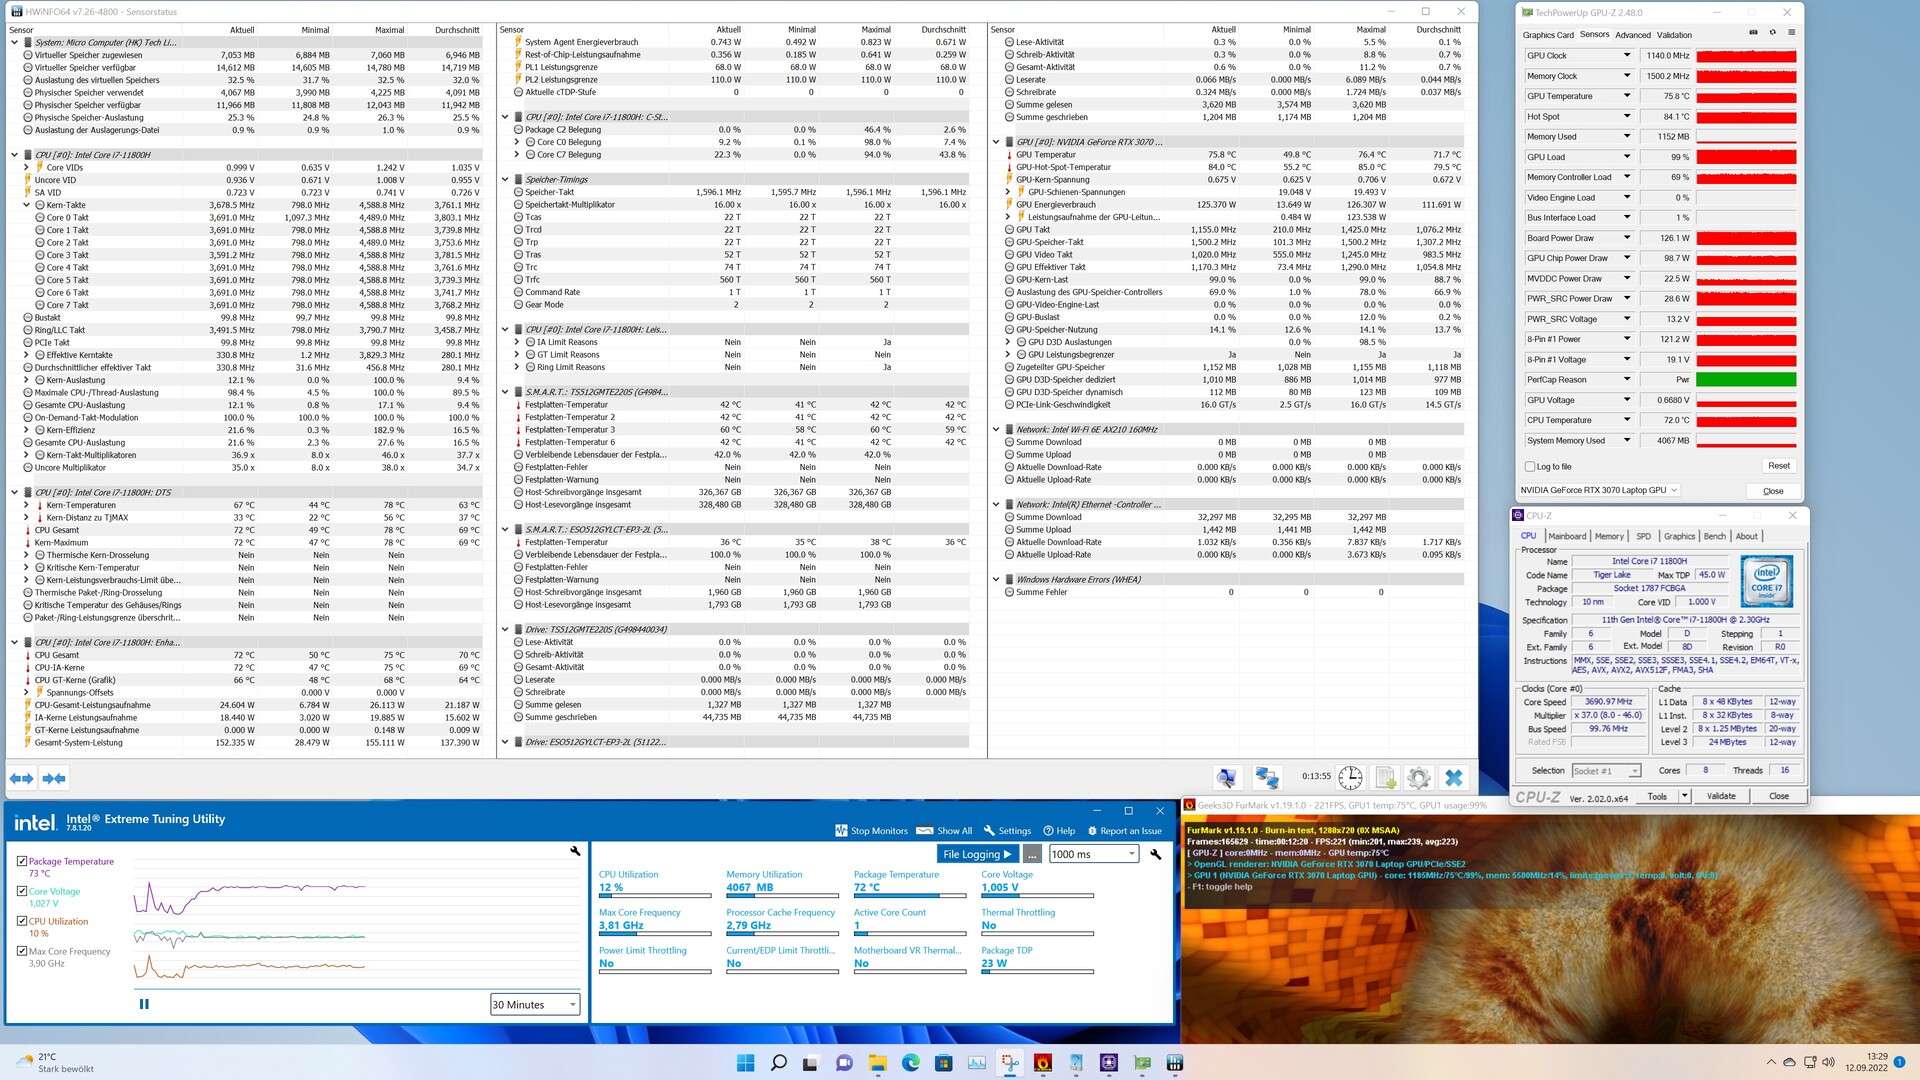
Alle Leistungstests haben wir im Gaming-Mode durchgeführt. Dieser lässt sich mit einem Knopfdruck an der Front aktivieren und ermöglicht der GPU eine höhere Leistungsaufnahme unter Last. Genauer bedeutet dies eine Erhöhung der Leistungsaufnahme der GPU auf 125 Watt.
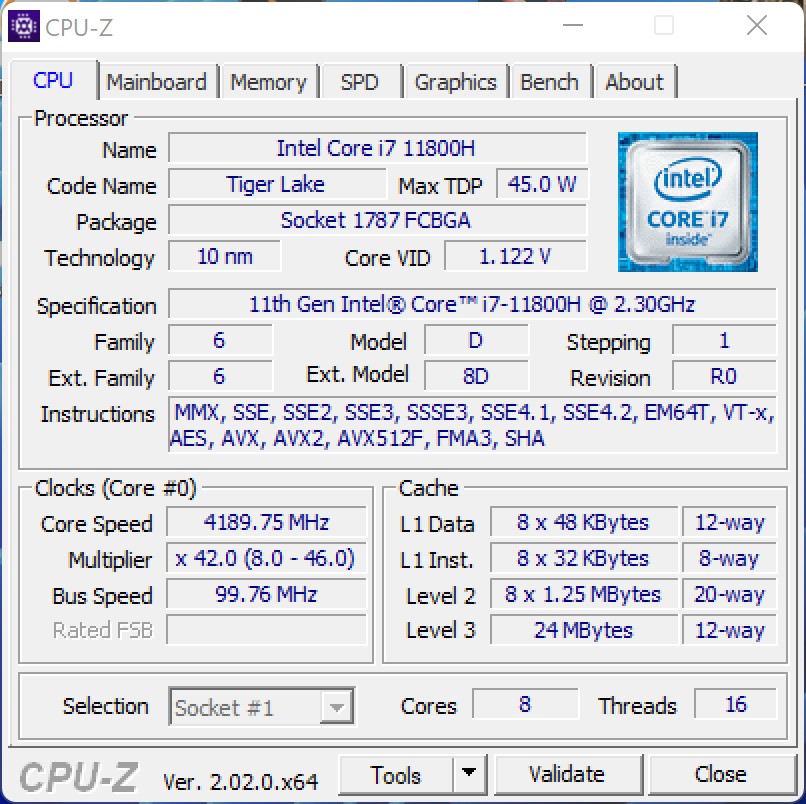
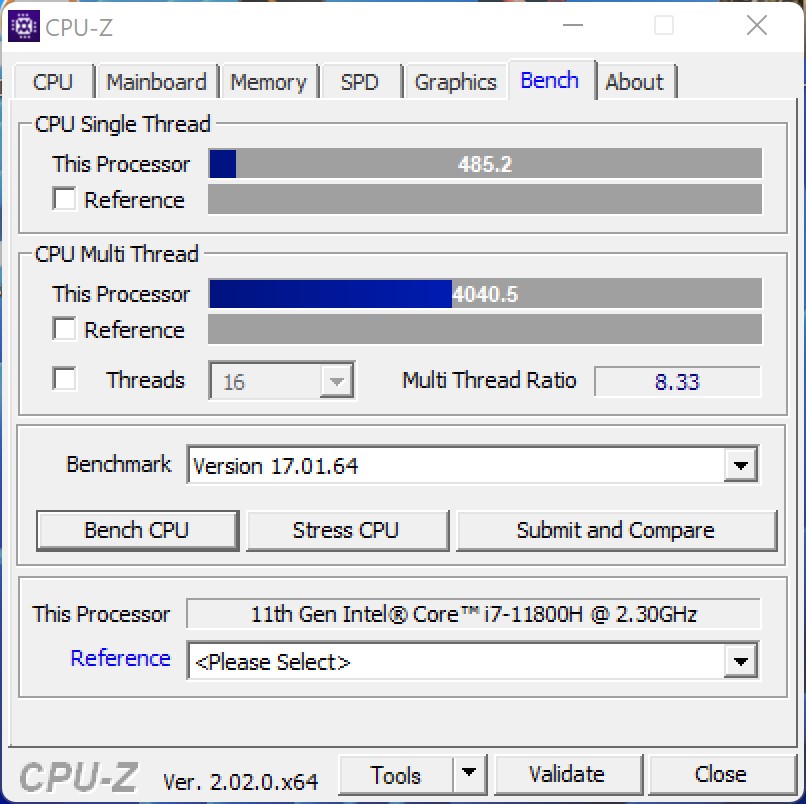
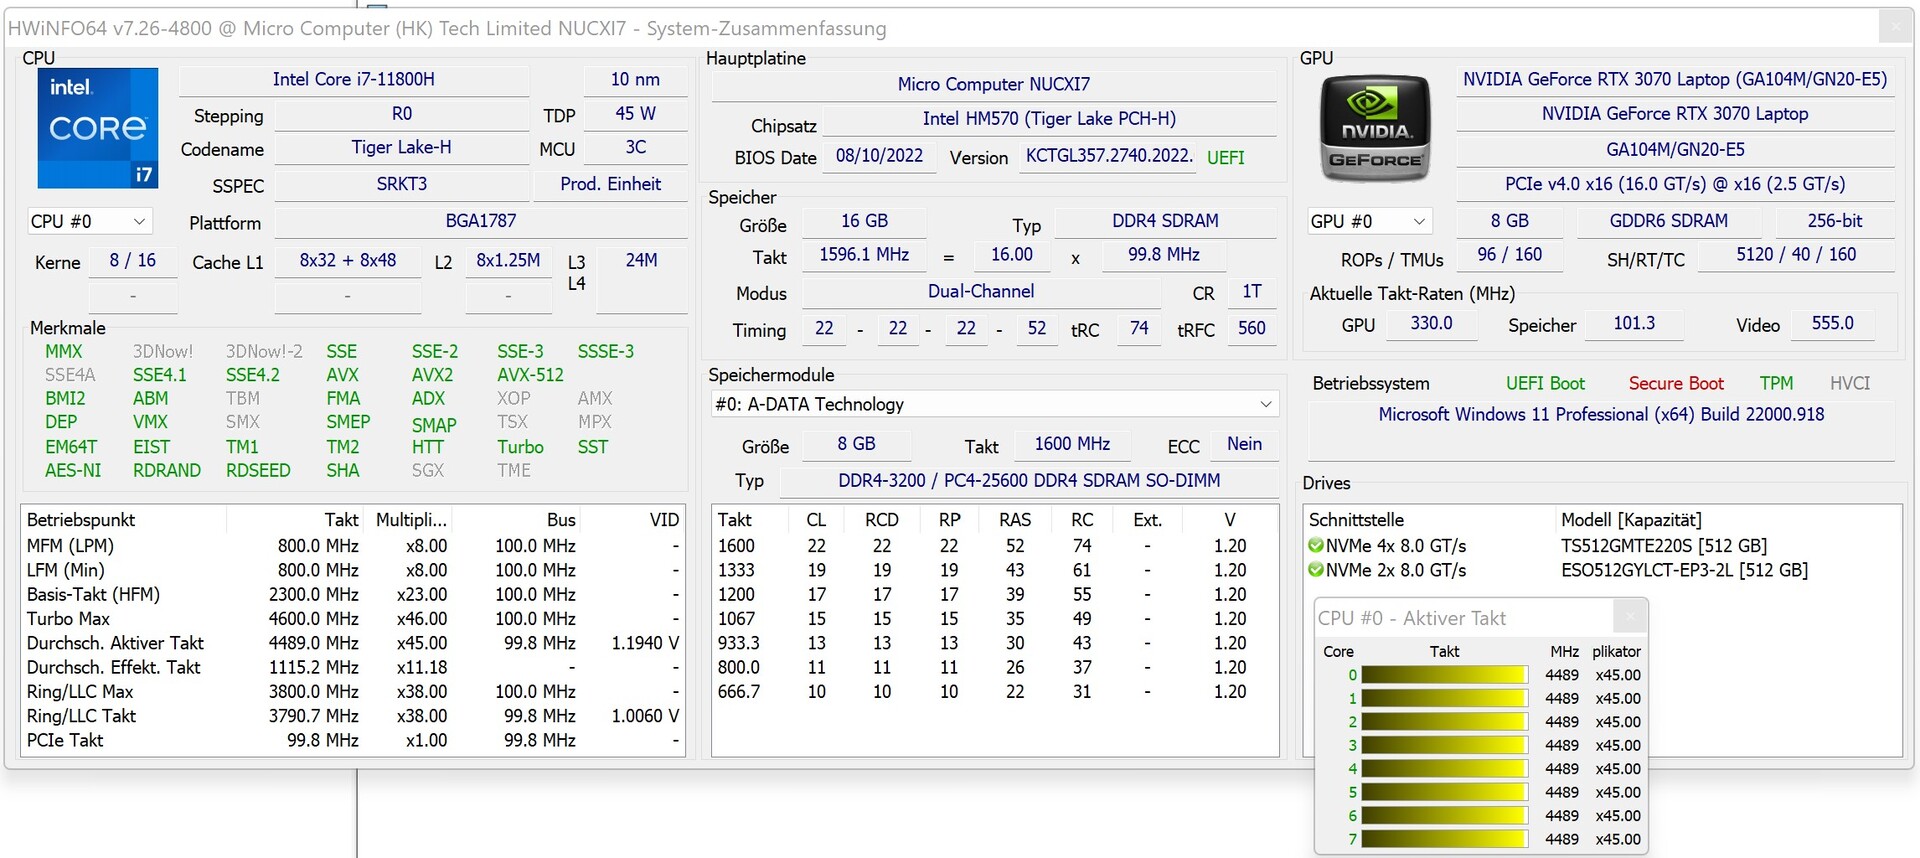
Prozessor
Der Intel Core i7-11800H bietet 8 native Rechenkerne und basiert auf Intels Tiger-Lake-Architektur. Minisforum lässt dem SoC einen Spielraum bei der Leistungsaufnahme von bis zu 110 Watt (PL2), wenngleich das PL1 mit 68 Watt immer noch ein sehr guter Wert ist, um viel Leistung zu erzielen. Und so ist es auch, denn bei unseren Tests kann sich unser Testsample mit der gezeigten Leistung einen guten Platz im Mittelfeld sichern. Der Rückstand auf die schnelleren Vergleichsgeräte ist gering und subjektiv nicht spürbar.
Weitere Benchmarks zu den Prozessoren finden Sie hier.
* ... kleinere Werte sind besser
AIDA64: FP32 Ray-Trace | FPU Julia | CPU SHA3 | CPU Queen | FPU SinJulia | FPU Mandel | CPU AES | CPU ZLib | FP64 Ray-Trace | CPU PhotoWorxx
| Performance Rating | |
| Durchschnitt der Klasse Desktop | |
| Gigabyte A7 X1 | |
| Intel Beast Canyon NUC | |
| Intel Dragon Canyon NUC - RTX 3060 | |
| Minisforum NUCX i7 | |
| Zotac ZBOX Magnus EN173070C | |
| Zotac MEK Mini (RTX 2070 Super) | |
| AIDA64 / FP32 Ray-Trace | |
| Durchschnitt der Klasse Desktop (12248 - 84577, n=15, der letzten 2 Jahre) | |
| Gigabyte A7 X1 | |
| Intel Beast Canyon NUC | |
| Intel Dragon Canyon NUC - RTX 3060 | |
| Zotac ZBOX Magnus EN173070C | |
| Minisforum NUCX i7 | |
| Zotac MEK Mini (RTX 2070 Super) | |
| AIDA64 / FPU Julia | |
| Durchschnitt der Klasse Desktop (65152 - 246125, n=15, der letzten 2 Jahre) | |
| Gigabyte A7 X1 | |
| Intel Beast Canyon NUC | |
| Intel Dragon Canyon NUC - RTX 3060 | |
| Zotac ZBOX Magnus EN173070C | |
| Minisforum NUCX i7 | |
| Zotac MEK Mini (RTX 2070 Super) | |
| AIDA64 / CPU SHA3 | |
| Durchschnitt der Klasse Desktop (2982 - 10804, n=15, der letzten 2 Jahre) | |
| Intel Beast Canyon NUC | |
| Intel Dragon Canyon NUC - RTX 3060 | |
| Zotac ZBOX Magnus EN173070C | |
| Minisforum NUCX i7 | |
| Gigabyte A7 X1 | |
| Zotac MEK Mini (RTX 2070 Super) | |
| AIDA64 / CPU Queen | |
| Durchschnitt der Klasse Desktop (76512 - 187912, n=15, der letzten 2 Jahre) | |
| Gigabyte A7 X1 | |
| Intel Beast Canyon NUC | |
| Intel Dragon Canyon NUC - RTX 3060 | |
| Minisforum NUCX i7 | |
| Zotac ZBOX Magnus EN173070C | |
| Zotac MEK Mini (RTX 2070 Super) | |
| AIDA64 / FPU SinJulia | |
| Durchschnitt der Klasse Desktop (6443 - 35251, n=15, der letzten 2 Jahre) | |
| Gigabyte A7 X1 | |
| Intel Beast Canyon NUC | |
| Intel Dragon Canyon NUC - RTX 3060 | |
| Minisforum NUCX i7 | |
| Zotac ZBOX Magnus EN173070C | |
| Zotac MEK Mini (RTX 2070 Super) | |
| AIDA64 / FPU Mandel | |
| Durchschnitt der Klasse Desktop (31697 - 129745, n=15, der letzten 2 Jahre) | |
| Gigabyte A7 X1 | |
| Intel Beast Canyon NUC | |
| Intel Dragon Canyon NUC - RTX 3060 | |
| Zotac ZBOX Magnus EN173070C | |
| Minisforum NUCX i7 | |
| Zotac MEK Mini (RTX 2070 Super) | |
| AIDA64 / CPU AES | |
| Durchschnitt der Klasse Desktop (57777 - 513073, n=15, der letzten 2 Jahre) | |
| Intel Beast Canyon NUC | |
| Intel Dragon Canyon NUC - RTX 3060 | |
| Minisforum NUCX i7 | |
| Zotac ZBOX Magnus EN173070C | |
| Gigabyte A7 X1 | |
| Zotac MEK Mini (RTX 2070 Super) | |
| AIDA64 / CPU ZLib | |
| Durchschnitt der Klasse Desktop (887 - 2674, n=15, der letzten 2 Jahre) | |
| Gigabyte A7 X1 | |
| Minisforum NUCX i7 | |
| Intel Beast Canyon NUC | |
| Intel Dragon Canyon NUC - RTX 3060 | |
| Zotac ZBOX Magnus EN173070C | |
| Zotac MEK Mini (RTX 2070 Super) | |
| AIDA64 / FP64 Ray-Trace | |
| Durchschnitt der Klasse Desktop (6471 - 44013, n=15, der letzten 2 Jahre) | |
| Gigabyte A7 X1 | |
| Intel Beast Canyon NUC | |
| Intel Dragon Canyon NUC - RTX 3060 | |
| Zotac ZBOX Magnus EN173070C | |
| Minisforum NUCX i7 | |
| Zotac MEK Mini (RTX 2070 Super) | |
| AIDA64 / CPU PhotoWorxx | |
| Durchschnitt der Klasse Desktop (38071 - 55966, n=15, der letzten 2 Jahre) | |
| Zotac ZBOX Magnus EN173070C | |
| Minisforum NUCX i7 | |
| Intel Beast Canyon NUC | |
| Intel Dragon Canyon NUC - RTX 3060 | |
| Zotac MEK Mini (RTX 2070 Super) | |
| Gigabyte A7 X1 | |
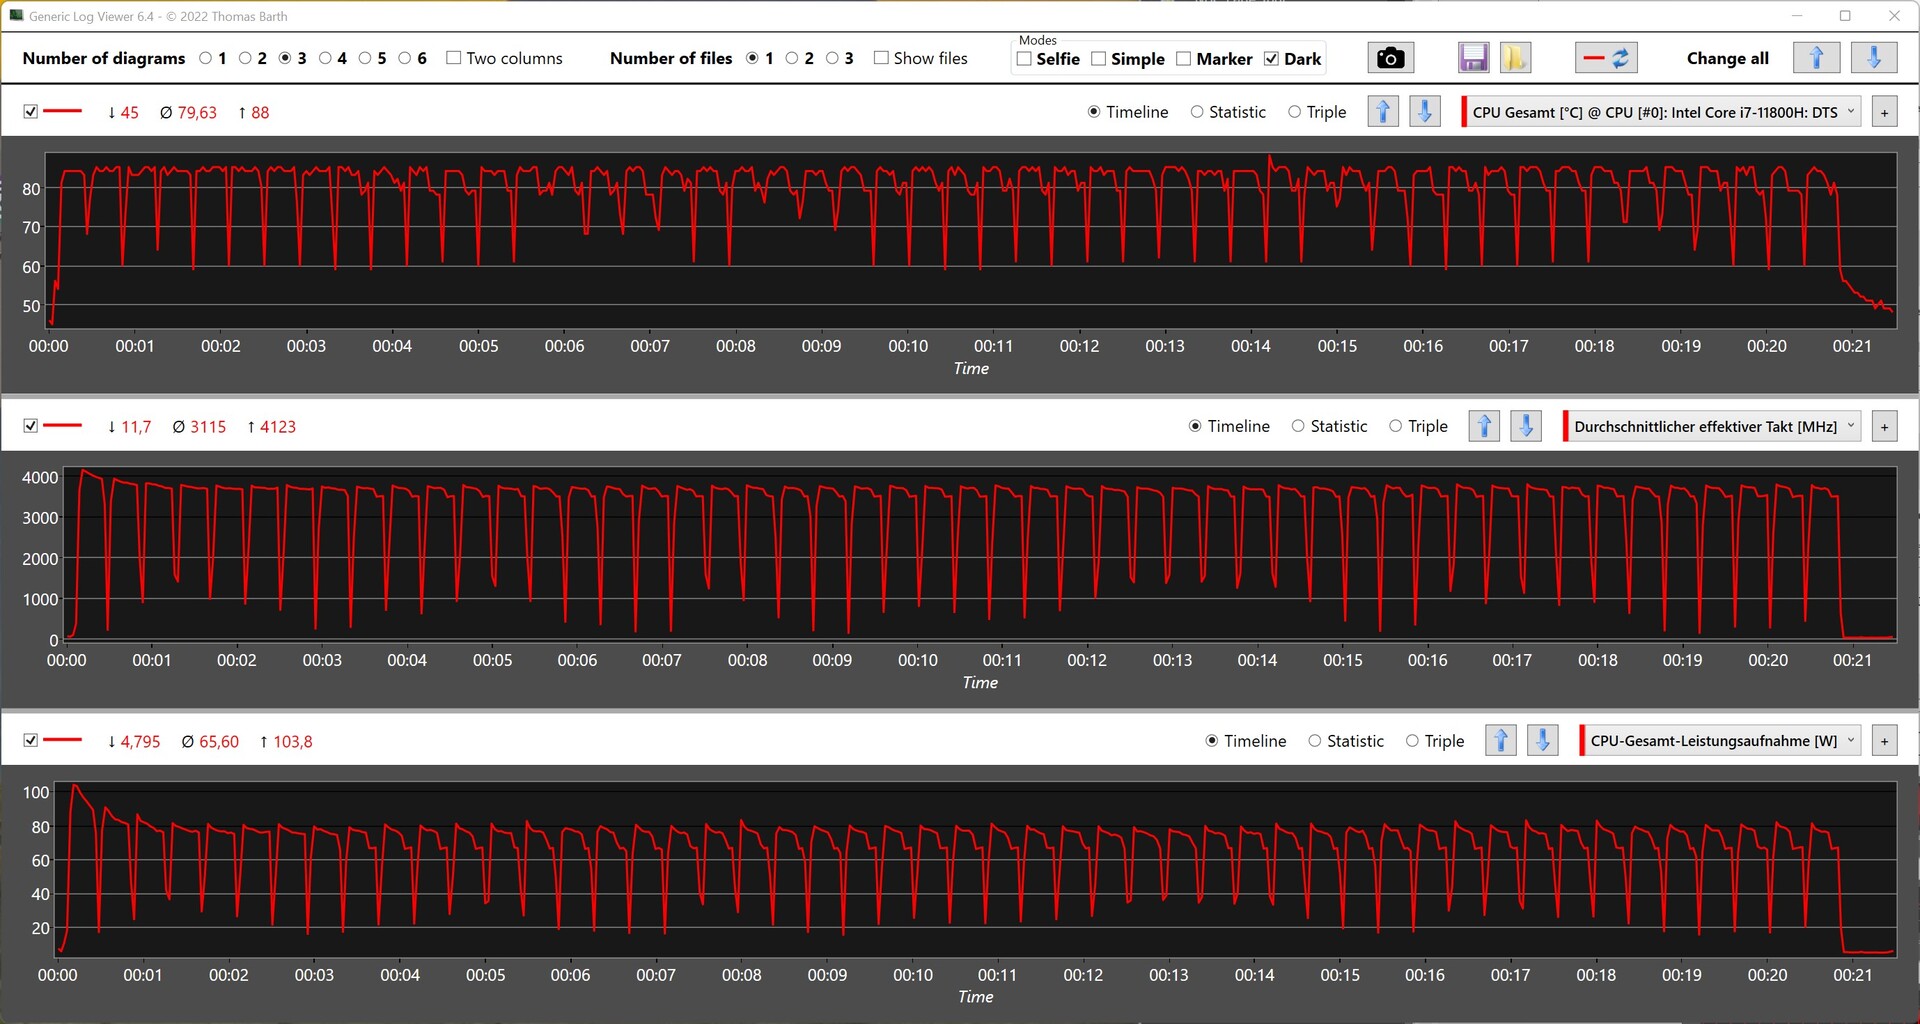
Minisforum NUCXi7 bei der Cinebench-R15-Multi-Schleife
Einen guten Einblick hinsichtlich der Effizienz der verbauten Kühlung bekommen wir bei der Cinebench-R15-Dauerschleife. Nach den ersten Durchläufen sinkt die Leistung nur minimal und pendelt sich im weiteren Verlauf bei durchschnittlich 1.828 Punkten ein.
System Performance
Bei den System Benchmarks hinterlässt der Minisforum NUCXi7 einen guten Eindruck. Der Rückstand auf den Intel Dragon Canyon NUC mit Intel Core i9-12900 beträgt 17 Prozent. Gleichwohl zeigt der inzwischen schon gut über ein Jahr alte Intel Core i7-11800H, dass dieser noch lange nicht zum alten Eisen gehört. Nichtsdestotrotz könnte Minisforum mit einem Upgrade auf Intels Alder-Lake-SoCs noch einmal deutlich nachlegen. In der aktuellen Ausstattung leistet der Minisforum NUCXi7 eine solide Leistung, die auch im Alltag überzeugen konnte.
| AIDA64 / Memory Copy | |
| Durchschnitt der Klasse Desktop (55366 - 88386, n=15, der letzten 2 Jahre) | |
| Intel Beast Canyon NUC | |
| Intel Dragon Canyon NUC - RTX 3060 | |
| Minisforum NUCX i7 | |
| Zotac ZBOX Magnus EN173070C | |
| Durchschnittliche Intel Core i7-11800H (24508 - 48144, n=21) | |
| Gigabyte A7 X1 | |
| Zotac MEK Mini (RTX 2070 Super) | |
| AIDA64 / Memory Read | |
| Durchschnitt der Klasse Desktop (58375 - 92063, n=15, der letzten 2 Jahre) | |
| Zotac ZBOX Magnus EN173070C | |
| Intel Beast Canyon NUC | |
| Intel Dragon Canyon NUC - RTX 3060 | |
| Minisforum NUCX i7 | |
| Durchschnittliche Intel Core i7-11800H (25882 - 50365, n=20) | |
| Gigabyte A7 X1 | |
| Zotac MEK Mini (RTX 2070 Super) | |
| AIDA64 / Memory Write | |
| Durchschnitt der Klasse Desktop (60635 - 85195, n=15, der letzten 2 Jahre) | |
| Zotac ZBOX Magnus EN173070C | |
| Minisforum NUCX i7 | |
| Intel Beast Canyon NUC | |
| Intel Dragon Canyon NUC - RTX 3060 | |
| Durchschnittliche Intel Core i7-11800H (22240 - 46214, n=20) | |
| Zotac MEK Mini (RTX 2070 Super) | |
| Gigabyte A7 X1 | |
| AIDA64 / Memory Latency | |
| Minisforum NUCX i7 | |
| Durchschnitt der Klasse Desktop (68.5 - 168, n=15, der letzten 2 Jahre) | |
| Intel Beast Canyon NUC | |
| Intel Dragon Canyon NUC - RTX 3060 | |
| Zotac ZBOX Magnus EN173070C | |
| Gigabyte A7 X1 | |
| Zotac MEK Mini (RTX 2070 Super) | |
| Durchschnittliche Intel Core i7-11800H (71.9 - 104.1, n=44) | |
* ... kleinere Werte sind besser
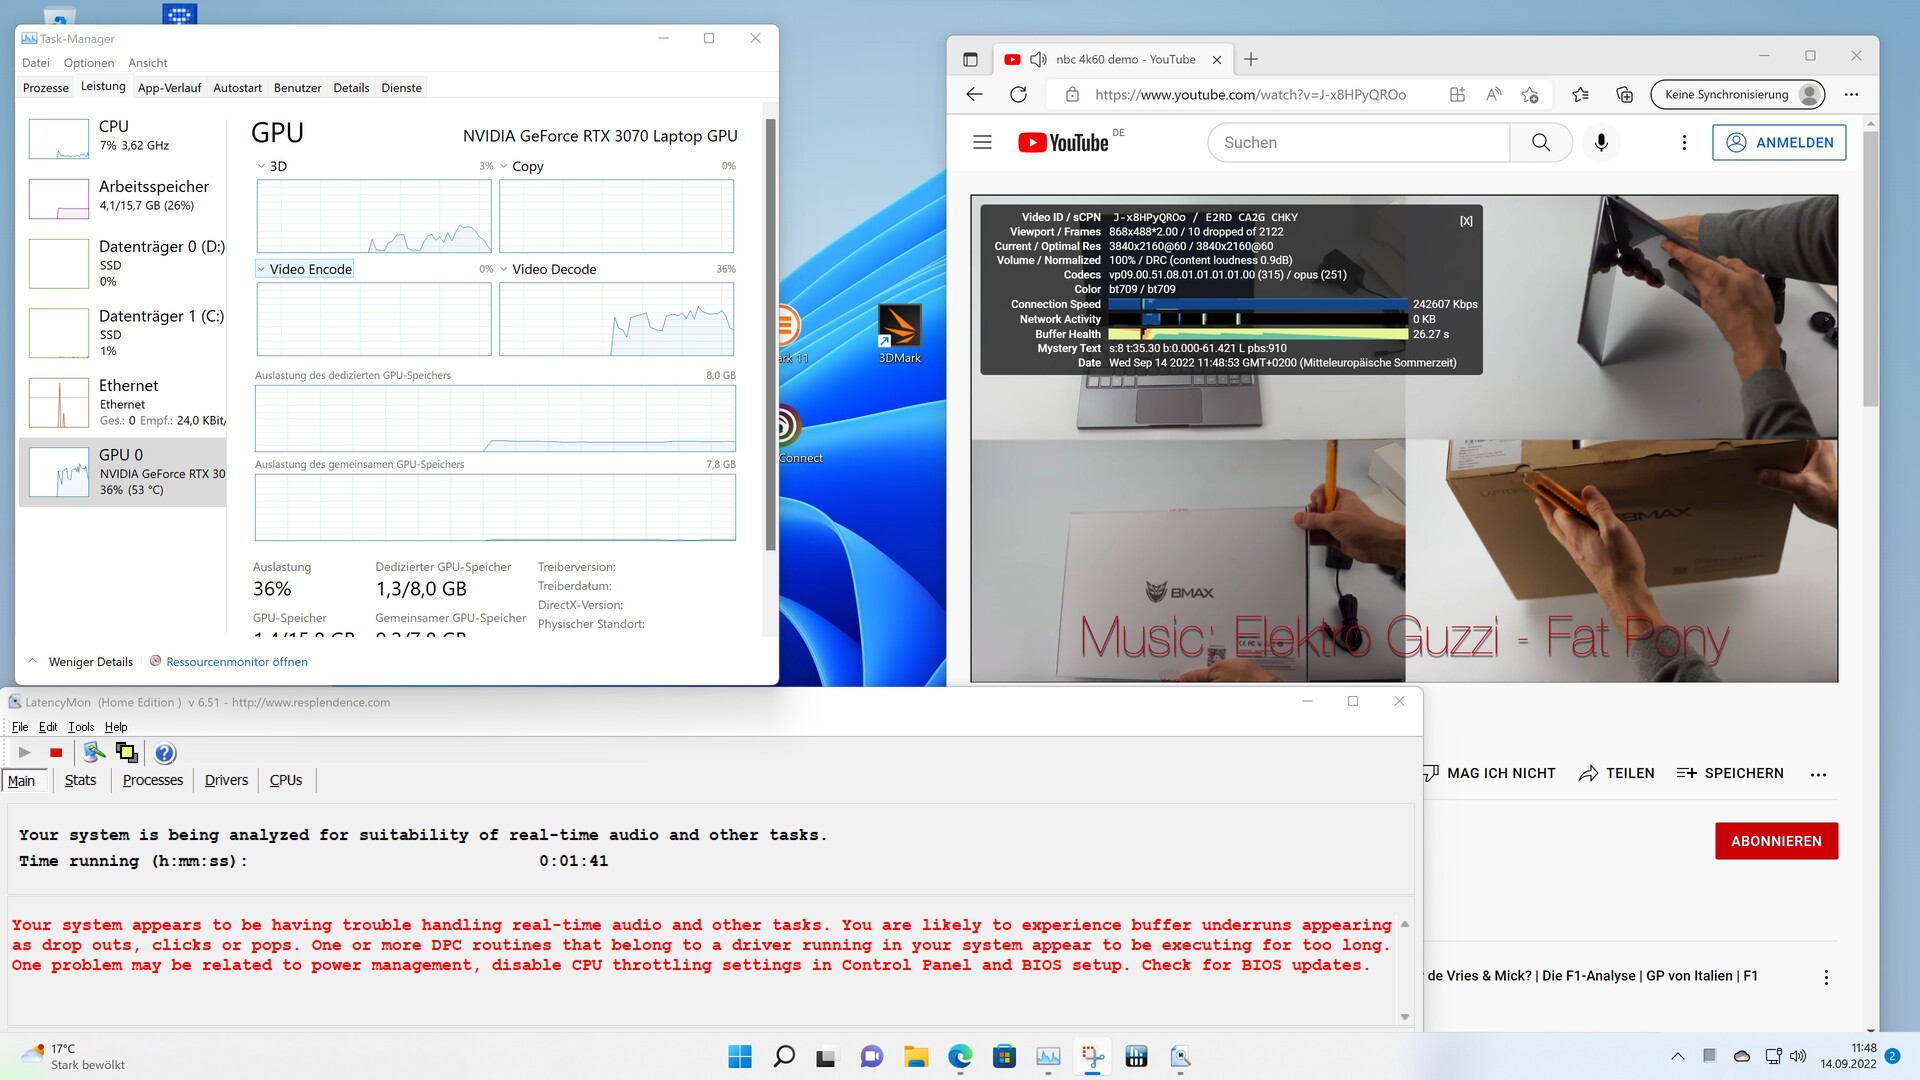
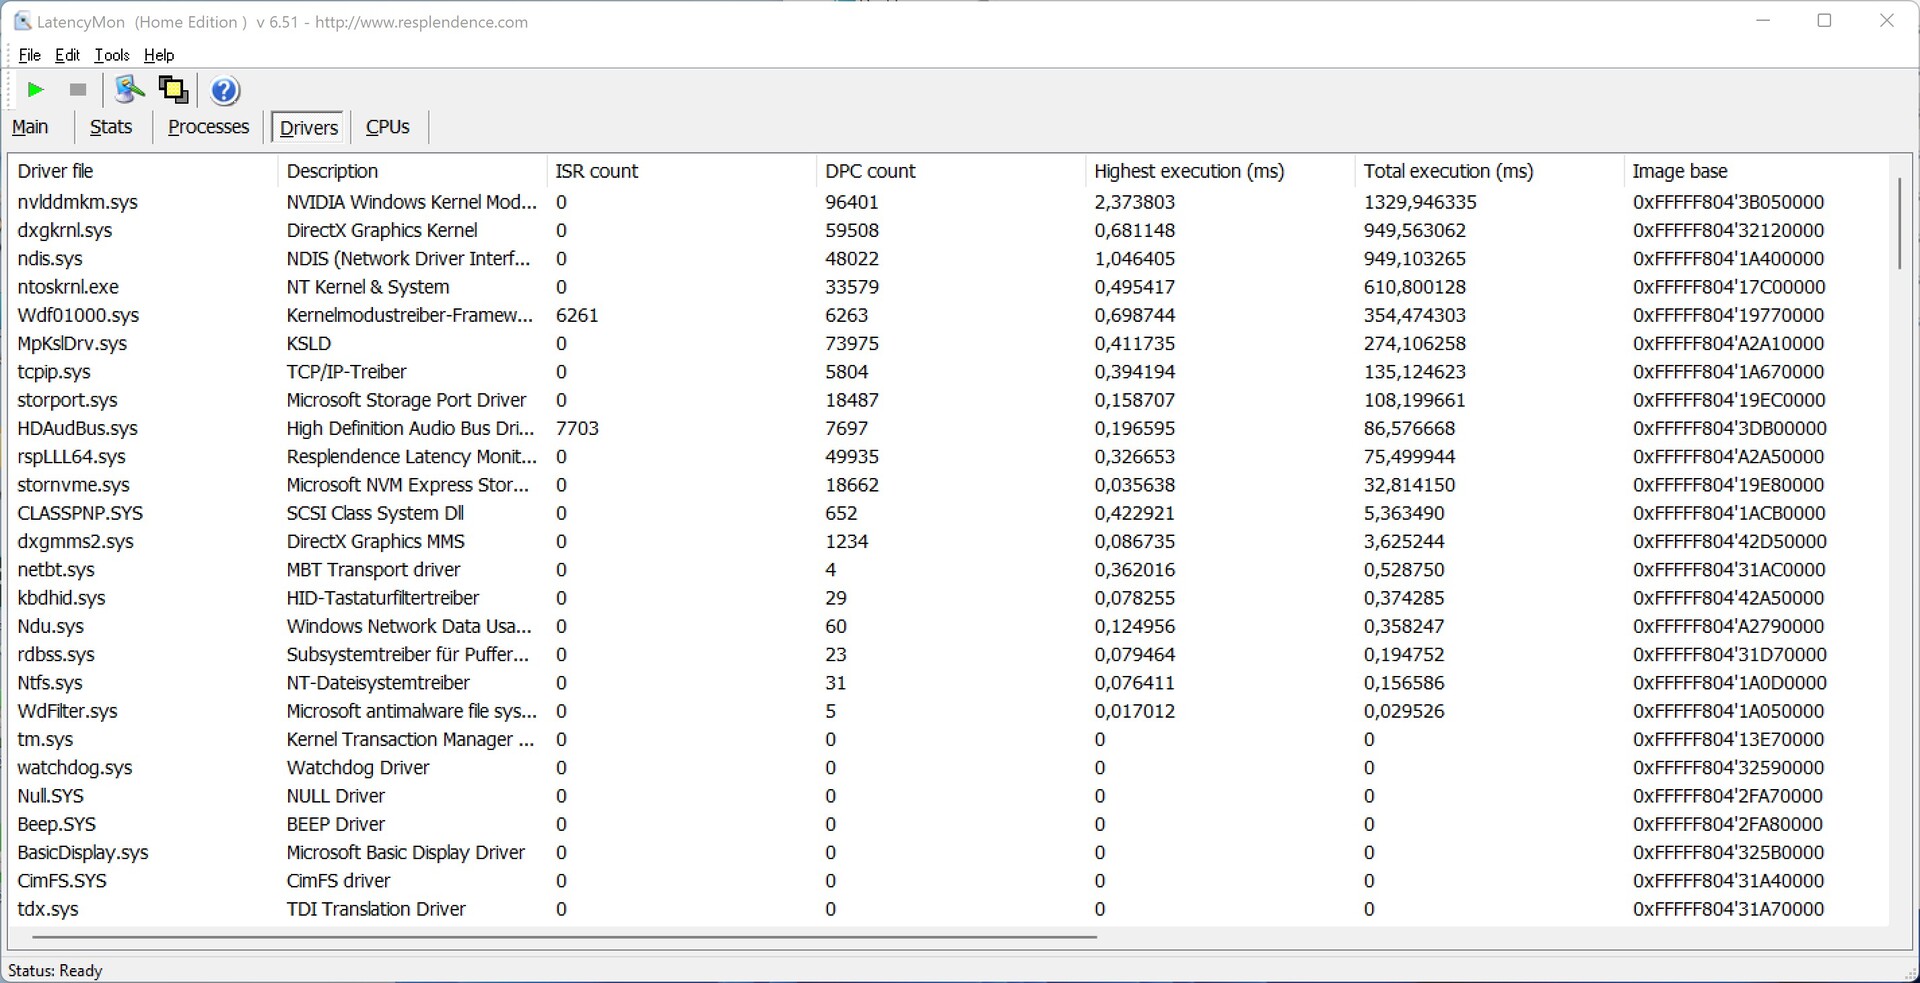
DPC-Latenzen
Mit erhöhten Latenzen hat der Minisforum NUCXi7 schon beim Öffnen mehrere Tabs in Edge zu kämpfen. Bei der Wiedergabe des 4K-Testvideos wird die Nvidia GeForce RTX 3070 Laptop GPU zu ca. 36 Prozent ausgelastet.
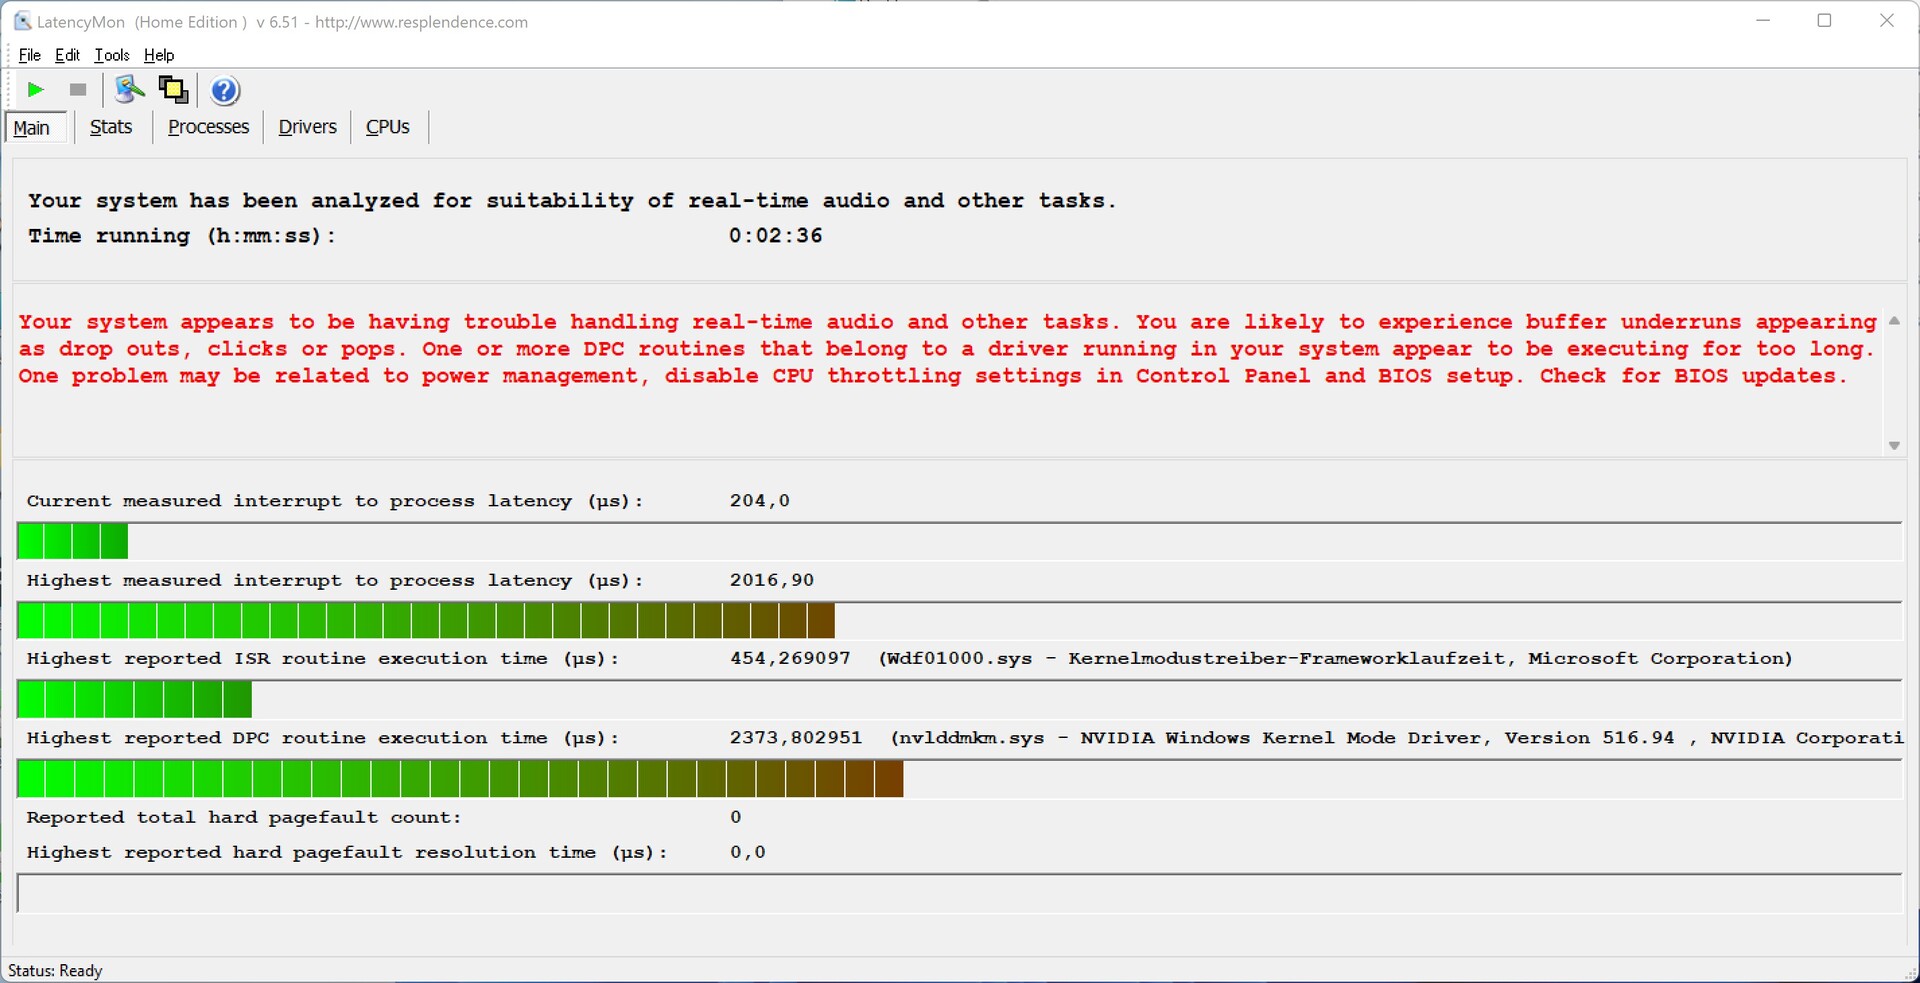
| DPC Latencies / LatencyMon - interrupt to process latency (max), Web, Youtube, Prime95 | |
| Minisforum NUCX i7, Intel Core i7-11800H | |
| Zotac ZBOX Magnus EN173070C, Intel Core i7-11800H | |
| Gigabyte A7 X1, AMD Ryzen 9 5900HX | |
* ... kleinere Werte sind besser
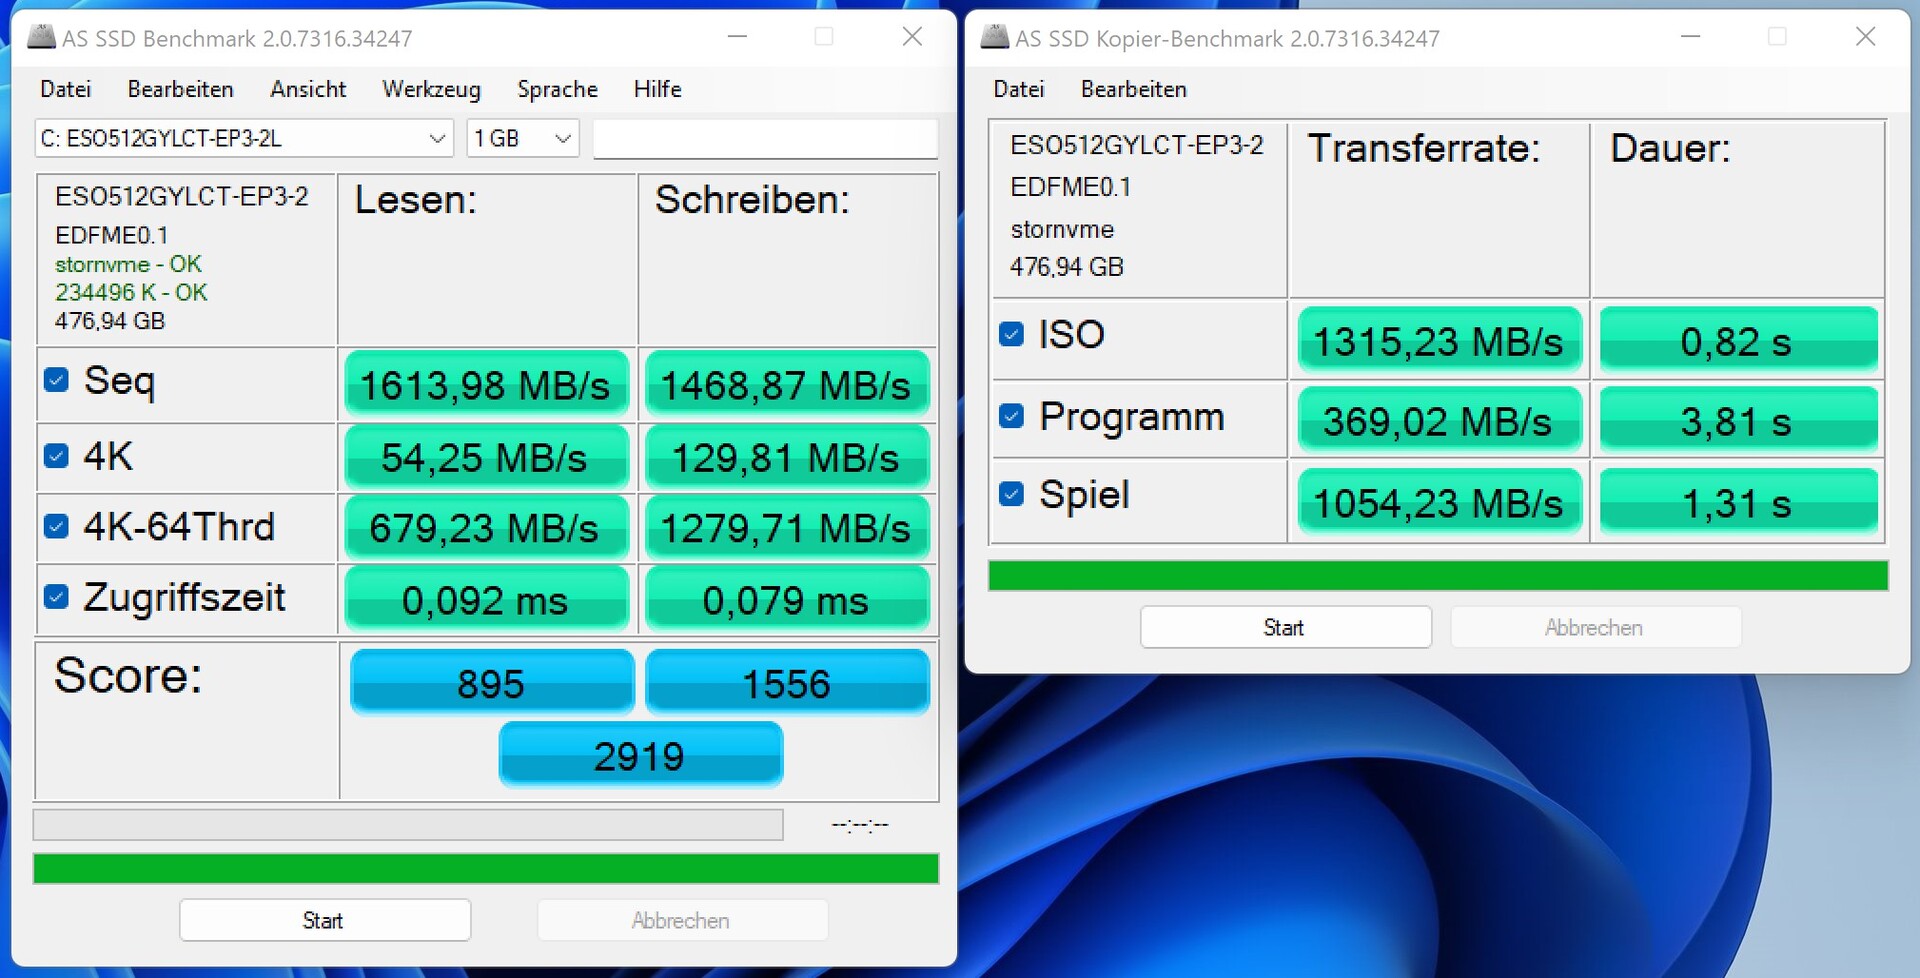
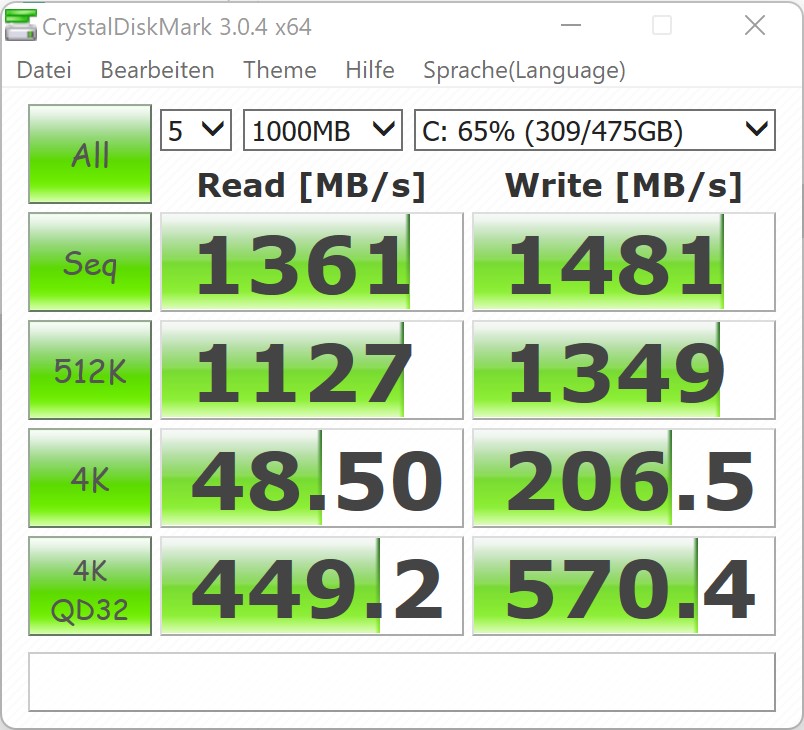
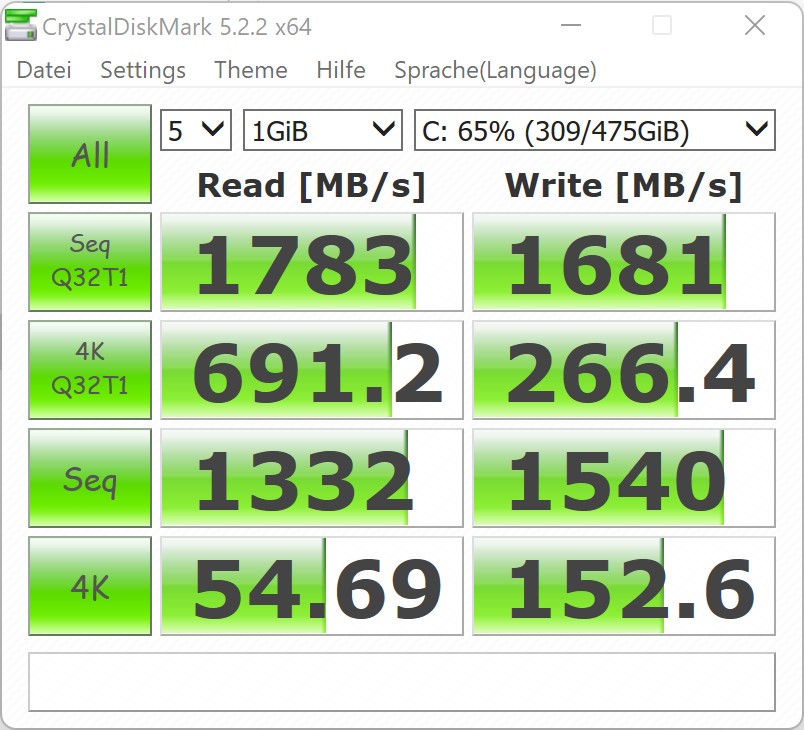
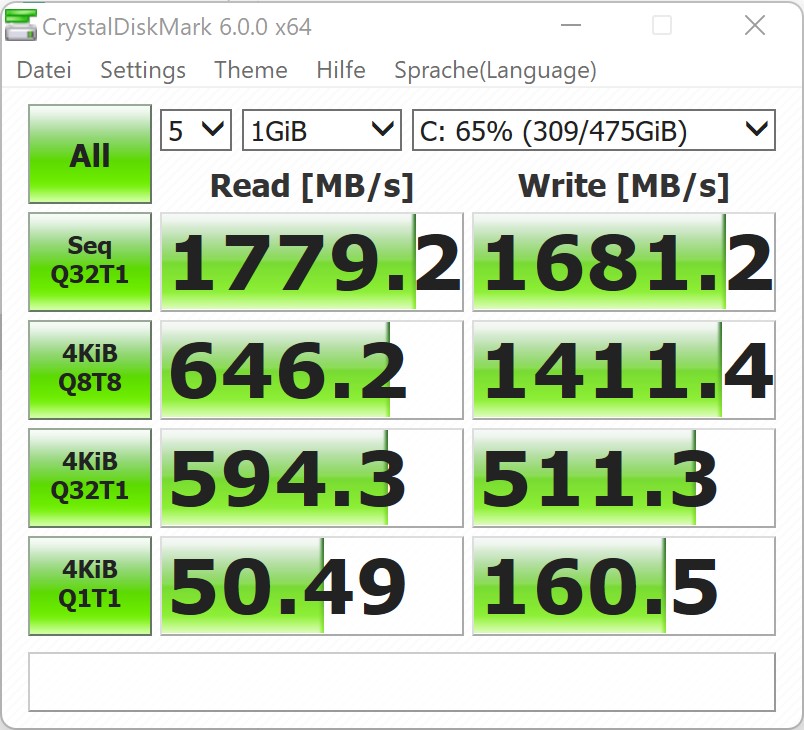
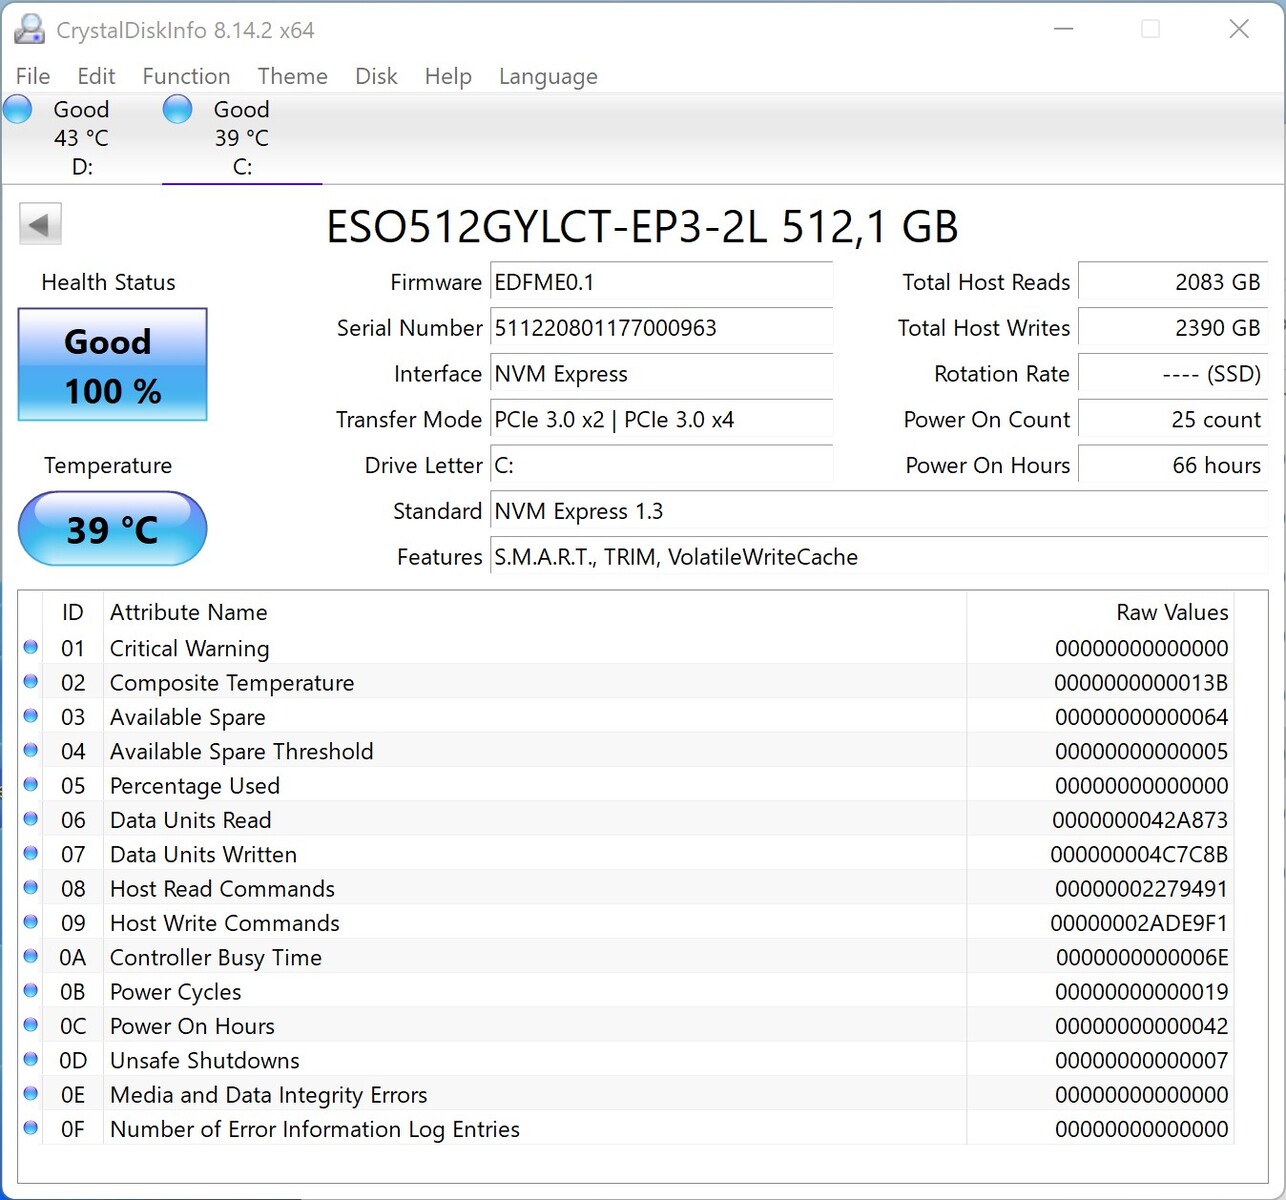
Massenspeicher
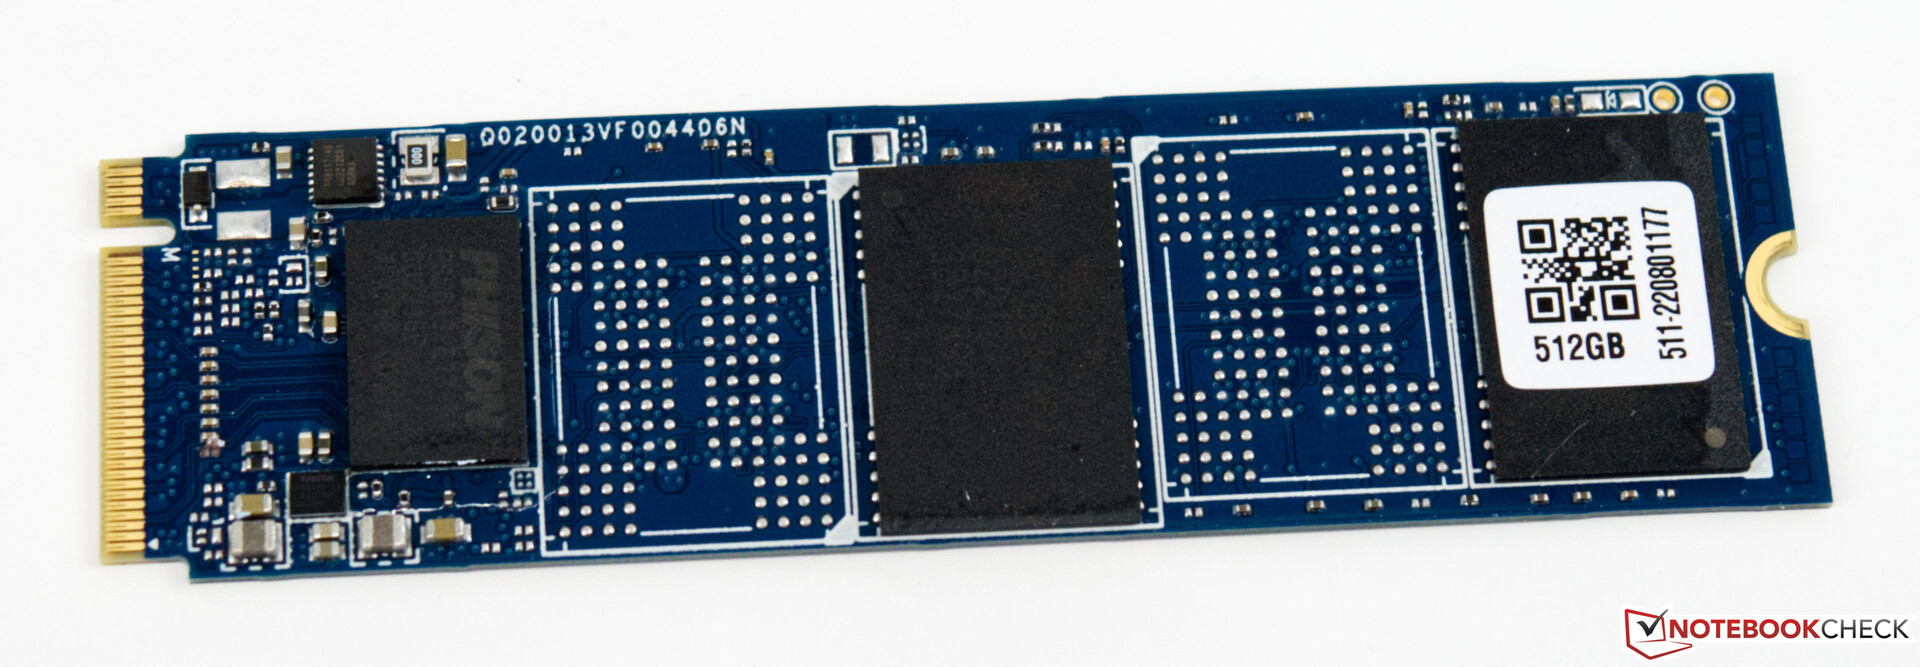
Als Massenspeicher gibt es in unserer Ausstattung eine NVMe SSD mit 512 GB Speicherplatz. Das verbaute Modell ist schnell, kann aber nicht ganz mit der Leistung unserer Vergleichsgeräte mithalten. Dennoch reicht die Leistung für alle gängigen Anwendungen aus. Zudem konnten wir keine unnötigen Latenzen aufgrund der SSD-Performance feststellen. Mit 512 GB fällt der Speicherplatz in Anbetracht der Zielgruppe allerdings sehr gering aus. Als Gaming-Gerät erwarten wir mindestens 1 TB hierfür. Mit dem zweiten M.2-Slot lässt sich der Speicher aber auch zu einem späteren Zeitpunkt erweitern.
Für weitere Vergleiche und Benchmarks verweisen wir auf unsere Vergleichstabelle.

* ... kleinere Werte sind besser
Dauerleistung Lesen: DiskSpd Read Loop, Queue Depth 8
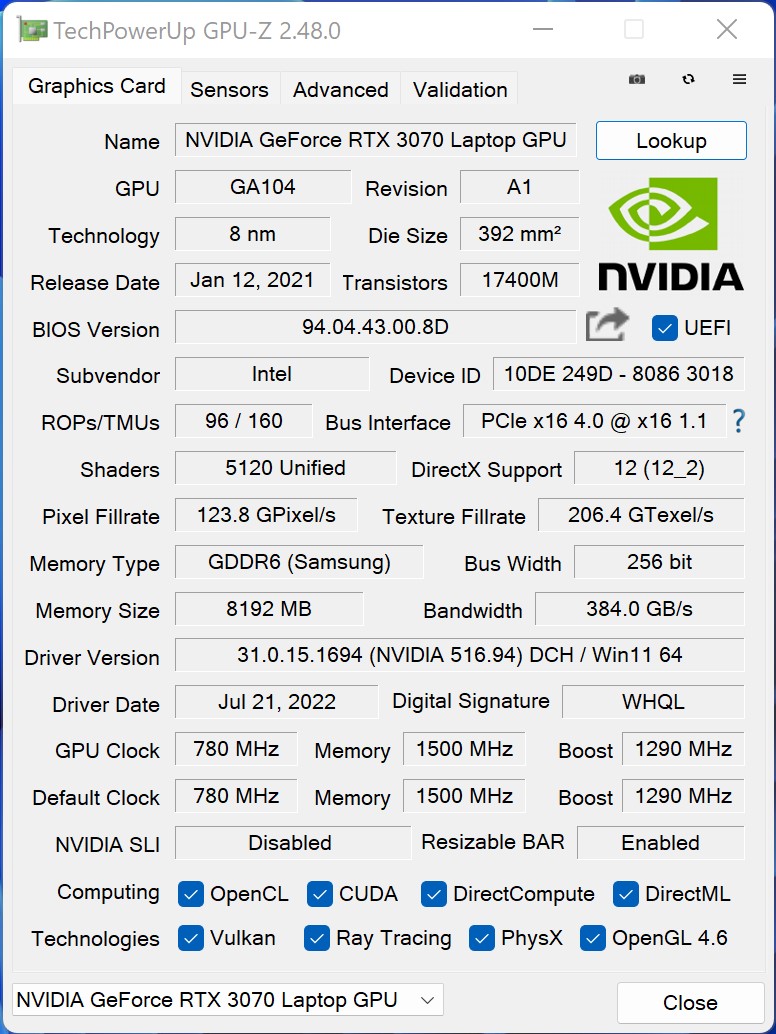
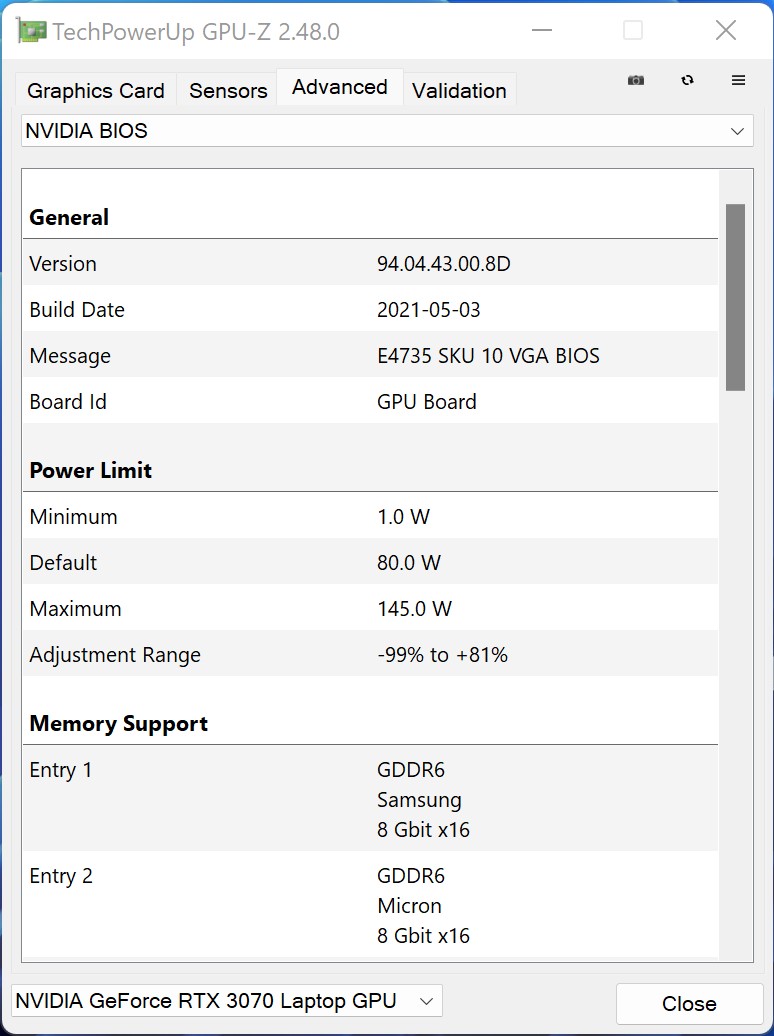
Grafikkarte
Die Nvidia GeForce RTX 3070 Laptop GPU werkelt in dem Minisforum NUCXi7 und kann im Gaming-Mode die volle Leistung von 125 Watt abrufen. Dennoch muss man bedenken, dass es sich hierbei um den mobilen Ableger der GeForce RTX 3070 handelt und die Leistung nicht an die Desktop-Version heranreicht. Etwa 25 bis 30 Prozent ist die Nvidia GeForce RTX 3070 Laptop GPU langsamer als eine Nvidia GeForce RTX 3070 Desktop GPU. Die Kontrahenten auf Basis einer Nvidia GeForce RTX 3060 Desktop GPU hat unser Testsample aber sehr gut im Griff. Um die ungefähre Leistung des Minisforum NUCXi5 abzubilden, haben wir auch einmal die durchschnittlichen Leistungswerte der Nvidia GeForce RTX 3060 Laptop GPU mit einfließen lassen.
Weitere Benchmarks zu der Nvidia GeForce RTX 3070 finden Sie hier.
| 3DMark 05 Standard | 46264 Punkte | |
| 3DMark 06 Standard Score | 47138 Punkte | |
| 3DMark Vantage P Result | 76594 Punkte | |
| 3DMark 11 Performance | 27592 Punkte | |
| 3DMark Ice Storm Standard Score | 218821 Punkte | |
| 3DMark Cloud Gate Standard Score | 53894 Punkte | |
| 3DMark Fire Strike Score | 21258 Punkte | |
| 3DMark Fire Strike Extreme Score | 11291 Punkte | |
| 3DMark Time Spy Score | 9337 Punkte | |
| 3DMark Steel Nomad Score | 2368 Punkte | |
| 3DMark Steel Nomad Light Score | 10548 Punkte | |
Hilfe | ||
Gaming Performance
Als Gaming-PC eignet sich der Minisforum NUCXi7 erstaunlich gut: Die Systemleistung reicht für 1.440p Gaming in den meisten Fällen aus. Hin und wieder kann man der Nvidia GeForce RTX 3070 Laptop GPU auch 2.160p zumuten, wenn das Spiel nicht zu hardwarefordernd ist. Erstaunlich ist jedoch die dokumentierte Gaming-Leistung hier im Vergleich. Oftmals kann unser Testsample mit den Vergleichsgeräten auf Basis der schnelleren Desktop-GPUs mithalten oder sogar besser abschneiden.
Für einen Überblick über die Leistung aller getesteten Spiele im Vergleich zu anderen Modellen verweisen wir auf unsere GPU-Spieleliste.
| GTA V | |
| 1920x1080 Highest AA:4xMSAA + FX AF:16x | |
| Minisforum NUCX i7 | |
| Zotac ZBOX Magnus EN173070C | |
| Intel Beast Canyon NUC | |
| Intel Dragon Canyon NUC - RTX 3060 | |
| Zotac Magnus One (ECM73070C) | |
| Durchschnittliche NVIDIA GeForce RTX 3070 Laptop GPU (21.7 - 125.8, n=50) | |
| Gigabyte A7 X1 | |
| 1920x1080 High/On (Advanced Graphics Off) AA:2xMSAA + FX AF:8x | |
| Intel Beast Canyon NUC | |
| Intel Dragon Canyon NUC - RTX 3060 | |
| Minisforum NUCX i7 | |
| Zotac ZBOX Magnus EN173070C | |
| Zotac Magnus One (ECM73070C) | |
| Durchschnittliche NVIDIA GeForce RTX 3070 Laptop GPU (58.2 - 181.4, n=38) | |
| Gigabyte A7 X1 | |
| The Witcher 3 | |
| 1920x1080 High Graphics & Postprocessing (Nvidia HairWorks Off) | |
| Zotac Magnus One (ECM73070C) | |
| Minisforum NUCX i7 | |
| Zotac ZBOX Magnus EN173070C | |
| Intel Dragon Canyon NUC - RTX 3060 | |
| Zotac MEK Mini (RTX 2070 Super) | |
| Durchschnittliche NVIDIA GeForce RTX 3070 Laptop GPU (122.1 - 207, n=34) | |
| 1920x1080 Ultra Graphics & Postprocessing (HBAO+) | |
| Zotac Magnus One (ECM73070C) | |
| Zotac ZBOX Magnus EN173070C | |
| Minisforum NUCX i7 | |
| Gigabyte A7 X1 | |
| Zotac MEK Mini (RTX 2070 Super) | |
| Durchschnittliche NVIDIA GeForce RTX 3070 Laptop GPU (34.9 - 109, n=52) | |
| Intel Dragon Canyon NUC - RTX 3060 | |
| F1 2020 | |
| 2560x1440 Ultra High Preset AA:T AF:16x | |
| Minisforum NUCX i7 | |
| Zotac ZBOX Magnus EN173070C | |
| Intel Beast Canyon NUC | |
| Intel Dragon Canyon NUC - RTX 3060 | |
| Durchschnittliche NVIDIA GeForce RTX 3070 Laptop GPU (74 - 123.7, n=4) | |
| 1920x1080 Ultra High Preset AA:T AF:16x | |
| Minisforum NUCX i7 | |
| Zotac ZBOX Magnus EN173070C | |
| Intel Beast Canyon NUC | |
| Intel Dragon Canyon NUC - RTX 3060 | |
| Durchschnittliche NVIDIA GeForce RTX 3070 Laptop GPU (97 - 173, n=7) | |
| min. | mittel | hoch | max. | QHD DLSS | QHD | 4K DLSS | 4K FSR | 4K | |
|---|---|---|---|---|---|---|---|---|---|
| GTA V (2015) | 184.7 | 179.4 | 171.5 | 106 | 90.6 | 85.6 | |||
| The Witcher 3 (2015) | 417 | 315 | 204 | 104.1 | 71.6 | ||||
| Dota 2 Reborn (2015) | 169.9 | 151.2 | 145.8 | 135.6 | 124.3 | ||||
| Rise of the Tomb Raider (2016) | 293 | 206 | 138.7 | 122 | 56.9 | ||||
| Final Fantasy XV Benchmark (2018) | 187.3 | 135.9 | 103.3 | 76.7 | 45.6 | ||||
| X-Plane 11.11 (2018) | 143.2 | 125.9 | 94.8 | 81.5 | |||||
| Far Cry 5 (2018) | 157 | 134 | 127 | 119 | 99 | 55 | |||
| Strange Brigade (2018) | 501 | 265 | 213 | 184.7 | 137.3 | 78.6 | |||
| Shadow of the Tomb Raider (2018) | 167.7 | 143.5 | 134.3 | 123.1 | 88.6 | 48 | |||
| Forza Horizon 4 (2018) | 211 | 189 | 188 | 167 | 140 | 93 | |||
| Far Cry New Dawn (2019) | 133 | 115 | 112 | 100 | 91 | 58 | |||
| Metro Exodus (2019) | 185 | 120.8 | 93.1 | 74.6 | 59.9 | 37.6 | |||
| Anno 1800 (2019) | 143.6 | 132.6 | 109.8 | 56.7 | 48.2 | 32.1 | |||
| Control (2019) | 240 | 131.7 | 96.1 | 61 | 30.3 | ||||
| Borderlands 3 (2019) | 141.9 | 124.9 | 101 | 84.7 | 62.6 | 34.8 | |||
| F1 2020 (2020) | 333 | 273 | 230 | 166.2 | 123.7 | 69.7 | |||
| Watch Dogs Legion (2020) | 114 | 106 | 96 | 73 | 64 | 27 | |||
| Dirt 5 (2020) | 210 | 147 | 114 | 91 | 73 | 49 | |||
| F1 2021 (2021) | 381 | 303 | 244 | 123.1 | 90.2 | 51.1 | |||
| New World (2021) | 115.7 | 95.2 | 89.1 | 84.2 | 67.5 | 35.7 | |||
| Far Cry 6 (2021) | 139.1 | 120 | 106.5 | 102.3 | 78.6 | ||||
| Forza Horizon 5 (2021) | 206 | 145 | 132 | 81 | 70 | 50 | |||
| God of War (2022) | 128.1 | 111 | 91.5 | 67.7 | 57.4 | 37 | |||
| GRID Legends (2022) | 147 | 163 | 153 | 122 | 81 | 56 | |||
| Cyberpunk 2077 1.6 (2022) | 145.6 | 129.2 | 113.9 | 72.3 | 47.3 | 22.3 | |||
| Tiny Tina's Wonderlands (2022) | 194.1 | 158.8 | 111.6 | 88.3 | 62.1 | 33.6 | |||
| F1 22 (2022) | 239 | 208 | 172.1 | 61.9 | 39.7 | 19.1 | |||
| A Plague Tale Requiem (2022) | 107.9 | 84.8 | 66.2 | 50.1 | 36.3 | 20.4 | |||
| Uncharted Legacy of Thieves Collection (2022) | 83.4 | 80.6 | 76.8 | 73.7 | 56.4 | 21.9 | |||
| Call of Duty Modern Warfare 2 2022 (2022) | 129 | 117 | 90 | 87 | 62 | 58 | 37 | ||
| Spider-Man Miles Morales (2022) | 124.8 | 114.7 | 111.3 | 100.4 | 66.6 | 44.6 | |||
| The Callisto Protocol (2022) | 124.9 | 105.2 | 100.2 | 72.5 | 53.2 | 30.8 | |||
| Need for Speed Unbound (2022) | 116.8 | 108.2 | 92.7 | 89.7 | 78.1 | 44.8 | |||
| High On Life (2023) | 216 | 157 | 124.3 | 103 | 65.5 | 27.6 | |||
| The Witcher 3 v4 (2023) | 161.1 | 151.2 | 128.4 | 112.6 | 81.9 | 46.5 | |||
| Dead Space Remake (2023) | 87.7 | 83.9 | 73.3 | 73.6 | 53.8 | 27.5 | |||
| Hogwarts Legacy (2023) | 97.1 | 88.4 | 72.4 | 59.1 | 47 | 26.7 | |||
| Returnal (2023) | 104 | 101 | 93 | 79 | 59 | 34 | |||
| Atomic Heart (2023) | 186.7 | 143.9 | 88.5 | 69.8 | 53.8 | 32.5 | |||
| Company of Heroes 3 (2023) | 193.5 | 167.4 | 134.3 | 133.9 | 100.8 | 58.4 | |||
| Sons of the Forest (2023) | 80.4 | 75.8 | 72.8 | 72.5 | 57.7 | 37.8 | |||
| Resident Evil 4 Remake (2023) | 140 | 103.1 | 96.7 | 67.6 | 52.6 | 30.5 | |||
| The Last of Us (2023) | 96.6 | 82.2 | 71.6 | 56.9 | 36.6 | 31 | 16.5 | ||
| Dead Island 2 (2023) | 209 | 205 | 164.3 | 126.1 | 89.9 | 45.1 | |||
| Star Wars Jedi Survivor (2023) | 81.1 | 72.3 | 67.4 | 64.2 | 40.5 | 19.8 | |||
| Diablo 4 (2023) | 250 | 197.9 | 164.1 | 155.6 | 111.2 | 57.3 | |||
| Ratchet & Clank Rift Apart (2023) | 87.6 | 75.7 | 66.8 | 63.5 | 61.7 | 51.3 | |||
| Atlas Fallen (2023) | 144.5 | 135 | 127 | 106.8 | 42.6 | 75.9 | |||
| Immortals of Aveum (2023) | 62.4 | 51.2 | 41.7 | 28.2 | 15.9 | ||||
| Armored Core 6 (2023) | 104.3 | 102.4 | 101.1 | 96.3 | 76.6 | 44.6 | |||
| Starfield (2023) | 73.5 | 64 | 51.6 | 47.1 | 32.5 | 23.1 | |||
| Lies of P (2023) | 160.7 | 152 | 130.2 | 117.1 | 80.2 | 65 | 41.6 | ||
| Baldur's Gate 3 (2023) | 163.1 | 121.6 | 102 | 86.7 | 84.7 | 30.3 | |||
| Cyberpunk 2077 (2023) | 122.9 | 99.3 | 84.8 | 75 | 46.9 | 20.9 | |||
| Counter-Strike 2 (2023) | 241 | 230 | 193.8 | 149.5 | 105.9 | 63.3 | |||
| EA Sports FC 24 (2023) | 249 | 199.3 | 161.7 | 151.4 | 129 | 79.5 | |||
| Assassin's Creed Mirage (2023) | 114 | 106 | 101 | 79 | 64 | 52 | 41 | ||
| Total War Pharaoh (2023) | 329.3 | 205.4 | 127.1 | 99.1 | 78.3 | 42.5 | |||
| Lords of the Fallen (2023) | 68 | 68.1 | 65.2 | 53.9 | 54.6 | 26.1 | 34 | ||
| Alan Wake 2 (2023) | 67 | 61.2 | 53.2 | 33.6 | 14.1 | ||||
| EA Sports WRC (2023) | 130.8 | 98.1 | 90.7 | 83.4 | 63.2 | 52.5 | 35.5 | ||
| Call of Duty Modern Warfare 3 2023 (2023) | 146 | 129 | 101 | 83 | 67 | 46 | 43 | ||
| Avatar Frontiers of Pandora (2023) | 76 | 72 | 61 | 46 | 31 | 28 | 16 | ||
| The Finals (2023) | 222 | 181.7 | 160.6 | 127.2 | 80.2 | 37.6 | |||
| Ready or Not (2023) | 210 | 189.1 | 174.8 | 131.3 | 82 | 75.1 | 37.2 | ||
| Prince of Persia The Lost Crown (2024) | 356 | 356 | 356 | 340 | 178 | ||||
| Palworld (2024) | 116.7 | 106.1 | 103 | 102.1 | 72.9 | 54.9 | 38.7 | ||
| Enshrouded (2024) | 80.3 | 68.8 | 58.8 | 49.2 | 38 | 34 | 32.8 | 22.8 | |
| Helldivers 2 (2024) | 130 | 101 | 91.3 | 89.5 | 65.6 | 35.3 | |||
| Skull & Bones (2024) | 112 | 103 | 84 | 63 | 50 | 46 | 43 | 31 | |
| Last Epoch (2024) | 192.2 | 184.2 | 167.2 | 127.3 | 83.6 | 40.7 | |||
| Alone in the Dark (2024) | 172.9 | 156.8 | 149.9 | 102.4 | 51.5 | 36.7 | 53.1 | 16.1 | |
| Dragon's Dogma 2 (2024) | 54.2 | 52.7 | 49.3 | 38.7 | 37.5 | 33.9 | |||
| Horizon Forbidden West (2024) | 104.2 | 96.2 | 62.7 | 60.5 | 47 | 42.2 | 38.8 | 29.3 | |
| Ghost of Tsushima (2024) | 88.6 | 80.7 | 74.5 | 60.3 | 63 | 48.3 | 8.5 | 4.8 | |
| Senua's Saga Hellblade 2 (2024) | 60.9 | 52.5 | 38.4 | 39.2 | 26.1 | 24.8 | 9.4 | ||
| F1 24 (2024) | 248 | 234 | 181.7 | 60 | 61.7 | 38.1 | 33 | 18.3 | |
| The First Descendant (2024) | 151.7 | 96.9 | 78.4 | 66.1 | 43.6 | 23.3 | 23.8 | ||
| Once Human (2024) | 184.4 | 126.1 | 108.6 | 99 | 68.2 | 35.6 | |||
| Black Myth: Wukong (2024) | 80 | 60 | 46 | 24 | 27 | 18 | 19 | 10 | |
| Star Wars Outlaws (2024) | 50.2 | 44.9 | 38.1 | 30.9 | 30.8 | 22.2 | |||
| Space Marine 2 (2024) | 77.3 | 71 | 68 | 62 | 61.8 | 46.4 | 38.8 | 24.2 | |
| Final Fantasy XVI (2024) | 69.4 | 66.7 | 56.5 | 49.6 | 40.8 | 36.2 | 17.9 | ||
| God of War Ragnarök (2024) | 127.7 | 107 | 91.4 | 83.1 | 90.6 | 63.2 | 35.6 | ||
| Until Dawn (2024) | 65.3 | 51.5 | 39.1 | 28.1 | 16.1 | ||||
| Call of Duty Black Ops 6 (2024) | 111 | 99 | 72 | 69 | 50 | 31 | |||
| Stalker 2 (2024) | 77.7 | 66.7 | 53.3 | 43.9 | 36.1 | ||||
| Indiana Jones and the Great Circle (2024) | 93.5 | 63 | |||||||
| Kingdom Come Deliverance 2 (2025) | 109 | 84.3 | 69.2 | 50.2 | 49.1 | 35.9 | 23 | 20.1 | |
| Monster Hunter Wilds (2025) | 60.2 | 51.1 | 30.5 | 31.1 | 24.6 | ||||
| Civilization 7 (2025) | 292 | 174.7 | 122.3 | 79.9 | 34.9 | ||||
| Assassin's Creed Shadows (2025) | 54 | 45 | 39 | 24 | 23 | ||||
| The Elder Scrolls IV Oblivion Remastered (2025) | 80.4 | 70.4 | 47.9 | 23.7 | 25.8 | 14.2 | |||
| Doom: The Dark Ages (2025) | 68 | 60.2 | 54.7 | 52.6 | 49.9 | 33.1 | |||
| F1 25 (2025) | 185.3 | 167.5 | 138.1 | 14.9 | 15.2 | 8.48 | 6.36 | 3.44 |
Emissionen - Gute Kühlung und leise unter Last
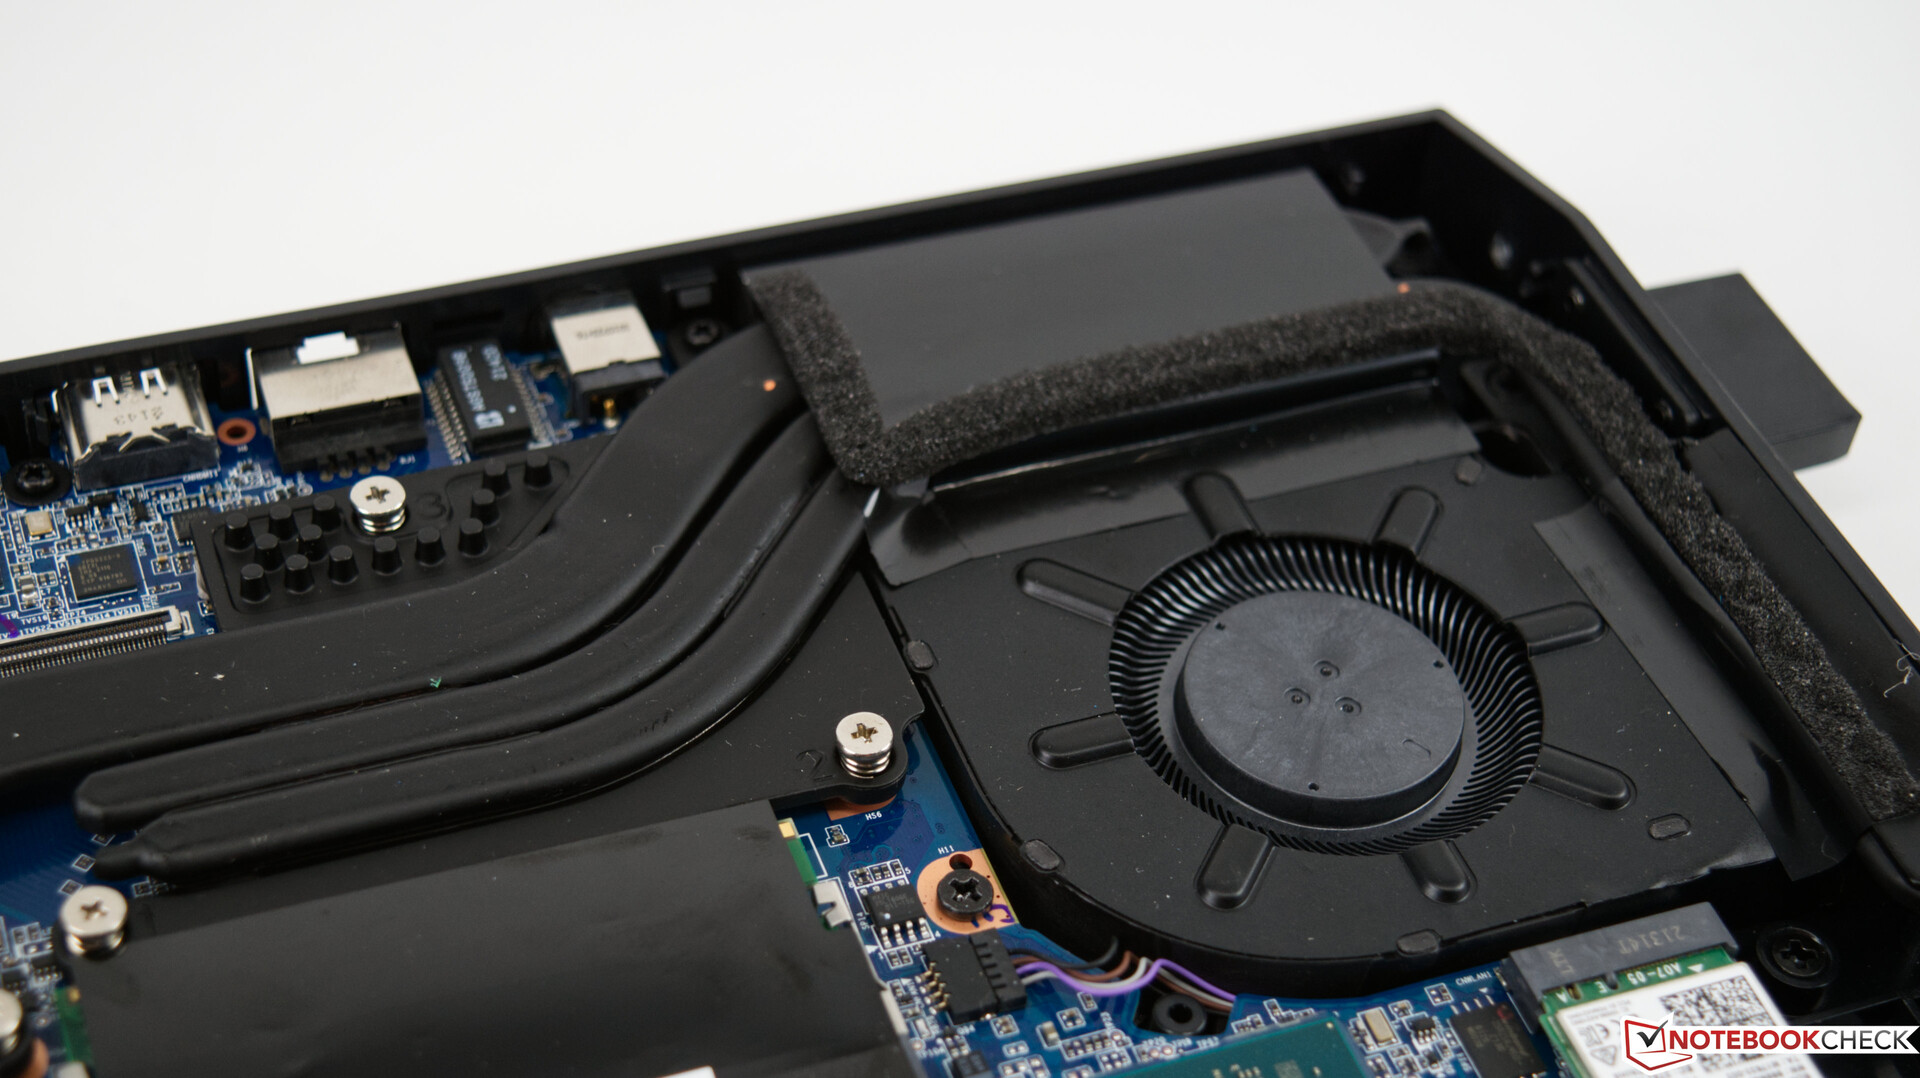
Geräuschemissionen
Die Kühlung des Minisforum NUCXi7 besteht aus fünf Heatpipes und zwei Lüftern, welche im Leerlauf kaum hörbar sind oder sogar komplett stillstehen. Aber auch unter Last wird das Gerät nie richtig laut. Maximal notieren wir 40,8 dB(A).
Lautstärkediagramm
| Idle |
| 29.5 / 29.5 / 29.5 dB(A) |
| Last |
| 32.8 / 40.8 dB(A) |
 | ||
30 dB leise 40 dB(A) deutlich hörbar 50 dB(A) störend |
||
min: | ||
| Minisforum NUCX i7 i7-11800H, GeForce RTX 3070 Laptop GPU | Zotac Magnus One (ECM73070C) i7-10700, GeForce RTX 3070 | Zotac ZBOX Magnus EN173070C i7-11800H, GeForce RTX 3070 Laptop GPU | Intel Dragon Canyon NUC - RTX 3060 i9-12900, GeForce RTX 3060 | |
|---|---|---|---|---|
| Geräuschentwicklung | -18% | -13% | -4% | |
| aus / Umgebung * (dB) | 29.5 | 30 -2% | 30.7 -4% | 30.2 -2% |
| Idle min * (dB) | 29.5 | 33.58 -14% | 32.7 -11% | 30.2 -2% |
| Idle avg * (dB) | 29.5 | 32.8 -11% | 30.4 -3% | |
| Idle max * (dB) | 29.5 | 32.8 -11% | 30.8 -4% | |
| Last avg * (dB) | 32.8 | 44.25 -35% | 41.7 -27% | |
| Last max * (dB) | 40.8 | 48.72 -19% | 45.4 -11% | 45.1 -11% |
* ... kleinere Werte sind besser
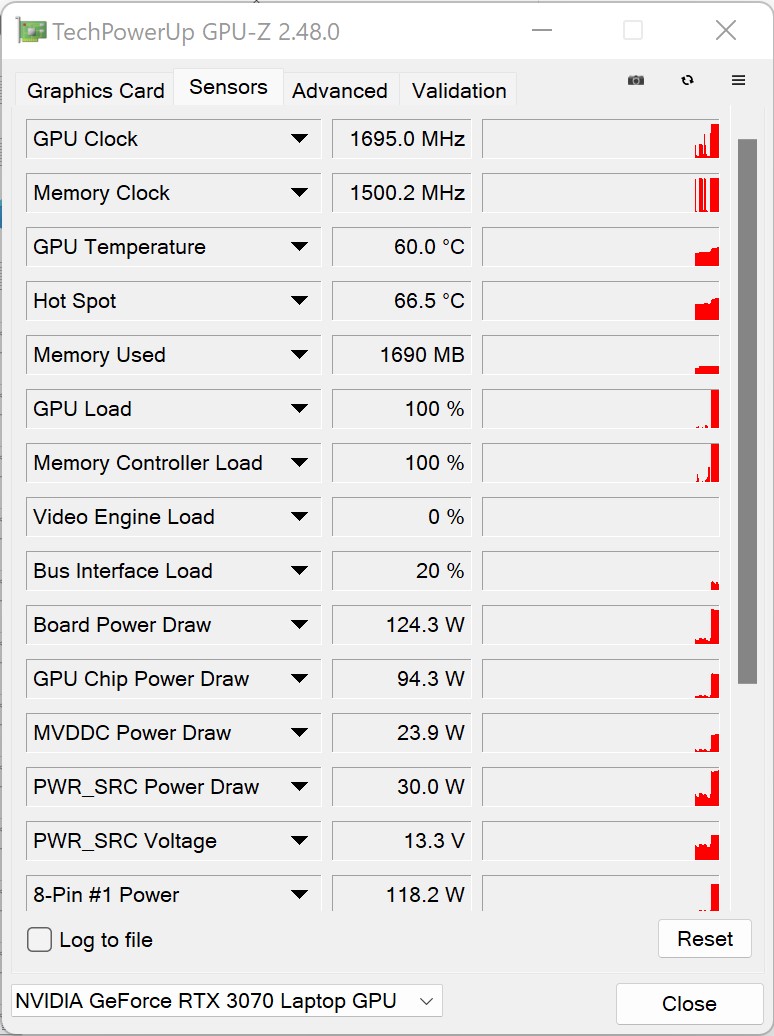
Temperatur
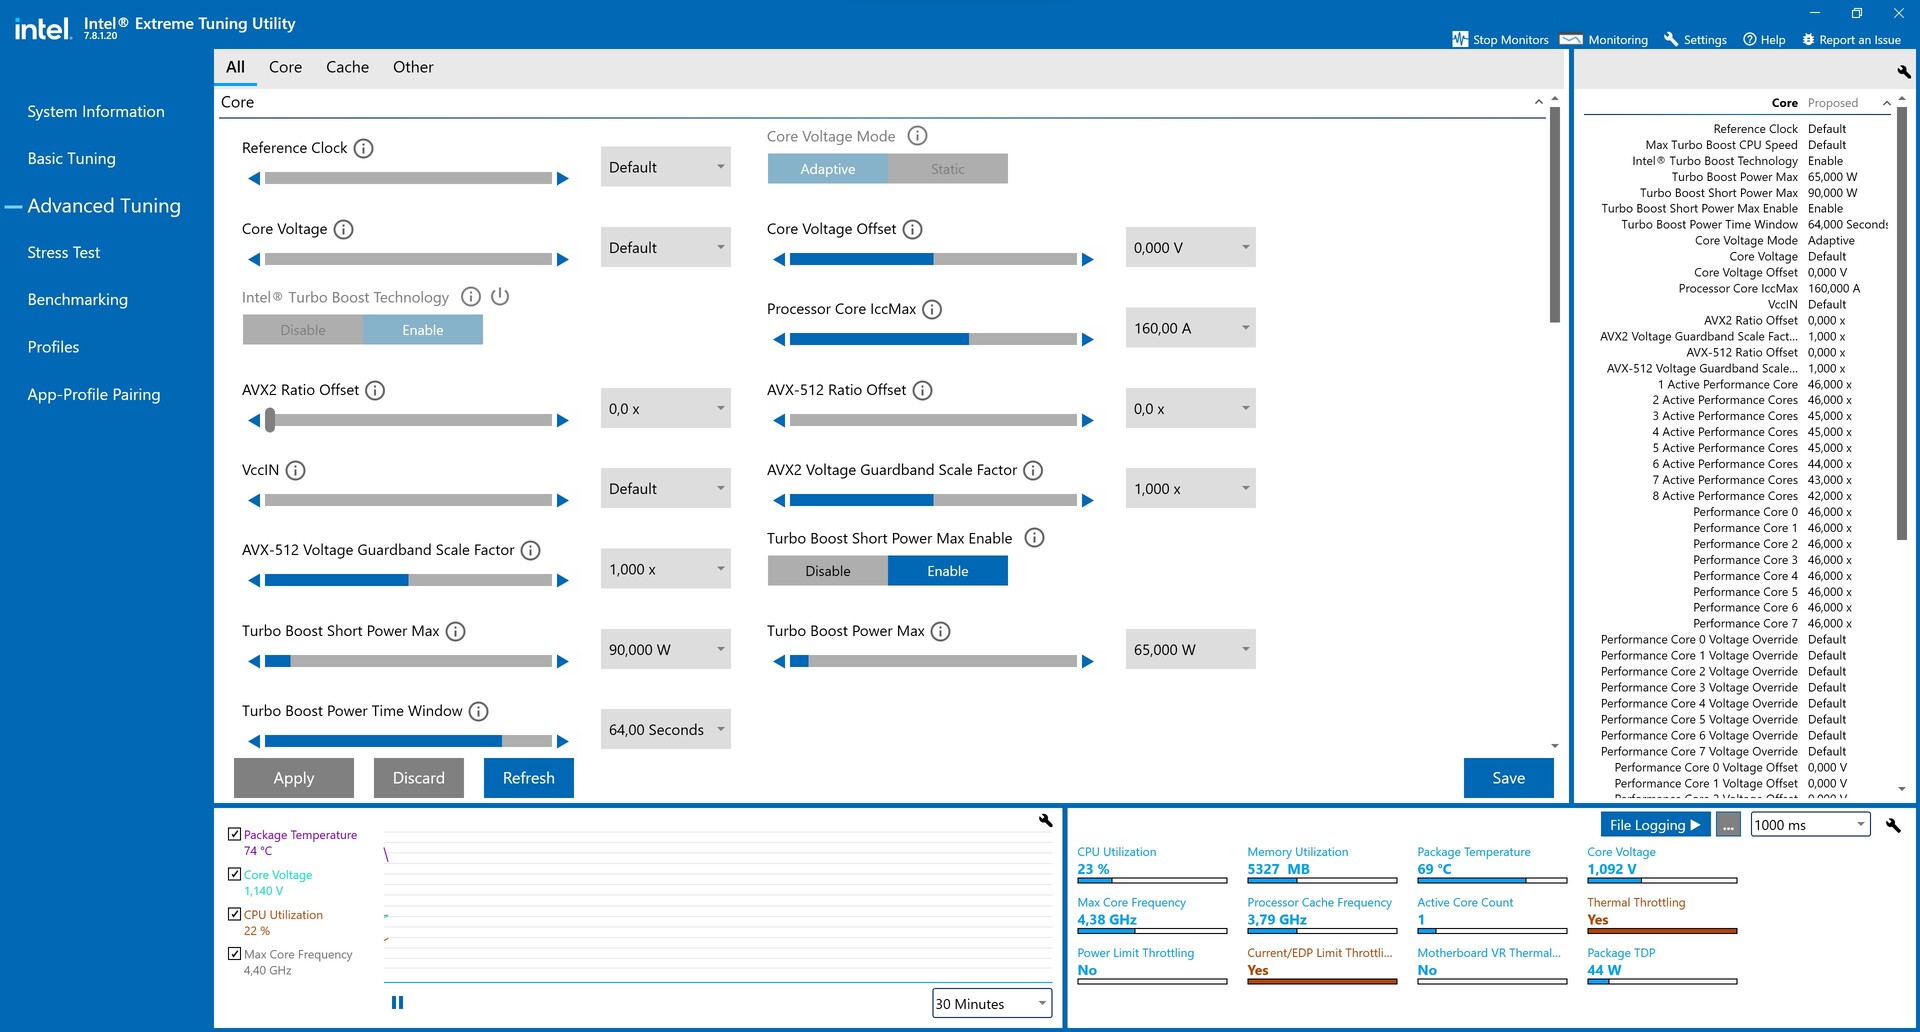
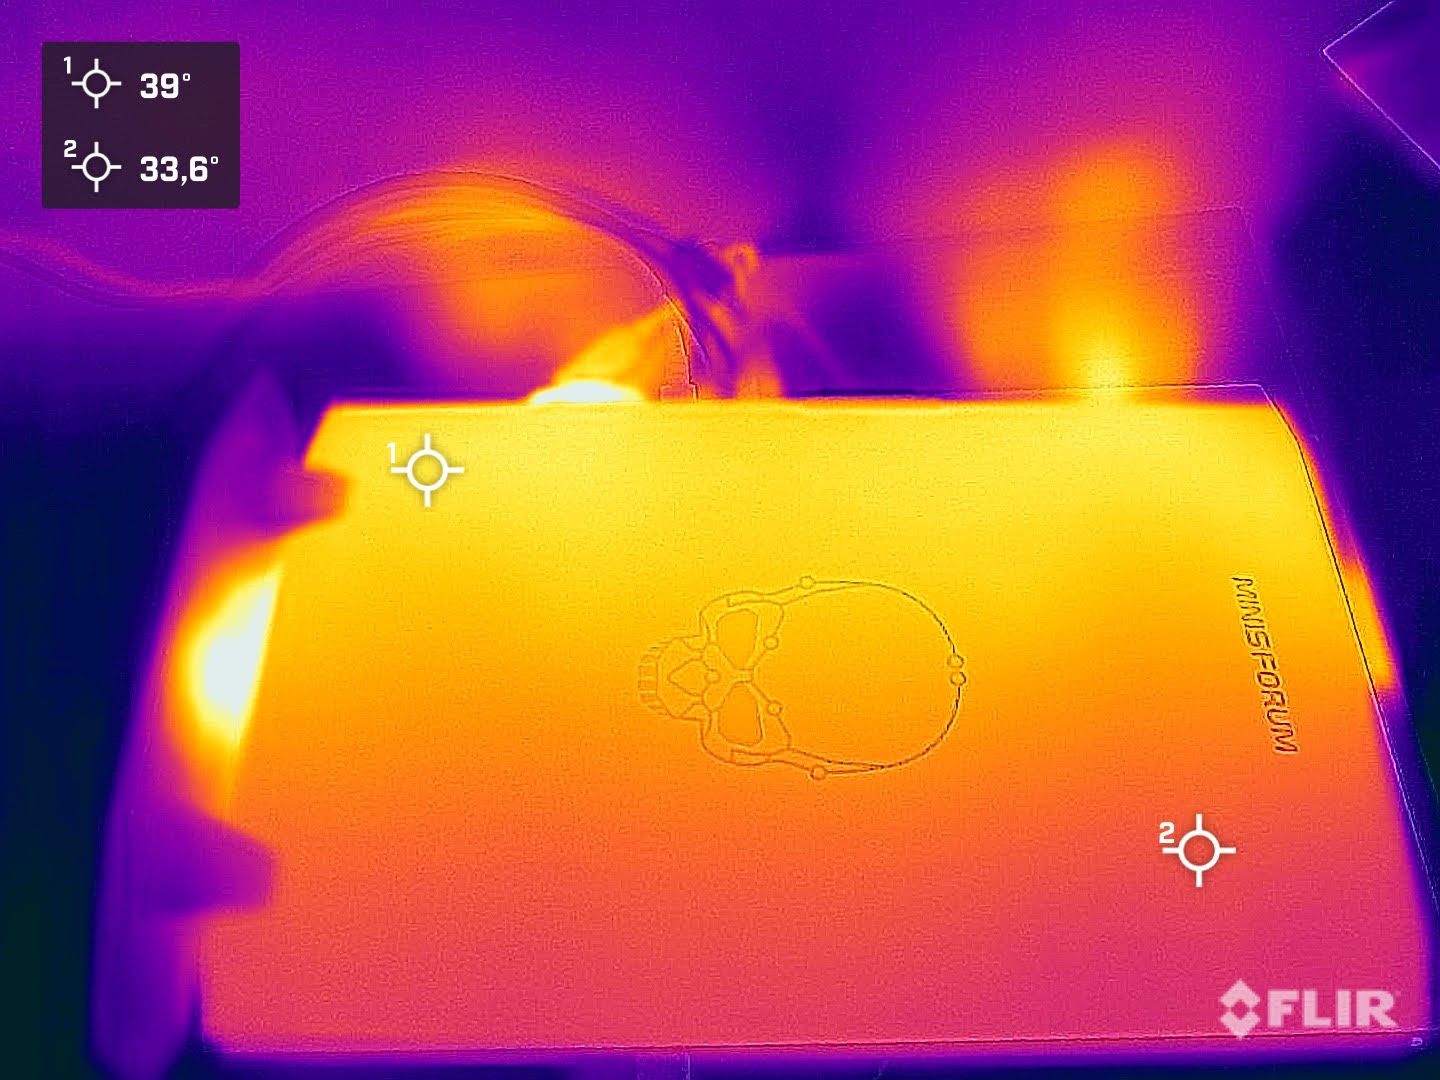
Die Gehäusetemperaturen ähneln aufgrund des Aufbaus sehr denen eines Gaming-Laptops. Mit 45,9 °C messen wir den wärmsten Spot beim Stresstest auf der Sichtseite, die auch das Logo und den Schriftzug trägt. Beim Spielen sind die ermittelten Gehäusetemperaturen etwas geringer.
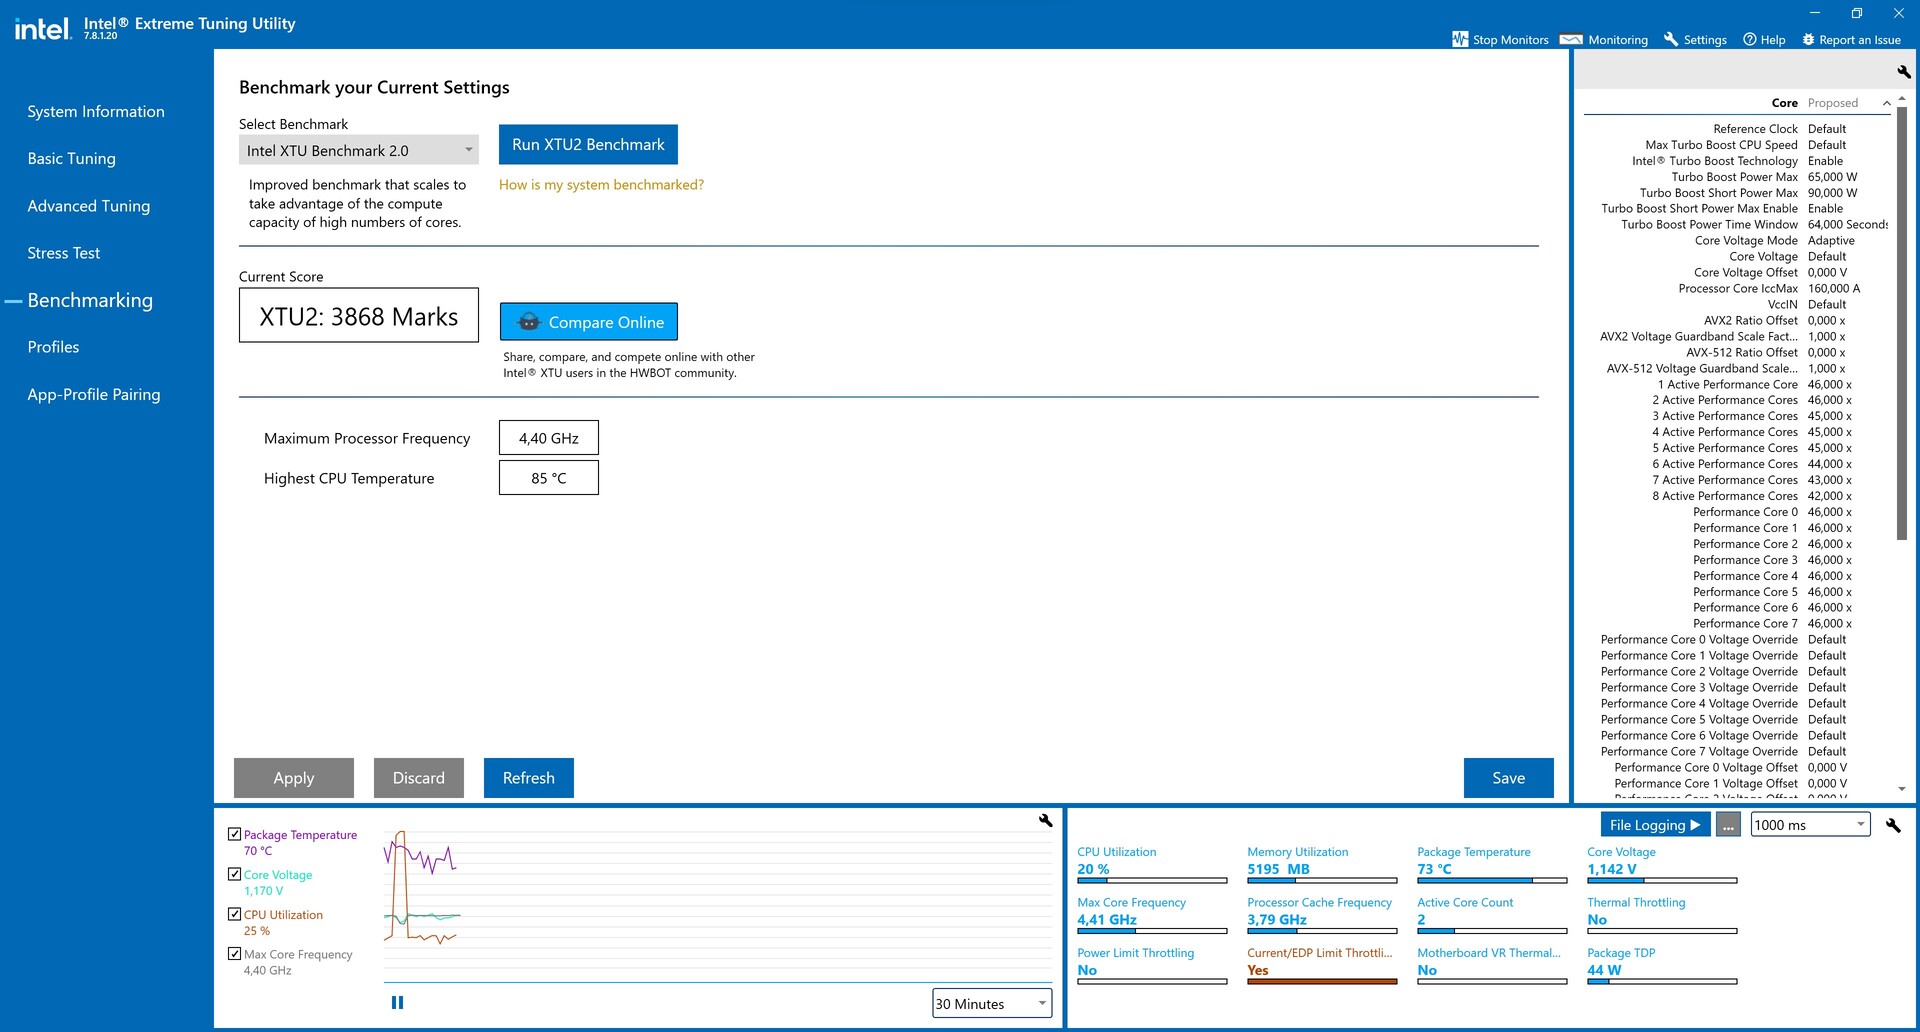
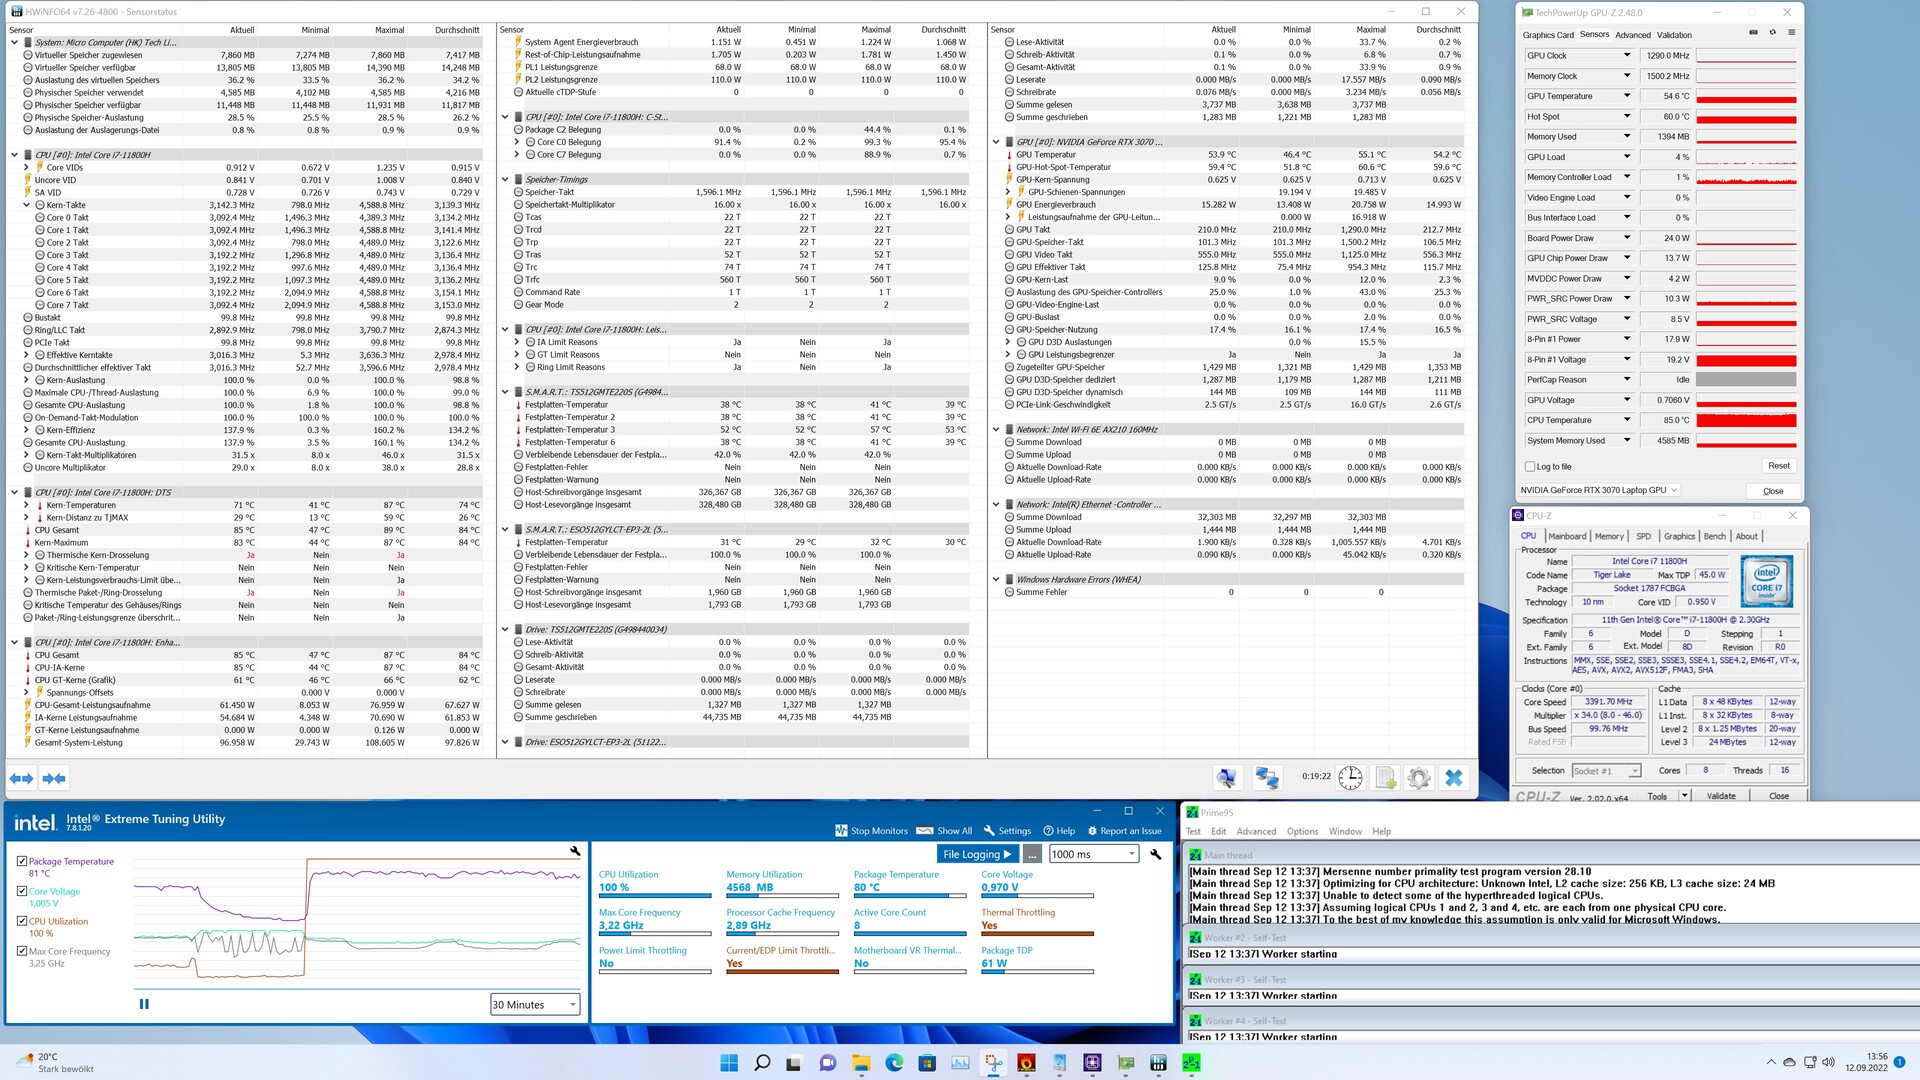
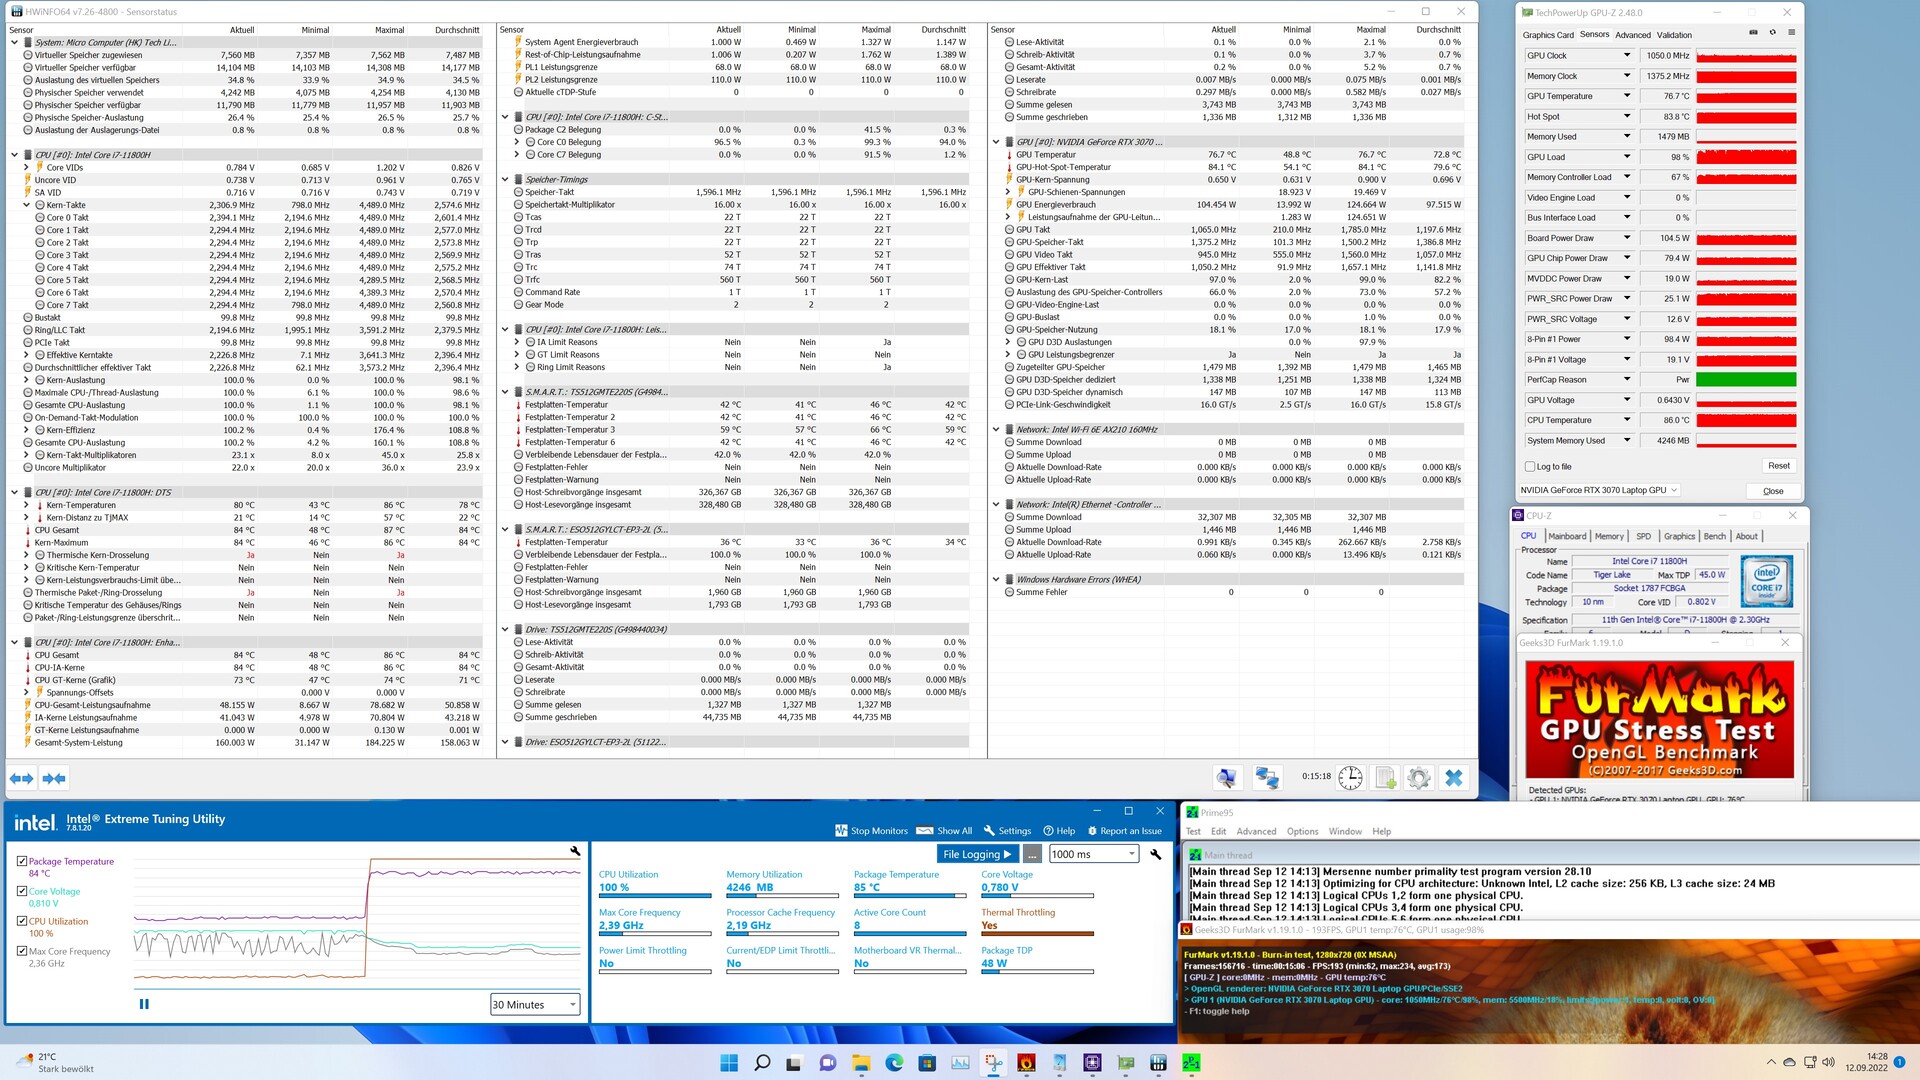
Bei den Komponenten sieht es ebenfalls recht gut aus. Der Intel Core i7-11800H erreicht unter Last 86 °C, wenngleich die Nvidia GeForce RTX 3070 Laptop GPU mit 77 °C beim Stresstest etwas kühler bleibt. Intel XTU meldet uns genauso wie auch HWiNFO Thermal-Throttling unter Last, was uns bestätigt, dass der Hersteller hier eine thermische Grenze beim Prozessor von 85 °C definiert hat. Im BIOS lässt sich diese Grenze für den Prozessor auf 94 °C erhöhen. Für die Grafikkarte gilt hingegen immer das Limit von 87 °C.
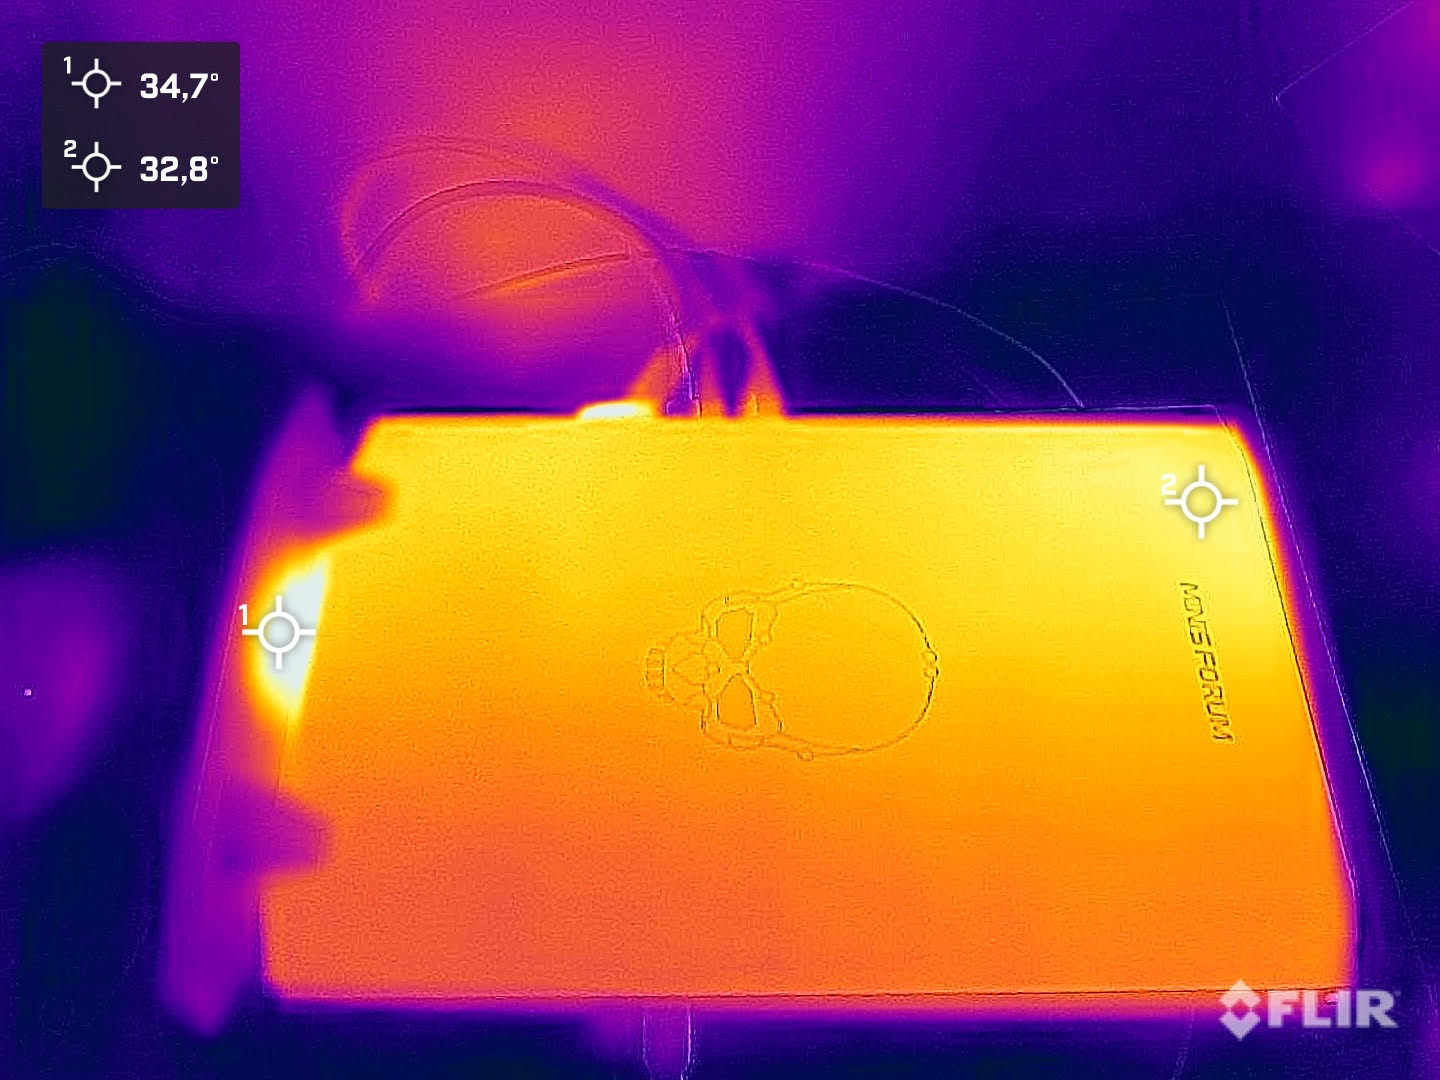
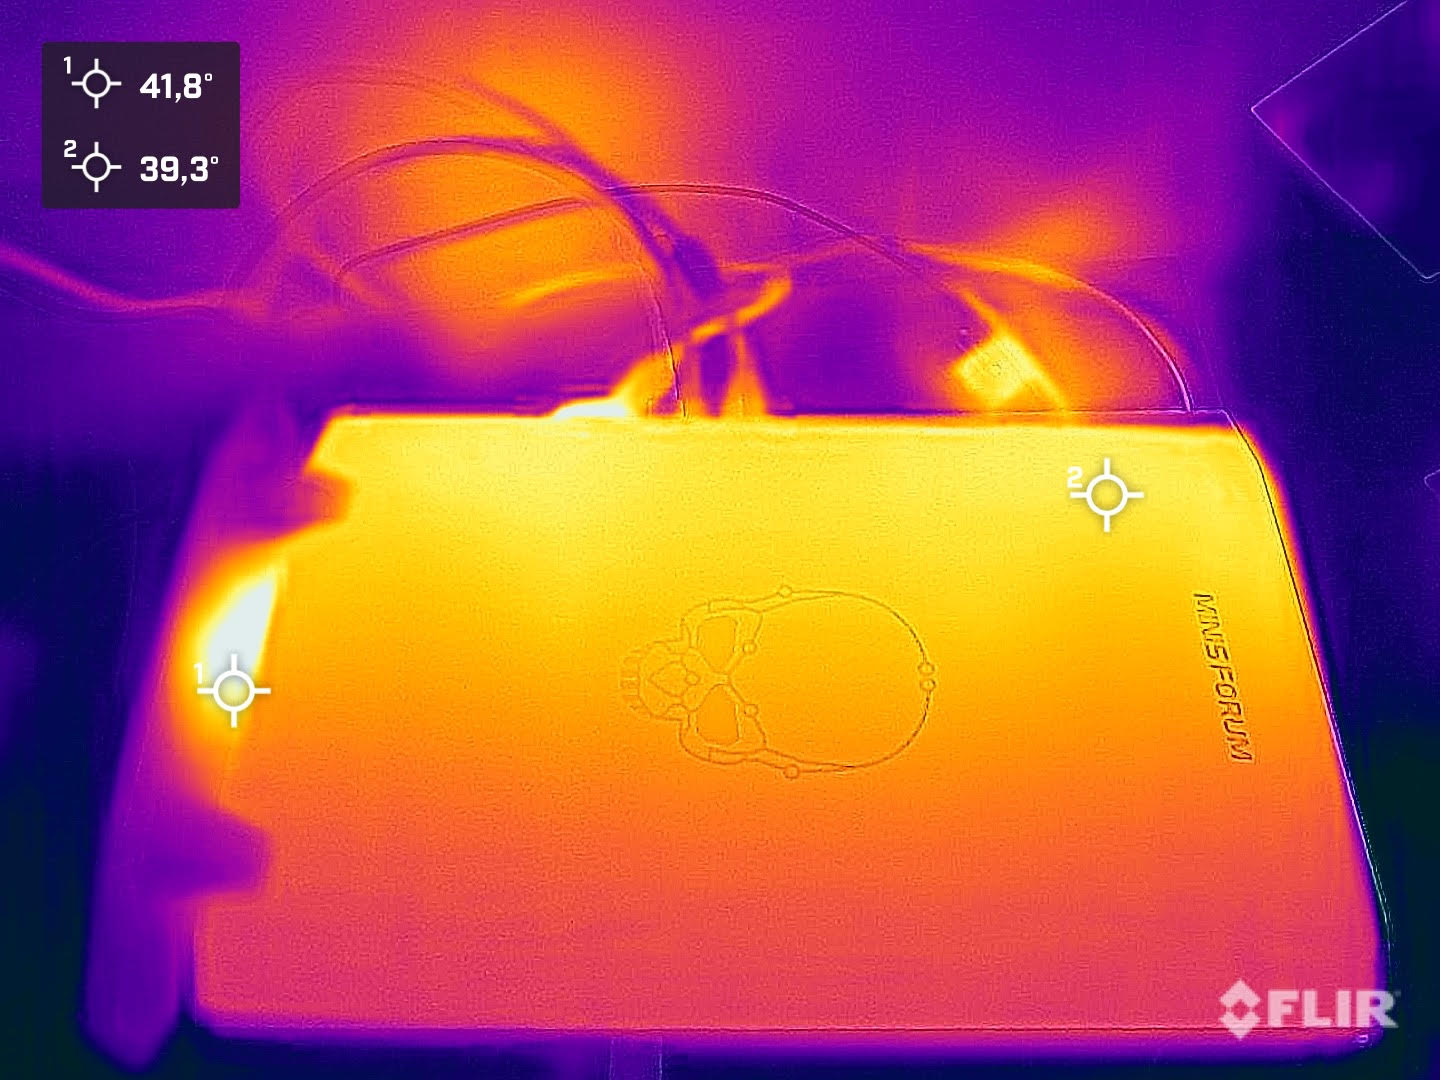
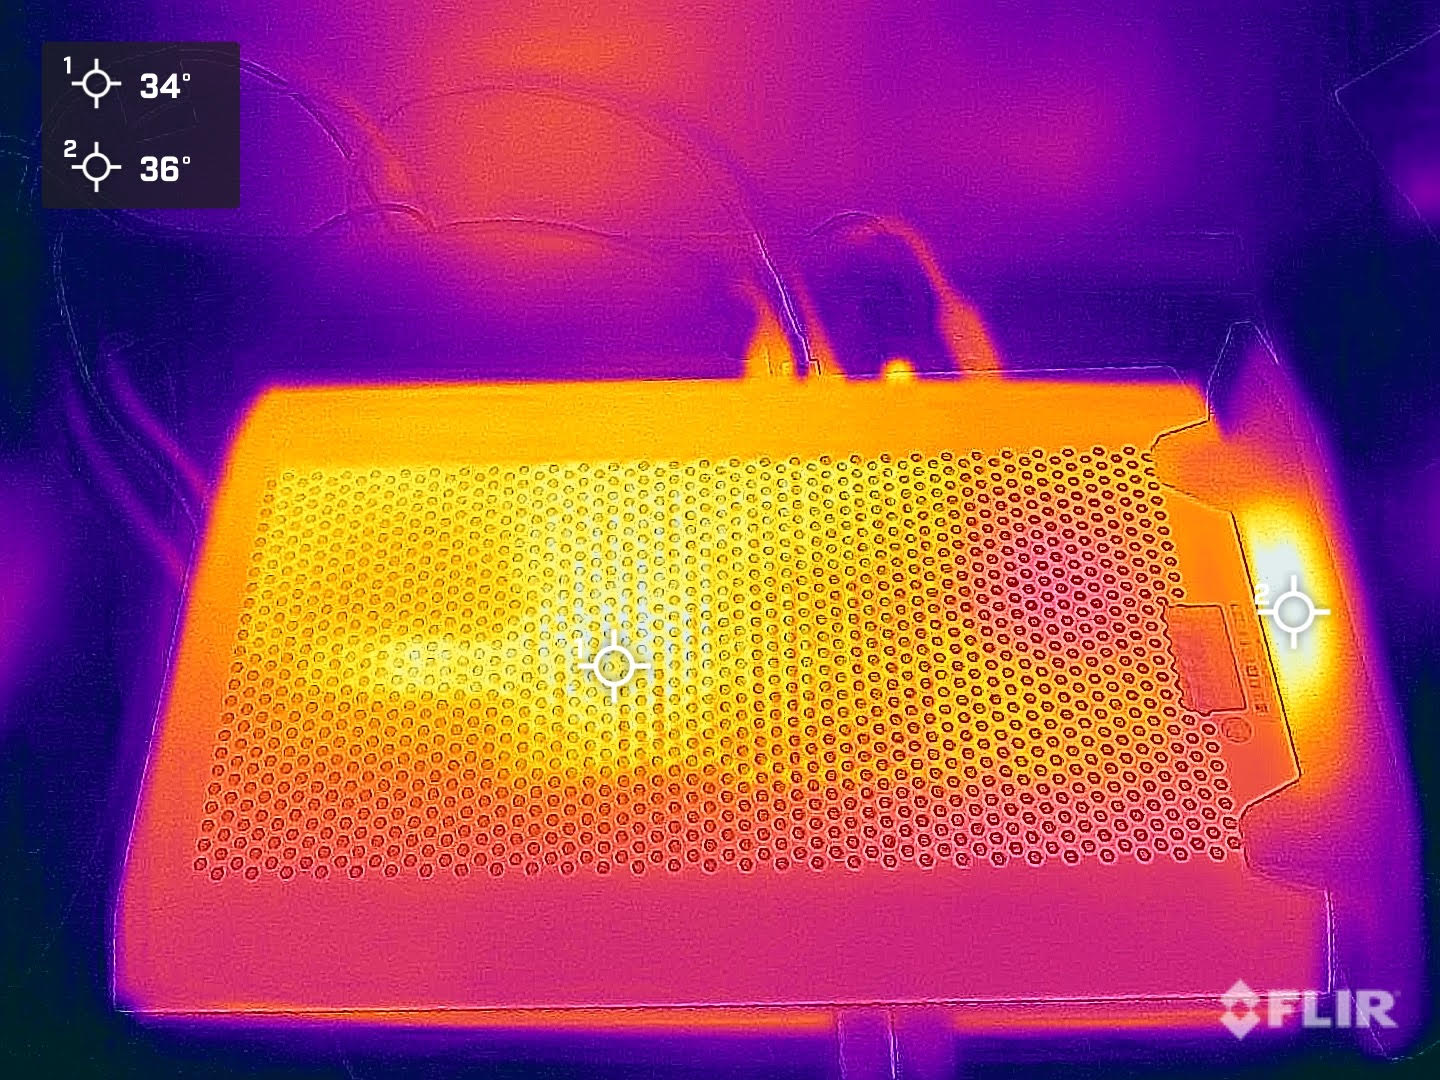
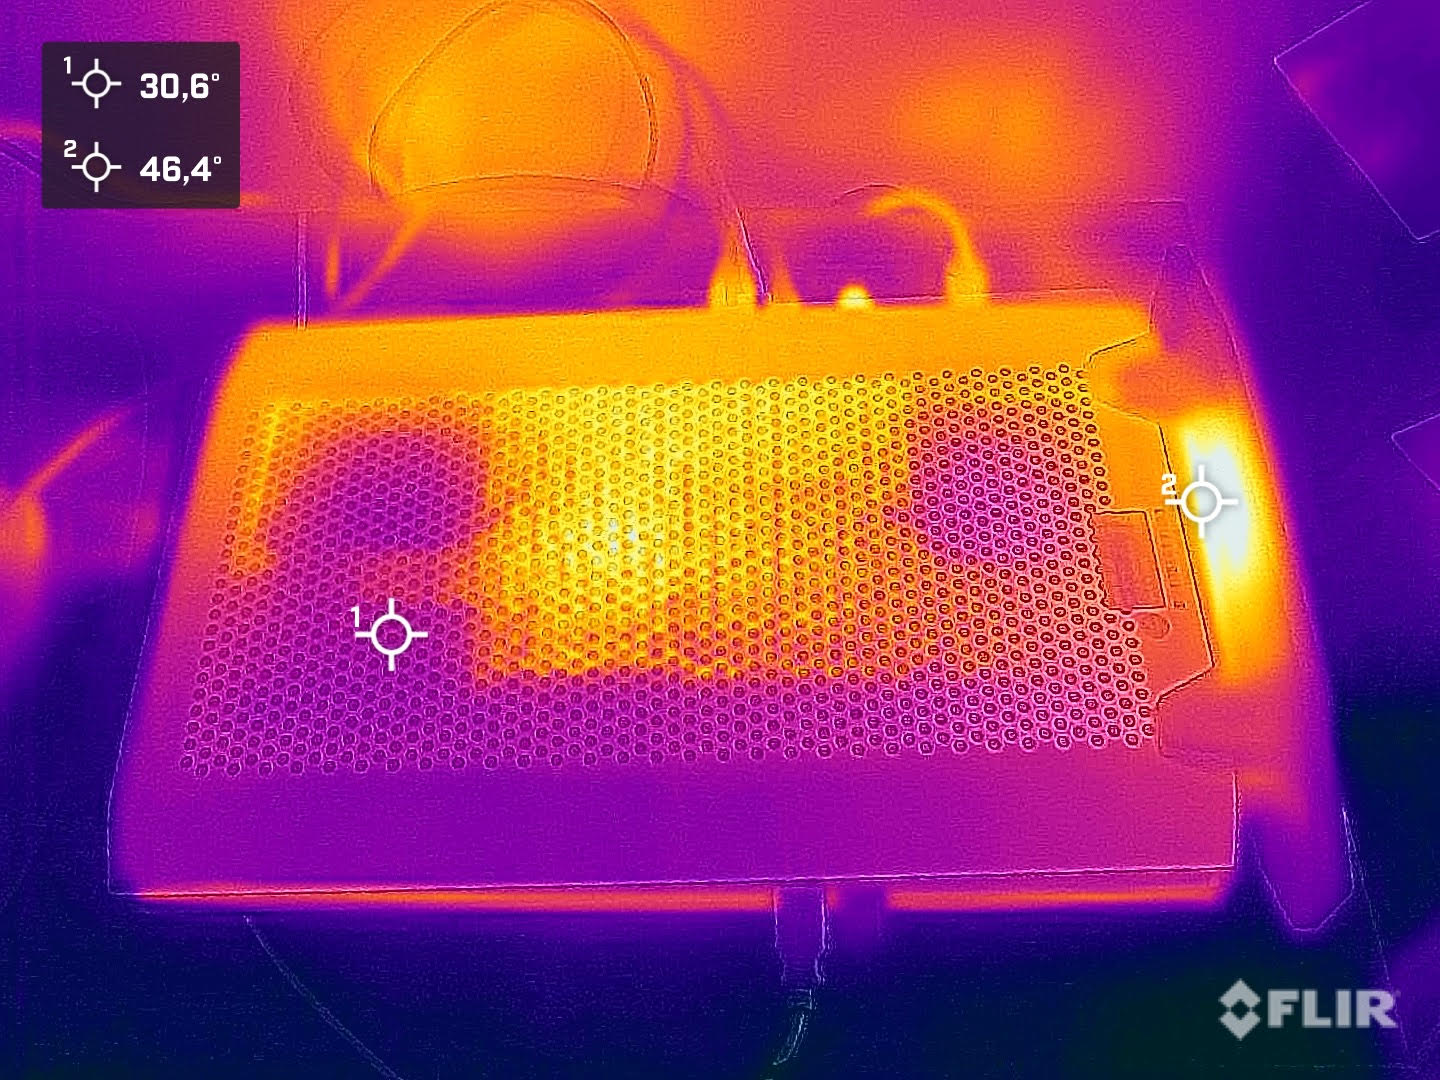
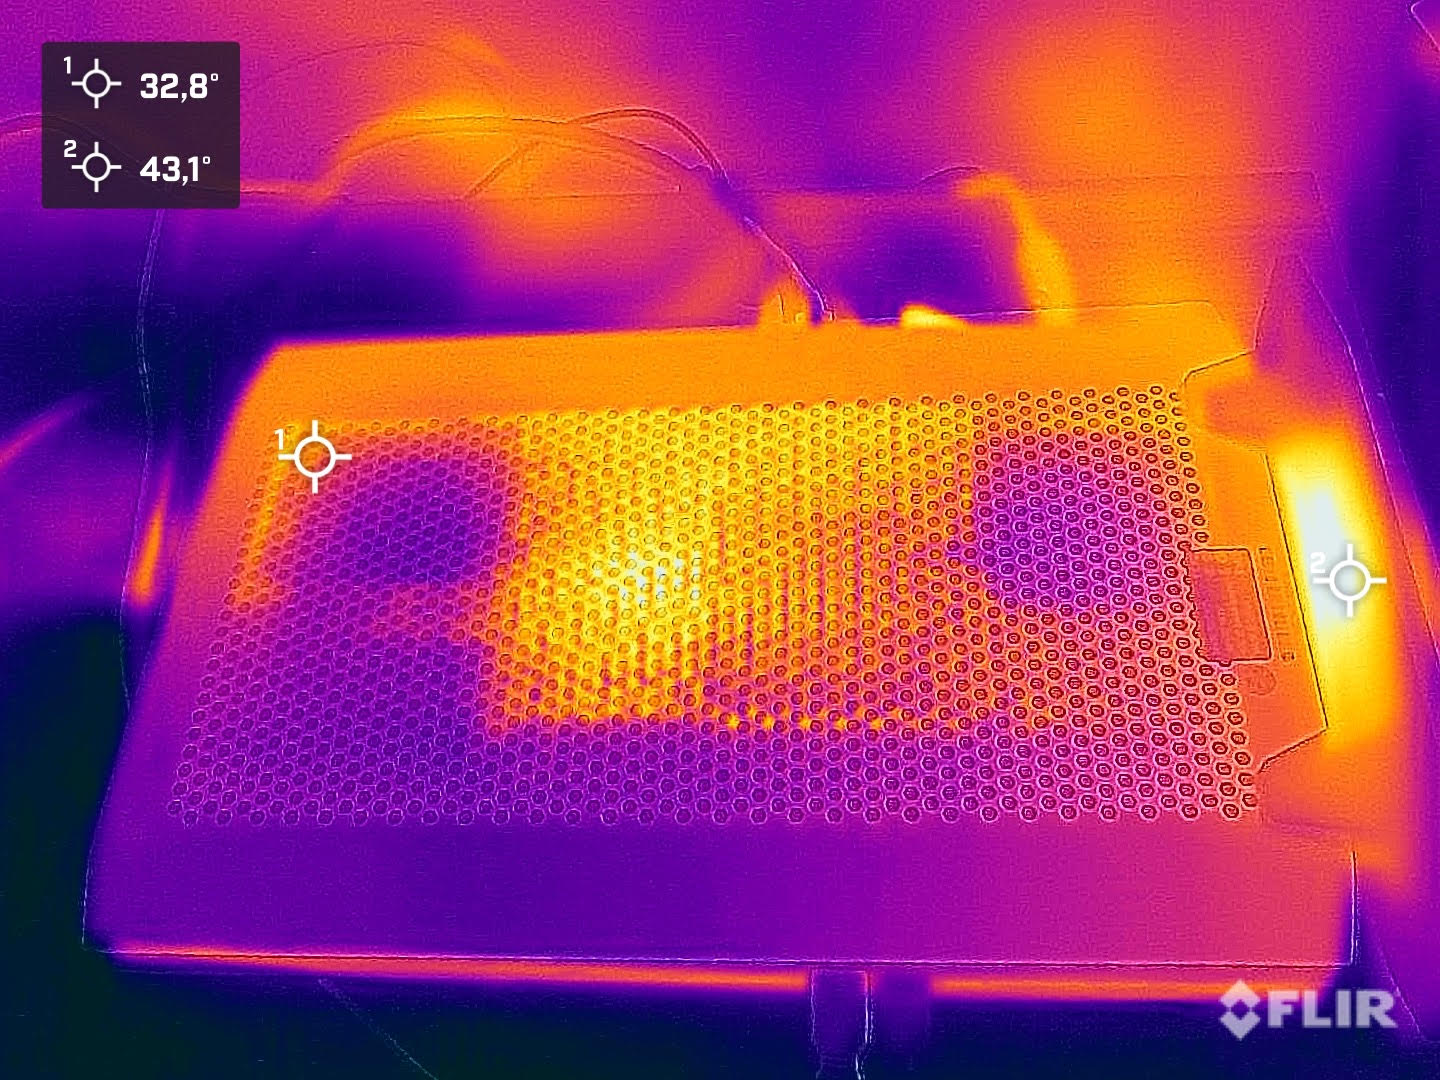
(-) Die maximale Temperatur auf der Oberseite ist 45.9 °C. Im Vergleich liegt der Klassendurchschnitt bei 33.9 °C (von 25 bis 47 °C für die Klasse Desktop).
(+) Auf der Unterseite messen wir eine maximalen Wert von 39.3 °C (im Vergleich zum Durchschnitt von 33.6 °C).
(±) Ohne Last messen wir eine durchschnittliche Temperatur von 35.7 °C auf der Oberseite. Der Klassendurchschnitt erreicht 29.5 °C.
(-) Beim längeren Spielen von The Witcher 3 erhitzt sich das Gerät durchschnittlich auf 40.2 °C. Der Durchschnitt der Klasse ist derzeit 29.5 °C.
Energieaufnahme
Gegenüber einem herkömmlichen Desktop-PC ist der Minisforum NUCXi7 aufgrund der sparsamen Komponenten klar im Vorteil. Selbst gegenüber dem Zotac ZBOX Magnus EN1730C kann sich unser Testgerät klar durchsetzen und ist trotz fast identischer Hardware deutlich sparsamer, ohne an Leistung einzubüßen. Mit nur 28 bis 36 Watt ist der Energiebedarf ohne Last gering, doch im Vergleich zum Gigabyte A7 X1 dennoch deutlich höher. Unter Last begnügt sich der Minisforum NUCXi7 dann mit durchschnittlich 83 Watt, wenngleich beim Spielen 167 Watt auf dem Messgerät angezeigt werden. In Spitzen notieren wir kurzfristig auch mal bis zu 215 Watt, womit das 230-Watt-Netzteil noch nicht an seine Grenzen kommt.
| Aus / Standby | |
| Idle | |
| Last |
|
Legende:
min: | |
| Minisforum NUCX i7 i7-11800H, GeForce RTX 3070 Laptop GPU | Zotac ZBOX Magnus EN173070C i7-11800H, GeForce RTX 3070 Laptop GPU | Gigabyte A7 X1 R9 5900HX, GeForce RTX 3070 Laptop GPU | Durchschnittliche NVIDIA GeForce RTX 3070 Laptop GPU | Durchschnitt der Klasse Desktop | |
|---|---|---|---|---|---|
| Stromverbrauch | -37% | 15% | 13% | 3% | |
| Idle min * (Watt) | 28.2 | 31.3 -11% | 12 57% | 15.6 ? 45% | 17.9 ? 37% |
| Idle avg * (Watt) | 29.9 | 35.1 -17% | 14 53% | 20.1 ? 33% | 37.2 ? -24% |
| Idle max * (Watt) | 36.2 | 41.6 -15% | 19 48% | 29.4 ? 19% | 41.3 ? -14% |
| Last avg * (Watt) | 83.2 | 214 -157% | 118 -42% | 110.8 ? -33% | 96.7 ? -16% |
| Witcher 3 ultra * (Watt) | 167 | 193.5 -16% | 205 -23% | ||
| Cyberpunk 2077 ultra external monitor * (Watt) | 177 | ||||
| Last max * (Watt) | 215.7 | 231 -7% | 229 -6% | 214 ? 1% | 141.6 ? 34% |
* ... kleinere Werte sind besser
Energieaufnahme mit externem Monitor
Pro
Contra
Fazit - Ultraflacher Gaming-PC
Mit dem Minisforum NUCXi7 hat der Hersteller einen sehr spannenden Gaming-PC im Portfolio und setzt dabei auf bewährte Laptop-Technik. Das Zusammenspiel aus Intel Core i7-11800H und Nvidia GeForce RTX 3070 Laptop GPU klappt sehr gut und sorgt für ein flott arbeitendes System. Das sehr flache Gehäuse wirkt hochwertig und modern zugleich. Der Betrieb des Minisforum NUCXi7 sollte aufgrund der Kühlung nur im vertikalen Zustand erfolgen. Ein Umstand, den man akzeptieren muss, wenn man sich für das Gerät entscheidet. Auch bei der Anschlussvielfalt muss man mit kleinen Kompromissen leben, denn nur an der Vorderseite gibt es USB-A-Ports, welche für gewöhnlich für Maus und Tastatur verwendet werden. Mit der 512-GB-SSD ist man für den ersten Start einigermaßen gut gewappnet. Angesichts der anvisierten Zielgruppe könnte es hier schnell zu einem Engpass kommen. Wir empfehlen hier mindestens 1 TB als Standard.
Der Minisforum NUCXi7 ist ein leiser Gaming-PC in einem ultraflachen Gehäuse, der für 1.440p-Gaming ausgelegt ist.
Sehr gut gefallen haben uns die geringen Emissionswerte des Minisforum NUCXi7. Das Gerät ist nicht nur leise, sondern auch sparsam und hat die Temperaturen zu jeder Zeit unter Kontrolle. Dabei muss man bei der Leistung der CPU und der GPU keine Abstiche in Kauf nehmen. Zudem leistet sich das Sample zu keiner Zeit grobe Schnitzer. Die Systemleistung ist sowohl beim Arbeiten als auch beim Spielen gut. Teilweise kann der Minisforum NUCXi7 auch mit herkömmlichen Desktop-PCs mithalten.
Als mögliche Alternative zum Minisforum NUCXi7 könnte auch ein Gaming-Laptop in Betracht kommen. Der Mehrwert ist zweifelsohne gegeben, wenngleich bei ähnlicher Ausstattung ein kleiner Aufpreis fällig wird: Das Gigabyte A7 X1 kostet etwa 1.900 Euro.
Preise und Verfügbarkeit
Den Minisforum NUCXi7 kann man direkt im Shop bei Minisforum bekommen. Aktuell gibt es noch attraktive Rabatte für den Vorverkauf. So muss man aktuell nur 1.169 Euro für unser Testsample auf den Tisch legen. Ohne Rabatt liegt der Preis bei 1.629 Euro. Der preiswertere NUCXi5 kostet bei gleicher RAM und SSD-Bestückung aktuell nur 979 Euro (regulär 1.369 Euro). Verschickt wird das Gerät aus Hongkong, aber auch in Deutschland gibt es ein Lager, was die Lieferzeit auf 3 bis 7 Tage deutlich reduziert. Jedoch werden zu Beginn alle Geräte, die im Vorverkauf geordert werden, direkt aus Hongkong verschickt. Die Lieferzeit beträgt in der Regel 2-3 Wochen, was auf die aktuelle pandemische Lage zurückzuführen ist.
Minisforum NUCX i7
- 14.09.2022 v7 (old)
Sebastian Bade
