Notebookcheck Logo

Intel UHD Graphics 617 vs Intel HD Graphics 5000

Intel UHD Graphics 617

► remove from comparison Intel UHD Graphics 617

Die Intel UHD Graphics 617 (GT2) ist eine Prozessorgrafikkarte der im Sommer 2018 vorgestellten Amber-Lake-Generation. Als Nachfolger der Intel HD Graphics 615 (Kaby-Lake-Y) ist die UHD 615 und 617 dabei in der besonders sparsamen Y-Serie mit 5-7 Watt TDP zu finden. Die sogenannte GT2-Ausbaustufe der GPU verfügt über 24 Ausführungseinheiten (EUs) und taktet je nach Modell mit bis zu 1.050 MHz. Technisch gibt es keine Unterschiede zur alten HD Graphics 615, nur die Taktraten wurden leicht abgeändert und durch den verbesserten 14nm++ Prozess könnte der Turbo etwas länger gehalten werden. Im Vergleich zur UHD Graphics 615 in anderen Amber Lake Modellen, bietet die 617 einen höheren Boost-Takt und 7 Watt TDP.

Mangels eigenem Grafikspeicher oder eDRAM-Cache greift die UHD Graphics 617 über das Interface des Prozessors auf den System-RAM zu (2x 64 Bit DDR3L/LPDDR3).

Performance

Die exakte Leistung der UHD Graphics 617 hängt stark vom jeweiligen CPU-Modell sowie dem konkreten Endgerät ab, da sich Maximaltaktrate sowie TDP-Konfiguration/Kühlung erheblich unterscheiden können. Zum anderen bestimmt auch der verwendete Speicher (DDR3L/LPDDR3) die Performance. Insgesamt dürfte die UHD 617 etwa das Niveau der alten Kaby-Lake HD Graphics 615 erreichen. Einige aktuelle anspruchslose Spiele wie Farming Simulator 17 oder Rocket League können so in niedrigsten Einstellungen flüssig dargestellt werden. Mit gelegentlichen Rucklern muss man jedoch immer rechnen. Detaillierte Benchmarks und viele Spieletests der gleich schnellen HD Graphics 615 finden sie hier.

Anders als Skylake kann Kaby Lake und damit auch Amber Lake nun auch H.265/HEVC im Main10-Profil mit 10 Bit Farbtiefe sowie Googles VP9-Codec in Hardware decodieren. HDCP 2.2 sollte unterstützt werden, was beispielsweise für die Ausgabe von Netflix-Videos in 4K benötigt wird. HDMI 2.0 unterstützt die UHD Graphics 615 jedoch weiterhin nur per Wandler (LSPCon) über den DisplayPort.

Leistungsaufnahme

Die UHD Graphics 617 ist in ULV-Prozessoren der 7-Watt-Klasse zu finden (TDP kann vom Gerätehersteller angepasst werden) und damit für passiv gekühlte Subnotebooks wie das MacBook Air geeignet.

Intel HD Graphics 5000

► remove from comparison Intel HD Graphics 5000

Die Intel HD Graphics 5000 (GT3) ist eine Prozessorgrafikkarte in den CPUs der Haswell-Generation. Zunächst wird die GPU in einigen ULV-Modellen mit 15 Watt TDP eingesetzt (z.B. Core i5-4250U). Sie stellt die maximale Ausbaustufe der integrierten Grafikeinheit dar (40 Execution Units), muss im Gegensatz zur Iris Pro (GT3e) aber auf den zusätzlichen eDRAM-Cache verzichten. Abhängig von der Taktrate (diese fällt bei den 15-Watt-Modellen relativ niedrig aus) sowie der Hauptspeicheranbindung kann sich die Performance von Modell zu Modell leicht unterscheiden.

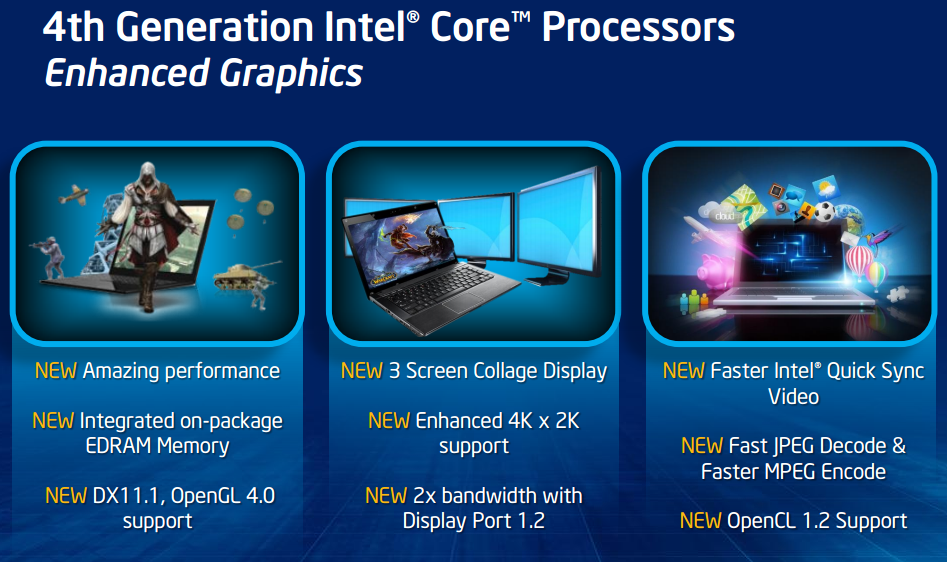
Der Grafikkern wurde im Vergleich zum Intel HD Graphics 4000 der Ivy-Bridge-Generation in verschiedenen Punkten weiterentwickelt. So unterstützt die GPU nun mit DirectX 11.1, OpenCL 1.2 und OpenGL 4.0 alle wichtigen aktuellen Standards. Auch ein verbesserter Decoder für 4K-Videos sowie ein überarbeiteter Quick-Sync-Encoder sind mit an Bord.

Die Performance der HD Graphics 5000 liegt im 3DMark 11 um etwa 50 Prozent oberhalb der HD 4000 der Vorgängergeneration. In Spielen fällt die Mehrleistung dagegen deutlich geringer aus: Bei gleichzeitiger Belastung der CPU kann die Grafikeinheit ihren starken Turbo-Boost nur sehr eingeschränkt ausschöpfen, da die niedrige TDP der ULV-Modelle (15 Watt) zu limitieren beginnt. Obwohl die HD 5000 mit 40 Execution Units (EUs) doppelt so viele Ausführungseinheiten wie die HD Graphics 4600 besitzt (HD 4000: 16 EUs), ist die Grafikleistung darum dennoch etwas schwächer. Unterm Strich liegt die HD 5000 damit knapp hinter AMDs Radeon HD 7660G und auf dem Niveau einer dedizierte Radeon HD 7650M. Aktuelle 3D-Spiele (Stand 2013) können in niedrigen, seltener auch mittleren Einstellungen flüssig dargestellt werden.

Der Stromverbrauch ist dank des 22-Nanometer-Prozesses mit Tri-Gate-Transistoren relativ gering und wird dynamisch vom TDP-Budget des gesamten Chips abgezweigt. Die HD 5000 wird zunächst in einigen Dual-Core-Modellen der 15-Watt-Klasse (ULV) eingesetzt, beispielsweise dem Core i7-4650U.

Weitere Details zur Grafikkartenarchitektur der Haswell Generation finden Sie in unserem Artikel zur Vorstellung der Haswell-Generation.

Intel UHD Graphics 617Intel HD Graphics 5000
HD Graphics Serie
Iris Plus Graphics 655 compare 48 @ 0.3 - 1.2 GHz
Iris Plus Graphics 650 compare 48 @ 0.3 - 1.1 GHz64/128 Bit
Iris Plus Graphics 645 compare 48 @ 0.3 - 1.15 GHz
Iris Plus Graphics 640 compare 48 @ 0.3 - 1.05 GHz64/128 Bit
UHD Graphics 630 compare 24 @ 0.3 - 1.15 GHz64/128 Bit
UHD Graphics P630 compare 24 @ 0.3 - 1.2 GHz64/128 Bit
HD Graphics 630 compare 24 @ 0.3 - 1.15 GHz64/128 Bit
HD Graphics P630 compare 24 64/128 Bit
UHD Graphics 620 compare 24 @ 0.3 - 1.15 GHz
HD Graphics 620 compare 24 @ 0.3 - 1.05 GHz64/128 Bit
UHD Graphics 617 24 @ 0.3 - 1.15 GHz64/128 Bit
UHD Graphics 615 compare 24 @ 0.3 - 1 GHz64/128 Bit
HD Graphics 615 compare 24 @ 0.3 - 1.05 GHz64/128 Bit
HD Graphics P530 compare 24 @ 0.35 - 1.05 GHz64/128 Bit
HD Graphics 5600 compare 24 @ 0.3 - 1.05 GHz64/128 Bit
HD Graphics 6000 compare 48 @ 0.3 - 1 GHz64/128 Bit
HD Graphics 4600 compare 20 @ 0.2 - 1.35 GHz64/128 Bit
HD Graphics 5500 compare 24 @ 0.3 - 0.95 GHz64/128 Bit
HD Graphics 5000 40 @ 0.2 - 1.1 GHz64/128 Bit
HD Graphics 4400 compare 20 @ 0.2 - 1.1 GHz64/128 Bit
HD Graphics 5300 compare 24 @ 0.1 - 0.9 GHz64/128 Bit
HD Graphics 4000 compare 16 @ 0.35 - 1.35 GHz64/128 Bit
HD Graphics (Broadwell) compare 12 @ 0.1 - 0.85 GHz64/128 Bit
HD Graphics 4200 compare 20 @ 0.2 - 0.85 GHz64/128 Bit
HD Graphics (Skylake) compare 12 @ 0.3 - 0.8 GHz64/128 Bit
HD Graphics 405 (Braswell) compare 16 @ 0.32 - 0.7 GHz64/128 Bit
HD Graphics (Braswell) compare 16 @ 0.32 - 0.7 GHz64/128 Bit
HD Graphics 400 (Braswell) compare 12 @ 0.32 - 0.64 GHz64/128 Bit
HD Graphics (Haswell) compare 10 @ 0.2 - 1 GHz64/128 Bit
HD Graphics (Cherry Trail) compare 16 @ 0.2 - 0.6 GHz64/128 Bit
HD Graphics 3000 compare 12 @ 0.35 - 1.35 GHz64/128 Bit
HD Graphics 2500 compare 6 @ 0.65 - 1.15 GHz64/128 Bit
HD Graphics (Ivy Bridge) compare 6 @ 0.35 - 1.1 GHz64/128 Bit
HD Graphics 2000 compare 6 @ 0.85 - 1.35 GHz64/128 Bit
HD Graphics (Sandy Bridge) compare 6 @ 0.35 - 1.1 GHz64/128 Bit
HD Graphics (Bay Trail) compare 4 @ 0.31 - 0.9 GHz32/64/128 Bit
CodenameKaby-Lake GT2Haswell GT3
ArchitekturGen. 9 Amber LakeGen. 7.5 Haswell
Pipelines24 - unified40 - unified
Kerntakt300 - 1150 (Boost) MHz200 - 1100 (Boost) MHz
Speicherbandbreite64/128 Bit64/128 Bit
SpeichertypDDR3L/LPDDR3
Shared Memoryjaja
APIDirectX 12_1, OpenGL 4.4DirectX 11.1, Shader 5.0, OpenGL 4.0
Herstellungsprozess14 nm22 nm
FeaturesQuickSyncQuickSync
Erscheinungsdatum30.10.2018 05.06.2013
CPU in UHD Graphics 617GPU Base SpeedGPU Boost / Turbo
Intel Core i7-10510Y4 x 1200 MHz, 7 W300 MHz1150 MHz
Intel Core i5-8210Y2 x 1600 MHz, 7 W300 MHz1050 MHz
min. - max.300 MHz1050 - 1150 MHz
CPU in HD Graphics 5000GPU Base SpeedGPU Boost / Turbo
Intel Core i7-4650U2 x 1700 MHz, 15 W200 MHz1100 MHz
Intel Core i7-4550U2 x 1500 MHz, 15 W200 MHz1100 MHz
Intel Core i5-4360U2 x 1500 MHz, 15 W200 MHz1100 MHz
min. - max.200 - 300 MHz1000 - 1150 MHz

Benchmarks

Performance Rating - 3DMark 11 + Fire Strike + Time Spy - HD Graphics 5000
0.3 pt (1%)
3DMark - 3DMark Time Spy Score
min: 322     avg: 338.3     median: 337 (1%)     max: 356 Points
3DMark - 3DMark Time Spy Graphics
min: 286     avg: 299     median: 300 (1%)     max: 311 Points
3DMark - 3DMark Ice Storm Unlimited Graphics
77156 Points (9%)
65904 Points (7%)
3DMark - 3DMark Ice Storm Extreme Graphics
37346 Points (5%)
3DMark - 3DMark Cloud Gate Score
4841 Points (5%)
3DMark - 3DMark Cloud Gate Graphics
7231 Points (2%)
3DMark - 3DMark Fire Strike Standard Score
min: 845     avg: 890     median: 889.5 (2%)     max: 934 Points
3DMark - 3DMark Fire Strike Standard Graphics
min: 947     avg: 997     median: 997 (1%)     max: 1047 Points
3DMark - 3DMark Night Raid
3711 Points (4%)
3DMark - 3DMark Night Raid Graphics Score
4496 Points (2%)
3DMark 11 - 3DM11 Performance Score
min: 1632     avg: 1672     median: 1671.5 (2%)     max: 1711 Points
3DMark 11 - 3DM11 Performance GPU
min: 1509     avg: 1541     median: 1540.5 (1%)     max: 1572 Points
3DMark Vantage
3DM Vant. Perf. total + Intel HD Graphics 5000
3DMark Vantage - 3DM Vant. Perf. total
min: 3418     avg: 4231     median: 4276.5 (1%)     max: 4734 Points
3DM Vant. Perf. GPU no PhysX + Intel HD Graphics 5000
3DMark Vantage - 3DM Vant. Perf. GPU no PhysX
min: 2917     avg: 3639     median: 3665 (2%)     max: 4108 Points
3DMark 03 - 3DMark 03 - Standard
min: 15752     avg: 18768     median: 18768 (10%)     max: 21784 Points
3DMark 05 - 3DMark 05 - Standard
min: 9623     avg: 9763     median: 9763 (11%)     max: 9903 Points
3DMark 06 3DMark 06 - Standard 1280x1024 + Intel UHD Graphics 617
3DMark 06
8662 Points (11%)
3DMark 06 - Standard 1280x1024 + Intel HD Graphics 5000
min: 4751     avg: 5775     median: 5940 (8%)     max: 6160 Points
3DMark 06 - Standard 1280x800 + Intel HD Graphics 5000
3DMark 06
6675 Points (9%)
Unigine Heaven 3.0 - Unigine Heaven 3.0 DX 11
12.1 fps (4%)
Unigine Heaven 3.0 - Unigine Heaven 3.0 OpenGL
12.1 fps (5%)
Unigine Heaven 2.1 - Heaven 2.1 high
min: 12.3     avg: 13     median: 13.1 (2%)     max: 13.5 fps
SPECviewperf 11
specvp11 snx-01 + Intel HD Graphics 5000
SPECviewperf 11 - specvp11 snx-01
min: 1.26     avg: 1.5     median: 1.5 (1%)     max: 1.64 fps
specvp11 tcvis-02 + Intel HD Graphics 5000
SPECviewperf 11 - specvp11 tcvis-02
min: 1.77     avg: 2.1     median: 2.1 (1%)     max: 2.51 fps
specvp11 sw-02 + Intel HD Graphics 5000
SPECviewperf 11 - specvp11 sw-02
min: 7.95     avg: 9.9     median: 9.9 (8%)     max: 11.8 fps
specvp11 proe-05 + Intel HD Graphics 5000
SPECviewperf 11 - specvp11 proe-05
min: 1.42     avg: 1.6     median: 1.6 (2%)     max: 1.78 fps
specvp11 maya-03 + Intel HD Graphics 5000
SPECviewperf 11 - specvp11 maya-03
min: 12.95     avg: 14.2     median: 14.2 (11%)     max: 15.43 fps
specvp11 lightwave-01 + Intel HD Graphics 5000
SPECviewperf 11 - specvp11 lightwave-01
min: 13.34     avg: 14.5     median: 14.5 (16%)     max: 15.62 fps
specvp11 ensight-04 + Intel HD Graphics 5000
SPECviewperf 11 - specvp11 ensight-04
min: 2.06     avg: 2.1     median: 2.1 (1%)     max: 2.11 fps
specvp11 catia-03 + Intel HD Graphics 5000
SPECviewperf 11 - specvp11 catia-03
4.5 fps (2%)
Windows 7 Experience Index - Win7 Gaming graphics
min: 6.5     avg: 6.6     median: 6.6 (84%)     max: 6.7 Points
Windows 7 Experience Index - Win7 Graphics
min: 5.8     avg: 5.9     median: 5.9 (74%)     max: 5.9 Points
Cinebench R10 Cinebench R10 Shading (32bit) + Intel HD Graphics 5000
Cinebench R11.5 Cinebench R11.5 OpenGL 64 Bit + Intel HD Graphics 5000
Cinebench R15
Cinebench R15 OpenGL 64 Bit + Intel UHD Graphics 617
Cinebench R15 - Cinebench R15 OpenGL 64 Bit
min: 34.7     avg: 39.1     median: 39.1 (2%)     max: 43.5 fps
Cinebench R15 OpenGL 64 Bit + Intel HD Graphics 5000
min: 24.15     avg: 27.4     median: 27.4 (2%)     max: 30.64 fps
Cinebench R15 OpenGL Ref. Match 64 Bit + Intel UHD Graphics 617
Cinebench R15 - Cinebench R15 OpenGL Ref. Match 64 Bit
min: 97.8     avg: 98.6     median: 98.6 (99%)     max: 99.3 %
Cinebench R15 OpenGL Ref. Match 64 Bit + Intel HD Graphics 5000
min: 63.3     avg: 81.1     median: 80.7 (81%)     max: 99.6 %
GFXBench 3.0 - GFXBench 3.0 Manhattan Offscreen
22.5 fps (1%)
GFXBench (DX / GLBenchmark) 2.7
GFXBench T-Rex HD Offscreen C24Z16 + Intel HD Graphics 5000
GFXBench (DX / GLBenchmark) 2.7 - GFXBench T-Rex HD Offscreen C24Z16
min: 62     avg: 72.5     median: 72.5 (1%)     max: 83 fps
LuxMark v2.0 64Bit - LuxMark v2.0 Room GPU
min: 139     avg: 187     median: 201 (1%)     max: 221 Samples/s
LuxMark v2.0 64Bit - LuxMark v2.0 Sala GPU
min: 286     avg: 305.3     median: 306 (1%)     max: 324 Samples/s
ComputeMark v2.1 - ComputeMark v2.1 Result
min: 775     avg: 817     median: 816.5 (1%)     max: 858 Points

Average Benchmarks Intel UHD Graphics 617 → 100% n=10

Average Benchmarks Intel HD Graphics 5000 → 76% n=10

- Bereich der Benchmarkergebnisse für diese Grafikkarte
- Durchschnittliche Benchmarkergebnisse für diese Grafikkarte
* Smaller numbers mean a higher performance
1 This benchmark is not used for the average calculation

Spiele-Benchmarks

Die folgenden Benchmarks basieren auf unseren Spieletests mit Testnotebooks. Die Performance dieser Grafikkarte bei den gelisteten Spielen ist abhängig von der verwendeten CPU, Speicherausstattung, Treiber und auch Betriebssystem. Dadurch müssen die untenstehenden Werte nicht repräsentativ sein. Detaillierte Informationen über das verwendete System sehen Sie nach einem Klick auf den fps-Wert.

low 1280x720
100%
UHD Graphics 617:
20.2  fps
med. 1920x1080
100%
UHD Graphics 617:
14.1  fps
high 1920x1080
100%
UHD Graphics 617:
12.8  fps
low 1280x720
100%
UHD Graphics 617:
61.2  fps
med. 1920x1080
100%
UHD Graphics 617:
26  fps
high 1920x1080
100%
UHD Graphics 617:
18.3  fps
low 1024x768
100%
UHD Graphics 617:
16.1  fps
low 1280x720
100%
UHD Graphics 617:
67.2  fps
med. 1366x768
100%
UHD Graphics 617:
28.2  fps
high 1920x1080
100%
UHD Graphics 617:
14.6  fps
ultra 1920x1080
100%
UHD Graphics 617:
13.6  fps
GTA V

GTA V

2015
low 1024x768
HD Graphics 5000:
19.2  fps
med. 1366x768
HD Graphics 5000:
16  fps
high 1920x1080
HD Graphics 5000:
4.4  fps
ultra 1920x1080
HD Graphics 5000:
2.6  fps
low 1024x768
HD Graphics 5000:
20.8  fps
med. 1366x768
HD Graphics 5000:
15.1  fps
high 1920x1080
HD Graphics 5000:
7  fps
ultra 1920x1080
HD Graphics 5000:
4.3  fps
Evolve

Evolve

2015
low 1024x768
HD Graphics 5000:
12.7  fps
med. 1366x768
HD Graphics 5000:
9.6  fps
high 1920x1080
HD Graphics 5000:
5.5  fps
ultra 1920x1080
HD Graphics 5000:
2.9  fps
The Crew

The Crew

2014
low 1280x720
HD Graphics 5000:
15.8  fps
med. 1366x768
HD Graphics 5000:
10.6  fps
low 1024x768
HD Graphics 5000:
17.4  fps
med. 1366x768
HD Graphics 5000:
12  fps
high 1920x1080
HD Graphics 5000:
4.5  fps
ultra 1920x1080
HD Graphics 5000:
2.1  fps
Far Cry 4

Far Cry 4

2014
low 1024x768
HD Graphics 5000:
14.3  fps
med. 1366x768
HD Graphics 5000:
10.6  fps
low 1024x768
HD Graphics 5000:
5.4  fps
low 1024x768
HD Graphics 5000:
25.4  fps
med. 1366x768
HD Graphics 5000:
16.2  fps
high 1920x1080
HD Graphics 5000:
9.7  fps
low 1024x768
HD Graphics 5000:
15.5  fps
med. 1366x768
HD Graphics 5000:
12.2  fps
F1 2014

F1 2014

2014
low 1024x768
HD Graphics 5000:
51  fps
med. 1366x768
HD Graphics 5000:
35  fps
high 1920x1080
HD Graphics 5000:
20  fps
ultra 1920x1080
HD Graphics 5000:
13  fps
low 1024x768
HD Graphics 5000:
14.2  fps
med. 1366x768
HD Graphics 5000:
10.6  fps
low 1024x768
HD Graphics 5000:
14.7  fps
med. 1366x768
HD Graphics 5000:
9.2  fps
low 1024x768
HD Graphics 5000:
28.9  fps
med. 1366x768
HD Graphics 5000:
20.9  fps
high 1920x1080
HD Graphics 5000:
11.4  fps
low 1280x720
HD Graphics 5000:
20.1  fps
med. 1344x756
HD Graphics 5000:
13  fps
high 1920x1080
HD Graphics 5000:
7.2  fps
Fifa 15

Fifa 15

2014
low 1280x720
HD Graphics 5000:
36.2  fps
high 1366x768
HD Graphics 5000:
28.1  fps
ultra 1920x1080
HD Graphics 5000:
17.4  fps
Sims 4

Sims 4

2014
low 1024x768
HD Graphics 5000:
168.3  fps
med. 1366x768
HD Graphics 5000:
32.8  fps
high 1920x1080
HD Graphics 5000:
14.2  fps
ultra 1920x1080
HD Graphics 5000:
10  fps
low 1024x768
HD Graphics 5000:
28.7  fps
med. 1366x768
HD Graphics 5000:
17.6  fps
high 1920x1080
HD Graphics 5000:
6.6  fps
ultra 1920x1080
HD Graphics 5000:
5.2  fps
low 1024x768
HD Graphics 5000:
85.7  fps
med. 1366x768
HD Graphics 5000:
30.2  fps
high 1920x1080
HD Graphics 5000:
14.9  fps
ultra 1920x1080
HD Graphics 5000:
12.5  fps
low 1024x768
HD Graphics 5000:
17 18.1 ~ 18 fps
med. 1366x768
HD Graphics 5000:
10.9 11.6 ~ 11 fps
low 1280x720
HD Graphics 5000:
27.2  fps
med. 1280x720
HD Graphics 5000:
22.1  fps
high 1920x1080
HD Graphics 5000:
10.7  fps
Titanfall

Titanfall

2014
low 1024x768
HD Graphics 5000:
33.2  fps
med. 1366x768
HD Graphics 5000:
20.2  fps
high 1366x768
HD Graphics 5000:
13.2  fps
Thief

Thief

2014
low 1024x768
HD Graphics 5000:
11.9 14.8 ~ 13 fps
med. 1366x768
HD Graphics 5000:
8.4 9.7 ~ 9 fps
high 1366x768
HD Graphics 5000:
7.6  fps
ultra 1920x1080
HD Graphics 5000:
3.9  fps
low 1024x768
HD Graphics 5000:
24  fps
med. 1366x768
HD Graphics 5000:
20.5  fps
high 1366x768
HD Graphics 5000:
6.2  fps
low 1024x768
HD Graphics 5000:
28.6  fps
med. 1366x768
HD Graphics 5000:
19.9  fps
high 1366x768
HD Graphics 5000:
13.3  fps
F1 2013

F1 2013

2013
low 1024x768
HD Graphics 5000:
51  fps
med. 1366x768
HD Graphics 5000:
34  fps
high 1366x768
HD Graphics 5000:
28  fps
ultra 1920x1080
HD Graphics 5000:
12  fps
Fifa 14

Fifa 14

2013
low 1024x768
HD Graphics 5000:
165.1  fps
med. 1366x768
HD Graphics 5000:
100.2  fps
high 1366x768
HD Graphics 5000:
71.4  fps
ultra 1920x1080
HD Graphics 5000:
39.3  fps
low 1024x768
HD Graphics 5000:
39.8  fps
med. 1366x768
HD Graphics 5000:
29.4  fps
high 1366x768
HD Graphics 5000:
21.6  fps
ultra 1920x1080
HD Graphics 5000:
6.6  fps
Dota 2

Dota 2

2013
low 1024x768
HD Graphics 5000:
59.6 69.8 ~ 65 fps
med. 1366x768
HD Graphics 5000:
31.5 36.8 ~ 34 fps
ultra 1920x1080
HD Graphics 5000:
14.4 15.5 ~ 15 fps
low 1024x768
HD Graphics 5000:
13.3  fps
med. 1366x768
HD Graphics 5000:
10.4  fps
high 1366x768
HD Graphics 5000:
6  fps
GRID 2

GRID 2

2013
low 1024x768
HD Graphics 5000:
58.6  fps
med. 1366x768
HD Graphics 5000:
31.3  fps
high 1366x768
HD Graphics 5000:
22.7  fps
ultra 1920x1080
HD Graphics 5000:
12.5  fps
low 1024x768
HD Graphics 5000:
18.8 18.9 ~ 19 fps
med. 1366x768
HD Graphics 5000:
13.9 13.9 ~ 14 fps
high 1366x768
HD Graphics 5000:
8.6 10.4 ~ 10 fps
low 1280x720
100%
UHD Graphics 617:
47.6  fps
74%
HD Graphics 5000:
32 34.3 34.3 38.3 ~ 35 fps
med. 1366x768
100%
UHD Graphics 617:
27.9  fps
72%
HD Graphics 5000:
17 20.1 20.9 22.5 ~ 20 fps
high 1366x768
100%
UHD Graphics 617:
25  fps
64%
HD Graphics 5000:
14 14.2 16.6 18.2 ~ 16 fps
ultra 1920x1080
100%
UHD Graphics 617:
8.4  fps
92%
HD Graphics 5000:
7.7  fps
low 1024x768
HD Graphics 5000:
44 52.5 53.9 54.3 55.3 56 ~ 53 fps
med. 1366x768
HD Graphics 5000:
23 25 26 27.5 28.3 28.6 ~ 26 fps
high 1366x768
HD Graphics 5000:
14 14.9 15 15.8 17.4 17.5 ~ 16 fps
ultra 1920x1080
HD Graphics 5000:
7.9 8 9.5 ~ 8 fps
Crysis 3

Crysis 3

2013
low 1024x768
HD Graphics 5000:
20.9  fps
med. 1366x768
HD Graphics 5000:
13  fps
high 1366x768
HD Graphics 5000:
9.4  fps
Far Cry 3

Far Cry 3

2012
low 1024x768
HD Graphics 5000:
28.6  fps
med. 1366x768
HD Graphics 5000:
19.2  fps
high 1366x768
HD Graphics 5000:
7.1  fps
med. 1366x768
HD Graphics 5000:
16.6  fps
high 1366x768
HD Graphics 5000:
11.2  fps
low 1024x768
HD Graphics 5000:
22.3  fps
med. 1366x768
HD Graphics 5000:
15.7  fps
high 1366x768
HD Graphics 5000:
7.3  fps
low 1024x768
HD Graphics 5000:
40.5  fps
med. 1366x768
HD Graphics 5000:
28  fps
high 1366x768
HD Graphics 5000:
14.1  fps
low 1024x768
HD Graphics 5000:
83  fps
med. 1366x768
HD Graphics 5000:
46  fps
ultra 1920x1080
HD Graphics 5000:
28  fps
low 1024x768
HD Graphics 5000:
54 58 59 ~ 57 fps
med. 1366x768
HD Graphics 5000:
38 42 ~ 40 fps
high 1366x768
HD Graphics 5000:
31 32 ~ 32 fps
ultra 1920x1080
HD Graphics 5000:
13 19 21 ~ 18 fps
Anno 2070

Anno 2070

2011
low 1024x768
HD Graphics 5000:
57.8 59.2 61 ~ 59 fps
med. 1366x768
HD Graphics 5000:
30 32.2 32.8 ~ 32 fps
high 1366x768
HD Graphics 5000:
16.2 18 20.1 ~ 18 fps
ultra 1920x1080
HD Graphics 5000:
9  fps
low 1280x720
HD Graphics 5000:
29.5  fps
med. 1366x768
HD Graphics 5000:
18.4  fps
high 1366x768
HD Graphics 5000:
11.6  fps
Total War: Shogun 2

Total War: Shogun 2

2011
low 1024x768
HD Graphics 5000:
88.8  fps
low 1024x768
HD Graphics 5000:
126 169 ~ 148 fps
med. 1360x768
HD Graphics 5000:
38 43 ~ 41 fps
high 1360x768
HD Graphics 5000:
24 26 ~ 25 fps
ultra 1920x1080
HD Graphics 5000:
10 16 ~ 13 fps
Anno 1404

Anno 1404

2009
low 1024x768
HD Graphics 5000:
122  fps
ultra 1280x1024
HD Graphics 5000:
18  fps
World of Warcraft

World of Warcraft

2005
low 800x600
HD Graphics 5000:
162  fps
med. 1024x768
HD Graphics 5000:
78  fps
high 1280x1024
HD Graphics 5000:
31  fps
ultra 1920x1080
HD Graphics 5000:
9  fps

Average Gaming Intel UHD Graphics 617 → 100%

Average Gaming 30-70 fps → 100%

Average Gaming Intel HD Graphics 5000 → 75%

Average Gaming 30-70 fps → 74%

Intel UHD Graphics 617lowmed.highultraQHD4K
X-Plane 11.1120.214.112.8
Rocket League61.22618.3
Rise of the Tomb Raider16.1
Dota 2 Reborn67.228.214.613.6
BioShock Infinite47.627.9258.4
< 30 fps
< 60 fps
< 120 fps
≥ 120 fps
2
1
2
4


4


2


Intel HD Graphics 5000lowmed.highultraQHD4K
GTA V19.2164.42.6
Battlefield Hardline20.815.174.3
Evolve12.79.65.52.9
The Crew15.810.6
Dragon Age: Inquisition17.4124.52.1
Far Cry 414.310.6
Assassin's Creed Unity5.4
Call of Duty: Advanced Warfare25.416.29.7
Civilization: Beyond Earth15.512.2
F1 201451352013
The Evil Within14.210.6
Ryse: Son of Rome14.79.2
Alien: Isolation28.920.911.4
Middle-earth: Shadow of Mordor20.1137.2
Fifa 1536.228.117.4
Sims 4168.332.814.210
Risen 3: Titan Lords28.717.66.65.2
GRID: Autosport85.730.214.912.5
Watch Dogs1811
Wolfenstein: The New Order27.222.110.7
Titanfall33.220.213.2
Thief1397.63.9
Call of Duty: Ghosts2420.56.2
Battlefield 428.619.913.3
F1 201351342812
Fifa 14165.1100.271.439.3
Total War: Rome II39.829.421.66.6
Dota 2653415
Company of Heroes 213.310.46
GRID 258.631.322.712.5
Metro: Last Light191410
BioShock Infinite3520167.7
Tomb Raider5326168
Crysis 320.8912.989.44
Far Cry 328.5819.187.07
Assassin´s Creed III16.5611.23
Hitman: Absolution22.315.77.3
Call of Duty: Black Ops 240.52814.1
Torchlight 2834628
Diablo III57403218
Anno 20705932189
The Elder Scrolls V: Skyrim29.518.411.6
Total War: Shogun 288.8
StarCraft 2148412513
Anno 140412218
World of Warcraft16278319
< 30 fps
< 60 fps
< 120 fps
≥ 120 fps
25
11
4
5
30
10
2
32
2
1
22
1


Eine Liste mit weiteren Spielen und allen Grafikkarten finden Sie auf unserer Seite: Welches Spiel ist mit welcher Grafikkarte spielbar?

Add one or more devices and compare

In the following list you can select (and also search for) devices that should be added to the comparison. You can select more than one device.

restrict list:

show all (including archived), 2024, 2023
v1.26
log 01. 14:39:58

#0 checking url part for id 9356 +0s ... 0s

#1 checking url part for id 4574 +0s ... 0s

#2 not redirecting to Ajax server +0s ... 0s

#3 did not recreate cache, as it is less than 5 days old! Created at Sat, 01 Jun 2024 05:39:27 +0200 +0.001s ... 0.001s

#4 composed specs +0.104s ... 0.105s

#5 did output specs +0s ... 0.105s

#6 start showIntegratedCPUs +0s ... 0.106s

#7 getting avg benchmarks for device 9356 +0.028s ... 0.133s

#8 got single benchmarks 9356 +0.01s ... 0.143s

#9 getting avg benchmarks for device 4574 +0.018s ... 0.161s

#10 got single benchmarks 4574 +0.026s ... 0.187s

#11 got avg benchmarks for devices +0s ... 0.187s

#12 min, max, avg, median took s +0.287s ... 0.474s

#13 before gaming benchmark output +0s ... 0.474s

#14 Got 212 rows for game benchmarks. +0.022s ... 0.496s

#15 composed SQL query for gamebenchmarks +0s ... 0.496s

#16 got data and put it in $dataArray +0.033s ... 0.529s

#17 benchmarks composed for output. +0.117s ... 0.646s

#18 calculated avg scores. +0s ... 0.646s

#19 return log +0.082s ... 0.728s

Teilen Sie diesen Artikel, um uns zu unterstützen. Jeder Link hilft!
> Notebook Test, Laptop Test und News > Benchmarks / Technik > Benchmarks / Technik > Grafikkarten Vergleich - Head 2 Head
Autor: Klaus Hinum,  8.09.2017 (Update:  1.07.2023)