AMD Radeon RX Vega 11 vs Intel HD Graphics P630 vs Intel Iris Plus Graphics 645
AMD Radeon RX Vega 11 ► remove from comparison
Die AMD Radeon RX Vega 11 ist eine integrierte Grafikkarte in den Ryzen APUs. Anfangs ist die höchste Ausbaustufe nur in den Anfang 2018 vorgestellten Ryzen Desktop APUs erhältlich (z.B. Ryzen 5 2400G). Die GPU basiert auf die Vega Architektur (5. Generation GCN) und bietet 11 CUs (= 704 Shader) mit bis zu 1240 MHz.
Die Vega Architektur bietet einige Verbesserungen zur Polaris Generation und unterstützt nun z.B. DirectX 12 Feature Level 12_1. Mehr Informationen dazu finden Sie in unserem Raven Ridge Architekturartikel .
Die theoretische Leistung sollte vergleichbar mit einer dedizierten Radeon R9 M280X sein (3DMark Fire Strike laut AMD). In Spielen kann der fehlende dedizierte Grafikspeicher zum Flaschenhals werden und dadurch zu einer reduzierten Leistung führen. Aktuelle Spiele sollten dadurch in niedrigsten Details flüssig spielbar sein.
Der Stromverbrauch ist dank 14nm Prozess und ausgeklügelten Stromsparmechanismen relativ gering, durch die 65 Watt TDP Einstufung aber wohl deutlich höher als bei den mobilen APUs (15 Watt).
Intel HD Graphics P630 ► remove from comparison
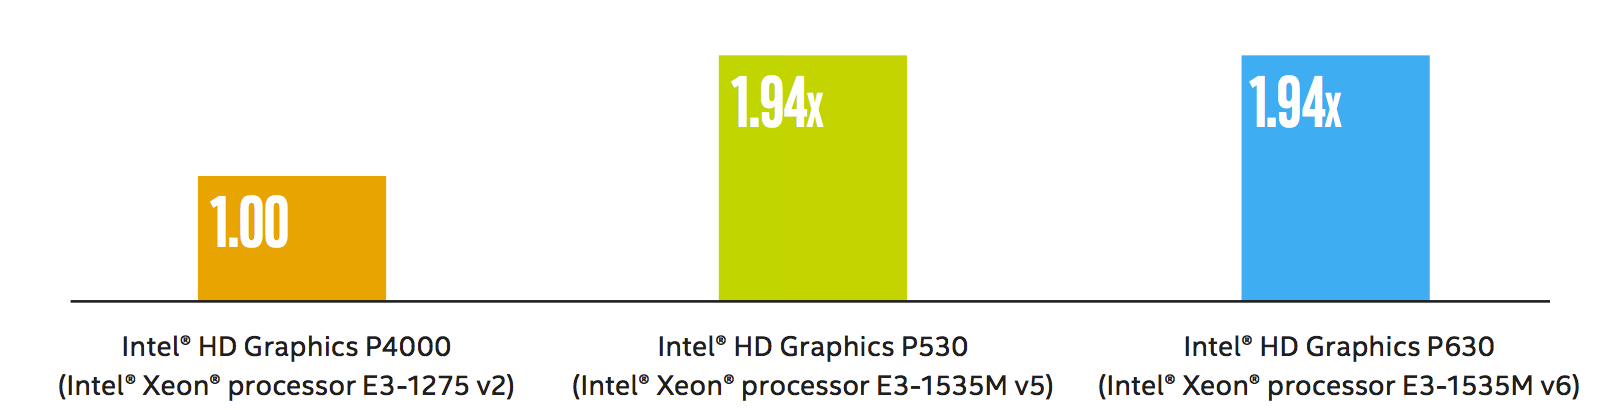
Die Intel HD Graphics P630 (GT2) ist eine integrierte Workstation-Grafikeinheit, die in verschiedenen Desktop- und Notebook-Prozessoren der 2017 vorgestellten Kaby-Lake-Generation zu finden ist (Xeon E3-1200 v6 und e3-1500M v6 Serien). Sie ist identisch mit der Intel HD Graphics 630, jedoch sind die Treiber für professionelle Software optimiert. Daher unterscheidet sie sich auch nicht von der Intel HD Graphics P530 und erreicht laut Intel auch die selbe Leistung im SPEC Viewperf12 (1.94x der alten Intel HD Graphics P4000). Die Grafikkarte ist derzeit für 15 CAD- und Workstation-Anwendungen zertifiziert .
Features
Neu bei der Kaby-Lake Generation ist die verbesserte Videoengine, welche nun auch H.265/HEVC im Main10-profil mit 10 Bit Farbtiefe sowie Googles VP9-Codec in Hardware dekodieren kann. Die Chips mit HD Graphics 530 sollten auch bereits HDCP 2.2 unterstützen und somit z.B. Netflix-Videos unter Windows 10 in 4K ausgeben können (im Gegensatz zu den ersten Kaby-Lake Dual-Core Chips mit Intel HD Graphics 620 ).
Leistungsaufnahme
Die HD Graphics P630 ist in Desktop- und Notebook-Prozessoren verschiedener TDP-Klassen zu finden. Die Quad-Core CPUs sind jedoch meistens in größeren und schwereren Notebooks verbaut. Der verbesserte 14nm+ Prozess verspricht jedoch eine etwas geringere Leistungsaufnahme im Vergleich zur Intel HD Graphics P530.
Quelle : http://www.intel.com/content/dam/www/public/us/en/documents/guides/hd-graphics-performance-guide.pdf
Intel Iris Plus Graphics 645 ► remove from comparison
Die Intel Iris Plus Graphics 645 (GT3e) ist eine Prozessorgrafikkarte, die Mitte 2019 vorgestellt wurde. Sie wird in Coffee-Lake-U-CPUs der 15-Watt-Klasse verbaut und ist daher mit der Iris Plus Graphics 655 in den 28 W Coffee-Lake-CPUs verwandt. Auch hier beträgt der eDRAM-Cache 128 MB, die maximale Taktung ist derzeit jedoch 50 MHz geringer (im i7-8557U z.B.).
Die sogenannte GT3e-Ausbaustufe der Coffee-Lake-GPU verfügt weiterhin über 48 Execution Units (EUs), die je nach Modell nun mit bis zu 1.150 MHz takten. Neben dem eDRAM-Cache kann die Iris 645 auch über das Interface des Prozessors auf den Hauptspeicher zugreifen (2x 64 Bit LPDDR3-2133/DDR4-2400).
Performance
Die exakte Leistung der Iris Plus Graphics 645 hängt vom jeweiligen CPU-Modell ab, da sich die Maximaltaktrate sowie die Größe des Caches leicht unterscheiden können. Zum anderen beeinflusst auch der verwendete Speicher (DDR3/DDR4) die Performance.
Die höchste Leistung erreichen hochtaktende Core-i7-Ableger wie der Core i7-8557U. Je nach Spiel ordnet sich die Iris Plus 645 vermutlich im Bereich einer dedizierten GeForce 930M oder GeForce 940MX ein und kann aktuelle Titel in niedrigen bis mittleren Einstellungen flüssig darstellen.
Features
Die überarbeitete Videoeinheit dekodiert H.265-/HEVC-Videos vollständig in Hardware. Anders als Skylake kann Kaby Lake nun auch H.265/HEVC im Main10-Profil mit 10 Bit Farbtiefe sowie Googles VP9-Codec in Hardware dekodieren. Die Bildausgabe erfolgt über DP 1.2/eDP 1.3 (max. 3.840 x 2.160 @ 60 Hz), wohingegen HDMI nur in der älteren Version 1.4a angeboten wird. Ein HDMI-2.0-Anschluss kann aber mittels Konverter von DisplayPort ergänzt werden. Maximal lassen sich drei Displays parallel ansteuern.
Leistungsaufnahme
Die Iris Plus Graphics 645 ist in den Prozessoren der 15-Watt-Klasse zu finden und damit für kleine Laptops geeignet.
AMD Radeon RX Vega 11 Intel HD Graphics P630 Intel Iris Plus Graphics 645 Gen. 9.5 Serie Codename Vega Raven Ridge Kaby-Lake-H-GT2 Kaby Lake GT3e Architektur Vega Gen. 9.5 Kaby Lake Gen. 9.5 Coffee Lake Pipelines 704 - unified 24 - unified 48 - unified Kerntakt 1240 (Boost) MHz 300 - 1150 (Boost) MHz Shared Memory nein ja ja API DirectX 12_1 DirectX 12_1, OpenGL 4.4 DirectX 12_1, OpenGL 4.5 Stromverbrauch 65 Watt Transistors 4.5 Billion Herstellungsprozess 14 nm 14 nm 14 nm Features Tiled Rasterization, Shared Memory (up to Dual-Channel DDR4-2400) QuickSync QuickSync Erscheinungsdatum 26.10.2017 05.08.2015 10.07.2019 Speicherbandbreite 64/128 Bit Speichertyp DDR3, DDR4
Benchmarks Performance Rating - 3DMark 11 + Fire Strike + Time Spy - Vega 11
1.6 pt (5%)
...
...
max:
3DMark - 3DMark Time Spy Score
min: 886 avg: 1075 median: 1127 (3%) max: 1212 Points
400 Points (1%)
624 Points (2%)
3DMark - 3DMark Time Spy Graphics
min: 786 avg: 936 median: 935.5 (2%) max: 1085 Points
550 Points (1%)
3DMark - 3DMark Ice Storm Unlimited Graphics
min: 149941 avg: 160025 median: 157382 (16%) max: 175397 Points
3DMark - 3DMark Ice Storm Extreme Graphics
min: 69751 avg: 87099 median: 87098.5 (11%) max: 104446 Points
Modell CPU GPU RAM Wert AMD Ryzen 5 2400G R5 2400G Vega 11 8 GB 69751 CUK Axiom TS Ryzen 5 2400G Vega 11 400 / 3200 MHz 2 GB 16 GB 104446
3DMark - 3DMark Cloud Gate Score
min: 13263 avg: 14436 median: 14579 (16%) max: 15323 Points
8280 Points (9%)
3DMark - 3DMark Cloud Gate Graphics
min: 17047 avg: 20261 median: 20847.5 (5%) max: 22303 Points
3DMark - 3DMark Fire Strike Standard Score
min: 2219 avg: 2934 median: 3038.5 (5%) max: 3264 Points
1040 Points (2%)
1736 Points (3%)
3DMark - 3DMark Fire Strike Standard Graphics
min: 3476 avg: 3523 median: 3494 (4%) max: 3599 Points
1893 Points (2%)
3DMark - 3DMark Ice Storm Graphics
min: 88177 avg: 108334 median: 108334 (13%) max: 128491 Points
Modell CPU GPU RAM Wert AMD Ryzen 5 2400G R5 2400G Vega 11 8 GB 88177 CUK Axiom TS Ryzen 5 2400G Vega 11 400 / 3200 MHz 2 GB 16 GB 128491
3DMark - 3DMark Night Raid
8516 Points (8%)
3DMark - 3DMark Night Raid Graphics Score
9324 Points (4%)
3DMark 11 - 3DM11 Performance Score
min: 4277 avg: 5210 median: 5350 (7%) max: 5635 Points
3238 Points (4%)
3DMark 11 - 3DM11 Performance GPU
min: 4337 avg: 5213 median: 5483 (5%) max: 5549 Points
2985 Points (3%)
3DMark 06 3DMark 06 - Standard 1280x1024 + AMD Radeon RX Vega 11
20608 Points (27%)
Cinebench R10 Cinebench R10 Shading (32bit) + AMD Radeon RX Vega 11 Cinebench R10 - Cinebench R10 Shading (32bit)
min: 10880 avg: 11001 median: 11001 (8%) max: 11122 Points
Cinebench R11.5 Cinebench R11.5 OpenGL 64 Bit + AMD Radeon RX Vega 11 Cinebench R11.5 - Cinebench R11.5 OpenGL 64 Bit
min: 59.7 avg: 65 median: 65 (21%) max: 70.3 fps
Cinebench R15 + AMD Radeon RX Vega 11 Cinebench R15 - Cinebench R15 OpenGL 64 Bit
min: 80.1 avg: 80.2 median: 80.1 (5%) max: 80.4 fps
Cinebench R15 OpenGL 64 Bit + Intel Iris Plus Graphics 645
min: 55.3 avg: 67.1 median: 67.1 (4%) max: 78.9 fps
Cinebench R15 OpenGL Ref. Match 64 Bit + AMD Radeon RX Vega 11 Cinebench R15 - Cinebench R15 OpenGL Ref. Match 64 Bit
98 % (98%)
Cinebench R15 OpenGL Ref. Match 64 Bit + Intel Iris Plus Graphics 645
min: 97.8 avg: 98.6 median: 98.6 (99%) max: 99.3 %
GFXBench - GFXBench 5.0 Aztec Ruins High Tier Offscreen
20.2 fps (4%)
GFXBench - GFXBench 5.0 Aztec Ruins Normal Tier Offscreen
53.4 fps (4%)
GFXBench 3.1 - GFXBench Manhattan ES 3.1 Offscreen
69.6 fps (1%)
GFXBench 3.0 - GFXBench 3.0 Manhattan Offscreen
101.8 fps (6%)
GFXBench (DX / GLBenchmark) 2.7 + Intel Iris Plus Graphics 645 GFXBench (DX / GLBenchmark) 2.7 - GFXBench T-Rex HD Offscreen C24Z16
198.3 fps (2%)
LuxMark v2.0 64Bit - LuxMark v2.0 Room GPU
min: 447 avg: 465 median: 465 (2%) max: 483 Samples/s
LuxMark v2.0 64Bit - LuxMark v2.0 Sala GPU
min: 1019 avg: 1074 median: 1074 (2%) max: 1129 Samples/s
ComputeMark v2.1 - ComputeMark v2.1 Result
min: 3392 avg: 3425 median: 3425 (4%) max: 3458 Points
Power Consumption - Furmark Stress Test Power Consumption - external Monitor *
min: 78.7 avg: 89.3 median: 89.3 (13%) max: 99.9 Watt
Power Consumption - The Witcher 3 Power Consumption - external Monitor *
min: 63.1 avg: 76.1 median: 74.7 (10%) max: 90.5 Watt
Power Consumption - Witcher 3 Power Consumption *
90.5 Watt (20%)
Modell CPU GPU RAM Wert CUK Axiom TS Ryzen 5 2400G Vega 11 400 / 3200 MHz 2 GB 16 GB 90.5
Power Consumption - Witcher 3 ultra Power Efficiency - external Monitor
0.2 fps per Watt (13%)
Emissions Witcher 3 Fan Noise + AMD Radeon RX Vega 11 Emissions - Witcher 3 Fan Noise
42 dB(A) (67%)
Clock Speed - GPU Clock Witcher 3 ultra
1240 MHz (49%)
Clock Speed - GPU Clock Speed Furmark
1240 MHz (49%)
Average Benchmarks AMD Radeon RX Vega 11 → 100% n=2 Average Benchmarks Intel HD Graphics P630 → 35% n=2 Average Benchmarks Intel Iris Plus Graphics 645 → 56% n=2
- Bereich der Benchmarkergebnisse für diese Grafikkarte
- Durchschnittliche Benchmarkergebnisse für diese Grafikkarte
* Smaller numbers mean a higher performance
1 This benchmark is not used for the average calculation
Spiele-Benchmarks Die folgenden Benchmarks basieren auf unseren Spieletests mit Testnotebooks. Die Performance dieser Grafikkarte bei den gelisteten Spielen ist abhängig von der verwendeten CPU, Speicherausstattung, Treiber und auch Betriebssystem. Dadurch müssen die untenstehenden Werte nicht repräsentativ sein. Detaillierte Informationen über das verwendete System sehen Sie nach einem Klick auf den fps-Wert.
100%
Vega 11:
38.1 [X] AMD Ryzen 5 2400G AMD Ryzen 5 2400G 3.6GHz
Vega 11
56.1 [X] AMD Ryzen 5 2400G 3.6GHz
Vega 11
~ 47 fps
100%
Vega 11:
14.3 [X] AMD Ryzen 5 2400G AMD Ryzen 5 2400G 3.6GHz
Vega 11
21.7 [X] AMD Ryzen 5 2400G 3.6GHz
Vega 11
~ 18 fps
100%
Vega 11:
8.2 [X] AMD Ryzen 5 2400G AMD Ryzen 5 2400G 3.6GHz
Vega 11
13.2 [X] AMD Ryzen 5 2400G 3.6GHz
Vega 11
~ 11 fps
100%
Vega 11:
6.2 [X] AMD Ryzen 5 2400G AMD Ryzen 5 2400G 3.6GHz
Vega 11
8.9 [X] AMD Ryzen 5 2400G 3.6GHz
Vega 11
~ 8 fps
100%
Vega 11:
41.2 [X] AMD Ryzen 5 2400G 3.6GHz
Vega 11
fps
100%
Vega 11:
12.5 [X] AMD Ryzen 5 2400G 3.6GHz
Vega 11
fps
100%
Vega 11:
7.1 [X] AMD Ryzen 5 2400G 3.6GHz
Vega 11
fps
100%
Vega 11:
84 [X] AMD Ryzen 5 2400G 3.6GHz
Vega 11
min:
72 fps, max:
101 fps
fps
100%
Vega 11:
43 [X] AMD Ryzen 5 2400G 3.6GHz
Vega 11
min:
37 fps, max:
46 fps
fps
100%
Vega 11:
30 [X] AMD Ryzen 5 2400G 3.6GHz
Vega 11
min:
27 fps, max:
33 fps
fps
100%
Vega 11:
37.5 [X] AMD Ryzen 5 2400G 3.6GHz
Vega 11
fps
100%
Vega 11:
31.9 [X] AMD Ryzen 5 2400G 3.6GHz
Vega 11
fps
100%
Vega 11:
31.1 [X] AMD Ryzen 5 2400G 3.6GHz
Vega 11
fps
100%
Vega 11:
58.5 [X] AMD Ryzen 5 2400G 3.6GHz
Vega 11
fps
100%
Vega 11:
21.3 [X] AMD Ryzen 5 2400G 3.6GHz
Vega 11
fps
100%
Vega 11:
12.9 [X] AMD Ryzen 5 2400G 3.6GHz
Vega 11
fps
100%
Vega 11:
62 [X] AMD Ryzen 5 2400G 3.6GHz
Vega 11
fps
100%
Vega 11:
33 [X] AMD Ryzen 5 2400G 3.6GHz
Vega 11
fps
100%
Vega 11:
17 [X] AMD Ryzen 5 2400G 3.6GHz
Vega 11
fps
100%
Vega 11:
121.1 [X] MSI B350I Pro AC - DDR4-2933, 512 MB GPU AMD Ryzen 5 2400G 3.6GHz
Vega 11
fps
100%
Vega 11:
44.3 [X] MSI B350I Pro AC - DDR4-2933, 512 MB GPU AMD Ryzen 5 2400G 3.6GHz
Vega 11
fps
100%
Vega 11:
35.8 [X] MSI B350I Pro AC - DDR4-2933, 512 MB GPU AMD Ryzen 5 2400G 3.6GHz
Vega 11
fps
100%
Vega 11:
18.5 [X] MSI B350I Pro AC - DDR4-2933, 512 MB GPU AMD Ryzen 5 2400G 3.6GHz
Vega 11
fps
Vega 11:
0 (!) [X] MSI B350I Pro AC - DDR4-2933, 512 MB GPU AMD Ryzen 5 2400G 3.6GHz
Vega 11
fps
100%
Vega 11:
28 [X] AMD Ryzen 5 2400G AMD Ryzen 5 2400G 3.6GHz
Vega 11
min:
21 fps, max:
33 fps
39 [X] MSI B350I Pro AC - DDR4-2933, 512 MB GPU AMD Ryzen 5 2400G 3.6GHz
Vega 11
~ 34 fps
100%
Vega 11:
14 [X] AMD Ryzen 5 2400G AMD Ryzen 5 2400G 3.6GHz
Vega 11
min:
12 fps, max:
17 fps
21 [X] MSI B350I Pro AC - DDR4-2933, 512 MB GPU AMD Ryzen 5 2400G 3.6GHz
Vega 11
~ 18 fps
100%
Vega 11:
13 [X] AMD Ryzen 5 2400G AMD Ryzen 5 2400G 3.6GHz
Vega 11
min:
11 fps, max:
16 fps
19 [X] MSI B350I Pro AC - DDR4-2933, 512 MB GPU AMD Ryzen 5 2400G 3.6GHz
Vega 11
~ 16 fps
100%
Vega 11:
13 [X] AMD Ryzen 5 2400G AMD Ryzen 5 2400G 3.6GHz
Vega 11
min:
9 fps, max:
15 fps
18 [X] MSI B350I Pro AC - DDR4-2933, 512 MB GPU AMD Ryzen 5 2400G 3.6GHz
Vega 11
~ 16 fps
100%
Vega 11:
26 [X] AMD Ryzen 5 2400G AMD Ryzen 5 2400G 3.6GHz
Vega 11
min:
16.08 fps, max:
36.45 fps
fps
100%
Vega 11:
11.3 [X] AMD Ryzen 5 2400G AMD Ryzen 5 2400G 3.6GHz
Vega 11
min:
4.88 fps, max:
16.88 fps
fps
100%
Vega 11:
8.3 [X] AMD Ryzen 5 2400G AMD Ryzen 5 2400G 3.6GHz
Vega 11
min:
3.72 fps, max:
13.18 fps
fps
100%
Vega 11:
7 [X] AMD Ryzen 5 2400G AMD Ryzen 5 2400G 3.6GHz
Vega 11
min:
3.25 fps, max:
10.35 fps
fps
100%
Vega 11:
64.6 [X] MSI B350I Pro AC - DDR4-2933, 512 MB GPU AMD Ryzen 5 2400G 3.6GHz
Vega 11
min:
59 fps, max:
73 fps
fps
100%
Vega 11:
32.6 [X] MSI B350I Pro AC - DDR4-2933, 512 MB GPU AMD Ryzen 5 2400G 3.6GHz
Vega 11
min:
29 fps, max:
40 fps
fps
100%
Vega 11:
23.8 [X] MSI B350I Pro AC - DDR4-2933, 512 MB GPU AMD Ryzen 5 2400G 3.6GHz
Vega 11
min:
21 fps, max:
28 fps
fps
100%
Vega 11:
39.4 [X] MSI B350I Pro AC - DDR4-2933, 512 MB GPU AMD Ryzen 5 2400G 3.6GHz
Vega 11
min:
36 fps, max:
44 fps
fps
100%
Vega 11:
24.9 [X] MSI B350I Pro AC - DDR4-2933, 512 MB GPU AMD Ryzen 5 2400G 3.6GHz
Vega 11
min:
22 fps, max:
29 fps
fps
100%
Vega 11:
19.4 [X] MSI B350I Pro AC - DDR4-2933, 512 MB GPU AMD Ryzen 5 2400G 3.6GHz
Vega 11
min:
17 fps, max:
21 fps
fps
100%
Vega 11:
18.1 [X] MSI B350I Pro AC - DDR4-2933, 512 MB GPU AMD Ryzen 5 2400G 3.6GHz
Vega 11
min:
16 fps, max:
20 fps
fps
100%
Vega 11:
79.6 [X] MSI B350I Pro AC - DDR4-2933, 512 MB GPU AMD Ryzen 5 2400G 3.6GHz
Vega 11
min:
32 fps, max:
105 fps
fps
100%
Vega 11:
26.8 [X] MSI B350I Pro AC - DDR4-2933, 512 MB GPU AMD Ryzen 5 2400G 3.6GHz
Vega 11
min:
17 fps, max:
32 fps
fps
100%
Vega 11:
20.8 [X] MSI B350I Pro AC - DDR4-2933, 512 MB GPU AMD Ryzen 5 2400G 3.6GHz
Vega 11
min:
16 fps, max:
24 fps
fps
100%
Vega 11:
17.3 [X] MSI B350I Pro AC - DDR4-2933, 512 MB GPU AMD Ryzen 5 2400G 3.6GHz
Vega 11
min:
15 fps, max:
20 fps
fps
100%
Vega 11:
66.9 [X] AMD Ryzen 5 2400G 3.6GHz
Vega 11
min:
43 fps, max:
99 fps
66.9 [X] MSI B350I Pro AC - DDR4-2933, 512 MB GPU AMD Ryzen 5 2400G 3.6GHz
Vega 11
min:
43 fps, max:
99 fps
~ 67 fps
100%
Vega 11:
30.9 [X] AMD Ryzen 5 2400G 3.6GHz
Vega 11
min:
24 fps, max:
47 fps
30.9 [X] MSI B350I Pro AC - DDR4-2933, 512 MB GPU AMD Ryzen 5 2400G 3.6GHz
Vega 11
min:
24 fps, max:
47 fps
~ 31 fps
100%
Vega 11:
26.1 [X] AMD Ryzen 5 2400G 3.6GHz
Vega 11
min:
19 fps, max:
42 fps
26.1 [X] MSI B350I Pro AC - DDR4-2933, 512 MB GPU AMD Ryzen 5 2400G 3.6GHz
Vega 11
min:
19 fps, max:
42 fps
~ 26 fps
100%
Vega 11:
25.1 [X] AMD Ryzen 5 2400G 3.6GHz
Vega 11
min:
18 fps, max:
42 fps
25.1 [X] MSI B350I Pro AC - DDR4-2933, 512 MB GPU AMD Ryzen 5 2400G 3.6GHz
Vega 11
min:
18 fps, max:
42 fps
~ 25 fps
100%
Vega 11:
8.4 [X] AMD Ryzen 5 2400G 3.6GHz
Vega 11
min:
6 fps, max:
15 fps
8.4 [X] MSI B350I Pro AC - DDR4-2933, 512 MB GPU AMD Ryzen 5 2400G 3.6GHz
Vega 11
min:
6 fps, max:
15 fps
~ 8 fps
100%
Vega 11:
125.8 [X] MSI B350I Pro AC - DDR4-2933, 512 MB GPU AMD Ryzen 5 2400G 3.6GHz
Vega 11
min:
110 fps, max:
162 fps
fps
100%
Vega 11:
64.2 [X] MSI B350I Pro AC - DDR4-2933, 512 MB GPU AMD Ryzen 5 2400G 3.6GHz
Vega 11
min:
56 fps, max:
83 fps
fps
100%
Vega 11:
36.6 [X] MSI B350I Pro AC - DDR4-2933, 512 MB GPU AMD Ryzen 5 2400G 3.6GHz
Vega 11
min:
30 fps, max:
55 fps
fps
100%
Vega 11:
15.7 [X] MSI B350I Pro AC - DDR4-2933, 512 MB GPU AMD Ryzen 5 2400G 3.6GHz
Vega 11
min:
7 fps, max:
31 fps
fps
100%
Vega 11:
44.5 [X] AMD Ryzen 5 2400G 3.6GHz
Vega 11
min:
41 fps, max:
51 fps
44.5 [X] MSI B350I Pro AC - DDR4-2933, 512 MB GPU AMD Ryzen 5 2400G 3.6GHz
Vega 11
min:
41 fps, max:
51 fps
~ 45 fps
100%
Vega 11:
24.2 [X] AMD Ryzen 5 2400G 3.6GHz
Vega 11
min:
21 fps, max:
29 fps
24.2 [X] MSI B350I Pro AC - DDR4-2933, 512 MB GPU AMD Ryzen 5 2400G 3.6GHz
Vega 11
min:
21 fps, max:
29 fps
~ 24 fps
100%
Vega 11:
22.3 [X] AMD Ryzen 5 2400G 3.6GHz
Vega 11
min:
20 fps, max:
26 fps
22.3 [X] MSI B350I Pro AC - DDR4-2933, 512 MB GPU AMD Ryzen 5 2400G 3.6GHz
Vega 11
min:
20 fps, max:
26 fps
~ 22 fps
100%
Vega 11:
21.6 [X] AMD Ryzen 5 2400G 3.6GHz
Vega 11
min:
10 fps, max:
26 fps
21.6 [X] MSI B350I Pro AC - DDR4-2933, 512 MB GPU AMD Ryzen 5 2400G 3.6GHz
Vega 11
min:
10 fps, max:
26 fps
~ 22 fps
100%
Vega 11:
35.9 [X] AMD Ryzen 5 2400G 3.6GHz
Vega 11
min:
26 fps, max:
45 fps
35.9 [X] MSI B350I Pro AC - DDR4-2933, 512 MB GPU AMD Ryzen 5 2400G 3.6GHz
Vega 11
min:
26 fps, max:
45 fps
~ 36 fps
Vega 11:
0 (!) [X] AMD Ryzen 5 2400G 3.6GHz
Vega 11
0 (!) [X] MSI B350I Pro AC - DDR4-2933, 512 MB GPU AMD Ryzen 5 2400G 3.6GHz
Vega 11
~ 0 fps
100%
Vega 11:
61.3 [X] AMD Ryzen 5 2400G 3.6GHz
Vega 11
61.3 [X] MSI B350I Pro AC - DDR4-2933, 512 MB GPU AMD Ryzen 5 2400G 3.6GHz
Vega 11
~ 61 fps
100%
Vega 11:
22.5 [X] AMD Ryzen 5 2400G 3.6GHz
Vega 11
22.5 [X] MSI B350I Pro AC - DDR4-2933, 512 MB GPU AMD Ryzen 5 2400G 3.6GHz
Vega 11
~ 23 fps
100%
Vega 11:
37 [X] AMD Ryzen 5 2400G 3.6GHz
Vega 11
min:
16 fps, max:
68 fps
fps
100%
Vega 11:
20 [X] AMD Ryzen 5 2400G 3.6GHz
Vega 11
min:
7 fps, max:
29 fps
fps
100%
Vega 11:
16 [X] AMD Ryzen 5 2400G 3.6GHz
Vega 11
min:
4 fps, max:
25 fps
fps
100%
Vega 11:
11 [X] AMD Ryzen 5 2400G 3.6GHz
Vega 11
min:
7 fps, max:
17 fps
fps
100%
Vega 11:
5 [X] AMD Ryzen 5 2400G 3.6GHz
Vega 11
min:
2 fps, max:
6 fps
fps
100%
Vega 11:
78 [X] AMD Ryzen 5 2400G 3.6GHz
Vega 11
fps
100%
Vega 11:
38 [X] AMD Ryzen 5 2400G 3.6GHz
Vega 11
fps
100%
Vega 11:
35 [X] AMD Ryzen 5 2400G 3.6GHz
Vega 11
fps
100%
Vega 11:
29 [X] AMD Ryzen 5 2400G 3.6GHz
Vega 11
fps
100%
Vega 11:
12 [X] AMD Ryzen 5 2400G 3.6GHz
Vega 11
fps
100%
Vega 11:
123.6 [X] AMD Ryzen 5 2400G 3.6GHz
Vega 11
min:
98 fps, max:
146 fps
fps
100%
Vega 11:
89.3 [X] AMD Ryzen 5 2400G 3.6GHz
Vega 11
min:
83 fps, max:
96 fps
fps
100%
Vega 11:
77.6 [X] AMD Ryzen 5 2400G 3.6GHz
Vega 11
min:
69 fps, max:
85 fps
fps
100%
Vega 11:
76.6 [X] AMD Ryzen 5 2400G 3.6GHz
Vega 11
min:
69 fps, max:
84 fps
fps
100%
Vega 11:
25 [X] AMD Ryzen 5 2400G 3.6GHz
Vega 11
min:
23 fps, max:
27 fps
fps
100%
Vega 11:
49 [X] AMD Ryzen 5 2400G 3.6GHz
Vega 11
fps
100%
Vega 11:
19 [X] AMD Ryzen 5 2400G 3.6GHz
Vega 11
fps
100%
Vega 11:
17 [X] AMD Ryzen 5 2400G 3.6GHz
Vega 11
fps
100%
Vega 11:
14 [X] AMD Ryzen 5 2400G 3.6GHz
Vega 11
fps
100%
Vega 11:
4 [X] AMD Ryzen 5 2400G 3.6GHz
Vega 11
fps
100%
Vega 11:
49.9 [X] AMD Ryzen 5 2400G 1.47.22.14 D3D12
AMD Ryzen 5 2400G 3.6GHz
Vega 11
min:
38 fps, P1:
43.5 fps, max:
73.5 fps
fps
100%
Vega 11:
20.2 [X] AMD Ryzen 5 2400G 1.47.22.14 D3D12
AMD Ryzen 5 2400G 3.6GHz
Vega 11
min:
16 fps, P1:
18 fps, max:
25.6 fps
fps
100%
Vega 11:
17.1 [X] AMD Ryzen 5 2400G 1.47.22.14 D3D12
AMD Ryzen 5 2400G 3.6GHz
Vega 11
min:
13.2 fps, P1:
13.4 fps, max:
26.7 fps
fps
100%
Vega 11:
14.8 [X] AMD Ryzen 5 2400G 1.47.22.14 D3D12
AMD Ryzen 5 2400G 3.6GHz
Vega 11
min:
5 fps, P1:
11.8 fps, max:
154 fps
fps
100%
Vega 11:
71 [X] AMD Ryzen 5 2400G 3.6GHz
Vega 11
min:
54 fps, max:
84 fps
fps
100%
Vega 11:
38 [X] AMD Ryzen 5 2400G 3.6GHz
Vega 11
min:
28 fps, max:
46 fps
fps
100%
Vega 11:
29 [X] AMD Ryzen 5 2400G 3.6GHz
Vega 11
min:
19 fps, max:
32 fps
fps
100%
Vega 11:
19 [X] AMD Ryzen 5 2400G 3.6GHz
Vega 11
min:
15 fps, max:
22 fps
fps
100%
Vega 11:
10 [X] AMD Ryzen 5 2400G 3.6GHz
Vega 11
min:
3 fps, max:
12 fps
fps
100%
Vega 11:
43.5 [X] AMD Ryzen 5 2400G 3.6GHz
Vega 11
min:
40 fps, max:
50 fps
fps
100%
Vega 11:
19.9 [X] AMD Ryzen 5 2400G 3.6GHz
Vega 11
min:
16 fps, max:
24 fps
fps
100%
Vega 11:
18.3 [X] AMD Ryzen 5 2400G 3.6GHz
Vega 11
min:
15 fps, max:
22 fps
fps
100%
Vega 11:
13.9 [X] AMD Ryzen 5 2400G 3.6GHz
Vega 11
min:
11 fps, max:
16 fps
fps
100%
Vega 11:
58.8 [X] AMD Ryzen 5 2400G 3.6GHz
Vega 11
fps
100%
Vega 11:
28.4 [X] AMD Ryzen 5 2400G 3.6GHz
Vega 11
fps
100%
Vega 11:
24.6 [X] AMD Ryzen 5 2400G 3.6GHz
Vega 11
fps
100%
Vega 11:
17.8 [X] AMD Ryzen 5 2400G 3.6GHz
Vega 11
fps
100%
Vega 11:
5.5 [X] AMD Ryzen 5 2400G 3.6GHz
Vega 11
fps
100%
Vega 11:
32 [X] AMD Ryzen 5 2400G AMD Ryzen 5 2400G 3.6GHz
Vega 11
min:
29 fps, max:
37 fps
49 [X] AMD Ryzen 5 2400G 3.6GHz
Vega 11
min:
45 fps, max:
58 fps
~ 41 fps
100%
Vega 11:
15 [X] AMD Ryzen 5 2400G AMD Ryzen 5 2400G 3.6GHz
Vega 11
min:
13 fps, max:
18 fps
23 [X] AMD Ryzen 5 2400G 3.6GHz
Vega 11
min:
17 fps, max:
28 fps
~ 19 fps
100%
Vega 11:
14 [X] AMD Ryzen 5 2400G AMD Ryzen 5 2400G 3.6GHz
Vega 11
min:
12 fps, max:
17 fps
22 [X] AMD Ryzen 5 2400G 3.6GHz
Vega 11
min:
20 fps, max:
27 fps
~ 18 fps
100%
Vega 11:
13 [X] AMD Ryzen 5 2400G AMD Ryzen 5 2400G 3.6GHz
Vega 11
min:
12 fps, max:
16 fps
20 [X] AMD Ryzen 5 2400G 3.6GHz
Vega 11
min:
16 fps, max:
25 fps
~ 17 fps
100%
Vega 11:
38.7 [X] AMD Ryzen 5 2400G AMD Ryzen 5 2400G 3.6GHz
Vega 11
44.8 [X] AMD Ryzen 5 2400G 3.6GHz
Vega 11
~ 42 fps
89%
Iris Plus Graphics 645:
37.4 fps
100%
Vega 11:
29.8 [X] AMD Ryzen 5 2400G AMD Ryzen 5 2400G 3.6GHz
Vega 11
34.6 [X] AMD Ryzen 5 2400G 3.6GHz
Vega 11
~ 32 fps
82%
Iris Plus Graphics 645:
26.1 fps
100%
Vega 11:
28 [X] AMD Ryzen 5 2400G AMD Ryzen 5 2400G 3.6GHz
Vega 11
31.8 [X] AMD Ryzen 5 2400G 3.6GHz
Vega 11
~ 30 fps
75%
Iris Plus Graphics 645:
22.5 fps
100%
Vega 11:
15.7 [X] AMD Ryzen 5 2400G AMD Ryzen 5 2400G 3.6GHz
Vega 11
18.1 [X] AMD Ryzen 5 2400G 3.6GHz
Vega 11
~ 17 fps
100%
Vega 11:
50.6 [X] AMD Ryzen 5 2400G 3.6GHz
Vega 11
min:
41 fps, max:
57 fps
fps
100%
Vega 11:
22.3 [X] AMD Ryzen 5 2400G 3.6GHz
Vega 11
min:
18 fps, max:
26 fps
fps
100%
Vega 11:
18.7 [X] AMD Ryzen 5 2400G 3.6GHz
Vega 11
min:
15 fps, max:
22 fps
fps
100%
Vega 11:
14.1 [X] AMD Ryzen 5 2400G 3.6GHz
Vega 11
min:
11 fps, max:
17 fps
fps
100%
Vega 11:
24.4 [X] AMD Ryzen 5 2400G 1.3
AMD Ryzen 5 2400G 3.6GHz
Vega 11
27.2 [X] MSI B350I Pro AC - DDR4 Standard AMD Ryzen 5 2400G 3.6GHz
Vega 11
min:
15 fps, max:
34 fps
31.1 [X] MSI B350I Pro AC - DDR4-2933, 512 MB GPU AMD Ryzen 5 2400G 3.6GHz
Vega 11
min:
25 fps, max:
44 fps
31.3 [X] AMD Ryzen 5 2400G 3.6GHz
Vega 11
min:
25 fps, max:
39 fps
~ 29 fps
100%
Vega 11:
12.9 [X] AMD Ryzen 5 2400G 1.3
AMD Ryzen 5 2400G 3.6GHz
Vega 11
14.7 [X] MSI B350I Pro AC - DDR4 Standard AMD Ryzen 5 2400G 3.6GHz
Vega 11
min:
8 fps, max:
19 fps
16.4 [X] MSI B350I Pro AC - DDR4-2933, 512 MB GPU AMD Ryzen 5 2400G 3.6GHz
Vega 11
min:
9 fps, max:
22 fps
16.4 [X] AMD Ryzen 5 2400G 3.6GHz
Vega 11
min:
7 fps, max:
22 fps
~ 15 fps
100%
Vega 11:
7.7 [X] AMD Ryzen 5 2400G 1.3
AMD Ryzen 5 2400G 3.6GHz
Vega 11
fps
100%
Vega 11:
5.8 [X] AMD Ryzen 5 2400G 1.3
AMD Ryzen 5 2400G 3.6GHz
Vega 11
fps
100%
Vega 11:
3.3 [X] AMD Ryzen 5 2400G 1.3
AMD Ryzen 5 2400G 3.6GHz
Vega 11
fps
100%
Vega 11:
183 [X] AMD Ryzen 5 2400G 3.6GHz
Vega 11
min:
128 fps, max:
244 fps
fps
100%
Vega 11:
86 [X] AMD Ryzen 5 2400G 3.6GHz
Vega 11
min:
68 fps, max:
104 fps
fps
100%
Vega 11:
30.8 [X] AMD Ryzen 5 2400G 3.6GHz
Vega 11
min:
26 fps, max:
35 fps
fps
100%
Vega 11:
37 [X] MSI B350I Pro AC - DDR4 Standard AMD Ryzen 5 2400G 3.6GHz
Vega 11
min:
10 fps, max:
63 fps
41 [X] MSI B350I Pro AC - DDR4-2933, 512 MB GPU AMD Ryzen 5 2400G 3.6GHz
Vega 11
min:
9 fps, max:
72 fps
41 [X] AMD Ryzen 5 2400G 3.6GHz
Vega 11
min:
15 fps, max:
66 fps
~ 40 fps
100%
Vega 11:
20 [X] MSI B350I Pro AC - DDR4 Standard AMD Ryzen 5 2400G 3.6GHz
Vega 11
min:
4 fps, max:
34 fps
23 [X] MSI B350I Pro AC - DDR4-2933, 512 MB GPU AMD Ryzen 5 2400G 3.6GHz
Vega 11
min:
6 fps, max:
40 fps
23 [X] AMD Ryzen 5 2400G 3.6GHz
Vega 11
min:
11 fps, max:
40 fps
~ 22 fps
100%
Vega 11:
18 [X] MSI B350I Pro AC - DDR4 Standard AMD Ryzen 5 2400G 3.6GHz
Vega 11
min:
6 fps, max:
34 fps
19 [X] MSI B350I Pro AC - DDR4-2933, 512 MB GPU AMD Ryzen 5 2400G 3.6GHz
Vega 11
min:
4 fps, max:
86 fps
20 [X] AMD Ryzen 5 2400G 3.6GHz
Vega 11
min:
10 fps, max:
35 fps
~ 19 fps
100%
Vega 11:
56.7 [X] MSI B350I Pro AC - DDR4-2933, 512 MB GPU AMD Ryzen 5 2400G 3.6GHz
Vega 11
P1:
38.5 fps
fps
100%
Vega 11:
30.8 [X] MSI B350I Pro AC - DDR4-2933, 512 MB GPU AMD Ryzen 5 2400G 3.6GHz
Vega 11
P1:
23.9 fps
fps
100%
Vega 11:
28.2 [X] MSI B350I Pro AC - DDR4-2933, 512 MB GPU AMD Ryzen 5 2400G 3.6GHz
Vega 11
P1:
20.9 fps
fps
100%
Vega 11:
23.9 [X] MSI B350I Pro AC - DDR4-2933, 512 MB GPU AMD Ryzen 5 2400G 3.6GHz
Vega 11
P1:
19.3 fps
fps
100%
Vega 11:
48 [X] AMD Ryzen 5 2400G 3.6GHz
Vega 11
min:
28 fps, max:
70 fps
53 [X] MSI B350I Pro AC - DDR4-2933, 512 MB GPU AMD Ryzen 5 2400G 3.6GHz
Vega 11
min:
19 fps, max:
109 fps
~ 51 fps
100%
Vega 11:
24 [X] MSI B350I Pro AC - DDR4-2933, 512 MB GPU AMD Ryzen 5 2400G 3.6GHz
Vega 11
min:
15 fps, max:
44 fps
24 [X] AMD Ryzen 5 2400G 3.6GHz
Vega 11
min:
14 fps, max:
38 fps
~ 24 fps
100%
Vega 11:
18 [X] AMD Ryzen 5 2400G 3.6GHz
Vega 11
min:
12 fps, max:
31 fps
19 [X] MSI B350I Pro AC - DDR4-2933, 512 MB GPU AMD Ryzen 5 2400G 3.6GHz
Vega 11
min:
11 fps, max:
26 fps
~ 19 fps
100%
Vega 11:
101 [X] AMD Ryzen 5 2400G 3.6GHz
Vega 11
min:
86 fps, max:
115 fps
fps
100%
Vega 11:
45 [X] AMD Ryzen 5 2400G 3.6GHz
Vega 11
min:
39 fps, max:
50 fps
fps
100%
Vega 11:
35 [X] AMD Ryzen 5 2400G 3.6GHz
Vega 11
min:
28 fps, max:
38 fps
fps
100%
Vega 11:
75.4 [X] AMD Ryzen 5 2400G 3.6GHz
Vega 11
min:
67 fps
fps
100%
Vega 11:
26.5 [X] AMD Ryzen 5 2400G 3.6GHz
Vega 11
min:
24 fps
fps
100%
Vega 11:
144 [X] MSI B350I Pro AC - DDR4-2933, 512 MB GPU AMD Ryzen 5 2400G 3.6GHz
Vega 11
min:
120 fps, max:
164 fps
215 [X] AMD Ryzen 5 2400G 3.6GHz
Vega 11
min:
157 fps, max:
251 fps
~ 180 fps
100%
Vega 11:
57.6 [X] MSI B350I Pro AC - DDR4-2933, 512 MB GPU AMD Ryzen 5 2400G 3.6GHz
Vega 11
min:
51 fps, max:
65 fps
71 [X] AMD Ryzen 5 2400G 3.6GHz
Vega 11
min:
63 fps, max:
80 fps
~ 64 fps
100%
Vega 11:
40 [X] MSI B350I Pro AC - DDR4-2933, 512 MB GPU AMD Ryzen 5 2400G 3.6GHz
Vega 11
min:
34 fps, max:
50 fps
47.1 [X] AMD Ryzen 5 2400G 3.6GHz
Vega 11
min:
40 fps, max:
61 fps
~ 44 fps
100%
Vega 11:
15.2 [X] AMD Ryzen 5 2400G 3.6GHz
Vega 11
min:
9 fps, max:
21 fps
fps
100%
Vega 11:
48.9 [X] DX12
AMD Ryzen 5 2400G 3.6GHz
Vega 11
min:
24.4 fps, max:
65.4 fps
50 [X] DX11
AMD Ryzen 5 2400G 3.6GHz
Vega 11
min:
38 fps, max:
68 fps
~ 49 fps
100%
Vega 11:
18.1 [X] DX11
AMD Ryzen 5 2400G 3.6GHz
Vega 11
min:
14.7 fps, max:
23.3 fps
fps
100%
Vega 11:
139 [X] MSI B350I Pro AC - DDR4-2933, 512 MB GPU AMD Ryzen 5 2400G 3.6GHz
Vega 11
min:
109 fps, max:
170 fps
fps
100%
Vega 11:
96 [X] MSI B350I Pro AC - DDR4-2933, 512 MB GPU AMD Ryzen 5 2400G 3.6GHz
Vega 11
min:
76 fps, max:
116 fps
fps
100%
Vega 11:
54.2 [X] MSI B350I Pro AC - DDR4-2933, 512 MB GPU AMD Ryzen 5 2400G 3.6GHz
Vega 11
min:
36 fps, max:
67 fps
fps
100%
Vega 11:
28.3 [X] MSI B350I Pro AC - DDR4-2933, 512 MB GPU AMD Ryzen 5 2400G 3.6GHz
Vega 11
min:
23 fps, max:
35 fps
fps
100%
Vega 11:
68 [X] MSI B350I Pro AC - DDR4 Standard AMD Ryzen 5 2400G 3.6GHz
Vega 11
min:
39 fps, max:
94 fps
70 [X] AMD Ryzen 5 2400G 3.6GHz
Vega 11
min:
39 fps, max:
97 fps
~ 69 fps
100%
Vega 11:
47.8 [X] MSI B350I Pro AC - DDR4 Standard AMD Ryzen 5 2400G 3.6GHz
Vega 11
min:
29 fps, max:
69 fps
52.9 [X] AMD Ryzen 5 2400G 3.6GHz
Vega 11
min:
38 fps, max:
73 fps
~ 50 fps
100%
Vega 11:
15 [X] MSI B350I Pro AC - DDR4 Standard AMD Ryzen 5 2400G 3.6GHz
Vega 11
min:
9 fps, max:
24 fps
15.9 [X] AMD Ryzen 5 2400G 3.6GHz
Vega 11
min:
10 fps, max:
25 fps
~ 15 fps
100%
Vega 11:
96.4 [X] AMD Ryzen 5 2400G AMD Ryzen 5 2400G 3.6GHz
Vega 11
min:
77.8 fps, max:
-1 fps
103.3 [X] AMD Ryzen 5 2400G 3.6GHz
Vega 11
min:
88.6 fps
~ 100 fps
77%
Iris Plus Graphics 645:
76.5 fps
100%
Vega 11:
72 [X] AMD Ryzen 5 2400G AMD Ryzen 5 2400G 3.6GHz
Vega 11
min:
53.4 fps, max:
-1 fps
80.5 [X] AMD Ryzen 5 2400G 3.6GHz
Vega 11
min:
69.5 fps
~ 76 fps
75%
Iris Plus Graphics 645:
57.3 fps
100%
Vega 11:
37 [X] AMD Ryzen 5 2400G AMD Ryzen 5 2400G 3.6GHz
Vega 11
min:
34.6 fps, max:
-1 fps
54.2 [X] AMD Ryzen 5 2400G 3.6GHz
Vega 11
min:
49.5 fps
~ 46 fps
63%
Iris Plus Graphics 645:
29 fps
100%
Vega 11:
34.7 [X] AMD Ryzen 5 2400G AMD Ryzen 5 2400G 3.6GHz
Vega 11
min:
32.7 fps, max:
-1 fps
50.2 [X] AMD Ryzen 5 2400G 3.6GHz
Vega 11
min:
45.7 fps
~ 42 fps
64%
Iris Plus Graphics 645:
26.9 fps
100%
Vega 11:
13.2 [X] AMD Ryzen 5 2400G AMD Ryzen 5 2400G 3.6GHz
Vega 11
min:
12.5 fps, max:
-1 fps
20.7 [X] AMD Ryzen 5 2400G 3.6GHz
Vega 11
min:
19.5 fps
~ 17 fps
100%
Vega 11:
41.8 [X] AMD Ryzen 5 2400G AMD Ryzen 5 2400G 3.6GHz
Vega 11
min:
37 fps, max:
46 fps
fps
100%
Vega 11:
13.8 [X] AMD Ryzen 5 2400G AMD Ryzen 5 2400G 3.6GHz
Vega 11
min:
12 fps, max:
15 fps
fps
100%
Vega 11:
9.6 [X] AMD Ryzen 5 2400G AMD Ryzen 5 2400G 3.6GHz
Vega 11
min:
8 fps, max:
11 fps
fps
100%
Vega 11:
68.1 [X] AMD Ryzen 5 2400G AMD Ryzen 5 2400G 3.6GHz
Vega 11
min:
30 fps, P1:
47.6 fps, max:
102 fps
102 [X] AMD Ryzen 5 2400G 3.6GHz
Vega 11
~ 85 fps
100%
Vega 11:
63.7 [X] AMD Ryzen 5 2400G AMD Ryzen 5 2400G 3.6GHz
Vega 11
min:
15 fps, P1:
41.7 fps, max:
97.4 fps
fps
100%
Vega 11:
17.6 [X] AMD Ryzen 5 2400G AMD Ryzen 5 2400G 3.6GHz
Vega 11
min:
6.34 fps, P1:
12.3 fps, max:
28.9 fps
28.7 [X] AMD Ryzen 5 2400G 3.6GHz
Vega 11
~ 23 fps
100%
Vega 11:
8.3 [X] AMD Ryzen 5 2400G AMD Ryzen 5 2400G 3.6GHz
Vega 11
min:
0.725 fps, P1:
5.46 fps, max:
12.8 fps
14.3 [X] AMD Ryzen 5 2400G 3.6GHz
Vega 11
~ 11 fps
100%
Vega 11:
65.9 [X] AMD Ryzen 5 2400G 3.6GHz
Vega 11
fps
100%
Vega 11:
44.7 [X] AMD Ryzen 5 2400G 3.6GHz
Vega 11
fps
100%
Vega 11:
20.1 [X] AMD Ryzen 5 2400G 3.6GHz
Vega 11
fps
100%
Vega 11:
17.5 [X] MSI B350I Pro AC - DDR4 Standard AMD Ryzen 5 2400G 3.6GHz
Vega 11
20 [X] AMD Ryzen 5 2400G 3.6GHz
Vega 11
~ 19 fps
Iris Plus Graphics 645:
104.6 fps
Iris Plus Graphics 645:
60 fps
Iris Plus Graphics 645:
51.6 fps
Iris Plus Graphics 645:
22.1 fps
Average Gaming AMD Radeon RX Vega 11 → 100% Average Gaming 30-70 fps → 100%
Average Gaming Intel Iris Plus Graphics 645 → 75% Average Gaming 30-70 fps → 82%
Intel Iris Plus Graphics 645 low med. high ultra QHD 4K X-Plane 11.11 37.4 26.1 22.5 Dota 2 Reborn 76.5 57.3 29 26.9 BioShock Infinite 104.6 60 51.6 22.1 < 30 fps < 60 fps < 120 fps ≥ 120 fps 1 2 1 1 1 2 1 2
v1.28
log 01. 00:24:37
#0 ran 0s before starting gpusingle class +0s ... 0s
#1 checking url part for id 8470 +0s ... 0s
#2 checking url part for id 7657 +0s ... 0s
#3 checking url part for id 9902 +0s ... 0s
#4 redirected to Ajax server, took 1730417077s time from redirect:0 +0s ... 0s
#5 did not recreate cache, as it is less than 5 days old! Created at Thu, 31 Oct 2024 05:16:44 +0100 +0s ... 0s
#6 composed specs +0.029s ... 0.029s
#7 did output specs +0s ... 0.029s
#8 start showIntegratedCPUs +0s ... 0.029s
#9 getting avg benchmarks for device 8470 +0.024s ... 0.053s
#10 got single benchmarks 8470 +0.006s ... 0.059s
#11 getting avg benchmarks for device 7657 +0s ... 0.06s
#12 got single benchmarks 7657 +0s ... 0.06s
#13 getting avg benchmarks for device 9902 +0s ... 0.06s
#14 got single benchmarks 9902 +0.003s ... 0.063s
#15 got avg benchmarks for devices +0s ... 0.063s
#16 min, max, avg, median took s +0.018s ... 0.081s
#17 before gaming benchmark output +0s ... 0.081s
#18 Got 233 rows for game benchmarks. +0.007s ... 0.088s
#19 composed SQL query for gamebenchmarks +0s ... 0.088s
#20 got data and put it in $dataArray +0.002s ... 0.09s
#21 benchmarks composed for output. +0.014s ... 0.104s
#22 calculated avg scores. +0s ... 0.104s
#23 return log +0.001s ... 0.104s
Teilen Sie diesen Artikel, um uns zu unterstützen. Jeder Link hilft!
Autor: Klaus Hinum, 8.09.2017 (Update: 1.07.2023)
 Deutsch
 English
 Español
 Français
 Italiano
 Nederlands
 Polski
 Português
 Русский
 Türkçe
 Svenska
 Chinese
 Magyar