Notebookcheck Logo

Intel HD Graphics 2500 vs Intel HD Graphics 5000

Intel HD Graphics 2500

► remove from comparison Intel HD Graphics 2500

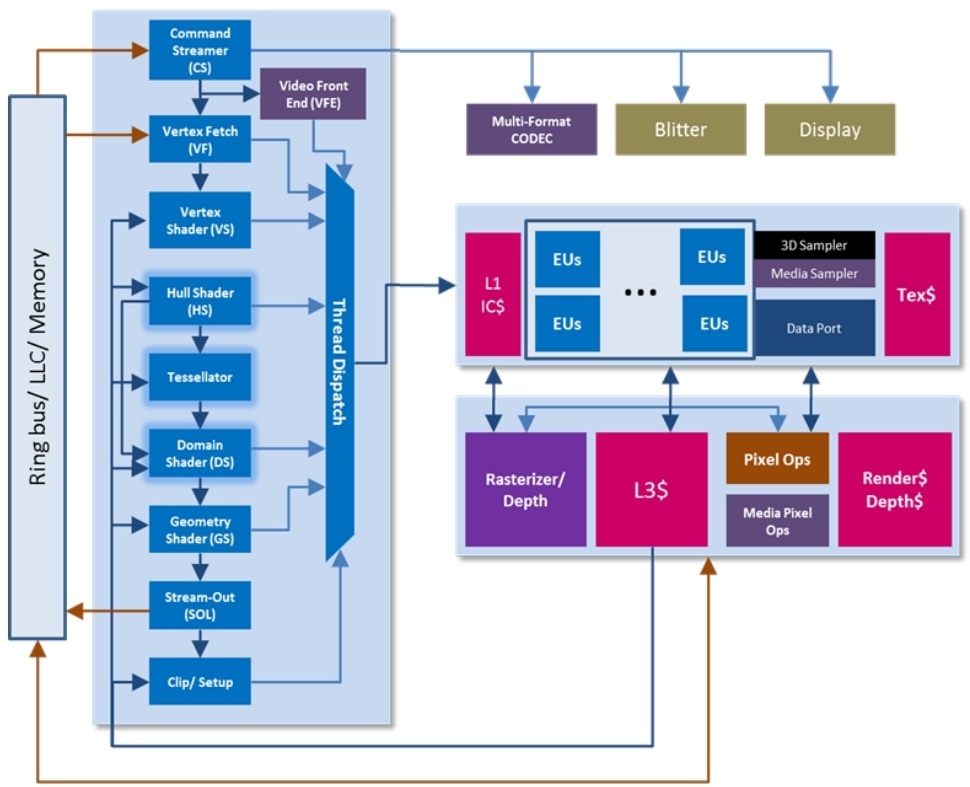
Die Intel HD Graphics 2500 (oder Ivy Bridge GT1) ist eine in den Ivy Bridge Prozessoren integrierte Grafikkarte. Sie kommt ausschließlich in Desktop CPUs zum Einsatz. Das mobile Pendant nennt sich schlicht Intel HD Graphics. Im Vergleich zur stärkeren Intel HD Graphics 4000 ist die HD 2500 deutlich abgespeckt und bietet weniger Execution Units (6 EUs) und Texture Sampler (nur einer). Daher ist die Performance deutlich geringer und nur etwas oberhalb der alten Intel HD Graphics 2000. Je nach Prozessor weist die HD Graphics 2500 eine unterschiedliche Basis- und Turbo-Taktrate auf.

Da die Leistung nur zwischen der HD Graphics 2000 und 3000 liegt (siehe Benchmarks), reicht die HD Graphics 2500 nur für ältere und anspruchslose Spiele aus. Im Konkurrenzvergleich entspricht die Performance etwa den integrierten Einstiegslösungen von AMD, zum Beispiel der Radeon HD 8210.

Eine Besonderheit der Ivy Bride Grafikkerne ist, das nur 4x MSAA von der Hardware unterstützt wird. 2x MSAA wird per Software berechnet und geht durch die 4x MSAA Pipeline. Daher empfiehlt sich der Einsatz des gleich schnellen 4x MSAA. 

Auch der integrierte Videodecoder genannt Multi Format Codec Engine (MFX) wurde kräftig überarbeitet und soll nun sogar mehrere 4K Videos parallel dekodieren können (ev. nur in den High-End Modellen). DXVA Checker gibt weiterhin die Formate MPEG2, VC1, WMV9 und H264 als unterstütz an. QuickSync zum schnellen Transkodieren von Videos wurde ebenfalls verbessert und soll nun schneller bei gleichzeitig höherer Qualität laufen.

Ebenfalls neu ist die Unterstützung für drei unabhängige Bildschirme. Bis Sandy Bridge waren nur zwei möglich und lediglich die AMD Grafikkarten mit Eyefinity Support bieten mehr als zwei Anschlüsse für Notebooks (jedoch nur mit DisplayPorts). 

Aufgrund der Integration in den mit 22nm gefertigten Prozessor und die halbierte Shaderzahl ist der Stromverbrauch relativ gering.

Intel HD Graphics 5000

► remove from comparison Intel HD Graphics 5000

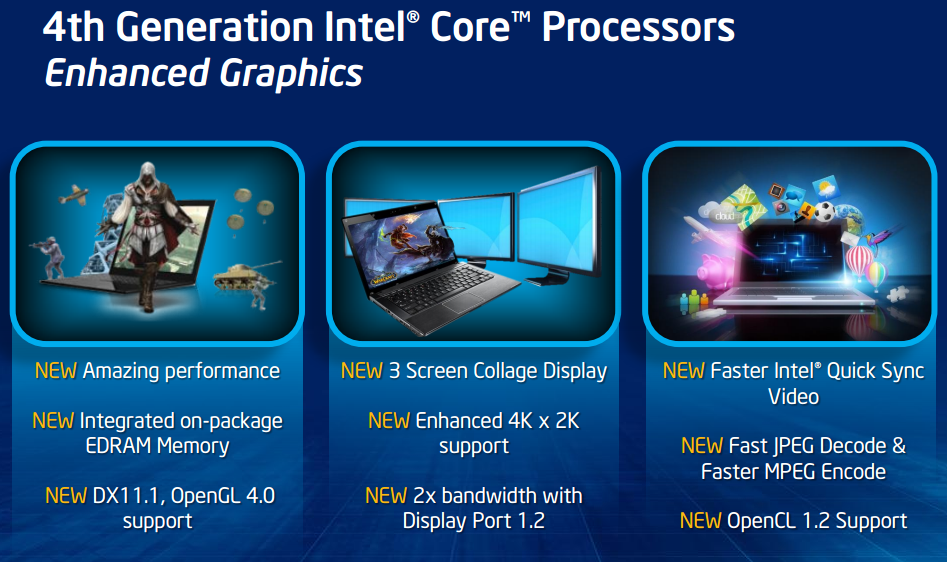
Die Intel HD Graphics 5000 (GT3) ist eine Prozessorgrafikkarte in den CPUs der Haswell-Generation. Zunächst wird die GPU in einigen ULV-Modellen mit 15 Watt TDP eingesetzt (z.B. Core i5-4250U). Sie stellt die maximale Ausbaustufe der integrierten Grafikeinheit dar (40 Execution Units), muss im Gegensatz zur Iris Pro (GT3e) aber auf den zusätzlichen eDRAM-Cache verzichten. Abhängig von der Taktrate (diese fällt bei den 15-Watt-Modellen relativ niedrig aus) sowie der Hauptspeicheranbindung kann sich die Performance von Modell zu Modell leicht unterscheiden.

Der Grafikkern wurde im Vergleich zum Intel HD Graphics 4000 der Ivy-Bridge-Generation in verschiedenen Punkten weiterentwickelt. So unterstützt die GPU nun mit DirectX 11.1, OpenCL 1.2 und OpenGL 4.0 alle wichtigen aktuellen Standards. Auch ein verbesserter Decoder für 4K-Videos sowie ein überarbeiteter Quick-Sync-Encoder sind mit an Bord.

Die Performance der HD Graphics 5000 liegt im 3DMark 11 um etwa 50 Prozent oberhalb der HD 4000 der Vorgängergeneration. In Spielen fällt die Mehrleistung dagegen deutlich geringer aus: Bei gleichzeitiger Belastung der CPU kann die Grafikeinheit ihren starken Turbo-Boost nur sehr eingeschränkt ausschöpfen, da die niedrige TDP der ULV-Modelle (15 Watt) zu limitieren beginnt. Obwohl die HD 5000 mit 40 Execution Units (EUs) doppelt so viele Ausführungseinheiten wie die HD Graphics 4600 besitzt (HD 4000: 16 EUs), ist die Grafikleistung darum dennoch etwas schwächer. Unterm Strich liegt die HD 5000 damit knapp hinter AMDs Radeon HD 7660G und auf dem Niveau einer dedizierte Radeon HD 7650M. Aktuelle 3D-Spiele (Stand 2013) können in niedrigen, seltener auch mittleren Einstellungen flüssig dargestellt werden.

Der Stromverbrauch ist dank des 22-Nanometer-Prozesses mit Tri-Gate-Transistoren relativ gering und wird dynamisch vom TDP-Budget des gesamten Chips abgezweigt. Die HD 5000 wird zunächst in einigen Dual-Core-Modellen der 15-Watt-Klasse (ULV) eingesetzt, beispielsweise dem Core i7-4650U.

Weitere Details zur Grafikkartenarchitektur der Haswell Generation finden Sie in unserem Artikel zur Vorstellung der Haswell-Generation.

Intel HD Graphics 2500Intel HD Graphics 5000
HD Graphics Serie
HD Graphics P530 compare 24 @ 0.35 - 1.05 GHz64/128 Bit
HD Graphics 5600 compare 24 @ 0.3 - 1.05 GHz64/128 Bit
HD Graphics 6000 compare 48 @ 0.3 - 1 GHz64/128 Bit
HD Graphics 4600 compare 20 @ 0.2 - 1.35 GHz64/128 Bit
HD Graphics 5500 compare 24 @ 0.3 - 0.95 GHz64/128 Bit
HD Graphics 5000 40 @ 0.2 - 1.1 GHz64/128 Bit
HD Graphics 4400 compare 20 @ 0.2 - 1.1 GHz64/128 Bit
HD Graphics 5300 compare 24 @ 0.1 - 0.9 GHz64/128 Bit
HD Graphics 4000 compare 16 @ 0.35 - 1.35 GHz64/128 Bit
HD Graphics (Broadwell) compare 12 @ 0.1 - 0.85 GHz64/128 Bit
HD Graphics 4200 compare 20 @ 0.2 - 0.85 GHz64/128 Bit
HD Graphics (Skylake) compare 12 @ 0.3 - 0.8 GHz64/128 Bit
HD Graphics 405 (Braswell) compare 16 @ 0.32 - 0.7 GHz64/128 Bit
HD Graphics (Braswell) compare 16 @ 0.32 - 0.7 GHz64/128 Bit
HD Graphics 400 (Braswell) compare 12 @ 0.32 - 0.64 GHz64/128 Bit
HD Graphics (Haswell) compare 10 @ 0.2 - 1 GHz64/128 Bit
HD Graphics (Cherry Trail) compare 16 @ 0.2 - 0.6 GHz64/128 Bit
HD Graphics 3000 compare 12 @ 0.35 - 1.35 GHz64/128 Bit
HD Graphics 2500 6 @ 0.65 - 1.15 GHz64/128 Bit
HD Graphics (Ivy Bridge) compare 6 @ 0.35 - 1.1 GHz64/128 Bit
HD Graphics 2000 compare 6 @ 0.85 - 1.35 GHz64/128 Bit
HD Graphics (Sandy Bridge) compare 6 @ 0.35 - 1.1 GHz64/128 Bit
HD Graphics (Bay Trail) compare 4 @ 0.31 - 0.9 GHz32/64/128 Bit
CodenameIvy Bridge GT1Haswell GT3
ArchitekturGen. 7 Ivy BridgeGen. 7.5 Haswell
Pipelines6 - unified40 - unified
Kerntakt650 - 1150 (Boost) MHz200 - 1100 (Boost) MHz
Speicherbandbreite64/128 Bit64/128 Bit
Shared Memoryjaja
APIDirectX 11.0, Shader 5.0DirectX 11.1, Shader 5.0, OpenGL 4.0
Herstellungsprozess22 nm22 nm
Notebookgrößegroß (17" z.B.)
Erscheinungsdatum01.04.2012 05.06.2013
FeaturesQuickSync
CPU in HD Graphics 2500GPU Base SpeedGPU Boost / Turbo
Intel Core i5-35504 x 3300 MHz, 77 W650 MHz1150 MHz
Intel Core i5-34704 x 3200 MHz, 77 W650 MHz1100 MHz
Intel Core i3-32202 x 3300 MHz, 55 W650 MHz1050 MHz
min. - max.650 MHz1050 - 1150 MHz
CPU in HD Graphics 5000GPU Base SpeedGPU Boost / Turbo
Intel Core i7-4650U2 x 1700 MHz, 15 W200 MHz1100 MHz
Intel Core i7-4550U2 x 1500 MHz, 15 W200 MHz1100 MHz
Intel Core i5-4360U2 x 1500 MHz, 15 W200 MHz1100 MHz
min. - max.200 - 650 MHz1000 - 1150 MHz

Benchmarks

Performance Rating - 3DMark 11 + Fire Strike + Time Spy - HD Graphics 2500
0.1 pt (0%)
Performance Rating - 3DMark 11 + Fire Strike + Time Spy - HD Graphics 5000
0.3 pt (1%)
3DMark - 3DMark Ice Storm Unlimited Graphics
65904 Points (7%)
3DMark - 3DMark Ice Storm Extreme Graphics
37346 Points (5%)
3DMark - 3DMark Cloud Gate Score
min: 1906     avg: 2659     median: 2817 (3%)     max: 3095 Points
3DMark - 3DMark Cloud Gate Graphics
min: 2301     avg: 2584     median: 2604.5 (1%)     max: 2825 Points
3DMark - 3DMark Fire Strike Standard Score
min: 257     avg: 293.3     median: 294.5 (1%)     max: 327 Points
3DMark - 3DMark Fire Strike Standard Graphics
min: 289     avg: 319.5     median: 318 (0%)     max: 353 Points
3DMark - 3DMark Ice Storm Graphics
min: 21978     avg: 23693     median: 24058 (3%)     max: 24676 Points
3DMark 11 - 3DM11 Performance Score
min: 374     avg: 419     median: 430 (1%)     max: 449 Points
3DMark 11 - 3DM11 Performance GPU
min: 321     avg: 349     median: 350.5 (0%)     max: 374 Points
3DMark Vantage
3DM Vant. Perf. total + Intel HD Graphics 2500
3DMark Vantage - 3DM Vant. Perf. total
min: 1375     avg: 1849     median: 1930.5 (1%)     max: 2068 Points
3DM Vant. Perf. total + Intel HD Graphics 5000
3DM Vant. Perf. GPU no PhysX + Intel HD Graphics 2500
3DMark Vantage - 3DM Vant. Perf. GPU no PhysX
min: 1115     avg: 1369     median: 1400.5 (1%)     max: 1561 Points
3DM Vant. Perf. GPU no PhysX + Intel HD Graphics 5000
3DMark 2001SE - 3DMark 2001 - Standard
20814 Points (22%)
3DMark 03 - 3DMark 03 - Standard
10138 Points (5%)
min: 15752     avg: 18768     median: 18768 (10%)     max: 21784 Points
3DMark 05 - 3DMark 05 - Standard
min: 6341     avg: 6627     median: 6627 (7%)     max: 6913 Points
min: 9623     avg: 9763     median: 9763 (11%)     max: 9903 Points
3DMark 06 3DMark 06 - Standard 1280x1024 + Intel HD Graphics 2500
3DMark 06
min: 3300     avg: 3933     median: 3816 (5%)     max: 4442 Points
3DMark 06 - Standard 1280x1024 + Intel HD Graphics 5000
min: 4751     avg: 5775     median: 5940 (8%)     max: 6160 Points
3DMark 06 - Standard 1280x800 + Intel HD Graphics 5000
3DMark 06
6675 Points (9%)
Unigine Heaven 3.0 - Unigine Heaven 3.0 DX 11
12.1 fps (4%)
Unigine Heaven 3.0 - Unigine Heaven 3.0 OpenGL
12.1 fps (5%)
Unigine Heaven 2.1 - Heaven 2.1 high
min: 12.3     avg: 13     median: 13.1 (2%)     max: 13.5 fps
SPECviewperf 11
specvp11 snx-01 + Intel HD Graphics 2500
SPECviewperf 11 - specvp11 snx-01
1.6 fps (1%)
specvp11 snx-01 + Intel HD Graphics 5000
min: 1.26     avg: 1.5     median: 1.5 (1%)     max: 1.64 fps
specvp11 tcvis-02 + Intel HD Graphics 2500
SPECviewperf 11 - specvp11 tcvis-02
2.7 fps (2%)
specvp11 tcvis-02 + Intel HD Graphics 5000
min: 1.77     avg: 2.1     median: 2.1 (1%)     max: 2.51 fps
specvp11 sw-02 + Intel HD Graphics 2500
SPECviewperf 11 - specvp11 sw-02
6.8 fps (5%)
specvp11 sw-02 + Intel HD Graphics 5000
min: 7.95     avg: 9.9     median: 9.9 (8%)     max: 11.8 fps
specvp11 proe-05 + Intel HD Graphics 2500
SPECviewperf 11 - specvp11 proe-05
1.9 fps (2%)
specvp11 proe-05 + Intel HD Graphics 5000
min: 1.42     avg: 1.6     median: 1.6 (2%)     max: 1.78 fps
specvp11 maya-03 + Intel HD Graphics 2500
SPECviewperf 11 - specvp11 maya-03
12.9 fps (10%)
specvp11 maya-03 + Intel HD Graphics 5000
min: 12.95     avg: 14.2     median: 14.2 (11%)     max: 15.43 fps
specvp11 lightwave-01 + Intel HD Graphics 2500
SPECviewperf 11 - specvp11 lightwave-01
15.6 fps (17%)
specvp11 lightwave-01 + Intel HD Graphics 5000
min: 13.34     avg: 14.5     median: 14.5 (16%)     max: 15.62 fps
specvp11 ensight-04 + Intel HD Graphics 2500
SPECviewperf 11 - specvp11 ensight-04
2.4 fps (1%)
specvp11 ensight-04 + Intel HD Graphics 5000
min: 2.06     avg: 2.1     median: 2.1 (1%)     max: 2.11 fps
specvp11 catia-03 + Intel HD Graphics 2500
SPECviewperf 11 - specvp11 catia-03
0 fps (0%)
specvp11 catia-03 + Intel HD Graphics 5000
4.5 fps (2%)
Windows 7 Experience Index - Win7 Gaming graphics
min: 6.5     avg: 6.6     median: 6.6 (84%)     max: 6.7 Points
Windows 7 Experience Index - Win7 Graphics
min: 5.8     avg: 5.9     median: 5.9 (74%)     max: 5.9 Points
Cinebench R10 Cinebench R10 Shading (32bit) + Intel HD Graphics 2500
Cinebench R10 - Cinebench R10 Shading (32bit)
min: 3409     avg: 5543     median: 6037 (4%)     max: 6687 Points
Cinebench R10 Shading (32bit) + Intel HD Graphics 5000
Cinebench R11.5 Cinebench R11.5 OpenGL 64 Bit + Intel HD Graphics 2500
Cinebench R11.5 - Cinebench R11.5 OpenGL 64 Bit
min: 9.09     avg: 10.6     median: 10.8 (4%)     max: 11.98 fps
Cinebench R11.5 OpenGL 64 Bit + Intel HD Graphics 5000
Cinebench R15
Cinebench R15 OpenGL 64 Bit + Intel HD Graphics 5000
Cinebench R15 - Cinebench R15 OpenGL 64 Bit
min: 24.15     avg: 27.4     median: 27.4 (2%)     max: 30.64 fps
Cinebench R15 OpenGL Ref. Match 64 Bit + Intel HD Graphics 5000
Cinebench R15 - Cinebench R15 OpenGL Ref. Match 64 Bit
min: 63.3     avg: 81.1     median: 80.7 (81%)     max: 99.6 %
GFXBench 3.0 - GFXBench 3.0 Manhattan Offscreen
22.5 fps (1%)
GFXBench (DX / GLBenchmark) 2.7
GFXBench T-Rex HD Offscreen C24Z16 + Intel HD Graphics 5000
GFXBench (DX / GLBenchmark) 2.7 - GFXBench T-Rex HD Offscreen C24Z16
min: 62     avg: 72.5     median: 72.5 (1%)     max: 83 fps
LuxMark v2.0 64Bit - LuxMark v2.0 Room GPU
min: 30     avg: 31     median: 31 (0%)     max: 32 Samples/s
min: 139     avg: 187     median: 201 (1%)     max: 221 Samples/s
LuxMark v2.0 64Bit - LuxMark v2.0 Sala GPU
min: 47     avg: 50     median: 50 (0%)     max: 53 Samples/s
min: 286     avg: 305.3     median: 306 (1%)     max: 324 Samples/s
ComputeMark v2.1 - ComputeMark v2.1 Result
min: 282     avg: 287.3     median: 286 (0%)     max: 294 Points
min: 775     avg: 817     median: 816.5 (1%)     max: 858 Points

Average Benchmarks Intel HD Graphics 2500 → 100% n=24

Average Benchmarks Intel HD Graphics 5000 → 211% n=24

- Bereich der Benchmarkergebnisse für diese Grafikkarte
- Durchschnittliche Benchmarkergebnisse für diese Grafikkarte
* Smaller numbers mean a higher performance
1 This benchmark is not used for the average calculation

Spiele-Benchmarks

Die folgenden Benchmarks basieren auf unseren Spieletests mit Testnotebooks. Die Performance dieser Grafikkarte bei den gelisteten Spielen ist abhängig von der verwendeten CPU, Speicherausstattung, Treiber und auch Betriebssystem. Dadurch müssen die untenstehenden Werte nicht repräsentativ sein. Detaillierte Informationen über das verwendete System sehen Sie nach einem Klick auf den fps-Wert.

GTA V

GTA V

2015
low 1024x768
HD Graphics 5000:
19.2  fps
med. 1366x768
HD Graphics 5000:
16  fps
high 1920x1080
HD Graphics 5000:
4.4  fps
ultra 1920x1080
HD Graphics 5000:
2.6  fps
low 1024x768
HD Graphics 5000:
20.8  fps
med. 1366x768
HD Graphics 5000:
15.1  fps
high 1920x1080
HD Graphics 5000:
7  fps
ultra 1920x1080
HD Graphics 5000:
4.3  fps
Evolve

Evolve

2015
low 1024x768
HD Graphics 5000:
12.7  fps
med. 1366x768
HD Graphics 5000:
9.6  fps
high 1920x1080
HD Graphics 5000:
5.5  fps
ultra 1920x1080
HD Graphics 5000:
2.9  fps
The Crew

The Crew

2014
low 1280x720
HD Graphics 5000:
15.8  fps
med. 1366x768
HD Graphics 5000:
10.6  fps
low 1024x768
HD Graphics 5000:
17.4  fps
med. 1366x768
HD Graphics 5000:
12  fps
high 1920x1080
HD Graphics 5000:
4.5  fps
ultra 1920x1080
HD Graphics 5000:
2.1  fps
Far Cry 4

Far Cry 4

2014
low 1024x768
HD Graphics 5000:
14.3  fps
med. 1366x768
HD Graphics 5000:
10.6  fps
low 1024x768
HD Graphics 5000:
5.4  fps
low 1024x768
HD Graphics 5000:
25.4  fps
med. 1366x768
HD Graphics 5000:
16.2  fps
high 1920x1080
HD Graphics 5000:
9.7  fps
low 1024x768
HD Graphics 5000:
15.5  fps
med. 1366x768
HD Graphics 5000:
12.2  fps
F1 2014

F1 2014

2014
low 1024x768
HD Graphics 5000:
51  fps
med. 1366x768
HD Graphics 5000:
35  fps
high 1920x1080
HD Graphics 5000:
20  fps
ultra 1920x1080
HD Graphics 5000:
13  fps
low 1024x768
HD Graphics 5000:
14.2  fps
med. 1366x768
HD Graphics 5000:
10.6  fps
low 1024x768
HD Graphics 5000:
14.7  fps
med. 1366x768
HD Graphics 5000:
9.2  fps
low 1024x768
HD Graphics 5000:
28.9  fps
med. 1366x768
HD Graphics 5000:
20.9  fps
high 1920x1080
HD Graphics 5000:
11.4  fps
low 1280x720
HD Graphics 5000:
20.1  fps
med. 1344x756
HD Graphics 5000:
13  fps
high 1920x1080
HD Graphics 5000:
7.2  fps
Fifa 15

Fifa 15

2014
low 1280x720
HD Graphics 5000:
36.2  fps
high 1366x768
HD Graphics 5000:
28.1  fps
ultra 1920x1080
HD Graphics 5000:
17.4  fps
Sims 4

Sims 4

2014
low 1024x768
HD Graphics 5000:
168.3  fps
med. 1366x768
HD Graphics 5000:
32.8  fps
high 1920x1080
HD Graphics 5000:
14.2  fps
ultra 1920x1080
HD Graphics 5000:
10  fps
low 1024x768
HD Graphics 5000:
28.7  fps
med. 1366x768
HD Graphics 5000:
17.6  fps
high 1920x1080
HD Graphics 5000:
6.6  fps
ultra 1920x1080
HD Graphics 5000:
5.2  fps
low 1024x768
HD Graphics 5000:
85.7  fps
med. 1366x768
HD Graphics 5000:
30.2  fps
high 1920x1080
HD Graphics 5000:
14.9  fps
ultra 1920x1080
HD Graphics 5000:
12.5  fps
low 1024x768
HD Graphics 5000:
17 18.1 ~ 18 fps
med. 1366x768
HD Graphics 5000:
10.9 11.6 ~ 11 fps
low 1280x720
HD Graphics 5000:
27.2  fps
med. 1280x720
HD Graphics 5000:
22.1  fps
high 1920x1080
HD Graphics 5000:
10.7  fps
Titanfall

Titanfall

2014
low 1024x768
HD Graphics 5000:
33.2  fps
med. 1366x768
HD Graphics 5000:
20.2  fps
high 1366x768
HD Graphics 5000:
13.2  fps
Thief

Thief

2014
low 1024x768
HD Graphics 5000:
11.9 14.8 ~ 13 fps
med. 1366x768
HD Graphics 5000:
8.4 9.7 ~ 9 fps
high 1366x768
HD Graphics 5000:
7.6  fps
ultra 1920x1080
HD Graphics 5000:
3.9  fps
low 1024x768
HD Graphics 5000:
24  fps
med. 1366x768
HD Graphics 5000:
20.5  fps
high 1366x768
HD Graphics 5000:
6.2  fps
low 1024x768
HD Graphics 5000:
28.6  fps
med. 1366x768
HD Graphics 5000:
19.9  fps
high 1366x768
HD Graphics 5000:
13.3  fps
F1 2013

F1 2013

2013
low 1024x768
HD Graphics 5000:
51  fps
med. 1366x768
HD Graphics 5000:
34  fps
high 1366x768
HD Graphics 5000:
28  fps
ultra 1920x1080
HD Graphics 5000:
12  fps
Fifa 14

Fifa 14

2013
low 1024x768
HD Graphics 5000:
165.1  fps
med. 1366x768
HD Graphics 5000:
100.2  fps
high 1366x768
HD Graphics 5000:
71.4  fps
ultra 1920x1080
HD Graphics 5000:
39.3  fps
low 1024x768
HD Graphics 5000:
39.8  fps
med. 1366x768
HD Graphics 5000:
29.4  fps
high 1366x768
HD Graphics 5000:
21.6  fps
ultra 1920x1080
HD Graphics 5000:
6.6  fps
Dota 2

Dota 2

2013
low 1024x768
HD Graphics 5000:
59.6 69.8 ~ 65 fps
med. 1366x768
HD Graphics 5000:
31.5 36.8 ~ 34 fps
ultra 1920x1080
HD Graphics 5000:
14.4 15.5 ~ 15 fps
low 1024x768
HD Graphics 5000:
13.3  fps
med. 1366x768
HD Graphics 5000:
10.4  fps
high 1366x768
HD Graphics 5000:
6  fps
GRID 2

GRID 2

2013
low 1024x768
HD Graphics 5000:
58.6  fps
med. 1366x768
HD Graphics 5000:
31.3  fps
high 1366x768
HD Graphics 5000:
22.7  fps
ultra 1920x1080
HD Graphics 5000:
12.5  fps
low 1024x768
100%
HD Graphics 2500:
11.1  fps
172%
HD Graphics 5000:
18.8 18.9 ~ 19 fps
med. 1366x768
100%
HD Graphics 2500:
9.8  fps
142%
HD Graphics 5000:
13.9 13.9 ~ 14 fps
high 1366x768
100%
HD Graphics 2500:
9.6  fps
104%
HD Graphics 5000:
8.6 10.4 ~ 10 fps
low 1280x720
100%
HD Graphics 2500:
17.7  fps
198%
HD Graphics 5000:
32 34.3 34.3 38.3 ~ 35 fps
med. 1366x768
100%
HD Graphics 2500:
8  fps
250%
HD Graphics 5000:
17 20.1 20.9 22.5 ~ 20 fps
high 1366x768
100%
HD Graphics 2500:
7  fps
230%
HD Graphics 5000:
14 14.2 16.6 18.2 ~ 16 fps
ultra 1920x1080
HD Graphics 5000:
7.7  fps
low 1024x768
100%
HD Graphics 2500:
145  fps
med. 1366x768
100%
HD Graphics 2500:
26  fps
high 1366x768
100%
HD Graphics 2500:
13.7  fps
ultra 1920x1080
100%
HD Graphics 2500:
4.3  fps
SimCity

SimCity

2013
low 1024x768
100%
HD Graphics 2500:
14.8  fps
med. 1366x768
100%
HD Graphics 2500:
8  fps
low 1024x768
100%
HD Graphics 2500:
20.1  fps
264%
HD Graphics 5000:
44 52.5 53.9 54.3 55.3 56 ~ 53 fps
med. 1366x768
100%
HD Graphics 2500:
10.9  fps
239%
HD Graphics 5000:
23 25 26 27.5 28.3 28.6 ~ 26 fps
high 1366x768
100%
HD Graphics 2500:
7.1  fps
225%
HD Graphics 5000:
14 14.9 15 15.8 17.4 17.5 ~ 16 fps
ultra 1920x1080
HD Graphics 5000:
7.9 8 9.5 ~ 8 fps
Crysis 3

Crysis 3

2013
low 1024x768
100%
HD Graphics 2500:
13.8  fps
151%
HD Graphics 5000:
20.9  fps
med. 1366x768
HD Graphics 5000:
13  fps
high 1366x768
HD Graphics 5000:
9.4  fps
low 1024x768
100%
HD Graphics 2500:
43 46.2 ~ 45 fps
med. 1366x768
100%
HD Graphics 2500:
18.8  fps
high 1366x768
100%
HD Graphics 2500:
13.5  fps
ultra 1920x1080
100%
HD Graphics 2500:
7.3  fps
Far Cry 3

Far Cry 3

2012
low 1024x768
100%
HD Graphics 2500:
18 20.5 ~ 19 fps
150%
HD Graphics 5000:
28.6  fps
med. 1366x768
100%
HD Graphics 2500:
11.9  fps
161%
HD Graphics 5000:
19.2  fps
high 1366x768
HD Graphics 5000:
7.1  fps
med. 1366x768
100%
HD Graphics 2500:
13.8  fps
120%
HD Graphics 5000:
16.6  fps
high 1366x768
HD Graphics 5000:
11.2  fps
low 1024x768
100%
HD Graphics 2500:
18.4 20.1 ~ 19 fps
117%
HD Graphics 5000:
22.3  fps
med. 1366x768
100%
HD Graphics 2500:
10.7 11.6 ~ 11 fps
143%
HD Graphics 5000:
15.7  fps
high 1366x768
100%
HD Graphics 2500:
3.8  fps
192%
HD Graphics 5000:
7.3  fps
ultra 1920x1080
100%
HD Graphics 2500:
1.9  fps
low 1024x768
100%
HD Graphics 2500:
18  fps
225%
HD Graphics 5000:
40.5  fps
med. 1366x768
HD Graphics 5000:
28  fps
high 1366x768
HD Graphics 5000:
14.1  fps
Fifa 13

Fifa 13

2012
low 1024x768
100%
HD Graphics 2500:
29.7 99 101 ~ 77 fps
med. 1366x768
100%
HD Graphics 2500:
23.6 51 52 60 ~ 47 fps
high 1366x768
100%
HD Graphics 2500:
17.2 28 31.2 32 ~ 27 fps
ultra 1920x1080
100%
HD Graphics 2500:
14.5  fps
F1 2012

F1 2012

2012
low 1024x768
100%
HD Graphics 2500:
37 40 ~ 39 fps
med. 1366x768
100%
HD Graphics 2500:
21 26 ~ 24 fps
high 1366x768
100%
HD Graphics 2500:
21 22 ~ 22 fps
ultra 1920x1080
100%
HD Graphics 2500:
12 12 ~ 12 fps
low 1024x768
HD Graphics 5000:
83  fps
med. 1366x768
HD Graphics 5000:
46  fps
ultra 1920x1080
HD Graphics 5000:
28  fps
low 1024x768
100%
HD Graphics 2500:
37  fps
high 1366x768
100%
HD Graphics 2500:
8  fps
low 1024x768
100%
HD Graphics 2500:
77 82 ~ 80 fps
med. 1366x768
100%
HD Graphics 2500:
36 39 ~ 38 fps
high 1366x768
100%
HD Graphics 2500:
18 20.6 ~ 19 fps
ultra 1920x1080
100%
HD Graphics 2500:
11.7  fps
low 1024x768
100%
HD Graphics 2500:
21.7  fps
med. 1366x768
100%
HD Graphics 2500:
15.5  fps
low 1024x768
HD Graphics 5000:
54 58 59 ~ 57 fps
med. 1366x768
HD Graphics 5000:
38 42 ~ 40 fps
high 1366x768
HD Graphics 5000:
31 32 ~ 32 fps
ultra 1920x1080
HD Graphics 5000:
13 19 21 ~ 18 fps
Anno 2070

Anno 2070

2011
low 1024x768
100%
HD Graphics 2500:
23.2  fps
255%
HD Graphics 5000:
57.8 59.2 61 ~ 59 fps
med. 1366x768
100%
HD Graphics 2500:
9.8  fps
327%
HD Graphics 5000:
30 32.2 32.8 ~ 32 fps
high 1366x768
100%
HD Graphics 2500:
5.2  fps
344%
HD Graphics 5000:
16.2 18 20.1 ~ 18 fps
ultra 1920x1080
HD Graphics 5000:
9  fps
low 1280x720
HD Graphics 5000:
29.5  fps
med. 1366x768
HD Graphics 5000:
18.4  fps
high 1366x768
HD Graphics 5000:
11.6  fps
low 1024x768
100%
HD Graphics 2500:
16.8  fps
med. 1366x768
100%
HD Graphics 2500:
11  fps
Total War: Shogun 2

Total War: Shogun 2

2011
low 1024x768
HD Graphics 5000:
88.8  fps
low 1024x768
HD Graphics 5000:
126 169 ~ 148 fps
med. 1360x768
HD Graphics 5000:
38 43 ~ 41 fps
high 1360x768
HD Graphics 5000:
24 26 ~ 25 fps
ultra 1920x1080
HD Graphics 5000:
10 16 ~ 13 fps
Anno 1404

Anno 1404

2009
low 1024x768
HD Graphics 5000:
122  fps
ultra 1280x1024
HD Graphics 5000:
18  fps
Supreme Commander - FA Bench

Supreme Commander - FA Bench

2007
low 1024x768
100%
HD Graphics 2500:
46  fps
med. 1024x768
100%
HD Graphics 2500:
22.2  fps
high 1024x768
100%
HD Graphics 2500:
18.7  fps
ultra 1920x1080
100%
HD Graphics 2500:
7.6  fps
Crysis - GPU Benchmark

Crysis - GPU Benchmark

2007
low 1024x768
100%
HD Graphics 2500:
48.8 52.8 ~ 51 fps
med. 1024x768
100%
HD Graphics 2500:
20.2 21.6 ~ 21 fps
high 1024x768
100%
HD Graphics 2500:
12  fps
ultra 1920x1080
100%
HD Graphics 2500:
3  fps
World of Warcraft

World of Warcraft

2005
low 800x600
100%
HD Graphics 2500:
104  fps
156%
HD Graphics 5000:
162  fps
med. 1024x768
100%
HD Graphics 2500:
29  fps
269%
HD Graphics 5000:
78  fps
high 1280x1024
HD Graphics 5000:
31  fps
ultra 1920x1080
HD Graphics 5000:
9  fps

Average Gaming Intel HD Graphics 2500 → 100%

Average Gaming 30-70 fps → 100%

Average Gaming Intel HD Graphics 5000 → 202%

Average Gaming 30-70 fps → 254%

Intel HD Graphics 5000lowmed.highultraQHD4K
GTA V19.2164.42.6
Battlefield Hardline20.815.174.3
Evolve12.79.65.52.9
The Crew15.810.6
Dragon Age: Inquisition17.4124.52.1
Far Cry 414.310.6
Assassin's Creed Unity5.4
Call of Duty: Advanced Warfare25.416.29.7
Civilization: Beyond Earth15.512.2
F1 201451352013
The Evil Within14.210.6
Ryse: Son of Rome14.79.2
Alien: Isolation28.920.911.4
Middle-earth: Shadow of Mordor20.1137.2
Fifa 1536.228.117.4
Sims 4168.332.814.210
Risen 3: Titan Lords28.717.66.65.2
GRID: Autosport85.730.214.912.5
Watch Dogs1811
Wolfenstein: The New Order27.222.110.7
Titanfall33.220.213.2
Thief1397.63.9
Call of Duty: Ghosts2420.56.2
Battlefield 428.619.913.3
F1 201351342812
Fifa 14165.1100.271.439.3
Total War: Rome II39.829.421.66.6
Dota 2653415
Company of Heroes 213.310.46
GRID 258.631.322.712.5
Metro: Last Light191410
BioShock Infinite3520167.7
Tomb Raider5326168
Crysis 320.8912.989.44
Far Cry 328.5819.187.07
Assassin´s Creed III16.5611.23
Hitman: Absolution22.315.77.3
Call of Duty: Black Ops 240.52814.1
Torchlight 2834628
Diablo III57403218
Anno 20705932189
The Elder Scrolls V: Skyrim29.518.411.6
Total War: Shogun 288.8
StarCraft 2148412513
Anno 140412218
World of Warcraft16278319
< 30 fps
< 60 fps
< 120 fps
≥ 120 fps
25
11
4
5
30
10
2
32
2
1
22
1


Intel HD Graphics 2500lowmed.highultraQHD4K
Metro: Last Light11.079.849.64
BioShock Infinite17.6686.96
StarCraft II: Heart of the Swarm1452613.74.3
SimCity14.88
Tomb Raider20.110.97.1
Crysis 313.8
Dead Space 34518.813.57.3
Far Cry 31911.9
Assassin´s Creed III13.8
Hitman: Absolution19113.81.9
Call of Duty: Black Ops 218
Fifa 1377472714.5
F1 201239242212
Guild Wars 2378
Counter-Strike: GO80381911.7
Sleeping Dogs21.715.5
Anno 207023.159.785.23
Battlefield 316.811
Supreme Commander - FA Bench4622.218.77.6
Crysis - GPU Benchmark5121123
World of Warcraft10429
< 30 fps
< 60 fps
< 120 fps
≥ 120 fps
11
5
3
1
16
2

13


8


Eine Liste mit weiteren Spielen und allen Grafikkarten finden Sie auf unserer Seite: Welches Spiel ist mit welcher Grafikkarte spielbar?

Add one or more devices and compare

In the following list you can select (and also search for) devices that should be added to the comparison. You can select more than one device.

restrict list:

show all (including archived), 2024, 2023
v1.26
log 29. 06:28:42

#0 checking url part for id 2887 +0s ... 0s

#1 checking url part for id 4574 +0s ... 0s

#2 not redirecting to Ajax server +0s ... 0s

#3 did not recreate cache, as it is less than 5 days old! Created at Thu, 28 Mar 2024 05:37:00 +0100 +0.001s ... 0.001s

#4 composed specs +0.128s ... 0.129s

#5 did output specs +0s ... 0.129s

#6 start showIntegratedCPUs +0s ... 0.129s

#7 getting avg benchmarks for device 2887 +0.044s ... 0.173s

#8 got single benchmarks 2887 +0.017s ... 0.19s

#9 getting avg benchmarks for device 4574 +0.019s ... 0.209s

#10 got single benchmarks 4574 +0.025s ... 0.234s

#11 got avg benchmarks for devices +0s ... 0.234s

#12 No cached benchmark found, getting uncached values +0.35s ... 0.584s

#13 min, max, avg, median took s +0.045s ... 0.629s

#14 before gaming benchmark output +0s ... 0.629s

#15 Got 277 rows for game benchmarks. +0.024s ... 0.653s

#16 composed SQL query for gamebenchmarks +0s ... 0.653s

#17 got data and put it in $dataArray +0.045s ... 0.697s

#18 benchmarks composed for output. +0.142s ... 0.839s

#19 calculated avg scores. +0s ... 0.839s

#20 return log +0.056s ... 0.895s

Teilen Sie diesen Artikel, um uns zu unterstützen. Jeder Link hilft!
> Notebook Test, Laptop Test und News > Benchmarks / Technik > Benchmarks / Technik > Grafikkarten Vergleich - Head 2 Head
Autor: Klaus Hinum,  8.09.2017 (Update:  1.07.2023)